Learning Resources Write And Wipe Bar Graph Chart Ler 9300 Users Manual
LER 9300 to the manual 3166010f-5f5e-470b-8bbb-1e3f69115b61
2015-02-09
: Learning-Resources Learning-Resources-Write-And-Wipe-Bar-Graph-Chart-Ler-9300-Users-Manual-570664 learning-resources-write-and-wipe-bar-graph-chart-ler-9300-users-manual-570664 learning-resources pdf
Open the PDF directly: View PDF ![]() .
.
Page Count: 2
LER 9300
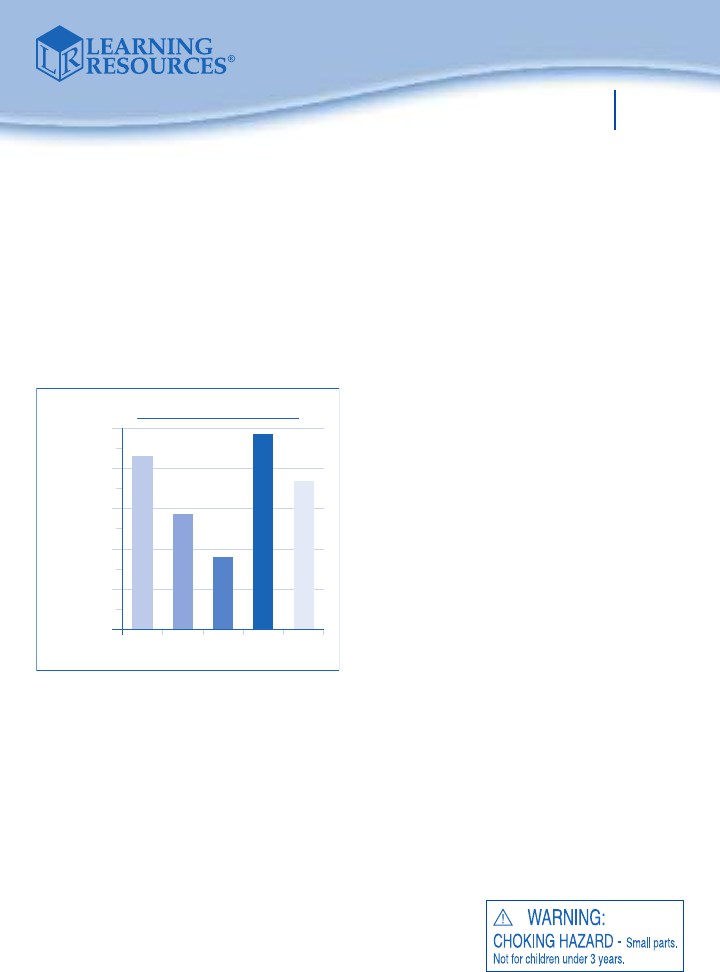
The Write & Wipe Bar Graph is a great tool for practicing graphing and data
analysis. Use the five adjustable color bands to easily create “bars” of data
corresponding to units of measure.
To Use:
Write the following on the chart with a
dry-erase marker*:
• A title at the top of the bar graph
• An axis label for the y-axis along the
left-hand side of the graph
• A scale of measurement for the y-axis
data
• Bar labels on the x-axis for each bar
used in the graph
To graph data, gently pull and slide a
color band upward or downward to adjust
its length. Hide unused bars by gently
pulling their bands around until they no
longer show in the front of the chart.
*Marker is not included. Test your dry-erase marker on the back of the board to
ensure that it doesn’t leave a permanent mark. Remove marks with a paper towel
or dry-marker eraser. The chart will warp if saturated with water.
Tips for working with bar graphs:
1. Always read the title first to learn what the bar graph is about.
2. Next, read the bar labels to find out what the bars represent.
3. Look at the axis label to see what the scale
measures and which units it employs to do so.
Does the scale measure an amount, or does it
measure a percentage?
Write & Wipe
Bar Graph Chart
LER 9300
© Learning Resources, Inc.
Title
Bar Labels
Axis Label
Scale
Ages
6+
Grades
1+
Look for these other great products from Learning Resources®:
LER 1639 Write & Wipe Graph Desk Mats
LER 5400 Graphing Flip Chart
4. Decide what the height of each bar means. (Use your finger to trace over from
the top of the bar to the scale if you need help reading a bar’s measurement.)
5. If needed, look at the marks (intervals) between the numbers measured on the
scale. Use the interval marks to help estimate the value of a bar that stops
between two numbers on the scale.
6. Look for patterns in the bars. Which bar is longest? Which is least in length?
What does that mean according to the scale?
Intervention Strategies
•Scaffolded Instruction: Begin with one bar and a scale that measures easily
countable units (such as 1, 2, 5, or 10). Move the bar’s band to show that
quantity increases or decreases based on the bar’s length. After students master
one bar of data, add a second bar of data, and so on. Do not explore all five bars
until students can readily interpret and track at least three bars of data.
•Visual Tracking: When reading graphs, students often lose track of data visually.
Encourage students to touch a graph to help them read it. Have students use
index fingers to lightly trace over from the top of a bar to the corresponding
measurement on the graph’s scale. (Students can also trace with a small ruler or
a pencil on its side.) Remind students to concentrate on one bar at a time,
beginning with the bar closest to the scale, rather than trying to decode all the
bars at once.
Note: The back side of the chart includes a 10" x 10" grid that can be used to
create a line graph or alternative bar graph. Use a dry-erase marker to post data
on the grid.
© Learning Resources, Inc., Vernon Hills, IL (U.S.A.)
Learning Resources Ltd., King’s Lynn, Norfolk (U.K.)
Please retain our address for future reference.
Made in China. LRM9300-GUD
Fabriqué en Chine. Informations à conserver.
Made in China. Bitte bewahren Sie unsere
Adresse für spätere
Nachfragen auf.
Hecho en China. Conservar estos datos.
Visit our website to write a product review
or to find a store near you.
