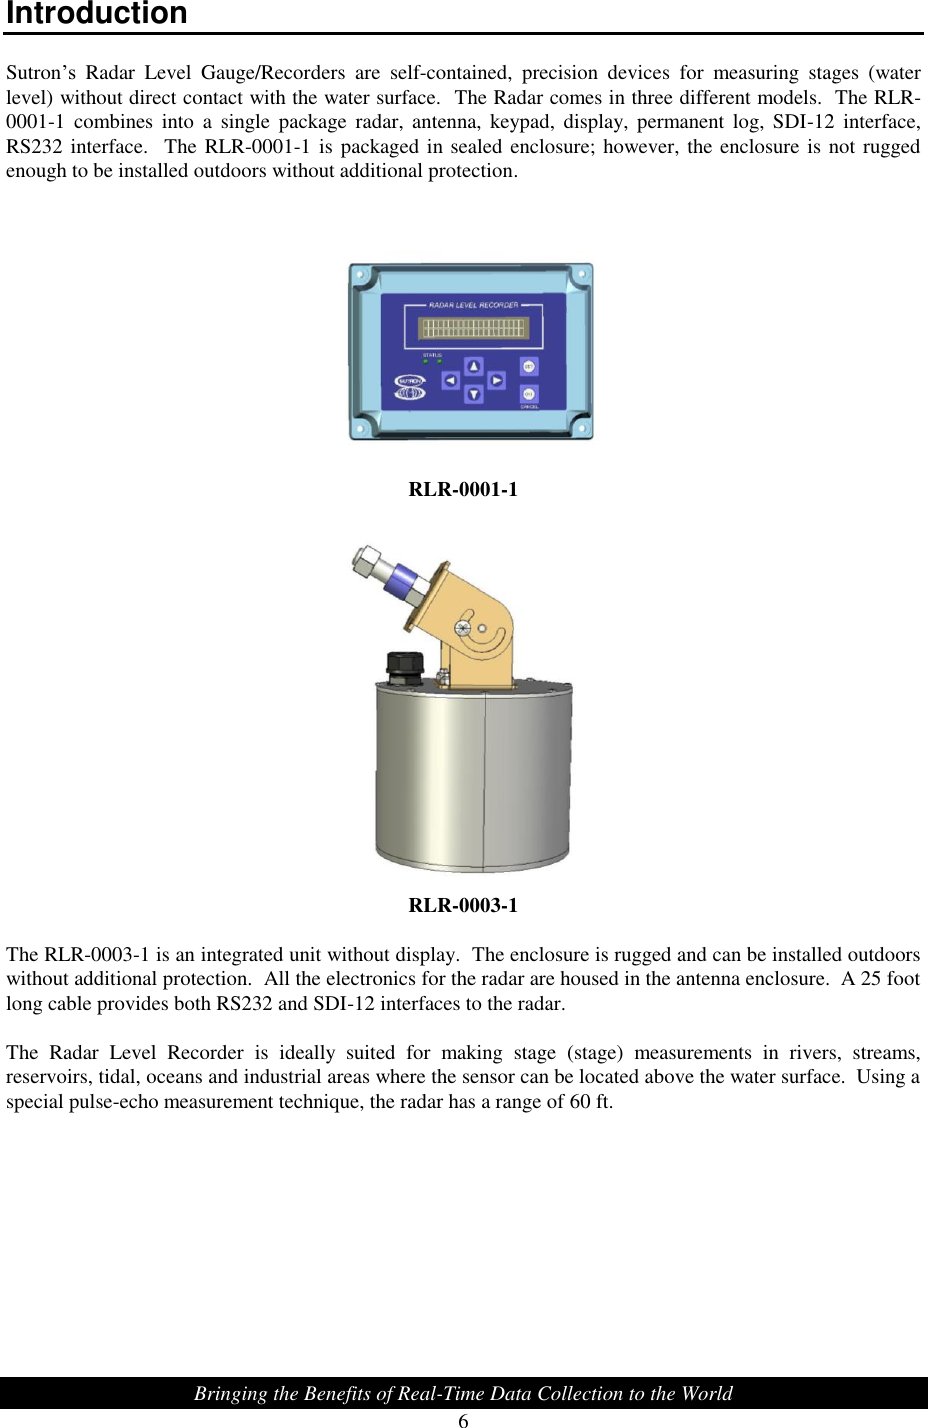
Sutron RLR-0003-1 Downward pointing Water level sensor User Manual SUTRON
Sutron Corporation Downward pointing Water level sensor SUTRON
UserManual.wiki
>
Sutron
>
RLR 0003 1 User Manual
User manual
Navigation menu
Upload a User Manual
Namespaces
Wiki Guide
HTML
PDF
Info
Views
User Manual
Discussion / Help
Navigation
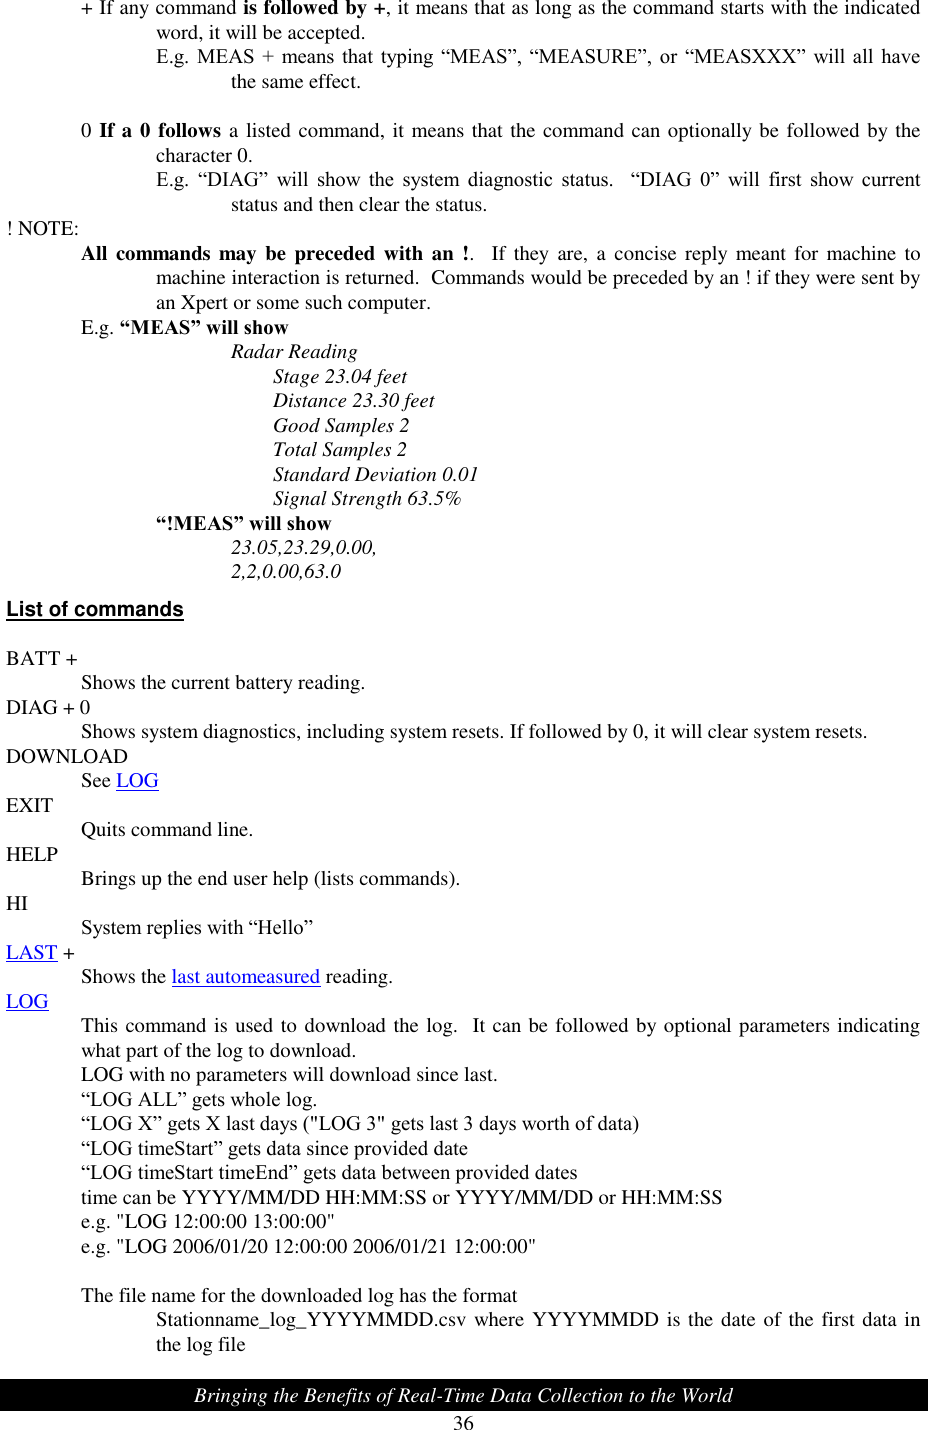
![Bringing the Benefits of Real-Time Data Collection to the World 18 Last Automeasured Stage measurements made by the radar are not instantaneous; how long they take depends on averaging time (page 17). When a logger is communicating with the radar, it can ask the radar to make a new measurement. However, the logger then has to wait for the radar to complete the measurement. If the user desires data that is instantly available, the radar can provide the last measured data. The radar automatically measures based on the automeasure interval (see page 16) . That data can be retrieved as the last measured data. For example, if radar is setup to automeasure every 10 minutes, with an averaging time of 10 seconds: 12:00:00 to 12:00:10 radar measures stage 12:01:00 logger asks for last measured data; radar immediately returns 12:00:10 data 12:10:00 to 12:10:10 radar measures stage 12:11:00 logger asks for last measured data; radar immediately returns 12:10:10 data If the user desires data that is both immediately available and current, continuous mode (page 16) is the way to go. Last measured data can be accessed via SDI-12 M3 and via LAST command. Discharge Discharge is a measurement of water volume flowing over time. Please refer to the discharge section on page 41 for complete details. Logging A secure flash chip in the radar provides a logging capacity of more than 300,000 entries. Data will not be lost if power is removed. There is not a means of erasing data from the log. Once the log is full, the oldest data will be overwritten. Each log entry consists of date and time (with a second resolution) name of the logged entry measurement reading (optional) measurement quality and units (optional) The format of logged data is the Sutron Standard CSV format which was introduced in the Summer of 2009. It is a format common to current Sutron products. The general format specification for Sutron Standard CSV format is mm/dd/yyyy,hh:mm:ss,label,data[,units,qual][,label,data[,units,qual]] Here are several examples of log entries: 01/19/2010,09:21:49,Reset Powerup,1 01/19/2010,09:30:00,Stage,1.25,feet 01/19/2010,09:45:00,Stage,1.27,feet 01/19/2010,09:50:27,Setup Change Minimally, radar will log stage and various events. The user can decide how often to log stage (via automeasure settings see page 15), and the user can chose to log stage details (via front panel, access Station](https://usermanual.wiki/Sutron/RLR-0003-1/User-Guide-1257271-Page-18.png)
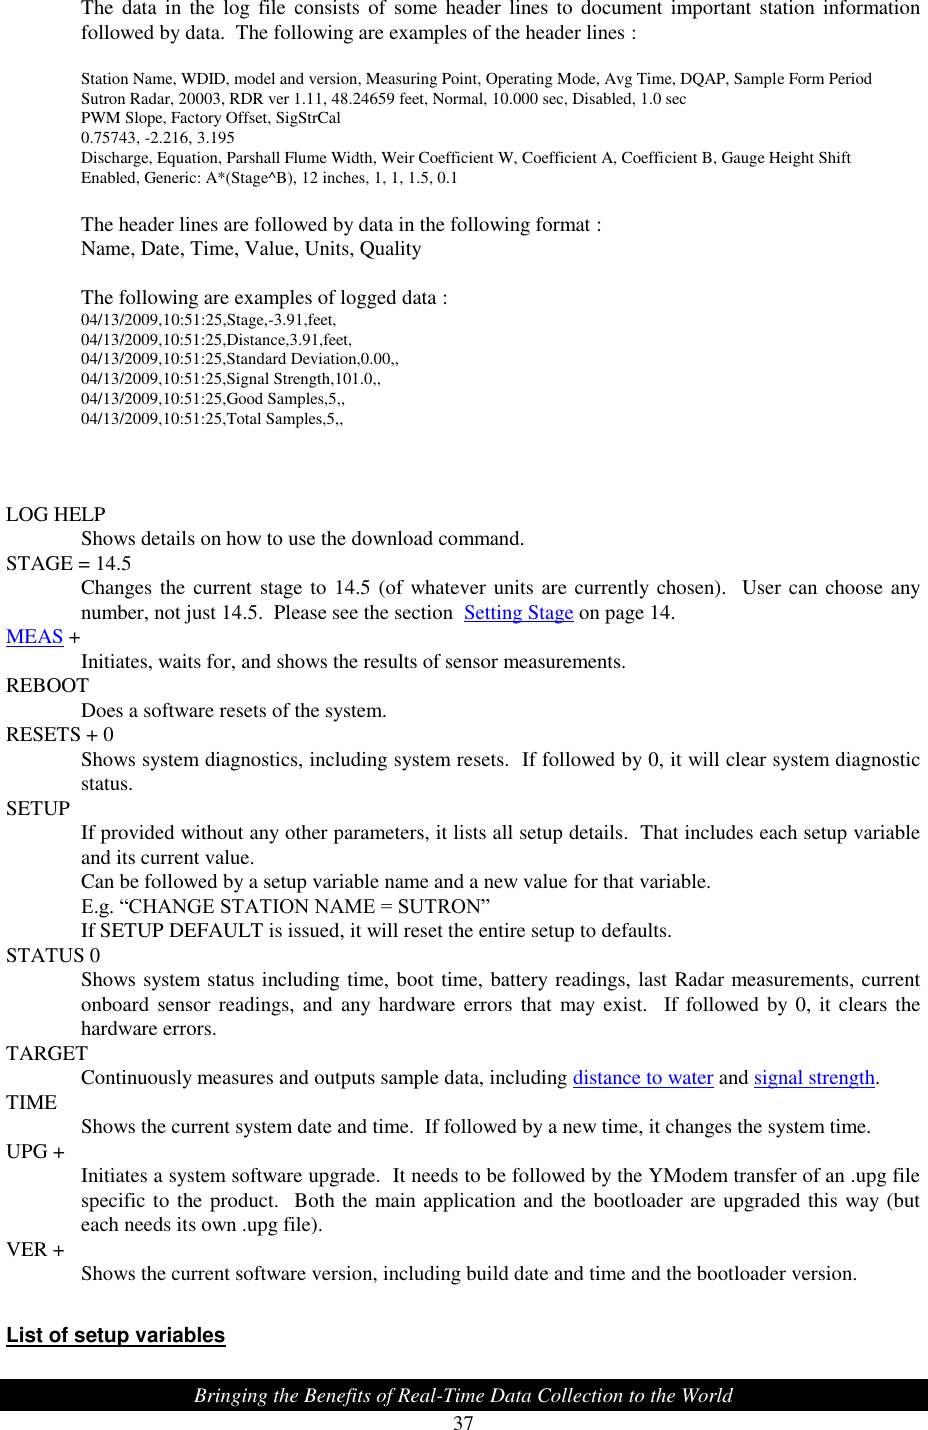
![Bringing the Benefits of Real-Time Data Collection to the World 57 Get Log Command The Get Log subcode is used to retrieve log data from the unit. The format of the command is as follows: GL,logfilename,datetime,recordID,numbytes The logfilename can be used to return log entries of specific types. The available types are data, events, and all. The datetime value must be in the following format: MM/DD/YYYY HH:MM:SS. The numbytes value refers to the number of data bytes from the log entry to include in the response, not the number of bytes to store in the return packet. Since the master station or transport medium may be limited in the number of bytes that can be handled in a single packet, the numbytes value should be sized small enough to allow for header and CRC information, as well as translation to ASCII if that is the selected protocol (the ASCII protocol uses two bytes to represent every data byte). If numbytes is *, the all log records found will be returned. Regardless of the requested numbytes, only complete log records are returned. The format of the reply is as follows: GLR,status,recordID,numbytes,data[numbytes,data] The value of status can be any of the following values: Value Description 0 Ok. 1 File not found. 6 Record not found. 7 Command format error The datetime value in the response message is the datetime of the returned record and, therefore, may be different from the datetime in the GetLog command statement. The data to the end of the file can be read by leaving datetime at the desired starting point and incrementing recordID until the status indicates record not found. The [numbytes,data] represents an additional record of data if there is room in the message. Example: command: GL,data,02/07/2007 15:50:00,80,0 reply: GLR,0,0,38,02/07/2007,15:51:00,VBAT,13.16,Volts,G 37,10/07/2003,15:51:10,A,10.89,5.2,-25.4 command: GL,data,02/07/2007 15:50:00,80,2 reply: GLR,0,2,37,02/07/2007,15:54:00,C,10.89,5.2,-25.4,0 The GLR response will contain as many log records as can fit into the response. The numbytes value in the GLR response does not include the comma preceding the data, and refers to the number of data bytes from the log that are being returned, not the number of packet bytes used to store the response (which would be twice the data bytes when ASCII protocol is selected). Wrapped for illustration purposes only.](https://usermanual.wiki/Sutron/RLR-0003-1/User-Guide-1257271-Page-57.png)