Sutron RLR-0003-1 Downward pointing Water level sensor User Manual SUTRON
Sutron Corporation Downward pointing Water level sensor SUTRON
Sutron >
User manual

Radar Level Recorder
RLR-0001-1
RLR-0003-1
Operations & Maintenance
Manual
Part No. 8800-1169
Revision – 1.31
Mar 11th, 2010

Bringing the Benefits of Real-Time Data Collection to the World
2

Bringing the Benefits of Real-Time Data Collection to the World
3
INTRODUCTION ............................................................................................................................................ 6
FEATURES ....................................................................................................................................................... 7
UNPACKING ................................................................................................................................................... 8
CABLING ......................................................................................................................................................... 9
RLR-0003-1 ................................................................................................................................................... 9
TERMINAL BLOCK – RLR-0001-1 ................................................................................................................... 9
Power Connections .................................................................................................................................... 9
SDI-12 Connections ................................................................................................................................. 10
DB9 CONNECTOR ......................................................................................................................................... 10
QUICK INSTALL .......................................................................................................................................... 11
STANDALONE QUICK INSTALL ...................................................................................................................... 11
QUICK INSTALL WITH A LOGGER ................................................................................................................... 11
Redundant Data Collection...................................................................................................................... 12
SETUP AND OPERATION .......................................................................................................................... 13
OVERVIEW .................................................................................................................................................... 13
STARTING THE RADAR ................................................................................................................................... 13
STAGE, DISTANCE TO WATER, AND MEASUREMENT POINT .......................................................................... 14
SETTING STAGE............................................................................................................................................. 14
MEASURING STAGE ....................................................................................................................................... 15
Signal Strength ......................................................................................................................................... 15
Stage Details ............................................................................................................................................ 15
Stage Units ............................................................................................................................................... 15
Right Digits .............................................................................................................................................. 15
Automeasure ............................................................................................................................................ 16
Operating Modes ..................................................................................................................................... 16
Averaging Time ........................................................................................................................................ 17
Averaging ................................................................................................................................................. 17
DQAP ....................................................................................................................................................... 17
Sample Form Period ................................................................................................................................ 17
LAST AUTOMEASURED ................................................................................................................................. 18
DISCHARGE ................................................................................................................................................... 18
LOGGING ....................................................................................................................................................... 18
Events ....................................................................................................................................................... 19
Logged Measurement Time ...................................................................................................................... 19
Log Daily Values ..................................................................................................................................... 19
SETUP ........................................................................................................................................................... 19
CONNECTING RADAR TO A LOGGER .............................................................................................................. 19
Satlink and Radar .................................................................................................................................... 20
STATION NAME ............................................................................................................................................. 20
RADAR TIME ................................................................................................................................................. 20
WDID .......................................................................................................................................................... 20
BATTERY VOLTAGE ...................................................................................................................................... 20
PASSWORD .................................................................................................................................................... 21
DIAGNOSTICS ................................................................................................................................................ 21
Raw Radar Sensor Data........................................................................................................................... 21
Subsamples............................................................................................................................................... 21
Lock/Unlock Quality Engine .................................................................................................................... 21
DEFAULT, MAX, MIN SETTINGS .................................................................................................................... 23
FRONT PANEL INTERFACE ..................................................................................................................... 24

Bringing the Benefits of Real-Time Data Collection to the World
4
NAVIGATING THE MENUS.............................................................................................................................. 24
TURNING DISPLAY ON/OFF ........................................................................................................................... 24
BACKLIGHT ................................................................................................................................................... 24
CONTRAST .................................................................................................................................................... 24
VIEWING CURRENT DATA ............................................................................................................................. 25
Understanding the “?” indicator. ............................................................................................................ 25
VIEWING LOGGED DATA ............................................................................................................................... 25
FRONT PANEL MENU TREE .................................................................................................................... 26
SDI-12 SENSOR OPERATION .................................................................................................................... 28
SDI-12 REFERENCE ...................................................................................................................................... 28
XXS Generic Change Radar Setup Command ..................................................................................... 33
RS232 COMMAND LINE INTERFACE .................................................................................................... 34
RS232 SETUP ................................................................................................................................................ 34
MACHINE TO MACHINE COMMUNICATION .................................................................................................... 34
VIEWING STAGE ............................................................................................................................................ 34
DOWNLOADING THE LOG .............................................................................................................................. 35
AUTO OUTPUT .............................................................................................................................................. 35
TARGET MODE ............................................................................................................................................. 35
RS232 COMMAND REFERENCE ..................................................................................................................... 35
List of commands ..................................................................................................................................... 36
List of setup variables .............................................................................................................................. 37
List of calibration setup variables ........................................................................................................... 38
SETUP TRANSFER VIA HYPERTERMINAL ....................................................................................................... 38
CONNECTING A MODEM ................................................................................................................................ 38
Xpert-Xlite Modem 8080-0005 ................................................................................................................ 39
Raven Modem .......................................................................................................................................... 39
DISCHARGE ................................................................................................................................................. 41
WHAT THE RADAR CAN DO FOR YOU .......................................................................................................... 41
DISCHARGE SETUP SEQUENCE ...................................................................................................................... 41
CORRECTLY RECORDING DISCHARGE ........................................................................................................... 41
Enabling The Computation ...................................................................................................................... 41
Selecting the Calculation Type ................................................................................................................ 42
Entering the Coefficients .......................................................................................................................... 44
INSTALLATION ........................................................................................................................................... 46
ELECTRICAL CONNECTIONS: ......................................................................................................................... 46
MOUNT THE RADAR ...................................................................................................................................... 46
TARGETING THE RADAR ................................................................................................................................ 46
FIRMWARE UPGRADE .............................................................................................................................. 48
METHODS FOR UPGRADE:.............................................................................................................................. 48
Method 1: Using „UPGRADE‟ command using Hyperterm: .................................................................. 48
Method 2: Using Hyperterm and „Escape‟ key: ..................................................................................... 48
GPS .................................................................................................................................................................. 49
TIMEKEEPING ................................................................................................................................................ 49
GPS INSTALLATION AND SETUP .................................................................................................................... 49
GPS POSITIONING ......................................................................................................................................... 49
GPS OPERATION ........................................................................................................................................... 50
GPS ERRORS ................................................................................................................................................ 50
JUMPERS ....................................................................................................................................................... 50
RJ45 TO RS232 CONNECTOR ........................................................................................................................ 51

Bringing the Benefits of Real-Time Data Collection to the World
5
MODBUS ........................................................................................................................................................ 53
MODBUS MENU OPTIONS.............................................................................................................................. 53
Modbus Enabled ...................................................................................................................................... 53
Modbus Device ID ................................................................................................................................... 53
Modbus Protocol ...................................................................................................................................... 53
Modbus Parity .......................................................................................................................................... 53
Modbus Delay before Tx .......................................................................................................................... 54
Modbus Delay after Tx ............................................................................................................................. 54
Modbus Baud Rate ................................................................................................................................... 54
MODBUS FUNCTION CODES .......................................................................................................................... 54
Identifying Registers ................................................................................................................................ 54
GET LOG COMMAND ..................................................................................................................................... 57
APPENDIX A – SPECIFICATIONS FOR THE RADAR ......................................................................... 58
ORDERING INFORMATION ............................................................................................................................. 58
APPENDIX B – SUTRON CUSTOMER SERVICE POLICY .................................................................. 59
APPENDIX C – COMMERCIAL WARRANTY ....................................................................................... 60
SUTRON MANUFACTURED EQUIPMENT ............................................................................................ 60
NON-SUTRON MANUFACTURED EQUIPMENT .................................................................................. 60
REPAIR AND RETURN POLICY .............................................................................................................. 60
EXTENDED WARRANTY AND ON-SITE MAINTENANCE ................................................................. 60
APPENDIX D – FCC INFORMATION ...................................................................................................... 61
INDEX............................................................................................................................................................. 62
Bringing the Benefits of Real-Time Data Collection to the World
6
Introduction
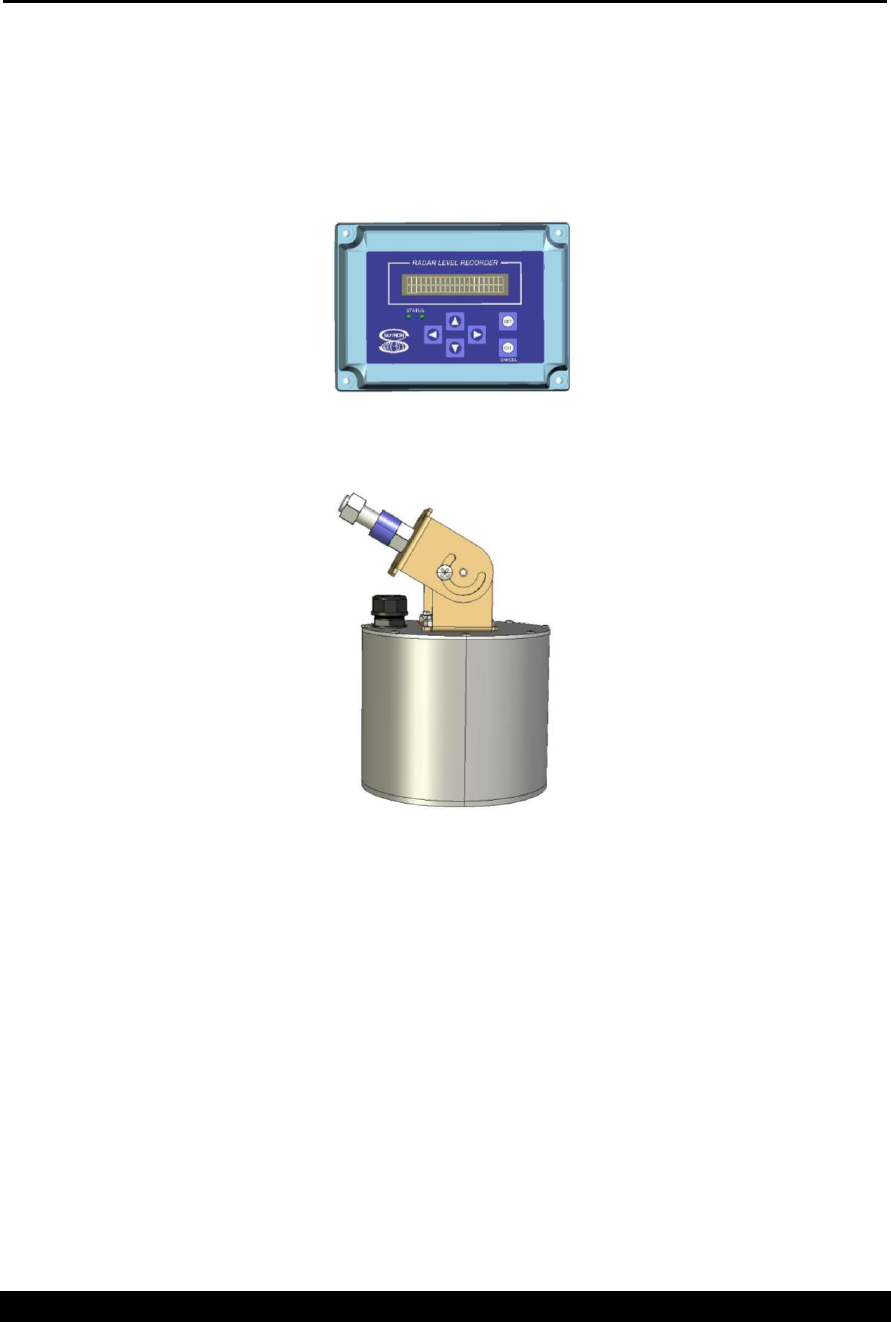
Sutron‟s Radar Level Gauge/Recorders are self-contained, precision devices for measuring stages (water
level) without direct contact with the water surface. The Radar comes in three different models. The RLR-
0001-1 combines into a single package radar, antenna, keypad, display, permanent log, SDI-12 interface,
RS232 interface. The RLR-0001-1 is packaged in sealed enclosure; however, the enclosure is not rugged
enough to be installed outdoors without additional protection.
RLR-0001-1
RLR-0003-1
The RLR-0003-1 is an integrated unit without display. The enclosure is rugged and can be installed outdoors
without additional protection. All the electronics for the radar are housed in the antenna enclosure. A 25 foot
long cable provides both RS232 and SDI-12 interfaces to the radar.
The Radar Level Recorder is ideally suited for making stage (stage) measurements in rivers, streams,
reservoirs, tidal, oceans and industrial areas where the sensor can be located above the water surface. Using a
special pulse-echo measurement technique, the radar has a range of 60 ft.

Bringing the Benefits of Real-Time Data Collection to the World
7
The radars that have a front panel that allow a user to setup the operating parameters, monitor performance
and perform tests via the front panel.
The radar is both a sensor and a logger, allowing for stand-alone and integrated applications. The log inside
radar is capable of holding more than 300 000 readings, and allows the recording of status and stage (stage)
data. The radar has an SDI-12 interface as well as RS232 so it can provide data to data loggers or
communications equipment.
All radars provide an RS232 port that supports a simple command line mode compatible with HyperTerminal
and other communications programs to display data from the log and perform some essential operating
functions. It is possible to connect the radar to a modem or radio.
Features
Non-contact measurement of stage (water level).
Low power consumption (<1ma quiescent, <20ma measuring @ 12V) for long battery life.
High precision featuring 0.001 ft resolution a range of 60ft.
High accuracy 0.01ft 5- 20ft, 0.05% reading 20-60ft.
Powerful and configurable processing filters out waves (Averaging and DQAP)
Automatically saves data in permanent log
User-settable measurement, logging, and averaging
Built-in flash log for 300,000 readings safeguards your data even if power is lost
Stand-alone operation or operation with other loggers/communications via SDI-12 and RS232
Automatically computes discharge
Front panel allows full access to setup, status and data
Provides redundant data storage when connected to a logger

Bringing the Benefits of Real-Time Data Collection to the World
8
Unpacking
Remove the Radar from the shipping container and visually inspect the unit for signs of damage during
shipment. Report any such damage to the factory immediately to ensure a prompt response and resolution.
Retain one shipping container in the event a factory return is necessary.
Please note that if a return is required, a return material authorization (RMA) number is required. To get this
RMA number, call the Sutron Customer Service Department at (703) 406-2800.
Bringing the Benefits of Real-Time Data Collection to the World
9
Cabling
RLR-0003-1
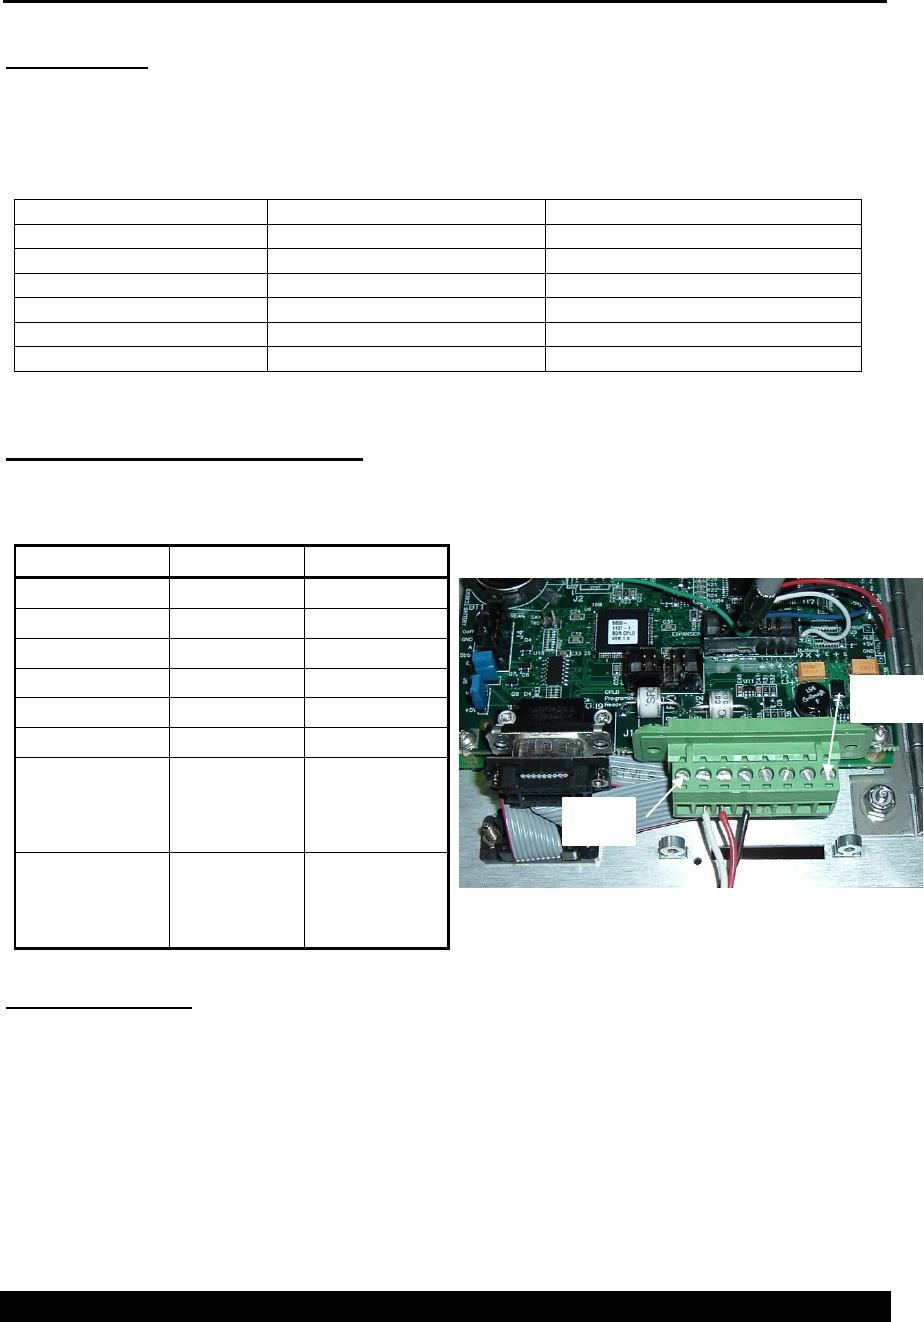
The RLR-0003-1 comes with the interface cable already connected. The interface cable provides both SDI-
12 and RS232 communications. DO NOT open the radar enclosure during the course of installation or
maintenance as the water tight seal may be broken. The DB9 is wired as described on the following page.
The SDI and power wiring is as follows:
Color
Description
Notes
GREEN
Earth
Earth ground for protection
WHITE
SDI Data
To Data Logger SDI-12 Data
RED
SDI +12V
To Data Logger SDI-12 Power
BLACK
SDI GND
To Data Logger SDI-12 Ground
RED /w Black Stripe
Backup Battery +12
Optional backup battery connection
BLUE /w WHITE STRIPE
Backup Battery GND(-)
Optional backup battery connection
Terminal Block – RLR-0001-1
The following table contains the pin descriptions for the terminal block. You must open the radar enclosure
to access this terminal block:
Terminal Block
Description
Notes
1
Earth
Earth
2
Data
SDI-12
3
+12V
SDI-12
4
GND
SDI-12
5
6
7
Battery +12V
Battery power
-- Not needed
when powered
via SDI-12
8
Battery GND
Battery power
-- Not needed
when powered
via SDI-12
Power Connections
The radar requires external +12V power to operate. Power may be given via the battery connector (pins 7
and 8), and /or via the SDI-12 connector (pins 3 and 4). When both sets of connections are used, the
radar will operate off either power source. This allows a redundant power source for the radar. The
two sets of power connections are separate – current will not flow from one to the other.
Use wire that is at least 24 gauge.
When using the radar with a Satlink or other logger, you may use the SDI-12 power connection with or
without the battery connection.
Pin 1
Pin 8
Bringing the Benefits of Real-Time Data Collection to the World
10
Please note that the radar battery voltage (page 20) measurement will measure the higher of the two voltages
(battery and SDI-12) that can be supplied to it.
SDI-12 Connections
The SDI-12 interface has only 3 connections – GND, +12V and Data. The connections are made to the
terminal block as given in the table above and as shown in the above picture. Wire all three connections
directly to the SDI-12 connections on a compatible data logger. The sensor is shipped to respond to SDI-12
address 0 (the address can be changed via the front panel). See the section titled SDI-12 Sensor Operation on
page 28 for more details.
Note that if operating without a logger, nothing need be connected to the SDI-12 pins.
DB9 Connector
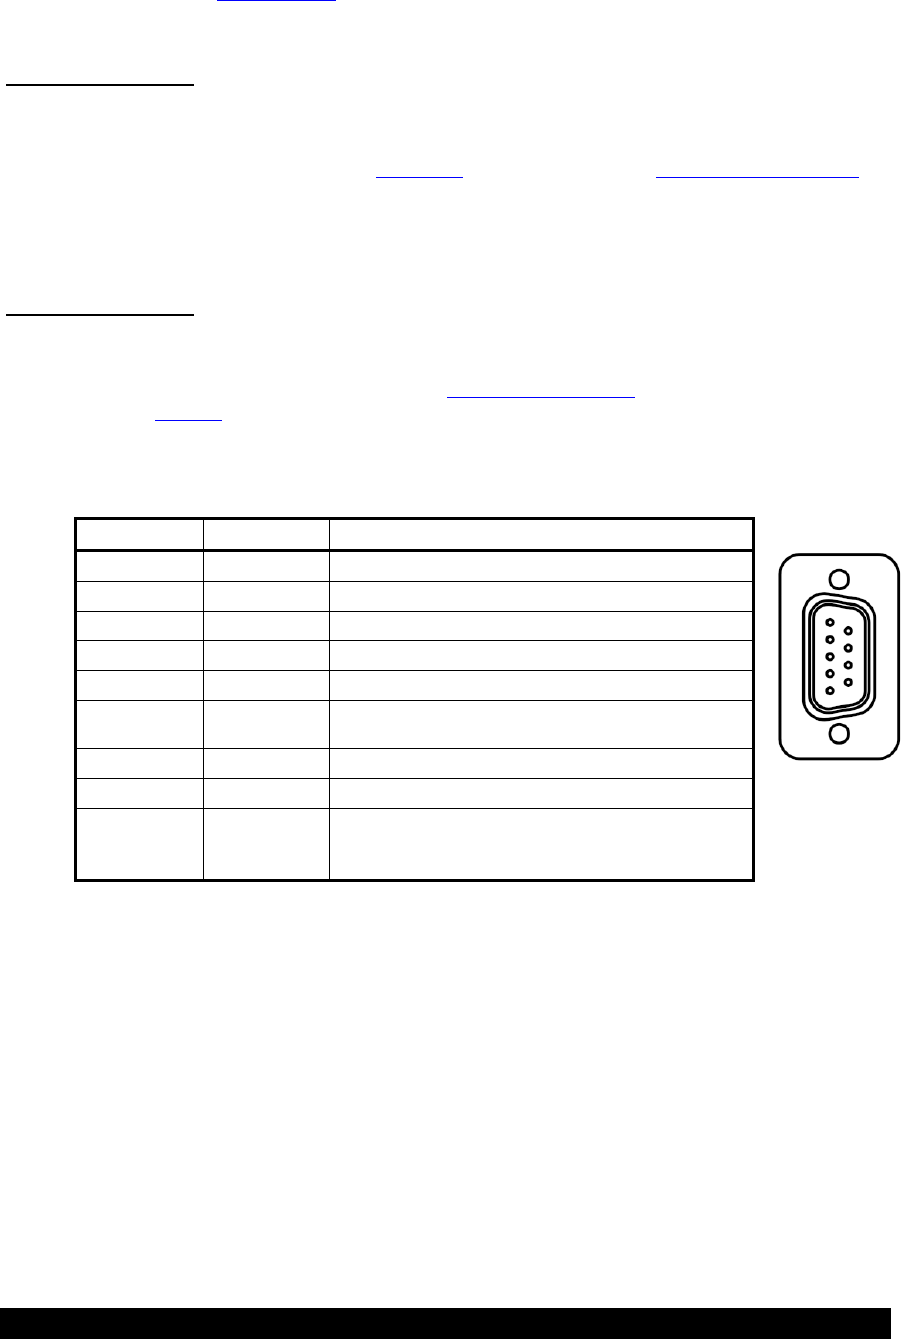
The radar comes with a DB9F connector for connection to RS-232 devices. The DB9F can be connected to
the serial port on most PCs using a straight cable. A null modem adapter is needed to connect to most PDAs
and modems. This connector allows for access to the command line interface (see page 34) using a terminal
program. Some modems (see page 38) and radios can be connected to this port. A logger can be
programmed to use this port.
The following table shows the pin assignments of the DB9F connector.
DB9F Pin
Name
Notes
1
N/C
No Connection
2
RXD
Data from Radar
3
TXD
Data to the radar
4
DTR
Signal to the radar
5
Ground
6
DSR
Signal from unit, asserted as long as unit has
power
7
RTS
Request to Send, signal to the radar
8
CTS
Clear to Send, signal from the radar
9
VOUT
Jumper J8 selectable for 5V (default) or VBAT
(100ma max) - this line is usually NOT passed by
a null modem
Bringing the Benefits of Real-Time Data Collection to the World
11
Quick Install
It is very important to properly install the radar sensor. The RLR-0001-1 radar is designed to mount with the
front panel display facing up. In this orientation, the radar antenna points down to the water surface. You
may switch the orientation of the antenna by opening the enclosure and changing the mounting plate so the
antenna points to the side of the enclosure. Do not install the RLR-0001-1 outdoors without an additional
protective enclosure.
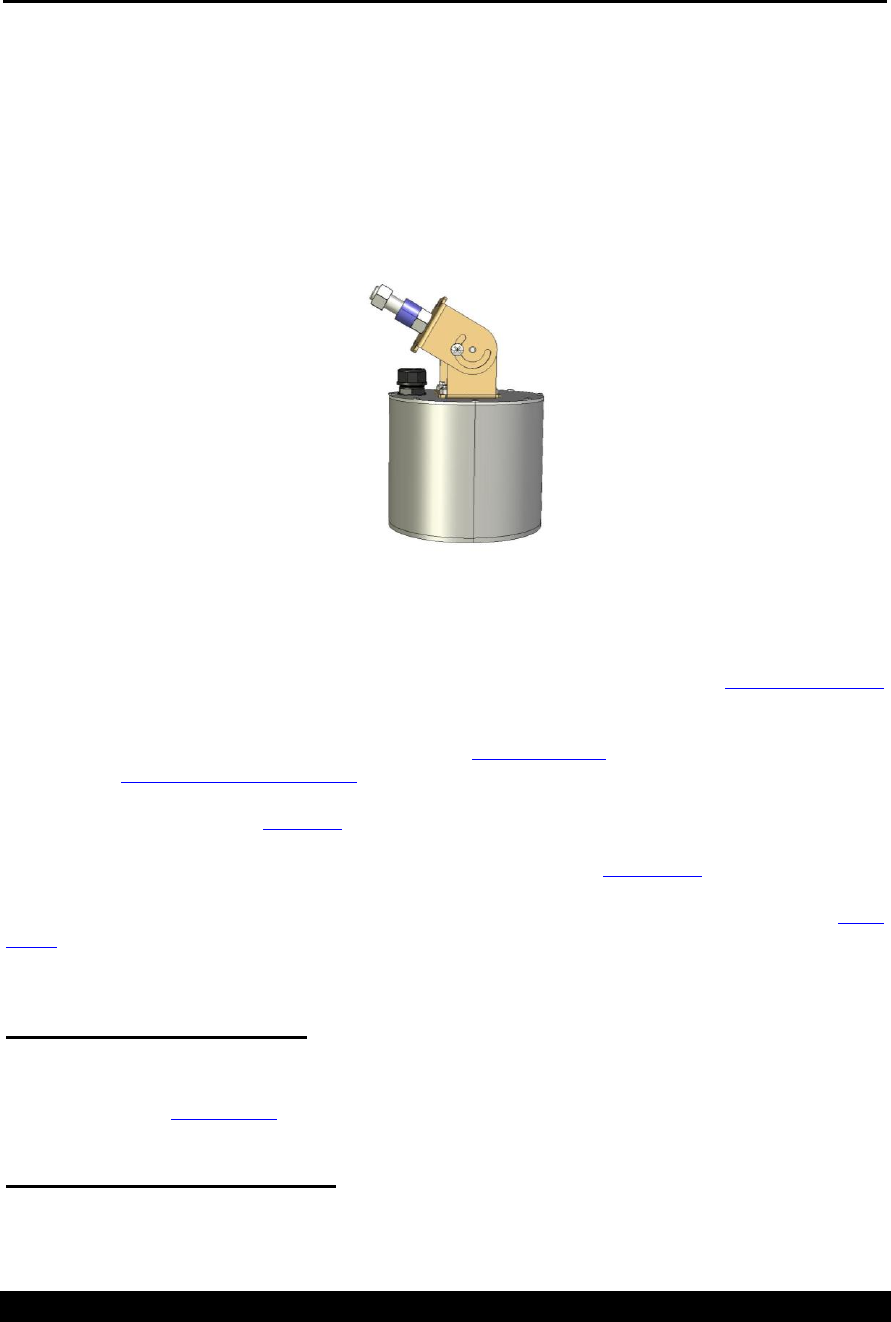
The RLR-0003-1 is designed with a 5/8” bolt for connection to a mounting arm. The bolt and the swivel
bracket can be adjusted to allow the radar to point directly to the water surface no matter what the angle is of
the mounting arm. The adjustments are made by loosening the two screws in the sides of the swivel bracket
and also rotating the bracket relative to the bolt.
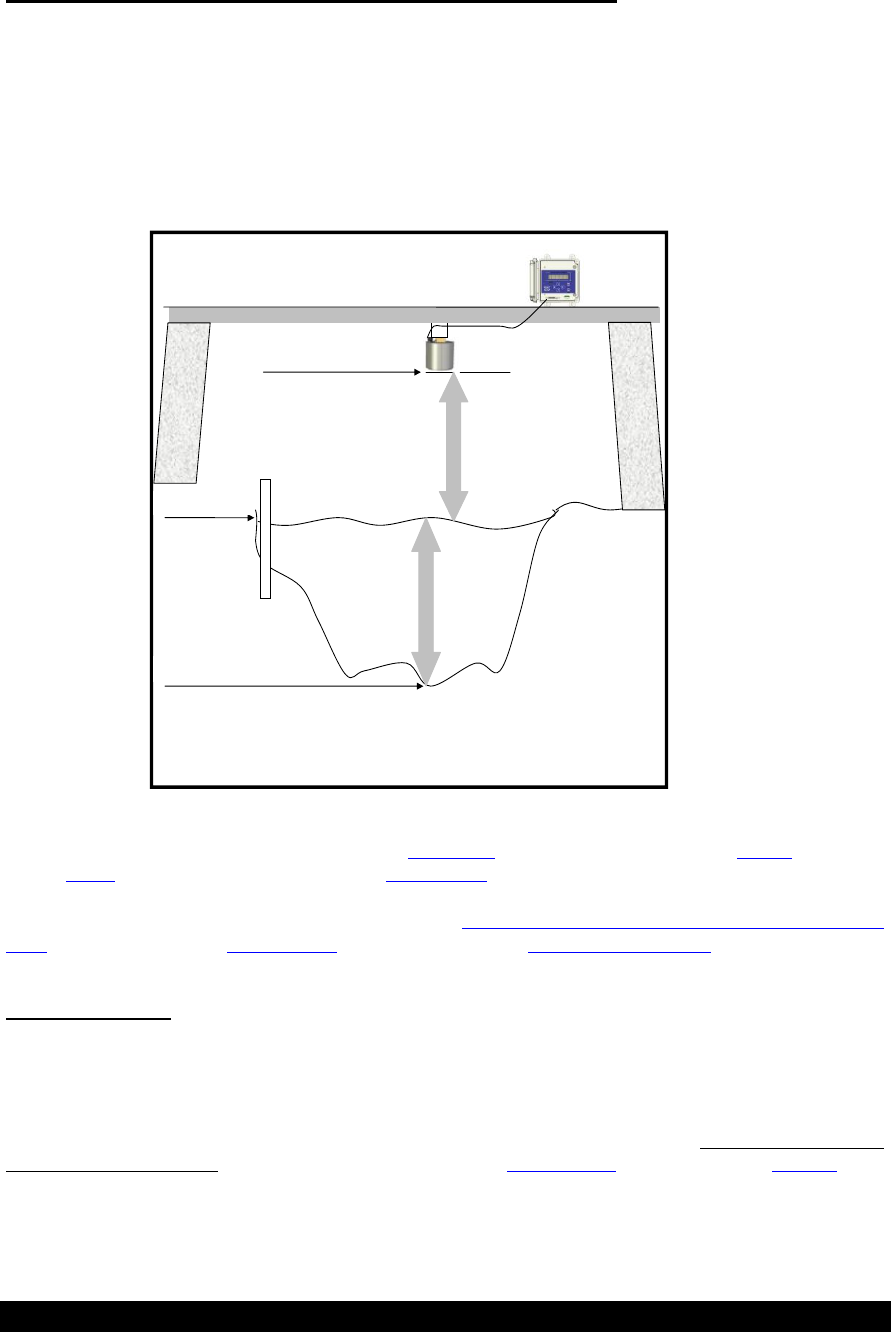
Mount the radar directly above the water surface, such that the radar beam is perpendicular to the
water. The radar will not operate well if the beam strikes the water at an angle or if there objects other than
the water that will reflect the signals from the radar. A circular level is provided to simplify the process of
pointing the antenna at the water surface. For more details on the antenna beamwidth see Targeting the Radar
on page 46. Keep in mind that the range of the sensor is up to 60 feet with a minimum of 5 feet.
After setting up the radar above the water‟s surface and providing power to the unit, use the front panel to
bring up the Diagnostic > Signal Quality menu (press the up arrow several times until “Diagnostic” is
displayed, then press right). Adjust the antenna pointing to the water surface for a peak signal. Additionally,
you may find the command line TARGET mode useful for setting up the Radar.
Once the radar is properly mounted and indicates a good signal strength, set the stage. The stage is the first
item shown on the front panel after power-up. Once the stage is shown, press set, enter the new stage, and
press set again. After a few seconds, the radar will show the entered stage. Ensure that ? is not shown. If ? is
shown, it means the radar does not have a good signal. Please see page 14 for more details on setting the
stage.
Standalone Quick Install
The radar starts measuring and collecting data as soon as it is powered up. By default, the radar will measure
and log stage every 15 minutes; each reading is averaged for 10 seconds. All of these settings and more can
be changed – please refer to page 16 to learn more about how the radar measures.
Quick Install with a Logger
Radar can be connected to other devices via either SDI-12 and RS232.
For SDI-12 operation, connect the three wire interface to the properly labeled pins on the radar and
setup the logger to periodically collect data from the sensor. The first parameter of the M! command

Bringing the Benefits of Real-Time Data Collection to the World
12
will provide the stage. For more details on SDI-12, please refer to the SDI-12 Sensor Operation
section on page 28.
If connecting using the RS232 port, the data can be polled from the radar, or it can be automatically
output by the radar. Setup the connected device (which may be a logger, a modem, or even a direct
connection to a PC running HyperTerminal) for 115200 baud, 8 data bits, no parity (the baud rate
can be changed via the front panel Setup > Other Settings > Baud Rate).
To poll for data, have the connected device issue a carriage return, wait for prompt, issue the
ASCII command “!MEAS” followed by a carriage return, and capture the returned data. The
first data item returned is the stage.
To capture data, setup the radar for auto output via the front panel Setup > Other Settings >
Auto Output. Once setup, the radar will periodically output the stage in ASCII.
Please refer to the section RS232 Command Line Interface on page 34 for more details.
Redundant Data Collection
Connect the radar via SDI-12 to a logger and setup the logger to get data from the radar.
Provide a redundant power supply to the radar (via the Battery connector).
With this setup, if the logger malfunctions, the radar will keep on collecting data.

Bringing the Benefits of Real-Time Data Collection to the World
13
Setup and Operation
Overview
Radar operates as both a sensor and a logger. As a sensor, it is capable of performing stage measurements.
As a logger, it is capable of recording those stage measurements.
Radar will measure and log data as long as it has power, regardless of whether it is connected to a logger.
This ensures that data is not lost if the logger malfunctions.
The digital SDI-12 interface allows for a standardized connection to a logger. SDI-12 also provides power to
the radar. For full details on SDI-12, please refer to the section on page 28.
The radar can be attached to a telemetry device, such as a modem, via its RS232 port. Radar allows full
access to status, setup and data via the RS232 port, using the command line interface (detailed on page 34).
Loggers that do not support SDI-12 should interface via the RS232 port.
The front panel offers a means of viewing data, status, and configuring the unit. Please see page 24 for
details. The RLR-0003-1 without a front panel can be setup and operated via the RS232 and/or SDI-12
interfaces.
Starting the radar
The radar starts operating as soon as power is applied. On models with displays, the green LED will flash
occasionally to let you know that the radar is operational. The Radar cannot be stopped from measuring
without removing power from it.
Green LED flashes every several seconds to indicate the radar is operating normally
Red LED flashes if the radar has encountered a problem
When the radar first starts, it may display the message “Calculating…” on the LCD. This means that the
radar is in the process of taking a measurement. This message will be displayed for as long as it takes to
make one measurement (see Averaging Time). The message “Error in Reading” means that the radar was
unable to get valid signals from the radar.
Bringing the Benefits of Real-Time Data Collection to the World
14
Stage, Distance to Water, and Measurement Point
Ultimately, the job the radar is to compute a stage measurement. However, the direct measurement made by
the radar is distance to water.
Distance to water is the length between the radar and the water surface.
Stage is the depth of water; for a river it is distance between the water surface and the riverbed.
Stage = Measurement point – Distance to water
Measurement point is the length between the radar and the riverbed (or ocean floor or well bottom).
(NOTE: Calibration of the radar unit has been made with respect to the front cover of the
antenna unit.)
Measuring Point:
Bridge or Structure over Water
Stage
Water Level (Stage)
Riverbed:
Distance to Water
Staff
Gauge
Stage Reading:
Measuring Point = Stage + Distance to Water
or
Stage = Measuring Point – Distance to Water
Stage is displayed on the first menu shown on the front panel. Via command line, use the “MEAS” command
or the “LAST” command. Via SDI-12, use the M command.
Measurement point can be accessed via the front panel Station setup > Measurement Setup > Measurement
point, via SDI-12 using the XE command, and the command line MEASURING POINT.
Setting Stage
When the radar is installed, you will typically read the current stage off a staff gauge and then set this new
stage into the radar.
To set the stage via front panel, power up the radar, wait for it to show a stage reading (which will be negative
until the stage is set), and the press SET. Enter the correct stage and press set again. Don‟t forget to change
the sign of the stage to “+”. It is also possible to use SDI-12 XS command and command line STAGE to set
the stage.
The radar compares this user entered value with its own reading and uses it to set the Measuring Point. From
then on, the radar will report the stage relative to this Measuring Point – so it will match the staff gauge.

Bringing the Benefits of Real-Time Data Collection to the World
15
Alternatively, if you know the exact elevation of the radar, you can enter this elevation as the Measuring Point
and the radar will automatically display the stage relative to this elevation.
Measuring Stage
The radar takes multiple samples and computes a stage from them. Each sample is itself the average of
millions of radar pulses to the water surface and as such has a quality reading and signal strength associated
with it. If the radar is not getting a good reflection from the water surface, the quality of the sample will be
bad. If less than half of the samples were good, the quality will be set to bad. The user controls when the
samples are collected and how the average is computed through the Measurement Setup settings. Please see
sections on Operating Modes, Averaging and Sample Form Period for further details.
A bad quality is indicated with a “?” after the reading if using the front panel. The command line interface
will say „error‟, and SDI-12 will indicate an invalid reading. In addition, the red LED will flash and the front
panel will show „Error in reading‟ if the last reading was invalid. Logged data will be marked as invalid..
To see the stage, use the first menu shown on the front panel. Via command line, use the “MEAS” command.
Via SDI-12, use the M command.
Signal Strength
The radar gives a signal strength expressed as a percentage 0 to 100%. The higher the number, the better the
signal. Signal strength can be viewed via the front panel Diagnostic > Signal Strength.
Stage Details
In addition to providing a stage, the radar sensor can provide additional details:
average signal strength
standard deviation (of good samples)
number of good samples
total number of samples
These details can be viewed by pressing right when viewing the stage via front panel. Also, command lines
MEAS and LAST, and SDI-12 M2 will reveal stage details.
In order to log all these details, make sure to enable the measurement setup field Station Setup >
Measurement Setup > Log Stage Details.
Stage Units
Radar can report stage readings in feet, meters, centimeters or millimeters. Please use Station Setup >
Measurement Setup > Stage units to change the units. Units are logged along with stage. They are also
shown on the front panel and reported with the results of SDI-12 and command line measurements.
Right Digits
The number of digits shown after the decimal place is referred to as the Right Digits. If you would like the
stage to read 10.12 rather than 10.12345, set the right digits to 2.

Bringing the Benefits of Real-Time Data Collection to the World
16
Automeasure
Automeasure refers to the radar‟s ability to automatically measure and log stage data. The user can determine
when this will occur by changing Station Setup > Measurement Setup > Automeasure Interval and Offset
settings. Automeasure cannot be turned off.
Automeasure time and interval determine when the radar measures and logs data.
E.g. Automeasure time 00:00:00 interval 00:10:00
00:10:00 data measured and logged
00:20:00 data measured and logged
00:30:00 data measured and logged
and every ten minutes afterwards…
E.g. Automeasure time 00:00:30 interval 00:05:00
00:00:30 data measured and logged
00:05:30 data measured and logged
00:10:30 data measured and logged
and every five minutes afterwards...
The last automeasured data can be accessed via SDI-12 and command line – please see page 18.
Operating Modes
There are two operating modes: normal and continuous:
In normal mode, radar spends its time in low power mode until it is time to measure or a
measurement is requested via the front panel, RS232 or SDI-12. Once the measurement is complete,
radar goes back to low power mode. This is the most commonly used mode and is recommended
unless the radar will be measuring very frequently.
In the continuous mode, radar is constantly collecting data. When it is time to measure, radar will
use the previously collected data to instantly come up with a stage reading. The radar does not go
into low power in continuous mode. The continuous mode adds about 10 mA to the quiescent power
consumption compared with 0.25mA in the normal mode. Please note that Radar can hold only
180 samples in continuous mode. If the averaging time and the sample form period are such that
more than 180 samples are collected, the system will only use the last 180 samples. For example, if
the averaging time is 10 minutes, and the sample form period is one second, the radar compute the r
based on three and not ten minutes worth of data. Normal mode is unaffected by this limitation.
These examples illustrate the difference between continuous and normal modes:
Normal mode with 10 second averaging:
1. 12:00:00 measure command is received (via SDI-12, front panel, RS232, or automeasure)
2. 12:00:00 sensors are powered on and measurement starts
3. 12:00:11 measurement completes with data collected between 12:00:00 and 12:00:10
4. 12:00:11 sensors are powered down
Continuous mode with 10 second averaging (sensors are powered on all the time):
1. 12:00:00 measure command is received (via SDI-12, front panel, RS232, or automeasure)
2. 12:00:00 measurement completes with data collected from 11:59:50 to 12:00:00
Desired Effect
Appropriate Mode
Low power consumption
Normal mode
Low power consumption and immediately ready data
Normal mode, use last measured readings (page 18)
Immediately ready and current data
Continuous mode
Very frequent measurements (every 15 seconds or less)
Continuous mode
More than 180 samples
Normal mode
Operating mode can be changed via front panel Station Setup > Measurement Setup > Operating Mode, via
SDI-12 XOM and via OPERATING MODE command line

Bringing the Benefits of Real-Time Data Collection to the World
17
Averaging Time
Every time the radar measures it will collect samples for a user defined period (Station Setup > Measurement
Setup > Averaging Time) in order to produce a stage reading. The setting avg time determines how long to
collect samples for. Averaging time can be changed via SDI-12 XT, and via AVG TIME command line.
In addition to the averaging time, the sample form period can be adjusted, allowing for control of the number
of samples collected. The sample form period determines how often each sample is collected.
Two methods are offered for computing a stage from multiple samples: averaging and DQAP.
Averaging
Adding all the (good) samples and dividing the sum by the number of (good) samples will provide
the average distance to water. In addition to the averaged distance to water, radar will also provide
the average signal strength, the standard deviation of the good samples, the total number of samples
and the number of good samples. Finally, the quality of the stage will be set to good if at least half
of the samples were good. In order to log all these details, make sure to enable the measurement
setup field log water details. They can also be accessed via command line or SDI-12.
Averaging is enabled by default. If DQAP is disabled, averaging is enabled (Station Setup >
Measurement Setup > DQAP Enable).
DQAP DQAP is a method defined by the NOS (National Ocean Service) of computing the stage that is
designed to eliminate erroneous values from the calculation. With DQAP, the distance to water is
calculated using two computations:
For the first computation, the average and standard deviation of all the samples are calculated.
Then, two limits are figured: the average plus/minus three times the computed standard deviation.
Each sample is then compared against the two limits. If the sample is outside the limits, it will not
be used in the final computation.
In the final computation, the average and standard deviation are recomputed from all the samples
remaining from the first calculation. The quality of the stage reading will be set to good if at least
half of the samples were selected for the secondary computation; it will be set to bad otherwise. The
good sample count of the stage reading will be set to the number of samples selected for the
secondary computation.
To enable DQAP, use the Station Setup > Measurement Setup > DQAP Enable menu. If DQAP is
enabled, averaging is disabled.
Sample Form Period
As mentioned in measuring stage, each sample of the stage is actually the average of millions or radar pulses
to the water. The sample form period value controls how much raw radar data to include in each sample.
The default value for sample form period is 1.0 second. Do not change this value without consulting with the
factory. The quality of the sample depends on the number of good subsamples collected. If there are not
enough good subsamples, the quality is set to bad.
The details of each sample can be viewed in the diagnostic menu. The details consist of distance to water,
standard deviation, number of good and number of total subsamples, sample validity, signal strength,
minimum and maximum. Each sample may be logged by activating log every sample setting.
Log entry
Description
Sample Min
The minimum distance to water
Sample Max
The maximum distance to water
Sample Avg
The average distance to water
Sample StdDev
The standard deviation of all the subsamples
Sample Good Subs
The number of valid subsamples included in the average
Sample Total Subs
The total number of subsamples collected (only the good subsamples are included in
computation)

Bringing the Benefits of Real-Time Data Collection to the World
18
Last Automeasured
Stage measurements made by the radar are not instantaneous; how long they take depends on averaging time
(page 17). When a logger is communicating with the radar, it can ask the radar to make a new measurement.
However, the logger then has to wait for the radar to complete the measurement.
If the user desires data that is instantly available, the radar can provide the last measured data. The radar
automatically measures based on the automeasure interval (see page 16) . That data can be retrieved as the
last measured data.
For example, if radar is setup to automeasure every 10 minutes, with an averaging time of 10 seconds:
12:00:00 to 12:00:10 radar measures stage
12:01:00 logger asks for last measured data; radar immediately returns 12:00:10 data
12:10:00 to 12:10:10 radar measures stage
12:11:00 logger asks for last measured data; radar immediately returns 12:10:10 data
If the user desires data that is both immediately available and current, continuous mode (page 16) is the way
to go.
Last measured data can be accessed via SDI-12 M3 and via LAST command.
Discharge
Discharge is a measurement of water volume flowing over time. Please refer to the discharge section on page
41 for complete details.
Logging
A secure flash chip in the radar provides a logging capacity of more than 300,000 entries. Data will not be
lost if power is removed. There is not a means of erasing data from the log. Once the log is full, the oldest
data will be overwritten.
Each log entry consists of
date and time (with a second resolution)
name of the logged entry
measurement reading (optional)
measurement quality and units (optional)
The format of logged data is the Sutron Standard CSV format which was introduced in the Summer of 2009.
It is a format common to current Sutron products.
The general format specification for Sutron Standard CSV format is
mm/dd/yyyy,hh:mm:ss,label,data[,units,qual][,label,data[,units,qual]]
Here are several examples of log entries:
01/19/2010,09:21:49,Reset Powerup,1
01/19/2010,09:30:00,Stage,1.25,feet
01/19/2010,09:45:00,Stage,1.27,feet
01/19/2010,09:50:27,Setup Change
Minimally, radar will log stage and various events. The user can decide how often to log stage (via
automeasure settings see page 15), and the user can chose to log stage details (via front panel, access Station

Bringing the Benefits of Real-Time Data Collection to the World
19
Setup>Measurement Setup>Log Stage Details), which consist of signal strength, standard deviation of
samples, number of good and total samples.
Events
Occasionally, the radar will log events. Events are used to help troubleshoot the data.
The following actions will cause the radar to log an event:
Setup change (whenever any setting is changed)
Log download (whenever the log is downloaded)
Display On and Display off (whenever the user wakes the unit up by pressing a button)
Command line enter (whenever the user connects via the RS232 port)
Reset (log contains reset type and count)
Errors (such as low battery and sensor failure)
Before cal and after cal (logged whenever the user sets the stage to record the stage before and after
the calibration)
Log in events (if password is enabled), including failure to log in.
The log can be examined via the front panel (the Logged Data menu), or downloaded via command line
(using the LOG command). SDI-12 does not provide access to the log.
Logged Measurement Time
Measurements are not instant. Once initiated, a radar measurement will take the user defined averaging time
plus some overhead to complete. For example, a measurement that starts at 12:00:00, with an averaging time
of 10 seconds will complete at about 12:00:11. That measurement will be logged with 12:00:00 as the
timestamp. The timestamp of the logged measurement is the time the measurement was started.
Log Daily Values
The Radar log the battery voltage into at 23:59:59 each day. Whether it does is controlled by the log daily
values setting (Station Setup > Other Setup > Log Daily Values).
Setup
The radar‟s setup is stored in secure memory, meaning it will not be lost if power is removed (for any time
period). The setup of the radar is broken into sections: Measurement Setup, Discharge Setup, and Other
Setup. All setup can be changed through any interface: SDI-12, front panel or RS232 command line.
Setting the setup to defaults (Station Setup > Other Setup > Default Setup) will reset all the settings to factory
defaults.
Connecting Radar to a Logger
The radar will measure on its own schedule regardless of whether it is connected to another logger. This
ensures redundancy of logged data. If the connected logger malfunctions, the radar will keep collecting data.
The digital SDI-12 interface allows for a standardized connection to a logger. SDI-12 also provides power to
the radar. For full details on SDI-12, please refer to the section on page 28.
The radar can be attached to a telemetry device, such as a modem, via its RS232 port. Radar allows full
access to status, setup and data via the RS232 port, using the command line interface (detailed on page 34).
Loggers that do not support SDI-12 should interface via the RS232 port.
To ensure that the logs of the radar and the attached logger match (as far as stage goes), make sure that the
automeasure time and interval of the radar are the same as the measurement time and interval of the logger.

Bringing the Benefits of Real-Time Data Collection to the World
20
To set the radar‟s time and interval, use the Station Setup > Measurement Setup > Automeasure Time and
Automeasure Interval menus.
Ensure that the time of the radar and logger match by changing the time of either one (page 20).
Satlink and Radar
When connecting a radar to a Satlink, use the SDI-12 connection. Setup Satlink for an SDI-12 measurement
(please see the Satlink manual for details). Make sure that Satlink measurement time and interval match the
radar‟s automeasure time and interval (Station Setup > Measurement Setup > Automeasure Time and
Automeasure Interval).
Satlink will automatically synchronize the radar‟s clock via SDI-12. This will happen as soon as Satlink is
started; Satlink will then periodically ensure that radar and Satlink clocks are in sync.
Station Name
The station name can be viewed and set via the front panel Station Name and Time or by using the STATION
NAME command. The name is used to name the file when data is downloaded from the Radar.
Radar Time
Radar time can be viewed and set via the front panel Station Name and Time, via the front panel Station
Name, via the SDI-12 XDT command, or by using the TIME command line.
Radar sports an RTC (real time clock) backed by an internal battery. The RTC keep ticking even if the main
battery to the radar is removed. The RTC will, at worst case drift ±2 minutes per month (0 to +50C). The
lifetime of the RTC battery is about 5 years.
WDID
The WDID is a 7 character code given to stations. The code is included in ???
Battery Voltage
Radar can be powered via either the SDI-12 connector, the battery connector, or via both for redundant power
(see page 9 for connection details). The two power connections are separate – current will not flow from one
to the other.
When reporting battery voltage, radar will report the higher of the two voltages (battery and SDI-12) that can
be supplied to it. Battery voltage can be read from the front panel, SDI-12 M1 command, or BATT
command.

Bringing the Benefits of Real-Time Data Collection to the World
21
Password
You can enable password protection by configuring a password. If password protection is enabled, the user is
allowed view setup and data. However, no changes to setup will be allowed until a password is entered. A
password prompt will automatically appear whenever a setup change is attempted.
Via front panel, go to Station Setup > Other Setup > Password. Press set and enter a password. Press set
again and the password will be enabled.
Using the command line, type "PASSWORD = XXX" to set password to XXX. Type "PASSWORD =" to
disable password usage.
To disable the password, enter a blank password.
Logging out is accomplished by turning off the display, by typing EXIT in the command line, or by powering
down the unit.
SDI-12 is unaffected by password protection.
If you forget the password and want to clear it, reset the unit and press and hold the DOWN key. You must
keep the key pressed until you see the message “Password Cleared” appear on the front panel.
Diagnostics
This section provides details about how Sutron‟s Radar Level Recorder computes stage based upon radar
sensor data.
The purpose of the radar level sensor is to produce a stage measurement. The measurement cycle consists of
different processes. At the lowest level, raw signal data is acquired the radar sensor. That data is converted
into a subsample. As multiple subsamples are collected, their data is analyzed and processed into a sample.
Numerous samples are finally converted into a stage reading.
Raw Radar Sensor Data
Two measurements come from the radar sensor hardware: distance to water and signal strength. The distance
to water signal coming from the radar sensor is a PWM signal, provided as a percentage. It is computed into
distance to water in feet by multiplying it with the PWM Slope and adding the Factory Offset to it. The signal
strength is expressed as a percent, and is recorded along with stage data.
The diagnostic menu will show the raw PWM signal (expressed as a percentage) along with the signal
strength.
Subsamples
Based upon raw sensor data and the history of previous sensor data, the radar will form a subsample. The
subsamples are coming in at a rate of about 10 per second.
Every new subsample gets checked to see if it is valid. The distance reading of every new subsample (in
percent) is compared to PWM minimum (in percent) and PWM maximum (in percent). We will also compare
the new subsample to the last good subsample and make sure the difference does not exceed the PWM Delta.
The subsample diagnostic menu will show subsample details, including distance to water in PWM, signal
strength, the state of the lock/unlock engine, along with a quality rating.
Lock/Unlock Quality Engine
In addition to checking each new subsample for quality, radar will monitor a brief history of the subsamples
in order to determine the overall quality of the sensor signal. The term „unlock‟ is used to mean that there is

Bringing the Benefits of Real-Time Data Collection to the World
22
inadequate sensor signal quality to make stage readings, and the term „lock‟ means that there is good sensor
signal quality. If, at the time when sample is created, the state is unlocked, that sample becomes invalid.
The lock/unlock quality is dependent on these settings:
Signal Lock Count: number of good subsamples required to change state to locked.
Signal CBad Count: number of consecutive bad subsamples required to change the state to unlocked
Signal Unlock Count: number of bad samples required to reset the quality engine a when unlocked
The subsample diagnostic menu shows the state of the lock/unlock engine. Subsamples may be logged by
activating log every subsample setting. Please note that since about 10 subsamples are created every second,
the log will fill up in a matter of hours if this setting is enabled. When log every subsample is enabled, the
log entry “Sub Duty” will record the PWM signal as a percentage. The log entry “Sub SigStr” will represent
the signal strength (also a percentage). Additionally, the lock/unlock engine will report any changes with the
log entry “Lock”. If the value logged with “Lock” is 1 it means the signal locked, a value of 0 means the
signal unlocked, and a value of -1 means the engine restarted.

Bringing the Benefits of Real-Time Data Collection to the World
23
Default, Max, Min Settings
The table below indicates the default settings and the maximum and minimum ranges it may be set to.
Parameter
Default Setting
Minimum
Maximum
Comment
Automeasure Interval
00:15:00
00:00:01
01:00:00
Automeasure Time
00:00:00
00:00:00
23:59:59
Operating Mode
Normal
0 = Normal
1 = Continuous
Avg Time
10.000 sec
0
900
seconds
Right Digits
2
0
7
Stage Units
Feet
0
3
0=feet,1=m, 2=cm,
3=mm
Measuring Point
1.00000 feet
-1000000.00499
1000000.00499
Indirectly set when
user sets stage.
DQAP
Disabled
0=Disabled
1=Enabled
Discharge
Disabled
0=Disabled
1=Enabled
Discharge Equation
Parshall Flume
0=Disabled
1=Enabled
Parshall Flume Width
12 inches
1
600
inches
Coefficient A
1.0000000
-1000000.0049999
1000000.0049999
Coefficient B
1.5000000
-1000000.0049999
1000000.0049999
Gauge Height Shift
0.0000000
-1000000.0049999
1000000.0049999
Weir Coefficient W
1.0000000
-1000000.0049999
1000000.0049999
Station Name
Sutron Radar
1 Char ASCII
24 char ASCII
Numbers included
WDID
Auto Output
Disabled
0=Disabled
1=Enabled
Log Every Subsample
Disabled
0=Disabled
1=Enabled
Log Every Sample
Disabled
0=Disabled
1=Enabled
Log Level Details
Disabled
0=Disabled
1=Enabled
Log Daily Values
Disabled
0=Disabled
1=Enabled
Sample Form Period
1.0 sec
0.1
10000.0
Seconds
PWM slope
0.755105
Contact Customer
Factory Offset
-1.2
Service for further
information on
SigStrCal
3.300
these items.

Bringing the Benefits of Real-Time Data Collection to the World
24
Front Panel Interface
The radar features a two line LCD interface, six buttons and two LEDs. The front panel interface can be used
to setup the radar, examine its status, view the current stage readings, and view logged data.
Navigating the Menus
The menu has a tree structure, like directories in an operating system.
1. The radar menu tree (page 24) can be navigated with the arrow keys. Press ▲ (up) and ▼ (down) to
browse the menu items that are on the same level. On certain menus, press ► (right) to enter a sub
menu, and ◄ (left) to go up to the parent menu.
2. Some menu items offer a means to change setup. To change a value press SET. The prompt will change
and a flashing cursor will appear. You can then use the arrow keys to select a different value.
3. Once you have the desired value on the display, press SET again to make the change permanent or to
cancel a change, press the OFF/CANCEL button.
4. In the case where there are only two possible values for a setting, pressing SET will flip-flop between the
values and the change is made immediately.
Front panel key functions
RIGHT will navigate to a sub-menu (assuming there is one).
LEFT will go back to the parent menu.
UP and DOWN will navigate among the menus on the same level.
SET starts a change or confirms an action.
CANCEL cancels a change or action. The CANCEL key is also labeled OFF.
CANCEL also goes back levels.
Hold CANCEL to go to the top of the menu.
Hold UP or DOWN to change contrast setting.
Turning Display On/Off
The radar will continue to measure and log data as long as a good battery is connected. The display turns off
automatically after 5 minutes of inactivity in order to conserve power. The display can be turned on at any
time by pressing any key.
To turn off the display, press the OFF/Cancel button. You may need to press it several times to exit out of
some menus first. Holding the OFF/Cancel button in any menu will turn off the display.
Backlight
The display is equipped with a backlight to assist in viewing in many different lighting conditions. The
backlight will automatically turn on whenever the display is turned on.
Contrast
If it becomes difficult to read the display, you may need to adjust the contrast. To set the contrast, press and
hold the UP or DOWN arrow buttons until you see the CONTRAST prompt and keep holding the button until
the display is readable. If the display becomes too dark or too light, press the opposite arrow key to reverse
the contrast. Once the display is readable, release the arrow, and this setting will be stored for the next time
the display is turned on.

Bringing the Benefits of Real-Time Data Collection to the World
25
Viewing Current Data
When the display is turned on, the last measured stage will display. The radar will then initiate a new
measurement and display the results as soon as the measurement completes (which is based on averaging
time).
Understanding the “?” indicator.
The radar displays a “?” after a value if there is a question about the quality of the data. This is most likely
due to poor targeting of the radar (see Targeting the Radar on page 46). The “?” is a reminder that user
action is needed for the station to be operational.
If you are viewing the live stage, you may press right to see the details of the measurement. Details like
signal strength and number of good samples may provide clues as to why the reading is bad.
You can look at the events in the log to determine the exact time of the event that caused the questionable
data. This can be used to help reconstruct the data should there be an error.
Viewing Logged Data
The radar will save the stage in its flash memory each time a measurement is made. To view logged data, use
the down arrow to display the menu Logged Data. The press right, and press up/down to select the desired
item (Logged Events, Entire Log) and press the right arrow. The last logged value for the item will be
displayed along with the date/time, and units. Press the down arrow to go back in time and the up arrow to go
forward. When you reach the end of the log, a message will be displayed. Continuing to press the arrow will
wrap to the oldest or most recent values.
Note: when viewing the log, the contrast adjustment is disabled so you can hold an arrow key to “scroll” up
and down through the log.

Bringing the Benefits of Real-Time Data Collection to the World
26
Front Panel Menu Tree
Errors (only show if errors are present)
Hardware error details
Stage (live) and time of reading -- Press set to calibrate
Stage Details
Distance to Water and signal strength (live)
Discharge * (when discharge is enabled)
Battery Voltage
GPS* (when Garmin GPS is enabled)
GPS Status
GPS Time of Last Sync
Local Time Offset
Logged Data
Stage
Discharge * (when discharge is enabled)
Logged Events
All Logged Data
Station Setup
Measurement Setup
Automeasure Interval
Automeasure Time
Operating Mode (Single | Continuous)
Averaging Time
Stage Units (feet | cm | m | mm)
Right Digits
Measurement Point
DQAP Enable
Log Stage Details
Sample Form Period
Discharge Setup
Discharge Enable
Discharge Equation ( Parshall | Weir | Generic )*
Parshall Flume Width (Pequation only)*
Weir Coefficient (weir equation only)*
Coefficient A (generic equation only)*
Coefficient B (generic equation only)*
Gauge Height Shift*
Modbus Settings
Modbus Enable
Modbus Device ID
Modbus Protocol
Modbus Parity
Delay before Tx
Delay after Tx
Modbus BaudRate
Other Setup
Station Name
WDID
Garmin GPS
Password
Default Setup
RS232 Baud Rate
RS232 Wakeup
Hardware Flow Ctrl
Auto Output
SDI-12 Address

Bringing the Benefits of Real-Time Data Collection to the World
28
SDI-12 Sensor Operation
The radar can function as an SDI-12 Sensor. This allows the radar to connect to another data logger or
transmitter to provide the data when requested. If you are not using the radar with another data recorder or
transmitter, you can skip this section.
For details on SDI-12 wiring, please refer to page 10.
The most common SDI-12 command used with the radar is the “M” measure command followed by the “D0”
command. The “M” command requests the radar to make a measurement and the “D0” command gets the
data. While there are a lot of other commands available, most users will simply use the M, D0 commands.
Note: The radar „Mode‟ of operation, ie Normal vs. Continuous Mode, will have an impact on the
communication delays experienced with the SDI-12 operation. See section Operating Modes for more details
on operation.
The remainder of this section documents all the SDI-12 commands supported by the radar. Note that most
any setting that can be changed from the front panel, can also be changed via SDI-12.
Changing the SDI-12 address can be accomplished via the front panel (Station Setup > Other Setup > SDI-12
Address).
SDI-12 Reference
The radar will respond to all standard SDI-12 commands. To use the SDI-12 commands you must have a
data logger or interface that supports the SDI-12 standard. The radar is compliant with SDI-12 Specifications
version 1.3. More details on the SDI-12 interface can be found at http://www.sdi-12.org.
The general form of an SDI-12 command is:
aC!<CR><LF>
where a is the sensor address 0-9,A-Z,a-z,*, ?. (Addresses * and ? will address any sensor, regardless
of its address.)
C is the command and ! is the last character of the command.
The standard SDI commands are as follows
Name
Command(s)
Response
Example/Notes
Acknowledge Active
a!
a
I
Send Identification
aI!
A13 SUTRON 1.0
RLRXXXV1.21
Where 1.0 is the board
revision, V1.21 is the
software revision
A
Change Address
aAb!
b
?
Address Query
?!
a
M
MC
C
CC
Measure Stage and
discharge
aM!
aD0!
atttn
a
+stage
+discharge
+units
+distance
+validity
Returns stage in user set
units, discharge (0 if
disabled), units
indicator, and validity.
The validity can be 0-
valid, 1-sensor failure,
2-data old, 3-system not
configured properly

Bringing the Benefits of Real-Time Data Collection to the World
29
Name
Command(s)
Response
Example/Notes
M1
MC1
C1
CC1
Measure Distance to
Water and Battery
aM1!
aD0!
atttn
a
+distance
+battery
Returns distance to
water in feet and
battery voltage.
M2
MC2
C2
CC2
Measure Stage, Return
stage details
aM2!
aD0!
atttn
a
+stage
+deviation
+outliers
+total count
+signal strength
+validity
M3
MC3
C3
CC3
Returns last
automeasured stage and
Related stage details.
This command does not
cause a measurement to
be made.
aM3!
aD0!
atttn
a
+stage
+deviation
+outliers
+total count
+signal strength
+validity
+age
This command does not
cause a measurement to
be made. It returns the
extended information
for the last
measurement.
Age is the number of
seconds since the
measurement was made.
M4
MC4
C4
CC4
Return raw radar sensor
readings
aM4!
aD0!
atttn
a
+duty cycle
+signal strength
Diagnostic command,
not intended for field
use.
M5
MC5
C5
CC5
Measures and returns
radar subsample data.
aM5!
aD0!
atttn
a
+duty cycle
+signal strength
+ quality (0=not graded,
1=good, 2=out of range,
3=delta error, 4=sensor
failure)
+lock/unlock (1=locked)
Diagnostic command,
not intended for field
use. May return more
data than allowed by
SDI-12 specification.
M6
MC6
C6
CC6
Measures and returns
radar sample data.
aM6!
aD0!
atttn
a
+distance
+standard deviation
+minimum
+maximum
+signal strength
+good count
+total count
+quality (0=bad, 1=good)
Diagnostic command,
not intended for field
use. May return more
data than allowed by
SDI-12 specification.
M7
MC7
C7
CC7
Return automeasured
stage and discharge. This
command does not cause
a measurement to be
made
aM7!
aD0!
atttn
a
+stage
+discharge
+units
+distance
+validity
+age
Age is the number of
seconds since the
measurement was made
Bringing the Benefits of Real-Time Data Collection to the World
30
Name
Command(s)
Response
Example/Notes
M8
MC8
C8
CC8
Returns last measured
radar sample data (same
as M6, but no new
measurement is initiated)
aM8!
aD0!
atttn
a
+distance
+standard deviation
+minimum
+maximum
+signal strength
+good count
+total count
+quality (0=bad, 1=good)
Diagnostic command,
not intended for field
use. May return more
data than allowed by
SDI-12 specification.
V
Verification
aV!
Errcount+resets
Name
Command(s)
Response
Example/Notes
X?
Request unknown
address
*X?!
a
Address of the sensor
This command causes
the Bubble to identify
itself.
XAD
Set SDI-12 address
aXADnAn!
n the new SDI-12
address, repeated
twice
a0011
no response if the addresses
do not match
Note: a D0 command
issued after will return
the new address.
XE
Set Measuring Point
aXE+d+u!
d is the Measuring
Point in the units
indicated by u.
attt1
0XE+0+0
(set the Measuring Point
to 0 causing all stages to
be inverse of the
distance to water.)
0XE+15.25+0
(set the Measuring Point
to 15.25ft)
Note: a D0 command
issued after XE is
complete will display
the new Measuring
Point in the current units
(as set by the XUP
command).
XS
Set Stage
aXS+d+u!
d is the desired
reading for the
sensor and in the
units indicated by u.
The sensor will
adjust the Measuring
Point to ensure the
reading matches the
value entered.
attt1
Example: 0XS+7.87+0
(sensor is at 7.87 feet,
adjust Measuring Point
to ensure this reading)
Note: a D0 command
issued after XS is
complete will display
the Measuring Point in
the current units (as set
by the XUP command).
XOM
Set/display
operating mode
aXOM+m!
m is optional. Omit
m to read the current
mode, include it to
change the mode.
attt1
Example: 0XOM+0!
(puts device into single
mode)
Note: a D0 command
issued after XS is

Bringing the Benefits of Real-Time Data Collection to the World
31
Name
Command(s)
Response
Example/Notes
m = 0, single mode,
measure only when
data is requested
m = 1, continuous
mode, measure
continuously and
provide data when
requested.
complete will display
the operating mode.
XT
Set/display
averaging time
aXT+t!
t is optional. Omit t
to read the current
value, include it to
change.
t = averaging time in
seconds (0 to 900
seconds)
attt1
Example: 0XT+10!
(sets the averaging time
to 10 seconds)
Note: A D0 command
issued after will return
the averaging time.
XUP
Set/display stage
units & number of
right digits
aXUP+n+d!
Both n and d are
optional. Include
them if you want to
change the values.
n = 0 feet water
n = 1 m water
n = 2 cm of water
n = 3 mm water
d = number of
places right of the
decimal
attt2
Example: 0XUP+1+2!
select m with 2 right
digits
Note: a D0 command
issued after the XUP
will return the value of
the units that are
selected and the number
of digits right of the
decimal point.
XFD
Set factory defaults
aXFD!
a0011
Note: a D0 command
issued after the XFD
command will return the
operating mode.
XOP
Set/display auto
serial output
aXOP+a!
a is optional.
Include it to change
the value.
a = 0 disable output
a = 1 enable output
a0011
Note: a D0 command
issued after command
will return the auto
serial output.

Bringing the Benefits of Real-Time Data Collection to the World
32
Name
Command(s)
Response
Example/Notes
XDT
Set/display date and
time
aXDT!
this command reads
the current time
aXDTYYYY/MM/
DD HH:MM:SS!
a is address
XDT is the
command to set the
date and time
YYYY is the year
MM is the month
(01 to 12)
DD is the day of the
month (01 to 31)
HH is the hour
(military time 0 to
23)
MM is the minutes
SS is the seconds
aYYYY/MM/DD
HH:MM:SS+q+g
a is address
YYYY is the year
MM is the month (01 to 12)
DD is the day of the month
(01 to 31)
HH is the hour (military time
0 to 23)
MM is the minutes
SS is the seconds
q is a single digit that
indicates the quality of the
time. 0 means the time is
invalid. 1 can mean that time
was set since bootup (if no
GPS is present), or that the
time has been synced to the
GPS in the last 12 hours (if a
GPS is present).
g is a single digit that
indicates the presence of the
GPS. 0 means no GPS is
present, 1 means that a GPS is
present.
Example set date time
command:
0XDT2005/09/01
13:15:00!
Sets the date to the 1st
of September2005, and
the time to 1:15:00 PM.
XXS
Generic setup
command
See page 33 for
details

Bringing the Benefits of Real-Time Data Collection to the World
33
XXS Generic Change Radar Setup Command
This command is used to view and change all setup data in the unit. It is used in the following manner:
XXS+s+n+v1+v2+v3+…+vx where
s is the setup identifier and must be equal to 1
n is the setup variable to start making changes at.
v1 is the new value to write for the first variable
v2 is the value to write for the next variable
The setup variables are accessed using their order in the software meta variable map as seen in the following
table. The values than can be used for any of the variables can be seen in the radar Settings and Radar
Settings sections.
1. Automeasure Interval
2. Automeasure Time
3. Operating Mode
4. Avg Time
5. Right Digits
6. Stage Units
7. Measuring Point
8. DQAP Enable
9. Discharge Enable
10. Discharge Equation
11. Parshall Width
12. Coefficient A
13. Coefficient B
14. Gauge Height Shift
15. Weir Coefficient W
16. Station Name
17. WDID
18. Auto Output
19. Log Every Subsample
20. Log Every Sample
21. Log Stage Details
22. Log Daily Values
23. Sample Form Period
24. Garmin GPS Enable
25. GPS Local Time Offset
An example command to change the right digits to 5 is:
XXS+1+5+5
You can also change right digits to 6 and stage units to 2 together in the same command by typing:
XXS+1+5+5+2
To read a setup value, issue command XXS+1+n!, where n is the setup variable whose value you are
interested in. For example, to read the current right digits, issue command XXS+1+5! and follow it up with a
D0! command. The reply to D0 will have the right digits.
Any settings that allow for a negative value can be set using a „-„ as a delimiter.
Changing the station name can use either a „+‟ or „-„ delimiter and may contain spaces:
XXS+1+16+New Name would change the station name to “New Name”.

Bringing the Benefits of Real-Time Data Collection to the World
34
RS232 Command Line Interface
The RS232 interface provides a simple way to connect the radar to PCs, modems and other communications
devices. Details on the DB9 connector are on page 10.
Microsoft Windows usually comes with a program called HyperTerminal. It can be found by going to the
Windows start menu, Programs, Accessories, Communications.
By default the RS232 interface operates at 115200 Baud, no parity, 8 data bits, 1 stop bit. Changing the baud
rate can be done via the front panel: Station Setup > Other Settings > Baud Rate, or via the command line by
typing “BAUD RATE”.
If connecting to a PC, use a standard DB9 serial cable. If connecting to a modem or a logger, you are likely
to need a null modem adapter.
To start command line mode, send carriage return or line feed (or both). If using HyperTerminal or a similar
program, simply press ENTER. Radar will respond with a prompt >
Once in command line mode, type “HELP” to get a list of supported commands.
RS232 Setup
The setting RS232 Wakeup controls what is required to wake the unit up via the RS232 connection. The
options are:
Wake on RTS (default)
Wake on DTR
Wake on either RTS or DTR
Always on
If setup to wake on RTS, DTR, and RTS or DTR, the connected device must assert said line for
communication to work. At least half a second needs to occur between the assertion of the correct control
line and the start of communication (automatically done by HyperTerminal). The unit can also be setup to be
always on, which increases power consumption but requires neither RTS nor DTR to establish RS232
communication. If setting up the unit with a modem, it is likely that Wake on DTR would be the correct
option that results in lowest power consumption. However, it will depend on the modem. Access this setting
via the front panel: Station Setup > Other Settings, or via the command line.
Please note that the unit will always assert DSR (as long as it has power).
Hardware flow control via lines RTS and CTS (a.k.a. hardware handshaking) can be enabled via the
Hardware Flow Ctrl setting. Enabling the setting can improve communication, especially if using a modem.
When handshaking is on, the receiver is able to pause the data flow from the transmitter. Access this setting
via the front panel: Station Setup > Other Settings, or via the command line.
Please note that if RS232 Wakeup is set to wake on RTS, it is not possible to use Hardware Flow Ctrl.
Machine to Machine Communication
All commands may be preceded with an !. If they are, there is no echo, and a concise reply meant for
machine to machine interaction is returned. Commands would be preceded by an ! if they were sent by an
Xpert or some such computer.
Viewing Stage
To initiate a new stage measurement, type MEAS. To see the last automeasured stage, including details, type
LAST. The output by the radar will look like this:
Radar Reading
Stage 7.01 feet

Bringing the Benefits of Real-Time Data Collection to the World
35
Discharge 52.21 CFS
Distance 23.38 feet
Good Samples 2
Total Samples 2
Standard Deviation 0.00
Signal Strength 59.7%
For details on what each of the measurements means, please refer to Stage Details on page 15.
For a concise version, try !LAST or !MEAS;
7.01,23.38,53.21,
2,2,0.01,59.7
Downloading the Log
The radar will save the stage in its flash memory each time a measurement is made. This data is then
available to download to via the RS232 port. The command “LOG” command will start a Y-Modem transfer
of the log to the connected device. There are optional parameters that alter what data is downloaded as
follows:
“LOG” with no parameters will download since last.
“LOG ALL” gets whole log.
“LOG X” gets X last days ("LOG 3" gets last 3 days worth of data)
“LOG timeStart” gets data since provided date
“LOG timeStart timeEnd” gets data between provided dates
time can be YYYY/MM/DD HH:MM:SS or YYYY/MM/DD or HH:MM:SS
e.g. "LOG 12:00:00 13:00:00"
e.g. "LOG 2006/01/20 12:00:00 2006/01/21 12:00:00"
Appending NH will omit the header : « LOG ALL NH »
“LOG HELP” Shows details on how to use the download command.
Auto Output
When the radar has auto output mode enabled (via front panel, Station Setup>Other Settings>Auto Output,
command line AUTO OUTPUT), it will automatically send data out on the RS232 port. The data will come
out at whatever baud rate is setup (via front panel, Station Setup>Other Settings>Baud Rate, command line
BAUD RATE). If connected via HyperTerminal, and if command line mode is active, type EXIT to leave
command line mode and to capture the auto output.
The data auto output is the stage. It is output as fast as it is measured (which depends on user settings), once
a second at most. The data is ASCII. This is an example of the output:
46.3
46.3
46.4
46.4
Target Mode
In order to help setup the Radar so that its antenna correctly points at the water‟s surface, the TARGET
command may be issued. Once issued, the Radar will continuously output distance to water and signal
strength. readings. The readings are output once a second. To ensure fresh data is output, make sure that the
sample form period is one second or less (which it is at default).
RS232 Command Reference
Documentation Legend:

Bringing the Benefits of Real-Time Data Collection to the World
36
+ If any command is followed by +, it means that as long as the command starts with the indicated
word, it will be accepted.
E.g. MEAS + means that typing “MEAS”, “MEASURE”, or “MEASXXX” will all have
the same effect.
0 If a 0 follows a listed command, it means that the command can optionally be followed by the
character 0.
E.g. “DIAG” will show the system diagnostic status. “DIAG 0” will first show current
status and then clear the status.
! NOTE:
All commands may be preceded with an !. If they are, a concise reply meant for machine to
machine interaction is returned. Commands would be preceded by an ! if they were sent by
an Xpert or some such computer.
E.g. “MEAS” will show
Radar Reading
Stage 23.04 feet
Distance 23.30 feet
Good Samples 2
Total Samples 2
Standard Deviation 0.01
Signal Strength 63.5%
“!MEAS” will show
23.05,23.29,0.00,
2,2,0.00,63.0
List of commands
BATT + Shows the current battery reading.
DIAG + 0
Shows system diagnostics, including system resets. If followed by 0, it will clear system resets.
DOWNLOAD
See LOG
EXIT Quits command line.
HELP Brings up the end user help (lists commands).
HI
System replies with “Hello”
LAST + Shows the last automeasured reading.
LOG This command is used to download the log. It can be followed by optional parameters indicating
what part of the log to download.
LOG with no parameters will download since last.
“LOG ALL” gets whole log.
“LOG X” gets X last days ("LOG 3" gets last 3 days worth of data)
“LOG timeStart” gets data since provided date
“LOG timeStart timeEnd” gets data between provided dates
time can be YYYY/MM/DD HH:MM:SS or YYYY/MM/DD or HH:MM:SS
e.g. "LOG 12:00:00 13:00:00"
e.g. "LOG 2006/01/20 12:00:00 2006/01/21 12:00:00"
The file name for the downloaded log has the format
Stationname_log_YYYYMMDD.csv where YYYYMMDD is the date of the first data in
the log file

Bringing the Benefits of Real-Time Data Collection to the World
37
The data in the log file consists of some header lines to document important station information
followed by data. The following are examples of the header lines :
Station Name, WDID, model and version, Measuring Point, Operating Mode, Avg Time, DQAP, Sample Form Period
Sutron Radar, 20003, RDR ver 1.11, 48.24659 feet, Normal, 10.000 sec, Disabled, 1.0 sec
PWM Slope, Factory Offset, SigStrCal
0.75743, -2.216, 3.195
Discharge, Equation, Parshall Flume Width, Weir Coefficient W, Coefficient A, Coefficient B, Gauge Height Shift
Enabled, Generic: A*(Stage^B), 12 inches, 1, 1, 1.5, 0.1
The header lines are followed by data in the following format :
Name, Date, Time, Value, Units, Quality
The following are examples of logged data :
04/13/2009,10:51:25,Stage,-3.91,feet,
04/13/2009,10:51:25,Distance,3.91,feet,
04/13/2009,10:51:25,Standard Deviation,0.00,,
04/13/2009,10:51:25,Signal Strength,101.0,,
04/13/2009,10:51:25,Good Samples,5,,
04/13/2009,10:51:25,Total Samples,5,,
LOG HELP
Shows details on how to use the download command.
STAGE = 14.5
Changes the current stage to 14.5 (of whatever units are currently chosen). User can choose any
number, not just 14.5. Please see the section Setting Stage on page 14.
MEAS +
Initiates, waits for, and shows the results of sensor measurements.
REBOOT
Does a software resets of the system.
RESETS + 0
Shows system diagnostics, including system resets. If followed by 0, it will clear system diagnostic
status.
SETUP If provided without any other parameters, it lists all setup details. That includes each setup variable
and its current value.
Can be followed by a setup variable name and a new value for that variable.
E.g. “CHANGE STATION NAME = SUTRON”
If SETUP DEFAULT is issued, it will reset the entire setup to defaults.
STATUS 0
Shows system status including time, boot time, battery readings, last Radar measurements, current
onboard sensor readings, and any hardware errors that may exist. If followed by 0, it clears the
hardware errors.
TARGET
Continuously measures and outputs sample data, including distance to water and signal strength.
TIME Shows the current system date and time. If followed by a new time, it changes the system time.
UPG + Initiates a system software upgrade. It needs to be followed by the YModem transfer of an .upg file
specific to the product. Both the main application and the bootloader are upgraded this way (but
each needs its own .upg file).
VER + Shows the current software version, including build date and time and the bootloader version.
List of setup variables

Bringing the Benefits of Real-Time Data Collection to the World
38
Type SETUP to get a list of the whole setup. Every setup variable can be viewed by typing its name.
E.g. “STATION NAME” will show the current station name.
Every setup variable can be changed by typing its name = new value.
E.g. “STATION NAME = SUTRON” will set the station name to “SUTRON”.
AUTO OUTPUT
AUTOMEASURE INTERVAL
AUTOMEASURE TIME
AVG TIME
COEFFICIENT A
COEFFICIENT B
DISCHARGE ENABLE
DISCHARGE EQUATION
DQAP ENABLE
GAUGE HEIGHT SHIFT
HARDWARE FLOW CTRL
STAGE UNITS
LOG STAGE DETAILS
LOG DAILY VALUES
MEASURING POINT
OPERATING MODE
PARSHALL WIDTH
RIGHT DIGITS
RS232 BAUD RATE
RS232 WAKEUP
STATION NAME
WDID
WEIR COEFFICIENT W
List of calibration setup variables
These settings are set at the factory for optimum operation and should not be changed. If they are, radar may
stop functioning, Note: Consult Sutron Customer Service for further information regarding factory
calibration.
Setup Transfer via Hyperterminal
It is possible to capture a Radar‟s setup and save it to file. Using HyperTerminal, establish RS232 connection
first. Once you are able to talk to the Radar, use HyperTerminal‟s Transfer menu and select Capture Text.
Then type !SETUP on the command line. The Radar will stream out it‟s entire setup and it will be saved in
the file selected. Make sure to tell HyperTerminal to stop text capture after getting the setup in the file.
Once the setup is saved to file, feel free to edit the file, changing any of the settings. To send a setup file to
the Radar, HyperTerminal will need to be properly configured to delay after sending every line. To do so,
user HyperTerminal‟s File, Properties menu. Click on the Settings tab and click the ASCII Setup button.
Change the Line delay to 1000 milliseconds and change the Character delay to 5 milliseconds. If these
changes are not made, HyperTerminal will send the file too fast for the Radar to capture any but the first few
settings. Once the changes are made, choose HyperTerminal‟s Transfer menu and click Send Text File.
Select the file with the saved setup. You will see the transfer take place on HyperTerminal‟s main window.
Radar will report which settings have been changed.
Connecting a Modem
It is possible to connect a modem to the Radar, allowing for remote access to the station. Use the RS232 port
to connect the modem. Most modems will need a null modem adapter between the modem and the Radar.

Bringing the Benefits of Real-Time Data Collection to the World
39
The modem will need to be configured before it can be used. Please make sure to test out the modem-Radar
connection before deploying them in the field. The following modem settings must be configured:
Autoanswer: enable (otherwise a connection will never be established)
Connect timeout: enable (otherwise the modem will keep the Radar awake, increasing power
consumption)
Command echo: disable (otherwise the modem and the Radar will forever talk to each other,
preventing further connections and increasing power consumption)
Telnet mode: enable (this is required only if using a modem over TCP/IP – if not enabled, log
downloads may fail, especially if using HyperTerminal)
RTS: enable (this is likely on by default – unless the setting RS232 Wakeup is changed, the Radar
will not notice the modem unless RTS is on)
Carrier Detect: always on (also know as LSD Action, DCD, and CD)
Baud rate, parity, etc: set this up to match the settings of the Radar (Radar defaults are 115200
Baud, no parity, 8 data bits, 1 stop bit)
Xpert-Xlite Modem 8080-0005
Sutron manufactures a modem (Xpert-Xlite Modem part number 8080-0005) that is suitable for use with the
Radar. On the Radar, setup RS232 Wakeup to wake on RTS (it is that way by default).
A null modem cable is needed between the device and the modem since they are both configured as DCE
devices. If the null modem cable routes pin 9 through from end to end, you can power the modem from the
device, but most null modem adapters leave pin 9 disconnected. In that case, just connect the power (5V-16V
DC) to the power connector. Note: this can be done even if the cable routes power through pin 9. The modem
will utilize which ever is providing the higher voltage. The modem also must be configured to power up on
RTS instead of DTR and to output CD on the DSR pin.
Set J4 to pins 1-2 to have the modem wake up on RTS
Set J5 to pins 1-2 to route CD out the DSR pin
The default settings from Sutron for the modem will work. If the settings have been changed, issue these
commands to the modem:
AT&F
ATS0=1
ATE0Q1&D0&W
This is what the commands mean:
AT&F set to factory defaults
S0=1 answer on first ring
E0 don't echo characters
Q1 don't send result codes
&D0 ignore DTR
&W save settings into profile.
Raven Modem
A Raven modem allows you to access the Radar through the Internet. The Raven should be ordered with a
fixed IP address. Using that IP address, you will be able to use HyperTerminal or other TCP/IP aware
communications programs to use the command line interface of the Radar.
Make sure to place a null modem adapter between the Raven and the Radar.
The Raven modem must be configured as follows:
Device Port 3001
Configure Serial Port 115200,8N1
Command Echo 0

Bringing the Benefits of Real-Time Data Collection to the World
40
TCP Auto Answer 2
TCP Connect Timeout 30
TCP Idle Timeout 2
Telnet Echo Mode 0
UDP Auto Answer 2
You can connect the Raven to the same battery powering the Raven; however, remember that it will increase
the power consumption (both when the modem is idle and when it is connected). As a result, you will need to
make sure your battery is large enough to provide the power needed by the station.

Bringing the Benefits of Real-Time Data Collection to the World
41
Discharge
What the Radar Can Do For You
The radar was specifically designed to eliminate most of the labor involved in working up records from a
discharge measurement site. Traditionally, the stage values have been recorded as a line on a strip chart.
Discharge has been computed by drawing lines to represent the mean daily stage, and then looking up the
discharge in a rating table or graph. The radar eliminates the need for hand computations and data recording.
The radar supports real-time calculation of discharge for the following:
Parshall flumes
Broad-crested weirs
Any flow measuring device whose rating takes the form Discharge = A * Stage ^ B, where A and B
are constants
You can eliminate the need for after-the-fact hand calculations by enabling discharge calculation and entering
the coefficients for your flume or weir.
Discharge Setup Sequence
Very little extra effort is required to make an radar record discharge as well as stage. The steps are as
follows:
1. Set up stage (see Setting Stage on page 14)
2. Follow the steps in the next section to enable discharge recording and enter the correct coefficients for
your flume or weir
Correctly Recording Discharge
Enabling The Computation
Discharge calculation can be enabled either from the front panel or via the command line interface. Via the
front panel, go to Station Setup > Discharge Setup > Discharge Enable and press set to enable discharge.
Once discharge is enabled, press down to choose the discharge equation: The choices are:
Parshall Flume
Weir
Generic
WORD OF CAUTION
The radar follows standard computer “execution order” rules when solving the discharge equations. The
exponential calculation ( Stage ^ B ) is made first, followed by the multiplication by the constant A. Rating
tables (see next page) are computed this way.
(A * Stage) ^ B is NOT the same as A * (Stage ^ B). If you are checking values in a table, or creating your
own equation by curve fitting values in a table, be sure to do the calculations in the same order as done by the
RADAR.
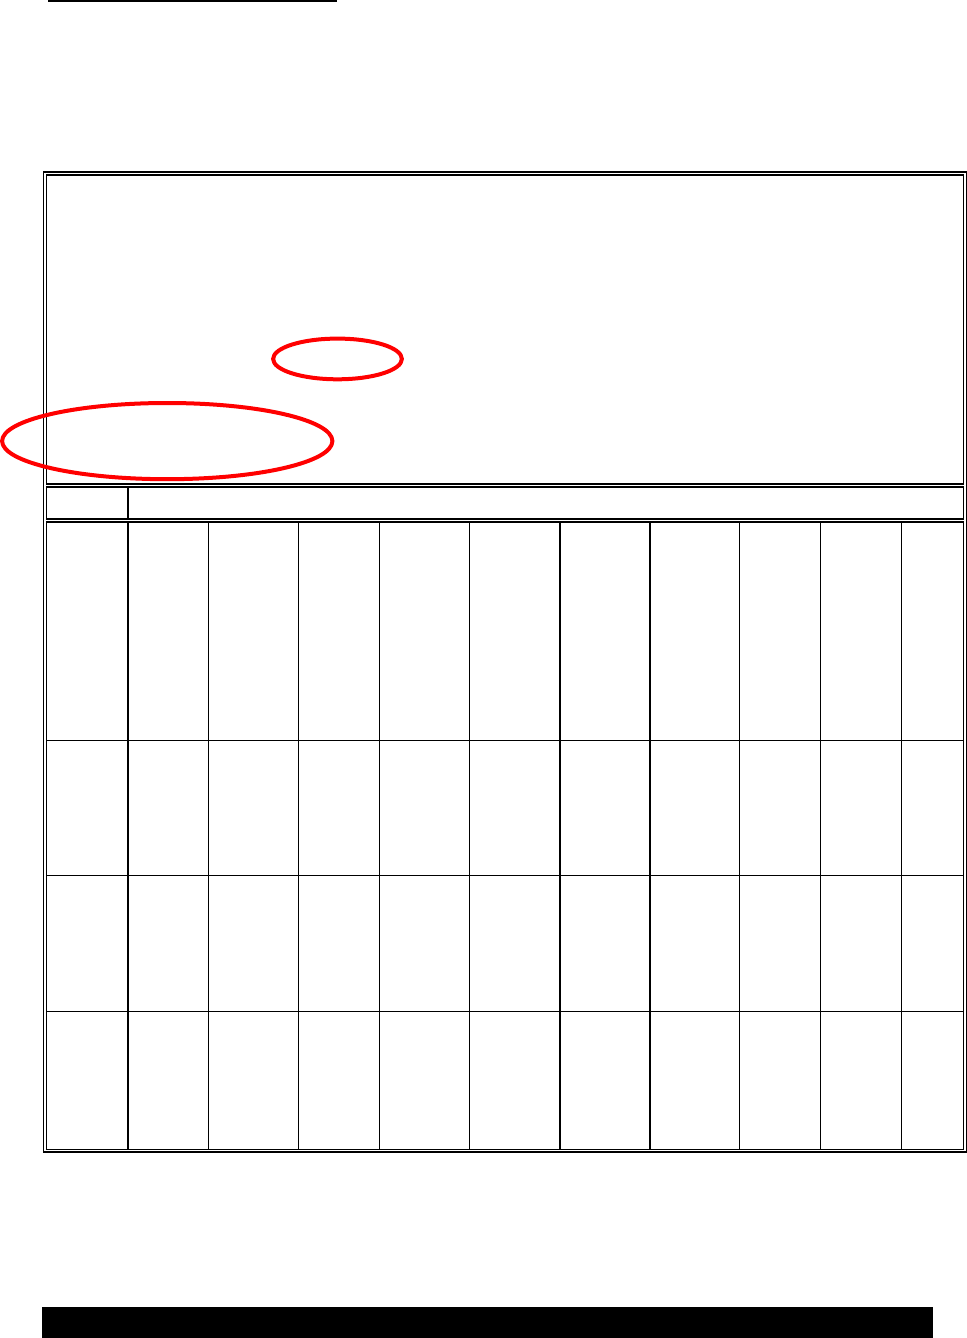
Bringing the Benefits of Real-Time Data Collection to the World
42
Selecting the Calculation Type
Rating Curves and Equations
Every flow measurement device is rated to determine the relationship between the stage at a fixed location
(staff gage) and the discharge. The ratings are presented as equations and/or tables that allow the user to
determine the discharge. A typical rating table is illustrated in the figure below.
State of Colorado
Division of Water Resources
Office of State Engineer
Computed by: RVS
Division 1
Checked by: RVS
Rating Table ID:
JUMBOSCO01
Jumbo Outlet #1 @ 22.8'
Weir
Time of Last Edit: 23-Oct-2002
A
73.994
EQ: Q=73.994(GH)^1.8537
B
1.8537
GH
0.00
0.01
0.02
0.03
0.04
0.05
0.06
0.07
0.08
0.09
Feet
cfs
Cfs
cfs
cfs
cfs
cfs
cfs
cfs
cfs
cfs
0.00
0.10
1.04
1.24
1.45
1.69
1.93
2.20
2.48
2.77
3.08
3.41
0.20
3.75
4.10
4.47
4.85
5.25
5.66
6.09
6.53
6.99
7.46
0.30
7.94
8.44
8.95
9.48
10.02
10.57
11.14
11.72
12.31
12.92
0.40
13.5
14.2
14.8
15.5
16.2
16.8
17.5
18.3
19.0
19.7
0.50
20.5
21.2
22.0
22.8
23.6
24.4
25.3
26.1
27.0
27.8
0.60
28.7
29.6
30.5
31.4
32.4
33.3
34.3
35.2
36.2
37.2
0.70
38.2
39.2
40.2
41.3
42.3
43.4
44.5
45.6
46.7
47.8
0.80
48.9
50.1
51.2
52.4
53.6
54.7
55.9
57.2
58.4
59.6
0.90
60.9
62.1
63.4
64.7
66.0
67.3
68.6
69.9
71.3
72.6
1.00
74.0
75.4
76.8
78.2
79.6
81.0
82.4
83.9
85.3
86.8
1.10
88.3
89.8
91.3
92.8
94.3
95.9
97.4
99.0
101
102
1.20
104
105
107
109
110
112
114
115
117
119
1.30
120
122
124
126
127
129
131
133
134
136
1.40
138
140
142
144
145
147
149
151
153
155
1.50
157
159
161
163
165
167
169
171
173
175
1.60
177
179
181
183
185
187
189
191
194
196
1.70
198
200
202
204
207
209
211
213
215
218
1.80
220
222
225
227
229
231
234
236
238
241
1.90
243
246
248
250
253
255
258
260
262
265
2.00
267
270
272
275
277
280
282
285
288
290
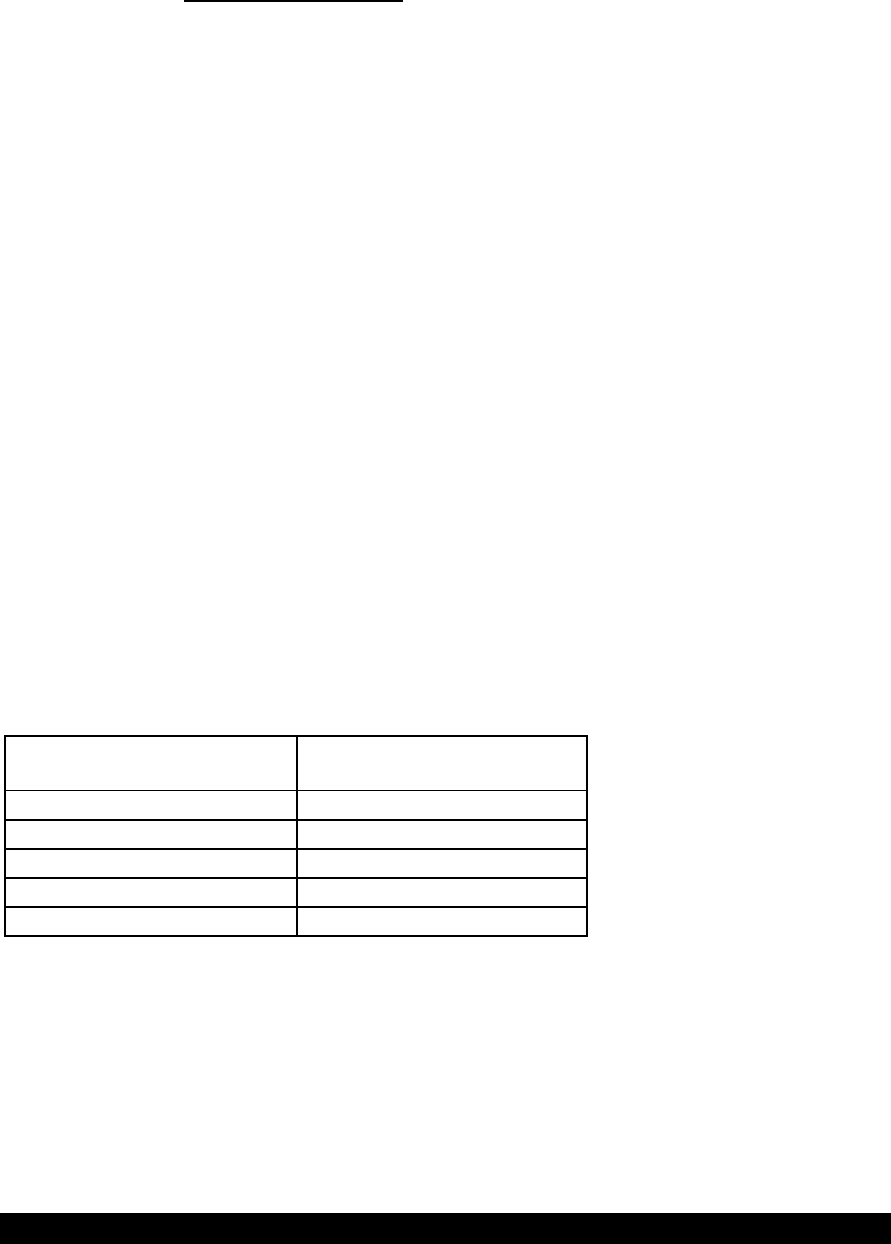
Bringing the Benefits of Real-Time Data Collection to the World
43
The figure illustrates a typical rating table as provided by the State of Colorado‟s Division of Water
Resources. Note at the top that the rating is for a weir and that the equation upon which the table is based is
provided. The type of device, along with the equation, determine how you should set up the radar.
Base your radar setup primarily on the equation, if one is given.
The radar is designed to support discharge calculations based on the general formula
Discharge = A * (Stage ^ B)
where A and B are constants and ^ represents the operation of raising a number to a power. The values of A
and B are determined by the flow measuring device you are using. Here is how to decide.
1. Are you using a Parshall flume? If so, select Parshall Flume as the discharge calculation type.
2. Are you using a weir? Examine the coefficient B in the equation. If the coefficient is EXACTLY 1.5
or 3/2, then select Weir as the calculation type.
3. If you are not using a Parshall Flume or weir, or the B coefficient is NOT 1.5, then select Generic as
the calculation type.
In the example table above, the device type is weir, and the equation is:
Q=73.994 * ( (GH)^1.8537 )
Note that since the B coefficient is 1.8537 the correct calculation type will be Generic, and NOT Weir. This
is because the B coefficient is NOT 1.5.
The following paragraphs provide additional information on how the radar computes discharge for the three
calculation types.
Parshall Flume
Parshall flumes are one of the most widely used discharge measuring devices in the world. The following
equation family is used to compute the discharge for Parshall flumes:
W, in feet
Discharge equation, Q in CFS
0.25 (3 inches)
Q = 0.992 H ^ 1.547
0.5 (6 inches)
Q = 2.06 H ^ 1.58
0.75 (9 inches)
Q = 3.07 H ^ 1.53
1 to 8
Q = 4W H ^ (1.522 W ^ 0.026)
10 to 50
Q = (3.6875W + 2.5) H ^ 1.6
(Reference: Open Channel Hydraulics, Chow, Ven Tee, McGraw Hill Book Company, New York, 1959)
If you are using a Parshall flume you will only have to enter the throat width, W. The radar will compute the
appropriate values for A and B in the discharge equation. Note that these equations DO NOT account for
submerged outlet conditions.

Bringing the Benefits of Real-Time Data Collection to the World
44
Weir
Weirs are also widely used for discharge measurement, but, unlike Parshall flumes, are not standardized.
There is an infinite variety of widths, side shapes, and constructions. In general, the discharge over a weir
can be represented by the equation:
Discharge = K * L * ( Stage ^ (3/2) )
where K is a coefficient determined by the rating process, and L is the length of the crest. Examine the rating
equation for your weir carefully. Some weirs will provide the coefficient K and some will provide the
product K * L. You will need the PRODUCT, K * L to enter as W in the setup. For example, if the weir
equation is given as:
Q=73.994 * ( (GH)^1.5 )
then you would enter 73.994 for W in the setup.
General-Purpose Equation
The general purpose equation should be used for any non-standard flume or weir. As long as the device
rating can be expressed in the form:
Q=A * ( (GH)^B )
then the radar can be used to compute the discharge. For example, from the rating table presented earlier we
were given the discharge equation:
Q=73.994 * ( (GH)^1.8537 )
Enter the value 73.99 for A in the setup and 1.8537 for B. The procedures for entering coefficients are given
in the next section.
Entering the Coefficients
The flume and weir constants are entered after you make your selection for the computation type (Parshall
Flume, Weir, Generic).
If you are setting your radar up from the front panel, the coefficient entry is “context sensitive.” That is, the
radar will determine what you need to enter.
If you select Parshall Flume as the device type and scroll down one position you will see the prompt
“Parshall Flume Width”, followed by a value. Press the SET key to change the width. When you press SET
you will see the prompt “Change width”, followed by the current value. Use the UP/DOWN arrow keys to
scroll through the available widths.
If you select Weir as the device type and scroll down one position you will see the prompt “Weir Coefficient
W”. Press the SET key to change the value. Note that W represents the K*L product in the general weir
equation. When you press SET you will see the prompt “Change Weir Coefficient W”, followed by a value
containing a blinking cursor. Use the arrow keys to position the cursor and to scroll the individual digits.
Press SET to make the coefficient permanent after you are done editing.

Bringing the Benefits of Real-Time Data Collection to the World
45
If you select Generic as the device type and scroll down one position you will see the prompt “Coefficient A”,
followed by a value. Press SET to change the value. You will see the prompt “Change Coefficient A”,
followed by a value containing a blinking cursor. Use the arrow keys to position the cursor and to scroll the
individual digits. Press SET to make the coefficient permanent after you are done editing. Press the down
arrow key after Setting the value of Coefficient A. You will see the prompt “Coefficient B”, followed by a
value. Press SET to change the value. You will see the prompt “Change Coefficient B”, followed by a value
containing a blinking cursor. Use the same procedures you used to set and store Coefficient A.
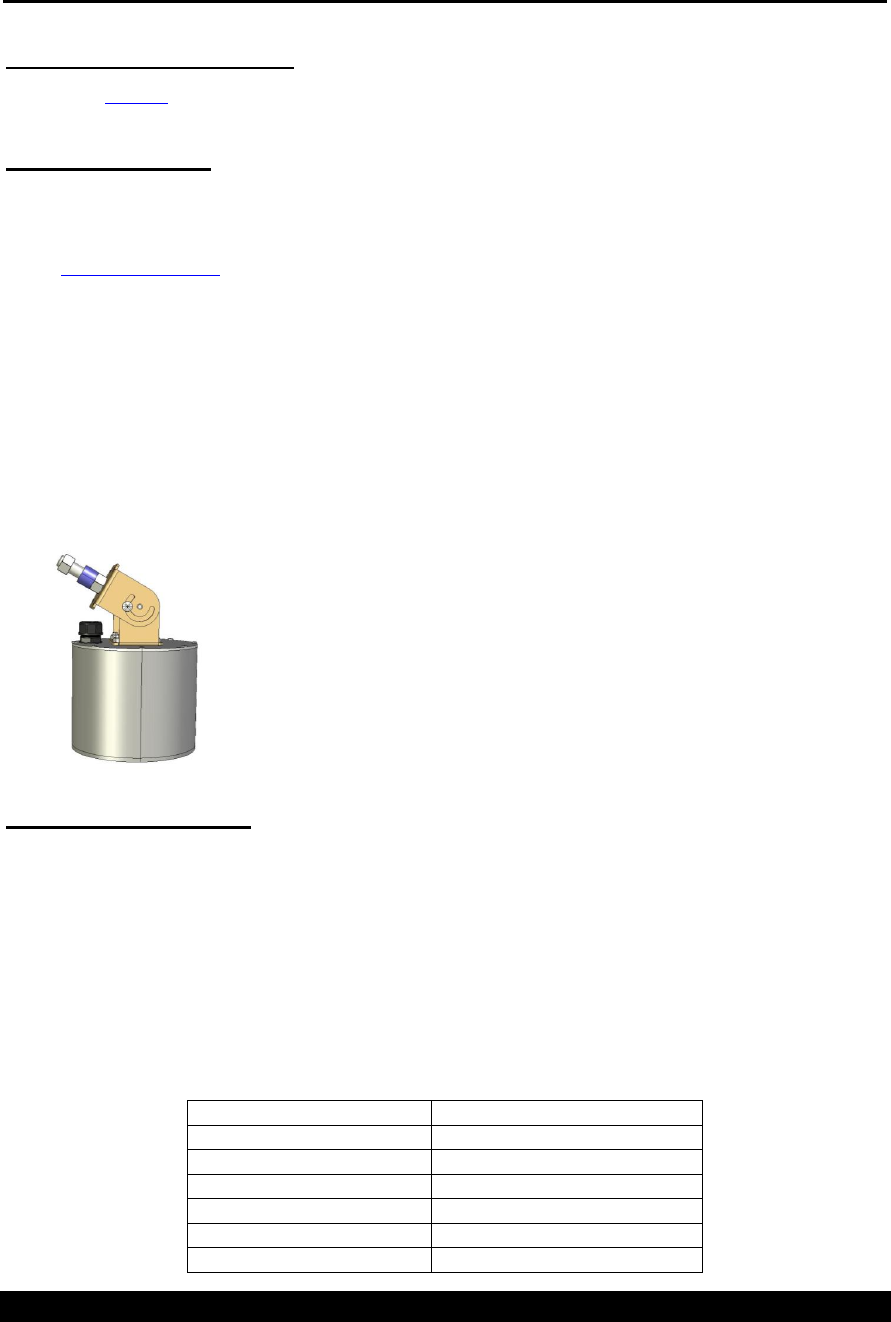
Bringing the Benefits of Real-Time Data Collection to the World
46
Installation
Electrical Connections:
Refer to the Cabling section on page 9 for a description of the electrical connections.
Mount the Radar
Be sure to pick a location for the radar where it has a clear, unobstructed view of the water below it. The
minimum distance for the sensor is 5 feet so make sure that the sensor is at least 5 feet above the highest stage
that can be measured. The maximum distance from the sensor to the water is 60ft. Read the next section
titled “Targeting the Radar” for additional before mounting the radar.
The RLR-0001-1 radar is designed to mount with the front panel display facing up. In this orientation, the
radar antenna points down to the water surface. You may switch the orientation of the antenna by opening the
enclosure and changing the mounting plate so the antenna points to the side of the enclosure. Do not install
the RLR-0001-1 outdoors without an additional protective enclosure. The radar mounts to a panel or surface
through four holes that are accessible in the corners of the enclosure
The RLR-0003-1 antenna enclosure is designed with a 5/8” bolt for connection to a mounting arm. The bolt
and the swivel bracket can be adjusted to allow the radar to point directly to the water surface no matter what
the angle is of the mounting arm. The adjustments are made by loosening the two screws in the sides of the
swivel bracket and also rotating the bracket relative to the bolt.
Targeting the Radar
The radar sensor operates by emitting a pulse and capturing its reflection. The pulse is meant to be reflected
on the surface of water. To operate properly, the antenna emitting the pulse must be carefully pointed at the
water surface.
For best results, mount the radar directly above the water surface, such that the radar beam is
perpendicular to the water. The radar will not operate well if the beam strikes the water at an angle.
The Half-power beamwidth of the radar is 32 degrees -- +/-16 degrees off a center line). The radar can get a
reflection off anything that is within the area of the beamwidth. The following table shows the width of the
beam at different distances from the water. Make sure that this area is free from obstructions.
Distance to Water
Beamwidth (radius in feet)
10
3
20
6
30
9
40
12
50
15
60
18

Bringing the Benefits of Real-Time Data Collection to the World
47
When installing the radar, please use the front panel diagnostic feature (Diagnostic > Signal Quality).
The radar gives a signal strength expressed as a percentage 0 to 100%. Before mounting the enclosure move
the enclosure a small amount in each direction and note the change in the signal strength. When you have
found the maximum signal strength, mount the radar in the same orientation. You may also use the circular
level to point the antenna at the water surface.
If using the front panel is not convenient, try the command line TARGET mode. It will continuously output
Radar readings on the RS232 port which may a useful aid during installation.
Please see the section Quick Install for more installation tips.

Bringing the Benefits of Real-Time Data Collection to the World
48
FIRMWARE Upgrade
The radar level recorder has been designed using the most modern techniques such that at any time the system
firmware may be upgraded while it is in the field preventing the need to ever return a unit to the factory for
firmware upgrades. The factory may offer new features or bug fixes that may only be accessed through
firmware upgrades. The techniques below will illustrate how to install the upgraded firmware into the radar
unit.
Methods for upgrade:
There are several possible methods to use to upgrade the software in the radar unit. The first step in all three
methods is to download from the Sutron web site the program upgrade file, such as
„v1_24mainRLR1260.upg‟, found at http://www.sutron.com/downloads/software.htm. Select the radar and
download the UPG file to a temporary folder or desktop location where it may be accessed at a later time.
Method 1: Using „UPGRADE‟ command using Hyperterm:
Open and run Hyperterm on a PC. Set the properties to:
Baud Rate: 115200
Bits: 8
Parity: None
Stop Bits: 1
Start with the radar unit powered up and running.
Connect DB-9 serial cable and establish communications by typing „enter‟. (connect port)
Once the prompt is found, type „UPGRADE” or „UPG‟.
Now the system is waiting for Hyperterm to send the file.
An upper case “C” will repeat every 2 seconds or so over the serial port. Select „Send File” and
choose „Y-Modem‟ and then select the upgrade file name previously stored on the computer.
Once the download is completed, the system will reboot.
Type the command „Ver‟ to confirm that the upgrade was successful
Method 2: Using Hyperterm and „Escape‟ key:
Open and run Hyperterm on a PC. Set the properties to:
Baud Rate: 115200
Bits: 8
Parity: None
Stop Bits: 1
Start with the radar unit powered DOWN.
Open the serial port with hyperterm.
Power up the radar unit simultaneously while holding the „Escape‟ key on the keyboard of the
computer running Hyperterm. Release the escape key once the unit has powered up.
An upper case “C” will repeat every 2 seconds or so over the serial port. At this time, use „Send
File‟ and choose „Y-Modem‟ and then select the upgrade file name previously stored on the
computer.
Once the download is completed, the system will reboot.
Type the command „Ver‟ to confirm that the upgrade was successful.

Bringing the Benefits of Real-Time Data Collection to the World
49
GPS
It is possible to use a GPS to provide the RLR with an accurate, self setting clock. RLR can be connected to
a Garmin GPS 16HVS. RLR needs to be have software version 1.15 or newer to support GPS.
Timekeeping
When equipped with a GPS, the RLR will keep UTC time. UTC (Universal Coordinated Time) is an
internationally accept time standard. UTC will differ from the local time by a number of hours. The user can
setup the RLR so that it keeps local time by changing the variable Local Time Offset. To get EST, set the
local time offset to -5 hours.
If a Sutron Satlink (versions 6.17 and newer) is connected to the RLR via SDI-12 (in addition to the Garmin
GPS), note that Satlink will set the clock of the RLR once per day. Please ensure that Satlink’s local time
offset is equal to that of the RLR.
An RLR equipped with a GPS will provide a timing accuracy of ± 1 second.
GPS Installation and Setup
When first installing the GPS, make sure the GPS is positioned so that it has a clear view of the sky. Make
sure to connect the GPS to the RLR via RS232. Sutron provides a custom RJ45 to RS232 connector for this
purpose (the diagram for the connector is on page 51).
After connecting the two devices, go the Station Setup menu on the front panel of the RLR. Find the entry
called Garmin GPS and press set to enable the GPS. Then go back to the top of the menu, and hit the down
button until the GPS status menu is shown. If RLR is communicating with the GPS, the menu will say
GPS initializing. If the GPS has acquired a time fix, the RLR will show GPS functioning.
Pressing right in the GPS status menu will provide more details.
If the GPS has locked on satellites and is providing accurate time, the menu will show a message such as
GPS has valid time
5 satellites used in time fix
Pressing down from the detailed status menu will show the last GPS time sync. The time show is the time
when the GPS last had a time fix. If it has been more than 12 hours since the last valid time fix, the GPS is
not working properly and may need to be repositioned (please see page 49).
The next entry in the menu is local time offset. The user can setup the RLR so that it keeps local time by
changing the variable Local Time Offset. To get EST, set the local time offset to -5 hours.
When installing, it is recommended that the user wait until the GPS has valid time before leaving the station.
If the GPS does not acquire the time in ten minutes, the GPS should be repositioned so that it has a better
view of the sky.
Keep in mind that whenever the display is turned on, RLR will power up the GPS. This helps with GPS
positioning. As long as the display is on, the RLR will provide power the GPS, allowing it to track satellites.
When the display is off, the RLR will power the GPS once an hour for up to 15 minutes.
GPS Positioning
If the RLR is reporting that the GPS cannot get a time fix, it means that the GPS is unable to get a clear view
of the sky. It could also be the case that the GPS is picking up interference. The best solution is to reposition
the GPS. The GPS needs to have a clear view of the sky in order to properly function.

Bringing the Benefits of Real-Time Data Collection to the World
50
Place the GPS antenna in the most open space possible. Do not place it directly under anything nor directly
beside something. Always attempt to achieve a "full sky" view with the antenna.
Place the GPS antenna high up on a pedestal or in a protected location. Flat surfaces may tend to cover with
ice and snow more so than elevated locations. Keep away from areas where birds may nest. Placement is
very important and great care should be taken in selecting the location.
GPS Operation
Once every hour, the RLR will wake up the GPS. Once the GPS has acquired a time fix (should not take
more than 40 seconds), the RLR will set its clock and put the GPS in low power mode. Powering the GPS
once an hour provides the optimal power consumption.
In addition, whenever the display is turned on, RLR will power up the GPS. This allows the user to see
whether the GPS can acquire a time fix and helps in positioning the antenna.
GPS Errors
If the GPS is either not communicating with the RLR or if the GPS cannot acquire a time fix, the RLR will
blink the red LED to indicate that there is a problem. In addition, the RLR will show a message describing
the problem on the front panel. Once a day, the RLR will write an event to the log indicating that it has GPS
problems.
The RLR reporting “No GPS Detected” can indicate that the connector between the GPS and RLR is bad
(please refer to the section on the connector on page 51) or that the RLR does not have its jumpers set
properly (please see the section on page 50 about Jumpers)
If the GPS cannot get a time fix, please see the section on GPS Positioning on page 49.
If the RLR reports “GPS Comm Failure”, it means the RLR is detecting data on the RS232 line, but that the
data is incomprehensible. It could indicate that the GPS has been improperly configured. If possible, try
using a different GPS module.
If a faulty GPS is connect to the RLR, of it the GSP is not connected to the RLR, the RLR will take a full
minute before deciding it cannot talk to the GPS. Ensure that the RLR is given enough time to talk to the
GPS before leaving the station.
Jumpers
There is a jumper inside the RLR that ensures that the RLR provides 12 Volts on RS232 which the Garmin
GPS requires in order to function. Normally, Sutron sets this jumper so that the unit can work with a GPS.
However, if the RLR is reporting “No GPS Detected”, it may be the case that the jumper is not properly
setup.
There is a way to determine the jumper setup without opening the unit. It does require a voltmeter. Firstly,
enable the Garmin GPS setting via the front panel. Then, measure the voltage across pins 5 and 9 of the
RS232. Those are the two rightmost pins (closest to right side panel). One pin is above the other. If the
voltage is NOT 12V, GPS will NOT work. You will then need to open the unit and set the jumper.
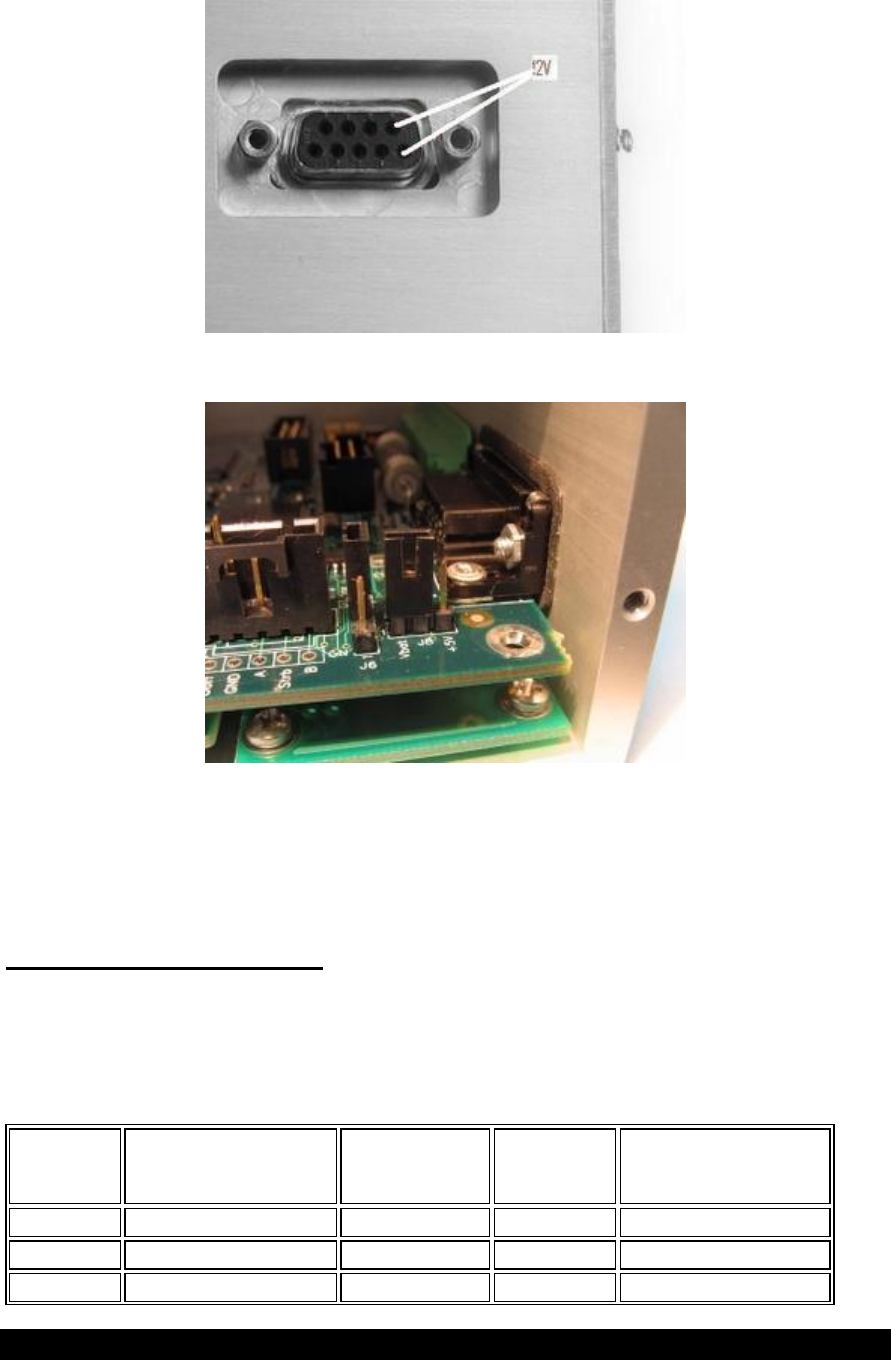
Bringing the Benefits of Real-Time Data Collection to the World
51
To setup the jumper, the case must be opened. Once the case is open, the jumper is easily accessible. Place a
connector on jumper J8 so that it connects Vbat to the middle pin.
In addition to J8, there is another jumper needs to be properly configured in order for the unit to provide
power to the GPS. However, this jumper is properly setup at the factory and it is unlikely to be the cause of
the problem. The jumper in question is J6 (located next to J8). It should have a connector across pins 2 and
3 or have no connector at all.
RJ45 to RS232 Connector
A custom connector is required to get the Sutron and the Garmin GPS together. The connector bridges the
RJ45 on the Garmin GPS to the RS232 on the Sutron unit. The table below provides the wiring diagram for
the connector.
Note: The colors on the Garmin GPS RJ45 do not match the colors of the RJ45 to RS232 converter.
Rj45 pin
Garmin plug
color
RJ45 to Rs232 converter
RS232 on Sutron
unit
Function
comments
1 Red
Blue
9
Power
8 to 40V for 16HVS
2 Black
Orange
5
Ground
3 Yellow
Black
8 CTS
Remote power
On if <0.3V, Off if open

Bringing the Benefits of Real-Time Data Collection to the World
52
on/off
circuit
4 Blue
Red
2
Port 1 Data in
NMEA input to GPS
5 White
Green
3
Port 1 Data
out
NMEA output from GPS
6 Gray
Yellow
no connect
PPS
1Hz
7 Green
Brown
no connect
Port 2 Data in
RTCM output
8 Violet
White
no connect
Port 2 Data
out
reserved

Bringing the Benefits of Real-Time Data Collection to the World
53
Modbus
RLR can be configured as a Modbus slave device. In this mode, the unit will respond to properly formed
Modbus messages in either RTU (default) or ASCII format. Keep in mind that when Modbus has been
enabled, the unit will not be capable of connecting to a PC/PDA to download a log or make setup changes,
but AutoPoll can be used to access log data. For more information on AutoPoll, please visit www.sutron.com
To enable Modbus, go to the Station Setup menu on the front panel and press right when the Modbus Setup
option is shown. The first option shown is the current status of Modbus, enabled or disabled. Pressing Set
will switch between the two options. If Modbus is disabled and it is turned on, a warning message will
display showing that GPS and PC communications will cease to work. Hitting Set will enable Modbus.
Modbus Menu Options
After enabling Modbus, other setup options become available allowing more customization of the unit.
Initially, each of these settings is defaulted to those expected by the Modbus protocol.
Modbus Enabled
Default is DISABLED. Enabling will cause the unit to not communicate properly with any other type of
device on the DB9 connector for example a PC/PDA or Garmin GPS unit.
Modbus Device ID
Default is 1. The device ID is the address that is used by the Modbus master to select which device to
communicate with. Each slave on the bus must have a unique device ID ranging from 1 – 247. Address „0‟ is
reserved as the broadcast address.
Modbus Protocol
Default is RTU. There are two protocols available to the user, RTU and ASCII.
In RTU mode a compatible Modbus master device must generate messages, as strict timing is required for a
successful communication. This mode allows for better data throughput than ASCII mode for the same baud
rate.
When using Modbus over a radio, use ASCII rather than RTU mode. Radios tend to break up Modbus data
packets as they are sent over the air. Since RTU does not allow for a timeout between the bytes of the packet,
communications errors occur.
In ASCII mode, the user may connect to the device using a serial communication program (i.e.
HyperTerminal or ProComm) set to 7 data bits and 1 stop bit. Messages can then be sent to the unit by typing
the proper command. Each command is prefixed with a „:‟ and ended with a carriage-return / line-feed
(<CR><LF> usually just the „Enter‟ key). This mode offers much less throughput than RTU since 2 ASCII
characters are required to describe a single binary byte (e.g., the value 0xB5 would be communicated by
sending the ASCII characters „B‟ and „5‟). Since a Cyclic Redundancy Check (CRC) is required on each
message, the ability to send the message via HyperTerminal is almost of no use unless the CRC can be
generated by the user.
Note: Care must be taken to make sure the selected protocol matches that of the master or there will be
communication problems.
Modbus Parity
Default is Even. Available choices include Even, Odd and None.
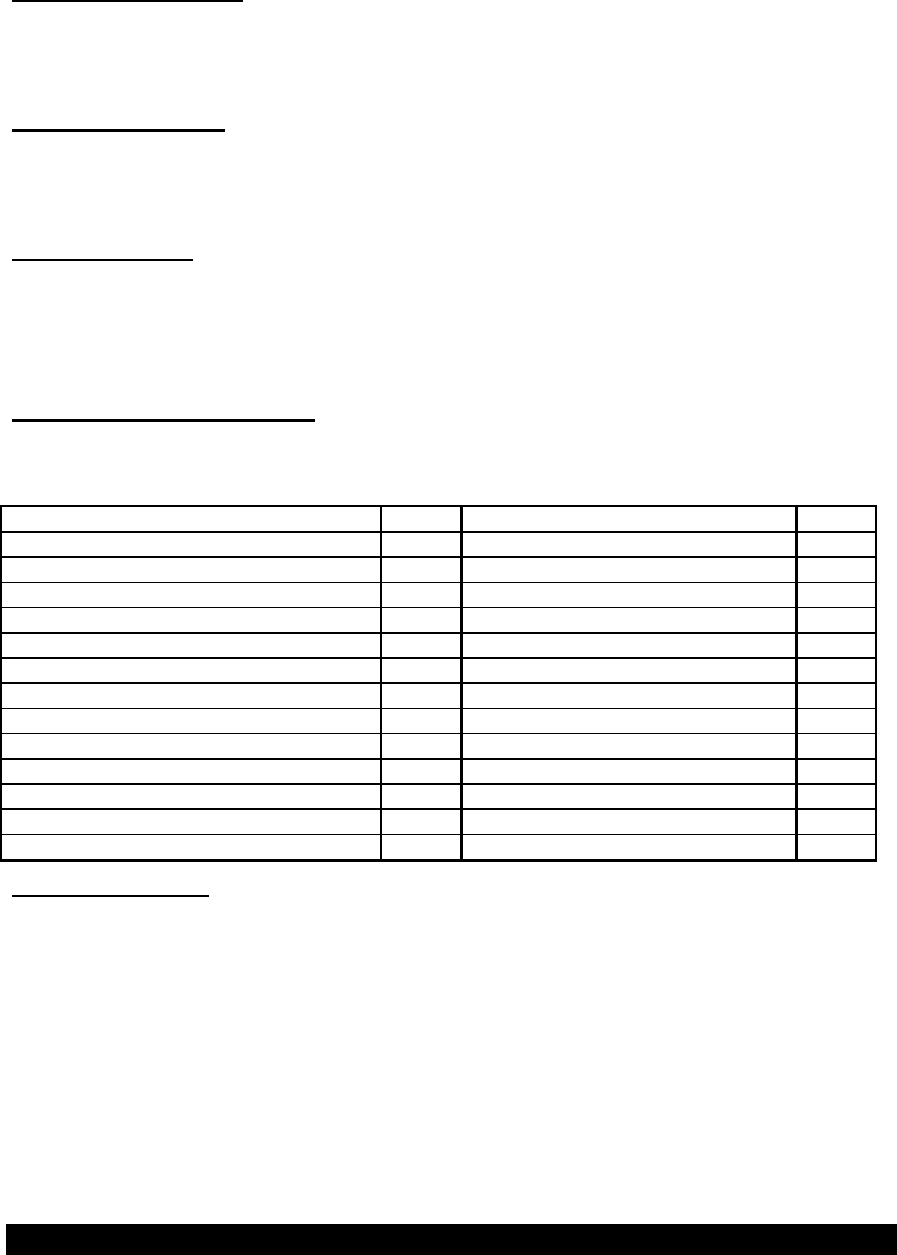
Bringing the Benefits of Real-Time Data Collection to the World
54
Note: Care must be taken to make sure the selected parity matches that of the master or there will be
communication problems.
Modbus Delay before Tx
Default is 10ms. This identifies the number of milliseconds to wait after asserting CTS before starting data
transmission. This is useful if the device is connected to a radio requires keying initialization before data
transmission. The possible delay ranges are 10ms – 2000ms.
Modbus Delay after Tx
Default is 10ms. This identifies the number of milliseconds to wait after data transmission is complete before
de-asserting CTS. This is useful if the device is connected to a radio that requires a hold-off time after data
transmission has completed. The possible delay ranges are 10ms – 2000ms.
Modbus Baud Rate
Default is 19.2 Kbps. Available communication speeds range from 1200bps – 115 Kbps.
Note: Care must be taken to make sure the selected speed matches that of the master or there will be
communication problems.
Modbus Function Codes
The following table identifies the functions that are supported. Each diagnostic counter is cleared when the
device is powered up or reset.
Code
Hex
Subcode
Hex
Read Holding Registers
0x03
Read Input Register
0x04
Write Single Register
0x06
Diagnostic
0x08
Return Query Data
0x00
Diagnostic
0x08
Clear Counters
0x0A
Diagnostic
0x08
Return Bus Message Count
0x0B
Diagnostic
0x08
Return Bus Comm Error
0x0C
Diagnostic
0x08
Return Bus Exception Count
0x0D
Diagnostic
0x08
Return Slave Message Count
0x0E
Diagnostic
0x08
Return Slave Broadcast Count
0x0F
Diagnostic
0x08
Return Bus Char Overrun Count
0x12
Write Multiple Registers
0x10
User Defined Code
0x41
GetLog
GL
Identifying Registers
There are two types of data that can be accessed using the Modbus protocol. These include Holding and
Input registers.
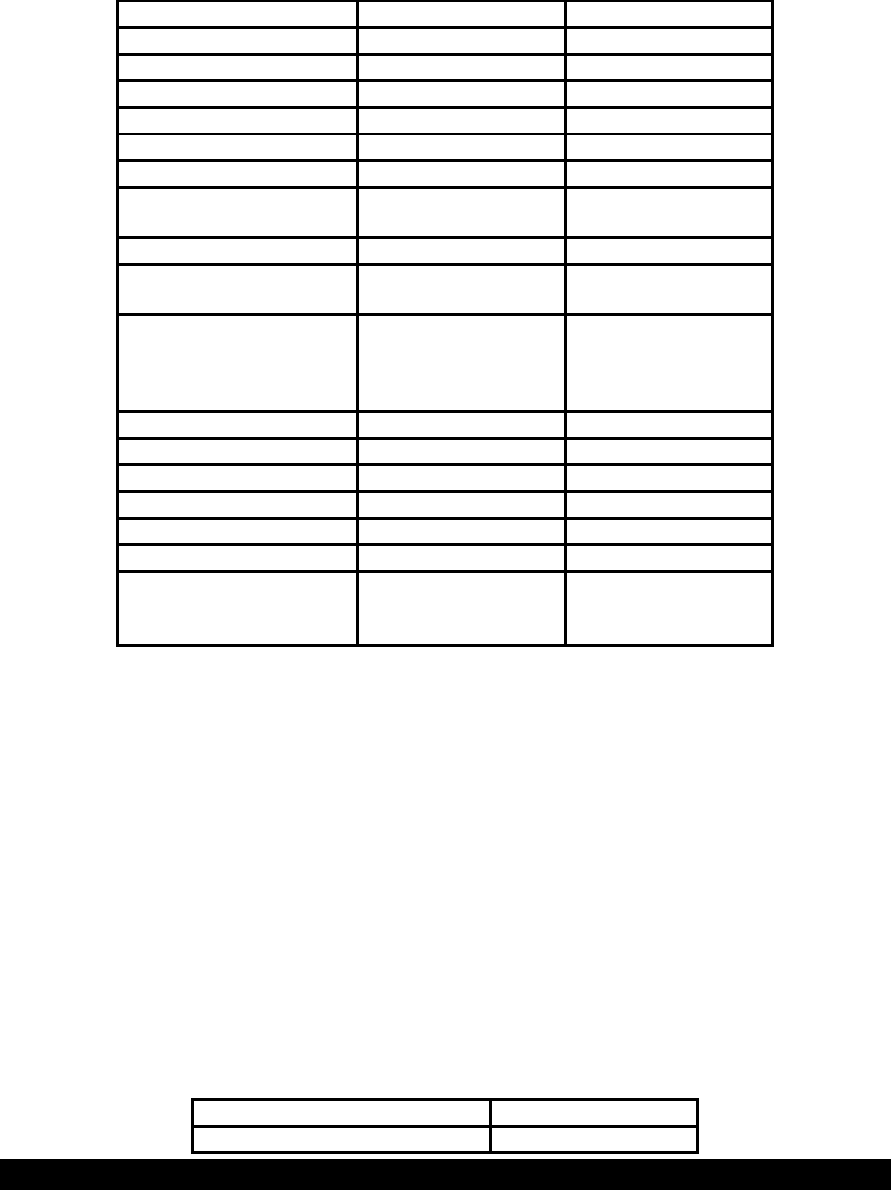
Bringing the Benefits of Real-Time Data Collection to the World
55
Holding Registers
Holding registers are reserved for the purpose of setting and getting data such as the date and time and
diagnostic counts if the ability to send the above Diagnostic (0x08) command is not available. The following
table identifies the holding registers and their locations. Each of these registers is an unsigned 16-bit value (if
readings registers using an Xpert, set the data type to ushort).
Data
Register
Valid Data Values
Hour of current time
1001
0 – 23
Minute of current time
1002
0 – 59
Second of current time
1003
0 – 59
Year of current time
1004
> 2000
Month of current date
1005
1 – 12
Day of current month
1006
1 – 31
Recording status
1007
1 means running
0 means stopped
Reset Unit
1008
Write 1 to reset
Modbus Protocol
1009
0 – RTU
1 – ASCII
Force Measurement *
1010
0 – force all active
measurements
1-16 force that
measurement only
Bus Message Count
1011
Read Only
Bus Comm Error
1012
Read Only
Slave Exception Count
1013
Read Only
Slave Message Count
1014
Read Only
Broadcast Message Count
1015
Read Only
Char Overrun Count
1016
Read Only
Modbus Enable
1022
Read/Write
0=OFF
1=ON
*Note: When forcing a measurement, be sure to wait the proper amount of time for a measurement to finish
before requesting data.
Input Registers
Input registers return the last measured data from the device including stage, discharge, today and yesterday‟s
volume and battery voltage. Ideally these values should be requested on a schedule slightly lagging the
measurement schedule on the RLR. This will ensure data will follow that found in the RLR log. If the last
measured data is not acceptable, a live reading can be forced by writing a „1‟ to the Force Measurement
(1010) holding register. Care must be taken to allow enough time to pass for taking a measurement before
requesting the data, especially if an analog reading is being taken.
Since the unit works with floating point numbers and Modbus only allows for 16-bit registers, a multiple
register read can be used to access the entire reading. The Modbus master device should be configured to
treat these reads as a single floating point number. For example, if accessing Last measured Stage via an
Xpert, read 1 value of type float starting at register 1. If the quality is also desired, change the number of
values to 2 and choose ushort for the second reading type. The complete list of registers and their locations
are below.
Data
Register
Last measured Stage (MSW)
1

Bringing the Benefits of Real-Time Data Collection to the World
56
Last measured Stage (LSW)
2
Quality (see below)*
3
Last measured Discharge (MSW)
4
Last measured Discharge (LSW)
5
Last measured Distance to Water
(MSW)
6
Last measured Distance to
Water(LSW)
7
Last measured Signal Strength
(MSW)
8
Last measured Signal Strength
(LSW)
9
Last measured Standard Deviation
(MSW)
10
Last measured Standard Deviation
(LSW)
11
Battery Voltage (MSW)
12
Battery Voltage (LSW)
13
*Quality – the quality register will hold the value 1 if the reading is valid, and the value 0 if an error occurred
during the reading. Quality relates to Stage, Discharge, Distance to Water, Signal Strength, and Standard
Deviation.

Bringing the Benefits of Real-Time Data Collection to the World
57
Get Log Command
The Get Log subcode is used to retrieve log data from the unit. The format of the command is as follows:
GL,logfilename,datetime,recordID,numbytes
The logfilename can be used to return log entries of specific types. The available types are data,
events, and all.
The datetime value must be in the following format: MM/DD/YYYY HH:MM:SS.
The numbytes value refers to the number of data bytes from the log entry to include in the response,
not the number of bytes to store in the return packet. Since the master station or transport medium
may be limited in the number of bytes that can be handled in a single packet, the numbytes value
should be sized small enough to allow for header and CRC information, as well as translation to
ASCII if that is the selected protocol (the ASCII protocol uses two bytes to represent every data
byte). If numbytes is *, the all log records found will be returned. Regardless of the requested
numbytes, only complete log records are returned.
The format of the reply is as follows:
GLR,status,recordID,numbytes,data[numbytes,data]
The value of status can be any of the following values:
Value
Description
0
Ok.
1
File not found.
6
Record not found.
7
Command format error
The datetime value in the response message is the datetime of the returned record and, therefore, may be
different from the datetime in the GetLog command statement.
The data to the end of the file can be read by leaving datetime at the desired starting point and incrementing
recordID until the status indicates record not found. The [numbytes,data] represents an additional record of
data if there is room in the message.
Example:
command: GL,data,02/07/2007 15:50:00,80,0
reply: GLR,0,0,38,02/07/2007,15:51:00,VBAT,13.16,Volts,G
37,10/07/2003,15:51:10,A,10.89,5.2,-25.4
command: GL,data,02/07/2007 15:50:00,80,2
reply: GLR,0,2,37,02/07/2007,15:54:00,C,10.89,5.2,-25.4,0
The GLR response will contain as many log records as can fit into the response.
The numbytes value in the GLR response does not include the comma preceding the data, and refers to the
number of data bytes from the log that are being returned, not the number of packet bytes used to store the
response (which would be twice the data bytes when ASCII protocol is selected).
Wrapped for
illustration
purposes only.

Bringing the Benefits of Real-Time Data Collection to the World
58
Appendix A – Specifications for the radar
Electrical
Power Required
8-16VDC
Current
(during measure)
< 30mA @ 12V
Quiescent current
< 1 mA @ 12V
Outputs
SDI-12 V1.3, RS232
Radar
6.2 GHz
32 Half power beamwidth
Accuracy
0.01 ft up to 20 ft,
0.05% reading 20 to 60ft
Range
60ft
Resolution
< 0.001ft
Mechanical
RLR-0001-1
Enclosure
NEMA-4 Plastic
Dimensions
5.2”x7.1”x5.75”
Weight
2 lbs.
Mechanical
RLR-0003-1
Enclosure
NEMA-4 ABS plastic
Dimensions
Weight
5.6 lbs.
Environmental
Temperature
-40C to +60C
Humidity
0-95% Non-condensing
Log
Flash memory, 300,000 readings
>20 years data retention
Keypad/Display
2x20 character LCD
6 button keypad
2 status LED
Operating Modes
Standalone or SDI-12/RS232
Discharge/Volume calculations
Average/DQAP calculations
Ordering Information
Part Number
Description
RLR-0001-1
Radar Level Sensor with built-in antenna
RLR-0003-1
Radar Level Sensor with built-in antenna

Bringing the Benefits of Real-Time Data Collection to the World
59
Appendix B – Sutron Customer Service Policy
CUSTOMER SERVICE POLICY
Dear Customer:
Thank you for making the important decision to purchase Sutron equipment. All Sutron equipment is
manufactured and tested to the highest quality standards as set by Sutron‟s Quality Assurance Department.
Our Customer Service Representatives have years of experience with equipment, systems, and services. They
are electronic technicians with field and applications experience, not just with a technical background.
Customer Phone Support
Customer Service Representatives routinely handle a wide variety of questions every day. If questions arise,
please feel free to contact me or one of the Customer Service Representatives. We are available from 8:00 am
to 5:00 pm Monday through Friday and will be happy to take your call.
We can answer most sensor and interface questions on the first call. If we cannot quickly answer a question
on an interface, we will work with you until we find a solution.
Sometimes a problem is application related. Although we pride ourselves on handling 95% of application
related questions over the phone, we maintain constant contact with our Integrated Systems Division and
Engineering Division for additional assistance.
Introductory Training
Training is an important part of the Sutron Customer Service philosophy. The Sutron training policy is
simple---If you buy Sutron equipment, you get Sutron training! Without the proper training, you cannot take
advantage of the benefits and advantages that Sutron equipment provides. We often supply on-site
introductory training at your facility for no charge. You provide the classroom, students, equipment, and
coffee---we'll provide the instructor.
On-Site Visits
Of course not all problems can be fixed over the phone. Sometimes a customer needs an on-site technician to
identify site related problems or troubleshoot a network. Sutron can provide these services at a reasonable
cost. Call for details. If you would like to learn more about Sutron products email sales@sutron.com
Thanks again for your order,
Paul Delisi
Customer Service Manager
Sutron Corporation

Bringing the Benefits of Real-Time Data Collection to the World
60
Appendix C – Commercial Warranty
SUTRON MANUFACTURED EQUIPMENT
THE SUTRON CORPORATION WARRANTS that the equipment manufactured by its manufacturing
division shall conform to applicable specifications and shall remain free from defects in workmanship and
material for a period ending two years from the date of shipment from Sutron‟s plant.
Sutron‟s obligation under this Warranty shall be limited to repair at the factory (21300 Ridgetop Circle,
Sterling, VA 20166), or at its option, replacement of defective product. In no event shall Sutron be
responsible for incidental or consequential damages, whether or not foreseeable or whether or not Sutron has
knowledge of the possibility of such damages. This warranty shall not apply to products that have been
damaged through negligence, accident, misuse, or acts of nature such as floods, fires, earthquakes, lightning
strikes, etc.
Sutron‟s liability, whether in contract or in tort, arising out of warranties or representations, instructions or
defects from any cause, shall be limited exclusively to repair or replacement parts under the aforesaid
conditions.
Sutron requires the return of the defective electronic products or parts to the factory to establish claim under
this warranty. The customer shall prepay transportation charges to the factory. Sutron shall pay transportation
for the return of the repaired equipment to the customer when the validity of the damage claim has been
established. Otherwise, Sutron will prepay shipment and bill the customer. All shipments shall be
accomplished by best-way surface freight. Sutron shall in no event assume any responsibility for repairs or
alterations made other than by Sutron. Any products repaired or replaced under this warranty will be
warranted for the balance of the warranty period or for a period of 90 days from the repair shipment date,
whichever is greater. Products repaired at cost will be warranted for 90 days from the date of shipment.
NON-SUTRON MANUFACTURED EQUIPMENT
The above Warranty applies only to products manufactured by Sutron. Equipment provided, but not
manufactured by Sutron, is warranted and will be repaired to the extent of and according to the current terms
and conditions of the respective equipment manufacturers.
REPAIR AND RETURN POLICY
Sutron maintains a repair department at the factory, 21300 Ridgetop Circle, Sterling, VA 20166. Turn around
time normally ranges from 10-30 days after Sutron receives equipment for repair. Call Customer Service at
(703) 406-2800 for a Return Material Authorization (RMA) number. Return the defective equipment to
the factory, transportation charges paid.
EXTENDED WARRANTY AND ON-SITE MAINTENANCE
Extended warranty and on-site maintenance contracts are available. Price quotations may be obtained from
Sutron customer service representatives.

Bringing the Benefits of Real-Time Data Collection to the World
61
Appendix D – FCC Information
The Sutron Radar model RLR-0003-1 has been designed and tested to comply with the FCC Code of Federal
Regulations Title 47 Part 15 rules for intentional and unintentional radiating devices. Under no circumstance
shall the user open and modify/change in any way the hardware or software content of the product. Opening
of the product (thereby breaking the tamper seals) and/or any of its sub modules for any reason not expressly
approved by the manufacturer will violate any warranty and risk generating illegal emissions that may cause
interference with other equipment. This is a direct violation of the FCC rules.
This equipment has been tested and found to comply with the limits for a Class B digital device, pursuant to
Part 15 of the FCC Rules. These limits are designed to provide reasonable protection against harmful
interference in a residential installation. This equipment generates, uses and can radiate radio frequency
energy and, if not installed and used in accordance with the instructions, may cause harmful interference to
radio communications. However, there is no guarantee that interference will not occur in a particular
installation. If this equipment does cause harmful interference to radio or television reception, which can be
determined buy turning the equipment off and on, the user is encouraged to try to correct the interference by
one or more of the following measures:
--Reorient or relocate the receiving antenna.
--Increase the separation between the equipment and receiver.
--Connect the equipment into an outlet on a circuit different from that to which the receiver is connected.
--Consult the dealer or an experienced radio/TV technician for help.
Additional Compliance Information:
1) Sutron Water Level Sensor Model Number „ RLR-0003-1‟.
2) This device complies with part 15 of the FCC Rules. Operation is subject to the following two
conditions: (1) this device may not cause harmful interference, and (2) this device must accept any
interference received, including interference that may cause undesired operation.
3) Contact Information:
Sutron Corporation
22400 Davis Drive
Sterling, VA 20164-4444
Phone: 703-406-2800
Fax: 703-406-2801
Web: www.Sutron.com

Bringing the Benefits of Real-Time Data Collection to the World
62
INDEX
? 25
Auto Output ....................................................... 35
Automeasure ...................................................... 16
averaging ............................................................ 17
avg time .............................................................. 17
Backlight ............................................................ 24
Battery voltage ................................................... 20
beamwidth .................................................... 46, 58
Calculating ......................................................... 13
clock ................................................................... 20
Command line .................................................... 34
Connections
DB9 ................................................................ 10
Power ............................................................... 9
RS-232 ........................................................... 10
SDI-12 ............................................................ 10
continous operating mode ......................................
Contrast .............................................................. 24
DB9 .................................................................... 10
Discharge ........................................................... 41
Display
Turning on/off ................................................ 24
Distance to water ................................................ 14
DQAP ................................................................ 17
Error in reading .................................................. 15
Error in Reading ................................................. 13
events ................................................................. 19
Front panel ......................................................... 24
key functions .................................................. 24
Turning on/off ................................................ 24
Front Panel
Menu .............................................................. 26
GPS .................................................................... 49
Hardware Flow Control...................................... 34
Install
Quick ........................................................ 11, 46
Installation ................................................... 46, 48
Last Automeasured............................................. 18
LED .................................................................... 13
local time offset .................................................. 49
lock/unlock ................................................... 21, 23
Log ..................................................................... 18
Download ....................................................... 35
Events ............................................................ 19
Format ............................................................ 18
Timestamp ..................................................... 19
Log every sample ............................................... 17
Log every subsample ......................................... 22
Logger
connecting to .................................................. 19
Satlink ............................................................ 20
Measurement point ............................................ 14
Menu Tree ......................................................... 26
Modbus .............................................................. 53
modem ............................................................... 38
Raven ............................................................. 39
Modem
Xpert .............................................................. 39
normal operating mode ...................................... 16
operating modes ................................................. 16
Parshall flume .................................................... 41
password ............................................................ 21
PWM settings .................................................... 21
quality ................................................................ 15
right digits .......................................................... 15
RS-232 ............................................................... 10
RS232 Wakeup .................................................. 34
RTC ................................................................... 20
sample ................................................................ 17
Satlink ................................................................ 20
SDI-12
Connections ................................................... 10
Operation ....................................................... 28
Reference ....................................................... 28
setup
file .................................................................. 38
Setup
capturing ........................................................ 38
saving ............................................................. 38
signal strength .................................................... 15
stage
details ............................................................. 15
measuring ....................................................... 15
right digits ...................................................... 15
units ............................................................... 15
Stage .................................................................. 14
stage details........................................................ 19
Starting radar ..................................................... 13

Bringing the Benefits of Real-Time Data Collection to the World
63
Stopping radar .................................................... 13
subsample ........................................................... 21
Sutron Standard CSV ......................................... 18
Target mode ....................................................... 35
Targeting radar ................................................... 46
terminal block ...................................................... 9
time .................................................................... 20
units ................................................................... 15
Upgrade ............................................................. 48
Weir ................................................................... 41