See instrument instruction manual for more information or if using a different instrument. a. Place the 96-well plate in the instrument. b. Set the thermal cycling conditions. For PowerTrack SYBR Green Master Mix, use one of the following: c. Run the plate.
PowerTrack SYBR Green Master Mix | Thermo Fisher Scientific - US
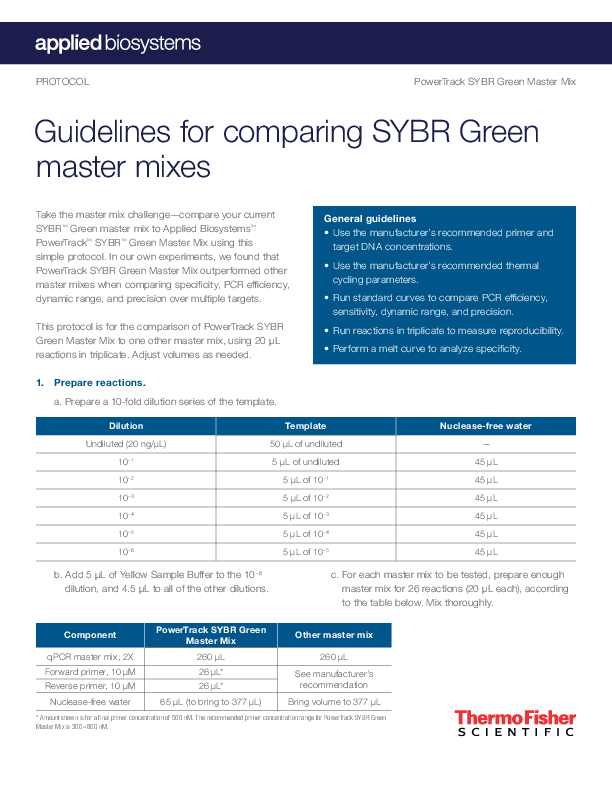
PROTOCOL PowerTrack SYBR Green Master Mix Guidelines for comparing SYBR Green master mixes Take the master mix challenge--compare your current SYBRTM Green master mix to Applied BiosystemsTM PowerTrackTM SYBRTM Green Master Mix using this simple protocol. In our own experiments, we found that PowerTrack SYBR Green Master Mix outperformed other master mixes when comparing specificity, PCR efficiency, dynamic range, and precision over multiple targets. This protocol is for the comparison of PowerTrack SYBR Green Master Mix to one other master mix, using 20 L reactions in triplicate. Adjust volumes as needed. General guidelines · Use the manufacturer's recommended primer and target DNA concentrations. · Use the manufacturer's recommended thermal cycling parameters. · Run standard curves to compare PCR efficiency, sensitivity, dynamic range, and precision. · Run reactions in triplicate to measure reproducibility. · Perform a melt curve to analyze specificity. 1. Prepare reactions. a. Prepare a 10-fold dilution series of the template. Dilution Undiluted (20 ng/µL) 10 1 10 2 10 3 10 4 10 5 10 6 Template 50 µL of undiluted 5 µL of undiluted 5 µL of 101 5 µL of 102 5 µL of 103 5 µL of 104 5 µL of 105 Nuclease-free water -- 45 µL 45 µL 45 µL 45 µL 45 µL 45 µL b. Add 5 µL of Yellow Sample Buffer to the 106 dilution, and 4.5 µL to all of the other dilutions. c. For each master mix to be tested, prepare enough master mix for 26 reactions (20 µL each), according to the table below. Mix thoroughly. Component PowerTrack SYBR Green Master Mix Other master mix qPCR master mix, 2X 260 µL 260 µL Forward primer, 10 µM Reverse primer, 10 µM 26 µL* 26 µL* See manufacturer's recommendation Nuclease-free water 65 µL (to bring to 377 µL) Bring volume to 377 µL * Amount shown is for a final primer concentration of 500 nM. The recommended primer concentration range for PowerTrack SYBR Green Master Mix is 300800 nM. d. Pipet 14.5 L of the PowerTrack SYBR Green Master Mix prepared in step c to wells of a 96-well optical plate, according to the plate map below. 1 2 3 4 5 6 A 1x 1x B 10 1x 10 1x C 10 2x 10 2x D 10 3x 10 3x E 10 4x 10 4x F 10 5x 10 5x G 10 6x 10 6x H NTC NTC e. Pipet 5.5 L of each template dilution from step a into the wells used in step d according to the plate map below. For no-template control (NTC) reactions, use 5.5 L of nuclease-free water. 7 8 1x 10 1x 10 2x 10 3x 10 4x 10 5x 10 6x NTC 9 10 11 12 f. Repeat steps ce for the other master mix to be compared, using a new plate. Note: Reactions for both master mixes can be loaded on the same plate if the thermal protocols are identical. g. Mix the components thoroughly. Seal the plates, and briefly centrifuge to remove any bubbles. 2. Run the real-time PCR. a. Place the 96-well plate in the instrument. c. Run the plate. b. Set the thermal cycling conditions. For PowerTrack SYBR Green Master Mix, use one of the following: Standard cycling conditions (for most instruments, and primer Tm 60°C)* Step Temperature Duration Polymerase activation 95°C 2 min Denaturation 95°C 15 sec Annealing/extension 60°C 1 min * For primers with Tm <60°C, please refer to the PowerTrack SYBR Green Master Mix instruction manual. Cycles Hold 40 Fast cycling conditions (for Applied BiosystemsTM ViiATM 7, QuantStudioTM, 7500 Fast, StepOneTM, and StepOnePlusTM instruments, and primer Tm 60°C)* Step Temperature Duration Cycles Polymerase activation 95°C 2 min Hold Denaturation 95°C 5 sec 40 Annealing/extension 60°C 30 sec * For primers with Tm <60°C, please refer to the PowerTrack SYBR Green Master Mix instruction manual. For Applied Biosystems instruments, use the following settings: Experiment type Reagent Reporter Quencher Passive reference dye Ramp speed Standard curve SYBR Green SYBR Green dye None ROX Standard or Fast (see thermal cycler profiles above) See instrument instruction manual for more information or if using a different instrument. 3. Run the melt curve. For Applied Biosystems instruments, use settings and conditions as noted in these two tables: Experiment type Reagent Reporter Quencher Passive reference dye Ramp speed Melt curve ramp increment Melt curve SYBR Green SYBR Green dye None ROX Standard Continuous (default) Stage Melt curve Step Step 1 Step 2 Step 3 (dissociation) Ramp rate 1.6°C/sec 1.6°C/sec 0.05°C/sec Temperature 95°C 60°C 95°C TIme 15 sec 1 min 15 sec 4. Repeat steps 23 for the other master mix. Use the other manufacturer's recommended thermal cycling profile. 5. Analyze the data. On most qPCR systems, the data can be analyzed for the following parameters by the qPCR system software. a. Slope and amplification efficiency c. Standard deviation (precision) The amplification efficiency is calculated using the For each dilution, the standard deviation of the slope of the regression line in the standard curve. A slope of -3.3 indicates optimal, 100% PCR Ct values is calculated. To be able to quantify a 2-fold dilution with 95% confidence, the standard amplification efficiency. Reactions with efficiencies deviation of a dilution should be 0.250. of 100% ± 10% over a broad dynamic range are d. Melt curve (specificity) needed to reliably use the Ct method for gene expression analysis. A melt curve is viewed using a derivative reporter plot (derivative reporter (Rn) vs. temperature). A b. R2 values (correlation coefficient) single peak indicates specific amplification, whereas The R2 value is a measure of the closeness of fit multiple peaks or shoulders indicate nonspecific between the regression line and the individual Ct data points of the standard curve reactions. An R2 amplification or primer-dimer formation. value of 1.00 indicates a perfect fit between the regression line and the data points; a value of >0.99 is desirable. Caution: Don't be fooled by lower Ct values when comparing master mixes. The only way to compare the sensitivity and performance of two master mixes is to perform a dilution series and examine the amplification efficiency, linearity, and precision across that range. Find out more at thermofisher.com/sybr For Research Use Only. Not for use in diagnostic procedures. © 2020 Thermo Fisher Scientific Inc. All rights reserved. All trademarks are the property of Thermo Fisher Scientific and its subsidiaries unless otherwise specified. COL23884 0220Adobe InDesign 15.0 (Macintosh) Adobe PDF Library 15.0