Introduction
The Honeywell Air Detective system enables HVAC and environmental test professionals to capture a snapshot of indoor air quality, connecting to an extensive allergen database for near real-time analysis. This empowers professionals to provide customers with immediate, on-the-spot information about airborne particles and suggest relevant products and services.
This system is designed for HVAC and environmental test professionals to analyze residential air quality for selected allergens, including spores, specific pollen types, and other organic particles.
The Honeywell Air Detective system comprises three key elements:
- The device and associated hardware: Collects air samples and provides particle holographic imagery to the cloud database for analysis.
- Cloud-based, machine-learning software: Analyzes detected particles and delivers a near real-time particle report.
- User-supplied iPad tablet: Controls the device application, interfaces with the cloud, and displays the particle report.
The device draws in air samples using a fan and an impaction sampler integrated into a single-use, disposable cassette. After a three-minute sampling period, the device records holographic images of the detected particles. These images are then transmitted to the cloud for on-the-spot classification and display. Detailed performance characteristics are available in Table 2.
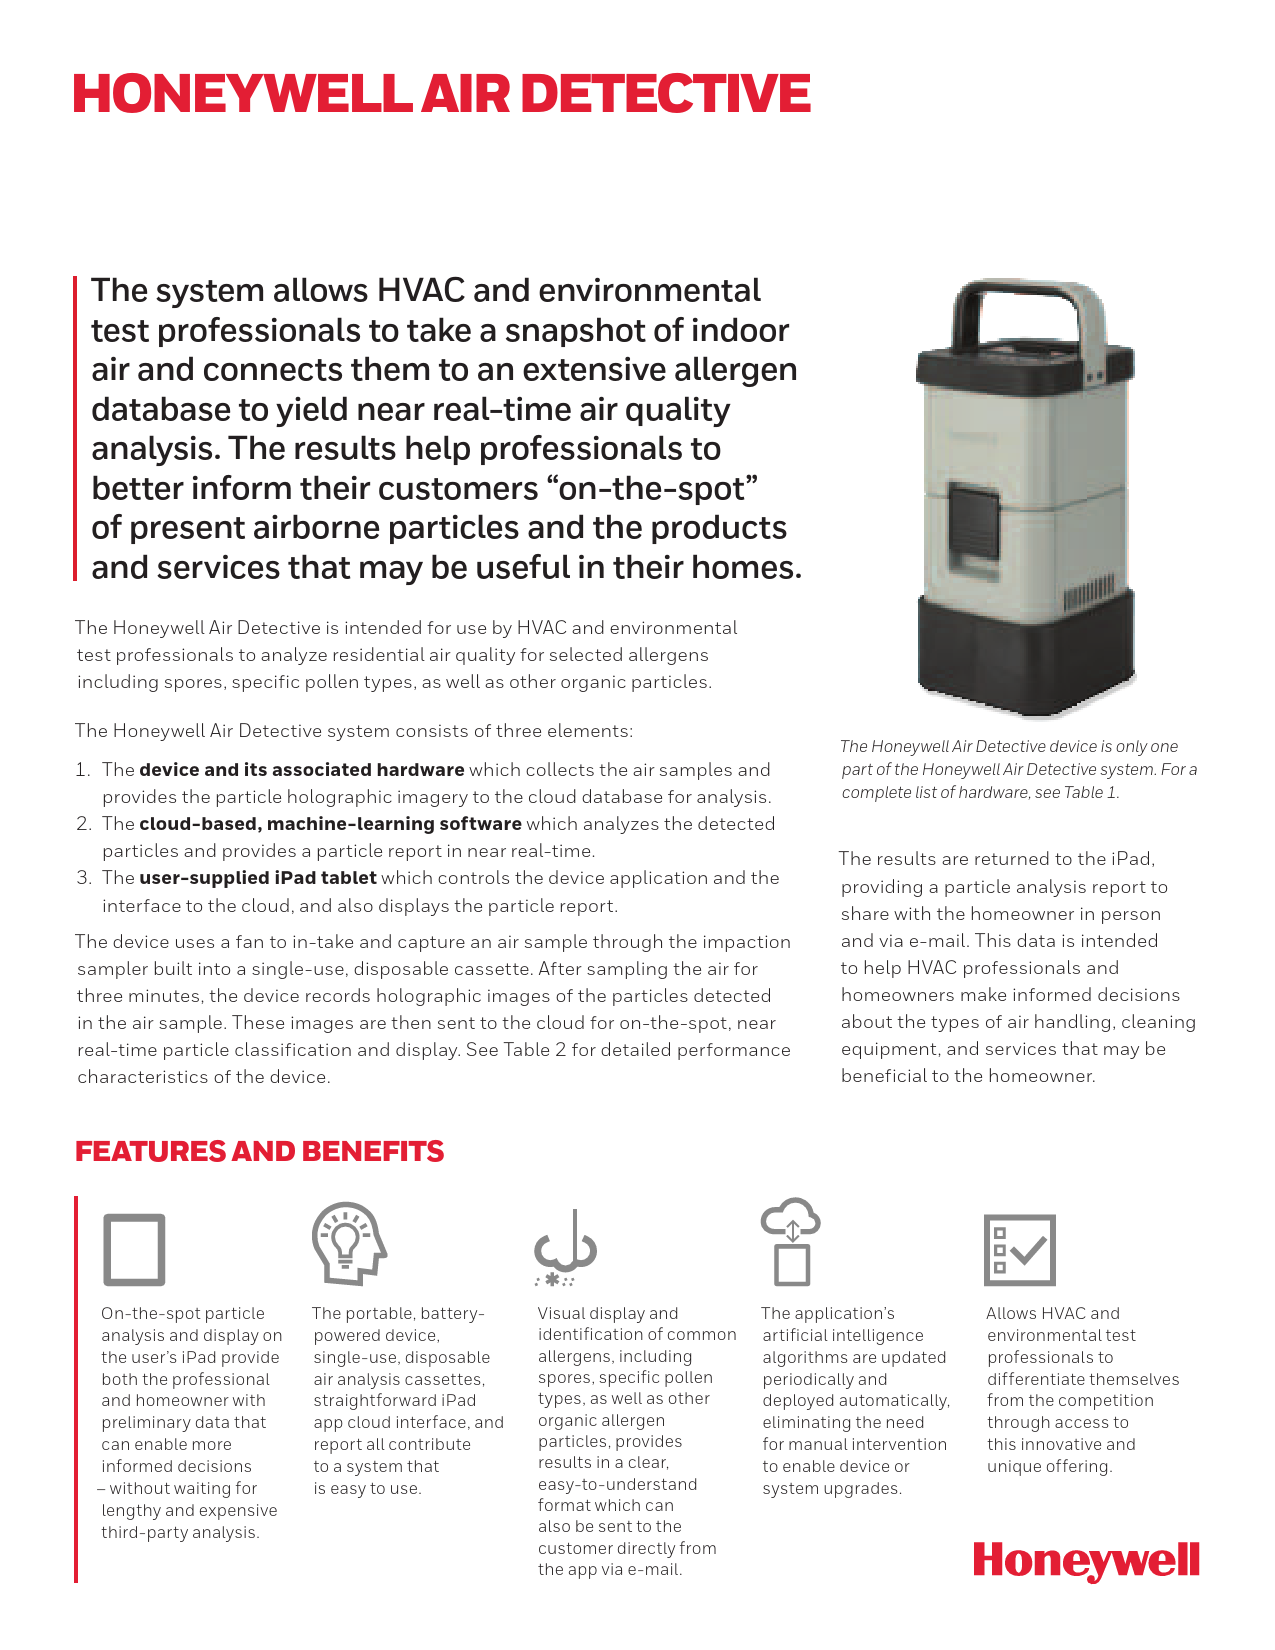
The Honeywell Air Detective device is a component of the larger Honeywell Air Detective system. A comprehensive list of hardware is provided in Table 1.
Results are sent to the iPad, presenting a particle analysis report that can be shared in person or via email with the homeowner. This data assists HVAC professionals and homeowners in making informed decisions regarding air handling, cleaning equipment, and beneficial services.
Features and Benefits
- ? On-the-spot particle analysis and display: Provides immediate data on the user's iPad, enabling more informed decisions without waiting for lengthy third-party analysis.
- ? Portable and user-friendly: Features a battery-powered device, single-use disposable cassettes, a straightforward iPad app cloud interface, and an easy-to-use reporting system.
- ? Visual display and identification: Clearly displays and identifies common allergens like spores and specific pollen types, along with other organic allergen particles. Results are presented in an easy-to-understand format, shareable via email directly from the app.
- ? Automated AI updates: The application's artificial intelligence algorithms are updated and deployed automatically, eliminating the need for manual intervention for device or system upgrades.
- ? Competitive differentiation: Empowers HVAC and environmental test professionals to stand out by offering this innovative and unique air analysis solution.
Differentiation
- Unlike particle sensors that only provide particle volume without images or classification, or samplers requiring remote lab analysis, the Honeywell Air Detective offers on-the-spot airborne particle analysis with visualization and classification.
- The portable Honeywell Air Detective, combined with cloud connectivity, leverages advanced imaging technology and artificial intelligence algorithms.
Potential Applications
- Periodic service visits
- HVAC system diagnosis and consultation
- Collection of airborne allergen information to support marketing and sales
Value to HVAC and Environmental Test Professionals
The Honeywell Air Detective is an innovative tool for professionals, providing preliminary insights into customer indoor air quality. This allows customers to make more informed decisions about their HVAC systems, potentially driving:
- Additional filter and upgraded air cleaning system sales during service visits.
- Increased sign-up and renewal rates for HVAC service contracts.
- Increased high-value web traffic to dealer home pages with regularly updated pollen counts.
- Appropriate additional testing of the homeowner's indoor air.
Honeywell Air Detective Hardware
Table 1. Honeywell Air Detective Hardware
| ITEM | QUANTITY |
|---|---|
|
1 each (included in case) |
|
18 (Packaged in two clear plastic tubes containing nine cassettes each, included in case) |
|
Two sets of two (one set included in case, the other set provided separately) |
|
1 each (not included in case, provided separately) |
|
1 |
Honeywell Air Detective Report
The detailed Honeywell Air Detective Report provides particle concentrations, images, and categories, along with size data. It also includes important information and helpful links for interpreting the results. Figure 1 shows excerpts from a particle report sampled in an indoor office location. Tables 2 and 3 offer further details.
Figure 1. Honeywell Air Detective Report Excerpts
Description of Report Excerpts:
- Report Header: Includes Reading ID, Job ID, Tested By, Technician, Test Location (e.g., Living room - Indoor), Date, and Time.
- Particle Concentrations: Displays counts per cubic meter for Total Count, Spores, Other Particles, Total Pollen, Tree Pollen, Weed Pollen, and Grass Pollen.
- Image of Particles: A visual representation of collected particles as seen under the device's imaging system.
- Particle Category: A breakdown of particle types, typically showing percentages for 'Other Particles', 'Spores', and 'Pollen'.
- Particle Size Data: A bar chart illustrating particle concentration across various size ranges (in microns).
- Allergen Details: Specific information on detected allergens like Spores (e.g., Asp/Pen), Pine pollen, and Other Particles, including concentration, typical size, category, and severity level.
- Test Information: Details such as Sensor Model Number, Cassette Serial Number, Sensor Serial Number, and firmware versions for Image Processing and Particle Classification.
- Contact Information: Placeholder for company and individual contact details.
The report also contains sections on "Important Information About Interpreting Test Results and Disclaimers," which outline the preliminary nature of the results and limitations.
Performance Specifications
Table 2. Performance
| CHARACTERISTIC | PARAMETER |
|---|---|
| Collected airborne particle image | 8 mega pixel reconstructed holographic image, gray scale |
| Collected particle minimum diameter¹ | 2 µm typical |
| Field of view | 3.7 mm x 2.8 mm or 10.1 mm² |
| Typical particle collection efficiency² ³: | |
| >10 µm diameter | >90% |
| 5 µm diameter | approximately 50% |
| 2.5 µm diameter | approximately 20% |
| Precision %⁴: | |
| Detailed pollen classes as shown in Table 3⁵ | 91% typical |
| Spore class as shown in Table 3⁵ | 73% typical |
| % recall for spore class as shown in Table 3⁶ | 74% typical |
| Air sampling time per reading | 3 min typical |
| Time to analyze one air sample reading in cloud⁷ | 3 min to 5 min typical |
Footnotes for Table 2:
- The minimum diameter of detectable particles may be larger or smaller than 2 µm due to refractive index and opacity at the light source wavelength (850 nm). High opacity particles smaller than 2 µm may be detected; larger translucent particles may not.
- Collection efficiencies are approximations derived from fluid dynamics models (assuming 21 liter-per-minute sampling flow and perfectly spherical particles), not empirical lab characterization. Assumes new, properly sealed and stored cassettes.
- Collection efficiencies are used to translate imaged particle counts to average airborne particle concentration in #/m³. For example, a single 15 µm particle (100% efficiency) translates to ~1 particle per 63 liters (~16/m³); a 2.5 µm particle (20% efficiency) translates to ~5 particles per 63 liters (~79/m³).
- Precision % values for pollen and spore classes reflect average correct detection/identification rates based on Honeywell lab analysis vs. software analysis. The report also includes total pollen and non-pollen particles. Precision % is lower for total particles due to machine-learning not being trained on every particle type and appearance variability. Precision % does not account for false negatives. % recall for spores measures the probability of detection (avoiding false negatives). Values may not reflect field performance with untrained particle types.
- For comparison, impaction sampling and lab analysis typically have a coefficient of variation (CV) between 10% and 50%. Refer to J. Environ. Monit., 2007, 9, 855-861 and AIHA "FAQs About Spore Trap Air Sampling for Mold...", 2020.
- % recall is a machine-learning metric for detection probability (avoiding false negatives): (TP / [TP + FN]) * 100%. Indicated % recall is for Aspergillus and Penicillium spores only. A "true positive" requires matching location and identification by Honeywell lab personnel.
- Highly dependent on iPad's cellular connection (3G/4G typical; 2G recommended to avoid longer upload/download times).
Honeywell Air Detective Report Summaries
Table 3. Honeywell Air Detective Report
| CHARACTERISTIC | PARAMETER |
|---|---|
| Indoor sample particle concentration summary | Separate summaries for:
|
| Outdoor sample particle concentration summary | Separate summaries for:
|
| Detailed pollen classes detected (indoor and outdoor) | Eight classes from 11 pollen genera:
|
| Spore class detected (indoor and outdoor) |
|
General Specifications
Table 4. General Specifications
| CHARACTERISTIC | PARAMETER |
|---|---|
| Operating temperature range | 0°C to 50°C [32°F to 122°F] |
| Operating humidity | 95% non-condensing, at 50°C [122°F], steady state |
| Mains supply voltage fluctuations | not applicable |
| Pollution degree of the intended environment | Degree 2 |
| Device dimensions | 303 mm x 130 mm x 130 mm [11.9 in x 5.1 in x 5.1 in] |
| Approvals (provided by UL) | IEC/EN 60825-1, IEC/UL 61010-1 |
| Laser class | 1 |
CLASS 1 LASER PRODUCT
IEC 60825-1:2014
Power Supplies
Table 5. Power Supplies¹
| COMPONENT | MANUFACTURER | DESCRIPTION |
|---|---|---|
| Device DC voltage power supply | Cincon Electronics Co. LTD P/N: TR70MB120-01E02 VI |
12 V, 5.8 A adapter AC input is 80 VAC to 264 VAC |
| Device power cord | Cincon Electronics Co. LTD P/N: 223020-01 |
— |
| Honeywell Rechargeable lithium-ion battery pack¹ | Honeywell Model: CK65-BTSC P/N: 318-063-001 |
nominal output: 3.6 V capacity: 7000 mAh, 25.2 Wh |
| Temperature ranges: |
|
|
| CK3 Series Quad Battery Charger dock | Honeywell Model: AC20 P/N: 871-230-101 |
charges four CK3 Honeywell Rechargeable lithium-ion battery packs |
| Battery charger power supply | Phihong 851-810-002 |
— |
| Battery charger power cord | — | — |
¹See documentation included with packaging for complete specifications, charging, and recommended use information.
Disclaimers
- Results from the Honeywell Air Detective (HAD) are preliminary. A complete analysis of air quality or contaminants requires secondary laboratory analyses. The HAD should not be used for diagnosing diseases or for other healthcare/medical applications. Honeywell provides no warranty regarding the accuracy of detection, failure to detect, identification, or classification of particles. Recommendations or decisions based on HAD results should be made with caution due to their preliminary nature.
- The HAD system is designed for continuous improvement via machine-learning algorithms and additional data sets. The product may exhibit inaccuracies, misidentifications, false positives, or false negatives impacting results.
- The HAD is not the exclusive method for detecting or analyzing particles. Data analyzed is a one-time snapshot of the immediate surrounding air and not the sole source of particle data. Distinct samples from the same location may show significant variation in particle types, classes, and numbers. The report does not determine particle source or viability. The HAD cannot determine why a particle was detected or predict its past or future presence. The HAD and its report should not be the sole basis for a comprehensive indoor air quality assessment. Long-term, professional testing with laboratory analysis is recommended for the most accurate assessment of indoor air quality and causes of concerns.
- Specific Comments Regarding Spores: The American Industrial Hygiene Association (AIHA) cautions that spore air sampling alone cannot support definitive conclusions about mold presence indoors or assess health risks. Air sampling should be a tool supporting informed inspection. See https://aiha-assets.sfo2.digitaloceanspaces.com/AIHA/resources/FAQs-About-Spore-Trap-Air-Sampling-for-Mold-for-Direct-Examination-Guidance-Document.pdf. Professionals experienced in mold assessment and remediation can provide detailed evaluations of identified spores. State laws may require specific training, certifications, or licenses for mold assessment/remediation services, which must be performed by duly licensed professionals.
- It is the buyer's sole responsibility to: (1) determine the HAD's suitability for their application, (2) operate the HAD according to the user manual and Honeywell's instructions (including single-use cassette disposal), (3) accurately communicate report contents to the homeowner, and (4) determine the suitability of any product or service offered based on their expertise and available tools.
⚠️ WARNING: MISUSE OF DOCUMENTATION
- This data sheet is for reference only and should not be used as a product guide.
- Complete operation and maintenance information is provided in the product's supplied instructions. Failure to comply could result in death or serious injury.
For More Information
Advanced Sensing Technologies provides services through a worldwide network of sales offices and distributors. For application assistance, current specifications, pricing, or to find the nearest Authorized Distributor, visit the website or contact:
techsupport-honeywellairdetective@honeywell.com
Honeywell
Sensing and Internet of Things
830 East Arapaho Road
Richardson, TX 75081
sps.honeywell.com/ast