RUCKUS Analytics Data Sheet
File info: application/pdf · 8 pages · 2.09MB
RUCKUS Analytics Data Sheet
RUCKUS Analytics, Network intelligence, Servie Assurance, Cloud Service, network trouble shoorting, artificial intelligence, PA-114203.2, 1-EN
Extracted Text
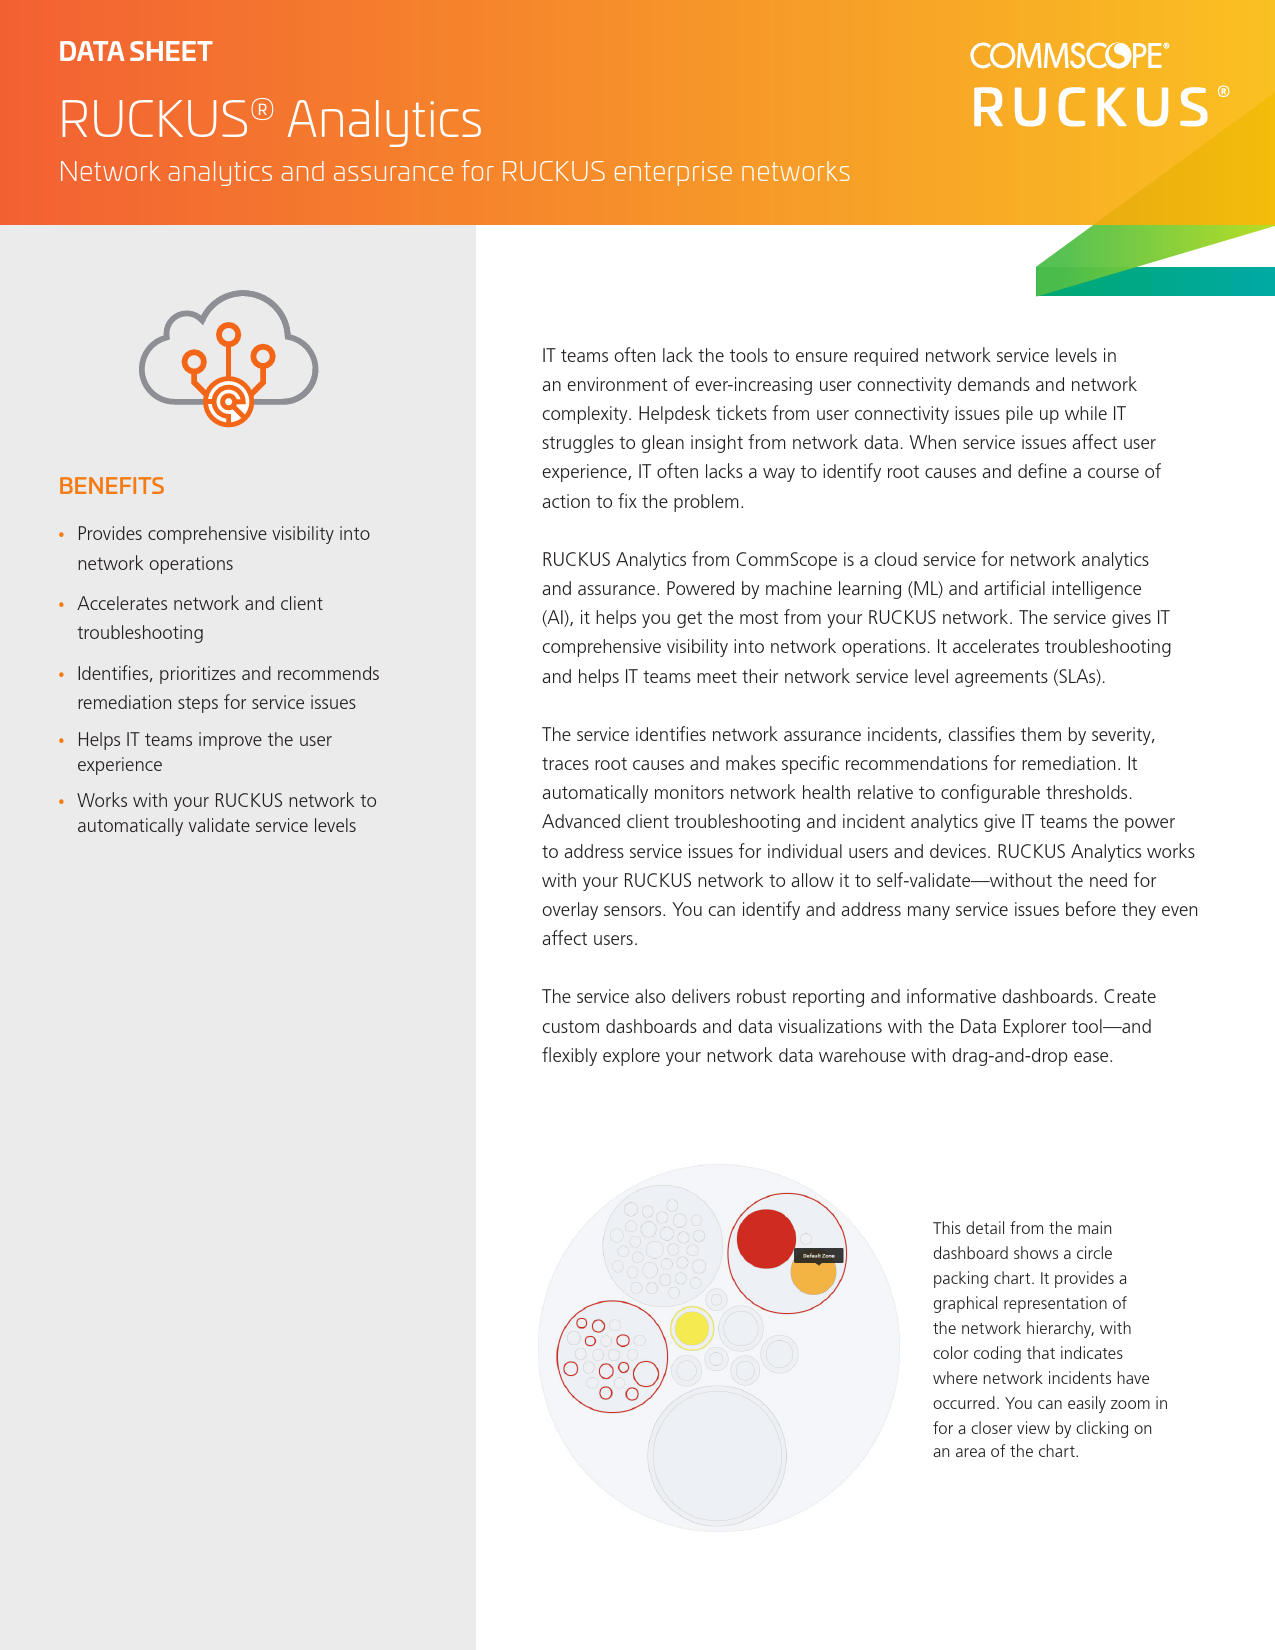
DATA SHEET
RUCKUS� Analytics
Network analytics and assurance for RUCKUS enterprise networks

BENEFITS
� Provides comprehensive visibility into network operations
� Accelerates network and client troubleshooting
� Identifies, prioritizes and recommends remediation steps for service issues
� Helps IT teams improve the user experience
� Works with your RUCKUS network to automatically validate service levels

IT teams often lack the tools to ensure required network service levels in an environment of ever-increasing user connectivity demands and network complexity. Helpdesk tickets from user connectivity issues pile up while IT struggles to glean insight from network data. When service issues affect user experience, IT often lacks a way to identify root causes and define a course of action to fix the problem.
RUCKUS Analytics from CommScope is a cloud service for network analytics and assurance. Powered by machine learning (ML) and artificial intelligence (AI), it helps you get the most from your RUCKUS network. The service gives IT comprehensive visibility into network operations. It accelerates troubleshooting and helps IT teams meet their network service level agreements (SLAs).
The service identifies network assurance incidents, classifies them by severity, traces root causes and makes specific recommendations for remediation. It automatically monitors network health relative to configurable thresholds. Advanced client troubleshooting and incident analytics give IT teams the power to address service issues for individual users and devices. RUCKUS Analytics works with your RUCKUS network to allow it to self-validate--without the need for overlay sensors. You can identify and address many service issues before they even affect users.
The service also delivers robust reporting and informative dashboards. Create custom dashboards and data visualizations with the Data Explorer tool--and flexibly explore your network data warehouse with drag-and-drop ease.
This detail from the main dashboard shows a circle packing chart. It provides a graphical representation of the network hierarchy, with color coding that indicates where network incidents have occurred. You can easily zoom in for a closer view by clicking on an area of the chart.

Customer premises

RUCKUS Analytics

SmartZone cluster

Secure bi-directional telemetry and control

Compute Fast analytic Ensemble Data

cluster queries

ML visibility

RUCKUS Analytics aggregates raw data and automatically transforms it into deep insight into network operations. This MLand AI-powered analytics service frees you from a wide variety of manual tasks associated with network assurance. Comprehensive network intelligence helps you deliver on network SLAs in support of users, devices and applications.
RUCKUS Analytics automatically measures the impact of SmartZone configuration changes on network performance. You can observe the effects of each change on a portion of the network before rolling it out more broadly. This helps to avoid fully rolling out changes that might have an adverse effect on network performance.
It scales to support the largest deployments--expanding capacity transparently to meet your requirements. RUCKUS Analytics supports two control and management architectures: SmartZone* for on-premises and private cloud/data center deployments, and RUCKUS Cloud for cloud-managed deployments. RUCKUS Analytics has an industry-unique combination of attributes: � Automated data baselining and insights driven by ML and AI � Health and SLA monitoring � Powerful, holistic troubleshooting � Automatic classification of incident severity � Service validation without the need for an on-site data collector
or overlay sensors � Granular access to raw data with deep exploration and custom
dashboards � 12 months of storage with flexible data reporting
* SmartZone 5.1.2 or higher is required.

Streaming telemetry with a modern data stack for advanced analytics
RUCKUS Analytics is designed for the unique data profile generated by network devices. On-premises controllers securely connect to the cloud and stream lightweight health KPIs and telemetry. The high-performance data stack ingests and processes the data to serve as the basis for queries, reports and baseline metrics.
Network health monitoring
The service automatically monitors network health, with an overview tab that provides a high-level summary view. Select other health monitoring tabs to view metrics in specific health categories: connection, performance and infrastructure. Network health monitoring gives you instant visibility into metrics like AP service uptime, time to connect, connection success rate, client throughput and more. You define the service levels you want to measure against. For example, you might want to set the "time to connect" goal at five seconds--RUCKUS Analytics will tell you what percentage of the time the network meets that goal. The service lets you readily demonstrate to others in your organization performance to SLAs.
Incident analytics powered by machine learning and artificial intelligence
RUCKUS Analytics enables machine-assisted proactive networking for your RUCKUS deployment. It automatically establishes a normal range of behavior for each network element, without requiring any input from IT. Then it uses machine learning to automatically identify service incidents related to connectivity, performance and infrastructure that affect user experience. It uses artificial intelligence to classify service incidents by severity--so you can address the highest-priority issues first.

2 RUCKUS ANALYTICS Network analytics and assurance for RUCKUS enterprise networks

The system provides details for each incident, including: � Root cause and recommended action � Affected areas (client operating system types, access point
models, firmware versions, WLANs and more) � Other impact details, including severity, client impact and
duration � List of impacted clients � Presentation of the underlying data that drives the incident
RUCKUS Analytics dramatically reduces mean time to resolution for service incidents. It can eliminate some helpdesk tickets by letting you address issues before they affect users. By addressing the root cause for one incident, you can avoid other incidents that might arise from that cause. Service providers can realize instant business value when level 1/2 helpdesk personnel can remediate complex network problems using RUCKUS Analytics.
Powerful client troubleshooting
With simple and flexible search and a holistic client troubleshooting page, RUCKUS Analytics gives you a complete picture of client experience for easy connectivity and user experience diagnostics, including: � Successful, slow and failed connections � Disconnect events � Roaming events and failed roams � Connection quality (RSSI, MCS, client throughput) � Network incidents affecting users, with links to see incident
details
Client troubleshooting is a powerful tool that helps you understand and address issues affecting specific clients on the network.

Automatic service validation
RUCKUS Analytics works with your RUCKUS network to automatically validate service levels without the need for overlay sensors. Access points act as virtual clients to identify possible service disruptions, often before they affect users. The system can perform a variety of tests, including:
� WLAN, LAN and WAN connectivity
� EAP, RADIUS, DHCP and DNS
� Ping, traceroute and speed test (upload/download)
Melissa--your own AI-powered virtual network assistant
RUCKUS Analytics includes a powerful AI-powered virtual network assistant called Melissa. Combining an intuitive interface with advanced natural language processing, Melissa determines the administrator's intent in posing a wide variety of inquiries and delivers highly insightful responses. IT teams save valuable time with ready access to information that helps them manage network operations--without the need for any coding.
IT service management integration
RUCKUS Analytics integrates closely with leading IT service management (ITSM) products from ServiceNow and Salesforce to initiate helpdesk tickets automatically and let IT get a head start in resolving them. This ensures that, when a service issue occurs, it is flagged for the helpdesk to address. Without such a system in place many issues that affect user experience go unreported.
Prepackaged reports and dashboards
A wide variety of standardized reports provides visibility into network performance, traffic patterns, application usage and more. Summary views provide high-level information, and you can drill down to the level of individual network components and devices. Examples of standardized reports include:
� Network--traffic and client trends, top devices, top SSIDs, traffic distribution and more
� Client--reports by OS and device manufacturer, top clients by usage, client trends, session details and more

3 RUCKUS ANALYTICS Network analytics and assurance for RUCKUS enterprise networks

� Inventory--AP, switch and controller count, models, firmware, status and more
� Application--top apps and their usage trends, top app groups and usage, top ports and more
� Device-specific reports--complete visibility and usage reports for clients, APs and switches
The service lets you download reports as raw data, a PDF file or a CSV file. Forward the results to stakeholders inside or outside the organization.
Data Explorer--custom dashboards, data visualizations and more
The RUCKUS Analytics Data Explorer tool lets you create custom dashboards to dissect and analyze data from your network ecosystem. Drag-and-drop dashboard creation makes it easy to design views tailored to your needs. You can easily position and reposition dashboard tiles, edit tiles at will and toggle between different views.

Cloud deployment for scalability and expandability
As a hosted service, RUCKUS Analytics relieves you of the burden of managing an in-house network analytics platform. Because the system stores data in the cloud, capacity is virtually limitless and expands instantly as your network environment generates more data. You don't have to worry about running out of capacity, forecasting disk utilization or figuring out when to add resources. RUCKUS Analytics does that for you transparently using containers and microservice orchestration. The software does not require an on-site data collector. Cloud deployment enables the machine learning algorithms embedded in RUCKUS Analytics to provide maximum insight.
Customers can designate a third party--such as a RUCKUS networking solution provider--to administer their account. Managed service providers (MSPs) can manage multiple endcustomer RUCKUS Analytics accounts from within their own account.

Analyze and filter data by dozens of dimensions--including time, device type, traffic type, application, AP group, controller, access point, band, SSID and more. Use multiple visualization methods to view your data, including pivot tables, line charts, bar charts, sunbursts, Sankey diagrams, stacked charts and heat maps. Data Explorer puts your full network data warehouse at your fingertips so you can answer any number of network questions.

4 RUCKUS ANALYTICS Network analytics and assurance for RUCKUS enterprise networks

Health Monitoring | RUCKUS Analytics automatically monitors network health across a variety of metrics in three areas: connection, performance and infrastructure.
Incident Analytics | RUCKUS Analytics provides a root cause analysis of each service incident with specific recommendations for how to resolve the issue. 5 RUCKUS ANALYTICS Network analytics and assurance for RUCKUS enterprise networks

Advanced Client Troubleshooting | Lets you investigate and resolve issues that have impacted a specific client on the network.
Data Explorer | The Data Explorer tool in RUCKUS Analytics lets you create custom dashboards with drag-and-drop ease. 6 RUCKUS ANALYTICS Network analytics and assurance for RUCKUS enterprise networks

Service Validation | RUCKUS Analytics works with your RUCKUS network to allow the network to automatically validate network service levels.
Reporting | RUCKUS Analytics includes a wide variety of pre-packaged reports. This report shows metrics related to the RUCKUS switches in the network.
7 RUCKUS ANALYTICS Network analytics and assurance for RUCKUS enterprise networks

Specifications

Security, privacy and data protection
Cloud data center
SLA Support Part numbers

� All traffic to and from the cloud is encrypted � Only AP, switch, and client management traffic are sent to the cloud � Client data traffic stays local (broken out to local LAN and sent through existing firewall) � All data stored in RUCKUS Cloud is encrypted at rest � RUCKUS offers EU-located data centers for European customers � Latest security patches are automatically updated � Role-based access control is provided for administrative privileges
� Hosted in USA, Europe and Asia on world-class IAAS provider with: � ISO 27001 information security certification � SSAE-16, SOC 1, SOC 2 and SOC 3 certifications � Stringent physical, data access and data disposal security measures � Per-tenant migration capabilities � Green carbon-neutral facilities � Dedicated inter-DC fiber connectivity
� 99.9 percent network availability (does not include planned maintenance, including periodic software upgrades and other pre-announced activities)
� 24x7 chat/web/phone support included for the term of the subscription
� CLD-ANAP-1001 � RUCKUS Analytics one-year subscription for one Cloud- or SmartZone-managed AP or ICX switch
� CLD-ANAP-3001 � RUCKUS Analytics three-year subscription for one Cloud- or SmartZone-managed AP or ICX switch
� CLD-ANAP-5001 � RUCKUS Analytics five-year subscription for one Cloud- or SmartZone-managed AP or ICX switch
� CLR-ANAP-1001 � RUCKUS Analytics one-year renewal for one Cloud- or SmartZone-managed AP or ICX switch
� CLR-ANAP-3001 � RUCKUS Analytics three-year renewal for one Cloud- or SmartZone-managed AP or ICX switch
� CLR-ANAP-5001 � RUCKUS Analytics five-year renewal for one Cloud- or SmartZone-managed AP or ICX switch

Admin can grant and revoke access to partners and RUCKUS support
View RUCKUS Cloud privacy policy
Ability to choose the hosting region for your service (USA, EU or Asia)

commscope.com
Visit our website or contact your local CommScope representative for more information.
� 2021 CommScope, Inc. All rights reserved. Unless otherwise noted, all trademarks identified by � or TM are registered trademarks, respectively, of CommScope, Inc. This document is for planning purposes only and is not intended to modify or supplement any specifications or warranties relating to CommScope products or services. CommScope is committed to the highest standards of business integrity and environmental sustainability with a number of CommScope's facilities across the globe certified in accordance with international standards, including ISO 9001, TL 9000, and ISO 14001. Further information regarding CommScope's commitment can be found at www.commscope.com/About-Us/Corporate-Responsibility-and-Sustainability.
PA-114203.3-EN (05/21)