5988 RadioScan Spectrum Analyzer User's Manual
File info: application/pdf · 16 pages · 507.89KB
5988 RadioScan Spectrum Analyzer User's Manual
5988, RadioScan, Spectrum, Analyzer, User's, Manual
RadioScan Spectrum Analyzer
User Manual Provides a link to the 5988 RadioScan product manual -City Theatrical website Provides a link to the CTI website -Update Firmware Updates the firmware in the RadioScan dongle. Note: The latest RadioScan soft…
Help -User Manual Provides a link to the 5988 RadioScan product manual -City Theatrical website Provides a link to the CTI website -Update Firmware Updates the firmware in the...
Extracted Text
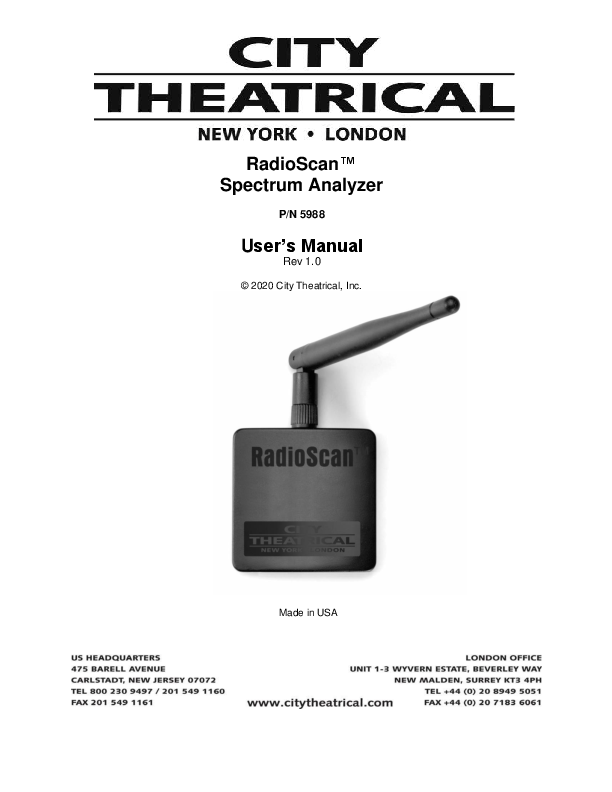
RadioScanTM Spectrum Analyzer
P/N 5988
User's Manual
Rev 1.0
� 2020 City Theatrical, Inc.
Made in USA

5988 RadioScan Spectrum Analyzer
Table of Contents
1 Foreword ..............................................................................................................3 2 Compliance Requirements ...................................................................................3 3 Introduction.......................................................................................................... 4 4 Specifications .......................................................................................................7 5 Using RadioScan..................................................................................................7 6 Troubleshooting................................................................................................. 16 7 Customer Service .............................................................................................. 16
List of Tables
Table 1: Part Number ................................................................................................ 5 Table 2: Physical Characteristics .............................................................................. 7 Table 3: LED Indicator Light Colors........................................................................... 8 Table 4: Troubleshooting Guide .............................................................................. 16
List of Figures
Figure 1: Product Top, Bottom and Side ....................................................................6 Figure 2: Multiverse SHoW ID ................................................................................. 15
2

5988 RadioScan Spectrum Analyzer
1 Foreword
1.1 Safety Notice
This product is designed for use in dry locations only. Exposure to rain or moisture may cause damage.
2 Compliance Requirements
The 5988 is compliant to the following standards: CE: EMC Directive of EU 2014/30/EU
Low Voltage Directive of EU 2014/35/EU FCC: CFR 47 Part 15 Subpart B, Class B IC: ICES-003 (Issue 6), Class B
2.1 FCC Compliance Statement (United States) This device complies with Part 15 of the Federal Communications Commission (FCC) Rules. Operation is subject to the following two conditions: (1) This device may not cause harmful interference; and (2) This device must accept any interference received, including interference that may cause undesired operation.
2.2 IC Statement This device complies with Industry Canada's license-exempt RSSs. Operation is subject to the following two conditions: (1) This device may not cause interference; and (2) This device must accept any interference, including interference that may cause undesired operation of the device. Le pr�sent appareil est conforme aux CNR d'Industrie Canada applicables aux appareils radio exempts de licence. L'exploitation est autoris�e aux deux conditions suivantes : (1) l'appareil ne doit pas produire de brouillage, et (2) l'utilisateur de l'appareil doit accepter tout brouillage radio�lectrique subi, m�me si le brouillage est susceptible d'en compromettre le fonctionnement.
3

5988 RadioScan Spectrum Analyzer
3 Introduction
RadioScan is a 900MHz and 2.4GHz spectrum analyzer (includes a RadioScan hardware dongle and accompanying free RadioScan software) that enables you to easily visualize radio energy that is otherwise invisible to you. Using RadioScan helps you to create a broadcast plan that optimizes available spectrum in your area, and helps prevent interference with other mission critical radio devices near you.
RadioScan shows all radio activity near you in your chosen frequency, including frequency hopping gear like wireless DMX, as well as Wi-Fi networks, Bluetooth, wireless headsets, video transmitters, cordless phones, baby monitors, and microwave ovens. RadioScan can view spectrum data either in Spectrogram view or Waterfall view, notes can be added, and snapshots can be taken and saved. Scans of any length can be recorded, saved, and emailed, and can be played back and reviewed by others with just the free RadioScan software, without the need for the RadioScan hardware dongle.
By identifying SSIDs, broadcast channel, and the signal strength of wireless networks, RadioScan can help IT departments setup, maintain, and troubleshoot their wireless installations.
For users of City Theatrical Multiverse� wireless DMX/RDM products, RadioScan will guide you in creating the optimum broadcast plan for your production by helping choose the best SHoW ID based on the number of universes being broadcast and the best area of the spectrum on which to broacast.
RadioScan is compatible with both Windows and macOS computers. RadioScan software is available as a free download at: http://www.citytheatrical.com/Products/radioscan (Scroll down to the Downloads tab)
3.1 Features
 900MHz and 2.4GHz spectrum analyzer with dual band antenna  Finds all radio activity nearby in chosen spectrum  Identifies SSID (network name) and RSSI (signal strength) of Wi-Fi networks  Shows either Spectrogram or Waterfall view  Records and play back scans of unlimited length using free RadioScan software  Takes and saves snapshots  Records notes onto scans  Guides users in choosing Multiverse SHoW IDs  Compatible with Windows and macOS computers (USB-A to USB-C cable provided)
4

5988 RadioScan Spectrum Analyzer
3.2 Part Number
Table 1: Part Number
Part # Description 5988 RadioScanTM Spectrum Analyzer
5

5988 RadioScan Spectrum Analyzer
3.3 Product Detail Top/bottom diagram shown to scale.
1.187" (30.15mm)
2.0" (50mm)

4.5" (114.3mm)
2.0" (50mm)

USB-C Port

Indicator Light

0.5" (12.7mm)

*Product side view shown smaller than actual size.

Figure 1: Product Top, Bottom and Side 6

5988 RadioScan Spectrum Analyzer

4 Specifications

Specifications Frequency Size (not including antenna)
Antenna
Construction Power/Data Connector

Table 2: Physical Characteristics
Description 902-928MHz and 2.4-2.483GHz Length: 2.0" (50mm) Width: 2.0" (50mm) Height: 0.5" (12.7mm) Detachable external omnidirectional broadband, 2dBi 900MHz, 4dBi 2.4GHz NEMA 4 IP20 ABS Plastic USB-C with 1m (39.37") USB-A to USB-C cable

Computer Requirements Operating System Display resolution Wi-Fi Radio USB Port RAM

Windows 10 / Mac OS 10.15 or higher 800x600 Internal or USB Wi-Fi adaptor 1.1 or higher 4GB

Product Information Configuration Use Environment Warranty Compliance

City Theatrical RadioScan software program Indoor One year FCC / IC / CE / RoHS

5 Using RadioScan
5.1 Download RadioScan Software Go to http://www.citytheatrical.com/Products/radioscan (Scroll down to the Downloads tab) to download the free RadioScan software program. 5.2 Plug In RadioScan Dongle Attach the 1m USB-A to USB-C cable from the RadioScan dongle to your computer. 5.3 Run RadioScan Software Find and open the RadioScan software program on your computer. It will recognize your RadioScan dongle and will begin a 2.4GHz scan.
7

5988 RadioScan Spectrum Analyzer

5.4 RadioScan Dongle Indicator Lights
The RadioScan dongle has one multicolor LED indicator light that can inform you of various functions, as follows.
Table 3: LED Indicator Light Colors

Red Green Blue Flashing Blue Magenta

Powered, no connection to computer Powered, connected to computer Powered, connected, and application is connected Powered, connected, application is connected and scanning Dongle is updating firmware

5.5 Screen View By default, when you open the RadioScan software application, you will see Spectrogram view:

Frequency is shown on the X-axis on the bottom of the screen, and Wi-Fi channels are shown on the X-axis on the top of the screen. Amplitude is shown on the Y-axis on the left side of the screen.
A cross hair travels with the cursor showing frequency, amplitude, and density data at any point on the screen.
A 2.4GHz scan starts automatically when the program is opened and a RadioScan dongle is found, and Wi-Fi networks are displayed by default.
8

5988 RadioScan Spectrum Analyzer
5.6 Other Controls
Top of screen controls:
Connect Connects RadioScan dongle to RadioScan program.
Disconnect Disconnects RadioScan dongle from RadioScan program.
Open Opens a saved RadioScan recording.
Help -User Manual Provides a link to the 5988 RadioScan product manual -City Theatrical website Provides a link to the CTI website -Update Firmware Updates the firmware in the RadioScan dongle. Note: The latest RadioScan software application can be found on the Downloads tab of the RadioScan webpage on the City Theatrical website. -About Provides License Information related to the RadioScan program and the current version of the software.
Quit Quits the RadioScan software program.
2.4GHz Selects the 2.40-2.483GHz portion of the spectrum to scan.
900MHz Selects the 902-928MHz portion of the spectrum to scan.
Snapshot Takes a snapshot of the current screen, and prompts for a location to save. Scan does not need to stop to take a snapshot.
Save Saves a recording of the current scan, and prompts for a location to save. Scan does not need to stop before saving.
Spectrogram View/Waterfall View Toggles between Spectrogram view and Waterfall view of the chosen frequency band.
9

5988 RadioScan Spectrum Analyzer
Wi-Fi Chan./Zigbee Chan. Toggles the X axis at the top of the screen between Wi-Fi channels and Zigbee channels. Multiverse SHoW IDs Opens a table that shows the relationship of Multiverse SHoW IDs to the spectrum, and helps to choose the optimum area of the band on which to broadcast. See pages 13-15 for complete information. Show Wi-Fi Shows the frequency range of Wi-Fi networks nearby and identifies their SSID (name). Note: your computer must have Wi-Fi hardware installed for this feature to be available. Wi-Fi List Displays a table of Wi-Fi networks found, including their Wi-Fi channel, SSID (name) and RSSI (signal strength). List can be undocked, dragged to another location, and expanded. Bottom of Screen
Scan Starts a new scan. Stop Stops a scan. After stopping, scans can't be restarted, so save the scan if a record is required.
Scan Time Scan time is shown in the lower right hand corner of the screen in both elapsed time and clock time. After each 24 hour period, scan time resets to zero and starts again, while preserving all previous scan data and timings.
Scan Bar The Scan Bar tracks the course of the scan across the screen after the first two minutes of data collection. The scan can be rewound to view previous events by pulling the Scan Bar to the left (the scan continues to record), and the scan resumed by pulling it back to the right.
10

5988 RadioScan Spectrum Analyzer
5.7 Spectrogram View The default view of the RadioScan program is the Spectrogram view. The Y axis represents the amplitude of the radio energy on any frequency across the X axis. The cross hair cursor shows information as you move it around the screen.
The crosshairs of the cursor show the frequency across the X axis, the amplitude of the point where the cursor is on the Y axis, the density of that frequency, the current amplitude reading of that frequency, and the average, and maximum amplitudes over the previous two minutes, for that frequency. Although the Spectrogram is two dimensional, color provides a third dimension of analysis. The color of the Spectrogram describes the density of radio energy on each frequency. Density is described as the percentage of time a specific amplitude of radio energy was measured on a specific frequency during the immediately preceding two-minute period. Density can be expressed as colors, like the chart on the upper right side of the RadioScan Spectrogram View screen. Density is an important tool in analysis of the broadcast spectrum. Blue designates a radio signal of short duration, like a frequency hopping radio, and means the frequency has been utilized less than 6.25% of the time during the last two minutes. This may signify a radio signal of high amplitude, but very short duration, like wireless DMX. Cyan designates the frequency was used slightly more of the time, with green, yellow, and orange progressing to higher usages of time over until reaching red, which shows the frequency was used more than 50% of the time over the two previous two minutes. This is a rolling two-minute calculation that updates automatically as conditions change. Generally, when looking for a suitable place to put a broadcast, look for areas with more blue and less red. Areas of high amplitude and high density should be avoided. An area of low amplitude and high density represents a noise floor that your signal would need to overcome to be successful. Spectrogram view often changes over time. By dragging the scan bar at the bottom of the screen, you can scroll back through your scan to quickly see changes in the environment. This is valuable in diagnosing the source of broadcast problems.
11

5988 RadioScan Spectrum Analyzer
Notes can be added in Spectrogram view. Place your cursor at the spot you want to add a note (anywhere on the screen) and left click your mouse. Enter a note of unlimited length. Click OK and the note will be pinned to the screen starting at the point of your mouse click. Multiple notes can be added this way at various locations on the screen. If a recording of the scan is saved, the note will appear in the entire recording. Left click on an existing note to edit. Right click on an existing note to delete. 5.8 Waterfall View Waterfall view gives a different look at radio energy. Devices around you that are controlled by others can affect your own radio signal. Using Waterfall View allows you to roll back time to see the moment a device is turned on or off. This can help to track down sources of interference. The X axis again represents frequency, while the Y axis represents real time, showing the previous two minutes on the screen. Each colored mark on the screen represents radio energy on a given frequency at a particular moment. The amplitude of the radio signal is denoted by its color, with blue representing low amplitude signals, and red representing high amplitude signals. Whereas Spectrogram view collects elapsed time on the scan bar, Waterfall view uses actual clock time (adjusted automatically for your location) and allows you to roll back time to see the moment a device is turned on or off. This can help to track down sources of interference.
Notes can be added in Waterfall view. Place your cursor at the spot you want to add a note and left click your mouse. Enter a note of unlimited length. Click OK and the note will be pinned to the left margin of the screen at that point in time and a line will be drawn across the screen. Left click on an existing note to edit. Right click on an existing note to delete the note and the horizontal line.
12

5988 RadioScan Spectrum Analyzer
5.9 Multiverse IDs The Multiverse IDs feature is for users of City Theatrical Multiverse wireless DMX, and will describe the SHoW IDs that may be selected for various areas of the band (either 2.4GHz or 900MHz). Multiverse SHoW IDs are a descriptive number that designates the portion of the spectrum on which to broadcast (900MHz or 2.4GHz), the data rate (this determines the number of universes of DMX that can be broadcast, the distance of the broadcast, and the degree of broadcast fidelity that can be expected), the portion of the broadcast band (full, adaptive, low, mid, high, and max), and the actual hopping pattern. See the SHoW ID chart on page 15 to see this explained graphically. When the Multiverse IDs button is selected, a table appears showing examples of SHoW IDs available. These SHoW IDs are a function of the number of universes needed (the "X" axis of the table), and the relative position in the band (the "Y" axis of the table).
Hovering over each individual SHoW ID reveals more information about it. Additionally, when hovering over a SHoW ID, an overlay will appear over the scan that shows the portion of the band that the broadcast will reach while using the selected SHoW ID. Below, SHoW ID 24340 has been selected (a "Max" bandwidth selection that will broadcast in the area of Wi-Fi channels 1314, outside of the normal Wi-Fi range in the U.S.). Clicking on any SHoW ID button will lock the overlay to the screen where it will appear in all recordings and screen shots.
13

5988 RadioScan Spectrum Analyzer
Begin your thought process of creating a broadcast plan by deciding how many universes need to be transmitted. SHoW IDs that carry fewer universes travel longer distances and often have more perfect fidelity than SHoW IDs that carry more universes. A good rule of thumb is to choose SHoW IDs with lower universe capacity whenever possible, and spread out your broadcast over more than one radio when possible, such as splitting your broadcast between the 2.4GHz and 900MHz radios on a 5910 Multiverse Transmitter. The most challenging shows for wireless DMX often involve direct view LED pixel chases and they require careful planning and the use of SHoW IDs that carry a low universe count for perfect operation. Nearly any other combination of equipment including moving lights, LED fixtures, and conventional dimmers will operate well on SHoW IDs that can carry multiple universes. If longer distance broadcasts or direct view LED pixel chases of more universes are needed (such as nine or 10 universe broadcasts from one 5910 or 5911 Multiverse Transmitter), performance can often be improved by the use of a specialized antenna such as a panel or Yagi.
14

5988 RadioScan Spectrum Analyzer
Multiverse SHoW ID Example: 24 3 0 2

Prefix

Data Rate

Band

Hop Pattern

9 900MHz Multiverse 24 2.4GHz Multiverse

Faster data rates provide more DMX universes. Slower data rates travel longer distances and provide more immunity to interference.

900MHz: Universes

1

1

2

2

3

4

Range
2000' Outdoor 300' Indoor 2000' Outdoor 300' Indoor 500' Outdoor 300' Indoor

2.4GHz: Universes

1

1

2

2

3

5

Range
1500' Outdoor 300' Indoor 1500' Outdoor 300' Indoor 1000' Outdoor 100' Indoor

Specifies which sections of the wireless band the frequency hopping utilizes.
0 Use full range of 900MHz or 2.4GHz band.
1 Use only low band channels.
2 Use only mid band channels (available for Data Rate 1 only).

If multiple wireless systems need to operate with the same data rate and band this value will change the hopping pattern to minimize overlapping between the two systems. Can be any number from 0 � 9 (not all bands have all Hop Patterns).

3 Use only high band channels.

4 Use only extreme high band to avoid WiFi (2.4GHz only).

5 Adaptive hopping. Avoids busy channels by analyzing spectrum.

Note: Not all combinations of digits are possible and unused numbers are reserved for future use.

Note: SHoW ID, SHoW Key (if used) and Universe must match between Transmitter and Receiver Cards.

Figure 2: Multiverse SHoW ID

5.10 Software Updates
City Theatrical issues software updates occasionally to add features or to fix bugs. The software version in use on your RadioScan dongle is found on the Help/About section of the RadioScan software program. Software updates are found on the CTI website on the 5988 Downloads tab.

15

5988 RadioScan Spectrum Analyzer

6 Troubleshooting

Symptom

Table 4: Troubleshooting Guide
Solution(s)

Unable to find any RadioScan device error.

Check for working USB data cable and not charging cable Verify that a USB Serial port was added to computer system.

LED is red

Device has not enumerated on the USB bus, check cable and computers USB port.

No Wi-Fi access points

are show

Make sure your computer has Wi-Fi hardware and it is turned on.

7 Customer Service

City Theatrical, Inc. 475 Barell Avenue Carlstadt, NJ 07072 USA
Phone: (800) 230-9497 or (201) 549-1160 Fax: (201) 549-1161 support@citytheatrical.com

City Theatrical Ltd. Office 31, Units 1-3, Wyvern Estate, Beverley Way New Malden, Surrey KT3 4PH United Kingdom Phone: +44 (0) 20 8949 5051 support@citytheatrical.com

For additional resources and documentation, please visit our website: www.citytheatrical.com

16