Autel Intelligent Tech MAXISYSMS906TS MaxiSys MS906TS User Manual part One
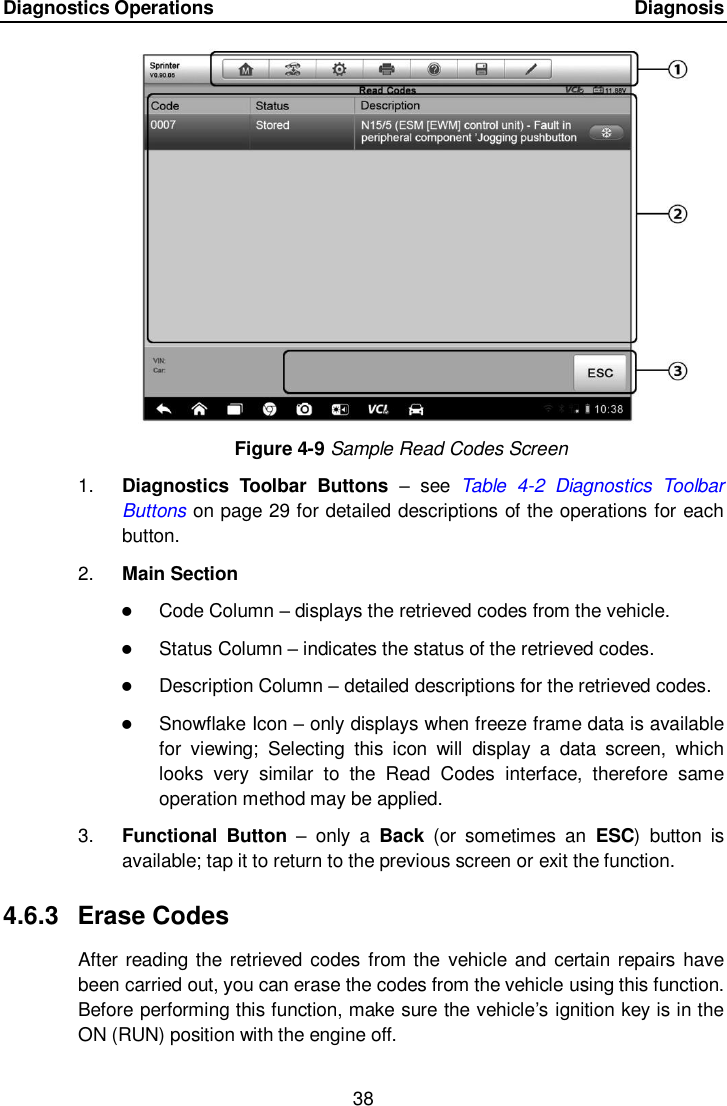
Autel Intelligent Tech. Corp., Ltd. MaxiSys MS906TS Users Manual part One
Contents
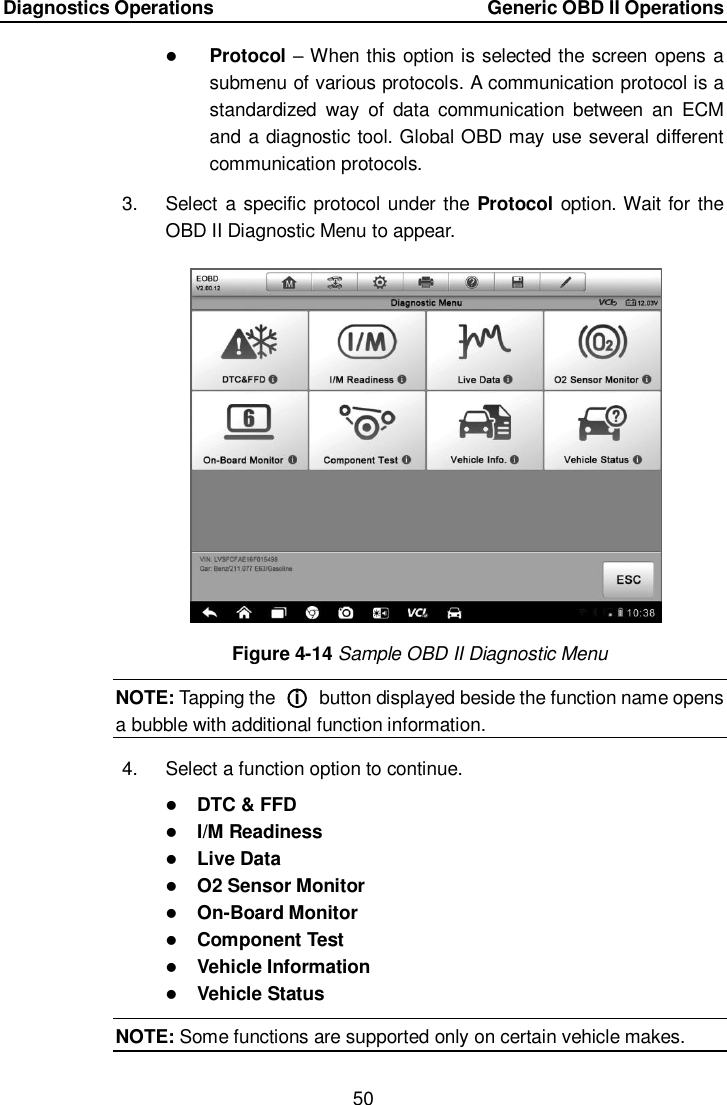
- 1. Users Manual Part Two
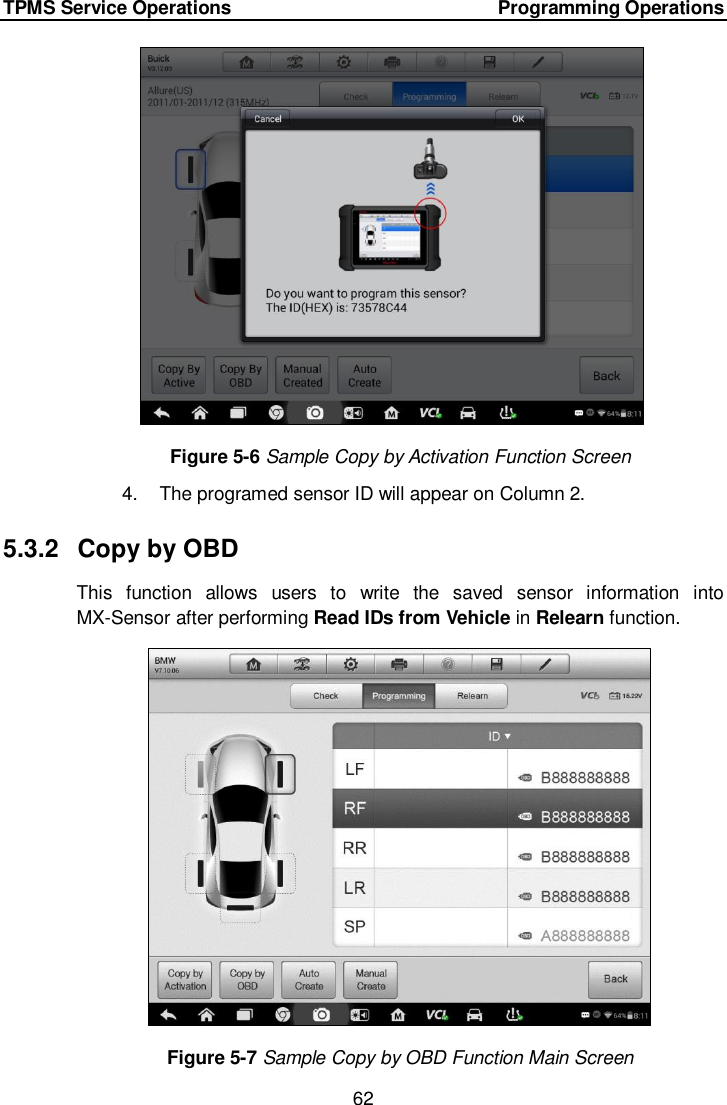
- 2. Users Manual Part One
- 3. Users Manual part One
Users Manual part One