Aztech Associates S0000552 Wireless Utility Meter Reader and Information Display User Manual
Aztech Associates Inc. Wireless Utility Meter Reader and Information Display
user manual
D 097-0552 611
1
In-Home Display - User Guide
V2.4 HQ
Overview
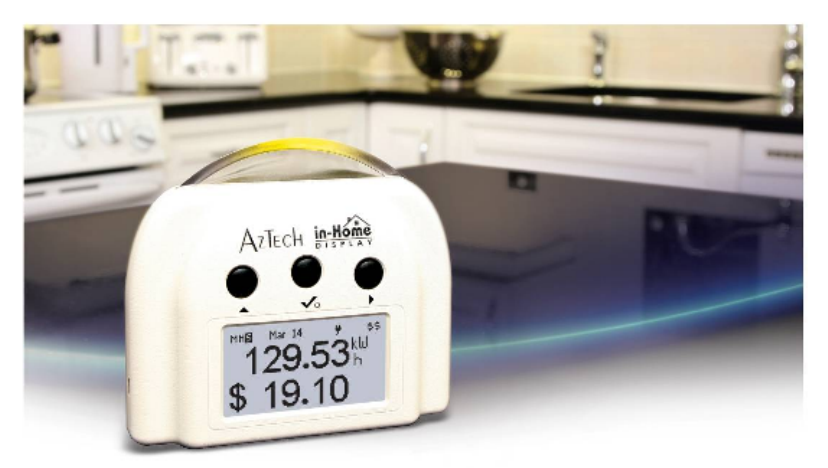
The In-Home Display from Aztech Associates Inc. is an easy-to-use product for monitoring energy
consumption and its associated cost within the home. It communicates wirelessly to the smart
electricity meter. Electricity used and its associated estimated cost, and historical power
consumption can all be shown. This guide explains what information can be displayed and how to
use the Aztech In-Home Display.
The In-Home Display is lightweight and compact so that it can be placed in a convenient easy to
view location. The top indicator light bar (green, yellow, or red) is used to indicate the different
electricity rates at an easy glance from across the room. The LCD display clearly shows numerical
and graphical information, and has adjustable backlighting.
The In-Home Display operates via an AC adapter connected to the USB port.
Utility messaging to notify of a pending Critical Peak event is also possible with the Aztech In-Home
Display. The indicator light bar changes to Red to attract the resident’s attention for messaging and
during Critical Peak rates.
Although efforts have been made to provide accurate electricity cost information, it should be noted
that all electricity cost data are estimates for informational only, not for billing.
FCC Warning
This equipment has been tested and found to comply with the limits for a Class B digital device, pursuant to Part 15 of the
FCC Rules. These limits are designed to provide reasonable protection against harmful interference in a residential
installation. This equipment generates, uses and can radiate radio frequency energy and, if not installed and used in
accordance with the instructions, may cause harmful interference to radio communications. However, there is no guarantee
that interference will not occur in a particular installation. If this equipment does cause harmful interference to radio or
television reception, which can be determined by turning the equipment off and on, the user is encouraged to try to correct the
interference by one or more of the following measures:
• Reorient or relocate the receiving antenna. • Increase the separation between the equipment and receiver. • Connect the
equipment into an outlet on a circuit different from that to which the receiver is connected. • Consult the dealer or an
experienced radio/TV technician for help.
Changes or modifications not expressly approved by the party responsible for compliance could void the user's authority to
operate the equipment. To comply with FCC RF exposure compliance requirements, a separation distance of at least 20 cm
must be maintained between the antenna of this device and all persons. This device must not be co-located or operating in
conjunction with any other antenna or transmitter.
D 097-0552 611
2
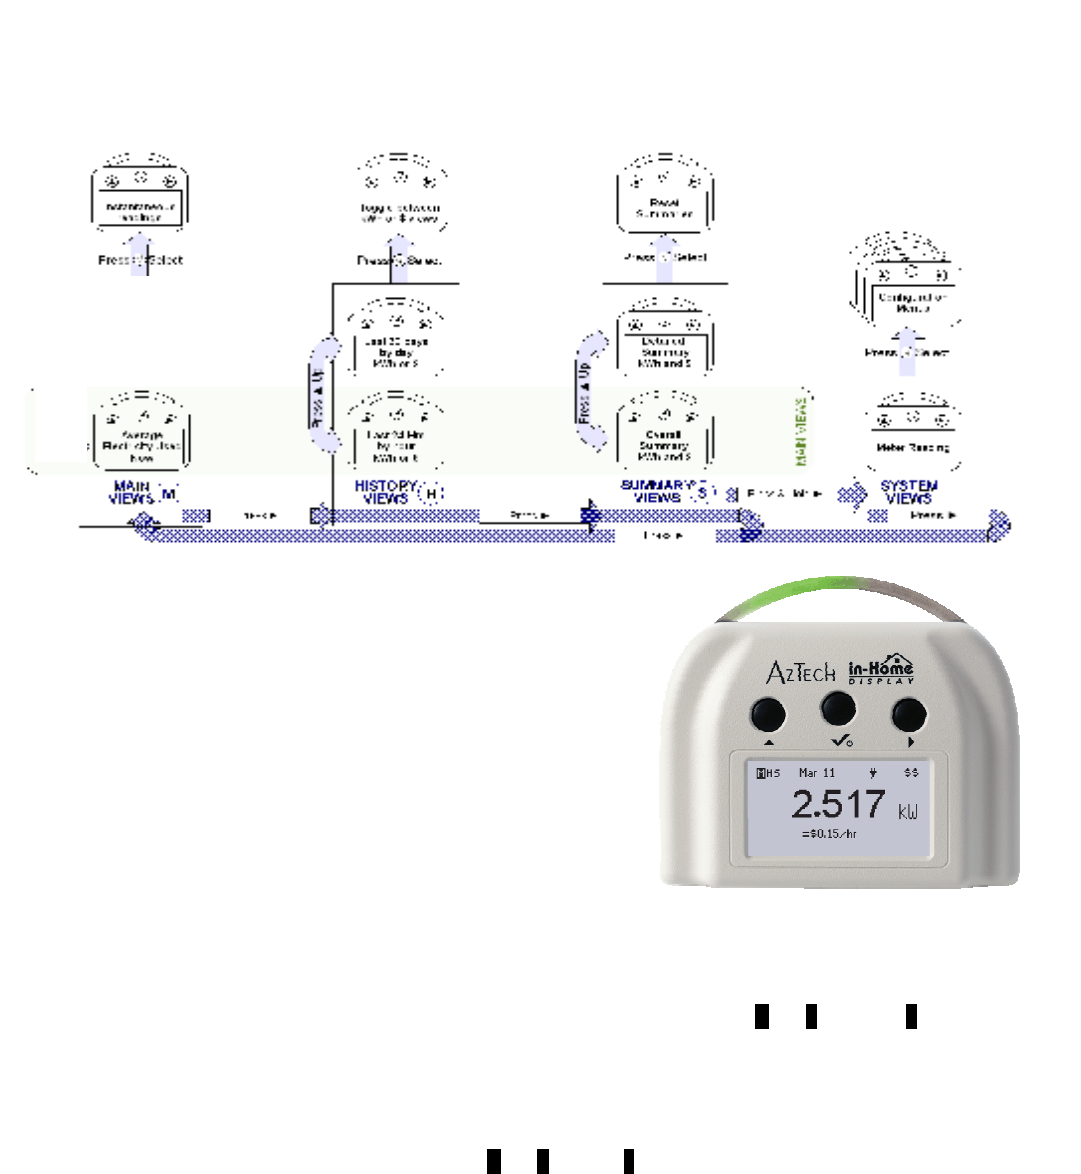
Display Screen Layout
How to use the Buttons
The three buttons are located on the front of the enclosure, above the display
screen. All viewing and programming functions can be done with these three
buttons, as described below.
The middle √ button turns ON the In-Home Display. Pressing and holding
this button turns OFF the unit. (Note that the In-Home Display also turns on
when the AC adapter is plugged in.)
When ON, this button allows for specific actions to occur, depending on
which screen is being displayed.
• In the Main views pressing the button switches from averaged
consumption to instantaneous consumption.
• In the Summary views, this button accesses the Reset Summaries
screens to reset the Summary information.
• In the History views, this button selects between kWh and $ views
• In the System views, this button assesses the Configuration Menus.
• In the Configuration Menus, this button selects the menu items listed.
The right ►button moves from one view to another. It normally cycles between the
M
ain,
H
istory and
S
ummary
views. It also functions as a DOWN button in the Configuration Menus.
• Press to move from the Main to History to Summary views.
• Press and Hold to view the absolute meter reading and access the menus
• The ►button also functions as a DOWN button in the Configuration Menus.
The left ▲button allows for the display of additional
M
ain,
H
istory or
S
ummary views. It also functions as an UP
button in the Configuration Menus.
• In the Summary views, press to alternate between the Overall Summary and the Detailed Summary.
• In the History views, press to alternate between the Last 24 Hours and Last 30 Days.
• In the Configuration Menus, the UP button scrolls up between selections.
Indicator Light Bar
The Indicator Light Bar can light up in Red, Yellow or Green. The color selection is determined by the Time-of-Use
(TOU) rate period. Red is used in the most expensive (Critical Peak, $$$) rate period, Green is used for the least
expensive (Off-Peak, $) rate period, and Yellow is used for the mid-rate (On-Peak, $$) period. For non-TOU
applications, the light bar glows in Yellow only.
The Indicator Light Bar normally rotates from Left to Right at a rate corresponding to the amount of power being
consumed. The higher the amount of power consumed, the faster the rate of light movement.
D 097-0552 611
3
When the AC power adapter is connected, the Indicator Light Bar sweeps continuously. When operating on batteries,
the Indicator Light Bar normally stays off to conserve battery power. It turns on for a short duration when changing
display screens or when the buttons are pressed.
The Indicator Light Bar can be turned on (default) or off. See the Configuration Menu screens below for details.
Time-of-Use Rates and Times
The times and rates for TOU periods are factory programmed, as per instructions from your utility. Rates can also be
updated manually in the Configuration Menu.
Prior to a Critical Peak event, you should be notified on your In-Home Display by your utility of the pending event.
During the Critical Peak time, your In-Home Display light bar will be red with the sweeping motion at a rate
corresponding to your electricity consumption at that time.
The costs associated with the rate periods can be viewed in the Configuration Menus. Although efforts have been
made to ensure cost accuracy, all cost information is estimates for informational and educational purposes only, not
for billing.
AC vs. DC Operation
The AC power adapter should be used at all times. Battery operation is only meant for temporary use to retain data
during loss of AC power. While operating on batteries, the Indicator Light Bar and LCD backlight will normally turn off
after a delay to preserve battery power. Pressing a button will turn them on for a short duration.
Note: In-Home Displays contain rechargeable batteries. The unit should be operated on AC power only for at least 8
hours before operating on battery power only.
Critical Peak Operation
If supported by your utility, the Aztech In-Home Display is capable of specialized operation before and during a Critical
Peak event. Critical Peak events are rare times when electricity demand exceeds or nearly exceeds the available
electricity supply. During this time, which usually lasts for only a few hours, the cost of electricity goes up.
The In-Home Display is capable of notifying the user of a pending Critical Peak event. This timing of the advance
notification is programmable by the utility and can occur up to 2 days in advance of the Critical Peak event. When
notification occurs, the time of the Critical Peak rate change is displayed. The display will replace the current view for a
message this will remain on the screen until a button press. The message will re-appear every 30 minutes until the
start of the Critical Peak Period.
During Critical Peak, the light bar will be Red and will sweep at a rate corresponding to the amount of electricity being
consumed. The Critical Peak symbol ($$$) will display in the upper right corner of the display for most views.
During Critical Peak, the Main, History and Summary views will all function as normal. The cost per hour will be
displayed on the Main view. The accumulated Critical Peak electricity costs can be viewed in the Detailed Summary
screen.
Messaging
If supported by your utility, the Aztech In-Home Display is capable of displaying messages from your utility. These may
be for a scheduled power outage, Amber Alerts in case of a missing child, a weather related warning, or for some
other purpose

D 097-0552 611
4
Screen Descriptions
Initialization Screens
When powered up for the first time, the language selection screen is displayed. Simply use the
left ▲or right ►buttons to scroll up or down to the desired language. Then press the middle √
button to select. All subsequent screens will be in the language chosen: English, French, or
Spanish.
If desired, the language selection can be changed again through the Configuration Menus. See
below for details.
After selecting language, the next screen will ask for the setting of the meter ID.
Enter the 8 digits for your particular smart electricity meter, as provided by your utility or In-
Home Display provider. The correct meter ID must be entered for your In-Home Display to
communicate with your smart electricity meter.
For more information on entering or changing your meter ID, refer to the Configuration Menu –
Meter ID section below.
After entering the meter ID for the first time, or upon power-up, the Initialization Screen will be
displayed with the message “Acquiring Data”, indicating that the unit is searching for a meter
connection. During this time, the Light Bar will sweep back and forth in RED. If the AC Power
Adapter is connected, the Indicator Light Bar stay on while it tries to synchronize with electricity
meter. If operating on batteries and a meter connection is not quickly established, the Light
Bar will turn off after a short time to conserve battery life.
If no connection is found after 10 minutes, a message “No Signal Found” will be shown. The
unit will continue to search for a meter connection.
When a meter connection is found, the Main view will be displayed.
To set or change the Meter ID during initialization, the Configuration Menu screen can be
accessed at any time by pressing and holding the right ►button and then pressing the middle
√ Button. See Configuration Menu (top level) and– Meter ID for further details.
Main View - Numerical
The Main view - Numerical screen is displayed immediately after the unit’s connected to a meter.
The value is updated at a minimum every 1 minute and represents the average of how much
electricity is presently being used.
The top line contains status indicators that show the following:
three possible views,– Main, History or Summary, a highlighted Letter is the current view
Today’s date. This value is obtained automatically from your smart meter.
AC or Battery indicator. Battery operation is for temporary backup operation only (<8
hours). The AC adapter should normally be used at all times. A solid battery icon
indicates battery operation only, not the amount of battery charge remaining..
Rate indicator. The present rate period indicator is displayed showing relative cost ($ for
Off-Peak, $$ for On-Peak, $$$ for Critical Peak).
The middle √ button will access the Instantaneous mode. In this display, the electricity meter is
queried five times with six seconds between each reading, and each real-time electricity
consumption value is displayed, Afterward 30 seconds the display reverts back to the Main view.
History View – Last 24 Hours
D 097-0552 611
5
The History view – Last 24 Hours is selected by pressing the ►button when in the Main view
This screen displays up to 24 vertical bars showing the hourly consumption for the last 24 hours. Each bar contains the amount of
electricity consumed in kWh or $ during each hour long interval. For example, in the above graphs, the last bar shows the amount of
consumed during 1:01pm to 2:00pm. Bars above the tick marks are for the period during 11:01pm to 12 midnight and 11:01am to 12 noon.
Pressing the √ button will alternate between displaying in kWh or $.
The bar graph automatically scales to the largest column. The size of each bar is shown by the tick marks along the vertical axis together
with the number at the top of the axis. The total amount for the time period is displayed in the bottom left of the screen.
The upper left highlights the “H” for the History view. The time this screen was viewed is displayed below it.
It should be noted that the History view is a static display, unlike the other views which are updated as they are displayed. The History
views are not updated automatically while they are being displayed.
Note: although efforts are made to provide accurate electricity cost information, ALL COSTS ARE ESTIMATES FOR INFORMATIONAL
PURPOSES ONLY, NOT FOR BILLING.
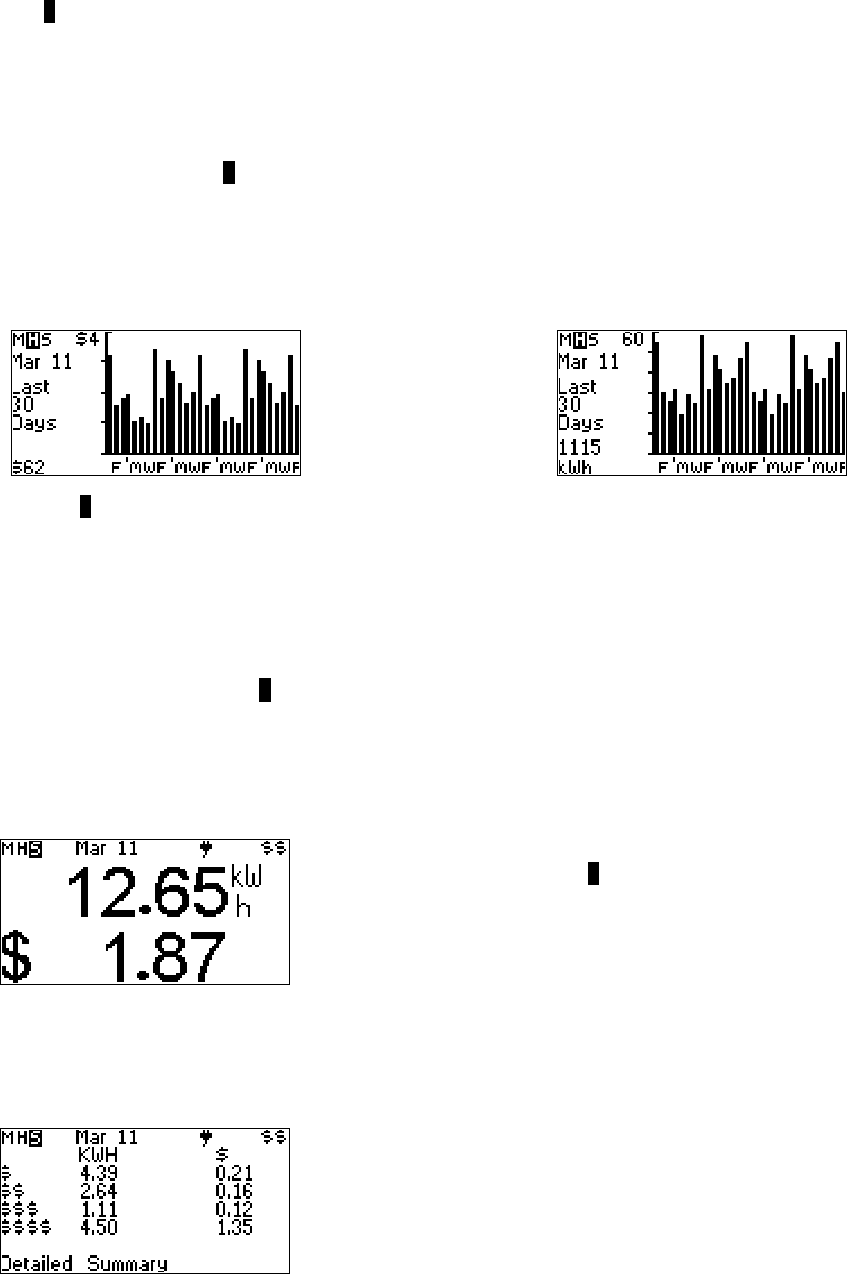
History View – Last 30 days
The History – Last 30 Days view is selected by pressing the ▲button from the History - Last 24 Hours view
This screen displays up to 30 vertical bars showing the daily consumption for the last 30 days. Each bar contains the amount of
electricity consumed in kWh or $ during each day long interval. The bars for Saturday and Sunday are placed directly beside each
other to easily distinguish weekend days. For example, in the above graphs, the last bar shows the amount of electricity consumed
during the last full day, Sunday, Dec 9. Along the bottom scale are MWF below the Monday, Wednesday and Friday daily bars.
Pressing the √ button will alternate between displaying in kWh or $.
The bar graph automatically scales to the largest column. The size of each bar is shown by the tick marks along the vertical axis
together with the number at the top of the axis. The total amount for the time period is displayed in the bottom left of the screen.
The upper left highlights the “H” for the History view. The Date this screen was viewed is displayed below it.
It should be noted that the History view is a static display, unlike the Main and Summary views which are updated as they are
displayed. The History views are not updated automatically while they are displayed.
Note: although efforts are made to provide accurate electricity cost information, ALL COSTS ARE ESTIMATES
FOR INFORMATIONAL PURPOSES ONLY, NOT FOR BILLING.
Summary View – Overall Summary
The Overall Summary view is accessed by pressing the ►button from any of the History
views. The upper left highlights the “S” for the Summary view
The total power consumed and its associated estimated cost are displayed. The cost is factory
programmed as per your utility. The values are updated every minute, although if your
consumption is low, it may take several minutes or longer to notice any changes.
Both Overall and Detailed Summary information can be reset to a user-selected date. To reset,
press the √ button and follow the menu options.
Pressing the ▲button will access the Detailed Summary view.
Pressing the √ button will access the Reset Summaries menu.
Note: although efforts are made to provide accurate electricity cost information, ALL COSTS
ARE ESTIMATES FOR INFORMATIONAL PURPOSES ONLY, NOT FOR BILLING.
Summary View – Detailed Summary
The Detailed Summary view is accessed by pressing the ▲button when in Overall Summary.
This screen displays the breakdown by rate period for the total power consumed and the
associated cost for each rate period. The sum of the kWh and $ columns add up to the
amounts displayed in the Overall Summary view.
The kWh and $ values are updated every minute, although if your consumption is low, it may
take several minutes or longer to notice any changes.
The electricity rates are factory programmed per your utility
Both Overall and Detailed Summary information can be reset to a user-selected date. To reset,
press the √ button and follow the menu options.
Pressing the ▲button will access the Overall Summary view.
Pressing the √ button will access the Reset Summaries menu.
Note: although efforts are made to provide accurate electricity cost information, ALL COSTS
ARE FOR INFORMATIONAL PURPOSES ONLY, NOT FOR BILLING.

D 097-0552 611
6
Summary View – Reset Summaries
Pressing the √ button from the Overall or Detailed Summary views accesses the Reset
Summaries menu.
If the summaries are reset Now, then both the Overall Summary and Detailed Summary views
will be reset to zero as soon as the action is confirmed. Before implementing the reset, the
user will be asked “Are you sure?” to confirm the reset operation. The Summary views will then
be reset immediately with new cost and usage information being effective the date and time
the reset action occurred.
If the summaries are reset By Date, a different screen will appear. The user will be asked to
“Set Start Date” which is the date for which the Summary information will be effective from, as
of 12:01am on that date. For example, if January 1, 2007 is selected for the reset date, then
the Overall and Detailed Summary views will display the electricity consumed in kWh and $
from Jan 1, 2007 till today. Any dates chosen before the date of installation for your In-Home
Display will not contain any electricity usage information.
The date shown when viewing the Set Start Date screen is the last date reset.
The difference between resetting to today’s date vs resetting Now is the amount and cost of
electricity consumed from 12:01am today until Now.
In the Reset Summaries screens, the ▲button and ►button allow for scrolling up and down
respectively. The √ button makes the menu selection.
System View – Meter Reading
The Meter Reading screen is displayed by pressing and holding the ►button from any of the
Main, History or Summary views.
The large number on this screen matches the kWh reading on the smart electricity meter’s
display, together with tier details, if applicable.
From this screen, the Configuration Menus can be accessed by pressing the √ button
Configuration Menu (Top Level)
The Configuration Menu can be accessed from the System view – Meter Reading screen by
pressing the middle √ Button.
Use the left ▲or right ►buttons to scroll UP or DOWN. Then press the √ Button to make the
desired selection.
To change the language for all screens, go to the language desired and press the √ button. All
screens will then appear in the selected language.
Set Date/Time allows for manual setting of Date and Time. If selected, a sub-menu will appear.
This is normally not required as the date and time are automatically obtained from the
electricity meter. If manual setting of the date/time are implemented, these values may be
overwritten by the date/time from the electricity meter.
The Setup option allows for setting or viewing other system parameters such as Setting Meter
ID, Light Pipe On/Off, Tone On/Off, Display Settings, Viewing the programmed Electricity
Rates, and Viewing key System parameters.
Select Exit to return back to the System view – Meter Reading screen.
Configuration Menu – Set Date/Time
This menu is accessed via the Set Date/Time selection in the top level Configuration Menu
Use the left (▲) or right (►) buttons to scroll UP or DOWN. Then press the √ Button to make
the desired selection.
Setting the Date and Time should not normally be required since it is automatically obtained
from the meter. The meter’s date and time will be selected over the manually chosen values.
To Set Time, scroll to this option and select. A new screen will appear. Use the left (▲) or right
(►) buttons to select the desired hour, minute and seconds setting. Press √ to select and
advance to the next entry or to complete the time setting.
D 097-0552 611
7
To Set Date, scroll to this option and select. A new screen will appear. Use the left (▲) or right
(►) buttons to select the desired year, month and day. To help verify the date selected, the day
of the week will be automatically displayed. Press √ to select and advance to the next entry or
to complete the date setting.
To change from 12 hour format to 24 hour format, select “24 hour clock”. Time will then be
displayed in 24 hour format on the all applicable display screens. Once in 24 hour format, select
“12 hour clock” to return to a 12 hour format for all display screens. Default mode is 24 hour
format.
If desired, you can select a Time Zone Offset to set an offset to match the time in your local
area. This is done in minutes. Use the left (▲) or right (►) buttons to select the desired time
offset to obtain your local time. Press √ to select and return back to the Set Date/Time menu.
Select Exit to return back to the Configuration Menu top level.
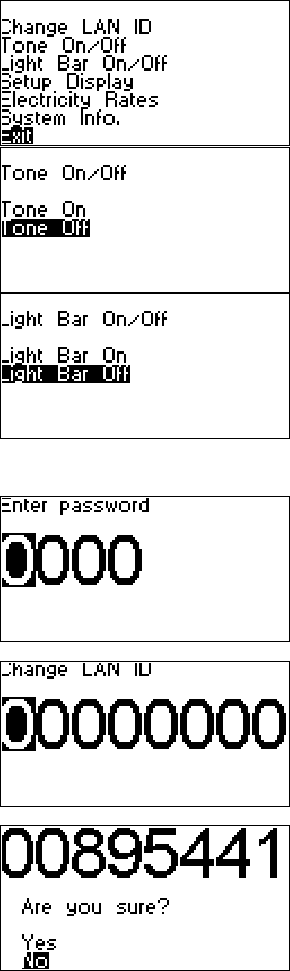
Configuration Menu - Meter ID
The LAN ID menu is accessed from the Change LAN ID option in Configuration Menu – Setup
screen
The LAN ID menu screen allows for programming the unique identifier of the radio in your
smart electricity meter.
This unique identifier must be properly entered for your In-Home Display to communicate with
your smart electricity meter.
Note: This unique identifier may have already been programmed into your unit when you
received it, or it should be provided by your In-Home Display provider. If you do not have it,
consult your In-Home Display provider.
The ability to change this LAN ID is password protected.
Once the meter ID has been successfully entered, it should not be changed. Entering a wrong
meter ID will prevent your In-Home Display from communicating to your smart electricity meter.
To enter the radio ID, use the left (▲) or right (►) buttons to increase or decrease the number
for each digit. Then press the √ Button to move to the next digit.
When the last digit has been entered, a confirmation message will be displayed. If you wish to
correct your meter ID, select No to go back and correct it. If you are satisfied that you have
entered the correct number, select Yes to continue. You will then return to the Configuration
Menu – Setup screen.
Configuration Menu
-
Setup
The Configuration Menu - Setup is accessed from the Configuration Menu (top level).
This menu allows for setting or viewing system parameters such as Setting Radio ID, Light Pipe
On/Off, Tone On/Off, Display Settings, Viewing the programmed Electricity Rates, and Viewing
key System parameters.
Use the left (▲) or right (►) buttons to scroll UP or DOWN. Then press the √ Button to make
the desired selection.
To Change Meter ID, scroll to this option and select. Refer to the Configuration Menu – Meter ID
section below.
To turn the button Tone On or Off, scroll to this option and select. Another screen will appear.
Simply scroll to the desired option and select. You will then return to the Setup menu.
To turn the Light Bar On or Off, scroll to this option and select. Another screen will appear.
Simply scroll to the desired option and select. You will then return to the Setup menu.
To change the LCD display contrast and backlight settings, scroll to the Setup Display option
and select. Another screen will appear. Refer to the Configuration Menu – Setup Display section
below.
To view the programmed electricity rates, scroll to Electricity Rates and select. Another screen
will appear. Refer to the Configuration Menu – Electricity Rates section below.
To view internal system information, scroll to the System Info option and select. Another screen
will appear. Refer to the Configuration Menu – System Information section below.
Select Exit to return back to the Configuration Menu top level.
D 097-0552 611
8
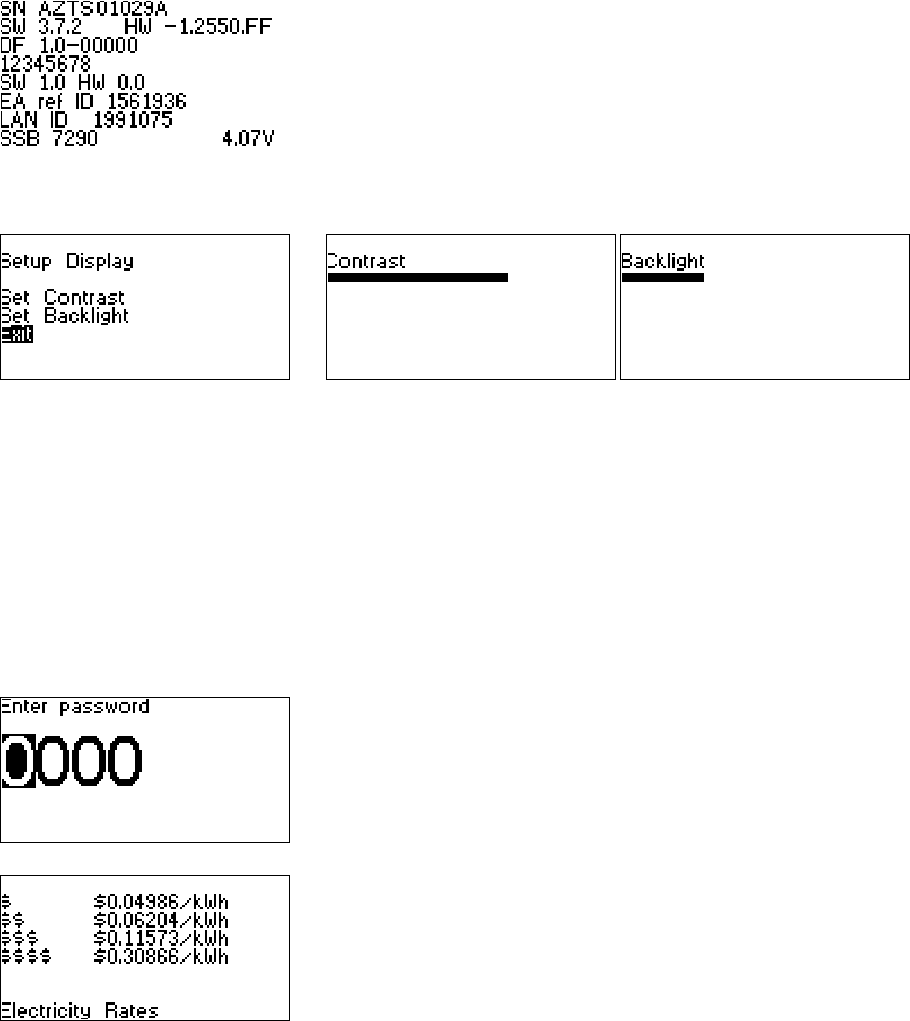
Configuration Menu - System Info.
Configuration Menu – Setup Display
The Setup Display menu is accessed from the Configuration Menu – Setup.
This menu allows for setting the LCD contrast and backlight levels.
Use the left (▲) or right (►) buttons to scroll UP or DOWN. Then press the √ Button to make
the desired selection.
To Set Contrast, scroll to this option and select. Another screen will appear. Use the left (▲) or
right (►) buttons to increase or decrease the setting. Then press the √ Button to make the
desired selection.
To Set Backlight, scroll to this option and select. Another screen will appear. Use the left (▲)
or right (►) buttons to increase or decrease the setting. Then press the √ Button to make the
desired selection.
Select Exit to return to the Configuration Menu – Setup screen.
Configuration Menu – Electricity Rates
The Electricity Rates programmed into the unit are viewable in this screen.
These rates are used by the Summary and History views for displaying costs based on usage.
Electricity costs are calculated and stored using the rates in effect at the time the electricity is
consumed. New electricity rates will impact electricity costs as of their effective date and time.
They will not change stored electricity costs. Electricity usage and cost data are stored every
hour for recall by the History and Summary views.
The rates show each Time-of-Use (TOU) period starting with the lowest cost rate period first
($= Off-Peak, $$=Mid-Peak, $$$= Critical Peak). For non-TOU applications, the rates shown
are for each tier level, together with the kWh level they are valid to. The $ symbol is for the
lowest cost rate; with each successive level represented by an additional $. The Base rate, a
default cost for each billing period, is also included.
The TOU Electricity Rates are initially factory programmed. They are manually adjustable..
Manual entry has password protection as per LAN ID adjust
Note: although efforts are made to provide accurate electricity cost information, ALL COSTS
ARE ESTIMATES FOR INFORMATIONAL PURPOSES ONLY, NOT FOR BILLING.
System Information is accessed from the Configuration Menu
–
Setup.
System Info displays the Serial Number for the main internal circuit assembly, followed by its
Software and Hardware Versions.
The 3
rd
line contains the version of the DataFlash memory
The 4
th
to 7
th
lines contain radio information.
At the bottom of the display are the Seconds Since Boot up or Power up (SSB) and internal
Battery voltage.
Pressing any button will return to the previous menu.