Baron Weather XDD-1000C C-BAND DOPPLER WEATHER RADAR User Manual VIPIR User s Guide
Baron Services Inc C-BAND DOPPLER WEATHER RADAR VIPIR User s Guide
Contents
- 1. Modulator Manual
- 2. Users Manual Part 1
- 3. Users Manual Part 2
- 4. Users Manual Part 3
- 5. S10 OPERATION AND MAINTENANCE MANUAL
- 6. S10 FAST TRAC MILLENIUM USERS GUIDE
- 7. S10 TECHNICAL MANUAL
- 8. S10 RECEIVER AND PROCESSOR USERS MANUAL PART 1
- 9. S10 RECEIVER AND PROCESSOR USERS MANUAL PART 2
- 10. S10 RECEIVER AND PROCESSOR USERS MANUAL PART 3
S10 FAST TRAC MILLENIUM USERS GUIDE
FasTrac Millennium
User’s Guide

FasTrac Millennium User’s Guide – May 2003
FasTrac Millennium, FasTrac, NexTrac, VIPIR, City Streets, StormScan, Storm Spotter,
Neighborhood Weather Net and Street Spotter are registered trademarks of Baron
Services, Inc. FutureScan, PasTrac and Severe Weather Module are trademarks of Baron
Services, Inc.
The products, systems, and/or methods described or otherwise mentioned herein are
covered by one or more of the following U.S. Patents: 5,717,589; 5,940,776; 6,018,699;
6,125,328; 6,163,756; 6,188,960; 6,266,063; 6,272,433; 6,275,744; and 6,278,947.
2001 Geographic Data Technology, Inc. This document contains images with proprietary and
confidential property of Geographic Data Technology, Inc. Unauthorized use, including
copying for other than testing and standard backup procedures, of this product are expressly
prohibited.
Microsoft Windows products are registered trademarks of Microsoft Corporation.
The trademarks of other companies used in this manual are the respective property of
those companies. All efforts were taken to ensure the accuracy of this document.
However, this information is subject to change without notice.
Copyright 1994-2003.
Baron Services, Inc.
4930 Research Drive
Huntsville, Alabama 35805-5906
ii

FasTrac Millennium User’s Guide – May 2003
Table of Contents
Table of Contents___________________________________________________________iii
Preface_____________________________________________________________________ vii
1. Overview ________________________________________________________________ 1
1.1 Databases ___________________________________________________________ 1
1.2 File Structure ________________________________________________________ 1
1.3 Protecting Your Data _________________________________________________ 2
1.4 NetRad____________________________________________________________ 3
1.5 Starting Your FasTrac Millennium ______________________________________ 4
1.6 System Commands Not Meant for Client Use______________________________ 7
1.7 Points to Remember __________________________________________________ 8
2. Setting Up Your System ______________________________________________________ 9
2.1 Setting Up Map Layers _______________________________________________ 10
2.2 Setting Up Display Levels (for clients without .psf mapping data)____________ 10
2.2.1 Editing Display Levels for Roads ____________________________________ 11
2.2.2 Editing Display Levels for Bodies of Water ____________________________ 12
2.2.3 Setting the Enable Range for City Streets ______________________________ 13
2.3 Adding Water-Fill Points (for clients without .psf mapping data) ____________ 13
2.4 Fixing Floods with Anti-Fill Points (for clients without .psf mapping data) ____ 16
2.5 Editing the Places Database ___________________________________________ 16
2.6 Adjusting the Color Palette____________________________________________ 20
2.7 Using the Baron Chart _______________________________________________ 21
2.8 Editing Colors for 256-Color Palettes ___________________________________ 22
2.8.1 Creating Gradients ________________________________________________ 23
2.8.2 Duplicating Palettes _______________________________________________ 23
2.9 Customizing Font Displays ____________________________________________ 24
2.10 Manipulating the Automatic Legend ____________________________________ 25
2.11 Using Overlays ______________________________________________________ 26
2.11.1 Creating new Overlays ____________________________________________ 26
2.11.2 Adding an Overlay to a View _______________________________________ 26
2.11.3 Removing Overlays _______________________________________________ 28
2.11.4 Setting Overlays for Data Products ___________________________________ 28
2.11.5 Setting the FutureScan Product Overlay _______________________________ 29
2.12 Setting Up Icons _____________________________________________________ 29
2.13 Points to Remember _________________________________________________ 31
iii

FasTrac Millennium User’s Guide – May 2003
3. Adjusting Views__________________________________________________________ 33
3.1 Using the View Main Panel____________________________________________ 34
3.2 Setting Map Parameters ______________________________________________ 35
3.3 Editing Topographical Data ___________________________________________ 36
3.4 Saving and Organizing Views__________________________________________ 37
3.4.1 Saving Views____________________________________________________ 37
3.4.2 Organizing Your Views____________________________________________ 38
3.5 Using the View Options _______________________________________________ 39
3.5.1 Adding Text to a View ____________________________________________ 39
3.5.2 Zooming In and Out From a View____________________________________ 39
3.5.3 Pointing to Features on a View ______________________________________ 39
3.5.4 Panning on a View________________________________________________ 39
3.5.5 Labeling Streets with Street Spotter __________________________________ 40
3.5.6 Controlling Display of Radar Data ___________________________________ 42
3.5.7 Utilizing TeleTrac ________________________________________________ 42
3.5.8 Displaying Lightning Strikes on a View _______________________________ 43
3.5.9 Displaying Storm Spotter Van data _________________________________ 44
3.5.10 Toggling High-Definition Data Processing _____________________________ 45
3.5.11 Displaying NEXRAD forecast data___________________________________ 45
3.5.12 Displaying Neighborhood Weather Net Sensor Data____________________ 46
3.5.13 Zooming to a Specific City _________________________________________ 48
3.5.14 Adding Fronts and Pressure Markers__________________________________ 48
3.5.15 Creating Temporary Pixel Query Points _______________________________ 49
3.5.16 Creating Fixed Pixel Query Points ___________________________________ 49
3.5.17 Displaying Precipitation Type Maps __________________________________ 50
3.5.18 Saving the Current View as a Bitmap _________________________________ 51
3.5.19 Printing the Current View __________________________________________ 51
3.5.20 Highlighting Your Spotter Network On-Air ____________________________ 52
3.5.21 Displaying National Weather Service Warnings_________________________ 53
3.5.22 Displaying Wind Speed and Direction ________________________________ 54
3.6 Points to Remember _________________________________________________ 56
4. Managing Storm Tracks_________________________________________________ 57
4.1 Setting Defaults for Storm Tracks ______________________________________ 58
4.2 Creating Storm Tracks _______________________________________________ 59
4.2.1 Creating Fan Projections ___________________________________________ 59
4.2.2 Creating Circle Projections _________________________________________ 60
4.2.3 Creating Squall Projections _________________________________________ 61
4.2.4 Deleting Storm Tracks_____________________________________________ 63
4.3 Editing Storm Tracks ________________________________________________ 63
4.4 Editing the Storm Marquee ___________________________________________ 65
4.4.1 Selecting Communities for Your Storm Track ETA Box __________________ 65
4.4.2 Moving the Storm Track Marquee____________________________________ 65
iv

FasTrac Millennium User’s Guide – May 2003
4.5 Using PasTrac ______________________________________________________ 66
4.5.1 Auto-Tracking Real-Time Radar Data ________________________________ 66
4.5.2 Auto-Tracking NEXRAD Data ______________________________________ 66
4.6 Identifying Storms with StormScan_____________________________________ 67
4.6.1 Setting Up StormScan _____________________________________________ 68
4.6.2 Using Storm Marquees ____________________________________________ 69
4.6.3 Using the Storm Table _____________________________________________ 70
4.7 Creating Automatic Storm Sequences ___________________________________ 71
4.8 Points to Remember _________________________________________________ 72
5. Using SEQUENCER _____________________________________________________ 73
5.1 Starting SEQUENCER _______________________________________________ 74
5.1.1 Creating a New Sequence __________________________________________ 74
5.1.2 Inserting New Events______________________________________________ 75
5.1.3 Deleting Events from Sequences _____________________________________ 75
5.1.4 Deleting Sequences _______________________________________________ 75
5.1.5 Starting and Playing a Sequence _____________________________________ 75
5.1.6 Exiting SEQUENCER _____________________________________________ 76
5.2 Using SEQUENCER with Zooms and Pans ______________________________ 76
5.2.1 Creating Zooms and Pans __________________________________________ 77
5.2.2 Previewing Your Zoom Event _______________________________________ 77
5.3 Working with Time-Lapse Events ______________________________________ 78
5.3.1 Creating Real-Time Radar Time-Lapses _______________________________ 79
5.3.2 Creating NEXRAD Time-Lapses ____________________________________ 80
5.3.3 Previewing Your Time Lapse _______________________________________ 81
5.3.4 Editing Time-Lapse Frames ________________________________________ 81
5.4 Combining Time-Lapse and Zoom Events _______________________________ 81
5.5 Repainting to a Sequence _____________________________________________ 82
5.6 Adding a Radar Lapse to a Sequence ___________________________________ 82
5.7 Inserting NEXRAD Data in a Sequence _________________________________ 82
5.8 Points to Remember _________________________________________________ 83
6. Controlling Your Radar ___________________________________________________ 85
6.1 Controlling Your Non-Baron Radar ____________________________________ 86
6.2 Controlling Your Baron Radar ________________________________________ 86
6.3 Manipulating NEXRAD Data__________________________________________ 89
6.3.1 Using the NEXRAD Main Panel_____________________________________ 89
6.3.2 Adjusting Shear Marker Settings_____________________________________ 95
6.3.3 Using the Advanced Baron Chart ____________________________________ 96
6.3.4 Customizing Product and Time Marquees______________________________ 97
v

FasTrac Millennium User’s Guide – May 2003
6.4 Utilizing Multiple Real-Time Radars Via Network ________________________ 98
6.4.1 Using Network America ___________________________________________ 98
6.4.2 Changing the Width of the Radar Sweep Cursor_________________________ 98
6.5 Comparing Base Reflectivity and Composite Reflectivity ___________________ 99
6.6 Points to Remember ________________________________________________ 101
Glossary_____________________________________________________________________ 1
vi
Preface
This manual describes the operating procedures for Baron Services’ FasTrac Millennium
software, the industry standard for display and storm tracking. You can use these products to
present critical weather data that will provide customized weather displays.
Document Organization
The information in this manual is organized as follows:
Chapter 1 is a general overview of the system and provides the information needed to
start the program.
Chapter 2 describes the operations needed to set up your system.
Chapter 3 describes how to manipulate your views (screen displays).
Chapter 4 describes how to create and manage storm tracks.
Chapter 5 describes how to use SEQUENCER
Chapter 6 describes how to control both non-Baron radars and Baron radars.
Before using FasTrac Millennium, you should have a working knowledge of Microsoft
Windows.
Support Information
The Baron Services support team is available to answer questions about technical-support issues
and to assist you with operations and procedures. You can reach the support team by calling
(256) 881-8811. You will need the following information when you call:
Product name and version.
Station name, your name and your job title.
Number of a telephone close to your workstation. Do not give a fax number.
Brief description of your problem.
You can also access troubleshooting documentation from the Baron Services Tech Support
website. You will need your username and password to enter the site. The site URL is:
http://techpage.baronservices.com
To learn about our about Baron Services' products, the newest enhancements and additions to our
product lines, and the latest in news and weather events, go to our primary website at:
http://www.baronservices.com
vii
Preface FasTrac Millennium User’s Guide – May 2003
Type Faces
Italic Indicates a document title, the first occurrence of a new term, a
directory or file name, or a system response that explains what the
system is doing. For example: Open the example cities.bmp file in your
C:\fastrac\places directory.
Bold Indicates an item in the graphical interface, such as the OK button or a
command button.
Courier Indicates information you type. For example, Set the signal processor
parameters by typing SOPRM.
Symbols
The following document conventions are used throughout this manual:
Information that is not critical to system operation but describes useful
procedures or information that will optimize system operation.
Very important information about a command or a procedure.
Critical instructions that must be followed to prevent loss of data.
Keyboard Conventions
ALT Alternate key.
CTRL Control key.
DEL Delete key.
ENTER Return/enter key.
ESC Escape key.
SHIFT Shift key.
TAB Tab key
viii

FasTrac Millennium User’s Guide – May 2003 Preface
Terminology
Click To position the pointer on the screen, and then to press and quickly
release the left mouse button.
Double click To quickly press and release a mouse button twice without moving
the mouse. This action is used as a shortcut for common actions, such
as activating an icon, opening a file, or selecting a word or graphic
element.
Click and drag To click and hold a mouse button while moving the mouse. This
action is used to identify a range of objects, to move objects, or to
resize objects.
Enter To input information by typing or by using the mouse.
Identify To locate an element on the screen either by clicking it or by typing
the name.
Click and hold To press and hold down a mouse button to perform an action, such as
resizing a window.
Scroll To move through text or graphics.
Select To click a button, a text box, an item in a list, or some other item on a
menu or window.
Type To key in data. To complete this action, you may also need to click
OK, press ENTER, or press TAB.
What to Expect from This Document
This document describes how to start, set-up, and run FasTrac Millennium. All of the menus and
procedures you will use while working with the program are fully explained in this guide. After
reading this manual, you should be able to:
Start FasTrac Millennium.
Customize the weather displays to fit your needs.
Use storm tracks and sequences to quickly and effectively inform viewers about
pertinent weather information.
Understand the capabilities of every feature you have on your system.
ix
1. Overview
This manual describes the FasTrac Millennium product. FasTrac Millennium is the industry
standard for providing real-time, local weather information to your users, allowing you to analyze
real-time radar and to translate it into meaningful predictions of potentially harmful weather
phenomena for your community. It also provides NEXRAD data, combining exceptional
resolution, topography, and street-level mapping with Baron’s unique, intuitive user interface.
Most users use the program both for NEXRAD sites and their own, real-time radar. This chapter
introduces the main system components, including the databases, the file structure and the main
FasTrac Millennium display.
1.1 Databases
Two databases, known as Places and Maps, provide the mapping information underlying the
functions. When Baron Services introduced these databases to the meteorological world, they
were referred to as liquid databases because the user could smoothly change the map display and
effortlessly zoom into and out from points of interest rather than using the static one or two radar
displays that were then the norm.
When Baron Services installs your system, the databases are populated and ready for use.
However, as discussed in Chapter 2, you can specify which communities are displayed (referred
to as prioritizing places) and add important features, such as schools, malls, and parks, to the
Places database. Thus, you easily can customize your display to fit your needs.
1.2 File Structure
All the Baron files are in the C:\fastrac directory or one of its subdirectories. While there are
many files and subdirectories in the \fastrac directory, the following table lists the ones that you
must have to run your system properly.
File or Directory Name Description
Basepal.bmp file The color palette bitmap that defines the colors for
all data displays.
Fast95.exe file An executable file that activates the main program.
Lapses directory The directory that contains time-lapse files created
through SEQUENCER (see Chapter 5, Using
SEQUENCER).
Logs directory The directory that contains archived radar data (in
the \Radar subdirectory) and archived lightning
strike data (in the \Strikes subdirectory).
Maps directory The directory that contains the files for the map
databases, including roads, rivers, and state lines.
Nexrad directory The default directory for storing NEXRAD files.
1
Overview FasTrac Millennium User’s Guide – May 2003
File or Directory Name Description
Omninet.ini file The main configuration file.
Overlays directory The directory that contains bitmap files that can be
placed on the screen.
Places directory The directory that contains the data files for all the
communities in the Places database.
Views.ini file The View configuration file that contains parameters
for every saved view.
Zooms directory The directory that contains all files for zooms created
with SEQUENCER.
Do not adjust the .ini files or the Basepal.bmp file unless you receive directions from
a Baron Services representative. We preset all settings and software in your system
according to your specific needs. Tinkering with Windows or any program outside
your FasTrac Millennium is potentially dangerous. If you are not sure about what
you are doing, please call our Client Services Department at (256) 881-8811.
1.3 Protecting Your Data
You may back up your system by whatever normal backup procedures your business uses to
protect important software. A CD R/W drive is provided with all new systems, letting you
perform backup operations.
When your system is delivered, we strongly recommend that you back up your \fastrac directory
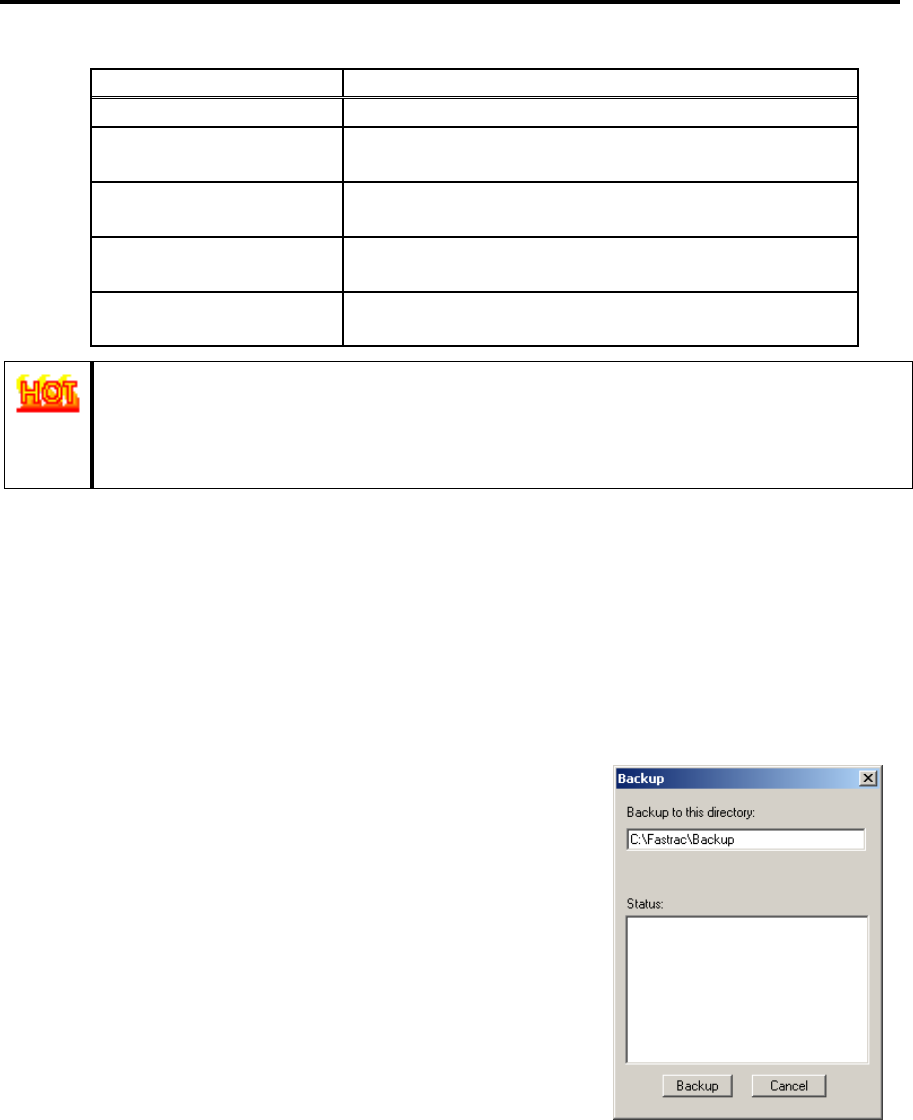
to a CD. Alternatively, you can back up the system on your hard drive using the Backup
command:
1. Open FasTrac Millennium.
2. Select File > Backup to open the Backup menu.
3. The menu to the right will appear, asking you to designate a
directory in which to create the backup. You must have
C:\FasTrac as a parent directory.
4. Click Backup to automatically copy system files to the
designated directory. This will take several minutes.
5. When a message indicating that backup is complete appears
in the text box, click Cancel to exit the menu.
Our system offers unique customization opportunities. You may want to back up individual files
to protect your customized set-up.
If possible, shut down Windows before restarting your computer. Shutting down a computer
before exiting Windows may create hardware complications.
Experienced Windows operators will often have FasTrac Millennium operating simultaneously
with other programs. If FasTrac Millennium is operating and you return to the desktop before
2
FasTrac Millennium User’s Guide – May 2003 Overview
exiting the program, you may not return to it by clicking on the icon. You must click on the
minimized icon on the task bar to return to the program. This safety feature is designed to prevent
multiple copies of FasTrac Millennium from running at the same time.
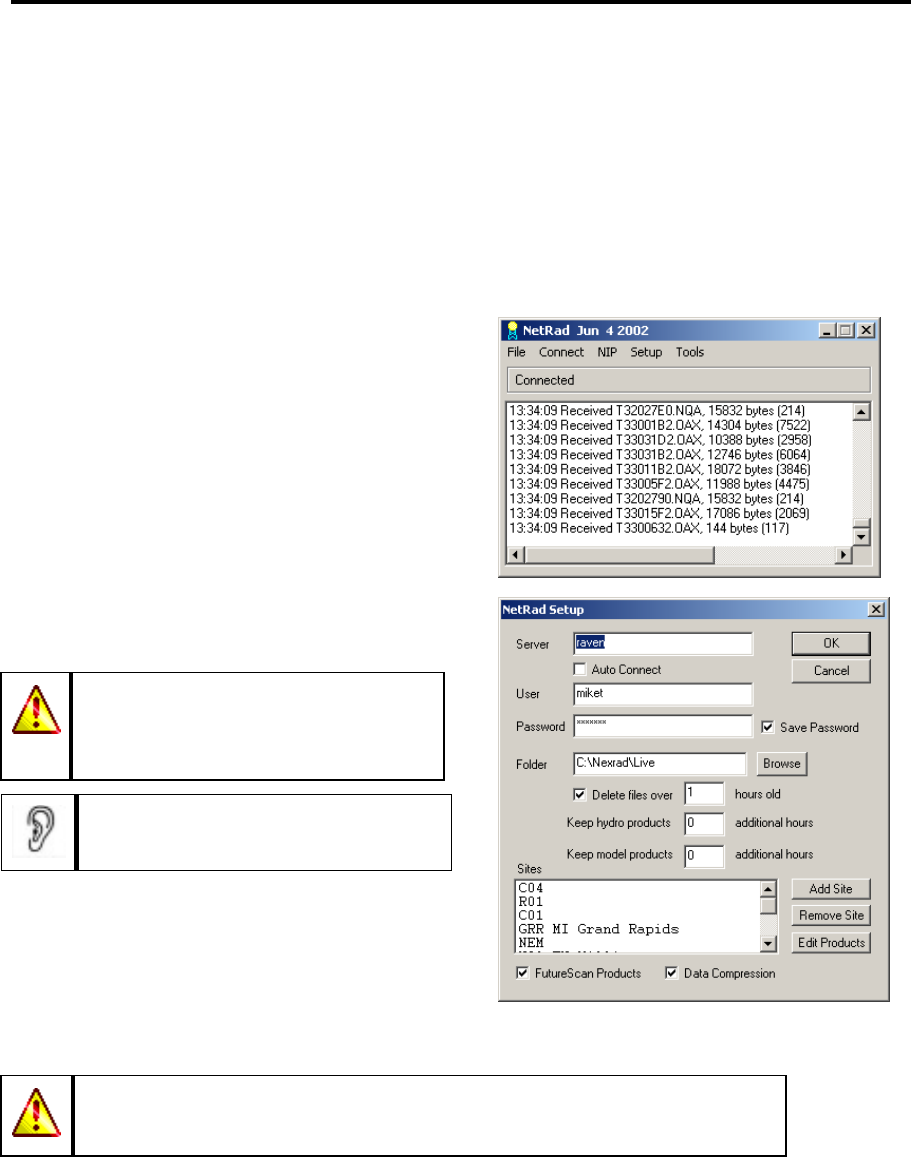
1.4 NetRad
The NetRad module lets you specify which radar sites provide NEXRAD data to your system.
You must enable it before starting FasTrac Millennium, as described in this section.
1. Double-click on your NetRad desktop icon or
double click on the netrad.exe filename to
open NetRad.
2. Select Connect > Disconnect, and then select
Setup > Main Setup to open the NetRad
Setup menu.
3. Use the Add Site and Remove Site
commands to select the sites you wish to
display.
The FutureScan products option on
the NetRad Setup menu is available
only if you own the FutureScan
module.
Be sure that the Data Compression box
is checked, as this reduces the load on
the NetRad server.
4. Set the Folder pathname to reflect the
directory that will contain the NEXRAD
product files, and click OK to return to the
NetRad main menu.
5. Select Connect > Connect to reconnect to the NEXRAD server.
If you have modified your NEXRAD sources, go to the folder to which
NetRad delivers files (the folder defined in the Folder field in the NetRad
Setup dialog box) and delete all of the files in the folder.
You may now view NEXRAD products in FasTrac using the NEXRAD panel, as described in
section 6.3.1.
3
Overview FasTrac Millennium User’s Guide – May 2003
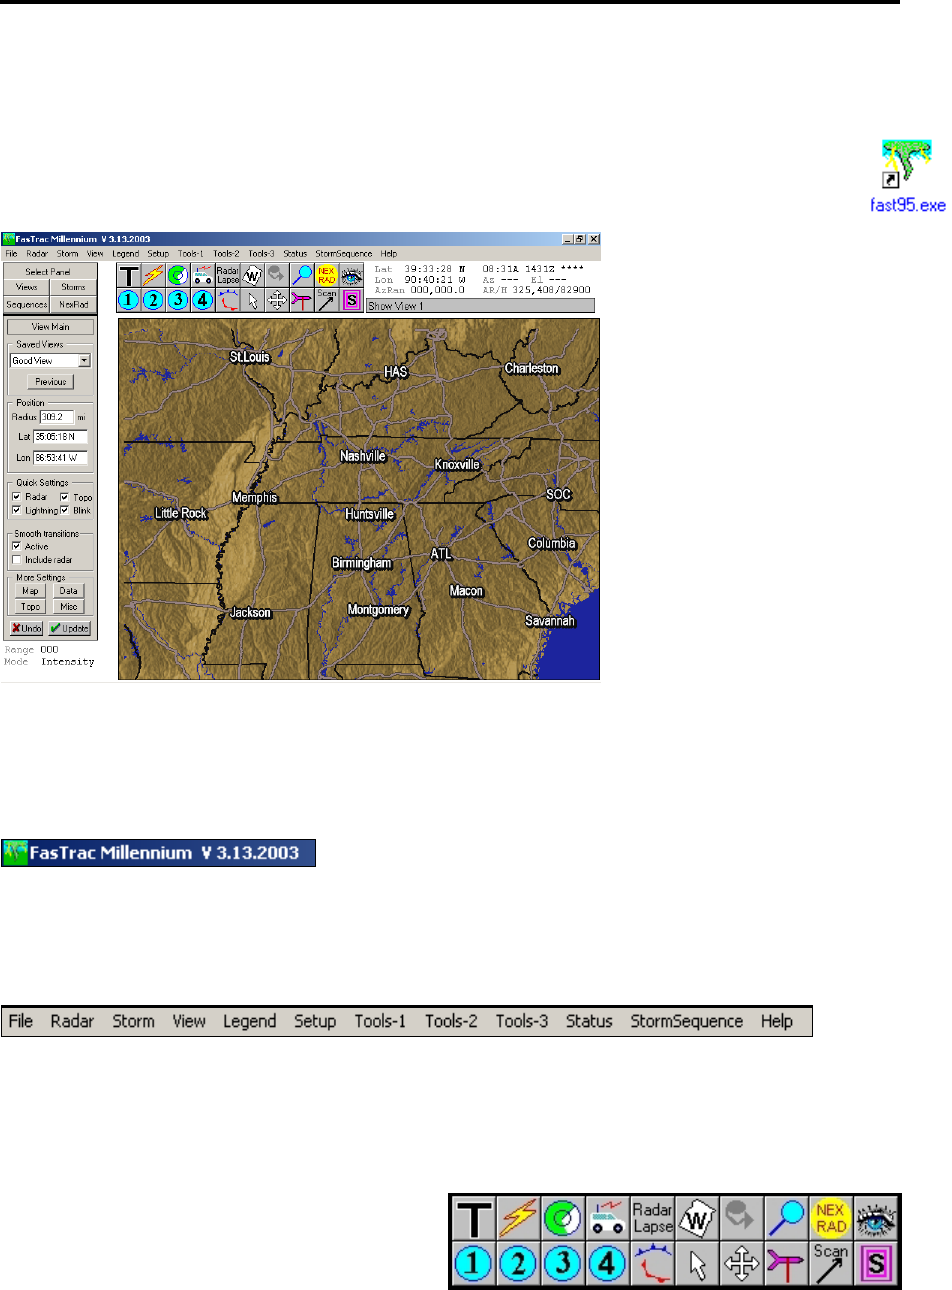
1.5 Starting Your FasTrac Millennium
FasTrac Millennium automatically starts up when you boot up the computer. To manually
start, double-click on the FasTrac desktop icon (shown on the right). Either method
displays the following main FasTrac screen:
To exit the program, select File > Exit or click the Close (X) button in the upper-right corner of
the screen. Subsequent paragraphs describe each screen component.
Program Name and Release Date
The title bar at the top-left of the FasTrac Millennium screen
display is information you will need when calling in for
technical support. The release date is very important in determining which version of software
you are using.
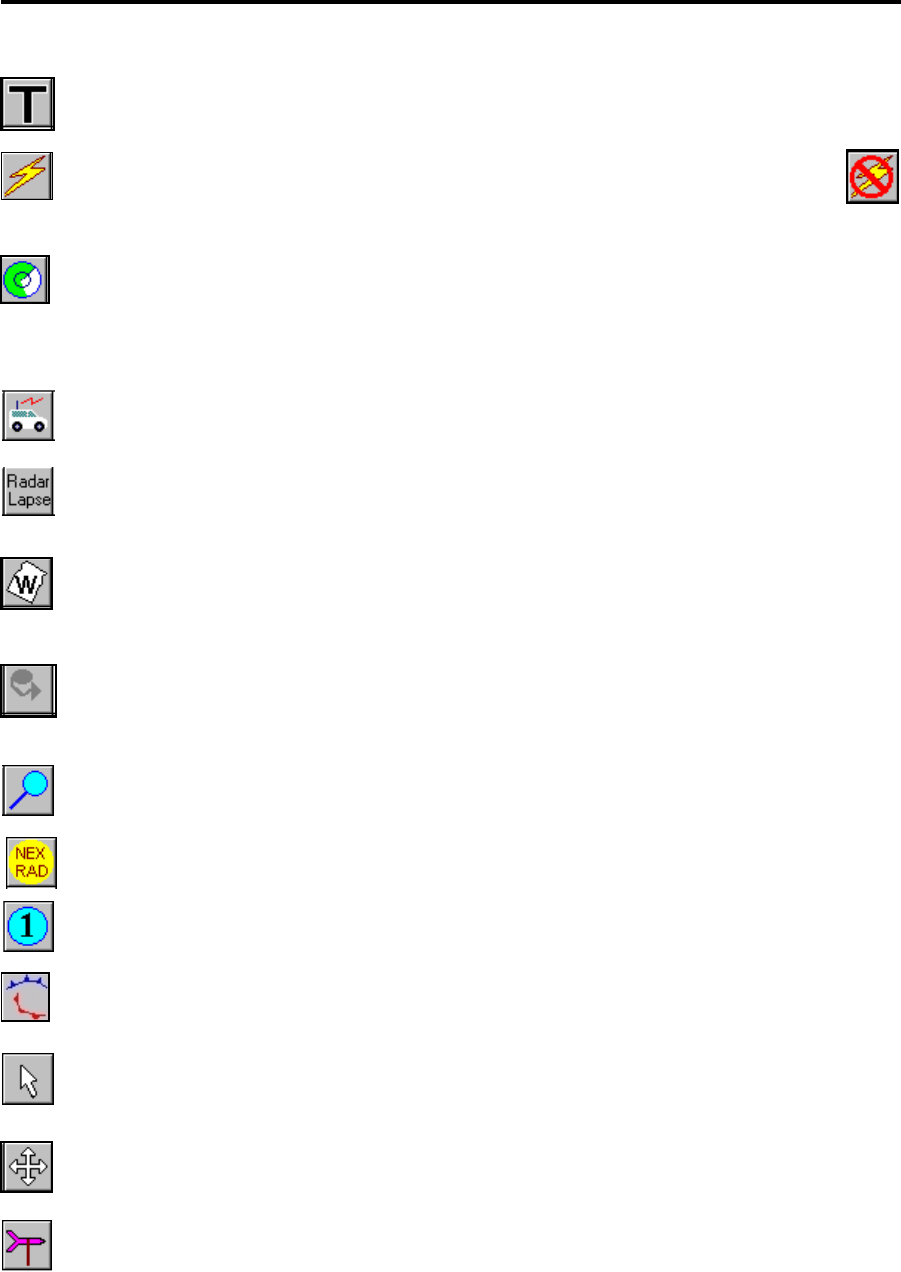
Main Menu Bar
This tool bar provides access to the main pull-down lists, referred to as Main Menus in this
manual, which allow you to access advanced functions of your system. Clicking on a menu title
at the top of the screen opens a pull-down list. To activate a particular function, hold down the
mouse button, place the cursor over your choice on the menu, and release the mouse button.
Hot Buttons
Hot buttons appear just under the Main
Menus. There are two rows of ten symbols
each. You can use these buttons for simple,
one-click execution of system functions. Left-clicking activates the main function of the button.
Some buttons have dual functions, activated by right-clicking the mouse button.
4
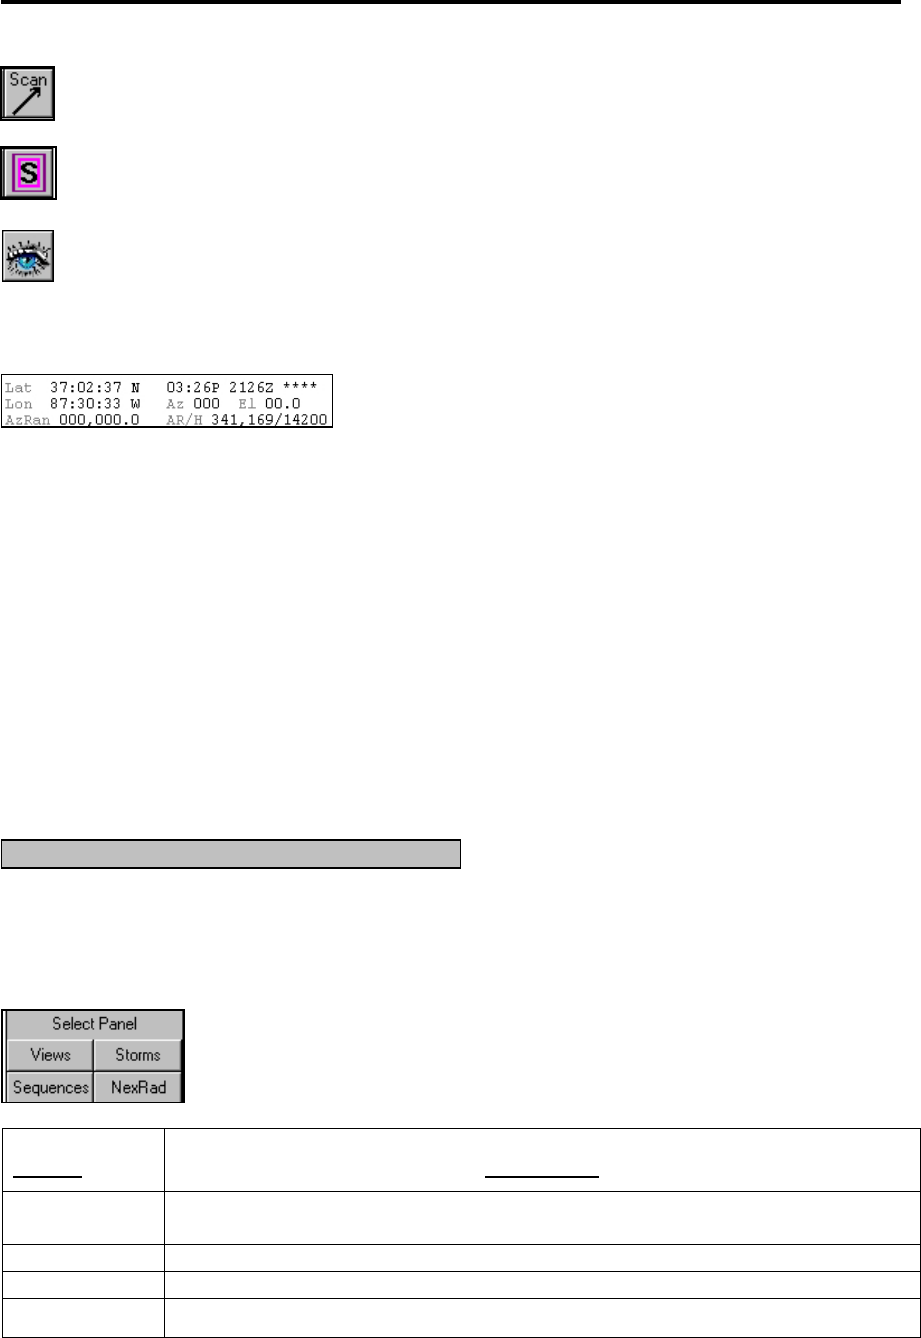
FasTrac Millennium User’s Guide – May 2003 Overview
Temporary Text opens the Temporary Text dialog box, which lets you key in text that
displays when you click OK and click on the text location.
Lightning replays the lightning in the past hour. Right-click on this hot button to
disable Lightning. Note that the button changes to the button shown on the right.
This button blinks when the connection to the TCP/IP lightning server is down.
Sweep displays real-time radar data. Left-click on the Sweep hot button to display
intensity, and right-click on it to display velocity. If you are viewing NEXRAD data, left-
clicking on the icon refreshes the display with the current NEXRAD product. (This icon
blinks when the RDAC connection is inoperable.)
Storm Spotter Van displays the current location of your Storm Spotter Van. The button
blinks when Van data is being received. See Section 3.5.8 for more information.
Radar Lapse lets you display time-lapse frames. If you have real-time radar, seven
minutes of radar data displays. If you have NEXRAD data, the number of frames
specified for the Lapse parameter on the NEXRAD Main panel displays.
Weather Wire Data lets you set up and edit Weather Wire warning features. This icon
blinks when the National Weather Service data feed is not operational. See section 3.5.20
for more information.
Telestrator lets you do free-form drawing on your weather display. Right-click on this
icon to open the Telestrator Pen Information menu, which lets you specify the width,
color, and type of drawing.
Zoom closes in on the area defined by your cursor. Right-clicking on this icon zooms out
to double the current range.
NEXRAD activates the NEXRAD Main Panel on the left side of the FasTrac display.
This icon blinks when the NEXRAD connection is not operational.
Show View displays the saved view corresponding to the number on the hot button.
Fronts/Hi/Low lets you draw weather fronts with the cursor, as well as create high and
low pressure markers. See section 3.5.13 for details.
Map Pointer activates the Map Pointer. When you select this hot button, Telestrator
drawings disappear. Left-clicking on a road causes its name to appear in the Cursor Status
Area. Right-click on this button to enter Pixel Query mode, which indicates the radar data
(this works for all data products) and level at your cursor position.
Map Pan enables Pan mode, letting you set a different center point for the current view.
Neighborhood Weather Net lets you edit and manipulate live weather data that can then
be displayed on map views. See Section 3.5.11 for more information.
5
Overview FasTrac Millennium User’s Guide – May 2003
StormScan activates the Arrow Filter panel on the left side of the FasTrac display. See
Section 4.6, StormScan, for more details.
Street Spotter allows you to find and label the streets in your database. See Section 3.5.4
for details.
SpotterNet lets you display a network of eyewitnesses for weather activity. See Section
3.5.19 for details.
Main Status Area
The Main Status Area is the area in white, just to the right
of the hot buttons. This area displays the following:
• Latitude and longitude of the map pointer.
• Azimuth and range of the current pointer from its last selected position (reset this by
right-clicking on the view).
• Current system time in local time and in Greenwich Mean Time (ZULU). We equip our
systems with time keeping software to ensure that the system time remains accurate, but
you may use a different time keeping program if you wish.
• Azimuth and elevation of the live radar.
• Azimuth, range, and height of the your radar’s beam center at the cursor position.
Cursor Status Area
The gray bar located under the main status
area is the Cursor Status Area. This bar is
dual-purpose. First, it displays information about your last selected command. For instance, if
you place the cursor over the Lightning hot button, the words replay last hour’s lightning
appear. Secondly, this area displays various status messages relating to system activity.
Select Panel
The Select Panel options, described below, occupy the left column of your
screen.
Option Description
VIEWS Opens the View Main panel, which displays map radius, map center, and map
name. This is the default panel and displays upon system startup.
STORMS Opens the Storm Track panel, which lets you control storm track settings.
SEQUENCES Opens the SEQUENCER panel.
NEXRAD Opens the NEXRAD Main panel, which lets you display NEXRAD products.
6
FasTrac Millennium User’s Guide – May 2003 Overview
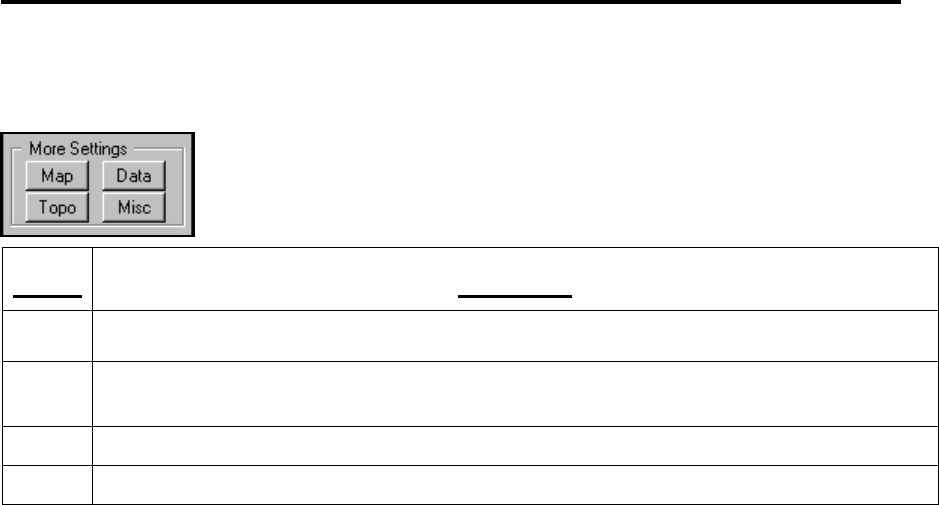
More Settings
The More Settings area, which appears at the bottom of the left column
when the View panels are active, lets you display the following panels:
Option Description
MAP Controls street, road, water, and county line displays for the current view.
DATA Controls appearance of radar and lightning data on the current view. The Radar Control
option lets you control the real-time radar.
TOPO Controls the topography display, and specifies the textured background bitmap.
MISC Controls radar cursor appearance, radar range height indicator (RHI) mode, and overlays.
1.6 System Commands Not Meant for Client Use
In the Setup and Misc Main Menus, there are several commands that are intended for use by
Baron Services personnel for the purpose of system maintenance and troubleshooting. You
should not use any of these commands without the assistance of a Baron Services
representative.
The commands are as follows:
• Setup > Map > Advanced > Map Window
• Setup > Miscellaneous
• Setup > Data > NexRad
• Status > Debug Window
• Status > Advanced > System Report
• Status > Advanced > Memory Check
• Status > Advanced > Toggle Debug
7

Overview FasTrac Millennium User’s Guide – May 2003
1.7 Points to Remember
When you start your system, you automatically enter the FasTrac environment. If
you have exited FasTrac, you can double-click on the FasTrac icon on your desktop
to manually initialize FasTrac.
Perform back-up operations often, to protect your data and setup configurations.
All of the operations that you may use are covered in this manual. If you find
something that is not discussed, it is best not to tamper with it. Again, if you have
questions, feel free to call the Client Services Department at (256) 881-8811.
This chapter merely provides an overview of FasTrac Millennium’s capabilities. The other
chapters describe the five primary areas of program functionality.
Description Chapter
Setting Up Your System Chapter 2
View Manipulation Chapter 3
Storm Tracking Chapter 4
Sequencing Chapter 5
Radar Control Chapter 6
8
2. Setting Up Your System
This chapter describes how to prepare your system for displaying crucial weather data in
meaningful formats for your users. While you can readily perform most of the Setup commands,
some operations are not so apparent.
Before you start setting up, you should back up the delivered \fastrac directory as explained in
section 1.3, Protecting Your Data.
This chapter addresses the functions described in the following list:
Setting Up Map Layers
Setting Up Display Levels
Editing the Places Database
Prioritizing the Places Database
Adjusting the Color Palette
Using the Baron Chart
Customizing Font Displays
Manipulating the Automatic Legend
Using Overlays
Setting Up Icons
9
Setting Up Your System FasTrac Millennium User’s Guide – May 2003
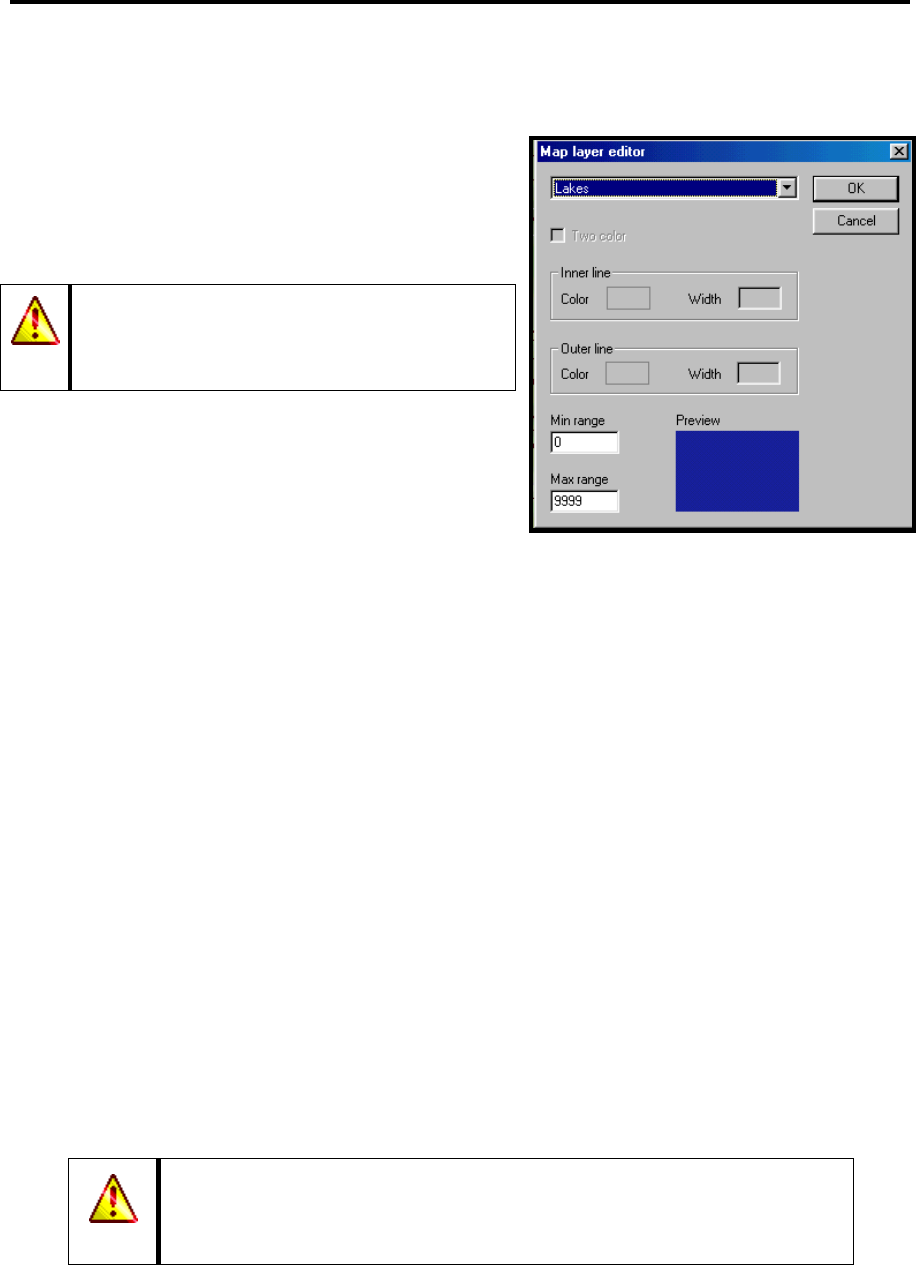
2.1 Setting Up Map Layers
The Map layer editor menu, which you can access
with the Setup > Map > Map Layers command,
allows you to edit the appearance and viewing range
of all the water and road types in your map database,
as well as county and state lines.
The pull-down list lets you select which map feature
type you wish to modify (for example, Lakes, Rivers,
County Lines, State Lines and Roads).
Two Color specifies that two colors define the
selected map feature and is available only for county lines, state lines, and various types of roads.
Clients without .psf mapping data should use
the Display Levels commands detailed in
Section 2.2 to adjust the appearance of roads
and water.
Inner Line defines the color of one-color features, and the inside color of two-color features.
Outer Line is enabled only if you select the Two Color option. This option defines the outside
color of two-color features.
Min Range defines the minimum range at which you can see the selected feature. You will not
see the feature when your view’s range is less than the specified Min Range.
Max Range defines the maximum range at which you can see the selected feature. You will not
see the feature when your view’s range is greater than the specified Max Range.
Preview displays the selected feature type and the one or two specified colors for that feature.
2.2 Setting Up Display Levels (for clients without .psf
mapping data)
For clients without .psf map data, the Setup > Map > Advanced > Display Levels commands
control what roads and bodies of water are displayed within your map at a particular range. This
system utilizes both the 1:2,000,000 database and the City Streets database. See Section 2.2.3 for
information on how to set the range at which the display switches between the two databases.
The Display Levels commands only appear for clients that do not use
.psf data for mapping. Clients with .psf data should use the Setup >
Map > Map Layers command detailed in Section 2.1 to edit the
appearance of roads and water.
10
FasTrac Millennium User’s Guide – May 2003 Setting Up Your System
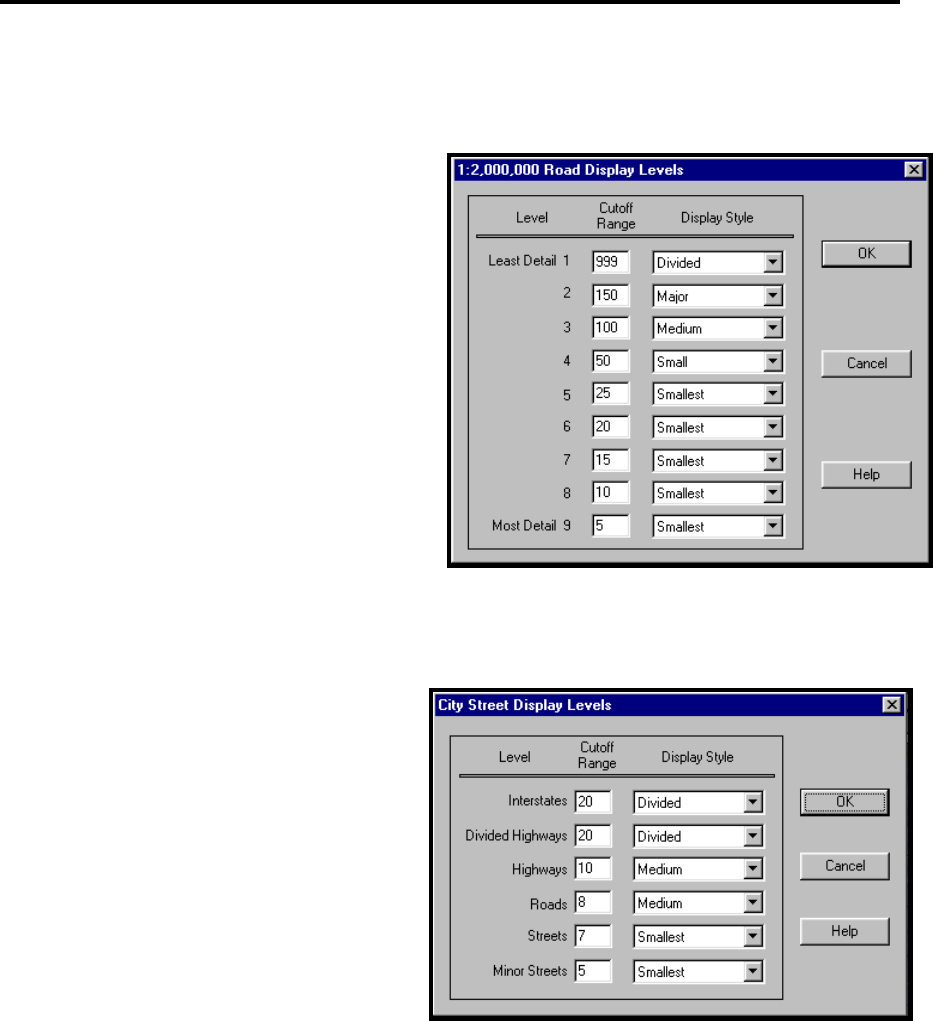
2.2.1 Editing Display Levels for Roads (for clients without .psf mapping
data)
Select the Setup > Map > Advanced >
Display Levels > 1:2,000,000 Roads
command to open the 1:2,000,000 Road
Display Levels menu.
This menu has nine categories reflecting
different levels, or subsets, of roads. The
Cutoff Range area lets you activate the
databases at different ranges so that an
appropriate amount of detail appears,
regardless of range. For example, interstates
are appropriate at any range, so they receive a
high value, like 999. Residential roads, on the
other hand, are only appropriate when you
zoom in close, so they receive a low value,
like 10. This configuration results in
interstates appearing on any map with a range of less than 999 miles - in effect, on every map.
Residential roads only appear when your map range is less than 10 miles - a more appropriate
activation range. These ranges are adjustable to suit your needs.
Select the Setup > Map > Advanced >
Display Levels > City Streets Roads
command to open the City Street Display
Levels menu. Although City Streets Roads
is a separate menu with six levels, levels 1
through 4 (Interstates, Divided Highways,
Highways, and Roads) are roughly
comparable to the 1:2,000,000 database.
Streets and Minor Streets occupy levels 5
and 6 and use the City Streets database.
This prevents the database from placing
much detail at longer ranges.
too
11
Setting Up Your System FasTrac Millennium User’s Guide – May 2003
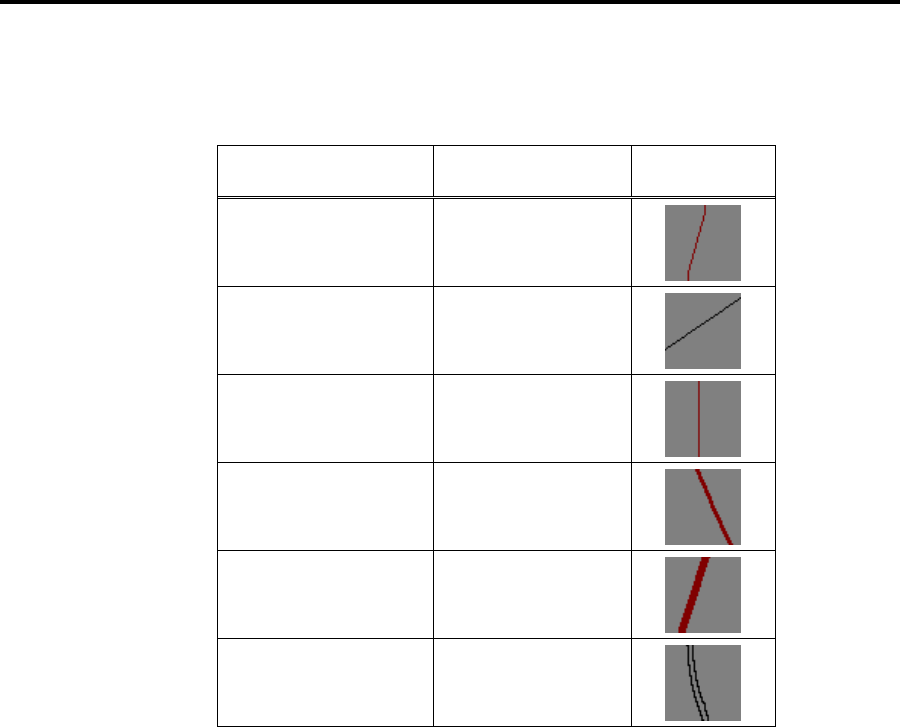
The Display Style area lets you adjust the graphic look of the roads in your system. There are six
graphic styles:
Road Style Type Example
Smallest Single Line
Small Single Line
Medium Double Line
Major Double Line
Divided Triple Line
Two Color Triple Line
Triple-line styles are usually assigned to interstates, and divided highways and double-line styles
are usually assigned to state and county highways. Single-line styles work best when assigned to
the smallest roads. Use the Setup > Colors command to adjust the road colors.
2.2.2 Editing Display Levels for Bodies of Water (for clients without .psf
mapping data)
The Setup > Map > Advanced > Display Levels > 1:2,000,000 Water and Setup > Map >
Advanced > Display Levels > City Streets Water menus operate exactly the same way as their
respective Roads menus, except that you do not need to assign different looks. Water is usually
blue (unless you would like to select a different color). Again, you use this command to set
ranges for the different levels where you want the water database to appear. If you want to
display more water bodies at a certain range, see what the current level is and raise the cutoff
range value.
12
FasTrac Millennium User’s Guide – May 2003 Setting Up Your System
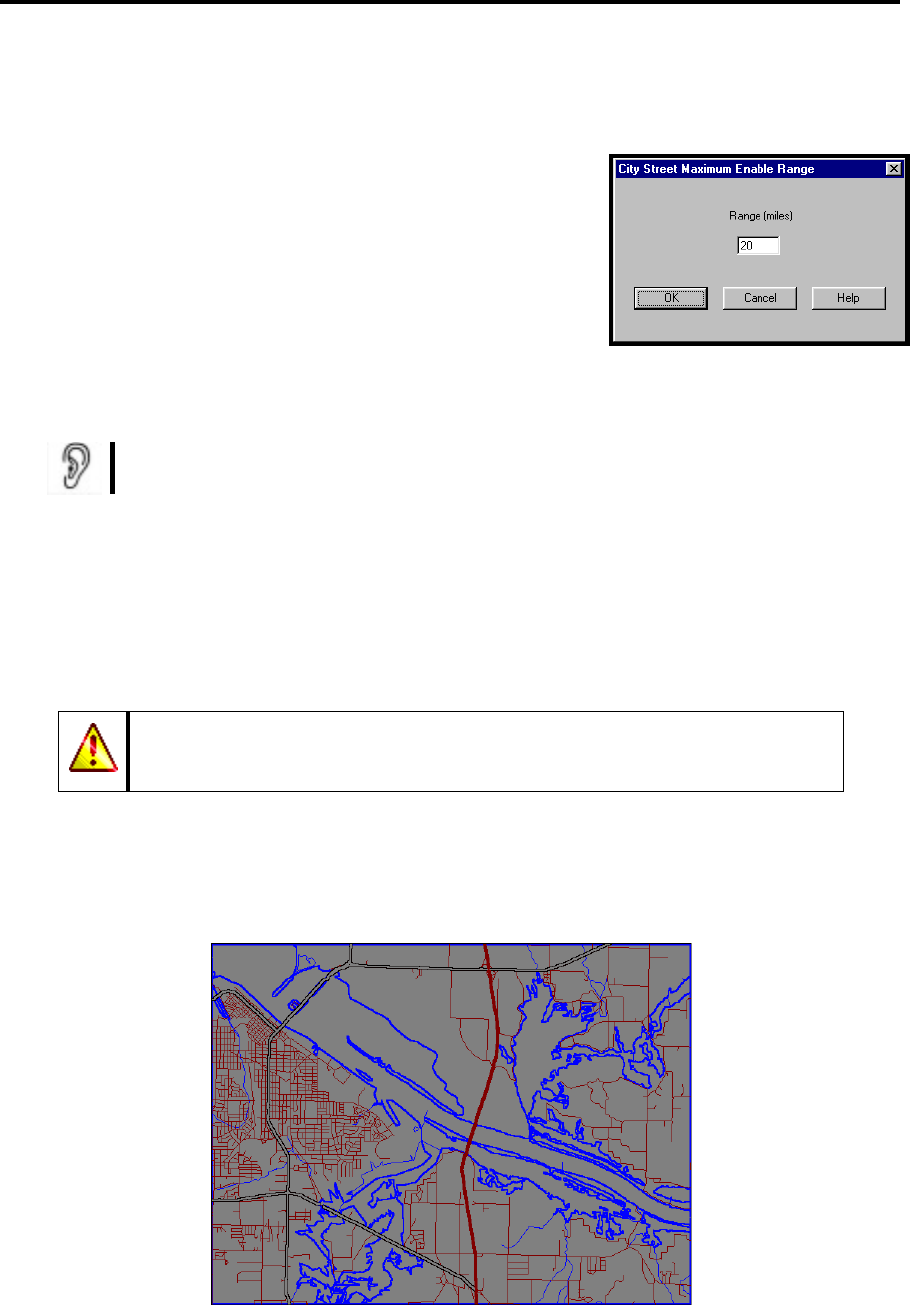
2.2.3 Setting the Enable Range for City Streets (for clients without
.psf mapping data)
Select the Setup > Map > Advanced > Display Levels > City
Streets Range command to open the City Street Maximum
Enable Range menu. This menu lets you set the range threshold
at which the system will move between the 1:2,000,000
database and the City Streets database. If you specify 20, for
example, the system will use the 1:2,000,000 database at ranges
greater than 20 miles. At ranges less than 20 miles, it will use
the City Streets database. Setting this value too high can result
in excessive clutter and slower processing times. The City Streets database is very large and is
usually too great for any computer to handle at ranges above 20 miles.
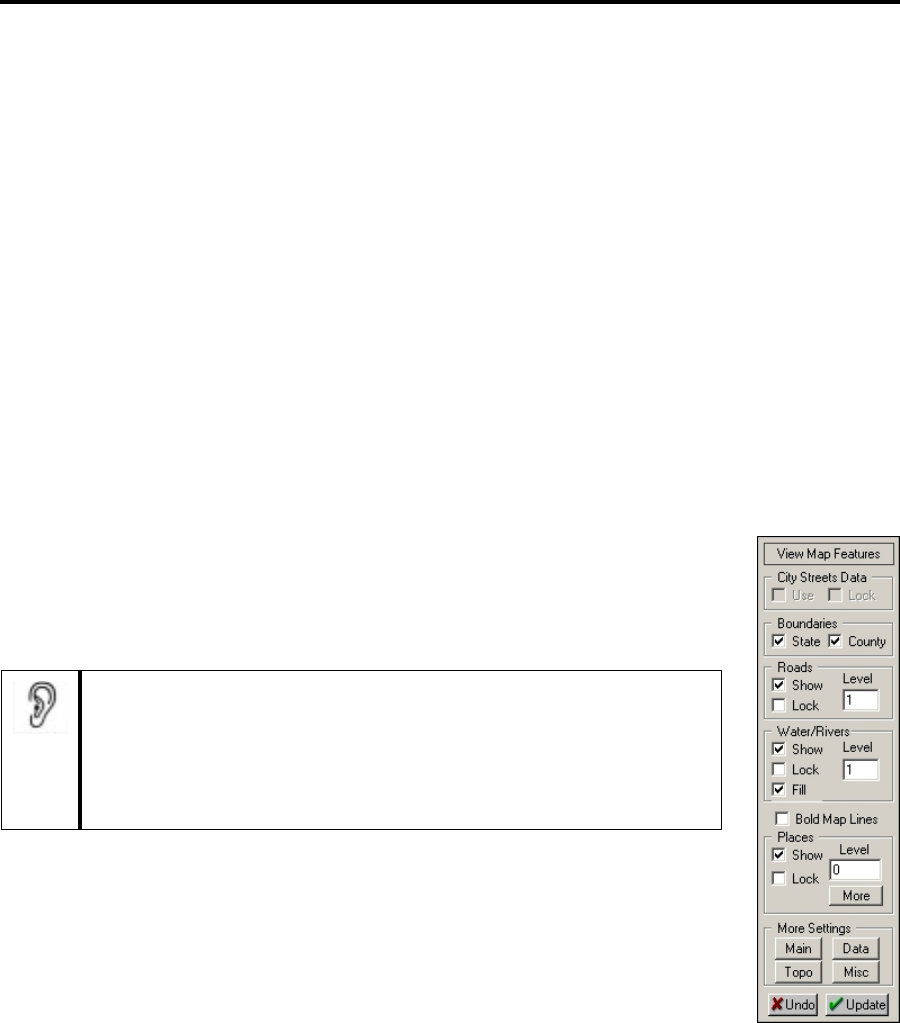
You can override the range by selecting the City Streets Use control and its
associated Lock control on the View Map Features panel.
2.3 Adding Water-Fill Points (for clients without .psf
mapping data)
The main water database contains only the outlines of bodies of water. While water bodies
normally appear as solid, blue shapes, you may have to use the Setup > Map > Advanced >
Water Fill command to fill in a water shape.
The Water Fill command only appears for clients that do not use .psf data
for mapping. Clients with .psf data should use the Setup > Map > Map
Layers command detailed in Section 2.1 to edit the appearance of water.
1. Use the Setup > Colors command to verify that the water color is correct. Adjust as
required.
2. Use the Zoom Out option to display the body of water in question. Note in the following
example how the river body, bounded by the dark, bolded lines, is empty.
13
Setting Up Your System FasTrac Millennium User’s Guide – May 2003
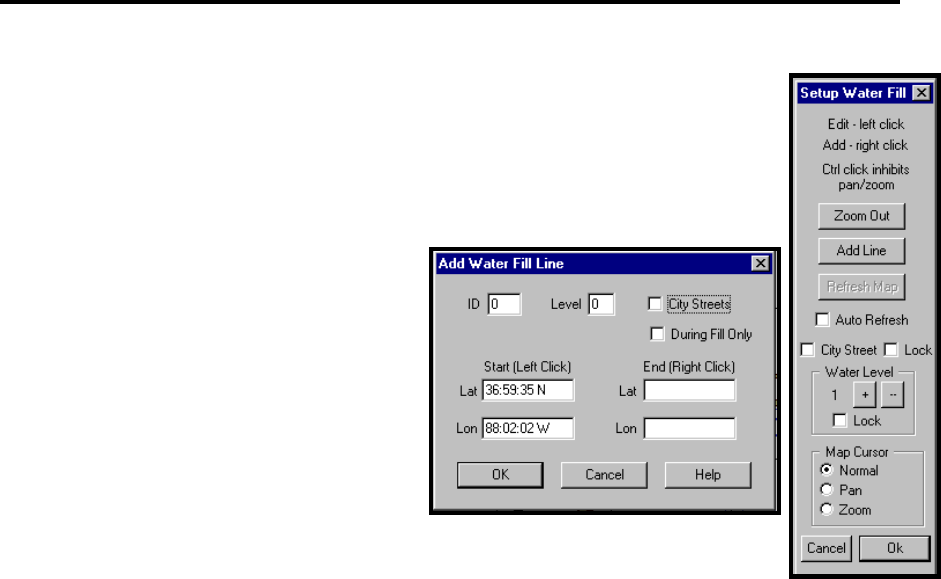
3. Select the Setup > Map > Advanced > Water Fill command to display the
Setup Water Fill panel on the left side of the screen.
Zoom Out automatically zooms out the map display to 50% of the current
range. You can continue to issue this command until you have the
appropriate view.
Add Line opens the Add Water Fill
Line dialog box. This dialog box
lets you fix the display of two
separate bodies of water. If there is
a gap between such features, the
water fill could extend beyond the
intended boundaries (referred to as
a flood). You can use Add Line to
connect the two bodies for a water-
fill operation. You then could
select During Fill Only to display
the line only during a water-fill operation.
Refresh Map updates the map display.
Auto Refresh automatically updates the map display when you add a line or point.
eets. (This option is available only if you have the
optional City Streets module.)
f the
view. (This option is available only if you have the optional City Streets module.)
Water Level +/- lets you move to different levels on the map.
> 1:2,000,000 Water command from changing when you zoom in and out of the
view.
Map Cursor Normal places your map cursor in pointer mode.
sor Pan places your map cursor in pan mode, letting you move around the map
display.
your map cursor in zoom mode, letting you get closer views
of points of interest.
4. Right-click your mouse button on the body of water in question to add a water-fill point.
City Street displays the city str
City Street Lock prevents the street levels that you specified with the Setup > Display
Levels > City Streets Roads command from changing when you zoom in and out o
Water Level Lock prevents the water level that you specified with the Setup > Display
Levels
Map Cur
Map Cursor Zoom places
14
FasTrac Millennium User’s Guide – May 2003 Setting Up Your System
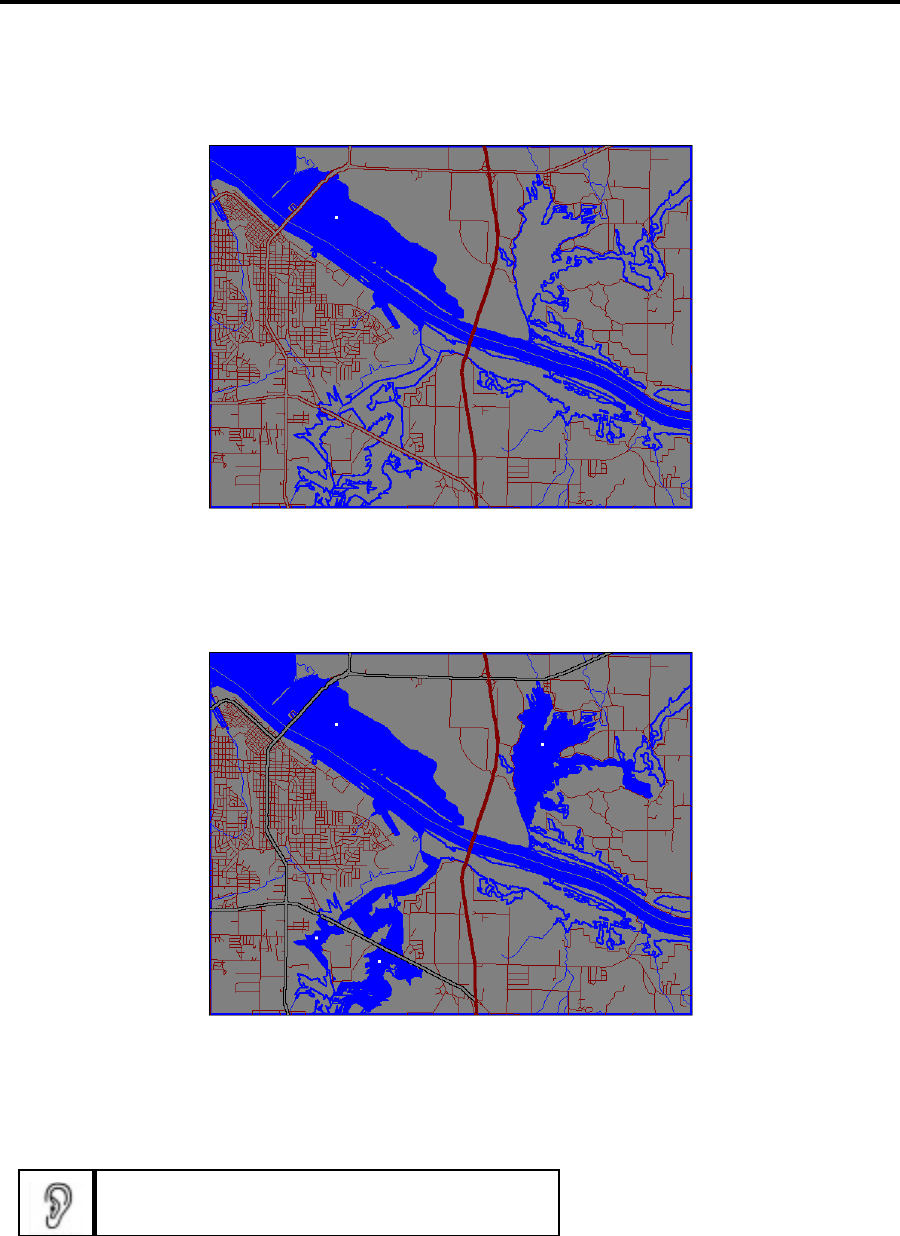
5. Verify that the water body is filled with the water color. The following example depicts the
water fill. Note that the water-fill point appears as a small white square on the map
For best results, click near the center of the water body, away from the boundary lines.
6. Zoom out to ensure that the entire body of water is filled in correctly, as shown in the
following example. Notice that multiple water-fill points have been added.
To edit an existing water fill point, click on it to open a dialog box that has places to enter the fill
point’s ID and to enable or disable it. There are also boxes that specify the display level, the
minimum a ude of the point. To change the
latitude and tion.
nd maximum ranges, and the latitude and longit
longitude, click on the map at the new loca
A water-fill point must be visible on the screen
before it will fill water bodies with color.
15
Setting Up Your System FasTrac Millennium User’s Guide – May 2003
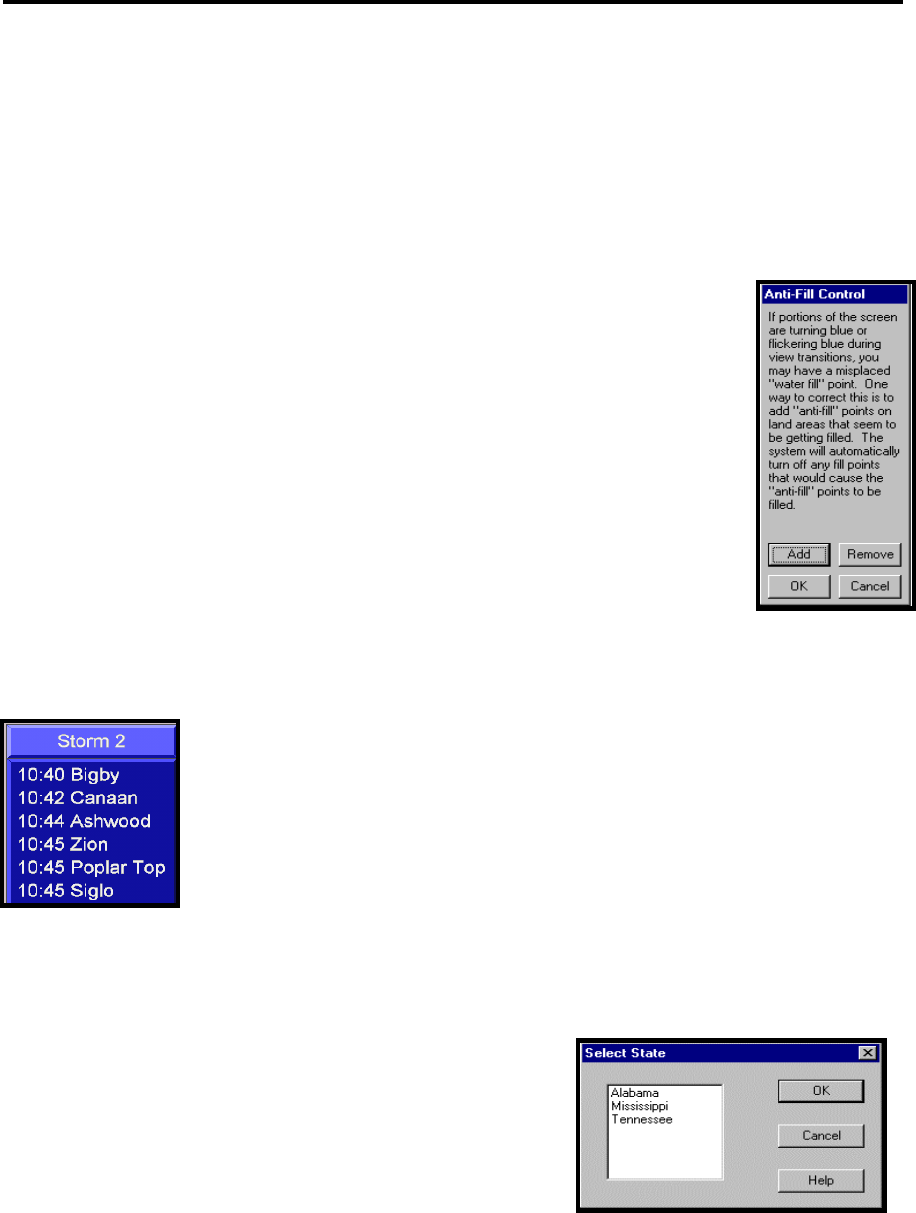
2.4 Fixing Floods with Anti-Fill Points (for clients
without .psf mapping data)
Som with water-fill points, you may accidentally place a
point that makes the land area fill with the blue color. This is referred to as a flood. Since it can
to u d to fix the problem.
Anti-Fill Control dialog box on the left side of the display.
2. oded area. Notice
that a small, green-filled point appears.
3. To remove a point, select Remove and click on the point you want to
o
4. Click OK, and s
e
M
g
every
re tracking severe weather, you do not want to miss the
small communities that could be affected the most. The Setup > Map >
ine the priority level (in miles)
of every populated community in your area. In this manner, you determine
e
orm Track ETA Marq
left. You can also use the Places Database
ommunity names from the database.
he following steps describe how to customize your database:
1. Select the Setup > Map > Places Database command
to open the Select State menu.
etimes when filling a large body of water
be difficult to find the particular fill point that is causing the flood, the Baron program allows you
se Anti-Fill comman
1. Select the Setup > Map > Advanced > Anti-Fill command to display the
Select Add, and click on the map somewhere in the flo
rem ve.
elect the Setup > Map > Advanced > Water Fill
n the Setup Water Fill panel on the left side of the screen.
ap to see your adjustments.
the Places Database
As part of your system, we include every populated community in
state. When you a
command to op
5. Select Refresh
2.5 Editin
Places Database command lets you determ
at what range various communities app
listed in the St
ar on the map and when they are
uees, such as the one displayed on the
command to add or delete
c
T
16
FasTrac Millennium User’s Guide – May 2003 Setting Up Your System
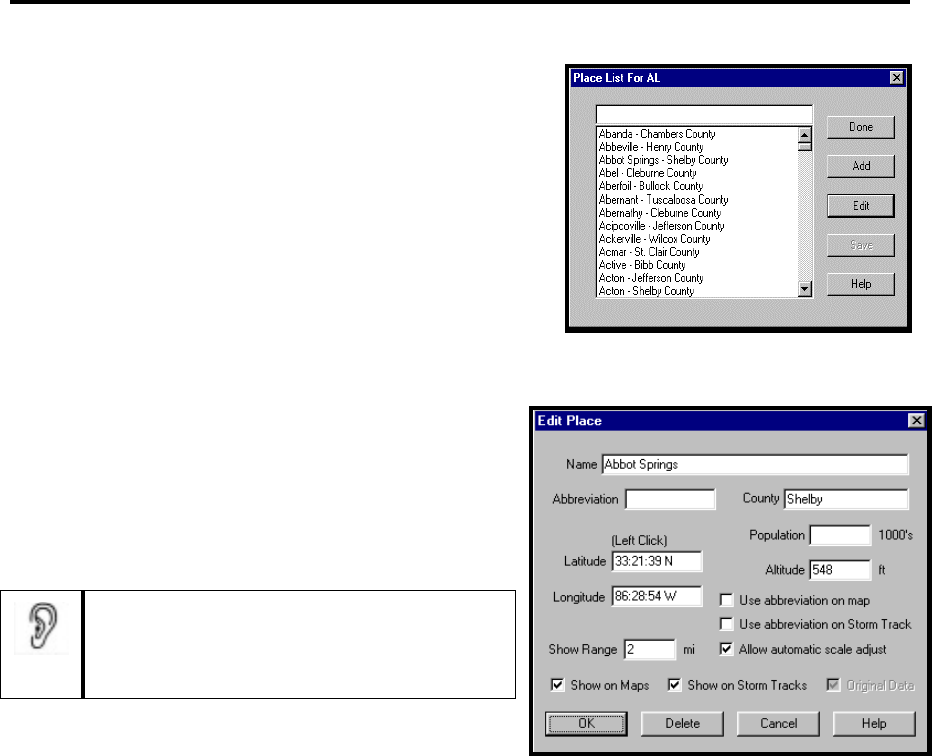
2. Click on a state name, and click OK to open the
Place List for the selected state. Note that all the
populated communities in the selected state
alphabetically.
are listed
will
on filled in.
ameter:
3. Click Add to create a new place, or click an
existing place name and click Edit to modify it.
The Add Place and Edit Place menus have
identical features, although a place you edit
already have informati
You can also select an existing place by
clicking on the community name then
pressing the ENTER key, or double-clicking
on the community name.
4. Enter the desired parameters on the Add Place or
Edit Place menu. The following paragraphs
describe each par
Name – Defines the full place name.
Abbreviation – Defines an abbreviation that can be displayed instead of the full place
name.
County – Specifies the county in which the place is located.
Population – Defines the known population, in thousands.
Altitude – Defines the altitude, in feet, if known.
Latitude and Longitude – Specifies the geographical coordinates. You can automatically
assign coordinates to the place by left clicking on the desired spot in your view.
Use abbreviation on map – Displays the abbreviated name, rather than the full place
name, on views.
Use abbreviation on Storm Track – Displays the abbreviated name on storm tracks.
This is a useful tool for managing the size of storm track boxes. For example,
abbreviating Mahan Center Cross Roads to Mahan. Cen. results in a much smaller box.
Allow automatic scale adjust – Automatically adjusts the storm marquee to fit the
displayed places.
17
Setting Up Your System FasTrac Millennium User’s Guide – May 2003
Show Range – Defines the range, in miles, at which the place will display. For example,
a place with a Show Range parameter of 1 will not display until your view range is one
mile or less.
Show on maps – Displays the place name on views when it is in range.
Show on Storm Tracks – Displays the place name on Storm Track ETA displays.
Original Data – Reserved for future use.
When adding places, do not start them with a number (e.g., 1st Street).
The system functions best with all letters in the name, rather than
numbers. Spell out the number if you want to use it.
While your Places database contains thousands of place names, you need not adjust them all. The
program defaults all of its communities to a Show Range of 1, which means that a community
will never appear on a map unless your map range is one mile or less. By default, all
communities appear in storm tracks, which is where community names are most powerful. The
only thing you need to do in the Setup Places operation is to raise the Show Range value for the
appropriate communities in your viewing area, as explained in the following subsection. This
allows communities to appear in your maps when you are creating saved views or when you are
moving around the map in a real-time situation.
Changing the Show Range Parameter
This function is one of the most powerful operations you will perform with your system. This
subsection describes how to easily and efficiently prioritize the places that are already present on
your system. The Places database includes every populated community in range of your radar,
for approximately a 300-mile radius from your location. Use your discretion when you prioritize
the database to meet the needs of your users.
1. Select the Map Pan hot button and click on the major city in your viewing area
to center the map on it.
2. Select Views to activate the View Main panel, key in 250 in the Radius text box, and click
the Update button to show a 250-mile view of the city.
3. Decide which cities you want to appear at this range.
4. Select Setup > Map > Places Database to open the Select State menu, select the state, and
click OK to open the Place List for the selected state.
5. Select a city, and click Edit to open the Edit Place menu.
6. Key in 250 in the Show Range text box, make any other relevant changes, select the Show
on Maps and Show on Storm Tracks options, and click OK.
7. Repeat steps 5 through 7 for each city that you wish to display at the 250-mile range.
8. Click Update on the View Main panel to refresh the map, and verify that the cities you want
appear. You may end up repeating this process several times.
18

FasTrac Millennium User’s Guide – May 2003 Setting Up Your System
9. Repeat steps 2 through 8 to set up map displays for 200-, 150-, 100-, 75-, 50-, 25-, 10-, 5-,
and 3-mile ranges.
10. Repeat steps 1 through 9 for each important city in your viewing area.
11. Verify that you have a good coverage of the cities you want to see by zooming in and out on
relevant areas of your viewing area.
Customizing the Places Database
Many of our clients have gone beyond editing to customizing their Places Database. An example
of this customization process is identifying important intersections. At times, some locations
should be emphasized to stress the importance and location of weather phenomenon to your
users. The Baron database is completely client-customizable. You can take advantage of the
opportunity by creating identifiers for local features like schools, malls, churches, parks, and
stadiums. To add places for this purpose, follow these steps:
1. Select Setup > Map > Places Database to open the Select State menu, select the state, and
click OK to open the Place List for the selected state.
2. Click Add to open the Add Place menu.
3. Click on the appropriate location on your map display to have the longitude and latitude
coordinates automatically generated, or key in the longitude and latitude coordinates.
4. Key in the text (for example, enter an intersection name) in the Name box, type in the range
at which you want the place to display in the Show Range Text box, select the Show on
Maps options, and click OK to return to the Place List.
5. Click Done. You will be asked if you want to save the new name to a file. Click OK.
6. Go to the Views panel on the left side of the display. Verify that the view is in the range
specified in step 4, and click Update. Make sure that the new text is displayed.
To further emphasize a customized place, you can use the Street Spotter feature to import an icon
for it. See Section 3.5.5 for details.
19
Setting Up Your System FasTrac Millennium User’s Guide – May 2003
2.6 Adjusting the Color Palette
The Setup > Colors command lets you adjust the color palette used by FasTrac Millennium.
If you have access to the Advanced Baron Chart (via the Setup > Data > Baron
Chart command, see section 6.3.3), you should use it rather than the Setup Colors
menu to adjust radar colors. Also, you should use the Setup > Map > Map Layers
command discussed in section 2.1 to adjust mapping colors.
The following steps describe how to use this particular
function:
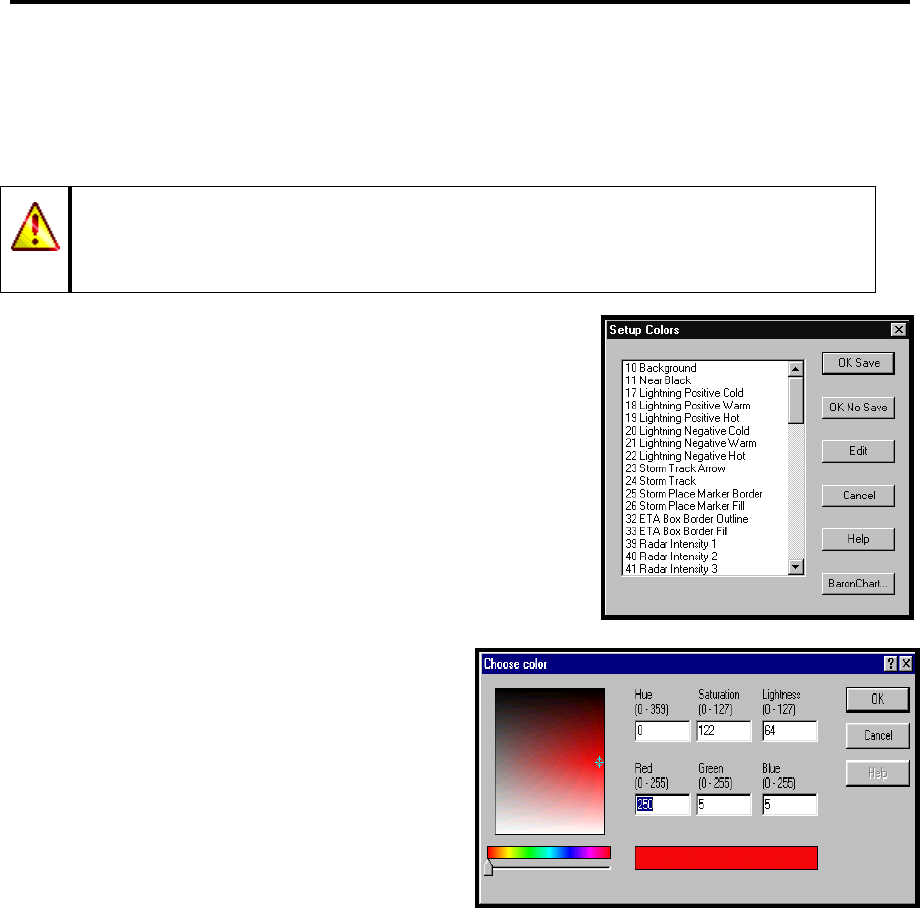
1. Select Setup > Colors to open the Setup Colors menu.
Note that a color value is assigned to each listed element.
2. Select an element, and click Edit to open the Choose
Color menu.
3. Adjust the color, which changes as you edit the values.
There are six options: Hue, Saturation,
Lightness, Red, Green, and Blue. Enter a
number from 0 through 255 in each of these
spaces to specify the amount of that component
to include. You can also move the sliding
pointer below the rainbow colored bar to raise
and lower the hue value. You can click
anywhere on the large colored box to the left of
the number boxes to automatically change the
values of that color (this method affects every
value except the hue). As you change the
numbers, the rectangle below the number spaces indicates the color.
Press ENTER or click OK when you have adjusted the color to the way you want. You can exit
without making any changes by pressing the escape key (ESC) or by clicking Cancel.
20
FasTrac Millennium User’s Guide – May 2003 Setting Up Your System
2.7 Using the Baron Chart
The Baron Chart lets you specify the colors used for the various NEXRAD products and your
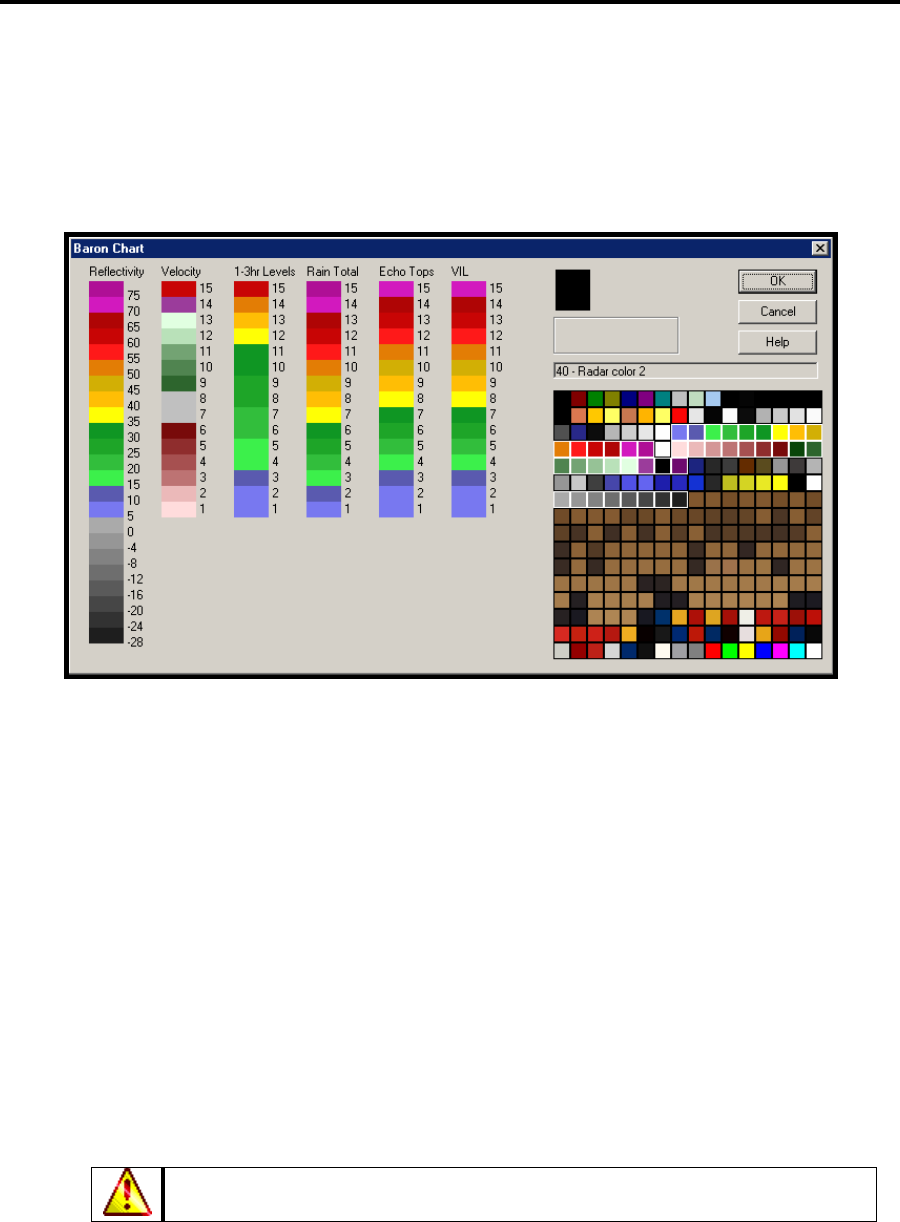
real-time radar data. All of these use the Baron Chart. To display it, select Setup > Colors to
open the Setup Colors menu, and select Baron Chart.
The square on the right shows all 256 colors in the color palette. When you move the mouse
cursor over these colors, the text box lists the index number of the color to which the mouse
cursor is pointing and specifies the color title. If appropriate, the text box describes the red,
green, and blue values that define the color and the general classification, which is described in
the following list:
MODIFIABLE indicates that the color is available for use in any product, and you can
change its RGB components by double-clicking on it to open the Edit Color menu.
UNSTABLE indicates that the color is available for use in any product, but you cannot
change it from this menu. We do not recommend that you use these colors since other
features use them and they are subject to change.
FIXED indicates that you cannot change this color, but it is safe to use in your products
since it will not change.
RESERVED indicates that you cannot use or change this color.
Palette entries surrounded by white squares are the safest to use with
Baron Chart, since they were originally reserved for radar.
The left portion of the Baron Chart contains colors for the different NEXRAD product types. The
numbers in the Reflectivity column indicate dBZ values, while the other columns indicate the
levels (1 - 15). As you move the mouse cursor over these, the rectangle above the palette box
21
Setting Up Your System FasTrac Millennium User’s Guide – May 2003
displays text that identifies the colors used. The following steps describe how to change a
particular level in a product:
1. Select a color for a particular level from the palette by clicking on a color on the Baron Chart.
2. Click on the level that you want to change (for example, level 7 of VIL).
3. Click OK to save your edit and to return to the Setup Colors menu.
You can change any MODIFIABLE color on the palette. To do so, double-click on the color to
open the Color Edit menu, which is described in section 2.5, Adjusting the Color Palette.
Changing a color in the palette will affect everything that uses that color.
Clicking OK saves any changes you have made. You must, however, select OK Save on the
Setup Colors menu to effect the changes. For example, if you click OK on the Baron Chart menu
and then click Cancel on the Setup Colors menu, you cancel the changes to the palette. The
changes to the color representations of product levels stay the same. To avoid confusion, it is best
either to click OK in both places or to click Cancel in both places.
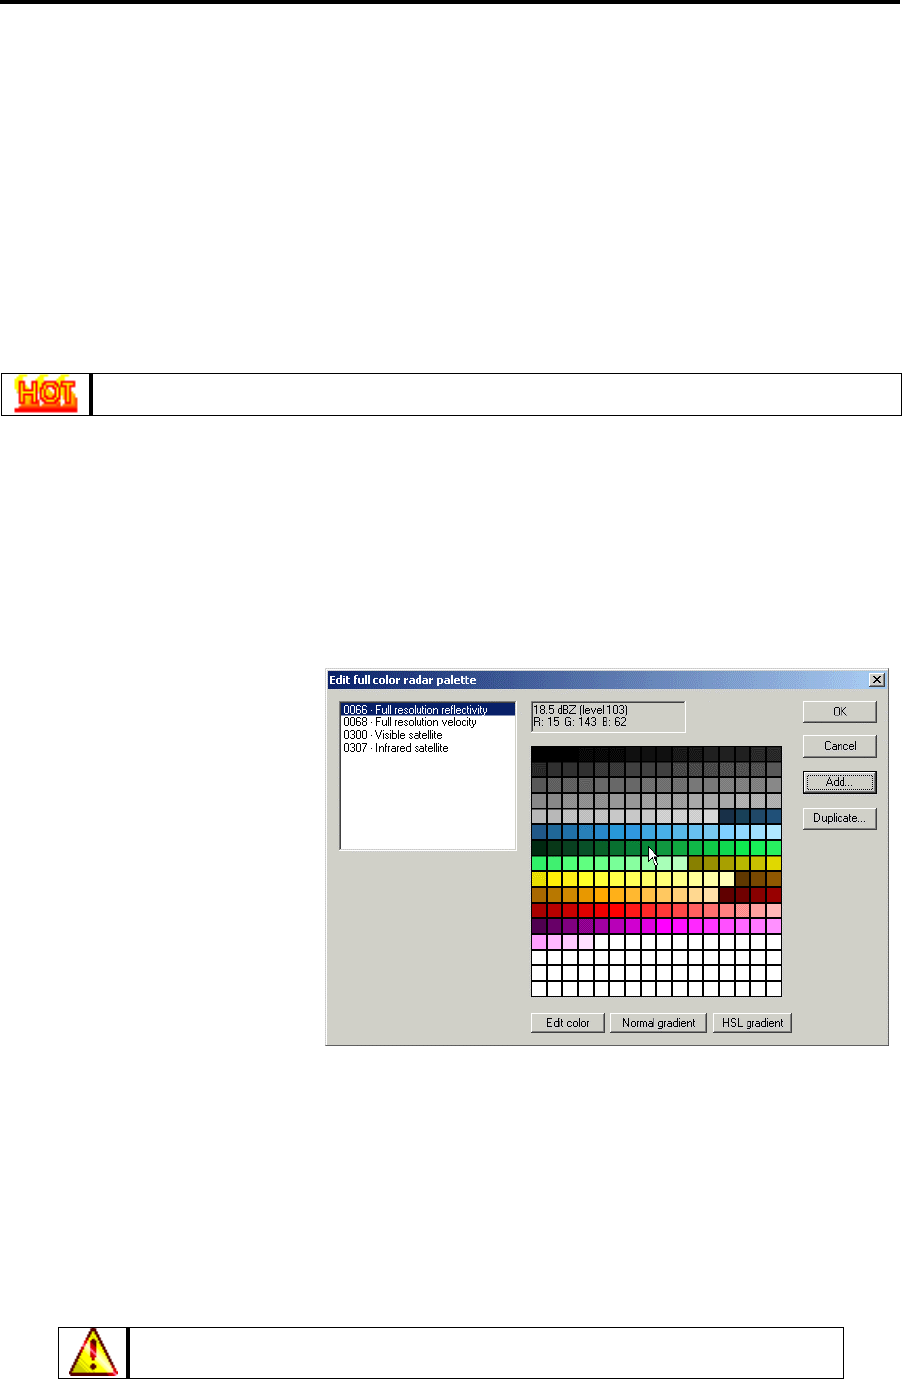
2.8 Editing Colors for 256-Color Palettes
There are several new data
products that utilize a 256-color
palette rather than the normal 16
colors. These products can be
edited with a separate menu
called the Edit full color radar
palette menu. To access this
menu, select Setup > Data >
BaronChart256.
The box in the upper left corner
displays the names and product
codes of the currently existing
256-color palettes. The product
highlighted in this box displays
its palette in the center area.
The box to the right of the box containing the product names and codes displays the level number
and RGB values of the palette entry over which your cursor is currently positioned. For
reflectivity palettes, the dBZ value corresponding to that level also appears.
The Edit Color button below the palette area allows you to edit the colors for the palette entries.
See section 2.5, Adjusting the Color Palette, for information on using the Choose color menu.
The Add button lets you create a new 256-color palette. The palette will be black by default.
256-color palettes will not display properly if a precipitation type map is
currently displaying (see section 3.5.17, Displaying Precipitation Type Maps).
22
FasTrac Millennium User’s Guide – May 2003 Setting Up Your System
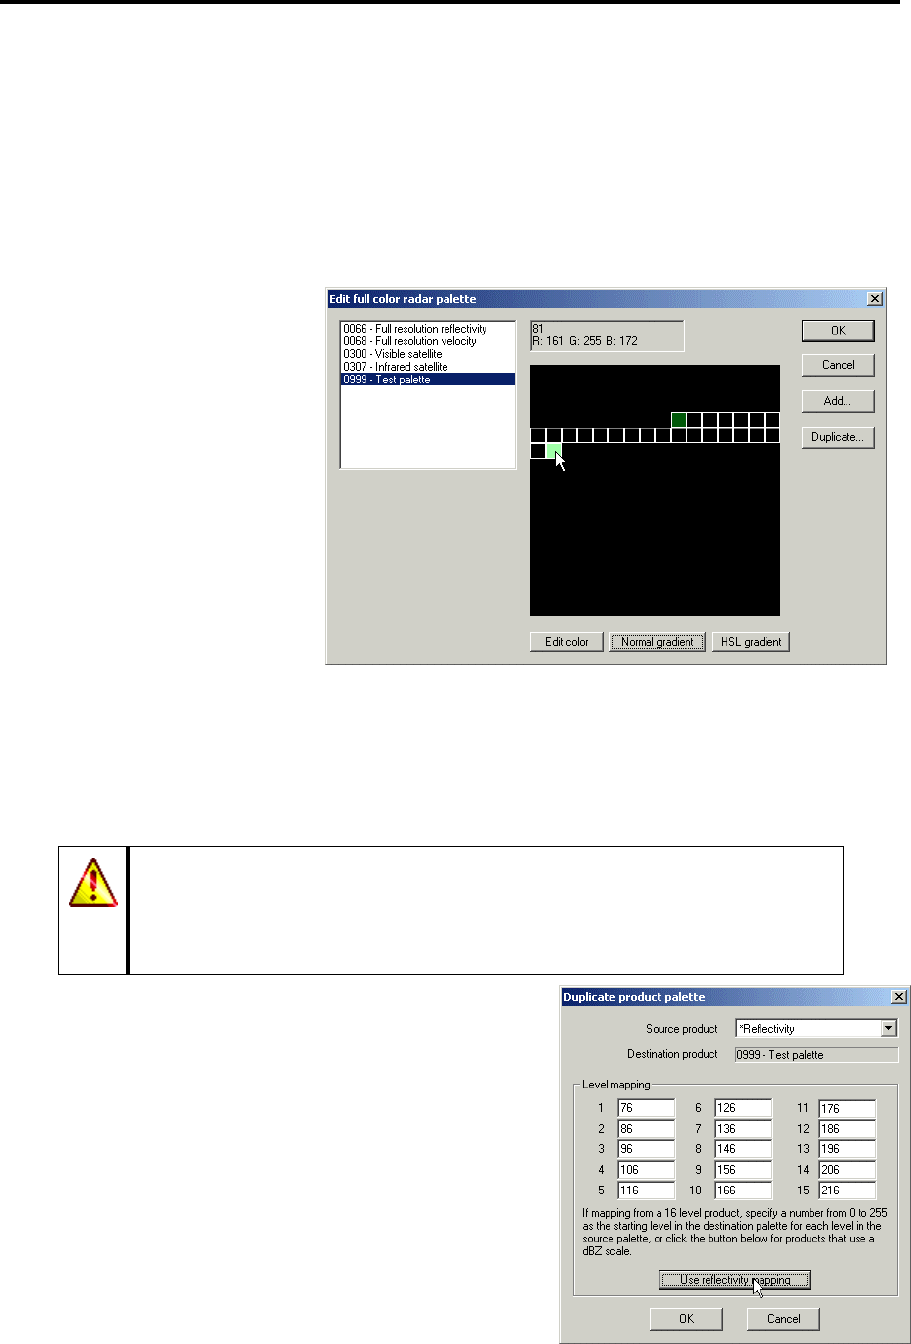
2.8.1 Creating Gradients
The Normal Gradient and HSL Gradient buttons let you automatically create a smooth scale of
colors between two entries on a palette.
1. Manually edit the colors of the palette entries that you wish to be the starting and ending
points of the gradient, using the Edit Color button.
2. Select the range of palette
entries for the gradient by
left-clicking on the starting
entry and dragging the
mouse to the ending entry.
The entries in between the
two entries will be
highlighted, as shown in the
example to the right.
3. Click either the Normal
Gradient or HSL Gradient
button to create the gradient.
You should experiment with
both options to find which
one you prefer.
2.8.2 Duplicating Palettes
You can use the Duplicate button to apply the color scheme of an existing weather product to the
currently selected product.
This process is intended to replace the colors of the currently selected palette
with the colors of another palette, not to create a copy of a palette. If you wish
to create a palette with the same color scheme as an existing palette, you
should first create a blank palette with the Add button, then use the Duplicate
button to copy the colors of the original palette into the blank palette.
When you click the Duplicate button, the Duplicate
product palette menu appears.
The pull-down list labeled Source product indicates the
product whose color palette you wish to duplicate.
Product names with an asterisk at the beginning are 16-
color palettes.
The area labeled Destination product indicates the
product to which you are copying colors. If this is not the
palette you wish to change, click Cancel to exit the menu.
23
Setting Up Your System FasTrac Millennium User’s Guide – May 2003
You only need to use the Level mapping area if the palette you are duplicating is a 16-color
palette. In the text boxes, type the number in the 256-color range that you wish each of the 16-
level colors to appear.
The Use reflectivity mapping button automatically assigns reflectivity values and colors to the
target palette.
To assign the new color scheme, click OK. To exit without changing the palette, click Cancel.
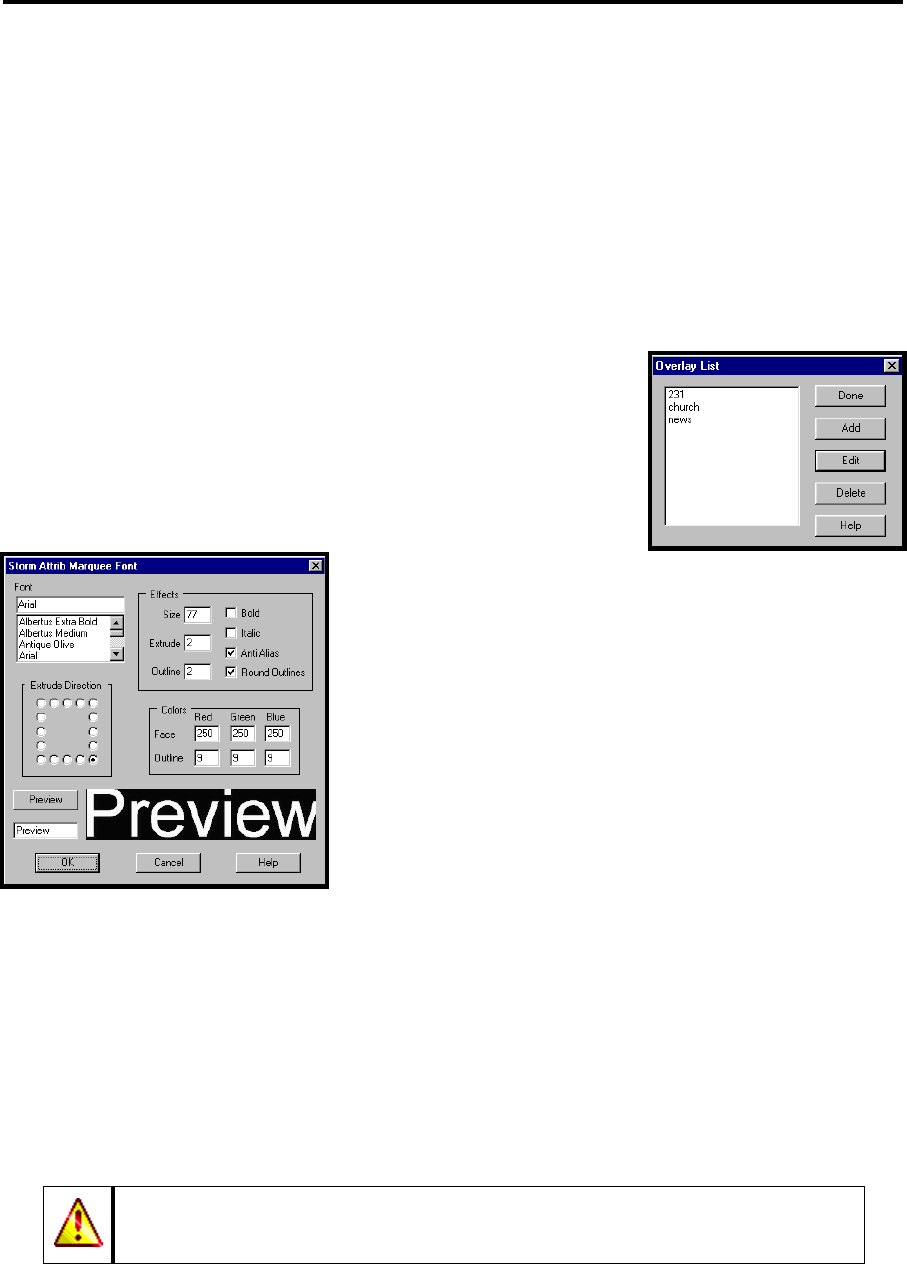
2.9 Customizing Font Displays
The Setup > Fonts command lets you customize the font displays
for Places, Storm ETA displays, Storm Marquees, Temporary Text,
Street Names, NexRad products, Pixel Query Point text and Metar
data. All of the menus opened by the Setup > Fonts command
have the same components, which are described in the following
list:
s or
t list will
then be updated.
e Round Outlines
option gives anti-aliasing to the font outlines.
n
lor. You may select any color you wish by varying the amounts of red,
green, and blue.
Extrude Direction specifies the direction of your drop shadow.
o save the
changes you made, or click Cancel to discard your changes and close the menu.
The Font pull-down list
lets you choose any font installed in Windows. The
listed fonts are true type fonts that are available in the
\Windows\Fonts directory. You can add new font
delete existing fonts in this directory. The Fon
The Effects area lets you define, in pixels, the size of
the letters, the extrusion or degree of shadowing, and
the width of the outline. The Bold option doubles the
width of the font. The Italic option angles the font
forward. The Anti-Alias option eliminates the blocky
appearance of computer fonts. Th
The Colors area lets you define color values for both the font and the shadow. We suggest
that black outlines have an RGB value of at least 12 - 12 - 12. True black, 0 - 0 - 0, is ofte
the default key co
Preview displays the changes you have made and have not yet saved. Click OK t
When you change fonts, they change only for that time forward. The new fonts
not affect saved views. When changing fonts for Storm Track ETA boxes, you
do
must select Update at the bottom of the storm track panel to enact your changes.
24
FasTrac Millennium User’s Guide – May 2003 Setting Up Your System
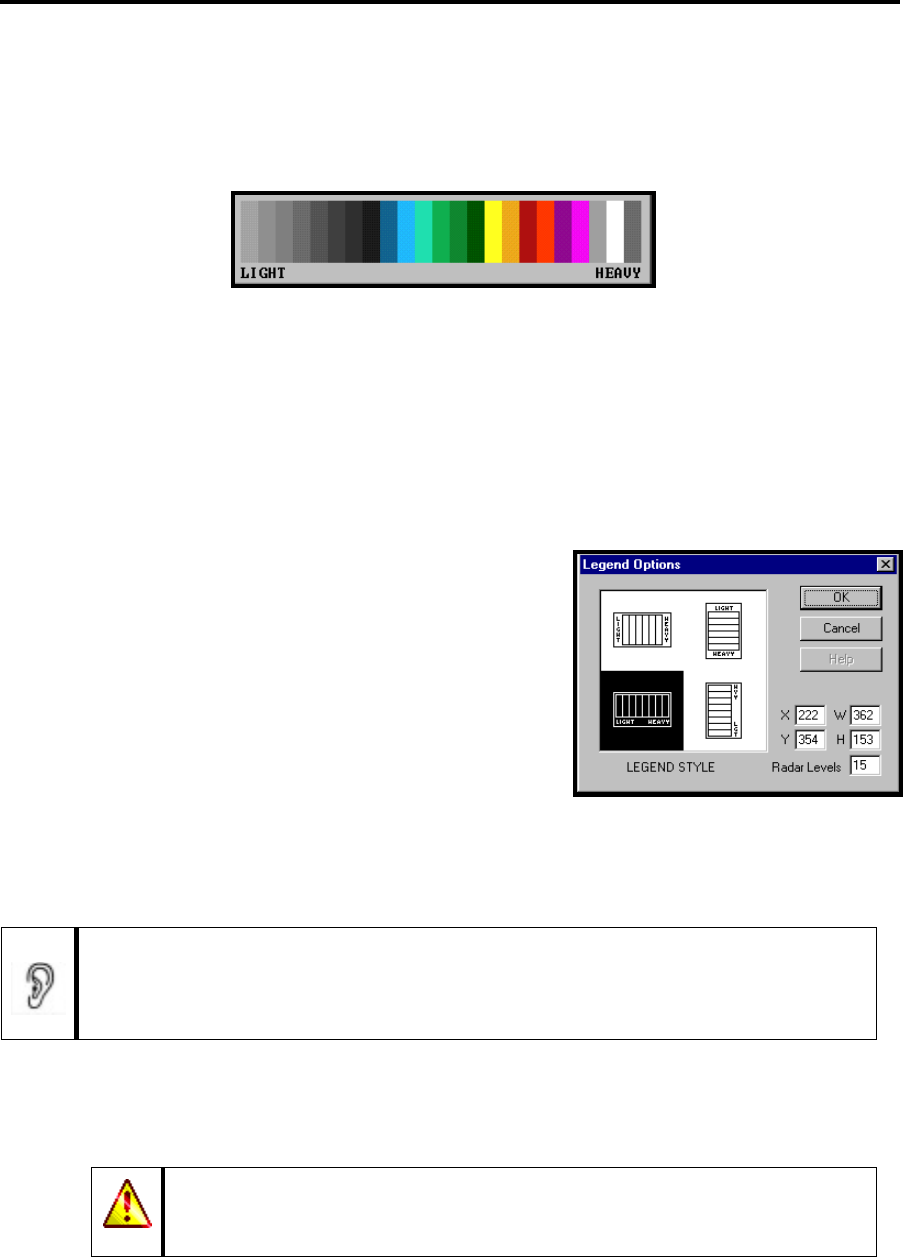
2.10 Manipulating the Automatic Legend
Use the options under the Legend menu to control the automatic legend, shown below.
DISPLAY lets you toggle the automatic legend on and off. When the legend is on, a check
appears next to this option.
RAIN MODES lets you display rain, snow, and mixed weather in the legend.
RESIZABLE BORDER lets you adjust the size of the legend for the best fit on maps. When
selected, a Windows-style resizable frame appears around the legend. Use normal Windows
techniques to resize the legend.
OPTIONS opens the Legend Options menu, which lets
you change the configuration and location of the legend
display. Radar Levels specifies the levels for your
radar products. The legend will not display color bars
for the higher levels that do not apply to your radar. It
can take some trial and error to get the results you want
with this setting, so it will help to test it before using it
in a real-time situation. This option does not affect the
NEXRAD display mode.
The colors on the legend automatically change when you display a different type of radar
product. If you are in velocity mode, the legend says TOWARD on one side and AWAY on the
other; for intensity modes, it says LIGHT on one side and HEAVY on the other.
One interesting thing to note about the automatic legend is that any level with a
color set to transparent in the Baron Chart does not appear in the legend. The other
bars expand to fill the gap. This is possibly a more flexible technique than the
Radar Levels command in the Legend Options menu.
The legend is actually a separate window, and is always on top of everything else in the display.
You can move the legend to any position on the screen while it is active by left-clicking and
dragging it.
You may want to adjust the legend’s size off air, and then turn off the
RESIZABLE BORDER option before going on air. This prevents you
from accidentally resizing the legend while trying to move it.
25
Setting Up Your System FasTrac Millennium User’s Guide – May 2003
2.11 Using Overlays
The Tools-1 > Overlay > Add Overlay and Tools-1 > Overlay > DragDrop Overlay
commands let you bring logos, customized legends, or other kinds of pictures into your system,
and then place them on your map at a specific pixel location. Overlays retain their screen
position, no matter how you switch your views.
2.11.1 Creating new Overlays
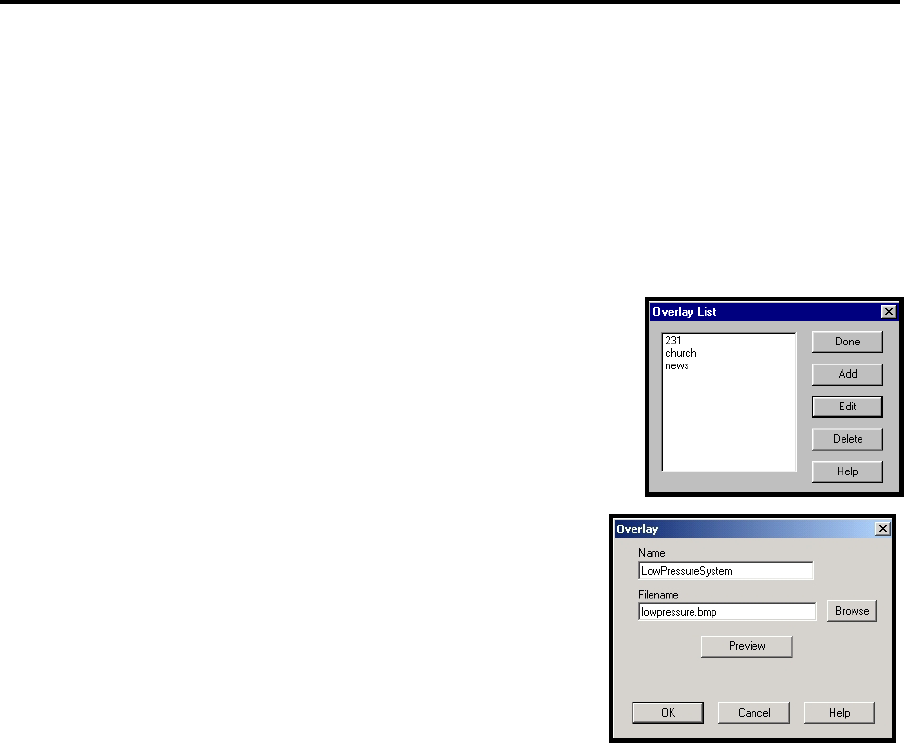
1. The Setup > Overlays/Icons > Overlays command lets you
associate a bitmap in your /fastrac/Overlays subdirectory with
a meaningful mnemonic. Select the command to open the
Overlay List menu.
2. Select the Add option to create a new overlay, or select Edit to
modify an existing overlay. Either way, a menu labeled
Overlay appears.
3. In the text box labeled Name, type the name you want to
appear in the Overlay List.
4. In the Filename textbox, enter the filename of the picture
you wish to use for your overlay (or click the Browse
button to select it from a menu).
5. Click the Preview button to verify that you have selected
the picture you want.
6. Press ENTER or click OK to save the overlay and return to the Overlay List.
To permanently remove an overlay name from the Overlay List, left-click on its name, then click
the Delete button.
When you are finished working with overlays, click Done.
2.11.2 Adding an Overlay to a View
There are two methods for adding an overlay, using the commands Tools-1 > Overlay > Add
Overlay and Tools-1 > Overlay > DragDrop Overlay, respectively. Add Overlay allows you
to apply the overlay to a fixed screen position with a single click. DragDrop Overlay lets you
add the overlay, then move it by clicking and dragging before fixing its position.
26
FasTrac Millennium User’s Guide – May 2003 Setting Up Your System
For the Add Overlay procedure, follow these steps:
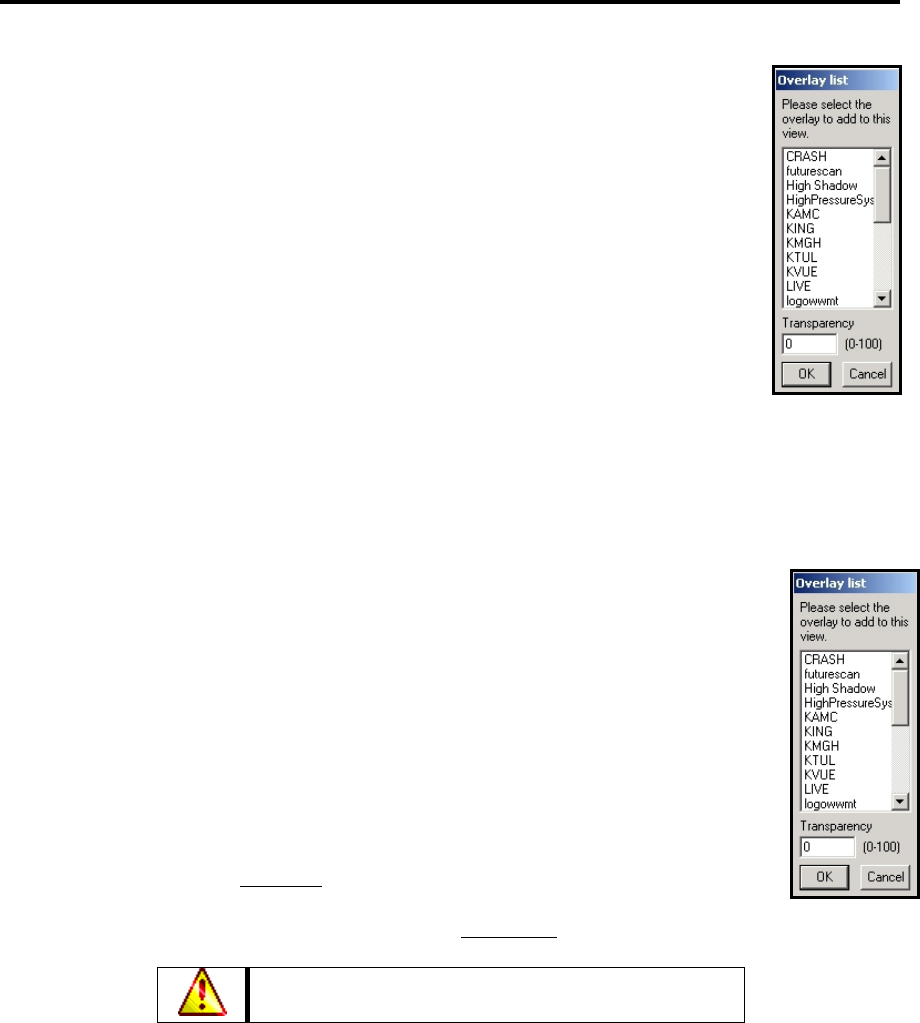
1. Select the Tools-1 > Overlay > Add Overlay command to open the
OVERLAY LIST.
2. Select the overlay you want to place on screen from the list by left-clicking
it.
3.
overlay to move behind other screen elements (0 is least and 100 is most).
4. Press ENTER or click OK to close the menu.
5. he view where you want the upper-left corner of the overlay
to appear.
6. Left-click to add the overlay to the screen.
For the DragDrop Overlay procedure, follow these steps:
1. Overlay > DragDrop Overlay command to open the
OVERLAY LIST.
2. Select the overlay you want to place on screen from the list by left-clicking it.
3.
overlay to move behind other screen elements (0 is least and 100 is most).
4. se the menu. The overlay will appear in the
upper-left corner of the screen.
5. To move the overlay, left-click
In the text box labeled Transparency, select the amount that you want the
Move the cursor to the point on t
Select the Tools-1 >
In the text box labeled Transparency, select the amount that you want the
Press ENTER or click OK to clo
and drag it with the mouse.
6. When the overlay is in the position you want, right-click it to fix it in place.
Use the View > Save As command to permanently
associate an overlay with a view.
27
Setting Up Your System FasTrac Millennium User’s Guide – May 2003
2.11.3 Removing Overlays
When you wish to remove a fixed overlay from the screen, follow these steps:
1. Select the Tools-1 > Overlay > Remove Overlay command to open the
Remove Overlay menu.
2. Left-click on the overlay you wish to remove.
3. Press ENTER or click OK to close the menu. The overlay will then
disappear.
mount
You cannot remove an overlay that you add using the DragDrop
Overlay command until you fix its position by right-clicking it.
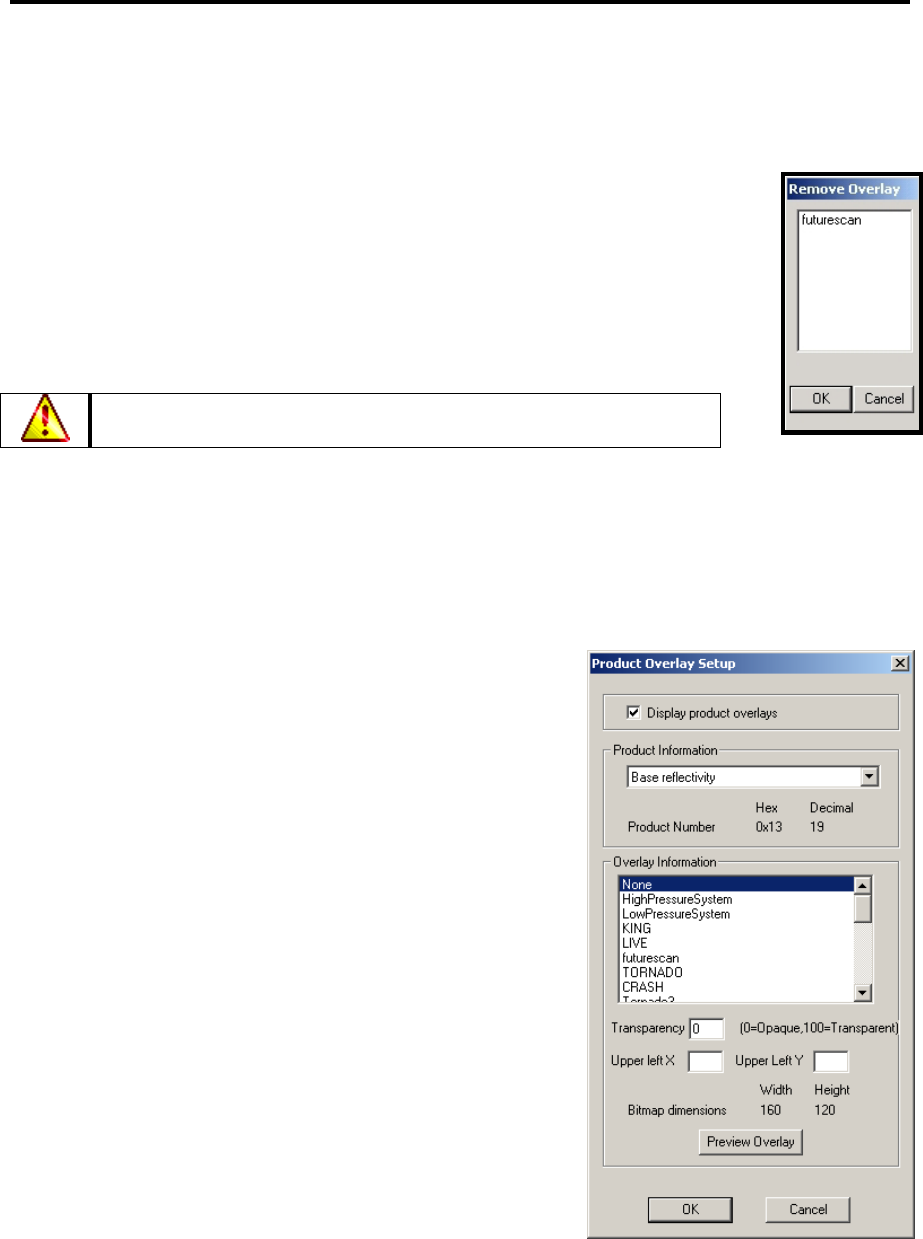
2.11.4 Setting Overlays for Data Products
With the Setup > Overlays/Icons > Product Overlays command, you can assign an overlay to
appear whenever you display a data product. Select this command to open the Setup Product
Overlay menu.
The Display product overlays checkbox toggles the
display of overlays for all products.
The pull-down list labeled Product Information lets
you select the data product that you want to associate
with an overlay. When you select a product, the
Product Number area changes to reflect the new
product.
In the list under Overlay Information, select the
overlay you wish to associate with the data product.
In the text box labeled Transparency, select the a
that you want the overlay to move behind other screen
elements (0 is least and 100 is most).
The Upper Left X textbox determines how far to the
right from the upper left corner (in pixels) that the
overlay will appear, while the Upper Left Y textbox
determines how far below the upper left corner (in
pixels) that the overlay will appear.
The Preview Overlay button allows you to look at the
overlay you selected, to ensure that it is the one you want.
Click OK to save your changes and exit the menu, or Cancel to exit without saving changes.
28
FasTrac Millennium User’s Guide – May 2003 Setting Up Your System
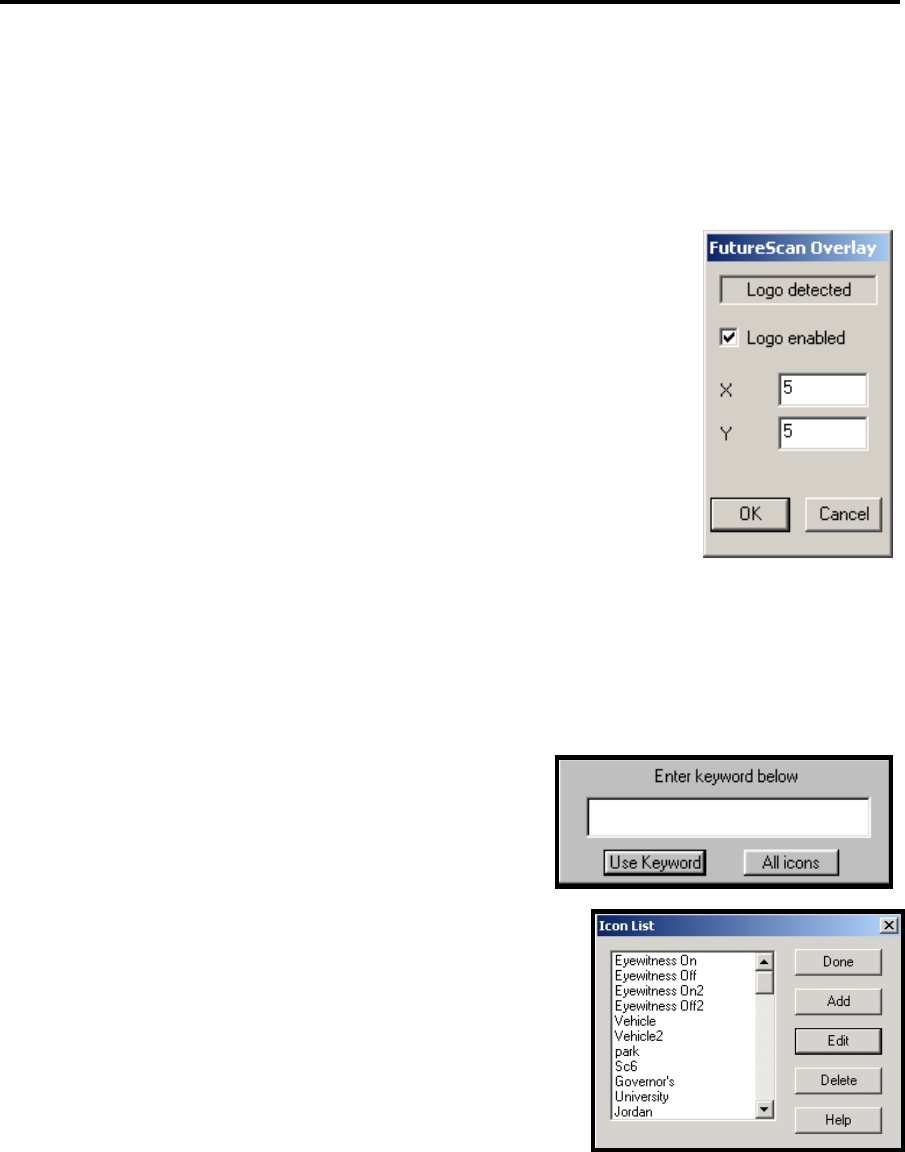
2.11.5 Setting the FutureScan Product Overlay
For clients with the FutureScan module (see section 3.5.11), the FutureScan product is
automatically associated with a bitmap labeled futurescan.bmp. You should therefore check to
ensure that this bitmap is in your fastrac/overlays folder.
You can control the appearance of the FutureScan overlay through the
FutureScan Overlay menu. Select Setup > Overlays/Icons >
FutureScan Overlay to open this menu.
The area at the top of the menu should display the message Logo
Detected if the FutureScan overlay is in the proper place.
The checkbox labeled Logo Enabled allows you to toggle whether
the overlay appears when FutureScan is active.
The X and Y textboxes allow you to control how far to the right and
down, respectively, the overlay will appear from the upper left corner
of the screen (in pixels).
2.12 Setting Up Icons
Icons are similar to overlays, with the exceptions that they are attached to specific geographical
coordinates and are permanently displayed once you create them. This section discusses how to
set up your icons for display.
1. Select Setup > Overlays/Icons > Icons to open a
menu that prompts you for a keyword.
2. If you wish to find a specific icon, type in all or part
of the icon’s name and click the Use Keyword
button. Otherwise, hit ENTER or click the All Icons
button to display the entire Icon List.
3. The Icon List menu is similar to the Overlay List menu.
Click the Add button to create a new icon, or click the
Edit button to change an existing icon.
29
Setting Up Your System FasTrac Millennium User’s Guide – May 2003
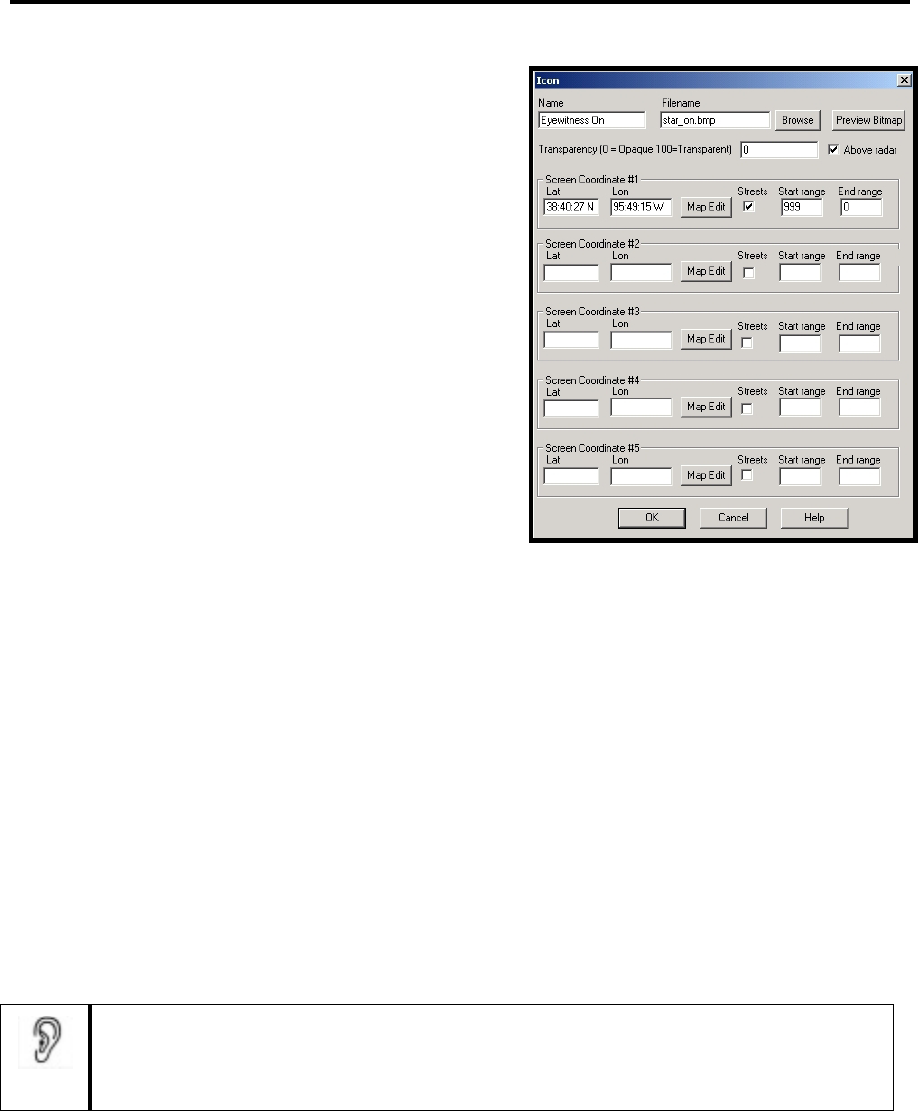
4. Either way, a menu labeled Icon appears. Enter
the name you wish to associate with the icon in
the Name text box.
5. Enter the filename for the picture you wish to use
for the icon, or click the Browse button to select
it from a menu.
6. Click the Preview Bitmap button to verify that
you have selected the picture you wanted for the
icon.
7. In the Transparency text box, enter the degree to
which you want the icon to move behind other
screen elements (0 is lowest, 100 is highest).
8. Check the box labeled Above radar if you wish
the icon to display over radar data.
9. If you know the latitude and longitude of the location where you want to display the icon, key
in the coordinates in the Lat and Lon text boxes. Alternatively, you can click on the desired
map location, and then click Map Edit.
10. In the Start Range text box, type in the maximum range (in miles) at which the icon
displays.
11. In the End Range text box, type in the minimum range (in miles) at which the icon displays.
Upon completion, select OK to return to the Icon List. You will need to change or refresh the
view before the icons display.
To permanently remove an icon name from the Icon List, left-click on its name, then click the
Delete button.
When you are finished working with icons, click Done in the Icon List menu.
If you set an icon to appear at both long and short ranges, you may run into
problems due to the latitude and longitude data not always matching up at different
ranges. If this happens, try adding additional screen coordinates for the icon to
appear for multiple subsets of the desired total range.
30

FasTrac Millennium User’s Guide – May 2003 Setting Up Your System
2.13 Points to Remember
Before you make any major changes, back up your \fastrac directory and
subdirectories.
One of the most important commands is the Setup > Map > Map Layers
command, which controls the roads and bodies of water that appear on your map
display.
For systems without .psf mapping data, the Display Levels, Water Fill, and
Anti-Fill commands control the appearance of roads and water.
Use the Setup > Map > Places Database command to specify which locations
(places) display on your map.
Use the Setup > Colors command to adjust the colors on your views.
Use the Legend commands to control the automatic legend.
Use the Setup > Fonts command to customize the display of various font types.
You can insert bitmap images into your system as overlays and icons, then
display them on views.
31
3. Adjusting Views
This chapter describes how to control the display of your weather map displays, or views. Views
control how your weather data is presented.
This chapter addresses such functions as:
Using the View Main Panel
Setting Map Parameters
Editing Topographical Data
Saving and Organizing Views
Using the View Options
33
Adjusting Views FasTrac Millennium User’s Guide – May 2003
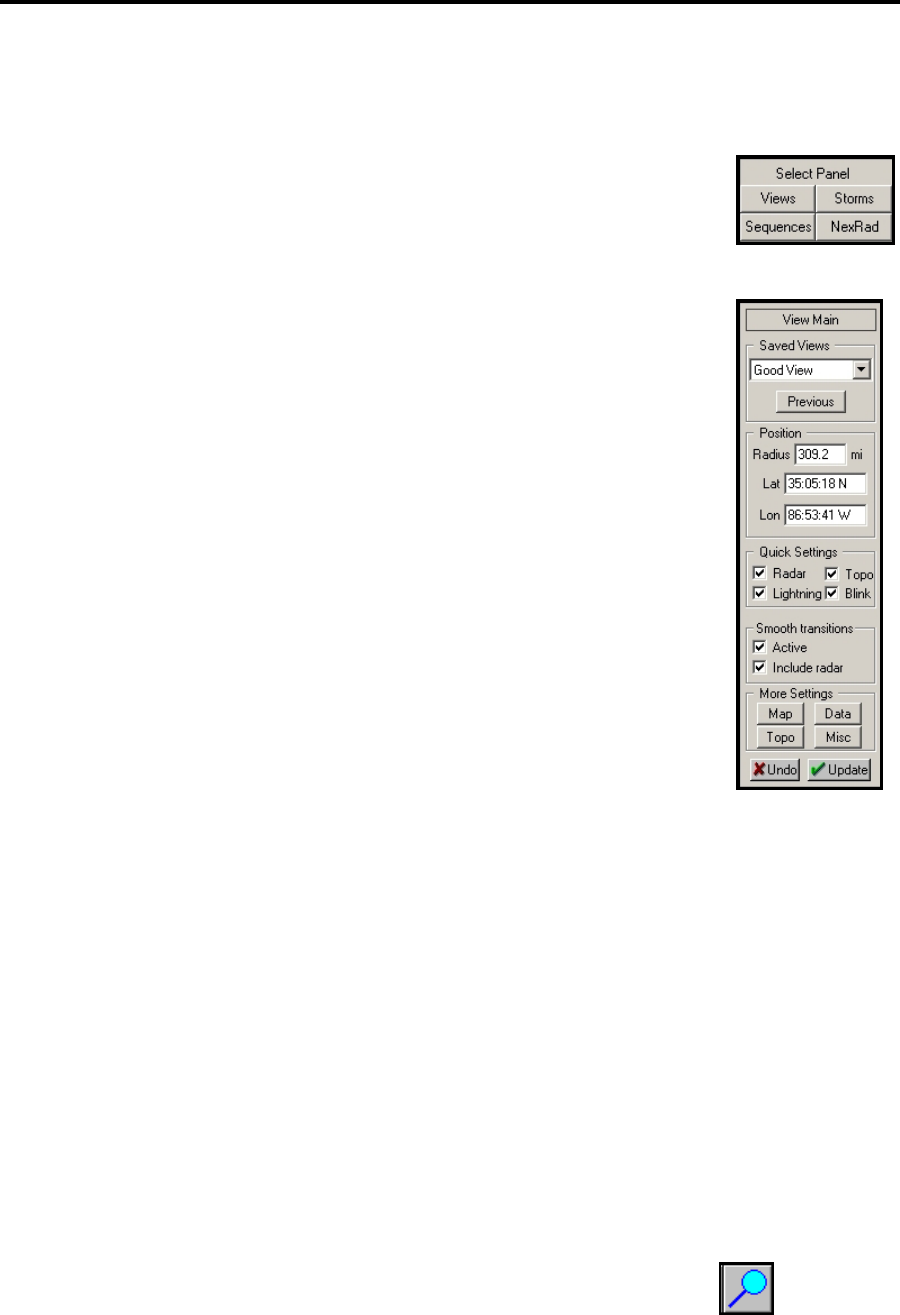
3.1 Using the View Main Panel
The View Main window is the first panel available upon opening the
program. (The name of the current view window is always at the top of the
window.) Buttons for the four other windows appear in the More Settings
area at the bottom of the panel. If you are currently viewing another panel,
the Views button is always availabl
e in the Select Panel area.
The following paragraphs describe all the controls available on the View
Main panel:
Saved Views identifies all views that you have saved. Click on the down
arrow to display available views and click on a name to open that view.
Note that there are two temporary views, Temporary 1 and Temporary 2,
which are the last two updates you have made.
Previous recalls the view that was active before you switched to the
current one. This option lets you toggle back and forth between two
views. You can use this option to recover from mistakes.
Radius is the vertical distance, in miles, between the center of the screen
and the top of the screen.
Lat-Lon are the center coordinates for the map display.
Quick Settings allows you to toggle the display of Radar, Lightning,
and Topography data, as well as whether the lightning data icons Blink.
Smooth Transitions lets you perform dynamically smooth pans and zooms when you zero in
on areas of interest. Checking Active activates the feature, while checking Include radar
causes radar data to smoothly transition as well.
More Settings lets you activate the other panels.
Update renews the map display after you have changed display parameters.
Undo returns the view parameters to those existing when Update was last selected.
You will use the View Main commands often to adjust your display. For example, if you want to
change the size of your viewing area, key in the new range in the Radius text box and click
Update. The Previous command is particularly helpful in moving rapidly from one storm to the
next while maintaining your bearings, as shown in the following scenario:
1. Show the base view that has all the storms of interest.
2. Give your users an overview of the current weather situation.
3. Select the Zoom hot button to display your area of concern.
34
FasTrac Millennium User’s Guide – May 2003 Adjusting Views
4. Click the Previous button on the Main View panel to return to your base view, and then
zoom in to the next area of interest. Once you are comfortable with using this sequence to
present storm views, you will want to use it often.
Many broadcast clients use the Previous button as a quick map switch, as shown in the following
example. Assume that you are doing a short cut-in before going on the air.
1. Zoom into the area of concern, then click the Previous button to return to the overview so
that you are ready for your cut-in.
2. When your cut-in starts, show the overview, and then say something similar to, “Let’s zoom
into the area of concern.”
3. Select Previous to have the system instantly zoom into that location. You can now discuss
the situation and even place a storm track.
3.2 Setting Map Parameters
The View Map Features panel controls the map display. To activate it, click
on the Map button in the More Settings area at the bottom of the panel. After
you save all parameters for a view, any other manipulation of that view keeps
those same parameters.
Topographical and texture mapping is also saved as a parameter.
This lets you have specialty backgrounds for instantly displaying
news graphics. Your most often used parameters should be on your
default view. (You can activate Views 1 through 4 by using the hot
buttons at the top of the screen.) The system will use those
parameters when the view is activated.
The following paragraphs describe each option on the panel.
Boundaries lets you turn both state and county lines on or off individually.
Roads lets you display roads at the specified level. Show controls whether
any roads appear. Lock sets the display of roads at the specified level. (The
higher the level, the more roads will be posted.)
Waters/Rivers functions are similar to the Roads functions. Show lets you turn on and turn
off displays of rivers and other bodies of water. Lock sets the display of bodies of water and
rivers at the specified level. If rivers are turned off when you update the view, subsequent
zoom or pan operations result in a view with no river features. Fill automatically fills in
empty water features. When selected, Fill bolds the river water lines. Thus, if a river is
narrow enough, it will be filled.
Bold Map Lines doubles the size of all map lines. While it usually is inappropriate at large
distances, this option can be quite useful at close ranges.
35
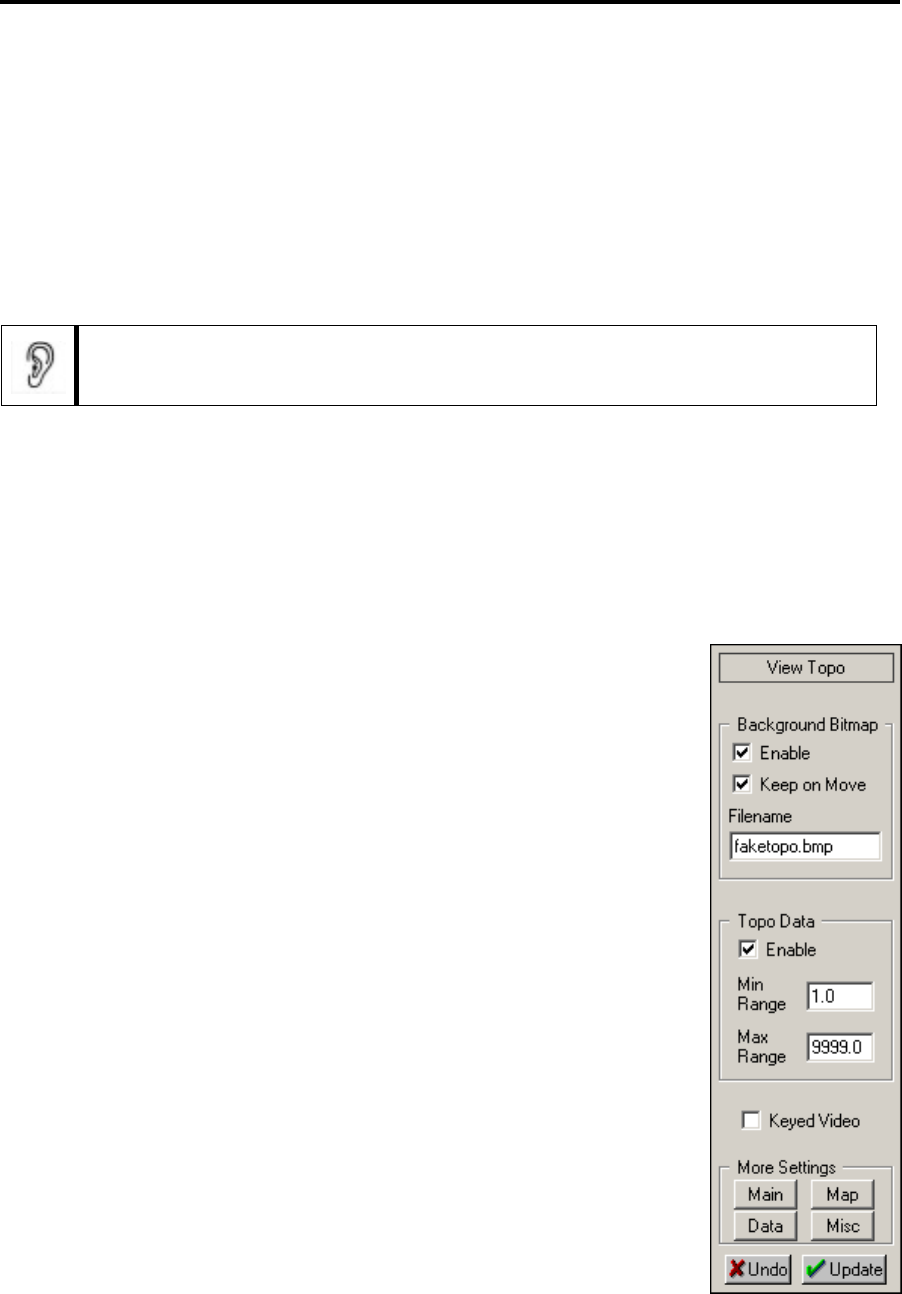
Adjusting Views FasTrac Millennium User’s Guide – May 2003
Places controls the display of city names. Show turns on and turns off the display of
community names. Normally, the system uses the default settings you established with the
Setup > Map > Places Database command (see section 2.4, Editing the Places Database).
To override the default settings, key in a new level in the Level text box, and click Update.
Click Lock to set the specified priority level for future pans and zooms.
More is reserved for future enhancements.
Undo returns all parameters to their previous settings following the last Update command.
While you can select Update after changing each map feature, we designed the
system so that you can change as many mapping parameters as you like and then
click Update one time to effect all of your desired changes.
3.3 Editing Topographical Data
Click on the Topo button under the More Settings panel area to activate the View Topo panel.
While all Millennium systems have actual topographical capability out to a specific distance, you
can supplement displays by using texture maps. If the topographical data is inappropriate for any
reason, the system reverts to a backup, generalized texture bitmap that approximates
topographical features.
Background Bitmap lets you display a single background that is loaded
from a graphic file. Although the display of roads and rivers changes when
zooming or panning the map, the bitmap will not change in perspective.
The background bitmap may also be a customized 640 x 480 pixel-sized
file developed specifically for your weather presentation.
Enable displays the background graphic supplied by the specified file.
If you do not select Enable, the background is a solid gray.
Keep on Move lets you keep the bitmap displayed as you zoom or pan
around the map. Select this option unless you want a gray background.
Filename specifies the bitmap. You can use any bitmap as a
background. It must be 24-bit (full color) file. The mandatory bitmap
size is 640 x 480. The bitmap displays only when the topography is o
of range.
ut
e
Topo Data allows you to toggle your real topographical data on and off
with the Enable checkbox. In addition, you can set the range in miles at
which the topographical data will appear with the Min Range and Max
Range textboxes. When zooming in to a very close range, the real
topographical data can cease to appear properly, at which point it would b
a good idea to switch over to the background texture map. You should
experiment at different ranges to find the appropriate range at which to set
this threshold.
36
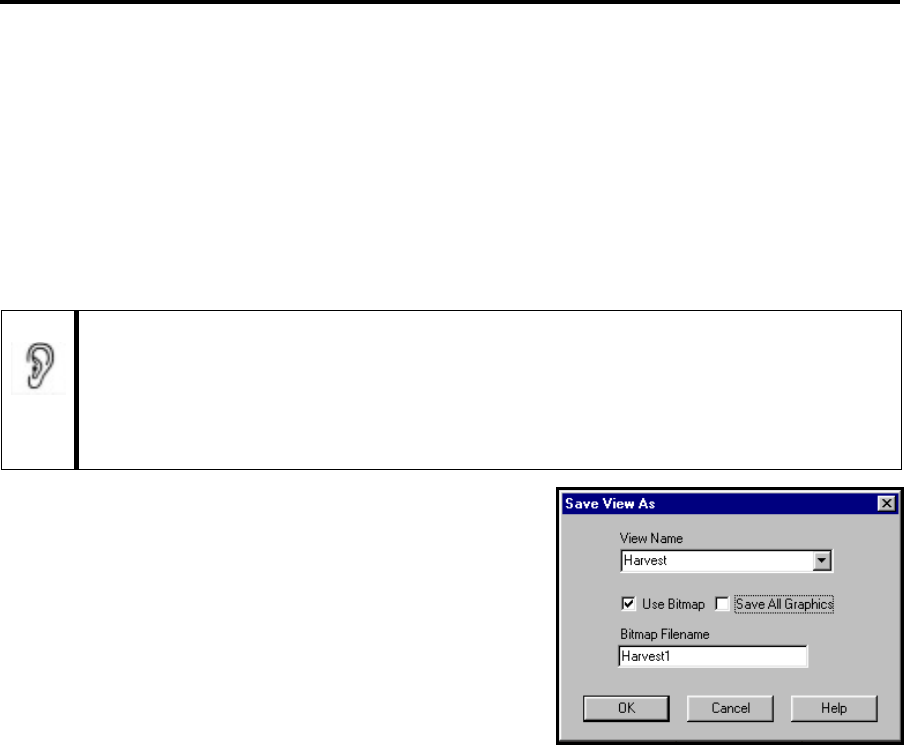
FasTrac Millennium User’s Guide – May 2003 Adjusting Views
3.4 Saving and Organizing Views
This section describes how to save and organize your views.
3.4.1 Saving Views
Once you have all the parameters defined for a given view, you will want to save it. When saving
a view, you have the option of just saving the view or of saving the view as a bitmap file.
For most purposes, the liquid databases are such powerful tools that there is little
need to save a large number of views. The first four views you create correspond to the
four numbered hot buttons. Traditionally, the first view is your overview map; the
other four views are those that you use the most. Therefore, you should try to only save
views that you know you will use many times. You may also save views specifically for
SEQUENCER use.
1. Select the View > Save As command to open the
Save View As menu, which has a pull-down list
labeled View Name.
2. Select a view from the pull-down list, or key in a new
name. If you use an existing view name, the old view
will be overwritten. Use descriptive names that will
help you identify them later.
3. Click the Use Bitmap button to save the view to the
bitmap file specified in the Bitmap Filename text box, as described below. The bitmap name
should be eight or less letters, followed by the .bmp extension. If you do not add an
extension, the system automatically adds the .bmp extension.
If you save the view as a bitmap, you save everything except the background and logos as a .bmp
file. Your system stores views as full color images; therefore, the number of actual colors used is
quite small. One advantage is that recall may be somewhat faster for bitmap views saved with
this approach, depending upon your hardware configuration. In addition, you can export a view’s
bitmap to a paint program. You can then add features, and return the finished product to the
system. The only restrictions pertain to the set of colors used by map features.
If you choose not to save the view without using a bitmap, you store the data with the saved
view, but not as part of it. In other words, the system knows which background to put with a
foreground but does not save both as a single view. It can also save all the mapping parameters,
such as rivers and roads, as a data file. The result is that when you call up a view, the system first
opens the background map and then draws all the rivers, roads, communities, radar, and lightning
(if available), as required. It then displays the finished map. There are three advantages to this
approach. First, it uses less room on the hard drive because it stores fewer bitmaps. Second, if
you choose to change fonts or backgrounds at some point, it will use the latest choice in putting
your view together. Finally, the system does not have to create a foreground bitmap.
37
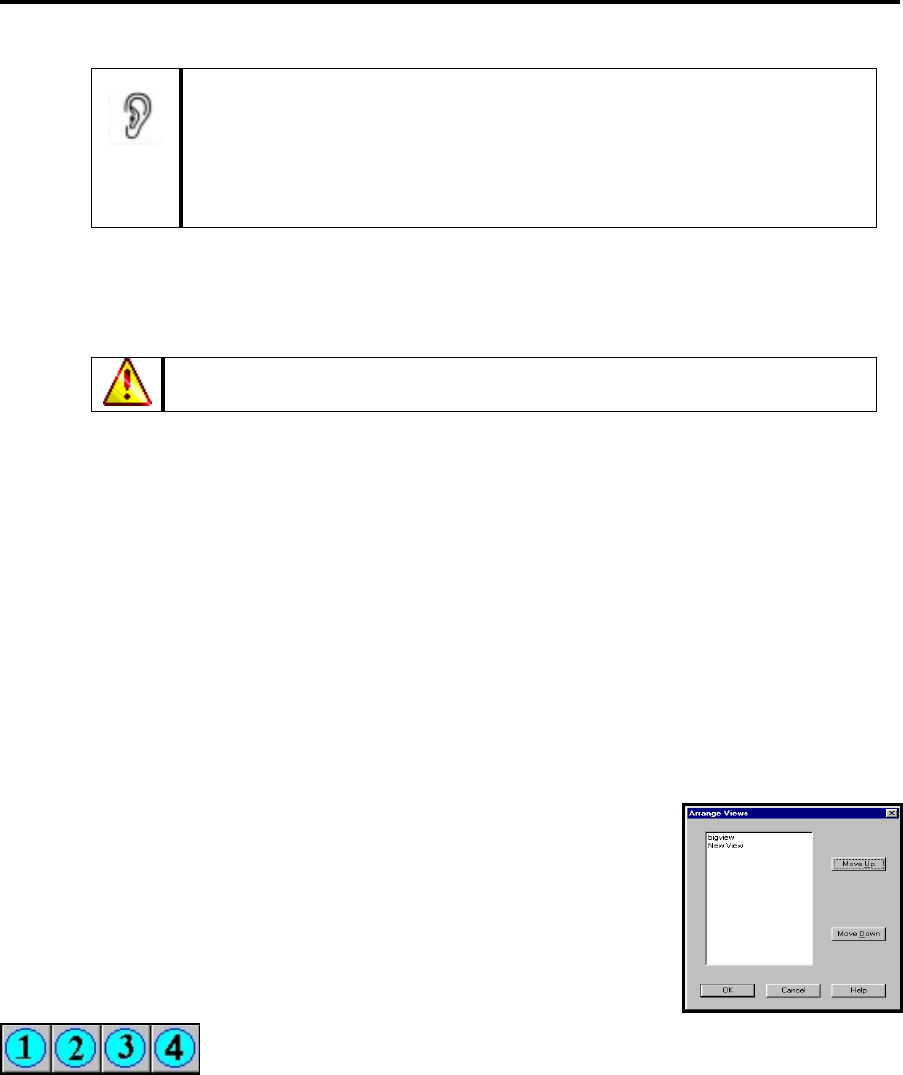
Adjusting Views FasTrac Millennium User’s Guide – May 2003
Whenever you are saving views, it is very important to use a consistent
naming convention. We recommend the name (or abbreviation) of the
community closest to the center of the view and the range of the view.
For example, you could save a 150-mile view that is centered over
Huntsville, Alabama as HSV 150. This naming convention makes it easy
to identify what the saved views represent.
Save All Graphics saves the current view with the current data, such as radar sweep,
lightning, and storm tracks. (This is particularly useful in creating a static view of a severe-
weather event. Later, you could use the saved image for such events as promotions.)
New radar data will not paint over a view saved with all graphics, and the
system warns you if you select a saved view that includes graphics.
3.4.2 Organizing Your Views
Several commands are available for you to arrange your views: Arrange View, Delete View, and
Export View.
If you are creating numerous views to cover every region, county, and city in your area, it is
important to use a structure that facilitates the easy access to them. One method is to start with a
view of the region. Under that region, you should place every associated county and, under each
county, place every associated city. This lets you easily find important locations quickly. Some
clients have arranged all of their views first alphabetically and then by range. Following this
method, every view of the city appearing first alphabetically from 200 miles to 3 miles would be
grouped together, from the farthest to the closest, followed by all other cities in alphabetical
order.
View > Arrange lets you move views to the desired location in
your Recall List. When selected, the Arrange Views menu opens,
listing the saved views. To move views, scroll through the saved
views until you find the view you wish. Click on the view, and
press the Move Up or Move Down buttons until the view is where
you want it. When you finish arranging, select OK. To cancel your
changes, select Cancel.
The first four views in the Recall List correspond to the hot buttons
labeled 1 though 4 across the top of the screen.
View > Delete lets you remove the current view. When you select the command, a small
warning appears in the left corner of the control screen, telling you which view you will
delete. To delete, click OK.
38
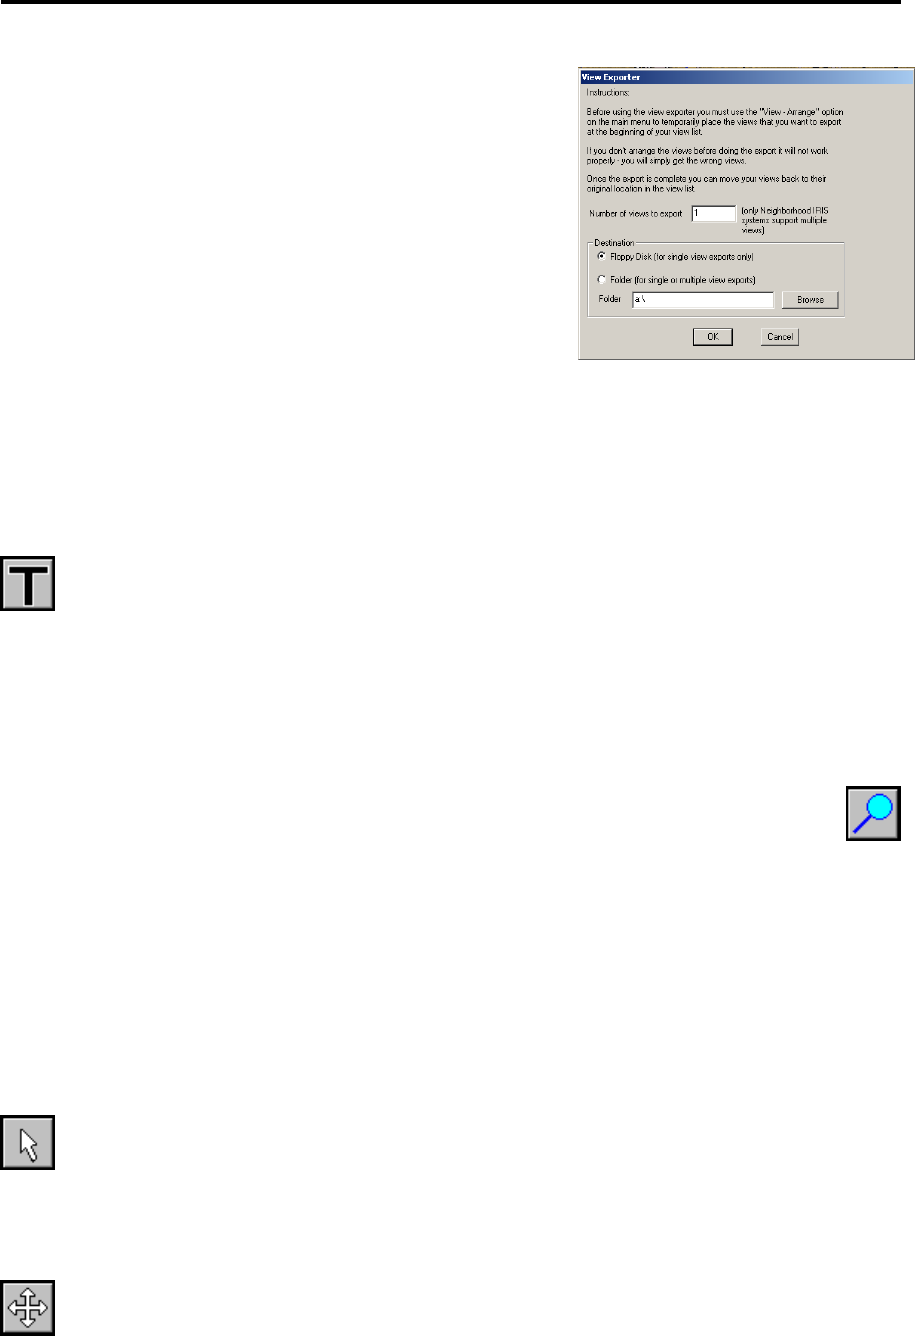
FasTrac Millennium User’s Guide – May 2003 Adjusting Views
View > Export saves the current view to a floppy disk
or your hard drive. You may then transfer the view to
your IRIS computer and post the view on the Internet.
When you select this option, the menu to the right
appears, which contains instructions on preparing views
for exporting. Follow these instructions, then select the
number of views you wish to export and the destination
folder for the view files (either a floppy disk or a
specified folder on your hard drive). When these
parameters are set, click OK to export the views.
3.5 Using the View Options
This section covers other features used in connection with views. All of these involve
manipulating the current view.
3.5.1 Adding Text to a View
The Temporary Text hot button lets you quickly add additional text of user-specified
size and color to a view. Some example messages are "Tornado Warning until 6:00 p.m.,"
or "Ferry Capsized Here." Click the Temporary Text hot button, key in the text on the
menu that appears, and then click on the map where you want the text to appear (it will be
centered around the cursor). Left-clicking on the Temporary Text button adds text and right-
clicking on it removes text. See section 2.8, Customizing Font Displays, to adjust the font.
3.5.2 Zooming In and Out From a View
1. Click on the Zoom hot button, and then move the Zoom tool (the magnifying glass)
over the area of interest. If you have any Telestrator graphics, they disappear.
2. Click and hold on the center point of the desired new view. As you move the Zoom tool, a
red rectangular box that delineates the boundaries of your zoom appears. The zoom range in
miles appears in the Cursor Status Area.
3. Release the mouse button at the desired range. The system automatically redraws the view to
your specifications.
Right-click on the Zoom hot button to zoom out to double the current range.
3.5.3 Pointing to Features on a View
Use the Map Pointer hot button when you do not wish to make any changes to the map
but want to point out a feature. You can activate Pixel Query Mode, which is described in
section 3.5.15, by right clicking on this hot button.
3.5.4 Panning on a View
The Map Pan hot button lets you maintain the same radius while moving your map to the
right, left, up, or down. Select the Map Pan button, move your cursor around the map,
39
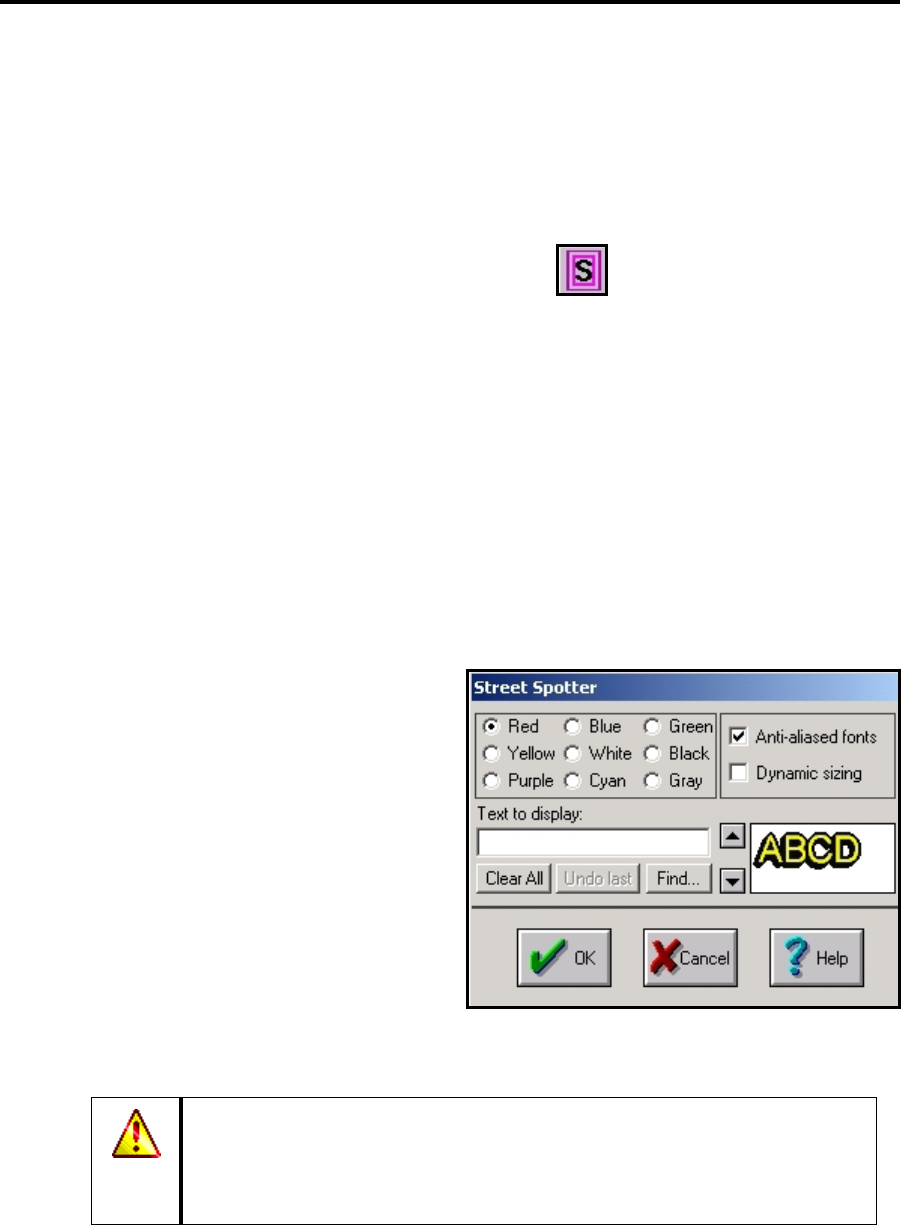
Adjusting Views FasTrac Millennium User’s Guide – May 2003
and click on the new center.
3.5.5 Labeling Streets with Street Spotter
The Street Spotter feature allows you to locate and label important streets and landmarks.
Basic Operation
1. To activate Street Spotter, click on the Street Spotter hot button. The cursor
icon will then change to a small arrow above a two-lane street. You will use this cursor to
perform Street Spotter operations.
2. Right-click on the desired street and its name should appear in the Cursor Status Area.
3. Label the street by left-clicking on it, dragging the line in the direction that you want your
text to appear, and releasing the mouse button where you want the line to end.
4. Repeat steps 2 and 3 for every street you want to label.
5. Erase all the Street Spotter labels by right clicking on the Street Spotter hot button.
Editing Street Spotter Text Displays
Select Setup > Street Spotter to open the
Street Spotter menu, which lets you adju
appearance of Street Spotter text.
st the
The options in the upper-left area control
text color. These buttons have no effect if
you select the Anti-Alias option; in that
case, you must the select the color using the
Setup > Fonts > Street Spotter command.
Anti-aliased fonts eliminate the blocky
appearance of computer fonts.
Dynamic sizing changes the size of Street
Spotter text proportionally to the view’s range when you zoom. This option works for both
anti-aliased and non-anti-aliased fonts.
If you do not select Dynamic Sizing, you must select the font size to use.
For anti-aliased text, you must use the Setup > Fonts > Street Spotter
command to change the font size. For non-anti-aliased text, you can change
the text size by clicking the up and down arrows just below the Dynamic
Sizing checkbox, and view the result in the adjacent sample text viewer.
Text to display lets you enter a message to display instead of a street name. If you select a
street, its name will appear in this textbox when you open the Street Spotter menu.
40
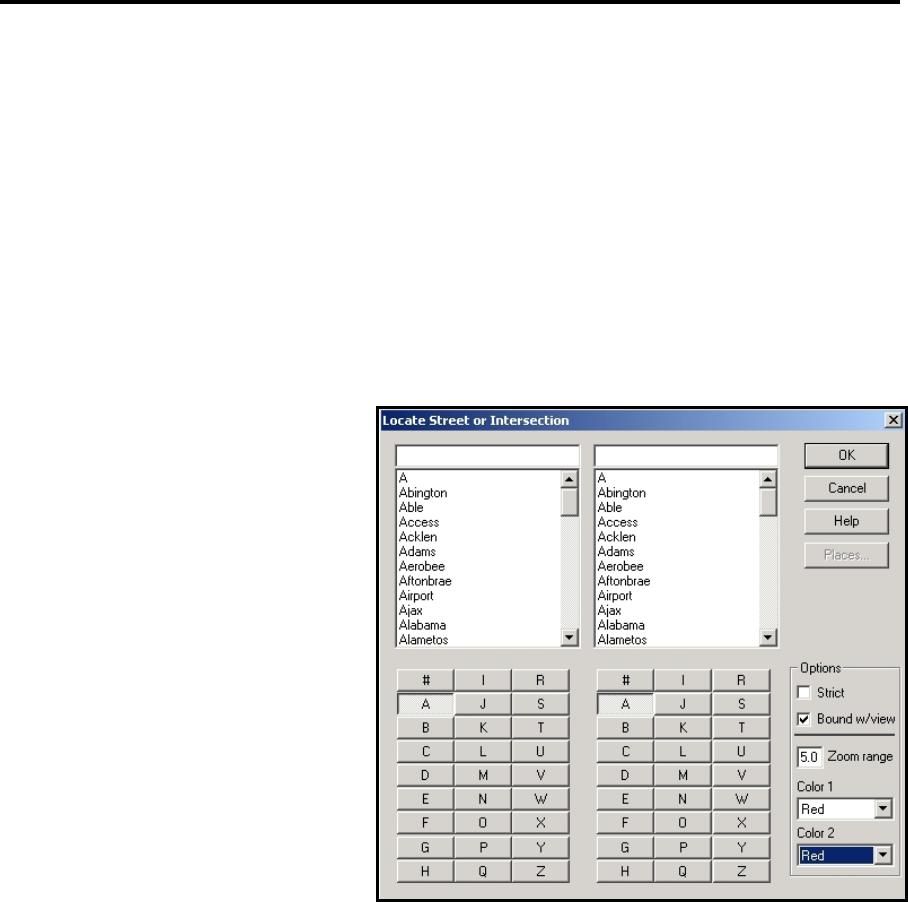
FasTrac Millennium User’s Guide – May 2003 Adjusting Views
Undo last removes the most recently placed Street Spotter text. You can use this option as
many times as there are blocks of text, even if you change the view after placing text.
Clear all removes all Street Spotter text from the view.
Find opens the Locate Street or Intersection menu, as explained in the next section.
OK saves changes and closes the menu.
Cancel closes the menu without saving changes.
Locating Streets or Intersections
The Locate Street or Intersection
menu helps you find a street or
intersection that appears in your
database.
1. Set up your view to include the
streets or intersections that you
wish to find.
2. Select Setup > Street Spotter to
open the Street Spotter menu.
3. Click Find to open the Locate
Street or Intersection menu.
4. Select Strict and/or Bound
w/view to facilitate finding the
desired street(s). Bound w/view
causes only the streets appearing
in the current view to appear in
the list. Strict causes the extensions of streets (St., Rd., etc.) to appear, making it easier
determine the right street if there are multiple streets with similar names.
to
5. Enter the zoom range in the Zoom range text box.
6. Set Color 1 and Color 2 to the desired color for your streets. Color 1 is used for the street
selected from the left box, and Color 2 is used for the street selected from the right box.
7. From the list of letters below each box, click the first letter of the name of both streets (or the
same letter for both boxes if you are looking for a single street) to list all the streets that begin
with that letter.
8. If you are looking for an intersection, select one of the intersecting streets from the left list
box and the other street from the right list box. If you are looking for a single street, select it
in both boxes.
41
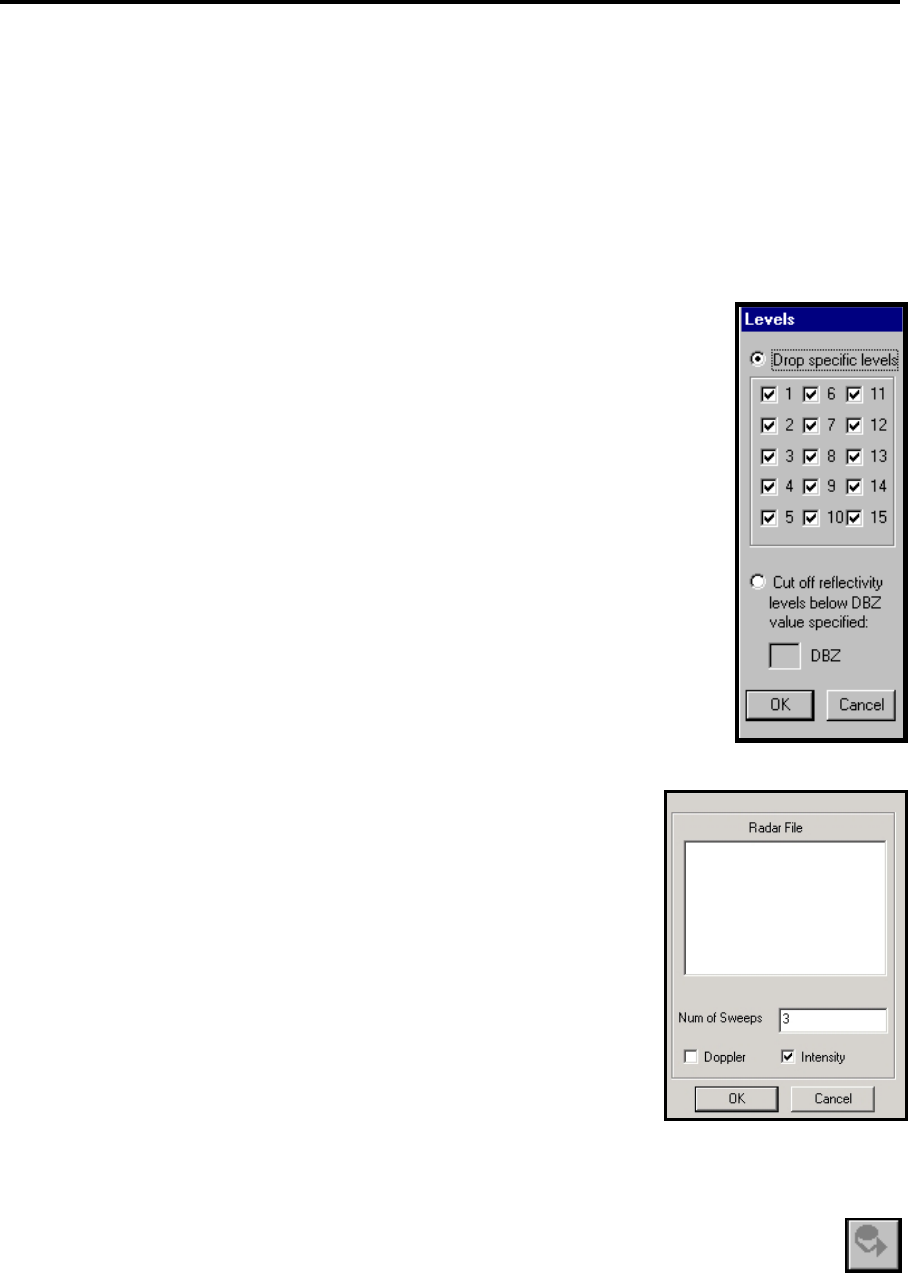
Adjusting Views FasTrac Millennium User’s Guide – May 2003
9. Click OK when you have made your selections. After a few seconds, a new view at the
specified zoom range will appear, centered either on the intersection or on some point on the
street. The streets will be shown in the colors that you selected for them.
3.5.6 Controlling Display of Radar Data
There are several commands located in the Radar Main Menu that allow you to control the
appearance of live radar data on a view, as well as replay recorded data from past weather
patterns.
The Radar > Radar Levels command opens the Levels menu, which lets
you toggle the real-time radar display levels on and off. For instance, should
you decide not to show radar data for the lowest level of intensity, open the
Levels menu and click the square labeled "1" to remove the selection.
• Drop specific levels deletes the selected radar levels from your real-time
radar.
• Cut off reflectivity levels below DBZ value specified displays only
levels that are above the specified dBZ value. This option is useful for
dropping data from both real-time and NEXRAD radars. It also
automatically removes the dropped colors from the on-screen legend.
The Radar > NEXRAD Levels command works similarly to the Radar >
Radar Levels command except that the command controls the display levels
of your NEXRAD products and is product-specific.
The Radar > Log to File command records real-time radar data to a
log file in the C:\fastrac\Logs\Radar directory. The file then can be
used to display for use in time-lapse sequences. The radar log files
are purged every 24 hours. By default, this command is selected.
The Radar > Play File and Radar > NEXRAD File commands
allow you to display stored real-time radar and NEXRAD radar data,
respectively. These commands are mostly used for troubleshooting.
For real-time data, the system will also ask you to specify the number
of radar sweeps to display, as well as whether to show wind velocity
and intensity data, if applicable.
3.5.7 Utilizing TeleTrac
The TeleTrac feature lets you draw freehand lines on your view with a graphics tablet and pen.
These lines are used mostly to emphasize data currently on the screen.
To begin drawing TeleTrac lines, left click the TeleTrac hot button. The cursor will
change to a marker-like icon and the Cursor Status Menu will indicate with which color
you are drawing. To draw a line, left click on the view where you wish to start the line,
42
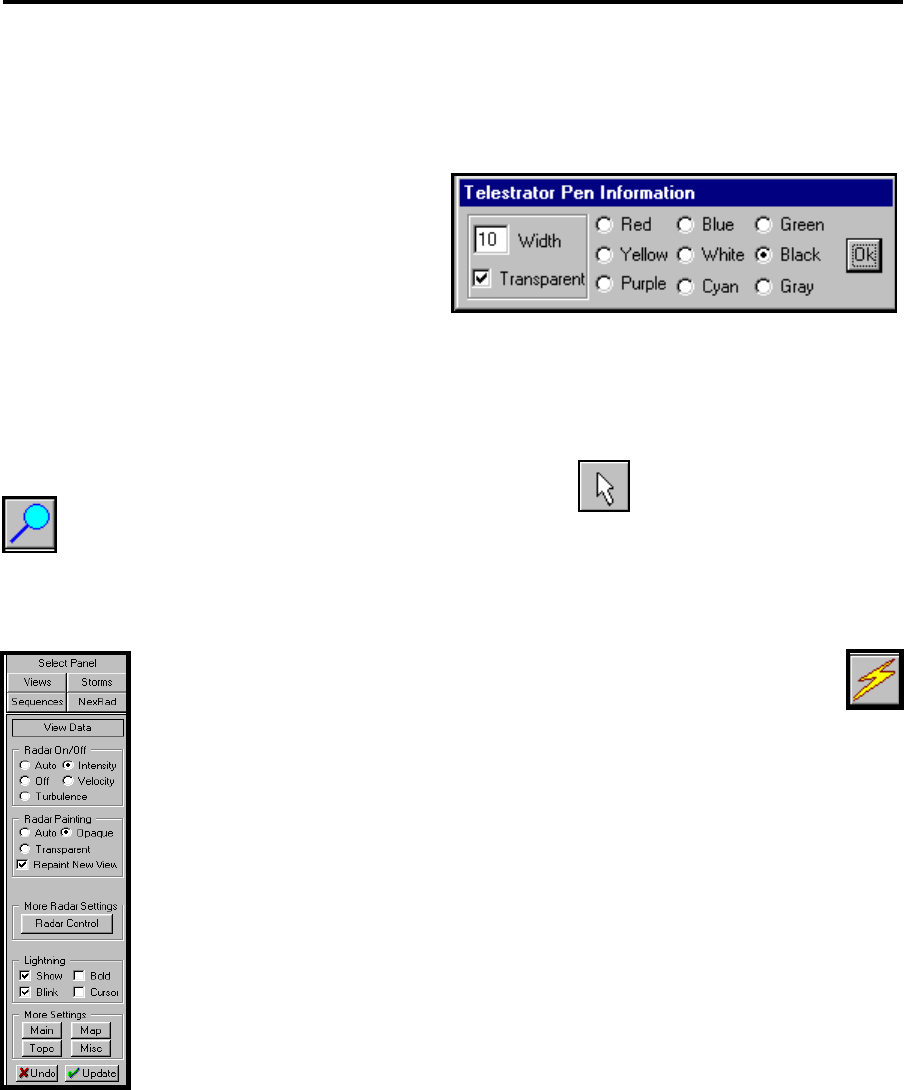
FasTrac Millennium User’s Guide – May 2003 Adjusting Views
hold down the button on the pen, and drag the cursor to where you want the line to end. To
change line colors quickly, click the right mouse button. The colors appear in the order: red, blue,
green, yellow, white, black, purple, cyan, and
gray.
hich
ge
s to
ge
colors, click on another color.
ove Telestrator lines from the screen, click either the Map Pointer or
Zoom hot button.
3.5.8 Displaying Lightning Strikes on a View
y deselecting the Lightning and Blink options under the Quick
Settings area.
nts into
a Sequence (see Chapter 5, Using SEQUENCER, for more information).
Editing Lightning Displays
In the View Data panel, you can select from several options.
Show turns on the lightning display.
Blink causes lightning strikes to flash.
Bold doubles the thickness of the displayed strikes.
r as a larger icon, which
continually jumps to the newest lightning strike.
Specifying Lightning Colors
ightning Positive
(Hot, Warm and Cold), and Lightning Negative (Hot, Warm, and Cold).
You can change additional settings with the
Telestrator Pen Information menu, w
you can open by right clicking on the
TeleTrac hot button. You can change the
Width of the Telestrator lines to any value
from 0 to 99. If you select the Transparent option, the Telestrator lines you draw will chan
appearance so that you can see the map graphics under the line. The last option in this menu i
select the line color. The currently selected color has a dot in the center of its circle. To chan
To rem
Select the Lightning hot button to display a lapse of the lightning strikes
that have occurred over the past hour. Right-click on the button to
deactivate lightning. You may also turn off lightning through the View
Main panel, b
Both Lightning displays and Lightning time-lapses can be inserted as eve
Cursor causes the latest lightning bolt to appea
There are six colors in the Setup > Colors menu associated with Lightning: L
43
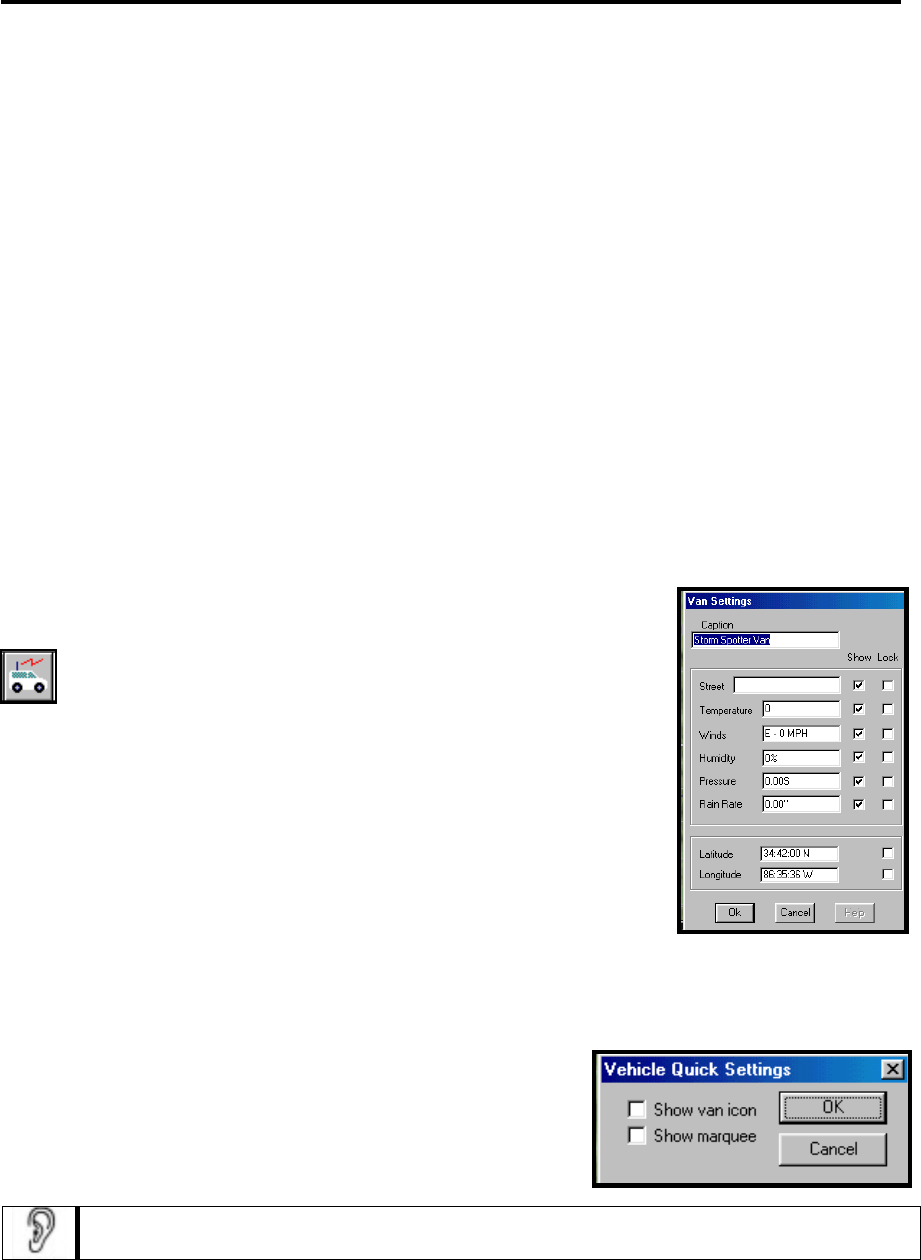
Adjusting Views FasTrac Millennium User’s Guide – May 2003
Positive refers to the cloud-to-ground movement of lightning.
Negative refers to the ground-to-cloud movement of lightning.
Hot refers to a strike that occurred less than five minutes previously. *
Warm indicates a strike that hit between five and ten minutes previously. *
Cold refers to a strike that occurred between ten and fifteen minutes previously. *
*The fade times for these attributes are user-definable in the omninet.ini file.
See section 2.7, Adjusting the Color Palette, for instructions on editing these colors.
3.5.9 Displaying Storm Spotter Van data
The Storm Spotter Van feature lets you track the position of, and receive data from, a Baron
Storm Spotter vehicle. The connection between the Storm Spotter Van and FasTrac is made
possible by a cellular telephone that is linked to FasTrac and is available in the van.
Configuring the Van Marquee
Right-click on the Storm Spotter Van hot button or select
Tools-3 > Vehicle Info to open the Van Settings menu.
•
•
•
•
Caption contains the words that appear at the top of the Van
Marquee.
Show displays the associated attribute on the marquee.
Lock secures the associated parameter as the stated value. The
value will not change when new data is available.
Latitude and Longitude define the location of the van icon. Select
Lock to keep the icon’s location at the specified coordinates.
Displaying the Van Icon and Marquee
Left-click on the Storm Spotter Van hot button to open the
Vehicle Quick Settings menu. To remove either the icon or
marquee, uncheck the associated option.
Sometimes the Storm Spotter Van icon will not appear even when if Show van icon is
selected. If this occurs, try locking the latitude and longitude on the Van Settings menu.
44
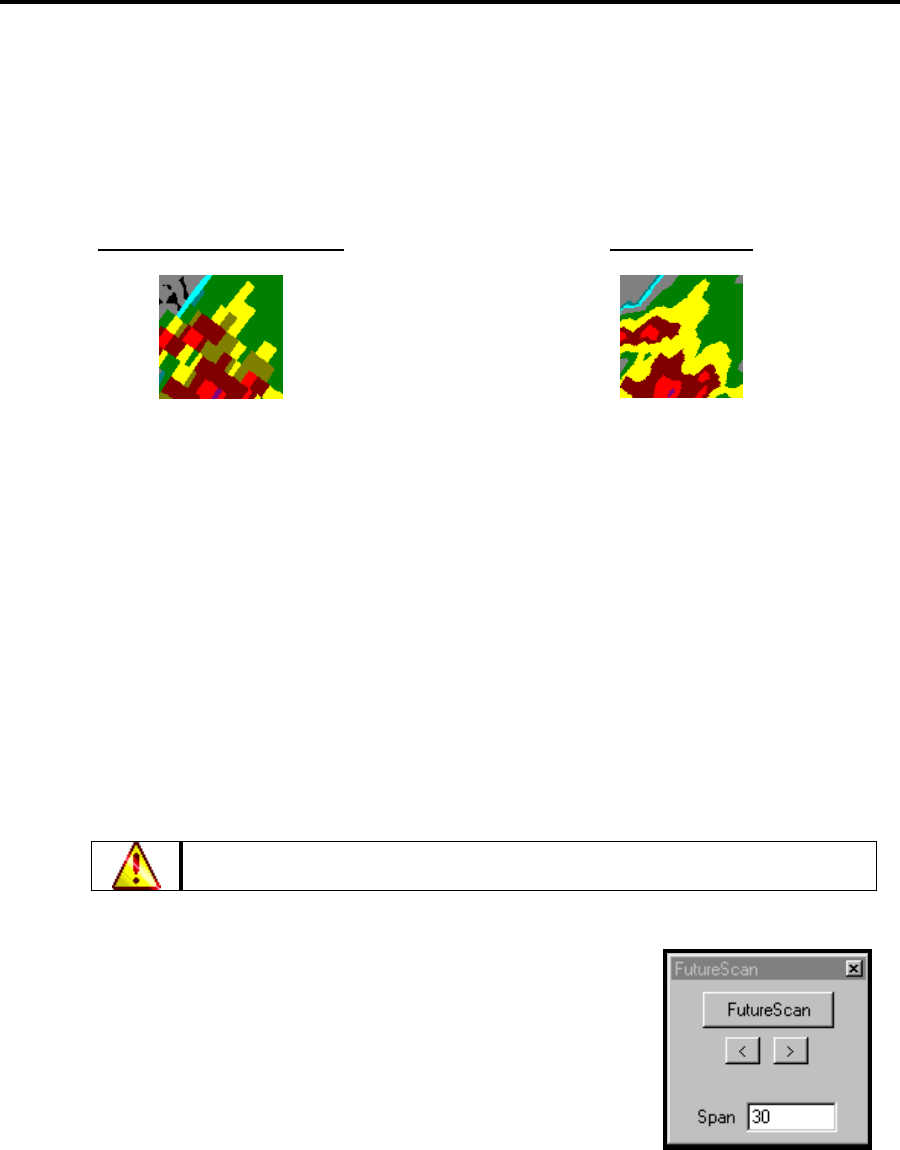
FasTrac Millennium User’s Guide – May 2003 Adjusting Views
3.5.10 Toggling High-Definition Data Processing
The High Definition Data Processing (HDDP) feature creates clearer NEXRAD displays than
those available with the normal pixilated display. The HDDP display is generated in real time
without loss of accuracy as shown in the following comparison:
Normal, Pixilated Display HDDP Display
To enable high-definition processing, select Radar > High Definition. A check mark next to
High Definition option means that the HDDP feature is active.
To enable dithering of high definition radar colors, select Radar > Dither. A check mark next to
Dither means that the Dither feature is active.
It is best to have HDDP enabled at all times. Disable it only if you wish to look at unprocessed
radar data.
3.5.11 Displaying NEXRAD forecast data
The optional FutureScan module forecasts and displays up to thirty minutes of projected
NEXRAD radar data. Although very complicated processes and calculations are involved in
producing a forecast, it is all done for you. All you must do is select a compatible site and
product and then use the FutureScan menu to create your forecast.
FutureScan is inoperable when the radar is in Clear Air mode.
Using FutureScan
1. Open the NEXRAD Main panel.
2. Select a site to display.
3. Select Max Reflectivity.
4. Select Tools-2 > FutureScan to open the FutureScan menu.
5. Specify the Span number. FutureScan creates one frame for each 5-minute span into the
future. Span should be a multiple of 5 and not exceed 30.
Click the FutureScan button, and frames will appear on the screen. Use the forward (>) button to
scroll forward through the sequence, and the back (<) button to scroll backward.
45
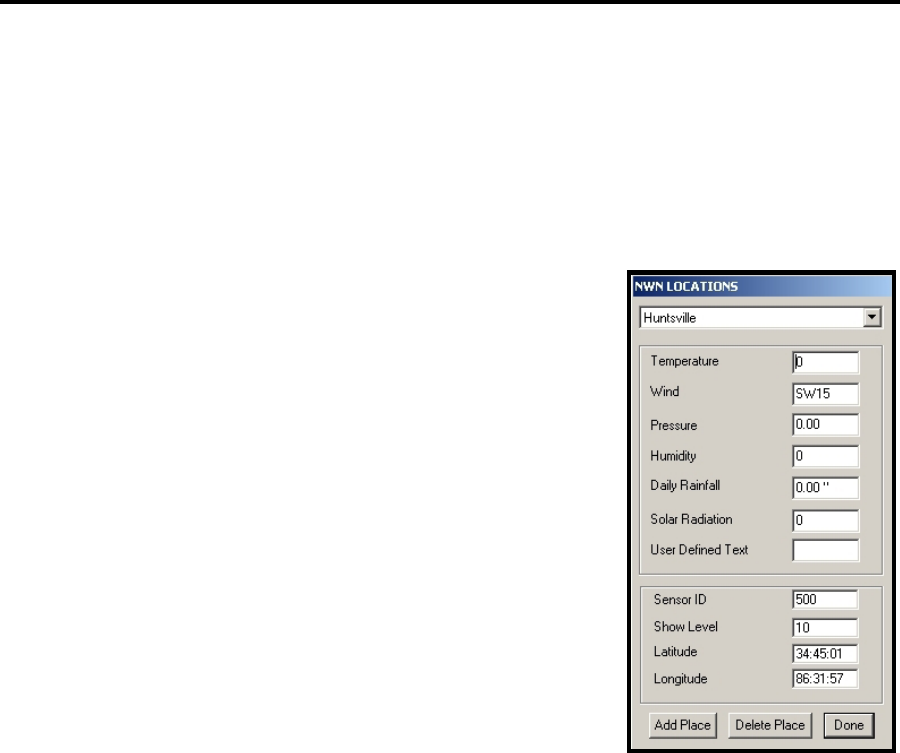
Adjusting Views FasTrac Millennium User’s Guide – May 2003
3.5.12 Displaying Neighborhood Weather Net Sensor Data
You can use the Neighborhood Weather Net (NWN) interface to show NWN sensor data on your
maps. NWN provides non-storm related data, such as temperature, humidity, wind speed, wind
direction, and barometric pressure.
Setting Up Locations to Receive Data
1. Select Setup > Data > Advanced > NWN Interface to open
the NWN Locations menu. All of the values in the upper
section (except for User Defined Text) are updated
automatically if you have a NWN system. Otherwise, you
must change them manually.
The Pull-down list contains all of the locations you have
already set up. Select Delete Place to remove the
displayed location from the list. Select Add Place to add
a new location.
Temperature displays the latest recorded temperature, in
degrees Fahrenheit.
Wind displays the wind direction and force, in miles per
hour.
Pressure displays the amount of barometric pressure,
measured in millibars.
Humidity, which is measured in percentages, displays the amount of moisture that the air
contains compared to how much it could hold at a given temperature. A figure of 100%
means that the air has become saturated.
Daily Rainfall displays the amount of rainfall within the last 24 hours. The daily rainfall
sensor is zeroed every day at midnight.
Solar Radiation displays the total electromagnetic radiation emitted by the sun.
User Defined Text is the user-specified text that appears at the specified latitude and
longitude coordinates.
Sensor ID must correspond to the number used in the NWN program.
Show Level indicates the maximum range at which the sensor data appears on the map.
Latitude and Longitude specify where the text will appear. It will always appear at these
coordinates regardless of where you go on your maps.
Add Place lets you create a new location.
Delete Place removes the currently displayed location.
46
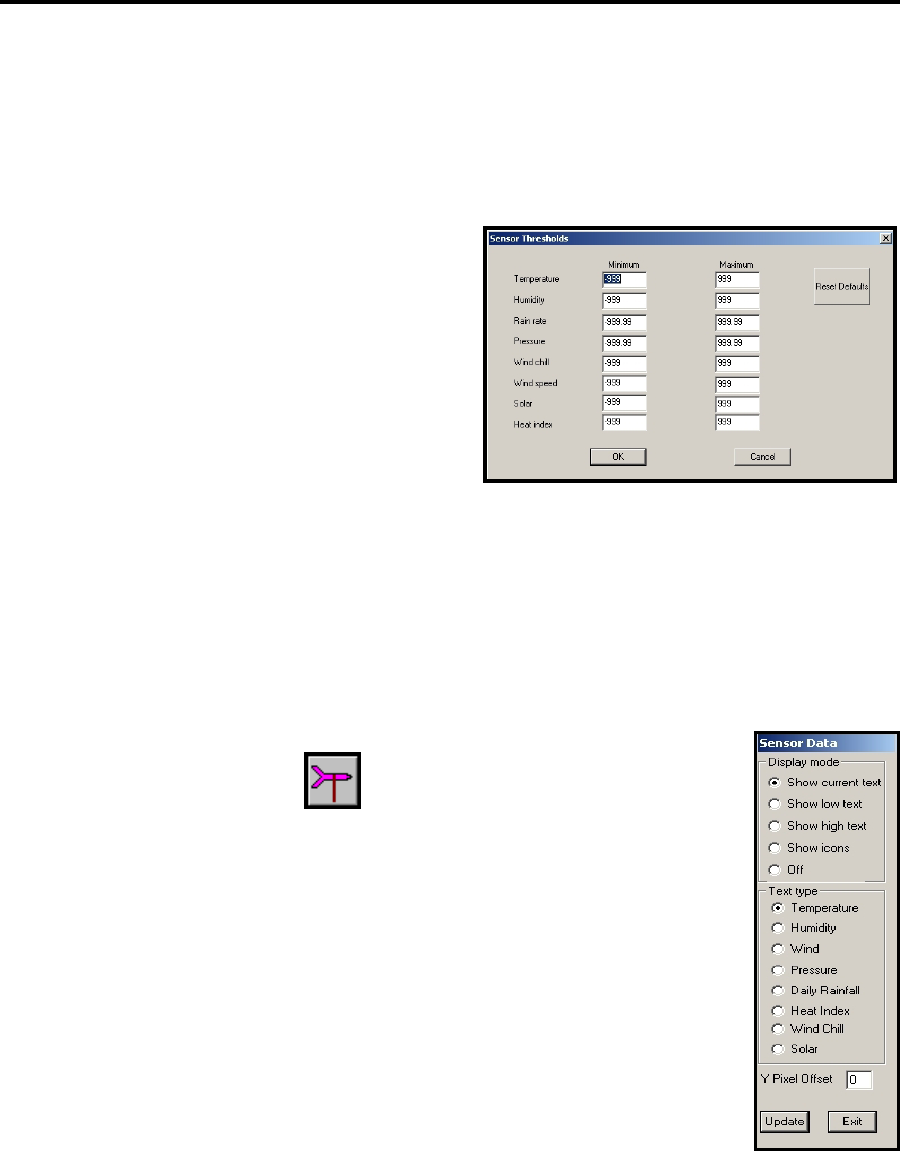
FasTrac Millennium User’s Guide – May 2003 Adjusting Views
2. When you have completed editing locations, click Done.
3. Select Setup > Fonts > Temp Text to specify the font size, type, and color.
Setting Data Thresholds
You can set the minimum and maximum values
that will display for an NWN data item with the
Sensor Thresholds menu. Open this menu by
selecting the Setup > Data > Advanced > NWN
Thresholds command.
There are two additional data types for which you
can set thresholds. Both are derived from other
data:
Temperature and Humidity are used to calculate the Heat Index.
Wind Chill is calculated from an equation involving Temperature and Wind Speed.
Displaying Sensor Data
Now that your places are set up, you must either use another menu or SEQUENCER to display
the data. Set the map view within the range of the location that you specified in the previous
section.
1. Click on the Sensor Data hot button to open the Sensor Data
menu.
2. In the Mode area, you can select the current day’s lowest or highest value.
If you are manually inputting values, you can only show the current value.
3. Select the desired data type Text type area.
4. You may specify the Y Pixel Offset to indicate the location of the data.
The data will appear the specified number of pixels below the selec
geographic coordinates. This lets you prevent conflicts with places shown
on the map at certain ranges.
ted
5. Select Update to display the appropriate data at the latitude and longitude
you specified in the NWN Locations menu. You must be within the cutoff
range to see the data.
47
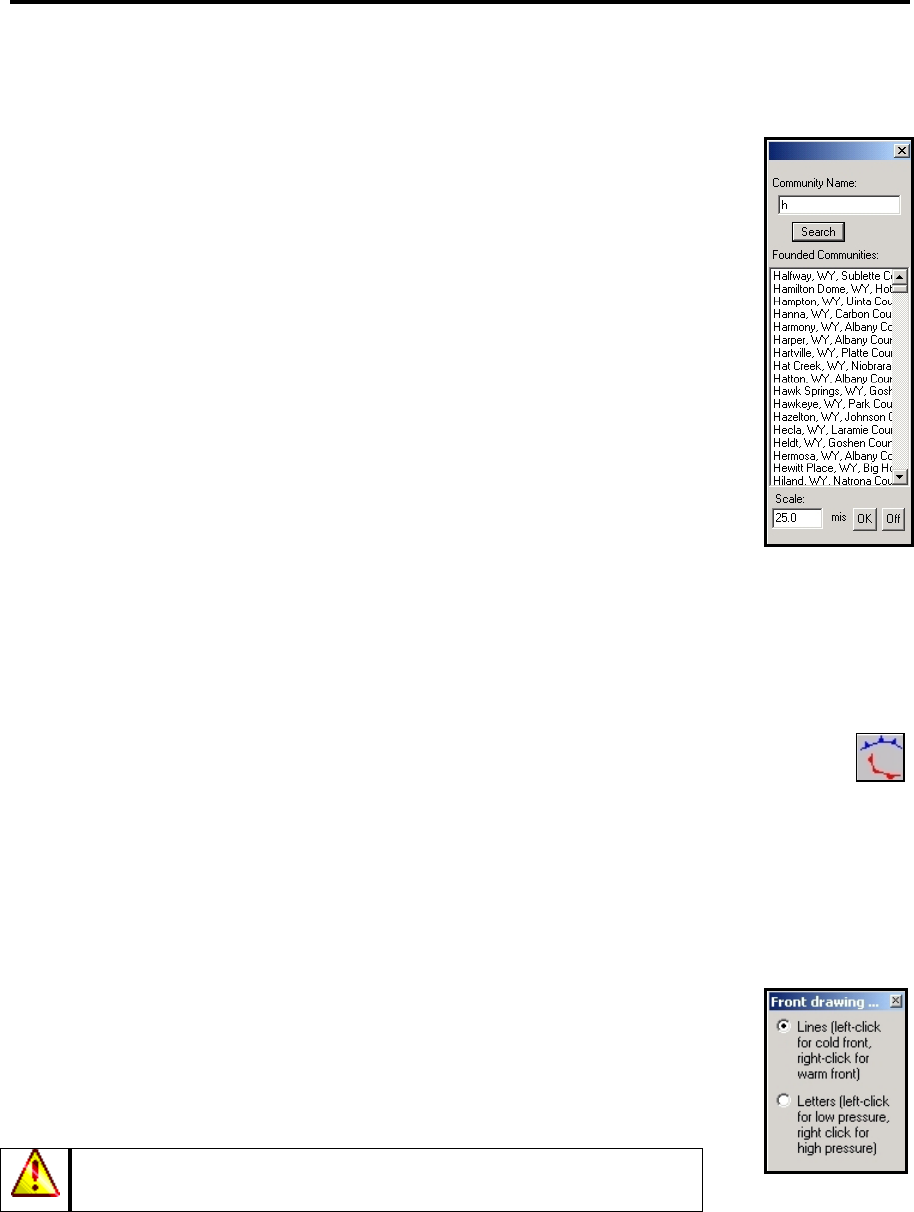
Adjusting Views FasTrac Millennium User’s Guide – May 2003
3.5.13 Zooming to a Specific City
The Find City feature allows you to automatically zoom to any city in your
database at a selected range.
1. Select Tools-1 > Find City to open the Find City menu.
2. In the text box labeled Community Name, type in the name of the
community you wish to focus on.
3. Click Search, and the system will display a list of all of the communities
that start with the letters you typed (capitalization is ignored for this
process).
4. Select the desired community by clicking on it.
5. In the text box labeled Scale, enter the range, in miles, at which you wish
to view the selected city.
6. Click OK to zoom to the selected city.
Note that the menu remains on the screen, so that you may select another city to focus on using
the same process. If you do not wish to find any more cities, click Off to remove the menu.
3.5.14 Adding Fronts and Pressure Markers
Using the Fronts Hot Button, you can add graphics that represent fronts and pressure
markers to a view.
To begin drawing cold and warm fronts, left-click on the Fronts Hot Button. You may then draw
cold fronts by clicking and dragging with the left mouse button, and draw warm fronts by
clicking and dragging with the right mouse button. Clicking and dragging in a clockwise
direction will cause the front “arrows” to appear on the outside of the curve. Clicking and
dragging in a counterclockwise direction causes the front arrows to appear on the inside of the
curve.
To begin adding low and high-pressure markers, right click on the Fronts Hot
Button. The Front Drawing menu will appear, which allows you to choose
between adding fronts and adding pressure markers. Click the Letters circle to
select pressure markers, then left-click to add low-pressure markers and right-
click to add high-pressure markers.
Overlays labeled “HighPressureSystem” and “LowPressureSystem”
must be present in your system for pressure markers to appear.
To remove front and pressure markers from the screen, right-click on the Temporary Text hot
button.
48
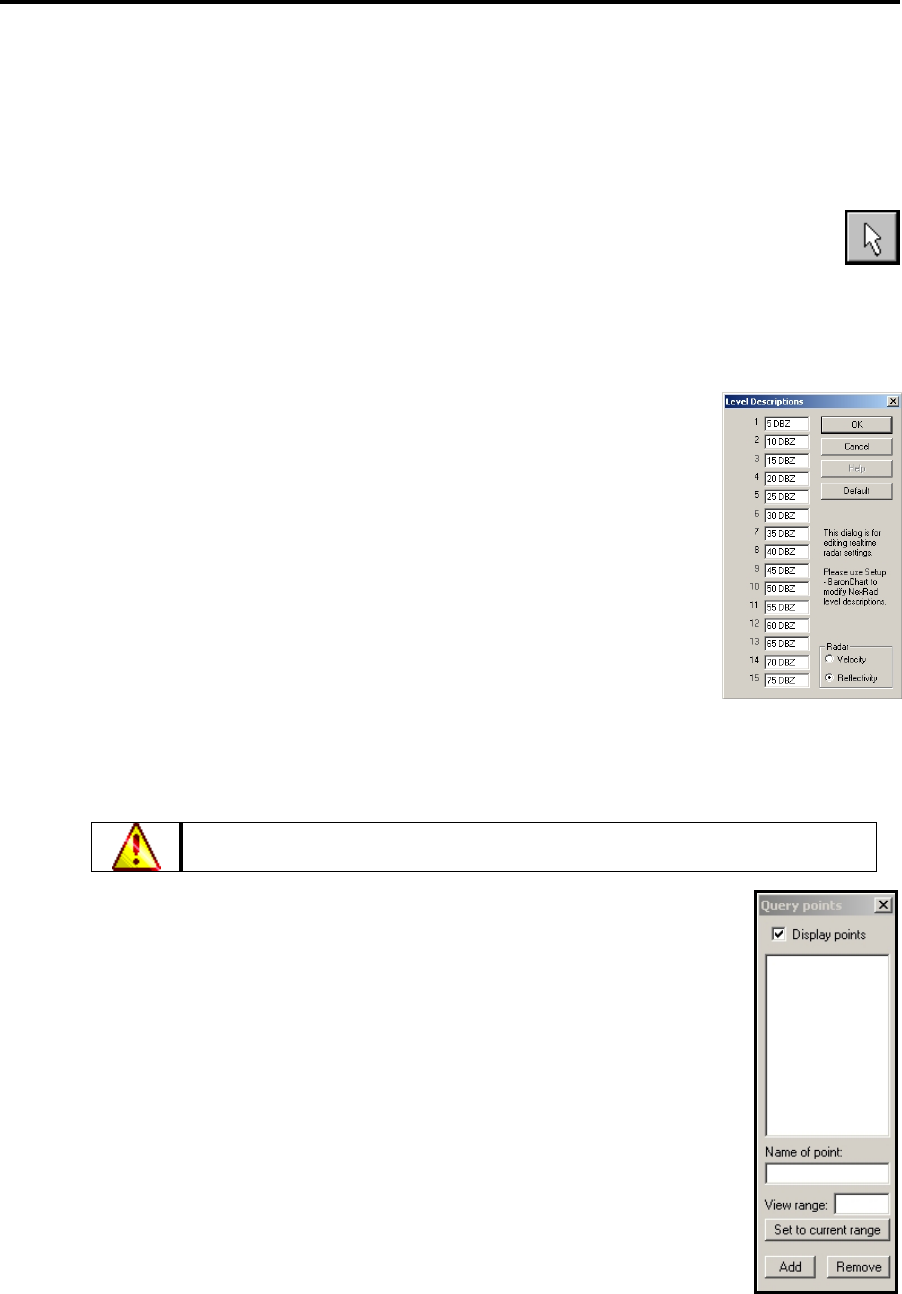
FasTrac Millennium User’s Guide – May 2003 Adjusting Views
3.5.15 Creating Temporary Pixel Query Points
Using the Map Pointer hot button, you can create text messages that indicate the severity of
various types of radar data such as reflectivity. These messages are known as pixel query points.
To begin the process of adding pixel query points, right-click on the Map Pointer hot
button to enter pixel query mode. You will notice that when you move the cursor over
radar data while in this mode, the text associated with the level of severity of the data
appears in the Cursor Status Area.
To add a pixel query point, left-click on the view at the desired spot. A text message will appear
indicating the weather type (for example, “5 dBZ” for reflectivity). You can remove pixel query
points by refreshing or adjusting your view.
You can change the appearance of pixel query point text with the Setup >
Fonts > Pixel Query Mode command.
To change the text used for pixel query point messages based on real-time
data, open the Level Descriptions menu using the Setup > Data >
Descriptions command and edit the textboxes corresponding to reflectivity
or wind velocity. To edit the pixel query text for NEXRAD data types, use
the Advanced Baron Chart (see section 6.3.3).
3.5.16 Creating Fixed Pixel Query Points
An added feature of FasTrac Millennium is the ability to create pixel query points that will
remain where you set them regardless of how your view changes. Use the following procedure to
add these points:
You must have radar data present on your view to add pixel query points.
1. Select the Setup > Map > Pixel Query Points command to open the
Query Points menu.
2. Click the Add button to set your cursor for adding pixel query points.
3. In the text box labeled Name of point, enter a name for the point you wish
to place.
4. Enter the maximum range at which you want the point to appear in the
View range text box, or click the button labeled Set to current range to
automatically enter the current view range.
5. Click on the desired spot on your view to add the point.
6. Repeat steps 3 through 5 to add more points.
You will notice that you can pan and zoom around your view without removing the pixel query
points, as long as they are within the view range.
49
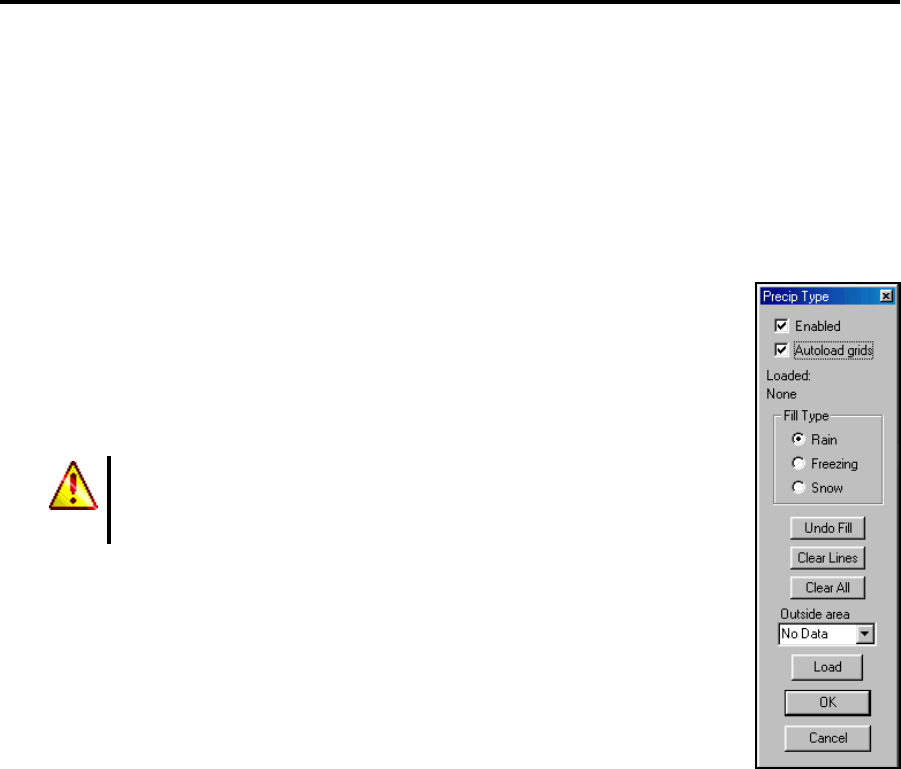
Adjusting Views FasTrac Millennium User’s Guide – May 2003
To temporarily hide your fixed pixel query points, uncheck the box at the top of the Query
Points menu labeled Display points.
To permanently remove a fixed pixel query point, select it from the list in the Query Points
menu and click Remove.
3.5.17 Displaying Precipitation Type Maps
Select Tools-2 > Precip Type Map to open the Precip Type panel, which
allows you to download a 461 x 461 pixel (kilometer) map from Baron
Services’ Snow Machine server. You can then modify the grid, which is
overlaid on the current view, to reflect the current situation in your area.
Enabled forces a new grid to be downloaded each time one is created.
You must have both Enabled and Autoload grids
selected to automatically download grids from Baron
Services.
Autoload grids downloads a new grid from the Snow Machine server
every time a new one is created. The only reason to not select this option is
when you want to keep the manual map for display purposes.
Fill Type lets you create a Rain, Freezing, or Snow area. When you select
this option, the mouse cursor turns into a pencil and you can then define the
weather line by clicking and dragging.
Undo Fill clears the last area that was manually filled.
Clear Lines erases all the lines you have drawn.
Clear All erases everything off the screen and returns to the display shown before you
downloaded the grid.
Outside Area changes the area outside of the grid to rain, freezing, or snow.
Load allows you to manually load a previously downloaded grid file.
To clear the Precip Map from your viewing area and close the Precip Type menu, click OK.
50
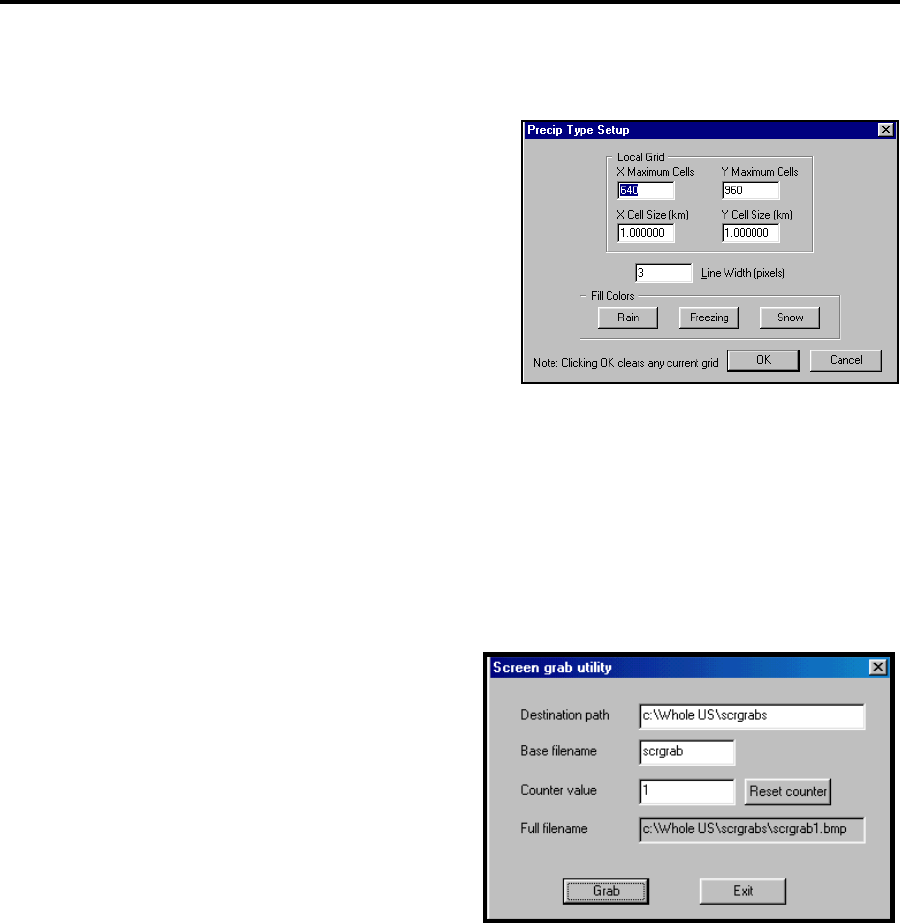
FasTrac Millennium User’s Guide – May 2003 Adjusting Views
Setting Up the Precip Type Background
While your precipitation type map is set up for you
upon delivery, you may have to adjust it during
troubleshooting procedures. To open the Precip
Type Setup menu, select Setup > Data > Precip
Type Map. The only items you should change are
the Line Width and Fill Colors settings.
The Line Width text box lets you set the width (in
pixels) of the boundary lines you draw between
precipitation types.
The Fill Colors commands open the Edit Color menu, which lets you set the fill colors for rain,
freezing rain, and snow. Click OK to save the color setting and to return to the Precip Type
Setup menu. Upon completion, click OK to save your changes and to close the Precip Type
Setup menu.
3.5.18 Saving the Current View as a Bitmap
A fast way to save the current view along with its weather and other data as a bitmap is to use the
Screen Grab Utility. The process for saving a
bitmap in this manner is as follows:
1. Select Tools-2 > Screen Grab Utility to
open the Screen Grab Utility menu.
2. Specify the filename path in which the screen
grab will reside in the Destination path
textbox.
3. Choose a filename for the bitmap in the Base
filename textbox.
4. Verify that the Counter Value textbox contains a 1 if you are using a new filename for these
bitmaps, or that it is at the desired number if you are using the same filename as you
previously have used. The Full Filename box should now list the path you want for the
bitmap.
5. Click Grab to save the bitmap. The counter value will increment by one.
Exit closes the screen grab utility.
3.5.19 Printing the Current View
To quickly print out the currently displayed view, select the File > Print command. The view
will print to the designated printer for your FasTrac Millennium computer, and a message will
appear indicating a successful print operation.
51
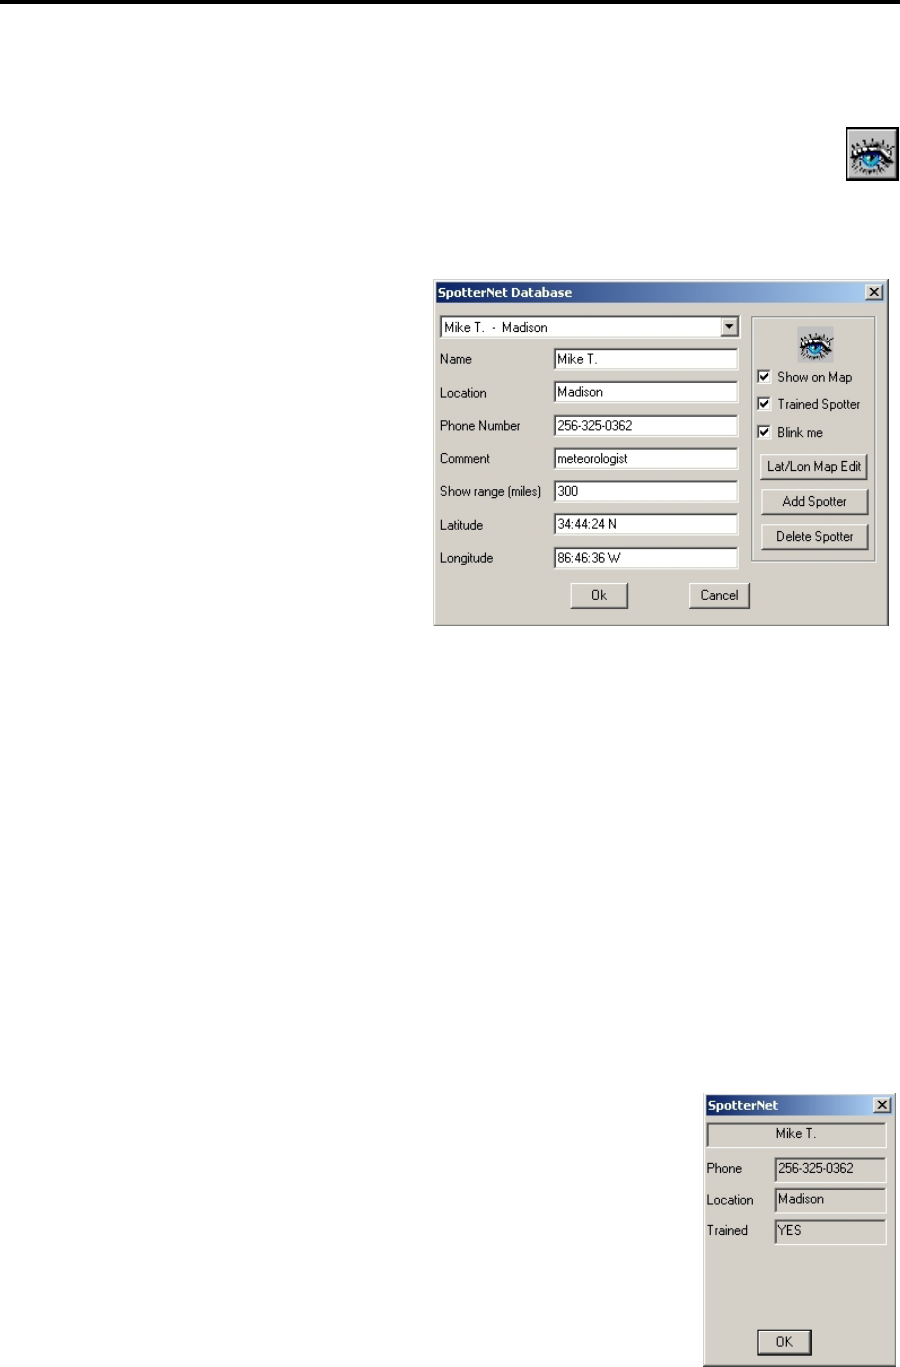
Adjusting Views FasTrac Millennium User’s Guide – May 2003
3.5.20 Highlighting Your Spotter Network On-Air
The SpotterNet feature, which Millennium users can access through the SpotterNet hot
button, gives you the opportunity to show the positions of your storm spotters in the field
to your viewers.
Setting Up Your SpotterNet Database
1. Right-click the SpotterNet hot
button to open the SpotterNet
Database menu.
2. The existing list of spotters appears
in the pull-down list at the top of the
menu. To add a new spotter, click
Add Spotter.
3. Type in identification data for the
spotter in the Name, Location,
Phone Number, and Comment
textboxes.
4. Enter the maximum range at which the spotter icon should appear in the Show range
(miles) textbox.
5. Enter the geographic coordinates at which you want the icon to appear in the Latitude
and Longitude textboxes, or click on the desired spot on the view with the map pointer
and then click the Lat/Lon Map Edit button to automatically set coordinates.
6. Click Show on Map to set the spotter’s icon to appear when your view is in range and
SpotterNet is toggled on.
Checking Trained Spotter causes the system to identify the spotter as trained when you
click on his or her icon.
Blink me makes the spotter’s icon appear to blink on the view, making it easier to identify.
The Delete Spotter button lets you remove the spotter whose data currently appears on the
menu.
Using SpotterNet On-Air
Once your SpotterNet database is set up, using it during a broadcast is a
matter of left-clicking on the SpotterNet hot button to toggle on the icons
you want to display. You can then indicate one of the icons near the
weather pattern while mentioning to your viewers that you are receiving a
live report from the spotter at that location. You can also left-click on the
icon to open a small menu providing some of the data you entered about
the spotter, to facilitate correct identification.
52
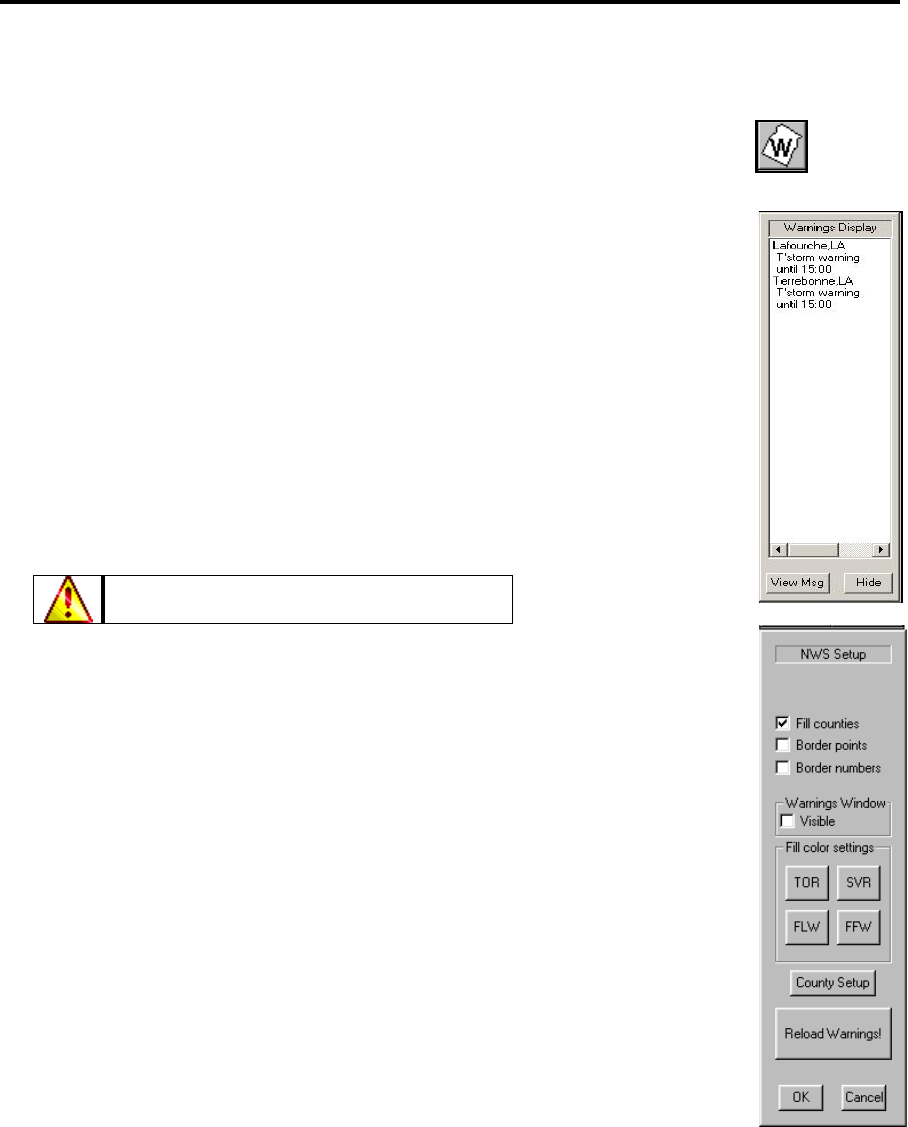
FasTrac Millennium User’s Guide – May 2003 Adjusting Views
3.5.21 Displaying National Weather Service Warnings
Using the Weather Wire Data hot button, you can control the display of
National Weather Service warnings for counties in your viewing area.
Left clicking the button opens the Warnings Display panel, which shows the
current alerts that are in effect, which counties are involved and when the alerts
expire.
To view the full text of a warning, click on a line of the warning in the
Warnings Display text box and click View Msg.
To close the Warnings Display menu, click Hide.
Right clicking the button opens the NWS Setup menu, which allows you to
toggle settings for display of NWS warnings.
Fill counties toggles whether counties that are under a warning are filled
with the appropriate color.
The fill color will replace your topo image.
Border points toggles the display of points indicating the boundary lines
for a county. This feature is intended for troubleshooting and should n
be used on-air.
ot
Border numbers toggles the display of numbers indicating the boundary
lines for a county. This feature is intended for troubleshooting and
should not be used on-air.
The Fill Color Settings allow you to set the colors for Tornado (TOR),
Severe Thunderstorm (SVR), Flood (FLW), and Flash Flood (FFW)
warnings. See section 2.6 for information on adjusting colors.
County Setup is an advanced feature used for testing purposes. You
should not use this feature without the assistance of a Baron Services
representative.
Reload Warnings lets you reload warnings that the system parsed during
the previous FasTrac session, in the event that you are forced to close and
restart FasTrac.
To save your changes and close the menu, click OK. To exit without saving changes, click
Cancel.
53
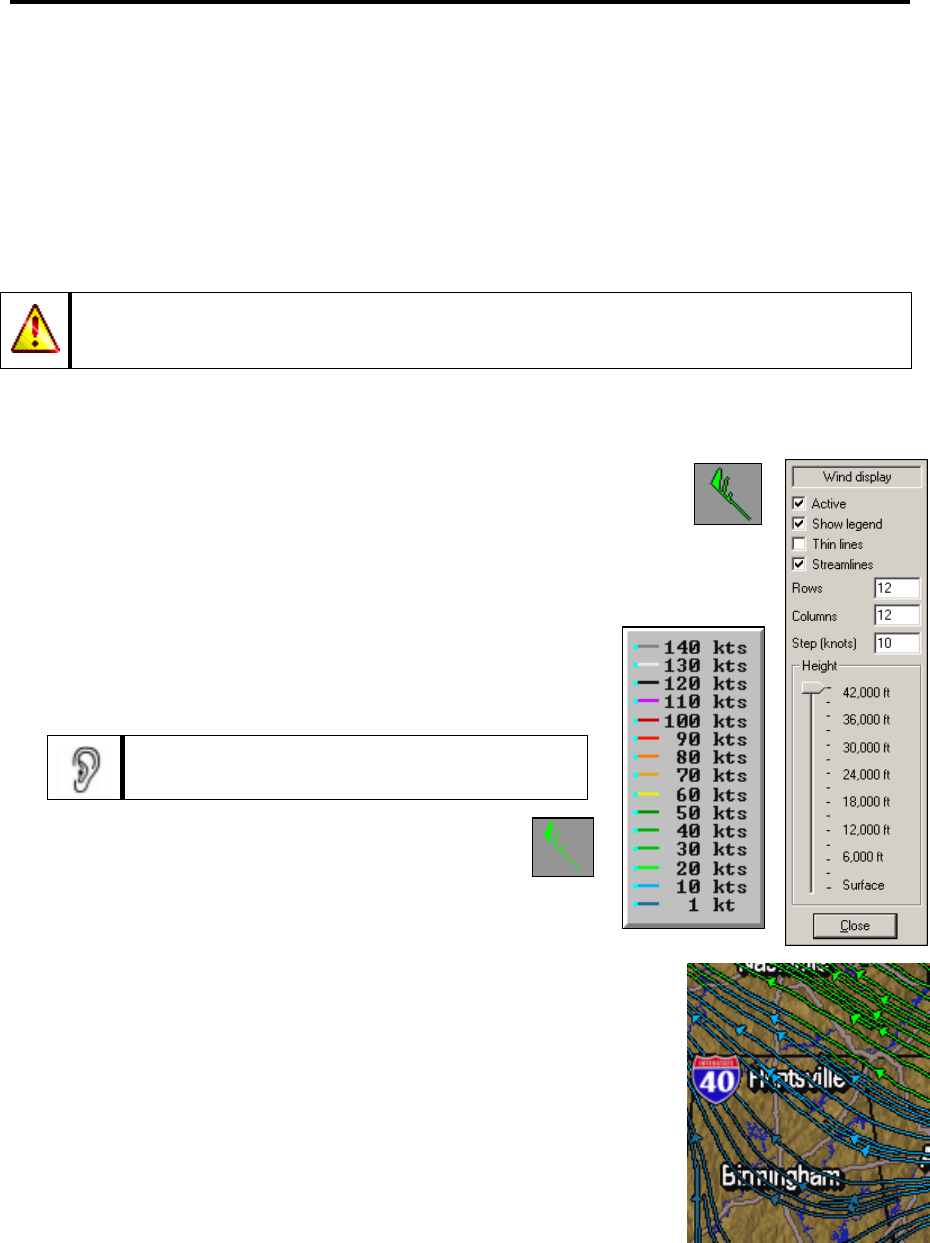
Adjusting Views FasTrac Millennium User’s Guide – May 2003
3.5.22 Displaying Wind Speed and Direction
The Wind Display feature allows you to quickly show the speed and direction of winds at various
elevations over your broadcast area. The Rapid Update Cycle Model (RUC) provides wind data.
The RUC is an operational atmospheric prediction system comprising primarily of a numerical
forecast model and an analysis system to initialize that model. It serves users needing short-range
weather forecasts, including those in the U.S. aviation community.
Wind data will appear over any other data that you display and remains on screen until you
uncheck the Active button, even if you close the menu. Therefore, always remember to
uncheck Active before exiting the menu.
To begin using this feature, select Tools-3 > Wind display to open the Wind display menu.
• Active toggles the display of wind data. Wind markers such as the
one on the right appear, showing wind speed in the area they appear
over, at the height selected. A triangle indicates 50 knots, a long
line indicates 10 knots, and a short line indicates 5 knots. Adding up all of the
lines on a marker gives the wind speed. (The marker in the example indicates
65 knots total.)
• Show legend toggles a legend depicting colors for different
levels of wind speed. This legend is used in conjunction
with the Streamlines option, which is described below.
You can change the colors for the legend with
the Advanced Baron Chart (see section 6.3.3).
• The Thin lines option, when checked, removes
the black line from around the wind markers (or
streamlines if they are activated). This makes the
data update faster, but can make the markers harder to see.
• Streamlines changes the display to show the direction of the winds
as well as their speed. As shown in the example on the right, the
arrows indicate the direction in which wind is traveling along the
lines. The wind speed is indicated by the variations in color along
the lines, with the color values appearing in the legend.
• Rows and Columns affect the number of wind markers and
streamlines that appear on the screen. For example, if your Rows
and Columns boxes both have 10 entered, there will be 10 rows
and 10 columns of wind markers. Similarly, if Streamlines is
activated with 10 entered for both Rows and Columns, there will
be 100 total streamlines on the screen (10x10).
54
FasTrac Millennium User’s Guide – May 2003 Adjusting Views
• Step (knots) changes the number by which the levels of wind speed increment when you are
in streamlines mode. For example, if you have 10 entered in the Step box, the legend will
change to increments of 10 knots each, up to 140 knots. Entering 12 will produce increments
of 12 and a maxiumum of 168 knots.
• The Height area contains a slider bar that allows you to change the height at which winds are
being measured. The range is from winds along the surface to a maximum of 42,000 feet, in
increments of 3,000 feet. Sliding the bar up or down will cause the system to automatically
display the winds for the new height.
The Surface level in the Height bar measures wind speed along the land or
water surface regardless of height above sea level; therefore, data will always
be present. However, with the other heights data will not appear if the land
surface is higher in elevation than the height selected.
Close closes the Wind Display menu, allowing you to use other menus while viewing wind data.
55

Adjusting Views FasTrac Millennium User’s Guide – May 2003
3.6 Points to Remember
The panels shown on the left side of the display can be used to change commands
that were specified by the Setup commands. Changing parameters through these
panels is often a faster and more efficient way to control your display.
Use the Radius setting on the Main View panel to specify your map range.
Use the View Map Features panel to control map features, such as roads and
rivers.
Use the View Topo panel to display a topographical background.
Use the hot buttons to zoom in, zoom out, and re-center your map.
Remember to save your views for later recall.
56
4. Managing Storm Tracks
We designed the new series of FasTrac, as its name implies, to provide you with the fastest, most
detailed tracking of storms. You will find storm tracking an easy, instantaneous process with
some truly inventive features. This chapter describes the processes for designing your storm
presentations, such as:
Setting Defaults for Storm Tracks
Creating Storm Tracks
Editing Storm Tracks
Editing the Storm Marquee
Using PasTrac
Using StormScan
57
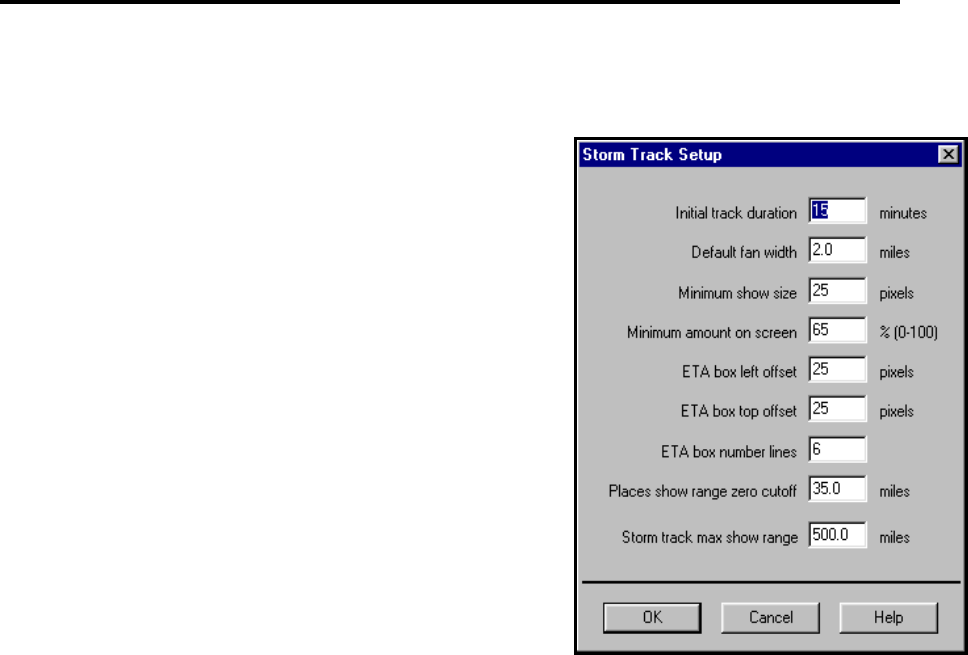
Managing Storm Tracks FasTrac Millennium User’s Guide – May 2003
4.1 Setting Defaults for Storm Tracks
The Setup > Storm > Storm Track command, which
opens the Storm Track Setup menu, lets you establish
default settings for storm tracking. In essence, you
determine the original settings (defaults) for each storm
track and then individually adjust parameters to meet your
needs.
INITIAL TRACK DURATION specifies the length,
in minutes, of the tracking period. When you create
your storm track, this number specifies the amount of
time in which the storm will travel the distance of the
red line you create. For example, if you create a 15-mile
storm track with Initial Track Duration of 15 minutes,
the computer will calculate a speed of 60 miles per
hour. If you change your Initial Track Duration to 60
minutes, the speed then will be 15 miles per hour.
DEFAULT FAN WIDTH refers to the width of the
base of a fan-projection of a storm track. You can either
set the default fan width value on the Storm Track
Setup menu or enter a specific Width value on the
Storm Track panel. Typically, the Default Fan Width value is between 2 and 5 miles.
MINIMUM SHOW SIZE specifies, in pixels, the minimum size of the storm track. Use
this variable to prevent storm tracks from appearing in long-range maps (e.g., a 150-mile
map). Minimum Show Size specifies how large the track graphic should be before the storm
track can be seen. This prevents storm tracks intended for close ranges from cluttering up
long-range map displays. Thus, you can use long-range maps to show your audience where
the storm is located. You can then zoom in to show a small storm track at close range.
MINIMUM AMOUNT ON SCREEN specifies the smallest amount of the storm projection
that appears on the map display. This lets you prevent a small portion of a large storm track
from appearing on your map display. When only part of the storm-track area (the area
defined by the yellow storm track box) is on screen, it can be confusing. Just as Minimum
Show Size prevents small storm tracks from cluttering long-range maps, Minimum Amount
on Screen prevents pieces of long-range storm tracks from appearing on close-range maps.
The usual setting for Minimum Amount on Screen is 65. When Minimum Amount on
Screen is set to 65, you must display 65% of the storm track area for the storm track to
appear. Displaying anything less makes the storm track disappear until you select an
appropriate range and center for your map display.
ETA BOX LEFT OFFSET defines the number of pixels from the left of the screen at which
the Storm Track ETA Box will appear. You may then drag-and-drop the Storm Track ETA
box anywhere on the screen.
ETA BOX TOP OFFSET defines the number of pixels from the top of the screen at which
the Storm Track ETA Box will appear.
58

FasTrac Millennium User’s Guide – May 2003 Managing Storm Tracks
ETA BOX NUMBER OF LINES specifies the size, in lines, of the ETA box graphics. For
example, to display eight communities, enter 8.
PLACES SHOW RANGE ZERO CUTOFF specifies at which range every community
appears. For example, if you create a storm projection based on a 60-mile view and have all
the communities posted, your projection would be crowded by locations. To alleviate this
problem, we have created an option that tells the computer the range at which you want each
community to show. Typically, that value is between 25 and 75 miles.
At distances greater than specified value, the system will post every community, prioritized
at half the map range. For instance, if you set Places Show Range Zero Cutoff to 50 and
you have a 60-mile radius map and do a storm projection, the system will post all
communities with priorities 30 miles or above. Once the radius is within the zero cutoff zone,
it will post all communities.
Clients who prioritize their Places database usually set a low value (between 25 and 50
miles) for the Places Show Range Zero Cutoff variable. The earlier prioritization of cities at
different miles means that cities will appear in a storm track displayed above the specified
range. Clients who have done relatively little Places prioritization should set Places Show
Range Zero Cutoff to a relatively high value (between 50 and 75 miles). Of course, even
after you set this parameter, you should test storm tracks a few times to verify that the desired
number of cities appears in the storm track. If not, set the Places Show Range Zero Cutoff
value higher to display more cities; set the value lower to display fewer cities.
STORM TRACK MAX SHOW RANGE specifies the maximum range, in miles, at which
storm track graphics (the storm track and the Storm ETA box) begin to appear.
4.2 Creating Storm Tracks
The Storm > Add command contains options for creating three kinds of storm projections: Fan,
Circle, and Squall. The following subsections describe each type of projection.
4.2.1 Creating Fan Projections
Fan projections indicate a fan-shaped area, which depicts storm tracks that are close to the
leading edge of the storm.
1. Select Storm > Add > Fan, and move your cursor to the location of the storm. You will see a
small storm projection icon with a small crosshairs (+) above it. The crosshairs represent the
center point.
2. Place the storm project icon the leading edge of the storm you wish to track, and then press
and hold down the left mouse button. Note that a red elastic band forms, rooted from the
point of your initial click to where your mouse is now.
3. Move the red rubber band in the direction of storm movement, and note that the status bar
indicates your azimuth (direction in degrees), speed, and range. The speed is based on the
Initial Track Duration parameter you set in the Initial Track Setup menu (see section 4.1,
Setting Defaults for Storm Tracks).
59
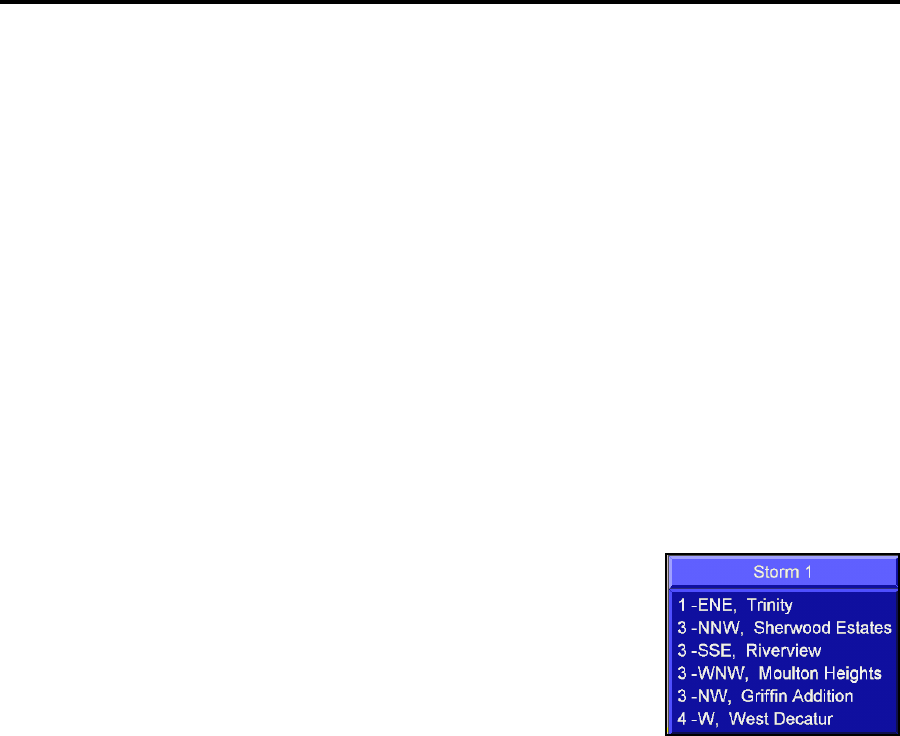
Managing Storm Tracks FasTrac Millennium User’s Guide – May 2003
4. When the direction and speed displayed in the status area match the known storm conditions,
release the mouse button to display the storm projection. The marquee will appear at the
position defined by the ETA BOX LEFT OFFSET and ETA BOX TOP OFFSET
variables on the Storm Track Setup menu (see section 4.1).
4.2.2 Creating Circle Projections
Circle projections show where the cities and communities are in relation to a storm in a circle-
shaped area.
1. Select Storm > Add > Circle, and move your cursor to the storm location. Unlike the fan
projection, you use the normal default cursor when you define a circle projection
2. Place the tip of this arrow cursor over the storm you wish to track, and then press-and-hold
the left mouse button. Note that a red elastic band forms, rooted from the point of your initial
left-click to where your mouse is now. Notice that the azimuth, speed, and range that are
displayed in the status bar change as you move the red rubber band.
3. Release the left mouse button when range matches the distance
from the center of the storm to the edge, or when the red band
reaches the edge of the area affected by the storm. Note that the
special circle projection marquee indicates the communities that
are inside the circle projection, as well as their distance and
direction with respect to the storm. This marquee appears at the
position defined by the ETA BOX LEFT OFFSET and ETA
BOX TOP OFFSET variables on the Storm Track Setup menu
(see section 4.1).
60
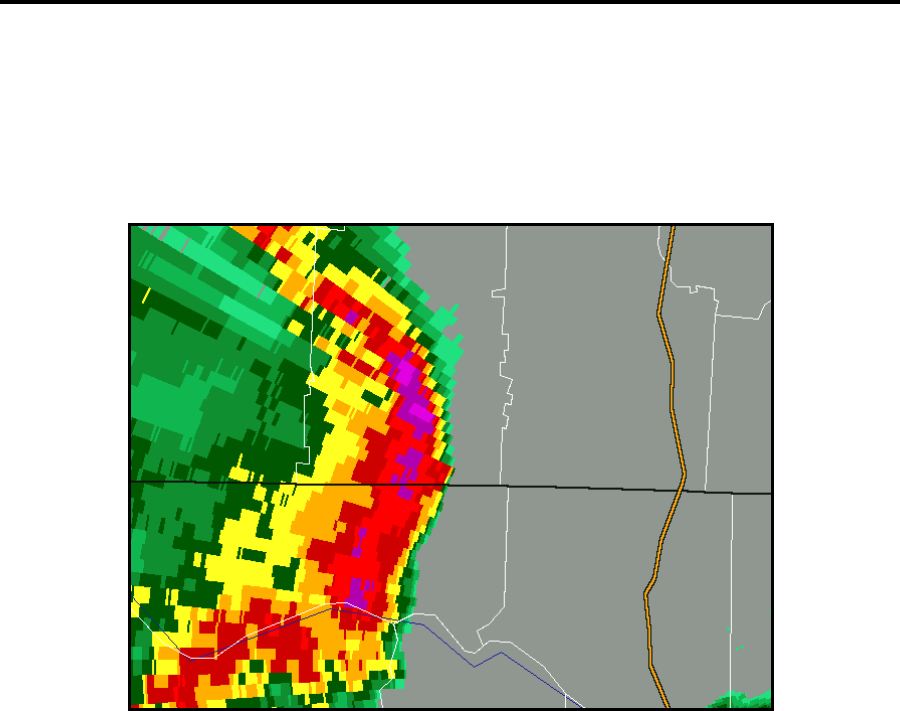
FasTrac Millennium User’s Guide – May 2003 Managing Storm Tracks
4.2.3 Creating Squall Projections
Squall projections track the progress of a line of storms.
1. Zoom in on the storm that is to be tracked, as shown in the following example:
2. Select Storm > Add > Squall from the Storm menu to add the squall projection.
61
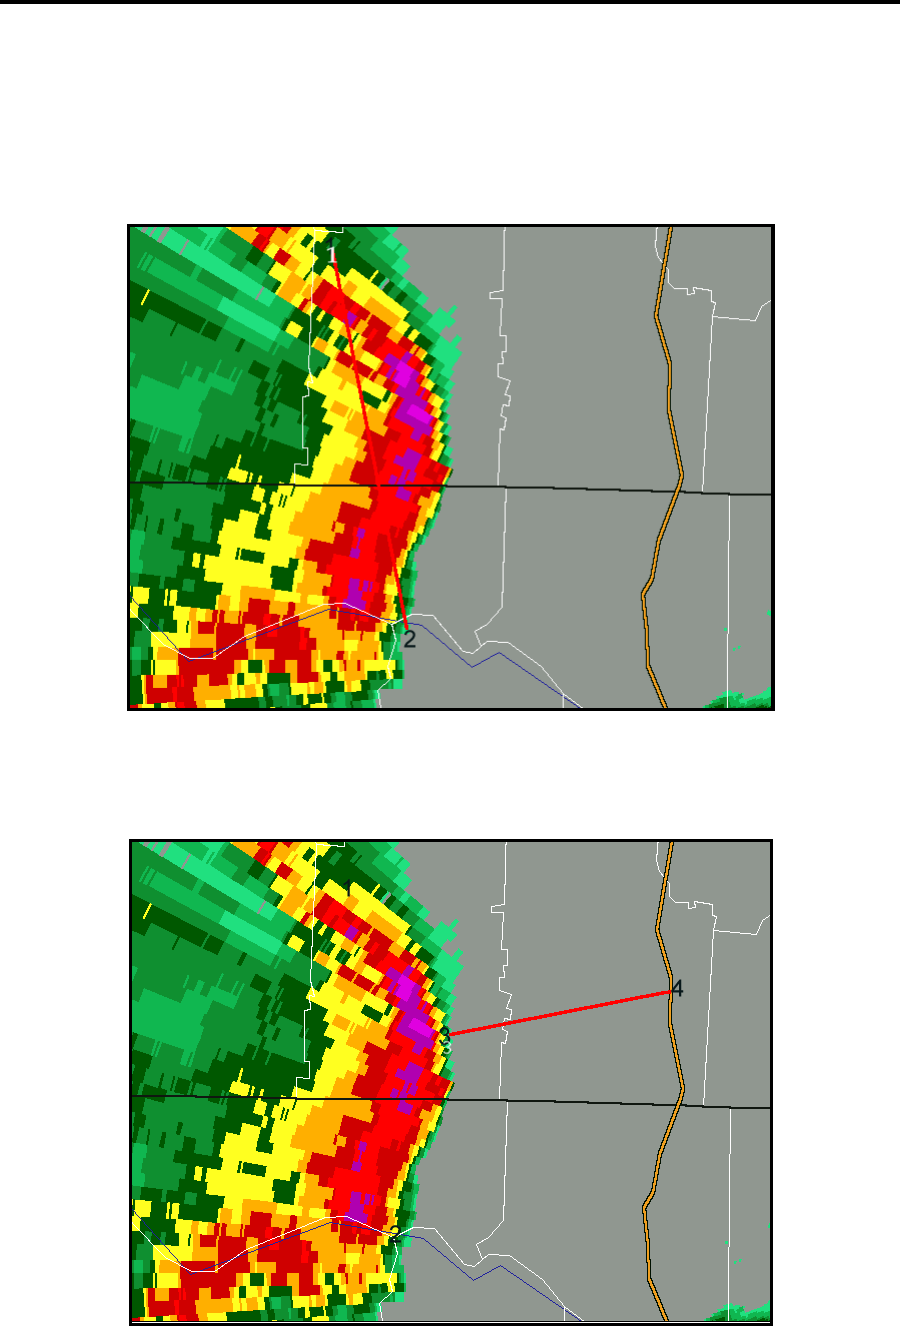
Managing Storm Tracks FasTrac Millennium User’s Guide – May 2003
3. Click and drag your mouse to define the height of the storm and the two points that define the
northernmost and southernmost edges of the storm. If the storm is moving north or south,
define the width of the storm and the easternmost and westernmost points. In both cases, you
will define a line that is perpendicular to the storm’s movement (shown in the following
figure as line 1-2).
4. Click and drag the mouse to define the leading edge of the storm, the squall amount, the
speed, and the direction. The four points (including the two points defined in step 3 and the
two points defined in this step (Line 3-4) are used to calculate the squall.
62
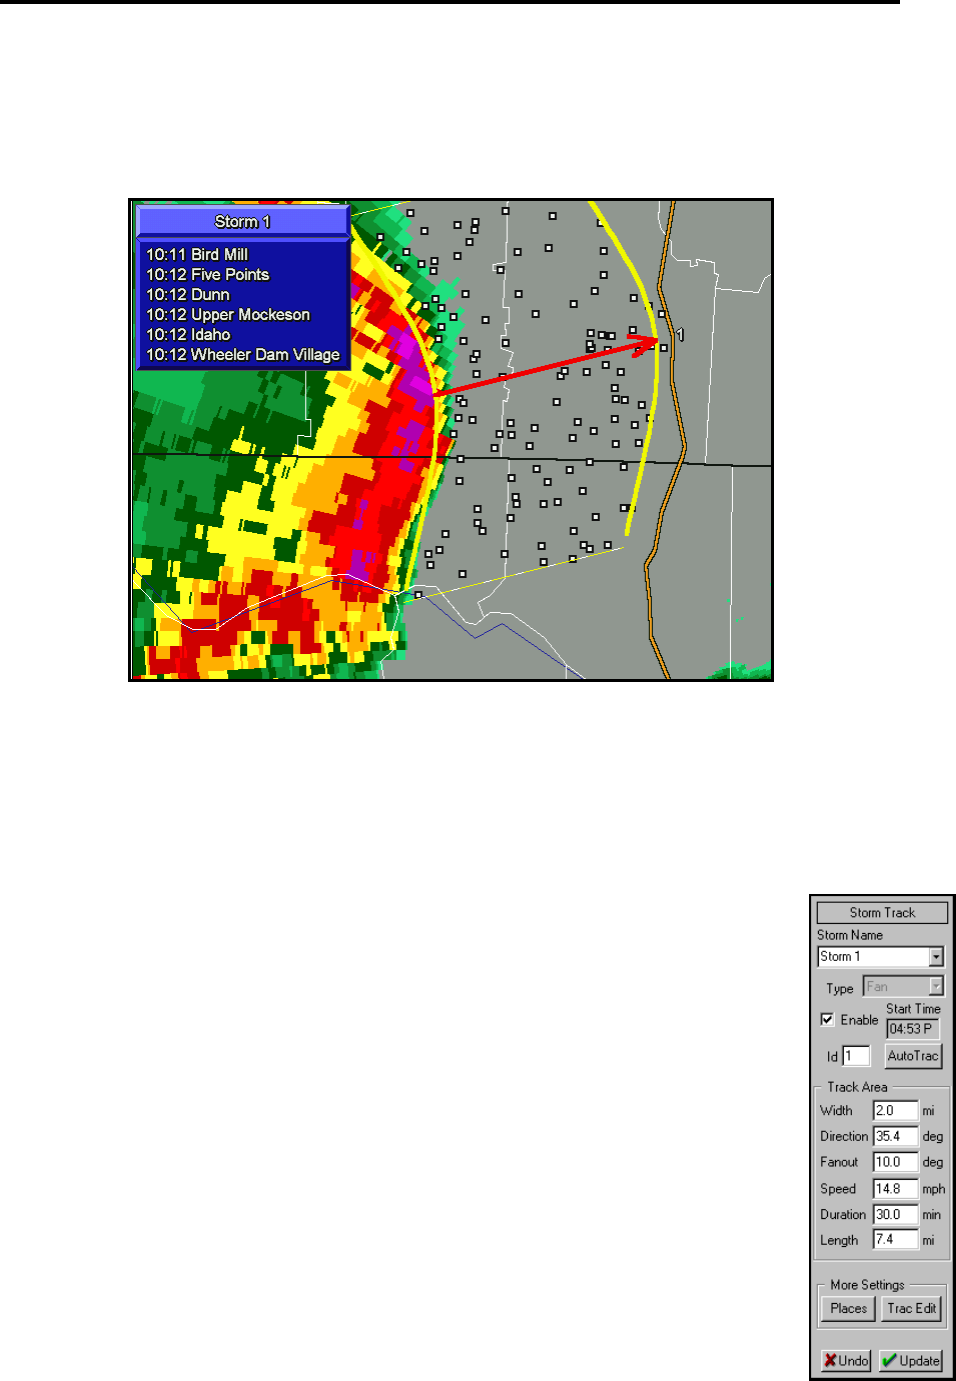
FasTrac Millennium User’s Guide – May 2003 Managing Storm Tracks
5. Release the mouse to display the squall projection, as shown in the following example. If the
projection is smaller than your default criteria for posting, you will see nothing, but the
parameters will display in the track area box. If you choose a closer view and the storm
projection is within it, the projection will be posted.
4.2.4 Deleting Storm Tracks
To remove the currently selected storm track, select Storm > Delete. To remove all existing
storm tracks, select Storm > Delete All.
4.3 Editing Storm Tracks
Once you create a storm track, you can edit the storm track and the places that appear
in the storm marquee box. You can do this with the Storm Track panel as described
below, or with the Storm Track Places panel (described in section 4.4).
Modifying Storm Tracks
Select the Storms option in the upper part of the panel to display the Storm Track
panel.
Storm Name identifies the current storm track (in this example, it is Storm 1).
Select a storm from the pull-down list. You can key in another storm name (for
example, Athens Storm 1 or Possible Tornado). In either case, click Update at
the bottom of the window. You should retain the number identification in the
heading and on the storm projection itself in case you post more than one
projection.
Type identifies the type of the current storm projection.
63
Managing Storm Tracks FasTrac Millennium User’s Guide – May 2003
Enable displays the current storm projection. It is possible, and in many cases preferable, to
create a storm projection but not display it. In this manner, you can track a storm that has
severe weather potential. Regardless, by deselecting Enable, you maintain the storm track in
memory without actually posting it.
Start Time refers to the time you made the storm projection. Make sure the computer time is
accurate. To change the time, go to the Windows desktop. Select Start ⇒ Settings ⇒
Control Panel to open the Control Panel menu. Double-click on the Date/Time option to
open the Date/Time Properties menu, and make your changes.
ID refers to the storm reference number noted at the time you made the projection. You may
delete earlier projections at times. For example, if the current storm track is the third
projection you have made, ID will be 3. The ID number resets when you use the Storm >
Delete All command.
AutoTrac invokes the AutoTrac function, which creates a new projection based on your
real-time radar or NEXRAD data. Wait at least five minutes after tracking a storm before
selecting AutoTrac. This gives the system enough time to make accurate updates. Select
AutoTrac, and click on the storm’s leading edge. The system computes the storm’s direction
and speed since the last update and plots a new projection. AutoTrac is more accurate at
closer viewing ranges because fewer pixels represent each mile on the screen. See Section
4.5, Using PasTrac, for more information. (PasTrac lets you track a storm’s progress by
comparing older radar data to the storm’s current position.)
Track Area parameters describe the storm. You can change any one or more of these
parameters and click Update to renew the storm track display. Some parameters are not
applicable to all storm track types. You can also click on Trac Edit, and then click on the
new storm’s leading edge to update to the new storm track.
Trac Edit maintains the same direction and speed. This helps when you
are tracking multiple storms associated with a storm front. Instead of
dragging for direction and speed for each storm, click Trac Edit and
you can move from storm to storm, all the way down a line of storms.
This lets you focus on each storm and clearly identify which
communities will be affected by that storm instead of displaying
multiple storm tracks on the same screen.
64
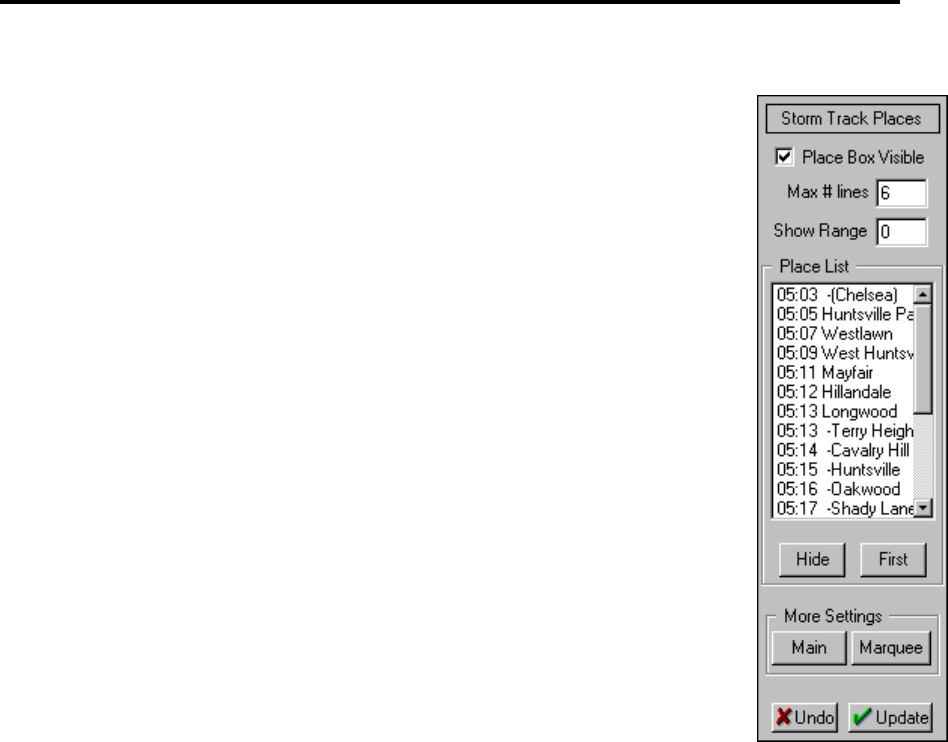
FasTrac Millennium User’s Guide – May 2003 Managing Storm Tracks
4.4 Editing the Storm Marquee
While the Storm Track panel is displayed, select the Places button to display
the Storm Track Places panel.
Place Box Visible lets you keep a storm projection but not post the storm
marquee. Deselect Place Box Visible, and then click Update to hide the
marquee.
Max # of Lines lets you change the number of communities listed in the
Storm ETA box, overriding the default number of lines defined by the ETA
Box Number Lines variable in your Storm Track Setup menu. This
allows you to quickly change the Storm ETA box.
Show Range lets you change the priority setting for communities posted.
For example, a Show Range of 0 will show all communities and a value of
15 will show all communities normally displayed at a 15-mile range. You
must click on Update to effect the change.
Place List shows all communities at risk according to the given storm
projection. Note that all the items in the list include the time and name.
Communities that have a hyphen (-) sign in front of them means they are
not listed (for example, the –Cavalry Hill listing in our example Storm
Track Places illustration). Surrounding parentheses means that the item is
hidden, such as -(Chelsea).
4.4.1 Selecting Communities for Your Storm Track ETA Box
The First and Hide buttons on the Storm Track Places panel control how communities appear
on the Storm Marquee.
Use the First button to assign a community to the first place in a track. In this example, assume
that a storm has passed the first three communities in your storm track. Go to the fourth; then
click First. Note that the communities instantly update. Repeat the procedure with any other
community to have it be the first displayed. The communities that are located before the one you
select as the first automatically assume a hyphen (-) sign to show that they no longer appear.
Use the Hide button to temporarily remove a community from the marquee. Select the
community, and click Hide. A set of parentheses appears around the community. Repeat the
procedure to hide other communities. To return a community to the display, highlight the hidden
community and click Hide. The system automatically hides places that have ETAs that are older
than the current system time.
4.4.2 Moving the Storm Track Marquee
If you would like to change the position of the storm track marquee, click on the Marquee option
under the More Settings area on the Storm Track Places panel. Move your cursor to the map.
You will see a miniature marquee on the screen. Click at whatever point you would like the
upper-left corner of the marquee to be displayed. The marquee will move to its new location,
65

Managing Storm Tracks FasTrac Millennium User’s Guide – May 2003
staying there through any map change until you move it again or delete it. You can also move the
storm track marquee around by clicking on it, holding down the mouse button, and dragging it to
the new location. The system holds in memory as many storm projections as you will ever use in
one severe-weather event.
4.5 Using PasTrac
The PasTrac feature lets you easily track the progress of a storm by comparing its current
position to its position in recent data. You can use PasTrac to automatically track either real-time
radar data or NEXRAD data, but the process is slightly different.
4.5.1 Auto-Tracking Real-Time Radar Data
Use the Radar > Log to File command to log your incoming data. You need to log radar data at
least five minutes before you can use PasTrac. Your radar should be in reflectivity mode five
minutes in advance. (This option should be active, by default.)
1. Zoom in for a close view of the storm (less than 25 miles). This will let you accurately depict
the storm.
2. Make sure you are in conventional mode (i.e., no NEXRAD product is in use).
3. Select Storm > Add Fan from the menu bar.
4. Display the Storm Track panel.
5. Click AutoTrac. The status panel on the upper-left portion of the display will indicate
Replaying archived data for AutoTrac. After a short period, the status panel indicates
Finished replay.
6. Carefully click on the storm’s position (where the storm was several minutes ago). Only click
once.
7. The status panel will indicate “Resweeping current radar for AutoTrac.” Upon completion,
carefully click only once on the storm’s new position for an instant auto-track.
4.5.2 Auto-Tracking NEXRAD Data
1. Show the product that you want to use (with the proper site selected) by using the
NEXRAD Main panel.
2. Zoom in to a close view of the storm (25 miles or less). This will let you accurately
depict the storm.
3. Select the Storm > Add > Fan command.
4. Invoke the Storm Track panel (if it is not already on screen).
66
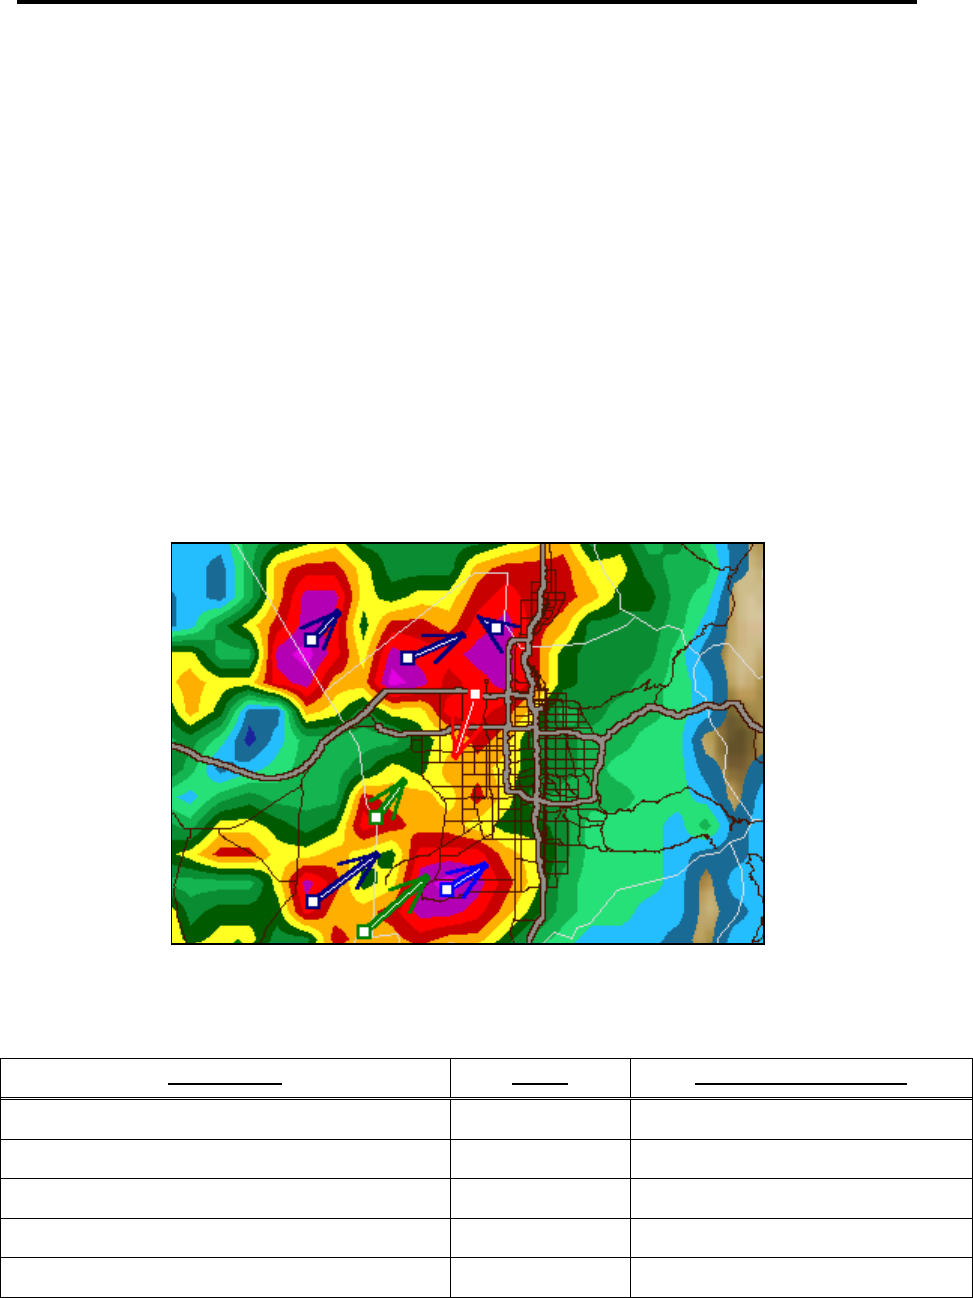
FasTrac Millennium User’s Guide – May 2003 Managing Storm Tracks
5. Select the AutoTrac button. The status panel will indicate, “Replaying archived data for
AutoTrac.” After a short pause, it will read, “Finished replay. Left-click on storm’s
position.”
6. Carefully click the position of the storm during this archived sweep. Click only once.
7. After the system finishes the NEXRAD replay, carefully click on the new position for an
instant auto-track.
4.6 Identifying Storms with StormScan
StormScan displays cell-by-cell characteristics of a storm system, letting you easily view and
summarize the characteristics of a storm, including the presence of hail, hail size, storm top
height, storm speed, and the direction in which the storm is traveling. You may also access
tornado signatures, max dBZ, and circulation through StormScan. You can easily review current
and past storm parameters by comparing two consecutive NEXRAD sweeps. In short, StormScan
displays the complete attributes of the storm system, as shown in the following example:
The following tables describe the default color codes used to describe weather characteristics.
The five SCITs in the first table are derived from National Weather Service data:
Description Color Code and RGB Value
Storms with Tornado Vortex Signature (TVS) LIGHT RED TVSAttributeColor=255,0,0
Storms with mesocyclonic activity DARK RED MesoAttributeColor=128,0,0
Storms with a chance of severe hail DARK BLUE SevHailAttributeColor=0,0,128
Storms with a chance of hail LIGHT BLUE HailAttributeColor=0,0,255
Normal thunderstorms GREEN StormAttributeColor=0,128,0
67
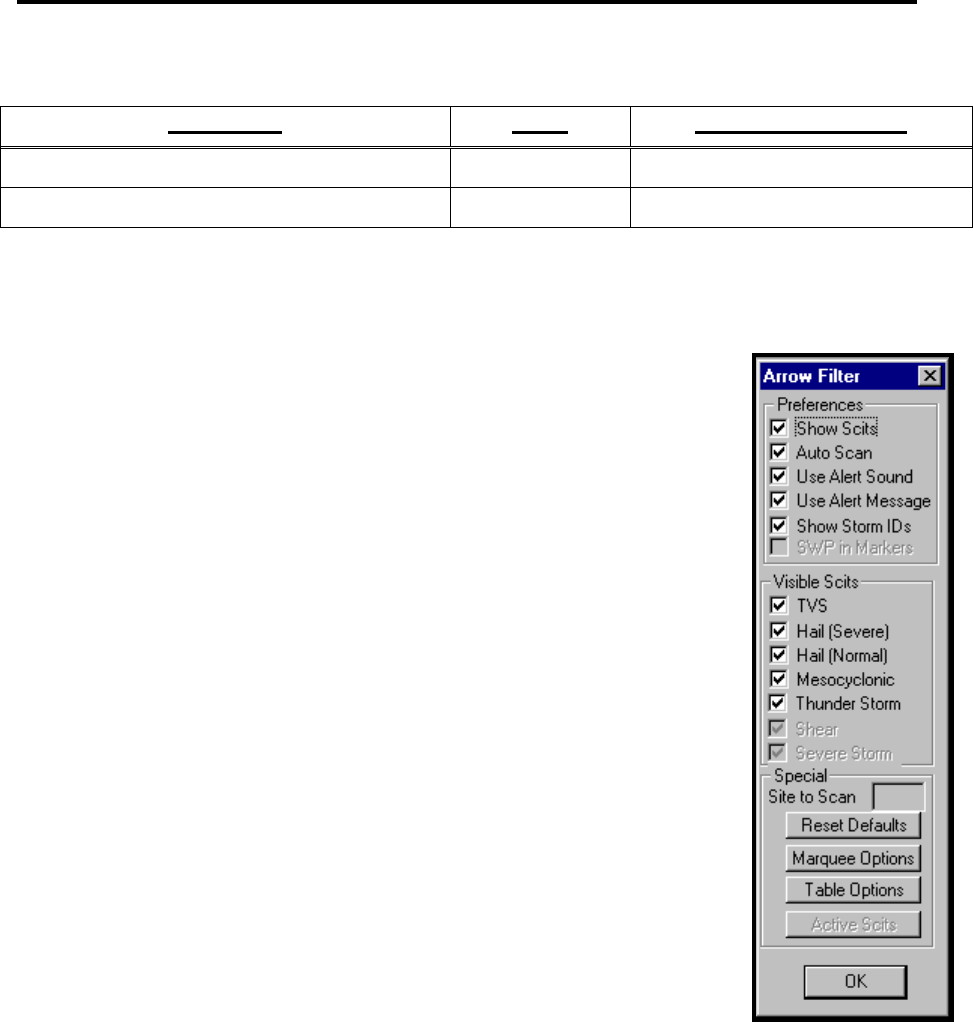
Managing Storm Tracks FasTrac Millennium User’s Guide – May 2003
The SCITs in the second table are derived from data provided by Baron Services algorithms:
Description Color Code and RGB Value
Storms with heavy rain, lightning, and hail PINK SevStormAttributeColor=255,0,255
Storms with wind shear ORANGE ShearAttributeColor=255,153,0
4.6.1 Setting Up StormScan
1) Open the NEXRAD Main panel, select Reflectivity or Composite and select Auto Update
on the NEXRAD More panel (NEXRAD page 2).
2) Select Setup > Storm > StormScan or click on the Scan hot button to
open the Arrow Filter panel.
Show SCITs displays storm arrows.
Auto Scan uses the most recent product for storm arrows.
Use Alert Sound issues an audible beep when a new product updates
attribute data.
Use Alert Message displays a small message box in an off-air area
of the screen to notify you of attribute updates.
Show Storm IDs displays the ID given to each storm by the National
Weather Service on the SCIT arrow.
SWP in Markers shows Severe Weather Probability on the SCIT
arrow.
Visible SCITs lets you toggle the display of SCIT arrows with
certain types of storms. For example, if you unselect the Thunder
Storm option, no green storm arrows will appear.
Site to Scan indicates the site that is currently using its composite
reflectivity products to provide storm attribute data. You cannot
change this attribute from the Arrow Filter panel; the currently active NEXRAD site
controls this display.
Reset Defaults resets the selections to the default selections.
Marquee Options opens the StormScan Marquee Setup menu (see section 4.6.2).
Table Options opens the StormScan Table Setup menu (see section 4.6.3).
You can left click on the base of one these arrows to make a regular storm track that matches this
storm’s criteria. The header of the storm track ETA box indicates the storms’ contents. Other
than the header, this storm acts just like any other storm track.
68
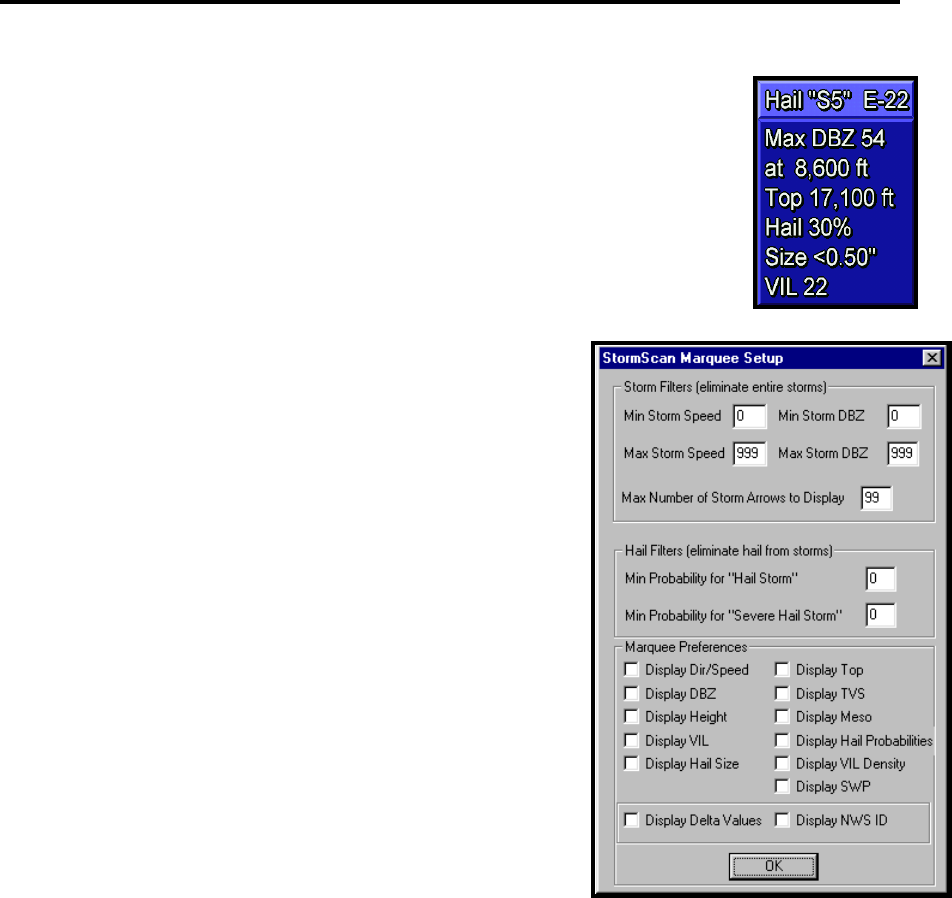
FasTrac Millennium User’s Guide – May 2003 Managing Storm Tracks
4.6.2 Using Storm Marquees
Right-clicking on the base of the storm arrow displays the marquee for the
storm. The marquee is similar in style to the storm ETA box, but it gives
information about the storm. This information includes storm direction, speed,
max dBZ level, height, VIL level, top altitude, probability of hail, hail size, and
whether it exhibits Tornado Vortex Signature (TVS) or mesocyclonic activity.
You can control which of these attributes to display by
selecting Marquee Options in the Arrow Filter panel and
opening the StormScan Marquee Setup menu. Be careful.
This menu appears in the on-air portion of the screen. To
toggle display of a particular attribute, click the option in the
Marquee Preferences area. VIL Density and SWP displays
are reserved for COBRA Storm Tracking.
The top-half of the StormScan Marquee Setup menu has two
other areas. Be careful: these options can be confusing. The
Storm Filters area lets you set the minimum values for speed
and dBZ. Storm arrows will not appear for any storm whose
speed or dBZ falls below the minimum specified value. The
maximum attributes work differently. Storms with values
higher than the specified maximums do not filter from
display. Instead, the marquee shows the maximum speed or
dBZ instead of the storm’s real values, and storm arrows
shorten to reflect the maximum speed rather than the storm’s
speed. This can be useful because the National Weather
Service sometimes sends values that are excessively high.
This ceiling feature prevents your viewers from seeing these
anomalies.
To understand the Max Number of Storms Arrows to Display option, you must understand
how the system decides which storms to display. You also should know the storm priority
formula. According to the current formula, the first attribute by which the system sorts storms is
the presence of a TVS. The next attribute that has priority is mesocyclonic activity, followed by
severe hail, normal hail, hail size, dBZ, and storm speed. The formula sorts storms with TVS and
mesocyclonic activities matched by the probability of severe hail. The process continues until it
sorts all of the storms. After sorting the list, the system takes the maximum number of storms
from the list.
The second part of the StormScan Marquee Setup menu is Hail Filters. This part does not filter
storm arrows from display. It merely flags the system that the marquee for that storm should not
display the value in question if the probability of hail or severe hail for any storm is below a
certain level. For instance, you might set the Min Probability for Severe Hail Storm to 50%. If
you then activate the marquee for a storm whose severe hail probability is less than 50%, the
marquee will not have a line that indicates the storm’s probability of severe hail. Furthermore, the
storm will not be dark blue, which normally indicates hail presence.
69
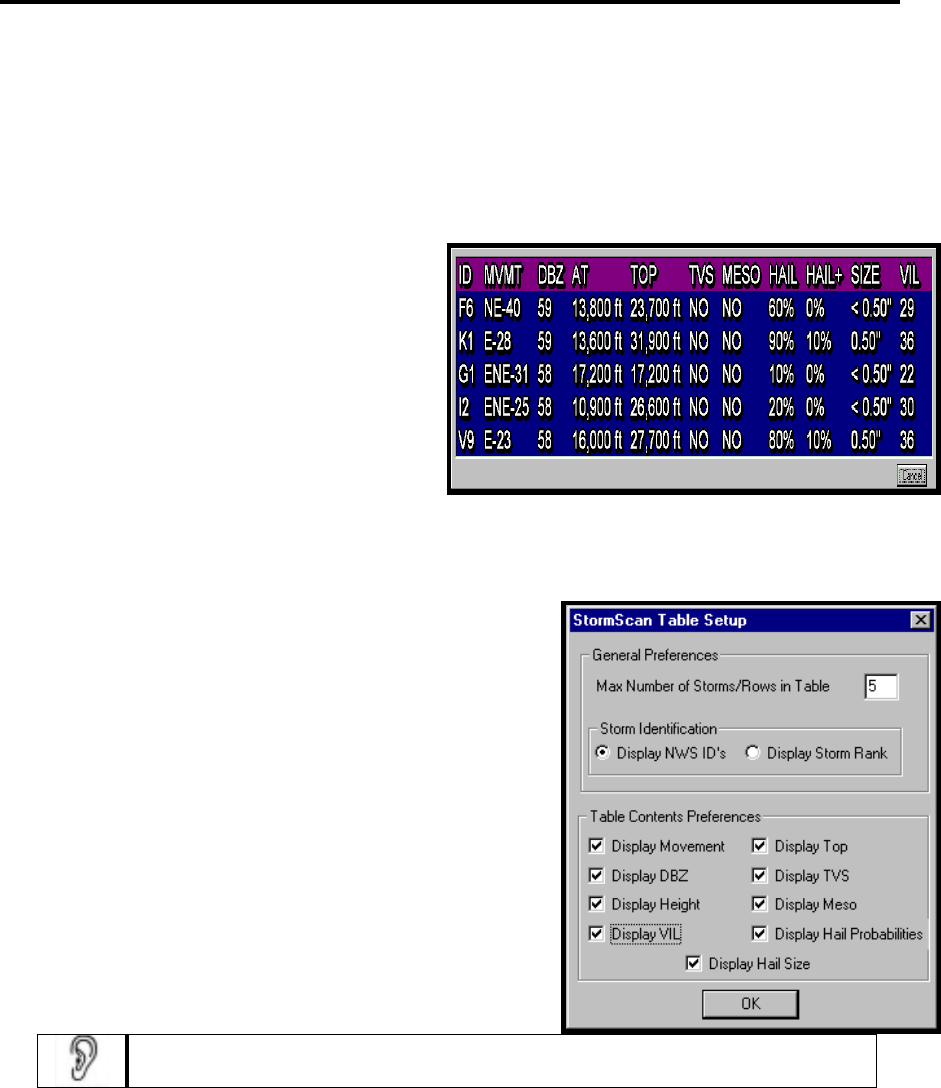
Managing Storm Tracks FasTrac Millennium User’s Guide – May 2003
Display Delta Values controls the feature that shows how much an attribute has changed for a
particular storm since the previous sweep. Display NWS ID causes the marquee header to show
the storm’s designation used by the National Weather Service.
4.6.3 Using the Storm Table
Another useful feature of StormScan is the
Storm Table, which is opened by right
clicking on the Scan hot button. The Storm
Table appears in the on-air portion of the
screen and displays the highest priority
storms. You can click on an item in this list to
activate the marquee for a storm. The system
will zoom in on that storm arrow, post the
storm marquee, and eliminate the other storm
arrows. You can then left-click on the storm
arrow to display an automatic storm track
based on the National Weather Service data. Right-click anywhere on the view to restore the
other arrows.
The StormScan Table Setup menu, which is opened by the
Table Options command in the Arrow Filters panel,
controls the Storm Table.
Max Number of Storms/Rows in Table specifies the
maximum number of storms that will display in the
Storm Table. If there are more storms than the
specified value, the system uses the storms with the
highest priority calculated by the formula.
Display NWS ID’s identifies the storm according to
the National Weather Service.
Display Storm Rank identifies the storm according
to the rank calculated by the storm priority formula.
Selecting Display NWS ID or Display Storm Rank does not change the order in
which storms are displayed. They are sorted by rank, regardless of the selection.
The Table Contents Preferences area lets you select which attributes are displayed in the Storm
Table. Be careful. If you select too many of these items, the table may not fit in the on-air portion
of the screen. Experiment before you present the Storm Table to your users. The font that is used
is controlled by the Setup > Fonts > Storm ETA Boxes command.
70
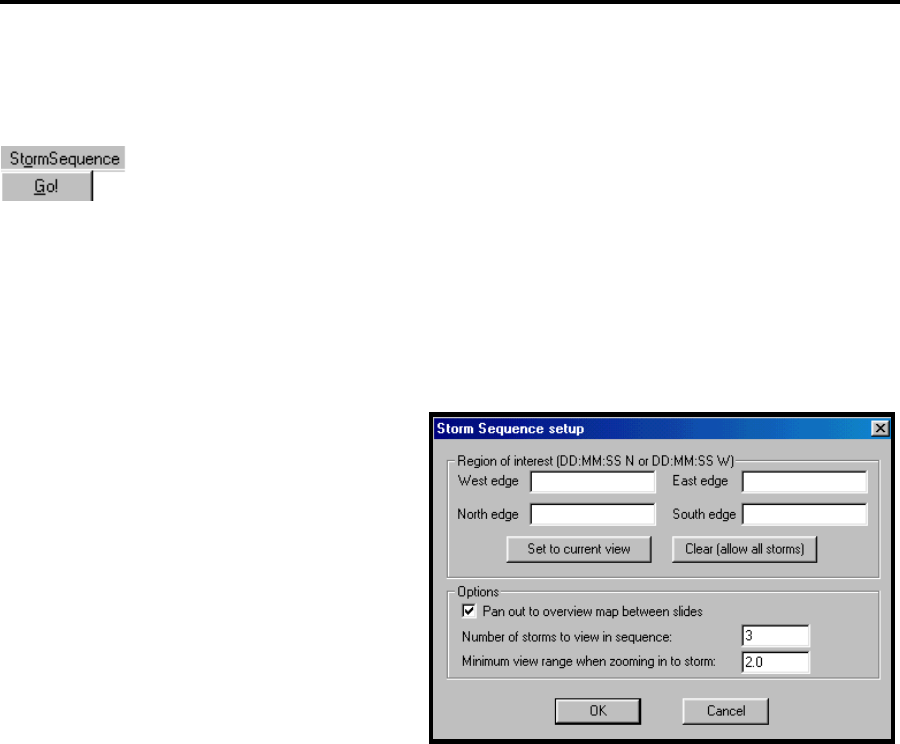
FasTrac Millennium User’s Guide – May 2003 Managing Storm Tracks
4.7 Creating Automatic Storm Sequences
The Storm Sequence Main Menu has only one control: Go!. The area is restricted
by the parameters you specify in the Setup > Storm > Storm Sequence
command. When you select Go, the program locates the most dangerous storm
within the current range, generates an ETA box that lists the communities that lie in the path of
the storm and the time at which the storm is predicted to arrive at each community, generates the
SCITs for the storm in question, and displays the storm track.
When you select Go again, the program repeats the same process for the next most dangerous
storm. We recommend that you limit the number of storms to four.
Setting up Storm Sequences
When you select Setup > Storm > Storm
Sequence, the Storm Sequence Setup menu
opens.
•
•
•
•
•
Region of Interest defines the
boundaries of your sequence by the
specified coordinates.
Set to current view changes the
sequence boundaries to match the
currently displayed view.
Clear (allow all storms) displays all storms regardless of geographical location.
Pan out to overview map between sides displays the overview map between lapses in your
sequence.
Number of storms to view in sequence specifies the maximum number of storms you can
track (we recommend 4).
Minimum view range when zoom in to storm specifies the minimum zoom range, in miles,
when you zoom in on a sequence. The zoom range is based on storm speed. This prevents the
system from zooming in too closely.
71

Managing Storm Tracks FasTrac Millennium User’s Guide – May 2003
4.8 Points to Remember
Before you begin to project storm tracks, use the Setup > Storm Track command to
set up the default parameters.
Determine what type of storm track will best depict the storm: fan, circle, or squall.
Change your storm track display quickly through the Storm Track panel. Always
select the Update option to put your changes into effect.
Use the Storm Track Places panel to change the storm track marquee listings and
the marquee’s position. You can always move the storm track marquee by clicking on
it and dragging it to a new location.
Use the AutoTrac command to have your system use real-time radar data or
NEXRAD data to create your storm track based on the actual movement of the storm
over a period of time.
Trac Edit moves storm tracks to a new position but does not change direction or
speed.
72
5. Using SEQUENCER
The Storm Tracking system has a variety of functions that you may automate by using
SEQUENCER capabilities. SEQUENCER lets you perform various operations, such as
displaying various maps, repainting radar sweeps, zooming and panning from one map to
another, and creating time lapses of radar and lightning data. When you group these functions in
a sequence, they become events. You may permanently save sequences of zoom, pan, and time-
lapse events on the system for later use.
SEQUENCER loads your events into RAM memory. This can take anywhere from a few seconds
to a minute to load the first time. On subsequent playbacks, the load takes only a few seconds. It
is best to preview your sequence before going on the air. This maximizes the performance of
your system.
This chapter describes the steps you need to execute to create an event, as described in the
following list:
Starting SEQUENCER
Creating and Manipulating Sequences
Creating and Using Zooms and Pans
Working with Time-Lapse Events
Combining Time-Lapse and Zoom Events
Repainting a Time-Lapse Event
Inserting NEXRAD Data in a Sequence
73
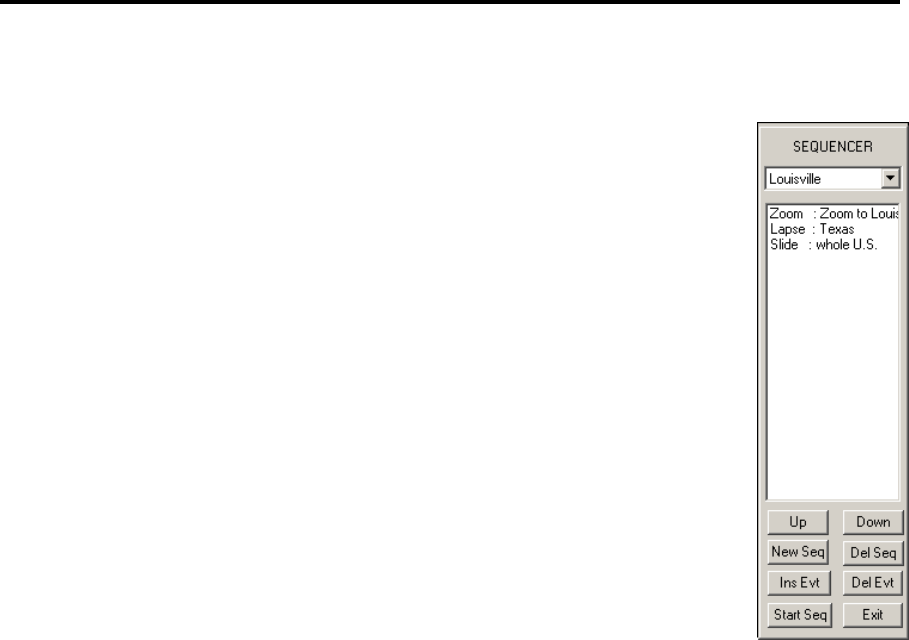
Using SEQUENCER FasTrac Millennium User’s Guide – May 2003
5.1 Starting SEQUENCER
To invoke SEQUENCER, click the Sequences button on the Select Panel at the
left side of your display. The SEQUENCER panel then opens. While this panel
is open, most non-sequence functions are inoperable. To exit the SEQUENCER
panel, click EXIT.
The SEQUENCER text box specifies the current sequence. To choose a
different sequence, open the pull-down list and select another sequence. If this
section is empty, it indicates that the system currently has no sequences.
The second part of the panel lists the current sequence's events. This list
appears directly beneath the name of the current sequence. Some of the events
have user-defined names. For example, you may call a zoom Zoom to L
or name a time lapse Texas. If an event consists of a slide (view), the event
name is identical to the name of the view. Other events, such as radar-sweep
repaints, do not have user-defined names. To view details about a particul
event, highlight the event to display a menu that describes the event in detail.
For example, slide events indicate the view’s name, range and mapping d
(such as the level of roads and water bodies). Other events, of course, have
different characteristics. The extended menu that describes zoom events
indicates the starting view, the ending view, and the number of frames in the
zoom. You can characterize time-lapse events by their base view, beginning time, ending time
iterations (the number of times that the full lapse repeats), and number of frames.
ouisville
ar
etails
,
The third part of the Sequence Control Panel is the section of buttons at the bottom of the panel:
Up, Down, New Seq, Ins Evt, Start Seq, Del Seq, Del Evt, and Exit. Use the Up and Down
buttons to move events around in the sequence. The remaining buttons provide functionalities
that are essential to the creation and manipulation of sequences and events. The following
subsections describe the use and functionality of each of these buttons.
5.1.1 Creating a New Sequence
Click New Seq to invoke a small menu that asks you for a sequence name. Choose the name
carefully because once you enter a sequence name you may never change it. You may, however,
delete the sequence.
1. Key in the name of the new sequence, and press ENTER or click OK to create the sequence.
2. When you create a sequence, the name automatically appears in the SEQUENCER panel.
The list of events (the second part of the SEQUENCER panel) is always empty when you
create a sequence. To fill the sequence with events you must use the Ins Evt command.
74
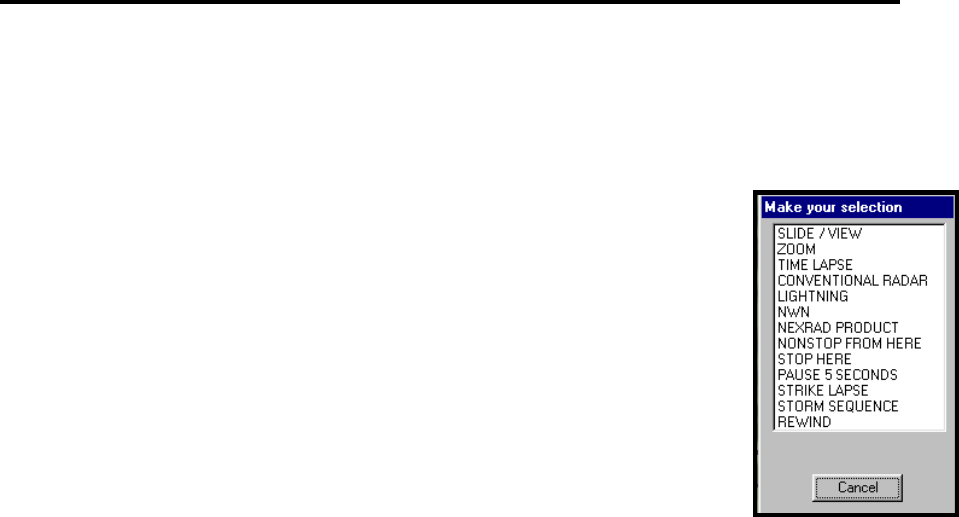
FasTrac Millennium User’s Guide – May 2003 Using SEQUENCER
5.1.2 Inserting New Events
1. If you have existing events and want to insert a new event, select the event under which you
want to place the new event.
2. Click Ins Evt button to open a selection menu. You can use this command
to create new events or to add existing events (such as zooms or time
lapses created for other sequences).
3. Review the menu that appears, including such items as SLIDE, ZOOM,
TIME LAPSE, RADAR, LIGHTNING, and NWN. The list of events
depends on the configuration of your system. For example, NWN events
are restricted to users who also have the optional Neighborhood Weather
Net system and LIGHTNING events are restricted to users with integrated
lightning detection. You may use the Ins Evt function to insert an event in
a particular location (such as between two existing events in the list).
4. Double-click on the event you want to insert, and verify that the selected
event displays in the sequence list.
5.1.3 Deleting Events from Sequences
1. Select the event you wish to delete.
2. Click Del Evt. A confirmation menu will ask you to verify the deletion.
3. Click Yes to remove the event.
The Del Evt command does not permanently delete events from your system. For example, if
you delete a zoom called Zoom to Huntsville from a particular sequence, it may still exist as an
event in other sequences. It will still be available as a choice when you select INS EVT and
select a zoom event. To permanently delete a zoom or time-lapse from the system you actually
have to use the insert event feature. When the menu offers a particular event name, you may
highlight it and hit the delete button.
5.1.4 Deleting Sequences
Select Del Seq to delete the current sequence. The current sequence’s name and events appear on
the SEQUENCER panel. When you delete a sequence, its events are not deleted from your
system. Instead, zooms or time lapses that are part of the system are still available as choices
when you use the Insert Event option.
5.1.5 Starting and Playing a Sequence
The Start Seq command displays all events in the current sequence.
1. Select Start Seq. SEQUENCER scans the sequence for zooms and time lapses. If
SEQUENCER locates such events, the Loading Frames message displays and you cannot
select any SEQUENCER command. SEQUENCER then loads the frames of the first zoom or
75
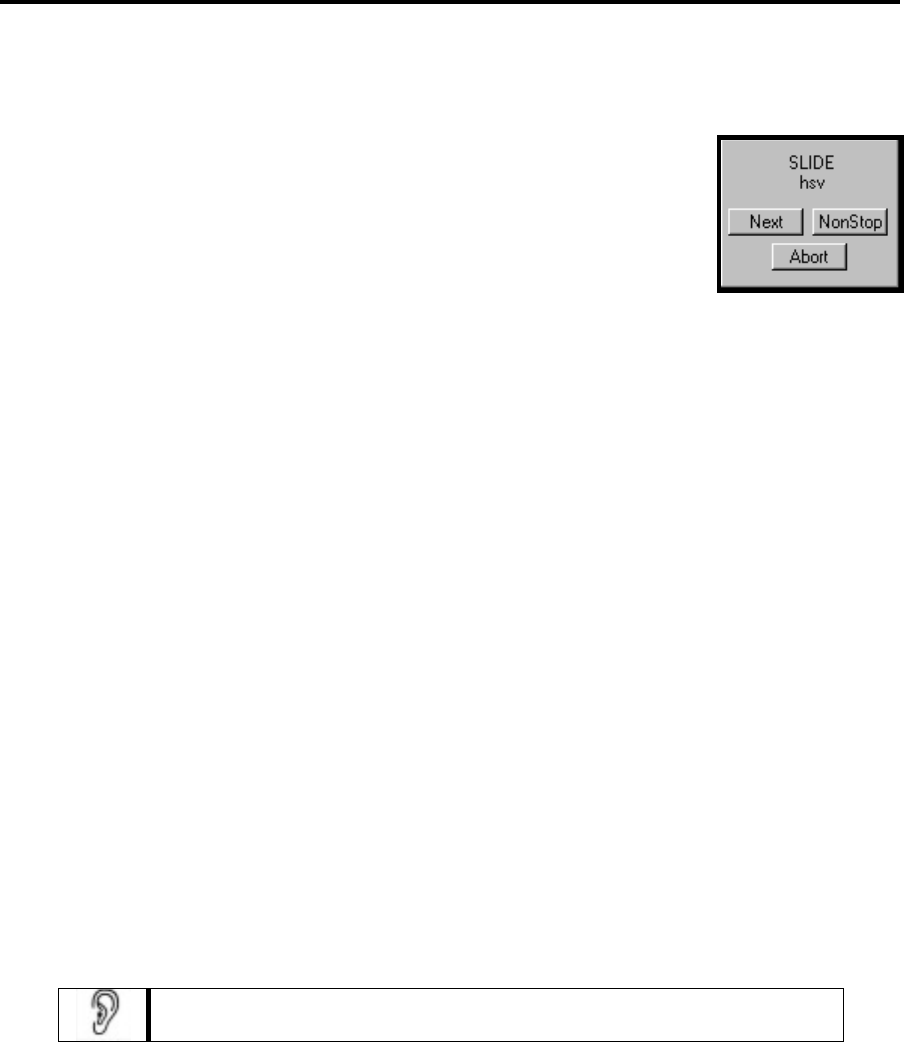
Using SEQUENCER FasTrac Millennium User’s Guide – May 2003
time lapse to electronic memory. This allows the system to display these frames at a higher
speed upon recall. This operation may take several seconds.
2. SEQUENCER displays a window that describes the first event. This
window also has three command buttons: Next, NonStop, and Abort.
Next displays the next event. During the sequence, the machine
will pause before each zoom or time lapse to load the event's
frames. SEQUENCER displays the Loading Frames message each
time that this occurs.
NonStop displays the ensuing events without pausing. You may select NonStop button
at any time during the sequence execution to display the remainder of the sequence
without pausing.
Abort exits from the sequence review function.
5.1.6 Exiting SEQUENCER
EXIT simply exits SEQUENCER. This command removes the SEQUENCER panel and enables
the functions that are not sequence related. You may use the EXIT command any time that it is
visible. Your sequence and event data are saved. If SEQUENCER is busy, such as when creating
a zoom or prompting the operator for input, EXIT will have no effect.
5.2 Using SEQUENCER with Zooms and Pans
Zooms and pans are special groups of .bmp picture files that you use to create a zoom or pan
effect. In the case of zooms, the map's center remains the same, while the range decreases to
create a zooming-in effect. (The range may increase instead of decreasing when you zoom
outward.) In the case of pans, the map's range stays the same but the center point changes to
create a panning effect. You may also combine the zoom and pan effects by allowing the map’s
center and range to change at the same time to create a simultaneous zooming and panning effect.
Frequently, we refer to zooms and pans separately, but a pan is merely a zoom with a center point
that changes considerably more than its range.
You can create the same effect for non-SEQUENCER zooms and pans by
using the Smooth Transitions feature, found on the View Main panel.
The following conditions must exist before you start this operation:
You must have already created the view at which you want to start and the view at
which you want to end. You cannot create views from inside the zoom function: you
can select only from pre-saved views. See Section 3.4.1 for information on creating
views.
It is important to use a meaningful naming convention when you create your zooms,
so that you can recognize and use them in the future. We highly recommend
descriptive names. Assume that you might have a start with a 150-mile map centered
over Huntsville, Alabama, and name it HSV 150. You then zoom in to a 5-mile map
76
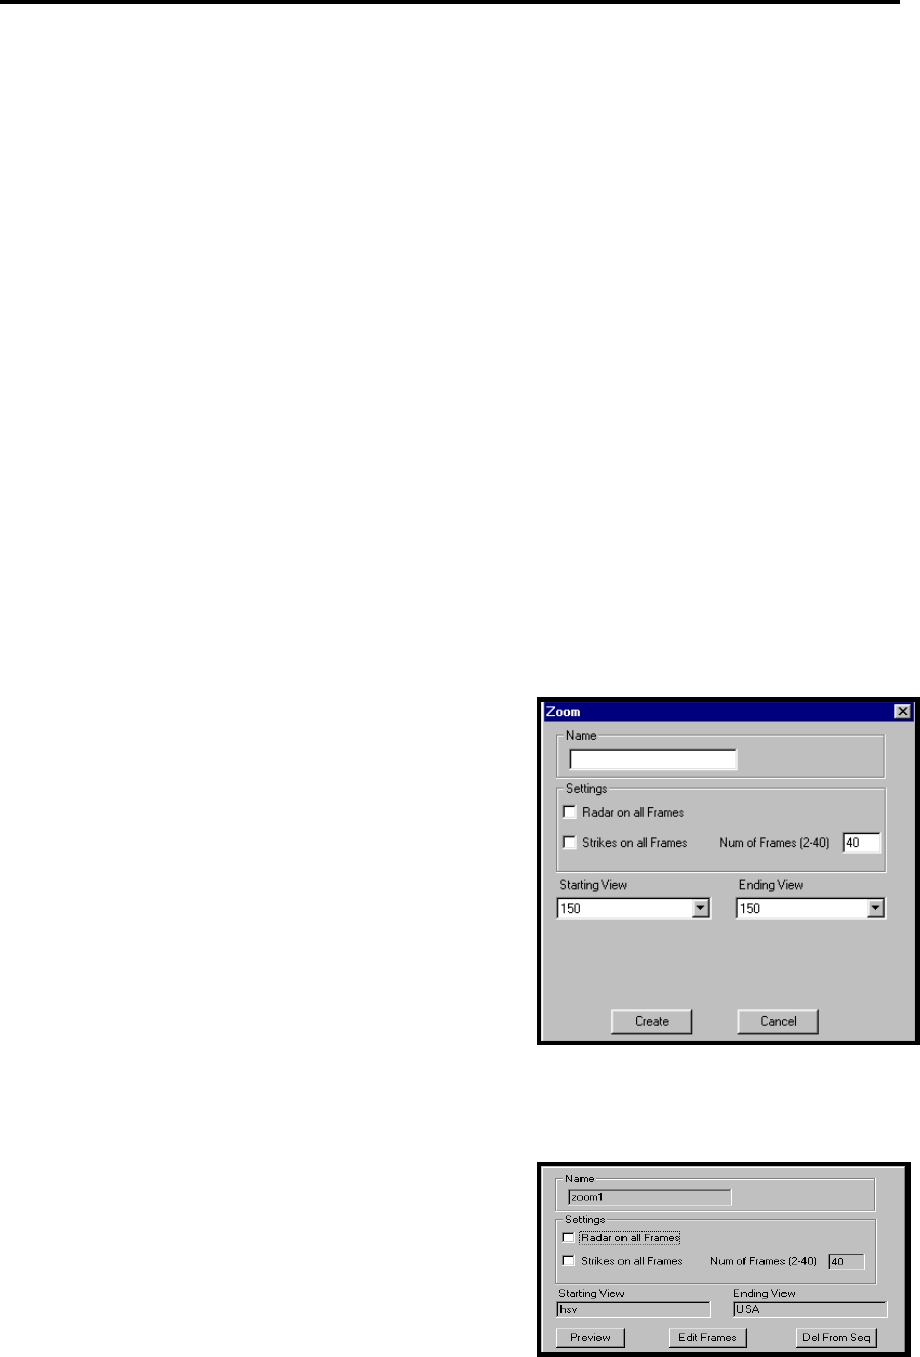
FasTrac Millennium User’s Guide – May 2003 Using SEQUENCER
centered over Athens, Alabama, and name it Athens 5. One suggested name of this
zoom is HSV 150 to Athens 5. This naming convention makes it very easy to return to
SEQUENCER, identify the pans and zooms you have created, and retrieve them for
immediate use.
The system uses the starting view parameters to determine the parameters of the other
views. This means, for example, that if the map lines are bold for the starting view,
they will be bold for all the views in between.
5.2.1 Creating Zooms and Pans
The following operation is the same used to create pan events. If the starting and ending views
have the same approximate center point but have considerably different ranges, the event will be
a zoom. If the views have completely different center points and equal ranges, the event will be a
pan. The system does not differentiate between a zoom and a pan. It just creates the intermediate
frames based on the specified starting and ending views. Zooms and pans are both in the zoom
category.
1. Open SEQUENCER, and click Ins Evt to open the selection menu.
2. Double-click on the ZOOM listing to open the Event List menu. This menu lists the available
zooms and includes the Create New, Delete, and Cancel commands. If no zooms or pans are
in the system, the list of available zooms will be blank (the maximum allowed at one time is
19).
3. Click Create New to open the Zoom menu, which
lets you to define the new zoom parameters.
4. Key in the new zoom name in the Name text box.
5. Specify the starting and ending views from the pull-
down lists. You must create your views before you
create a zoom event.
6. Specify the number of frames that that will be in
the zoom event. (You can display 2 to 40 frames.)
7. Click Create. The Creating Frames message
displays. SEQUENCER will post the starting view, the ending view, and each intermediate
frame and then play the new zoom event. The intermediate frames and the zoom name are
saved on the hard drive. This data will remain on your system until you choose to delete it.
5.2.2 Previewing Your Zoom Event
After you create a zoom or pan, the event appears on
the event list beneath the current sequence name. Click
on the event name to open a menu that describes the
zoom. This menu indicates the name of the zoom or
pan, the number of frames, the starting view's name,
77
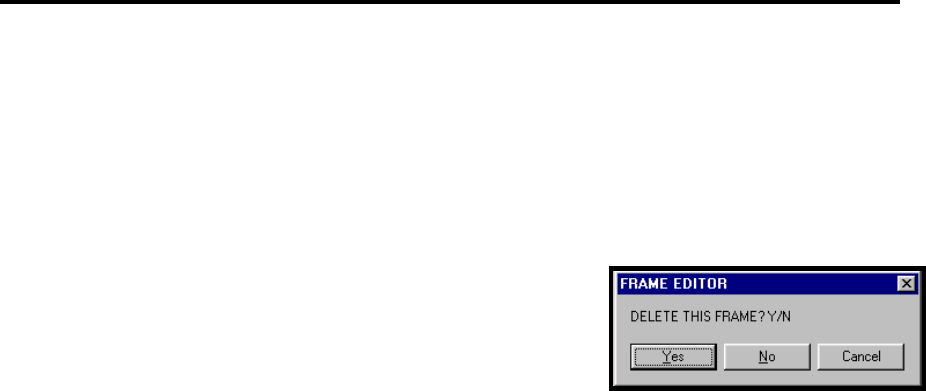
Using SEQUENCER FasTrac Millennium User’s Guide – May 2003
and the ending view's name. It also contains the Preview, Edit Frames, and Del From Seq
commands.
1. pears
previewing an event, this message does not appear on the screen during sequence play.
2.
e
s,
you
select CANCEL or until the preview is complete.
3. Evt
command at the bottom of the SEQUENCER panel to perform this same operation.
5.3 Working with Time-Lapse Events
There are several important points to remember when creating a time-lapse event:
erely pick from pre-
saved views. See Section 3.4.1 for information on creating views.
,
ge
n you look at this time lapse, you will be able to identify it for
future use or deletion.
e
at the lapse will cover. (The Log to File
command should be active, by default.)
by inserting a
NEXRAD product with more than one frame. See Section 5.6 for details.
Click Preview. As your system loads the zoom frames, the Loading Frames message ap
and remains during frame loading and the preview of the zoom frames. Unless you are
Click Edit Frames to display the event frame-by-frame.
The Loading Frame message appears. After loading, th
first frame displays and the Frame Editor menu open
asking if you want to delete the frame. This process
continues through the frame-by-frame display until
Click Del from Seq to delete the zoom from the sequence. You may also use the Del
You must create the view you wish to show before you create the time-lapse event. You
cannot create views from inside the time-lapse function. You can m
It is very important to use a meaningful naming convention when creating time lapses, so
that you can recognize and use them in the future. We recommend that you use the date
time frame, and map of the time lapse. For example, 2-26 4-6pm HSV 25 could be the
name for a time lapse on February 26, from 4 to 6 p.m., on a Huntsville map with a ran
of 25 miles. Later, whe
Before you can create a real-time time lapse, you must use the Radar > Log to Fil
command to log data during the period th
You can create a NEXRAD time-lapse that always displays the latest data
78
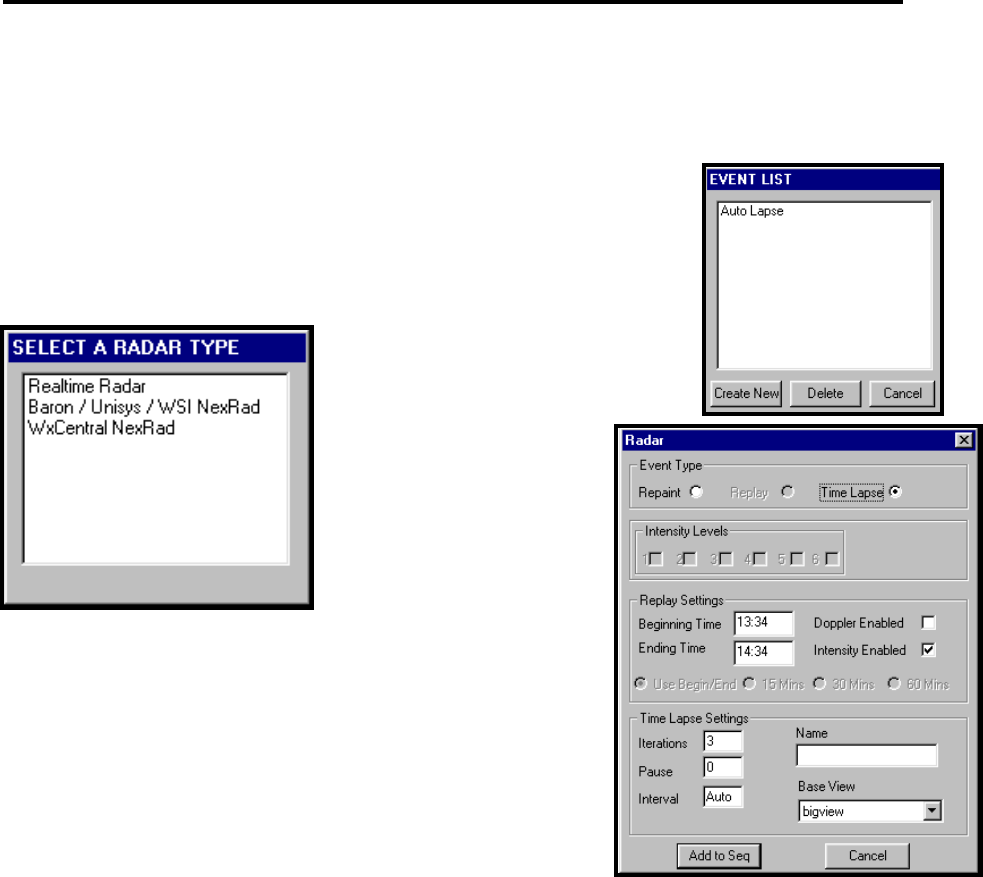
FasTrac Millennium User’s Guide – May 2003 Using SEQUENCER
5.3.1 Creating Real-Time Radar Time-Lapses
1. Open SEQUENCER, and click Ins Evt to open the selection menu.
2. Double-click on the TIME LAPSE listing to open the Event List,
which lists the available time lapses. If no time lapses are in the
system, the list will be blank.
w time.
3. Click Create New to open the
Radar Type menu.
4. Select REALTIME
RADAR to open the
Radar menu, which lets
you define the radar
parameters for a time
lapse. In the Event Type
area, click Time Lapse.
5. Key in the time-lapse name in the Name text box.
6. Select the base view that the time lapse will use. To keep
the current view, do not change Base View.
7. Set the Beginning Time and Ending Time parameters to
fit your needs. The default times create a lapse for the last
hour according to the system clock. These times are in
military time. To change them, click in the appropriate time
text box and key in the ne
8. Change the following parameters to fit your needs:
Iterations specifies the number of times that the entire time lapse will appear when
viewing the lapse event.
Pause specifies the time, in milliseconds, between time-lapse frames. 1000
milliseconds=1 second.
Interval specifies the number of sweeps composed in each frame. For example, an
interval of 1 (the default value) records a frame after each sweep. An interval of 2
records a frame every other sweep.
9. Click Add to Seq. The system will then create the time lapse and insert it into the current
sequence. This data will remain on your system until you choose to delete it.
79
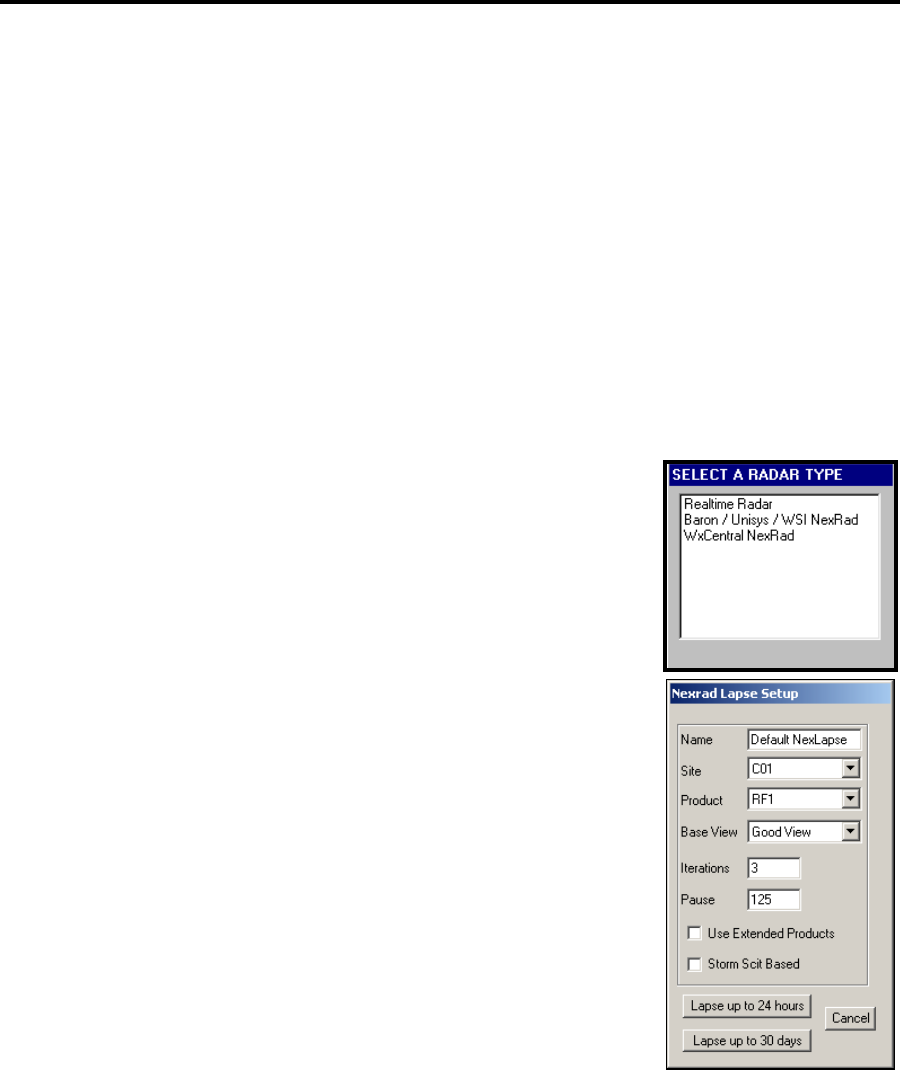
Using SEQUENCER FasTrac Millennium User’s Guide – May 2003
5.3.2 Creating NEXRAD Time-Lapses
1. Configure your ingestor program (such as NetRad or WSIrad) to delete NEXRAD files that
are older than four hours. (This will retain the setting and only needs to be set once.) The
procedure is different for different programs.
2. Open SEQUENCER, and highlight the sequence's event after which you want to insert the
time lapse. (If no events exist in this sequence, the new time lapse will become the first
event.)
3. Click Ins Evt to open the selection menu.
4. Double-click on the TIME LAPSE listing to open the Event List, which lists the available
time lapses. If no lapses are in the system, the list of available lapses will be blank.
5. Click Create New to open the Radar Type menu.
6. Select the radar type that describes your needs:
Baron/Unisys/WSI NexRad or WxCentral NexRad.
7. Select the Name text box, and type in a unique name (the system
will warn you if you pick an existing name). Select the NEXRAD
site from the Site pull-down list. The system will only let you
choose sites from which your system has products. The product
pull-down list, however, lists all possible products, not just the
ones available.
8. Specify the number of iterations and the pause between frames, in
milliseconds. (See step 8 in section 5.3.1 for explanations of the
terms.)
9. Click Lapse up to 24 hours to list all the available NEXRAD
files for the specified site and product from the last 24 hours, or
click Lapse up to 30 days to list all files from the past 30 days.
10. Select individual products to use in the time lapse by clicking on the first file you want, and
then holding down the CTRL key while you select subsequent files, or select a range by
clicking on the first file you want and then holding down the SHIFT key while you select the
last product.
11. When you have highlighted all the products you want in the lapse, click Create Lapse. If you
have done everything correctly, the system will use the selected products to create a time
lapse. You can play back and edit this time-lapse event like any other time-lapse event.
80
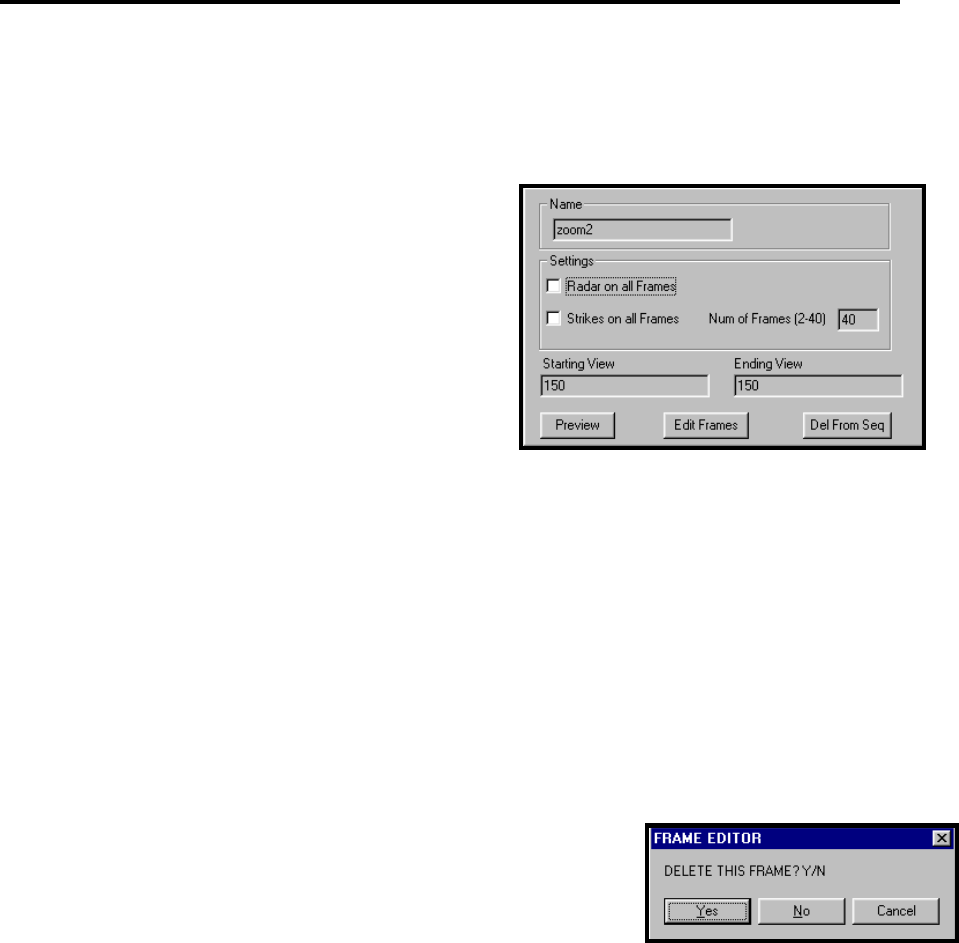
FasTrac Millennium User’s Guide – May 2003 Using SEQUENCER
5.3.3 Previewing Your Time Lapse
After you create a time-lapse event, SEQUENCER adds the new event to the list on the
SEQUENCER panel, which you can them preview.
1. Open the SEQUENCER panel.
2. Click the event name to open the menu that
describes the lapse. This menu indicates all of the
information that you entered for the lapse.
3. Click Preview. As the your system loads the
lapse frames, a message displays Loading
Frames. This message remains on the screen
during frame loading and during the preview of
the time lapse.
4.
es, select
SEQUENCER panel or select Exit from the bottom of the
SEQUENCER panel.
5.3.4 Editing Time-Lapse Frames
a particular frame in a time-lapse event, use the following steps to permanently
delete the frame:
1. Open the SEQUENCER panel.
2.
s all of the information that you have
entered for the time lapse.
3.
lect Edit Frames, the first frame displays and you are asked if you want to
delete the frame.
4. Click Yes to delete the frame, or click No to advance to the next frame.
5. Click Cancel to end the frame editing and to quickly display the remaining frames.
5.4 Combining Time-Lapse and Zoom Events
tive operation is to combine the time-lapse and zoom events, as described
in the following steps:
1. Create a sequence with an overview slide. (A slide is just a static map view.)
2. Add a time lapse of the past several hours.
To delete the time lapse from the sequence, select Del From Seq or select Del Evt at the
bottom of the SEQUENCER panel. To exit from the process without making chang
another event from the
If you do not like
Click the event name to open the menu that describes the lapse.
This menu indicate
Click Edit Frames to display the time-lapse one frame at a
time. When you se
One dramatic and effec
81
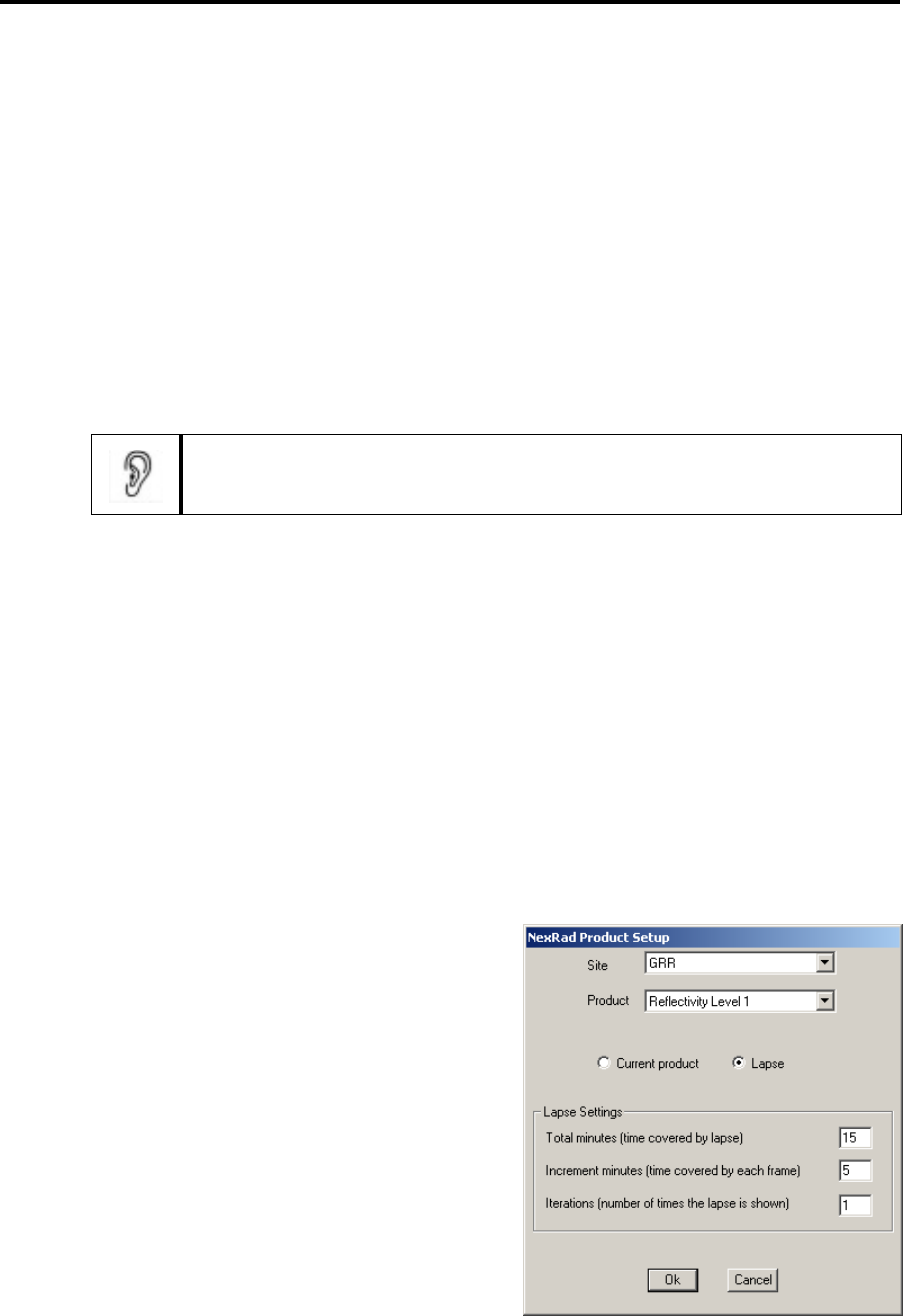
Using SEQUENCER FasTrac Millennium User’s Guide – May 2003
3. Zoom in to the location where the heaviest rain occurred.
4. Do another time lapse over that location. This provides both the overview and the local
weather information, which makes a difference to your viewers.
5.5 Repainting to a Sequence
1. Open SEQUENCER, and click Ins Evt to open the event types menu.
2. Double-click CONVENTIONAL RADAR. This will open the menu that we used earlier to
create a time lapse.
3. Select Repaint, and click Add to Seq.
In SEQUENCER, the system usually paints (displays radar sweeps) views
in the sequence. Repainting is still useful, however, for switching from
NEXRAD mode to real-time radar mode in the middle of a sequence.
5.6 Adding a Radar Lapse to a Sequence
This function allows you to add a real-time radar lapse into a sequence.
1. Open SEQUENCER, and click Ins Evt to open the event types menu.
2. Double-click CONVENTIONAL RADAR. This will open the menu that we used earlier to
create a time lapse.
3. Select Replay, specify the lapse time and whether you want Doppler or Intensity data, and
click Add to Seq.
5.7 Inserting NEXRAD Data in a Sequence
1. Open SEQUENCER.
2. Select Ins Evt, and double-click NEXRAD
PRODUCT to open the NEXRAD Product Setup
menu.
3. Click the Lapse radio button to activate the Lapse
Settings area.
4. Under Lapse Settings, enter the number of
Iterations (times the lapse is shown), the time in
minutes for the entire lapse and the time allocated
to each frame (the total time divided by the time
per frame equals the number of frames that will be
created).
5. Select the site and the product, and click OK.
82
FasTrac Millennium User’s Guide – May 2003 Using SEQUENCER
You should insert this event after a slide/view event. The system will continue to be in NEXRAD
mode until you activate a repaint event.
Specifying a number of frames greater than 1 allows you to
create a NEXRAD time-lapse that is always up to date.
5.8 Points to Remember
Use SEQUENCER to display saved mapping scenarios, such as zooming into
areas with critical weather and time lapses of radar and lightning data.
Before you create zoom and time-lapse events, you must create the starting and
ending views.
Name your events so that you easily can recognize them when you need to replay
them.
Use Preview to review your zoom and time-lapse events before you play them
for your viewers.
Use the Repaint and Replay options under the Conventional radar menu to add
real-time radar sweeps and time-lapses, respectively.
83
6. Controlling Your Radar
This chapter describes how to control both Baron and non-Baron radars. Non-Baron radars are
controlled through the Radar Control panel and Baron radars are controlled through the Radar
Data Acquisition and Control System (RDACS). The operations described in the following
subsections include:
Controlling Your Non-Baron Radar
Controlling Your Baron Radar
Using NEXRAD Data
Comparing Base Reflectivity and Composite Reflectivity
85
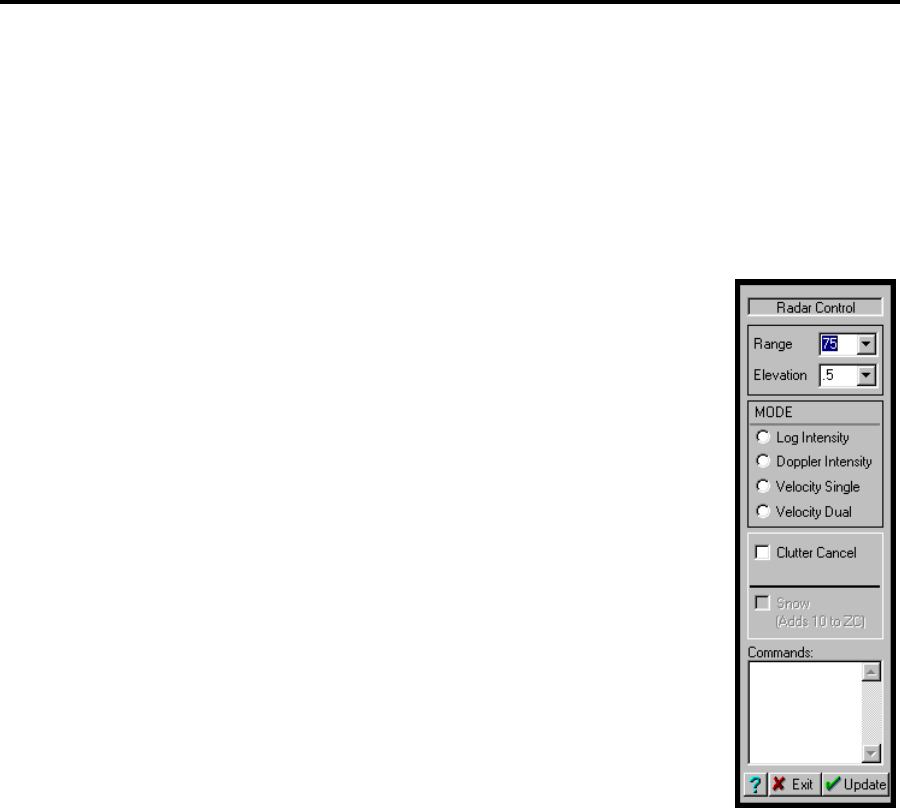
Controlling Your Radar FasTrac Millennium User’s Guide – May 2003
6.1 Controlling Your Non-Baron Radar
If you have a Baron Radar Processor, you can use the procedures described in this section to
control your radar’s range and operating mode.
1. Click the Views button on the Select Panel, then click the Data button on the More Settings
panel.
2. Click the Radar Control button to open the Radar Control panel.
Range specifies the radar’s range. You can either enter a number or
select a choice from the pull-down list.
Elevation specifies the radar’s elevation. You can either enter a
number or select a choice from the pull-down list.
Log Intensity selects the long-lapse log mode, which extends 300
miles.
Doppler Intensity selects the 75-mile Doppler mode.
Velocity Single selects the single-PRF mode, which extends 75 miles
and has a +/- signal of 16 miles per hour.
Velocity Dual selects the dual-PRF mode, which extends 75 miles
per hour and has a +/- signal of 37 miles per hour.
Clutter Cancel negates the clutter filter. There are two types of
clutter filters: Mask and Doppler. The system automatically
determines which one applies, based on the current mode of operation.
Snow opens the Snow Machine panel, which allows you to select from several products
created by the Snow Machine. Refer to section 6.3.1 for product descriptions.
Commands lists the radar command that fits the requested adjustment. This area merely
lists the commands, which are not sent until you select Update. If you select Exit, the
commands are not sent and you exit from the Radar Control process.
3. Make the required selections, and review the Commands area. To remove a command, drag
the mouse across the command text, and press Delete. To add a command, click after the last
command and key in the command. If there are more commands than can be listed, use the
scrollbar on the right side of the box to review them.
4. Click Update.
6.2 Controlling Your Baron Radar
If you have RDACS, you can use the procedures described in this section to control your radar’s
range and operating mode.
86
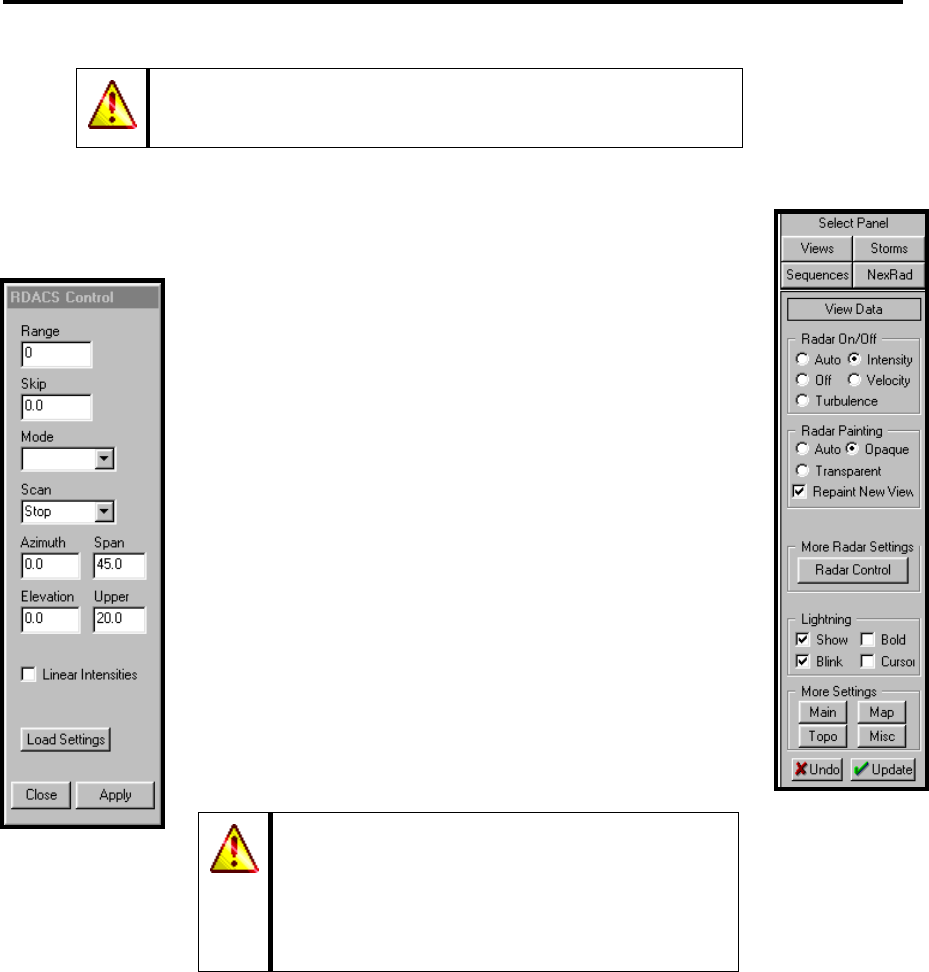
FasTrac Millennium User’s Guide – May 2003 Controlling Your Radar
The Status > Rdac status command allows you to quickly
ensure that your radar is connected and functioning properly.
Click the Views button on the Select Panel, then click the Data button on the
More Settings panel.
Click the Radar Control button to open the RDACS
Control panel.
Range sets the range, in miles. In Doppler mode, the
maximum range is usually 75 miles; in log mode, the
range is usually 300 miles. The radar’s configuration,
however, may affect the maximum. For better
resolution of closer targets, set the range less than the
maximum range. If you apply a range greater than the
maximum allowed for the radar mode, RDACS will
use the maximum valid range and will display the
“corrected” value.
Skip specifies the range, in miles, from which
acquisition begins. For example, a value of 1 means
that data sampling will begin one mile from the radar.
Use Skip to remove the display of the strong signal
received just after the radar pulse. (A typical value to
use for Skip is 0.5 to 5.0 miles.)
The Radar Paint Skip Zone setting in the
Omninet.ini file controls what appears in the
skip zone. A value of 1 means that no radar data
appears in the skip zone. A value of 0 means
that a new sweep does not clear any previously
displayed data in the skip zone.
87
Controlling Your Radar FasTrac Millennium User’s Guide – May 2003
Mode specifies the radar mode. While not all modes are valid for all radar types and may
not appear in the pull-down list, the following list describes the possible modes:
Mode Description
Powerdown Radar electronics are off.
Standby Radar electronics are on, but the transmitter is off.
Long Long pulse, no velocity, and range up to 300 miles.
Log+Turb Log mode plus detection and display of turbulence in return data.
Single PRF Single-pulse Doppler mode, range 75 miles, +/- 16 m/s.
Dual PRF Dual-pulse Doppler mode, range 75 miles, +/- 32 m/s.
VHD Very High Definition (dual-pulse) Doppler mode, range 49 miles, +/- 48 m/s.
When you select a mode, the typical values for range and velocity appear. When you
select Powerdown, it may take several minutes before the radar shuts down (cools off).
When the radar powers up, it will take several minutes before radiation is possible. You
can observe the status at the RDACS computer or view the H250C.EXE or config.exe
programs.
Scan specifies one of the antenna modes described in the following list. Select PPI for
constant rotation in azimuth with a fixed elevation. Use Sector to scan a sector in
azimuth. Use RHI to scan in elevation with a vertical cross-section. Use Stop to point the
antenna to a target. The following table shows which fields work in each antenna mode:
Mode Azimuth Span Elevation Upper
Stop X X
PPI X
Sector X X X
RHI X X X
Azimuth sets the antenna azimuth, in degrees.
Span sets the antenna angle, in degrees, traversed in Sector mode.
Elevation sets the lower scan limit for antenna elevation, in degrees, in RHI
mode.
Upper sets the upper elevation limit, in degrees, in RHI mode.
88
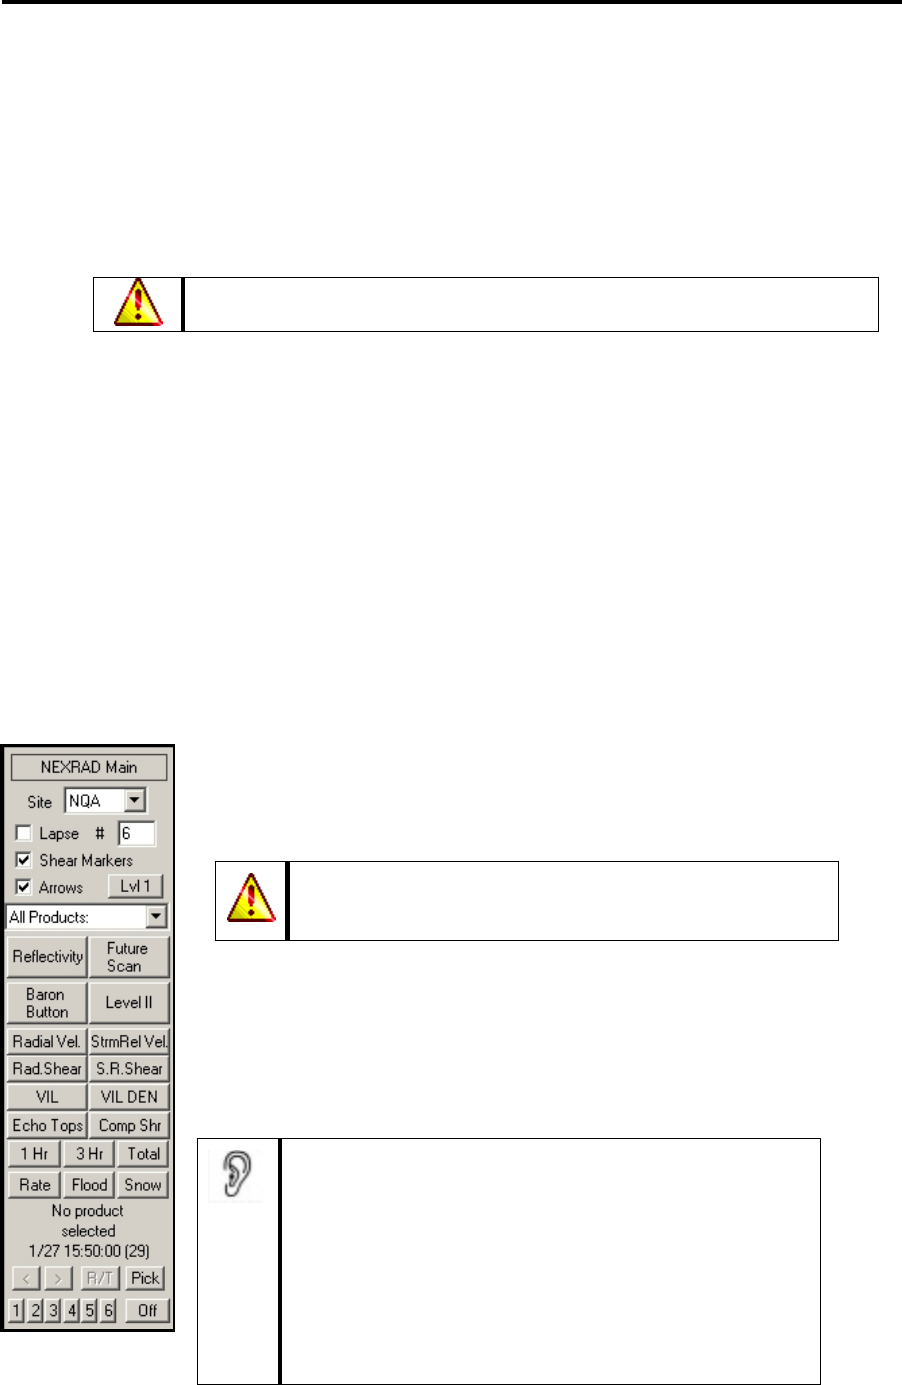
FasTrac Millennium User’s Guide – May 2003 Controlling Your Radar
Linear Intensities controls which format of reflectivity data the radar uses when it is in
one of the Doppler modes. Typically, early RDACS controllers leave it off and later
controllers leave it on. On the early RDACS controllers (HDDS.EXE), both linear and log
reflectivity data are available and the log data is usually of higher quality, so leave the
Linear Intensities option unselected. On the newer RDACS controllers (H250S.EXE),
only linear data is available during Doppler modes, so you must select Linear
Intensities.
The Linear Intensities option is set in later versions. Once activated, it
will remain set, even if you exit and reload the program.
Load Settings loads a saved RDACS configuration. You can create and save up to 10
configurations (labeled 0 to 9) using the RDACS control program, the H250C.EXE or
HDDC.EXE file. Configuration 0 is the loaded whenever you restart RDACS. The other
configurations can be whatever you desire. For example, Configuration 1 could use a
different color level table to implement a clear air mode. By convention, Configurations 8
and 9 are temporary "saves" of test configuration. Load Settings opens up a menu that
lets you select the numbered configuration to load.
6.3 Manipulating NEXRAD Data
The system’s functionality allows direct manipulation of NEXRAD radar data.
6.3.1 Using the NEXRAD Main Panel
Click the NexRad button on the Select Panel to open the NEXRAD Main
panel. You can use this panel to display any NEXRAD product (such as a
reflectivity or velocity sweep) on any view. You may also show several
products at the touch of a button to create a time-lapse effect.
The Status > Nip status command allows you to quickly
ensure that your NEXRAD data is arriving properly.
•
•
Site lists the current NEXRAD site that you are monitoring. One to four
sites are available to the typical NEXRAD client.
Lapse lets you view a specified number of frames when viewing
products.
You can create a continuous Lapse of current radar
data by toggling the Tools-3 > Nexrad Loop active
command. When this feature is checked, the system will
automatically create Lapses of the specified product,
with a 10-second delay between each lapse.
You can edit the length in seconds between lapses by
adding the following line into your omninet.ini file:
RadarLoopPeriodInSeconds=(desired #)
89
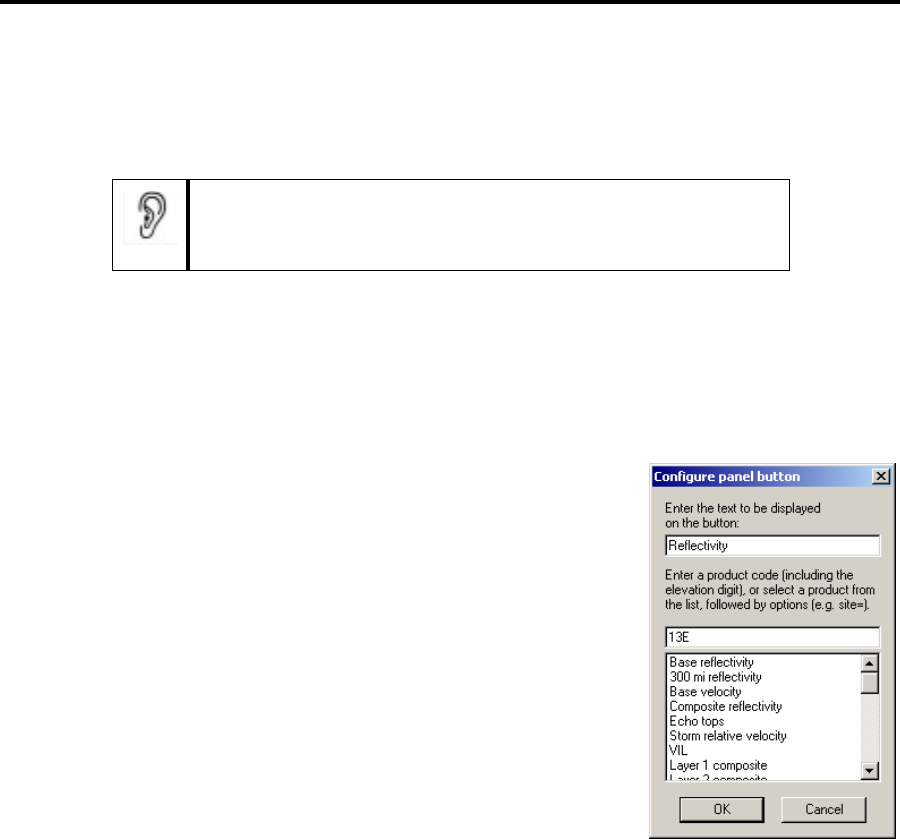
Controlling Your Radar FasTrac Millennium User’s Guide – May 2003
• Shear Markers displays two types of rings that represent the presence of significant shear. A
yellow ring indicates that the shear is in level 2 or above, while a red ring indicates a Low
Level Lock at level 1.
Upper level shear markers appear when the wind shear reaches
50 knots. Low Level Lock appears when the wind shear reaches
50 knots at level 1 and 30 knots at level 2.
•
•
Arrows displays NWS and Baron Services SCITs. A more detailed description of storm
arrows is in section 4.6, Storm Scan.
Lvl determines the sweep’s elevation level (1, 2, 3, or 4) for a product. Any product
described as using a certain number of scans uses this button to switch between levels.
The Product pull-down list lets you choose from any available
NEXRAD product. The menu will always show All Products even
after you choose a single one, but the radar image will show only
the product that you selected.
You may program the buttons above the product menu to display
your products in any configuration you wish. To change a button
product, right click on the button to open the Configure Panel
Button menu, shown to the right.
The text box at the top of the menu allows you to assign the text to
display on the button.
The second text box lets you enter the product code and modifiers.
The syntax for the code entry text box is as follows:
<product code> <lapse duration> <frame update> <options>
You can either type in the product code or select it from the menu below the text box.
<lapse duration> is the total lapse time in minutes, while <frame update> is the interval
between lapse frames in minutes. For example you could enter 13E 1440 5 to have the
product give a 24-hour lapse of reflectivity with a frame interval of 5 minutes (for a total of 288
frames).
There are two values you can enter in the options field:
Site=xxx overrides the site list box and specifies a single site for the button.
Lapse=n overrides the lapse checkbox and count.
Continuing the previous example, you could enter 13E 1440 5 site=C04 lapse=12 to
have the button give a 24 hour lapse of reflectivity with a frame interval of 5 minutes from site
C04 that repeats 12 times.
90
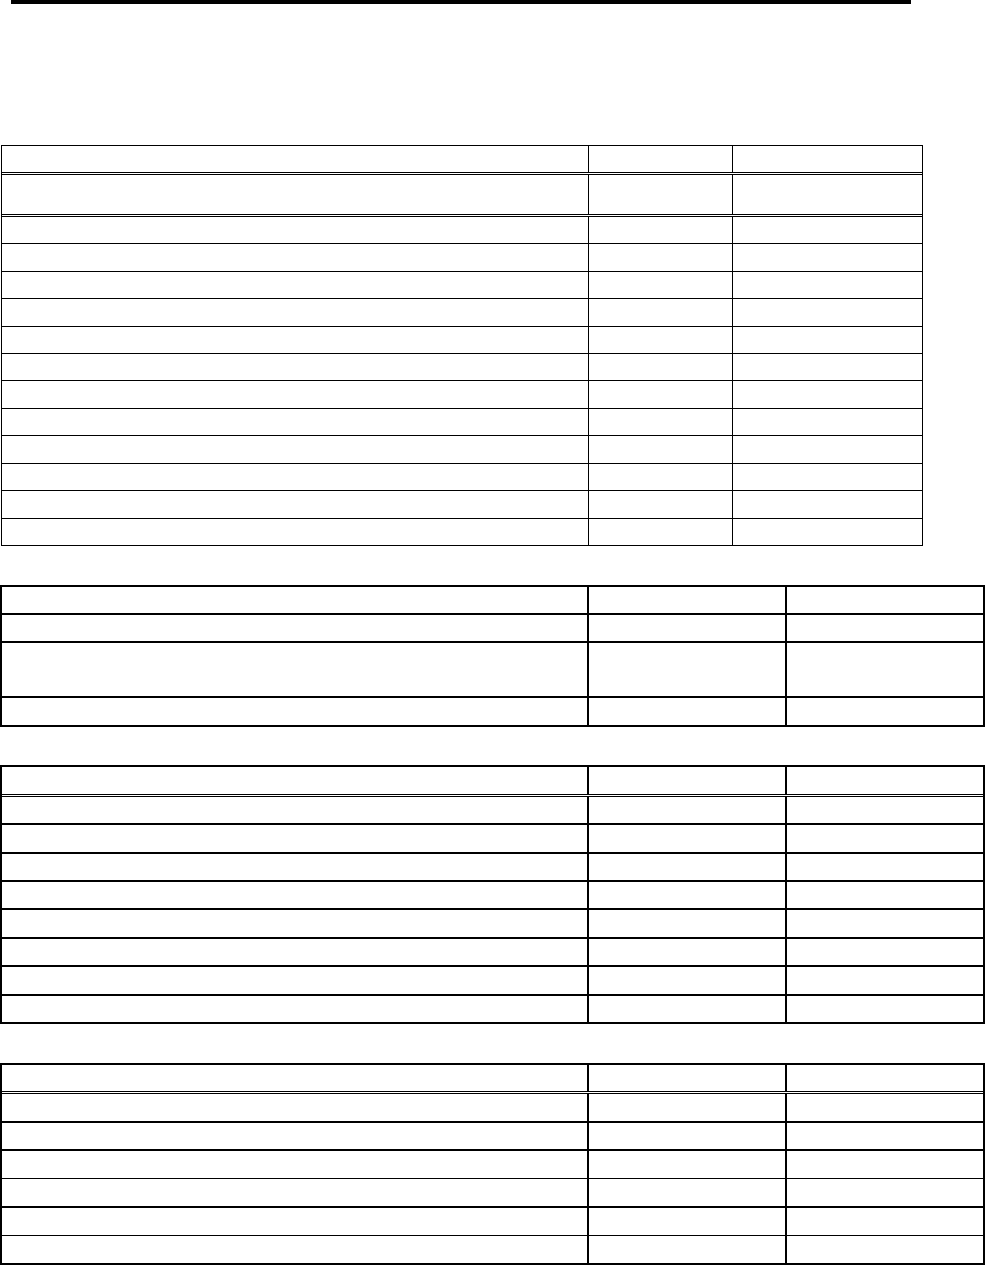
FasTrac Millennium User’s Guide – May 2003 Controlling Your Radar
The following table lists the code for each product.
Baron Level III Data
Product Name Code (0x) Location
Free Text – Radar Site Information 4B Netrad
Base Reflectivity (4 tilts) 13E Panel Button
Corrected (De-Alaised) Mean Base Velocity (4 Tilts) 31BE Panel Button
Mean Base Velocity (4 Tilts) 1BE Panel Button
Echo Tops (4km) 29 Panel Button
Corrected (De-Alaised) Storm Relative Velocity (2 Tilts) 31CE Panel Button
Storm Relative Velocity (2 Tilts) 38E Panel Button
VIL (Vertical Integrated Liquid) (4 km) 39 Panel Button
1 hour Accumulation 4E Panel Button
3 hour Accumulation 4F Panel Button
Storm Total Accumulation 50 Panel Button
Base 300 mile reflectivity 14 Panel Button
Composite Reflectivity (4k) 26 Panel Button
Millennium:
Product Name Code (0x) Location
Baron Shear and Severe Storm Arrows (SCITS) 62 See Section 4.6
4 EMWIN Warnings (Tornado, Severe Thunderstorm,
Flood, and Flash Flood)
EMWIN Server
Connection
See Section 3.5.20
METAR’s 883 Panel Button
Severe Weather Module:
Product Name Code (0x) Location
Max Reflectivity (1km) 226 Panel Button
Baron Button (1 km) [Heavy Rain/Shear Hail] 265 Panel Button
Max Composite Gate-to-Gate Shear (1 km) 25F Panel Button
VIL Density (1 km) 160 Panel Button
Storm Relative Velocity Shear (1 km) 161E Panel Button
Storm Relative Velocity Shear Markers 64 See Section 6.3.2
Mean Base Velocity Shear (1 km) 15FE Panel Button
Mean Base Velocity Shear Markers 63 See Section 6.3.2
Hydro Module:
Product Name Code (0x) Location
Precipitation Rate 266 Panel Button
1 Hourly Total Precipitation Accumulation 270 Panel Button
3 Hourly Total Precipitation Accumulation 271 Panel Button
12 Hourly Total Precipitation Accumulation 272 Panel Button
24 Hourly Total Precipitation Accumulation 27C Panel Button
Heavy Rain/Flood Product 290 Panel Button
91

Controlling Your Radar FasTrac Millennium User’s Guide – May 2003
Snow Machine:
Product Name Code (0x) Location
Snow Machine (1 km) [Precipitation Type/Rate] 268 Panel Button
4 km Precipitation Type Mask 401 Panel Button
1 Hourly Snow Accumulation 279 Panel Button
1 Hourly Mixed Accumulation 276 Panel Button
3 Hourly Snow Accumulation 27A Panel Button
3 Hourly Mixed Accumulation 277 Panel Button
12 Hourly Snow Accumulation 27B Panel Button
12 Hourly Mixed Accumulation 278 Panel Button
24 Hourly Snow Accumulation 27F Panel Button
24 Hourly Mixed Accumulation 27E Panel Button
Heavy Snow (1 km) 291 Panel Button
1 Hourly Winter Precipitation 292 Panel Button
3 Hourly Winter Precipitation 293 Panel Button
12 Hourly Winter Precipitation 294 Panel Button
Whole US Snow Machine Mask Site R01 1001
FutureScan:
Product Name Code (0x) Location
FutureScan 5 minutes into future 326 See Section 3.5.11
FutureScan 10 minutes into future 326 See Section 3.5.11
FutureScan 15 minutes into future 326 See Section 3.5.11
FutureScan 20 minutes into future 326 See Section 3.5.11
FutureScan 25 minutes into future 326 See Section 3.5.11
FutureScan 30 minutes into future 326 See Section 3.5.11
National Composites
Product Name Code (0x) Location
Hybrid Maximum Reflectivity Composite (1km) CO4 302 Panel Button
24 Hour Precipitation Composite (1km) C04 30D Panel Button
VIL Density Composite (1km) C04 310 Panel Button
Echo Tops (1km) C04 311 Panel Button
Whole US Baron SCITS (1km) C04 62 Panel Button
RUC Model
Product Name Code (0x) Location
Winds data from (Surface to 42,000 ft) X01 49 See Section 3.5.22
FasTrac Level II Data
Product Name Code (0x) Location
256 Color Intensity (4 Tilts) 66 Panel Button
256 Color Velocity (4 Tilts) 68 Panel Button
92

FasTrac Millennium User’s Guide – May 2003 Controlling Your Radar
The following paragraphs describe most of the possible products:
•
•
•
•
•
•
•
•
•
•
•
•
•
•
•
Base Reflectivity displays the 150-mile reflectivity sweep of the site. This product is
available only for the first four scans of the volume.
Composite Reflectivity shows the greatest reflectivity at a location, regardless of height.
Base Velocity displays wind speed and direction in reference to the radar beam. It is
available only for the first four scans of the volume.
Storm Relative Velocity displays Storm Relative Velocity (SRV), which indicates wind
speed and direction relative to storm movement. SRV is available only for the first two
scans of the volume.
Shear products, such as SRV Shear (Storm Relative Velocity Shear) and BV Shear (Base
Velocity) are the respective velocity products, showing the amount of gate-to-gate shear on
adjacent radials. SRV Shear is available for the first two scans of the volume. RV Shear is
available for the first four scans of the volume.
Composite Shear is derived from both Storm Relative and Radial shears, showing the
greatest shear, regardless of the storm’s velocity or height.
Baron Button enables the system to display a special product designed to provide an
overall assessment of a storm in one display. It incorporates Rain Rate, VIL Density, and
Composite Shear parameters into one product.
Vertically Integrated Liquid (VIL) uses the water content feature to estimate the
amount of water in kilograms per meter squared (kg/m2). Its primary use is for hail
detection.
VIL Density uses the NEXRAD VIL and Echo Tops products to determine the amount
of water in kilograms per meter cubed (kg/m3). This gives a more accurate reflectivity
reading of surface hail that meets or exceeds 18.5 dBZ.
Echo Tops indicates the highest altitude that the radar senses.
Storm Total graphically represents the total rain in an area after the radar mode changes
from Clear Air Mode to Precipitation Mode.
Rate shows the amount of rainfall, in inches per hour, for a given time period.
C01 indicates that no recent data has been received from the site.
C02 indicates that the radar is in Clear Air Mode.
R01 displays the precipitation type forecast grid for the eastern U.S.
The 1 hr and 3 hr buttons show the estimated rain accumulations over one-hour and
three-hour periods.
93
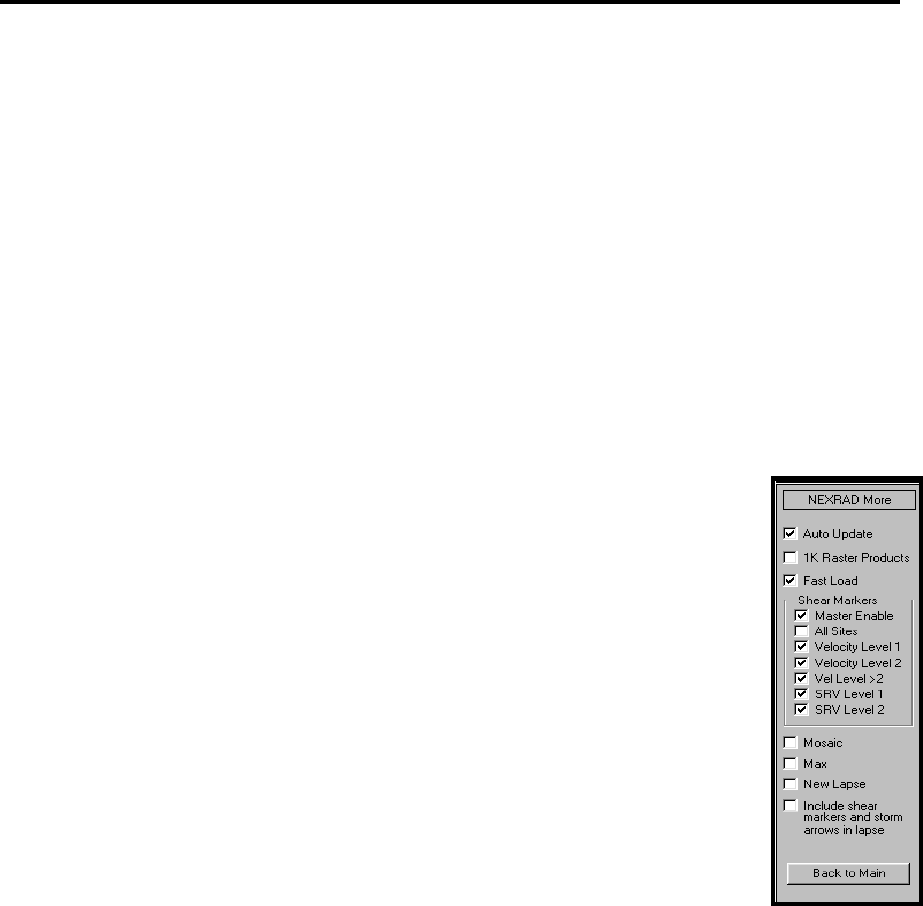
Controlling Your Radar FasTrac Millennium User’s Guide – May 2003
• Pick lets you select a single frame from a list of archived frames. After you select a
frame, use the < and > buttons to move the radar sweep forward or back one frame. Use
this option to review data that is not current.
•
•
•
D.
f.
ed.
R/T switches the radar to real time to show new frames as they appear.
Off puts the system back into real-time radar mode (that is, your own radar’s sweeps start
to display again and NEXRAD is deactivated).
At the bottom of the panel is a row of buttons labeled 1 through 6. The 1 button opens the
NEXRAD Main panel. The 2 button opens a panel with additional settings that are
described below. The 3 and 4 buttons open panels intended for Snow Machine products.
The 5 and 6 buttons open panels that are identical to the NEXRAD Main panel, allowing
you to configure buttons for additional products if there was not room for them on the
main panel.
The 2 button opens the NEXRAD More panel, shown on the right.
Auto Update makes the system update automatically when a new product is
ingested.
1K Raster Products can show a higher resolution (1 km x 1 km) of all
products. The 1K Raster products are derived by using the 4-km products
and the 1-km radial from NEXRA
Fast Load decreases the loading time when switching between products.
This box should always be checked.
Master Enable controls the display of all shear markers. Uncheck this box
to turn all shear markers of
All sites turns shear markers on or off for all sites. We recommend that you
leave all sites on until some display shear markers. Once markers appear,
you can turn off sites you do not ne
Velocity Level 1 shows shear markers from the lowest level radial velocity.
Velocity Level 2 shows shear markers from the second lowest level radial velocity.
Vel Level >2 shows the shear markers from the third and fourth levels of radial velocity.
SRV Level 1 shows the shear markers from the lowest Storm Relative Velocity.
SRV Level 2 shows the shear markers from the Level 2 SRV.
Mosaic forms product composites from multiple sites. These continue to update as new
products arrive.
Max posts the highest levels from the selected Mosaic.
94
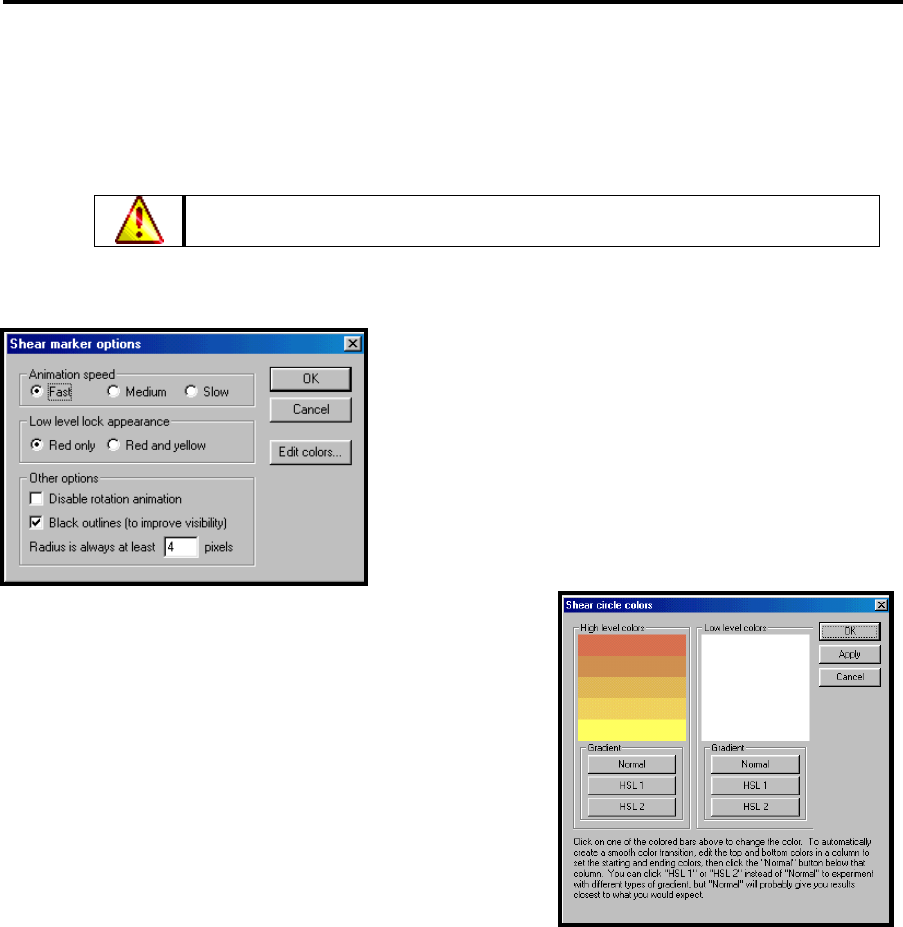
FasTrac Millennium User’s Guide – May 2003 Controlling Your Radar
New Lapse clears the screen each time you create a time-lapse with the Max option on.
Include in Lapse moves the shear markers in time lapses, along with the displayed radar.
Otherwise, the markers lock to the latest location.
If you select Mosaic, Max and New Lapse simultaneously, the system
displays the requested product lapse without erasing the prior frame.
6.3.2 Adjusting Shear Marker Settings
Select Setup > Data > Shear Markers to open the
Shear Marker Options menu.
•
•
•
s.
•
Animation Speed lets you change the rotation
speed of the shear markers.
Low Level Lock Appearance lets you choose to
make your low-level shear markers red only or red
and yellow.
Other Options lets you choose to disable the rotation
animation, give black outlines to the shear markers,
or change the minimum radius of the shear markers,
as measured in pixel
Edit Colors opens the Shear Circle Colors menu,
where you may edit the high and low level colors. As
the menu explains, you only need to edit the top and
bottom colors for each level.
95
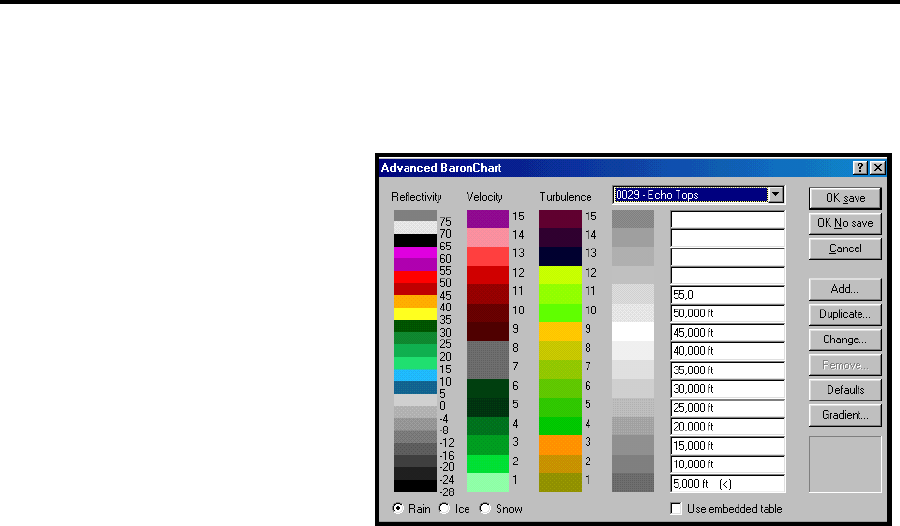
Controlling Your Radar FasTrac Millennium User’s Guide – May 2003
6.3.3 Using the Advanced Baron Chart
Any Advanced BSI Data Products
you may purchase include an
Advanced Baron Chart for NEXRAD
products. You can open the Advance
Baron Chart with the Setup > Data >
Baron Chart command. The
Advanced Baron Chart allows you to
change the default colors of any
NEXRAD products you have. You
may also display the Pixel Que
status messages for NEXRAD
d
ry
products.
its own
ectivity product, by default.
•
•
•
•
•
•
•
•
•
•
•
The Reflectivity, Velocity, and
Turbulence palettes are defaults. Use
these options to configure the display for real-time radar data. If a product does not have
palette, the program uses the Refl
Choose the NEXRAD product you want to edit from the pull-down list on top of the menu. The
default level colors appear in the fourth column, along with a table describing their Pixel Query
values.
OK save saves your changes permanently.
OK – No save makes temporary changes that disappear when you reboot.
Cancel returns the palette to original settings.
Add lets you configure a new NEXRAD product by entering a name and the four-letter or
number product code.
Duplicate opens the Duplicate Palette menu, which lets you copy color palettes from one
product to another.
Change lets you edit the cursor products name or product code.
Remove lets you delete the cursor products name or, if the code is standard, the code.
Defaults resets the selections to the default settings.
Gradient lets you quickly use a gradient for level colors.
Rain, Ice, and Snow let you select the precipitation type for the reflectivity column.
Use embedded table indicates that the standard table of level descriptions are used for the
selected products.
96
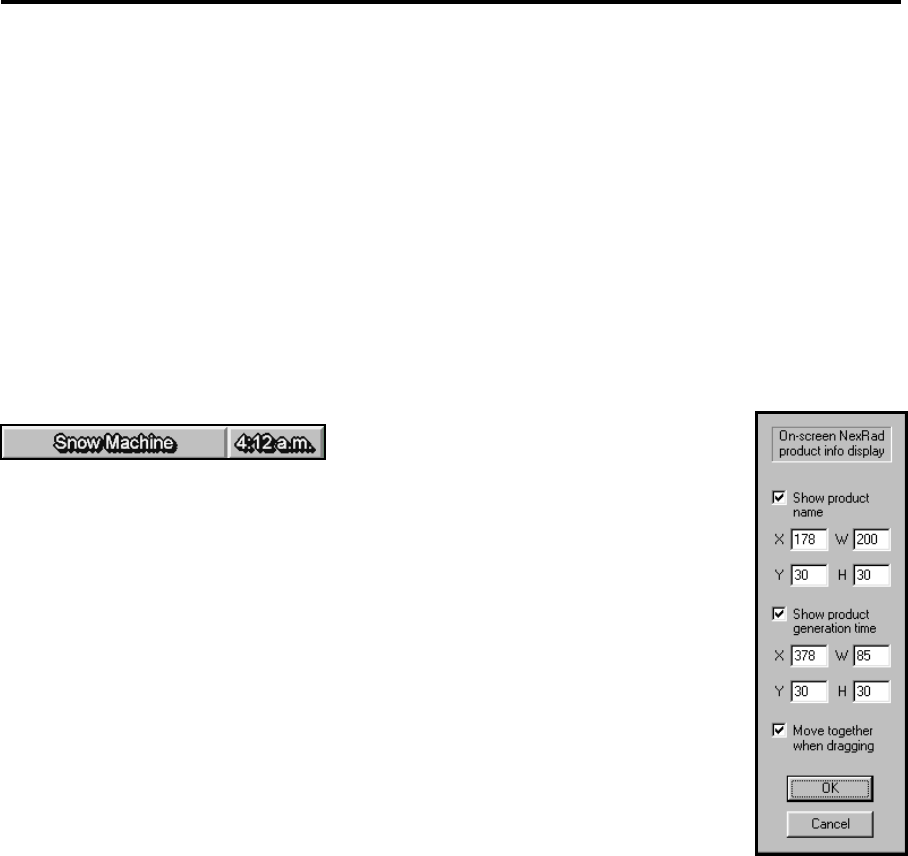
FasTrac Millennium User’s Guide – May 2003 Controlling Your Radar
One of the important issues to remember when adding a Baron Chart entry is that the Baron
Chart does not expect the elevation digit to be appended when you enter the product code. When
you right-click on a button in the NEXRAD panel, the product code that appears has the
elevation code appended.
For example, if you right-click on a button that is configured to display one-hour rain products,
you will see something like 4e Rain 1hr as the configuration text. Users often see this and
think they need to type 4e0 as the product code in the Baron Chart. In fact, the proper code is
4e since the extra 0 in the button configuration merely indicates that the product does not vary
with elevation.
6.3.4 Customizing Product and Time Marquees
The product info display panel allows
you to control the display of NEXRAD
product names and generation times on your views. Open this panel by
selecting Setup > Data > NexRad Stats.
Show product name toggles the display of the product name marquee.
The X and Y textboxes control how many pixels to the right and down,
respectively, from the upper left corner that the product name marquee
appears. The W field controls the width in pixels of the product name
marquee, while the H field controls the height in pixels of the marquee.
Show product generation time toggles the display of the product
generation time marquee.
The X and Y textboxes control how many pixels to the right and down,
respectively, from the upper left corner that the product generation time
marquee appears. The W field controls the width in pixels of the
product generation time marquee, while the H field controls the height in pixels of the
marquee.
Move together when dragging lets you move the product name marquee and the product
generation time marquee simultaneously. When you select this option and click OK, you can
move both displays at one time by left-clicking in an area on or between the product name
marquee and product generation time marquee (this area is defined by the corners of the
marquees that are farthest apart) and dragging the cursor to the new position. Otherwise, you can
reposition either display separately, by clicking and dragging.
97
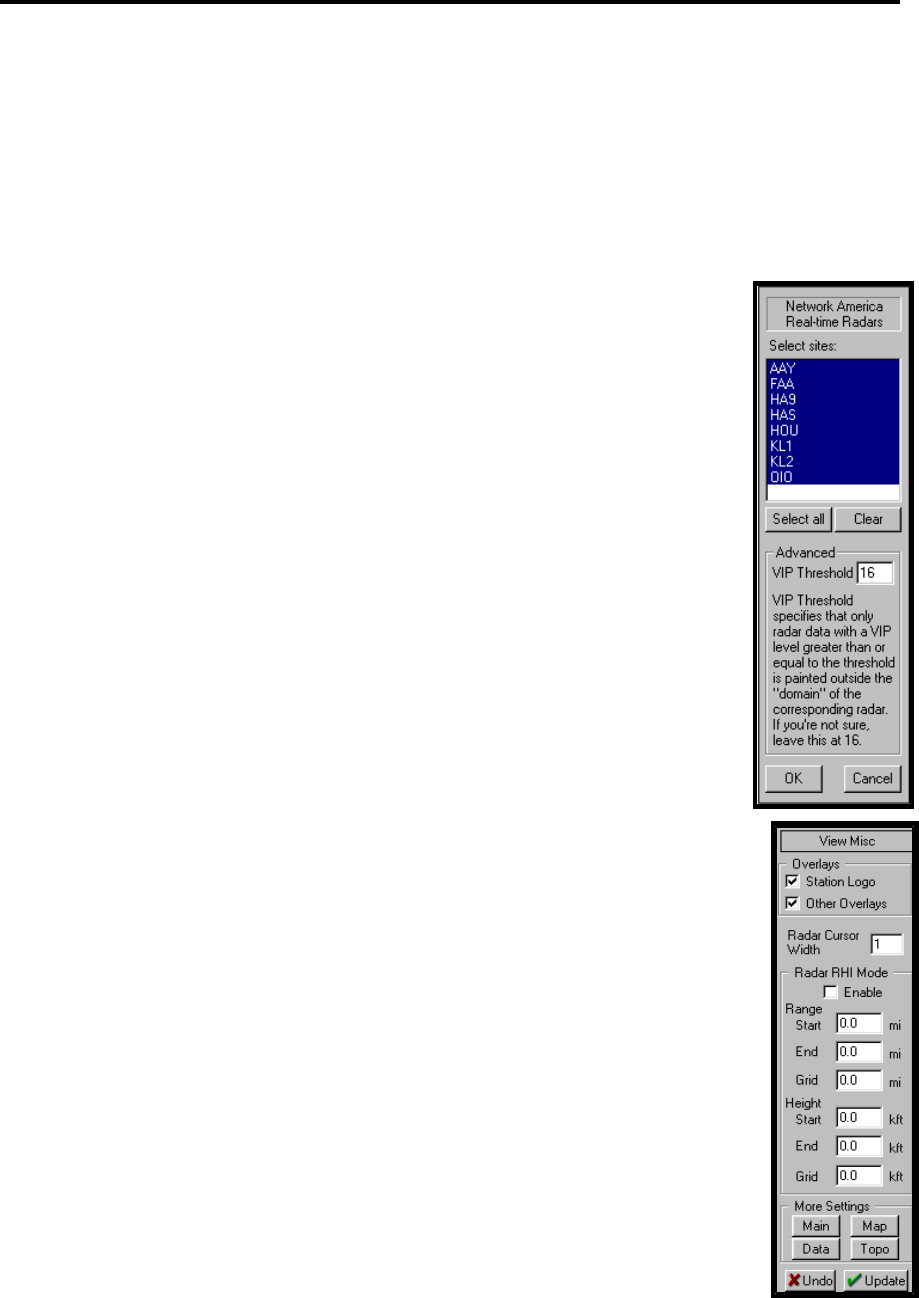
Controlling Your Radar FasTrac Millennium User’s Guide – May 2003
6.4 Utilizing Multiple Real-Time Radars Via Network
The Network America system augments your real-time Doppler data by linking to multiple
Doppler sites (including your own real-time radar), letting you monitor numerous meteorological
scenarios, including severe weather, more closely.
6.4.1 Using Network America
1. Open NetRad to display the NetRad interface.
2. Select Setup > Main Setup to open the NetRad Setup menu.
3. Click the Add Site button, and select up to twenty-one locations.
4. Upon completion, click OK.
5. Open FasTrac.
6. Select Radar > Multisweep to open the Multisweep menu, displayed to
the right.
7. Select the desired sites by clicking on them or by pressing Select All to
enable all the listed sites.
8. When you have selected the sites you want, click OK.
9. To turn off Network America, go back to the Radar menu and select Stop
Multisweep.
6.4.2 Changing the Width of the Radar Sweep Cursor
1. Open the View Misc panel.
2. Set the Radar Cursor Width parameter to 1 to display the standard width.
Set the parameter to 2 to double the width, and set the value to 0 to remove
the radar sweep.
3. Click Update at the bottom of the panel to make the changes. You can save
the view with the cursor set to the selected width. This will always display
the setting. If you do not save the view, it will revert to the previous setting.
98
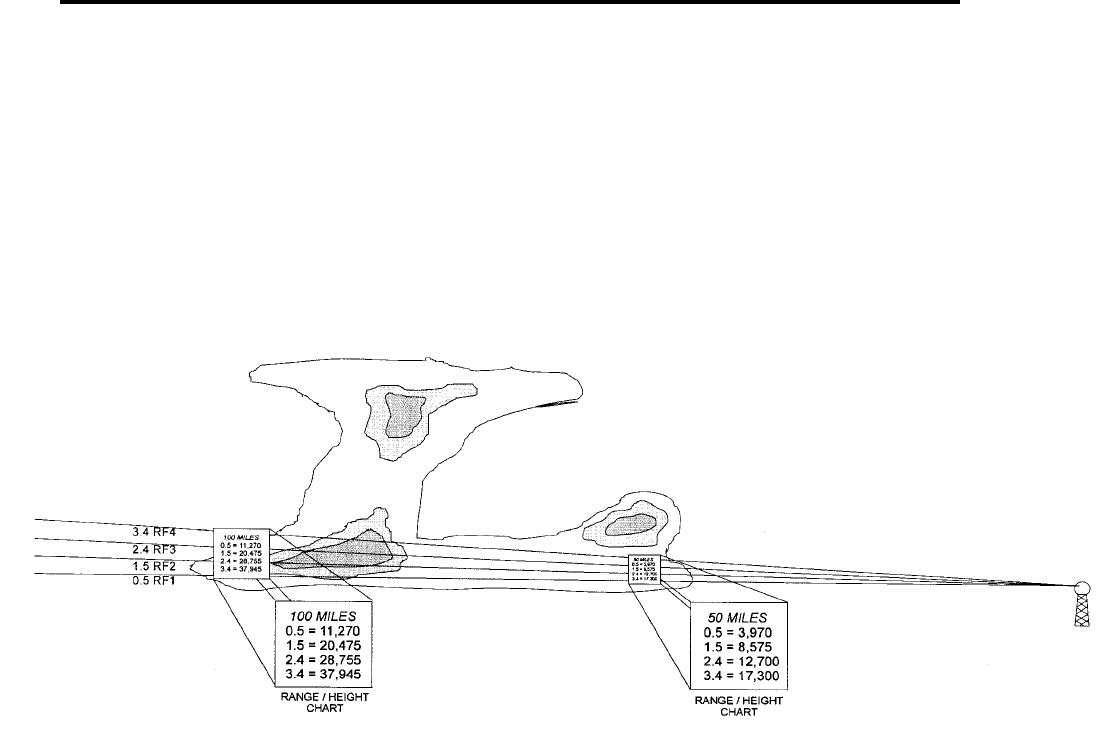
FasTrac Millennium User’s Guide – May 2003 Controlling Your Radar
6.5 Comparing Base Reflectivity and Composite
Reflectivity
Base reflectivity shows the intensities at each of the elevation angles. In the following example,
base reflectivity 1-4 shows a small storm event very far off, but undershoots the closer storm.
The elevations for the four-base reflectivity NEXRAD products are also depicted.
BASE REFLECTIVITY
99
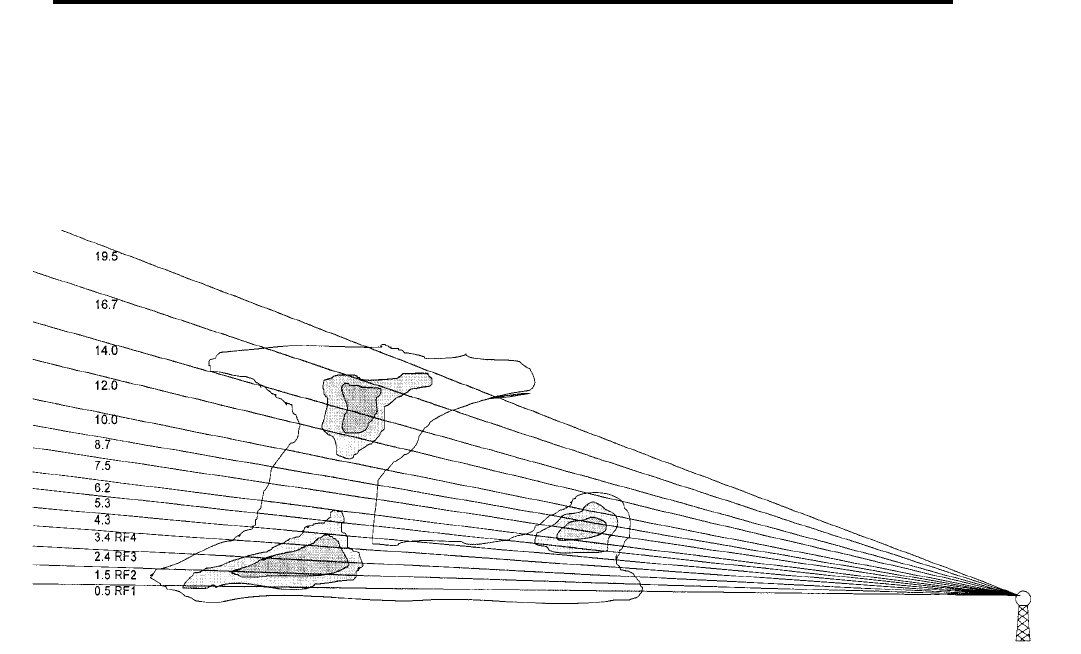
Controlling Your Radar FasTrac Millennium User’s Guide – May 2003
Composite reflectivity shows the greatest intensity regardless of height in storms. In the following
example, the greatest intensities for the storm further from the radar are shown, both aloft and
closer to the ground. The composite image also reveals another storm closer to the radar.
COMPOSITE REFLECTIVITY
100

FasTrac Millennium User’s Guide – May 2003 Controlling Your Radar
6.6 Points to Remember
Use the Radar Control panel to control your real-time, non-Baron radar.
Use the RADACS Control panel to control your Baron radar.
Use the NEXRAD Main panel to control your NEXRAD radar data.
Use the Advanced Baron Chart to set color schemes for NEXRAD data.
Base reflectivity shows the intensities at each of the elevation angles and should
be used to view storms that are far from the radar.
Composite reflectivity shows the greatest intensity, regardless of height, and
should be used to view storms that are relatively close.
101
Glossary
Anti-Alias – An option that provides a smoothing effect to the pixels used in text.
Auto Scan – An option in the StormScan setup menu that automatically updates the status of
Storm Cell Information and Tracking (SCIT) indicators when new radar data is available.
azimuth – The angle of horizontal deviation, measured clockwise in degrees, from one point on a
map to another.
base view – A saved view that acts as a starting point for a zoom, pan, or time-lapse operation.
bend – The curve in a squall projection that indicates the shape of the storm front.
circle projection – A type of storm projection that indicates the communities within a storm and
their distance, in miles, from the storm’s center.
creating a storm track – The action of clicking and dragging to create a fan, circle, or squall
projection.
cut off range – A range that defines when a parameter appears on a view. Any view with a view
range at or below that cut-off range shows the parameter; any view with a view range larger than
the cut-off range will not show the parameter.
database – A collection of associated data.
dynamic sizing – An option available only for Street Spotter text. This option, which is available
when you select Setup ⇒ Street Spotter, makes the system automatically select a font size that
fits the length of the line when labeling a street in Street Spotter mode. It also proportionally
changes the text size when you zoom in or out of a view.
extrusion – A text option that places a shadow behind each letter at a user-defined angle. This
option is available when you select Setup ⇒ Fonts commands.
fan projection – A fan-shaped storm projection used to track a single storm cell. Select Storm >
Add > Fan to create a fan projection.
fanout – This parameter determines the degree to which a fan-type storm track’s border expands
from the base to the end, to account for the possibility of the storm not moving in a straight line.
The value is set on the Storm Track panel and has a maximum width of 40 degrees.
frames – These are extra images added automatically by SEQUENCER when creating zooms,
pans, and time lapses. The extra images provide a smooth transition between the starting and
ending view.
GL-1

Glossary FasTrac Millennium User’s Guide – May 2003
FutureScan – This is an optional module that predicts and displays the intensity and location
changes of precipitation fields.
High Definition Data Processing (HDDP) – This feature smoothes out the pixelated
appearance of NEXRAD radar data.
hot buttons – A set of 20 buttons, directly above the view area, that lets you execute various
features with a single left click. Some hot buttons also have right-click features.
Ingestor program – A separate program that receives local or NEXRAD radar data and makes it
available on your system.
intensity repaint - This is a SEQUENCER event that redisplays the radar sweep to depict the
weather intensity. Use this only when you are switching from NEXRAD to real-time radar data.
lightning – An optional module that allows for the ingestion of live lightning data and the
manipulation of its display.
latitude – The angular distance, measured north or south from a point on the map view to the
equator. The main status area displays the latitude of the current cursor position.
Log to file – The Radar ⇒ Log to File command that logs your radar files so that you can recall
them later. This command is essential for replaying real-time radar data and displaying time-
lapses of real-time radar.
longitude – The angular distance, measured east or west from a point on the map view to the
prime meridian in Greenwich, England. The main status area displays the longitude of the current
cursor position.
liquid database – The system of databases that determines how map features such as roads,
rivers, and places appear. It allows for smooth transition between views.
main menus – The row of pull-down lists along the top of the FasTrac window that lets you
access many advanced features.
map pointer – A Windows-style mouse pointer tool that is used to point out things on the map.
module – A feature or set of features that does not come with the basic FasTrac system but can
be purchased separately. Every module either adds new features or enhances existing features.
multisweep – The operation used by the Network America module to conduct a sweep of several
radar sites simultaneously.
Neighborhood Weather Net – The optional module that provides non-storm related weather
data, such as temperature, humidity, and air pressure.
Network America – The optional module that simultaneously displays data from up to 20 radar
sites.
Omninet.ini – FasTrac’s main configuration file.
GL-2

FasTrac Millennium User’s Guide - May 2003 Glossary
pan – Changing the center point of a view.
Previous – The View Main panel command that lets you switch back to the preceding view.
product – Radar data that is intended to depict a certain type of weather (such as Reflectivity for
rain).
radius – The distance, measured in miles, from the center point of a view to the top or bottom
edge.
radar levels – Divisions in the color scheme of a radar product that indicate the severity of that
product.
Radar Level Pixel Query Mode – The special mode that lets you see the level of a product at a
specific location by placing the cursor at that location.
real-time radar – A privately owned radar (as opposed to a NEXRAD radar) that obtains data as
it sweeps.
Replay – The option used to replay archived data as a time lapse.
RGB – The Red-Green-Blue values that compose colors. Use the Setup ⇒ Colors command to
specify specific RGB colors to generate a new color for a feature, such as the state boundary.
Round Outlines – The Setup ⇒ Fonts option that gives anti-aliasing to font borders.
SCIT (Storm Cell Information and Tracking)– An arrow produced by StormScan that
identifies specific types of storms.
SEQUENCER – The FasTrac feature used to group many related views together and to display
them in a continuous order for various effects.
Show Range – The range at which individual communities will appear on a view. Use the Setup
⇒ Places Database command to set this parameter for specific communities.
site – The name of a NEXRAD radar at a specific location. Use the NEXRAD Main panel to
select a NEXRAD site.
Snow Machine – The optional module that displays winter weather, such as ice and snow.
squall projection – The storm projection that shows the direction, speed, and shape of an entire
line of storms. Use the Storm ⇒ Add ⇒ Squall command to create a squall projection.
storm marquee – The box that shows the cities in the path of a storm and the estimated time that
the storm will hit those places. This text box is also known as the ETA box.
StormScan – This is used to automatically detect and track the most severe storm cells in a
region.
Gl-3

Glossary FasTrac Millennium User’s Guide – May 2003
storm track – The projection of a storm’s direction and speed; normally used to calculate when a
storm will hit certain places.
Storm Track Estimated Time of Arrival (ETA) – The clock time that a storm will hit a place,
based on the storm’s location, speed, and movement.
Street Spotter – The feature used to label important streets and landmarks.
SWP (Severe Weather Probability) – The product that provides a visual display of a set of
probability values for “severe” storm cells.
TeleTrac – The module used to draw freehand lines on the screen.
time lapse – The SEQUENCER-created series of views that depict radar data on the same area
over a period of time.
turbulence – A state of atmospheric flow in which random fluctuations are exhibited and cause
changes in the normal flow pattern.
van marquee – The text box that shows the current data being received from the optional Storm
Spotter Van.
Vehicle SpotterTrac – The optional module that utilizes a link to a mobile unit equipped with
weather equipment, to establish a mobile data source.
view – The current map displaying on the screen.
VIPIR – Separate radar program that shows both NEXRAD and Baron-derived products in
three-dimensional displays.
zoom – A change in the range of a view.
GL-4
Product Glossary
In this Product Glossary, B denotes Baron-generated products, while N denotes non-Baron-
generated products. All product numbers (for example, 4E) are in hexadecimal code.
Italicized words are terms that are defined elsewhere in this glossary.
Base and Convective Storm Products:
1-hour accumulation (4E): Shows the NEXRAD-estimated horizontal distribution of
precipitation over a one-hour time period. N
3-hour accumulation (4F): Shows the NEXRAD-estimated horizontal distribution of
precipitation over a three-hour time period. N
Baron Button 1K (265): A special product that is designed to provide an overall
assessment of a storm. It incorporates VIL density, composite shear and rain rate parameters
into one product, and is displayed in 1 km by 1km pixel resolution. B
base (63) and relative (64) velocity shear markers: Enables the system to display
two types of rings, which are representative of the location where shear is present. A yellow
ring signifies that shear is present in the upper levels (2, 3 or 4) of the atmosphere, while a
red ring signifies a “Low Level Lock”, or shear is present near the surface (level 1). Note:
Once the shear reaches a threshold of 50 knots, a ring is displayed. B
base reflectivity (13): Displays the current 150-mile reflectivity sweep of a site. Note:
Base reflectivity is only available for the first four elevations of the volume. N
base reflectivity 1K (113): This is the base reflectivity product, however, instead of the
pixels being shown in Azimuth-Range (AzRan) format, they are displayed in 1km by 1km
(1km2) format. B
base reflectivity 300 miles (14): Displays the current 300-mile reflectivity sweep of a
site. N
composite reflectivity (26): Displays the greatest reflectivity in a vertical column
regardless of height in a storm. Note: NEXRAD can scan up to a 19.5º elevation angle, so
the greatest reflectivity within this scanning volume is reported. N
composite reflectivity 1K (126): The composite reflectivity converted to a 1km by 1km
product. B
composite shear (25F): Shows the maximum value of shear located in the storm within
the first four scanning level. B
corrected radial velocity (31B): This product displays the velocity, which is result of
correcting the radial velocity for various errors, including second-trip echoes and range
folding. This product is also known as corrected base velocity. B
corrected storm relative velocity (31C): This product displays the velocity, which is
the result of correcting the storm relative velocity for various errors, including second-trip
echoes and range folding. B
echo tops (29): Indicates the highest level that the radar is receiving a return of at least 18
dBZ. N
echo tops 1K (129): The echo tops product converted to 1 km by 1 km format. B
layer 1 composite (41): Displays the greatest reflectivity in a vertical column between
the surface and 24,000 feet (from mean sea level). N
layer 2 composite (42): Displays the greatest reflectivity in a vertical column between
24,000 feet to 33,000 feet (from mean sea level). N
layer 3 composite (5A): Displays the greatest reflectivity in a vertical column between
33,000 feet to 60,000 feet (from mean sea level). N
maximum reflectivity 1K (226): Shows the greatest reflectivity measured within the first
four radar scanning levels, and is converted to 1 km by 1 km resolution. B
maximum shear 1K (25F): Shows the maximum value of shear located in the storm
within the first four scanning levels, and is converted to 1 km by 1 km resolution. B
radial velocity (1B): The average velocity of targets (i.e. rain droplets, etc.) moving
towards or away from the radar beam. Radial velocity is displayed as either positive (moving
away from the radar) or negative (moving towards the radar). Generally, the positive values
are displayed in warm colors, while negative values are indicated by cool colors. Note:
Radial velocities are only available for the first four elevation scans of the volume. This
product is also known as base velocity. N
radial velocity 1K (11B): This is the radial velocity product converted to a 1km by 1km
pixel format. B
radial velocity shear (5F): The change in radial velocity per unit distance along a radial.
Note: Basically, shear is defined as the change or variation in velocity over a specified
distance. This product is also known as base velocity shear. B
radial velocity shear 1K (15F): The radial velocity shear product converted to 1 km by
1 km resolution. B
rain rate (266): The rate of rainfall or rainfall intensity as estimated by NEXRAD over one
hour. N
storm relative velocity (38): The velocity that is relative to storm movement. This
product is the base velocity with the average movement of storms, which are defined by a
storm-defining algorithm, being subtracted out. Therefore, the motion appears relative to the
storms. Note: Storm relative velocities are only available for the first two scanning
elevations of the volume. N
storm relative velocity 1K (138): The storm relative velocity converted to a 1 km by 1
km pixel display. B
storm relative velocity shear (61): The change in storm relative velocity per unit
distance along a radial. This product is also known as relative velocity shear. B
storm relative velocity shear 1K (161): The storm relative velocity shear product
converted to 1 km by 1 km resolution. B
storms (62): This product includes the National Weather Service SCITs (thunderstorm,
hail, severe hail, mesocyclonic and TVS), in addition to the Baron-generated SCITs (storm
and shear). Therefore, it enables a more comprehensive identification of severe weather that
may affect a given location. B
total precipitation (storm total accumulation) (50): Displays the total precipitation
amount estimated by the Doppler radar after the radar mode has changed from “clear-air” to
“precipitation”. To determine the estimated amount of rain, the radar uses a Z-R relationship,
which matches reflectivity values to a corresponding rain rate. Note: There are specific Z-R
relationships for various precipitation events. N
VIL (39): The Vertically Integrated Liquid water content represents the amount of liquid
water present in a cross-sectional area in the atmosphere, and is usually measured in units of
kilograms per meter squared (kg/m2). B
VIL 1K (139): This is the VIL product converted to a 1 km by 1 km format. B
VIL density (60): The Vertically Integrated Liquid density displays the calculated value of
VIL divided by echo tops ((VIL)/(echo tops)). It is reported in units of kilograms per meter
cubed (kg/m3). B
VIL density 1K (160): The VIL density product converted to a 1 km by 1 km resolution. B
Snow/Hydrological Package Products
1-hourly (273), 3-hourly (274), 12-hourly (275) and 24-hourly (27D) liquid
precipitation rate 1K: These products provide a 5-minute by 5-minute look at liquid
accumulations in a 1 hour, 3 hour, 12 hour or 24 hour window. B
1-hourly (276), 3-hourly (277), 12-hourly (278) and 24-hourly (27E) mixed
precipitation rate 1K: These products provide a 5-minute by 5-minute look at mixed
precipitation accumulations in a 1-hour, 3-hour, 12-hour or 24-hour window. B
1-hourly (279), 3-hourly (27a), 12-hourly (27b) and 24-hourly (27F) snow rate
1K: These products provide a 5-minute by 5-minute look at snow precipitation
accumulations in a 1-hour, 3-hour, 12-hour or 24-hour window. B
1-hourly (270), 3-hourly (271), 12-hourly (272) and 24-hourly (27C) total
precipitation rate 1K: These products provide a 5-minute by 5-minute look at total
precipitation accumulations in a 1-hour, 3-hour, 12-hour or 24-hour window. B
1-hourly (292), 3-hourly (293), 12-hourly (294) and 24-hourly winter (295)
precipitation 1K: This product provides an overview of a winter weather event. In
combining the 1-hourly or 3-hourly or 12-hourly or 24-hourly liquid, mixed and snow rates,
it allows the user to more completely understand the intensity of the event. B
flood 1K (290): This product is designed to provide insight into the potential for flooding.
It incorporates the 1-hour, 3-hour and 12-hour total precipitation rates into its calculations. B
heavy snow 1K (291): In combining the 1-hourly, 3-hourly and 12-hourly snow rates, this
product provides an assessment of the intensity of a snow event. B
past 1-hour liquid (26D), mixed (26E) and snow accumulations (26F) 1K: These
products are animation sequences of imagery that depict the accumulation of liquid, mixed or
snow precipitation during the past 1 hour. B
past 1-hour total precipitation accumulation 1K (26C): This product is an animation
sequence of imagery that depicts the growth of the total accumulated precipitation during the
past 1 hour. B
past 24-hour liquid (28D), mixed (28E) and snow accumulations (28F) 1K: These
product are animation sequences of imagery that depict the growth of liquid, mixed or snow
accumulations during the past 24 hours. B
past 24-hour total precipitation accumulation (28C) 1K: This product is an
animation sequence of imagery that depicts the growth of the total accumulated precipitation
during the past 24 hours. B
precipitation type 1K (Snow Line) (269): This product depicts the areas of snow,
mixed precipitation, and rain areas. While it does not show actual precipitation, it does show
what the precipitation type would be if any were falling. Although it is not really designed for
display, it can be used as a product to define where the changeover points are in advance of
actual precipitation. B
precipitation type 4K (401): This is the precipitation type 1K product converted to a
display of 4 km by 4km resolution. N
Snow Machine (268): This product enables the ability to display rain, mixed precipitation
and snow, as well was their respective rates. The result is a radar display where the first five
levels represent liquid precipitation, the next five levels indicate mixed precipitation, and the
last five levels depict snow rates. In addition, this module allows the user to see the transition
of precipitation type and rate as a system moves across a viewing area. B
Other Products
arrows: Enables the system to display storm SCITs (an identification box and an associated
arrow), which visually depict various characteristics of the storm. By right clicking on the
box, an information chart appears, which contains various numerical parameters pertaining to
the storm.
Baron US Composite Products (3010, 3020, 3030, 3040, 3050, 3060): These products
display US Radar NEXRAD status, 8 km Composite reflectivity, and 1 km quadrant
composite reflectivity in the southeast, southwest, northeast and northwest, respectively.