Bosch Automotive Service Solutions KT720 Automotive Diagnostics Equipment User Manual KT720 EN part 2
Bosch Automotive Service Solutions (Suzhou) Co., Ltd Shenzhen Branch Automotive Diagnostics Equipment KT720 EN part 2
Contents
- 1. KT720 EN User Manual -part 1
- 2. KT720 EN User Manual -part 2
KT720 EN User Manual -part 2
1 697 021 785 | 2015-05-20 Bosch Automotive Products (Nanjing) Co., Ltd
32 | KT720 | Measure functionen
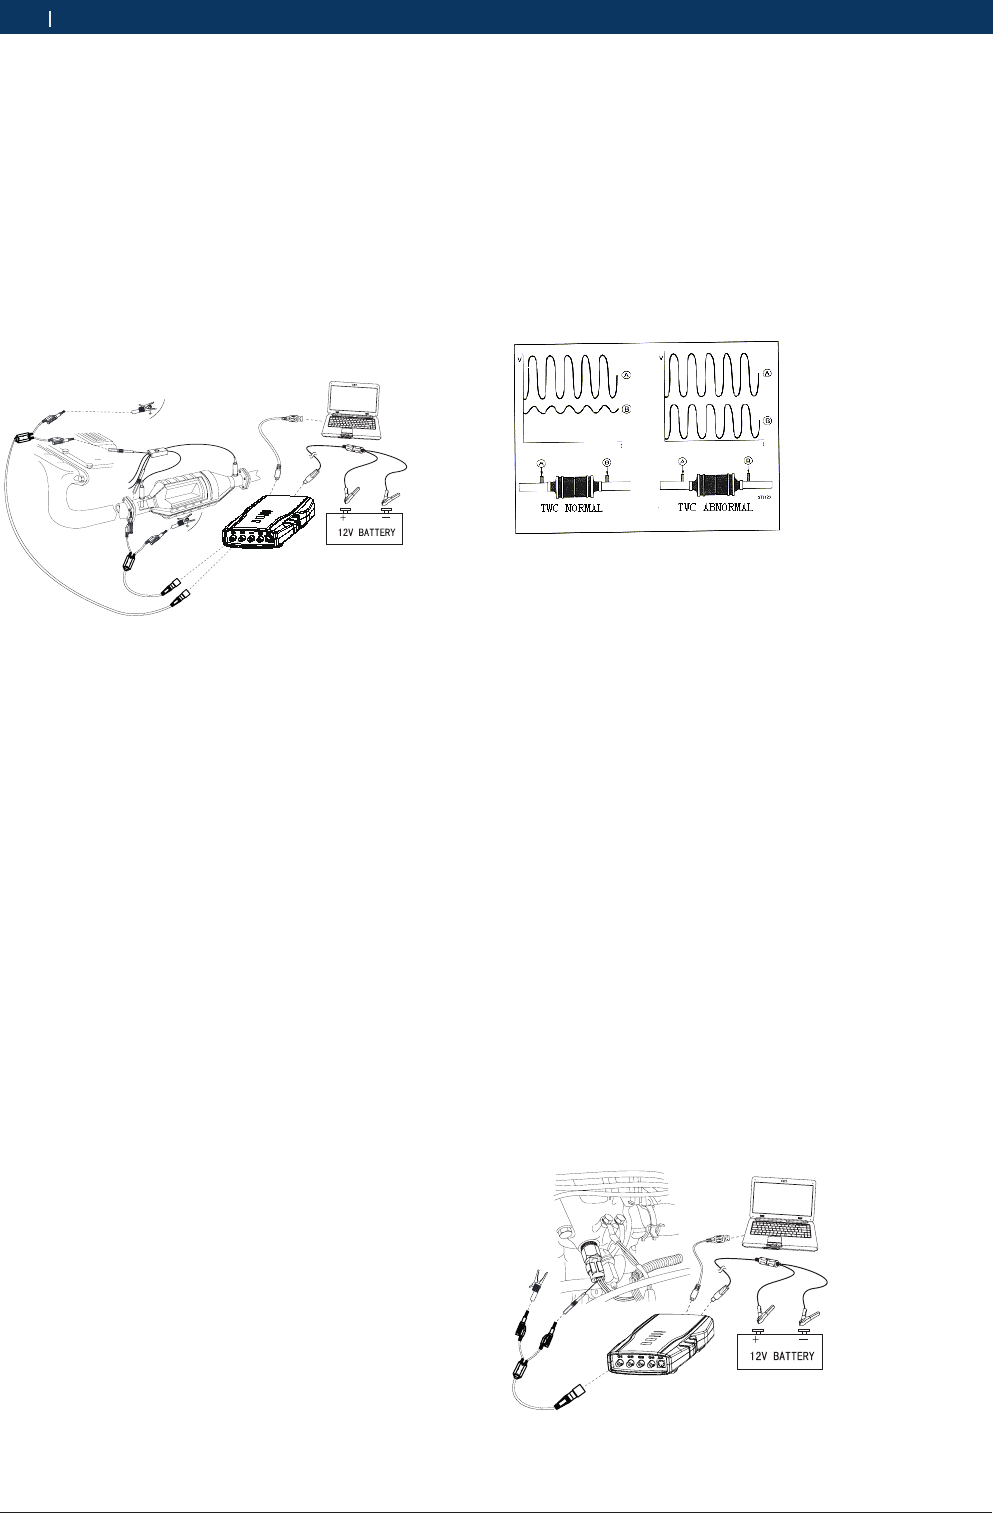
11.6.3.1 Equipment connection
When connecting KT720 to power extension cable for
power supply, choose power supply according to the
battery position of vehicle mode tested. All connec-
ting diagrams in this users manual take power supply
by battery clip power cable as example. Connect BNC
end of 2KT720 oscilloscope probes to CH1 and CH2,
then connect the other end of the both black banana
plugs and 2 alligator clips to negative pole of battery
or grounding, and connect the other end of red banana
plugs and 2 banana sockets into the trigger signal line.
Fig. 13: Equipment connection
11.6.3.2 Measure conditions
RStart engine to heat oxygen sensor to over 315˚C,
with engine in closed-loop state.
RIncrease engine speed from idle.
11.6.3.3 Measure steps
1. Connect equipment according to Fig.13, switch on
power supply.
2. Start engine to heat oxygen sensor to over 315˚C,
with engine in closed-loop state.
3. Double click run KT720 software.
4. Select communication mode: USB communication or
wireless communication, the KT720 and the compu-
ter are successfully communicated.
5. Click Analyzer --> Sensor --> Dual Oxygen Sensor;
6. Waveform will be displayed on the screen depending
on measure conditions.
7. You can adjust to cycle, amplitude, coupling,
reversed-phase, and cursor. If the cycle locates at
high-frequency section, the triggering channel and
triggering modes can be adjusted.
8. You can print measured data, load snapshot data
and reference waveform data, save current confi-
guration or acquire old configuration, automatically
adjust the amplitude, snapshot current waveform
and waveform comparison;
9. You can check the details of current waveform by cli-
cking “Pause” button. After click, the button turns to
“Start”, click it again to carry forward measurement.
10. You can record a continuous waveform section by
clicking “Record” button.
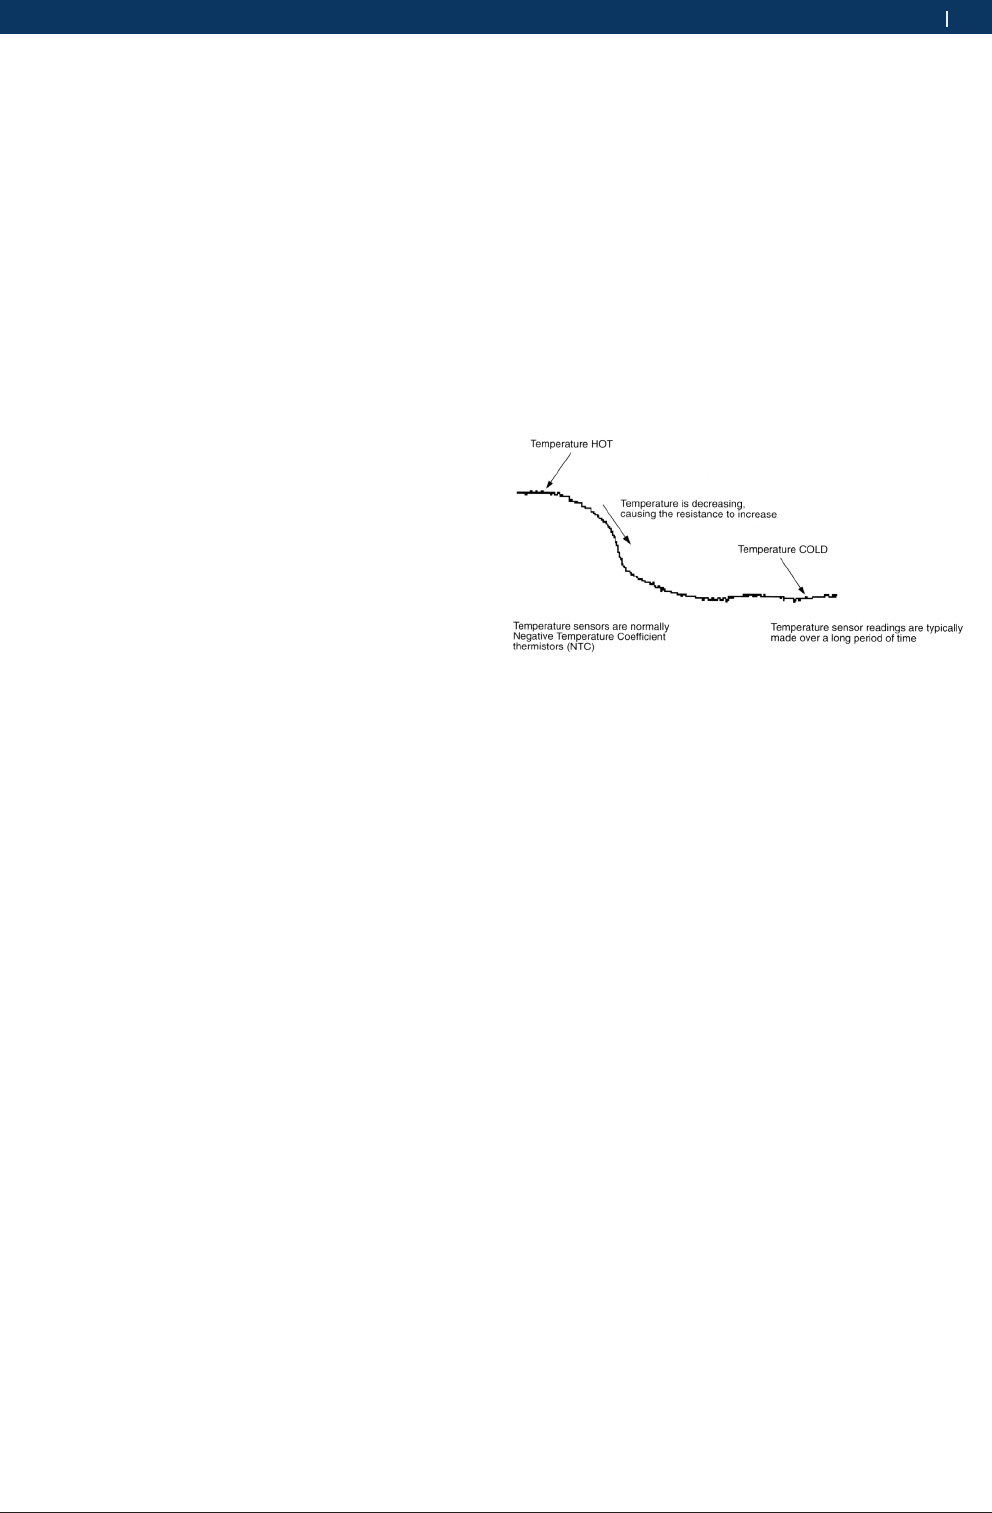
11.6.3.4 Waveform analysis
When testing waveform of double oxygen sensor, we
can judge, through the waveform of front and rear oxy-
gen sensors, whether the ability of three-way catalyst
device to convert deleterious gas is lost. Generally
speaking, the bigger the amplitude value of two wave-
forms is, it indicates that three-way catalyst device
has perfect function; if amplitude value is basically
the same, it indicates that it has lost its function. See
Fig.14 for schematic diagram.
Fig. 14: Catalytic convert
11.6.4 Temperature sensor
They are mainly water temperature sensor and air
intake temperature sensor, and most temperature
sensors adopt negative temperature coefficient (NTC)
thermistor made of semi-conducting materials. When
temperature changes, its resistance is expected to
experience a large change. When temperature rises,
resistance decreases; when temperature decreases,
resistance increases.
11.6.4.1 Equipment connection
When connecting KT720 to power extension cable for
power supply, choose power supply according to the
battery position of vehicle mode tested. All connecting
diagrams in this users manual take power supply by
battery clip power cable as example. Connect BNC end
ofKT720 oscilloscope probe to CH1, then connect the
other end of the black banana plug and black alligator
clip to negative pole of battery or grounding, and con-
nect the other end of red banana plug and red banana
socket into the trigger signal line.
Fig. 15: Equipment connection
1 697 021 785 | 2015-05-20Bosch Automotive Products (Nanjing) Co., Ltd
Measure function | KT720 | 33 en
11.6.4.2 Measure conditions
RSwitch on ignition switch, do not start engine. Secu-
rely connect temperature sensor, and measure the
output voltage of temperature sensor with engine in
non-running state.
RStart engine, observe voltage falling of temperature
sensor when engine gets heated.
RYou may also disconnect sensor and use multimeter
to measure resistance value.
11.6.4.3 Measure steps
1. Connect equipment according to Fig.15, switch on
power supply.
2. Double click run KT720 software.
3. Select communication mode: USB communication or
wireless communication, the KT720 and the compu-
ter are successfully communicated.
4. Click Analyzer --> Sensor --> Temperature Sensor.
5. Waveform will be displayed on the screen depending
on measure conditions.
6. You can adjust to cycle, amplitude, coupling,
reversed-phase, and cursor. If the cycle locates at
high-frequency section, the triggering channel and
triggering modes can be adjusted.
7. You can print measured data, load snapshot data
and reference waveform data, save current confi-
guration or acquire old configuration, automatically
adjust the amplitude, snapshot current waveform
and waveform comparison;
8. You can check the details of current waveform by cli-
cking “Pause” button. After click, the button turns to
“Start”, click it again to carry forward measurement.
9. You can record a continuous waveform section by
clicking “Record” button.
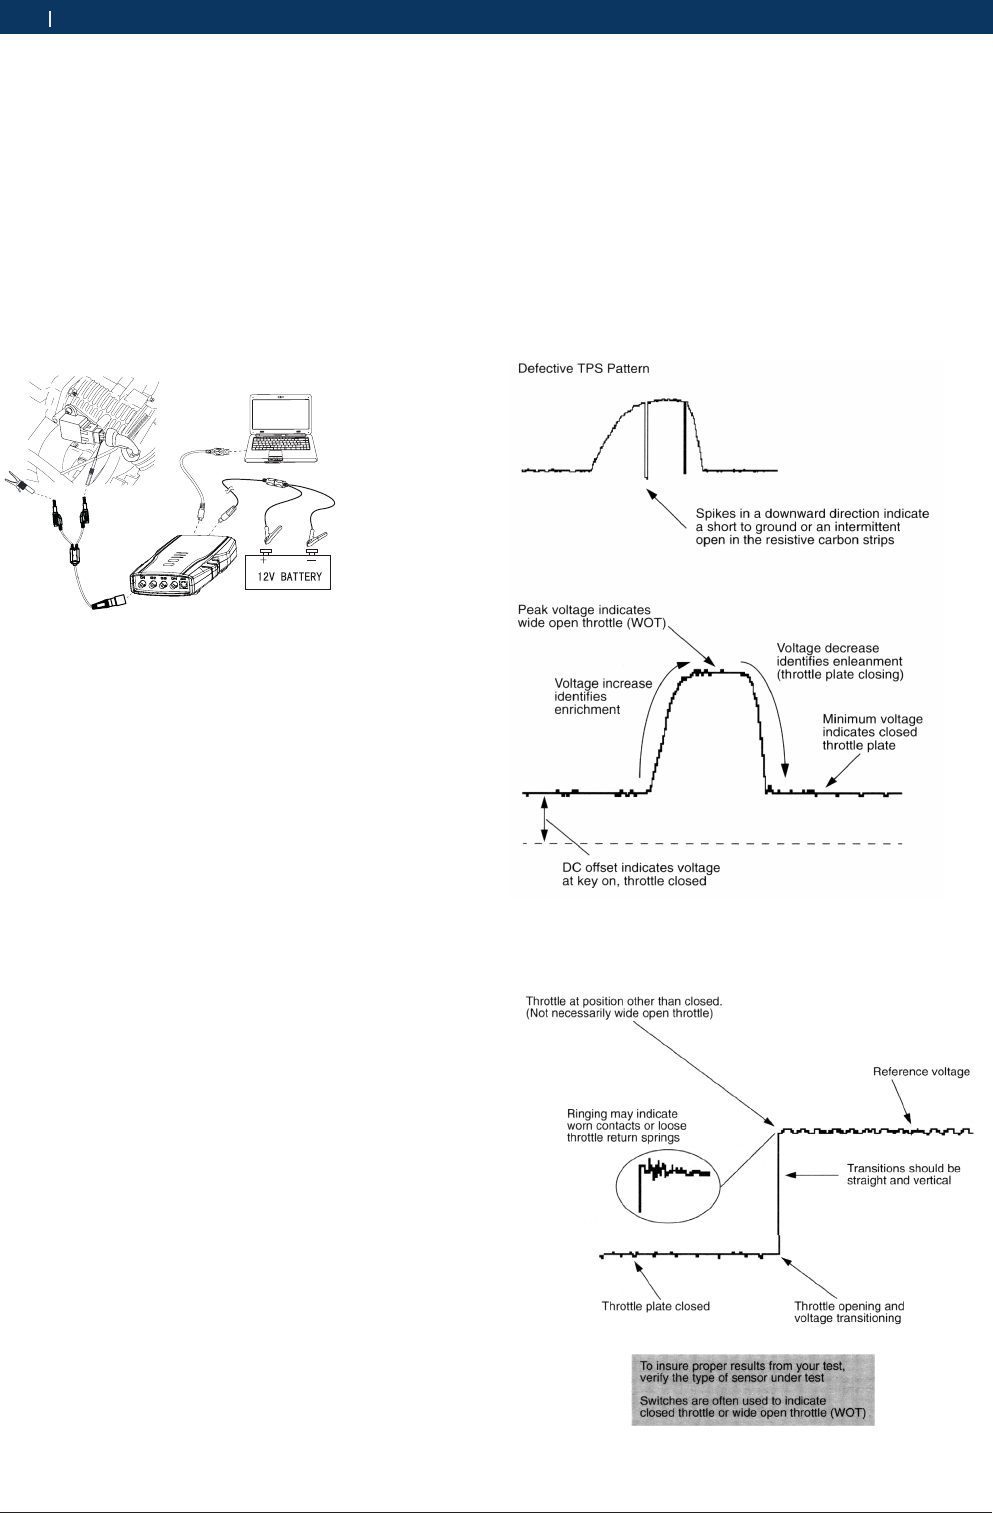
11.6.4.4 Waveform analysis
You can get precise voltage range of sensor response
by referring to standard manual from manufacturer. Ge-
nerally, the voltage of sensor should be 3~5V (fully cold
state) when engine is not started, and it should have
correspondingly variable output voltage signal under
different temperature conditions. When temperature
sensor circuit is open, voltage increases till it reaches
the peak (5V) of reference voltage; when temperature
sensor is short to ground, voltage decreases till it
reaches the peak of grounding voltage. As shown Fig.16
for temperature characteristics of common thermistor
type coolant and air intake temperature sensor, subject
to manufacturer’s manual.
Fig. 16: Temperature characteristics
11.6.5 Throttle position sensor
Throttle position sensor (TPS) is common failure source
on computer board of modern automobile. TPS informs
computer of opening degree of throttle, open or closed
state and open/close speed, or working conditions
where engine works. When TPS resistance changes,
the voltage signal it sends to computer changes conse-
quently.
Common throttle position sensors include two types:
one is potentiometer type sensor. When its shaft chan-
ges, it will cause resistance to change (potentiometer),
and will provide a direct current voltage. TPS is a varia-
ble resistance fixed on throttle shaft, which provides a
direct current voltage as an input signal for ECU.
The other is switch type sensor. After the signal from
this kind of sensor is input to ECU, computer is infor-
med of controlling idle (switch closed, throttle closed),
or of not controlling idle (because accelerator pedal is
pressed to make switch on), and ECU is informed of
throttle open position when the other switch is swit-
ched on. Such linear throttle position sensor is installed
on throttle shaft, with two movable contacts rotating
with the same shaft. One contact is for measuring
opening angle of throttle, and the other contact is for
measuring closing angle of throttle. Be sure to connect
circuit correctly when testing sensor.
1 697 021 785 | 2015-05-20 Bosch Automotive Products (Nanjing) Co., Ltd
34 | KT720 | Measure functionen
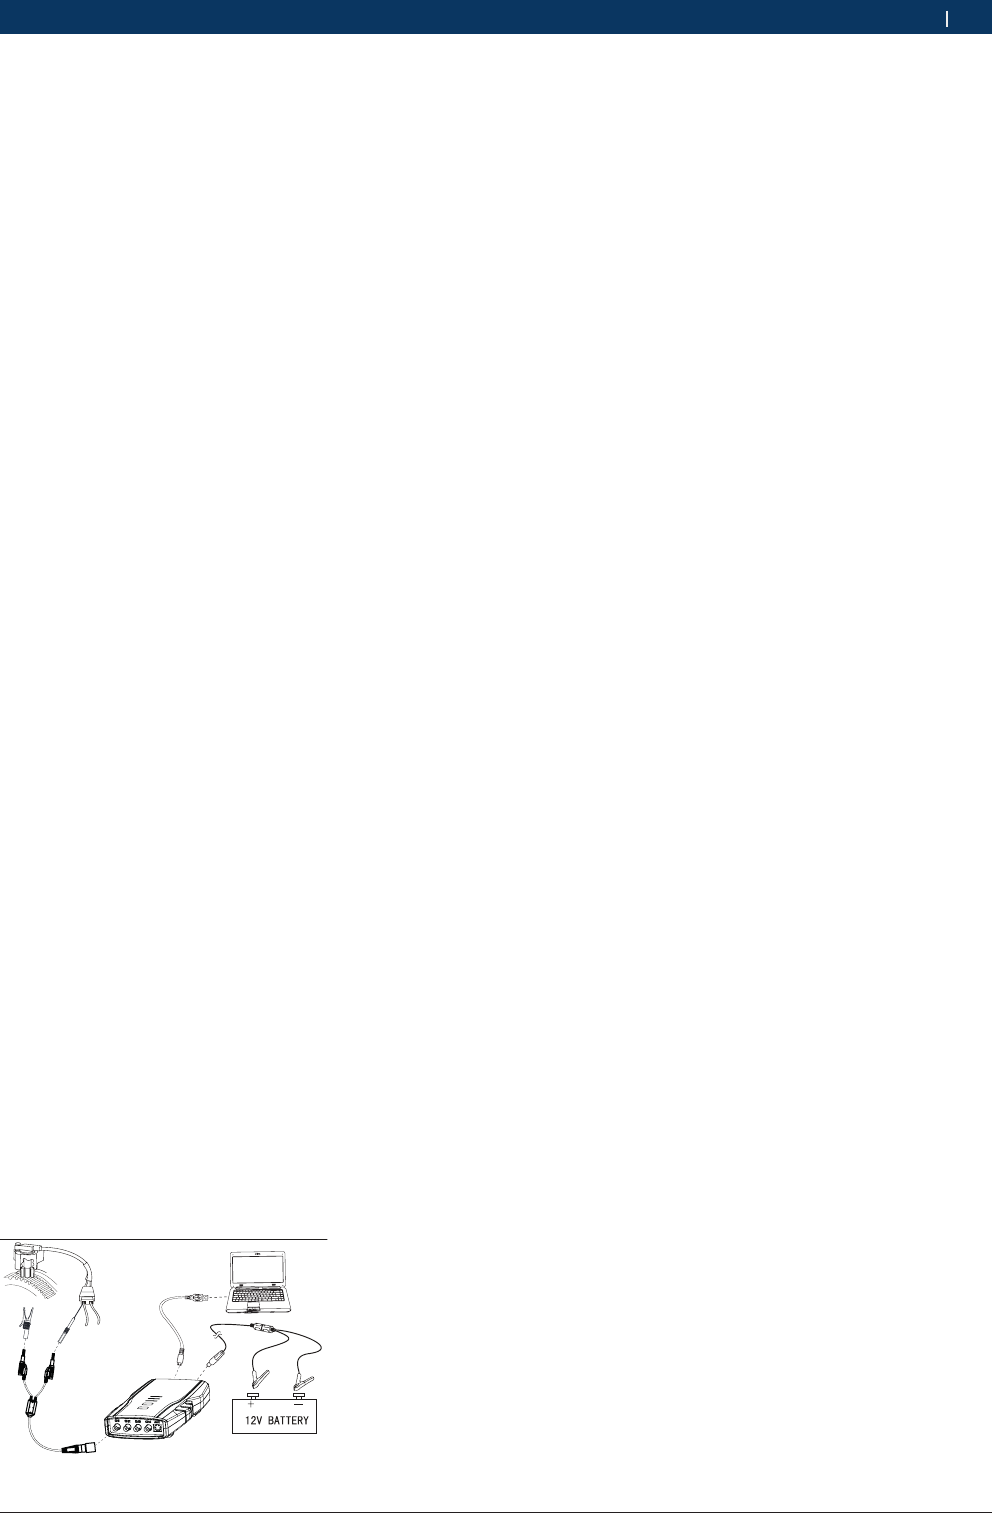
11.6.5.1 Equipment connection
When connecting KT720 to power extension cable for
power supply, choose power supply according to the
battery position of vehicle mode tested. All connecting
diagrams in this users manual take power supply by
battery clip power cable as example. Connect BNC end
ofKT720 oscilloscope probe to CH1, then connect the
other end of the black banana plug and black alligator
clip to negative pole of battery or grounding, and con-
nect the other end of red banana plug and red banana
socket into the trigger signal line.
Fig. 17: Equipment connection
11.6.5.2 Measure conditions
RSwitch on ignition switch, do not start engine, turn
throttle to fully open position, and then turn to fully
closed position, or opposition.
11.6.5.3 Measure steps
1. Connect equipment according to Fig.17, switch on
power supply.
2. Double click run KT720 software.
3. Select communication mode: USB communication or
wireless communication, the KT720 and the compu-
ter are successfully communicated.
4. Click Analyzer --> Sensor --> TPS.
5. Waveform will be displayed on the screen depending
on measure conditions.
6. You can adjust to cycle, amplitude, coupling,
reversed-phase, and cursor. If the cycle locates at
high-frequency section, the triggering channel and
triggering modes can be adjusted.
7. You can print measured data, load snapshot data
and reference waveform data, save current confi-
guration or acquire old configuration, automatically
adjust the amplitude, snapshot current waveform
and waveform comparison;
8. You can check the details of current waveform by cli-
cking “Pause” button. After click, the button turns to
“Start”, click it again to carry forward measurement.
9. You can record a continuous waveform section by
clicking “Record” button
11.6.5.4 Waveform analysis
Potentiometer type TPS is normally a variable potenti-
ometer. Referring to repair manual from manufacturer,
you can get precise voltage range of TPS. Waveform
should be free from any breakpoint, cuspate peak TO
GROUND or large wave break. The normally closed con-
tact of switch type TPS constitutes idle switch. When
throttle is in idle position, normally closed contact is
in closed state; normally open contact indicates that
throttle opens to full load. As shown Fig.18 and Fig.19
for waveform of two throttle sensors.
Fig. 18: Throttle position sensor (potentiometer)
Fig. 19: Throttle position sensor- switch type
1 697 021 785 | 2015-05-20Bosch Automotive Products (Nanjing) Co., Ltd
Measure function | KT720 | 35 en
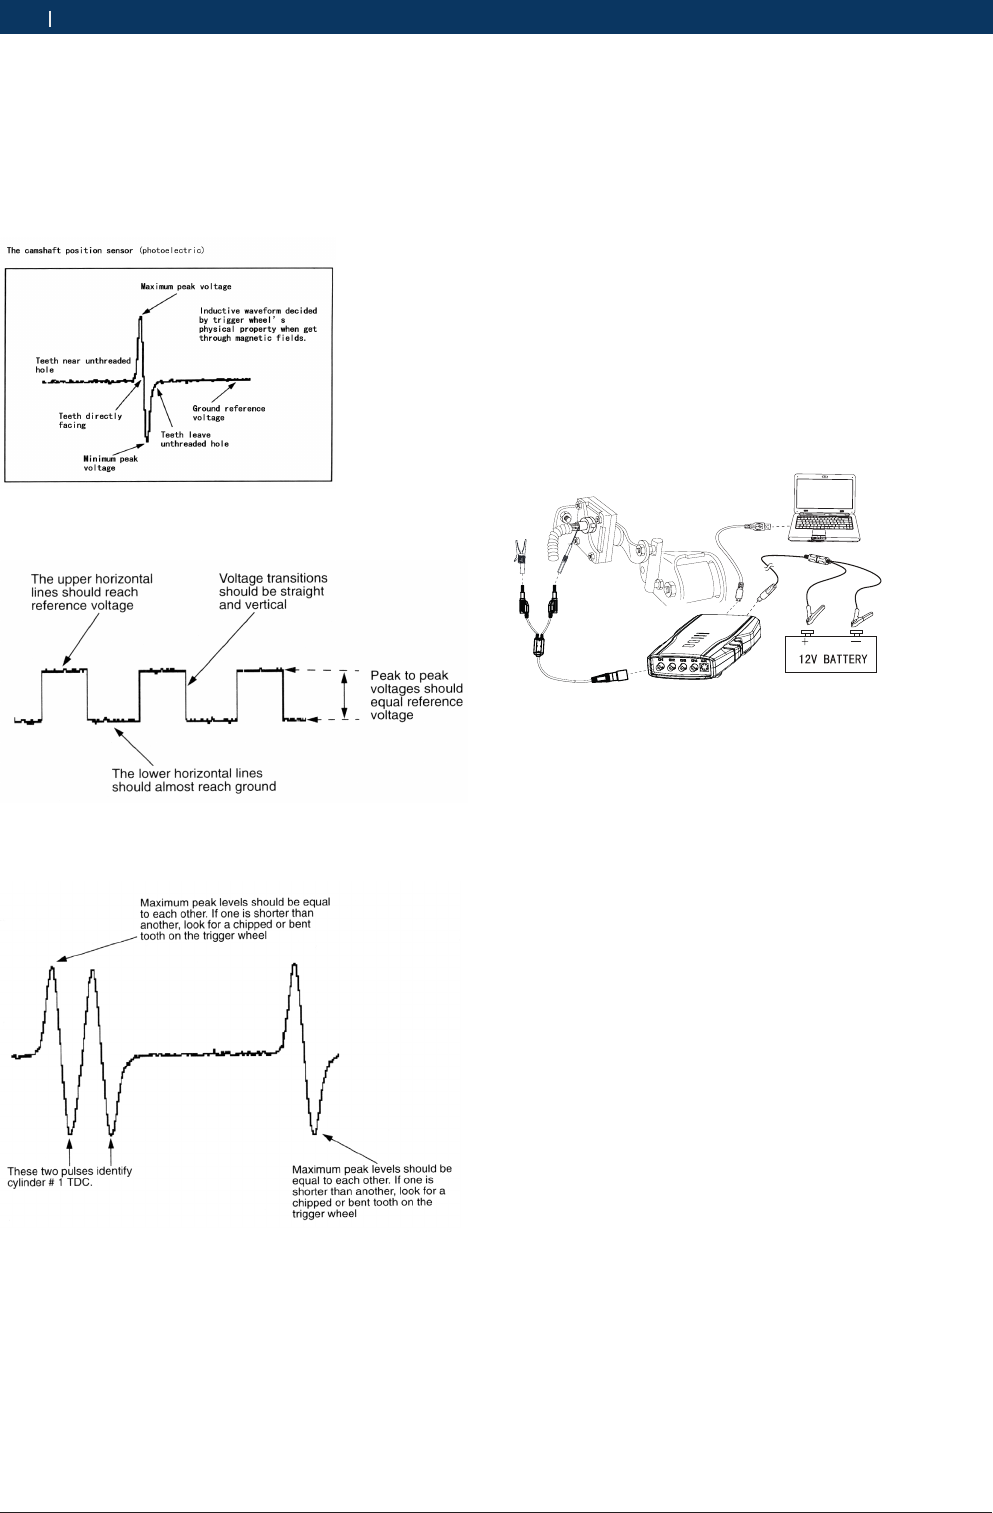
11.6.6 Crankshaft/Camshaft position sensor
It can be used to test waveform for electromagnetic
sensor, Hall effect sensor and photoelectric sensor.
Electromagnetic sensor (variable magnetoresistive sen-
sor) does not need external power supply, and has two
shielded lines connected to magnetostatic coil. When
trigger wheel passes the magnetic field formed by coil
and static magnet, small voltage signal is produced.
Trigger wheel is made of steel with low magnetic resis-
tance. Crankshaft position sensor (CPS), ABS wheel
sensor and automobile speed sensor are all examples
of variable magnetic resistance. Output voltage and
frequency change with vehicle speed.
Hall effect sensor has a current passing a semicon-
ductor placed very close to a variable magnetic field.
Magnetic field change occurs when crankshaft or dis-
tributor shaft rotates. Hall effect sensor is used in CPS
and distributor, and the amplitude of its output voltage
is constant, its frequency changes with speed.
Photoelectric sensor uses a rotary disc to separate
LED light source from optical pickup unit. With a small
hole in the disc, pickup unit can receive light emitted
from the light source. A pulse is sent each time pickup
unit receives light when the disc rotates and meets the
small hole. The result of voltage change can be used as
reference signal for other system, and the amplitude
of its output voltage is constant, while its frequency
changes with speed.
Camshaft sensor is normally installed in ignition distri-
butor, and sensor sends electric pulse to coil module to
provide data indicating camshaft and valve position.
11.6.6.1 Equipment connection
When connecting KT720 to power extension cable for
power supply, choose power supply according to the
battery position of vehicle mode tested. All connecting
diagrams in this users manual take power supply by
battery clip power cable as example. Connect BNC end
ofKT720 oscilloscope probe to CH1, then connect the
other end of the black banana plug and black alligator
clip to negative pole of battery or grounding, and con-
nect the other end of red banana plug and red banana
socket into the trigger signal line.
Fig. 20: Equipment connection
11.6.6.2 Measure conditions
RCheck sensor for signal output. If there is no signal
output, it is possible that sensor is damaged or lines
are poorly connected.
RIf that engine cannot be started is determined, con-
nect the instrument according to diagram and then
start engine.
RIf engine can be started, connect the instrument
according to diagram and then start engine; conduct
test in idle and relatively high speed state.
11.6.6.3 Measure steps
1. Connect equipment according to Fig.20, switch on
power supply.
2. Double click run KT720 software.
3. Select communication mode: USB communication or
wireless communication, the KT720 and the compu-
ter are successfully communicated.
4. Click Analyzer --> Sensor --> CPS.
5. Waveform will be displayed on the screen depending
on measure conditions.
6. You can adjust to cycle, amplitude, coupling,
reversed-phase, and cursor. If the cycle locates at
high-frequency section, the triggering channel and
triggering modes can be adjusted.
7. You can print measured data, load snapshot data
and reference waveform data, save current confi-
guration or acquire old configuration, automatically
adjust the amplitude, snapshot current waveform
and waveform comparison;
8. You can check the details of current waveform by cli-
cking “Pause” button. After click, the button turns to
“Start”, click it again to carry forward measurement.
1 697 021 785 | 2015-05-20 Bosch Automotive Products (Nanjing) Co., Ltd
36 | KT720 | Measure functionen
9. You can record a continuous waveform section by
clicking “Record” button.
11.6.6.4 Waveform analysis
2 kinds of waveform characteristics of the crankshaft/
camshaft position sensor as shown in follow pictures:
Fig. 21: Photoelectric CAM crankshaft position sensor
Fig. 22: Crankshaft position sensor (Hall effect)
Fig. 23: Crankshaft position sensor (Magnetic)
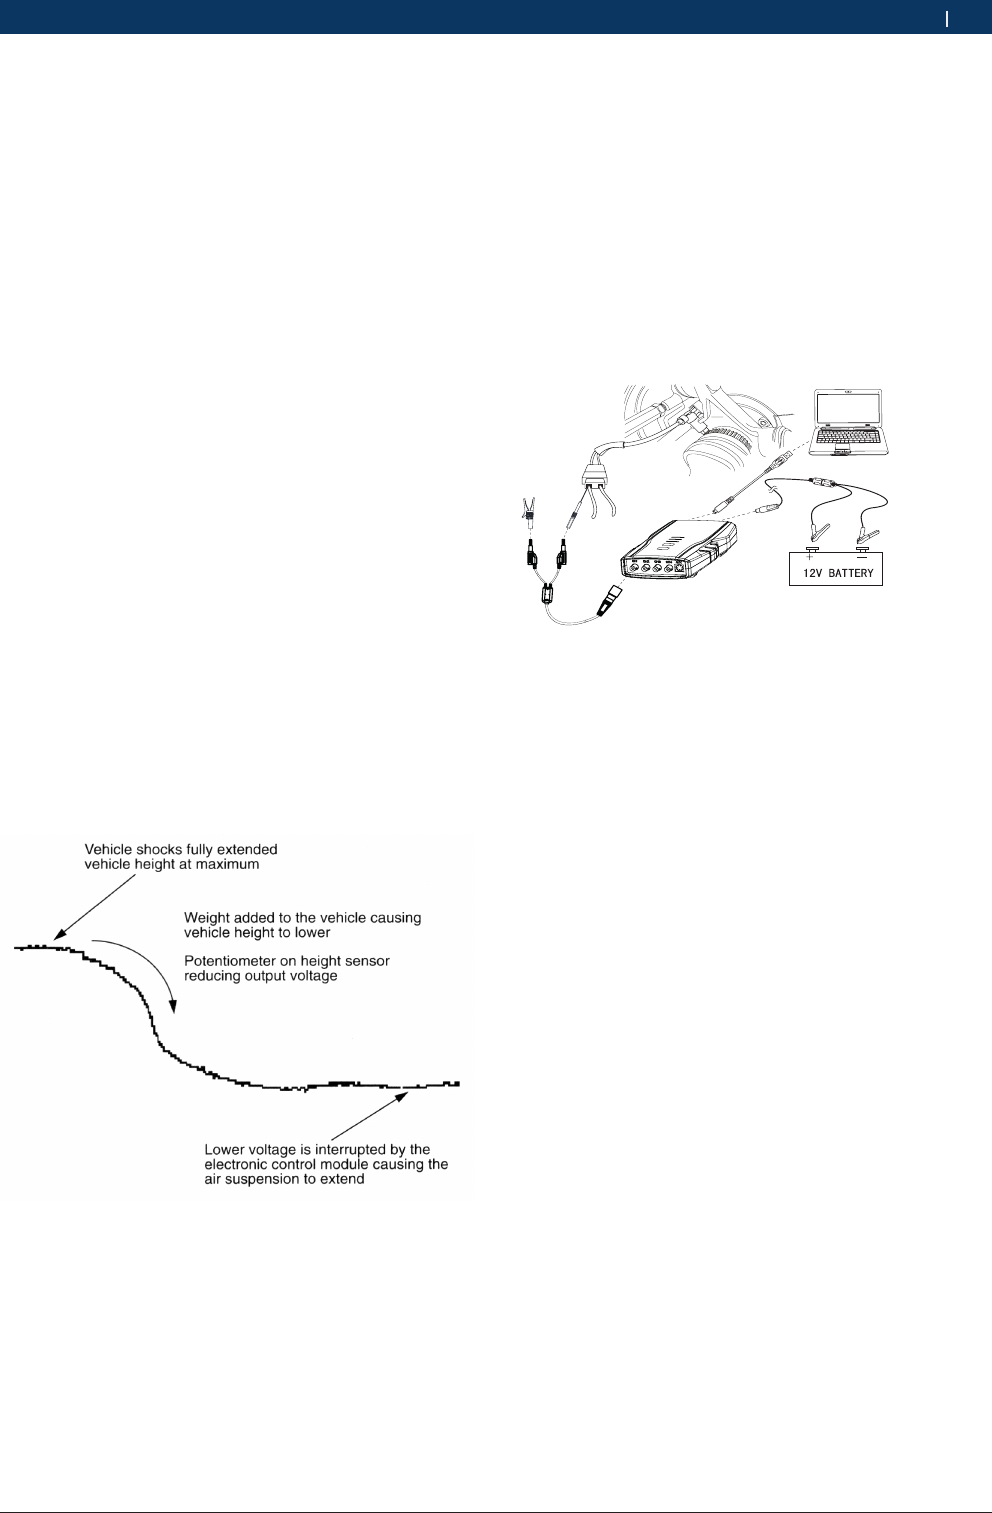
11.6.7 Ride height (position) sensor
All kinds of position sensors produce a direct current
voltage output according to the movement of variable
resistance (potentiometer) shaft. Position sensor is a
variable resistance connected between frame and rear
axle or installed in support system. As an input signal
for ECU, variable direct current voltage is used to con-
trol vehicle height. Some manufacturers use photoelec-
tric or Hall effect sensor, corresponding sensors can be
selected for test.
11.6.7.1 Equipment connection
When connecting KT720 to power extension cable for
power supply, choose power supply according to the
battery position of vehicle mode tested. All connecting
diagrams in this users manual take power supply by
battery clip power cable as example. Connect BNC end
ofKT720 oscilloscope probe to CH1, then connect the
other end of the black banana plug and black alligator
clip to negative pole of battery or grounding, and con-
nect the other end of red banana plug and red banana
socket into the trigger signal line.
Fig. 24: Equipment connection
11.6.7.2 Measure conditions
RSwitch on ignition switch, do not start engine, se-
parate rotational shaft (fixed on the rear shaft) from
sensor, and turn the shaft from stop end to the other
end to measure the whole travel.
RSwitch on ignition switch, do not start engine, care-
fully disconnect the connecting line from sensor, and
then measure sensor resistance to make sure whe-
ther there is open or short circuit in the sensor.
RRe-install the rotational shaft to the rear shaft, and
adjust ride height sensor according to the indexes
specified in manufacturer manual.
1 697 021 785 | 2015-05-20Bosch Automotive Products (Nanjing) Co., Ltd
Measure function | KT720 | 37 en
10.6.7.3 Measure steps
1. Connect equipment according to Fig.24, switch on
power supply.
2. Double click run KT720 software.
3. Select communication mode: USB communication or
wireless communication, the KT720 and the compu-
ter are successfully communicated.
4. Click Analyzer --> Sensor --> RH(Pos) Sensor.
5. Waveform will be displayed on the screen depending
on measure conditions.
6. You can adjust to cycle, amplitude, coupling,
reversed-phase, and cursor. If the cycle locates at
high-frequency section, the triggering channel and
triggering modes can be adjusted.
7. You can print measured data, load snapshot data
and reference waveform data, save current confi-
guration or acquire old configuration, automatically
adjust the amplitude, snapshot current waveform
and waveform comparison;
8. You can check the details of current waveform by cli-
cking “Pause” button. After click, the button turns to
“Start”, click it again to carry forward measurement.
9. You can record a continuous waveform section by
clicking “Record” button.
11.6.7.4 Waveform analysis
As shown Fig.24 for waveform characteristics of ride
height (position) sensor, and different vehicle models
may have different indexes, subject to manufacturer’s
manual.
Fig. 25: Waveform characteristics
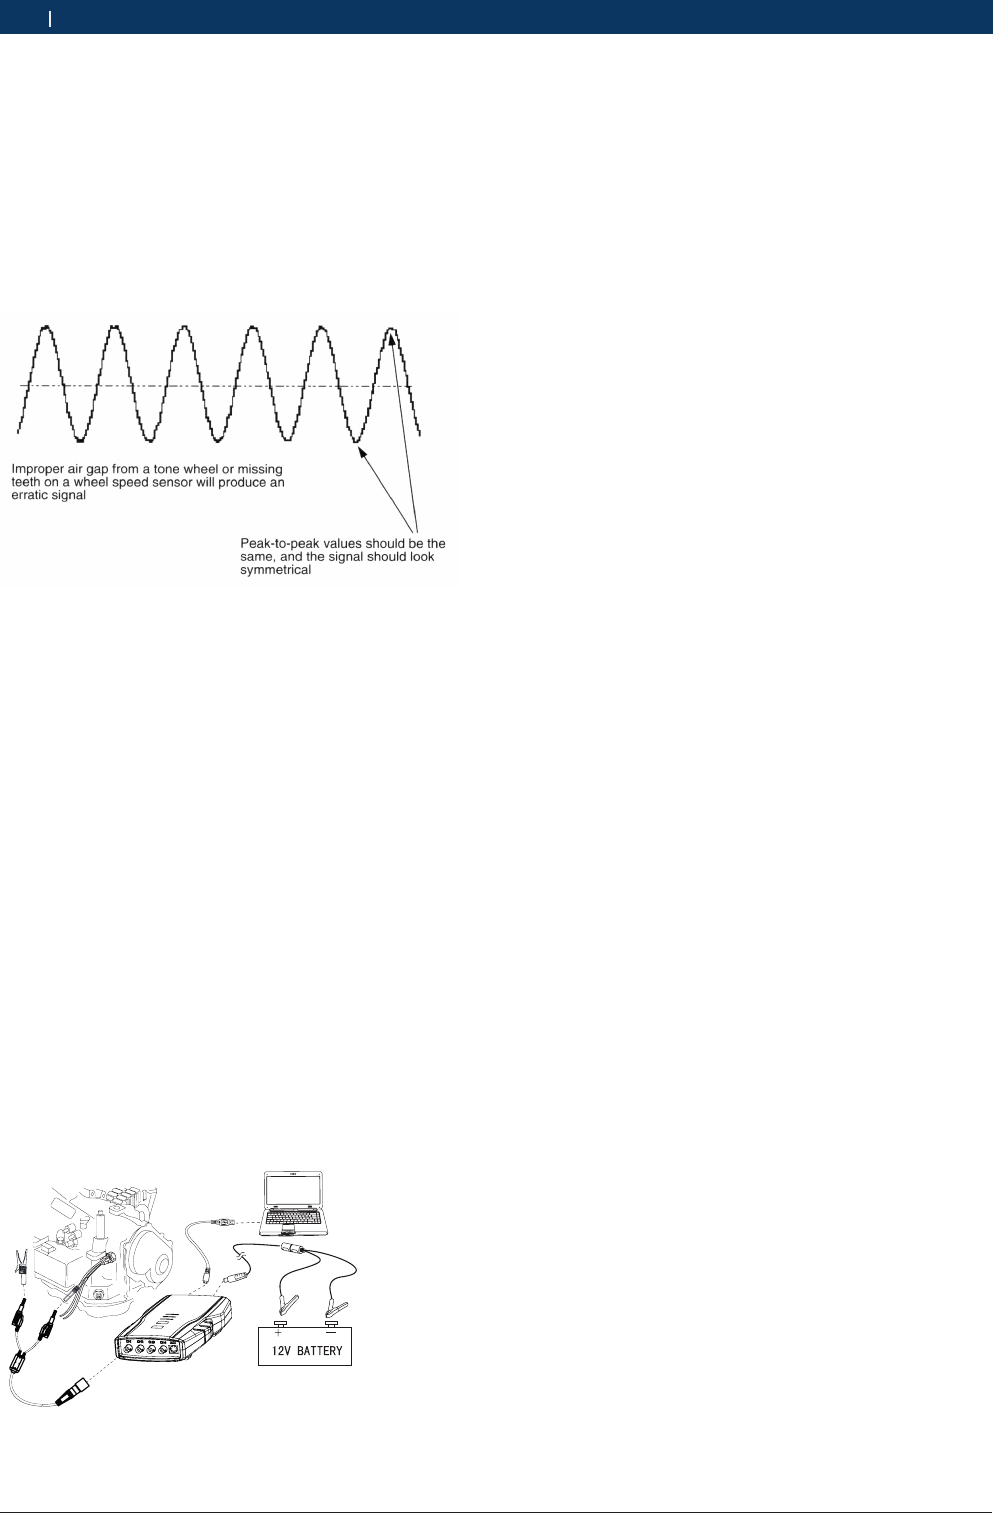
11.6.8 Anti-lock braking speed sensor
ABS control unit controls vehicle speed at braking by
comparing the frequency (instead of voltage) from ve-
hicle speed sensor, and making use of this signal. The
frequency is proportional to vehicle speed and increa-
ses when vehicle speed increases.
11.6.8.1 Equipment connection
When connecting KT720 to power extension cable for
power supply, choose power supply according to the
battery position of vehicle mode tested. All connecting
diagrams in this users manual take power supply by
battery clip power cable as example. Connect BNC end
ofKT720 oscilloscope probe to CH1, then connect the
other end of the black banana plug and black alligator
clip to negative pole of battery or grounding, and con-
nect the other end of red banana plug and red banana
socket into the trigger signal line.
Fig. 26: Equipment connection
11.6.8.2 Measure conditions
RLift vehicle body to make driving wheel hang in the
air and be able to rotate freely.
RSwitch off ignition switch, disconnect connecting
line from ABS speed sensor, connect the instrument
to ABS speed sensor, and then rotate wheel.
ROr start engine, pierce test probe into the back
of ABS speed sensor joint, place transmission to
driving gear and slowly accelerate driving; as for non-
driving wheel, refer to the above mentioned method
of switching off ignition switch.
11.6.8.3 Measure steps
1. Connect equipment according to Fig.26, switch on
power supply.
2. Double click run KT720 software.
3. Select communication mode: USB communication or
wireless communication, the KT720 and the compu-
ter are successfully communicated.
4. Click Analyzer --> Sensor --> ABS.
5. Waveform will be displayed on the screen depending
on measure conditions.
6. You can adjust to cycle, amplitude, coupling,
reversed-phase, and cursor. If the cycle locates at
high-frequency section, the triggering channel and
triggering modes can be adjusted.
7. You can print measured data, load snapshot data
and reference waveform data, save current confi-
guration or acquire old configuration, automatically
adjust the amplitude, snapshot current waveform
and waveform comparison;
1 697 021 785 | 2015-05-20 Bosch Automotive Products (Nanjing) Co., Ltd
38 | KT720 | Measure functionen
8. You can check the details of current waveform by cli-
cking “Pause” button. After click, the button turns to
“Start”, click it again to carry forward measurement.
9. You can record a continuous waveform section by
clicking “Record” button.
11.6.8.4 Waveform analysis
As shown follow picture for waveform characteristics of
ABS speed sensor.
Fig. 27: Waveform characteristics
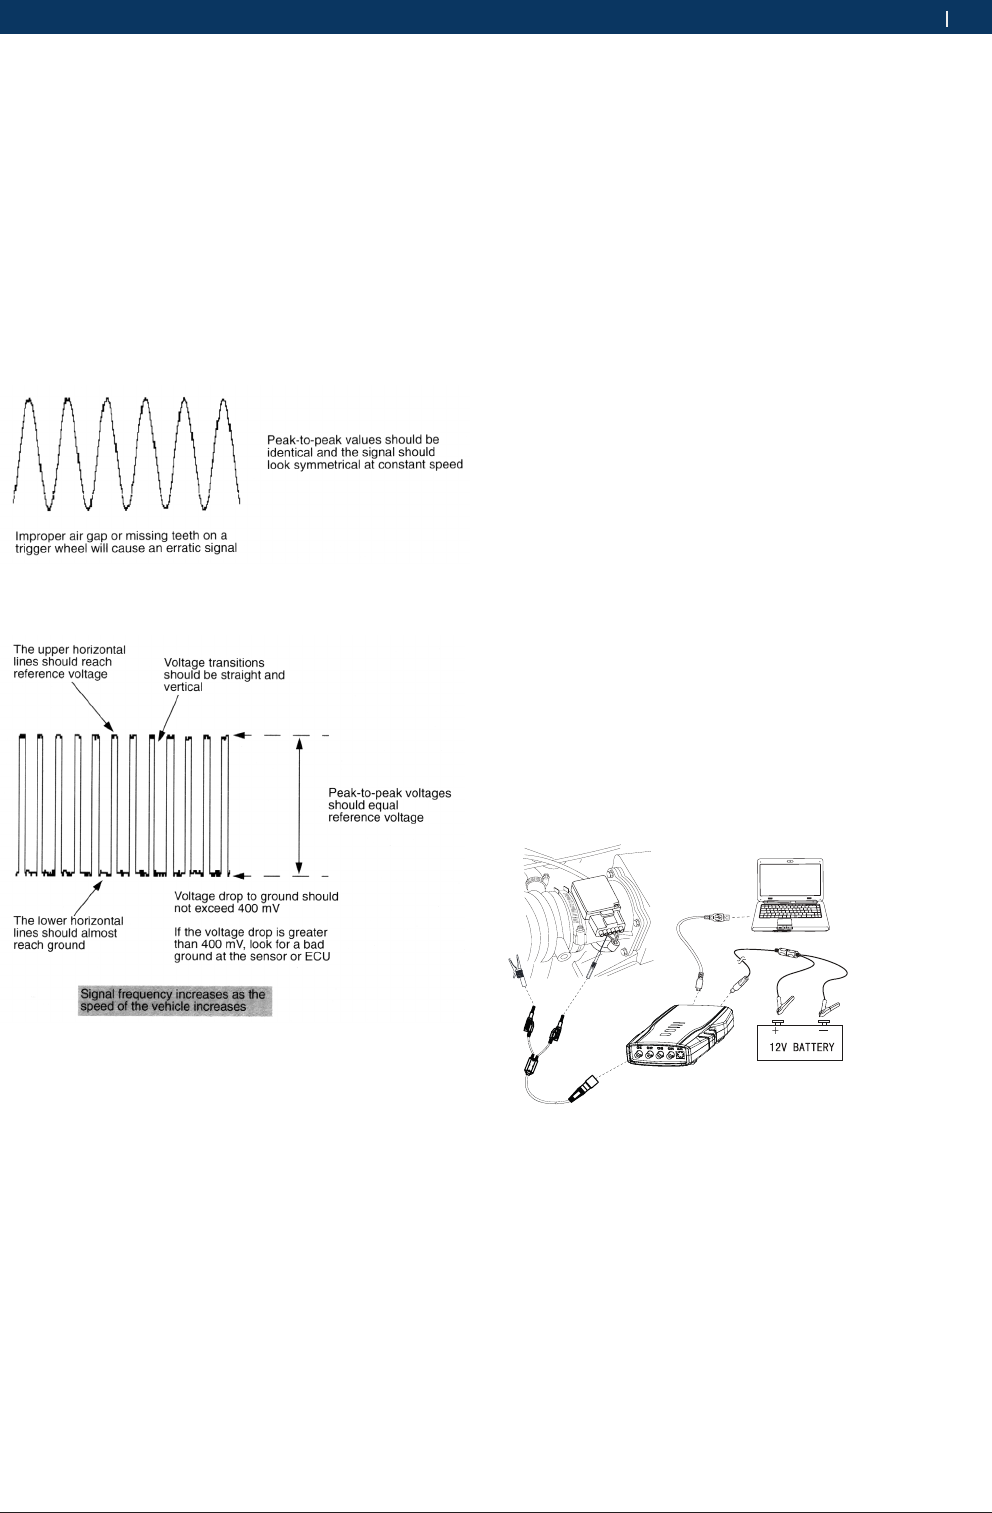
11.6.9 Vehicle speed sensor (VSS)
The output signal of vehicle speed sensor is proporti-
onal to vehicle speed. With this signal, ECU controls
torque converter lockup clutch, shift point of electric
control transmission and other functions. The sensors
used include electromagnetic, Hall effect and photo-
electric type.
11.6.9.1 Equipment connection
When connecting KT720 to power extension cable for
power supply, choose power supply according to the
battery position of vehicle mode tested. All connecting
diagrams in this users manual take power supply by
battery clip power cable as example. Connect BNC end
ofKT720 oscilloscope probe to CH1, then connect the
other end of the black banana plug and black alligator
clip to negative pole of battery or grounding, and con-
nect the other end of red banana plug and red banana
socket into the trigger signal line.
Fig. 28: Equipment connection
11.6.9.2 Measure conditions
RLift vehicle body to make driving wheel hang in the
air and be able to rotate freely.
RConnect equipment according to Fig.28, start engine
and apply driving gear.
RMonitor the output signal of vehicle speed sensor
at low speed and gradually increase the speed of
driving wheel.
11.6.9.3 Measure steps
1. Connect equipment according to Fig.28, switch on
power supply.
2. Double click run KT720 software.
3. Select communication mode: USB communication or
wireless communication, the KT720 and the compu-
ter are successfully communicated.
4. Click Analyzer --> Sensor --> VSS.
5. Waveform will be displayed on the screen depending
on measure conditions.
6. You can adjust to cycle, amplitude, coupling,
reversed-phase, and cursor. If the cycle locates at
high-frequency section, the triggering channel and
triggering modes can be adjusted.
7. You can print measured data, load snapshot data
and reference waveform data, save current confi-
guration or acquire old configuration, automatically
adjust the amplitude, snapshot current waveform
and waveform comparison;
8. You can check the details of current waveform by cli-
cking “Pause” button. After click, the button turns to
“Start”, click it again to carry forward measurement.
9. You can record a continuous waveform section by
clicking “Record” button.
1 697 021 785 | 2015-05-20Bosch Automotive Products (Nanjing) Co., Ltd
Measure function | KT720 | 39 en
11.6.9.4 Waveform analysis
Generally, if the amplitude of waveform of electroma-
gnetic vehicle speed sensor is too low, check whether
the air gap between trigger wheel and pickup unit is too
big; if waveform is not steady, check whether trigger
wheel or shaft deforms; if there is one twisted wave-
form, check whether certain tooth of the trigger wheel
deforms or is damaged. It is basically the same case
with Hall effect sensor which produces square wave. As
shown Fig.29 and Fig.30 for waveform characteristics
of electromagnetic and photoelectric vehicle speed
sensor.
Fig. 29: Vehicle speed sensor (Magnetic)
Fig. 30: Vehicle speed sensor (Optical)
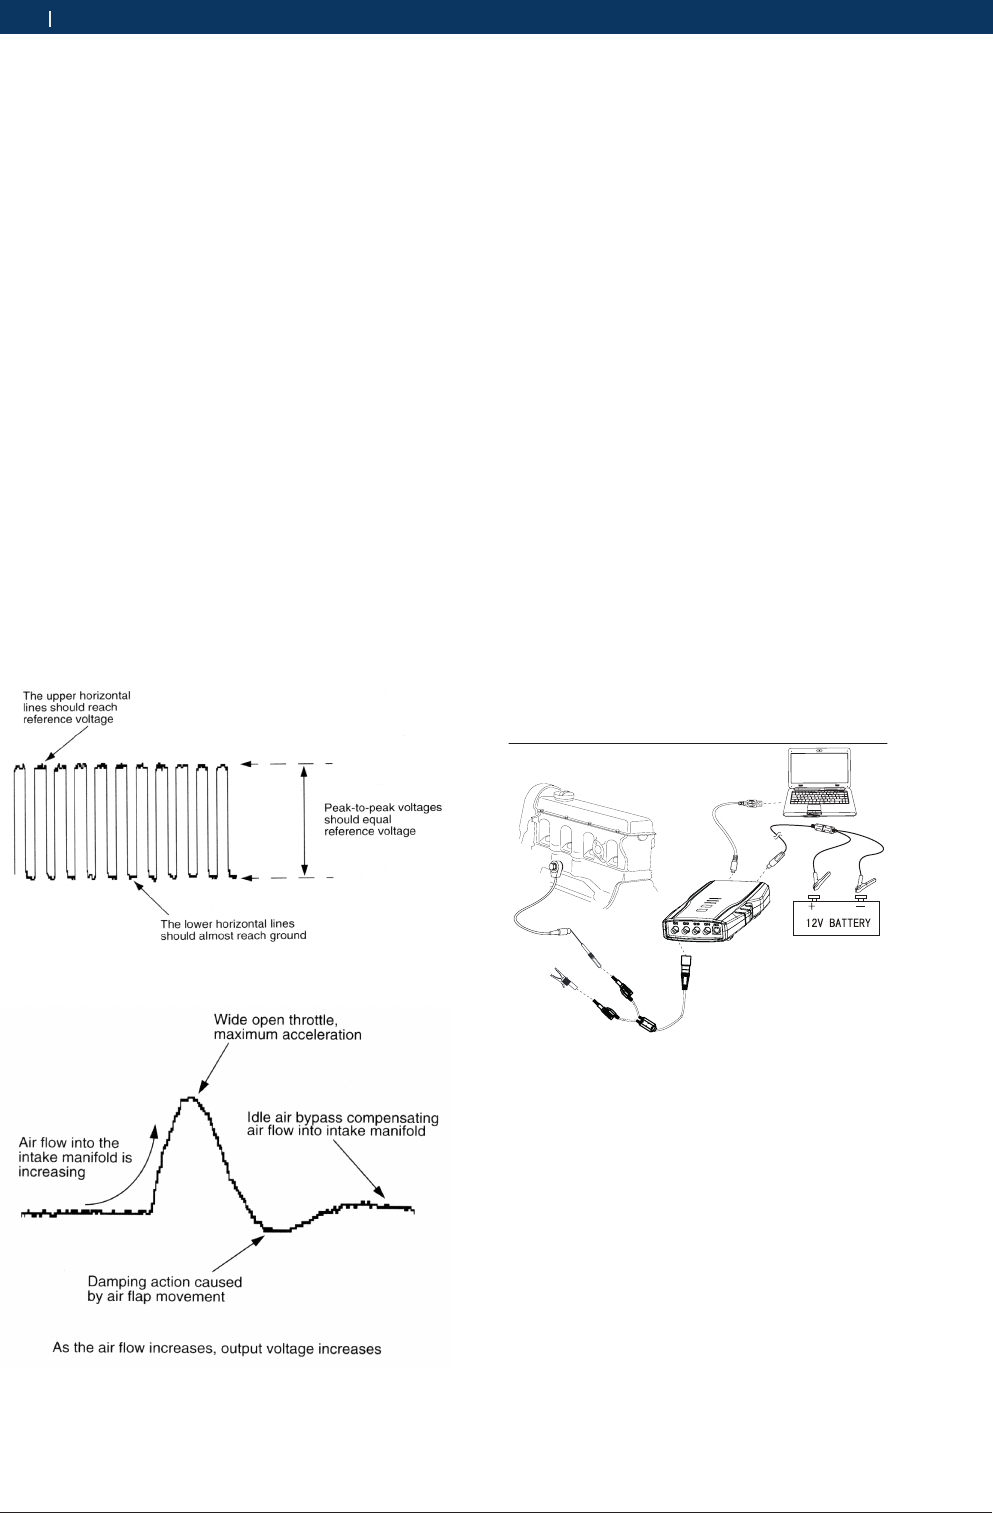
11.6.10 Air flow sensor
Analog air flow sensor: This kind of air flow sensor
uses a preheated thin metal element to measure the air
flow into the air intake manifold. This element is heated
to 77˚C and its temperature will decrease and conse-
quently its resistance will decrease when air passes it,
which causes current to increase and voltage to decre-
ase. This signal is regarded by computer as a change of
voltage reduction (increment of air flow causes voltage
reduction), and also as an indication of air flow.
Digital air flow sensor: This kind of air flow sensor
takes 5V sent by computer as reference and sends back
frequency signal equivalent to air amount of engine.
Output signal is a square wave, its amplitude is fixed at
0-5V, and signal frequency changes between 30-150Hz.
Low frequency represents small amount of air flow
while high frequency indicates large amount of air flow.
11.6.10.1 Equipment connection
When connecting KT720 to power extension cable for
power supply, choose power supply according to the
battery position of vehicle mode tested. All connecting
diagrams in this users manual take power supply by
battery clip power cable as example. Connect BNC end
ofKT720 oscilloscope probe to CH1, then connect the
other end of the black banana plug and black alligator
clip to negative pole of battery or grounding, and con-
nect the other end of red banana plug and red banana
socket into the trigger signal line.
Fig. 31: Equipment connection
11.6.10.2 Measure conditions
RConnect equipment, start engine and run it at idle,
slowly accelerate and observe display result.
RUse screwdriver handle to tap the sensor when
testing and temporary delay and unsteady accelera-
tion will be caused if the connecting line inside the
sensor is loose.
11.6.10.3 Measure steps
1. Connect equipment according to Fig.31, switch on
power supply.
2. Double click run KT720 software.
1 697 021 785 | 2015-05-20 Bosch Automotive Products (Nanjing) Co., Ltd
40 | KT720 | Measure functionen
3. Select communication mode: USB communication or
wireless communication, the KT720 and the compu-
ter are successfully communicated.
4. Click Analyzer --> Sensor --> Air Flow Sensor.
5. Waveform will be displayed on the screen depending
on measure conditions.
6. You can adjust to cycle, amplitude, coupling,
reversed-phase, and cursor. If the cycle locates at
high-frequency section, the triggering channel and
triggering modes can be adjusted.
7. You can print measured data, load snapshot data
and reference waveform data, save current confi-
guration or acquire old configuration, automatically
adjust the amplitude, snapshot current waveform
and waveform comparison;
8. You can check the details of current waveform by cli-
cking “Pause” button. After click, the button turns to
“Start”, click it again to carry forward measurement.
9. You can record a continuous waveform section by
clicking “Record” button.
11.6.10.4 Waveform analysis
As shown Fig.32 and Fig.33 for waveform characteris-
tics of two air flow sensors.
Fig. 32: Mass air flow meter (Digital)
Fig. 33: Mass air flow meter (Analog)
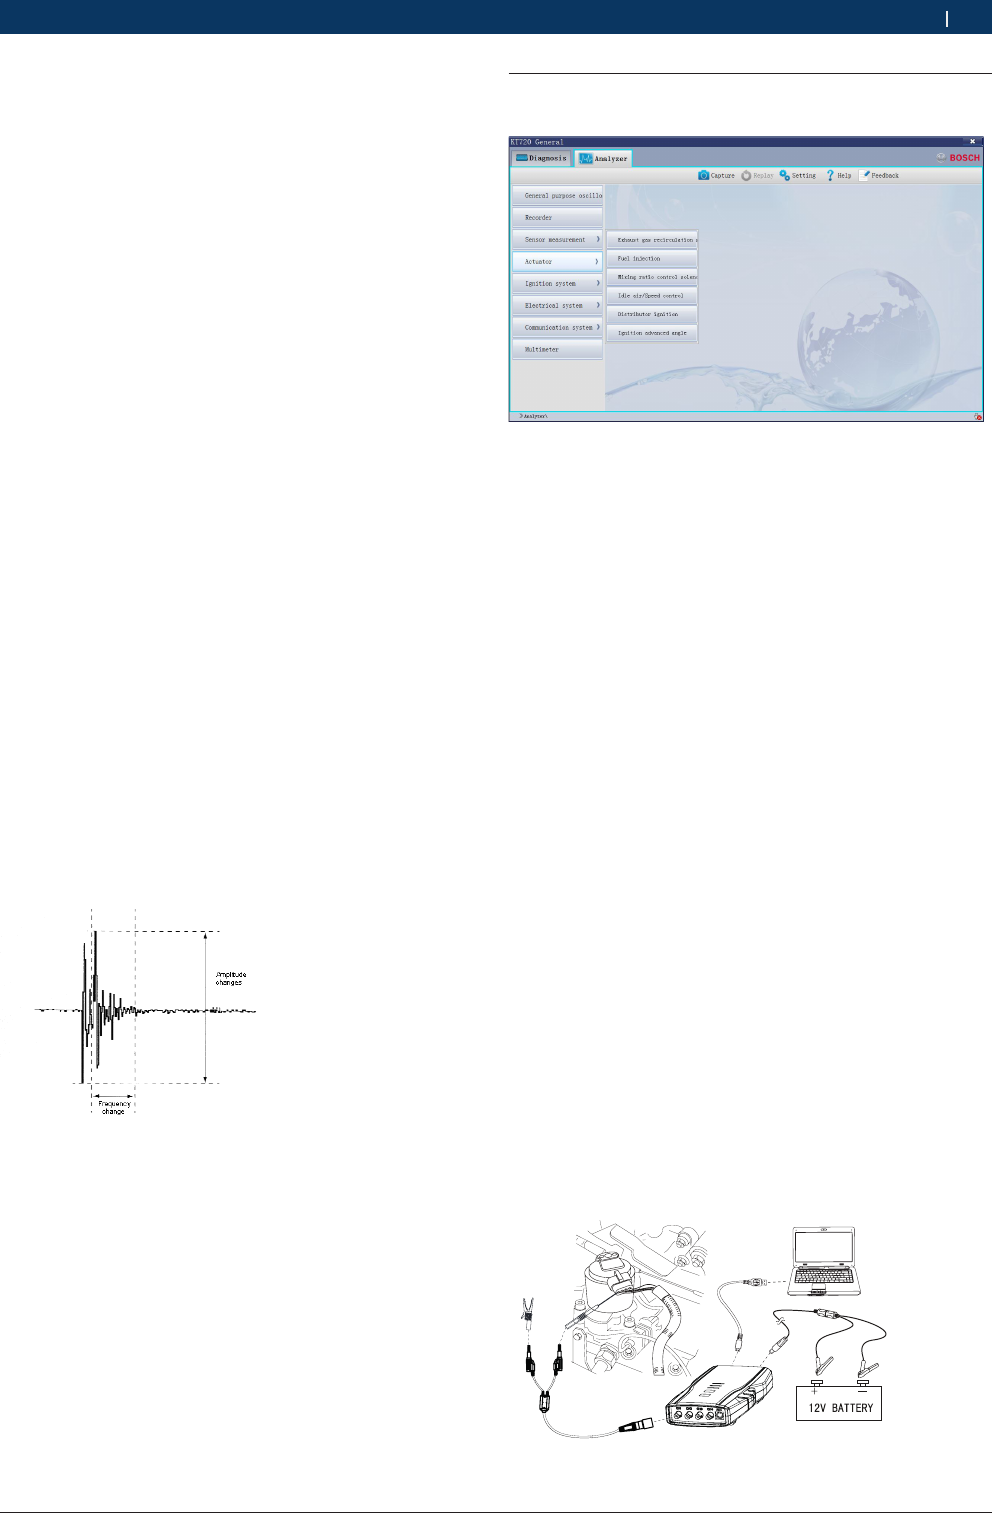
11.6.11 Knock sensor-piezoelectric crystal
In order to achieve optimal performance and fuel
economy for engine, ignition time should be adjusted
properly to make combustion occur when crankshaft
rotates to a particular angle, and start at the top dead
center (TDC) of working stroke. If ignition occurs late,
the power of the cylinder decreases, if ignition occurs
early, knock occurs. Most knock sensor is made of pie-
zoelectric crystal, and bolted to engine body. It is a kind
of very special crystal which produces voltage when
it is under mechanic stress. The voltage signal differs
a lot due to knock conditions. The voltage, after being
processed by ECU, is used to adjust ignition timing to
achieve optimal engine performance.
11.6.11.1 Equipment connection
When connecting KT720 to power extension cable for
power supply, choose power supply according to the
battery position of vehicle mode tested. All connecting
diagrams in this users manual take power supply by
battery clip power cable as example. Connect BNC end
ofKT720 oscilloscope probe to CH1, then connect the
other end of the black banana plug and black alligator
clip to negative pole of battery or grounding, and con-
nect the other end of red banana plug and red banana
socket into the trigger signal line.
Fig. 34: Equipment connection
11.6.11.2 Measure conditions
Offline test of knock sensor (sensor disconnected)
RDisconnect knock sensor, and connect instrument to
sensor.
RUse mallet strike cylinder body near sensor to make
sensor produce signal.
Online test of knock sensor (delayed ignition test)
RConduct advance time test according to chapter
11.7.6.
RUse mallet strike cylinder body near sensor to make
sensor produce signal.
RObserve ignition time to confirm that ignition delays
when knock signal is received by ECU.
1 697 021 785 | 2015-05-20Bosch Automotive Products (Nanjing) Co., Ltd
Measure function | KT720 | 41 en
11.6.11.3 Measure steps
1. Connect equipment according to Fig.34, switch on
power supply.
2. Double click run KT720 software.
3. Select communication mode: USB communication or
wireless communication, the KT720 and the compu-
ter are successfully communicated.
4. Click Analyzer --> Sensor --> Knock sensor.
5. Waveform will be displayed on the screen depending
on measure conditions.
6. You can adjust to cycle, amplitude, coupling,
reversed-phase, and cursor. If the cycle locates at
high-frequency section, the triggering channel and
triggering modes can be adjusted.
7. You can print measured data, load snapshot data
and reference waveform data, save current confi-
guration or acquire old configuration, automatically
adjust the amplitude, snapshot current waveform
and waveform comparison;
8. You can check the details of current waveform by cli-
cking “Pause” button. After click, the button turns to
“Start”, click it again to carry forward measurement.
9. You can record a continuous waveform section by
clicking “Record” button.
11.6.11.4 Waveform analysis
The waveform of knock sensor has direct relation with
knock degree and reason, so each waveform looks a litt-
le different. Knock sensor mainly checks whether there
is signal. For most vehicles, when ECU receives signal
from knock sensor, it will delay ignition till knock disap-
pears. As shown Fig.35 for characteristic waveform of
ordinary knock.
Fig. 35: Waveform characteristic
11.7 Actuator measure
Measured the waveform of actuator.
11.7.1 Exhaust gas recirculation
EGR valve position sensor is a variable resistance
connected to EGR valve. EGR valve position sensor
provides a direct current voltage which changes with
the movement of knob on the variable resistance (po-
tentiometer). Variable direct current voltage is used as
input signal by computer to indicate working conditions
of EGR.
When engine has excessive combustion temperature
and air-fuel ratio is lean, EGR system dilutes air fuel
ratio and limits formation of NOx. Gasoline engine EGR
should work at middle acceleration and cruise speed
between 50-120Km/h. Computer makes use of method
of providing power supply or cutting off solenoid coil,
or uses pulse width modulated solenoid, to switch on
or switch off solenoid coil to achieve the goal of cont-
rolling vacuum.
11.7.1.1 Equipment connection
When connecting KT720 to power extension cable for
power supply, choose power supply according to the
battery position of vehicle mode tested. All connecting
diagrams in this users manual take power supply by
battery clip power cable as example. Connect BNC end
ofKT720 oscilloscope probe to CH1, then connect the
other end of the black banana plug and black alligator
clip to negative pole of battery or grounding, and con-
nect the other end of red banana plug and red banana
socket into the trigger signal line.
Fig. 36: Equipment connection

1 697 021 785 | 2015-05-20 Bosch Automotive Products (Nanjing) Co., Ltd
42 | KT720 | Measure functionen
11.7.1.2 Measure conditions
RStart engine, connect KT720 to EGR valve, and slow-
ly increase engine speed to cruise speed.
iMost EGR valves only start when engine is at load
state. Therefore, it is possible to use road test or
make use of horsepower tester to assist test.
!Only conduct the following tests when engine is at
cold state to avoid burn.
RIgnition switch is at switch-on position, engine stops,
insert probe into position sensor on the top of EGR
valve, and carefully (cold engine) lift EGR from chas-
sis. If EGR diaphragm has obstacle or is not easily
accessible, it is possible to move EGR valve when
vehicle is at load state.
RSwitch off ignition switch, disconnect sensor, and
then carefully lift EGR valve from chassis. Some posi-
tion sensors can be disconnected from EGR valve so
as to make sensor terminal accessible;
RApply potentiometer test function of common sen-
sors when testing position sensor.
11.7.1.3 Measure steps
1. Connect equipment according to Fig.36, switch on
power supply.
2. Double click run KT720 software.
3. Select communication mode: USB communication or
wireless communication, the KT720 and the compu-
ter are successfully communicated.
4. Click Analyzer --> Actuator --> EGT.
5. Waveform will be displayed on the screen depending
on measure conditions.
6. You can adjust to cycle, amplitude, coupling,
reversed-phase, and cursor. If the cycle locates at
high-frequency section, the triggering channel and
triggering modes can be adjusted.
7. You can print measured data, load snapshot data
and reference waveform data, save current confi-
guration or acquire old configuration, automatically
adjust the amplitude, snapshot current waveform
and waveform comparison.
8. You can check the details of current waveform by cli-
cking “Pause” button. After click, the button turns to
“Start”, click it again to carry forward measurement.
9. You can record a continuous waveform section by
clicking “Record” button.
10.7.1.4 Waveform analysis
Most vehicles start exhaust gas recirculation control
when they travel or accelerate. EGR system does not
work when engine runs at idle and decelerates since
control signal is cut off. Peak height of waveform redu-
ces when failure occurs, which indicates that vacuum
solenoid coil of EGR is short; if no control signal is
found, it indicates that failure occurs to PCM or EGR
control conditions for PCM does not meet, or there is
something wrong with the circuit of EGR system.
11.7.2 Fuel Injection(FI)
Electronically-controlled fuel injection is controlled by
computer and also affected by many working factors,
including water temperature, engine load and oxygen
sensor signal in closed-loop work.
Fuel injection time can be expressed in pulse width in
ms, representing the amount of fuel injected into the
cylinder. Wide pulse indicates more fuel injected under
the same injection pressure. ECU provides a path for
nozzle through a driving triode. When triode is through,
current passes from nozzle and triode to ground, which
makes nozzle open There are three kinds of fuel injec-
tion system currently, and each has its own fuel injec-
tion control method. All nozzles have a method of limi-
ting current, because large current will damage nozzle.
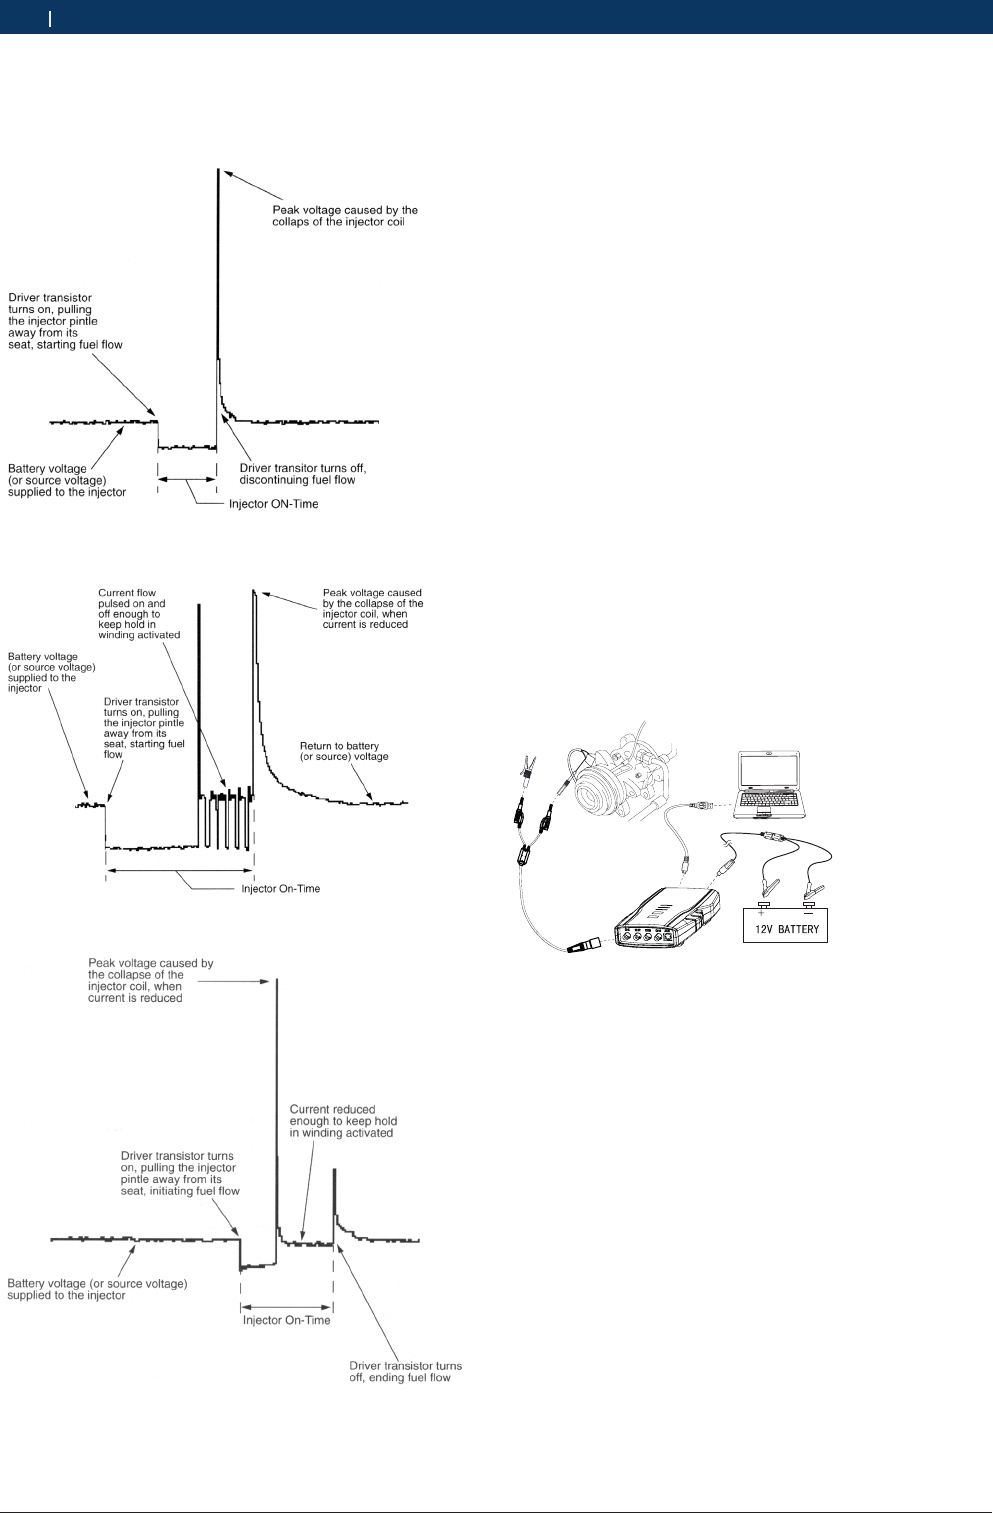
Peak value keeping type: In nozzle circuit, nozzle is
actually powered by two different circuits. When two
circuits work for nozzle at the same time, nozzle is
supplied with high starting current and opens quickly;
after nozzle opens, one of the circuits is cut off, and the
other circuit continues to work to keep the nozzle open
till the end of injection time. In the circuit, one resis-
tance is used to reduce the current passing through
nozzle. When the second circuit is cut off, nozzle clo-
ses, and fuel injection ends. The method for measuring
opening time is to locate the falling edge of opening
pulse and the rising edge representing the second
circuit is cut off.
Throttle injection system: is designed to take the place
of carburetor, and pulse width represents working or
opening time of nozzle. ECU controls pulse width accor-
ding to engine working and driving conditions.
The triode of traditional (saturated switch type): nozz-
le provides nozzle with fixed current. Some nozzles use
resistance to control current, and other nozzles have
high internal impedance, with only one injection pulse.
Nozzles of pulse width: modulation type have high
starting current to quickly open nozzle. After nozzle
opens, pulse switch-on begins at grounding end to cut
current off to extend opening time of nozzle, and limit
the current passing through nozzle at the same time.
1 697 021 785 | 2015-05-20Bosch Automotive Products (Nanjing) Co., Ltd
Measure function | KT720 | 43 en
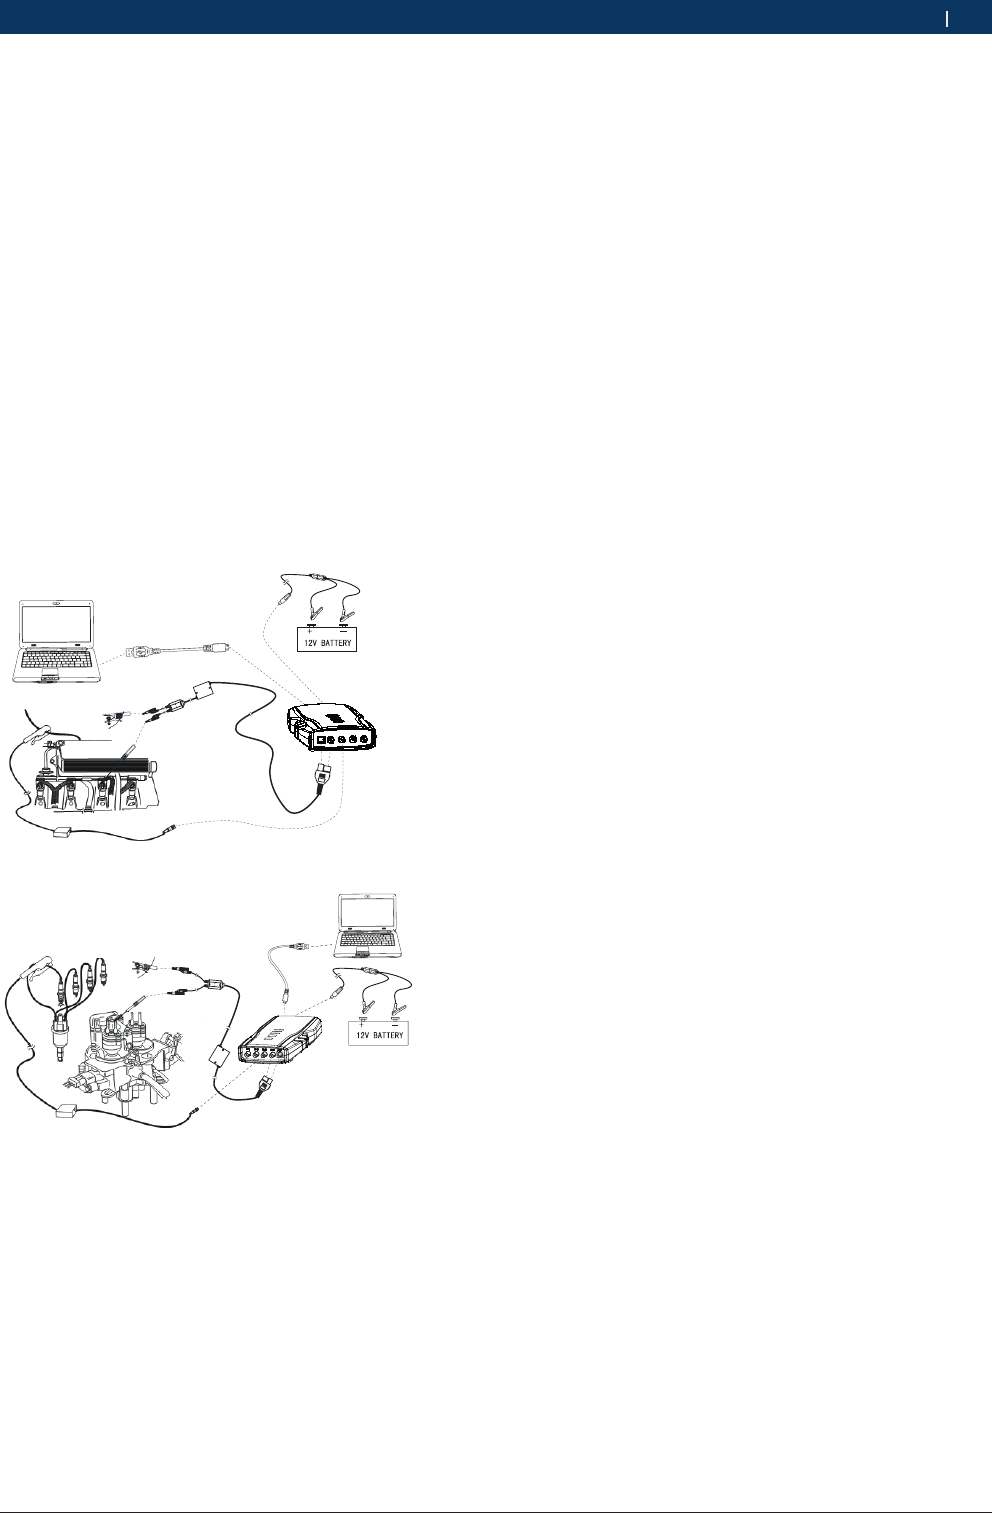
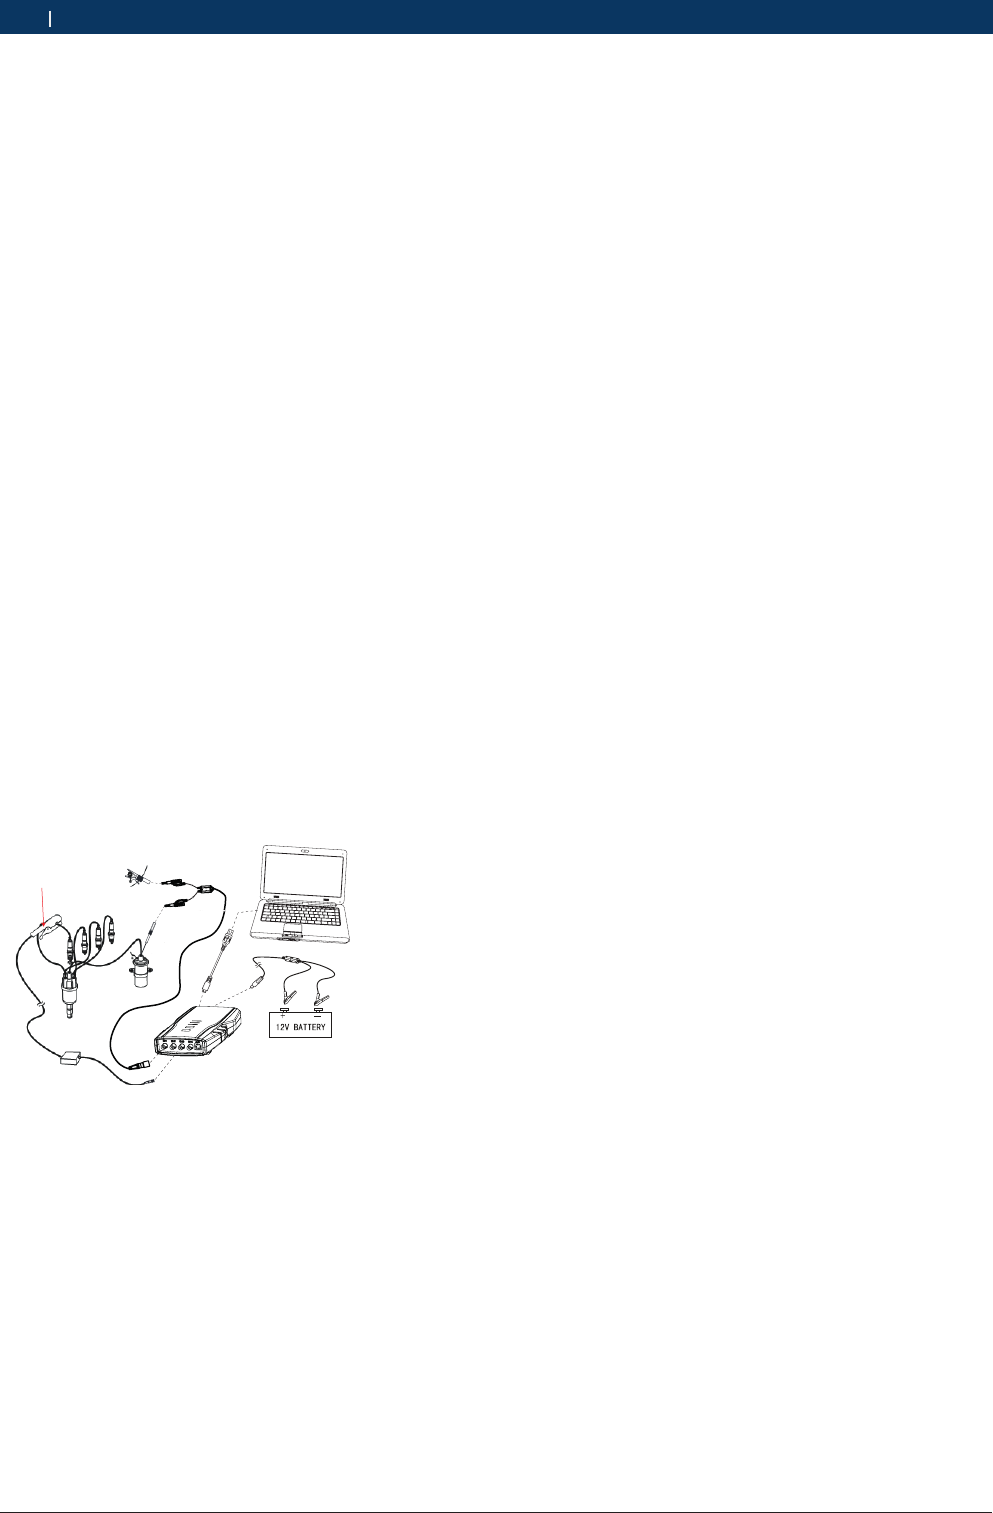
11.7.2.1 Equipment connection
When connecting KT720 to power extension cable for
power supply, choose power supply according to the
battery position of vehicle mode tested. All connecting
diagrams in this users manual take power supply by
battery clip power cable as example. Connect BNC end
of 1 cylinder signal to CH3 of KT720,use signal clip to
clip high voltage line of one cylinder of engine. Please
check that there is “This side faces to spark plug” on
the signal clip, do not clip reversely. Connect BNC end
of mulriple end ofKT720 differential probes to CH4,
connect the other end of mulriple end to assistant chan-
nel. Then connect the other end of the black banana
plug ofKT720 differential probes and black alligator
clip to negative pole of battery or grounding, and con-
nect the other end of red banana plug and red banana
socket into the signal line. Multi-point fuel injection
connection method as shown fig. 37, single-point fuel
injection connection methods as shown fig. 38.
Fig. 37: Connecting diagram of multi-point fuel injection
Fig. 38: Connecting diagram of single point fuel injection
!Inductive pickup measures speed signal of engine. If
engine speed is not displayed inKT720 , re-clip the
high voltage line after turning it 180˚C.
11.7.2.2 Measure conditions
RStart engine after connecting equipment. Start test
from idle, slowly increase engine speed and observe
nozzle signal at the same time.
RChange output signal of MAP sensor or oxygen sen-
sor to increase engine load.
RAnother method is to disconnect oxygen sensor,
which will decrease the voltage signal sent to ECU,
and ECU will increase injection pulse width, but this
method may lead to occurrence of DTC.
RConnect signal end of oxygen sensor to positive (+)
of battery to increase the voltage signal sent to ECU,
and ECU will decrease injection pulse width.
11.7.2.3 Measure steps
1. Connect equipment according to Fig.37 or Fig.38,
switch on power supply.
2. Double click run KT720 software.
3. Select communication mode: USB communication or
wireless communication, the KT720 and the compu-
ter are successfully communicated.
4. Click Analyzer --> Actuator --> FI.
5. Waveform will be displayed on the screen depending
on measure conditions.
6. You can adjust to cycle, amplitude, coupling, rever-
sed-phase, and cursor.
7. You can print measured data, load snapshot data
and reference waveform data, save current configu-
ration or acquire old configuration, snapshot current
waveform and waveform comparison;
8. You can check the details of current waveform by cli-
cking “Pause” button. After click, the button turns to
“Start”, click it again to carry forward measurement.
1 697 021 785 | 2015-05-20 Bosch Automotive Products (Nanjing) Co., Ltd
44 | KT720 | Measure functionen
11.7.2.4 Waveform analysis
As shown Fig.39, 40 and 41 for waveform characteris-
tics of all nozzles.
Fig. 39: Conventional (Saturated switch driver) fuel injector
Fig. 40: Pulse-sidth modulated fuel injector
Fig. 41: Current-controlled (Peak and hold) fuel injector (Throttle
body and port fuel injection systems)
11.7.3 Coil and diode test
When the energy of electromagnetic control unit dis-
appears, change of magnetic field can induce burr of
voltage. Clamping diode (or suppression diode) is used
to filter these burrs, horn, relay, fan motor, clutch of air
conditioning compressor and some fuel injection equip-
ment are all examples.
A faulty diode produces noises that can be heard
normally in sound system of vehicle. The waveform of
these noise burrs will contain big burr when one level
changes to another. These burrs can also affect sensiti-
ve sensors or control system in the vehicle.
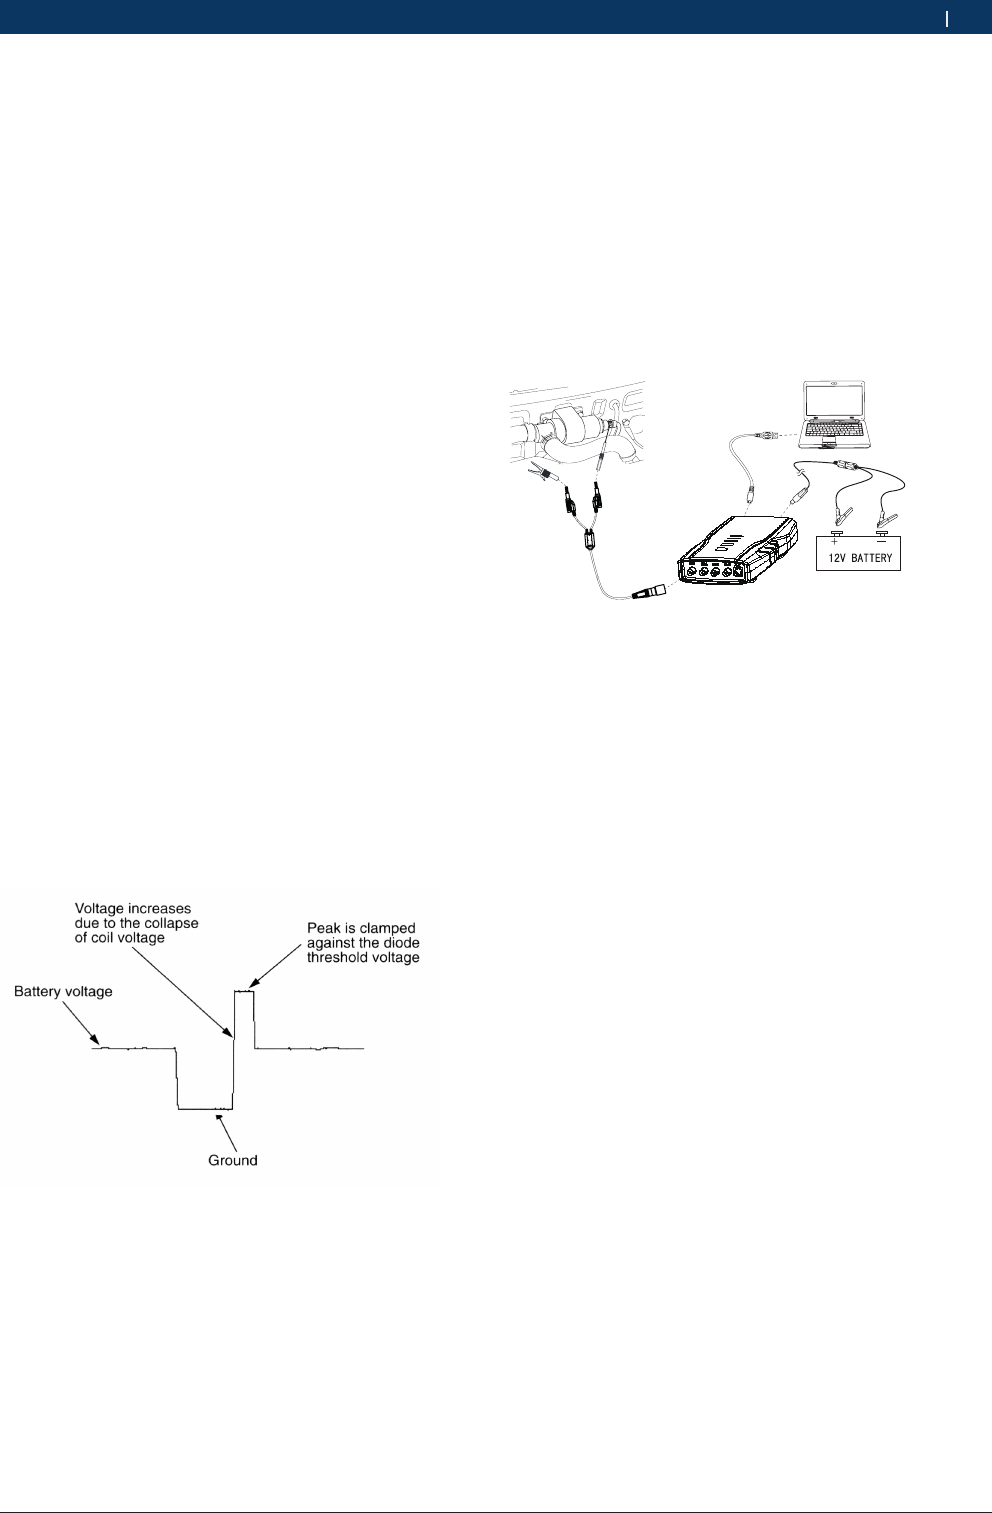
11.7.3.1 Equipment connection
When connecting KT720 to power extension cable for
power supply, choose power supply according to the
battery position of vehicle mode tested. All connecting
diagrams in this users manual take power supply by
battery clip power cable as example. Connect BNC end
ofKT720 oscilloscope probe to CH1, then connect the
other end of the black banana plug and black alligator
clip to negative pole of battery or grounding, and con-
nect the other end of red banana plug and red banana
socket into into the power supply of solenoid coil.
Fig. 42: Equipment connection
1 697 021 785 | 2015-05-20Bosch Automotive Products (Nanjing) Co., Ltd
Measure function | KT720 | 45 en
11.7.3.2 Measure conditions
RExcite tested equipment, and then observe display of
KT720 .
10.7.3.3 Measure steps
1. Connect equipment according to Fig.42 switch on
power supply.
2. Double click run KT720 software.
3. Select communication mode: USB communication or
wireless communication, the KT720 and the compu-
ter are successfully communicated.
4. Click Analyzer --> Actuator --> MC.
5. Waveform will be displayed on the screen depending
on measure conditions.
6. You can adjust to cycle, amplitude, coupling,
reversed-phase, and cursor. If the cycle locates at
high-frequency section, the triggering channel and
triggering modes can be adjusted.
7. You can print measured data, load snapshot data
and reference waveform data, save current confi-
guration or acquire old configuration, automatically
adjust the amplitude, snapshot current waveform
and waveform comparison;
8. You can check the details of current waveform by cli-
cking “Pause” button. After click, the button turns to
“Start”, click it again to carry forward measurement.
9. You can record a continuous waveform section by
clicking “Record” button.
11.7.3.4 Waveform analysis
As shown Fig.43 for characteristic waveform of clam-
ping diode.
Fig. 43: Waveform characteristic
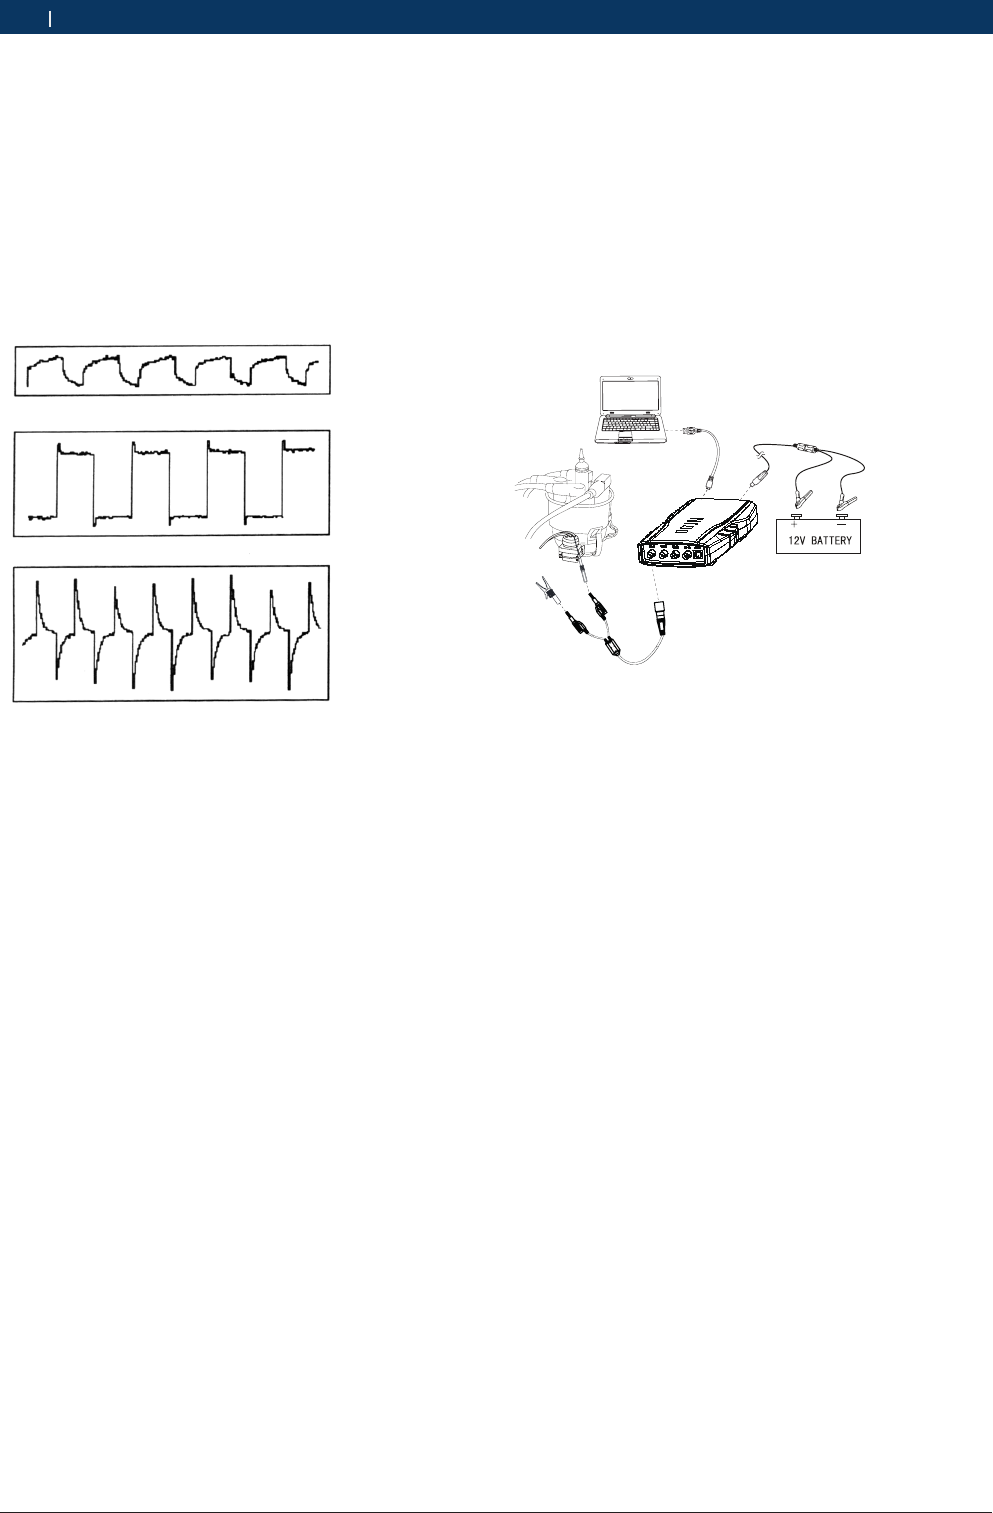
11.7.4 Idle air/speed control (IAC/ISC)
Idle air controller (IAC) of engine control unit adjusts
engine idle and prevents stop. Some idle control system
adopts step motor to control the air flow into bypass of
throttle; other idle control systems use bypass control
valve controlled by square wave signal sent by ECU.
Due to impedance of coil, the square wave signals may
be slightly different in shape.
11.7.4.1 Equipment connection
When connecting KT720 to power extension cable for
power supply, choose power supply according to the
battery position of vehicle mode tested. All connecting
diagrams in this users manual take power supply by
battery clip power cable as example. Connect BNC end
ofKT720 oscilloscope probe to CH1, then connect the
other end of the black banana plug and black alligator
clip to negative pole of battery or grounding, and con-
nect the other end of red banana plug and red banana
socket into the single line.
Fig. 44: Equipment connection
11.7.4.2 Measure conditions
RStart engine after connecting instrument to air con-
trol valve, and monitor conditions in cold, warm and
hot engine state.
RIntentionally cause small vacuum leak and pay at-
tention to the signal from engine control unit how to
adjust opening of valve.
11.7.4.3 Measure steps
1. Connect equipment according to Fig.44, switch on
power supply.
2. Double click run KT720 software.
3. Select communication mode: USB communication or
wireless communication, the KT720 and the compu-
ter are successfully communicated.
4. Click Analyzer --> Actuator --> IAC/ISC.
5. Waveform will be displayed on the screen depending
on measure conditions.
6. You can adjust to cycle, amplitude, coupling,
reversed-phase, and cursor. If the cycle locates at
high-frequency section, the triggering channel and
triggering modes can be adjusted.
7. You can print measured data, load snapshot data
and reference waveform data, save current confi-
guration or acquire old configuration, automatically
adjust the amplitude, snapshot current waveform
and waveform comparison;
8. You can check the details of current waveform by cli-
cking “Pause” button. After click, the button turns to
“Start”, click it again to carry forward measurement.
9. You can record a continuous waveform section by
clicking “Record” button.
1 697 021 785 | 2015-05-20 Bosch Automotive Products (Nanjing) Co., Ltd
46 | KT720 | Measure functionen
11.7.4.4 Waveform analysis
When switches for accessorial appliances (air condi-
tioning, etc.) switch on or off and transmission apply
or does not apply, engine control unit will change idle
by controlling IAC/ISC to open/close throttle bypass. If
idle remains unchanged, it is the most possible reason
that IAC/ISC is damaged or throttle bypass is blocked.
As shown Fig.45 for characteristic waveform of common
IAC/ISC, and refer to manufacturer’s manual for possib-
le special shapes.
Fig. 45: Waveform characteristic
11.7.5 Distributor trigger
Electromagnetic distributor trigger: the electromagne-
tic sensor used for distributor trigger consists of a per-
manent magnet and a magnetic core. Filament wrapped
on the core functions as pickup coil. Non-magnetic trig-
ger wheel is installed on distributor shaft and has the
same number of teeth as cylinder number. When one
tooth of trigger wheel passes magnetic field (formed by
pickup coil), a signal is produced. Magnetic sensor or
variable magnetoresistive sensor usually has two con-
ducting wires and produces its own signal.
Hall effect distributor trigger: Hall effect switch has a
fixed sensor and a trigger wheel, and requires a small
input voltage to produce output voltage. When rotary
vane passes through between magnet and Hall element,
output voltage changes. This signal is sent, in square
waveform, to ignition module to trigger ignition coil.
Photoelectric distributor trigger: photoelectric signal
generator produces voltage signal by using light pro-
duced by LED to trigger photoelectric triode. Trigger
wheel is a piece of disc with small hole, which rotates
in the clearance between LED and photoelectric triode.
11.7.5.1 Equipment connection
When connecting KT720 to power extension cable for
power supply, choose power supply according to the
battery position of vehicle mode tested. All connecting
diagrams in this users manual take power supply by
battery clip power cable as example. Connect BNC end
ofKT720 oscilloscope probe to CH1, then connect the
other end of the black banana plug and black alligator
clip to negative pole of battery or grounding, and con-
nect the other end of red banana plug and red banana
socket into the single line.
Fig. 46: Equipment connection
11.7.5.2 Measure conditions
RIf you are diagnosing “Cannot start” failure, connect
wires as connection note, and then start engine.
Check whether there is signal. If there is, problem is
not here; if there is no signal or signal is too weak,
check whether sensor fails or lines have problem.
RIf engine can be started, connect wires as connec-
tion note. Start engine, and check engine in various
working conditions.
11.7.5.3 Measure steps
1. Connect equipment according to Fig.46, switch on
power supply.
2. Double click run KT720 software.
3. Select communication mode: USB communication or
wireless communication, the KT720 and the compu-
ter are successfully communicated.
4. Click Analyzer --> Actuator --> DIST Trig.
5. Waveform will be displayed on the screen depending
on measure conditions.
6. You can adjust to cycle, amplitude, coupling,
reversed-phase, and cursor. If the cycle locates at
high-frequency section, the triggering channel and
triggering modes can be adjusted.
7. You can print measured data, load snapshot data
and reference waveform data, save current confi-
guration or acquire old configuration, automatically
adjust the amplitude, snapshot current waveform
and waveform comparison;
1 697 021 785 | 2015-05-20Bosch Automotive Products (Nanjing) Co., Ltd
Measure function | KT720 | 47 en
8. You can check the details of current waveform by cli-
cking “Pause” button. After click, the button turns to
“Start”, click it again to carry forward measurement.
9. You can record a continuous waveform section by
clicking “Record” button.
11.7.5.4 Waveform analysis
As shown Fig.47, 48 and 49 for characteristic waveform
triggered by three kinds of distributors.
Fig. 47: Primary distributor triggering (Hall effect)
Fig. 48: Primary distributor triggering (Magnetic)
Fig. 49: Primary distributor triggering (Optical)
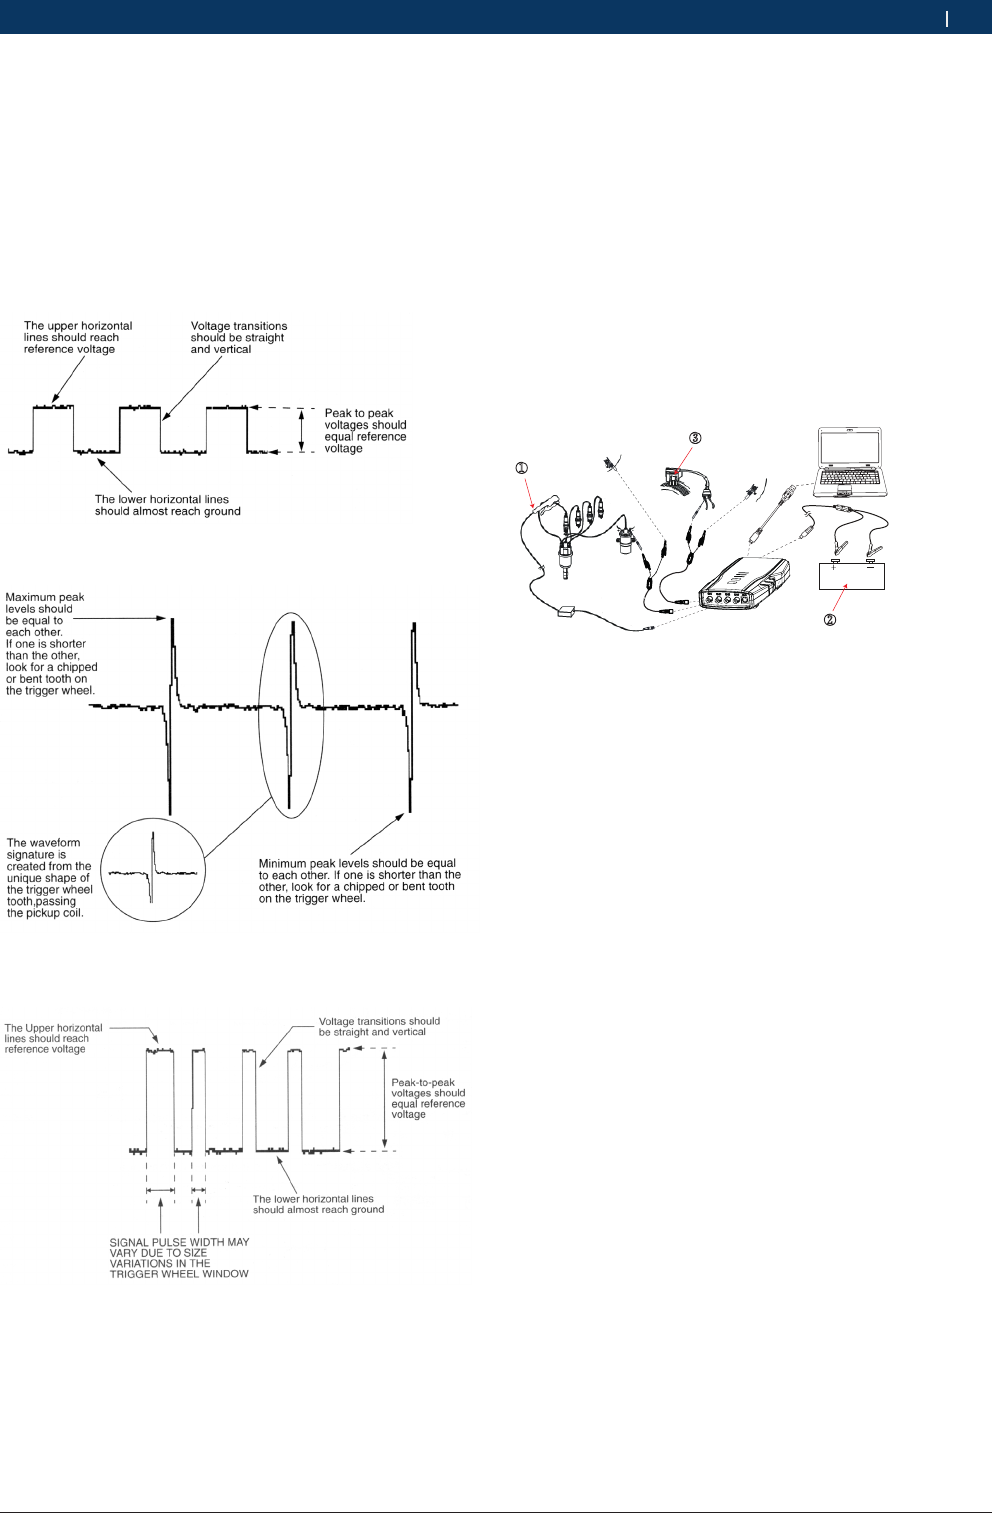
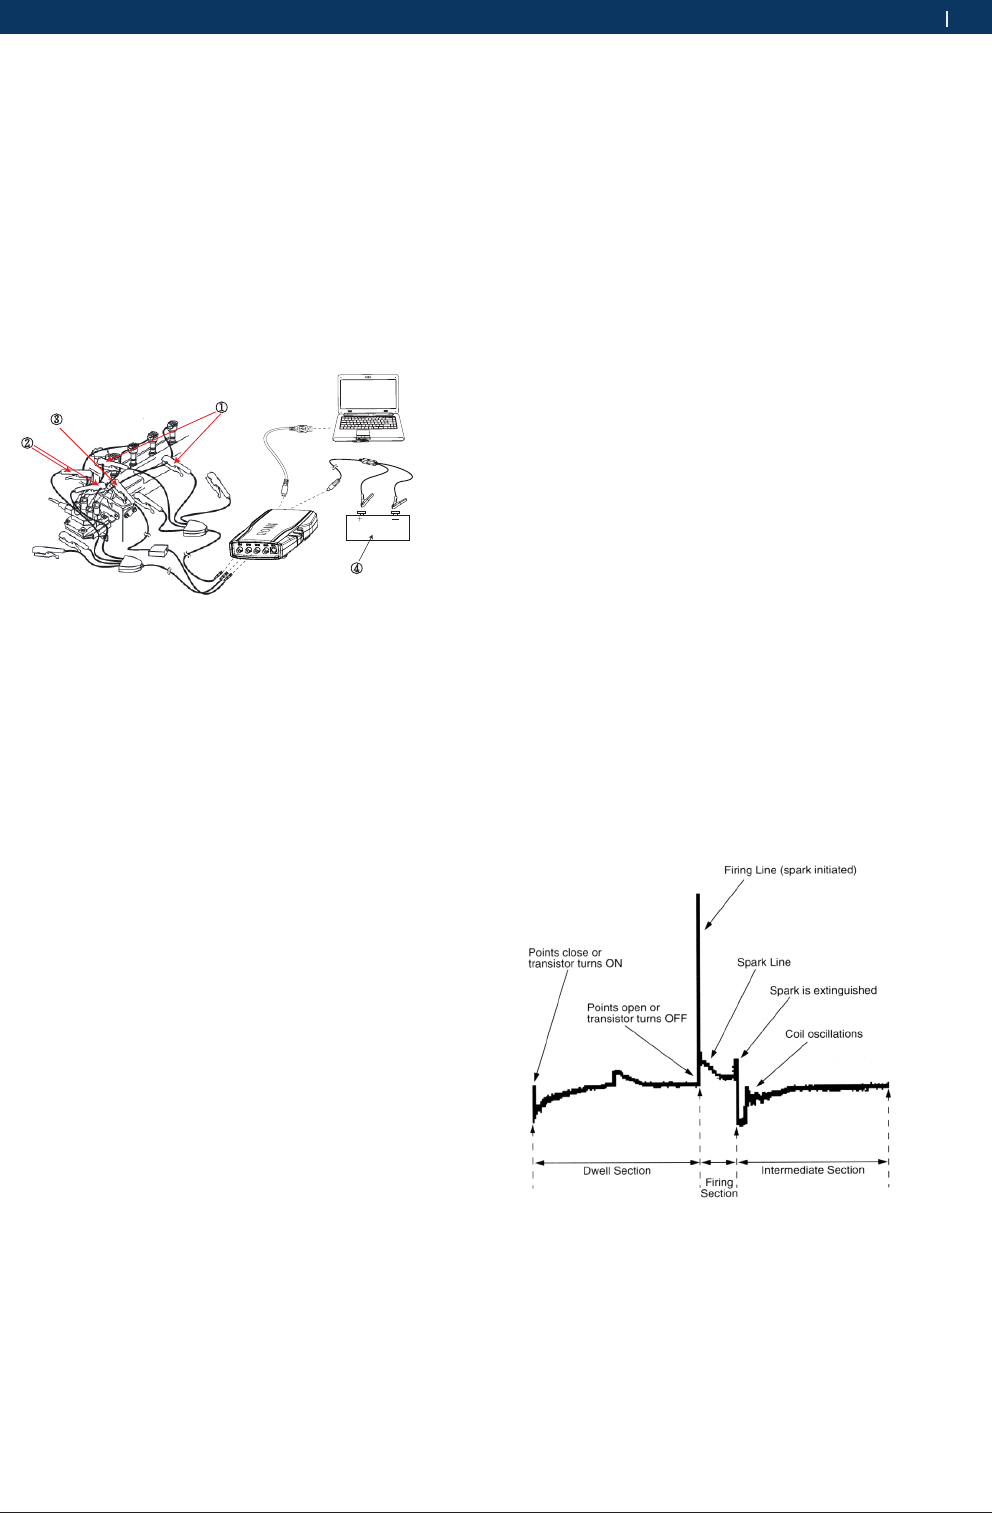
11.7.6 Advance time
Two channels of KT720 can determine ignition advance
time of the ignition system. Connect CH1 to the first
cylinder or primary of ignition coil (ignition module),
and CH2 to TDC signal.
11.7.6.1 Equipment connection
When connecting KT720 to power extension cable for
power supply, choose power supply according to the
battery position of vehicle mode tested. All connecting
diagrams in this users manual take power supply by
battery clip power cable as example. Connect BNC end
of 2KT720 oscilloscope probes to CH1 and CH2, and
connect BNC end of 1 cylinder signal to CH3, then con-
nect the other end of the both black banana plugs and
2 alligator clips to negative pole of battery or ground-
ing, and connect the other end of red banana plugs and
2 banana sockets into the “-“ connector of ignition coil
and signal line of crankshaft position sensor.
②
①
③
Fig. 50: Equipment connection
1 1 Cylinder Signal
2 Battery
3 Capacitive Pickup
11.7.6.2 Measure conditions
RConnectKT720 , and the test line on Channel CH2
cannot be grounded.
RStart engine and let it run at idle, slowly accelerate it
and observe result displayed on the screen.
RWhen electronic and mechanic (if found) advances
begin to function, the increment of ignition advance
can be observed.
11.7.6.3 Measure steps
1. Connect equipment according to Fig.50, switch on
power supply.
2. Double click run KT720 software.
3. Select communication mode: USB communication or
wireless communication, the KT720 and the compu-
ter are successfully communicated.
4. Click Analyzer --> Actuator --> Adv Time.
5. Waveform will be displayed on the screen depending
on measure conditions.
6. You can adjust to cycle, amplitude, coupling,
reversed-phase, and cursor. If the cycle locates at
high-frequency section, the triggering channel and
triggering modes can be adjusted.
7. You can print measured data, load snapshot data
and reference waveform data, save current confi-
guration or acquire old configuration, automatically
adjust the amplitude, snapshot current waveform
and waveform comparison;
1 697 021 785 | 2015-05-20 Bosch Automotive Products (Nanjing) Co., Ltd
48 | KT720 | Measure functionen
8. You can check the details of current waveform by cli-
cking “Pause” button. After click, the button turns to
“Start”, click it again to carry forward measurement.
9. You can record a continuous waveform section by
clicking “Record” button.
11.7.6.4 Waveform analysis
As shown Fig.51 for characteristic waveform.
Fig. 51: Waveform characteristic
11.8 Ignition system
Measured the waveform of secondary and primary igni-
tion.
iIf the ignition cylinder is greater than 4, you need to
used 2 capacitive pickup to measured.
11.8.1 Secondary ignition
We can effectively check traveling performance of ve-
hicle and reason for emission problem through analysis
of ignition secondary waveform. Generally, the wave-
form is mainly used to check whether high voltage line
of spark plug is short or open, and whether spark plug
misfires due to carbon deposit. Secondary waveform of
ignition is also affected by different engine, fuel supply
system, air intake system and ignition condition, so we
can effectively test the failure in mechanic parts of en-
gine, fuel supply system parts and ignition system parts
in accordance with secondary waveform of ignition.
When testing, we generally divide into three kinds
according to ignition system: traditional ignition, direct
ignition and double end ignition. Traditional ignition
generally refers to distributor ignition, which is usu-
ally adopted by domestic vehicles of old model; direct
ignition generally refers to ignition mode in which one
cylinder corresponds to one ignition coil, which is nor-
mally used in high grade car; double end ignition means
one ignition coil ignites two cylinders at the same time,
which is common currently in Era Superman, JETTA GT,
Fukang and Audi V6 engine.
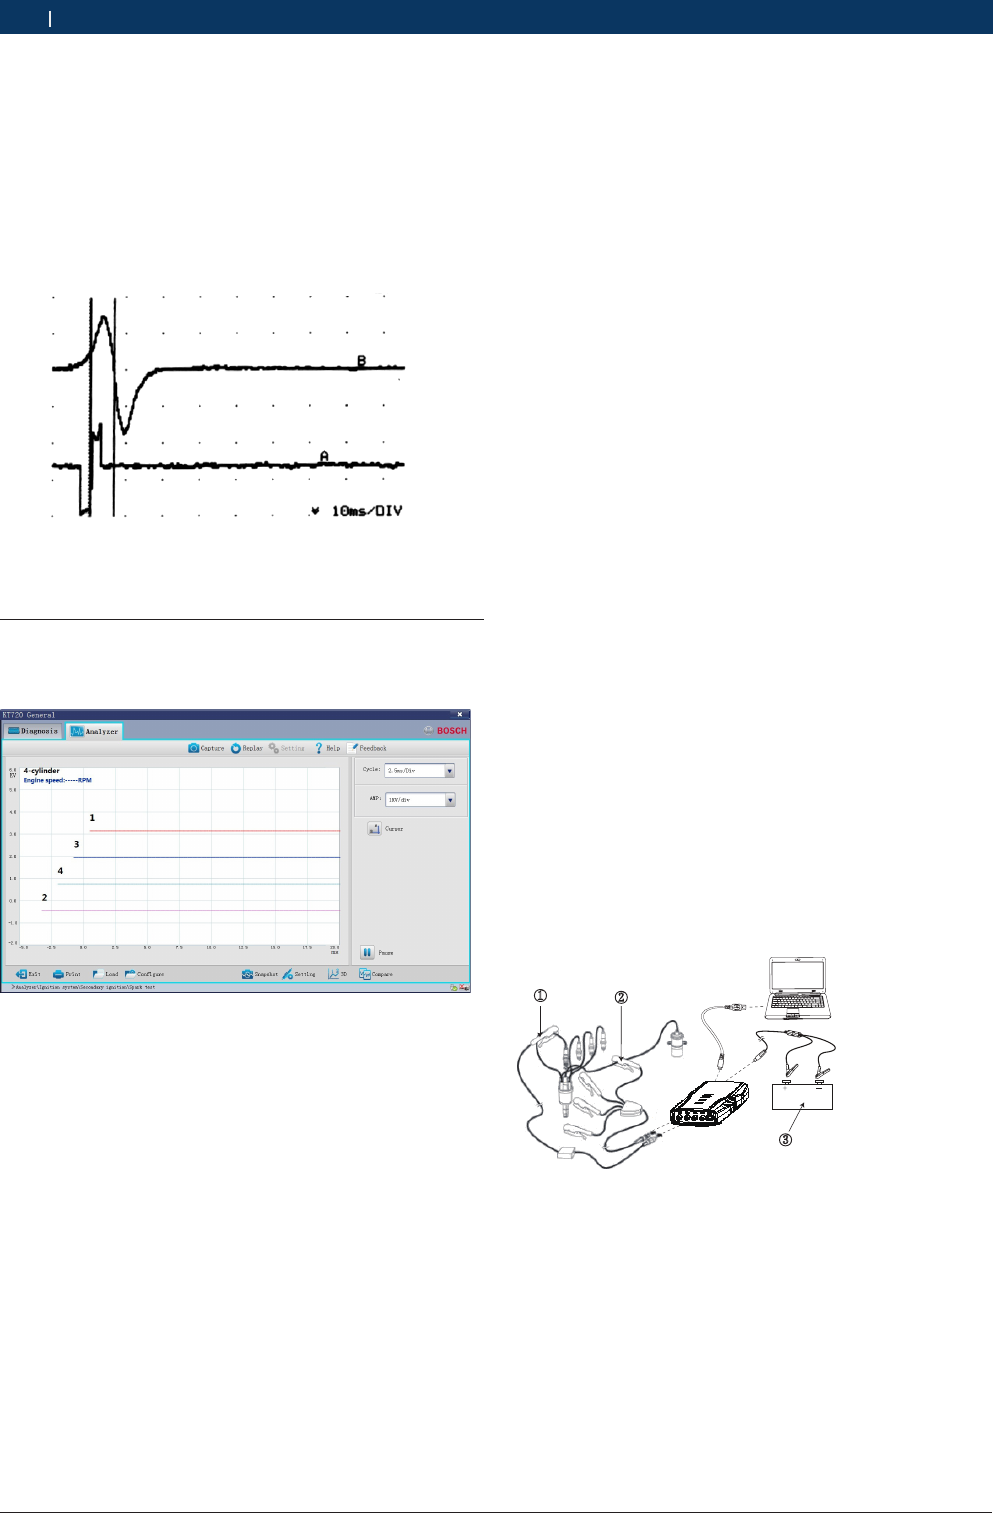
11.8.1.1 Equipment connection
Since ignition mode and ignition system of the engines
to be tested differ in connection, connecting method is
also different. Please confirm ignition mode of engine
to be tested before testing secondary ignition wave-
form. We will illuminate the test and connecting method
of three common ignition modes in the following.
When connecting KT720 to extension line for power
supply, choose power supply according to the bat-
tery position of vehicle mode tested. All connecting
diagrams in this users manual take power supply by
battery as example.
Traditional ignition / Direct ignition: Connect BNC end
of 1 cylinder signal to CH3 ofKT720 , use signal clip to
clip high voltage line of one cylinder of engine. Please
check that there is “This side faces to spark plug” on
the signal clip, do not clip reversely; connect BNC end
of capacitive pickup to CH1, and then use capacitive
pickup to clip high voltage line of each cylinder. As
shown Fig.52 for connecting method.
①②
③
Fig. 52: Equipment connection of traditional ignition
1 1 Cylinder Signal
2 Capacitive Pickup
3 Battery
1 697 021 785 | 2015-05-20Bosch Automotive Products (Nanjing) Co., Ltd
Measure function | KT720 | 49 en
Double end ignition: Connect BNC end of 1 cylinder
signal to CH3 ofKT720 , used for synchronization of cy-
linder signal, use signal clip to clip high voltage line of
one cylinder of engine. Please check that there is “This
side faces to spark plug” on the signal clip, do not clip
reversely. Connect BNC end of one capacitive pickup
to CH1, then connect the other end to positive of high
voltage cylinder line. Connect BNC end of the other
capacitive pickup to CH2, then connect the other end to
negative of high voltage cylinder line. As shown Fig.53
for connecting method.
③
④
①
②
Fig. 53: Equipment connection of double end ignition
1 Capacitive Pickup
2 Capacitive Pickup
3 1 Cylinder Signal
4 Battery
11.8.1.2 Measure conditions
RStart engine, and test the performance of testing
elements at different load and speed. Spark plug,
ignition connector and the elements of other secon-
dary circuit may function abnormally at high load.
Conduct these tests (on power tester or road test)
at load state to precisely locate failure position in
the system.
11.8.1.3 Measure steps
1. Connect equipment according to Fig.52 or Fig. 53,
switch on power supply.
2. Double click run KT720 software.
3. Select communication mode: USB communication or
wireless communication, the KT720 and the compu-
ter are successfully communicated.
4. Click Analyzer --> Ignition SYS --> Secondary IGN -->
Spark Test.
5. Waveform will be displayed on the screen depending
on measure conditions.
6. Depending on the parameters of engine to set IGN
settings, include ignition mode, sensation,number of cylin-
der and ignition order.
7. You can adjust to cycle, amplitude, and cursor.
8. You can print measured data, load snapshot data
and reference waveform data, save current configu-
ration or acquire old configuration, snapshot current
waveform, display mode of waveform and waveform
comparison;
9. You can check the details of current waveform by cli-
cking “Pause” button. After click, the button turns to
“Start”, click it again to carry forward measurement.
11.8.1.4 Waveform analysis
Secondary waveform of ignition is divided three parts:
closed part, ignition part and middle part.
Closed part: This period of time is the time when trio-
de is on or platinum contact is connected, and falling
edge of waveform should be kept consistent, indicating
that each cylinder has the same dwell angle and igniti-
on timing is correct.
Ignition part: including an ignition line and a spark line
(combustion line). Ignition line is a vertical line, repre-
senting breakdown voltage; spark line is an approxi-
mate horizontal line, representing a voltage needed to
keep current pass clearance of spark plug.
Middle part: it displays that ignition coil consumes sur-
plus energy through primary and secondary oscillation,
normally 2 oscillatory wave at least. As shown Fig.54
for characteristic waveform of traditional secondary
ignition.2
Fig. 54: Waveform characteristic
1 697 021 785 | 2015-05-20 Bosch Automotive Products (Nanjing) Co., Ltd
50 | KT720 | Measure functionen
11.8.2 Primary ignition
The display of primary ignition dwell angle brings con-
venience for diagnosis of traditional ignition. The ad-
vent of electronic ignition control system removes the
need to adjust dwell angle since ignition dwell angle
is controlled by ECU. Due to mutual inductance of pri-
mary and secondary coil of ignition, spark that occurs
at secondary circuit will be fed back to primary circuit,
therefore, primary ignition is also very important.
Primary Ignition have 2 modes: multi-cylinder and
single -cylinder.
11.8.2.1 Equipment connection
When connecting KT720 to extension line for power
supply, choose power supply according to the battery
position of vehicle mode tested. All connecting dia-
grams in this users manual take power supply by batte-
ry as example.
Connect one end of 1 cylinder signal to CH3 ofKT720 ,
use signal clip to clip high voltage line of one cylinder
of engine. Please check that there is “This side faces
to spark plug” on the signal clip, do not clip reversely.
Connect BNC end ofKT720 oscilloscope probe to CH1,
then connect the other end of the black banana plug
and black alligator clip to negative pole of battery or
grounding, and connect the other end of red banana
plug and red banana socket into “IG-“ signal line of
ignition coil, as shown Fig.55.
1 Cylinder Signal
Fig. 55: Equipment connection
Primary ignition single-cylinder mode connection me-
thod 1: When the trigger channel is CH3, connect one
end of 1 cylinder signal to CH3 of Kt720, use signal clip
to clip high voltage line of one cylinder of engine. Ple-
ase check that there is "This side faces to spark plug"
on the signal clip, do not clip reversely. Connect BNC
end of VMI differential probe composite joint to CH4
port, the other port connect to auxiliary port. Then con-
nect the other end of the black banana plug of VMI dif-
ferential probe and black alligator clip to negative pole
of battery or grounding, and connect the other end of
red banana plug of VMI differential probe and red bana-
na socket into "IG-"signal line of ignition coil.
11.8.2.2 Measure conditions
RStart engine, and test ignition system at different
load to test the performance of elements. Primary
ignition module may not work properly at high load
and high temperature.
11.8.2.3 Measure steps
1. Connect equipment according to Fig.55, switch on
power supply.
2. Double click run KT720 software.
3. Select communication mode: USB communication or
wireless communication, the KT720 and the compu-
ter are successfully communicated.
4. Click Analyzer --> Ignition SYS --> Primary IGN -->
Multi-Cylinder mode or Single-Cylinder mode.
5. Waveform will be displayed on the screen depending
on measure conditions.
6. Depending on the parameters of engine to set IGN
settings, include ignition mode, sensation,number of cylin-
der and ignition order.
7. You can adjust to cycle, amplitude, and cursor.
8. You can print measured data, load snapshot data
and reference waveform data, save current configu-
ration or acquire old configuration, snapshot current
waveform, display mode of waveform and waveform
comparison;
9. You can check the details of current waveform by cli-
cking “Pause” button. After click, the button turns to
“Start”, click it again to carry forward measurement.
11.8.2.4 Waveform analysis
Observe whether the height of ignition breakdown
peak voltage of each cylinder is relatively consistent,
and change of dwell angle when engine load and speed
change.

1 697 021 785 | 2015-05-20Bosch Automotive Products (Nanjing) Co., Ltd
Measure function | KT720 | 51 en
11.9 Electrical system
Measured the waveform of electrical system.
11.9.1 Battery test
The problem of charging system is usually from vehicle
owner who complains about “Cannot start”, battery
cannot provide electric energy at this time, while star-
ting motor cannot drive engine. The first step usually is
to test battery, and charge battery first if necessary.
When measuring system voltage, surface charge of the
battery can be released several minutes after turning on
headlight, and then turn off headlight and measure the
voltage between two terminals of the battery. If possi-
ble, use gravimeter to measure specific gravity of each
separate cell of the battery. Battery load test should be
conducted to check battery performance at load state.
Because only charging state is displayed in voltage test,
not in battery conditions.
11.9.1.1 Equipment connection
When connecting KT720 to power extension cable,
choose power supply according to the battery position
of vehicle mode tested. All connecting diagrams in this
users manual take power supply by battery as example.
Connect BNC end ofKT720 oscilloscope probe to CH1,
then connect the other end of the black banana plug
and black alligator clip to negative pole of battery or
grounding, and connect the other end of red banana
plug and red banana socket to positive of battery.
11.9.1.2 Measure conditions
Let headlight on for about 3 minutes to remove the sur-
face charge in the battery.
11.9.1.3 Measure steps
1. Connect equipment, switch on power supply.
2. Double click run KT720 software.
3. Select communication mode: USB communication or
wireless communication, the KT720 and the compu-
ter are successfully communicated.
4. Click Analyzer --> Electrical SYS --> Battery Test.
5. Waveform will be displayed on the screen depending
on measure conditions.
6. You can adjust to cycle, amplitude, coupling,
reversed-phase, and cursor. If the cycle locates at
high-frequency section, the triggering channel and
triggering modes can be adjusted.
7. You can print measured data, load snapshot data
and reference waveform data, save current confi-
guration or acquire old configuration, automatically
adjust the amplitude, snapshot current waveform
and waveform comparison;
8. You can check the details of current waveform by cli-
cking “Pause” button. After click, the button turns to
“Start”, click it again to carry forward measurement.
11.9.1.4 Waveform analysis
Generally, amplitude value of battery voltage is dis-
played as a line on the oscillograph.
11.9.2 Charge test
Charging output test: new electric regulator can main-
tain charging voltage between 13-15V, and charging
system must provide sufficient output to maintain bat-
tery charging and need of vehicle.
Test rectifying diode: three-phase alternator uses three
pairs of diodes to rectify output current. These diodes
are usually installed on a insulating radiating seat or in
rectifying bridge. Diode allows current to pass through
in only one direction but not in the other. If diode is
short, current can pass through in both directions; if
open, current can pass through in neither direction.
The way of testing open or short diode is to connect
one end of testing line of KT720 to one end of the
diode, and to connect the other testing line to radiating
seat or generator housing. And then test again in rever-
se direction. It should be displayed on KT720 that one
direction is on while the other direction is off. If the tes-
ting result is on in both directions, the diode is short. If
it is off in both directions, the diode is open.
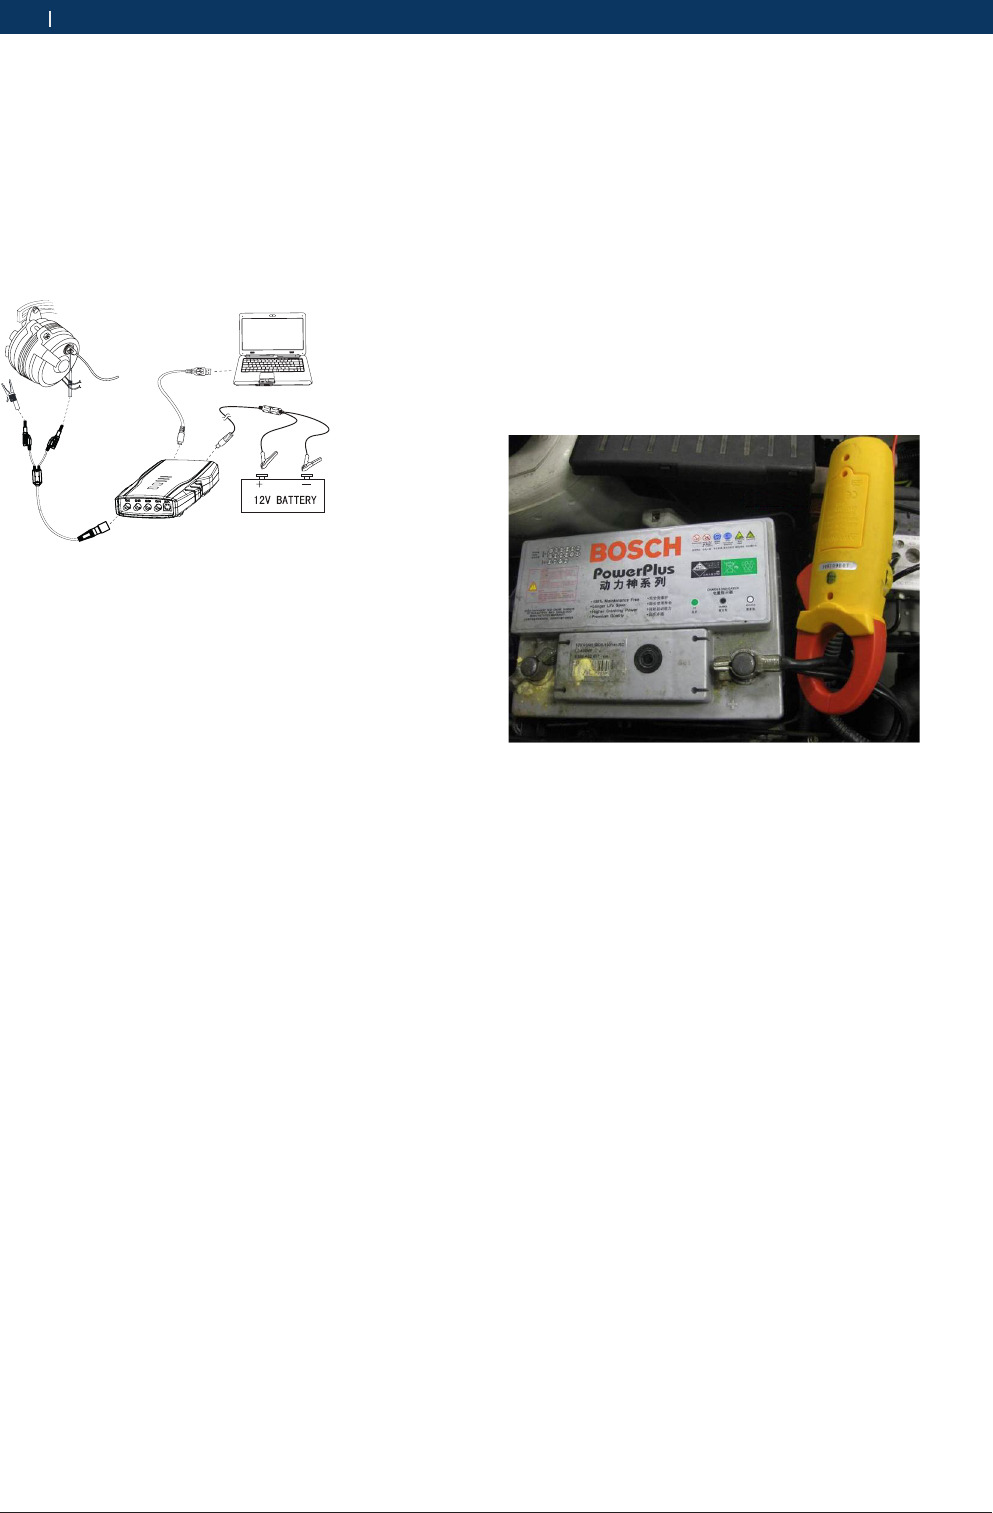
11.9.2.1 Equipment connection
When connecting KT720 to power extension cable,
choose power supply according to the battery position
of vehicle mode tested. All connecting diagrams in this
users manual take power supply by battery as example.
Connect BNC end ofKT720 oscilloscope probe to CH1,
then connect the other end of the black banana plug
and black alligator clip to the negative of battery or
grounding. For different function test, the test location
ofKT720 oscilloscope probe is also different. Refer to
testing conditions for details.
1 697 021 785 | 2015-05-20 Bosch Automotive Products (Nanjing) Co., Ltd
52 | KT720 | Measure functionen
11.9.2.2 Measure conditions
RConnect KT720 to the generator on the vehicle, as
shown in Fig.56.
RStart engine, and conduct test at idle and load state,
slowly increase engine speed.
RTurn on the electric appliances on the vehicle to
make charging system loaded, such as headlight,
water tank fan motor and wiper, etc.
Fig. 56: Equipment connection
11.9.2.3 Measure steps
1. Connect equipment, switch on power supply.
2. Double click run KT720 software.
3. Select communication mode: USB communication or
wireless communication, the KT720 and the compu-
ter are successfully communicated.
4. Click Analyzer --> Electrical SYS --> Charge Test.
5. Waveform will be displayed on the screen depending
on measure conditions.
6. You can adjust to cycle, amplitude, coupling,
reversed-phase, and cursor. If the cycle locates at
high-frequency section, the triggering channel and
triggering modes can be adjusted.
7. You can print measured data, load snapshot data
and reference waveform data, save current confi-
guration or acquire old configuration, automatically
adjust the amplitude, snapshot current waveform
and waveform comparison;
8. You can check the details of current waveform by cli-
cking “Pause” button. After click, the button turns to
“Start”, click it again to carry forward measurement.
9. You can record a continuous waveform section by
clicking “Record” button.
11.9.2.4 Waveform analysis
The waveform of charging voltage is a steady line.
11.9.3 Current waveform
Current waveform is be used to measure paramenter
trends at work of vehicle electrical lines.
iCurrent waveform must be connected current clamp
to measured.
11.9.3.1 Equipment connection
When connecting KT720 to power extension cable,
choose power supply according to the battery position
of vehicle mode tested. All connecting diagrams in this
users manual take power supply by battery as example.
Connect BNC end ofKT720 oscilloscope probe to CH3,
then connect the other end of the black banana plug
and black alligator clip to negative pole of battery or
grounding, and connect the other end of red banana
plug and red banana socket to positive of battery.
iDC 1000A current clamp should be reverse connec-
ted to positive of battery, and the other end connec-
ted to CH4.
Fig. 57: Current clamp connection
11.9.3.2 Measure conditions
RTurn off before connected cables.
RTurn on after connected cables, then automatically
measured.
11.9.3.3 Measure steps
1. Connect equipment, switch on power supply.
2. Double click run KT720 software.
3. Select communication mode: USB communication or
wireless communication, the KT720 and the compu-
ter are successfully communicated.
4. Click Analyzer --> Electrical SYS --> Current Wave-
form.
5. Waveform will be displayed on the screen depending
on measure conditions.
6. You can adjust to cycle, amplitude, coupling,
reversed-phase, and cursor. If the cycle locates at
high-frequency section, the triggering channel and
triggering modes can be adjusted.
7. You can print measured data, load snapshot data
and reference waveform data, save current confi-
guration or acquire old configuration, automatically
adjust the amplitude, snapshot current waveform
and waveform comparison;
8. You can check the details of current waveform by cli-
cking “Pause” button. After click, the button turns to
“Start”, click it again to carry forward measurement.

1 697 021 785 | 2015-05-20Bosch Automotive Products (Nanjing) Co., Ltd
Measure function | KT720 | 53 en
9. You can record a continuous waveform section by
clicking “Record” button.
11.10 Communication system
Measure waveform of the vehicle’s communication sys-
tem.
11.10.1 High-speed CAN communication
As for high-speed CANBUS test, the waveform data of
CAN bus can be acquired by the user.
11.10.1.1 Equipment connection
Connect KT720 and extension line of power supply,
choose power supply mode according to battery loca-
tion of the vehicle to be tested. Connect BNC end of
OSC detector to CH1; then connect the alligator clip
of the probe to the vehicle ground or battery negative
pole, and connect the other end of the probe to CAN_H
and CAN_L of CAN network.
11.10.1.2 Measure conditions
RTurn the key to position ON.
RIf diagnostic data needs to be viewed, a diagnostic
analysis shall be conducted on ECU during measure-
ment.
11.10.1.3 Measure steps
1. Connect equipment, switch on power supply.
2. Double click run KT720 software.
3. Select communication mode: USB communication or
wireless communication, the KT720 and the compu-
ter are successfully communicated.
4. Click Analyzer --> Communication SYS --> High-
Speed CAN.
5. Waveform will be displayed on the screen depending
on measure conditions.
6. You can adjust to cycle, amplitude, coupling,
reversed-phase, and cursor. If the cycle locates at
high-frequency section, the triggering channel and
triggering modes can be adjusted.
7. You can print measured data, load snapshot data
and reference waveform data, save current confi-
guration or acquire old configuration, automatically
adjust the amplitude, snapshot current waveform
and single change between simulation model and
digtal model;
8. You can check the details of current waveform by cli-
cking “Pause” button. After click, the button turns to
“Start”, click it again to carry forward measurement.
11.10.2 Low-speed CAN communication
As for low-speed CANBUS test, the waveform data of
CAN bus can be acquired by the user.
11.10.2.1 Equipment connection
Connect KT720 and extension line of power supply,
choose power supply mode according to battery lo-
cation of the vehicle to be tested. Connect BNC end
ofKT720 oscilloscope probe to CH1, then connect the
other end of the black banana plug and black alligator
clip to negative pole of battery or grounding, and con-
nect the other end of red banana plug and red banana
socket to CAN_H and CAN_L of CAN network.
11.10.2.2 Measure conditions
RTurn the key to position ON.
RIf diagnostic data needs to be viewed, a diagnostic
analysis shall be conducted on ECU during measure-
ment.
11.10.2.3 Measure steps
1 697 021 785 | 2015-05-20 Bosch Automotive Products (Nanjing) Co., Ltd
54 | KT720 | Measure functionen
1. Connect equipment, switch on power supply.
2. Double click run KT720 software.
3. Select communication mode: USB communication or
wireless communication, the KT720 and the compu-
ter are successfully communicated.
4. Click Analyzer --> Communication SYS --> Low-
Speed CAN.
5. Waveform will be displayed on the screen depending
on measure conditions.
6. You can adjust to cycle, amplitude, coupling,
reversed-phase, and cursor. If the cycle locates at
high-frequency section, the triggering channel and
triggering modes can be adjusted.
7. You can print measured data, load snapshot data
and reference waveform data, save current confi-
guration or acquire old configuration, automatically
adjust the amplitude, snapshot current waveform
and single change between simulation model and
digtal model;
8. You can check the details of current waveform by cli-
cking “Pause” button. After click, the button turns to
“Start”, click it again to carry forward measurement.
11.10.3 K-line communication
The waveform data of K-line can be acquired by the
user.
11.10.3.1 Equipment connection
Connect KT720 and extension line of power supply,
choose power supply mode according to battery lo-
cation of the vehicle to be tested. Connect BNC end
ofKT720 oscilloscope probe to CH1, then connect the
other end of the black banana plug and black alligator
clip to negative pole of battery or grounding, and con-
nect the other end of red banana plug and red banana
socket to K-line network.
11.10.3.2 Measure conditions
RTurn the key to position ON.
RIf diagnostic data needs to be viewed, a diagnostic
analysis shall be conducted on ECU during measure-
ment.
10.10.3.3 Measure steps
1. Connect equipment, switch on power supply.
2. Double click run KT720 software.
3. Select communication mode: USB communication or
wireless communication, the KT720 and the compu-
ter are successfully communicated.
4. Click Analyzer --> Communication SYS --> K-Line.
5. Waveform will be displayed on the screen depending
on measure conditions.
6. You can adjust to cycle, amplitude, coupling,
reversed-phase, and cursor. If the cycle locates at
high-frequency section, the triggering channel and
triggering modes can be adjusted.
7. You can print measured data, load snapshot data
and reference waveform data, save current confi-
guration or acquire old configuration, automatically
adjust the amplitude, snapshot current waveform
and single change between simulation model and
digtal model;
8. You can check the details of current waveform by cli-
cking “Pause” button. After click, the button turns to
“Start”, click it again to carry forward measurement.
11.11 Multimeter
It is used to measure values of DC voltage, AC voltage,
switch, resistance and diode. Value of DC voltage can
be measured through CH1, CH2, CH3 and CH4, and va-
lues of AC voltage, switch and resistance and diode can
be measured through CH4 only.
Judge channel by the color displayed. Red indicates
CH1, Blue indicates CH2, Green indicates CH3, Yellow
indicates CH4.
Display modes of measured values: including display by
panel, display by column, display by waveform, and dis-
play by digital. You can select a proper mode according
to the actual requirement.
Click the correct channel display frame, and select the
check box at the top right corner of each display frame.
The maximum and minimum value: the maximum and
minimum value during the measurement will be recor-
ded automatically for each channel.
Maximize the display frame of channel: Click the maxi-
mization button locating at right corner of each dis-
play frame to maximize the frame. After maximization,
clikc the restoration button locating at right corner
to restored the frame.
11.11.1 DC voltage
Measure DC voltage of vehicle components.
11.11.1.1 Equipment connection
Connect KT720 and extension line of power supply,
choose power supply mode according to battery loca-
tion of the vehicle to be tested. All connection schema-

1 697 021 785 | 2015-05-20Bosch Automotive Products (Nanjing) Co., Ltd
Measure function | KT720 | 55 en
tic diagrams therein are based on connection of battery
clip. Connect BNC end of KT720 oscilloscope probe to
CH4, then connect the other end of the black banana
plug and black alligator clip to negative pole of battery
or grounding. Different tests on functions. Connect the
other end of red banana plug and red banana socket to
DC signal to be measured.
iDC voltage on 4 vehicle components can be measu-
red simultaneously by KT720 .
11.11.1.2 Measure conditions
Start the automotive generator.
11.11.1.3 Measure steps
1. Connect the equipment; switch on power supply
ofKT720 .
2. Double click to run KT720 application.
3. Select communication mode: USB communication or
wireless communication, the KT720 and computer
are successfully connected.
4. Click Analyzer --> Multimeter.
5. Since measured value of CH1 is set as default, ple-
ase remove the CH1 and then select CH4.
6. Click “DC Voltage” button on the right to display the
value of DC voltage measured through CH4.
7. You can select display mode of measured values and
decide whether the display frame to be maximized
or not.
8. You can print the measured data.
9. Click “Pause” button to hold off the measurement.
Meanwhile, the button turns to “Start” and click it
again to carry forward the measurement.
11.11.2 AC voltage
Measure AC voltage of vehicle components.
11.11.2.1 Equipment connection
Connect KT720 and extension line of power supply,
choose power supply mode according to battery loca-
tion of the vehicle to be tested. All connection schema-
tic diagrams therein are based on connection of battery
clip. Connect BNC end ofKT720 oscilloscope probe to
CH4, then connect the other end of the black banana
plug and black alligator clip to negative pole of battery
or grounding. Different tests on functions. Connect the
other end of red banana plug and red banana socket to
AC signal to be measured.
11.11.2.2 Measure conditions
Start the automotive generator.
11.11.2.3 Measure steps
1. Connect the equipment; switch on power supply
ofKT720 .
2. Double click to run KT720 application.
3. Select communication mode: USB communication or
wireless communication, the KT720 and computer
are successfully connected.
4. Click Analyzer --> Multimeter.
5. Since measured value of CH1 is set as default, ple-
ase remove the CH1 and then select CH4.
6. Click “DC Voltage” button on the right to display the
value of DC voltage measured through CH4.
7. You can select display mode of measured values and
decide whether the display frame to be maximized
or not.
8. You can print the measured data.
9. Click “Pause” button to hold off the measurement.
Meanwhile, the button turns to “Start” and click it
again to carry forward the measurement.
11.11.3 Switch
Measure the conduction ability of vehicle components.
11.11.3.1 Equipment connection
Connect BNC end ofKT720 oscilloscope probe to CH4,
then connect the other end of the black banana plug
and black alligator clip. Then connect the other end of
red banana plug and red banana socket to switchl to be
measured.
10.11.3.2 Measure conditions
Switch off the vehicle power.
11.11.3.3 Measure steps
1. Connect the equipment; switch on power supply
ofKT720 .
2. Double click to run KT720 application.
3. Select communication mode: USB communication or
wireless communication, the KT720 and computer
are successfully connected.
4. Click Analyzer --> Multimeter.
5. Since measured value of CH1 is set as default, ple-
ase remove the CH1 and then select CH4.
6. Click “DC Voltage” button on the right to display the
value of DC voltage measured through CH4.
7. You can select display mode of measured values and
decide whether the display frame to be maximized
or not.
8. You can print the measured data.
9. Click “Pause” button to hold off the measurement.
Meanwhile, the button turns to “Start” and click it
again to carry forward the measurement.
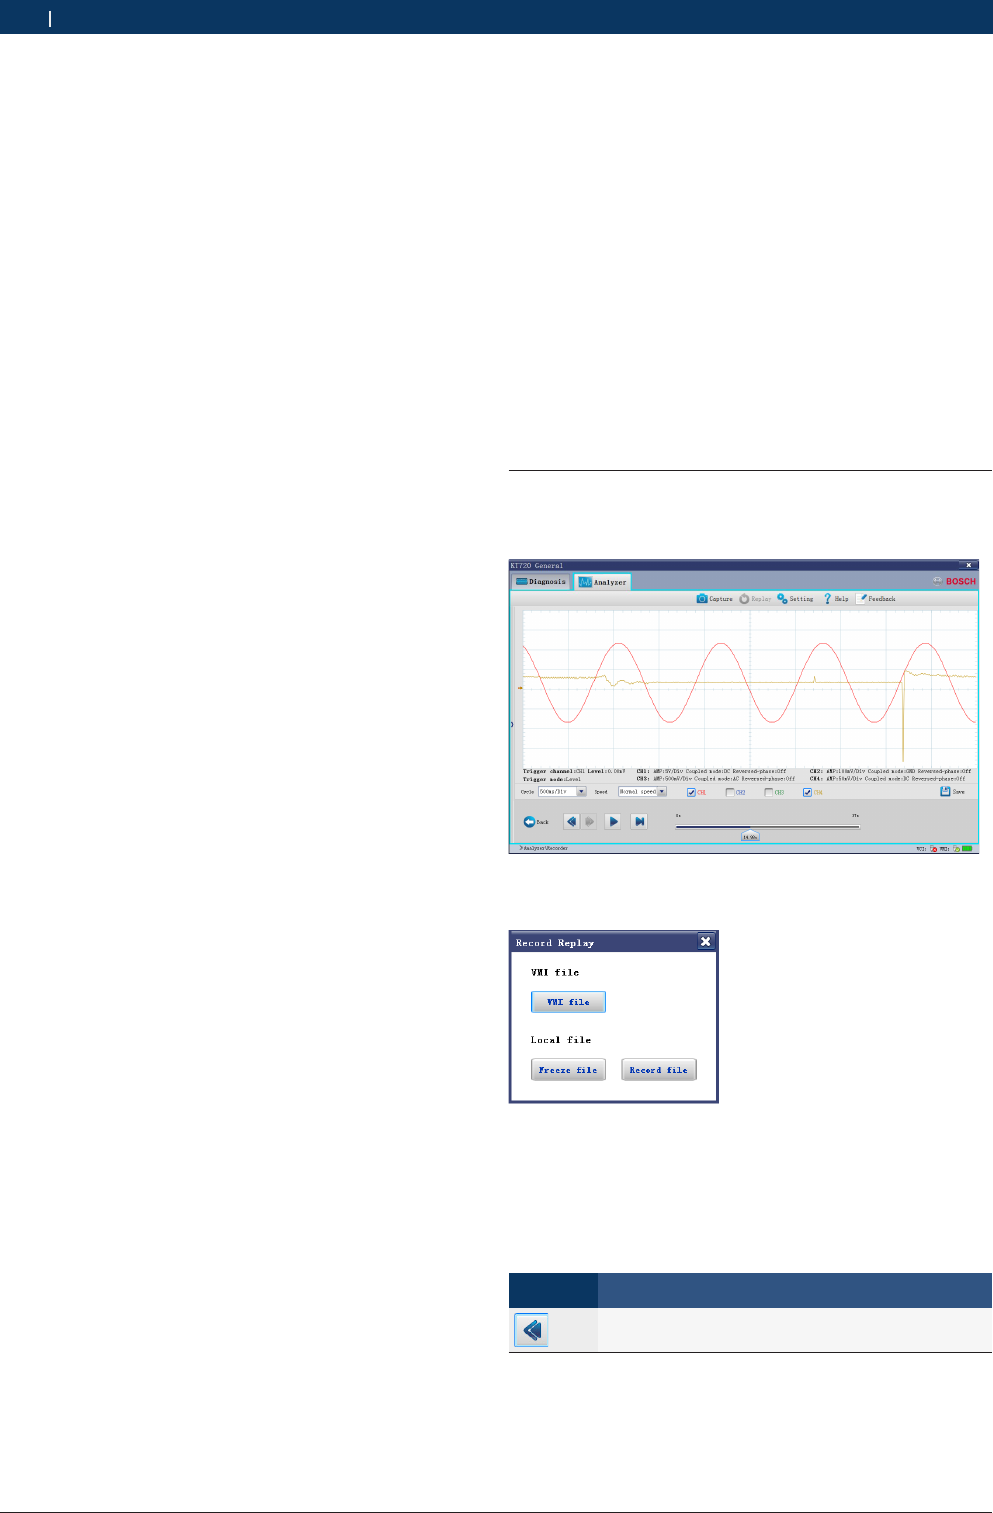
1 697 021 785 | 2015-05-20 Bosch Automotive Products (Nanjing) Co., Ltd
56 | KT720 | Measure functionen
iWhen measuring, if resistance <= 60 ohm, the buzzer
will ring.
11.11.4 Resistance
Measure resistance value of vehicle components.
11.11.4.1 Equipment connection
Connect BNC end ofKT720 oscilloscope probe to CH4,
then connect the other end of the black banana plug
and black alligator clip to negative pole of battery or
grounding. Then connect the other end of red banana
plug and red banana socket to resistance to be measu-
red.
11.11.4.2 Measure conditions
Switch off the vehicle power.
11.11.4.3 Measure steps
1. Connect the equipment; switch on power supply
ofKT720 .
2. Double click to run KT720 application.
3. Select communication mode: USB communication or
wireless communication, the KT720 and computer
are successfully connected.
4. Click Analyzer --> Multimeter.
5. Since measured value of CH1 is set as default, ple-
ase remove the CH1 and then select CH4.
6. Click “DC Voltage” button on the right to display the
value of DC voltage measured through CH4.
7. You can select display mode of measured values and
decide whether the display frame to be maximized
or not.
8. You can print the measured data.
9. Click “Pause” button to hold off the measurement.
Meanwhile, the button turns to “Start” and click it
again to carry forward the measurement.
11.11.5 Diode test
Measure diode value of vehicle components.
11.11.5.1 Equipment connection
Connect BNC end ofKT720 oscilloscope probe to CH4,
then connect the other end of the black banana plug
and black alligator clip to negative pole of battery or
grounding. Then connect the other end of red banana
plug and red banana socket to diode to be measured.
11.11.5.2 Measure conditions
Test the rectifier bridge after the generator is discon-
nected.
Diagnose the faulted generator according to methods
suggested by the manufacturer.
11.11.5.3 Measure steps
1. Connect the equipment; switch on power supply
ofKT720 .
2. Double click to run KT720 application.
3. Select communication mode: USB communication or
wireless communication, the KT720 and computer
are successfully connected.
4. Click Analyzer --> Multimeter.
5. Since measured value of CH1 is set as default, ple-
ase remove the CH1 and then select CH4.
6. Click “DC Voltage” button on the right to display the
value of DC voltage measured through CH4.
7. You can select display mode of measured values and
decide whether the display frame to be maximized
or not.
8. You can print the measured data.
9. Click “Pause” button to hold off the measurement.
Meanwhile, the button turns to “Start” and click it
again to carry forward the measurement.
11.12 Record and playback functions
KT720 can playback the data acquired, but this could
be realized only in the measuring course.
3 Kinds of files including KT720 file, freeze file and re-
cord file can be played back by KT720 .
File: waveform files saved in SD card in measuring
course.
Freeze File: waveform files saved by clicking “Frozen”
button.
Record File: waveform files saved by clicking “Record”
button in recorder interface.
Button Function and description
Playback button
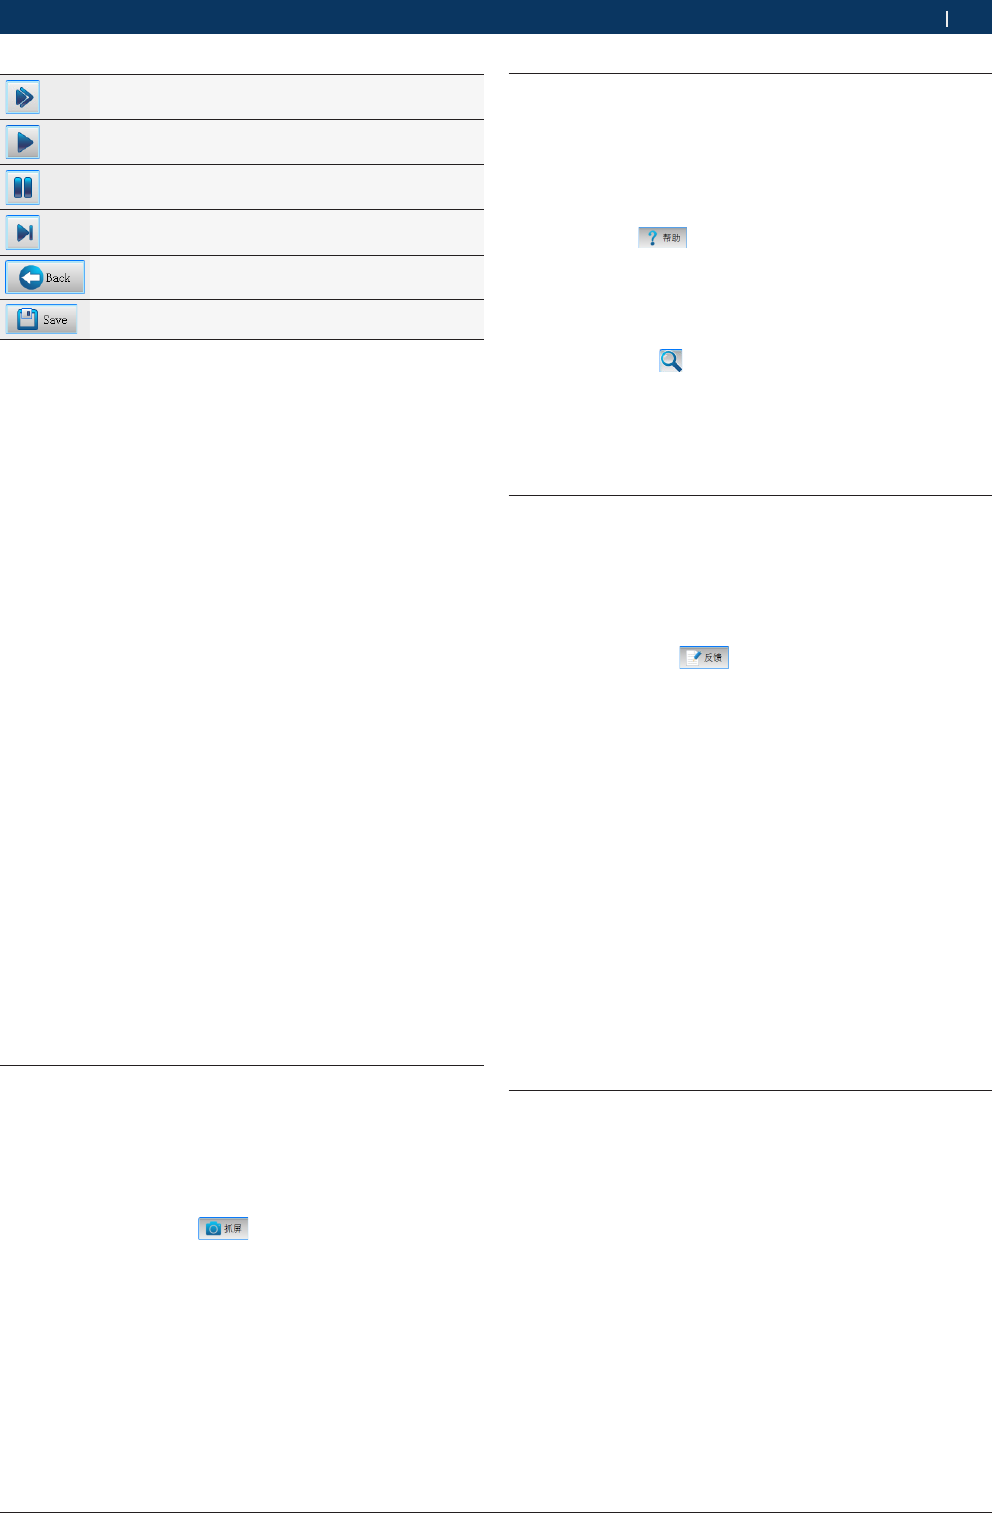
1 697 021 785 | 2015-05-20Bosch Automotive Products (Nanjing) Co., Ltd
Auxiliary Function | KT720 | 57 en
Play Forward button, default play mode
Play button, click this button to replay waveform
Pause button, click this button to hang replay
Fast Forward button
Back button, back to current interface
Save button, save waveform data
Cycle: waveform data can be replayed by means of com-
pression and compression cycle must be greater than
the replay cycle: Waveform data could be compressed
to one-fifth. For instance, when the cycle of the wave-
form to be replayed is 5ms/Div, the waveform could
be compressed to 10ms/Div. This waveform could be
compressed to 250ms/Div where it reaches the highest
compression level.
Play Speed: speed when playing back the waveform
includes normal speed, speed after slowed down by 1
time, speed after slowed down by 2 times, speed after
accelerated by 1 time, speed after accelerated by 2
times.
Progress Bar: monitor playback progress, in percenta-
ge.
iIf multi-channel data are acquired, you can select
the waveform displaying channel according to your
preference.
iWaveform parameter can be displayed during play-
back.
12. Auxiliary Function
12.1 Screen shot
Catch the current window information, the system will
save it to your selected path with format of .JPG, you
just need to enter a available name of this file.
Operate Method:
1. Click "Screen Shot" button in system function
area, the system will save the file automatically; a
window pops up to display the file's save path and
name.
2. Click "OK" button to exit Screen Shot.
12.2 Help
This function is KT720's online help function, which
help you to know how to operate KT720, how to diagno-
se or measure; and this interface is individual.
Operate Method:
1. Click "help" button in system function area to
enter the help interface.
2. 2.You can figure out what you want to know accor-
ding to the left navigation column.
3. 3.You can ask for help by searching key words
through "find" button.
iYou can put some contents that you usually view
in favorites, which will convenient for you to quick
search; you could print the current page.
12.3 Feedbacks
KT720 provides online feedback function to help you to
feedback any questions you meet. However, your com-
puter must connect to Internet.
Operate Method:
1. Click "feedback" button in system function
area to enter the feedback interface;
2. The system will check test path automatically, please
write vehicle and fault information correctly so that
the feedbacks can be figured out quickly and exactly.
3. All contents attached red "*" must be filled.
4. Click "submit" to submit your feedback.
13. Maintenance Help
This function is vehicle maintenance information offe-
red by Bosch for repairman reference.
14. Service and maintenance
14.1 Cleaning
It is not recommended to clean the KT720 host with the
corrosive detergent or any coarse cloth; only the soft
cloth and neutral detergent can be used.

1 697 021 785 | 2015-05-20 Bosch Automotive Products (Nanjing) Co., Ltd
58 | KT720 | Warrantyen
14.2 Maintenance
RPlace the KT720 in the flat and dry place with mo-
derate temperature and less dust when the KT720 is
not used.
RDon’t place the KT720 in the place with direct sun-
light or close to the heating device.
RDon’t place the KT720 near the stove or in the place
where will be easily subjected to smoke erosion,
water entry, and oil splashing.
RDon’t disassemble the host without permission.
RIf the vehicle test is not performed for a long time,
please periodically run the KT720 host to avoid being
affected with damp.
14.3 Battery maintenance
RThe battery shall be charged when the power is
used up; the battery shall not be charged too long, 5
hours generally.
RIt is prohibited to put the instrument in the vehicle
with high temperature when using.
RBe sure to used battery of Bosch supply.
RDo not heat the battery or drop it in the fire.
RThe battery shall be kept away from water. Keep the
anode and cathode of the battery dry.
RDo not distort, dismantle or refit the battery.
RDo not attempt to peel or cut off the battery
housing.
RDo not drop or knock the battery, or collide the bat-
tery in other ways.
RDo not put the battery at extremely warm or humid
place.
RIf the battery duration is obviously shortened after
correct charging, it means that the effective life time
of the battery is over, replace it.
15. Warranty
RWarranty period of the KT720 is twelve (12) months
dating from the day of user’s registration. Warranty
period of accessories is six (6) months dating from
the day of registration.
RIf the KT720 breaks down within the warranty period
under normal operation, the Company will provide
maintenance service free of charge.
If the KT720 breaks down in any of the following cases,
the Company will charge the material costs or other
expenses as appropriate:
$Breakdown caused by misuse or accident.
$Breakdown caused by dismantling or repairing
without authorization.
$The accessories damage or get worn naturally;
$Breakdown caused by natural disasters and force
majeure.
RWarranty service is limited to the equipment; the
Company is not liable to damages go beyond the
equipment.
16. Device parameters
16.1 Device parameters
Item Index
Size 227*134*44(mm)
Weight Approximately 760g
POWER ≤30W
WORKING TEMPERA-
TURE
-10~45°C
STORAGE TEMPERA-
TURE
-15~50°C

1 697 021 785 | 2015-05-20Bosch Automotive Products (Nanjing) Co., Ltd
Device parameters | KT720 | 59 en
Item Index
RELATIVE HUMIDITY 10%~95%
INPUT VOLTAGE DC 7~32V
USB USB2.0 FULL SPEED
KEY RECORDER KEY
LED 3 LED INDICATOR LAMPS INDICATING
THE WORKING STATUS
WLAN COMPATIBILITY IEEE 802.11B/G/N
PROTECTION GRADE IP30
BATTERY(OPTIONAL) 2200MAH
SD CARD ≤32GB
HOOK LOADING CAPACITY: 5KG
16.2 Oscillograph parameters
Item Index
Sampling channels 4 channels
Bandwidth DC~2MHz
Sampling rate 40MS/s
Memory depth 64Kbyte/CH
*Vertical scope 20mVDIV~20V/DIV
Level of collection 1uSec~50Sec/Div
Electric level reference With hardware adjustable(0~100%)
*) You can only measured 100VDC or ±50VAC singles when you
connectedKT720 differential probes.
16.3 Multimeter parameters
Item Index
AC voltage 30VAC
DC voltage 60VDC
Diodes 0~2.0V
Resistance 0~60MΩ
Switching 0~60Ω

1 697 021 785 | 2015-05-20 Bosch Automotive Products (Nanjing) Co., Ltd
60 | KT720 | Safety instructionsen

Bosch Automotive Products (Nanjing) Co., Ltd
No.1 Runbo Road, East Zone of Nanjing Economic and
Technological Development Zone, Nanjing, Jiangsu
210034
China
400 000 5109
www.bosch-diagnostics.com.cn
1 697 021 785 | 2015-05-20