Casio 3 Chapter 10 Sketch Function Cfx9970 Chapter10 EN
User Manual: Casio Chapter 10 Sketch Function CFX-9970G | Calculators | Manuals | CASIO
Open the PDF directly: View PDF ![]() .
.
Page Count: 14

Sketch Function
The sketch function lets you draw lines and graphs on an existing
graph.
• Note that Sketch function operation in the STAT, GRAPH,
TABLE, RECUR and CONICS Modes is different from Sketch
function operation in the RUN and PRGM Modes.
10-1 Before Using the Sketch Function
10-2 Graphing with the Sketch Function
Chapter
10
154
10-1 Before Using the Sketch Function
Press ! 4 (Sketch) to display the sketch menu.
STAT, GRAPH, TABLE, RECUR, CONICS Mode
•{Cls} ... {clears drawn line and point}
•{Tang}/{Norm}/{Inv} ... {tangent}/{line normal to a curve}/{inverse graph}
• {Tang}, {Norm}, and {Inv} menus appear only when you display the sketch
menu while in the GRAPH and TABLE Modes.
•{PLOT} ... {plot menu}
•{LINE} ... {line menu}
•{Crcl}/{Vert}/{Hztl} ... {circle}/{vertical line}/{horizontal line}
• {PEN} ... {freehand drawing}
• {Text} ... {comment text}
RUN, PRGM Mode
• {GRPH} ... {graph command menu}
• {PIXL} ... {pixel menu}
• {Test} ... {tests pixel on/off status}
• Other menu items are identical to those in the STAT, GRAPH, TABLE, RECUR,
CONICS Mode menu.
P.166
P.155
P.157
P.158
P.160
P.162
P.163
P.164
P.165
P.166
~
155
10-2 Graphing with the Sketch Function
The sketch function lets you draw lines and plot points on a graph that is already
on the screen.
All the examples in this section that show operations in the STAT, GRAPH, TABLE,
RECUR, and CONICS Modes are based on the assumption that the following
function has already been graphed in the GRAPH Mode.
Memory Area Y1 = x(x + 2)(x – 2)
The following are the View Window parameters used when drawing the graph.
Xmin = –5 Ymin = –5
Xmax = 5 Ymax = 5
Xscale = 1 Yscale = 1
kk
kk
kTangent [Sketch]-[Tang]
This function lets you draw a line that is tangent to a graph at any point.
uu
uu
uTo draw a tangent in the GRAPH or TABLE Mode
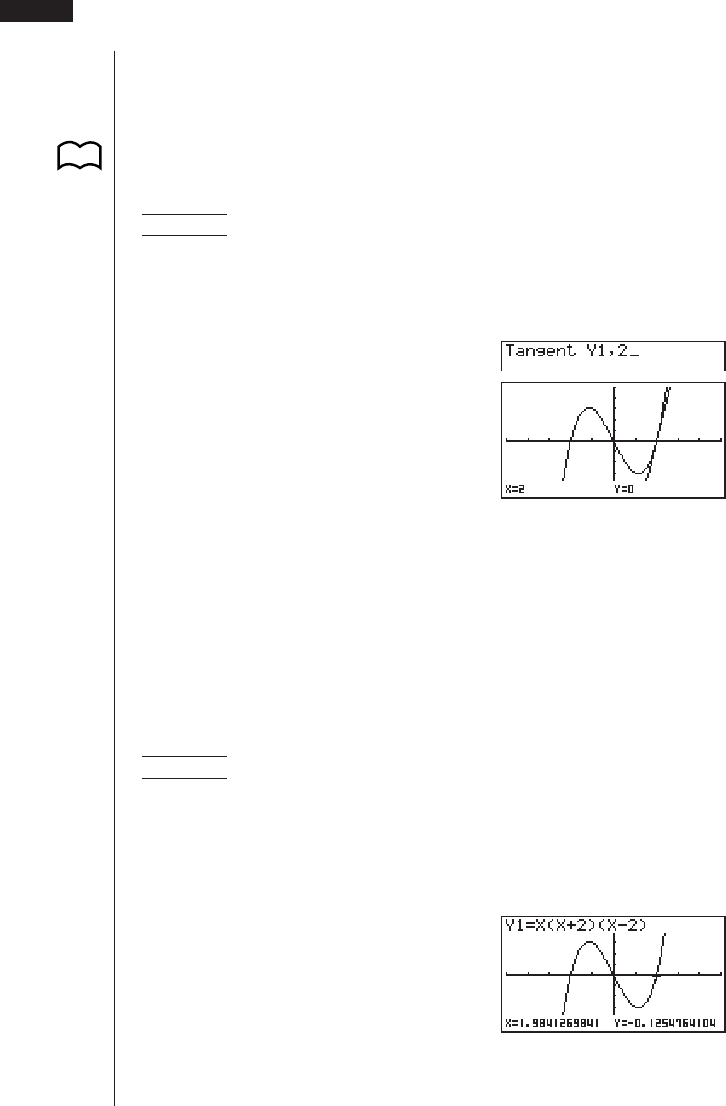
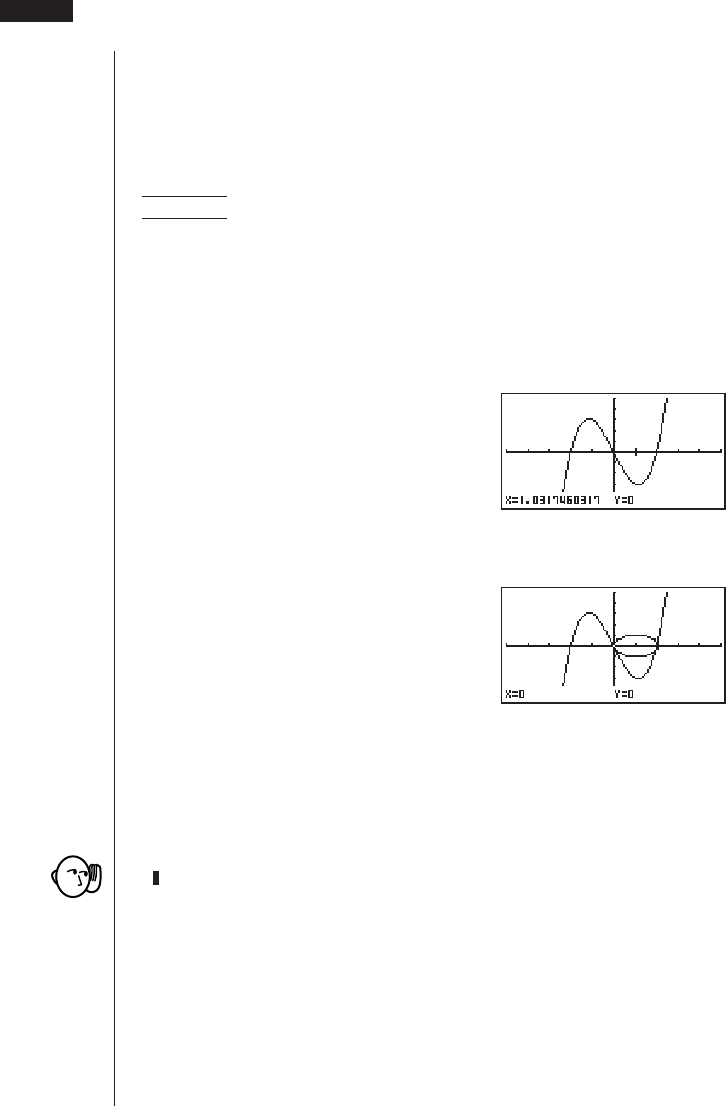
Example To draw a line that is tangent to point (x = 2, y = 0) of y = x(x + 2)
(x – 2)
1. After graphing the function, display the sketch menu and press 2 (Tang).
2. Use the cursor keys to move the pointer the position of the point where you
want to draw the line.
3. Press w to draw the line.
P. 1 1 2
156
uu
uu
uTo draw a tangent in the RUN or PRGM Mode
The following is the command syntax for drawing a tangent in these modes.
Tangent <graph function>, <x-coordinate>
• Use the variable data (VARS) menu to specify the function to be graphed.
Example To draw a line that is tangent to point (x = 2, y = 0) of y = x(x + 2)
(x – 2)
1. In the RUN Mode, display the sketch menu, press 2 (Tang), and then
perform the following input.
J4(GRPH)1(Y)b,c
2. Press w to draw the tangent line.
kk
kk
kLine Normal to a Curve [Sketch]-[Norm]
With this function you can draw a line that is normal to the curve at a specific
point.
• A line that is normal to the curve at a given point is one that is perpendicular to
the tangent line at that point.
uu
uu
uTo draw a line normal to a curve in the GRAPH or TABLE Mode
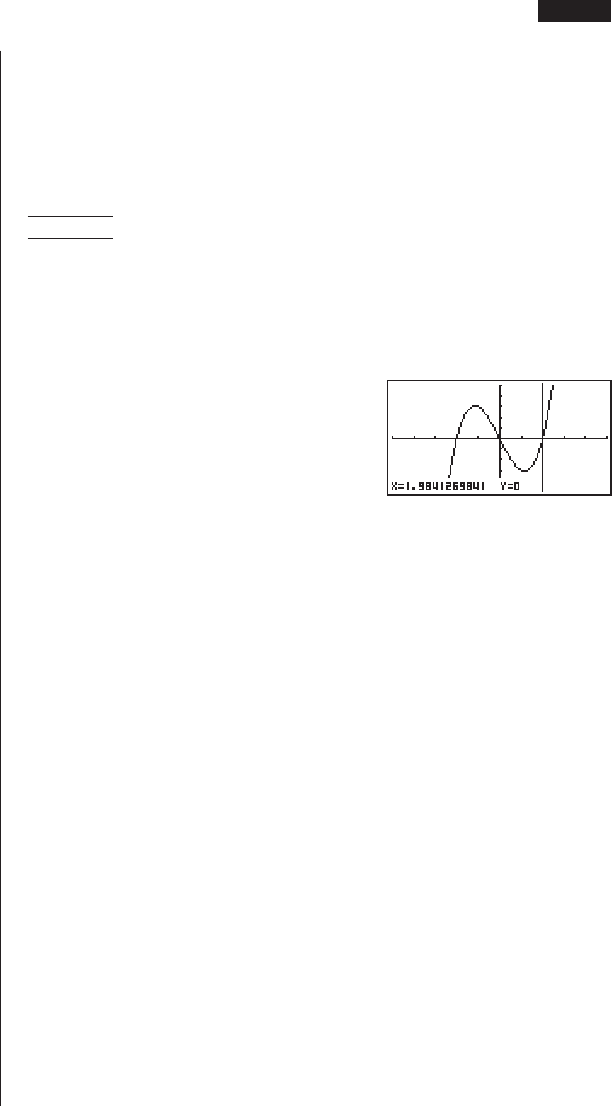
Example To draw a line that is normal to the curve at point (x = 2, y = 0) of
y = x(x + 2)(x – 2)
1. After graphing the function, display the sketch menu and press 3 (Norm).
2. Use the cursor keys to move the pointer the position of the point where you
want to draw the line.
10 - 2 Graphing with the Sketch Function
P.30
157
3. Press w to draw the line.
uu
uu
uTo draw a line normal to a curve in the RUN or PRGM Mode
The following is the syntax for drawing a line normal to a curve in these modes.
Normal <graph function>, <x-coordinate>
• Use the variable data (VARS) menu to specify the function to be graphed.
kk
kk
kGraphing an Inverse Function [Sketch]-[Inv]
This function lets you graph the inverse of the function used to produce your
original graph.
uu
uu
uTo graph an inverse function in the GRAPH or TABLE Mode
Example To graph the inverse of y = x(x + 2)(x – 2)
After graphing the function, display the sketch menu and press 4 (Inv).
• When graphing an inverse function when there is more than one graph function
stored in memory, select one of the functions and then press w.
uu
uu
uTo graph an inverse function in the RUN or PRGM Mode
The following is the syntax for graphing an inverse function in these modes.
Inverse <graph function>
• Use the variable data (VARS) menu to specify the function to be graphed.
• You can only graph the inverse of functions whose graph type is specified as
rectangular coordinate type.
Graphing with the Sketch Function 10 - 2
P.30
P.30
158
10 - 2 Graphing with the Sketch Function
kk
kk
kPlotting Points [Sketch]-[PLOT]
When plotting points on a graph, first display the sketch menu and then press 6
(g) 1 (PLOT) to display the plot menu.
• {Plot} ... {plot a point}
• {Pl·On} ... {plot point at specific coordinates}
• {Pl·Off} ... {delete point at specific coordinates}
• {Pl·Chg} ... {switch status of point at specific coordinates}
uu
uu
uTo plot points in the STAT, GRAPH, TABLE, RECUR and CONICS
Modes [Sketch]-[PLOT]-[Plot]
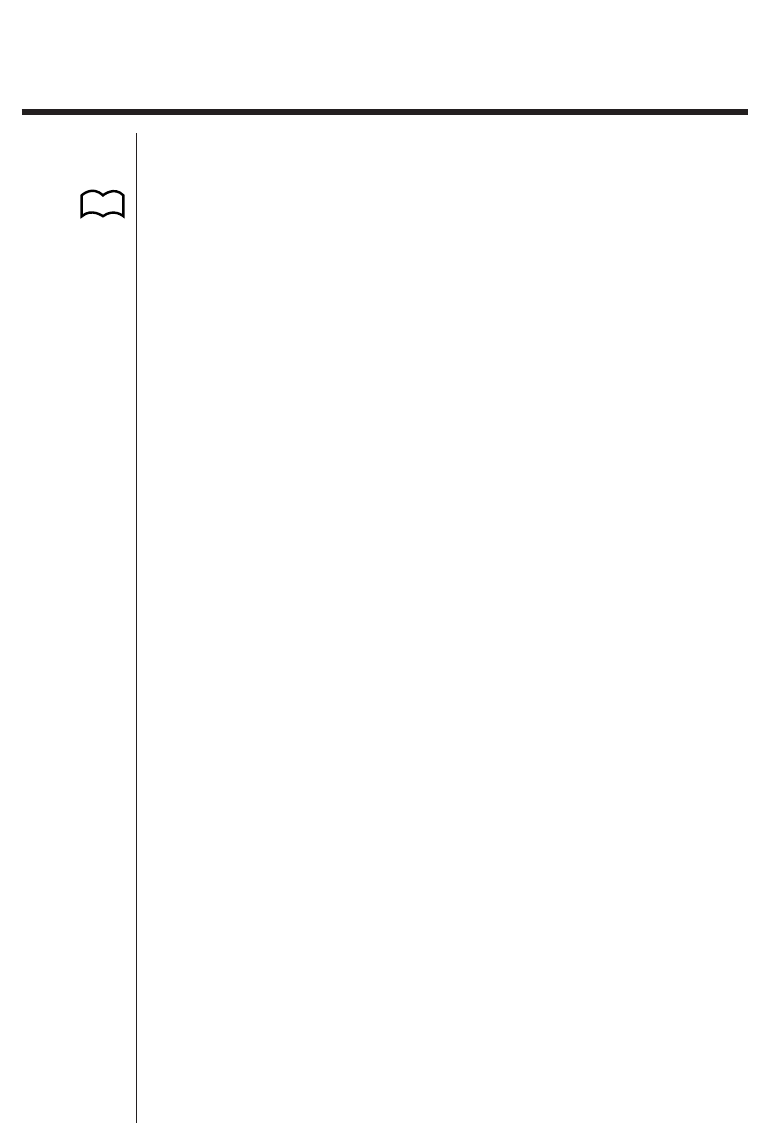
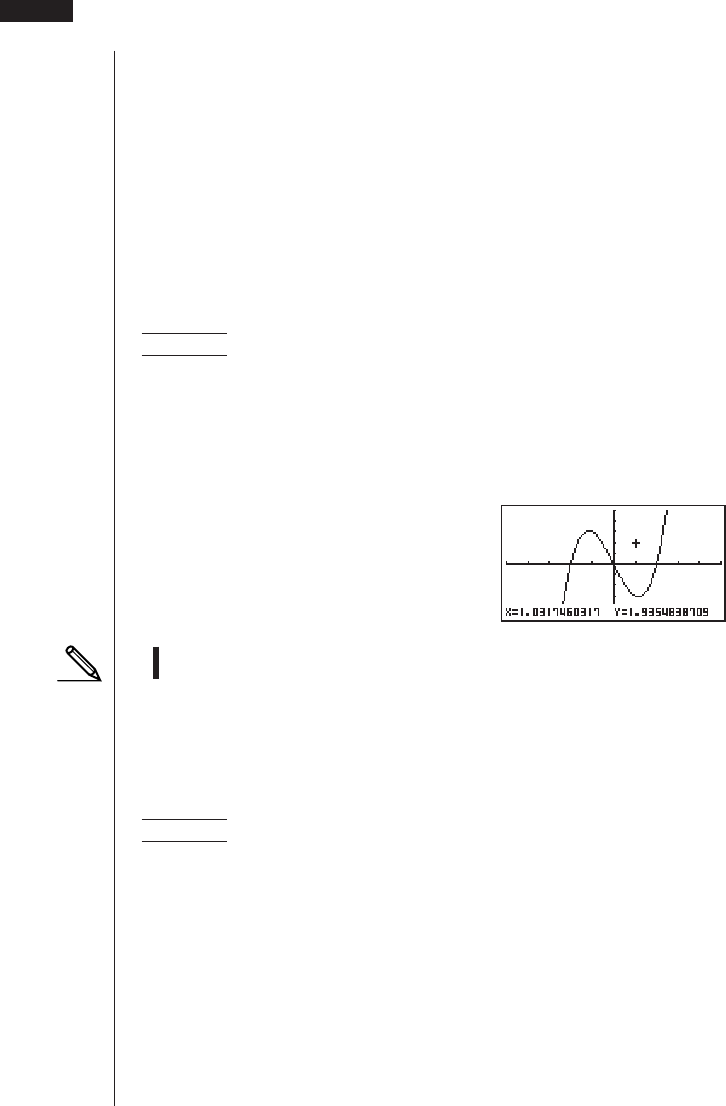
Example To plot a point on the graph of y = x(x + 2)(x – 2)
1. After drawing the graph, display the sketch menu and press 6 (g) 1 (PLOT)
1 (Plot) to display the pointer in the center of the screen.
2. Use the cursor keys to move the pointer the locations of the points you want to
plot and press w to plot.
• You can plot as many points as you want.
• The current x- and y-coordinate values are assigned respectively to variables
X and Y.
uu
uu
uTo plot points in the RUN or PRGM Mode [Sketch]-[PLOT]-[Plot]
The following is the syntax for plotting points in these modes.
Plot <x-coordinate>, <y-coordinate>
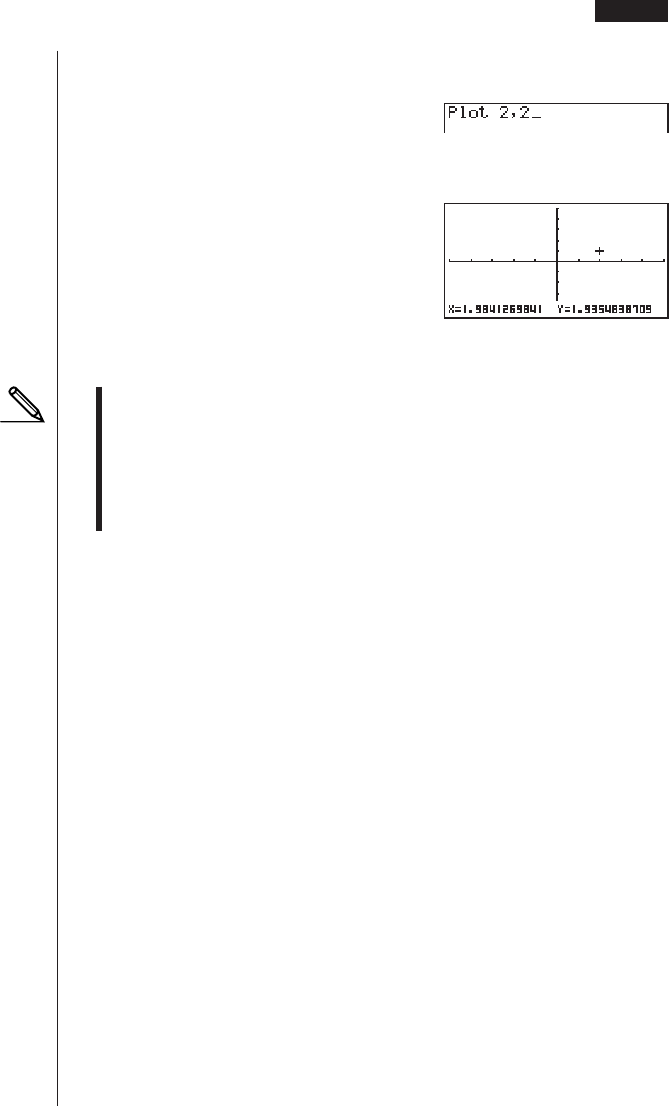
Example To plot a point at (2, 2)
Use the following View Window parameters.
Xmin = –5 Ymin = –10
Xmax = 5 Ymax = 10
Xscale = 1 Yscale = 2
159
1. After entering the RUN Mode, display the sketch menu and perform the
following operation.
!4(Sketch)6(g)
1(PLOT)1(Plot)c,c
2. Press w and the pointer appears on the display. Press w again to plot a
point.
• You can use the cursor keys to move the pointer around the screen.
• If you do not specify coordinates, the pointer is located in the center of the
graph screen when it appears on the display.
• If the coordinates you specify are outside the range of the View Window
parameters, the pointer will not be on the graph screen when it appears on
the display.
• The current x- and y-coordinate values are assigned respectively to variables
X and Y.
kk
kk
kTurning Plot Points On and Off
[Sketch]-[PLOT]-[Pl·On]/[Pl·Off]/[Pl·Chg]
Use the following procedures to turn specific plot points on and off.
uu
uu
uTo turn plot points on and off in the STAT, GRAPH, TABLE, RECUR
and CONICS Modes
• To turn a plot point on
1. After drawing the graph, display the sketch menu and press 6 (g) 1
(PLOT) 2 (Pl·On) to display the pointer in the center of the screen.
2. Use the cursor keys to move the pointer to the location where you want to plot
a point and then press w.
• To turn a plot point off
Perform the same procedure as described under “To turn a plot point on” above,
except press 3 (Pl·Off) in place of 2 (Pl·On).
• To change the on/off status of a plot point
Perform the same procedure as described under “To turn a plot point on” above,
except press 4 (Pl·Chg) in place of 2 (Pl·On).
Graphing with the Sketch Function 10 - 2
160
uu
uu
uTo turn plot points on and off in the RUN or PRGM Mode
The following are the syntax for turning plot points on and off in these modes.
• To turn a plot point on
PlotOn <x-coordinate>, <y-coordinate>
• To turn a plot point off
PlotOff <x-coordinate>, <y-coordinate>
• To change the on/off status of a plot point
PlotChg <x-coordinate>, <y-coordinate>
kk
kk
kDrawing a Line [Sketch]-[LINE]
To draw a line on a graph, first display the sketch menu and then press 6 (g)
2 (LINE) to display the line menu.
• {Line} ...{Draw a line between two plotted points}
• {F·Line} ... {Draw a line}
uu
uu
uTo connect two plotted points with a line in the STAT, GRAPH,
TABLE, RECUR and CONICS Modes [Sketch]-[LINE]-[Line]
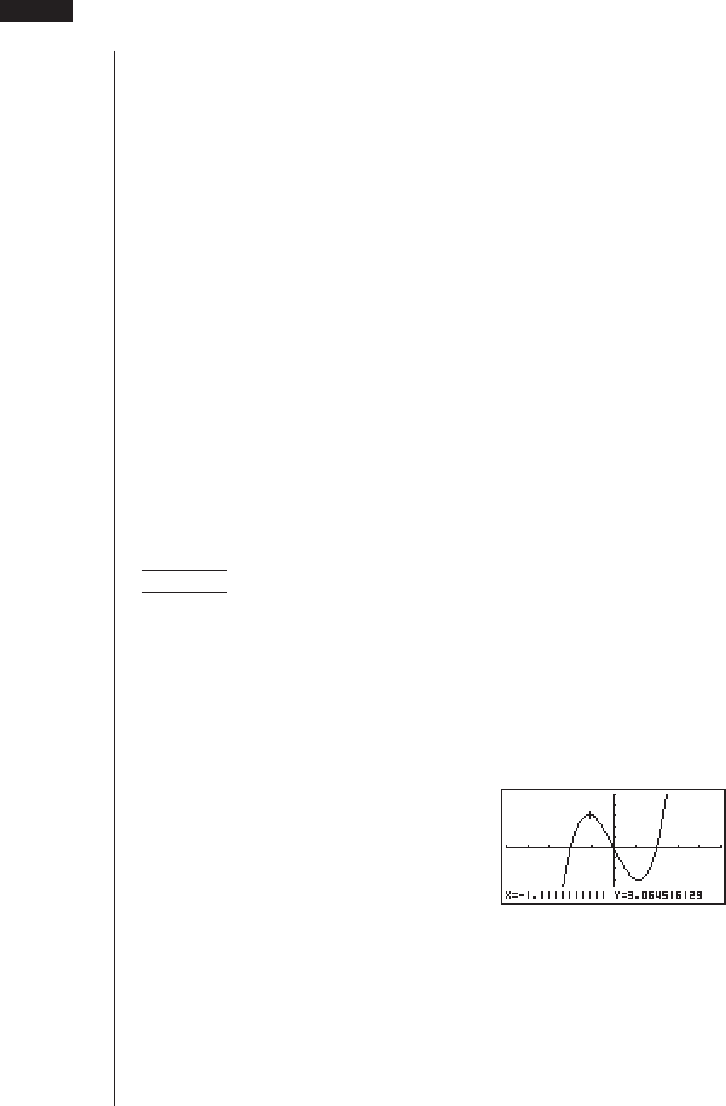
Example To draw a line between the two points of inflection on the
graph of y = x(x + 2)(x – 2)
Use the same View Window parameters as in the example on page
155.
1. After drawing a graph, display the sketch menu and then press 6 (g) 1
(PLOT) 1 (Plot) to display the pointer in the center of the screen.
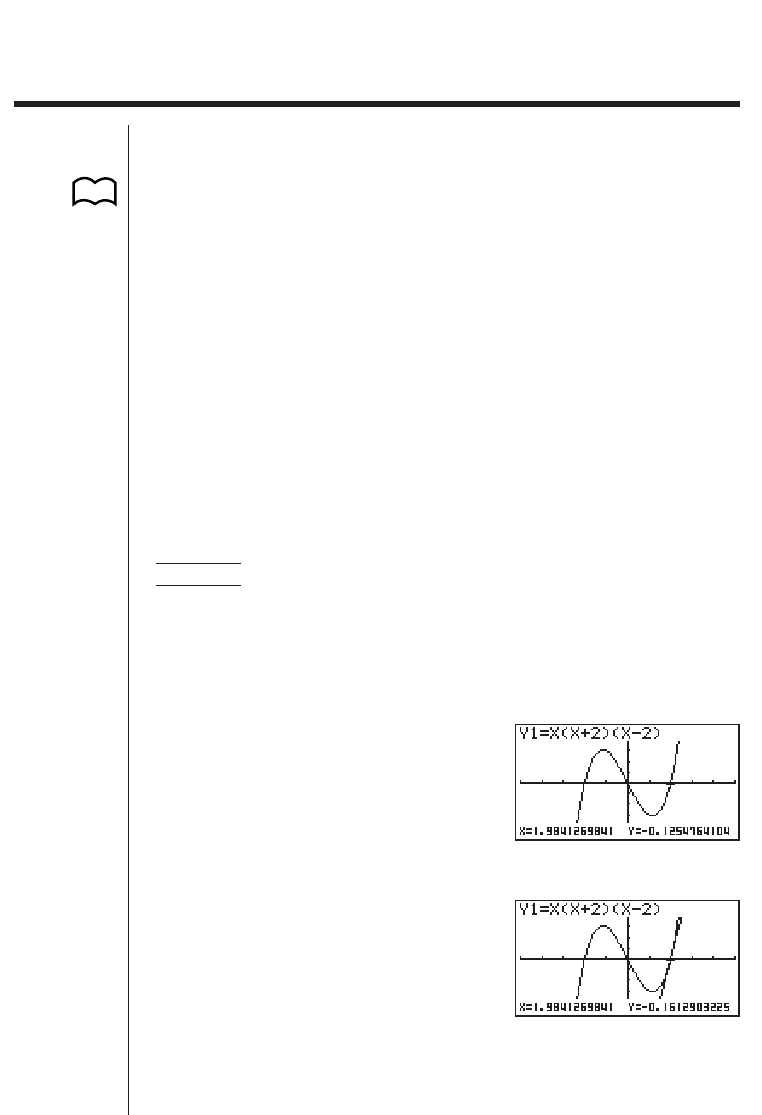
2. Use the cursor keys to move the pointer to one of the points of inflection and
press w to plot it.
3. Use the cursor keys to move the pointer to the other point of inflection.
10 - 2 Graphing with the Sketch Function
161
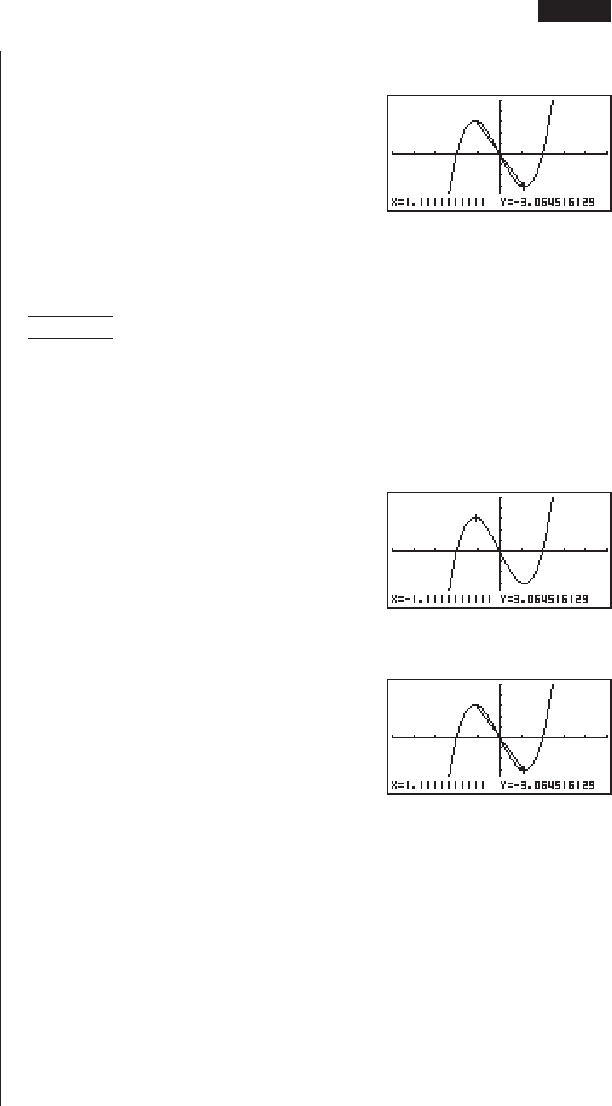
4. Display the sketch menu and then press 6 (g) 2 (LINE) 1 (Line) to draw
a line to the second dot.
uu
uu
uTo draw a line between any two points in the STAT, GRAPH,
TABLE, RECUR and CONICS Modes [Sketch]-[LINE]-[F·Line]
Example To draw a line between two points of inflection on the graph of
y = x(x + 2)(x – 2)
1. After drawing a graph, display the sketch menu and then press 6 (g) 2
(LINE) 2 (F·Line) to display the pointer in the center of the screen.
2. Use the cursor keys to move the pointer to one of the points of inflection and
press w.
3. Use the cursor keys to move the pointer to the other point of inflection and
press w to draw the line.
uu
uu
uTo draw a line in the RUN or PRGM Mode
The following is the syntax for drawing lines in these modes.
F-Line <x-coordinate 1>, <y-coordinate 1>, <x-coordinate 2>, <y-coordinate 2>
Graphing with the Sketch Function 10 - 2
162
kk
kk
kDrawing a Circle [Sketch]-[Crcl]
You can use the following procedures to draw a circle on a graph.
uu
uu
uTo draw a circle in the STAT, GRAPH, TABLE, RECUR and CONICS
Modes
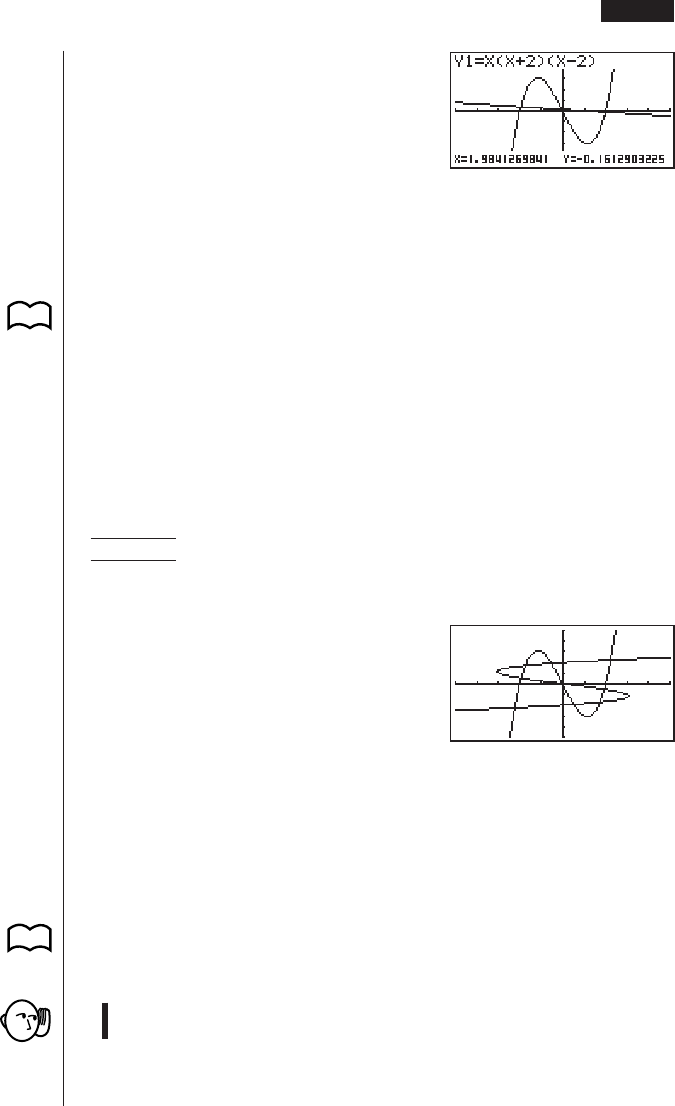
Example To draw a circle with a radius of R = 1 centered at point (1, 0)
on the graph of y = x(x + 2)(x – 2)
1. After drawing a graph, display the sketch menu and then press 6 (g) 3
(Crcl) to display the pointer in the center of the screen.
2. Use the cursor keys to move the pointer to the location where you want the
center point of the circle to be and press w to plot it.
3. Use the cursor keys to move the pointer to a point on the circumference of the
circle (here to point x = 0) and then press w to draw the circle.
uu
uu
uTo draw a circle in the RUN or PRGM Mode
The following is the syntax for drawing circles in these modes.
Circle <center point x-coordinate>, <center point y-coordinate>, <radius R
value>
• Certain View Window parameters can make a circle appear as an ellipse.
10 - 2 Graphing with the Sketch Function
163
kk
kk
kDrawing Vertical and Horizontal Lines [Sketch]-[Vert]/[Hztl]
The procedures presented here draw vertical and horizontal lines that pass
through a specific coordinate.
uu
uu
uTo draw vertical and horizontal lines in the STAT, GRAPH, TABLE,
RECUR and CONICS Modes
Example To draw a vertical line on the graph of y = x(x + 2)(x – 2)
1. After drawing a graph, display the sketch menu and then press 6 (g) 4
(Vert) to display the pointer along with a vertical line in the center of the screen.
2. Use the d and e cursor keys to move the line left and right, and press w
to draw the line at the current location.
To draw a horizontal line, simply press 5 (Hztl) in place of 4 (Vert), and use the
f and c cursor keys to move the horizontal line on the display.
uu
uu
uTo draw vertical and horizontal lines in the RUN or PRGM Mode
The following is the syntax for drawing vertical and horizontal lines in these
modes.
• To draw a vertical line
Vertical <x-coordinate>
• To draw a horizontal line
Horizontal <y-coordinate>
kk
kk
kFreehand Drawing [Sketch]-[PEN]
This function lets you make freehand drawings on a graph, just as if you were
using a pen.
• Freehand drawing is available only in the STAT, GRAPH, TABLE, RECUR and
CONICS Modes.
Graphing with the Sketch Function 10 - 2
164
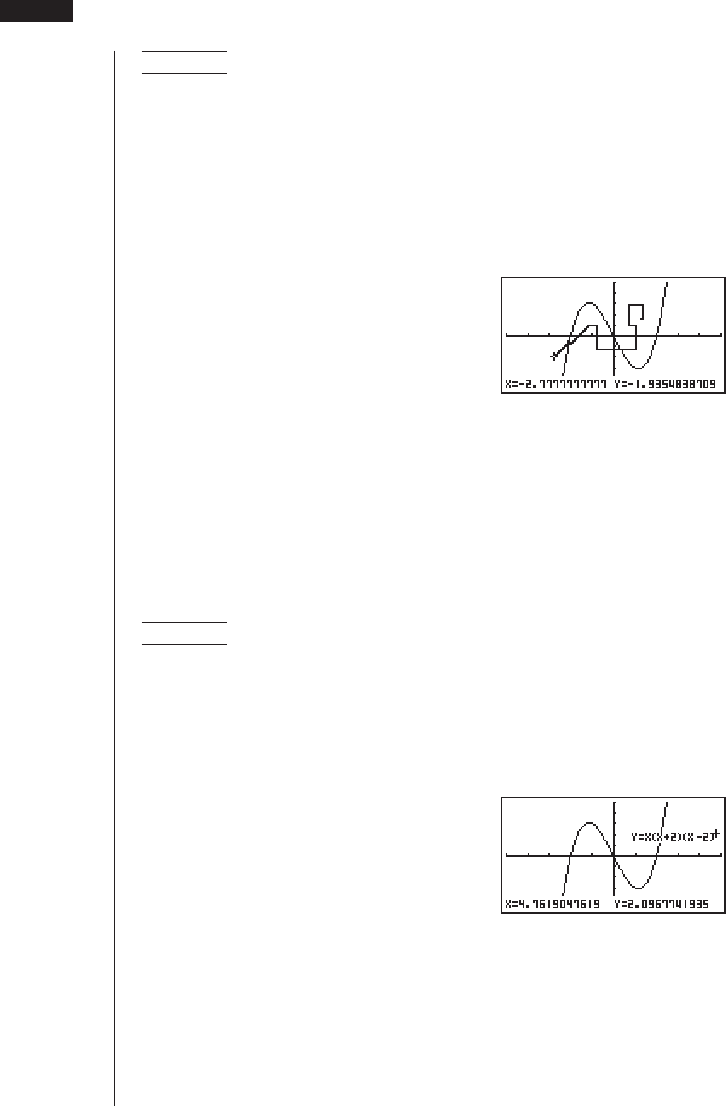
Example To draw on the graph of y = x(x + 2)(x – 2)
1. After drawing a graph, display the sketch menu and then press 6 (g) 6 (g)
1 (PEN) to display the pointer in the center of the screen.
2. Use the cursor keys to move the pointer to the location where you want to start
drawing and press w to plot it.
3. Use the cursor keys to move the pointer, drawing a line as it moves. Press w to
stop the draw operation of the pointer.
• Press A to quit the freehand draw operation.
kk
kk
kComment Text [Sketch]-[Text]
Use the following procedure to insert text for comments and labels into a graph.
uu
uu
uTo insert text in the STAT, GRAPH, TABLE, RECUR and CONICS
Modes
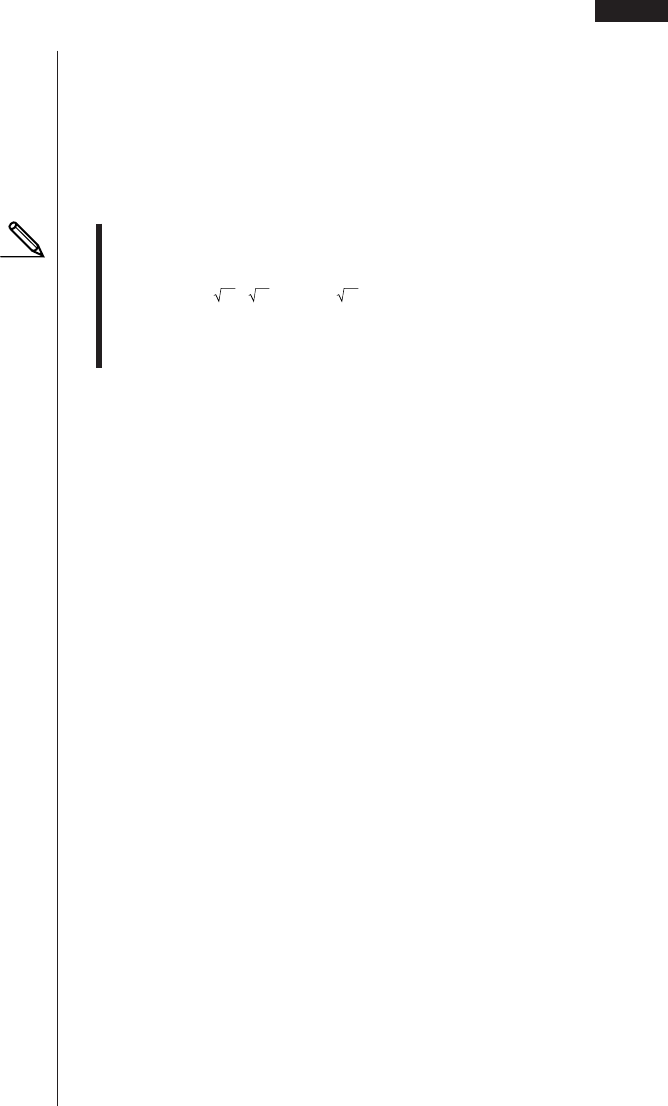
Example To insert the graph function as comment text into the graph of
y = x(x + 2)(x – 2)
1. After drawing a graph, display the sketch menu and then press 6 (g) 6 (g)
2 (Text) to display the pointer in the center of the screen.
2. Use the cursor keys to move the pointer to the location where you want to insert
the comment text, and then input the text.
e ~ ef ~ f
aY!=v
(v+c)(v-c)
10 - 2 Graphing with the Sketch Function
165
Graphing with the Sketch Function 10 - 2
uu
uu
uTo insert text in the RUN or PRGM Mode
The following is the syntax for inserting text in these modes.
Text <line number>, <column number>, “<text>”
• The line number can be specified within the range of 1 to 63, while the column
number can be specified in the range of 1 to 127.
• The following are the characters that can be used inside of comment text in
the STAT, GRAPH, TABLE, RECUR, or CONICS Mode.
A~Z, r,
θ
, space, 0~9, ., +, –, ×, ÷, (–), EXP, π, Ans, {, (, ), [, ], {, }, comma, →,
x2, ^, log, In, , x, 10x, ex, 3, x–1, sin, cos, tan, sin–1, cos–1, tan–1
• A newline operation cannot be performed when inserting comment text. To
input multiple lines, you have to perform the above comment text insert
operation more than once.
kk
kk
kTurning Pixels On and Off [Sketch]-[PIXL]
The following procedure lets you turn each individual screen pixel on and off. You
can specify any pixel from the upper left-hand corner (1, 1) to the lower right-hand
corner (63, 127) of the screen.
Line range: 1 to 63
Column range: 1 to 127
• Note that you can turn pixels on and off only in the RUN and PRGM Modes.
When turning pixels on and off, first display the sketch menu and then press 6
(g) 6 (g) 3 (PIXL) to display the pixel menu.
• {On} ... {turns specified pixel on}
• {Off} ... {turns specified pixel off}
• {Chg} ... {switches status of specified pixel}
uu
uu
uTo turn pixels on and off [Sketch]-[PIXL]-[On]/[Off]/[Chg]
• To turn a pixel on
PxlOn <line number>, <column number>
• To turn a pixel off
PxlOff <line number>, <column number>
• To change the on/off status of a pixel
PxlChg <line number>, <column number>

166
uu
uu
uTo check the on/off status of a pixel [Sketch]-[Test]
While the sketch menu is on the screen, press 6 (g) 6 (g) 4 (Test) and then
input the command shown below to check the status of the specified pixel. 1 is
returned when the pixel is on, and 0 is returned when the pixel is off.
PxlTest <line number>, <column number>
• Specify a line in the range of 1 to 63 and a column in the range of 1 to 127.
• Trying to perform one of the above operations without specifying a line and
column number results in an error.
• Pixel operations are valid only within the allowable line and column ranges.
kk
kk
kClearing Drawn Lines and Points [Sketch]-[Cls]
The following operation clears all drawn lines and points from the screen.
uu
uu
uTo clear lines and points in the STAT, GRAPH, TABLE, RECUR and
CONICS Modes
Lines and points drawn using sketch menu functions are temporary. Display the
sketch menu and press 1 (Cls) to clear drawn lines and points, leaving only the
original graph.
uu
uu
uTo clear drawn lines and points in the RUN or PRGM Mode
The following is the syntax for clearing drawn lines and points, as well as the
graph itself.
Cls EXE
10 - 2 Graphing with the Sketch Function
