Casio 21 Chapter 16 Recursion Table And Graph Fx9750g Ch16 EN
User Manual: Casio Chapter 16 Recursion Table and Graph fx-9750G | Calculators | Manuals | CASIO
Open the PDF directly: View PDF ![]() .
.
Page Count: 13

Recursion Table and Graph
You can input two formulas for any of the three following types of
recursion, which you can then use to generate a table and draw
graphs.
• General term of sequence {an}, made up of an and n
• Formulas for linear recursion between two terms, made up of an+1,
an, and n
• Formulas for linear recursion between three terms, made up of
an+2, an+1, an, and n
16-1 Before Using the Recursion Table and Graph Function
16-2 Inputting a Recursion Formula and Generating a Table
16-3 Editing Tables and Drawing Graphs
Chapter
16
250
16-1 Before Using the Recursion Table and
Graph Function
uu
uu
uTo enter the RECUR Mode
On the Main Menu, select the RECUR icon and enter the RECUR Mode. This causes
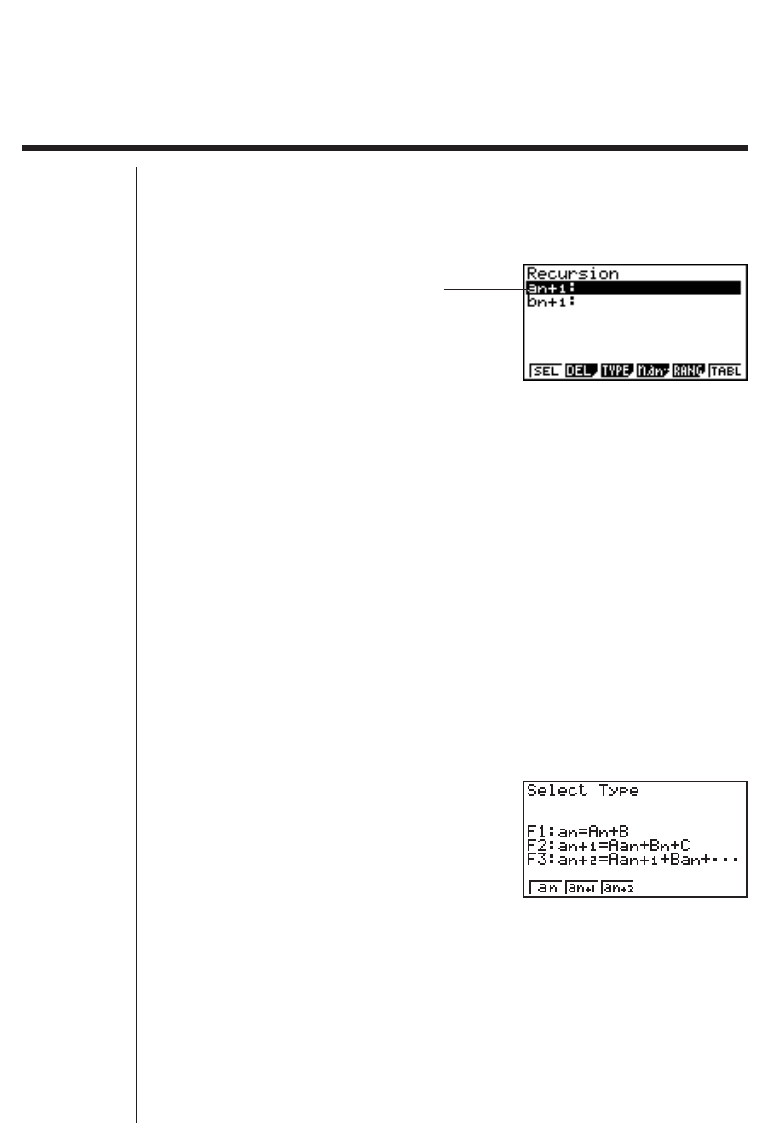
the Recursion Menu to appear.
• All recursion formulas that are stored in memory appear in the Recursion Menu.
1 (SEL)........ Menu for control of table generation
2 (DEL) ....... Recursion formula delete
3 (TYPE) ..... Recursion formula type specification
4 (n, an...) .... Menu for input of variable n and general terms an and bn
5 (RANG) .... Screen for setting of table range
6 (TABL) ...... Recursion formula table generation
uu
uu
uTo specify the recursion formula type
Before inputting a recursion formula, you must first specify its type.
1. In the Recursion Menu, press 3 (TYPE).
3(TYPE)
• In this display, “an = An + B” is the general term (an = A × n + B) of {an}.
1 (an) ........... General term of sequence {an}
2 (an+1) ......... Linear recursion between two terms
3 (an+2) ......... Linear recursion between three terms
2. Press the function key for the recursion formula type you want to set.
123456
Selected storage area
Press
f
and
c
to move.
123456
251
16-2 Inputting a Recursion Formula and
Generating a Table
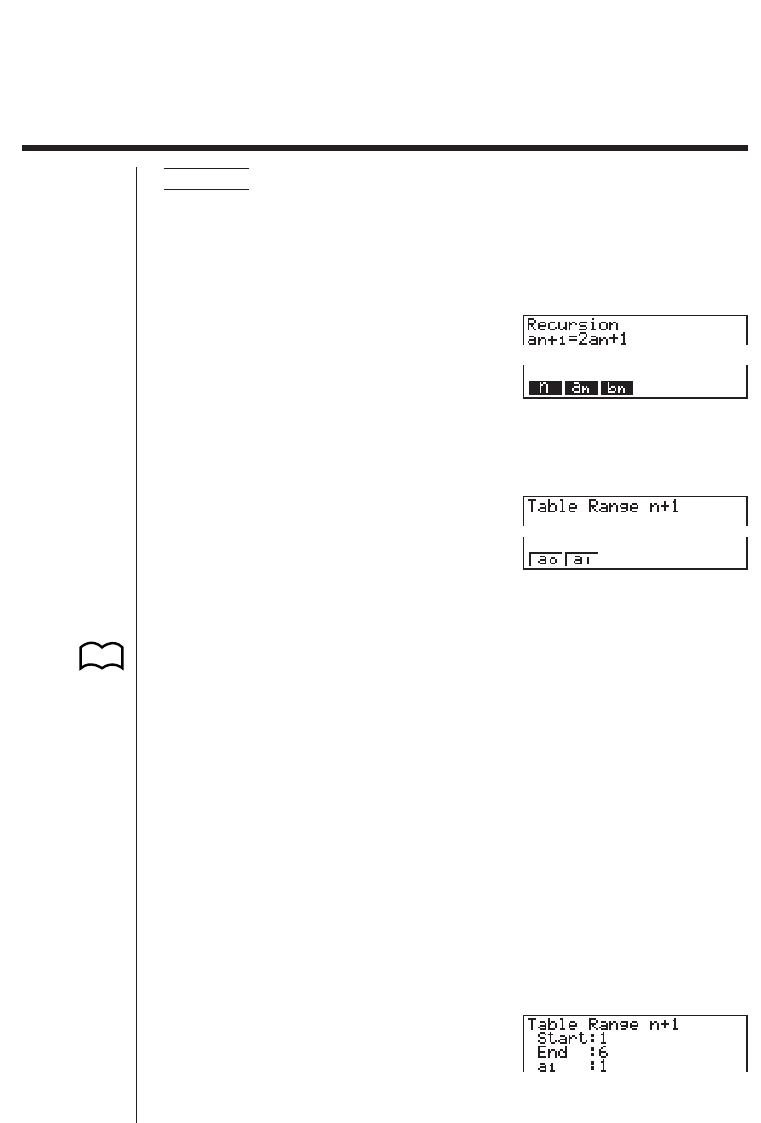
Example 1 To input an+1 = 2an + 1 and generate a table of values as the
value of n change from 1 to 6
Make a1 = 1.
1. Specify the recursion formula type as linear recursion between two terms and
then input the formula.
c4(n, an...)
2(an)+b
2. Press w and then press 5 (RANG) to display the table range setting screen.
w5(RANG)
1 (a0) ........... Value for a0 (b0)
2 (a1) ........... Value for a1 (b1)
The table range settings specify the conditions that control the value of variable n in
the recursion formula, and the initial term of the numeric value table. You should also
specify a starting point for the pointer when drawing a convergence/divergence graph
(WEB graph) for a formula for linear recursion between two terms.
Start................ Starting value of variable n
End ................. Ending value of variable n
a0, b0............... Value of 0th term a0/b0 (a1, b1 .... Value of 1st term a1/b1)
anStr, bnStr ...... Pointer starting point for convergence/divergence graph (WEB
graph)
• The value of variable n increments by 1.
3. Specify the range of the table.
2(a1)
bwgwbw
123456
123456
P.258
252
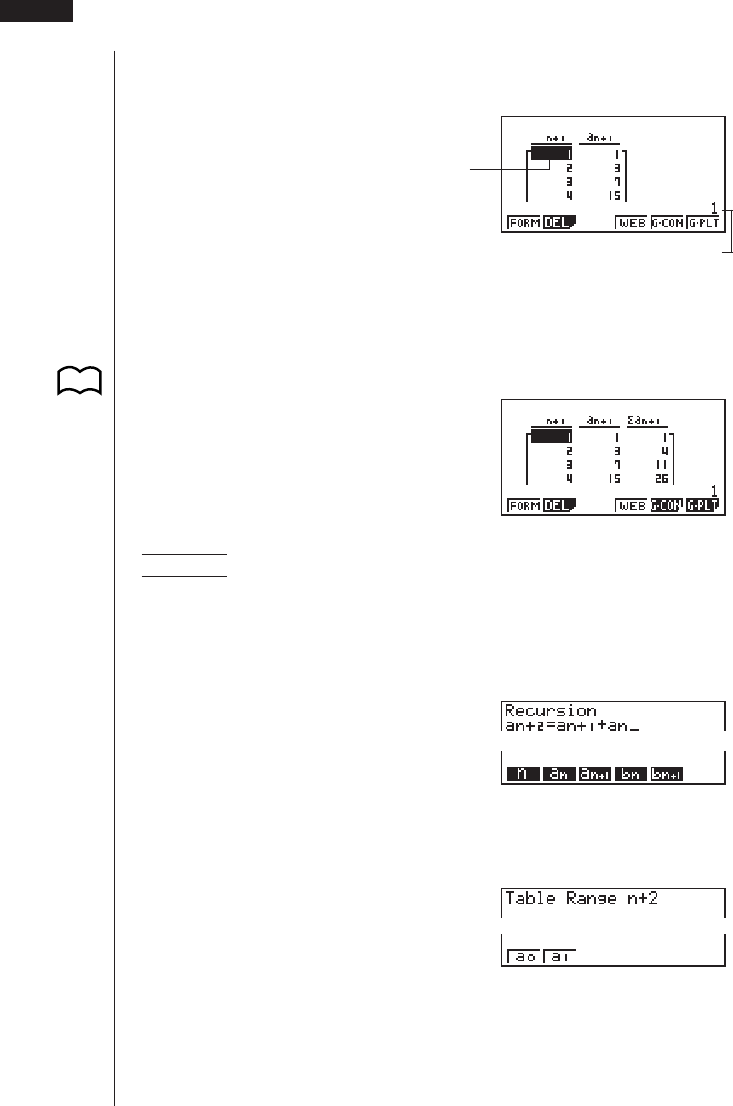
4. Display the table of the recursion formula. At this time, a menu of table functions
appears at the bottom of the screen.
J6(TABL)
Value in currently highlighted cell
• Displayed cell values show positive integers up to six digits, and negative inte-
gers up to five digits (one digit used for negative sign). Exponential display can
use up to three significant digits.
• You can see the entire value assigned to a cell by using the cursor keys to move
the highlighting to the cell whose value you want to view.
• You can also display the sums of the terms
(Σan or Σbn) by turning on Σ Display.
Example 2 To input an+2 = an+1 + an (Fibonacci series) and generate a table
of values as the value of n change from 1 to 6
Make a1 = 1 and a2 = 1.
1. Specify the recursion formula type as linear recursion between three terms and
then input the formula.
3(TYPE)3(an+2)
4(n, an...)
3(an+1)+2(an)
2. Press w and then press 5 (RANG) to display the table range setting screen.
w5(RANG)
1 (a0) ........... Value for a0 (b0) and a1 (b1)
2 (a1) ........... Value for a1 (b1) and a2 (b2)
P.9
16 - 2 Inputting a Recursion Formula and Generating a Table
123456
Currently selected cell (up to six digits)
123456
253
The table range settings specify the conditions that control the value of variable n in
the recursion formula, and the initial term of the numeric value table.
Start................ Starting value of variable n
End ................. Ending value of variable n
a0, a1, a2.......... Values of 0th term a0/b0, 1st term a1/b1, and 2nd term a2/b2.
• The value of variable n increments by 1.
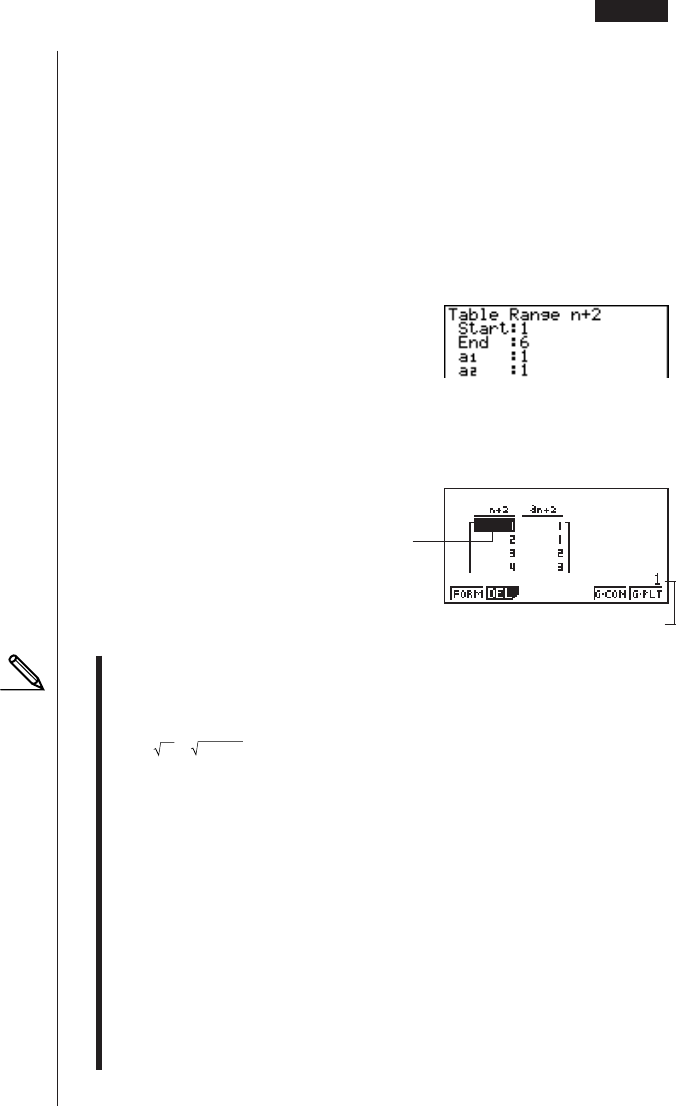
3. Specify the range of the table.
2(a1)
bwgwbwbw
4. Display the table of the recursion formula. At this time, a menu of table functions
appears at the bottom of the screen.
J6(TABL)
• There can be only one recursion table stored in memory at one time.
• Except for linear expression n, any of the following can be input for general
term {an} to generate a table: exponential expressions (such as an = 2n – 1),
fractional expressions (such as an = (n + 1)/n), irrational expressions (such as
an = n – ), trigonometric expressions (such as an = sin 2nπ).n – 1
• Note the following points when specifying a table range.
• If a negative value is specified as a start or end value, the calculator drops
the negative sign. If a decimal value or fraction is specified, the unit uses
only the integer part of the value.
• If the value of a0/b0 (or a1/b1) is greater than the start value, the calculator
makes the starting value of variable x the same as the value of a0/b0 (or a1/
b1) before generating the table.
• If the start value is greater than the end value, the calculator swaps the two
values before generating the table.
• If the start value is the same as the end value, the calculator generates a
table using the start value of variable x only.
• If the start value is very large, it may take a long time to generate a table for
linear recursion between two terms and linear recursion between three terms.
Inputting a Recursion Formula and Generating a Table 16 - 2
Currently selected cell (up to six digits)
Value in currently highlighted cell
254
16 - 2 Inputting a Recursion Formula and Generating a Table
123456
• Changing the angle unit setting while a table generated from a trigonometric
expression is on the display does not cause the displayed values to change. To
cause the values in the table to be updated using the new setting, display the
table, press 1 (FORM), change the angle unit setting, and then press 6
(TABL).
uu
uu
uTo specify the generation/non-generation status of a formula
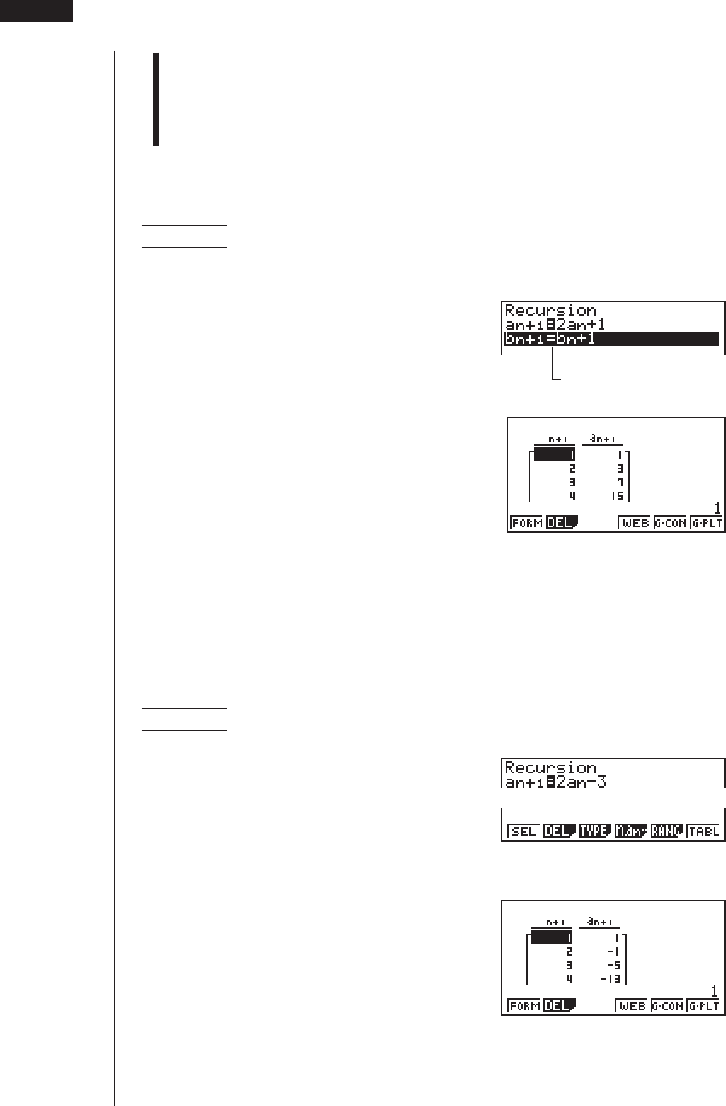
Example To specify generation of a table for recursion formula an+1 = 2an+1
while there are two formulas stored
c1(SEL)
(Specifies non-generation status.)
Unhighlights this formula
6(TABL)
(Generates table.)
• To change the status of a recursion formula from non-generation to generation,
select the formula and press 1 (SEL).
uu
uu
uTo change the contents of a recursion formula
Changing the contents of a recursion formula causes the values in the table to be
updated using the current table range settings.
Example To change an+1 = 2an+1 to an+1 = 2an–3
e
(Displays the cursor.)
ee-dw
(Changes the formula contents.)
6(TABL)
255
uu
uu
uTo delete a recursion formula
1. Display the Recursion Menu and then use f and c to highlight the formula
you want to delete.
2. Press 2 (DEL).
3. Press 1 (YES) to delete the formula or 6 (NO) to abort the operation without
deleting anything.
Inputting a Recursion Formula and Generating a Table 16 - 2
123456
256
16-3 Editing Tables and Drawing Graphs
You get a choice of four options for editing tables and drawing graphs.
• Deletion of a recursion formula table
• Drawing of a connect type graph
• Drawing of a plot type graph
• Drawing of a graph and analysis of convergence/dievergence (WEB)
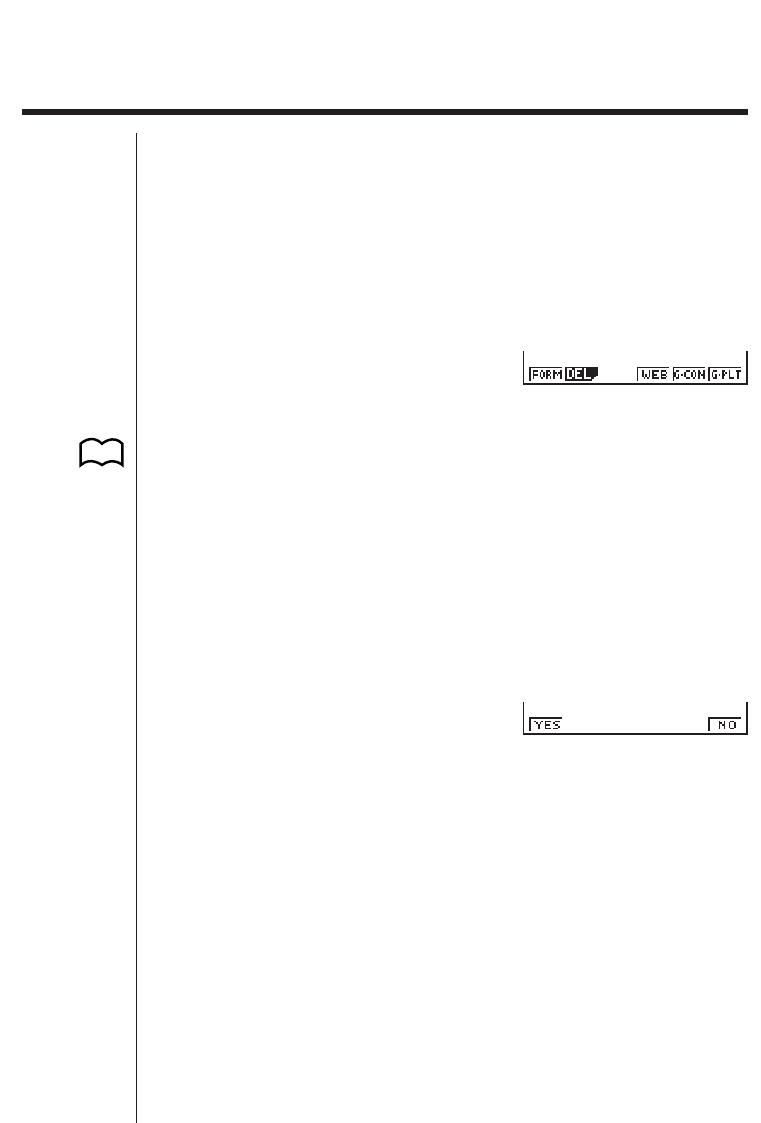
You can access these options from the function menu that appears at the bottom of
the screen whenever a table is displayed.
1 (FORM) .... Returns to Recursion Menu.
2 (DEL) ....... Table delete
4 (WEB) ...... Draws convergence/divergence graph (WEB graph).
5 (G•CON) .. Draws connected type recursion graph.
6 (G•PLT) .... Draws plot type recursion graph.
• The WEB item (4) is available only when a table generated using a formula for
linear recursion between two terms (an+1 =, bn+1 =) is on the display.
uu
uu
uTo delete a recursion table
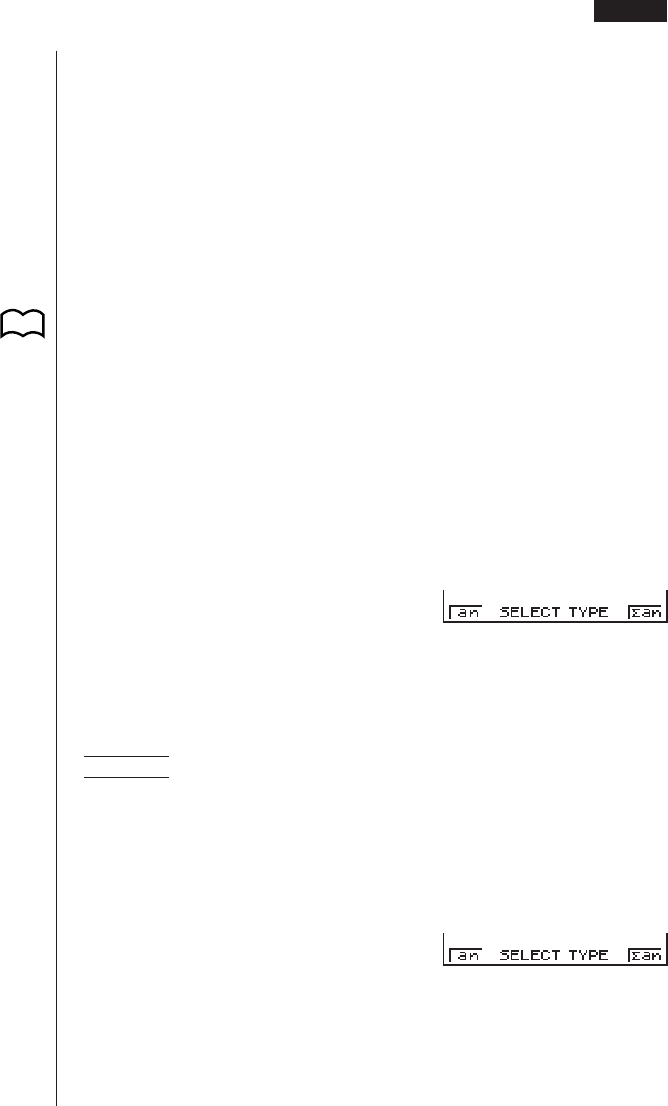
1. Display the recursion table you want to delete and then press 2 (DEL).
2. Press 1 (YES) to delete the table or 6 (NO) to abort the operation without
deleting anything.
123456
P.259
P.146
P.146
123456
257
Editing Tables and Drawing Graphs 16 - 3
kk
kk
kBefore Drawing a Graph for a Recursion Formula
You must first specify the following.
• Draw/non-draw status of for the recursion formula
• The type of data to be plotted
To specify the draw/non-draw status, display the Recursion Menu and then press
1 (SEL).
uu
uu
uTo specify the draw/non-draw status of a formula
There are two options for the draw/non-draw status of a recursion formula graph.
• Draw the graph for the selected recursion formula only
• Overly the graphs for both recursion formulas
To specify the draw/non-draw status, use same procedure as that for specifying
generation/non-generation status.
uu
uu
uTo specify the type of data to be plotted (Σ Display: On)
You can specify one of two types of data for plotting.
•an on the vertical axis, n on the horizontal axis
•Σan on the vertical axis, n on the horizontal axis
In the function menu that appears while a table is on the display, press 5 (G•CON)
or 6 (G•PLT) to display the Plot Data Menu.
1 (an) ........... an on the vertical axis, n on the horizontal axis
6 (Σan) ......... Σan on the vertical axis, n on the horizontal axis
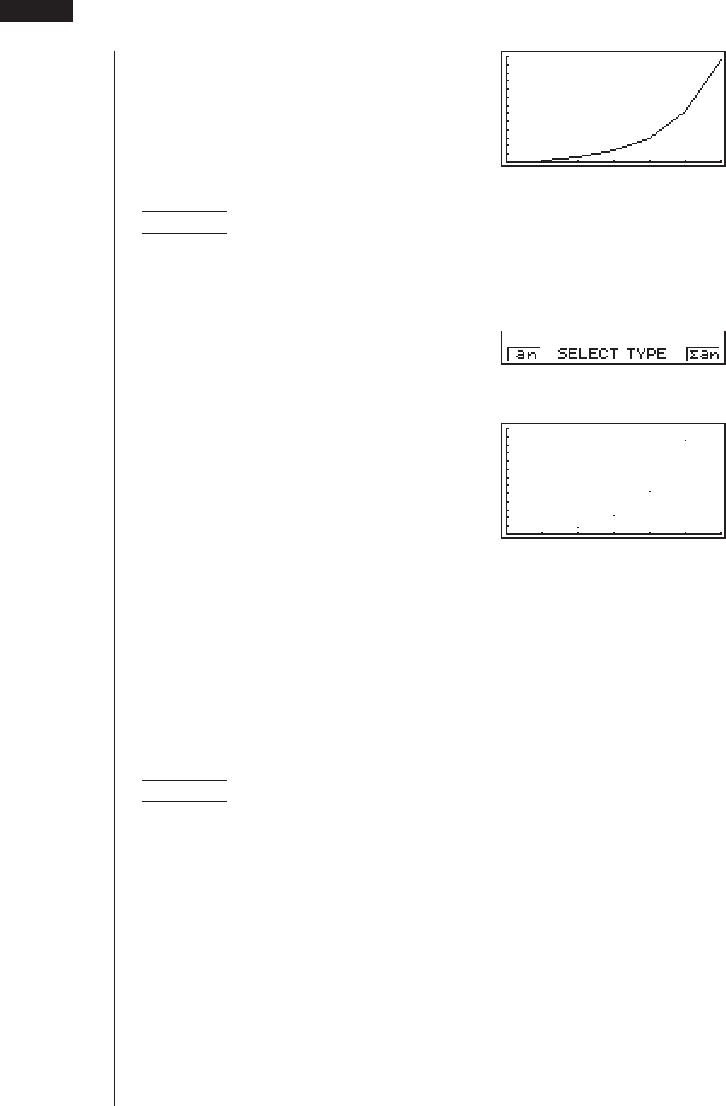
Example 1 Draw a graph of an+1 = 2an + 1 with an on the vertical axis and n
on the horizontal axis, and with the points connected.
Set the following parameters in the View Window.
Xmin = 0 Ymin = 0
Xmax = 6 Ymax = 65
Xscale = 1 Yscale = 5
6(TABL)5(G•CON)
(Selects connected type.) 123456
P.254
123456
258
1(an)
(Draws graph with an on the vertical
axis.)
Example 2 Draw a graph of an+1 = 2an + 1 with Σan on the vertical axis and n
on the horizontal axis, and with the points unconnected.
Use the same View Window parameters as those provided in Exam-
ple 1.
6(TABL)6(G•PLT)
(Selects plot type.)
6(Σan)
(Draws graph with Σan on the vertical
axis.)
• To input a different recursion formula after a graph is drawn, press ! Q. This
displays the Recursion Menu where you can input a new formula.
kk
kk
kDrawing a Convergence/Divergence Graph (WEB graph)
With this feature, you can draw a graph of an+1 = f
(an) where an+1 and an are the terms
of linear recursion between two terms, substituted respectively for y and x in the
function y = f
(x). The resulting graph can then be viewed to determine whether or not
the graph is convergent or divergent.
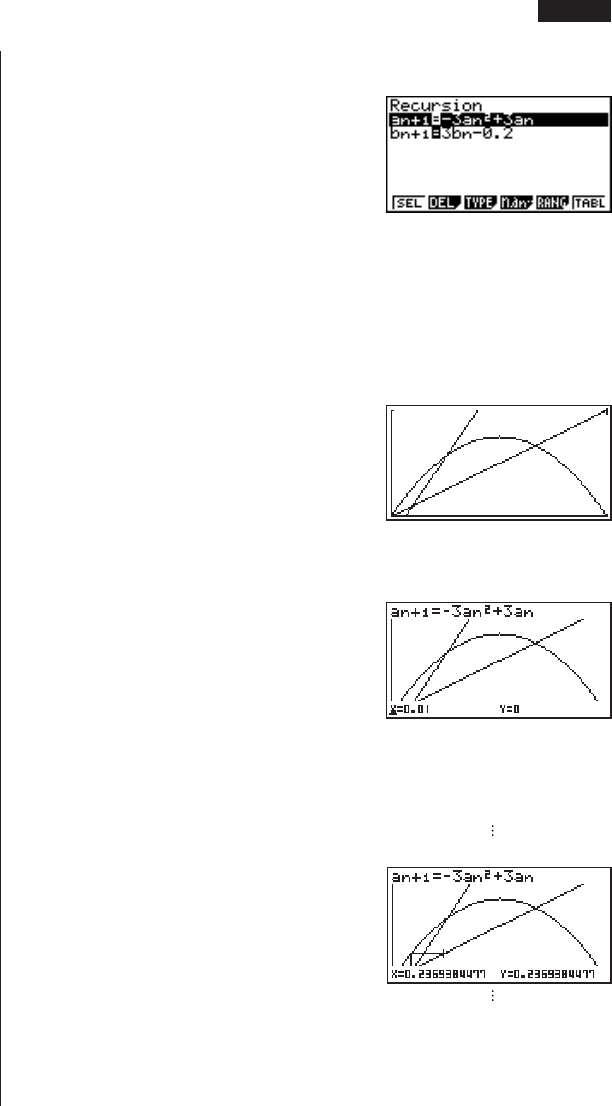
Example 1 To determine whether or not the recursion formula an+1 = –3an2 +
3an is convergent or divergent.
Use the following table range.
Start = 0 End = 6
a0= 0.01 an Str = 0.01
b0= 0.11 bn Str = 0.11
Use the following View Window parameters.
Xmin = 0 Ymin = 0
Xmax = 1 Ymax = 1
Xscale = 1 Yscale = 1
16 - 3 Editing Tables and Drawing Graphs
123456
259
This example assumes that the following two recursion formulas are already stored
in memory.
1. Press 6 (TABL) to generate a table.
6(TABL)
2. Press 4 (WEB) to draw the graph.
4(WEB)
3. Press w, and the pointer appears at the pointer start point (anStr = 0.01).
w
• The Y value for the pointer start point is always 0.
4. Each press of w draws web-like lines on the display.
w
↓
w
↓
Editing Tables and Drawing Graphs 16 - 3
123456
260
16 - 3 Editing Tables and Drawing Graphs
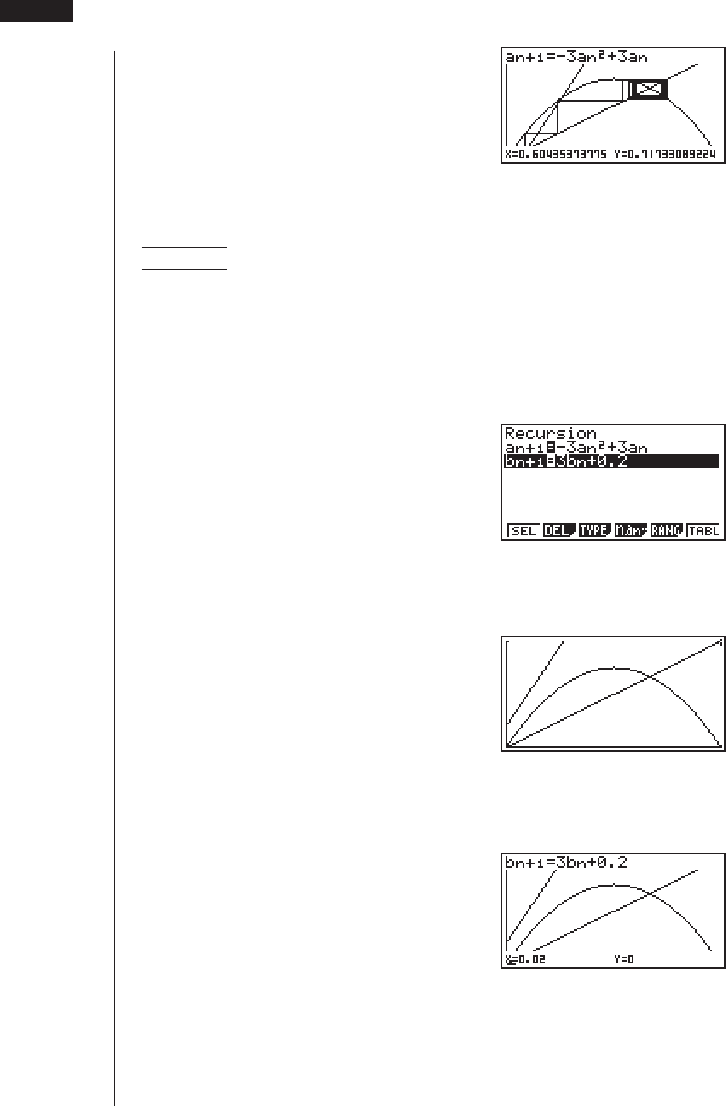
This graph indicates that recursion formula an+1 = –3an2 + 3an is convergent.
Example 2 To determine whether or not the recursion formula bn+1 =
3bn + 0.2 is convergent or divergent.
Use the following table range.
Start = 0 End = 6
b0= 0.02 bn Str = 0.02
Use the View Window parameters from Example 1.
1. Press 6 (TABL) 4 (WEB) to draw the graph.
6(TABL)
4(WEB)
2. Press w and then either f or c to make the pointer appear at the pointer
start point (bnStr = 0.02).
wc (or f)
• The Y value for the pointer start point is always 0.
123456
261
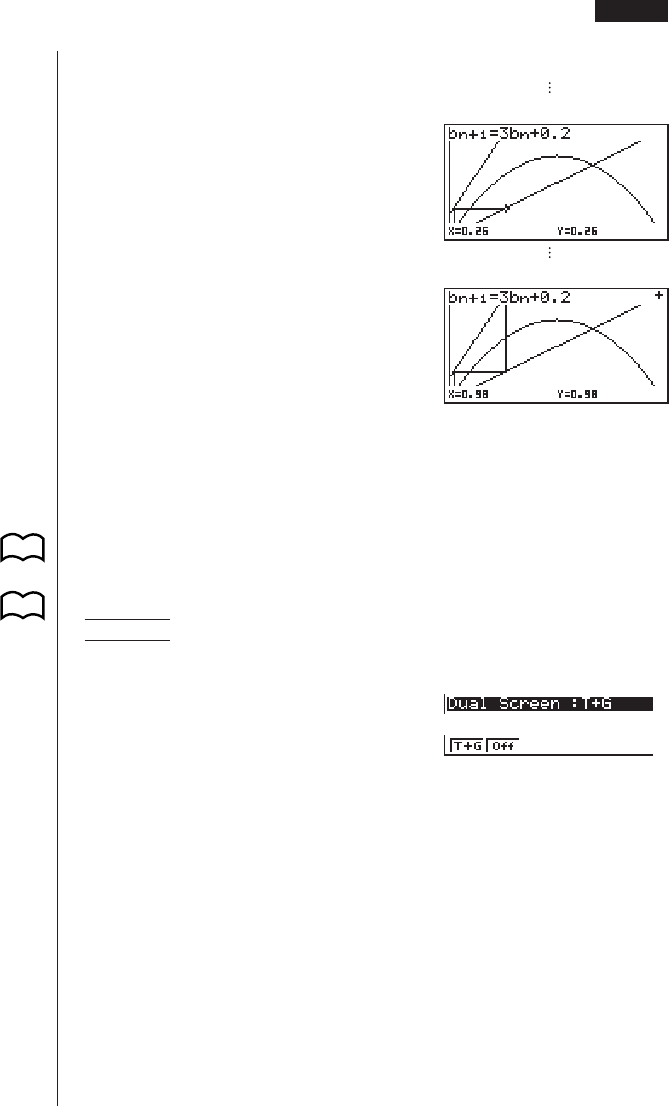
3. Each press of w draws web-like lines on the display.
w
↓
w
↓
This graph indicates that recursion formula bn+1 = 3bn + 0.2 is divergent.
• Inputting bn or n for the expression an+1, or Inputting an or n for the expression bn+1
for linear recursion between two terms causes an error.
uu
uu
uTo draw a recursion formula graph using Dual Screen
Selecting “T+G” for the Dual Screen item of the Set Up Screen makes it possible to
display both the graph and its numerical table of values.
Example To draw the graph of an+1 = 2an+ 1 from Example 1, displaying
both the graph and its table
!Z
ccc1(T+G)
(Specifies T+G for Dual Screen.)
J6(TABL)
(Draws the graph and shows the table.)
6(G•PLT)
(Draws plot type graph.)
• Pressing !6 (G↔T) causes the graph on the left side of the Dual Screen to
fill the entire display. Note that you cannot use the sketch function while a graph
is displayed using !6 (G↔T).
Editing Tables and Drawing Graphs 16 - 3
123456
P.8
P.258
