Casio CFX9850GC PLUS_Eng Getting Acquainted Read This First! Fx Plus Ch Gett EN
User Manual: Casio Getting Acquainted - Read This First! fx-9750G PLUS | Calculators | Manuals | CASIO
Open the PDF directly: View PDF ![]() .
.
Page Count: 12

Getting Acquainted — Read This First!
Getting Acquainted
— Read This First!
About this User’s Guide
uFunction Keys and Menus
•Many of the operations performed by this calculator can be executed by pressing function
keys 1 through 6. The operation assigned to each function key changes according to
the mode the calculator is in, and current operation assignments are indicated by function
menus that appear at the bottom of the display.
•This user’s guide indicates the current operation assigned to a function key in parentheses
following the key cap marking for that key. 1 (Comp), for example, indicates that
pressing 1 selects {Comp}, which is also indicated in the function menu.
•When {g} is indicated in the function menu for key 6, it means that pressing 6
displays the next page or previous page of menu options.
uMenu Titles
•Menu titles in this user’s guide include the key operation required to display the menu
being explained. The key operation for a menu that is displayed by pressing K and then
{MAT} would be shown as: [OPTN]-[MAT].
•6 (g) key operations to change to another menu page are not shown in menu title key
operations.
uCommand List
•The Program Mode Command List (page 453) provides a graphic flowchart of the various
function key menus that shows how to maneuver to the menu of commands you need.
Example: The following operation displays Xfct: [VARS]-[FACT]-[Xfct]
uIcons Used in This User’s Guide
•The following are the meanings of the icons used in this user’s guide.
: Function not supported by fx-9750G PLUS
: Important : Note : Reference page
P.000
CFX
2
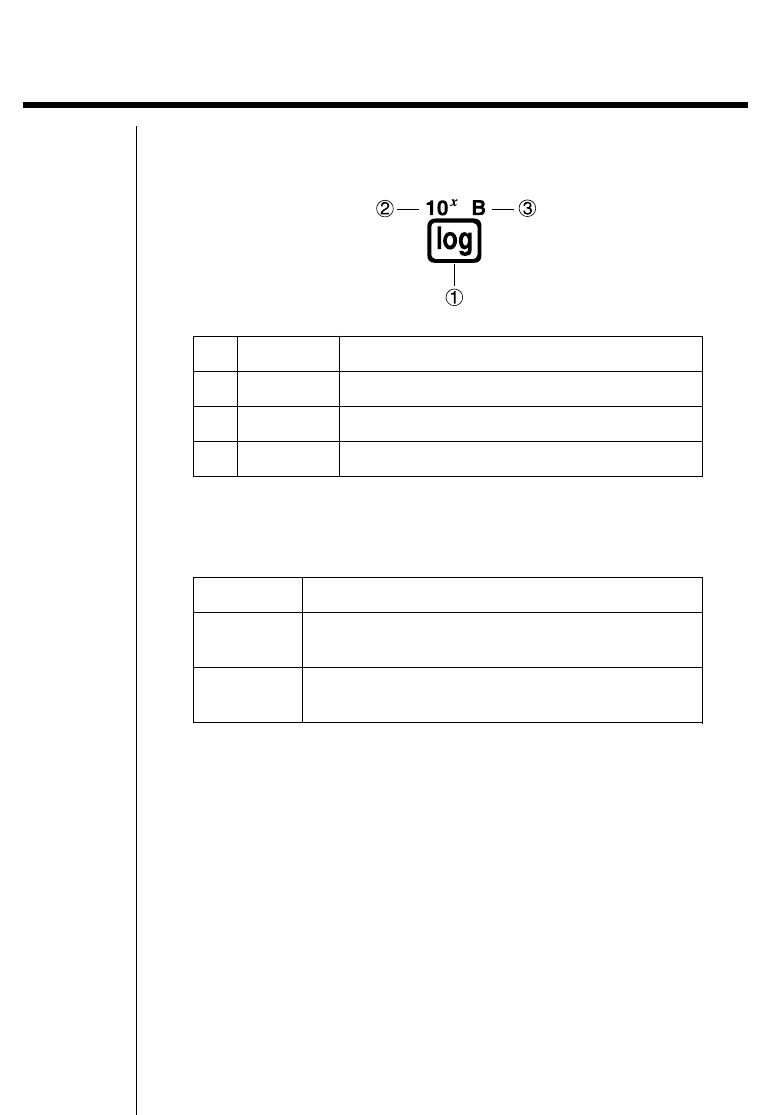
1. Key Markings
Many of the calculator’s keys are used to perform more than one function. The
functions marked on the keyboard are color coded to help you find the one you
need quickly and easily.
Function Key Operation
1log l
210x!l
3Bal
The following describes the color coding used for key markings.
Color Key Operation
Orange Press ! and then the key to perform the marked
function.
Red Press a and then the key to perform the marked
function.
3
2. Selecting Icons and Entering Modes
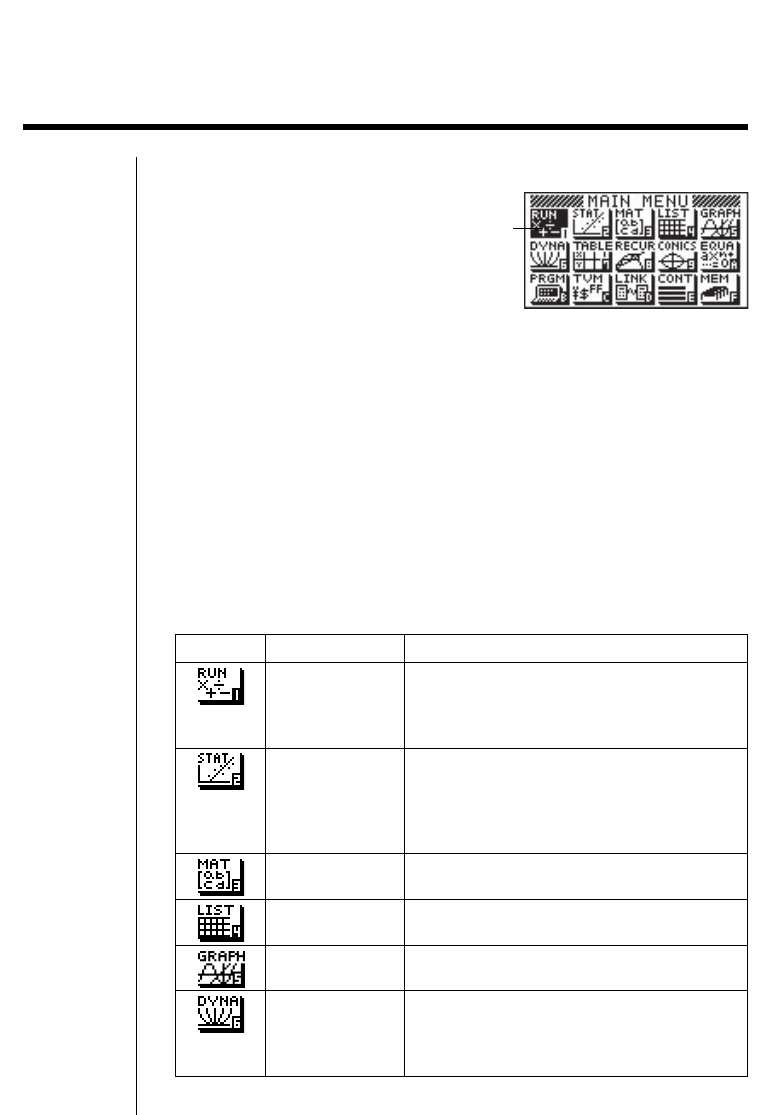
This section describes how to select an icon in the Main Menu to enter the mode you want.
uTo select an icon
1. Press m to display the Main Menu.
Currently selected icon
2. Use the cursor keys (d, e, f, c) to move the highlighting to the icon
you want.
3. Press w to display the initial screen of the mode whose icon you selected.
•You can also enter a mode without highlighting an icon in the Main Menu by
inputting the number or letter marked in the lower right corner of the icon.
•Use only the procedures described above to enter a mode. If you use any other
procedure, you may end up in a mode that is different than the one you thought
you selected.
The following explains the meaning of each icon.
Icon Mode Name Description
RUN Use this mode for arithmetic calculations
and function calculations, and for
calculations involving binary, octal, decimal
and hexadecimal values.
STATisticsUse this mode to perform single-variable
(standard deviation) and paired-variable
(regression) statistical calculations, to
perform tests, to analyze data and to draw
statistical graphs.
MATrix Use this mode for storing and editing
matrices.
LIST Use this mode for storing and editing
numeric data.
GRAPH Use this mode to store graph functions and
to draw graphs using the functions.
DYNAmic graph Use this mode to store graph functions and
to draw multiple versions of a graph by
changing the values assigned to the
variables in a function.
* The above shows the CFX-9850
GB PLUS screen.
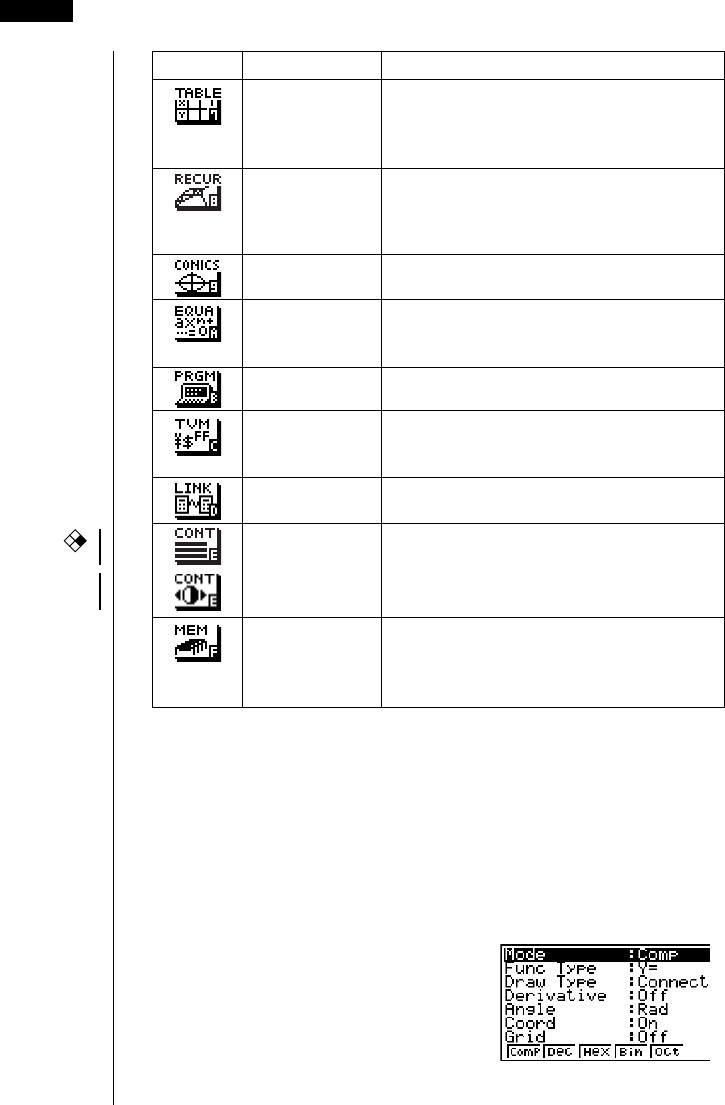
4
TABLE Use this mode to store functions, to
generate a numeric table of different
solutions as the values assigned to variables
in a function change, and to draw graphs.
RECURsion Use this mode to store recursion formulas,
to generate a numeric table of different
solutions as the values assigned to variables
in a function change, and to draw graphs.
CONICS Use this mode to draw graphs of conic
sections.
EQUAtion Use this mode to solve linear equations with
two through six unknowns, quadratic
equations, and cubic equations.
PRoGraM Use this mode to store programs in the
program area and to run programs.
Time Value of Use this mode to perform financial calcula-
Money tions and to draw cash flow and other types
of graphs.
LINK Use this mode to transfer memory contents
or back-up data to another unit.
CONTrast Use this mode to adjust the contrast of the
display.
MEMory Use this mode to check how much memory
is used and remaining, to delete data from
memory, and to initialize (reset) the
calculator.
Icon Mode Name Description
2Selecting Icons and Entering Modes
kUsing the Set Up Screen
The mode's set up screen shows the current status of mode settings and lets you
make any changes you want. The following procedure shows how to change a set
up.
uTo change a mode set up
1. Select the icon you want and press w to enter a mode and display its initial
screen. Here we will enter the RUN Mode.
2. Press !Z to display the mode’s set up
screen.
•This set up screen is just one possible
example. Actual set up screen contents will
differ according to the mode you are in and
that mode’s current settings. 12345
6
·
·
·
CFX
fx-9750G
PLUS
5
Selecting Icons and Entering Modes 2
3. Use the f and c cursor keys to move the highlighting to the item whose
setting you want to change.
4. Press the function key (1 to 6) that is marked with the setting you want to
make.
5. After you are finished making any changes you want, press J to return to
the initial screen of the mode.
kSet Up Screen Function Key Menus
This section details the settings you can make using the function keys in the set
up display.
uMode (calculation /binary, octal, decimal, hexadecimal mode)
•{Comp} ... {arithmetic calculation mode}
•{Dec}/{Hex}/{Bin}/{Oct} ... {decimal}/{hexadecimal}/{binary}/{octal}
uFunc Type (graph function type)
•{Y=}/{r=}/{Parm}/{X=c} ... {rectangular coordinate}/{polar coordinate}/
{parametric coordinate}/{X = constant} graph
•{Y>}/{Y<}/{Y }/{Y } ... {y>f(x)}/{y<f(x)}/{y≥f(x)}/{y≤f(x)} inequality graph
•The v key inputs one of three different variable names. Which variable
name it inputs is determined by the {Func Type} setting you make.
uDraw Type (graph drawing method)
•{Con}/{Plot} ... {connected points}/{unconnected points}
uDerivative (derivative value display)
•{On}/{Off} ... {display on}/{display off} while Graph-to-Table, Table & Graph,
andTrace are being used
uAngle (default unit of angular measurement)
•{Deg}/{Rad}/{Gra} ... {degrees}/{radians}/{grads}
P. 7 5
P. 123
P. 125
P. 126
P. 128
P. 129
P. 177
P. 209
P. 1 4
12345
~

6
uCoord (graph pointer coordinate display)
•{On}/{Off} ... {display on}/{display off}
uGrid (graph gridline display)
•{On}/{Off} ... {display on}/{display off}
uAxes (graph axis display)
•{On}/{Off} ... {display on}/{display off}
uLabel (graph axis label display)
•{On}/{Off} ... {display on}/{display off}
uDisplay (display format)
•{Fix}/{Sci}/{Norm}/{Eng} ... {fixed number of decimal places specification}/
{number of significant digits specification}/{exponential format display
range toggle}/{Engineering Mode}
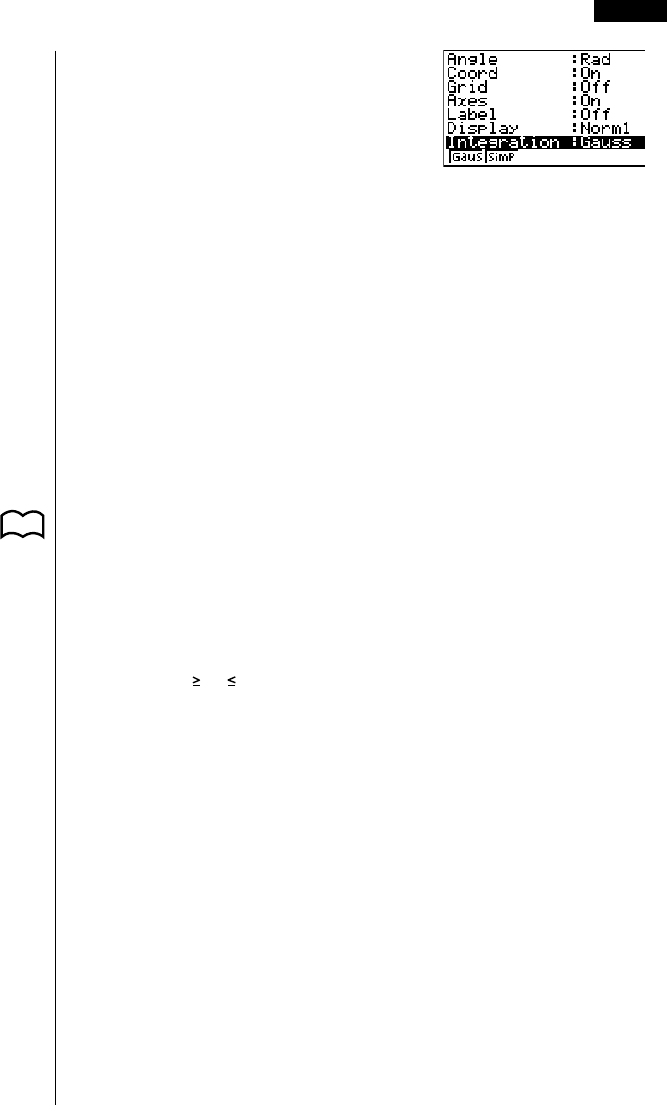
uIntegration (Integration calculation)
•{Gaus}/{Simp} ... integration calculation using {Gauss-Kronrod rule}/
{Simpson’s rule}.
uStat Wind (statistical graph view window setting method)
•{Auto}/{Man} ... {automatic}/{manual}
uGraph Func (function display during graph drawing and trace)
•{On}/{Off} ... {display on}/{display off}
uBackground (graph display background)
•{None}/{PICT} ... {no background}/{graph background picture specification}
uPlot/Line (plot and line graph color setting)
• {Blue}/{Orng}/{Grn} ... {blue}/{orange}/{green}
uResid List (residual calculation)
•{None}/{LIST} ... {no calculation}/{list specification for the calculated residual
data}
P. 1 4
P. 1 5
2Selecting Icons and Entering Modes
P. 121
P. 121
P. 121
P. 130
P. 6 0
P. 251
P. 187
P. 140
P. 267
CFX
7
uList File (list file specification)
•{File 1} to {File 6} ... {specification of which list file to display while using the
List function}
uDual Screen (Dual Screen Mode status)
The Dual Screen Mode settings you can make depends on whether you pressed
!Z while in the GRAPH Mode, TABLE Mode, or RECUR Mode.
GRAPH Mode
•{Grph}/{GtoT}/{Off} ... {graphing on both sides of Dual Screen}/{graph on one
side and numeric table on the other side of Dual Screen}/{Dual Screen off}
TABLE/RECUR Mode
•{T+G}/{Off} ... {graph on one side and numeric table on the other side of Dual
Screen}/{Dual Screen off}
uSimul Graph (simultaneous graphing mode)
•{On}/{Off} ... {simultaneous graphing on (all graphs drawn simultaneously)}/
{simultaneous graphing off (graphs drawn in area numeric sequence)}
uDynamic Type (Dynamic Graph type)
•{Cnt}/{Stop} ... {non-stop (continuous)}/{automatic stop after 10 draws}
uLocus (Dynamic Graph Locus Mode)
•{On}/{Off} ... {locus identified by color}/{locus not drawn}
uVariable (Table Generation and Graph Draw settings)
•{Rang}/{LIST} ... {use table range}/{use list data}
uΣ Display (Σ value display in recursion table)
•{On}/{Off} ... {display on}/{display off}
uSlope (display of derivative at current pointer location in conic
section graph)
•{On}/{Off} ... {display on}/{display off}
uPayment (payment period setting)
•{BGN}/{END} ... {beginning}/{end} setting of payment period
uDate Mode (number of days per year setting)
•{365}/{360} ... interest calculations using {365}/{360} days per year
*The 365-day year must be used for date calculations in the Financial Mode.
Otherwise, an error occurs.
Selecting Icons and Entering Modes 2
P. 248
P. 215
P. 186
P. 187
P. 208
P. 224
P. 331
P. 324
P. 168
P. 176
CFX
P. 188
P. 132
8
2Selecting Icons and Entering Modes
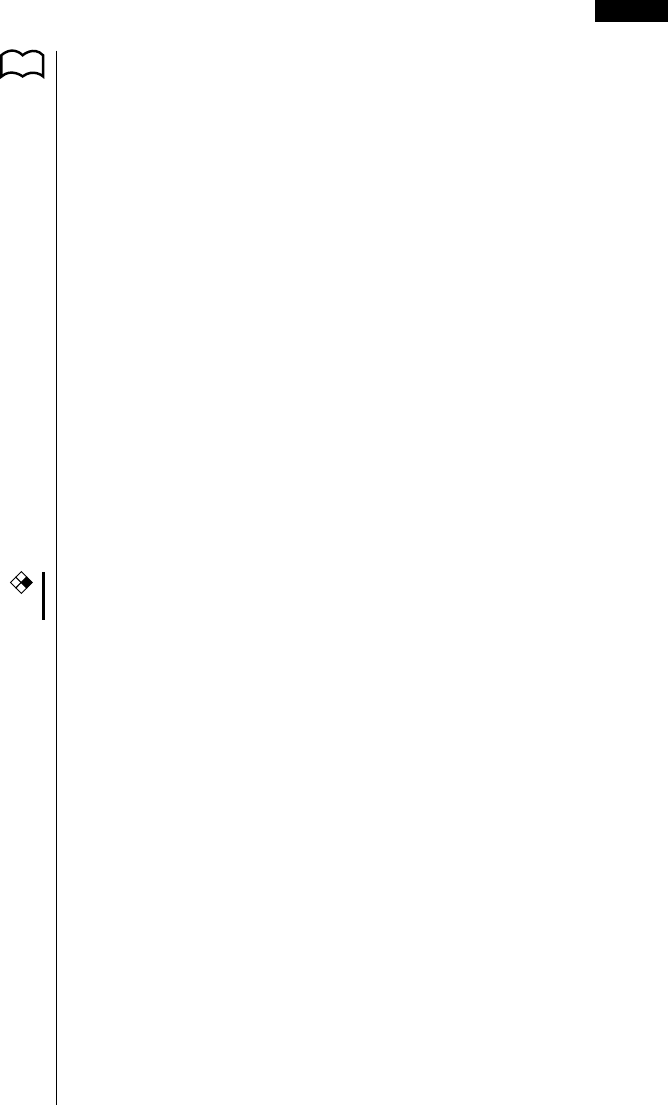
3. Display
kAbout the Display Screen
This calculator uses two types of display: a text display and a graphic display. The
text display can show 21 columns and eight lines of characters, with the bottom
line used for the function key menu, while the graph display uses an area that
measures 127 (W) × 63 (H) dots.
Text Display Graph Display
kAbout Display Colors [OPTN]-[COLR]
The calculator can display data in three colors: orange, blue, and green. The
default color for graphs and comment text is blue, but you can specify orange or
green if you want.
•{Orng}/{Grn} ... {orange}/{green}
•The above setting affects the color of graphs and comment text. Specify the
color you want to use before inputting the graph’s function or the program
comment text.
kAbout Menu Item Types
This calculator uses certain conventions to indicate the type of result you can ex-
pect when you press a function key.
• Next Menu
Example:
Selecting displays a menu of hyperbolic functions.
• Command Input
Example:
Selecting inputs the sinh command.
CFX
9
• Direct Command Execution
Example:
Selecting executes the DRAW command.
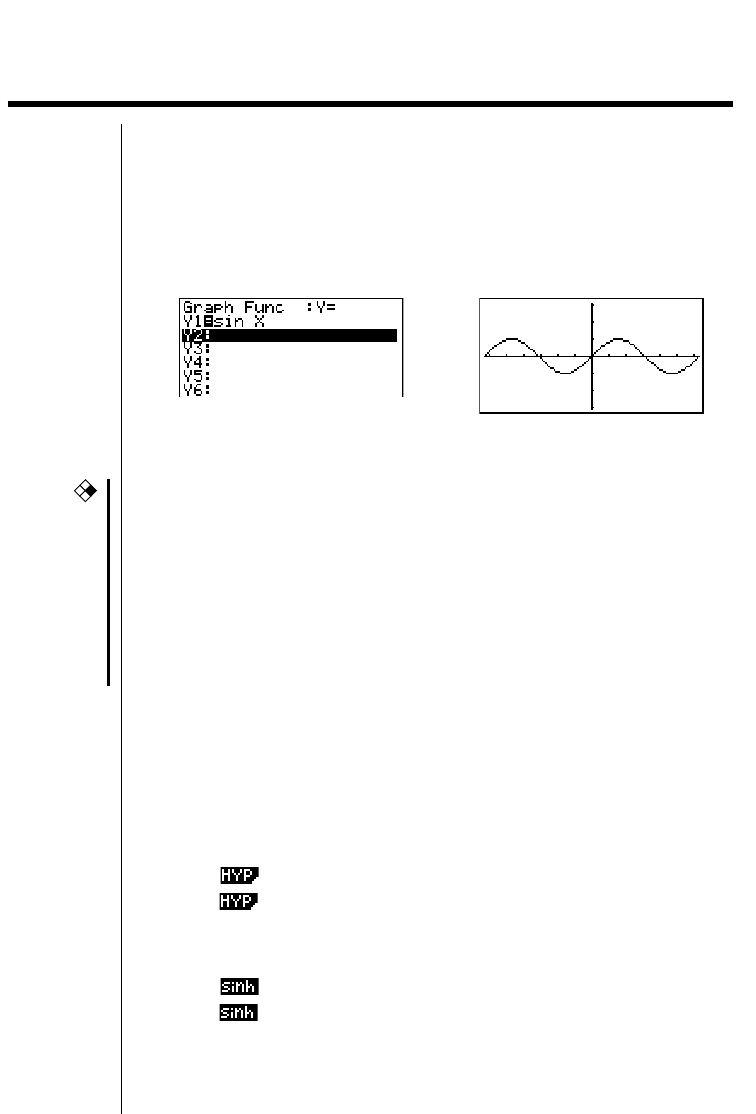
kExponential Display
The calculator normally displays values up to 10 digits long. Values that exceed
this limit are automatically converted to and displayed in exponential format. You
can specify one of two different ranges for automatic changeover to exponential
display.
Norm 1 ........... 10–2 (0.01) > |x|, |x| > 1010
Norm 2 ........... 10–9 (0.000000001) > |x|, |x| > 1010
uTo change the exponential display range
1. Press !Z to display the set up screen.
2. Use f and c to move the highlighting to “Display”.
3. Press 3 (Norm).
The exponential display range switches between Norm 1 and Norm 2 each time
you perform the above operation. There is no display indicator to show you which
exponential display range is currently in effect, but you can always check it by
seeing what results the following calculation produces.
Ab/caaw (Norm 1)
(Norm 2)
All of the examples in this manual show calculation results using Norm 1.
uHow to interpret exponential format
1.2E+12 indicates that the result is equivalent to 1.2 × 10¹². This means that you
should move the decimal point in 1.2 twelve places to the right, because the
exponent is positive. This results in the value 1,200,000,000,000.
1.2E–03 indicates that the result is equivalent to 1.2 × 10⁻³. This means that you
should move the decimal point in 1.2 three places to the left, because the
exponent is negative. This results in the value 0.0012.
Display 3
10
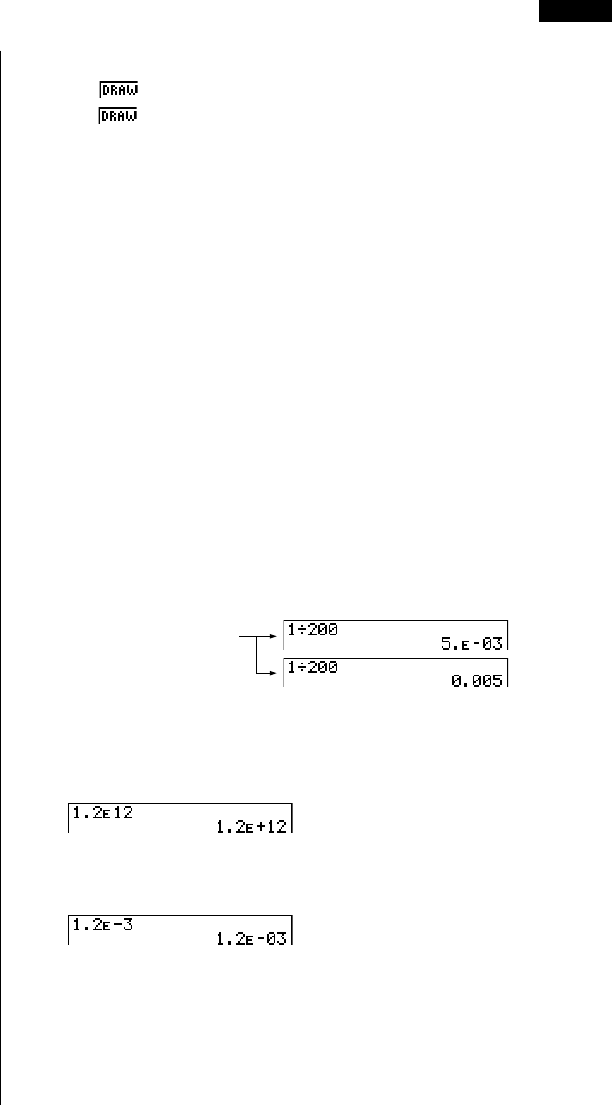
kSpecial Display Formats
This calculator uses special display formats to indicate fractions, hexadecimal
values, and sexagesimal values.
uFractions
..... Indicates: 456
uHexadecimal Values
..... Indicates: ABCDEF12(16), which
equals –1412567278(10)
uSexagesimal Values
..... Indicates: 12° 34’ 56.78"
•In addition to the above, this calculator also uses other indicators or symbols,
which are described in each applicable section of this manual as they come up.
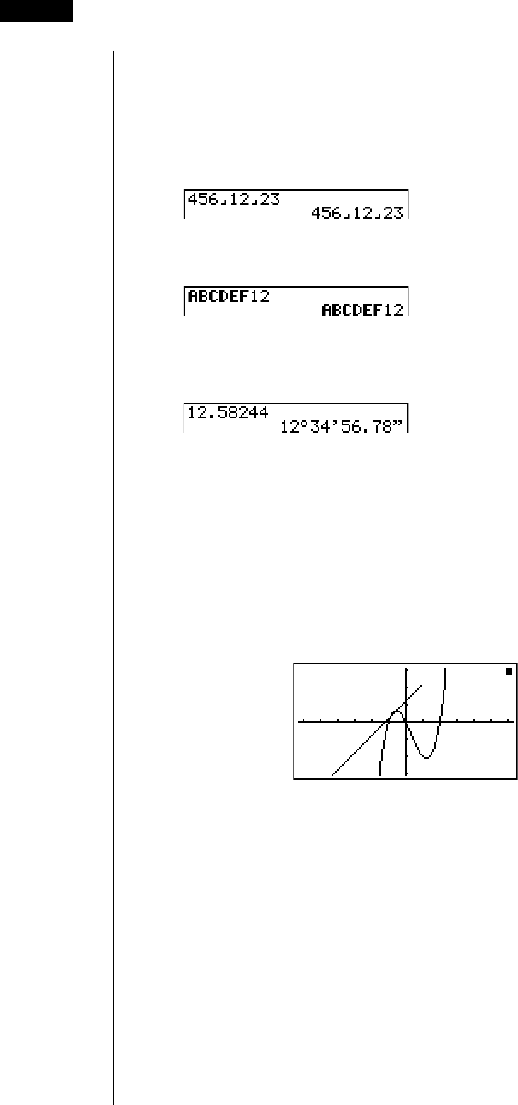
kCalculation Execution Indicator
Whenever the calculator is busy drawing a graph or executing a long, complex
calculation or program, a black box (k) flashes in the upper right corner of the
display. This black box tells you that the calculator is performing an internal
operation.
3Display
12
––––
23
11
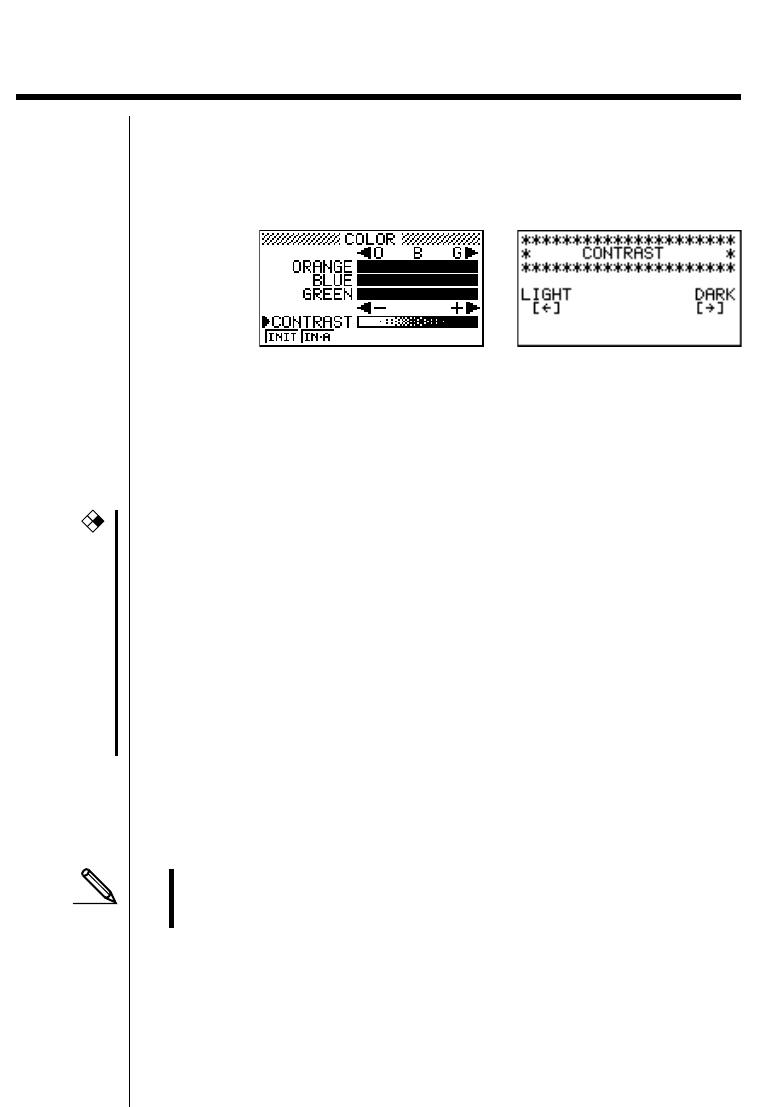
4. Contrast Adjustment
Adjust the contrast whenever objects on the display appear dim or difficult to see.
uTo display the contrast adjustment screen
Highlight the CONT icon in the Main Menu and then press w.
uTo adjust the contrast
Press the e cursor key to make the display darker and the d cursor key to
make it lighter. Holding down either key changes the setting at high speed.
uTo adjust the color tint
It is recommended that you always adjust the CONTRAST setting first.
1. Use the cursor f and c keys to move the pointer so it is next to the color
(ORANGE, BLUE, GREEN) whose tint you want to adjust.
2. Press the e cursor key to give the color a greener tint and the d cursor key
to give it an orange tint. Holding down either key changes the setting at high
speed.
uTo initialize color tint settings
•{INIT}/{IN·A} ... {initialize highlighted color}/{initialize all colors}
uTo exit the contrast adjustment screen
Press m to return to the Main Menu.
•You can change the CONTRAST setting at any time without displaying the
contrast adjustment screen. Simply press ! and then d or e to change
the setting. Press ! once again after the setting is the way you want.
fx-9750G PLUSCFX-9850(9950)GB PLUS,
CFX-9850G PLUS
CFX
12
5. When you keep having problems…
If you keep having problems when you are trying to perform operations, try the
following before assuming that there is something wrong with the calculator.
kGet the Calculator Back to its Original Mode Settings
1. In the Main Menu, select the RUN icon and press w.
2. Press ! Z to display the set up screen.
3. Highlight “Angle” and press 2 (Rad).
4. Highlight “Display” and press 3 (Norm) to select the exponential display
range (Norm 1 or Norm 2) that you want to use.
5. Now enter the correct mode and perform your calculation again, monitoring the
results on the display.
kIn Case of Hang Up
•Should the unit hang up and stop responding to input from the keyboard,
press the P button on the back of the calculator to reset the memory. Note,
however, that this clears all the data in calculator memory.
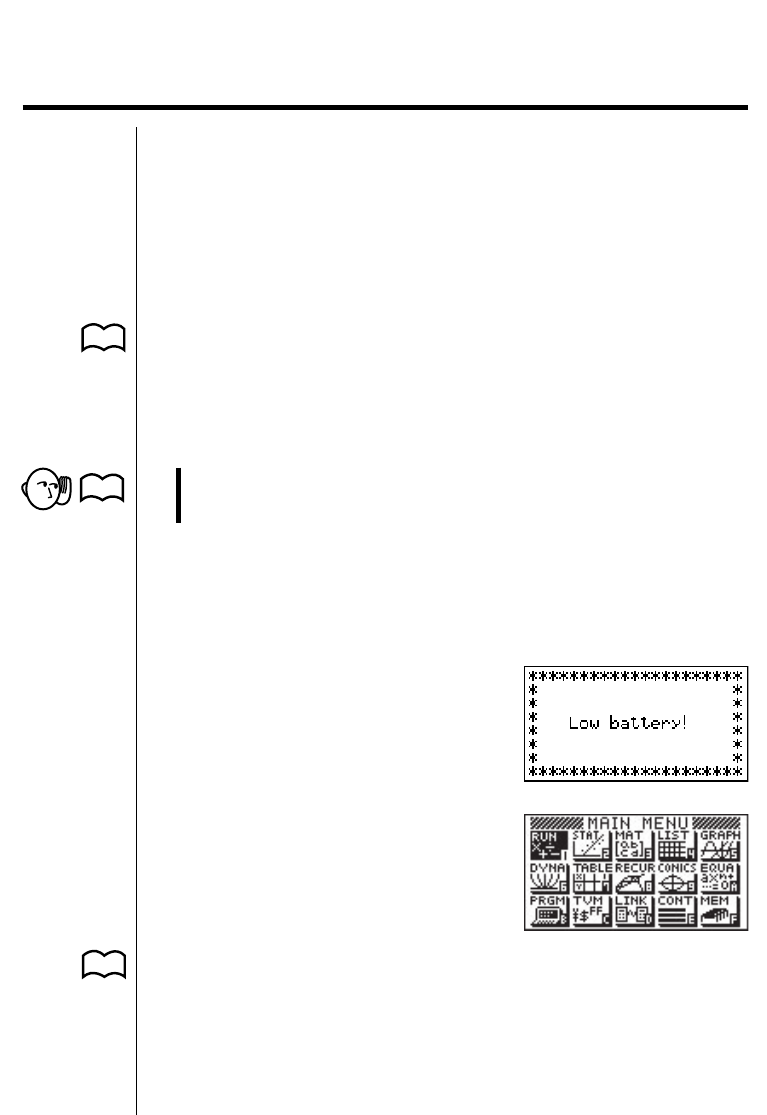
kLow Battery Message
The low battery message appears whenever you press o to turn power on or
m to display the Main Menu while the main battery power is below a certain
level.
o or m
↓
About 3 seconds later
If you continue using the calculator without replacing batteries, power will auto-
matically turn off to protect memory contents. Once this happens, you will not be
able to turn power back on, and there is the danger that memory contents will be
corrupted or lost entirely.
•You will not be able to perform data communications operations once the low
battery message appears.
P. 3
P. 431
P. 433
* The above shows the CFX-9850
GB PLUS screen.
