Cisco Systems 2305-BTS2-R1 Base Station Transmitter User Manual Part 4 98 119 Custom
Cisco Systems, Inc Base Station Transmitter Part 4 98 119 Custom
UserManual.wiki
>
Cisco Systems
>
2305-BTS2-R1 User Manual
>
Manual part 7
Contents
1.
Manual part 1
2.
Manual part 2
3.
Manual part 3
4.
Manual part 4
5.
Manual part 5
6.
Manual part 6
7.
Manual part 7
8.
Manual part 9
Manual part 7
Navigation menu
Upload a User Manual
Namespaces
Wiki Guide
HTML
PDF
Info
Views
User Manual
Discussion / Help
Navigation
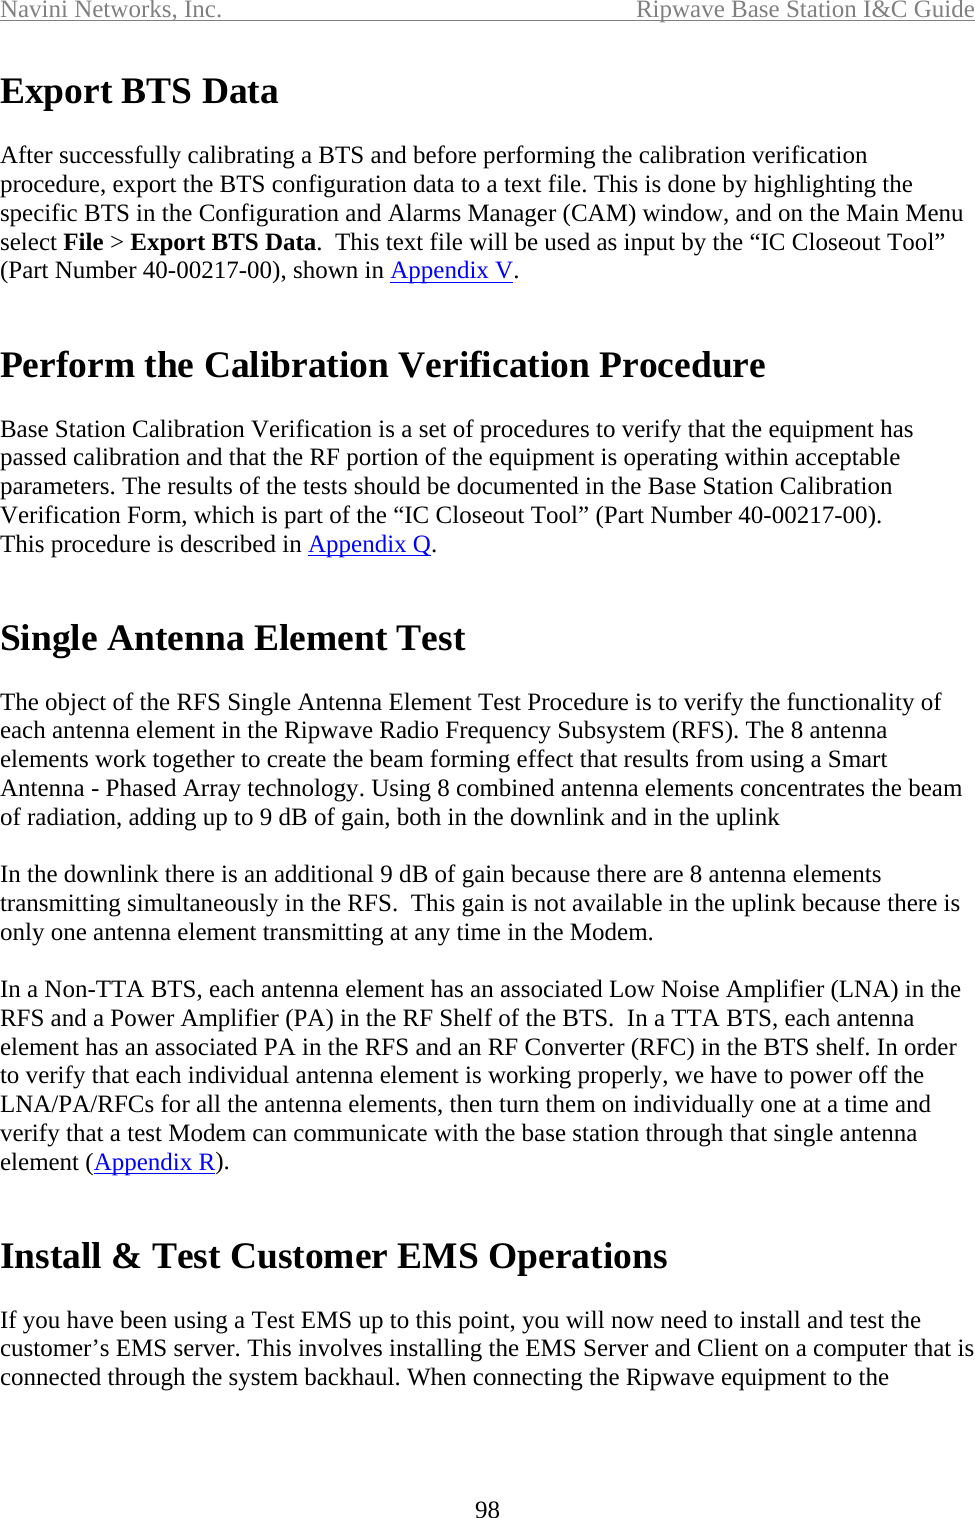
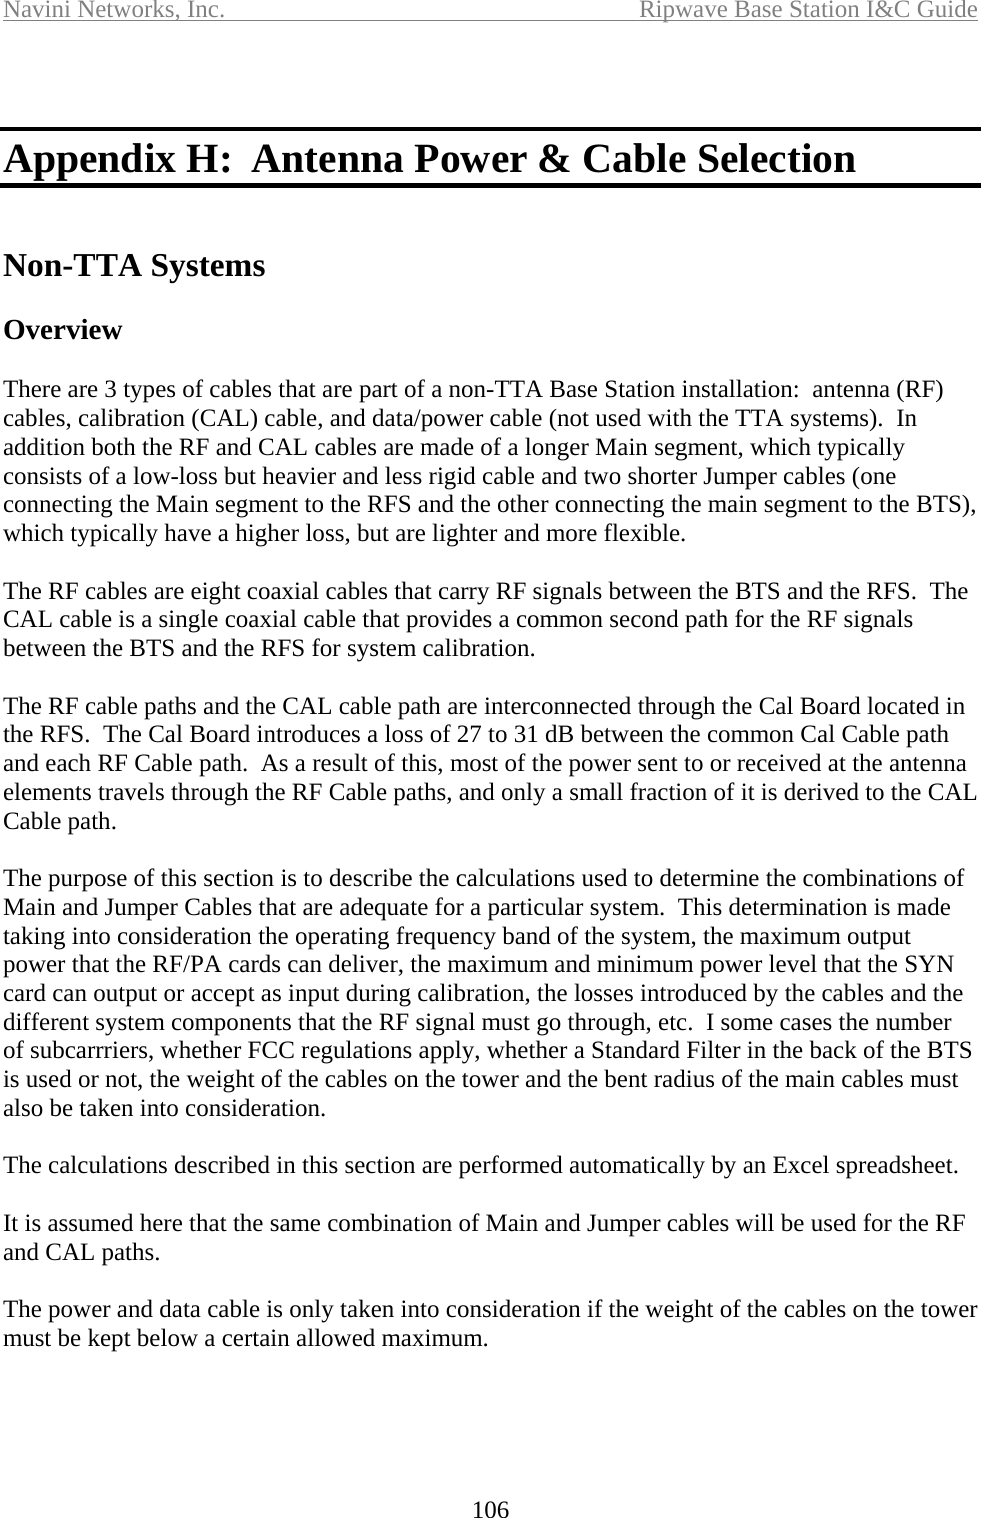
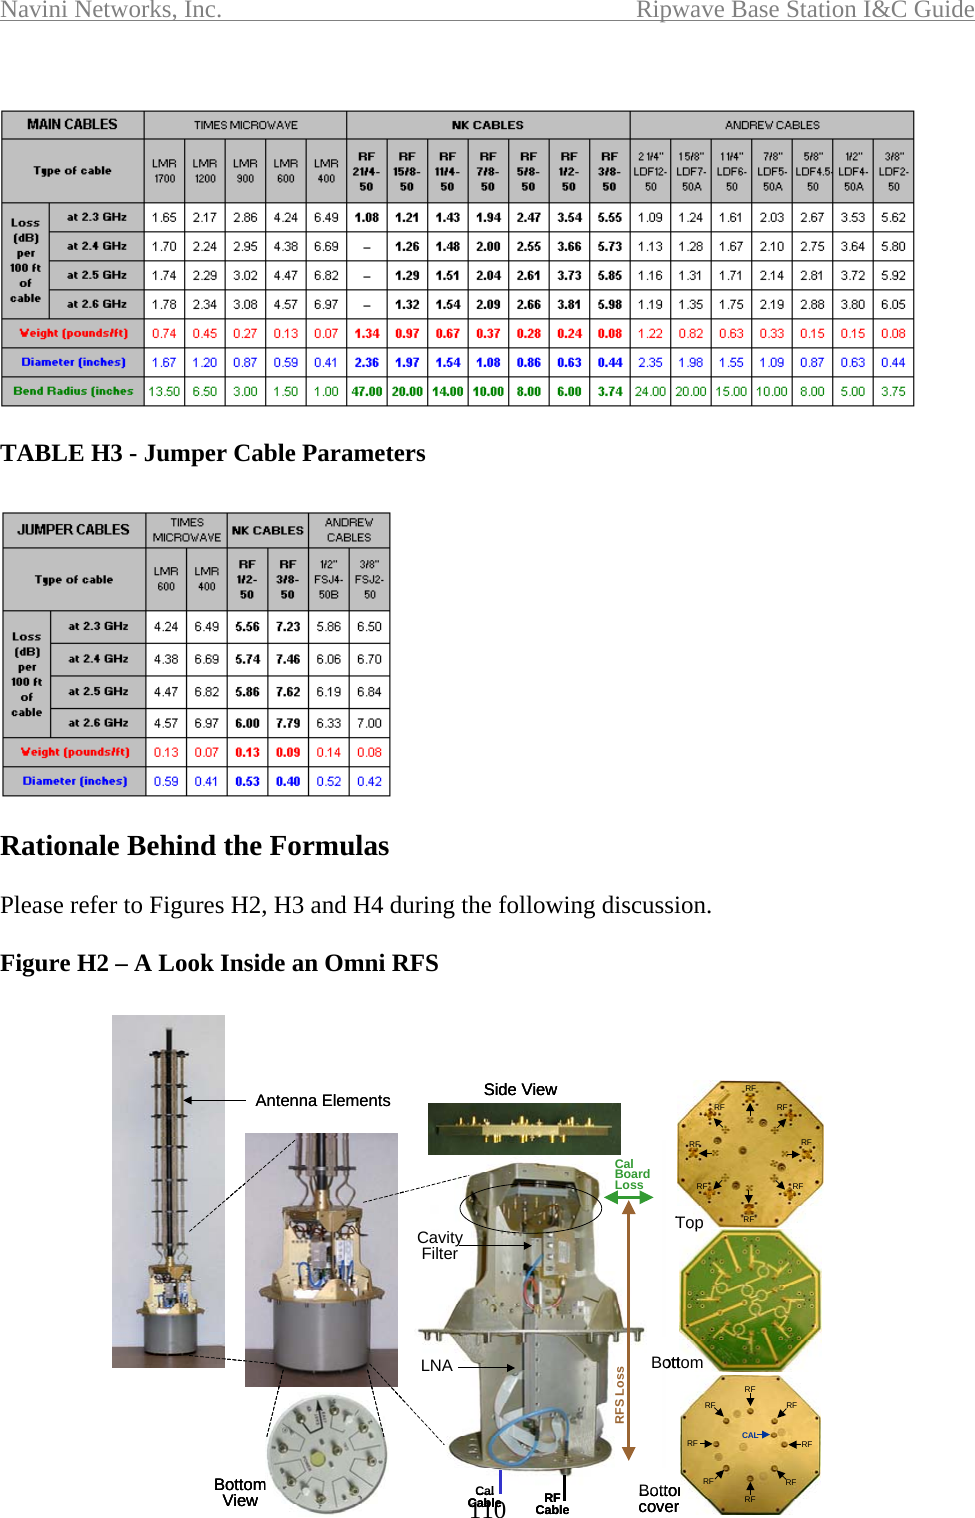
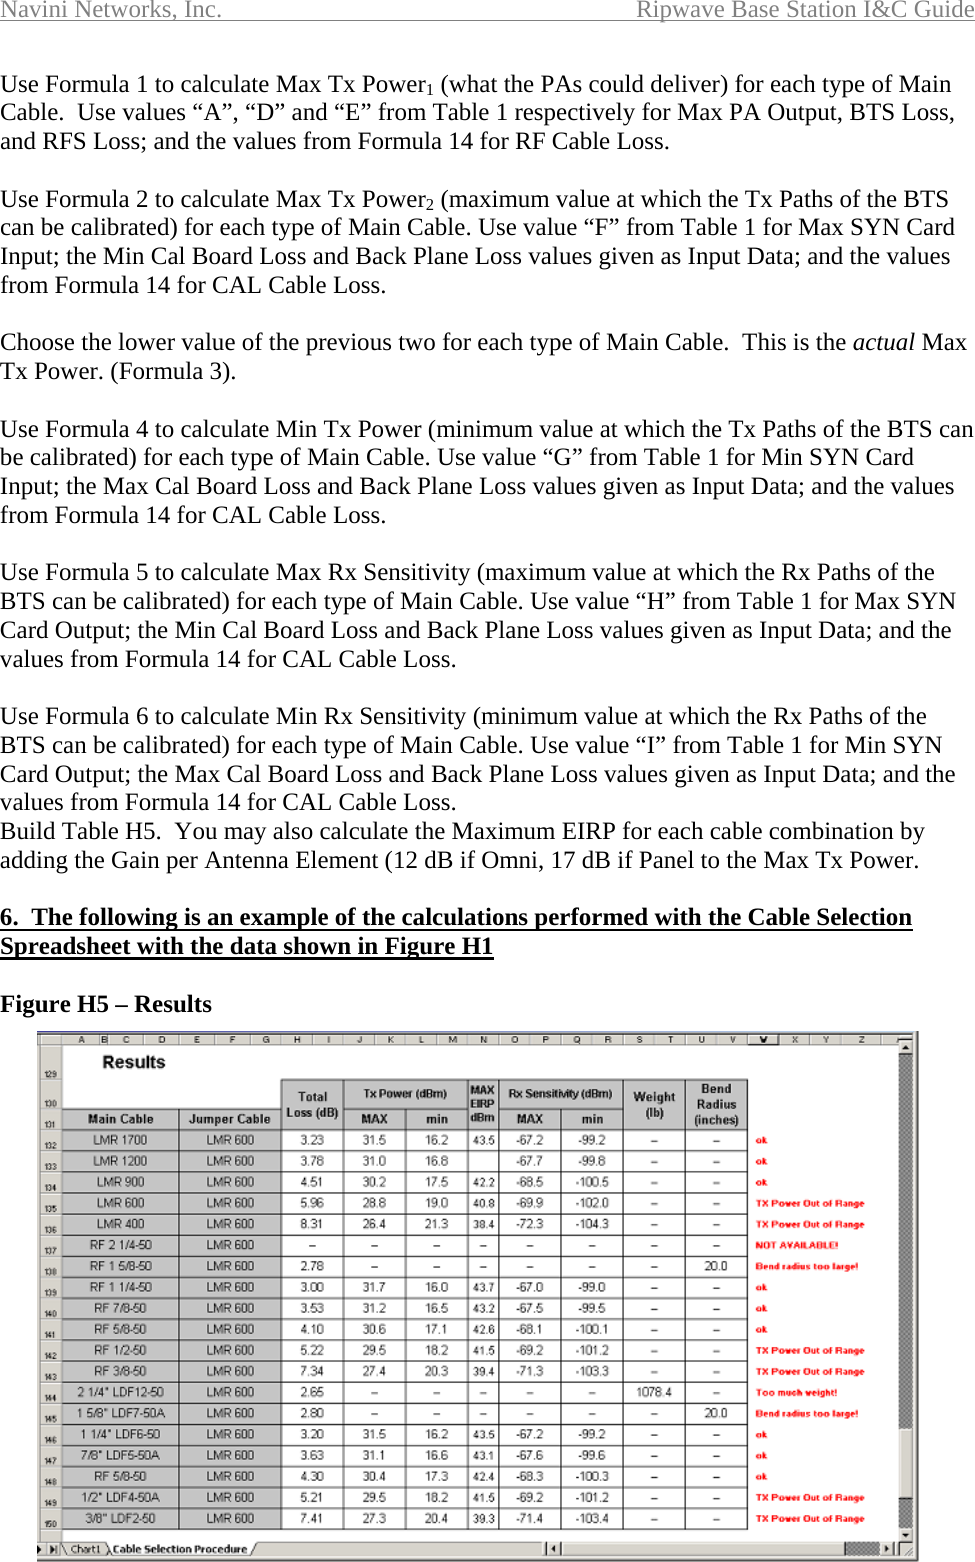
![Navini Networks, Inc. Ripwave Base Station I&C Guide 112 There are upper and lower limits to the TX Power and RX Sensitivity to which a BTS can be set. One of the two conditions that determine the Maximum amount of power that can be delivered at the antenna elements (Max TX Power1) is how much power can be output by the each one of the PAs. The losses in the RF paths are: (1) the BTS Loss introduced by the Standard Filter, if used, or by the Bypass Cable, if no filter is used; (2) The loss on the RF Cable (Main + Higher and Lower Jumper cables + 6 terminators and lightening arrestors, estimated as 0.6 dB); and (3) the loss at the base of the RFS, between the N-type connectors where the RF & Cal cables are connected and the SMA connectors at the bottom of the Cal Board. Max Tx Power1 = Max PA Output – BTS Loss [Formula 1] – RF Cable Loss – RFS Loss The other condition is related to the Calibration process. During the calibration of the TX paths (one at a time), a fraction of the power delivered by the a PA to the corresponding antenna element is derived through the Cal Board to the common CAL cable and through the BTS back plane until it arrives at the SYN card. The Calibration process requires that the Input Power received by the SYN card be in a certain range. Lets find a formula for the Max TX Power2 (power at the antenna elements) that would allow the system to be calibrated. Above this level the input power received by the SYN card would be over the maximum allowed. Therefore, Max SYN Card Input = Max Tx Power2 – Min Cal Board Loss – CAL Cable Loss – Back Plane Loss or Max Tx Power2 = Max SYN Card Input + Min Cal Board Loss [Formula 2] + CAL Cable Loss + Back Plane Loss As both conditions must be satisfied, we take the most restrictive one, that is, the one that produces the lower value: Max Tx Power = Min { Max Tx Power1 , Max Tx Power2 } [Formula 3] Substituting the Min SYN Card Input for the Max SYN Card Input and the Min Cal Board Loss for the Max Cal Board Loss in Formula 4 we get the formula for the Min TX Power (at the antenna elements) that allows the system to be calibrated. Below this level the input power received by the SYN card would be less than the minimum required.](https://usermanual.wiki/Cisco-Systems/2305-BTS2-R1.Manual-part-7/User-Guide-588304-Page-15.png)
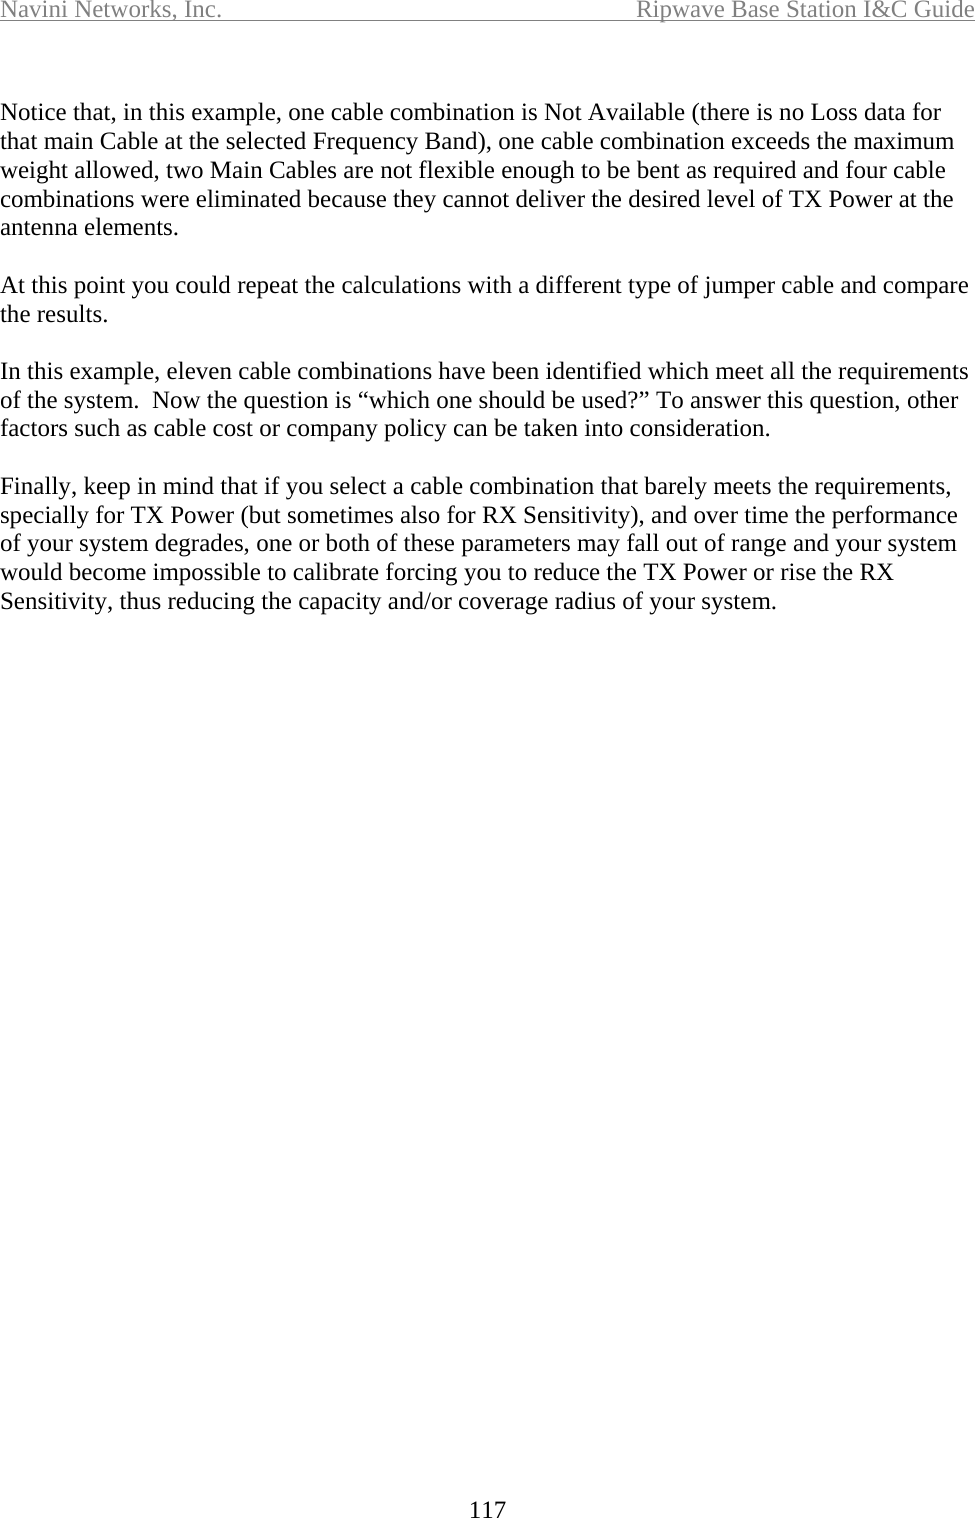
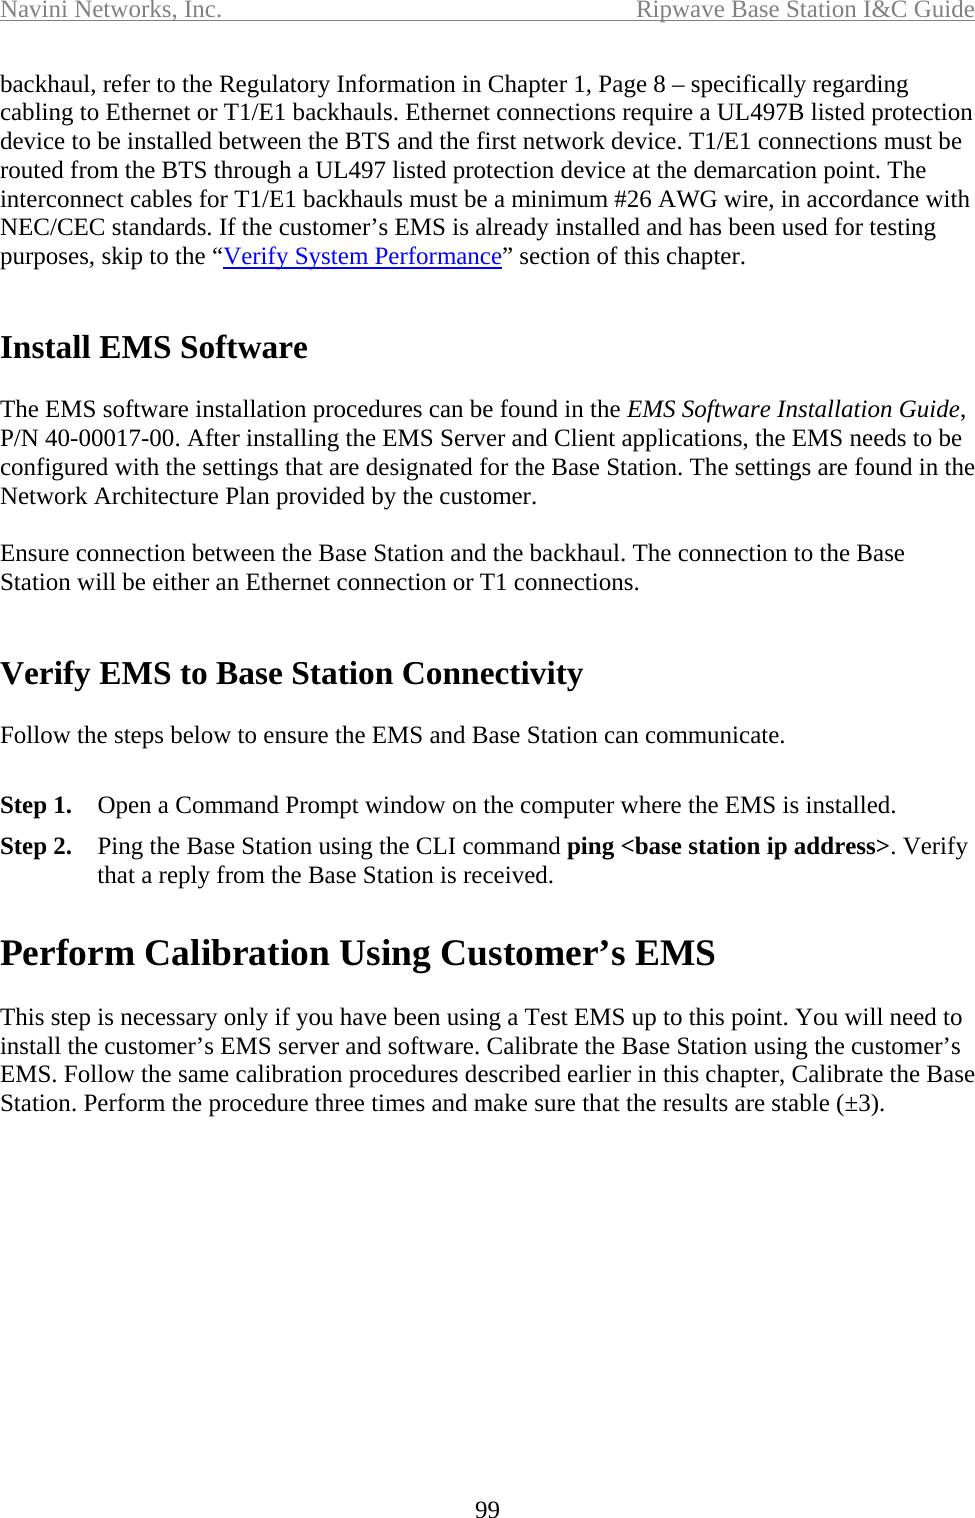
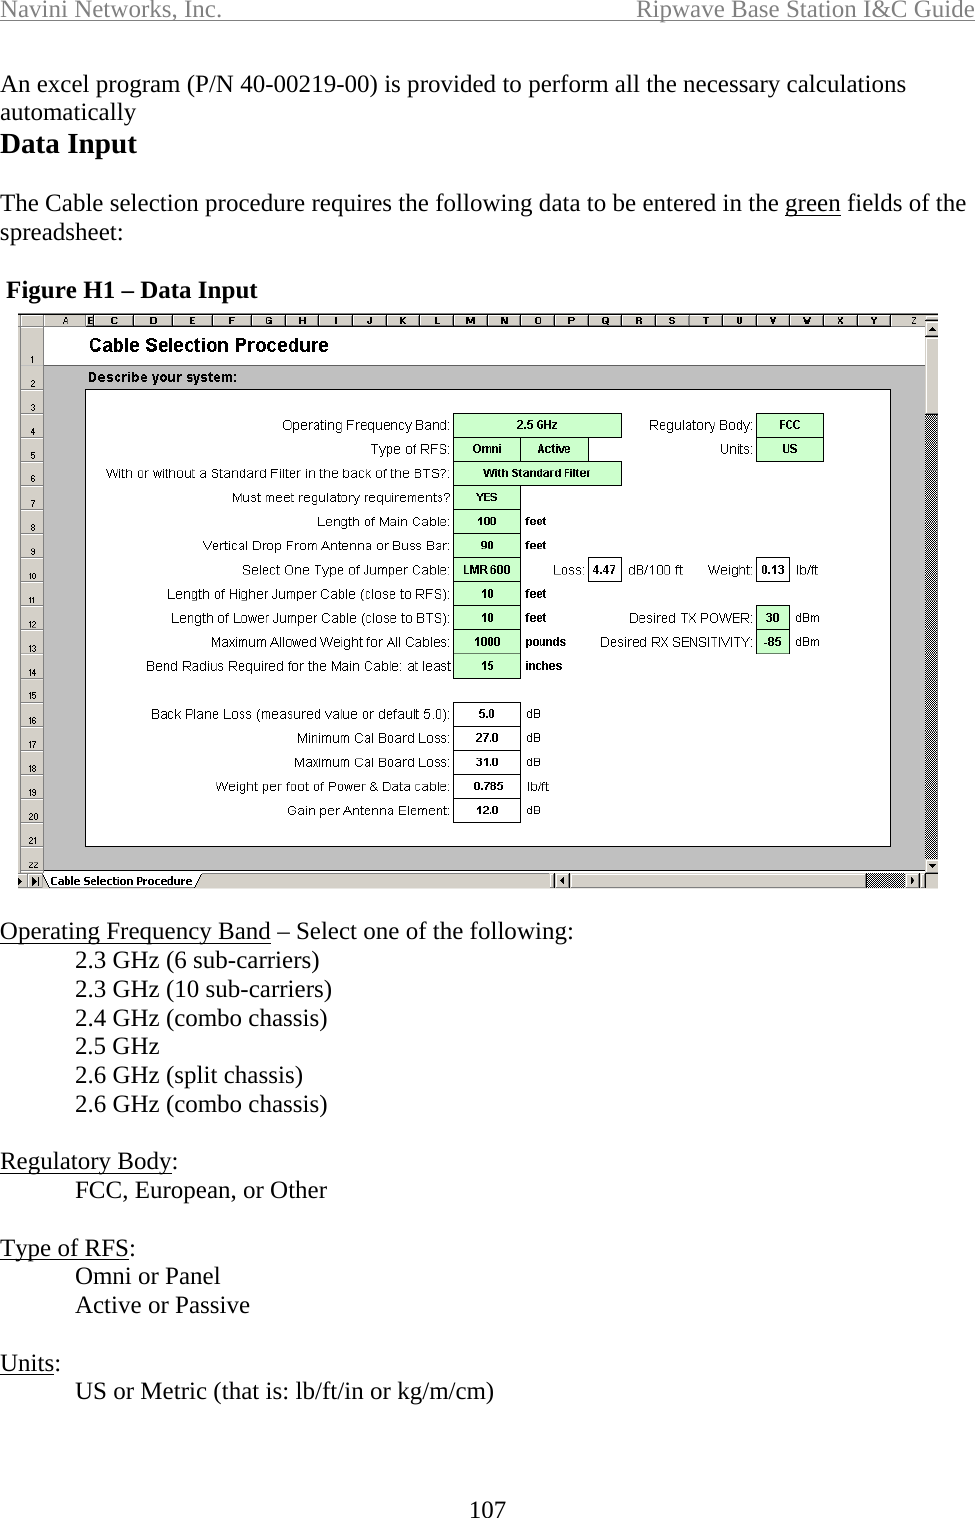
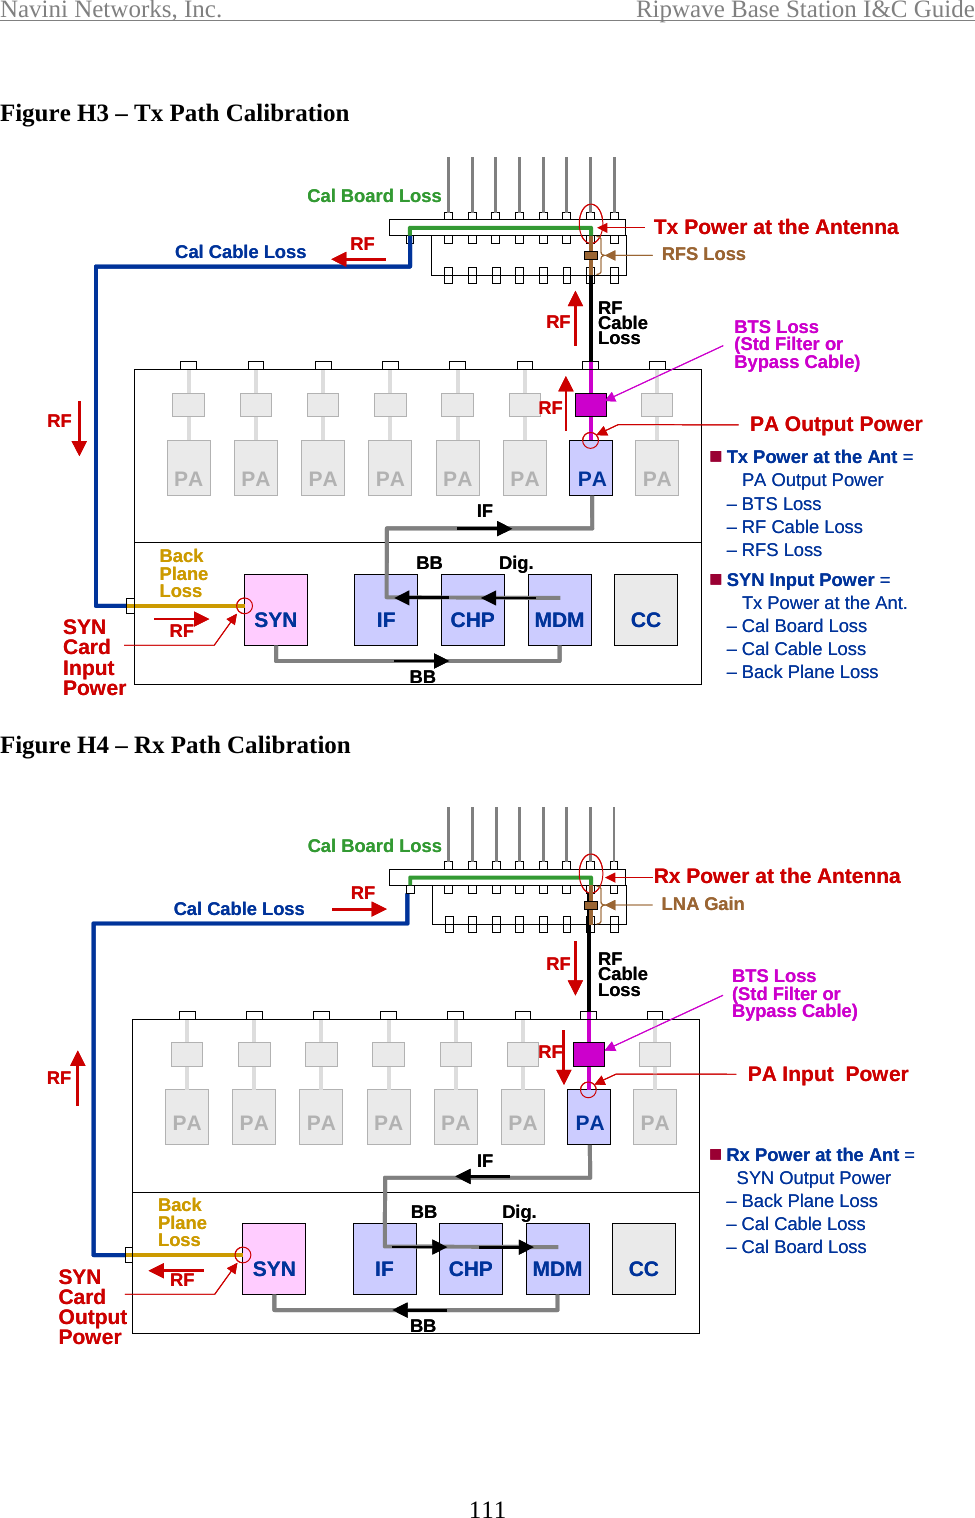
![Navini Networks, Inc. Ripwave Base Station I&C Guide 113 Min Tx Power= Min SYN Card Input + Max Cal Board Loss [Formula 4] + CAL Cable Loss + Back Plane Loss Let’s now determine the maximum and minimum RX Sensitivity at which the BTS can be calibrated. During the RX Paths calibration, the SYN card generates an RF signal that must travel to (and suffer losses at) the BTS Back Plane, the CAL Cable, and the Calibration Board before it arrives at the base of the antenna elements. The maximum and minimum level of power that can be delivered at the antenna elements during this simulated reception (that is, the possible range for the RX Sensitivity) are determined, respectively, by the maximum and minimum level of the signal output by the SYN card. Setting the RX Sensitivity outside this range will make the system impossible to calibrate. Max Rx Sensitivity = Max SYN Card Output + Min Cal Board Loss [Formula 5] + CAL Cable Loss + Back Plane Loss Min Rx Sensitivity = Min SYN Card Output + Max Cal Board Loss [Formula 6] + CAL Cable Loss + Back Plane Loss Notice that when determining maximum power levels (formulas 3 and 5) we assume the Cal Board path that introduces the minimum possible loss (27 dB), while when determining minimum power levels (formulas 4 and 6) we assume the Cal Board path that introduces the maximum possible loss (31 dB). The Procedure 1. Eliminate the Main Cables with Bend Radius exceeding the minimum required Compare the Bend Radius for each type of Main Cable (last row in Table I2) with the Minimum Required Bend Radius given as input data. Eliminate from further consideration the Main Cables that have a Bend Radius exceeding the minimum required. 2. Eliminate combinations of cables that weight too much Calculate the weight of the Higher Jumper cable for the selected type of Jumper Cable Weight of Higher Jumper Cable= [Formula 7] Length of the Higher Jumper Cable × Weight of one foot of the Selected type of Jumper Cable](https://usermanual.wiki/Cisco-Systems/2305-BTS2-R1.Manual-part-7/User-Guide-588304-Page-16.png)
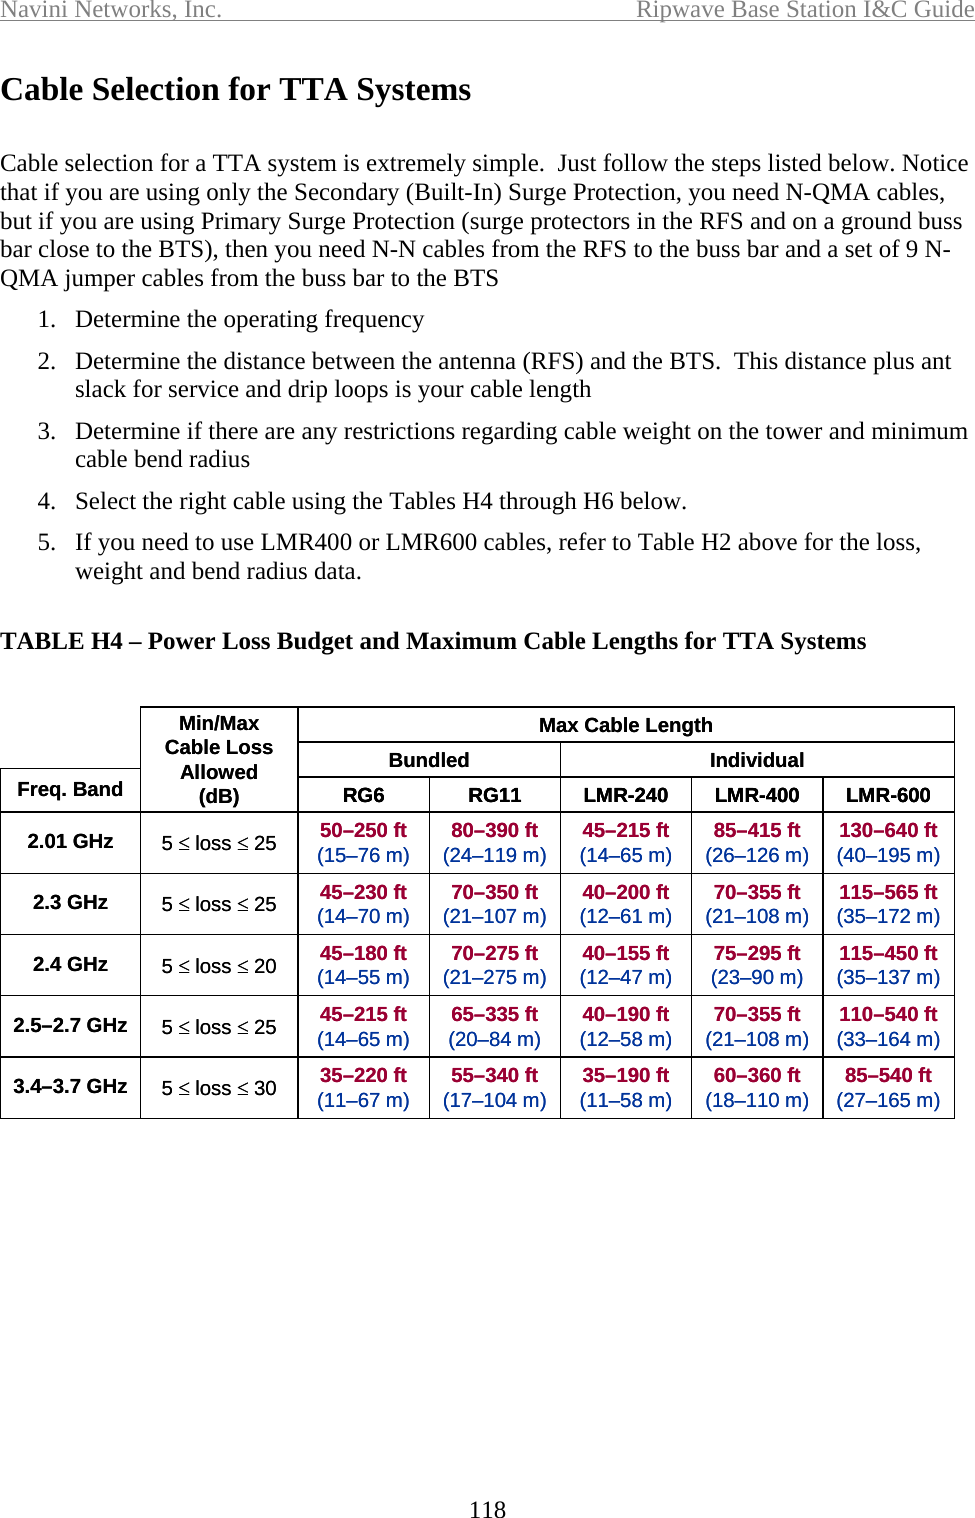
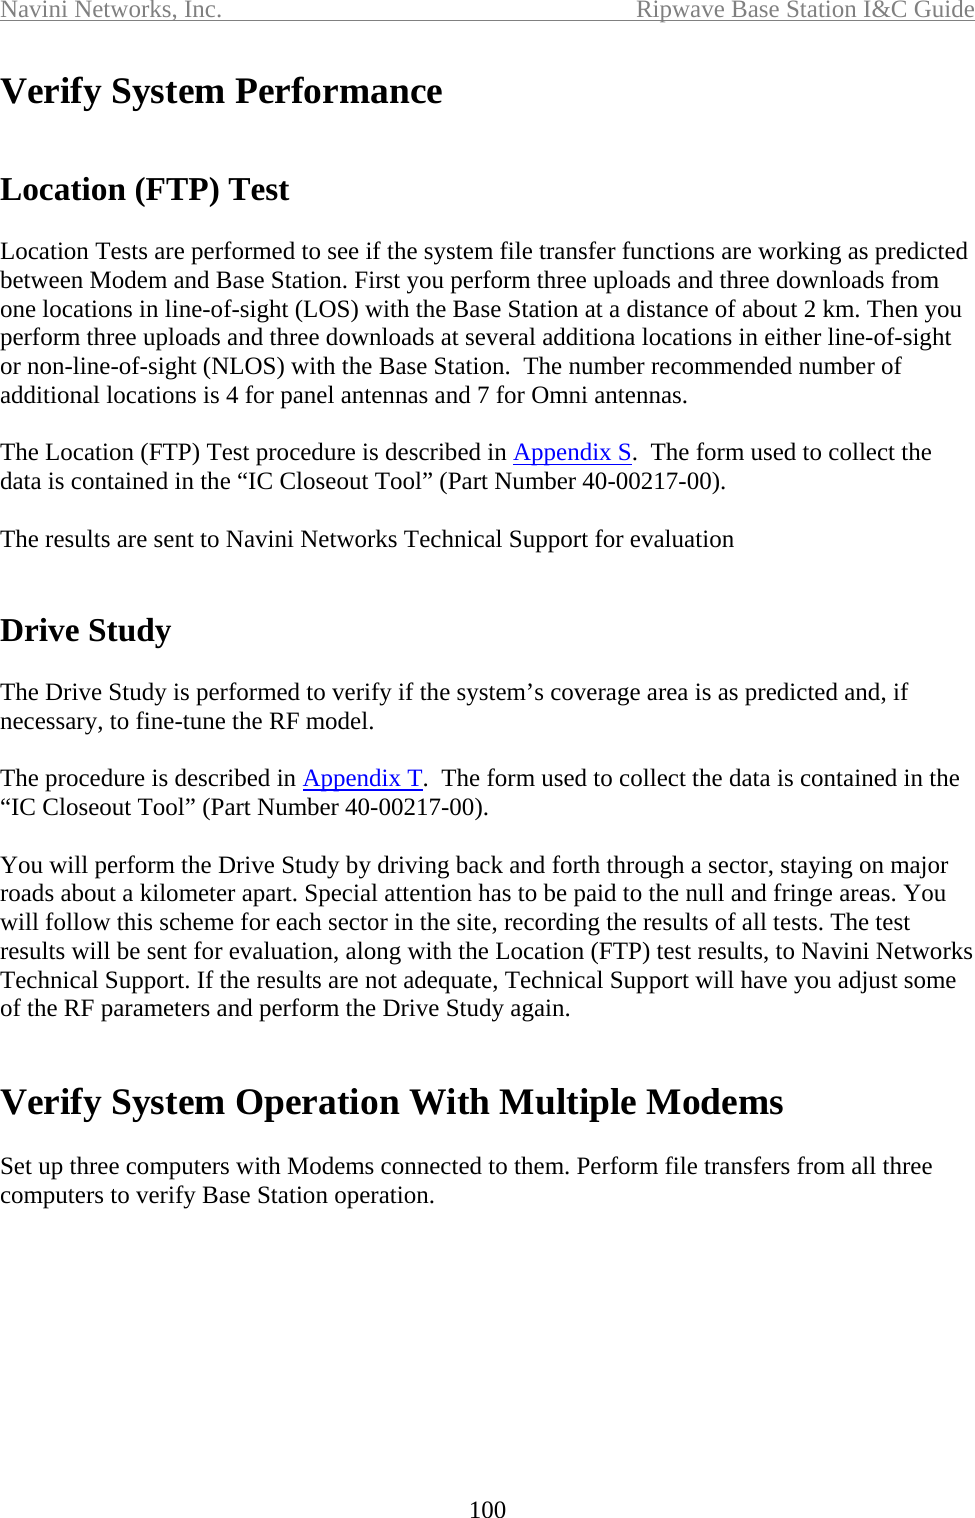
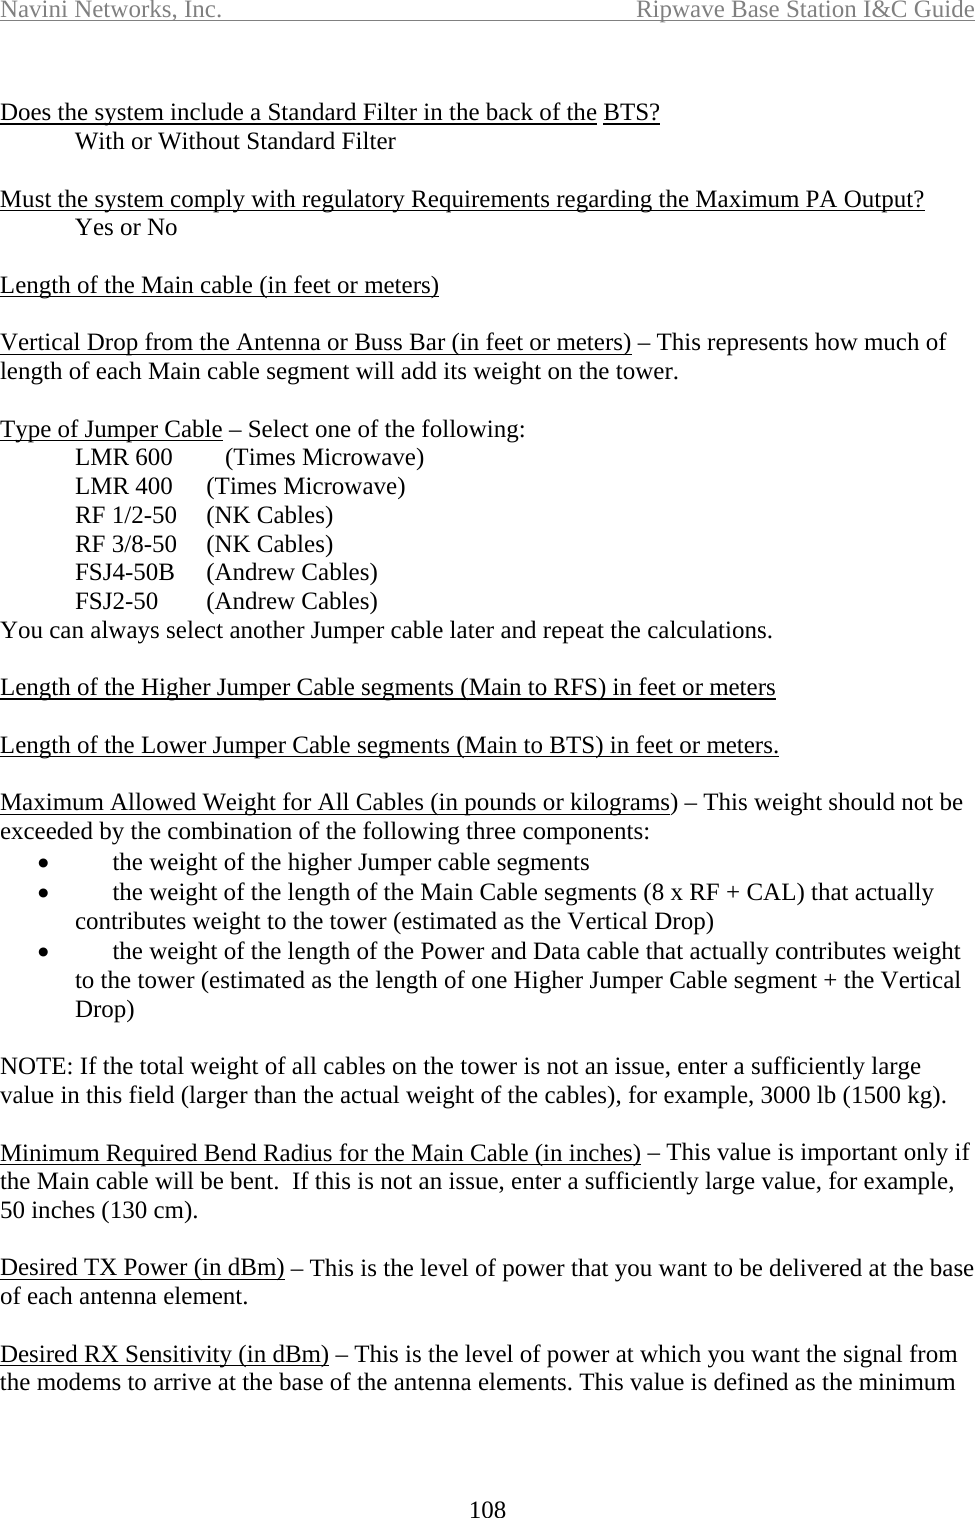
![Navini Networks, Inc. Ripwave Base Station I&C Guide 114 Calculate the weight of the section of main Cable hanging from the tower for each type Main cable. Weight on Tower of one type of Main Cable = [Formula 8] Vertical Drop × Weight of one foot of that type of Main Cable Calculate the weight of the power and data cable Weight of a P&D Cable = [Formula 9] (Length of the Higher Jumper Cable + Vertical Drop) × Weight of one foot of P&D Cable Calculate the weight of all cables on the tower for each type Main cable Weight of All Cables = [Formula 10] (Weight of Higher Jumper Cable + Weight on Tower of one type of Main Cable) × 9 + Weight of P&D Cable Eliminate for further consideration the cable combinations that exceed the maximum allowed weight for all cables. 3. Perform preliminary calculations in Table H1 Using the Input Data, fill the cells A through I at the bottom of the Table H1 with the appropriate values. • Select first one row based on the operating frequency (plus the number of sub-carriers if 2.3 GHz or whether the chassis is split or combo if 2.6 GHz). • For that row, copy the values in columns B, F, G, H and I at the bottom of the table. • Choose between the value in column A1 and the value in column A2 based on whether your system must comply with FCC regulations or not (write it down at the bottom of the table and call it A). • If the operating frequency is 2.3 or 2.4 GHz, choose between the value on column C1 or the value in column C2 based on the antenna type, Omni or Panel; If the operating frequency is 2.4 GHz, take also into consideration whether the regulatory body is the FCC or European (write the value down at the bottom of the table and call it C). • Choose between the value in column D1 and the value in column D2 based on](https://usermanual.wiki/Cisco-Systems/2305-BTS2-R1.Manual-part-7/User-Guide-588304-Page-17.png)
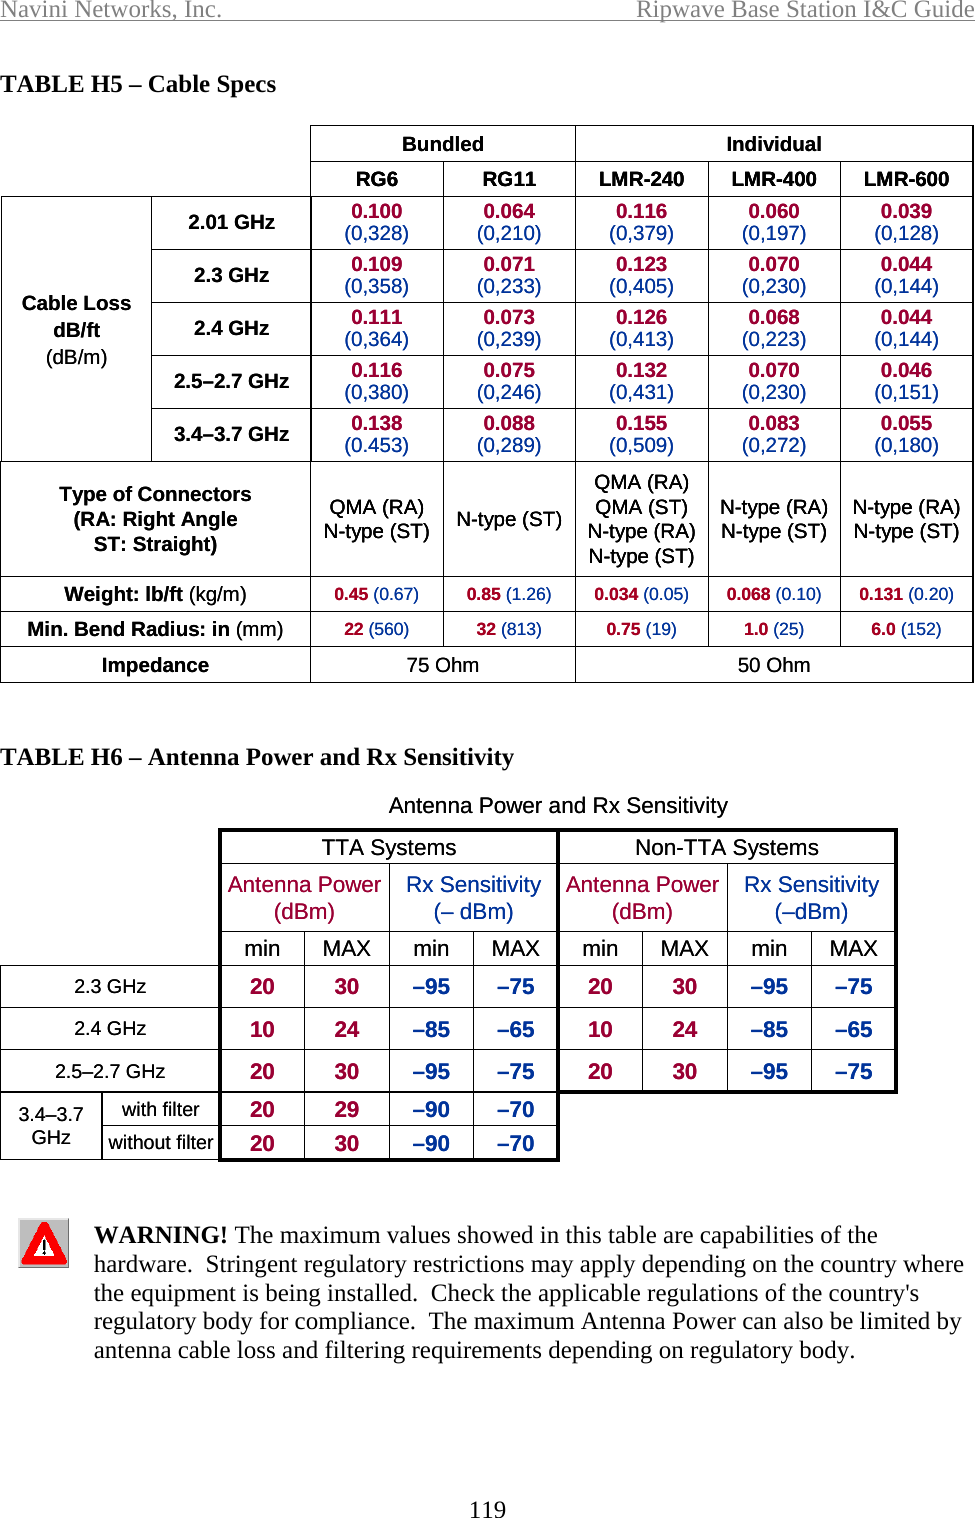
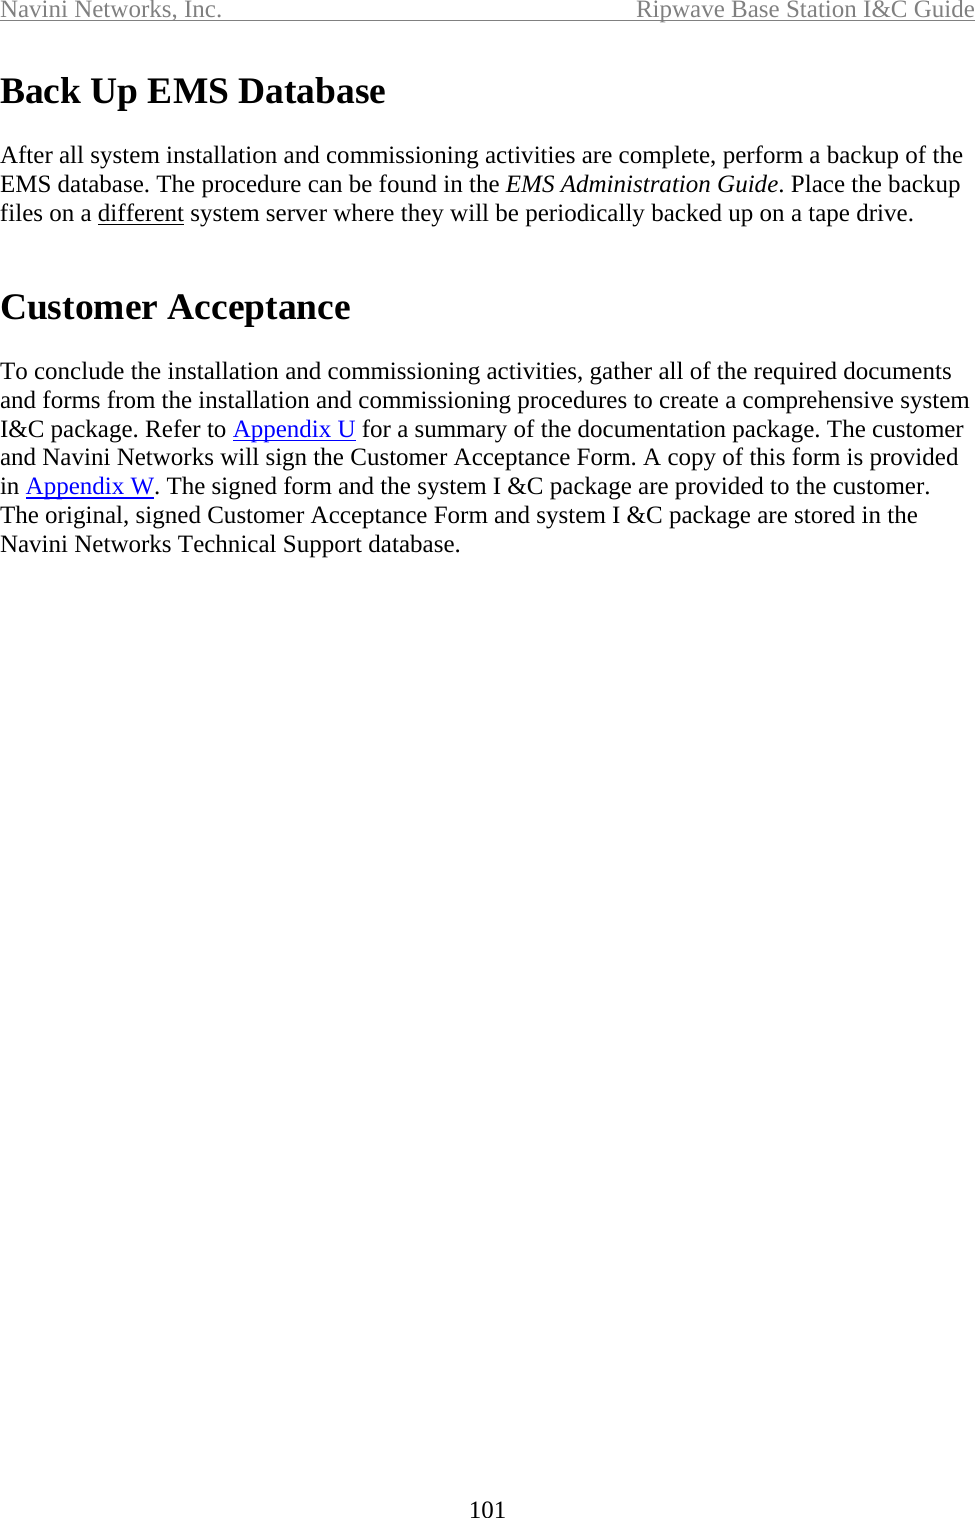
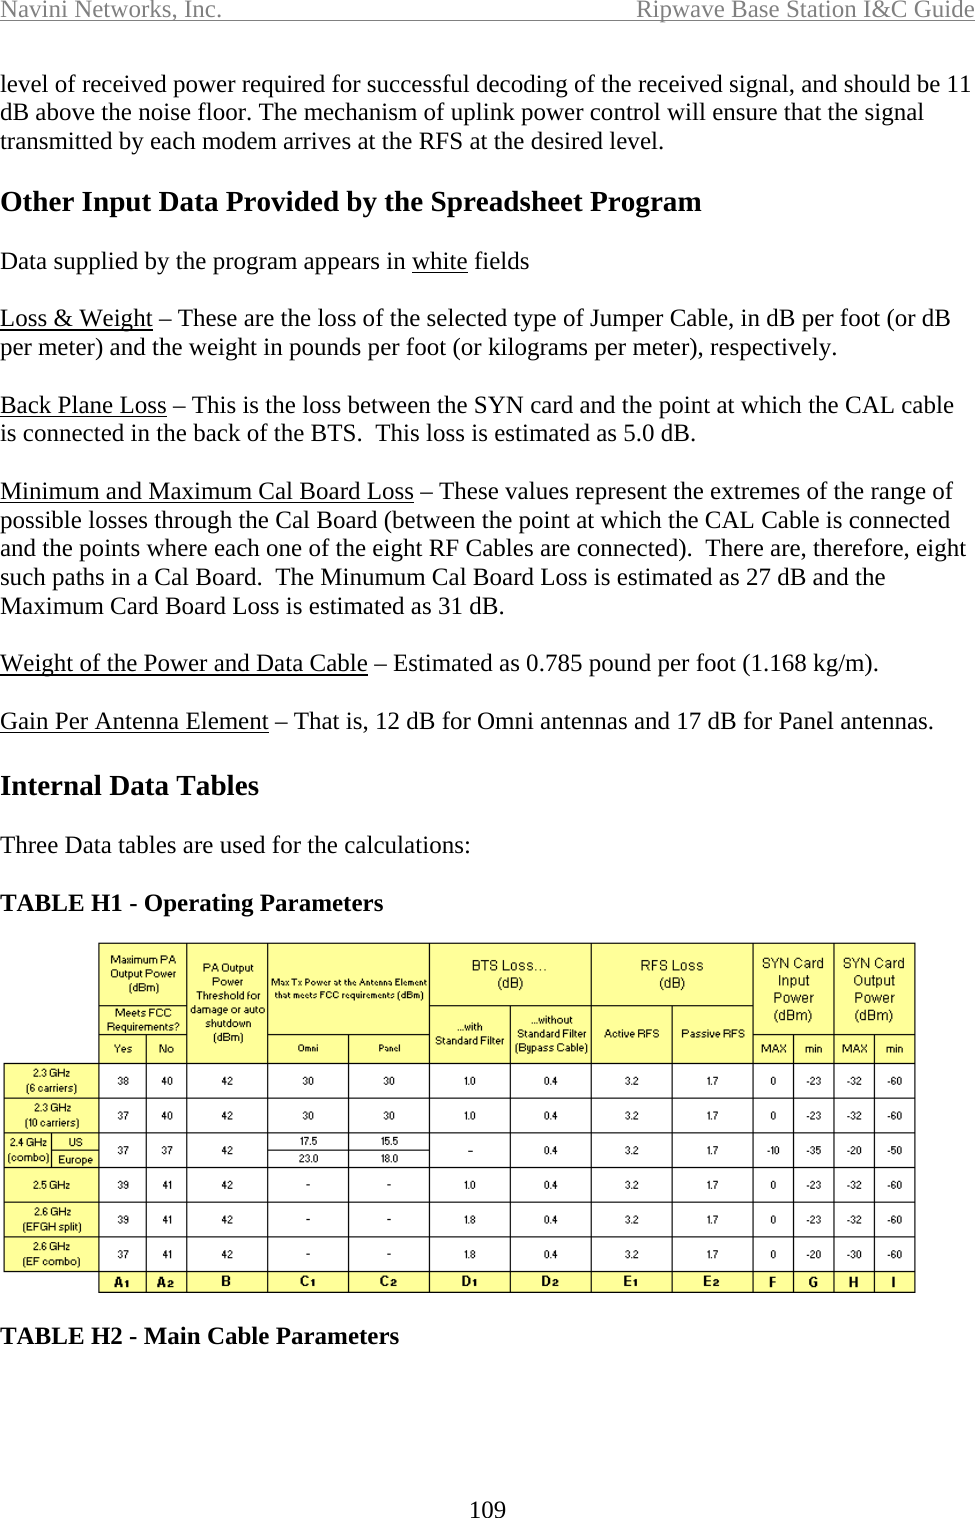
![Navini Networks, Inc. Ripwave Base Station I&C Guide 115 whether your system has a Standard Filter in the back of the BTS (write it down at the bottom of the table and call it D). • Choose between the value in column E1 and the value in column E2 based on whether your system has an Active or Passive RFS (write it down at the bottom of the table and call it E) 4. Calculate the total loss for the combination of each type of Main Cable and the selected type of Jumper Cable Calculate the loss of the Higher and Lower Jumper Cables. Read the loss per 100 ft for the selected type of the selected Jumper Cable for the Operating Frequency Band of your system, then divide it by 100 and multiply it times the Length of the Higher Jumper Cable. Loss of Higher Jumper Cable = [Formula 11] Length of the Higher Jumper Cable ÷ 100 × Loss per 100 feet of the Selected type of Jumper Cable Loss of Lower Jumper Cable = [Formula 12] Length of the Lower Jumper Cable ÷ 100 × Loss per 100 feet of the Selected type of Jumper Cable Calculate the loss of the Main Cable. Read the loss per 100 ft for each type of Main Cable for the Operating Frequency Band of your system, then divide it by 100 and multiply it times the Length of the Main Cable. Loss of one type of Main Cable = [Formula 13] Length of the Main Cable ÷ 100 × Loss per 100 feet of that type of Main Cable Calculate the TOTAL CABLE LOSS (RF or CAL Cable) for each type of Main Cable. This is the sum of the losses on both Jumper Cables plus the loss of one type of Main Cable, plus 0.6 dB for terminators and surge arrestors. TOTAL CABLE LOSS = [Formula 14] Loss of Higher Jumper Cable + Loss of Lower Jumper Cable + Loss of one type of Main Cable + 0.6 dB 5. Calculate the maximum and minimum values of TX Power and RX Sensitivity at the base of the antenna elements and build Table I5 with the results. Notice that TOTAL CABLE LOSS in Formula 14 is the same as RF Cable Loss in Formula 1 and the same as CAL Cable Loss in formulas 2, 4, 5 and 6.](https://usermanual.wiki/Cisco-Systems/2305-BTS2-R1.Manual-part-7/User-Guide-588304-Page-18.png)