Computer Access Technology BT004APA-X Bluetooth Protocal Analyzer and Test Generator User Manual 01 BTTracer
Computer Access Technology Corporation Bluetooth Protocal Analyzer and Test Generator 01 BTTracer
Contents
- 1. Main User Manual
- 2. WAND Manual 1 of 2
- 3. WAND Manual 2 of 2
Main User Manual

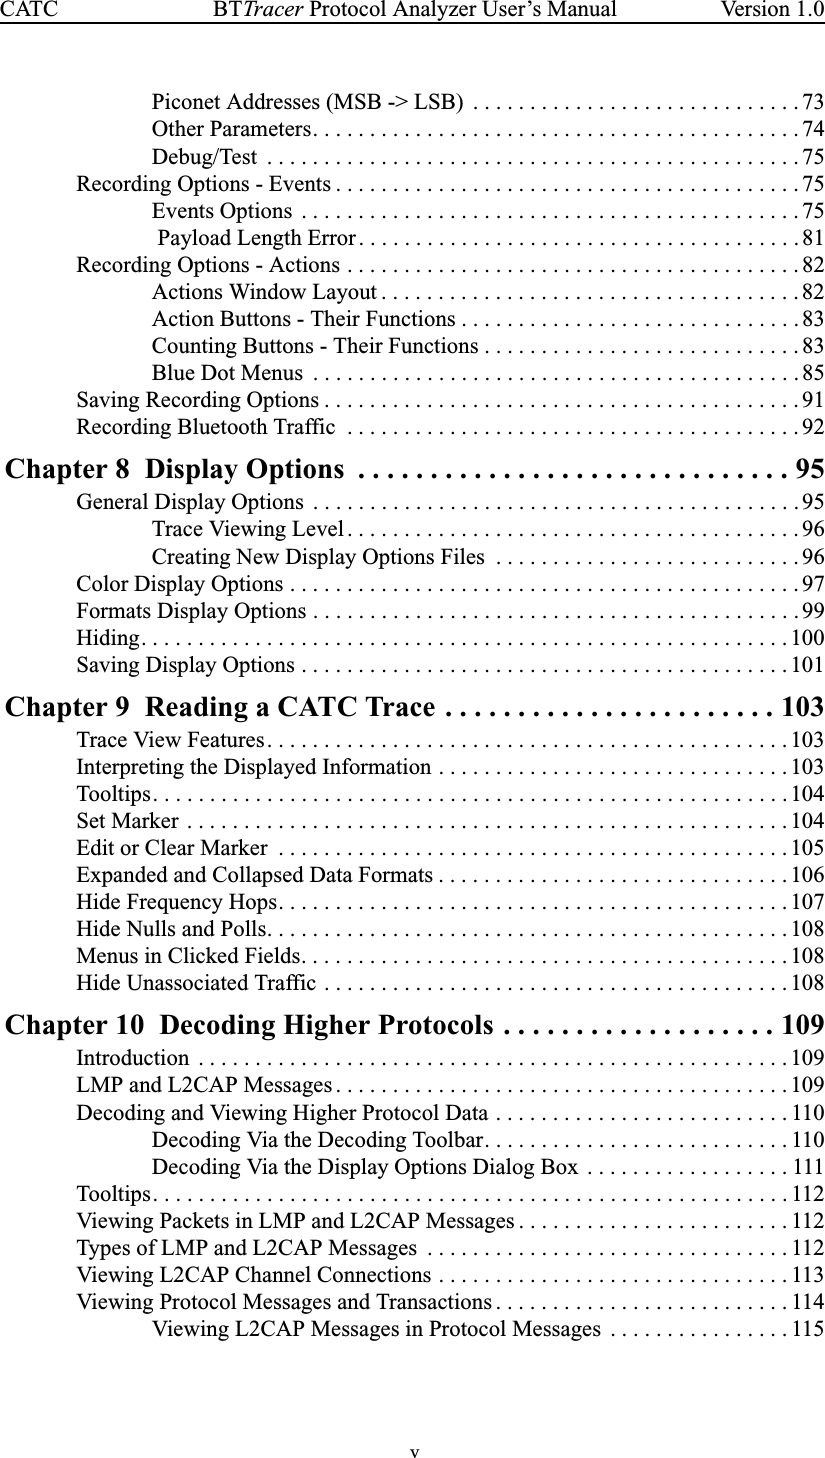


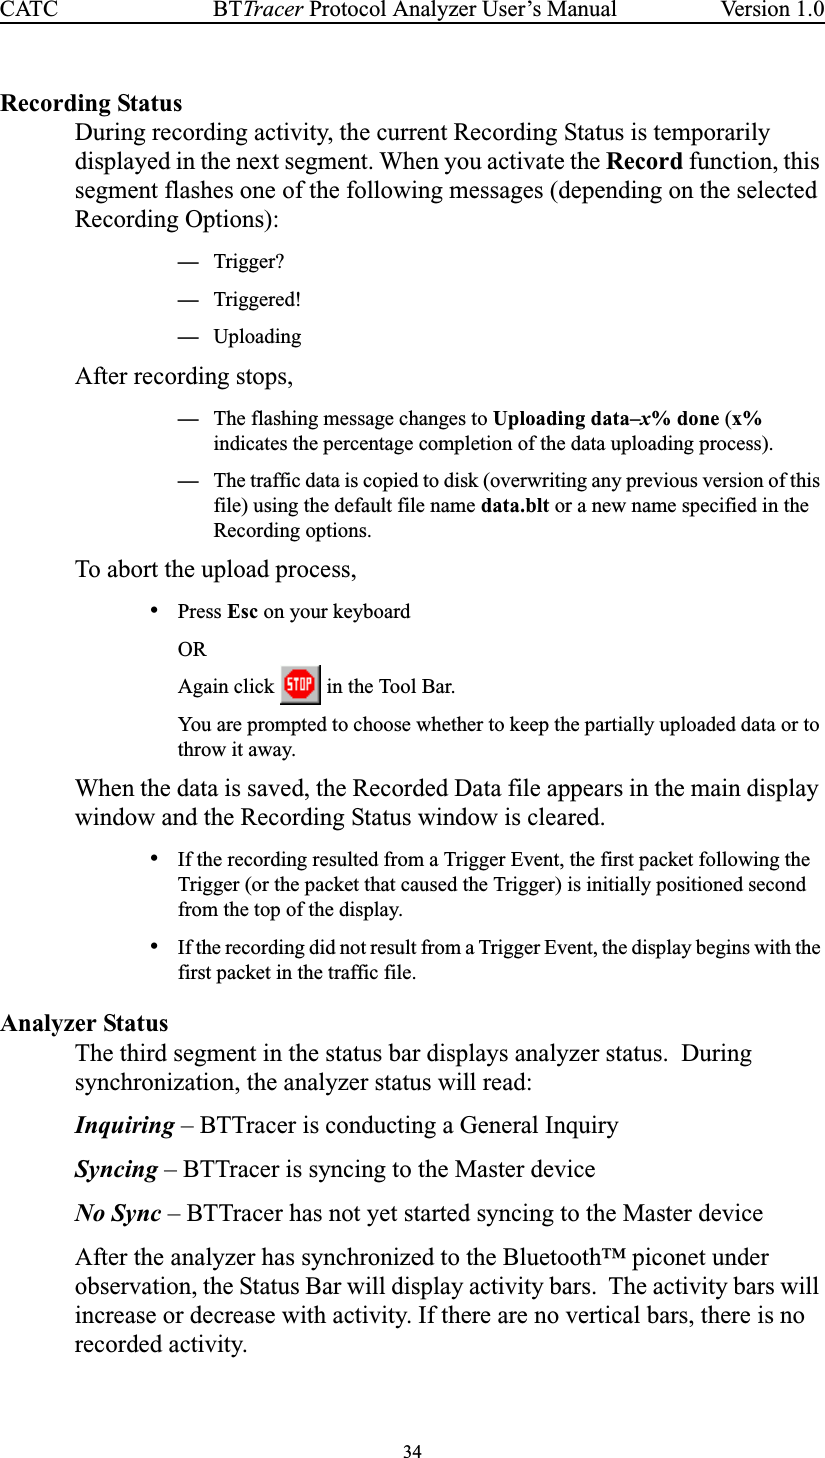
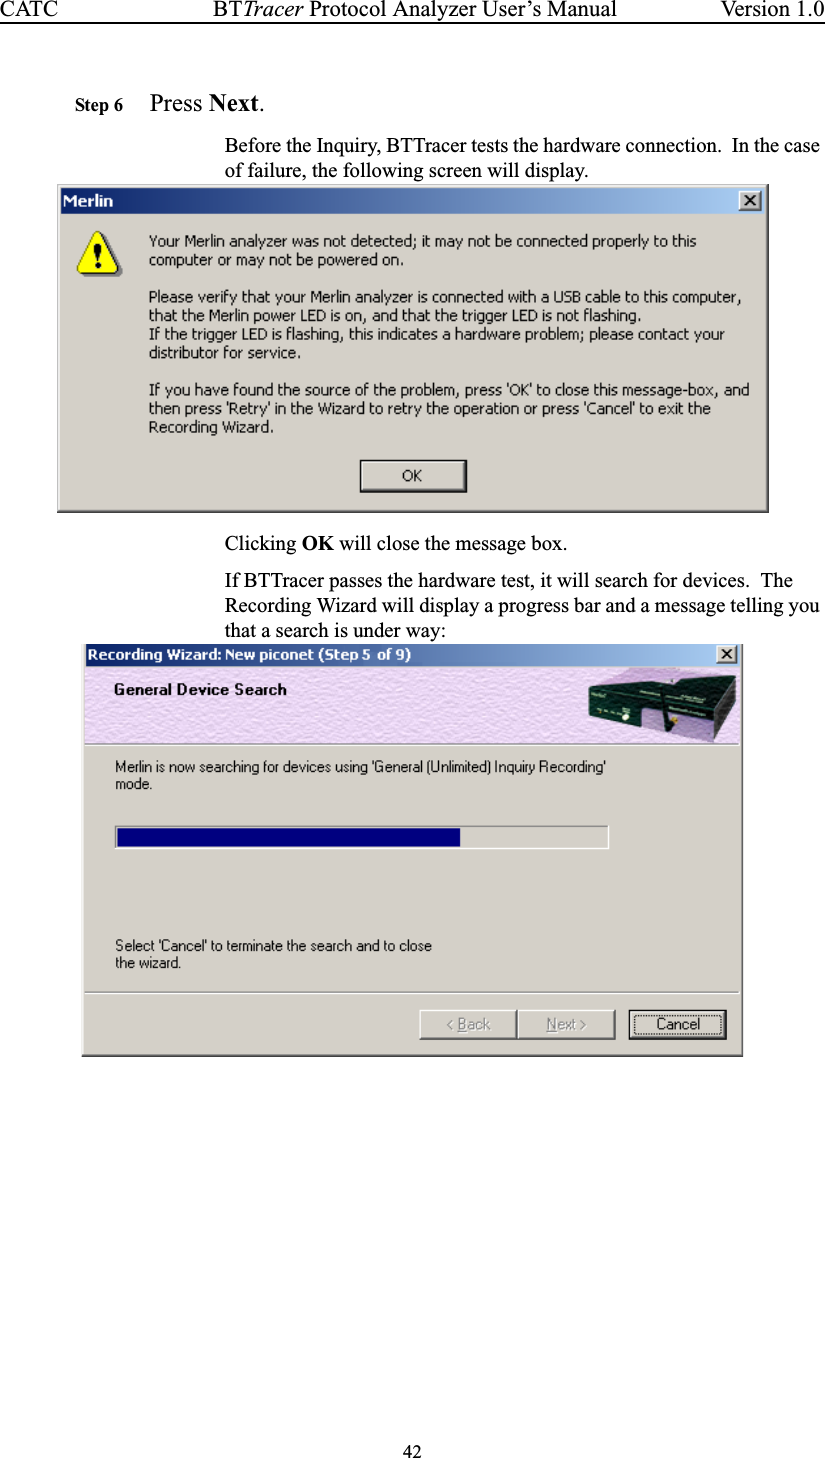
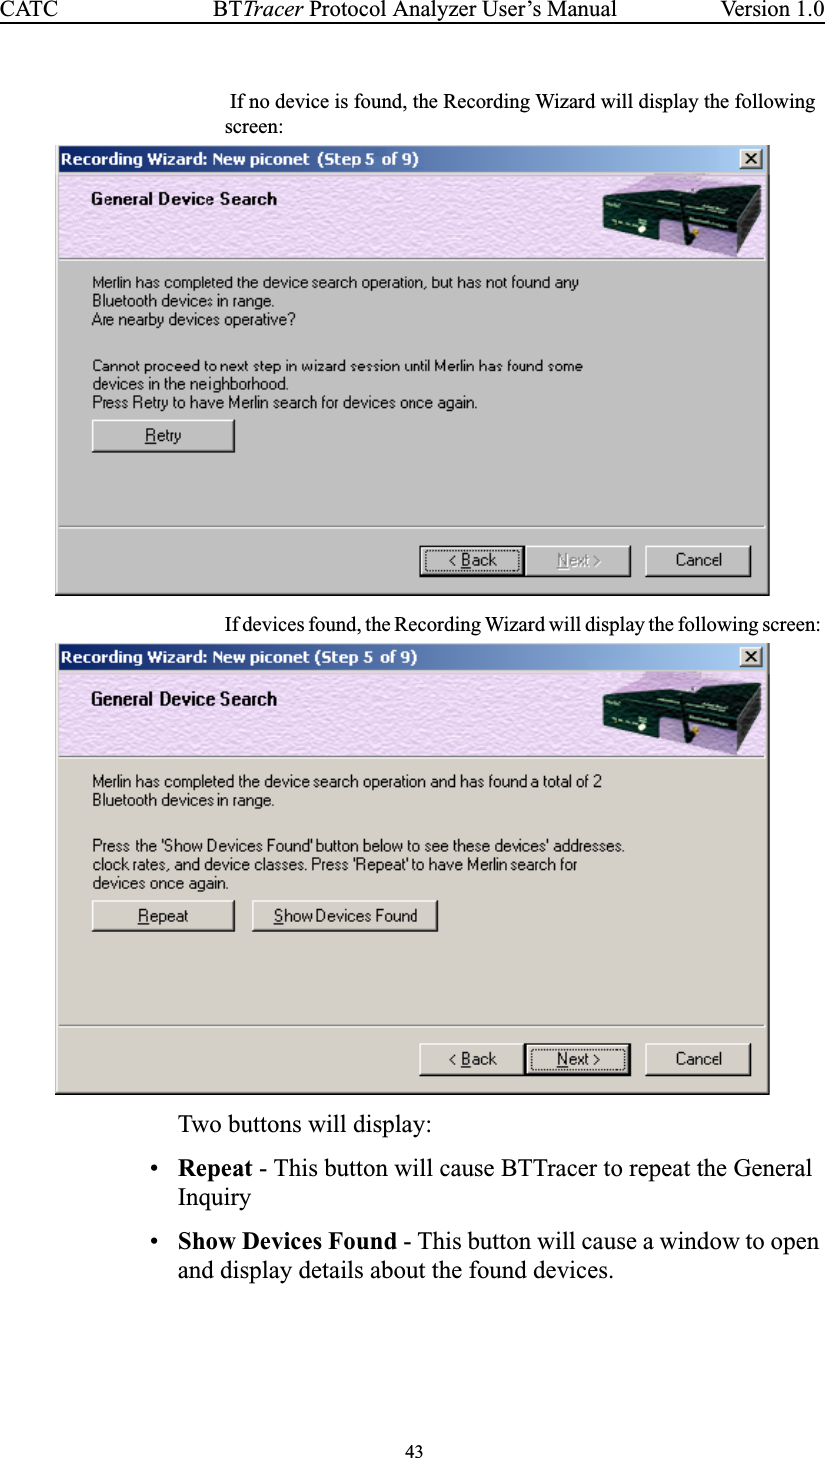
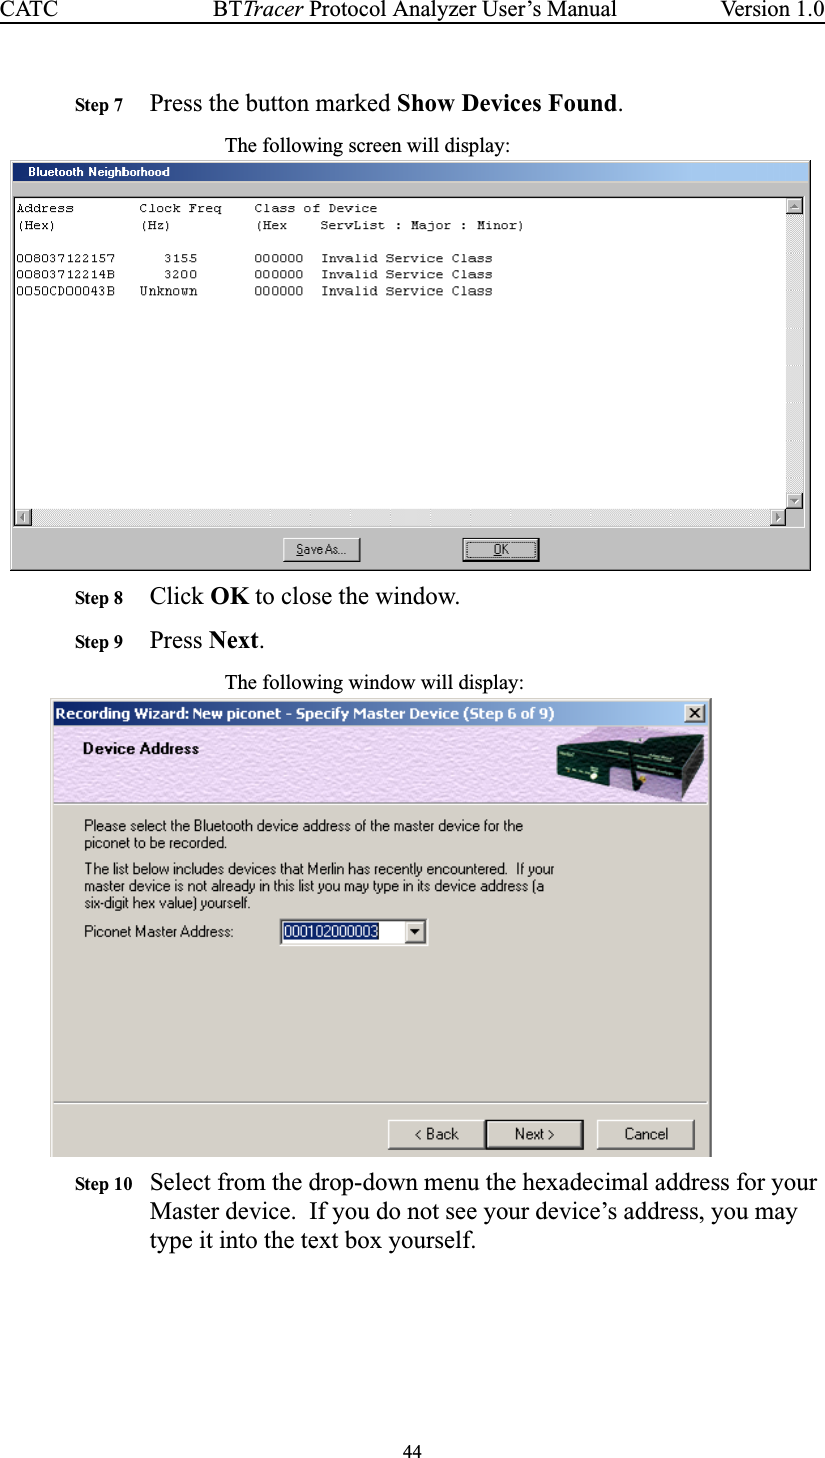
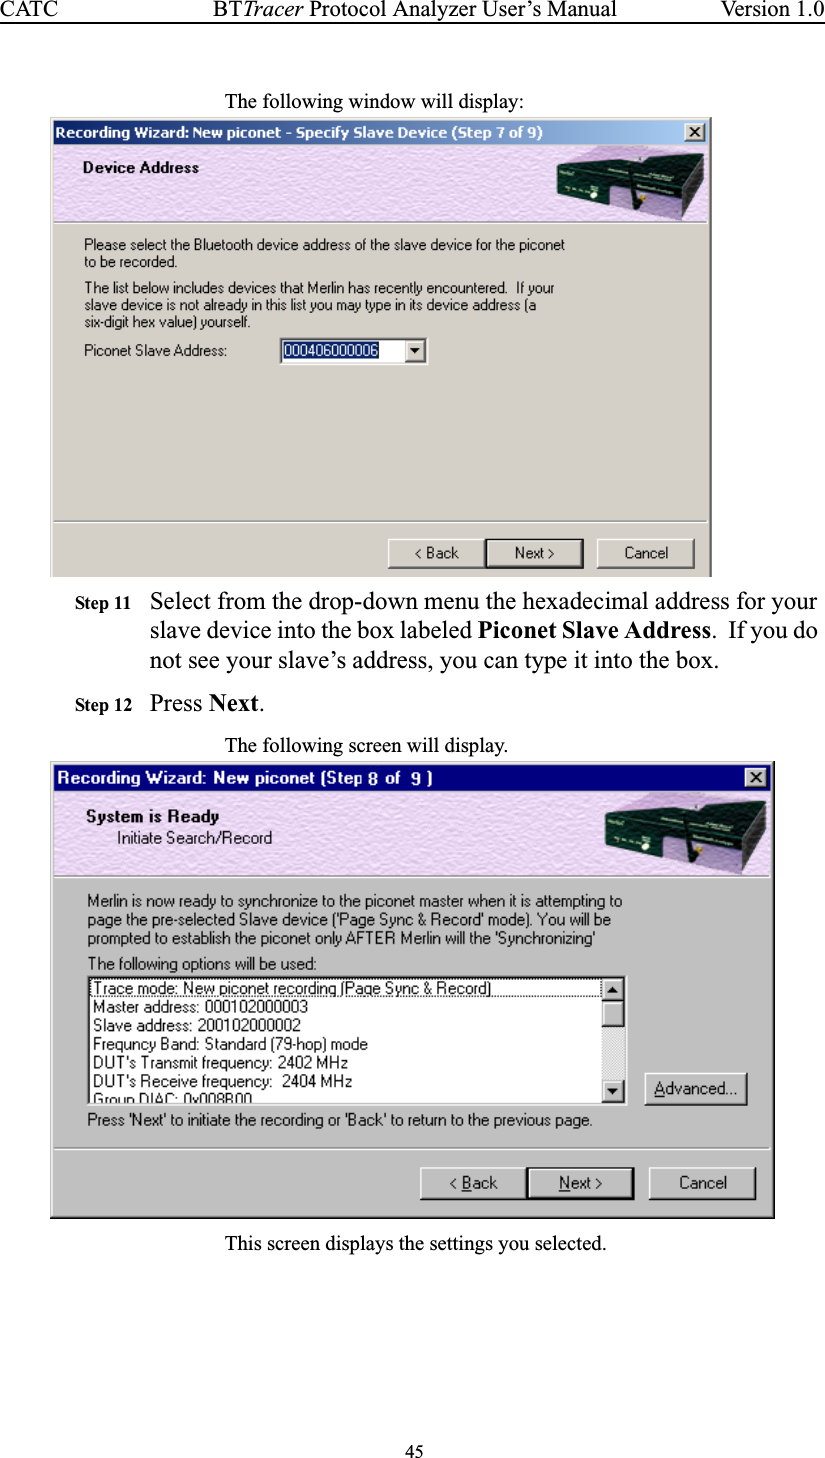
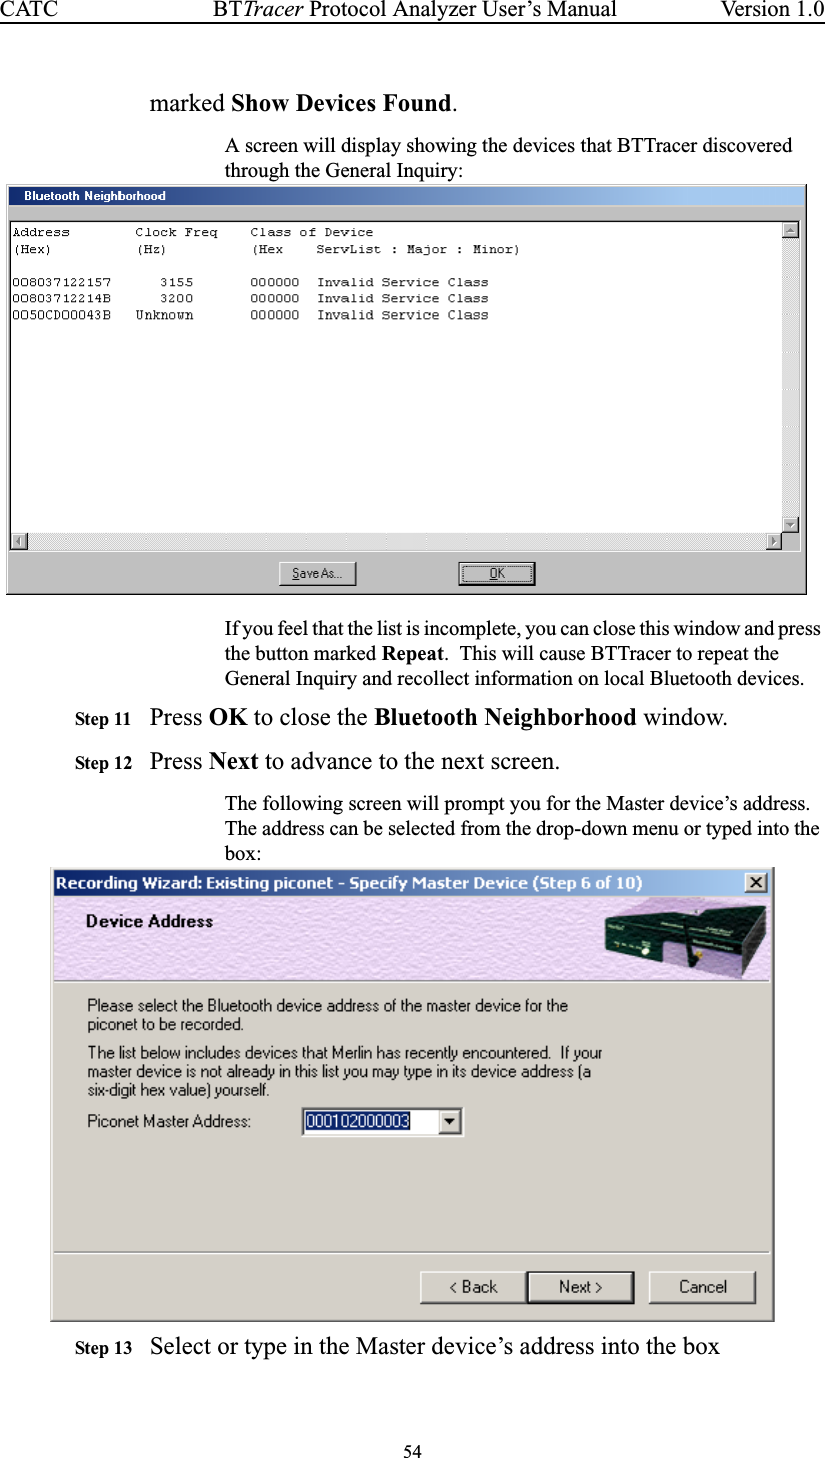
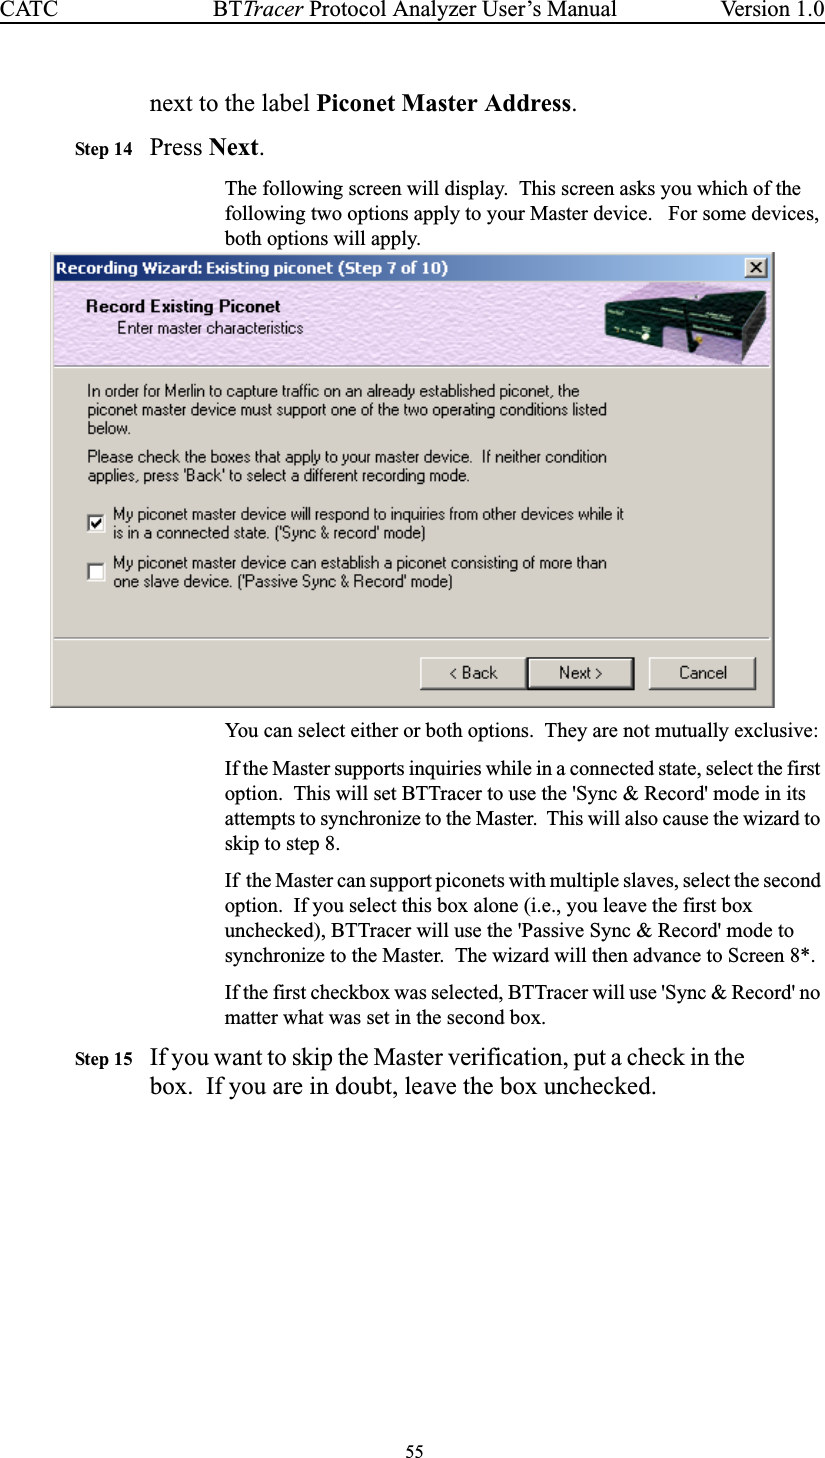
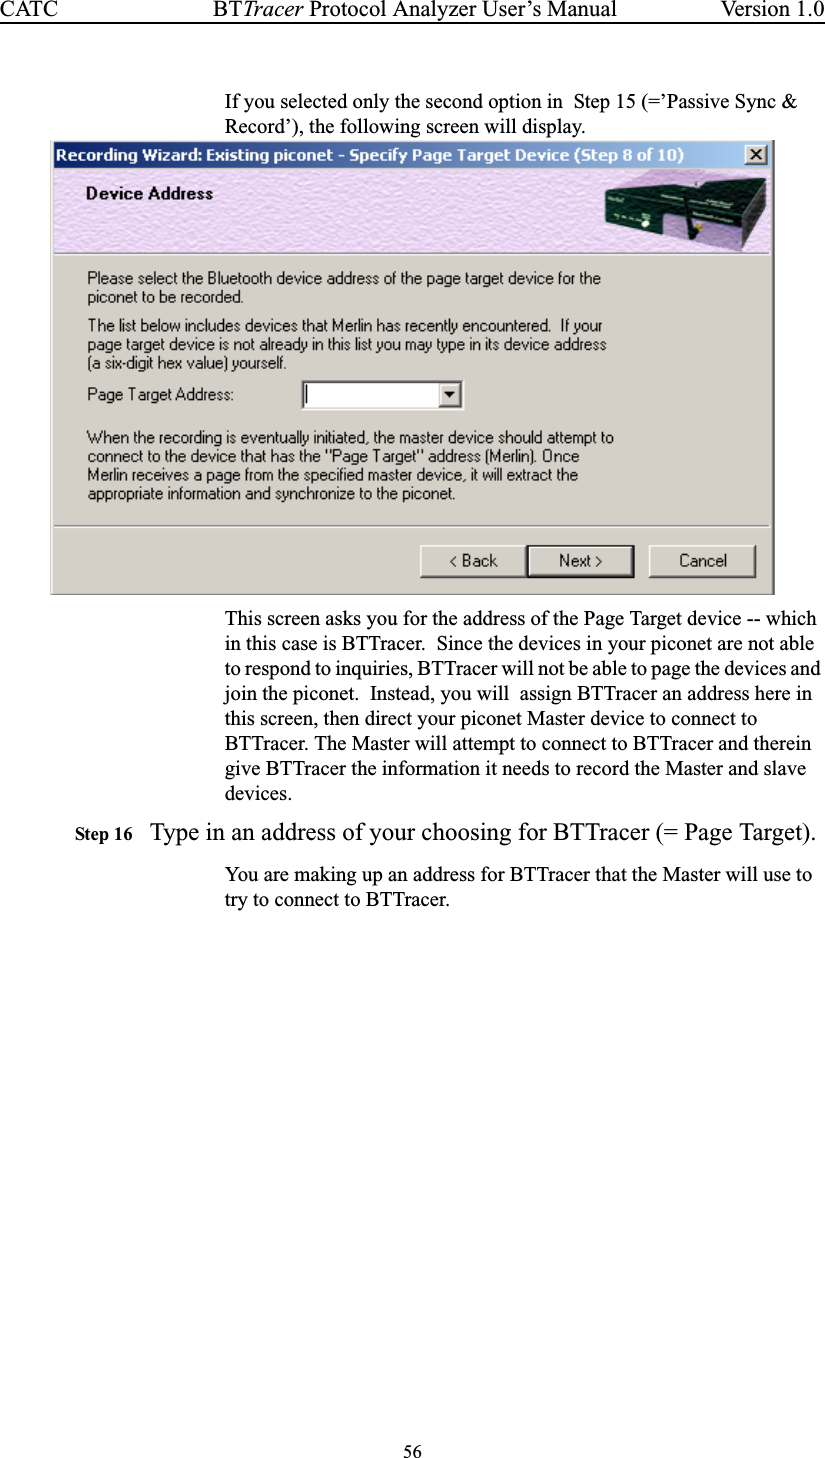
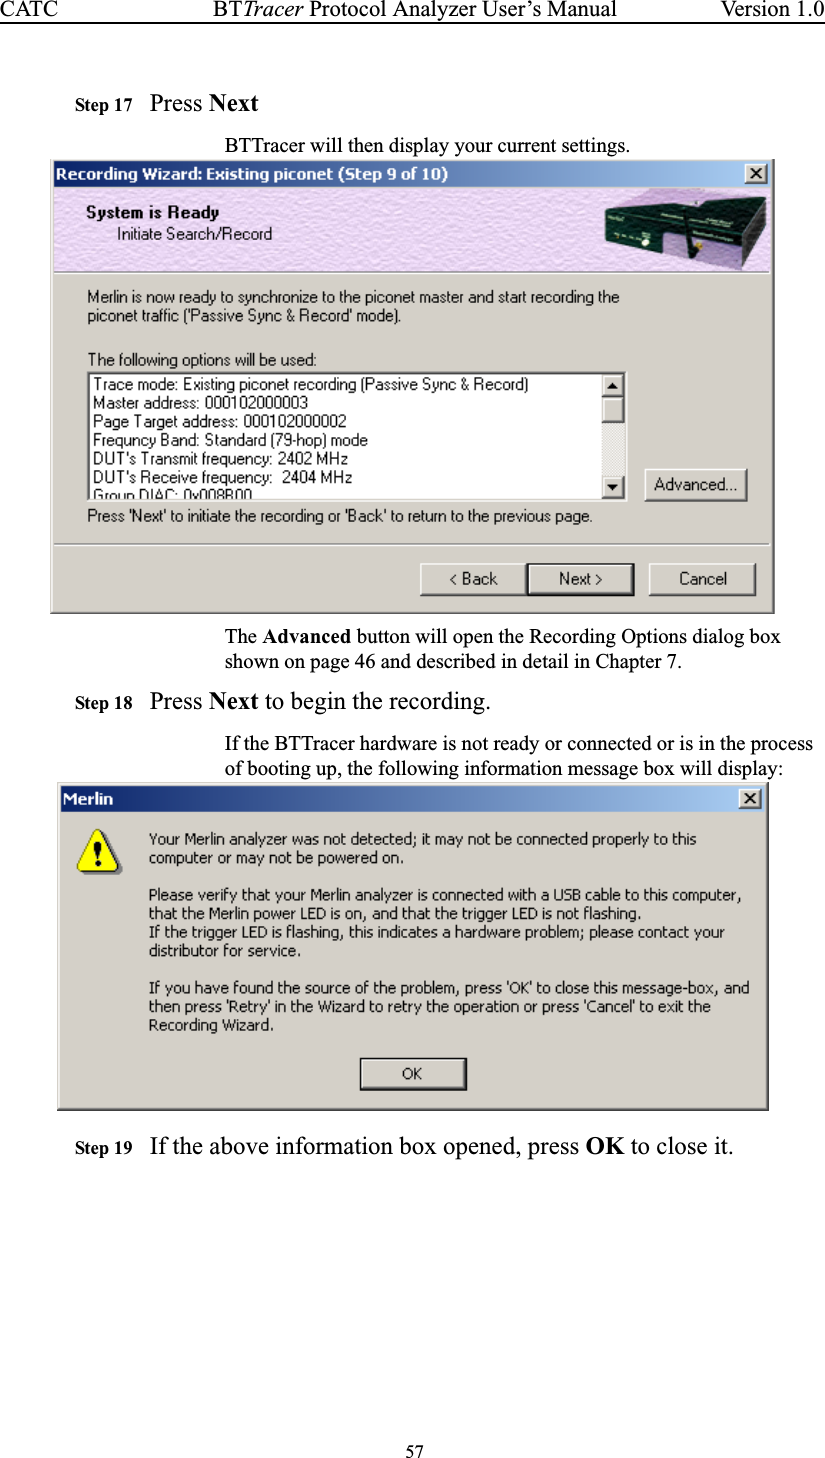
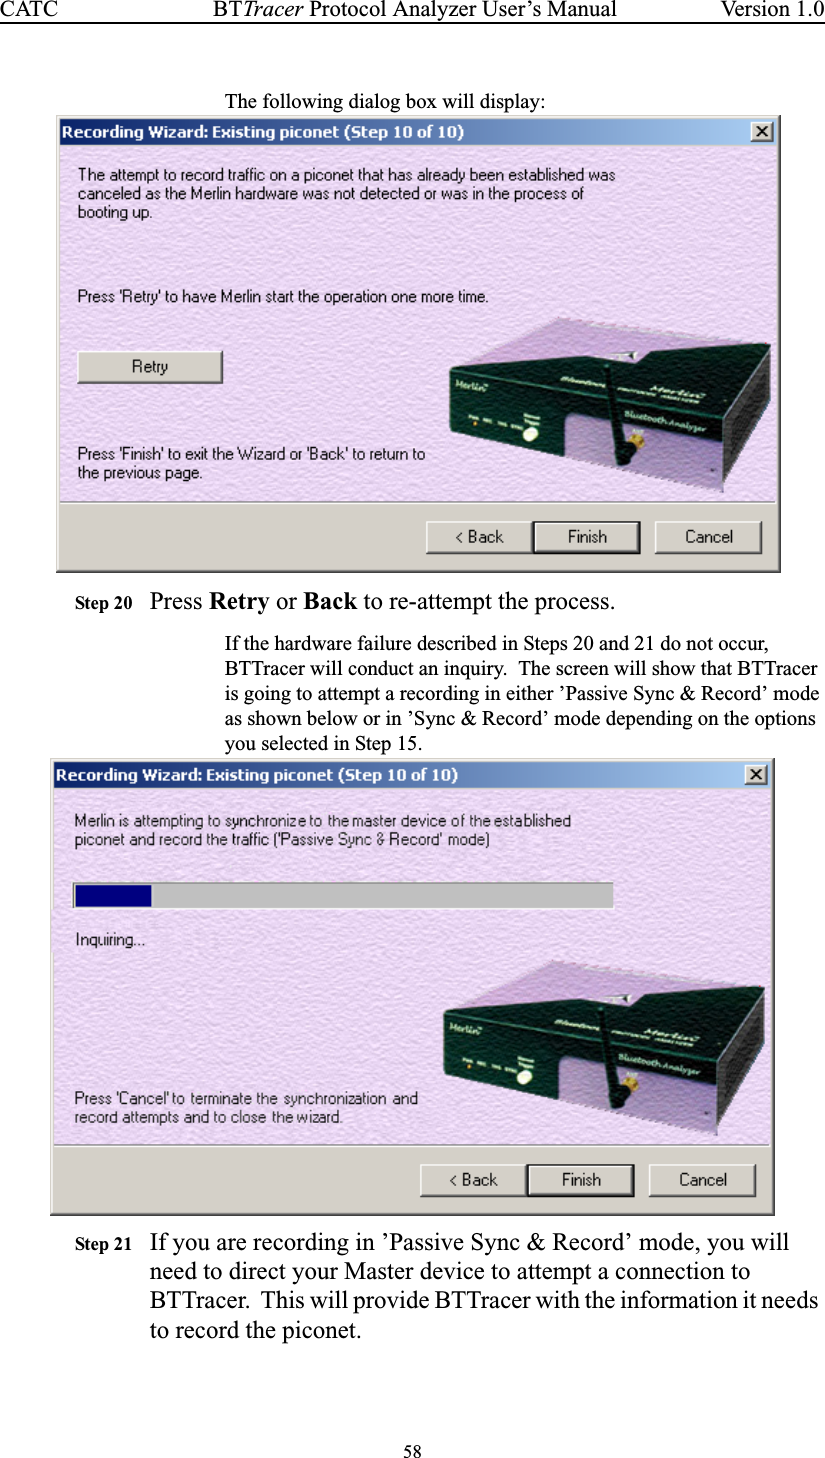
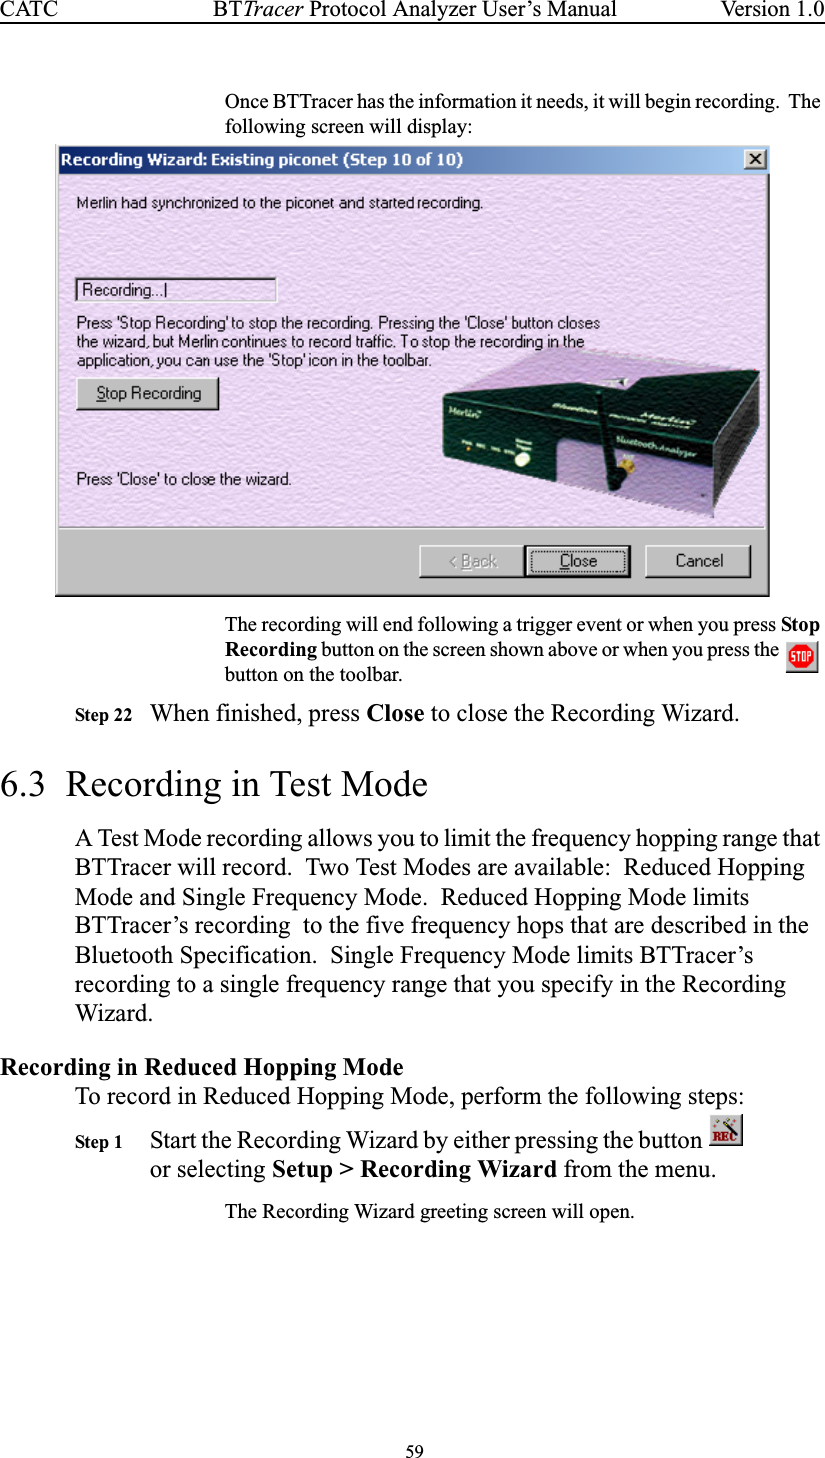
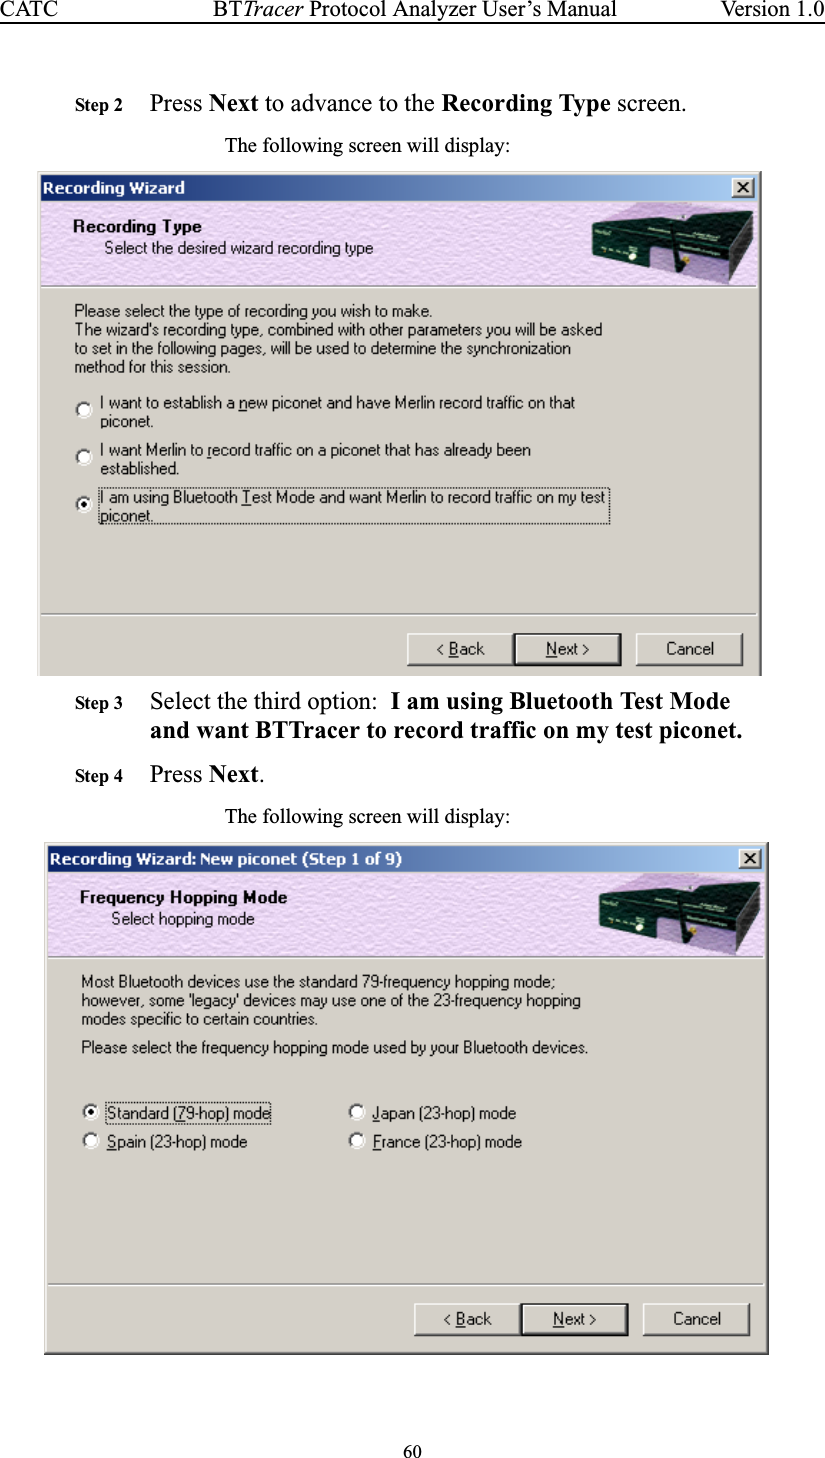
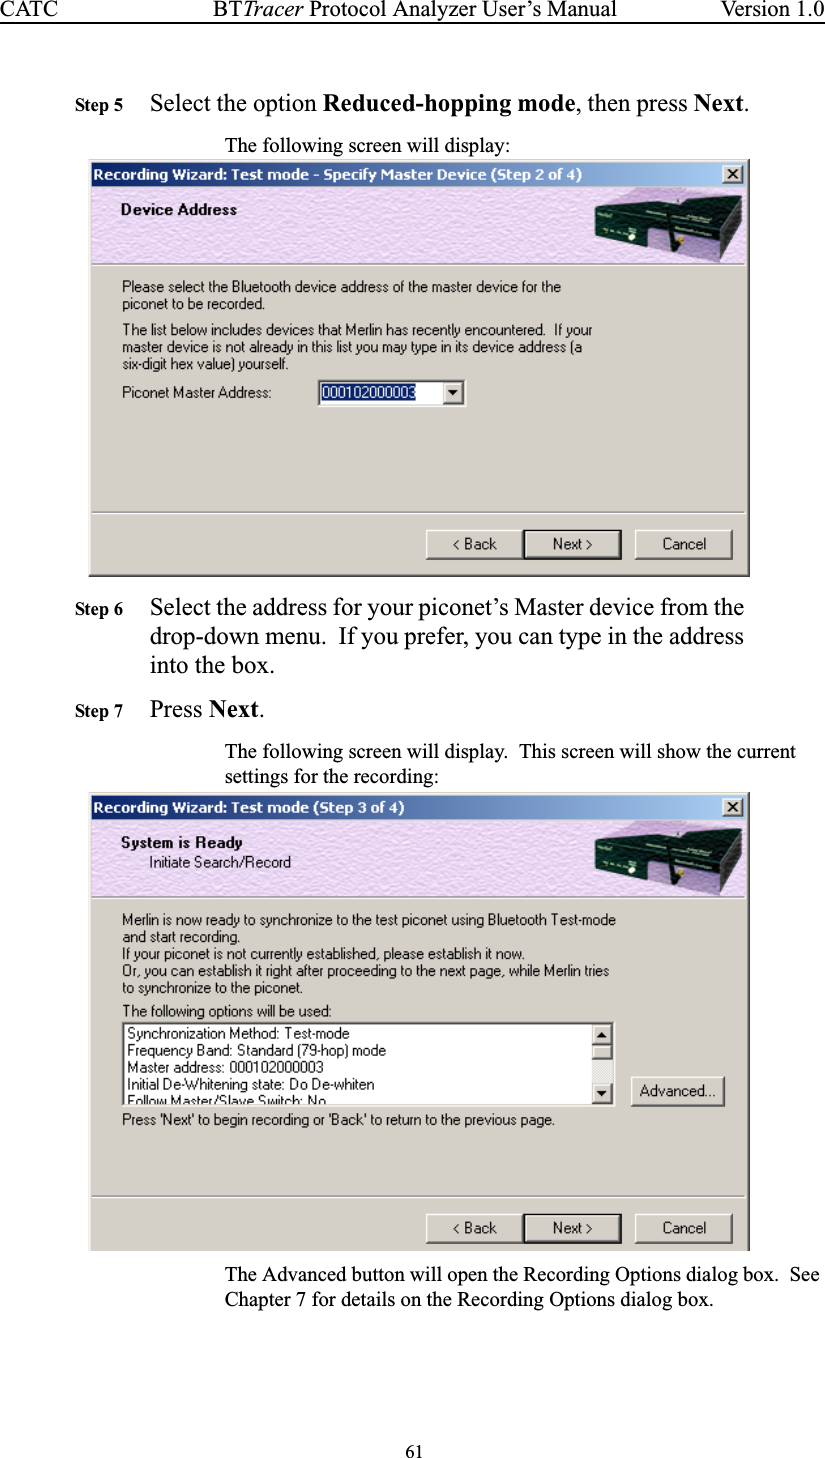

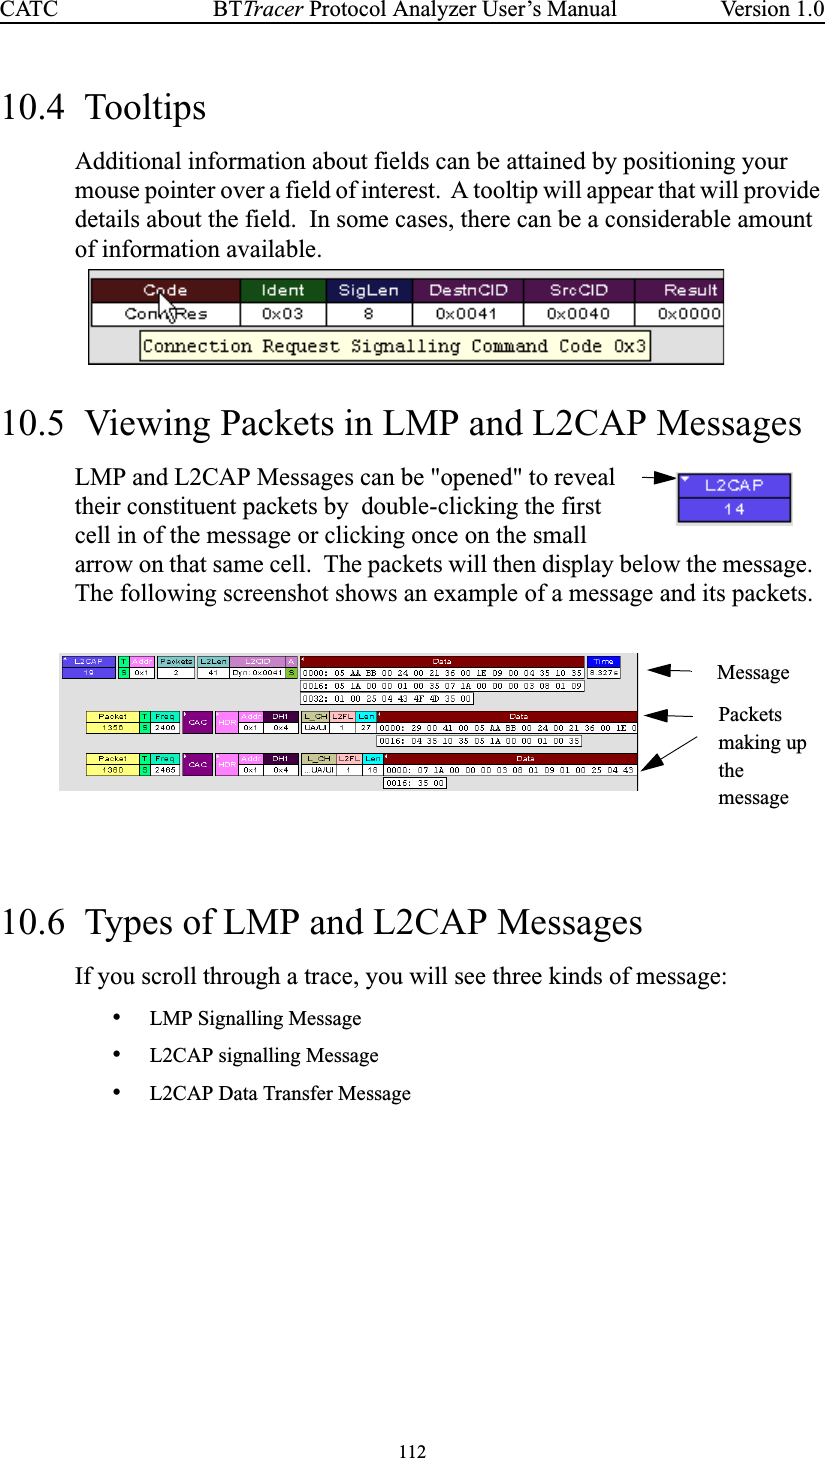
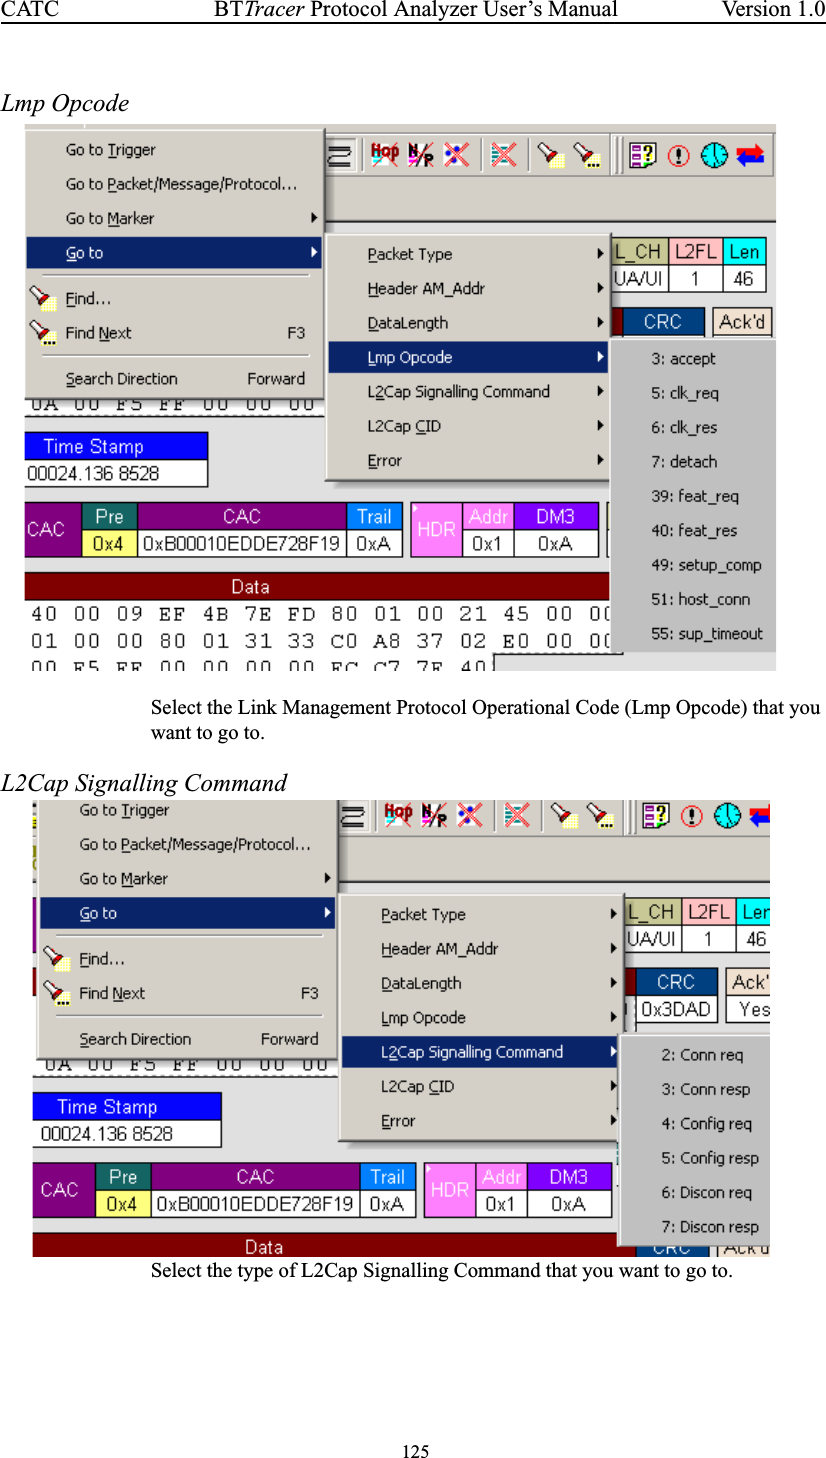
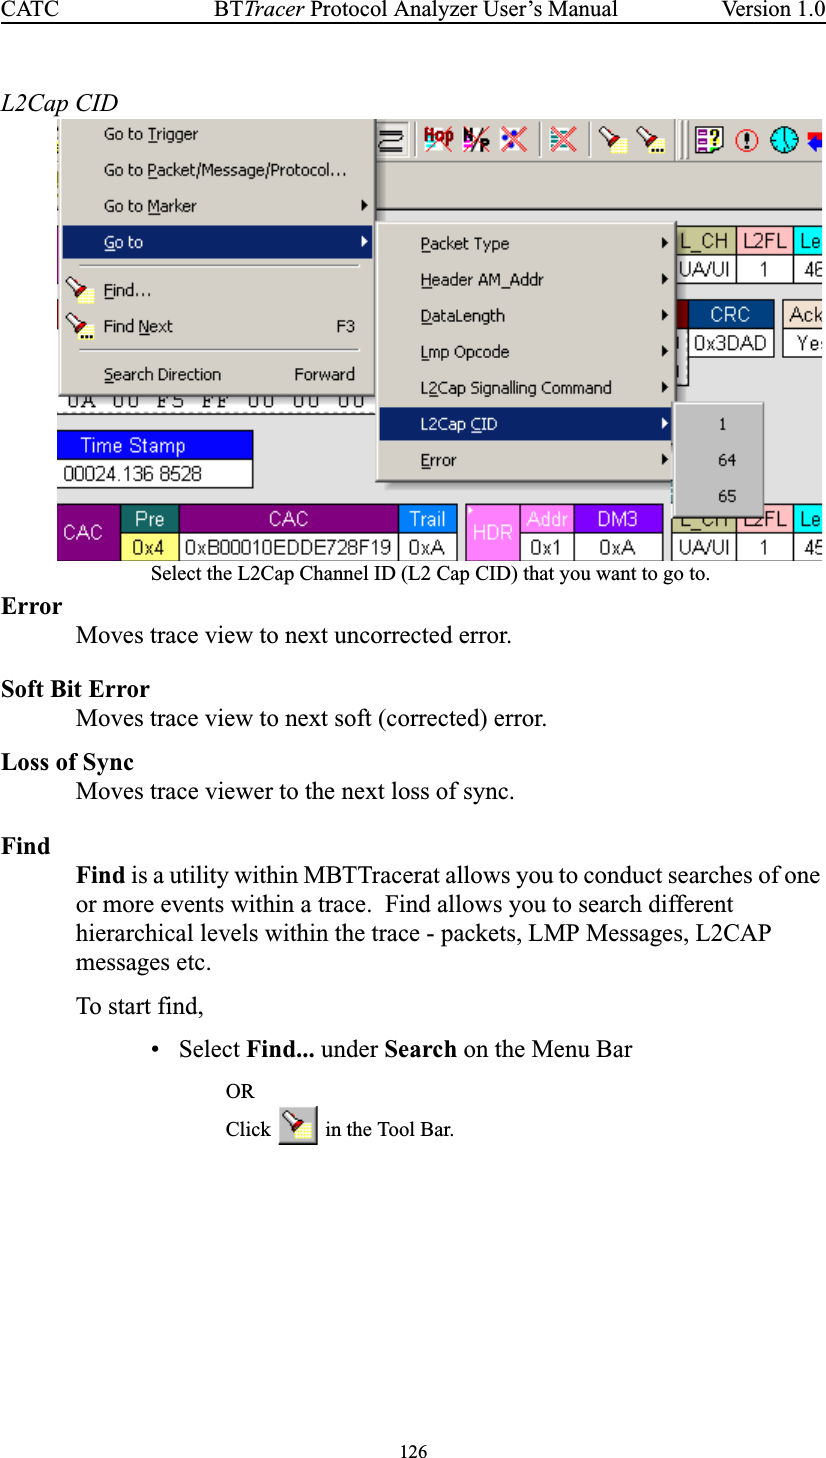
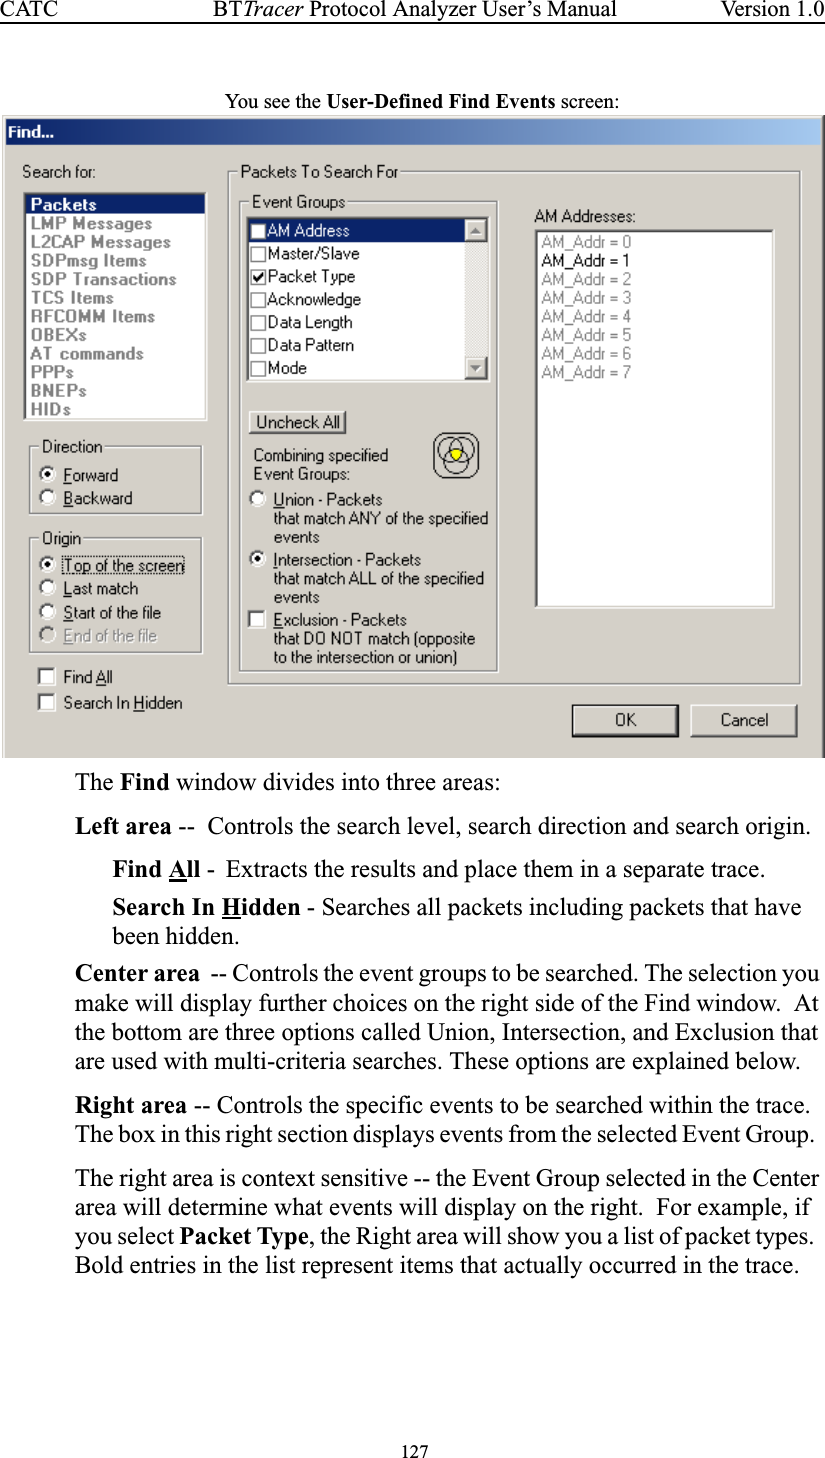
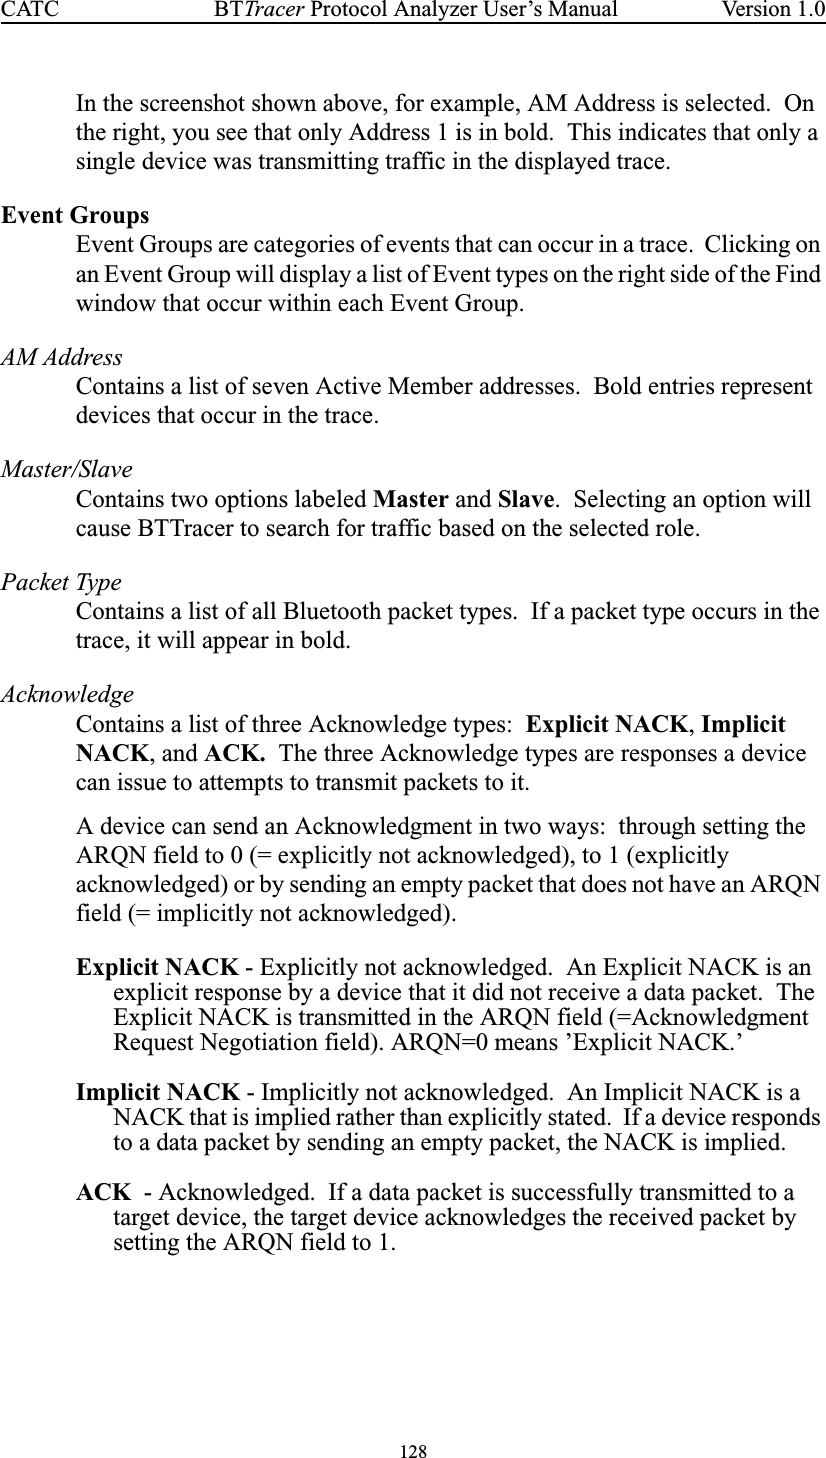
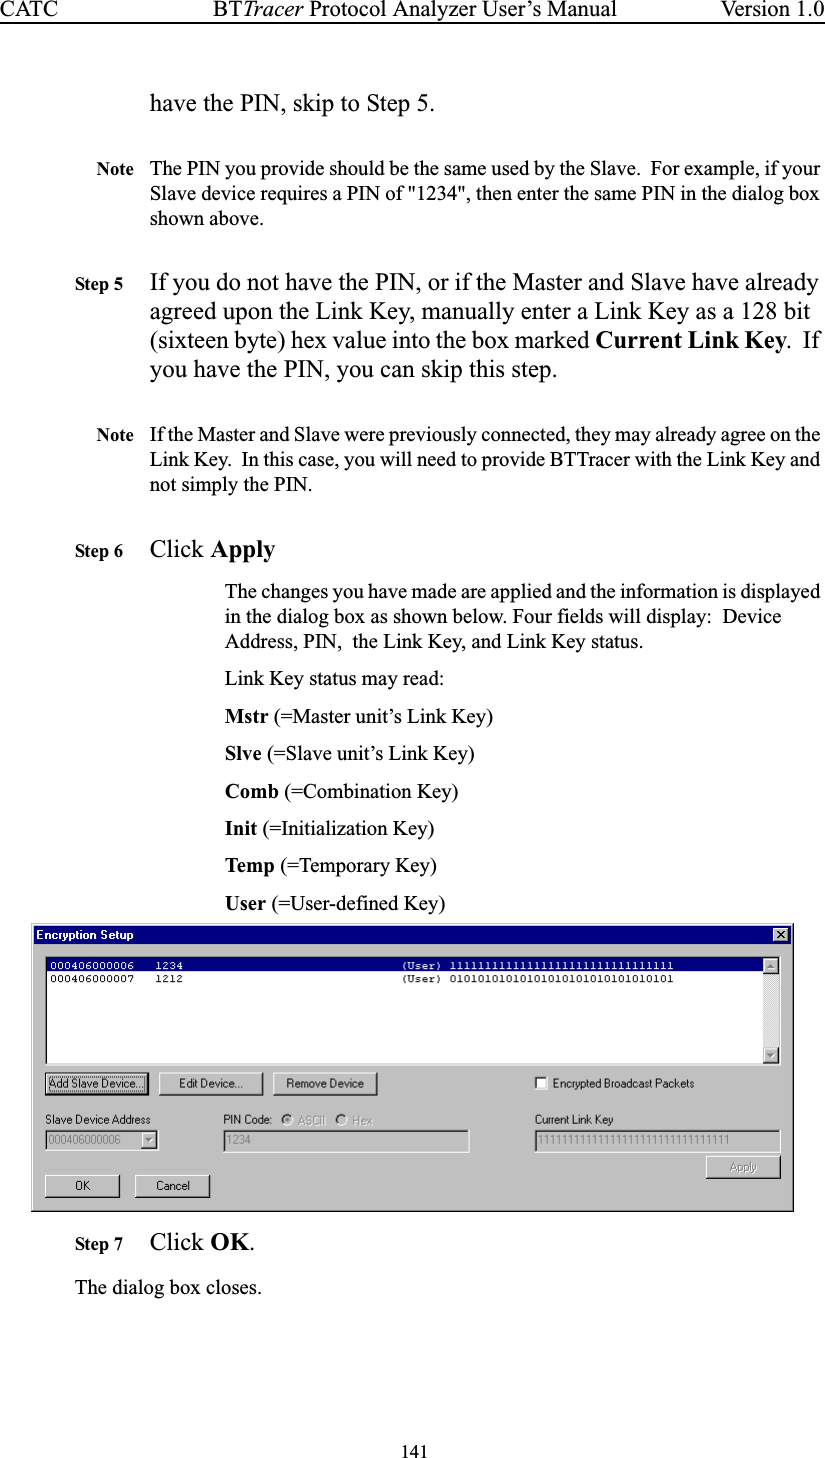
![81BTTracer Protocol Analyzer User’s ManualCATC Version 1.0Header Length ErrorIndicates that a received Bluetooth™ data packet was terminated before allbits of the packet header were received.Payload Length ErrorIndicates that the payload of a received Bluetooth™ data packet was eitherlonger than expected, or that a Bluetooth™ data packet terminated beforethe expected end of the payload data.Sync LossWhen set, indicates that a loss of piconet synchronization occurred duringthe frequency slot prior to this slot.External Input SignalsClicking "External Input Signals" causes two check boxes to appear forsetting conditions based on breakout board input signals. The names of thetwo check boxes are the same ones you will find on the break out board:• Trigger Input [TRIG IN]• General Purpose Input [G.P. IN]](https://usermanual.wiki/Computer-Access-Technology/BT004APA-X.Main-User-Manual/User-Guide-272615-Page-91.png)