Computer Access Technology BT006UAA-X Bluetooth Protocol Analyzer User Manual 01 Merlinii
Computer Access Technology Corporation Bluetooth Protocol Analyzer 01 Merlinii
Contents
- 1. User Manual 1 of 2
- 2. User Manual 2 of 2
User Manual 2 of 2
83
Merlin II Protocol Analyzer User’s ManualCATC SW Version 2.30
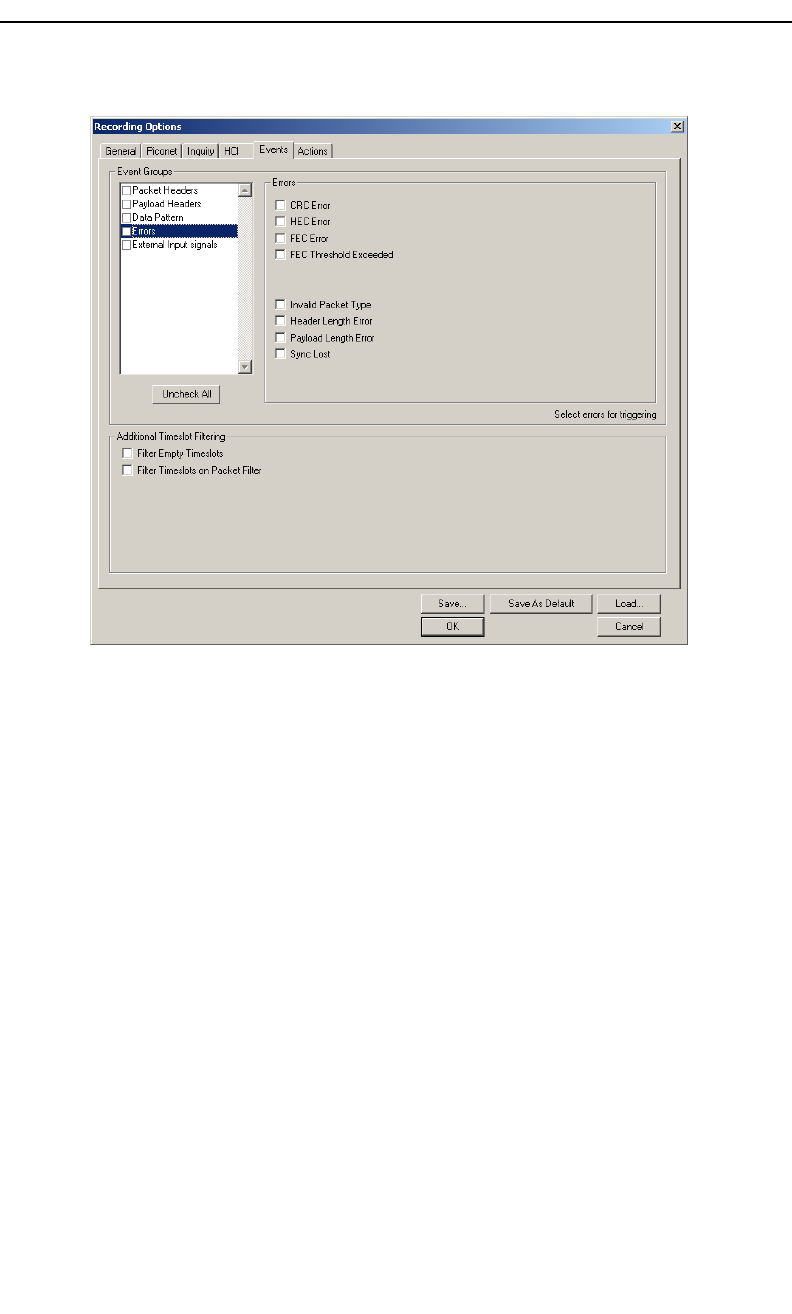
You see the Errors window:
Use any combination of the listed packet/signaling/protocol errors as a Trigger.
CRC Error
A CRC error in the packet data payload of the previous data packet.
HEC Error
An HEC (header error check) error in the packet header for the previous
Bluetooth data packet.
FEC Error
An uncorrectable FEC (Forward Error Correction) error in the packet
header for the previous Bluetooth data packet.
Threshold Exceeded
Indicates that the number of single-bit FEC errors detected since the current
recording started has exceeded the specified value.
Invalid Packet Type
An invalid value was detected in the 'packet type' field of the packet header
for the previous Bluetooth data packet.
Header Length Error
Indicates that a received Bluetooth data packet was terminated before all
bits of the packet header were received.
84
Merlin II Protocol Analyzer User’s ManualCATC SW Version 2.30
Payload Length Error
Indicates that the payload of a received Bluetooth data packet was either
longer than expected, or that a Bluetooth data packet terminated before the
expected end of the payload data.
Sync Loss
When set, indicates that a loss of piconet synchronization occurred during
the frequency slot prior to this slot.
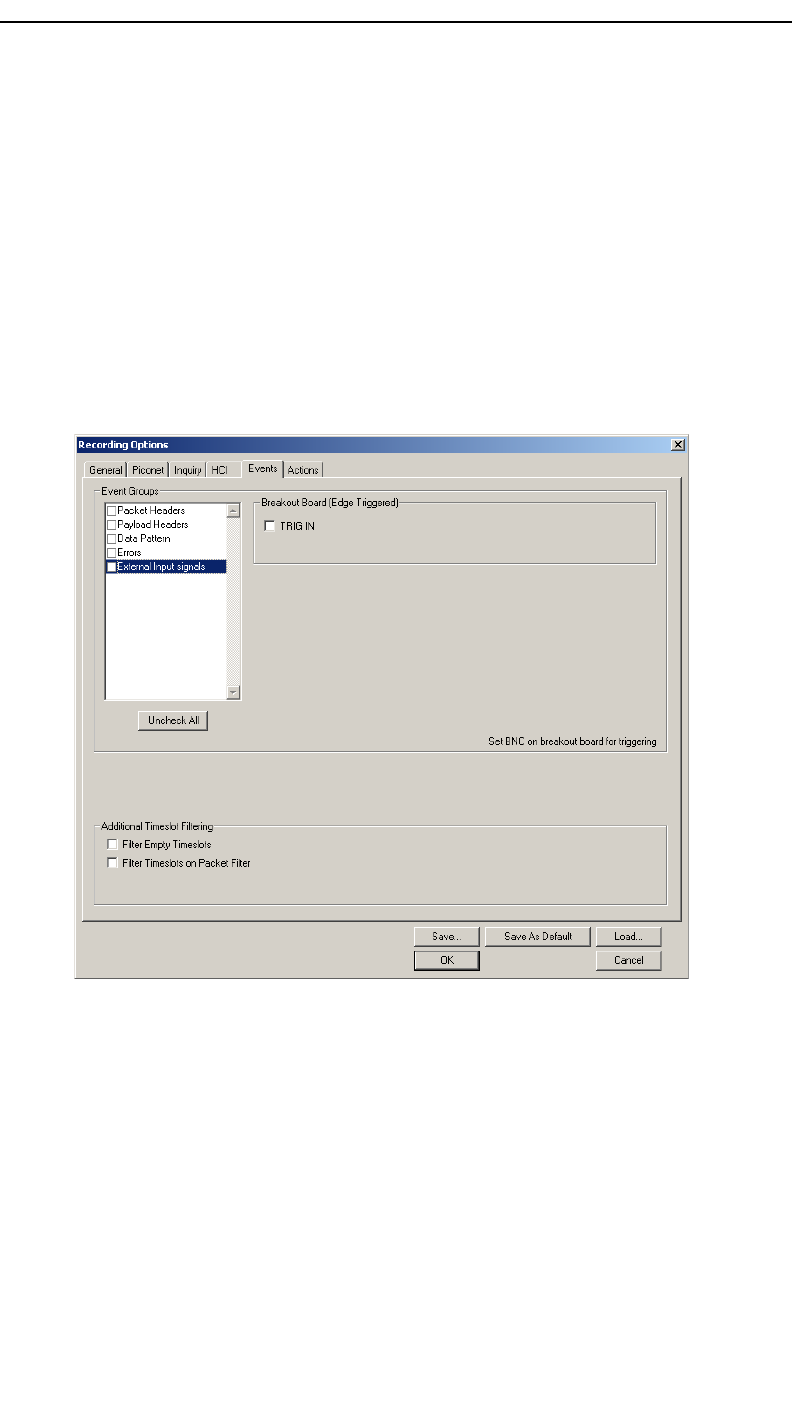
External Input Signals
Selecting "External Input Signals" causes the analyzer to trigger on an
external signal received from the breakoutboard.
Breakout Board (Edge Triggered)
The following names are derived from pins on the CATC-provided breakout
board.
•TRIG IN - Selectable Edge triggered inputs. Will trigger on any
edge it detects.
85
Merlin II Protocol Analyzer User’s ManualCATC SW Version 2.30
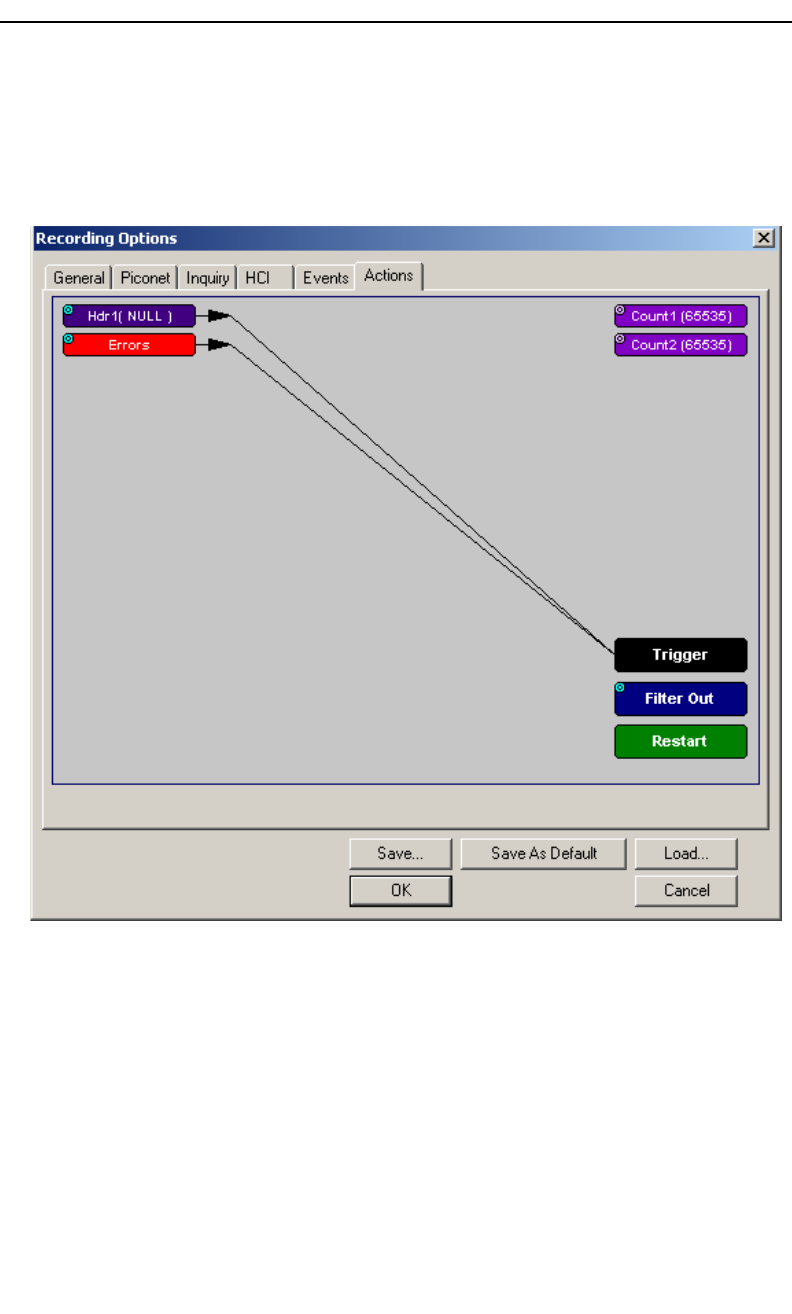
6.7 Recording Options - Actions
The Actions screen allows you to specify the type of action that Merlin II
should perform when it encounters the events specified in the Events
window.
Action Buttons - Their Functions
The Action buttons in the right side of the window provide the means of
setting triggers, filters, and restarts. To set an action, you simply drag your
mouse from an Event to an Action. As described further on, this movement
will link the two via an arrow.
Trigger
The Trigger button enables event triggering.
Filter In/Out
The Filter In/Out button allows events to be filtered in or out of the
recording. Filtering provides a useful method of excluding data from the
trace so you can conserve recording memory.
86
Merlin II Protocol Analyzer User’s ManualCATC SW Version 2.30
Restart
The Restart button causes the two counters Count1 and Count2 to be reset
to zero. It also causes the search for event sequences to restart. Event
sequences are sequences of events that trigger the end of the recording.
Restart buttons provide you with a way of saying "If you see a sequence of
A, B, C, and D, then trigger. However, if you see X anywhere during the
sequence, restart your search."
Count1, Count2
Count1 and Count2 are counters for specifying how many events must occur
before an event can cause a trigger. Counters allow conditions to be made
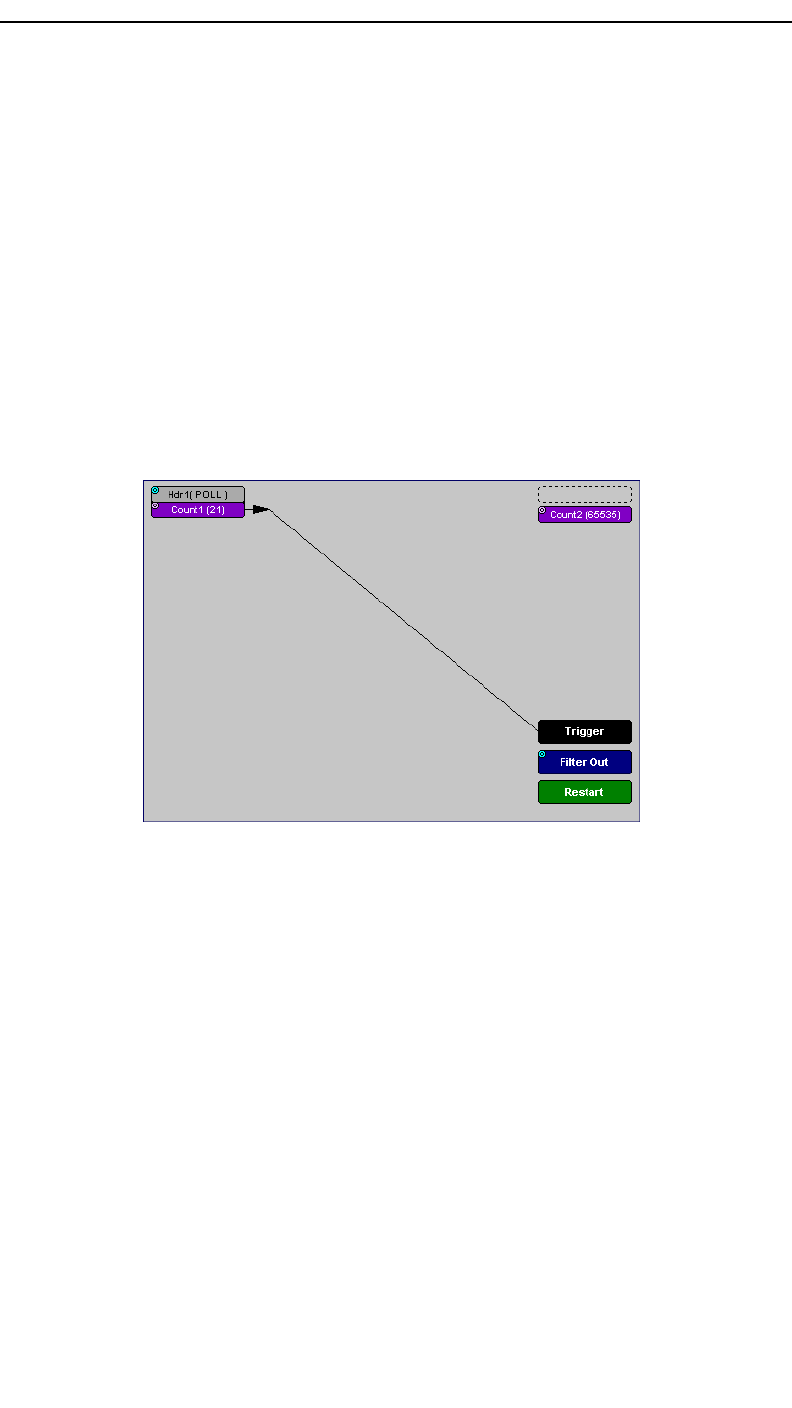
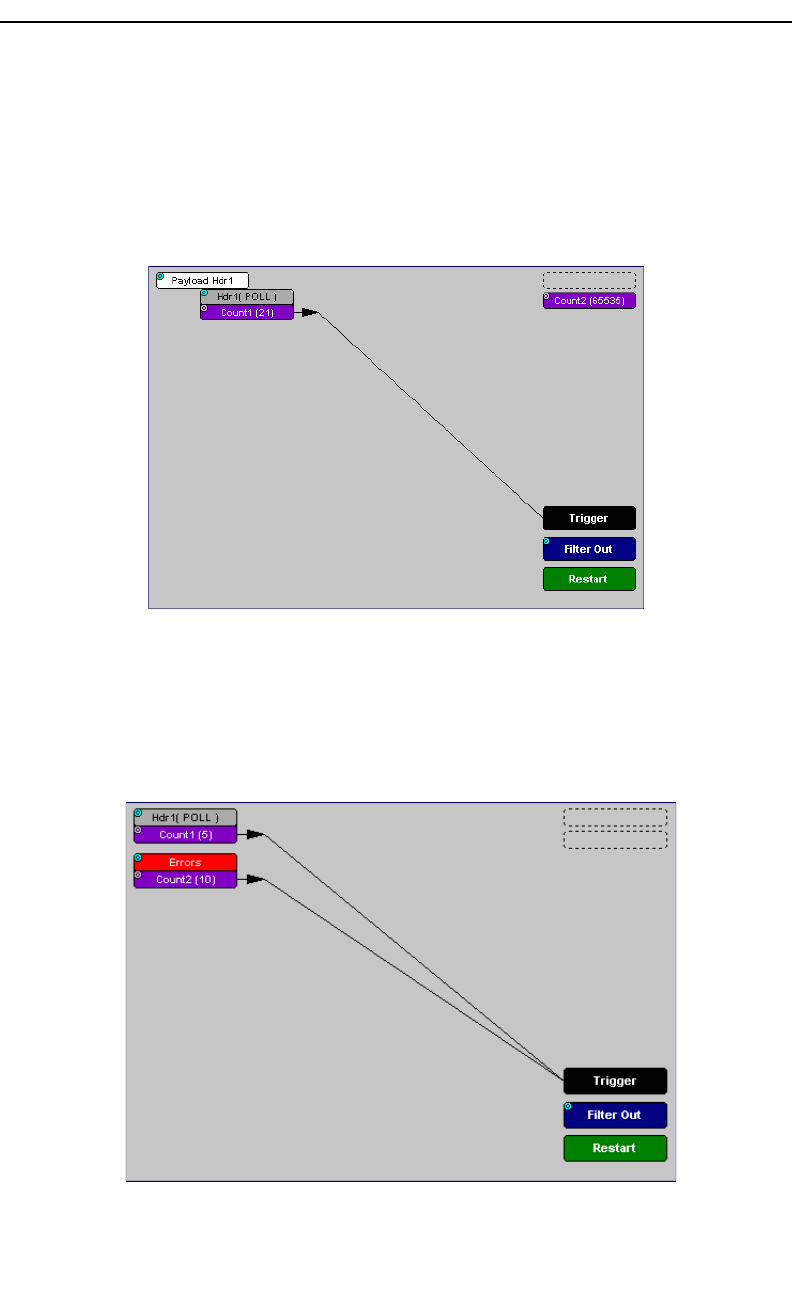
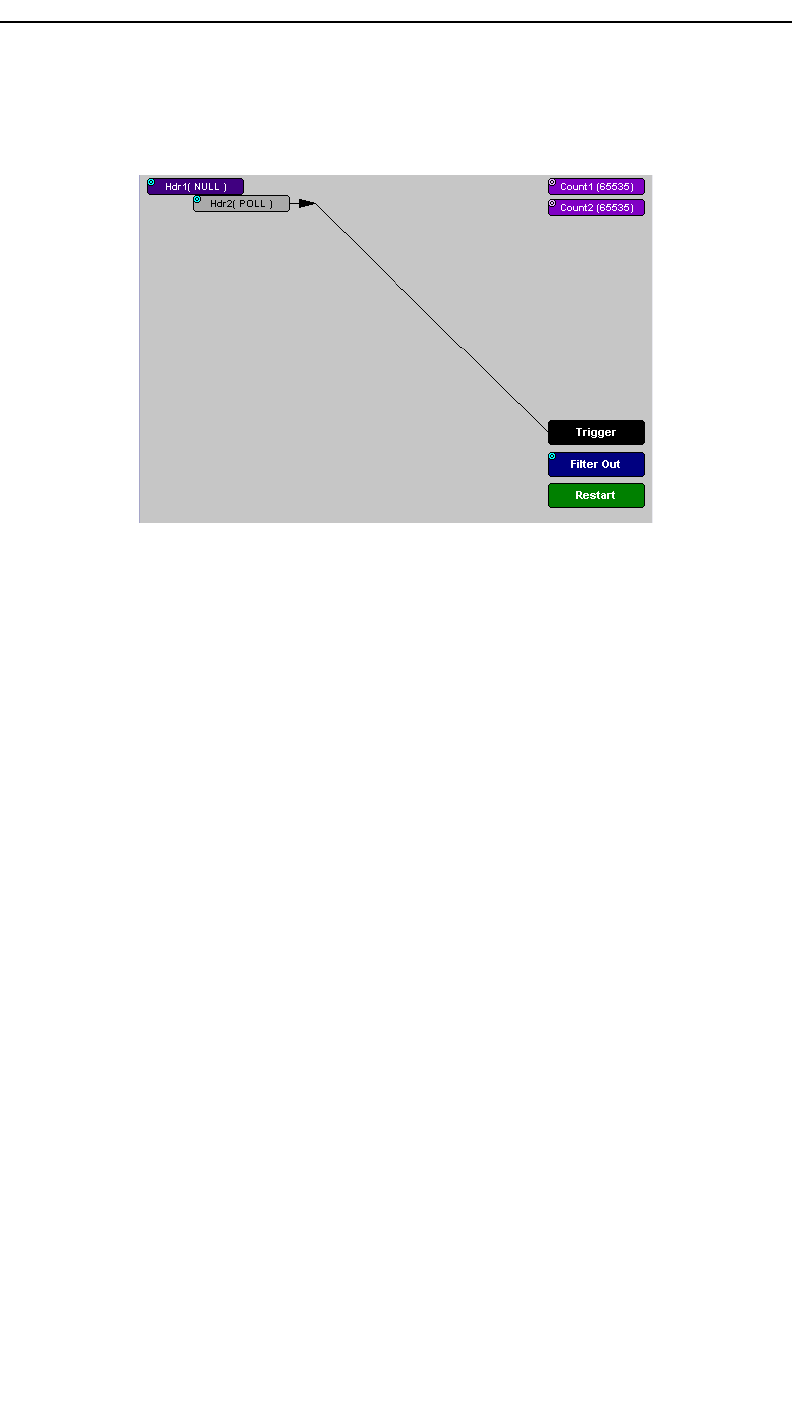
such as "Trigger after the 21st Poll packet" (see screenshot below).
The Actions window showing a condition based on a Poll packet and a
counter. This condition reads "Trigger after the 21st Poll packet."
Connecting Events to Counters
To connect an event to a counter, click an Event button, then click one of the
two counter buttons. The Counter will reposition itself immediately below
the event. A line will the connect the counter to the Trigger button.
This latter connection between the Counter button and the Trigger button
occurs because counters always work in association with triggers. Counters
act as assistants to triggers.
Setting Multiple Conditions with Counters
You can create multiple event conditions by linking a counter to multiple
events or by linking two counters to two or more events.
87
Merlin II Protocol Analyzer User’s ManualCATC SW Version 2.30
Linking Multiple Events to One Counter - When two or more Events are
strung together and then connected to a counter, the event button that is
touching the counter gets counted. The example below reads "Trigger after
you see a sequence of a packet with the specified payload followed by a 21
null packets."
Linking Two Events to Two or More Counters - If an Event is linked to
Count1 and a second event is linked to Count2, it creates an "or" statement.
This statement reads "Trigger when Count1 OR Count2 has reached their
specified values."
This example reads "Trigger when Count1 has counted 5 Poll packets or
Count2 has counted 10 errors."
88
Merlin II Protocol Analyzer User’s ManualCATC SW Version 2.30
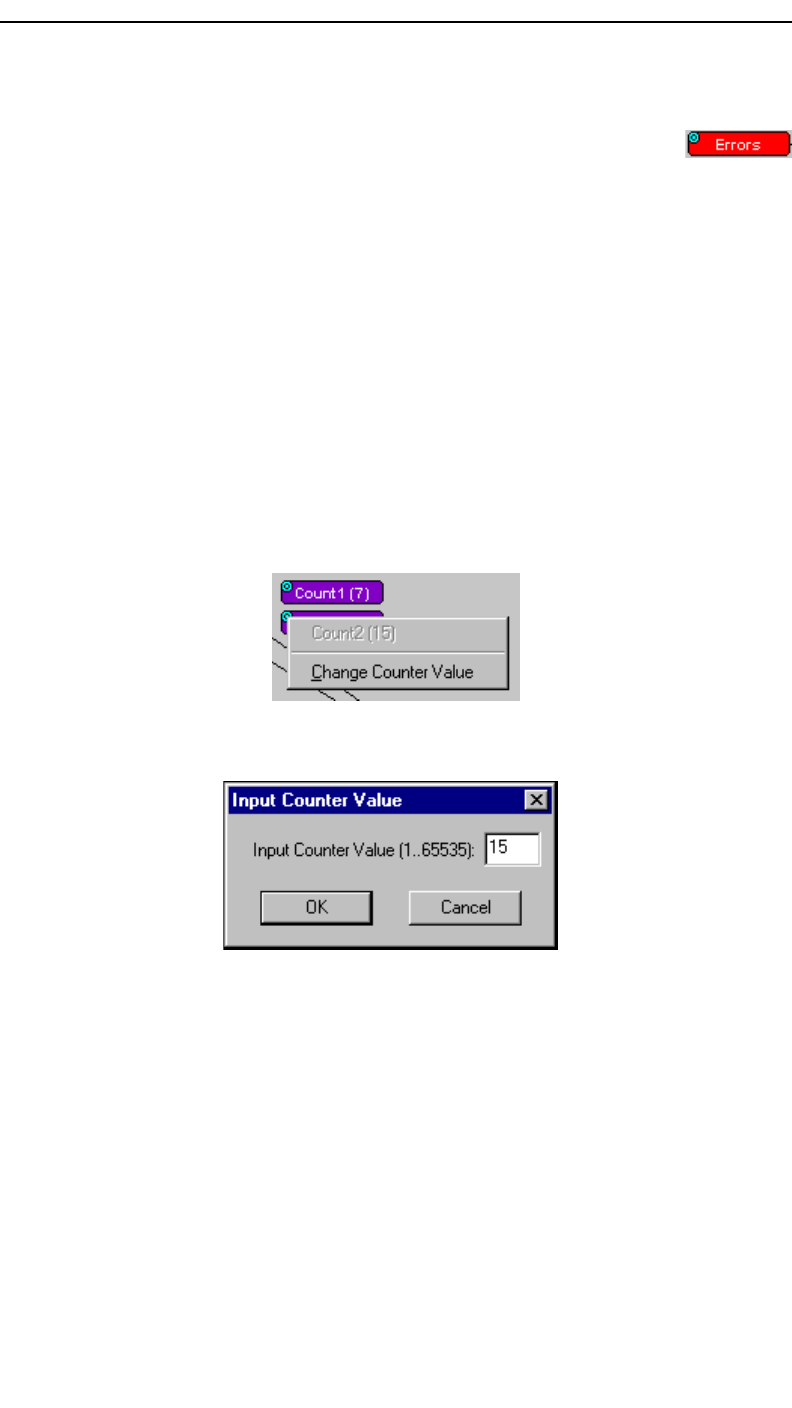
Blue Dot Menus
Count1, Count2 and a few other buttons in the Actions
window have blue dots in their top left-hand corners that
indicate the presence of context-sensitive menus. These menus
let you set the button’s values and/or operations. Click the left
mouse button on a dot to open the menu.
Counters Blue Dot Menu
The Count1 and Count2 blue dot menus allow the value of their counters
to be changed. The value you specify here tells Merlin II how many
instances of an event must take place before a trigger occurs. The counter
can be set between 1 and 65,535.
To set a Counter,
Step 1 Click on the blue dot in the upper left corner of the Count
button.
You see the Change Counter Value menu:
Step 2 Click Change Counter Value
You see the Input Counter Value menu
Step 3 Enter an input value to tell the Analyzer how many times this
event must occur before triggering the end of a recording
Step 4 Click OK.
Filter Out/In Blue Dot Menu
The Filter Out/In button toggles between "Filter Out" and "Filter In".
•Filter In records ONLY those packets related to the specified
event.
•Filter Out records all packets EXCEPT those related to the
specified event.

89
Merlin II Protocol Analyzer User’s ManualCATC SW Version 2.30
To filter an event in or out of a recording,
Step 1 Click the blue dot on Filter Out. (Note: the button may say
Filter In depending on the last action specified.)
You see the Filter Out/In menu:
Use this menu to toggle the selection between Filter Out and Filter In.
Step 2 Select "Filter In".
The button changes to read "Filter In".
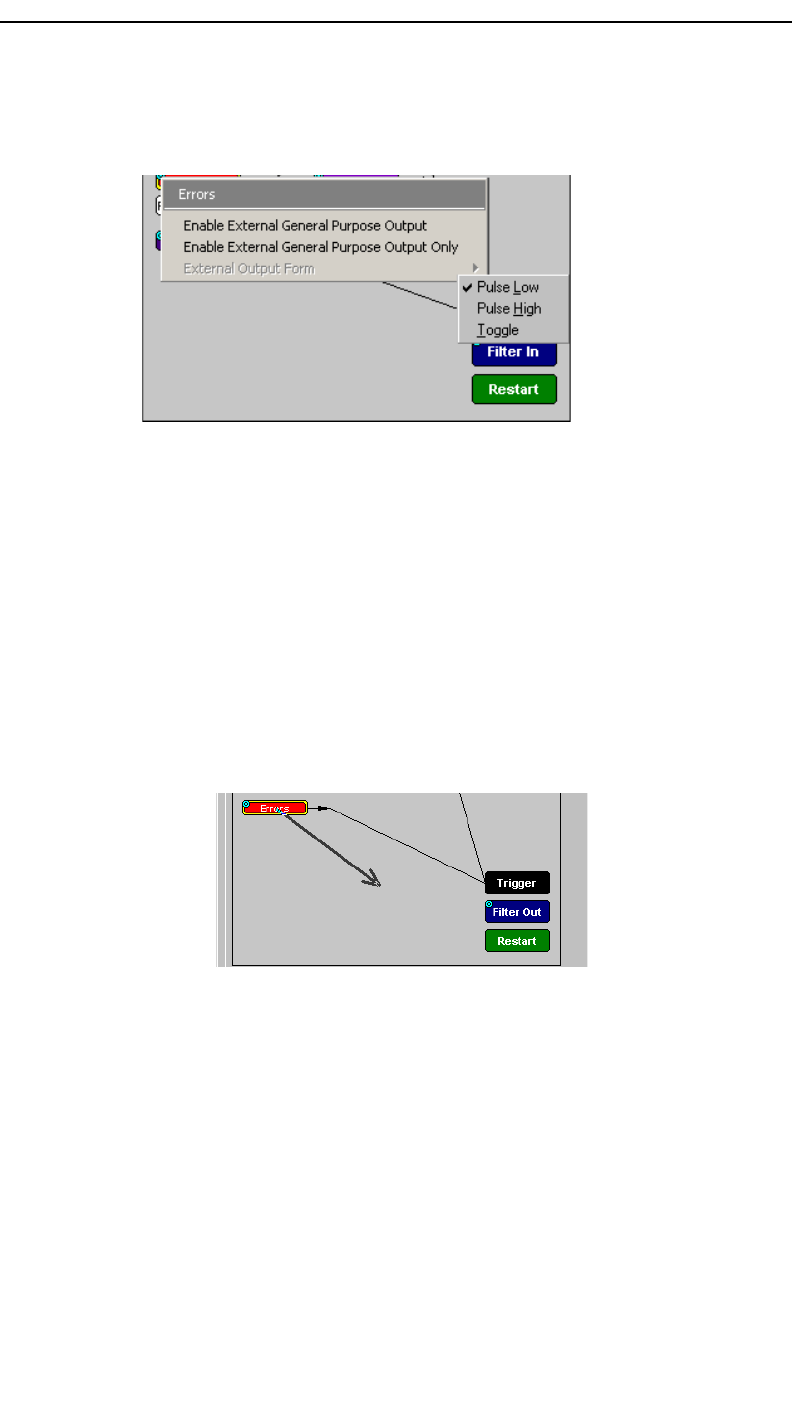
Enabling High Pulse, Low Pulse or Pulse Toggle Signal Outputs
Once External Trigger Output has been enabled, you can configure the
output signal to one of three formats:
Pulse High - This is the default format. The Pulse High setting causes the
Analyzer to transmit a 5 volt, 16.66 nanosecond signal.
Pulse Low - This format causes the Analyzer to transmit a -5 volt, 16.66
nanosecond signal.
Toggle - This format causes the Analyzer to transmit a signal that will
toggle with each trigger event between a continuous 5 volt signal and a
continuous -5 volt signal.
To configure the output signal,
Step 1 Click the blue dot on an Event button that has a small arrow
attached to it like the one shown above.
A Blue Dot Menu will open. "External Trigger Form" should be a
choice available. If it is not, you will need to choose "Enable External
Trigger" and then reopen the menu.
90
Merlin II Protocol Analyzer User’s ManualCATC SW Version 2.30
Step 2 Choose "External Trigger Form"
A menu will appear with choices for "Pulse Low", "Pulse High", and
"Toggle".
Step 3 Choose an option not currently selected.
The menu closes.
Step 4 Reopen the menu.
Note that your new selection is now checked.
Elastic Arrow
Elastic arrows allow you to associate Events, Counters, and Actions. To
make an association,
Step 1 Click the left mouse button on an Event button such as Hdr1
or Errors.
The elastic arrow appears.
Step 2 Drag the arrow to the desired Action button.
Step 3 With the pointer over an Actions button, click again the left
mouse button again.
The arrow is replaced with a black line connecting the Event button to
the Action button.
91
Merlin II Protocol Analyzer User’s ManualCATC SW Version 2.30
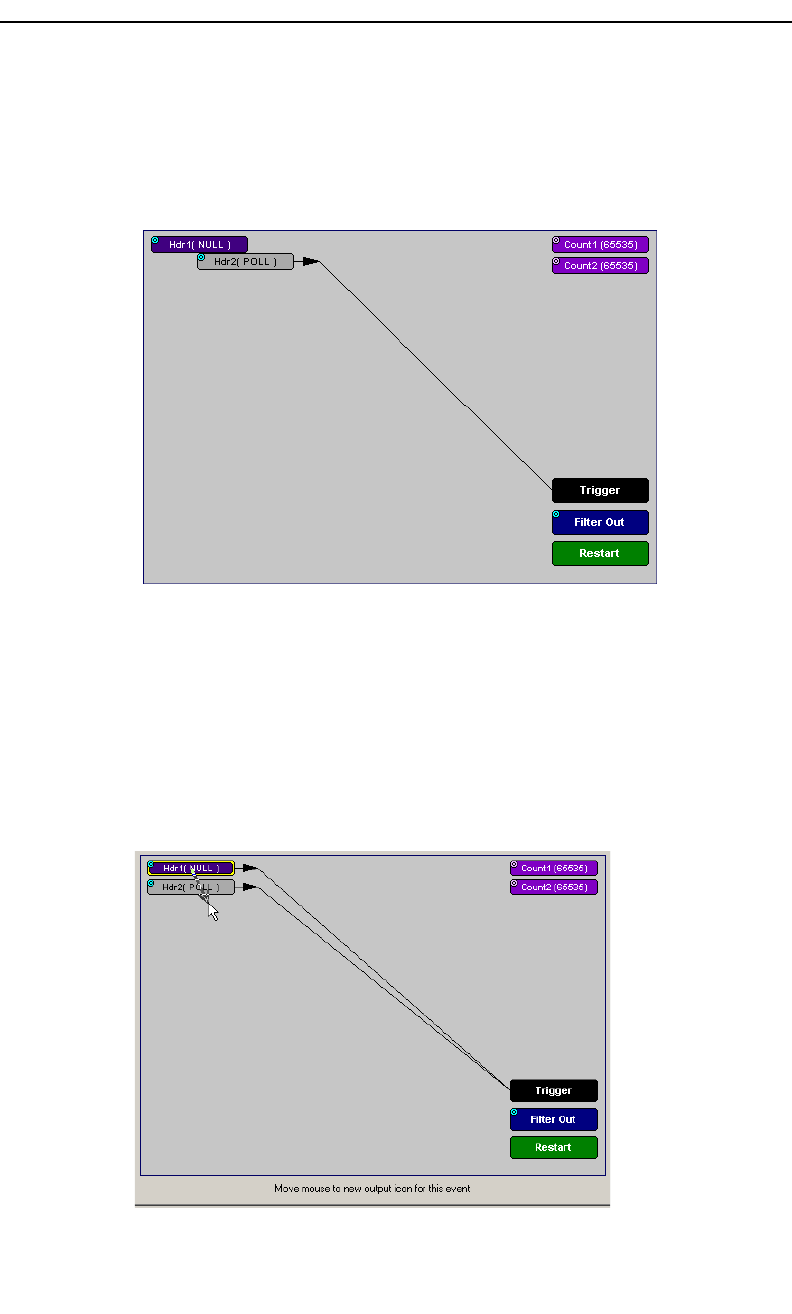
Event Sequencing
If you drag your mouse from one event button to another, you will create a
compound condition known as an Event Sequence. An event sequence is a
condition that says "Trigger when you see the following sequence of
packets." The example below may help to clarify.
This example means "Trigger when you see a packet with an Null Header
followed by a packet with a Poll Header."
To create an event sequence, perform the following steps:
Step 1 Select two events from the Events window
Step 2 Open the Actions window and click on one of the two Event
buttons.
An elastic arrow should appear.
92
Merlin II Protocol Analyzer User’s ManualCATC SW Version 2.30
Step 3 Click on the other event.
The arrow should connect to the second button and the second button
should instantly change locations to the center section of the window.
6.8 Saving Recording Options
To complete your Recording Options settings, use the features at the bottom
of the Recording Options screen. These features remain the same no matter
which of the three Recording Options screens you are working in.
•Click Save to save the currently specified Recording Options for
use in future recording sessions. Any file name can be specified,
though use of the .rec is recommended; if no extension is
specified, .rec is added by default.
•Click Load to load a previously saved *.rec file, thus restoring a
previous set of Recording Options. You can also load the
recording options from trace files.
• The Save as Default function is equivalent to the Save function,
specifying the file name default.rec. Whenever you start up the
Analyzer, it automatically loads the default.rec file if one exists.
•Click OK to apply any changes and close this dialog box.
•Click Cancel to cancel any immediate changes you have made
and exit the Recording Options menu.
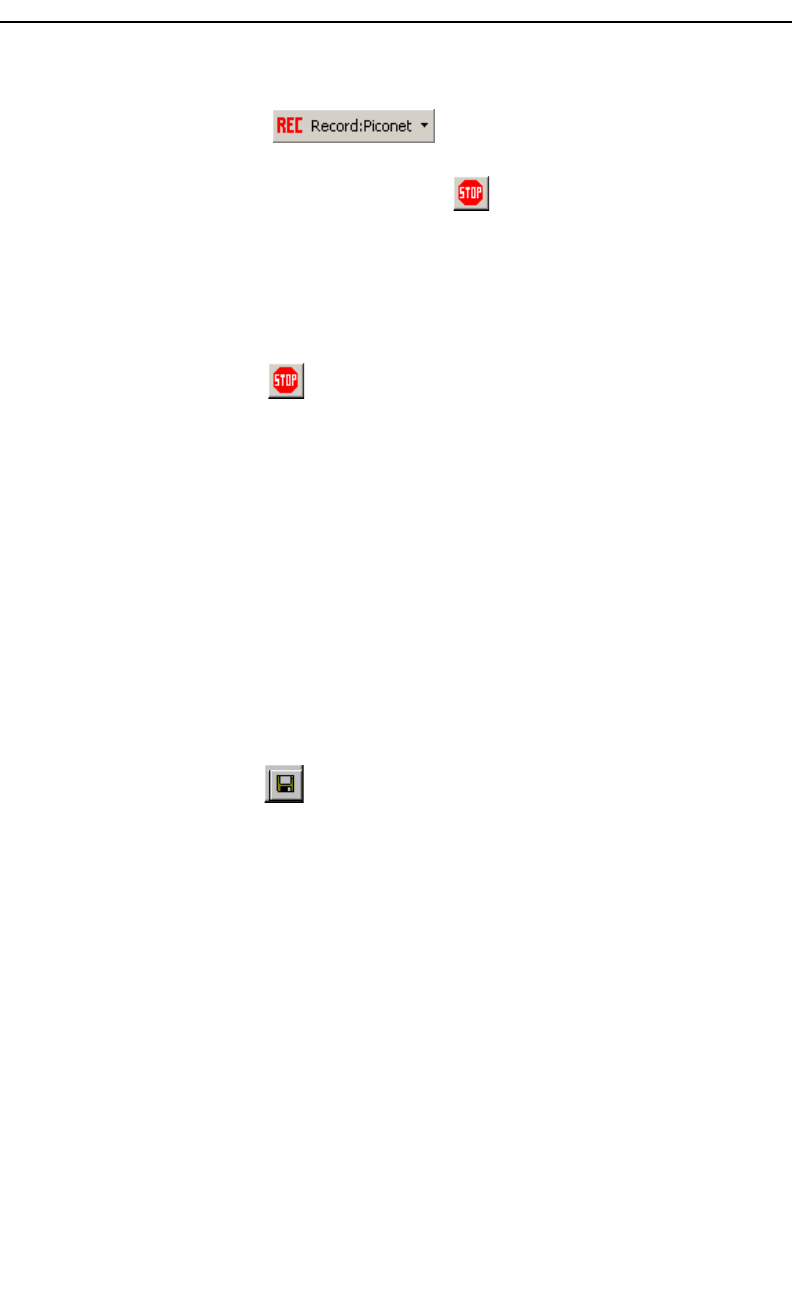
6.9 Recording Bluetooth Traffic
To start a recording once the appropriate Recording Options have been set,
Step 1 Select Start under Record on the Menu Bar
93
Merlin II Protocol Analyzer User’s ManualCATC SW Version 2.30
OR
Click on the Tool Bar.
Your recording session can continue until it has finished naturally or you
may need to stop manually by clicking on the Tool Bar, depending on
how you set the Recording Options.
To manually stop recording,
Step 2 Select Stop under Record on the Menu Bar
OR
Click on the Tool Bar.
Note The manual Stop Recording feature is primarily of use when recording
low-volume traffic, which can take a long time to fill the recording buffer.
When the recording is finished, the bus traffic is saved to the hard drive as
a file named data.tfb or whatever name you assign as the default filename.
If you have enabled the recording is serial HCI traffic from IUT, then a
second trace file is created called data_hci.tfb.
To save a current recording for future reference,
Step 3 Select Save As under File on the Menu Bar.
OR
Click on the Tool Bar.
You see the standard Save As screen.
Step 4 Give the recording a unique name and save it to the
appropriate directory.

94
Merlin II Protocol Analyzer User’s ManualCATC SW Version 2.30
95
Merlin II Protocol Analyzer User’s ManualCATC SW Version 2.30
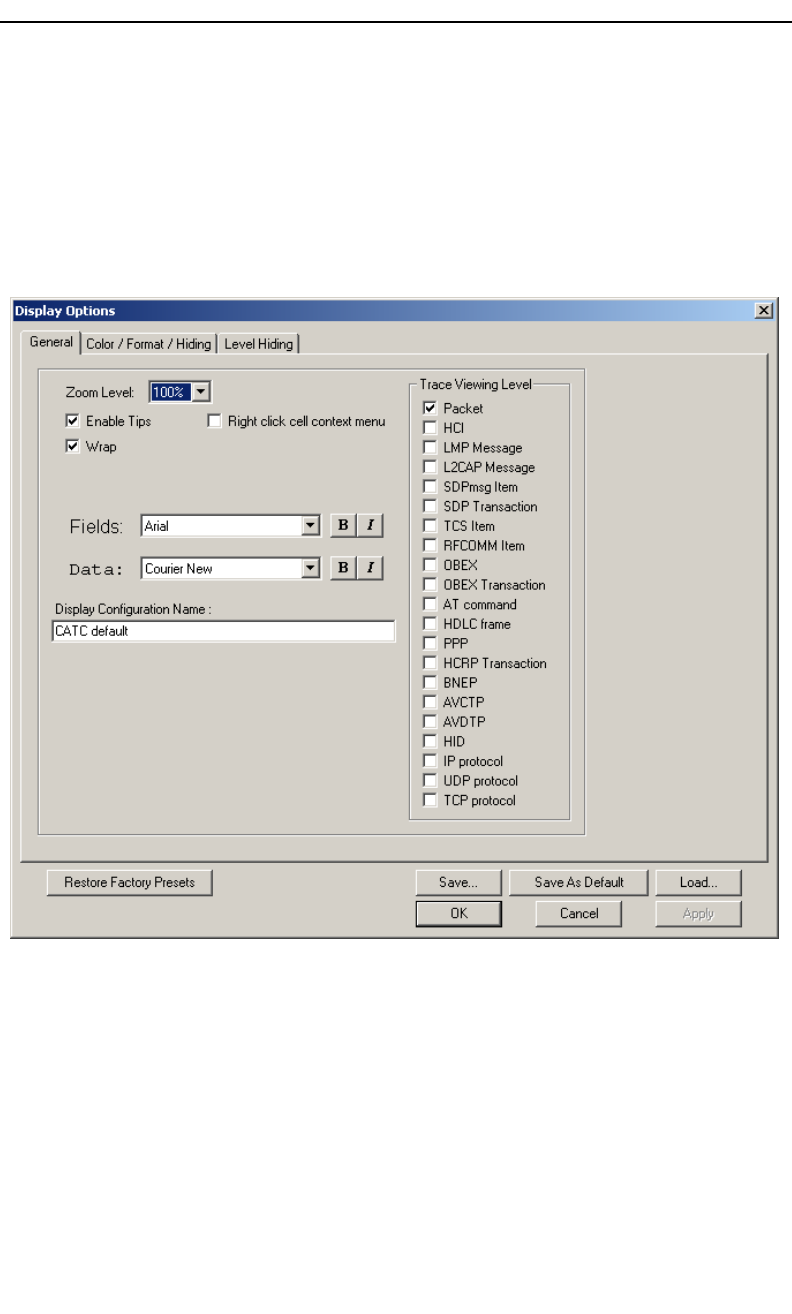
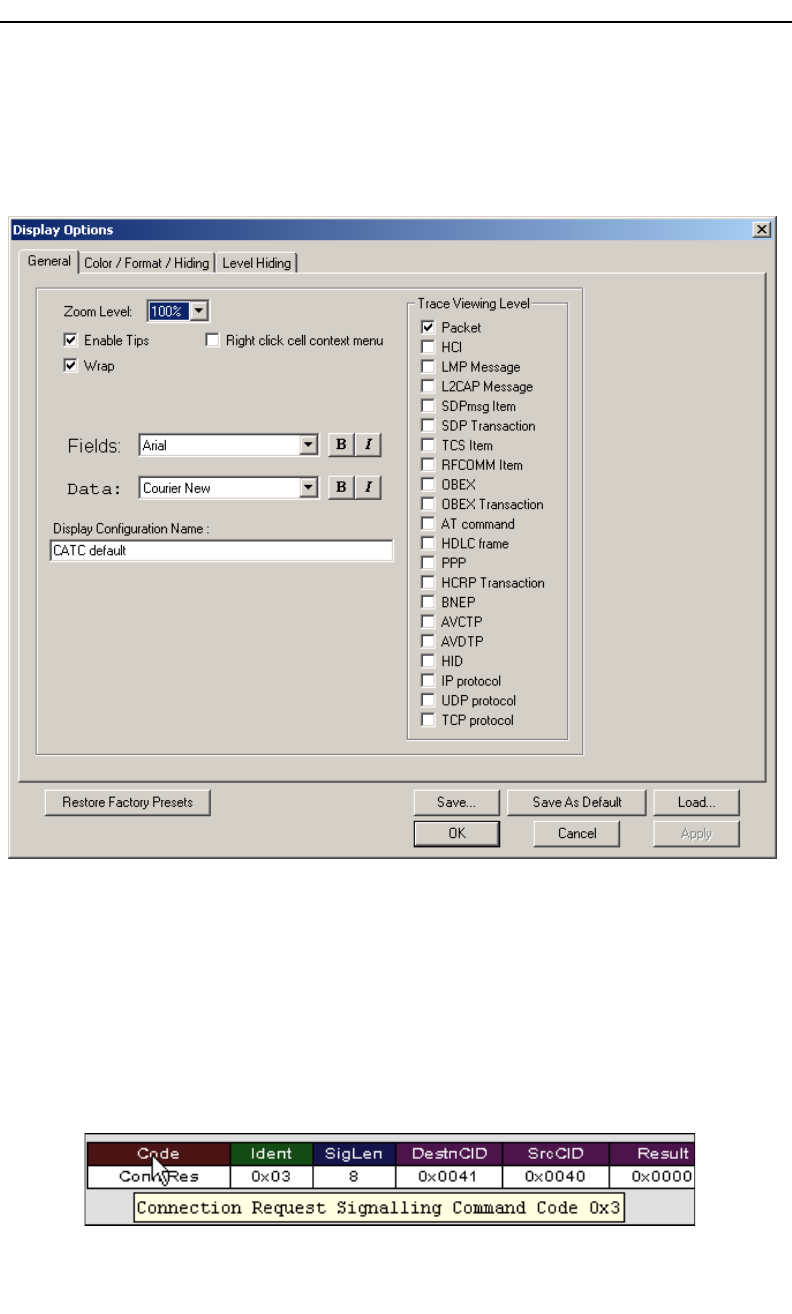
7. Display Options
Use the Display Options menu to specify the way CATC Trace information
is displayed.
From the Setup menu, select Display Options.

96
Merlin II Protocol Analyzer User’s ManualCATC SW Version 2.30
7.1 General Display Options
Use the General Display Options to specify the basic appearance of a Trace
view.
•Zoom Level: Adjustable in discrete increments from 10% to 200%
percent.
•Enable Tips: Select to enable Tool Tips with explanation text to
pop up when you position your cursor over various fields in the
Trace View.
•Wrap: Causes packets to wrap within the window if their length
exceeds the width of the window.
• Right click cell context menu: Activates the right mouse button
for opening cell context menus.
•Trace Viewing Level: Allows you to select the hierarchical level at
which traffic is displayed.
•Fields: Configures the appearance of field text within the trace.
•Data: Configures the appearance of data within the trace.
•Display Configuration Name: Comment field associated with the
*.opt file containing the current Display Options values. You can
also create and store your unique Display Options for future use.
To create a new Display Options file, follow these steps:
Step 1 Enter a comment for the new file in the Display
Configuration Name field.
Step 2 Click Save...
Step 3 Specify a filename (*.opt).
Step 4 Click Save.
97
Merlin II Protocol Analyzer User’s ManualCATC SW Version 2.30
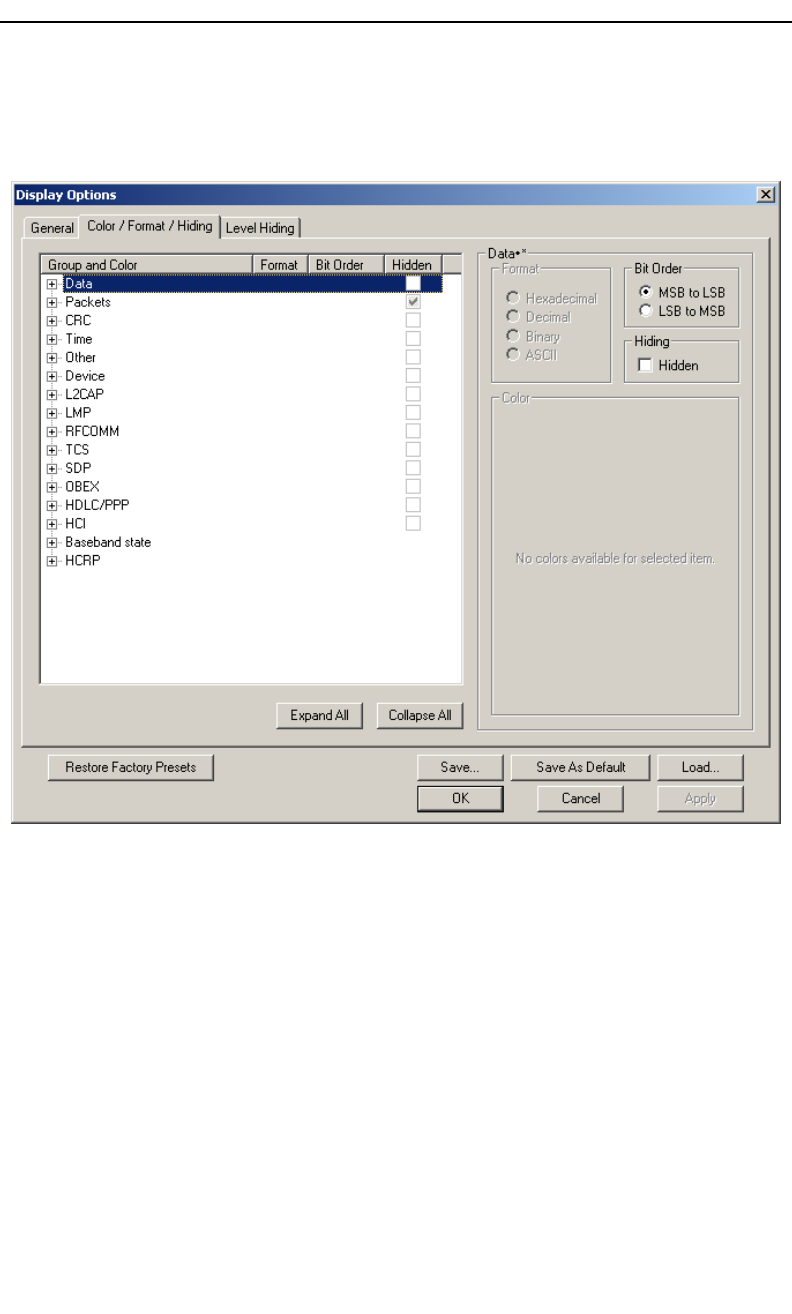
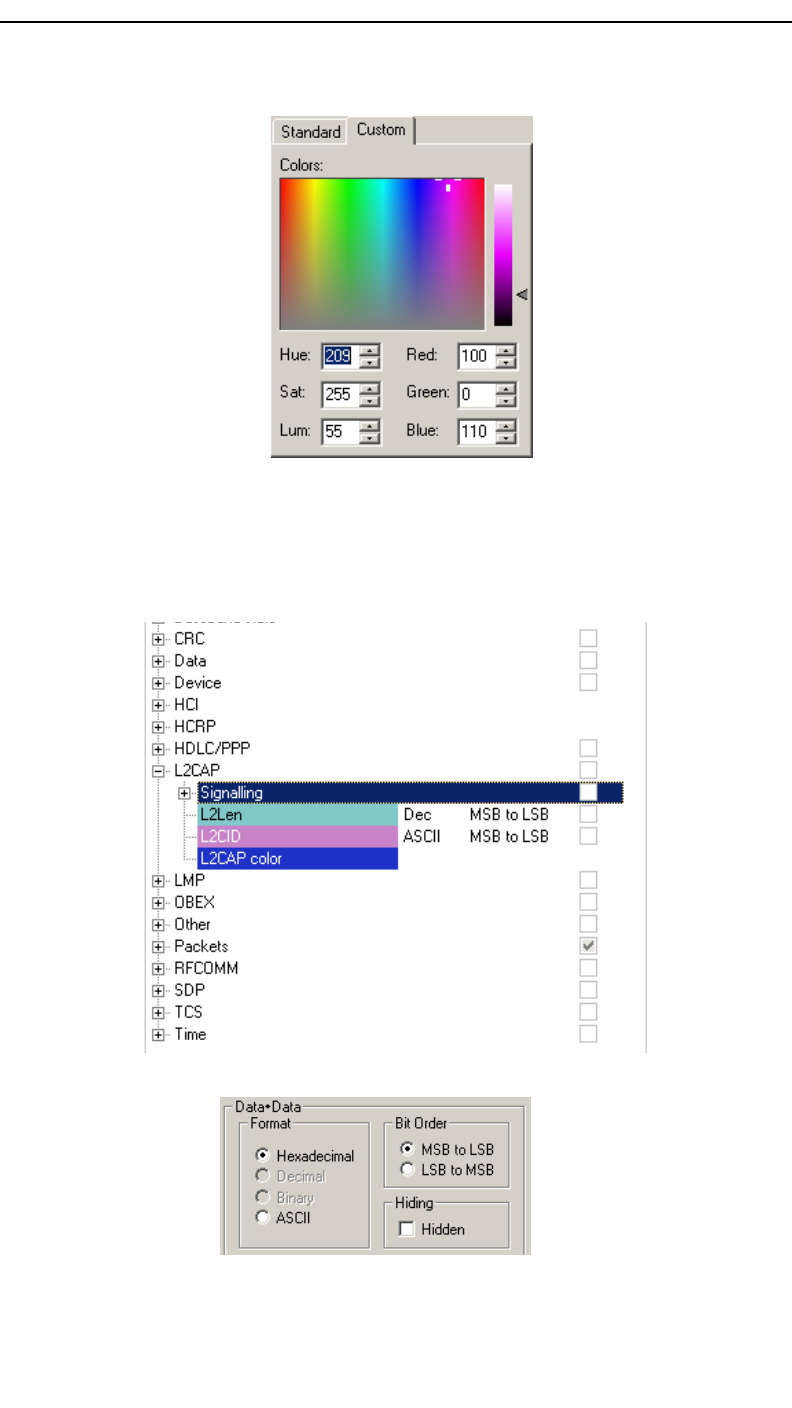
7.2 Setting Color, Formatting, and Hiding Options
Click the Color/Format/Hiding tab on the Display Options screen.
Use this window to customize the colors and formats associated with each
field in the Trace view. You can also use this window to hide fields within
the trace.
Setting Color Display Options
To change the colors of elements in the trace, select an item in the Group
and Color column and use the color pallet screen on the right to make the
desired changes.
Note The color of an Invalid Data (packet error) field cannot be
changed; it is permanently set to red.
Use this window to customize the colors associated with each field in the
trace. You can experiment with these options to achieve the color
combination best suited to a particular graphic system.
98
Merlin II Protocol Analyzer User’s ManualCATC SW Version 2.30
You can also customize the colors by using the options in the Custom tab.
Changing Field Formats
To change field formats, select an item under the Group and Color column.
This action will enable the formats radio buttons on the right. The format
types change with respect to the item selected under the Group and Color
column. For example, if L2CAP is selected, the following displays:
The following formats are available:
Note Not every format is available for every item.
99
Merlin II Protocol Analyzer User’s ManualCATC SW Version 2.30
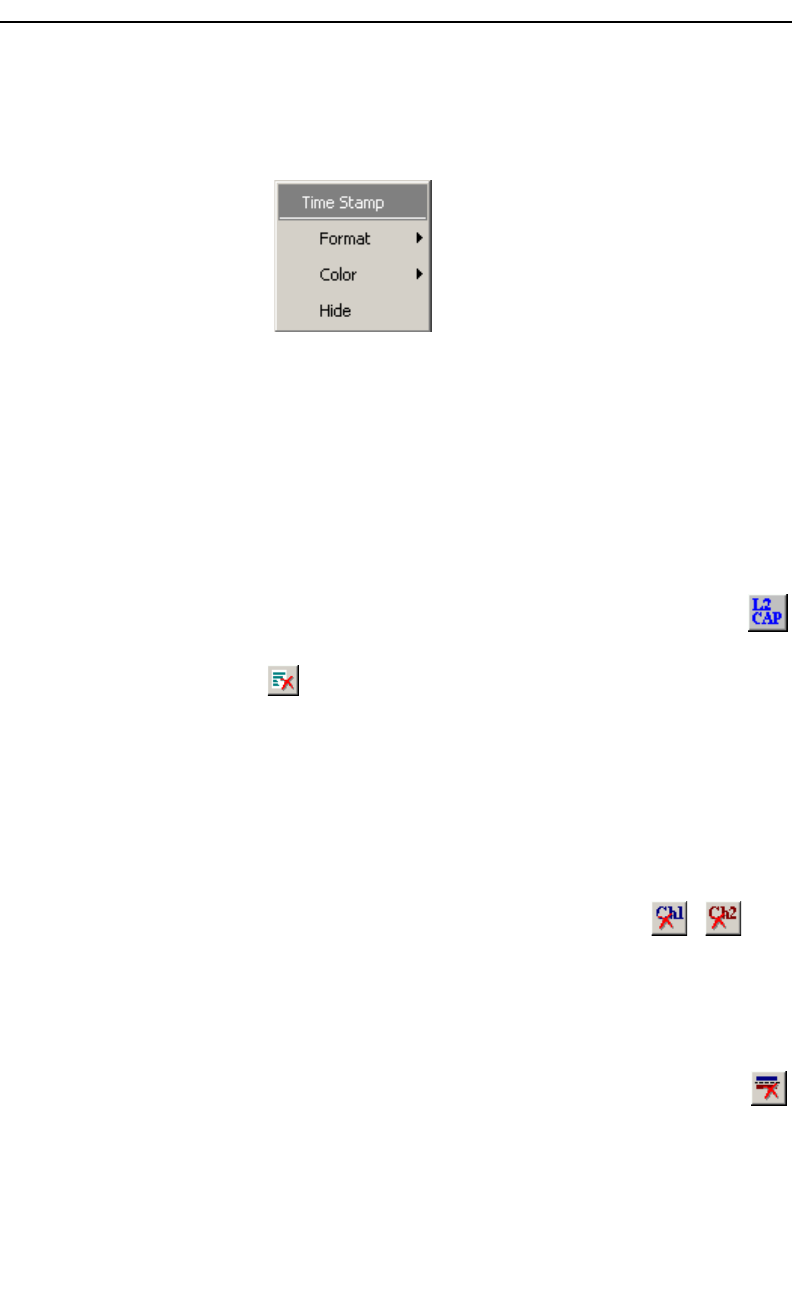
Hiding Display Options
To hide one or more fields in the trace, select the
appropriate item from the Group and color column, click
the checkbox marked Hidden, and click the Save button.
You can also hide Sequences from a trace by selecting the desired options
from the checkboxes.
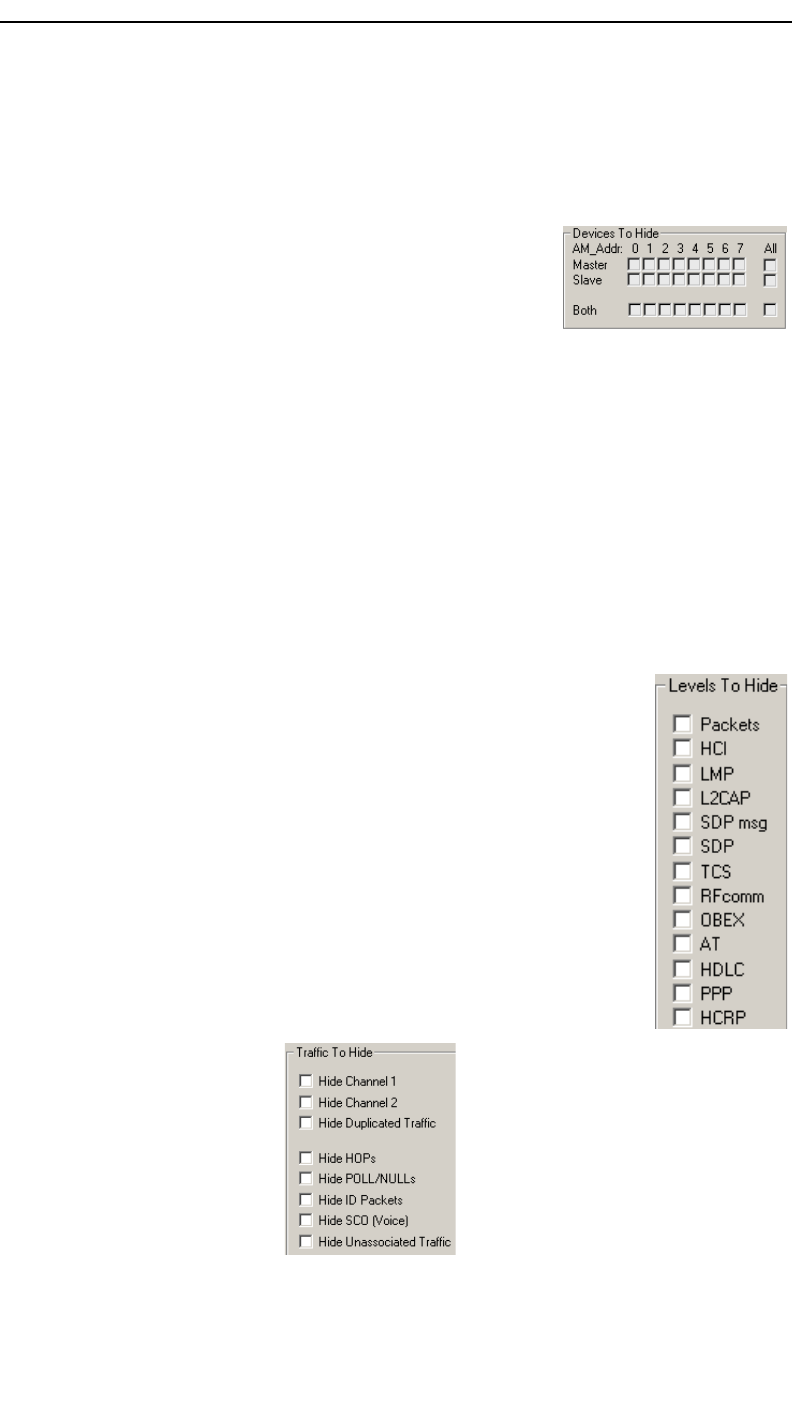
7.3 Level Hiding Options
The Level Hiding tab allows you to hide various types of traffic. To hide
traffic, select one or more items, then click Save.
Level Hiding Parameters
Use the Hiding window to hide various fields, packets, messages, and
protocols from the Trace View screen. You can modify these settings at will
to display a specific area of a Trace.
Hiding Fields
The "Hide Fields" checkboxes allow individual fields to be hidden within a
trace. Click the checkbox(es) of your choice to hide one or more fields.
100
Merlin II Protocol Analyzer User’s ManualCATC SW Version 2.30
Hiding Packets, Messages, and Protocols
The "Hide Packets and Transactions" box contains two grids of checkboxes
for hiding whole packets, messages, protocols, and traffic from individual
devices. The grids are labeled "Devices to Hide" and "Levels to Hide".
Devices to Hide
The "Devices to Hide" grid lets you hide traffic
according to device address. The grid divides into
columns which represent different devices.
Columns labeled "0" through "7" and "All" represent the Active Member
Address of a device. By checking one of the boxes in a column, you hide
the traffic of the selected device (or traffic from all devices if you have
selected All.)
The row in which you place your checkmark determines whether you are
hiding traffic going to or from a device.
• Master - Hide traffic from a Master to selected Slaves
• Slave - Hide traffic from selected Slaves to the Master
• Both - Hide all traffic between the Master and selected Slave
Example: to hide all traffic from a Master to a Slave device
with an address of six, click the checkbox under column 6
on the row marked Master.
Levels to Hide
The "Levels to Hide" grid divides into rows which represent
the different packet, message, and protocol levels. Clicking
a checkbox will cause Merlin II to hide all traffic of a
selected level.
Traffic To Hide
At the bottom of the Hiding tab of the Display Options
window are check boxes for hiding HOPs, POLLs, NULLs,
and other kinds of traffic.

101
Merlin II Protocol Analyzer User’s ManualCATC SW Version 2.30
7.4 Saving Display Options
To complete your display options settings, use the features at the bottom of
the Display Options window. These features remain the same no matter
which of the four Display Options windows you are working in.
• Click Save to save the currently specified display options for use in
future sessions. Any file name can be specified, but you must use
the .opt extension. If no extension is specified, .opt is added by
default.
• Click Load to load a previously saved *.opt file, thus restoring a
previous set of display options.
• The Save as Default function is equivalent to the Save function,
specifying the file name default.opt. Whenever you start up the
Analyzer, it automatically loads the default.opt file if one exists.
• Click OK to apply any changes you have made to Display Options
and close this dialog box.
• Click Cancel to cancel any immediate changes you have made and
exit the Display Options menu.
• Click Apply to apply your changes while keeping the Display
Options window open.

102
Merlin II Protocol Analyzer User’s ManualCATC SW Version 2.30
103
Merlin II Protocol Analyzer User’s ManualCATC SW Version 2.30
8. Reading a CATC Trace
8.1 Trace View Features
•The Merlin II packet view display makes extensive use of color and graphics
to fully document the captured traffic.
•Packets are shown on separate rows, with their individual fields both labeled
and color coded.
•Packets are numbered (sequentially, as recorded), time-stamped, and
highlighted to show the device status (master or slave).
•Display formats can be named and saved for later use.
•Pop-up Tool Tips annotate packet fields with detailed information about their
contents.
•Data fields can be collapsed to occupy minimal space in the display (which can
in turn be zoomed in and out to optimize screen utilization).
•The display software can operate independent of the hardware and so can
function as a stand-alone Trace Viewer that may be freely distributed.
8.2 Interpreting the Displayed Information
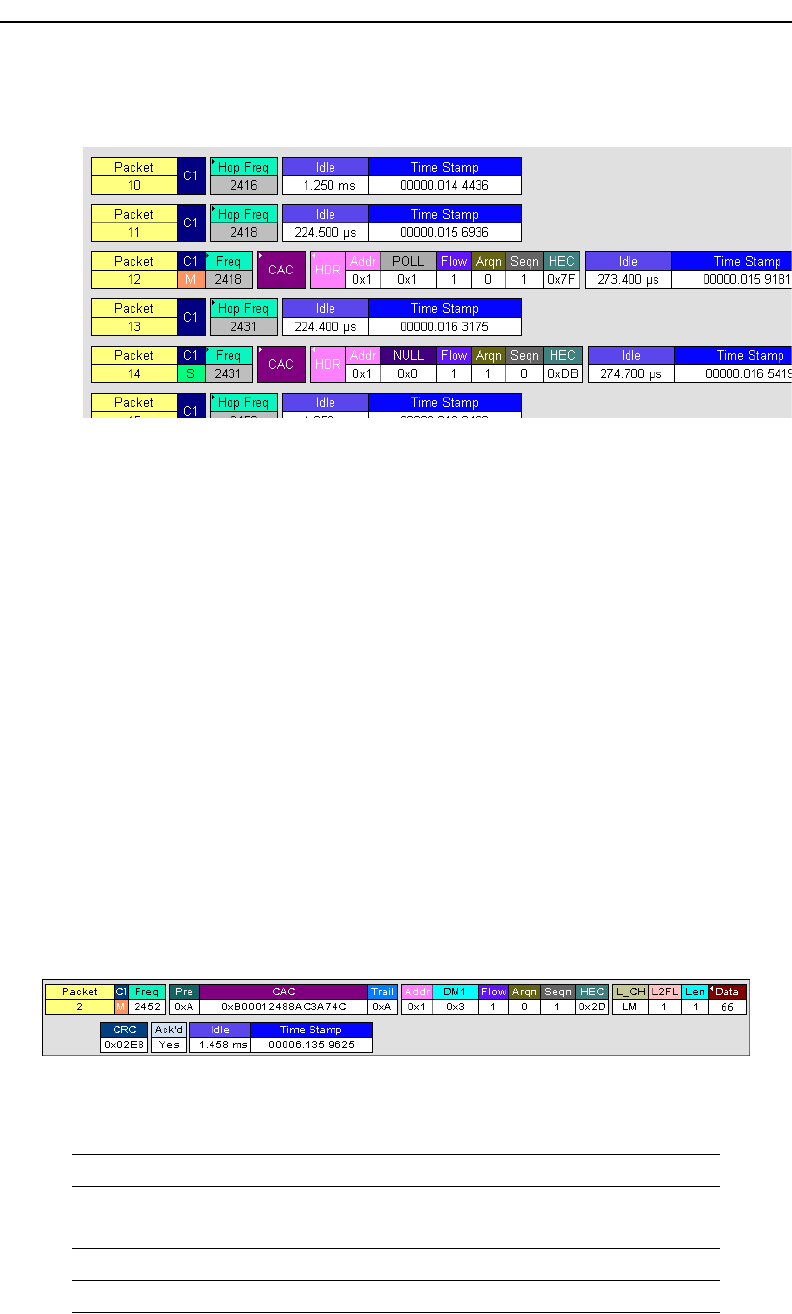
The following table describes some of the abbreviations used in the
BTTracer display. Packet #0 is described from left to right:
Packet:# Packet/Event Number
C1/M, C2/S M =Master Device Transmitting; S = Slave Device Transmitting
C1 = Channel 1; C2 = Channel 2
Freq Current Hop Frequency (in MHz)
Pre Preamble of the Sync word

104
Merlin II Protocol Analyzer User’s ManualCATC SW Version 2.30
8.3 Tooltips
You can get additional information about each field in a trace by holding
your mouse pointer over a field. A tooltip will appear with details about the
field.
8.4 Set Marker
Note Set Marker works in conjunction with the Go to Marker feature.
CAC Channel Access Code
Trail Access Code Trailer of the Sync word
Addr Active Member Address
DM1 DM1 Packet Type
Flow ACL Link Flow Control
Arqn Acknowledgment Indication Flag
Seqn Sequential Numbering
HEC Header Error Correction Code
L_CH LMP Message
L2FL L2CAP Flow Control Flag
Len Message Length in Bytes including Opcode
TID LMP Transition initiated by Master
Opcode LMP-host_connection_req
CRC Cyclic Redundancy Check
Ack’d Packet Acknowledgment based on subsequent packet’s ARQN with
same LT_ADDR
Idle Idle Time in nanoseconds
Time Stamp Decimal in Seconds.Milliseconds.Microseconds*10
This is the analyzer internal clock as a reference with resolution of
100 ns.
Packet:# Packet/Event Number
105
Merlin II Protocol Analyzer User’s ManualCATC SW Version 2.30
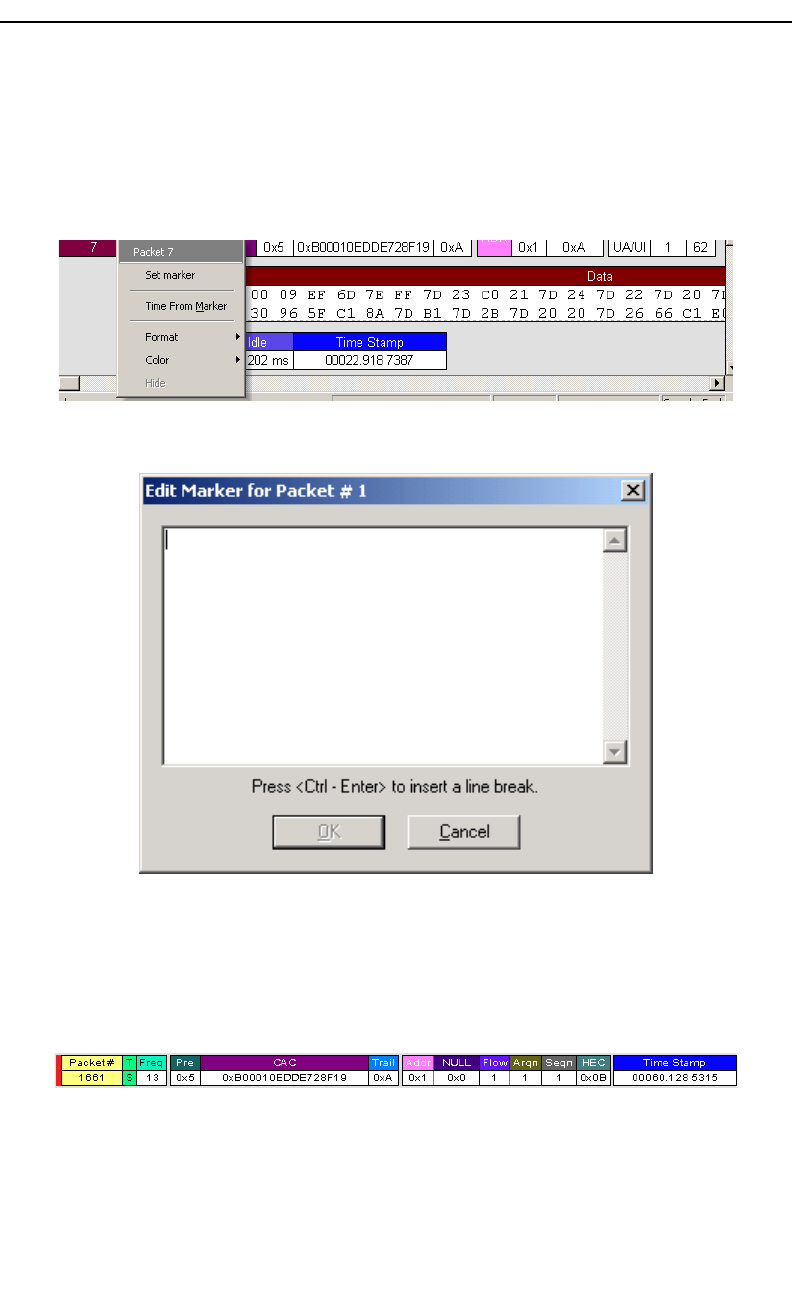
You can define a unique Marker for each packet.
To place a marker on a packet,
Step 1 Left-click on Packet # for the packet you wish to mark.
Step 2 Select Set Marker.
You see the Edit Marker Comment window where you can enter a
unique comment about this packet.:
Step 3 Enter your comment.
Step 4 Click OK.
A marked packet is indicated by a vertical red bar along the left edge of the
packet # block:
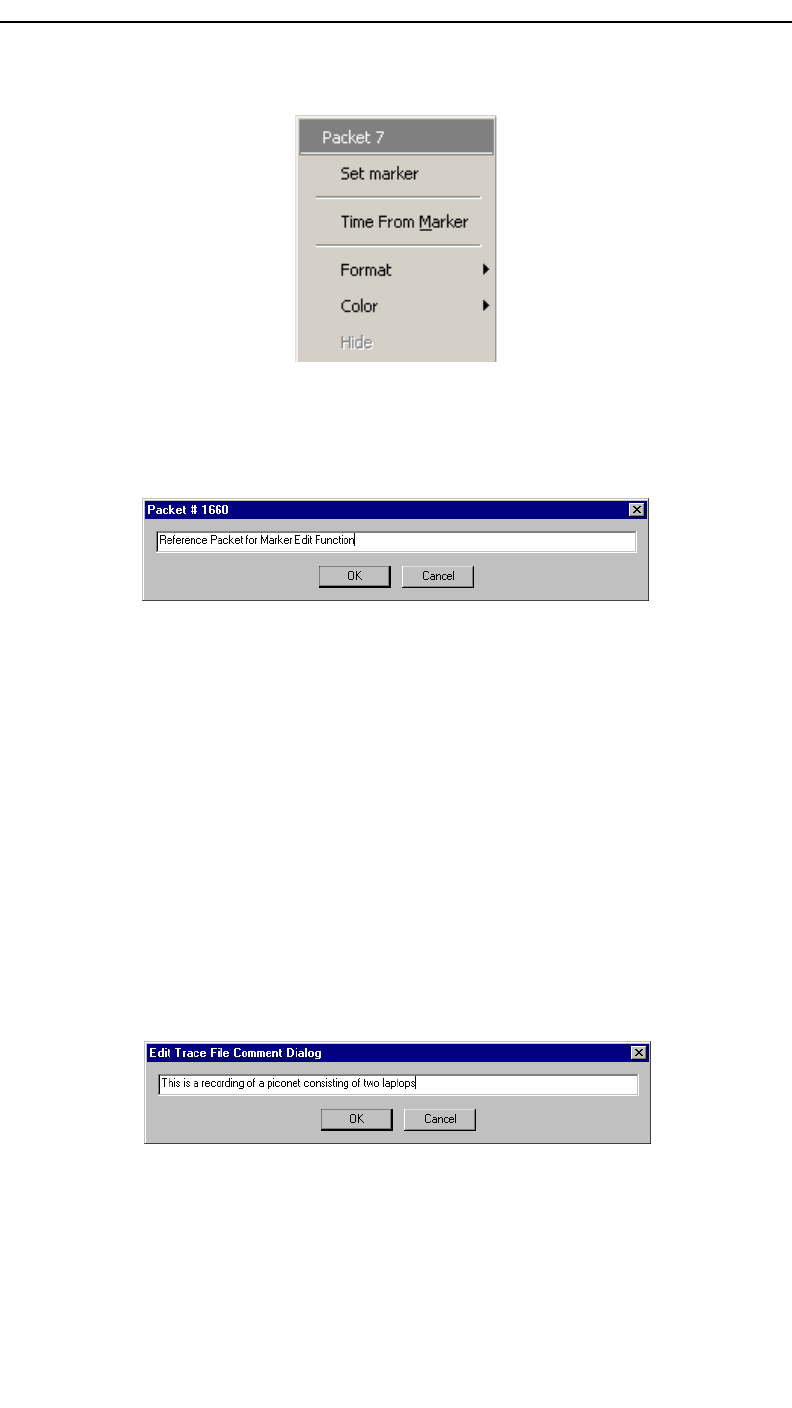
8.5 Edit or Clear Marker
To clear or edit the comments associated with a packet marker,
Step 1 Left-click on Packet # for the chosen packet.
106
Merlin II Protocol Analyzer User’s ManualCATC SW Version 2.30
You see the Packet menu:
To edit the Marker Comment,
Step 2 Select Edit marker.
You see the Edit marker comment window:
Step 3 Edit the comment as desired.
Step 4 Click OK.
To clear a Marker,
Step 5 Click Clear marker.
The vertical red Marker bar disappears.
8.6 Adding Comments to a Trace File
You can create, view, or edit the 100-character comment field associated
with each Trace file.
Step 1 Select Edit Comment under File on the Menu Bar.
You see the Edit comment for trace file window:
Step 2 Create, view, or edit the comment.
Step 3 Click OK.
107
Merlin II Protocol Analyzer User’s ManualCATC SW Version 2.30
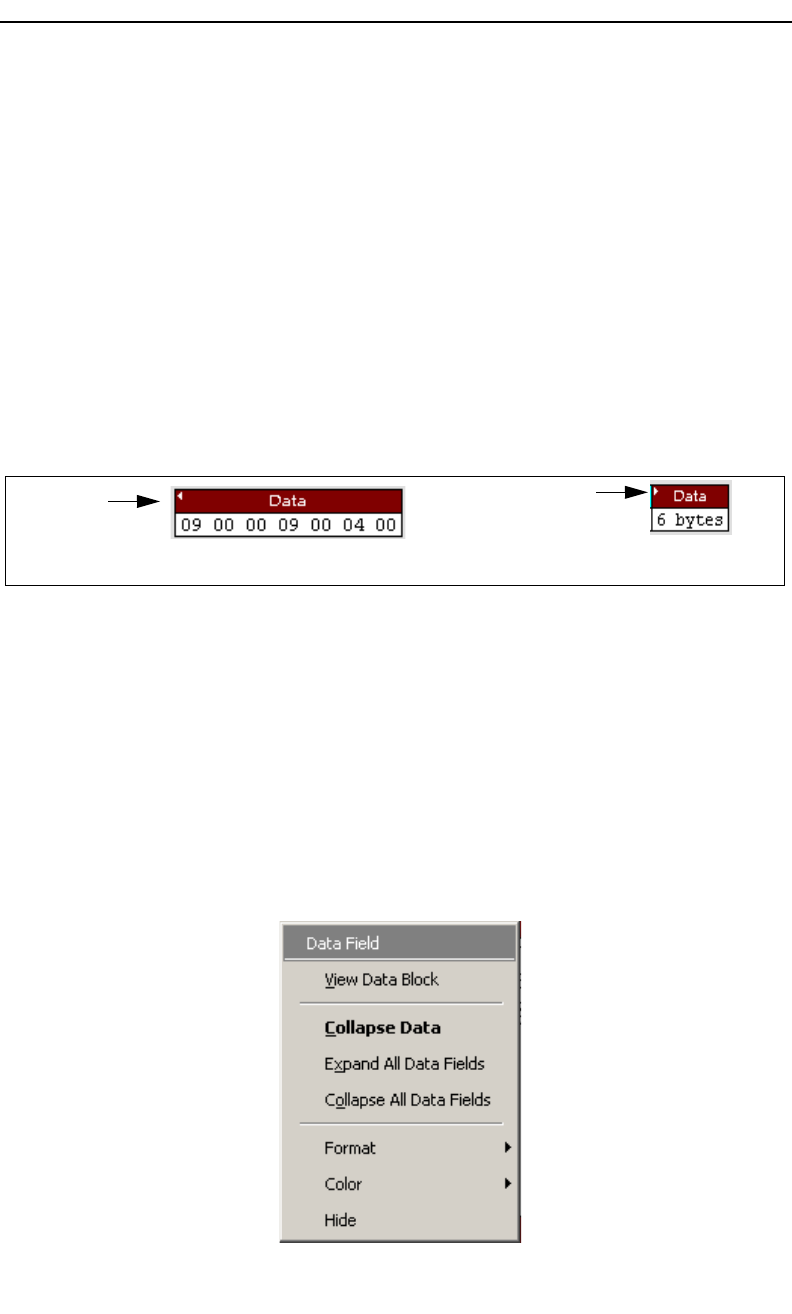
8.7 Expanded and Collapsed Data Formats
The data field can be expanded to display greater detail or collapsed to a
compact view. The Expand/Collapse Data feature operates as a toggle.
There are three ways to toggle between the two views.
Double-Clicking
You can expand or collapse a Data field by double-clicking anywhere in the
Data field of a packet.
Left-clicking a Field Arrow
Many fields have small arrows in the top left corner. If you left-click this
arrow, the field will toggle back and forth between collapsed and expanded
views.
If you click and hold down the left mouse button on one of these arrows, you
can collapse or expand the field for ALL packets, messages or protocols.
Using the Shortcut Menu
If you left-click on a Data field, a menu will open for expanding or
collapsing data fields.
Step 1 Left-click on Data in the Data packet you want to expand or
collapse.
If your Data Trace View is currently expanded, you see the Collapse
Data menu:
data
the field
Left-facing
field arrow
will collapse Expanded Data
Right-facing
arrow will
expand data Collapsed
108
Merlin II Protocol Analyzer User’s ManualCATC SW Version 2.30
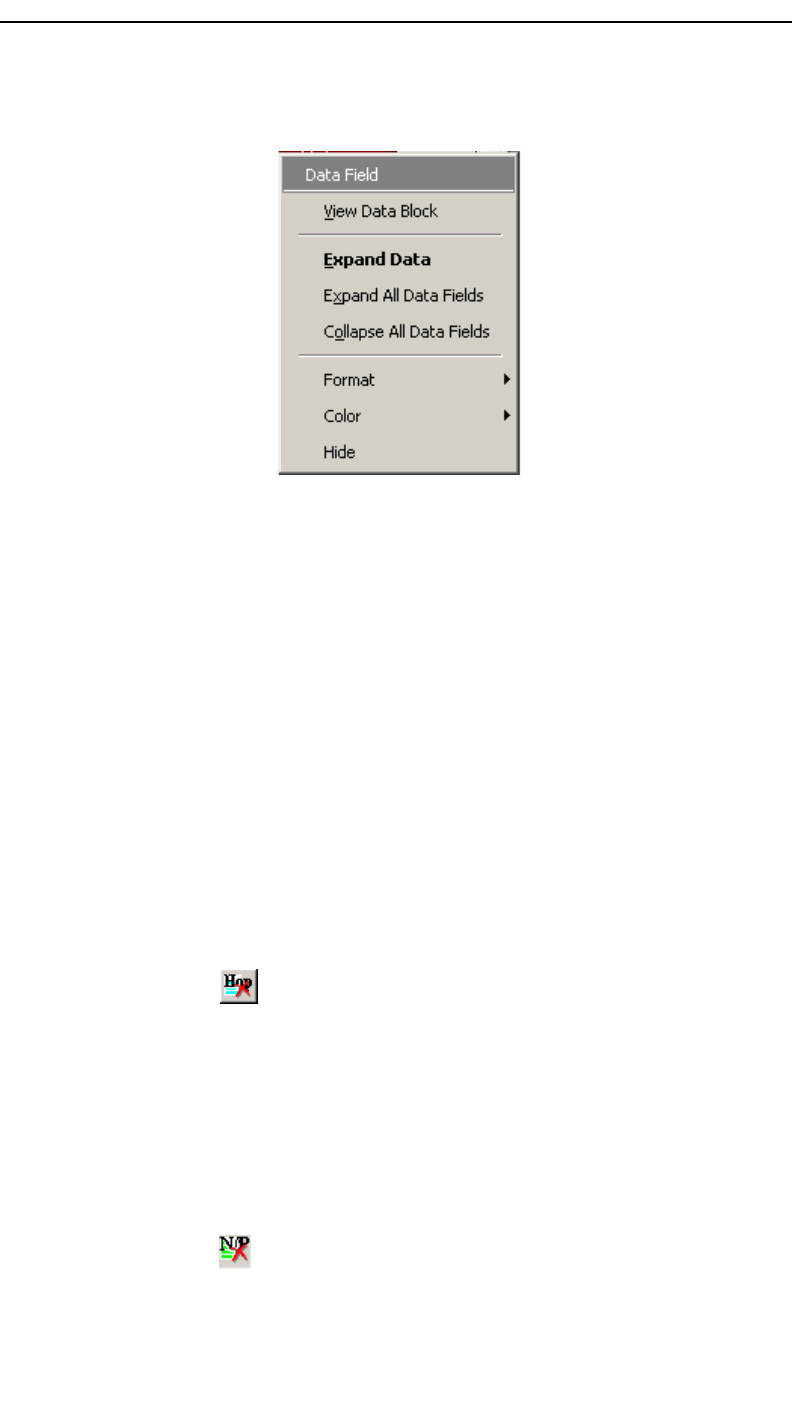
If your Data Trace View is currently collapsed, you see the Expand Data
menu:
Note that you can choose to expand or collapse
•Only the Data in the selected Data packet
OR
•All Data Fields in the Trace View.
Step 2 Select the desired Expand Data or Collapse Data menu item.
The Trace View is repositioned with the selected packet(s) adjusted in
the format you have specified.
8.8 Hide Frequency Hops
You can hide Frequency Hops (Hops) from a trace by pressing the Hide
Hops button on the Tool Bar:
From the Tool Bar
•Click to hide all Hop packets.
8.9 Hide Nulls and Polls
You can hide Nulls and Polls from a trace by pressing the Hide Nulls and
Polls button on the Tool Bar.
From the Tool Bar
•Click to hide all Nulls and Polls.
109
Merlin II Protocol Analyzer User’s ManualCATC SW Version 2.30
8.10 Menus in Clicked Fields
You can display the following menu when you click in a field in a trace.
8.11 Hide Unassociated Traffic
You can hide all traffic that is not associated with the current decode level
by pressing the Hide Unassociated Traffic button on the Tool Bar.
From the Tool Bar
•First, click one or more decode buttons such as the View L2CAP
Messages . This button will cause Merlin II to decode the trace
and display selected level of decode.
•Next, click to hide all unassociated traffic.
The Hide Unassociated Traffic button will cause Merlin II to hide all
traffic except for the selected decode messages or protocols. In the example
above, all packets would be hidden and only L2CAP messages would
display.
8.12 Hide Channel
You can hide all traffic recorded by the channel by pressing . on
the toolbar.
8.13 Hide Duplicated Traffic
On two-channel recordings some packets may be recorded by both
channels. You can hide duplicated packets by pressing on the toolbar.

110
Merlin II Protocol Analyzer User’s ManualCATC SW Version 2.30
111
Merlin II Protocol Analyzer User’s ManualCATC SW Version 2.30
9. Searching Traces
Merlin II has several search commands that enable you to navigate a trace
in search of key events such as errors and triggers. These commands are
launched from the search menu.
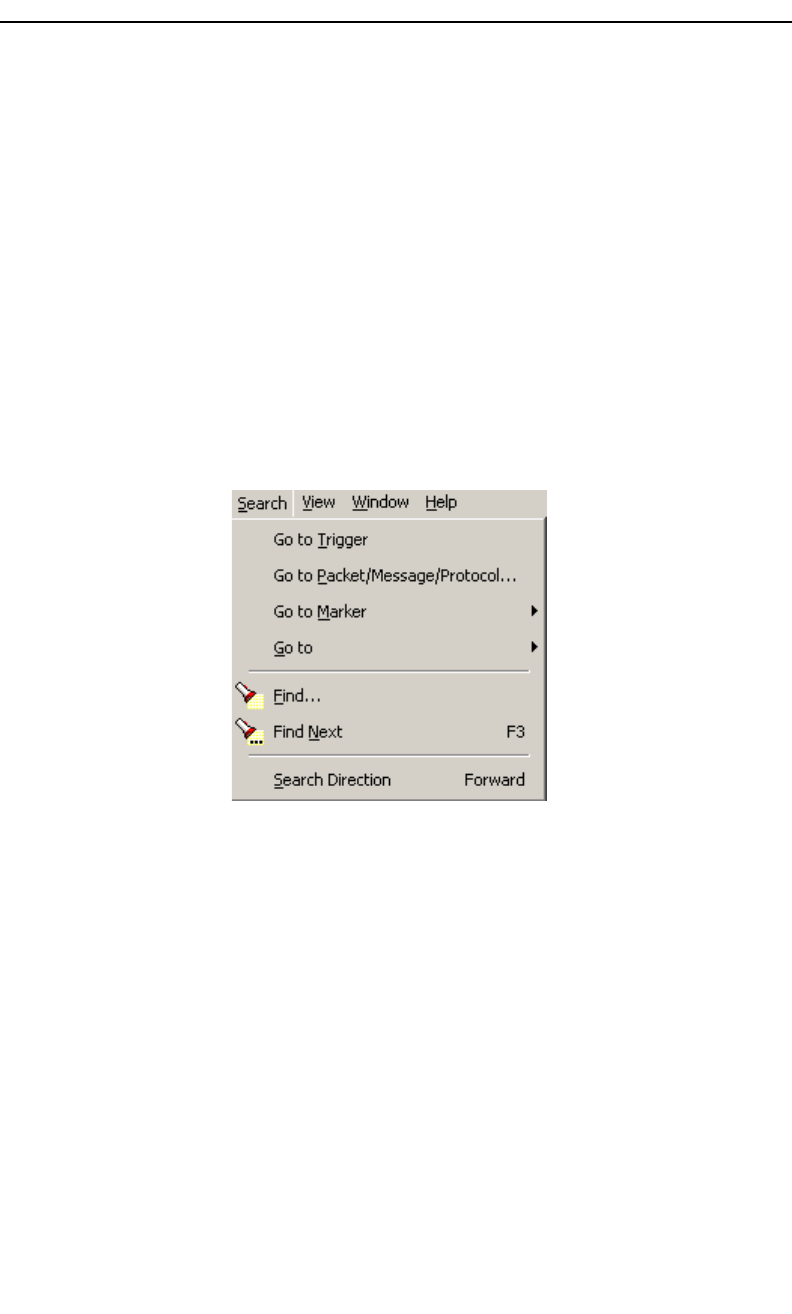
9.1 Search Menu
The Search menu provides several options for searching through recorded
traffic, allowing you to find specific packets based on triggering status,
packet number, marking, or content.
•Click Search in the Menu bar.
You see the Search drop-down menu:
Go to Trigger
To display a triggering event, select Go to Trigger under Search on the
Menu bar. The Trace Viewer display will reposition the trace to show the
triggering event at the top of the screen.
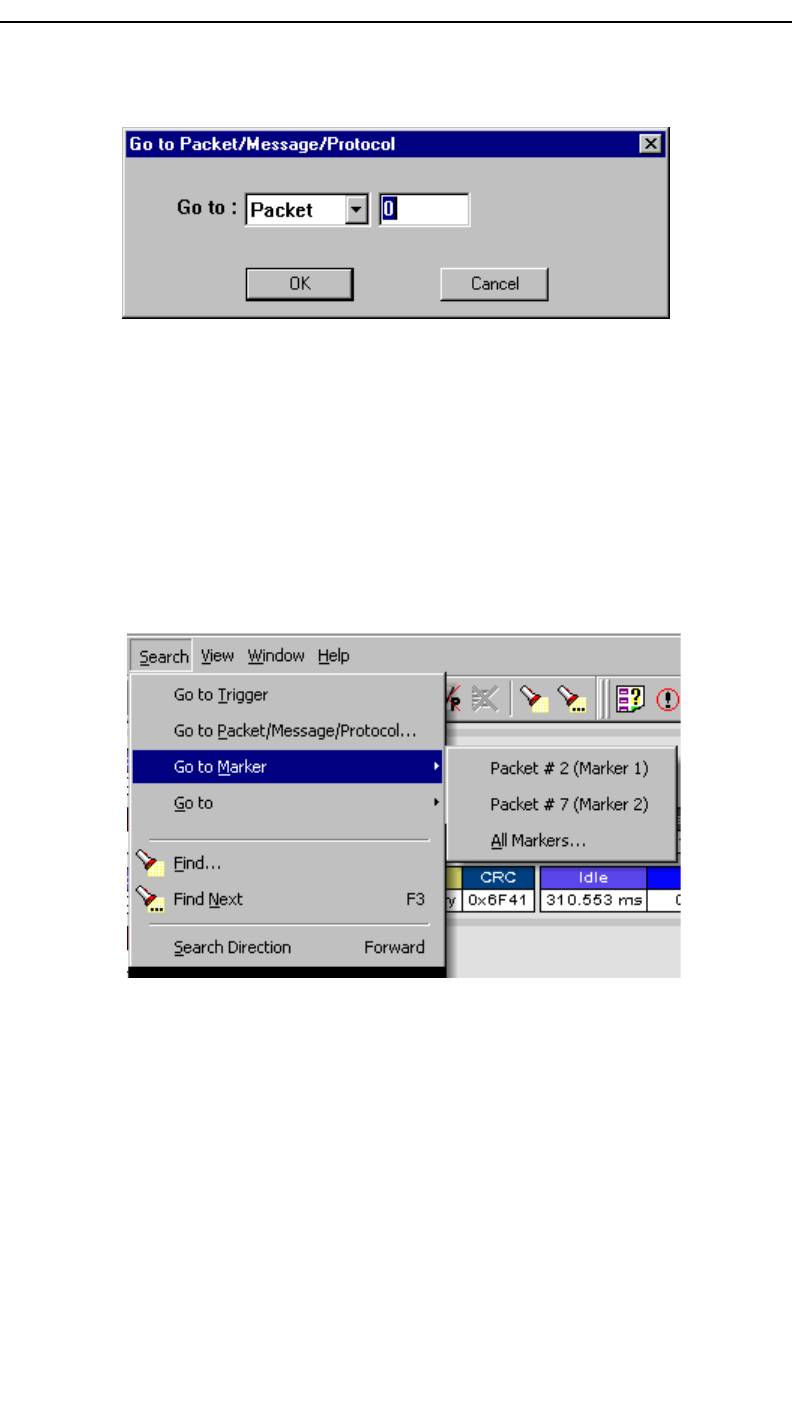
Go to Packet/Message/Protocol
To display a specific packet, Message or Protocol
Step 1 Select Go to Packet/Message/Protocol under Search on the
Menu Bar.
112
Merlin II Protocol Analyzer User’s ManualCATC SW Version 2.30
You see the Go to Packet/Message/Protocol window:
Step 2 Enter the number of the packet, message or protocol you want to
display.
Step 3 Click OK.
The Trace View repositions to show the packet at the top of your screen.
Go to Marker
To instruct the analyzer to display a marked packet,
Step 1 Select Go to Marker under Search on the Menu Bar.
You see a drop-down menu listing the marked packets in that Trace View:
Step 2 Select the desired packet from the displayed list.
The Trace View repositions to show the packet at the top of your screen.
Note The Go to Marker feature functions in conjunction with the Set Marker feature.
The comments within the parentheses following each marked packet are added or
edited with the Set Marker feature.
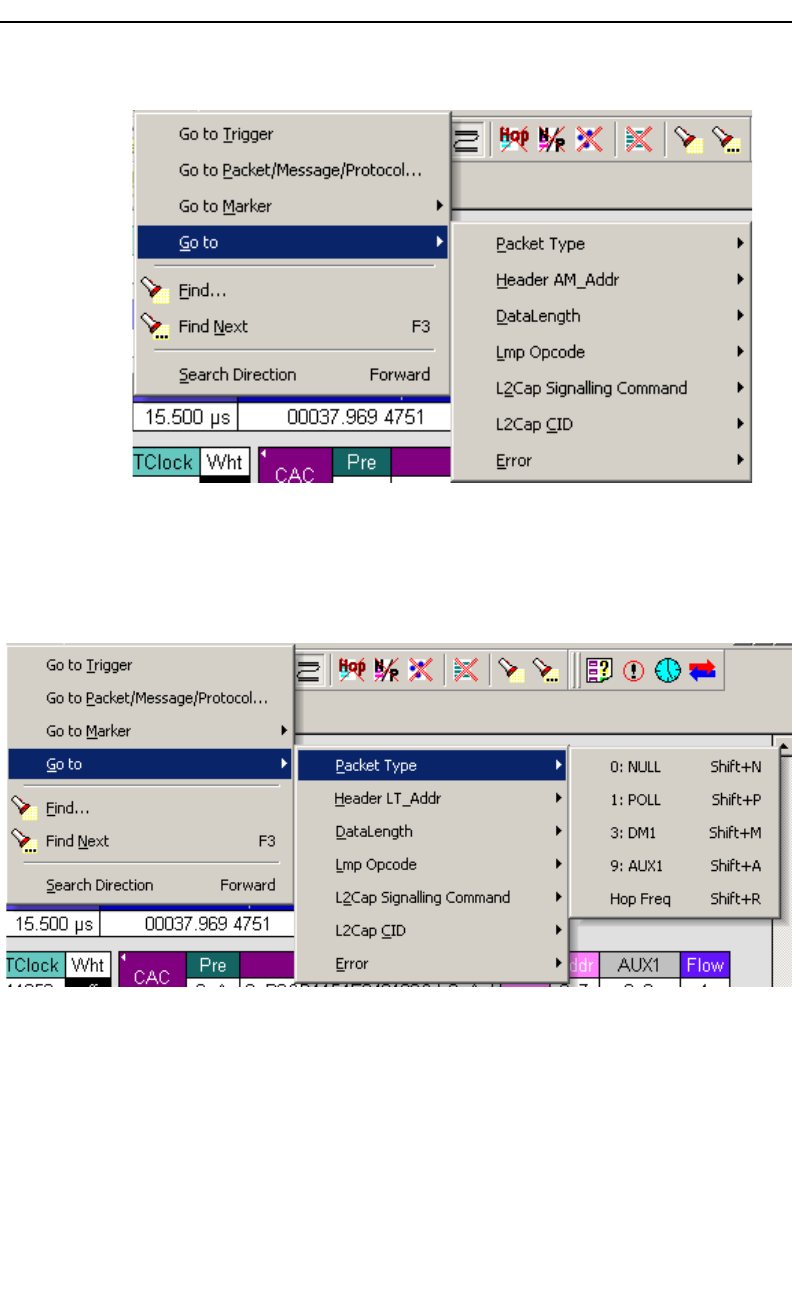
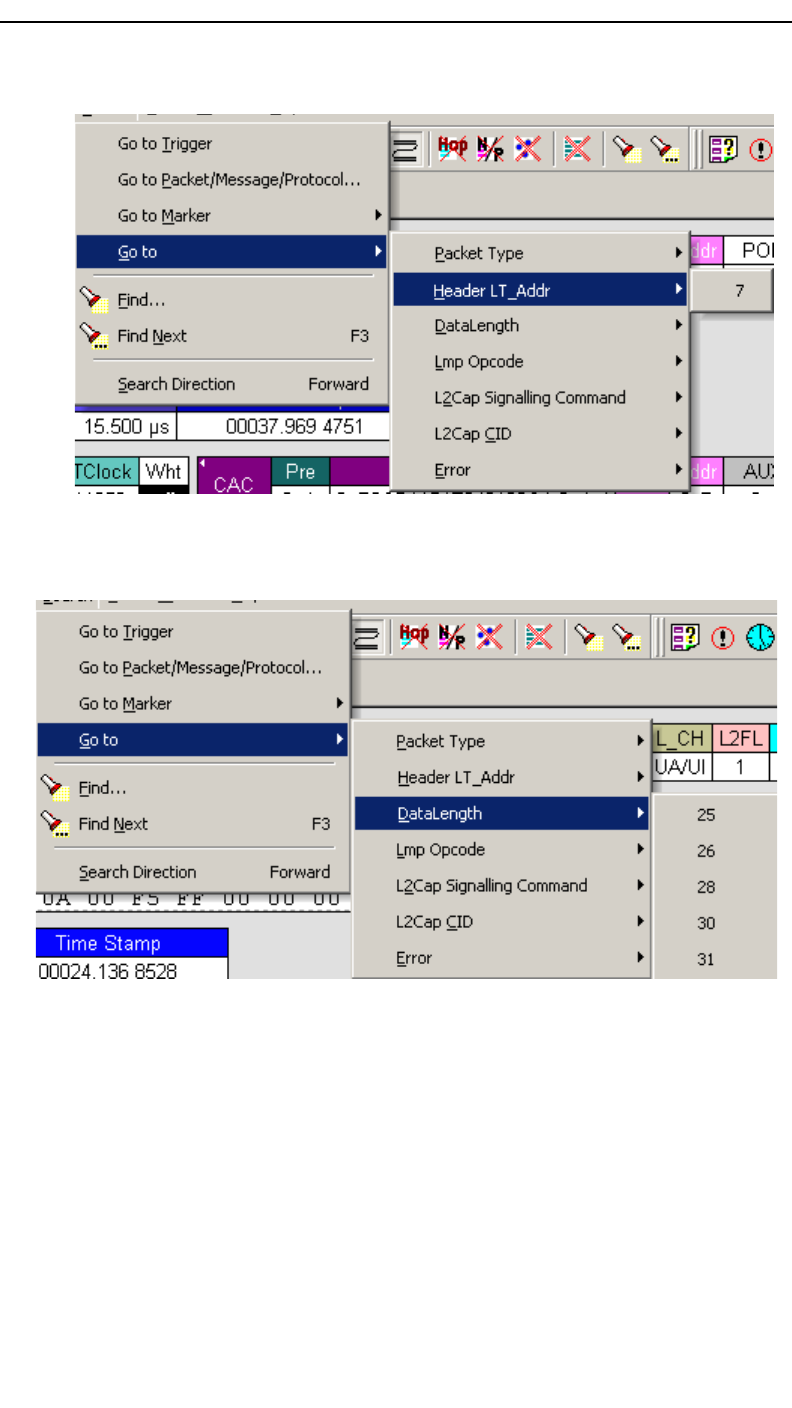
Go to
The Go To feature takes you directly to an event in a Trace.
Step 1 Select Go To under Search on the Menu Bar.
113
Merlin II Protocol Analyzer User’s ManualCATC SW Version 2.30
You see the Go To drop-down menu:
Step 2 Select the event you want to go to and enter the necessary
information.
Packet Types
Select the type of packet you want to go to.
114
Merlin II Protocol Analyzer User’s ManualCATC SW Version 2.30
Header LT_Addr
Select an Logical Transport Address from the list.
DataLength
Allows searching based on data length in bytes from the recording.
115
Merlin II Protocol Analyzer User’s ManualCATC SW Version 2.30
Lmp Opcode
Select the Link Management Protocol Operational Code (Lmp Opcode) that you
want to go to.
L2Cap Signalling Command
Select the type of L2Cap Signalling Command that you want to go to.
116
Merlin II Protocol Analyzer User’s ManualCATC SW Version 2.30
L2Cap CID
Select the L2Cap Channel ID (L2 Cap CID) that you want to go to.
Error
Moves trace view to next uncorrected error.
Soft Bit Error
Moves trace view to next soft (corrected) error.
Loss of Sync
Moves trace viewer to the next loss of sync.
Find
Find is a utility that allows you to conduct searches of one or more events
within a trace. Find allows you to search different hierarchical levels within
the trace - packets, LMP Messages, L2CAP messages etc.
To start find,
• Select Find... under Search on the Menu Bar
OR
Click in the Tool Bar.
117
Merlin II Protocol Analyzer User’s ManualCATC SW Version 2.30
You see the User-Defined Find Events screen:
The Find window divides into three areas:
Left area -- Controls the search level, search direction and search origin.
Find All - Extracts the results and place them in a separate trace.
Search In Hidden - Searches all packets including packets that have
been hidden.
Center area -- Controls the event groups to be searched. The selection you
make will display further choices on the right side of the Find window. At
the bottom are three options called Union, Intersection, and Exclusion that
are used with multi-criteria searches. These options are explained below.
Right area -- Controls the specific events to be searched within the trace.
The box in this right section displays events from the selected Event Group.
The right area is context sensitive -- the Event Group selected in the Center
area will determine what events will display on the right. For example, if
you select Packet Type, the Right area will show you a list of packet types.
Bold entries in the list represent items that actually occurred in the trace.

118
Merlin II Protocol Analyzer User’s ManualCATC SW Version 2.30
In the screenshot shown above, for example, LT Address is selected. On the
right, you see that only Address 1 is in bold. This indicates that only a single
device was transmitting traffic in the displayed trace.
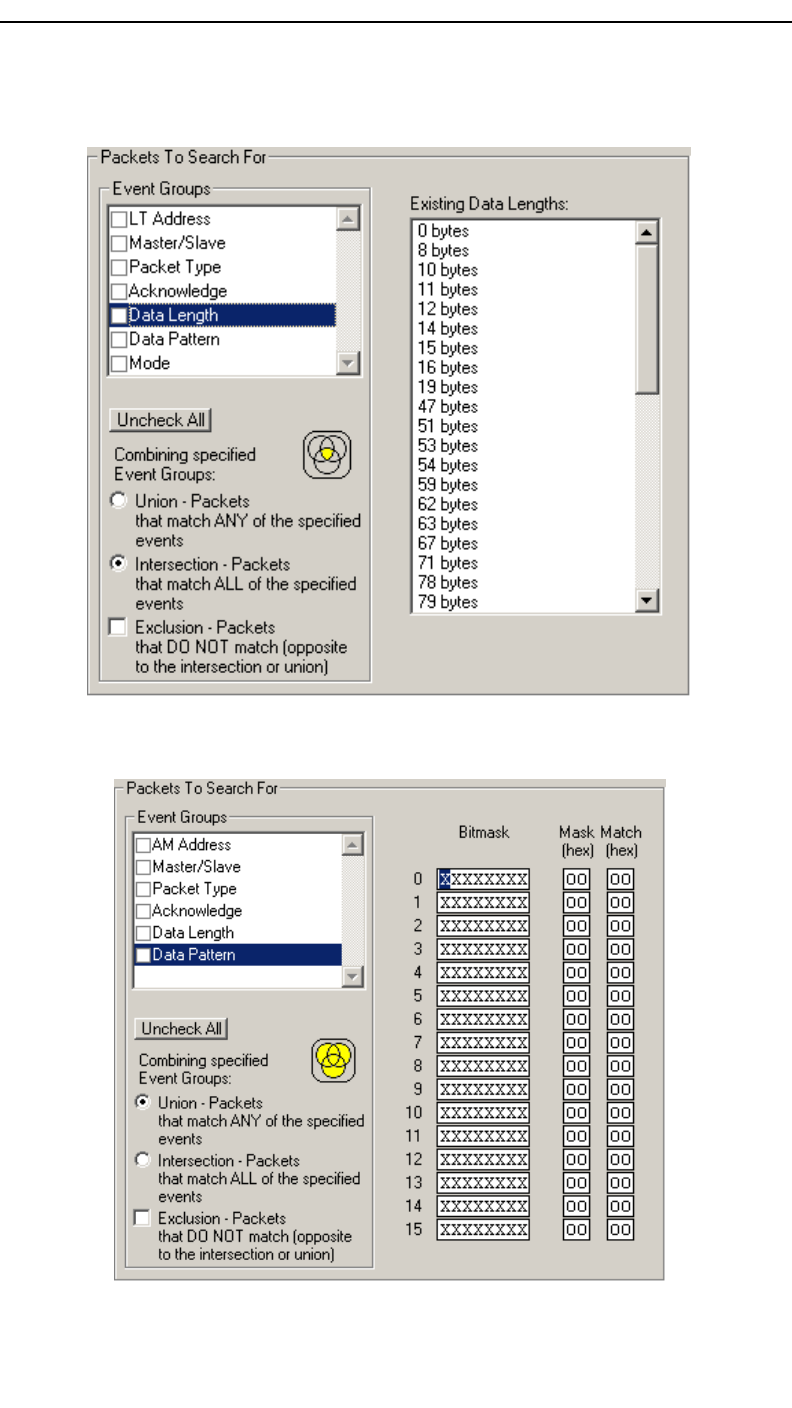
Event Groups
Event Groups are categories of events that can occur in a trace. Clicking on
an Event Group will display a list of Event types on the right side of the Find
window that occur within each Event Group.
LT Address
Contains a list of seven Logical Transport addresses. Bold entries represent
devices that occur in the trace.
Master/Slave
Contains two options labeled Master and Slave. Selecting an option will
cause Merlin II to search for traffic based on the selected role.
Packet Type
Contains a list of all Bluetooth packet types. If a packet type occurs in the
trace, it will appear in bold.
Acknowledge
Contains a list of three Acknowledge types: Explicit NACK, Implicit
NACK, and ACK. The three Acknowledge types are responses a device
can issue to attempts to transmit packets to it.
A device can send an Acknowledgment in two ways: through setting the
ARQN field to 0 (= explicitly not acknowledged), to 1 (explicitly
acknowledged) or by sending an empty packet that does not have an ARQN
field (= implicitly not acknowledged).
Explicit NACK - Explicitly not acknowledged. An Explicit NACK is an
explicit response by a device that it did not receive a data packet. The
Explicit NACK is transmitted in the ARQN field (=Acknowledgment
Request Negotiation field). ARQN=0 means ’Explicit NACK.’
Implicit NACK - Implicitly not acknowledged. An Implicit NACK is a
NACK that is implied rather than explicitly stated. If a device responds
to a data packet by sending an empty packet, the NACK is implied.
ACK - Acknowledged. If a data packet is successfully transmitted to a
target device, the target device acknowledges the received packet by
setting the ARQN field to 1.
119
Merlin II Protocol Analyzer User’s ManualCATC SW Version 2.30
Acknowledgments are easily seen in Merlin II traces because Merlin II adds
an Ack’d field on data packets of the transmitting device. This means that
you do not have to hunt through the trace to see if the packet was
acknowledged.
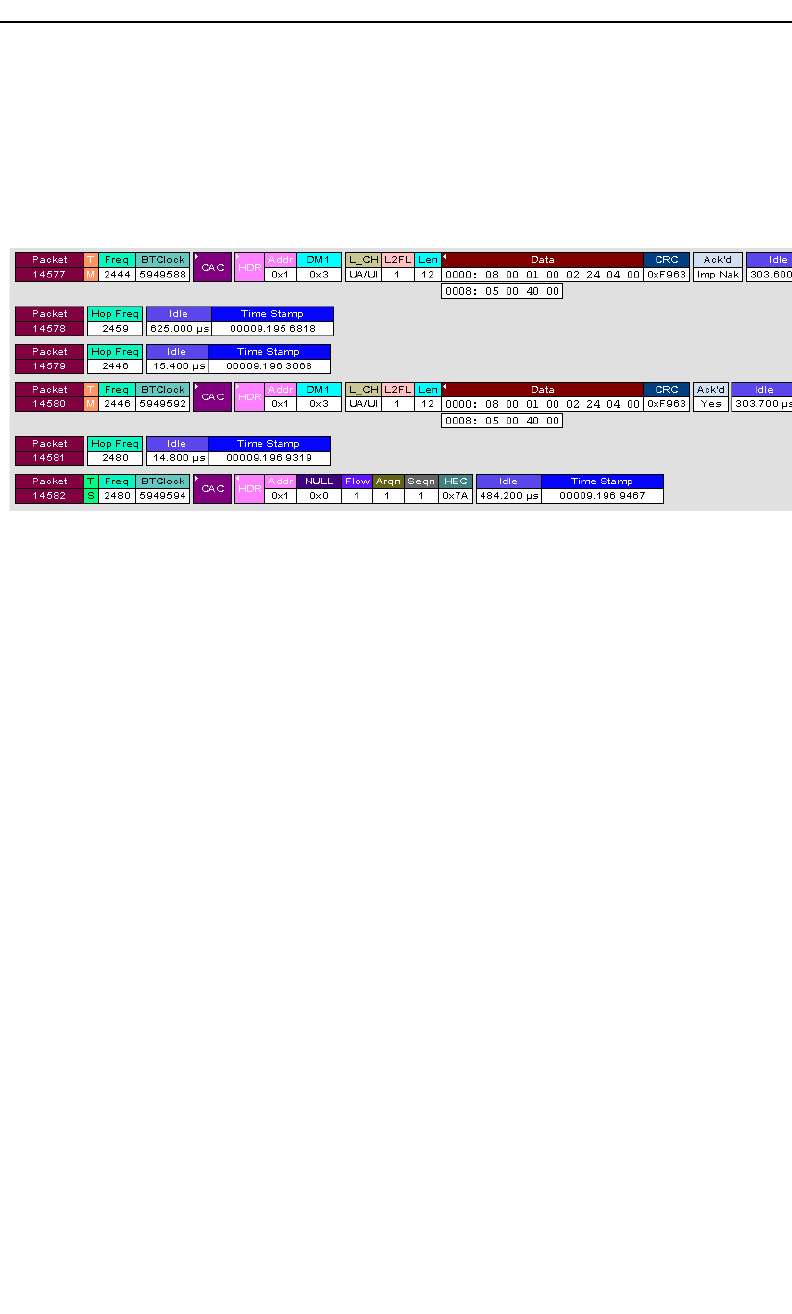
The following screenshot shows two examples of Acknowledgments.
Implicit NACK - Packet 14577 is a data packet sent by the piconet Master
device. Packet 14579 should have been a data packet with an
acknowledgment. Instead, it is an empty packet. This Master interprets this
empty packet as an Implicit NACK (i.e., implicitly not acknowledged).
Merlin II summarizes this packet exchange by adding an Ack’d field to the
Master’s data packet and setting the Ack’d field to Imp Nak.
ACK - Packet 14580 is the Master’s retransmission of the data sent in
packet 14577. Packet 14582 is the reply by the Slave device. This reply
contains an ARQN field with a value of (= Acknowledge). Merlin II
summarizes this packet exchange by setting the Ack’d field on packet
14580 to Ack.
120
Merlin II Protocol Analyzer User’s ManualCATC SW Version 2.30
Data Length
Contains a list of all data lengths that occur in the trace.
Data Pattern
Searches for the next packet that has a specified data pattern.
121
Merlin II Protocol Analyzer User’s ManualCATC SW Version 2.30
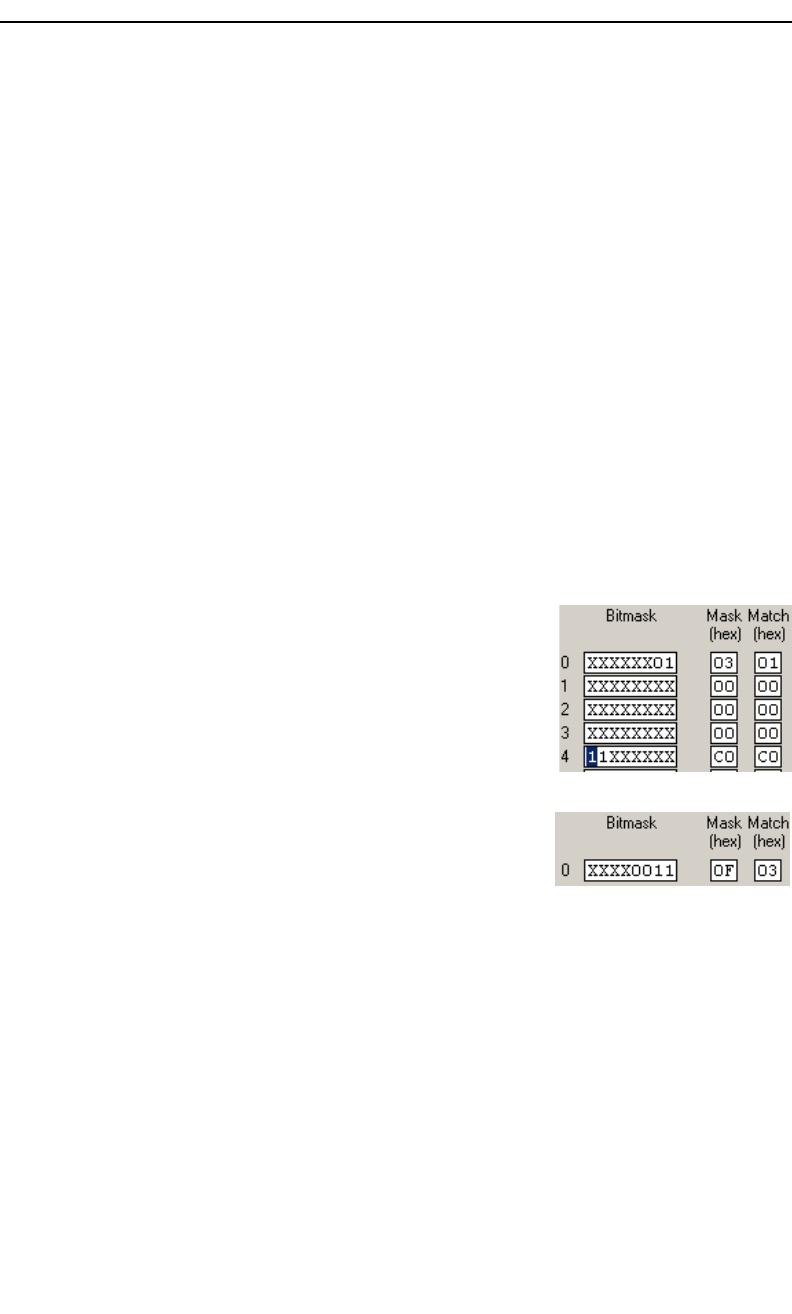
Searching for Bit Patterns
You search for a bit pattern by using the box labeled Bitmask. Enter one of
the three following values:
•X = 'Don't care,'
•0 = 'Match a 0',
•1 = 'Match a 1.'
Example -- xxxxxx01 means 'Look for a data pattern where the first 6 bits
can be any value but the last two bits must be 01.'
Searching for Long Patterns
You can search for long pattern sequences by entering patterns into multiple
rows within the editor. Entering a pattern on one row and skipping several
rows before entering the second pattern tells Merlin II to search for the
entire pattern between the two specified rows.
Example - Enter xxxxxx01 in row 1 and 11xxxxxx in row 2. This pattern
means 'Look for the pattern xxxxxx0111xxxxxx.'
Example - If you enter xxxxxx01 into row 0 and
11xxxxxx into row 4, it means 'Look for the pattern
xxxxxx01 xxxxxxxx xxxxxxxx xxxxxxxx
11xxxxxx.'
Searching for Hexadecimal Patterns
The columns marked Match and Mask allow you
to specify a pattern in hex. You enter the pattern
you want to match in the column marked Match,
and enter the mask in the column marked Mask. The Mask column allows
you to specify which bits you are searching for.
Example - A Match of 03 and a Mask of '0F' tells Merlin II that you are
looking for the hex pattern of 03 occurring in the last four bits of the pattern.
If you enter these values in the Match and Mask columns, the Bitmask
section will automatically display the equivalent bit values: XXXX0011.
Union, Intersection, and Exclusion
If you select multiple events, you will need to use the options Union or
Intersection to conduct the search.
Union is used to search for any selected event: "Find x or y." Union lets
you tell the analyzer to search the trace for any of any of the selected items.

122
Merlin II Protocol Analyzer User’s ManualCATC SW Version 2.30
Intersection is used to search for all selected events: "Find x and y."
Intersection lets you tell the analyzer to search the trace for any packet
having all of the selected events.
Exclusion is used to exclude selected traffic from the trace. Exclusion is
used with Union and Intersection --i.e., you select Exclusion with Union or
Intersection.
•Exclusion + Union -- tells Merlin II to exclude packets with any of the
specified events.
•Exclusion + Intersection -- tells Merlin II to exclude packets with all of the
specified events.
Using Find
Step 1 Select the display level to be searched from the Search For
box on the left side of the window.
For example, to search through L2CAP messages, select L2CAP. The display
level that you select will affect options presented in the Events Group box.
Step 2 Select a search direction and origin.
Step 3 Select one or more events from the Events Group box.
Your choices will affect options presented in the box on the right side of the
screen.
Step 4 If you have selected two or more criteria, then select either :
•Union: Find all packets that match ANY of the specified events. An
example would be to find packets with either X or Y.
•Intersection: Find all packets that match ALL of the specified
events. An example would be to find all packets with X and Y.
If you want to selected events from the trace, then select:
•Exclusion: Exclude all packets that match any of the specified
events. This option works in conjunction with Union and Intersection.
Select an exclusion plus one of the other two options. If you select
Exclusion and Union, it means Exclude packets in any of the
following events. An example would be to exclude packets with
either X or Y.

123
Merlin II Protocol Analyzer User’s ManualCATC SW Version 2.30
Step 5 Click OK.
The search will then occur. Afterwards, the packets meeting the search criteria
will display.
Some Find Examples
Search for all DM1 and Poll packets with an Active Member Address of 7.
Step 1 From the Event Group, select Packet Types.
Step 2 From the box on the right, select DM1 and Poll.
Step 3 From the Event Group, select Header LT_Addr.
Step 4 From the box on the right, select LT_Addr=7.
Step 5 From the Center area, select Intersection.
Selecting Intersection tells Merlin II to find packets with ALL of the selected
traits.
Step 6 Press OK.
The trace should reposition to the first DM1 or Poll packet that has an Active
Member address of 7.
Exclude all DM1 and Poll Packets with Logical Transport Addresses of 7.
Step 1 Select Packet Types from the From the Event Group
Step 2 Select DM1 and Poll from the box on the right.
Step 3 Select Header LT_Addr from the Event Group.
Step 4 Select LT_Addr=7 from the box on the right.
Step 5 From the Center area, select Intersection and Exclusion
Step 6 Press OK.
The trace will re-display so that it excludes DM1 packets with LT_Addr=7 and
Poll packets with LT_Addr=7.
Exclude all packets with ANY of the following attributes: DM1, Poll, or
LT_Addr=7.
Step 1 Select Packet Types from the Event Groups.
Step 2 Select DM1 and Poll from the box on the right.
Step 3 Select Header LT_Addr from Event Group.
Step 4 Select LT_Addr=7 from the box on the right
Step 5 Select Union and Exclusion.
Selecting Union causes the analyzer to search for any of the selected events.

124
Merlin II Protocol Analyzer User’s ManualCATC SW Version 2.30
Step 6 Press OK.
The trace will re-display so that it excludes DM1s, Polls, or any packet with
LT_Addr=7.
Find Next
To apply the previous Find parameters to the next search,
•Select Find Next under Search on the Menu Bar
OR
Click on the Tool Bar.
125
Merlin II Protocol Analyzer User’s ManualCATC SW Version 2.30
10. Decoding Protocols
10.1 Introduction
Merlin II can decode HCI, LMP and L2CAP messages, and RFCOMM,
SDP, TCS, HDLC, PPP, OBEX, HCRP, BNEP, HID, IP, TCP, and UDP
protocols. The default is packet level decoding, which means that baseband
packets will be displayed when you first view a trace. If these packets are
carrying LMP, L2CAP or other protocols, the protocols will display as
undecoded fields such as the L2CAP packet below.
By issuing a decode command, Merlin II can decode these LMP and higher
fields and display the data in summary statements called LMP/L2CAP
Messages, Protocols Messages, and Protocol Transactions.
10.2 LMP and L2CAP Messages
LMP and L2CAP Messages are lines in a trace that summarize LMP and
L2CAP actions such as an LMP connection request. LMP and L2CAP
Messages summarize the type of action, the number of packets involved in
the action, and the device performing the action. If the message is carrying
higher protocol data such as RFCOMM, TCS, OBEX or SDP data, the
message displays this data in an undecoded format that can be decoded later.
Undecoded L2CAP fields
Undecoded higher protocol data
126
Merlin II Protocol Analyzer User’s ManualCATC SW Version 2.30
10.3 Decoding and Viewing Higher Protocol Data
Higher protocol data can be decoded two ways: by clicking a decode button
on the toolbar or by selecting a decode command from a pull down menu.
Decoding Via the
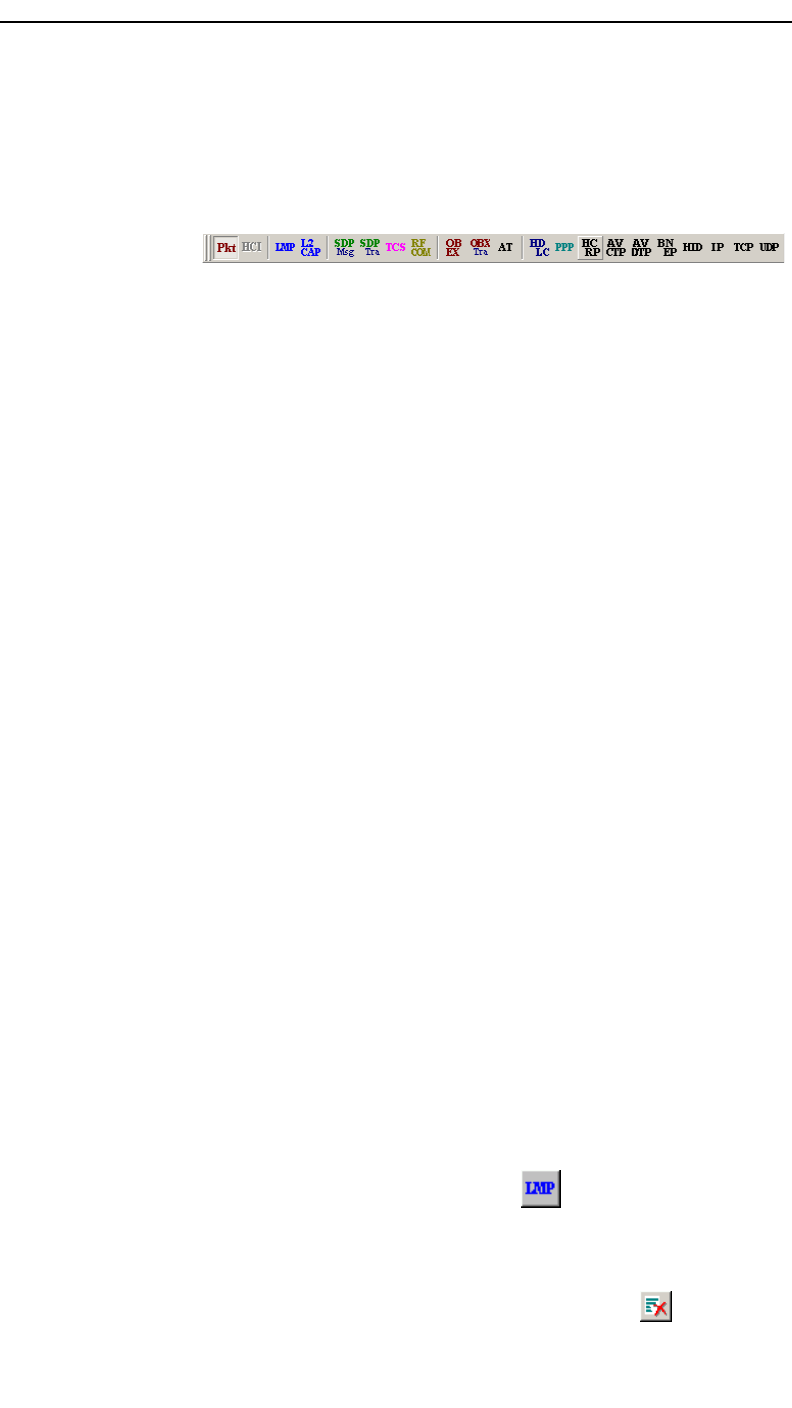
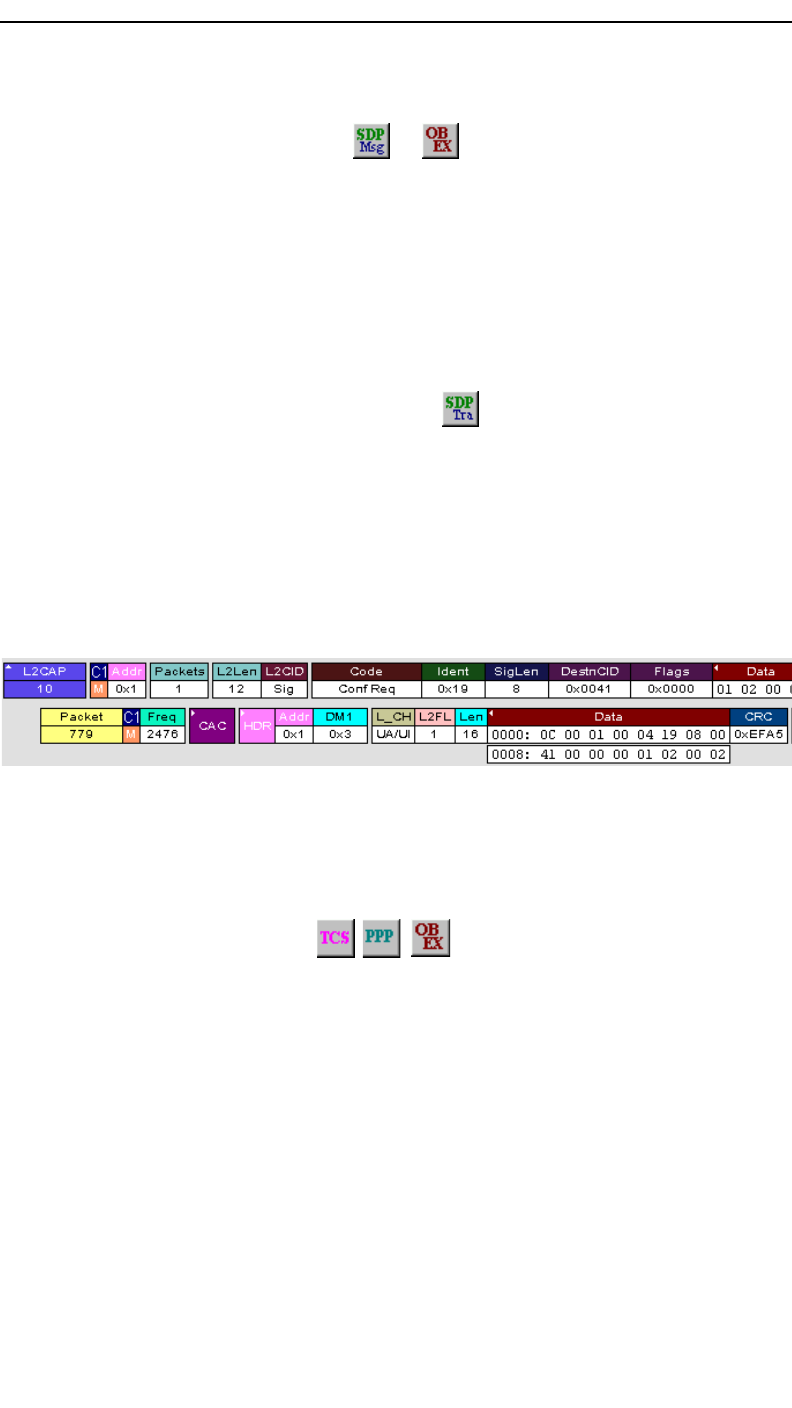
Decoding Toolbar
The Decoding Toolbar has ten buttons for decoding packets, messages, and
protocols:
• Pkt (Display Packets)
• HCI (Display HCI Protocol)
• LMP (Display LMP Messages)
• L2CAP (Display L2CAP Messages)
• SDP Msg (Display SDP Protocol Messages)
• SDP Tra (Display SDP Transactions)
• TCS (Display TCS Protocol messages)
• RFCOMM (Display RFCOMM Protocol)
• OBEX (Display OBEX Protocol)
• OBEX Tra (Display OBEX Protocol Transactions)
• AT (Display AT Commands Protocol)
• HDLC (Display HDLC Protocol)
• PPP (Display PPP)
• HCRP (Display HCRP)
• AVCTP (Display AVCTP)
• AVDTP (Display AVDTP)
• BNEP (Display Bluetooth Network Encapsulation Protocol)
• HID (Display HID Protocol)
• IP (Display IP)
• TCP (Display TCP)
• UDP (Display UDP)
For example, to display LMP messages, click .
Note Once a decode has been performed, it will probably be necessary to scroll through
the display to find the decoded messages or protocols. You can shorten your
search by first clicking the Hide Unassociated Traffic button .
127
Merlin II Protocol Analyzer User’s ManualCATC SW Version 2.30
Decoding Via the Display Options Dialog Box
The Display Options dialog box has three options for issuing decode
commands. To issue a command,
Step 1 From the menu bar, select Setup>Decoding Options
Step 2 Select the option for the desired level of decoding.
Step 3 Click OK or Apply.
10.4 Tooltips
Additional information about fields can be attained by positioning your
mouse pointer over a field of interest. A tooltip will appear that will provide
details about the field. In some cases, there can be a considerable amount
of information available.
128
Merlin II Protocol Analyzer User’s ManualCATC SW Version 2.30
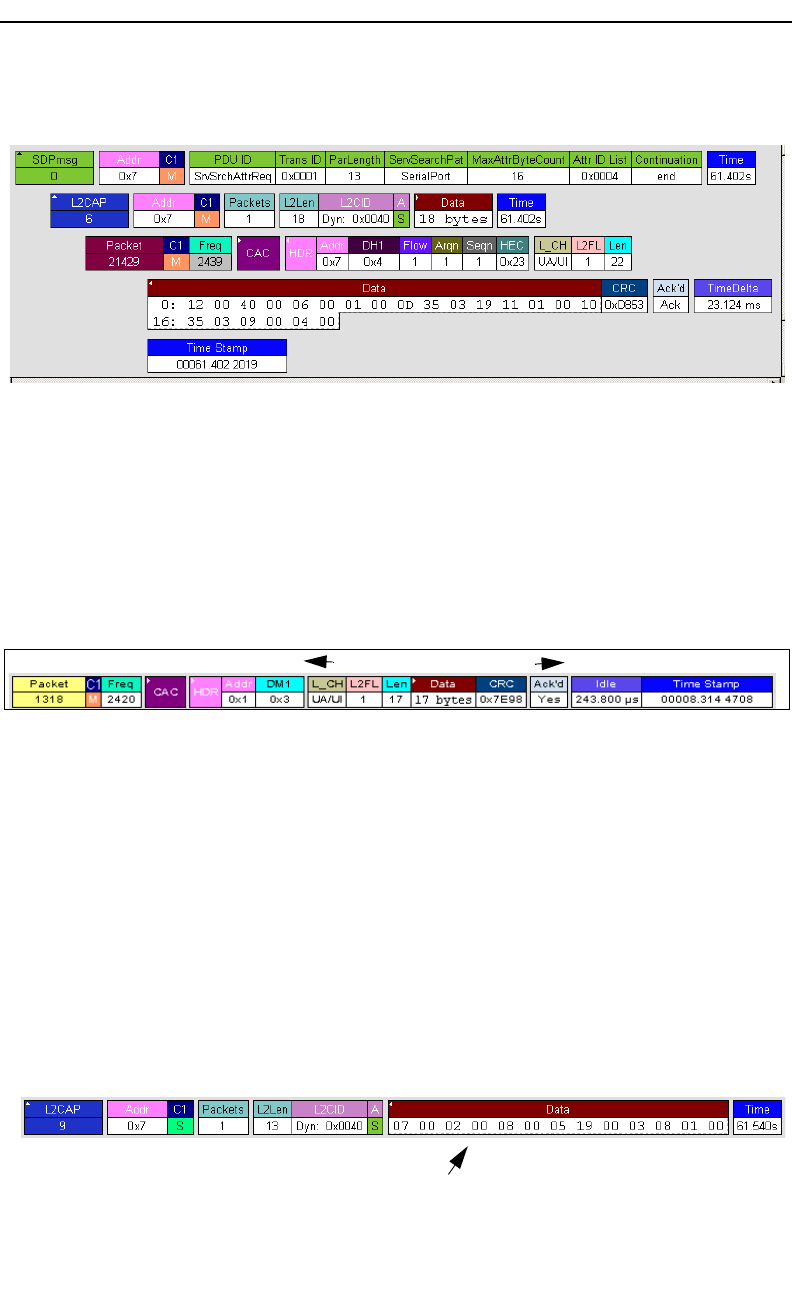
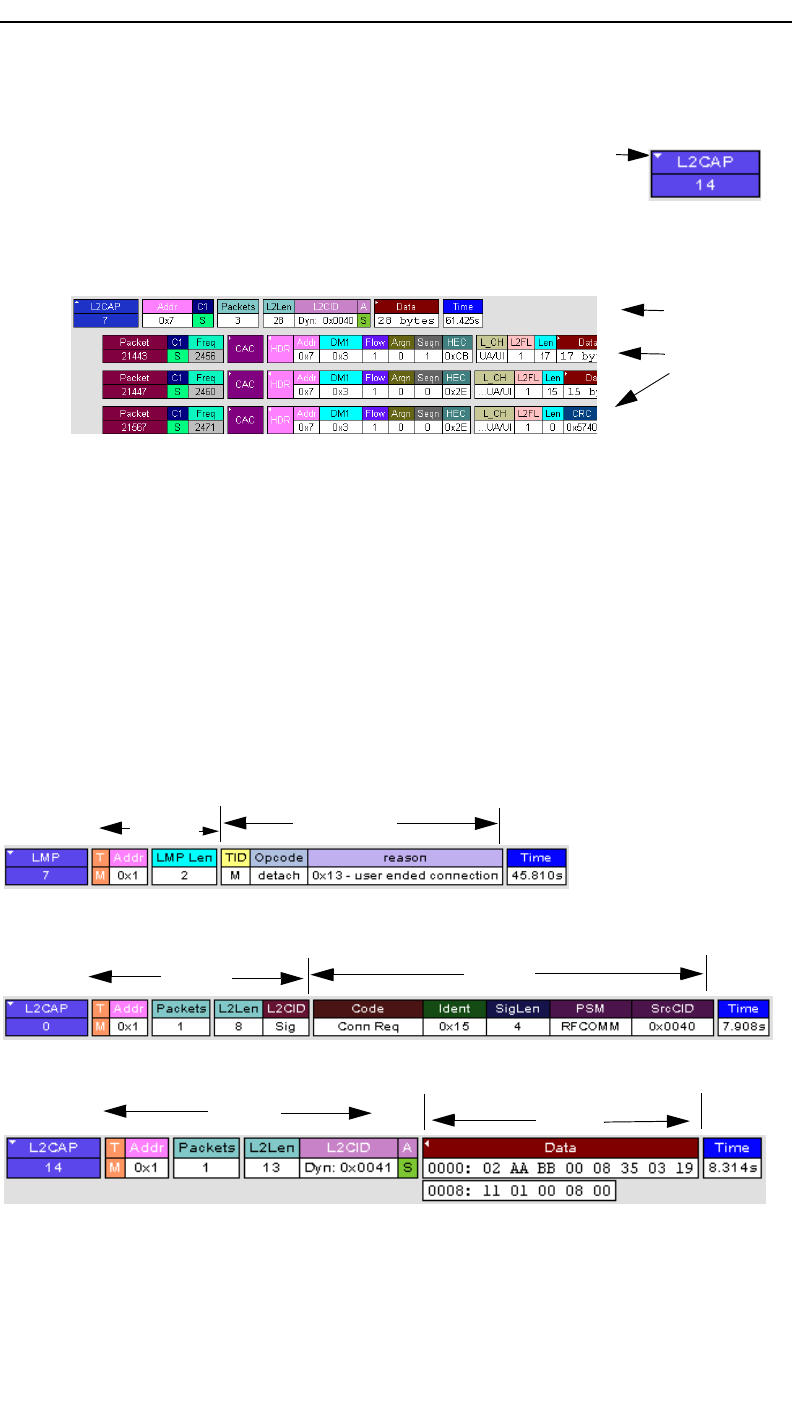
10.5 Viewing Packets in LMP and L2CAP Messages
LMP and L2CAP Messages can be "opened" to reveal
their constituent packets by double-clicking the first
cell in of the message or clicking once on the small
arrow on that same cell. The packets will then display below the message.
The following screenshot shows an example of a message and its packets.
10.6 Types of LMP and L2CAP Messages
If you scroll through a trace, you will see three kinds of message:
•LMP Signalling Message
•L2CAP signalling Message
•L2CAP Data Transfer Message
Each message has the same basic message header but differs in its payload.
LMP and L2CAP Signalling messages have payloads of commands for
establishing LMP and L2CAP channels. L2CAP Data-Transfer messages
have a payload that may include RFCOMM, SDP, or TCS data. In order to
Message
Packets
making up
the
message
LMP Signalling Message
L2CAP Signalling Message
L2CAP Data Transfer Message
Payload
Payload
Header Payload
Header
Header
129
Merlin II Protocol Analyzer User’s ManualCATC SW Version 2.30
view higher protocol data, you will need to decode the messages (shown in
the next section). The decoded data will appear as new lines in the trace
called "Protocol Messages."
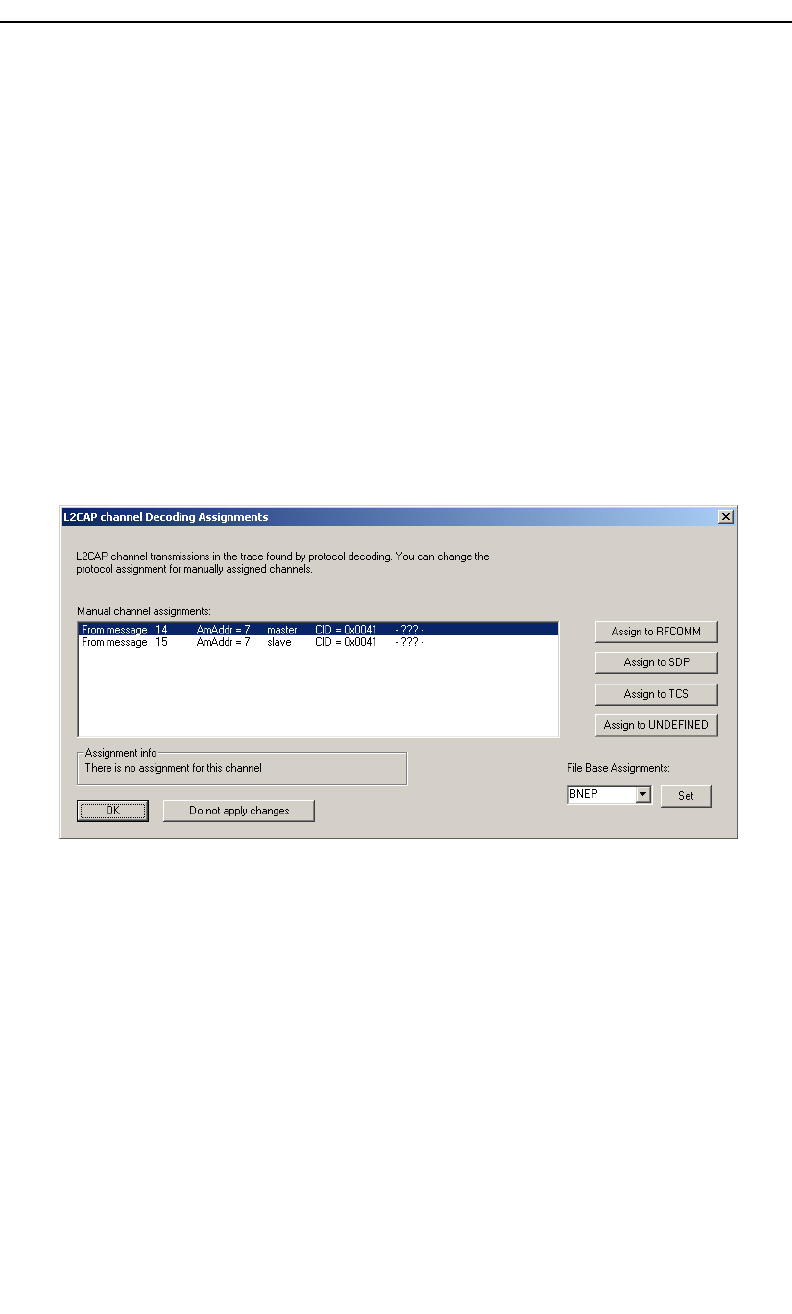
10.7 Viewing L2CAP Channel Connections
Once L2CAP messages have been decoded and displayed, you can check or
change their L2CAP channel connections by opening the L2CAP Decoding
Connections dialog box.
To view or change an L2CAP channel connection,
Step 1 Select from the menu bar
View>Decoding Assignments
The following dialog box will open.
Step 2 Click on a channel assignment and then look at the Connect
and Disconnect buttons on the far right of the dialog box.
If the Connect and Disconnect buttons are grayed-out, it means that
Merlin II made the channel assignments using data in the trace. You can
verify that Merlin II performed the assignments by looking at the text in
the "Slave Channel" box in the lower left corner of the dialog box. If
you see "Connection Recorded" it means that Merlin II performed the
channel assignments.
If Merlin II was not able to make these channel assignments, then the
Connect and Disconnect buttons on the right side of the dialog box will
be active. You can then assign and edit channel connections.
Step 3 Open the drop-down menu labeled LT_Addr (Active
Member Address). If possible, select an address other than
the currently displayed address.
The connections for the ’new’ device should now display.
130
Merlin II Protocol Analyzer User’s ManualCATC SW Version 2.30
10.8 Viewing Protocol Messages and Transactions
By pressing a button such as or , you can cause Merlin II to decode
the higher level protocol data contained within L2CAP messages and
display them as packet-like rows called Protocol Messages. Protocol
Messages have headers marked "protocol" and fields that vary in
appearance and content depending on the type of protocol.
Some Protocol Messages can be grouped into a higher level entity called a
Protocol Transaction. A Protocol Transaction is a row in a trace that
summarizes the higher level protocol data that is transmitted between a
Master and Slave device when one sends a request and the other sends back
a response. For example, if you press , Merlin II will locate SDP
requests and responses between a Master and Slave device summarize their
data.
Viewing L2CAP Messages in Protocol Messages
If the protocol heading is double-clicked, the L2CAP data-transfer
messages that make up the protocol will display below the protocol. You
can also expand the protocol by left-clicking the small downward pointing
arrow on the protocol header.
How to Decode
Decoding Protocol messages is the same process as decoding LMP and
L2CAP messages.
Using the Toolbar - To decode using the Toolbar, press one of the protocol
decode buttons such as: . .
Using the Menu - To decode using the menu, select:
Setup>Display Options
Then select one of the decode checkboxes.
Once a decode command has been issued, Merlin II will create Protocol
Messages in the trace. You will probably have to hide hops, polls, and null
packets and then scroll through the trace in order to find Protocol messages.
Expanding Protocol Messages
Protocol messages can be expanded to reveal their constituent packets using
any of the following methods:
131
Merlin II Protocol Analyzer User’s ManualCATC SW Version 2.30
•Left-click the small downward pointing arrow in
the message/protocol header
•Double-click a message/protocol header
•Left-click the message/protocol header and choose "Expand Transaction"
from the short-cut menu
10.9 Decoding via the Profiles Toolbar
The Profiles toolbar presents buttons that represent profiles. The Profiles
buttons do not represent an additional set of decodes; rather, they represent
shortcuts for the existing decodes. By clicking a Profiles button, the
analyzer software will automatically depress the protocol buttons needed to
decode all of the protocols associated with the selected Profile - for
example, RFCOMM, PPP, or IP.
To display the Profiles toolbar, select View > Toolbars > Profiles.
10.10 Changing Protocol Assignments
If a sequence of messages is assigned the wrong protocol, errors will
display. To change or remove a protocol assignment, you will need to
access the Assignment menu and issue an Add Assignment command.
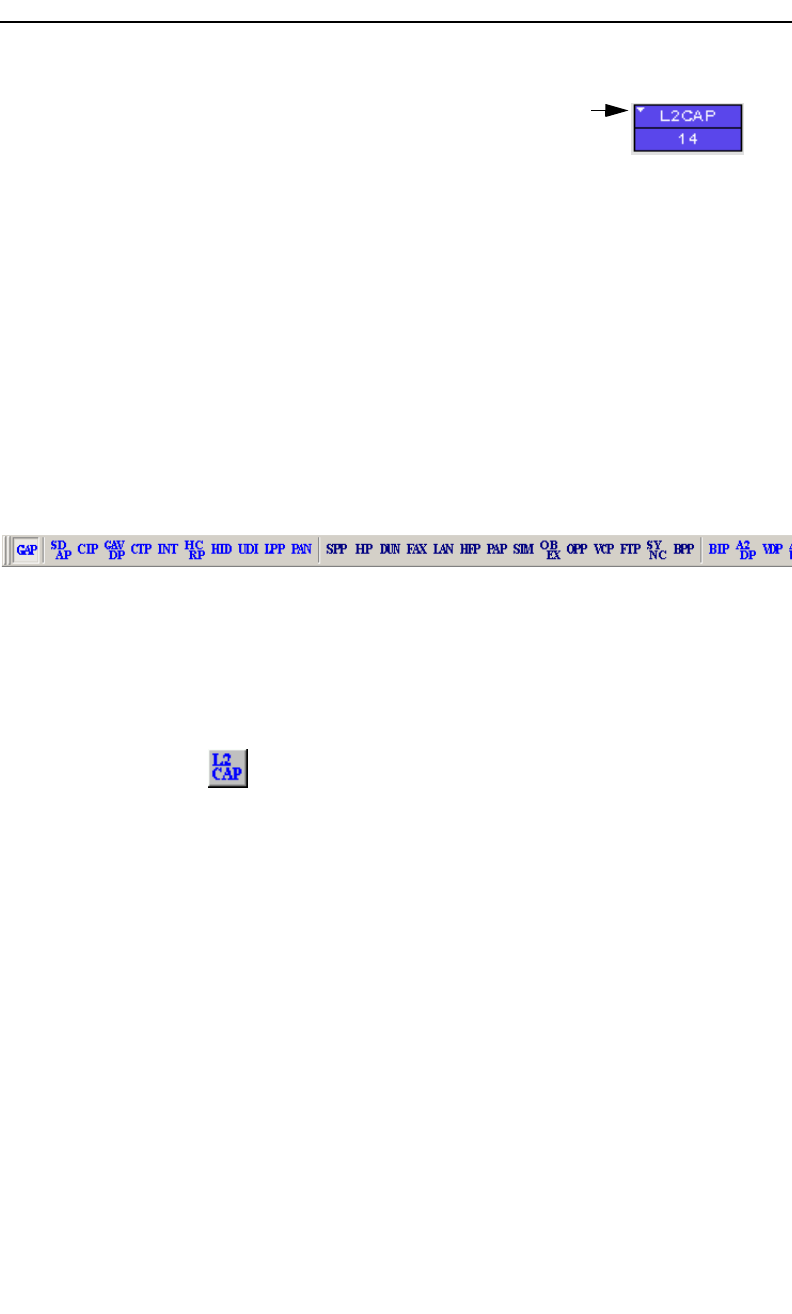
Step 1 Click to display L2CAP messages.
Note You need to view L2CAP Messages in order to have access to the "A" field that
permits reassigning protocols.
Step 2 Scroll through the trace until you have located an L2CAP
message with a field marked "A."
132
Merlin II Protocol Analyzer User’s ManualCATC SW Version 2.30
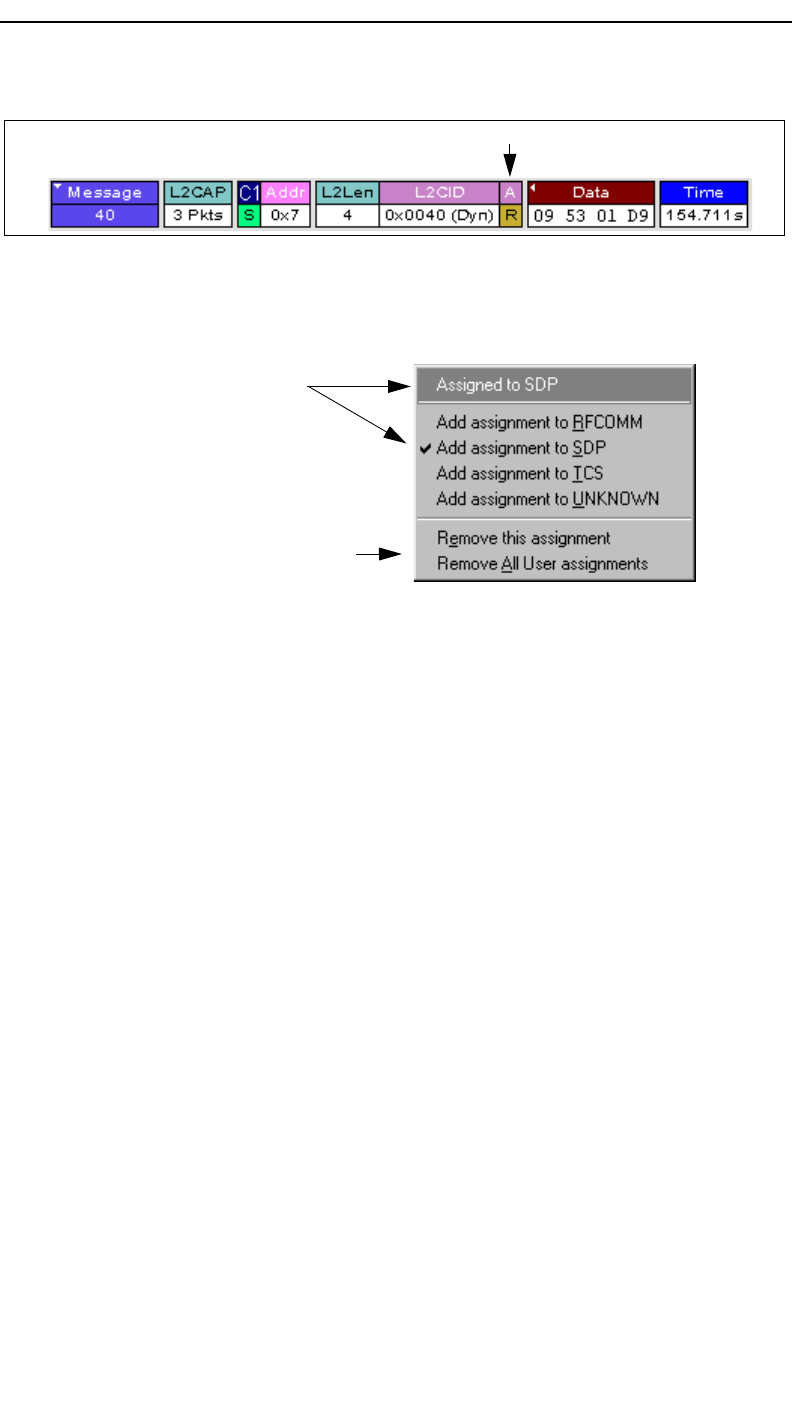
Step 3 Left-click the field marked "A."
An Assignment menu will open for assigning, re-assigning, or
un-assigning protocols to messages. This menu is context-sensitive and
will vary in content depending on the protocols in the trace.
Step 4 From the menu, select one of the "Add Assignment" options
not already selected.
At this point, the protocol assignment will change to your selection.
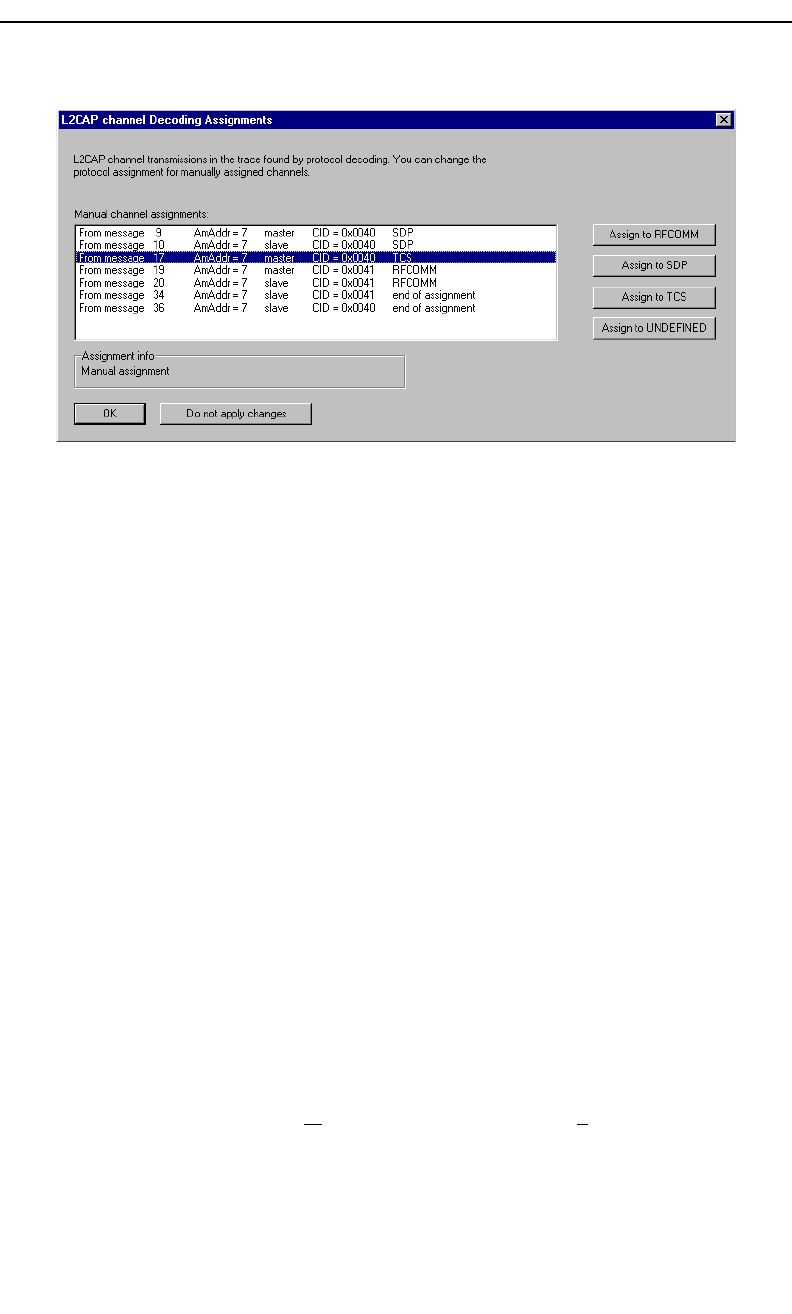
Using the Decoding Assignments Dialog Box
You can get a complete list of all protocol assignments by opening the
Decoding Assignments dialog box. This dialog box will tell you which
protocol assignments were made by Merlin II and which are user-assigned.
User-assigned protocols can be reassigned if need be using this dialog box.
To open the Decoding Assignments dialog box and reassign a protocol,
Step 1 Select from the menu
View>Decoding assignments
Left-click
The Assignment Menu
Current assignment
Select another assignment
to change assignment from
this point downward
through the trace
Will let one or all protocol
assignments be removed
133
Merlin II Protocol Analyzer User’s ManualCATC SW Version 2.30
The Decoding Assignments dialog box will open. A status message in
the bottom left corner of the dialog box will indicate who assigned the
protocol.
Step 2 Click on one of the displayed assignments.
If the protocol was assigned by Merlin II, the Assign buttons on the right
will be grayed out and unavailable. If you want to change these
assignments, you will have to use the pop-up menus described in the
previous section. If a protocol has been manually assigned by a user, the
Assign buttons will become active and allow you to make a change in
assignment.
Step 3 If possible, click the appropriate Assign button.
Removing User-Assigned Protocol Assignments
As you practice assigning and reassigning protocols, you will find that one
of the more useful commands is "Remove All User Assignments." This
command allows you to undo all of your assignments.
To remove some or all user-assigned protocol assignments,
Step 1 Double-click any Protocol Message header to open view
L2CAP messages.
Step 2 Locate a message with a field marked "A."
Step 3 Left-click on the "A" field to open the Assignment menu.
Step 4 Select "Remove All User assignments" or "Remove this
assignment."
134
Merlin II Protocol Analyzer User’s ManualCATC SW Version 2.30
Manually Assigning Protocols
If a recording does not capture the beginning of a dialog between a Master
and Slave devices, Merlin II may not have the L2CAP messages it needs to
determine the correct protocol assignments. In this case, L2CAP messages
will display an "N" in the Assignment field that means "Not Assigned."
If you know what the protocol assignment should be for the missing
assignments, you can manually add them by right-clicking your mouse over
the A field shown above and selecting from the pop-up Assignment menu
shown on the previous page.
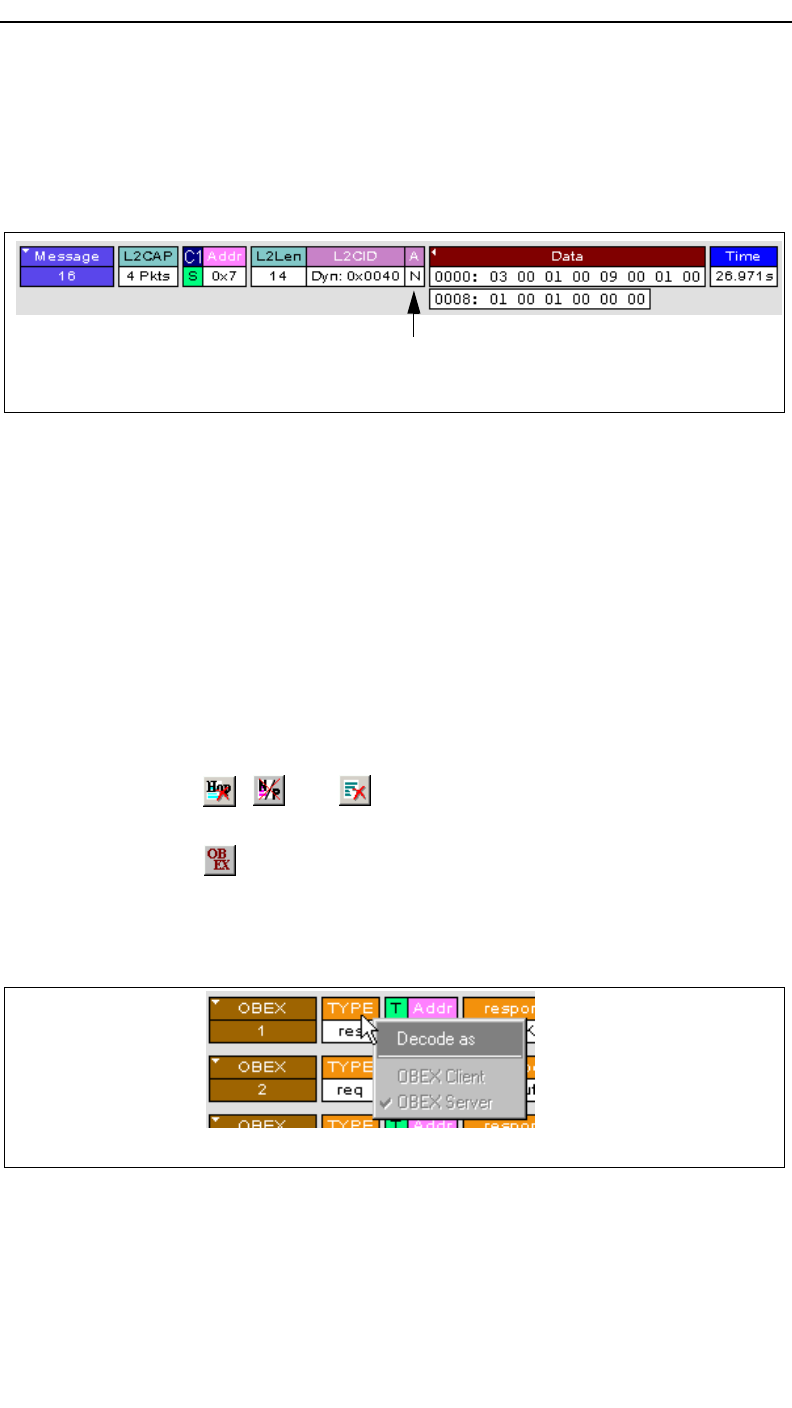
Other Assignments: OBEX Client/Server Status
OBEX messages carry a status that indicates whether the transmitting
device is an OBEX client or OBEX server.
To view an OBEX message’s client/server status,
Step 1 Open an OBEX trace file such as the sample file
"OBEXsample.tfb" in C:\Program files\CATC\Merlin II.
Step 2 Press . , and to hide Hops, NAKs, and unassociated
traffic.
Step 3 Press to decode OBEX.
Step 4 Left-click your mouse over the field marked Type.
A pop-up menu will appear indicating whether the message was
produced by an OBEX client or server. If the menu items appear
grayed-out (as they do in this example) it means that Merlin II assigned
the client or server status based on data it found in the trace. If the menu
items appear in black, it means that the user assigned the status and is
therefore free to change the assignment.
N=Protocol not assigned
An L2CAP message without a protocol assignment for the higher protocol data.
Left-click over the Type field to open the OBEX Client/Server Assign menu.

135
Merlin II Protocol Analyzer User’s ManualCATC SW Version 2.30
Changing an OBEX Client or Server Status
If the beginning sequence of traffic is not recorded in a trace, the
client/server status of the transmitting devices will not be preserved in the
trace. In this case, the OBEX Client/Server pop-up menu will become
active and you will be able to change the assignment.
Decoding BNEP
BNEP (Bluetooth Network Encapsulation Protocol) is a protocol that allows
devices to encapsulate network protocols such as IP. Since BNEP can carry
different types of network protocols, you need to tell Merlin II what protocol
the BNEP is going to be carrying. You do this via a script file called
bnep.dec that is read during the initialization of the Merlin II software. This
file tells Merlin II how to decode BNEP fields. Once read, BNEP can be
correctly decoded by pressing the button on the toolbar. If the decode
file is not read at initialization, Merlin II will display the data in an
undecoded format.
For more information on BNEP decoding, see a supplemental document on
BNEP in the support directory on the CATC web site:
http://www.catc.com/products/support/sup_Merlin II/bluetooth.html
Decoding HID
HID (Human Interface Device) is a profile associated with traffic from
devices such as a mouse or a keyboard. To decode HID traffic, you will
need to tell Merlin II what types of HID traffic it will be recording. You do
this by editing a script file called hid.dec. Merlin II reads this file during the
initialization of the Merlin II software. This file tells Merlin II how to
decode the HID fields. Once read, HID can be correctly decoded by
pressing the button. If the decode file is not read at initialization, Merlin
II will display the data in an undecoded format.
Other Decoding Options
Other decoding options include the following:
•IP
•TCP
• UDP
• AVCTP
• AVDTP
•HCRP
136
Merlin II Protocol Analyzer User’s ManualCATC SW Version 2.30
10.11 Encryption
Bluetooth encryption is a multi-staged process that provides devices with
secure, encrypted communications. The process begins with a device
prompting the user for a Personal Identification Number (PIN). When the
right PIN is entered, the Slave begins an encryption setup dialogue with the
Master. At the beginning of this dialogue, the Slave and the Master agree
on a Link Key. A Link Key is a 128-bit value that the two devices use for
authentication. When the Slave and Master agree on a Link Key, the Slave
then negotiates for the transfer of the Encryption Key from the Master
device. The Encryption Key is used to encrypt and decrypt messages. Once
the Encryption Key is transferred, both devices use it to encrypt all
subsequent communications.
In order for Merlin II to decode encrypted traffic, it needs the Link Key for
each Master-Slave connection for which encryption will be used. If you
know the Link Key, you can enter the Key into the Encryption Options
dialog box. If you do not know it, you give Merlin II the PIN for a device
and allow Merlin II to discover the Link Key on its own. Once Merlin II has
the Link Key, it can capture the rest of what it needs by listening to the
Master and Slave devices as they negotiate for the Encryption Key.
Note - The encryption settings here are for the Merlin II only. The
BTTrainer has its own encryption settings.
Note - There is no need to configure Encryption settings if Merlin II is used
to record BTTrainer traffic.
Configuring Merlin II for Encryption
For Merlin II to successfully decrypt traffic, two steps need to be performed:
1) Merlin II needs to be given the PIN or Link Key for each Master-Slave
connection; and 2) Recording needs to be begun before the Slave connects
to the Master. If recording is begun prior to the creating the Master-Slave
connection, Merlin II will be able to obtain the encryption key and decode
encrypted traffic.
The following steps show how to configure Merlin II for encrypted traffic.
Step 1 Select View >Device List
The Device List appears.
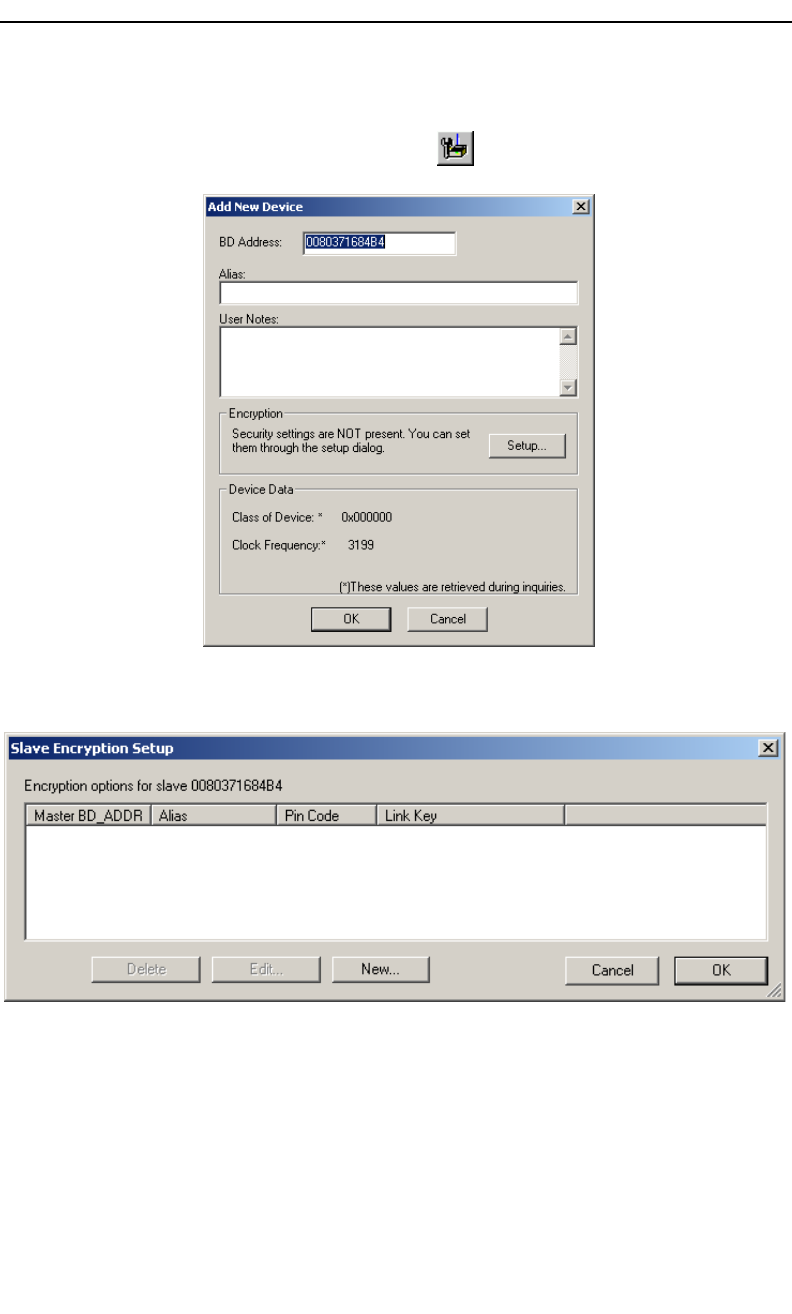
137
Merlin II Protocol Analyzer User’s ManualCATC SW Version 2.30
Step 2 Click in the row for the device of interest.
Step 3 Click the Edit Devices button
The following dialog box opens.
Step 4 Click the Setup ... button.
The following dialog box opens:
138
Merlin II Protocol Analyzer User’s ManualCATC SW Version 2.30
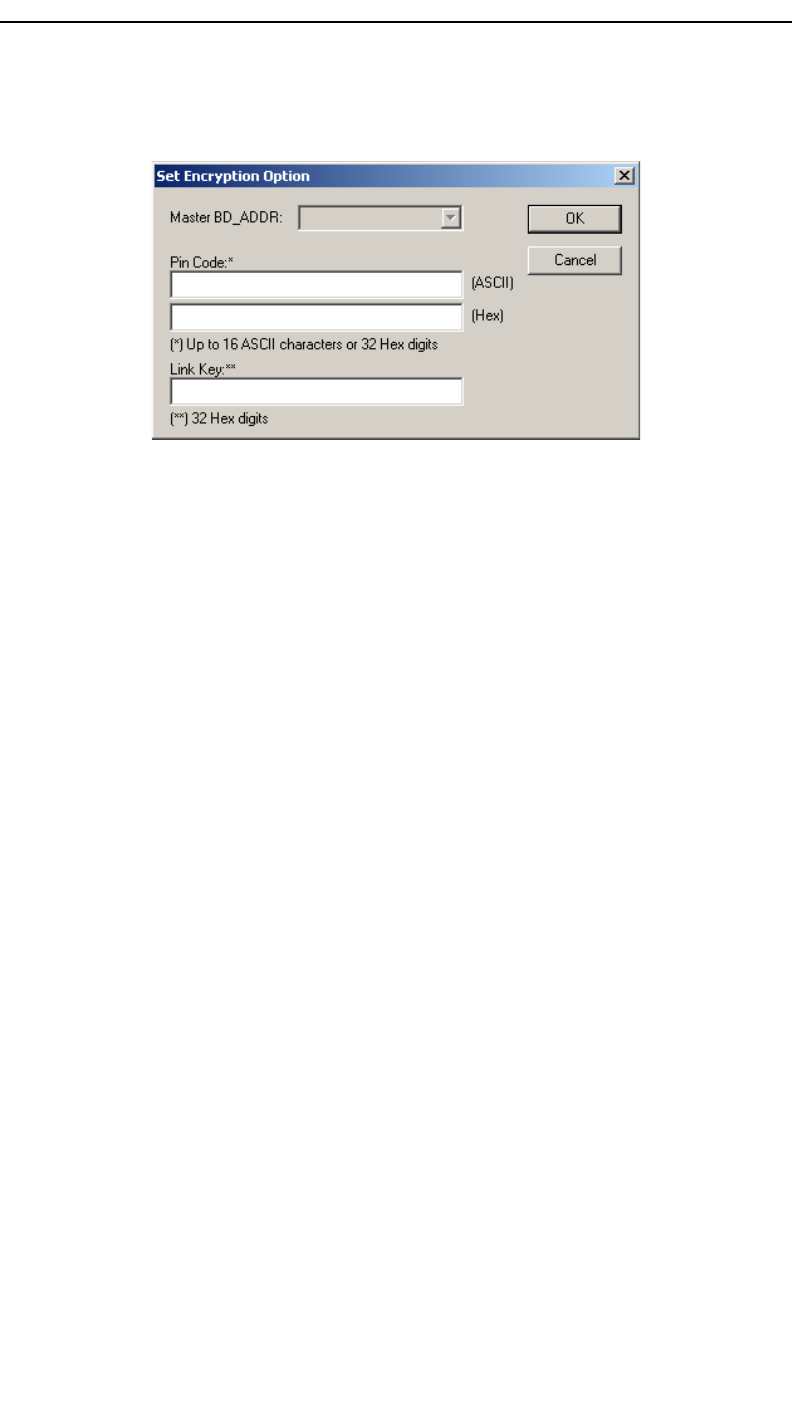
Step 5 Click the button marked New.
The following dialog box appears.
Step 6 Enter the appropriate Personal Identification Number (PIN)
for the selected device to the box marked PIN Code. This
PIN allows Merlin II to learn the Link Key. If you do not
have the PIN, skip to Step 5.
Note The PIN you provide should be the same used by the Slave. For example, if your
Slave device requires a PIN of "1234", then enter the same PIN in the dialog box
shown above.
Step 7 If you do not have the PIN, or if the Master and Slave have already
agreed upon the Link Key, manually enter a Link Key as a 128 bit
(sixteen byte) hex value into the box marked Current Link Key. If
you have the PIN, you can skip this step.
Step 1 If the Master and Slave were previously connected, they may
already agree on the Link Key. In this case, you will need to
provide Merlin II with the Link Key and not simply the PIN.
Step 2 Click OK
The changes you have made are applied and the information is displayed in the
Slave Encryption Setup dialog box as shown previously.
Step 3 Click OK.
The Slave Encryption Setup dialog box closes. Within the Device List, you
should see a "Yes" in the Security field for the selected device.
10.12 Re-applying Encryption Settings
If you record a trace with the wrong encryption settings, the trace will not
decrypt properly. Merlin II lets you correct the problem by re-applying
encryption settings after a recording is finished.
139
Merlin II Protocol Analyzer User’s ManualCATC SW Version 2.30
To correct an improperly decrypted trace file, perform the following steps.
Step 1 With the trace open, open the Device List by selecting View
> Device List from the menu.
The Device List opens.
Step 2 Follow the directions outlined above in Section 10.11,
“Encryption” on page 136 for adding/editing encryption
settings.
Step 3 Once the new encryption settings have been applied, run the
command File > Re-apply Encryption Settings ...
A Save As dialog box opens.
Step 4 Enter a file name (or use the default) and click OK.
The file is saved and the new settings are automatically applied. The new file
opens automatically.
The file should now be decrypted properly.
140
Merlin II Protocol Analyzer User’s ManualCATC SW Version 2.30
Re-applying Encryption On Incomplete Traces
If your trace does not capture the authentication procedure, there will be no
way for the analyzer to determine the BD Address of the Slave device.
Accordingly, the software will not be able to decrypt the trace file.
If you are using a development kit and already know the BD Address of the
Slave device and the Link Key, you can enter it manually in the Save As
dialog box shown above.
Note LMP_start_encryption_req still has to be present in the trace in order to manually
correct the settings.
Step 1 Select File > Re-apply Encryption Settings.
The Save As dialog opens (shown on preceding page.)
Step 2 Select the LT Address for the device whose traffic you are
trying to decrypt.
Step 3 Click the Edit button.
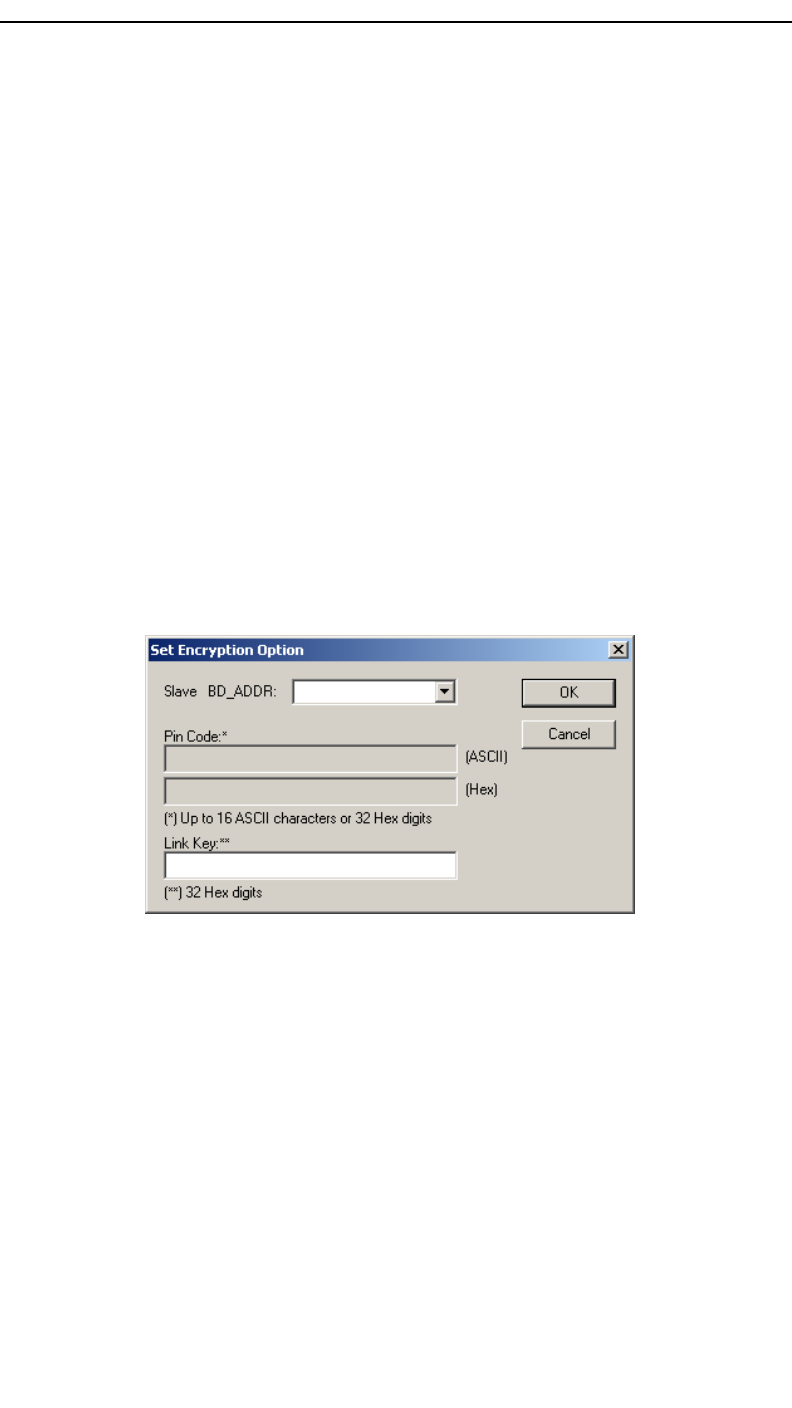
Step 4 The Set Encryption Options dialog box opens.
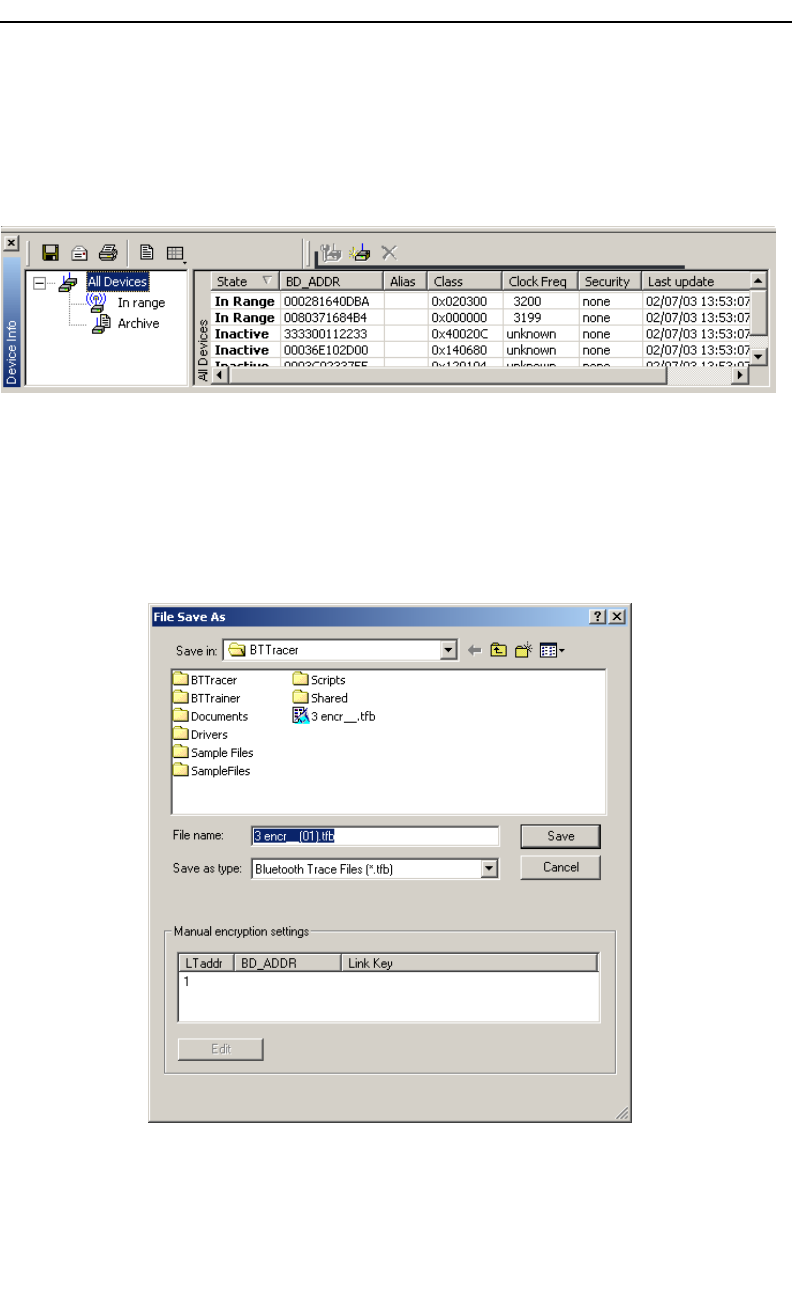
Step 5 Enter the BD Address and Link Key.
Step 6 Click OK.
The dialog box closes.
Step 7 Click Save.
The dialog box closes and the traffic is decrypted according to your settings.
141
Merlin II Protocol Analyzer User’s ManualCATC SW Version 2.30
11. Reports & Exporting Data
Merlin II has several utilities for producing statistics and graphs and for
exporting data to files.
Reports include Device List, File Information, Error Summary, Bus
Utilization, Timing and Bus Usage Calculation, Traffic Summary and Real
Time Statistics.
Trace data can be exported to three formats: text, .csv (a format suitable for
spreadsheets and database applications), and, if audio data is present,
various audio formats.
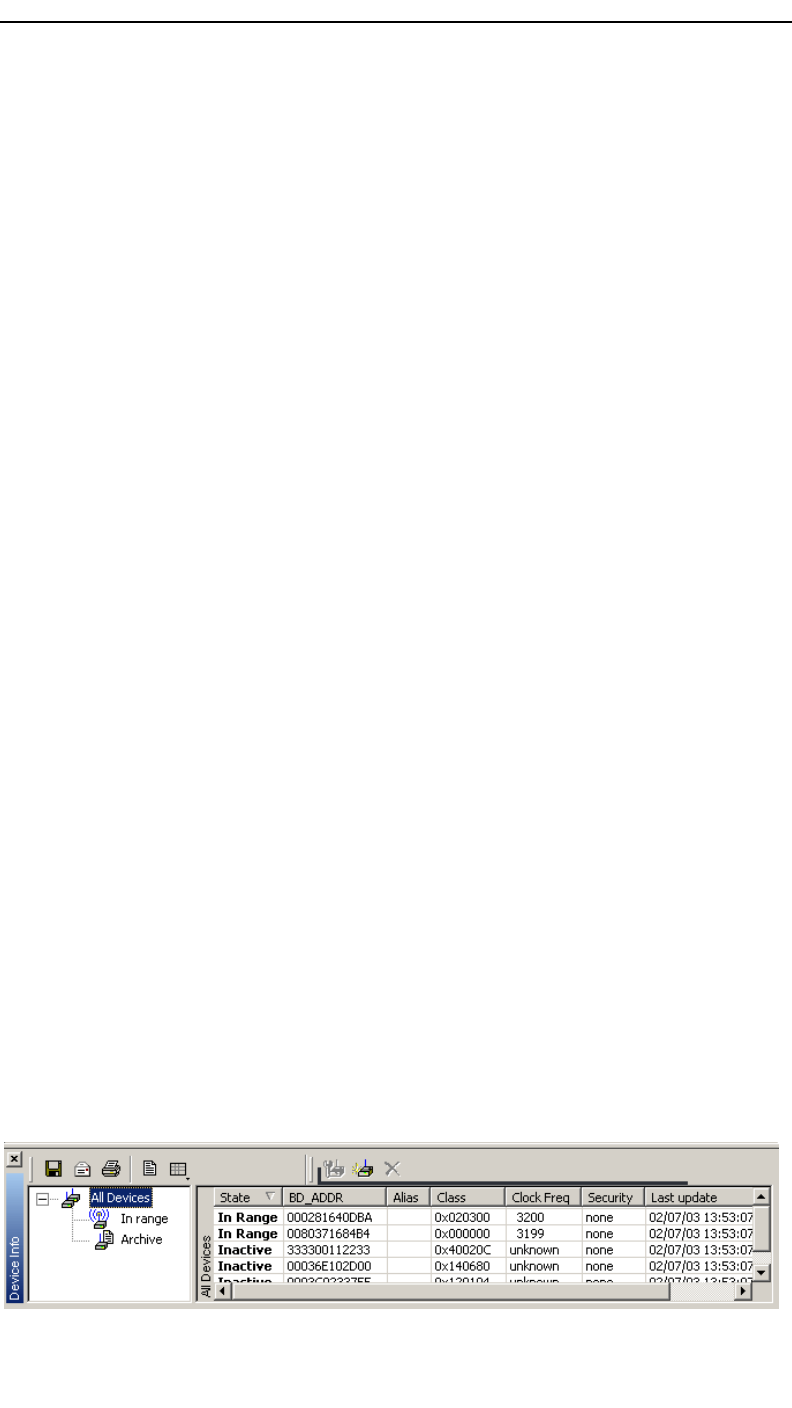
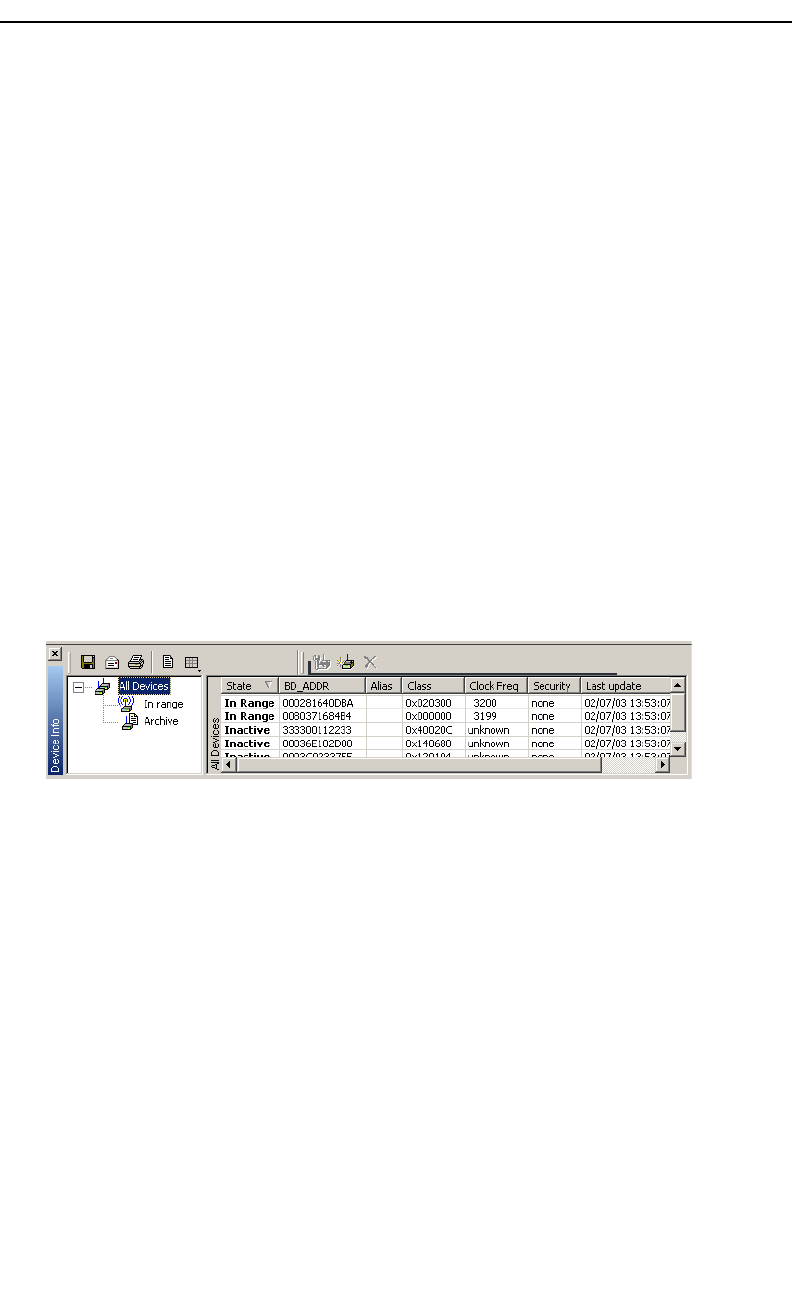
11.1 Device List
Device List describes devices discovered in a previous inquiry or devices
entered by the user.
You open Device List by selecting View > Device List.
The list is stored in a file that is updated from one session to the next.
By default, Device List appears at the bottom of the Merlin II window.
Fields in the Device List
•State -- Device State
•BD_ADDR -- Bluetooth Device Address
•Alias -- Whatever alias you entered for the device in the Add New
Device dialog
•Class -- The device class for each listed device
•Clock Freq -- Shows the device's Clock Frequency
•Security -- If Encryption is enabled, then this field will be marked
with a "Yes." You enter Encryption by clicking the Add Devices
button, and then clicking Options
•Last Update -- Shows when device information was last updated
•User Notes -- User comments. You add notes by clicking Add
Devices and entering text into the dialog box
142
Merlin II Protocol Analyzer User’s ManualCATC SW Version 2.30
Buttons
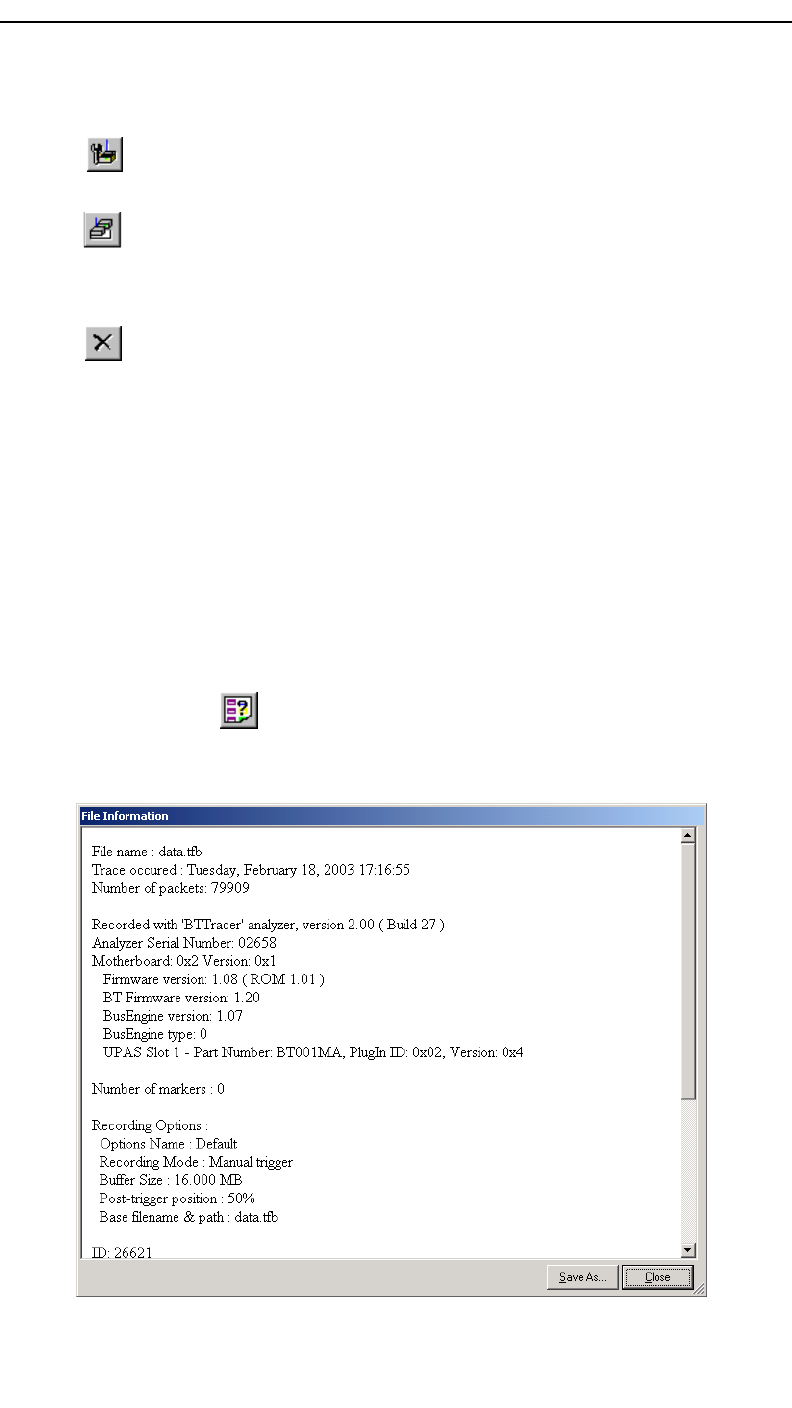
11.2 File Information
The File Information report provides valuable information about how the
recording was made, what the buffer settings were, what the trigger options
were, and what version of all the analyzer hardware was used to make the
recording.
To display a File Information report,
•Select File Information under Report in the Menu Bar
OR
Click in the Tool Bar.
You see the File Information screen:
Edit Device -- Opens a dialog box for editing the device settings in the
Device List.
Add New Device -- Opens a dialog box for adding new devices to the list.
(You can also enter devices by performing an Inquiry.) This dialog box
lets you enter information that will appear in the device list: device
names, addresses, aliases, and comments.
Remove Device -- Removes the selected device from the Device List.
143
Merlin II Protocol Analyzer User’s ManualCATC SW Version 2.30
11.3 Error Summary
The Error Summary command opens the Traffic Summary dialog box and
displays an error summary of the current trace file. The dialog box allows
you to go to a specific packet, and save the error file to a uniquely named
file. See the discussion below on Traffic Summary for more information.
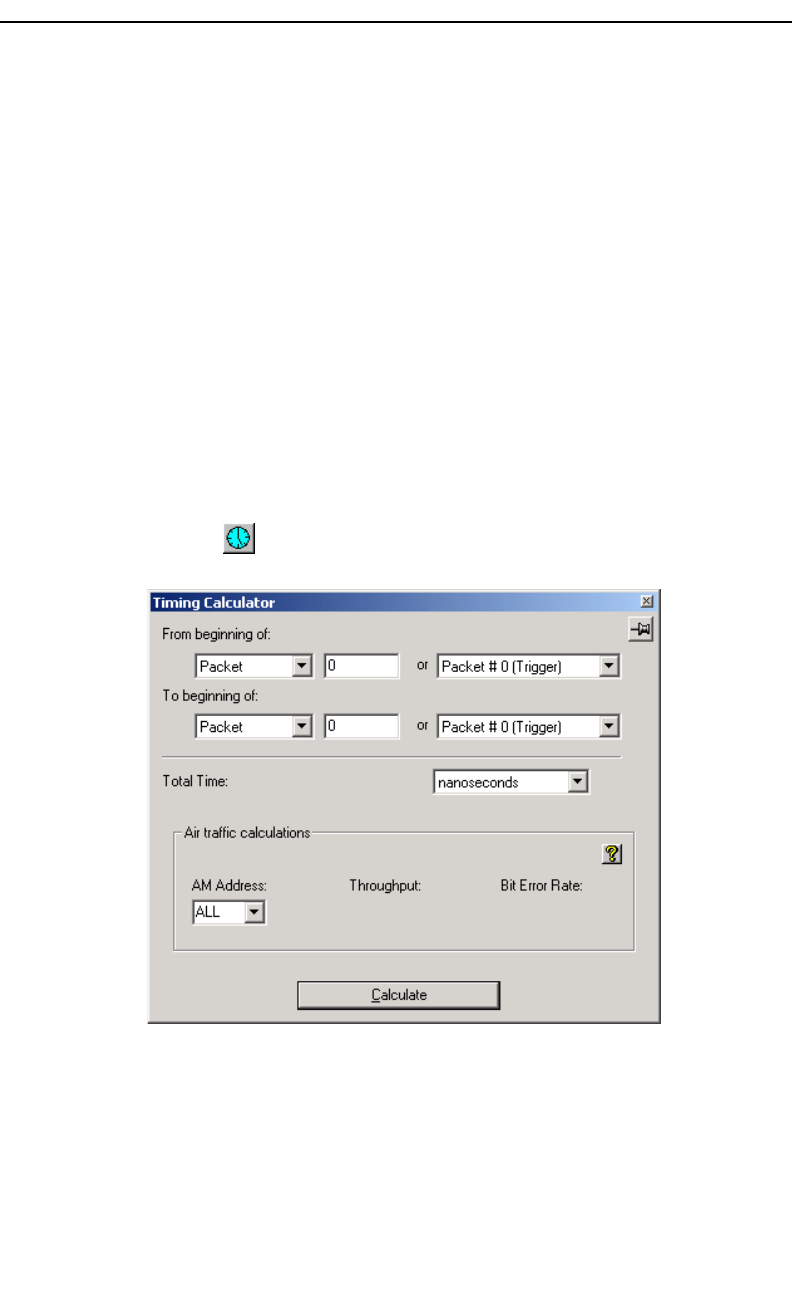
11.4 Timing Calculations
Starts the modeless calculator dialog for calculating various timing and
bandwidth parameters in the recording file.
To display a File Information report,
•Select Timing Calculations under Report in the Menu Bar
OR
Click in the Tool Bar.
You see the Timing and Bus Usage Calculator screen:
To calculate bus usage and bit rate errors,
Step 1 Enter the range of packets to be examined in the text boxes
marked "From packet" and "To packet."
Step 2 If you wish to limit your calculations to a single device,
select the device’s address from the LT Address drop-down
menu.
Step 3 Click the "Calculate" button.
At this point, bus usage will be calculated.
144
Merlin II Protocol Analyzer User’s ManualCATC SW Version 2.30
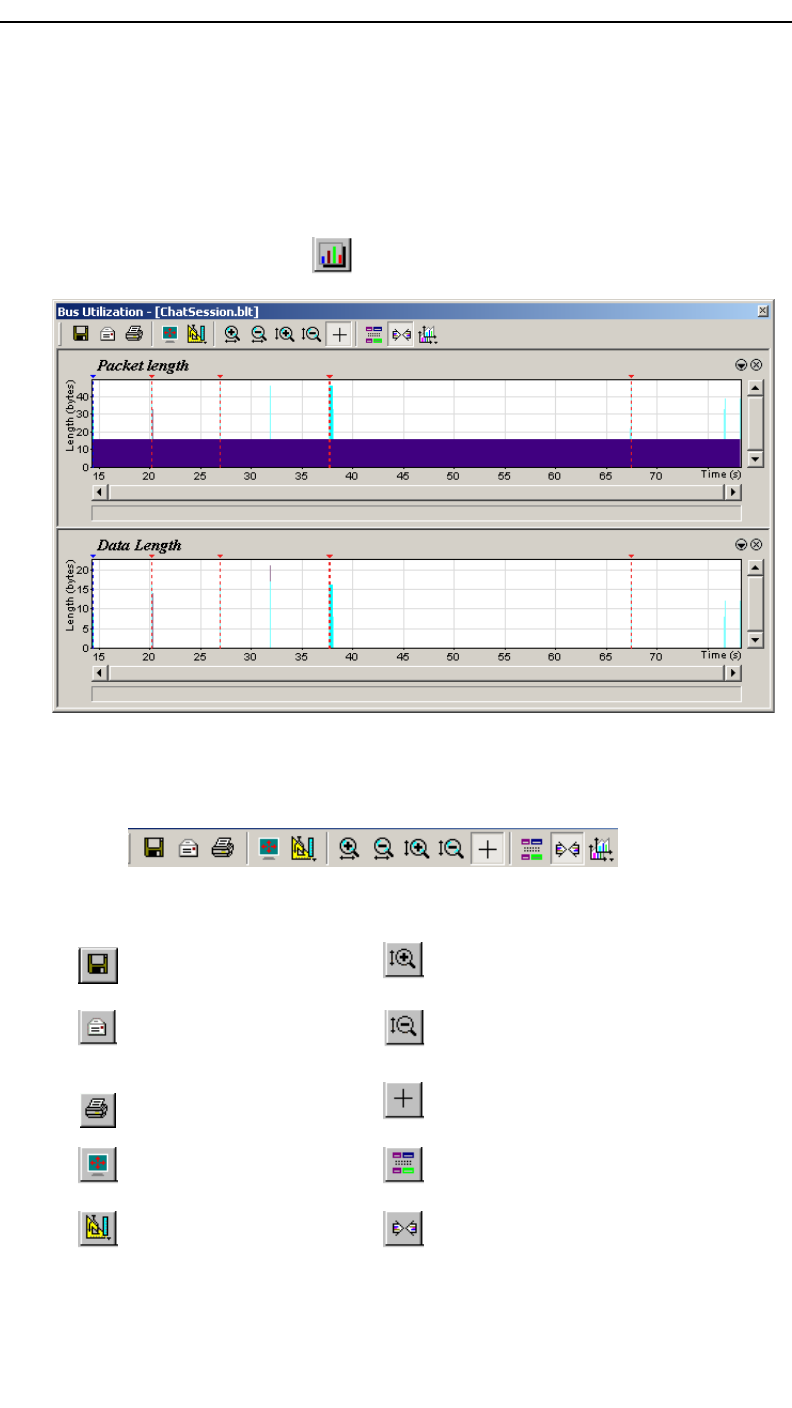
11.5 Bus Utilization
The Bus Utilization window displays a graph of bandwidth use within a
displayed trace.
To open the Bus Utilization window, select Report >Bus Utilization or
click the button marked . A window will open with graphs of Link
Utilization, Data Throughput, and Packet Counts:
Bus Utilization Buttons
The Bus Utilization window has a row of buttons for changing the format of
the displayed data and for exporting data:
The buttons have the following functions:
Save As - Saves the graphs
as a bitmap file (*.bmp) Vertical zoom in
Email - Creates an email
with a *.bmp file attachment
of the graphs Vertical zoom out
Print
Click and Drag zoom - Click diagonally to
select and zoom in on part of the graph
Full Screen Select Range
View Settings - opens a
sub-menu with options for
formatting the display. See
“View Settings Menu”
below.
Sync and Graph areas - If two or more
graphs are displayed, this button will
synchronize the graphs to one another. Once
synchronized, the positioning slider of one
graph will move the other graphs
145
Merlin II Protocol Analyzer User’s ManualCATC SW Version 2.30
View Settings Menu
Clicking the View settings button causes a menu
to open with options for formatting the display.
•Orient Horizontally - changes the
orientation of bus usage to horizontal.
After selecting this option, the menu will
say "Orient Vertically."
•Tile Vertically - tiles the two graphs
vertically (i.e., side by side).
•Show Markers - Places "tick" marks along
the x axis of each graph.
•Show Plumb Line - Displays a vertical
line that connects your cursor to the
horizontal axis. As the mouse is moved, the status bar will show
the packet and time frame to which the cursor is pointing.
•Status - Opens a sub-menu with the following options:
—Bar - Displays a status bar at bottom of graph.
—Tooltip - Causes a tooltip to appear if you position your mouse
pointer over part of the graph and leave it there for a couple of
seconds.
—None - Turns off tooltips and the status bar.
•Grid Lines - Opens a sub-menu with the following options:
—Both - Displays both X and Y axis gridlines.
—X Axis - Displays X axis gridlines.
—Y Axis - Display Y axis gridlines.
—None - Turns off gridlines.
•Grid on Top - Moves the grid lines above the graph.
Horizontal zoom in
Graph Areas - Presents options for
displaying additional graphs of data lengths,
packet lengths, and percentage of bus
utilized.
Horizontal zoom out
146
Merlin II Protocol Analyzer User’s ManualCATC SW Version 2.30
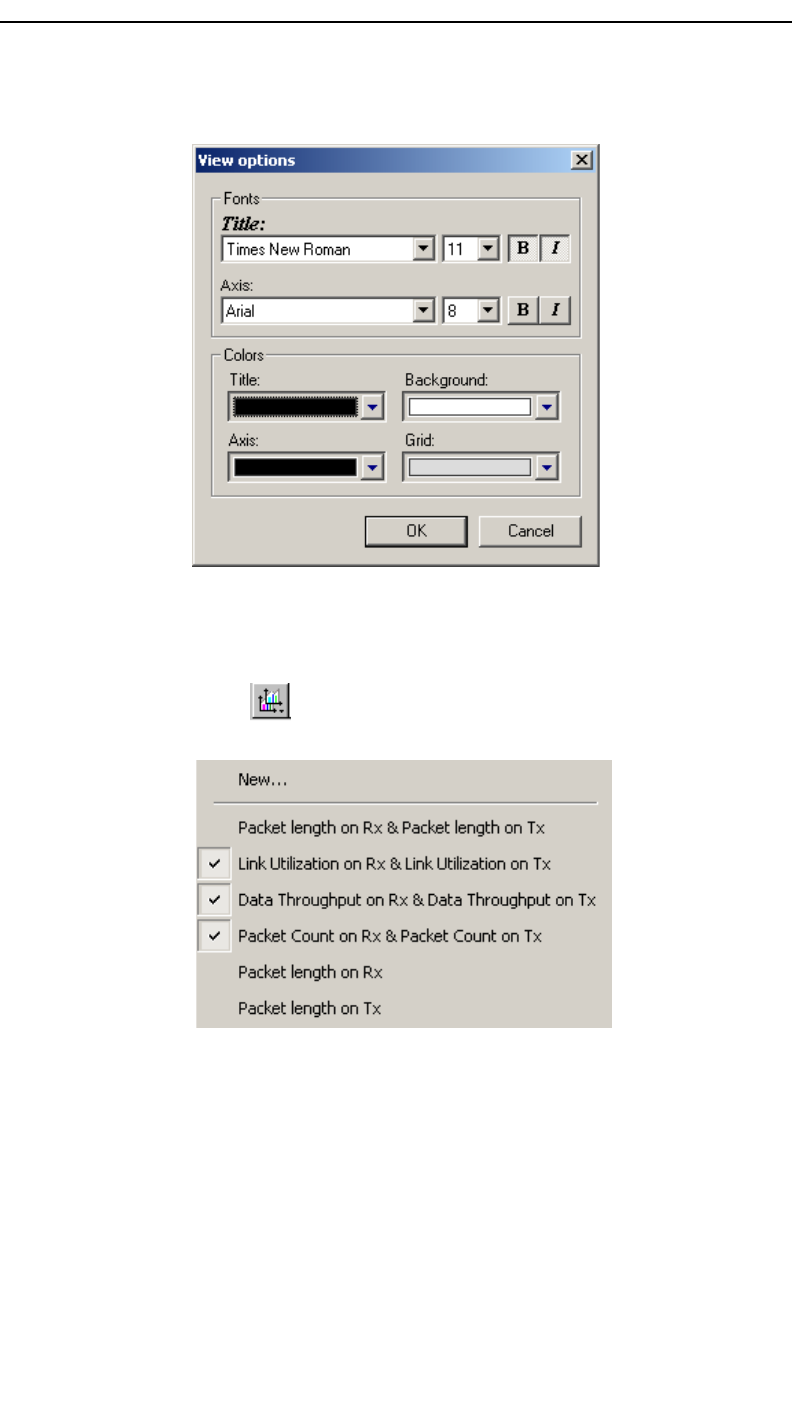
•Fonts and Colors - Opens a dialog box for setting the colors and
fonts used in the graphs:
Graph Areas Menu
The Graph Areas menu allows you to view different information in the Bus
Utilization window.
Step 1 Click the button.
The Graph Areas menu opens.
Step 2 Select the data you want to appear in the Graph Areas window.
To change the properties in the Bus Utilizations graph, follow these steps:
Step 1 In the Graph Areas menu, select the type of data to be displayed.
Step 2 Click OK.
Or
To make a new graph, click New.
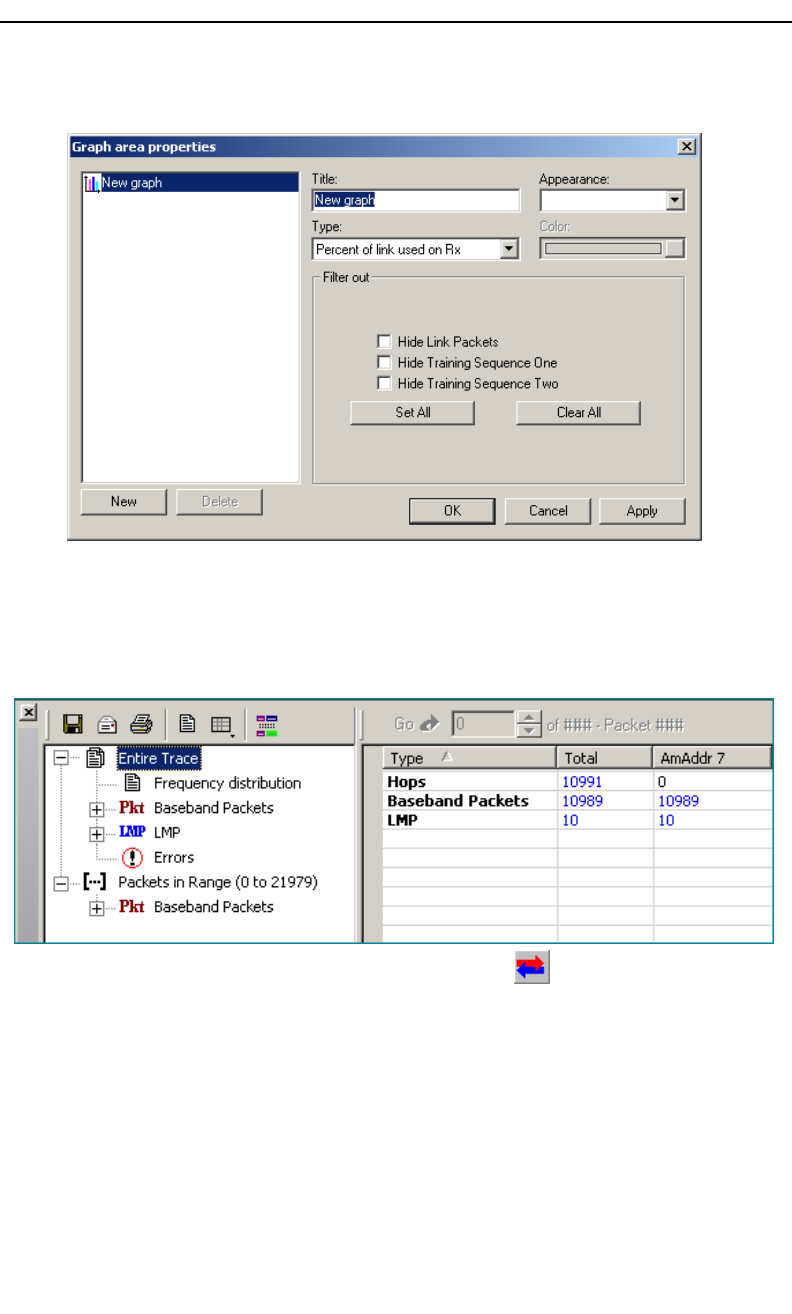
147
Merlin II Protocol Analyzer User’s ManualCATC SW Version 2.30
The following dialog box will open. It will display options for setting the title,
data, color, and line type for the graph.
11.6 Traffic Summary
The Traffic Summary dialog box displays a text summary of traffic captured
in the current trace.
To open the Traffic Summary window, press .
The left pane displays a tree of the different protocol levels. Click the plus
symbol (+) to expand the tree. The example above is fully expanded. The
right pane displays a summary of the traffic for the selected level.
11.7 Real-Time Statistics
The Real-Time Statistics window displays a graph of real-time link activity.
Real Time Statistics displays a summary of the traffic currently being
recorded by the analyzer.
148
Merlin II Protocol Analyzer User’s ManualCATC SW Version 2.30
To display the Real-Time Statistics window, click in the Tool Bar.
The Real Time Statistics window opens:
In order to see a graph of traffic, you will need to start recording. After
starting piconet activity, press to start the Real-Time statistics monitor.
Merlin II will then synchronize to the piconet and stream data in real time
to this window and presented in a format of your choice.
To stop the monitor, press .
Real-Time Statistics Buttons
The Real-Time Statistics toolbar has buttons for changing the format of the
displayed data and for exporting data:
The buttons have the following functions:
Save As - Saves Real-Time
graphs as bitmap files
(*.bmp) Vertical zoom in
Email - Creates an email
with a *.bmp file attachment
of the graphs Vertical zoom out
Print
Click and Drag zoom - Click diagonally to
select and zoom in on part of the graph
Full Screen Select Range
View Settings - opens a
sub-menu with options for
formatting the display.
Sync and Graph areas - If two or more
graphs are displayed, this button will
synchronize the graphs to one another. Once
synchronized, the positioning slider of one
graph will move the other graphs
149
Merlin II Protocol Analyzer User’s ManualCATC SW Version 2.30
Real-Time Statistical Monitor Pop-up Menu
If you right-click a graph in the Real-Time window, a
pop-up menu will appear with options for changing the
format of the display.
Undo Zoom - If you have zoomed in, this command will
undo the zoom.
Fit to Graph Area - Redisplays graph so that the entire
trace fits inside graph area.
Y Scale Type -·
Linear - Converts display to linear format.
Logarithmic - Converts display to logarithmic format.
Hide - Hides the selected graph.
Properties - Opens a dialog box with options for changing the colors, titles
and other features of the graphs.
Displaying Multiple Graphs
The Real Time Statistics window gives you the ability to create up to three
separate graphing windows so that you can create separate graphs of traffic
and tile them vertically. Within these windows, you can format the graphs
in a number of ways.
Horizontal zoom in
Graph Areas - Presents options for
displaying additional graphs of data lengths,
packet lengths, and percentage of bus
utilized.
Horizontal zoom out
Start. Starts the Real-Time Monitor.
Stop Real-Time Monitoring.
Reset. Resets the graphs.
150
Merlin II Protocol Analyzer User’s ManualCATC SW Version 2.30
To view two or three graphs simultaneously, click the Graph Areas button.
A menu opens with the following graph options:
•General Statistics
•Packet Occurrence (rate)
•Errors Occurrence (rate)
•Retransmissions - This graph shows the rate of retransmitted
packets. In the Real-Time Statistics, a packet is evaluated as
'retransmitted' if at least one non-FHS seqn bit has already been
received and if the previous sequence bit is the same as the
current sequence bit. As the sequence bit toggles on data
payloads carrying CRC, the Real-Time Statistics tracks the seqn
bits in DM, DV, DH payload, and checks for correctness only if
the payload was correctly decoded without errors.
11.8 Exporting Trace Data
Merlin II has export commands that enable you to extract trace data to CSV,
text and other file formats. This chapter describes the export process.
Export commands are accessible through the menu: File > Export. The
Export menu has five options:
•Packets to Text (Packets View Format) ...
•Packets to CSV Text ...
•Audio Streams ...
11.9 Exporting To Text Format
To export trace data to a text file,
Step 1 Select File > Export > Packets to Text (Packet View
Format) ...
The following dialog box opens.
151
Merlin II Protocol Analyzer User’s ManualCATC SW Version 2.30
Step 2 Select the type and range of traffic to be searched from the
From and To menus
Step 3 Click OK.
A Save As dialog box opens.
Step 4 Enter a name for the file and click OK.
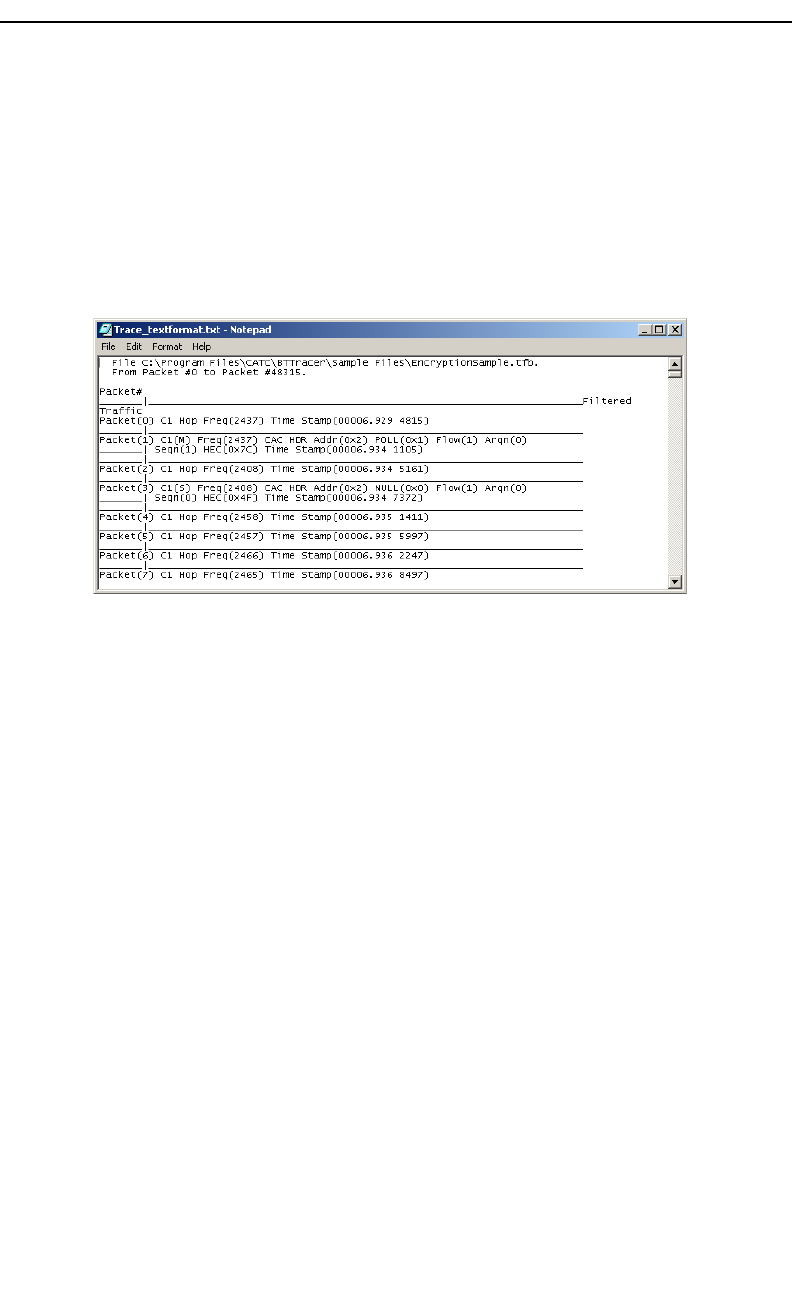
The file is then saved. Exported text files look like this:
11.10 Exporting Trace Data to a .CSV Format
CATC’s Merlin II generates over a dozen performance metrics
automatically for every trace and measures them in the Traffic Summary,
Bus Utilization, and Timing Calculations dialogs. Merlin II also has the
ability, however, to extract a far wider range of performance data to a
Comma Separated Value (.csv) format where it can be analyzed and
measured with a spreadsheet, database or other application.
The command that extracts performance data to .csv format is called Export
to CSV Text and is found under the File menu. This section describes the
export process.
Step 1 In Merlin II, open a trace.
Step 2 From the SATracer menu, select File > Export > CSV Text.
The CSV Export dialog box opens.
Step 3 Select a range using the From and To boxes.
Step 4 Select a folder where you want to export the file, and click
OK. A .csv file will then be created. Below is an example
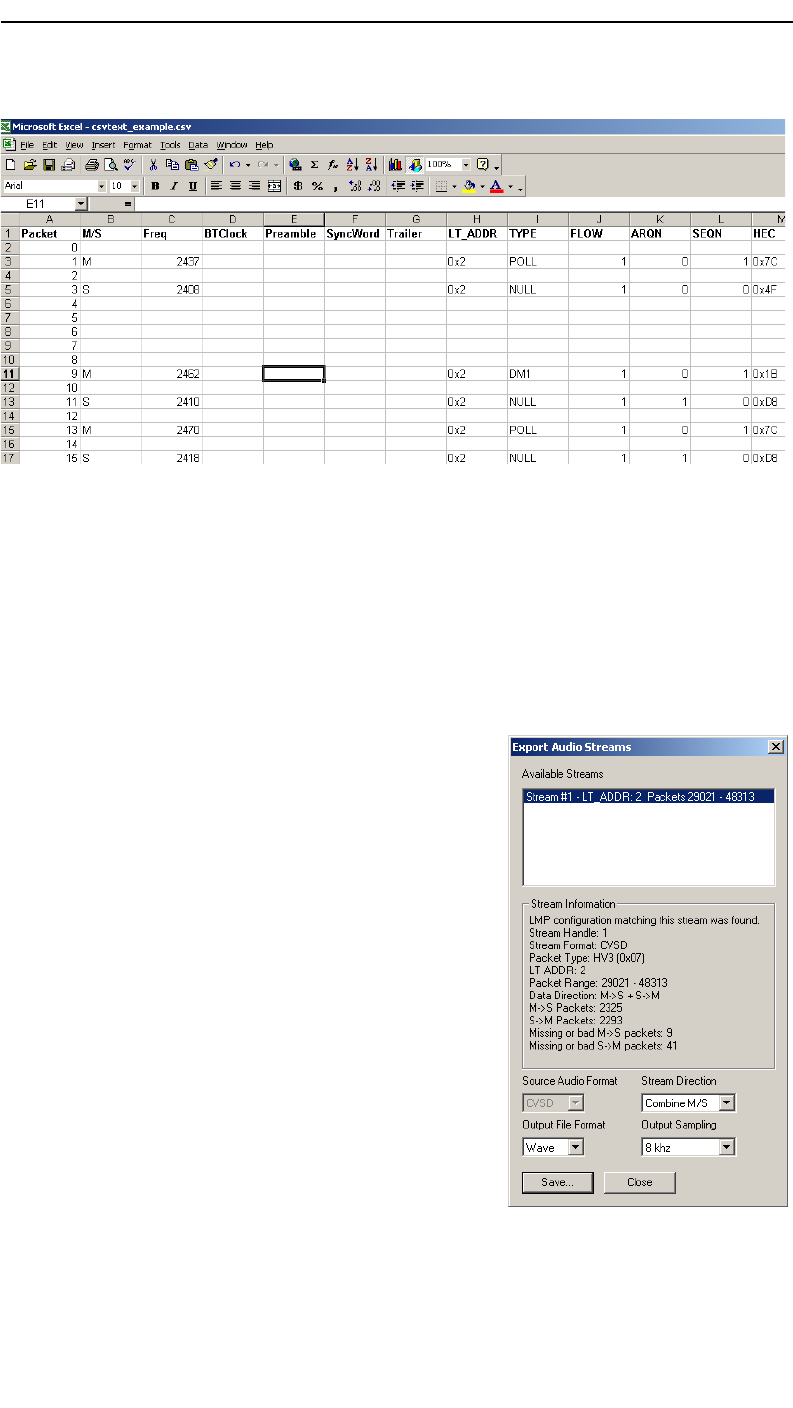
152
Merlin II Protocol Analyzer User’s ManualCATC SW Version 2.30
of a .csv file opened in Microsoft Excel.
11.11 Exporting Audio Data
Merlin II has an Export Audio Streams command that allows you to
extract audio data from a trace and export it into a file. The command lets
you narrow your selection to a particular stream direction (master to slave
or slave to master), and to set the output file format and output sampling.
Step 1 Select File > Export > Audio Streams from the menu.
The dialog box shown right opens.
Source Audio Format - Select the
Source format.
Output File Format - Select an
output format: WAVE or raw.
Stream Direction - Select stream
direction that you wish to capture:
Master to Slave, Slave to Master, or
both ("Combine M/S").
Output Sampling - Select a
sampling rate for the exported audio.
Step 2 Set the parameters, then click Save.
A Save As dialog opens.
Step 3 Select the name of the file to be
created and its location, then click OK.

153
Automation API for CATC Bluetooth AnalyzersCATC Ve r. 1.3 0
Appendix A:Merlin II Clock Calibration
The Merlin II system comes with a factory-tuned oscillator used to
generated the internal clock. This clock is used for tracking the Bluetooth
traffic and has to be kept calibrated.
The following is a detailed procedure for measuring and calibrating the
oscillator.
Please do not try to do this calibration without the proper tools. Tempering
with the clock calibration might void the warranty on Merlin II.
Tools needed for the calibration:
•The Merlin II system that you want to calibrate.
•Breakout board
•Mini DIN cable to connect the breakout board to the Merlin II
•Frequency counter
•BNC cable to connect the counter to the breakout board.
Steps prior to the procedure
Step 1 Make sure the breakout board is connected to the analyzer.
Step 2 Connect a frequency counter you want to use for the frequency
measurement to the 'EXT OUT' BNC connector on the breakout
board through a BNC cable. The frequency counter must be able to
count frequencies up to 30MHz.
Step 3 Verify that the analyzer is powered and connected to the host
machine.
1.1 Procedure:
To be able to access the clock calibration functionality in the
application, you should run the Merlin II application from a
command line with a -CLK argument:
Step 1 Select Start > Run.
154
Automation API for CATC Bluetooth AnalyzersCATC Ve r. 1.3 0
Step 2 Enter MerlinII.exe -CLK
The application appears on the screen.
Step 3 Select Setup > Recording Options to open the Recording Options
dialog box.
Step 4 Set Inquiry Timeout to 0.
Step 5 Press the Start Recording button run inquiry for at least 5 minutes.
This will bring the analyzer to its operating temperature.
Step 6 Press Stop to stop the inquiry.
Step 7 Select Setup >Connectors from the menu.
The following window appears:
Step 8 Select the option Output Clock for Calibration.
At this point the clock signal should be directed to the 'TRIG OUT'
BNC connector. The frequency counter should start showing a value
around 26 MHz now.
Step 9 Click on the Clock Cal... button. Please note that this button is
visible only when the Merlin II application is run with the -CLK
argument.
155
Automation API for CATC Bluetooth AnalyzersCATC Ve r. 1.3 0
The 'Calibrate Clock' window appears:
Step 10 Set frequency counter to use integration time of at least 1 second.
Step 11 Use the slider to adjust the clock only according to the following
steps:
A.Adjust the frequency to 26 MHz (+/- 1ppm), i.e. to a value
between 25.99998 MHz and 26.00002 MHz
B.Wait 5 minutes and verify that frequency is still within the range
specified in step A.
Step 12 When finished, Click the OK button to confirm the setting.
If the calibration value has changed, a pop-up message appears.
Step 13 Select OK to cause the application to write the new calibration value
to the Merlin II flash memory.
Step 14 In the Setup Connectors window select the 'Default Configuration'
option and then click on the OK' button.
The Setup Connectors window closes.
At this point you can continue with normal operation.

156
Automation API for CATC Bluetooth AnalyzersCATC Ve r. 1.3 0

157
Merlin II Protocol Analyzer User’s ManualCATC SW Version 2.30
How to Contact CATC
Limited Hardware Warranty
So long as you or your authorized representative
("you" or "your"), fully complete and return the
registration card provided with the applicable
hardware product or peripheral hardware
products (each a "Product") within fifteen days of
the date of receipt from Computer Access
Technology Corporation ("CATC") or one of its
authorized representatives, CATC warrants that
the Product will be free from defects in materials and workmanship for a
period of three years (the "Warranty Period"). You may also complete your
registration form via the internet by visiting
http://www.catc.com/support/register/. The Warranty Period commences
on the earlier of the date of delivery by CATC of a Product to a common
carrier for shipment to you or to CATC's authorized representative from
whom you purchase the Product.
What this Warranty Does Not Cover
This warranty does not cover damage due to external causes including
accident, damage during shipment after delivery to a common carrier by
CATC, abuse, misuse, problems with electrical power, including power
surges and outages, servicing not authorized by CATC, usage or operation
not in accordance with Product instructions, failure to perform required
preventive maintenance, software related problems (whether or not
provided by CATC), problems caused by use of accessories, parts or
components not supplied by CATC, Products that have been modified or
Type of Ser vice Contact
Call for technical support… US and Canada: 1 (800) 909-2282
Worldwide: 1 (408) 727-6600
Fax your questions… Worldwide: 1 (408) 727-6622
Write a letter… Computer Access Technology Corp.
Customer Support
3385 Scott Blvd
Santa Clara, CA 95054-3115
Send e-mail… support@CATC.com
Visit CATC’s web site… http://www.CATC.com/

158
Merlin II Protocol Analyzer User’s ManualCATC SW Version 2.30
altered by someone other than CATC, Products with missing or altered
service tags or serial numbers, and Products for which CATC has not
received payment in full.
Coverage During Warranty Period
During the Warranty Period, CATC or its authorized representatives will
repair or replace Products, at CATC's sole discretion, covered under this
limited warranty that are returned directly to CATC's facility or through
CATC's authorized representatives.
How to Obtain Warranty Service
To request warranty service, you must complete and return the registration
card or register via the internet within the fifteen day period described above
and report your covered warranty claim by contacting CATC Technical
Support or its authorized representative. CATC Technical Support can be
reached at 800-909-7112 or via email at support@catc.com. You may also
refer to CATC's website at http://www.catc.com for more information on
how to contact an authorized representative in your region. If warranty
service is required, CATC or its authorized representative will issue a
Return Material Authorization Number. You must ship the Product back to
CATC or its authorized representative, in its original or equivalent
packaging, prepay shipping charges, and insure the shipment or accept the
risk of loss or damage during shipment. CATC must receive the Product
prior to expiration of the Warranty Period for the repair(s) to be covered.
CATC or its authorized representative will thereafter ship the repaired or
replacement Product to you freight prepaid by CATC if you are located in
the continental United States. Shipments made outside the continental
United States will be sent freight collect.
Please remove any peripheral accessories or parts before you ship the
Product. CATC does not accept liability for lost or damaged peripheral
accessories, data or software.
CATC owns all parts removed from Products it repairs. CATC may use new
and/or reconditioned parts, at its sole discretion, made by various
manufacturers in performing warranty repairs. If CATC repairs or replaces
a Product, the Warranty Period for the Product is not extended.
If CATC evaluates and determines there is "no trouble found" in any
Product returned or that the returned Product is not eligible for warranty
coverage, CATC will inform you of its determination. If you thereafter
request CATC to repair the Product, such labor and service shall be
performed under the terms and conditions of CATC's then current repair

159
Merlin II Protocol Analyzer User’s ManualCATC SW Version 2.30
policy. If you chose not to have the Product repaired by CATC, you agree
to pay CATC for the cost to return the Product to you and that CATC may
require payment in advance of shipment.
General Provisions
THIS LIMITED WARRANTY GIVES YOU SPECIFIC LEGAL RIGHTS.
YOU MAY HAVE ADDITIONAL RIGHTS THAT VARY BY
JURISDICTION. CATC'S RESPONSIBILITY FOR DEFECTS IN
MATERIALS AND WORKMANSHIP IS LIMITED TO REPAIR AND
REPLACEMENT AS SET FORTH IN THIS LIMITED WARRANTY
STATEMENT. EXCEPT AS EXPRESSLY STATED IN THIS
WARRANTY STATEMENT, CATC DISCLAIMS ALL EXPRESS AND
IMPLIED WARRANTIES FOR ANY PRODUCT INCLUDING, BUT
NOT LIMITED TO, ANY IMPLIED WARRANTIES OF AND
CONDITIONS OF MERCHANTABILITY AND FITNESS FOR A
PARTICULAR PURPOSE, AND ANY WARRANTIES THAT MAY
ARISE FROM ANY COURSE OF DEALING, COURSE OF
PERFORMANCE OR TRADE USAGE. SOME JURISDICTIONS MAY
NOT ALLOW LIMITATIONS ON HOW LONG AN IMPLIED
WARRANTY LASTS, SO THE PRECEDING LIMITATION MAY NOT
APPLY TO YOU.
CATC DOES NOT ACCEPT LIABILITY BEYOND THE REMEDIES
SET FORTH IN THIS LIMITED WARRANTY STATEMENT OR FOR
INCIDENTAL OR CONSEQUENTIAL DAMAGES INCLUDING,
WITHOUT LIMITATION, ANY LIABILITY FOR THIRD PARTY
CLAIMS AGAINST YOU FOR DAMAGES, PRODUCTS NOT BEING
AVAILABLE FOR USE, OR FOR LOST DATA OR SOFTWARE.
CATC'S LIABILITY TO YOU MAY NOT EXCEED THE AMOUNT
YOU PAID FOR THE PRODUCT THAT IS THE SUBJECT OF A
CLAIM. SOME JURISDICTIONS DO NOT ALLOW THE EXCLUSION
OR LIMITATION OF INCIDENTAL OR CONSEQUENTIAL
DAMAGES, SO THE PRECEDING EXCLUSION OR LIMITATION
MAY NOT APPLY TO YOU.
The limited warranty on a Product may be transferred for the remaining
term if the then current owner transfers ownership of the Product and
notifies CATC of the transfer. You may notify CATC of the transfer by
writing to:
Technical Support
Computer Access Technology Corporation
3385 Scott Blvd
Santa Clara, CA 95054-3115 USA

160
Merlin II Protocol Analyzer User’s ManualCATC SW Version 2.30
or by email at: support@catc.com.
Please include the transferring owner's name and address, the name and
address of the new owner, the date of transfer, and the Product serial
number.

161
Merlin II Protocol Analyzer User’s ManualCATC SW Version 2.30
Symbols
!IXGEN_DONT_EDIT_THIS! 35
Numerics
1100 packet 80
1101 packet 80
A
Abort upload 32
Acknowledge 118
Action buttons 24, 85
Actions tab 85
Addr 104
Addresses
AM_ADDR 80
Bluetooth 52
slave device 42
target 53
Analyzer
describing Bluetooth 2
set up 7
status 32
API 3
Application installation 8
Arqn 104
ARQN condition 80
AT 126
Authentication 136
Automation Feature 3
AUX1 packet 80
B
Basic installation 7
Bit pattern, searching 121
Blue dot menus 88
Bluetooth
BusEngine 5
described 1
device address 52
first recording 10
limited search 76
recording traffic 92
search for device 48
searching for devices 38
target address 53
BNEP 126

162
Merlin II Protocol Analyzer User’s ManualCATC SW Version 2.30
Bubble help 33
Buffer size 10, 66
Bus utilization 144
BusEngine
Bluetooth 5
Buttons
bus utilization 144
graph area 146
toolbar 24
C
CAC 104
Calculations, timing 143
CATC Technical Support 157
Channel connections, L2CAP 129
Clicked fields, menus in 109
Clock rate, match 75
Collapse data 107
Comments, editing 106
Components, physical 4
Configuring encryption 136
Connecting events 86
Correlation Value 74
Counters
connecting events 86
value 88
CRC 104
CRC error 83
D
Data
decoding 126
expand, collapse 107
filename 10
length 82
pattern 77, 82
searching by length 114
searching by pattern 120
transfer message 128
Debug file 67
Decoding 126
Description of Merlin 2
Device
Bluetooth address 52
general search 40

163
Merlin II Protocol Analyzer User’s ManualCATC SW Version 2.30
search 38
search for Bluetooth 48
slave address 42
DH1, 2, 3 packet 80
Displaying information 103, 142
DM1 104
DM1, 2, 3 packet 80
Duration of search 48
DUT Recv/Xmit Freq 69
DV packet 80
E
Editing comments 106
Enable
debug file 67
Encryption 136
Environmental Conditions 6
Error summary 143
Errors
CRC 83
FEC 83
header length 83
HEC 83
invalid packet 83
payload length 84
Searching for 116
setting conditions for 83
sync loss 84
threshold exceeded 83
types of 77
Established Piconets 71
Events
conditions 80
connecting 86
sequencing 91
tab 77
trigger 10, 65
Exclusion search 121
Existing Piconet, recording 46
Expand data 107
Explicit NACK 118
External
input signals 77, 84
trigger form 90

164
Merlin II Protocol Analyzer User’s ManualCATC SW Version 2.30
F
Features 3
FEC Error 83
FHS packet 80
File information, displaying 142
File menu 21
Filename and data 10
Filter In/Out button 85
Filter Out/In 88
Filtering 78, 80
Find feature, using 121
Finding 116
Finding devices 38
Flow 104
Fonts 146
Force resynchronization 73
Frequencies, DUT 69
Frequency hops, hiding 108
G
General description 2
General features 3
General inquiry 72, 76
General options
recording 63
General purpose output 90
Go to
DataLength 114
error 116
Header AM_Addr 114
L2Cap CID 116
Lmp Opcode 115
marker 112
packet types 113
packet/Message/Protocol 111
Graphs
areas menu 146
bus utilization 144
buttons 146
Grid
lines 145
on Top 145
Groups, events 77

165
Merlin II Protocol Analyzer User’s ManualCATC SW Version 2.30
H
HDLC 126
Headers
AM_Addr 114
length error 83
packets 79
payload 80
HEC 104
HEC Error 83
Help menu 23
Hexadecimal patterns, searching 121
HID 126
Hiding 108, 109
Higher protocols, decoding 125
High-pulse output 89
Hops
hiding 108
reduced mode 56
Hot keys 33
Humidity 6
HV1, 2, 3 packet 80
I
Idle 104
Implicit NACK 118
Information, interpreting 103
Input signals 77, 84
Inquiry
general 76
perform/skip 37
Installation
basic 7
Interpreting a trace 103
Intersection search 121
Introduction 1
Invalid packet type error 83
K
Keyboard shortcuts 33
L
L_CH (Logical Channel) 81, 104
L2CAP
channel connections 129
CID, searching 116
described 126

166
Merlin II Protocol Analyzer User’s ManualCATC SW Version 2.30
messages 109, 125, 128
L2FL 104
Len 104
Length of data 82
License 157
Linking events 86
LMP
described 126
messages 125, 128
Opcode 115
Logical Channel 81
Long pattern, searching 121
Loss of sync
searching for 116
timeout 73
Low-pulse output 89
M
Manual trigger 10, 65
Markers
editing and clearing 105
searching 112
setting 104
Master
and slave 118
switch 74
Master/address 52
Match clock rate 75
Menus
blue dots in events 88
clicked fields 109
pulldown 21
veiw settings 145
Merlin
configure encryption 136
description of 2
Message
searching 111
Messages
LMP, L2CAP 125, 128
transfer 128
Modes
test, recording in 56

167
Merlin II Protocol Analyzer User’s ManualCATC SW Version 2.30
N
NULL packet 80
Nulls, hiding 108
O
OBEX 126
Opcode 104
Operating temperature 6
Options
general recording 63
name 10
search 54
Orient horizontally 145
Output signals, enabling 89
Overview 1, 21
P
Package dimensions 6
Packets
1100, 1101 80
AUX1 80
DM1, 2, 3 80
DV 80
FHS 80
headers 77, 79
headers in 79
hiding 100
HV1, 2, 3 80
invalid type error 83
NULL 80
POLL 80
searching 111, 113
types 80, 118
viewing 128
Page
sync and record 77
Paging traffic 74
Passive sync and record 71
Patterns, data 82
Payload
headers 77, 80
length error 84
Percentage of triggering 66
Phone numbers, Technical Support 157
Physical Components 4

168
Merlin II Protocol Analyzer User’s ManualCATC SW Version 2.30
Piconet
established devices 71
master address 52
private device 72
recording 42, 46
recording traffic on 36
search options 54
slave address 42
sync and record 71
synchronizing 42
target address 53
Wizard 43
PIN 136
Pkt 126
Polls
hiding 108
POLL packet 80
Position of trigger 66
Post triggering, percentage 66
PPP 126
Pre-triggering 66
Private Device Piconets 72
Program
installation 8
Progress indicator, recording 30
Protocol
Analyzer 2
decoding 126
searching 111
Pull-down menus 21
Pulse low signal 89
Pulse toggle signal 89
R
Reading a trace 103
Real time statistics 147
Record inquiry 76
Record menu 21
Recording
Bluetooth traffic 10, 92
existing Piconet 46
Piconet 42
progress indicator 30
reduced hop mode 56

169
Merlin II Protocol Analyzer User’s ManualCATC SW Version 2.30
session 11
type 65
Recording Options
events 77
general 10, 63, 65
in Wizard 43
saving 92
Recording type 46
Recv, DUT freq 69
Reduced hops 56
Reports
menu 21
Restart button 86
Resynchronization, forced 73
RFCOMM 126
S
Sample
recording 11
Saving
recording options 92
SDP Msg 126
Search 40
duration of 48
general 50
Search menu 21
Search options 54
Search type 38, 48
Searching
by data pattern 120
complex 116
data length 114
for bit pattern 121
for bit patterns 121
for errors 116
Header AM_Addr 114
L2Cap CID 116
Lmp Opcode 115
packet types 113
recorded traffic 111
Security 136
SEQN condition 80
Sequence
event 91

170
Merlin II Protocol Analyzer User’s ManualCATC SW Version 2.30
Set marker 104
Setup
menu 21
Shortcuts, keyboard 33
Show markers 145
Show plumb Line 145
Signalling
message 128
Signals
input 77, 84
outputs, enabling 89
Size of buffer 66
Slave device, address 42
Slave switch 74
Snapshot 10, 65
Soft Bit Error, searching 116
Software
installation 8
overview 21
Special Interest Groups (SIGs) 1
Specifications 6
Statistics
real-time 147
Status
status bar 145
Status of Analyzer 32
Storage temperature 6
Summary
error 143
traffic 147
Support, technical 157
Switches 6, 74
Sync
and record 70, 71
loss error 84
loss of, searching 116
timeout, loss of 73
window 76
Synchronization, forced 73
Synchronize Piconet 42
T
Tabs
recording events 77

171
Merlin II Protocol Analyzer User’s ManualCATC SW Version 2.30
recording, general 10, 64
recording, options 63
Technical Support 157
Temperature tolerances 6
Test debug 67
Test mode, recording in 56
Threshold Exceeded error 83
TID 104
Tile vertically 145
Time Stamp 104
Timeout
loss of sync 73
Timeslot filtering 78
Timing calculations 143
Tips, tool 33
Toggle signal 89
Toolbar 24
Tooltips 33, 104, 127
Trace
filename 10
reading 103
sample 11
Traffic
Bluetooth 92
hiding 109
on Piconet 46
paging 74
recording 54
recording on piconet 36
searching 111
summary 147
Trail 104
Transfer message, data 128
Trigger
event 65
external form 90
position 10, 66
post triggering 66
recording, manual 65
Type of recording 65
U
Unassociated traffic, hide 109
Union search 121
