Computer Access Technology MRLN-A128 Bluetooth Protocol Analyzer User Manual 01 Merlin
Computer Access Technology Corporation Bluetooth Protocol Analyzer 01 Merlin
Contents
- 1. Manual Part 1
- 2. Manual Part 2
Manual Part 2
45
Merlin Protocol Analyzer User’s ManualCATC Version 1.6
The wizard will close and your trace will display.
6.2 Recording an Existing Piconet
Using Recording Wizard to record an existing piconet is similar to recording
a new piconet. The main difference is that you will be asked if your Master
device can support multiple slave devices and whether it can respond to
pages once it has created a piconet with another device.
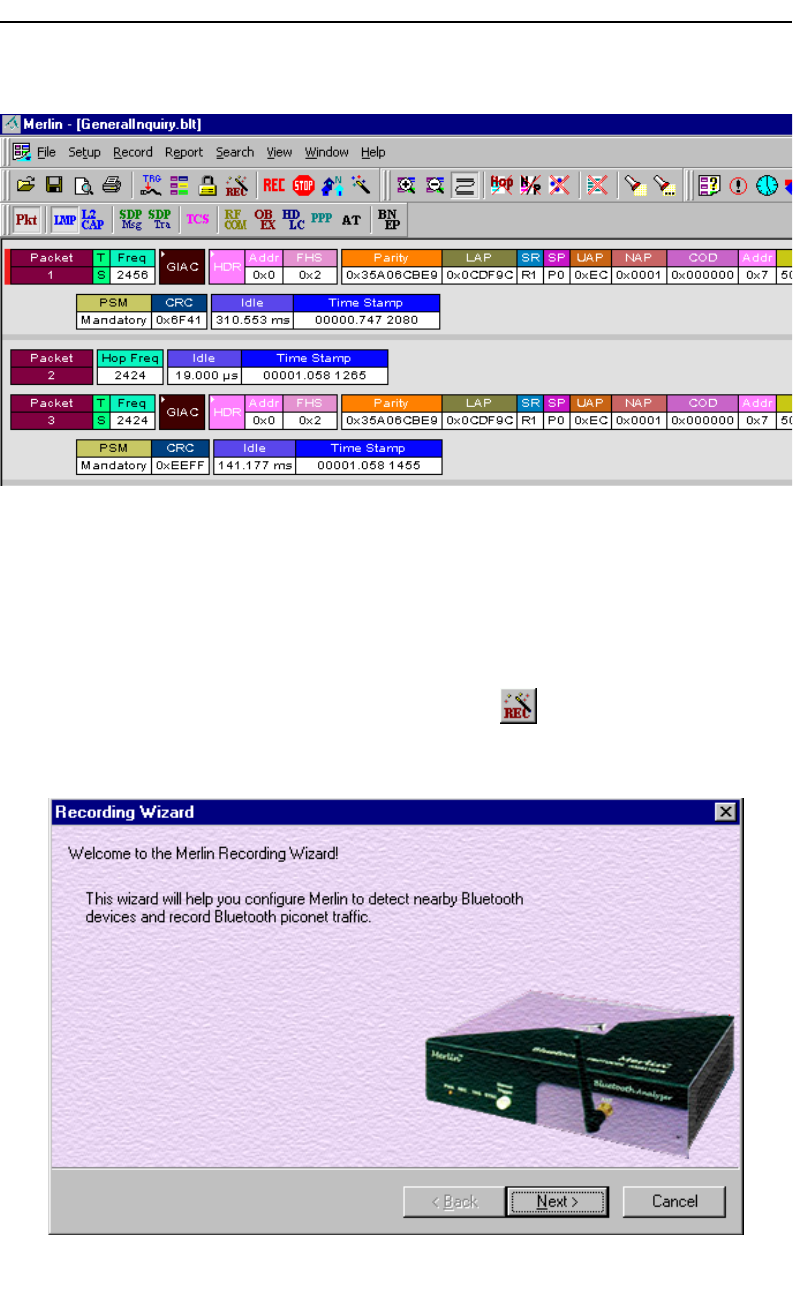
Step 1 To start the Recording Wizard, press or select Setup >
Recording Wizard from the menu.
The Recording Wizard introductory page will open:
46
Merlin Protocol Analyzer User’s ManualCATC Version 1.6
Step 2 Press Next to advance to the next screen.
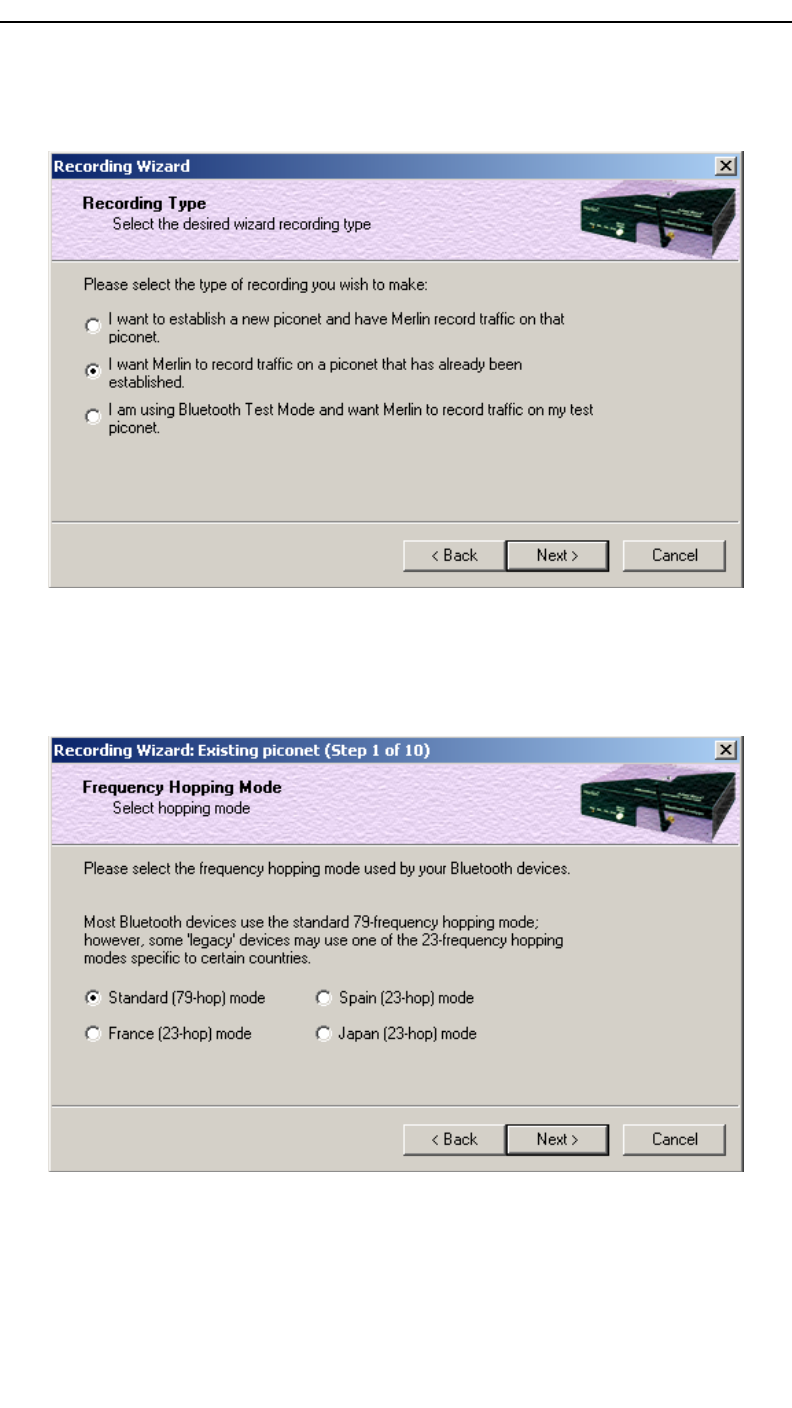
You will see three choices:
Step 3 Select the second option: I want Merlin to record traffic
on a piconet that has already been established.
Step 4 Press Next.
You will see four choices:
Select the hop mode appropriate to your area.
Step 5 Select the hop mode appropriate to your area, then press
Next.
47
Merlin Protocol Analyzer User’s ManualCATC Version 1.6
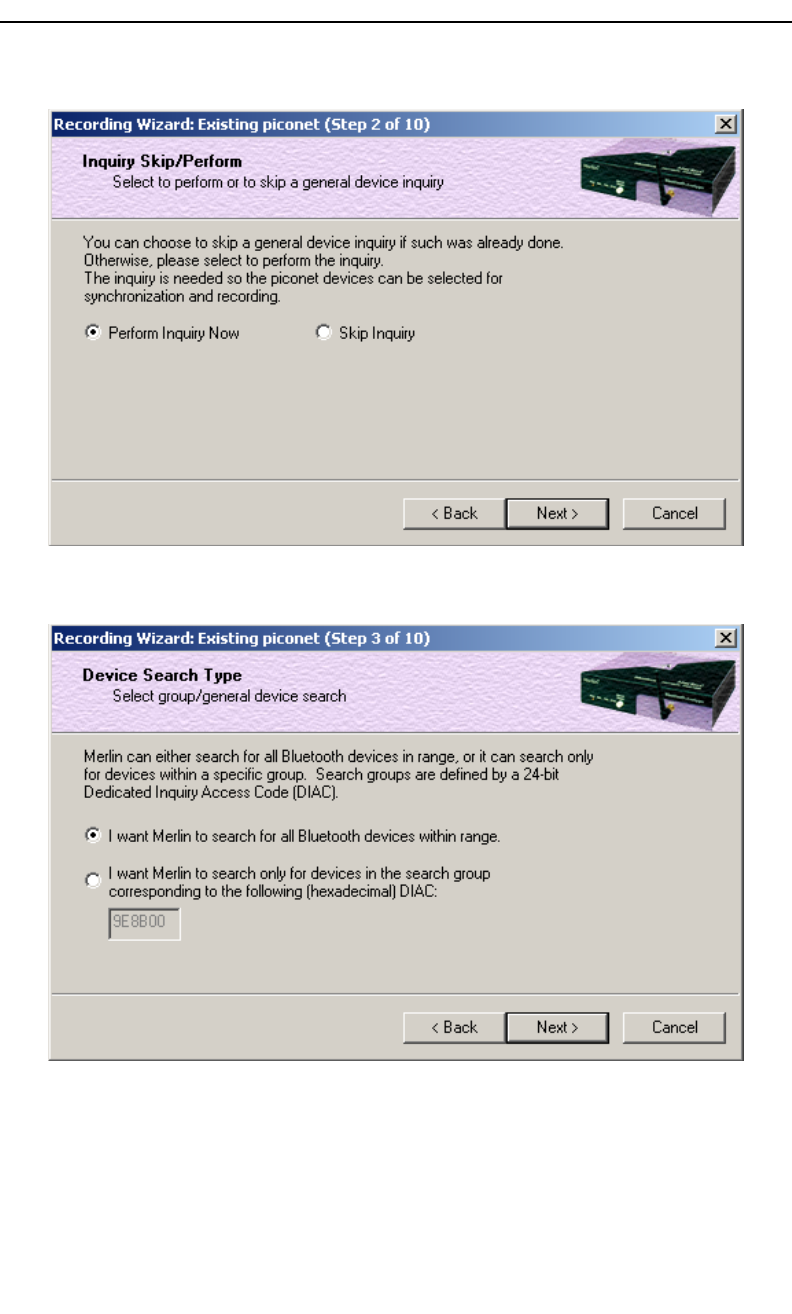
You will see two choices:
Step 6 Select Perform Inquiry Now.
You will see two choices:
Step 7 Select the first option: I want Merlin to search for all
Bluetooth devices within range.
If you want to limit the inquiry to a class of devices, select the second
option and enter the hexadecimal value for the device class in the text
box.
48
Merlin Protocol Analyzer User’s ManualCATC Version 1.6
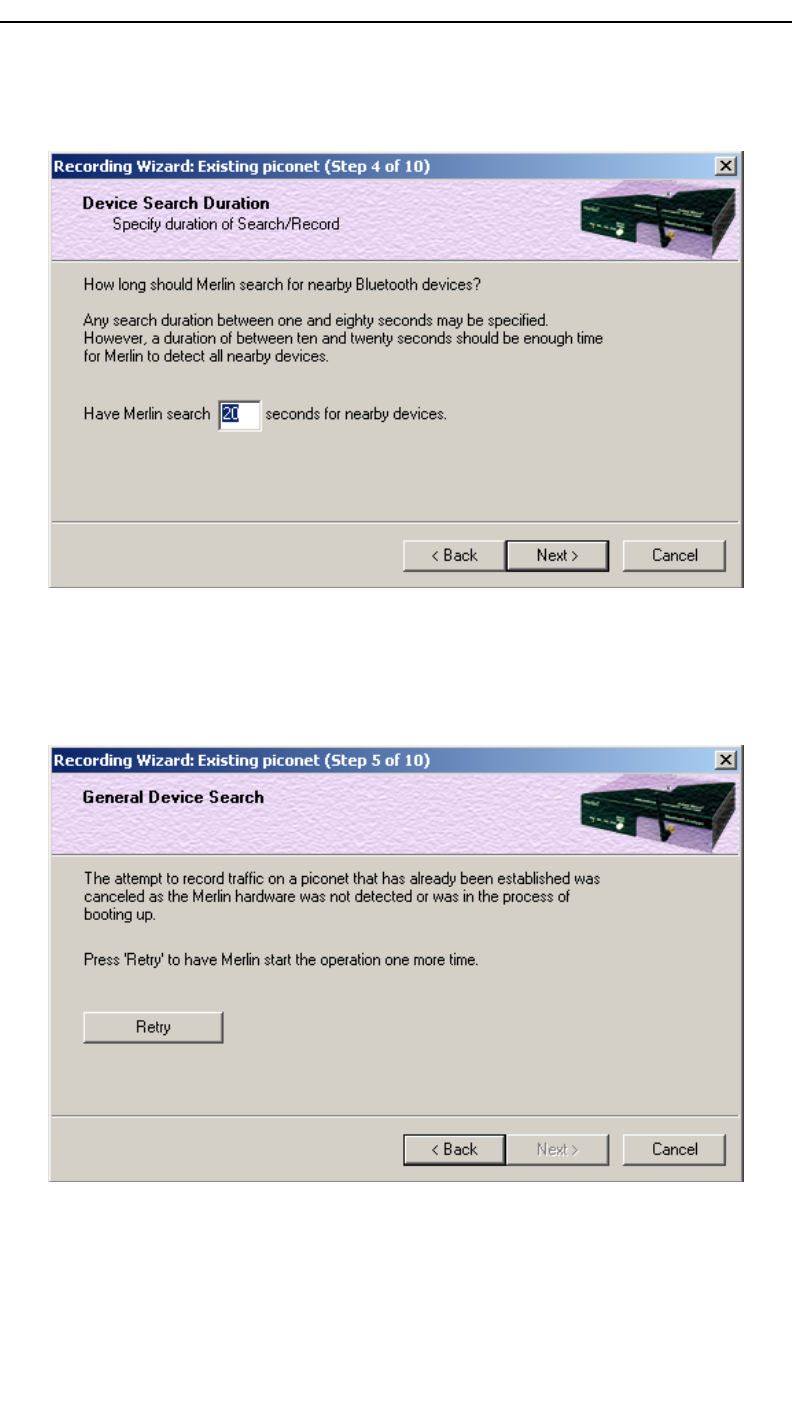
Step 8 Press Next.
You will see two choices:
Step 9 If you want to change the search duration, type in a new
value into the text box. Otherwise, use the default value (20
seconds), then press Next.
The PC-Merlin hardware connection will be tested. If Merlin cannot be
detected, the following message will display:
49
Merlin Protocol Analyzer User’s ManualCATC Version 1.6
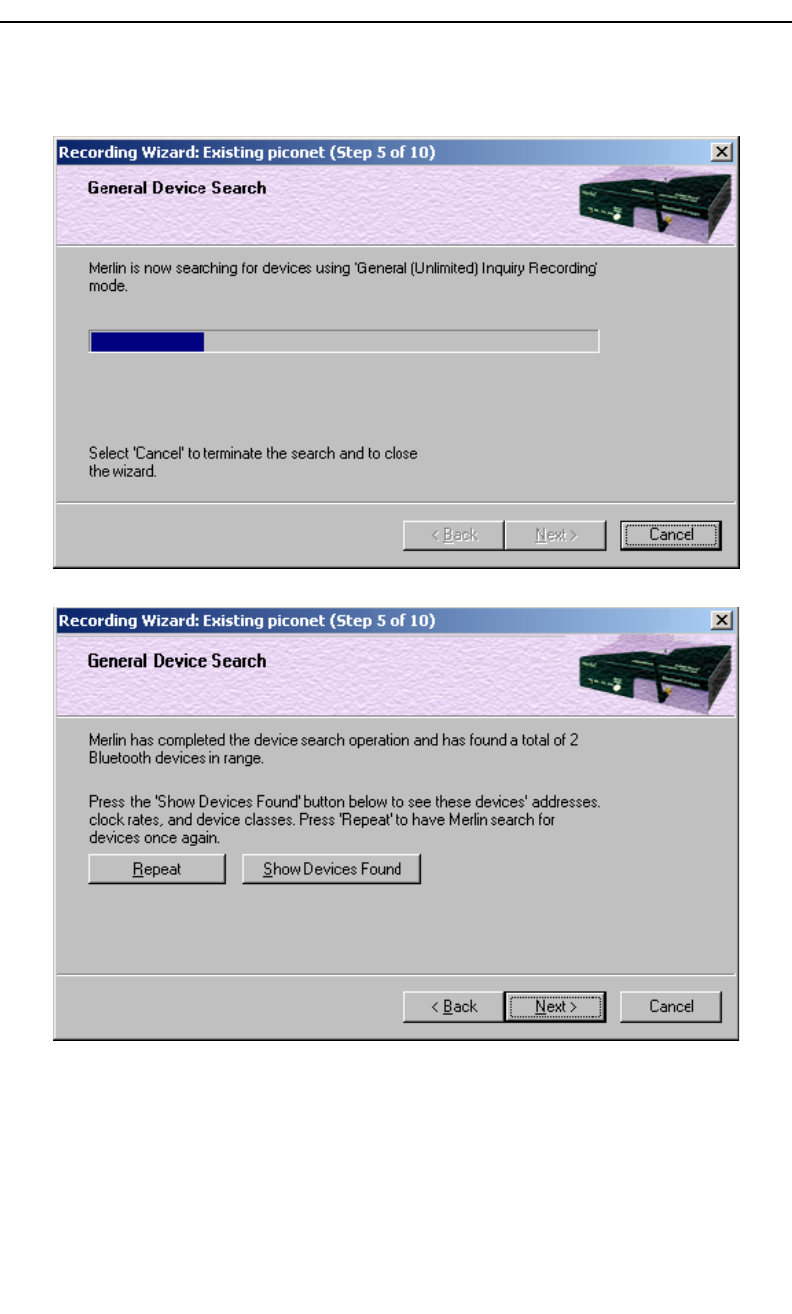
If Merlin passes the hardware test, it will then goes onto conduct a
General Inquiry to locate local Bluetooth devices.
If Merlin finds Bluetooth devices, it will display the following message:
Step 10 To display a list of the discovered devices, press the button
50
Merlin Protocol Analyzer User’s ManualCATC Version 1.6
marked Show Devices Found.
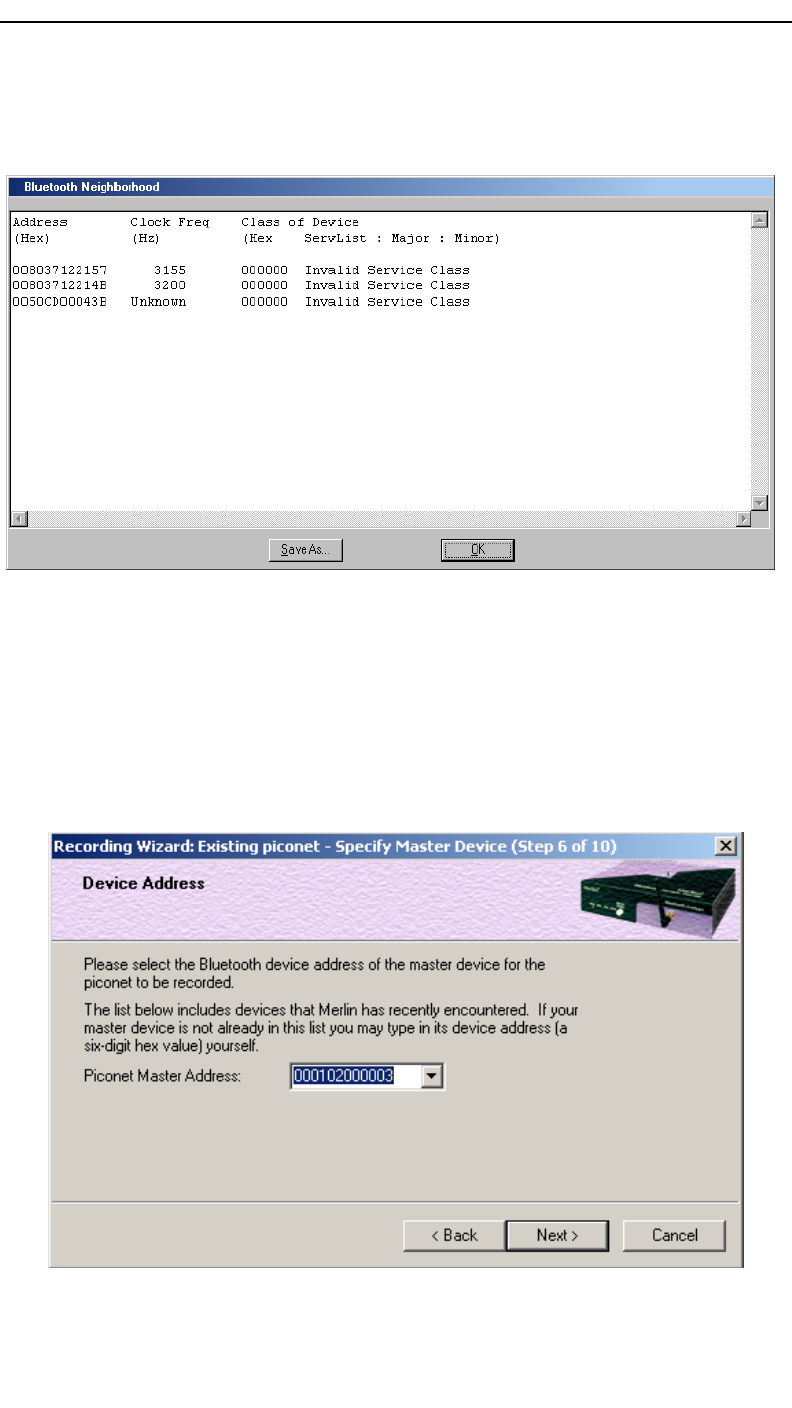
A screen will display showing the devices that Merlin discovered
through the General Inquiry:
If you feel that the list is incomplete, you can close this window and press
the button marked Repeat. This will cause Merlin to repeat the General
Inquiry and recollect information on local Bluetooth devices.
Step 11 Press OK to close the Bluetooth Neighborhood window.
Step 12 Press Next to advance to the next screen.
The following screen will prompt you for the Master device’s address.
The address can be selected from the drop-down menu or typed into the
box:
Step 13 Select or type in the Master device’s address into the box
51
Merlin Protocol Analyzer User’s ManualCATC Version 1.6
next to the label Piconet Master Address.
Step 14 Press Next.
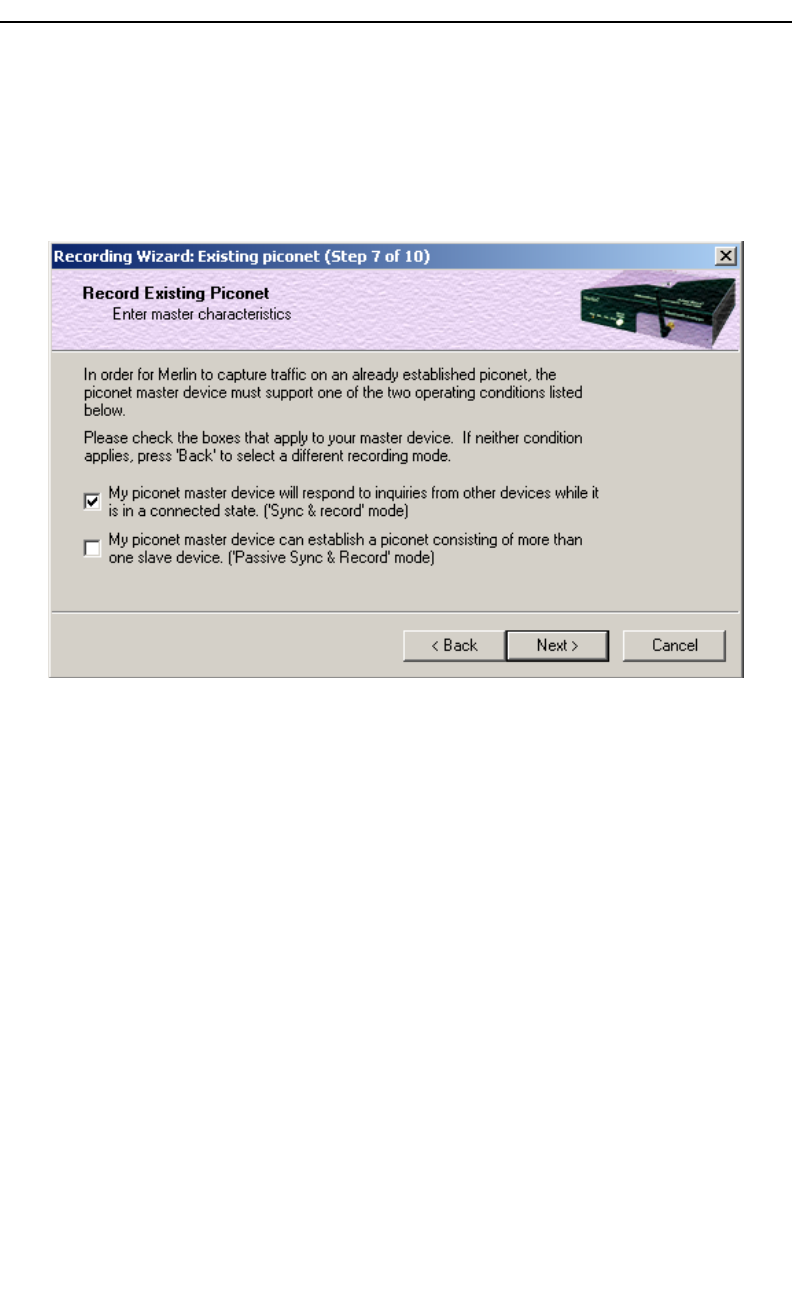
The following screen will display. This screen asks you which of the
following two options apply to your Master device. For some devices,
both options will apply.
You can select either or both options. They are not mutually exclusive:
If the Master supports inquiries while in a connected state, select the first
option. This will set Merlin to use the 'Sync & Record' mode in its
attempts to synchronize to the Master. This will also cause the wizard to
skip to step 8.
If the Master can support piconets with multiple slaves, select the second
option. If you select this box alone (i.e., you leave the first box
unchecked), Merlin will use the 'Passive Sync & Record' mode to
synchronize to the Master. The wizard will then advance to Screen 8*.
If the first checkbox was selected, Merlin will use 'Sync & Record' no
matter what was set in the second box.
Step 15 Select the options that pertain to your device, then press
Next.
52
Merlin Protocol Analyzer User’s ManualCATC Version 1.6
The screen that follows will depend on the options you selected above.
If you selected the first option (=’Sync & Record’), the following screen
will display. This screen gives you the option of verifying the presence
of the Master device just before synchronizing.
Step 16 If you want to skip the Master verification, put a check in the
box. If you are in doubt, leave the box unchecked.
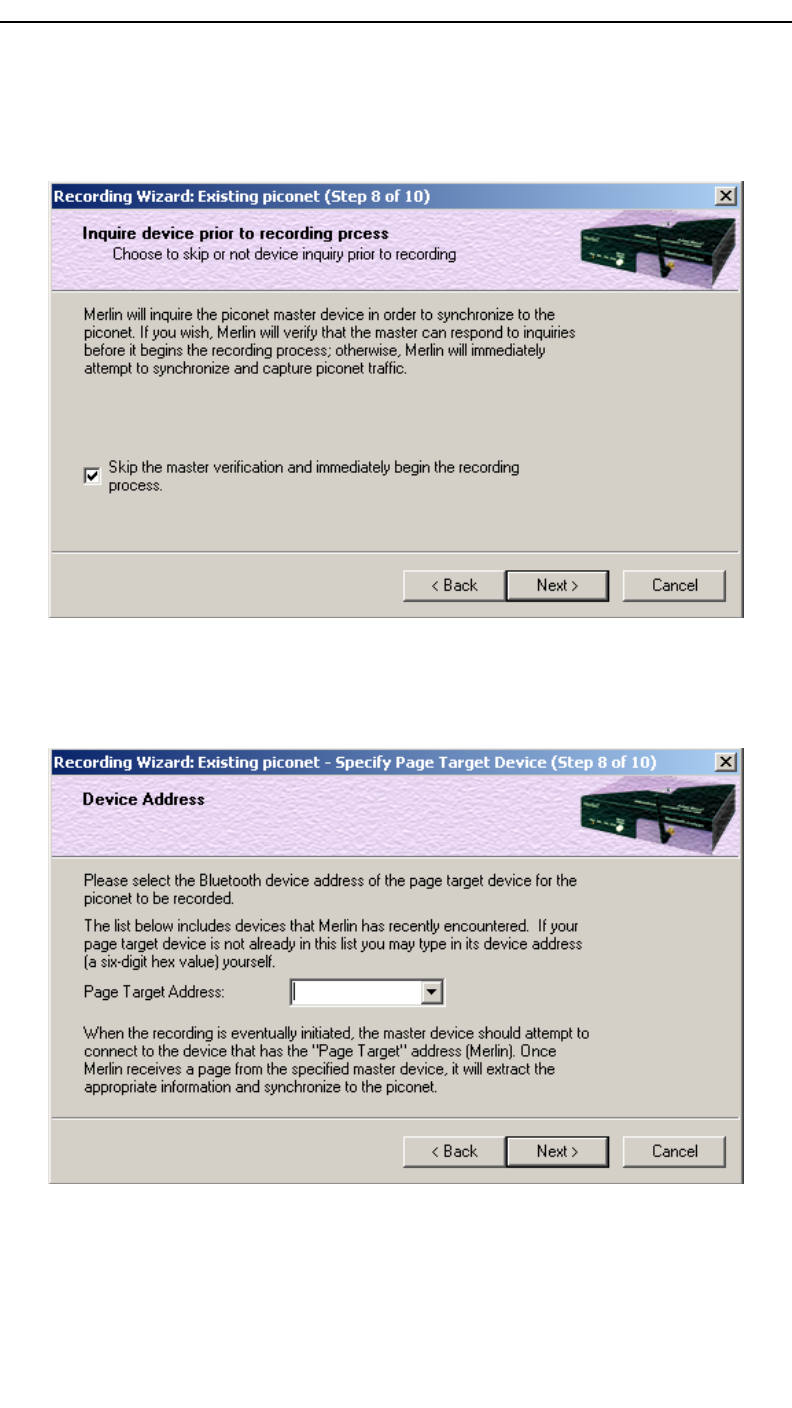
If you selected only the second option in Step 15 (=’Passive Sync &
Record’), the following screen will display.
This screen asks you for the address of the Page Target device -- which
in this case is Merlin. Since the devices in your piconet are not able to
respond to inquiries, Merlin will not be able to page the devices and join
the piconet. Instead, you will assign Merlin an address here in this
53
Merlin Protocol Analyzer User’s ManualCATC Version 1.6
screen, then direct your piconet Master device to connect to Merlin. The
Master will attempt to connect to Merlin and therein give Merlin the
information it needs to record the Master and slave devices.
Step 17 Type in an address of your choosing for Merlin (= Page Target).
You are making up an address for Merlin that the Master will use to try
to connect to Merlin.
Step 18 Press Next
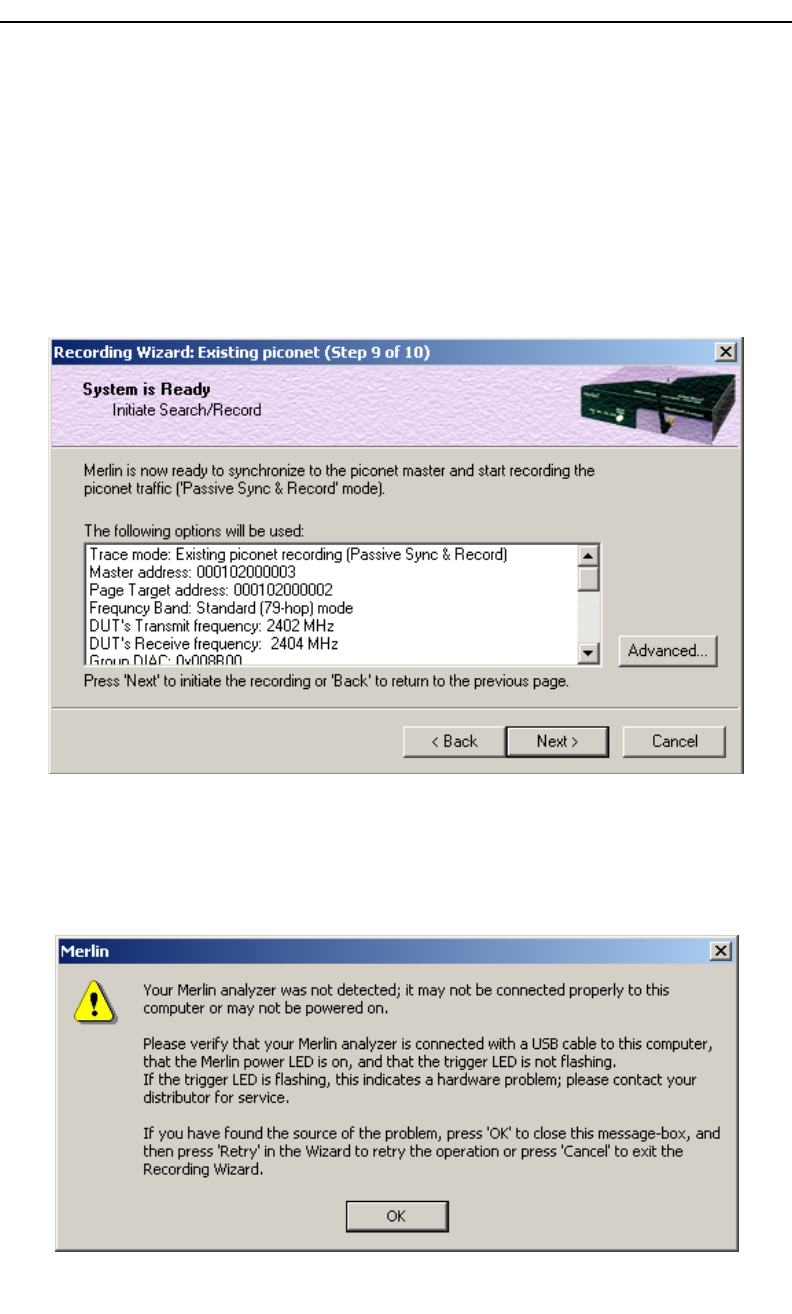
Merlin will then display your current settings.
The Advanced button will open the Recording Options dialog box
shown on page 42 and described in detail in Chapter 7.
Step 19 Press Next to begin the recording.
If the Merlin hardware is not ready or connected or is in the process of
booting up, the following information message box will display:
Step 20 If the above information box opened, press OK to close it.
54
Merlin Protocol Analyzer User’s ManualCATC Version 1.6
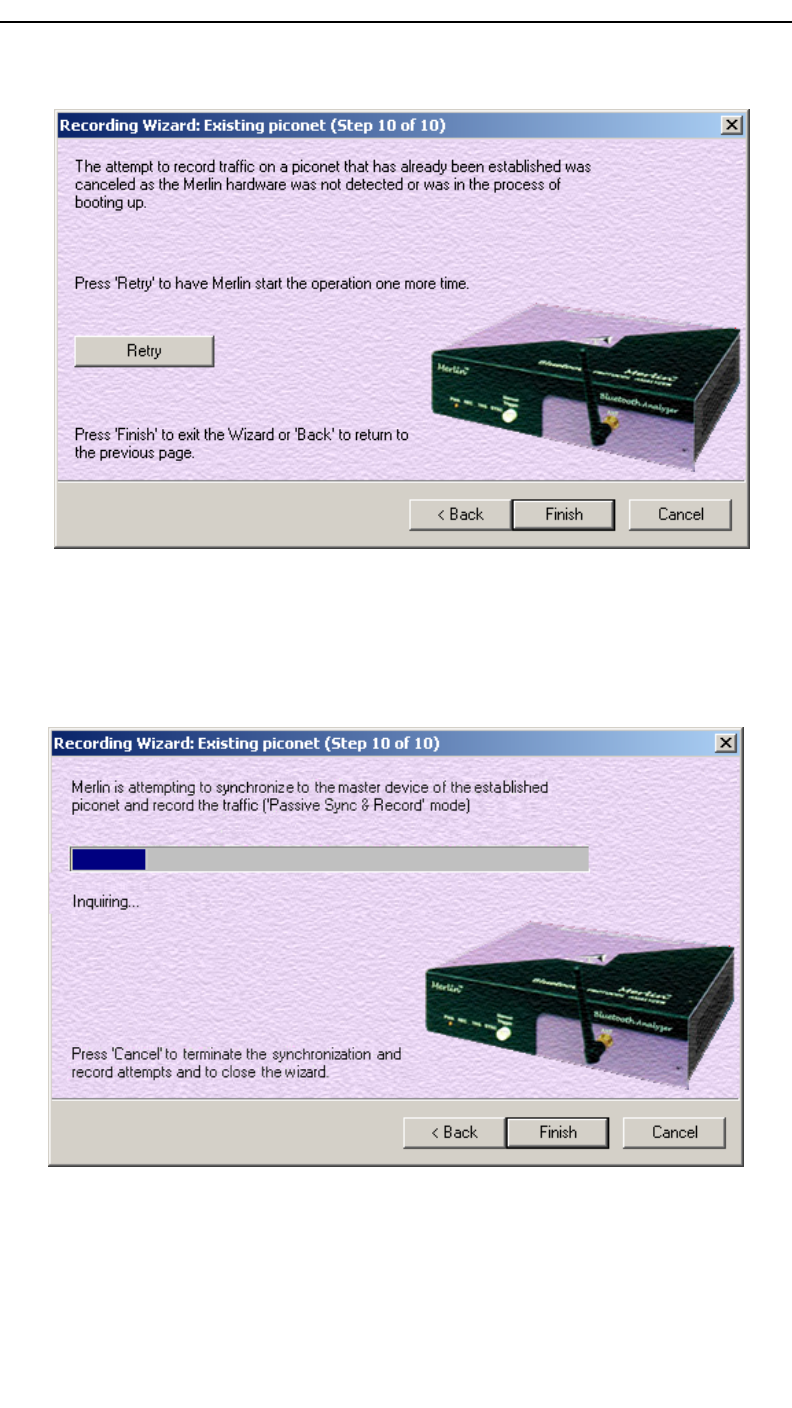
The following dialog box will display:
Step 21 Press Retry or Back to re-attempt the process.
If the hardware failure described in Steps 20 and 21 do not occur, Merlin
will conduct an inquiry. The screen will show that Merlin is going to
attempt a recording in either ’Passive Sync & Record’ mode as shown
below or in ’Sync & Record’ mode depending on the options you
selected in Step 15.
Step 22 If you are recording in ’Passive Sync & Record’ mode, you will
need to direct your Master device to attempt a connection to Merlin.
This will provide Merlin with the information it needs to record the
piconet.
55
Merlin Protocol Analyzer User’s ManualCATC Version 1.6
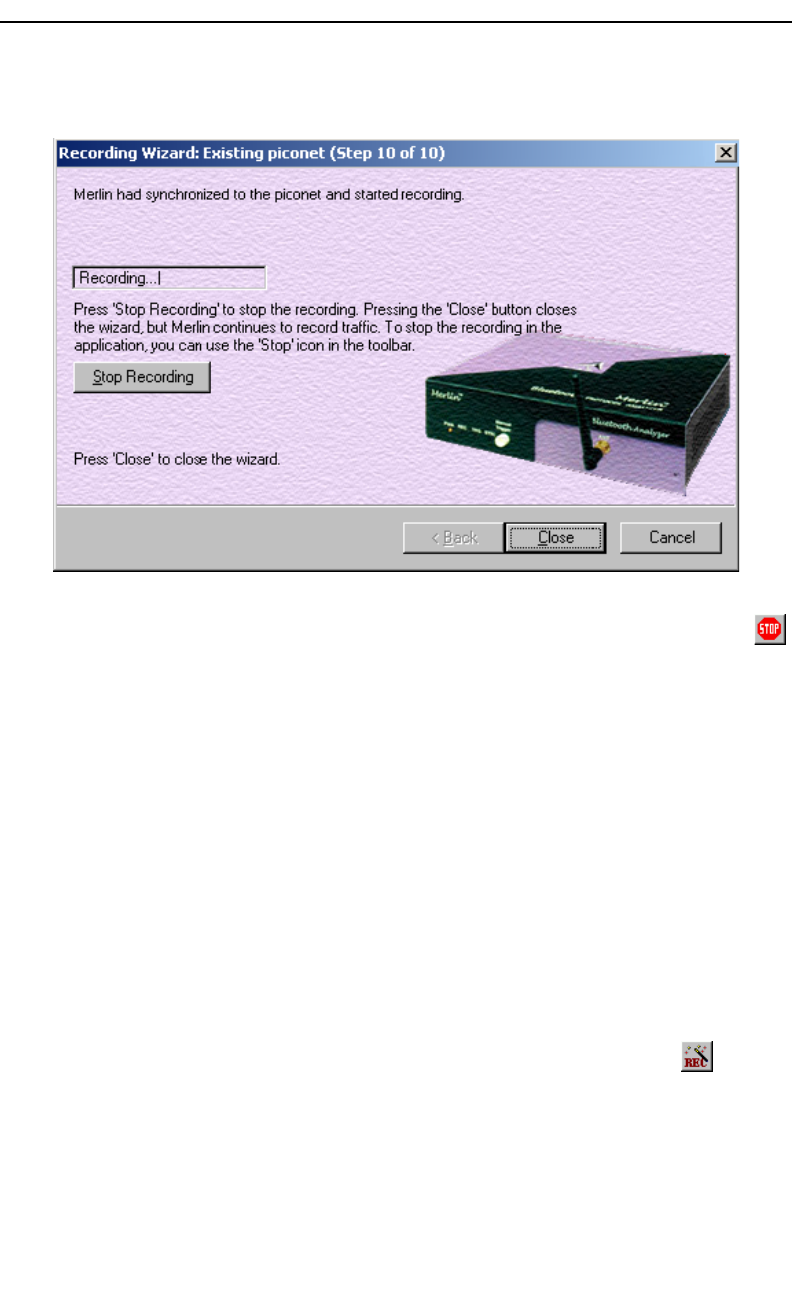
Once Merlin has the information it needs, it will begin recording. The
following screen will display:
The recording will end following a trigger event or when you press Stop
Recording button on the screen shown above or when you press the
button on the toolbar.
Step 23 When finished, press Close to close the Recording Wizard.
6.3 Recording in Test Mode
A Test Mode recording allows you to limit the frequency hopping range that
Merlin will record. Two Test Modes are available: Reduced Hopping
Mode and Single Frequency Mode. Reduced Hopping Mode limits
Merlin’s recording to the five frequency hops that are described in the
Bluetooth Specification. Single Frequency Mode limits Merlin’s recording
to a single frequency range that you specify in the Recording Wizard.
Recording in Reduced Hopping Mode
To record in Reduced Hopping Mode, perform the following steps:
Step 1 Start the Recording Wizard by either pressing the button
or selecting Setup > Recording Wizard from the menu.
The Recording Wizard greeting screen will open.
56
Merlin Protocol Analyzer User’s ManualCATC Version 1.6
Step 2 Press Next to advance to the Recording Type screen.
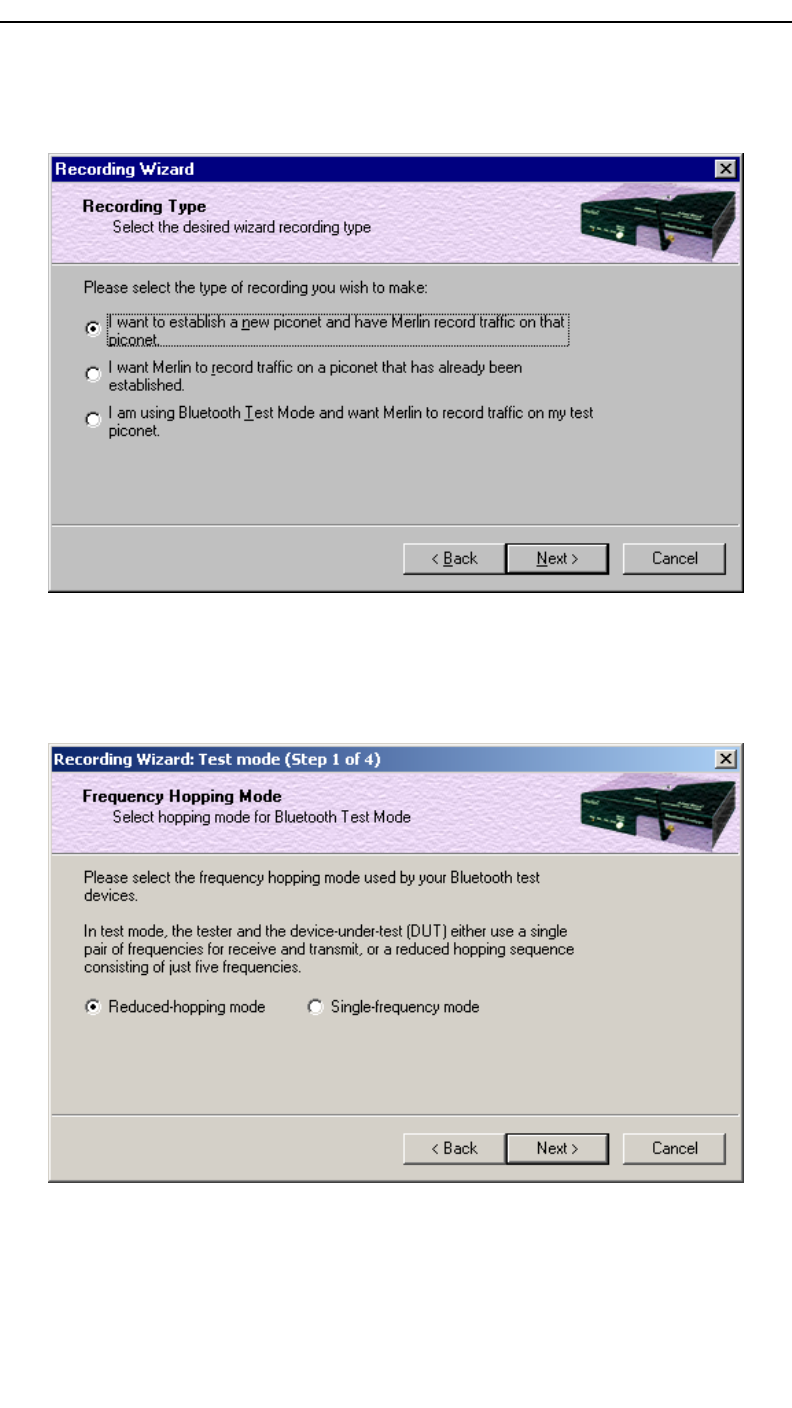
The following screen will display:
Step 3 Select the third option: I am using Bluetooth Test Mode
and want Merlin to record traffic on my test piconet.
Step 4 Press Next.
The following screen will display:
57
Merlin Protocol Analyzer User’s ManualCATC Version 1.6
Step 5 Select the option Reduced-hopping mode, then press Next.
The following screen will display:
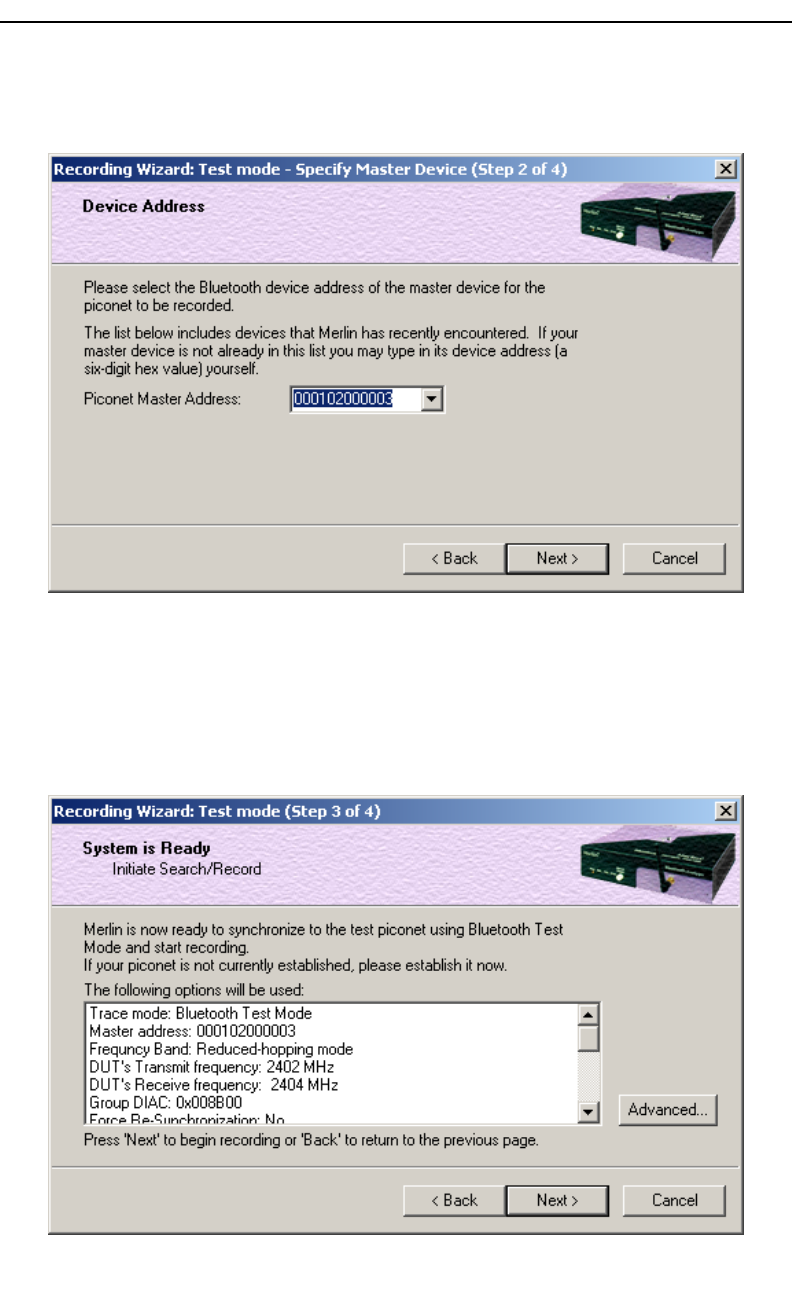
Step 6 Select the address for your piconet’s Master device from the
drop-down menu. If you prefer, you can type in the address
into the box.
Step 7 Press Next.
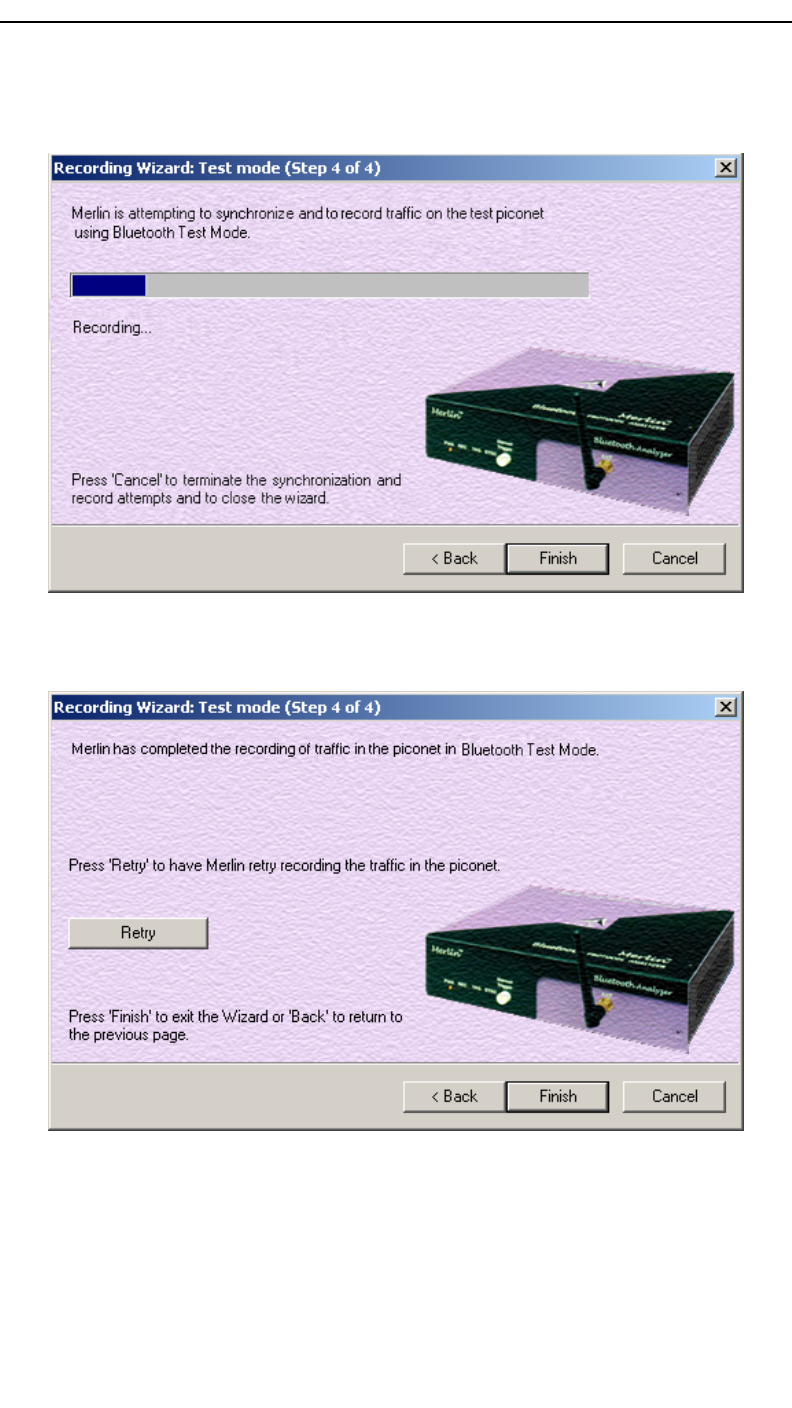
The following screen will display. This screen will show the current
settings for the recording:
The Advanced button will open the Recording Options dialog box. See
Chapter 7 for details on the Recording Options dialog box.
58
Merlin Protocol Analyzer User’s ManualCATC Version 1.6
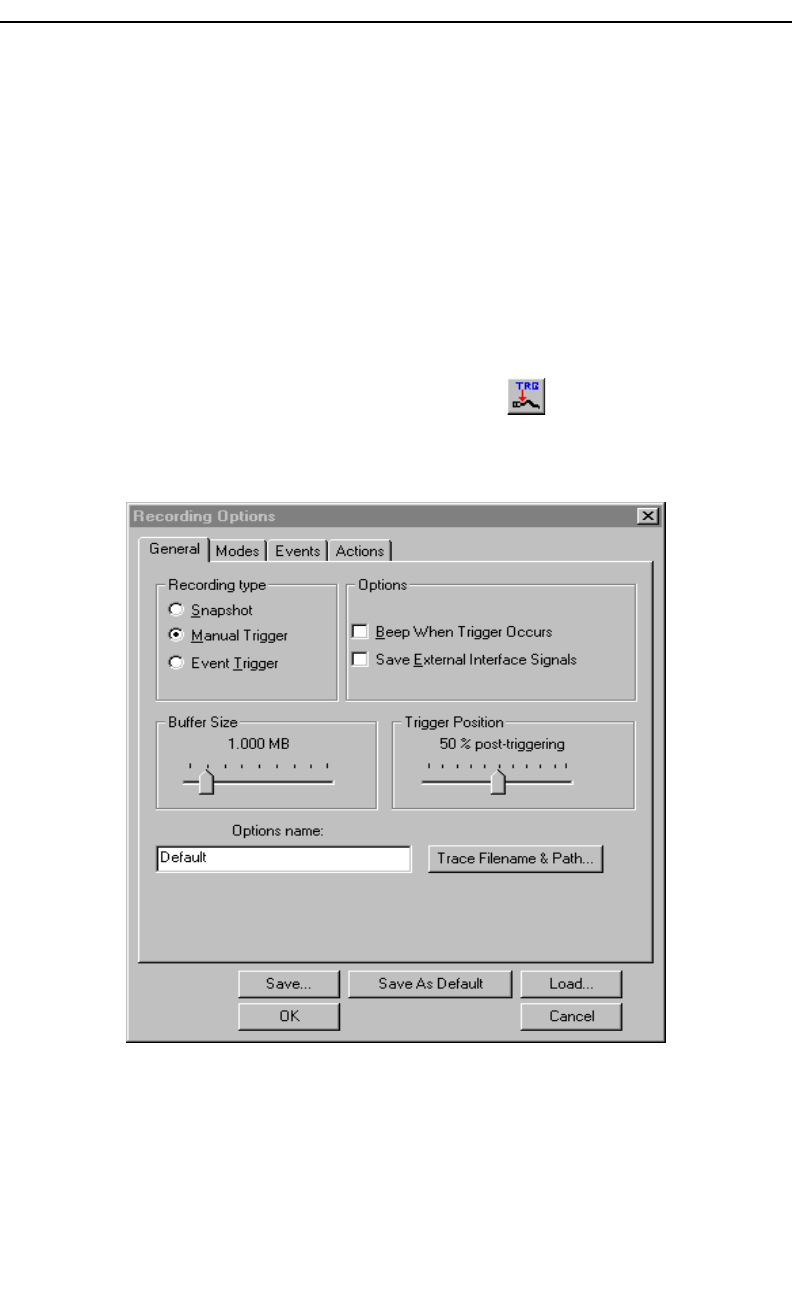
Step 8 Press Next to begin the recording.
The following screen will display:
Step 9 When the recording finishes, the following screen will
display. You can repeat the recording by pressing the
Repeat button.
Step 10 To close the wizard, press Finish.
59
Merlin Protocol Analyzer User’s ManualCATC Version 1.6
7. Recording Options
The Recording Options dialog box controls how Merlin records
Bluetooth™ data. At the top of the Recording Options dialog box are four
tabs that provide access to dialog boxes called General, Modes, Events, and
Actions. Using these dialog boxes, you can configure Merlin to create event
triggers, increase or decrease memory allocation for recording, and interact
with other Bluetooth™ devices in different ways.
Opening the Recording Options Dialog Box
To open the Recording Options menu, click on the Tool Bar or select
Recording Options under Setup on the Menu Bar.
You see the Recording Options window:
The Recording Options window has four tabs marked
•General
•Modes
•Events
•Actions
60
Merlin Protocol Analyzer User’s ManualCATC Version 1.6
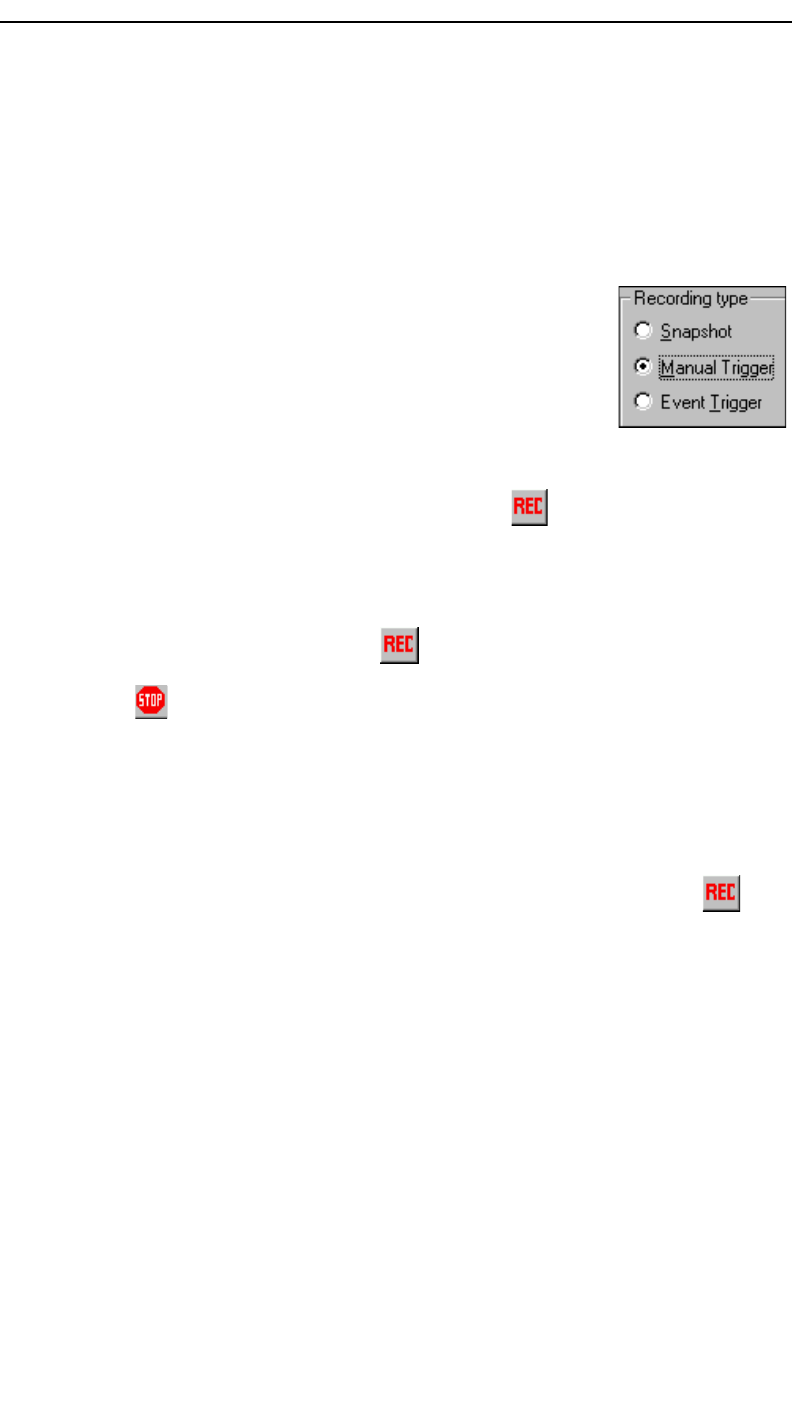
7.1 Recording Options - General
The General tab opens a window shown in the previous illustration made up
of four boxes marked Recording Type, Buffer Size, Trigger Position, and
Options.
Recording type
The Recording Type box presents three options that
allow you to set how Merlin begins and ends a recording.
The options are: Snapshot, Manual Trigger, and Event
Trigger.
Snapshot
A Snapshot is a fixed-length recording whose size is determined by the
"Buffer Size" box in the Recording Options dialog or by a manual click of
the Stop button. Recording begins by clicking on the Tool Bar and ends
when either the selected buffer size is filled or you press the Stop button.
Manual Trigger
A Manual Trigger recording is a one that is manually begun and ended.
Recording is begun by pressing on the Tool Bar. Recording continues
in a circular manner within the limits set by the buffer size. Recording ends
when is clicked on the Tool Bar or the Trigger button is pressed on the
analyzer's front panel. If you press the Trigger button, recording will
continue until the post-trigger memory has been filled.
Event Trigger
An Event Trigger recording is one that uses an event trigger to end the
recording. Before recording begins, you define the event trigger in the
Trigger Options dialog box. You begin the recording by clicking on
the Tool Bar. Recording continues in a circular manner within the limits set
by the buffer size. Once the trigger event occurs, some post-trigger
recording occurs, then the recording ends.
Note In this mode, the recording can be stopped manually in the same way as for
"manual trigger" mode.
61
Merlin Protocol Analyzer User’s ManualCATC Version 1.6
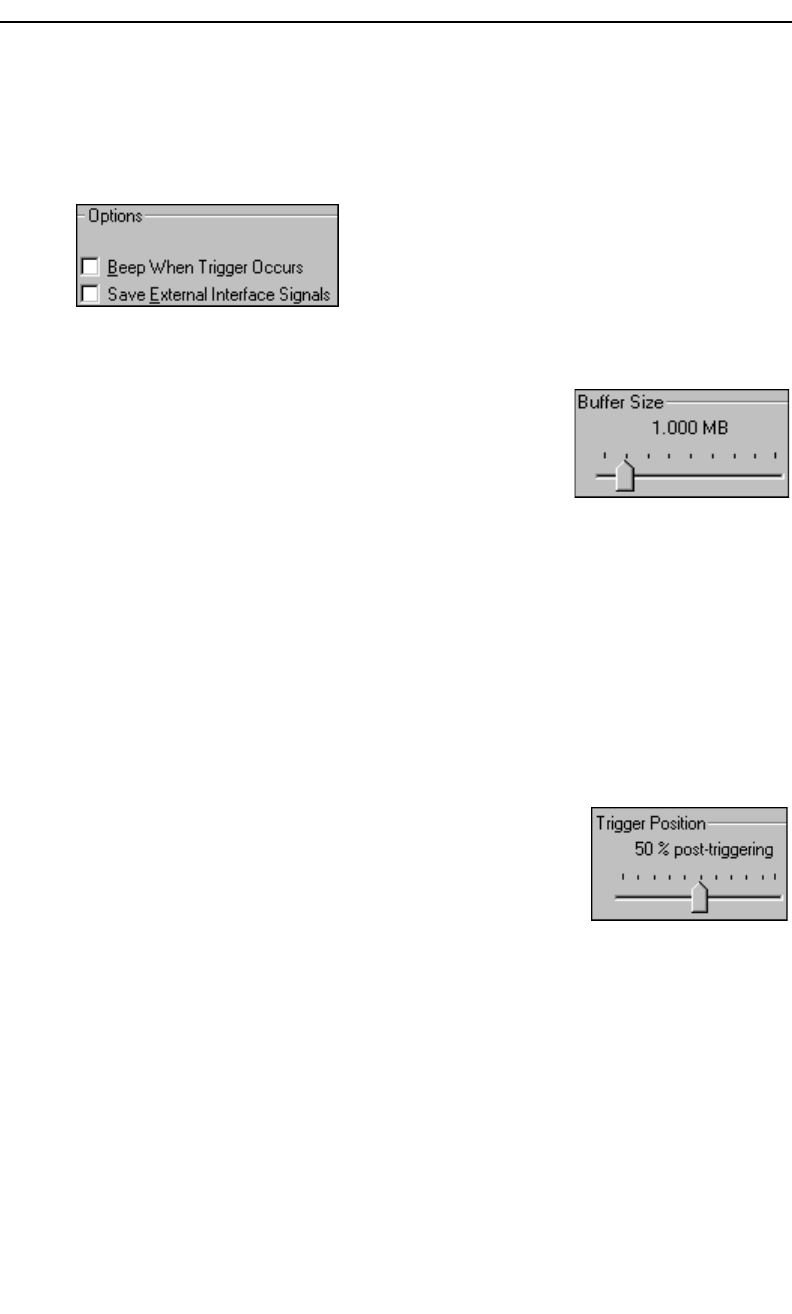
Options
The Options box contains two options:
Beep When Trigger Occurs
Will cause the PC to beep when a trigger event
has occurred.
Save External Interface Signals
Will enable Merlin to record input signals from
a breakout board as fields in a trace.
Buffer Size
The Buffer Size box has a slide bar for adjusting the
recording buffer size from 0.1 megabytes to 128
megabytes.
The Recording Type option determines how this buffer is used. Although
there are 128 megabytes of physical memory in the analyzer, the efficiency
of the recording ranges from 2:1 to 4:1 ratios of physical memory to actual
Bluetooth™ traffic. Shorter Bluetooth™ packets yield a less efficient
recording. The non-traffic portion of physical memory is utilized for control
and timing information.
Note The scale is not linear and affords more granularity in the smaller buffer sizes.
Trigger Position
The Trigger Position slide bar sets the amount of
post-trigger recording that Merlin will perform. It also
allows adjustment of the location of the trigger within
the defined buffer. You can adjust the Triggering
Position between 1 and 99% post-Trigger. Trigger
Position is available only when Manual Trigger or Event Trigger is
selected as Recording type.
As an example, if the buffer size is set to 16MB, then for the following
Trigger Position settings, the amount of pre- and post-Trigger data is
62
Merlin Protocol Analyzer User’s ManualCATC Version 1.6
• 95% post-triggering: 0.8MB pre-trigger, 15.2MB post-trigger
• 75% post-triggering: 4MB pre-trigger, 12MB post-trigger
• 50% post-triggering: 8MB pre-trigger, 8MB post-trigger
• 25% post-triggering: 12MB pre-trigger, 4MB post-trigger
• 5% post-triggering: 15.2MB pre-trigger, 0.8MB post-trigger
Note When a Trigger occurs, recording continues until the post-Trigger amount of the
buffer is filled.
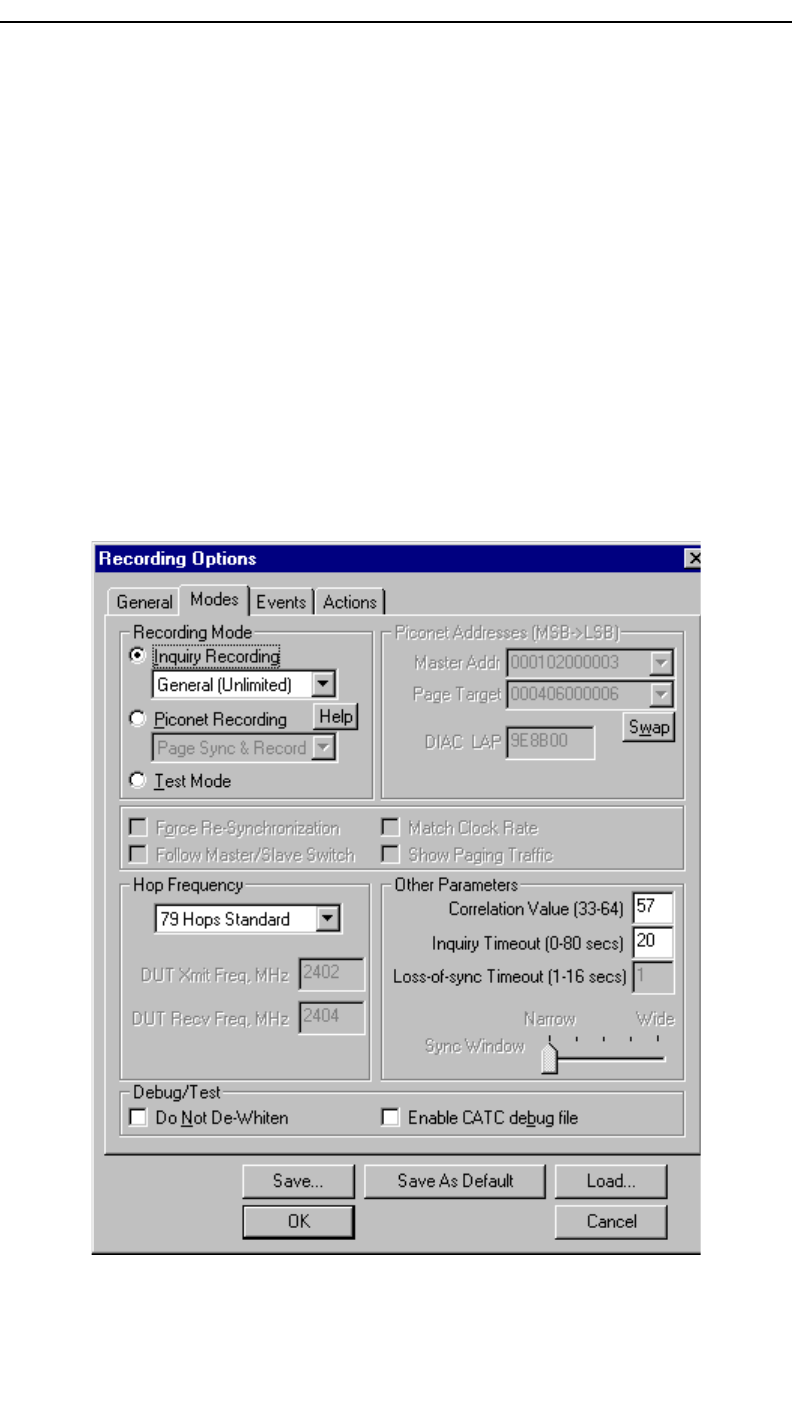
7.2 Recording Options - Modes
The tab marked Modes opens a window for setting recording mode options.
This window is divided into six boxes marked Recording Mode, Piconet
Addresses, Hop Frequency, Other Parameters, and Debug/Test.

63
Merlin Protocol Analyzer User’s ManualCATC Version 1.6
Recording Mode
To record Bluetooth™ traffic, the Merlin analyzer needs to synchronize to
the piconet under observation. Merlin does not participate in the piconet and
behaves as a passive listener. It needs, however, to communicate briefly
with the devices in the piconet to learn the Master clock and frequency
hopping sequence.
To synchronize to the piconet under observation, Merlin can be set up in
different recording modes. Two drop-down menus present these modes:
Inquiry Recording and Piconet Recording.
Inquiry Recording
The "Inquiry Recording" drop-down menu presents two choices for
recording Inquiries: "General (Unlimited)" and "Dedicated (Limited)."
General (Unlimited)
"General" means "General Inquiry" and is used to search for ALL
Bluetooth™ devices that are within range, for the amount of time specified
in the Inquiry Timeout field. Completion of the inquiry process is indicated
by illumination of the "trigger" light on the front of the analyzer. All
responding packets will be displayed when data upload from the analyzer
completes.
Dedicated (Limited)
"Dedicated" means a specific class or group of Bluetooth™ devices
(designated by the DIAC field of the Recording Options dialog). Selecting
"Dedicated" causes Merlin to search for all devices from a specific class or
group that are within range, for the amount of time specified in the Inquiry
Timeout field. Completion of the inquiry process is indicated by
illumination of the "trigger" light on the front of the analyzer. All
responding packets will be displayed when stop is selected.
Piconet Recording
The "Piconet Recording" drop-down menu presents three choices for
recording piconet traffic: Sync and Record, Passive Sync & Record, and
Page Sync & Record.
A Help button next to the menu briefly explains these options.
Page Sync & Record is the preferred option and should be used whenever
possible. If Page Sync & Record can not be used, then Sync & Record
should be used. Passive Sync and Record should be used only if the first
two options can not be used.

64
Merlin Protocol Analyzer User’s ManualCATC Version 1.6
Page Sync & Record
"Page Sync and Record" is the recommended method of recording. "Page
Sync and Record" should be implemented before a piconet is established.
This mode causes Merlin to perform a General Inquiry and collect sync
information from the specified slave device when it responds. Merlin then
waits for the Master to begin paging the Slave devices. When paging
begins, Merlin synchronizes to the Master and begins recording.
Note In order for this mode to work, the intended Slave must support "inquiry scan".
The following steps describe the simplest way to use this mode:
Step 1 Place both the "intended master" as well as its first "intended
slave" into inquiry scan mode.
Step 2 Have Merlin perform a General Inquiry. You do this by
selecting "General (Unlimited)" from the "Inquiry
Recording" drop-down menu on the "Modes" tab in the
"Recording Options" window, and then depressing the
"REC" button found on Merlin's toolbar.
Step 3 After the General Inquiry completes, as indicated by the
automatic uploading and displaying of a CATC trace
(approximately 20 seconds), reselect the "Modes" tab in the
"Recording Options". At this point, the addresses of all
Bluetooth™ devices that were in range will be listed in the
pull-down windows in the "Piconet Addresses" area of this
window. Using the pull-down windows select both your
"Intended BT Master" as well as your "Intended Slave"
address for display in their appropriate windows.
Step 4 After closing this window by pressing the "OK" button at the
bottom of the window, once again depress the "REC" button
found on Merlin's toolbar. After approximately 20 seconds,
the "SYNC" light on the front of Merlin will begin to flash,
meaning that Merlin has acquired all the information it needs
to fully synchronize with the piconet about to be established.
At this point, you should establish the piconet using the
devices previously defined as master and slave.
Step 5 When the piconet is established, the "Sync" light on the front
of Merlin will change from flashing to solid, indicating that
Merlin is fully synchronized to the piconet and is currently
recording all traffic within that piconet.

65
Merlin Protocol Analyzer User’s ManualCATC Version 1.6
Note If the "sync" light on the front of Merlin does not change from flashing to solid it
means that Merlin did not synchronize with the piconet when it was established.
Sync & Record
Sync and Record works just like "Page Sync and Record" except that Merlin
takes its sync data directly from the Master instead of the Slave devices.
With Sync and Record, Merlin conducts a General Inquiry to get hop
frequency and clock information from the Master. Merlin then waits to
detect piconet traffic from the Master device’s piconet. When the piconet is
established, Merlin is able to synchronize to the Master and begin recording.
In contrast to "Page Sync and Record", "Page Sync and Record" can be run
with or without an established piconet.
Note This mode can only be used to find master devices that support Inquiry Scan.
To perform a "Sync and Record", follow the steps below:
Step 1 Turn on the Bluetooth™ devices under observation, and set up
the master device so it is ready to respond to Inquiry scan. For
a typical recording, ensure that the Master and Slave device(s)
are not yet connected.
Step 2 In the Modes tab under Recording Options, enter the Master
Device’s address.
Step 3 Start Merlin recording by pressing REC icon in the toolbar.
Step 4 When the analyzer is able to Sync up to the Piconet Master Clock,
the Green Sync LED in the Merlin front panel will start blinking.
Step 5 Establish connection between the Bluetooth™ devices under
analysis.
Step 6 When Merlin senses Piconet traffic, the Green Sync light
goes ON solid, recording starts and the status bar in the
bottom of the analyzer screen shows activity.
Recording may be stopped manually or when the recording buffer is filled.
Note After the Sync light starts blinking, a connection between the Bluetooth™ devices
should be established within one (1) minute.
Passive Sync & Record
Passive Sync and Record is used in situations where the Master device and
slave devices do not support Inquiry Scan mode. When selected, Merlin
enters Inquiry Scan and Page Scan mode and waits for a page from the

66
Merlin Protocol Analyzer User’s ManualCATC Version 1.6
Master device. When the piconet Master pages Merlin, Merlin obtains the
information necessary for synchronization and then attempts to synchronize
to the piconet controlled by that Master.
"Passive Sync and Record" is designed to be used with established piconets
or private device networks.
Running "Passive Sync and Record" with Established Piconets
For most situations, "Passive Sync and Record" will be run after a piconet
has been established. The steps are as follows:
Step 1 Establish a connection between two or more Bluetooth™
devices.
Step 2 Under General Recording Options, select "Passive Sync and
Record."
Step 3 Under the Modes tab in Recording Options, enter the address for the
piconet’s master device.
Step 4 Make up an address for Merlin and enter it into the Page
Target address in the Modes tab in Recording Options.
Make sure you do not select an address for any other local
device.
Step 5 Press the REC button on the toolbar in Merlin to start a
recording session.
Step 6 If necessary, have Master "discover" Merlin through a
General Inquiry.
Step 7 From the Master device, initiate a page to Merlin’s address.
This action will enable Merlin to synchronize to the piconet.
However, the analyzer will not complete the page sequence
from the Master. This will cause the Master to time out in
this request.
Step 8 At the end of this sequence, the green Sync light will go on
solid, recording will begin and activity will be displayed on
the status bar in the bottom of the analyzer screen.

67
Merlin Protocol Analyzer User’s ManualCATC Version 1.6
Running "Passive Sync and Record" with Private Device Piconets
Because private device networks do not allow other devices to join the
network, Merlin needs to temporarily assume the identity of a slave in the
network in order to join that network. To do this requires disabling the slave
and beginning the operation without an established piconet. The following
steps show the process.
Step 1 Turn the Master device on and the slave device off. You
need the slave device turned off so that Merlin can take its
place in the piconet.
Step 2 Enter the slave’s address into Merlin’s "Page Target" field in
the Modes tab in the Recording Options dialog box.
Step 3 Run "Passive Sync and Record." The Master will then page
the slave’s address and Merlin will be able to sync.
Step 4 When Merlin synchronizes to the Master, turn the slave back
on. When the Master re-pages the address the slave will be
admitted into the private network. Since Merlin is passive in
this mode, the slave and Merlin do not conflict over the
shared address. Merlin is then able to record the traffic
between the Master and slave.
Test Mode
Test Mode allows you to set Merlin’s Hop Frequency to a some preset test
frequencies. When "Test Mode" is selected, the parameters marked
"Limited Hop" and "Single Frequency" in the list under “Hop Frequency”
(described below) become selectable.
Hop Frequency
Until recently, local regulations in Japan, France, and Spain defined a
Bluetooth™ frequency range that was different than the range used by the
rest of the world. We have included the selections for organizations for
testing of devices developed before all frequencies were made available on
a world-wide basis.
To set Merlin to the correct Hop Frequency, select from the drop-down
menu one of the following choices:
•79 Hops Standard
• 23 Hops Japan
• 23 Hops Spain
• 23 Hops France
• Limited Hop - When "Test Mode" is selected (see above), the

68
Merlin Protocol Analyzer User’s ManualCATC Version 1.6
Hop Frequency menu changes and displays two options called
Limited Hop and Fixed Frequency. The "Limited Hop" setting
restricts Merlin to five hop frequencies defined in the test mode
specification of the Bluetooth™ Specification.
• Fixed Frequency - Allows the the transmit and receive frequency
ranges to be specified. Selecting this option highlights the "DUT
Xmit" and "DUT Recv" text boxes. Enter values into the two text
boxes to the set the transmit and receive frequency ranges:
• DUT Xmit Freq, MHz (+2402) – Allows the setting of the
transmit signal for the Device Under Test
• DUT Recv Freq, MHz (+2404) – Allows the setting of the
receive signal for the Device Under Test
Force Re-synchronization
"Force Re-Synchronization" forces Merlin to re-synchronize at the
beginning of each "Page Sync & Record," "Passive Sync & Record," or
"Sync & Record" operation. By default, "Force Re-Synchronization" is
disabled (i.e., unchecked).
Unchecking the "Force Re-Synchronization" checkbox tells Merlin to use
its existing data on Bluetooth™ devices, thereby bypassing the
synchronization process and saving a few seconds from the beginning of the
trace. If you know that Merlin’s data is correct, you can uncheck this
checkbox and cause Merlin to try to use the existing data. If the data is
incomplete or incorrect, however, Merlin will automatically perform a
refresh.
To examine Merlin’s Bluetooth™ data, open "BT Neighborhood" under the
View menu.
Follow Master/Slave Switch
If enabled, this option allows Merlin to follow a role switch between a
Master and Slave. This capability allows Merlin to keep track of changes in
a device’s role when it changes from one role to another.
Merlin is able to follow a role change by listening to the Slave device’s
Bluetooth clock and hop frequency as soon as it becomes a Master.
Match Clock Rate
Match Clock Rate is a useful option if the Master device’s clock is
inaccurate. Match Clock Rate causes Merlin to do a General Inquiry to
determine the Page Target's clock rate prior to synchronizing to the piconet.
If unchecked, Merlin will begin piconet synchronization without first doing
a General Inquiry.

69
Merlin Protocol Analyzer User’s ManualCATC Version 1.6
This option only works with Page Sync and Record mode.
Show Paging Traffic
Show Paging Traffic causes Merlin to capture paging traffic between the
Master and Page Target devices. This option is used only with Page Sync
and Record Mode.
Piconet Addresses (MSB -> LSB)
•Master Addr - Piconet Master Address for device under
observation. Used for all Piconet recording modes.
•Page Target - User selectable address for the Merlin Analyzer.
Used for Passive Sync & Record and Page Sync & Record.
•DIAC LAP- Device Inquiry Access Code. Used for Device
Inquiry.
•Swap - The "swap" button swaps the addresses between the
Master Addr and Page Target text boxes. This button will allow
addresses to be swapped even if the boxes are grayed out.
Note GIAC - General Inquiry Access Code is hard-coded in the analyzer and does not
require user selection.
Other Parameters
Correlation Value (33-64)
This value tells Merlin how many bits in the sync word of each received
packet must be matched in order for Merlin to consider the packet valid and
start recording.
Inquiry Timeout (0-80 secs)
Default value is 20 seconds.
This value specifies how long Merlin should perform the Inquiry process for
the General (unlimited) and Dedicated (limited) recording modes. After the
specified time has elapsed, Merlin will illuminate the trigger light on the
front of the analyzer.
Loss of Sync Timeout (1-16 secs)
This value specifies the amount of time that Merlin will wait for piconet
traffic before determining that synchronization has been lost.

70
Merlin Protocol Analyzer User’s ManualCATC Version 1.6
Sync Window
The Sync Window slide bar controls the amount of time that Merlin should
wait between receiving an Inquiry Response (which will cause the Sync
LED to blink) and detecting Master-Slave piconet traffic (which will cause
the Sync LED to turn solid.)
A "Narrow" setting means that the wait time will be minimal, a "Wide"
setting means it will be "maximal." The default is "Narrow" and this is
suitable for most recordings. However, if significant drift occurs between
Merlin’s clock and that of the Master, Merlin may not be able to sync
properly to the piconet. Under these conditions, you should move the slide
bar towards the "Wide" Setting. The slide bar has five discrete settings.
After sync is established, Merlin will remain in sync as long as there is
piconet traffic.
Debug/Test
Do Not De-Whiten
Normally, all data packets sent between Bluetooth™ devices are whitened
(scrambled) to eliminate DC bias in the transmitted data stream. For debug
purposes or in the case where you have not integrated whitening into your
design, this option can be turned off. If you check this box, Merlin will
assume that none of the data it receives has been whitened, and will
therefore not apply dewhitening (descrambling) to received packets.
Enable CATC debug file
Checking this box enables the creation of a file that can be used by CATC
Support to aid in debugging. This option should always be disabled unless
you are requested to enable it by CATC personnel.
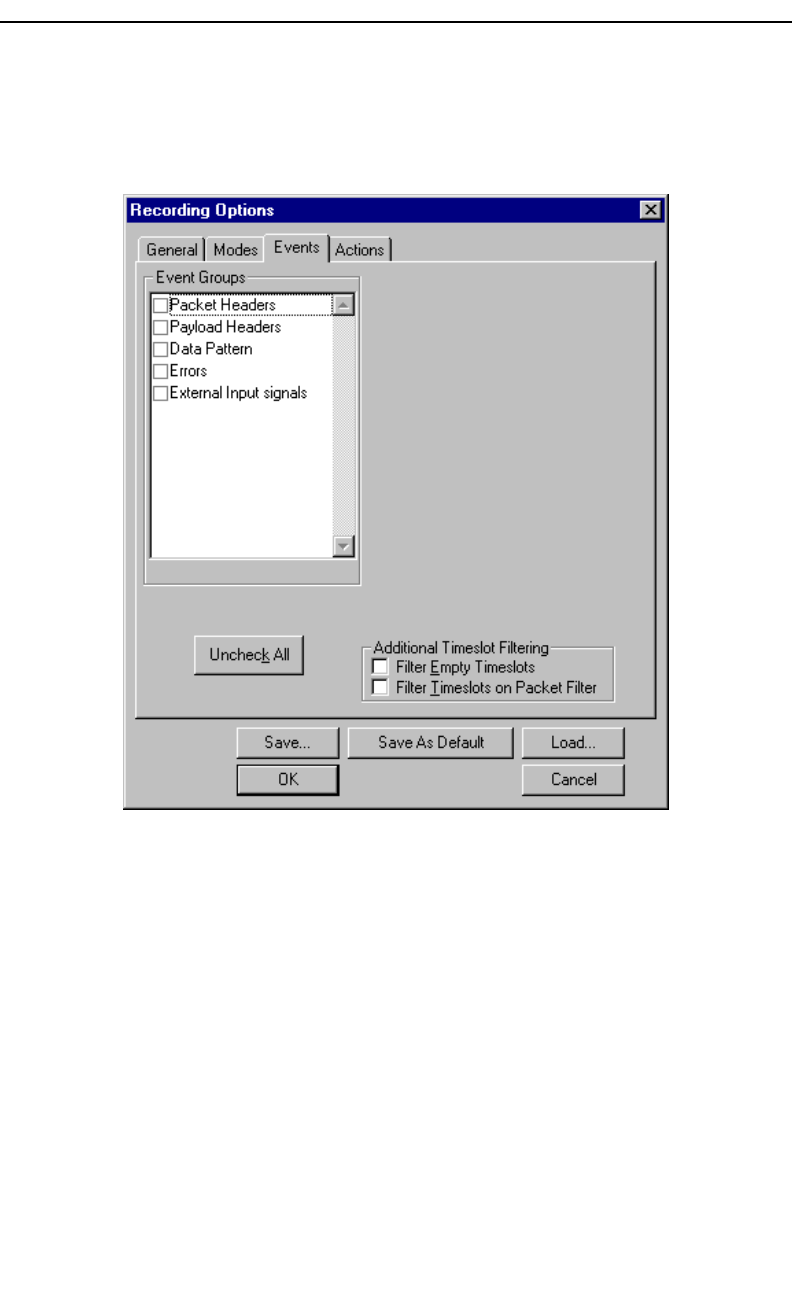
7.3 Recording Options - Events
If you have selected Event Trigger mode under the General tab in the
Recording Options screen, you may now select specific Bluetooth™ events
using the Events tab on the Recording Option Screen. You can also use the
Actions tab to define specific event sequences that will trigger Merlin to
record a Bluetooth™ session.
In addition, the Events and Actions screens allow you to specify which
packets you want to include or exclude from the recording.
71
Merlin Protocol Analyzer User’s ManualCATC Version 1.6
Events Options
• Click the Events tab on the Recording Options screen.
You see the Event Groups window:
The Event triggering and filtering options allow you to set event conditions
for errors and/or a variety of packet characteristics.
Clicking a check box causes further options to display in the right side of the
window.
Additional Timeslot Filtering
By default, Merlin records frequency hop and timestamp information for all
time slots in the Piconet under analysis, regardless of whether the time slot
contained a Bluetooth™ packet. This means that in instances where there
is little piconet traffic, Merlin will display row after row of empty packets
-- each representing an empty time slot. Through the use of timeslot
filtering, these empty packets can be filtered out. Filtering out this
information has the benefit of freeing memory so that more traffic can be
recorded.
72
Merlin Protocol Analyzer User’s ManualCATC Version 1.6
Filter Empty Slots
If "Filter Empty Slots" is checked, Merlin will exclude all empty time slots
from a recording except for those that lie immediately in front of
Bluetooth™ communications packets. These remaining empty packets are
preserved to give timestamp and frequency hop reference data to the packets
that follow.
Filter Slots on Packet Filter
If filters are used to exclude FHS, DM1 or other packets, Merlin will
exclude these packets from a trace and mark their locations with empty
packets. The result can be rows and rows of empty packets. The option
"Filter Empty Slots" will not exclude these empty slots because they lie
immediately in front of Bluetooth™ communications packets - even though
those packets were not recorded. To eliminate these empty packets, select
"Filter Slots on Packet Filter."
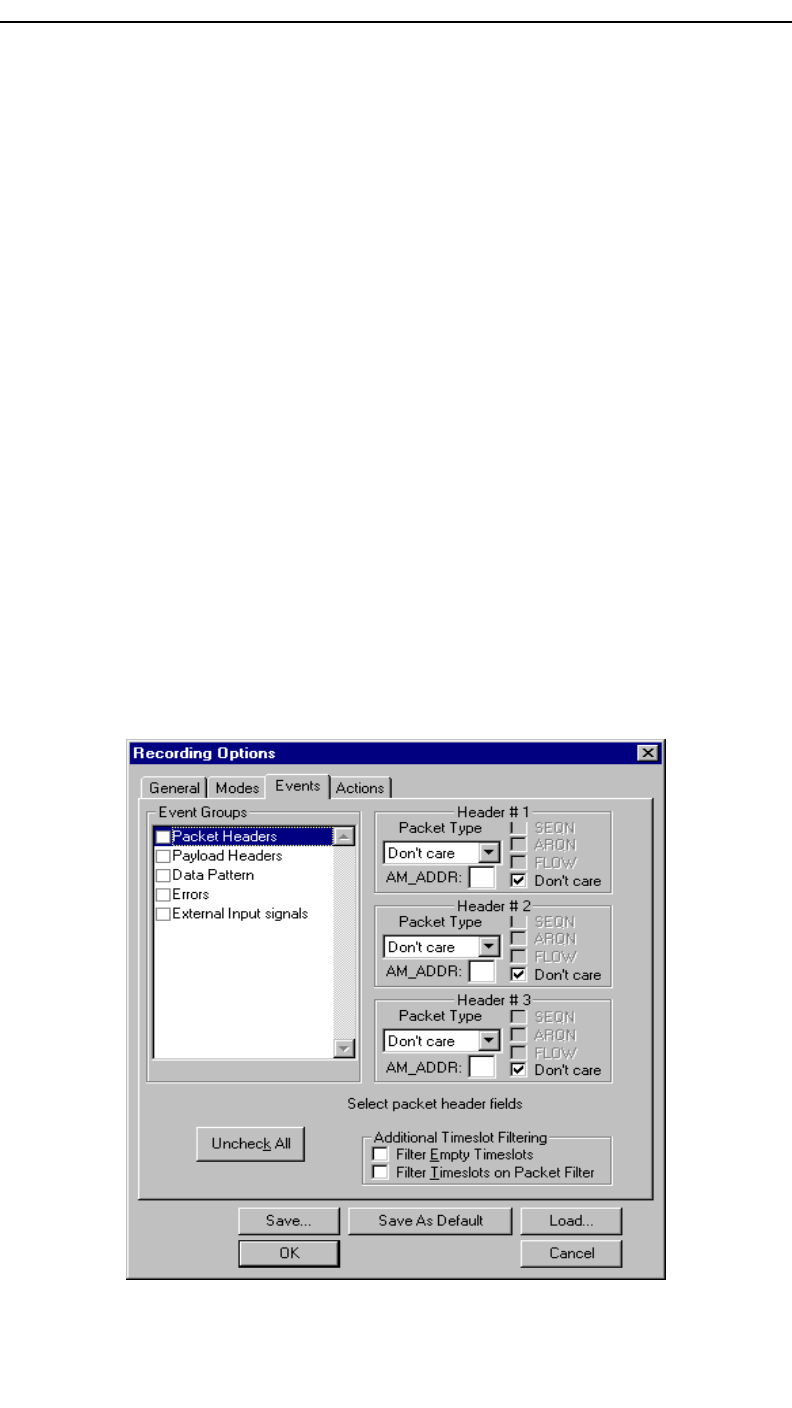
Packet Headers
Clicking "Packet Headers" opens three sets of check boxes and menus on
the right that represent fields within packet headers: Packet Type, Active
Member Address, Flow Control, Acknowledgment, and Sequence Number.
• Select Packet Headers under Event Groups.
You see the Packet Headers window:

73
Merlin Protocol Analyzer User’s ManualCATC Version 1.6
Packet Type
The Packet Type drop down menu lets you select the following packet types
for filtering or triggering: NULL, POLL, FHS, DM1, DH1, HV1, HV2,
HV3, DV, AUX1, DM3, DH3, 1100, 1101, DM5, or DH5.
Select “Don’t Care” if you want Merlin to ignore this field.
AM_ADDR
(Active Member Address) The AM_ADDR is a three bit slave address. To
select packets from a particular slave device for filtering or triggering, enter
an address into the AM_ADDR text box. You can target up to three devices
using the three text boxes.
SEQN, ARQN, and Flow Control Bits
To set event conditions on SEQN, ARQN, and Flow control, uncheck
"Don't Care." Unchecking "Don't Care" sets the event condition to
SEQN=0 AND ARQN=0 AND Flow=0. This action also puts a checkmark
in the box marked "Packet Headers." A checkmark next to SEQN, ARQN,
or Flow changes the value of this field from zero to one. For example, if
SEQN is checked, the event condition becomes "SEQN=1 AND ARQN=0
AND Flow=0.
To cause Merlin to ignore this set of check boxes, choose "don't care."
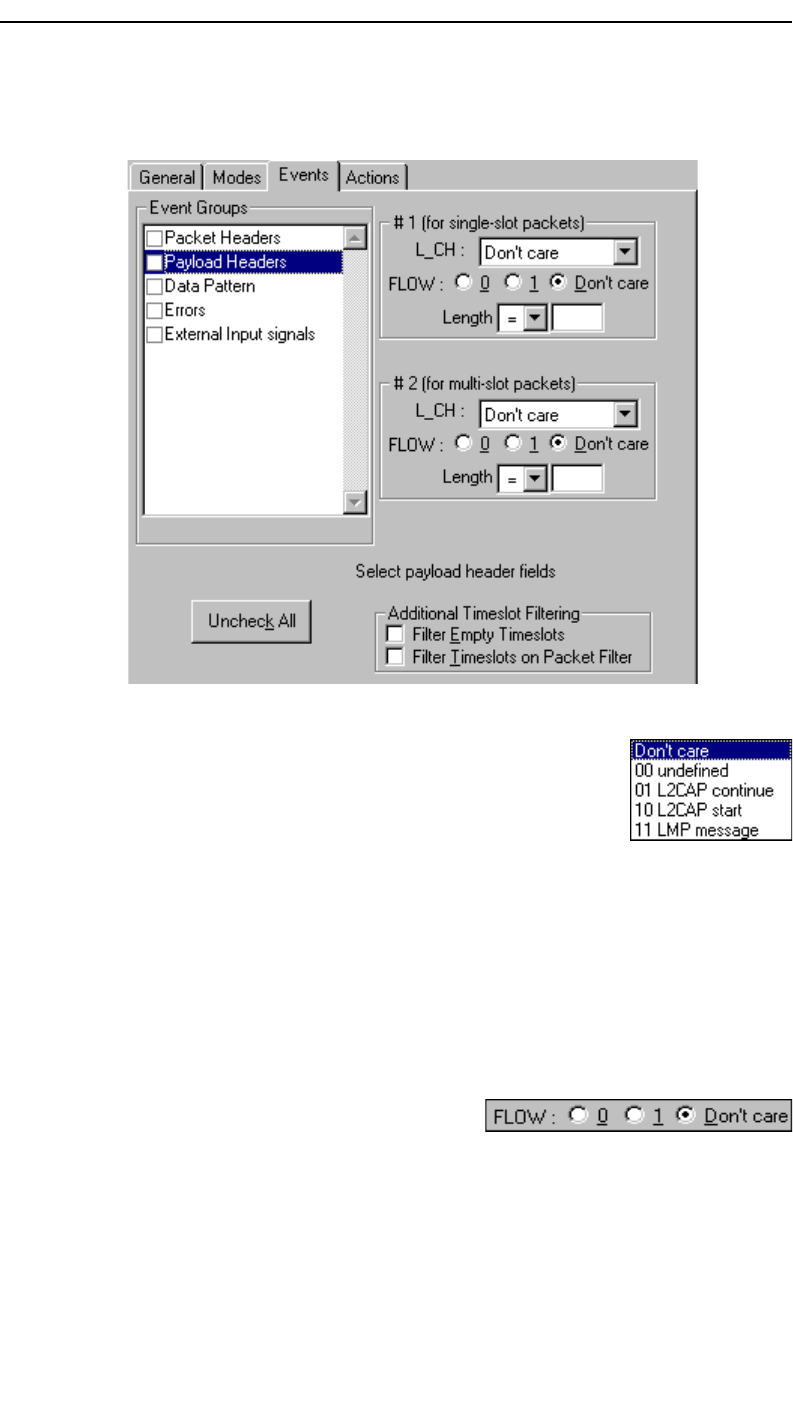
Payload Headers
Clicking "Payload Headers" causes a series of options to display on the right
for setting conditions on payload headers. You will see two sets of options
- one for single slot packets such as DM1 packets and a second for multi-slot
packets such as DM3 packets. Within each set is a menu for the Logical
Channel and sub-options for Flow Control, and Payload length. These latter
two options allow you to modify searches based on the Logical Channel.
An example would be "Trigger on a start L2CAP message whose flow
control bit is 1 and whose data field length is less than 20."
74
Merlin Protocol Analyzer User’s ManualCATC Version 1.6
• Select Payload Headers under Event Groups.
You see the Payload Headers window
L_CH (Logical Channel)
The "L_CH" drop down menu presents five options for
setting conditions on the Logical Channel:
• Don’t care
• 00 Undefined
• 01 L2CAP continue
• 10 L2CAP start
• 11 LMP message
Select "Don’t care" if you do not want to set conditions on Logical Channel.
Flow
Three "radio buttons" are presented for
setting conditions based on Flow control:
•0
•1
• Don’t care
75
Merlin Protocol Analyzer User’s ManualCATC Version 1.6
Flow works in conjunction with the Logical Channel (L_CH) menu - you
select an option from the L_CH menu and then select an option under Flow.
Select "Don’t care" if you do not want to set conditions on Flow control.
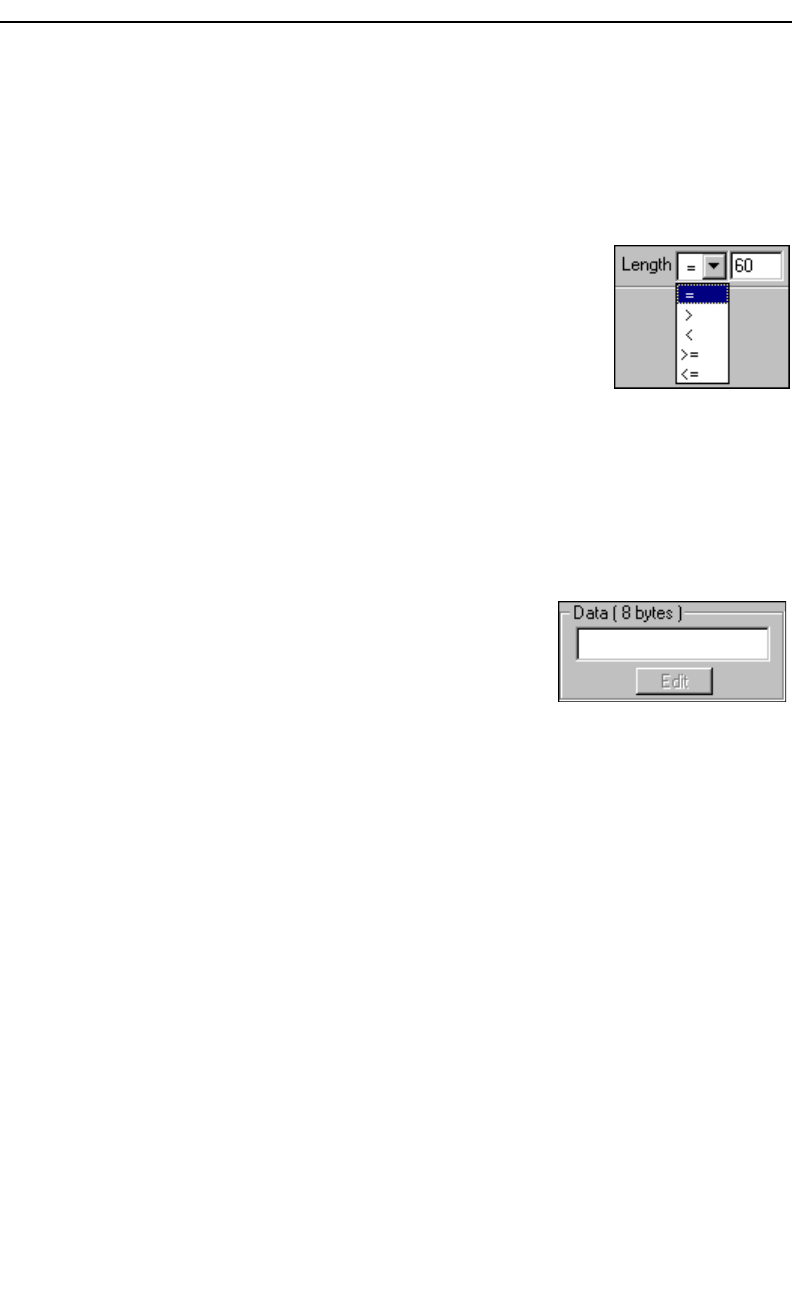
Length (in bytes)
Using both the drop down menu and the text box, you
can set conditions based on data field length. The
maximum length for a single slot packet is 29 bytes. The
maximum length for multi-slot packets is 339 bytes.
The drop-down menu gives you options for selecting
operators such as "greater than" and "equal to." The text box to the right of
the drop-down menu lets you enter values.
The Length option works in conjunction with the Logical Channel (L_CH)
menu - you first select an option from the L_CH menu and then select an
option under Length.
Data Patterns
Clicking "Data Patterns" causes a text box to
appear for entering patterns to be matched in the
raw payload data. Patterns of up to eight
hexidecimal bytes can be entered.
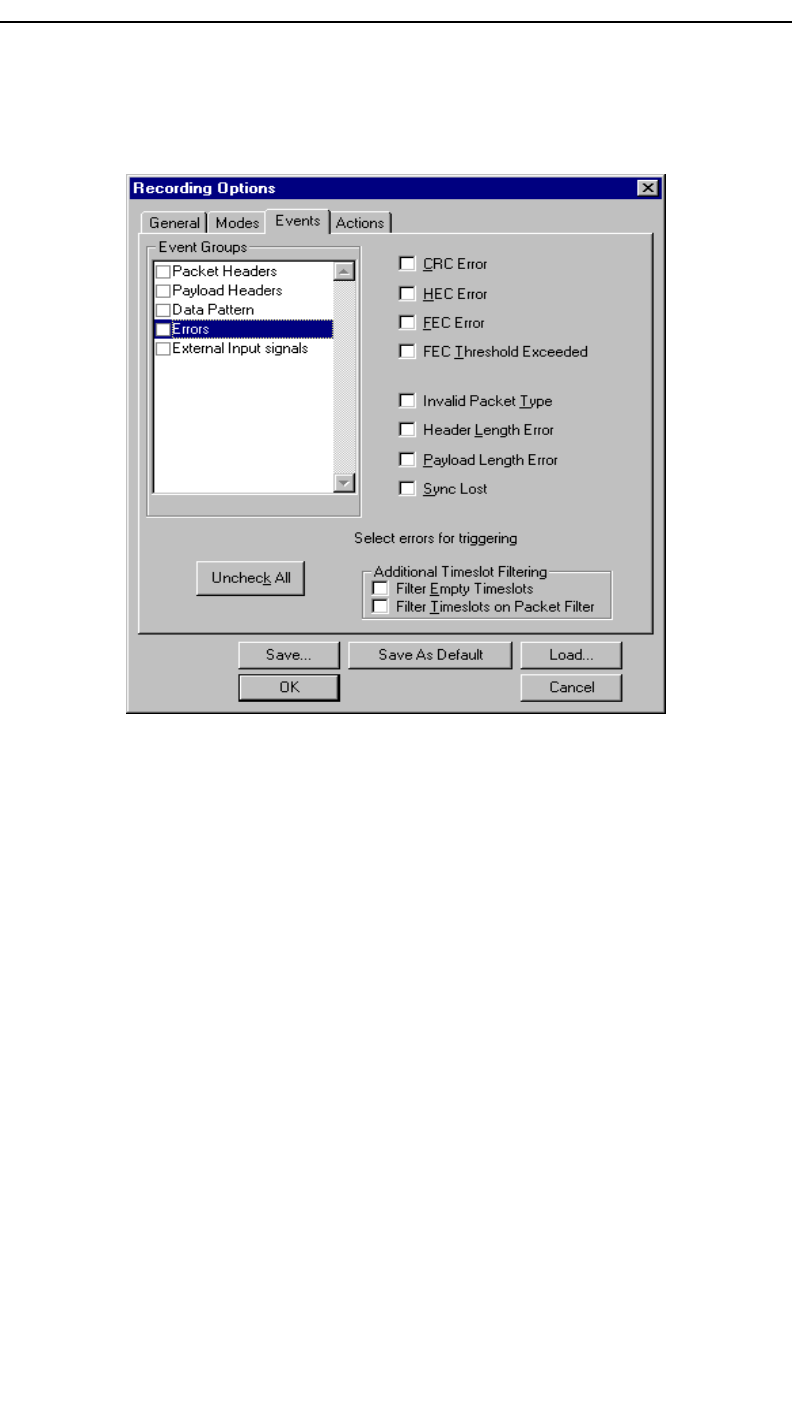
Errors
Clicking "Errors" causes check boxes to appear for setting conditions for
triggering or filtering based on packet/signaling/protocol errors. You can
select one or a combination of errors.
76
Merlin Protocol Analyzer User’s ManualCATC Version 1.6
• Select Errors under Event Groups.
You see the Errors window:
Use any combination of the listed packet/signaling/protocol errors as a Trigger.
CRC Error
A CRC error in the packet data payload of the previous Bluetooth™ data
packet.
HEC Error
An HEC (header error check) error in the packet header for the previous
Bluetooth™ data packet.
FEC Error
An uncorrectable FEC (Forward Error Correction) error in the packet
header for the previous Bluetooth™ data packet.
Threshold Exceeded
Indicates that the number of single-bit FEC errors detected since the current
recording started has exceeded the specified value.
Invalid Packet Type
An invalid value was detected in the 'packet type' field of the packet header
for the previous Bluetooth™ data packet.

77
Merlin Protocol Analyzer User’s ManualCATC Version 1.6
Header Length Error
Indicates that a received Bluetooth™ data packet was terminated before all
bits of the packet header were received.
Payload Length Error
Indicates that the payload of a received Bluetooth™ data packet was either
longer than expected, or that a Bluetooth™ data packet terminated before
the expected end of the payload data.
Sync Loss
When set, indicates that a loss of piconet synchronization occurred during
the frequency slot prior to this slot.
External Input Signals
Clicking "External Input Signals" causes two check boxes to appear for
setting conditions based on breakout board input signals. The names of the
two check boxes are the same ones you will find on the break out board:
• Trigger Input [TRIG IN]
• General Purpose Input [G.P. IN]
78
Merlin Protocol Analyzer User’s ManualCATC Version 1.6
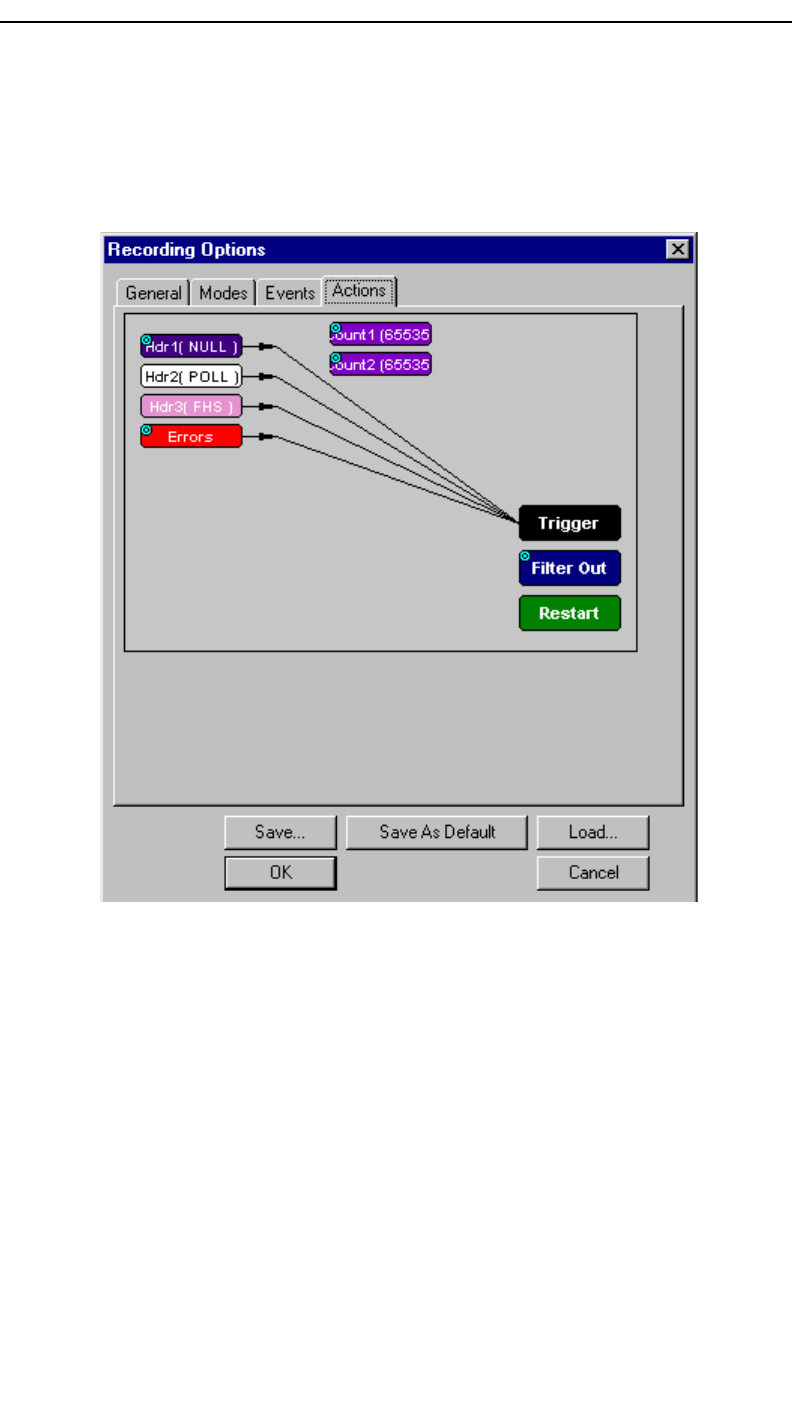
7.4 Recording Options - Actions
The Actions screen allows you to specify the type of action that Merlin
should perform when it encounters the events specified in the Events
window.
Actions Window Layout
The Actions window divides into three sections: a left, a center, and a right
section.
The left section displays Event buttons such as Header buttons and Error
buttons. The number of Event buttons displayed depends on the number of
Events you selected in the Events window. If you selected no Events, no
Event buttons will display. If all Events were selected, eight Event buttons
will display.
The center section displays two Counter buttons marked Count1 and
Count2. These buttons are used for counting events and are permanent
features of this section.

79
Merlin Protocol Analyzer User’s ManualCATC Version 1.6
This center section can also hold Event buttons such as Errors and Payload
Hdr1. Event buttons in this section are used to create triggers based on a
sequence of Events. Event Sequencing is explained later in the chapter.
The right section has three permanent buttons for setting actions. These
buttons are Trigger, Filter Out/In, and Restart. These buttons allow you
to set actions such as triggering or filtering.
Arrows connect Event, Counting, and Action buttons. Arrows represent
the current associations between actions and events. As will be described
further on, these associations can be easily changed with the mouse.
Action Buttons - Their Functions
The Action buttons in the right side of the window provide the means of
setting triggers, filters, and restarts. To set an action, you simply drag your
mouse from an Event to an Action. As described further on, this movement
will link the two via an arrow.
Trigger
The Trigger button enables event triggering.
Filter In/Out
The Filter In/Out button allows events to be filtered in or out of the
recording.
Restart
The Restart button causes the two counters Count1 and Count2 to be reset
to zero.
Counting Buttons - Their Functions
The center section of the Actions window has two buttons for counting
events called Count1 and Count2. Below these buttons, you can add Event
buttons to create Event Sequencing.
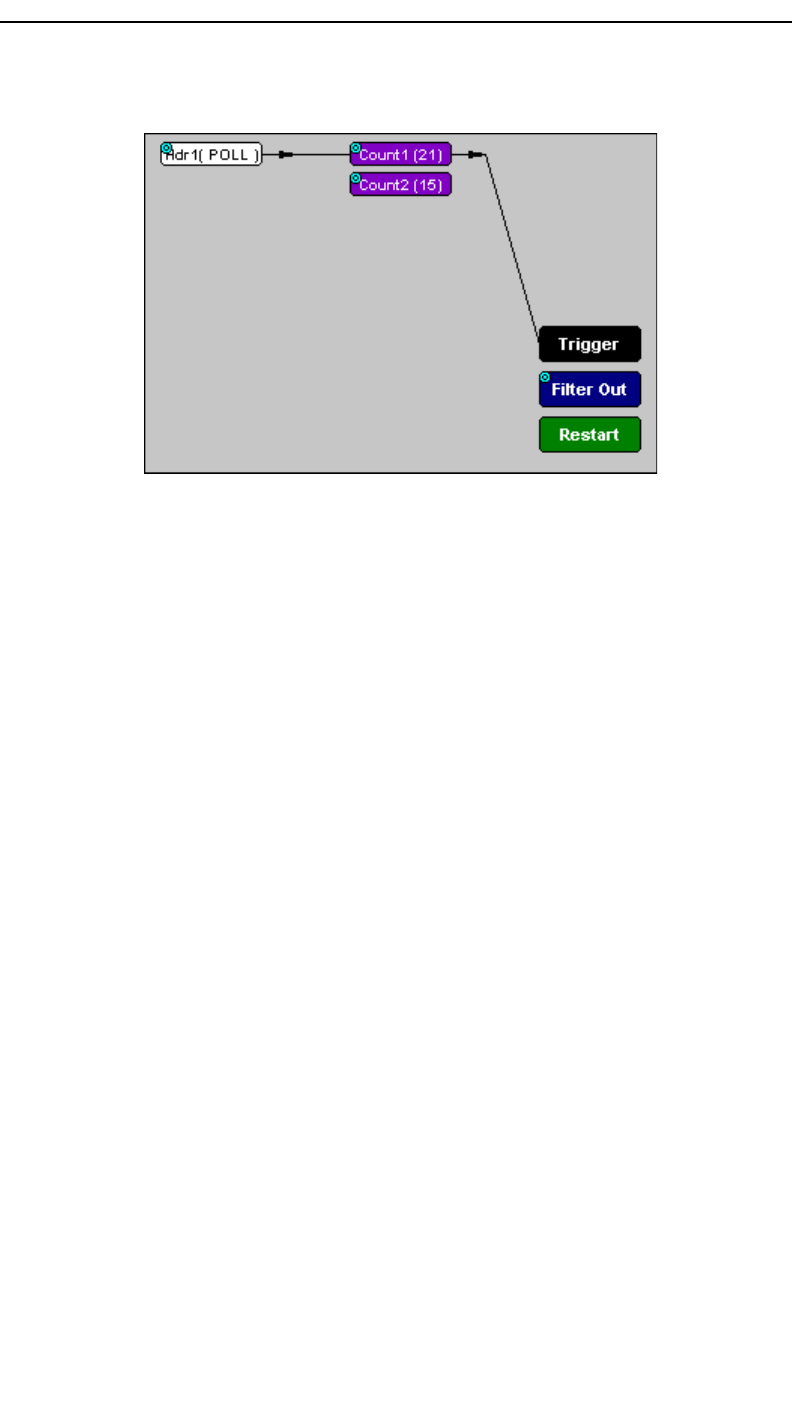
Count1, Count2
Count1 and Count2 are counters for specifying how many events must occur
before an event can cause a trigger. Counters allow conditions to be made
such as "Trigger after the 21st Poll packet" (see screenshot below).
80
Merlin Protocol Analyzer User’s ManualCATC Version 1.6
The Actions window showing a condition based on a Poll packet and a
counter. This condition reads "Trigger after the 21st Poll packet."
Connecting Events to Counters
To connect an event to a counter, click an Event button, then click one of the
two counter buttons. An arrow will appear that will join the Event to the
Counter and then to a trigger.
This latter connection between the Counter button and the Trigger button
occurs because counters always work in association with triggers. Counters
act as assistants to triggers.
Setting Multiple Conditions with Counters
You can create multiple event conditions by linking a counter to multiple
events or by linking two counters to two or more events.
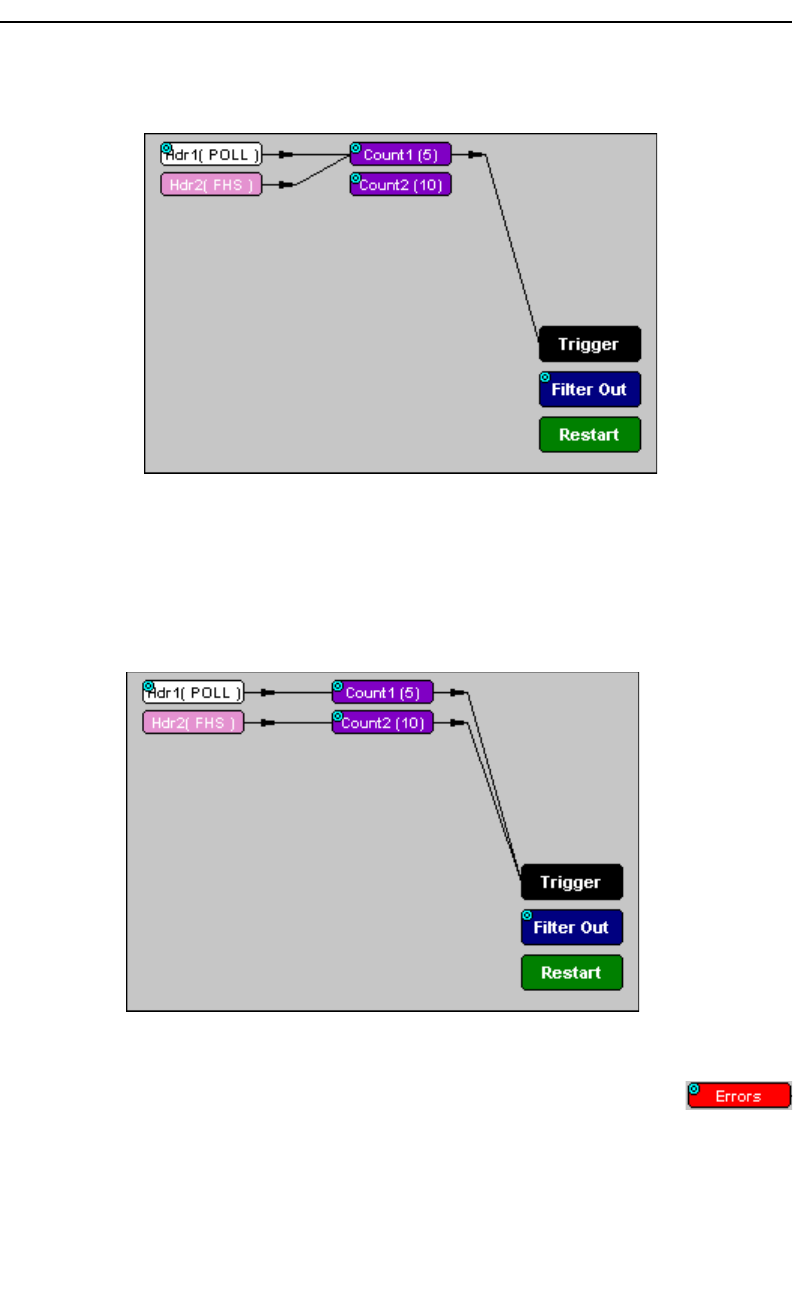
Linking Multiple Events to One Counter - When two or more Events are
connected to a counter, it creates a condition that reads "Trigger when the
counter value is reached by any combination of the specified events."
81
Merlin Protocol Analyzer User’s ManualCATC Version 1.6
The following example reads "Trigger after any combination of 5 Poll
packets and FHS packets have occurred."
Linking Two Events to Two or More Counters - If an Event is linked to
Count1 and a second event is linked to Count2, it creates an "or" statement.
This statement reads "Trigger when Count1 OR Count2 has reached their
specified values."
This example reads "Trigger when Count1 has counted 5 Poll packets or
Count2 has counted 10 FHS packets."
Blue Dot Menus
Count1, Count2 and a few other buttons in the Actions
window have blue dots in their top left-hand corners that
indicate the presence of context-sensitive menus. These menus
let you set the button’s values and/or operations. Click the left
mouse button on a dot to open the menu.
82
Merlin Protocol Analyzer User’s ManualCATC Version 1.6
Counters Blue Dot Menu
The Count1 and Count2 blue dot menus allow the value of their counters
to be changed. The value you specify here tells Merlin how many instances
of an event must take place before a trigger occurs. The counter can be set
between 1 and 65,535.
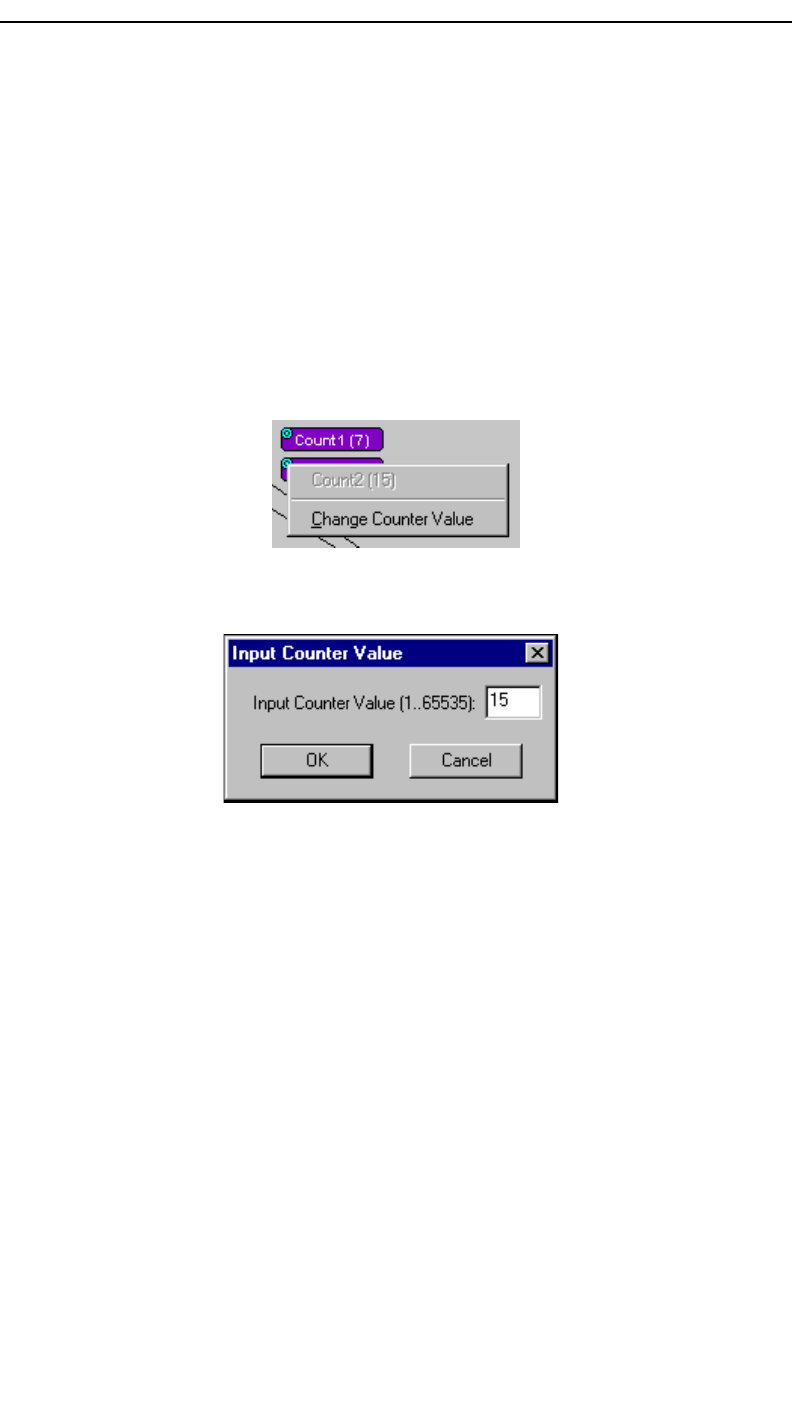
To set a Counter,
Step 1 Click on the blue dot in the upper left corner of the Count
button.
You see the Change Counter Value menu:
Step 2 Click Change Counter Value
You see the Input Counter Value menu
Step 3 Enter an input value to tell the Analyzer how many times this
event must occur before triggering the end of a recording
Step 4 Click OK.
You may connect as many Event buttons to a counter as you like.
However, the Counter does not treat each event as a discrete specification
but treats them all as one event.
83
Merlin Protocol Analyzer User’s ManualCATC Version 1.6
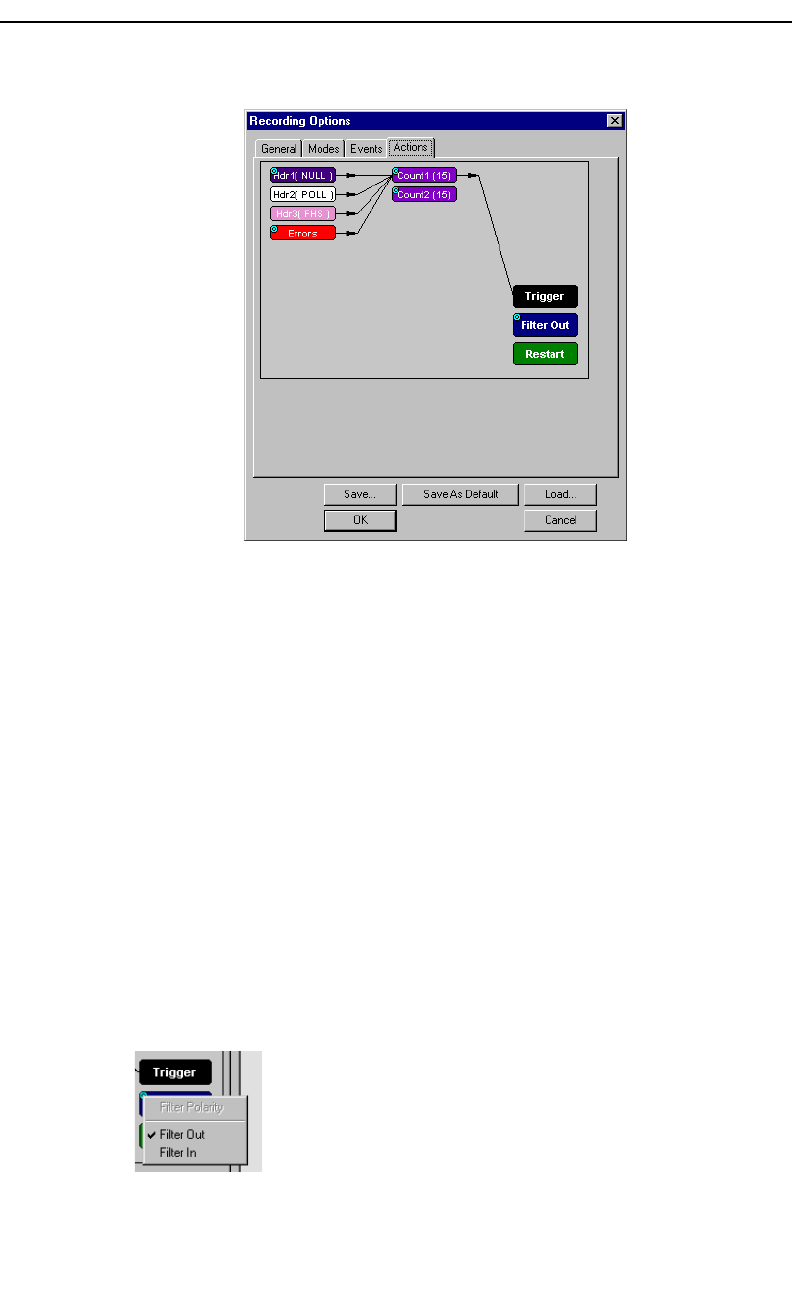
As an example, look at the specifications set in the following screen:
Counter 1 has been set to trigger four events after 15 occurrences. But the
Counter does not count 15 occurrences for EACH event. It counts ALL
events as they happen to occur until it reaches a total of 15 and then
triggers.
Filter Out/In Blue Dot Menu
The Filter Out/In button toggles between "Filter Out" and "Filter In".
•Filter In records ONLY those packets related to the specified
event.
•Filter Out records all packets EXCEPT those related to the
specified event.
To filter an event in or out of a recording,
Step 1 Click the blue dot on Filter Out. (Note: the button may say
Filter In depending on the last action specified.)
You see the Filter Out/In menu:
Use this menu to toggle the selection between Filter Out and Filter In.
Step 2 Select "Filter In".
The button changes to read "Filter In".
84
Merlin Protocol Analyzer User’s ManualCATC Version 1.6
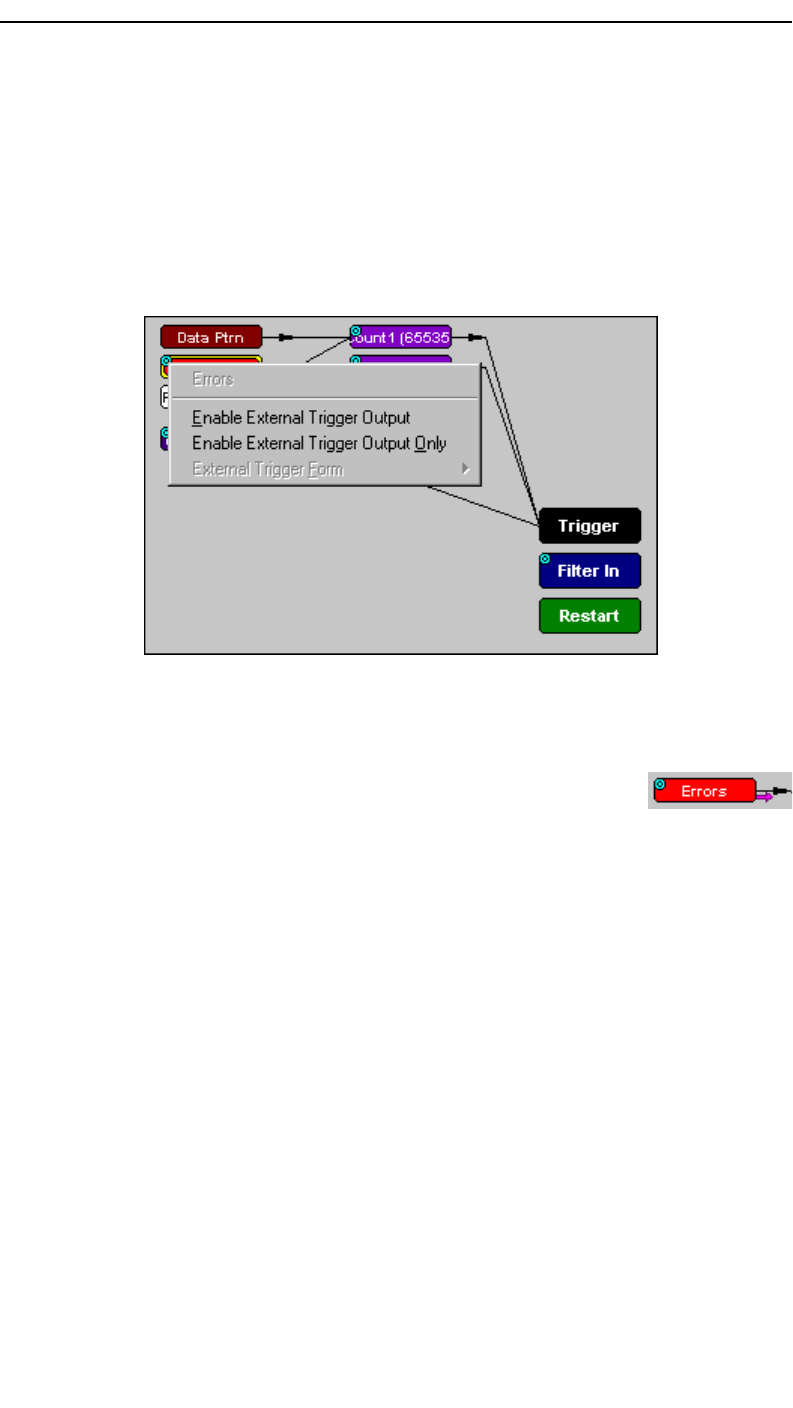
Blue Dot Menus for the Event Buttons
The Errors button and the first Headers button (marked "Hdr1") have the
same Blue Dot menus. These menus allow Merlin to trigger external output.
To enable or disable external trigger output,
Step 1 Click the Blue Dot on an Event button such as Hdr1 or Errors.
A menu similar to the one below will open. Your menu may say
"Disable" instead of "Enable."
Step 2 Select "Enable External Trigger Output" (or "Disable
External Trigger Output" if that is the choice presented.)
If you have chosen "Enable External Trigger
Output", a small arrow will appear on the right side
of the button. This arrow indicates that a condition
has been set for creating an external output signal.
Choosing "Disable External Trigger" will cause the arrow to disappear.
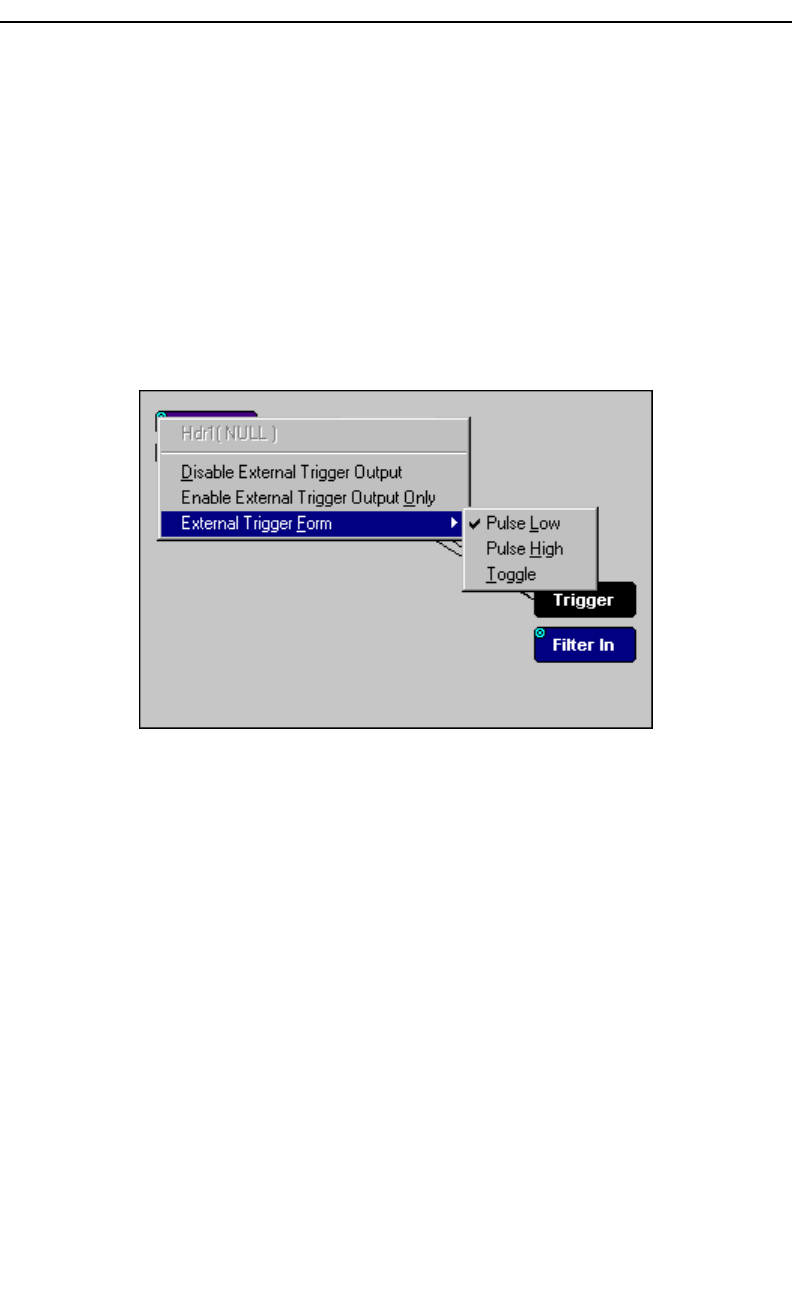
Enabling High Pulse, Low Pulse or Pulse Toggle Signal Outputs
Once External Trigger Output has been enabled, you can configure the
output signal to one of three formats:
Pulse High - This is the default format. The Pulse High setting causes the
Analyzer to transmit a 5 volt, 16.66 nanosecond signal.
Pulse Low - This format causes the Analyzer to transmit a -5 volt, 16.66
nanosecond signal.
Toggle - This format causes the Analyzer to transmit a signal that will
toggle with each trigger event between a continuous 5 volt signal and a
continuous -5 volt signal.
85
Merlin Protocol Analyzer User’s ManualCATC Version 1.6
To configure the output signal,
Step 1 Click the blue dot on an Event button that has a small arrow
attached to it like the one shown above.
A Blue Dot Menu will open. "External Trigger Form" should be a
choice available. If it is not, you will need to choose "Enable External
Trigger" and then reopen the menu.
Step 2 Choose "External Trigger Form"
A menu will appear with choices for "Pulse Low", "Pulse High", and
"Toggle".
Step 3 Choose an option not currently selected.
The menu closes.
Step 4 Reopen the menu.
Note that your new selection is now checked.
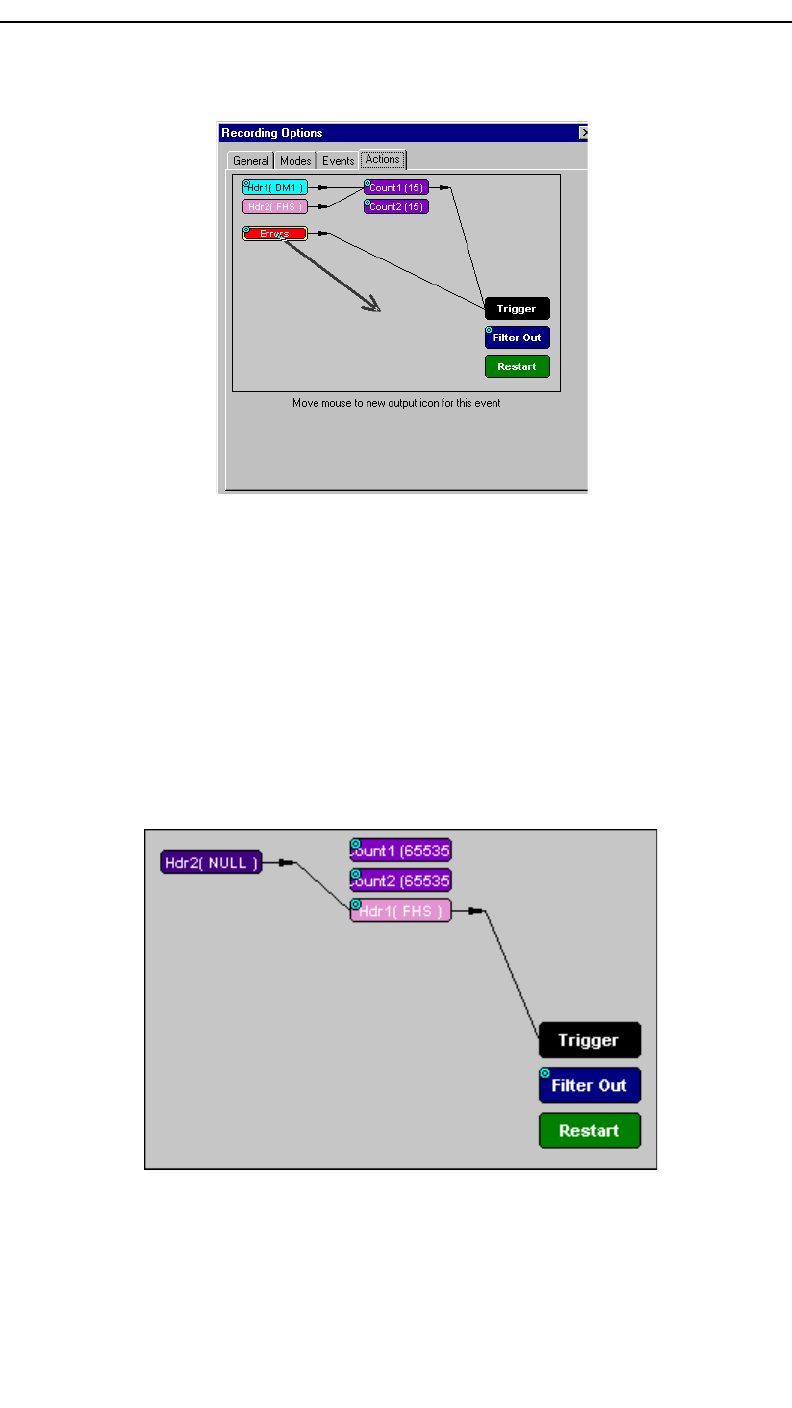
Elastic Arrow
Elastic arrows allow you to associate Events, Counters, and Actions. To
make an association,
Step 1 Click the left mouse button on an Event button such as Hdr1
or Errors.
86
Merlin Protocol Analyzer User’s ManualCATC Version 1.6
The elastic arrow appears.
Step 2 Drag the arrow to the desired Action button.
Step 3 With the pointer over an Actions button, click again the left
mouse button again.
The arrow is replaced with a black line connecting the Event button to
the Action button.
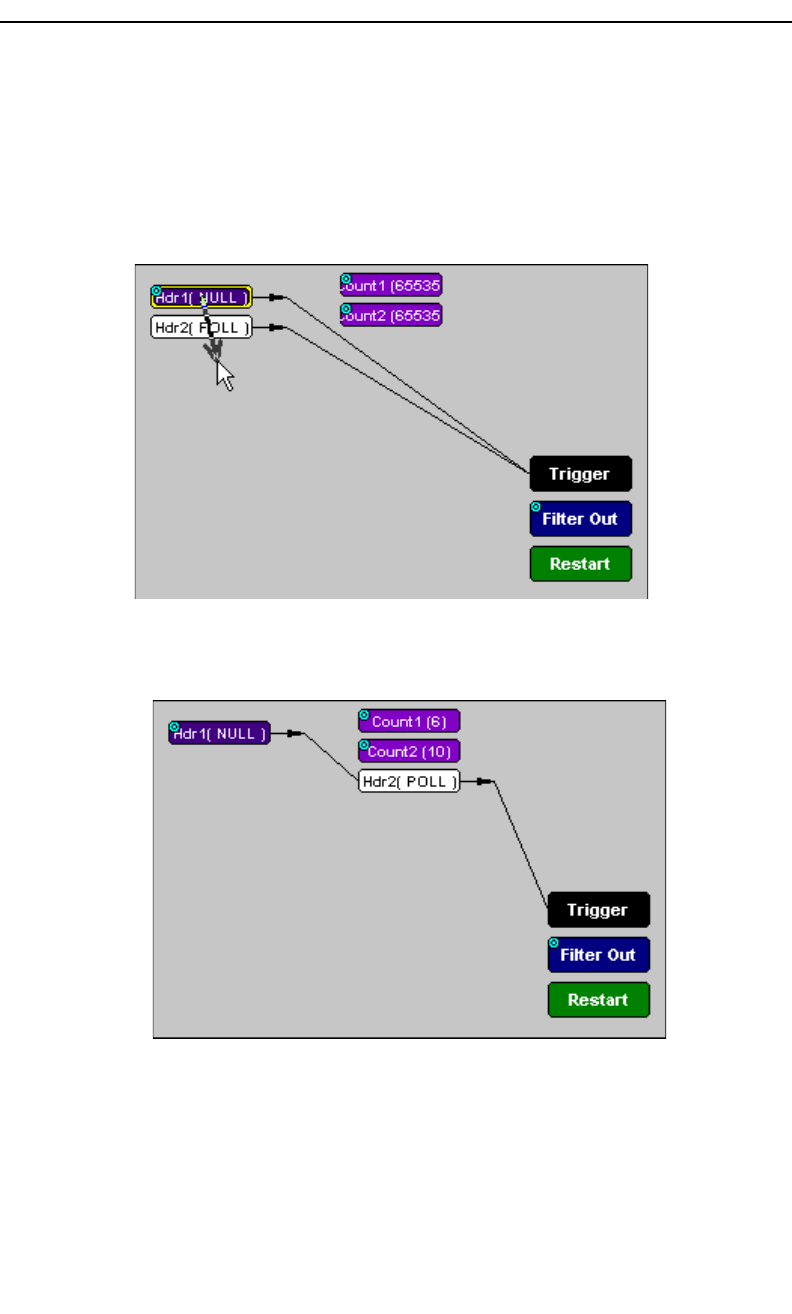
Event Sequencing
If you drag your mouse from one event button to another, you will create a
compound condition known as an Event Sequence. An event sequence is a
condition that says "Trigger when you see the following sequence of
packets." The example below may help to clarify.
This example means "Trigger when you see a packet with an Null Header
followed by a packet with a FHS Header."
87
Merlin Protocol Analyzer User’s ManualCATC Version 1.6
To create an event sequence, perform the following steps:
Step 1 Select two events from the Events window
Step 2 Open the Actions window and click on one of the two Event
buttons.
An elastic arrow should appear.
Step 3 Click on the other event.
The arrow should connect to the second button and the second button
should instantly change locations to the center section of the window.
7.5 Saving Recording Options
To complete your Recording Options settings, use the features at the bottom
of the Recording Options screen. These features remain the same no matter
which of the three Recording Options screens you are working in.
•Click Save to save the currently specified Recording Options for
use in future recording sessions. Any file name can be specified,
88
Merlin Protocol Analyzer User’s ManualCATC Version 1.6
though use of the .rec is recommended; if no extension is
specified, .rec is added by default.
•Click Load to load a previously saved *.rec file, thus restoring a
previous set of Recording Options.
• The Save as Default function is equivalent to the Save function,
specifying the file name default.rec. Whenever you start up the
Analyzer, it automatically loads the default.rec file if one exists.
•Click OK to apply any changes and close this dialog box.
•Click Cancel to cancel any immediate changes you have made
and exit the Recording Options menu.
7.6 Recording Bluetooth™ Traffic
To start recording Bluetooth™ traffic once the appropriate Recording
Options have been set,
Step 1 Select Start under Record on the Menu Bar
OR
Click on the Tool Bar.
Your recording session can continue until it has finished naturally or you
may need to stop manually by clicking on the Tool Bar, depending on
how you set the Recording Options.
To manually stop recording,
Step 2 Select Stop under Record on the Menu Bar
OR
Click on the Tool Bar.
Note The manual Stop Recording feature is primarily of use when recording
low-volume traffic, which can take a long time to fill the recording buffer.
When the recording session is finished, the bus traffic is saved to the hard
drive as a file named data.blt or whatever name you assign as the default
filename.
To save a current recording for future reference,
Step 3 Select Save As under File on the Menu Bar.
OR

89
Merlin Protocol Analyzer User’s ManualCATC Version 1.6
Click on the Tool Bar.
You see the standard Save As screen.
Step 4 Give the recording a unique name and save it to the
appropriate directory.

90
Merlin Protocol Analyzer User’s ManualCATC Version 1.6
91
Merlin Protocol Analyzer User’s ManualCATC Version 1.6
8. Display Options
Use the Display Options menu to specify the way CATC Trace information
is displayed.
To open the Display Options menu,
•Select Display Options under Setup on the Menu Bar
OR
•Click on the Tool Bar
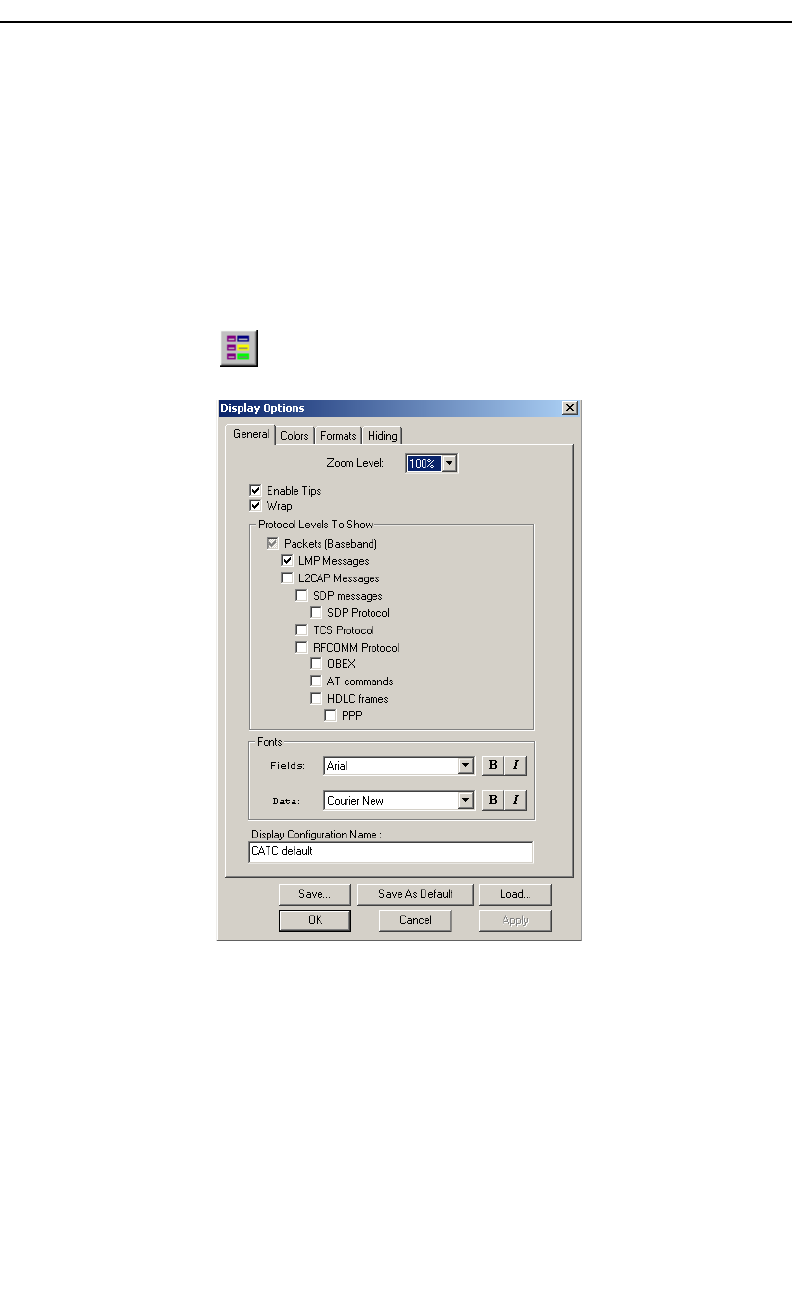
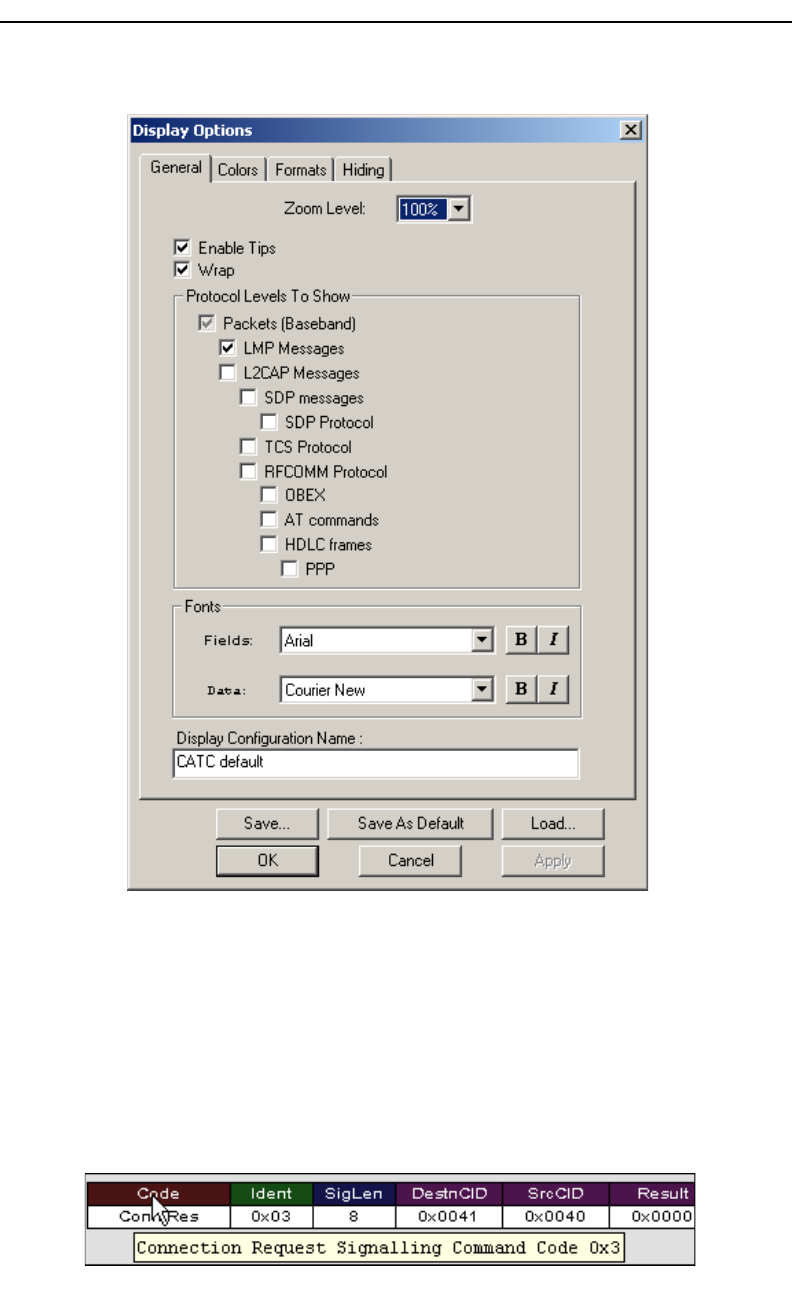
You see the Display Options window:
The Display Options window always opens with the screen for the General
tab displayed.
8.1 General Display Options
Use the General Display Options to specify the basic appearance of a Trace
View.
•Zoom Level: Adjustable in discrete increments from 10% to 200% percent.
•Enable Tool Tips: Select to enable tool tips with explanation text to pop up
when you position your cursor over various fields in the Trace View.
92
Merlin Protocol Analyzer User’s ManualCATC Version 1.6
•Wrap: Inhibits carriage returns in packets when they exceed the width of the
window.
•Trace Viewing Level: Enables different levels of transaction to be displayed.
•Display Configuration Name: A Comment field associated with the *.opt file
containing the current Display Options values. You can also create and store
your unique Display Options for future use.
•Fonts: Allows field fonts and data fonts to be changed. The fonts can be
italisized and/or bolded by pressing the I and/or B buttons.
Trace Viewing Level
Trace Viewing Level allows Merlin to display ten levels of transaction:
•Packet
Packet is the default selection.
•LMP Messages
•L2CAP Messages
•STP Messages
•STP Protocol
•TCS Messages
•TCS Protocol
•RFCOMM Protocol
•OBEX Protocol
•AT Commands Protocol
•HDLC Frames
•PPP
•BNEP
Changing the Trace View
Level
To change the
Trace Viewing Level, use the decode buttons on the toolbar or select a
checkbox in the Display Options dialog box.
For further details on these viewing levels, see the Chapter 7: Decoding
Higher Protocols.
Creating New Display Options Files
To create a new Display Options file,
Step 1 Enter a comment for the new file in the Display
Configuration Name field.
93
Merlin Protocol Analyzer User’s ManualCATC Version 1.6
Step 2 Click Save...
You see the Save As window.
Step 3 Specify a filename (*.opt).
Step 4 Click Save.
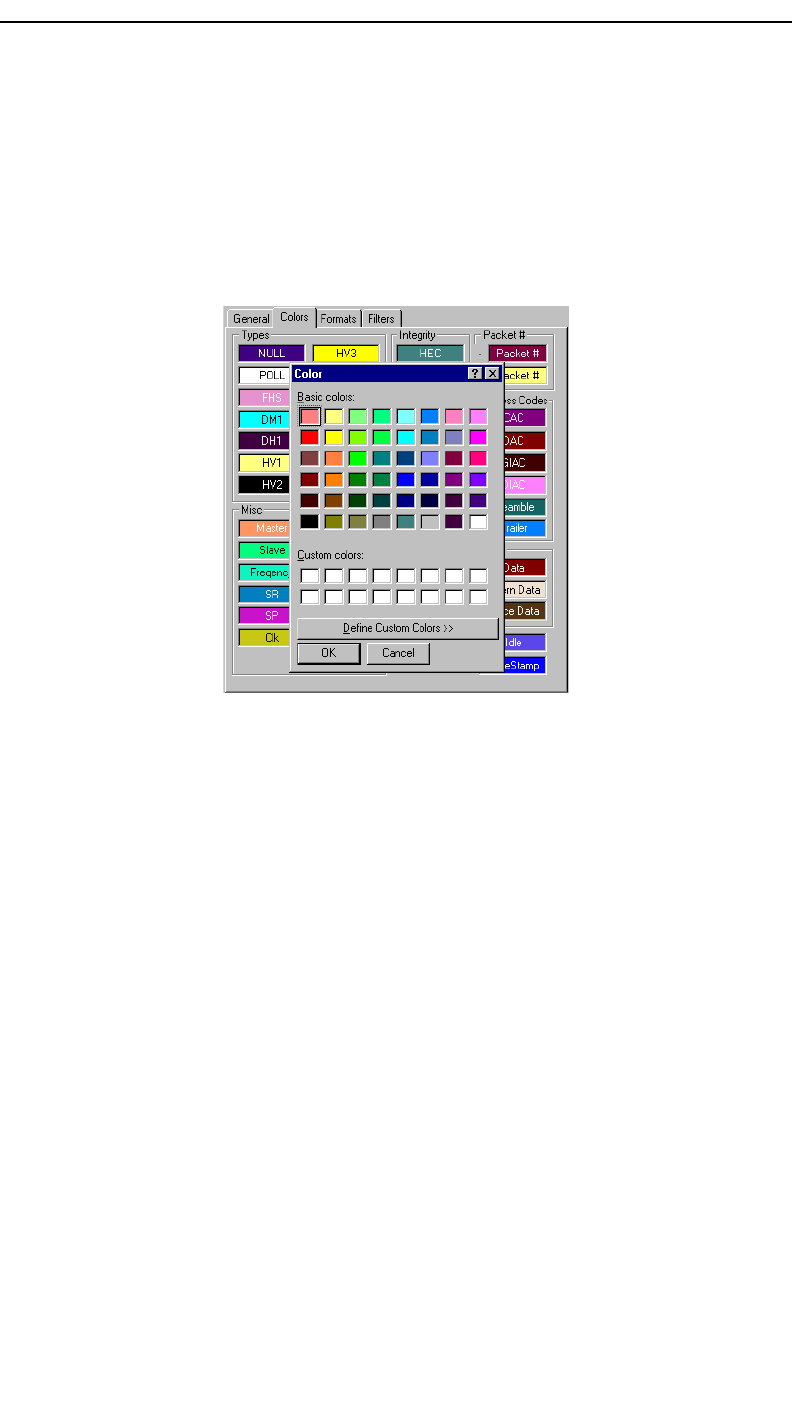
8.2 Color Display Options
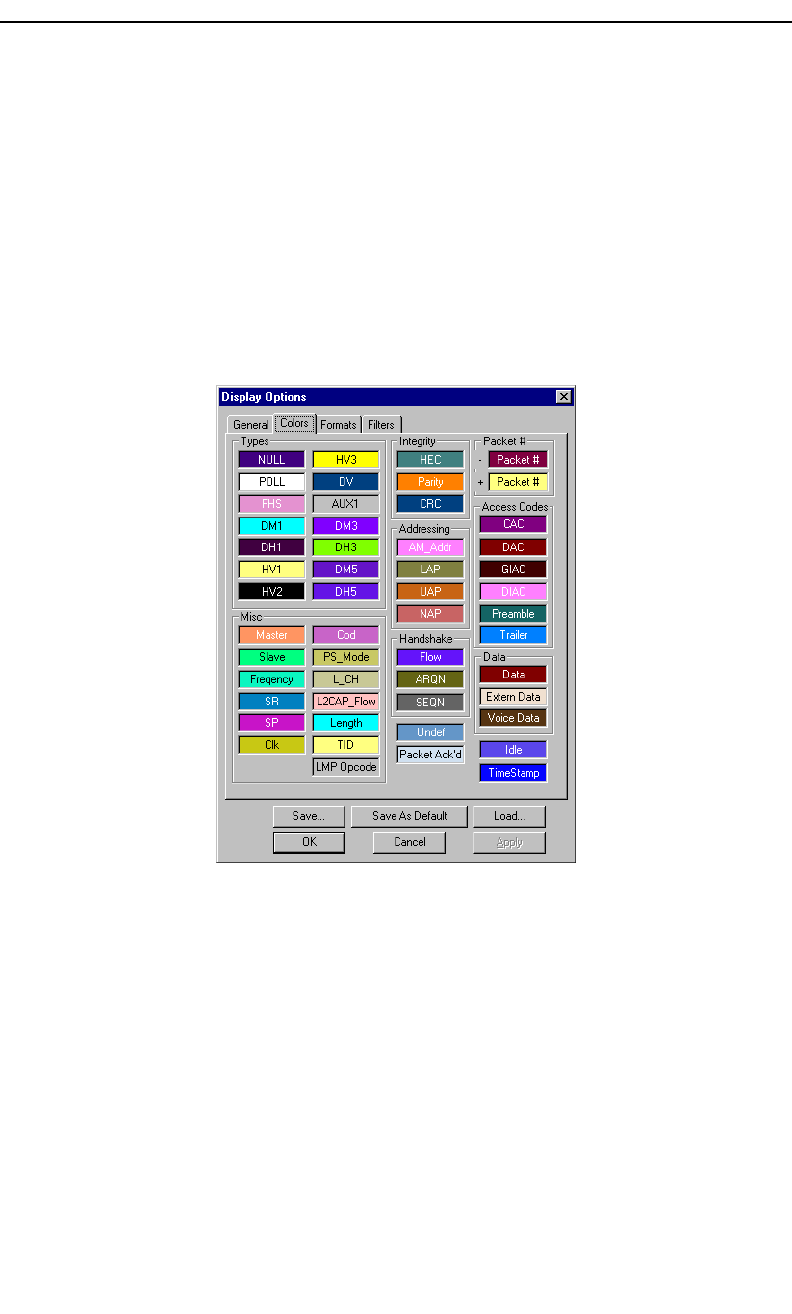
•Click the Colors tab on the Display Options screen.
You see the Colors screen:
Use this menu to customize the colors associated with each field in the Trace
View. You can experiment with this option to achieve the color combination
best suited to a particular graphic system. A brighter color might be
appropriate for a specific field that should stand out in the display (e.g. the
Packet Types).
Note The colors of the following packet types cannot be changed: Invalid Data (packet
error) field (red) and Softbit Errors (yellow.)
Two color fields are provided for packet number displays to differentiate
between pre-Trigger traffic and post-Trigger traffic.
•The packet that causes the Trigger and all the packets before it are colored with
the - color.
•The packet that follows a Trigger is colored with the + color.
94
Merlin Protocol Analyzer User’s ManualCATC Version 1.6
•All packets are colored with a + color when there is no Trigger.
Use the color buttons labeled + and - under the Packet # section of the
Colors screen to select a Trigger color.
To select or change a color,
•Click the appropriate color button.
You see the color palette:
Use this palette to choose the desired color for the Packet Types,
Miscellaneous, Integrity, Handshake, Packet #, Access Codes, Data, Idle
and Timestamp.
95
Merlin Protocol Analyzer User’s ManualCATC Version 1.6
8.3 Formats Display Options
•Click the Formats tab on the Display Options screen.
You see the Formats window:
Select a number format corresponding to the column labels along the top of
the screen for each number field that labels the rows along the left of the
screen. The number format changes in the respective location in the packet
view window. You can also select the bit ordering to be displayed. Not
every number format is available for every number field.
96
Merlin Protocol Analyzer User’s ManualCATC Version 1.6
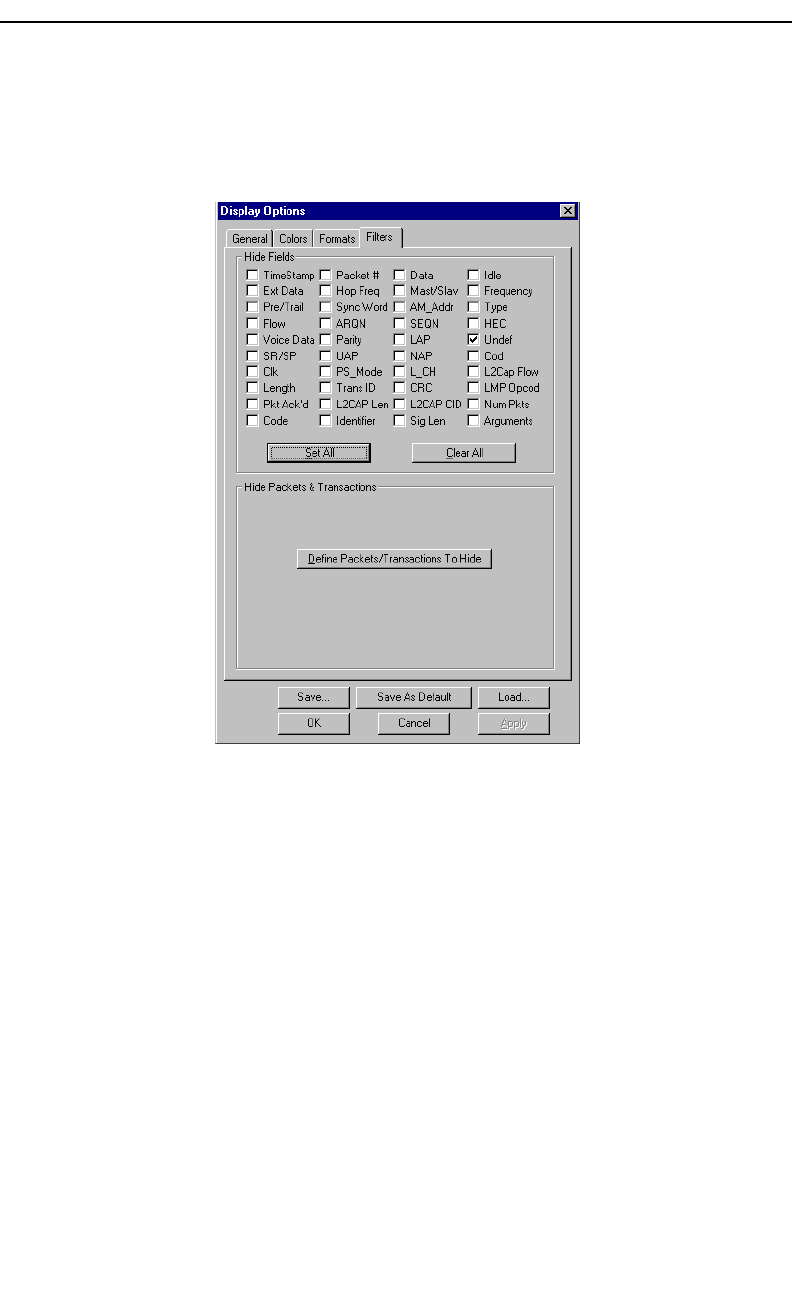
8.4 Hiding
•Click the Hiding tab on the Display Options screen.
You see the Hiding window:
Use the Hiding window to hide various fields, packets, messages, and
protocols from the Trace View screen. You can modify these settings at will
to display a specific area of a Trace.
Hiding Fields
The "Hide Fields" checkboxes allow individual fields to be hidden within a
trace. Click the checkbox(es) of your choice to hide one or more fields.
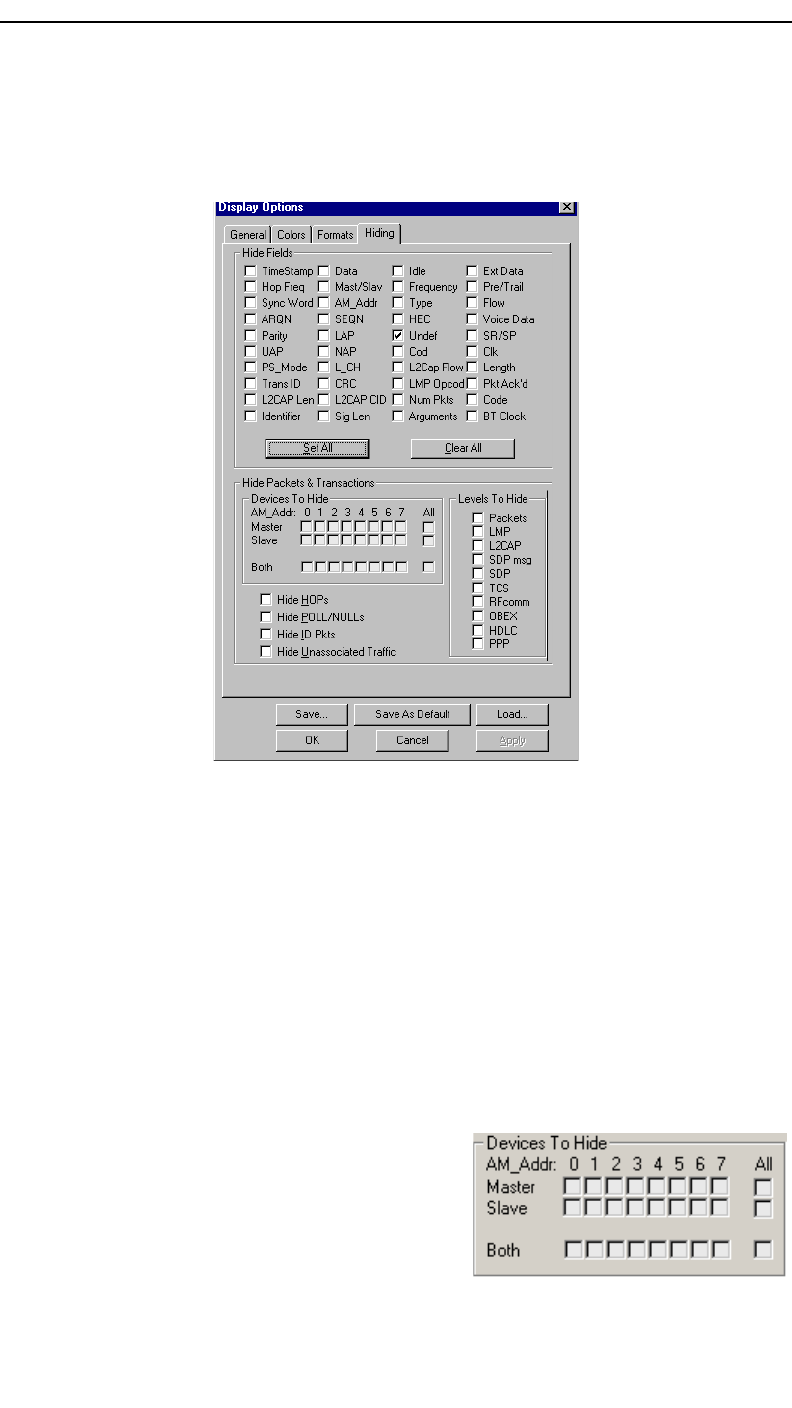
Hiding Packets, Messages, and Protocols
The "Hide Packets and Transactions" box contains two grids of checkboxes
for hiding whole packets, messages, protocols, and traffic from individual
devices. The grids are labeled "Devices to Hide" and "Levels to Hide".
Devices to Hide
The "Devices to Hide" grid lets you hide
traffic according to device address. The
grid devides into columns which
represent different devices.
97
Merlin Protocol Analyzer User’s ManualCATC Version 1.6
Columns labeled "0" through "7" and "All" represent the Active Member
Address of a device. By checking one of the boxes in a column, you hide
the traffic of the selected device (or traffic from all devices if you have
selected All.)
The row in which you place your checkmark determines whether you are
hiding traffic going to or from a device.
• Master - Hide traffic from a Master to selected Slaves
• Slave - Hide traffic from selected Slaves to the Master
• Both - Hide all traffic between the Master and selected Slave
Example: to hide all traffic from a Master to a Slave device with an address
of six, click the checkbox under column 6 on the row marked Master.
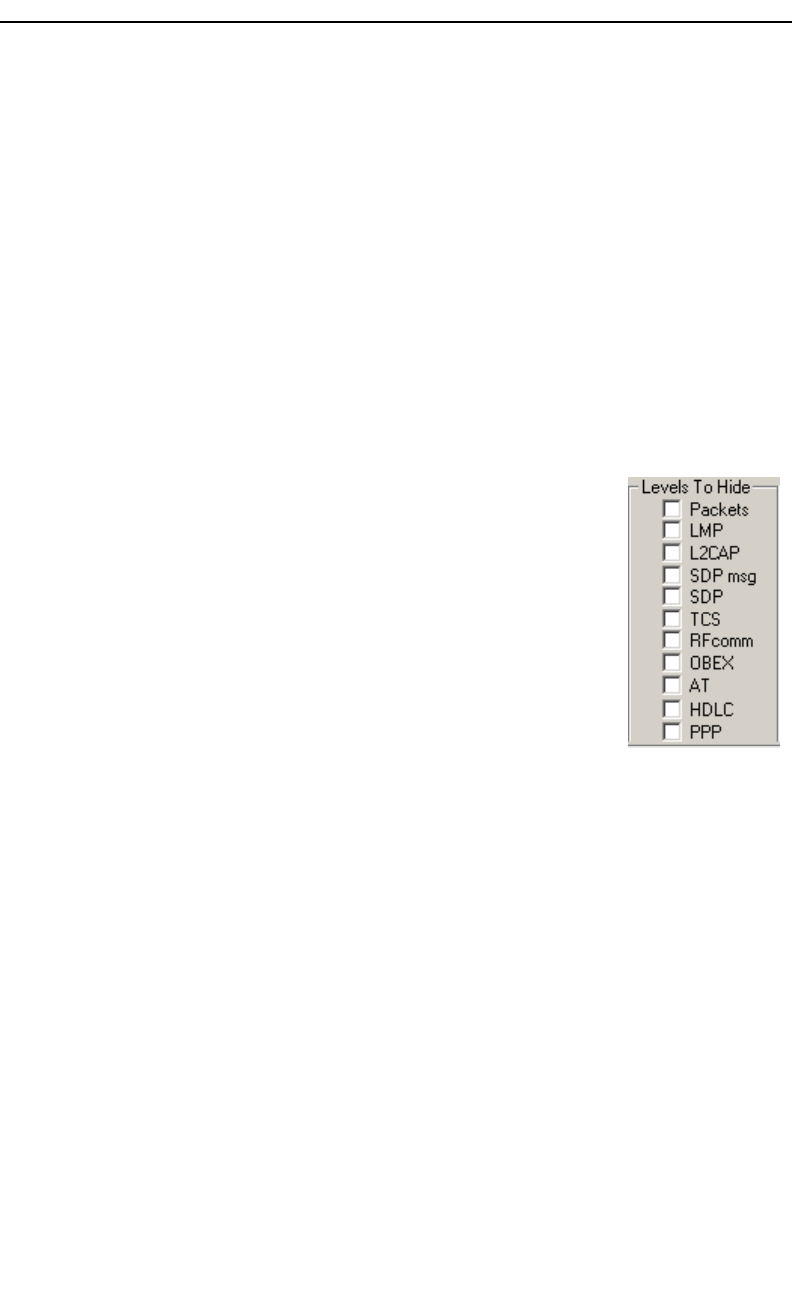
Levels to Hide
The "Levels to Hide" grid divides into rows which
represent the different packet, message, and protocol
levels. Clicking a checkbox will cause Merlin to hide all
traffic of a selected level.
8.5 Saving Display Options
To complete your Display Options settings, use the
features at the bottom of the Display Options screen. These features remain
the same no matter which of the four Display Options screens you are
working in.
•Click Save to save the currently specified Display Options for use in future
sessions. Any file name can be specified, but you must use the .opt extension.
If no extension is specified, .opt is added by default.
•Click Load to load a previously saved *.opt file, thus restoring a previous set
of Display Options.
•The Save as Default function is equivalent to the Save function, specifying the
file name default.opt. Whenever you start up the analyzer, it automatically
loads the default.opt file if one exists.
•Click OK to apply any changes you have made to Display Options and close
this dialog box.
•Click Cancel to cancel any immediate changes you have made and exit the
Display Options menu.
•Click Apply to apply your changes.

98
Merlin Protocol Analyzer User’s ManualCATC Version 1.6
99
Merlin Protocol Analyzer User’s ManualCATC Version 1.6
9. Reading a CATC Trace
9.1 Trace View Features
•The Merlin packet view display makes extensive use of color and graphics to
fully document the captured traffic.
•Packets are shown on separate rows, with their individual fields both labeled
and color coded.
•Packets are numbered (sequentially, as recorded), time-stamped, and
highlighted to show the device status (master or slave).
•Display formats can be named and saved for later use.
•Pop-up Tool Tips annotate packet fields with detailed information about their
contents.
•Data fields can be collapsed to occupy minimal space in the display (which can
in turn be zoomed in and out to optimize screen utilization).
•The display software can operate independent of the hardware and so can
function as a stand-alone Trace Viewer that may be freely distributed.
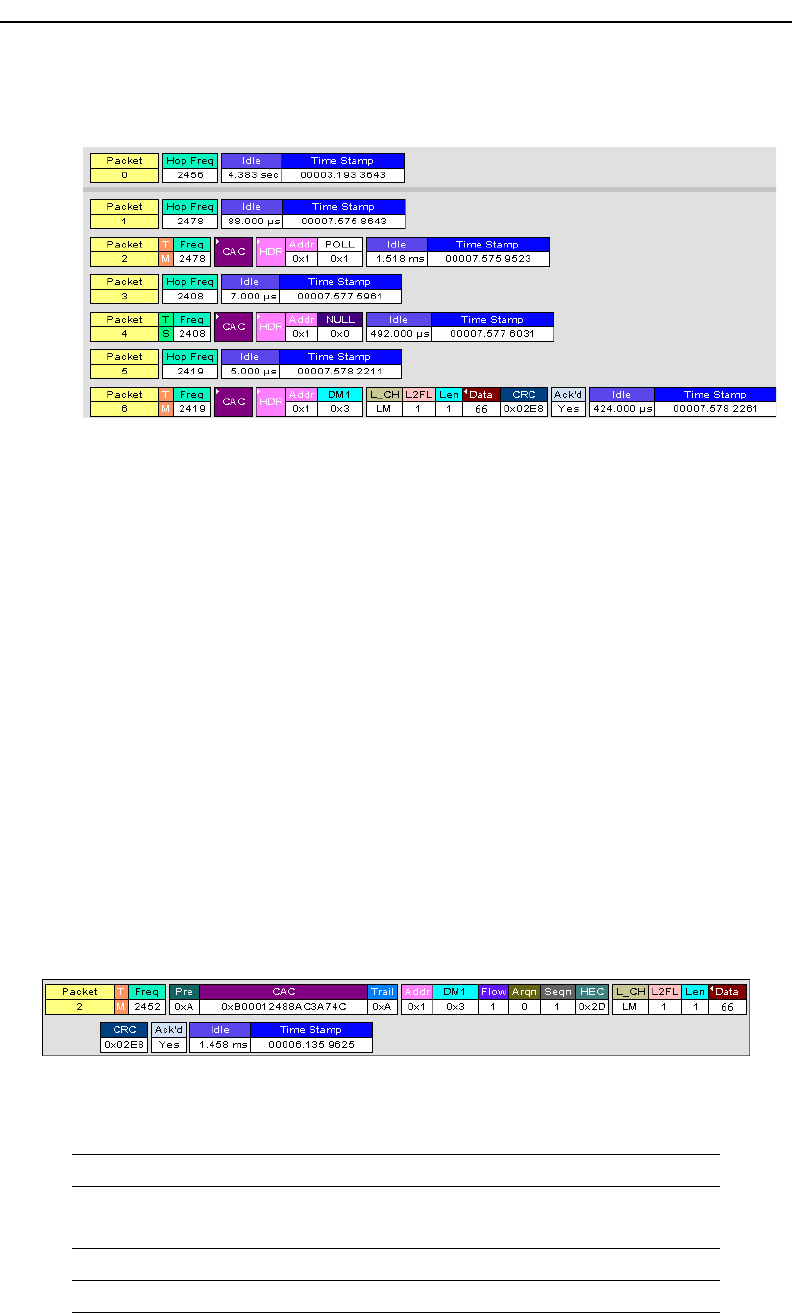
9.2 Interpreting the Displayed Information
The following table describes the abbreviations used in the Merlin display.
Packet #0 is described from left to right:
Packet:# Packet/Event Number
T/M, T/S M =Master Device Transmitting
S = Slave Device Transmitting
Freq Current Hop Frequency (in MHz)
Pre Preamble of the Sync word

100
Merlin Protocol Analyzer User’s ManualCATC Version 1.6
9.3 Tool Tips
You can get additional information about
each field in a trace by holding your
mouse pointer over a field. A tool tip will
appear with details about the field.
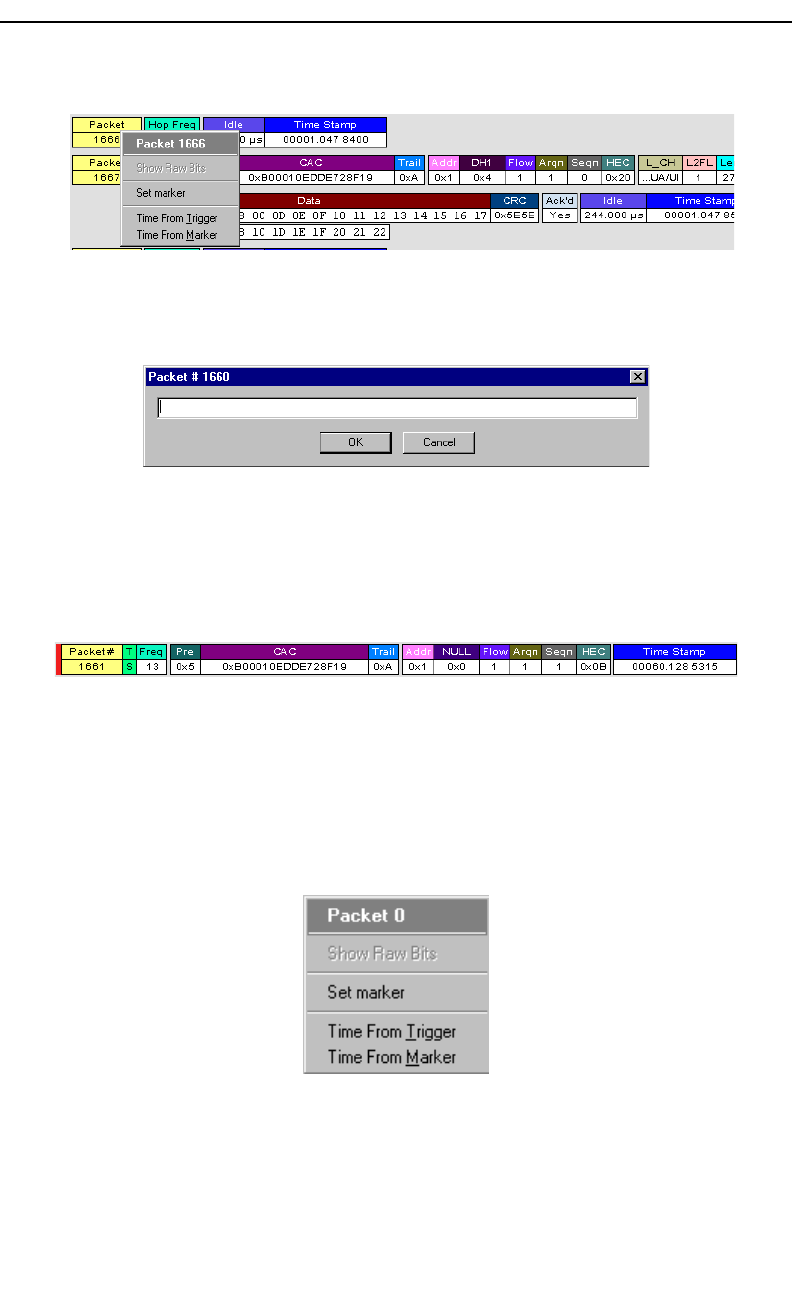
9.4 Set Marker
Note The Set Marker works in conjunction with the Go to Marker feature.
You can define a unique Marker for each packet.
To place a marker on a packet,
Step 1 Left-click on Packet # for the packet you wish to mark.
CAC Channel Access Code
Trail Access Code Trailer of the Sync word
Addr Active Member Address
DM1 DM1 Packet Type
Flow ACL Link Flow Control
Arqn Acknowledgment Indication Flag
Seqn Sequential Numbering
HEC Header Error Correction Code
L_CH LMP Message
L2FL L2CAP Flow Control Flag
Len Message Length in Bytes including Opcode
TID LMP Transition initiated by Master
Opcode LMP-host_connection_req
CRC Cyclic Redundancy Check
Ack’d Packet Acknowledgment based on subsequent packet’s ARQN with
same AM_ADDR
Idle Idle Time in nanoseconds
Time Stamp Decimal in Seconds.Milliseconds.Microseconds*10
This is the analyzer internal clock as a reference with resolution of
100 ns.
Packet:# Packet/Event Number
101
Merlin Protocol Analyzer User’s ManualCATC Version 1.6
You see the Packet menu:
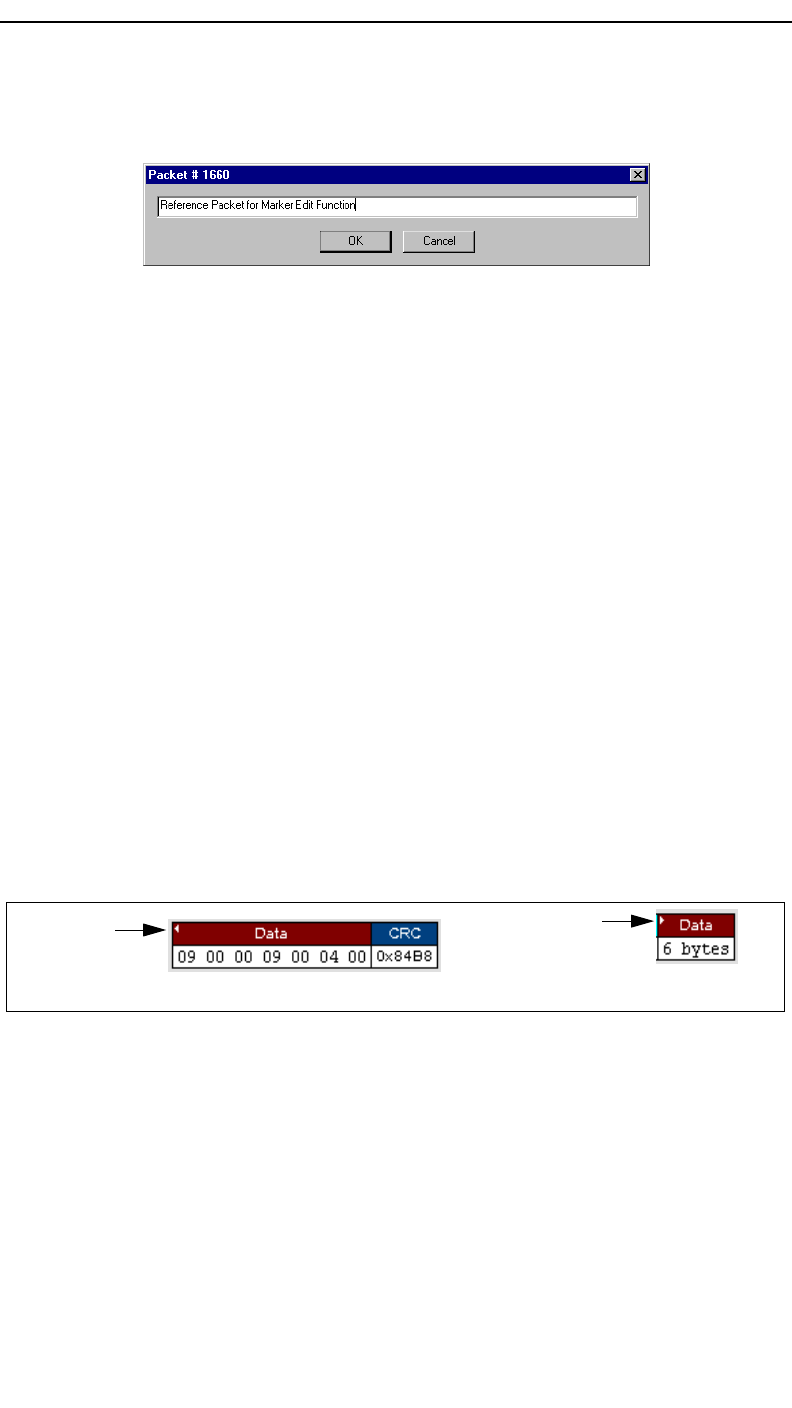
Step 2 Select Set Marker.
You see the Edit Marker Comment window where you can enter a
unique comment about this packet.:
Step 3 Enter your comment.
Step 4 Click OK.
A marked packet is indicated by a vertical red bar along the left edge of the
packet # block:
9.5 Edit or Clear Marker
To clear or edit the comments associated with a packet marker,
Step 1 Left-click on Packet # for the chosen packet.
You see the Packet menu:
To edit the Marker Comment,
102
Merlin Protocol Analyzer User’s ManualCATC Version 1.6
Step 2 Select Edit marker.
You see the Edit marker comment window:
Step 3 Edit the comment as desired.
Step 4 Click OK.
To clear a Marker,
Step 5 Click Clear marker.
The vertical red Marker bar disappears.
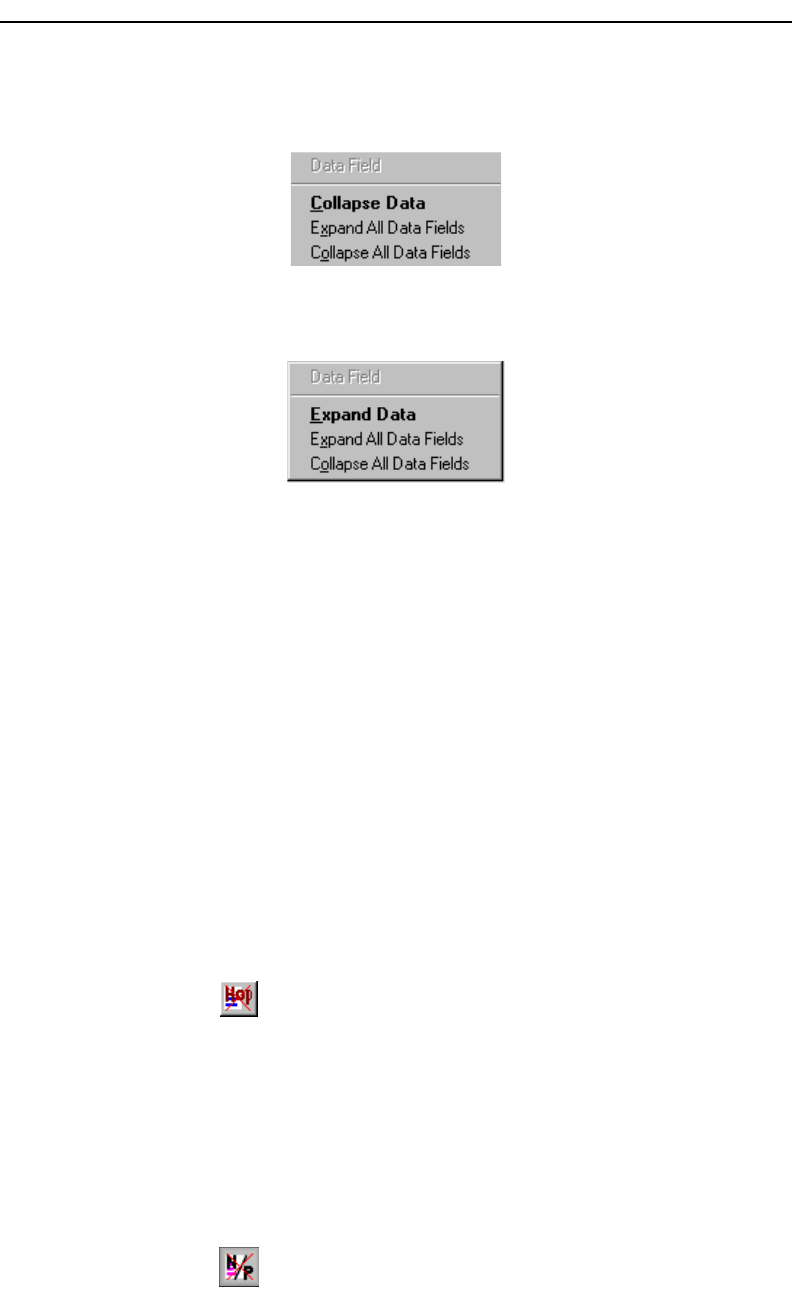
9.6 Expanded and Collapsed Data Formats
The data field can be expanded to display greater detail or collapsed to a
compact view. The Expand/Collapse Data feature operates as a toggle.
There are three ways to toggle between the two views.
Double-Clicking
You can expand or collapse a Data field by double-clicking anywhere in the
Data field of a packet.
Left-clicking a Field Arrow
Many fields have small arrows in the top left corner. If you left-click this
arrow, the field will toggle back and forth between collapsed and expanded
views.
If you click and hold down the left mouse button on one of these arrows, you
can collapse or expand the field for ALL packets, messages or protocols.
Using the Shortcut Menu
If you left-click on a Data field, a menu will open for expanding or
collapsing data fields.
Step 1 Left-click on Data in the Data packet you want to expand or
collapse.
data
Left-facing
field arrow
will collapse Expanded Data
Right-facing
arrow will
expand data Collapsed
the field
103
Merlin Protocol Analyzer User’s ManualCATC Version 1.6
If your Data Trace View is currently expanded, you see the Collapse
Data menu:
If your Data Trace View is currently collapsed, you see the Expand Data
menu:
Note that you can choose to expand or collapse
•Only the Data in the selected Data packet
OR
•All Data Fields in the Trace View.
Step 2 Select the desired Expand Data or Collapse Data menu item.
The Trace View is repositioned with the selected packet(s) adjusted in
the format you have specified.
9.7 Hide Frequency Hops
You can hide Frequency Hops (Hops) from a trace by pressing the Hide
Hops button on the Tool Bar:
From the Tool Bar
•Click to hide all Hop packets.
9.8 Hide Nulls and Polls
You can hide Nulls and Polls from a trace by pressing the Hide Nulls and
Polls button on the Tool Bar.
From the Tool Bar
•Click to hide all Nulls and Polls.

104
Merlin Protocol Analyzer User’s ManualCATC Version 1.6
9.9 Hide Unassociated Traffic
You can hide all traffic that is not associated with the current decode level
by pressing the Hide Unassociated Traffic button on the Tool Bar.
From the Tool Bar
•First, click one or more decode buttons such as the View L2CAP Messages
. This button will cause Merlin to decode the trace and display
selected level of decode.
•Next, click to hide all unassociated traffic.
The Hide Unassociated Traffic button will cause Merlin to hide all traffic
except for the selected decode messages or protocols. In the example above,
all packets would be hidden and only L2CAP messages would display.
105
Merlin Protocol Analyzer User’s ManualCATC Version 1.6
10. Decoding Higher Protocols
10.1 Introduction
Merlin can decode LMP and L2CAP messages, and RFCOMM, SDP, TCS,
HDLC, PPP, and OBEX protocols. The default is packet level decoding,
which means that baseband packets will be displayed when you first view a
trace. If these packets are carrying LMP, L2CAP or higher protocols, the
protocols will display as undecoded fields such as the L2CAP packet below.
By issuing a decode command, Merlin can decode these LMP and higher
fields and display the data in summary statements called LMP/L2CAP
Messages, Protocols Messages, and Protocol Transactions.
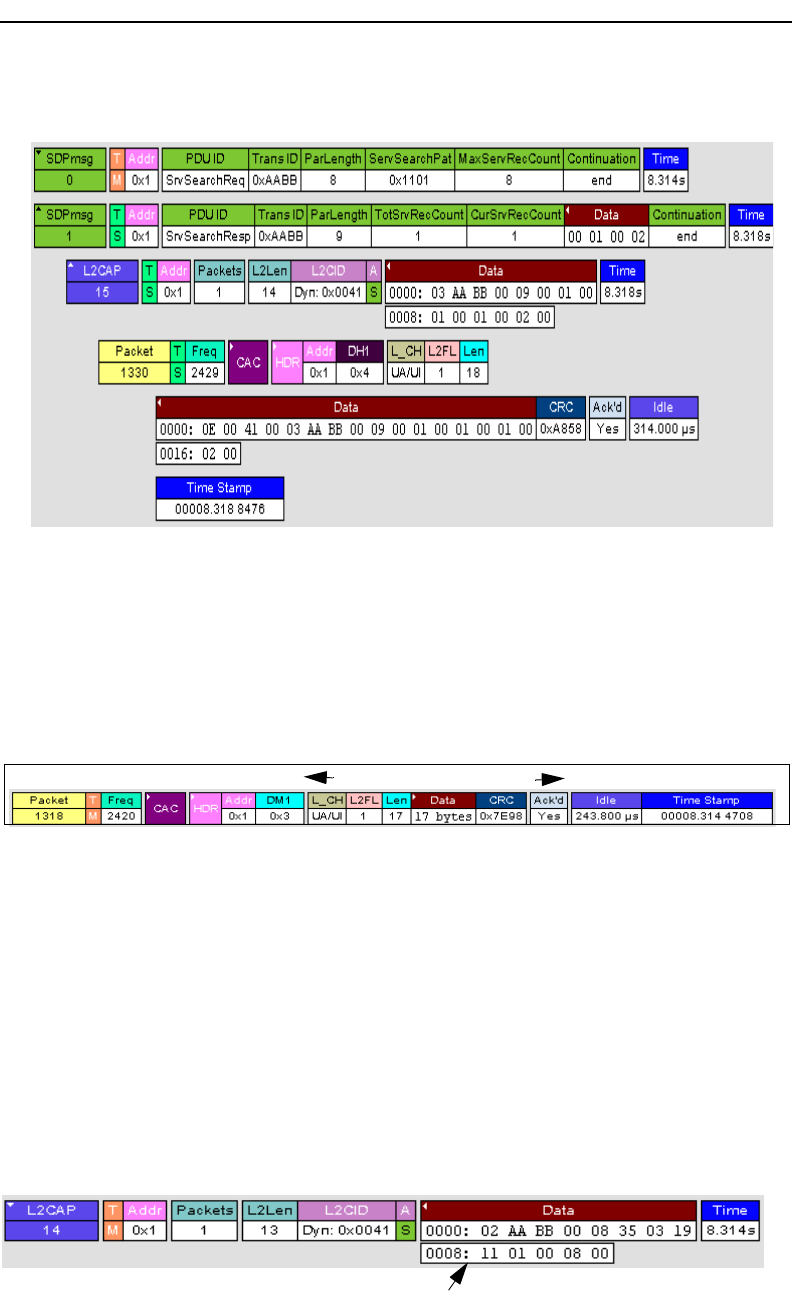
10.2 LMP and L2CAP Messages
LMP and L2CAP Messages are lines in a trace that summarize LMP and
L2CAP actions such as an LMP connection request. LMP and L2CAP
Messages summarize the type of action, the number of packets involved in
the action, and the device performing the action. If the message is carrying
higher protocol data such as RFCOMM, TCS, OBEX or SDP data, the
message displays this data in an undecoded format that can be decoded later.
Undecoded L2CAP fields
Undecoded higher protocol data
106
Merlin Protocol Analyzer User’s ManualCATC Version 1.6
10.3 Decoding and Viewing Higher Protocol Data
Higher protocol data can be decoded two ways: by clicking a decode button
on the toolbar or by selecting a decode command from a pull down menu.
Decoding Via the Decoding
Toolbar
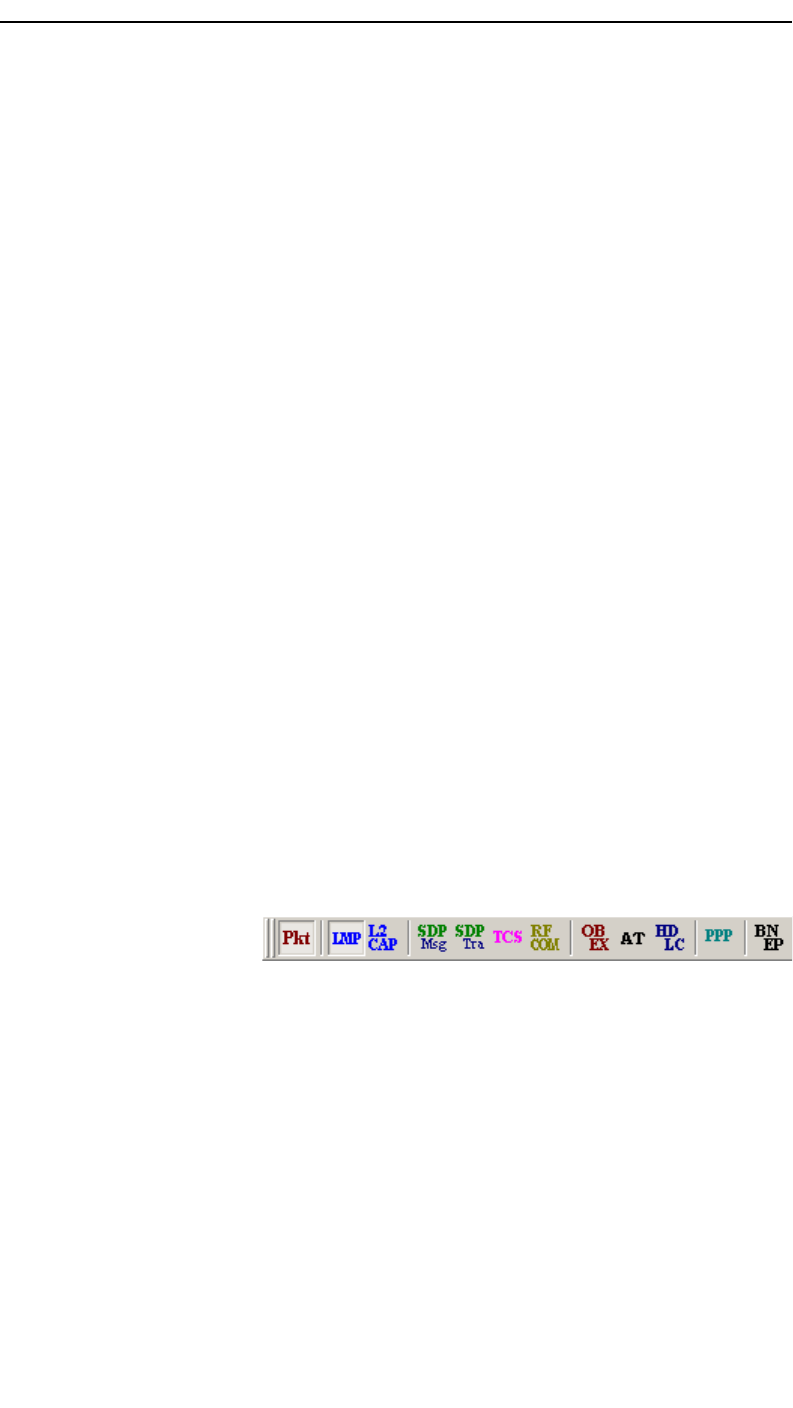
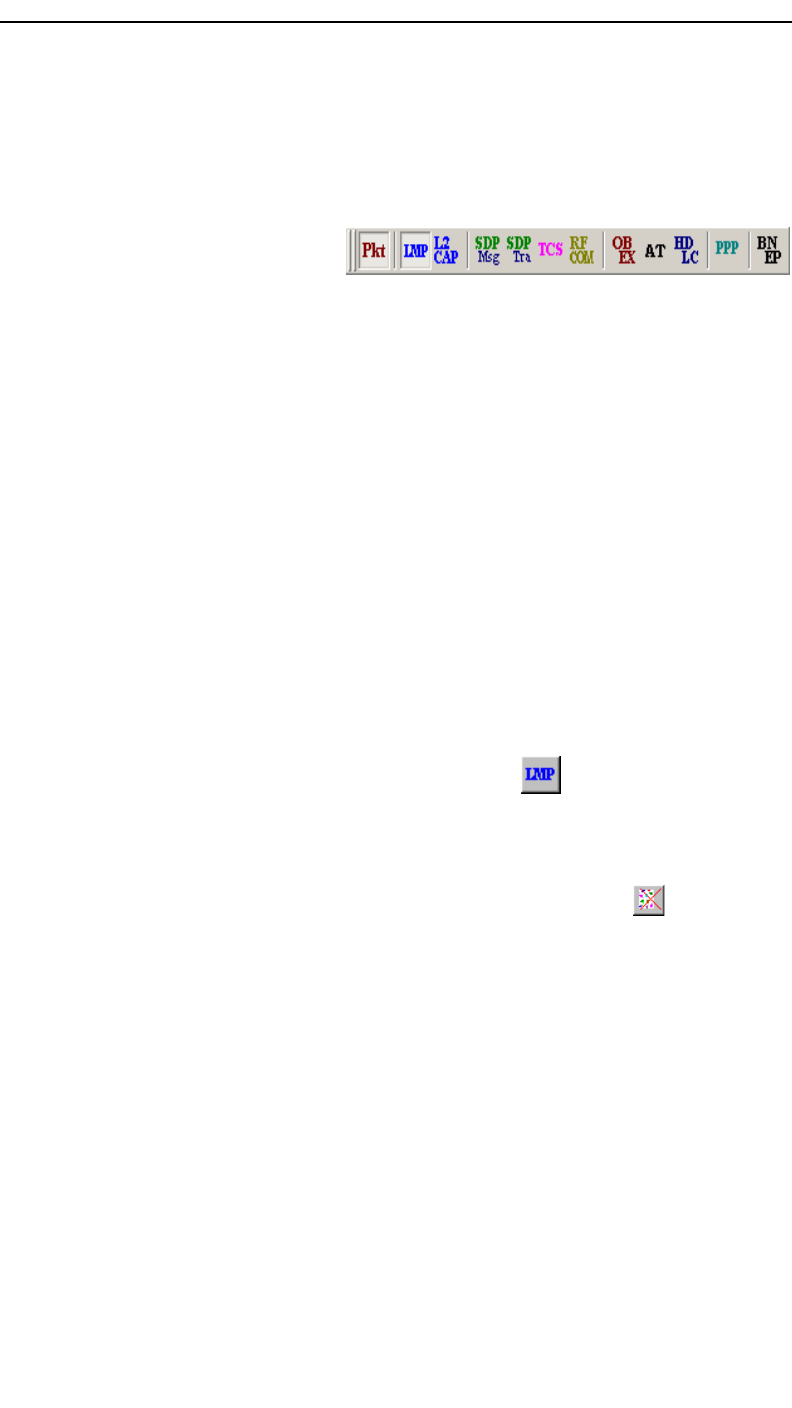
The Decoding Toolbar has ten buttons for decoding packets, messages, and
protocols:
• Pkt (Display Packets)
• LMP (Display LMP Messages)
• L2CAP (Display L2CAP Messages)
• SDP Msg (Display SDP Protocol Messages)
• SDP Tra (Display SDP Transactions)
• TCS (Display TCS Protocol messages)
• RFCOMM (Display
• OBEX (Display OBEX Protocol)
• AT (Display AT Commands Protocol)
• HDLC (Display HDLC Protocol)
• PPP (Display Point to Point Protocol)
For example, to display LMP messages, click .
Note Once a decode has been performed, it will probably be necessary to scroll through
the display to find the decoded messages or protocols. You can shorten your
search by first clicking the Hide Unassociated Traffic button .
Decoding Via the Display Options Dialog Box
The Display Options dialog box has three options for issuing decode
commands. To issue a command,
Step 1 From the menu bar, select
107
Merlin Protocol Analyzer User’s ManualCATC Version 1.6
Setup>Decoding Options
Step 2 Select the option for the desired level of decoding.
Step 3 Click OK or Apply.
10.4 Tooltips
Additional information about fields can be attained by positioning your
mouse pointer over a field of interest. A tooltip will appear that will provide
details about the field. In some cases, there can be a considerable amount
of information available.
108
Merlin Protocol Analyzer User’s ManualCATC Version 1.6
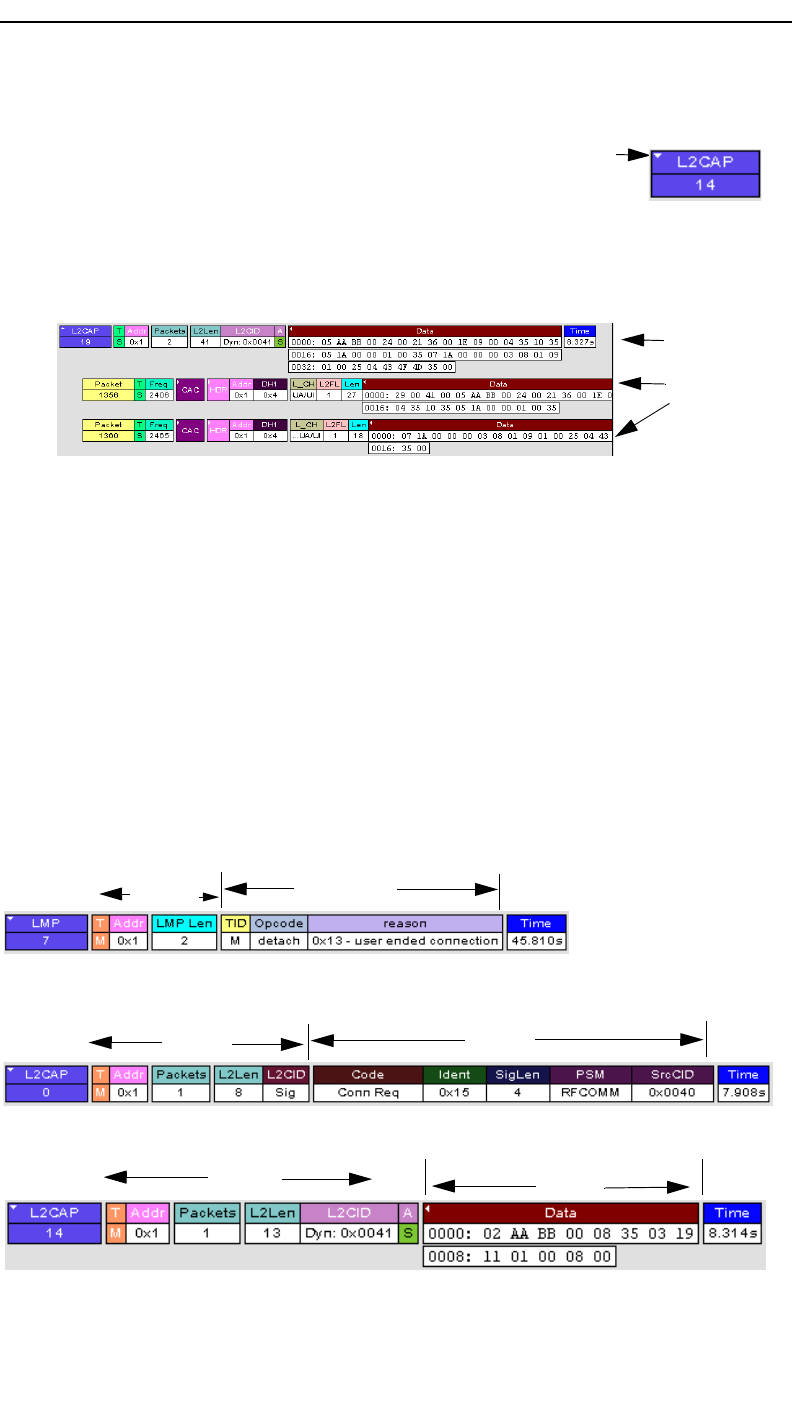
10.5 Viewing Packets in LMP and L2CAP Messages
LMP and L2CAP Messages can be "opened" to reveal
their constituent packets by double-clicking the first
cell in of the message or clicking once on the small
arrow on that same cell. The packets will then display below the message.
The following screenshot shows an example of a message and its packets.
10.6 Types of LMP and L2CAP Messages
If you scroll through a trace, you will see three kinds of message:
•LMP Signalling Message
•L2CAP signalling Message
•L2CAP Data Transfer Message
Each message has the same basic message header but differs in its payload.
Message
Packets
making up
the
message
LMP Signalling Message
L2CAP Signalling Message
L2CAP Data Transfer Message
Payload
Payload
Header Payload
Header
Header
109
Merlin Protocol Analyzer User’s ManualCATC Version 1.6
LMP and L2CAP Signalling messages have payloads of commands for
establishing LMP and L2CAP channels. L2CAP Data-Transfer messages
have a payload that may include RFCOMM, SDP, or TCS data. In order to
view higher protocol data, you will need to decode the messages (shown in
the next section). The decoded data will appear as new lines in the trace
called "Protocol Messages."
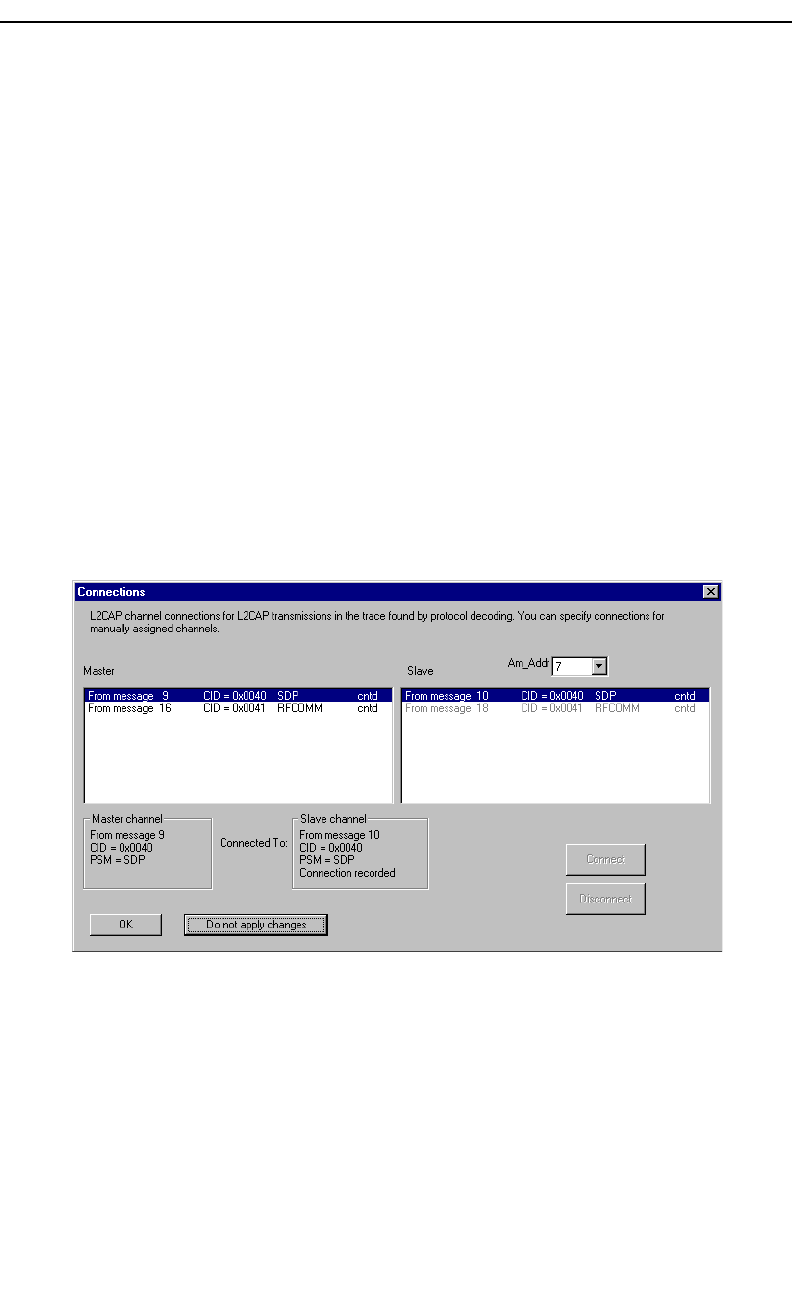
10.7 Viewing L2CAP Channel Connections
Once L2CAP messages have been decoded and displayed, you can check or
change their L2CAP channel connections by opening the L2CAP Decoding
Connections dialog box.
To view or change an L2CAP channel connection,
Step 1 Select from the menu bar
View>Decoding Connections
The following dialog box will open.
Step 2 Click on a channel assignment and then look at the Connect
and Disconnect buttons on the far right of the dialog box.
If the Connect and Disconnect buttons are grayed-out, it means that
Merlin made the channel assignments using data in the trace. You can
verify that Merlin performed the assignments by looking at the text in the
"Slave Channel" box in the lower left corner of the dialog box. If you
see "Connection Recorded" it means that Merlin performed the channel
assignments.
If Merlin was not able to make these channel assignments, then the
Connect and Disconnect buttons on the right side of the dialog box will
be active. You can then assign and edit channel connections.
Step 3 Open the drop-down menu labeled AM_Addr (Active
110
Merlin Protocol Analyzer User’s ManualCATC Version 1.6
Member Address). If possible, select an address other than
the currently displayed address.
The connections for the ’new’ device should now display.
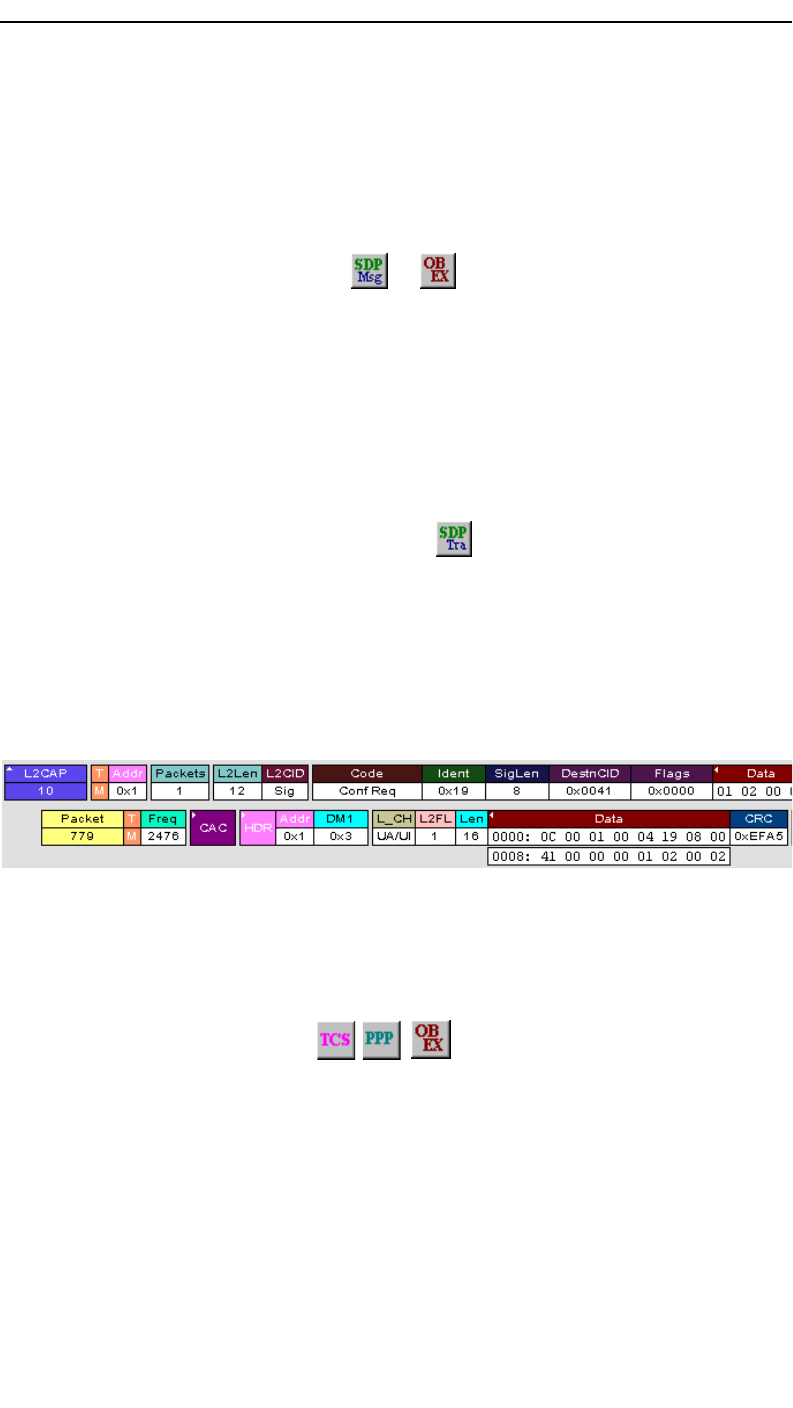
10.8 Viewing Protocol Messages and Transactions
By pressing a button such as or , you can cause Merlin to decode the
higher level protocol data contained within L2CAP messages and display
them as packet-like rows called Protocol Messages. Protocol Messages
have headers marked "protocol" and fields that vary in appearance and
content depending on the type of protocol.
Some Protocol Messages can be grouped into a higher level entity called a
Protocol Transaction. A Protocol Transaction is a row in a trace that
summarizes the higher level protocol data that is transmitted between a
Master and Slave device when one sends a request and the other sends back
a response. For example, if you press , Merlin will locate SDP requests
and responses between a Master and Slave device summarize their data.
Viewing L2CAP Messages in Protocol Messages
If the protocol heading is double-clicked, the L2CAP data-transfer
messages that make up the protocol will display below the protocol. You
can also expand the protocol by left-clicking the small downward pointing
arrow on the protocol header.
How to Decode
Decoding Protocol messages is the same process as decoding LMP and
L2CAP messages.
Using the Toolbar - To decode using the Toolbar, press one of the protocol
decode buttons such as: . .
Using the Menu - To decode using the menu, select:
Setup>Display Options
Then select one of the decode checkboxes.
Once a decode command has been issued, Merlin will create Protocol
Messages in the trace. You will probably have to hide hops, polls, and null
packets and then scroll through the trace in order to find Protocol messages.
111
Merlin Protocol Analyzer User’s ManualCATC Version 1.6
Expanding Protocol Messages
Protocol messages can be expanded to reveal their constituent packets using
any of the following methods:
•Left-click the small downward pointing arrow in
the message/protocol header
•Double-click a message/protocol header
•Left-click the message/protocol header and choose "Expand Transaction"
from the short-cut menu
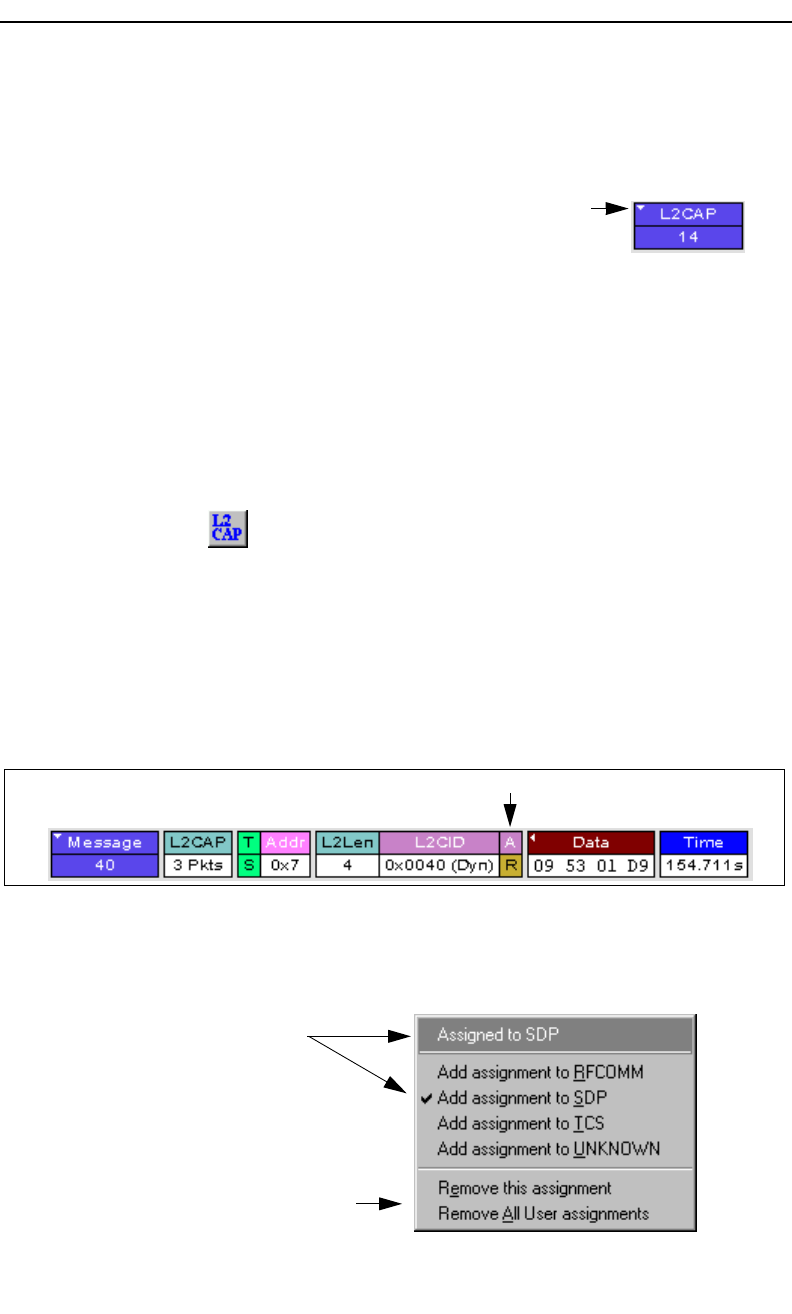
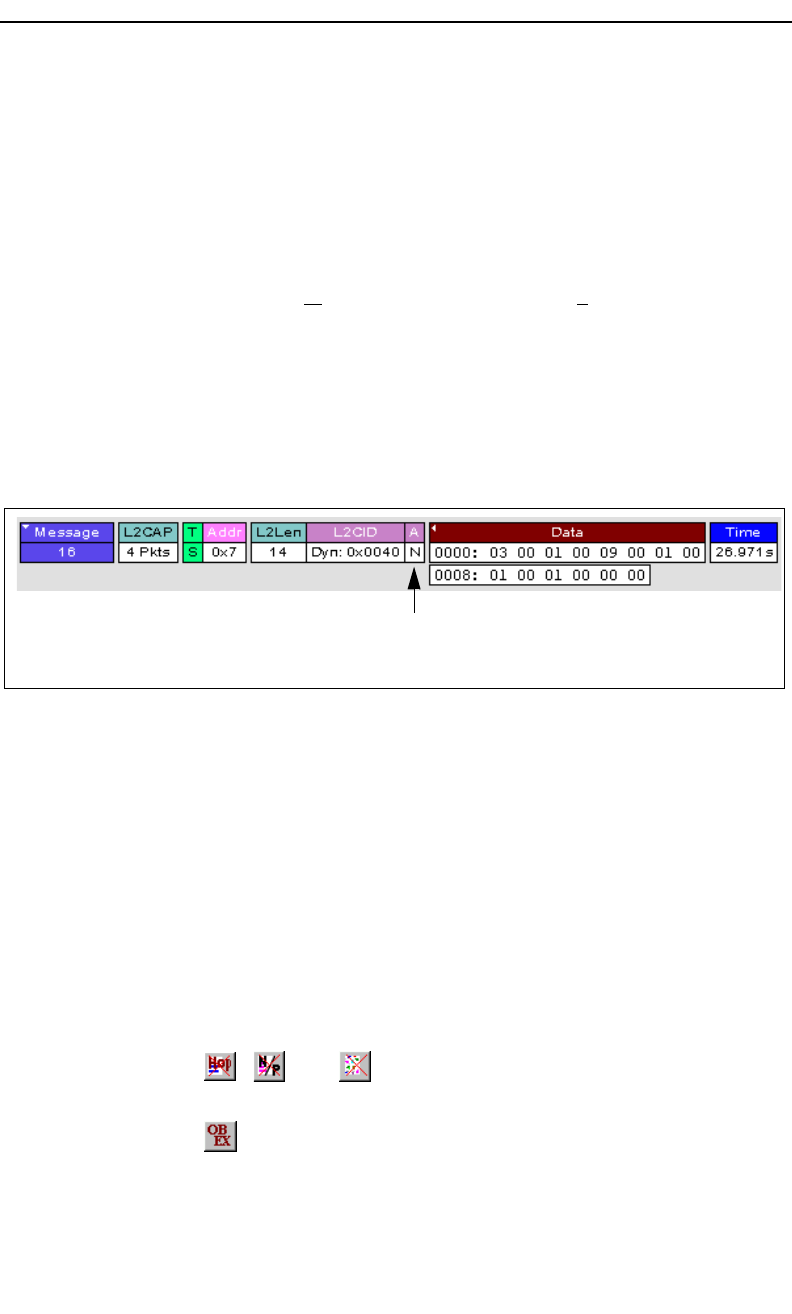
10.9 Changing Protocol Assignments
If a sequence of messages is assigned the wrong protocol, errors will
display. To change or remove a protocol assignment, you will need to
access the Assignment menu and issue an Add Assignment command.
Step 1 Click to display L2CAP messages.
Note You need to view L2CAP Messages in order to have access to the "A" field that
permits reassigning protocols.
Step 2 Scroll through the trace until you have located an L2CAP
message with a field marked "A."
Step 3 Left-click the field marked "A."
An Assignment menu will open for assigning, re-assigning, or
un-assigning protocols to messages. This menu is context-sensitive and
will vary in content depending on the protocols in the trace.
Step 4 From the menu, select one of the "Add Assignment" options
Left-click
The Assignment Menu
Current assignment
Select another assignment
to change assignment from
this point downward
through the trace
Will let one or all protocol
assignments be removed
112
Merlin Protocol Analyzer User’s ManualCATC Version 1.6
not already selected.
At this point, the protocol assignment will change to your selection.
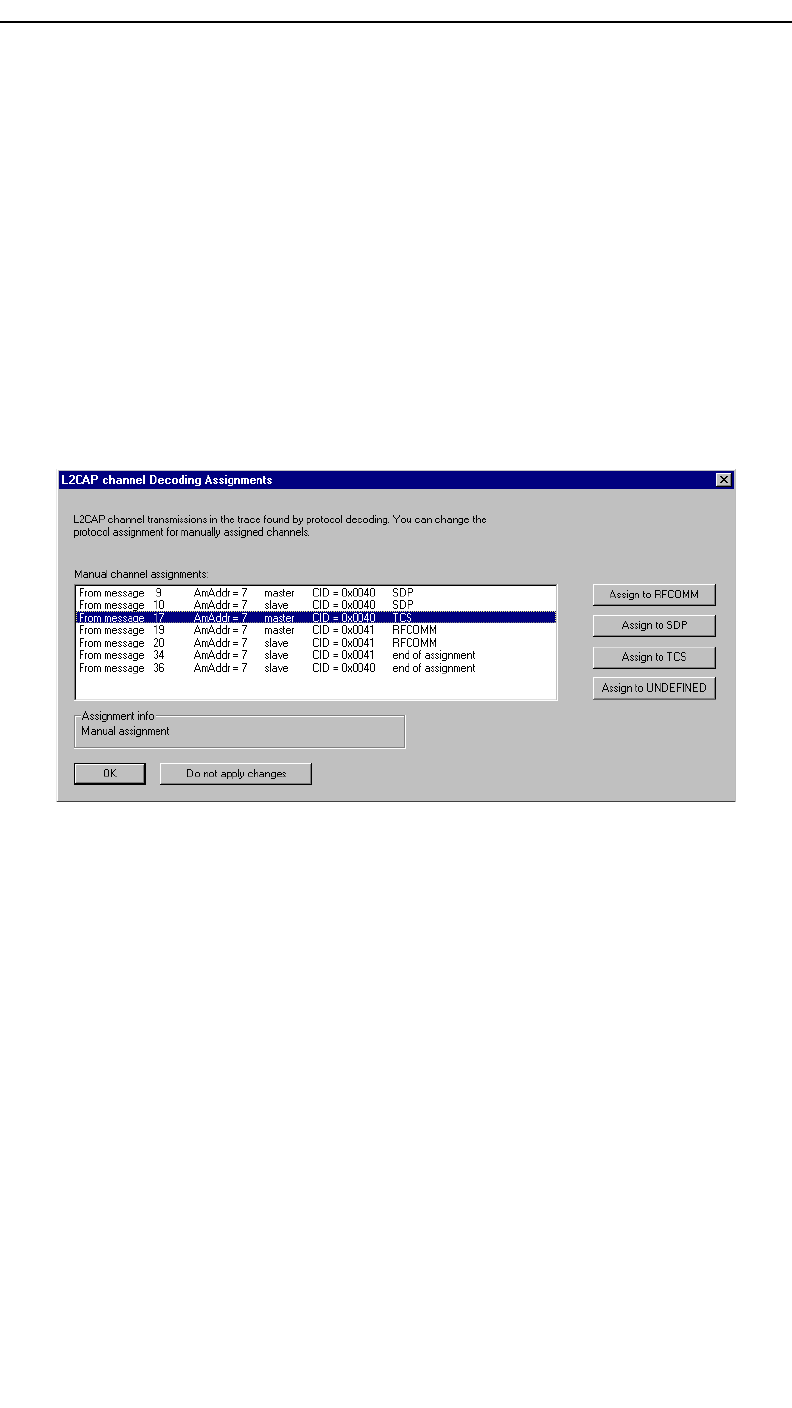
Using the Decoding Assignments Dialog Box
You can get a complete list of all protocol assignments by opening the
Decoding Assignments dialog box. This dialog box will tell you which
protocol assignments were made by Merlin and which are user-assigned.
User-assigned protocols can be reassigned if need be using this dialog box.
To open the Decoding Assignments dialog box and reassign a protocol,
Step 1 Select from the menu
View>Decoding assignments
The Decoding Assignments dialog box will open. A status message in
the bottom left corner of the dialog box will indicate who assigned the
protocol.
Step 2 Click on one of the displayed assignments.
If the protocol was assigned by Merlin, the Assign buttons on the right
will be grayed out and unavailable. If you want to change these
assignments, you will have to use the pop-up menus described in the
previous section. If a protocol has been manually assigned by a user, the
Assign buttons will become active and allow you to make a change in
assignment.
Step 3 If possible, click the appropriate Assign button.
Removing User-Assigned Protocol Assignments
As you practice assigning and reassigning protocols, you will find that one
of the more useful commands is "Remove All User Assignments." This
command allows you to undo all of your assignments.
113
Merlin Protocol Analyzer User’s ManualCATC Version 1.6
To remove some or all user-assigned protocol assignments,
Step 1 Double-click any Protocol Message header to open view
L2CAP messages.
Step 2 Locate a message with a field marked "A."
Step 3 Left-click on the "A" field to open the Assignment menu.
Step 4 Select "Remove All User assignments" or "Remove this
assignment."
Manually Assigning Protocols
If a recording does not capture the beginning of a dialog between a Master
and Slave devices, Merlin may not have the L2CAP messages it needs to
determine the correct protocol assignments. In this case, L2CAP messages
will display an "N" in the Assignment field that means "Not Assigned."
If you know what the protocol assignment should be for the missing
assignments, you can manually add them by right-clicking your mouse over
the A field shown above and selecting from the pop-up Assignment menu
shown on the previous page.
Other Assignments: OBEX Client/Server Status
OBEX messages carry a status that indicates whether the transmitting
device is an OBEX client or OBEX server.
To view an OBEX message’s client/server status,
Step 1 Open an OBEX trace file such as the sample file
"OBEXsample.blt" in C:\Program files\CATC\Merlin.
Step 2 Press . , and to hide Hops, NAKs, and unassociated
traffic.
Step 3 Press to decode OBEX.
Step 4 Left-click your mouse over the field marked Type.
N=Protocol not assigned
An L2CAP message without a protocol assignment for the higher protocol data.
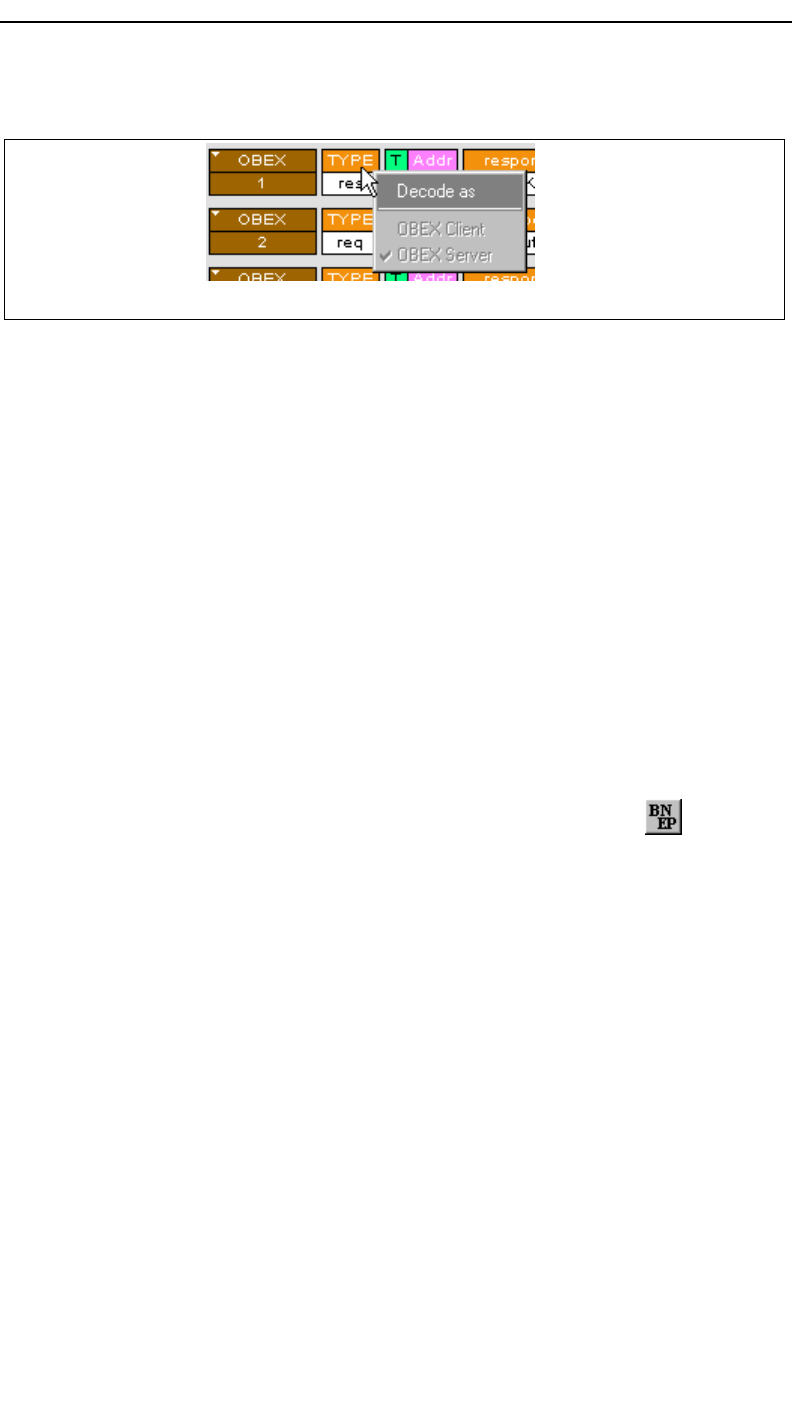
114
Merlin Protocol Analyzer User’s ManualCATC Version 1.6
A pop-up menu will appear indicating whether the message was
produced by an OBEX client or server. If the menu items appear
grayed-out (as they do in this example) it means that Merlin assigned the
client or server status based on data it found in the trace. If the menu
items appear in black, it means that the user assigned the status and is
therefore free to change the assignment.
Changing an OBEX Client or Server Status
If the beginning sequence of traffic is not recorded in a trace, the
client/server status of the transmitting devices will not be preserved in the
trace. In this case, the OBEX Client/Server pop-up menu will become
active and you will be able to change the assignment.
Decoding BNEP (Bluetooth Network Encapsulation Protocol)
BNEP is a protocol that allows devices to encapsulate network protocols
such as IP. Since BNEP can carry different types of network protocols, you
need to tell Merlin what protocol the BNEP is going to be carrying. You do
this via a script file called bnep.dec that is read during the initialization of
the Merlin software. This file tells Merlin how to decode BNEP fields.
Once read, BNEP can be correctly decoded by pressing the button on
the toolbar or by selecting the BNEP option from the Decoding Options
dialog box. If the decode file is not read at initialization, Merlin will display
the data in an undecoded format.
For more information on BNEP decoding, see a supplemental document on
BNEP in the support directory on the CATC web site:
http://www.catc.com/products/support/sup_merlinbluetooth.html
Left-click over the Type field to open the OBEX Client/Server Assign menu.
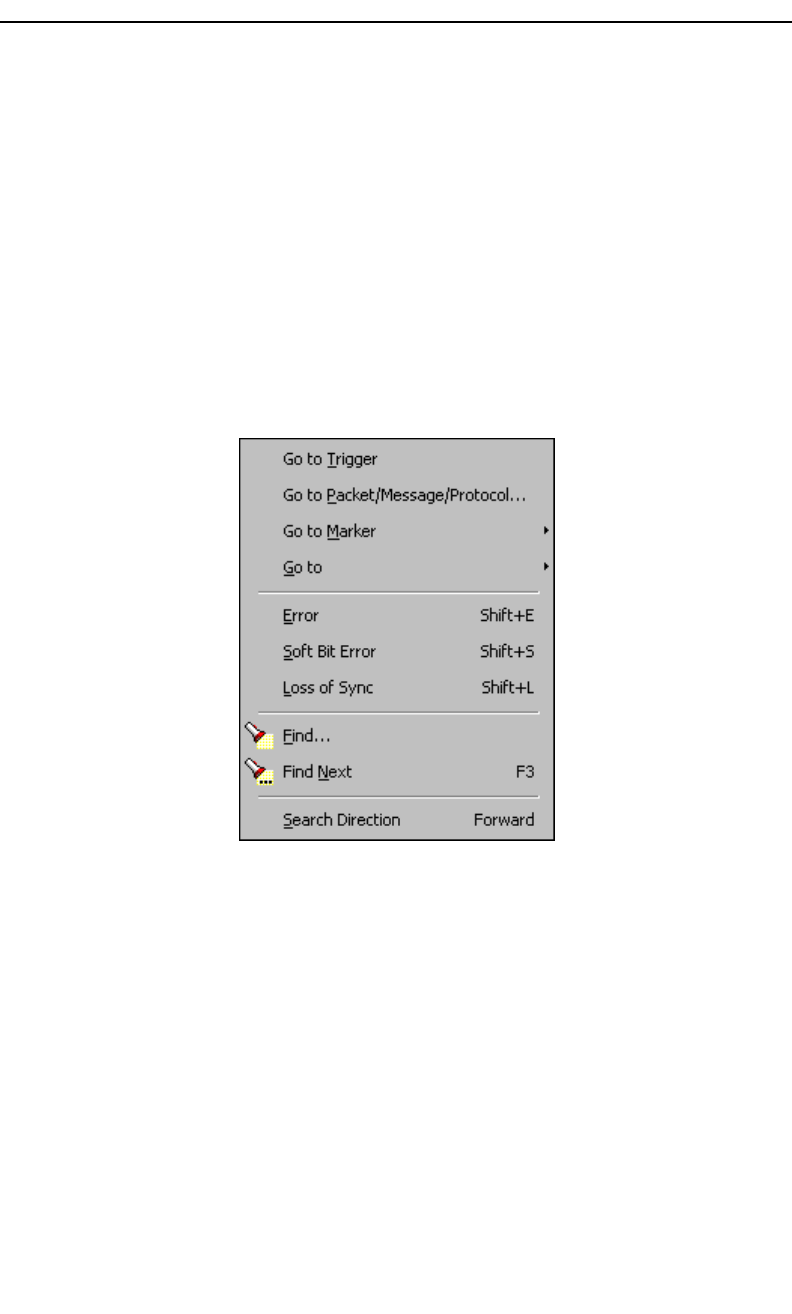
115
Merlin Protocol Analyzer User’s ManualCATC Version 1.6
11. Other Features
11.1 Search
The Search feature provides several options for searching through recorded
traffic, allowing you to find specific packets based on triggering status,
packet number, marking, or content.
To view the Search options,
•Click Search in the Menu bar.
You see the Search drop-down menu:
Go to Trigger
To display a triggering event, select Go to Trigger under Search on the
Menu bar. The Trace Viewer display will reposition the trace to show the
triggering event at the top of the screen.
Go to Packet/Message/Protocol
To display a specific packet, Message or Protocol
Step 1 Select Go to Packet/Message/Protocol under Search on the
Menu Bar.
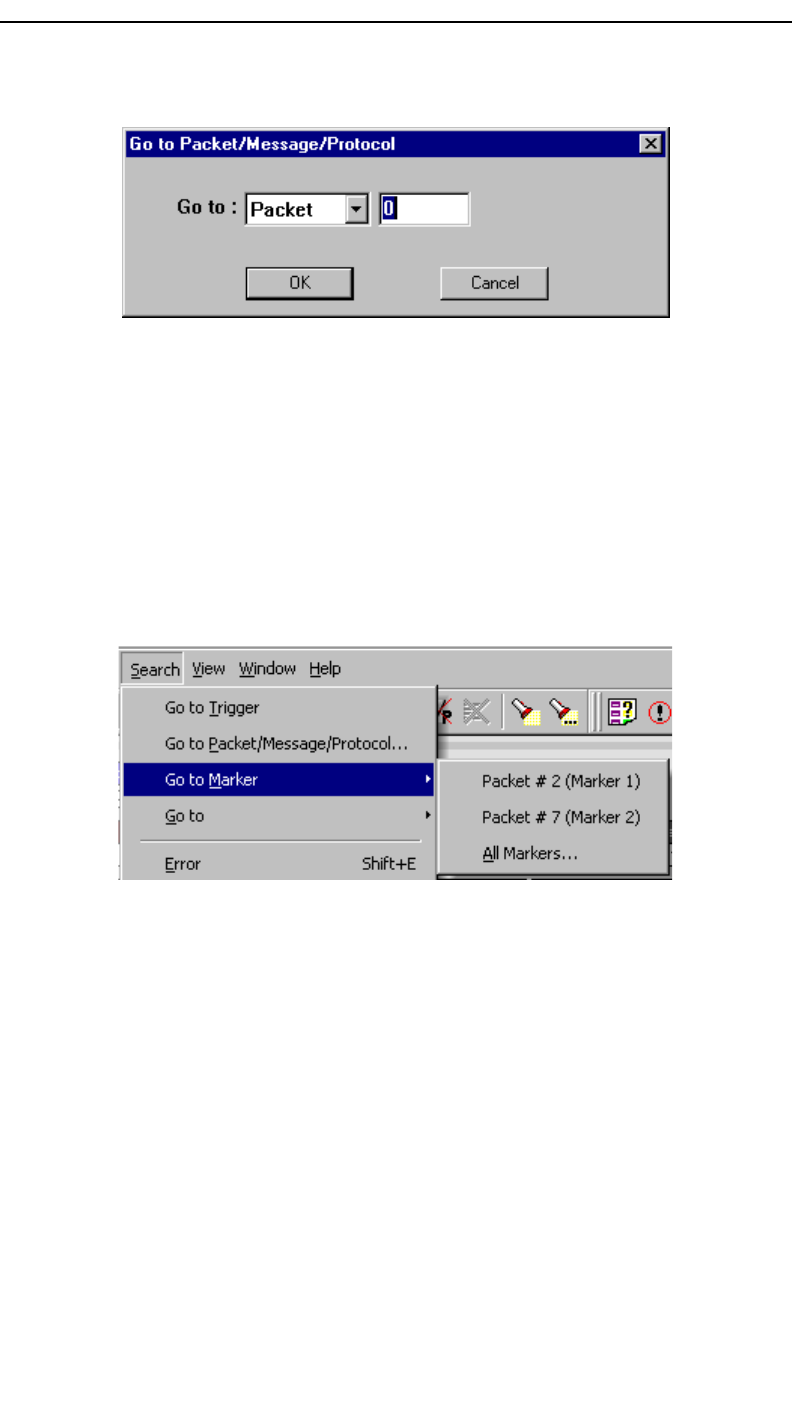
116
Merlin Protocol Analyzer User’s ManualCATC Version 1.6
You see the Go to Packet/Message/Protocol window:
Step 2 Enter the number of the packet, message or protocol you
want to display.
Step 3 Click OK.
The Trace View repositions to show the packet at the top of your screen.
Go to Marker
To instruct the analyzer to display a marked packet,
Step 1 Select Go to Marker under Search on the Menu Bar.
You see a drop-down menu listing the marked packets in that Trace View:
Step 2 Select the desired packet from the displayed list.
The Trace View repositions to show the packet at the top of your screen.
Note The Go to Marker feature functions in conjunction with the Set Marker feature.
The comments within the parentheses following each marked packet are added or
edited with the Set Marker feature.
Go to
The Go To feature takes you directly to an event in a Trace.
Step 1 Select Go To under Search on the Menu Bar.
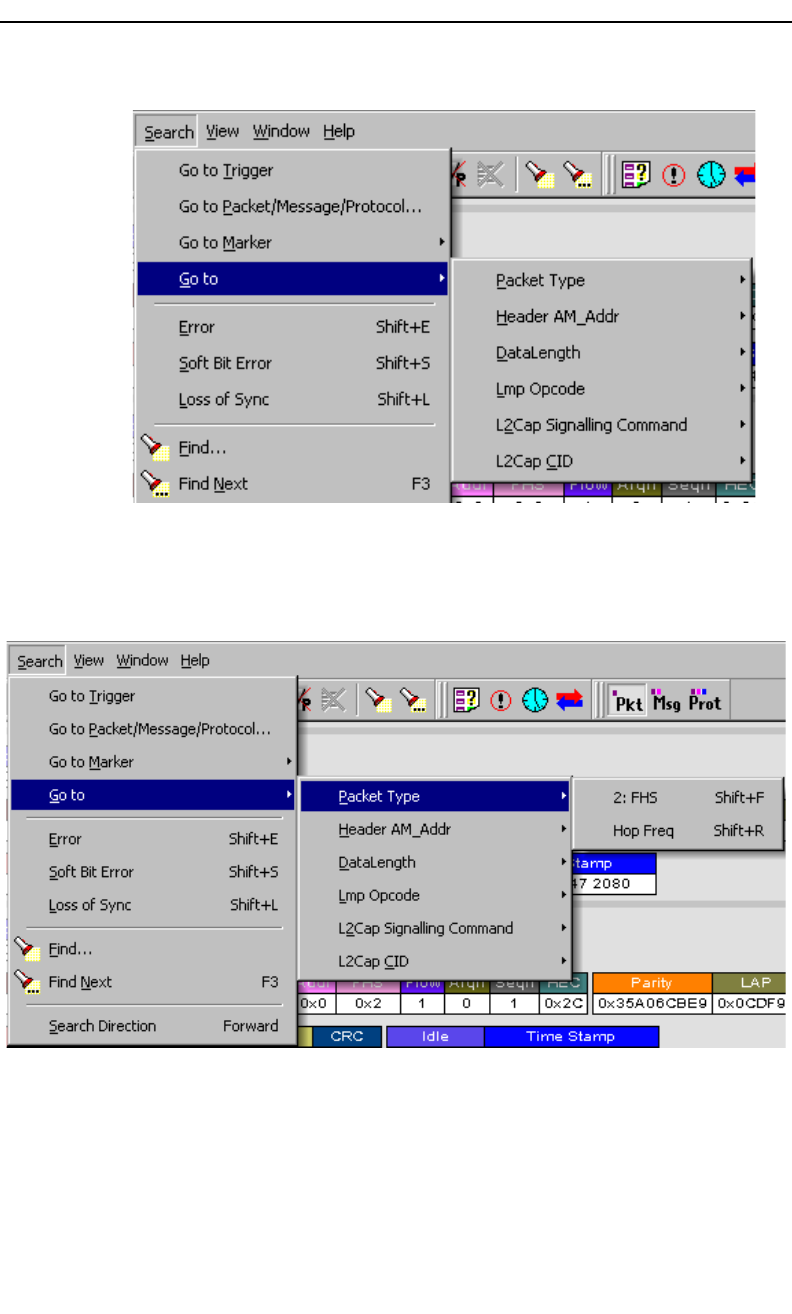
117
Merlin Protocol Analyzer User’s ManualCATC Version 1.6
You see the Go To drop-down menu:
Step 2 Select the event you want to go to and enter the necessary
information.
Packet Types
Select the type of packet you want to go to.
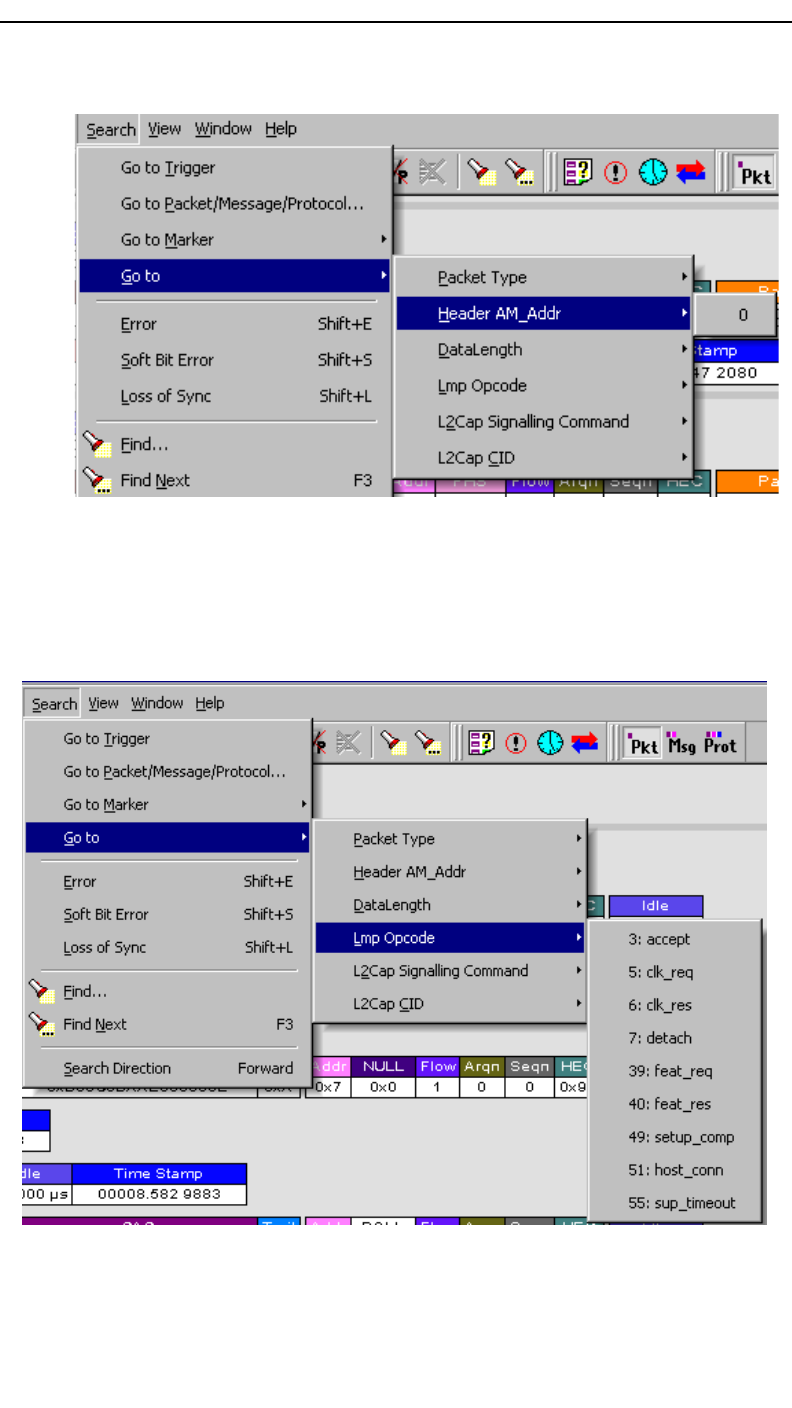
118
Merlin Protocol Analyzer User’s ManualCATC Version 1.6
Header AM_Addr
Select an Active Member Address from the list.
DataLength
Not yet implemented. Will allow searching based on data length in bytes from
the recording.
Lmp Opcode
Select the Link Management Protocol Operational Code (Lmp Opcode) that you
want to go to.
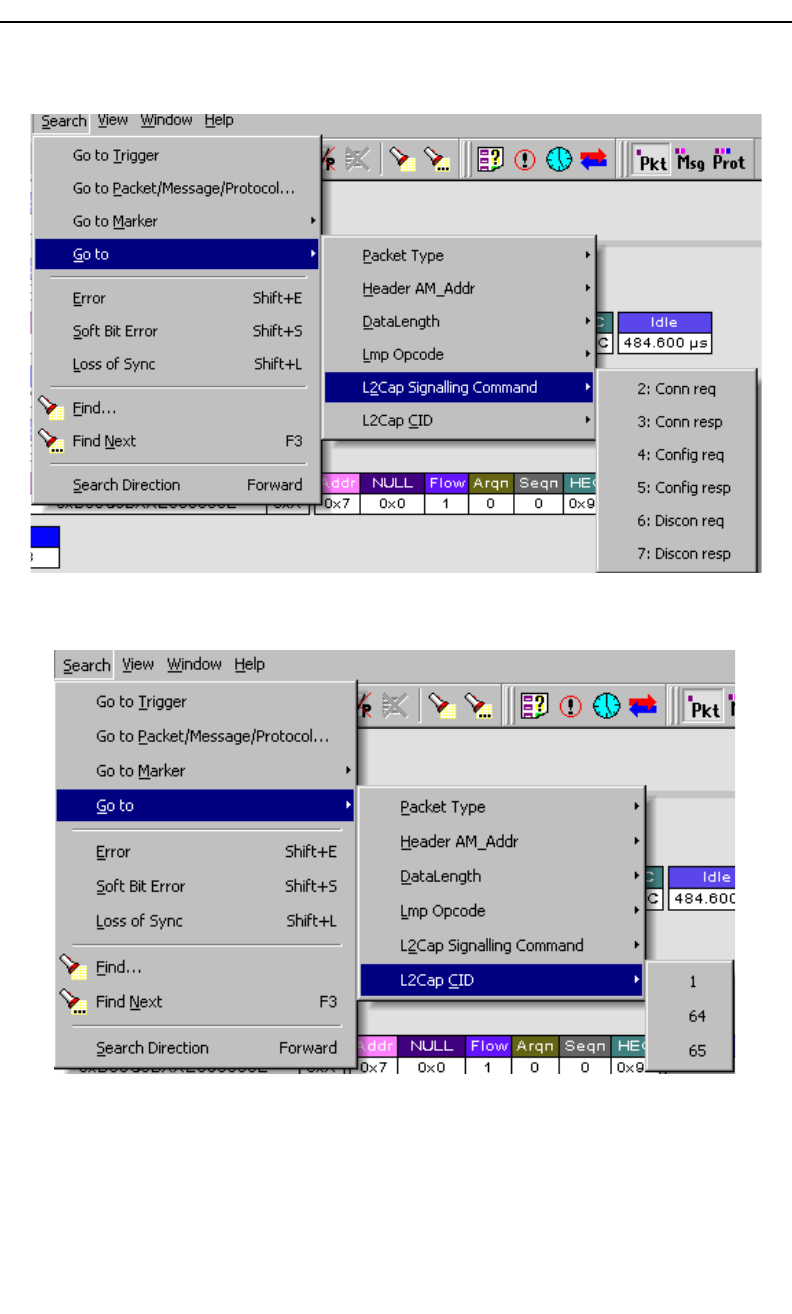
119
Merlin Protocol Analyzer User’s ManualCATC Version 1.6
L2Cap Signalling Command
Select the type of L2Cap Signalling Command that you want to go to.
L2Cap CID
Select the L2Cap Channel ID (L2 Cap CID) that you want to go to.
Error
Moves trace view to next uncorrected error.
Soft Bit Error
Moves trace view to next soft (corrected) error.
Loss of Sync
Moves trace viewer to the next loss of sync.
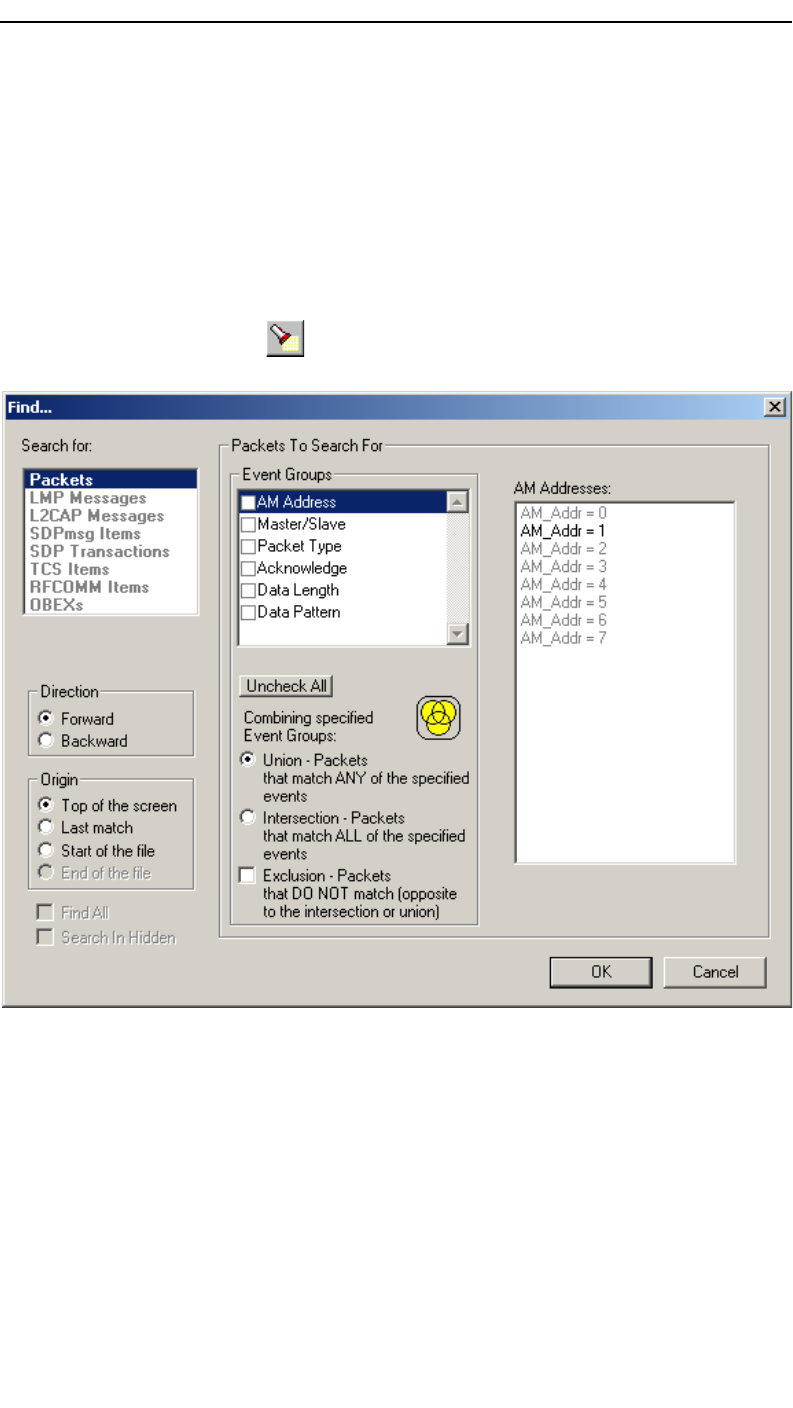
120
Merlin Protocol Analyzer User’s ManualCATC Version 1.6
Find
Find is a utility within Merlin that allows you to conduct searches of one or
more events within a trace. Find allows you to search different hierarchical
levels within the trace - packets, LMP Messages, L2CAP messages etc.
To start find,
• Select Find... under Search on the Menu Bar
OR
Click in the Tool Bar.
You see the User-Defined Find Events screen:
The Find window divides into three areas:
Left area -- Controls the search level, search direction and search origin.
Center area -- Controls the event groups to be searched. The selection you
make will display further choices on the right side of the Find window. At
the bottom are three options called Union, Intersection, and Exclusion that
are used with multi-criteria searches. These options are explained below.
Right area -- Controls the specific events to be searched within the trace.
The box in this right section displays events from the selected Event Group.

121
Merlin Protocol Analyzer User’s ManualCATC Version 1.6
The right area is context sensitive -- the Event Group selected in the Center
area will determine what events will display on the right. For example, if
you select Packet Type, the Right area will show you a list of packet types.
Bold entries in the list represent items that actually occurred in the trace.
In the screenshot shown above, for example, AM Address is selected. On
the right, you see that only Address 1 is in bold. This indicates that only a
single device was transmitting traffic in the displayed trace.
Event Groups
Event Groups are categories of events that can occur in a trace. Clicking on
an Event Group will display a list of Event types on the right side of the Find
window that occur within each Event Group.
AM Address
Contains a list of seven Active Member addresses. Bold entries represent
devices that occur in the trace.
Master/Slave
Contains two options labeled Master and Slave. Selecting an option will
cause Merlin to search for traffic based on the selected role.
Packet Type
Contains a list of all Bluetooth packet types. If a packet type occurs in the
trace, it will appear in bold.
Acknowledge
Contains a list of three Acknowledge types: Explicit NACK, Implicit
NACK, and ACK. The three Acknowledge types are responses a device
can issue to attempts to transmit packets to it.
A device can send an Acknowledgment in two ways: through setting the
ARQN field to 0 (= explicitly not acknowledged), to 1 (explicitly
acknowledged) or by sending an empty packet that does not have an ARQN
field (= implicitly not acknowledged).
Explicit NACK - Explicitly not acknowledged. An Explicit NACK is an
explicit response by a device that it did not receive a data packet. The
Explicit NACK is transmitted in the ARQN field (=Acknowledgment
Request Negotiation field). ARQN=0 means ’Explicit NACK.’
Implicit NACK - Implicitly not acknowledged. An Implicit NACK is a
NACK that is implied rather than explicitly stated. If a device responds
to a data packet by sending an empty packet, the NACK is implied.
ACK - Acknowledged. If a data packet is successfully transmitted to a
target device, the target device acknowledges the received packet by
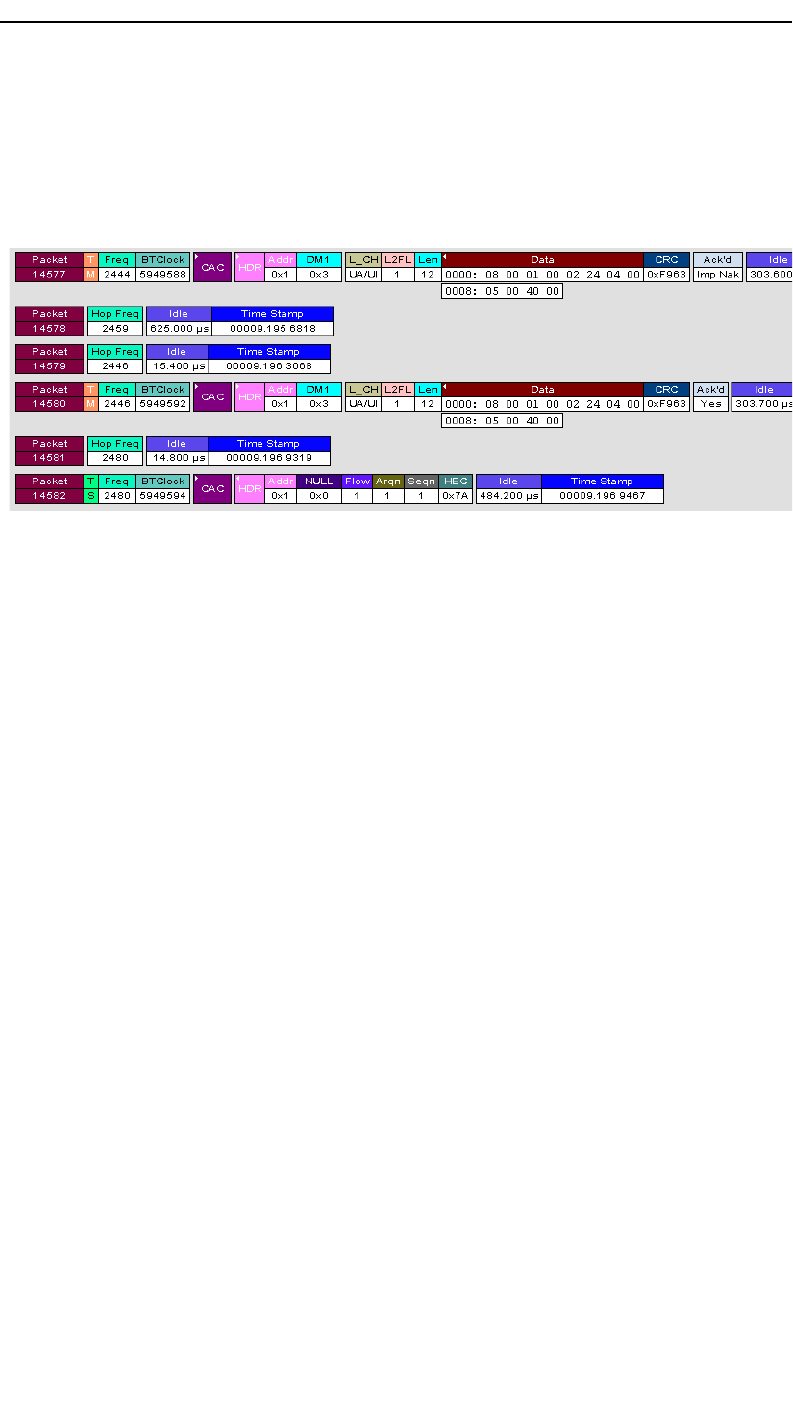
122
Merlin Protocol Analyzer User’s ManualCATC Version 1.6
setting the ARQN field to 1.
Acknowledgments are easily seen in Merlin traces because Merlin adds an
Ack’d field on data packets of the transmitting device. This means that you
do not have to hunt through the trace to see if the packet was acknowledged.
The following screenshot shows two examples of Acknowledgments.
Implicit NACK - Packet 14577 is a data packet sent by the piconet Master
device. Packet 14579 should have been a data packet with an
acknowledgment. Instead, it is an empty packet. This Master interprets this
empty packet as an Implicit NACK (i.e., implicitly not acknowledged).
Merlin summarizes this packet exchange by adding an Ack’d field to the
Master’s data packet and setting the Ack’d field to Imp Nak.
ACK - Packet 14580 is the Master’s retransmission of the data sent in
packet 14577. Packet 14582 is the reply by the Slave device. This reply
contains an ARQN field with a value of (= Acknowledge). Merlin
summarizes this packet exchange by setting the Ack’d field on packet
14580 to Ack.
Data Length
Contains a list of all data lengths that occur in the trace.
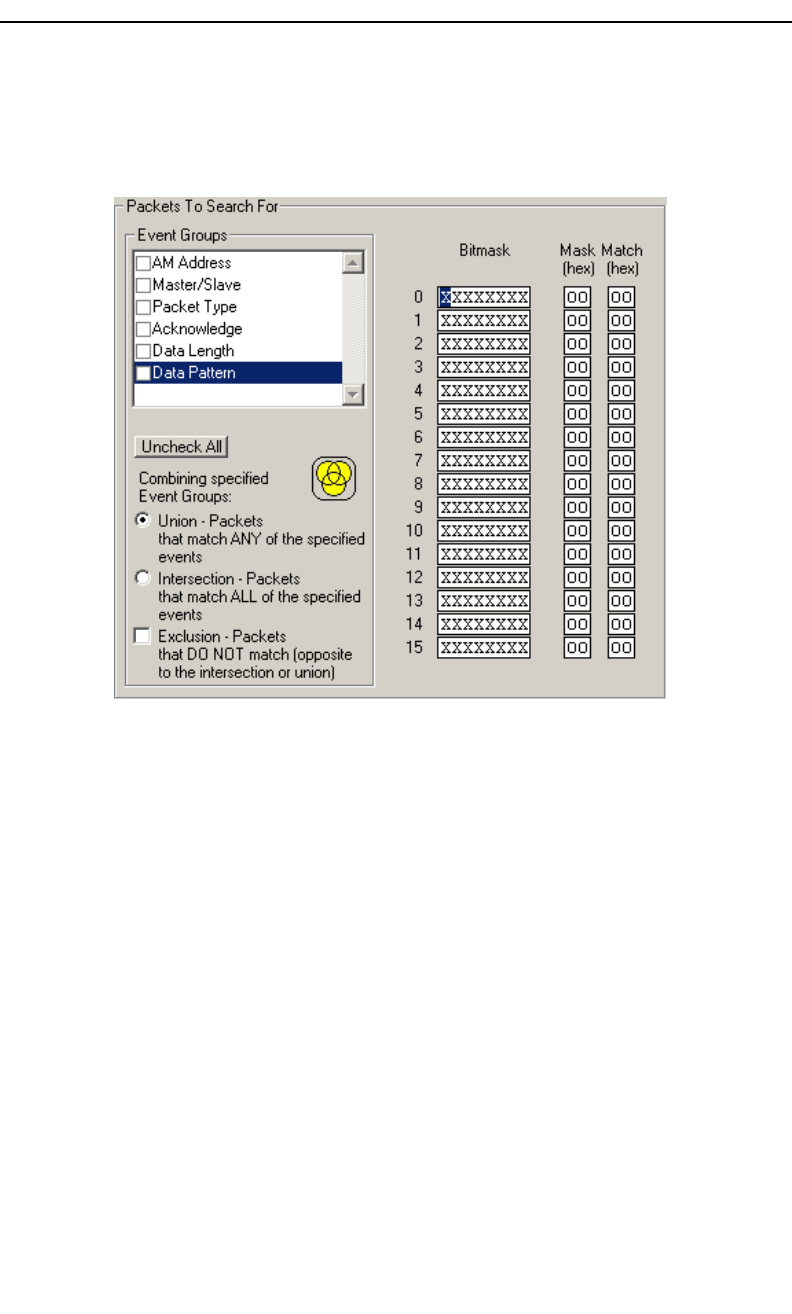
123
Merlin Protocol Analyzer User’s ManualCATC Version 1.6
Data Pattern
Contains a pattern editor for entering data patterns in binary or hexadecimal
format. A pattern editor is a utility that allows you to search for a data
pattern.
Searching for Bit Patterns
You search for a bit pattern by using the box labeled Bitmask. Enter one of
the three following values:
•X = 'Don't care,'
•0 = 'Match a 0',
•1 = 'Match a 1.'
Example -- xxxxxx01 means 'Look for a data pattern where the first 6 bits
can be any value but the last two bits must be 01.'
Searching for Long Patterns
You can search for long pattern sequences by entering patterns into multiple
rows within the editor. Entering a pattern on one row and skipping several
rows before entering the second pattern tells Merlin to search for the entire
pattern between the two specified rows.
Example - Enter xxxxxx01 in row 1 and 11xxxxxx in row 2. This pattern
means 'Look for the pattern xxxxxx0111xxxxxx.'
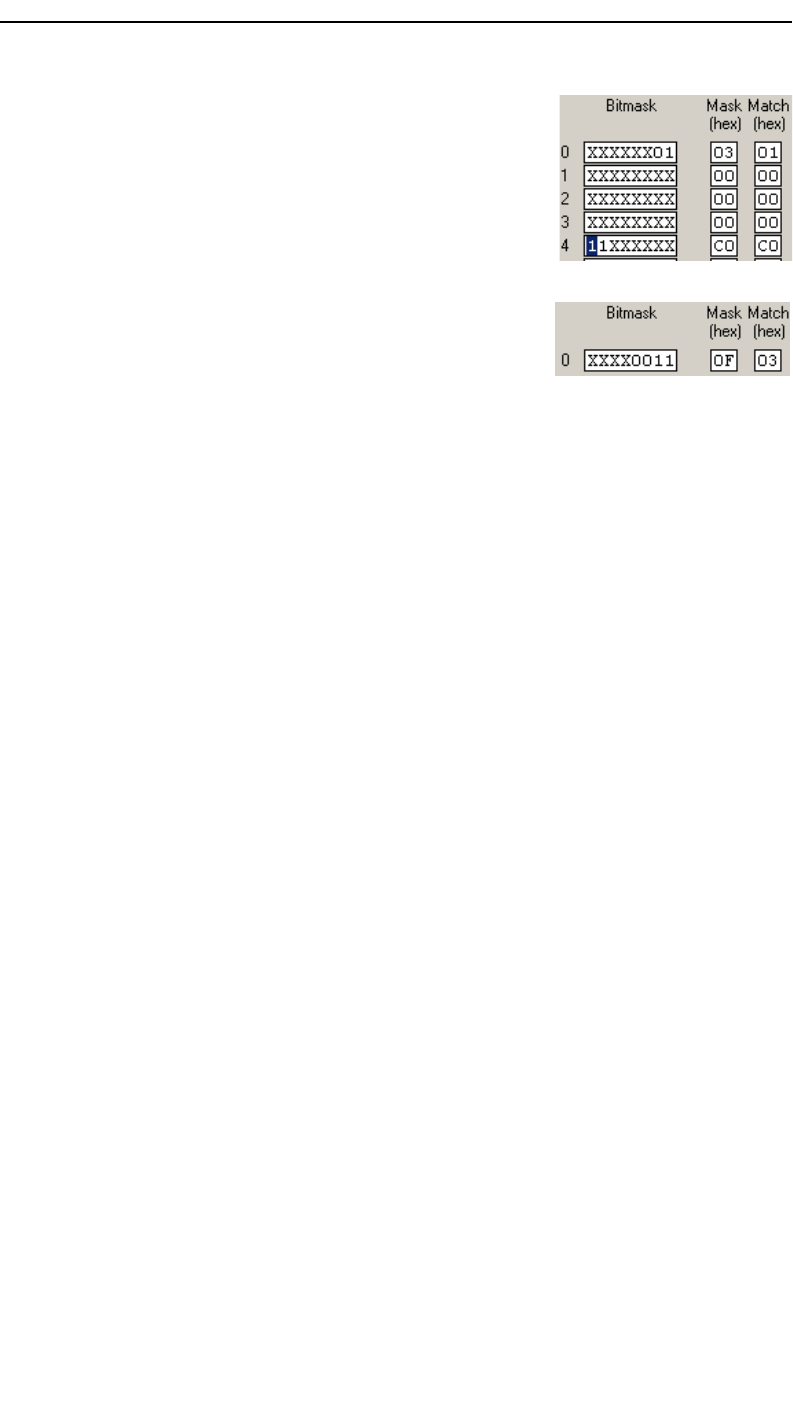
124
Merlin Protocol Analyzer User’s ManualCATC Version 1.6
Example - If you enter xxxxxx01 into row 0 and
11xxxxxx into row 4, it means 'Look for the pattern
xxxxxx01 xxxxxxxx xxxxxxxx xxxxxxxx
11xxxxxx.'
Searching for Hexadecimal Patterns
The columns marked Match and Mask allow you
to specify a pattern in hex. You enter the pattern
you want to match in the column marked Match,
and enter the mask in the column marked Mask. The Mask column allows
you to specify which bits you are searching for.
Example - A Match of 03 and a Mask of '0F' tells Merlin that you are
looking for the hex pattern of 03 occurring in the last four bits of the pattern.
If you enter these values in the Match and Mask columns, the Bitmask
section will automatically display the equivalent bit values: XXXX0011.
Union, Intersection, and Exclusion
If you select multiple events, you will need to use the options Union or
Intersection to conduct the search.
Union is used to search for any selected event: "Find x or y." Union lets
you tell the analyzer to search the trace for any of any of the selected items.
Intersection is used to search for all selected events: "Find x and y."
Intersection lets you tell the analyzer to search the trace for any packet
having all of the selected events.
Exclusion is used to exclude selected traffic from the trace. Exclusion is
used with Union and Intersection --i.e., you select Exclusion with Union or
Intersection.
•Exclusion + Union -- tells Merlin to exclude packets with any of the specified
events.
•Exclusion + Intersection -- tells Merlin to exclude packets with all of the
specified events.
Using Find
Step 1 Select the display level to be searched from the Search For
box on the left side of the window.
For example, to search through L2CAP messages, select L2CAP. The
display level that you select will affect options presented in the Events
Group box.
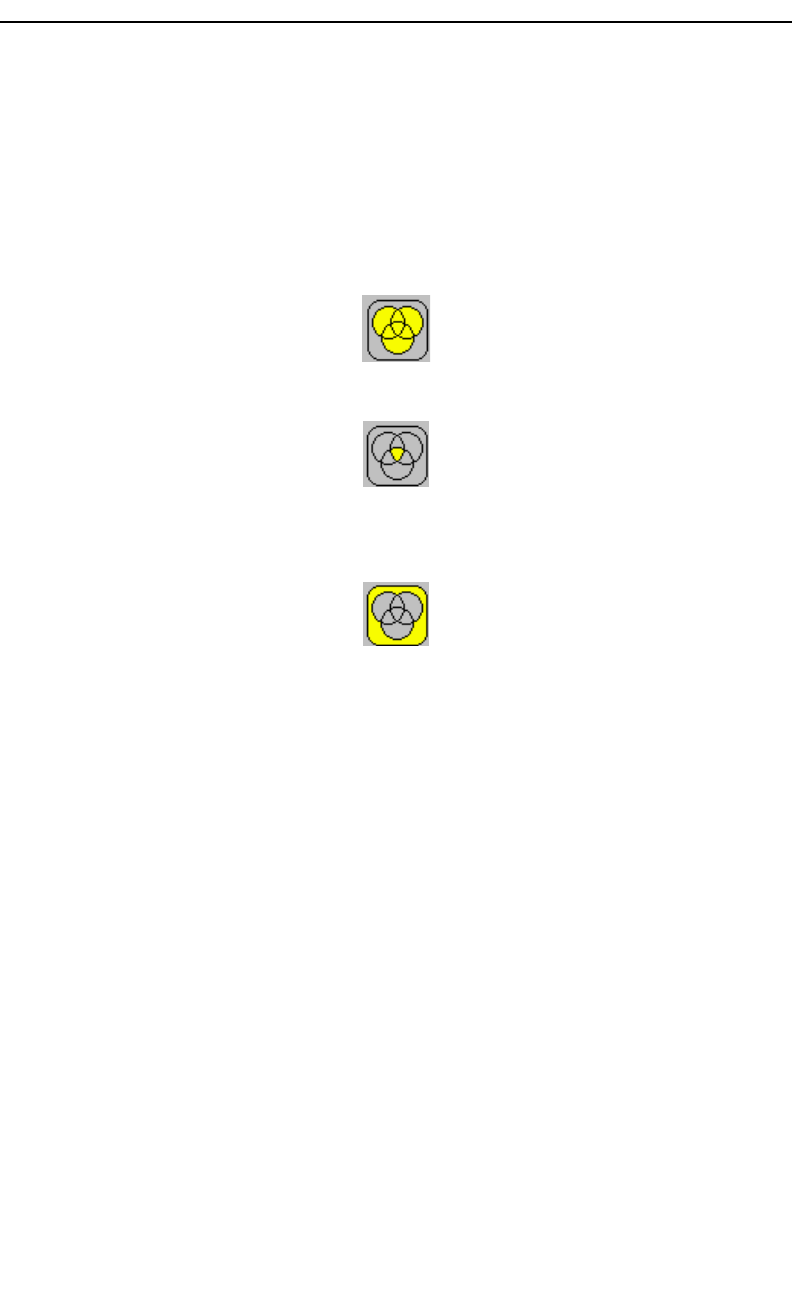
125
Merlin Protocol Analyzer User’s ManualCATC Version 1.6
Step 2 Select a search direction and origin.
Step 3 Select one or more events from the Events Group box.
Your choices will affect options presented in the box on the right side of
the screen.
Step 4 If you have selected two or more criteria, then select either :
•Union: Find all packets that match ANY of the specified events.
•Intersection: Find all packets that match ALL of the specified
events.
If you want to selected events from the trace, then select:
•Exclusion: Exclude all packets that match any of the specified
events.
Step 5 Click OK.
The search will then occur. Afterwards, the packets meeting the search criteria
will display.
Some Find Examples
Search for all DM1 and Poll packets with an Active Member Address of 7.
Step 1 From the Event Group, select Packet Types.
Step 2 From the box on the right, select DM1 and Poll.
Step 3 From the Event Group, select Header AM_Addr.
Step 4 From the box on the right, select AM_Addr=7.
Step 5 From the Center area, select Intersection.
Selecting Intersection tells Merlin to find packets with ALL of the
selected traits.
Step 6 Press OK.
The trace should reposition to the first DM1 or Poll packet that has an
Active Member address of 7.
Exclude all DM1 and Poll Packets with Active Member Addresses of 7.
Step 1 Select Packet Types from the From the Event Group
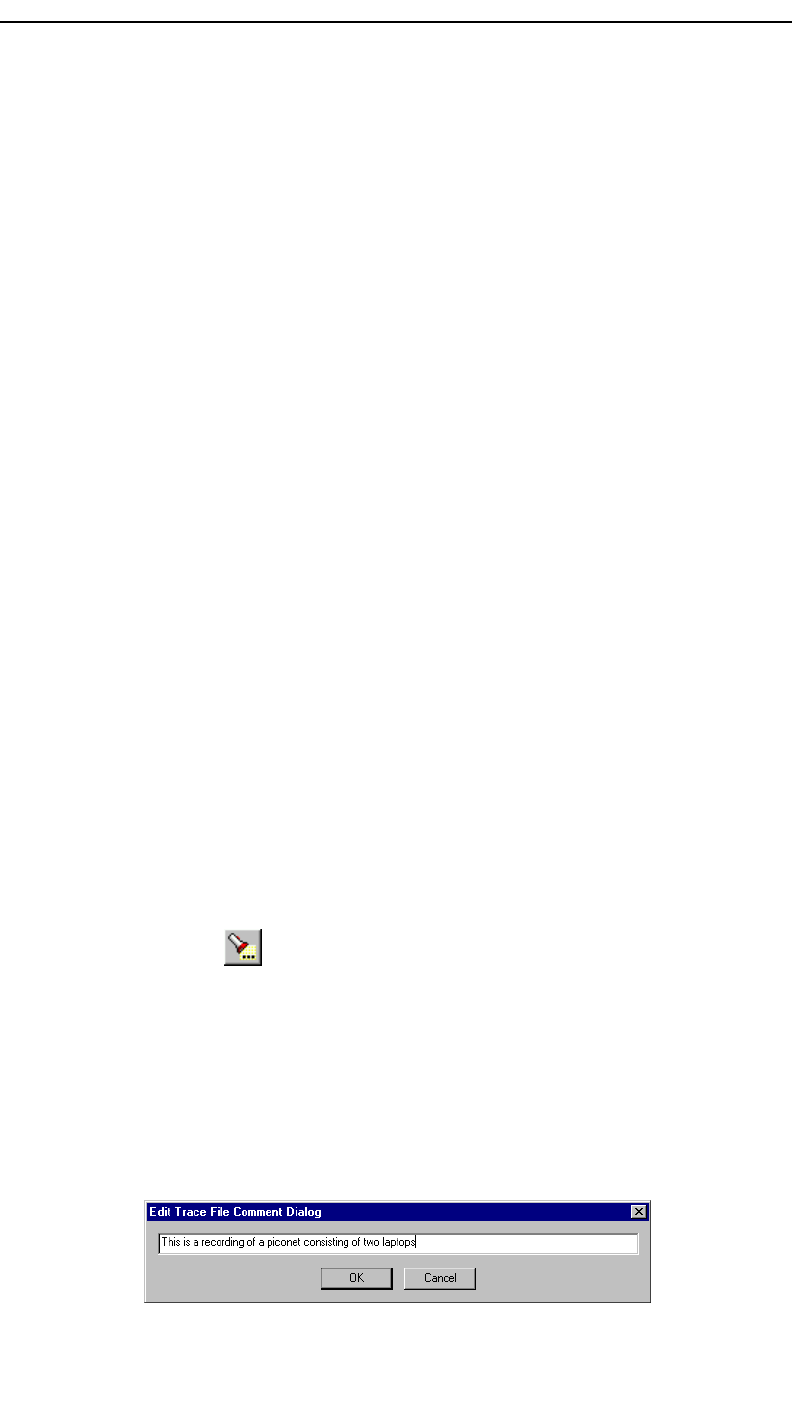
126
Merlin Protocol Analyzer User’s ManualCATC Version 1.6
Step 2 Select DM1 and Poll from the box on the right.
Step 3 Select Header AM_Addr from the Event Group.
Step 4 Select AM_Addr=7 from the box on the right.
Step 5 From the Center area, select Intersection and Exclusion
Step 6 Press OK.
The trace will redisplay so that it excludes DM1 packets with AM_Addr=7 and
Poll packets with AM_Addr=7.
Exclude all packets with ANY of the following attributes: DM1, Poll, or
AM_Addr=7.
Step 1 Select Packet Types from the Event Groups.
Step 2 Select DM1 and Poll from the box on the right.
Step 3 Select Header AM_Addr from Event Group.
Step 4 Select AM_Addr=7 from the box on the right
Step 5 Select Union and Exclusion.
Selecting Union causes the analyzer to search for any of the selected
events.
Step 6 Press OK.
The trace will redisplay so that it excludes DM1s, Polls, or any packet with
AM_Addr=7.
Find Next
To apply the previous Find parameters to the next search,
•Select Find Next under Search on the Menu Bar
OR
Click on the Tool Bar.
11.2 Edit Comment
You can create, view, or edit the 100-character comment field associated
with each Trace file.
Step 1 Select Edit Comment under File on the Menu Bar.
You see the Edit comment for trace file window:
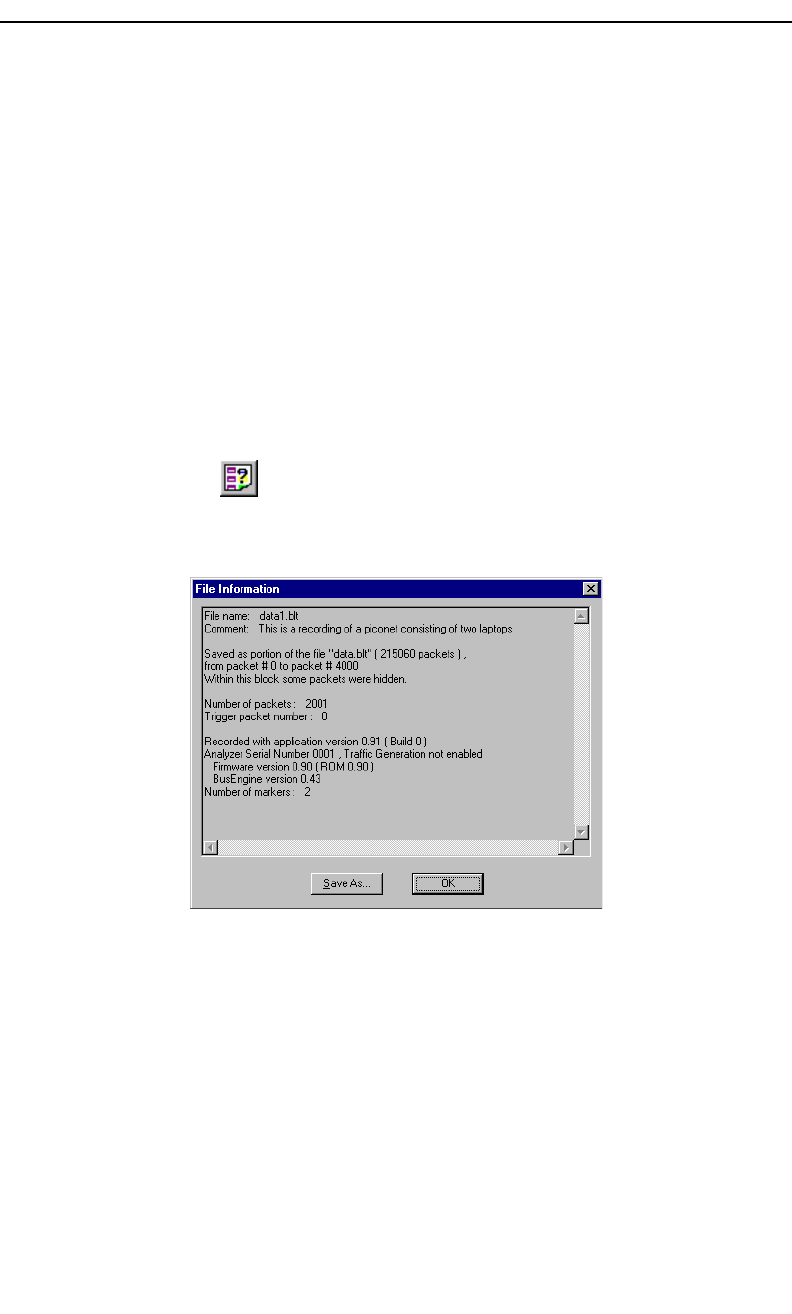
127
Merlin Protocol Analyzer User’s ManualCATC Version 1.6
Step 2 Create, view, or edit the comment.
Step 3 Click OK.
11.3 Reports
The Report menu provides several reports to assist you in analyzing
Bluetooth™ traffic recorded by the analyzer.
File Information
To display a File Information report,
•Select File Information under Report in the Menu Bar
OR
Click in the Tool Bar.
You see the File Information screen:
The File Information report provides valuable information about how the
recording was made, what the buffer settings were, what the trigger options
were, and what version of all the analyzer hardware was used to make the
recording.
Error Summary
The Error Summary command displays an error summary of the current
trace file and allows you to go to a specific packet, and save the error file to
a uniquely named file.
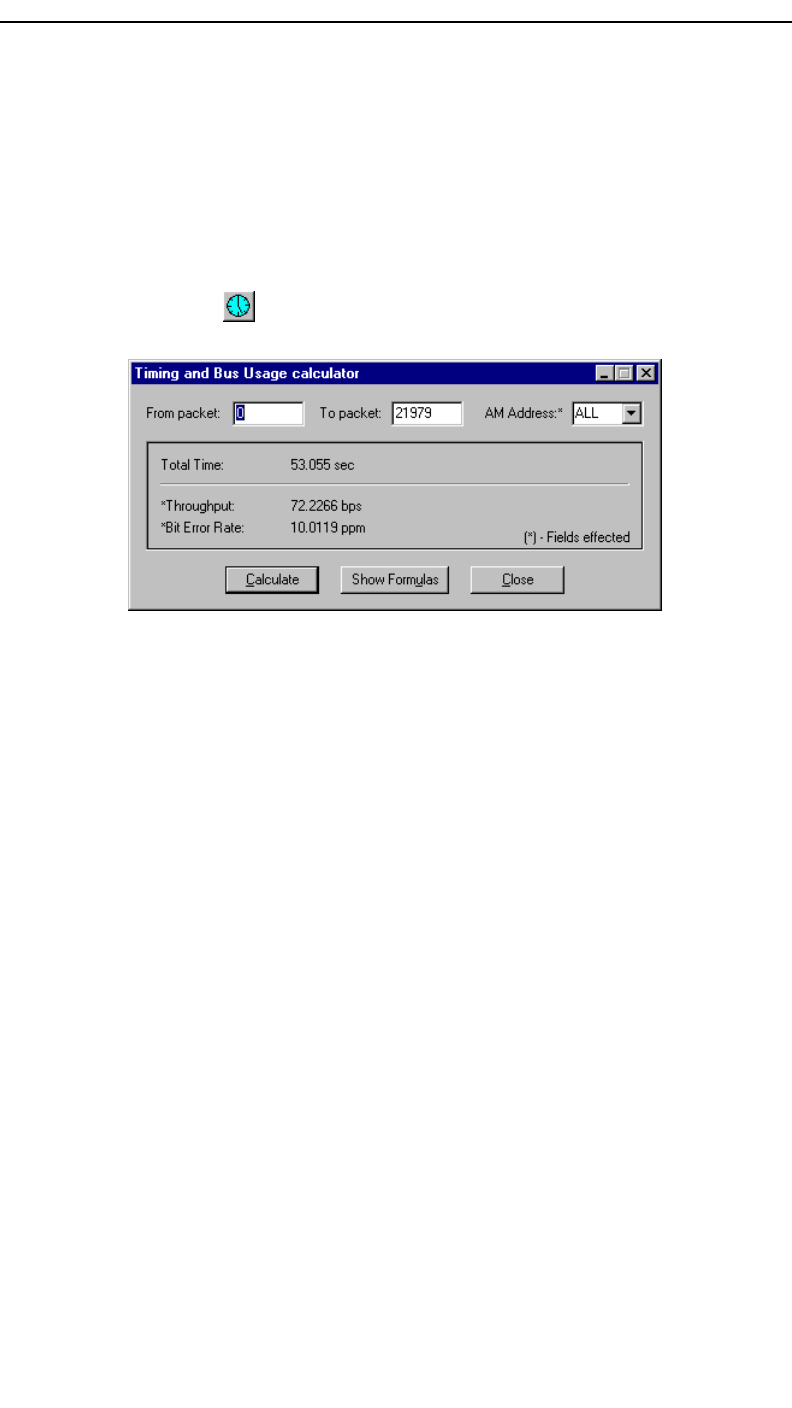
128
Merlin Protocol Analyzer User’s ManualCATC Version 1.6
Timing Calculations
Starts the modeless calculator dialog for calculating various timing and
bandwidth parameters in the recording file.
To display a File Information report,
•Select Timing Calculations under Report in the Menu Bar
OR
Click in the Tool Bar.
You see the File Information screen:
To calculate bus usage and bit rate errors,
Step 1 Enter the range of packets to be examined in the text boxes
marked "From packet" and "To packet."
Step 2 If you wish to limit your calculations to a single device,
select the device’s address from the AM Address drop-down
menu.
Step 3 Click the "Calculate" button.
At this point, bus usage will be calculated.
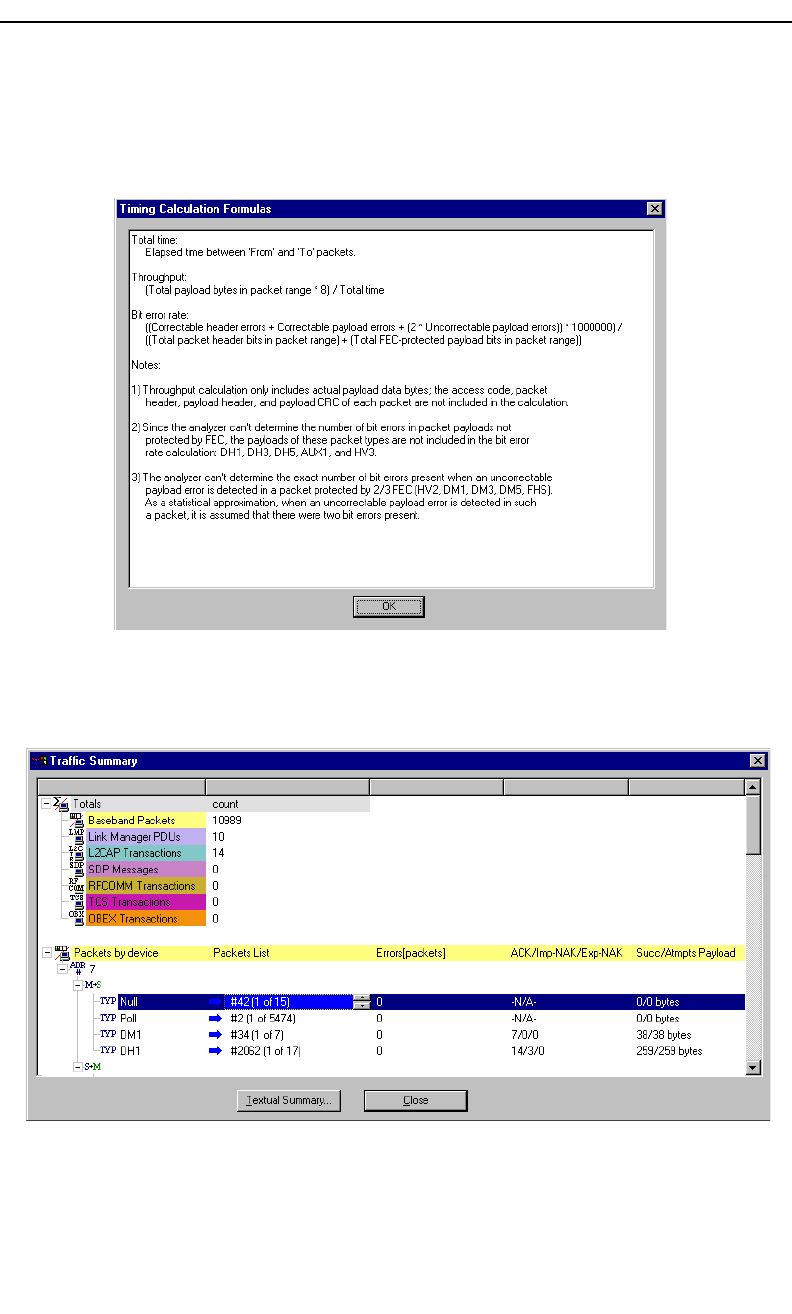
129
Merlin Protocol Analyzer User’s ManualCATC Version 1.6
Show Formulas Button
At the bottom of the Timing and Bus Usage window is a button marked
"Show Formulas." If clicked, the window shown below will open and
describe how the bus usage calculations were performed.
Traffic Summary
The Traffic Summary command displays a text box with a summary of
traffic captured in the current trace.
The Traffic Summary window divides into two main sections: a short top
section (shown above in the top left corner of the window) that summarizes
traffic for each protocol level, and a long section below describing the traffic
details for each protocol level.
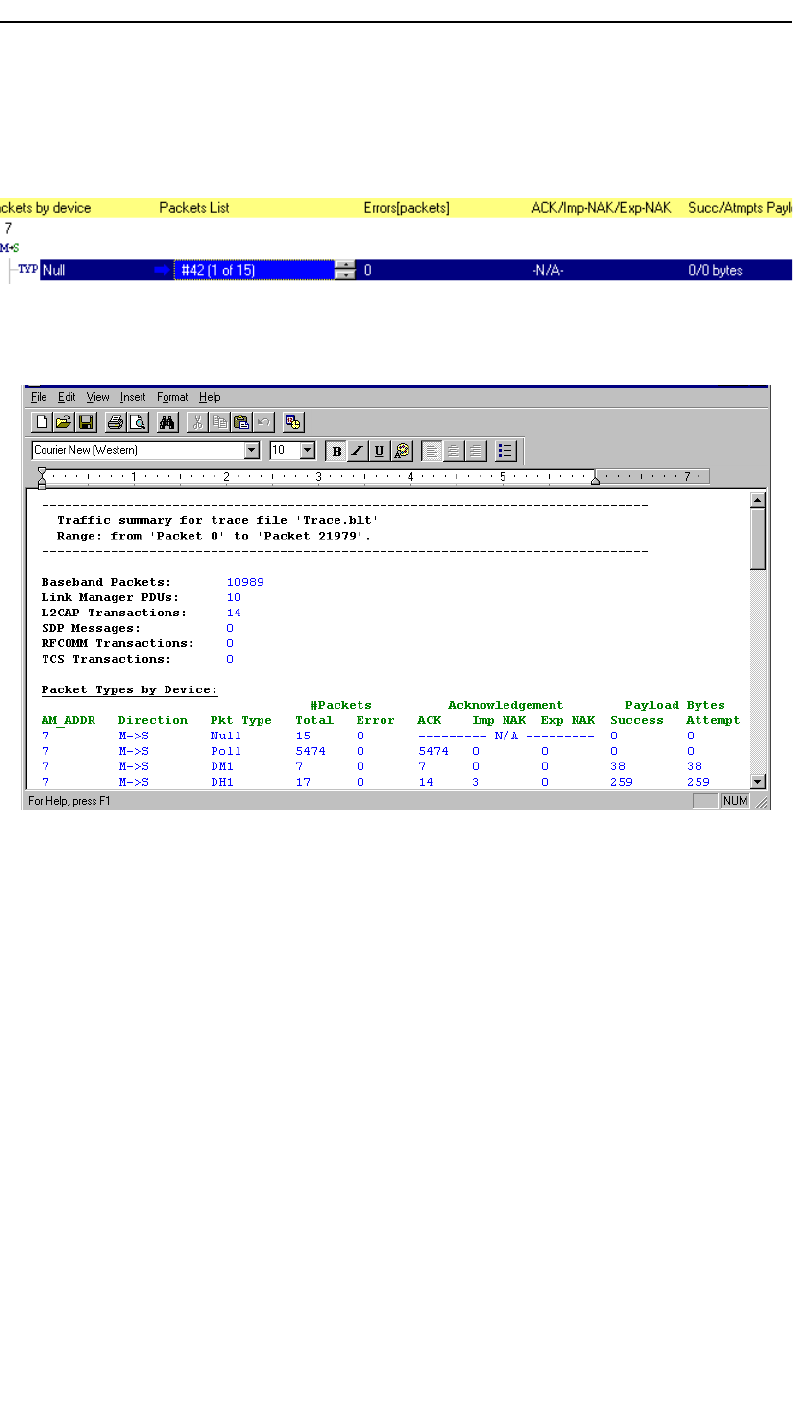
130
Merlin Protocol Analyzer User’s ManualCATC Version 1.6
The second section is scrollable: click on an item below one of the headings
to display scroll arrows. The arrows will allow you to scroll through the
packets or transactions within that section. As you scroll, the trace will
simultaneously jump to the packet or transaction that is listed.
At the bottom of the Traffic Summary window is a button marked "Textual
Summary." Clicking this button will cause WordPad to open and display
the current Traffic Summary. This data can then be printed or saved.
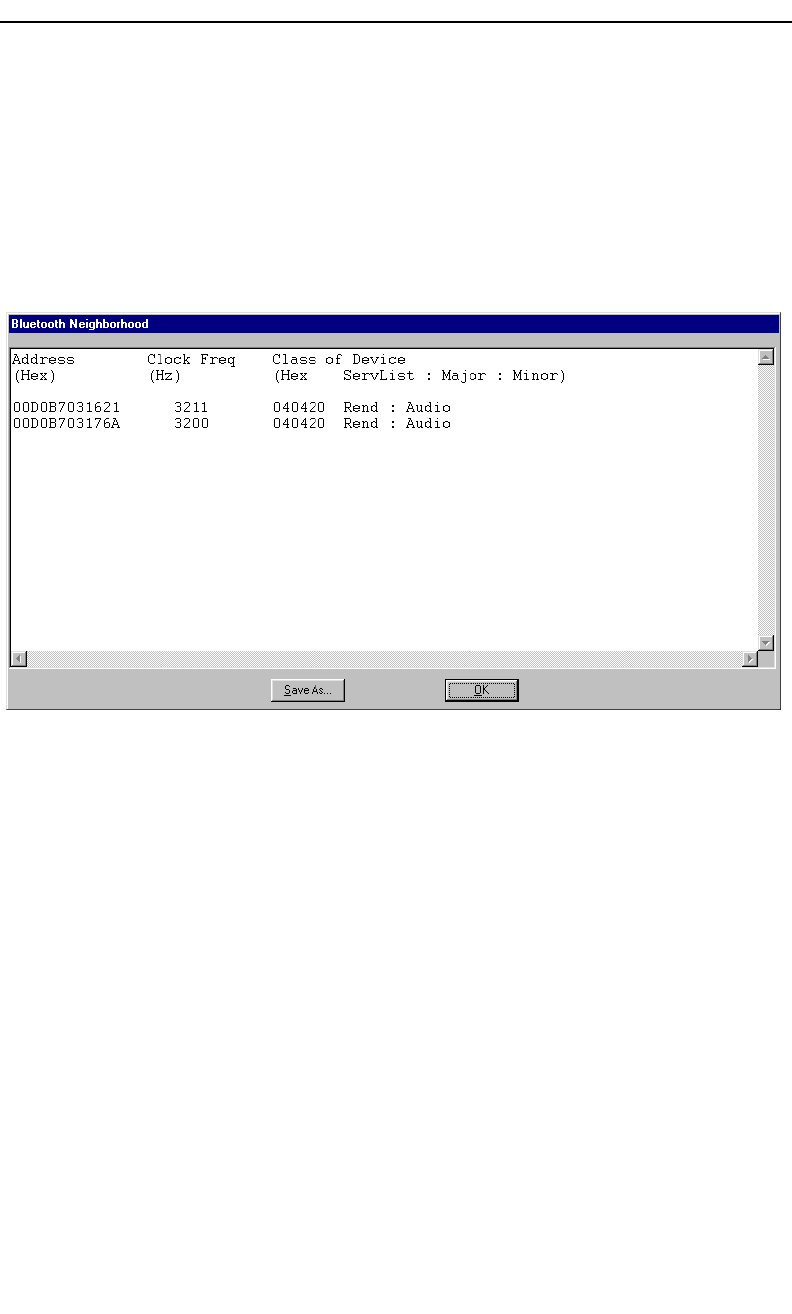
131
Merlin Protocol Analyzer User’s ManualCATC Version 1.6
11.4 BT Neighborhood
The BT Neighborhood status box displays information about known
Bluetooth™ devices. This command is accessible through the View menu
in the menu bar. Three types of data are displayed: Device Address, Class
of Device (COD), and the Bluetooth™ Clock Frequency for each
discovered device. The expected Bluetooth™ clock frequency is 3200 Hz
+/- 250 PPM.
11.5 Encryption
Bluetooth encryption is a multi-staged process that provides devices with
secure, encrypted communications. The process begins with a device
prompting the user for a Personal Identification Number (PIN). When the
right PIN is entered, the Slave begins an encryption setup dialogue with the
Master. At the beginning of this dialogue, the Slave and the Master agree
on a Link Key. A Link Key is a 128-bit value that the two devices use for
authentication. When the Slave and Master agree on a Link Key, the Slave
then negotiates for the transfer of the Encryption Key from the Master
device. The Encryption Key is used to encrypt and decrypt messages. Once
the Encryption Key is transferred, both devices use it to encrypt all
subsequent communications.
In order for Merlin to decode encrypted traffic, it needs the Link Key for
each Master-Slave connection for which encryption will be used. If you
know the Link Key, you can enter the Key into the Encryption Options
dialog box. If you do not know it, you give Merlin the PIN for a device and
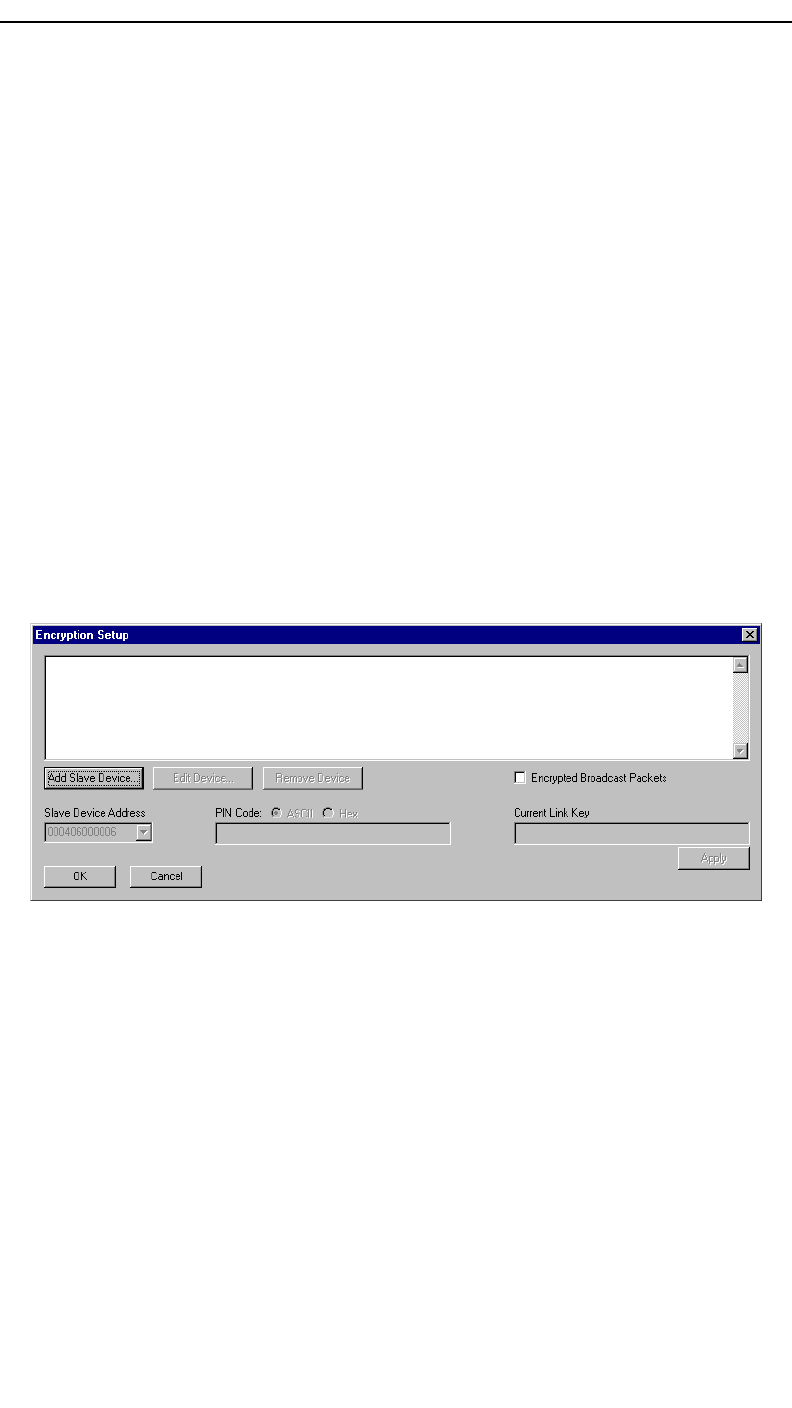
132
Merlin Protocol Analyzer User’s ManualCATC Version 1.6
allow Merlin to discover the Link Key on its own. Once Merlin has the Link
Key, it can capture the rest of what it needs by listening to the Master and
Slave devices as they negotiate for the Encryption Key.
Configuring Merlin for Encryption
For Merlin to successfully decrypt traffic, two steps need to be performed:
1) Merlin needs to be given the PIN or Link Key for each Master-Slave
connection; and 2) Recording needs to be begun before the Slave connects
to the Master. If recording is begun prior to the creating the Master-Slave
connection, Merlin will be able to obtain the encryption key and decode
encrypted traffic.
The following steps show how to configure Merlin for encrypted traffic.
Note Be sure to begin the following process prior to connecting your Slave device to
the Master or Merlin will not be able to capture the Link Key.
Step 1 Select Setup >Encryption Options ...
The following dialog box opens.
Step 2 Click the button marked Add Slave Device.
When you click this button, a list of devices will appear in the Slave
Device Address drop-down menu.
Step 3 Select an address from the drop-down menu marked Slave
Device Address or enter the Device Address manually if it
is not in the list.
Step 4 Enter the appropriate Personal Identification Number (PIN)
for the selected device to the box marked PIN Code. This
PIN allows Merlin to learn the Link Key. If you do not have
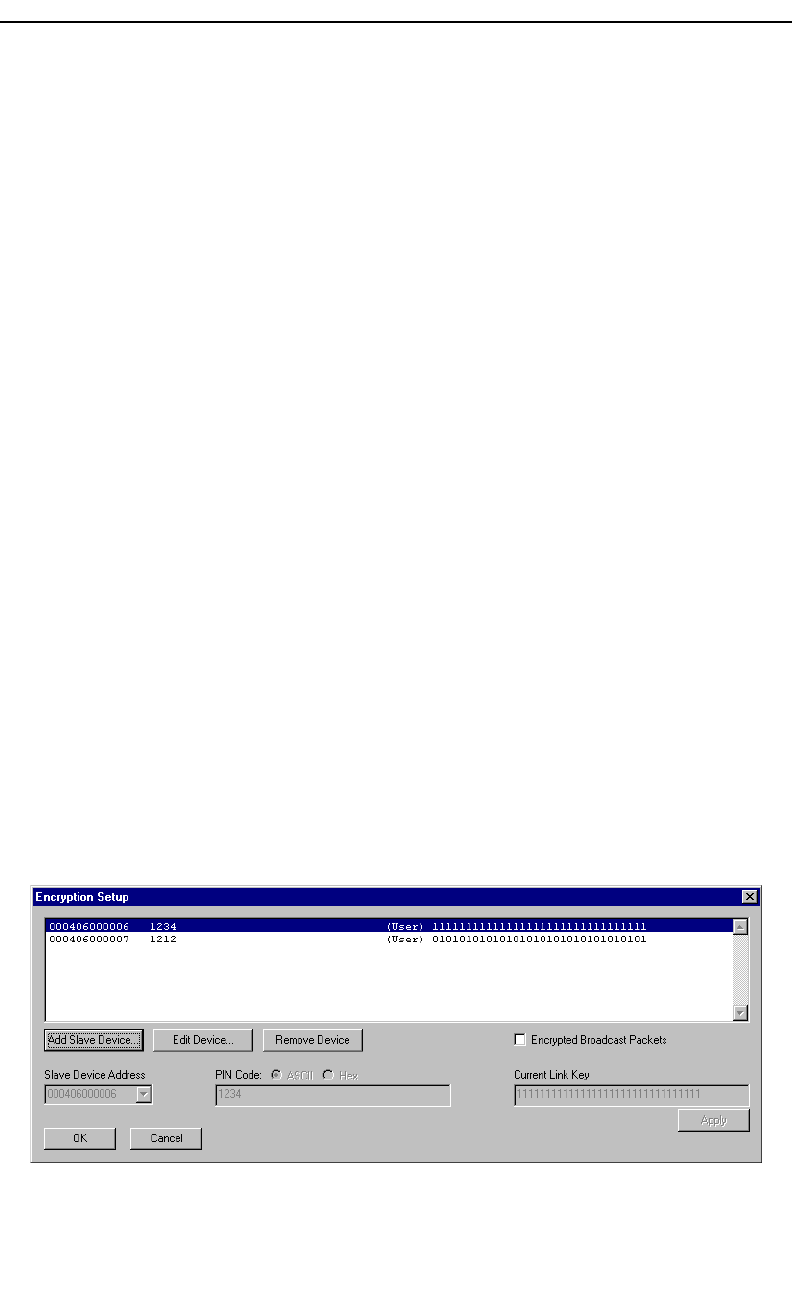
133
Merlin Protocol Analyzer User’s ManualCATC Version 1.6
the PIN, skip to Step 5.
Note The PIN you provide should be the same used by the Slave. For example, if your
Slave device requires a PIN of "1234", then enter the same PIN in the dialog box
shown above.
Step 5 If you do not have the PIN, or if the Master and Slave have already
agreed upon the Link Key, manually enter a Link Key as a 128 bit
(sixteen byte) hex value into the box marked Current Link Key. If
you have the PIN, you can skip this step.
Note If the Master and Slave were previously connected, they may already agree on the
Link Key. In this case, you will need to provide Merlin with the Link Key and not
simply the PIN.
Step 6 Click Apply
The changes you have made are applied and the information is displayed
in the dialog box as shown below. Four fields will display: Device
Address, PIN, the Link Key, and Link Key status.
Link Key status may read:
Mstr (=Master unit’s Link Key)
Slve (=Slave unit’s Link Key)
Comb (=Combination Key)
Init (=Initialization Key)
Temp (=Temporary Key)
User (=User-defined Key)
Step 7 Click OK.
The dialog box closes.

134
Merlin Protocol Analyzer User’s ManualCATC Version 1.6

135
Merlin Protocol Analyzer User’s ManualCATC Version 1.6
12. How to Contact CATC
13. Warranty and License
Computer Access Technology Corporation
(hereafter CATC) warrants this product to be free
from defects in material, content, and
workmanship, and agrees to repair or replace any
part of the enclosed unit that proves defective
under these terms and conditions. Parts and labor
are warranted for one year from the date of first
purchase.
The CATC software is licensed for use on a single personal computer. The
software may be copied for backup purposes only.
This warranty covers all defects in material or workmanship. It does not
cover accidents, misuse, neglect, unauthorized product modification, or acts
of nature. Except as expressly provided above, CATC makes no warranties
or conditions, express, implied, or statutory, including without limitation
the implied warranties of merchantability and fitness for a particular
purpose.
CATC shall not be liable for damage to other property caused by any defects
in this product, damages based upon inconvenience, loss of use of the
product, loss of time or data, commercial loss, or any other damages,
whether special, incidental, consequential, or otherwise, whether under
theory of contract, tort (including negligence), indemnity, product liability,
or otherwise. In no event shall CATC's liability exceed the total amount paid
to CATC for this product.
CATC reserves the right to revise these specifications without notice or
penalty.
Type of Service Contact
Call for technical support… US and Canada: 1 (800) 909-2282
Worldwide: 1 (408) 727-6600
Fax your questions… Worldwide: 1 (408) 727-6622
Write a letter… Computer Access Technology Corp.
Customer Support
2403 Walsh Avenue
Santa Clara, CA 95051-1302
Send e-mail… support@CATC.com
Visit CATC’s web site… http://www.CATC.com/