Daintree Networks 2400E 2.4GHz Sensor Network Adapter User Manual usermanual
Daintree Networks Inc. 2.4GHz Sensor Network Adapter usermanual
User Manual

Sensor Network Analyzer
User Guide
Version 1.1.1
May 2005

SENSOR NETWORK ANALYZER USER GUIDE
DAINTREE NETWORKS PAGE 2 OF 86
Version History
Edition Publication Date
1.0 February 2005
1.1 April 2005
1.1.1 May 2005
References
[1] IEEE Standard 802.15.4-2003, IEEE Standard for Part 15.4: Wireless Medium Access Control
(MAC) and Physical Layer (PHY) specifications for Low Rate Wireless Personal Area Networks
(LR-WPANS).
[2] ZigBee Network Layer Specification, Version 1.00, ZigBee Alliance.
[3] Application Support Sub-layer Specification, Version 1.00, ZigBee Alliance.
[4] ZigBee Device Objects, Version 1.00, ZigBee Alliance.
[5] Security Services Specification, Version 1.00, ZigBee Alliance.
[6] ZigBee Application Framework, Version 1.00, ZigBee Alliance.
[7] ZigBee Device Profile, Version 1.00, ZigBee Alliance.
SENSOR NETWORK ANALYZER USER GUIDE
DAINTREE NETWORKS PAGE 3 OF 86
Table of Contents
1 System Overview.........................................................................................................................................5
2 Installation & Licensing..............................................................................................................................6
2.1 Software Installation............................................................................................................................... 6
2.2 Software Activation................................................................................................................................7
2.3 Capture Hardware Installation...............................................................................................................8
2.4 Connecting the 2400E Sensor Network Adapter.................................................................................. 9
2.5 Configure SNA For Capture Hardware...............................................................................................12
2.6 2400E Regulatory Guidelines ..............................................................................................................13
3 Sensor Network Analyzer Overview........................................................................................................15
3.1 Major Components ...............................................................................................................................15
3.2 Opening the Example Capture Files....................................................................................................15
3.3 Capture from live network...................................................................................................................18
4 Operating the Sensor Network Analyzer .................................................................................................19
4.1 Single and Multi-Node Operation .......................................................................................................19
4.2 Modes of Operation..............................................................................................................................19
4.3 SNA Operating Model..........................................................................................................................20
4.4 Initiating a Capture Session .................................................................................................................21
4.5 Capture Options ....................................................................................................................................23
4.6 Multi-Node Capture..............................................................................................................................24
5 The Protocol Decoder................................................................................................................................25
5.1 Packet List Window..............................................................................................................................26
5.2 The Packet Decode Window................................................................................................................27
5.3 The Packet Data Window.....................................................................................................................29
5.4 Protocol Decoder Display Filters.........................................................................................................29
5.5 Logging .................................................................................................................................................33
6 Device Tree................................................................................................................................................35
6.1 Device Tree Window............................................................................................................................35
6.2 Device Tree Options.............................................................................................................................36
7 Measurements ............................................................................................................................................38
7.1 Measurements Window........................................................................................................................38
7.2 Context Menus......................................................................................................................................39
7.3 Measurements Options.........................................................................................................................42
7.4 Available Measurements ......................................................................................................................43
8 Visual Device Tree ....................................................................................................................................45
8.1 MAC Layer Visualization....................................................................................................................45
8.2 Network Layer Visualization...............................................................................................................46
8.3 Application (APS) Layer Visualization ..............................................................................................50
8.4 Context Menus......................................................................................................................................52
8.5 Visualization Options...........................................................................................................................56
8.6 Custom Icons.........................................................................................................................................57
8.7 Device Naming Table...........................................................................................................................58
9 Security.......................................................................................................................................................62
9.1 Security Options ...................................................................................................................................62
SENSOR NETWORK ANALYZER USER GUIDE
DAINTREE NETWORKS PAGE 4 OF 86
9.2 Decoding Encrypted Packets ...............................................................................................................62
9.3 MAC Layer Security............................................................................................................................63
9.4 NWK Layer Security............................................................................................................................64
9.5 APS Layer Security..............................................................................................................................65
Appendix A: Application Navigation.................................................................................................................67
Appendix B: Capture File Formats.....................................................................................................................71
Appendix C: Protocol Decoder Display Filter Fields........................................................................................74
Appendix D: 2400E Firmware Upgrade............................................................................................................83
Appendix E: Sensor Network Access Point (Model 2400A) Firmware Upgrade...........................................84
Appendix F: IEEE 802.15.4 Channels and Frequencies ...................................................................................85
SENSOR NETWORK ANALYZER USER GUIDE
DAINTREE NETWORKS PAGE 5 OF 86
1 System Overview
Welcome to Version 1.1 of the Daintree Networks Sensor Network Analyzer (SNA). The Sensor Network
Analyzer combines a powerful protocol analyzer with network visualization, measurements and diagnostics
for IEEE 802.15.4™ and ZigBee™ applications. The analyzer provides automatic display of network
formation, topology changes, and router and coordinator state changes allowing rapid detection of incorrect
network behavior and identification of device or network failures.
The Sensor Network Analyzer works in conjunction with other products in the Daintree Networks Sensor
Network product family, like the 2400E Sensor Network Adapter, to provide analysis for small and large
networks. With multi-node capture, analysis of large networks across wide areas (such as multiple rooms
within a facility) is possible.
The SNA application also supports several chipset evaluation boards as capture devices, allowing
flexibility in making use of existing development hardware.
Figure 1 System Overview
SENSOR NETWORK
ANALYZER
SOFTWARE
DEVELOPER AND
EVALUATION BOARDS
USB
SINGLE NODE
ANALYSIS
MULTI-NODE
ANALYSIS
SENSOR NETWORK
ADAPTERS
SENSOR NETWORK
ADAPTER
ETHERNET
SENSOR NETWORK ANALYZER USER GUIDE
DAINTREE NETWORKS PAGE 6 OF 86
2 Installation & Licensing
Installation consists of the following steps:
• Installing SNA software
• Entering activation code to activate license
• Attaching capture hardware (Daintree supplied, and/or third party development kit)
• Configuring SNA software for the specific capture hardware
2.1 Software Installation
To install the SNA software, follow these steps:
• Make sure you have at least 100 MB of available disk space for a typical installation,
• Run the SNA install executable
- CD Version: Insert the Sensor Network Analyzer CD; the installation starts
automatically. If the installation does not start automatically, browse to the CD and
manually run Setup.exe,
- Downloaded Version: unzip and run the downloaded executable SNA_Setup_v1.1.exe
(or applicable file name),
• Follow the installation instructions:
- Read and accept (or decline) the License Agreement (as shown below)
If you accept the License Agreement:
- Enter User Information,
- Accept the default installation location, or choose an alternative location, then proceed
through confirmation to begin the install process. ,
- If you have a previous version of the SNA it will be automatically uninstalled at this
time,
- The Installation will proceed to completion.
As described above, the End User License Agreement is presented at installation time and outlines the full
terms and conditions of use. Subsequent to installation, this file can also be viewed in the Daintree
Networks\Sensor Network Analyzer installation directory.
Once the installation is complete you will be presented with the following screen. It is suggested that you
view the readme file at this time, which contains notes specific to this release. Choose to launch the
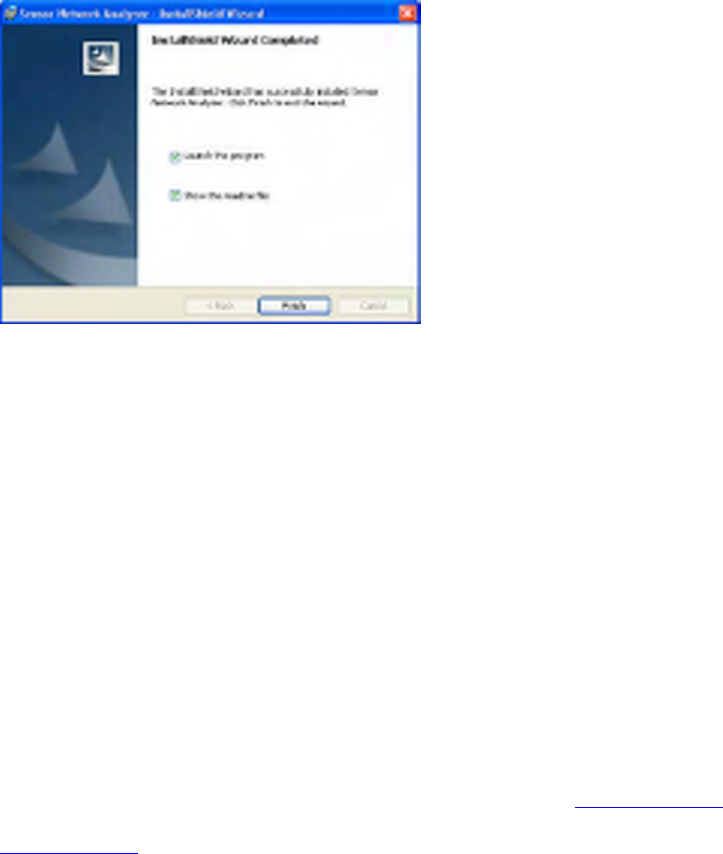
SENSOR NETWORK ANALYZER USER GUIDE
DAINTREE NETWORKS PAGE 7 OF 86
program at this time to continue with the activation process. Otherwise run the application at a later time
when you are ready to activate.
2.2 Software Activation
The Daintree Networks Sensor Network Analyzer requires an activation code to enable the software.
Activation consists of an on-line validation of the activation code. Note that the computer on which the
software is to be activated must be connected to the Internet during the activation process. If you are
upgrading from a previous version of the SNA which was activated under a perpetual license the pre-
existing activation will be preserved and you will not be prompted for a new activation.
The software provides support for a 30 day evaluation license. The evaluation period begins when the
activation code is entered. When a license is purchased, a permanent activation code is provided. This will
enable activation for perpetual use of the software. The software may be activated for perpetual use during
installation, or an evaluation license upgraded during or following an evaluation period.
At the end of the evaluation period, and in the absence of a perpetual license, the software will default back
to a 802.15.4 MAC and ZigBee NWK layer protocol analyzer providing packet sniffing and decode
capability. The unique SNA visualization and measurement features and application layer decodes will not
be available.
Enquiries related to the evaluation and/or purchase of the Daintree Networks Sensor Network Analyzer
software, including access to an activation code, can be made by email to sales@daintree.net, or contact
Daintree Networks or a representative directly. For contact details see the Daintree Networks web site at
www.daintree.net.
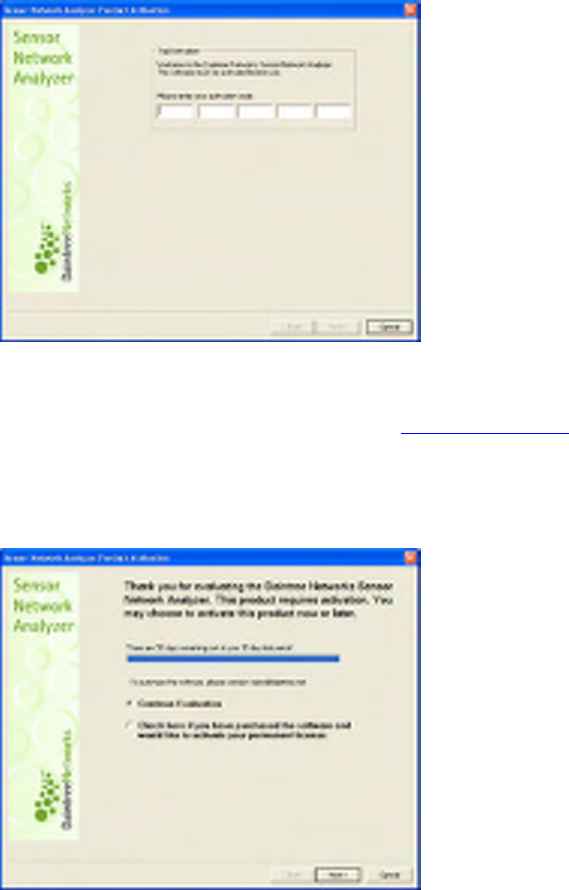
When the application is first run you will be presented with an activation screen. Enter either a trial or
perpetual activation code and continue.
SENSOR NETWORK ANALYZER USER GUIDE
DAINTREE NETWORKS PAGE 8 OF 86
Once activated, the software is tied to the PC on which the software was activated. The activation code
cannot be used to activate the software on another PC. Questions relating to the use of the licensing
mechanisms and activation codes should be sent to support@daintree.net.
If you are using the software under an evaluation version of the license you will be presented with an
evaluation status screen following activation, and again each time the application is started during the trial
period. You may continue the evaluation during the trial period, or enter a perpetual activation code which
is supplied when the product is purchased.
2.3 Capture Hardware Installation
To capture and analyze packets from a live 802.15.4/ZigBee network, the Sensor Network Analyzer (SNA)
must be connected to one or more capture devices.
The SNA supports the following capture devices:
• Daintree Networks 2400E Sensor Network Adapter.
• Daintree Networks 2400A Sensor Network Access Point. Note that the 2400A provides equivalent
functionality to the 2400E when used as an analyzer capture device.
• Development and evaluation hardware components from a number of third parties, including Chipcon,
Ember, Freescale, Atmel and ZMD. Refer to the SNA release notes (readme file viewable within the
program file installation directory for a list of supported hardware components).
SENSOR NETWORK ANALYZER USER GUIDE
DAINTREE NETWORKS PAGE 9 OF 86
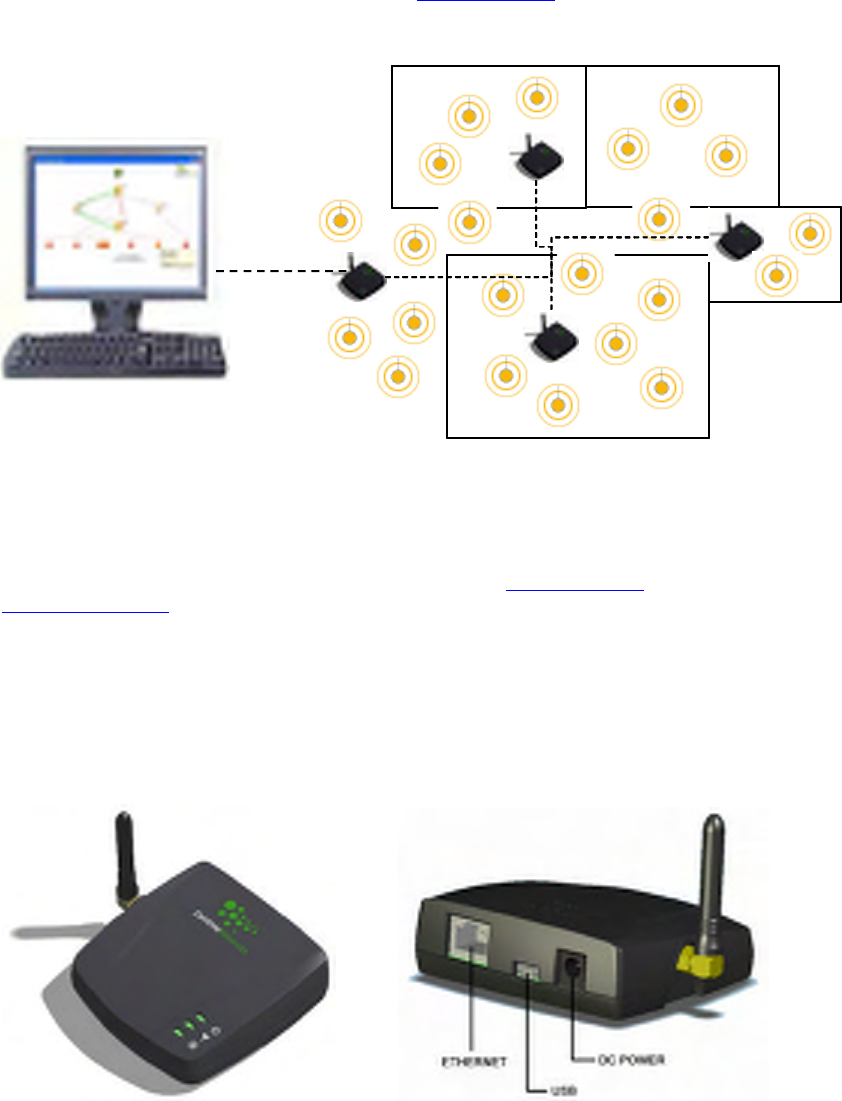
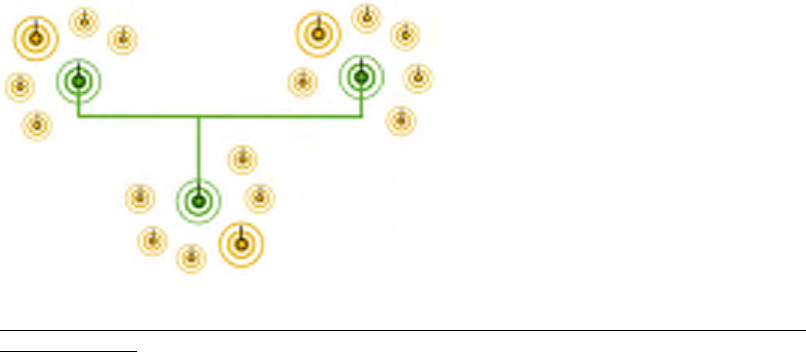
Multi-node capture is only supported using the 2400E Sensor Network Adapter. Use of multiple 2400E
Adapters enables analysis of a physically distributed network, where one or more devices in the network
are outside of the range of a single capture device. To purchase the 2400E contact Daintree Networks or a
representative. Contact information can be found at www.daintree.net.
Figure 2 Multi-node Capture
This User Guide describes how to use the SNA with the Daintree Networks 2400E Sensor Network
Adapter. To use one of the chipset vendor evaluation boards as a capture device, consult the appropriate or
Daintree Networks SNA Getting Started Guide supplied with the evaluation kit, or Daintree Networks
Application Note. Application Notes are available on the web at www.daintree.net or by contacting
support@daintree.net.
2.4 Connecting the 2400E Sensor Network Adapter
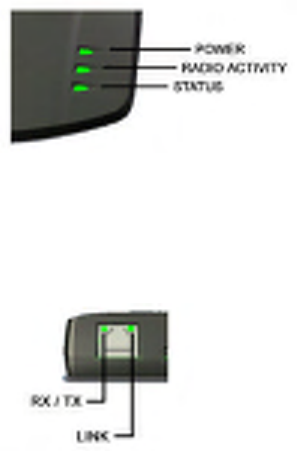
The 2400E Sensor Network Adapter is shown below. The 2400E can be connected to the system using
USB or Ethernet. The connections are at the rear of the device, as shown below.
Figure 3 Sensor Network Adapter and Connectors
SENSOR NETWORK ANALYZER USER GUIDE
DAINTREE NETWORKS PAGE 10 OF 86
Adapter Indicators
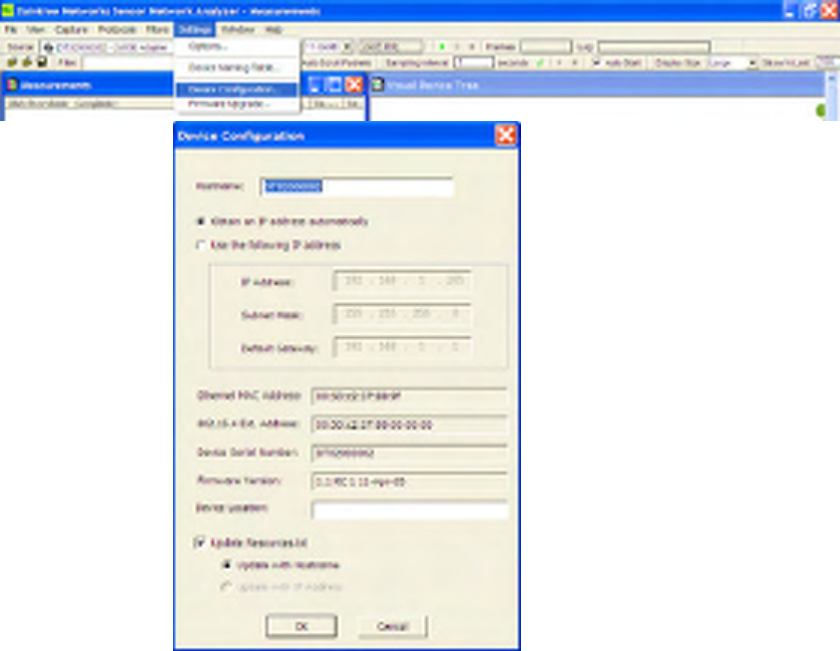
Various indicators provide status information for the adapter. The indicators at the front are as follows:
• POWER will light when powered by means of USB or the DC jack,
• RADIO ACTIVITY flashes to indicate receipt of packets over the wireless interface on the
selected channel,
• STATUS will be on and green when the adapter is ready to be used. This LED will turn orange
when the adapter is booting or having its firmware updated. It will be red or will not lit should
there be some problem with the hardware device
Figure 4 Sensor Network Adapter Indicators - Front
There are two indicators integrated into the Ethernet connector.
• RX / TX indicates activity on the network,
• LINK indicates that an Ethernet connection has been established.
Figure 5 Sensor Network Adapter Ethernet Indicators
Connecting via USB
If you connect the 2400E to the SNA PC using USB, the adapter will draw power from the USB connection.
The adapter may also be powered using 9V DC power. When a 9VDC source is applied, the 2400E will
draw power from that source and not the USB. A multi-country AC adapter is included with the purchase
of the 2400E. If installing for the first time, the Found New Hardware wizard will prompt you to install
drivers for the new hardware.
• Select “Install from a list or specific location” and click Next.
• Select “Search for the best driver in these locations”, and “Include this location in the search” and
Browse for the Program Files\Daintree Networks\Drivers\2400E (or alternative application
installation) directory.
• Select Next and the wizard will automatically find and install the required drivers. Note that
during installation you will see a Windows warning message “The software you are installing for
this hardware: Daintree Networks – 2400E Sensor Network Adapter has not passed Windows
Logo testing to verify its compatibility with windows XP.” Click Continue.
SENSOR NETWORK ANALYZER USER GUIDE
DAINTREE NETWORKS PAGE 11 OF 86
Connecting via Ethernet
To connect the 2400E Sensor Network Adapter to the SNA application via Ethernet the 2400E must first be
configured for use on the network using one of two methods:
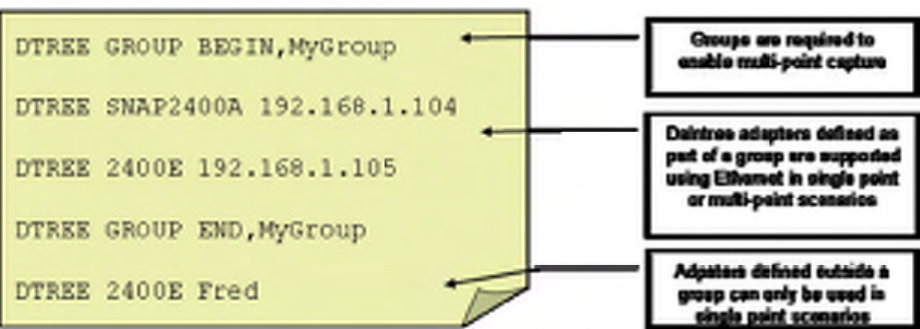
• By means of the Device Configuration utility. The Device Configuration utility enables the
configuration of the Hostname and IP address of the 2400E. By default, 2400E’s ship with DHCP
enabled and the hostname is set to the unit’s serial number. The utility is found under the SNA’s
Settings menu.
• Manually, by editing the resources.txt file as explained later in this document (‘Configure SNA for
Capture Hardware’).
The Device Configuration utility is available for the capture device currently selected in the capture device
Source drop down toolbar list. The given device may be connected via Ethernet or USB for the purpose of
configuration. If there is no currently selected capture device, the Device Configuration utility will not be
available. It is recommended that the 2400E be connected via USB if the current IP configuration
parameters are unknown.
Figure 6 Device Configuration Utility
The Device Configuration Utility provides useful information about the current device configuration and
allows the user to configure:
• Hostname (Default value corresponds to Device serial number),
• IP Address
- Obtain automatically (using DHCP), or
SENSOR NETWORK ANALYZER USER GUIDE
DAINTREE NETWORKS PAGE 12 OF 86
- Define static IP Address,
• User Defined Location String (to help identify the unit)
• Options to update resources.txt (see next section below).
NOTE: When using the Device Configuration utility to change the hostname and/or IP address of a
Daintree capture device (2400E or 2400A), it is possible for connectivity to the device is lost. This will
occur if the IP address is not valid on the current subnet, or if the IP address for a given hostname is
changed and a router/gateway/server device caches the previous hostname binding. If IP connectivity is lost
to a given device it can be reconfigured by connecting it to the PC via USB.
2.5 Configure SNA For Capture Hardware
The resources.txt file is currently used to enumerate hardware available to the SNA. Inclusion of entries
for capture hardware you wish to use in conjunction with the SNA is a necessary pre-requisite to it being
available to the SNA. The only exceptions to this are capture devices connected via USB, once installed,
they will be automatically recognized and do not require an entry in resources.txt. When operating over the
Ethernet interface an entry is required to specify the IP address or hostname of the device.
The resources.txt file is located in the Daintree Networks\Sensor Network Analyzer directory (or other
program installation directory as chosen at installation time). It should also be available through the Start >
Program Files menu for the SNA. This file can be edited using your favorite text editor.
Figure 7 Resources.txt File Entries
File Format
The format of each line in the resources.txt file is as follows:
MFR TYPE [PARAMS]
Where
MFR = manufacturer code (DTREE = Daintree Networks)
TYPE = capture device type
[PARAMS] = device specific configuration parameters

SENSOR NETWORK ANALYZER USER GUIDE
DAINTREE NETWORKS PAGE 13 OF 86
The resources.txt file also supports the concept of device groups for the purpose of multi-point capture. To
nominate the specific devices to be used in a multi-point session, enclose the device identifiers between the
following statements:
DTREE GROUP BEGIN,[Group Name]
…
DTREE GROUP END,[Group Name]
Where [Group Name] is a user-defined common name for the group of devices, for example “Warehouse”.
Note that the commas are required. Multiple groups may be defined in the same file. The same device may
be listed multiple times in the same file. To capture using the group, select the group by name from the list
of available capture sources.
Supported Devices
Daintree Networks Sensor Network Access Point Model 2400A
Config Format: DTREE SNAP2400A [PARAMS]
[PARAMS]: IPAddress | Hostname
where IPAddress = IP Address of 2400A
Daintree Networks Sensor Network Adapter 2400E
Config Format: DTREE 2400E [PARAMS]
[PARAMS]: IPAddress | Hostname
where IPAddress = IP Address of 2400E
Daintree adapters can be referred to by hostname or by IP address. The use of a hostname depends on the
ability of the network to respond to address queries for the given hostname based on protocols such as DNS
or NetBIOS. If such facilities are not available, the 2400E (or 2400A) can be referred to by its’ IP address.
Other third party development kits are also supported. Specific hardware supported is listed in the release
notes for the SNA, viewable at install time or by opening the file SNA Read Me.htm located in the
application program file directory. Instructions for configuring third party hardware via the resources.txt
file are contained in application notes describing how to use the SNA with that specific hardware
component. These may be found at www.daintree.net.
Using the Device Configuration Utility to Update resources.txt
When using the Daintree Networks’ supplied 2400A or 2400E units, the IP address and hostname can be
configured using the Device Configuration utility as described in the previous section. When changing the
IP address or the hostname, the resources.txt file will be automatically updated with the new device
configuration parameters. There is a selection available which allows the user to select whether to update
the resources.txt file with the hostname or the IP address. The IP address option is not available if the
“Obtain an IP address automatically” option is selected. If the user chooses to define a static IP address the
user can choose to write the IP address or the hostname into resources.txt.
2.6 2400E Regulatory Guidelines
The Daintree Networks 2400E Sensor Network Adapter is a Low Power Wireless Communications Device
and as such is subject to various international regulations with respect to emissions and associated
regulatory standards. The product should be installed with a minimum separation distance from persons of
20 cm.
Changes or modifications not expressly approved by Daintree Networks could void the user's authority to
operate the equipment.
SENSOR NETWORK ANALYZER USER GUIDE
DAINTREE NETWORKS PAGE 14 OF 86
NOTE: This equipment has been tested and found to comply with the limits for a Class B digital device,
pursuant to Part 15 of the FCC Rules. These limits are designed to provide reasonable protection against
harmful interference in a residential installation. This equipment generates uses and can radiate radio
frequency energy and if not installed and used in accordance with the instructions may cause harmful
interference to radio communications. However, there is no guarantee that interference will not occur in a
particular installation. If this equipment does cause harmful interference to radio or television reception,
which can be determined by turning the equipment off and on, the user is encouraged to try to correct the
interference by one or more of the following measures:
-- Reorient or relocate the receiving antenna.
-- Increase the separation between the equipment and receiver.
-- Connect the equipment into an outlet on a circuit different from that to which the receiver is connected.
-- Consult the dealer or an experienced radio/TV technician for help.
The 2400E may only be used with the supplied antenna. Use of the device with any other antenna is a
violation of FCC rules and will void the user's authority to operate the equipment.
SENSOR NETWORK ANALYZER USER GUIDE
DAINTREE NETWORKS PAGE 15 OF 86
3 Sensor Network Analyzer Overview
This section provides a brief overview of the Sensor Network Analyzer (SNA) application. Subsequent
sections will provide additional detail on each major application area.
The Sensor Network Analyzer is a tool for developers of wireless sensor networking technology and
applications. A range of hardware devices enable comprehensive network analysis through passive
observation from one or more vantage points. The analyzer provides visualization, measurements and
packet decodes for IEEE 802.15.4™ and ZigBee™ wireless communications.
With device tree visualization, the network structure can be analyzed and changes to the network structure
can be observed. Overlaid on the same device tree are routes and application endpoint flows. These allow
developers and implementers to rapidly determine how packets are flowing through the network, how
alternate routes are used and to analyze end-to-end application-layer connectivity. A measurement system
also provides detailed measurements such as packet counts and latency. With integrated diagnostic tools
that provide detailed packet-by-packet, field-by-field information, switching between summary visual and
measurement information, and detailed protocol information will allow rapid diagnosis of root causes of
problems.
The Sensor Network Analyzer works in the Daintree Sensor Network family to provide analysis for small
and large networks. With multi-node capture, analysis of large networks across wide areas or multiple
rooms is possible. The analyzer also supports several chipset evaluation boards to allow flexibility in using
available hardware.
3.1 Major Components
To get started with the SNA application, launch the application. From the Start menu, choose All Programs,
Daintree Networks, Sensor Network Analyzer. Enter activation code as required.
You will see each of the major components of the SNA application:
• Visual Device Tree window, used to display network topology using a device association tree,
• Measurement window, used to display network wide statistics,
• Packet List window, used to display a scrolling list of packets,
• Packet Decode window, which provides the detailed decode of the selected packet in the Packet List.
Each window can be maximized, minimized, hidden, or resized.
There are two additional windows that are minimized by default:
• Device Tree window, which provides a textual view of the device association tree,
• Packet Data window, used to display raw hex dump of the selected packet in the Packet list.
All application windows can be reached via the menu items listed in the menu bar along the top of the main
application window. Toolbars are available for the most commonly used features.
3.2 Opening the Example Capture Files
The best way to learn the key features of the application is to open files from previously captured live
networks. This can be done prior to installing capture hardware. Two sample capture files are provided
with the standard installation and can be found in the Daintree Networks/Sensor Network/Analyzer/Capture
Files directory (or alternative installation directory if chosen):
• “topology_and_route.dcf”, which demonstrates the formation of a small network, and
• “HCL_demo.dcf”, which demonstrates a simple Home Control Lighting application.
SENSOR NETWORK ANALYZER USER GUIDE
DAINTREE NETWORKS PAGE 16 OF 86
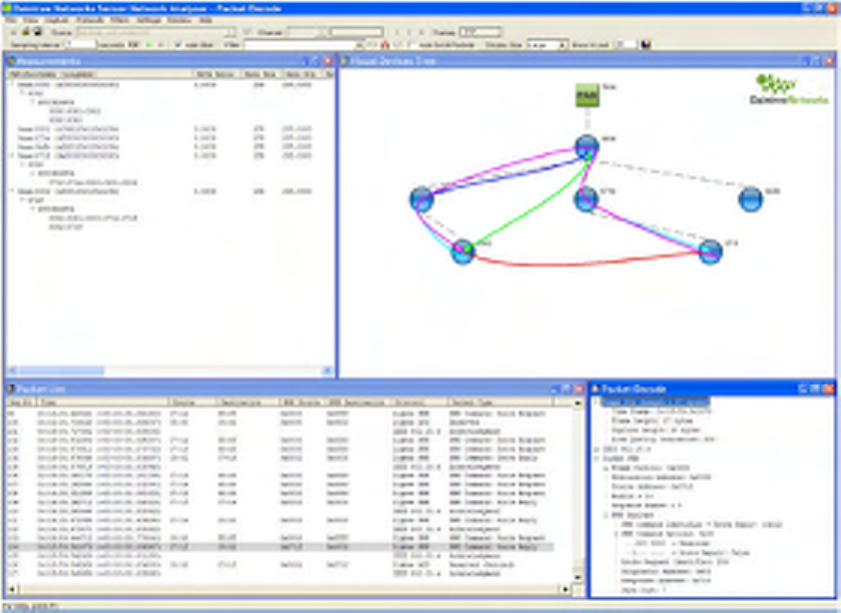
First Example: topology_and_routes.dcf
Use the File -> Open menu item or corresponding toolbar item to open the example
“topology_and_routes.dcf” file. This can be found in the “Capture Files” directory.
Once the capture playback is complete, you will see the following screen shot:
Figure 8 Default screen layout after loading “topology_and_routes” capture file
This highlights each of the major components of the application:
The Visual Device Tree window shows network topology by means of a device association tree:
• Devices are added dynamically based on 802.15.4 Association Response messages,
• Routes are displayed on the Visual Device Tree. The number of Routes shown may be varied using
the “Show Last N” option available from the Visualization Options or directly from the toolbar,
• Routes can be filtered to show only those routes between two devices by selecting (clicking on) the
devices on the Visual Device Tree,
• A given route can be selected by clicking on the route itself; each of the devices traversed by the
given route are highlighted.
The Measurements window displays network wide statistics:
• Measurements are broken down by Device, Stream (Source/Destination Device Pair), and Route,
• Expand the Measurements view to display the full set of available statistics.
SENSOR NETWORK ANALYZER USER GUIDE
DAINTREE NETWORKS PAGE 17 OF 86
The Packet List window shows a scrolling list of packets:
• The selected Packet from the Packet List is shown in the Packet Decode window,
• There is an additional Packet Data window (hidden by default) that shows a raw hexadecimal and
ASCII dump of the selected packet,
• A Filter can be applied to the Packet List to display only packets matching a given criteria (typically
the value of one or more protocols fields),
• Filters can be defined from the Filters menu, Filters Toolbar or by right-clicking on a protocol field in
the Packet Decode window.
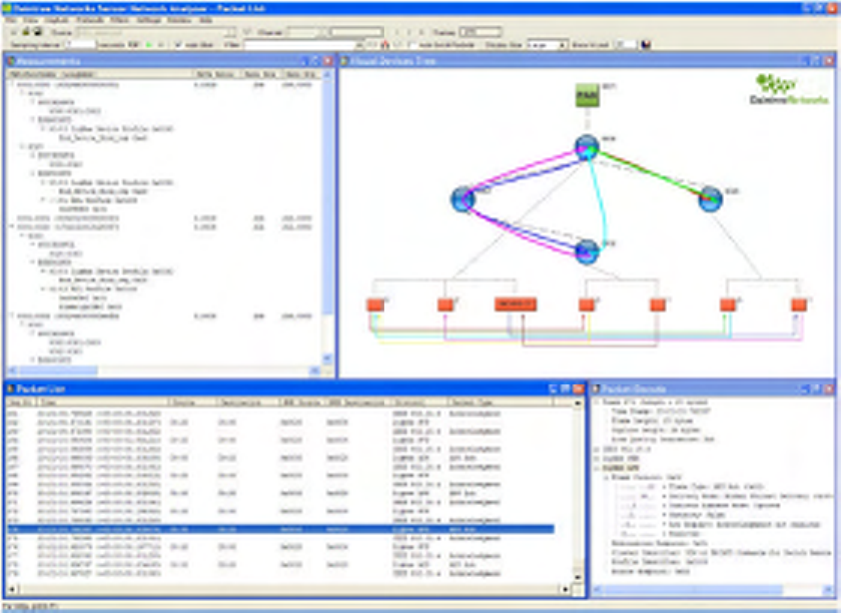
Second example: HCL_demo.dcf
Open the file “HCL_demo.dcf”, which is located in the same Daintree Networks\Sensor Network
Analyzer\Capture Files directory. After opening this file, the SNA will look like the following screen shot.
Figure 9 Default screen layout after loading “HCL_demo” capture file
This file contains additional application layer endpoint information. This reveals additional information in
the Visual Device Tree and Measurements windows. In particular:
The Visual Device Tree window contains an extra layer of information corresponding to APS endpoints:
• The lines linking the endpoints represent the flow of APS messages between endpoints and typically
correspond to APS layer bindings,
• Endpoint 0 represents the ZigBee Device Object (ZDO) on each device, and the lines linking them
represent ZDO messages between devices. There is an option available to turn off the display of ZDO
endpoints and bindings to reduce clutter on the screen,
SENSOR NETWORK ANALYZER USER GUIDE
DAINTREE NETWORKS PAGE 18 OF 86
• A line directly linking a non-zero endpoint corresponds to a direct binding from source to destination,
• The “INDIRECT” endpoint is used to indicate the flow of indirectly addressed packets to and from
the ZigBee coordinator. This does not correspond to an actual APS endpoint,
• Lines linking endpoints to and from the logical “INDIRECT” endpoint, show the flow of indirectly
addressed APS packets from source endpoint to coordinator and coordinator to destination endpoint,
• Bindings to and from a given endpoint can be filtered by selecting (clicking on) an endpoint,
• A Binding can be selected by clicking on the line linking two endpoints,
• The Application layer profile and clusters corresponding to a given binding are shown when the
binding is selected.
The Measurements window is extended with the list of endpoints detected on each device.
3.3 Capture from live network
To setup the Sensor Network Analyzer application to capture from a live capture device, follow the
following steps:
• Ensure required capture hardware has been installed and configured (refer to the installation section
earlier in this document).
• Select Capture Device from list of available capture devices,
• Select Channel,
• Start Capture.
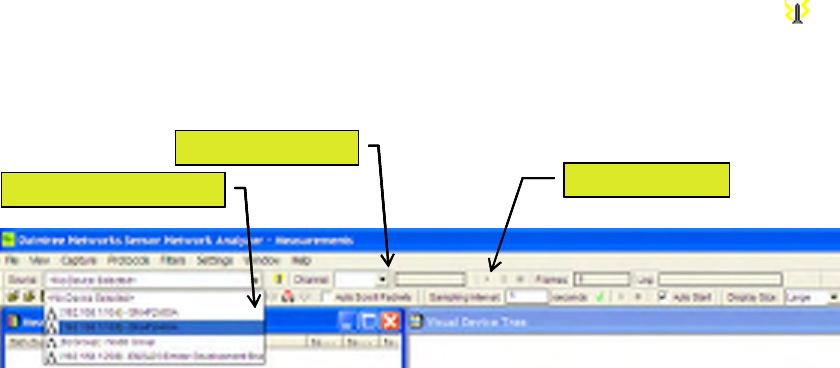
Select the Capture Source from the list of available devices as shown below. If the given device is not
shown but it has been added to the resources.txt and connected to the PC, click the antenna like icon to
search for capture devices. If the device is correctly connected it will be shown in the list of available
devices.
Select Capture Device Start Capture
Select channel
Select Capture Device Start Capture
Select channel
Figure 10 Selecting Capture Source
Select the Channel from the drop down list of available channels. The list of channels will automatically
update based on the available frequency range.
Start Capture using the Capture -> Start menu item or using the start button on the main toolbar. If the Auto
Start option is selected the Measurements will automatically start when capture starts. Measurements may
be started and stopped independently of the capture. Restarting measurements clears all statistics from the
measurements window, and clears all routes and endpoint bindings from the Visual Device Tree.
SENSOR NETWORK ANALYZER USER GUIDE
DAINTREE NETWORKS PAGE 19 OF 86
4 Operating the Sensor Network Analyzer
4.1 Single and Multi-Node Operation
One of the key differentiating features of the Sensor Network Analyzer over basic “sniffers” is its multi-
node capability. This is important for the following reasons.
The low power nature of 802.15.4-based wireless sensor radios means that there transmission range is
relatively limited. With the help of the ZigBee networking protocol, the fact that such devices can link
with each other and forward traffic on behalf of one another helps overcome what would otherwise be a
major limitation.
Nevertheless, from a passive analysis point of view this provides a significant challenge. It is important
that an analyzer operating in as a passive observer of the network to be able to see all communications
between devices. The SNA addresses this by enabling multiple capture devices (observational points) to be
networked together to provide a complete view of network activity. The analyzer is able to both
synchronize traffic streams from Daintree’s capture devices, and filter out duplicate packets, and in so
doing create a composite and correctly time ordered sequence of packets representing the overall network
traffic.
It is very important that for reliable analysis, sufficient capture devices be placed around the network to
observe all traffic. Failure to do so may lead to missing transactions resulting to incorrect conclusions
being drawn about network activity. For example, a device association not observed during network
formation may result in significant inaccuracies in the network topology represented. For more information
on capture device placement and conditions which may lead to loss of multi-node synchronization, contact
Daintree Networks directly.
4.2 Modes of Operation
The SNA is able to operate in two modes:
• Live network analysis;
• Post-analysis using logs of previously captured live traffic.
SENSOR NETWORK ANALYZER USER GUIDE
DAINTREE NETWORKS PAGE 20 OF 86
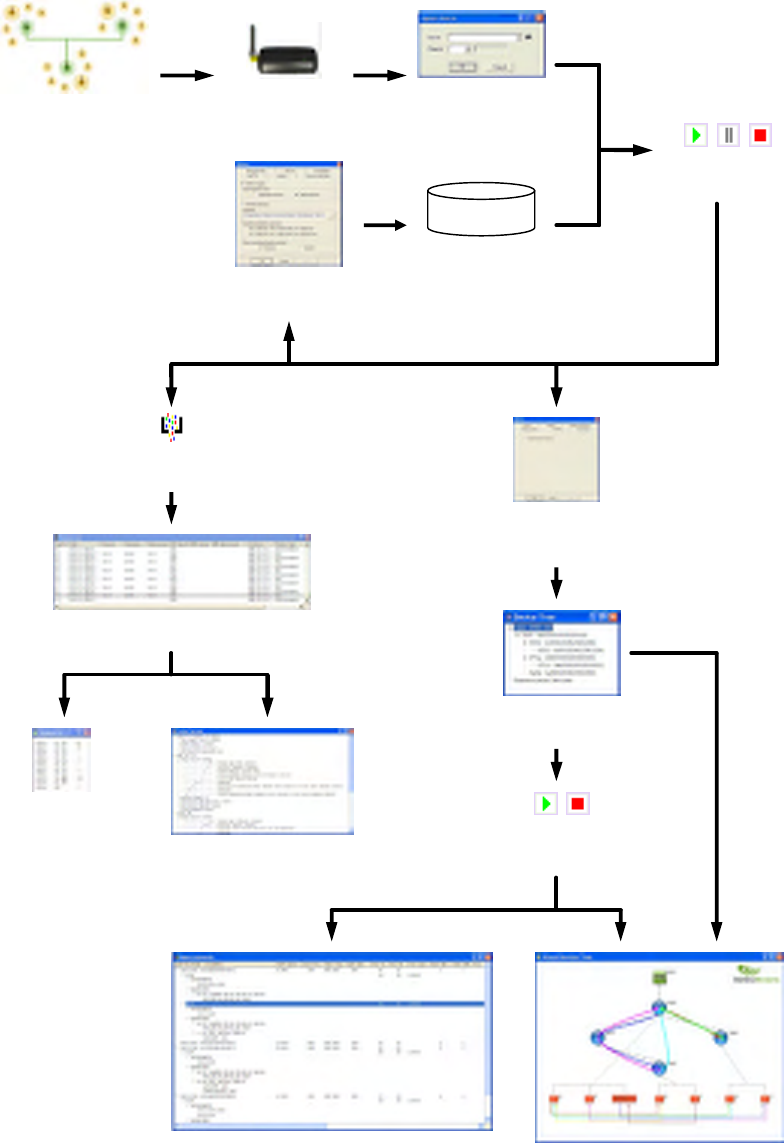
4.3 SNA Operating Model
Capture Controls
Start, Pause, Stop
Logging Controls
Capture File
Capture Source and
Channel Selection
Live Network
Capture
Hardware
Protocol Decoder
Display Filters
Packet List
Packet Decode
Packet Data
Enable/Disable
Table of Devices
Measurements
Measurement
Controls
Device Tree
Visual Device Tree
SENSOR NETWORK ANALYZER USER GUIDE
DAINTREE NETWORKS PAGE 21 OF 86
Figure 11 SNA Operating Model
The available controls include:
• Start/Stop Capture: this is the master control whether the analyzer is capturing from a live network or
replaying a previously saved capture. When capture is started, ALL data from a previous capture is cleared
including the Packet List, the Device Tree and any measurements,
• Enable/Disable Device Tree: this will enable/disable the Device Tree, Measurements and
Visualization. However it is independent of the Packet List,
• Start/Stop Measurements: this will stop and stop the collection of measurements and much of the
derived information (NWK layer routes, APS layer bindings) that are used to populate the Visual Device
Tree. For a given capture session, measurements can be stopped and restarted multiple times.
Subsequent sections of this User Guide will describe each of these components and their corresponding
window in more detail.
4.4 Initiating a Capture Session
A capture session is a discrete and continuous period of time during which all air interface activity is
captured to memory and displayed (subject to any display filters in effect). A capture session can be
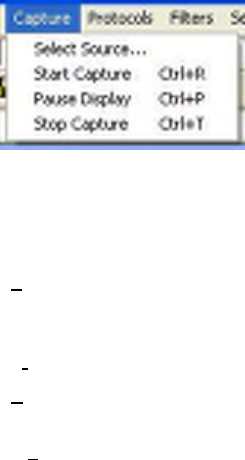
initiated and controlled by means of the Capture Menu or the Capture Toolbar.
All incoming data during a capture session can be logged to disc as it arrives. Alternatively, the capture
data can be saved to a log file post-capture. In this way it can be retrieved and analysed at a later time.
Note that while the results from a previous capture session are open within the viewer a new capture
session cannot be initiated.
Figure 12 Capture Menu
Each of the Capture Menu items is described below:
Select Source… Allows selection of a capture source through a dialog box. The dialog box
includes the search button, drop down list of sources and channel
selection.
Start Capture Starts capture operations from the selected device.
Pause Display Toggles the updating of the display of captured data, allowing the user to
check through the data whilst the capturing continues.
Stop Capture Stops capture operation.
SENSOR NETWORK ANALYZER USER GUIDE
DAINTREE NETWORKS PAGE 22 OF 86
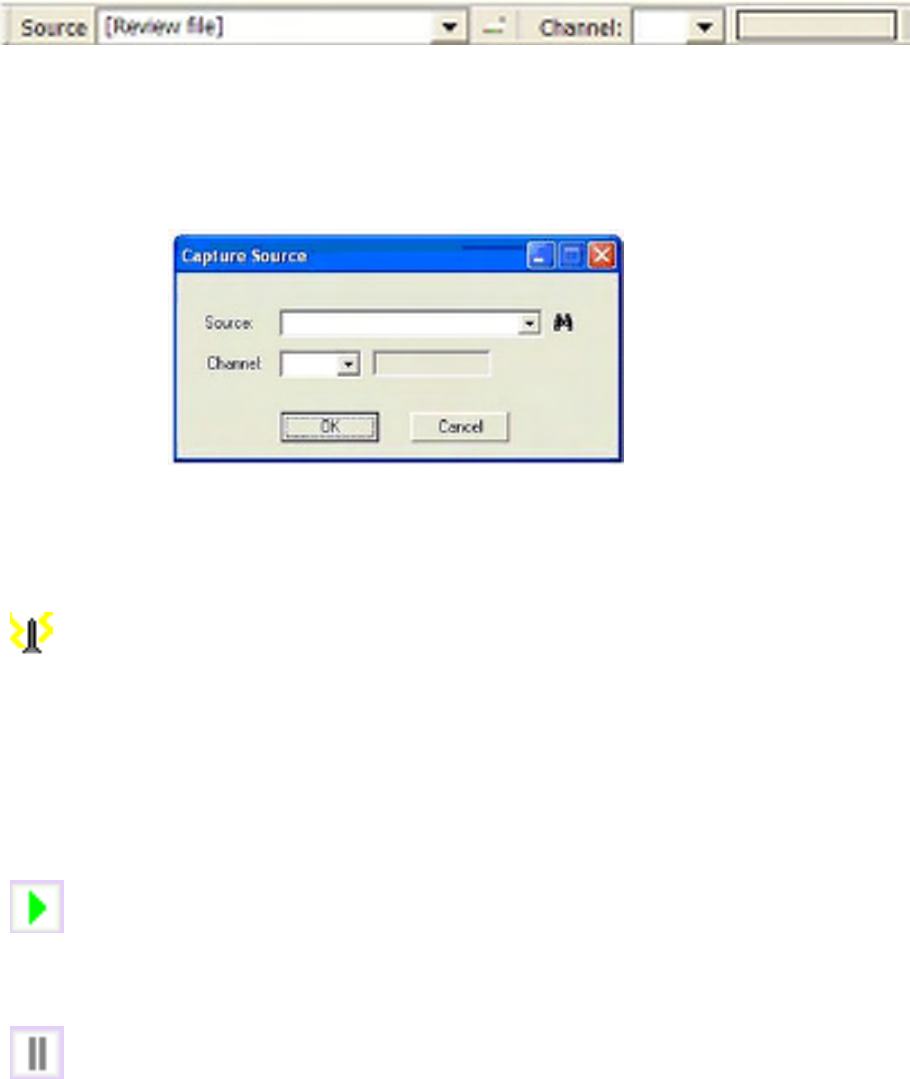
The most common capture controls are also available from the Capture toolbar.
Figure 13 Capture Toolbar
Each of the capture menu and toolbar items is described below.
Select Source Select Source enables selection of the source for the capture session. If there is a
capture operation in progress, this menu item is disabled. Otherwise it results in
a dialog box as follows.
The Source drop down list will list all available capture devices.
Otherwise, after selection of a capture device, a specific channel may be
selected from the drop down box. The channel will default to the first channel
in the band. The dialog box also includes a Search for Capture Devices button
(see below).
(Search for Capture Devices) Results in an operation whereby new capture
sources are identified. Refer to the sections of this manual detailing hardware
configuration for more information.
Channel Enables selection of the receive channel by means of a drop down list. The
channel number is shown in both decimal and hexadecimal. Note that only valid
channels for the specific source device are listed. The frequency of the selected
channel is displayed adjacent to the channel number. If the Resource Manager
has been launched and is active then this button will be disabled.
Start
Capture
Begins a new capture session. If there is no capture source selected or if a
capture operation is already in progress this menu item is disabled. Whether or
not the display is cleared at the start of the capture session is determined by
application configuration settings. To erase the existing display contents at the
start of a new capture session, enable ‘Clear Display on Capture Start’ on the
Capture tab of the Options panel in the Settings.
Pause
Display
This will not pause the capture session itself, but will ensure that incoming
packets are not presented via the display. This can be useful for studying
existing display contents without the distraction of updates being presented. If
there is no capture operation in progress, this menu item is disabled. Clicking
the ‘Pause Display’ toolbar button again will result in the display being updated
with all received information since the pause began.
Stop Capture
Clicking on this toolbar button (or selecting the action from the Capture Menu)
terminates the capture session. If there is no capture operation in progress this
menu item is disabled.
SENSOR NETWORK ANALYZER USER GUIDE
DAINTREE NETWORKS PAGE 23 OF 86
Frames: Displays the total number of frames received since the capture session began.
Note that this may be different to the number displayed in the packet list if the
user chose not to clear the display when the capture session was initiated, or if
filters have been applied.
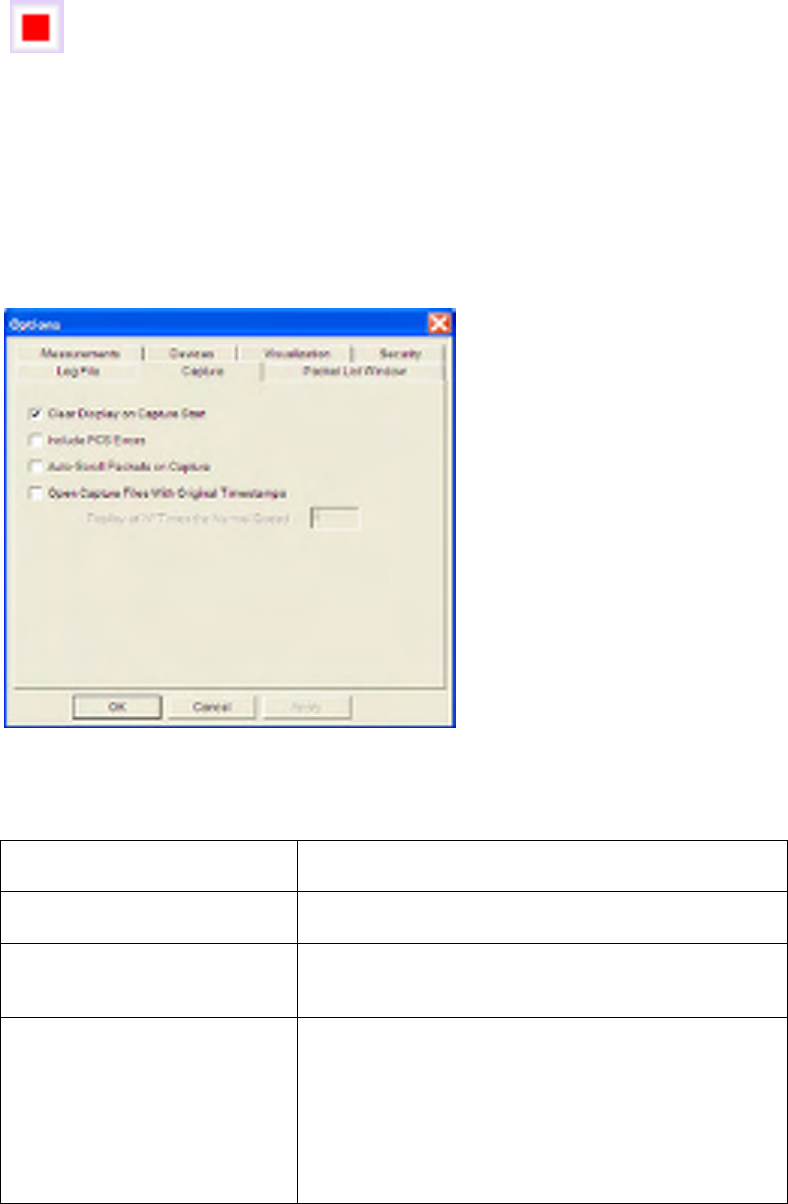
4.5 Capture Options
The capture options dialog is as shown below.
Figure 14 Capture Options
The following options are available:
Clear Display on Capture Start To erase the existing display contents at the start of a new
capture session.
Include FCS Errors If enabled, packets with FCS errors are forwarded to the
Packet List, otherwise they are discarded.
Auto Scroll If enabled, the Packet List will automatically scroll to show
the latest packets as they arrive. This option is also
available on the Capture Toolbar.
Open Capture File with Original
Timestamps When a capture file is saved, it is saved together with a
marker indicating the time at which each of the packets
arrived. This option allows the capture file to be played
back at a the same rate as the original capture from the live
network. Furthermore there is an additional option to replay
at an integer multiple of the normal rate to speed up the
playback. If this option is not enabled captured packets are
played back at the maximum rate possible.
SENSOR NETWORK ANALYZER USER GUIDE
DAINTREE NETWORKS PAGE 24 OF 86
4.6 Multi-Node Capture
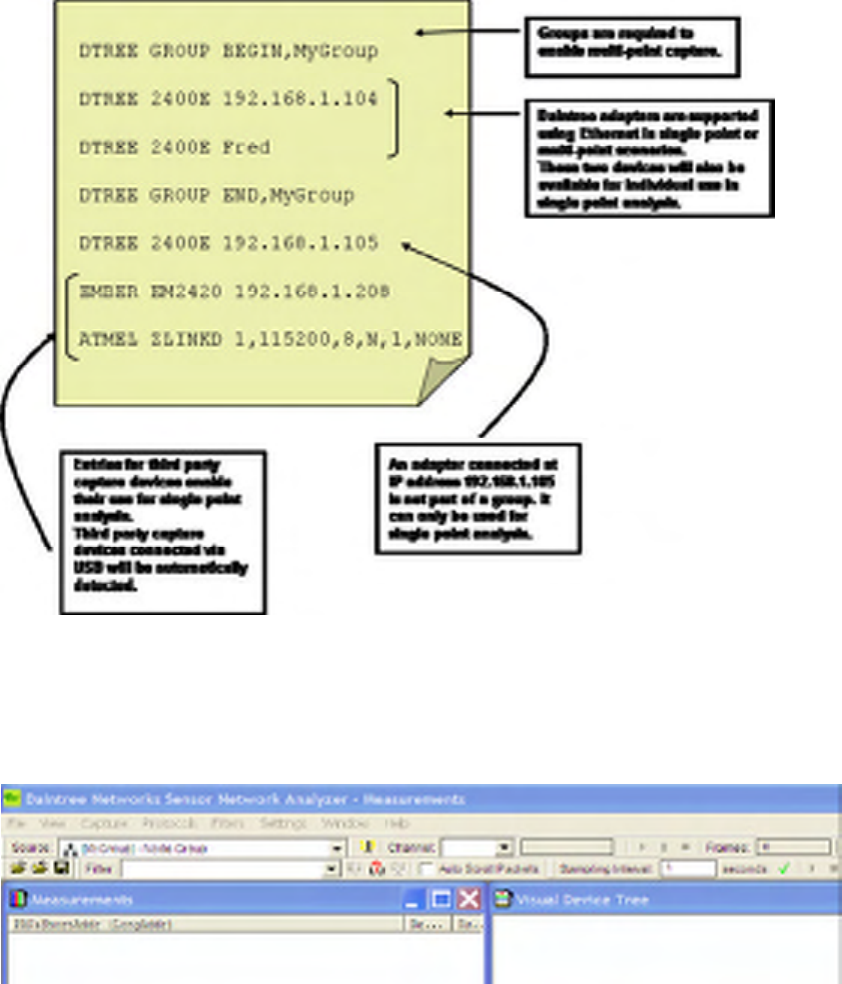
Multi-node capture is available by setting up a node-group in the resources.txt file as shown below.
Figure 15 Multi-node Capture Setup
Multiple groups may be defined in the same resources.txt file. Furthermore the same device may be defined
multiple times in the same resources.txt, potentially appearing in multiple groups.
Figure 16 Multi-node Group Selection
A multi-node group may then be selected as the current capture source. Once selected, packets from each of
the nodes will be correlated together and presented to the SNA application as a single stream of packets for
decode and analysis.
SENSOR NETWORK ANALYZER USER GUIDE
DAINTREE NETWORKS PAGE 25 OF 86
5 The Protocol Decoder
Together the Packet List, Packet Decode and Packet Data windows provide a comprehensive protocol
decoder for 802.15.4 and ZigBee networks.
Packet List Window
Lists received packets sequentially with summary
information.
Packet Decode Window Displays the decoded structure of an individual packet.
Packet Data Window Displays the packet data itself in hexadecimal and ASCII.
SENSOR NETWORK ANALYZER USER GUIDE
DAINTREE NETWORKS PAGE 26 OF 86
5.1 Packet List Window
Figure 17 Packet List Window
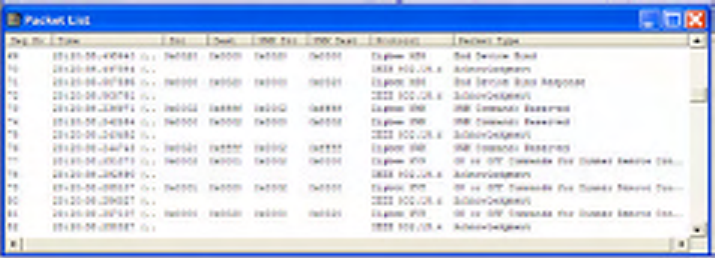
The Packet List shows packets received sequentially, in the time order they were received. Display filters
can be used to define a subset of received information for display. For example, only MAC command
frames may be displayed. Each individual packet is listed on a separate line, and includes summary
information for that packet.
Selecting a packet in the list (by clicking on it) will result in a decode of that packet appearing in the Packet
Decode window if open. The packet list can be scrolled through using the up and down arrow keys.
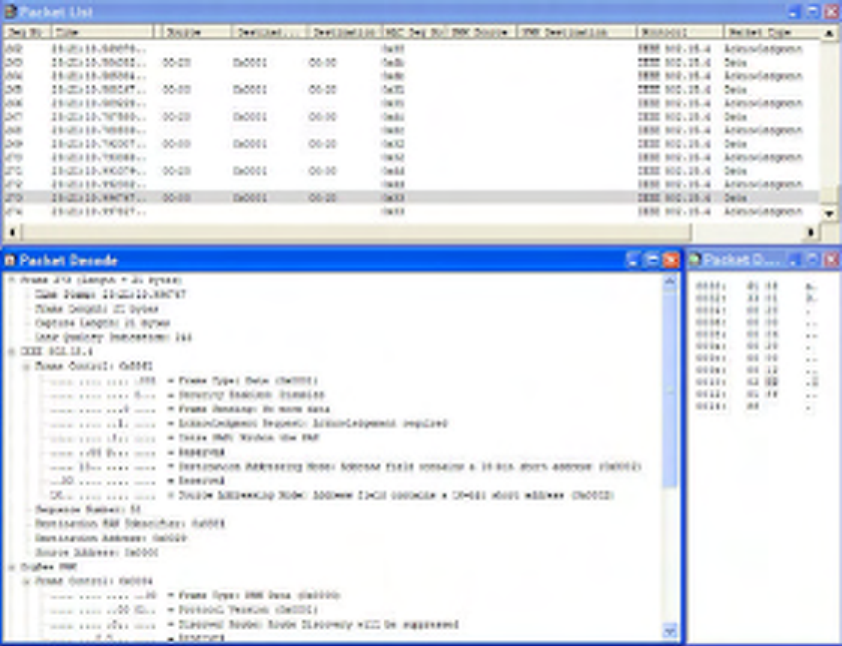
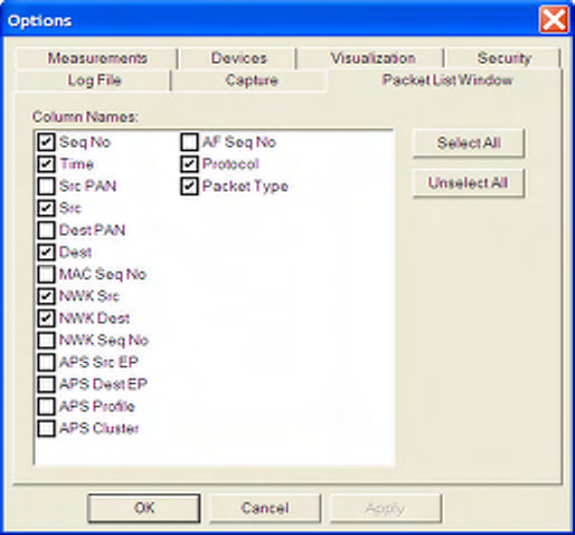
The available summary fields are as follows. The user can control which fields are shown (fields that are
disabled by default are highlighted as such in the table below).
Index Index (sequence) number of the packet. The index is initialized to 1 at the
beginning of a capture session. Note that indices are assigned to all
packets received, so an index omitted in this list will be indicative of a
filter being applied.
Time Time at which the packet was received, as provided by the capture device.
The format is ‘seconds.microseconds’ where ‘seconds’ is the time in
seconds since midnight, January 1, 1970, and ‘microseconds’ is an offset
in microseconds from this time.
Src PAN The MAC Source PAN field (disabled by default)
Src The MAC source address field.
Dest PAN The MAC Destination PAN field (disabled by default)
Dest The MAC destination address field.
MAC Seq No The MAC Sequence Number (disabled by default)
NWK Src The NWK source address field.
NWK Dest The NWK destination address field.
NWK Seq No The NWK Sequence Number (disabled by default
APS Src EP The APS Source Endpoint (disabled by default)
APS Dest EP The APS Destination Endpoint (disabled by default)
APS Profile The APS Profile ID (disabled by default)
APS Cluster The APS Cluster ID (disabled by default)
AF Seq No Application Frame Sequence number (disabled by default)
Protocol The appropriate protocol layer corresponding to the packet. All packets
will be decoded to the maximum extent possible, unless protocol layer
SENSOR NETWORK ANALYZER USER GUIDE
DAINTREE NETWORKS PAGE 27 OF 86
decoding is disabled through the Protocols Menu.
Packet Type The actual packet type. For example, ZigBee NWK layer packet types
may be ‘Command’ or ‘Data’.
The list of summary fields can be manipulated using the Packet List Options dialog available from the
Settings -> Options menu item.
Figure 18 Packet List Options
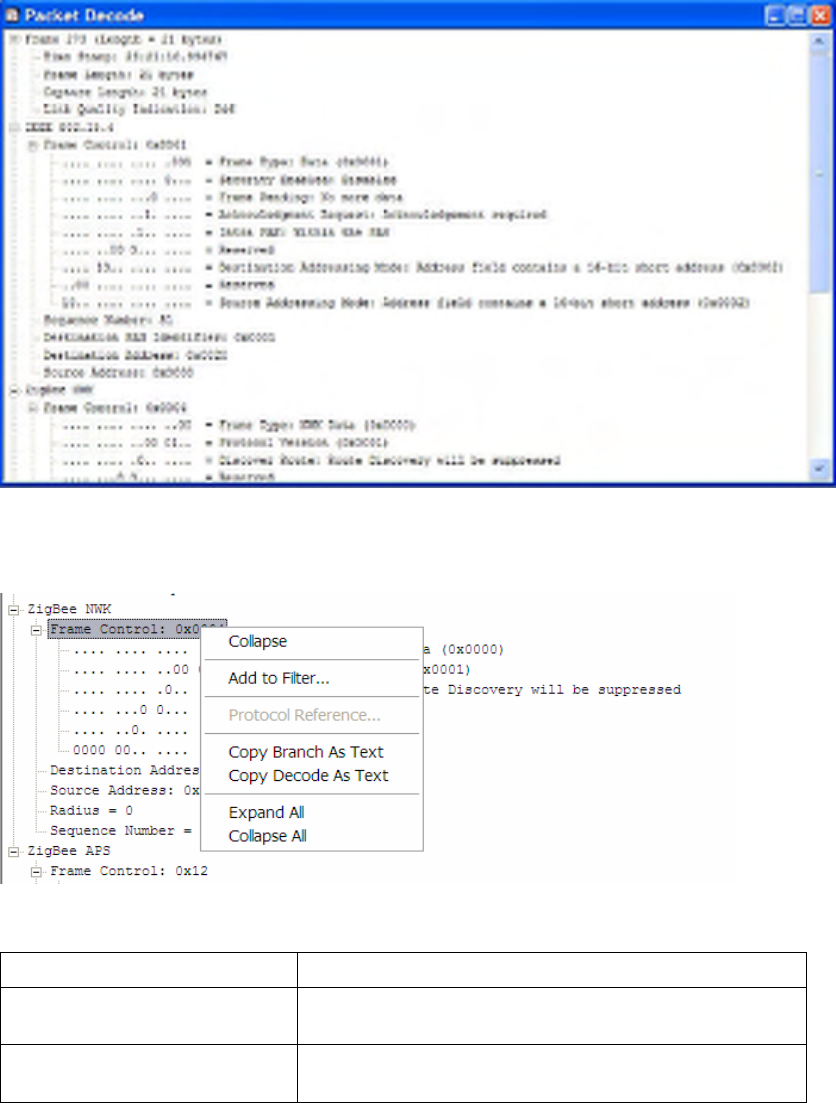
5.2 The Packet Decode Window
The Packet Decode window shows the decoded structure of the packet currently selected in the Packet List
window.
SENSOR NETWORK ANALYZER USER GUIDE
DAINTREE NETWORKS PAGE 28 OF 86
The decode appears as an expandable tree. The state of each node defaults to ‘collapsed’ when the
application starts. Clicking on a node (the [+] or [-] symbols) will expand or collapse that branch of the
tree accordingly. The application will remember which nodes in the decode tree have been expanded. As
subsequent packets are selected, the same expanded or contracted state of equivalent nodes will be carried
over, provided they are contained within the packet.
Figure 19 Packet Decode Window
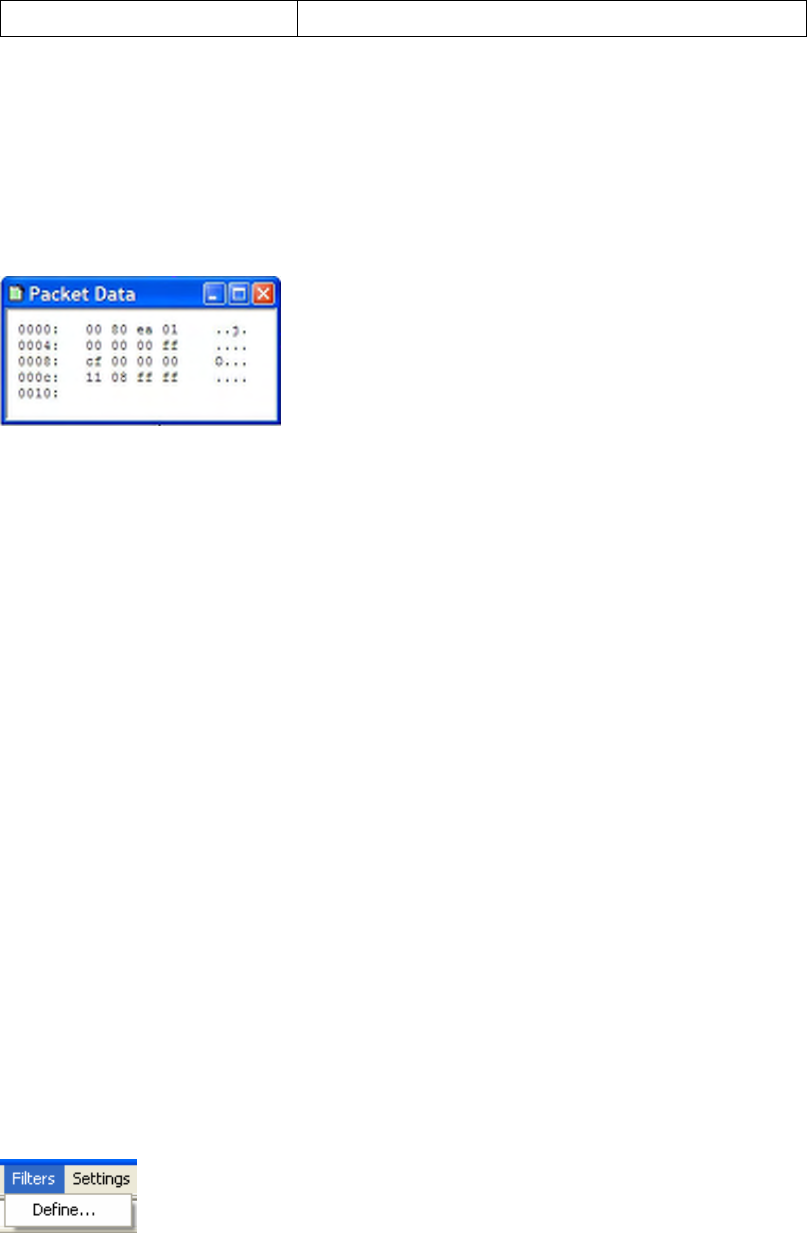
Right-clicking on a node inside the Packet Decode tree brings up the context sensitive menu.
Figure 20 Packet Decode Context Sensitive Menu
Expand/Collapse Expands or Collapses the current level of the tree
Add to Filter… Opens the Define Filter… dialog with a pre-defined filter
based on the highlighted field and its current value.
Copy As Text Copy the requested text to the Clipboard for pasting into
another application (e.g. text editor)
SENSOR NETWORK ANALYZER USER GUIDE
DAINTREE NETWORKS PAGE 29 OF 86
Expand/Collapse All Expands of Collapses the entire decode
Selecting particular fields within the Packet Decode window will cause the packet data corresponding to
that field to be highlighted in the Packet Data window when that window is displayed.
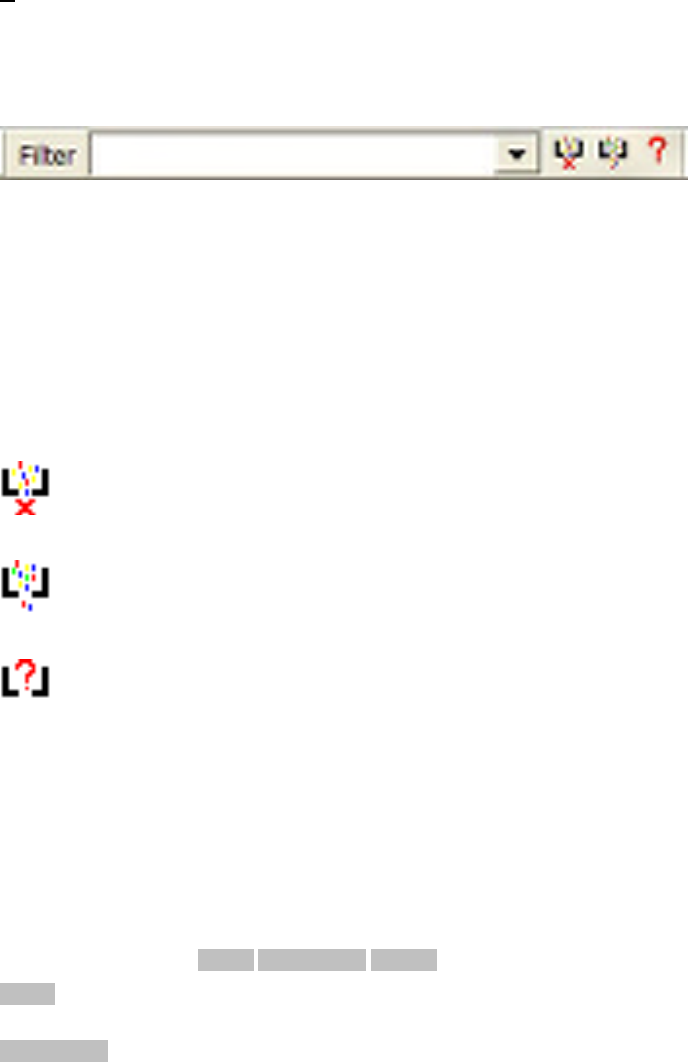
5.3 The Packet Data Window
The Packet Data window displays all data contained within the packet in its raw hexadecimal and ASCII
form, 16 octets per line. The first column is an index of octet numbering. Packet data corresponding to a
field which has been selected within the Packet Decode window will be highlighted.
Figure 21 Packet Data
Selecting particular bytes in the Packet Data window will automatically highlight the corresponding fields
in the Packet Decode window.
5.4 Protocol Decoder Display Filters
Display filters provide a means of pre-selecting the types of packets displayed within the Packet List (and
hence Packet Decode and Packet Data) windows. This can be useful when wishing to observe particular
device or network activity, for example, only NWK layer commands initiated by a particular device.
Display filters invoke filtering for display purposes only. In other words they limit what is displayed
according to the conditions specified by the filter. Defining and applying a filter will not result in data
accumulated within a capture session to be discarded. When a display filter is removed, the Packet List
window will revert to containing all received packets during that particular capture session.
Display filters are applied to the protocol decoder windows only. They do not provide filtering for
measurements or visualization.
Defining Filters
Several methods are available to define a filter.
• Using the Filter Menu or the Filter Toolbar (if displayed). See below.
• By right clicking on a field within the Packet Decode window. Right clicking on a field within the
Packet Decode window will provide an option to define a new filter using that field by means of
the ‘Define Filter’ menu item. Selecting this will launch the Define Filter dialog box with the
field in question pre-selected.
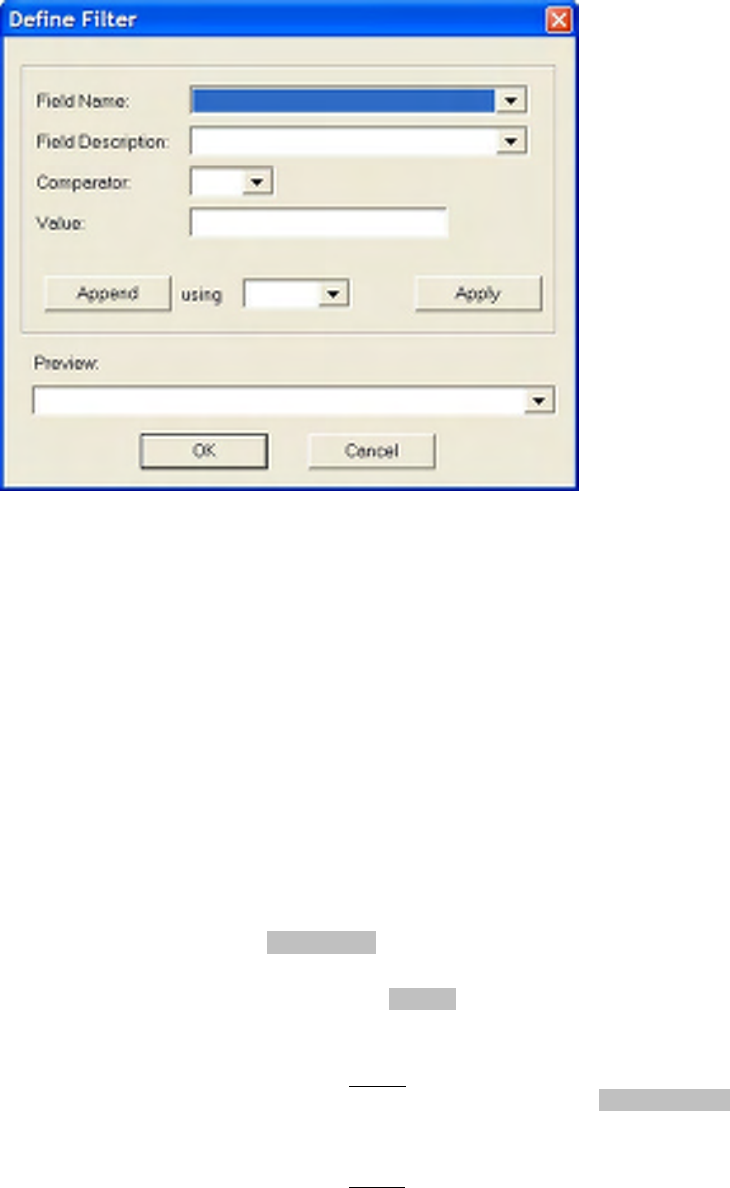
Filter Menu and Filter Toolbar
The Filters Menu may be used to define the filter conditions.
SENSOR NETWORK ANALYZER USER GUIDE
DAINTREE NETWORKS PAGE 30 OF 86
Define… This menu item brings up the ‘Filters’ dialog box. If a capture operation is
in progress, this menu item will be disabled.
Filters may also be defined using the Filters Toolbar. In addition, the Filters Toolbar allows Filters to be
applied or reset.
Filter: Indicates any display filter currently applied. If no filter is active
then the field will be blank. A drop down list can be used to retrieve
recently defined filters. An existing filter may be edited or a new
filter typed or pasted into this toolbar field.
This drop down list will display the filter as it is being created and
will also allow the user to manually update the filter string. The user
will also be able to choose from the drop down list any of the last 10
defined filters.
Reset Filter
Disables any currently active filtering, clearing the Filter field in the
Filter Toolbar.
Apply Filter
Applies a filter which has just been defined.
Define Filter
Opens the filter definition window, enabling construction of a new
filter.
Note that when filters are active the display window titles will be appended with ‘Filtered’.
Filter Expressions
Filters may be specified to varying degrees of complexity, as described below.
Simple Filters
A simple filter is a conditional relationship between a single protocol field and some defined value,
expressed in the format ( FIELD field operator VALUE ), where
FIELD is the name of a specific protocol field. Valid field names and their descriptions are listed in an
appendix to this document.
field operator is a comparator which can be one of the following
== Equal to
!= Not equal to
< Less than
> Greater than
<= Less than or Equal to

SENSOR NETWORK ANALYZER USER GUIDE
DAINTREE NETWORKS PAGE 31 OF 86
>= Greater than or Equal to
VALUE is a constant
Example: ( mac-layer.seqNo == 170 )
Note that simple filter expressions are required to be bracketed.
Compound Filters
A compound filter consists of two or more simple filter conditions conjugated in the following manner
( ( SIMPLE FILTER ) append operator ( SIMPLE FILTER ) ) where
append operator is a comparator which can be one of the following
&& And
|| Or
Example: ((mac-layer.seqNo == 170) || (mac-layer.seqNo == 87))
As with simple filters, compound filter expressions are required to be bracketed.
Multi-Stage Filters
Typical syntax for multi stage filters:
( ( SIMPLE FILTER ) append operator ( SIMPLE FILTER ) append operator ( SIMPLE FILTER ) )
( ( SIMPLE FILTER ) append operator ( COMPOUND FILTER ) )
( ( COMPOUND FILTER ) append operator ( SIMPLE FILTER ) )
( ( COMPOUND FILTER ) append operator ( COMPOUND FILTER ) )
Example: ((mac-layer.seqNo == 170) || (mac-layer.seqNo == 87) && ( mac-layer.fcFrmType == 0))
Again, multi-stage filter expressions are required to be bracketed.
The Define Filters Dialog Box
The Define Filters dialog box may be launched from the Filter Menu, Filter Toolbar or from within the
Packet Decode window. The appearance and use of the define filters dialog box is described below. Refer
to the information above concerning filter expressions for more information on field operators and append
operators.
SENSOR NETWORK ANALYZER USER GUIDE
DAINTREE NETWORKS PAGE 32 OF 86
Field Name The name of a specific protocol field in shorthand notation. Valid names
are listed later in this manual.
The protocol field name may be typed or pasted. Alternatively, it may be
selected from the drop down list, which contains all possible field names.
When the define filter dialog box is launched from the Packet Decode
window using the right click it will be preloaded with the relevant filter
name. When launched from the Filter Menu or Filter Toolbar it will
default to blank.
Field Description Is a textual description of the protocol field shown in Field Name above it.
This is an informational display only, but does allow a protocol field to be
chosen from the drop down list, providing a more meaningful field
description. If a protocol field is chosen from this drop down list, it’s
shorthand notation will be shown in Filed Name above it, replacing any
previously selected field name.
Comparator Is the field operator described above in the reference information on filter
expressions. A comparator may only be selected from the drop down list.
Value A constant, being the VALUE described in the reference information on
filter expressions above. This text field will allow the user to enter the
protocol field value against which the comparison is to take place.
Append using This button will append the currently defined filter onto the end of the
preview string using the selected operator as the append operator. This
allows the user to build compound filters. Valid operators are && (and)
and || (or), chosen from the drop down list.
Apply This button will replace the contents of the preview string with the defined
simple filter.
Preview This drop down list will display the filter as it is being created and will
SENSOR NETWORK ANALYZER USER GUIDE
DAINTREE NETWORKS PAGE 33 OF 86
also allow the user to manually update the filter string. The user is also be
able to choose from the drop down list any of the last 10 defined filters.
OK Accept the filter and close the dialog. If the filter has changed this will
apply the new filter and make it active.
Cancel Closes the dialog, causing any changes to be discarded.
5.5 Logging
If enabled, logging saves incoming packets as they are received as a background activity, automatically and
transparently to the user. An alternative to logging is to save a capture session to a log file at the end of
that session. Logging options are available from the Settings -> Options Menu item as shown below.
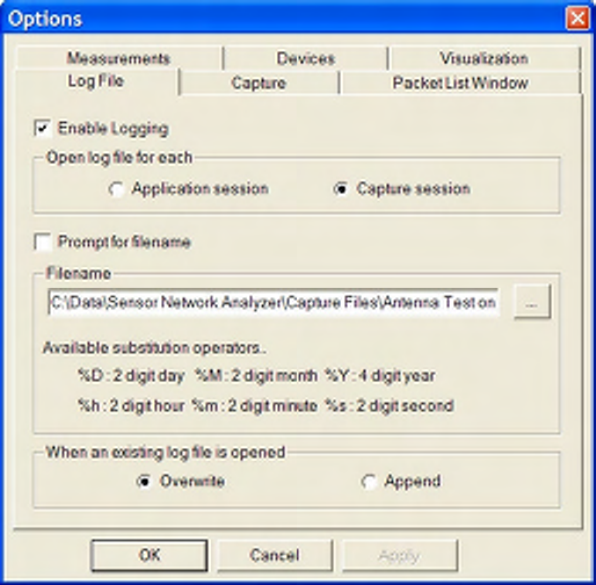
Figure 22 Logging Options
Each of the available options is described below:
Enable Logging Background logging will not occur unless this box is checked. If logging
is disabled, all remaining fields in this tab will be inactive. The
application will initially default to logging disabled.
Open log file for each This radio button selection allows the user to determine whether the log
file logic is executed once only at application start up time or each time a
capture session is started. If ‘Application session’ is selected, one log file
will be created, consisting of all data including that from multiple capture
sessions. If ‘Capture session’ is selected, a new log file will be created at
the start of each capture session. That is, the log file is opened concurrent
with a Start Capture operation, and closed when a Stop Capture operation
SENSOR NETWORK ANALYZER USER GUIDE
DAINTREE NETWORKS PAGE 34 OF 86
occurs.
Prompt for filename If checked, each time the application launches or a capture session is
initiated (depending upon the ‘Open log file for each’ preference) the user
will be prompted to manually enter a log file name.
Filename Specifies the log file name. If ‘Prompt for file name’ is selected this field
will be disabled and its contents ignored.
The file extension defaults to .dcf unless otherwise specified, and assumes
default text format. Refer to the description of capture file formats later in
this document for more information. The contents of this field will default
to the last filename specified even if it is from a previous application
session.
To enable automatic unique file name creation facilitating completely
automatic background operation, the file name may be constructed from or
appended with date and time descriptors. For example, specifying
c:\temp\mycapturefile_%M%D%Y_%h%m%s.dcf would result in a log
file name of the format c:\temp\mycapturefile_08272004_140312.dcf.
When an existing log
file is opened
This radio selection will allow the user to specify what happens to an
existing log file of the same name when the log file logic is executed. If
‘Overwrite’ is selected the log file will be overwritten without warning. If
‘Append’ is selected the log file is appended with new data.
SENSOR NETWORK ANALYZER USER GUIDE
DAINTREE NETWORKS PAGE 35 OF 86
6 Device Tree
The Device Tree offers a network and device-centric view of an 802.15.4 or ZigBee network. It
automatically detects network formation, reports changes to the network structure and notifies of the states
of individual devices in the network, especially with regard to formation. The Device Tree is created from
the same packet stream, using the same live capture packets or opened capture file as the Protocol Decoder
Windows. Note that Protocol Decoder Display Filters have no affect on the Device Tree (or for that matter,
measurement or visualization windows).
6.1 Device Tree Window
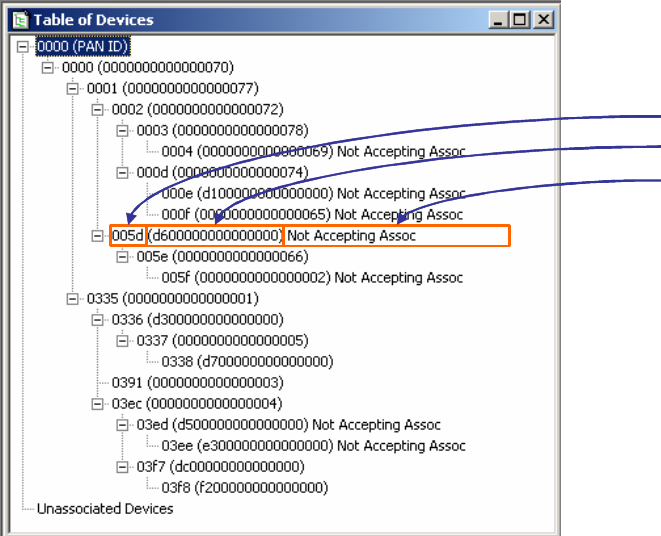
The Device Tree window displays the network topology by observing 802.15.4 ASSOCIATION-Response
messages.
It provides a tree-view of the network topology, as shown below.
Short Address Field
Long Address Field
Information Field
Short Address Field
Long Address Field
Information Field
Figure 23 Device Tree Window
The Device Tree provides topology information for multiple PANs, and within each PAN, each device’s
long and short addresses, and the device hierarchy.
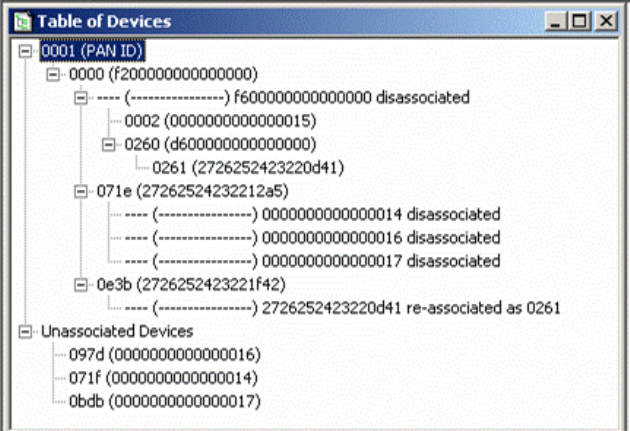
An additional information field is provided which may display:
• If the device is accepting associations
• If the device has reassociated to another location in the device tree.
• Disassociated devices are shown in a separate section.
Each level of the tree may be expanded or collapsed as implied by the tree display format.
The Device Tree window will be updated only when a change occurs to the table, but no more often than
once a second.
SENSOR NETWORK ANALYZER USER GUIDE
DAINTREE NETWORKS PAGE 36 OF 86
Figure 24 Device Tree - with Dis-associations and Re-associations
NOTE: The Device Tree uses MAC layer Association Response messages to detect new devices joining the
network. As such it is important for the capture session to begin when the network is formed such that it
detects these association messages. If a capture session is started after the formation of the network, the
Visual Device Tree will not be displayed.
6.2 Device Tree Options
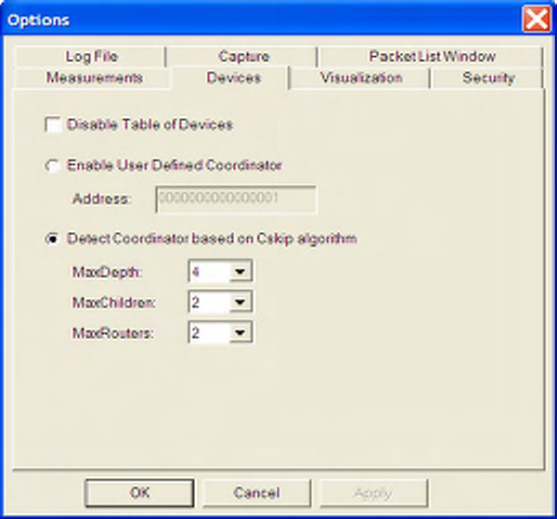
The Settings -> Options menu item contains a Devices tab.
SENSOR NETWORK ANALYZER USER GUIDE
DAINTREE NETWORKS PAGE 37 OF 86
Figure 25 Devices Options
The first option is a checkbox option to disable the Table of Devices. This will default to “Enabled”. If
“Disabled”, the Table of Devices will not process any subsequent packets, and this will disable all
measurements and visualization features which are dependent on the Table of Devices. Under normal
operation, when disabled, the Table of Devices simply slaves off the capture system controls.
The other options associated with the Table of Devices are concerned with coordinator detection.
Coordinator detection is complicated by the fact that there is no message defined in 802.15.4/ZigBee
networks that carries both the short and long address of the coordinator. The Device Tree component
typically requires the first device that associates with the coordinator to be a Router device. It uses
detection of the Short Address of 0x0001 to identify such an association. If instead an End-Point device,
with short address other than 0x0001, joins the coordinator the default algorithm used to identify the
coordinator and device tree may be unreliable. To overcome this issue the user should define a User
Defined Coordinator, or set the Cskip parameters in the Device Options (Options menu, Devices Tab).
When using the User Defined Coordinator, the SNA will look for the device with the supplied long address
and when detected configure it as the coordinator with address 0x0000.
When using the CSKIP based approach, the SNA will calculate which short addresses the coordinator may
assign to its children and if its see one of those addresses being allocated it assumes the parent device is the
coordinator with address 0x0000.
SENSOR NETWORK ANALYZER USER GUIDE
DAINTREE NETWORKS PAGE 38 OF 86
7 Measurements
7.1 Measurements Window
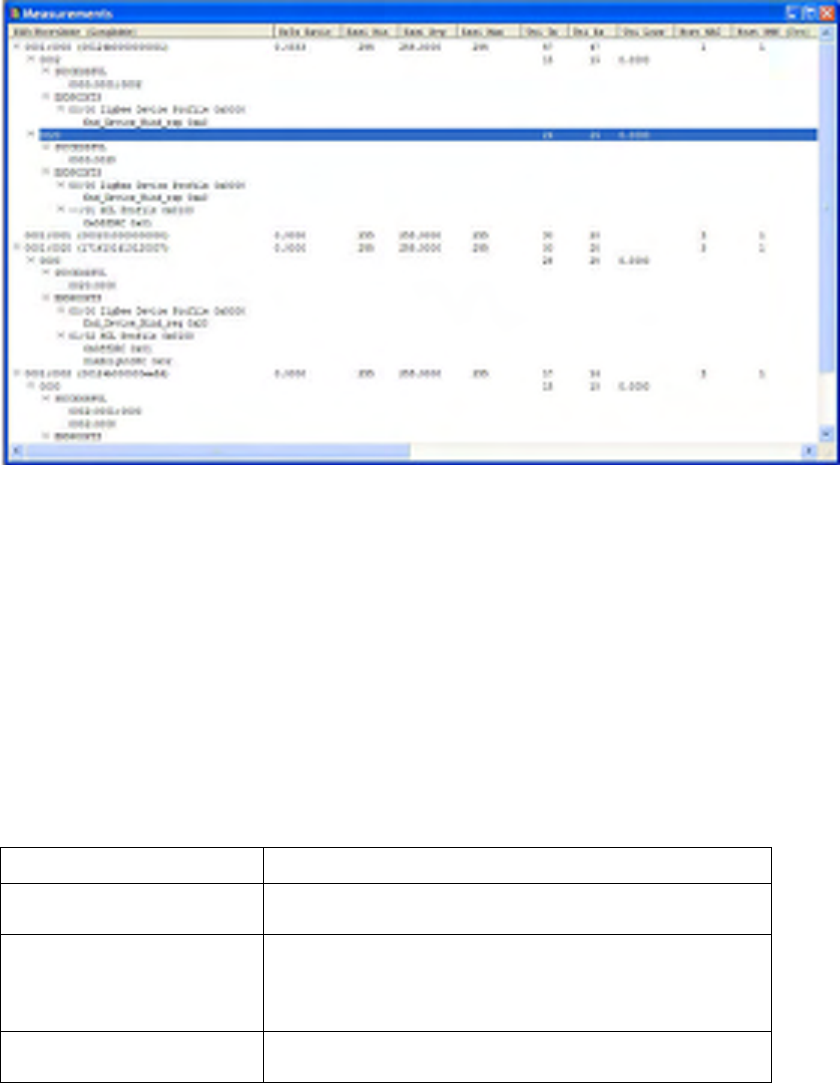
The measurement system provides summary information on the state of devices, streams and routes.
Figure 26 Measurements Window
The Measurements window is a multi-column display with the first column containing an
expandable/collapsible tree that will adjust the display (ie., show/hide) for the entire row (across all
columns). The hierarchy supported in the tree is PAN, device, stream, route type, and route. All but the
route can be expanded and collapsed.
A Stream is defined as all packets transmitted at the NWK layer between two devices.
A Route is defined as a unique sequence of nodes traversed by a given stream of packets. Hence a stream
will be comprised of one or more routes. Packets on a given route are tracked using the Source device and
the NWK layer sequence number.
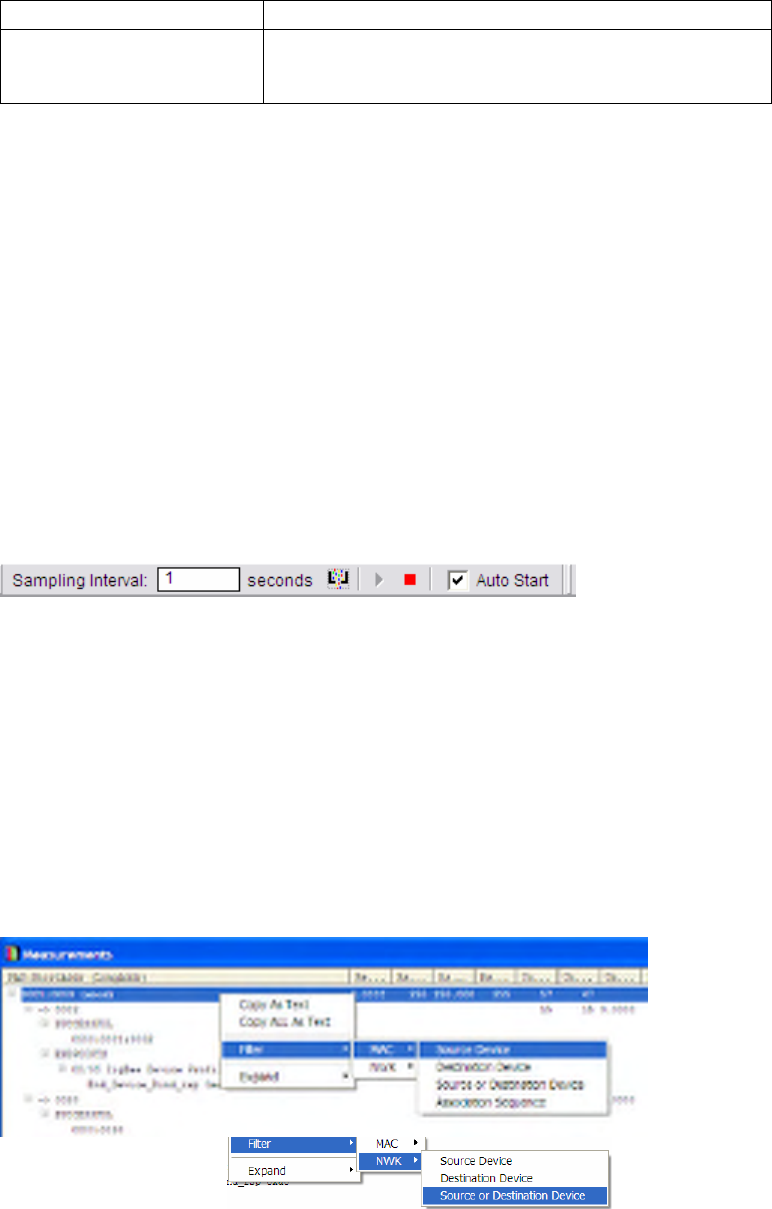
Route Types
A number of route types are supported. These include:
Route Type Description
SUCCESSFUL A given packet correctly arrived at its destination and all hops
from source to destination device were detected.
MALFORMED A given packet correctly arrived at its destination but some
hops were not detected and the analyzer cannot be 100% sure
of the path taken by the packet. For this route type, the first
hop was detected.
MALFORMED-S A variant of the MALFORMED route where the first hop was
not detected.
SENSOR NETWORK ANALYZER USER GUIDE
DAINTREE NETWORKS PAGE 39 OF 86
REROUTE For packets that arrive at the destination but via a re-route.
FAILED A given network layer packet was detected at one or more
hops but the packet was not detected arriving at its intended
destination.
Note the comments on multi-node capture earlier in this user guide for appropriate configuration of the
system and placement of capture hardware.
Start/Stop Controls
The Measurement System is provided with an additional set of start/stop controls. This enables multiple
measurement sessions within a single capture session (the Start/Stop capture controls provide the
overriding capture controls for the analyzer). When the measurement system is turned on, any existing
measurements will be flushed (set to zero). Measurements will be taken from the time it is turned on. The
measurement system cannot be turned on (and its controls must be disabled) if the capture system is off.
For more information see the chapter on operating the SNA, earlier in this user guide.
When a logfile is loaded, the measurement system is turned on automatically. There is an option to disable
this Auto-Start feature in the measurements tab of the Options dialog box.
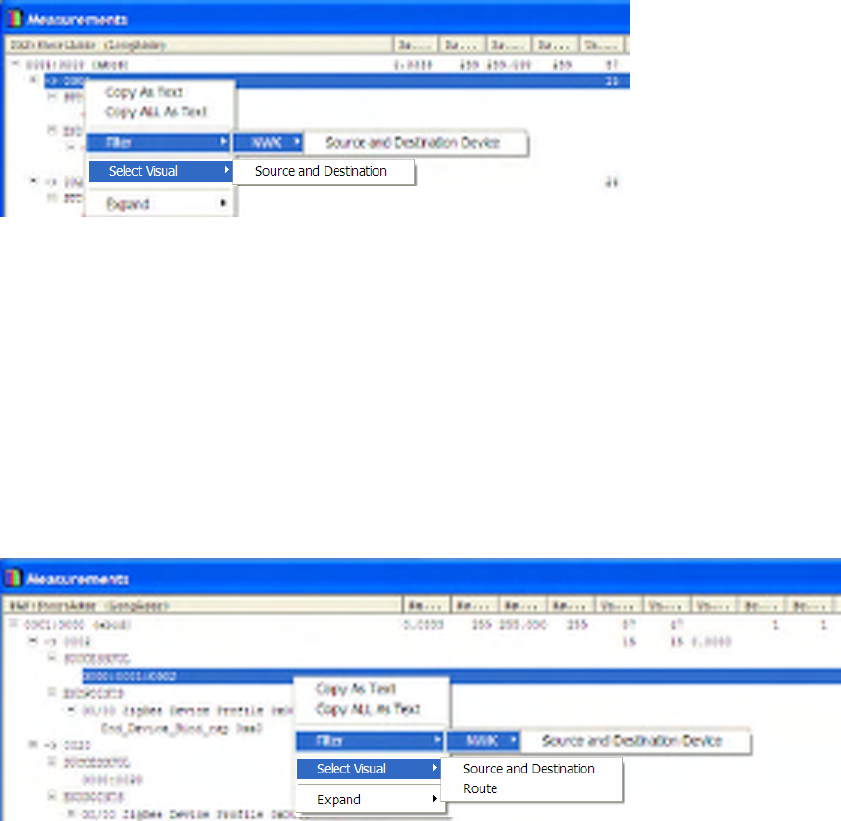
The Measurement System is subject to a sampling interval that determines how often the measurements are
updated. The sampling interval is set to 1 sec by default but can be changed to any integral number of
seconds. When Measurements are stopped, the current sampling interval is completed and the
measurements updated.
The Measurement Start/Stop controls, sampling interval and Auto-Start selection are available from the
Measurement Toolbar.
Figure 27 Measurements Toolbar
7.2 Context Menus
Each level of the Measurements hierarchy provides a unique right-click context menu. Context menus
enable the selection (and highlighting) of corresponding items in the Visual Device Tree, or provide
shortcut packet filter operations to filter the packets shown in the packet list based on the selected item in
the Measurements View. Different context menu items are available for different items.
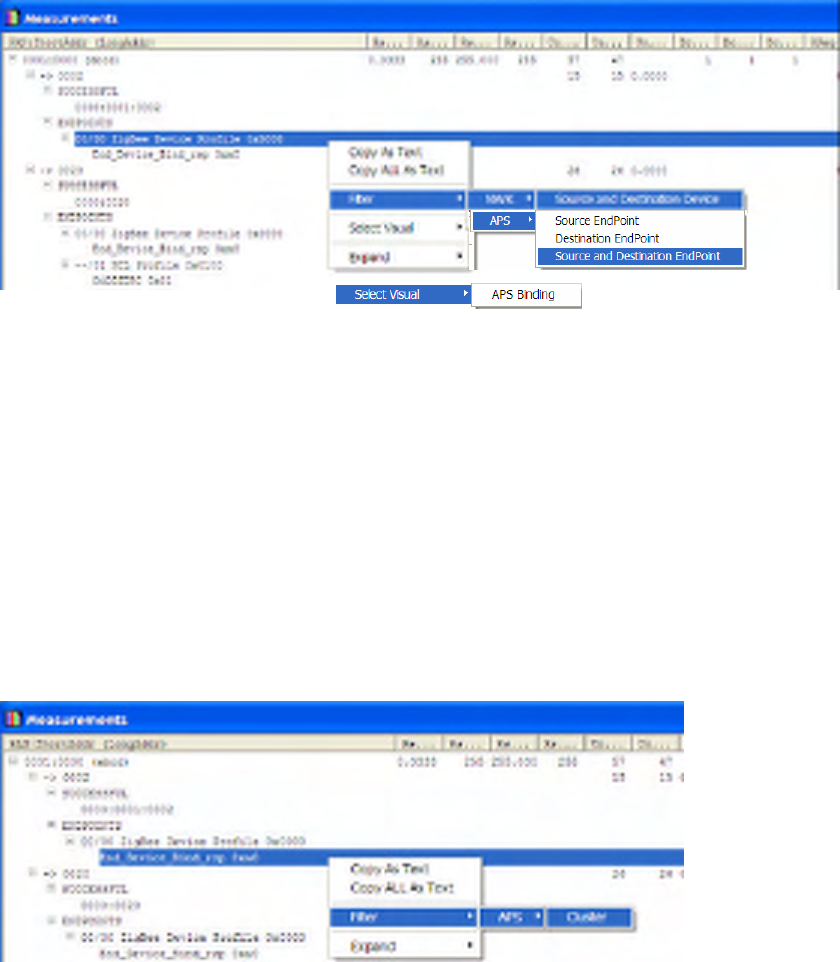
Device Context Menu
The Device Context menu is available by right-clicking on a device in the measurements window.
Figure 28 Device Context Menus
SENSOR NETWORK ANALYZER USER GUIDE
DAINTREE NETWORKS PAGE 40 OF 86
The following context menus are available:
• MAC Layer Filters to match all packets where the selected device is the Source, Destination, or
either (this will match both short and long addresses),
• Mac Layer Filter to match when this device has participated in the MAC layer association
sequence; this is useful to debug network formation issues,
• NWK Layer Filters to match all packets where the selected device is the Source, Destination, or
either.
Stream Context Menu
As described earlier, a Stream represents all of the Network layer packets flowing between two devices. At
the stream level the following context menus are available.
Figure 29 Stream Context Menus
The following context filters are available:
• NWK Layer Filters to match all packets corresponding to this stream i.e. between the given source
and destination,
• Select Visual -> Source and Destination option to highlight the given source and destination
device in the Visual Device Tree.
Route Context Menu
As described earlier, a Route represents all of the Network layer packets flowing between two devices
along a given path (identified by the sequence of nodes traversed by the packets). The Route Context Menu
is available by right-clicking on a Route in the Measurement window.
Figure 30 Route Context Menus
The following context menus are available:
SENSOR NETWORK ANALYZER USER GUIDE
DAINTREE NETWORKS PAGE 41 OF 86
• NWK Layer Filters to match all packets corresponding to the associated stream i.e. between the
given source and destination,
• Select Visual -> Source and Destination option to highlight the given source and destination
device in the Visual Device Tree
• Select Visual -> Route to select and highlight the corresponding route in the Visual Device Tree.
APS Binding Context Menu
An APS Binding represents all of the APS layer packets flowing between two APS end-points on two
different devices. The APS Binding context menu is available by right-clicking on an APS binding in the
Measurements window.
Figure 31 APS Binding Context Menus
The following context menus are available:
• NWK Layer Filters to match all packets corresponding to the associated stream i.e. between the
given source and destination,
• APS Layer Filters to match packets flowing from the Source Endpoint and/or to the Destination
Endpoint
• Select Visual -> APS Binding to select and highlight the corresponding APS Binding in the Visual
Device Tree.
APS Cluster Context Menu
An APS Cluster identifies a specific class of Application layer attributes being exchanged by two APS end-
points on two different devices. The APS Cluster Context Menu is available by right-clicking on an APS
Cluster in the Measurements window.
SENSOR NETWORK ANALYZER USER GUIDE
DAINTREE NETWORKS PAGE 42 OF 86
Figure 32 APS Cluster Context Menus
The following context menus are available:
• APS Layer Filters to match all packets on the given cluster between the given source
device/endpoint and the given destination device/endpoint.
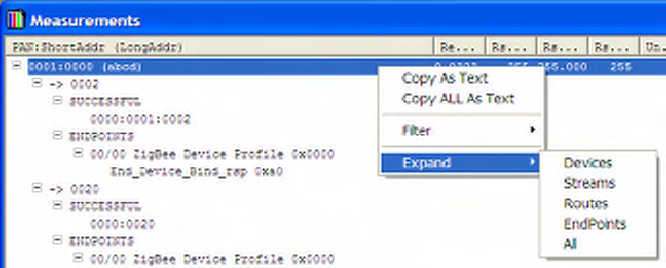
Expand Context Menu
The Expand right-click context menu is available for the entire Measurements Window and is not specific
to different levels of the measurement hierarchy. The Expand menus determine to what level the
Measurements hierarchy is expanded and collapsed and hence determines what is shown at any point in
time.
Figure 33 Expand Context Menus
The following context menus are available:
• Expand Devices will show the device level but collapse all others,
• Expand Streams will show Devices and Streams but collapse routes and APS Endpoints,
• Expand Routes will show Devices, Streams and Routes, but not APS Endpoints,
• Expand Endpoints will show Devices, Streams and APS Endpoints but not Routes,
• Expand All will show everything.
7.3 Measurements Options
There is an Options tab in the Options dialog available from the Settings -> Options menu item.
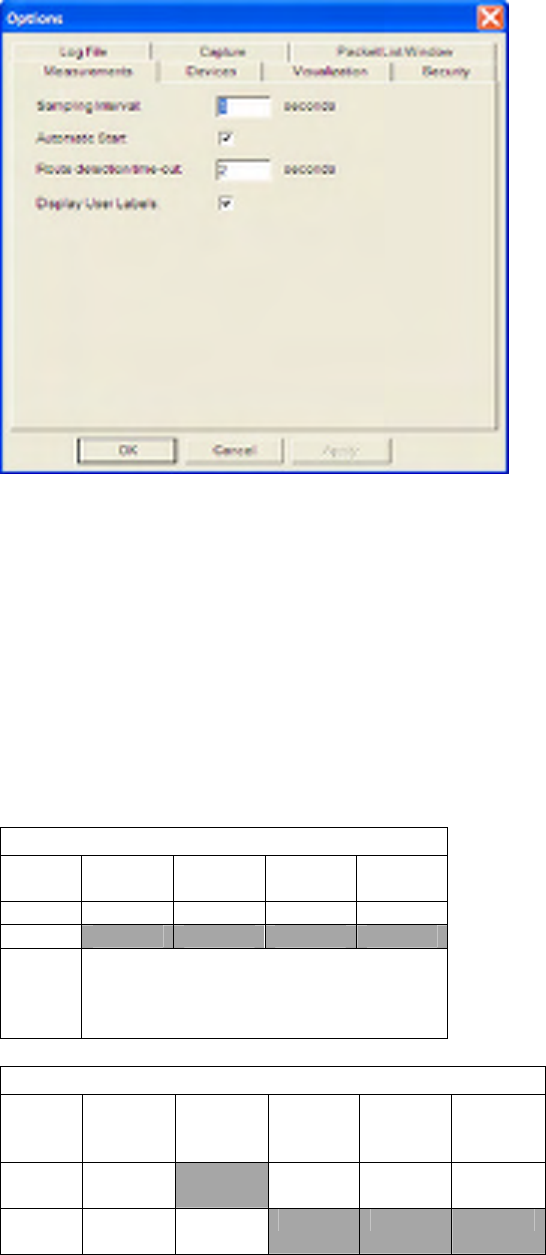
SENSOR NETWORK ANALYZER USER GUIDE
DAINTREE NETWORKS PAGE 43 OF 86
This provides an alternate location for setting the sampling interval and for selecting the Auto-Start feature.
The Options dialog also provides for setting of a “Route Detection Timeout”. This is the amount of time in
seconds during which the Analyzer will wait for all hops of a given route to be detected. If at the end of the
route detection timeout the final hop has not been detected the given Route will be marked as FAILED.
Routes are timed out at the end of each sampling interval if it has been longer than the Route Detection
Timeout since the last packet was detected on the route.
The “Display User Labels” option will show user labels for devices shown in the Measurements view based
on the label defined in the Device Naming Table (see later section). If selected the user label will be shown
instead of the devices long address. This option is disabled by default.
7.4 Available Measurements
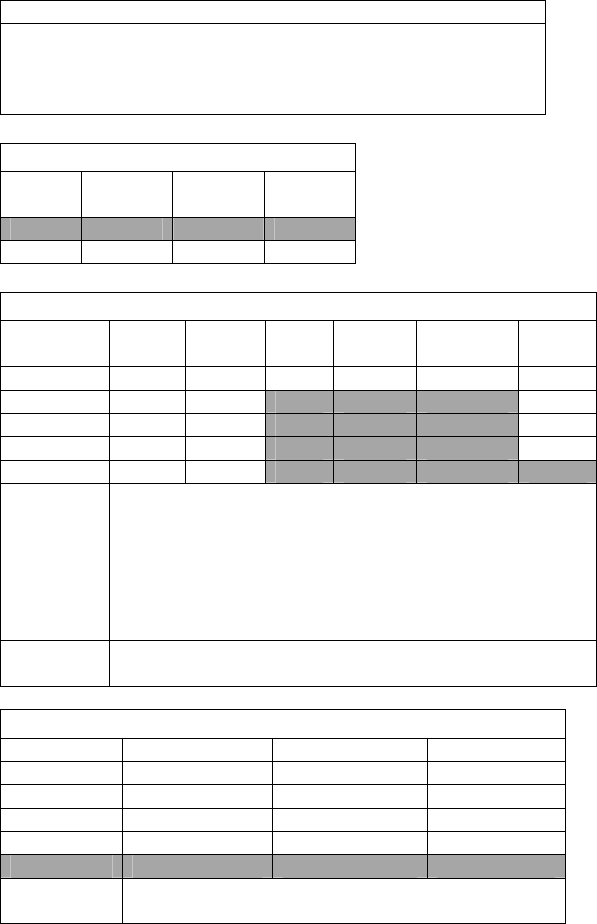
Transmission Measurements
ReTx
Ratio RSSI
Min RSSI
Avg RSSI
Max
Device Yes Yes Yes Yes
Stream
Status Retransmission ratio: the proportion of
retransmitted packets detected
RSSI values are as reported by the Capture
Device for each packet.
Basic Packet Measurements
Uni Tx Uni Rx Uni Loss Bcst
MAC Bcst
NWK
(Tot)
Bcst
NWK
(Unique)
Yes
(MAC) Yes
(MAC) Yes Yes Yes
Yes
(NWK) Yes
(NWK) Yes
(NWK)
SENSOR NETWORK ANALYZER USER GUIDE
DAINTREE NETWORKS PAGE 44 OF 86
All of these are running in Alpha-1 (except for UNI Loss)
These measurements are basic counts that do not do any route
tracking. They simply count on the basis of packets transmitted
from source (MAC or NWK) and packets received at destination
(MAC or NWK)
Route Discovery Measurements
RReq RRep Rrep
Cost Rerr
Yes Yes Yes Yes
Packet Performance Measurements
Tx
Count Rx
Count Loss SeqErr Duplicate BitErr
Stream Yes Yes Yes Yes Yes Yes
Simple
Yes Yes Yes
Reroute
Yes Yes Yes
Malformed
Yes* Yes Yes
Failed
Yes Yes**
Status These measurements are all reliant on the use of a unique
sequence number, identifying the packet uniquely transiting
through the network. The four types of routes are : Simple
(normal transmission through the network), Reroute (one or
more reroute occurred), Malformed (missing hops or did
not see initial transmission) and Lost (packet did not arrive
at destination, or did not see last hop)
Notes * Tx count may be less than Rx count. ** By definition, Rx
count = 0 and Loss = 100%.
Latency Measurements
Delay Min Delay Avg Delay Max
Stream Yes Yes Yes
Simple
Yes Yes Yes
Reroute
Yes Yes Yes
Malformed
Yes* Yes* Yes*
Failed
Status Latency measurements are only possible for packets
that were detected through their final hop.
SENSOR NETWORK ANALYZER USER GUIDE
DAINTREE NETWORKS PAGE 45 OF 86
8 Visual Device Tree
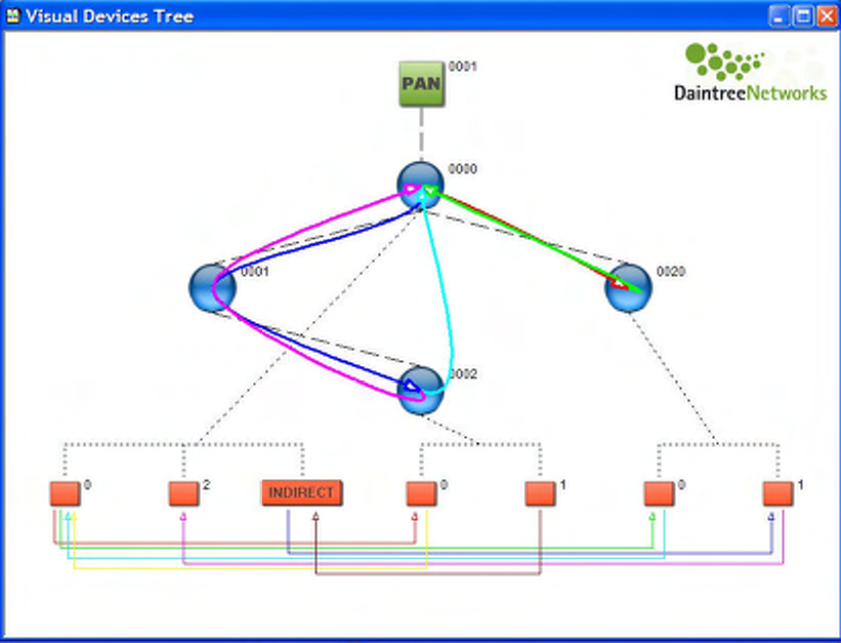
The Visual Devices Tree Window provides a graphical rendition of network topology and information
flows between devices.
Figure 34 Visual Device Tree
8.1 MAC Layer Visualization
In its most basic form, the Visual Device Tree Window provides a graphical tree diagram that represents
the latest device association tree. This corresponds to the Device Tree Window contents.
Devices are shown as circles (or icons as described below) with links between them corresponding to each
MAC layer association. Devices are labeled with the Short Address. Fly-over help is available for each
device which displays the long IEEE address.
The Visual Device Tree Window displays the device association tree for a single PAN at a time. The
current PAN ID will be shown in a rectangle as the root of the tree. Right clicking on the PAN ID will
allow the user to select from a list of available PANs.
The window has a resize option which can be useful for optimizing the visibility of various sized networks.
The user may choose from large, medium and small devices and fonts. This essentially provides a three
level zoom-in and zoom-out capability. This selection is available from the toolbar and by right-clicking
anywhere in the Visual Device Tree window. If the network is too large to fit in the current window scroll-
bars will appear enabling the user to scroll around the diagram.
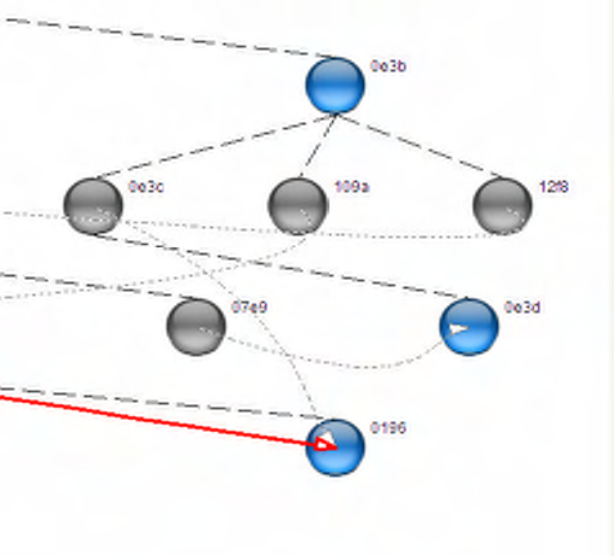
SENSOR NETWORK ANALYZER USER GUIDE
DAINTREE NETWORKS PAGE 46 OF 86
NOTE: The Visual Device Tree uses MAC layer Association Response messages to detect new devices
joining the network. As such it is important for the capture session to begin when the network is formed
such that it detects these association messages. If a capture session is started after the formation of the
network, the Visual Device Tree will not be displayed.
Reassociations
In 802.15.4 networks it is not uncommon for a device to lose its association and reassociate with another
device in the tree. For these reassociated devices, the previous location in the tree is shown in grey (for the
default application icons). There is a grey arrow linking the old location to the new location in the tree with
an arrow head indicating the old and new location. A chain of linked re-associated nodes is used to display
multiple reassociations of the same device.
A configuration option is available to hide re-associated nodes and an additional option to disable the re-
association arrows (which is only available if the user chooses to show the reassociated nodes). Re-
associated nodes can only be hidden if they do not have any active children.
The following demonstrates the appearance of a Reassociation, where device previously a child of 0e3b
assigned short address 0e3c has reassociated elsewhere as 0196.
Figure 35 Visual Reassociations
Note that inactive devices, such as a device that has been powered off or removed, will reassociate if re-
introduced to the network, but will remain displayed until such a reassociation occurs. As such it is often
difficult to identify idle or inactive devices. This is an artifact of there being no requirement in
802.15.4/ZigBee that a device make such an event known, or polling-like events which would reveal it.
8.2 Network Layer Visualization
The network layer visualization adds NWK layer routing information to the visualization. This will show
the flow of packets between devices. The display of NWK layer routes can be enabled or disabled
explicitly by the user using the Protocol Menu selections.
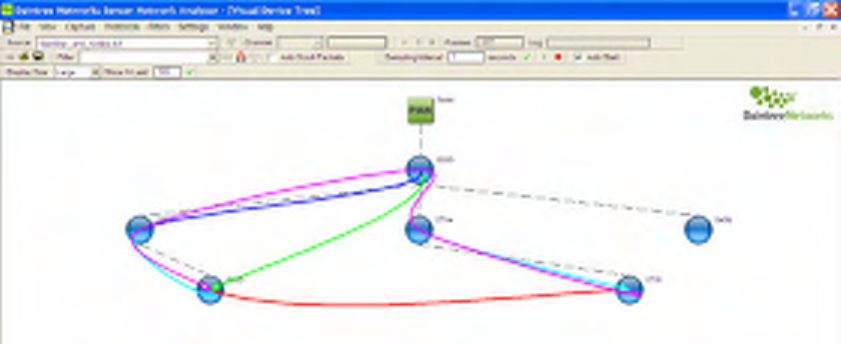
SENSOR NETWORK ANALYZER USER GUIDE
DAINTREE NETWORKS PAGE 47 OF 86
The Visual Devices Tree Window will display routes that indicate the flow of packets through the network.
Each route is shown as a spline that intersects each device the route traverses. An arrow-head is used to
show the direction of the route.
Routing information is based on the same route detection algorithm used by the Measurement System. As
such routes will only be displayed if the Measurement System is active. Whenever the Measurement
System is restarted, all routes are cleared from the measurement system data structures, and all routes will
be removed from the visualization. The device association tree will remain intact.
Routes are shown in a variety of colors. The color of an individual route is selected from a color palette of
16 different colors, different from the color used to draw the devices. If more routes are required than
number of available colors, colors are reused. Colors are used to differentiate the routes; there is no special
meaning associated with any particular color.
Figure 36 Visual Display of Routes
Device Selection
The user can choose to restrict display of routes to those between a particular source and destination device.
Devices are selected by clicking the devices on the diagram, first the source and then the destination.
Devices are unselected by clicking in an open area of the display. The selected devices are highlighted.
Both source and destination are highlighted using the same highlighting mechanism, but the user can
distinguish them based on the arrow-head on the route/s. If there are no devices selected, routes will be
shown for the entire PAN.
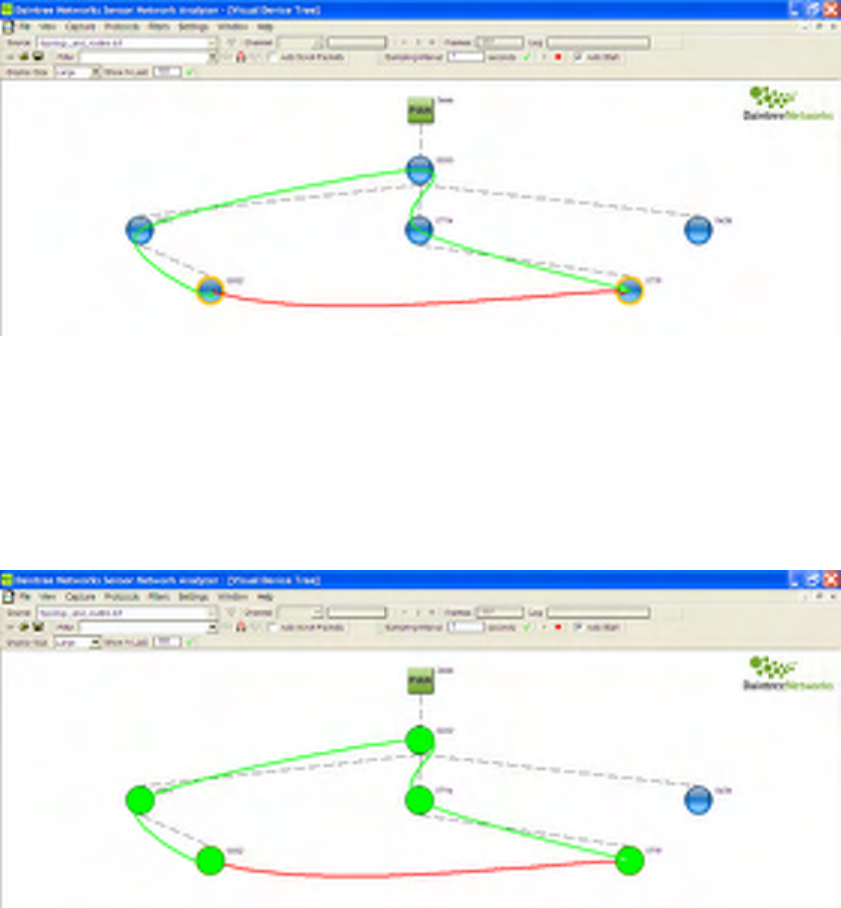
SENSOR NETWORK ANALYZER USER GUIDE
DAINTREE NETWORKS PAGE 48 OF 86
Figure 37 Device Selection
In the example shown above device 0002 has been selected as the source, and device 071f has been
selected as the destination. Only the routes between those two devices are shown.
Route Selection
Routes can be selected by clicking on the spline representing the route. When a route is selected, each of
the devices the route traverses will be highlighted using the same colour as the route spline. The route can
be unselected by clicking on an open area of the display.
Figure 38 Route Visualization
The system will auto-select the latest route such that when a new route is detected, it is automatically
highlighted together with each of the devices it traverses. This applies whether or not there is a selected
source and destination device. If there is a currently selected source and destination device only the latest
route between those two devices is auto-selected. If the user explicitly selects a route the SNA will
maintain the user selection. Auto-selection only occurs when there is no current user selected route.
Displaying different route types
The Visual Device Tree displays SUCCESSFUL, FAILED, MALFORMED and MALFORMED-S routes:
• For FAILED routes the SNA shows only the segment of the route that was detected ,
SENSOR NETWORK ANALYZER USER GUIDE
DAINTREE NETWORKS PAGE 49 OF 86
• FOR MALFORMED-S routes the SNA shows the route from the first node detected up to its
destination
• For MALFORMED routes the SNA shows the complete route from source to destination with dashed
lines indicating the missed hops.
There is an option to disable the display of FAILED/MALFORMED routes and as such only display
SUCCESSFUL routes.
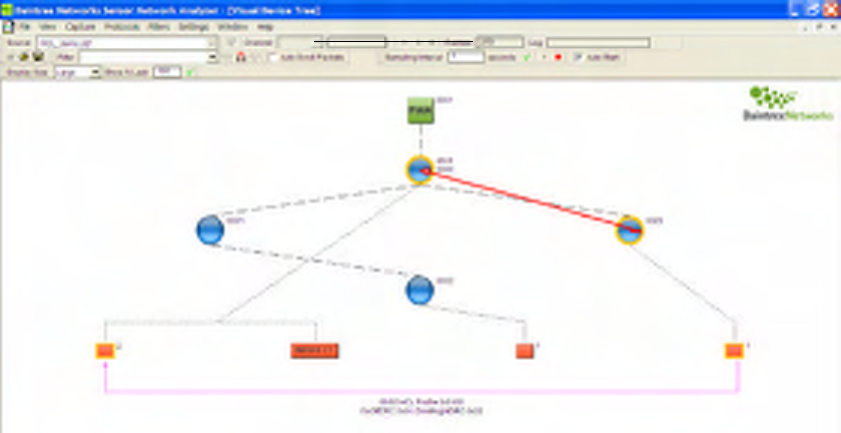
SENSOR NETWORK ANALYZER USER GUIDE
DAINTREE NETWORKS PAGE 50 OF 86
8.3 Application (APS) Layer Visualization
The APS layer visualization adds application endpoint and binding information to the visualization. This
includes:
• Extended device tree to show endpoint information on the end devices
• Display of (implicit) bindings between endpoints on different devices,
• Display of the flow of packets (routes) between endpoints.
The APS layer support can be enabled or disabled explicitly by the user using the Protocol Menu
selections.
Like the network layer visualization, the application layer visualization will only be displayed if the
Measurement System is active. The APS layer analysis is based on the detection of APS data packets. The
APS packet header includes the source endpoint, Profile ID, cluster ID, and destination endpoint (although
source or destination EP may be absent in when indirect addressing is used).
One of the complexities involved with APS layer analysis is the use of indirect addressing. Indirect
addressing is used when a particular end device does not have direct support for binding i.e. it doesn’t
know the final destination for the APS packets it sends. Instead the end device will forward the APS
packets to the co-ordinator, the co-ordinator performs a binding table lookup and then forwards the packets
to the associated destination/s. Direct (unicast) and indirect addressing are treated separately as described
below.
Direct (Unicast) Addressing
APS Packet Flows between end devices are identified. These packet flows are broken down by end-point
pairs and then further broken down by profile ID and cluster ID. When a new packet flow is detected
between endpoints, the visualization is updated to show the endpoints on each end device, and a link
between the source and destination endpoints to represent the (implicit) binding. We mean implicit in that
the link is based on the flow of APS data packets as opposed to the detection of explicit bind requests. The
link will be shown as a line linking the endpoints as shown below.
Figure 39 APS Layer Visualization – Direct Addressing
SENSOR NETWORK ANALYZER USER GUIDE
DAINTREE NETWORKS PAGE 51 OF 86
Endpoint Selection
The user is able to select an end-point, and if multiple bindings exist for the given endpoint, the selected
endpoint acts as a filter that results in the display of only those bindings associated with this endpoint. If a
single binding exists for this end-point, this will select the corresponding source and destination end
devices for the purpose of showing routing information. The selected end-points, devices and binding are
be highlighted. If an existing binding does not exist, the selection acts as a filter whereby only future
bindings that include this endpoint will be shown. Under these circumstances, when a new binding is added,
the corresponding source and destination device are automatically selected for the purpose of drawing
routes. The selection can be unselected by selecting another device, end-point or clicking on an empty area
of the display. While selected, the drawing of new bindings is suppressed.
ZDO and Endpoint 0
ZDO bindings (those between end-point zero) are shown by default on the visual representation just like
any other APS binding. However there is an option to disable the display of ZDO bindings (enabled by
default). Disabling the display of ZDO bindings can reduce clutter on the screen since there is usually
significant ZDO activity on the network.
Endpoint Flyover Help
Flyover help is provided on each endpoint to display the Profile ID and the list of Cluster IDs (incoming
and outgoing) active on the end-point. It is important to note that the list of Cluster IDs only include those
clusters where the measurement system has detected a packet flow, as opposed to the full list of Cluster IDs
supported by the end-point.
Binding Selection
A binding can be selected by selecting the line drawn between two endpoints. Once selected, information
about the binding including the Profile ID and the list of cluster IDs is shown directly under the selected
binding.
Indirect Addressing
Indirect addressing is handled by considering separately the following packet flows:
• The flow of packets from the source end-point (EP) to the co-ordinator
• The flow of packets from the co-ordinator to destination end-points (EPs).
Each segment is shown independently in the Visual Devices Tree window. These are displayed as follows:
• There is a special INDIRECT endpoint associated with the coordinator. All indirect bindings are
shown intersecting with this special endpoint.
• Packet flows from source endpoint to the coordinator are shown as a binding from the source endpoint
to the INDIRECT endpoint.
• Packet flows from the co-ordinator to destination endpoints are shown as a binding from the
INDIRECT endpoint to the destination endpoints.
• Selecting a source endpoint results in automatic selection of the corresponding end device and route to
the coordinator.
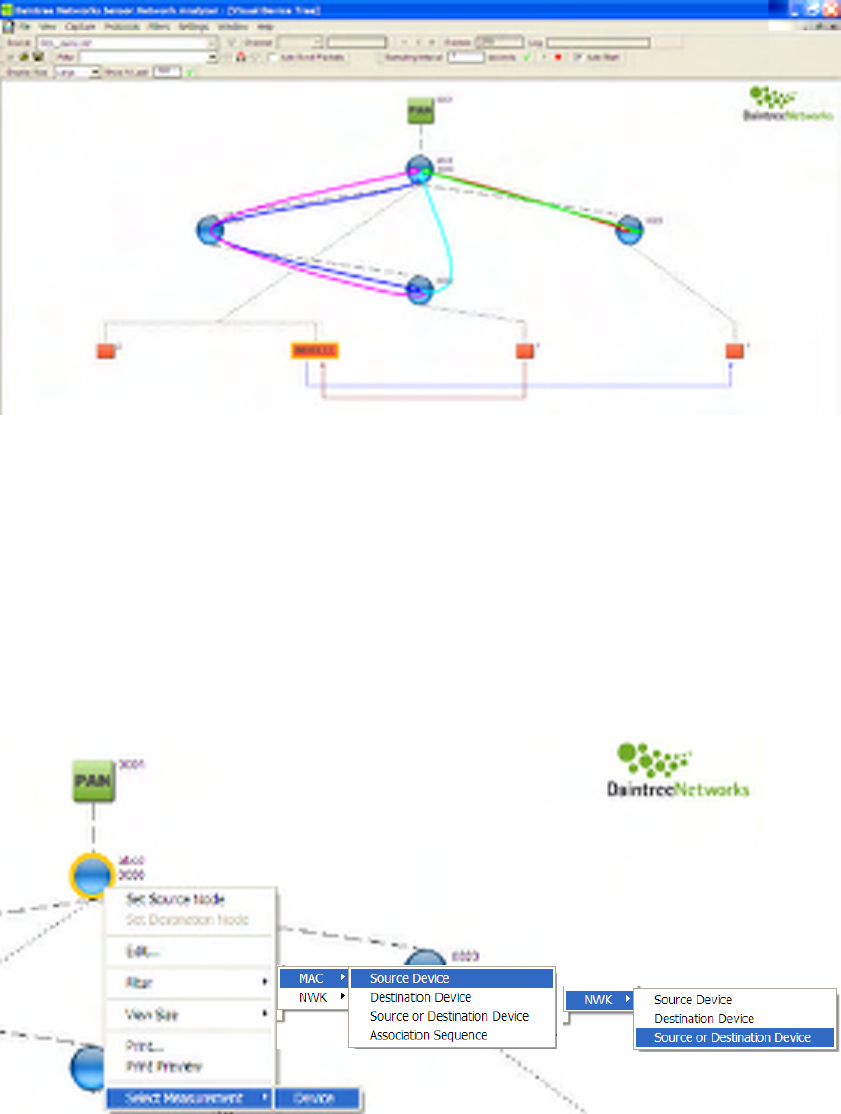
SENSOR NETWORK ANALYZER USER GUIDE
DAINTREE NETWORKS PAGE 52 OF 86
Visually this will look something like the following diagram.
Figure 40 APS Layer Visualization – Indirect Addressing
8.4 Context Menus
The Visual Device Tree provides context menus to quickly access important functions relative to various
items in the Visual Device Tree window. The right-click menu item can be selected after moving the mouse
above interesting item in the VDT window and selecting the right-click menu button.
Device Context Menu
A right-click menu item is available when clicking on a device in the Visual Device Tree.
Figure 41 Device Context Menu
The available menu items include:
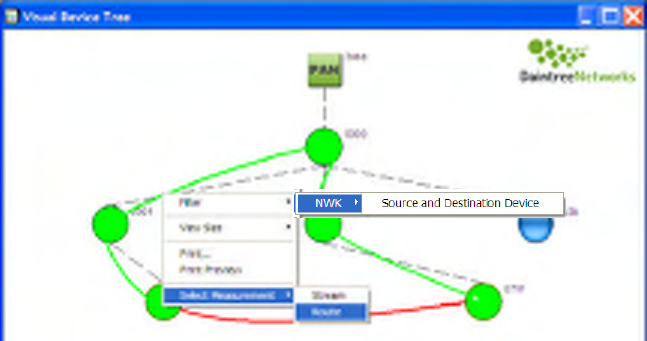
SENSOR NETWORK ANALYZER USER GUIDE
DAINTREE NETWORKS PAGE 53 OF 86
• Edit… menu item to bring up the Device Naming Table to edit the device properties,
• MAC Layer Filters to match all packets where the selected device is the Source, Destination, or
either (this will match both short and long addresses),
• Mac Layer Filter to match when this device has participated in the MAC layer association
sequence; this is useful to debug network formation issues,
• NWK Layer Filters to match all packets where the selected device is the Source, Destination, or
either.
• A Select Measurement -> Device menu option that will select the corresponding device entry and
bring it into focus in the Measurements window.
Route Context Menu
As described earlier, a Route represents all of the Network layer packets flowing between two devices
along a given path (identified by the sequence of nodes traversed by the packets). The Route Context menu
is available by right-clicking on the route spline on the Visual Device Tree window.
Figure 42 Route Context Menus
The following context menus are available:
• NWK Layer Filters to match all packets corresponding to the associated stream i.e. between the
given source and destination,
• Select Measurement -> Stream option to highlight the given source and destination device in the
Measurements window
• Select Measurement -> Route to select and highlight the corresponding route in the Measurements
window.
APS Endpoint Context Menu
The Route Context menu is available by right-clicking on the APS Endpoint on the Visual Device Tree
window.
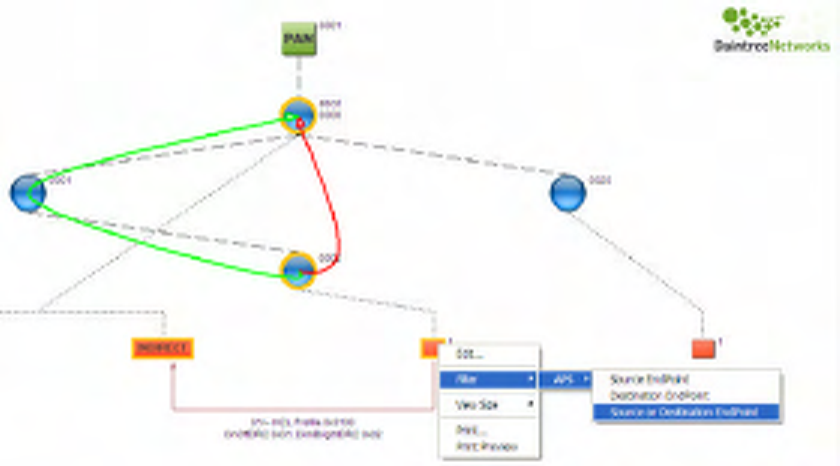
SENSOR NETWORK ANALYZER USER GUIDE
DAINTREE NETWORKS PAGE 54 OF 86
Figure 43 APS Endpoint Context Menus
The following context menus are available:
• APS Layer Filters to match all packets corresponding to the associated endpoint, as a Source, a
Destination or either.
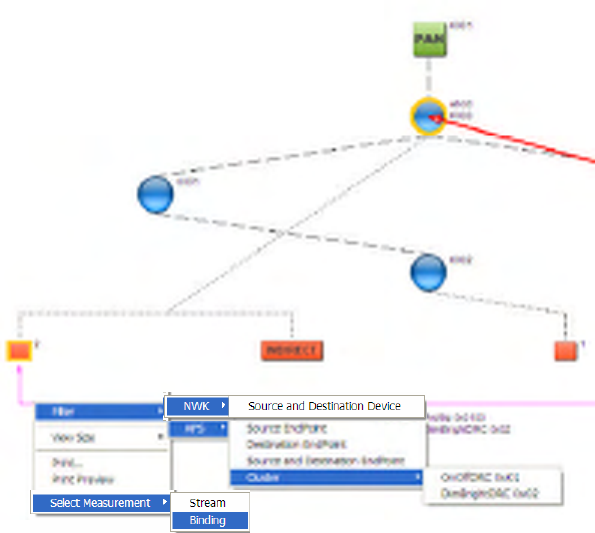
SENSOR NETWORK ANALYZER USER GUIDE
DAINTREE NETWORKS PAGE 55 OF 86
APS Binding Context Menu
An APS Binding represents all of the APS layer packets flowing between two APS end-points on two
different devices. The Route Context menu is available by right-clicking on the APS Endpoint on the
Visual Device Tree window.
Figure 44 APS Binding Context Menus
The following context filters are available:
• NWK Layer Filters to match all packets corresponding to the associated stream i.e. between the
given source and destination,
• APS Layer Filters to match packets flowing from the Source Endpoint and/or to the Destination
Endpoint
• APS Layer Filters to match packets between the associated endpoints on a specific APS Cluster ID
• Select Measurement -> Stream option to highlight the given source and destination device in the
Measurements window
• Select Measurements -> APS Binding option to select and highlight the corresponding APS
Binding in the Measurements window.
Common Context Menus
There are other context menu items available from the Visual Device Tree that do not depend on the
currently selected item. These include:
• View menu to select Large, Medium or Small icons,
• Print and Print Preview menu items.
Printing the Visual Device Tree
There is a Print option available from all Visual Device Tree context menus. To preview the Print option,
select the Print Preview option.
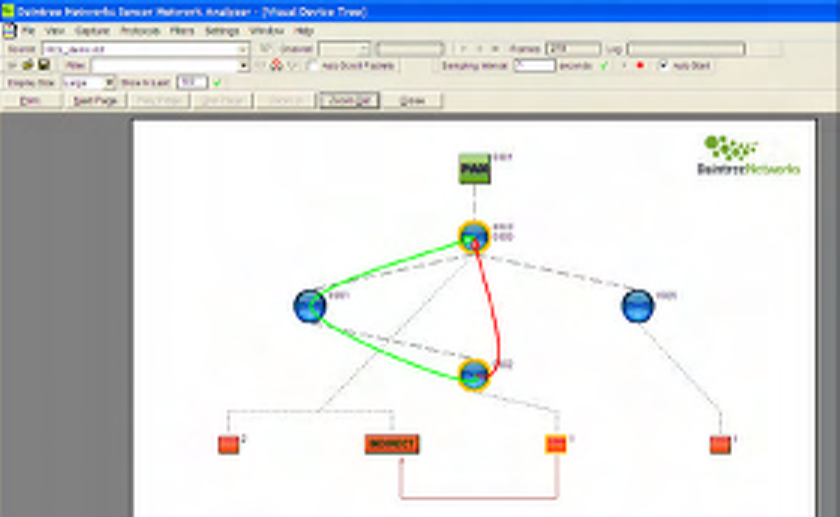
SENSOR NETWORK ANALYZER USER GUIDE
DAINTREE NETWORKS PAGE 56 OF 86
Figure 45 Visual Device Tree Print Preview
The Print Preview window provides a preview of what the Print will look like. The Preview image can be
zoomed in and out and if too large to fit on one page the image can be viewed a page at a time.
8.5 Visualization Options
There are visualization options which can be set within the Visualization tab in the Options dialog,
available from the Settings -> Options menu item.
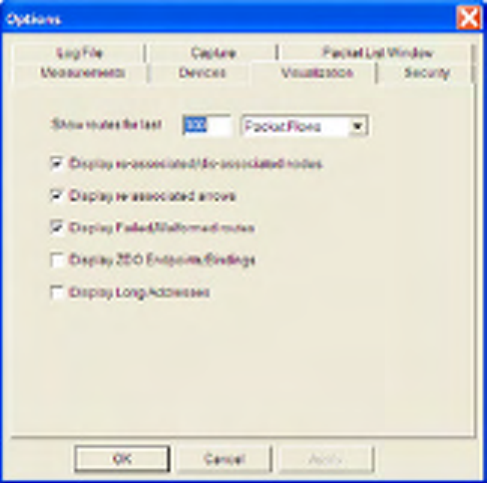
SENSOR NETWORK ANALYZER USER GUIDE
DAINTREE NETWORKS PAGE 57 OF 86
Figure 46 Options Dialog
The user can choose to show routes based on the last N packet flows or the last N distinct routes, where the
user nominates the number N. The default value is 10. The same value N applies to routes shown for the
entire PAN or for a selected source and destination. The analyzer stores the routes for the last N packet
flows (or routes) for the entire PAN and for all streams (source/destination pairs) such that as the user
changes the selected nodes, routes will appear for the last N rather than having to wait for the next N for
routes to be drawn.
NOTE: There is an option to show the last N routes (regardless of the number of packet flows). This option
results in a deterministic number of routes being shown as opposed to the last N flows option which could
result in 1 route or N routes.
Reassociations and Reassociation arrows may be hidden. This can help reduce clutter on an otherwise busy
visualization.
Failed/Malformed Routes can be hidden such that only SUCCESSFUL routes are shown.
ZDO Bindings/Endpoints may be hidden. This essentially removes control messages and leaves only those
endpoints and endpoints carrying application layer data messages.
There is also an option to show long addresses for each of the devices in the Visual Device Tree. By default,
only short addresses, and if defined, user labels from the Device Naming Table are shown. While long
addresses are typically very informative, they occupy significant real estate.
8.6 Custom Icons
Each device in the visualization is drawn based on the contents of a standard Windows® bitmap (.bmp) file
stored externally to the analyzer. Default icons are shipped with the application. Furthermore the default
icons are compiled into the application such that they can still be displayed if the external files are not
available. The user may override the default icons by replacing the external icon files with an icon of their
own creation or choosing.
The default icons are stored in the Daintree Networks\Sensor Network Analyzer\Graphics directory (or an
alternative program directory of the user’s choosing at install time).
Standard Windows® bitmap files which are used to create node and other icons in the Visual Devices Tree
Window. The application uses three sizes of icons, depending upon whether the view scale is Small,
SENSOR NETWORK ANALYZER USER GUIDE
DAINTREE NETWORKS PAGE 58 OF 86
Medium or Large. The icons are provided as 48x48, 256 color bitmaps and are then resized by the
application based on the currently selected scale.
The standard icon files are
• Node.bmp (standard node)
• NodeSel.bmp (a selected node)
• Endpoint.bmp (standard endpoint)
• EndpointSel.bmp (a selected endpoint)
• PAN.bmp (PAN symbol at the top of the tree)
1. Locate the the SNA application graphics subdirectory. The default location is \Program
Files\Daintree Networks\Sensor Network Analyzer\Graphics\
2. Save the existing icons for re-installation in future if required, for example for the node icons by
renaming as follows:
Node.bmp to Node_default.bmp
NodeSel.bmp to NodeSel_default.bmp
3. Place the custom icons into this directory as Node.bmp and NodeSel.bmp. For example
NodeSpecial.bmp as Node.bmp
NodeSpecialSel.bmp as NodeSel.bmp
8.7 Device Naming Table
The Device Naming Table stores information about wireless devices under test and impacts how each
device is represented by the SNA software. Devices may be associated with a logical name (text label)
and/or custom icon to highlight the purpose of the device in the network.
The device naming table is available from the Settings -> Device Naming Table menu item. It is also
possible to bring up the Device Naming Table from the Visual Device Tree by right-clicking on a device
and selecting the Edit… menu item.
The Device Naming Table is shown in the figure below.
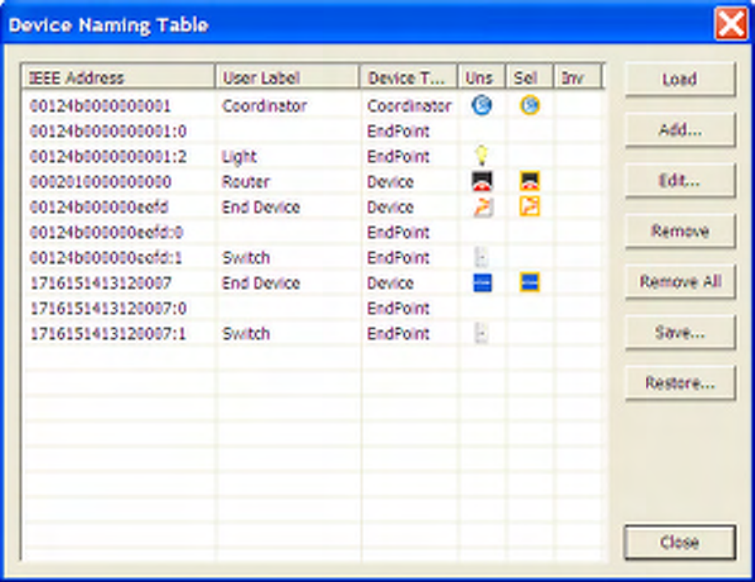
SENSOR NETWORK ANALYZER USER GUIDE
DAINTREE NETWORKS PAGE 59 OF 86
Figure 47 Device Naming Table
The Device Naming Table contains a list of device identified by the IEEE Address, and listing various
attributes associated with each device. These attributes include:
• User Label: this label will be shown on the Visualization and optionally on the measurements
window.
• Device Type: this differentiates between coordinator, device or the endpoints on each device,
• Icons: Unselected, Selected or Invalid icons can be associated with each device.
The Device Naming Table provides the following operations:
• Load: the contents of the DNT can be loaded based on the devices detected as part of the current
capture session,
• Add…: to add a new device,
• Edit…, to edit the currently selected device,
• Remove, the currently selected device,
• Remove All; clear the Device Naming Table,
• Save…; save the contents of the DNT to file,
• Restore…; restore a previously saved DNT file.
When adding or editing a device entry, the following edit… dialog is displayed:
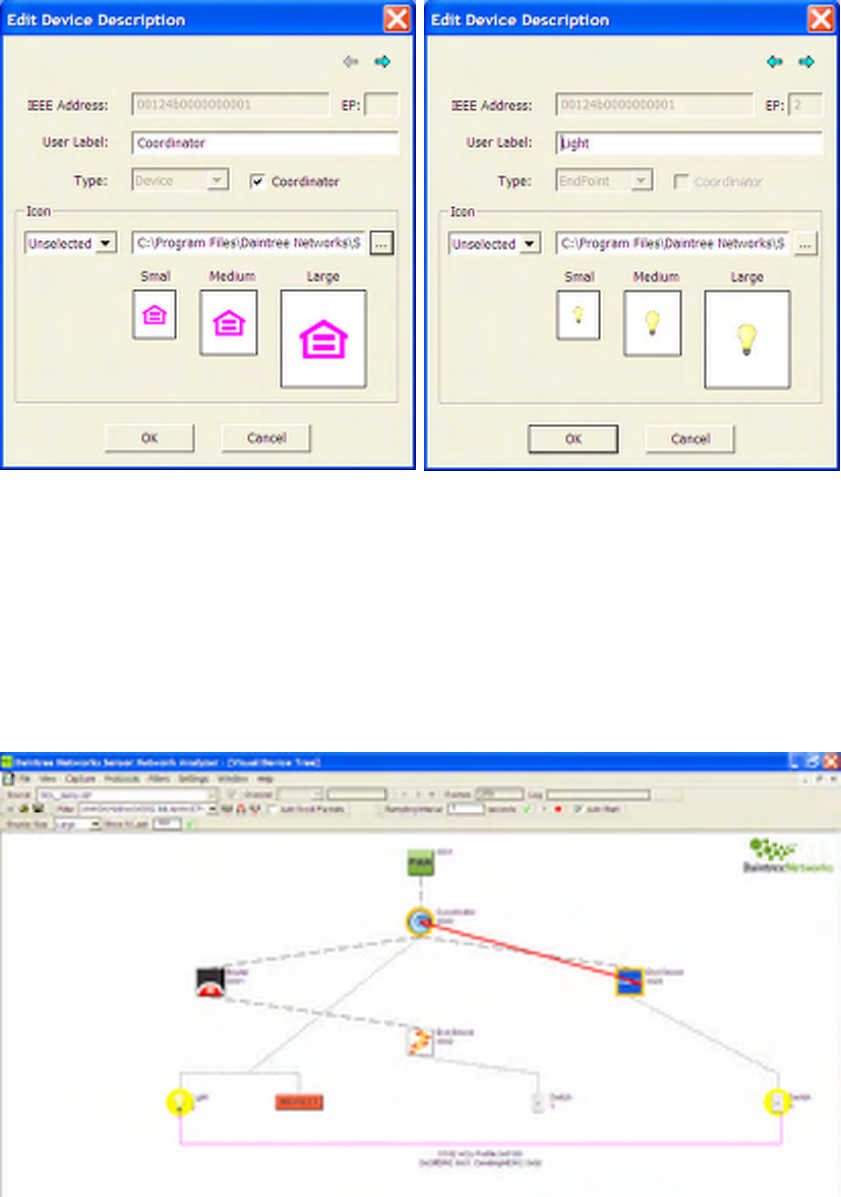
SENSOR NETWORK ANALYZER USER GUIDE
DAINTREE NETWORKS PAGE 60 OF 86
Figure 48 Device Naming Table – Edit Device Description
It is possible to edit the details of a device or its endpoints. When editing a device, the endpoint field is
blank. Both devices and endpoints can have an associated User Label and/or Custom Icons associated with
it. The Icons may indicate the purpose of the device or endpoint, the vendor or any other visual description
that can meaningfully be associated with it. Icons are selected by browsing to the location of the icon in the
file system. By default icons are stored in the Daintree Networks/Sensor Network Analyzer/Graphics
directory.
After assigning user labels and/or custom icons to a device, the representation of the device in the Visual
Device tree is modified accordingly, as shown in the image below.
Figure 49 Visual Device Tree – with User Labels and Custom Icons
SENSOR NETWORK ANALYZER USER GUIDE
DAINTREE NETWORKS PAGE 61 OF 86
In this example, devices are shown with icons representing different ZigBee platform vendors, while
endpoints are shown based on their application layer purpose e.g. light or switch. Example device icons are
provided in the Daintree Networks/Sensor Network Analyzer/Graphics directory.
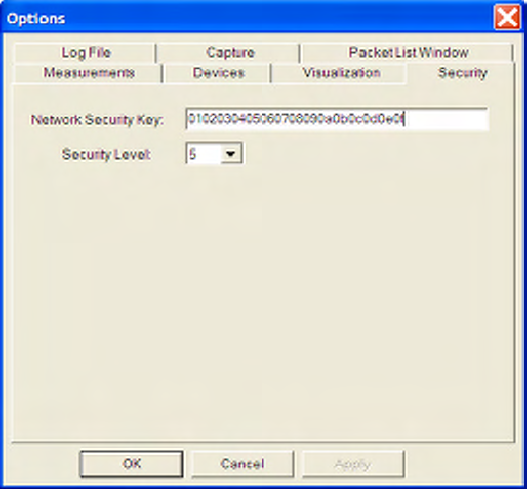
SENSOR NETWORK ANALYZER USER GUIDE
DAINTREE NETWORKS PAGE 62 OF 86
9 Security
The SNA application, and more specifically the protocol decoder and network analysis capability can
operate on encrypted traffic streams. The software decrypts these traffic streams and presents the decrypted
streams for subsequent decoding and analysis. Decryption requires access to the appropriate key/s as
described below.
ZigBee uses the CCM* mode of authentication and encryption. The CCM* mechanisms are described in
the Appendices of the ZigBee Security Services specification.
9.1 Security Options
There is a Security tab available from the Options dialog (available from the Settings menu).
There will be a field available to enter the Network Key as a 16 digit hex string. The key is defined in user
order (the opposite of Network byte order). The default key is all zeroes.
There will be a field available for the user to enter the current security level. This will default to 0x05
corresponding to the default security level used by the Home Controls (Residential) Stack Profile. In a
future release we will consider having the Security Level automatically detected as one of the Settable
Parameters associated with the current Stack Profile (as carried in the Beacon Payload).
Each of these options will apply to the MAC, NWK and APS layer security.
9.2 Decoding Encrypted Packets
This section describes how encrypted packets are handled by the Packet List, Packet Decoder and Packet
Data windows.
Packet List Window
Packets that are successfully decrypted are shown in the Packet List as if they were never encrpypted.
Subsequent fields in the packet are displayed as usual. If packets are encrypted and cannot be decrypted

SENSOR NETWORK ANALYZER USER GUIDE
DAINTREE NETWORKS PAGE 63 OF 86
that Packet Type field in the Packet List will show to what layer the packet was decoded and highlight that
the subsequent contents are encrypted using the (Secured) identifier.
Packet Decode Window
The Packet Decode will decode the contents of the decrypted payload (as if the payload was never
encrypted)
Additional security headers and trailers added to the encrypted packet like the Auxiliary Header and MIC
field will be left in place and decoded.
If decryption fails, the Decode will show the payload as “Encrypted Payload: Decryption Failed” and not
attempt to decode the payload any further.
Packet Data
For packets that have security enabled, the packet data window will display the decrypted data (after
decryption) such that it corresponds to the data shown in the Packet Decode window.
9.3 MAC Layer Security
MAC Layer security requirements are spread across the 802.15.4 spec and the ZigBee Security Services
spec. The Daintree Networks SNA Security support is based on the ZigBee 1.0 specifications.
The SNA will decrypt secure MAC layer packets that were encrypted as follows:
o Encrypted MAC layer packets have the “Security Enabled” flag set in the MAC Frame Control
field.
o There is a common Network wide key used to secure all layers of the ZigBee Stack.
o There is a common security level operating across all layers of the ZigBee Stack (as defined by
the active Stack profile)
o The Nonce is formed using the 64-bit Source Address, 32-bit Frame Counter and 8-bit Security
field (in that order). All fields are stored in Network byte order. The 8-bit Security Field
corresponds to the Security Level currently in use (all other bits in the Security field are clear).
o When encryption is applied to MAC layer packets, the encryption will only apply to the payload
portion of the MAC payload, i.e. the Beacon payload, the Command payload or the Data payload,
depending on the type of the MAC frame type.
o The Secured Payload consists of the Frame Counter, the Key Sequence Number (Security Field?),
Encrypted Payload and Encrypted Integrity Code.
o Authentication occurs over the Full MAC Header and MAC payload (including the additional
Frame Counter and Key Sequence Number field).
NOTE: This description describes the Daintree interpretation of the ZigBee MAC layer specifications.
Hence an encrypted MAC layer Command frame looks like the following:
MAC Header Command
Frame Identifer Frame
Counter
Key Sequence
Number Payload
(Encrypted)
MIC
(Encrypted)
Secured Payload
MAC Payload

SENSOR NETWORK ANALYZER USER GUIDE
DAINTREE NETWORKS PAGE 64 OF 86
Hence MAC frames are decrypted as follows:
o Use the user supplied Network Key and Security Level. The security level determines whether
encryption is used and the length of the message integrity check (MIC) field used to authenticate
the packet.
o Create the nonce string using the fields from the Packet in the following order: MAC Source
Address (8 octets), Frame Counter (4 octets), Security Control Field (1 octet). Each field is set in
the nonce using network byte order.
o If the security level indicates that decryption is required (4 <= Level <= 7) invoke the CCM*
decryption routine with the MAC command payload as the encrypted payload (including the
additional integrity bytes) and the MAC Header and unencrypted MAC payload fields (including
the Frame Counter and Key Sequence Number/Security Control Field) as the additional
unencrypted authentication data.
o If authentication succeeds the CCM* decryption routine returns the decrypted payload.
o The decrypted payload can be used to override the previously encrypted NWK payload in the
packet for subsequent downstream processing by the decode engine or analysis algorithms.
o If decryption is not required we will not even bother to authenticate the packet, but instead will
just decode each of the additional security fields.
9.4 NWK Layer Security
NWK Layer Security features are as defined in the ZigBee 1.0 Security Services specification.
The Daintree SNA can decrypt secure NWK layer packets that were encrypted as follows:
o Encrypted NWK layer packets have the “Security Enabled” flag set in the NWK Frame Control
field.
o There is a common Network wide key used to secure all layers of the ZigBee Stack.
o There is a common security level operating across all layers of the ZigBee Stack (as defined by
the active Stack profile)
o The AUX Security Header is placed in the NWK layer packet between the NWK Header and
Network Payload. The AUX Header consists of the Security Field, Frame Counter, Source
Address, and Key Sequence Number.
o The Nonce is formed using the 64-bit Source Address, 32-bit Frame Counter and 8-bit Security
field from the AUX Header. All fields are stored in Network byte order.
o The low order three bits of the Security Field correspond to the current Security Level. These bits
are masked out (set to zero) in the AUX Header prior to transmission (but after authentication).
These bits must be masked back in at the receiver prior to authenticating and decrypting the
received packet (in both the AUX Header and the Nonce).
o When encryption is applied to NWK layer packets, the encryption applies to the entire NWK
payload.
o Authentication occurs over the Full NWK Header, the AUX Header and the NWK payload.
Hence an encrypted NWK layer frame that looks like the following:
NWK Header Aux Header NWK Payload
(Encrypted)
MIC
(Encrypted)
The SNA will decrypt the frame as follows:

SENSOR NETWORK ANALYZER USER GUIDE
DAINTREE NETWORKS PAGE 65 OF 86
o Use the user supplied Network Key and Security Level. The security level determines whether
encryption is used and the length of the message integrity check (MIC) field used to authenticate
the packet.
o Create the nonce string using the fields from the AUX Header in the following order: Source
Address (8 octets), Frame Counter (4 octets), Security Control Field (1 octet). Each field is set in
the nonce using network byte order.
o If the security level indicates that decryption is required (4 <= Level <= 7), invoke the CCM*
decryption routine with the NWK payload as the encrypted payload (including the additional
integrity bytes) and the NWK Header and AUX Header as the additional unencrypted
authentication data.
o If authentication succeeds the CCM* decryption routine returns the decrypted payload.
o The decrypted payload is used to override the previously encrypted NWK payload in the packet
for display by the Packet Decode engine or subsequent downstream processing by the
Measurements or Visualization analysis algorithms.
9.5 APS Layer Security
APS Layer Security features are as defined in the ZigBee 1.0 Security Services specification.
The Daintree SNA can decrypt secure APS layer packets that were encrypted as follows:
o Encrypted APS layer packets have the “Security Enabled” flag set in the APS Frame Control
field.
o There is a common Network wide key used to secure all layers of the ZigBee Stack.
o There is a common security level operating across all layers of the ZigBee Stack (as defined by
the active Stack profile). Note however that APS command frames are always secured using a
security level of 7.
o The AUX Security Header is placed in the APS layer packet between the APS Header and APS
Payload. The AUX Header consists of the Security Field, Frame Counter, and Key Sequence
Number.
o The Nonce is formed using the 64-bit Source Address, 32-bit Frame Counter and 8-bit Security
field. The Source Address is derived from the Network layer source address by looking up the
corresponding IEEE long address in the AID address table (or using a ZDO query). The Frame
Counter and Security field are derived from the AUX Header. All fields are stored in Network
byte order.
o The low order three bits of the Security Field correspond to the current Security Level. These bits
are masked out (set to zero) in the AUX Header prior to transmission (but after authentication).
These bits must be masked back in at the receiver prior to authenticating and decrypting the
received packet (in both the AUX Header and the Nonce).
o When encryption is applied to APS layer packets, the encryption applies to the entire APS
payload.
o Authentication occurs over the Full APS Header, the AUX Header and the APS payload.
Hence an encrypted NWK layer frame that looks like the following:
APS Header Aux Header APS Payload
(Encrypted)
MIC
(Encrypted)
SENSOR NETWORK ANALYZER USER GUIDE
DAINTREE NETWORKS PAGE 66 OF 86
The SNA will decrypt the frame as follows:
o Use the user supplied Network Key and Security Level. The security level determines whether
encryption is used and the length of the message integrity check (MIC) field used to authenticate
the packet.
o Create the nonce string using the Source Address (derived from NWK source address) and fields
from the AUX Header in the following order: Source Address (8 octets), Frame Counter (4 octets),
Security Control Field (1 octet). Each field is set in the nonce using network byte order.
o If the security level indicates that decryption is required (4 <= Level <= 7), invoke the CCM*
decryption routine with the APS payload as the encrypted payload (including the additional
integrity bytes) and the APS Header and AUX Header as the additional unencrypted
authentication data.
o If authentication succeeds the CCM* decryption routine returns the decrypted payload.
o The decrypted payload is used to override the previously encrypted APS payload in the packet for
display by the Packet Decode engine or subsequent downstream processing by the Measurements
or Visualization analysis algorithms.

SENSOR NETWORK ANALYZER USER GUIDE
DAINTREE NETWORKS PAGE 67 OF 86
Appendix A: Application Navigation
The application provides the following menu items:
File Menu
Menu Item Function and Action Resulting
Open…(Ctrl-O) Opens a previous capture file in the decoder. The dialog box’s “Files of
Type” list box will contain “Capture Files (*.dcf)” and “All Files
(*.*)” with the former being the default. Displays the first PDU’s in the
list, selects the first and decodes it. If there is any unsaved data the user
will be prompted to save it, using the same operation as described for
File|Save. If a capture is currently in progress, this menu item is disabled.
Close (Ctrl-W) Closes the capture file and clears the capture windows. If the current
capture has not been saved, provides the option to save the capture to a file
before closing. Otherwise the capture data is lost (unless it has been saved
using the logging functionality). If a capture is currently in progress then
this menu item is disabled.
Save…(Ctrl-S) Allows the user to save a capture to a named file prompting for a filename
in all cases. The input field will be preloaded with the previous filename
used. The dialog box’s “Save as Type” list box will contain “Capture
File (*.dcf)”. The user will be able to choose whether the data saved
consists of filtered or unfiltered data. If a capture is currently in progress
then this menu item is disabled.
Exit Exits the application, prompting the user to choose a file name for saving
of the capture data if they wish, using the same operation as described for
File|Save.
View Menu
Menu Item Function and Action Resulting
Packet List Opens/closes the packet list window (check mark against item in list when
displayed).
Packet Decode Opens/closes the packet decode window (check mark against item in list
when displayed).
Packet Data Opens/closes the packet data window (check mark against item in list
when displayed).
Device Tree Open/Close the device tree, a tabular view of all devices detected on the
network
Measurements Open/Close the Measurements View
Visual Device Tree Open/Close the Visual Device Tree
All Opens/closes all display windows. Selecting this item will cause all
unopened windows to be opened.
Toolbars This is a submenu.
Capture Displays/hides the capture toolbar (check mark against item in list when
displayed).
Filter Displays/hides the filter toolbar (check mark against item in list when
displayed).
File Displays/hides the file toolbar (check mark against item in list when
displayed).
Measurements Displays/hides the measurements toolbar (check mark against item in list
when displayed).
Visualization Displays/hides the visualization toolbar (check mark against item in list
when displayed).

SENSOR NETWORK ANALYZER USER GUIDE
DAINTREE NETWORKS PAGE 68 OF 86
All Displays/hides all toolbars.
Capture Menu
NOTE: If the user is viewing a file previously recorded this menu will be disabled.
Menu Item Function and Action Resulting
Select Source… Allows selection of a capture source (from those available) through a
dialog box. The dialog box includes the search button, drop down list of
sources and channel selection. If there is a capture operation in progress,
this menu item is disabled.
Start Capture Starts capture operations from the selected device. If there is no source
selected or a capture operation is in progress, this menu item is disabled.
Pause Display Toggles the updating of the display of captured data, allowing the user to
check through the data whilst the capturing continues. If there is no capture
operation in progress, this menu item is disabled.
Stop Capture Stops capture operation. If there is no capture operation is progress, this
menu item is disabled.
Protocols Menu
Menu Item Function and Action Resulting
ZigBee NWK Toggle ZigBee NWK layer decodes and analysis. Toggles check mark
against the item in list. The value of this setting is stored in the registry.
Upon application start up this item will be reinitialised to its last setting.
ZigBee APS Toggle ZigBee APS layer decodes and analysis. Toggles check mark
against the item in list. The value of this setting is stored in the registry.
Upon application start up this item will be reinitialised to its last setting.
If ZigBee NWK decodes are disabled data remaining after the 802.15.4 header information is decoded will
be labelled “MAC Payload.” If ZigBee APS decodes are disabled, data remaining after the NWK header
information is decoded will be labelled “NWK Payload.”
In both cases, the length of data will be appended to the name. For example: “MAC Payload (41 octets)”.
The data will not be displayed in the “Decode” window, only in the “Data” window.
If ZigBee NWK is disabled then ZigBee APS will be disabled by default. If ZigBee APS in enabled,
ZigBee NWK will be enabled by default.
Filters Menu
Menu Item Function and Action Resulting
Define… This menu item brings up the “Filters” dialog box. If a capture operation is
in progress, this menu item will be disabled.
Reset Clear any active filter and display all packets

SENSOR NETWORK ANALYZER USER GUIDE
DAINTREE NETWORKS PAGE 69 OF 86
Settings Menu
Menu Item Function and Action Resulting
Options Displays a tabbed dialog box which allows the user to alter configurable
settings. These settings are persevered in the system registry. The
supported tabs are:
• LogFile
• Capture
• Packet List Window
• Measurements
• Devices
• Visualization.
Device Naming Table… The device naming table allows users to assign custom icons and logical
names to devices based on their 802.15.4 IEEE Address.
Device Configuration… This menu item is used to configure the networking properties of the
device and also reports device specific information. If a capture operation
is in progress, a capture file is open or a third party capture device is
currently selected this menu item will be disabled.
Firmware Upgrade… This menu item allows the firmware upgrade of 2400E Adapters connected
via USB. If a capture operation is in progress, a capture file is open or a
third party capture device is currently selected this menu item will be
disabled.
Window Menu
Menu Item Function and Action Resulting
Cascade Cascades the currently open windows so that they are overlapped in the top
left hand corner of the screen.
Tile Horizontally Tiles the currently open windows horizontally so that they share the screen
space evenly.
Tile Vertically Tiles the currently open windows vertically so that they share the screen
space evenly.
Tile Default Layout Tile all windows according to the default layout with:
• Measurements shown in top left corner, 40% width, 60% height
of the total screen size,
• Visualization shown in the top right corner, 60% width and 60%
height,
• Packet List shown bottom left, 40% height, 60% width,
• Packet Decode shown bottom right, 40% height, 40% width.
This provides a quick overview of the full capabilities of the application
with the visualization taking up the a sizeable portion of the screen area.
The Packet Data and Device Tree windos will be hidden by default.
Arrange Icons Arranges the minimised window icons in the bottom left hand corner of the
screen.
(Window Selection) A dynamically created list of the open windows. This allows the user to
select between the currently open windows.
Help Menu
Menu Item Function and Action Resulting
Quick Start Guide Causes this user guide to be displayed. It will open a PDF file using the

SENSOR NETWORK ANALYZER USER GUIDE
DAINTREE NETWORKS PAGE 70 OF 86
default PDF viewer (if installed).
User’s Guide (F1) Causes this user guide to be displayed. It will open a PDF file using the
default PDF viewer (if installed).
About Displays copyright, identification and version information.
Toolbars
A toolbar exists for each major function of the application to provide easy access to common tasks. The
description of each toolbar will be contained in the relevant section of the document.
SENSOR NETWORK ANALYZER USER GUIDE
DAINTREE NETWORKS PAGE 71 OF 86
Appendix B: Capture File Formats
The Sensor Network Analyzer uses a default file extension of .dcf (for Daintree Capture File).
Format Descriptor
To convey the format of the information in the capture file, the first line or record of the file may contain be
formatted as below:
#Format=type
where type is the format type specification. For example,
#Format=1
If this line is not present in the file then file format 1 is assumed. Note that including the format descriptor
will be ignored if it appears on any line or in any record other than the first.
Format 1
This is the format used by the Sensor Network Protocol Decoder (SNPD) and pre-1.0 release versions of
the SNA. It consists of readable text, fields are delimited by a white space (one ASCII space character).
Records (packets) are delimited by a new line (CR LF characters).
Field Descriptions
Field Name Length
(chars)
Field Data Type
(all fields appear as text)
Description
Sequence
Number 1–10 32-bit unsigned decimal integer. Sequence number for the packet. The
Sequence Number is initialised to 1 at the
beginning of a capture session.
Timestamp 1–10.1–6 32-bit unsigned decimal
integer.32-bit unsigned decimal
integer.
Time at which the packet was received, as
provided by the capture device. The first
integer is the time in seconds since
midnight, January 1, 1970. The second
integer is an offset in microseconds from
this time. The integers are separated by a
period (‘.’).
Length 3 8-bit unsigned decimal integer. This is the number of octets represented in
the Data and Signal fields combined.
Data 2–250 Concatenated 8-bit hexadecimal. The actual packet data. This comprises the
IEEE 802.15.4 PSDU (PHY Service Data
Unit, or payload), in other words, the entire
MAC frame. Its length is indicated by the
Length field, being Length - 4.
Signal 4 8-bit signed hexadecimal integer.
8-bit unsigned hexadecimal
integer
This contains information concerning signal
strength and packet checksum. It’s format
is capture device dependent.
Signal Field Details
Capture Device First Octet Second Octet
Daintree Networks
Sensor Network Access
Point
RSSI (Received Signal Strength
Indicator). Most significant bit indicates
received packet Frame Check
Sequence (FCS) status.
1 = FCS OK
SENSOR NETWORK ANALYZER USER GUIDE
DAINTREE NETWORKS PAGE 72 OF 86
0 = FCS in error.
The least significant 7 bits is an
unsigned integer being a measure
of the average signal strength
correlation between the first 8
symbols of the received PHY
protocol data unit. It can be
considered a measure of the “chip
error rate” of the received signal.
A value of ~110 indicates a
maximum quality frame, a typical
value of ~50 is indicative of lowest
quality frame reception.
Example
A log file example is shown below.
#Format=1
1 1087369893.0 13 0080d8addebeba44cf000002eb
2 1087369893.139287 21 23c8dfaddebebaffff0989952248000000018e02eb
3 1087369893.140347 5 0200df01eb
4 1087369893.245415 21 0080d9addebeba44cf0010098995224800000001ec
5 1087369893.251246 18 63c8e0addebeba09899522480000000402e9
Format 2
This is the default format used since SNA Version 1.0. Fields are delimited by a white space (one ASCII
space character). Records (packets) are delimited by a new line (CR LF characters).
Field Descriptions
Field Name Length
(chars)
Field Data Type
(all fields appear as text)
Description
Sequence
Number 1–10 32-bit unsigned decimal integer. Sequence number for the packet. The
Sequence Number is initialised to 1 at the
beginning of a capture session.
Timestamp 1–10.1–6 32-bit unsigned decimal
integer.32-bit unsigned decimal
integer.
Time at which the packet was received, as
provided by the capture device. The first
integer is the time in seconds since
midnight, January 1, 1970. The second
integer is an offset in microseconds from
this time. The integers are separated by a
period (‘.’).
Length 3 8-bit unsigned decimal integer. This is the number of octets represented in
the Data and Signal fields combined.
Data 2–250 Concatenated 8-bit hexadecimal. The actual packet data. This comprises the
IEEE 802.15.4 PSDU (PHY Service Data
Unit, or payload), in other words, the entire
MAC frame. Its length is indicated by the
Length field, being Length - 4.
LQI 5 16-bit unsigned decimal integer. This is the LQI of the packet.
FCS 1 0 or 1 This is the FCS correctness of the packet. If
1 the FCS was correct. If 0 it was incorrect.
SENSOR NETWORK ANALYZER USER GUIDE
DAINTREE NETWORKS PAGE 73 OF 86
Example
An example of the log file is shown below:
#Format=2
1 1087369893.0 13 0080d8addebeba44cf0000ffff 22 1
2 1087369893.139287 21 23c8dfaddebebaffff0989952248000000018effff 23 1
3 1087369893.140347 5 0200dfffff 25 1
4 1087369893.245415 21 0080d9addebeba44cf00100989952248000000ffff 19 1
5 1087369893.251246 18 63c8e0addebeba098995224800000004ffff 21 1
6 1087369893.252211 5 1200e0ffff 23 1
SENSOR NETWORK ANALYZER USER GUIDE
DAINTREE NETWORKS PAGE 74 OF 86
Appendix C: Protocol Decoder Display Filter Fields
The following tables list the valid protocol decoder display filter arguments and their
descriptions.
CAPTURED FRAME
hdr-frame.frmLength Frame Length
hdr-frame.capLength Capture Length
hdr-frame.malformedData Malformed Packet
MAC
Mac IEEE 802.15.4
mac.fc MAC Frame Control
mac.fcFrmType MAC Frame Control Frame Type
mac.fcSec MAC Frame Control Security Enabled
mac.fcFrmPend MAC Frame Control Frame Pending
mac.fcAckReq MAC Frame Control Acknowledgment Request
mac.fcIntraPAN MAC Frame Control Intra PAN
mac.fcResBits789 MAC Frame Control Reserved Bits 7-9
mac.fcDestAddrMode MAC Frame Control Destination Addressing Mode
mac.fcResBits1213 MAC Frame Control Reserved Bits 12-13
mac.fcSrcAddrMode MAC Frame Control Source Addressing Mode
mac.seqNo MAC Sequence Number
mac.destPANId MAC Destination PAN Identifier
mac.destAddr MAC Destination Address
mac.srcPANId MAC Source PAN Identifier
mac.srcAddr MAC Source Address
mac.Pay MAC Payload
mac.PaySupFrm MAC Beacon Superframe Specification
mac.PaySupFrmBcnOrd MAC Beacon Superframe Specification Beacon Order
mac.PaySupFrmSupOrd MAC Beacon Superframe Specification Superframe Order
mac.PaySupFrmFinalCAP MAC Beacon Superframe Specification Final CAP Slot
mac.PaySupFrmBatExtn MAC Beacon Superframe Specification Battery Life Extension
mac.PaySupFrmResBit13 MAC Beacon Superframe Specification Reserved Bit 13
mac.PaySupFrmPANCord MAC Beacon Superframe Specification PAN Coordinator
mac.PaySupFrmAssPermit MAC Beacon Superframe Specification Association Permit
mac.PayGTSSpec MAC Beacon GTS Information GTS Specification
SENSOR NETWORK ANALYZER USER GUIDE
DAINTREE NETWORKS PAGE 75 OF 86
mac.PayGTSSpecDescCount MAC Beacon GTS Information GTS Descriptor Count
mac.PayGTSSpecResBits36 MAC Beacon GTS Information Specification Reserved Bits 3-6
mac.PayGTSSpecPermit MAC Beacon GTS Information GTS Permit
mac.PayGTSDir MAC Beacon GTS Directions
mac.PayGTSDirMask MAC Beacon GTS Information GTS Directions Mask
mac.PayGTSDirResBit7 MAC Beacon GTS Information Directions Reserved Bit 7
mac.PayGTSListDesc MAC Beacon GTS Information GTS List
mac.PayGTSListDescDevAddr MAC Beacon GTS Information GTS List Device Short Address
mac.PayGTSListDescStartSlot MAC Beacon GTS Information GTS List GTS Starting Slot
mac.PayGTSListDescLength MAC Beacon GTS Information GTS List GTS Length
mac.PayPendAddrSpec MAC Beacon Pending Address Specification
mac.PayPendAddrSpecAddrPend MAC Beacon Pending Address Specification Number of Short
Addresses Pending
mac.PayPendAddSpecResBit3 MAC Beacon Pending Address Specification Reserved Bit 3
mac.PayPendAddrSpecExtAddrPend MAC Number of Extended Addresses Pending
mac.PayPendAddSpecResBit7 MAC Beacon Pending Address Specification Reserved Bit 7
mac.PayPendAddrSpecShortAddr MAC Beacon Pending Address Pending Short Address
mac.PayPendAddrSpecExtendAddr MAC Beacon Pending Address Pending Extended Address
mac.PayCmdFrmId MAC Command Frame Identifier
mac.PayCmdFrmArqCapInfo MAC Command Association Request Capability Information
mac.PayCmdFrmArqCapInfoAltPAN MAC Command Association Request Capability Info Alternate
PAN Coordinator
mac.PayCmdFrmArqCapInfoDev MAC Command Association Request Capability Info Device Type
mac.PayCmdFrmArqCapInfoPowerSrc MAC Command Association Request Capability Info Power
Source
mac.PayCmdFrmArqCapInfoReceiver MAC Command Association Request Capability Info Receiver On
When Idle
mac.PayCmdFrmArqCapInfoResBits45 MAC Command Association Request Capability Info Reserved
Bits 4-5
mac.PayCmdFrmArqCapInfoSecCAP MAC Command Association Request Capability Info Security
Capability
mac.PayCmdFrmArqCapInfoAllocAddr MAC Command Association Request Capability Info Allocate
Address
mac.PayCmdFrmArsShortAddr MAC Command Association Response Short Address
mac.PayCmdFrmArsAssStat MAC Command Association Response Association Status
mac.PayCmdFrmDntDisReas MAC Command Disassociation Notification Disassociation
Reason
mac.PayCmdFrmCrlPANID MAC Command Coordinator Realignment PAN Identifier
mac.PayCmdFrmCrlCordAddr MAC Command Coordinator Realignment Coordinator Short
Address
SENSOR NETWORK ANALYZER USER GUIDE
DAINTREE NETWORKS PAGE 76 OF 86
mac.PayCmdFrmCrlLogChan MAC Command Coordinator Realignment Logical Channel
mac.PayCmdFrmCrlShortAddr MAC Command Coordinator Realignment Short Address
mac.PayCmdFrmGTSChar MAC Command GTS Request GTS Characteristics
mac.PayCmdFrmGTSCharLength MAC Command GTS Request GTS Characteristics GTS Length
mac.PayCmdFrmGTSCharDir MAC Command GTS Request GTS Characteristics GTS Direction
mac.PayCmdFrmGTSCharType MAC Command GTS Request GTS Characteristics Characteristics
Type
mac.PayCmdFrmGTSReqResBits67 MAC Command GTS Request GTS Characteristics Reserved Bits
6-7
mac.BcnPay MAC Beacon Payload
mac.BcnPayProt MAC Protocol ID
mac.FCS MAC Frame Check Sequence
NWK
nwk ZigBee NWK
nwk.fc NWK Frame Control
nwk.fcFrmType NWK Frame Control Frame Type
nwk.fcProtoVer NWK Frame Control Protocol Version
nwk.fcDiscRoute NWK Frame Control Discover Route
nwk.fcResBits78 NWK Frame Control Reserved Bits 7-8
nwk.fcSec NWK Frame Control Security
nwk.fcResBits1015 NWK Frame Control Reserved Bits 10-15
nwk.destAddr NWK Destination Address
nwk.srcAddr NWK Source Address
nwk.bcstRadius NWK Broadcast Radius
nwk.bcstSeqNo NWK Broadcast Sequence Number
nwk.Pay NWK Payload
nwk.PayCmdFrmID NWK Network Command Identifier
nwk.PayCmdFrmCmdOpt NWK Network Command Options
nwk.PayCmdFrmResBits06 NWK Network Command Reserved Bits 0-6
nwk.PayCmdFrmCmdOptRouteRepair NWK Command Options Route Repair
nwk.PayCmdFrmRouteRequestID NWK Command Route Request Identifier
nwk.PayCmdFrmRouteRequestDestAddr NWK Command Route Request Destination Address
nwk.PayCmdFrmRouteReplyOrgAddr NWK Command Route Reply Originator Address
nwk.PayCmdFrmRouteReplyRespAddr NWK Command Route Reply Responder Address
nwk.PayCmdFrmRoutePathCost NWK Command Route Path Cost
nwk.PayCmdFrmRouteErrorCode NWK Command Route Error Code
nwk.PayCmdFrmRouteErrorDestAddr NWK Command Route Error Destination Address
SENSOR NETWORK ANALYZER USER GUIDE
DAINTREE NETWORKS PAGE 77 OF 86
nwk.Information NWK Network Layer Information
nwk.InfoProf NWK Stack Profile
nwk.InfoVer NWK Network Protocol Version
nwk.InfoSec NWK Network Security Level
nwk.InfoRteCap NWK Device Router Capacity
nwk.InfoDepth NWK Device Depth
nwk.InfoCap NWK Device Capacity
nwk.InfoTxOff NWK Tx Offset
APS
aps ZigBee APS
aps.fc APS Frame Control
aps.fcFrmType APS Frame Control Frame Type
aps.fcDeliveryMode APS Frame Control Delivery Mode
aps.fcSrcEPPresent APS Frame Control Source Endpoint Present
aps.fcSec APS Frame Control Security
aps.fcAckReq APS Frame Control Ack Request
aps.fcResBit7 APS Frame Control Reserved Bit 7
aps.destEP APS Destination Endpoint
aps.HCLClustID APS Cluster Identifier
aps.ZDOClustID APS Cluster Identifier
aps.profileID APS Profile Identifier
aps.srcEP APS Source Endpoint
aps.SecFrmHeader APS Auxiliary Frame Header
aps.SecCtrl APS Auxiliary Frame Header Security Control
aps.SecCtrlSecLevel APS Auxiliary Frame Header Security Control Security Level
aps.SecCtrlKeyID APS Auxiliary Frame Header Security Control Key Identifier
aps.SecCtrlExtndNonce APS Auxiliary Frame Header Security Control Extended Nonce
aps.SecCtrlReserved APS Auxiliary Frame Header Security Control Reserved Bits 6-7
aps.FrmCounter APS Auxiliary Frame Header Frame Counter
aps.SrcAddr APS Auxiliary Frame Header Source Address
aps.KeySeqNo APS Auxiliary Frame Header Key Sequence Number
aps.SecAPSPay APS Encrypted APS Payload
aps.Pay APS Payload
aps.PayCmdFrmID APS Command Frame Command Identifier
aps.PayCmdSKKEInitAddr APS Security SKKE Command Initiator Address
aps.PayCmdSKKERespAddr APS Security SKKE Command Responder Address
SENSOR NETWORK ANALYZER USER GUIDE
DAINTREE NETWORKS PAGE 78 OF 86
aps.PayCmdSKKEData APS Security SKKE Command Data
aps.PayCmdTKeyKeyType APS Security Transport-key Command Key Type
aps.PayCmdTKeyKeyDesc APS Security Transport-key Command Key Descriptor
aps.PayCmdTKeyKeyDescKey APS Security Transport-key Command Key Descriptor Field Key
aps.PayCmdTKeyKeyDescDestAddr APS Security Transport-key Command Key Descriptor Destination
Address
aps.PayCmdTKeyKeyDescSrcAddr APS Security Transport-key Command Key Descriptor Source
Address
aps.PayCmdTKeyKeyDescSeqNo APS Security Transport-key Command Key Descriptor Sequence
Number
aps.PayCmdTKeyKeyDescPartnerAddr APS Security Transport-key Command Key Descriptor Partner
Address
aps.PayCmdTKeyKeyDescInitFlag APS Security Transport-key Command Key Descriptor Initiator
Flag
aps.PayCmdUpdDevDevAddr APS Security Update-Device Command Device Address
aps.PayCmdUpdDevStat APS Security Update-Device Command Status
aps.PayCmdRemoveDevChildAddr APS Security Remove Device Command Child Address
aps.PayCmdReqKeyKeyType APS Security Request Key Command Key Type
aps.PayCmdReqKeyPartnerAddr APS Security Request Key Command Partner Address
aps.PayCmdSwitchKeySeqNo APS Security Switch Key Command Sequence Number
ZIGBEE DEVICE OBJECTS
zdo ZigBee ZDO
zdo.IEEEAddr ZDO Discovery IEEE Address
zdo.ReqType ZDO Discovery Request Type
zdo.StartIndex ZDO Discovery Start Index
zdo.NWKAddrOfInterest ZDO NWK Address Of Interest
zdo.InterfaceEndpoint ZDO Endpoint/interface
zdo.Interface ZDO Interface
zdo.Endpoint ZDO Endpoint
zdo.ProfileId ZDO Profile Id
zdo.NumInClust ZDO Number of Input Clusters
zdo.InClustList ZDO Input Cluster List
zdo.NumOutClust ZDO Number of Output Clusters
zdo.OutClustList ZDO Output Cluster List
zdo.NWKAddr ZDO Network Address
zdo.LocalCoord ZDO Local Coordinator
zdo.SrcAddr ZDO Surce Address
zdo.SrcEndPint ZDO Source End Point
SENSOR NETWORK ANALYZER USER GUIDE
DAINTREE NETWORKS PAGE 79 OF 86
zdo.ClustId ZDO Cluster Id
zdo.DstAddr ZDO Destination Address
zdo.DstEndPint ZDO Destination End Point
zdo.ScanChannels ZDO Scan Channel
zdo.ScanChanVal ZDO Channel Frequency
zdo.ScanChanReserved ZDO Reserved
zdo.DevAddr ZDO Device Address
zdo.Stat ZDO Status
zdo.IEEEAddrRemDev ZDO IEEE Address of Remote Device
zdo.NWKAddrRemDev ZDO Nework Address of Remote Device
zdo.NumAssocDev ZDO Number of Associated Device
zdo.AssocDevList ZDO Associated Device List
zdo.NWKAddrAssocDev ZDO Network Address of Associate Device
zdo.StatDisRegRsp ZDO Discovery Register Response Status
zdo.StatEndDevAnnceRsp ZDO Discovery End Device Announce Response Status
zdo.StatEndDevBindRsp ZDO End Device Bind Response Status
zdo.StatBindRsp ZDO Bind Response Status
zdo.StatUnbindRsp ZDO Unbind Response Status
zdo.StatActiveEPIFRsp ZDO Active End Point/InterfaceStatus
zdo.ActiveEPIFCount ZDO Active End Point/Interface Count
zdo.ActiveEPIFList ZDO Active End Point/Interface List
zdo.MatchLength ZDO Match Length
zdo.StatActiveMatchList ZDO Match List
zdo.ActiveNetworkCount ZDO Active Network Count
zdo.ActiveNetworkListCount ZDO Active Network List Count
zdo.ActiveNetworkListCount ZDO Active Network List
zdo.Length ZDO Length
zdo.NodeDesc ZDO Node Descriptor
zdo.NodeDescLogReserved ZDO Logical Type and Reserved
zdo.NodeDescLogType ZDO Logical Type
zdo.NodeDescLogReserved ZDO Reserved
zdo.APSFlagFreq ZDO APS Flags and Frequency
zdo.APSFlags ZDO APS Flags
zdo.Freq ZDO Frequency band
zdo.MACCapFlags ZDO MAC capability flags
zdo.MACCapFlagsAltPANCoord ZDO Alternate PAN coordinator
zdo.MACCapFlagsDevType ZDO Device Type
SENSOR NETWORK ANALYZER USER GUIDE
DAINTREE NETWORKS PAGE 80 OF 86
zdo.MACCapFlagsPowerSrc ZDO Power source
zdo.MACCapFlagsReceiver ZDO Receiver on when idle
zdo.MACCapFlagsReserved1 ZDO Reserved
zdo.MACCapFlagsSecCap ZDO Security capability
zdo.MACCapFlagsReserved2 ZDO Reserved
zdo.MFGCode ZDO Manufacturer code
zdo.MaxBufSize ZDO Maximum buffer size
zdo.MaxTransferSize ZDO Maximum transfer size
zdo.PowerDesc ZDO Node Power Descriptor
zdo.PowerDescCurrentMode ZDO Current power Mode
zdo.PowerDescAvailNode ZDO Avaliable power sources
zdo.PowerDescCurrentSrc ZDO Current power source
zdo.PowerDescCurrentSrcLevel ZDO Current Power source level
zdo.SimpleDescRspStat ZDO Status
zdo.SimpleDescRspLength ZDO Length
zdo.SimpleDesc ZDO Simple Descriptor
zdo.SimpleDescEPIface ZDO End Point/Interface
zdo.SimpleDescEndPoint ZDO End Point
zdo.SimpleDescIface ZDO Interface
zdo.SimpleDescAppProfileId ZDO Application Profile Identifier
zdo.SimpleDescAppDevId ZDO Application Device Identifier
zdo.SimpleDescAppDevVerFlags ZDO Application Device Version/Flags
zdo.SimpleDescAppDevVer ZDO Application Device Version
zdo.SimpleDescAppFlags ZDO Application Flags
zdo.SimpleDescAppInpClustCount ZDO Application Input Cluster Count
zdo.SimpleDescAppInpClustList ZDO Application Input Cluster List
zdo.SimpleDescAppInpClustVal ZDO Cluster
zdo.SimpleDescAppOutClustCount ZDO Application Output Cluster Count
zdo.SimpleDescAppOutClustList ZDO Application Output Cluster List
zdo.SimpleDescAppOutClustVal ZDO Cluster
zdo.ComplexDesc ZDO Complex Descriptor
zdo.ComplexDescFieldCount ZDO Field Count
zdo.ComplexDescField ZDO Field
zdo.ComplexDescFieldXMLTag ZDO Compressed XML Tag
zdo.ComplexDescFieldData ZDO Field Data
zdo.ComplexDescLanguageCode ZDO ISO 639-1 language code
zdo.ComplexDescCharSetId ZDO Character set identifier
SENSOR NETWORK ANALYZER USER GUIDE
DAINTREE NETWORKS PAGE 81 OF 86
zdo.UserDesc ZDO User Description
zdo.NWKCount ZDO Network Count
zdo.NWKListCount ZDO Network List Count
zdo.NWKList ZDO Network List
zdo.NWKDesc ZDO Network Descriptor
zdo.NWKDescPANId ZDO PAN ID
zdo.NWKDescFlags ZDO Network Descriptor Flags
zdo.NWKOpMode ZDO Operational Mode
zdo.NWKLogChan ZDO Logical Channel
zdo.NWKBcnOrder ZDO Beacon Order
zdo.NWKPermitJoining ZDO Permit Joining
zdo.NbrTableEntries ZDO Neighbor Table Entries
zdo.NbrListCount ZDO Neighbor Table List Count
zdo.NbrList ZDO Neighbor Table List
zdo.NbrEntries ZDO Neighbor Entry
zdo.NbrPANID ZDO PAN ID
zdo.NbrExtAddr ZDO Extended Address
zdo.NbrNWKAddr ZDO Network Address
zdo.NbrDevType ZDO Device Type
zdo.NbrRelationship ZDO Relationship
zdo.NbrDepth ZDO Depth
zdo.NbrRNCapacity ZDO RN Capacity
zdo.NbrBcnOrder ZDO Beacon Order
zdo.NbrRNCapacity ZDO Permit Joining
zdo.NbrTransFail ZDO Transmit Failure
zdo.NbrPotentialParent ZDO Potential Parent
zdo.NbrLQI ZDO LQI
zdo.NbrLogChan ZDO Logical Channel
zdo.RtgTableEntries ZDO Routing Table Entries
zdo.RtgListCount ZDO Routing Table List Count
zdo.RtgList ZDO Routing Table List
zdo.RtgEntries ZDO Routing Entry
zdo.RtgDestAddr ZDO Destination Address
zdo.RtgStat ZDO Status
zdo.RtgNextHopAddr ZDO Next-Hop Address
zdo.BdgTableEntries ZDO Binding Table Entries
zdo.BdgListCount ZDO Binding Table List Count
SENSOR NETWORK ANALYZER USER GUIDE
DAINTREE NETWORKS PAGE 82 OF 86
zdo.BdgList ZDO Binding Table List
zdo.BdgEntries ZDO Binding Entry
zdo.BdgSrcAddr ZDO Source Address
zdo.BdgDstAddr ZDO Destination Address
MSG
msg ZigBee MSG
msg.transSeqNo MSG Transaction Sequence Number
msg.transLength MSG Transaction Length
msg.transData MSG Transaction Data
KVP
kvp ZigBee KVP
kvp.transSeqNo KVP Transaction Sequence Number
kvp.transAttrType KVP Transaction/Attribute Data Type
kvp.transType KVP Transaction Type
kvp.attribDataType KVP Attribute Data Type
kvp.attribId KVP Attribute Identifier
kvp.errorCode KVP Error Code
kvp.attribData KVP Attribute Data
kvp.attribDataCharCount KVP Character Count
kvp.attribDataCharData KVP Character Data
kvp.attribDataOctetCount KVP Octet Count
kvp.attribDataOctetData KVP Octet Data
SENSOR NETWORK ANALYZER USER GUIDE
DAINTREE NETWORKS PAGE 83 OF 86
Appendix D: 2400E Firmware Upgrade
There is a firmware upgrade utility available for the 2400E. Under normal circumstances the firmware
loaded on to the module prior to shipment is suitable for use with the Sensor Network Analyzer software. If
the SNA software detects the need for an upgrade it will display detailed instructions to the user.
Under all other circumstances the user should not run the Firmware Upgrade utility to upgrade the
firmware of the 2400E unless requested to do so and given detailed instructions by a Daintree support
representative.
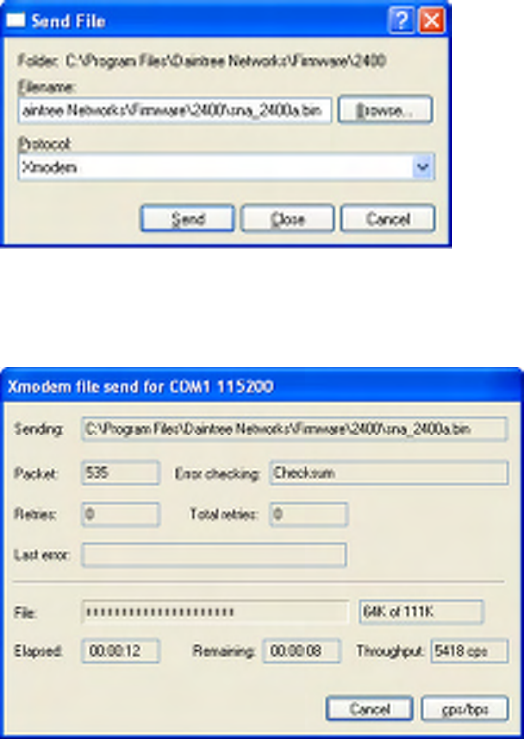
SENSOR NETWORK ANALYZER USER GUIDE
DAINTREE NETWORKS PAGE 84 OF 86
Appendix E: Sensor Network Access Point (Model
2400A) Firmware Upgrade
The firmware used on Daintree Networks 2400A Sensor Network Access Point capture devices needs to be
upgraded for these devices to function as capture devices with the SNA Version 1.1 software. This
firmware upgrade is achieved on the 2400A by connecting to the 2400A’s serial port and using a terminal
emulation program, such as HyperTerminal, which supports the XMODEM protocol.
Procedure
• Start HyperTerminal (or other terminal program) and connect to the 2400A’s serial port. The
connection settings are 115200, 8N1:
• Choose “Transfer|Send File…” option from the menu.
• Ensure that “Xmodem” is selected and enter the name of the .bin file to download to the 2400A.
The firmware file to download can be found at Program Files\Daintree
Networks\Firmware\2400\sna_2400a.bin (or alternative application installation directory):
• Power cycle the 2400A’s power connection.
• Press the send button in HyperTerminal within 5 seconds of turning the 2400A’s power on.
• A dialog box will appear, showing the progress of the transfer:
• When the transfer has completed the firmware will have been successfully upgraded and be ready
for use.

SENSOR NETWORK ANALYZER USER GUIDE
DAINTREE NETWORKS PAGE 85 OF 86
Appendix F: IEEE 802.15.4 Channels and Frequencies
868MHz BAND
CHANNEL CHANNEL CHANNEL FREQ.
LOGICAL NUMBER NUMBER MHz
SEQ NUM (DECIMAL) (HEX)
1 0 0 868.3
915MHz BAND
CHANNEL CHANNEL CHANNEL FREQ.
LOGICAL NUMBER NUMBER MHz
SEQ NUM (DECIMAL) (HEX)
1 1 01 906
2 2 02 908
3 3 03 910
4 4 04 912
5 5 05 914
6 6 06 916
7 7 07 918
8 8 08 920
9 9 09 922
10 10 0A 924
2.4GHz BAND
CHANNEL CHANNEL CHANNEL FREQ.
LOGICAL NUMBER NUMBER MHz
SEQ NUM (DECIMAL) (HEX)
1 11 0B 2405
2 12 0C 2410
3 13 0D 2415
4 14 0E 2420
5 15 0F 2425
6 16 10 2430
7 17 11 2435
8 18 12 2440
9 19 13 2445
10 20 14 2450
11 21 15 2455
12 22 16 2460
13 23 17 2465
14 24 18 2470
15 25 19 2475
16 26 1A 2480
SENSOR NETWORK ANALYZER USER GUIDE
DAINTREE NETWORKS PAGE 86 OF 86
Copyright
This document and the Sensor Network Analyzer software are subject to Copyright © Daintree Networks
Inc, 2003-2005. All Rights reserved.
Windows is a registered trademark of Microsoft Corporation.
ZigBee is a trademark of the ZigBee Alliance.
802.15.4 is a trademark of the Institute of Electrical and Electronics Engineers
Notice
Information in this document is subject to change without notice.
DAINTREE NETWORKS INC. MAKES NO WARRANTY OF ANY KIND WITH REGARD TO THIS
MATERIAL, INCLUDING, BUT NOT LIMITED TO, THE IMPLIED WARRANTIES OF
MERCHANTABILITY AND FITNESS FOR A PARTICULAR PURPOSE.
Rev. April 15, 2005