Davis Instruments DWW6351 Weather Station Console User Manual
Davis Instruments Weather Station Console
Contents
- 1. Users Manual 1
- 2. Users Manual 2
Users Manual 2
Displaying Weather Variables
22
Pressure Trend
The pressure trend arrow indicates the current barometric trend,
measured over the last three hours. The pressure trend is updated
every 15 minutes. The pressure trend requires three hours of data
in order to be calculated so it won’t display right away on a new
station. The pressure trend is indicated on the console screen, as
long as the required data is available.
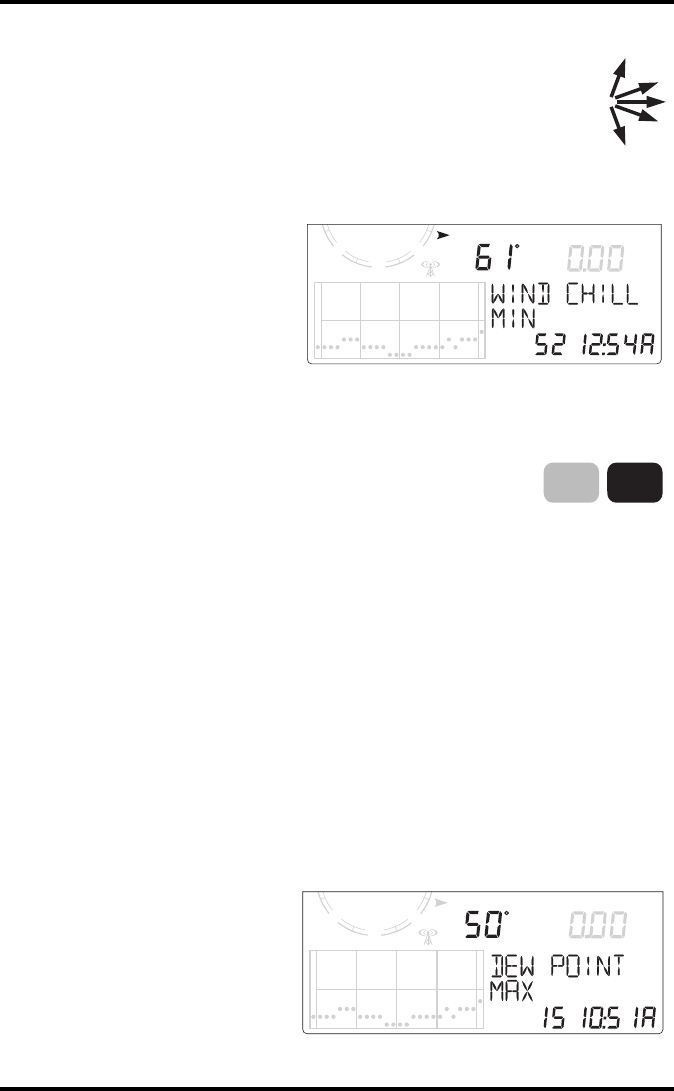
Wind Chill
Wind Chill shares the same
section on the console as Dew
Point and Heat Index, below
the Barometric Pressure
variable, next to the compass
rose.
1. Press 2ND then press CHILL to select Wind Chill. Wind
Chill is displayed in either Fahrenheit (°F) or Celsius
(°C) in whole degrees. See “Selecting Units of Measure”
on page 26 for more information on changing the unit of
measure.
If the unit of measure for any temperature-related weather variable is
changed, the unit of measure also changes for all temperature-related
variables. See “Inside and Outside Temperature” on page 18 for more
information.
The console uses the ten-minute average wind speed to calculate wind chill.
2. Press WxCEN to display the weather information available for Wind Chill in
the Weather Center.
3. Press WxCEN twice to scroll through the Wind Chill-related Weather Center
screens, which include:
•Minimum Wind Chill — Displays lowest wind chill measurement for the
day and the time it was recorded.
•Maximum Wind Speed — Displays the maximum wind speed for the
day and the time it was recorded.
Dew Point
Dew Point shares the same
section on the console as
Wind Chill and Heat Index,
below the Barometric
Pressure variable, next to the
compass rose.
S
SESW
MPH
WIND
CHILL
F
RAIN RATE
in/hr
Wind Chill with information displayed
in the Weather Center
2ND
CHILL
WIND
in
DEW
S
SESW
MPH
WIND
F
RAIN RATE
in/hr
Dew Point with information displayed in
the Weather Center
Displaying Weather Variables
23
1. Press 2ND then press DEW to select Dew Point. Dew
Point is displayed in either Fahrenheit (°F) or Celsius
(°C) in whole degrees. See “Selecting Units of Measure”
on page 26 for more information on changing the unit of
measure.
If the unit of measure for any temperature-related weather variable is
changed, the unit of measure also changes for all temperature-related
variables. See “Inside and Outside Temperature” on page 18 for more
information.
2. Press WxCEN to display the weather information available for Dew Point in
the Weather Center. Press WxCEN twice to scroll through the Weather
Center screens, which include:
•Maximum Dew Point — Displays the highest dew point measurement
for the day with the time it was recorded.
•Minimum Dew Point — Displays the lowest dew point measurement for
the day with the time it was recorded.
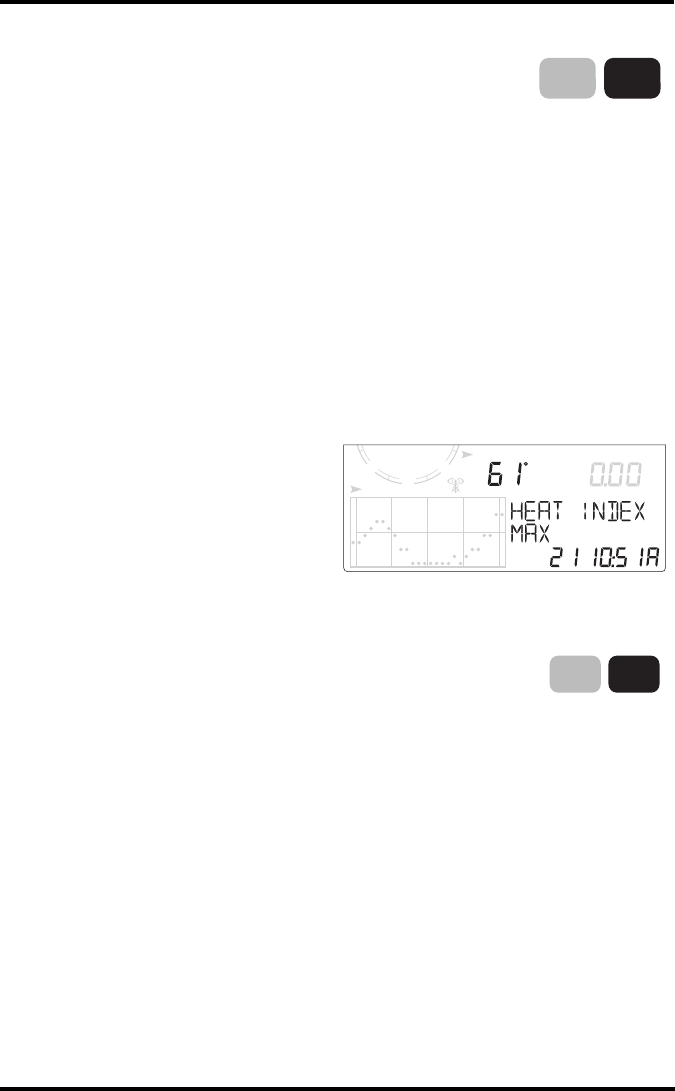
Heat Index
Heat Index shares the same section
on the console as Wind Chill and
Dew Point, below the Barometric
Pressure variable, next to the
compass rose.
Press 2ND then press HEAT to display the Heat Index.
Heat Index is displayed in either Fahrenheit (°F) or Celsius
(°C) in whole degrees.
See “Selecting Units of Measure” on page 26 for more
information on changing the unit of measure. If the unit of measure for any
temperature-related weather variable is changed, the unit of measure also
changes for all temperature-related variables. See “Inside and Outside
Temperature” on page 18 for more information. The Maximum Heat Index (the
highest Heat Index measurement recorded for the day) along with the time it
occurred displays in the Weather Center section of the console.
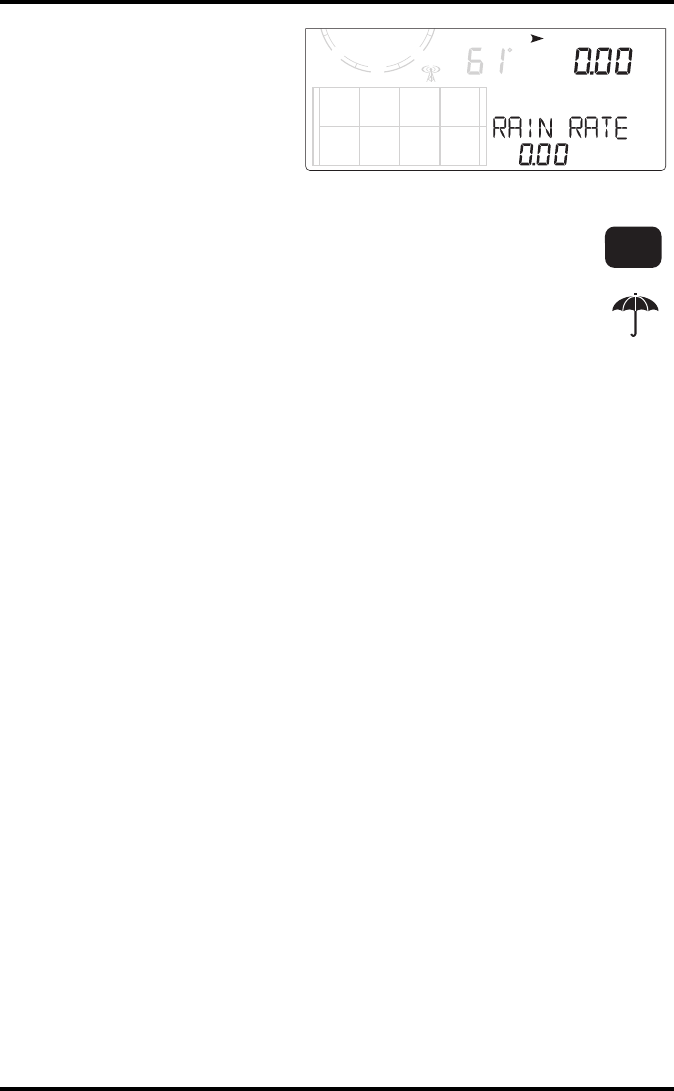
Rain
All the rain values are displayed in the same section on the console below the
Barometric Pressure variable, on the right side.
DEW
HUM
2ND
HEAT
S
SESW
MPH
WIND
F
RAIN RATE
in/hr
Heat Index with information displayed
in the Weather Center
HEAT
TEMP
2ND
Displaying Weather Variables
24
The rain values include RAIN
RATE, RAIN DAY (current
day’s rain total), RAIN MO
(monthly rain total), and
RAIN YEAR (yearly rain
total).
1. Press RAIN to display the current rain rate.
Rain Rate will display a number other than zero and the
umbrella icon appears when two tips of the rain spoon have
occurred within a 15-minute period.
2. Press RAIN again to display RAIN DAY, the rain accumulated
since 12:00 midnight.
3. Press RAIN a third time to select the month-to-date precipitation data.
Monthly rain displays the precipitation accumulated since the calendar
month began.
4. Press RAIN a fourth time to display the year-to-date precipitation data.
Yearly rain displays the precipitation accumulated since the first of the
month you’ve chosen as the beginning of your rain season in Setup Mode
(See “Screen 14: Rain Season” on page 13).
All rain measurements may be displayed as either inches per hour (in/hr.) or
millimeters per hour (mm/hr.). See “Selecting Units of Measure” on page 26
for more information on changing the unit of measure.
5. Press WxCEN to display the weather information available for all of the rain
variables in the Weather Center.
6. Press WxCEN multiple times to scroll through the rain-related Weather
Center screens, which include:
•Rain Rate — Displays the current rate of rain (unless already displayed).
•Rain Rate Maximum — Displays the maximum rain rate for the day and
the time the rate occurred.
•Rain Last 15 Minutes — Displays the total amount of rain recorded over
the last 15 minutes.
•Rain Last 24 Hours — Displays the total amount of rain recorded over the
last 24 hours.
•Rain Day -- Displays rain since midnight (unless already displayed).
•Last Storm — Displays the rain total from the last rain event and the date
on which the most recent storm ended. It takes two tips of the rain spoon
to begin a storm event and 24 hours without rain to end a storm event.
•Rain Last __ Days — Displays the total rain amount over a user-selected
number of days. To change the number of days over which the total rain
amount is displayed, press the + and - keys when this screen is displayed
in the Weather Center. The number of days allowable is 26 (the last 25
days plus the current day).
in
DAYRAIN
S
SESW
MPH
WIND
HEAT
F
Daily Rain Total with information displayed
in the Weather Center
RAIN
Displaying Weather Variables
25
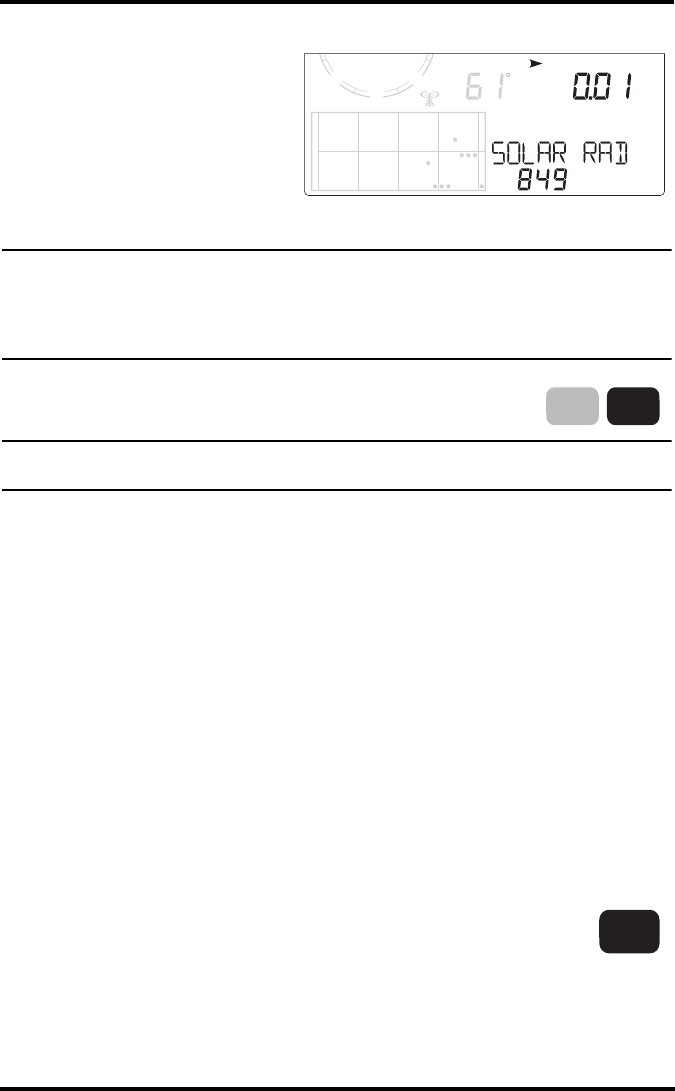
Evapotranspiration (ET) (Optional)
All the Evapotranspiration
values share the same section
on the console as Rain values,
below the Barometric
Pressure variable, on the right
side.
Note: The Evapotranspiration, Solar Radiation and UV Index measurements are only available
when the Vantage Vue console is listening to a Vantage Pro2 Plus station or other
Vantage Pro2 ISS station in which a Solar Radiation and UV sensor have been installed
and “VP2” has been selected in Screen 6 of the Setup Mode. See “Screen 6: Configuring
Transmitter IDs” on page 9.
1. Press and release 2ND then press ET to display the daily
evapotranspiration reading.
Note: If you hear a beep when selecting ET, it means the station the console is selected to hear
is not a Vantage Pro2 station.
2. Press and release 2ND then press ET again to display the monthly
evapotranspiration reading.
3. Press and release 2ND then press ET a third time to display the
evapotranspiration reading since January 1st of the current year.
4. Press WxCEN to display the weather information available for all of the ET
variables in the Weather Center.
5. Press WxCEN multiple times to scroll through the ET-related Weather
Center screens, which include:
•ET Last __ Days — Displays the total ET amount over a user-selected
number of days. To change the number of days over which the total ET
amount is displayed, press the + and - keys when this screen is displayed
in the Weather Center. The number of days allowable is 26 (the last 25
days plus the current day).
•Solar Radiation — Displays the current solar radiation measurement for
the day.
•UV Index — Displays the current UV Index.
Weather Center
Press WxCEN to view added information in the Weather
Center section of the console for each variable. See each
individual variable for a list of Weather Center screens available
for each variable.
in
ET DAY
S
SESW
MPH
WIND
HEAT
F
Daily Evapotranspiration with Solar Radiation
information displayed in the Weather Center
ET
RAIN
2ND
WXCEN
Selecting Units of Measure
26
Light
Press LIGHT to turn on the backlight for the screen display.
Press LIGHT again to turn the backlight off.
Use the backlight when the LCD is not clearly visible. When
the console is battery operated, the backlight remains on as long as keys are
pressed. If no keys are being used, the backlight automatically turns off about
fifteen seconds after it is turned on. If any key is pressed while it is turned on, it
will stay illuminated for 60 seconds from the last key press. When battery
power is low, the backlight does not light.
Note: When the console receives power from the AC adapter, the backlight remains on until it is
toggled off. Leaving the backlight on for an extended period of time raises the inside
temperature reading and lowers the inside humidity reading.
To adjust the screen’s contrast, press and release 2ND then
press the + and - keys multiple times while the 2nd icon
appears on the screen. The + key darkens the segments
currently displaying on the console screen. The - key lightens
the segments currently displaying on the console screen.
Adjust the contrast as desired.
Note: The step changes are subtle. You may need to press the keys several times.
Selecting Units of Measure
Most weather variables may be displayed in at least two different
measurement units, including US and metric systems, although some variables
feature more possibilities. Barometric pressure, for example, may be displayed
in millibars, millimeters, inches, or hectoPascals. You can change each
variable’s units independently and at any time.
To change units:
1. Select the weather variable. See “Displaying Weather Variables” on page 16.
2. Press and release 2ND then press UNITS.
The selected variable’s units change. Repeat steps 1 and 2
until the desired units appear.
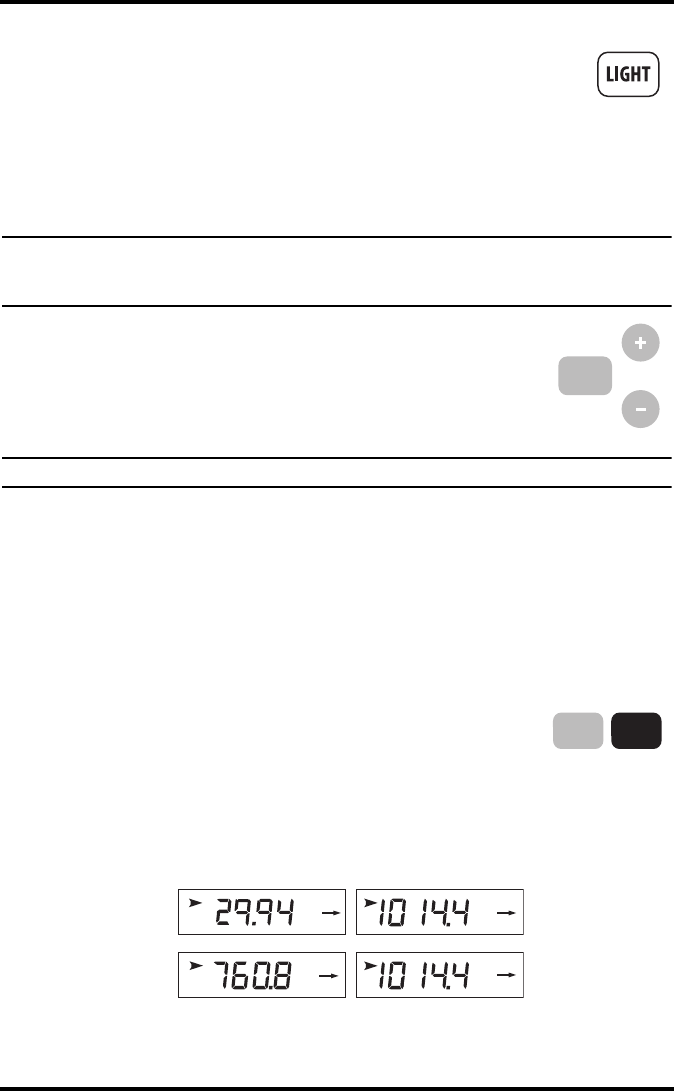
For example, to change the barometric pressure units,
first select barometric pressure by pressing BAR. Next, press and release
2ND, then press UNITS. Repeating these steps cycles through the units
available for barometric pressure: inches, millimeters, hectoPascals, and mil-
libars.
Displaying Barometric Pressure Units:
inches (in), millimeters (mm), hectoPascals (hPa) and millibars (mb)
2ND
UNITS
TIME2ND
mb
mm
hPa
in
Calibrating, Setting, and Clearing Variables
27
Calibrating, Setting, and Clearing Variables
To fine-tune your station, you can calibrate most of the weather variables. For
example, if your outside temperature seems consistently too high or too low,
you can enter an offset to correct the deviation.
Calibrating Temperature And Humidity
You can calibrate inside and outside temperature; inside and outside humidity
on your Vantage Vue.
1. Press TEMP to select the temperature variable to be calibrated. See “Inside
and Outside Temperature” on page 18.
2. Press and release 2ND, then press and hold SET.
After a moment, the variable you’ve selected begins
to blink. Keep holding SET until the Calibration
Offset message displays in the Weather Center.
3. Press the + or - keys to add or subtract from the temperature offset value.
Inside and outside temperature are calibrated in 0.1° F or 0.1° C increments,
up to a maximum offset of + or -12.7 (°F or °C). The variable will change
value and the Weather Center shows the offset you’ve entered.
4. Press DONE to exit calibration.
Calibrating Wind Direction Reading
The wind vane is calibrated at the factory to be accurate when the solar panel
above it is pointing south. If your solar panel does not point south, you can use
this procedure to correct the wind direction.
Note: Wind direction calibration must be done with the ISS mounted in its final position.
1. With the wind vane stationary, ascertain its actual direction. Compare it to
the direction reading on the console.
2. Press WIND until the wind direction in degrees is displayed.
3. Press and release 2ND, then press and hold SET. The wind direction variable
will begin to blink.
4. Continue holding the key until “CAL” displays in the Weather Center. The
Weather Center displays the previously set wind direction calibration value,
if one has been set.
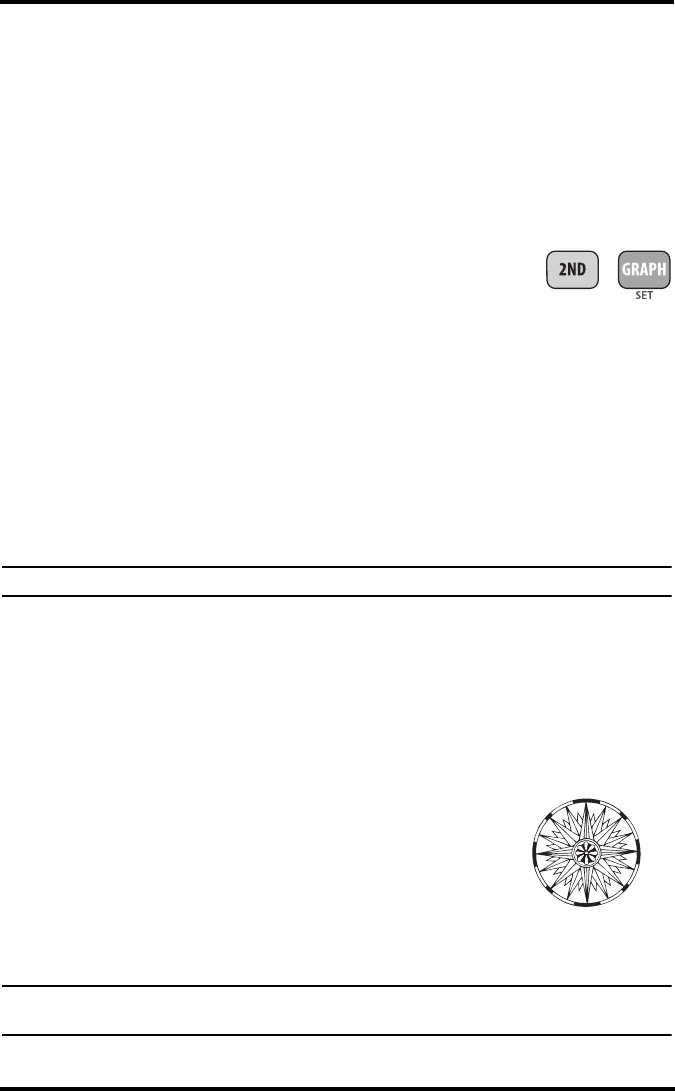
5. Change the value of the wind direction in the
compass rose based on the direction the
anemometer is currently pointing. Due north is
360°, east is 90°, south is 180° and west is 270°.
6. Press the < and > keys to select digits in the
anemometer’s current reading.
7. Press the + and - keys to set the anemometer
reading.
8. Press DONE to exit calibration.
Note: Wind direction can not be corrected on the Vantage Vue ISS, Vantage Pro2 ISS or
Anemometer Transmitter kit by repositioning the wind vane.
360˚ N
˚
45˚ NE
˚
90˚ E
˚
135˚ SE
˚
180˚ S
˚
225˚ SW
˚
270˚ W
˚
315˚ NW
˚
Calibrating, Setting, and Clearing Variables
28
Calibrating Barometric Pressure
Before calibrating the barometric pressure, be sure the station is set to the
correct elevation. See “Screen 10: Elevation” on page 11 for more information.
Find the nearest source of barometric pressure, such as a local airport, to get a
current barometric pressure.
1. Press BAR to select barometric pressure.
2. Press and release 2ND, then press and hold SET. The barometric pressure
variable blinks.
3. Continue holding the key until the Weather Center reads “SET BAR”.
4. Press the < and > keys to select digits in the variable.
5. Press + and - keys to add to or subtract from the digit’s value.
6. Press DONE to exit calibration.
Calibrating Rain
The Rain Error in Percent refers to the measuring error of your rain collector.
This is called the Rain Error percentage. To set the rain error percentage:
1. Enter Setup Mode by pressing 2ND and then SETUP.
2. Press DONE multiple times until Screen 13: Rain Collector displays. See
“Screen 13: Rain Collector” on page 12 for more information.
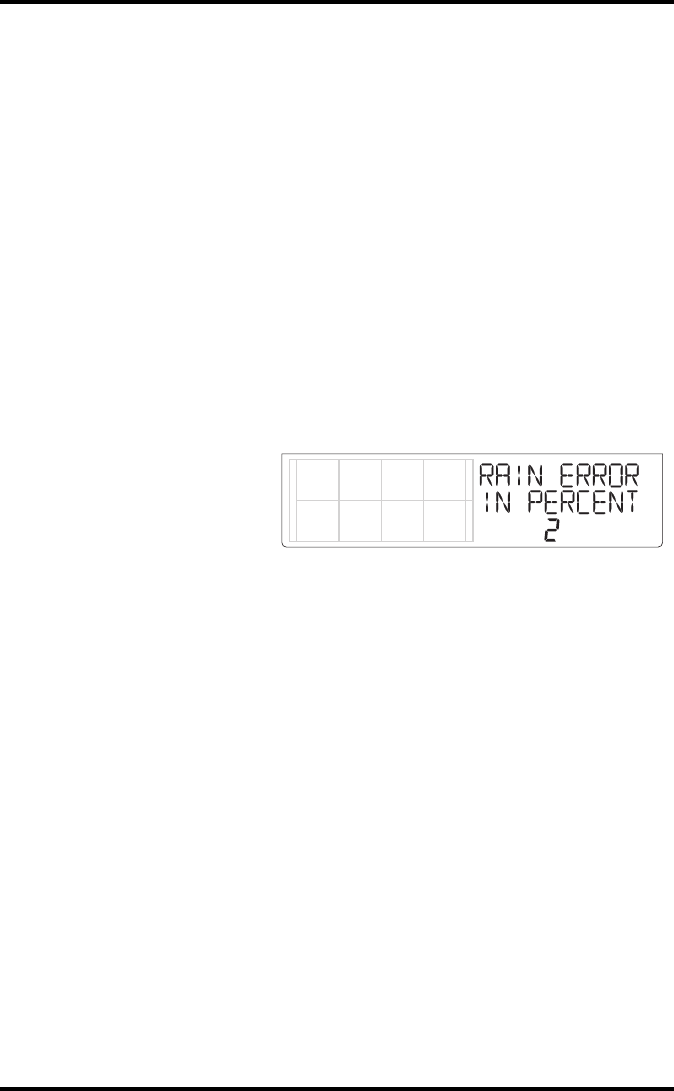
3. Press and release 2ND
and then press SET to
display the RAIN
ERROR IN PERCENT
screen.
4. Press the + and - keys to add or subtract from the percent amount. A positive
percentage rate adds a certain percentage to all the rain fall totals. A
negative percentage rate subtracts a certain percentage from all rain fall
totals. The Rain Error Percentage range is -25 to 25 percent. (Not all
corrections are available, so you may have to choose the closest one.)
5. Press and hold DONE to save the setting and exit Setup Mode.
Setting Weather Variables
Setting a weather variable allows you to manually enter a total for that weather
variable that accrued prior to installation of your weather station.
You can set values for the following weather variables:
•Daily Rain — Sets the daily rain total. Monthly and yearly rain totals are
updated.
•Monthly Rain — Sets the total rain for the current month. Does not affect
the yearly rain total.
•Yearly Rain — Sets the current year’s rain total.
•Daily ET (Evapotranspiration) — Sets the daily ET total. Monthly and
yearly ET totals are updated.
•Monthly ET— Sets the current month’s ET. Does not affect yearly total.
•Yearly ET — Sets the current year’s total ET.
Rain Error in Percent
Calibrating, Setting, and Clearing Variables
29
To set a weather variable’s value:
1. Select the variable you wish to change (either RAIN or ET).
2. Press and release 2ND, then press and hold SET. The variable blinks.
3. Keep holding SET until all digits are lit and stop flashing. Release SET; only
one digit is now blinking.
4. Press the < or > keys to select digits in the value.
5. Press the + and - keys to add to or subtract from the selected digit.
6. When you are finished, press DONE to exit.
Clearing Weather Variables Accumulations & Calibrations
The following weather variables can be cleared:
•Wind—Clears the wind direction calibration.
•Barometer — Clears any pressure offset used to calibrate the station. Clear-
ing the barometric pressure offset value also clears the elevation setting in
Setup Mode. See “Screen 10: Elevation” on page 11.
•Daily rain—Clearing the daily rain value is reflected in the daily rain total,
the last 15 minutes of rain, the last three hours of rain sent to the forecast
algorithm, the umbrella icon, and the monthly and yearly rain totals. Clear
the daily rain total if the station accidentally recorded rain when the ISS
was installed.
•Monthly rain — Clears the monthly rain total. Does not affect the yearly
rain total.
•Yearly rain — Clears the yearly rain total.
•Daily ET — Clears daily ET and subtracts the old daily ET total from the
monthly and yearly ET totals.
•Monthly ET — Clears the current monthly ET total. Does not affect the
yearly ET total.
•Yearly ET — Clears the current yearly ET total.
•Heating and Cooling Degree Days— Clears the accumulated degree day
total.
To clear a single weather variable:
1. Select the weather variable. (For degree days, select outside temperature,
press WxCtr until degree days is displayed.)
2. Press and release 2ND, then press and hold CLEAR.
The variable you’ve chosen blinks. Keep holding the
key until the value changes to zero or, in the case of
the barometer, the raw barometer value.
Note: Clearing the barometer value also clears the elevation setting.
Clear All Command
This command clears all stored high and low weather data, including monthly
and yearly highs and lows, and clears alarm settings all at once.
1. Press WIND, making sure wind speed is displayed.
2. Press 2ND then press and hold CLEAR for at least six seconds.
3. Release CLEAR when “CLEARING NOW” displays at the bottom of the
screen.
Highs and Lows Mode
30
Highs and Lows Mode
The Vantage Vue records highs and lows for many weather conditions over
three different periods: days, months, and years. Except for yearly rainfall, all
high and low registers are cleared automatically at the end of each period.
For example, daily highs are cleared at midnight, monthly highs are cleared at
month–end midnight, yearly highs are cleared at year–end midnight. You may
enter the month that you would like the Yearly Rainfall accumulation to clear.
The Yearly Rainfall clears on the first day of the month you have chosen. The
Yearly High Rain rate clears using the same setting.
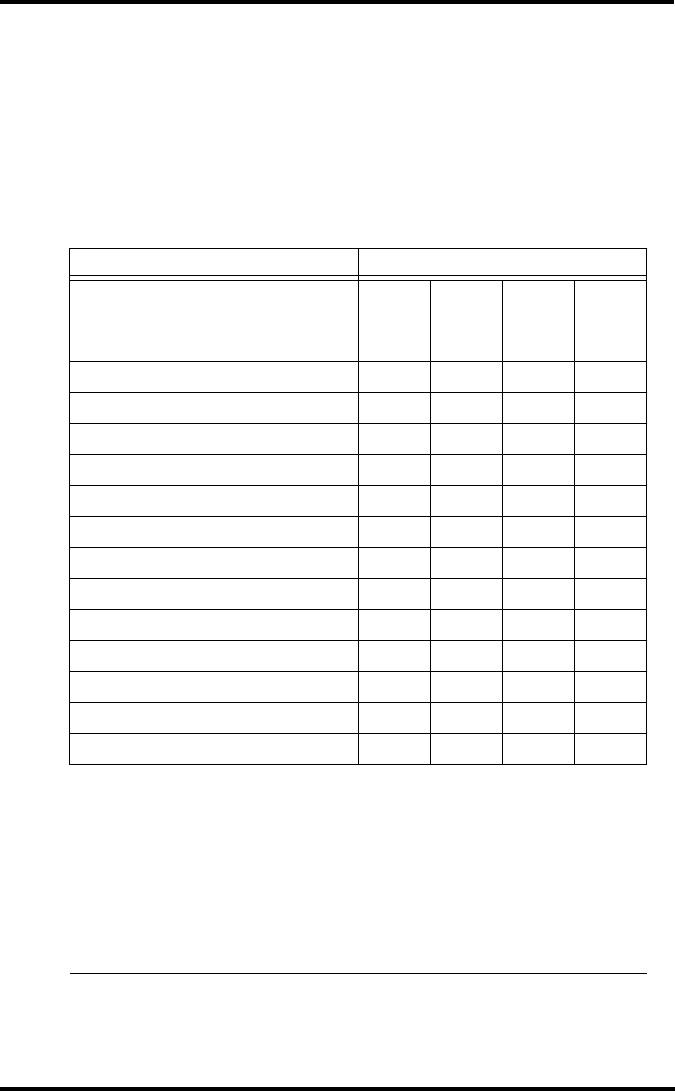
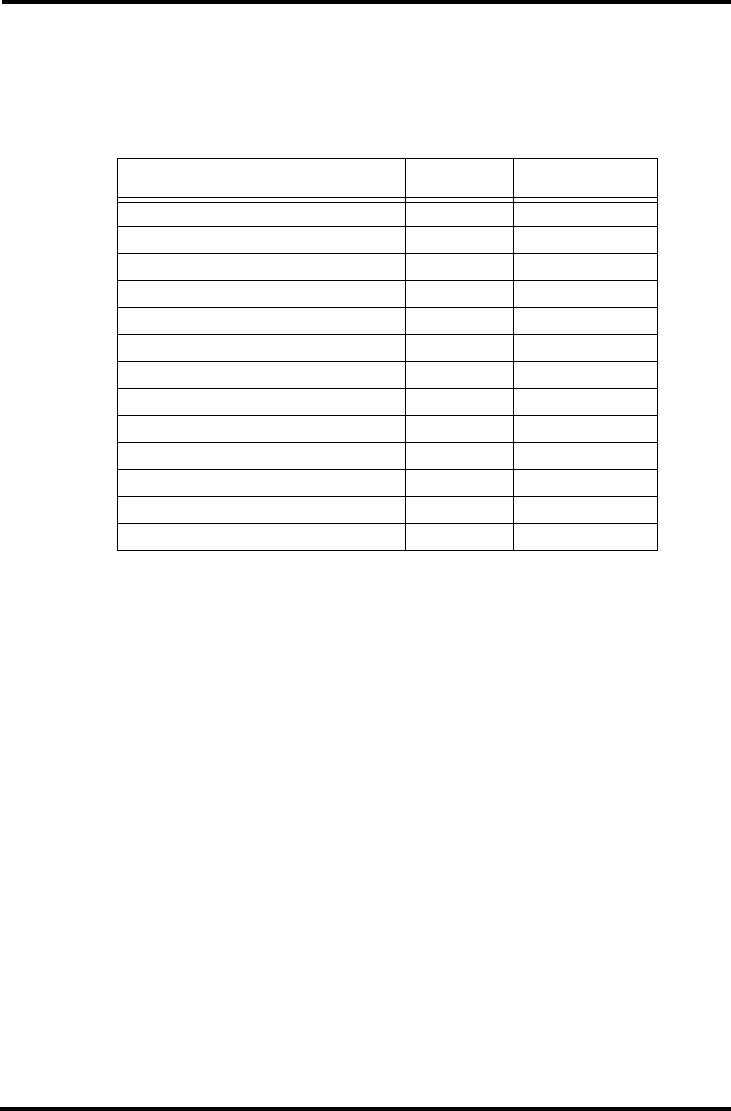
The following table lists the high and low modes for all the weather variables:
Weather Data Highs and Lows
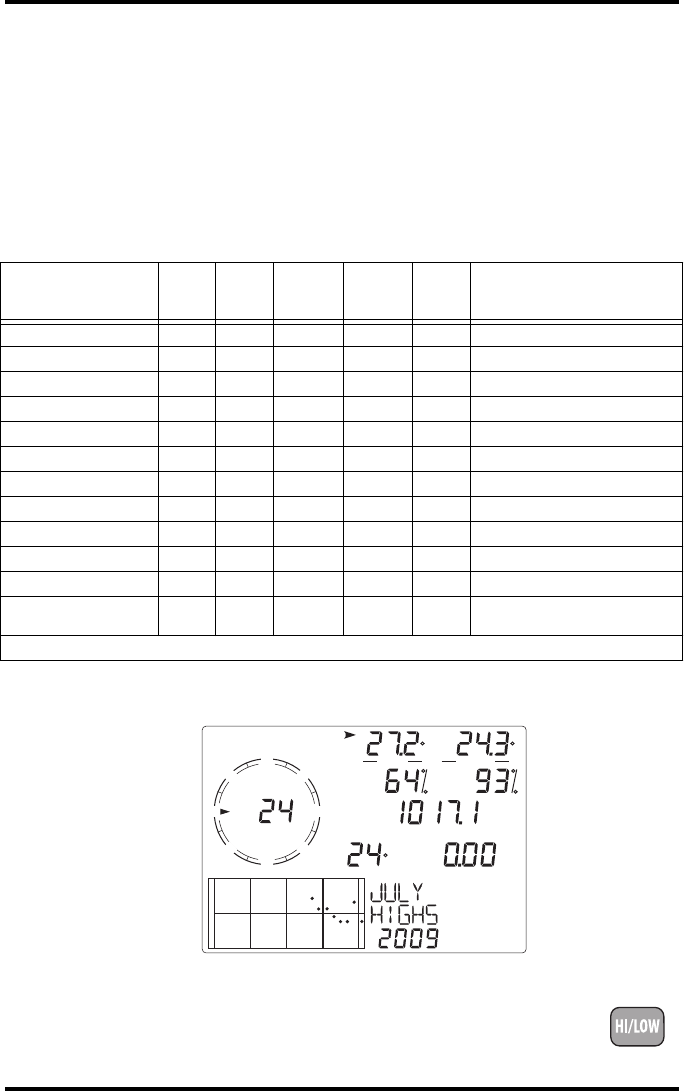
Viewing Highs and Lows
1. Press HI/LOW to enter the Highs and Lows Mode.
The day of the week and “DAILY HIGHS” display in the
Weather Center section of the console and the console
displays the highs for all visible fields.
Weather Variable High Low
Day,
Time &
Date
Month Year Additional Information
Wind Speed Yes Yes Yes Yes Includes direction
Outside Temperature Yes Yes Yes Yes Yes
Inside Temperature Yes Yes Yes Yes Yes
Outside Humidity Yes Yes Yes Yes Yes
Inside Humidity Yes Yes Yes Yes Yes
Barometer Yes Yes Yes Yes Yes
Heat Index Yes Yes Yes Yes
Wind Chill Yes Yes Yes Yes
Dew Point Yes Yes Yes Yes Yes
Rainfall Rate Yes Yes Yes Yes*
Daily Rain Total Total Total*
Evapotranspiration Total Total Total Requires a Vantage Pro2 ISS
with solar radiation sensor
* Stores yearly data for current and past years.
N
S
WE
NE
SE
NW
SW
MPH
WIND
C C
INSIDE OUTSIDE
MO HEAT
HIGHS
in
mb
C
RAIN
View of Monthly Highs
Alarm Mode
31
2. Press the + and - keys to scroll through Day Highs, Day Lows, Month Highs,
Month Lows, Year Highs and Year Lows.
The information provided in the Weather Center displays the day of the
week, month or year being viewed as well as indicates if the screen currently
being viewed is displaying Highs or Lows. The reading’s time and date,
where applicable, appear in the time and date fields.
3. Press the < and > keys to scroll back and forth through the last 26 values in
the graph section of the console screen.
Pressing the < key displays the previous day’s highs. Each time you press the
< key, the date moves back another day. The 26 dots in the graph field also
represent each of the last 26 days, months, or years; the right-most dot is the
present. As you move backward and forward the flashing dot changes to
show what value is being displayed.
4. Use the console navigation keys to select a different weather variable.
The console’s time displays the time of the selected variable’s high or low.
5. Press DONE to exit the Highs and Lows Mode. The console screen displays
the Current Weather Mode.
Note: The low reading for Wind Chill and the high reading for Heat Index are displayed in the
same place. When scrolling through the high and low screens with either of these
variables selected, the Wind Chill and Heat Index readings toggle on and off depending
on the screen displaying. If Dew Point is selected, neither Wind Chill nor Heat will be
displayed.
Alarm Mode
The Vantage Vue features 22 alarms that can be programmed to sound
whenever a reading exceeds or drops below a set value. With the exception of
barometric pressure and time, all alarms sound when a reading reaches the
alarm threshold. For example, if the high outside temperature alarm is set at
65° F/18°C, the alarm sounds when the temperature rises to or above 65.0° F/
18°C. A barometric pressure alarm is triggered based on trend. A time alarm is
based on a preset time.
Low alarms work the same way. For example, if the wind chill threshold is set
for 30°F/-1°C, the alarm condition begins when the wind chill drops to 30°F/-
1°C and will continue until the wind chill rises above 30°F/-1°C.
When an alarm condition exists, the audible alarm sounds, the alarm
icon blinks repeatedly, and an alarm description appears in the
Weather Center at the bottom of the screen. The alarm sounds for a
maximum of two minutes if the console is battery-powered, but the icon
continues to blink and the message stays in the Weather Center until you clear
the alarm or the condition clears. If you’re using the AC adapter, the alarm will
continue sounding as long as the condition exists.
The alarm will sound again for each new alarm. If more than one alarm is
active, the description for each active alarm along with a “+” symbol cycles
onto the Weather Center section of the screen every four seconds.
Alarm Mode
32
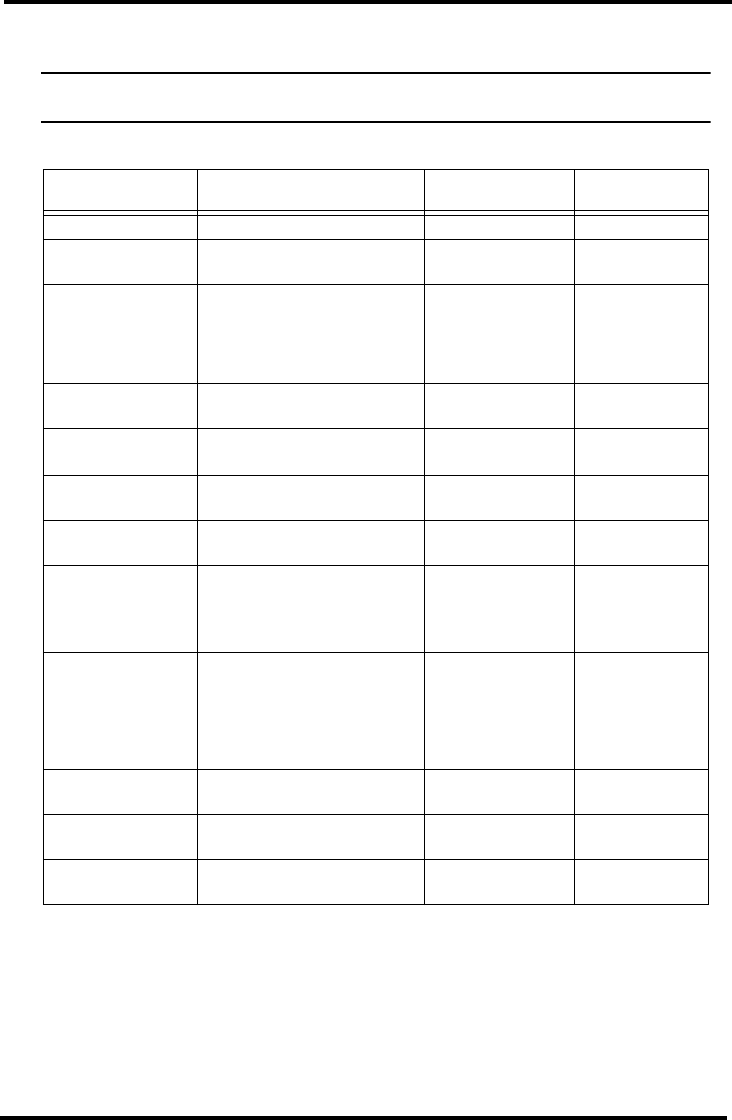
Vantage Vue Alarms
Special Alarms
ET (Evapotranspiration) (Optional)
ET is updated only once an hour, on the hour. If during a given hour the ET
value exceeds the alarm threshold, the ET alarm sounds at the end of that hour.
This is true for daily, monthly, and yearly ET alarms. You must have the
optional solar radiation sensor to use this alarm. See “Evapotranspiration (ET)”
on page 46 for a description of this variable.
Note: The ET Alarm is only available when the console is receiving data from a Vantage Pro2
Plus station. If your Vantage Vue console is not listening to a Vantage Pro2 Plus ISS, you
cannot set an ET alarm.
Barometric Pressure
The Vantage Vue allows you to set two barometric pressure alarms: a “rise”
alarm and a “fall” alarm. You may select any rate of change per three hours
between 0.00 and 0.25 inches (6.35 mm) Hg, (8.5 mb, hPa). The alarm will
sound if the rate of change (in either direction) exceeds the threshold you set.
This alarm is updated every minute.
Setting Alarms
1. Press and release 2ND then press ALARM to enter
the Alarm Mode to view or set the high alarm
thresholds. The screen displays the current high
Variable Alarms
Barometric Pressure Trend Storm Warning - uses trend value rising rate
Storm Clearing - uses trend value falling rate
Evapotranspiration* ET Alarm - uses total ET for the day
Humidity, Inside High and Low
Humidity, Outside High and Low
Dew Point High and Low
Rain
Flash Flood Alarm - uses current 15 minute rainfall
total
24 Hour Rain Alarm - uses current 24 hour rainfall total
Storm Storm Alarm - uses current storm rainfall total
Rain Rate High
Inside Temperature High and Low
Outside Temperature High and Low
Heat Index Temperature High
Wind Chill Temperature Low
Wind Speed High
Time & Date The alarm sounds for 1 minute.
*Evapotranspiration measurements are only available when receiving data from Vantage
Pro2 Plus stations or other Vantage Pro2 ISS stations in which a solar radiation sensor
has been installed.

Graph Mode
33
alarm thresholds. The Alarm icon displays and “HIGH ALARMS” displays
in the Weather Center.
2. Press the < and >keys to select one of the variables displayed on the screen or
use the console keys to select any weather variable. Also, press HI/LOW to
display then toggle between the high and low alarm threshold settings.
3. Press 2ND then press SET to activate the
currently selected weather variable.
4. Press the < and > keys to select digits in the
threshold value.
5. Press the + and - keys to change the digit’s value up and down.
6. Press DONE to finish changing the alarm setting.
7. Repeat steps 2 through 6 to change additional alarm settings.
8. Press DONE to exit Alarm Mode.
Setting the Time Alarm
1. Press and release 2ND then press ALARM to enter the Alarm Mode
The Alarm Icon displays and “HIGH ALARMS” displays in the Weather
Center.
2. Press TIME, then press and release 2ND and press SET.
The hour digit in the time field begins blinking, displaying the current time.
3. Press the < and > keys to select between the hour digit and the minutes
digits.
4. Press the + and - keys to change the digit’s value up and down. To change
between AM and PM, keep pressing + and - when the hour value is blinking.
5. Press DONE to exit Alarm Mode.
Clearing Alarm Settings
1. Press 2ND and ALARM to enter the Alarm Mode.
The ALARM and HIGHS icons appear.
2. Select the alarm setting you wish to clear.
3. Press and release 2ND, then press and hold CLEAR until the setting changes
to all dashes.
You have cleared the alarm setting.
4. Press DONE to exit Alarm Mode.
Silencing Alarms
1. Press DONE to silence (but not clear) an alarm when it sounds.
Graph Mode
The Vantage Vue console includes a powerful Graph Mode that allows you to
view over 50 graphs of different weather data right on the screen, all without
connecting to a personal computer.
The horizontal axis is time, showing the current and last 25 intervals (hours,
days, months, or years). The vertical axis scale changes automatically to fit the
information of the period graphed.
Graph Mode
34
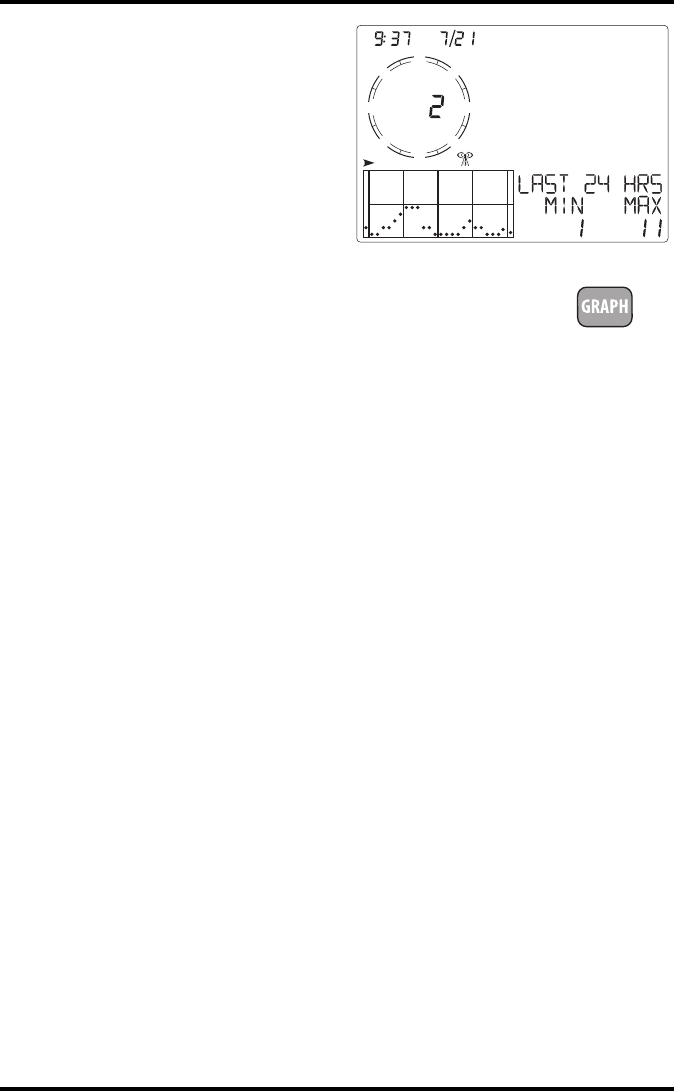
Viewing Graphs
Although the graphs available may
vary for each weather variable, all
are displayed in the same way.
1. Select a variable to graph.
2. Press GRAPH to enter Graph Mode. Only the time, date,
graph, graph icon, selected variable and information
pertaining to the selected variable are visible. The rest of
the screen is blank.
Values for the present time and each of the preceding 25 hours are displayed
in the graph, each hour represented by a dot. The dot at the right end of the
graph is the value for the current hour. You’ll notice that the dot is blinking.
The dot at the left end of the graph is the value at least 24 hours ago.
3. Press the < key and the second dot from the right starts to blink.
The screen displays the new dot’s value. The time display shows what hour
is being viewed.
4. Press the < and > keys to view the variable’s high values for each of the last
25 hours.
5. Press the + and - keys to shift the graph’s time span.
If you press the - key, the graph shifts from the current and last 25 hours to
the current and last 25 days. Each dot represents the high recorded on the
day shown in the date field. To see the lows recorded in the current and last
25 days, press HI/LOW. Press the < and > keys to move between days.
By pressing the - key again, the graph shifts to show the highs of the current
and last 25 months. As before, use the < and > keys to move between
months. Press HI/LOW to shift between the highs and lows.
By pressing the - key again, the graph shifts one more time to show the
highs of the current and last 25 years, but only for Rain Rate, Rain, and ET.
The console beeps when you’ve reached the first or last possible value or
time span for the graph. Since the console only graphs data collected by the
station, graphs can only show data collected since the station was installed.
WIND GRAPH
MPH
am
N
S
WE
NE
SE
NW
SW
Graph Mode for the wind variable
GRAPH
Graph Mode
35
View graphs of all other variables the same way.
1. Select the variable you want to view.
2. Press GRAPH.
3. Use the < and > keys to select different values.
4. Press the + key to shorten the time range.
5. Press the - key to lengthen the time range.
6. Press HI/LOW to shift between highs and lows.
7. Press DONE to exit.
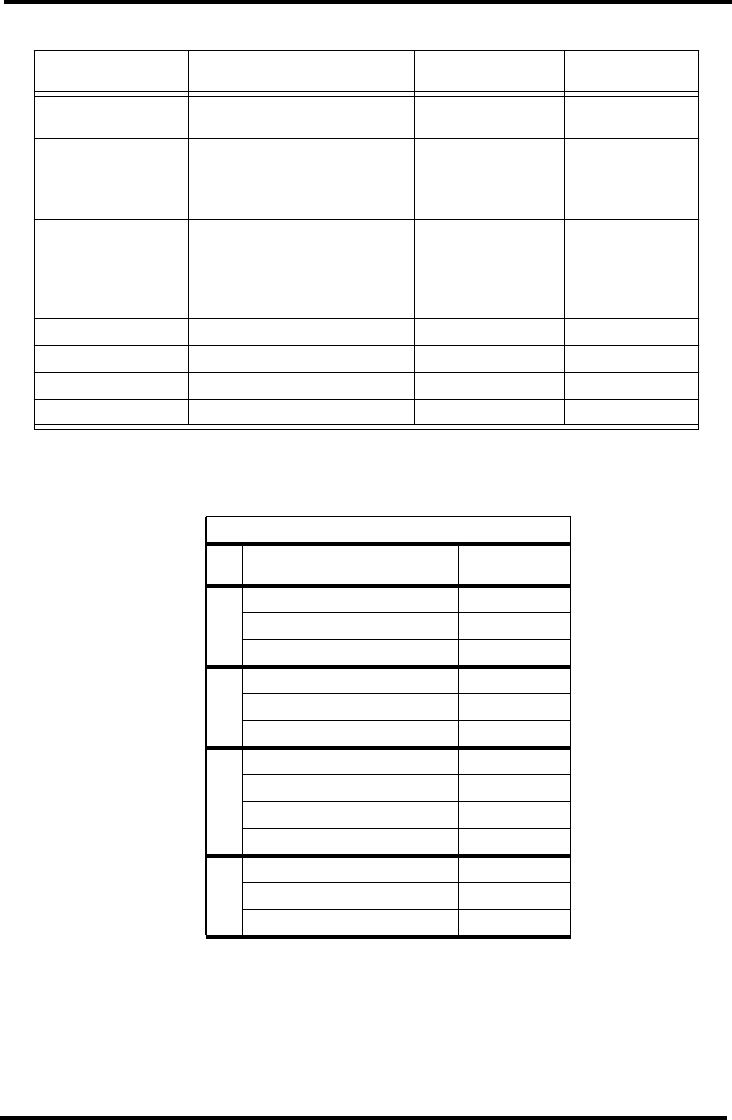
Vantage Vue Console Graphs
Weather Variable Available Graphs
Hourly
Daily
Monthly
Yearly
Barometric Pressure C H, L H, L
Humidity, Inside C H, L H, L
Humidity, Outside C H, L H, L
Dew Point C H, L H, L
Rain T T T T
Rain Rate HHHH
ET (optional) T T T T
Inside Temperature C H, L H, L
Outside Temperature C H, L H, L
Heat Index Temperature C H H
Wind Chill Temperature L L L
Wind Speed* A, H H H
Direction of High Wind Speed Y Y
Legend:
A = Average
H = Highs
L = Lows
T =Totals
Y = Yes
C = Current reading at the end of each period
* Also available: 10-Minute High Wind Speeds For Last 4 Hours; Last 26
Packets of Wind Speed.
36
Chapter 4
Troubleshooting and Maintenance
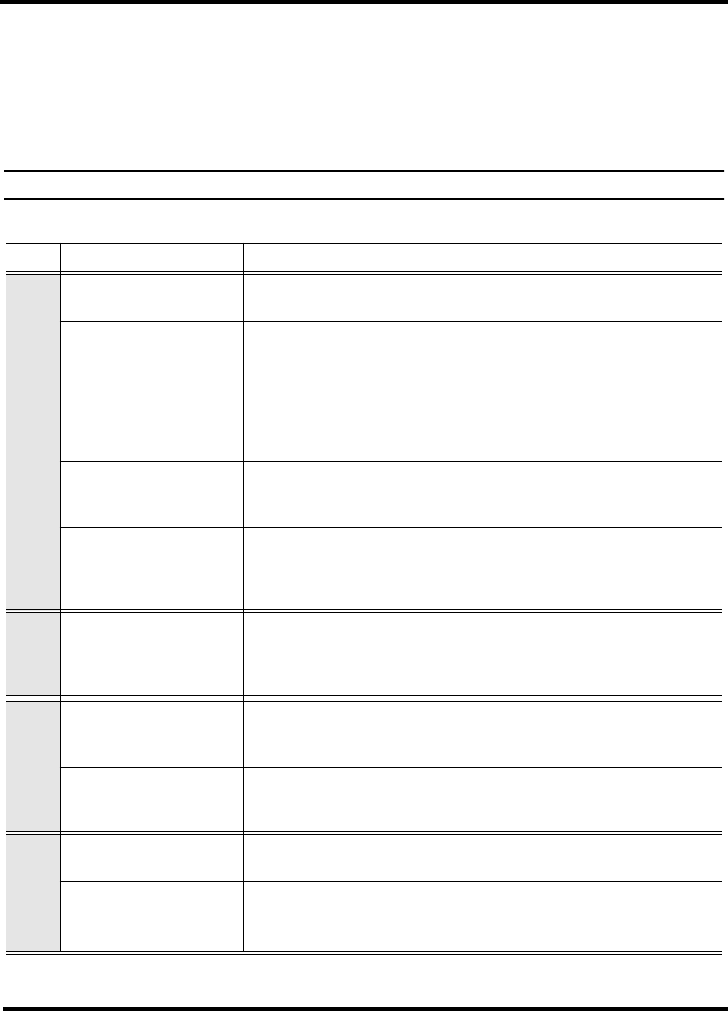
Vantage Vue Troubleshooting Guide
While your Vantage Vue weather station is designed to provide years of trouble-free
operation, occasional problems may arise. If you are having a problem with your
station, please consult this troubleshooting guide before calling Davis technical
support. You may be able to quickly solve the problem yourself. Please see
“Contacting Davis Technical Support” on page 52.
Note: Refer to the ISS Installation Manual for additional troubleshooting information.
TABLE 4-1: TROUBLESHOOTING GUIDE
Problem Solution
Display
Display is blank Unit is not receiving power. Check the power adapter connections
and/or replace batteries.
Display shows dashes
in place of weather data
• Station not transmitting. See ISS manual.
• Console not receiving - See “Troubleshooting Reception
Problems” on page 37.
• A reading has exceeded the limits indicated in the
specifications table.Calibration numbers may be causing
readings to exceed display limits. Check calibration number
and adjust if necessary.
Console is sluggish or
does not work at low
temperatures
The console and display may not work below 32° F (0° C). Use an
external temperature sensor in low-temperature locations or install
the console indoors.
Display “locks up”
Reset the console by removing AC and battery power then
restoring power. If this occurs frequently in an AC-powered
console, plug the AC power adapter into a surge suppressor, or
use batteries. (They will last up to a year.)
Humidity
Inside humidity seems
too high or too low
Make sure the console is not near a humidifier or de-humidifier.
Check calibration number and adjust if necessary. If inside
humidity is low, and inside temperature is too high, see “inside
temp” below. Also make sure the console backlight is not on.
Wind Speed
Wind speed reading
seems too high or too
low.
For low readings, remove wind cups and check for friction sources.
Check the anemometer location. Is it sheltered from the wind? See
ISS manual for additional wind speed troubleshooting information.
Wind speed reads 0
either all the time or
intermittently
The problem may be with the anemometer. Test anemometer by
spinning wind cups. Check the corresponding wind fields in the
diagnostic screens and call technical support.
Wind Direction
Wind direction reading
is dashed out Check reception. See Reception Problems below.
Wind direction always
says north
Could be an ISS problem, especially if outside temperature is
dashed out as well. See the ISS manual for troubleshooting
information
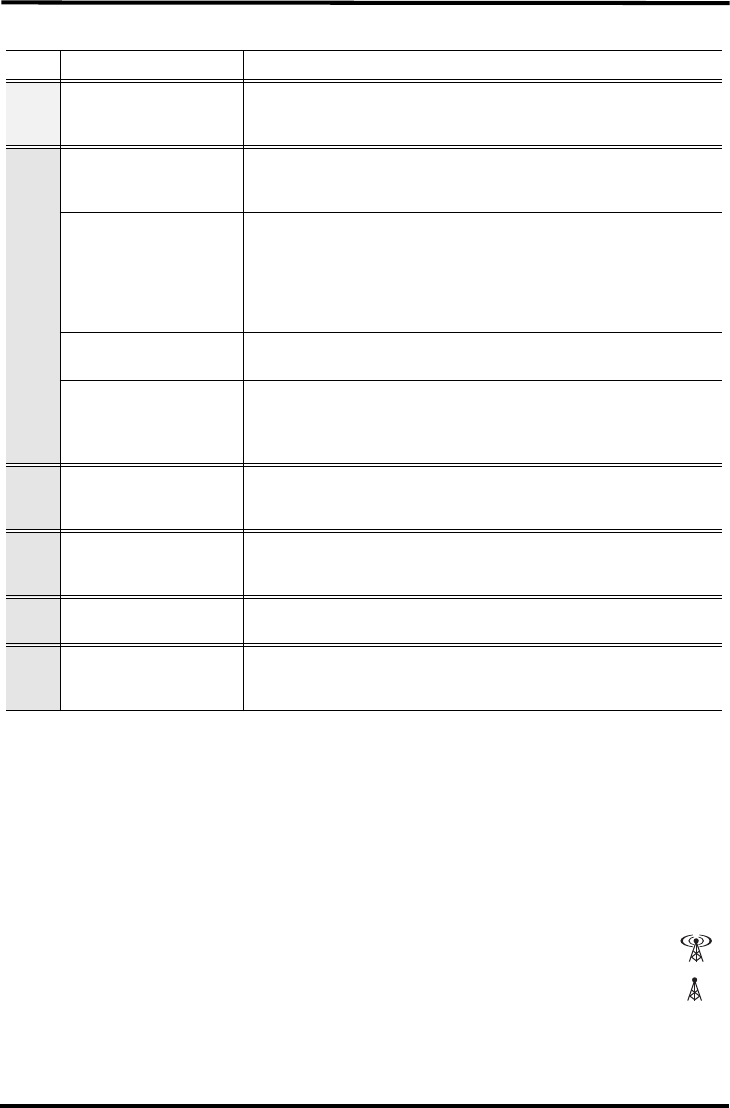
Vantage Vue Troubleshooting Guide
37
Troubleshooting Reception Problems
While we have tested the Vantage Vue radio extensively, each site and each
installation presents its own issues and challenges. Obstructions, particularly metallic
ones, can cut down your station’s reception distance. Be sure to test reception
between the console and ISS in the locations you intend to install them before
permanently mounting your ISS.
The console’s reception status displays as an antenna icon above the graph portion of
the console screen
• The antenna icon displays with waves flashing around it when the
console is receiving data from the ISS.
• The antenna icon displays alone when the console is trying to re-
establish a lost connection. When no data packets have been received
for 10 minutes, the console dashes-out any missing sensor readings.
• The antenna icon disappears when the connection between the ISS and console is
lost. The console tries for 10 minutes to re-establish a connection, then stops trying
to connect with the ISS for 15 minutes, and then redisplays the antenna alone
Dew
Dew Point reading
seems too high or too
low
Check calibration numbers for temperature. Dew point depends on
outside temperature and humidity. Make sure both sensors are
working.
Temperature
Outside temperature
reading seems too high
Check calibration number and adjust if necessary. The ISS may
need to be relocated away from radiant heat sources. See the ISS
Installation manual.
Inside temperature
sensor reading seems
too high
Move the console out of direct sunlight. Make sure the console or
sensor is not in contact with an exterior wall that heats up in
sunlight or when outside temperature rises. Make sure the console
or sensor is not near a heater or other internal heat source (lamps,
appliances, etc.). Check calibration number and adjust if
necessary.
Outside temperature
seems too low
Check calibration number and adjust if necessary. Sprinklers may
be hitting the ISS radiation shield. Relocate. See ISS manual.
Inside temperature
sensor reading seems
too low
Make sure the console temperature sensor is not in contact with
an exterior wall that cools down when outside temperature drops.
Make sure the console temperature sensor is not near an air con-
ditioning vent. Check calibration number and adjust if necessary.
Chill
Wind chill reading
seems too high or too
low
Check calibration numbers for temperature. Wind chill depends on
temperature and wind speed. Make sure they’re working.
Heat
Heat Index reading
seems too high or too
low
Check calibration numbers for temperature. The heat index
depends on temperature and outside humidity. Make sure the sen-
sors are working.
Rain
No rain readings Make sure the rain funnel is not clogged with debris. See the ISS
manual.
Time
Incorrect times for
sunrise and sunset
Check your latitude, longitude, time zone, and daylight saving time
settings. Sunrise and sunset times are calculated from the console
using all of these settings.
TABLE 4-1: TROUBLESHOOTING GUIDE
Problem Solution
Console Diagnostic Mode
38
while it tries to re-establish a connection with the ISS. Enter and exit Setup Mode
to re-display the antenna icon and manually force the console to re-establish a
connection with the ISS.
Check Console Reception
Enter Setup Mode by pressing and releasing 2ND and pressing SETUP. Keep pressing
DONE until the Receiving From screen displays. (See “Screen 5: Active Transmitters”
on page 8 for more information.) Wait a few minutes while the console lists all the
stations transmitting within range. If the console does not detect your transmitter,
check the following:
• Adjust the console antenna so that it is vertical and in line of sight the Vantage
Vue ISS antenna.
Note: The ISS antenna for the Vantage Vue can not be adjusted. Ensure that the console antenna
is vertical.
• Check the ISS and transmitter ID numbers. See“Screen 6: Configuring Transmitter
IDs” on page 9.
• Try reducing or increasing the distance between the ISS and the console. They
should be at least 10 feet /3 meters apart. Maximum range is 1000’ (300m).
Refer to the ISS Installation Manual for instructions on how to check the station for
potential transmission problems.
Console Diagnostic Mode
In addition to logging weather data, the console continuously monitors the station’s
radio reception. You may find this information very helpful, especially when you are
choosing locations for your console and ISS.
The Console Diagnostics Mode consists of two screens, the Statistical Diagnostic
Screen and the Reception Diagnostic Screen.
Note: Radio transmission data used by the diagnostic screens clears each day at midnight, except
for good packet graph data. Diagnostic screens are also cleared if you change your ID or go
into the Setup Mode.
Diagnostic Screen Commands
• Press and hold TEMP, then press HUM to display the Statistical Diagnostic
screen.
• Press 2ND and then press CHILL to toggle between the Statistical and Reception
Diagnostic screens.
• Press DONE to exit the diagnostic screens.
• A degree (°) sign displays to the right of the last digit in Value 3 (in the area of the
compass rose, see illustration below) of the Reception Diagnostic screen (Screen 2)
to differentiate which screen is currently displayed.
Console Diagnostic Mode
39
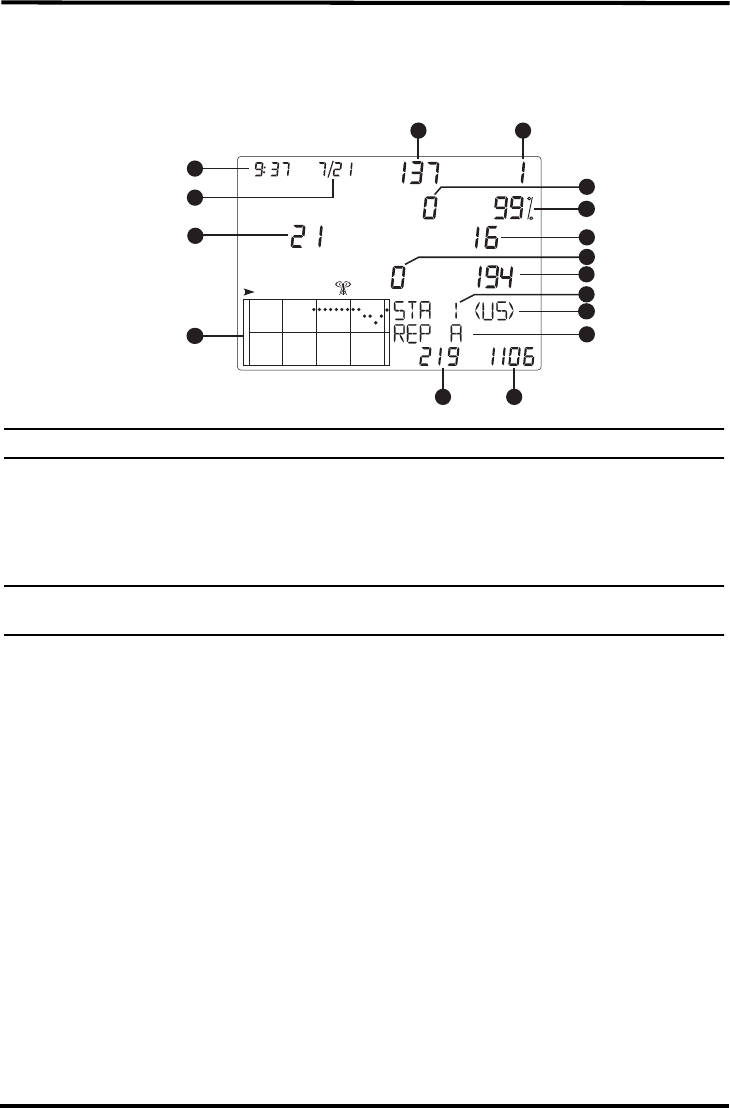
Screen 1: Statistical Diagnostic Screen
The Statistical Diagnostic Screen displays information about how well data is being
received from the weather station to the console. The information that is displayed in
this screen includes:
Note: Several of these values, with a *, are used by Davis engineers.
1. Time of day or number of times the anemometer reed switch was seen closed*.
The reed switch closes once each revolution of the anemometer wind cups. Press
WIND to toggle between these two values.
2. Date or the number of times the anemometer reed switch was seen open*. Press
WIND to toggle between these two values.
Note: The time and date displays can be toggled in both statistical and reception diagnostic
screens.
3. Number of packets containing received “Cyclical Redundancy Check” (CRC)
errors. The system runs a CRC check on data packets. Any data packets that don’t
pass this check are considered to contain errors and are discarded. These are
considered bad packets. This also includes the CRC errors received during radio
acquisition.
4. The firmware version currently installed on the console.
5. Maximum number of bad packets in a row without resynchronization.
6. Number of times the console resynchronized with the transmitter. The console will
attempt to resynchronize with the station after 20 consecutive bad packets.
7. Percentage of good packets received. Graph shows the current and last 25 days of
good packet percentage data. The scale is fixed at 10% per dot.
8. The total number of bad data packets including missed packets and CRC errors.
Missed packets are described as when a data packet is expected, but is not
recognized as a data packet by the console. This does not include bad packets
received during acquisition.
9. Current streak of consecutive bad packets. The counter increments when the
console is synchronized but the packet is bad. This value is reset to zero when a
good packet is received.
10.Current streak of consecutive good packets received.
am
1
2
3
45
6
7
8
9
11
10
12
13
1415
7
Console Diagnostic Mode
40
11.Station Number
12.Transmitter Domain
13.Repeater ID currently communicating with the console. If a repeater or group of
repeaters is used to relay station information to the console, the Repeater ID
displayed is the repeater that the console is set to receive. If the console is not
listening to repeaters, this section remains blank.
14.Total number of good packets received.
15.Longest streak of consecutive good packets.
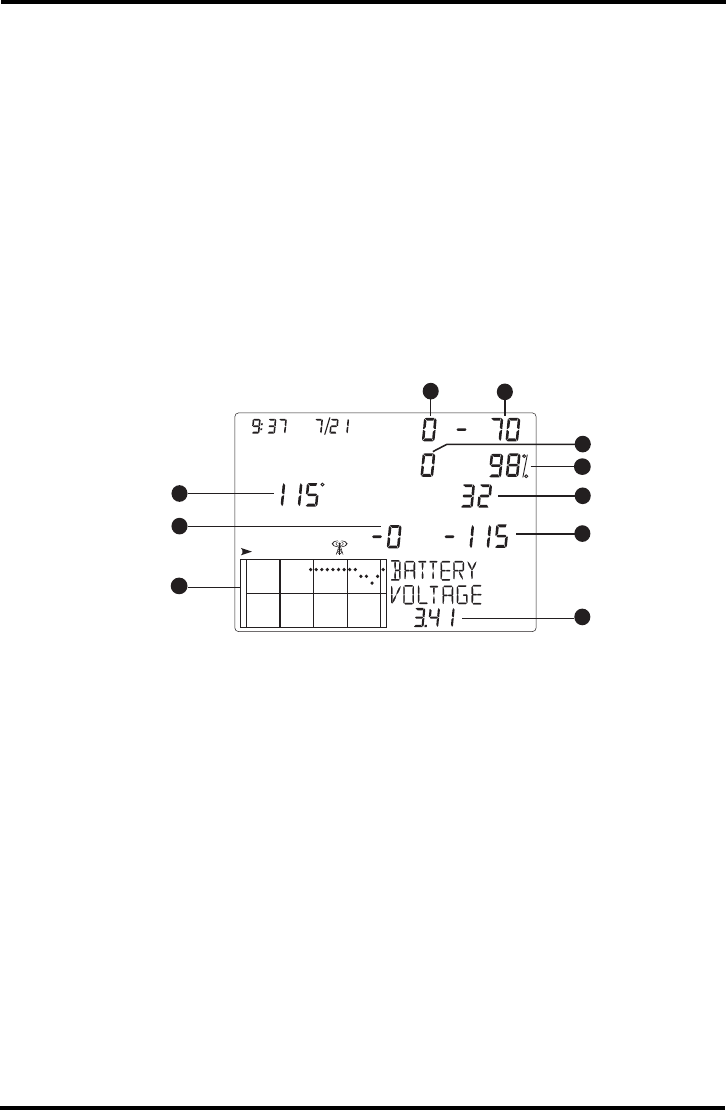
Screen 2: Reception Diagnostic Screen
The Reception Diagnostic screen displays information pertinent to the console’s
wireless reception. To view this screen from the Statistical Diagnostic screen, press
2ND and then press CHILL. The degree sign displaying to the right of the last digit in
Value 1 (see illustration below) verifies that the Reception Diagnostic screen is
currently displayed.
The information that is displayed in this screen includes:
1. 8-bit timer value of next reception.*
2. Radio frequency error of the last packet received successfully. The ideal number
should be zero after frequency correction is added. This value affects the value of
#3.
3. Current frequency correction factor. Shows the frequency adjustment to the
console.
4. Signal strength of the last packet received. The values displayed in this field show
the received signal strength in dBm power. A more negative number means the
signal strength is weaker while a less negative number means the signal strength is
stronger. (Range: -100 to -20.) If a packet is not received successfully, the signal
strength field is dashed out (--).
5. The number of times that the Phase Lock Loop did not lock.*
6. Percentage of good data packets. Graph shows the current and last 25 days of good
packet percentage data. The scale is fixed at 10% per dot.
7. Frequency index of the next packet to be received.*
8. Background noise level. This refers to the signal level that the console hears while
it is not listening to a transmitter. Background noise is displayed as power level in
am
1
34
5
6
7
8
9
2
6
Console Maintenance
41
dBm. The more negative the number is, the lower the background noise is.
(Typically, this number should be about 15 lower than signal strength.)
9. Current console battery voltage. Ignore this value if using only an AC adapter to
power the console. The value is dashed out (--) if no batteries are installed.
Console Maintenance
Changing Batteries
Use this procedure to change console batteries without losing any stored weather
data or console configuration settings.
1. Plug in the AC adapter or, if the AC adapter is not present.
2. Enter Setup Mode by pressing and releasing 2ND and pressing SETUP.
Entering Setup Mode makes sure the station isn’t writing any data to memory
when power is removed.
3. Remove the battery cover located on the back of the console by pressing down on
the two latches at the top of the cover.
4. In the top battery compartment, insert a fingertip between the battery and the
notched end of the compartment and remove the battery.
5. Repeat the process for the batteries in the bottom battery compartment.
6. Install the new batteries. (See “Installing Batteries” on page 3.)
7. Replace the battery cover and remove the AC power adapter, if desired.
Console Firmware Versions
From time to time Davis engineers update the Vantage Vue
console firmware. View the firmware version in Value 4 in
the Statistical Diagnostic screen, or by pressing and holding
DONE and + from the Current Weather Mode screen.
You can check the firmware version currently available and download, at no charge,
the newest firmware to your console on the Weather Software Support section of our
website (http://www.davisnet.com/support). A WeatherLink data logger is required
to update the firmware into the console.
One Year Limited Warranty
For details on our warranty policy, please refer to the Maintenance, Service, and Repair
Information brochure included with your station.
Contacting Davis Technical Support
If you have any questions, or encounter problems installing or operating your
Vantage Vue weather station, please contact Davis Technical Support. We’ll be glad to
help.
(510) 732-7814 — Monday - Friday, 7:00 a.m. - 5:30 p.m. Pacific Time. We are unable to
accept collect calls.
(510) 670-0589 — Technical Support Fax.
support@davisnet.com — E-mail to Technical Support.
info@davisnet.com — General e-mail.
www.davisnet.com — Davis Instruments website.
See the Weather Support section for copies of user manuals, product specifications,
application notes, and information on software updates. Watch for FAQs and other
updates.
42
Time
Appendix A
Weather Data
Refer to this appendix to learn more about the weather variables that are measured,
displayed, and logged by your Vantage Vue station. The following variables are
arranged below in the order they are viewed on the console screen: left to right, top to
bottom, starting with time.
Time
A built-in clock and calendar track the time and date. The console automatically
adjusts for daylight saving time and leap year in most of North America, and Europe
(and allows manual adjustment elsewhere). The console also displays the sunrise and
sunset times based on the latitude and longitude, time and date, and your time zone/
UTC offset.
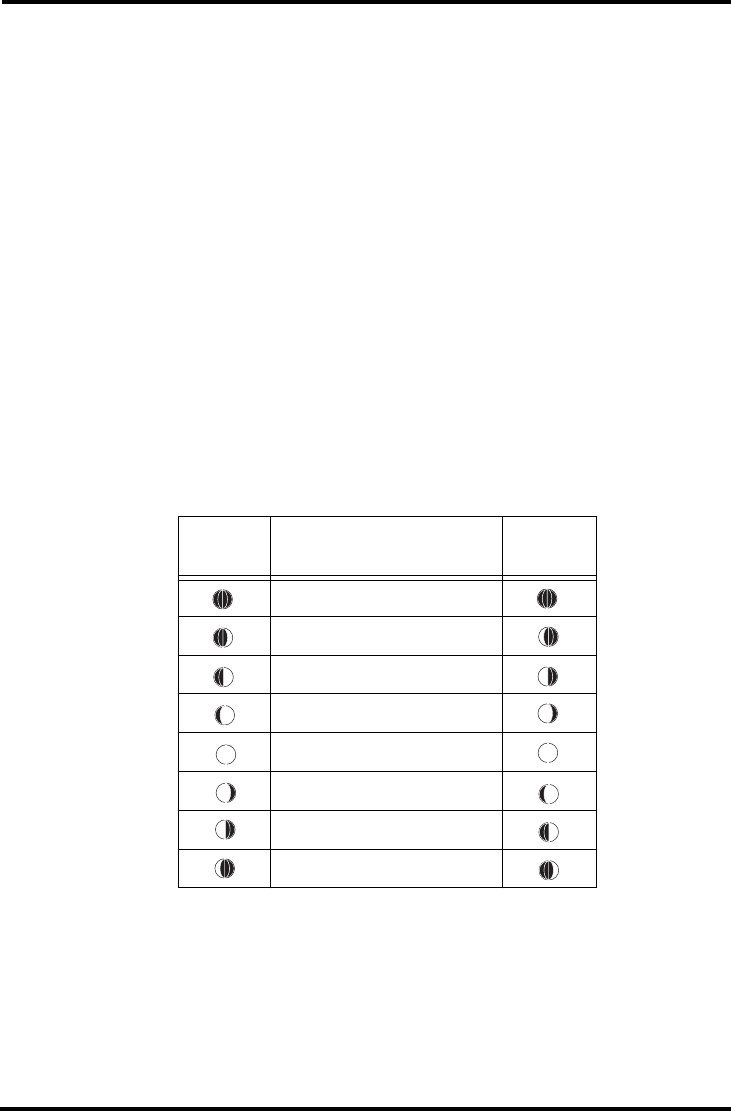
Moon Phases
The moon phase icons and moon phase description in the Weather Center section of
console screen are calculated based on latitude and longitude, time and date and your
time zone/UTC Offset. The following table displays the moon phase for the Northern
and Southern Hemispheres.
Icon:
Northern
Hemisphere
Moon Phase Description
in the Weather Center
Icon:
Southern
Hemisphere
NEW MOON
WAXING CRESCENT MOON
FIRST QUARTER MOON
WAXING GIBBOUS MOON
FULL MOON
WANING GIBBOUS MOON
LAST QUARTER MOON
WANING CRESCENT MOON
43
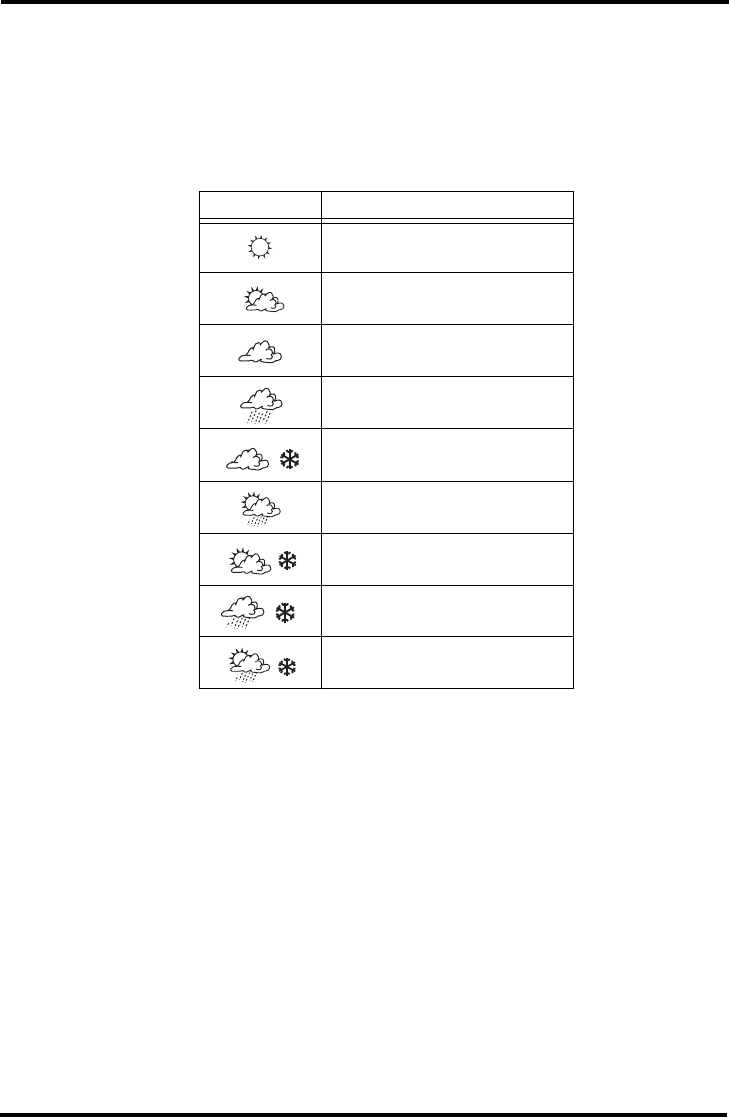
Forecast
Forecast
The forecast icons show what weather conditions may occur within the next 12 hours.
The console generates a weather forecast based on the barometric reading and trend;
wind speed and direction; rainfall; temperature; humidity; latitude and longitude;
and time of year. The forecast is updated once an hour, on the hour and requires three
hours of data. Predictions are made for cloud cover and the likelihood of
precipitation.
Wind
The anemometer measures wind speed and direction, and is part of the Integrated
Sensor Suite (ISS). The console calculates a 2-minute average wind speed, a 10-minute
average wind speed and 10-minute dominant wind direction. The 10- and 2-minute
average wind speed is displayed in the Weather Center whenever wind has been
selected on the console. The last six 10-minute dominant wind directions are included
in the compass rose wind display.
Forecast Icon Description of Forecasted Weather
Mostly clear
Partly cloudy
Mostly cloudy
Rain likely
Snow likely
Rain possible but not likely
Snow possible but not likely
Rain, freezing rain, sleet and/or snow
likely
Rain, freezing rain, sleet and/or snow
possible but not likely
44
Temperature
Beaufort Scale
The Beaufort Scale is an empirical measure for describing wind speed which ranks
wind speeds in classes. The Beaufort Scale classification for the current wind
condition is listed in the Weather Center when WIND is pressed and WxCEN is
pressed several times. See “Wind Speed and Direction” on page 17 for more
information.
Temperature
The ISS houses the outside temperature sensor in a vented and shielded enclosure
that minimizes solar radiation induced temperature error. The console houses the
inside temperature sensor.
Humidity
Humidity itself simply refers to the amount of water vapor in the air. However, the
total amount of water vapor that the air can contain varies with air temperature and
pressure. Relative humidity takes into account these factors and offers a humidity
reading which reflects the amount of water vapor in the air as a percentage of the
amount the air is capable of holding. Relative humidity, therefore, is not actually a
measure of the amount of water vapor in the air, but a ratio of the air’s water vapor
content to its capacity. When we use the term humidity in the manual and on the
screen, we mean relative humidity.
It is important to realize that relative humidity changes with temperature, pressure,
and water vapor content. If a parcel of air with a capacity for 10 g of water vapor
contains 4 g of water vapor, the relative humidity would be 40%. Adding 2 g more
water vapor (for a total of 6 g) would change the humidity to 60%. If that same parcel
of air is then warmed so that it has a capacity for 20 g of water vapor, the relative
humidity drops to 30% even though water vapor content does not change.
Relative humidity is an important factor in determining the amount of evaporation
from plants and wet surfaces since warm air with low humidity has a large capacity
to absorb extra water vapor.
Wind Speed Beaufort
Number Description
0 -1 mph; (0 -1.6 kph) 0 Calm
1-3 mph; (1.6 - 4.8 kph) 1 Light Air
3 - 7 mph; (4.8 - 11.3 kph) 2 Light Breeze
7 -12 mph; (11.3 - 19.3 kph) 3 Gentle Breeze
12 - 18 mph; (19.3 - 29.0 kph) 4 Moderate Breeze
18 - 24 mph; (29.0 - 38.6 kph) 5 Fresh Breeze
24 - 31 mph; (38.6 - 49.9 kph) 6 Strong Breeze
31 - 38 mph; (49.9 - 61.2 kph) 7 Near Gale
38 - 46 mph; (61.2 -74.1 kph) 8 Gale
46 - 54 mph; (74.1 - 86.9 kph) 9 Severe Gale
54 - 63 mph; (86.9 - 101.4 kph) 10 Storm
63 - 73 mph; (101.4 - 117.5 kph) 11 Violent Storm
73 mph or above; (117.5 kph) 12 Hurricane

45
Wind Chill
Wind Chill
Wind chill takes into account how the speed of the wind affects our perception of the
air temperature. Our bodies warm the surrounding air molecules by transferring heat
from the skin. If there’s no air movement, this insulating layer of warm air molecules
stays next to the body and offers some protection from cooler air molecules.
However, wind sweeps that warm air surrounding the body away. The faster the
wind blows, the faster heat is carried away and the colder you feel. Wind has a
warming effect at higher temperatures.
Note: There is no windchill when the air temperature is at or above 93° F (-34° C).
Heat Index
The Heat Index uses temperature and the relative humidity to determine how hot the
air actually “feels.” When humidity is low, the apparent temperature will be lower
than the air temperature, since perspiration evaporates rapidly to cool the body.
However, when humidity is high (i.e., the air is more saturated with water vapor) the
apparent temperature “feels” higher than the actual air temperature, because
perspiration evaporates more slowly.
Note: Heat Index and air temperature are equal at or below 0° F (-18° C).
Dew Point
Dew point is the temperature to which air must be cooled for saturation (100%
relative humidity) to occur, providing there is no change in water vapor content. The
dew point is an important measurement used to predict the formation of dew, frost,
and fog. If dew point and temperature are close together in the late afternoon when
the air begins to turn colder, fog is likely during the night. Dew point is also a good
indicator of the air’s actual water vapor content, unlike relative humidity, which takes
the air’s temperature into account. High dew point indicates high water vapor
content; low dew point indicates low water vapor content. In addition a high dew
point indicates a better chance of rain, severe thunderstorms, and tornados.
You can also use dew point to predict the minimum overnight temperature. Provided
no new fronts are expected overnight and the afternoon relative humidity is greater
than 50%, the afternoon’s dew point gives you an idea of what minimum temperature
to expect overnight. The higher the humidity is, the more accurate the dew point
prediction.
Note: Dew Point is equal to the air temperature when the humidity is 100%.
Rain
Vantage Vue incorporates a tipping spoon rain collector in the ISS that measures 0.01''
or 0.2 mm for each tip of the spoon. Your station logs rain data in the same units it is
measured in and converts the logged totals into the selected display units (inches or
millimeters) at the time it is displayed. Converting at display time reduces possible
compounded rounding errors over time.
Four separate variables track rain totals: “rain rate,” “daily rain,” “monthly rain,” and
“yearly rain.” Rain rate calculations are based on the interval of time between each
spoon tip, which is each 0.01'' or 0.2 mm rainfall increment.

46
Barometric Pressure
Barometric Pressure
The weight of the air that makes up our atmosphere exerts a pressure on the surface
of the earth known as atmospheric pressure. Generally, the more air above an area,
the higher the atmospheric pressure. This means that atmospheric pressure changes
with altitude. For example, atmospheric pressure is greater at sea level than on a
mountaintop. To compensate for this difference and facilitate comparison between
locations with different altitudes, atmospheric pressure is adjusted to the equivalent
sea level pressure. This adjusted pressure is known as barometric pressure. In reality,
the Vantage Vue measures atmospheric pressure. When you enter your location’s
altitude in Setup Mode, the Vantage Vue stores the necessary offset value to
consistently translate atmospheric pressure into barometric pressure.
Barometric pressure also changes with local weather conditions, making barometric
pressure an extremely important and useful weather forecasting tool. High pressure
zones are generally associated with fair weather while low pressure zones are
generally associated with stormy weather. For forecasting purposes, however, the
value of the absolute barometric pressure is generally less important than the change
in barometric pressure. In general, rising pressure indicates improving weather
conditions while falling pressure indicates deteriorating weather conditions.
Evapotranspiration (ET)
Evapotranspiration (ET) is a measurement of the amount of water vapor returned to
the air in a given area. It combines the amount of water vapor returned through
evaporation (from wet surfaces) with the amount of water vapor returned through
transpiration (exhaling of moisture through plant stomata) to arrive at a total.
Effectively, ET is the opposite of rainfall, and it is expressed in the same units of
measure (inches, millimeters).
The Vantage Vue uses air temperature, relative humidity, barometric pressure,
average wind speed, and solar radiation data to estimate ET, which is calculated once
an hour on the hour. Measuring ET requires that the Vantage Vue console listen to a
an optional Vantage Pro2 Plus station with a solar radiation sensor installed.
Solar Radiation
What we call “current solar radiation” is technically known as Global Solar Radiation,
a measure of the intensity of the sun’s radiation reaching a horizontal surface. This
irradiance includes both the direct component from the sun and the reflected
component from the rest of the sky. The solar radiation reading gives a measure of the
amount of solar radiation hitting the solar radiation sensor at any given time,
expressed in Watts/sq. meter (W/m2). Measuring solar radiation requires that the
Vantage Vue console listen to an optional Vantage Pro2 Plus station with a solar
radiation sensor installed. Solar Radiation is displayed in the Weather Center when
ET is pressed and WxCEN is pressed multiple times.
UV (Ultra Violet) Radiation
Energy from the sun reaches the earth as visible, infrared, and ultraviolet (UV) rays.
Exposure to UV rays can cause numerous health problems, such as sunburn, skin
cancer, skin aging, cataracts, and immune system suppression. Measuring UV radia-
tion requires that the Vantage Vue console listen to an optional Vantage Pro2 Plus sta-
tion with a UV radiation sensor installed. The UV Index is displayed in the Weather
Center when ET is pressed and WxCEN is pressed multiple times.

47
Appendix B
Specifications
See complete specifications for your Vantage Vue Station at our website:
www.davisnet.com.
Console Specifications
Console Operating Temperature . . . . . . . . . . . 0° to +140°F (-18° to +60°C)
Display Temperature . . . . . . . . . . . . . . . . . . . . +32° to +140°F (0° to +60°C)
Non-Operating Temperature. . . . . . . . . . . . . . . below +14° or above +158°F (-10° or
+70°C)
Console Current Draw . . . . . . . . . . . . . . . . . . . 0.9 mA average, 30 mA peak,
(add 120 mA for display lamps, add 0.125
mA for each transmitter station received by
console) at 4.4 VDC
Power Adapter . . . . . . . . . . . . . . . . . . . . . . . . . 5 VDC, 200 mA
Battery Backup . . . . . . . . . . . . . . . . . . . . . . . . 3 C-cells
Battery Life (no AC power) . . . . . . . . . . . . . . . Up to 9 months (approximately)
Housing Material . . . . . . . . . . . . . . . . . . . . . . . UV-resistant ABS plastic
Console Display Type . . . . . . . . . . . . . . . . . . . LCD Transflective
Display Backlight . . . . . . . . . . . . . . . . . . . . . . . LEDs
Dimensions:
Console (with antenna) on table . . . . . . . . 7.5" x 5.75" x 4.5"
(190 mm x 146 mm x 114 mm)
Console (with antenna) mounted on wall. . 7.5" x 7.0" x 3.0"
(190 mm x 178 mm x 76 mm)
Display . . . . . . . . . . . . . . . . . . . . . . . . . . . 4.13" x 3.0" (105 mm x 76 mm)
Weight (with batteries) . . . . . . . . . . . . . . . 1.88 lbs. (.85 kg)
Wireless Communication Specifications
Transmit/Receive Frequency . . . . . . . . . . . . . . US Models: 902 - 928 MHz
Overseas Models: 868.0 -
868.6 MHz
ID Codes Available. . . . . . . . . . . . . . . . . . . . . . 8
Output Power . . . . . . . . . . . . . . . . . . . . . . . . . . 902 - 928 MHz FHSS: FCC-certified low
power, less than 8 mW, no license required
868.0 -868.6 MHz: CE-compliant, less than
8 mW, no license required
Range
Line of Sight . . . . . . . . . . . . . . . . . . . . . . . up to 1000 feet (305 m)
Through Walls . . . . . . . . . . . . . . . . . . . . . 200 to 400 feet (60 to 120 m)

Console Data Display Specifications
48
Console Data Display Specifications
Historical Data . . . . . . . . . . . . . . . . . . . . . . . . . Includes the past 25 values plus the
current value unless otherwise noted; all
can be cleared and all totals reset.
Daily Data . . . . . . . . . . . . . . . . . . . . . . . . . . . . Includes the earliest time of occurrence of
highs and lows; period begins/ends at
12:00 am.
Monthly Data . . . . . . . . . . . . . . . . . . . . . . . . . . Period begins/ends at 12:00 am on the first
of every month.
Yearly Data . . . . . . . . . . . . . . . . . . . . . . . . . . . Period begins/ends at 12:00 am on
January 1st unless otherwise noted.
Current Data . . . . . . . . . . . . . . . . . . . . . . . . . . Current data appears in the right-most
column in the console graph and
represents the latest value within the last
period of the graph; totals can be set or
reset.
Graph Time Interval . . . . . . . . . . . . . . . . . . . . . 10 min., 15 min., 1 hour, 1 day, 1 month, 1
year (user-selectable, availability depends
upon variable selected).
Graph Time Span. . . . . . . . . . . . . . . . . . . . . . . 26 Intervals (Current interval plus 25 past
values included; see Graph Intervals to
determine time span).
Graph Variable Span (Vertical Scale) . . . . . . . . Automatic (varies depending upon data
range); maximum and minimum value in
range appear in Weather Center.
Alarm Indication . . . . . . . . . . . . . . . . . . . . . . . . Alarms sound for 2 minutes if operating on
battery power. Alarm message displays in
Weather Center as long as threshold is met
or exceeded. Alarms can be silenced, but
not cleared, by pressing DONE.
Update Interval. . . . . . . . . . . . . . . . . . . . . . . . . Varies with sensors. See “Update Interval
by Sensor” on page 50. Also varies with
transmitter ID code - 1 = shortest,
8 = longest.
Forecast:
Variables Used . . . . . . . . . . . . . . . . . . . . . Barometric reading & trend, wind speed &
direction, rainfall, temperature, humidity,
latitude & longitude, time of year.
Update Interval . . . . . . . . . . . . . . . . . . . . . 1 hour
Display Format . . . . . . . . . . . . . . . . . . . . . Icons on top center of display; displays
weather conditions that may occur for the
next 12 hours;
Variables Predicted. . . . . . . . . . . . . . . . . . Sky condition, precipitation, temperature
changes, wind direction and speed
changes.
Weather Data Specifications
49
Weather Data Specifications
Note: The following weather data specifications are listed as they are displayed on the
console.
Weather Data Specifications
Variable Resolution Range Nominal
Accuracy (+/-)
Wind Direction 10 to 3603
Compass Rose 22.516 compass pts. 0.13 compass
pt.
Wind Speed
1 mph;
1 kt;
0.1 m/s;
1 km/h
2 to 150 mph;
2 to 130 kts
3 to 241 km/h,
1 to 67 m/s
greater of
2 mph/kts;
1 m/s;
3 km/h
or 5%
Inside Temperature 0.1F;
0.1C
+32 to +140F;
0 to +60C
1F;
0.5C
Outside
Temperature*0.1F;
0.1C
-40 to +150F;
-40 to +65C
1F;
0.5C
Inside Humidity 1% 0 to 100% 3% RH;
4% above 90%
Outside Humidity 1% 0 to 100% 3% RH;
4% above 90%
Barometric
Pressure**
0.01'' Hg;
0.1 mm Hg;
0.1 hPa;
0.1 mb
26'' to 32'' Hg;
660 to 810 mm Hg;
880 to 1080 hPa;
880 to 1080 mb***
0.03'' Hg;
0.8 mm Hg
1.0 hPa;
1.0 mb
Barometric Trend
(3 hour)
Change Rates
Rapidly: .06'' Hg;
1.5 mm Hg; 2 hPa; 2 mb
Slowly: .02'' Hg;
0.5 mm Hg; 0.7 hPa; 0.7 mb
5 Arrow Positions:
Rising Rapidly
Rising Slowly
Steady
Falling Slowly
Falling Rapidly
Dew Point) 1F; 1C-105 to +130F;
-76 to +54C3F; 1.5C
Heat Index 1F; 1C-40to +165F;
-40 to +74 C 3F (1.5C)
Wind Chill 1F; 1C-110 to +135F
-79 to +57C2F;1C
*Outside temperature accuracy is based on the temperature sensor itself and not on the sensor and the passive shielding
together. The solar radiation induced error for the radiation shield: +4F (2C) at solar noon with the wind speed at less than
or equal to 2 mph (1 ms); The higher the wind speed, the less solar radiation induced error.
**Barometric pressure readings are standardized to sea level. Elevation Range: -1500’ to +15,300’; -430 to
+4660 m. Note: The console screen limits display of lower elevation to -999’ when using feet as elevation unit.
***This is the reduced value after standardizing to sea level.
Weather Data Specifications
50
* Console must be receiving from a Vantage Pro2 Plus or Vantage Pro2 with solar radiation sensor installed.
**Console must be receiving from a Vantage Pro2 Plus or Vantage Pro2 with UV radiation sensor installed.
Rainfall 0.01''; 0.2 mm
(1mm at totals over 2000 mm)
to 199.99'';
6553 mm
greater of 3% or
1 tip
Rain Rate 0.01”; 0.1 mm to 40''/hr.;
1016 mm/hr.
5%
when rate is
under 5”/hr.;
127 mm/hr.
Evapotranspiration
(ET)* 0.01''; 0.2 mm
Daily to 99.99”;
999.9 mm
Monthly & Yearly
to 199.99”;
1999.9mm
greater of 5% or
0.01''; 0.25 mm
Solar Radiation* 1 W/m20 to 1800 W/m25% of full scale
UV Index** 0.1 Index 0 to 16 5% of full scale
Time 1 min 24 hours 8 sec/Mon.
Date 1 day month/day 8 sec/Mon.
Weather Data Specifications
Variable Resolution Range Nominal
Accuracy (+/-)
Update Interval by Sensor
BAR
Barometric Pressure 1 min.
HUMIDITY
Inside Humidity 1 min.
Outside Humidity 50 sec.
Dew Point 10 sec.
RAIN
Rainfall Amount 10 sec.
Rain Storm Amount 10 sec.
Rain Rate 10 sec.
TEMPERATURE
Inside Temperature 1 min.
Outside Temperature 10 sec.
Heat Index 10 sec.
Wind Chill 10 sec.
WIND
Wind Speed 2.5 sec.
Wind Direction 2.5 sec.
Direction of High Speed 2.5 sec.
51
Appendix C
Wireless Repeater Configuration
Vantage Pro2 Wireless Repeaters (#7626, #7627) or Long-Range Wireless Repeaters
(#7653, #7654) can be added to increase transmission distances or improve
transmission quality between a station and a console. A repeater receives information
transmitted from a Vantage Vue or Vantage Pro2 station and retransmits it to a
console. Depending on transmission distance, one repeater or several repeaters can be
used to collect and retransmit weather data.
All consoles communicating with repeaters must be set up with the correct
Transmitter ID and Repeater ID before the console can correctly receive station
information.
Setting Repeater ID
To set Repeater ID on the console:
1. Press 2ND and SETUP to enter Setup Mode.
2. Press DONE to display Screen 6: Configuring Transmitter IDs.
See “Screen 6: Configuring Transmitter IDs” on page 9 for more information on
configuring Transmitter IDs.
3. Press 2ND and then WIND to turn the repeater function on and to select a
Repeater ID. Pressing 2ND and WIND sets the console to receive the signal from a
repeater instead of directly from a station. The first Repeater ID displayed is
repeater A.
4. Press WIND repeatedly to cycle through all eight repeater IDs possible or to clear
the repeater ID in the right hand corner. When no repeater ID is shown, the console
is configured to listen directly to a station and not to a repeater.
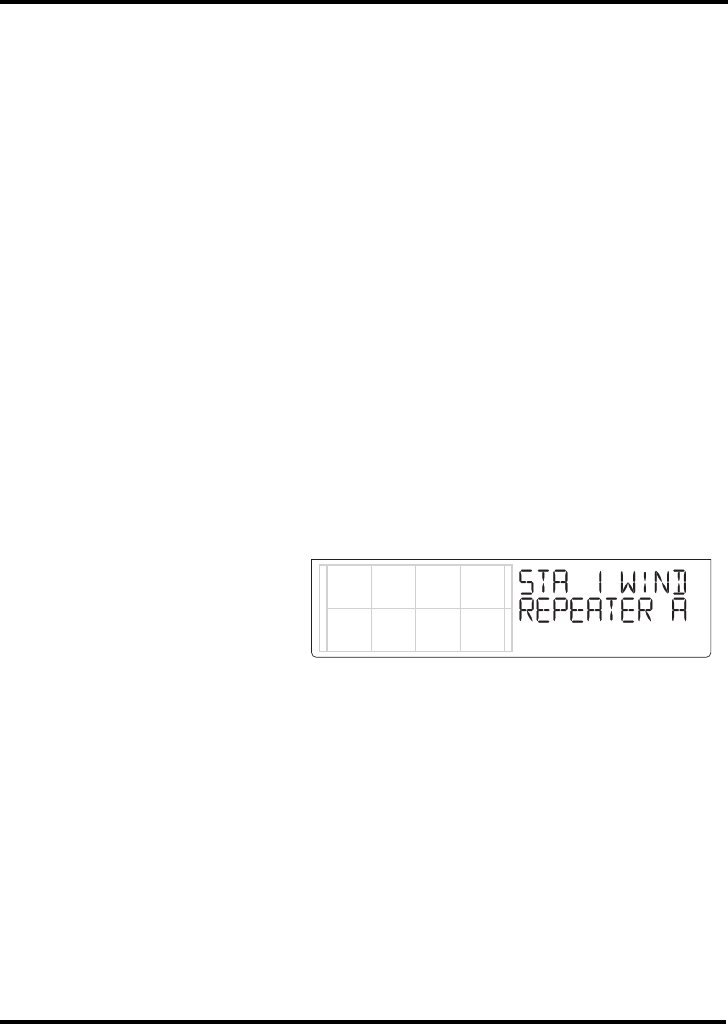
In this example, the console
is set up to receive from an
ISS station on transmitter
ID 1 from repeater A.
5. Press DONE to continue to
the other screens in the
Setup Mode, or press and
hold DONE to return to the Current Weather Mode.
Clearing Repeater ID
If a repeater ID is being displayed in Screen 6 and you are not using a repeater, you
must turn off the repeater function to receive station information successfully.
In Setup Screen 6:
Press 2ND and then press WIND repeatedly so that the console cycles through the list
of repeater IDs (Repeaters A-H) until the section where the repeater ID was displayed
is blank. Press DONE to continue to the next screen or press and hold DONE to
return to the Current Weather Mode.
52
Vantage Vue Console Icons
Console icons indicate weather conditions and special functions.
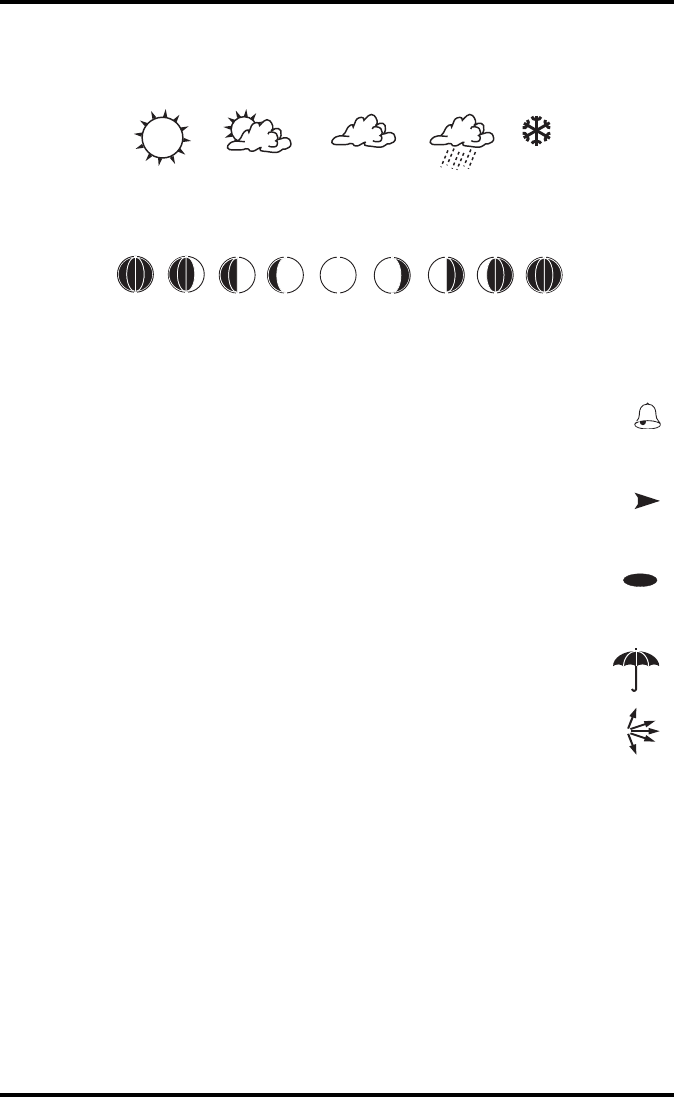
Forecast
Forecast icons show what weather conditions may occur for the next 12 hours.
Moon Phase
Shows the current moon phase. Sequence shown for Northern Hemisphere. The sequence of
the icons is reversed in the Southern Hemisphere.
Alarm Bell
Flashes when an alarm is triggered. Indicates when the console is in Alarm
Mode.
Graph
Appears next to the currently selected weather variable. Indicates the graphed
variable on most screens.
Second Function
Appears when you press
2ND
. Indicates that console key secondary func-
tions are enabled.
Rain
Appears when the console is currently detecting rain.
Barometric Pressure Trend
Arrows show direction of pressure change for last three hours.
Contacting Davis Technical Support
If you have any questions or encounter problems installing or operating your
Vantage Vue weather station, contact Davis Technical Support. We’ll be glad to help.
(510) 732-7814 — Monday - Friday, 7:00 a.m. - 5:30 p.m. Pacific Time. We are unable to
accept collect calls.
(510) 670-0589 — Technical Support Fax.
support@davisnet.com — E-mail to Technical Support.
info@davisnet.com — General e-mail.
www.davisnet.com — Davis Instruments web site.
See the Weather Support section for copies of user manuals, product specifications,
application notes, and information on software updates. Watch for FAQs and other
updates.
Mostly Clear Partly Cloudy Mostly Cloudy SnowRain
New
Moon
First
Quarter
Full
Moon
Last
Quarter
New
Moon
Waxing
Crescent
Waning
Crescent
Waxing
Gibbous
Waning
Gibbous
2
nd