Dell Openmanage Network Manager Users Manual User Guide 5.3 SP2
2015-01-05
: Dell Dell-Dell-Openmanage-Network-Manager-Users-Manual-136342 dell-dell-openmanage-network-manager-users-manual-136342 dell pdf
Open the PDF directly: View PDF ![]() .
.
Page Count: 474 [warning: Documents this large are best viewed by clicking the View PDF Link!]
- Preface
- Getting Started with Dell OpenManage Network Manager
- System Basics
- Single Server Hardware
- Device Drivers
- Ports Used
- Getting Started
- Installation and Startup
- Secure Connections: SSL & HTTPS
- Control Panel
- Redcell > Database Aging Policies (DAP)
- LDAP
- Configuring Pages and User Access
- Quick Navigation
- Network Tools
- License Viewer
- Discovery Profiles
- Managed Resources
- Common Setup Tasks
- Deploying and Extensions
- Portal Conventions
- Key Portlets
- Resource Management and Reports
- Display Strategies
- File Server / File Management
- Monitoring
- Traffic Flow Analyzer
- Change Management / ProScan
- Actions and Adaptive CLI
- Index

Dell OpenManage Network Manager Version 5.3 Service
Pack 2
Web Client Guide

Notes and Cautions
A NOTE indicates important information that helps you make better use of your computer.
A CAUTION indicates either potential damage to hardware or loss of data and tells you how to avoid the problem.
____________________
© 2014 Dell Inc.
Trademarks used in this text: Dell™, the DELL logo, PowerEdge™, PowerVault™, PowerConnect™, OpenManage™, EqualLogic™,
KACE™, FlexAddress™ and Vostro™ are trademarks of Dell Inc. Microsoft
®
, Windows
®
, Windows Server
®
, MS-DOS
®
and Windows Vista
®
are either trademarks or registered trademarks of Microsoft Corporation in the United States and/or other countries. Red Hat Enterprise Linux
®
and Enterprise Linux
®
are registered trademarks of Red Hat, Inc. in the United States and/or other countries.
Other trademarks and trade names may be used in this publication to refer to either the entities claiming the marks and names or their products.
Dell Inc. disclaims any proprietary interest in trademarks and trade names other than its own.
2014-6
Rev. A02

iii
Why Dell OpenManage Network Manager?. . . . . . . . . . . . . . . . . . . . . . . . . 1
Key Features
. . . . . . . . . . . . . . . . . . . . . . . . . . .
2
Networks with Dell OpenManage Network Manager
. . . . . . .
3
Additional Products
. . . . . . . . . . . . . . . . . . . . . . .
4
Online Help / Filter
. . . . . . . . . . . . . . . . . . . . . . . .
4
A Note About Performance . . . . . . . . . . . . . . . . . . . . . . . . . . . . . . . . . . . . . . . 5
1 Getting Started with Dell OpenManage Network Manager . .7
System Basics
. . . . . . . . . . . . . . . . . . . . . . . . . .
8
Single Server Hardware. . . . . . . . . . . . . . . . . . . . . . . . . . . . . . . . . . . . . . . . . 12
Sizing for Standalone Installations
. . . . . . . . . . . . . . . .
13
Network Basics
. . . . . . . . . . . . . . . . . . . . . . . . .
15
Authentication
. . . . . . . . . . . . . . . . . . . . . . . . . .
17
Device Drivers . . . . . . . . . . . . . . . . . . . . . . . . . . . . . . . . . . . . . . . . . . . . . . . . . 17
Base Driver
. . . . . . . . . . . . . . . . . . . . . . . . . . . .
18
Supported PowerConnect Models
. . . . . . . . . . . . . . . .
19
Windows Management Instrumentation (WMI) Driver
. . . . . .
19
Web-Based Enterprise Management (WBEM) Driver
. . . . . . .
20
Ports Used. . . . . . . . . . . . . . . . . . . . . . . . . . . . . . . . . . . . . . . . . . . . . . . . . . . . . 22
Protocol Flows
. . . . . . . . . . . . . . . . . . . . . . . . . .
26
Ports and Application To Exclude from Firewall
. . . . . . . . . .
27
Installed Third Party Applications
. . . . . . . . . . . . . . . . .
27
Windows Management Instrumentation Ports
. . . . . . . . . .
28
Getting Started. . . . . . . . . . . . . . . . . . . . . . . . . . . . . . . . . . . . . . . . . . . . . . . . . 28
Installation and Startup . . . . . . . . . . . . . . . . . . . . . . . . . . . . . . . . . . . . . . . . . 29
Install on Linux
. . . . . . . . . . . . . . . . . . . . . . . . . .
32
Perl
. . . . . . . . . . . . . . . . . . . . . . . . . . . . . . . .
38
Starting Web Client
. . . . . . . . . . . . . . . . . . . . . . . .
38
Secure Connections: SSL & HTTPS . . . . . . . . . . . . . . . . . . . . . . . . . . . . . . . 39
Enabling Secure SSL
. . . . . . . . . . . . . . . . . . . . . . .
39
Install on Linux
. . . . . . . . . . . . . . . . . . . . . . . . . .
41
Control Panel . . . . . . . . . . . . . . . . . . . . . . . . . . . . . . . . . . . . . . . . . . . . . . . . . . 43
Admin / [My Account]
. . . . . . . . . . . . . . . . . . . . . .
44
[Domain]
. . . . . . . . . . . . . . . . . . . . . . . . . . . . .
44
Portal > Users and Organizations
. . . . . . . . . . . . . . . . .
44
Public / Private Page Behavior
. . . . . . . . . . . . . . . . . .
48
Portal > Roles
. . . . . . . . . . . . . . . . . . . . . . . . . .
49
Portal > Portal Settings
. . . . . . . . . . . . . . . . . . . . . .
51
Portal > [Other]
. . . . . . . . . . . . . . . . . . . . . . . . . .
52
Redcell > Permission Manager
. . . . . . . . . . . . . . . . . .
52
Redcell > Data Configuration
. . . . . . . . . . . . . . . . . . .
55
Contents

iv
Redcell > Filter Management
. . . . . . . . . . . . . . . . . . .
56
Redcell > Application Settings
. . . . . . . . . . . . . . . . . .
57
Redcell > Database Aging Policies (DAP). . . . . . . . . . . . . . . . . . . . . . . . . . 58
Aging Policies Editor
. . . . . . . . . . . . . . . . . . . . . . .
61
Aging Policies Options
. . . . . . . . . . . . . . . . . . . . . .
63
Sub-Policies
. . . . . . . . . . . . . . . . . . . . . . . . . . .
63
Repositories
. . . . . . . . . . . . . . . . . . . . . . . . . . .
64
Server
. . . . . . . . . . . . . . . . . . . . . . . . . . . . . .
67
LDAP . . . . . . . . . . . . . . . . . . . . . . . . . . . . . . . . . . . . . . . . . . . . . . . . . . . . . . . . . 67
LDAP Portal Settings
. . . . . . . . . . . . . . . . . . . . . . .
70
Configuring Pages and User Access . . . . . . . . . . . . . . . . . . . . . . . . . . . . . . 71
Page Level Permissions
. . . . . . . . . . . . . . . . . . . . .
72
Portlet Level Permissions
. . . . . . . . . . . . . . . . . . . . .
74
Quick Navigation . . . . . . . . . . . . . . . . . . . . . . . . . . . . . . . . . . . . . . . . . . . . . . . 77
Network Tools . . . . . . . . . . . . . . . . . . . . . . . . . . . . . . . . . . . . . . . . . . . . . . . . . 77
Ping Tool
. . . . . . . . . . . . . . . . . . . . . . . . . . . . .
78
MIB Browser Tool
. . . . . . . . . . . . . . . . . . . . . . . .
79
Direct Access Tool
. . . . . . . . . . . . . . . . . . . . . . . .
79
License Viewer. . . . . . . . . . . . . . . . . . . . . . . . . . . . . . . . . . . . . . . . . . . . . . . . . 81
License Expiration Warning Alarms
. . . . . . . . . . . . . . . .
81
Discovery Profiles . . . . . . . . . . . . . . . . . . . . . . . . . . . . . . . . . . . . . . . . . . . . . . 83
Incomplete Discovery
. . . . . . . . . . . . . . . . . . . . . .
86
Managed Resources. . . . . . . . . . . . . . . . . . . . . . . . . . . . . . . . . . . . . . . . . . . . 87
Common Setup Tasks . . . . . . . . . . . . . . . . . . . . . . . . . . . . . . . . . . . . . . . . . . . 87
Password Reset
. . . . . . . . . . . . . . . . . . . . . . . . .
87
SMTP Configuration
. . . . . . . . . . . . . . . . . . . . . . .
88
Netrestore File Servers
. . . . . . . . . . . . . . . . . . . . . .
90
Deploying and Extensions . . . . . . . . . . . . . . . . . . . . . . . . . . . . . . . . . . . . . . . 90
Deploy Files
. . . . . . . . . . . . . . . . . . . . . . . . . . .
91
Extensions
. . . . . . . . . . . . . . . . . . . . . . . . . . . .
91
.ocp and .ddp files
. . . . . . . . . . . . . . . . . . . . . . . .
91
Localizing Message Files
. . . . . . . . . . . . . . . . . . . . .
91
2 Portal Conventions . . . . . . . . . . . . . . . . . . . . . . . . . . . . . . . . . . . .93
Tooltips
. . . . . . . . . . . . . . . . . . . . . . . . . . . . . .
93
Refresh
. . . . . . . . . . . . . . . . . . . . . . . . . . . . . .
94
The Back Button
. . . . . . . . . . . . . . . . . . . . . . . . .
94
Shift+Click
. . . . . . . . . . . . . . . . . . . . . . . . . . . .
94
Show Versions
. . . . . . . . . . . . . . . . . . . . . . . . . .
95
The Dock . . . . . . . . . . . . . . . . . . . . . . . . . . . . . . . . . . . . . . . . . . . . . . . . . . . . . . 96
Status Bar Alerts . . . . . . . . . . . . . . . . . . . . . . . . . . . . . . . . . . . . . . . . . . . . . . . 98
Chat / Conferencing
. . . . . . . . . . . . . . . . . . . . . . .
99

v
Menu Bar
. . . . . . . . . . . . . . . . . . . . . . . . . . .
100
See How to: Create a new Page and Rearrange Pages on page 73 for more
information
. . . . . . . . . . . . . . . . . . . . . . . . . . . . . . .
101
.Site Map
. . . . . . . . . . . . . . . . . . . . . . . . . . . .
101
Graphs / Tooltips
. . . . . . . . . . . . . . . . . . . . . . . .
101
Portlets
. . . . . . . . . . . . . . . . . . . . . . . . . . . . .
102
Expanded Portlets
. . . . . . . . . . . . . . . . . . . . . . .
106
Locating Portlets
. . . . . . . . . . . . . . . . . . . . . . . .
109
Common Menu Items . . . . . . . . . . . . . . . . . . . . . . . . . . . . . . . . . . . . . . . . . . 109
Import / Export
. . . . . . . . . . . . . . . . . . . . . . . . .
109
Sharing
. . . . . . . . . . . . . . . . . . . . . . . . . . . . .
110
Edit Custom Attributes
. . . . . . . . . . . . . . . . . . . . .
112
View as PDF
. . . . . . . . . . . . . . . . . . . . . . . . . .
113
Tag
. . . . . . . . . . . . . . . . . . . . . . . . . . . . . . .
114
Audit Trail / Jobs Screen . . . . . . . . . . . . . . . . . . . . . . . . . . . . . . . . . . . . . . . 114
Audit Trail Portlet. . . . . . . . . . . . . . . . . . . . . . . . . . . . . . . . . . . . . . . . . . . . . . 116
Schedules . . . . . . . . . . . . . . . . . . . . . . . . . . . . . . . . . . . . . . . . . . . . . . . . . . . . 118
Schedules Portlet
. . . . . . . . . . . . . . . . . . . . . . .
120
3 Key Portlets . . . . . . . . . . . . . . . . . . . . . . . . . . . . . . . . . . . . . . . . .123
Alarms . . . . . . . . . . . . . . . . . . . . . . . . . . . . . . . . . . . . . . . . . . . . . . . . . . . . . . . 123
Expanded Alarm Portlet
. . . . . . . . . . . . . . . . . . . .
126
Alarm Editor
. . . . . . . . . . . . . . . . . . . . . . . . . .
131
Audible Alerts. . . . . . . . . . . . . . . . . . . . . . . . . . . . . . . . . . . . . . . . . . . . . . . . . 132
Adding Custom MP3 Sounds
. . . . . . . . . . . . . . . . . .
133
Event History. . . . . . . . . . . . . . . . . . . . . . . . . . . . . . . . . . . . . . . . . . . . . . . . . . 134
Event Processing Rules . . . . . . . . . . . . . . . . . . . . . . . . . . . . . . . . . . . . . . . . 136
Rule Editor
. . . . . . . . . . . . . . . . . . . . . . . . . . .
139
Event Definitions . . . . . . . . . . . . . . . . . . . . . . . . . . . . . . . . . . . . . . . . . . . . . . 158
Event Definition Editor
. . . . . . . . . . . . . . . . . . . . .
158
Alarm Propagation to Services and Customers: What Happens
.
167
Contacts . . . . . . . . . . . . . . . . . . . . . . . . . . . . . . . . . . . . . . . . . . . . . . . . . . . . . 169
Locations. . . . . . . . . . . . . . . . . . . . . . . . . . . . . . . . . . . . . . . . . . . . . . . . . . . . . 171
Vendors . . . . . . . . . . . . . . . . . . . . . . . . . . . . . . . . . . . . . . . . . . . . . . . . . . . . . . 174
4 Resource Management and Reports . . . . . . . . . . . . . . . . . . .177
Authentication . . . . . . . . . . . . . . . . . . . . . . . . . . . . . . . . . . . . . . . . . . . . . . . . 177
Resource Discovery . . . . . . . . . . . . . . . . . . . . . . . . . . . . . . . . . . . . . . . . . . . 180
Discovery Profiles . . . . . . . . . . . . . . . . . . . . . . . . . . . . . . . . . . . . . . . . . . . . . 181
Discovery Profile Editor
. . . . . . . . . . . . . . . . . . . . .
183
Managed Resource Groups. . . . . . . . . . . . . . . . . . . . . . . . . . . . . . . . . . . . . 190
Static Group
. . . . . . . . . . . . . . . . . . . . . . . . . .
193

vi
Dynamic Group
. . . . . . . . . . . . . . . . . . . . . . . . .
194
Managed Resources. . . . . . . . . . . . . . . . . . . . . . . . . . . . . . . . . . . . . . . . . . . 195
Links. . . . . . . . . . . . . . . . . . . . . . . . . . . . . . . . . . . . . . . . . . . . . . . . . . . . . . . . . 206
New Link
. . . . . . . . . . . . . . . . . . . . . . . . . . . .
207
Link Discovery
. . . . . . . . . . . . . . . . . . . . . . . . .
208
Search by IP or Mac Address . . . . . . . . . . . . . . . . . . . . . . . . . . . . . . . . . . . 209
Equipment Details . . . . . . . . . . . . . . . . . . . . . . . . . . . . . . . . . . . . . . . . . . . . . 210
Direct Access. . . . . . . . . . . . . . . . . . . . . . . . . . . . . . . . . . . . . . . . . . . . . . . . . 213
MIB Browser
. . . . . . . . . . . . . . . . . . . . . . . . . .
214
Terminal
. . . . . . . . . . . . . . . . . . . . . . . . . . . .
216
Ping (ICMP)
. . . . . . . . . . . . . . . . . . . . . . . . . .
217
HTTP / HTTPS
. . . . . . . . . . . . . . . . . . . . . . . . .
218
Ports. . . . . . . . . . . . . . . . . . . . . . . . . . . . . . . . . . . . . . . . . . . . . . . . . . . . . . . . . 218
Port Editor
. . . . . . . . . . . . . . . . . . . . . . . . . . .
221
Interfaces . . . . . . . . . . . . . . . . . . . . . . . . . . . . . . . . . . . . . . . . . . . . . . . . . . . . 222
Report Templates. . . . . . . . . . . . . . . . . . . . . . . . . . . . . . . . . . . . . . . . . . . . . . 223
Report Template Editors
. . . . . . . . . . . . . . . . . . . .
224
Reports . . . . . . . . . . . . . . . . . . . . . . . . . . . . . . . . . . . . . . . . . . . . . . . . . . . . . . 231
Report Editor
. . . . . . . . . . . . . . . . . . . . . . . . . .
235
Branding Reports
. . . . . . . . . . . . . . . . . . . . . . . .
237
Group Reports
. . . . . . . . . . . . . . . . . . . . . . . . .
238
User Login Report
. . . . . . . . . . . . . . . . . . . . . . .
239
5 Display Strategies . . . . . . . . . . . . . . . . . . . . . . . . . . . . . . . . . . .241
Context
. . . . . . . . . . . . . . . . . . . . . . . . . . . . .
242
Container Manager . . . . . . . . . . . . . . . . . . . . . . . . . . . . . . . . . . . . . . . . . . . . 242
Container Editor
. . . . . . . . . . . . . . . . . . . . . . . .
244
Container View
. . . . . . . . . . . . . . . . . . . . . . . . .
247
Map Context . . . . . . . . . . . . . . . . . . . . . . . . . . . . . . . . . . . . . . . . . . . . . . . . . . 249
Maps and Containers Together
. . . . . . . . . . . . . . . . .
251
Using Nokia Maps
. . . . . . . . . . . . . . . . . . . . . . .
253
Visualize My Network. . . . . . . . . . . . . . . . . . . . . . . . . . . . . . . . . . . . . . . . . . 254
Configuring Views
. . . . . . . . . . . . . . . . . . . . . . .
255
Tools
. . . . . . . . . . . . . . . . . . . . . . . . . . . . . .
257
Design Tools
. . . . . . . . . . . . . . . . . . . . . . . . . .
259
Linked View
. . . . . . . . . . . . . . . . . . . . . . . . . .
260
View
. . . . . . . . . . . . . . . . . . . . . . . . . . . . . .
261
Overview
. . . . . . . . . . . . . . . . . . . . . . . . . . . .
262
Properties and Settings > Layouts Tab
. . . . . . . . . . . . .
263
Properties and Settings > Properties
. . . . . . . . . . . . . .
265
Legend Tab
. . . . . . . . . . . . . . . . . . . . . . . . . . .
266
Top-Level Nodes Tab
. . . . . . . . . . . . . . . . . . . . . .
266

vii
Alarms in Visualizations / Topologies. . . . . . . . . . . . . . . . . . . . . . . . . . . . . 267
Links in Visualization. . . . . . . . . . . . . . . . . . . . . . . . . . . . . . . . . . . . . . . . . . . 267
Visualizer Views. . . . . . . . . . . . . . . . . . . . . . . . . . . . . . . . . . . . . . . . . . . . . . . 268
6 File Server / File Management . . . . . . . . . . . . . . . . . . . . . . . . .269
File Server Editor
. . . . . . . . . . . . . . . . . . . . . . . .
270
Recommended Windows File Servers
. . . . . . . . . . . . .
271
File Management. . . . . . . . . . . . . . . . . . . . . . . . . . . . . . . . . . . . . . . . . . . . . . 271
Configuration Files
. . . . . . . . . . . . . . . . . . . . . . .
278
Image Repository. . . . . . . . . . . . . . . . . . . . . . . . . . . . . . . . . . . . . . . . . . . . . . 281
Firmware Image Editor
. . . . . . . . . . . . . . . . . . . . .
283
Configuration Image Editor
. . . . . . . . . . . . . . . . . . .
284
Deploy Firmware . . . . . . . . . . . . . . . . . . . . . . . . . . . . . . . . . . . . . . . . . . . . . . 287
Deploy Configuration. . . . . . . . . . . . . . . . . . . . . . . . . . . . . . . . . . . . . . . . . . . 289
7 Monitoring . . . . . . . . . . . . . . . . . . . . . . . . . . . . . . . . . . . . . . . . . .291
Performance and Monitors
. . . . . . . . . . . . . . . . . . .
291
Application Server Statistics . . . . . . . . . . . . . . . . . . . . . . . . . . . . . . . . . . . . 295
Resource Monitors . . . . . . . . . . . . . . . . . . . . . . . . . . . . . . . . . . . . . . . . . . . . 297
Retention Policies
. . . . . . . . . . . . . . . . . . . . . . .
300
Monitor Editor
. . . . . . . . . . . . . . . . . . . . . . . . .
302
Self Management / Self Monitoring: Default Server Status Monitor
313
Monitor Options Type-Specific Panels
. . . . . . . . . . . . .
317
Scheduling Refresh Monitor Targets
. . . . . . . . . . . . . .
328
Top N [Assets] . . . . . . . . . . . . . . . . . . . . . . . . . . . . . . . . . . . . . . . . . . . . . . . . 330
Top Configuration Backups
. . . . . . . . . . . . . . . . . . .
331
Dashboard Views. . . . . . . . . . . . . . . . . . . . . . . . . . . . . . . . . . . . . . . . . . . . . . 331
Performance Dashboard
. . . . . . . . . . . . . . . . . . . .
334
Dashboard Editor
. . . . . . . . . . . . . . . . . . . . . . . .
335
Show Performance Templates . . . . . . . . . . . . . . . . . . . . . . . . . . . . . . . . . . 342
8 Traffic Flow Analyzer . . . . . . . . . . . . . . . . . . . . . . . . . . . . . . . . .347
How does it work?
. . . . . . . . . . . . . . . . . . . . . . .
348
Setup
. . . . . . . . . . . . . . . . . . . . . . . . . . . . . .
349
Exporter Registration
. . . . . . . . . . . . . . . . . . . . . .
350
Traffic Flow Portlet . . . . . . . . . . . . . . . . . . . . . . . . . . . . . . . . . . . . . . . . . . . . 350
Drill Down
. . . . . . . . . . . . . . . . . . . . . . . . . . .
354
Search
. . . . . . . . . . . . . . . . . . . . . . . . . . . . .
355
Traffic Flow Snapshot
. . . . . . . . . . . . . . . . . . . . . .
356
Traffic Flow Analyzer - Example . . . . . . . . . . . . . . . . . . . . . . . . . . . . . . . . . 356

viii
9 Change Management / ProScan . . . . . . . . . . . . . . . . . . . . . . .359
ProScan Portlet . . . . . . . . . . . . . . . . . . . . . . . . . . . . . . . . . . . . . . . . . . . . . . . 362
Compliance Policy Summary
. . . . . . . . . . . . . . . . . .
364
Creating or Modifying a ProScan Policy
. . . . . . . . . . . .
365
Creating or Modifying ProScan Policy Groups
. . . . . . . . .
381
Change Determination Process . . . . . . . . . . . . . . . . . . . . . . . . . . . . . . . . . 382
Change Determination Process Workflow
. . . . . . . . . . .
383
Triggering Change Management and ProScan
. . . . . . . . .
384
Change Determination Defaults
. . . . . . . . . . . . . . . . .
387
Compliance and Change Reporting . . . . . . . . . . . . . . . . . . . . . . . . . . . . . . 388
10 Actions and Adaptive CLI . . . . . . . . . . . . . . . . . . . . . . . . . . . . .393
Using Adaptive CLI
. . . . . . . . . . . . . . . . . . . . . . .
394
Actions Portlet . . . . . . . . . . . . . . . . . . . . . . . . . . . . . . . . . . . . . . . . . . . . . . . . 395
Adaptive CLI Editor
. . . . . . . . . . . . . . . . . . . . . . .
400
General
. . . . . . . . . . . . . . . . . . . . . . . . . . . . .
400
Attributes
. . . . . . . . . . . . . . . . . . . . . . . . . . . .
402
Scripts
. . . . . . . . . . . . . . . . . . . . . . . . . . . . .
408
Comparison
. . . . . . . . . . . . . . . . . . . . . . . . . .
413
External Commands. . . . . . . . . . . . . . . . . . . . . . . . . . . . . . . . . . . . . . . . . . . . 413
Seeded External Scripts
. . . . . . . . . . . . . . . . . . . .
416
Adaptive CLI Script Language Syntax . . . . . . . . . . . . . . . . . . . . . . . . . . . . 418
Attributes
. . . . . . . . . . . . . . . . . . . . . . . . . . . .
418
Conditional Blocks
. . . . . . . . . . . . . . . . . . . . . . .
419
Perl Scripts . . . . . . . . . . . . . . . . . . . . . . . . . . . . . . . . . . . . . . . . . . . . . . . . . . . 419
Monitoring Upload / Download Speeds
. . . . . . . . . . . . .
434
Regular Expression Testing
. . . . . . . . . . . . . . . . . . .
438
Scheduling Actions
. . . . . . . . . . . . . . . . . . . . . . .
439
Active Performance Monitor Support . . . . . . . . . . . . . . . . . . . . . . . . . . . . 440
Troubleshooting Adaptive CLI . . . . . . . . . . . . . . . . . . . . . . . . . . . . . . . . . . . 448
Adaptive CLI Records Aging Policy . . . . . . . . . . . . . . . . . . . . . . . . . . . . . . 449

Why Dell OpenManage Network Manager? |
1
Preface
Dell OpenManage Network Manager can give you automated, consolidated configuration and
control of your network’s resources. It is customizable, unifying multiple systems while still
communicating with other software systems (like billing) in generic WSDL, XML and SOAP.
OpenManage Network Manager’s
first chapter of theUser Guide
describes security and some of the
runtime features supporting these applications. Consult Release Notes for information about
changes not covered in this
User Guide
.
Why Dell OpenManage Network Manager?
Dell OpenManage Network Manager’s benefits:
Productive
Discovery and wizard-driven configuration features within minutes of installing Dell OpenManage
Network Manager, you can monitor your network.
Easy
Dell OpenManage Network Manager provides the network information you need, and offers
advanced capabilities with minimal configuration overhead.
Valuable
Dell OpenManage Network Manager often costs less to use and maintain than most other
solutions.
Scalability
You can scale Dell OpenManage Network Manager to almost any size.
LinkLight
Online Community
www.doradosoftware.com/thelinklight/
is a community site that OpenManage Network Manager
developed to provide users with useful information, tools and valuable resources related to
OpenManage Network Manager network management solutions.

2
Why Dell OpenManage Network Manager? |
Key Features
The following are some key features of Dell OpenManage Network Manager:
Customizable and Flexible Web Portal
You can customize the web portal, even providing custom designed views of your data assigned to
individual users. You can even create web portal accounts for departments, geographic areas, or
other criteria.
Automate and Schedule Device Discovery
Device discovery populates Dell OpenManage Network Manager’s database and begins network
analysis. You can also create network discovery schedules to automatically run Discovery whenever
you need them.
Dell OpenManage Network Manager Administration
You can now conduct administrative tasks—adding devices, user accounts, and web portal
displays—from a secure console on your network.
Open Integration
Dell OpenManage Network Manager supports industry standards. It comes with an open-source
MySQL database, and supports using Oracle databases. It also uses industry-standard MIBs and
protocols, and even lets you install open-source screen elements like Google gadgets to the web
portal.
Topology
The OpenManage Network Manager
topology screen lets you create multi-layered, fully
customizable, web-based maps of your network to track devices wherever they are in your network.
Alarms
You can configure custom alarms to respond to hundreds of possible network scenarios, including
multiple condition checks. Dell OpenManage Network Manager’s alarms help you recognize issues
before your network users experience productivity losses. Alarms can also trigger actions like email,
executing Perl scripts, paging, SNMP traps, Syslog messaging, and external application execution.
Traps and Syslog
Dell OpenManage Network Manager lets you investigate network issues with traps and Syslog
messages. You can use Dell OpenManage Network Manager to set up events / alarms and then
receive, process, forward, and send syslog and trap messages.

Why Dell OpenManage Network Manager? |
3
Reports and Graphs
Dell OpenManage Network Manager comes with many pre-configured reports and graphs to
display data from its database. You can archive and compare reports, or automate creating them
with Dell OpenManage Network Manager’s scheduler.
Modularity
With additional modules, Dell OpenManage Network Manager can analyze network traffic,
manage services and IP address and subnet allocations. OpenManage Network Manager modules
save time adding to existing Dell OpenManage Network Manager deployments to add feature
functionality without requiring additional standalone software.
Networks with Dell OpenManage Network Manager
The beginning of network management with Dell OpenManage Network Manager is Discovery
Profiles of the resources on a network. After that occurs, you can configure
Visualize My Network
(topology views), Resource Monitors and Performance Dashboards.
Once you have done these initial steps, Dell OpenManage Network Manager helps you understand
and troubleshoot your network. For example: Suppose a OpenManage Network Manager
Performance Dashboard displays something you want to troubleshoot. You can right-click the
impacted device in the
Visualize My Network
topology view to access configuration and actions.
The color of the icon in this view indicates the highest severity alarm on the device or its sub-
components. For example, red indicates a
Critical
alarm.
Displays include right-click access to the Details screen (see Equipment Details on page 210),
where you can examine each section of device information and right-click to see further applicable
actions. For example right-click to Show Performance, and edit and/or save that view of
performance as another Performance Dashboard. Performance can also display portlets that Show
Top Talkers (the busiest devices) or Show Key Metrics.
From looking at Performance Dashboards or Top N [Assets] you may conclude some configuration
changes made memory consumption spike. Right-click to access resource actions under
File
Management
that let you see the current configuration files on devices, and compare current to
previous. You can also back up devices (see Backup Configurations on page 274) and restore
previously backed up files (see Restore Configurations on page 276). Finally, you may simply want
to Resync (another right-click menu item) to insure the device and your management system are
up-to-date.
NOTICE
Alternatively, the Alarms portlet also lets you right-click to expose Alarm Actions.
You can right click for Direct Access – Telnet or Direct Access – MIB Browser to display a command
line telnetting to the device, or an SNMP MIB browser to examine SNMP possibilities for it.

4
Why Dell OpenManage Network Manager? |
The Managed Resources portlet can display the anatomy of a Resource with its right-click actions
(see Equipment Details on page 210). Click the plus in the upper right corner to see Managed
Resources Expanded. This displays detail or “Snap-in” panels with additional information about a
selected resource.
Reports let you take snapshots of network conditions to aid in analysis of trends, and
Audit Trail
Portlet
s track message traffic between Dell OpenManage Network Manager and devices.
Additional Products
The following describes how to increase the power of your Dell OpenManage Network Manager
installation. While the documents mentioned above describe everything available with Dell
OpenManage Network Manager, your installation may provide only a limited subset of those
features.
Updating Your License
If you have a limited license — for example OpenManage Network Manager may limit discovery to
a certain number of devices— then your application does not function outside those licensed
limits.
You can purchase additional capabilities, and can update your license for OpenManage Network
Manager by putting the updated license file in a convenient directory. Then click
License
Management
in the Quick Navigation portlet item to open a screen with a button leading to a file
browser (
Register License: Select File
). Locate the license file, and click the
Register License
button. Your updated license should be visible in the
License Viewer
(See
License Viewer on page
81
for details.)
NOTE:
If you update your installation from a previous one where you upgraded license, you must also install
new licenses.
Licenses now support three expiration formats: Never, Date certain, and a format that indicates the
license will be valid for a number of days after registration.
Online Help / Filter
Access general online help by clicking
Help
in the
The Dock
at the top of the screen. Help
appropriate to each portlet appears when you click question mark icon on the portlet title bar.

A Note About Performance |
5
By default, this opens a separate browser window which is not necessarily always in front of the
screen that calls it. Because it is separate, you can arrange the display so the help screen does not
conceal the portlet it describes. Click the
Show
button to display the contents, index and search
tabs (
Hide
conceals them again), and the
Prev / Next
buttons, or clicking table of contents topics
moves to different topics within the helpset.
NOTICE
Sometimes your browser’s cache may interfere with help’s correct appearance. If you see a table of
contents node without contents, you can often repair it by refreshing the panel or whole screen.
How To:
Use “How To”
Several sections of what follows contain the “How to” instructions for use. These are typically steps
to follow to produce the desired result. For a look at all such steps available, refer to the
How to
section of the Index.
A Note About Performance
Dell OpenManage Network Manager is designed to help you manage your network with alacrity.
Unfortunately, the devices managed or the networks that communicate with those devices are not
always as fast as this software. If discovery takes a long time (it can), often network and device
latency is the culprit. You can also optimize installations to be faster (see the recommendations in
the first chapter of the
User Guide
and
first chapter of theUser Guide
s), and limit device queries
with filters, but device and network latency limit how quickly your system can respond.
NOTICE
If you use management systems other than this one, you must perform a device level resync before
performing configuration actions. Best practice is to use a single management tool whenever possible.

6
A Note About Performance |

| Getting Started with Dell OpenManage Network Manager
7
3
Getting Started with Dell OpenManage
Network Manager
This chapter describes how to install and start Dell OpenManage Network Manager for basic
network monitoring and management. For more detailed descriptions of all this software’s features,
consult its other manuals (the OpenManage Network Manager first chapter of the
User Guide
,
OMNM User Guide
,
first chapter of theUser Guide
and
User Guide
) or the online help.
NOTICE
If you want to find something but are unsure about which manual it is in, you can search all text in the
Acrobat files in a single directory. You can also click on the blue cross-references to go to the target
destination of cross-references in Acrobat, however for such electronic cross-references to the other
documents to work, they must be in the same directory. Cross-document links do not work between
documents for different versions of this software, but may provide an approximate location to consult.
If you are sure your hardware, software and network is correct and just want to get started
immediately, go to Getting Started on page 28.
The Dell OpenManage Network Manager portal delivers powerful solutions to network problems,
and, in addition to the OpenManage Network Manager technology documented in the following
pages, Dell OpenManage Network Manager offers the following capabilities:
• Message Boards, Blogs, Wikis
• Shared Calendars
• Enterprise Chat / Messaging
• RSS Feeds
• Tagging, Ratings, Comments
Because many capabilities are only indirectly related to Dell OpenManage Network Manager’s
operation, this guide does not cover them comprehensively. The section Server on page 67
describes how to set up some of these features.
Troubleshooting
Suggested mini-troubleshooting steps:
1
Refresh the browser. If that doesn’t work,
2
Stop and start the web server and/or application server. Command lines for this:
startappserver / stopappserver

8
| Getting Started with Dell OpenManage Network Manager
For Windows, to start the web server manager:
oware\synergy\tomcat-
X.X.X\bin\startsynergy.
For Linux.
/etc/init.d/synergy start / /etc/init.d/synergy stop
3
Clear the browser’s cache (Firefox in particular loves persistent old pages), then refresh.
4
Stop and start the browser.
5
If all else fails: Reboot the host and re-start the application server, web server and browser.
When troubleshooting (or contacting technical support), you may find pertinent information in
logs located in the following directories:
..\oware\jboss-3.0.8\server\oware\log
..\oware\temp\soniqmq.log
..\app_setup.log
..\db_setup.log
You can also run
getlogs
from a command line. The
getlogs
script packages relevant logs. This
script creates a
logs.jar
file in the root installation directory, and moves any existing copy of
logs.jar
to
oware\temp
.
logs.jar
compresses all logs necessary for troubleshooting. Read
the jar yourself, or forward this jar to technical support to help troubleshoot.
System Basics
System requirements depend on how you use the application and the operational environment.
Your specific network and devices may require something different from the recommendations for
typical installations.
Generally, base the minimum configuration of any system on its expected peak load. Your
installation should spend 95% of its time idle and 5% of its time trying to keep pace with the
resource demands.
Upgrading from a Previous Version
When you upgrade your OpenManage Network Manager installation from a previous version, keep
the following in mind:
Operating System Upgrade
If your operating system is not supported in the upgrade version, upgrade to a supported operating
system before upgrading Dell OpenManage Network Manager. The way to do this is to do the
following:
• Back up the database.
• Upgrade the operating system.
• Install the original Dell OpenManage Network Manager on the new operating system.
• Restore the database.

| Getting Started with Dell OpenManage Network Manager
9
• Proceed with the installation / upgrade of Dell OpenManage Network Manager.
See Database Backup on page 65 and Restoring Databases on page 66 for details.
General Advice
• Make sure you log out of the operating system between installations.
• Upgrading requires a new license to activate new features.
• Close any open browsers when upgrading.
• The following require manual migration (export, then import) from previous versions: SMTP
settings, some scheduled items. Some schedules may require deletion / re-making. If you open
them and they are blank, use this method.
• You must re-create topologies as Visualizations. (suggestion: take a screenshot)
• Group Operations have been deprecated, replaced by Adaptive CLI.
• The default password policy puts no restrictions on password length.
• Adaptive CLI with Perl scripts must contain valid Perl under the “strict” pragma (use strict;).
If you import or migrate from a previous version a Perl script that does not pass this “strict”
criterion, you must rewrite it for “strict” compliance before it can be successfully edited or
copied.
• Any configured color changes to the portal may not persist and must be re-made manually.
Similarly, customized page layouts or page order may not persist and you must typically re-
arrange them manually.
Handling Missing Users
If you have upgraded your Dell OpenManage Network Manager installation, users and/or their role
associations may not appear. You can fix this by going to one of the following screens:
Roles > Administrator > Actions > Assign members.
Roles > Power users > Actions > Assign members.
Roles > [ROLENAME] > Actions > Assign members.
Then click
Update associations.
Supported Operating System Versions
The following are supported operating system versions:
Microsoft Windows
—This application supports most 64-bit Windows operating systems from
Windows Vista (Business or Ultimate) forward, with their latest service packs. The supported
operating systems include: Windows 2008 (including R2), Enterprise Edition, Windows
Vista, Windows 7 (Business or better) and Windows 2012.
To install on Windows 2012, click the win_install.exe file (not the shortcut, but the file in
Disk1\instdata directory), and select the
Compatibility
tab. Check
Run this program in
compatibility mode for ...
then select either Windows 7 or Vista. Command line installations

10
| Getting Started with Dell OpenManage Network Manager
are supported without any compatibility issues. Do likewise if you must uninstall (find the
uninstall program and run it in compatibility mode).
NOTE:
Windows 2008 R2 Enterprise may indicate a PermGen size problem.Workaround: Increase PermGen size
in the Synergy Network Management Properties’ Java tab from the tray icon (XX:MaxPermSize=512m).
Increase the specified memory from from 256m to 512m, then Stop Service and Start Service after right-
clicking the tray icon. This is a known issue for Windows 2008, not Dell OpenManage Network Manager.
• Windows Terminal Server is not supported. The installer becomes non-responsive with Data
Execution Prevention enabled. This option is disabled by default on Windows Server 2008,
but is enabled on a Windows Server 2008 machine running Terminal Server.
• You must disable User Account Control if you are installing on Vista or Windows Server 2008.
Alternatively, you can run application server as service. Another option is to run as
administrator on startappserver. In Vista, right click the startappserver icon and select run as
administrator.
• Installer may halt when pre-existing bash sessions or cmd sessions are left open. Close all such
sessions before installing.
CAUTION:
The Dell OpenManage Network Manager’s installer does not validate operating systems, so it allows
installation on unsupported operating systems
Linux
—This application supports Red Hat (Enterprise version 6.2) Linux, 64-bit only, and 64-bit
CentOS (6.2). See Install on Linux on page 41 for more about how to improve your Linux
experience.
CAUTION:
For Linux, you must install no more than a single instance of MySQL—the one installed with this
software. Before you install, remove any MySQL if it exists on your Linux machine. Make sure to remove
or rename the my.cnf file for that previous installation. If it is on the path, it can interfere with the correct
operation of Dell OpenManage Network Manager. The origin of the configuration in the several my.cnf
files on Linux is /opt/dorado/oware3rd/mysql/5.0.51-pc-linux-i686-64/my.cnf, so be sure to alter that one if
you are reconfiguring OpenManage Network Manager’s MySql.
NOTICE
To determine your Linux system’s version, run the following at a command prompt:
cat /etc/redhat-release

| Getting Started with Dell OpenManage Network Manager
11
VMware
—Dell OpenManage Network Manager supports the above operating systems on VMware
virtual machines. We test Dell OpenManage Network Manager primarily on Windows
2008R2 and Redhat on virtual machines. For a more extensive discussion of using VMware,
see the first chapter of the
User Guide
.
NOTE:
Windows handles upgrading the Windows operating system. Best practice is to export the database,
upgrade the operating system, then upgrade Dell OpenManage Network Manager. See Upgrading from a
Previous Version on page 8 and Upgrade on Linux on page 35 for more details about such upgrades.
Supported Web Browsers
Supported web browsers include:
• Chrome (v 22 and above)
• Safari (v 6 and above)
• Firefox (v 12 and above)—Some pop-ups may not appear in v. 14 and later.
• Internet Explorer (v 9 and above)
Internet Explorer versions 8 and older have display alignment issues, have slower JavaScript
and Flash processing, and some transparencies do not work. Other anomalies include non-
rounded corners, no alpha rendering, scroll bars in performance indicators, non-working
multi-level menus, a too-large OS Images schedule form, and others. To fix these anomalies,
install the Chrome plug-in you can download from the internet. After it installs, close IE and
re-open it. The look and feel should improve.
Internet Explorer 9 or above, if set up in compatibility mode with Internet Explorer 7 or
Internet Explorer 8 has difficulties rendering the user interface.
Screen resolution must equal or exceed 1280 x 1024 pixels. Users running Safari on an Apple
machine must modify Java preference to run applets as their own process. Java Preferences are
under Applications > Utilities on OSX.
You can download and install updates if your browser or version varies from those supported. To
have all Dell OpenManage Network Manager functionality, you must also install the latest version
of Java (v.1.6 or later) Adobe’s Flash and Adobe’s Acrobat that works with these browsers. Flash for
64-bit browsers is currently a preliminary version, but you can typically run a 32-bit browser even in
a 64-bit operating system, so Flash features will still be available even if you do not want to run
Adobe’s beta software. If Flash is installed, but the screen still requests it, reload the page in the
browser. Install the latest Flash. Also: Your screen must be at least 1250 pixels wide.
NOTICE
When no cursor or focus is onscreen, some browsers interpret backspace as the Previous button. Also:
Some browsers (Firefox) retain cached pages past their usefulness. To reload a page without cache, for
Firefox, hold Shift while clicking the reload button. You can also use Ctrl+Shift+R or Ctrl+F5 to do this. That
said, recent Firefox builds have still retained cache even after applying those remedies. Your mileage
may vary, but Chrome (or Internet Explorer with the Chrome plug-in) functions correctly now.

12
Single Server Hardware | Getting Started with Dell OpenManage Network Manager
Best practice/Web portal /Multitasking
You can open multiple tabs to different managers in OpenManage Network Manager. In most cases
this does not cause any issues for read–only browsing of data. Opening multiple tabs is not
recommend when creating, editing or deleting. In these scenarios there may be cases where
Web session information may not be reported back correctly and task completion may appear to
never finish. One example is a job status updates. In this case a job may be submitted and it will
appear to be stuck “running” when in reality it has already finished but the status has not updated
in the browser session. When this occurs the user can manually click the refresh button on the job
status window to manually force and update. It is not productive to watch a long running process in
the job status. The recommended process is to close the job status window and move on to other
tasks. The “My Alerts” feature will alert the user when they have a completed job status.
Single Server Hardware
The following describes hardware and sizing configuration for common Dell OpenManage Network
Manager deployments. Before any deployment, best practice is to review and understand the
different deployment options and requirements. Consider future growth of the network when
estimating hardware sizes. You can often expand modern systems running Dell OpenManage
Network Manager by adding more RAM to the host server(s). Selecting expandable hardware may
also be critical to future growth. For ease of management, deployments selection best practice is to
use the fewest possible servers.
Minimum Hardware
The minimum hardware specification describes the least of what Dell OpenManage Network
Manager needs. In such minimum installations, traffic flowing from the network to OpenManage
Network Manager may exceed the capacity of the hardware. When estimating the size of a
deployment, it is important to understand the applications configurations in the target
environment. For example, the most resource-intensive, demanding applications are typically
Traffic Flow Analyzer (TFA), Event Management and Performance Monitoring.
REQUIRED Minimum hardware
—6GB RAM, dual core CPU, 3.0GHz or better, 200 GB 7200
RPM Disk.
Supports
:
• Standalone installations (Single Server) are supported when you use high-resource demand
applications minimally.
RECOMMENDED Minimum hardware:
8GB RAM, quad core CPU (3.0GHz or better), 400
GB 10,000 RPM Disk
Supports:
• Standalone installations

Single Server Hardware | Getting Started with Dell OpenManage Network Manager
13
CAUTION:
The above assumes you have dedicated a host to OpenManage Network Manager alone. Other
applications may compete for ports or other resources and can impair the system’s performance.
Even OpenManage Essentials should not be on the same machine as Network Manager.
Sizing for Standalone Installations
The following are suggested sizing guidelines for your Dell OpenManage Network Manager system.
1
Assumptions: Servers have at least four cores (3.0GHz or better) and are no more than four years old. As
memory and usage increases, the number of CPU cores needs to increase. Two cores can work for the
most basic installations, but such configurations are not recommended.
2
Each device mentioned here is equivalent to a L2 or L3 switch with a total of 48 interfaces per device
being monitored. For each device not being monitored for 48 interfaces, you can add another 50 devices
to the overall inventory for ICMP-only monitoring.
3
Application Constraints are most relevant to Traffic Flow Analysis, Performance Management, and
Event Management.
Traffic Flow Analysis ratings map to constant throughput divided by sample rate, as in bandwidth /
sample rate. 20G / 2000 is easier to manage than 20G / 1000. 20G / 1 is a thousand times more demanding
than 20G / 1000. Best practice is to avoid such high sample rates. The bandwidth the hardware your Dell
OpenManage Network Manager installation can support is dramatically lower in such cases. Best
Operating System / Disks /
RAM / Hardware
Network Size Devices
2
Application Constraints
3
Installation Changes to
Heap (RAM) Settings
64-bit OS with 6GB RAM
All below are 64-bit OS’s:
<5 Users <20 <2Mbs Internet egress and a
1:1000 sample rate
Use defaults: (1 or 2GB
application server heap (32
v. 64-bit) 512M database
4
,
768M Synergy
8GB RAM, single disk,
consumer level PC
Single-site, less than 10
concurrent users
<100 <2Mbs Internet egress and a
1:1000 sample rate
3GB application server
heap, 2GB database, 1G
Synergy
12GB RAM, single disk,
business level PC
Single-site, less than 25
concurrent users.
< 500 < 10Gbs Internet egress and
a sample rate of 1:1000
4GB application server
heap, 3GB database, 3G
Synergy
16GB RAM, multi-disk,
server level PC
Medium-large network,
up to 50 concurrent
users
< 1,000 < 50Gbs Internet egress and
a sample rate of 1:1000
5G application server heap,
4G database, 4.5G Synergy
32GB RAM, multi-disk,
server level PC,
recommend fast disk array
or SSD drive array for the
many database actions
Large network, up to
100 concurrent users
< 2,000 < 200Gbs Internet egress
and a sample rate of 1:1000
10G application server
heap, 8G database, 9G
Synergy

14
Single Server Hardware | Getting Started with Dell OpenManage Network Manager
practice is to sample a maximum of one traffic flow for every 1000 (1:1000). Higher sampling rates
degrade database performance and increase network traffic without adding any significant statistical
information.
Performance Management can support 600 inserts per second using a single disk (SSD) Drive. 1 insert =
1 monitored attribute. Expect better performance as you add more drives (and worse performance with
slower drives).
Event Management can support a sustained 1200 traps /sec using a single (SSD) drive. Expect better
performance as you add more drives (and worse performance with slower drives).
4
Database memory settings increase as the number of database hits increases. At the 32GB level best
practice is to use an SSD drive or fast disk array because of the large number of database actions
possible.
CAUTION:
Java JVM problems can generate over 10GB of thread dump in case of a memory error. To solve the
problem of such files filling up your hard drive, delete the
*.hprof
files in the
/oware/jboss-
5.1/bin
directory to free up the disk space. You can also clean out
temp
directories. Finally, ensure
your hardware has enough RAM for the tasks it has been assigned. The Server Statistics portlet displays
performance information.
If the network you manage exceeds the parameters outlined above, or your system is balky and
unresponsive because, for one example, it monitors more devices than your hardware can handle,
consult your sales representative about upgrading to a more robust or multi-server version of Dell
OpenManage Network Manager. Also, see Performance and Monitors on page 291 for more about
tuning monitor performance. You can also monitor the application server itself. See Application
Server Statistics on page 295 and Self Management / Self Monitoring: Default Server Status
Monitor on page 313.
Tablets and iPads
Dell OpenManage Network Manager detects mobile devices and pads. For smaller screens, the
Navigation bar collapses to the left hand side and the page only displays a single column. Some
limits apply:
• Since touch devices do not support right click, the first time clicking on a row selects it. A
repeat click launches a menu displaying the available actions. Click the one you want.
• All major charts are rendered as HTML 5 which are mobile-friendly. These charts are Line,
Pie, Donut, Bar and Column. Some Gauges and LED charts require flash which is not
compatible with all mobile devices.
• Visualize / Topology is unavailable.
NOTE:
Apple products are most Dell OpenManage Network Manager-friendly. Android is only partly supported.

Single Server Hardware | Getting Started with Dell OpenManage Network Manager
15
Network Basics
OpenManage Network Manager communicates over a network. In fact, the machine where you
install it must be connected to a network for the application to start successfully. Firewalls, or even
SNMP management programs using the same port on the same machine where this software is
installed can interfere with communication with your equipment.
Dealing with any network barriers to communicating with OpenManage Network Manager, any
required initial device configuration to accept management, and managing security measures or
firewalls—all are outside the scope of these instructions. Consult with your network administrator
to ensure this software has access to the devices you want to manage with the Protocols described
below.
NOTICE
One simple way to check connectivity from a Windows machine to a device is to open a command shell
with Start > Run
cmd
. Then, type
ping [device IP address]
at the command line. If the
device responds, it is connected to the network. If not, consult your network administrator to correct this.
No useful information comes from disconnected or powered-down devices.
Name Resolution
OpenManage Network Manager server requires resolution of equipment names to work completely,
whether by host files or domain name system (DNS). The application server cannot respond to
hosts with IP addresses alone. The application server might not even be in the same network and
therefore the host would be unable to connect.
If your network does not have DNS, you can also assign hostnames in
%windir%\System32\drivers\etc\hosts
on Windows (
/etc/hosts
in Linux). Here,
you must assign a hostname in addition to an IP address somewhere in the system. Here are some
example hosts file contents (including two commented lines where you would have to remove the
# sign to make them effective):
# 102.54.94.97 rhino.acme.com # source server
# 38.25.63.10 x.acme.com # x client host
127.0.0.1 localhost
Protocols
OpenManage Network Manager uses the following protocols: TCP/IP, SNMP, HTTP/S, UDP
Multicast.
Overriding Properties
Dell OpenManage Network Manager lets you fine-tune various features of the application. Rather
than lose those changes if and when you upgrade your application, best practice is to override
changes. To do this for the web portal, first rename the provided file

16
Single Server Hardware | Getting Started with Dell OpenManage Network Manager
\oware\synergy\conf\server-overrides.properties.sample
to
server-
overrides.properties
, and enable the properties within it by uncommenting them, and
altering them to fit your needs. The comments in this file provide more information.
You can also override application server-related properties in
\owareapps\installprops\lib\installed.properties
.
Both of these properties files remain as configured if you install an upgrade, but upgrades overwrite
the
server-overrides.properties.sample
, so keep a copy if it has anything you want to
preserve.
Screen names
—A new property requires a minimum length for user screen names. For the existing
user base then any screen names that are shorter than the value must change to the required
length on the next edit/save for that user.
Fixed IP Address
OpenManage Network Manager includes a web server and application server which must be
installed to hosts with fixed IP addresses or permanently assigned Dynamic Host Control Protocol
(DHCP) leases.
If you do change your host’s IP address
1
Change the Virtual host IP to the new IP address in Manage > Control Panel > Portal.
2
Change the host IP address
3
Open a shell and run
oware
to set the environment
4
Run
ipaddresschange -n
in the shell followed by the new IP address
5
Restart the application server and the web server service.
6
Open a browser to see the web client at this URL:
[new IP address]:8080.
To do this without the script:
1
Change the Virtual host IP to the new IP address in Manage > Control Panel > Portal.
2
Change the host IP address
3
Delete the contents of
\oware\temp
.
4
Change your local IP address anywhere it appears in
\owareapps\installprops\lib\installed.properties
.
5
Change the address on your web server. Change this in
portal-ext.properties
in
\oware\synergy\tomcat-7.0.40\webapps\ROOT\WEB-INF\classes
Change property:
jdbc.default.url=jdbc:mysql://[IP address]/
lportal?useUnicode\=true&characterEncoding\=UTF-
8&useFastDateParsing\=false
and

Device Drivers | Getting Started with Dell OpenManage Network Manager
17
oware.appserver.ip=[IP address]
6
Restart the application server and the web server service.
Open a browser to see the web client at this URL:
[new IP address]:8080.
Portal
Memory Settings
To manually change Dell OpenManage Network Manager web portal heap settings, change the
setenv.sh
or
setenv.bat
file:
set "PORTAL_PERMGEN=256m"
set "PORTAL_MAX_MEM=3072m"
set "PORTAL_INIT_MEM=768m"
set "PORTAL_32BIT_MAX_MEM=768m"
These files are in the
Tomcat***/bin
directory. After you change their settings, run them, then
re-start the portal service.
Authentication
For successful discovery of the resources on your network, this software requires authenticated
management access to the device. To get this access, you must provide the correct SNMP
community strings, WMI login credentials, and any other command-line (Telnet / SSH) or browser
(HTTP/HTTPS) authentication, and SNMP must be turned on, if that is not the device’s default.
Some devices require pre-configuration to recognize this management software. Consult your
network administrator or the device’s manuals for instructions about how to enable those. See
Authentication on page 177 for more.
CAUTION:
If you do not get access to the deepest level of authentications—for example the “enable” user’s—you
cannot access all of Dell OpenManage Network Manager’s functionality.
Device Drivers
For complete communication with devices, Dell OpenManage Network Manager requires a device
driver. For example, to communicate with Dell devices, you must have a Dell driver installed. That
does not mean you cannot discover and communicate with devices without a driver installed. The
Base Driver capabilities appear below. See .ocp and .ddp files on page 91 for driver installation
instructions. The following sections include discussions of these drivers:
• Base Driver
• Windows Management Instrumentation (WMI) Driver
• Web-Based Enterprise Management (WBEM) Driver

18
Device Drivers | Getting Started with Dell OpenManage Network Manager
Base Driver
If you have no driver installed, Dell OpenManage Network Manager still provides the following
functionality. This functionality depends on devices supporting and providing data from the system
group (sysDescr, sysObjectID, sysUpTime, sysContact, sysName, sysLocation) and the ifTable
which provides list of device interface entries from the RFC1213-MIB. Dell OpenManage Network
Manager also depends on the entPhysicalTable in the ENTITY-MIB which provides list of physical
entities contained on device.
NOTE:
If device does not support ENTITY-MIB then Dell OpenManage Network Manager bases sub-component
creation entirely on contents of the ifTable.
Top Level Resourc e
—Dell OpenManage Network Manager creates top level resource for
discovered devices with the following attributes: Equipment Name, Description, IP Address,
Location, Contact, Vendor, Model, System Object Id, Date created, Creator, Discovery date,
Last Modified.
Subcomponents
—Dell OpenManage Network Manager creates subcomponents (modules, ports,
interfaces, power supplies, fans, and so on) for discovered device based on contents of
entPhysicalTable.
Port / Interface Attributes
—Dell OpenManage Network Manager sets Port/Interface Attributes
depending on port/interface type: Name, Port Description, MAC Address, Administrative
State, Operational State, Port Type, Speed, Encapsulation, Operation Type, Switch Mode,
CLI Name, If Index, Port Number, and Slot Number.
Direct Access
—SNMP and Ping (ICMP) are enabled.
Monitors
—Discovered device instances are automatically added to the Default ICMP Monitor for
updating its Network Status. Support for SNMP based performance monitors using
discovered ports and interfaces as targets. For example, Bandwidth Utilization.
Reports
—You can execute reports like the Port Inventory Report or Device Inventory and results
should include discovered device and device port entities.
Network View
—Discovered devices and their sub-components appear.
Events
—Dell OpenManage Network Manager supports standard MIB-II traps for discovered
device and or sub-components. For example, linkUp, linkDown, coldStart, warmStart, and so
on.
MIBs
—Dell OpenManage Network Manager can import MIBs for use within MIB Browser so you
can query device-specific OID values on the discovered device.
Containers
—Depending on the licensing, device and or contained sub-components are selectable
and manageable in filters and portlets like Containers.
Links
—You can manually create Links using discovered device or device subcomponents as end
points which are then visible in Network View.

Device Drivers | Getting Started with Dell OpenManage Network Manager
19
Attributes
—You can manually populate or modify device/port attributes. For example Serial
Number, Firmware Version, Port Type, Notes etc. Attribute values should then be included in
reports based on a given report template.
Supported PowerConnect Models
Refer to release notes for a list of supported devices. You can also look at the HTML files in the
SupportedDevices directory of your installation source for information about supported devices
and operating systems.
Windows Management Instrumentation (WMI) Driver
The Windows Management driver currently supports any Windows based operating system that
supports the Windows Management Instrumentation (WMI).
Windows Management must always install on the Vista (Business) or later.
The login credentials must be for an administrator on the installation host for complete
functionality. Both this and .NET installation are requirements for any installation managing
devices supported by this driver.
This driver supports global group operations.
NOTE:
Discovery may display benign retry warning messages in the application server shell or log. You can
safely ignore these.
Prerequisites
Before installing this software to manage other computers with a Windows Management Interface
driver (assuming you are installing that driver), if you do not already have it installed, you must
download and install the Microsoft .Net framework version 3.0 or later on the application server.
For complete functionality, the WMI login for this software must be a login for a domain user who
also belongs to the administrator group on the WMI device. Both are requirements for any
installation managing WMI devices.
The following are common Windows Base prerequisites:
Credentials
—You must use administrative credentials to manage the computer system.
Firewall
— Some firewalls installed on the computer may block Windows Management requests.
Allow those you want to manage. (See Firewall Issues below.)
License
—Make sure you have the proper Windows Base driver license installed. If you have a Dell-
only license and are discovering a non-Dell computer, discovery does not work. Or if you have
a Dell license for desktop discover you cannot discover a server.
License come in the following types:

20
Device Drivers | Getting Started with Dell OpenManage Network Manager
• Major Vendor by Name—For example: Dell, Compaq, HP, Gateway
• Server/Desktop individual license support
• Generic computers—Non-major vendors
• ALL—This gives the driver all capabilities for any computer system
Firewall Issues
Configure the firewall between your server and the Internet as follows:
• Deny all incoming traffic from the Internet to your server.
• Permit incoming traffic from all clients to TCP port 135 (and UDP port 135, if necessary) on
your server.
• Open Port 445 (WMI)
• Permit incoming traffic from all clients to the TCP ports (and UDP ports, if necessary) on
your server in the Ports range(s) specified above.
• If you are using callbacks, permit incoming traffic on all ports where the TCP connection was
initiated by your server.”
WMI queries will succeed only if you add the User account to local admin group. Refer to the
Microsoft knowledgebase articles for the way to do this. For example: Leverage Group Policies with
WMI Filters:
support.microsoft.com/kb/555253/en-us
For user rights for WMI access, see:
www.mcse.ms/archive68-2005541196.html
See also:
Service overview and network port requirements for the Windows Server system
(
support.microsoft.com/kb/832017/
)
Web-Based Enterprise Management (WBEM) Driver
The Web-Based Enterprise Management driver currently supports operating systems supporting
the Web-Based Enterprise Management interface (WBEM).
WBEM is always installed on the following operating systems versions (and later):
•Red Hat Linux 6.2.
• VM Ware (ESX) with WBEM installed.
You can install Web-Based Enterprise Management on some other systems if they do not already
use it, but monitored devices must have this installed.
NOTE:
To verify WBEM is running on your system, run the following command:
ps-e | grep cim
. You
should see a process labelled
cimserver
.

Device Drivers | Getting Started with Dell OpenManage Network Manager
21
Installing WBEM on Red Hat
You can download and install WBEM support for Red Hat linux. For example, for Red Hat 5, a
release for WBEM is
tog-pegasus-2.7.0-2.el5_2.1.i386.rpm
. This is what you need to
download once you have logged into the Red Hat network.
Install this as follows:
Install:
rpm -ih tog-pegasus-2.7.0-2.el5_2.1.i386.rpm
Upgrade:
rpm -Uh tog-pegasus-2.7.0-2.el5_2.1.i386.rpm
To determine if wbem is running, run
ps -ef | grep cimserver
in a shell.
To start | stop | get status of the WBEM service:
tog-pegasus start | stop | status"
If the system is running Fedora, then you can access tog-pegasus updates at this site:
https://
admin.fedoraproject.org/pkgdb/packages/name/tog-pegasus
WBEM Prerequisites
The following are common prerequisites:
Credentials
—WBEM credentials have a role in discovering the device. Your system must have
access to the computer using Administrative only credentials. These are the same credentials
as the user installing WBEM on the device.
Telnet / SSH credentials are necessary for other supported applications.
For full functionality, this WBEM device driver requires administrative (root) access. Many
devices may only allow root logins on a local console.
In such cases, configure the Telnet/SSH authentication for these devices to login as a non-
root user—and, in Authentication Manager, enter
su
in the
Enable User ID
field and enter
the root user’s password in
Enable User Password
in that same authentication. This enables
full device management functionality with root access.
NOTE:
Credentials for Telnet / SSH should have a privilege level sufficient to stop services and to restart the
computer system.
Firewall
— Some firewalls installed on the computer may block Web-Based Enterprise
Management requests. Allow those you want to manage.
License
—Make sure you have the correct WBEM driver license installed. Licenses come in the
following types:
• Major Vendor by Name - Such as Dell, Compaq, HP, Gateway.
• Server/Desktop individual license support.
• Generic computers - non-major vendors.

22
Ports Used | Getting Started with Dell OpenManage Network Manager
• ALL - this gives the driver all capabilities for any computer system.
CAUTION:
If you discover an Amigopod host that does not have its SNMP agent turned on, Dell OpenManage
Network Manager labels it a WMI or WBEM host rather than an Amigopod host.
Secure WBEM Access
Some monitoring capabilities require root access, even if you securely log into the UNIX host. In
this case, when configuring a secure (SSH) login, configure a telnet authentication with
su
as an
Enable User ID
, and the root user’s password as the
Enable Password.
For other WBEM access,
configure authentication as an HTTP/HTTPS login / password, and select WBEM as the protocol
after you have selected the WBEM authentication.
Ports Used
Initial installation scans the following ports, and reports any conflicts for the following ports:
Database:
3306 or user-configured database host, if using MySQL server.
Application server:
8089, 8162, 8489 [HTTPS], 8082
Web Portal:
8080, 8443 [HTTPS]
SNMP:
161, 162
Syslog:
514
When installation encounters a conflict with any of the above ports, a panel appears displaying a
warning and the ports in conflict. You can then elect to continue since you can change the
application ports after installation. If your installation has no port conflicts, then no panel appears.
NOTE:
The installation scans TCP ports to detect potential conflicts. It does not scan UDP port conflicts
including SNMP Ports 161 and 162. No SNMP or other applications should bind to UDP ports 161 and 162
since such bindings interfere with the application. If this conflict exists, the following error appears:
FATAL ERROR - Initializing SNMP Trap Listener
You may also sometimes configure port availability on firewalls. Sometimes, excluding applications
from firewall interference is all that is required (see Ports and Application To Exclude from Firewall
on page 27).

Ports Used | Getting Started with Dell OpenManage Network Manager
23
The following are some of the standard port assignments for installed components. These are often
configurable (even for “standard” services like FTP or HTTP), so these are the typical or expected
port numbers rather than guaranteed assignments. Also, see Protocol Flows on page 26 for more
about network connections. The JBoss directory’s number may vary with your package’s version; *.*
appears rather than actual numbers below
Destination
Port(s)
Service File(s) Notes Used from
Java Client
HTTP/S (Web Client)
8089
4
oware.webservices.port [user.root]\oware\lib\oww
eb services.properties
appserver.
Note: this port was
80 in previous
versions.
Yes
8489
4, 5, 7
org.apache.coyote.tomcat
4.CoyoteConnector
(Apache)
[user.root]\oware\jboss-
*.*\server\oware\deploy\j
bossweb-
tomcat41.sar\META-
INF\ jboss-service.xml
app/medserver, jmx
console, and web
services, including
Axis2
No
Other Ports
n/a
5
(ICMP) ping MedSrv ->
NtwkElement,
NtwkElement ->
MedSrv, ICMP ping
for connection
monitoring.
20
4, 5, 7
(TCP)
FTP Data Port n/a (Internally
configurable),
"MedSrv -> FTPSrv
NtwkElement ->
FTPSrv"
No
21
4, 5, 7
(TCP)
FTP Control Port n/a (Internally
Configurable)
"MedSrv -> FTPSrv
NtwkElement ->
FTPSrv"
No
22
4, 5, 7
(TCP)
SSH n/a MedSrv ->
NtwkElement,
secure craft access
No

24
Ports Used | Getting Started with Dell OpenManage Network Manager
23
4, 5, 7
(TCP)
Telnet n/a MedSrv ->
NtwkElement, non-
secure craft access
Yes
25
4, 5, 7
(TCP)
com.dorado.mbeans.OW
EmailMBean (mail)
[user.root]\oware\jboss-
*.*\owareconf\oware-
service.xml
AppSrv ->
SmtpRelay,
communication
channel to email
server from
Appserver
No
69
4, 5, 7
(UDP)
TFTP n/a (Configurable
internally), MedSrv -
> TFTPSrv
NtwkElement ->
TFTPSrv
No
161
4, 5, 7
(UDP)
com.dorado.media
tion.snmp.request.listene
r.port (SNMP),
oware.media
tion.snmp.trap.forward
ing.source.port
[user.root]\owareapps\ez
mediation\lib\owmediati
on.properties
MedSrv ->
NtwkElement,
SNMP request
listener and trap
forwarding source
No
162
4, 5
(TCP)
oware.media
tion.snmp.trap.forwardin
g.des tination.port
(SNMP)
[user.root]\owareapps\ez
mediation\lib\ezmediatio
n.properties change this
property:
com.dorado.snmp.trap.lis
tener.binding=0.0.0.0/
162
NtwkElement ->
MedSrv, SNMP trap
forwarding
destination port,
No
514
4, 5
(UDP)
com.dorado.mediation.sy
slog.port (syslog)
To change the syslog port,
add
com.dorado.mediation.sy
slog.port=[new port
number] to
owareapps\installprops\lib
\installed.properties
NtwkElement ->
MedSrv (mediation
syslog port)
No
Destination
Port(s)
Service File(s) Notes Used from
Java Client

Ports Used | Getting Started with Dell OpenManage Network Manager
25
1812
4, 7
(TCP)
RADIUS port (note,
RADIUS is not supported
in Dell OpenManage
Network Manager)
[user.root]\oware\jboss-
*.*\server\oware\conf\logi
n-config.xml
AppSrv -> RADIUS
Srv, Appserver
(RADIUS
client login
enabled–optional)
No
5988, 5989 WBEM Daemon (5989 is
the secure port) defaults
Yo u c a n a d d p o r t s
and daemons in
monitored services.
These are only the
default. WBEM
requires one port,
and only one, per
daemon.
No
7800
2
(TCP) org.jboss.ha.frame
work.server.ClusterPartiti
on (JBOSS)
[user.root]\oware\conf\cl
uster-service.xml
disabled - see UDP
for same, (JBOSS
HA frame work
server cluster
partition) TCP only
No
8009 (TCP) org.mort
bay.http.ajp.AJP13Listen
er
[user.root]\oware\jboss-
*.*\server\oware\deploy\j
bossweb-
tomcat41.sar\META-
INF\ jboss-service.xml
Obsolete —
appserver
No
8083 (TCP) org.jboss.web.WebService
(JBOSS)
[user.root]\oware\jboss-
*.*\owareconf\jboss–
root-service.xml
not used (JBoss web
services)
appserver
No
8443
2,4, 5, 7
org.apache.coyote.tomcat
4.CoyoteConnector
[user.root]\oware\jboss-
*.*\server\oware\deploy\j
bossweb-
tomcat41.sar\META-
INF\ jboss-service.xml
user client ->
AppSrv (Apache
Coyote Tomcat4
Coyote connector),
appserver. This is
the default HTTPS
port for the web
portal.
No
9996, 6343 Traffic Flow Analysis trafficanalyzer.ocp You must configure
the router to send
flow reports to the
OpenManage
Network Manager
server on 6343 for
sflow by default.
No
Destination
Port(s)
Service File(s) Notes Used from
Java Client

26
Ports Used | Getting Started with Dell OpenManage Network Manager
2
Unused in standard configuration.
3
Client does not connect to medserver on this port.
4
This port is configurable.
5
Firewall Impacting
7
Bidirectional
To operate through a firewall, you may need to override default port assignments.
NOTICE
To configure ports, open their file in a text editor and search for the default port number. Edit that, save
the file and restart the application server and client. Make sure you change ports on all affected
machines.
The mediation service also establishes a socket connection to client on ports 6500 to 6510 for cut
through. Such connections are specified in the
ezmediation/lib/
ezmediation.properties
file
.
[user.root] = $OWARE_USER_ROOT
Protocol Flows
The following network protocol flows represent the application’s interactions with Network Devices
(for example: Dell Powerconnect). The (N) in these lines identifies dynamic port assignments.
Often, several communication flows are established to a specified static port so N can represent
several dynamic ports. This list also outlines alternative flows for JBoss and SONIC (clustered) JMS
activation.
NOTE:
This does not identify time service flows like ntp that can manage the time on the servers.
The following were changes to a standard installation done for the sake of measuring the protocol
flows. In the J2EE Naming Service: the RMIPort was changed to 31310. Also,
owappserver.properties
(turns off mediation v2 services on application server) was
changed: mediation true->false. This essentially disables mediation on the application server.
Network Element to FTP/TFTP Server
FTP
Network Element (N) -> FTP/TFTP Svr (21)
Network Element (N) <-> FTP/TFTP Svr (21)

Ports Used | Getting Started with Dell OpenManage Network Manager
27
Network Element (N) <- FTP/TFTP Svr (20)
Network Element (N) <-> FTP/TFTP Svr (20)
Network Element (N) -> FTP/TFTP Svr (69)
Network Element (N) <-> FTP/TFTP Svr (M)
Devices should have connectivity to the external FTP/TFTP server.
M
means we recommend
installing external file servers on mediation servers for a performance improvement. You can also
use the internal FTP/TFTP server in Windows environments.
Email Network Element Config Differences
If email from the application server is turned on then the following port must be opened between
the application and email server:
TCP App Svr (N) -> smtp relay (25)
TCP App Svr (N) <-> smtp relay (25)
JBoss Management Access
The J2EE server has port 8080 open to allow web browsers access to the JBoss Management
console. If you want to access this capability then the system browsing the jmx console must have
access.
Mgmt client (N) -> App Server (8080)
To access the Mediation Servers:
Mgmt client (N) -> Med Server (8080)
Ports and Application To Exclude from Firewall
Exclude
java.exe
, tcp port 21 and udp port 69 from firewall interference to let the application
function. The java process to exclude from firewall blocking is
<Installdir>\oware3rd\
jdk[version number]\jre\bin\java.exe
.
If you have distributed the database functions then you must allow the database process to
communicate with your machine through your firewall as well. The embedded database process is
mysqld-max-nt.exe
(in Windows, the path is
<installdir>oware3rd\mysql\[version number]\bin\mysql-max-nt.exe).
Consult your DBA for Oracle processes, if applicable.
Installed Third Party Applications
This software includes the following applications:
•ant

28
Getting Started | Getting Started with Dell OpenManage Network Manager
•cygwin
•expect
• jboss (see directory name for version)
•JDK
• JLoox
•MySQL
• Open SSH (includes OpenSSL)
•TCL
•OpenLDAP
• Jasper Reports
• J Free Charts
Windows Management Instrumentation Ports
Windows Management Instrumentation uses the following ports:
These are relevant only if you are using any Windows-based server device driver.
Getting Started
The following section outlines the steps in a typical installation and subsequent first use. Because
the software described here is both flexible and powerful, this section does not exhaustively
describe all the details of available installations. Instead, this Guide refers to those descriptions
elsewhere in the OpenManage Network Manager first chapter of the
User Guide
,
OMNM User
Guide
,
first chapter of theUser Guide
,
User Guide
or online help.
A typical installation means doing the following:
Installation and Startup
below includes instructions for a basic installation. The Install on Linux
on page 41 below for Linux-only instructions.
Protocol or Function Ports Used
RPC, TCP 135,139,445,593
SNMP, UDP 161,162
Optional:
WINS, TCP 42
UDP 42, 137
PrintSpooler, TCP 139, 445
TCP/IP PrintServer, TCP 515

Installation and Startup | Getting Started with Dell OpenManage Network Manager
29
Administering User Permissions
—You can also set up users, device access passwords, and groups
for users, as you begin to use it. See Control Panel on page 43.
Discovering Resources
—After you install the application, you must discover the equipment you
want to manage, and model it in the Dell OpenManage Network Manager database. See
Discovery Profiles on page 83.
Resource Management and Reports
—See Managed Resources on page 87, and Chapter 6,
Resource Management and Reports in this Guide.
Configuration Management
—Use Dell OpenManage Network Manager to backup, restore, and
compare configuration files. See Top Configuration Backups on page 331.
Problem Diagnosis
—See Alarms on page 123 for information about Fault Management.
Network Troubleshooting
—See Alarms on page 123, and Chapter 10, Monitoring for details of
Dell OpenManage Network Manager’s performance management capabilities.
Reports
—Run reports to clarify the state of your network and devices. See Reports on page 231 for
details.
Real-time Diagnosis through Collaboration
—Collaborate with others about network issues,
both by sending them messages that display the device conditions of concern, and with online
chat within Dell OpenManage Network Manager. See Sharing on page 110, and Status Bar
Alerts on page 98 for details.
Unified View
—You can scale your Dell OpenManage Network Manager installation to handle the
largest, most complex environments with distributed deployment.
Finally, after you begin using Dell OpenManage Network Manager, make sure you attend to what
Common Setup Tasks on page 87 describes.
Installation and Startup
Application server produces the Dell OpenManage Network Manager information for web clients.
It monitors devices, and produces the output which the web server then makes available for those
web clients. See Install on Linux on page 41 for advice about installing to Linux only.
Typically, the installation wizard senses the default language of the operating system and installs
Dell OpenManage Network Manager so its default language agrees. If you want Dell OpenManage
Network Manager to install with English regardless of the installation platform’s default, then
remove the SynergyI8N.jar file from Synergy.zip before you install.
Initiate installation by executing shortcuts to
win_install.exe
[Windows]
1
or
linux_install.sh
2
[Linux] in the installation root directory of a local or mapped drive. If your
download is a compressed (.zip) file, you must extract it before installing. Put any extracted zip files
1. Windows installation sometimes installs Internet Information Services (IIS)—formerly called Internet Information
Server. Typical installations do not turn IIS on by default. Do not enable IIS on the host(s) running Dell OpenManage
Network Manager.

30
Installation and Startup | Getting Started with Dell OpenManage Network Manager
on your localhost for faster installation times. Using shared drive may introduce network latency
issues during the installation. Click through the installation wizard, accepting the license and
making the appropriate entries.
CAUTION:
Do not install if you are logged in as user “admin.”
During some installations, one screen lets you select the application’s memory size. Best practice is
to select the largest available on your hardware while leaving sufficient memory for the operating
system.
Heap
Heap settings let you, in effect, customize the number of devices being monitored by Dell
OpenManage Network Manager and the number of concurrent users. The default settings typically
support 100 devices or less and 25 concurrent users. See Single Server Hardware on page 12 for
more about memory requirements.
Memory on a single machine installation serves the operating system, database and web server. You
can configure the selected application server heap memory size any time, with the following
properties in
\owareapps\installprops\lib\installed.properties
. For example:
oware.server.min.heap.size=4096m
oware.server.max.heap.size=4096m
To manually change Dell OpenManage Network Manager web portal heap settings, change the
setenv.sh
or
setenv.bat
file:
set "PORTAL_PERMGEN=256m"
set "PORTAL_MAX_MEM=3072m"
set "PORTAL_INIT_MEM=768m"
set "PORTAL_32BIT_MAX_MEM=768m"
These files are in the
Tomcat***/bin
directory.
Installation and startup include:
• Running the installer, responding to its prompts.
2. Linux installation can start in the following ways: a) type ./linux_install.sh in a shell. This lets application server,
autostart function. b) Double click on the linux_install.sh file in the installation directory. This produces a screen
with running options. if you click Run application server autostart functions. If you click on Run in Terminal it does
not. Finally, follow the instructions in Install on Linux on page 41.

Installation and Startup | Getting Started with Dell OpenManage Network Manager
31
•
Starting application server
. In Windows, you can use the
Start
button (
Start >
OpenManage Network Manager
> Start application server
), or type
startappserver
in a
command shell, or right-click the server manager tray icon and select
Start (
if you have
installed Dell OpenManage Network Manager as a service
and that icon is red
,
not green
).
NOTICE
A message declares “Application server is now up” in My Alerts in the bottom left corner of the screen of
the web client when application server startup is complete. You can also make server monitor appear
with the
pmtray
command either in a shell or from a start menu icon.
•
Starting web server
. If this does not auto-start, you can use the
Start
button (
Start >
OpenManage Network Manager
> Synergy Manager
), or right click the web server’s tray icon
to start it. You can also double-click this icon and automate web server startup. From a
command line, you can also start this manager with
[installation
root]\oware\synergy\tomcat*\bin\startsynergy.
To start web server or Linux, in a shell type
/etc/init.d/synergy start.
Stop web
server with
/etc/init.d/synergy stop.
CAUTION:
If you are using Dell OpenManage Network Manager in an environment with a firewall, ports 8080 and 80
must be open for it to function correctly. If you want to use cut-thru outside of your network then ports
8082 – 8089 must be open. Dell OpenManage Network Manager uses the first one available, so typically
8082, but if another application uses 8082, Dell OpenManage Network Manager uses 8083 and so on.
Web Services for Dell OpenManage Network Manager previously used port 80, but for this version, they
use 8089.
Start using Dell OpenManage Network Manager as outlined in Getting Started on page 28, or
below.Here are the various ways to start (and stop) Dell OpenManage Network Manager
elements:
Windows Start Menu
Program Shortcut
Windows Command Line Linux Command Line
Server Monitor pmtray N/A
Start Application Server startappserver startappserver
Synergy Manager startsynergy.com
Note: this is in the
oware\synergy\tomcat*\b
in directory, and is not on
the path.
While no monitor display
appears, you can start the web
server with these commands:
startportal.sh start / startportal.sh
stop
These are in the oware/synergy/
tomcat-x.x.x/bin directory, and
are not on the path.

32
Installation and Startup | Getting Started with Dell OpenManage Network Manager
See Starting Web Client on page 38 for more information.
See the Troubleshooting chapter of first chapter of the
User Guide
to solve Dell OpenManage
Network Manager problems.
Install on Linux
To run Dell OpenManage Network Manager in Linux, rather than Windows, follow the Best
Practices and steps below.
Linux Installation Best Practices
• This application can run on any Linux desktop environment (CDE, KDE, Gnome, and so on)
but the installer will only install shortcuts for CDE. You can install Linux in its Desktop
option, or if you select Basic Server (default) - choose additional packages: XWindows, Basic /
Core Gnome Desktop without Gnome utilities, although we suspect any Gnome will work).
• Install your Linux distribution (example: CentOS) on the server, choosing
Basic Server
when
prompted to select software.
CentOS
should be the only repository selected. Choose
Customize Later
to decline further customizing the installation.
• Xvfb must be running to have a web client work correctly. This is automated when application
server starts automatically. You can manually start this process with root access using the
following:
[root@test X11]Xvfb :623 -screen 0 1152x900x8 2>/dev/null &
Confirm xvfb is running as follows:
>ps -ef | grep Xvfb
root 25991 21329 0 16:28 tty2 00:00:00 Xvfb :623 -screen 0 1152x900x8
qa 26398 26053 0 16:31 pts/3 00:00:00 grep Xvfb
(The path may differ from this example.)
Create a user and prepare for installation:
1
Add your IP and hostname to
/etc/hosts.
For example (for host
Test
):
10.18.0.241 Test
Also: verify that
/etc/hosts
points to new name-use the following command and you
should see similar output.
[qa@Test Desktop]$ cat /etc/hosts
10.18.0.241Test.localrh6Test# Added by NetworkManager
Synergy http://[application server
host IP]:8080
http://[application server host
IP]:8080
Windows Start Menu
Program Shortcut
Windows Command Line Linux Command Line

Installation and Startup | Getting Started with Dell OpenManage Network Manager
33
127.0.0.1localhost.localdomainlocalhost
::1 Test.localTestlocalhost6.localdomain6localhost6
2
Login as
root
, create a new user with a home directory, set the password and add the user to
the proper group. Here are examples of the commands for this. configuring user
test
:
useradd -m test
passwd abcxyz
usermod -aG wheel test
3
Copy the installation files to the system.
4
After unzipping the installation file from the website, copy the folder with source files as a
subdirectory of the
/home/test
directory on the server. Set permissions on the installation
directory:
chown -R test /home/test
chmod -R 777 /home/test/MyInstallation
5
Make sure the installation script has permission to execute:
chmod +x /home/test/MyInstallation/linux_install.sh
6
Create the target installation directory structure and set permissions. The following are
examples, not defaults:
mkdir /test
mkdir /test/InstallTarget
chown -R test /test
chmod -R 777 /test
7
Disable Firewall with System > Administration > Firewall, or disable the firewall, and
configure the network interface card with a static IP address from a command shell with the
following command(s):
setup
You may be prompted to enter the root password; the password dialog may also appear behind
the Firewall Configuration Startup dialog.
8
By default the Network Interface Card (NIC) is not active during boot, configure it to be
active and reboot:
nano /etc/sysconfig/networking/devices/ifcfg-eth0
Change
ONBOOT=no
to
ONBOOT=yes
9
Disable SELINUX. Turn this off in
/etc/selinux/config
. Change
SELINUX=disabled
.
This and the previous step typically requires a reboot to take effect.
10
From a command line, type
reboot
.

34
Installation and Startup | Getting Started with Dell OpenManage Network Manager
11
Once reboot is complete, login as
root
update the system:
yum update -y
12
Linux (CentOS particularly) sometimes installs MySQL libraries by default, this interferes
with Dell OpenManage Network Manager since it installs its own MySQL version. Remove
mysql-libs from the system:
yum remove mysql-libs -y
Dell OpenManage Network Manager needs the compatibility libraries installed and reboot:
yum install compat-libstdc++-33.x86_64 -y
reboot
Alternatively, do these steps in the System > Administration > Add/Remove Software user
interface.
13
Configure file handle maximums. Open
/etc/security/limits.conf
and ensure the
following are at minimum 65535:
test soft nofile 65536
test hard nofile 65536
test soft nproc 65536
test hard nproc 65536
Here,
test
is the installing user login.
Set these limits higher for more heavily used systems. You can also check/set file handles
temporarily using the
ulimit -H/Sn
command. For example:
$ ulimit -Hn
$ ulimit -Sn
CAUTION:
If you enter ulimit -a in a shell, open files should NOT be 1024, and User Processes should NOT be
1024. These are defaults that must be changed.
14
Restart Linux. (
reboot
)
Install Dell OpenManage Network Manager:
15
You cannot install as root user. Log out as root and login as the user (here,
test
) created in
the previous steps and run the installation script:
cd /home/test/MyInstallation
./linux_install.sh
...or if you prefer a text-only installation:
./linux_install.sh -i console

Installation and Startup | Getting Started with Dell OpenManage Network Manager
35
16
Now follow the instructions in the installation wizard or text, making sure to specify the
configured target directory (in this example
/test/InstallTarget
) as its installation
root.
17
As part of the installation, you must run a specified installation script as root. When you run
the setup script, among other things, it automatically re-routes event traffic from port 162 to
port 8162.
18
If you did not elect to autostart them, start the web server and/or application server. The
command line for application server:
startappserver
For web server.
/etc/init.d/synergy start
19
When application server and web server have completed their startup, open a browser to this
URL:
[application server IP or hostname]:8080
NOTE:
Upon Login, if you see the message “Credentials are needed to access this application.” Add
oware.appserver.ip=[application server IP address]
to
/oware/
synergy/tomcat-XXX/webapps/ROOT/WEB-INF/class/portal-
ext.properties
.
Upgrade on Linux
The following are best practices for upgrading from a previous version of OpenManage Network
Manager on a Linux machine (see also Upgrading from a Previous Version on page 8, if that
applies):
1
Verify your previous version’s installation application server starts without exceptions.
2
Back up the database, and any other resources that need manual installation. See Upgrading
from a Previous Version on page 8 for more specifics.
3
Make sure your operating system does not include a MySql database (or remove the Linux
MySql first). See step 12 in How to: Install on Linux on page 32.
4
Make sure to remove or rename the
my.cnf
file for that previous installation. The origin of
the configuration in the several my.cnf files on Linux is
[installation target]/
oware3rd/mysql/5.0.51-pc-linux-i686-64/my.cnf
, so be sure to alter that one if
you are reconfiguring OpenManage Network Manager’s MySql.
5
Ensure you have installed the 32-bit Linux Libraries, as described in step 12 of How to: Install
on Linux on page 32.
6
If necessary, disable firewalls and create directories and permissions as in How to: Install on
Linux on page 32.

36
Installation and Startup | Getting Started with Dell OpenManage Network Manager
The origin of the configuration in the several my.cnf files on Linux is
[installation
root]/oware3rd/mysql/5.0.51-pc-linux-i686-64/my.cnf
, so be sure to alter
that one if you are reconfiguring OpenManage Network Manager’s MySql.
Linux Upgrade Procedure
The following are suggested upgrade steps, when you are installing a new version of Dell
OpenManage Network Manager,
and
a new Linux operating system. See also Upgrading from a
Previous Version on page 8. Essentially, this outlines backing up what you can, upgrading the
operating system, then upgrading Dell OpenManage Network Manager:
1
Backup the MySQL database and copy the backup to another machine or network drive with
the following command lines:
mysqldump -a -u root --password=dorado --routines owbusdb > owbusdb.mysql
mysqldump -a -u root --password=dorado owmetadb > owmetadb.mysql
mysqldump -a -u root --password=dorado lportal > lportal.mysql
The password may be different than the default (
dorado
).
2
Install the upgraded Linux (in this example, 6.2).
a. Prepare ISO DVDs. For example, Centos-6.2-x86_64-bin-DVD1 and DVDBi2
b. Select boot from cd-rom in the Boot Menu
c. Install linux 6.2
d. Select your install type. For example: Desktop. Best practice is to use same settings for
hostname, IP, and so on.
3
Install the Dell OpenManage Network Manager upgrade on the updated Linux installation.
Make sure to look at How to: Install on Linux on page 32, including the following:
a. Remove package (if it exists)
"The shared libraries required for MySQL
clients" = mysql-libs-5.1.52-1.el6_0.1 (x86_64)
b. Install package
"Compatibility standard c++ libraries" = compat-
libstdc++-33-3.2.3-69.el6 (x86_64)
4
Import the MySQL database. Shutdown application server and webserver. Use
ps-ef |
grep java
to confirm no running java process exists. Kill them if any exist.
a. Drop the database with the following command lines:
mysqladmin -u root --password=dorado drop owmetadb
mysqladmin -u root --password=dorado drop owbusdb
mysqladmin -u root --password=dorado drop lportal
b. Create a new database with the following command lines:
mysqladmin -u root --password=dorado create owmetadb
mysqladmin -u root --password=dorado create owbusdb

Installation and Startup | Getting Started with Dell OpenManage Network Manager
37
mysqladmin -u root --password=dorado create lportal
c. Import the backed up database:
mysql -u root --password=dorado owmetadb < owmetadb.mysql
mysql -u root --password=dorado owbusdb < owbusdb.mysql
mysql -u root --password=dorado lportal < lportal.mysql
To validate data:
d. Start the application server with:
#service oware start
e. Start the webserver when the application server is ready:
#service synergy start
f. Log in to confirm data were imported correctly
5
Upgrade Dell OpenManage Network Manager further, if needed.
Shutdown application server and webserver. Use
ps-ef | grep java
to confirm no Java
process exists. Kill any such process if it lingers.
a. Go to the installation package’s InstData directory, open a terminal and type
. /etc/
.dsienv
.
b. Type
./linux_install.bin
to start installing (or include the
-i console
param-
eters for a text-based installation.
The servers autostart when they finish installing. You may need to reboot the
server if your performance monitor data do not appear.
Uninstalling
Use Control Panel to uninstall in Windows. Uninstall by running the following on Linux:
$OWARE_USER_ROOT/_uninst/uninstall.sh
You must uninstall from Linux as root. No graphic wizard appears, and you must respond to the
command-line prompts as they appear.
SNMP in Multi-Homed Environment
Trap listener, Inform listener and all outbound SNMP requests must bind to a specific interface in
a multi-homed environment. This interface is considered appropriate to use for all network-facing
SNMP activity. By default, this is localhost, interpreted as the application's local IP value (the NIC
selected at installation time). The following text in installed.properties provides a specific IP
address to control outbound SNMP interface binding on the local machine:
# specific interface used for all NMS initated
# communications to the network
com.dorado.mediation.outbound.address=localhost
Include the following text and provide a specific IP address to control inbound (listener) interface
binding on the local machine:

38
Installation and Startup | Getting Started with Dell OpenManage Network Manager
#
# specific interface used for binding mediation
# listeners such as SNMP trap listener
com.dorado.mediation.listener.address=localhost
Events with no corresponding definition appear as alarms of indeterminate severity. The only way
to change behavior of an unknown event in this version would be to locate the missing MIB and
load it into the system. This creates the missing event definition(s) needed to specify explicit
behaviors.
Perl
If you install Perl to take advantage of this application’s use of Perl Scripting capabilities, you must
install it on the path on the application server and mediation server host. Best practice is to use Perl
version 5.10 or later because some applications also require Perl as well as the Perl module
Net::Telnet.
This application does not package Perl. If you want to use the Perl scripting features, you must
make sure your system has Perl installed. You can find information about Perl at
www.perl.com.
Follow the downloads link to find the recommended distribution for your specific platform. (See
Adaptive CLI Script Language Syntax on page 418)
One of the recommended Perl packages is from ActiveState which can be found at:
www.activestate.com/activeperl/
Starting Web Client
You can also open the client user interface in a browser
1
. The URL is
http://[application server hostname or IP address]:8080
The default login user is
admin
, with a password of
admin
. The first time you log in, you can select
a password reminder. If you have forgotten your password, click the
Forgot Password
link in the
initial screen to begin a sequence that concludes by mailing your user’s e-mail address a password.
(See Password Reset on page 87)
CAUTION:
For this forgotten password sequence to work, you must configure users’ e-mails correctly, and the
portal’s SMTP server in Control Panel’s Server > Server Administration > Mail settings. To configure a
user’s e-mail, click the link user name in the upper right corner of the portal to configure an account’s
settings for this and other things. The same configuration settings are available in Control Panel’s tabs
labeled as that user’s login.
The
application server hostname
is the name of the system where OpenManage Network Manager
is installed.
1. See Supported Web Browsers on page 11

Secure Connections: SSL & HTTPS | Getting Started with Dell OpenManage Network Manager
39
Secure Connections: SSL & HTTPS
The following describes how to turn on SSL support within Dell OpenManage Network Manager
on single-server installations.
Enabling Secure SSL
The private key and certificate provides identity and browser verification against the CA signed
root certificate. For testing and internal usage this step is needed to create a Private Key and Private
Signed Certificate to enabled SSL encryption.
NOTE:
Some functions may fail using this approach as third party layers may expect a valid CA signed root.
Creating a Private Key (Linux / Windows)
1
Open a command prompt in Windows or a Terminal within Linux
2
Navigate to a
<INSTALL DIR>/oware/synergy/tomcat-XX/bin/certs
3
Enter the command:
openssl
NOTE:
If you do not find openssl, then enter the oware environment (in Windows type
oware
, in Linux, type . ./
etc/.dsienv
4
The OpenSSL prompt appears:
OpenSSL>
5
Enter the command:
genrsa -des3 -out tomcatkey.pem 2048
6
OpenSSL then asks for a pass phrase for the key. Enter
changeit
.
7
OpenSSL then creates the private key and stores it in the current directory
Creating a Certificate (Linux / Windows)
Once you have the private key created, you must create a certificate.
8
Assuming you are still running the OpenSSL program from the previous step, enter the
command:
req -new -x509 -key tomcatkey.pem -out tomcat.pem -days 1095
9
OpenSSL asks for the pass phrase defined for the private key. Enter the previous pass phrase
of
changeit
. This command creates a self-signed certificate with a lifetime of 3 years, using
the private key.

40
Secure Connections: SSL & HTTPS | Getting Started with Dell OpenManage Network Manager
10
When asked the other questions such as Country Code, Organization you can enter any data
you wish. When asked for the Common Name (FQN) you must enter the Hostname or IP
Address of the server.
11
OpenSSL generates the
tomcat.pem
in the directory you were in from the previous steps.
12
Exit OpenSSL by typing
exit
13
Two new files appear within the
//../tomcat-xx/bin/certs
directory:
tomcatkey.pem
and
tomcat.pem
Turning on SSL Within Synergy’s Web Portal
Windows: Changing the Environment:
First, update the
setenv.bat
with the SSL preferences. You must do this whether Dell
OpenManage Network Manager’s web server starts manually or runs as a service. if Dell
OpenManage Network Manager runs as a service, this file automatically updates the service on the
next portal service restart.
1
Stop Dell OpenManage Network Manager.
2
Navigate to the
<INSTALLDIR>/oware/synergy/tomcat-xx/bin
directory.
3
Edit the
setenv.bat
file in a text editor.
4
Change the property
ENABLE_SSL=false
to
ENABLE_SSL=true.
5
If you used a pass phrase different from
changeit
then you can set it for the
SSL_PASSWORD=changeit
value.
6
Save
setenv.bat
7
In a command prompt navigate to <INSTALLDIR>/oware/synergy/tomcat-xx/bin, and type:
service.bat update
8
Settings take affect after the you restart the service.
You are now ready for a secure, SSL connection to Dell OpenManage Network Manager. After it
has had a few minutes to start navigate to
https://[application server IP
address]:8443.
(The HTTPS port is 8443.)
Linux: Changing the Environment
1
Stop Dell OpenManage Network Manager.
2
Navigate to the
<INSTALLDIR>/oware/synergy/tomcat-xx/bin
directory
3
Edit the
setenv.sh
file.
4
Change
ENABLE_SSL
to
true
.
5
If you used a different pass phrase than
changeit
then you can set it for the
SSL_PASSWORD
property here.
6
Save the file.

Secure Connections: SSL & HTTPS | Getting Started with Dell OpenManage Network Manager
41
You are now ready for a secure, SSL connection to Dell OpenManage Network Manager. After it
has had a few minutes to start navigate to
https://[application server IP
address]:8443
Changing the Session Timeout Period
The timeout for the web portal extends automatically if data is changing onscreen. Nevertheless,
you can change the timeout period with (non-override-able) properties in some files, as follows:
You must modify two
web.xml
files with the same values to alter the session timeout. One
controls the overall server and the other is the push servers for Async-based views. These
web.xml
files are in the following directories:
/dorado/oware/synergy/tomcat-XX/webapps/ROOT/WEB-INF/web.xml
And
/dorado/oware/synergy/tomcat-xx/webapps/netview/WEB-INF/web.xml
The xml element that contains the session timeout is
<session-config>
<session-timeout>30</session-timeout>
</session-config>
The
portal.properties
file is in
/portal/portal-impl/classes
. The property
containing the session timeout (in minutes) is:
session.timeout=30
Install on Linux
To run Dell OpenManage Network Manager in Linux, rather than Windows, follow the steps
below. Make sure you configure your host as described in Linux Installation Best Practices on page
32, too.
Installation
1
Install your Linux distribution (here CentOS) on the server, choosing
Basic Server
when
prompted to select software.
CentOS
should be the only repository selected. Choose
Customize Later
to decline further customizing the installation.
Updates and Modification:
2
Once installation and initial reboot are complete, login as
root
.
3
Disable the firewall, and configure the network interface card with a static IP address.
setup
By default the Network Interface Card (NIC) is not active during boot, configure it to be
active and reboot:

42
Secure Connections: SSL & HTTPS | Getting Started with Dell OpenManage Network Manager
nano /etc/sysconfig/networking/devices/ifcfg-eth0
Change
ONBOOT=no
to
ONBOOT=yes
reboot
4
Once reboot is complete, login as
root
update the system:
yum update -y
5
Linux (CentOS) installs MySQL libraries by default, this interferes with Dell OpenManage
Network Manager since it installs its own version. Remove mysql-libs from the system:
yum remove mysql-libs -y
6
Dell OpenManage Network Manager needs the compatibility libraries installed and reboot:
yum install compat-libstdc++-33.x86_64 -y
reboot
Create a user and prepare for installation:
7
You cannot install Dell OpenManage Network Manager by the root user, so login as
root
,
create a new user with a home directory, set the password and add the user to the proper
group. Here are examples of the commands for this. configuring user
dell
:
useradd -m dell
passwd dell
usermod -aG wheel dell
8
Copy the installation files to the system.
9
After unzipping the installation file from the website on a client machine, copy the folder
with source files as a subdirectory of the
/home/dell
directory on the server. Set
permissions on the installation directory:
chown -R dell /home/dell
chmod -R 777 /home/dell/MyInstallation
10
Make sure the installation script has permission to execute:
chmod +x /home/dell/MyInstallation/linux_install.sh
11
Create the target installation directory structure and set permissions:
mkdir /dell
mkdir /dell/InstallTarget
chown -R dell /dell
chmod -R 777 /dell
Install Dell OpenManage Network Manager:
12
You cannot install as root user. Log out as root and login as the user (dell) created in the
previous steps and run the installation script:

Control Panel | Getting Started with Dell OpenManage Network Manager
43
cd /home/dell/MyInstallation
./linux_install -i console
13
Now follow the instructions in the installation script, making sure to specify the configured
target directory as its installation root.
Control Panel
To configure access to Dell OpenManage Network Manager, you must be signed in as a user with
the permissions. (The default
admin
user has such permissions.) The
Go to > Control Panel
menu
item opens a screen with the following tabs of interest:
•Admin / [My Account]
• [Domain]
• Portal > Users and Organizations
• Public / Private Page Behavior
•Portal > Roles
•Portal > Portal Settings
•Portal > [Other]
• Redcell > Permission Manager
• Redcell > Database Aging Policies (DAP))
• Redcell > Data Configuration
• Redcell > Filter Management
• Redcell > Application Settings
•Server
Tips describing these screens and fields appear when you
hover the cursor over fields, or click the blue circle around
a question mark next to them. This blue circle can also
toggle the appearance / disappearance of the tip.
Users with less-than-Administrator permissions may not
see all of the features described in this guide.
See Configuring Pages and User Access on page 71 for an example of using Control Panel
capabilities
1
.
Search Indexes
Sometimes Dell OpenManage Network Manager may display Control Panel objects like users,
roles, and organizations inaccurately. This occurs because search Indexes need to be re-indexed
every so often, especially when changes to roles, users and organizations are frequent.
1. More Control Panel capabilities exist than Dell OpenManage Network Manager uses. These are largely self-
explanatory, but are separate capabilities. For example, the Contacts portlet is not related to Control Panel’s Con-
tacts Center. Since Dell OpenManage Network Manager does not use capabilities like the Contacts Center on Con-
trol panel, and descriptions of how to use such capabilities do not appear here.

44
Control Panel | Getting Started with Dell OpenManage Network Manager
To re-index go to Control Panel > Server Administration and then click on the
Reindex all search
indexes
. This takes little time.
Admin / [My Account]
To configure information for your login, look for the bar titled with your account login’s name. It
has the following lines beneath it:
My Account
—This configures your information as a user, including your e-mail address, password,
and so on.
Contacts Center
—This configures contacts, in other words, people within your system that you
are following. Click the
Find People
link to see a list of potential contacts within your system.
Yo u m u s t c l i c k
Action > Follow
to see them listed in the
Contacts Home.
Use the
Action
button to explore other possibilities.
The contact has to approve you in their requests. To
Follow
means you want to receive the
followed person’s activity stream, blog postings, and so on.
Friend
ing means your friends can
see your activity and you can see theirs. They have to accept any
Friend
request.
NOTICE
You can export vCards for all contacts in the system to use with other software that uses contacts. For
example: e-mail clients.
[Domain]
A default domain name (Dell OpenManage Network Manager) in
Control Panel
.
Global
and
Administrator’s Personal Site
site configurations may appear as additional items to configure when
you click the down arrow to the right of the default. The
Global
option is unrelated to Dell
OpenManage Network Manager functionality. The items under this label configure the overall look
and feel of the portal, reference information, and so on. See the tooltips for more complete
descriptions. This also configures pages, documents, calendars, blogs, wikis, polls and so on.
Social Activity
lets you alter measurements for user participation in organizations. Equity values
determine the reward value of an action; equity lifespans determine when to age the reward of
action.
Portal > Users and Organizations
Create Users you later assign to roles and locations with the appropriate permissions (roles for
operators, administrators, and so on) in these screens. User Names are limited to 70 characters.
Define the default password policy in the Control Panel under Portal > Password Policies.
Control Panel | Getting Started with Dell OpenManage Network Manager
45
Users perform tasks using the portal. Administrators can create new users or deactivate existing
users. You can organize users in a hierarchy of organizations and delegate administrative rights.
After creating them, add Users to roles which configure their permissions for access and action with
the
Actions
menu to the right of a listed user, or during user creation.
NOTE:
Best practice is to spend some time designing your system’s security before creating users,
organizations and roles. Note also that By default, Dell OpenManage Network Manager makes every
new user have the roles Power User and User. To assign a new user to specific permissions only, remove
all rights on these roles, or confine their permissions to those that are universal first. You can remove
users from Power User, but not from User.
When you are signed in, you can edit your user information by clicking the link with your username
in the top right corner of the screen.
After upgrading from a previous versions, Users may not initially appear associated to their roles,
but you can work around this apparent failure by clicking
Update Associations
. This is in the Roles
portion of the Control Panel.
Click Actions > Assign Members
, then click the
Update Associations
button on the following screen. Alternatively, you can go to the Server Administration portion of
the Control Panel and click
Execute
to Reindex all search indexes.
User Role
This role’s description is
Portal Role: Portal users with view access.
To turn off most permissions
from the User Role, go to Redcell > Permission manager and edit the User role. The
Advanced
button opens a screen where you can select / de-select permissions in larger groups. Power User is
Portal users with extended privileges,
and Administrator is
Portal users with system privileges.

46
Control Panel | Getting Started with Dell OpenManage Network Manager
Default User Roles
To make new users
not
assigned as Power Users by default, go to the Portal > Portal Settings >
Users > Default Associations Tab and remove the roles you do not want assigned by default. Notice
that you can assign / unassign to existing users in this tab too. The role User appears in this default
list, but removal does not have an impact. Dell OpenManage Network Manager automatically
assigns all users to the User role.
Enabling Terms of Use
To Enable a “Terms of Use” statement required of each user use the following steps:
1
Login as Admin
2
Go to Control Panel
3
Click on Portal Settings and then the Users link on the right, and look in the Fields tab.
4
Check
Terms of Use Required
and save. You must then click
I Agree
to the Terms of Use
document that appears.
5
Logout and attempt to login as another user to validate the Terms of Use appear.
To change the Terms of Use wording:
1
Login as Admin
2
Go to the Synergy Control Panel
3
Click on Web Content
4
Click on the TERMS-OF-USE article link which will take you to the editor where you can
alter and save it.
NOTE:
Nothing prevents a user from deleting the Terms of Use article. If the Terms of Use seeded article is
removed then the static Liferay Terms of Use appears until next Dell OpenManage Network Manager
restart. The editable / delete-able article is a copy of the compiled static version but exposed as an article to
make editing easier. The next time Dell OpenManage Network Manager restarts, if the TERMS-OF-USE
article does not exist, it imports a new one.
How To:
Add Users and connect them to Roles
Add Users with the following steps:
1
Click
Go to > Control Panel
and navigate to Portal > Users and Organizations
.
2
Click the
Add > User
menu item at the top of the
Users
screen.
3
Enter the details of the new user. If you are editing an existing user, more fields appear.
Screen
Name,
and
Email Address
are required
.
Optionally, you can enter
Name, Job Title
, and so on.

Control Panel | Getting Started with Dell OpenManage Network Manager
47
4
After you click
Save
notice that the right panel expands to include additional information.
NOTE:
Make sure you specify a Password when you add a user. This is not optional.
The first time users log in, the application prompts them for a security question. E-mail for
password reminders / resets requires setting up the fields in Control Panel > Server
Administration > Mail, not the SMTP Configuration which is for Dell OpenManage
Network Manager-originated e-mails. See Password Reset on page 87
5
Notice that if you are editing an existing user, or creating a new one, you can use the links on
the right to configure connections with
Roles.
Roles, in particular, configure the OpenManage
Network Manager functional permissions for that user. For example the
Operators
role’s
capabilities are typically more limited than
Administrators
. See How to: Add and Configure
User Roles / Permissions on page 50.
6
Click
Save
again, and the user you just configured should appear listed in the
Users
screen
when you select
View > All Users
.
7
After you have configured roles as described in Add and Configure User Roles / Permissions
on page 50, return to the Users and Organizations screen, edit the User, and click the
Roles
link to associate the User with the Role(s) you have configured.
The most dramatic evidence of permission changes appears when you first remove Default
User Roles from your system in Portal > Portal Settings > Users > Default User Associations
(check
Apply to Existing Users
if you have already configured your user). If you impersonate
your user, and Go To > Control Panel, without User and Power User roles assigned, the
impersonated user can only see
My Account
and
Sites.
NOTICE
You can Export Users to a comma-separated value (CSV) file.
Once you have configured a user, you can click
Action
and to do the following:
Edit
—Re-configure the selected user. Select the user’s Role in the editor, too. Roles configure
access and action permissions.
Permissions
—Manage the user’s access to and control over various parts of the portal.
Impersonate User (Opens New Window or tab)
—This allows you to see the effect of any
configuration changes you have made on a user. The new window (typically a new tab) also
lets you click the
Sign Out
link in the upper right corner where you can return to your original
identity impersonation concealed.
Manage Pages—
Configure the
Public
or
Private
pages for a user, depending on the selected tab.
Possible actions here include changing the look and feel of pages (for computers and mobile
browsers), adding pages and child pages, and importing or exporting page configurations.
Notice that you can configure meta tags, and javascript on these pages too.

48
Control Panel | Getting Started with Dell OpenManage Network Manager
Exports are in
.lar
format, and go to the download location configured in the browser you
are using. The export screen lets you select specific features, and the date range of pages to
export.
NOTICE
If you want to set up several pages already configured elsewhere for another user, or even for an entire
community of users, export those pages from their origin, then Manage > Pages menu for the user or
community.
Deactivate
—Retires a user configured on your system. You can also check users and click the
Deactivate
button above the listed users. Such users are not deleted, but are in a disabled
state. You can do an Advanced search for inactive users and
Activate
them or permanently
delete them.
Your organization has a number of geographic locations and you plan to manage the network
infrastructure for all these locations using RC7 Synergy. You can define the geographic locations to
which devices can be associated. This will help you manage and view your network, grouped by
location or branches. See Locations on page 171 for the specifics about the portlet where you can
set up locations.
NOTICE
To edit your own information as a signed-in user, simply click your login name in the upper right corner of
the portal screen.
Organizations
Create Organizations just as you would create Users. You can create a
Regular
or
Location
type of
organization. You can do this only if your package includes the MSP option, so this capability is not
available to all users.
NOTE:
You must first create a Regular organization to be the parent for a Location.
Public / Private Page Behavior
Despite the small
Public / Private
label next to the My Private / My Public pages listed in the
Go To
menu, both types of pages appear only for the user(s) who created them. Page Standard settings are
Max Items
,
Default Filter
,
Max Items per Page
, and
Column Configuration
. These persist for
Admin users on the RCSynergy pages, or for users who have the portlet on their Public or Private
pages (which makes them the owner of that instance). Without Dell OpenManage Network
Manager portlets, URLs for pages labeled public are accessible even to users who do not log in.

Control Panel | Getting Started with Dell OpenManage Network Manager
49
Some portlets provide extra settings—for example Alarms portlet’s the charting options, or the
To p
N
portlets number of Top Items. These persist too.
NOTICE
Max Items, Max Items Per Page and Columns persist for both the summary and maximized portlets
independently. For example: If Max Items is 50 in minimized mode it does not affect the Max Items in the
Maximized window state. This lets you configure modes independently.
Dell OpenManage Network Manager remembers the default sort column and order per user,
whether the user has Admin rights or not. The Sort Column/Order (Descending/Ascending) is
also shared between both summary and maximized portlets. A sort on IP Address in Resources
persists if you expand the summary portlet to maximized mode.
See first chapter of the
User Guide
for more information about Multitenancy. In any case, the
administrative user can re-arrange pages and portlets in a way that persists. Non-administrative
users cannot do this.
Portal > Roles
Roles determine the applications permissions available to users assigned them; manage them in
this screen. To configure functional permissions for the application, see Redcell > Permission
Manager on page 52.
Click
Add
to create a
Regular Role, Site Role,
or
Organizational Role.
A
Regular Role
assigns its
permissions to its members. A
Site
or
Organizational Role
assigns its permissions to a site or
organization to which you can assign users.
Click the
Action
button to the right of a role to
Edit,
view or alter
Permissions, Assign Members
(this last works to see and assign users)
. Y
ou can also assign role members
in the Portal > Users and
Organizations
user editor
.
NOTE:
Owner Roles do not have an Action button. Owner implies something you have added or created and so
actions do not apply.
Notice also that when you
Assign Members,
a screen appears with tabs where you can assign
Users,
Sites, Organizations
and
User Roles.
Typical best practice is to assign users to one of these
collective designations, then assign the collection to a role.
Notice also that you can view both
Current
and
Available
members with those sub-tabs. You can
even
Search
for members.
Click
Back
(in the upper right corner) or the
View All
tab to return to the screen listing roles and
their
Action
buttons.
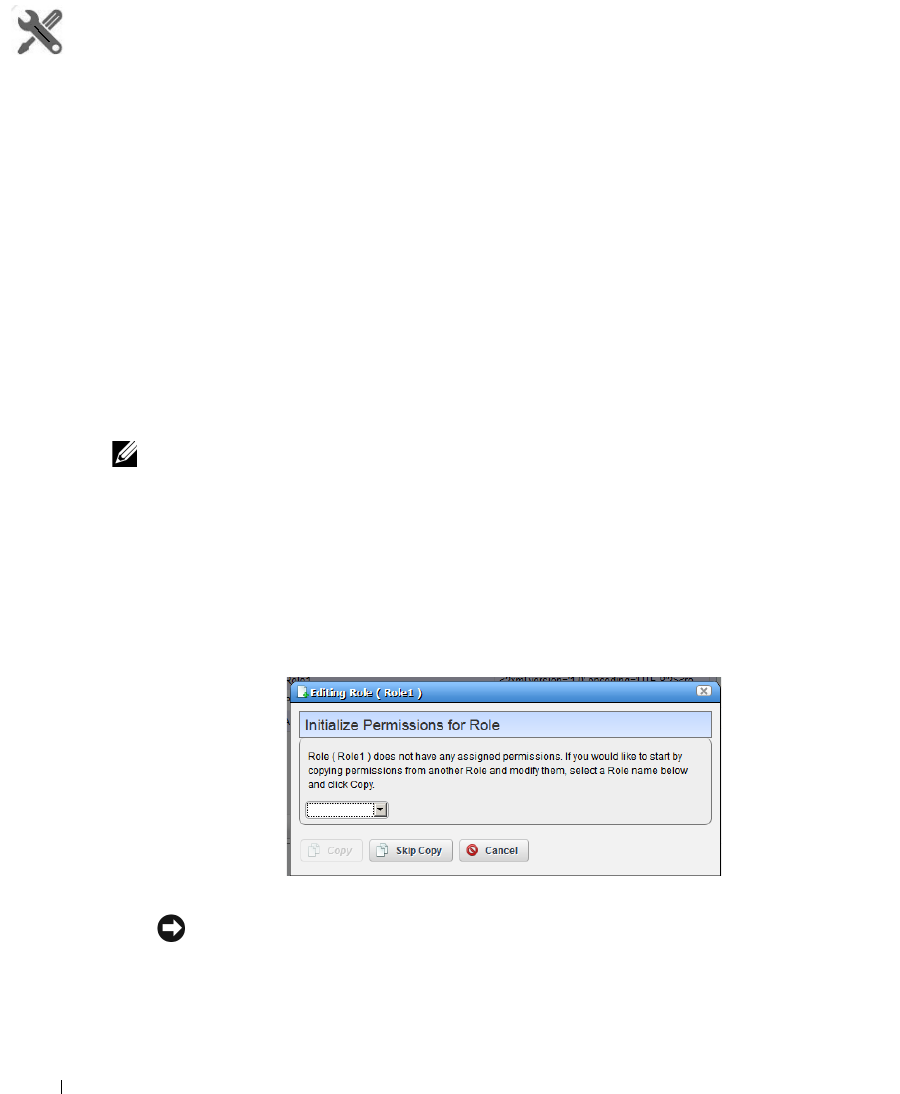
50
Control Panel | Getting Started with Dell OpenManage Network Manager
How To:
Add and Configure User Roles / Permissions
Add and configure User Roles with the following steps:
1
Click
Go to > Control Panel
and navigate to Portal > Roles
.
2
Click the
Add
tab under the heading at the top of the page, and select Regular
Roles
. Notice
that you can also add roles that configure permissions for sites and organizations.
3
Enter the details of the new role (
Name, Title, Description
), then
Save
it.
4
Click Portal > Roles’
View All
button to see a list of available roles, including the one you
added.
5
By clicking the
Action
icon to the right of any listed Role. Here, you can select the role’s
permissions to alter web portal access in the
Define Permissions
screen.
6
To configure Dell OpenManage Network Manager permissions, click
Define Permissions
.
Alternatively, select or delete Dell OpenManage Network Manager permissions by editing the
role in
Redcell > Permission Manager.
NOTE:
If you are restricting permissions for new users, you must also remove the permissions from the User and
Power User roles, automatically assigned to new users. The permissions available are the combination
of those configured here and the User / Power User roles’ permissions. You can remove users from the
Power User role altogether, but not from the User role. You must remove permissions from that User role
if you want users not to have them.
If you have eliminated all permissions from a role by removing the Default User Roles, an
intervening screens lets you copy another Role’s permissions so you do not have to enter all
permissions from scratch.
NOTICE
Defining a base role’s permissions can provide the start for non-base role’s permissions if you use this
screen to copy them, then edit them later for the difference between the base role and non-base role.
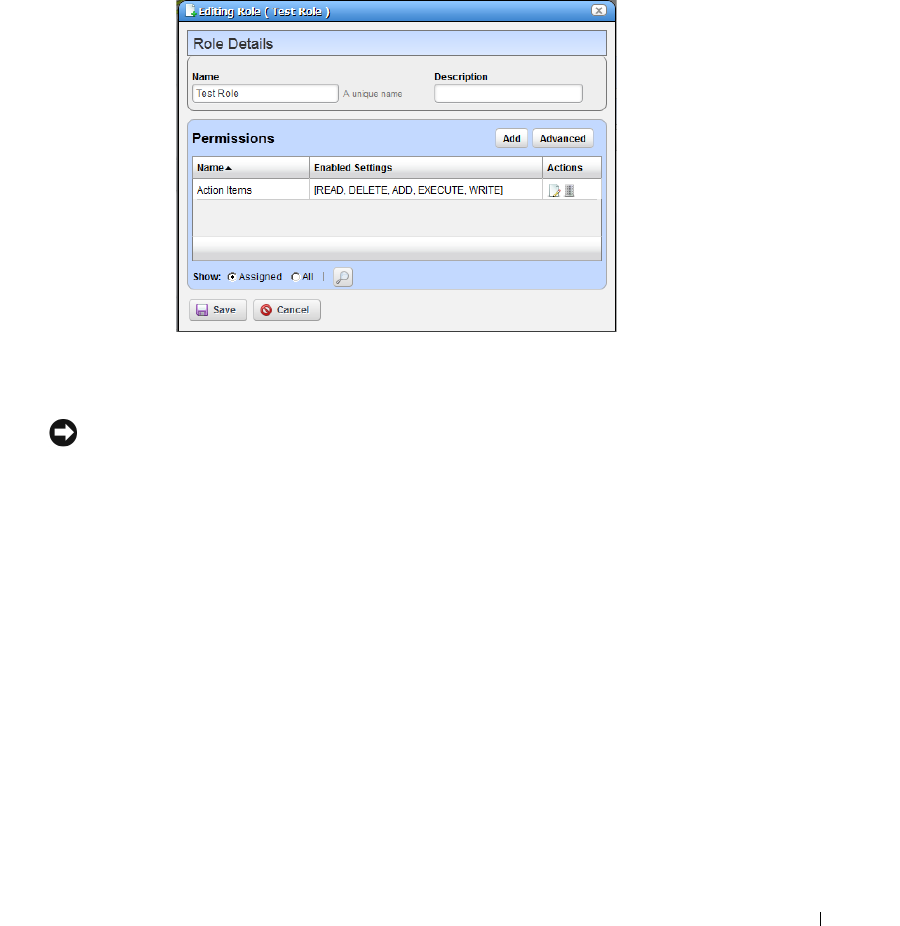
Control Panel | Getting Started with Dell OpenManage Network Manager
51
7
When the permission editor appears, select the type of permission from the pick list under
Add Permissions
, then select the appropriate checkboxes to enable the desired permission.
8
To alter or enable more of Dell OpenManage Network Manager’s functional permissions,
click the Redcell > Permission Manager.
9
The Role to Permission mapping screen appears. Click the
Edit
button to the right of listed
Roles to see and configure available permissions.
The Editing Role dialog appears where you can click
Add
to select more permissions, and edit
any existing permissions (with the Edit this entry icon to the right of the permission).
NOTICE
Notice that you can filter what appears in this screen with the Show Assigned / Show All radio buttons at
its bottom.
10
Click
Advanced
to see available permissions organized by
Read, Write, Execute, Add
or
Delete
actions.
11
After you have selected permissions, click
Apply
to accept them and add them to the role.
Click
Save
to preserve the permission configuration for the role, too.
Notice that you can revisit this role, manage it and its membership with the
Action
button to
the right of the role. You can also add users to the group by selecting and editing that user
with that same button.
Portal > Portal Settings
The
Settings
screens are where users who are administrators can configure the most basic global
settings for Dell OpenManage Network Manager, including names, authentication, default user
associations, and mail host names. These include the following:
•Mail host(s)

52
Control Panel | Getting Started with Dell OpenManage Network Manager
• Email notifications, who sends them, what the contents are for account creation notices, or
password change / reset notices.
• Identification, including address, phone, email and web sites.
• The default landing page, and display settings like the site logo.
• Google Apps login / password.
CAUTION:
Checking Allow Strangers to create accounts may produce a defective login screen.
Portal > [Other]
Some of the remaining portal labels permit the following:
Sites
—Configure sites. Sites are a set of pages that display content and provide access to specific
applications. Sites can have members, which are given exclusive access to specific pages or
content.
Site Template
—Configures pages and web content for organizations.
Page Template
—Configures a page and portlets, as well as permissions.
Password Policy
—Configure the security policies you want, including user lockout and password
expiration, and assign them to users. (See the Dell OpenManage Network Manager
first
chapter of theUser Guide
for details)
Custom Fields
—Lets you configure custom fields for Blog entries, Bookmarks or Bookmark
Folders, Calendar Events, and so on.
Monitoring
—Lets you see all the live sessions on the portal. Click a session to see its details. This
is usually turned off in production for performance reasons.
Plugins Configuration
—Configure role access to portlets and features. By default, only
administrators can add portlets / plugins to their pages.
Redcell > Permission Manager
Manage Permissions to manage user access to different features. These are configured as part of
Roles, which aggregate users regardless of community affiliation. Create Roles with Portal > Roles.

Control Panel | Getting Started with Dell OpenManage Network Manager
53
The
Users
editor screen accessible from the
Action
menu for users listed in Portal > Users and
Organizations lets you manage groups to which Users are assigned.
Click the
Edit
button (the pencil and paper) to the right of a listed group to see and configure its
permissions.
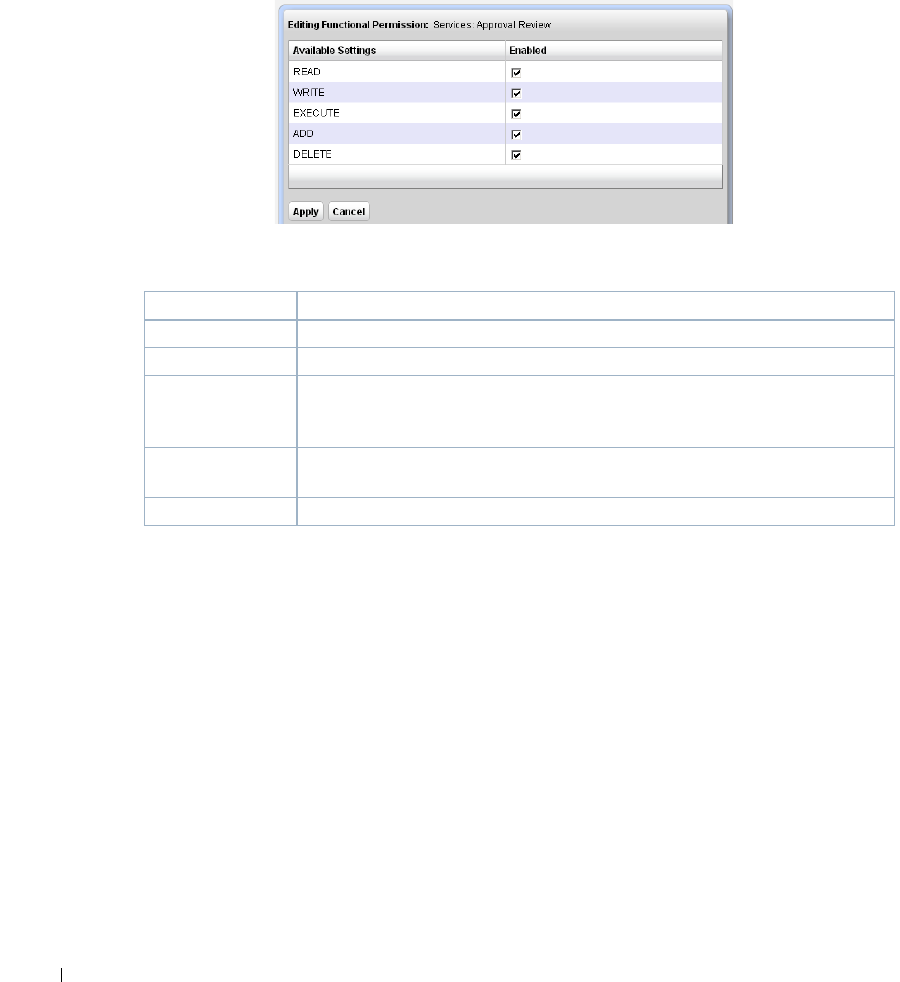
54
Control Panel | Getting Started with Dell OpenManage Network Manager
Notice that you can select
Assigned
or
All
permissions with the radio buttons at the bottom of this
screen. The magnifying glass icon opens a search field where you can enter the permission you want
to locate.
Edit permissions with the
Edit
button to the right of the listed permission.
The following describes the actions of the permissions, when checked:
Action Default Behavior
read Enables Details, Visualize and View as PDF
write Enables the Edit, Save, and Import / Export.
execute Lets you see the view altogether, launch from a portlet and query for elements.
Alternatively this action can control a specific application function, (typically
described by the permission name) like provisioning a policy.
add Enables the New menu item, and Save. If you do not check this action, then the
New menu item does not appear.
delete Enables the Delete menu item.
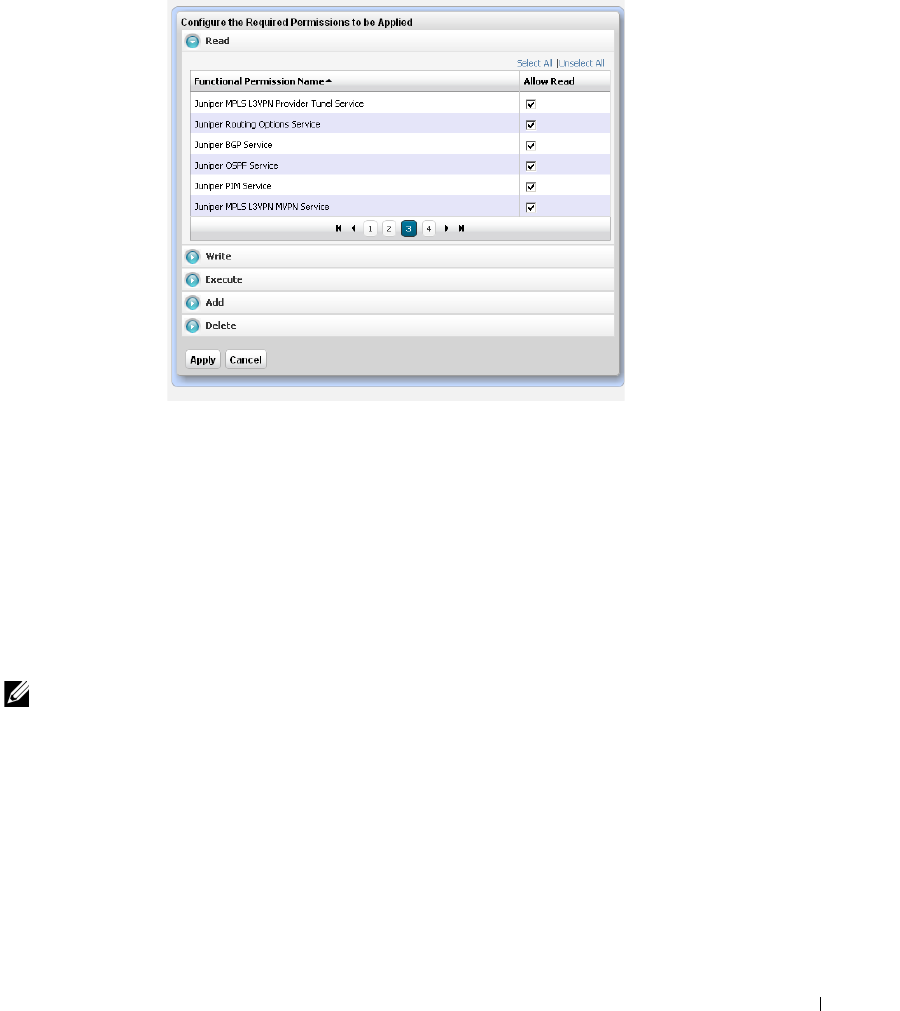
Control Panel | Getting Started with Dell OpenManage Network Manager
55
The
Add
button on the
Permissions
panel lets you add permissions previously deleted, if they are
available, and the
Advanced
button lets you configure permissions by type. For example, if you
want to see all of the READ permissions.
When you hover the cursor over a functional permission, tooltips provide a description. You can
also click on the
Search
button at the bottom to find a phrase within the functional permissions.
Redcell > Data Configuration
This panel configures custom attributes for Dell OpenManage Network Manager. Click the
Edit
button next to the
Entity Type
(Managed Equipment, Port, Contact, Vendor, or Location) for
which you want to create custom attributes. This opens an editor listing the available custom
attributes for the entity type. Edit Custom Attributes on page 112 describes right-clicking to access
this directly from the portlet menu, and the details of how to edit custom attributes.
NOTE:
The custom fields configured here are for Dell OpenManage Network Manager. only.The Custom Fields
editor in the Portal portion of Control Panel manages custom fields for the rest of the portal.
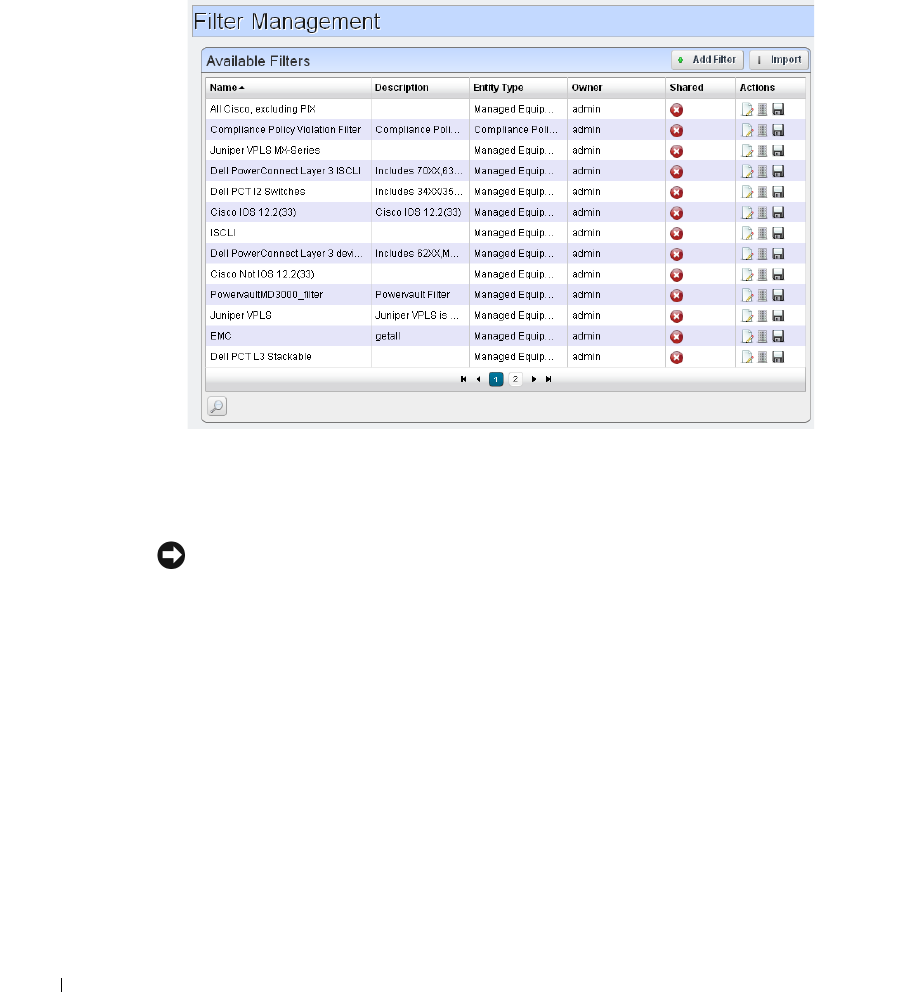
56
Control Panel | Getting Started with Dell OpenManage Network Manager
Redcell > Filter Management
This screen, accessible from
Go to > Control Panel
lets you manage the filters in OpenManage
Network Manager.
Click the
Delete
icon to the right of a listed filter to remove it from the system. Click the disk icon
to export the filter. Clicking the
Import
button at the top of the screen lets you import previously
exported filters.
NOTICE
To find a particular filter, click the Search (magnifying glass) icon in the lower left corner of this screen.
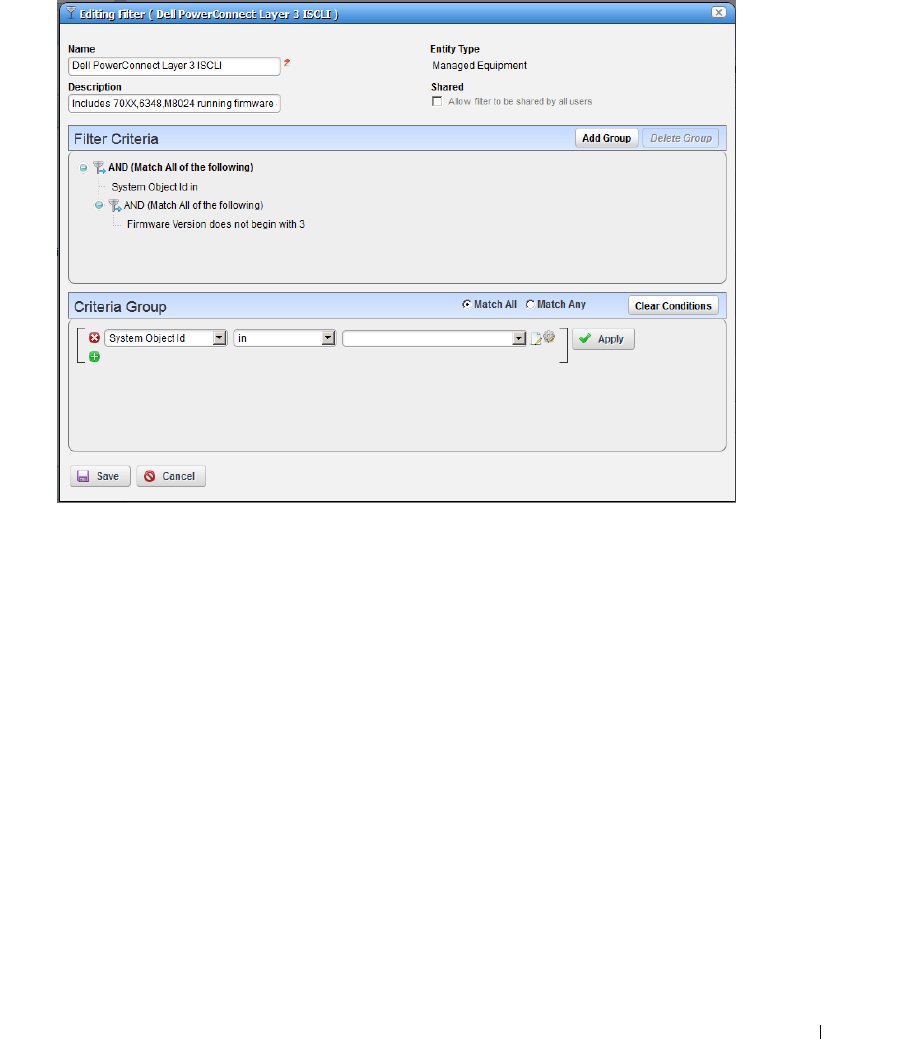
Control Panel | Getting Started with Dell OpenManage Network Manager
57
Clicking the
Edit
icon to the right of a listed filter, or clicking the
Add Filter
button opens the filter
editor.
Use this editor to configure filters. Enter a
Name
and
Description
, and use the green plus (+) to
select an entity type from a subsequent screen. Checking
Shared
makes the filter available for all
users, not just your user. You can add groups of filter criteria (click
Add Group
) that logical AND
(
Match All
)
or OR (
Match Any
) with each other. Click
Clear Conditions
to remove criteria.
Configure the filter in the
Criteria Group
panel as described in the How to: Filter Expanded
Portlet Displays on page 108. Delete filters with the
Delete this entry
icon next to the edit icon.
Redcell > Application Settings
This screen has several panels in two tabs:
• General > Entity Change Settings
• User Interface > Map Provider
• User Interface > Job Viewer
• User Interface > Performance

58
Redcell > Database Aging Policies (DAP) | Getting Started with Dell OpenManage Network Manager
General > Entity Change Settings
This panel lets you override polling / refreshing for the minimized Managed Resources, Alarms,
Container Tree, Visualizer and Map Context portlets. The valid range is 20 seconds -> 3600 (1
hour). By default, these portlets poll at 40 seconds for changes in the data and automatically
refresh. Times are configurable.
User Interface > Map Provider
The
Map Provider
panel lets you set whether Dell OpenManage Network Manager uses Google or
Nokia maps by default, and sets the Initial Latitude and Longitude. Check
Use Secure API
if you
want to load map APIs in secure SSL mode. Some browsers block non-secure external APIs if they
are viewing a secure page, so use this if you view Dell OpenManage Network Manager through an
HTTPS connection.
Follow the directions in Using Nokia Maps on page 253 to set the application to use those maps.
User Interface > Job Viewer
The
Job Viewer
panel lets you check the following checkboxes:
Show Job Viewer
—Checking this displays the job viewer after Execution (most cases). Leaving it
unchecked does not display it, although you can still view jobs with
My Alerts
in the lower left
portion of the screen.
Always show Job Viewer for Actions
—When checked, this displays the job viewer for execution
of Actions or Action Groups.
Show Information Messages by Default
—When checked, shows informational message nodes by
default.
User Interface > Performance
This panel displays available options for Day and Minute Format in performance dashboards. The
available options depend on the locale settings in the operating system running Dell OpenManage
Network Manager. Select them in the pick lists that appear in this panel.
Redcell > Database Aging Policies (DAP)
Database Aging Policies prevent the Dell OpenManage Network Manager database from filling up
by filling up by deleting old records. You can also save designated contents to an archive file on a
specified cycle. Database Aging Policies configure which contents to archive, the archive location,
and the configuration of that archive file.
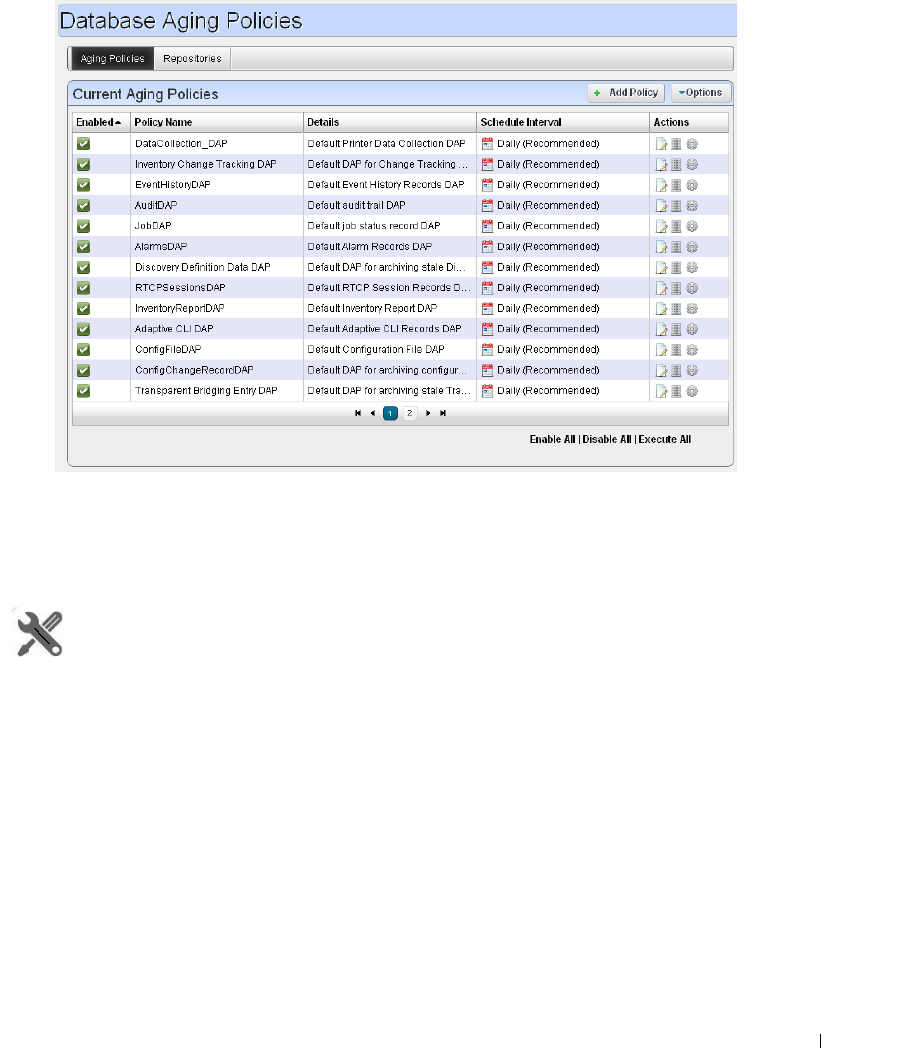
Redcell > Database Aging Policies (DAP) | Getting Started with Dell OpenManage Network Manager
59
To view and manage such policies, right click an item with them (for example, an alarm), or click
Manage > Control Panel
, and under
Redcell
click
Database Aging Policies.
Policies appear in the
Aging Policies
tab of this screen, with columns that indicate whether the
policy is
Enabled,
the
Policy Name, Details
(description),
Scheduled Intervals
and icons triggering
three
Actions
(
Edit, Delete
and
Execute
). Notice that the bottom right corner of this page also lets
you
Enable / Disable / Execute All
policies listed.
How To:
DAP Workflow
The following are steps typical for implementing DAP:
1
From the screen listing Database Aging Policies (DAP), click
Add Policy
, and select a policy
from the displayed list of alternatives.
2
This opens Aging Policies Editor.
3
In the
Aging Policies > General
tab, specify the name, schedule interval, whether this policy
is
Enabled
, and so on.
4
Specify the
Archive Location
. Those listed are the
Repositories
listed on the Repositories tab.
You can manage those on that tab.

60
Redcell > Database Aging Policies (DAP) | Getting Started with Dell OpenManage Network Manager
5
In the Aging Policies Options tab, specify either the archiving and retention you want, or
further specify Sub-Policies that refine the items archived, and specify archiving and retention
for those sub-policy elements. Which one you can specify depends on the type of DAP you
are configuring.
6
Click
Apply
until the displayed screen is the DAP manager.
To View / Verify DAP
DAP archives information into the specified repository under the installation root. You can open
archived .xml data with
dapviewer
. Launch this application from a command line after setting
the environment with
oware
in Windows or
. ./etc/.dsienv
in Linux.
Archived data is deleted from Dell OpenManage Network Manager’s database. You can verify that
by querying whether archived data still exist. You also can backup your database if you want to
preserve records not yet archived.
How To:
Open an Archived in dapviewer.
1
First, make sure you have an archived file. One way to do this is to edit the Events DAP, make
sure the archived events go to a directory you can access later, and retain them for zero days.
2
Manually run the Events DAP
3
Open a command shell. Type
oware
in Windows, or
. ./etc/.dsienv
in UNIX.
4
Ty p e
dapviewer.
5
Select the file with the ellipsis (...).
NOTE:
dapviewer opens both compressed and uncompressed files. It does not open empty files.
6
Click the
Load
button.
7
Examine the archived data.
Redcell > Database Aging Policies (DAP) | Getting Started with Dell OpenManage Network Manager
61
Aging Policies Editor
When you click
Add Policy
in the upper right corner of the Redcell > Database Aging Policies
(DAP) screen, first a selector appears where you can click on the kind of policy you want to create,
then the editor appears. If you click the
Edit
icon to the right of a listed policy, the Aging Policies
Editor appears with that policy’s information already filled out, ready to modify.
The
General
screen has the following fields:
Name
—An identifier for the policy
Description
—A text description of the policy
Enabled
—Check to enable the policy.
Schedule Interval
—Use the pick list to select an interval. Once you have configured an interval
here, you can re-configure it in the Schedules Portlet.
Base Archive Name
—The prefix for the archived file.
Compress Archive
—Check to compress the archive file.
Archive Location
—Select from the available Repositories in the pick list.
The contents of the
Options
tab depend on the type of DAP you are configuring. Typically, this tab
is where you set the retention thresholds.
62
Redcell > Database Aging Policies (DAP) | Getting Started with Dell OpenManage Network Manager
DAP SubPolicies
Some Options tabs include sub-policies for individual attribute retention.
Click
Add SubPolicy
or click the
Edit
button to the right of listed policies to access the editor.
Editing Tips
Archiving options that appear in the Aging Policies Editor vary, based on type of policy
selected. Inventory Change Tracking DAPs ask how long you would like to keep Config
reports, Inventory Report DAPs ask how long you would like to keep your Historical Reports
based on number of instances, days, and weeks, months or years.
Set these thresholds in the
Options
tab. All DAPs require a Name and a record threshold.
Check the
Enabled
checkbox to enable the policy.
DAPs run on a schedule. If the record threshold number is greater than or equal to the
configured threshold then the DAP runs at the scheduled time. You may also manually click
the gear icon to the right of a listed policy, and execute a DAP at any time to check that
threshold figure. In either case, if the threshold is not crossed Dell OpenManage Network
Manager creates no archives.
To verify when current DAPs are scheduled to run, open the Schedules portlet, and select the
schedule on which it runs. For most DAPs, this is the Daily (recommended) DAP. Right-click
to edit it. The Scheduled Aging Policies list should include all DAPs that have selected that
schedule.
Redcell > Database Aging Policies (DAP) | Getting Started with Dell OpenManage Network Manager
63
Aging Policies Options
The
Options
tab in this editor can vary, depending on the type of policy.
Fields can include the following:
Keep [Aged Item] for this many days
—The number of days to keep the aged item before
archiving it.
Archive [Aged Item]
—Check this to activated archiving according to this policy.
Sub-Policies
Some types of Database Aging Policies can have sub-policies that further refine the aging for their
type of contents.
These appear listed in the Aging Policies Options
tab. Click
Add Sub Policy
to create them. Notice
that you can
Edit
or
Delete
listed policies with the icons in the far-right
Action
column in this list.
Such sub-policies can contain the following types of fields:
Component
—Select the component for the sub-policy from the pick list.
Action Type
—This further sub-classifies the
Component
.
Retention (Days)
—The number of days to keep the aged item before archiving it.
Archive
—Check this to activated archiving according to this policy.
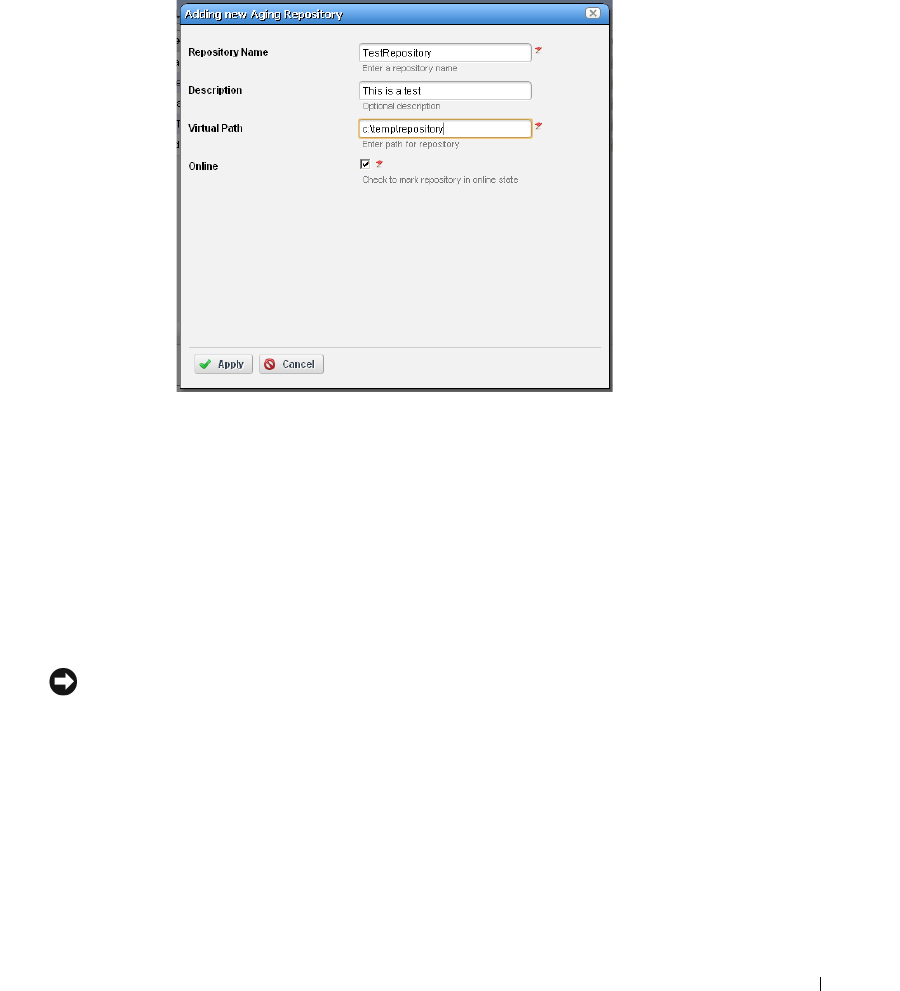
Redcell > Database Aging Policies (DAP) | Getting Started with Dell OpenManage Network Manager
65
Available repositories appear listed in the initial screen. Like the Aging Policies Editor, you can click
Add Repository
to create a new repository, and
Edit
or
Delete
selected, listed policies with the icons
in the
Action
column. Notice the listed policies indicated whether the archiving destination is
Online
with a green icon (this is red, when the destination is offline).
When you
Add Repository
or
Edit
an existing one, the following fields appear in the editor:
Repository Name
—An identifier for the archiving destination.
Description
—A text comment.
Virtual Path
—This is the path relative to the installation root directory. Any user with
administrator permissions can specify or change the default archive path here.
Online
—Check this to put this repository online.
Dell OpenManage Network Manager automatically writes to any configured failover repository if
the primary repository is full or not writable.
NOTICE
To view any archived DAP file, use
dapviewer
. Type
oware
in a command shell, then, after pressing
[Enter], type
dapviewer
to use this utility.
Database Backup
To back up your database, open a command shell (
Start > Run
cmd
, in Windows), and then type
the following at the prompt replacing USERNAME and owbusdb. By default, the database is
owbusdb
.
mysqldump -a -u USERNAME --password=[name] owbusdb > FILENAME.mysql

66
Redcell > Database Aging Policies (DAP) | Getting Started with Dell OpenManage Network Manager
For example:
mysqldump -a -u oware --password=dorado owmetadb > owmetadb.mysql
If you have Performance monitors or Traffic Analyzer, you must also back up your stored procedures
otherwise they do not get restored when you restore the database. The command line here adds
--
routines
. For example:
mysqldump -a -u oware --password=dorado --routines owbusdb > owbusdb.mysql
This writes the owbusdb to a plain-text file called
FILENAME.mysql
(
owbusdb.mysql
in our
examples). This file is a full backup with which you can fully restore your database in case of
problems.
Defaults for the database are oware (login) and dorado (password). These are typically different
from the login / password for the application.
NOTICE
To get a rough estimate of a database’s size, looking at the size of the directory
\oware3rd\mysql\data.
Restoring Databases
Restoring from
FILENAME.mysql
is a three step process. This occurs, again, in a command shell:
1
Drop the database:
mysqladmin -u USERNAME -p drop owbusdb
or
mysqadmin -u USERNAME --password=[password] drop owbusdb
2
Recreate the database
mysqladmin -u USERNAME -p create owbusdb
or
mysqadmin -u USERNAME --password=[password] create owbusdb
3
Import the backup data
mysql -u USERNAME -p owbusdb < FILENAME.mysql
or
mysql -u USERNAME --password=[password] owbusdb < FILENAME.mysql
Here are the backup commands for all the Dell OpenManage Network Manager databases:
mysqldump -a -u root --password=dorado owbusdb > owbusdb.mysql
mysqldump -a -u root --password=dorado owmetadb > owmetadb.mysql
mysqldump -a -u root --password=dorado lportal > lportal.mysql
mysqldump -a -u root --password=dorado synergy > synergy.mysql

LDAP | Getting Started with Dell OpenManage Network Manager
67
Portal Database Backup / Restore
The web portal itself has a MySQL database. Back it up as follows:
1
Open a command shell and type
oware.
2
Then type the following command:
mysqldump –uroot -–password=dorado lportal > mybackup.sql
3
The
mybackup.sql
file is the backup.
To restore the database, use another
oware
shell:
1
Drop the database:
mysqladmin -uroot --password=dorado drop lportal
2
Recreate the database
mysqladmin -uroot --password=dorado create lportal
3
Import the backup data
mysql -uroot --password=dorado lportal < mybackup.sql
Server
This portion of the
Control Panel
lets you manage the portal’s web server, and maintain its smooth
operation. Click the
Execute
buttons in this panel to do things like re-indexing the search indexes.
NOTICE
This panel is visible to administrators only, and contains helpful settings and resource information related
to the server.
LDAP
You can integrate LDAP with your Dell OpenManage Network Manager installation in the Portal
Settings > LDAP tabs. See LDAP Portal Settings for more about LDAP integration in addition to
what follows.
1
CAUTION:
Before enabling LDAP server in Portal, you must create and assign one user from LDAP server as Portal
administrator. You will not be able to access control panel without administrator role. See How to:Make
an LDAP Admin User on page 69 below for details.
1. For more information about LDAP capabilities generally, consult Liferay’s LDAP documents.

68
LDAP | Getting Started with Dell OpenManage Network Manager
Make sure
Import at Startup
is turned off and in Password Policies, edit the default password policy
and make sure that
Change Required
is off.
NOTICE
Notice that several test buttons appear in the LDAP screens, for example, Test LDAP Connection. Use
these to validate your entries as you make them.
Click
Add
under LDAP Servers to add the specifications of your LDAP server. After configuring
your LDAP server, restart the Dell OpenManage Network Manager server, and attempt to log in as
an LDAP user.
LDAP Server Settings
The following settings are required (the values below are examples, only):
Connection
Base Provider URL : ldap://192.168.50.25:389
Base DN : dc=dorado-exchange,dc=oware,dc=net
Principal: dorado@dorado-exchange.oware.net
NOTE:
The Principal user must have the necessary administrator rights in Active Directory Server or any other
LDAP server
Credentials: ********
Users
Authentication Search Filter:(sAMAccountName=@screen_name@)
Import Search Filter: (objectClass=person)
User Mapping
Screen Name: sAMAccountName
In the Portal Settings > Authentication > LDAP tab:
Authentication
Enabled
Import / Export
Import Enabled
Import on Startup Disabled

LDAP | Getting Started with Dell OpenManage Network Manager
69
How To:
Make an LDAP Admin User
All users imported from an LDAP server default to the Poweruser role. The default Dell
OpenManage Network Manager (login/password: admin/admin) cannot log into Dell OpenManage
Network Manager once you enable authentication through LDAP. Therefore you must manually
assign one user from the LDAP server as Portal administrator. Here is an example of an LDAP
database user with Administrator privileges:
Screen name: ITAdmin
User password: ITPassword
First Name: Scott
Last Name: Smith
Email: scott@dellhardware.com
NOTE:
You cannot import users without these five attributes into Dell OpenManage Network Manager from an
LDAP source.
Creating user ITAdmin with Administrator role:
1
As an Admin user, Go to > Control Panel.
2
Under the Portal category, click
Users
, then click the
Add
button.
3
Fill out the User form with name and email address and so on. Remember: screen name, first
name, and email address are required. Dell OpenManage Network Manager LDAP import will
not overwrite existing users.
4
When you are finished, click
Save
.
5
A message appears saying that the save was successful.
6
Select the
Password
, enter password: ITPassword then click
Save
.
7
Click the
Roles
link. A screen appears showing the roles to which your ID is currently
assigned. By default, all users are assigned the Power User role.
8
Remove the default PowerUser role (optional), and add the administrator role for the user,
then click
Save
.
Now you can enter LDAP server information. Please be patient, your changes may take a
while to take effect.
Stopping LDAP Authentication
1
To stop authenticating through LDAP, log in as the admin user with ITAdmin/ITPassword.
2
In control panel go to Portal > Portal Setting > Authentication > LDAP and uncheck the
Enabled
then
Save
.
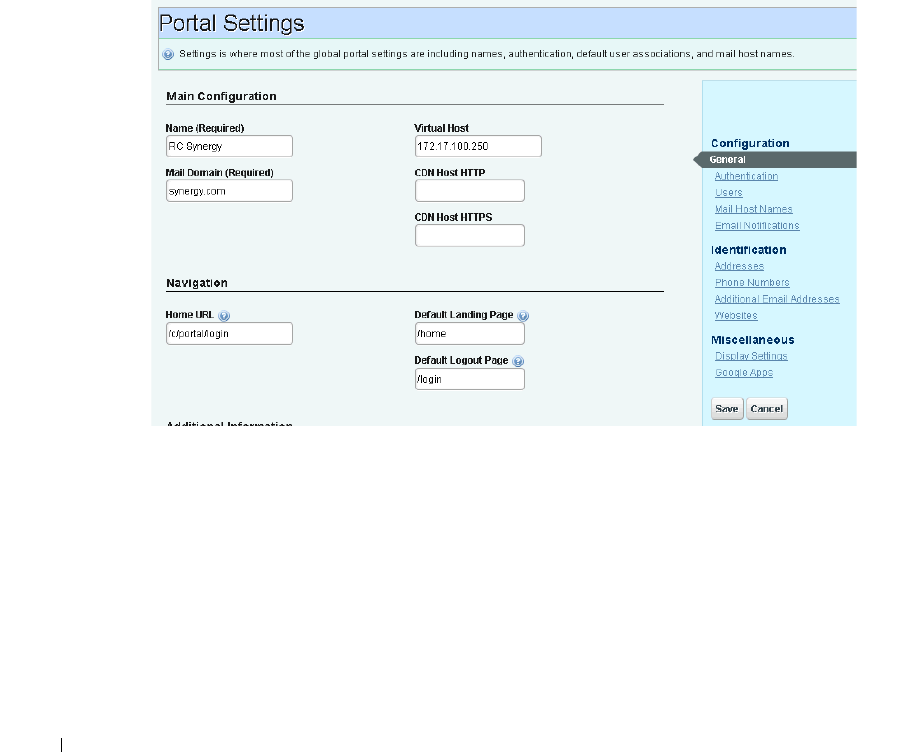
70
LDAP | Getting Started with Dell OpenManage Network Manager
3
After your changes have taken effect, Users can login only with credentials that exist on the
Dell OpenManage Network Manager database
LDAP Portal Settings
To use LDAP, you must make some adjustments to your Dell OpenManage Network Manager
installation. You must configure the following additional settings in the
Authentication
panel of
Portal > Portal Settings in Control panel. This has two tabs:
• General
•LDAP
General
Fill in the
General
panel. The
Home URL
must be
/c/portal/login
.
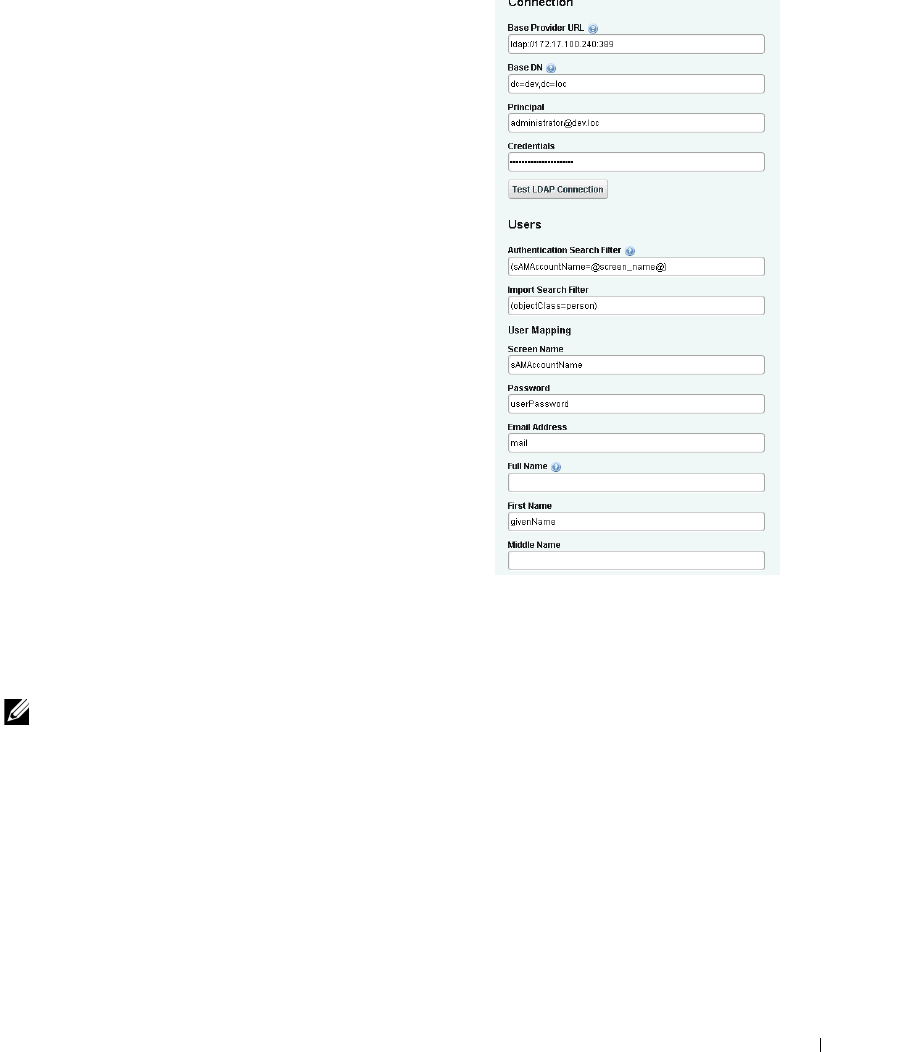
Configuring Pages and User Access | Getting Started with Dell OpenManage Network Manager
71
LDAP
In the LDAP tab of the Authentication screen, check the
Enabled
checkbox, then click
Add
under
LDAP Servers
and fill in that screen as appropriate.
Configuring Pages and
User Access
The following describes adding pages to your Dell
OpenManage Network Manager installation, and
configuring Role-based User Views. This is a way to
manage user access to Dell OpenManage Network
Manager’s features in a more complex environment. This
consists of the following configuration levels:
• Page Level Permissions
• Portlet Level Permissions
• Configure Resource Level Permissions
Pages display portlets in the following ways:
Summary / Minimized Mode
Any portlet's that have the
Settings
toolbar option (Filters and Max Results) can save/toggle the
Current Filter, Max Results, Max Items Per Page, and column choices. See Portlet Toolbar on page
103.
NOTE:
The Max Results settings for summary portlets differ from those for maximized / expanded portlets.
If you are an Admin and are on the Main portal site, Dell OpenManage Network Manager saves
these permanently. If you are a REGULAR user they are only saved temporarily unless the portlet is
on your personal Public/Private pages. See Public / Private Page Behavior on page 48 for details.

72
Configuring Pages and User Access | Getting Started with Dell OpenManage Network Manager
Maximized / Expanded Mode
The
Settings
button in expanded portlets lets you configure displayed columns and their order, and
the number of items to display. If the number of items in a list exceeds the maximum specified, a
[limit reached]
message appears next to the number of items listed in the bottom right corner of
the page.
NOTICE
For large list, filters are a more efficient use of computing resources than large maximum settings. See
How to: Filter Expanded Portlet Displays on page 108 for more about configuring filters.
Page Level Permissions
This level provides permission for a user/group/role/organization on a defined Dell OpenManage
Network Manager page.
How To:
Create new Users:
1
As an admin user, go to the Control Pane
2
Under the Portal category, click
Users and Organizations
, then click the
Add > User
menu
item.
3
Fill out the User form with name and email address and so on.
4
When you are finished, click
Save.
5
A message appears saying that the save was successful.
NOTE:
The expanded form lets you fill out more information about the user.
6
Select the Password, enter password for the user and click
Save.
7
Click the
Roles
link. A screen appears showing the roles to which your ID is currently
assigned. By default, all users are assigned the Power User role, and to the role User.
8
(You may want to do this step after configuring roles. See Add and Configure User Roles /
Permissions on page 50.) Remove the default PowerUser role, and add the appropriate new
role for the user with the
+Select
link, then click
Save.
You can optionally fill out other details
later.
9
In Control Panel’s Redcell > Permission Manager, remove any permissions from the User role
you do not want the user to have.

Configuring Pages and User Access | Getting Started with Dell OpenManage Network Manager
73
How To:
Create a new Page and Rearrange Pages
1
As an admin user, from the portal, not control panel, click
Add > Page.
That creates a new
page with a blank title in the doc. Name, then click on that page to see it.
2
Click
Manage > Page
to reconfigure it, add child pages, and so on.
3
An editor appears that lets you further configure the page.
Click the triangles on the left to expand the tree of pages in this schematic.
4
To re-arrange the pages in the portal, drag-and-drop them in the tree on the left.
5
When the page is configured as desired, click
Save
and then click the X in the upper right
corner of this editor. Your page should appear in the portal after you refresh it.
6
Click the page label to open any new page, and click
Add
>
Applications
to add portlets to
that page. You can also drag and drop the portlets within the page to rearrange them. The
applications under the
Portal
node are open source, and not documented here. The rest are
Dell OpenManage Network Manager-connected, and are documented in this guide.
NOTICE
Use the Search Applications field at the top of the Add > Applications menu to find portlets nested within
that menu’s categories. The Portal Applications and Global categories includes generic portlets; the
remaining categories are for Dell OpenManage Network Manager portlets.
How To:
Restrict Pages for a User
1
As an admin user click
Manage > Page
.
2
Expand the Page Layout tree. This represents the page layout as seen in the portal.
3
Select a page where you want to restrict access.
4
Click on the
Permissions
button at the top.
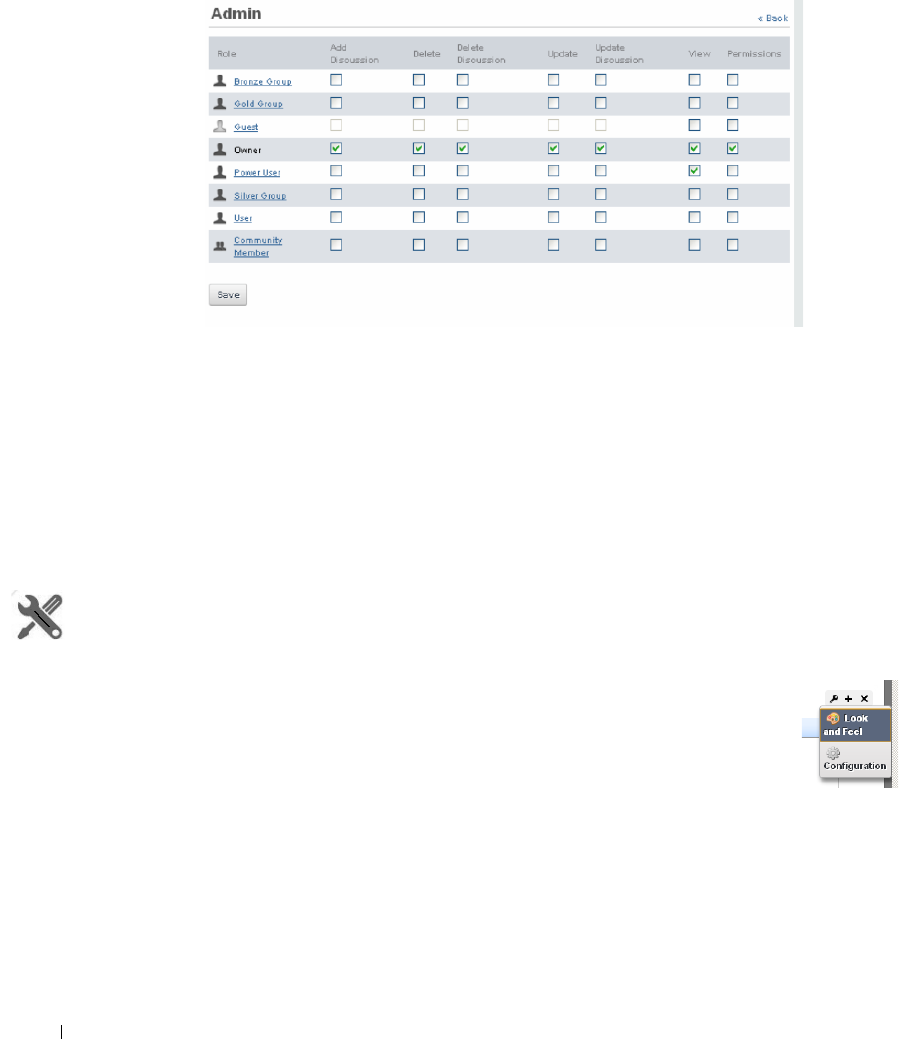
74
Configuring Pages and User Access | Getting Started with Dell OpenManage Network Manager
5
Uncheck the
View
permission for Guest and Community members. Make sure Owner and
PowerUser can still view the page.
6
Now select
View
for any other roles you want to give access.
7
Click
Save
.
8
You can log out and log back in as the new user. That the user should not be able to see
restricted pages.
Portlet Level Permissions
You can also provide permission for a user/group/role/organization on a defined portlet.
How To:
Configure Portlet Permissions
1
As an admin user, click on the Configuration icon (the wrench) in the top right
corner of the portlet of interest.
2
Click on the
Configuration
and go to the Permissions tab in the next screen.
Configuring Pages and User Access | Getting Started with Dell OpenManage Network Manager
75
3
Uncheck the View permission for Guest and Community members. Make sure Owner and
PowerUser still have View permissions.
4
Now check View for the relevant roles (for example,
Silver
Group).
5
Click
Save.
6
You should now be able to log out as admin, and log in as Guest or other community
members and confirm you cannot view the portlet you just configured.
How To:
Configure Resource Level Permissions
You can provide permission for a user/group/role/organization on a defined resource. The following
outlines the steps:
• Create a Container for each Customer
• Configure Membership for Container (resources that customer can access)
• Set Authorization for User Container
• Set up a Page for Device Level View
Create a Container for each Customer
1
In Container Manager Portlet, right-click to select
New.
2
Create a container for the desired customer, naming and describing it.
76
Configuring Pages and User Access | Getting Started with Dell OpenManage Network Manager
3
In the
Authorizations
tab for this container, delete authorization for ALL (non-portal), Add
authorization for Synergy Admin, Add authorization for Power User Role, and delete the
Vendors
Child Container.
Configure Membership for Container
4
Create Gold Customer as a Top Level Container.
5
Make it Shared, and configure its membership (Select and Add a group of devices)
Set Authorization for User Container
6
In the Authorizations tab, Add Gold Customer (with limited permission), and User Synergy
Admin (with full permission).
7
Delete Group: User
8
Create a Gold Customer user as described above.
Set up a Page for Device Level View
9
Add a Container View to the page of interest with portlets for which you want to restrict
access. Currently Container View is enabled for the following portlets: Managed Resources,
Alarms, Ports, Audit Trails, Printers.
10
Log out as admin, and log back in as a user with Gold Customer permissions.
11
Confirm your permission configuration is operating on this page.
Quick Navigation | Getting Started with Dell OpenManage Network Manager
77
Quick Navigation
The Quick Navigation portlet lets you quickly perform some basic tasks:
Resource Discovery
—Discover devices in your network with the Quick Discovery defaults, or lets
you construct a Quick Discovery profile if none exists. See Resource Discovery on page 180
for details.
Link Discovery
—After you have discovered resources, this discovers their connections. See Link
Discovery on page 208.
Backup Config Files
—This lets you back up discovered devices’ configuration files. Before you
can use this feature, you must have servers configured as described in Netrestore File Servers
on page 90. See also File Management on page 271.
OS Image Upload
—Upload firmware updates for devices. See Firmware Image Editor on page
283 for more about these capabilities.
Deploy OS Image
—This deploys firmware updates. To deploy images, you must have File Servers
configured, as described above for Backup. See Deploy Firmware on page 287.
License Management
—This lets you see and manage the licensed capabilities of Dell
OpenManage Network Manager. See License Viewer below for details.
Admin user and Power User can see all the above menu items. The User role sees only sees four.
Link discovery and OS image upload do not appear by default. To see them, you must give User
'write' permission.
Network Tools
The Network Tools portlet lets you invoke a variety of existing functions on a device without having
the device currently discovered. When installed, the Network Tools application appears listed as an
available Application to install as a portlet.
Before you can use the tools you must enter an ip address in the ip address field. Once you have
entered that address, 7you can use the following:
• Ping Tool
• MIB Browser Tool
78
Network Tools | Getting Started with Dell OpenManage Network Manager
• Direct Access Tool
NOTICE
If you want to restrict access for some users so they do not automatically log in with direct access, then
remove direct access permissions for users, and use Network Tools for direct access.
Ping Tool
The second button is the Ping tool, which pings the selected device.
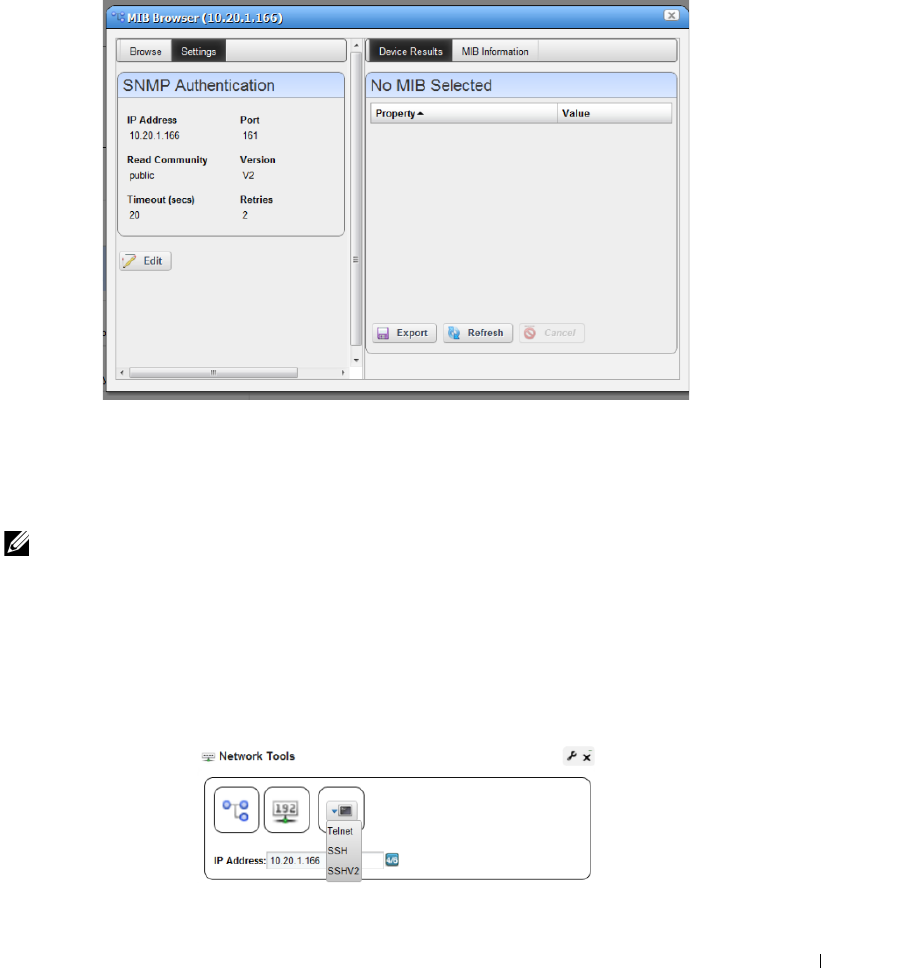
Network Tools | Getting Started with Dell OpenManage Network Manager
79
MIB Browser Tool
The first button displays the MIB browser with default SNMP settings. You can edit the settings to
match the SNMP settings for the device and save them. The next time Network Tools invokes the
MIB browser, it defaults to your previous settings.
Once you are done editing the SNMP settings, click
Save
. Click the
Browse
tab to look through
available MIBs as you would ordinarily do in MIB browser. See MIB Browser on page 214 for more
about using the MIB browser. You can also browse MIBs in the attribute selection panel for the
SNMP monitor. See SNMP on page 323.
NOTE:
MIB file locations are subject to change without notice, but generally are under the owareapps/
[application name]/mibs directory for different application modules.
Direct Access Tool
The third button on the Network Tools portlet toolbar opens the Direct Access tool. It provides a
command line interface terminal for Telnet, SSH and SSH V2 access to the device.
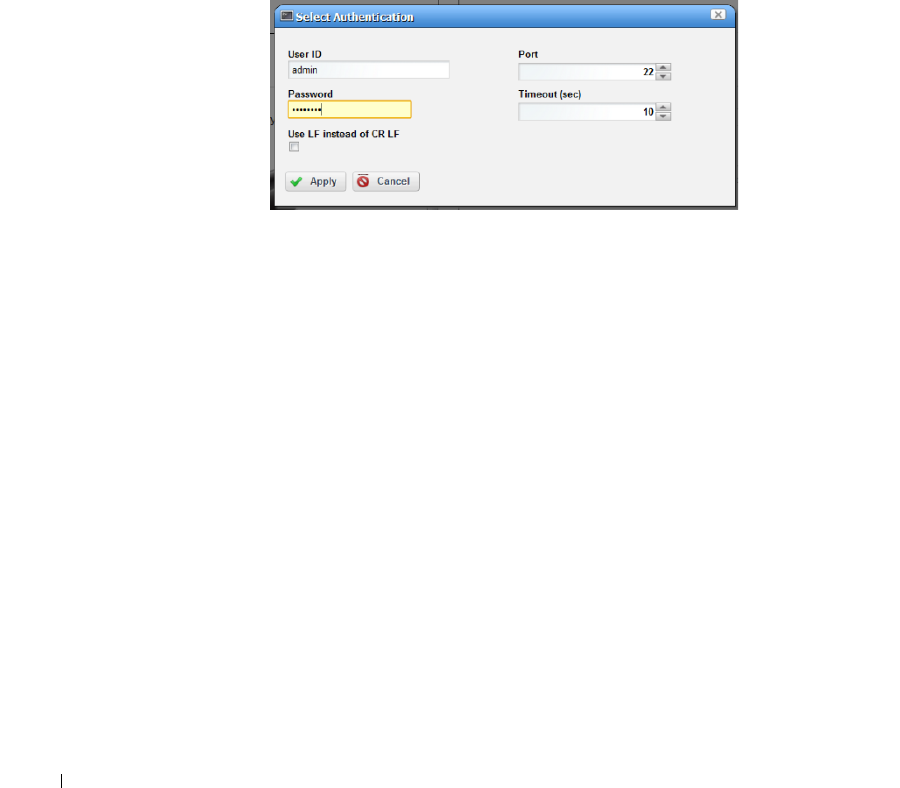
80
Network Tools | Getting Started with Dell OpenManage Network Manager
Click and select the type of direct access you want.
• Direct Access - Telnet
• Direct Access - SSH / SSH V2
Direct Access - Telnet
Telnet direct access connects to the device with telnet and displays the terminal session. You must
login to the device manually. See Direct Access on page 213 for more about using this form of
device access.
Direct Access - SSH / SSH V2
Direct Access for SSH or SSH V2 first prompts for a user name and password.
The
Use LF instead of CR LF
checkbox suppresses carriage returns when you click Enter key. This
is necessary for some devices (for example: some Dell Power Connect devices).
Once you log in, Dell OpenManage Network Manager attempts to connect with SSH or SSH V2
using the user id and password provided. Some Dell Power Connect devices do not log when
connected and prompt you to enter the user and password again.
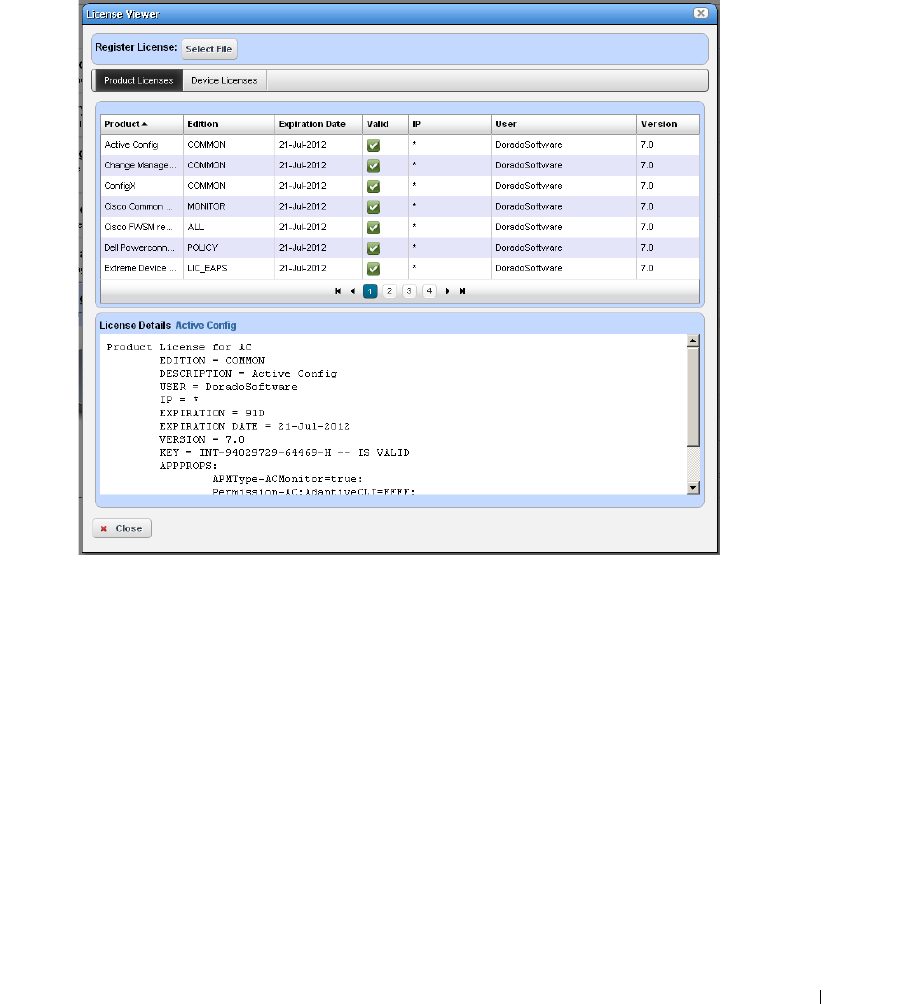
License Viewer | Getting Started with Dell OpenManage Network Manager
81
License Viewer
This screen appears when you click
License Management
in the Quick Navigation portlet.
Click
Close
to return to Dell OpenManage Network Manager. You may find Licenses in a name
slightly different from the one you expect. For example, the
Reports
portlet is licensed as part of
the Inventory Manager product.
License Expiration Warning Alarms
OpenManage Network Manager includes a critical event/alarm warning of a possible license
expiration (emsAppServerLicenseWillExpireSoon). In typical packages, this alarm first appears 14
days from license expiration, then recurs daily. The alarm’s message changes to indicate how many
days remain. Once expiration occurs, you can still log into OpenManage Network Manager, but
portlets are disabled. Contact your sales representative to update or extend your license.

82
License Viewer | Getting Started with Dell OpenManage Network Manager
How To:
Register a License
To register a license click the
Select File
button at the top, and use the subsequent screen to select
a license file.
NOTICE
To import a license when application server is not running, type
oware
then
licenseimporter
[license file path]
on a command line.
You must restart application server or wait up to 15 minutes before a license modification takes
effect.
Product Licenses
This portion of the License Viewer lists the products for which you have licenses already, displaying
the
Product, Edition, Expire Date,
whether the license is
Valid ,
any
IP
restrictions, the
User
who
installed the product and/or license, and the
Version
of product for which the license is valid.
License Details: [Product]
This portion of the screen displays the details of a license selected in the
Registered Product
Licenses
portion of the License Viewer screen. It is blank if you have not selected a license in the
list above this panel.
Device Licenses
This tab displays the
Maximum Allowed
number of devices, the
Count Managed
the
Varian ce
between maximum and managed, and
Ty p e
of license, along with sums of the maximum and count
managed.
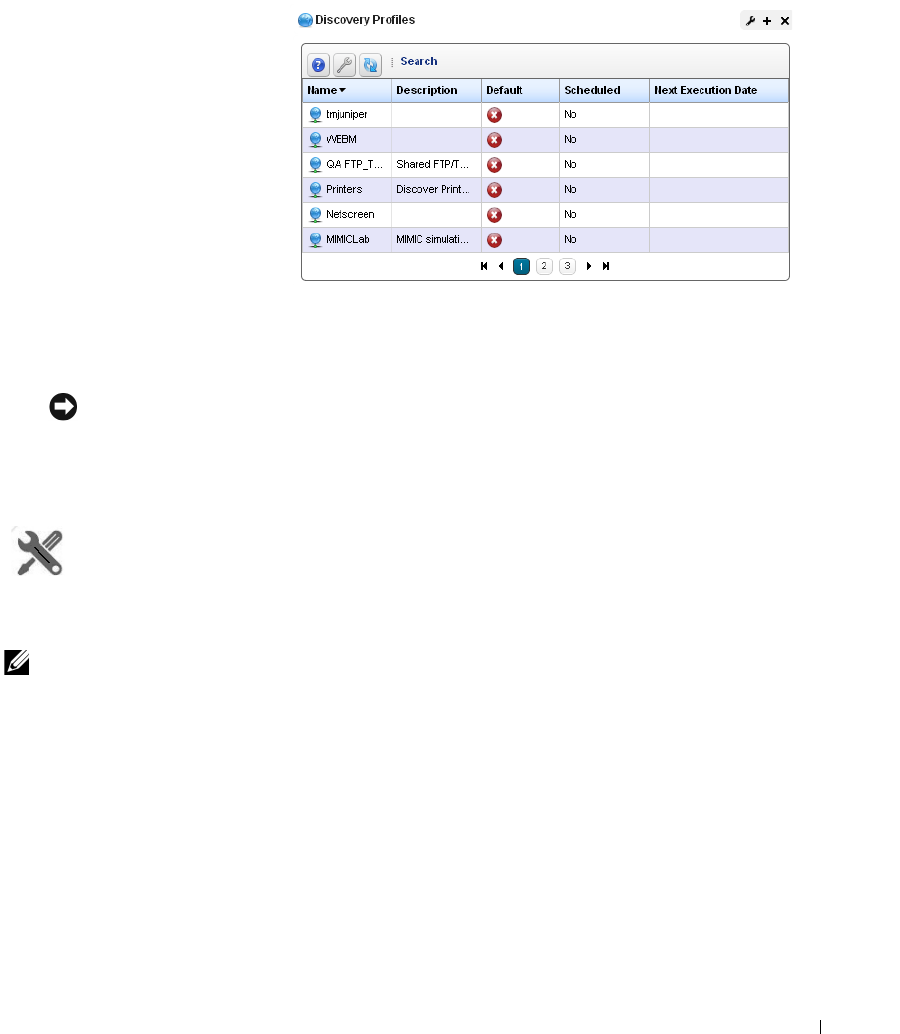
Discovery Profiles | Getting Started with Dell OpenManage Network Manager
83
Discovery Profiles
Discovery profiles configure
equipment discovery for Dell
OpenManage Network Manager.
The summary view displays the
Name, Description, Default
(the
green check indicates the default
profile), whether the profile is
Scheduled
and
Next Execution
Date
for scheduled discovery
.
The Expanded portlet adds a
Reference Tree snap panel that
displays a tree of associations
between selected profiles and
authentication and tasks that they execute. See Discovery Profiles on page 181 for more about this
portlet.
NOTICE
The date format follows the operating system’s conventions for the location and language selected.
Restarting the system changes system menus to the new language. If you want to revert back to the
original language in Linux, you may also need to update the cache file under
/var/cache/gdm.
How To:
Discover Your Network
1
Right click the Discovery Profiles list and select
New.
NOTE:
If you have a multitenant environment, you can create
2
The Discovery Profile Editor appears, with a step-by-step set of screens to configure resource
discovery. You can navigate through it by clicking the screen tab names at the top, or by
clicking the
Next
button at the bottom of the page.
Discovery Profile Editor
Use this editor to configure discovery once you have started Discover Your Network. Baseline
discovery is the initial discovery to compare to later discoveries. Follow these steps to discover
equipment on your network:
General

84
Discovery Profiles | Getting Started with Dell OpenManage Network Manager
3
General Parameters
—Set the
Name, Description
and whether this profile is the baseline
default.
4
Profile Options
—Select the
Device Naming Format
(how the device appears in lists, once
discovered), whether to
Manage by
IP address or hostname, and check whether to
Resolve
Hostname(s), ICMP Ping Device(s), Manage ICMP-only Device(s),
or
Manage Unclassified
Device(s).
This last checkbox determines whether Dell OpenManage Network Manager
attempts to manage devices that have no device driver installed. Management may be
possible, but more limited than for devices with drivers installed, provided this capability is
one you have licensed.
NOTE:
Some packages disable ICMP ping by default.
The Filters (by
Location, Vendor,
or
Device Type
) let you narrow the list of devices discovered
by the selected item(s). As the screen says, this filtering will not have any impact on the
processing that occurs during the Inspection step.
Make sure you
Save
profiles you alter, or these selections have no impact when you execute
discovery.
Network
5
After you click
Next,
the
Network
screen appears.
Network Type and Addresses
—Select the type of entry in the pick list (
IP Address(es),
CIDR Address, Hostname, SNMP Broadcast, Subnet
).
NOTICE
You can specify an IP Address range by separating the beginning and end with a dash. For example:
192.168.1.1 - 192.168.1.240.
The tooltips in the data entry field describe what valid entries look like.
6
Authentication
—You can
Create new
, or
Choose existing
authentications. (See Discovery
Profiles on page 181 for details.) Notice that authentications appear with
Edit / Delete
icons
and
Up / Down
arrows on their right. The
Up / Down
arrows order authentications, so Dell
OpenManage Network Manager tries the top authentication first, then the next, and so on. If
you have an authentication like
admin/abc
and one that is identical with an enable-level login / password (
admin/abc/
enable/enable
), make sure the enable authentication appears first in the list, otherwise,
you will discover the device, but not access its enable functionality.
CAUTION:
If you do not get to the correct level of authentications—for example the “enable” user—then Dell
OpenManage Network Manager’s full functionality is not available.

Discovery Profiles | Getting Started with Dell OpenManage Network Manager
85
The
Edit
icon opens the authentication editor. Click the arrows to arrange the order in which
credentials are tried (top first). Ordering only applies when two credentials are of the same
type.
Actions
7
You can configure Actions to run as part of discovery. By default, the actions screen includes
the
Resync
action. Use
Add Action
to select others to enter here. You can also edit parameters
(if available), delete and re-order the actions listed here by clicking the icons to the right of
them. Dell OpenManage Network Manager executes them in top-to-bottom order.
By default discovery now automatically updates monitor targets with discovered equipment.
For example, if you have a monitor targeting the dynamic All Dell Devices group, and
discover a Dell device, discovery automatically adds the discovered device to the monitor’s
target list.
Device discovery initiated by web services does not require an existing discovery profile,
however, if a default discovery profile exists, then discovery initiated by web services uses it. If
you have updated your system, you must add the Refresh Monitor Targets action to any
existing discovery profiles you have created before this default behavior occurs in upgraded
discovery profiles.
You can change this default by changing the settings in the
/owareapps/redcell/lib/
redcell.properties
file’s
redcell.discovery.taskactivity.order
property.
See also Refresh Monitor Targets for Newly Discovered Devices on page 329
Inspection
8
Inspect Network using your current settings
—This screen lets you preview the discovery
profile’s actions and access to devices. If you clicked
Next
rather than
Inspect
at the bottom of
the previous screen, click
Start Inspection
to begin the inspection process for selected
authentications that validates the device’s credentials.
Notice that the
Inspection Status
fields below listed authentications indicates the success or
failure of ping (if not disabled), Hostname resolution, and the listed Authentications.
If the device does not match all required authentications, you can click the
Fix it
icon (a
wrench with a red or yellow dot) to edit them for the selected device. You can also click
Te s t
Device
,
Create New,
or
Choose Existing
authentications while in the editor clicking the
Fix it
icon displays the authentication selection panel. The yellow dot on the
Fix it
icon means an
optional authentication is missing. A red dot means a required one is missing.
When authentications are unsuccessful, you can remove or edit them in this editor too. Click
the icons to the right of listed authentications to do this.
When they test successfully, the authentications appear in a nested tree under the
Discover
checkbox (checked when they test successfully).

86
Discovery Profiles | Getting Started with Dell OpenManage Network Manager
9
Save—
Click
Save
to preserve the profile. You can then right-click it to select
Execute
and
begin discovery
.
If you select
Execute
from the profile editor, Dell OpenManage Network
Manager does not save the profile to execute later.
Results
10
Execute
—Clicking
Execute
begins discovery, confirm you do not mind waiting, and the
message traffic between Dell OpenManage Network Manager and the device appears on the
Results
screen.
This is a standard
Audit
screen. See Audit Trail / Jobs Screen on page 114 for more about it.
11
A message (
Discovery Profile Execute is complete
) appears in the
Messages
at the bottom left
of the status bar.
NOTICE
You can also schedule discovery profiles to run periodically, updating your Dell OpenManage Network
Manager database with any network changes. For more, see Schedules on page 118.
12
The devices in your network now appear in the Managed Resources portlet, and elsewhere (in
Topology, for example).
See Discovery Profiles on page 181 for more about these capabilities.
NOTE:
Dell OpenManage Network Manager automatically adds discovered devices to the default ICMP monitor.
Incomplete Discovery
If the device is detected and responds to ping, but does not respond to Dell OpenManage Network
Manager actions (for example: Adaptive CLI), you may have only partially discovered it. Right-click
the device in the Managed Resources portlet and select
Direct Access > Telnet
. If that menu
option does not exist, it is only partially discovered. Right-click to edit the device, and add a Telnet
Management Interface and Authentication in those two tabs of the editor.
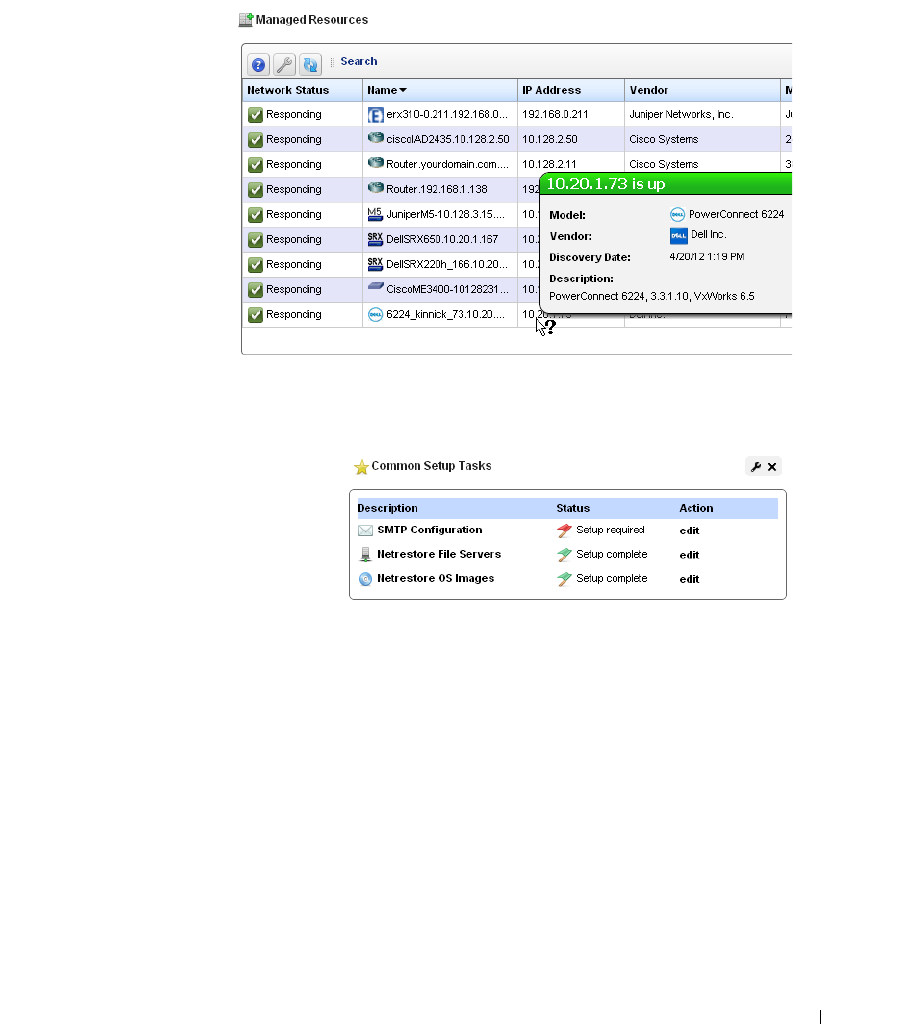
Managed Resources | Getting Started with Dell OpenManage Network Manager
87
Managed Resources
This portlet displays all
the devices you have
discovered.
See Managed Resources
on page 195 for the
details of this screen’s
capabilities.
See also Managed
Resource Groups on page
190.
Common
Setup
Tasks
By default this portlet usually appears
on the first page after you sign in. If
your package does not display it on that
page, you can click
Add > Applications
and put it there. This portlet reminds
you of the following common tasks:
• SMTP Configuration
• Netrestore File Servers
• Netrestore Image Repository
A red flag appears with the “Setup required” message in the
Status
column when these are not
configured. Configuring them displays a green flag with the “Setup complete” message. Click the
edit
link in the
Action
column to open editors for each of these.
Password Reset
You can reset a user's password two ways. One is to login as admin and change the user's password
in Portal Settings > Users and Organizations. For additional information please refer to Portal >
Users and Organizations on page 44.
For the second method, users themselves can request an email be sent to them with instructions to
set a new password. Follow the steps below.
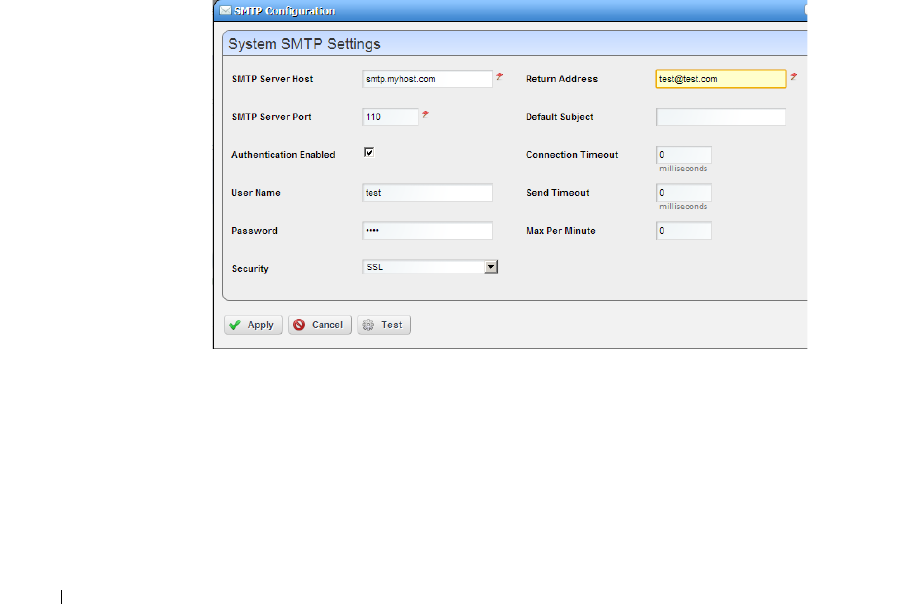
88
Common Setup Tasks | Getting Started with Dell OpenManage Network Manager
1
Login fails. At the bottom of the login screen is the Forgot Password link.
2
A prompt appears for user to enter a Screen Name.
3
A prompt appears to enter the answer to the reminder question (their Father's middle name)
that they set when logging in the first time.
4
After entering the correct answer for their account, Dell OpenManage Network Manager
sends an email to the user’s email address. E-mail for password reminders / resets requires
setting up the fields in Control Panel > Server Administration > Mail, not the SMTP
Configuration which is for Dell OpenManage Network Manager-originated e-mails.
After entering an incorrect answer, a request failed screen appears, with another chance for
entering a correct answer.
5
The e-mail provides a link where the user can enter a new password and confirm it.
SMTP Configuration
You can use Dell OpenManage Network Manager’s messaging capabilities to communicate with
other users, but if you want to receive e-mails automated by actions like configuration file backups,
Dell OpenManage Network Manager must have a mail account. This screen configures the e-mail
server so Dell OpenManage Network Manager can send such automated e-mails.
The
Apply
button accepts your edits.
Te s t
tries them.
Cancel
abandons them and returns to Dell
OpenManage Network Manager. This screen contains the following fields:
SMTP Server Host
—The IP address or hostname of your SMTP server.
SMTP Server Port
—The port for your SMTP server (110 is typical).
Authentication Enabled
—Check this to enable authentication for this server. Checking enables
the next two fields.

Common Setup Tasks | Getting Started with Dell OpenManage Network Manager
89
User Name
—The login ID for the SMTP server, if authentication is enabled.
Password
—The password for the SMTP server, if authentication is enabled.
Security
—Enable Secure Sockets Layer (SSL) protocol to interact with your SMTP server, or
Transport Layer Security (TLS).
Return Address
—The return address for mail sent from Dell OpenManage Network Manager.
Default Subject
—Text that appears by default in the subject line of mail sent by Dell
OpenManage Network Manager.
Connection / Send Timeout
—The time-outs for mail sent by Dell OpenManage Network
Manager. If your SMTP server or network is slow, increase the default timeout.
Max Per Minute
—The maximum number of e-mails Dell OpenManage Network Manager can
send per minute.
Two settings for e-mail servers appear in Control Panel, one in the Control Panel > Portal >
Settings Mail Host Names edit screen, and another in Control Panel > Server Administration >
Mail. These are for Liferay login and password reminders / resets (see Password Reset on page 87).
The Portal-based e-mail settings help Administrators limit signups to e-mails only existing in their
organization. The screen in that panel provides a list of allowed domain names, if that feature is
enabled.
Control Panel > Server Administration > Mail is where to configure the Main server and
authentication for routing mail
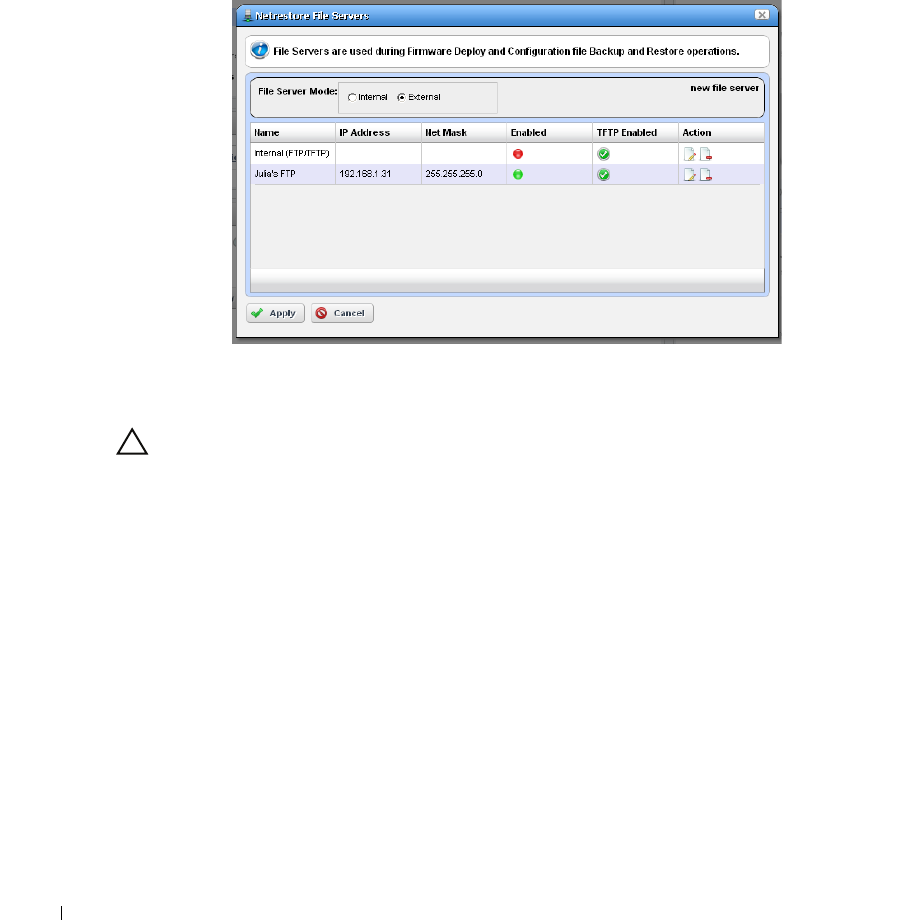
90
Deploying and Extensions | Getting Started with Dell OpenManage Network Manager
Netrestore File Servers
The Netrestore file servers provide FTP connections for retrieving and deploying devices’
configuration files, and for deploying firmware updates to devices on your network. See Chapter 8,
File Server / File Management for a description of the portlet that manages file servers. If you want
to configure servers from the
Common Setup Tasks
portlet, a slightly different screen appears when
you click
Edit.
This displays configured file servers. Configure new servers by clicking the
new file server
link in the
upper right corner. The editing process after that is as described in File Server Editor on page 270.
CAUTION:
If you select the internal file server, make sure no external file server is running on the same host. A port
conflict prevents correct operation. Either turn off the external file server, or use it as the FTP server.. We
strongly recommend using the internal file server only for testing, and external file server(s) for
production.
Dell OpenManage Network Manager selects the file server protocol for backup, restore or deploy
based on the most secure protocol the device supports.
Deploying and Extensions
You can get add-on capabilities in Dell OpenManage Network Manager in the following forms:
• Deploy Files
•Extensions
• .ocp and .ddp files
These add-on capabilities do not require a complete re-installation of the application. The
following sections describe how to update your initial system with them.

Deploying and Extensions | Getting Started with Dell OpenManage Network Manager
91
Deploy Files
Updates to Dell OpenManage Network Manager can come in .war files—for example, a new
helpset (
nvhelp.war
), that updates the information about the program. To deploy such files,
copy them to the
[installation root]\oware\ synergy\deploy
directory. In the next
few minutes, Dell OpenManage Network Manager will deploy them.
Extensions
Extended capabilities for Dell OpenManage Network Manager may appear in .jar files—for
example
synergy-msp.jar
. To deploy these, copy the file into the
[installation
root]\oware\synergy\extensions
directory.
.ocp and .ddp files
Device drivers and additional application capabilities come in files with the .ddp and .ocp
extensions, respectively. These install automatically during installation when they are in the
owareapps directory. To install them after your system is already up and running, use the following
command line programs:
ocpinstall -x [filename.ddp or filename.ocp]
ocpinstall -l [filename.ddp or filename.ocp]
ocpinstall -s [filename.ddp or filename.ocp]
Localizing Message Files
A message file is essentially a property file. The file name dictates which locale(s) it applies to. The
suggested naming convention is as follows:
<prefix>msgs[_languageCode[_countryCode[_variantCode]]].properties
Do not provide more precision than necessary. By default, all message files are named as:
<prefix>msgs_en.properties (English)
or
<prefix>msgs.properties (language independent)
No support exists for prepend or append operations.
All entries must follow this syntax:
category.number=message text
NOTICE
To find all available message files, search the installation root and directories below it for
*msg*.properties. You may also want to alter *.msgs files.

92
Deploying and Extensions | Getting Started with Dell OpenManage Network Manager
Finally, extract the
synergy-i18n.jar
in
oware/synergy/extensions
, edit the
appropriate file(s) in the localization subdirectory, then re-compress the
.jar
file.
CAUTION:
If you take the time to translate these files, make sure you keep a copy any files you modify because any
upgrade may return them to their original state. You must manually copy the localized files to their
original positions to see those translations after any update.
The localization/language functionality comes from Liferay. You may find additional information
regarding localization on
www.liferay.com/documentation.
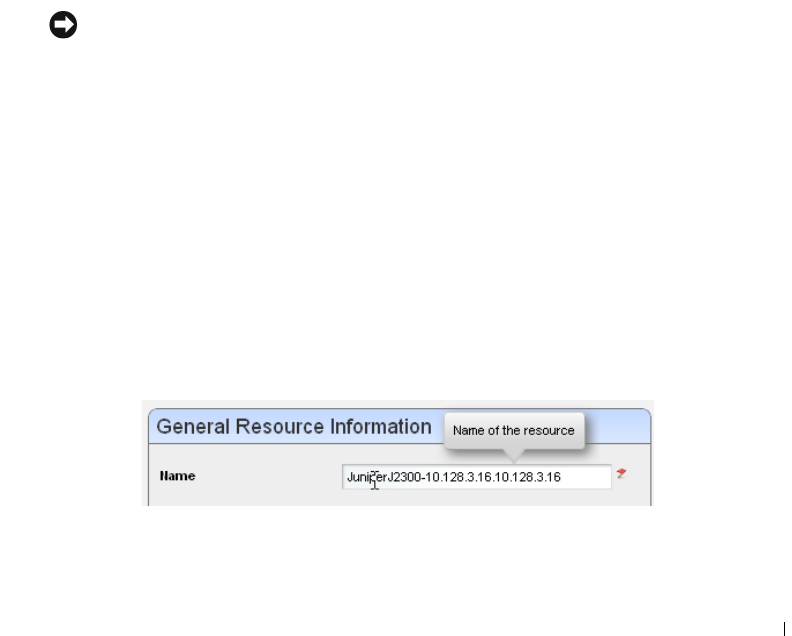
| Portal Conventions
93
4
Portal Conventions
This section explains how to navigate and configure the Dell OpenManage Network Manager web
portal. Because this portal is based on open source features, and can be so flexible, this is not a
comprehensive catalog of all its features. The following discusses only features significant for using
Dell OpenManage Network Manager.
The application’s web Portal contains the following common elements:
•The Dock
• Status Bar Alerts
• Menu Bar
•Portlets
Because the elements that manage the Web portal are so flexible, and can be very detailed, only
Dell OpenManage Network Manager’s most important, or most-frequently-used features appear
documented below.
NOTICE
Clicking Go to in the Dock and selecting My Private Pages to open pages not shared with others, unless
you configure sharing. (See Sharing on page 110.)
Because they are so fundamental to Dell OpenManage Network Manager’s functioning, this
section also describes the following portlets:
• Audit Trail Portlet
• Schedules
You can rename any portlet by clicking its title. You can also configure portlets’ default filters to
work in concert with the title. See Filtering / Settings on page 141.
Tooltips
Dell OpenManage Network Manager has help and tooltips that appear when you click the blue
circle with a question mark, or when you hover the cursor over a field.

94
| Portal Conventions
Tooltips also display the content most fields in portlets. If the screen does not allow a full field to
appear, you can still find out what is in a field by letting the tooltip re-state what it contains.
Refresh
You may have to refresh your browser to see screen updates. One way to refresh without re-loading
the entire window, however, is to click the
Refresh
button at the top of an individual portlet. (See
Settings on page 104)
The Back Button
Although browsers have a
Back
button, this is not always the best
way to return to a previous screen within the portal. For example,
clicking
Back
within a breadcrumb trail of links returns to the root of
that trail. If it is available, the
Return to previous
button in the
upper right corner of a screen provides the most dependable way to return to a previous screen.
Shift+Click
When you Shift+Click the Details menu item, Dell OpenManage Network Manager opens a new
window with that Details screen. See Equipment Details on page 210 for a commonly-used
example.
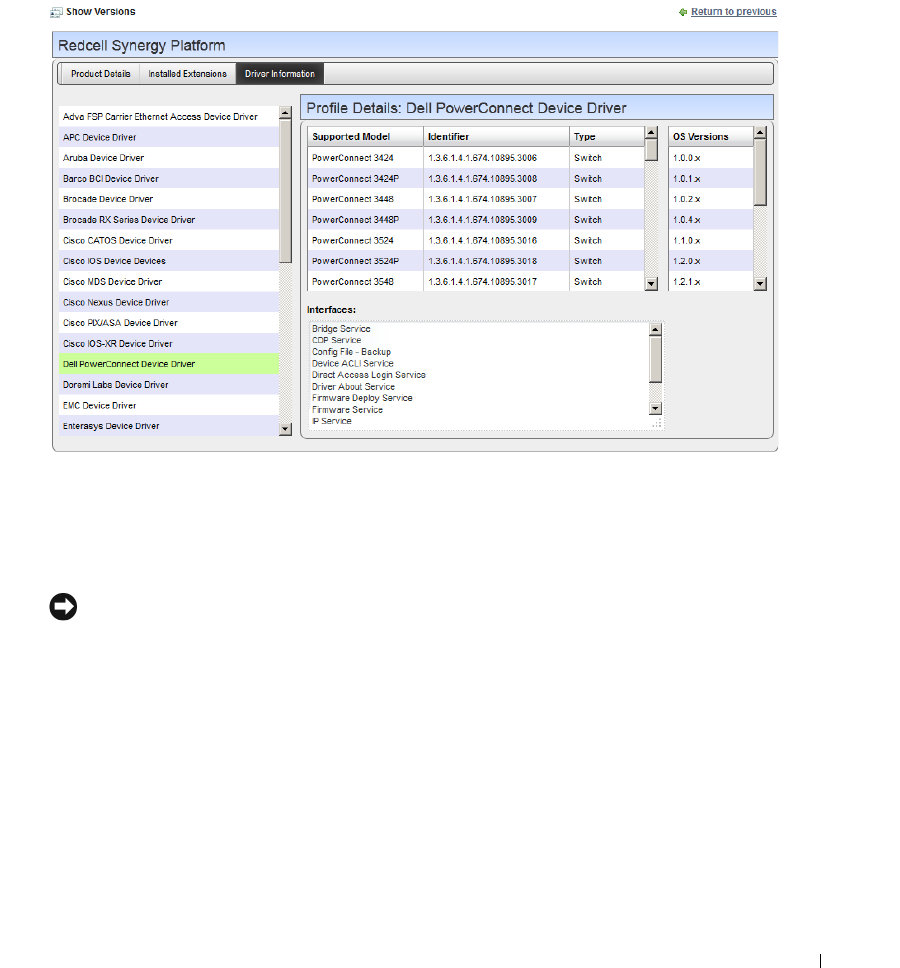
| Portal Conventions
95
Show Versions
To see which products are installed, and what versions, select the
Manage > Show Versions
menu
item. This displays the installed package and modules, as well as their version numbers in the
Product Details
tab.
The
Installed Extensions
tab displays any installed presentation layer enhancements, and the
Driver Information
tab displays individual drivers (see Device Drivers on page 17).
Profile Details
outlines the supported device models, identifiers (OIDs), types and interfaces, and the
OS
Versions
supported. This information can be important when you need technical support.
NOTICE
You can also produce an HTML version of this screen’s information from a command line. Run
drvrpt
(
drvrpt.cmd
in Windows) from
\owareapps\ddbase\bin
. The HTML appears in
[installation root]\reports\drivers.
While the focus is in the message board portlet, you cannot open the
Manage > Show Versions
screen. Select any of the other main menu options, and
Show Versions
becomes available.
Custom Debug
For more advanced users, any component under owareapps can define a
log4j.xml
file for each
component matching the following pattern:
owareapps\<component-dir>\server\conf\*log4j.xml
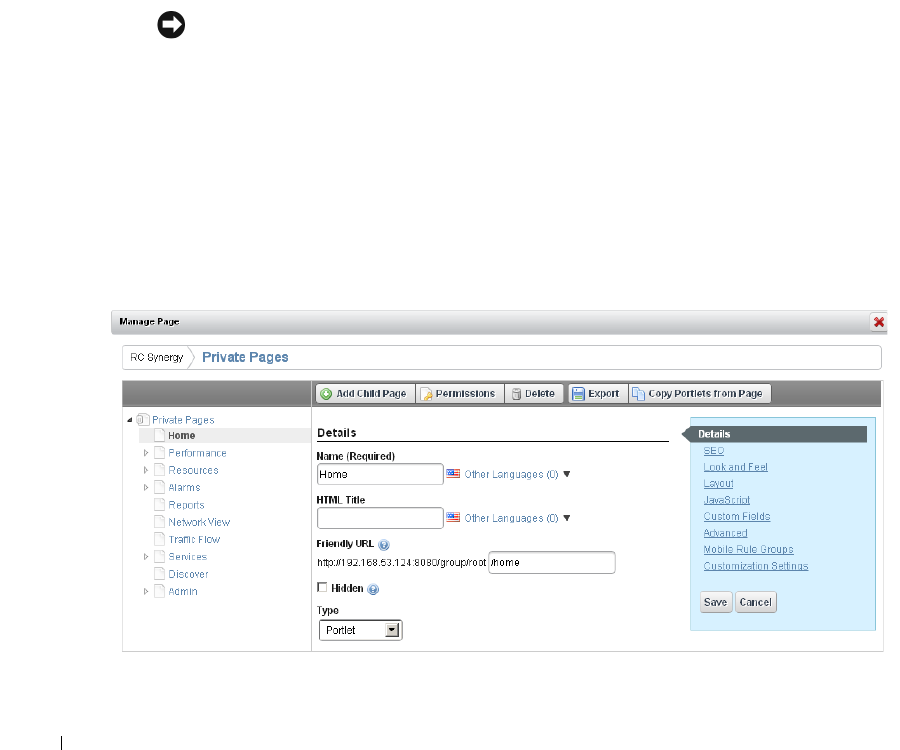
96
The Dock | Portal Conventions
Consult these files for categories you want to change, and copy those (altered) properties to the file
you created in owareapps\installprops. The categories altered in this file override any others.
Changing such properties can produce enhanced error output in server logs. See also Application
Server Statistics on page 295.
The Dock
This menu bar appears at the top of portal pages. Its exact appearance depends on your package.
With it, you can open online help, add, edit, and navigate to portal pages and content.
Click the down arrow to see menus for items on the dock. Here are its functions
Help
—Opens the online help.
Add—
This menu lets you add
Pages,
or
Applications
.
NOTICE
The “breadcrumb” trail that appears near the top of pages lets you navigate directly through the
hierarchy of parent / child pages directly by clicking links displayed there.
The
More...
menu item contains Dell OpenManage Network Manager’s
content. Click a node
to see available portlets. See Portlets on page 102.
Manage
—This menu lets you alter the following:
Page (page order [note that you can drag-and-drop pages within the Pages tab] permissions,
appearance and so on). You can create Children pages, and can Import / Export page
configurations as described below.

The Dock | Portal Conventions
97
Use the screen that appears after selecting Manage > Page to configure add or
delete pages and to manage their appearance and permissions. You must
refresh any altered page before edits take effect.
NOTICE
You can create a new page, then Copy Portlets from Page you can duplicate another page’s portlets on
the selected page.
Page L ayout —Configure the page’s columns. This menu item does not appear if you have
an expanded portlet open, because the focus is not in the context of a page.
The Freeform page layout may stack portlets on top of one another. Toggle the
Fullscreen icon in the upper right corner to see portlets so you can re-arrange
them.
Site Settings—Configures page behavior, look and feel. See also Import / Export on page
109.
Show Versions—See Show Versions on page 95.
Go To
—Makes the selected screen type appear. Select
My Public Pages
or
My Private Pages
, for
example. When you add a new Community, its configured pages appear in this menu too.
This also provides access to
Control Panel
(see Control Panel on page 43)
.
NOTICE
Best practice is to use multiple pages within Dell OpenManage Network Manager rather than multiple
tabs.
Administrators can permanently configure
Public
pages, while users with fewer rights can only
configure their
Private
pages. Any page changes persist after you make them, provided you
have the rights to make changes on a page. See Public / Private Page Behavior on page 48 for
the details.
[User Name]
(sign out)—Opens the
Manage My Account
screen, where you can configure your
name, job title, image, e-mail and so on. The
Sign out
link lets you log out of Dell
OpenManage Network Manager.
NOTICE
If you cannot see enough of the screen to use this editor as you like, manage your account from Go to >
Control Panel > [User Name] > My Account
Toggle Full Screen
—The icon on the far right of this bar toggles its appearance / disappearance so
you can use more screen area for portlets if you need it. This toggle also impacts the Menu
Bar.
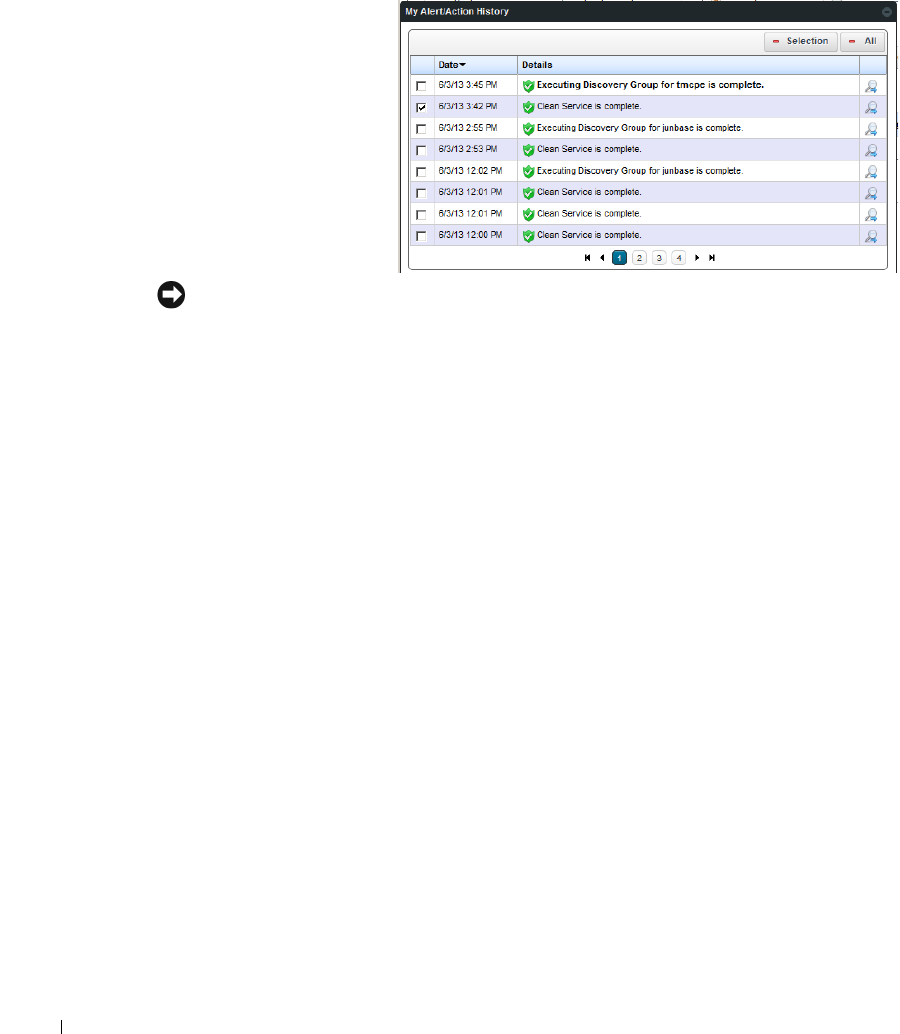
98
Status Bar Alerts | Portal Conventions
Status Bar Alerts
The Status bar appears at the
bottom of the portal. On the left,
it catalogs messages and
notifications you have received,
including generated reports in
My
Alerts
. Click the magnifying glass
to the right of reports and Job
Status notifications to open a
separate viewing window. The
panel includes
Current
and
Archived
messages tabs.
NOTICE
You can see the portal when web server is up, but application server is not. When application server runs
after web server has started, and you have already started the portal, an alert appears letting you know
application server is up.
Notice you can delete
Selection
items (checked on the left), or
All
items with the buttons at the
top of this screen.
Status Bar Alerts | Portal Conventions
99
Chat / Conferencing
This portion of the message bar lets you send and receive messages to colleagues who are online at
the same time you are.
Whatever item is of concern can be shared. So if a router is causing difficulties, you can share a link
that opens the router's information and share it with other users with Dell OpenManage Network
Manager’s internal instant messaging / chat system. With conferencing, you can invite more than
one person to collaborate.
These capabilities have the following fields and other possibilities for you to configure:
[Saying]
—Configure this text in the menu produced by the
Settings
icon (the next item).
(Settings)
—This configures your user settings for any online chat with your colleagues,
including the saying, whether your online presence appears, and whether to play a sound
when messages arrive.
NOTICE
When you have a message from another user, that user’s name appears on the status bar to the left of
this icon.

100
Status Bar Alerts | Portal Conventions
(Conferences)
—This configures your user settings for any online chat with multiple
colleagues. The
Create
tab lets you
edit
to invite colleagues, configure an invitation message
and check to make a private conference that only invites can attend. The
Join
tab becomes
active when you are invited to a conference. An online chat window appears after you join.
Conferencing also opens a screen that both records text and provides a virtual white board
where participants can draw.
Hover the cursor over the white board tools at the top to see what they do. Enter text in the
lower left corner, and it appears on the left after you click Enter. Conference participants
appear with icons and colors keyed to their text in the lowest portion of the screen.
NOTE:
If appearance or performance concerns impede your conferencing, clear your browser’s cache, then re-
try conferencing.
Colleagues (n)
— A green dot indicates others are online (it is red when you are alone), and
n
is
the number of colleagues online. Click to open the chat screen. Click on a colleague and enter
text at the bottom of the popup that appears to send messages. Previous chat history also
appears above any current text on that chat popup.
Click the minus icon in the top right corner of these screens to close them.
Menu Bar
The Menu Bar appears on the left side of the screen. It consists of Menu items that lead to separate
pages configured with
Manage > Page
.
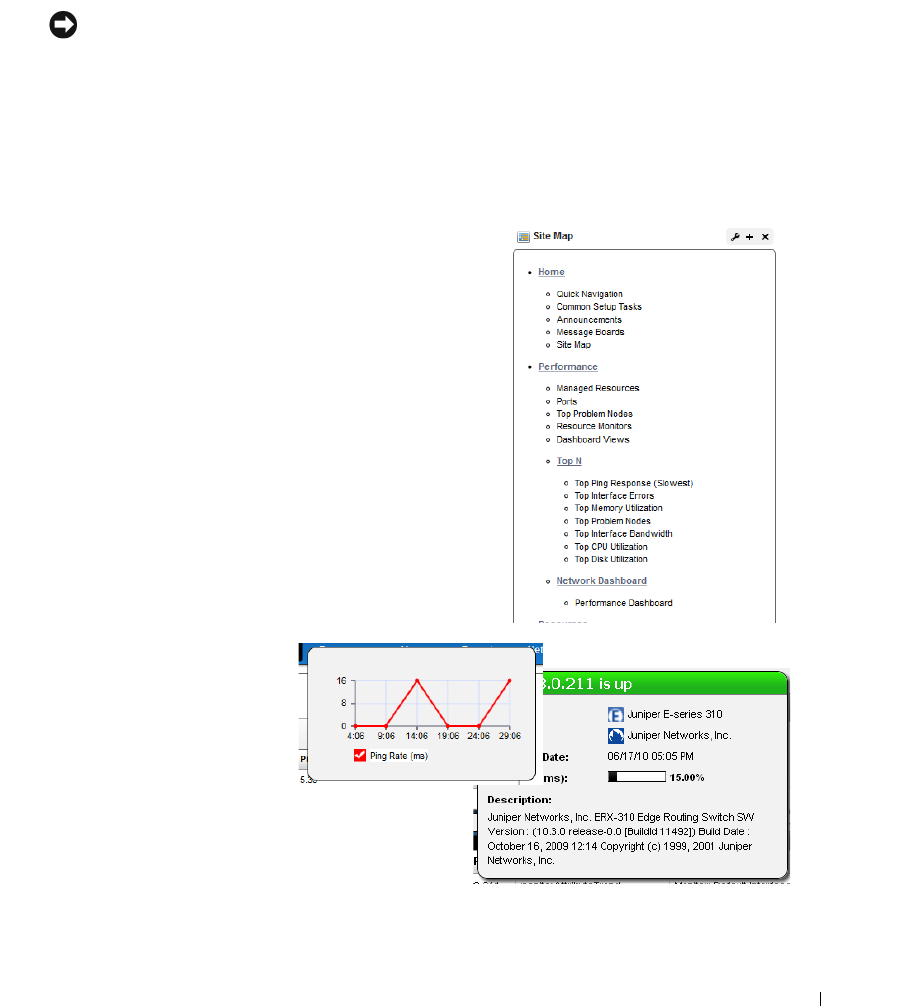
Status Bar Alerts | Portal Conventions
101
The pages that appear on this bar can vary, depending on which Dell OpenManage Network
Manager package you have installed.
The toggle on the right side of the The Dock makes this menu bar appear or disappear.
NOTICE
You can drag and drop the menu bar labels to different positions, and can click a label to rename the
page, or delete it (with the “x”).
See How to: Create a new Page and Rearrange Pages on page 73 for more information
.
Site Map
To see where pages sub-pages, and portlets are within your
installation look at the Site Map portlet.
Click the link(s) to go to the pages. Use your browser’s
search function to find portlet names within this Site Map.
Graphs / Tooltips
Graphs can appear in performance portlets. These display
the real-time division of performance metrics, and you can
change their appearance, or associated data lists display.
Hovering the cursor over a listed
item in the column where a
question mark appears indicates a
“tooltip” with more information is
available for this item. An
informational popup screen
appears after a brief wait to query
the application server. These pop-
ups can include graphs of recent
activity too.
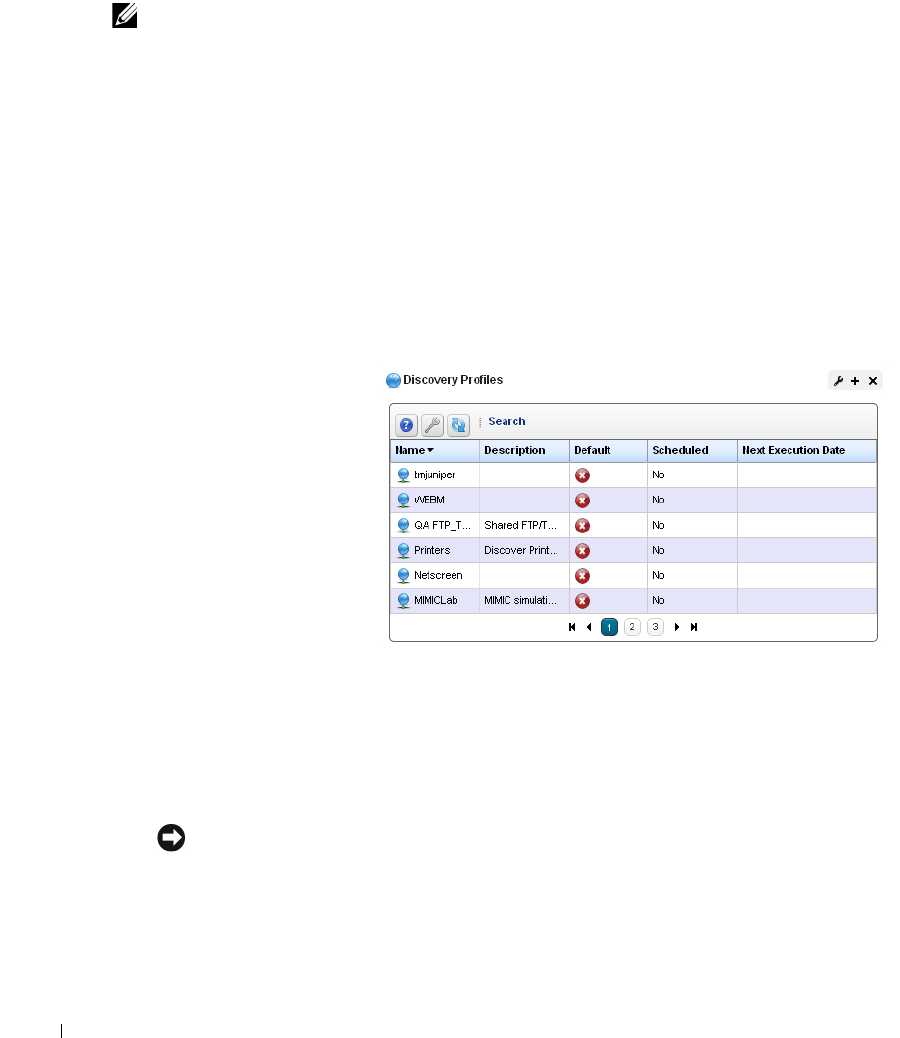
102
Status Bar Alerts | Portal Conventions
Graphs can appear as lines, bars or pie graphs, depending on the portlet, device and activity
monitored. For graphs like Top Talkers you can now see the port in the chart as a Legend tooltip.
NOTE:
Install the latest Adobe Flash for graph functionality.
Portlets
Portlets are the elements of any page within the Dell OpenManage Network Manager web client.
You can drag and drop them or add/delete them within pages to configure the portal’s appearance.
Initially, they appear in a small, summary screen format. Click
Add > More...
to add a portlet to a
page you have created. See Portlet Instances on page 105 below for the distinction between portlets
that display the same data, and portlets that can exist in more than one instance, displaying
different data.
For a more specific look at available portlets, see the chapters following this one. The following
describe common portlet features.
One of the first portlets
typical users see is Discovery
Profiles.
To act on listed items, right-
click. A menu appropriate to
the portlet appears.
The title bar for the portlet
displays its name. To rename
it, click on the name, and the
field becomes editable. You
can make changes, then click
the green checkbox to accept
them (or the red “X” to
abandon them). The right portion of the title bar contains several editing controls. Clicking on the
wrench icon produces a menu that leads to editors for the
Configuration
of this portlet (user
permissions to view and configure, Sharing, and so on).
1
The plus or minus (+ or -) icons
Minimize,
displaying only the title bar, or
Maximize,
displaying an
Expanded Portlets, and X removes the portlet from the page
.
NOTICE
To see information about listed items in a portlet, hover your cursor over the row until a question mark
appears. A mini-query about the selected item appears in a large tooltip. See Portlet Toolbar below for a
description of the buttons at the top of portlets.
1. Some portlets, like Site Map, let you import or export .lar files of their setup and user preferences.
Status Bar Alerts | Portal Conventions
103
Portlet summary screens support displaying up to 200 rows, the expanded portlet supports 1000.
Using the portlets’ filtering capability makes more sense than trying to see more rows. (See How to:
Filter Expanded Portlet Displays on page 108.)
Portlet Toolbar
Buttons on portlet toolbars let you do the following:
?
—The Question Mark icon accesses online Help, opening the page appropriate for the
portlet.
Refresh—
Isolates the browser’s page refresh to the selected portlet
Settings
—Configures the portlet’s filter, size, and so on. In portlets like
Alarms
, this also can
configure whether charts / graphs appear.
NOTICE
Even if the current filter is identical on summary and expanded portlets, the list of items may vary
between the two views because they have different numeric limits for the number retrieved items. The
workaround to make this difference irrelevant is to use the Search button to find items. It searches the
entire database.
Search—
Locates an item in the portlet. When you click this, the columns filtered in the database
appear indented. For example,
Name
and
Model
appear indented in the Managed Resource
portal.
This search function highlights the column header in columns searched. This search provides
a generic string search, and may not be compatible with all fields. For example you must use
advanced search available in Expanded Portlets to search IP addresses.
NOTICE
Search appears in the footer if the widget has pagination.
Similar functionality is available in Expanded Portlets when you click these buttons in the upper
right corner. The
Settings
button also lets you configure the columns displayed and their order. See
How to Show / Hide / Reorder Columns on page 107.
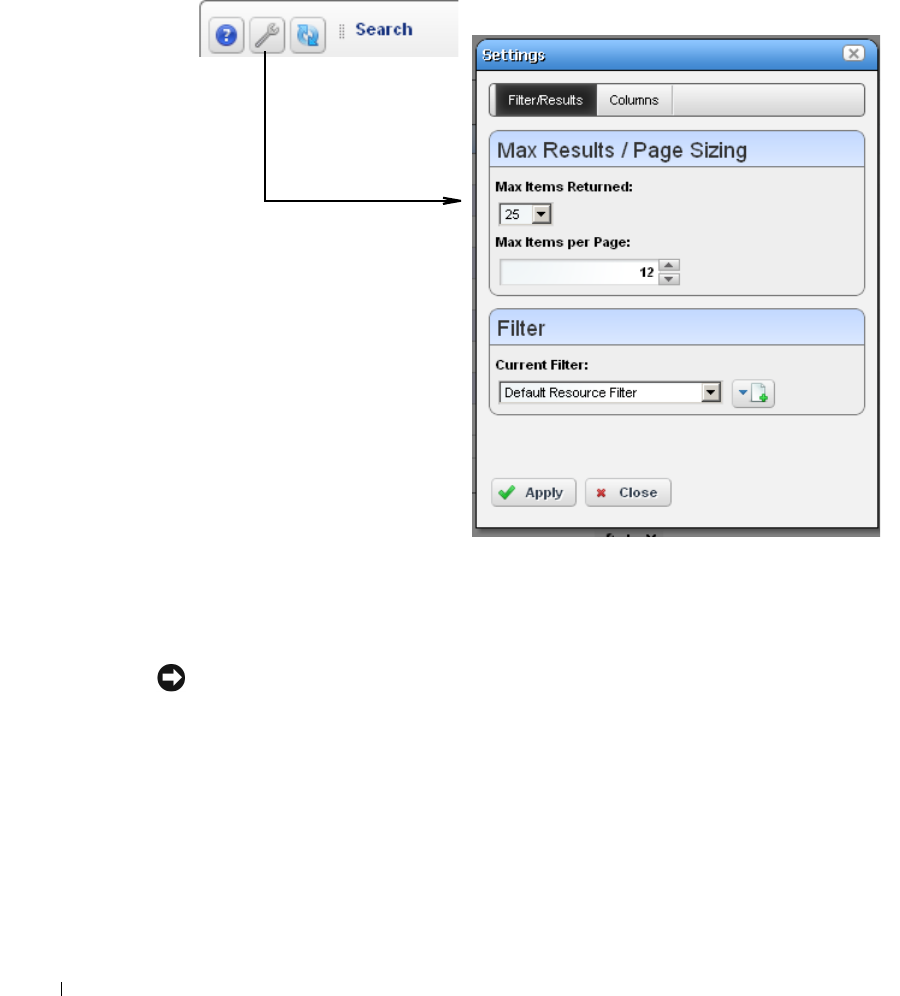
104
Status Bar Alerts | Portal Conventions
Settings
The
Settings
button opens a screen where you can configure the
Max Items
that appear in, and the
Filter
applied to the summary portlet with an
Apply
button to activate any changes you make there.
The
Settings
screen also includes a tab where you can Show / Hide / Reorder Columns.
For performance reasons, Max Items are often relatively low defaults.
Settings
in expanded portlet does not include the
Filter
item where you can set the default filter for
the portlet. See
Filter Expanded Portlet Displays on page 108
for information about the alternative.
NOTICE
As an Administrator, you can configure a portlet’s default display filter, then click the portlet name and re-
name it. For example, make the default filter in Managed Resources display only Dell Routers, then click
Managed Resources in the upper left corner of the portlet to rename it Dell Routers.
If you are not an administrator, you must make a personal page for such portlets if you want the
filter settings to persist.
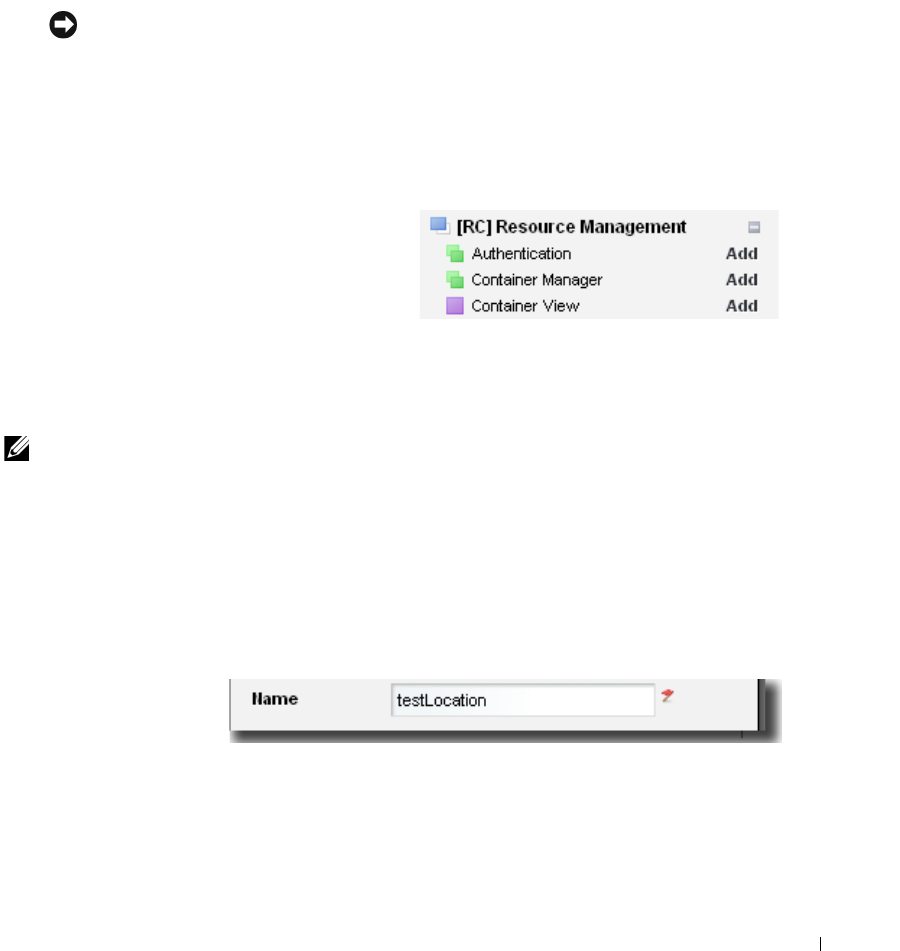
Status Bar Alerts | Portal Conventions
105
Search
You can search by clicking
Search
at the top of portlets. This opens a search field where you can
enter search terms for all the fields that appear in the list at the top of the portlet. The search is for
what you enter, no wildcards are supported. To clear a search, clear the field.
This searches all available items in the database, whether they appear listed or not.
NOTICE
Sort on a column by clicking on that column’s heading. Reverse the sort order by clicking it again. This
only sorts what appears in the portlet, whether expanded or not. The application remembers each user’s
choice saving the last Sort Column and Order on any page. Most portlets also “remember” settings for
Max Items and the selected Filter.
Portlet Instances
When you add content to a page, some portlets
(for example, the OpenManage Network
Manager Container View portlet) appear with a
purple icon and others (for example, the
Authentication or Container Manager portlets)
have green icons. The green-icon portlets are
instanceable and the purple-icon portlets are non-instanceable.
In other words, you can add only one instance of the (purple-icon) Container View portlet to a
community; and it displays the same data, even if it appears on more than one screen.
NOTE:
Once you have added a non-instanceable portlet to a page, its entry in the Add menu appears grayed out
and disabled. You can add more than one non-instanceable portlets to different pages, but they display
the same data. Instanceable portlets can appear multiple times on the same page, and can display
different data.
The Authentication portlet, for one example, is different. You can add it many times to pages in the
community, and can configure each instance of the portlet to display different authentication data.
Mandatory Fields
Some portlets include
editors. These appear after
you select an item, right-
click, and select either
New
or
Open.
Mandatory fields in these editors appear with a red flag icon to their right. That flag
may disappear once you fill in the field. Mandatory fields in an Action appear with a red flag icon to
their right. That flag disappears once you add the action to an Action Group.
106
Status Bar Alerts | Portal Conventions
Sorting Portlet Lists
Sorting tables that list items occurs when you click a
column heading. The arrow to the right of that heading’s
text displays the direction of the sort (ascending or
descending). When the arrow appears in a heading, the
selected column is the basis for sorting.
Expanded Portlets
Many portlets appear with a plus (+) icon in their upper-right corner, and can expand to display
more information and permit multi-selection of listed items. Return to the smaller portlet by
clicking
Return to Previous
in the expanded portlet’s upper right corner.
NOTICE
If you want to multi-select within listed items in a portlet, you must typically expand it. One exception to
this rule: the File Management portlet.
User permissions may limit access to the expanded portlets. For example, OpenManage Network
Manager can have many communities and limit users’ memberships. Such users can lightly browse
other Communities’ screens without full privileges
1
. See Control Panel on page 43 for more about
setting up user privileges for portlets.
1. Screen size limitations may require you to expand the browser to see expanded screens correctly. You must have at
least 1250 pixels in width.
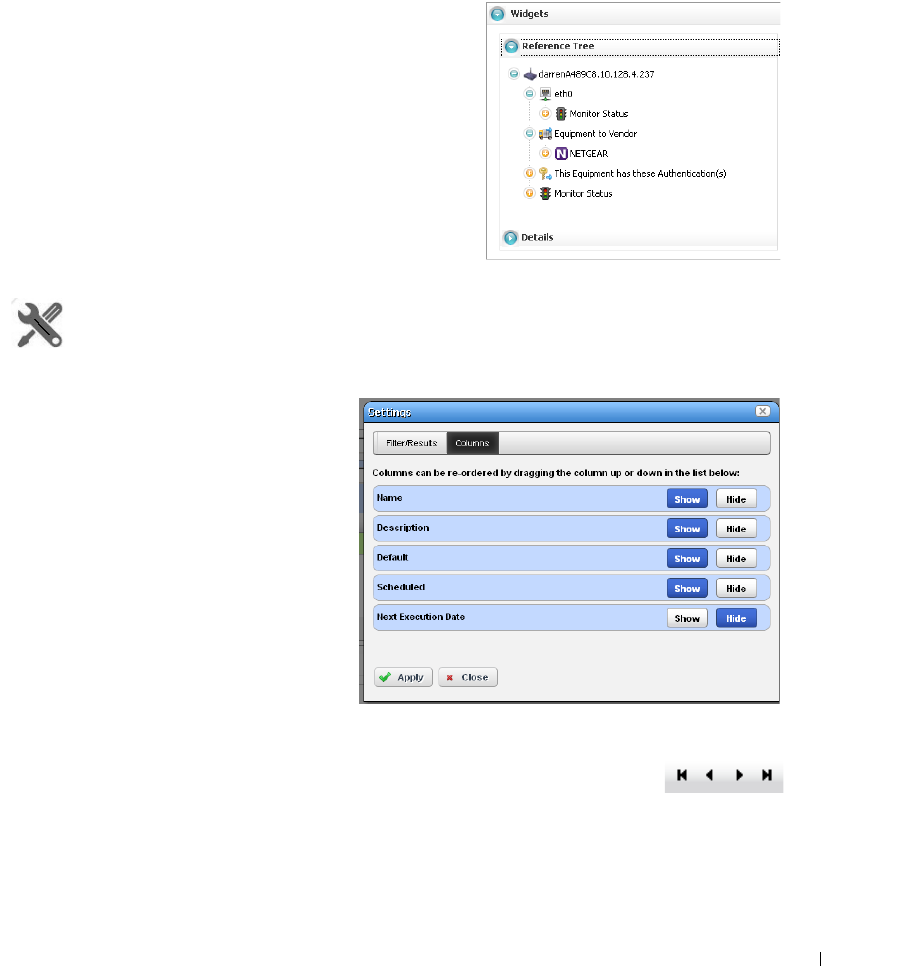
Status Bar Alerts | Portal Conventions
107
You can right-click to act on listed elements as in the basic, smaller portlet, but here you can also
see details about a selected row in the Widgets / Snap Panels
below the table list items in an
expanded portlet. Click on the circle / triangle labeled
Widgets
to collapse the lower panel.
Widgets / Snap Panels
The widgets, or snap panels that appear below the
expanded portlet’s list can “stack” on top of each other, so
several can appear simultaneously in each slot for Snap
Panels. Click the title bar of the panel to toggle its
expansion or collapse. In the Reference Tree snap panel,
click the plus (+) to expand the tree of connections.
You can collapse the entire snap panel area by clicking the
button next to
Widgets
at the top left of the bottom
portion of expanded portlets. These panels re-appear when
you click the
button again.
How To:
Show / Hide / Reorder Columns
Click the
Settings
button in an expanded
portlet, and screen appears with a
Columns
tab where you elect to show or
hide columns. Click the appropriate
buttons (they change color) to display the
columns you want. You can also drag-and-
drop the order in which columns appear
to re-arrange the display. Click
Apply
to
change the columns that appear on
screen by default. Abandon any changes
and
Close
this screen. The changes
appear instantaneously when you return
to the expanded portlet.
Pages
Most portlets use the “recorder” icons to page through a list that occupies more
than one screen. The right/left arrows go forward and back one page. The icons at
either end go to the beginning or end of the pages.
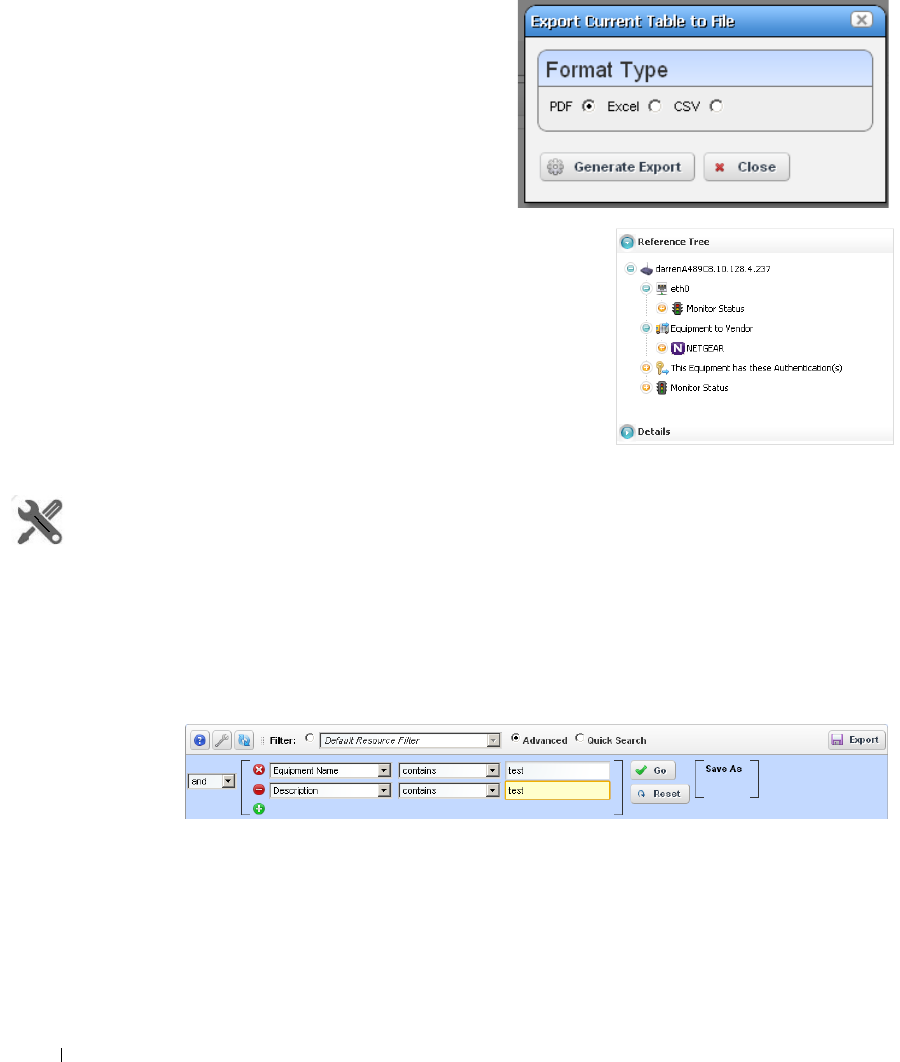
108
Status Bar Alerts | Portal Conventions
Exports
You can export from expanded portlets to Excel
and Acrobat formats. Click the
Export
button in
the upper right corner, and select the type of
export. These selections download to the default
download location you have configured on your
browser. Some browsers display the pdf before
you can save it.
Widgets / Snap Panels (Reference Tree)
These vary, depending on the portlet, but the
convention of displaying a
Reference Tree
panel is common.
This displays items related to the selected list item in tree
form. Click the plus (+) to expand a node on the tree.
Click
Return to previous
in the upper right corner of the
expanded portlet to return to the summary page where you
started. If the page you are on has a “breadcrumb trail” of
intervening detail pages (for example), you can click an
intervening page’s breadcrumb if you do not want to return
to the previous screen
How To:
Filter Expanded Portlet Displays
Among other places, filters appear at the top of expanded portlets. Many pre-installed filters come
from drivers your installed package. Filters match entity types, but may not necessarily be sensible
in the context of a particular portlet.
You can pick from already-configured filters with the drop-down on the left, or you can click
Advanced Filter
to create one of your own.
After you click the green plus (+), select
and
or
or
on the left to combine more than one filter.
Click
Apply Filter
to see the list after the filter acts on it. Click
Reset
to return the list to its original
state. This search function highlights the column header in columns searched if it looks in more
than one.

Common Menu Items | Portal Conventions
109
Click
Save As
to preserve a filter you have configured for future use. The pick list in the upper left
corner of this filter panel is where you would select it.
Create a name and description, then click
Save
on the next screen to preserve your filter
configuration. See Redcell > Filter Management on page 56 for the screen that lists all such filters.
When using a filter you must click the
Go
buttons to the right of the drop down list to make it take
effect.
NOTICE
You can also filter what appears on a page with the Container View portlet. Select a container, and the
rest of the portlets on that page confine displayed data to reflect the selected container’s contents.
Locating Portlets
Portlet locations can depend on package configuration and user preferences. To find the current
location of a portlet within the pages of your system, add the Site Map portlet to a page, locate the
portlet you want in the list of portlets in the Site Map, then click the link above the listed portlet to
go to that page.
Common Menu Items
Several (right-click) menu items appear in multiple portlets. In addition to editing commands
(
New, Open
), such menus let you:
•
Import / Export
[All]
•
Share with User
—See Sharing, below.
•
Edit Custom Attributes
•
View as PDF
Import / Export
Menus often contain these options:
Import
— Retrieve a file with an XML description of the listed items in the manager. Some imports
can come from a URL.
Export Selection
— Export a file with a text or XML description of the selected item(s) in the
manager

110
Common Menu Items | Portal Conventions
Export All
— Export a file with a text or XML descriptions of all listed items in the manager.
You must import into the correct portlet. You cannot import event processing rules into the Actions
portlet, for example. You must import event processing rules into the Event Processing Rule
portlet.
NOTICE
To Print a portlet’s contents Export an expanded portlet into PDF, Excel or CSV format and print or open
the exported file in another program. The filter applied to the portlet when you do this determines what
appears in the exported file.
Sharing
You can share elements within Dell OpenManage Network Manager with colleagues when more
than one user exists on your Dell OpenManage Network Manager system, and consult with them
using the texting described in Status Bar Alerts on page 98.
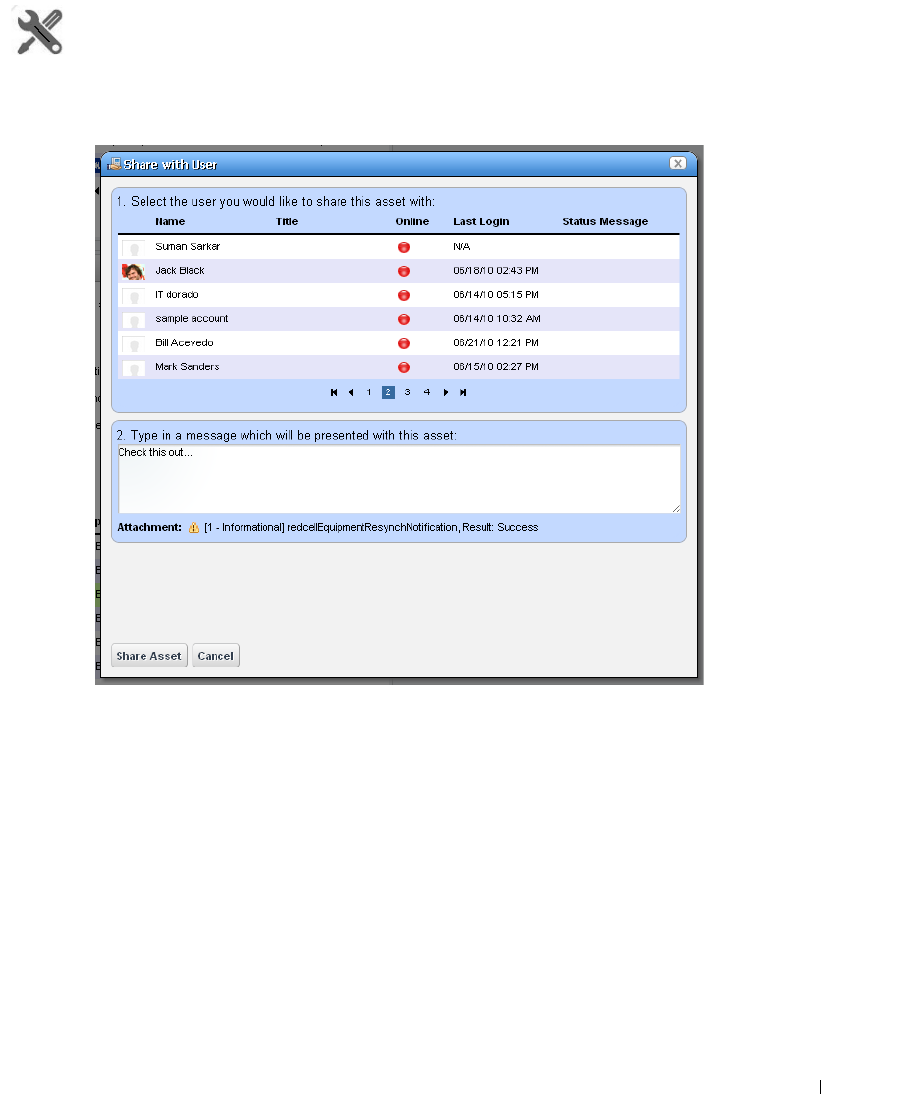
Common Menu Items | Portal Conventions
111
How To:
Share a Resource
To share an something, first select it where it appears listed in the appropriate portlet. Right click
and select
Share Asset
.
In the subsequent screen, select a user with whom you want to share, type any message you want to
include and click
Share Asset.
The chat message to the selected user includes your text and a link
that opens to display the Snap Panels for the selected item.
Cancel
aborts sharing.
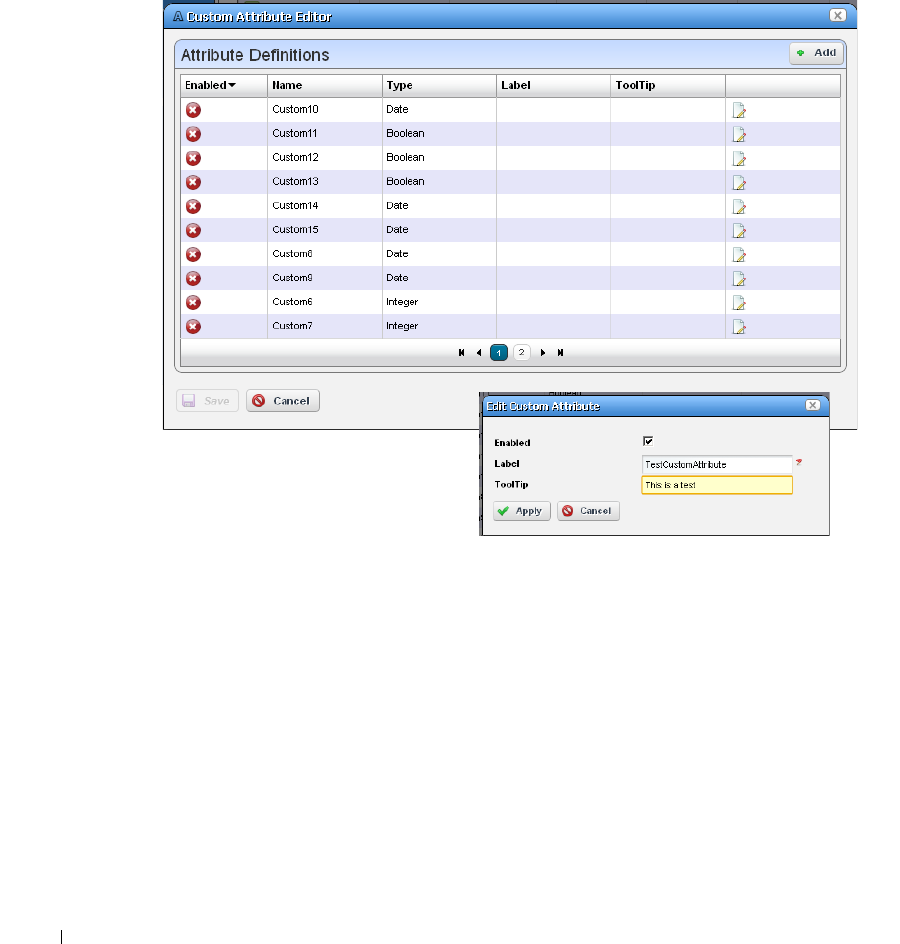
112
Common Menu Items | Portal Conventions
Edit Custom Attributes
In several right-click menus (Managed Equipment, Port, Contact, Vendor, or Location), the
Edit
Custom Attributes
menu item lets you open the custom attribute editor appropriate for the device
type listed in the portlet. See Redcell > Data Configuration on page 55 for another way to get to
this editor.
Clicking the
Edit
icon for a row in the editor lets you edit rows describing custom fields with the
popup editor. The following are typical custom attribute properties you can alter:
Enabled
— Check Enabled to activate the selected custom field.
Label
— This is a label for the tooltip identified in the
Name
. The Label is what you see in the
portlets appropriate for the entity type you have selected. The
Ty p e
column in the attribute
describes the data type of the custom attribute (String, Integer, Date, Boolean–read only).
When you select Boolean the field is a checkbox.
Tooltip
— The tip that appears when you hover the cursor over the custom field.
Click
Save
to preserve any changes you have made, or
Cancel
to abandon them. Edit a resource and
look in the Extended Details / Custom Attributes panel to see them.
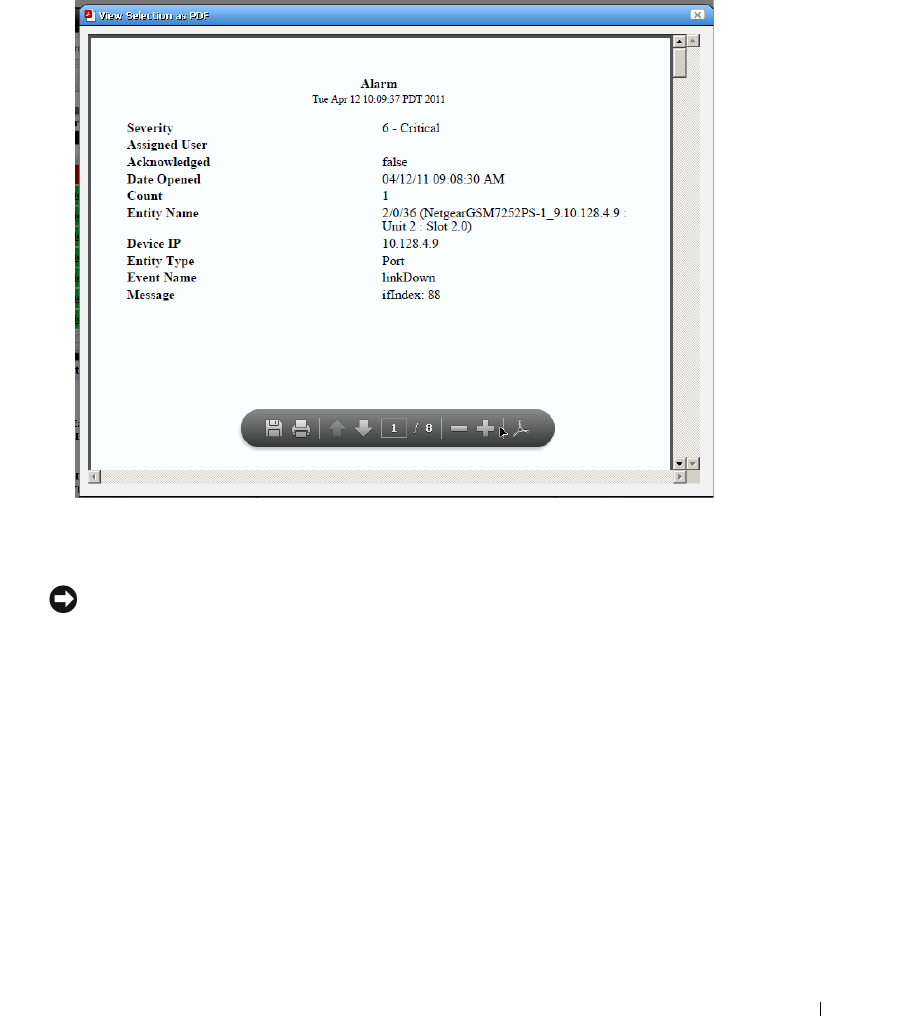
Common Menu Items | Portal Conventions
113
View as PDF
This displays the selected asset’s information as a PDF.
You can search, print or save this to file, and use any of the other Acrobat capabilities. Clicking the
acrobat logo docks the floating / disappearing Acrobat toolbar within this screen.
NOTICE
To search the PDF produced, click the binocular icon in the docked toolbar. Dock the toolbar by clicking
the Acrobat icon on the far right.
You can also create PDF reports containing descriptions of multiple selected assets, but you must
open an expanded portlet to multi-select.
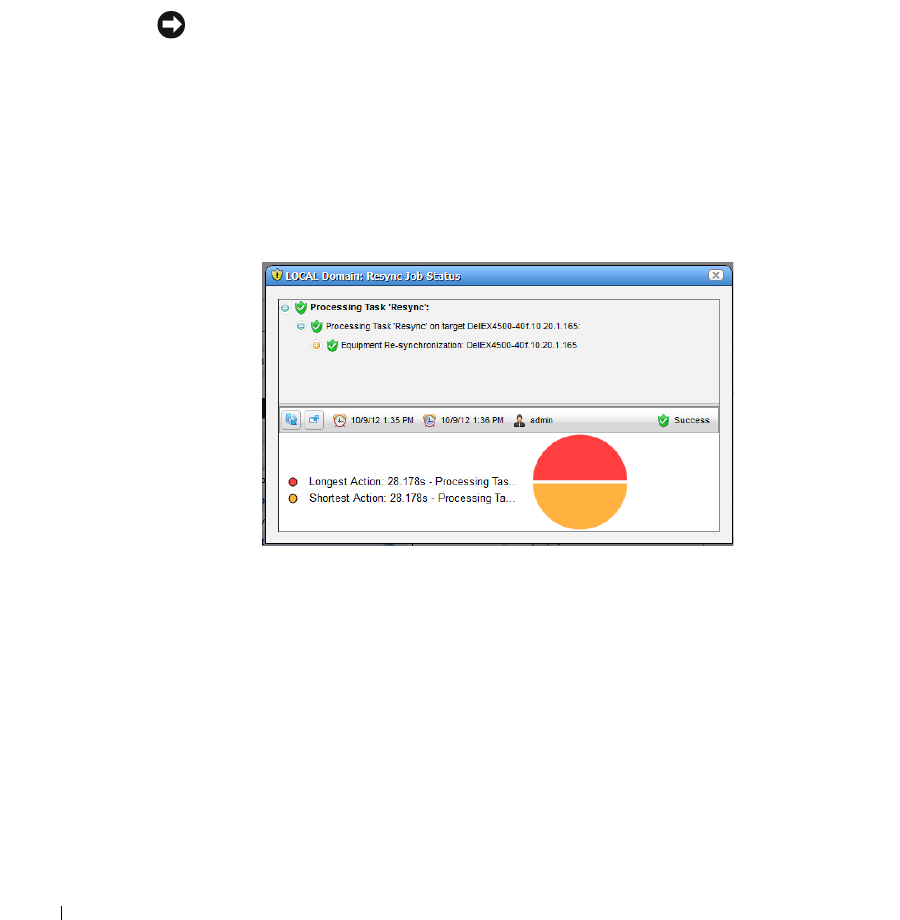
114
Audit Trail / Jobs Screen | Portal Conventions
Tag
The right-click menu of many items lets you tag them, for example Managed Resources, Locations,
Contacts, Customers, Services and Containers. When you select the
Tag
menu item, and
Coordinates
, a new Map popup appears (see Tag on page 173) and you can search for an address or
click on the map to specify its coordinates. See Map Context on page 249 for more information
about the uses of tagging.
NOTICE
If you want to enter the longitude and latitude of your Dell OpenManage Network Manager installation,
this is one way to get it. Go to Control Panel’s Redcell > Application Settings to enter the information.
Audit Trail / Jobs Screen
When you execute an action, for example when you resync network resources, an audit trail screen
appears with a tree displaying the message traffic between Dell OpenManage Network Manager
and the device(s) the action addresses.
To see the details of any message, click on it, and those details appear in the lowest panel of this
screen. If you click on a summary message (not a “leaf” on the tree), a graph appears displaying the
duration for its component messages. Hover your cursor over each portion of the graph for more
details.
The time for messages and logged in user initiating the action appear on the bar between the upper
and lower screen, and an icon summarizing the action appears on its right. Click the second icon
from the left to configure the amount of detail displayed in audit messages. Click the first
(
Refresh
)
icon to re-display messages if you re-configure the type(s) displayed.
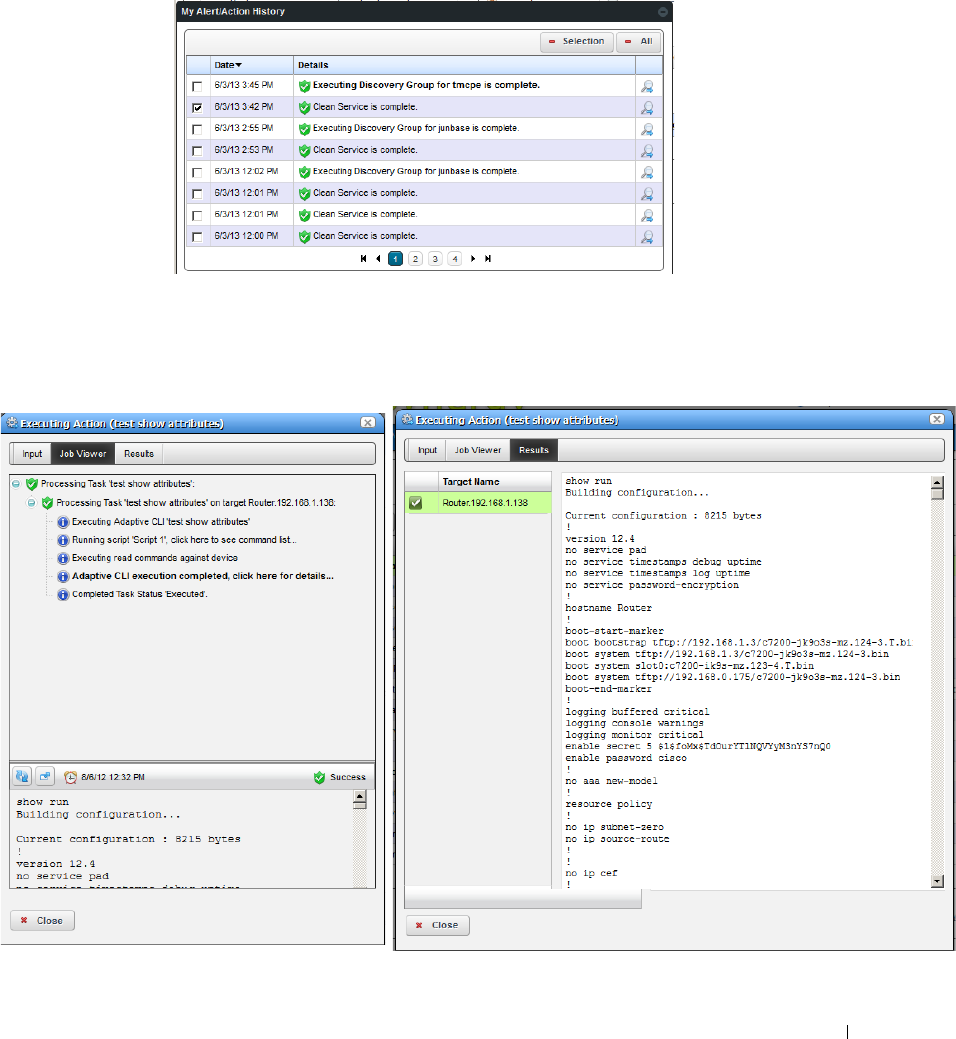
Audit Trail / Jobs Screen | Portal Conventions
115
To review the audit trail for recently completed processing, open the
My Alerts
tab in the lower left
corner of the portal, and click the magnifying glass to the right of the message.
Some audit trails display as many as three tabs for the
Input
(the command variables sent to the
device), the
Job Viewer
with the message traffic to the device, and finally the
Results
of sending the
messages to a device
1
. This lists devices on the left, and message traffic for a selected device on the
right.
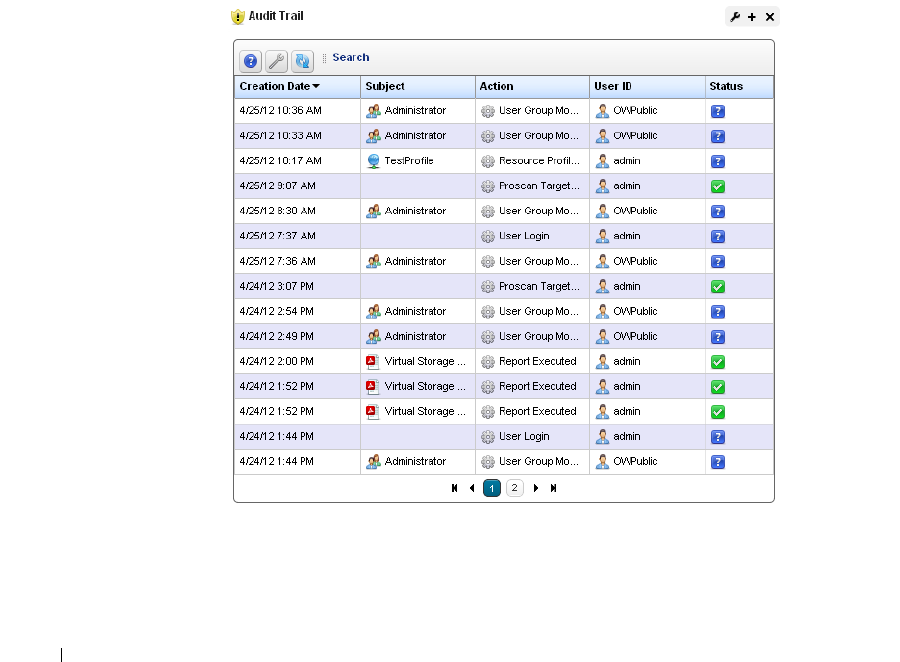
116
Audit Trail Portlet | Portal Conventions
Close the audit trail viewer any time, and the action continues in the background. The the audit
trail is archived in the portlet described in Audit Trail Portlet on page 116.
Configuring Job Viewer’s Appearance
In Control Panel, the Redcell > Application Settings screen contains a Job Viewer panel where you
can elect any of the following:
• Show Job Viewer after Execution
• Always show Job Viewer for Actions
• Show Information Messages by Default
Check the checkboxes next to these options to enable them.
Audit Trail Portlet
The audit trail summary portlet displays an archive of the message traffic between Dell
OpenManage Network Manager and monitored devices, as well as OpenManage Network
Manager’s reaction to failed message transmission.
1. This screen can, by default, conceal the info-level messages. To see them, click the icon next to the Refresh icon to
open the message level selector and check the info circle level of reporting, then click Refresh to see those blue
circles.
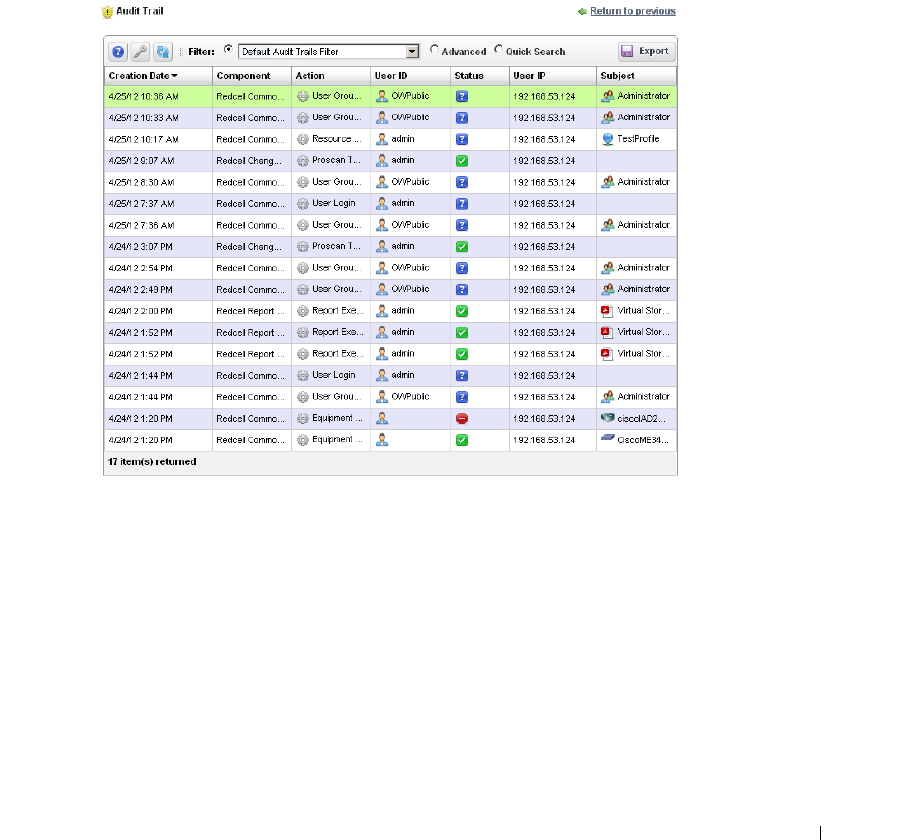
Audit Trail Portlet | Portal Conventions
117
The
Creation Date, Subject, Action
(the summary message of the audit trail)
, User ID
(the login
ID of the user whose actions resulted in this trail)
,
and
Status
of the messages appear in the table
(hover the cursor over the icon for a text message describing status). Right click to
Delete
a
message, manage its
Aging Policy
or
View as PDF.
See Redcell > Database Aging Policies (DAP) on
page 58 for more about such policies.
Expanded Audit Trail Portlet
When you click the plus (+) in the upper right corner of the summary screen, the expanded portlet
appears. Click the
Settings
button to configure the columns that appear in this screen and their
order. Filter the appearance of the screen with the
Advanced Filter
capabilities at its top.
In addition to the summary screen’s columns, the following are available in this screen:
User IP
—OpenManage Network Manager creates the Audit Entry for IP Address of the related
user. If it cannot acquire the user’s IP Address or if the audit entry occurred because of a
Scheduled or System event then the IP address is for the related Application Server.
Subject
—The equipment at the origin of the message traffic with Dell OpenManage Network
Manager.
You can right-click a selected item and either
Delete
it, or
View Job.
This last option displays a
screen with the details of the job itself.
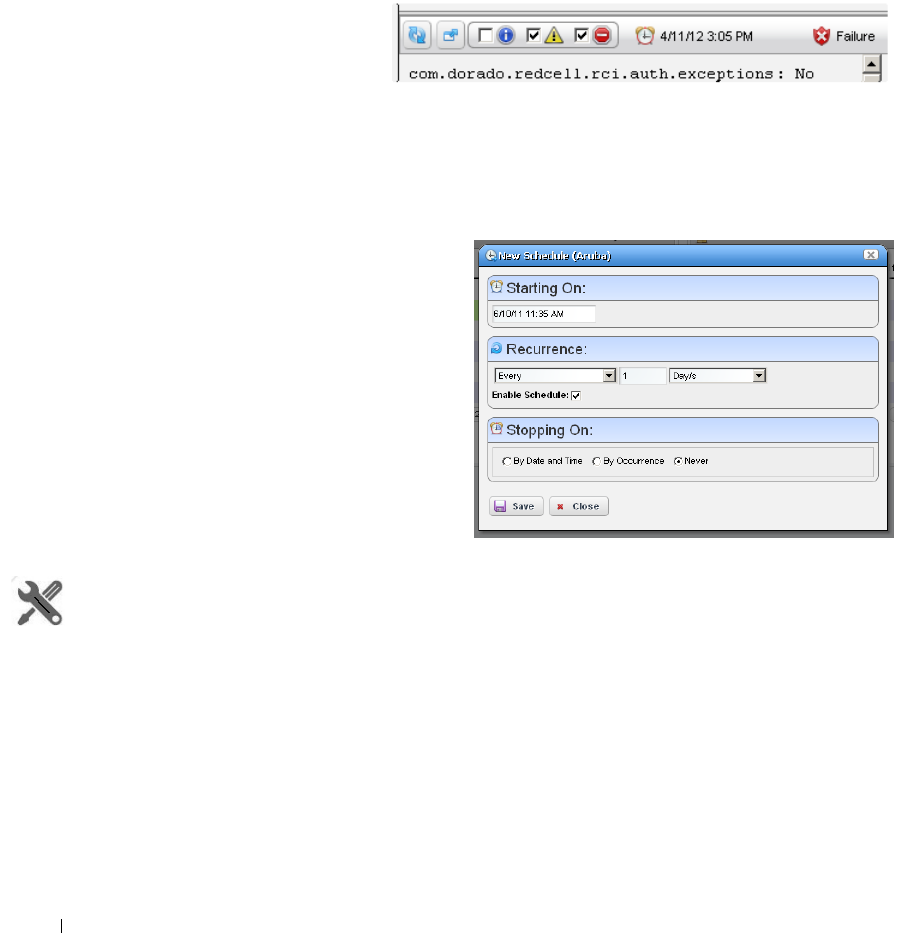
118
Schedules | Portal Conventions
View Job
The
Audit Job Viewer
displays the audit trail messages in tree form. To see the contents of an
individual message that appears in the upper panel, select it and view its contents in the bottom
panel. The divider has
Refresh
double-arrow, and screen/arrow icons in the left corner, and an icon
indicating the status of the job on the right. Click
Refresh
to clear an old message so you can view a
new one.
Click the screen/arrow icon to
check (info, warning, error) filters
that limit the types of visible
messages. Notice that when you
select a message, its date and
time appears to the right of screen/arrow icon.
Schedules
To schedule an action, for example using a
discovery profile, right click and select
Schedule
. The Schedule panel appears,
where you can create a new schedule,
entering a
Starting On
date and time, and
Stopping On
date and time or occurrence
number. You can also configure recurrence
in this screen.
Once you save the schedule, the action (for
example Discovery Profile) it also appears in
the Schedules Portlet as a scheduled item.
How To:
Schedule Actions
To schedule an action triggered from a right-click menu (for example from Managed Resources or
Schedules portlets) rather than execute it immediately, follow these steps.
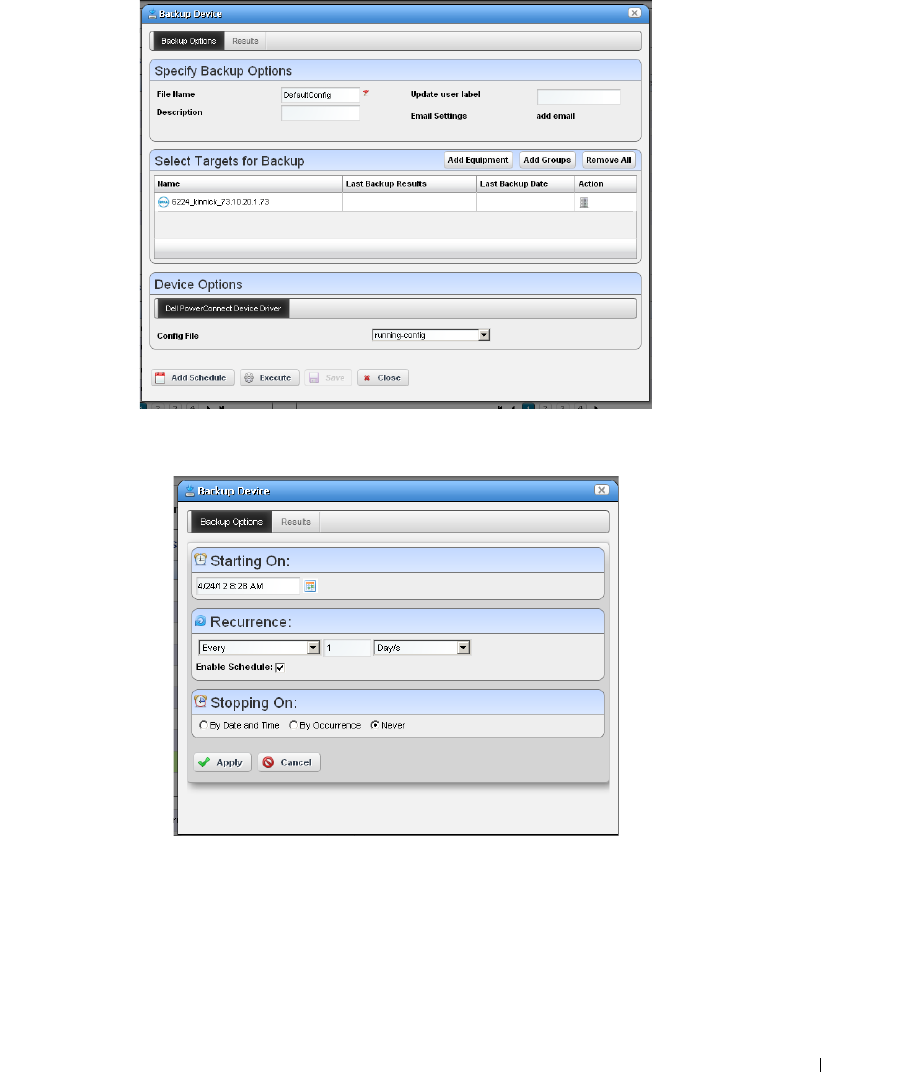
Schedules | Portal Conventions
119
1
Select the action in the right-click menu. For example: device Backup.
2
Rather than clicking
Execute
, click
Add Schedule
.
3
The schedule panel appears.
Configure the start time and date, recurrence, and stop parameters in this screen. The
Results
tab displays an audit trail when the action executes.
4
Once you click
Apply
on this panel, the previous panel returns, the
Add Schedule
button now
appearing as
Edit Schedule
.
120
Schedules | Portal Conventions
5
If you click
Save
, Dell OpenManage Network Manager creates a scheduled item around the
activity and its data. A row also appears in the screen described in Schedules Portlet on page
120 for this schedule.
6
When you have scheduled something from the
Add Schedule
button, clicking
Apply
in the
schedule panel returns you to the previous screen.
7
If you click
Execute
in that previous screen, the action begins, and audit trail panel appears,
displaying the running job for the activity. If you have attached a Schedule, Dell OpenManage
Network Manager also saves the activity as a scheduled item in the Schedules Portlet.
Schedules Portlet
You can view and modify schedules in the
Schedules
portlet, or the Expanded Schedules Portlet
This displays the
Enabled
status, a
Description,
the
Ty p e
of schedule, its
Next Execution
and
Recurrence
in columns. You can do the following by right-clicking a scheduled item, and selecting
the appropriate menu item:
New
—This lets you initiate new schedules for a variety of actions, selected from a sub-menu. The
subsequent screen’s appearance depends on the action selected. See Managed Resources on
page 195 for more about available actions. See Scheduling Actions on page 439 for the details
of scheduling actions that require parameters. You can also schedule Action Groups, Alarm
Suppression, Config File Backup / Restore, execution of a Database Aging Policy, and OS
Image Deployment.
Action Groups are named combinations of actions. The subsequent editor screen lets you
configure Actions, their targets, and the order in which they execute.
Edit
—This appears for an activity-based scheduled items. It opens the activity editor, and lets you
modify the activity’s data/properties and schedule parameters.
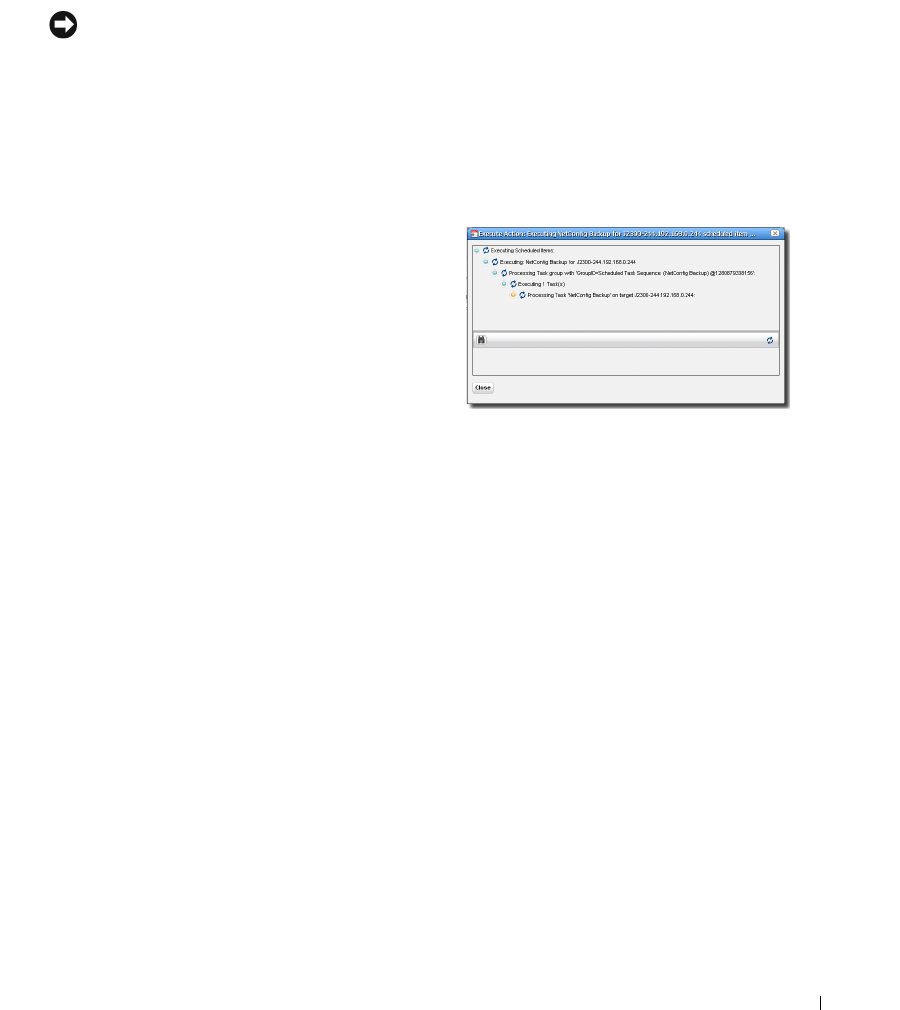
Schedules | Portal Conventions
121
To edit an existing schedule for an already scheduled action like a Discovery Profile, just right
click the item in its portlet and select
Schedule
. This displays the schedule information for the
discovery profile and lets you make modifications.
NOTICE
You can also schedule new actions from the portlet that ordinarily executes them, for example Resource
Discovery on page 180.
Delete
—Deletes the selected scheduled item, displaying a confirming dialog box.
Enable Schedule
—Appears on an already disabled scheduled item so you can change its status. To
enable the schedule, you can also edit it and check the
Enabled
check box.
Disable Schedule
—Appears on an already enabled scheduled item.
Execute
—Executes the scheduled item. If the
scheduled item is an activity-based or discovery-
profile based scheduled item, an audit viewer
appears progress of the selected item.
For other types of scheduled actions, a dialog
appears saying
The scheduled item(s) has been sent
to the application server for immediate execution.
You can monitor its progress in the audit trail
portlet. (see Audit Trail / Jobs Screen on page 114)
If you have Dell OpenManage Network Manager’s Change Management / Proscan capabilities
installed, you can use Schedules to initiate the Change Determination process. See Change
Determination Process on page 382. It is disabled by default.
122
Schedules | Portal Conventions
Expanded Schedules Portlet
When you expand this portlet, the additional columns that appear include
Submission Date, Start
Date,
whether the schedule is still active (
Scheduled
), and the
Execution Count.
If a green icon appears in the
Scheduled
column, it means the schedule will be executed on next
start date. If the schedule has exceeded execution count or passed stop date (if specified), then a
red icon appears there.

Alarms | Key Portlets
123
5
Key Portlets
This section describes some of the key Dell OpenManage Network Manager portlets. You may not
have access to all of these in your installation, or you may not be able to use them with the user
permissions you have been assigned by the portal administrator.
To see all available Dell OpenManage Network Manager portlets, click
Add > Applications
and use
the field at the top of the menu to search for the portlet functionality you want to add. This limits
the display to Dell OpenManage Network Manager portlets. The previous chapter discussed the
Schedules Portlet on page 120.
Filter what appears on a page with the
Container View
portlet. Select a container, and the rest of
the portlets on that page filter their data reporting to reflect that container’s contents. The only
caveat for this advice is that Container View is non-instanceable. In other words, you can only add
one of them per page.
Alarms
In its summary form, this portlet displays alarms. See General > Entity Change Settings on page
58 for the way to set the summary portlet refresh interval. The default is 40 seconds. If this portlet
is on the same page as the
Container View
portlet, or if it is in expanded mode, refresh does not
occur automatically, but you can refresh it manually.
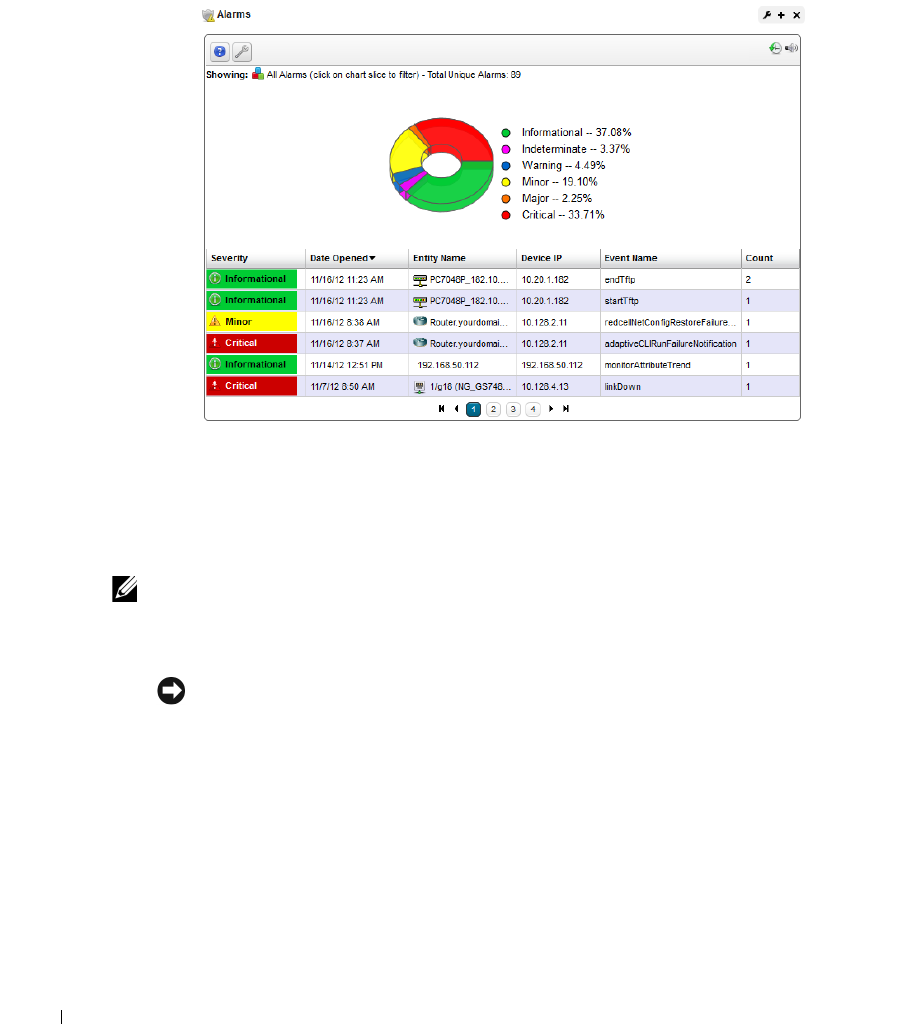
124
Alarms | Key Portlets
A small clock icon appears in the upper right corner of this portlet if auto-refresh is enabled. A
small speaker icon appears if audible alerts are enabled. See Audible Alerts on page 132 for more
about those.
The chart can act as a filter, too. For example, clicking the
Critical
alarms slice means only
Critical
alarms appear listed. Notice also that the chart “explodes” to highlight the selected slice. Hover the
cursor over a portion of the chart and a tooltip with information about that slice also appears. Click
exploded slices to return the graph to its unexploded state, and it stops filtering the list by the
selected slice.
NOTE:
If the legend appears below the Alarms graph, resize your browser (click and drag the right edge out,
then in), and the legend should re-appear to the right of the graph.
NOTICE
Different tooltips appear when you hover the cursor over columns for Entity Name and Device IP.
By default, the chart appears only when there are alarms. See Configuring the Alarms Chart below
for options available in configuring the display. See Menu on page 128 for details about menu items
available when you right-click in the summary and expanded portlets. The following columns
appear in this screen by default:
Severity
—The alarm severity indicated by the color of the leftmost icon. The severity only has
meaning for Alarms and Security Alarms. Informational Alarms get a severity level of
Indeterminate. Closed alarms appear without color.
Date Opened
—The date the alarm appeared.
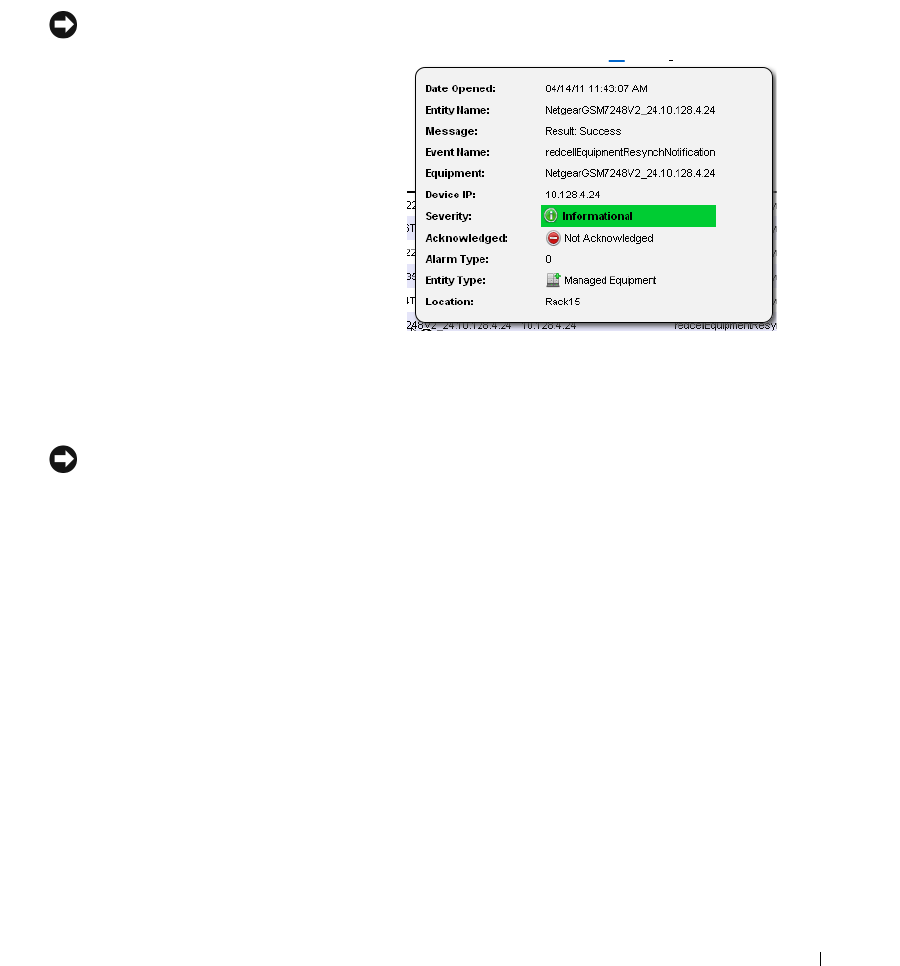
Alarms | Key Portlets
125
Entity Name
—The entity emitting this alarm (often within the Equipment).
DeviceIP
—The IP address of the equipment where the alarm appeared.
Event Name
—The event associated with the alarm.
Open the
Settings
>
Columns
screen to see additional possibilities for columns.
NOTICE
If you hover the cursor over a row in the portlet
display, a tooltip appears with information
about the alarm. This can include the alarm’s
Date Opened, the Entity Name, any alarm
Message, Event Name, Alarm and Entity Type,
its status as Service Affecting, Notification OID,
Equipment, Severity, whether the alarm was
Suppressed, or Acknowledged and the Device
IP.
If an alarm is
Service Affecting,
(reflect an
impact on a service) it can propagate to appear
as components of service- and customer-related
alarms. Service-Affecting alarms are of
indeterminate or greater severity. The Service Affecting alarm column in this portlet does not
appear by default. To see an alarm’s propagation, show that column in the Event Definitions
portlet, where it is concealed by default.
NOTICE
Many other columns are available, including those related to suppression, region, any parent alarm, and
so on.
See Alarms in Visualizations / Topologies on page 267 for a description of how alarms appear in the
topology portlet. The next section (Expanded Alarm Portlet) describes alarm actions and
additional alarm capabilities.
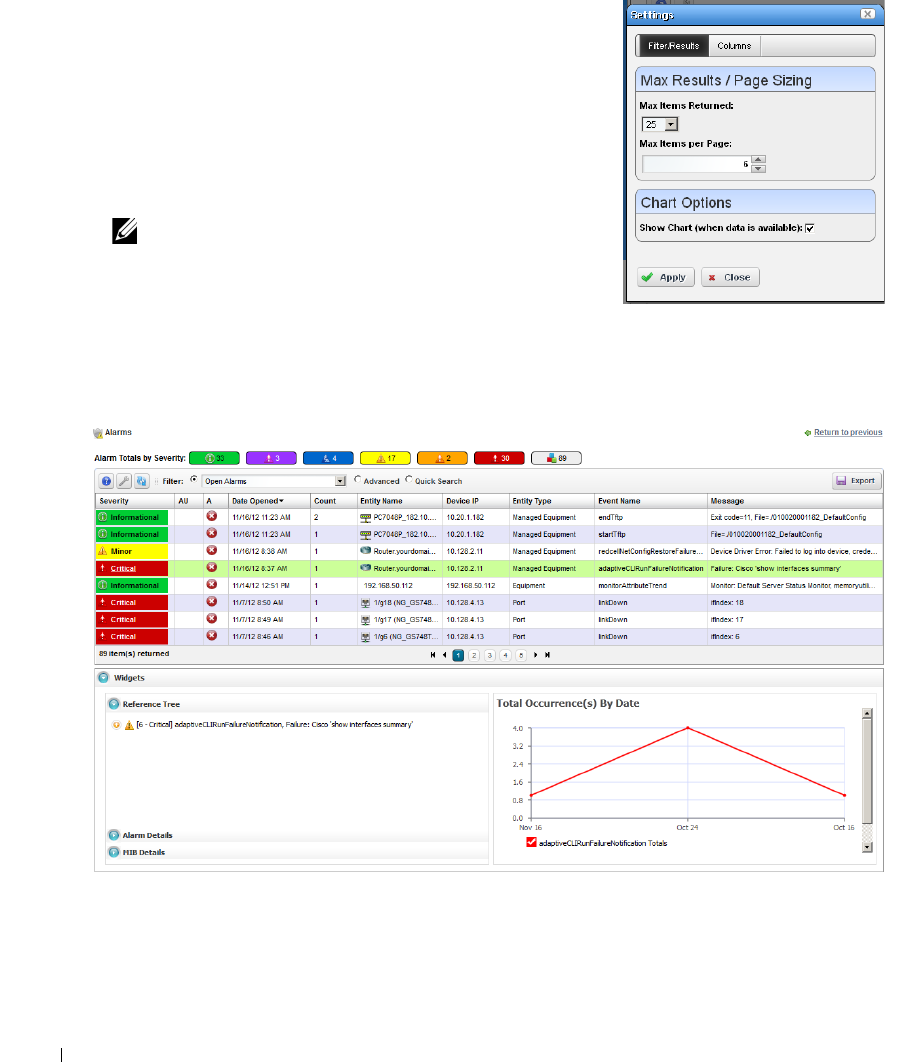
126
Alarms | Key Portlets
Configuring the Alarms Chart
Turn the chart on or off in the
Settings
screen’s
Chart Options
panel. If no data exists for the chart and the Chart option is
on, the portlet returns to “no-chart” mode.
When you enable the chart Filtering is disabled since the
chart, in effect, provides the filter. When the chart is disabled
then filtering options are available.
Settings are saved if you have Admin rights or the Portlet is on
your Public / Private pages (like standard behavior).
NOTE:
Changes appear after you click Apply. The Filter panel
disappears when you check the Show Chart checkbox.
Expanded Alarm Portlet
The expanded Alarm portlet appears when you click the plus (+) in the top right corner of the
smaller screen.

Alarms | Key Portlets
127
This displays listed alarms, totals by severity for alarm types found, and Snap Panel details of a
selected alarm. By default this screen adds the first of the following columns to those visible in the
Event History’s summary screen view. To add the others listed here, right click, and select
Add
Columns
to change the screen appearance.
NOTE:
All severity totals appear in expanded view. This display updates automatically when alarms clear.
The following are available additional columns, besides those visible in the Alarms summary
portlet:
Count
—A count of the instances of the alarm. Multiples of the same alarm appear as a single row,
but increment this count.
Entity Type
—The type of monitored entity.
Message
—Any message that accompanies the alarm / event.
Alarm State
—The state (open / closed) of the alarm.
Date Cleared
—The date and time that the alarm was closed.
UpdateDate Time
—The time stamp for when this alarm was updated (for an additional count,
the time the last duplicate was received).
Notification OID
—The identifier of the notification displayed as an alarm.
Equipment
—The name for the entity emitting the alarm.
Acknowledged
—
Tr u e
or
False
.
Assigned User
—The user who has been assigned this alarm (right click to do this). The assigned
user can then look for alarms by consulting the Assigned User (AU) column in the display
(concealed by default), or by filtering for his / her alarms in Advanced Filters. One can even
create an alarm portlet that filters for a single user’s assigned alarms.
Date Assigned
—The date and time that the alarm was assigned.
Ack Time
—The time the alarm was acknowledged.
Cleared By
—The user who cleared the alarm.
MIB Text
—The alarm’s MIB Text.
Rather than filtering with the pie graph, the expanded portlet lets you either the pick list at the top
left, or create custom filtering by clicking
Advanced Filters.
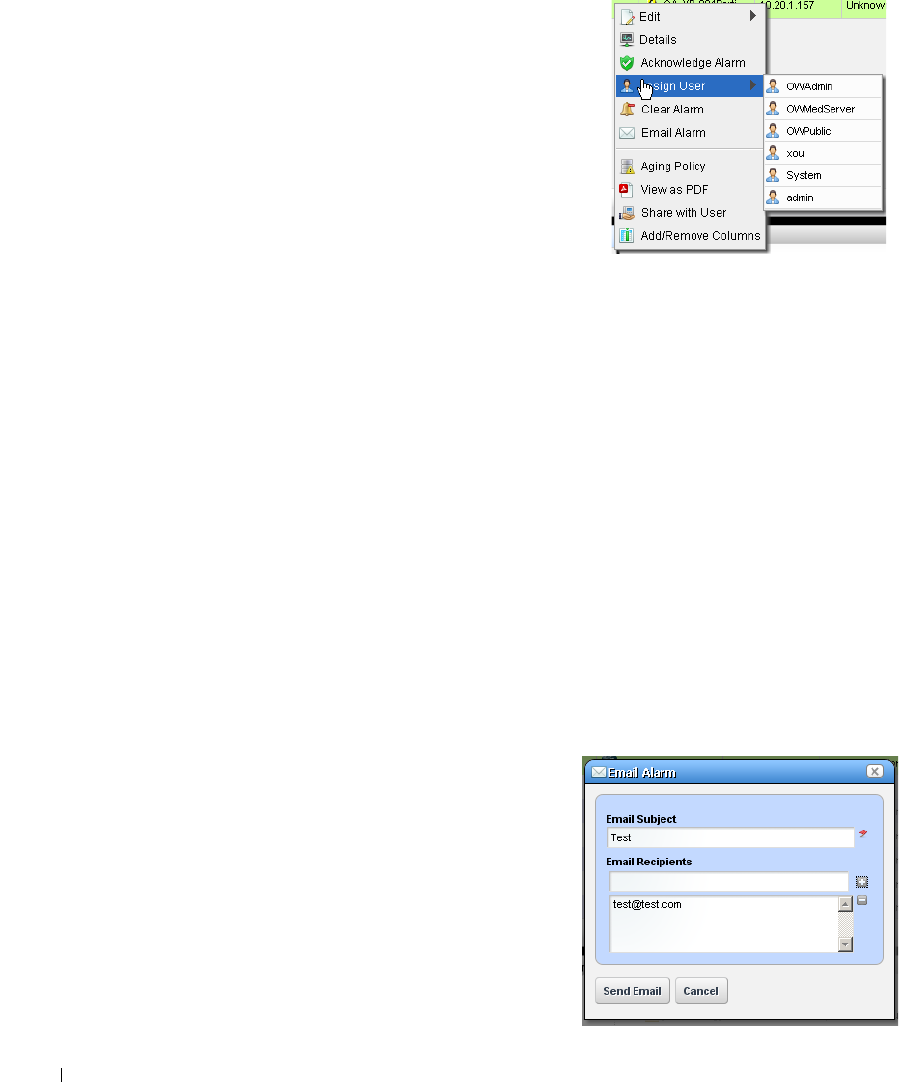
128
Alarms | Key Portlets
Menu
Right clicking an alarm lets you select from the following
menu items:
Edit
—Access the editors for the Alarm (see Alarm Editor
on page 131) or
Event Definition
(see Event
Definition Editor on page 158).
Details
—Open a Details screen for the alarm itself, not the
entity emitting it. (see Equipment Details on page
210 for an example of this type of screen). This
contains information like the MIB text, any Event
Processing Rules invoked, and a Reference Tree for the
alarm.
Visualize
—Display a topology map that includes the selected alarm(s). See Chapter 7, Display
Strategies for more about these maps.
Acknowledge / Unacknowledge Alarm
—Acknowledges the selected Alarm(s). The current date
and time appear in the Ack Time field. Unacknowledges previously acknowledged alarm(s),
and clears the entries in the Ack By and Ack Time fields. The red “unacknowledged” icon
appears in the expanded portlet and turns to a green check “acknowledged” icon the alarm
has been acknowledged.
Assign User—
Assign this alarm to one of the users displayed in the sub-menu by selecting that
user. An icon also appears in the expanded portlet indicating the alarm has been assigned to
someone.
Clear Alarm
—Clearing the alarm removes the alarm from the default alarm view and marks it as a
candidate for the database archiving process (DAP). Essentially it is an indication to the
system that the alarm has been resolved/addressed. If your system has enabled propagation
policies, clearing recalculates dependent alarms.
Direct Access
—Open an SNMP Mib Browser to the device alarmed, a CLI Terminal (Telnet
window) to the device alarmed, or ICMP Ping the device alarmed. Only those available
appear in the subsequent menu.
Email Alarm
—E-mail the alarm. Enter a subject an e-
mail address to which you want to mail the alarm’s
content, and click the + to add to the list of
addresses (the minus deletes them). Then click
Send Email.
Clicking
Cancel
ends this operation
without sending e-mail. See SMTP Configuration
on page 88 for instructions about setting up e-mail
from Dell OpenManage Network Manager. See
Alarm Email on page 129 for an example of what
the content looks like.
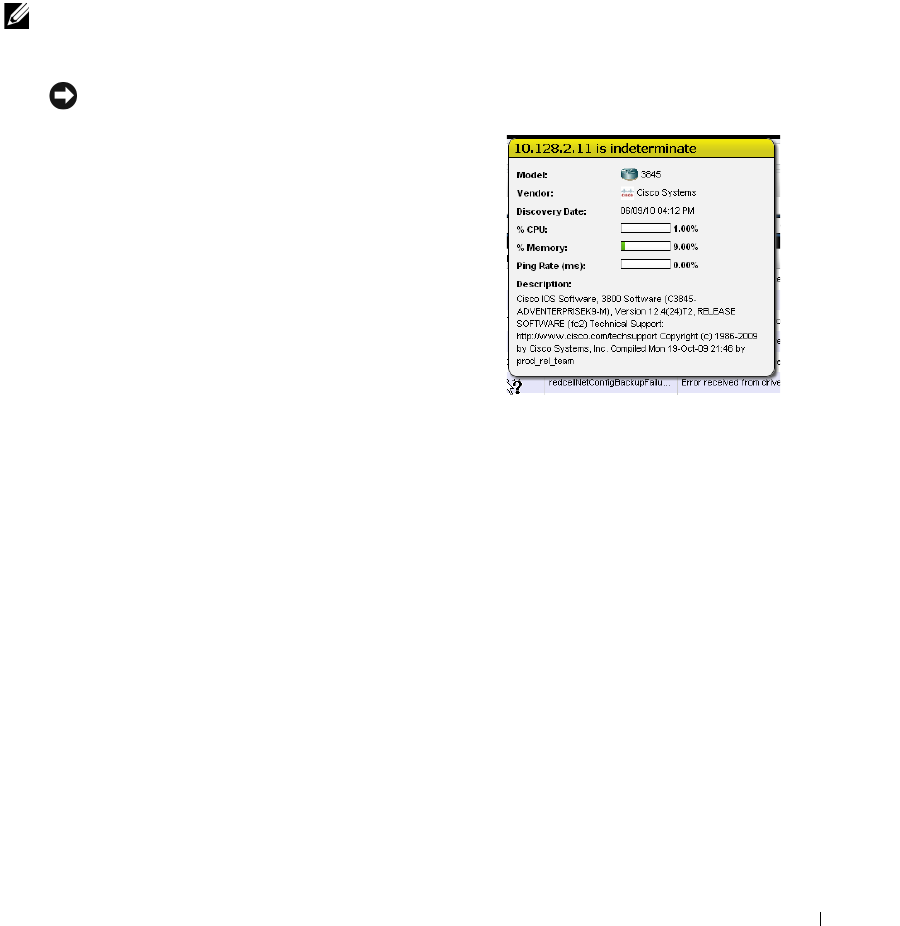
Alarms | Key Portlets
129
Show Performance—
If the equipment is monitored, this displays a performance dashboard for
the alarmed equipment. See Dashboard Views on page 331 for more about these.
Aging Policy—
This lets you select a policy that determines how long this alarm remains in the
database. See Redcell > Database Aging Policies (DAP) on page 58 for information about
configuring such policies.
View as PDF —
Create an Acrobat PDF document containing this portlet’s contents.
NOTE:
To resync alarms—that is, query the device for its alarm state—resync the device.
NOTICE
Hover your cursor over the Device IP Address column, and a
tooltip appears with information about the alarm source’s
Model, Vendor, Discovery Date, and a Ping Rate bar graph.
This can also include other device-dependent items. For
example: bar graphs to display the % CPU [utilization], %
Memory, and Description.
The convention indicating such tooltips are available is the
question mark that appears next to the cursor when you
hover it over the displayed field.
Alarm Snap Panels
These include the following:
Alarm Details
—The source,
Severity
,
Message
,
Date Opened
, and so on.
MIB Details
—The
Notification OID,
and
MIB Text
for the selected alarm.
Reference Tree
—The connection between the alarm and its source in tree form.
Total Occurrences by Date
—A graph of the total occurrences of this alarm, by date.
Alarm Email
The e-mail sent by right-clicking an alarm has the subject specified when you send it, and contains
the information within the alarm. For example:
Alarm: monitorIntervalSkip
Alarm Attributes:
===============================
Device IP =
Message =
Alarm State = Open

130
Alarms | Key Portlets
Severity = 5 - Major
Count = 1
Date Opened = Tue Dec 14 22:01:30 PST 2010
Update Date/Time = Tue Dec 14 22:01:36 PST 2010
Entity Name =
Entity Type =
Entity Description =
Equipment =
Region = SUPDEMOPartition
Location =
Assigned By = OWSystem
Date Assigned = Thu Dec 16 10:40:24 PST 2010
Assigned User = qatester
Acknowledged = false
Ack By =
Ack Time =
Cleared By =
Date Cleared =
MIB Text = Monitor session was skipped due to resource
constraints. Typically, this implies one or more monitors should run
less frequently. This may also be caused by a large number of timeouts
which force executions to take longer to complete than normal.
Advisory Text =
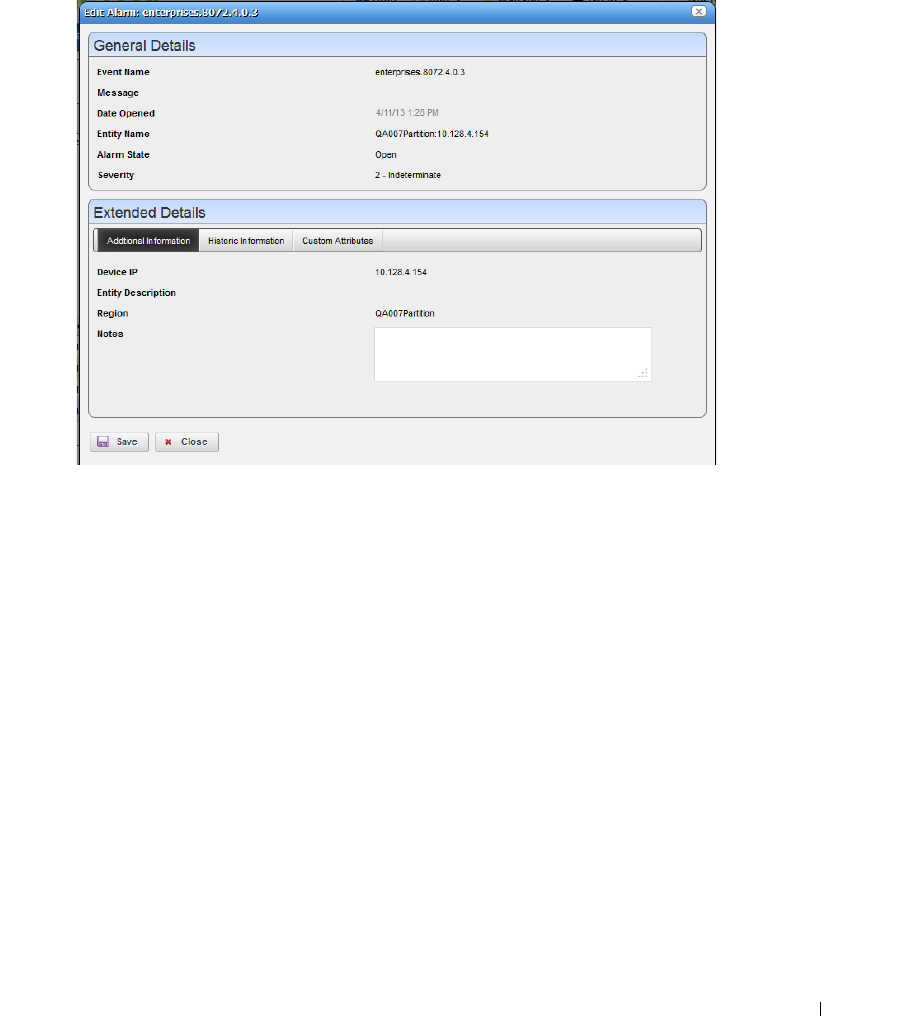
Alarms | Key Portlets
131
Alarm Editor
If you right-click and select
Edit Event
from an alarm in the Alarms portlet, this screen appears.
These screens contain the following fields:
General Details
Event Name
—The event that triggered the alarm.
Message
—The event message.
Date Opened
—The date the alarm occurred.
Entity Name
—The entity emitting this alarm (often within the Equipment).
Alarm State
—The state of the alarm (Open / Closed).
Severity
—The alarm severity indicated by the color of the leftmost icon. The severity only has
meaning for Alarms and Security Alarms. Informational Alarms get a severity level of
Indeterminate. Closed alarms appear without color.
Extended Details: Additional Information
Equipment
—The equipment (not subcomponent) that triggered the alarm.
DeviceIP
—The IP address of the equipment where the alarm appeared.
Entity Description
—A description of the triggering equipment.

132
Audible Alerts | Key Portlets
Region
—The partition / region for the alarm.
Notes
—A field where you can enter text.
Extended Details: Historic Information
This panel contains primarily read-only fields describing the alarm, including whether it was
Acknowledged, Ack by, Ack Time, Count
and so on.
Extended Details: Custom Fields
If you have created any Custom Fields for Alarms, this panel appears in the editor. See Edit
Custom Attributes on page 112 for instructions about these.
Audible Alerts
Audible Alerts produce a sound when a new alarm arrives in the (summary, not expanded) Alarms
Portlet. The sound occurs when Dell OpenManage Network Manager’s auto-refresh controller polls
for state changes. If you enable Audible Alerts and new table rows appear in the view, then the
preferred sound occurs.
If changes clear alarms, then no sound occurs. Only new Alarms added to the view trigger an
audible alert during auto-refresh. To cut down on audio clutter, only a single Audible Alert sounds
no matter how many alarms occur during an auto-refresh cycle.
Web Browsers and Sound
Each browser supports sound differently because of licensing for various sound formats. Audible
alarm support exists for most browsers, so if issues occur with a particular browser the workaround
is either to upgrade or use Chrome.
Browsers support MP3 the most, so this is the only format supported for Audible Alerts. Firefox
only support OGG format natively and Internet Explorer has issues with most sounds. To support
those browsers Dell OpenManage Network Manager plays the MP3 through a Flash Object, so
browsers need no special plugins.
Turning on Audible Alerts
To turn on Audible Alerts, navigate to a page containing Alarms Portlet. The portlet must be on a
page without Container View or other context broadcasting that can dynamically change the
Alarms portlet’s context. Auto refresh does not run when in this environment so as a result the
Audible Alerts are not exposed. (See Display Rules on page 241.)
1
Click the Settings (Wrench Icon).
2
The settings popup appears. In the Audible Alerts section, by default, alerts are off.
3
Click the
Enable Audible Alerts
checkbox.

Audible Alerts | Key Portlets
133
4
Select a desired sound to play with the up/down arrows. A play button appears next to the
available alerts so you can preview the current selected sound.
By default Dell OpenManage Network Manager ships with four standard Sound Alerts: Alert,
Bell, Chord and Ding. See Adding Custom MP3 Sounds below for the way to add custom
sounds.
Click
Apply
and this Alarms Portlet instance on this page now has Audible Alerts enabled.
Adding Custom MP3 Sounds
To add custom MP3 sounds, follow these steps:
1
In Control Panel, click on the
Documents and Media
section.
2
Click the
Add
button and Select
Basic Document
.
3
Under the
File
section click
Choose File
and pick an MP3 file to upload.
Since this interface lets you add any type of media, no validation of the file occurs, however
Audible Alerts only displays audio/MP3 mime-types.
4
Give the new MP3 a short title. For example, if you upload cowsound.mp3, call it Cow Sound
5
Click
Publish.
If you Navigate back to the Alarms Portlet and click the Settings button again you should now see
your new Alert to select.
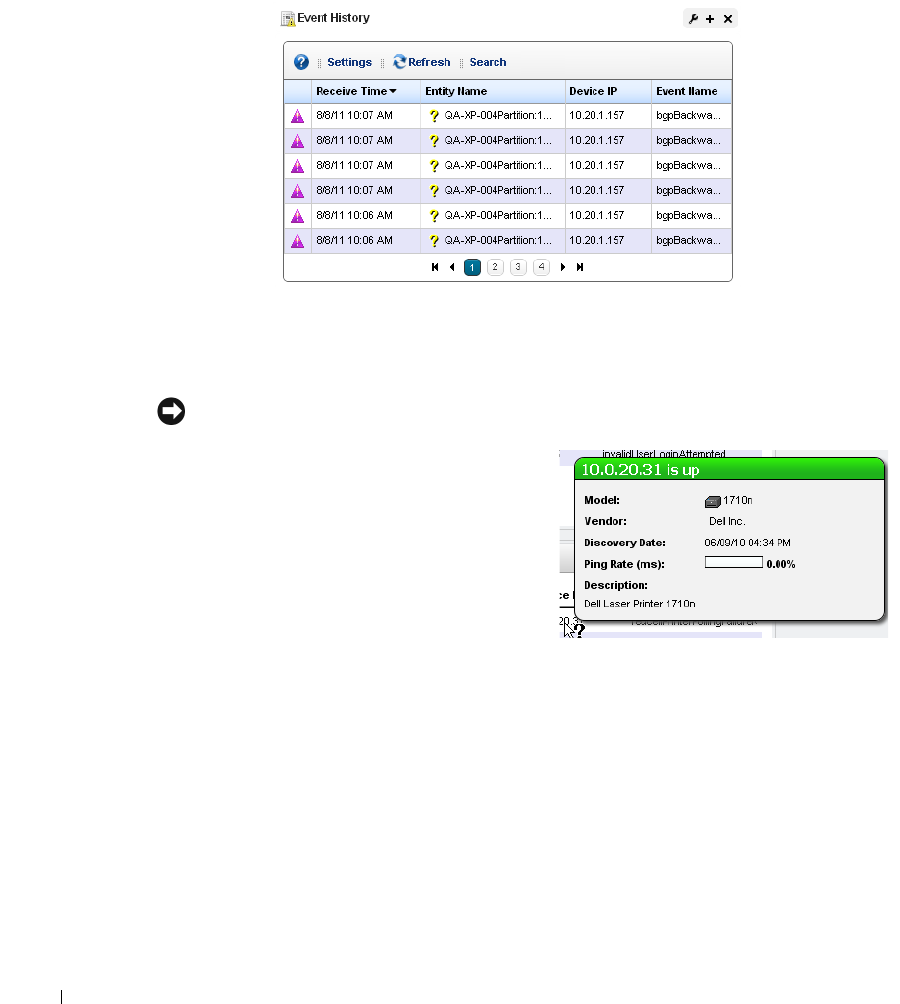
134
Event History | Key Portlets
Event History
Not all events appear as alarms. Event History preserves all event information for your system.
The initial portlet view displays an icon whose color reflects any alarm state associated with the
event. It also displays the
Receive Time, Entity Name, Device IP,
and
Event Name.
Yo u ca n r i g h t -
click to
Share with User
in this screen.
NOTICE
Hovering the cursor over the DeviceIP column
produces a tooltip that lets you know the device’s
current state (up / down) and that contains Model,
Vendor, Discovery Date, Ping Rate (ms), and the
device’s Description information.
The default filter for this portlet displays only recent
events. If you do not see events, expand the period
for which they appear.
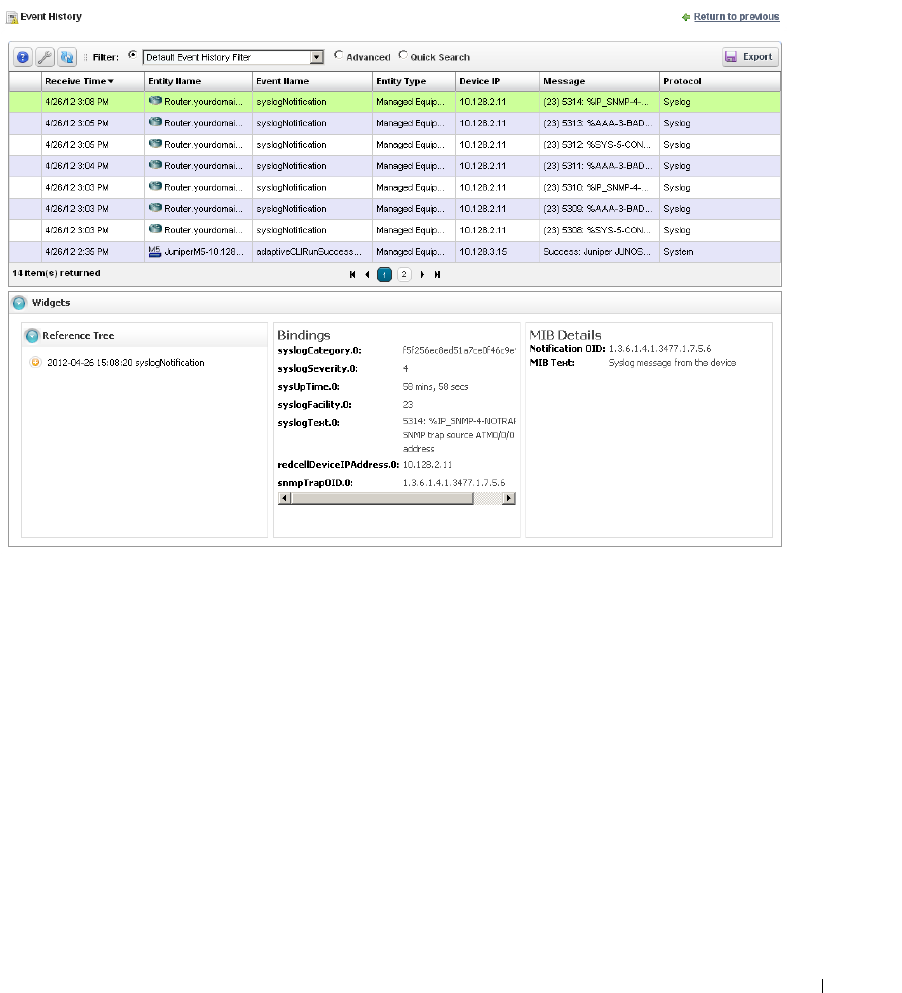
Event History | Key Portlets
135
Expanded Event History Portlet
Clicking the plus (+) in the upper right corner of the initial portlet view displays the expanded
Event History. As in other expanded portlets, you can use the filtering capabilities at the top of the
screen to further limit the default view of all events.
This screen has columns described in Alarms on page 123 or Expanded Alarm Portlet on page 126.
Configure these as visible or hidden by clicking
Settings.
The following are some additional
columns available.
Receive Time
—The date the event was received.
Event Name
—The event identifier.
Location
—The location of the equipment emitting the event.
SubType
—A classification for the event. For example:
Tr a p
.
Protocol
—The protocol that delivered the event. Frequently:
System
, indicating Dell
OpenManage Network Manager itself delivered it.
Notification OID
—The object identifier (OID) for the event type.
Instance ID
—The instance identifier for the event.
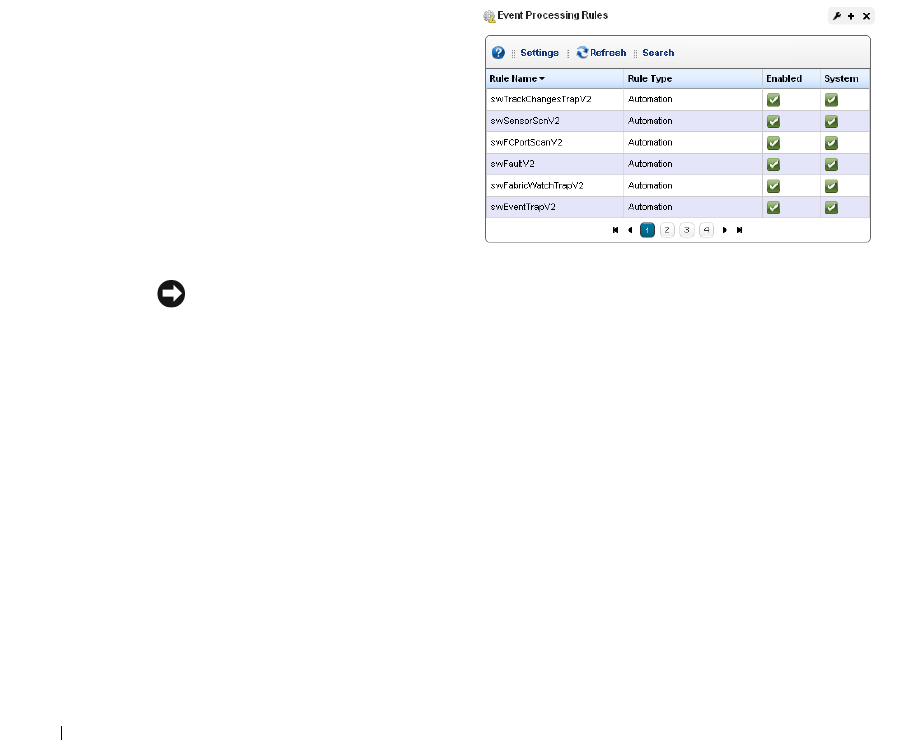
136
Event Processing Rules | Key Portlets
Event History Snap Panels
Click a listed alarm to display its details in the Snap Panels. The
Reference Tree
displays the event’s
relationship to any alarms, and to the source device. Click the plus (+) next to an item in the tree
to unpack it.
The
Bindings
Snap Panel displays the event’s varbind information, including the trap OID, the
device’s IP address, and other event-specific information.
The
MIB Details
Snap Panel includes MIB information like the Notification OID and MIB Text.
You can right-click the listed events and
Share
with User
(see
Sharing on page 110
), or (How to:)
Show / Hide / Reorder Columns
.
Event Processing Rules
This portlet manages Dell OpenManage
Network Manager’s response to events. By
default it appears with seeded rules, but
you can create your own (
New
), copy or
modify (
Copy
or
Open
) or delete (
Delete
)
existing rules by right-clicking in the
portlet. You can also
Import
and
Export
rules to files.
The
Rule Type
column indicates whether
rules are Pre-Processing (Correlation) or
Post-Processing (Automation).
NOTICE
In this version, you can make a pre-processing Event Processing Rule that sets an event as service-
affecting. These rules override the default service affecting field, which would otherwise be entirely
determined by the notification type.
Icons in the
Enabled
and
System
columns indicate whether the rule is enabled—green is enabled,
red is not—and whether it is a
System
rule, or a non-system (user-created) rule.
Modifying or creating rules opens Rule Editor. See How to: Create Event Processing Rules for steps
to create these rules.
When you
Copy
an event processing rule, Dell OpenManage Network Manager generates a new
name, but you must change that name before you save the event processing rule.
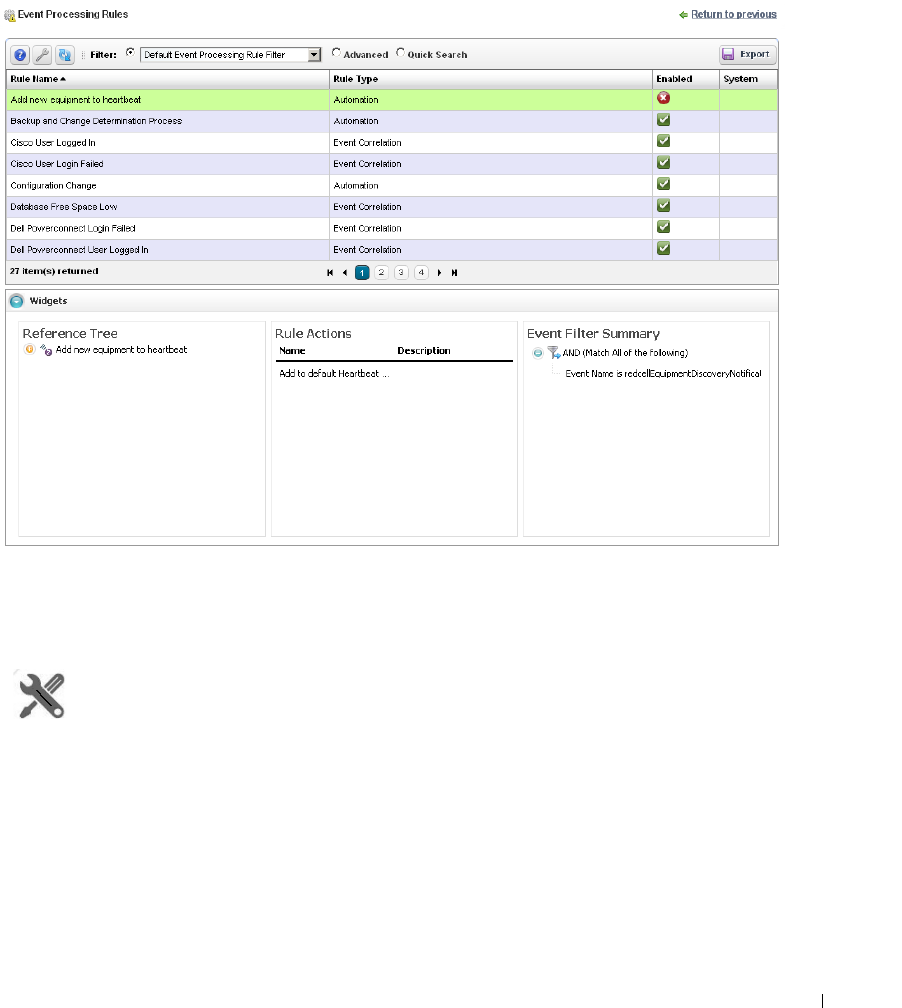
Event Processing Rules | Key Portlets
137
Expanded Event Processing Rules Portlet
The expanded portlet displays additional columns. Details about selected rules appear in the snap-
in panels at the bottom of this screen.
The
Reference Tree
panel displays the selected rule’s connection to events. The
Rule Actions
list
any configured actions associated with the rule. The
Event Filter Summary
summarizes any
configured filter(s) for the selected rule.
How To:
Create Event Processing Rules
To create a rule in this portlet, follow these steps:
1
Right-click and select
New
, then select a rule type. These can be
Pre-Processing
(correlation)
or
Post-Processing
(automation) rules
.
If
Pre-Processing
is your selection,
Device Access, Frequency Throttle, Reject Event, Set
Severity, Set Service Affecting
(overrides event’s settings)
, State Flutter, Suppress Alarm,
and
Syslog
are the types available. See
Filtering / Settings on page 141
, Syslog Escalation Criteria
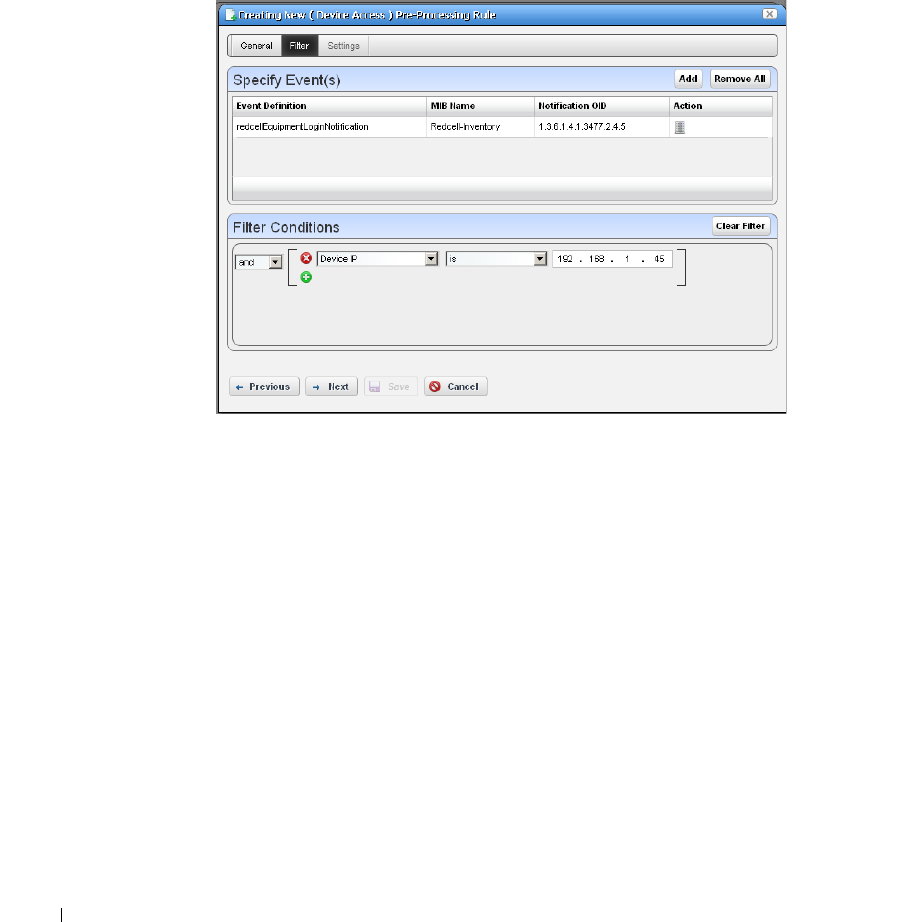
138
Event Processing Rules | Key Portlets
on page 144, and Actions on page 145 for more about the differences available between rule
types.
2
For this example, we select Pre-Processing > Device Access. The Rule Editor screen appears.
Enter a
Name
to identify the rule, an optional
Description
, and check
Enabled
if you want
this rule to begin working immediately.
3
Click
Next
to open the Filtering / Settings tab.
Specify Event Filtering
In this panel select the
Event Definition
. Click pick list to find available events. Typing a
letter goes to that letter in the list. You can then click to select from the pick list.
Click
Add Filter
to further filter the selected events. See Filter Expanded Portlet Displays on
page 108 for more about this feature.
Specify Settings for: [Selected Rule Type]
This panel’s appearance depends on the type of rule you selected when you clicked
New
.
When you are editing an existing rule, it defaults to that rule’s screen. For more about the
available alternatives, see Filtering / Settings on page 141.
4
The
Device Access
example creates a specific device access event for user login, logout, login
failure or configuration change. Select the
Access Type
(
Config Change, Login Failure, User
Login, User Logout
) from the pick list for that field.
5
Enter the
User Name Variable
and/or
User Name RegEx
match string in those fields. This
confines rule response to the selected users.

Event Processing Rules | Key Portlets
139
6
Check
Suppress Correlated
events if you do not want to see events correlated with this one.
7
Click
Save
to preserve the event processing rule.
Rule Editor
After you select between pre- and post-processing rules for new rules, the following screens manage
the event processing described in brief in the Create Event Processing Rules on page 137. The
following screens and fields appear in this editor.
• General
• Filtering / Settings
• Syslog Escalation Criteria (for pre-processing Syslog rules)
• Actions (for post-processing, automation rules)
Rules Referring to Subcomponents
Subcomponent names must cache on the server if you want to refer to them in rules. For example,
if you want e-mail whenever a linkDown occurs on a port, then you must cache subcomponents. If
you cache subcomponents, it impacts performance, which is why such caching is disabled by
default.
To enable caching, set the following property in installed.properties:
com.dorado.redcell.inventory.equipment.subcomponent.cache=true
...then restart application server.
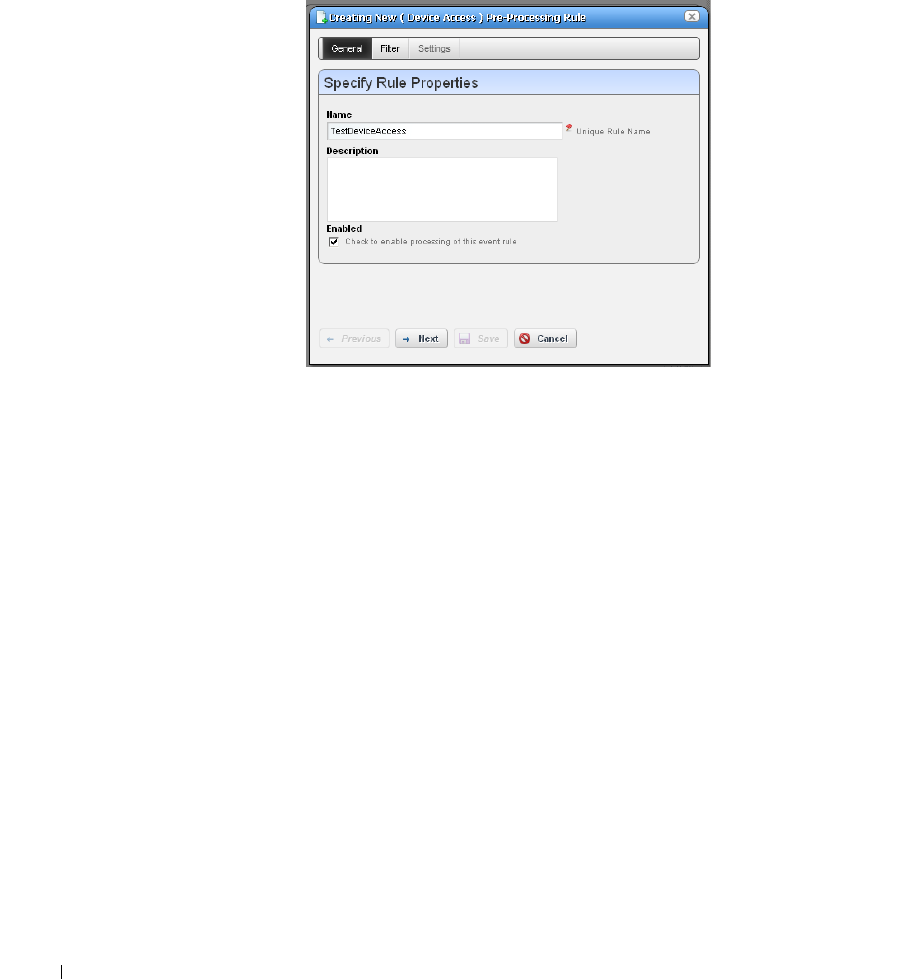
140
Event Processing Rules | Key Portlets
The following sections describe editing rules in more detail.
General
The General screen is common to all rule types.
It contains the following fields:
Name
—A text identifier for the rule.
Description
—An optional text description of the rule
Alarm Only
—This is visible only in post-processing rules. Check this to enable the rule only if an
alarm is generated, not suppressed.
Enabled
—Check this to enable the rule.
Event Processing Rules | Key Portlets
141
Filtering / Settings
For all rule types, select the
Event Definition
. Click
Add
to open a screen where you can select
events to include in the event you are creating. This incudes a filter at the top that you can use to
search for specific events. For example:
Event Name Contains ________.
You can then click
Add
Selection
to include selected items in this filter, or
Add All
to include all displayed events. After you
finish event selection, click
Done
at the bottom of this selection screen.
Click
Add Filter
to further filter the selected events. See Filter Expanded Portlet Displays on page
108 for more about this feature. After you
Add Filter
the button changes to
Clear Filter
so you can
remove any filter from the event rule.
NOTICE
Dell OpenManage Network Manager supports multiple IP addresses per resource. During event
processing, filters that include IP address criteria may behave incorrectly when Dell OpenManage
Network Manager evaluates the filter. Best practice is using resource name(s) instead of IP addresses.
The following are processing rule types, and a description of their properties.
Pre-Processing
—These rules either override the event definition, change the behavior of an event
or generate another event. The following are the different subtypes. These are also called
Correlation
rules. See the descriptions below for additional information about the available
types.
Post-Processing
—Also called
Automation
rules, these execute specified actions for the rule after
the event processing occurs.
The following are
Pre-Processing/ Correlation
rule subtypes:
142
Event Processing Rules | Key Portlets
Device Access
—The Device Access example creates a specific device access event for user login,
logout, login failure or configuration change. Select the
Access Type
(
Config Change, Login
Failure, User Login, User Logout
) from the pick list for that field.
Enter the
User Name Variable
and/or
User Name RegEx
match string in those fields. This
confines rule response to the selected users.
Check
Suppress Correlated
events if you do not want to see events correlated with this one.
Frequency Throttle
—This rule type changes event behavior based on the frequency of the
selected event.
Enter the
Time Period
(seconds) and
Maximum events to publish within time period
for the
event, then select an
Event Action to take when throttle exceeded
(
Reject
or
Suppress
the
event) and check
Publish frequency start and stop notifications
if you want it to register for
Dell OpenManage Network Manager. If you
Reject
an event, it does not appear in Event
history; if you
Publish
it, however, listeners for that event will “hear” it.
Reject Event
—This screen presents the
Specify Event Filtering
portion of the screen without any
Settings
in the lower screen. Specify events to reject with this selection and filtering.
Set Severity
—This rule overrides the default alarm severity of an event selected and filtered in the
upper screen.
Set Service Affecting—
Activate this by checking the checkbox in the
Settings
screen. This
overrides any default service-affecting settings for the impacted event.
Event Processing Rules | Key Portlets
143
State Flutter
—This type of rule changes event behavior on transient state change events like a
series of LinkUp and LinkDown events for the same interface.
After you select the event and filtering, enter the
Interval
(seconds), the
Action
(
Reject
or
Suppress
the event) and check
Publish Event
if you want it to register for Dell OpenManage
Network Manager. If you
Reject
an event, it does not appear in Event history; if you
Publish
it, however, listeners for that event will “hear” it.
Suppress Alarm
—This screen presents the
Specify Event Filtering
portion of the screen without
any
Settings
in the lower screen. Specify events/alarms to suppress with this selection and
filtering.
Syslog
—This screen presents the
Specify Event Filtering
portion of the screen without any
Settings
in the lower screen. Specify events to select. Then click
Next
to go to the
Escalation
tab.
Post-processing (automation) rules let you modify the
Specify Event Filtering
portion of the screen
without any
Settings
in the lower screen. Specify events to select. Then click
Next
to go to the
Actions
tab. See Actions on page 145 for more about that feature.
144
Event Processing Rules | Key Portlets
Syslog Escalation Criteria
This tab of Syslog Event Rules lets you manage events based on matching text, and configure
messages in response to such matches.
Criteria: Syslog Match Text
In this tab, enter the Syslog Match Text. Click the plus to add matching text to the list below the
Message Match Text
field. Check the
Match Any
to match any or all of the entered match text,
rather than one or more specific strings.
Criteria: Syslog Event Setup
This portion of the Criteria screen sets up the event emitted when matching occurs. Here are the
fields:
Category
—The syslog category varbind value.
Event Severity
—Select the alarm severity of the event emitted when a match occurs.
Message Pattern
—An optional regular expression for the text to retrieve and transmit in the
created event’s message.
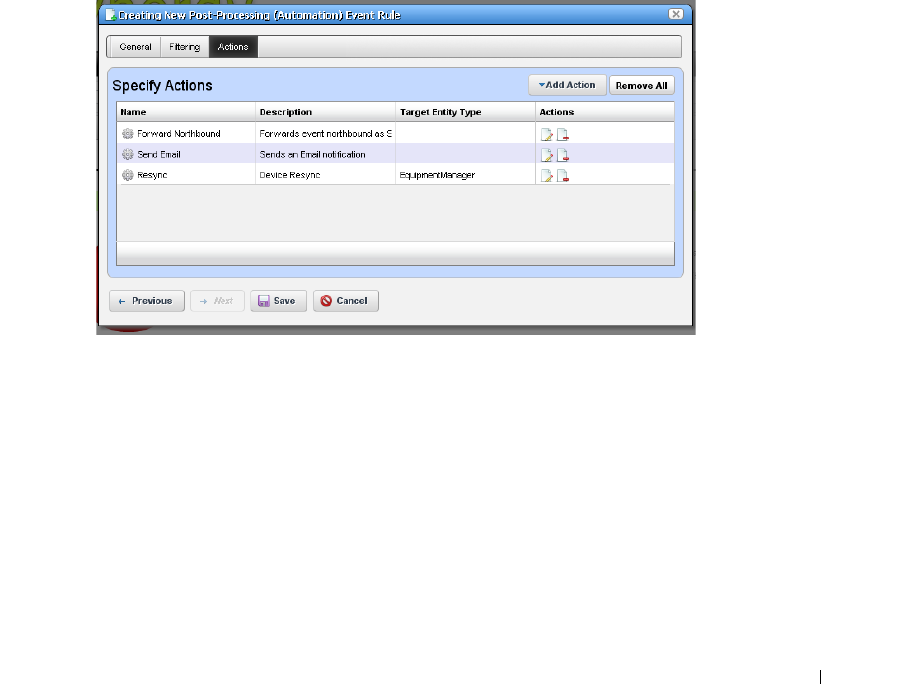
Event Processing Rules | Key Portlets
145
Message Template
—The configuration of the message when sent. For example: the template
%1
occurred on %3 for %2
creates a message with the first message pattern retrieved,
followed by the third, then the second within the specified text.
Message Test
This screen lets you test your message against the pattern and/or template. Click the
Te s t
button to
the right of the top field to activate this testing.
Test Message
—Enter a message to test.
Test Message Result
—The text extracted for the event as it appears in the template after you click
the
Te s t
button.
Click
Apply
to accept these escalation criteria, or
Cancel
to abandon them without saving.
Actions
This screen catalogs the actions configured for the Post-Processing (Automation) rule you have
configured in previous screens.
Click
Add Action
to create a new action in the editor. The
Actions
column lets you revise (
Edit this
entry
) or
Delete
entries in this table. Click
Save
to preserve the action(s) configured here, or
Cancel
to abandon any edits.
Clicking
Add Action
lets you select from the following:
•Custom
• Forward Northbound
•Email

146
Event Processing Rules | Key Portlets
Click
Apply
to accept configured actions, or
Cancel
to abandon their editor and return to this
screen.
NOTICE
Actions available here are like those for Discovery Profiles on page 181. You can also use actions to
Execute Proscan. See Chapter 12, Change Management / ProScan.
Custom
This screen lets you configure
Action
based on Adaptive CLI actions available in the system. Notice
that you can select by
most common
or by
keyword search,
depending on which of the links in the
upper right corner of the screen you select.
The
most common
actions include those you have used most recently. To search for actions, either
enter a keyword, or click the search icon (the magnifying glass) to produce a pick list below the
Action
field. Select an action by clicking on its appearance in that list.
Select the device target of the custom action by selecting from the
Targ et
pick list. If you do not
specify an explicit target, Dell OpenManage Network Manager uses the default entity for the event
as the target.
If you want to select an action with additional parameters, those parameters appear in the screen
below the
Ta rg e t
field. To see definitions for such parameters, hover the cursor over the field and a
tooltip describing the field appears.
You can specify parameter variables, dependent on the specifics of the event, rule, and selected
targets. Do this with either NOTIFICATION or VARBIND.

Event Processing Rules | Key Portlets
147
The following are valid attributes to use in a phrase like [[NOTIFICATION: <attr name>]]:
•TypeOID
•AlarmOID
•EntityOID
•EquipMgrOID
• DeviceIP
•SourceIP
NOTICE
Consult the relevant portlet to find and verify an OID. For example, Event Definitions portlet has an OID
column, and the varbind OIDs appear in the Message Template screen of the event editor.
Correct spelling is mandatory, and these are case sensitive. NOTIFICATION and VARBIND must
be all caps, and within double brackets. The colon and space after the key word are also required.
Dell OpenManage Network Manager converts anything that conforms to these rules and then
passes the converted information into the action before execution. Anything outside the double
square brackets passes verbatim.
For example, the string:
This is the alarm OID [[NOTIFICATION: AlarmOID]] of notification type
[[NOTIFICATION: TypeOID]] having variable binding [[VARBIND: 1.3.4.5.3]]
becomes something like...
This is the alarm OID 1OiE92tUjll3G03 of notification type
1.3.6.1.4.1.3477.1.27.20.7 having variable binding 151.
Click
Apply
to accept your edits, or
Cancel
to abandon them.

148
Event Processing Rules | Key Portlets
Email
Email actions configure destinations and messages for e-mail and SMS recipients. You can include
fields that are part of the event by using the variables described in Email Action Variables on page
152.
Notice that below the Description of the e-mail action, you can check to send this mail (and/or
SMS) to associated Contacts, if any are available, even if you specify no mail address destination.
The SMS tab is similar to the e-mail tab, but limits the number of characters you can enter with a
field at its bottom. You must send SMS to the destination phone carrier’s e-mail-to-SMS address.
For example sending text to 916-555-1212 when Verizon is the carrier means the destination
address is 9165551212@vtext.com.
When enabled, notification emails go to the Contact associated with the Managed Equipment for
the notification event. For the contact's email address, mail goes to the first specified address from
either the
Work Email
,
Home Email
or
Other Email
fields in the Contact editor. SMS messages go

Event Processing Rules | Key Portlets
149
to the
Page r Ema il
field for the contact. If a Contact was not found or the required addresses are
not specified for the Contact, then Dell OpenManage Network Manager uses the Recipient
addresses configured in the Email Action.
NOTICE
Programs other than Dell OpenManage Network Manager let you manipulate mail outside the scope of
OpenManage Network Manager. For example IFTTT (If This Then That) lets you send SMS in countries
whose providers do not provide e-mail equivalents to SMS addressing. You can also use such
applications to save mail attachments like reports to Dropbox accounts.
This screen has the following fields:
Recipient Addresses
—Enter an e-mail address in the field below this label, then click the plus (+)
sign to add it to the list of recipients. The minus (-) removes selected recipients.
Subject
—The e-mail subject.
Email Header / Footer
—The e-mail’s heading and footing.
SMS Body
—The e-mail contents to be sent as text.
SMS Max Length
—The maximum number of characters to send in the SMS. Typically this is
140, but the default is 0, so be sure to set to your carrier’s maximum before saving.
Here is what Email looks like when it arrives:
Sent: Wednesday, March 02, 2011 2:37 PM
To: techpubs@doradosoftware.com
Subject: Web Test
Notification: redcellInventoryAttribChangeNotification
Notification Attributes:
===============================
sysUpTime.0 = 5 hours, 16 mins, 43 secs
snmpTrapOID.0 = 1.3.6.1.4.1.3477.2.2.1
redcellInventoryAttrName.0 = RedCell.Config.EquipmentManager_Notes
redcellInventoryAttrChangedBy.0 = admin
redcellInventoryAttrNewValue.0 = hello
world
severity
auto
redcellInventoryAttrOldValue.0 = hello
world
severity
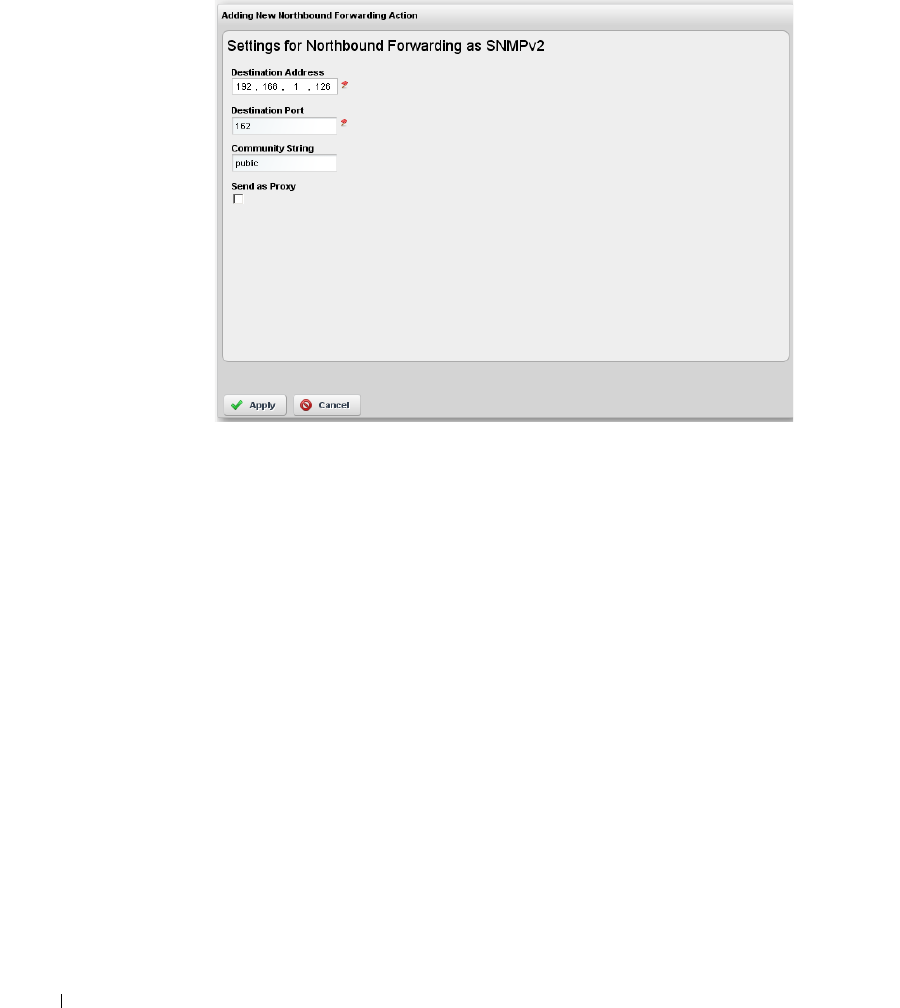
150
Event Processing Rules | Key Portlets
Forward Northbound
When you want to forward an SNMP v2 event (trap) to another host, then configure automation in
this screen to do that.
Enter the following fields:
Destination Address
—The IP address of the northbound destination.
Destination Port
—The port on the northbound destination.
Community String
—The SNMP community string for the northbound destination.
Send as Proxy
—When checked, this sends the IP address of the application server as the source of
the event. Unchecked, it sends the IP address of the source device. (See Send as Proxy on
page 151 for more.)
For details of the Trap Forwarding Process, see the next section.
Trap Forwarding Process
SNMPv1 and SNMPv3 traps become SNMPv2 Traps
SNMPv1 traps are converted according to RFC 1908. SNMPv3 traps are already in SNMPv2 format
and the application simply does not use SNMPv3 security when sending these northbound. The
following is the relevant snippet from RFC 1908:
3.1.2. SNMPv1 -> SNMPv2
When converting responses received from a SNMPv1 entity acting in an agent role into
responses sent to a SNMPv2 entity acting in a manager role:

Event Processing Rules | Key Portlets
151
(1) ...
(2) If a Trap-PDU is received, then it is mapped into a SNMPv2-Trap-PDU. This is done by
prepending onto the variable-bindings field two new bindings: sysUpTime.0 [6], which takes
its value from the timestamp field of the Trap-PDU; and, snmpTrapOID.0 [6], which is
calculated as follows: if the value of generic-trap field is
enterpriseSpecific
, then the
value used is the concatenation of the enterprise field from the Trap-PDU with two additional
sub- identifiers, ‘0', and the value of the specific-trap field; otherwise, the value of the
corresponding trap defined in [6] is used. (For example, if the value of the generic-trap field is
coldStart
, then the application uses the coldStart trap [6]) Then, one new binding is
appended onto the variable-bindings field: snmpTrapEnterprise.0 [6], which takes its value
from the enterprise field of the Trap-PDU. The destinations for the SNMPv2-Trap-PDU are
determined in an implementation-dependent fashion by the proxy agent.
Despite this description, many vendors defined a trap for SNMPv2 and then had to support
sending as SNMPv1 protocol. The assembly of v2 OID from v1 enterprise and specific is supposed
to include an extra ‘0'; enterpriseOID.0.specific. However, if a v2 trap is defined that has no '0' in it,
so it cannot be sent as v1 and converted back following the specifications
Send as Proxy
This application can forward a trap as though it came from device (sourceIP spoofing) or act as an
agent proxy according to the SNMP-COMMUNITY-MIB.
If not sending as proxy, we forward trap from application server cluster as an SNMPv2 notification
as though it is coming directly from the originating agent (device). This is a common and desired
behavior. Some operating systems prevent packet spoofing as a security measure so this behavior is
necessarily optional.
If sending as proxy, the trap is forwarded from application server using the application server IP as
sourceIP. The relevant snippet from SNMP-COMMUNITY-MIB is the following:
--
-- The snmpTrapAddress and snmpTrapCommunity objects are included
-- in notifications that are forwarded by a proxy, which were
-- originally received as SNMPv1 Trap messages.
--
snmpTrapAddress OBJECT-TYPE
SYNTAX IpAddress
MAX-ACCESS accessible-for-notify
STATUS current
DESCRIPTION
"The value of the agent-addr field of a Trap PDU which

152
Event Processing Rules | Key Portlets
is forwarded by a proxy forwarder application using
an SNMP version other than SNMPv1. The value of this
object SHOULD contain the value of the agent-addr field
from the original Trap PDU as generated by an SNMPv1
agent."
-- 1.3.6.1.6.3.18.1.3 -- ::= { snmpCommunityMIBObjects 3 }
snmpTrapCommunity OBJECT-TYPE
SYNTAX OCTET STRING
MAX-ACCESS accessible-for-notify
STATUS current
DESCRIPTION
"The value of the community string field of an SNMPv1
message containing a Trap PDU which is forwarded by a
a proxy forwarder application using an SNMP version
other than SNMPv1. The value of this object SHOULD
contain the value of the community string field from
the original SNMPv1 message containing a Trap PDU as
generated by an SNMPv1 agent."
-- 1.3.6.1.6.3.18.1.4 -- ::= { snmpCommunityMIBObjects 4 }
Dell OpenManage Network Manager always adds
snmpTrapAddress
to every trap forwarded as
proxy, (never adding
snmpTrapCommunity
). It does not keep track of the community string on
the traps received.
Email Action Variables
The following are the Email Action variables you can use in customizing the content of action e-
mail. These appear classified as follows:
• Basic Variables
• Managed Equipment Variables
•Entity Type: Port
• Entity Type: Interface, Logical interface
To successfully retrieve Custom attributes in e-mail, you must first create them. See Edit Custom
Attributes on page 112.

Event Processing Rules | Key Portlets
153
You can also configure more limited variables that are slightly more efficient in performance, if not
as detailed as those described in the following section.
For example, you can retrieve the following attributes:
{RedCell.Config.EquipmentManager_Custom1}
{RedCell.Config.EquipmentManager_Custom2}
{RedCell.Config.EquipmentManager_LastBackup}
{RedCell.Config.EquipmentManager_LastConfigChange} and
{RedCell.Config.EquipmentManager_HealthStatus}
NOTE:
If the entity does not contain/return these values, then the message [No data for <attribute name>]
appears in the email instead.

154
Event Processing Rules | Key Portlets
Basic Variables
The following section describe variables whose use may have a performance impact.
Managed Equipment Variables
Attribute Description Email Action Variable
Name The event / alarm name {Name}
Message Description from the event {Message}
Entity Name The entity (interface, card...) name {EntityName}
Equipment Manager
Name
The name of the equipment, parent or chassis. {EquipMgrName}
Device IP address the IP of the device in alarm {DeviceIP}
Entity Type Type of entity (Router, and so on) {EntityType}
Instance ID An identifier for the event {InstanceID}
Protocol Type Of originating alarm (SNMP, syslog, etc.) {ProtocolType}
Protocol Sub Type Inform, Trap, [blank] (for internal events) {ProtocolSubType}
Receive Time {RecvTime}
Region The mediation server partition name. {Region}
Severity 0 - cleared, through 6 - critical, from Alarm
Definition
{Severity}
Source IP address The IP of the component sending the alarm {SourceIP}
Attribute Description Email Action Variable
Custom 1 Note that although you
can re-name any Custom
attribute, you must use
the variable’s original
name. For example here,
that is
{RedCell.Config.Equipm
entManager_Custom1}
{RedCell.Config.EquipmentManager_Cu
stom1}
Custom 2 {RedCell.Config.EquipmentManager_Cu
stom2}
Custom 3 {RedCell.Config.EquipmentManager_Cu
stom3}
Custom 4 {RedCell.Config.EquipmentManager_Cu
stom4}
Custom 5 {RedCell.Config.EquipmentManager_Cu
stom5}

Event Processing Rules | Key Portlets
155
Custom 6 {RedCell.Config.EquipmentManager_Cu
stom6}
Custom 7 {RedCell.Config.EquipmentManager_Cu
stom7}
Custom 8 {RedCell.Config.EquipmentManager_Cu
stom8}
Custom 9 {RedCell.Config.EquipmentManager_Cu
stom9}
Custom 10 {RedCell.Config.EquipmentManager_Cu
stom10}
Custom 11 {RedCell.Config.EquipmentManager_Cu
stom11}
Custom 12 {RedCell.Config.EquipmentManager_Cu
stom12}
Custom 13 {RedCell.Config.EquipmentManager_Cu
stom13}
Description Description of the
equipment
{RedCell.Config.EquipmentManager_De
viceDescription}
DNS Hostname Hostname of equipment {RedCell.Config.EquipmentManager_Ho
stname}
Equipment Type Equipment Type {RedCell.Config.EquipmentManager_Co
mmonType}
Firmware Version Version of the
equipment’s firmware
{RedCell.Config.EquipmentManager_Fir
mwareVersion}
Hardware Version Version of the
equipment’s hardware
{RedCell.Config.EquipmentManager_Har
dwareVersion}
Last Backup Last Backup {RedCell.Config.EquipmentManager_Las
tBackup}
Last Configuration
Change
Last Configuration
Change
{RedCell.Config.EquipmentManager_Las
tConfigChange}
Last Modified Timestamp of Last
Modified
{RedCell.Config.EquipmentManager_Las
tModified}
Model Model number of the
equipment
{RedCell.Config.EquipmentManager_Mo
del}
Name Component name {RedCell.Config.EquipmentManager_Na
me}
Network Status Network Status {RedCell.Config.EquipmentManager_He
althStatus}
Notes Equipment Notes {RedCell.Config.EquipmentManager_Not
es}
Attribute Description Email Action Variable

156
Event Processing Rules | Key Portlets
Entity Type: Port
OSVersion OSVersion {RedCell.Config.EquipmentManager_OS
Version}
Serial Number Unique identifier for the
equipment
{RedCell.Config.EquipmentManager_Seri
alNumber}
Software Version Version of the
equipment’s software
{RedCell.Config.EquipmentManager_Sof
twareVersion}
System Object Id SNMP based system
object identifier
{RedCell.Config.EquipmentManager_Sys
ObjectID}
Attribute Description Email Action Variable
Custom 1 Note that although you can
re-name any Custom
attribute, you must use the
variable’s original name. For
example here, that is
{RedCell.Config.Equipment
Manager_Custom1}
{RedCell.Config.Port_Custom1}
Custom 2 {RedCell.Config.Port_Custom2}
Custom 3 {RedCell.Config.Port_Custom3}
Custom 4 {RedCell.Config.Port_Custom4}
Encapsulation Encapsulation {RedCell.Config.Port_Encapsulation}
Hardware Version Version of the port’s
hardware
{RedCell.Config.Port_HardwareVersion
}
If Index SNMP If Index {RedCell.Config.Port_IfIndex}
MAC Address “Typically a MAC Address,
with the octets separated by
a space, colon or dash
depending upon the device.
Note that the separator is
relative when used as part of
a query.”
{RedCell.Config.Port_UniqueAddress}
Model Model number of the port {RedCell.Config.Port_Model}
MTU Maximum Transmission
Unit
{RedCell.Config.Port_Mtu}
Name Port name {RedCell.Config.Port_Name}
Notes Port Notes {RedCell.Config.Port_Notes}
Port Description Description of the port {RedCell.Config.Port_DeviceDescriptio
n}
Attribute Description Email Action Variable

Event Processing Rules | Key Portlets
157
Entity Type: Interface, Logical interface
Best practice is to clarify such attributes by combining them with others that spell out their source.
Port Number Port Number {RedCell.Config.Port_PortNumber}
Slot Number Slot Number {RedCell.Config.Port_SlotNumber}
Speed Speed {RedCell.Config.Port_Speed}
Subnet Mask SubMask {RedCell.Config.Port_SubMask}
Attribute Description Redcell Email Action variable
Custom 1 Note that although you
can re-name any Custom
attribute, you must use
the variable’s original
name. For example here,
that is
{RedCell.Config.Equipm
entManager_Custom1}
{RedCell.Config.Interface_Custom1}
Custom 2 {RedCell.Config.Interface_Custom2}
Custom 3 {RedCell.Config.Interface_Custom3}
Custom 4 {RedCell.Config.Interface_Custom4}
Encapsulation Encapsulation {RedCell.Config.Interface_Encapsulation}
IfIndex SNMP Interface Index {RedCell.Config.Interface_IfIndex}
Interface Description Description of the
Interface
{RedCell.Config.Interface_DeviceDescripti
on}
Interface Number Interface Number {RedCell.Config.Interface_InterfaceNumbe
r}
Interface Type Common Interface Type {RedCell.Config.Interface_CommonType}
MTU Maximum Transmission
Unit
{RedCell.Config.Interface_Mtu}
Name Interface name {RedCell.Config.Interface_Name}
Notes Interface Notes {RedCell.Config.Interface_Notes}
Port Number Port Number {RedCell.Config.Interface_PortNumber}
Slot Number Slot Number {RedCell.Config.Interface_SlotNumber}
Subnet Mask Subnet Mask of the
Interface
{RedCell.Config.Interface_SubMask}
Attribute Description Email Action Variable
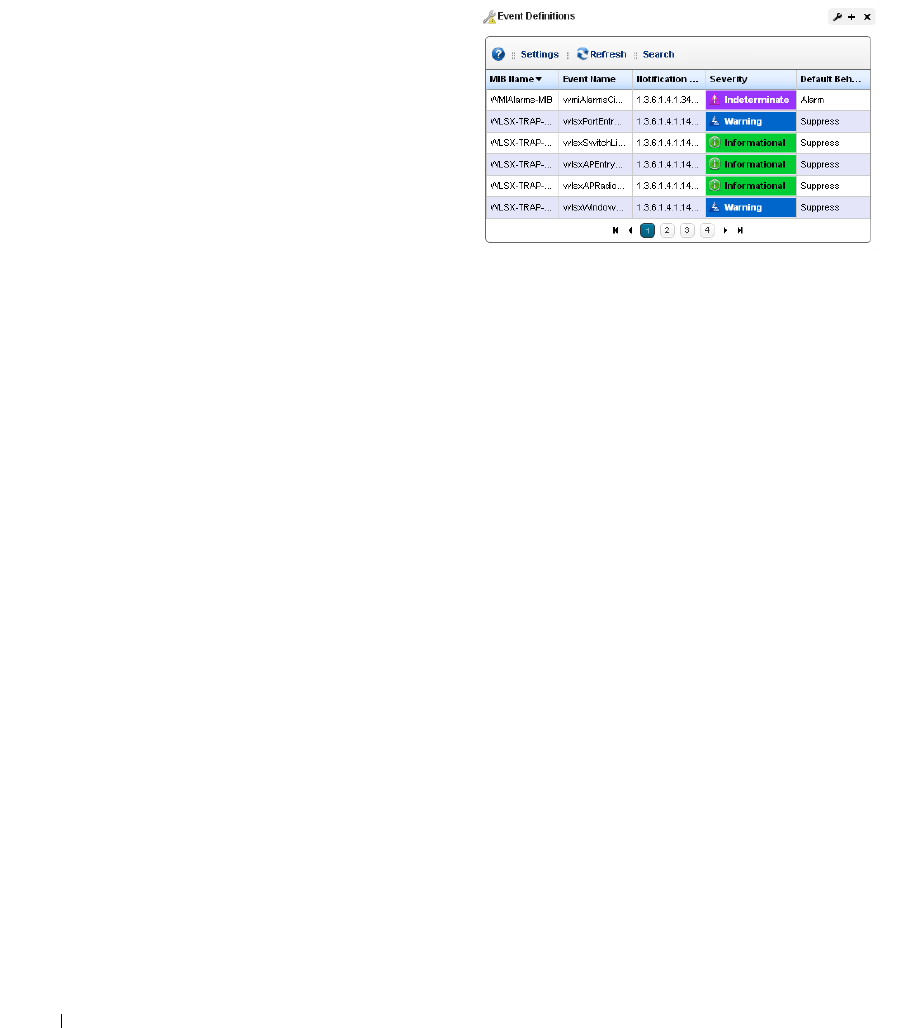
158
Event Definitions | Key Portlets
Event Definitions
You can define how the Dell OpenManage
Network Manager treats messages (events)
coming into the system. Administrators
can define event behavior deciding
whether it is suppressed, rejected or
generates an Alarm. Manage the
definitions of events in this portlet.
In this screen, you can configure events
that, when correlated as described in Event
Processing Rules on page 136, trigger
actions.
Columns include the
MIB Name, Event Name, Notification OID, Severity
for associated alarms
,
and
Default Behavior.
See Event Definition Editor for how to alter these. Right-click a selected
event definition for the following menu items:
Edit
—Either open the selected event in Event Definition Editor, or open a details panel for the
underlying equipment.
Set Behavior
—This lets you select from the following options
.
Reject–Every received message is rejected.
Suppress–The message is tracked in Event History and then ignored.
Alarm–The message is tracked in Event History and then processed, with Correlated events
and Event Processing Rules of any type other than Syslog.
Set Severity
—Set the alarm severity for the selected event.
MIB
—This lets you upload a new MIB to your event definitions.
You can also configure an Aging Policy and View events as PDF in this menu. See Redcell >
Database Aging Policies (DAP) on page 58, and View as PDF on page 113 for more about those
options.
To see an event’s propagation policy, you can view the editor panel described below. See also Alarm
Propagation to Services and Customers: What Happens on page 167.
Event Definition Editor
This editor lets you modify event definitions in the following tabs:
• General
• Message Template
• Correlations
Click
Save
to preserve any modifications you have made, or
Cancel
to abandon them.

Event Definitions | Key Portlets
159
General
This tab manages basics for Event Definitions.
It has the following fields:
Event Name
—A text identifier for the event.
Notification OID
—The object ID.
Severity
—The severity of any associated alarm. If a new alarm is a clearing severity, then it closes
any existing alarm to which it correlates. Otherwise, if a new alarm severity does not match
the existing severity then the existing alarm is closed and a new alarm opened for the new
severity.
MIB Name
—The MIB with which this event is associated.
Default Behavior
—The options for behavior (
Undefined, Alarm, Suppress, Reject
).
Alarm
means:
Process at the mediation server, generate event history and an alarm.
Suppress
means: Process
at the mediation server and generate an event (
not
an alarm).
Reject
means: Reject at the
mediation server (do not process)
Resource Propagation
—The hierarchical resource propagation behavior for any alarm based on
this event definition (either
Default, Impacts subcomponents,
or
Impacts top level
). (See also
Alarm Propagation to Services and Customers: What Happens on page 167 for more about
how this impacts services and customers.)
An event definition configures “Resource Propagation” (distinct from “Alarm propagation”)
based on the event type. Do alarms based on this event definition impact the overall device
(
Impacts top level
), subcomponents (
Impacts subcomponents
), or just the correlated
inventory entity (
Default
)?
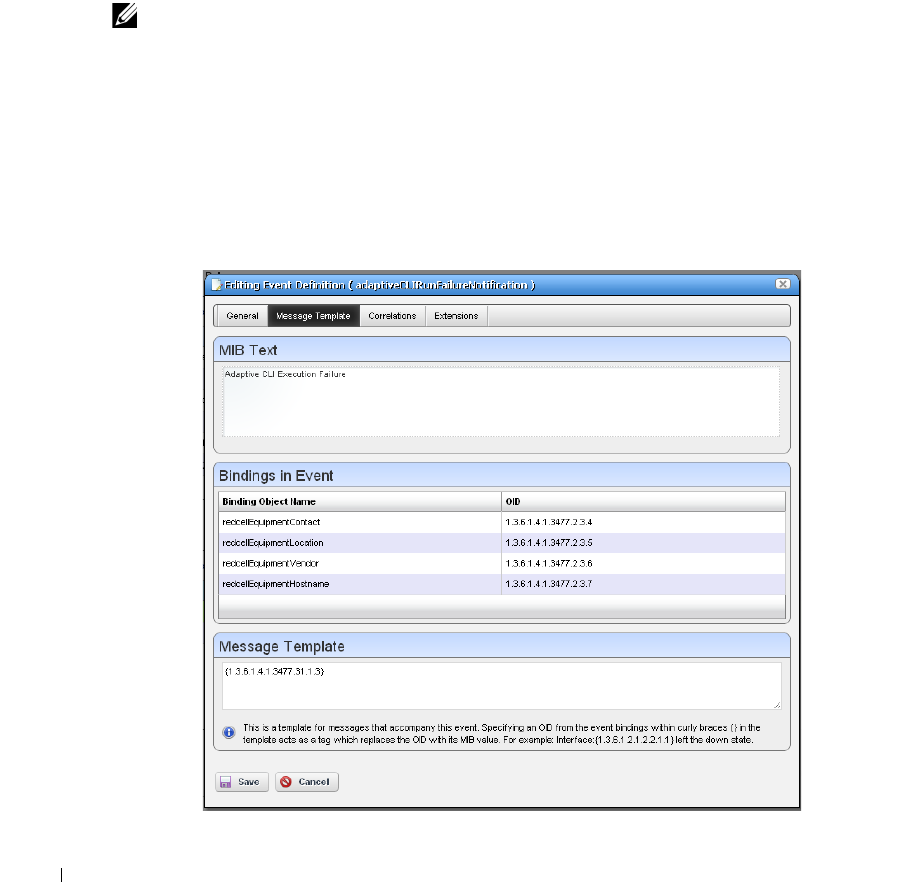
160
Event Definitions | Key Portlets
Service Affecting
—Check this if the event has an impact on services. Indicates whether the alarm
has an impact on services. If this is checked then alarms based on this event definition
propagate calculated alarm states across services and customers that depend on the (directly)
alarmed resource.
For example: If a resource has a service affecting alarm, then Dell OpenManage Network
Manager propagates the severity of this alarm across all associated services and customers. If
the resource alarm is “clear” then all services depending on this resource are “clear” too. If the
resource alarm is “critical,” then all services depending on that resource are “critical” too.
NOTE:
Alarms imported from previous versions appear as not service affecting, regardless of severity.
For more about propagation, see Alarm Propagation to Services and Customers: What
Happens on page 167.
Advisory Text
—The
Advisory Text
appears with the event. Configure it in the text box here.
Message Template
This panel lets you view or alter MIB Text, Bindings and the Message Template for the event
selected.

Event Definitions | Key Portlets
161
This contains three sections:
MIB Text
—A read-only reminder of the MIB contents for this OID.
Bindings in Event
—A read-only reminder of the MIB bindings for this event. This displays the
varbind contents of the event, matching the
Binding Object Name
and the
OID
(object
identifier).
Message Template
—A template for messages that accompany this event. Specifying an OID
within the curly braces {} in the template acts as a tag which replaces the OID with its MIB
value. For example: Interface: {1.3.6.1.2.1.2.2.1.1} left the down state.
You can also add optional messages surrounded by double brackets [[ ]]. if the event
definition has the message “aindex: {1.2.3}[[, bindex: {1.2.4}]]” and {1.2.3} is defined as say
“1” but {1.2.4} is not defined then this resolves to “aindex: 1". If they are both defined (say
{1.2.4} is “2”) then this resolves to “aindex: 1, bindex: 2"
If a message template exists for an existing, correlated alarm and the generated text does not
match the original alarm, then Dell OpenManage Network Manager closes the existing alarm,
and generates a new one. Leaving this blank transmits the original message.
NOTICE
Putting an OID in curly brackets amounts to a tag replaced by the MIB text for that OID. Look for OIDs and
messages in the MIB browser (as described in MIB Browser on page 214).
162
Event Definitions | Key Portlets
Correlations
This screen lets you configure Correlated Events and Correlation Key Bindings. For example, a link
down event could correlate with a link up event, or an alarm with a clear alarm event.
In the Correlated Events panel, click
Add
to display a selector (with filter) to find events to
correlate with the one you are editing.
In Correlation Key Bindings, use the right/left arrows to select
Key Variables
from
Available
Variables
. The variables considered keys for correlation are the key bindings for the target alarm in
the correlation process. This means that if event A is defined to include event B as a correlated
event, comparison of the key bindings defined for event B is also considered when comparing a new
alarm for event A to an existing alarm for event B.
Notification OID
—As with parent event definitions, this is the object ID. Dell OpenManage
Network Manager automatically generates this based on the Notification OID of the parent
and key binding values entered. For example, if the parent event definition has a Notification
OID of “1.2.3.4” and the key binding values of the extended definition are 5 and 6 (the parent
must have previously been configured to have two extension bindings available) then the
resulting Notification OID for this new extended event definition will be “1.2.3.4::5:6”.

Event Definitions | Key Portlets
163
Fine-Tuning Event Correlations
Dell OpenManage Network Manager’s
eventdefs.xml
files configure event definitions that
originate in installed MIBs. Dell OpenManage Network Manager’s editor is typically a more
convenient to configure them further.
No edit screen currently exists to configure variable binding objects. If you need to configure
CorrelationType, you can do so by editing the
/owareapps/redcell/server/conf/
bindobjectdefs.xml
file.
If an event definition does not correlate correctly for your system—for example the falling alarm
does not clear the initial raising alarm—then you can use one or more of the OIDs for the binding
objects on the Message Template tab, not the OID of the event definition itself, and create entries
for them in this file. The technical help desk may assist in this process.
To customize Dell OpenManage Network Manager’s standard bindings, edit the file. Here is an
example of what appears in that file:
<?xml version="1.0" standalone="yes"?>
<ow:owdata xmlns:ow="urn:doradosoftware" xmlns:tns="urn:com/dorado/
redcell/notifications" xmlns:xsi="http://www.w3.org/2001/XMLSchema-
instance">
<!-- ** Notification binding object definitions **
This feature was added to allow for different ways of correlating
notifications when the key bindings are structured differently.
CorrelationType
0 = On value, where all bindings have both an OID and a value, the value
is used to correlate (this is default)
1 = On index, e.g. OID of 1.4.5.3.4389.334 where no binding object
exists with this exact OID but 1.3.5.3 does exist
and is configured this way will use the remainder of the string
(4389.334 in this example) to correlate
-->
<!-- mplsTunnelAdminStatus -->
<bean xsi:type="tns:NotificationObjectDefNP">
<ObjectOID>1.3.6.1.2.1.10.166.3.2.2.1.34</ObjectOID>
<CorrelationType>1</CorrelationType>
</bean>
<!-- mplsLdpSessionState -->
<bean xsi:type="tns:NotificationObjectDefNP">

164
Event Definitions | Key Portlets
<ObjectOID>1.3.6.1.2.1.10.166.4.1.3.3.1.2</ObjectOID>
<CorrelationType>1</CorrelationType>
</bean>
<!-- mplsTunnelAdminStatus -->
<bean xsi:type="tns:NotificationObjectDefNP">
<ObjectOID>1.3.6.1.3.95.2.2.1.34</ObjectOID>
<CorrelationType>1</CorrelationType>
</bean>
</ow:owdata>
Event and Alarm Lifecycles
The following outline the logic Dell OpenManage Network Manager uses when processing events
and alarms.

Event Definitions | Key Portlets
165
Events
166
Event Definitions | Key Portlets
Alarms

Event Definitions | Key Portlets
167
Alarm Propagation to Services and Customers: What
Happens
The following describes the use cases where you Alarm Propagation to services and customers
occurs. This describes the sequence of events / alarms.
Alarm state must propagate to associated entities for each step and might take some time to reach
all of them, so matching mentioned below may not be instantaneous, depending on the complexity
of the associations. This propagation to services and customers occurs through a background
process, running on regular intervals.
A resource can have several levels of services that depend on it, and then customers can depend on
them, and so on. Potentially, several levels of dependency and a large database full of services and
customers to propagate alarm states can exist, so propagation processing occurs in the background.
By default, this process runs every 30 seconds, but you can configure this interval by setting the
com.dorado.assure.propagation.AlarmPropagationInterval
property. This value
is in milliseconds. The following...
com.dorado.assure.propagation.AlarmPropagationInterval=60000
sets the interval at 60 seconds. Best practice is to put this property in
\owareapps\installprops\lib\installed.properties
, so upgrading your Dell
OpenManage Network Manager package does not overwrite any change you make. After changing
this property, you must restart the application server for the change to take effect.
NOTE:
Only services associated with the alarmed subcomponents are affected by alarms on the subcomponent,
not services connected to the rest of the device. You can also override default service affecting alarm
behavior with an Event Processing Rule. See Event Processing Rules on page 136 for more about them.
A New Alarm Arrives, then...
Service Affecting Alarm Changes Source Alarm State:
The new alarm changes the alarm state
(higher or lower) of the resource that is its source.
Dependencies:
If this resource has services or customers that depend on it, the alarm state
matches for all such deployed, dependent services and their associated customers. Without
such dependencies, no alarm state changes, besides that of the source.
Parent Resources:
The alarm changes the alarm state of a child of the source and the alarm's
Resource Propagation value is
Impacts Subcomponents
.
Dependencies:
Child equipment matches the top level’s alarm state. All deployed services
and their related customers depending on this particular resource component match the
resource component’s alarm state.
Child Resources:
The alarm changes the alarm state of parent of the source and the alarm's
Resource Propagation value is
Impacts Top Level
.

168
Event Definitions | Key Portlets
Dependencies:
Parent equipment matches the child entities alarm state. All deployed
services and associated customers depending on only this resource’s alarmed component have
their alarm state match the resource’s component.
No Change to Alarm State:
The new alarm does not change the alarm state of its source, so no
services or customers have their alarm state changed
Alarm not Service Affecting:
The new alarm is not service affecting. The result is that no change
occurs to services’ or customers’ alarm state.
Cleared Existing Alarm
Clearing Service Affecting Existing Alarm Changes Alarm State:
This changes the alarm state
(higher or lower) of a resource.
Dependencies:
All deployed services and associated customers depending on this resource
have their alarm state match the resource.
No Dependencies:
No services or customers change their alarm state
Clearing Non-Service Affecting Existing Alarm:
No services or customers have their alarm state
changed
User Actions
Resync the resource’s alarm state:
if the resource’s displayed alarm state was incorrect, perhaps
because it is a parent or child of a resource whose alarm state has changed, then this corrects it.
If this action changes the alarm state and this resource’s most severe alarm is service affecting, then
resync makes alarm states propagate to any associated services and customers. If the deployed
services have the incorrect alarm state, then resync corrects that inaccuracy.
Viewing alarms associated with a service:
• If the service is deployed, and the target resource has open service affecting alarms, all open
service affecting alarms for the target resource appear.
• If the service is deployed, but the target resource has only cleared or non-service affecting
alarms against it, no alarms appear.
• If the service is deployed, and the target resource does not have open service affecting alarms,
but at least one descendent entity of this resource has open service affecting alarms against it,
those alarms propagate up to the resource. All open service affecting alarms that propagate up
(Resource Propagation is
Impacts top level
) for the target resource’s descendants appear
• If the target resource does not have service affecting alarms, and neither do any service
affecting alarms exist for its descendent entities, no alarms appear.
• If the service is undeployed, no alarms appear.
Viewing alarms associated with a given customer:
• If at least one service associated with the customer has open, service affecting alarms, all open
service affecting alarms for all services associated with this customer appear.
Contacts | Key Portlets
169
• If none of the services associated with this customer have open, service affecting alarms, so
alarms appear
User views the services impacted by a particular alarm:
• If the alarmed resource has at least one deployed service that depends on it, all deployed
services depending on the alarmed resource appear.
• If the alarmed resource does not have any deployed services that depend on it, no services
appear.
Deploying a service whose target resource has service affecting alarms:
• Before deploying, no alarms appear for the service. After deploying, all open, service affecting
alarms for the target resource appear.
Undeploying a service whose target resource has service affecting alarms:
• Before undeploying, all open, service affecting alarms for the target resource should appear.
After undeploying, no alarms appear.
Editing a deployed service to change the target from one resource to another:
• If the original resource has service affecting alarms but the new one does not, all open service
affecting alarms for the original target resource should appear before the edit. After the edit,
no alarms appear.
• If the original resource does not have service affecting alarms but the new one does, before
editing, no alarms appear. After editing, all open service affecting alarms for the new target
resource appear.
Contacts
The contact portlet displays available
contacts for your system. There is no
expanded version of this portlet, but you can
Ctrl+click to multi-select.
You can right-click to act on the the selected
contact with the following menu items.
New / Open
—Displays the Contacts
Editor, where you can create new
contacts or alter existing ones.
Details
—Displays a screen with contact-
associated alarms, and the information
entered in Contacts Editor.
Visualize
—Displays a mapping of the selected contact’s association to devices. See Chapter 7,
Display Strategies.
Delete
—Displays a mapping of the selected contact’s association to devices.
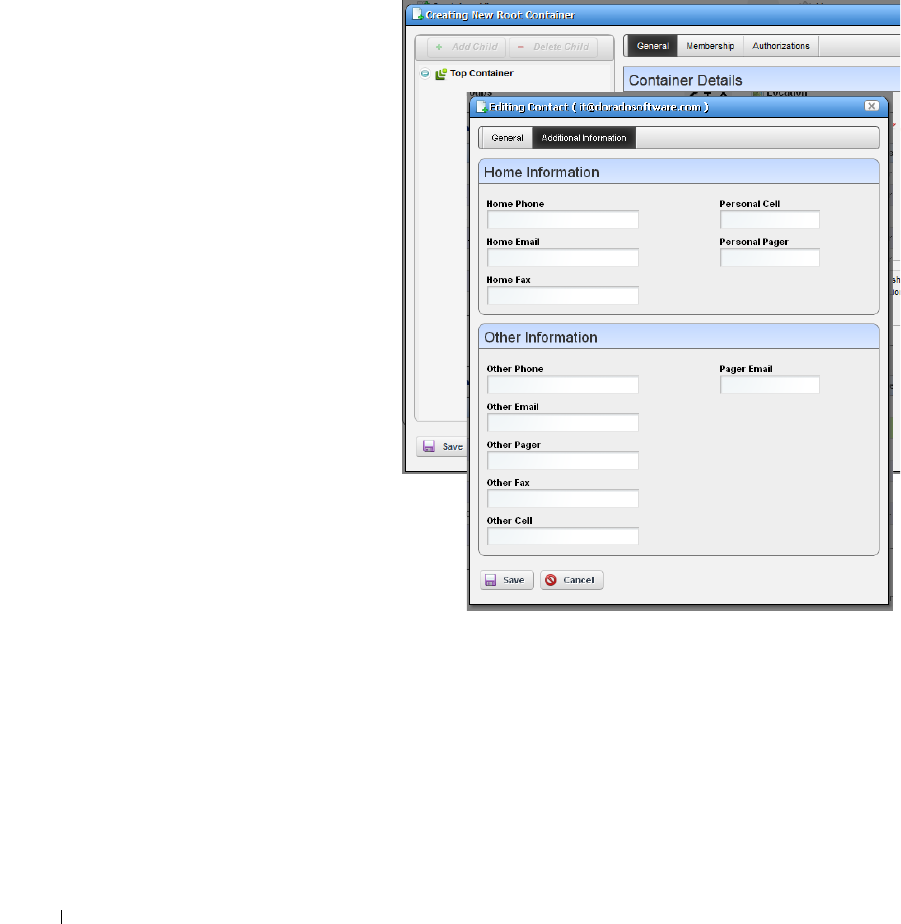
170
Contacts | Key Portlets
Visualize
—Displays a mapping of the selected contact’s association to devices.
Dell OpenManage Network Manager only retrieves Contact and Location information on initial
discovery. You can modify these once the resource is under management, however doing so will not
modify any system information on the device.
Contacts Editor
This editor has two panels where
you can enter contact
information (
Name, Address,
Phone,
and so on). Click the tabs
at the top of this screen to move
between the panels. The
Contact
ID
, a unique identifier for the
contact in your system, is a
required field at the top of the
first page.
Click
Save
to preserve your new
or modified contact information.
Click
Cancel
to leave the contact
unmodified.
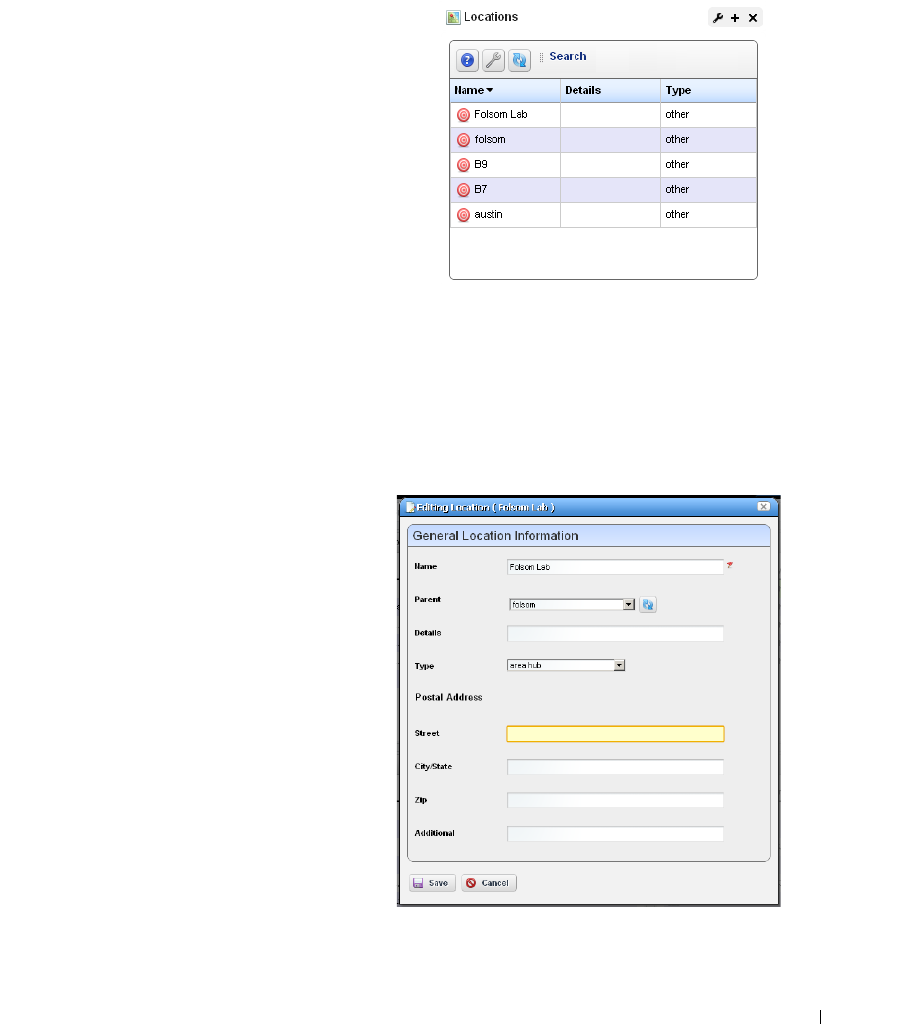
Locations | Key Portlets
171
Locations
In its summary form, the locations portlet displays
configured locations in your system.
You can right-click to create, modify or remove
(
New, Open, Delete
) the selected location. See
Location Editor description below for more about
editing or creating locations.
If you select
Visualize,
a map of the selected
location’s connection to equipment appears. See
Chapter 7, Display Strategies for more.
The
Ta g
option lets you record a location’s
longitude and latitude. See Tag on page 173 for
more.
This screen has the following columns:
[Icon]
—The icon for this location.
Name
—The name for this location.
Details
—A description for this location.
Ty p e
—A designated type for the location.
Location Editor
When you click
New
or
Open
, an editor
appears. The
Name
field is mandatory.
Name
—A unique name for the Location. If
you alter the name of an existing location
already in use by existing equipment, the
editor creates a new location. If you
change the name of a location, this
change may take a short period to
percolate to all managed objects that use
it. You can do this, though.
Parent
—The “parent” of this location (the
location to which this location is
subordinate). Select a Parent Location
from the pick list. The maximum
number of levels supported is 15.
Details
—A text description of the location.
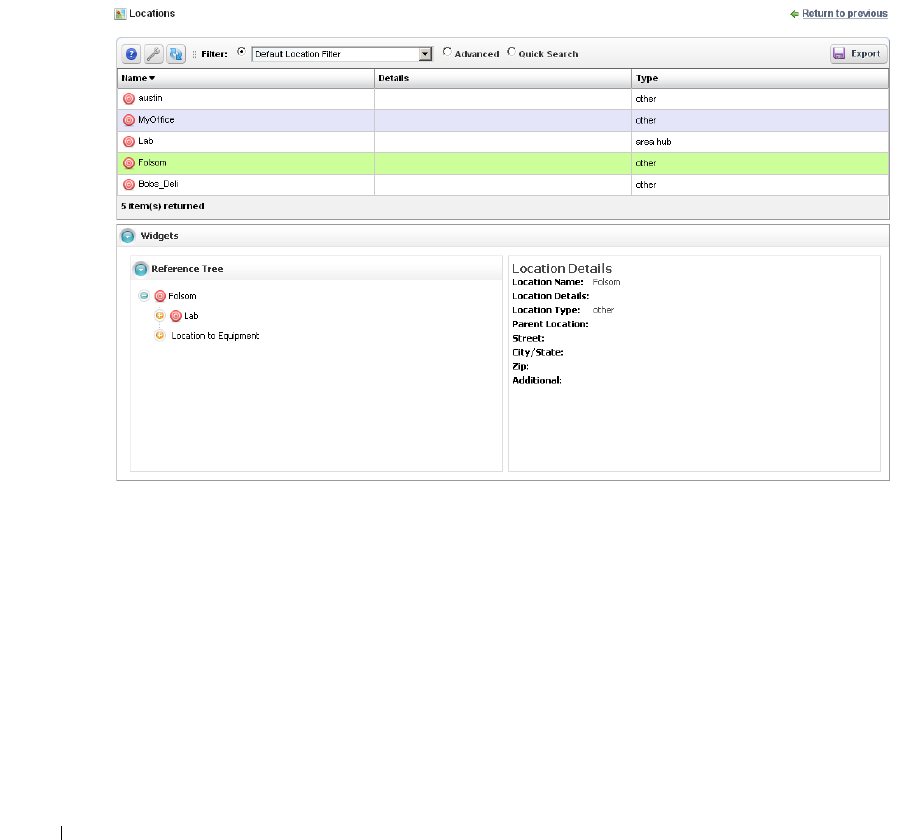
172
Locations | Key Portlets
Ty p e
—Type of location, as selected from the drop-down menu. Available types are: Area Hub,
Customer, National Hub, Other, Provider, Regional Hub, and State.
Postal Address
—The
Street, City/State, Zip
address of the location.
Additional
—Any optional notes.
Click
Save
save the Location, or any modifications you have made.
Expanded Location Portlet
The location portlet displays a list of all locations, with Snap Panels to display a selected location’s
connection to the network and details.
The
New
menu option appears in the expanded location portlet. Click
Settings
to change the
column appearance (see Show / Hide / Reorder Columns on page 107). This has the same columns
as Locations on page 171.
Locations Snap Panels
Selecting a location row displays the
Reference Tree
Snap Panel, with that location’s connection to
containers (see
Container View on page 247)
and equipment. Click the plus (+) icons to expand
the tree. The
Location Details
panel displays what has been configured in the
Location Editor.
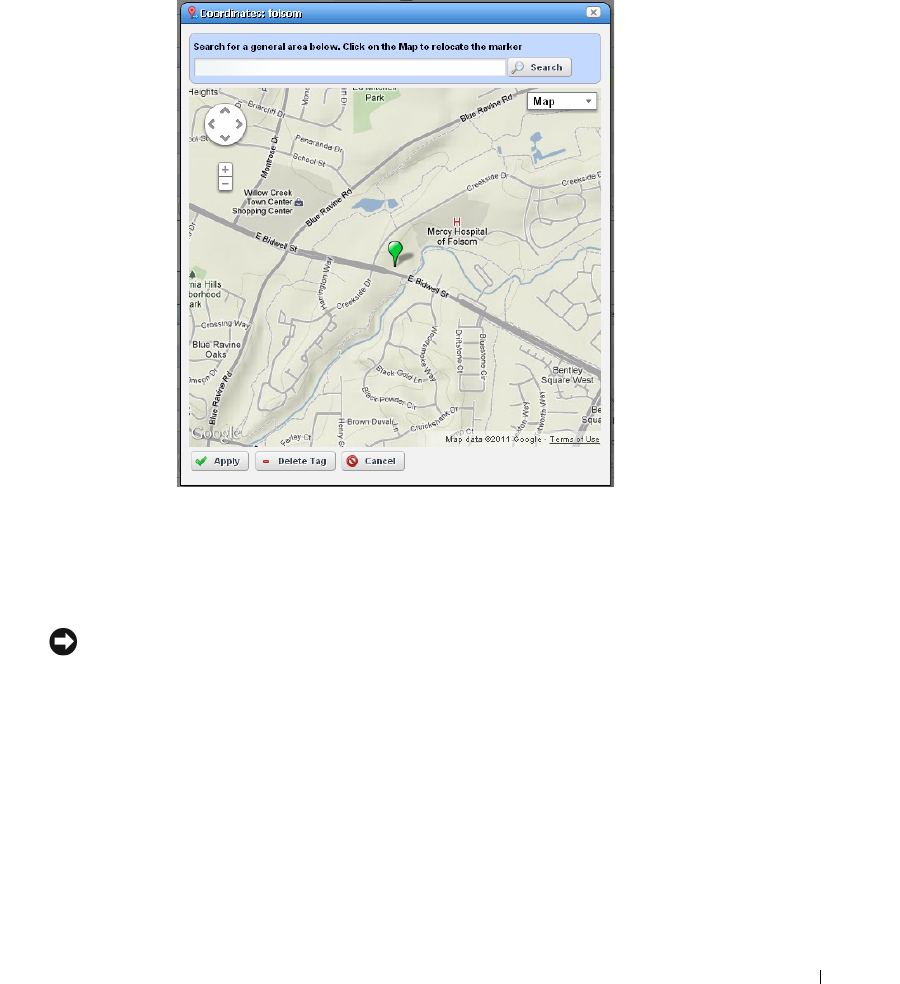
Locations | Key Portlets
173
Tag
When creating a location, Dell OpenManage Network Manager automatically selects the latitude
and longitude of the address entered for a location. Tag a location by right-clicking it in the
Locations portlet.
The location created by default is the address entered in the Locations editor. You can also enter
the address in the Search field, or click and drag the marker that appears on this screen. Click
Apply
to accept the re-location. A
Delete Tag
button appears when you have created a tag, and lets you
remove it.
Cancel
closes the screen.
NOTICE
You can zoom in or out on the displayed map with the + and - buttons in the upper left corner of this
screen.
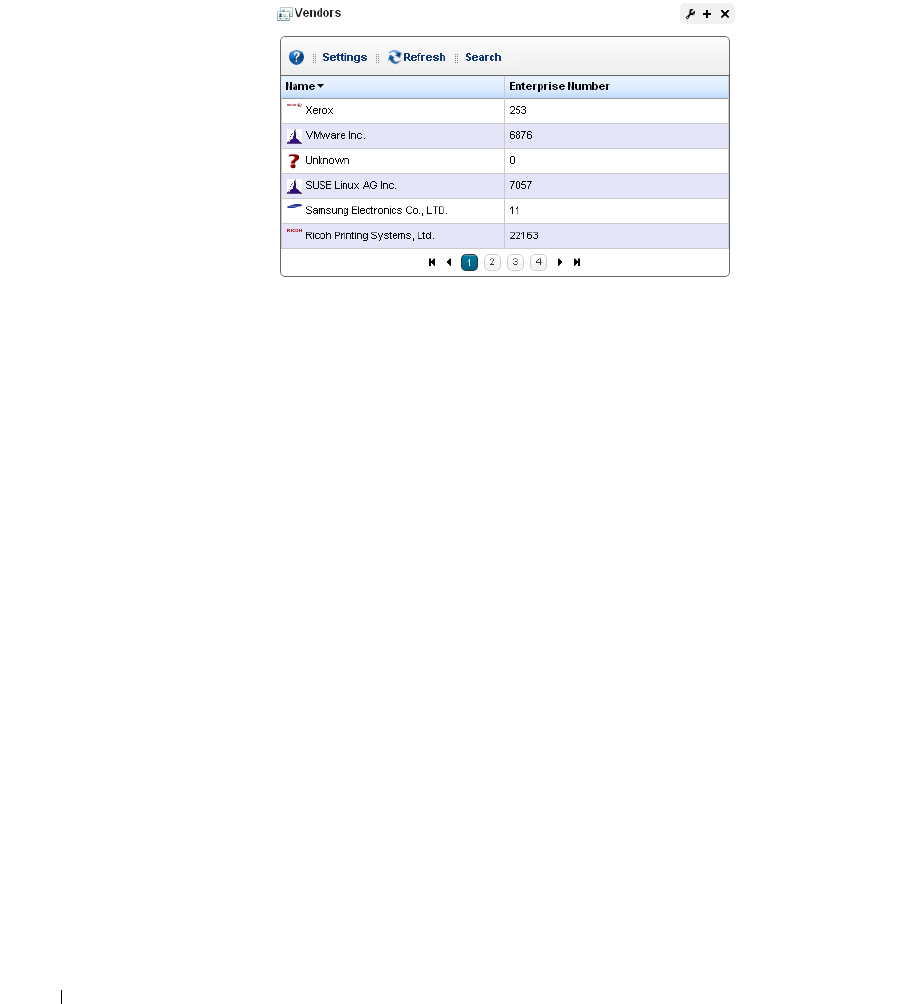
174
Vendors | Key Portlets
Vendors
In its summary form, this portlet displays the available vendors for network resources.
Right-clicking a row lets you do the following:
New / Edit—
Opens the Vendor Editor where you can configure or re-configure a vendor.
Details—
Displays a panel showing the alarms, registered models, and identifiers for the selected
vendor.
Visualize —
See a topology of the network filtered to display only the selected vendor, see Chapter
7, Display Strategies
Import / Export
—Common menu capabilities described in
Import / Export on page 109
.
This screen has the following columns:
Vendor Icon
—The icon for this vendor.
Enterprise Number
—The enterprise number for this vendor.
Vendor Name
—The name for this vendor.
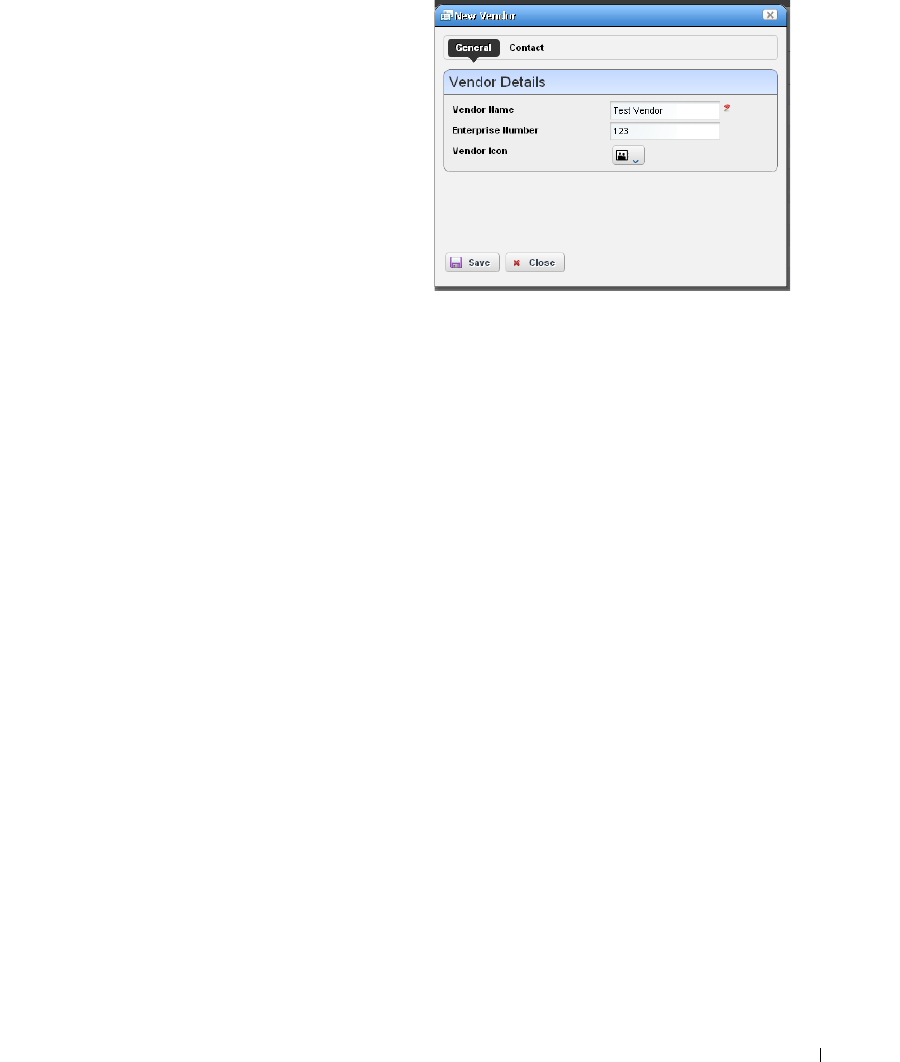
Vendors | Key Portlets
175
Vendor Editor
This editor configures (or re-configures) vendors.
It has the following fields:
General
Vendor Name
—A text identifier for the vendor.
Enterprise
—A numeric identifier for the vendor.
Vendor Icon
—Select an icon from the pick list.
Contact
Click the
Add
button to select from contacts in Dell
OpenManage Network Manager to associate with
this vendor. See
Contacts on page 169
for
instructions about configuring contacts.
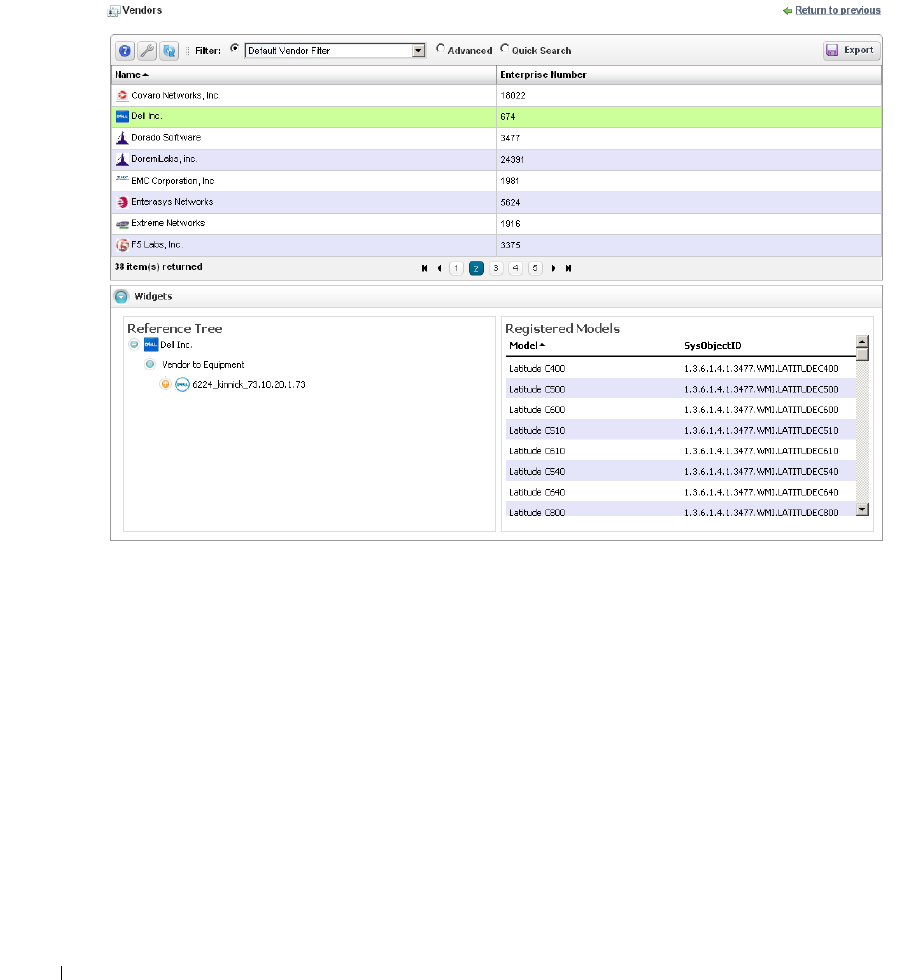
176
Vendors | Key Portlets
Expanded Vendor Portlet
When you expand the Vendor portlet, besides sharing you can also click
Settings
to configure the
columns that appear here (see Show / Hide / Reorder Columns on page 107). This screen has the
same columns available as the summary screen.
Vendors Snap Panel
The snap panel displays the icon for the selected vendor.
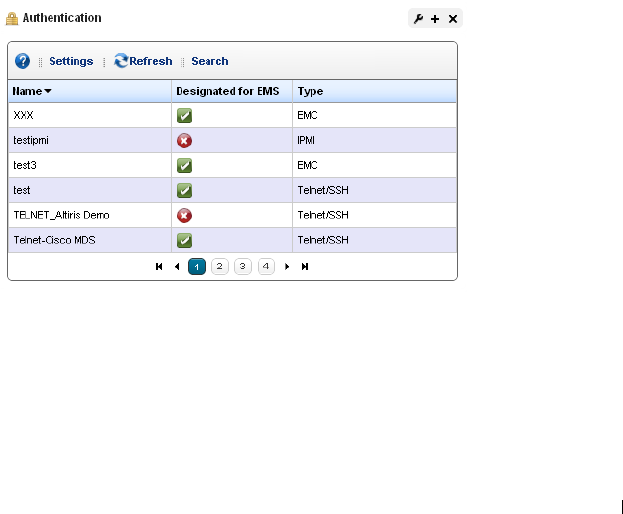
Authentication | Resource Management and Reports
177
6
Resource Management and Reports
The Resource management portlets let you manage devices you have discovered or created on your
network. Optional applications and device drivers may increase the basic functionality described
here, so your screens may not exactly match those appearing on the following pages.
Resource Management portlets let you view device-specific information, both general (name, type,
location, contact) and technical (vendor, subcomponents, and so on).
This chapter contains information about the following portlets:
• Authentication
• Discovery Profiles
• Managed Resources
•Ports
•Reports
Authentication
The authentication summary screen displays credentials used to communicate with and manage
devices.
This portlet displays credentials used in discovery and communication with network resources. The
Name
column identifies the set of credentials,
Designated for EMS
means it is available for all
users, and
Ty p e
indicates the protocol for that authentication.
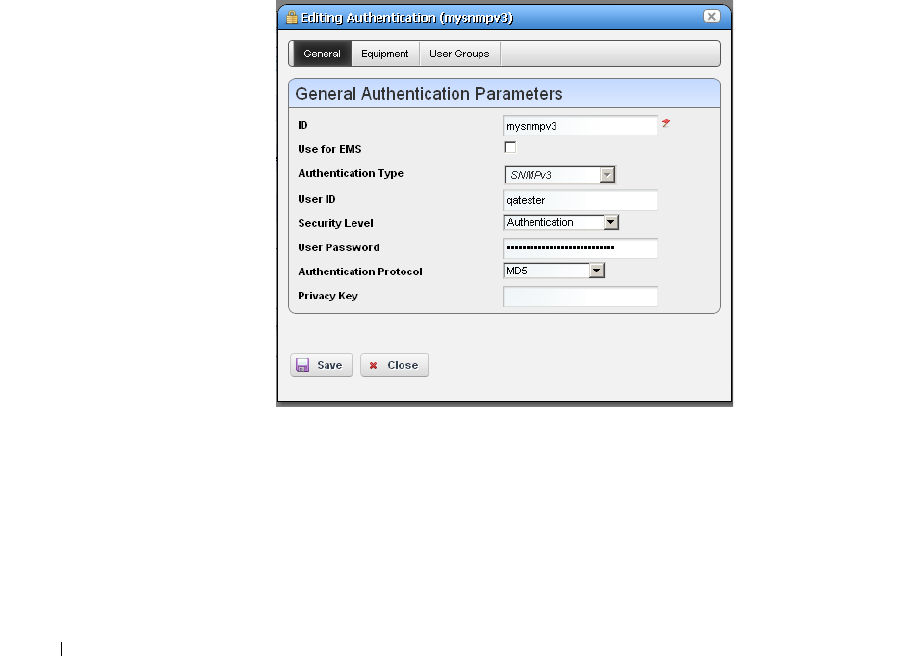
178
Authentication | Resource Management and Reports
Functions common to many menus, in addition to the Import / Export and Sharing, include the
following actions are available in the right-click menu:
New / Edit
—Opens Authentication Editor, where you can create a new authentication or edit the
selected authentication. You cannot change the Authentication Type when you edit an
existing authentication.
Details
—Displays a reference tree, associated equipment, and the configuration created or altered
in Authentication Editor.
Audit
—Opens an audit trail viewer for the selected authentication.
Delete
—Deletes the selected authentication. If it is in use, an error message appears saying that
deletion is not allowed.
Import / Export
—Imports or exports authentications to your Dell OpenManage Network
Manager system.
Authentication Editor
You can right-click and select
New
or
Open
to create or modify credentials for your system. You can
also
Delete
and
Share with User
from that right-click menu.

Authentication | Resource Management and Reports
179
The fields that appear in this editor vary, depending on the type of authentication. The
ID
(name)
for the authentication is mandatory. If you
Add
an existing authentication, for example to
Discovery Profiles, you can also configure the Management Interface Parameters like
Timeout,
Retries
, and
Port
used. If you have an authentication that works for multiple protocols (for example
SSH or Telnet), you can also select the
Protocol Type.
NOTICE
Discovery can fail because of network latency / timeout issues. Increasing the timeout or retries for Dell
OpenManage Network Manager authentications can circumvent that.
CAUTION:
If you do not get access to the deepest level of authentication—for example the “enable” user’s—you
cannot access all of Dell OpenManage Network Manager’s functionality. Also: many devices require
more than one authentication—for example SNMP and Telnet / SSH.
When attempting to access a device configured with SNMP v3, if you see an error message like
unable to read device serial number for selected credential
, discovery fails.
This indicates the SNMP v3 credential is faulty. Correct it, and discovery and other access should
be available.
NOTE:
The standard for SNMP v3 passwords is eight characters or larger. Some devices may accept shorter
passwords, but Dell OpenManage Network Manager requires eight characters or longer.
Use the
Equipment
and
User Groups
tabs to associate the authentication you configure here to
devices or groups of users.
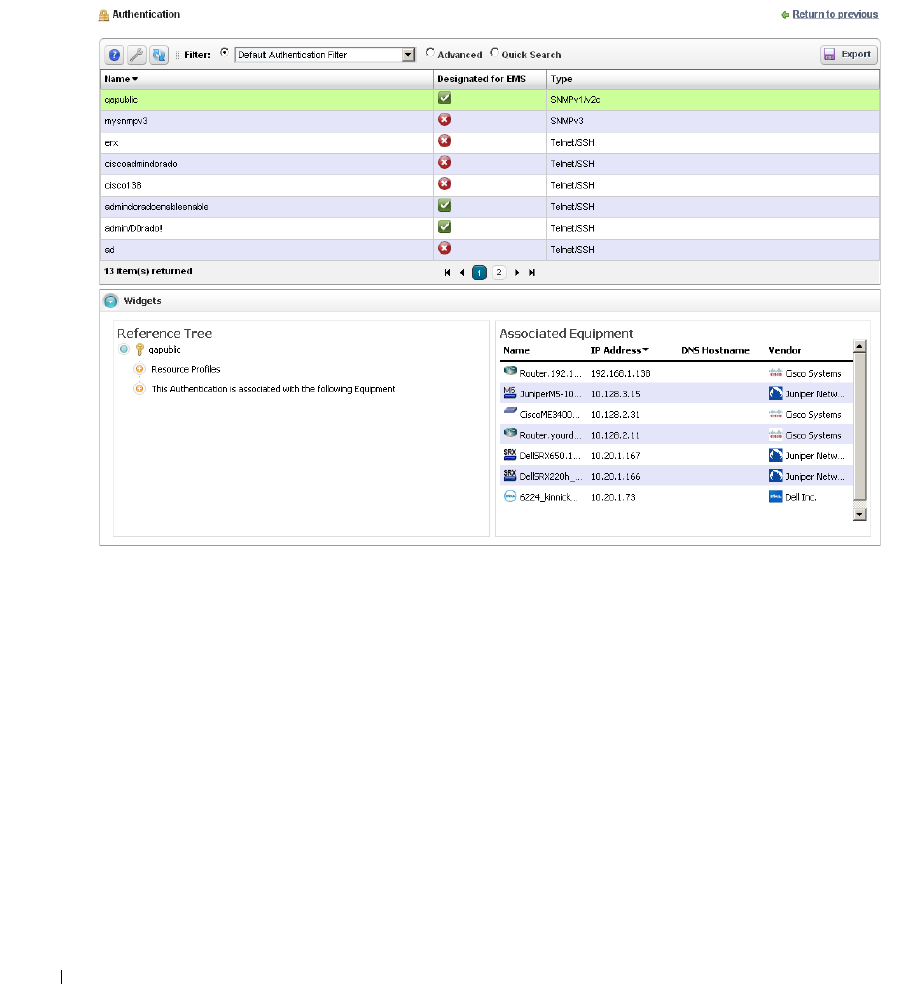
180
Resource Discovery | Resource Management and Reports
Expanded Authentication Portlet
The
Settings
button in the expanded Authentication portlet lets you configure column appearance
(see Show / Hide / Reorder Columns on page 107). This offers the same column setup as the
summary screen.
Authentication Snap Panel
When you select a listed authentication the
Reference Tree
Snap Panel displays a tree of that
authentication’s connections to Discovery profiles and equipment.
Resource Discovery
The following explains and demonstrates the features included in Resource Discovery. The guide
assumes you have full access to all the features (full license) included in the web portal.
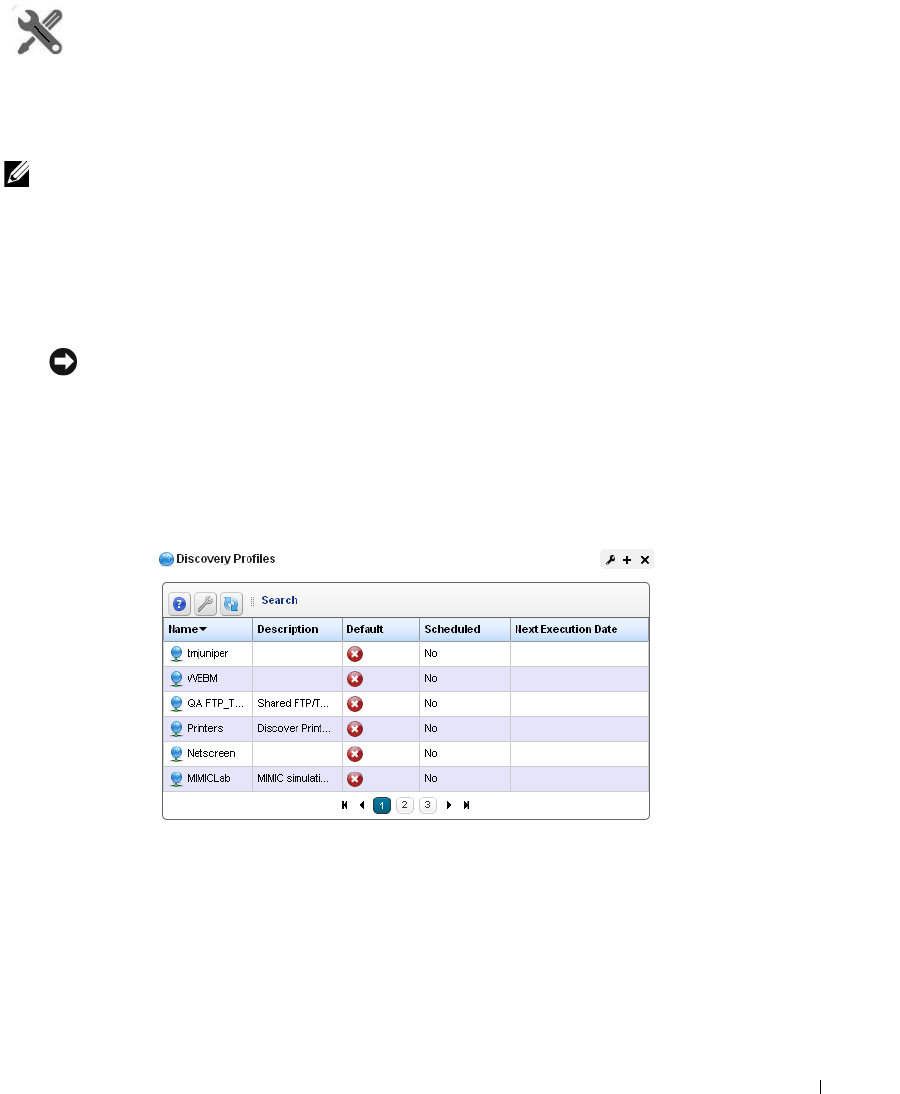
Discovery Profiles | Resource Management and Reports
181
How To:
Discover Resources
Here are the steps:
1
Set up Discovery Profiles for the resources you want to discover.
NOTE:
Dell OpenManage Network Manager must be authorized to set CLI session parameters; permissions-
related timeouts may occur during device access if it is not. For example, Cisco CLI access requires the
command
set terminal length 0
.
2
Execute the profile
3
View the results in the Managed Resources portlet.
NOTICE
Quick Discovery executes the basics of the selected discovery profile without any following actions.
Discovery Profiles
The discovery profiles set up equipment discovery for Dell OpenManage Network Manager.
The summary view displays the
Name, Description, Default
(the green check indicates the default
profile), whether the profile is
Scheduled
and
Next Execution Date
for scheduled discovery
.
When Dell OpenManage Network Manager discovers unknown devices, it examines the RFC1213
MIB for hints of the device's capabilities, determining if it looks similar to a layer 3 router or a layer
2 switch. Since some device can do both, Dell OpenManage Network Manager classifies such
ambiguous devices as routers.

182
Discovery Profiles | Resource Management and Reports
Menu Options
When you right-click a profile, the following menu options appear (in addition to the Common
Menu Items):
New
—Opens Discovery Profile Editor in new profile mode. (see General on page 183)
Edit
— Opens Discovery Profile Editor.
Copy
— Opens Discovery Profile Editor, and renames the selected profile as “CopyOf[Original
Name]”.
Execute
—Executes a discovery profile. This also produces an Audit trail (see Audit Trail / Jobs
Screen on page 114). A message appears indicating the success or failure of discovery
execution.
Discovery execution continues in the background even when you close the audit trail / jobs
screen, but the message indicating success / failure still appears when the discovery process is
done.
Inspect
—Validate the profile’s credentials, and that the device pings, and is licensed for discovery.
Described in Inspection on page 188.
Quick Discovery
—Opens discovery wizard displaying network and authentications, but without
the
Actions
and
Inspection
panels. Quick Discovery does not execute actions, either. Click the
Execute
button once you open this screen to quickly discover equipment. (See Network on
page 185 for more about the screen this displays.)
Schedule
—Opens schedule editor where you can create and/or modify the schedule for a discovery
profile’s execution.
Audit
—Displays audit trails for the selected profile. See Audit Trail / Jobs Screen on page 114.
Delete
—Deletes a discovery profile, after you confirm deletion. A notification message appears
when deletion is completed on the application server.

Discovery Profiles | Resource Management and Reports
183
The remaining menu items include
Import, Export Selection, Export All
and (if other users exist in
the system)
Share with User.
NOTE:
Dell OpenManage Network Manager discovers Aruba Access points through the controllers to which
they connect, discovery does not find stand-alone access points.
Discovery Profile Editor
This editor lets you create or modify profiles. It has the following sub-sections:
• General
•Network
•Actions
•Inspection
•Results
How To:
Edit Discovery Profiles
Here are the steps that appear in Discovery Profile Editor:
General
The General Panel collects all required data for a discovery profile. Dell OpenManage Network
Manager validates each field, one at a time. Hints and tooltips appear if you hover your cursor near
a field or label.
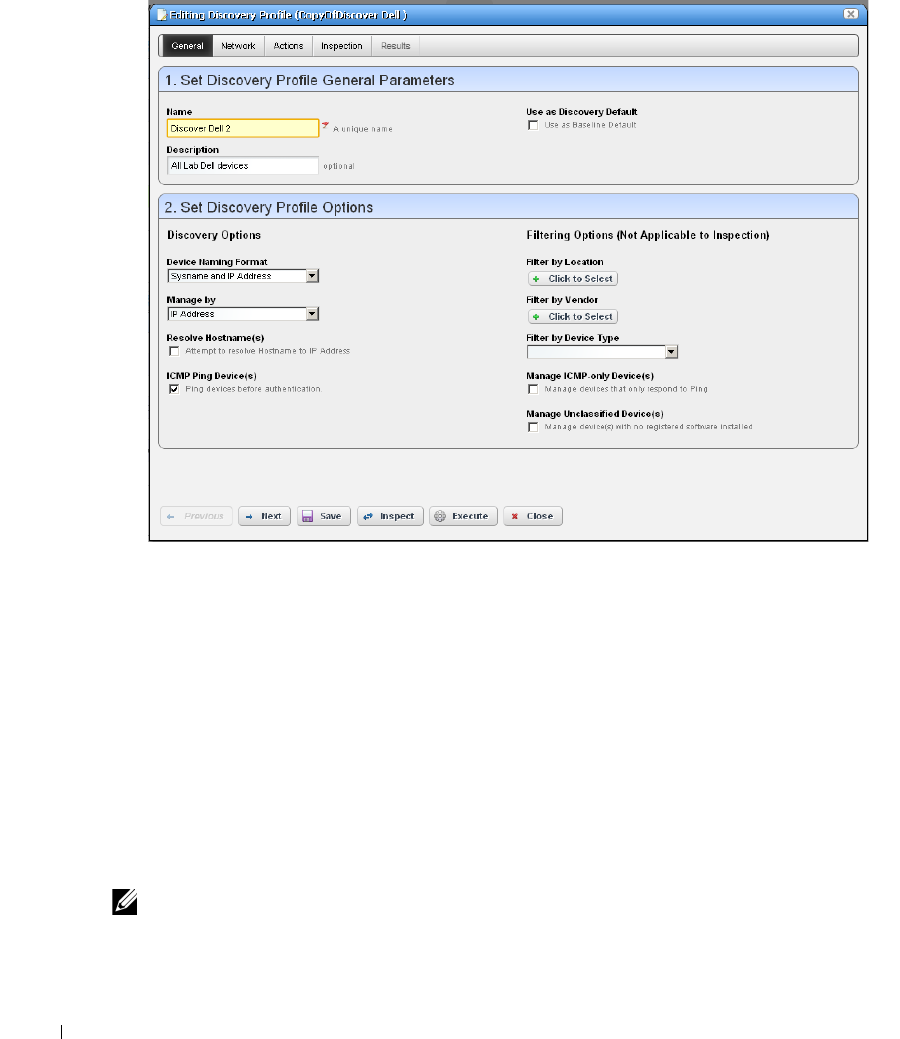
184
Discovery Profiles | Resource Management and Reports
1
General Parameters
—Set the
Name, Description
and a checkbox to indicate whether this
profile is the discovery default.
2
Profile Options
—Select the
Device Naming Format
(how the device appears in lists, once
discovered), whether to
Manage by IP
address or hostname, and check whether to
Resolve
Hostname(s), ICMP Ping Device(s), Manage ICMP-only Device(s),
or
Manage Unclassified
Device(s)
.
This last checkbox determines whether OpenManage Network Manager attempts
to manage devices that have no OpenManage Network Manager device driver installed. If
your system’s license permits it, such management may be possible, but more limited than for
devices with drivers installed.
If your license limits the number of devices you manage, discovering such “generic” devices
may count against that limit.
The Filters (by
Location, Vendor,
or
Device Type
) let you narrow the list of devices discovered
by the selected item(s). As the screen says, this filtering will not have any impact on the
processing that occurs during the Inspection step.
NOTE:
Fields like Location query the database for current information, so even though its field may appear
empty, Locations may exist. Click the Search button to the right of this field to populate it. Keeping such
fields empty until you use them enhances performance.
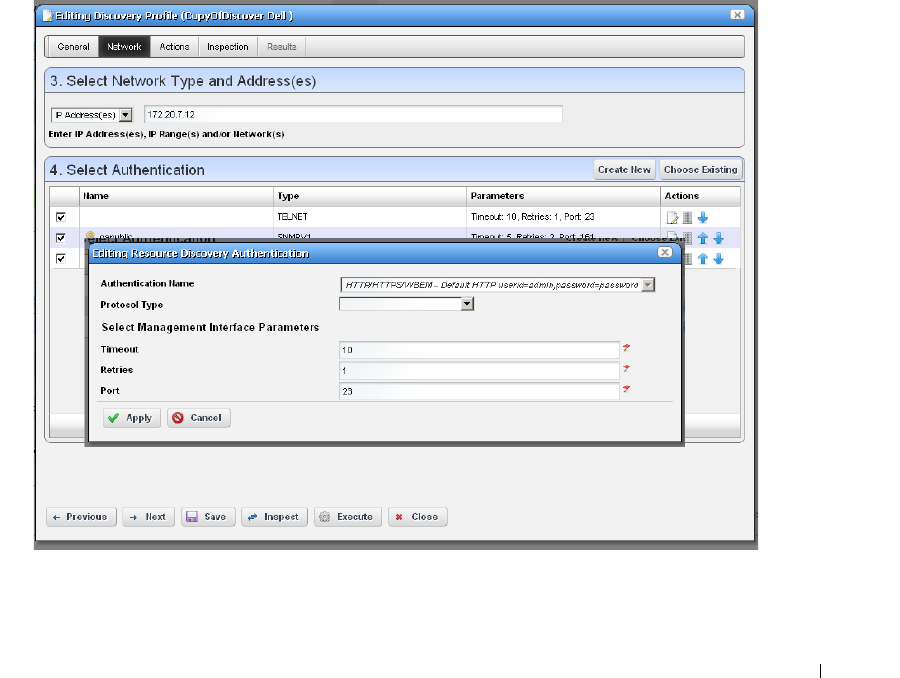
Discovery Profiles | Resource Management and Reports
185
The buttons at the bottom of the Profile Editor let you navigate through this series of panels.
Previous / Next
move back and forth between screens,
Save
lets you preserve whatever stage
you have configured, and close the editor,
Inspect
moves directly to the Inspection screen
(described below), and
Execute
triggers the discovery profile and opens the Results panel,
displaying message traffic between Dell OpenManage Network Manager and the device(s).
Click the “X” in the top right corner of these screens to close them without saving.
If you discover devices without retrieving their hostnames, and need that hostname later, you
can re-run discovery after checking
Resolve DNS Hostnames
. This fetches the DNS hostname
and resyncs the device.
Network
The Network Panel collects the network (IP range, hosts, and so on) and the authentication
information for the discovery profile.
3
After you click
Next
,
the
Network
panel appears.
Network Type and Addresses
—Select the type of entry in the pick list
(IP Address(es),
CIDR Address, Hostname, SNMP Broadcast, Subnet).

186
Discovery Profiles | Resource Management and Reports
The tooltips in the data entry field tell what valid entries look like.
NOTE:
Dell OpenManage Network Manager now discovers all IP addresses in a specified range, regardless of
the specified base IP address is (middle, starting IP, or last in the range). IP addresses outside of range
will not be discovered. You can use the CIDR specification of the network to discover rather that the
subnet ID.
4
Authentication
—You can create new, or add existing authentications. See Authentication on
page 177 for the way to create such authentications outside the discovery process.
CAUTION:
If a device or its driver requires two authentications and you only enter one, it may not appear in
inventory after discovery. To correct this, enter both authentications in the Discovery Profile or in Quick
Discovery. If you discover a device partially with only one authentication—typically the SNMP
community—you can re-discover with the correct authentications later, or Edit the resource to add that
correct authentication and the management interface for it.
Notice that authentications appear with
Edit / Delete
icons and
Up / Down
arrows on their
right. The
Edit
icon opens the authentication editor. Click the arrows to arrange the order in
which the application tries credentials (top first). Ordering only applies when two credentials
are of the same type.
If you have imported a discovery profile without importing or creating the authentications it
uses, editing its authentications is not possible. If you cannot import authentications, or have
not created them when you do attempt to edit them, the easiest solution is to delete the un-
imported un-created authentication the profile refers to and create a new one.
If two similar authentications include one with a “deeper,” enable login, and a “shallower”
one without that additional login, arrange to try the deeper login first. If the device rejects it,
discovery still tries the shallower one later.
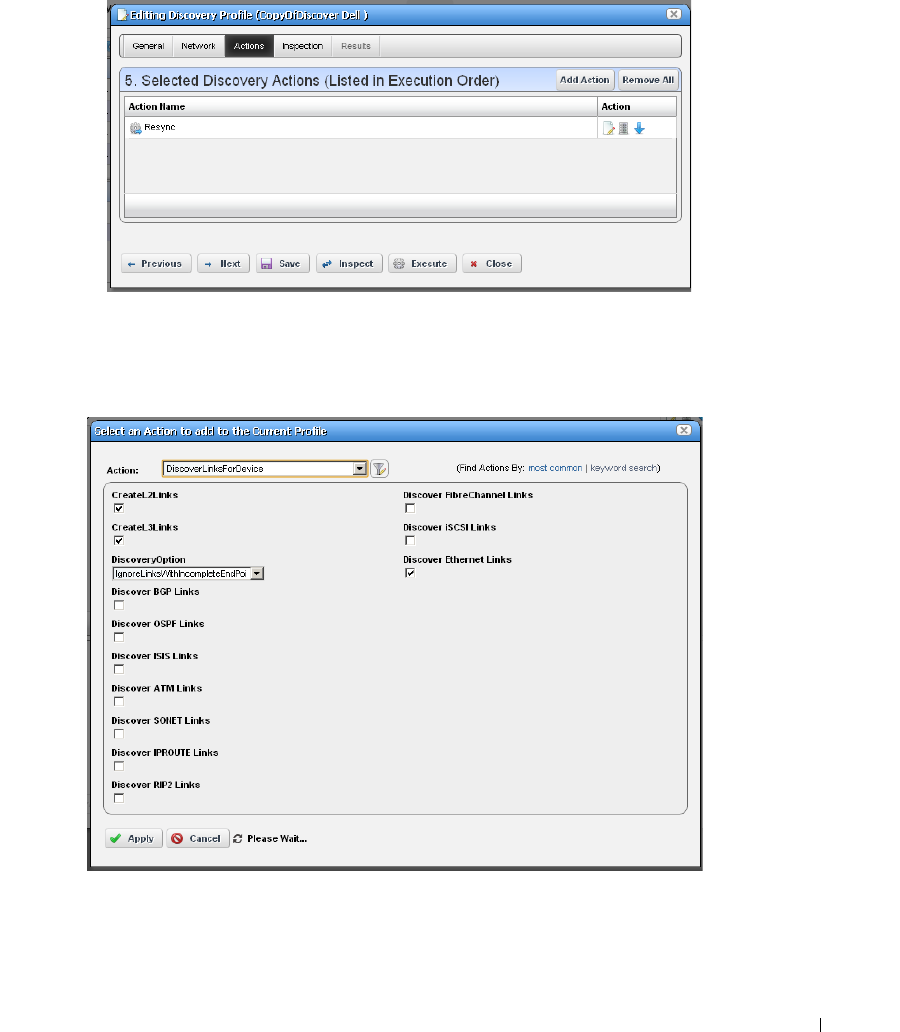
Discovery Profiles | Resource Management and Reports
187
Actions
5
When you click
Next
, the
Actions
panel appears.
You can simply accept the default actions that appear here (like
Resync,
and
Learned MAC
discovery) by clicking
Next
to the Inspection portion of discovery, or you can do the following:
Add Action—This opens a screen with a selection list of available actions. Click Apply to
select an action to add to the list for this profile.
Notice the default for this screen displays the most common actions, but you
can also click keyword search in the top right corner to display a search field
instead of a pick list with the most common actions. The search results
appear in the pick list. When you select an item, if it has parameters, they
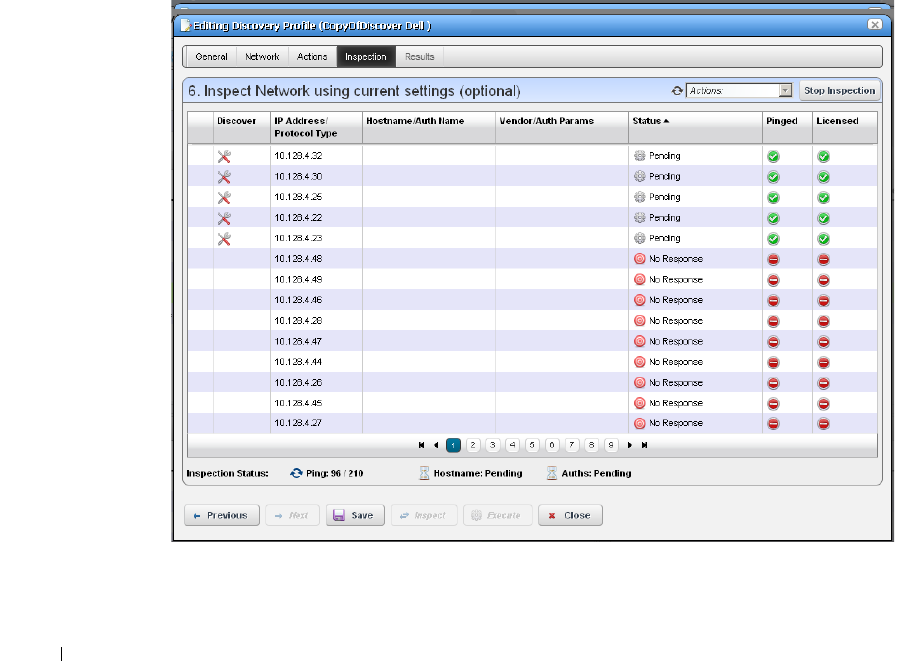
188
Discovery Profiles | Resource Management and Reports
appear listed below that item. Use the checkbox(es) or pick list to configure
these parameters, then click Apply to select this action as part of the profile.
See Actions on page 145 for more about these.
Edit, Delete, Move—These icons appear to the right of each action. If you Edit a profile
with parameters, you can change them. The screen looks like the one that appears when
you Add actions. Deleting actions removes them from the list, and the Move arrows
help arrange the order in which actions appear listed, and are executed. The list of
actions the profile executes goes from top-to-bottom.
Inspection
Using the Inspection Panel is an optional step. If you want to execute the profile after entering the
required information on the General and Network panels, you can skip this step, and just click
Execute
at the bottom of the panel.
6
Inspection
—This screen lets you preview the discovery profile’s actions and access to
devices. If you clicked
Next
rather than
Inspect
at the bottom of the previous screen, click
Start Inspection
in the top right corner of this screen to begin the inspection process that
validates the device’s credentials.
Notice that the
Inspection Status
fields at the bottom of the screen indicate the success or
failure of Ping, Hostname resolution, and Authentications, and the
Status
column displays
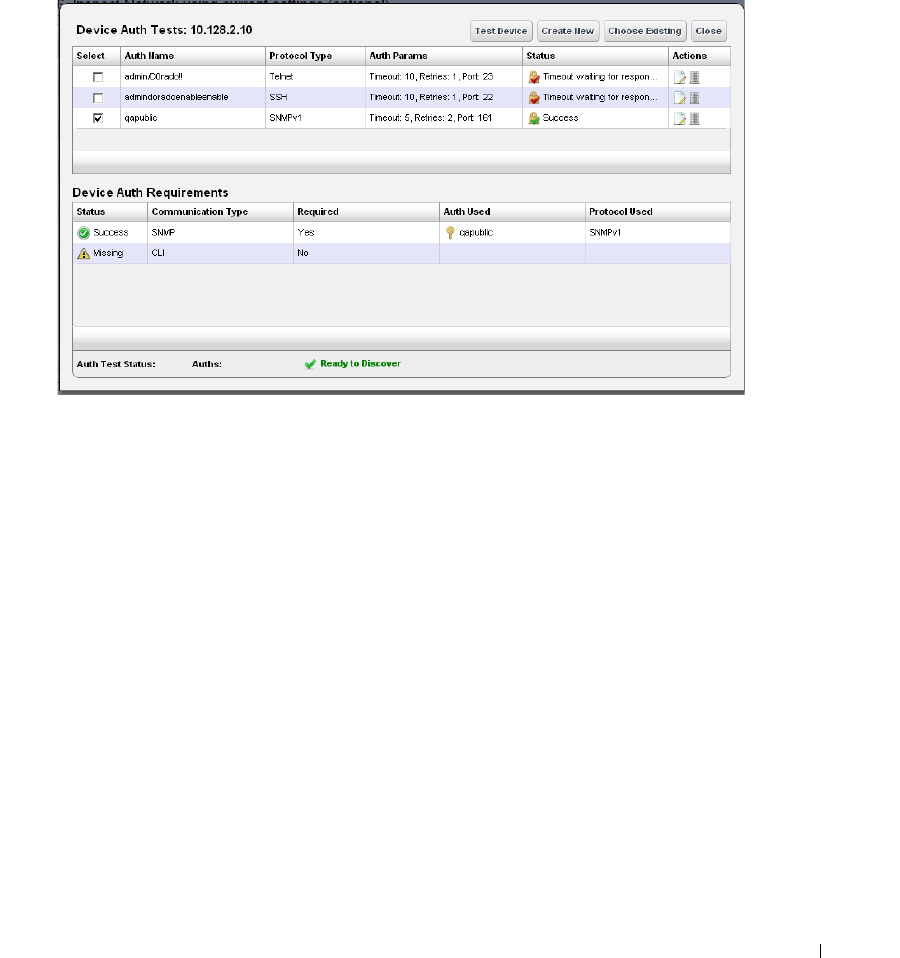
Discovery Profiles | Resource Management and Reports
189
whether a valid authentication exists, whether it has been tested, and whether the test is
successful.
When authentications are unsuccessful, click the icons to their right to remove or edit them.
You can also click the wrench / screwdriver “fix it” icon in the
Discover
column to open an
editor where you can revise the authentications for that device.
Clicking
Create New
lets you create new authentications,
Choose Existing
lets you select
from existing authentications,
Tes t D ev i c e
lets you try out the authentications you have
selected, and
Close
closes this screen. Notice that you can configure new or existing
authentications’ port, retry and timeout settings before you click
Apply
(or
Cancel
) in the
authentication editor that appears after clicking the “Fix it” button.
7
Save—
Click
Save
to preserve the profile. You can then right-click it to select
Execute
.
If you
select
Execute
from the profile editor, Dell OpenManage Network Manager does not save the
profile to execute later.
Results
8
Execute
—Clicking
Execute
begins discovery, and the message traffic between Dell
OpenManage Network Manager and the device appears on the
Results
screen.
This produces a standard Audit Trail / Jobs Screen
screen displaying the message traffic. See
also Audit Trail / Jobs Screen on page 114 for more about retrieving archives of such screens.
9
A message (
Discovery Profile Execute
is complete
) appears in the
Messages
at the bottom left
of the status bar.
10
Click the X in the top right corner of the discovery profile editor to close it.
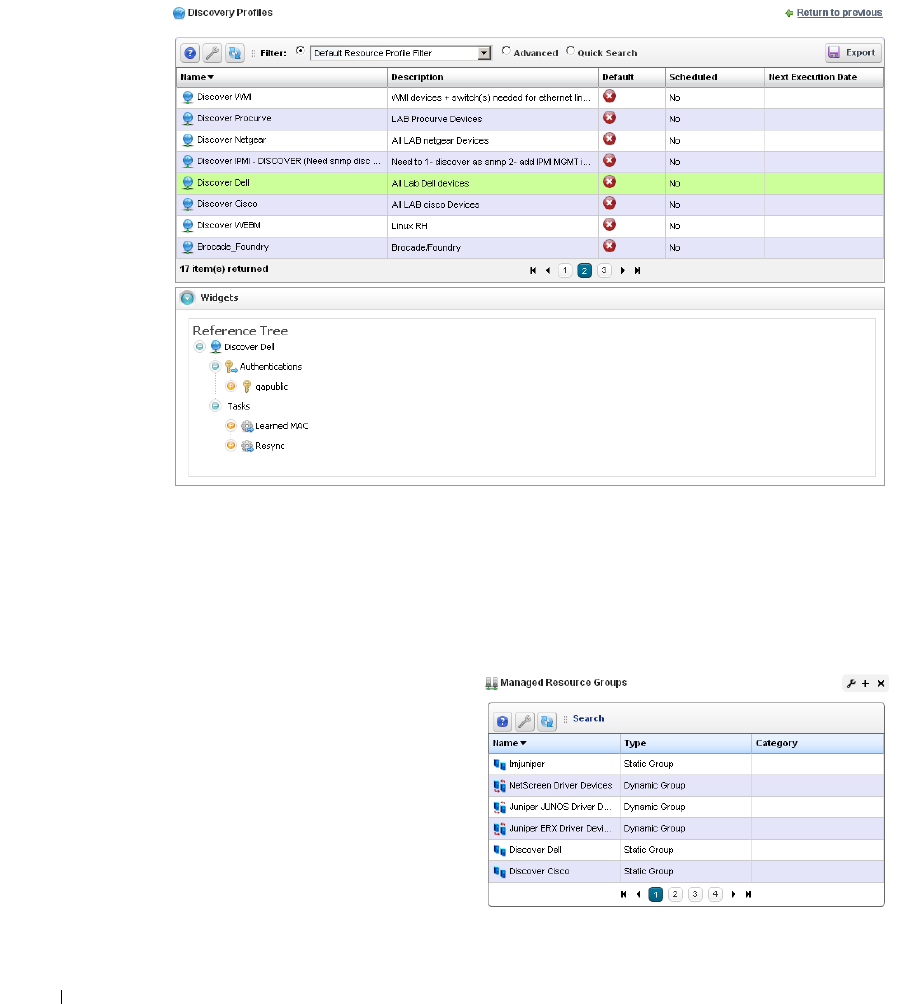
190
Managed Resource Groups | Resource Management and Reports
Discovery Profiles Expanded
This larger view offers a
Reference Tree
snap panel where you can see the connection between a
selected profile and the authentications and discovery tasks it includes.
In addition to the right-click available in the summary screen, you can also click
Settings
to
configure columns.
Managed Resource Groups
These groups make acting on several
devices at once more convenient, making
management of groups of devices possible.
The summary screen displays columns
describing the group
Name, Type,
and
Icon
.
You can also right-click to do the following:
New
—Lets you make either a Static
Group (one in which you select
devices) or a Dynamic Group (one in
which a filter selects devices). See
details of these screens below.
Edit
—This opens the same editors as
New
, populated with the information for the selected group.
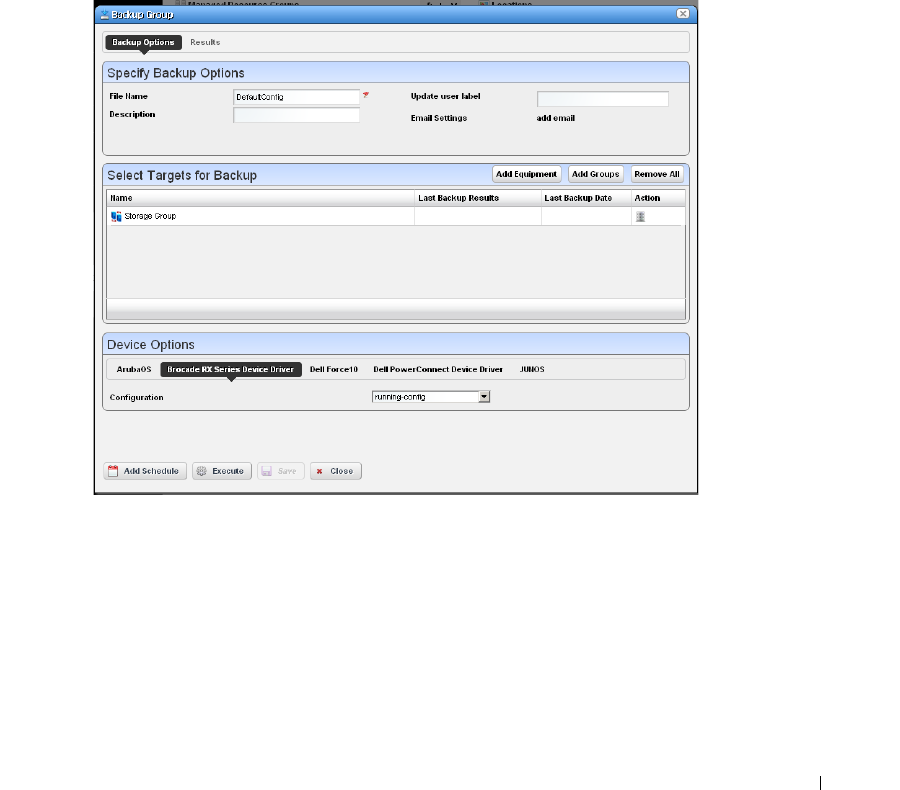
Managed Resource Groups | Resource Management and Reports
191
Edit Resources
—Lets you edit resources associated with the selected group like its location,
contact, or whether to manage it by hostname.
Visualize
—Displays a topology map of the selected group. See Chapter 7, Display Strategies for
more.
Actions
—Select from a sub-menu of actions available for the group.
Adaptive CLI
—Select from a sub-menu of Adaptive CLI
File Management > Backup, Restore, Deploy
—Lets you call on Dell OpenManage Network
Manager’s NetConfig configuration file backup, restore and deploy capabilities. See Backup
Configurations on page 274 for an example of the steps this follows. See also File
Management on page 271 and more about deploying updates to the OS for the selected
resource group. See Deploy Firmware on page 287 for details.
When you select a group backup, and the group contains devices of several types, the
Device
Options
panel displays a tab for each device type. Select the backup parameters there before
executing or scheduling backup.
Link Discovery
—Discover links between members of the selected group, and others. See New
Link on page 207 and Link Discovery on page 208 for details.
Resync Resources
—Queries the devices in the group to update Dell OpenManage Network
Manager’s database. Resyncing also resyncs alarms on the selected device.

192
Managed Resource Groups | Resource Management and Reports
Delete
—Remove the selected group from inventory. The devices remain in inventory, but this
removes the grouping.
Import / Export
—Lets you import from or export to file the group configuration.
Share with User
—Share the group with another user. See Sharing on page 110.
Dell OpenManage Network Manager does not supports static groups that include members
retrieved by (dynamic) filters. You can configure membership with dynamic resource groups that
include group memberships as filter criteria. For example you can create a filter for members of
ResourceGroupABC or members of ResourceGroupXYZ.
Expanded Managed Resource Groups
The expanded Managed Resource Groups screen lets you see the summary screen’s groups with a
Reference Tree snap panel that displays a selected group’s connection to its devices and any
assigned monitors.
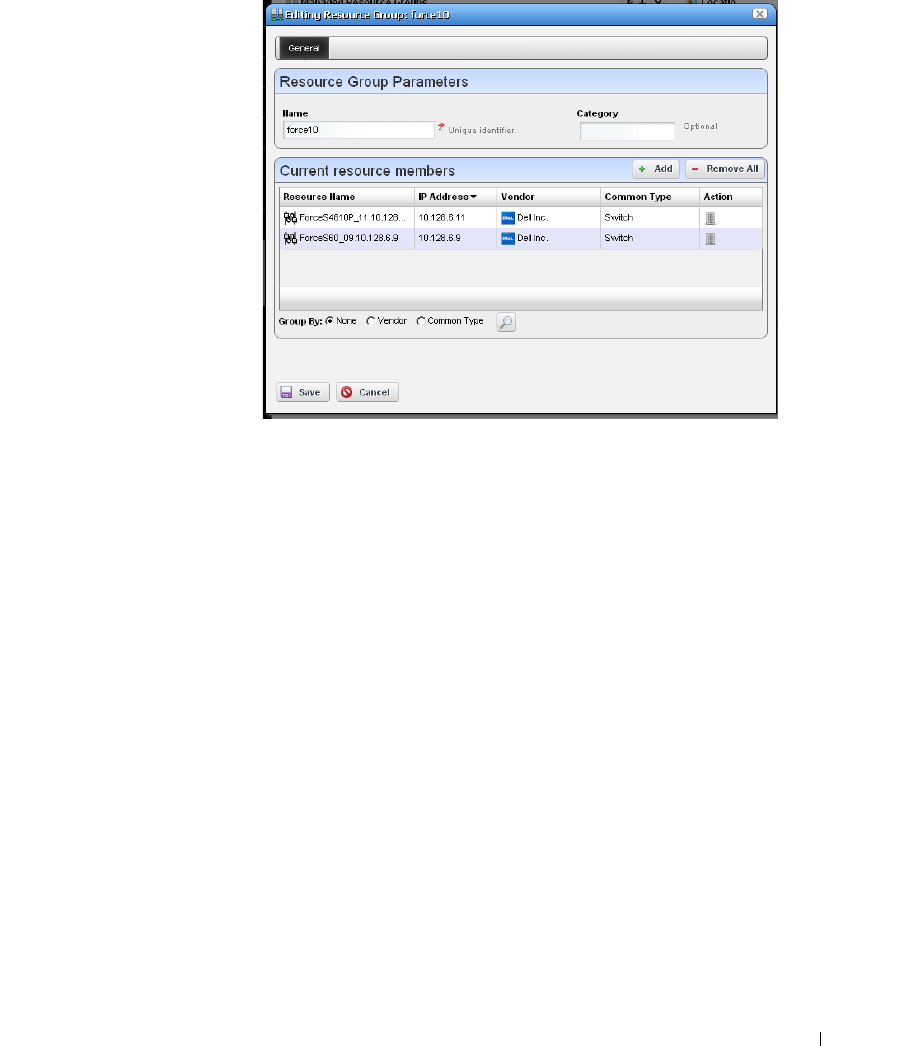
Managed Resource Groups | Resource Management and Reports
193
Static Group
Selecting
Static Group
as the
type to create displays a
selector screen where you can
Name
and select a
Category
for the group, then search for
available resources with a filter.
Click
Apply Filter
after you
have configured it, and a list of
devices fitting its criteria
appears. Select device(s) and
click
Add Selected
, or simply
click
Add All
to add the entire
list to your static group. Notice
that you can continue to re-use
this filter to list devices, and
continue to select them.
When you select a device, it
no longer appears listed.
When you click
Done
the
subsequent screen displays all devices you have selected. You can click
Add
on this screen to return
to the previous screen (or
Remove All
to delete the listed devices from the group). At the bottom of
this screen, you can also elect to group devices by
None, Vendor
or
Common Type
(Switch, Router,
and so on). These last two create “trees” with nodes for each vendor or type. You can also click the
magnifying glass to search through listed devices. Clicking
Remove All
removes all devices in the
group.
Click
Save
to preserve the group you have configured.
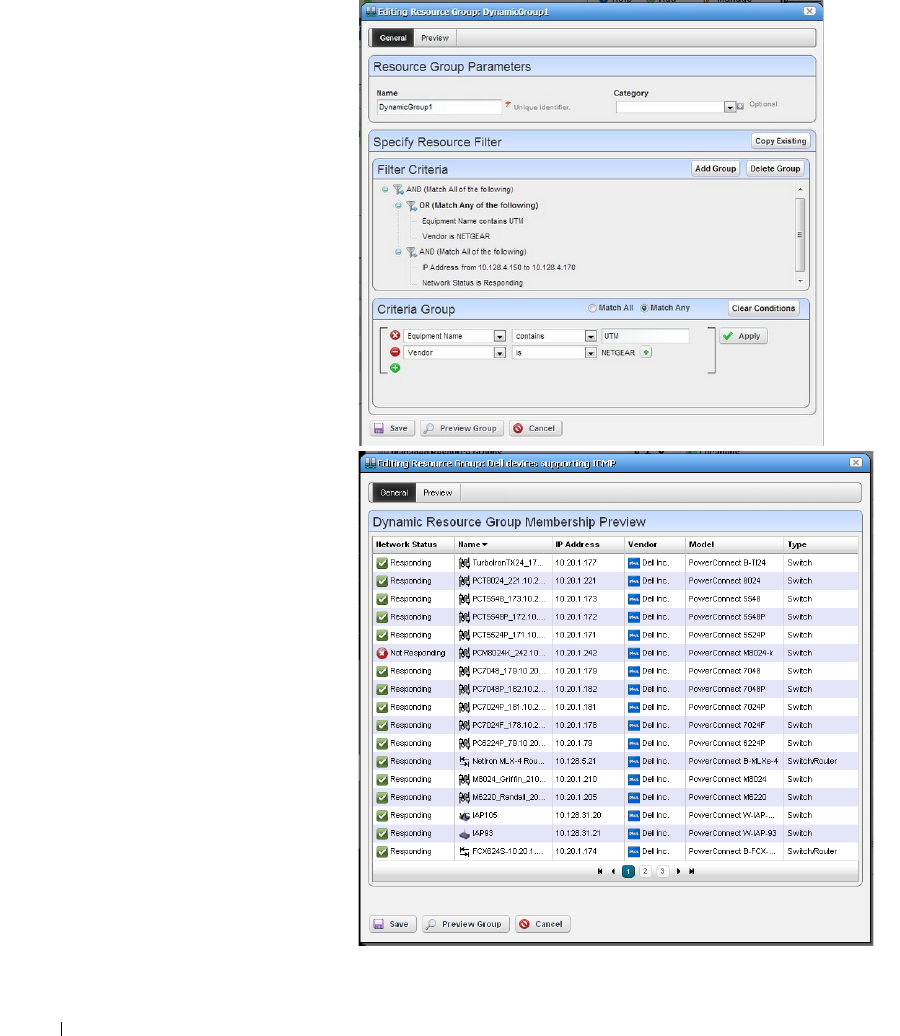
194
Managed Resource Groups | Resource Management and Reports
Dynamic Group
In contrast to Static
Groups, Dynamic Groups
do not let you select
individual equipment. You
simply configure a filter, and
OpenManage Network
Manager creates the group
on the fly. After you enter
the
Name
and
Category
for
the group, create the filter.
To see what the group
would look like, click
Preview Group
. This opens
the
Preview
tab, concealing
the
General
tab. To return
to
General
, click that at the
top of the screen. Click
Save
to preserve the group
configuration, or
Cancel
to
exit without saving.
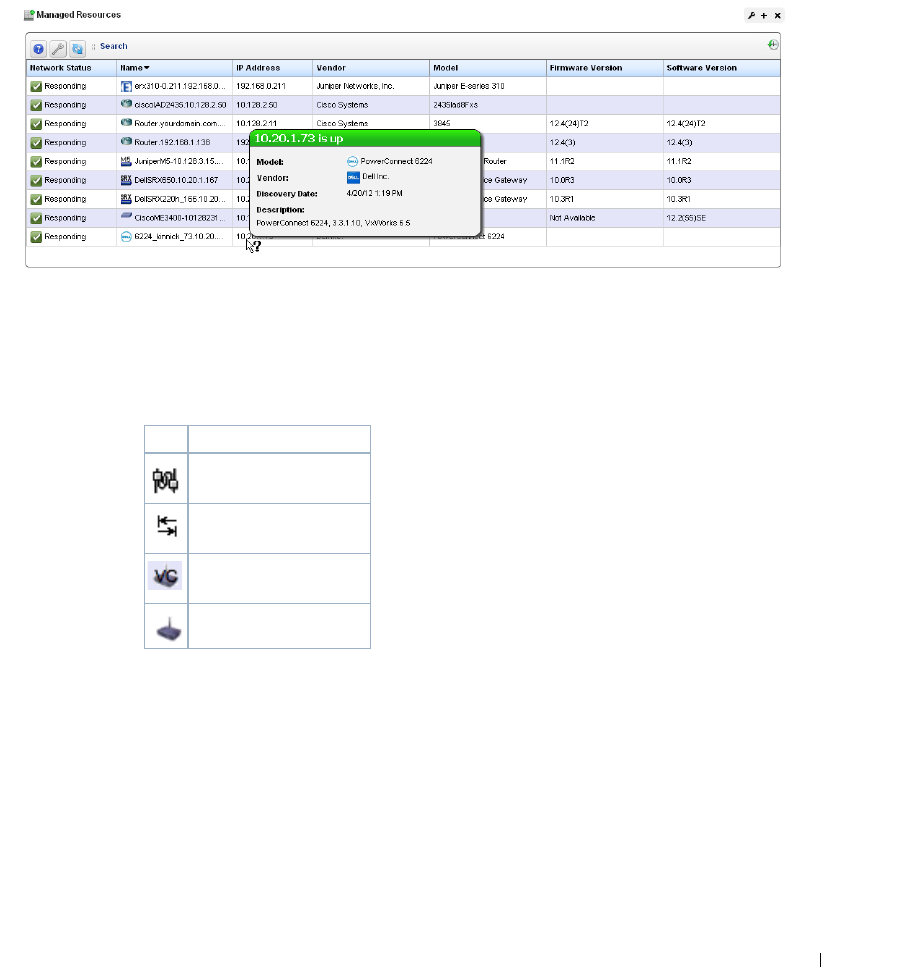
Managed Resources | Resource Management and Reports
195
Managed Resources
The
Managed Resources
summary portlet displays the discovered devices on your network, their
Network Status, Severity
(of their highest recent alarm),
Equipment Name, IP Address,
and
Vendor
Name
.
Hovering the cursor over a listed device’s IP address produces a popup with its alarm status in the
headline (both severity name and color), the
% CPU, % Memory
, and
Ping
.
See the Managed
Resources Expanded section for a description of columns and additional capabilities in that version
of the portlet. Icons that appear next to the equipment name have some significance. For example:
You can schedule actions selected here in addition to executing them immediately. See How to:
Schedule Actions on page 118 for more. Right-clicking a listed resource can display the following
menu items:
Icon Device Type
Switch
Router or Switch/
Router
Wireless Virtual
Controller
Wireless Access Point
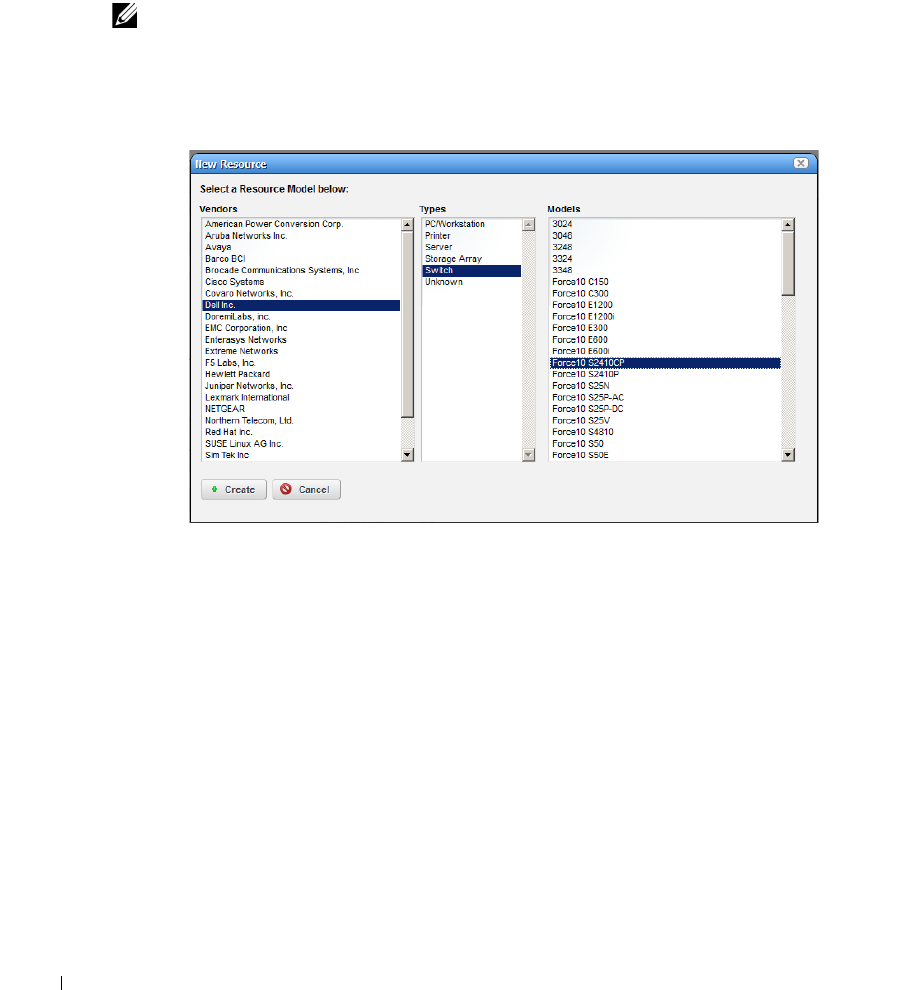
196
Managed Resources | Resource Management and Reports
See General > Entity Change Settings on page 58 for the way to set the summary portlet refresh
interval. The default is 40 seconds. If this portlet is on the same page as the
Container View
portlet, or if it is in expanded mode, refresh does not occur automatically, but you can manually
refresh it.
NOTE:
A small clock icon in the upper right corner of the portlet indicates that auto refresh is enabled.
New
—You can create a new device without discovering it with this menu item. Select the device
vendor, model and type in the next screen, then fill in the information about the device in the
editor that appears after that selection.
The editor description appears below.
Edit
—This lets you use the following screens:
• General
• Authentication
• Management Interface
• Custom Attributes—This tab appears only if you have configured custom attributes. See
Redcell > Data Configuration on page 55 for more about them.
Click
Save
to preserve any changes made in these screens to Dell OpenManage Network
Manager’s database, or
Close
to abandon any changes made in editor screens. Unless the
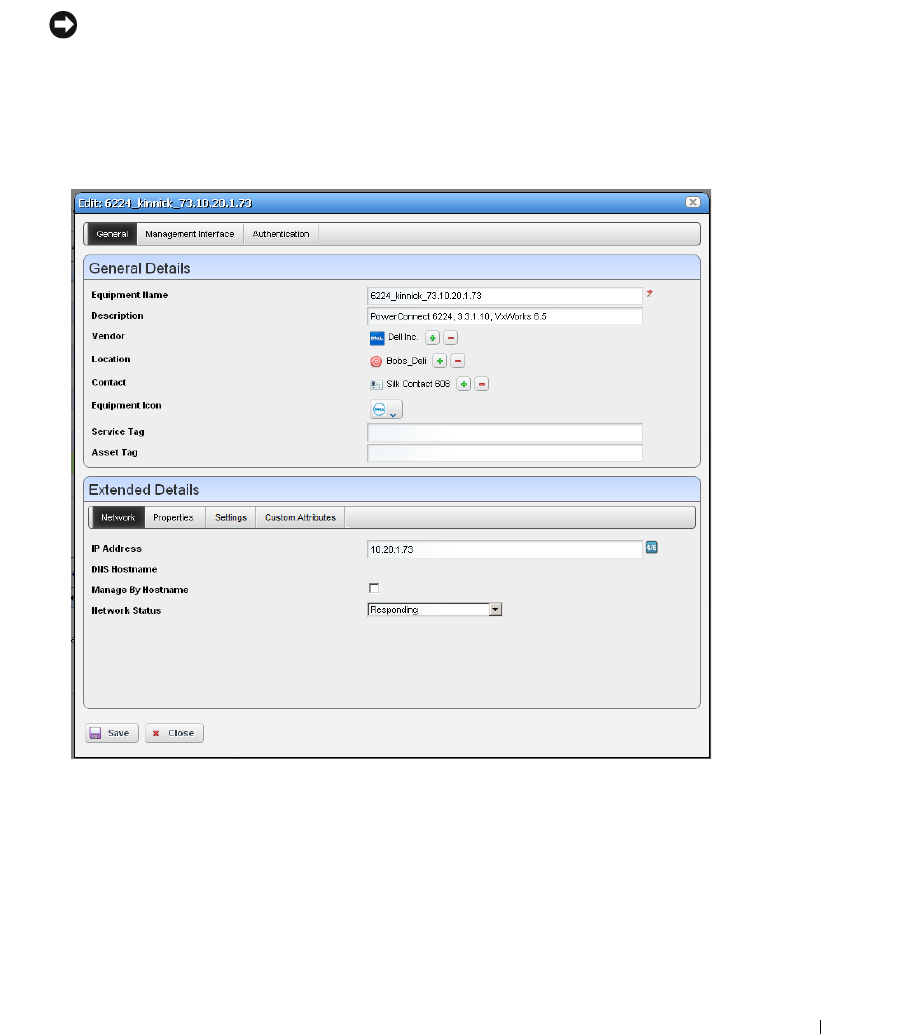
Managed Resources | Resource Management and Reports
197
device is a printer, changes to these screens typically make database changes, not changes on
the device.
NOTICE
You can edit fields like Notes and Description in subcomponent cards by right-clicking them in the
resource tree.
General
This screen may vary for different kinds of devices. Its
General Details
panel displays the
Name, Description, Vendor, Location, Contact,
and
Equipment Icon
for the selected device.
The
Extended Details
panel includes
Network,
Properties
and
Settings
tabs. These let you
view or alter things like
IP Address, DNS Hostname, Manage by Hostname, Network Status,
Model
and
Equipment Type, Serial Number, Software Version
Firmware
and
Hardware
versions
.
The
Settings
tab lists the
System Object ID, Date created
(the date this managed
device entered the database),
Creator
(the user who discovered or created the device),
Install
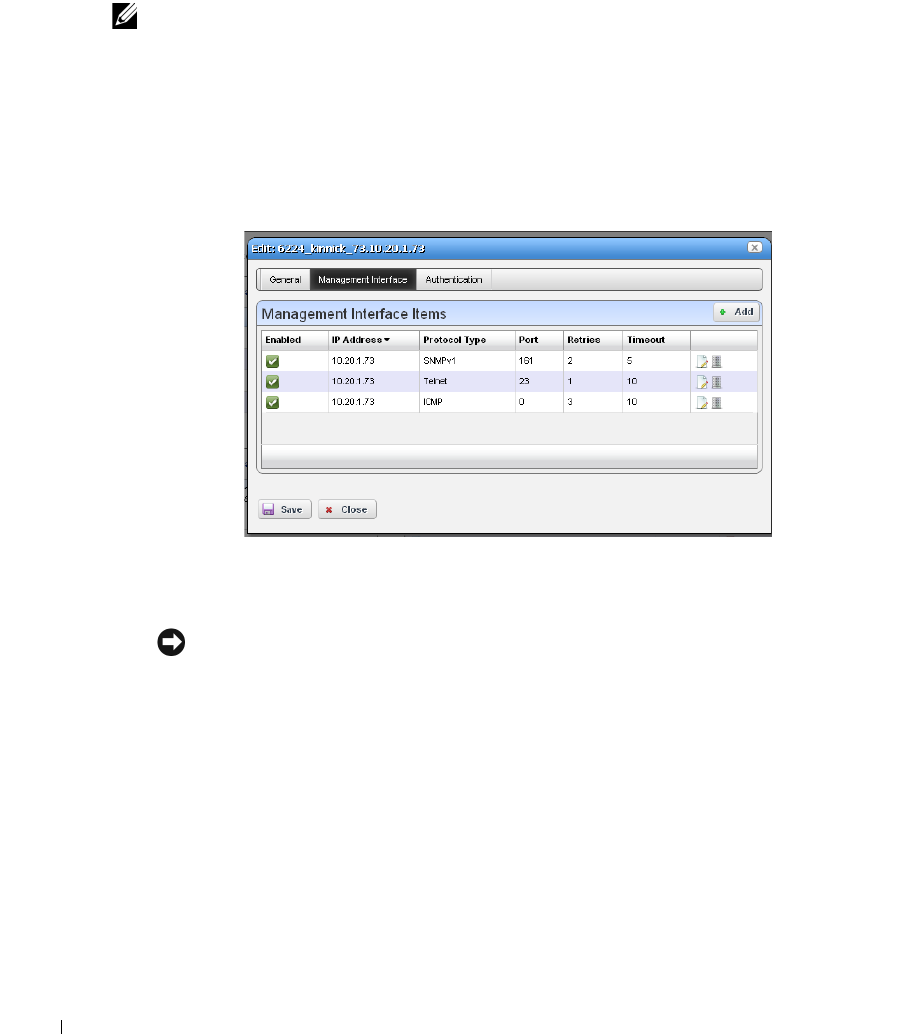
198
Managed Resources | Resource Management and Reports
Date, Administrative State
(see the
Manage > Administrative State
menu below)
,
Operational State,
and any
Notes
about the device.
NOTE:
Changing fields in the Editor screens like Network Status, Administrative State, Operational State (and
MAC address for ports) do not change the device; they change only the Dell OpenManage Network
Manager database. You can alter these fields to take notes or set aspirational values, but no change
goes to the device, and resync eradicates changes made if the device has conflicting values.
Management Interface
This lists the management interfaces for the selected device, including the
IP Address, Port,
Retries,
and
Timeout
.
You can
Add
interfaces with the button in the upper right corner, delete them with the icon to
the right of the listed interface.
NOTICE
If an operation produces an error saying the device lacks authentications, if none exists that
corresponds to the authentication type, make sure that you add a management interface as well as
authentication to remedy that problem.
Authentication
This lists the authentications for the selected device. You can
Add
authentications with the
button in the upper right corner, delete them with the icon to the right of the listed
authentication. These originate in the portlet described in Authentication on page 177.
Details
—Displays several tabs with detailed resource information. A reminder of the selected
device’s name appears above the tab bar. See Equipment Details on page 210 for more
information about this screen.

Managed Resources | Resource Management and Reports
199
Manage > Maintenance Log
—View the maintenance log for the selected device. See Equipment
Details on page 210 for more about maintenance logging capabilities.
Manage > Management State
—This lets you select from the following alternatives:
Normal
—The device is unconstrained by the other Administrative States. Changing from
Suspended to Normal stops alarm suppression. Standard access, and inclusion in right-to-
manage count.
Decommissioned
—While this device is in inventory, it is not active. No device access allowed,
no Monitor associations, no event processing, no Management Interfaces, no Authentication,
no links, and no services are permitted.
Suspended—
All device-related activities are suspended. No device access allowed,
Monitoring Suspended, No event processing, Counts against right-to-manage.
Planned
—Planned device. No device access allowed, no monitor associations, and no event
processing.
Maintenance
—Neither alarms or polling apply to the device. Does allow resync and Adaptive
CLI. Standard device access.
NOTE:
Write functional permissions control whether the Management State menu item appears in this menu.
Visualize
—Create a topology map of the selected resources. See Chapter 7, Display Strategies for
more about such maps.
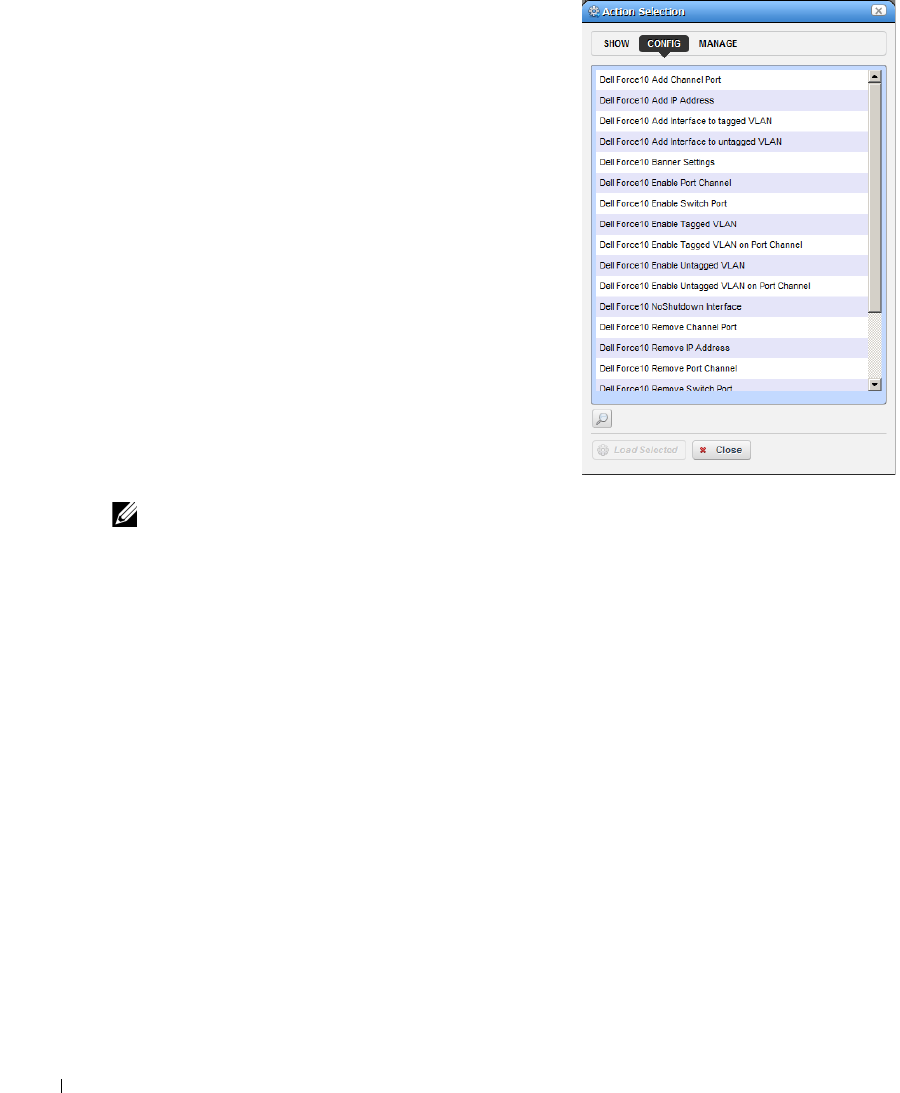
200
Managed Resources | Resource Management and Reports
Actions
—Actions you can initiate here can include
things Adaptive CLI Actions (see Chapter 13,
Actions and Adaptive CLI), and other actions
specific to the selected device.
Actions (including Adaptive CLI) appear in
SHOW,
CONFIG
and in some cases
MANAGE
categories.
The list that appears depends on the device
selected. You can also open search field by clicking
the magnifying glass at the bottom of this screen.
Using that field, the list narrows to actions
matching your search string. Select one, and click
Load Selected
to run it manually.
See Actions Portlet on page 395 for more about
configuring activities.
When you schedule an action (clicking the
Add
Schedule
button) through these screens, click
Apply
to accept the schedule. Finally, you must click
Save
in the Action Selection screen after confirming the
schedule, or no schedule applies.
NOTE:
Since menu items appear in alphabetical order, this may be in a different location, depending on the
device vendor name.
Change Management
—Select from
Change Determination
to run that process (see
Change
Determination Process on page 382
),
Execute Proscan
, to execute any Proscan policies
connected to the selected device, or
Execute Proscan Policy
to execute any Proscan. See
ProScan Portlet on page 362
for more about these.
Adaptive CLI
—This displays
Adaptive CLIs
related to the selected device, and opens with a
screen where you can enter any relevant parameters for those commands. See the previous
Action
menu item’s description, and Chapter 13, Actions and Adaptive CLI for more about
these.

Managed Resources | Resource Management and Reports
201
Direct Access
—This opens a sub-menu where you can select the type of available direct cut-
through access to the selected device, or ICMP ping that device. See MIB Browser on page
214 and Terminal on page 216 for more the about the available direct access options.
NOTE:
The client must have Java installed (and updated) for direct access to function correctly. See also: Java
Security on page 217.
NOTICE
Your ability to open a telnet session with a device depends on having the correct telnet authentication. If
you have only partially discovered a device with SNMP, but without telnet, then direct access telnet
connection will not work, nor will Adaptive CLIs. To repair such partial discoveries, edit the device and
add the correct telnet authentication and a telnet management interface.
Event Management
—This lets you suppress or update alarms related to the selected resource.
Yo u c a n
Start Alarm Suppression
(
Stop
appears, once you have started suppression)
,
Stop All
Alarm Suppression, Schedule Alarm Suppression, View Active Suppression(s),
and
Resync
Alarms
(corrects Dell OpenManage Network Manager’s display to match the latest
information from the device already in the database; device resync does this too, for the
selected device). Alarms resync for all devices. This corrects the display when the alarm color
displayed, either here or in topologies, does not match the highest severity alarm for the
device in the alarm portlet. Dell OpenManage Network Manager issues no alerts when resync
occurs.
When you
Start
alarm suppression, first enter a description in a subsequent screen, then a
Success / Failure message appears confirming suppression has started.
Schedule
displays a
Parameters
screen where you can describe the scheduled suppression and
select a duration and any additional suppression targets. The
Schedule
tab on this screen lets
you start suppression at a specific time and configure any recurrence, and termination
(
Stopping on
) for the scheduled suppression. The termination can either be a date, a number
of occurrences or
Never
.
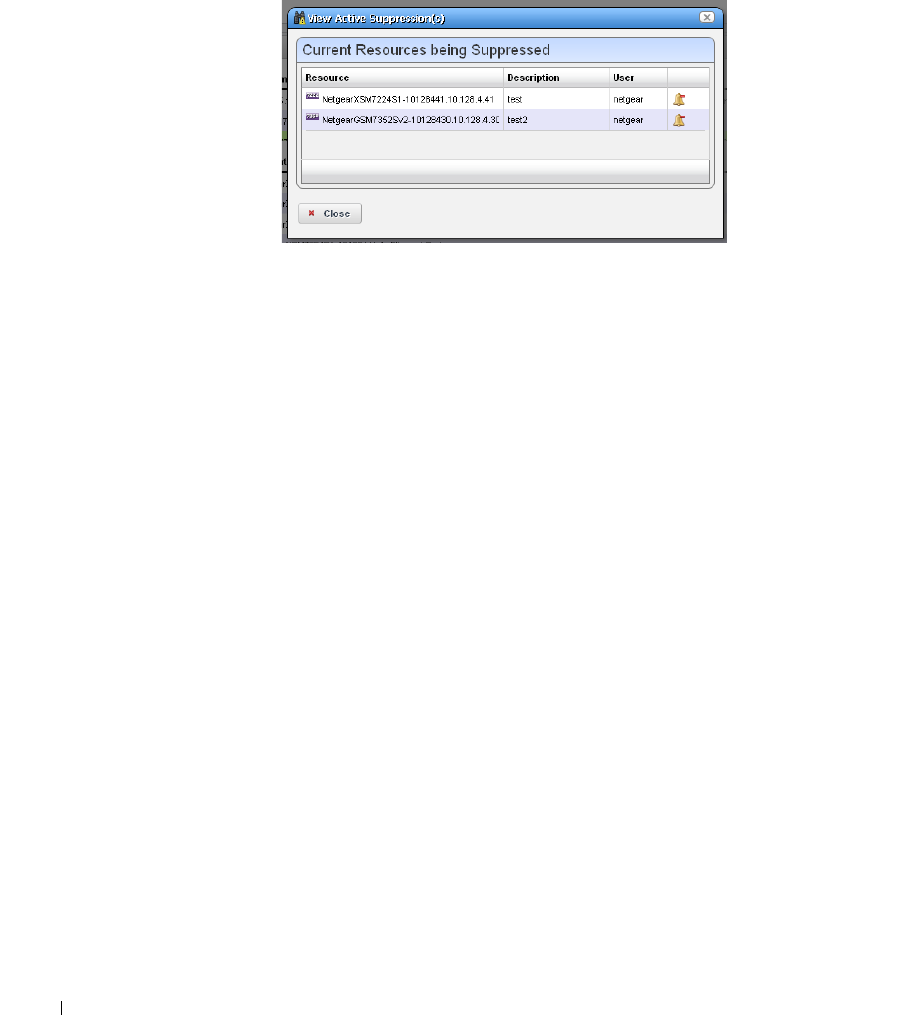
202
Managed Resources | Resource Management and Reports
Deleting, stopping or disabling a schedule does not interrupt suppression, once it has started.
You must right click selected devices and select
Stop All
Alarm Suppression
. You can also
delete suppressions after you select
Event Management > View Active Suppression(s)
.
The viewer lists devices for which alarm suppression is active, their description and
configuring user. Click the
Stop Suppression
icon to the right of listed devices to terminate
their alarm suppression.
Suppressed events / alarms do not appear in the Alarm display, but, unlike rejected events, the
Event History screen can display a record of them.
File Management
—View a current configuration file, compare it to previous backups, backup,
restore, import or export a configuration file. You can also deploy firmware to devices from
this menu.
If you go to the Configuration Files portlet, you can also edit backed up configuration files.
See File Management on page 271 for details.
Links
—Create a new link or discover links between members of the selected group, and others.
See New Link on page 207 and Link Discovery on page 208 for details.

Managed Resources | Resource Management and Reports
203
Performance
—Select from the following options:
Show Performance–This displays a dashboard with various performance metrics for the
selected device. These can include packet counts, RTT (round-trip time) measure-
ments, and CPU / Memory utilization graphs.
See Dashboard Views on page 331 and Show Performance Templates on page
342 for more about re-using and managing these capabilities.
S h ow Top Ta l k er s –This displays a Top Ta lk er s D as hb o a r d
of performance metrics for the
selected resource. Use the icon in the top right corner to re-configure the default dis-
play. See Dashboard Views on page 331 and Top N [Assets] on page 330 for more infor-
mation.
Show Key Metrics–This lets you see available key metrics for the selected resource, and con-
figure their display.
Resource Groups
—This lets you add the selected device to new Dynamic or Static groups, or to
existing groups. See for Managed Resource Groups on page 190 more about this.
Resync
—This re-queries the device for more current information, including alarms.
Traffic Analyzer
—
Register
configures the selected device to appear in the Traffic Flows displays
(see Chapter 11, Traffic Flow Analyzer).
Show Traffic
displays the traffic flow information for registered devices in an expanded Traffic
Flow portlet. This displays Traffic Flow Analysis data that contains the endpoint for the
selected device IP (if available) whether or not it is a
Register
ed exporter.
Services
—If you have the Service Center option installed, sub-menus let you
Redeploy
and
Undeploy
services for the device. A subsequent selector screen lets you pick the service.
204
Managed Resources | Resource Management and Reports
Traffic Analyzer
—
Register
or
Unregister
the selected resource for traffic analysis. You can also
select
Show Traffic
to see a screen with traffic for the selected device. See Chapter 11, Traffic
Flow Analyzer for more about Traffic Flow.
NOTICE
You can also display a Registered column in the Managed Resource portlet, and click the heading to sort
the Flow exporters to the top of the display.
Delete
—Remove the selected device from inventory.
View as PDF
—Displays the selected device as an Acrobat pdf. See View as PDF on page 113.
Managed Resources Expanded
If you click the plus (+) in the upper right corner of the summary screen, this expanded screen
appears. As in all such screens, you can limit what appears listed with the filters at the top of the
screen. Select the filter from default, seeded filters with the pick list at the top left corner of the
screen. You can also create your own custom filter by clicking
Advanced Filter
to the right of this
pick list (see Filter Expanded Portlet Displays on page 108 for more).

Managed Resources | Resource Management and Reports
205
The
Settings
button lets you configure the displayed columns and their order
.
NOTICE
You can select multiple devices by Ctrl+clicking them in the expanded portlet. This lets you do these
same tasks on more than one device. You can also perform such tasks on multiple devices with managed
resource groups. See Managed Resource Groups on page 190.
The following are available columns:
Network Status
—The network status of the device.
Alarm Severity
—The highest open alarm for the device.
Equipment Name
—The name of the device.
IP Address
—The IP address of the device.
Vendor Name
—The vendor for this device.
Model
—The model of the device.
Equipment Type
—The type of equipment.
Firmware Version
—The firmware version of the device.
Software Version
—The software version of the device.
Last Backup
—The device’s last backup date.
Location Name
—The device’s location.
Hardware Version
—The hardware version for the device.
Backup Result
—The result the device’s last backup.
Restore Result
—The result the device’s last restoration.
This screen has several snap panels, some compressed “windowshade” style. Click the title bar for
these snap panels to toggle expand / collapse. These display information about the device selected
in the list at the top of the panel.
Reference Tree
This displays the device and connected components, tree style.
General: Details
This includes information about the
Equipment Name, Vendor, Location, Contact, Icon,
and
its
Last Modified
and
Discovery Date
.
General: Properties
This tab includes the
IP Address, DNS Hostname, Firmware Version, Hardware Version, Model,
Serial Number, Software Version, Managed by Hostname
(if active, this resolves a DNS name
rather than use an IP address to manage this resources)
,
and
Equipment Type
information.
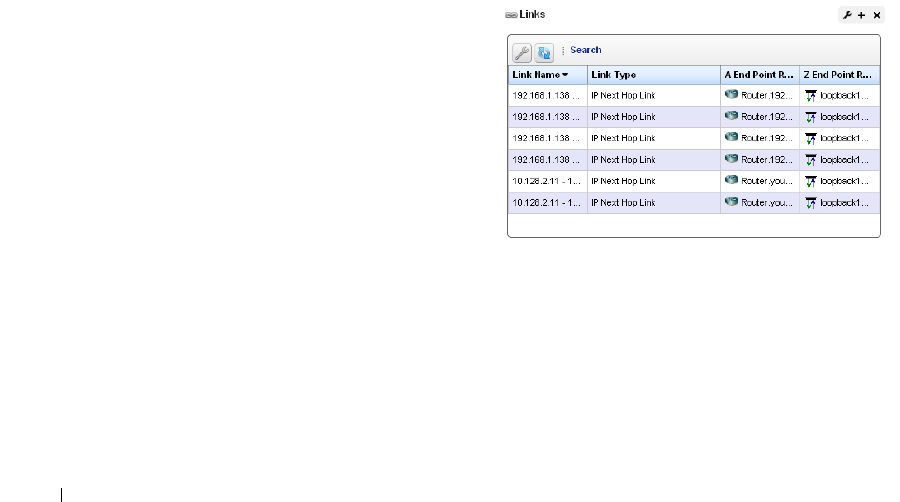
206
Links | Resource Management and Reports
General: Settings
This includes the
system Object Id, Date Created
(that is, discovered),
Creator
(the user who
performed discovery),
Install Date, Administrative State
(Locked [Device use is prohibited]
Shutting Down [Only existing users can use the device] Unlocked [Normal use of device is
permitted])
,
Operational State
(Disabled [Inoperable because of a fault, or resources are
unavailable] Enabled [Operable and available for use] Active [Device is operable and currently in
use with operating capacity available to support further services] Busy [Operable and currently in
use with no operating capacity to spare])OpenManage Network Manager.
Network Details
This displays network information like
VLAN(s) by ID, VLAN(s) by Port
and
STP Data
.
Use the
pick list in the upper right corner of this snap panel to select which to display.
Utilization Summary
A graph of the device utilization, typically for CPU, Disk I/O, Memory and ping rate.
Bandwidth Utilization
A graph of the device’s bandwidth utilization. Notice that you can change the number of top
interfaces graphed, when this is applicable.
Links
The links portlet displays discovered or
created links in your system. If information is
truncated, hover the cursor over a column to
see the contents of that column as a tooltip.
The expanded portlet displays link contents in
a Reference Tree snap panel.
By right-clicking, you can create a
New
link,
Edit
an existing, selected one, or
Discover
links for specified devices. See New Link
below, and
Link Discovery on page 208
for
more about creating, editing and discovering
links.
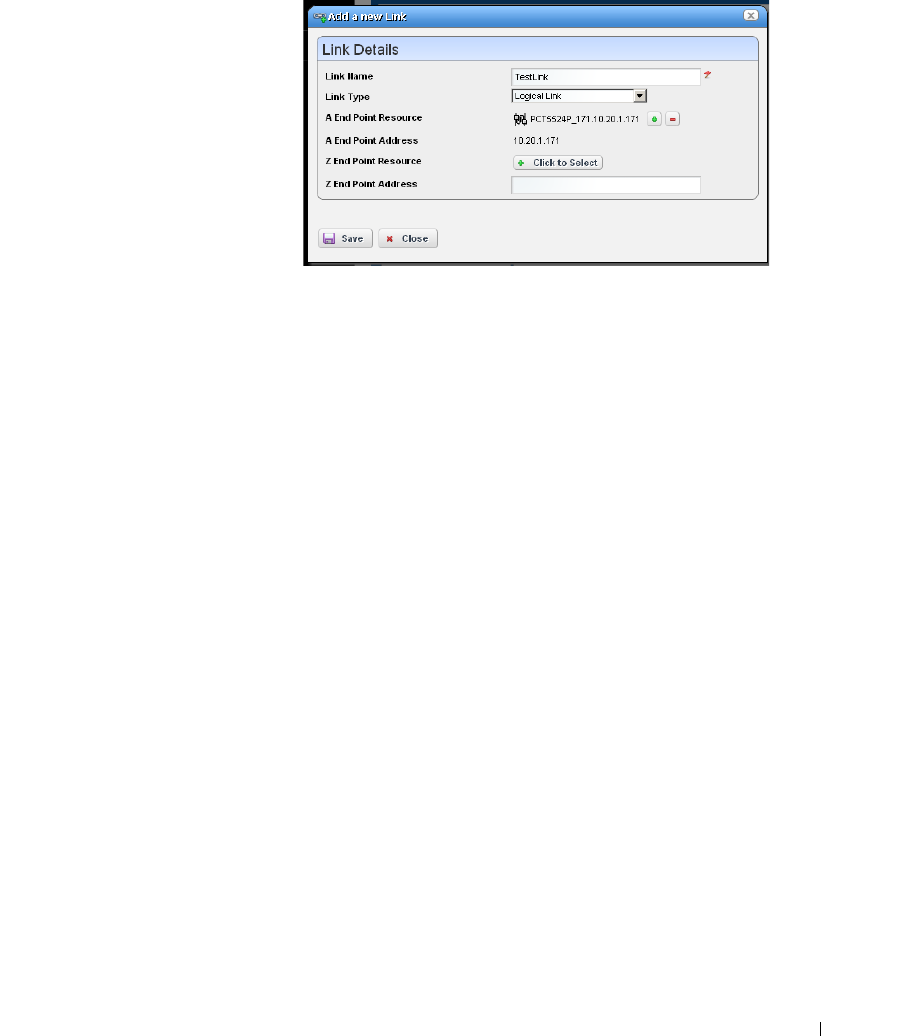
Links | Resource Management and Reports
207
New Link
When you create a new link or edit
an existing one, the
Link Details
screen appears where you can
configure the link.
This screen has the following
fields:
Link Name
—A text identifier for
the link.
Link Type
—Select the type of
link from the pick list.
A End Point Resource /
Address
—Click the plus (+)
to select a resource for one end of the link. When you right-click a selected resource, it
automatically appears here. Click the minus (-) to remove it.
Z End Point Resource / Address
—Click the plus (+) to select a resource for one end of the link.
When you have selected two resources, they automatically appear as A and Z endpoints.
208
Links | Resource Management and Reports
Link Discovery
This is an automated network link discovery feature that you can initiate from individual devices in
the Managed Resources portlet, or with the
Link Discovery
button on the home screen. See Link
Discovery Prerequisites on page 209 for a list of device features that provide link information. Links
discovered can also appear in the screen described in Links in Visualization on page 267.
When you elect to discover links from a right-click menu, the
Network Link Discovery
screen
appears. Check the type of links you want to discover or from which you want to refresh collected
data. Other options available on this screen include the following:
Layer 2 / Layer 3
[checkboxes]—Select the layer for which you want to discover links. Depending
on the layer selected, the available types appear as checkboxes below this tab selection.
NOTICE
Click All / None to select all or none of the displayed types for each layer. Remember, selecting more link
types consumes more time and processing power.
Search by IP or Mac Address | Resource Management and Reports
209
Advanced Options
Archive Data
—Checking this archives current data before collecting information about and
discovering links.
NOTE:
Links with incomplete endpoint information are not discovered
Click
Add Schedule
to schedule link discovery, or
Execute
to run it now (and confirm you are
willing to wait for results in a subsequent screen). The
Job Viewer
tab in the link discovery screen
displays the message traffic between Dell OpenManage Network Manager and the device(s). See
Audit Trail Portlet on page 116 for more about Job Viewer screens.
Link Discovery Prerequisites
Although Dell OpenManage Network Manager automates link discovery, you must enable the
sources for link discovery information on the devices where you do such discovery.
Supported data sources used to derive links appear listed below.
• IEEE Link Layer Discovery Protocol (LLDP) support
• Cisco Discovery Protocol (CDP) support
Search by IP or Mac Address
This portlet lets you find Managed Equipment, Ports and Interfaces for the IP or MAC address
entered.
The same right-click menus as appear in Managed Resources, Ports or Interfaces portlets appear in
the search results. The display confines those results to what is found; if only ports satisfy the
search criteria, then Managed Equipment and Interface do not appear.
210
Equipment Details | Resource Management and Reports
Equipment Details
This screen lets you “drill down” to display equipment details for resources. You can see it by
selecting
Details
in the right-click menu for the Managed Resources portlet. You can also install an
Equipment Details portlet on a page and use the
Container View
portlet to select individual
devices that appear in it. In that case, you must select an individual device before it displays data.
Details screens are available for a variety of things besides equipment, too. Here are some highlights
of the Equipment Details screen (and others):
The
Quick Actions
panel in the General tab also displays icons.
Click them direct access to the device (Terminal, MIB Browser, Ping (ICMP) or HTTP / HTTPS),
or to the Edit screens described above.
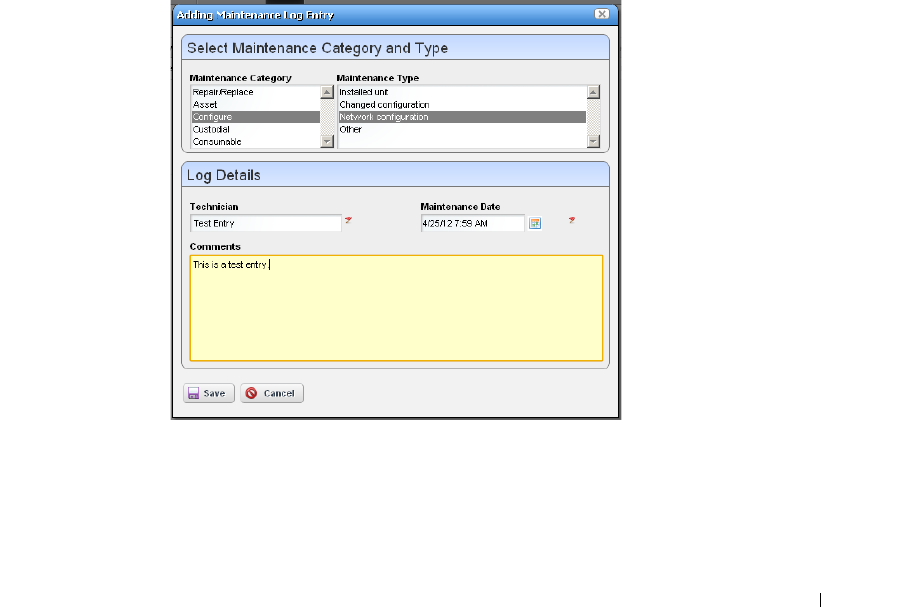
Equipment Details | Resource Management and Reports
211
Click the tab name to see the following:
General
–In addition to Quick Action icons, this includes details about the selected equipment.
This screen also includes performance indicators to report on the device’s CPU, memory and
disk utilization (flash memory) both currently and for the last 30 minutes (click the links
above the panel), a Monitor Status Summary, and Reference Tree, and a list of the
Authentications connected to the device. If disk utilization is less than one percent, an
indication that the device is still active may appear in that graph.
Network–
This screen lists the Ports and Interfaces for the selected device (some devices have one,
but not the other), VLANs and links associated with the device.
Alarms
–Displays the alarms and events associated with the selected device.
History
–Includes audit trails connected to the device, and any backed up configurations. Right-
click to view or otherwise act on these.
Performance
–This screen contains two links at its top. One displays a performance dashboard
(template) related to the selected device. See Show Performance Templates on page 342 for
how to configure these. The other displays any configured
Top Ta l k er s
for the device. See Top
N [Assets] on page 330.
Logs
–Displays maintenance logs connected to the device to users with permissions to see this tab.
Right-click to create or edit these.
Notice that you can right-click listed interfaces, configuration files, and so on to perform
more actions, or to see additional Detail screens.

212
Equipment Details | Resource Management and Reports
You can also right-click to open further
Details
screens about some subcomponents like Interfaces
and Ports. These display a
Reference Tree
(like Widgets / Snap Panels (Reference Tree) on page 108)
too. You can even right-click nodes in that reference tree to drill down to additional details.
NOTICE
Notice the breadcrumb trail at the top of the Equipment Detail panel tracks the levels through which you
drill down. You can click a level that appears in this trail to return to a previous screen. If you click Return
to previous in the upper right corner of the screen, you will return to the original screen from which you
selected the basic equipment.
Some fields may be truncated onscreen. Workaround: hover the cursor over the truncated field so
the text appears as a tooltip or drill down to see the detail.
Some devices populate the ports panel, but not the interfaces panel. This panel is empty for such
devices. Interfaces may appear for Force10. Force 10 devices interfaces details can display Port
Channels (LAGs), VLANs (SVIs) and Loopbacks.
If the Ports portlet is on the same page as the Managed Resources portlet, selecting a device in
Managed Resources makes its ports appear in the Ports portlet. The display can also get out of sync,
but clicking the browser’s
Refresh
restores the correspondence between a selected device and the
ports displayed. To resync a port, resync the device that contains it.
Field Definitions
The meaning of most fields that appear in details screens are self-evident. Here is a little more
information about some of them:
Operational State
—One of following possible values describing the availability of the resource.
Disabled—Inoperable because of a fault, or resources are unavailable.
Enabled—Operable and available for use.
Active—Device is operable and currently in use with operating capacity available to support
further services.
Busy—Operable and currently in use with no operating capacity to spare.
Administrative State
—One of the following values:
Locked—Device use is prohibited.
Shutting Down—Only existing users can use the device.
Unlocked—Normal use of device is permitted.

Direct Access | Resource Management and Reports
213
Network Status
—The status of the resource in the network. For example:
Responding
means this
application can, via some network protocol, get the device to respond.
Not Responding
means
the device does not respond to the protocol.
Indeterminate
means the monitoring software
has not tried to reach the device or there was some other error which prevented us from
determining one of the other two statuses.
The appearance of
Network Status
depends on the default ICMP monitor (see Resource
Monitors on page 297. If you exclude this equipment from the monitor or disable it (for
example, for performance reasons) then a status may appear, but it is not meaningful.
Direct Access
Direct access provides less-mediated access to the device in the following ways:
•MIB Browser
•Terminal
•Ping (ICMP)
•HTTP / HTTPS
The following sections describe those direct options in more detail.
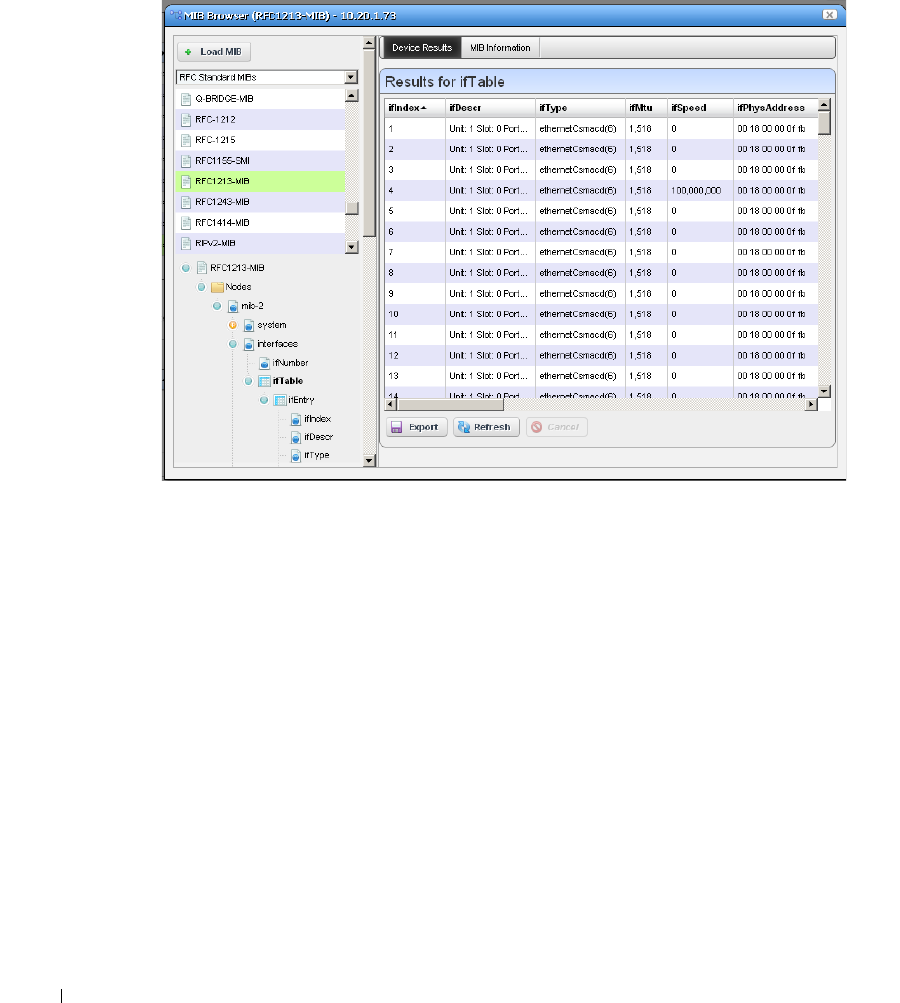
214
Direct Access | Resource Management and Reports
MIB Browser
As part of the
Direct Access
menu, the
MIB Browser
lets you examine SNMP data available about
devices.
The screen that opens when you select this option displays MIBs available in Dell OpenManage
Network Manager in a tree on the left. Notice that a pick list at the top of the left column narrows
what appears in the tree. A progress bar at the bottom of this screen indicates a query for the
selected information is in progress.
Click
Load MIB
at the top left corner of the screen to load a new MIB. A file selection dialog opens
after you click
Load MIB
. Click the
Refresh
button at the bottom of the browser to re-query the
device for new information. Click the
Export
button at the bottom of the browser to export the
screen contents to a spreadsheet (Excel-format) file.
Use the
Load MIB
button in the upper right corner, or the menu described in Event Definitions on
page 158 for loading new MIBs.
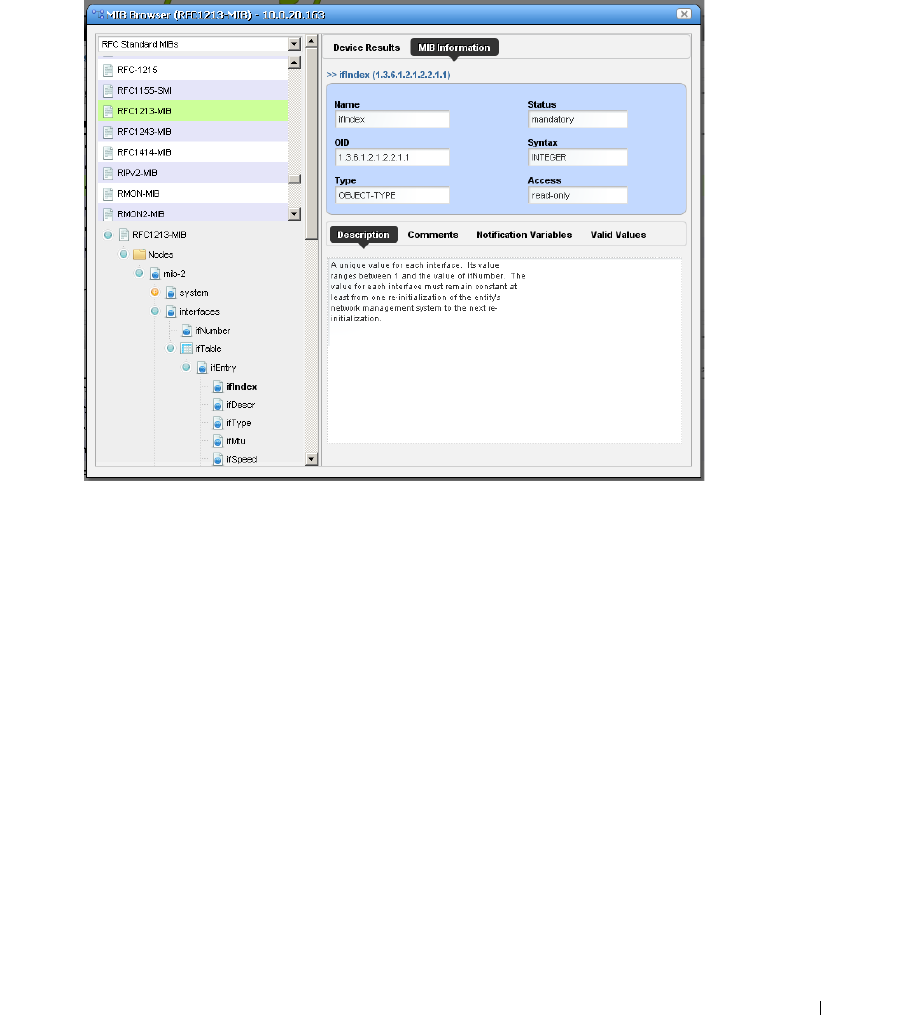
Direct Access | Resource Management and Reports
215
Select a MIB and expand it to see the contents for a selected node appear on the right. In addition
to the
Device Results
tab, which displays what the currently selected device uses from the MIB, the
MIB Information
tab displays the parameters available for the selected node.
Notice that the
Description, Comments, Notification Variables,
and
Valid Values
tabs appear at
the bottom of this screen.
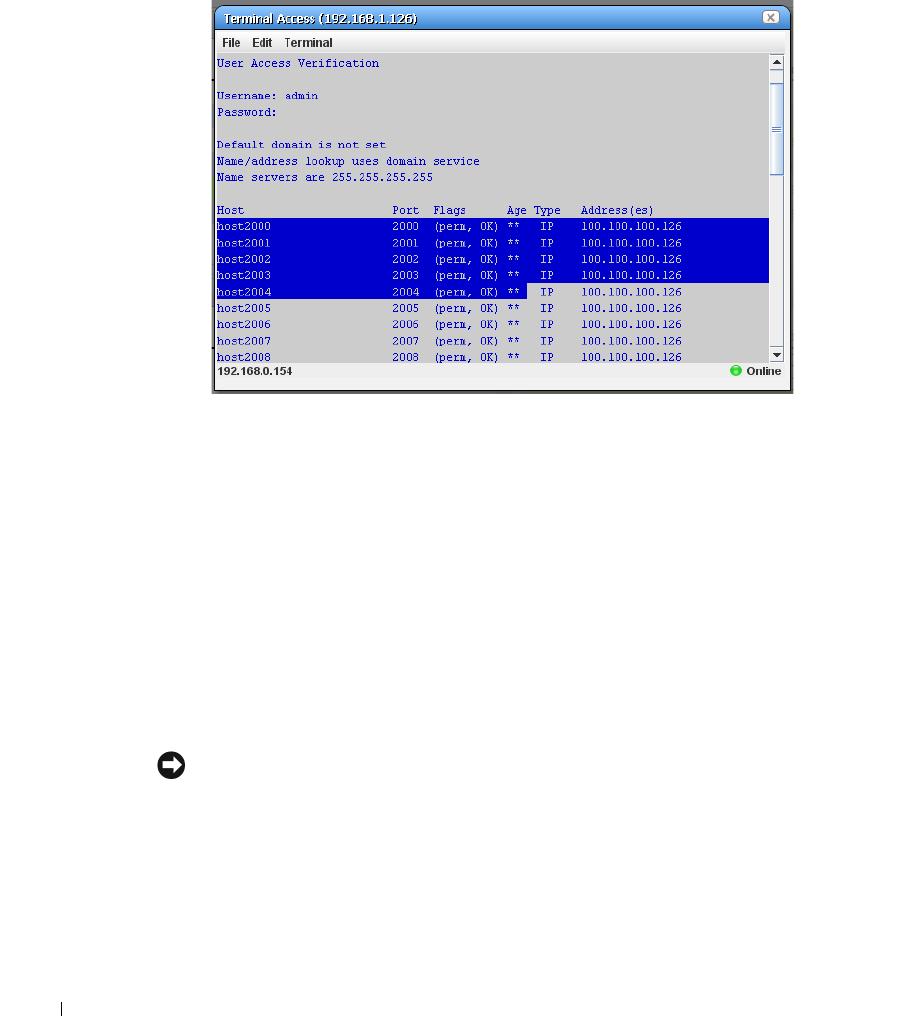
216
Direct Access | Resource Management and Reports
Terminal
This opens a terminal shell connected to the selected device.
A green icon in the lower right corner indicates the device is online, while the IP address of the
device appears in title bar. The IP address of Dell OpenManage Network Manager’s server also
appears in the lower left corner, when the connection is active.
The following menus appear for your terminal session:
File
—This menu lets you
Connect
or
Disconnect
to the device.
Edit
—This menu lets you
Copy
or
Paste
text within the terminal session. Click and drag to select
text.
Terminal
—This menu lets you set
Foreground
and
Background
colors, as well as configuring the
Font
and
Buffer
sizes
. Reset Terminal
restores the defaults.
Terminal is an applet that requires a Java Runtime Environment be installed and associated to
the browser as a plug-in on the client machine.
NOTICE
You can cut and paste from the Direct Access terminal.
Telnet sessions are synchronous. You cannot interrupt a command in progress with another
command you send, unless you have enabled something that periodically prompts for additional
commands (for example enabling line continuation prompts).
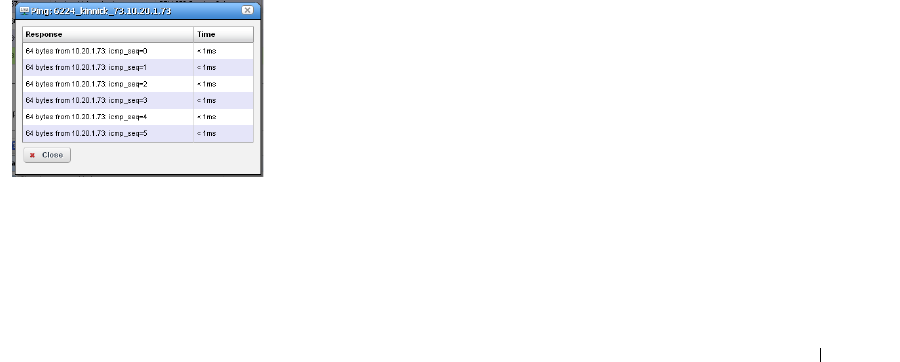
Direct Access | Resource Management and Reports
217
Logging Terminal Sessions
You can log terminal sessions if you like. Do the following:
1
Enable Java Console on the client. For Windows, do this in Control Panel. On Linux you
must navigate to the install location of your JRE and run the Console script. Select the
Advanced tab and change the Java Console setting to show the console.
Java Control Panel > General tab > Settings displays the location where the logs are stored.
2
Open a
Direct Access > Terminal
session by right-clicking a device. The Java Console
appears.
3
Configure the level of logging in the
Terminal
menu of the direct access screen. Levels, in
increasing order of detail, include
None, Info, Debug,
and
Tr a c e
, which echoes keystrokes.
Java Security
Some Java installations may block self-signed websites, interfering with Direct Access. The
workaround is to provide a security exception for the application server, as follows:
1
Click Start
2
Ty p e
configure java
and hit [Enter]
3
Select the
Security
tab.
4
Click
Edit Site List
5
Click
Add
6
Type the Dell OpenManage Network Manager URL (example: http://192.168.0.51:8080/
7
Click
OK
and
Continue.
8
Apply
this change, and/or click
OK.
Ping (ICMP)
Select this option from the Direct Access menu to initiate
ICMP ping, and to display a list of the selected device’s ping
responses.
Alternatively, an error message can appear describing the
device’s lack of response.
When ping responds in less than one millisecond, results
appear in a table with <1ms entries.
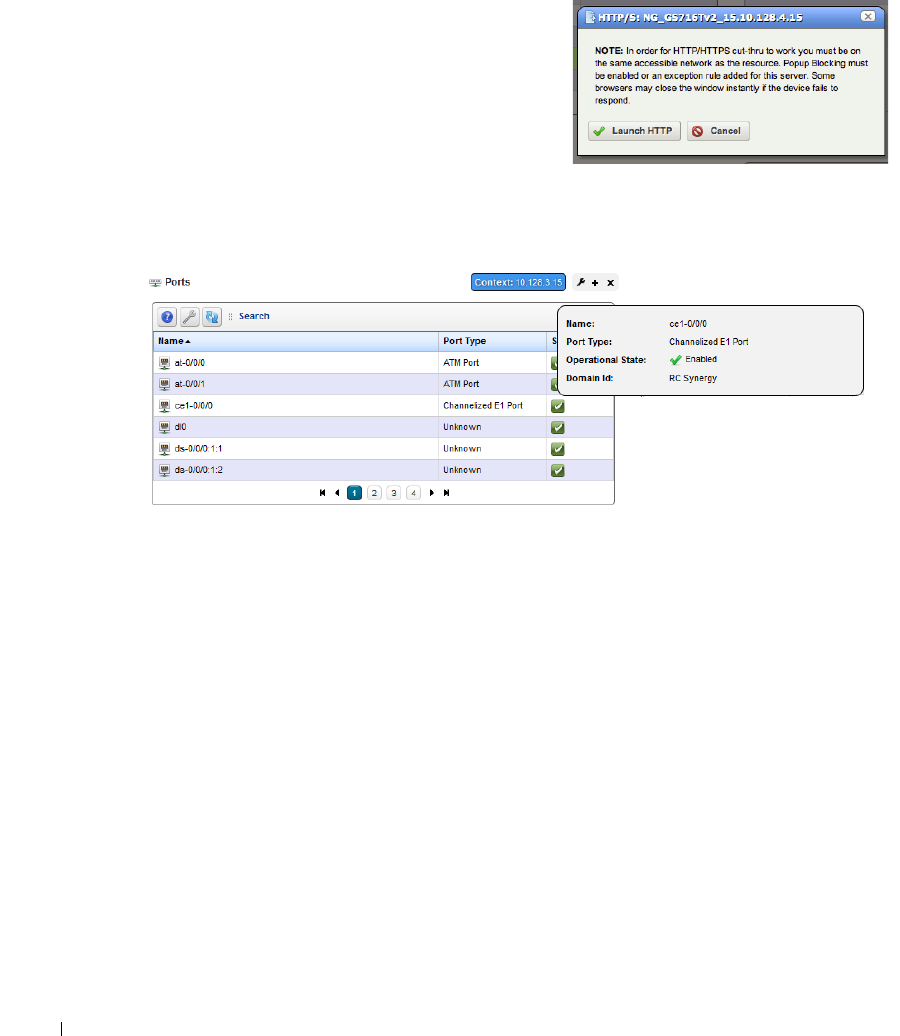
218
Ports | Resource Management and Reports
HTTP / HTTPS
Selecting this menu item opens the default browser,
connected to the selected device.
An intervening dialog appears advising you about the
required network conditions for a successful
connection.
Ports
This summary portlet displays discovered device ports.
This displays a list of ports, with columns for
Port Icon, Equipment Name, Name, Type
and
Encapsulation
.
Hover the cursor over the
State
column, and a popup appears to display the port’s
Name
,
Ty p e
and
Operational State
information. Right-clicking offers a subset of the actions listed
in Managed Resources on page 195
.
You can also create links. See Links on page 206. See Port
Editor on page 221 for details of the editor specifically for ports.
If the Ports summary portlet appears on the same page as the Managed Resources portlet, then a
selection made in Managed Resources makes the Ports portlet display only ports for the selected
resource. This “filter” through Managed Resources disables filters configured through the settings
menu. See Display Rules on page 241 and Context on page 242 for more about this feature and the
Context icon that appears with the portlet when it applies.
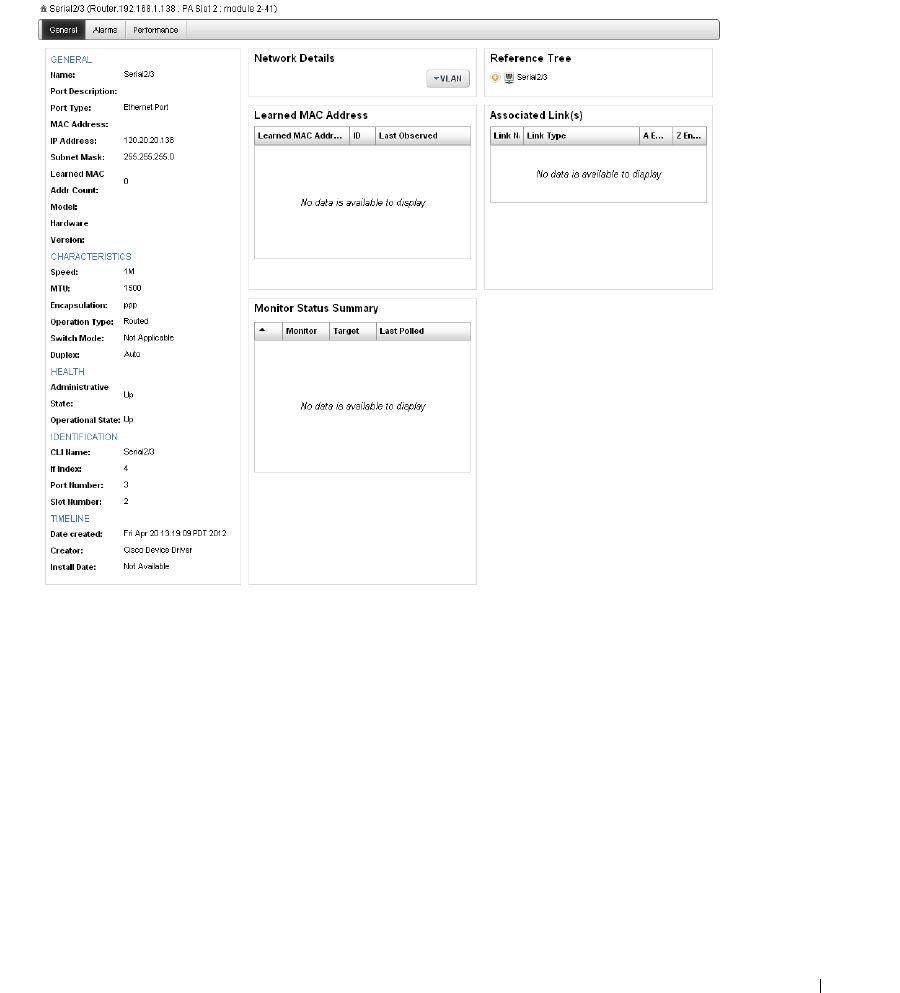
Ports | Resource Management and Reports
219
Port Details
This screen displays all the port’s settings that have been retrieved, including a Reference Tree of
logical interfaces below the port, a Learned MAC Address panel, Alarms related to the port, and
other Details.
This screen displays the following tabs, accessed by clicking their name in the top of the screen.
Just above their names, a reminder appears of the name of the selected port.
General
—In this tab, fields appear describing attributes for the selected port. For example
Date
Created
(typically, this is the date discovered)
.
Alarms
—This tab displays alarms and the Event History connected to the selected port. See
Alarms on page 123 and Event History on page 134 for more about that information.
Performance
—Displays monitor information connected to the selected port.
See also Equipment Details on page 210 and Managed Resources Expanded on page 204 for an
explanation of some of these fields.
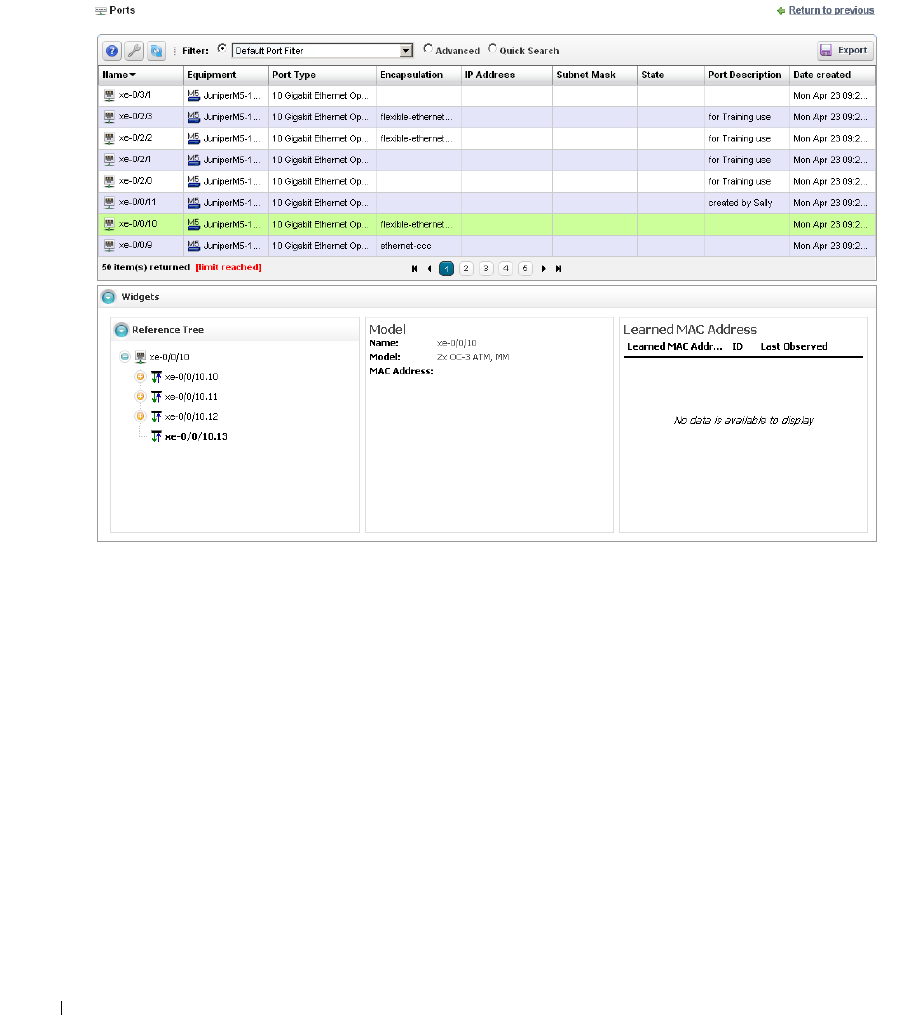
220
Ports | Resource Management and Reports
Ports Expanded
Clicking the plus (+) in the upper right corner of the summary screen displays this expanded view
of available ports.
The
Settings
button lets you configure columns that appear and their order. The available columns
for this view include many related to the attributes that appear in Port Details on page 219, above.
This screen also includes a
Reference Tree
displaying a tree of the selected port’s relationship to
logical interfaces and monitors.
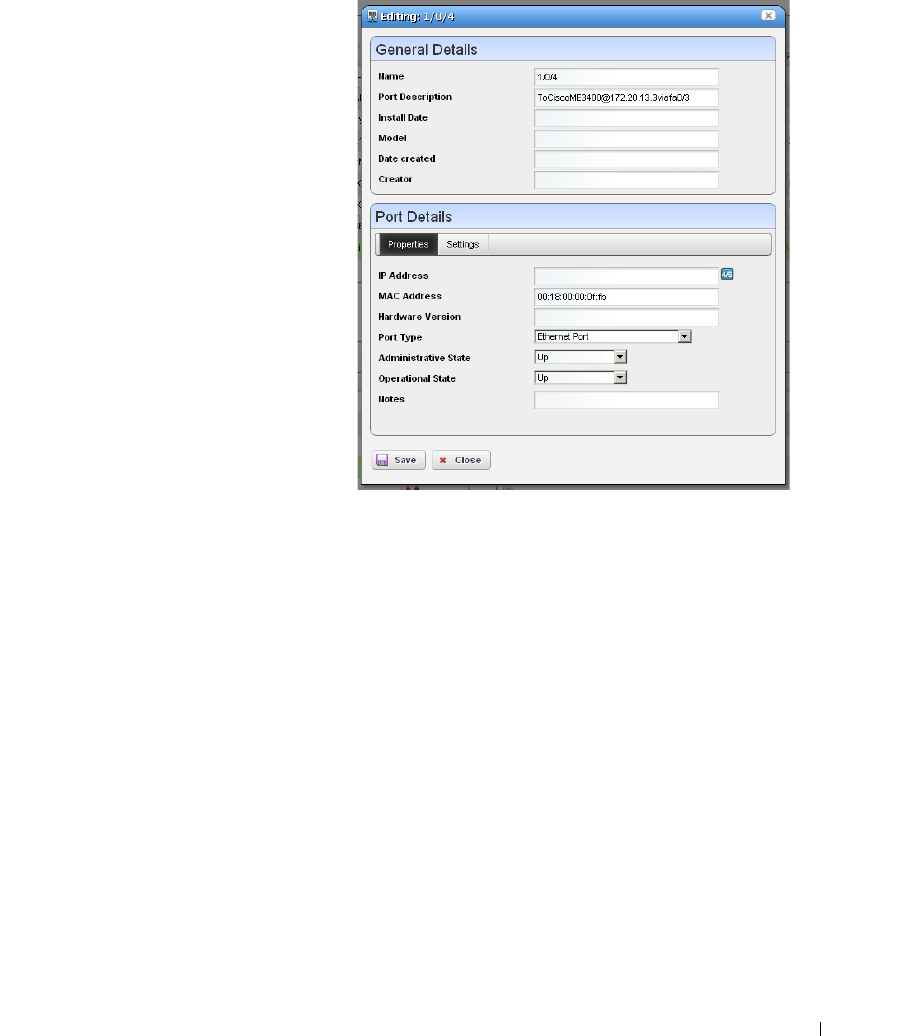
Ports | Resource Management and Reports
221
Port Editor
When you right-click a port, and select
Edit
this screen appears.
It has the following fields:
General Details
Name
—An identifier for the port.
Port Description
—A text description for
the port.
Install Date
—The date this port was
installed.
Model
—The port’s model.
Date created
—The date this port was
created.
Port Details - Properties
IP Address
—The IP address for the port.
MAC Address
—The port’s Media
Access Control (MAC) address.
Hardware Version
—The port’s hardware
version.
Port Type
—The type of port.
Administrative State
—One of three descriptive values. The options are:
Locked—Device use is prohibited.
Shutting Down—Only existing users can use the device.
Unlocked—Normal use of device is permitted.
Operational State
—One of the following values:
Down—Inoperable because of a fault, or resources are unavailable.
Dormant—The port is dormant.
Not Present—The port is absent.
Up—Operable and available for use.
Unknown—Status is unknown.
Te s t i n g —Status is testing.
Notes
—Any notes recorded about the device.
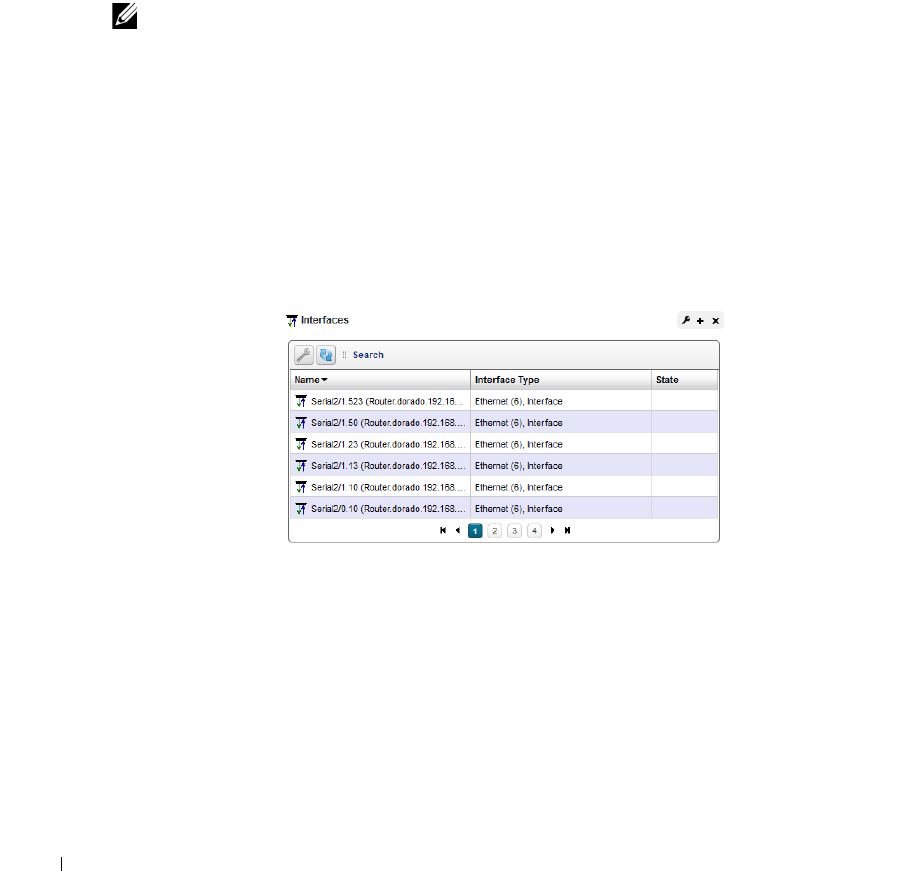
222
Interfaces | Resource Management and Reports
Port Details - Settings
Encapsulation
—An identifier for the port.
MTU
—The size of the maximum transmission unit.
Speed
—The port’s speed.
Subnet Mask
—Any subnet mask associated with the port.
In Use
—Checked if the port is in use.
IF Index
—The port’s SNMP If Index number.
NOTE:
Changing fields in the Editor screens like Network Status, Administrative State, Operational State and
MAC address do not change the device; they change only the Dell OpenManage Network Manager
database. You can alter these fields to take notes or set aspirational values, but no change goes to the
device, and resync eradicates changes made if the device has conflicting values.
Interfaces
This portlet, like Ports, displays subcomponents of discovered resources. Unlike Ports, however, it is
not driven by a Managed Resources portlet selection on the same page where it appears. Also,
unlike Ports, it does not display snap panels in its expanded form, just more columns.
Right-clicking lets you use the following menu items:
Details, Visualize, Domain Access Control,
Actions, Event Management, Links
and
Show Performance.
See
Managed Resources on page 195
for details about what those menu items do.
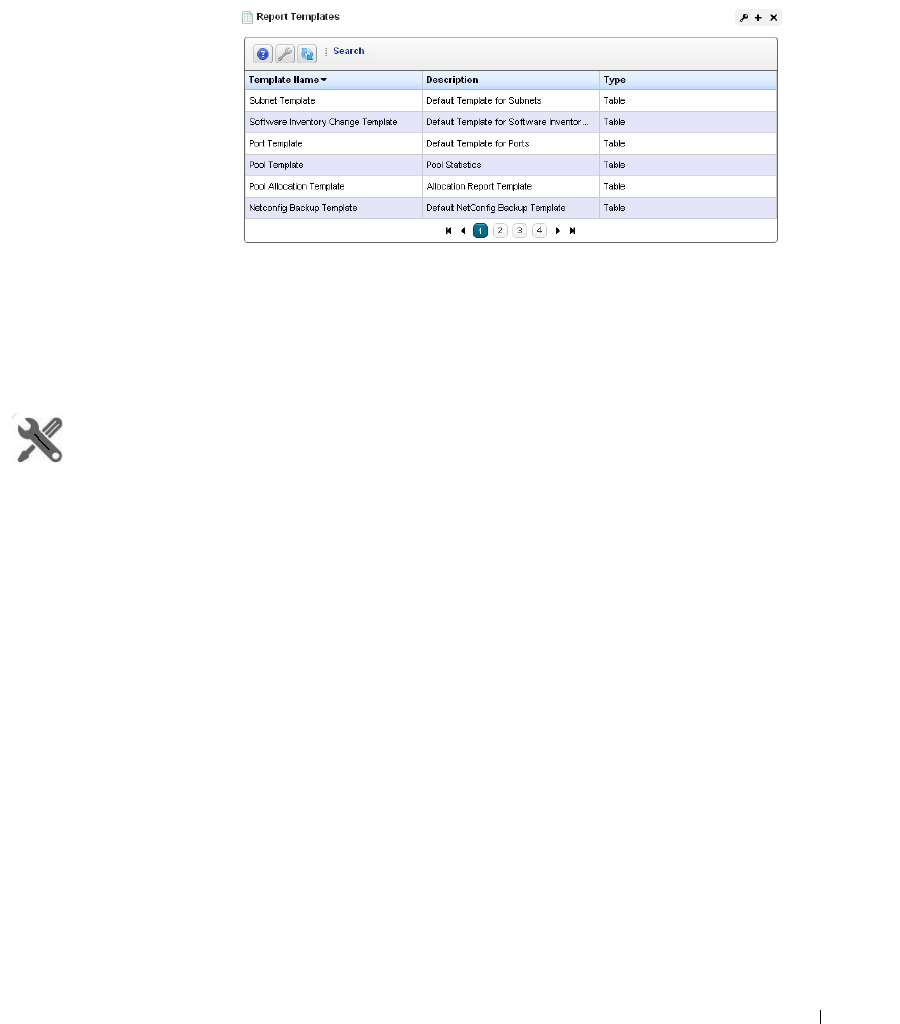
Report Templates | Resource Management and Reports
223
Report Templates
Report Templates are the
basis of reports. This
portlet displays the
Template Name,
Description, Inventory
Entity,
and
Ty p e
in
columns.
Right-clicking in this
portlet lets you create a
New
template,
Edit
a
selected template (see
Report Template Editors
for information about subsequent screens), view
Details
or
Delete
a selected template. You can also
Import / Export
report templates to files.
The expanded Report Templates portlet also includes a Reference Tree snap panel displaying a tree
for selected templates connecting them to Report Groups and specific reports.
How To:
Create a Report Template
The following steps create a report template:
1
In the Report Templates portlet, right-click and select
New
Tab le te m p la te .
2
Name the template (for example: Test Amigopod Report)
3
In the
Source
tab, select an inventory source (for example: Inventory resources [A - DD]
Amigopod).
4
Select
Inventory Columns
by clicking the arrow(s) between
Available
and
Selected
columns.
(for example: Amigopod: Administrative State, Amigopod: DNS Hostname, Amigopod:
Equipment Name, Amigopod:IP Address)
5
In the
Layout
tab, configure the column order (top is first, bottom is last).
6
Notice you can also configure the font size, color, alignment, and so on when you select a
column in this tab.
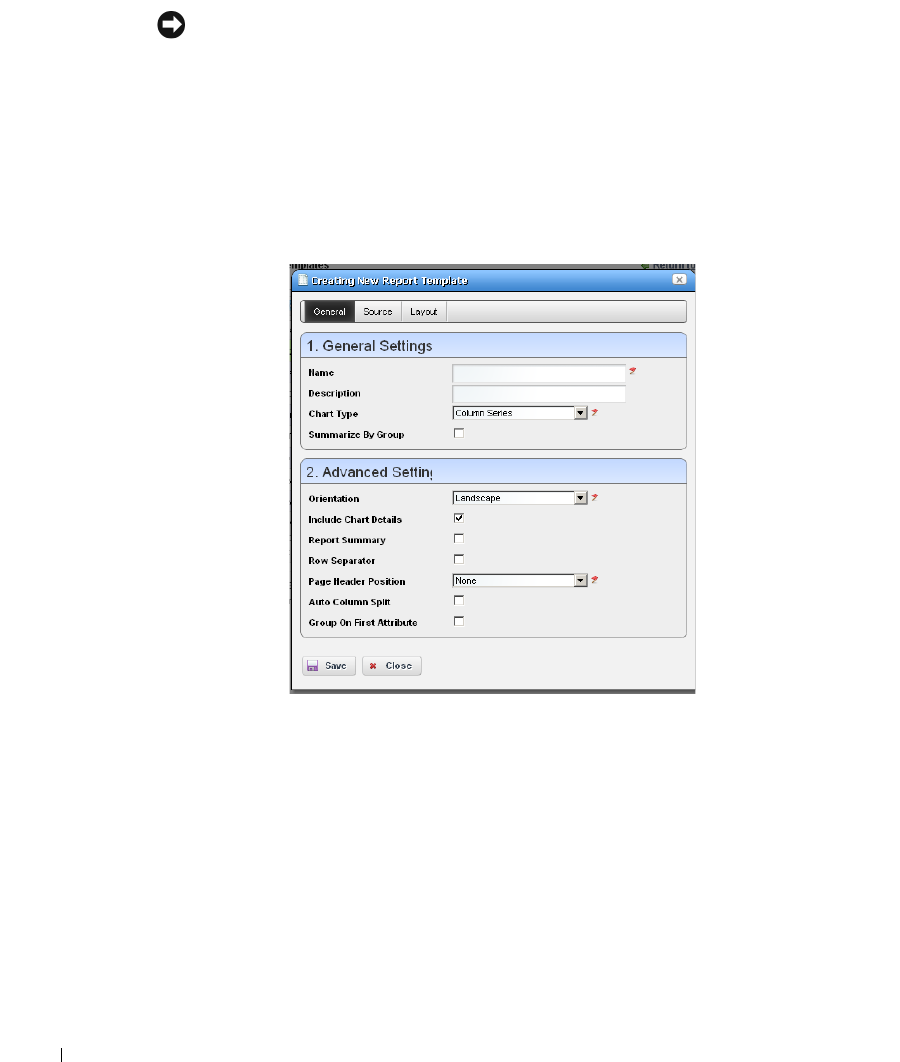
224
Report Templates | Resource Management and Reports
7
Click
Save.
You have successfully created a template.
NOTICE
Formatting counts in making reports useful. Sometimes the limitations of the output need to inform the
formatting you select. For example, PDF output does not handle large numbers of columns well, while
CSV (import-able into Excel) output has no problem with it. Best practice is to test reports you configure
before putting them into production.
Report Template Editors
Dell OpenManage Network Manager has several report template editors. Creating a
New
template,
can make
Comparison, Table
and
Tr e n d
templates.
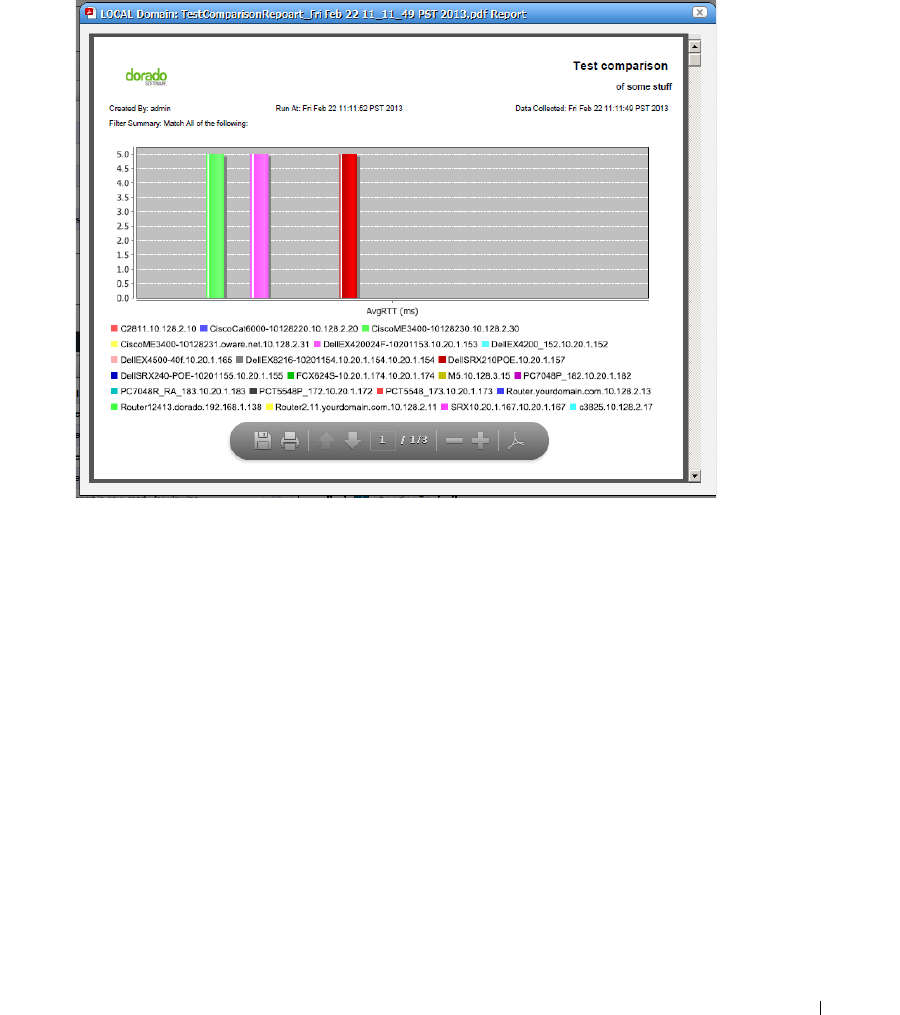
Report Templates | Resource Management and Reports
225
Table reports simply report the configured data in tabular form as you have configured the
columns. Comparison reports display selected attributes comparing reporting devices, for example
a summary graph then a list of devices’ ICMP monitor RTT in the following pages.
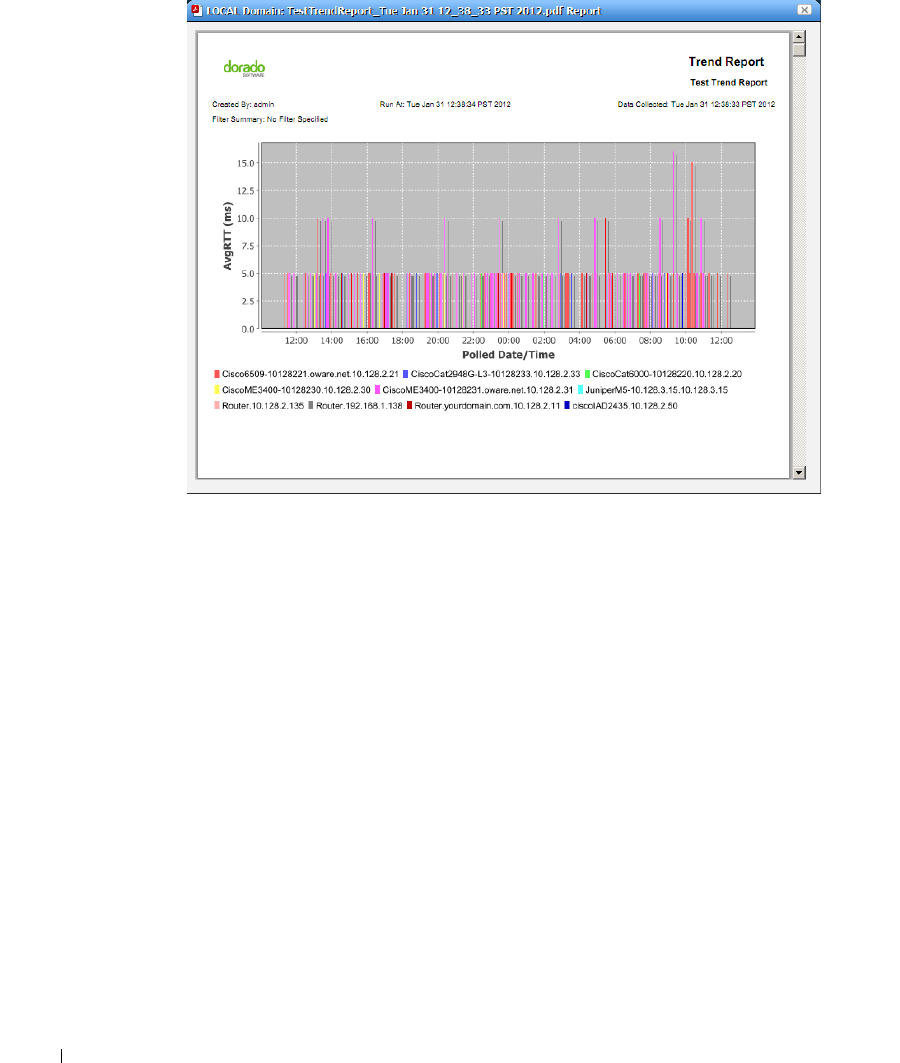
226
Report Templates | Resource Management and Reports
A Trend Report displays a data graph with data reported over a polled period.
You can now select more than one attribute for trend reports. Chart generation depends on the
number of attributes selected and the number of targets:
• 1 target, n attributes produces 1 chart with all attributes (line series graph only)
• n targets, 1 attribute produces 1 chart with all the targets
• x targets, n attributes produces n charts with x targets on each
This editor has General, Source, and Layout tabs.
You can edit any but pre-existing templates, whether they have reports attached to them or not.
Consider this example:
Template T has three columns; A, B and C. Someone creates a report R against Template T,
executes the report, saves the data as a historical report H1. Two weeks later, someone modifies the
Template T, removing column C, adding column D.
When executing report R against the revised Template T’, the report now shows columns A, B and
D. User saves the report as historical report H2. Here, H1 only has data for columns A, B and C. H2
has data for columns A, B and D.

Report Templates | Resource Management and Reports
227
If you view H1 you see Template T’ is in use and this template creates a report with columns A, B
and D. Unfortunately, H1 only has data for columns A, B and C, so the report created has data for
columns A and B only. Column D is empty. When viewing H2 you can see Template T’ is in use
and can create a report with columns A, B and D. H2 has data for columns A, B and D, so all data
appears.
General
The following are fields that appear on these screens. Not all screens have all
fields.
General Settings
Name
—An identifier for the template.
Description
—An optional description of the template.
Chart Type
—Select from the available alternatives (
column, line
).
Summarize by Group
—Group similar results together.
Advanced Settings
Orientation
—Select from
Portrait
and
Landscape
Include Chart Details
—Enables the following fields
Report Summary
—Enable a report summary
Row Separator
—Display a row separator.
Page Header Position
—Select
none, top, bottom
or
both.
Auto Column Split
—Enable automatic column splitting. This automatically aligns the columns
equally on the report providing the column widths that are most proportional.
Group on First Attribute
—Create a report that groups rows based on the first reported attribute.
This creates groups of items in the report whenever the left most column’s value changes.
For example, with disabled, a report looks like this:
Device Name Gig/e Port Name Health Status
M5 ge/0/0/1 Up
M5 ge/0/0/2 Down
M5 ge/0/0/3 Up
M5 ge/0/0/4 Unknown
M18 ge/0/1/1 Up
M18 ge/0/1/2 Starting
M18 ge/0/1/3 Up

228
Report Templates | Resource Management and Reports
M18 ge/0/1/4 Down
The same report looks like this with
Group on First Attribute
enabled:
Device Name Gig/e Port Name Health Status
M5
ge/0/0/1 Up
ge/0/0/2 Down
ge/0/0/3 Up
ge/0/0/4 Unknown
M18
ge/0/1/1 Up
ge/0/1/2 Starting
ge/0/1/3 Up
ge/0/1/4 Down
The Source and Layout tabs are common to all editors.
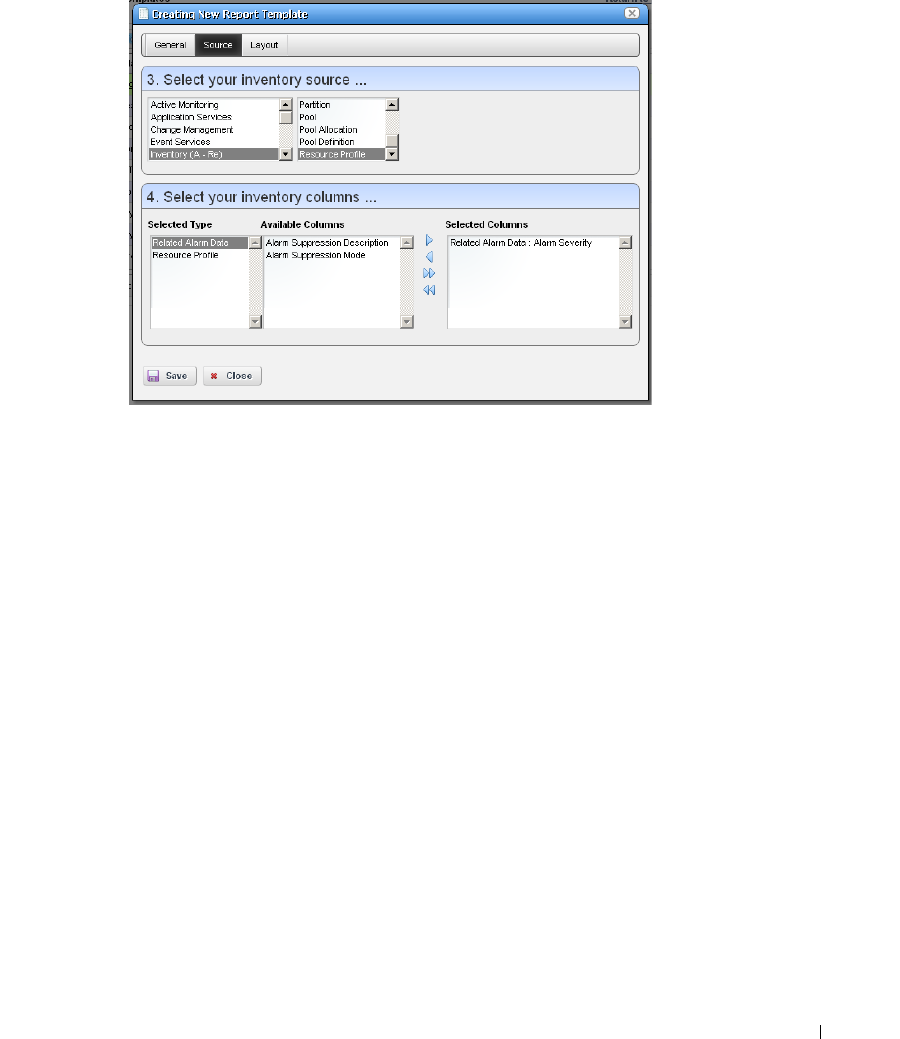
Report Templates | Resource Management and Reports
229
Source
Select the source inventory for a report, and its data types in this screen.
Click the green plus (+) to select the
Inventory Type
. The types of data available for that inventory
type appear in the leftmost column in this screen. Click on a
Selected Type
to see its
Available
Columns
.
Click the arrows to move columns from
Available
to
Selected
. The
Selected Columns
appear in the template’s report.
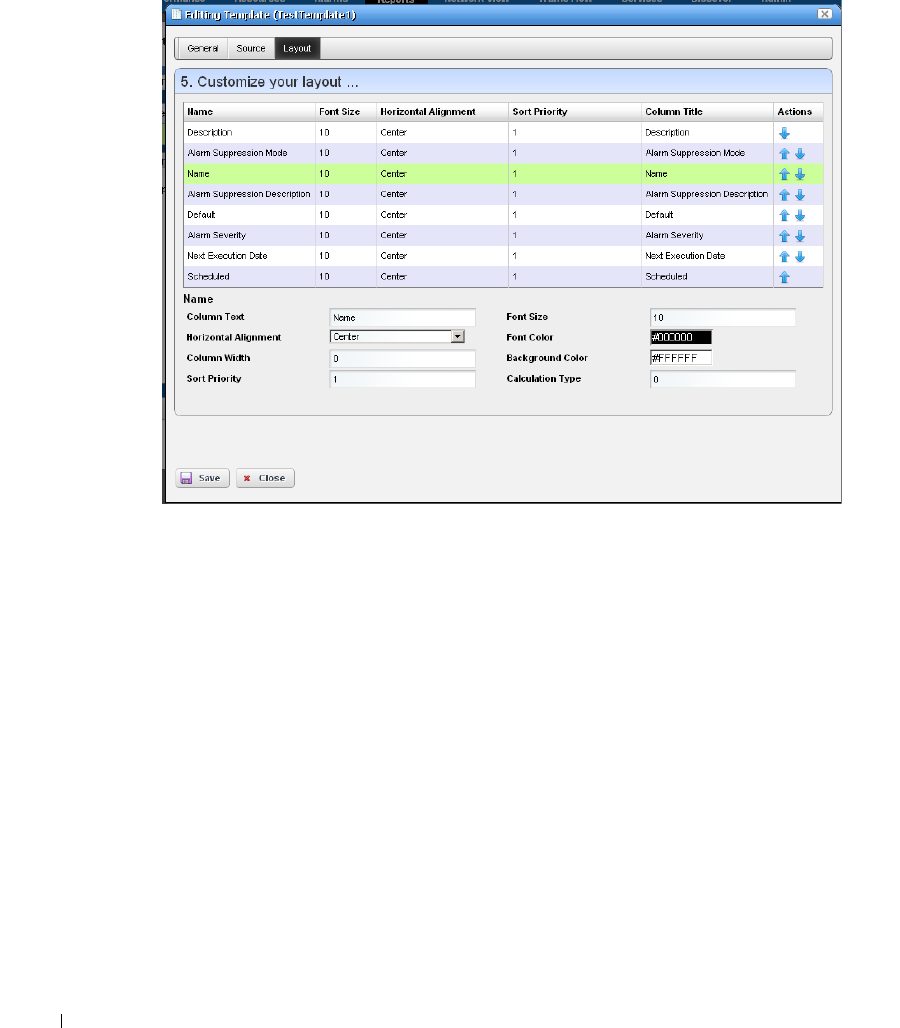
230
Report Templates | Resource Management and Reports
Layout
This tab outlines the column layout for the template.
Click on the up/down arrows on the right of each row to re-order data columns. Click to select a
row, and the editor panel at the bottom of the screen appears. It has the following fields:
Column Text
—The column label.
Horizontal Alignment
—
Right, Left, Center
(the default).
Column Width
—The column width in characters.
Sort Priority
—Configures report sorting. Define the attribute sort order here. You can sort within
a sort, so you can sort on Name and then by Location and then by IP Address, and so on. The
number configures the sort group, so 1 sorts, then 2 within 1, then 3, and so on.
Font Size
—The data’s font size.
Font / Background Color
—The color for the text/background. Click the field to open a color
chooser.
Calculation Type
—How to calculate for summarizing the numeric data. Select from the available
options (
Average, High, Low, Sum
).
Click
Save
to preserve any template you have configured, or
Close
to close the editor screens
without saving.
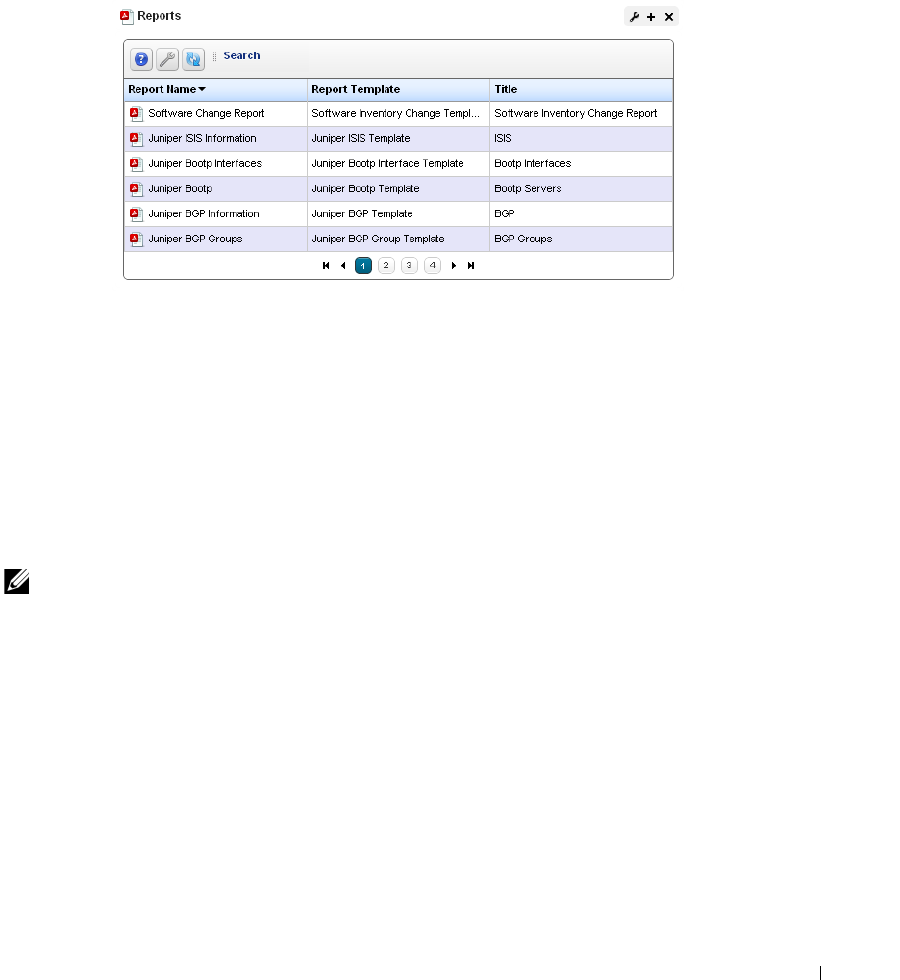
Reports | Resource Management and Reports
231
Reports
This portlet’s summary screen lists the available reports that you can run with Dell OpenManage
Network Manager.
The report
Icon, Name, Template,
and
Subtitle
appear in the columns in this summary screen.
Generally speaking, the report selects the target equipment, and the template configures the layout
and attributes reported. If the Interface details panel is empty, then the Interface reports will have
no contents. Some devices have ports, but no interfaces. Use the Ports report for such devices.
Dell OpenManage Network Manager generates reports with only the first 5,000 records by default.
Larger reports warn that they have reached the maximum, and have only those first 5,000 records.
You can change the maximum with the property
com.dorado.redcell.reports.max.report.query.size=5000
Larger numbers have an impact on the performance of the report and database.
NOTE:
You must have Adobe’s Acrobat reader installed to view reports.
Right-click a selected report to do the following:
New / Edit / Copy —
This opens the Report Editor, described below, to configure a new report,
edit or copy an existing, selected report.
Copy
automatically renames the selected report.
New Group
— Creates a collection of reports. See Group Reports on page 238 for details about
how to configure these.
Schedule
— Opens a scheduler screen to automate report creation.
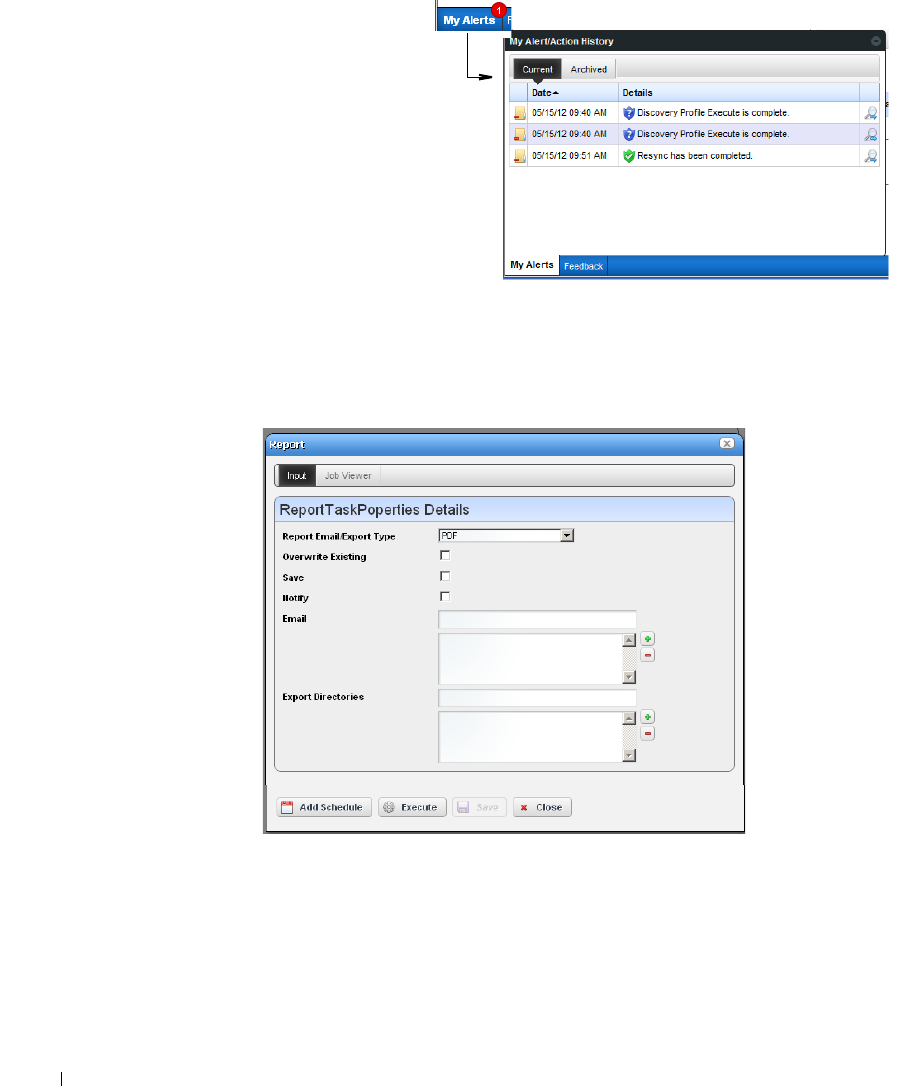
232
Reports | Resource Management and Reports
Execute Report
— When you execute
a report, a numbered message
notification appears, and a link
to the report appears in the
Messages
panel to notify you the
report is ready for viewing. Click
the magnifying glass to the right
of the notification to view either
the audit trail or the report.
Lengthy Reports may take a
some time to appear onscreen
without much indication that
they are in process. This is an
artifact of the Acrobat plug-in, and outside the scope of Dell OpenManage Network Manager
to influence. Acrobat also produces an error if a report has too much data to display
meaningfully.
Execute Report (Advanced)
—Also lets you schedule configure a few other things with reports.
When you
View or Execute Report (Advanced)
, by right clicking either a listed report or a
historical instance of that report, a configuration screen appears that lets you select several
parameters.
These include the following:

Reports | Resource Management and Reports
233
Report Email / Export Type—Select the export file type from the pick list. Options include
CSV, HTML, and PDF.
NOTICE
Programs other than Dell OpenManage Network Manager let you manipulate mail outside the scope of
OpenManage Network Manager. For example IFTTT (If This Then That) could save mail attachments like
reports to Dropbox accounts.
Overwrite Existing—Check to activate overwriting any existing report.
Save—Check to activate saving the report to the database.
Notify—Check to activate emitting a notification event.
Email Address—Enter an e-mail destination for the generated report, and click the plus (+)
to list it. You can enter several such e-mails.
Export Directory—Enter directory destinations for saved reports as you would e-mail desti-
nations.x
Click
Add Schedule
to schedule the report for future or repeated execution,
Execute
to run
the report immediately, or
Save
to preserve this report’s configuration. The
Job Viewer
tab
displays the report’s progress if you click
Execute
.
CAUTION:
Reports can be large. Typically the limitations on e-mail within your system are what limit the size of
deliverable reports. Best practice is to use filters and a limited number of targets to make reports
succinct rather than comprehensive.
Aging Policy
—If you automate report generation, you may also want to configure a Database
Aging Policy to insure the volume of reports does not overwhelm your storage capacity. See
Redcell > Database Aging Policies (DAP) on page 58 for more about doing that.
Delete
—Removes the selected report from the list display
Delete History
— Removes the selected report’s history.
To change reports’ appearance and contents, you must configure their Report Templates. Also, see
Branding Reports on page 237 for instructions about changing the default report logo.
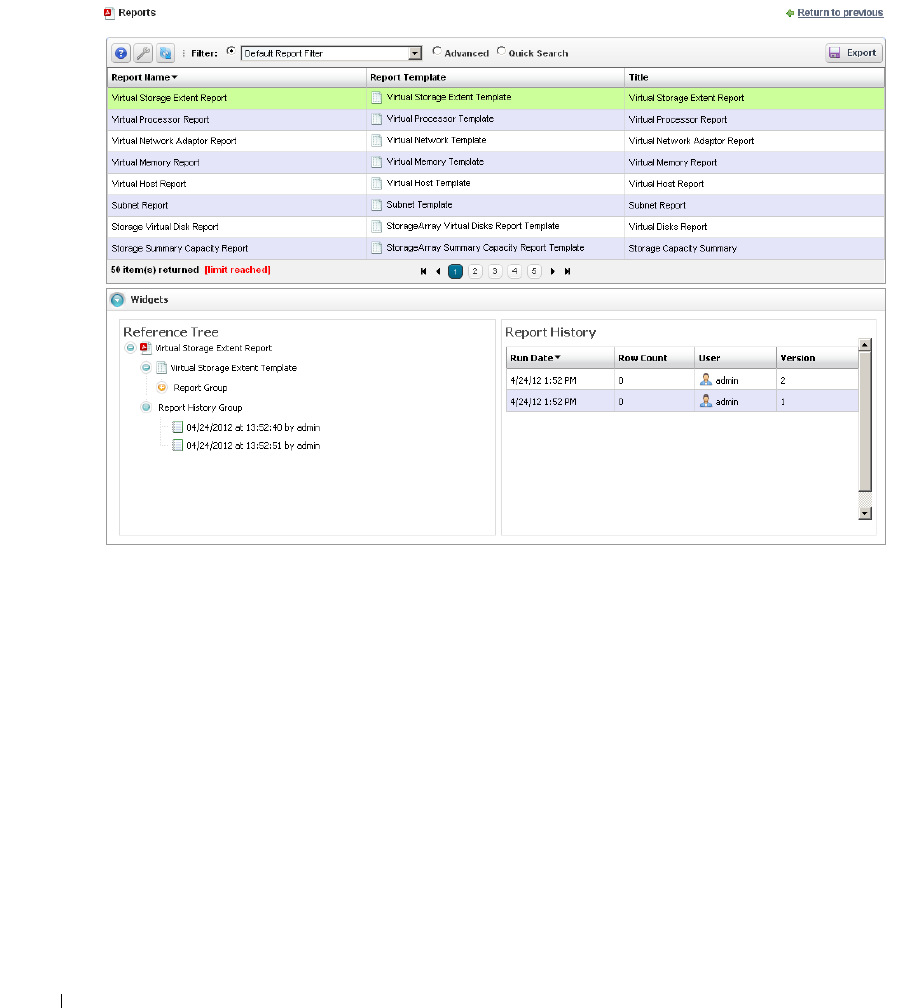
234
Reports | Resource Management and Reports
Expanded Reports Portlet
Clicking the plus (+) icon displays the expanded portlet. the expanded portlet adds
Add / Remove
Column
to the menu options available in the summary screen.
Available columns are the same as the summary screen’s. The
Reference Tree
snap panel displays
the selected report’s connection to devices, historical reports and any report template. Right-click
to view the reports in the Historical Reports node.
Reports Snap Panels
The Snap Panels for reports display a Reference Tree of connections between the selected report
and target equipment, and between the report and any Report Template.
The
Report History
Snap Panel displays the selected report’s
Run Date, Row Count
and the
User
who ran the report. Right-click a row in this panel, and you can
Delete, Print
(the report history) or
Export
(the report history)
,
View
(the report)
or
View (Advanced)
. If you
View
the report, a
message with a link to the report appears in the bottom left of the screen.

Reports | Resource Management and Reports
235
How To:
Generate a Report
The following steps configure, then generate, a report.
1
In the Reports portlet, right-click and select
New.
2
Name
the report (for example: Test Juniper Router Report)
3
Enter a title / subtitle for the report (“Juniper Routers”)
4
Select a template for the report in the pick list. (For example, the template configured in How
to: Create a Report Template.)
NOTICE
If you create a template, the first report you create after making that template automatically selects the
newly created template.
5
In the
Filters
tab, you can create a filter to confine the reports input to certain devices,
locations, and so on. (Here, select the existing All Juniper Routers filter)
6
Click
Save
.
7
Locate the newly created report in the Reports portlet.
8
Right-click and select
Execute.
9
Click the
My Alerts
panel in the lower left corner of the portal.
10
Click the magnifying glass icon to the right of the
Report is now ready for viewing
message.
11
The report appears onscreen.
12
Hover your cursor over the lower right corner of the report to
see a set of icons that let you expand, zoom out and in, save,
or print the report.
For an example of a standard system report, see User Login Report on page 239.
Report Editor
This editor configures reports, and their targets. It has the following screens and fields:
• General
•Filter
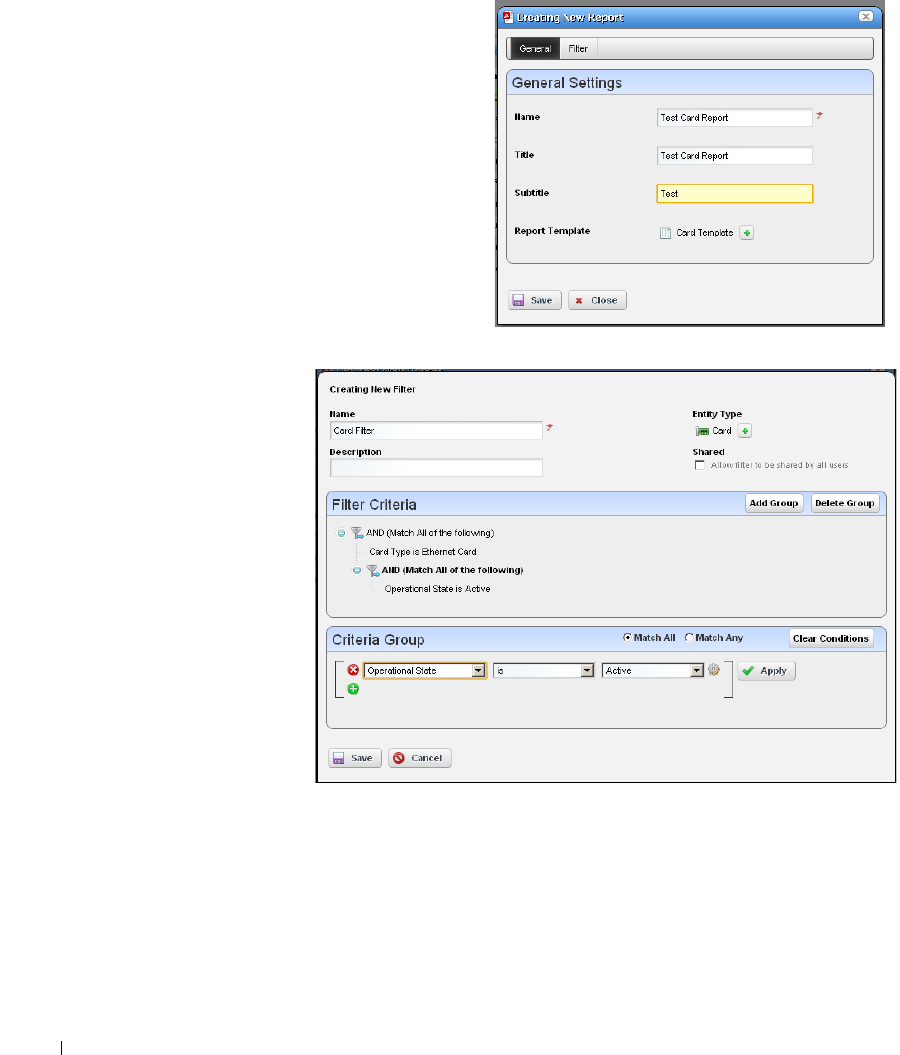
236
Reports | Resource Management and Reports
General
This screen configures the
Name, Title
(displayed text in the report),
Subtitle
, and
lets you select the
Report Template
for the
report (see Report Templates on page 223 for
more about them)
Filter
This screen configures a
filter to retrieve devices
that are the source of
the report.
Click
Add Filter
in the
filter panel to select an
existing filter, create a
new filter, or copy an
existing filter. When
you create a new filter,
you must enter a
Name
and optionally a
Description
for it, select
an
Entity Type
with the
green plus (+), and
elect whether this filter
is available to other
users
(Shared)
. See
How to: Filter
Expanded Portlet Displays on page 108 for instructions about configuring the filter itself in the
lower portion of this screen.
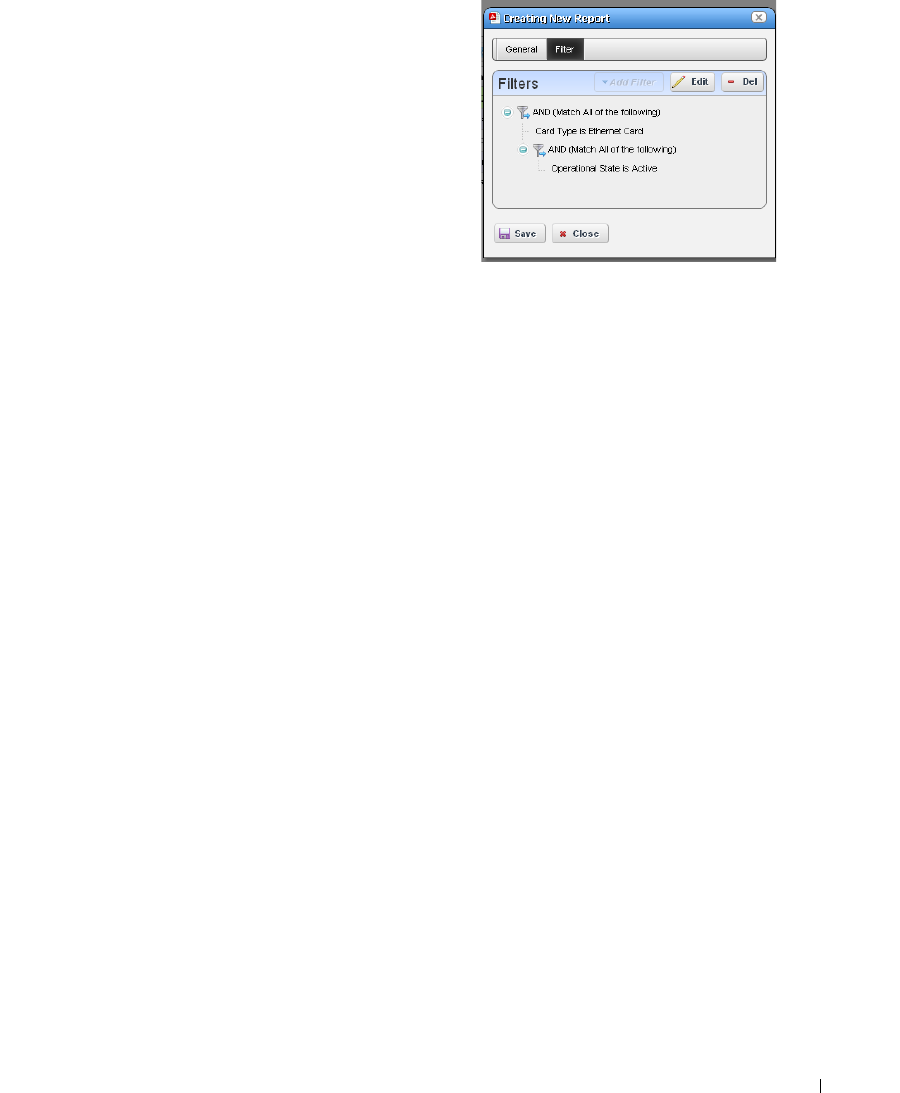
Reports | Resource Management and Reports
237
Once you have configured or selected a filter, the
Filter
panel displays its characteristics in tree form. Click
Edit
to
re-open the editor, or
Del
to remove the filter. Filters
appear only for the entity type of your Report template.
Branding Reports
Reports come with a default logo, but you can change
that, as is illustrated in the above screen. Put the
.png
,
.jpg
or
.gif
graphic file with your desired logo in a
directory on the application server. In the
owareapps\installprops\lib\installed.prop
erties
file, alter this property:
redcell.report.branding.image=<filename_here>
For example:
redcell.report.branding.image=C:/Dorado/owareapps/redcell/images/
Doradov3bar50.GIF
Create images that are no taller than 50 pixels, and no wider than 50 pixels. Notice that you must
use the forward-slanting slashes, not backslashes as is typical of Windows, if you specify the path.
238
Reports | Resource Management and Reports
Group Reports
You can print a collection of several reports and generate a table of contents if the collection is large
enough to warrant it.
When you right-click in the Reports portlet, and select
New Group
, the Group Reports editor
appears. It has the following fields and panels:
Name
— Identify the report group.
Title
— Optionally provide a title.
Subtitle
— Optionally provide a subtitle.
Generate Table of Contents
— Check this box to generate a table of contents listing the reports
grouped together by this group.
Reports
Click
Add Report
(the green plus) to open a selector with the available reports. Select reports to
appear in this group. Each report has an entry in the table of contents, if you elect to generate that.

Reports | Resource Management and Reports
239
User Login Report
In addition to reports about inventory, devices, and so on, Dell OpenManage Network Manager lets
you create a report documenting user logins.
This report can include the following attributes: Login Date, Status [SUCCESS, AUTH FAILURE,
IP RESTRICTION], UserID, User Name, User IP, Proxy IP (if going through a Load Balancer/
Proxy), AppServer IP, Browser [CHROME, FIREFOX, and so on], Operating System
[WINDOWS, LINUX, MAC, IPHONE, IPAD, and so on.]
The following attributes are available, but not in default seeded report to conserve Column space:
Portal IP and Browser Version.
When authentication fails, this report does not record the IP address from which the user made the
attempt, unless such users are behind a proxy or load balancer.
Browser ID, Version and Client appear only by best effort. Browsers do not always send the user-
agent and can change standard messaging with extra plugins.
NOTICE
A Default User Sign-On Log DAP is seeded which by default keeps the last 30 days.

240
Reports | Resource Management and Reports

| Display Strategies
241
7
Display Strategies
You can display devices and network arrangements in a variety of ways. The following sections
describe those display strategies.
•Container Manager
•Map Context
•Visualize My Network
Containers manage what appears in other portlets on the same page, including Visualize and Maps.
If a page with Visualize has no Containers, then clicking a node in Visualize limits other portlets on
that page to only that node’s information (for example Alarms). Maps does similar filtering.
Display Rules
Here are the rules for how portlets manage each others’ displays:
Rule 1
—If Container View is on the Screen its selections drive all portlets that accept context.
If it is not on a Page:
Rule 2
—If Visualize My Network portlets is on a page it acts like Container View and drive all
portlets’ appearance.
Rule 3
—If Rule 1 and 2 are not in effect, then Managed Resources drives Ports and Links portlets’
appearance.
Rule 4
—If Rule 1 is not in effect and Visualizer Views are on the same page as the Visualize My
Network portlet, the selected view appears in the Visualizer.
When a page with a container loads, the container typically loads first and starts polling. If it is on
the same page, Visualizer starts its polling after the page loads, so some lag may occur between the
container and Visualize screens, depending on your settings. Clicking Context or drilling or
expanding nodes in the Visualize screen resets the refresh timer since it may poll different nodes.
This can also offset refresh timing for different page elements. You can change refresh timing (see
General > Entity Change Settings on page 58 for the way to portlet refresh intervals), but
synchronizing such portlets absolutely is unlikely.
NOTE:
Some portlets may display a selected context without operating as though it was selected. For example if
you put Managed Resources
242
Container Manager | Display Strategies
Context
When other portlets determine the appearance of a portlets—as spelled out in Display Rules
above—a
Context
icon often appears in the right corner of the driven portlets.
The contents of the icon spell out what is selected in the portlet driving its appearance.
Container Manager
Container manager lets you create, edit and delete Container tree models displayed in Container
Views (described in the next section). These containers filter what appears in other portlets on the
page with the Container View portlet.
The relationship to users and devices appears in Container Manager Expanded.
Right-click to select from a menu with
New, Edit
and
Delete
,
and
Refresh Members / Alarm State
.
Refreshing
re-queries the database for members fitting the dynamic filter, or for new alarms for
members. Selecting
New,
or
Edit
displays the Container Editor, described below.
You can also
Tag
containers so Map views reflect container selections. See
Tag on page 114
for more
about how that works.
Container Manager | Display Strategies
243
Container Manager Expanded
The expanded view displays the same information as the summary view, but displays the selected
container’s authorized users, creator, owner, and membership in the Reference Tree snap panel.
How To:
Use Containers
1
Create the containers you would like for filtering views of resources. For example, you can
create a container for each customer or location.
CAUTION:
By default containers are configured without any authorizations. Make sure you configure authorizations
so you can see the container once it is configured, otherwise it will be invisible.
2
Create a page with Managed Resources or other container-filtered portlets (Ports, Alarms and
so on).
3
Add the Container View portlet to that page.
4
Click the container to filter by.
5
Observe the other portlets to see resources assigned to the selected container, for example,
customer or location.
244
Container Manager | Display Strategies
Container Editor
This editor lets you create and manage containers. You can also associate user authorizations with
container models to specify which groups or users have access to contained items.
In this editor, a tree panel on the left lets you build and navigate the container tree. Click
Add
Child (
or
Delete Child)
to create (or remove) a node to / from the node you have selected in the
tree. Clicking a node in the tree displays the tabbed panel on the right where you can edit it.
The
Container Details
panel has the following tabs:
• General
•Membership
•Authorizations
•Visualizer Display
Click the labels at the top of the screen to access these. Alarm states and severities are recalculated
and propagated for containers as they are for Visualize My Network.
General
This panel has the following fields:
Name
—The container identifier.
Description
—A text description of the container.
Owner
—Select an owner for the container. The owner of a container can also change the
ownership of the container
Container Manager | Display Strategies
245
Update View Authorizations
—Clicking the link here automatically includes the creating user in
those authorized to view the container. See Authorizations below for more about them.
Membership
Container membership defines the inventory items that are in a container. You can select either a
Static
membership, which cannot change, or a
Dynamic
one, based on a filter. When Dell
OpenManage Network Manager evaluates the filter it adds the resulting items as members in the
container.
The sub-tabs at the top of the screen let you edit these types. You can add individual items with the
Static
tab, or the results of a
Dynamic
filter with that tab. See Managed Resource Groups on page
190 for more about the specifics of editing these dynamic groups.
When you add an item or filter to your container, notice that the subsequent screen contains a pick
list
Select an entity of the following type.
The contents of that list can contain several types of
managed objects, including Contact, Equipment and Subcomponent, Interface, Location,
Managed Equipment, Port, Service, and Vendor. Select the type appropriate for your container.
Click
Save
to preserve the membership you have configured. If you
Group By Entity Type
(at the
bottom of the screen) rather than
None
, the list of devices appears in a tree, with each node as an
entity type. Click the plus (+) to the left of the entity label to expand the tree.
Authorizations
This tab configures user or role access to the container you are editing. By default, no authorization
exists to see a container or its contents, so you must permit specified users and roles to have access
before any containers or their contents are visible in Container View.
246
Container Manager | Display Strategies
Click
Add User
or
Add Role
to select the users or groups with permission to access the container
you are configuring. By default containers are accessible to everyone.
Each entry in the Container Authorizations list specifies the name of the user or role, and whether
the entry is inherited or not. A child container by default inherits the authorizations from parent
hierarchy, no explicit authorizations for child containers are necessary. Edit any authorizations in
the parent.
When editing a child container, click a listed authorized user or role and its permissions appear in
the panel at the bottom of this screen.
Clicking
Save
preserves any alterations you have made. Confirm the container is configured as you
like by examining it in a Container View portlet.
Visualizer Display
This tab configures how the container appears in the Visualize My Network portlet.
Selected containers’ labels appear in the Visualizer’s title bar. Configure the following display
settings in this panel:
Display Container within Graph as
—Select either
Node
or
Group
.
Container Manager | Display Strategies
247
Node Icon Type
—This appears if you select
Node
. Use the pick list to select among the various
icon types as is appropriate for your group.
Group Style
—Select either
Default (Rectangle Shaded Group)
or
Cloud (Cloud Background
Image).
The group is like the Expand Grouped capability described in
Configuring Views on
page 255
. The Cloud is a cloud icon like the one you can add to views as described in
Design
Tools on page 259.
Display Container Name within Group
—This appears if you select
Group
. Check it to display
the container name as a label within the group.
Container View
This (non-instanceable) container portlet
displays configured containers authorized for
the logged-in user, in the color of the most
severe alarm for equipment within that
container. Because it is non-instanceable, only
one can appear on a page.
Expand the container tree by clicking the plus to
each container’s left. Container contents sort
alphabetically, and alarms appear to the right of
equipment displayed.
The container selected acts as a filter for a
screen’s other Dell OpenManage Network
Manager portlets. If you select “Folsom” as a
location in the container portlet, then only
items related to Folsom devices appear in the
other portlets on the page. If you select a parent
container, that expands the selection to include all child containers’ selections. It does not, however
select everything. You can configure containers in Container Editor, described in the next section.
You may have to wait a few moments to see a container’s contents accurately.
Portlets that respond to Container or Map Context “filtering” include the following: Audit Trail,
Event History, Locations, Vendors, Contacts, Managed Resources, Ports, Authentications,
Discovery Profiles, Monitors, Services.
See General > Entity Change Settings on page 58 for the way to set the summary portlet refresh
interval. The default is 40 seconds. If this portlet is in expanded mode, refresh does not occur
automatically, but you can refresh it manually.
NOTICE
If a container displays unexpected results, right-click it to refresh its membership or alarm severity /
state.

248
Container Manager | Display Strategies
Right-clicking a container displays the following menu items:
Refresh Members
—Re-query the database to populate any dynamic filter that is part of the
container.
Details
—Opens a details panel with a list of the container’s contents (
Members
) as well as
container members’
Alarms
(Alarms and Event History) and
History
(Audit trails and
Configurations).
Refresh Alarm State
—Re-query the database to update the container’s alarm state based on its
contents.
Edit Resources
—Open an editor screen for the container that lets you change common attributes
within it.
Visualize
—Display a container in the Visualize screen where you can drill in to see its contents
(see Visualize My Network on page 254).
Tag
—Enter map location coordinates for the container.
Container View in Tenant Sites
Within a Multitenant environment, only containers configured to appear in tenant sites appear
there. If that container contains equipment only visible on the master site, those devices will
appear below the container node, but will have no impact in filtering other portlets, like Alarms, for
example.
Map Context | Display Strategies
249
Map Context
In addition to displaying filtered-by-container portlets, you can view discovered devices in the
Map
Context
portlet, automatically placed by location.
Notice that you can move the center of the map with the arrows in its upper left corner above the
zoom in / out (+/-) buttons. The menu in the upper right corner lets you select a
Map
or
Satellite
views, and fine-tune them to include labels, terrain and so on.
In addition to the
Help
and
Settings
icons at the top of this portlet, you can also
To g g l e
Marker Style
(pushpins or triangles),
Toggle Marker Clustering
(combine markers into
cluster marker when they are near each other), or
Search by Name
for a location.
Clustered markers display the number of separate markers combined within them.
NOTE:
The Search function is case-sensitive. Omit the initial letter if you are uncertain about
capitalization for a tagged location.
Clicking the
Settings
icon produces a screen where you can configure the default marker style,
whether clustering is enabled, and where you can save the current map boundaries (
Save Current
Bounds
), which appear, read-only, below that option.
See General > Entity Change Settings on page 58 for the way to set the summary portlet refresh
interval. The default is 40 seconds.
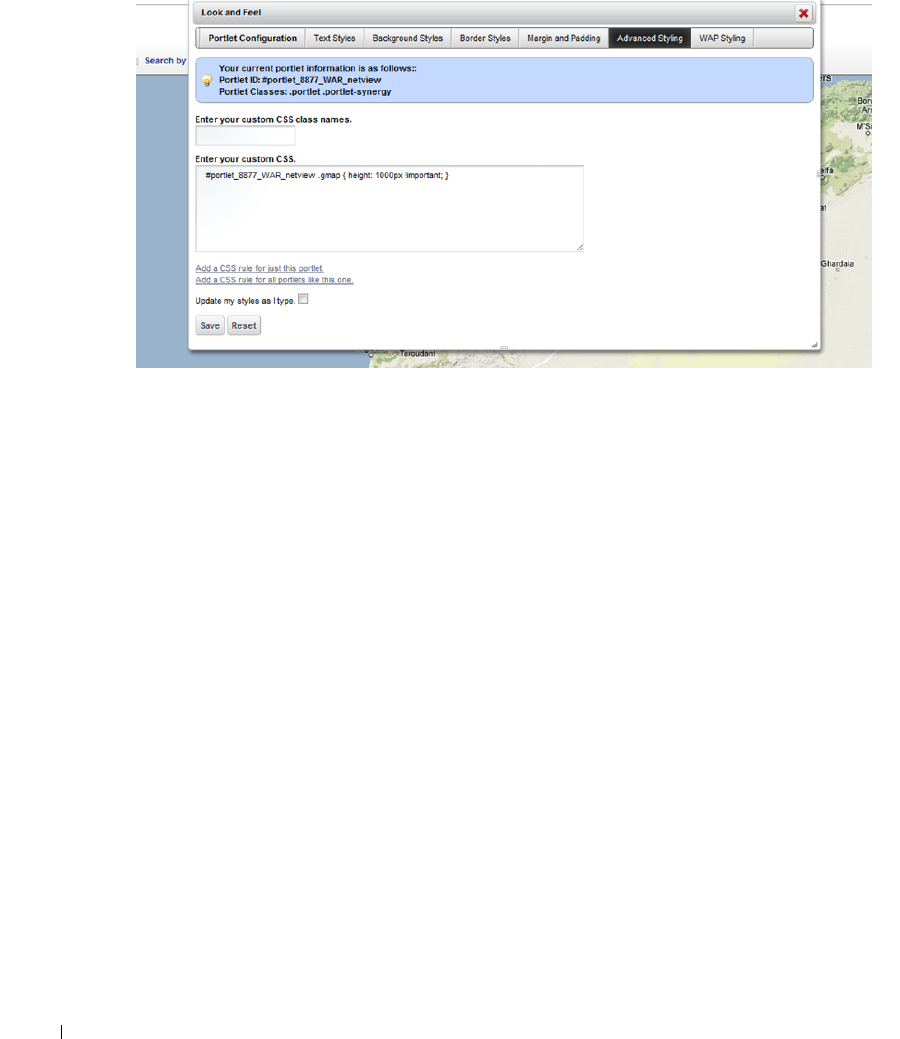
250
Map Context | Display Strategies
The page layout controls the width of the map. However you can control the height of the map
with the
Look and Feel
configuration in the
Advanced Styling
tab.
Add the following line to the custom CSS settings in this tab:
#portlet_8877_WAR_netview .gmap { height: 1000px !important; }
This sets the height of the map context portlet to the configured number of pixels, here, 1000.
Access this tab from the drop-down originating with the word
Map
in the top right corner of the
portlet.
Configure locations on the map with the
Ta g
menu item. See
Tag on page 114
for an
explanation. See Maps and Containers Together below for more about their joint capabilities.
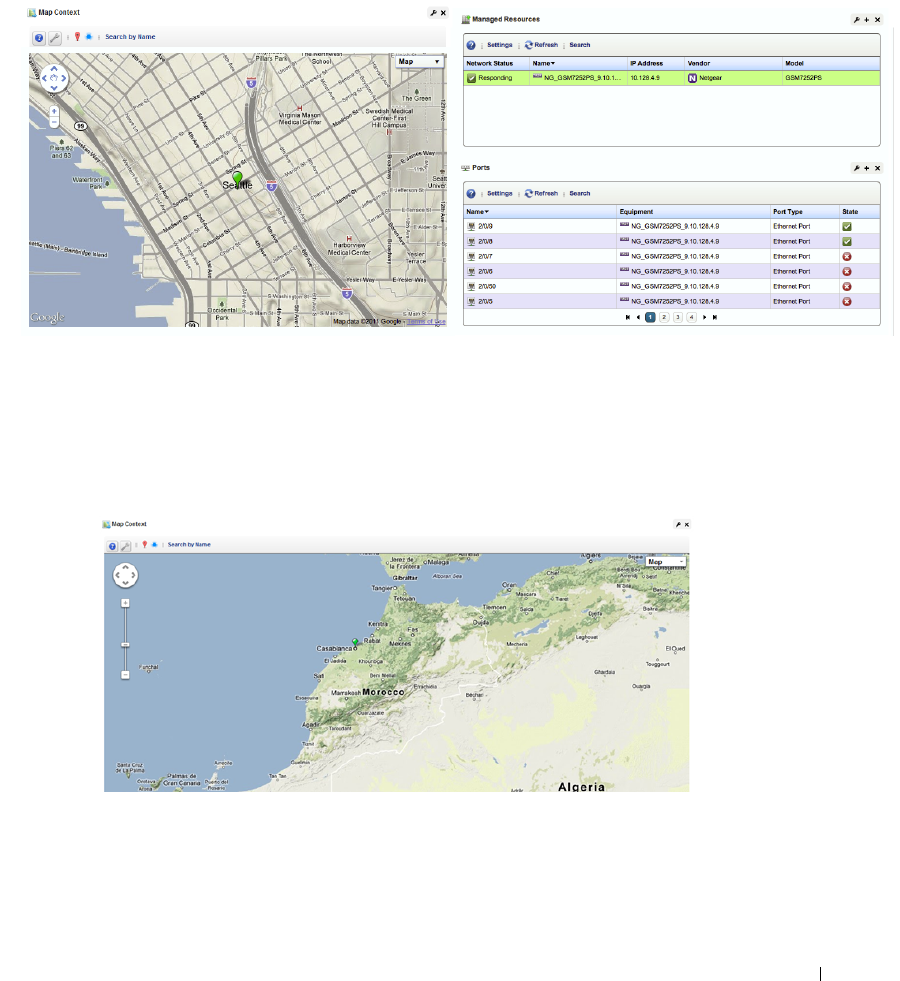
Map Context | Display Strategies
251
Map Context without Containers
If a page has no containers then the Map Context can act like a container too. It displays all tagged
resources within the system (see Tag on page 114). Clicking on a tagged item behaves like clicking
a Container, confining displayed resources, alarms, and so on, to those for the selected tag.
Each tagged coordinate is cross-correlated with the Alarm severity table (if there are alarms against
it) and its color reflects the current Alarm severity.
Maps and Containers Together
A map context portlet is in
Standalone
mode when no Container View portlet is on the same page.
In Standalone mode you can determine exactly what portion of the map appears through the
Settings
option (the wrench icon).
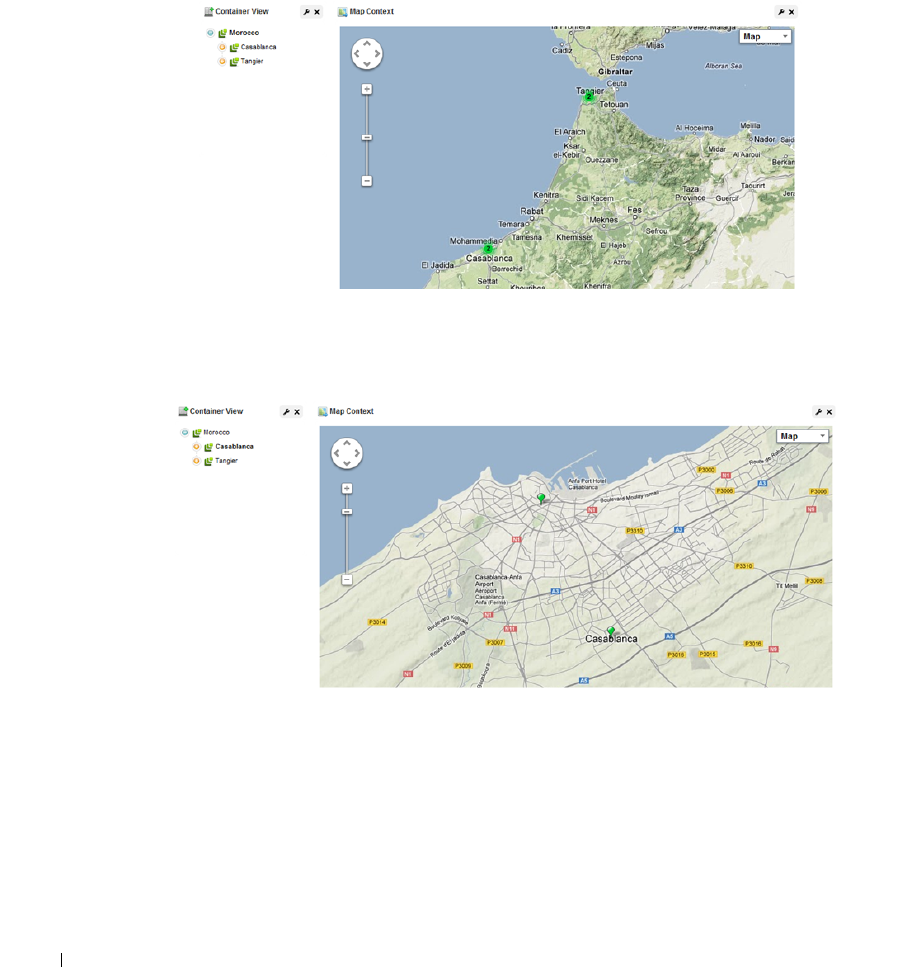
252
Map Context | Display Strategies
The map context portlet is in
Container Context
mode when a Container View portlet is on the
same page. In these Container Context configurations, the Container View determines what
appears in the Map portlet, so the Map Context portlet resets its boundaries based upon the
geographic position of the selected container's members. For example, you can select a container
(Morocco) resulting in two clustered pin for both Casablanca and Tangier.
However if you select Casablanca from the container view the map automatically changes its
presentation and boundaries based upon the members of the new selection. The view zooms to the
street level in Casablanca.
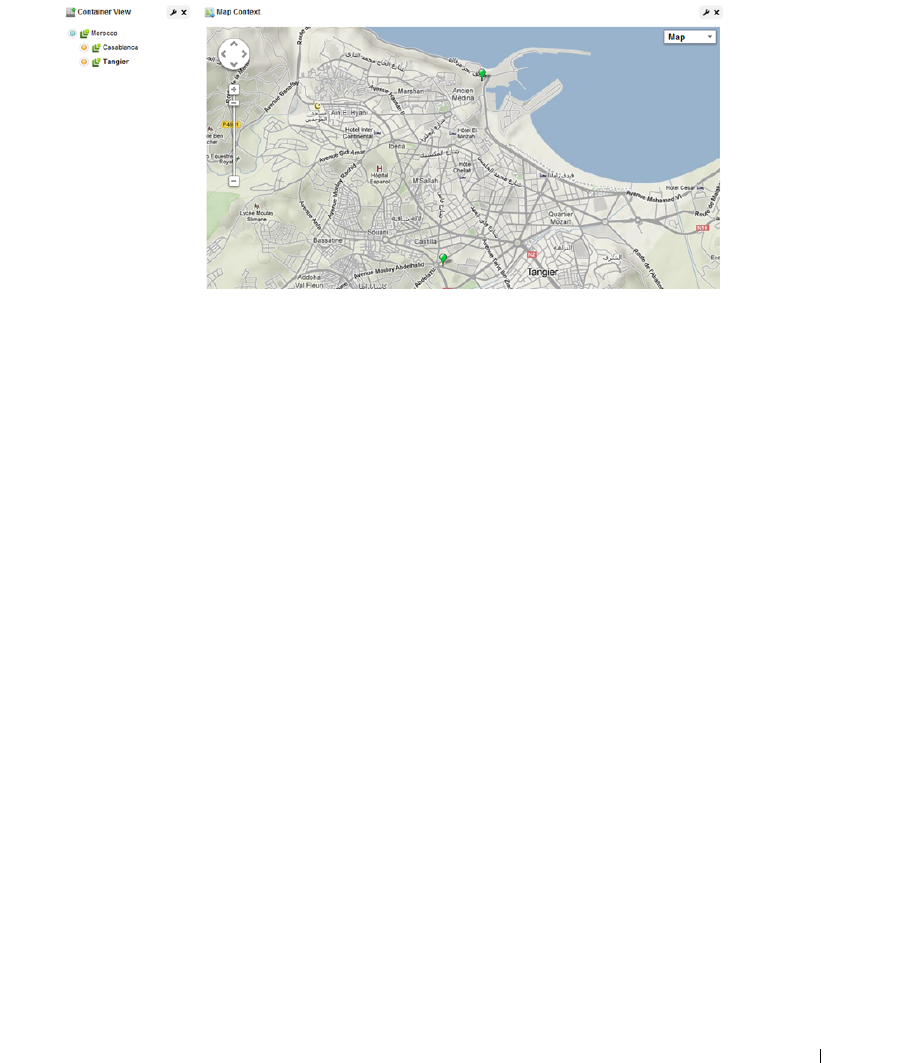
Map Context | Display Strategies
253
If you select Tangier and map presents the container’s sites in a street-level view of Tangier.
Using Nokia Maps
By default, Dell OpenManage Network Manager uses Google maps. To use Nokia’s maps, follow
these steps:
1
You need App ID and App token to use Nokia map service. Get an ID and token on
http://
developer.here.net.
2
At top of page, click
Sign In
3
Click on
Register
at bottom of page, and create Your Nokia Account.
4
Click
Register
5
Click on
Create app,
and provide and app name. For example: Dell OpenManage Network
Manager
6
Click
Get Started
7
Then click
Done
8
Copy the App ID and App token.
9
Go to Control Panel’s Redcell > Application Settings, and select Nokia Maps with the pick
list.
10
Enter both Application ID and Application Token in the appropriate fields, then
Save
.
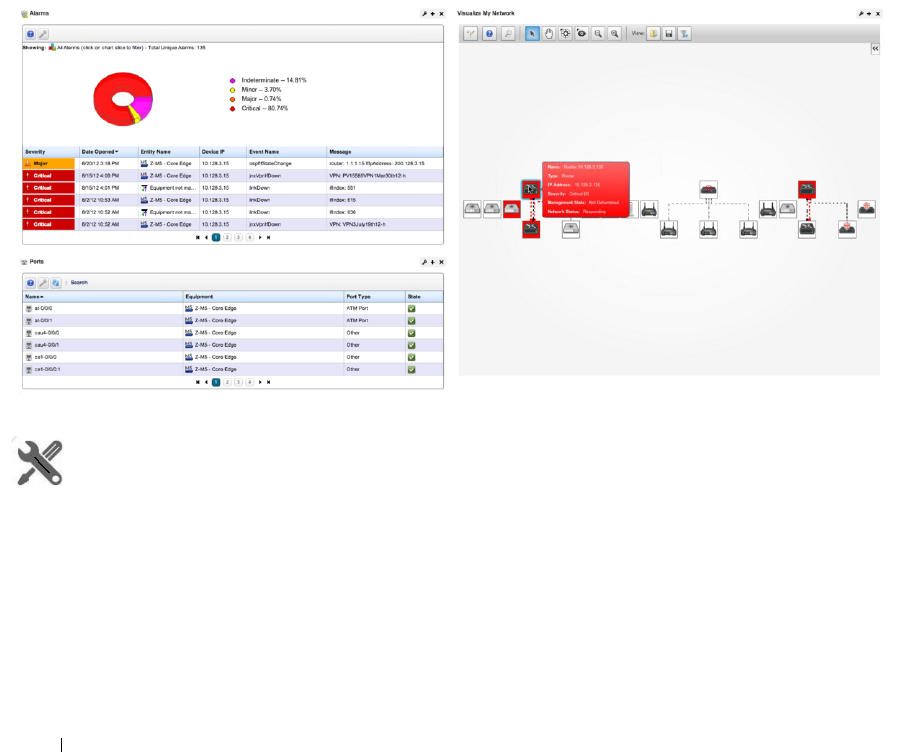
254
Visualize My Network | Display Strategies
Visualize My Network
The Visualize My Network portlet displays discovered devices, mapping them in relationship to
each other. It also lets you store and retrieve views you have arranged, as well as configure the
default view (see View on page 261 for more about these capabilities).
See General > Entity Change Settings on page 58 for the way to set the summary portlet refresh
interval. The default is 40 seconds.
The color displayed in these topologies indicates the alarm severity of the node or link (“edge”)
only. No color or icon indicates a device’s network status or availability, although hovering the
cursor over a node displays that information.
Visualize can act like a filter, too. Portlets like Alarms and Ports respond to clicking a node in
Visualize, displaying information relevant to only that node.
How To:
Create a Visualization
Creating a topology map of devices or services is as simple as right-clicking the item(s) you want to
map, and selecting
Visualize.
You can also save different topologies after you configure them. See View on page 261 for more
about that.
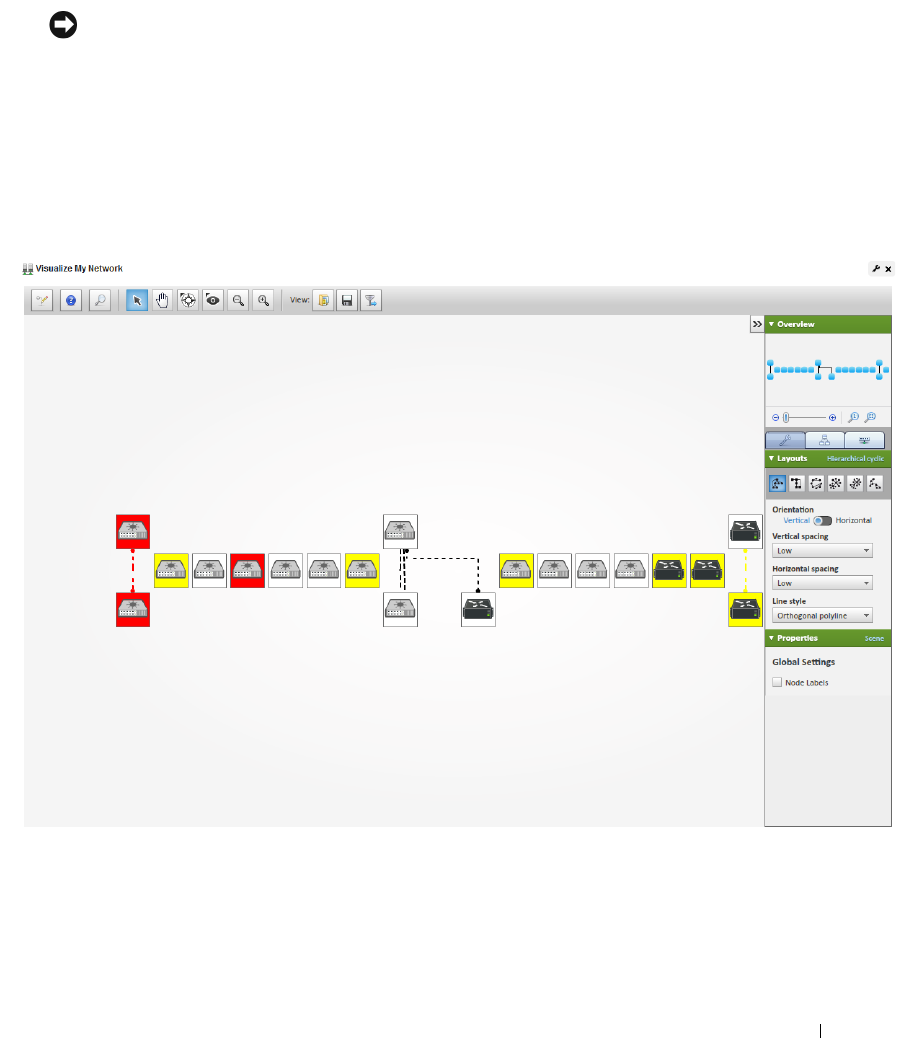
Visualize My Network | Display Strategies
255
You can fine-tune the appearance of what you see with the tools described in Configuring Views
and what follows.
NOTICE
If you do not see what you expect, make sure you have refreshed your browser so cached images do not
interfere with current ones.
Configuring Views
Click and drag displayed portions of this screen to see other parts of the topology. To move the
display more, click in the Overview panel. You can also expand / collapse the panels on the left of
the screen by clicking their title bars. (Figures below display them expanded.)
Nodes appear colored according to the alarm severity on the device, and white if no alarm exists for
the device. Hover the cursor over an icon or link between icons to see a small screen describing its
device (
Name, Type, IP address
), network status (
Responding / Not Responding
) and alarm severity.
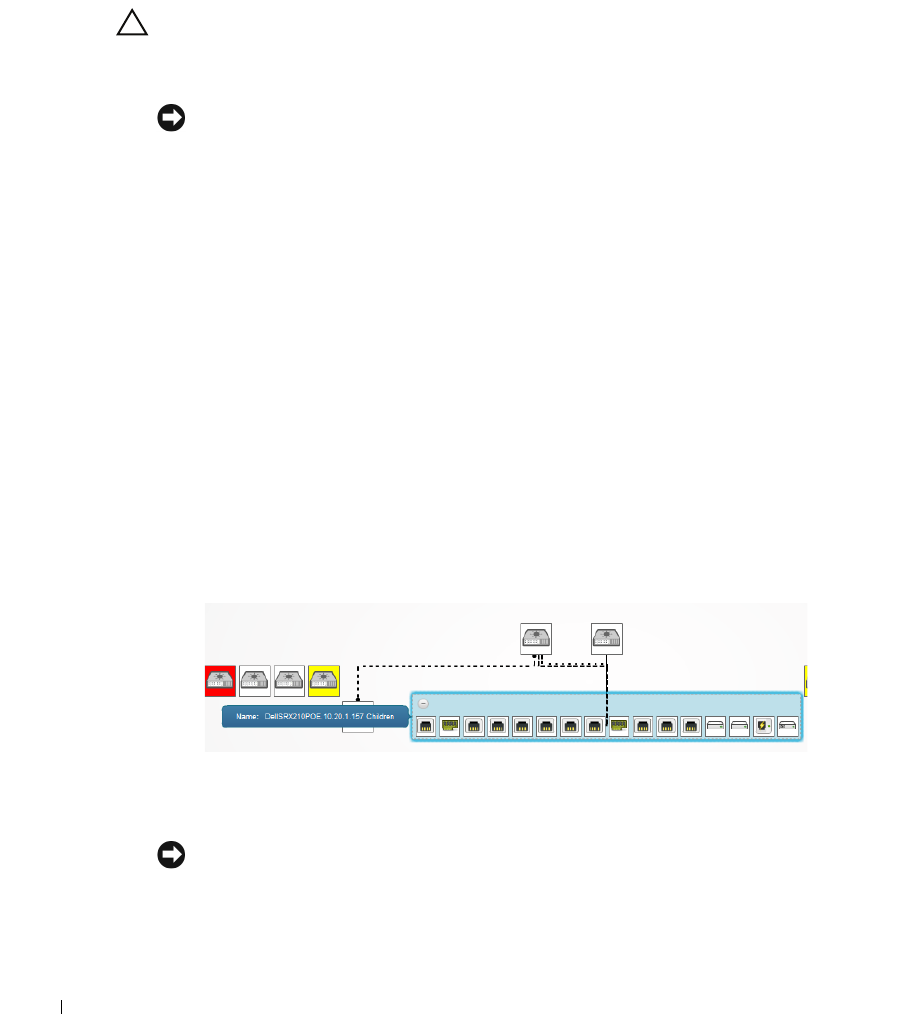
256
Visualize My Network | Display Strategies
Click an icon to highlight it (or click its name in the Top-Level Nodes Tab tab list) and its
connections to the network. See Alarms in Visualizations / Topologies on page 267 for more about
the alarm severities indicated by icons in topology.
CAUTION:
If you have installed a firewall on the application server, ports 80 and 8080 must both be open for topology
to work.
NOTICE
If you have a Container View portlet on the same page as Visualize My Network, the selected container
filters what appears in the view. Without containers, Visualize My Network can configure what appears
in other portlets on its page (for example Ports).
Click the Legend Tab to see the meaning of lines, links and alarm colors. Hover the cursor over a
link to see its type described.
The screen to the right of the Visualize My Network screen displays the following panels:
•Overview
• Properties and Settings > Layouts Tab
• Properties and Settings > Properties
• Legend Tab
• Top-Level Nodes Tab
Click the triangles to the left of these panels’ labels to collapse or expand them.
In addition to the screen components immediately displayed, you can right-click an icon or
component, and
Drill in
or
Expand
a device to see its subcomponents. If you expand, then its
subcomponents appear with the rest of the topology. If you
Expand Grouped
, then the
subcomponents appear in a minimize-able block (hover your cursor to see the block in color, and
click the circled minus to minimize the group).
If you drill in, other components do not appear. Finally, you can select the
Details
menu option to
open another browser window with the Details screen of the selected node.
NOTICE
If you want to initiate Actions on a node or its components, do so by right-clicking the Details screen’s
Reference Tree.
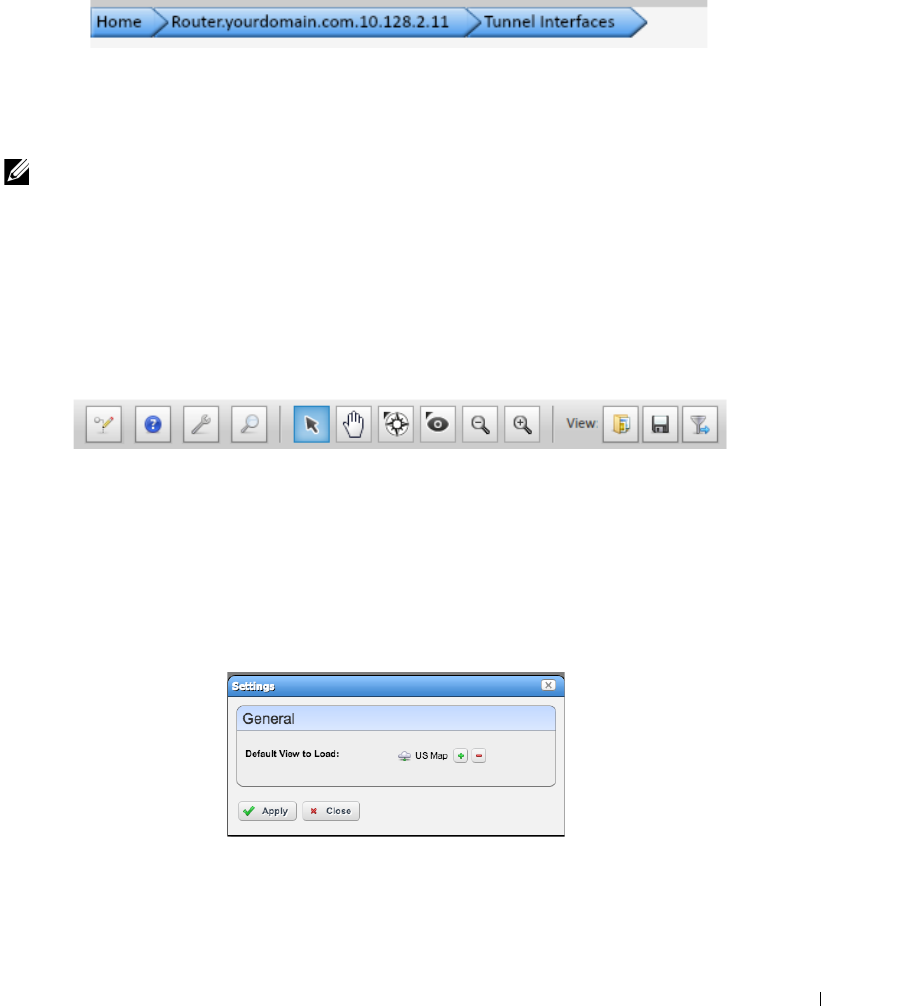
Visualize My Network | Display Strategies
257
The Properties and Settings > Layouts Tab selections determine the arrangement of such
expansions or drill-ins.
When you drill in, the path back to the top level appears below the topology.
Click the level where you want to “drill out,” or click
Home
to go to the top level.
If you right click the blank area of the screen, you can
Export
it as
either a .png image or GML
(graphic markup language), or print the displayed topology.
NOTE:
Because Topology uses Adobe Flash, menu items appear for that software when you right-click nodes.
This includes Settings, Global Settings and About Flash menu items. The text below does not discuss
these.
Tools
A toolbar at the upper left corner of the Visualize My Network to help navigate through the
topology onscreen.
These are the tools:
Toggle Design Mode
—Click this to turn on Design Tools, described below.
Help
—Click this to turn access the online help for this screen.
Default
—Click the wrench icon to configure the default view. If the Visualizer Portlet is on a page
not driven by another Context—for example, Containers—and you have write permission for
Visualizer, then this icon appears. Clicking this lets you associate the Visualizer portlet on the
current page to a selected view. To return to the default network view click the red minus (-)
button in the settings. Any view change requires a page refresh after applying the revised
setting.
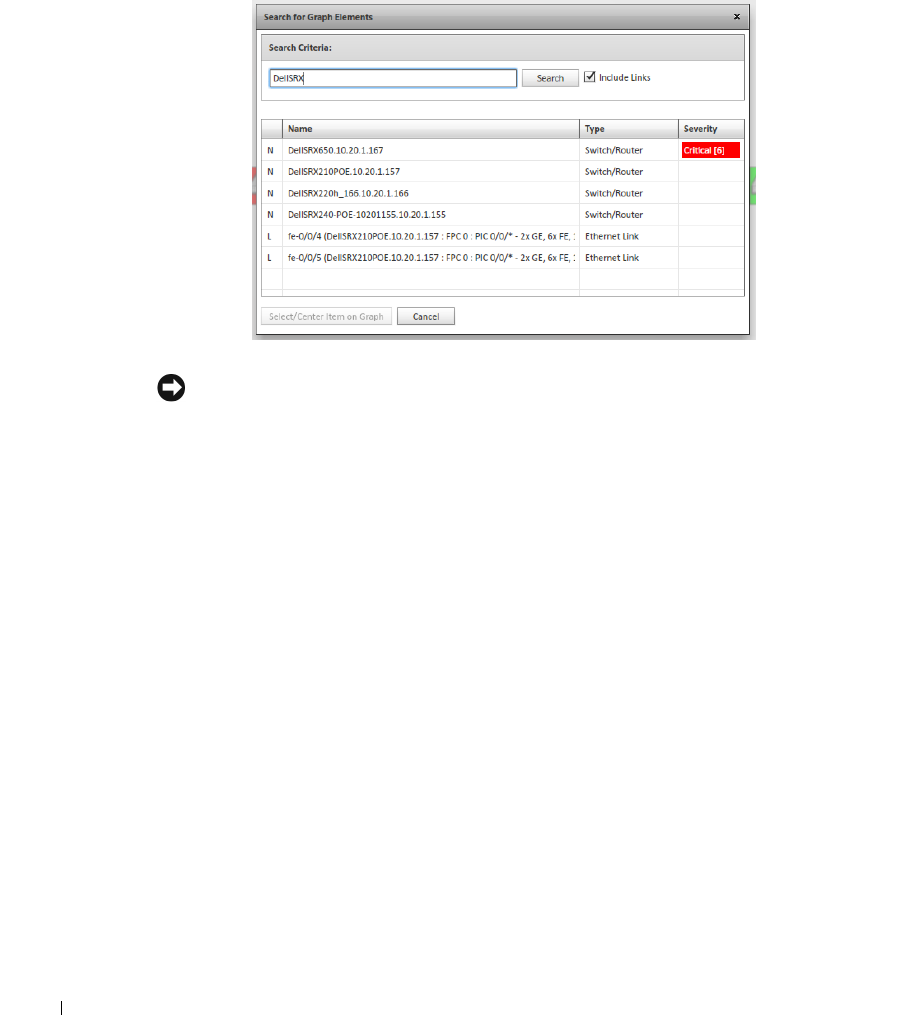
258
Visualize My Network | Display Strategies
Search Node Elements within this Graph
—Search for a particular node. This opens a screen
displaying the search results, name, type of node and the node’s alarm severity. Click Select /
Center Item on Graph to select a listed item.
NOTICE
Search also finds links or “edges” between devices, and saving a view preserves displayed links’
appearance.
Selection Tool
—The cursor selects nodes. Click and drag around nodes to select several.
Pan Tool
—The hand moves the background.
Shortest Path Tool
—Click two nodes to highlight the shortest path between them.
Bifocal Effect
—Move the cursor to magnify nodes under it. Handy in a crowded view.
Zoom In / Out
—These magnifying glass icons change the magnification for the view.
Open / Save View
—Open a saved view or save the current one. Views include visible nodes and
links, but you cannot save the location of these nodes. (See Map Context on page 249 for a
possible alternative.)
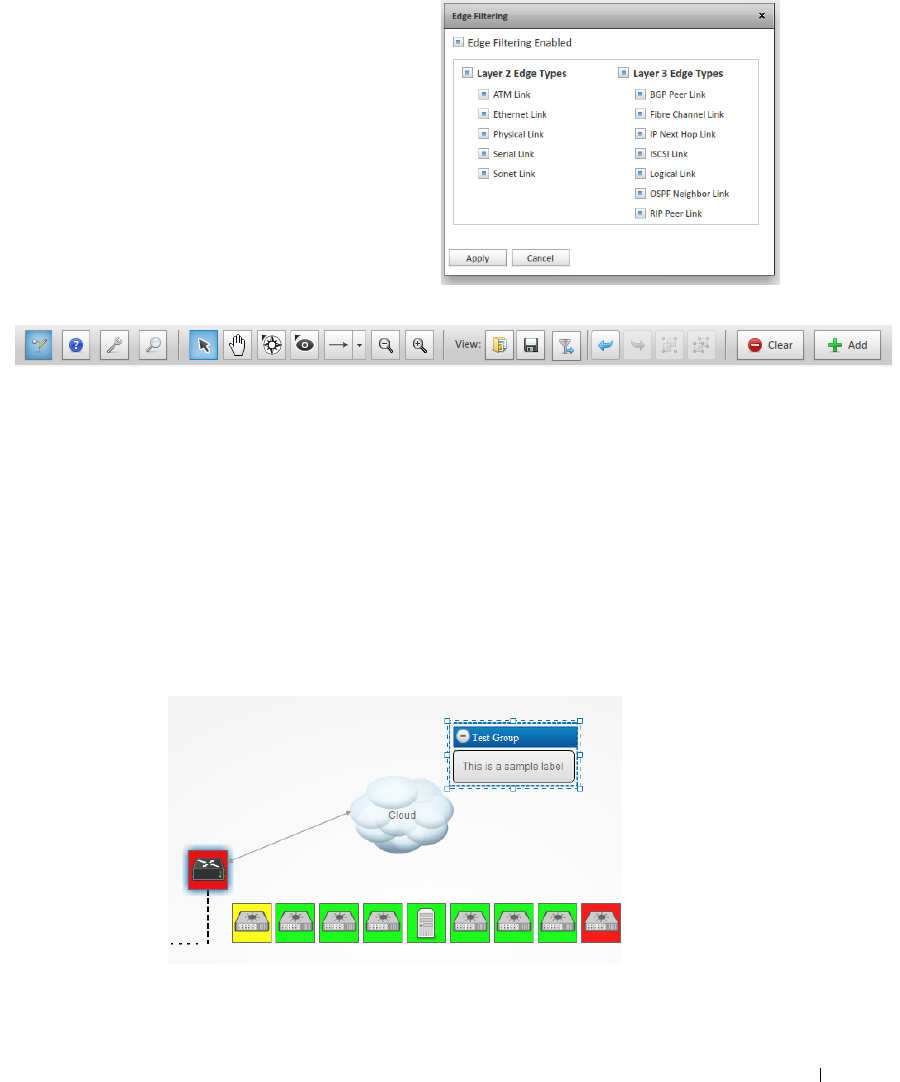
Visualize My Network | Display Strategies
259
Edge Filtering
—Configure the type of links that
appear onscreen (by default all appear). Click
the checkbox in the screen that appears after
clicking this icon, then check/uncheck to
configure what links appear in the topology.
You can also save views with different filtering.
Design Tools
When you click the
Toggle Design Mode
icon on
the left, several additional tools appear that let you
manipulate the Visualize My Network screen.
These tools include the following, in addition to those described above in Tools:
Line Drawing
—Click to select the type of line to draw, then shift+click two icons onscreen to
draw the line.
Group / Ungroup
—These two icons group or ungroup selected icons labels and lines together so
you can move them in tandem. Ctrl+click to multi-select icons.
Notice that when you create a group, the
Properties
panel provides additional configuration
parameters. These include the
Header
panel where you can configure whether the group
header is
Visible
, its
Label
the
Background
and
Tex t C ol or.
Click the minus in the header to
minimize the group (and plus to expand a minimized group).
The
Content
panel lets you configure whether the group appears as a
Panel
or
Cloud
, and its
Background
and
Stroke
colors.
Undo / Redo
—These two arrows undo and redo the last action(s).
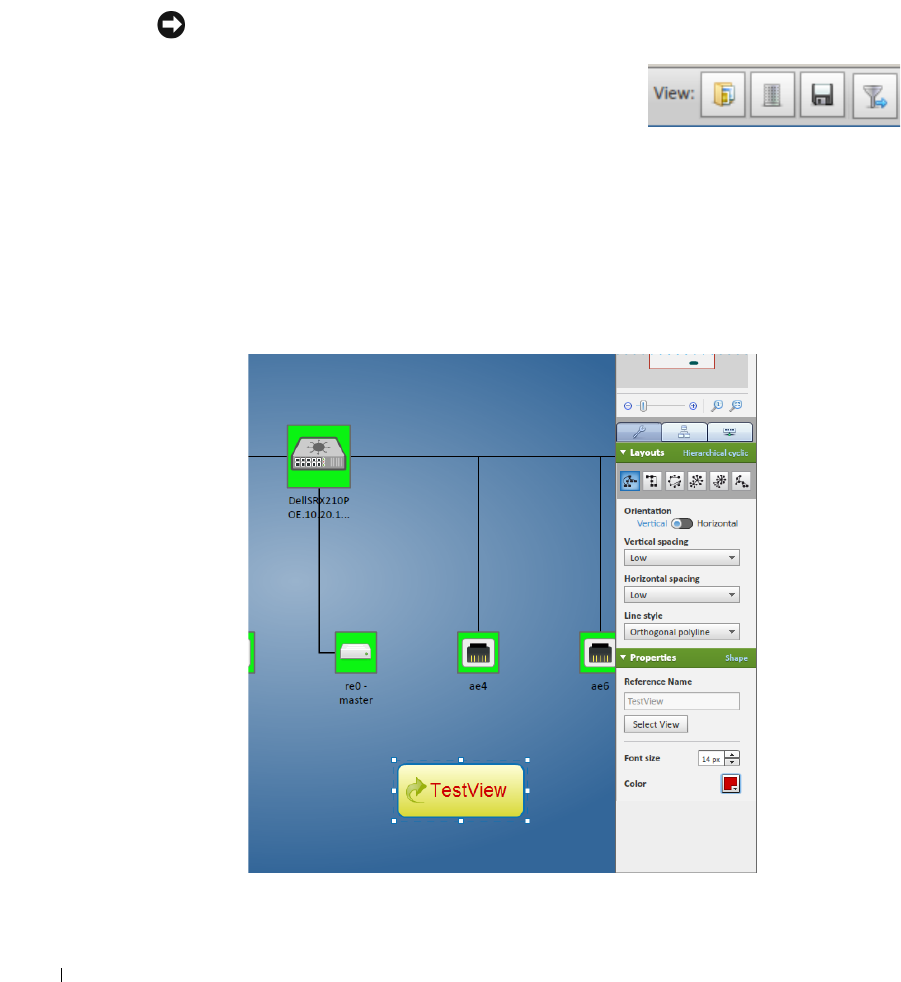
260
Visualize My Network | Display Strategies
Clear
—Clears the Visualize My Network screen.
Add
—Adds a
Label,
a
Cloud
or a
Linked View
to the Visualize My Network screen. use the
Properties
panel at the bottom right of the screen to configure the font, background color,
label contents, and so on, when you have selected the added element.
NOTICE
If you configure and save a Drill-in view with Design Tools, then
that view persists for all drill-ins from that device until you remove
it an icon that appears between view Open and Save when it is
enabled. Deleting such a drill-in view restores the default settings
When you add these elements, you can elect to check
Static Placement
and they will not move with graphic elements when they are automatically
re-arranged. You can, however, click and drag them.
Linked View
When you Add Element to a Linked View, the shortcut that appears onscreen provides a clickable
link to the view you select when you add it.
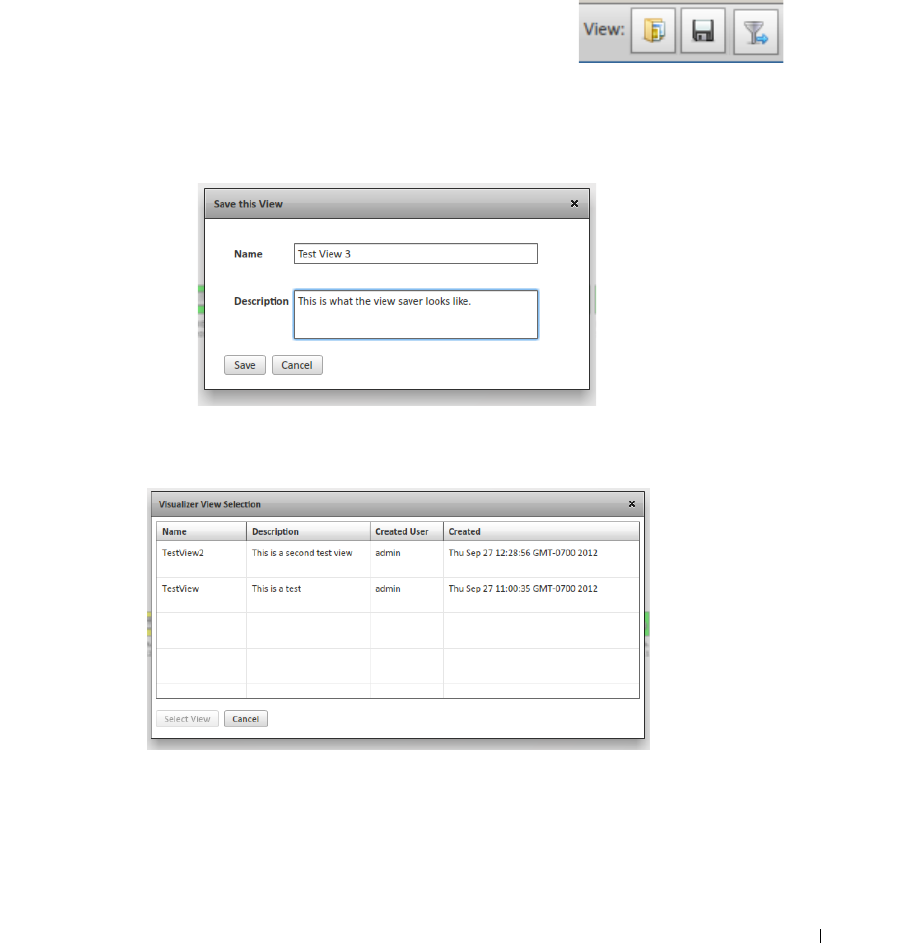
Visualize My Network | Display Strategies
261
Use the
Properties
panel in the lower right corner of the screen to select the view, and configure the
font on the link. The label is the linked view’s title. You must create and save views before they are
available to link.
View
These icons let you save views you have configured, and has buttons
to let you
Load a View, Save this view
, or activate
Edge Filtering
(links filtering).
Clicking
Save this view
displays a screen where you can
Name
and
enter a
Description
for the view you are saving. Saving preserves node coordinates, background
colors or graphics, and node sizes. The name of the current view appears on the right of the title bar
for the Visualize My Network screen.
Clicking
Load a view
loads saved views selected from a screen. Users who do not own the retrieved
view can save a copy.
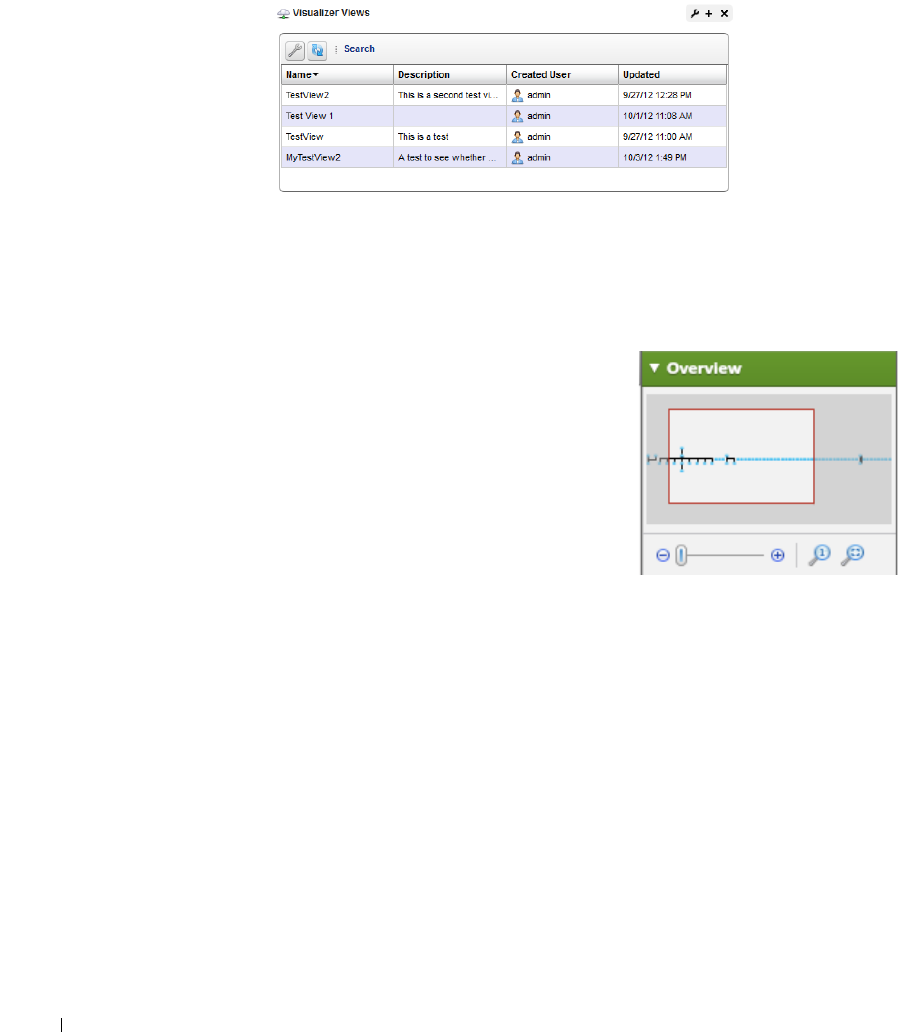
262
Visualize My Network | Display Strategies
Visualizer Views
To see a catalog of available views, you can add this portlet to a page.
This lets you Edit the name and description of available views, and delete those you no longer
need. You must open them in the Visualize My Network portlet.
Overview
This displays a thumbnail of the entire topology that appears in
the larger screen to the left, framed by the zoom level of the
view. Click a location to move the larger view to center on it.
Use the slider at the bottom of this panel to change the
magnification of your view. The icons to the right of the slider
let you click them to fit visible icons vertically and both
vertically and horizontally. You can also click and drag the cursor
within this overview to change the magnification.
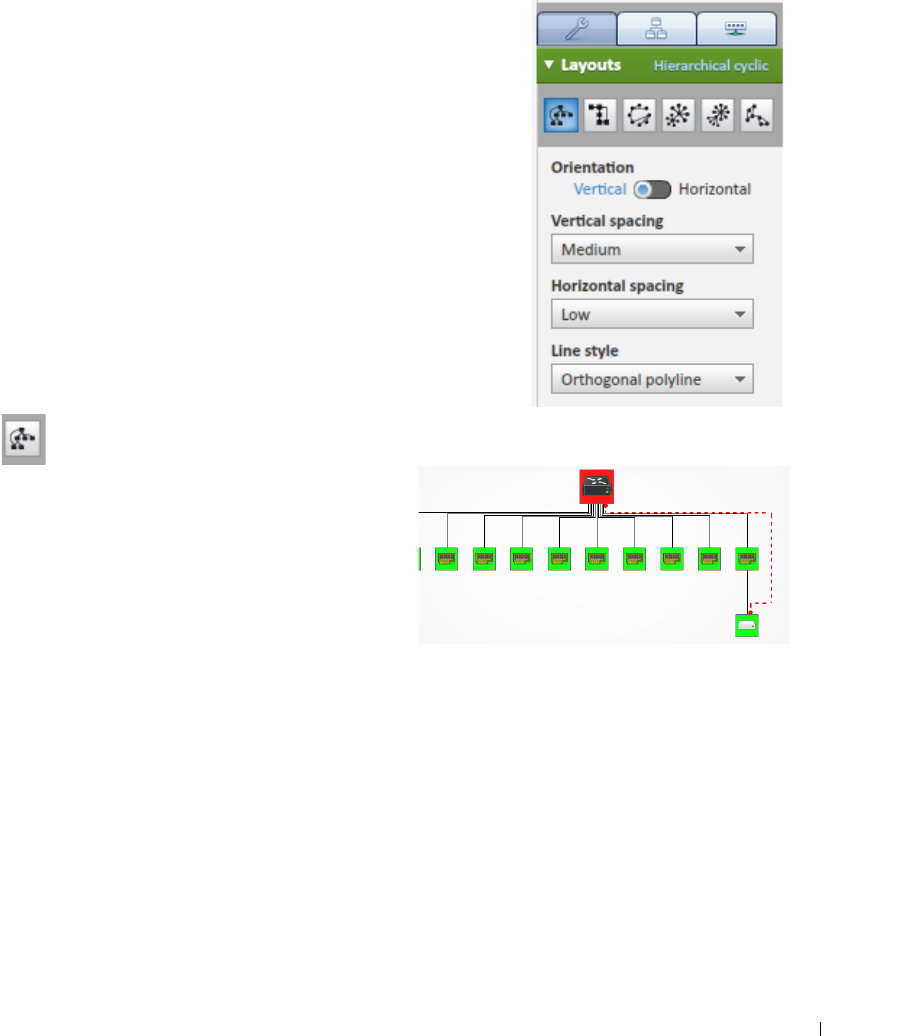
Visualize My Network | Display Strategies
263
Properties and Settings > Layouts Tab
The layout tab lets you select and configure the type of
automated node layout that appears in the topology display.
Use the icons below the Layouts label to select the type of
layout. The fields and selectors that appear below depend on
the selection. Here are the available layouts, and the fields that
go with them:
• Hierarchical-Cyclic
• Orthogonal
•Circular
•Radial
•Organic
Hierarchical-Cyclic
This arranges connections in a hierarchy.
Use the following settings to alter its appearance.
Orientation
– Select from
Vertical
or
Horizontal.
Vertical Spacing
– Select from
High, Medium
, or
Low
.
Horizontal Spacing
– Select from
High, Medium
,
or
Low
.
Line Style
–Select from
Orthogonal polyline, Straight, Straight polyline, Curved polyline,
or
Orthogonal curved
.
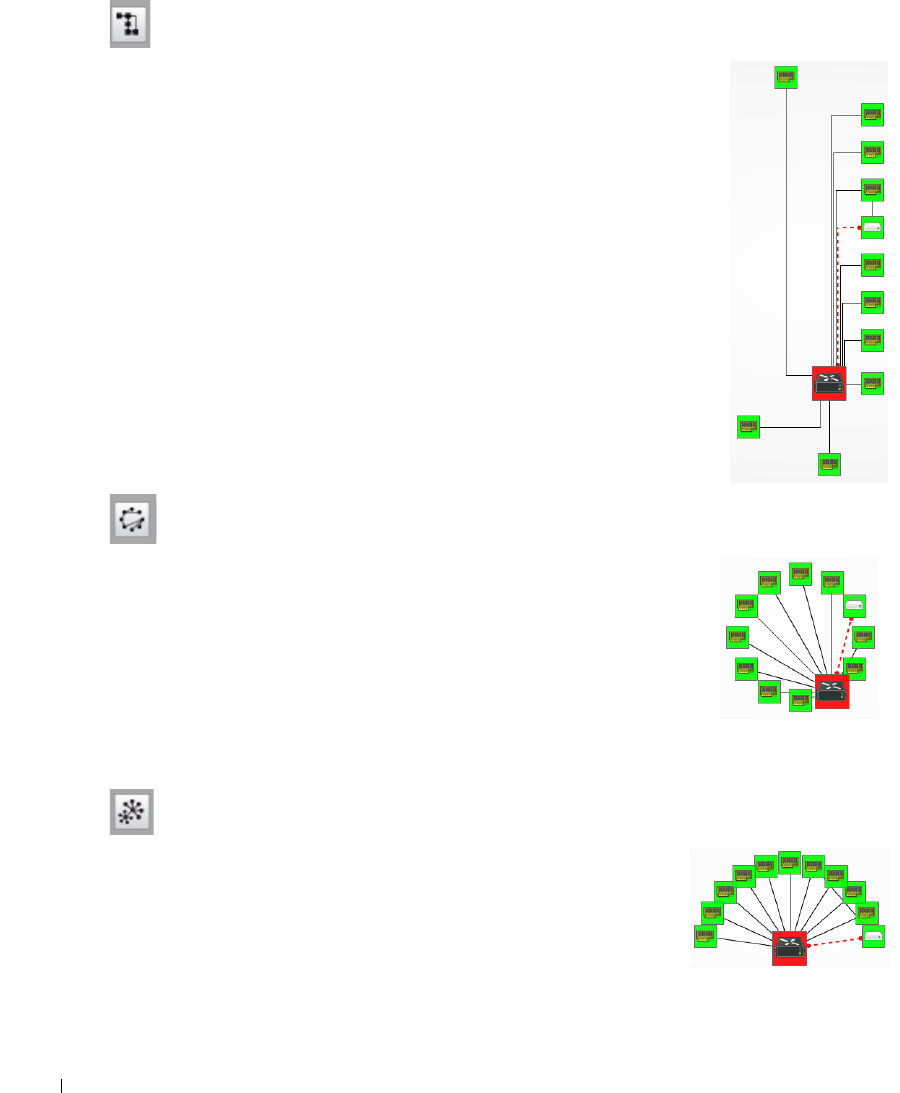
264
Visualize My Network | Display Strategies
Orthogonal
Orthogonal connections include right angles. You can specify the
following settings for such layouts
Grid Spacing
–Select from
High, Medium
, or
Low
.
Use Diagonal Edges
–Enable edges that have non-right angles
.
Circular
Circular layouts arrange all nodes in a circle.
Layout Angle
–Choose from
360
or
180
.
Nodes spacing
–Select from
High, Medium
, or
Low
.
Balloon
Balloon layouts display links between managed objects in a
balloon tree structure. The root is typically whatever device you have
expanded or drilled into.
You can specify the following in the settings for this layout:
Root / Child wedge angle sector
–Use the radio buttons determine
the angle (
360, 180
). The root sector determines how much of
an arc around that root the child nodes fill, and the child sector determines the orientation
around the child nodes.
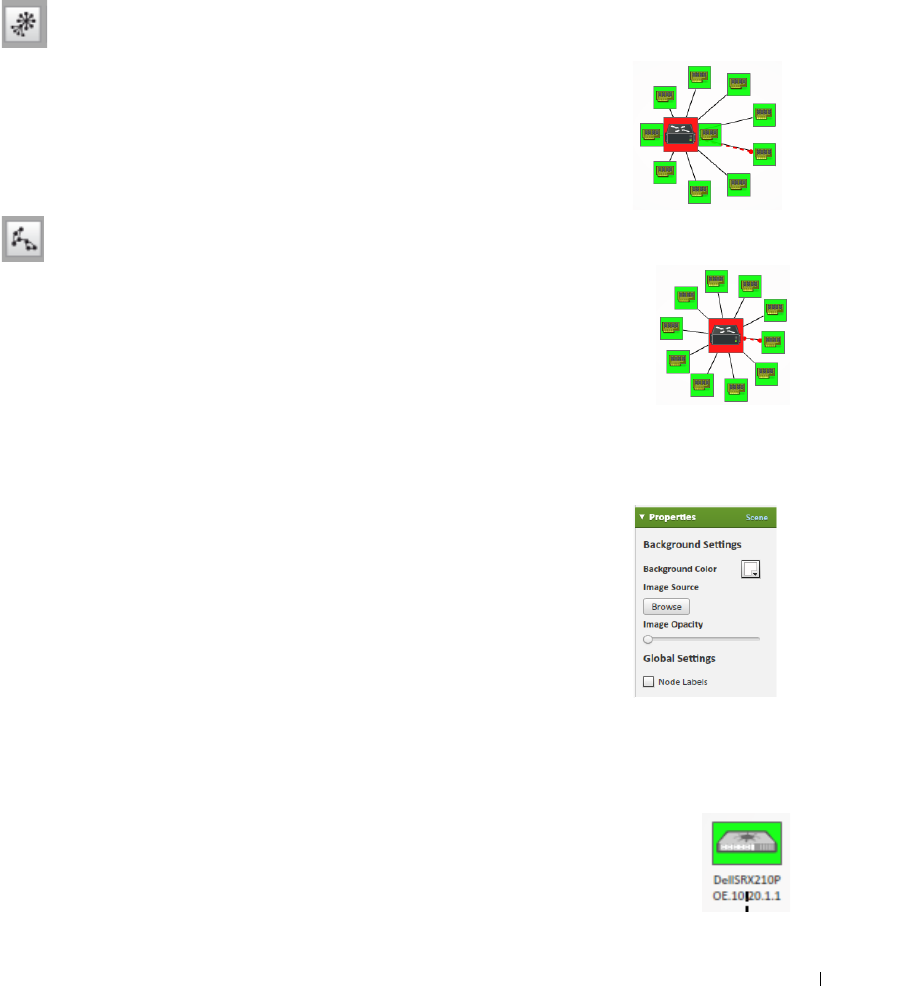
Visualize My Network | Display Strategies
265
Root selection policy—
Select the item you want at the center of this view (
Directed
[a pop-up
appears with the remaining selections],
Most closed / surrounded / weighted
).
Equal angle distribution—
Select whether to distribute nodes at equal angles.
Radial
Radial layouts arrange nodes in concentric rings.
Layout angle
–Use the radio buttons determine the angle (
360, 180
).
Root selection policy—
Select the item you want at the center of this view
(
Directed
[a pop-up appears with the remaining selections],
Most
closed / surrounded / weighted
).
Organic
This produces a static GEM layout, without any parameters to tune.
Properties and Settings > Properties
This panel configures the view properties in the Visualize My Network
panel. This panel has the following fields (you must click the
Design Mode
icon in the upper left corner to see all of them):
Background Settings
Background Color
—Click the icon to see a color selector where you can
select the background color for the Visualize My Network panel.
Image Source
—Click the
Browse
icon to select a graphic for the
background.
Image Opacity
—Use the slider to set the background opacity.
Global Settings
Node Labels
—Check to label nodes in the Visualize My Network panel.
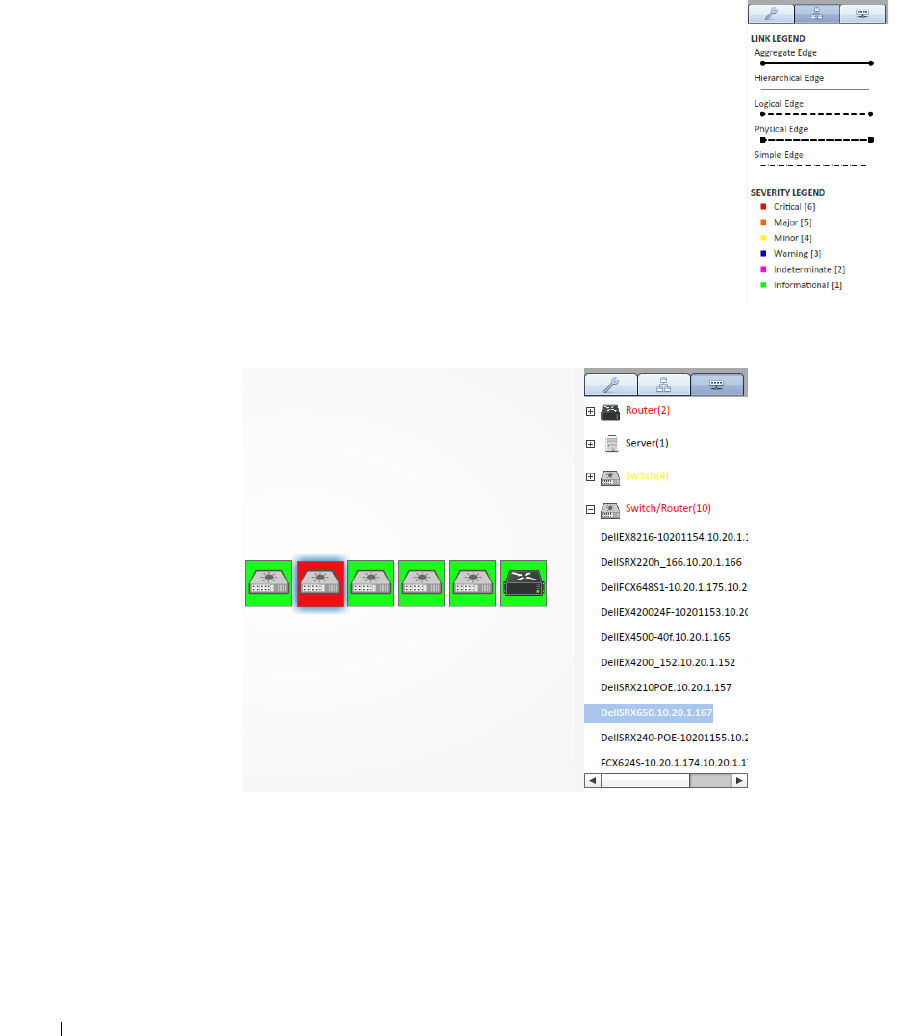
266
Visualize My Network | Display Strategies
Legend Tab
This displays the meaning of various link types and alarm severity colors in
Visualize My Network screens. It describes only the type of links that appear
onscreen in the Visualizer.
Top-Level Nodes Tab
This displays a legend of icon types followed by a count (in parentheses) of
how many of each appear in the topology. The switch at the bottom of this
panel centers the display around the selected icon.
Click the plus (+) to the left of the inventory category icons to display a list of devices in that
category in the topology. Click on a list item to highlight that device and its network connection in
the topology view. A colored glow highlights it and its network connection(s). The listed inventory
changes if you drill in.
The listed text appears in the alarm color of the device. See Alarms in Visualizations / Topologies
on page 267.
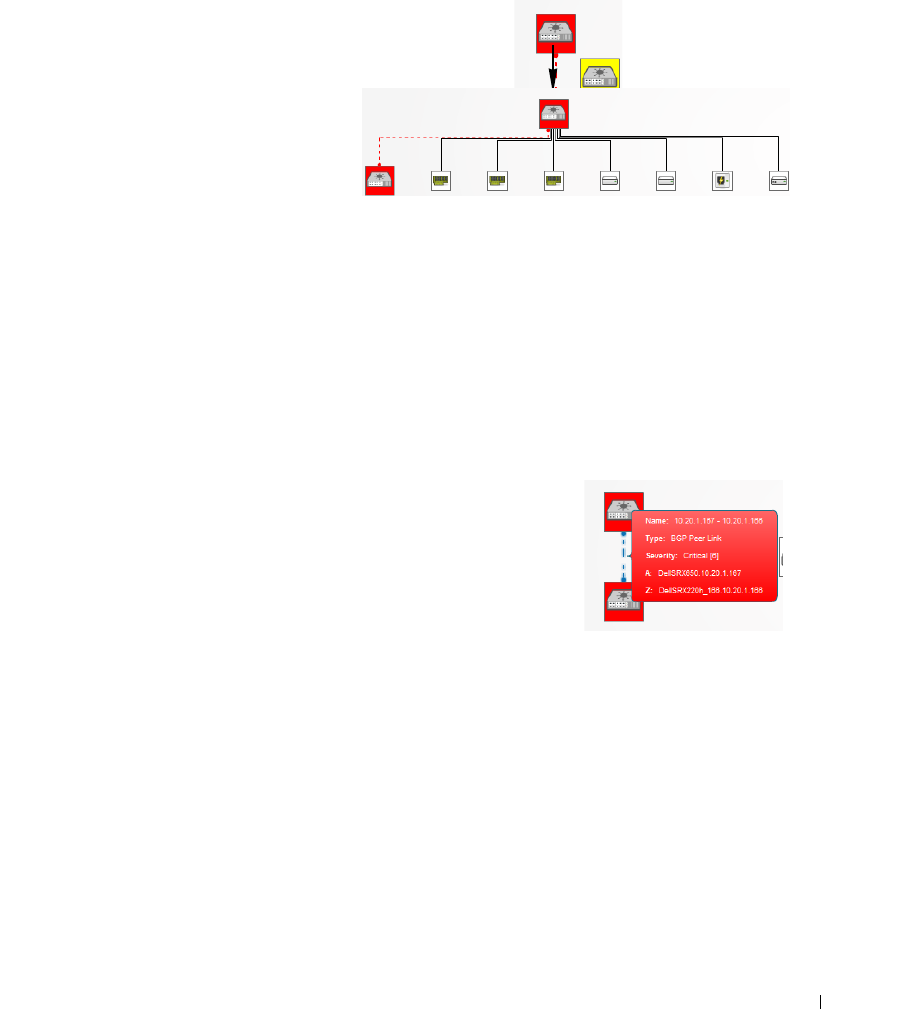
Alarms in Visualizations / Topologies | Display Strategies
267
Alarms in Visualizations / Topologies
Colored rectangles appear around
topology nodes to indicate the highest
alarm on them. Expand or drill in to see
alarms on the sub-components.
For information about the alarm, hover
your cursor over the device or
subcomponent, and a tooltip appears
describing the alarm’s severity appears.
The alarms indicated are like alarms
described in the portlet Alarms on page
123.
By default, un-alarmed nodes appear clear / white. You can alter this so they appear green instead.
To change this behavior, uncomment the
nodes.display.clear.severity.as.green=true
property in the
server-
overrides.properties.sample
file in
\oware\synergy\conf,
and save the file as
serveroverrides.properties
in that directory.
Links in Visualization
When you have discovered links between devices in your network (see
Link Discovery on page 208), they appear in the visualization.
Hover the cursor over a link, and a panel the color of the link’s alarm
severity, appears with the link information (
Name, Type
(for example:
Ethernet)
, Severity,
and
A / Z Name
s for the endpoints).
Dell OpenManage Network Manager currently does not support
displaying one-ended links.
Expanding to
see the
alarmed sub-
component.
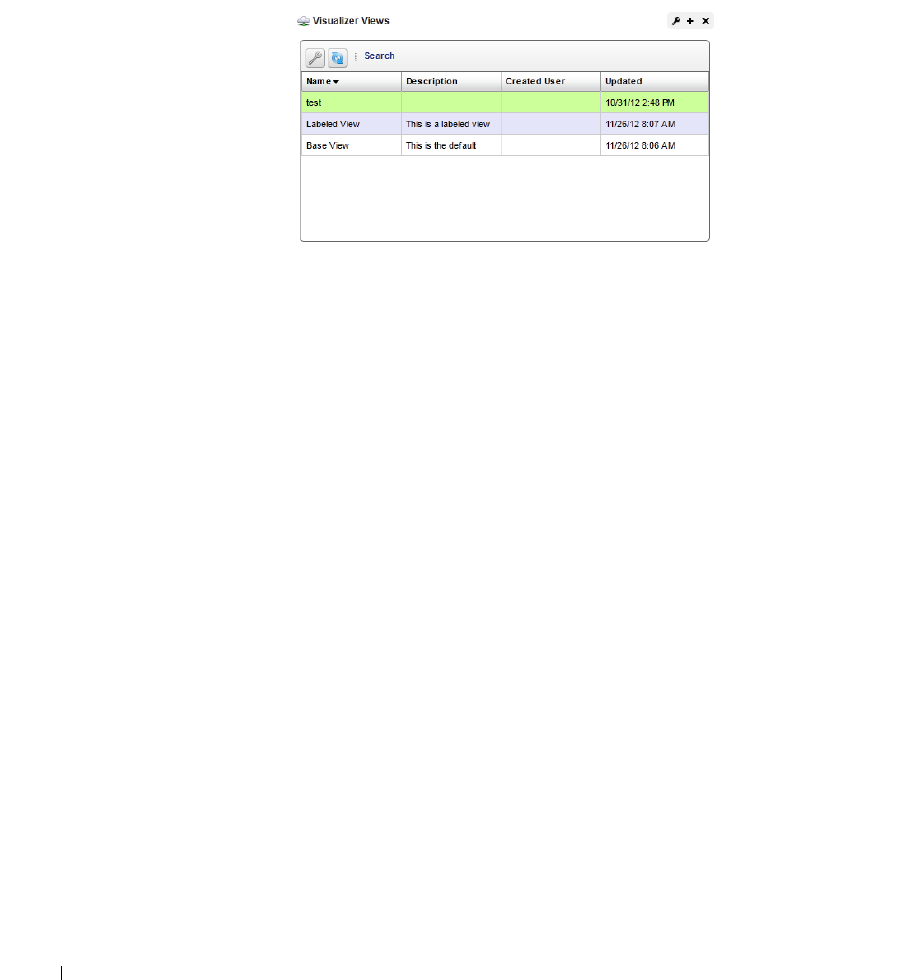
268
Visualizer Views | Display Strategies
Visualizer Views
This portlet displays saved views, and when it is on the same page as the Visualize My Network
portlet, filters that portlet so it displays the selected, saved visualization.
Right-clicking selected views, lets you
Edit
the title of the view, or its description, or
Delete
the
selected view.

| File Server / File Management
269
8
File Server / File Management
You must configure FTP and/or TFTP file
servers to push and pull configuration files
to and from devices, or to deploy firmware
updates. With this portlet you can enable
file servers you have configured.
Columns in this manager identify the
server, and describe whether it is enabled,
and has TFTP enabled. Right clicking a file
server, or the empty list space lets you do
the following:
New
—Displays the File Server Editor
screen.
Edit
—Displays the selected File Server in the File Server Editor screen.
Disable
—Disables the selected file server. When file servers are disabled, they are not used in a
Backup, Restore or Deploy operation. This too appears only for External File Servers.
Enable
—Activates the selected file server. Again, exposed for External file Servers only.
Test
—Tests the selected file server by sending and retrieving a file.
Delete
—Removes the selected file server from the list. This appears for External File Servers only.
Port conflicts prevent having an external file server and internal file server operate on the same
machine.
NOTE:
If you have installed a TFTP server on a Windows machine, you may see an error noting “FTP umask /
permissions of file on server are incorrect.” This is an artifact of Windows permission structure, and may
be safely ignored (it never hurts to test your TFTP server to be sure, though).
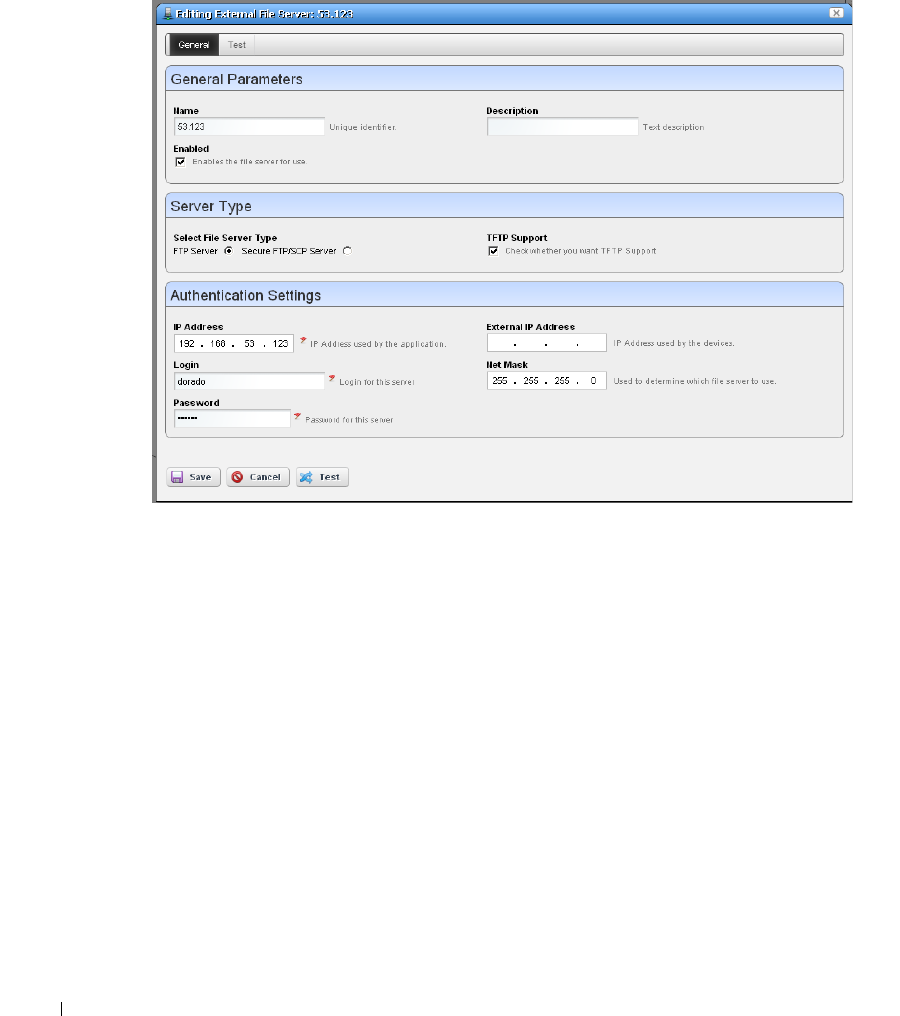
270
| File Server / File Management
File Server Editor
This editor lets you configure new and existing file servers.
This is where you specify the
Name,
whether the server is
Enabled,
whether the connection is
secure (
Secure FTP/SCP Server
), supports TFTP, internal and external (optional) IP addresses, and
Net Masks, and the login and password for the file server. Once you have configured a server, you
can test the file server credentials by clicking on the
Te s t
button at the bottom of the screen. Click
Save
to preserve your changes.
FTP servers typically must be on the same side of the firewall as the devices with which they
communicate. If you have several such servers, the specified
Net Mask
also determines which
server communicates with devices in which portion of the network.
The OpenManage Network Manager file server uses an internal, local LAN address
(192.168.100.100 example), however the routers with which it communicates often cannot
communicate to such internal addresses. This is why an external/reachable address is necessary.
Notice that you can now configure an IP address used by Dell OpenManage Network Manager, and
another
External IP Address
used by the devices. If you configure multiple file servers, Dell
OpenManage Network Manager selects the server with the
Net Mask
whose subnet is closest to the
device(s) with which it communicates.

File Management | File Server / File Management
271
Recommended Windows File Servers
You can install the Open Source Filezilla FTP and FTPS server as a service on Windows machines.
Any login / password access to these goes in the File Server Editor login/ password fields.To support
TFTP, install the Open Source Tftpd32 or Tftpd64 (for 32-bit or 64-bit machines).
These servers must read / write from/to the same directory. Also, make sure the directory offers open
read/write permissions so you can retrieve files put there temporarily.
File Management
In addition to letting you back up and restore configuration files, and deploy firmware updates to
devices, this menu manages viewing and comparing configuration files backed up from the selected
devices. Details about these capabilities appear below.
Compare
and
View
options have the following limitations:
• If you select a config file that is a single file, without any historical precedent, no comparison
option appears on the menu since the selected version does not have a prior version.
• If you select a single config file of version two or higher, comparison is an option. When
selected, OpenManage Network Manager automatically compares against the prior version for
that device and file name.
• If you select two config files of any version, compares is between those two versions.
• If you select three or more config files, no comparison option appears.
•The
View
option appears for a single selection only, and only lets you view files that are not
binary.
The icon to the left of the
File Name
listed in the portlet lets you know whether a configuration file
is binary ( ), and not viewable, or text ( ), and viewable.
The file management menu contains the following:
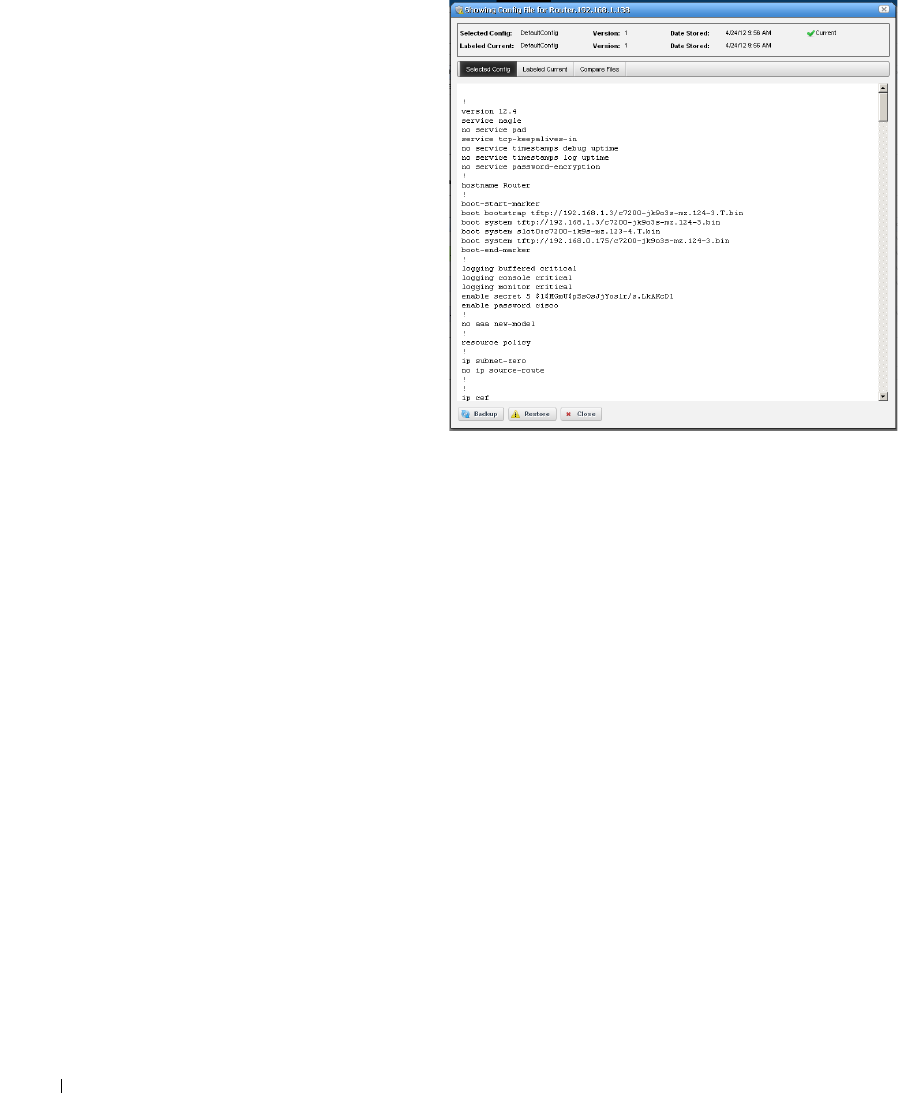
272
File Management | File Server / File Management
View / Edit
— This opens a panel
displaying the configuration file’s
contents. Use the browser’s
Find
function (as demonstrated on the right)
to locate specific text within the Config
File. You can also select and copy text
within this screen.
Notice that
Selected Config
and
Live
Config
(current) version and storage
dates appear at the top of this screen.
When you perform a backup that differs
from the config that is
Labeled Current
,
that label changes to
Live Config
if
changes are detected.
Selected Config
appears when you open
this screen from the Configuration Files
Portlet, but
Live Config / Current
Config
appear side-by-side when you
open this screen from the Managed
Resources portlet.
You can also compare two different configurations (
Selected Config
and
Labeled Current / Live
Config
) in the tabs that appear on this screen. with the
Compare Files
tab at the top.
Close
the screen with the buttons at its bottom. Notice you can also
Backup
or
Restore
what you
are viewing with buttons at the bottom of the screen.
Assign Labels
—Use this option to select an existing label or create a new one. You cannot assign
System labels (
Current, Compliant
, and so on).
Compare Current v. Previous / to Label
/
Selected
—You can compare configurations by right-
clicking a device, or two devices then selecting
Compare
. If you right click a single device with
a previous backup, then the comparison is between the latest and next-to-latest backup. If it
does not have a previous backup, then the menu offers to compare to a designated label. You
can compare two different
Selected
devices too. Ctrl+click to select two different devices
before you
Compare
.
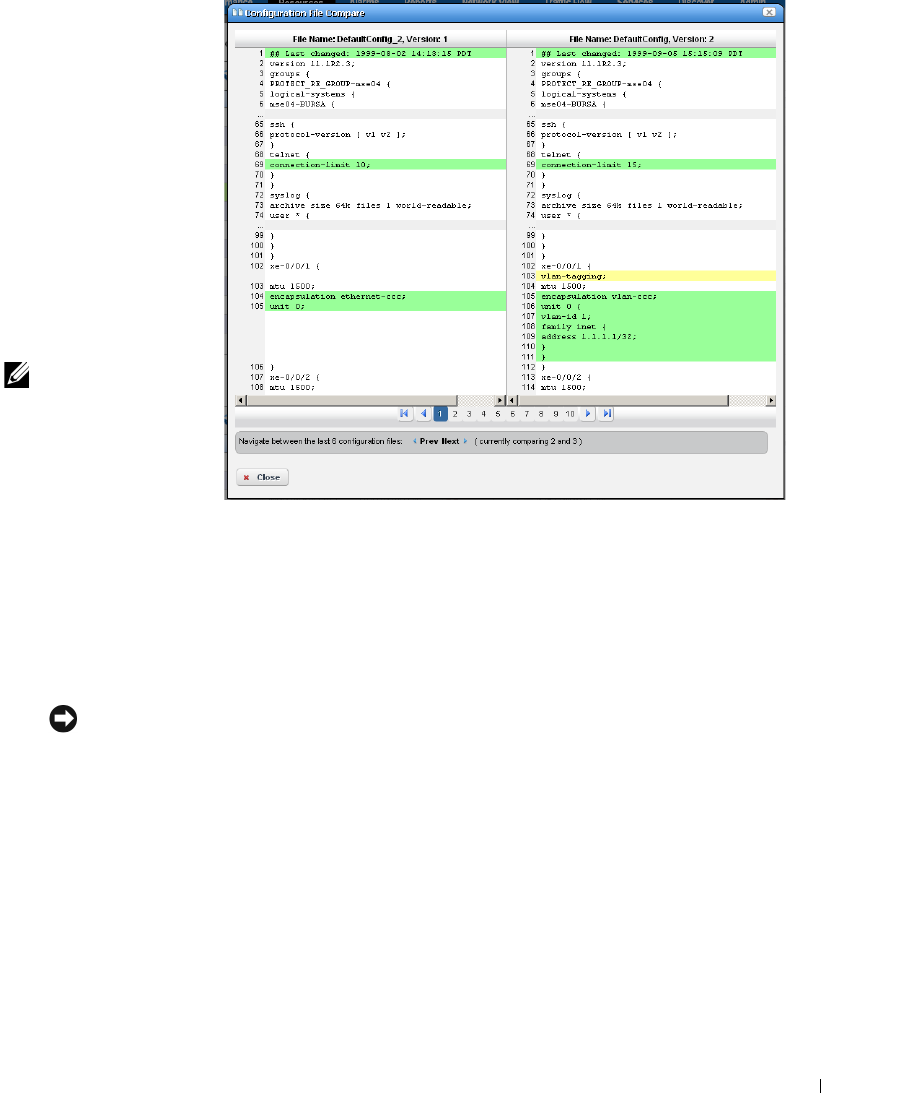
File Management | File Server / File Management
273
Notice that the
Prev / Next
buttons
at the bottom of
this screen cycle
through as many as
five previous
configuration files.
The comparison
screen appears with
the configurations
side-by-side (note
the file names in
the title bar of this
screen).
NOTE:
Colors: Lines that
differ between the
two configurations
appear highlighted
green. Lines missing
in one, but that
appear in another appear highlighted red. Added lines are yellow.
Use the right/left arrows to page through the side-by-side comparison. The page numbers and
beginning / forward / back / end arrows help you navigate between pages of pairs of files.
Notice also that if you have more than two such files, a panel appears at the bottom that lets
you navigate between adjacent pairs of such files (1 and 2, 2 and 3, 3 and 4, and so on). Click
the Prev / Next links to move between pairs of files.
Tip
Use the browser’s “Find” function (typically initiated by Ctrl+F) to locate text within these views.
Backup / Restore
—Select these to backup or restore a configuration file. See How to: Backup
Configurations on page 274 or Restore Configurations on page 276 for step-by-step
instructions.
Deploy
—Select this option to deploy an OS Image (firmware). See Deploy Firmware on page 287
for more.
Some devices, including the Dell Force10 C-Series and E-Series, first permit then drop telnet
connections during deployment or file restoration when you select restart as part of the
process. This can take from six to eight minutes, though it can take as long as fifteen minutes
for a fully populated chassis. During that time, ping detects the device; however, Dell
OpenManage Network Manager cannot log in to the device until the reboot is complete.

274
File Management | File Server / File Management
Restoring configurations to Dell Force 10 devices may produce errors when individual
commands already exist in the running config and cannot be overwritten. Dell OpenManage
Network Manager ignores such errors and reports success by default since the errors indicate a
command was not applied, not that restoration was unsuccessful. Best practice is to restore to
startup config to avoid these errors, especially when scheduling backup or backing up a group
on such devices.
Export / Import
—Export lets you save a local copy of the selected config file. Import opens a
screen that lets you select a locally-accessible file to store, view, compare and deploy.
View configuration files in the
History > Latest Configurations
portion of the Equipment Details
screen for a device or in the Configuration Files or Top Configuration Backups portlets.
How To:
Backup Configurations
Dell OpenManage Network Manager simplifies backing up devices so you always have their
configuration files, even if the one on the device becomes corrupted or out-of-date.
You can back up several devices at once for what amounts to a “group operation.” Select more than
one device by Ctrl+clicking in the expanded portlet, then right-click as outlined below. You must
expand portlets to multi-select.
Here are the steps to back up a device:
1
Make sure you have configured an FTP or TFTP server to handle the backup. See Netrestore
File Servers on page 90.
2
Right-click a device in the
Managed Resources
portlet.
3
Select
File Management > Backup.
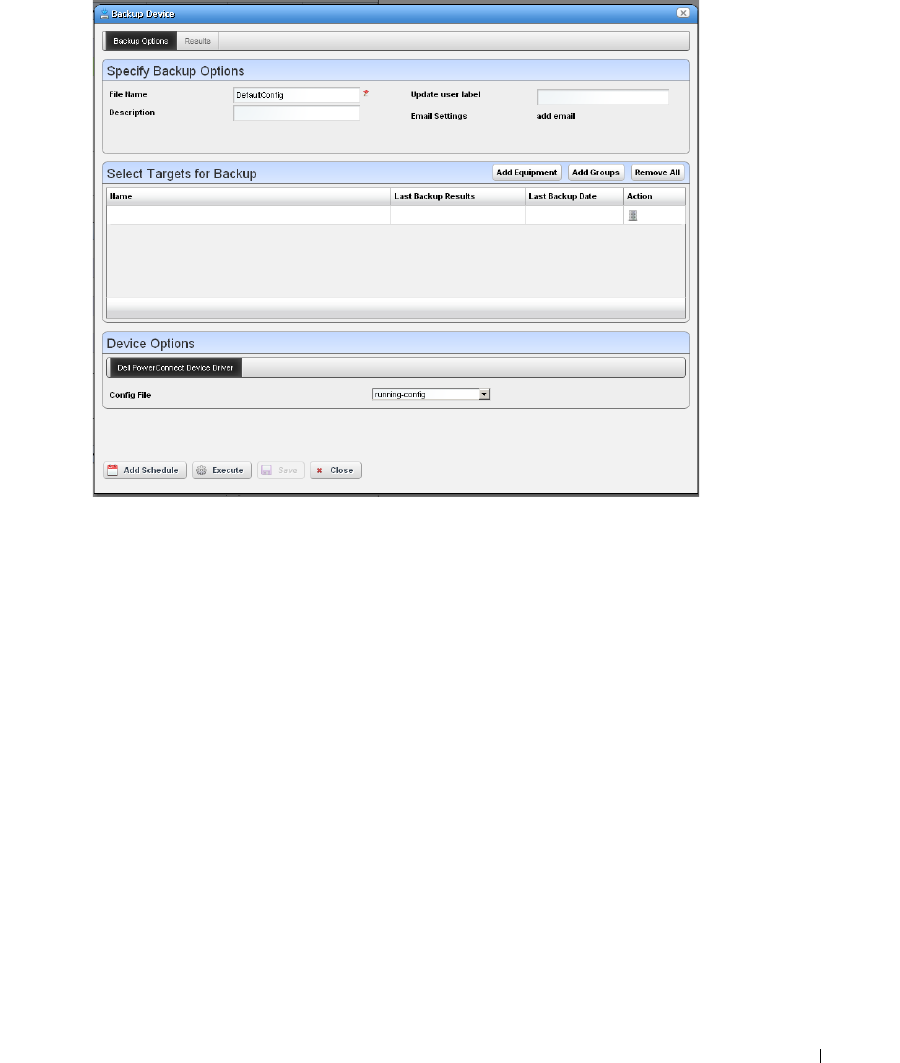
File Management | File Server / File Management
275
4
Configure the subsequent
Backup Device
screen.
This screen lets you configure the following:
File Name —A text identifier for the file
Description—A text identifier for the file
Update User Label—A text identifier for the file. Entering such a label creates it, and
makes it available for later restoration, comparison, and so on.
Email Settings—Click add email to configure an email notification about this backup.
Select Targets for Backup—This screen defaults to the device you selected in Managed
Resources
.
You can also click the Add Equipment to add individual devices, or Add
Groups to add groups, or Remove All to manage devices that appear in this list of tar-
gets.
Device Options—This portion of the Backup Options
screen displays detailed configura-
tion options available for the selected target. For example, you could select between
backing up the running-config and the startup-config.
5
Click one of the buttons at the bottom of the screen to initiate the next backup action.
Add Schedule
opens the scheduling screen to let you automate the backup you have
configured on a specified date, time, or repetition.
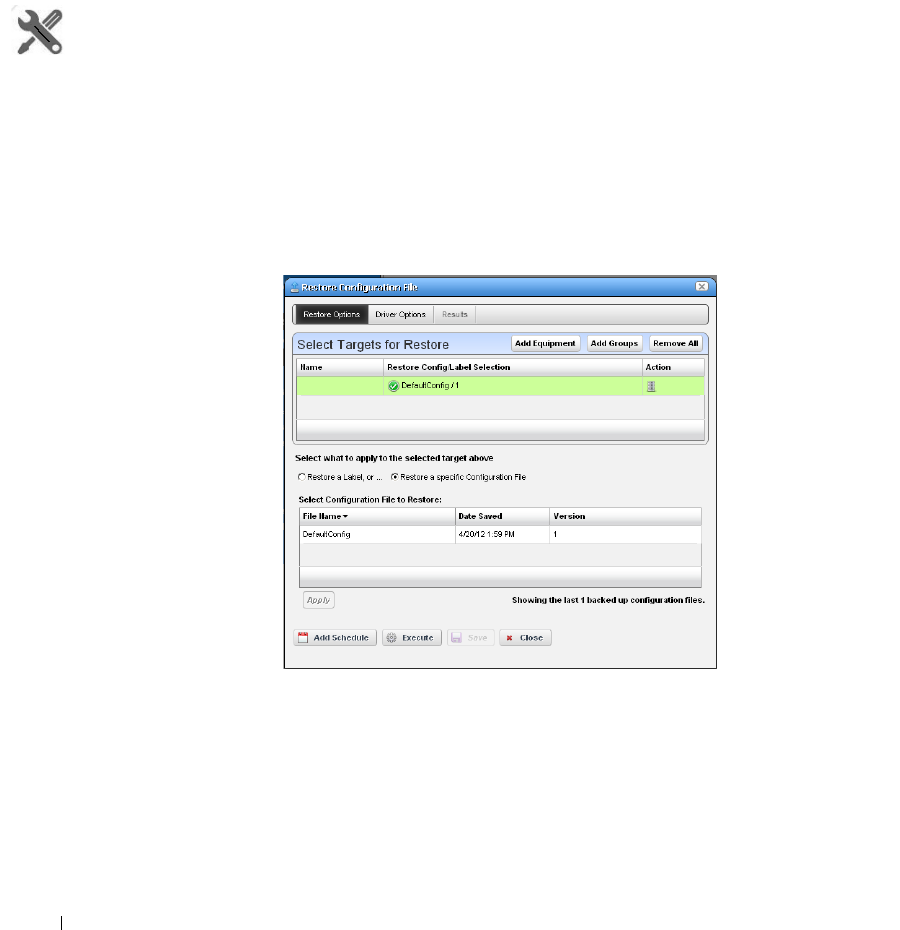
276
File Management | File Server / File Management
Execute
performs the backup immediately. The
Results
tab in this screen opens, displaying
the message traffic between Dell OpenManage Network Manager and the device(s). See
Audit Trail Portlet on page 116.
Save
preserves this configuration without scheduling or executing it.
Close
closes this screen without saving the configured restoration.
How To:
Restore Configurations
The following are the steps to restore a config file to a device:
1
Make sure you have configured an FTP or TFTP server to handle the backup. See Netrestore
File Servers on page 90.
2
Right-click a device in the
Managed Resources
portlet.
3
Select
File Management > Restore.
4
Configure the subsequent
Restore Device
screen.
This screen’s tabs lets you configure the following:
Select Targets for Restore—This portion of the screen lets you Add Equipment, Add
Groups, or Remove All target devices. Listed targets and their Restore Config / Label
Selection. Click the icon in the Action column to remove the listed target.
Select what to apply to the selected targets above —This panel lets you select either a label
(like Current, Compliant and so on—a selector listing available labels appears onscreen
once you click this option), or Restore a specific Configuration File. The latter lists avail-

File Management | File Server / File Management
277
able files and lets you click to select. Click Apply to configure the selected target, or
Apply to All to configure all targets.
Select Device Options based on selected targets—The Driver Options tab lets you select
device-specific restoration options.
5
Click one of the buttons at the bottom of the screen to initiate the next backup action.
Add Schedule
opens the scheduling screen to let you automate the restoration you have
configured on a specified date, time, or repetition.
Execute
performs the restoration immediately. The
Results
tab in this screen opens,
displaying the message traffic between Dell OpenManage Network Manager and the
device(s). See Audit Trail Portlet on page 116.
Save
preserves this configuration without scheduling or executing it.
Close
closes this screen without saving the configured restoration.
How To:
Troubleshoot File Backup, Restore or Deployment
Here are some steps to troubleshoot issues you may encounter with these capabilities. The
following example describes troubleshooting backup, but the steps apply in all three cases:
1
Make sure the FTP / TFTP server you are using is correctly set up, and still active. Use the
Te s t
button on the File Server Editor to confirm the server(s) work.
2
If, for example, backup fails, look in the Audit Trail for the failed job, and copy the contents of
the informational message
Executing read commands against the device
.
Example:
copy running-config tftp://192.168.0.138/
010128030139_DefaultConfig
3
Use Direct Access to get to a Telnet / SSH command line on the device having backup issues.
If you cannot get to a command line, then see Incomplete Discovery on page 86 for the way to
remedy that.
4
Paste the command you have copied in step 2 after the prompt.
5
Press [Enter], and observe whether the device executes this command.
6
If the device does not successfully execute the command, then either the authentication you
have used does not have permission to do such commands, or the device is configured to
prohibit their execution.
Consult with your network administrator to get the correct authentication, and either revise
the Discovery Profile that discovered this device, delete the device from OpenManage
Network Manager and re-discover it, or right-click to Edit the device, and enter the revised
authentication / management interface combination.
278
File Management | File Server / File Management
If the device is configured to prohibit this command’s execution, then consult the device’s
documentation and revise that.
Configuration Files
One place backed up configuration files can
appear is in this portlet. Right-clicking
offers you the following options (all options
listed may not be available):
View / Edit
—See or edit the backed up
configuration file, if it is not a binary
file. See File Management on page 271
and Configuration File Editor on page
280 for a description of these
capabilities.
Compare to Label / Compare Selected
—
Compare labeled configuration files to the current selection. See File Management on page
271 for a description of this capability. You can create labels when you back up a config file, or
you can compare to the default labels
(Change Determination, Current, Compliant)
. If you
select two configuration files in t he expanded portlet, you can also
Compare Selected
.
Promote —
Makes the selected config file available for mass deployment. This is a useful way to
make a “pattern” configuration file to deploy to several devices. See the description of the
screen for Configuration on page 285 for additional information about how to do this.
Backup / Restore
—Back up the device (again) related to the selected file, or restore the selected
file.
NOTE:
Dell OpenManage Network Manager automatically assigns the most recently restored file the Current
label.
Archive
—Save the selected file to disk, and optionally delete it from this list.
Import / Export
—Export the selected config file to disk, or import it from disk.
Delete
—Removes the file from the Dell OpenManage Network Manager database without
exporting it.
Aging Policy
—Opens the Aging Policy selector. See Redcell > Database Aging Policies (DAP) on
page 58 for more about these
.
You can also import and export a selected config file.
Tip
You cannot select multiple lines with Ctrl+click in most summary portlets. Configuration Files is an
exception.
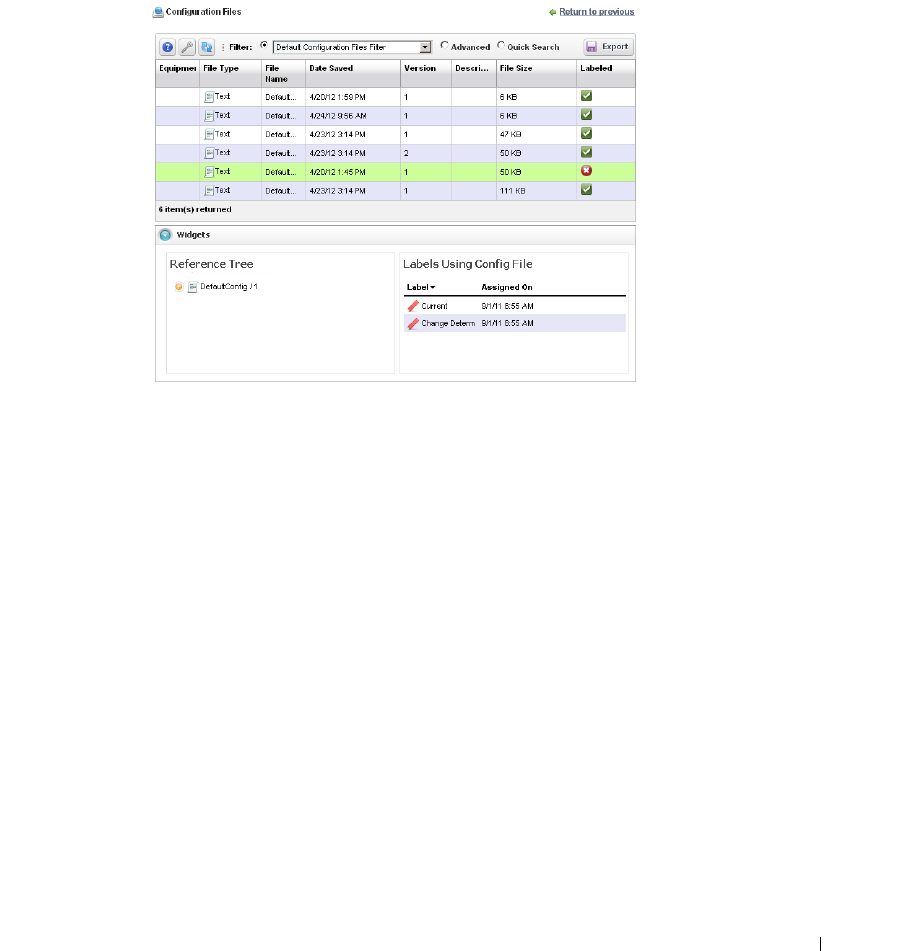
File Management | File Server / File Management
279
Configuration Files Expanded
The Expanded portlet lets you filter the list of displayed configuration files, and displays the
File
Type, Description, File Size
and whether the configuration file is
Labeled
in columns.
The Labeled column appears with green or red icons depending on whether the config file has a
label. When a label applies to a configuration, you cannot
Delete
or
Archive
it.
The
Labels Using Config File
snap-in displays all labels connected to the selected configuration
file, and the date on which that connection was made. The
Reference Tree
displays the
configuration file name, and lets you right-click it to access the available operations it supports.
To see the most recent configuration files, see Top Configuration Backups on page 331.
For advanced search in the expanded Configuration File portlet, enter the file size in bytes to
search using File size function. We suggest searching in range (between) to work around any
rounding error in the KB/MB conversion.
Dell OpenManage Network Manager converts from bytes to KB/MB and presents the file size in
terms of KB/MB after some rounding. For instance, 1484 bytes / 1024 = 1.44921875 KB; Dell
OpenManage Network Manager rounds it to 1.45 KB.
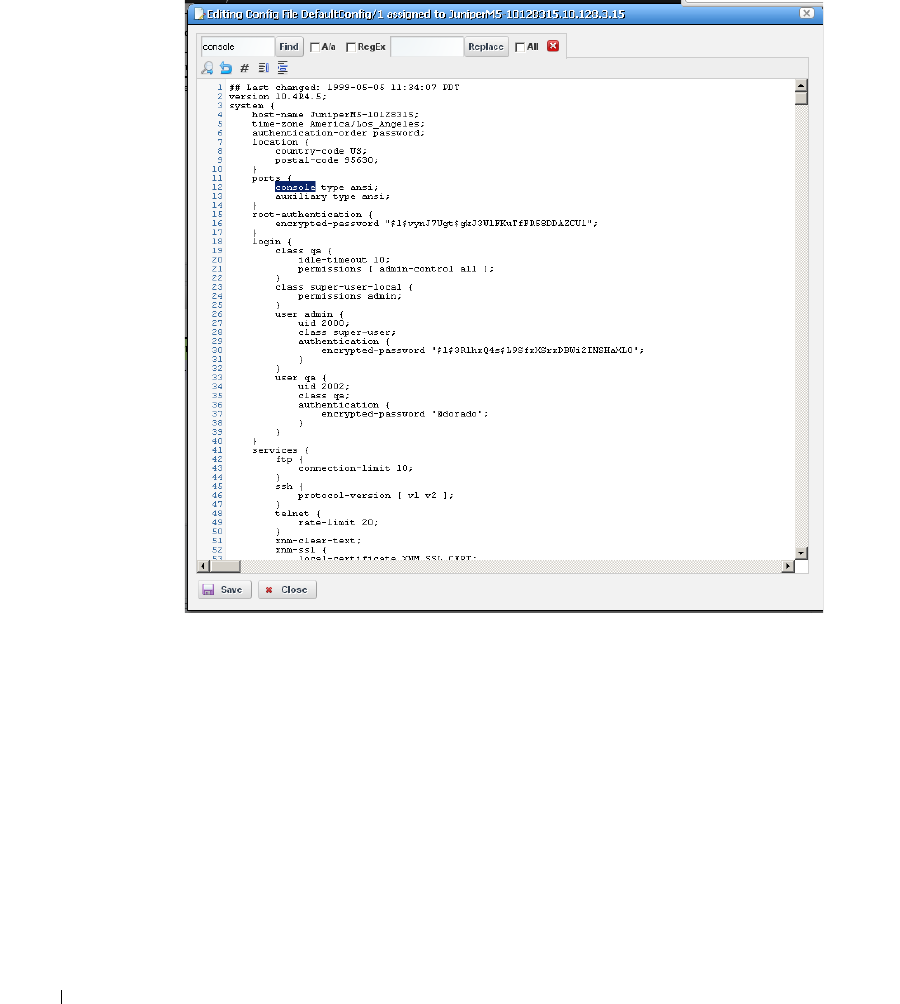
280
File Management | File Server / File Management
Configuration File Editor
This editor lets you manually edit configuration files, and save them to the Dell OpenManage
Network Manager database.
When you select a file in the Configuration Files portlet, and right-click to select
Edit
, this screen
appears with the following features.
Find / Replace
—Click the magnifying glass icon to open a text search feature. Notice that you can
check
A/a
to make your search case-sensitive, or
RegEx
to use regular expressions to search.
Click the
Find
button to locate text in the config file. Click
Replace
to replace found text,
once it is located. Check the
All
checkbox and click
Replace
to bulk replace all instances of
the
Find
text.
Click
Save
to preserve your edits, or
Close
to abandon them. Notice that the edited configuration
appears listed with the other Configuration Files in the portlet as a different version than the
original (the version increments by one every time you edit and save a configuration).
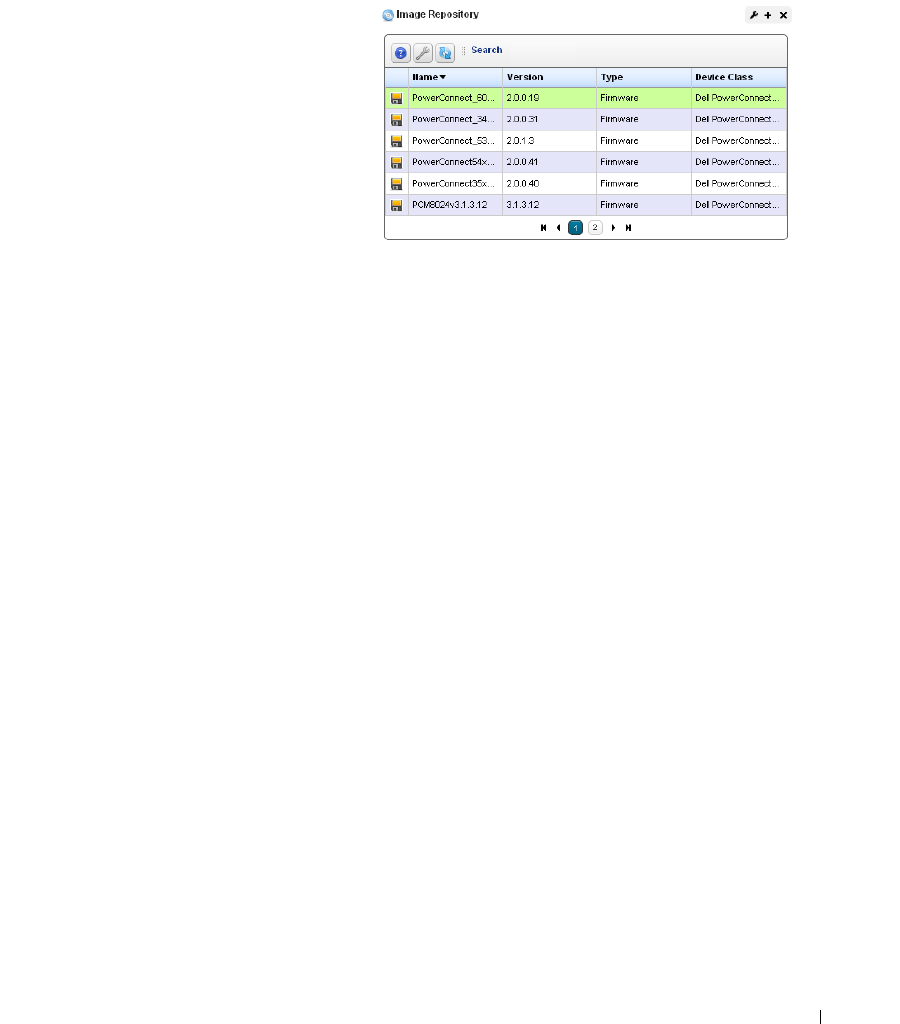
Image Repository |
281
Image Repository
The Image repository manages firmware
updates to deploy to devices in your
network, or configurations you want to
deploy to several devices.
You must add such files to your Dell
OpenManage Network Manager system
before you can deploy them. The summary
screen listing these images displays their
Name, Description, File Name, Image Type
and
Installed Date
. Right-clicking this
screen displays the following menu items:
New
—Select either
Firmware Image,
or
Configuration Image.
Firmware Image displays the Firmware Image Editor screen.
Configuration Images originate from Configuration Files that are promoted to mass restore.
See the Configuration Image Editor on page 284 for its functionality.
Edit
—Displays the selected Firmware image in the Firmware Image Editor screen, or the
Configuration Image Editor if the selected line is a configuration image.
Deploy
—Deploys the selected file to devices, and with the options you select in a subsequent
selection screen. For this to function, you must have enabled a server, as described in File
Management on page 271.
Download Firmware For
—Some devices (typically Dell) support downloading firmware from the
internet. These devices appear listed in a sub-menu. Select the type for which you want to
download OS images, and Dell OpenManage Network Manager automatically downloads
them.
Delete
—Removes the selected OS image / configuration from the list.
282
Image Repository |
Expanded Image Repository portlet.
When you click the plus, this portlet expands to display the OS images list, a snap panel Reference
tree of the connections to devices, and another panel listing the files within the selected image.
Image Repository |
283
Firmware Image Editor
When you open or create an OS image, its configuration appears in this editor. The
General
Paramete rs
tab contains its
OS Image Name, Description, Version,
and the
Device Class
and
Device Family
. The
Image Files
tab displays a selector that lets you create new OS Images,
retrieving files from the local file system (
Import from Disk
) or a URL (
Import from URL
). Because
such images can consist of multiple files, you can import multiple files here. Finally, you can also
import a
Readme File
to accompany this image, and view it in that tab.
Click
Save
to preserve the OS Image you have configured, or
Cancel
to exit these screens without
saving.
284
Image Repository |
Configuration Image Editor
This editor appears for new configuration images, or for configurations you
Promote
in the
Configuration Files portlet for mass restoration. This screen has the following tabs:
• General Parameters
• Configuration
General Parameters
In this screen you can name and describe the configuration file, and configure a filter to screen
restoration targets.
The
Version
field automatically tracks changes to the original.
The
Targe t Filte r
panel lets you configure how this configuration decides which devices to target.
When targets fail, restoration skips them.
Image Repository |
285
Configuration
This panel lets you configure what is restored, and what is variable in mass deployments.
This screen appears without contents when you create a new Configuration Image, but appears
with data from any
Promoted
configuration file, if it originated as a promoted config file.
Target Param
The panel of parameters that appears to the right of this screen lets you insert a value retrieved
from Dell OpenManage Network Manager’s database into the restored configuration file.
For example, if a Contact appears in the file, delete the specifics retrieved from a particular device’s
config and double-click the
Targe t Pa ram
“Contact.” Dell OpenManage Network Manager inserts
$_EquipmentManager_RedCell_Config_EquipmentManager_Contact
(a unique
identifier for the database’s Contact field) wherever you put the cursor.

286
Image Repository |
Now, when you deploy this config file to the devices that pass the filter in the General Parameters
editor screen, Dell OpenManage Network Manager first updates this parameter with discovered
data retrieved from the device before restoring the configuration. This facilitates deploying the
same config to many devices while retaining individual Target Params like contacts, DNS
Hostname, and so on.
NOTE:
Target Params include all available discover-able parameters. Some may not apply to the specific device
or configuration file.
CAUTION:
Firefox requires you click in the editor after double-clicking a variable to include it in a promoted
configuration. Otherwise, the inserted variable does not persist.
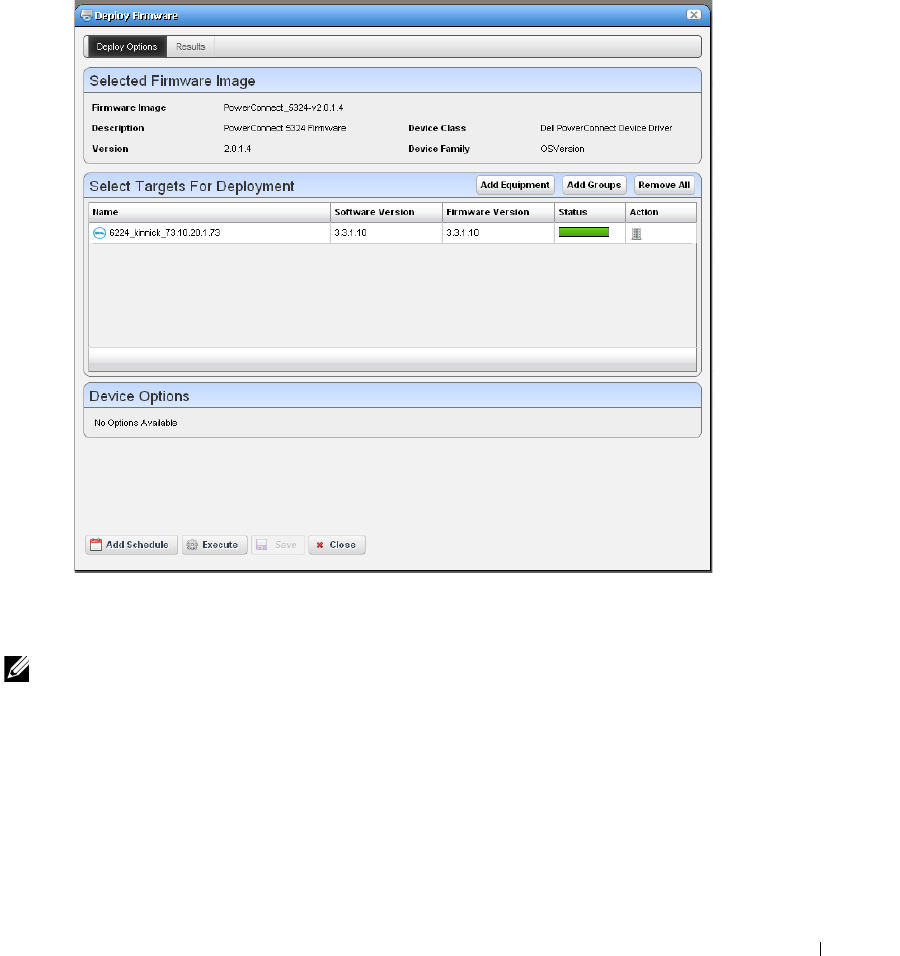
Deploy Firmware |
287
Deploy Firmware
This screen lets you configure a deployment, whether triggered from resource groups, individual
resources, or the Image Repository screen. Deployment validates the selected image is appropriate
for the selected devices, or appropriate devices within a group.
Notice you can
Add Schedule
to schedule this deployment rather than
Execute
it immediately.
Click
Save
if you schedule this deployment, or
Close
to abandon your edits.
NOTE:
When you add firmware to the Image Repository for 35xx and 55xx devices, you must add both the boot
image and firmware image together to deploy to these devices.
You may see multiple options for selecting the configuration file to backup for PowerConnect (not
Force10) devices. Layer 2 Powerconnect switches have just running and startup options while the Layer
3 router has running, startup and backup options, so different options appear for the two sets of
switches. When you do file backup for a group of devices, all those options are combined. Select only the
top entry selection for execution.

288
Deploy Firmware |
How To:
Deploy Firmware
To deploy firmware, follow these steps:
1
Make sure you have an FTP / TFTP server correctly configured. See File Management on page
271.
2
Right click a device in
Managed Resources
or the groups or Image Repository pages and select
File Management > Deploy.
3
The
Deploy Firmware
screen appears.
You can Select OS Image in the top panel, and configure deployment with the following
fields:
OS Image—Select an image. It must already have been uploaded in the Image Repository.
Description—A text description of the image.
Version —The image version.
Device Driver—The device driver associated with this image.
Image Type—A read-only reminder of the type of image.
Select Targets for Deployment—Select targets for deploying the image. This defaults to
the device right-clicked in Managed Resources to initiate this action, or devices that
match the selected file you want to deploy. You can then click the Add Equipment but-
ton (again, restricted to devices that match the deploy file’s type). You can also remove
devices from the target list with the Remove All button. Notice the Status column in
the table of targets shows whether the OS deployment is supported or not.
NOTE:
You can also select devices, then change the OS selection so a potential mismatch will occur. This will
likely trigger rejection of the deployment by the device, but is not a recommended experiment.
Device Options—The appearance of the Device Options panel, at the bottom of this
screen, depends on the device selected in the Target s panel. These vendor-specific fields
let you fine-tune the deployment.
4
Click one of the buttons at the bottom of the screen to initiate the next backup action.
Add Schedule
opens the scheduling screen to let you automate the backup you have
configured on a specified date, time, or repetition. See How to: Schedule Actions on page 118.
Execute
performs the backup immediately. The
Results
tab in this screen opens, displaying
the message traffic between Dell OpenManage Network Manager and the device(s). See
Audit Trail Portlet on page 116.
Save
preserves this configuration without scheduling or executing it.
Close
closes this screen without saving the configured backup.
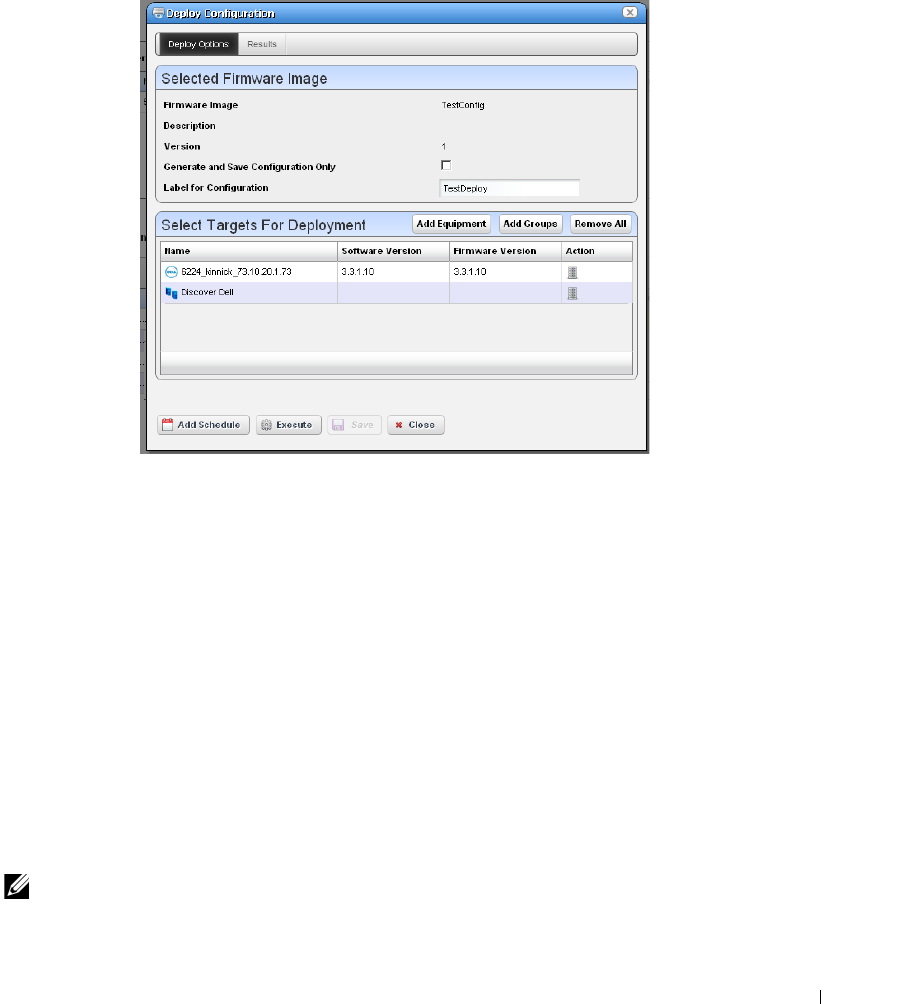
Deploy Configuration |
289
Deploy Configuration
When you deploy a configuration, a screen appears to configure how that occurs.
It has the following fields:
Select Firmware Image
Firmware Image
—The identifier for the image
Description
—The description for the image
Version
—The version for the image
Generate and Save Configuration Only
—Check this if you simply want to configure for later
restoration.
Label for Configuration
—Enter a label name, if applicable.
Select Targets for Deployment
Use the
Add Equipment
or
Add Groups
buttons to select individual devices or groups of devices
(both are possible together). Use
Remove All
to delete all targets, or use the delete icon in the
Action
column to delete individual equipment or groups.
NOTE:
The listed targets must still pass the filter set in the editor’s General Parameters.

290
Deploy Configuration |
How To:
Restore a single configuration to many target devices
The following steps describe restoring a single configuration to many discovered devices without
overwriting those devices’ essential information.
1
Back up a single device’s configuration that is nearest to the kind you would like to see
generally.
2
Right-click this backed up file in the File Management portlet, and
Promote
it so it appears in
the Image Repository portlet.
3
Right-click > Edit the promoted configuration in the Image Repository.
4
Name the file, and, if necessary, configure a filter In the General Parameters
tab of the editor.
5
In the Configuration tab, locate the parameters you want to preserve in discovered devices
when you restore this file. This can include items like the device’s DNS Hostname, IP
Address, and so on. Delete the file’s specifics and double-click to insert the
Ta rg e t Para m s
in
place of these variables.
6
Save the configuration.
7
Right-click to deploy this configuration.
8
You can check
Generate and save for configuration only
if you simply want to configure
deployment for later, and save for now. You can also optionally name a label for the deployed
files.
9
Select the devices, or groups of devices to which you want to deploy.
10
Click
Save, Execute
or
Add Schedule
depending on your desired outcome.
11
If you click
Execute
, you will have to confirm this action.
When Dell OpenManage Network Manager performs the restoration (deploy), it reads the
Target Params from those discovered for each device, inserts those in the config file, then
restores it, device by device, skipping any that do not pass the filter set up in step 4.

| Monitoring
291
10
Monitoring
This section describes Resource Monitors as they appears in Dell OpenManage Network Manager’s
web portal. The following describes these monitors:
• Application Server Statistics
• Resource Monitors
• Top N [Assets] (pre-configured monitors that come with your installation by default.
Finally, this chapter contains a reminder about scheduling refreshes of monitor target groups. See
Scheduling Refresh Monitor Targets on page 328.
Monitors and Discovery
Not all monitors are enabled for devices discovered by default. Typically discovery adds devices only
to ICMP (ping) monitoring. If you enable an SNMP monitor during discovery, for example,
performance degrades if discovery finds devices with many interfaces that the monitor attempts to
process.
To improve performance such behavior is disabled by default so processing occurs only for the
ICMP Monitors. To re-enable processing for other monitors during discover (assuming they are
enabled), set/create the following property in
owareapps/installprops/lib/
installed.properties
:
pm.monitor.process.implicits=true
By default, this is set to
false
. Monitors automatically refresh all implicit targets when a rule
executes independently of discovery in roughly six hour intervals. Alternatively you can select the
monitor(s), right mouse click and select
Refresh
Monitor
to manually refresh the target.
Performance and Monitors
Monitoring can impact system performance. Monitors with many targets, many attributes per
target and frequent polling intervals are most likely to slow system performance. The following are
the primary considerations when configuring monitors to get the desired performance from your
system:
Database Insertion Rate —
How many rows can your hardware realistically insert per second?
Every system has a maximum data insertion rate. This rate depends on the system’s hardware
configuration. A standard 7200 RPM disk can typically manage 300 insertions per second per
disk. 10000-15000 RPM disk can have as many as 600 insertions per second per disk. Your
experience may vary depending on your drive’s controller and configuration.

292
| Monitoring
The sum of all monitors’ insertion rate should not exceed the system’s maximum data
insertion rate. To calculate the insertion rate of a monitor apply the following formula:
<# of monitor targets> x <# of retained attributes> / <polling interval in seconds> =
inserts /second.
So a monitor with 100 targets, retaining 10 attributes once a minute would have an insertion
rate of 17 rows per second (100 * 10 / 60 = 16.67 inserts per second).
Example:
Monitor A
: 1000 targets * 10 retained attributes each / 120 = 83 insert per second
Monitor B
: 100 targets * 25 retained attributes each / 600 = 4 insert per second
Monitor C:
10000 targets * 10 retained attributes each / 60 = 1667 insert per second
System total insertion rate (A+B+C)
: 1754 insertions per second
This configuration would be too aggressive for a system with a 7200 RPM disk since it dramatically
exceeds the 300 insertions per second that the disk can support.
The following alternatives could resolve this:
• Upgrade to disk hardware that can keep up with the insertion rate. If the target insertion rate
is 1754 inserts per second, add a disk to the array. If 1754 inserts / 300 insertions per second on
a 7200 rpm disk amounts to 5.84 disks, use 6 disks (or more). If using 15000 RPM disks at 600
inserts per second, 1754/600 means you need 2.92 (3 discs) minimum.
• Modify the monitors to achieve a lower insertion rate. If you only have one 7200 RPM disk, it
can only support 300 insertions per second. You have the option of lowering the target count,
reducing what is retained or lengthening the polling interval.
So from the example above if we changed the polling interval from once a minute to once
every 10 minutes, Monitor C’s insertion rate would drop to 167 inserts per second. The overall
system would then only have an insert rate of 254 per second well below the hardware’s
limitation.
NOTE:
Traffic flow analysis can process and retain even larger amounts of information. Flows that correlate
50%, polled every minute for a day require roughly 109G of database, and require 4500 insertions per
second.
CAUTION:
These numbers and sample calculations represent best case scenarios. Any disk or disk array typically
serves other applications and processes besides monitors. Make sure to take account of that when
calculating how to accommodate your monitors. The system admin or system user should assist in
making that assessment.
Storage Requirements (Database Size) —
How much disk space do you need, based on your
retention policy? See Retention Policies on page 300 for more about configuring those.

| Monitoring
293
OpenManage Network Manager stores performance data in three different forms Detail,
Hourly and Daily data. It collects Detail metrics directly from the device or calculates these
from the collected data with each poll. Hourly data summarizes the detail data collected
during the hour. Daily data summarizes the hourly data collected during that day. The
retention policy associated to the monitor describes how long OpenManage Network
Manager retains each of these data types within the system.
OpenManage Network Manager stores a performance metric as a single row within a database
table. Each row in that database consumes roughly 150 bytes of disk space. The sum of each
monitor’s disk space required determines the amount of disk space. For each monitor add the
disk space required for the Detail, Hourly and Daily data using the following formula:
<Detail disk space> + <Hourly disk space> + <Daily disk space> = Monitor disk space in
bytes
where...
<# of metrics retained per poll> = <# of monitor targets> x <# of retained attributes>.
<# of metrics retained per day> = <# of metrics retained per poll> x <# of polls per
day>.
<Detail disk space> = <# of metrics retained per day> x <# of days to retain Detail data>
x 150.
<Hourly disk space> = <# of metrics retained per poll> x <# of days to retain Hourly
data> x 24 x 150.
<Daily disk space> = <# of metrics retained per poll> x <# of days to retain Hourly data>
x 150.
If the system does not have sufficient disk space consider the following options:
• Add more hardware to increase the available disk space.
• Reduce the retention period of one or more monitors to lower the overall disk space
requirements. Of the three data forms Detail data will consume the most disk space per day
of retention.
Tab l e si ze
— Based on your monitor configuration how large will database tables get? Each
monitor has a series of dedicated performance tables that store the Detail, Hourly and Daily
performance metrics. The number of tables depends on the retention policy associated with
the monitor.
A single table stores the monitor’s detail data for a 24 hour period. Detail data are individual
performance metrics collected and/or calculated during each poll. After that initial 24 hours,
OpenManage Network Manager creates a new table to store the next 24 hours’ of detail data
and so on.
Because of the resulting table size, the number of performance metrics generated by a single
monitor in a 24 hour period impacts performance. Best practic is to configure each monitor

294
| Monitoring
to produce less than 10 million rows per day. When monitors exceed that number noticeable
delays result when retrieving performance data. To determine the number of metrics retained
by monitors per day please refer to <# of metrics retained per day> calculation from the
previous section.
CAUTION:
These numbers depend entirely upon the system hardware, available memory and processor speed.
If a monitor does exceed the target maximum rows per day consider the following options singly or
in combination to change that:
• Reduce the number of retained attributes per poll.
• Reduce the polling frequency.
• Reduce the number of monitor targets per monitor. Notice that you can still have the same
number of targets if you split the targets among multiple monitors.
How To:
Instructions for Monitoring
This chapter contains the following step-by-step instructions for these features:
• Create a Server Status Monitor Dashboard
• Create an SNMP Interface Monitor
•Create an ICMP Monitor
• Create a Monitor Report
• Create a Simple Dashboard View
• Create A Performance Template
You can see Performance Options from a variety of locations by right-clicking in Dell OpenManage
Network Manager. For example:
• Ports in the Ports portlet
•Interfaces
• Ports / Interfaces in the Details panels lets you
Show Performance
• Right clicking on any of the above within a Reference tree displays Performance Options.
• All Top N [Assets] right click to offer Performance options.
Monitoring Strings
Monitors do not directly monitor string attributes, but you can create an extractive Adaptive CLI
monitor that responds to string values in devices. See Example 5: Monitor Text Values on page 433
for an example.
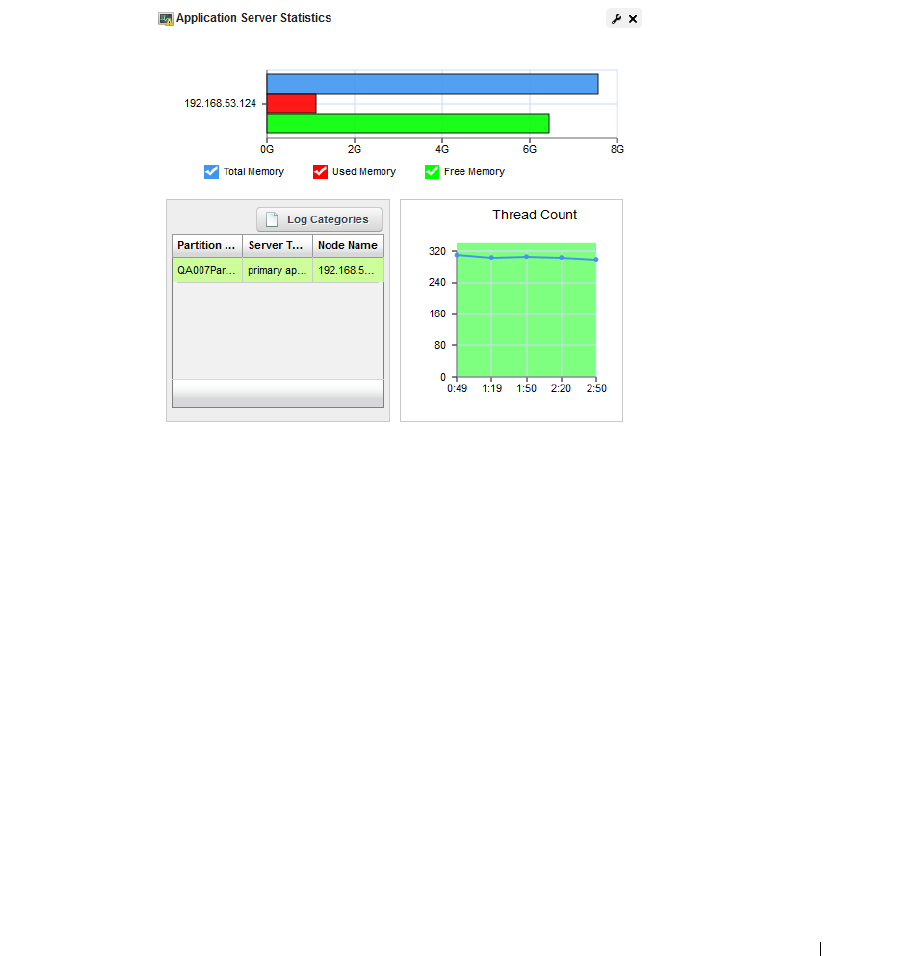
Application Server Statistics | Monitoring
295
Application Server Statistics
This summary screen has no expanded view. It displays the statistics for the OpenManage Network
Manager application server and provides access to set logging levels for a variety of categories on
the application server.
The bar graph displays
To t a l, U s e d ,
and
Free
memory on the server. One such graph appears per
server monitored. Hover your cursor over a bar to see its reading in a tooltip. Hover your cursor over
the bar graphs related to the server you want to monitor, and its information appears in a tooltip.
The Thread Count graph displays information for as long as this portlet is open, restarting when
you revisit it or refresh the page.
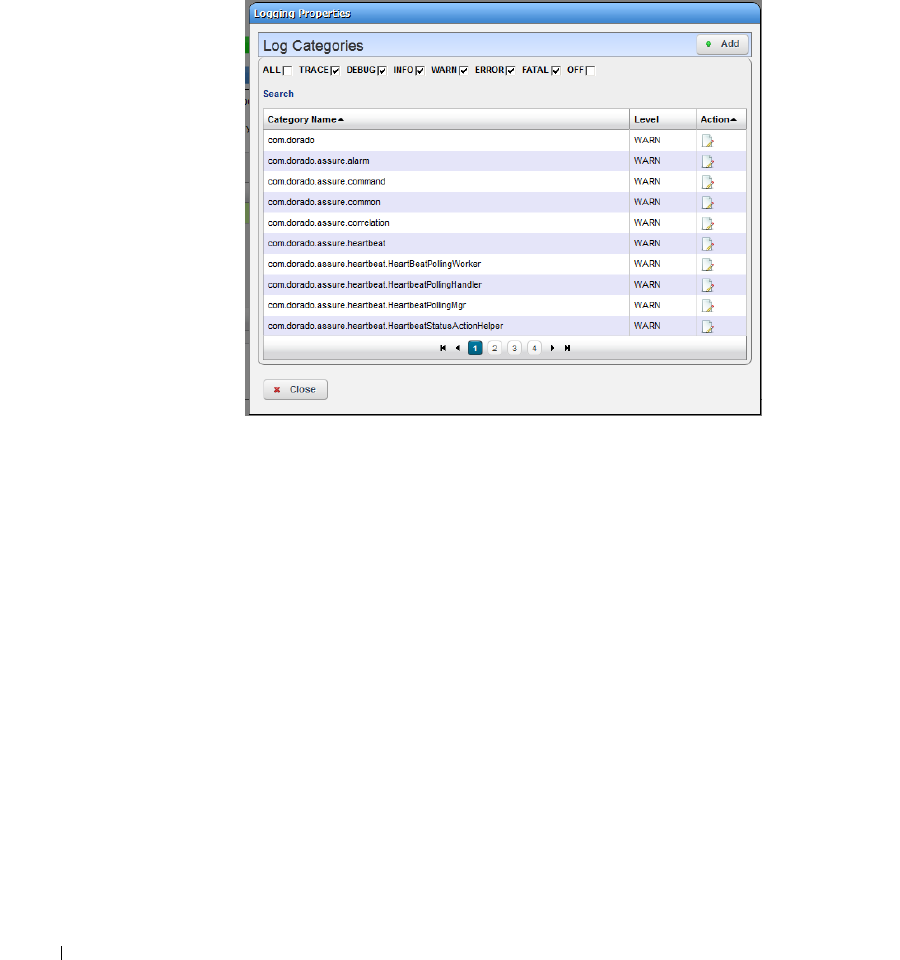
296
Application Server Statistics | Monitoring
Logging Categories
The Application Server Statistics portlet also displays a table that catalogs servers’
Partition Name,
Server Type
and
Node Name.
This includes a button the upper right corner where you can access
Log Categories
—
log4j.xml
items—without having to text edit that file. See
Custom Debug on
page 95
for more about
log4j.xml
.
The
log4j.xml
items appear listed with their default log levels. Altering log levels for the listed
items can provide more information for troubleshooting. Log levels determine the detail of server
log output.
Notice that you can sort these by clicking the table headers, and can look for items with the
Search
link below the checkboxes. You can check or uncheck categories at the top of this screen to confine
the display to only desired categories.
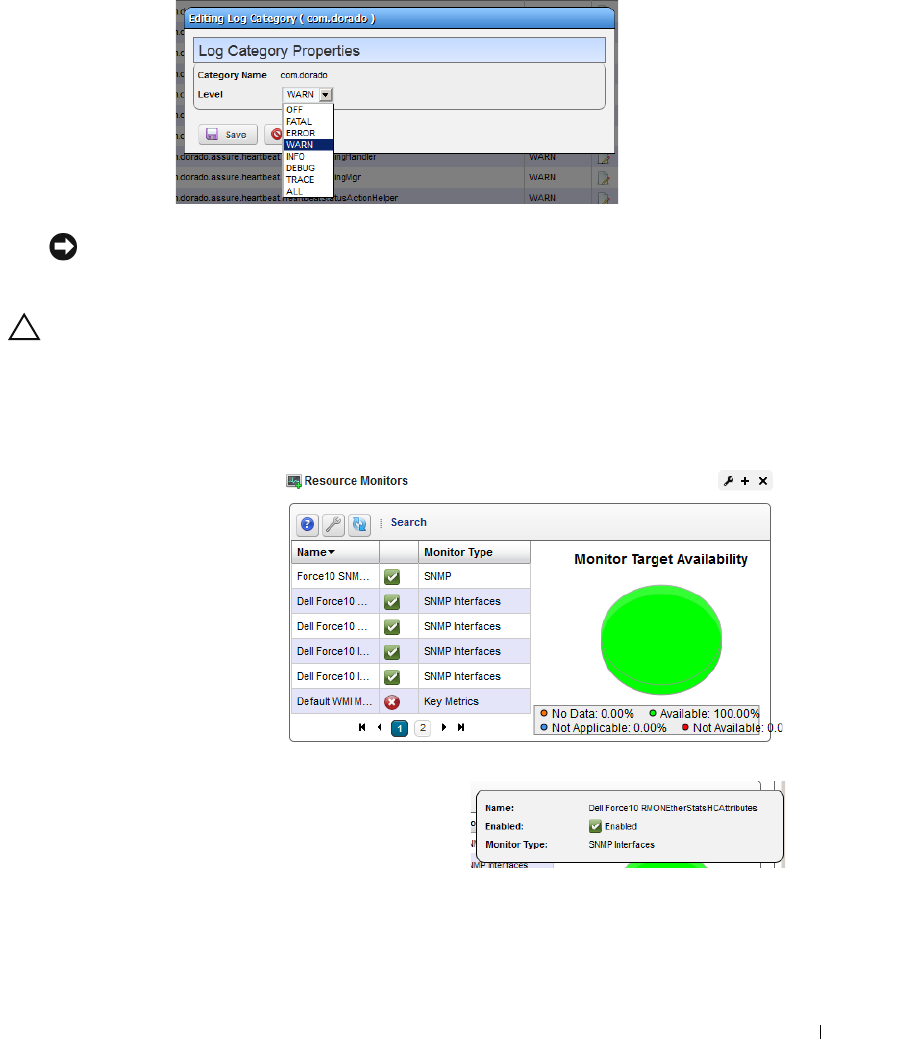
Resource Monitors | Monitoring
297
These self-monitoring capabilities let you tune Application Server logs to produce meaningful
output. Clicking the Edit icon to the right of an item lets you change its log level.
NOTICE
This simplifies setting log levels, and does not require editing the log4j.xml file.
CAUTION:
More, and more detailed logging can require more processing.
Resource Monitors
This summary screen displays
currently, active performance
monitors in brief.
The
Name
column displays the
identifier for each monitor
instance,
Enable
displays a green
check if it is currently enabled, or
a red minus if it is disabled.
The
Monitor Type
column
typically displays what the monitor covers. Hover your
cursor over this column to see a popup with the
selected monitor’s properties. The popup that appears
after this query displays the relevant information for the
monitor, including whether it is
Name, Enabled
, and
Monitor Type
.
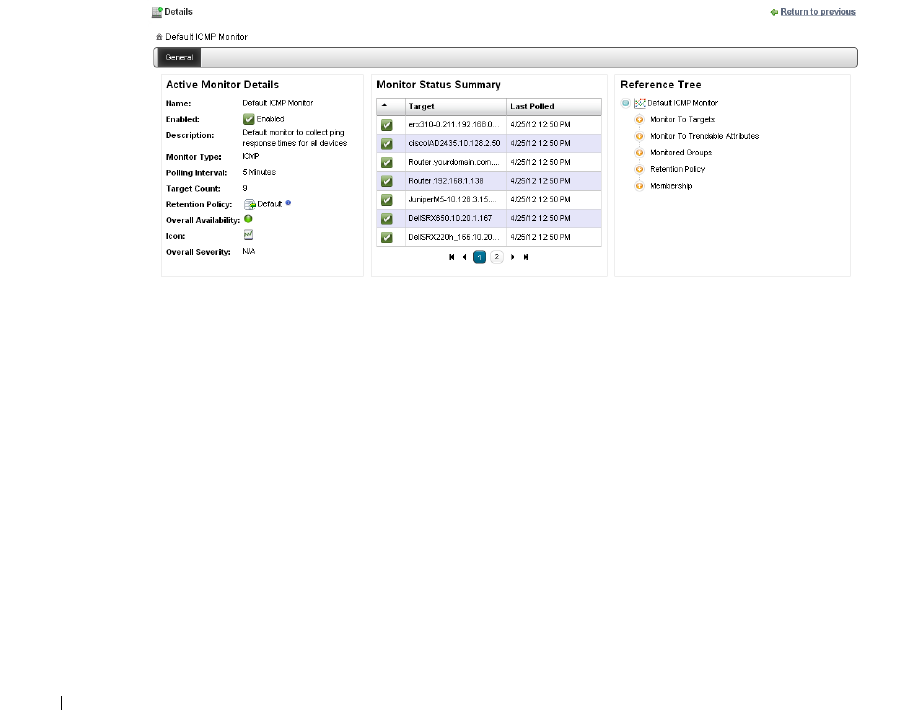
298
Resource Monitors | Monitoring
The graph that appears to the right of the monitors displays the aggregate availability information
for the enabled monitors. Topics graphed include,
Available, Not Available, No Data
and
Not
Applicable.
Right-click a listed monitor to do the following (not all menu items appear for all types of
monitors):
New Monitor
—Lets you either create a new monitor of the type you select in the sub-menu, or
edits the monitor selected in the portlet. See Monitor Editor on page 302 for details.
New (from Template)
—Opens the Monitor Editor, where you can configure the equipment
targets for template monitors, selected in the sub-menu. These templates already have
selected attributes and calculations. You can examine exactly what these are in the editor that
appears when you select one.
Edit Monitor
—Opens the Monitor Editor, where you can modify the selected monitor.
Details
—Opens a Detail panel, with a reference tree, status summary, and general information
about the selected monitor.
Enable / Disable
Monitor
—Enables or disables the monitor. Only one of these options appears.
Only enabled monitors report data (and demand resources), while disabled monitors do not.
Refresh Monitor—
Re-query to update any targets for the current monitor. See Scheduling
Refresh Monitor Targets on page 328 for instructions about automating this.
Manage Retention Policies
—Select this to manage the data retention policies for the selected
monitor. See Retention Policies on page 300 for details.
Delete
—Removes the selected monitor.
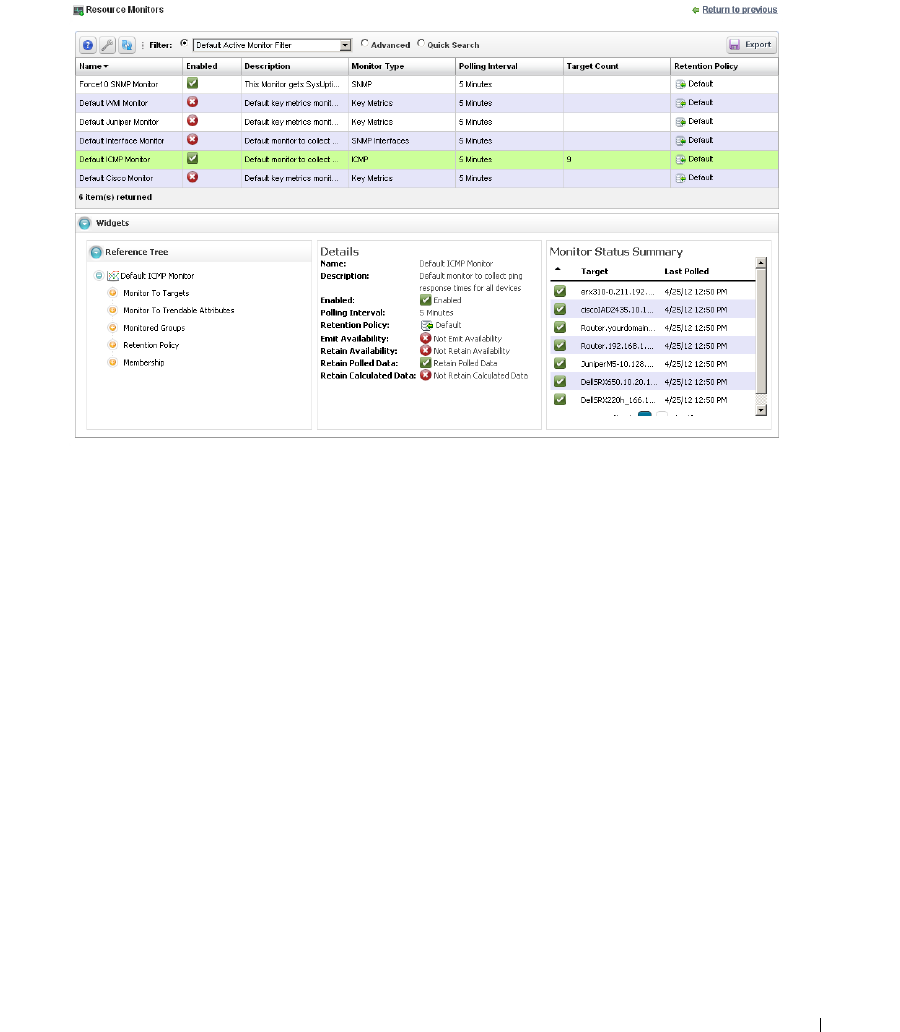
Resource Monitors | Monitoring
299
Expanded Resource Monitor
This screen appears when you click the plus in the upper right corner of the summary screen.
As in most expanded views, this one displays a list ordered by the
Name
of the monitor. Click
Settings
to configure the column display. Available columns include those on the summary screen
(
Name, Enabled, Monitor Type
) as well as
Description, Poling Interval, Target Count
and
Retention
Policy.
Resource Monitor Snap Panels
When you select a monitor, the Snap Panels at the bottom of the screen display details about it.
The
Reference Tree
shows the selected monitor’s connection to attributes, groups, retention
policies and its membership (the devices monitored).
The
Details
Snap Panel displays the attributes the popup shows when you hover the cursor over the
Monitor Type
column in the summary screen, and adds
Emit Availability
(events),
Retain
Availability, Retain Polled Data,
and
Retain Calculated Data
parameters.
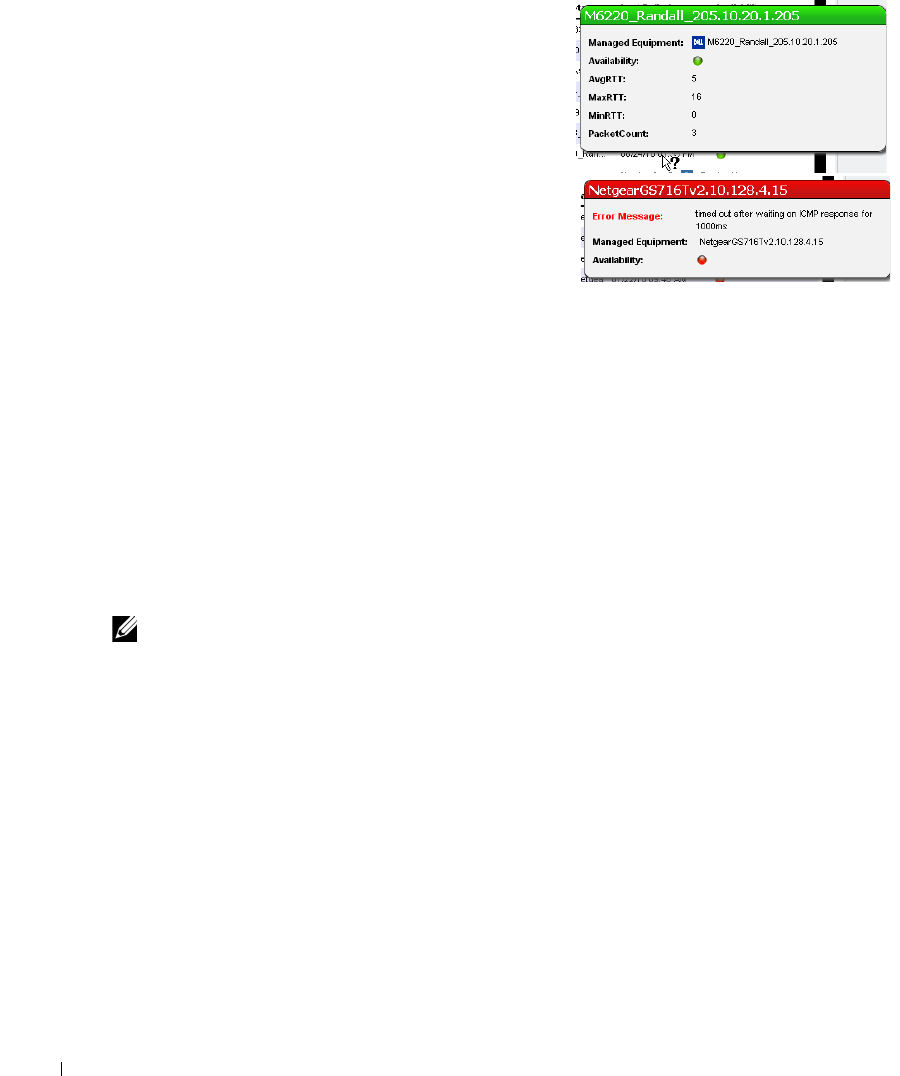
300
Resource Monitors | Monitoring
The
Monitor Status Summary
Snap Panel displays the
status of each individual member (
Ta rg e t
) of the
monitor, showing the
Last Polled
time and date, and a
title bar and icon indicating
Availability
(green is
available, red is not).
Hover the cursor over the Availability icon, and a popup
appears with details about availability. If the device is
available, the
RTT
(round-trip time) for
communication appears in
Avg
(average),
Max
(maximum), and
Min
(minimum) amounts, along with
the
PacketCount
. If it is not, an
Error Message
appears
instead of the
RTT
and
PacketCount
parameters.
To edit more performance settings and targets than are
available here, use the features described in Dashboard Views on page 331. You can create and
display dashboards by right-clicking items in Managed Resources, selecting
Show Performance
.
Excluding Attributes from Display
The
show.perf.exclude
property in the
portal-ext.properties
file contains a comma
delimited list of the attribute display names to exclude from display. Remember, best practice is to
override properties as described in Overriding Properties on page 15.
For example,
show.perf.exclude=CPU Utilization,AvgRTT
If you define this property, the
Show Performance
command creates charts for the listed attributes.
This has no impact on manually created dashboards.
NOTE:
You must restart tomcat after changing the properties file for the changes to take effect.
Retention Policies
The basis of all reporting and dashboard presentations is retained data from established monitors.
In other words, each monitor provides a simple schema from which you can produce a chart, graph
or report.
Resource Monitors | Monitoring
301
To reduce resource impacts, the
scope of retained data may
exclude some of the collected
data. A monitor may have no
retained data and only emit
events based on transient results
in the execution/calculation.
For example, the application
can derive a metric from several
collected values and you may
opt to retain only the derived result.
All monitors rely on a polling engine which provides runtime mediation activities for distributed
device interaction at regular intervals. Monitors may share a retention policy. Data is rolled up
hourly and daily into summary data. The retention policy controls how long data is held per roll-up
period. You must select the correct period see what has been collected.
When you manage these policies, you configure how monitored data is retained. When you select
Manage Retention Policies
in the Monitors portlet, first a list of available policies appears.
Clicking the
Add
button at the top of the screen lets you create a new policy, while clicking the
Edit
button to the right of selected, listed policies lets you modify existing policies. The
Delete
button
to the right of listed policies removes them from the list.
Editor
Monitors may share a retention policy. The retention policy controls how long data is held per roll-
up period. The editor for Retention policies lets you assign characteristics and monitors to them.
The editor contains the following fields:

302
Resource Monitors | Monitoring
General Retention Policy Options
Policy Name
—A text identifier for the policy.
Description
—An optional description for the policy.
Detail / Hourly / Daily Data (Days)
—How many days to retain the selected data.
The amount retained has both a performance and data storage impact. For example, retaining
day’s information from an active performance SNMP monitor configured with one target’s
worth of data, retrieved on one minute intervals can consume 0.7 G of database, and require
21 inserts per second.
Traffic flow analysis can process and retain even larger amounts of information. Flows that
correlate 50%, polled every minute for a day require roughly 109G of database, and require
4500 inserts per second.
Active Monitor Members
Select from
Available Monitors
on the left, and click arrows to move the desired monitor(s) to the
Selected Monitors
on the right.
Click
Save
to preserve your edits, and include the monitor as listed among existing Retention
Policies, or click
Cancel
to abandon any changes.
Monitor Editor
This editor lets you fine-tune the monitor you selected and right-clicked to open the editor. It
includes the following panels and fields:
• General
• Monitor Options
• Calculated Metrics
• Thresholds
• Inventory Mappings
• Conditions
Resource Monitors | Monitoring
303
General
The General panel is common to all different monitor types.
General Monitor Options
Name
—The identifier for this monitor.
Description
—A text description for this monitor.
Polling Interval
—Use these fields to configure how often the monitor polls its target(s).
Retention Options
Retention Policy
—This configures how long Dell OpenManage Network Manager retains the
monitor’s data. Manage these by right-clicking in the Resource Monitors portal, and selecting
Retention Policies
. You must make retention policies before you can select them here.
Enabled
—Check to enable.
Emit Availability Events
—Check to activate emitting availability events. The monitor does not
emit an event until the monitored entity’s state has changed. All monitors can generate
events on failure to contact the monitored device, port, and so on. For example, by default
ICMP monitor updates the network status after a selected number of consecutive failures.
You can configure the monitor to generate an event in addition to updating network status,
but Dell OpenManage Network Manager does not like the polling interval to be very small
especially when monitoring many devices.

304
Resource Monitors | Monitoring
Example: poll every 10 secs for 10,000 devices with Packet Size = 64 bytes, Packet Count = 3
Timeout (secs) = 1, and configure Unreachable attempts = 1 with polling interval = 10
seconds. This polls the device every 10 seconds and emits a “down” event on the first failed
attempt.
Retain Availability Data
—Check to activate. You must Retain availability data to enable alarms.
If you define thresholds, you should retain availability data.
Retain availability data
stores the
Boolean values of whether availability data was in the range your defined metrics.
Retain Polled Data
—Check to activate. If you uncheck
Retain polled data
only calculated data
remains, you cannot view data retrieved from monitored entities. Turning off
Retain polled
data
discards the data as it arrives from the device.
Retain Calculated Data
—Check to activate.
Retain calculated data
complements
Retain polled
data
. If checked, it stores the calculated results which came from the raw poll data received
from the device.
Update Network Status
—Check to activate reporting the network status of the target device(s).
The results of this monitor's activity then appear in the Network Status column of the
Managed Resources portlet. Only one monitor—and no monitors on interfaces or child
components—should ever update networks status. Any monitors on child components or
interfaces are rolled up to the top level device, so status may be erroneously reported. For
example the top level device is not necessarily down if the interlace is down.
If two monitors report the network status of a single device on different intervals, they must
both agree it is down before that state appears in Managed Resources. As long as one monitor
says a device is
Responding
, then that is the state displayed.
If ping fails (an endpoint is down) and update network status is configured, then Dell
OpenManage Network Manager tries to ping the switch/router in front of the endpoint to
determine if that device is reachable. If that device also failed, then the endpoint’s status
becomes
indeterminate
.
NOTICE
For clarity’s sake, best practice has only one monitor per device updating network status. By default
ICMP monitoring enables Update Network Status, and monitors all discovered devices.
Migrating from previous Dell OpenManage Network Manager versions automatically replaces
any configured Heartbeats with ICMP monitors with
Update Network Status
enabled. If your
previous system had HTTP or SNMP heartbeats, you must manually configure monitors to
provide equivalent monitoring in this version.
# of Unreachable Attempts before update
—The number of attempts to reach the device before
Dell OpenManage Network Manager updates the displayed network status of the device. (1-
100)
Click
Save
to preserve any edits you make, or
Cancel
to abandon them.
Resource Monitors | Monitoring
305
Monitor Options
Monitor options contains two panels. The entity panel lets you select the monitor targets. The
types of monitor entities allowed varies depending on the type of monitor. The second panel
contains options specific to the monitor type being edited.
The entity and options panels for the various types of monitors appear below in Monitor Options
Type-Specific Panels on page 317.
Calculated Metrics
The calculated metrics panel lets you create attributes that are calculated from existing monitor
attributes. The metric attribute legend assigns a letter value to each monitor attribute. The
Reassign
button reassigns the letters. This is useful if some attributes have been deleted and their
letters are no longer used.
306
Resource Monitors | Monitoring
The
Configured Metrics
table lists the calculated metrics. An edit and delete action appears to the
right of each row. The
Add
button creates a new calculated metric and the
Remove All
button
deletes all the calculated metrics.
Clicking on the Add button or edit button displays the calculation editor.
This panel contains the following properties:
Name
—The attribute name to be displayed for the calculation
Ty p e
—Calculation Type - Gauge or Counter
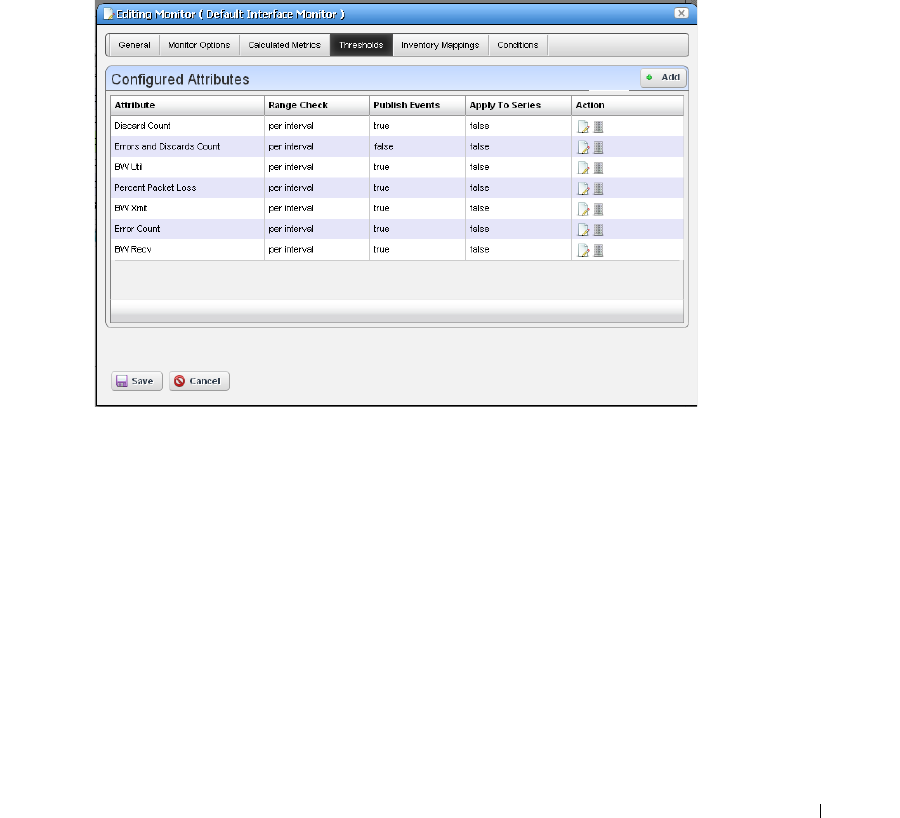
Resource Monitors | Monitoring
307
Units
—Units string to appear in graphs
Max Value
—Maximum value to be used in graphing (0 = no max)
Formula
—The formula for the calculation using the assigned formula codes from the metric
attribute legend.
Thresholds
The thresholds panel allows the user to set threshold intervals on attributes in the monitor. The
table lists the attributes for which attributes have been configured. Each row has an edit action and
delete action. The Add button allows thresholds to be specified for another attribute. If all monitor
attributes have thresholds defined for them the Add button will be disabled.
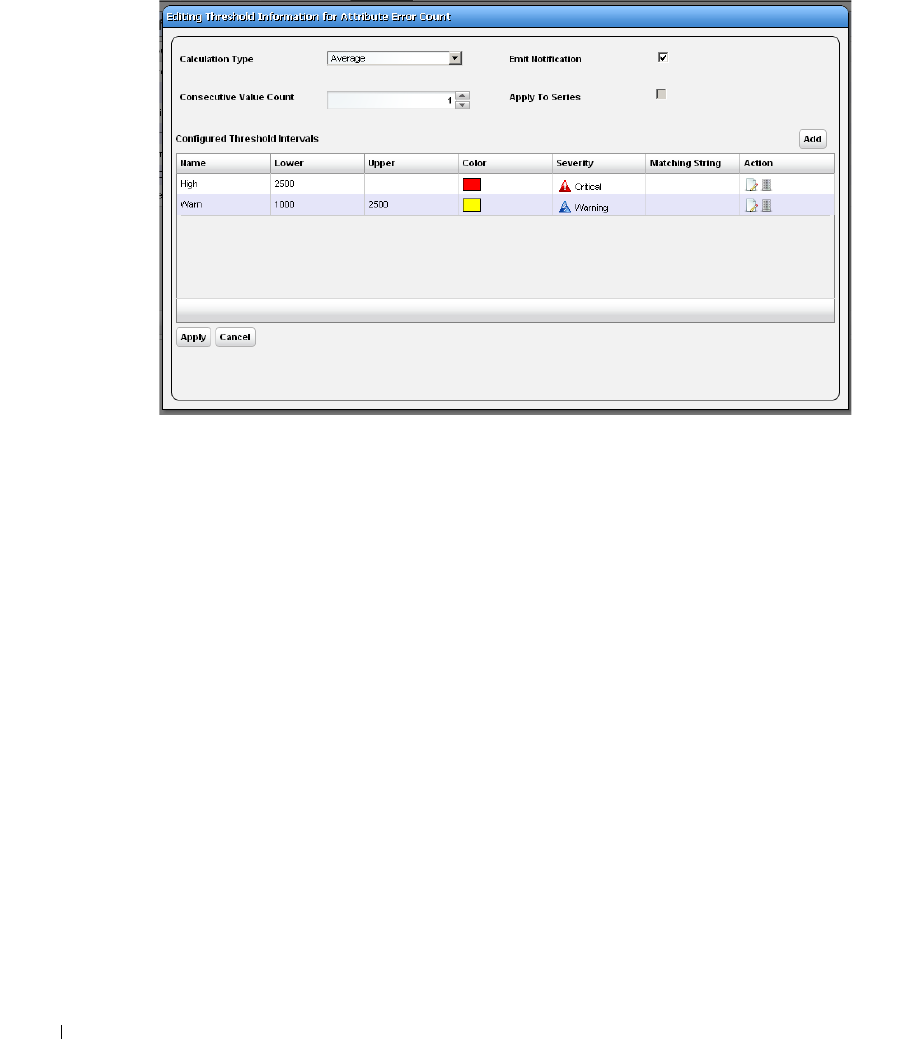
308
Resource Monitors | Monitoring
The
Add
or
Edit
buttons open a threshold editor (blank or with existing, configured thresholds,
respectively).
Configure threshold intervals you
Add
at in the editor screen according to the following
parameters.
Attribute Name—
Appears when you click
Add
rather than
Edit
ing a selected threshold
.
Use the
pick list that appears in this screen to select the attribute for which you are specifying
threshold information. When you
Edit
, the name of the attribute appears as a title within the
editor screen.
Calculation Type
—Select from the pick list. Specifies whether the range calculation is to be done
based on
Average
or
Consecutive
values.
Consecutive Value Count
—Select how many consecutive values to consider at once for a range
calculation. Typically the larger the number here, the less “flutter” in reporting threshold
crossings.
Emit Notification
—Check to emit an event if the device crosses the configured threshold(s). The
notification event contains the threshold-crossing value, as well as which threshold was
crossed, and is an alarm at the severity selected when you configure the threshold.
You can make a set of thresholds for each monitored attribute, so a single monitor can throw
different alarms for different attributes. To see available events and their descriptions, view
the contents of the RedcellMonitor-MIB in \owareapps\performance\mibs.
Apply to Series
—Check to enable on composite attributes only. Checking this applies the
threshold to individual elements within the series. When it is unchecked, the threshold
applies only to aggregate measurements (the overall value of the series), not individual
elements within the series.
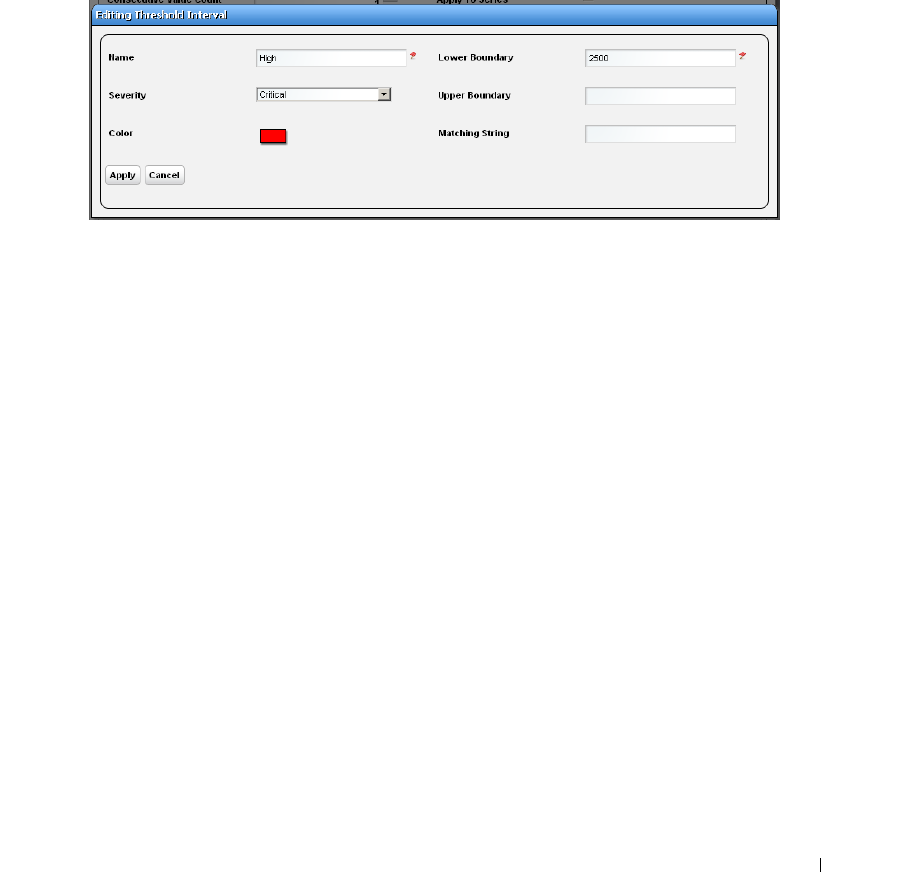
Resource Monitors | Monitoring
309
For example; a Key Metric monitor for CPU utilization on a device with two CPUs actually
monitors both CPUs. When unchecked, the threshold applies to the average of both CPUs,
when checked, the threshold applies to each individual CPU.
You can also apply thresholds to regular expressions. This is useful to monitor components
within components, for example cores within a CPU.
Click
Apply
to preserve your edits, or
Cancel
to abandon them.
The threshold interval editor pops up when you select the
Add
button or the
Edit
icon to the right
of a threshold’s row in the threshold attribute editor.
This screen contains the following fields:
Name
—The identifier for the threshold interval.
Severity
—The event severity for crossing this threshold interval (
informational/indeterminate/
warning/minor/major/critical
)
Color
—The color to display threshold interval on graphs.
Lower Boundary
—The interval’s lower boundary.
Upper Boundary
—The interval’s upper boundary. May be blank.
Matching String
—A Regex matching string.
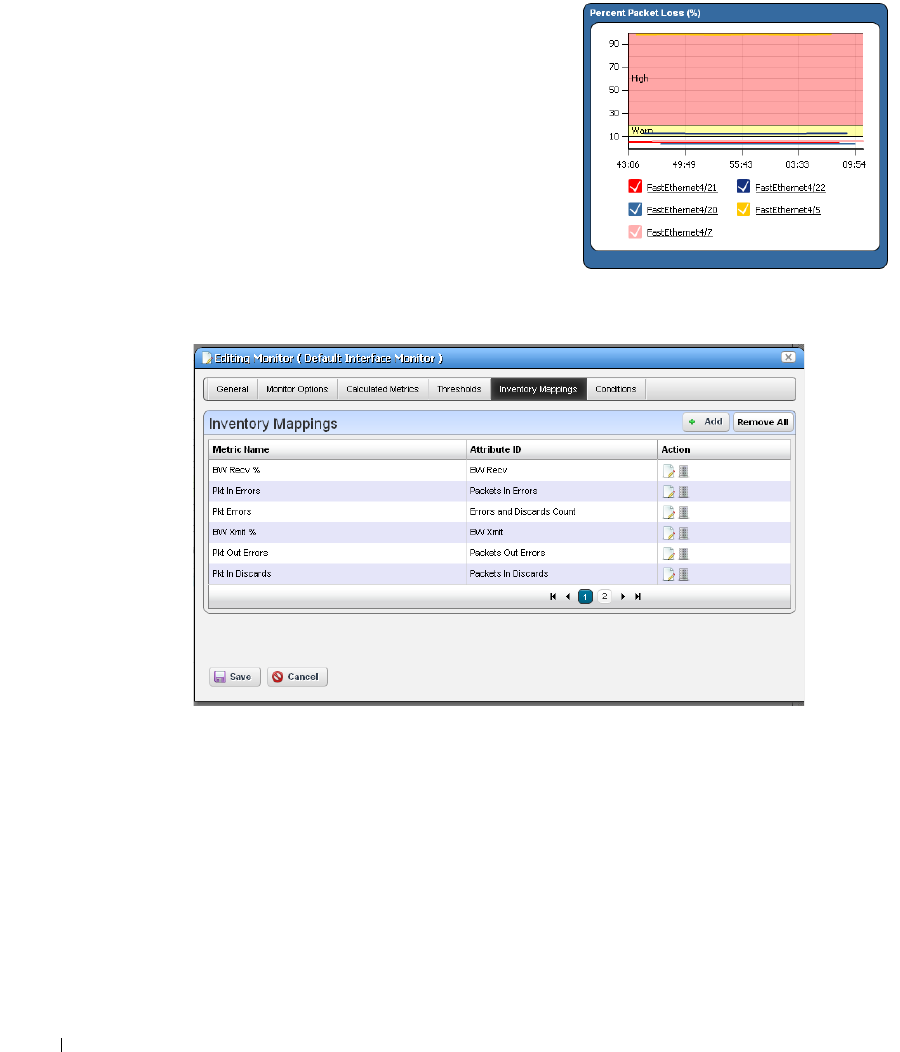
310
Resource Monitors | Monitoring
Threshold Graph Background
If you configure a set of thresholds, the dashboard graph
displaying the data monitored displays the threshold
colors in the background. When an upper or lower
threshold has no upper or lower bound, then those
background colors may appear as white.
Inventory Mappings
The inventory mappings panel lets you associate
predefined inventory metrics with a monitored attribute
to normalize the attribute if a device does not report
metrics in a way that matches the monitored attribute’s
name or format. Available metrics include
CPU
Utilization %, Memory Utilization %, ICMP Round
Trip Time, ICMP packet errors,
and
Bandwidth utilization %.
Common attributes include those for Top N. For example, service A may call it “Disk % Utility”
and Service B may call it “% Disk Utility”. We can map them to a common name and can display
them as Top N.
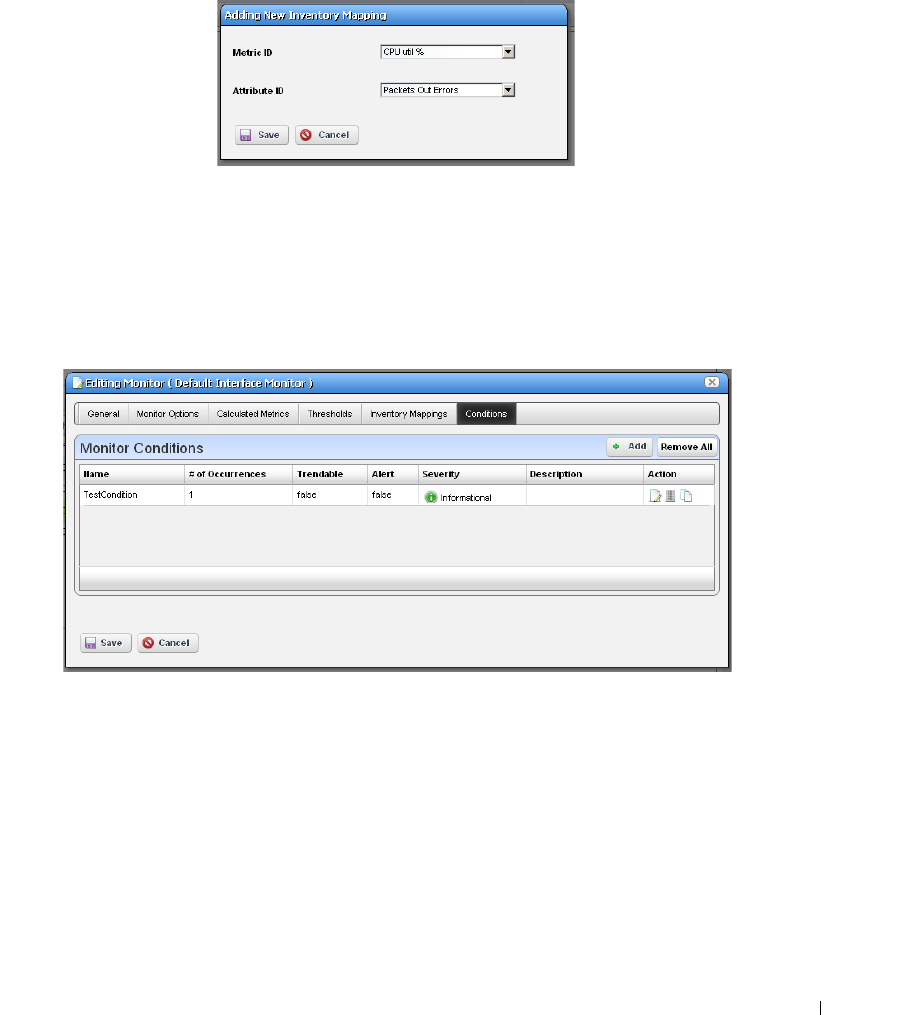
Resource Monitors | Monitoring
311
You can
Add
a new mapping with that button, or
Remove All
listed mappings with that button. You
can also edit or delete listed mappings with the
Action
icons to the right of each row. Adding or
editing opens the Inventory Mapping Editor.
This lets you configure the following:
Metric ID
—Inventory metric name
Attribute ID
— Attribute to associate with the inventory metric
Conditions
This panel lets you add multiple conditions to the monitor you are editing.
Click the
Add
button to enter a new set of conditions, or click the
Edit this entry
button to the
right of a listed Monitor Condition to open the editor. Click the
Delete
button to remove a listed
set of conditions. Click the
Copy
icon to duplicate the listed condition.
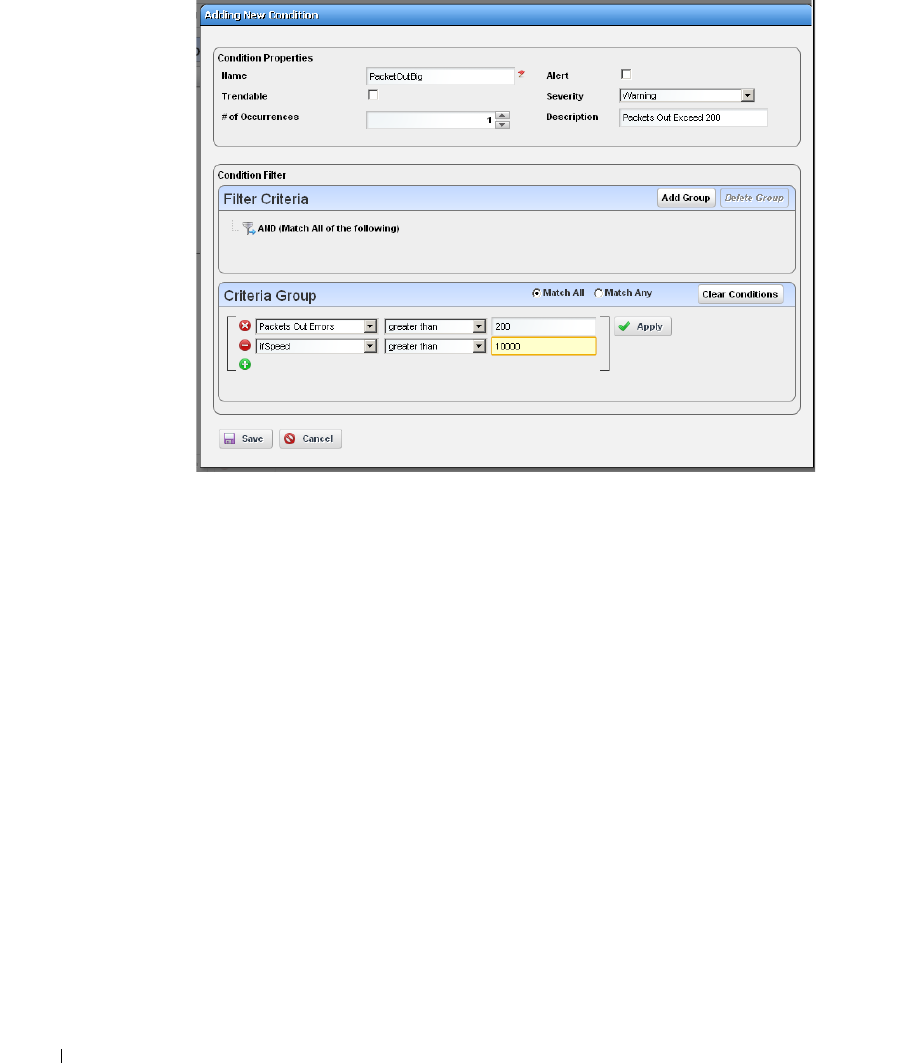
312
Resource Monitors | Monitoring
The editor has the following fields and settings to configure:
Condition Properties
Name
— Enter a text identifier for the conditions.
Alert
— Check this if you want Dell OpenManage Network Manager to emit an alert when the
monitor satisfies the conditions.
Trendable
— Check if the conditions specified are trendable. If this is true, the database retains
qualifying conditions (or thresholds) for later reporting / dashboards.
Severity
— Specify the severity of the emitted alert, if any.
# of Occurrences
— Enter the number of occurrences of what is specified in the Condition Filter
to satisfy the Conditions.
Description
— A text description for the conditions.
Condition Filter
Minimally, use this panel to select a condition, an operator and a value. If you want to use the
logical AND or OR operators with a second condition, click the green plus (+), and select a second
condition, operator and value. For example,
Packet Out Errors
greater than 200
AND
ifSpeed
greater than 10000
can be a set of conditions that only has to occur once to satisfy this monitor’s
condition.
Click
Save
to accept your edits, or
Cancel
to abandon them.
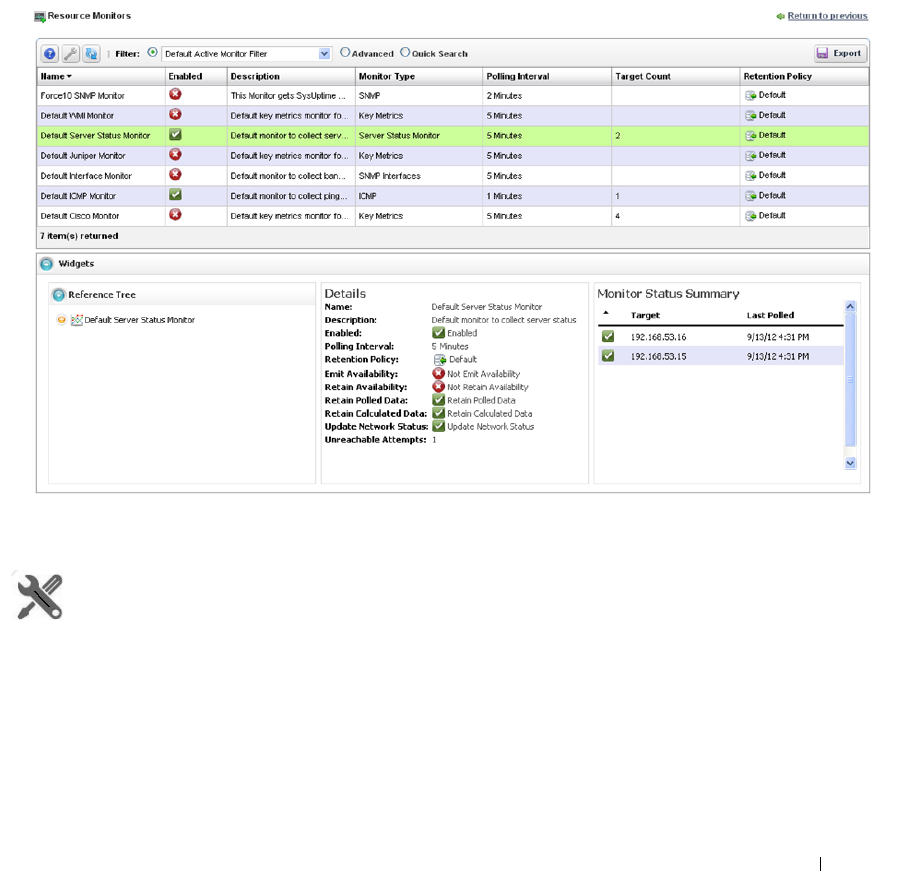
Resource Monitors | Monitoring
313
Self Management / Self Monitoring: Default Server Status
Monitor
Dell OpenManage Network Manager also includes a Default Server Status Monitor that monitors
its own serverYou can edit this monitor to alter polling intervals, and make different calculations for
the monitored attributes. Those attributes include TotalMemory, FreeMemory, MemoryInUse,
ThreadCount and TrapCount for Application Server and Mediation Server processes. You cannot
modify the targets for this monitor.
You must create your own Dashboard to view the data in this monitor. create a custom dashboard
How To:
Create a Server Status Monitor Dashboard
1
Create a custom dashboard.
2
Click the edit icon on one of the dashboard components and set the data source as the
Default Server Status Monitor, and the target as the server monitored.
3
Save the monitor

314
Resource Monitors | Monitoring
See Dashboard Views on page 331 and How to: Create a Simple Dashboard View on page 333 for
more about configuring dashboards.
How To:
Create an SNMP Interface Monitor
To set up a typical performance monitor, follow these steps:
1
In the
Resource Monitors
portlet, and create a new monitor by right-clicking and selecting
New
.
2
Select the type of monitor from the submenu—for this example, an
SNMP Interfaces
monitor.
NOTE:
Some devices have ports rather than interfaces. This monitor works for them too, even though it is an
“interface” monitor.
3
In the
General
screen, enter a polling interval (5 minutes is the default). For this example,
check
Retain polled data
and accept the remaining defaults for checkboxes and the retention
policy.
4
Select an entity to monitor by clicking the
Add
button in the top portion of the
Monitor
Options
screen. For an interface monitor, select
Interface
as the Type at the top of the screen.
You can also filter the list of interfaces that appear further by selecting
Interface Type
as
ge
(gigabit ethernet), for example.
NOTICE
Notice that you can add refinements like filtering on Administrative State and IP Address to the filter.
5
Select interfaces (Ctrl+click to add more than one), then click
Add Selection
then
Done
to
confirm your entity. Hover your cursor over a line describing an interface to have a more
complete description appear as a popup.
6
Click
Browse
to display the MIB Browser. For the sake of this example, we elect to monitor
ifInErrors (in RFC Standard MIBs, RFC1213-MIB > Nodes > mib-2 > interfaces > ifTable
> ifEntry > ifInErrors).
7
In the
Thresholds
screen, configure thresholds by first clicking
Add.
8
Click
Add
above the threshold levels list for each threshold you want to add.
9
In the threshold editor, enter a name (Examples:
Low, Medium, Overload
), an upper and
lower boundary, (0 - 10, 10 - 100, 100+), a severity (
Informational, Warning, Critical
) and
color (BLUE, YELLOW, RED). In this case, no string matching is necessary. When the data
crosses thresholds, the monitor reacts.
Attributes available depend on the type of monitor you are creating. Notice that you can also
check to make crossing this threshold emit a notification (an alarm that would appear on the

Resource Monitors | Monitoring
315
Alarm panel). You can also configure the type of calculation, and so on. You can even alter
existing thresholds by selecting one then clicking
Edit
to the right of the selected threshold.
10
Click
Apply
for each threshold interval you configure, then
Apply
for the entire threshold
configuration.
If a threshold’s counter is an SNMP Counter32 (a 32-bit counter) monitoring can exceed its
capacity with a fully utilized gigabit interface in a relatively short period of time. The defaults
configured in this monitor account for this, but if you know that this is an issue, you can
probably configure the monitor to account for it too.
After taking a look at Thresholds no more configuration is required. Notice, however, that you
can also configure
Calculated Metrics
,
Inventory Mappings
and
Conditions
on other screens
in this editor to calculate additional values based on the monitored attributes, to map them,
and to make conditional properties based on monitored behavior.
NOTICE
Calculated Metrics is particularly valuable if you want to monitor a composite like ifInErrors + ifOutErrors
or want to calculate a parameter like errors per minute when the monitor’s interval is 5 minutes.
11
Click
Save
and the monitor is now active.
Notice that the
Availability
icon appears at the top of a
Monitor Status Summary
snap panel
in the Expanded Resource Monitor next to a time/date stamp of its last polling. Right-click
the monitor and select
Refresh Monitor
to manually initiate polling.
Values displayed in the Overall Availability column of the Monitor Manager do not
automatically refresh and may be out of date. The
Reference Tree
snap panel maps the
monitor’s relationship to its target(s) attribute(s) and other elements. The
Details
snap panel
summarizes the monitor’s configuration.
12
For information about having the monitor’s results appear in the a
Dashboard
portlet, see
Dashboard Views on page 331
.
How To:
Create an ICMP Monitor
The following steps create an ICMP (ping) monitor.
1
In the
Resource Monitors
portlet, and create a new monitor by right-clicking and selecting
New
.
2
Select the type of monitor from the submenu—for this example, an
ICMP
monitor.
3
In the
General
screen, enter a name (Test ICMP Monitor), and a polling interval (5 minutes
is the default). For this example, check
Retain polled data
and accept the remaining defaults
for checkboxes and the retention policy.

316
Resource Monitors | Monitoring
4
Select an entity to monitor by clicking the
Add
button in the top portion of the
Monitor
Options
screen.
5
Select devices you want to ping, (Ctrl+click to add more than one), then click
Add Selection
then
Done
to confirm your entity.
6
Define packets in the ICMP Monitor Options panel, including Packet Size, Packet Count and
timeout. You can accept the defaults here, too.
7
In the Thresholds tab, select an attribute (MaxRTT, or maximum round trip time) and add
the following thresholds by clicking
Add
:
Name
High
color red, Lower Boundary 15 and Upper Boundary [blank] Severity
Critical
Name
Fine
color green, Lower Boundary 0 and Upper Boundary 15 Severity
Cleared
.
Notice that this example does not emit a notification. If you checked that checkbox, an alarm
of the configured severity would accompany crossing the threshold.
8
Accept the other defaults and click
Apply
9
Click
Save.
10
Test ICMP Monitor now appears in the portlet.
11
12
How To:
Create a Monitor Report
You can create reports based on your monitors. The following example creates a report based on
How to: Create an SNMP Interface Monitor above.
1
Create a new Report Template by right-clicking the Report Templates portlet, selecting
New
> Table Template.
2
Name the report (here: Test SNMP Interface Report).
3
Select a source in the
Source
tab. Here:
Active Monitoring > SNMP Interfaces.
4
Notice that the
Select your inventory columns
panel displays the attributes available based on
your monitor selection.
5
Select
Available
columns and click the right arrow to move them to
Selected.
In this case we
select SNMP Interfaces: Monitor Target, Polled Date / Time, ifInErrors.
6
Arrange the columns and fonts as you like in the
Layout
tab.
7
Save
the template.
8
Right-click, and select
New
in the Reports portlet.
9
Enter a
Name
and
Title
for the report.
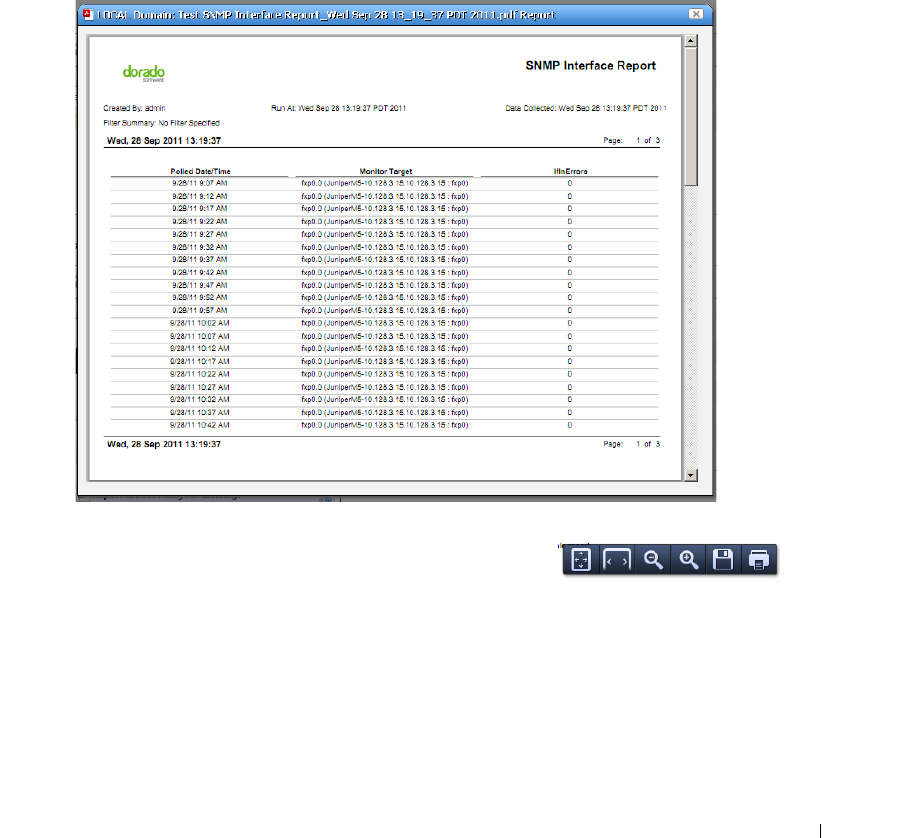
Resource Monitors | Monitoring
317
10
Notice that since this is the first report created since you made the Test SNMP Interface
Report template, that it is the
Report Template
already selected.
11
Since the monitor already filters devices, we add no filter in the Report, although you could
add one to further filter the monitored devices.
12
Test SNMP Interface Report should appear in the Reports portlet.
13
Right-click and select
Execute
(noticing that you can also schedule such reports, even
repeatedly).
14
Click the magnifying glass to the right of the Report Completed message in My Alerts to see
the report.
15
Hover your cursor over the lower right corner of the report to
see a set of icons that let you expand, zoom out and in, save,
or print the report.
Monitor Options Type-Specific Panels
The following describes the panels associated with the following Monitor Options types.
•ICMP
•Proscan
•SNMP

318
Resource Monitors | Monitoring
•SNMP Interfaces
•SNMP Table Monitor
IPSLA OIDS
The following are the object IDs for IPSLA, all found in CISCO-RTTMON-MIB
Monitor Attribute Name Mib Attribute name OID
NumOfPositvesDS rttMonEchoAdminNumPackets 1.3.6.1.4.1.9.9.42.1.2.2.1.1
8
NumOfRTT rttMonLatestJitterOperNumOfRTT 1.3.6.1.4.1.9.9.42.1.5.2.1.1
RTTSum rttMonLatestJitterOperRTTSum 1.3.6.1.4.1.9.9.42.1.5.2.1.2
RTTSum2 rttMonLatestJitterOperRTTSum2 1.3.6.1.4.1.9.9.42.1.5.2.1.3
MinRTT rttMonLatestJitterOperRTTMin 1.3.6.1.4.1.9.9.42.1.5.2.1.4
MaxRTT rttMonLatestJitterOperRTTMax 1.3.6.1.4.1.9.9.42.1.5.2.1.5
MinOfPositivesSD rttMonLatestJitterOperMinOfPositivesS
D
1.3.6.1.4.1.9.9.42.1.5.2.1.6
MaxOfPositvesSD rttMonLatestJitterOperMaxOfPositives
SD
1.3.6.1.4.1.9.9.42.1.5.2.1.7
NumOfPositivesSD rttMonLatestJitterOperNumOfPositives
SD
1.3.6.1.4.1.9.9.42.1.5.2.1.8
NumOfPositivesDS rttMonLatestJitterOperSumOfPositives
SD
1.3.6.1.4.1.9.9.42.1.5.2.1.9
Sum2PositivesSD rttMonLatestJitterOperSum2PositivesS
D
1.3.6.1.4.1.9.9.42.1.5.2.1.1
0
MinOfNegativesSD rttMonLatestJitterOperMinOfNegatives
SD
1.3.6.1.4.1.9.9.42.1.5.2.1.1
1
MaxOfNegativesSD rttMonLatestJitterOperMaxOfNegatives
SD
1.3.6.1.4.1.9.9.42.1.5.2.1.1
2
NumOfNegativesSD rttMonLatestJitterOperNumOfNegative
sSD
1.3.6.1.4.1.9.9.42.1.5.2.1.1
3
SumOfNegativesSD rttMonLatestJitterOperSumOfNegative
sSD
1.3.6.1.4.1.9.9.42.1.5.2.1.1
4
Sum2NegativesSD rttMonLatestJitterOperSum2NegativesS
D
1.3.6.1.4.1.9.9.42.1.5.2.1.1
5
MinOfPositivesDS rttMonLatestJitterOperMinOfPositives
DS
1.3.6.1.4.1.9.9.42.1.5.2.1.1
6
MaxOfPositivesDS rttMonLatestJitterOperMaxOfPositives
DS
1.3.6.1.4.1.9.9.42.1.5.2.1.1
7
NumOfPositivesDS rttMonLatestJitterOperNumOfPositives
DS
1.3.6.1.4.1.9.9.42.1.5.2.1.1
8

Resource Monitors | Monitoring
319
SumOfPositivesDS rttMonLatestJitterOperSumOfPositives
DS
1.3.6.1.4.1.9.9.42.1.5.2.1.1
9
Sum2PositivesDS rttMonLatestJitterOperSum2PositivesD
S
1.3.6.1.4.1.9.9.42.1.5.2.1.2
0
MinOfNegativesDS rttMonLatestJitterOperMinOfNegatives
DS
1.3.6.1.4.1.9.9.42.1.5.2.1.2
1
MaxOfNegativesDS rttMonLatestJitterOperMaxOfNegatives
DS
1.3.6.1.4.1.9.9.42.1.5.2.1.2
2
NumOfNegativesDS rttMonLatestJitterOperNumOfNegative
sDS
1.3.6.1.4.1.9.9.42.1.5.2.1.2
3
SumOfNegativesDS rttMonLatestJitterOperSumOfNegative
sDS
1.3.6.1.4.1.9.9.42.1.5.2.1.2
4
Sum2NegativesDS rttMonLatestJitterOperSum2Negatives
DS
1.3.6.1.4.1.9.9.42.1.5.2.1.2
5
PacketLossSD rttMonLatestJitterOperPacketLossSD 1.3.6.1.4.1.9.9.42.1.5.2.1.2
6
PacketLossDS rttMonLatestJitterOperPacketLossDS 1.3.6.1.4.1.9.9.42.1.5.2.1.2
7
PacketOutOfSequence rttMonLatestJitterOperPacketOutOfSeq
uence
1.3.6.1.4.1.9.9.42.1.5.2.1.2
8
PacketMIA rttMonLatestJitterOperPacketMIA 1.3.6.1.4.1.9.9.42.1.5.2.1.2
9
PacketLateArrival rttMonLatestJitterOperPacketLateArriv
al
1.3.6.1.4.1.9.9.42.1.5.2.1.3
0
OWSumSD rttMonLatestJitterOperOWSumSD 1.3.6.1.4.1.9.9.42.1.5.2.1.3
3
OWSum2SD rttMonLatestJitterOperOWSum2SD 1.3.6.1.4.1.9.9.42.1.5.2.1.3
4
OWMinSD rttMonLatestJitterOperOWMinSD 1.3.6.1.4.1.9.9.42.1.5.2.1.3
5
OWMaxSD rttMonLatestJitterOperOWMaxSD 1.3.6.1.4.1.9.9.42.1.5.2.1.3
6
OWSumDS rttMonLatestJitterOperOWSumDS 1.3.6.1.4.1.9.9.42.1.5.2.1.3
7
OWSum2DS rttMonLatestJitterOperOWSum2DS 1.3.6.1.4.1.9.9.42.1.5.2.1.3
8
OWMinDS rttMonLatestJitterOperOWMinDS 1.3.6.1.4.1.9.9.42.1.5.2.1.3
9
OWMaxDS rttMonLatestJitterOperOWMaxDS 1.3.6.1.4.1.9.9.42.1.5.2.1.4
0
Monitor Attribute Name Mib Attribute name OID

320
Resource Monitors | Monitoring
NumOfOW rttMonLatestJitterOperNumOfOW 1.3.6.1.4.1.9.9.42.1.5.2.1.4
1
MOS rttMonLatestJitterOperMOS 1.3.6.1.4.1.9.9.42.1.5.2.1.4
2
ICPIF rttMonLatestJitterOperICPIF 1.3.6.1.4.1.9.9.42.1.5.2.1.4
3
InterArrivalJitterOut rttMonLatestJitterOperIAJOut 1.3.6.1.4.1.9.9.42.1.5.2.1.4
4
InterArrivalJitterIn rttMonLatestJitterOperIAJIn 1.3.6.1.4.1.9.9.42.1.5.2.1.4
5
AvgJitter rttMonLatestJitterOperAvgJitter 1.3.6.1.4.1.9.9.42.1.5.2.1.4
6
AvgJitterSD rttMonLatestJitterOperAvgSDJ 1.3.6.1.4.1.9.9.42.1.5.2.1.4
7
AvgJitterDS rttMonLatestJitterOperAvgDSJ 1.3.6.1.4.1.9.9.42.1.5.2.1.4
8
OWAvgSD rttMonLatestJitterOperOWAvgSD 1.3.6.1.4.1.9.9.42.1.5.2.1.4
9
OWAvgDS rttMonLatestJitterOperOWAvgDS 1.3.6.1.4.1.9.9.42.1.5.2.1.5
0
LatestHTTPOperRT rttMonLatestHTTPOperRTT 1.3.6.1.4.1.9.9.42.1.5.1.1.1
LatestHTTPOperDNSRTT rttMonLatestHTTPOperDNSRTT 1.3.6.1.4.1.9.9.42.1.5.1.1.2
LatestHTTPOperTCPConnectR
TT
rttMonLatestHTTPOperTCPConnectR
TT
1.3.6.1.4.1.9.9.42.1.5.1.1.3
LatestHTTPOperTransactionRT
T
rttMonLatestHTTPOperTransactionRT
T
1.3.6.1.4.1.9.9.42.1.5.1.1.4
LatestHTTPOperMessageBodyO
ctets
rttMonLatestHTTPOperMessageBodyO
ctets
1.3.6.1.4.1.9.9.42.1.5.1.1.5
LatestHTTPOperSense rttMonLatestHTTPOperSense 1.3.6.1.4.1.9.9.42.1.5.1.1.6
LatestHTTPErrorSenseDescripti
on
rttMonLatestHTTPErrorSenseDescripti
on
1.3.6.1.4.1.9.9.42.1.5.1.1.7
LatestRttOperCompletionTime rttMonLatestRttOperCompletionTime 1.3.6.1.4.1.9.9.42.1.2.10.1.
1
Monitor Attribute Name Mib Attribute name OID
Resource Monitors | Monitoring
321
ICMP
The ICMP Monitor Options panel contains the following properties:
Packet Size
—Size of packet for ICMP transmission
Packet Count
—Number of packets to send.
Timeout
—Number of seconds without a response before a timeout is issued
The ICMP Entity Panel lets you select resource groups and Resource manager objects. Clicking
Add
button displays a selector panel for these.
Select the type of entity you want to add, then select any desired filter attributes, then click
Apply
Filter
. Select from the entities that appear and add them to the monitor.
NOTE:
Migrating from previous versions updates the Network Status check box to true and redeploys the
monitor.
322
Resource Monitors | Monitoring
Proscan
In this screen, you simply select the Proscan policy to monitor. In the Thresholds tab, you can set
thresholds for both in and out of compliance numbers.
The Proscan policy contains the target network assets.
Execute the Proscan only
after
creating the monitor. The Proscan monitor displays data when you
create it and its supporting Proscan policy in the following order:
1
Create Proscan policy X that has explicit targets.
2
Create a Proscan monitor referring to Proscan policy X, and modify polling to the desired
interval.
3
Execute Proscan X.
Resource Monitors | Monitoring
323
SNMP
The SNMP attributes panel lets you specify which SNMP attributes are to be monitored.
You can specify the SNMP attributes the following ways:
•With the SNMP browser, or
• Entering the SNMP attribute properties explicitly.
The
Browse
button launches the SNMP MIB browser. (See
MIB Browser on page 214) You can also click the
Device
Results
tab to open an SNMP authentication screen and
log into any device you specify, even undiscovered devices.
Specify the IP address, SNMP Read Community, port,
SNMP version, timeout and retries.
Click on the desired SNMP nodes and then click on the
Add Selection
button to add an SNMP attribute. When
done selecting, click the
Done
button to add selected
attributes to the monitor or
Cancel
to abandon the
operation and close the browser.
324
Resource Monitors | Monitoring
The Add and Edit buttons in the SNMP attribute panel launch the SNMP Attribute editor.
This panel contains the following properties:
Oid
—The object identifier for this attribute
Name
—This attribute’s name
Instance
—SNMP instance. 0 for scalar or the ifIndex value for an SNMP column.
View Type
—
Scalar
or
Column.
Syntax
—
Integer, Boolean, DisplayString,
and so on.
Meta Syntax
—
Counter, Gauge
, and so on.
If you type in an OID and click the search button next to the OID field, the browser searches the
MIB for the OID and fills in the other values if it finds the OID.

Resource Monitors | Monitoring
325
SNMP Interfaces
The SNMP Interface Monitor Entity editor supports the following entity types: group, equipment
manager, port and interface. It also supports port and interface filters on groups and equipment
manager objects.
If you check the
Collect from ifXTable
checkbox, then OpenManage Network Manager attempts to
fetch attributes from the ifXTable. These attributes are ifHighSpeed, ifHCInOctets,
ifHCInUcastPkts, ifHCOutOctets and ifHCOutUcastPkts. If any of these attributes are not
available, then it fetches from ifTable.
If an interface does not support ifxTable, SNMP get typically retrieves an error and Dell
OpenManage Network Manager uses the ifTable instead. Some ATM ports do not send errors from
the ifxTable oids, so Dell OpenManage Network Manager also uses the ifTable values if
ifHighSpeed is 0.
NOTE:
The SNMP V1 protocol does not support 64bit counters located in ifXtable. This means Dell OpenManage
Network Manager monitors only collect performance data from ifTable when a device is discovered
using the SNMP V1 protocol. Best practice: Discover devices using snmpV2c or snmpV3 protocols to
collect performance data located in ifXtable.

326
Resource Monitors | Monitoring
Even with this checked, Dell OpenManage Network Manager defaulting to 32-bit counters if 64-bit
is not available.
Dell OpenManage Network Manager now supports multiple indexes in the SNMP Interface
monitor. Specify them in the instance field, separated by dots. For
sfpTxPowerValue
1.3.6.1.4.1.28458.7.2.4.6.7.1.22.Y.Z
, where
Y
is the slot and
Z
is the @ifindex,
specify
@slotNumber.@ifIndex
as the instance. You can also specify a constant string. For
sonetLineIntervalUASs 1.3.6.1.2.1.10.39.1.3.2.1.5. X.16
Where
X
is the
@ifindex and 16 is the last record, specify
@ifIndex.16
.
The variable name following the “@” must correspond to an attribute in the port or interface bean.
When determining the “not available” status of a device, SNMP AdminStatus and
OperationalStatus messages both have to indicate a device is Available before a monitor
determines it is available.
Certain devices that do not support ifTable availability indicators. For the sake of these devices, a
Skip availability check
checkbox appears.
The
Skip Polling Interval
configures skipped availability checks when polling, so you can check
availability, for example, every fourth polling interval (skipping three). This helps the monitor avoid
flutter artifacts
The PF and IF table columns indicate if a port filter or interface filter is configured for the entity.
Click the icons on the right side of the list of Monitor Entities to configure filters. Clicking these
buttons displays an interface configuration panel.
This panel lets you specify filter attributes for the port or interface filters you want to monitor. For
example, if you select a device but only want to monitor active interfaces created by a particular
user, then these filters do the job.
The SNMP Attributes panel is the same as described in SNMP on page 323.
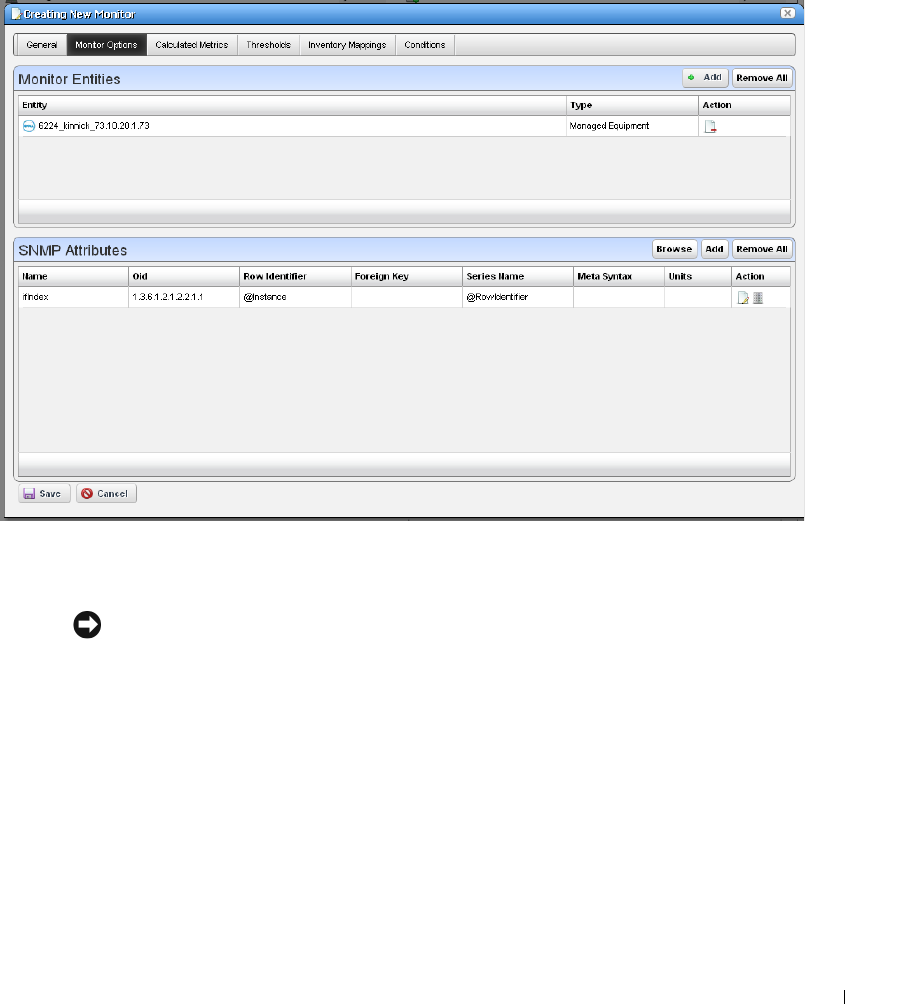
Resource Monitors | Monitoring
327
SNMP Table Monitor
This panel appears if you are editing an SNMP Table monitor. The application stores not absolute
numbers from counters but the counter’s change since its last measurement.
Columns include the SNMP Attribute Name, OID, Row Identifier, Foreign Key, Series Name, Meta
Syntax, Units, and Action.
NOTICE
If you select one of the 64-bit counters in ifXTable, make sure the Meta Syntax is 64-bit.
Clicking the
Add
or the
Edit
button to the right opens either a MIB Browser where you can retrieve
these attributes, or an Add / Edit SNMP Attributes editor at the bottom of the screen, See the
following sections for details.
MIB Browser
This lets you select attributes to monitor as described in MIB Browser on page 214. The SNMP
table monitor lets you pick a table column, not the entire table.
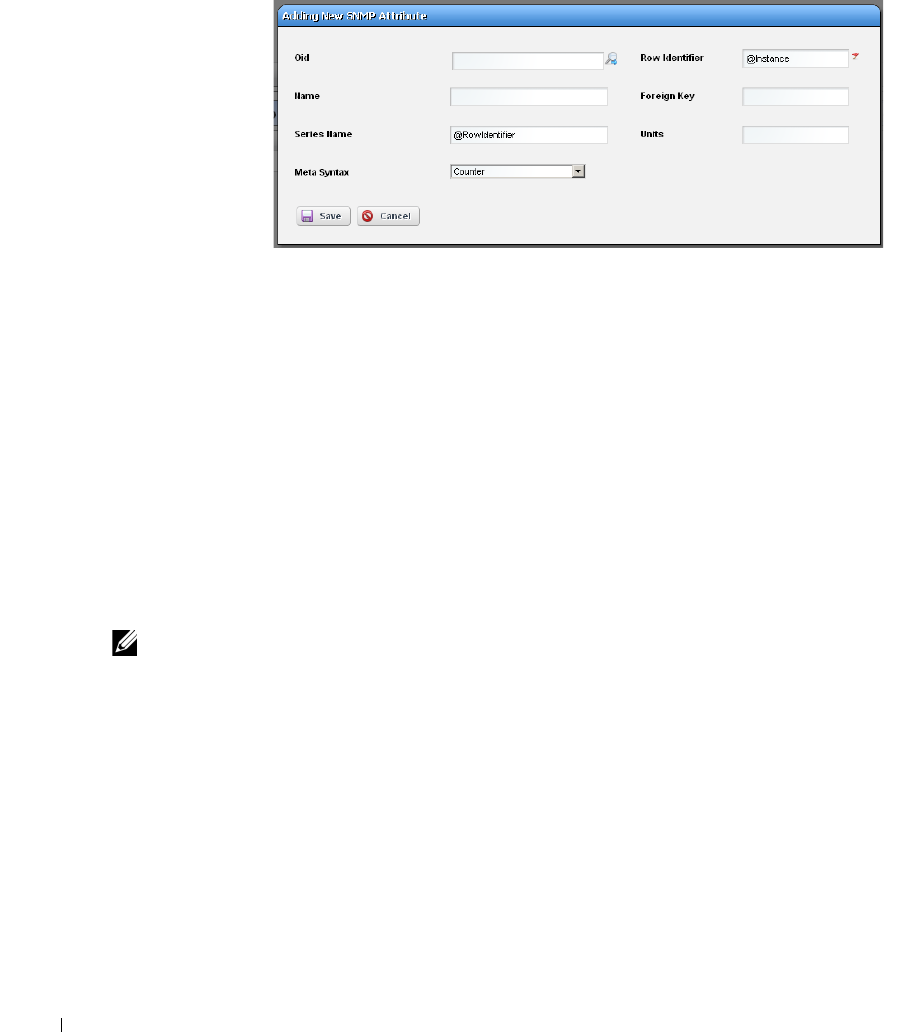
328
Resource Monitors | Monitoring
Add / Edit SNMP Attributes
This screen lets you specify individual attributes.
It has the following fields:
Oid
— A field where you can enter the object identifier. This also has an integrated search
function. Click the magnifying glass icon on the right to activate it. A successful search
populates the rest of the fields for the object identifier.
Row Identifier
—This mandatory field defaults to @instance (The OID instance).
Name
—The text identifier for the OID
Foreign Key
—Enter the foreign key, if any.
Series Name
—This defaults to @RowIdentifier.
Units
—Enter the units of measurement.
Meta Syntax
—Further refine the variable type with the pick list. For example, you can select
Counter32
(a 32-bit counter). For Counter types, the monitor computes change from
previous readings, and for Gauges it does not.
NOTE:
If a message appears saying: “Device fault: Return packet too big” in the Monitor Status Summary, then
you have selected too many SNMP attributes to poll in a single request. Please modify your monitor to
request smaller numbers of attributes
Scheduling Refresh Monitor Targets
Because monitors can address targets that are members of dynamic groups, refreshing these ensures
that group memberships are up-to-date. To do this, you can create or alter the schedule for Monitor
Target Refresh (in most packages, such a scheduled item appears by default). When executed, this
updates monitors with groups as targets based on current memberships. This removes targets no
longer members of a monitored group and adds new group members. A seeded schedule refreshes
these every six hours, by default.

Resource Monitors | Monitoring
329
Refresh Monitor
manually by right-clicking in the Resource Monitors table.
Refresh Monitor Targets for Newly Discovered Devices
If you discover a new device that is part of a monitored dynamic group, it may take some time
before monitoring includes that device. To provide immediate monitoring, as soon as discovery
finds the device, add the
Refresh Monitor
action to the discovery profile. See
Actions on page 100
for more about that Discovery Profile capability.
To make sure this refresh occurs, do
not
override the following in
redcell.properties
(This
section defines the actions executed when no default discovery profile exists):
#This shows the default order of Task Activities within Resource Discovery
Options
#The TaskDefOid will be used for identification and true/false will
determine if they are
#on by default
#format: <TaskDefOid>&&true,<TaskDefOid2>&&false,<TaskDefOid3>&&true
redcell.discovery.taskactivity.order=Resync&&true,\
DataCollectionForGroupOfDevices&&false,\
Discover_Links_for_a_Group_of_Devices&&false,\
Scheduled_Resync&&false,\
Refresh_Monitor_Targets&&true
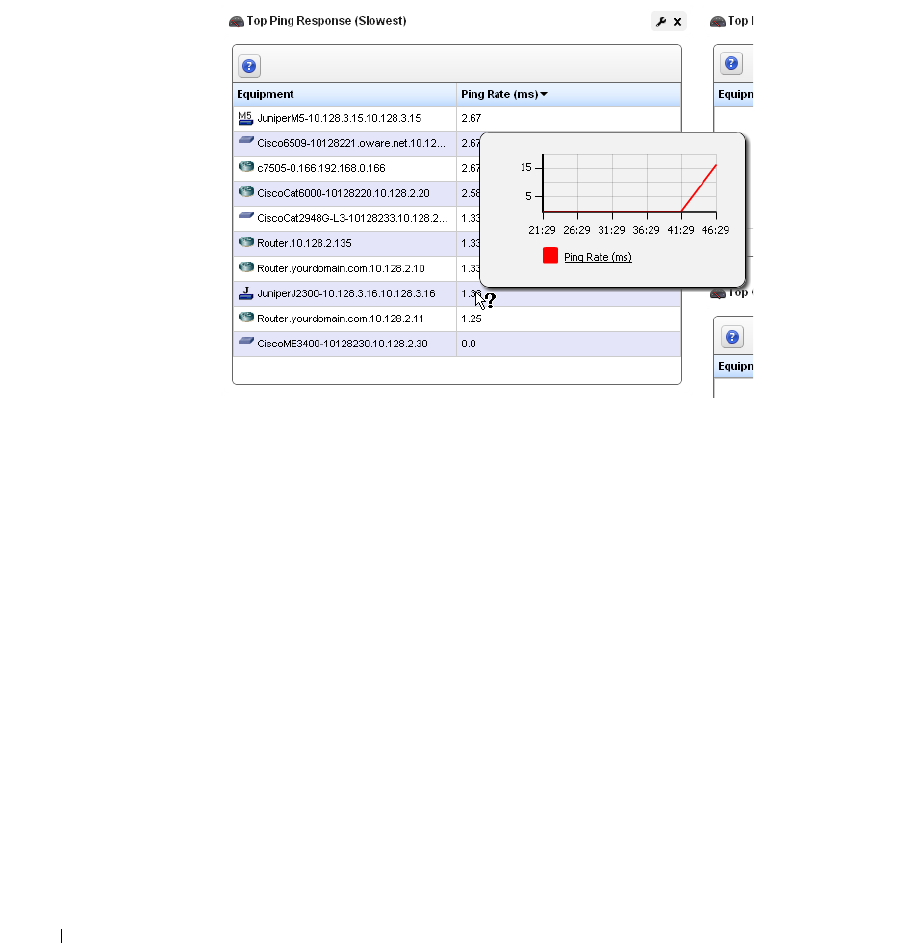
330
Top N [Assets] | Monitoring
Top N [Assets]
Dell OpenManage Network Manager uses seeded, default Active Performance Monitors (APM) to
display performance data in several categories. These portlets display the summary results of device
monitoring, for example, Top Ping Response (Slowest) displays the devices slowest to respond to
ping.
Devices appear, ranked by the monitored parameter. Hover the cursor over the Ping Rate column,
and a row’s a popup graph of recent activity over time appears.
If you right-click a monitored item, you can select from menu items like those that appear in the
portlet described in Managed Resources on page 195.
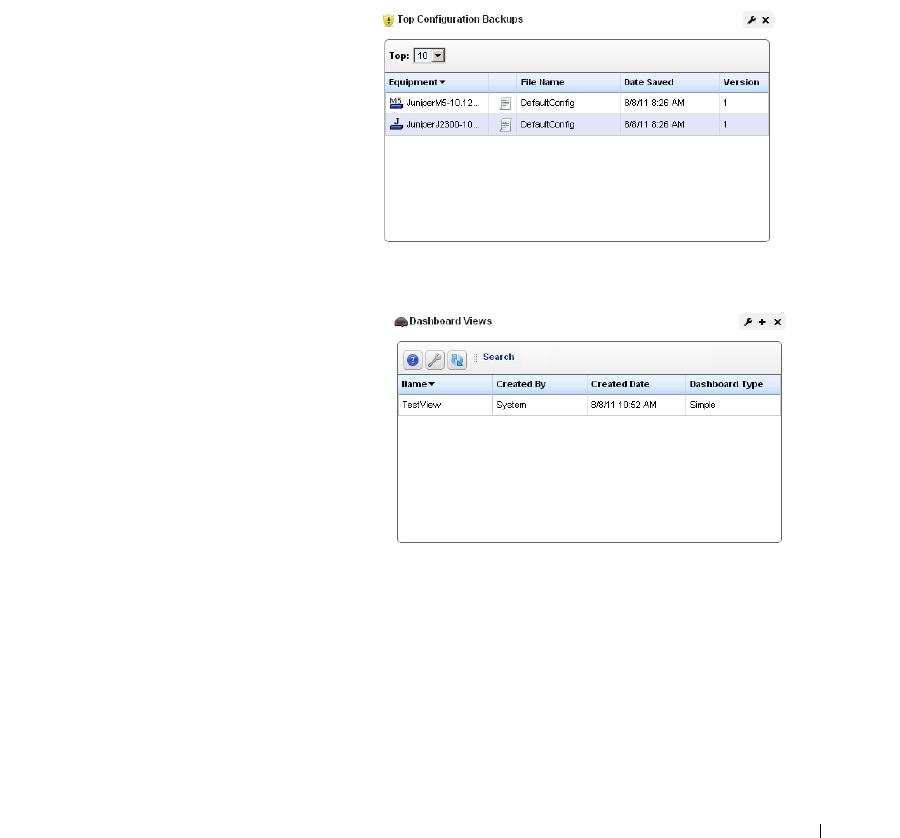
Dashboard Views | Monitoring
331
For some portlets (for example Top CPU / Disk / Memory Utilization, Top Interface Bandwidth /
Errors), the right-click Performance menu items include Key Metrics. The menu can include
Performance
which displays Dashboard Views related to the selected monitor.
For some packages, these can also include IP SLA statistics like the following: Top Bandwidth
Received / Transmitted, Top CPU / Disk Utilization, Top Ingress / Egress Packet Loss, Top Jitter,
and Top RT Delay. To see all available
Top
portlets, click
Add > Applications
and look below
Top N
on the subsequent panel.
Top Configuration Backups
This panel lists the most recent
configurations backed up from devices. The
pick list in the upper right corner lets you
select not just the top 10 such backups, but
the top 5, 10, 15, 20, and 25.
Right-clicking a backup offers the same
options as the portlet described in
Configuration Files on page 278.
Dashboard Views
The Dashboard Views portlet lets you
assemble several monitors into a single
display, or dashboard. You can create and
display dashboards by right-clicking items in
Managed Resources, selecting
Show
Performance
, or by selecting
New
in the
Dashboard Views
portlet.
Right-click the listed dashboards, and a menu
appears that lets you
Rename
,
Delete
,
Edit
,
create a
New
simple or custom dashboard, or
Launch
a Dashboard View (either
Maximize
—a larger view—or as a
Popup
). See
Dashboard Editor on page 335 for information about creating or modifying dashboards. For an
explanation of
Convert
, see
Convert Simple Dashboards to Custom Dashboards on page 342
.
The Performance Dashboard on page 334 and Dashboard Editor on page 335 describe configuring
simple dashboards. See the How to: Create a Custom Dashboard View on page 337 section for a
description of custom dashboard view creation.
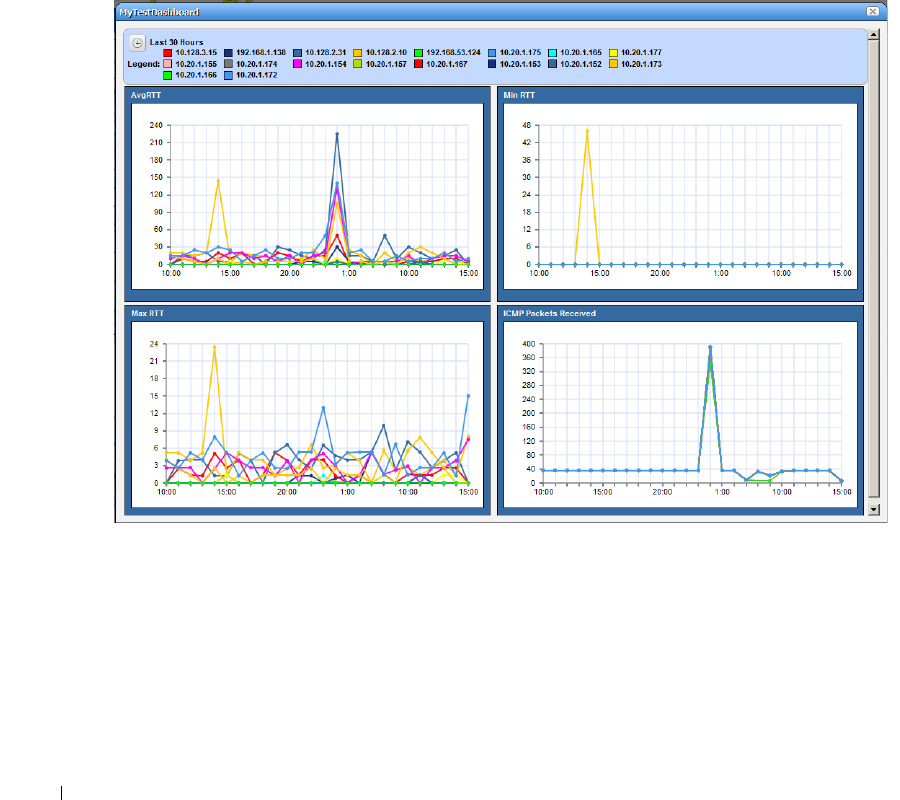
332
Dashboard Views | Monitoring
You can also Convert Simple Dashboards to Custom Dashboards, as described below. When you
Edit
a view, Dashboard Editor appears. It lets you select which monitors appear in the dashboard,
the monitored entities, and attributes.
The expanded portlet offers similar capabilities.To make a monitor appear on a page, use the
portlet described in Performance Dashboard on page 334.
When you create dashboards, data rollup is part of what the display shows. If, for example, the
monitor displays the results from a boolean (0 or 1 output), rollup may average values for a
duration, and values less than one will appear in the graph.
Launch a Dashboard View
Launching a view lets you view the monitors active for a Dashboard view.
Some packages display a
Network Dashboard
by default. If the Network Dashboard portlet is blank,
you can create a dashboard, then click the
select new
text in the upper right corner of the portlet to
select an alternative, already configured view from those in Dashboard Views portlet. Click the
edit
button in that same corner to alter the configuration of any existing dashboard. See Dashboard
Editor on page 335 for more about altering views.
You can configure Dashboards appear by configuring them in the Dashboard Views portlet, or by
selecting a device or devices in Managed Resources portlet, right-clicking and choosing
Show
Performance
. To select more than one device, use the expanded Managed Resources portlet.

Dashboard Views | Monitoring
333
The first time you create a default template dashboard for a single device, Dell OpenManage
Network Manager saves it in the Dashboard Views manager. Invoking
Show Performance
for that
device subsequently displays its default view.
The icons in the dashboard’s upper right corner let you edit
Dashboard Properties
with the
Dashboard Editor, or
Save
the dashboard with the other icon.
Displaying Values
Hovering the cursor over the individual points displays the charted attribute value(s) as popup
tooltips. If a graph has multiple lines, the data points for different lines are charted at different
times (Dell OpenManage Network Manager distributes polling to balance the load on its
mediation service). Hover the cursor over the time when a line’s data point appears, and that line’s
value appears as a tooltip. It may seem a device reporting the same value as others is not graphed
properly, but mousing over the graph displays the value.
The legend of devices and/or attributes that appear in each graph also provides interactive features.
Hover your cursor over a device or attribute color in the legend and only that device or attribute
appears onscreen. By default all such legend color squares contain checks. Uncheck the ones you do
not want to see. The legend can appear consolidated or for each chart, as is appropriate to the
distribution of charted devices and attributes.
If no data is available for an attribute in a dashboard, no panel appears for that data.
Changing Dashboard Time / Date Format
Control panel’s Redcell > Application Settings screen has a
Performance Chart Settings
panel
where you can set the
Day Format
and
Minute Format
so dashboards display time (the x axis) in a
meaningful way. If you want european date formats (day/month/year rather than month/day/year),
this is available if the language / location settings of the operating system on the computer running
Dell OpenManage Network Manager makes it available.
How To:
Create a Simple Dashboard View
Follow these steps to create a simple dashboard view. See How to: Create a Custom Dashboard
View on page 337 for more complex monitor creation.
1
In the Dashboard Views portlet, right click to select
New > Simple Dashboard.
2
Select a name (for example SNMP Interface, to display the monitor configured in How
to:Create an SNMP Interface Monitor on page 314).
3
Click
Add Entity
in the Entities panel.
4
In the filter that appears, select the type: Interface.
5
Filter for the IP address of the entity monitored in the previous SNMP interface monitor
creation, select it and click
Add Selection
and
Done.
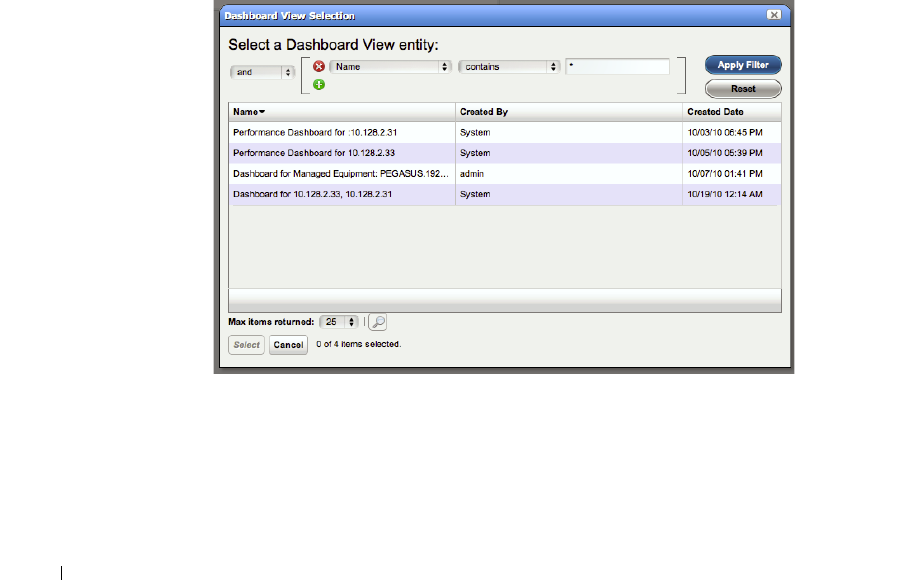
334
Dashboard Views | Monitoring
6
Select the ifInErrors attribute, and click the right arrow in the Dashboard View Attributes
panel.
7
Click
Save
. The dashboard view you have configured should appear in the portlet.
8
To launch it, right-click and either
Launch (Popup)
or
Launch (Maximize)
9
If you want to convert this simple dashboard to a custom dashboard so you can alter it further,
right-click and click
Convert.
10
Notice that you can also change the time/date format as described in Changing Dashboard
Time / Date Format above.
Performance Dashboard
This portlet lets you install and configure Dashboard Views as permanent displays rather than
portlets. When you initially install this portlet, it appears empty. The message “No Dashboard View
has been set:” appears with a
Select
button. Click that button to open the Dashboard View
Selection screen.
Dashboard View Selection
This screen displays any existing dashboards so you can select one for the Performance Dashboard
you want to appear on a page in Dell OpenManage Network Manager.
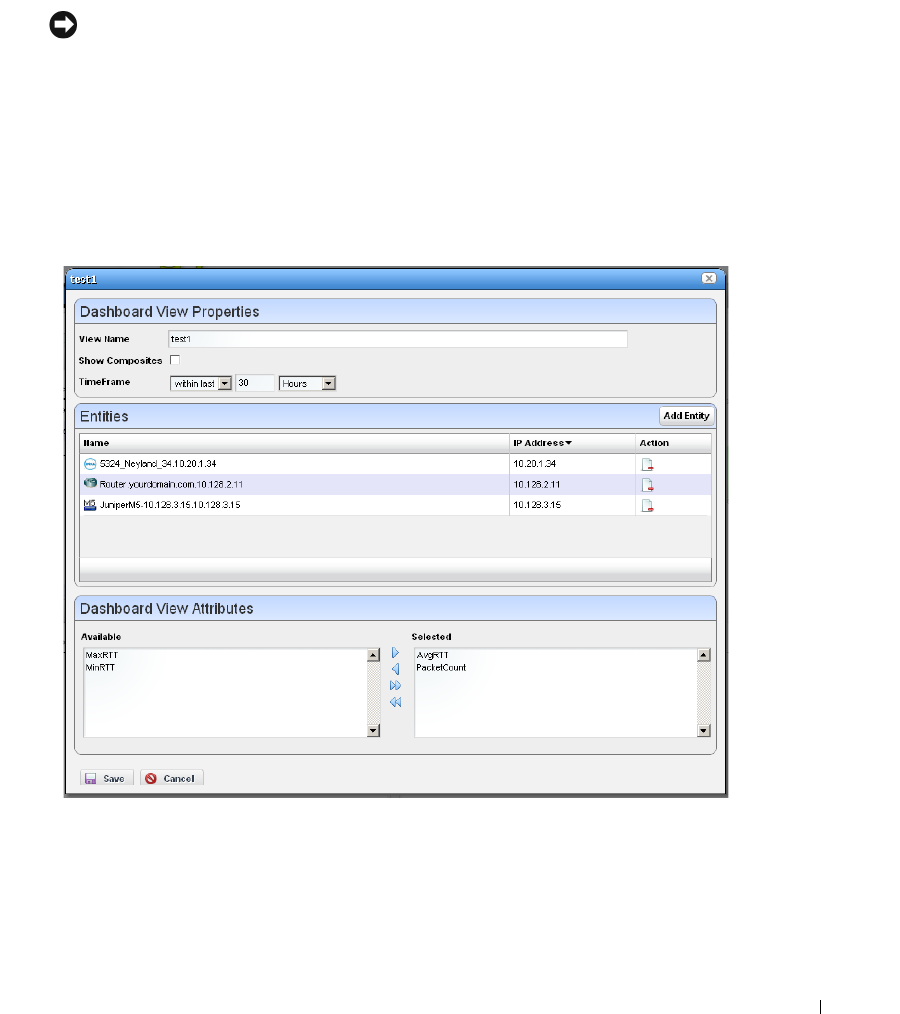
Dashboard Views | Monitoring
335
Use the filter at the top of this selector to limit the listed dashboards from which you can select.
See Dashboard Views on page 331 for more about creating and configuring the views from which
you select.
NOTICE
If you delete the Network Status Dashboard can put it back by adding the Performance Dashboard
portlet to the desired page, then select the desired Dashboard View you would like to display as your
Network Dashboard.
Dashboard Editor
When you
Edit
dashboard by right-clicking a resource in Managed Resources and selecting
Show
Performance
, or create (select
New
) a dashboard from the Dashboard Views portlet, an editor
appears that lets you select and rearrange the monitor components of the dashboard.
This screen has the following fields:
View Name
—The identifier for the dashboard. The default is “Performance dashboard for [IP
address],” but you can edit this. This is what appears in the Dashboard Views list.

336
Dashboard Views | Monitoring
Show Composites
—Show attributes that are constructed from other attributes. Composites
attributes are special attributes that consist of the attribute name and the instance name. For
example: CPU Utilization:cpu1. Some KPI metrics are composite. If you use SNMP Table
monitor, then pretty much all values retrieved are composite.
TimeFrame
—Use the selectors to configure the time frame for the performance measurement
displayed.
Entities
—Select the equipment you want to monitor. When you right-click to
Show Performance
with resource(s) selected, those resources appear in this list.
Dashboard View Attributes
—Click the arrows between
Available
and
Selected
panels to select
monitors for the dashboard. The Available Attributes list shows all the available attributes for
that device based on its monitor affiliations. If you select none, a chart appears for each
attribute that has data. This is the default. If the user moves some attributes to the
Selected
list then only charts for those attributes appear.
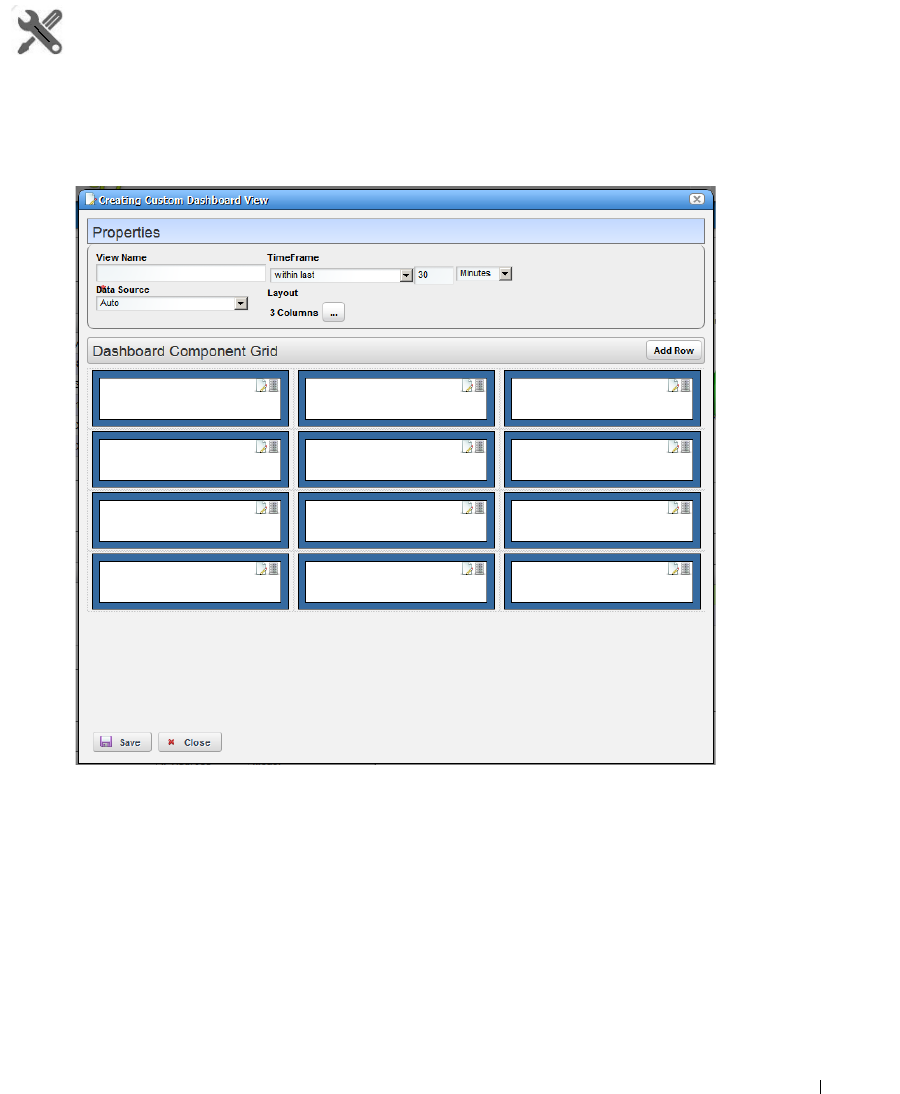
Dashboard Views | Monitoring
337
How To:
Create a Custom Dashboard View
The following steps create a custom dashboard view:
1
In the Dashboard Views portlet, select the
New Custom Dashboard
command. An empty
default view with twelve components appears.
The Properties panel contains the following controls:
View Name —The name of the dashboard view (Required)
Time Frame —The period over which to display the data. May be either relative (like last 30
minutes) or absolute (between specific dates and times). The specified frame applies to
all charts in the dashboard.
Data Source—Source for the data. Current displays current (raw) data. Hourly displays
rolled up hourly data. Daily displays rolled up daily data. Auto (default) determines
which data source to use based on the selected time frame.
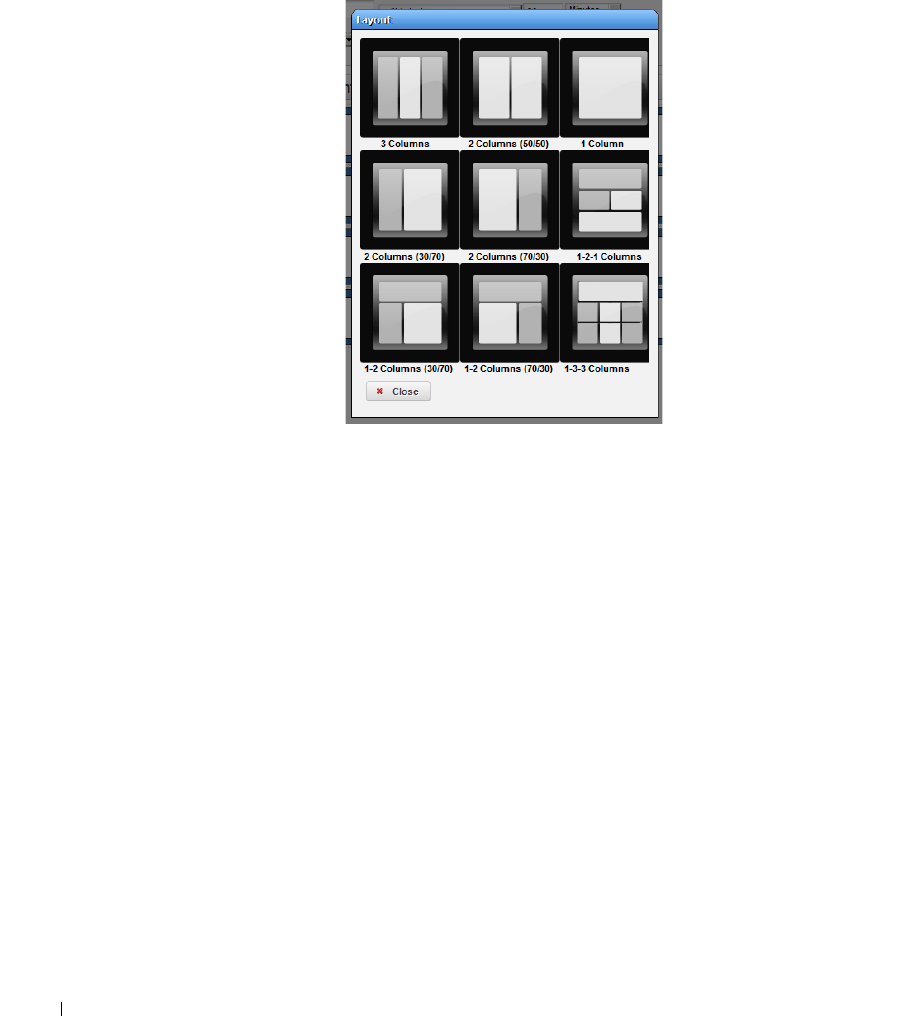
338
Dashboard Views | Monitoring
Layout—Select the desired layout style used to display the dashboard components.
2
To select a layout style, click on the ... button next to the current layout. The layout chooser
appears.
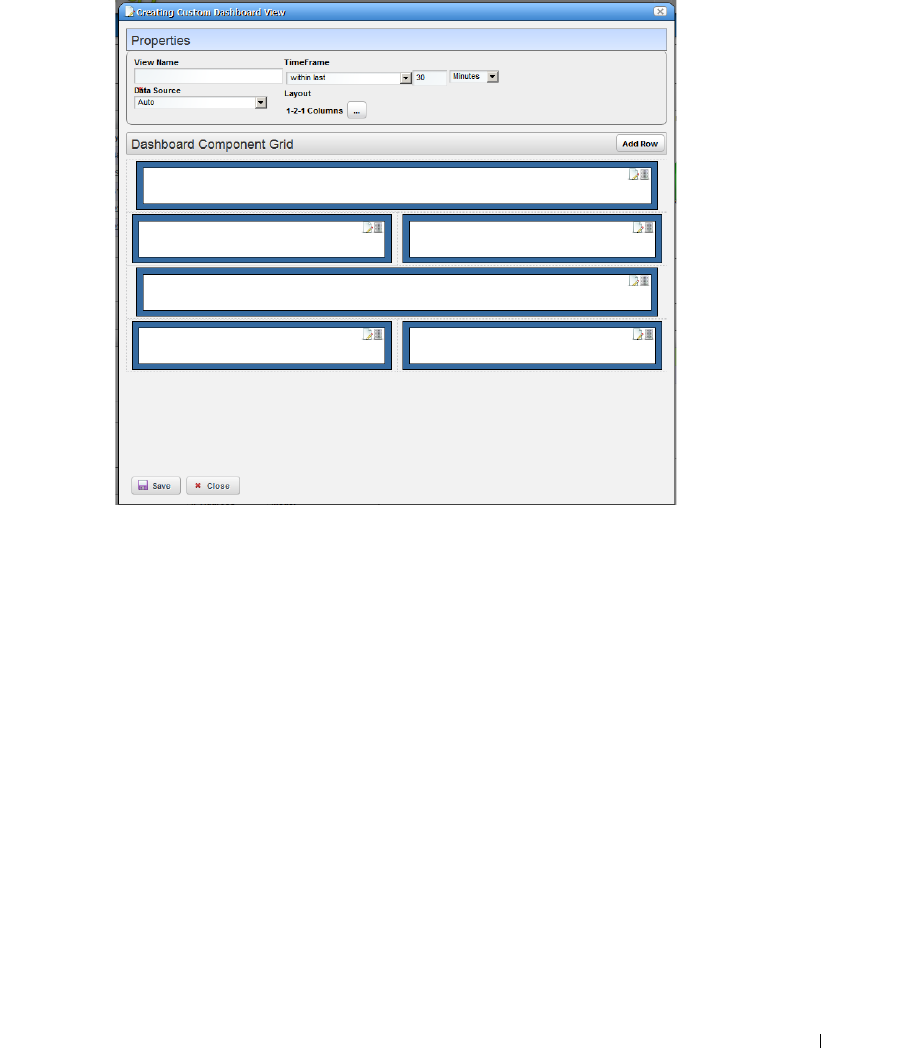
Dashboard Views | Monitoring
339
3
Click on the desired layout or click
Close
to keep the current layout. The components
displayed to reflect the selected new layout.
If no dashboard components have been configured yet a default configuration appears with
three or four rows depending on the dashboard style. If the dashboard components have been
configured it will create at least enough rows to display all the configured dashboard
components. Add more rows by clicking on the
Add Row
button. An individual dashboard
component can be deleted by clicking on the delete button on the component.
Moving Dashboard Components
4
To move a dashboard component to another location, click and drag it over another
component. When you release the mouse, the components exchange places.
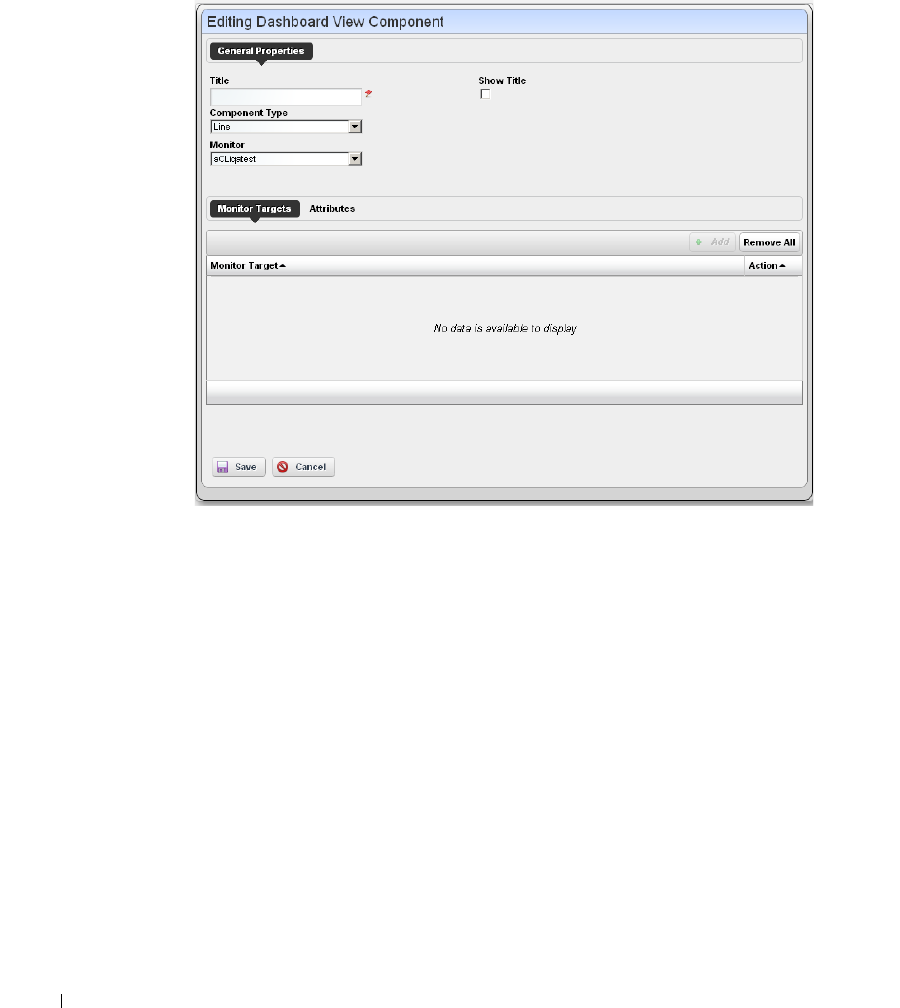
340
Dashboard Views | Monitoring
Configuring Dashboard Components
5
To configure a dashboard component, click the
Edit
button in the upper right corner of the
component. The component editor appears.
The following properties appear in the General Properties section:
Title —Title of this component (required)
Show Title—Check to display this title above the chart for this component. This overrides
the default title that is shown for some charts.
Component Type—Combo Box which specifies what type of component to create. These
include the following chart types, Line, Dial, Bar, Top Ta l k e rs (a line chart showing the
top [or bottom] n components for a specific attribute on a specific monitor) To p S ub -
components (a line chart showing the top [or bottom] n subcomponents belonging to a
specific device for a specific attribute. See
Other controls appear depending on the component type selected. These
components also have a Monitor control, a pick list where you can select from
which monitor the charted data originates. See Dial Chart Properties, Top
Talkers Properties and Top Subcomponents Properties below for specifics
about those.
The line and bar components have two tabs under the general properties sec-
tion: Monitor Targets and Attributes. The Monitor Targets section lets you select

Dashboard Views | Monitoring
341
the devices that are sources of data. Click the Add button displays the moni-
tor target selector.
6
The Attributes tab selects the attribute(s) that appear in the chart. If an attribute is a
composite, then its series appears in the Available Series listbox.
Select the desired series and click the right arrow to move them to the Selected Attributes
listbox.
If the attribute is not a composite, then nothing appears in the Available Series listbox. Here,
click the right arrow to move the attribute to the
Selected Attributes
listbox.
Dial Chart Properties
Dial charts have the following additional properties
Monitor
—Select which monitor the charted data comes from in the pick list.
Attribute
—The attribute to get data for.
Min / Max Value
—The minimum / maximum value on the dial.
Entity
—The monitor target to get the data for. Clicking on the + button brings up the entity
selector.
Top Talkers Properties
Top Talkers components have the following properties.
Monitor
—Select which monitor the charted data comes from in the pick list.
Attribute
—The attribute to get data for.
Max # of Entities—
The number of entities to display
Order
—Select either
Ascending
(Bottom n), or
Descending
(Top n).
Top Subcomponents Properties
Top Subcomponents components have the following properties.
Entity
—The parent entity for the found subcomponents. Clicking on the + button brings up the
entity selector.
Attribute
—The attribute to get data for.

342
Show Performance Templates | Monitoring
Max # of Entities—
The number of entities to display
Order
—Select either
Ascending
(Bottom n), or
Descending
(Top n).
Convert Simple Dashboards to Custom Dashboards
To convert a simple dashboard to a custom dashboard use the
Convert
command on the
Dashboard Views
menu. You cannot convert custom dashboards to simple dashboards.
Show Performance Templates
By default, the Show Performance command displays data for the first twelve attributes it finds.
You can control which attributes appear when you select Show Performance by creating a
performance template. A performance template lets you set dashboard parameters and associate
them to one or more device models. Then, when you execute Show Performance on a device of that
type, those dashboard parameters display the dashboard for that device.
How To:
Create A Performance Template
To create a performance template, follow these steps:
1
Right click in the Dashboard Views portlet and click on the
Performance Templates
menu
item.
2
The Performance Templates manager appears.
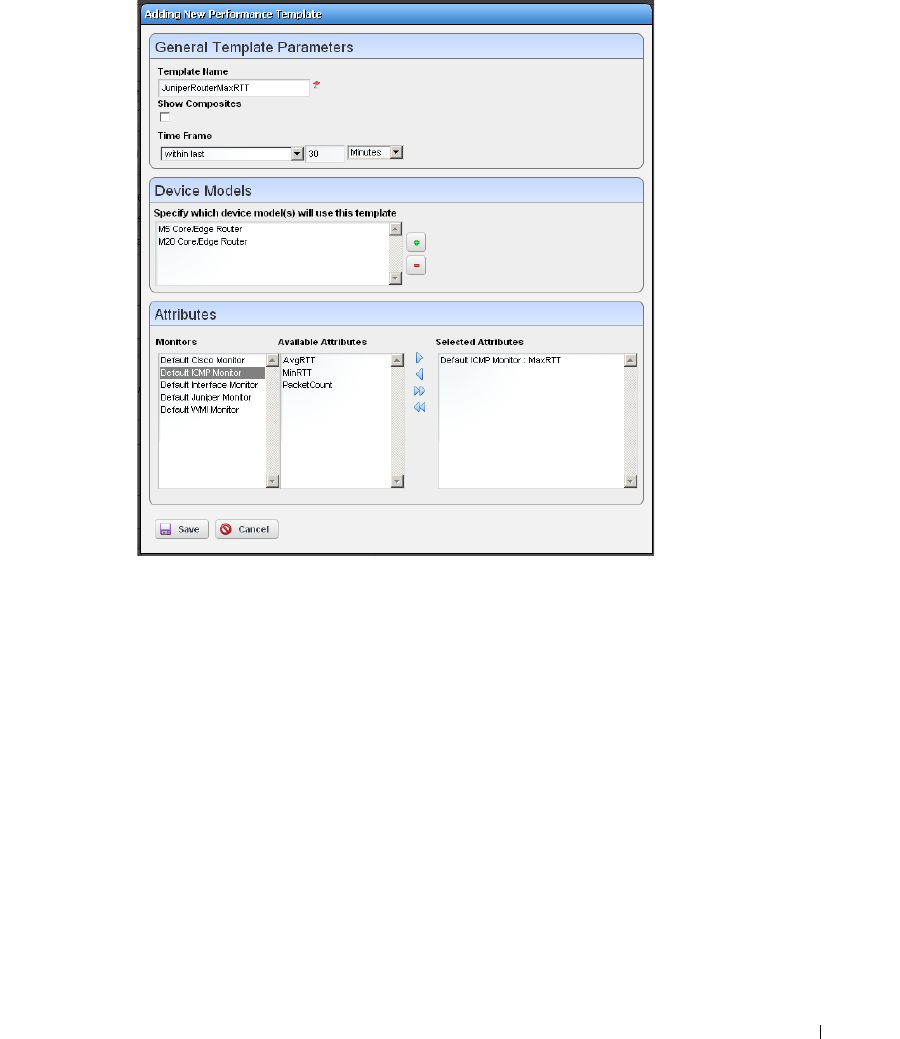
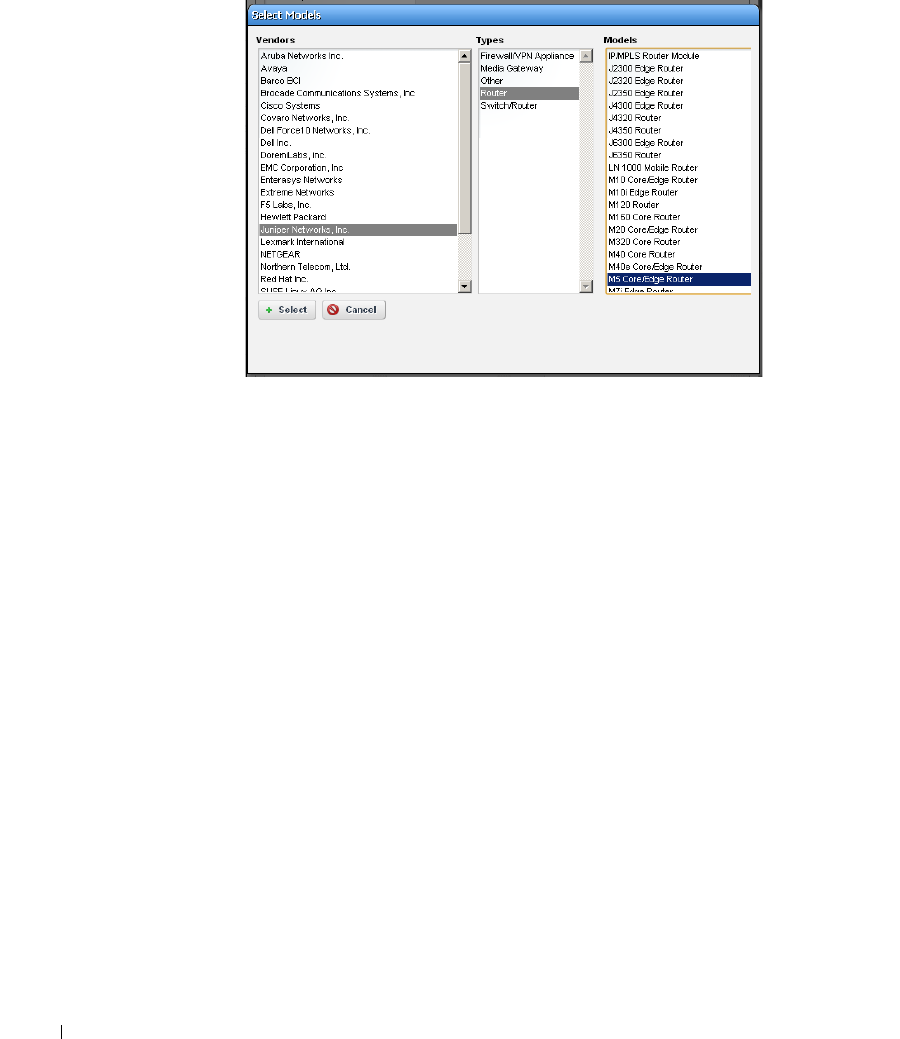
344
Show Performance Templates | Monitoring
5
To specify which device model(s) this template will apply to, click on the + button in the
Device Models panel. The model selector appears.
Select multiple devices by clicking + repeatedly, selecting a single device each time. You can
also make several templates for each device. See Multiple Performance Templates on page 345
for the way that works.
6
Click on a vendor to see the device types for that vendor. Then click on a device type to see
the models available for that vendor and device type. Select the model you want and click on
the select button.
7
To select the attributes that you want to appear by default in a performance dashboard for the
selected device, click on a monitor to see the attributes available for that monitor. Click on
the right arrow button to move the selected attributes from
Available
to
Selected
. Those are
the attributes that will appear by default in dashboards for the selected device.
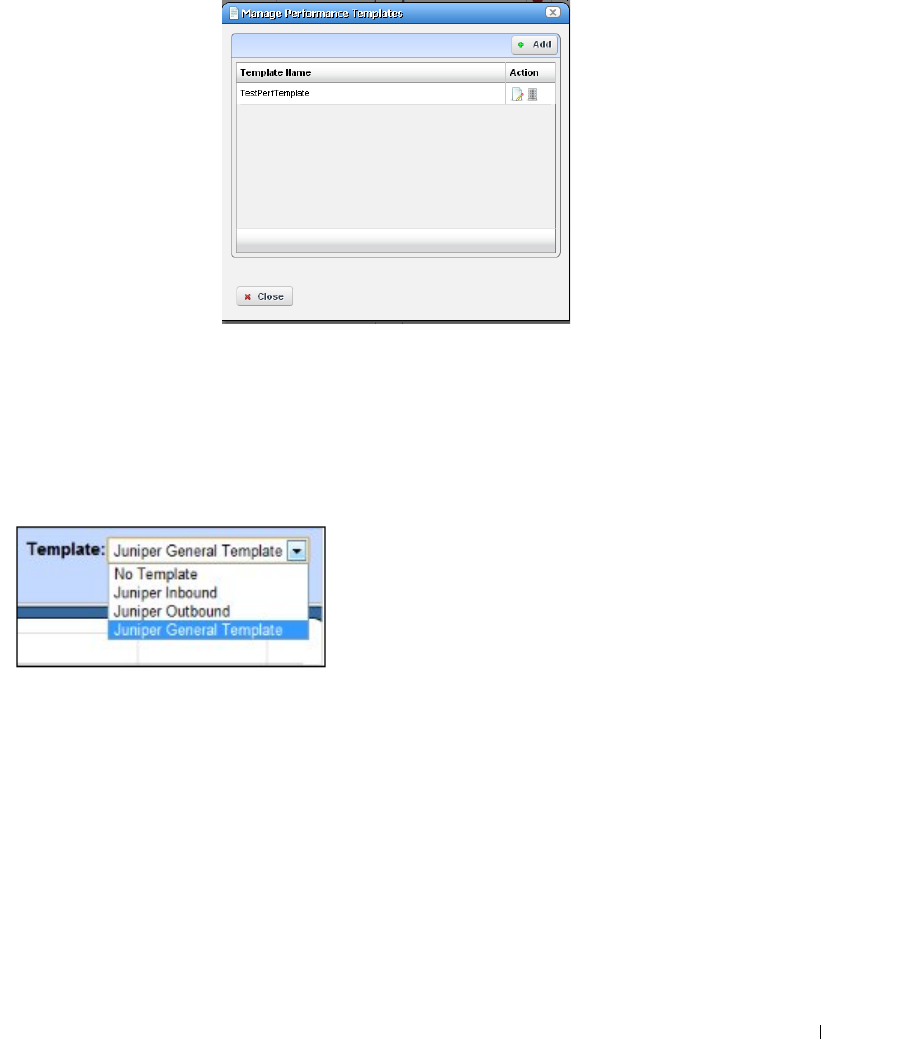
Show Performance Templates | Monitoring
345
8
When you have selected all the parameters you want, click
Save
. It then appears in the
template list.
To edit or delete your template, use the buttons in the action column of the table.
Now when you click on show performance, Dell OpenManage Network Manager checks whether a
template for that device type exists. If one exists, then that template guides what appears in the
performance view for the device.
Multiple Performance Templates
The template name appears in the upper right corner
of dashboards that appear when you select Show
Performance.
If other templates for that device type exist they also
appear in a template pick list in the upper right corner.
You can pick another template to display its attribute
selection. The
No Template
selection displays the
default dozen attributes that would appear if you
selected Show Performance without a template defined for the device.

346
Show Performance Templates | Monitoring

| Traffic Flow Analyzer
347
11
Traffic Flow Analyzer
OpenManage Network Manager’s Traffic Flow Analyzer listens on UDP ports for sFlow, datagrams.
A flow is a unidirectional stream of packets between two network nodes. The following key
parameters appear in flows:
• Source IP address
• Destination IP address
• Source port number
• Destination port number
• Layer 3 protocol type
• ToS byte (Type of Service)
•Input logical interface
Using that data, Traffic Flow Analyzer can help you visualize network traffic, troubleshoot and
anticipate bottlenecks.
NOTE:
Typical packages come with a default limit to the number of monitored devices. Upgrade your license if
you want to exceed the package limit.
Supported versions include sFlow v5.
Parse errors can appear in the application server log for some flow data.
Parse error: Unable to process non IP type flow. Type: <Number>
<Number>
represents an Sflow packet type. This application only parses data of type
IP
. When
Dell OpenManage Network Manager receives non-IP packets, it drops packets and this error
appears.
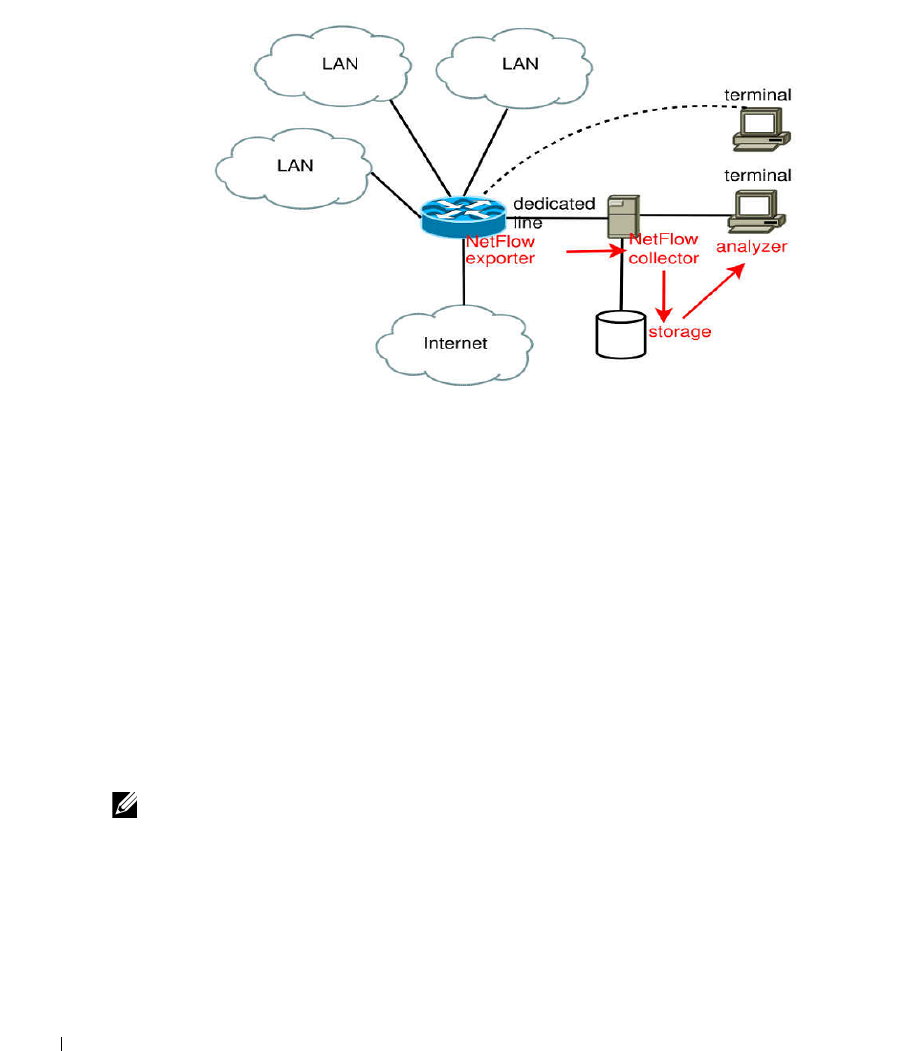
348
| Traffic Flow Analyzer
How does it work?
• The sFlow exporting router monitors traffic traversing it
• ...and the router becomes an Exporter of sFlow data.
• It forwards information to the sFlow Collector
• Collector stores, correlates and presents the information about
• Traffic bottlenecks in networks.
• Applications responsible for bandwidth utilization.
Definitions
sFlow
—For Delldevices.
Collector
—Application listening on a UDP port for sFlow datagram.
Exporter
—Network element that sends the sFlow datagram.
Conversations
— IP communications between two network nodes.
Flow
—A flow is a unidirectional stream of packets between two network nodes.
NOTE:
Counter sFlows do not appear as Traffic Flows, but essentially duplicate Performance metrics for
interfaces. Flows how data traverses between two endpoints. You can monitor interfaces with
Performance monitors. See Chapter 10, Monitoring.

| Traffic Flow Analyzer
349
Setup
If they are not already set up to emit flow information, set up devices themselves to emit flow data.
Consult the manuals for your devices for instructions about how to do this. Make sure your setup
does not overwhelm Dell OpenManage Network Manager with information.
Set up Dell OpenManage Network Manager with the following:
Exporter Registration
—To register a device, right-click in Resources portlet, after you select the
router and choose
Tr a f fi c A n a l y z e r > R e g i s t e r
. The system should then be ready to accept
flow data from the device.
Router Configuration
—You must configure the router to send flow reports to the OpenManage
Network Manager server on port 6343 for sflow by default.
Resolving Autonomous System (AS) Numbers
—OpenManage Network Manager provides local
resolution of autonomous system numbers (ASN) based on static mapping of AS number
registrations. It also supports user overrides to the default mappings. To do this, configure
properties you can find in the
\owareapps\trafficanalyzer\lib\ta.properties
file. Remember, best practice is to override properties as described in Overriding Properties on
page 15.
NOTE:
Dell Powerconnect devices allow only one collector per port.
How To:
Use Traffic Flow Analyzer
1
Register the device(s) you want to analyze. (As in Exporter Registration). A message confirms
registration’s success.
NOTICE
You can also display a Registered column in the Managed Resources portlet, and click the heading to
sort the registered Flow exporters to the top of the display.
2
Look in the Traffic Flow Portlet for the flows captured.
3
Remember, you can Drill Down to specific data, and Search for specific devices monitored.
For more about Traffic Flow in context of network management, see Traffic Flow Analyzer -
Example on page 356.
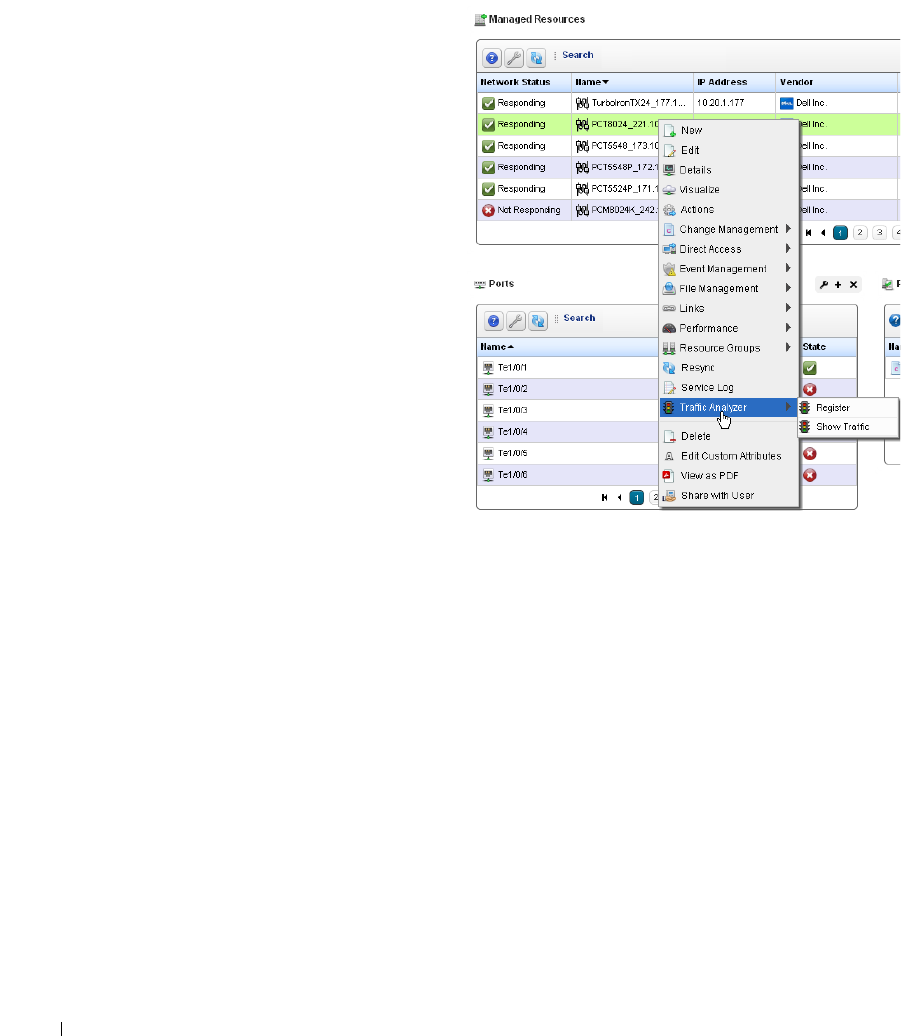
350
Traffic Flow Portlet | Traffic Flow Analyzer
Exporter Registration
Before you can collect traffic data from a
device, you must
Register
it as a traffic
flow exporter. If a device is not registered,
the
Register
command appears in the
menu. If it is registered the
Unregister
command appears. When you
successfully register an eligible device, a
success message appears; otherwise, a
failure message appears, and no
registration occurs.
The
Show Traffic
menu option opens a
drop-in (full screen) Traffic Flow Portlet
with a pick list of available information
types.
This displays the
Exporters Detail, Top 5
Applications, Top 5 Autonomous
Systems, Top 5 Conversations, Top 5
Endpoints, Top 5 Protocols, Top 5
Receivers,
and
Top 5 S enders
related to
the device selected before right-clicking.
Select a type and click the
Refresh
double arrow to the right of the selector.
The screen that then appears has the features of the Expanded Traffic Flow Portlet described
below. See also How to: Use Traffic Flow Analyzer on page 349.
Traffic Flow Portlet
Traffic Flow Analyzer uses several types of portlets, one for each of the types of objects on which it
reports. These are Applications, Autonomous Systems, Conversations, Endpoints, Exporters,
Protocols, Receivers and Senders.
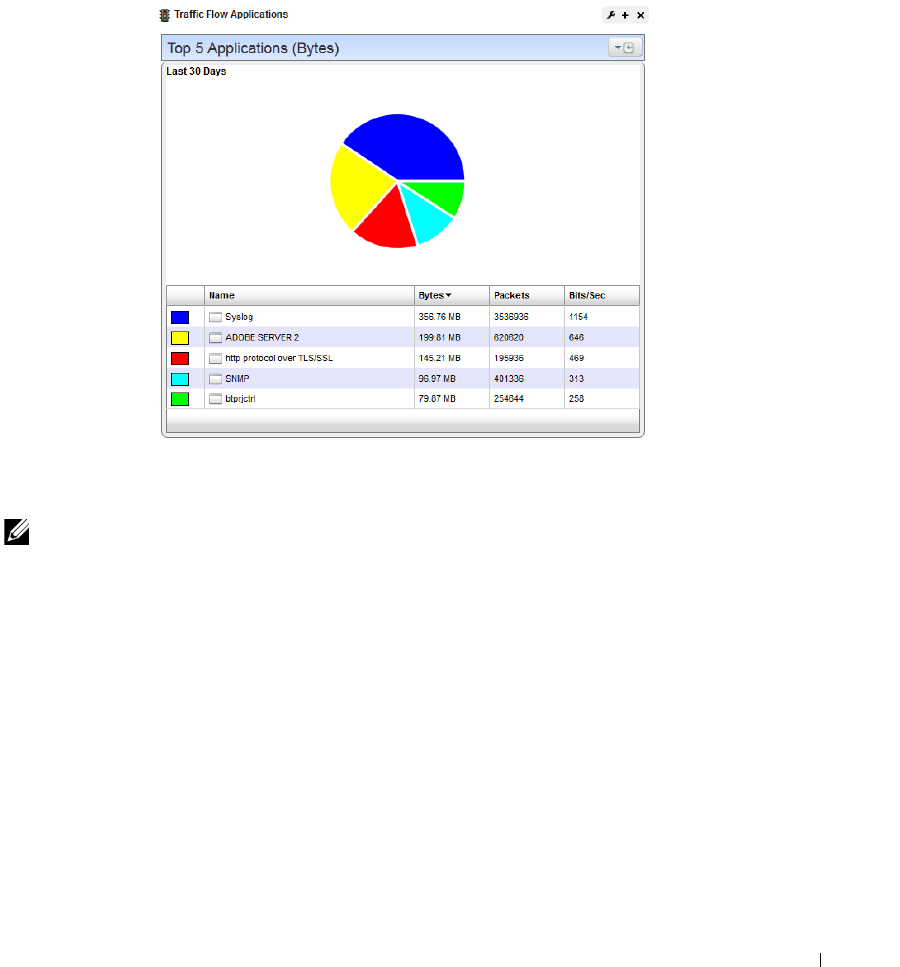
Traffic Flow Portlet | Traffic Flow Analyzer
351
When you add one of the traffic analyzer portlets to a page, its summary, or minimized form
appears. This displays a simple view containing a pie chart and a table showing the summarized
collected data over the configured time period. The only thing that can be changed in this view is
the period. Change this by clicking the clock dropdown button in the upper right corner of the
portlet.
The Expanded Traffic Flow Portlet displays an interactive graph. You can also Drill Down to details
about components within this portlet by clicking on one of the links in the table below the graph.
NOTE:
The selected period determines whether data is present, especially if you have just started monitoring
Traffic Flow. Choose the shortest period to see data immediately (it still takes a few minutes to appear),
and select longer periods only after monitoring has run for longer periods.
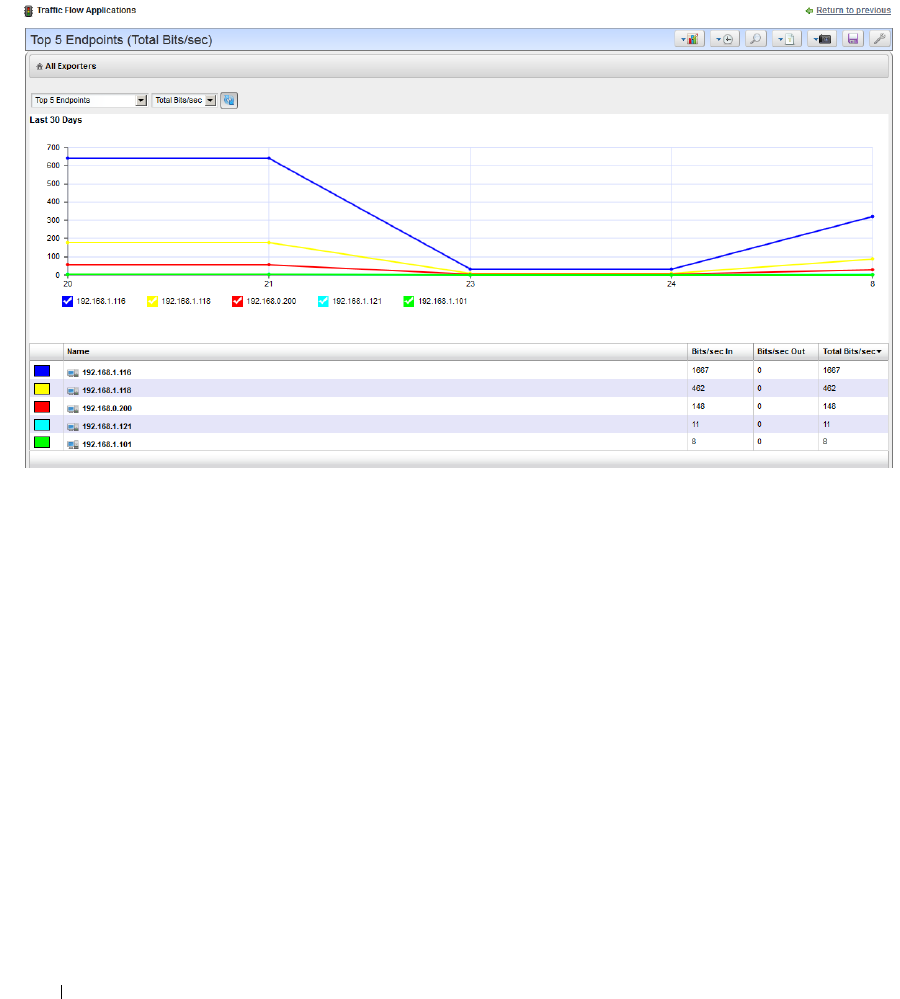
352
Traffic Flow Portlet | Traffic Flow Analyzer
Expanded Traffic Flow Portlet
When you expand the portlet, a more complex interactive view appears. Initially, it displays a line
graph for the selected period.
It may seem a device reporting the same value as others is not graphed properly, but mousing over
the graph displays the value.
The following controls appear in its title bar:
Select Chart Type
—Lets you change the chart type. Available chart types include
Pie, Line, Bar,
Stacked Bar
and
Column
.
Select Timeframe
—Lets you change the period between
Last 15 Minutes, Last Hour, Last 24
Hours, Last 5 Days
and
Last 30 Days.
Data “rolls up” in a summary for each period to the
next longest period, so you must select the correct period to see what has been collected.
Data for last 15 minutes typically appears after about 5-10 minutes of collection. At least one
point of rollup data appears for the longer periods after the next shorter duration has passed.
This means you need a minumum of 5 minutes collecting data to show chart data for the 15
minute interval. A minumum of 15 minutes collecting data needs to occur to show chart data
for the last hour, and a minumum of an hour collecting data needs to occur for 24 hour chart
data to appear. Finally, a minumum of 24 hours collecting data needs to occur for 30-day chart
data to appear.
These figures assume a maximum 256 bytes of data export at 15 second intervals, minimum.
If the interval is too much longer then only one flow appears per interval and less data

Traffic Flow Portlet | Traffic Flow Analyzer
353
appears. If the flow size is too large it takes more time to accumulate the flow data before the
device can send it.
Search
—Displays a search dialogue to find specific traffic data.
Select Report Type
—Lets you change the report type between Top 5, 10 or 25 and Bottom 5, 10 or
25.
Traffic Flow Snapshots
— Load or save a snapshot (preserved views) of traffic flow.
Export to PDF
—Saves the current view to a pdf file. You can retrieve the report in the
My Alerts
area at the lower left corner of the portal.
Settings
—Configures how to retain data, based on collection / rollup intervals. Minutes rollup to
10-minute intervals, which rollup to hourly, which rollup to daily, which rollup to weekly data.
You can also set the maximum number of rows per rollup table.
Below the title bar a navigation bar displays the context path. See Drill Down on page 354, below,
for more about this.
Below that navigation bar a row containing the following controls appear:
Entity Type
—Selects the type of entity to report on (Applications Detail, Conversations, End
points, and so on).
Attribute
—Selects which attribute to graph (Bytes, Packets, Bits/Sec).
Refresh
—Refreshes the screen (runs the report) applying any new settings.
NOTICE
You can check / uncheck by clicking on the colored squares in the legend below these graphs. This
reveals / conceals lines connected to the labelled item.
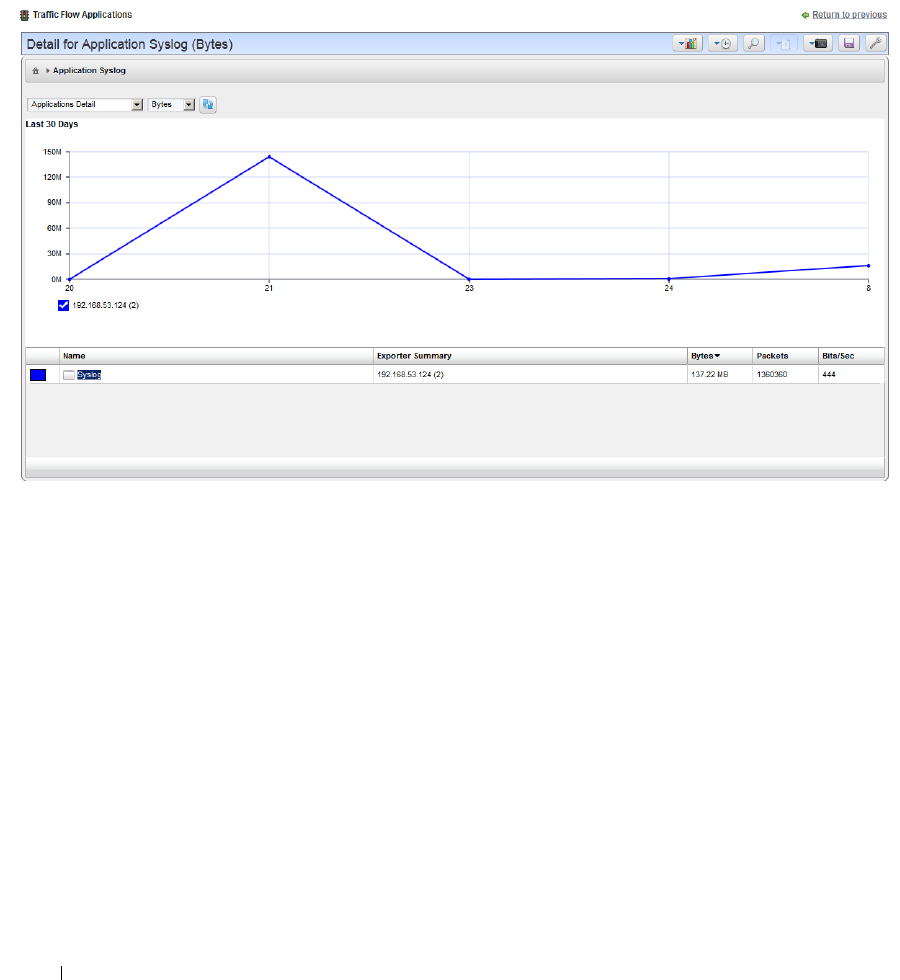
354
Traffic Flow Portlet | Traffic Flow Analyzer
Drill Down
you can “drill down” into a report by clicking on one of the links in the table. This displays a detail
view of the selected entity and the name of the entity appears in the navigation bar.
When a detail view appears, the entity type appears as in the title bar. You can change to a “Top /
Bottom n” report of a different type, then click refresh to display a report of the top entities that
apply to the current detailed entity. This process can continue until the conversation detail view is
reached. This is the end of the line.
To return to the root view, for the drill-down, click the house icon in the upper left corner of the
expanded portlet.
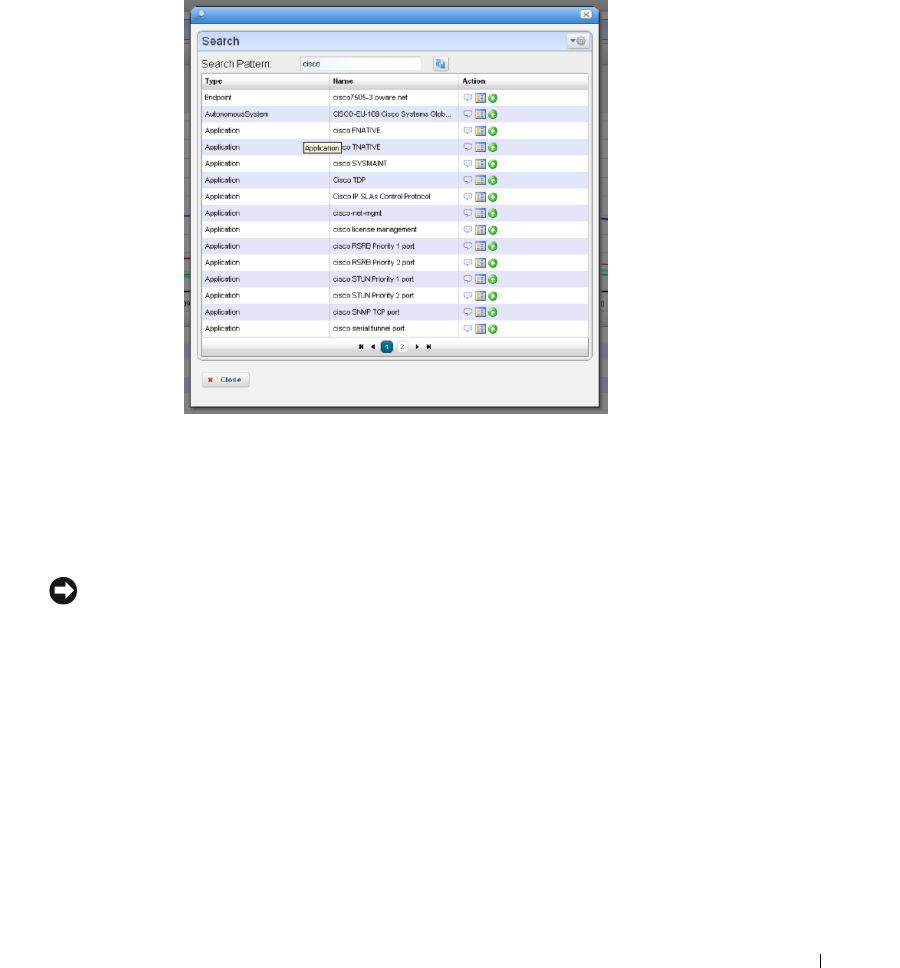
Traffic Flow Portlet | Traffic Flow Analyzer
355
Search
Search by clicking on the Search (magnifying glass) icon in the title bar. Type any string in the next
screen to search through the traffic data. A list of all entities found matching the string appears
below it.
Entity found in the search support the following actions:
View Top Conversations
—Displays the top n conversations for the selected entity.
Show Detail View
—Displays a top level detail view of the selected entity.
Add to Current View
—Adds the entity to the current view and drills down to it.
NOTICE
The Settings button (the gear in the upper right corner) lets you confine the search by types (All,
Applications, Protocols, and so on).
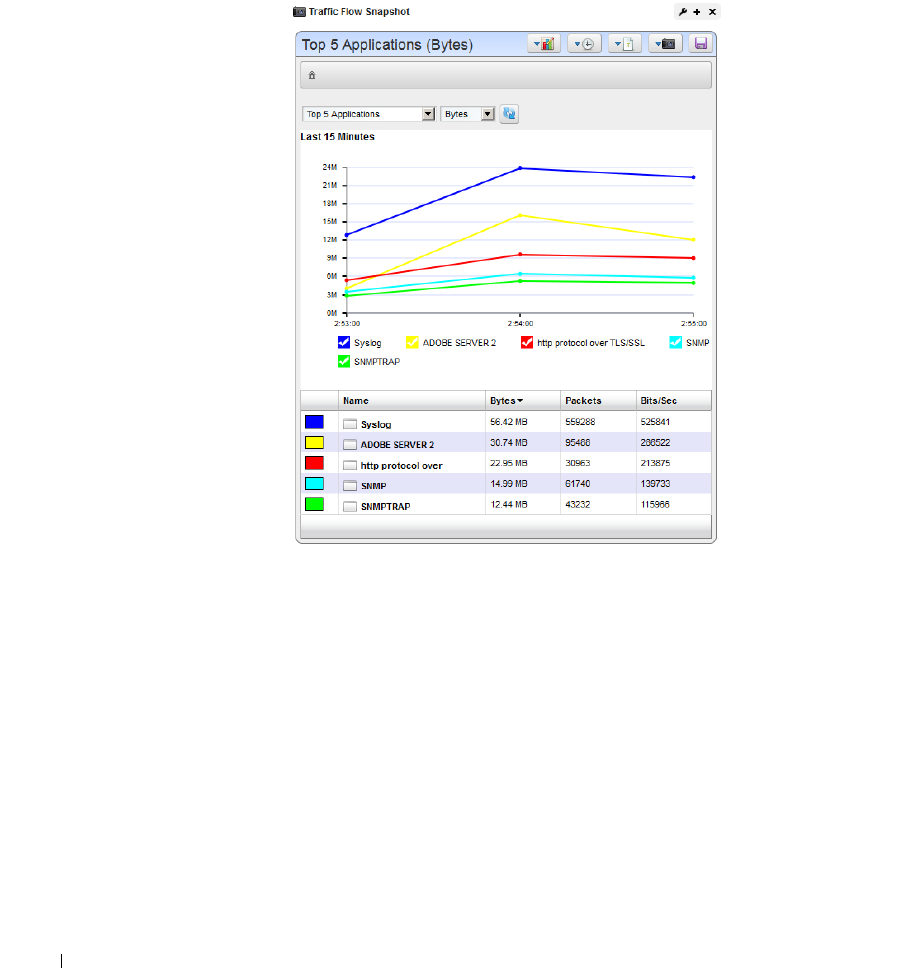
356
Traffic Flow Analyzer - Example | Traffic Flow Analyzer
Traffic Flow Snapshot
This portlet lets you display Traffic Flow you configure and save as a snapshot in a portlet visible on
any Dell OpenManage Network Manager page. It is, in effect, a portlet that permanently displays
the Expanded Traffic Flow Portlet, beginning with the selected snapshot.
After adding this portlet to a page, use the selector to choose which snapshot you want to appear.
Refresh the portlet with the double arrows to the right of the units displayed. You can also change
what appears, the units, the time interval, and so on, just as described in Expanded Traffic Flow
Portlet on page 352.
Traffic Flow Analyzer - Example
The following describes typical situations where flow is useful. When ports are over-utilized
because of intermittent performance problems diagnosis of the problem sometimes difficult. Turn
on flow traffic data collection to evaluate who, what applications, and so on, are responsible for the
traffic on the affected ports. This avoids getting overwhelmed with collection of traffic going in all
directions. Follow these steps to do this:
1
From the Resources monitor, select a desired router that has support for Flow

Traffic Flow Analyzer - Example | Traffic Flow Analyzer
357
2
Enable sFlow on most impacted routers that support sFlow. Also, register a number of
exporters to enable an efficient and scalable data collection environment.
NOTE:
You can disable sFlow and unregister exporters.
3
After sFlow has been running for a while, verify that bandwidth utilization is within
expectation. This will help insure optimum performance of critical business applications.
4
Select the Top 5 Applications portlet (or add it to the page).
5
From the list of the Top 5 Applications, you’ll typically see most bandwidth is being
consumed by the key applications in our organization.
Alternative 1
6
To ensure bandwidth is not being hijacked by unauthorized or unwanted video or music
streaming applications, select the Top 5 Conversations.
7
Often the top conversation is video streaming software.
8
To answer “Where and who is running this rogue application?,” drill down into the
conversation to see End points involved in the conversation. This identifies the user running
the streaming application. You could now go and stop (or block) this rogue application.
Alternative 2
An alarm indicates port X is surpassing its threshold. If the port has become a bottleneck in the
overall network bandwidth, we want to identify what applications are at cause, and who is
responsible for running them.
1
Look in the Top 5 Traffic Flow Endpoints portlet.
2
From the list of the Top 5 Endpoints, you will typically see that port X is high on the list.
3
Expand the portlet and drill down into the port X endpoint to see what are the top
conversations going through port X.
4
Drill down into conversations to identify any unauthorized applications.
5
Drill down further to identify users of any unauthorized applications
6
Now, go stop them!

358
Traffic Flow Analyzer - Example | Traffic Flow Analyzer

| Change Management / ProScan
359
12
Change Management / ProScan
Dell OpenManage Network Manager’s change management utility is ProScan, which lets you scan
stored configurations to verify managed devices compliance with company, department or industry
standards. This application automatically tracks all changes occurring to managed devices. You can
report on user-specified values found in persisted backup configuration files for a group of devices.
This lets network managers, security officers and external auditors generate detailed audit trail
documents to validate compliance with both internal standards (ISO 17799, NSA Guidelines) as
well as industry regulations (Sarbanes-Oxley, GLBA, HIPAA).
Compliance reporting lets you specify a text string, regular expression, or optionally the generated
configlet from File Management (NetConfig) for matching. Group results must be separated by
device like Adaptive CLI Manager. When ProScan policies run, the application emits notifications
whose contents depend on whether compliance was or was not maintained.
NOTICE
Your system may have several ProScan examples. You can use these as provided, or alter them to suit
your network.
How To:
Use ProScan / Change Management
The following outlines common use cases for this software, and the steps to achieve the goals of
each case:
Goal: Verify configurations are compliant on a scheduled / recurring basis.
1
Create ProScan policy(ies) based on what indicates compliance. Right-click
New > Policy
in
the ProScan portlet.
2
Specify the Name and Input source (based on Device Backup, Current Config, Configuration
Label, By Date and Adaptive CLI Results)

360
| Change Management / ProScan
3
Add Targets > Filter Option available for selecting Equipment/Group
NOTICE
The advantage of selecting dynamic device groups is that newly discovered devices of the selected type
are automatically members of the group, so they are scanned too. A benign warning (“No proscan
policies have target group(s)”) lets you know you have not selected groups when you execute a ProScan
policy without them.
4
Specify Proscan Compliance Criteria. Add Criteria. For example, SNMP communities
Do not
contain
the following:
snmp {
community public {
5
Save.
6
Execute or schedule your created ProScan policies.
7
Any out-of-compliance devices throw an alarm, which you can email, or configure to trigger
other actions (see the next use case).
Goal:...And if not compliant restore compliant configuration
In addition to the steps in the previous section:
8
In the Actions portlet, create an action to restore the labelled compliant configuration.
The Action here is
Netconfig Restore
. To find it in the Action panel, click
Add Action
, and
select
Custom
. Click the
Keyword Search
link on the right side of the screen, and notice the
magnifying glass appears in the
Action
field. Enter
Netconfig
in that field and click the
magnifying glass. The available Netconfig actions, including
Restore
appear in the drop-down
combo box.
9
Create event processing rule that says when ProScan fails execute the restore action in 7.
If you have multiple device types you do not need to assign actions for each device, or even each
device type. OpenManage Network Manager supports the assigned policies, so it knows which
actions to do to that device based on which device sent the trap.
How To:
Configure ProScan Groups
If you have different ProScans for different device type, then you can run a ProScan Group and
automatically scan even different types of devices. For more about this, see Creating or Modifying
ProScan Policy Groups on page 381.
1
Right-click and select
New > Group
.
2
Specify the Proscan Policy Group Parameters.
3
Add ProScan Policies. These policies can be in multiple groups.

| Change Management / ProScan
361
4
Add Targets. Notice that group targets appear in the “child” policies, grayed out. Child
policies can add more targets.
5
Save.
6
Execute or schedule the group policies to run against the selected targets.
How To:
Do Change Management (Example)
The following describes an example use of Change Manager. This backs up a configuration file,
modifies it, then scans the file for the modified text, and acts according to the result. The following
steps describe how to do this:
1
Back up a device configuration. Select a device and click the
File Management > Backup
right-click menu in Managed Resources portlet.
2
Right click, and Export this backup to a file in the Configuration Files portlet.
3
Edit this config file, adding the word “MyTestContact” somewhere in its text that has no
impact. For example, the snmp-server contact, or in comments. Some devices let you create
descriptions within their configurations so you can enter a word without impact there.
4
Now import this edited file from the Managed Resources portlet after you have right-clicked
on the same device from which you exported it. Renaming it something distinctive is helpful.
5
Right-click this file and
Restore
to the device. Since the name is a comment or description, it
should not interfere with the device’s operations.
6
Right-click the device and select
File Management > Backup
. This makes the
MyTestContact file label Current.
To confirm MyTestContact is labeled Current, you can use an Advanced filter in the
expanded Configuration Files portlet to view only Current labels.
7
Now, create a ProScan policy by right-clicking in the ProScan portlet, selecting
New > Policy.
8
In the General tab, name this policy MyTestContactScan, and as an input, select the
Configuration Label > Current
label as the Input Source.
9
In the Targets tab, select the equipment from which you exported the config file.
10
In the Criteria tab, click
Add Criteria
enter
contains
MyTestContact as the
Match All of the
following criteria
.
11
Click
Save.
12
Right-click the new policy and select
Execute Compliance
.
13
The audit screen that appears should indicate
Success.
14
Right-click and
Open
the MyTestContactScan policy, and change the Criteria to “does not
contain” MyTestContact.
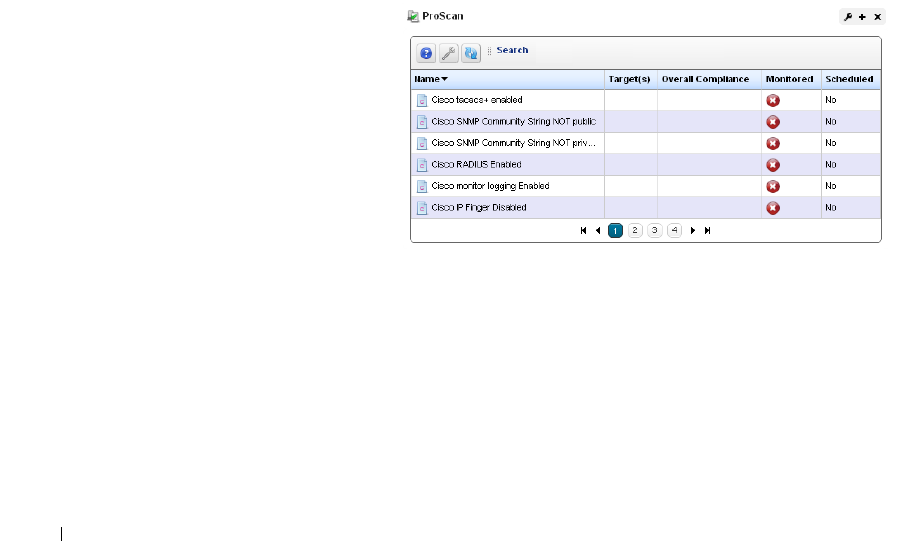
362
ProScan Portlet | Change Management / ProScan
15
Save
16
Re-execute the policy.
17
The audit screen that appears should indicate
Failure.
Alarms / Events
Once you have a ProScan policy that has failed, the redcellProScanFailureNotification alarm
appears in the Alarms portlet. Success produces an event, not an alarm (visible in the Event History
portlet) called redcellProScanClearNotification.
To create a response, create processing rules for the event / alarm (see Event Processing Rules on
page 136). For example, you could restore the Compliant-labeled configuration file if
redcellProScanFailureNotification occurs, or send an e-mail to a technician, among many other
responses.
Some Limitations in this Example
Note that this example does not change authentication, either for telnet or SNMP. If it did alter the
SNMP authentication, you would have to create an SNMP authentication alternative before
scanning could occur.
ProScan Portlet
This portlet lets you configure
compliance requirements. You
can use filtering in the Expanded
ProScan Portlet to limit the
visible policies.
The
Icon
and
ProScan Type
columns indicate whether the
policy is a single policy or a group.
Columns also display the
Overall
Compliance
of a policy, and the
Ta rg e t( s )
(number of devices to
scan), and whether the policy is
Monitored
(red means no, green means yes. See Proscan on page 322 in Chapter 10, Monitoring for
details). Finally, you can see whether a policy’s execution is scheduled (and whether the schedule
has occurred). To execute a policy manually, go to the Managed Resources portlet, and right-click
the targeted device to find the
Change Management
menu item. You can
Execute ProScan
policies
that target the device with that menu item. If you want to execute a ProScan policy not already
associated with the device or group, then select
Execute Proscan Policy.
A selection screen appears
where you can select a policy and either execute or schedule it.

ProScan Portlet | Change Management / ProScan
363
Overall Compliance
Overall Compliance can have the following values and flag icon colors:
All Compliant
—Icon: Green. All selected equipment is in compliance with the policy.
None Compliant
—Icon: Red. None of the selected equipment is in compliance with the policy.
None Determined
—Icon: blank. None of the equipment has been tested for compliance.
Partial Compliance
—Icon: Yellow. Not all equipment complies with the policy but all equipment
has been tested.
Compliance Varies
—Icon: Yellow Not all equipment has been tested for compliance. The tested
equipment might be compliant or not compliant.
Portlet Menu
This screen also has the following right-click menu items:
New
— Select either a new policy or group. Creating a new policy opens the ProScan Policy Editor,
through which you can define one. See Creating or Modifying a ProScan Policy on page 365
for more information about the Editor. See Creating or Modifying ProScan Policy Groups on
page 381 for the group editor.
Edit
—Opens the selected policy or group for modification. See Creating or Modifying a ProScan
Policy on page 365 for more information. See Creating or Modifying ProScan Policy Groups
on page 381 for the group editor.
Refresh Targets
—Queries to check targets, particularly those in dynamic groups, are up-to-date.
NOTICE
Best practice is to Refresh ProScan Targets before running a scan particularly if your network has
changed since the last scan. You can also schedule this. See Schedules on page 118.
Modify Targets
—Lets you modify and/or select target equipment for the policy.
Schedule
—Configure a policy to run on a schedule.
Audit
—Opens an Audit Viewer with the results of a selected policy’s runs. This is one way to see
the historical results of proscan policy runs. Another is to consult the Compliance Policy
Summary snap-in in the Expanded ProScan Portlet.
Delete
—Deletes the selected policy. Select the item to remove and click
Delete
. The application
prompts you for confirmation.
Import / Export
—Lets you import policies or export the selected policy.
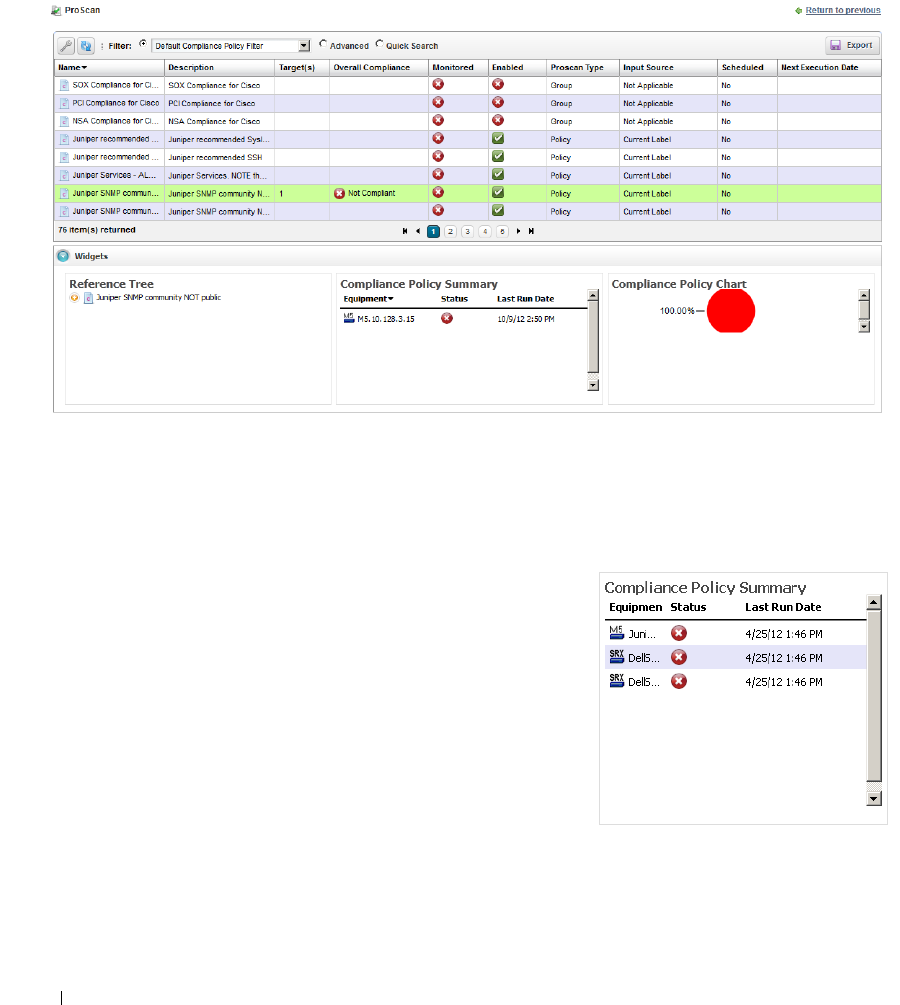
364
ProScan Portlet | Change Management / ProScan
Expanded ProScan Portlet
The expanded ProScan portlet lets you see the Compliance Policy Summary, a reference tree of the
connections between a policy and its targets, and a Compliance Policy Chart snap panel.
See Compliance Policy Summary on page 364 for a description of the snap panel that appears
below the listed policies in this manager.
Compliance Policy Summary
This snap panel appears at the bottom of the expanded
portlet described in
ProScan Portlet on page 362
. It
catalogs the compliance policy’s history and lists the
Equipment
scanned
,
a status icon indicating whether the
run discovered equipment
in
(green) or
out
(red)
of
compliance. If you added equipment to a policy before it
has run, you may also see a
Not Executed
(blue) status.
Each run date for the policy and equipment combination
selected in the list at the top of the detail panel screen
appears as a row in this panel. You can also see compliance
failure messages in OpenManage Network Manager’s audit
trails.
Compliance scans do not stop the first time they fail. They continue so all failures of compliance in
the entire device configuration appear cataloged in the result.
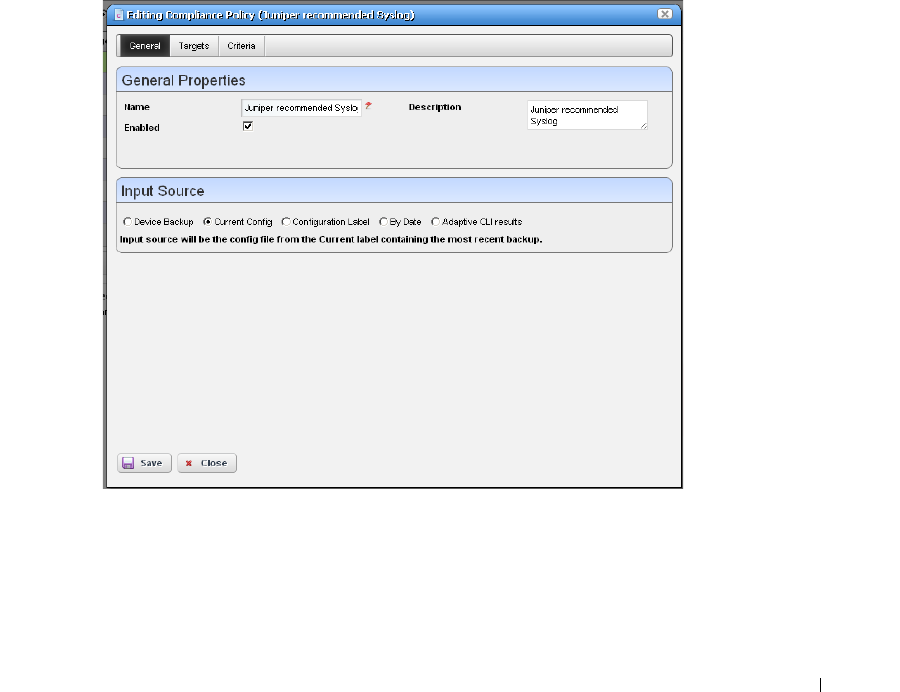
ProScan Portlet | Change Management / ProScan
365
Each time OpenManage Network Manager executes a compliance policy it stores a history record
in the database. Similarly, edits to these policies update history records. When you edit a
compliance policy to add/remove equipment, OpenManage Network Manager creates or deletes
the corresponding history record. Every time OpenManage Network Manager executes the
compliance policy, it updates the Last Run Date, Status and Details on the history record.
Groups
When you run a ProScan group policy, the history for the group appears in this detail panel just as
it would for a single policy. History concatenates the results of the component policies, as does
reporting. See Compliance and Change Reporting on page 388.
To see the Compliance Policy History, print a
Compliance Policy Violation
report from Report
Manager.
Creating or Modifying a ProScan Policy
This series of screens lets you configure ProScan policies.
This screen has the following tabs:
• General
•Targets
• Criteria

366
ProScan Portlet | Change Management / ProScan
The Compliance Policy Job Status screen displays progress of a ProScan policy as it executes.
CAUTION:
ProScan works only with text files; it does not work with binary configuration files.
If you have more than one type of device, you must typically have more than one ProScan policy to
address each device type. To run more than one ProScan, so you can address multiple types of
devices, create a ProScan group. See Creating or Modifying ProScan Policy Groups on page 381.
General
This tab has the following fields:
General Properties
Name
—A unique identifier for the policy (editable only when you click
New
, not on existing
policies).
Enabled
—Check to enable this policy.
Description
—A text description of the policy. This also appears when the policy is listed in the
manager.
Input Source
Use the radio buttons to select a source. Select from among the following options:
Device Backup
—Retrieve the configuration from the device and scan it for compliance.
Current Config
—The scan the current configuration backed up from the device.
Configuration Label
—Select the configuration to run against based on a label. This software
automatically updates the
Current
label so it points to the most recently backed up
configuration files.
By date
—When you click this radio button, you can then select a configuration file backed up
that precedes a specified date most closely in a selector that appears below the radio button.
You can scan even historic configurations for compliance, with the
Based on Date
field. No
validation ensures this date is the current one.
Adaptive CLI
—Select a desired
Show
Adaptive CLI to scan the target device below the radio
button. The policy configured scans the show results, and that show appears in the Audit
screen.
ProScan Portlet | Change Management / ProScan
367
Targets
The top of this screen (
Current Inherited Targets
) displays any targets inherited from already-
configured ProScan Groups. Click
Add Targets
in the
Current Implicit Targets
panel at the bottom
to select equipment that are targets to scan with this policy. You can also select listed equipment
click the
Remove
icon to delete it from the list.
NOTE:
Use filtering in the subsequent selector screen to make individual selection easier, but do not forget this
is not dynamic selection. You must assign policies whenever your managed environment adds new
equipment.
To provide information for individual policies that are part of groups, this screen displays inherited
group targets grayed out. See Creating or Modifying ProScan Policy Groups on page 381 for more
about groups.
368
ProScan Portlet | Change Management / ProScan
Criteria
This screen lets you filter configuration files based on text, or Regular Expressions. Click
Add
to
open an editor line.
This screen ultimately determines whether the configuration file(s) for the selected equipment
complies with the applicable policy. To create a policy, first select whether you want to
Match Any
(logical OR), or
All
(logical AND) of the criteria you configure with the radio buttons at the top of
this screen.
See these sections for more about criteria:
• Editing Compliance Policy Criteria
• Match Regex for each line
• Count number of occurrences
• Input Source Grouping
• Properties
For additional criteria information consult these sections:
• Create Source Group Criteria
• Regular Expressions
• Perl / Java (Groovy) Language Policies
ProScan Portlet | Change Management / ProScan
369
Editing Compliance Policy Criteria
After clicking
Add Criteria
, use the pick list on the upper right to select an operation to select a
criteria match type (
Contains, Doesn’t contain, [does not] match Regex
(see
Regular Expressions
on page 375), [does not]
Match Regex for each line, Count number of occurrences, Perl or Java
(Groovy)). Specify the match string or regular expression (Regex) in the text editor below the pick
list.
With the
Add Criteria
button, you can configure multi-criteria policies with several lines. For
example, configure one saying a maximum of four lines containing
name-server
can appear
(<5), in any order (Match Regex for each line), and another that says the configuration must
contain
no ip domain lookup [domain]
.
Notice the radio buttons
Match Any of the following
and
Match all of the following
. Selecting
Any
means that if either of the lines matched the policy would succeed. Selecting
All
says that both
lines must pass before the policy is successful.
For more complex scans, you can also enter Perl or Java (Groovy) language policies. See Perl / Java
(Groovy) Language Policies on page 377 for details about these. The does not operators are just the
negative of the match without does not.
Click the
Apply
green check button to accept your term, or the
Cancel
button to abandon your
edits.
You can edit already listed compliance tests by clicking the
Edit
button (pencil and paper) in the
list row. You can delete them by clicking the
Delete
button next to the criterion.
370
ProScan Portlet | Change Management / ProScan
Match Regex for each line
In using this type of term, OpenManage Network Manager processes each line separately,
comparing the input source to the match criteria. This returns a true value only if the criteria find a
match in the source. The order of matching is not important since OpenManage Network Manager
processes each line separately.
Count number of occurrences
This operator lets you specify a less than,
greater than, or equal mathematical
operator (<, >, =) and a number of lines
after you provide regex or string criteria
with the operator and count value.
This returns true if the criteria (as a
whole) match the input source count and
operator combination. On the other hand,
for example, if you choose a match
criterion that includes =9 lines as the
operator, and the scanned configuration
has ten lines that match, the scan returns
false
.
Input Source Grouping
Adaptive CLI show commands and
configuration files often have repeating
sections or groups of parameters.
OpenManage Network Manager scan configurations by section using
Start Criteria
and
End
Criteria
Regex group criteria patterns. A configuration can contain multiple start and stops. This is
especially useful when the criteria provided might occur multiple times in the input source but you
want to find only the instances which are preceded by a particular line in the source.
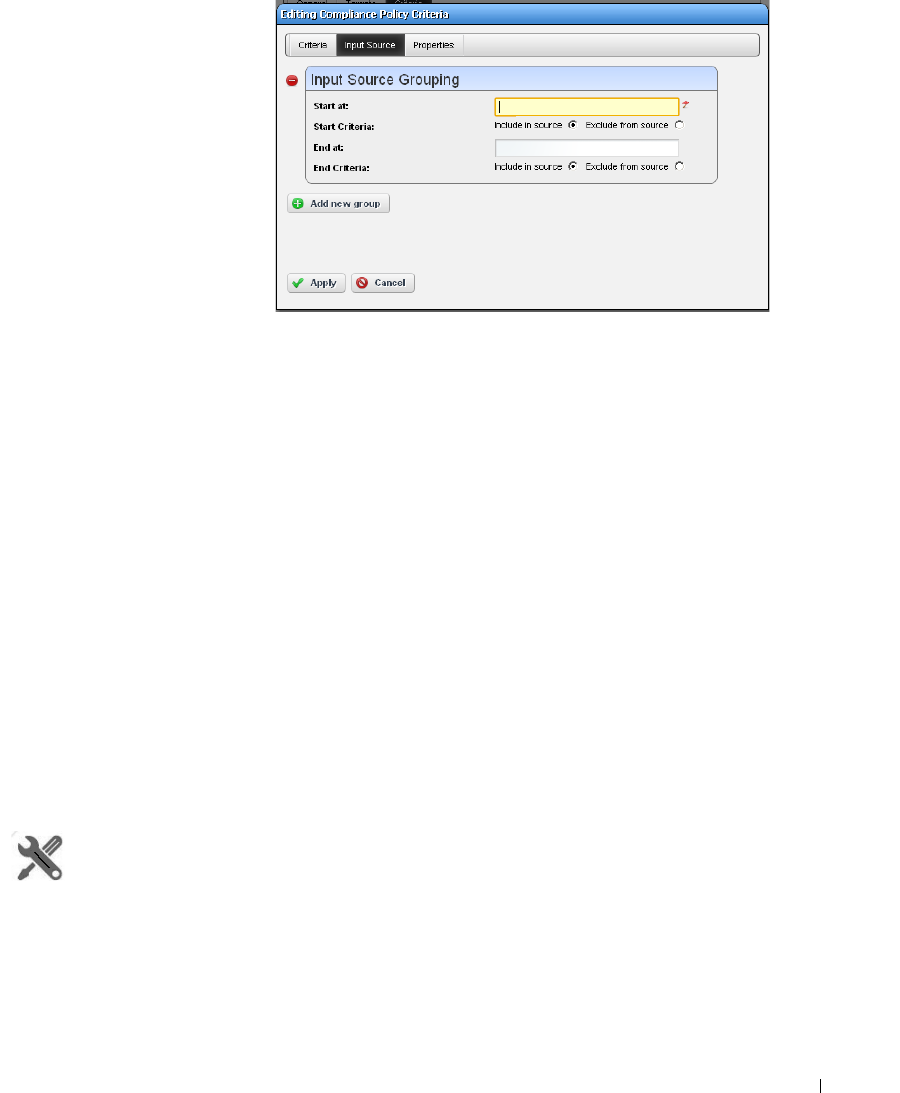
ProScan Portlet | Change Management / ProScan
371
Click
Add new group
in the
Input Source
panel in the
Criteria editor, and the grouping
editor appears. (Click the red
icon to the source grouping’s left
to delete it.)
Enter the starting and ending
regular expressions (
Start at /
End at
), and elect whether the
beginning or end of the source
group includes or excludes what
that expression matches. Click
Apply
to accept your edits, or
Cancel
to abandon them. You
can create multiple group criteria. OpenManage Network Manager applies the group criteria in
order, from top to bottom.
When you have defined a
Start
and
Stop
, OpenManage Network Manager finds the information
between these. OpenManage Network Manager logically extracts the data from the main config
(essentially creating sections) and then does the audit.
For example, if your configuration has one section of
router bgp
and multiple sections for each bgp
neighbor, you can specify matches within each neighbor. Your policy can audit each router bgp
section and each neighbor within each router bgp.
See Create Source Group Criteria below for an example of how to use these capabilities. Also, see
Regular Expressions below for more about what match criteria are supported.
Properties
Checkboxes on this page configure whether the proscan match is
Case Sensitive
, or has
Multi-Line
Support
. By default they are disabled. Check to enable them. If (upper / lower) case matters in
what you are scanning for, check
Case Sensitive
. If you want to scan for a target phrase or regular
expression that spans more than one line, check
Multi-Line Support
. Lines do not have to be
consecutive. For example: .*LINE1.*LINE2, where the target source has multiple lines, first line
containing the text LINE1, subsequent line containing the text LINE2.
How To:
Create Source Group Criteria
Here is an example of how you can use source group criteria. Suppose you want to scan for the
following text:
neighbor 2.3.4.5 activate
neighbor 2.3.4.5 route-map allanRM01

372
ProScan Portlet | Change Management / ProScan
This is within the following configuration:
router ospf 888
log-adjacency-changes
redistribute bgp 88 metric 10010 metric-type 1 subnets tag 334 route-map
allanRM02
network 2.3.4.0 0.0.0.255 area 123
network 2.3.5.0 0.0.0.255 area 124
network 2.3.6.0 0.0.0.255 area 125
!
router isis
!
router rip
version 2
network 175.92.0.0
no auto-summary
!
address-family ipv4 vrf VPN_PE_A
no auto-summary
no synchronization
exit-address-family
!
router bgp 88
bgp log-neighbor-changes
neighbor 2.3.4.5 remote-as 22
neighbor description "This is Test"
neighbor test-parameter xxx
neighbor 4.5.6.7 remote-as 66
neighbor description "This is Test"
neighbor test-parameter xxx
!
address-family ipv4
redistribute connected route-map map-12
redistribute static route-map hjlhjhjhjk
redistribute ospf 888 metric 500 match internal external 2 nssa-external 1
nssa-external 2 route-map allanRM03
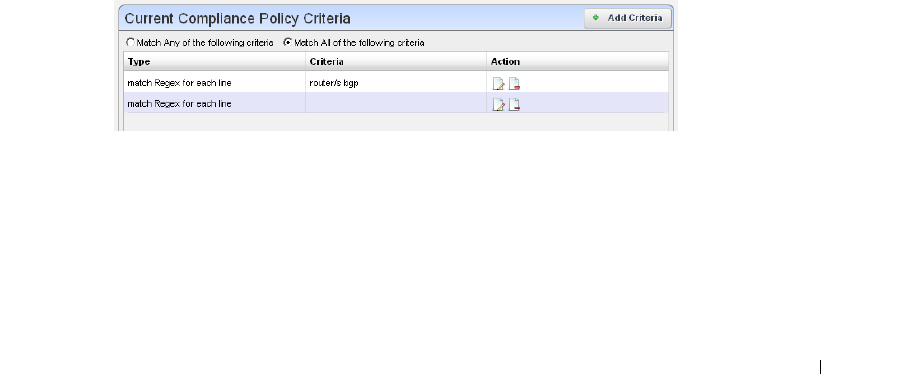
ProScan Portlet | Change Management / ProScan
373
neighbor 2.3.4.5 activate
neighbor 2.3.4.5 route-map allanRM01 in
neighbor 4.5.6.7 activate
neighbor 4.5.6.7 route-map allanRM02 in
default-information originate
no auto-summary
no synchronization
exit-address-family
!
address-family ipv4 vrf VPN_PE_A
redistribute ospf 10 vrf VPN_PE_A match internal external 1 external 2
no auto-summary
no synchronization
exit-address-family
!
In addition, within this configuration, you want to check if the target lines are present under each
address-family in the
router bgp
section. To scan for this, follow these steps:
1
Select the
Match All of the following
radio button and enter both of the above lines as match
criteria. Select the
Config Term
as
match Regex for each line
, so the order in which these lines
appears does not matter.
2
Add
a source group criterion to search for a section that begins with “routers bgp”—in regex:
routers\sbgp
. No end match criterion is needed. Click
Apply.
3
Click
Add
to make another criterion. This time, the start is
address-family\s
, and the
end is
exit-address-family
. Click
Apply.
4
You should see both criteria listed in the editor
5
Applying the first group criterion finds the match (underlined) in the following:
router bgp 88
bgp log-neighbor-changes
neighbor 2.3.4.5 remote-as 22
neighbor description "This is Test"
neighbor test-parameter xxx

374
ProScan Portlet | Change Management / ProScan
neighbor 4.5.6.7 remote-as 66
neighbor description "This is Test"
neighbor test-parameter xxx
!
address-family ipv4
redistribute connected route-map map-12
redistribute static route-map hjlhjhjhjk
redistribute ospf 888 metric 500 match internal external 2 nssa-external 1
nssa-external 2 route-map allanRM03
neighbor 2.3.4.5 activate
neighbor 2.3.4.5 route-map allanRM01 in
neighbor 4.5.6.7 activate
neighbor 4.5.6.7 route-map allanRM02 in
default-information originate
no auto-summary
no synchronization
exit-address-family
!
address-family ipv4 vrf VPN_PE_A
redistribute ospf 10 vrf VPN_PE_A match internal external 1 external 2
no auto-summary
no synchronization
exit-address-family
!
6
Applying the second group criterion on the above result divides the source:
Source 1:
address-family ipv4
redistribute connected route-map map-12
redistribute static route-map hjlhjhjhjk
redistribute ospf 888 metric 500 match internal external 2 nssa-external 1
nssa-external 2 route-map allanRM03
neighbor 2.3.4.5 activate
neighbor 2.3.4.5 route-map allanRM01 in
neighbor 4.5.6.7 activate
neighbor 4.5.6.7 route-map allanRM02 in

ProScan Portlet | Change Management / ProScan
375
default-information originate
no auto-summary
no synchronization
exit-address-family
Source 2:
address-family ipv4 vrf VPN_PE_A
redistribute ospf 10 vrf VPN_PE_A match internal external 1 external 2
no auto-summary
no synchronization
exit-address-family
This creates two sources sections.
7
Now OpenManage Network Manager applies the regex in the criteria field to each of the
sources. It returns
true
only if both sources pass (we selected the
Match All
radio button). In
this case “Source 2" does not have those lines, so OpenManage Network Manager returns a
false value.
8
The error details appear in the audit trail panel.
Regular Expressions
Regular expressions include metacharacters to instruct the program how to treat characters it
encounters. These include the following: ^, $, . , | , { , } , [ , ] , ( , ), *, +, ? , \. If you want to match
one of these metacharacters, you must prepend a backslash (\). So to match a literal question mark,
rather than instructing regular expression matching to match 0 or 1 of a previous expression, you
must enter \?.
The following table outlines standard, supported regular expressions.
Label Pattern
Single digit \d
Two di git s \ d{ 2 }
Three digits \d{3}
Four digits \d{4}
Five digits \d{5}
Number [0-9]+ One or more
[0-9]* Zero or more
Decimal .[0-9]+
Float [0-9]+.[0-9]+
IP Address (\d{1,3}.){3}\d{1,3}
IP Address/Mask (\d{1,3}.){3}\d{1,3}/\d+

376
ProScan Portlet | Change Management / ProScan
Here are some examples of such expressions:
Domestic phone
number with
extension
1?[\s\-\/\.]*\(?([1-9]\d{2})\)?[\s\-\/\.]*([0-9]{3})[\s\-\/\.]*([09]{4})[\s\-\/
\.x]*([0-9]{3,4})?
MAC Address ([0-9a-fA-F]{1,2}:){5}[0-9a-fA-F]{1,2}
MAC Address ([0-9a-fA-F]{1,2}.){5}[0-9a-fA-F]{1,2}
MIB2 OID (1.3.6.1.6.1.2.1.(\d+\.)+\d)
Enterprise OID (1.3.6.1.4.1.(\d+\.)+\d)
Time [0-1][0-3]:[0-5][0-9]:[0-5][0-9]
All .*
Ending Number \d+$
Character \w
Word \w+ One or more.
\w* Zero or more.
Whitespace \s+One or more.
\s* Zero or more.
String w/o space \S+One or more.
\S* Zero or more.
New Line \n
FormFeed \f
Tab \t
Carriage Return \r
Backspace \b
Escape \e
Backslash \B
URL (?:^|")(http|ftp|mailto):(?://)?(\w+(?:[\.:@]\w+)*?)(?:/
|@)([^"\?]*?)(?:\?([^\?"]*?))?(?:$|")
HTML Tag <(\w+)[^>]*?>(.*?)</\1>
Label Pattern
Label Pattern
Email address (U.S.) ^[A-Za-z0-9._%+-]+@[A-Za-z0-9.-]+\.[A-Za-
z]{2,4}$
MAC Address ([0-9a-fA-F]{1,2}:){5}[0-9a-fA-F]{1,2}
Time hh:mm:ss (0[0-9]|1[0-2]):[0-5][0-9]:[0-5][0-9]
IP Address (\d{1,3}.){3}\d{1,3}

ProScan Portlet | Change Management / ProScan
377
The following are examples of the kinds of matching possible:
CAUTION:
Cutting and pasting from notepad into OpenManage Network Manager may cause carriage return or
line-feed issues. Best practice is to compose these within OpenManage Network Manager.
Perl / Java (Groovy) Language Policies
In addition to regular expressions, you can enter Config Terms that use either Perl or Java (Groovy)
language capabilities for scans. The following sections describe these.
•Perl
• Java (Groovy)
These scans are compiled at runtime, and the Java scan uses the Groovy libraries, included with
OpenManage Network Manager. As always, you must install Perl on Windows application servers if
you want to use that type of Config Term (it typically comes with other supported operating
systems).
Validated IP Address (restricts what matches
better than the previous example)
(25[0-5]|2[0-4][0-9]|[01]?[0-9][0-9?])\.(25[0-
5]|2[0-4][0-9]|[01]?[0-9][0-9?])\.(25[0-5]|2[0-
4][0-9]|[01]?[0-9][0-9?])\.(25[0-5]|2[0-4][0-
9]|[01]?[0-9][0-9]?)
MIB2 OID (1.2.6.1.6.1.2.1.(\d+\.)+\d
Label Pattern
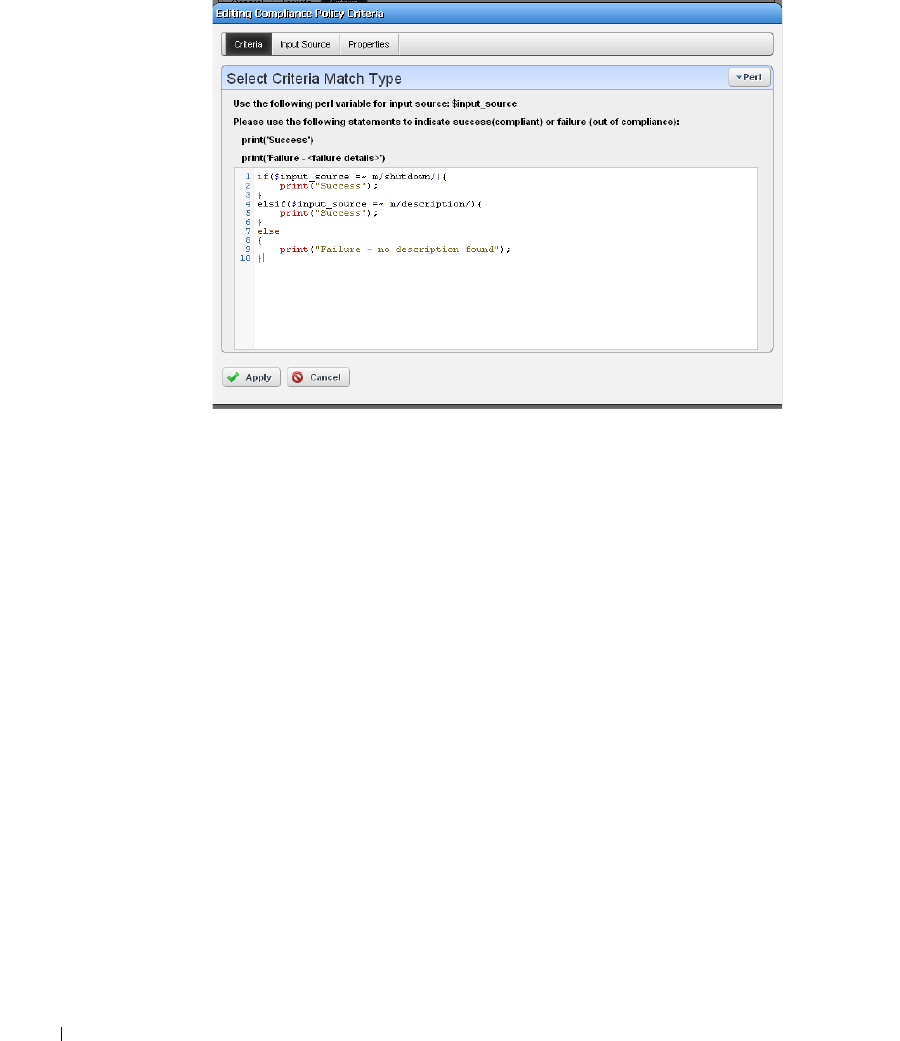
378
ProScan Portlet | Change Management / ProScan
Perl
When you select Perl as the type of Config term, an editor appears that lets you enter Perl scans.
As the screen says
$input_source
is what the code scans. The following is example of the type
of Perl you can enter that scans for contents like
description
in shut down interfaces, and prints
output “Success” visible in the Audit viewer when it finds a matching term like
description
in
whatever source you select:
if($input_source =~ m/shutdown/){
print("Success");
}
elsif($input_source =~ m/description/){
print("Success");
}
else
{
print("Failure - no description found");
}
Notice that you can also combine these scans with the
Edit Source Group Criteria
regular
expressions to streamline them.
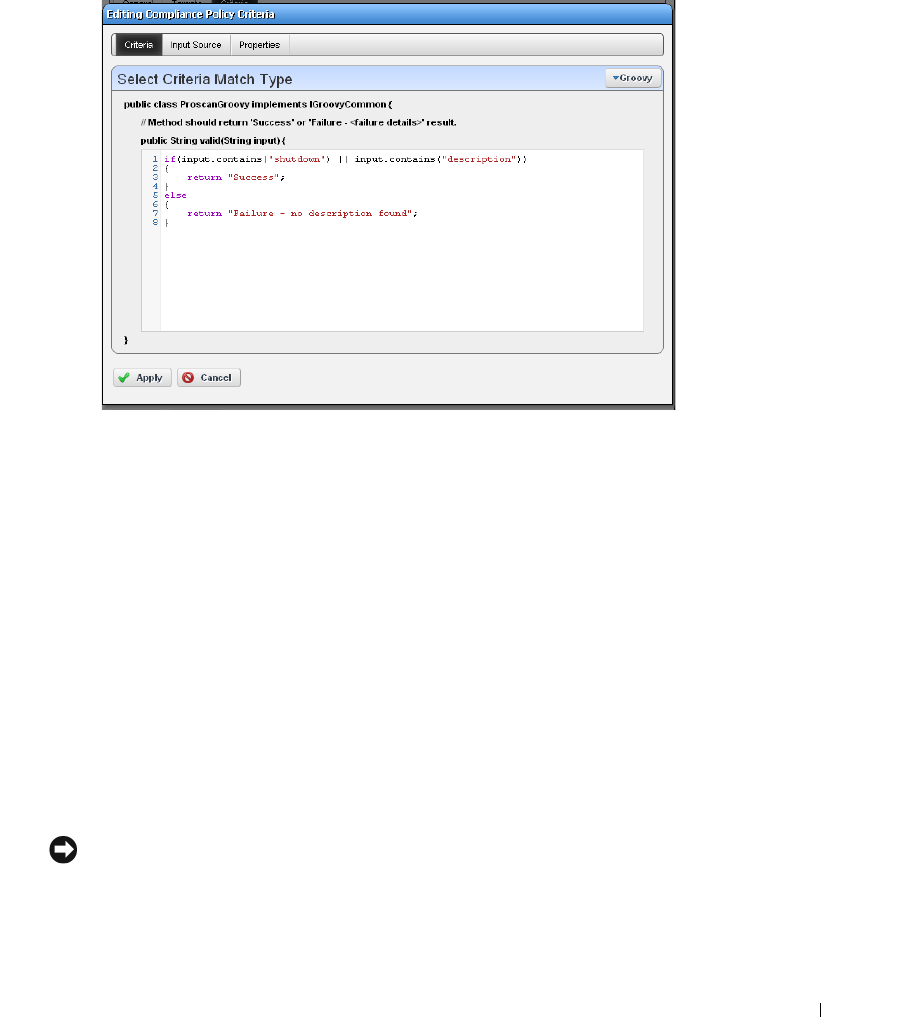
ProScan Portlet | Change Management / ProScan
379
Java (Groovy)
When you select Groovy as the type of Config term, an editor appears that lets you enter that type
of scans.
As the screen says this implements ProScanGroovy or Groovy Java classes. The method should
return ‘Success or ‘Failure -’ results, and assumes
public String validate (String
input) {
precedes what you enter in the text editor. The following is example of the type of Java
code you can enter that scans for contents like
description
in shut down interfaces, and prints
output “Success” visible in the Audit viewer when it finds a matching term like
description
in
whatever source you select:
if(input.contains("shutdown") || input.contains("description"))
{
return "Success";
}
else
{
return "Failure - no description found";
}
NOTICE
Notice that you can also combine these scans with the Edit Source Group Criteria regular expressions to
streamline them.
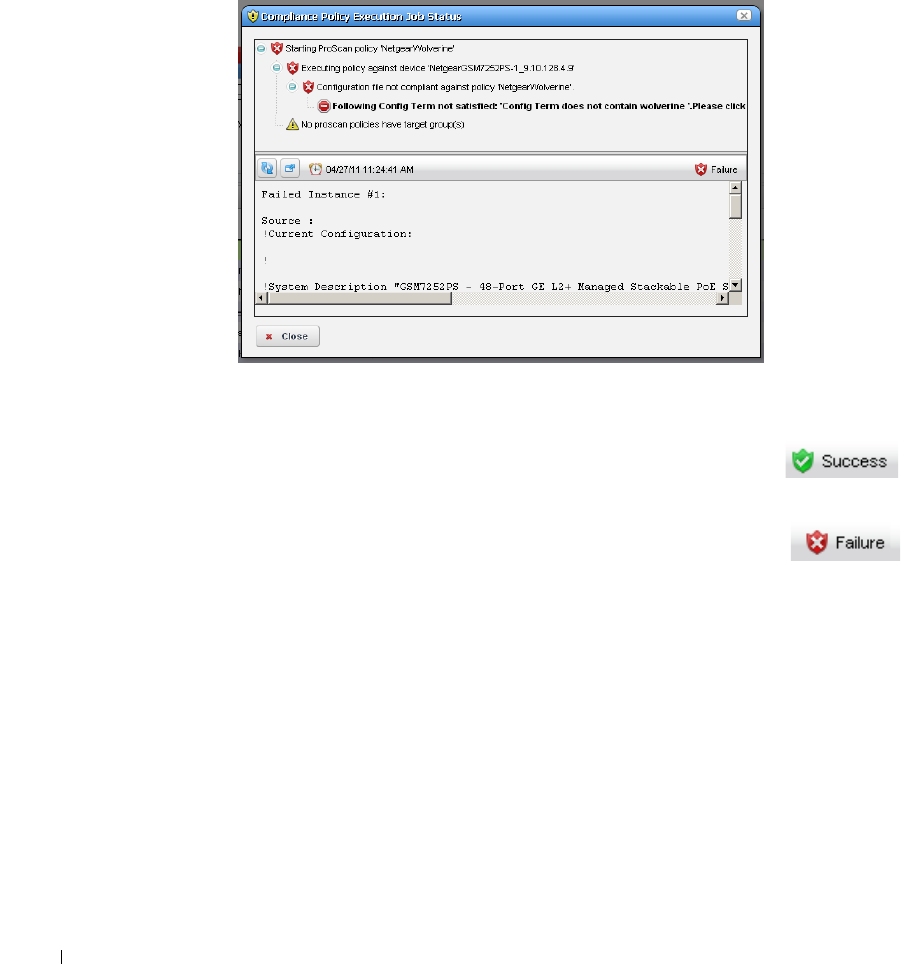
380
ProScan Portlet | Change Management / ProScan
Click
Save
to preserve the policy you have configured in these screens, or click
Close
(in the tool
bar) to abandon your edits.
Compliance Policy Job Status
This screen displays the progress of compliance scanning you have configured.
You can the revisit history of this policy’s use in the Audit portlet (see Audit Trail Portlet on page
116). Select an audit trail in this portlet to review details.
When you see the
Success
indicator, then the scanned item is compliant. If you
also see a warning message that no policies have target groups, this does not have
an impact on compliance.
When you see the
Failure
indicator, then the scanned item is
Not
compliant. Select
the “Following Config Term not satisfied” message to see the contents of the failed
file at the bottom of this screen.
Executing Proscan policies may trigger a benign warning that “No proscan policies have target
group(s).” You can safely ignore this warning message.
The advantage of selecting dynamic device groups is that newly discovered devices of the selected
type automatically become members of the group, so ProScan scans them too.
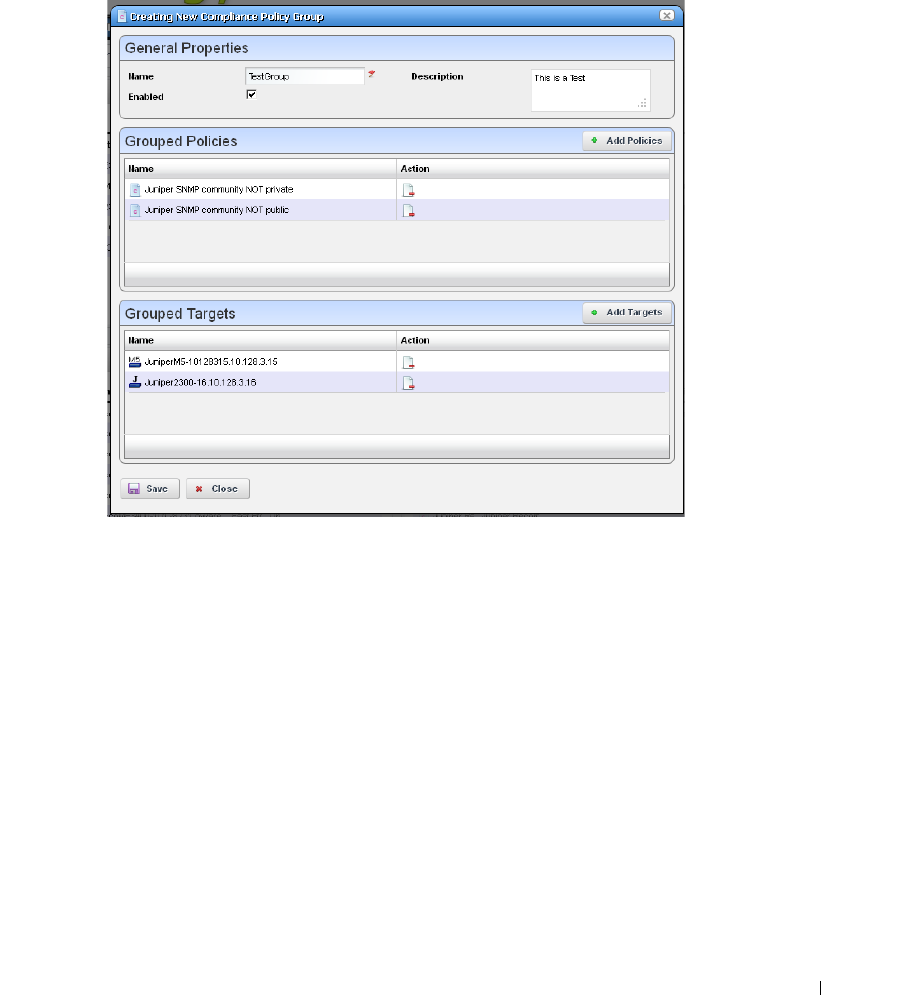
ProScan Portlet | Change Management / ProScan
381
Creating or Modifying ProScan Policy Groups
When you create or modify a ProScan Policy Group after right-clicking
New > Group
or
Open
when you have selected a group, the ProScan Policy Group editor appears.
This has the following to configure:
Name
—A text identifier for the group.
Enabled
—Check to enable this grouping.
Grouped Policies
—Click
Add Policy
to select ProScan policies in a selector screen. Click the
Remove
icon to delete a selected policy. You can use individual policies in several groups.
Individual policies that are part of groups display inherited group targets grayed out.
Grouped Targets
—Click
Add Targets
to select targets for the scans.
Executing a group executes all the member policies and update the history records of the group and
member policies. Any policy execution also update its parent group history records.

382
Change Determination Process | Change Management / ProScan
Change Determination Process
If you run the
Change Determination (CD) Process
, it collects all the configuration changes that
occurred on the target resources since the last time the CD process ran. It also associates these
changes with the date and time when the CD process runs. After running CD, you can then
produce a report (see
Compliance and Change Reporting on page 388
)
,
outlining all such changes
by date and time. This report comes seeded with installation.
Dell OpenManage Network Manager stores incremental changes as
RedcellConfigChangeRecords
by device/timestamp. The
ConfigChangeRecordsDAP
Database Aging Policy (DAP) manages how
long the OpenManage Network Manager database retains these records. This DAP’s default setting
stores incremental records for 30 days, then archives or purges them. Reporting shows only records
in the database; therefore, by default, the
Configuration Change Report
shows only resource
changes made in the last 30 days, but no older. Change this default by changing the number of days
to retain such records with the DAP.
The next section describes Change Determination Process Workflow.
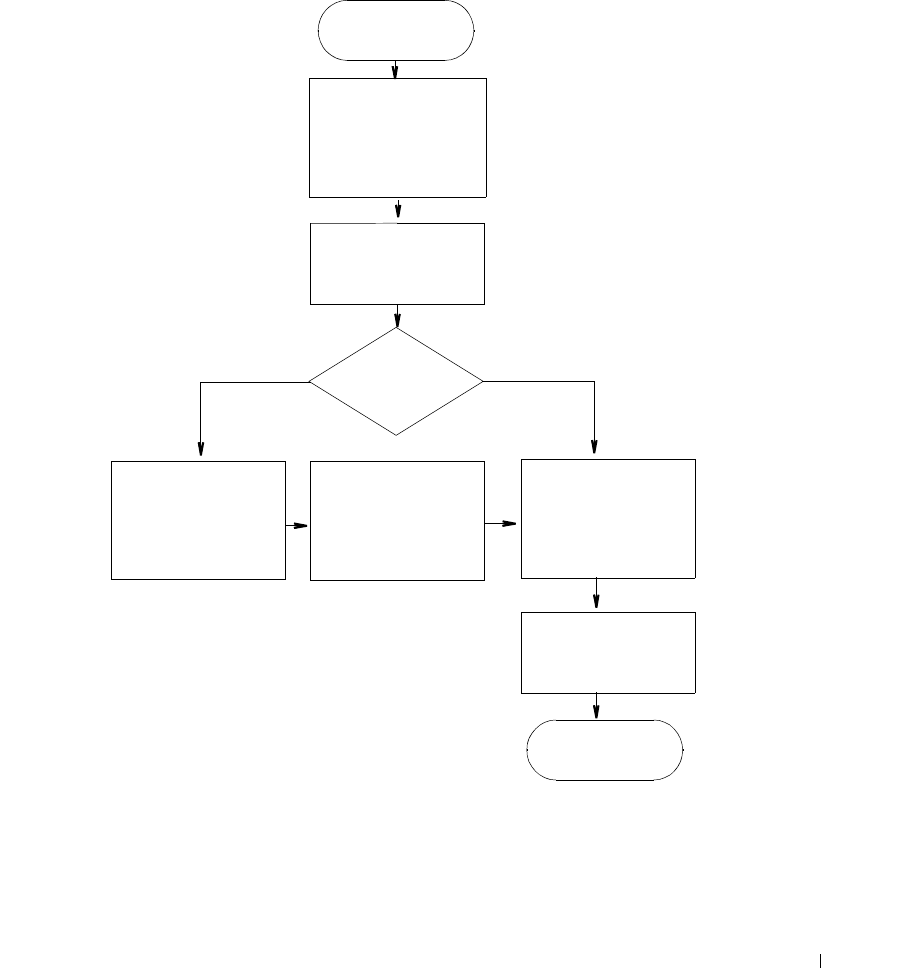
Change Determination Process | Change Management / ProScan
383
Change Determination Process Workflow
Change Manager seeds Change Determination Process and ProScan group operations. You can
configure this to run on groups of your choosing if you create a new Change Determination Process
group operation.
This process records what is removed, updated or added since it last ran on a scanned device’s
configuration. If you run the Change Determination Process, it first backs up the devices’
configuration(s), and stores those with the Change Determination label.
Initiate Change
Determination
Back up device con-
fig and add it to
label: Change
Determination
Check config
changed flag
Is there a
configuration
change?
Make equipment
change diff records
for later reporting
Copy the config in
the Change Determi-
nation label to the
Current label
Compare configura-
tion labels -
“Change Determina-
tion” and “Current”
End Change
Determination
Reset config
changed flag
Yes No

384
Change Determination Process | Change Management / ProScan
Change Determination Process then looks for Config Changed Flags, and if it finds such flags,
indicating a change occurred on the device and/or Change Determination has not run on it, the
process then compares the device’s changed configuration (in the Change Determination label) to
the one in the Current label, storing the difference for future reporting.
At its end, the Change Determination Process re-labels the configuration with the Change
Determination label to the Current label, and it un-sets the Config Changed Flag on scanned
resources so the flag will not signal change occurred when Change Determination runs again.
After running the Change Determination Process, you can run the Configuration Change report to
display what changed for a defined period. The contents of that report depends on the report filter,
and the specified period. This report lists changed attributes in the configurations.
Triggering Change Management and ProScan
To trigger the Change Management for a device, right-click it in the Managed Resources portlet
and select
Change Management > Change Determination
. You can also schedule Change
Determination to run repeatedly, on regular intervals in the Schedules portlet.
You can similarly trigger ProScan by right-clicking a device, and selecting
Change Management >
Execute ProScan
or
Execute ProScan Policy
. The former execute all policies connected with the
selected device, while the latter allows you to select policy (or policies) to run. Creating a ProScan
Group, lets you run all ProScan policies for each device within the selected group, scanning groups
even if they consist of devices from different vendors. In ProScan, you can scan device
configurations (of specified labels) or Adaptive CLI command output. (See How to: Use ProScan /
Change Management on page 359).
How To:
Run the Change Determination Process
The following describes an exercise for the Change Determination process based on manually
running it. To run the process as a response to events devices must transmit traps to OpenManage
Network Manager. The next sections describe using Change Determination in the following ways:
• Change Determination Confirmation
• Event/Trap-Based Change Determination
Change Determination Confirmation
The following steps confirm change determination is working.
1
Initialize the Change Determination Report and let it do a configuration backup. The first
time this runs, Dell OpenManage Network Manager creates no diffs. It just initializes the
Change Determination label.
2
Edit a configuration to make a change. For example, make a change in a device you have
discovered. One benign change is to add a contact or a description to an interface.
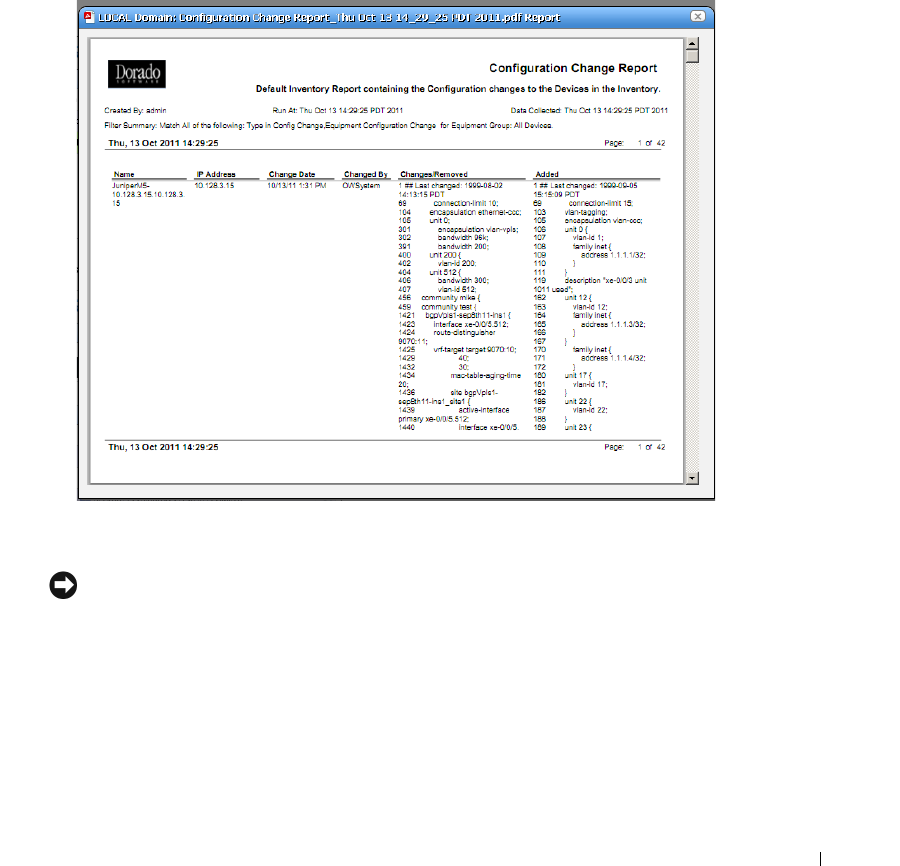
Change Determination Process | Change Management / ProScan
385
3
Restore it to the device.
4
Execute the Change Determination process on the device by right-clicking it in the Managed
Resources Portlet, and selecting
Change Management > Change Determination
.
This then backs up the device, compares the original and altered configurations, and writes
the difference to report later (see How to: Report on Change Determination on page 390 for
the steps to run the report to see such changes).
Since we have initialized the report in step 1, the updated report shows the changes made to
the config file.
5
Repeat step 2 through 5 if you like after you have made further changes.
NOTICE
Best practice in production is to schedule a recurring run for Change Determination in the Schedules
portlet. Notice that you can also disseminate the report by e-mail, or view previous reports in the web
client, as described in the Reports portion of the User Guide.
Event/Trap-Based Change Determination
The following steps to trigger Change Determination based on events received by OpenManage
Network Manager. Your devices must transmit traps to the OpenManage Network Manager
installation, and must emit traps when changes occur, or this does not work.

386
Change Determination Process | Change Management / ProScan
1
Back up the configuration file for a device you have discovered.
2
Make a change to that device with the Managed Resources editor, or from a Direct Access
command line.
3
Such changes make the device emit an event that may have further consequences. For
example, for Juniper devices, the Juniper JUNOS Configuration Changed event is a
correlation event.
4
To provite a response (and to normalize the emitted event), create an automation rule that
emits a
redcellEquipmentConfigChangeNotification
event when Dell
OpenManage Network Manager receives creates a event in response to events like the
jnxCmCfgChange
event that occurs when Juniper devices change.
5
Create a rule to respond to
redcellEquipmentConfigChangeNotification
by
running the Change Determination process. You do not have to back up the configuration
after the change. See How to: Create Event Processing Rules to Trigger Change
Determination Process below.
6
To see the change itself, run the Change Determination Report (see Compliance and Change
Reporting on page 388 and How to: Report on Change Determination on page 390). The
report displays the changes made.
How To:
Create Event Processing Rules to Trigger Change Determination Process
This exercise creates an Event Processing rule that has Change Determination respond to an event.
The steps to configure such an event processing rule are as follows:
1
Create a new event processing rule by right-clicking in Event Processing Rules >
New > Post
Processing
rule in the Event Processing Rule portlet.
2
Enter the name in the field labeled
Name.
(Example: Update Config Change Flag)
3
Click
Next
to go to the
Filter
tab.
4
For the
Specify Events
panel, click on the
Add
button to select the event to which this rule
responds. A selector listing available events appears.
NOTICE
Notice you can limit the selector’s displayed events by entering text in the filter at the top of the selector
screen.
5
In the selector, click the event definition (here:
redcellEquipmentConfigChangeNotification
), and confirm your selection.
6
Click
Done
to accept the
Event(s)
you have configured.
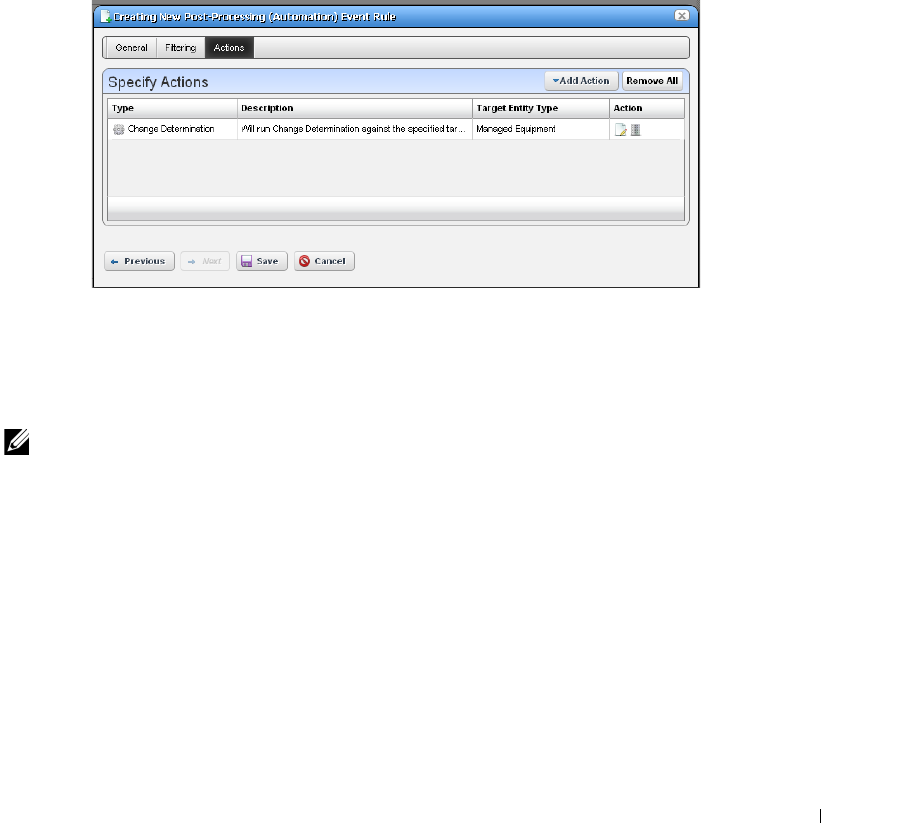
Change Determination Process | Change Management / ProScan
387
7
Notice you can further filter which events this rule responds to with the lowest panel in this
screen’s
Filter Conditions
panel by clicking
Add Filter.
For example, you could create a rule
that responds only to events from a particular IP address. For now, we will not configure
additional filters.
8
Click
Next
to open the
Actions
tab.
9
Click
Add Action
, and click the
Custom
action alternative, then click Keyword Search and
select Change Determination. That action appears in the drop-down combo box. Notice you
can also select a target in the action selector. By not selecting one, we run change
determination against all Managed Equipment.
10
Click
Apply
and view the Change Determination action listed in the Actions screen.
Notice that you can add more actions, and edit or delete existing ones with the icons to the
right. Click
Apply
once you have selected Change Determination.
11
Click
Save
to preserve this event processing rule. The rule should now respond to the
configured event, triggering the action you configured.
NOTE:
Backup and Change Determination automates backing up target devices.
Also: Change Determination’s current default is to compare files even if the “Config Change” flag has not
been modified. See the OpenManage Network Manager User Guide for instructions about how to
change this default.
Change Determination Defaults
By default, Change Determination can run against all devices without requiring the config change
update flag be set or updated based on events tied to the Update Config Change Flag event
processing rule/action.

388
Compliance and Change Reporting | Change Management / ProScan
To disable the manual run-ability of the Change Determination process, uncomment the property
in
\owareapps\changemgmt\lib\cm.properties
(or add it to
\owareapps\installprops\lib\installed.properties
).
#############################################
# Change Determination Flag
# Allows system to be flagged to only run
# change determination against devices we
# have received Config Change Event for.
# Default Behavior is to run change determination
# for All targets (the same as setting the below property = false)
#com.dorado.changemgmt.change.determination.require.config.events=true
Compliance and Change Reporting
The Compliance Policy Violation report is seeded when you have ProScan / Change Management
in Dell OpenManage Network Manager. Inventory Compliance Attributes for reporting can also
appear in report templates when you install ProScan. These report in-compliance or out-of-
compliance, the last compliance date (when last compliant or not compliant), last config date
(when configuration last changed), last checked date (when change was last determined).
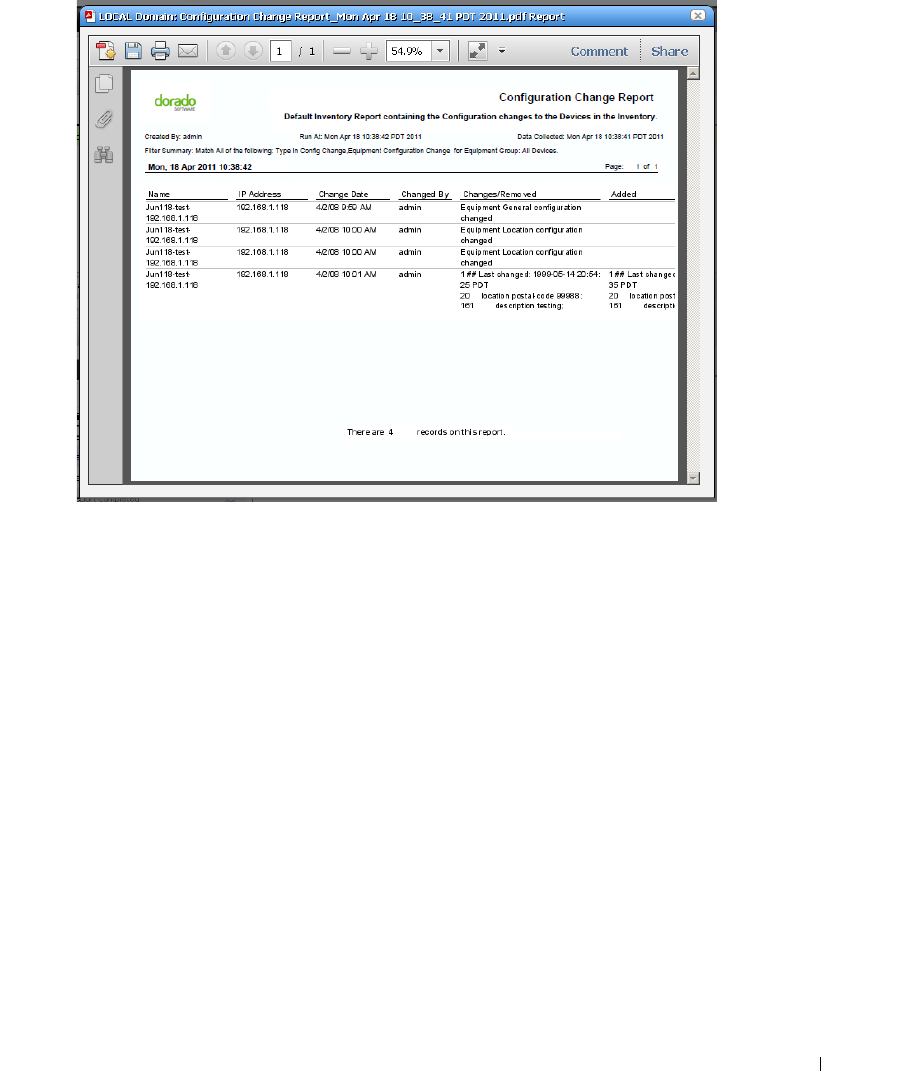
Compliance and Change Reporting | Change Management / ProScan
389
You can also run the Change Determination Report that displays changes made to configurations.
See
Reports on page 231
for more about reporting capabilities.
The Change Determination Report report displays detected changes based on a configuration
change flag set when OpenManage Network Manager detects a change made to the device. To
successfully execute this report, you must enable a scheduled Change Determination Process. The
process must run before the reports has any contents. To run the process, go to the Schedules
portlet, and schedule that change determination process.
Reporting Limitations
The Configuration Change Report only reports on incremental configuration changes discovered
in the CD process. Simply making changes to configurations and backing them up in OpenManage
Network Manager does
not
ensure these appear in
Configuration Change Reports
. They appear in
reports only after running the CD process.
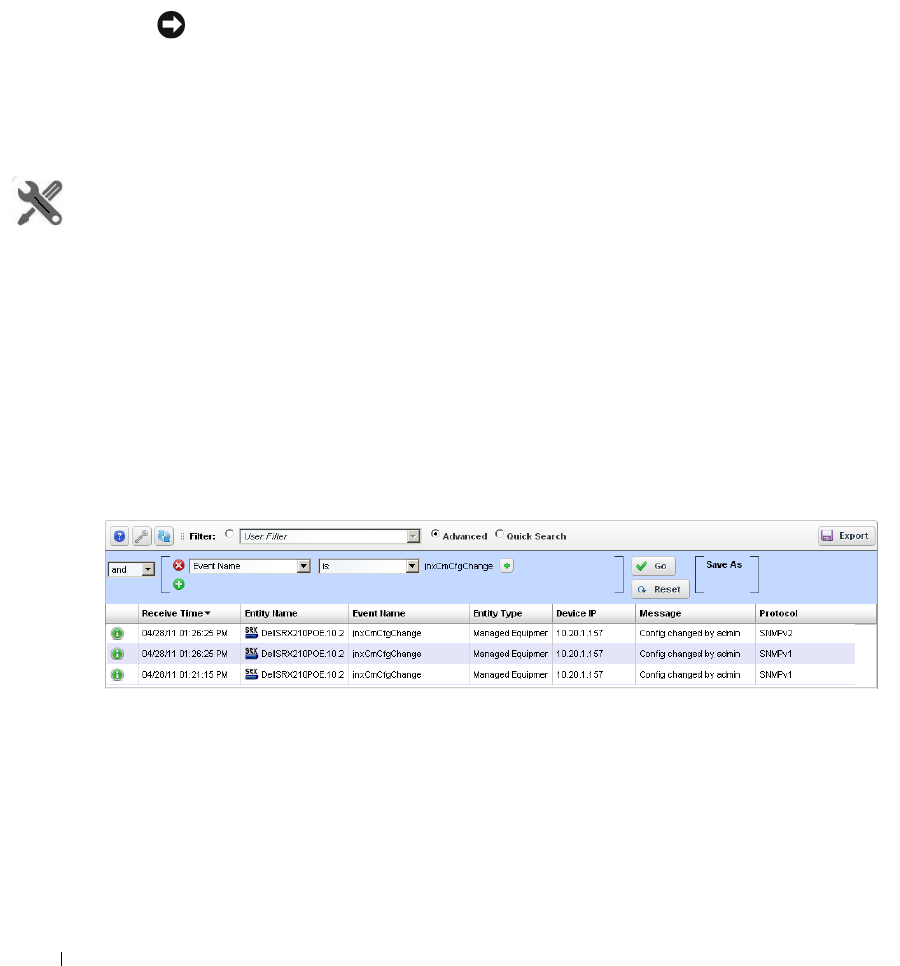
390
Compliance and Change Reporting | Change Management / ProScan
The
Configuration Change Report
includes a Filter that you can alter at runtime. By default, the
report filters on
Ty p e
only. If you want more filter criteria—like device IP, and/or date ranges—you
must edit the Report filter. To edit the filter, in the Reports manager, right click the
Configuration
Change Report,
and select
Open,
then edit the filter in the
Filter
screen by selecting that node on
the left.
NOTICE
A recommended best practice is to execute the CD process as an operation run against multiple
resources following a scheduled group backup of these resources. If you run backups every day, the
Configuration Change Report then shows the daily changes, until they are purged from the database.
The application stores the specifics of what changed for future reporting.
How To:
Report on Change Determination
Follow these steps to produce regular change determination reports:
1
First, insure the devices you want to scan are discovered, and send change notifications to the
application server.
Check your vendor’s manuals to determine how to forward configuration change information
to Dell OpenManage Network Manager for your system.
2
When Dell OpenManage Network Manager receives a configuration change notification, the
device transmits an event to the OpenManage Network Manager mediation server. When
received, this event automatically generates an event called OpenManage Network
ManagerEquipmentConfigChangeNotification. Event history displays that notification.
3
When OpenManage Network Manager receives the OpenManage Network
ManagerEquipmentConfigChangeNotification event, it can initiate (if enabled) an event
processing rule called
Configuration Change
.
This processing rule triggers a flag in the OpenManage Network Manager database saying a
change has occurred in the device’s configuration and that OpenManage Network Manager
should run change determination against the device when requested.

Compliance and Change Reporting | Change Management / ProScan
391
4
When you run OpenManage Network Manager’s change determination process, it reviews the
flag setting in the database and backs up a managed device if the flag indicates a change. This
backup updates the OpenManage Network Manager system label
Current
which is then
compared to the OpenManage Network Manager system
Change Determination
label.
OpenManage Network Manager then writes the differences between the two labelled
configurations to its database, where it is available for reporting purposes.
5
Once this occurs, the
Change Determination
label moves to point to the same configuration
which is reflected by the
Current
label.
6
The report which can run to display these changes is OpenManage Network Manager’s
Configuration Change Report
. It displays the name of the device in question, the IP address,
date/time of change, who made the change, what was removed and what was added. You can
schedule this report to run immediately after an Change Determination process too, so you
can capture a history of changes.

392
Compliance and Change Reporting | Change Management / ProScan

| Actions and Adaptive CLI
393
13
Actions and Adaptive CLI
The Actions Manager lets you manage actions like enabling monitors, file backups, resyncs and so
on. These actions are typically limited in scope, and not that complex. On the other hand, it also
manages Adaptive CLI (command-line interface) commands to run against devices which can be
complex.
These commands amount to “mini-scripts” to query and configure those devices. In it, you can
create commands to run against devices after the device driver has opened a connection to the
devices. The driver handles logins, and general connection management. You can even initiate
these actions with the application’s actions that target groups (see Discover Links for a Group of
Devices, for example)—although if you delete a target group, such operations fail. Many drivers
seed pre-configured command that appear listed when you first open this manager. For a brief
overview of creating and using these, see How to: Create Adaptive CLI Examples on page 420.
Adaptive CLI’s Attributes capabilities let you insert variables in scripts. See Attributes on page 402
for the details. You can also assemble configurations made here as component Tasks to execute
with other component Tasks. You can even use this capability to include Perls scripts within
OpenManage Network Manager. See Perl Scripts on page 419.
NOTICE
You can have Actions maintain lists like ACLs, and when these change, in the Adaptive CLI script, push
the updated list out to the appropriate devices.
Adaptive CLI commands let you map several vendor-specific commands to a single action, so you
could, for example, query two types of devices throughout the network for their MAC addresses
with a single action. Adaptive CLI actions can also help you debug more complex scripts that either
query or configure devices.
The Adaptive CLI manager displays a list of
Configure
and
Show
commands (the
Command Type
) with a
Name,
Description
and the
Last Run Date
. You can filter what appears in this manager with the fields at its top
.
NOTE:
The contents of the Action Portlet vary, depending on the various options you have installed.
CAUTION:
Particularly for Adaptive CLI, and possibly for other Dell OpenManage Network Manager capabilities, the
level of access to devices must match the desired effect. If Dell OpenManage Network Manager’s login
to a device permits only read access, then Adaptive CLI configuration commands which require write
capabilities will not be effective.

394
| Actions and Adaptive CLI
Using Adaptive CLI
You can quickly take a set of commands or configuration file snippet from a device, copy it directly
into the Script editor, mark it up, and save it as a working CLI.
When using the CLI Format, The Adaptive CLI tool will prompt you to create new attributes
based upon your script markup. This lets you quickly create a script and schema to create an ACLI.
If you have attributes that are mainly simple String attributes, this is a very quick and automated
approach.
Using Perl in Adaptive CLI
If you need conditional logic that goes beyond simple scripting, you can use Perl in Adaptive CLI.
The example below checks to see if a String Attribute is empty (null) or not. If the String attribute
(ShowCmdString
) has content, the show command with
ShowCmdString
as a parameter goes
to the device. Otherwise, the Perl script skips or excludes this statement.
Embedded CLI Example:
[IF ShowCmdString]
Show [ShowCmdString]
[ENDIF ShowCmdString]
You could use the CLI format for the above example, but if you need to check attributes of other
types, besides String, then you must switch to Perl. For example:
Boolean
myFlag
equals True:
if ($myFlag)
{
…
}
Integer
myInt
greater than zero:
Example:
if ($myInt > 0)
{
…
}
To check whether a string is a particular value—like from a valid values list entry assigned to the
String attribute—then you must also use Perl. The CLI format only can test if the String exists. It
cannot validate its value when populated. For example: EncapsulationType = “VLAN-CCC”,
“VLAN-TCC”, … You can not do this check with the CLI Format:
[IF EncapsulationType =
“VLAN-TCC”].
Instead, use a Perl script with a statement like this:
If ($EncapsulationType eq “VLAN-TCC”)
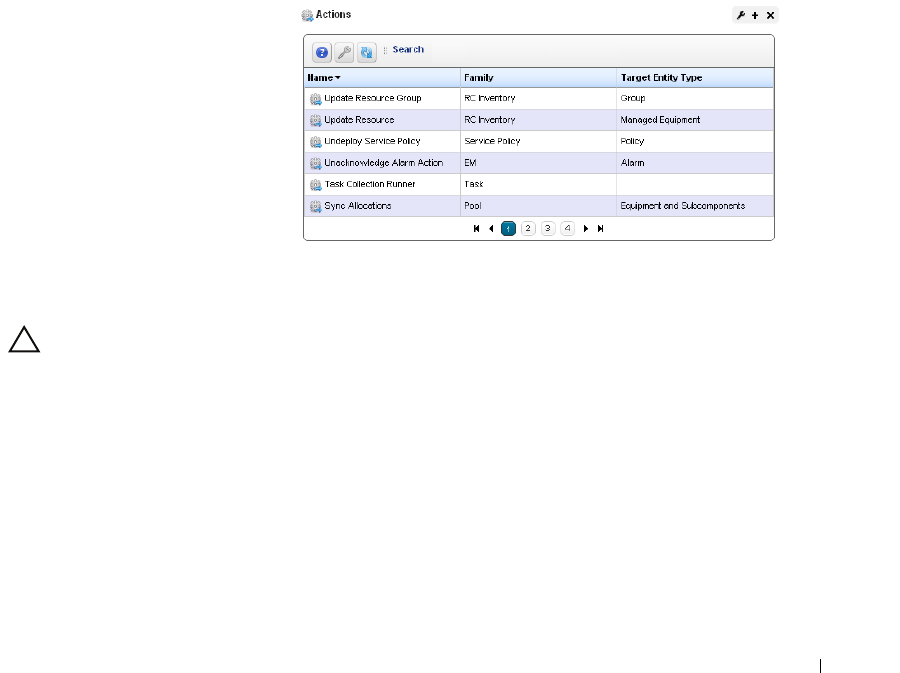
Actions Portlet | Actions and Adaptive CLI
395
{
print “set encapsulation $EncapsulationType\n”;
}
If any attributes in your script are a List (Collection), the only way to loop through the list’s items
during the Adaptive CLI execution is to use Perl. For example: Processing a List of Strings:
$count = 0;
foreach @MyCommandList)
{
print (“$MyCommandList[$count]\n”);
$count++
}
Actions Portlet
The Actions Portlet lets you
manage actions like Adaptive
CLI, backups, change
management actions, and so on.
The list of actions available to
your system depends on the exact
configuration you have installed.
This portlet is the primary access
point for Adaptive CLI editing.
The summary portlet displays
columns with the
Name, Family,
and
Target Entity Type
for the
listed Action. The Family column describes the type of Action.
CAUTION:
For Adaptive CLI to be fully functional, you must install Perl on your application server. See Perl on page
38 for more about this.
To configure and schedule groups of actions, right-click in the Schedules portlet, and create an
Action Group
. This lets you run several actions, and configure their order and targets.
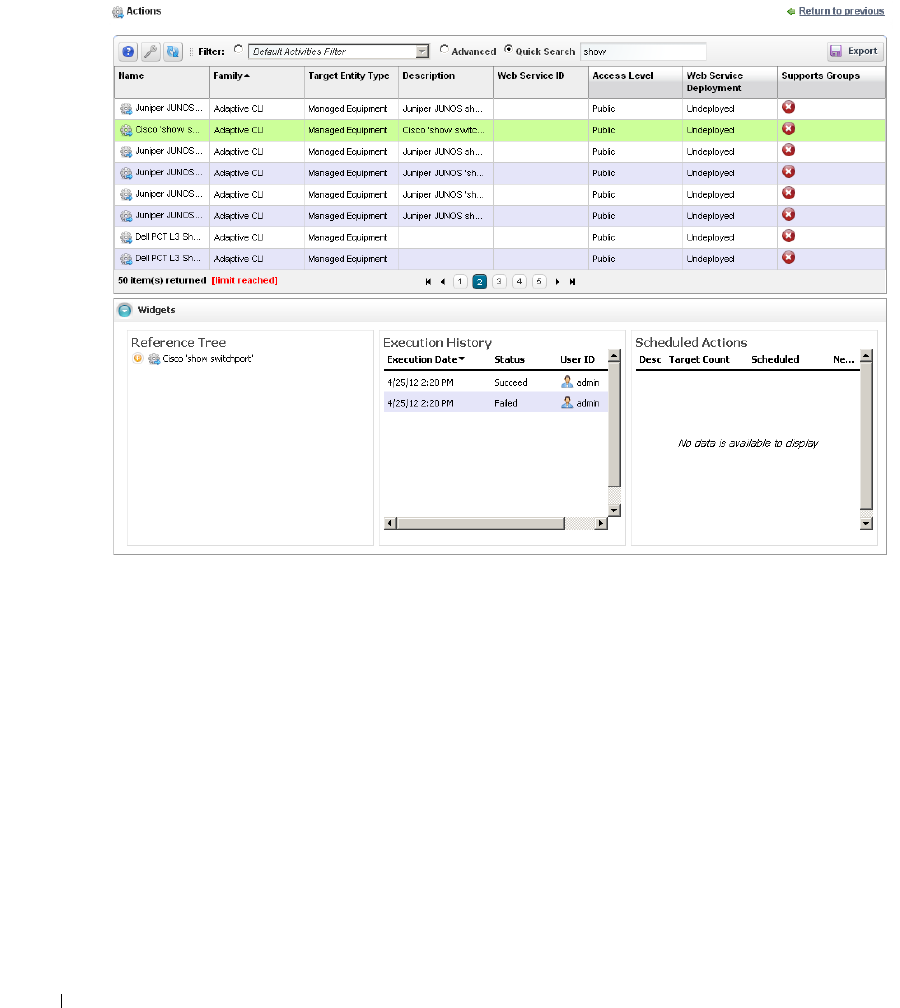
396
Actions Portlet | Actions and Adaptive CLI
Expanded Actions Portlet
The expanded portlet adds columns for
Description, Last Web Service ID, Access Level, Web
Service Deployment,
and
Supports Groups.
The expanded portlet also has snap panels to display Reference Tree connections between the
selection and other elements within Dell OpenManage Network Manager, as well as an Execution
History panel listing
Device Name
(s),
Execution Date
and
Status
for the selected Action, and a
Scheduled Actions panel cataloging any Schedules for the selected Action. Right-click a Schedule
to edit, execute or delete it.

Actions Portlet | Actions and Adaptive CLI
397
The Execution History snap panel displays history by device. Right-click to see the details of what
occurred when the selected action ran against a particular device (
Execution Details).
The Execution Details panel displays tabs showing the
Results
of running an Adaptive CLI, and
the
Sent Commands
.
Yo u c a n a l s o
View Job
to see a screen like
the Audit Trail / Jobs Screen on page 114,
or
Delete
to
remove a listed Action record from the list.
Right-click menus on the Actions portlet can include the following items (these vary, depending on
the Action’s family):
New / Edit
—Lets you create or modify a selected action in the Adaptive CLI Editor, described
below.
Execute
—Execute the selected Action. This typically displays a target equipment selector screen,
and a screen where you can configure any parameters necessary for execution, then a screen
like the Audit Trail / Jobs Screen on page 114. Dell OpenManage Network Manager validates
the parameters before executing the Adaptive CLI. If a parameter is invalid Dell
OpenManage Network Manager logs a validation error to the audit trail. In this case the
Adaptive CLI is not executed and leaves behind no history record.
Some Adaptive CLI scripts also let you
Preview
what is sent the device in a subsequent screen.
This does not appear in the execution of Targetless, and Multi-target Adaptive CLIs. Some
actions are configured to target groups, too.
Details
—Opens a screen displaying the Reference Tree, Execution History, and Action Details for
the selected Action.
Web Services
—You can elect to
Deploy / Undeploy
or
Export WSDL
to create a web service from
the selected Action.
Deploy / Undeploy Web Service
–Deploy or undeploy the selected activity as a web service.
Export WSDL
–This exports the WSDL for the selected activity. You must select the file
name and location. Web Services Description Language (WSDL) is an XML format for the
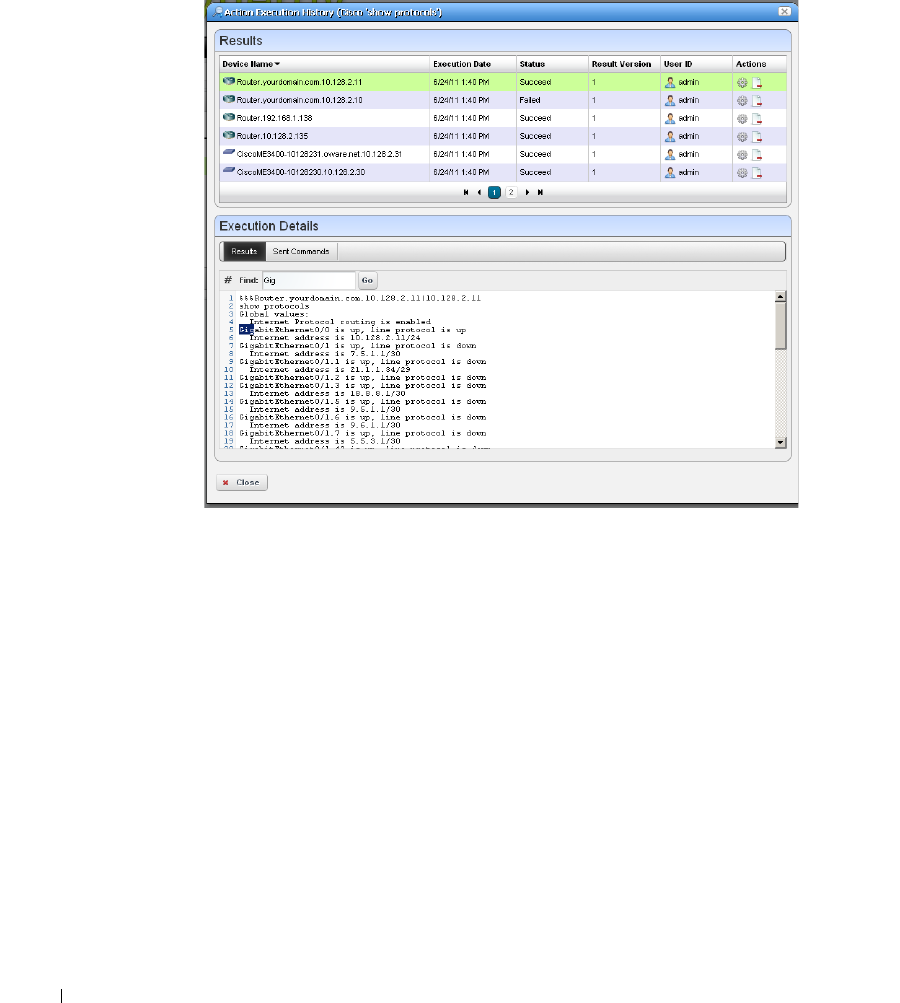
398
Actions Portlet | Actions and Adaptive CLI
description of network services as a set of endpoints operating on messages containing either
document-oriented or procedure-oriented information.
History
—Displays the history of the selected action.
In the
Results
(top of screen panel) click to select the device for which you want additional
information, and the
Execution
Details
panel displays the
Results
of execution in one tab and
the
Sent Commands
in another.
Notice that you can
Find
text within a result (click
Go
to repeat the find). You can also see the
bottom panel if you right-click a single execution within the
Execution History
snap panel in
the Expanded Actions Portlet.
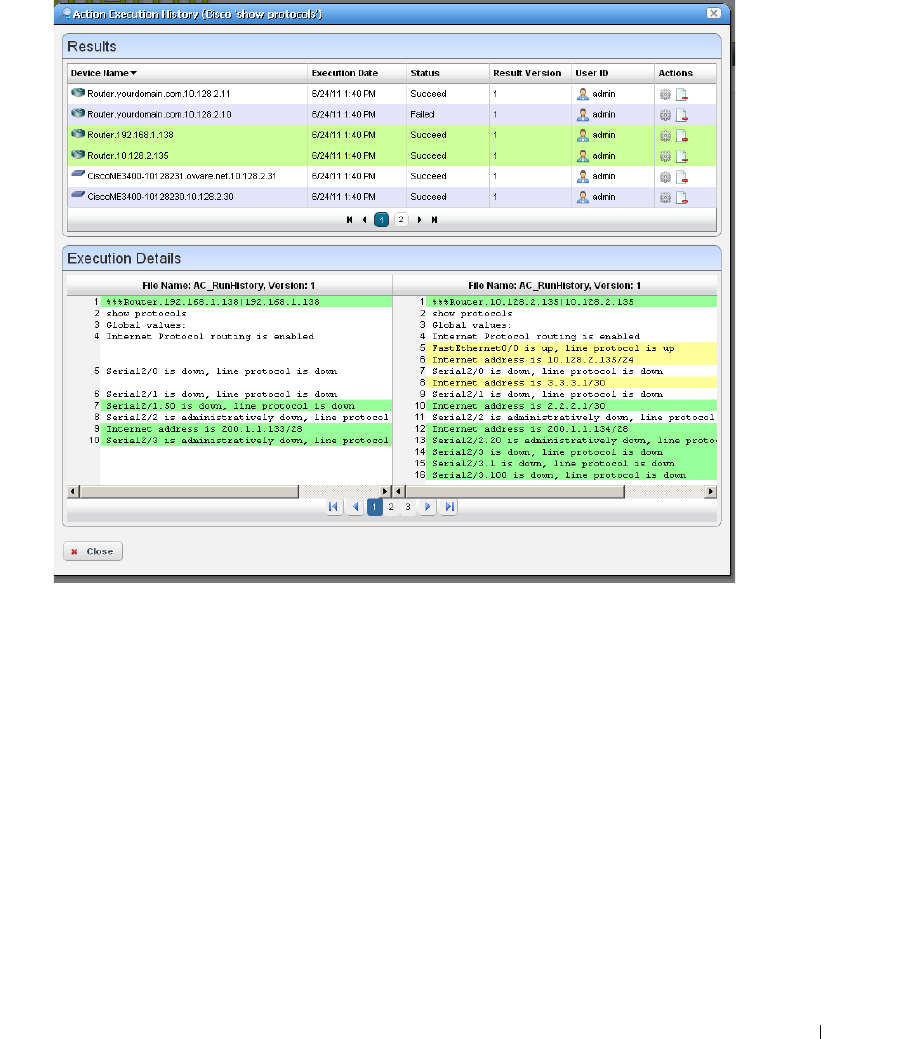
Actions Portlet | Actions and Adaptive CLI
399
If you select two executions in the top panel (or in the
Execution History
snap panel and
right-click), a comparison appears.
This has the same color coding as you would see comparing configuration files. Lines that
differ between the two Adaptive CLI results appear highlighted green. Lines that are missing
in one, but that appear in another appear highlighted red. Added lines appear highlighted in
yellow. Use the right/left arrows or the page numbers at the bottom of the screen to page
through the side-by-side comparison.
Audit
—Opens an Audit Trail Viewer for the selected Action. See Audit Trail / Jobs Screen on page
114 for details.
Show Last Results
—Show the last execution details (like history for a single run).
Schedule
—Schedule the selected Action. See Scheduling Actions on page 439 for details.
Delete
—Remove the selected Action from the list.
Import / Export
—Import or Export a file representations of the ACLI action selected. Dell
OpenManage Network Manager supports ACLI import / export only.
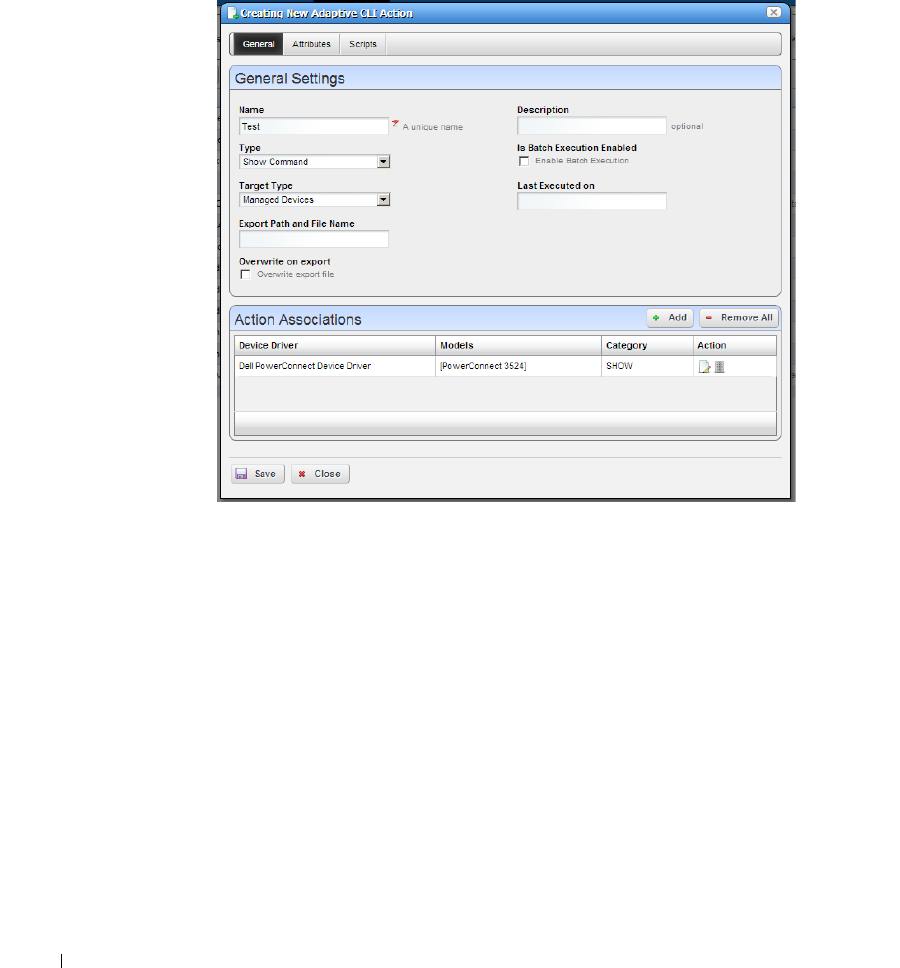
400
Actions Portlet | Actions and Adaptive CLI
Adaptive CLI Editor
This editor creates new Adaptive CLIs When you click
New,
or
Edit
after, selecting an existing
command, the command editor screen opens. You can create
Configure
Command
s,
External
Command
s, and
Show
Command
s.
The editor screen has the following tabs (the ones that appear depend on the type of command you
are editing):
• General
• Attributes
•Scripts
The Adaptive CLI Manager logs into devices in enable mode by default. For most configuration
commands (and even some show commands), you must typically first set the device to its
configuration mode. Dell OpenManage Network Manager also validates entries. If saving fails, a
red “X” appears next to required omitted entries.
Click
Save
to preserve the Adaptive CLI you have configured. Clicking
Close
does not save your
configuration.
General
The following are parameters to configure in this panel:

Actions Portlet | Actions and Adaptive CLI
401
Name
—A unique identifier for this action. For example: “Retrieve MyDevice MAC addresses.”
For a new action to appear on the right-click Action menu, begin its name with the vendor
name. For example,
Force10-showversion
would appear under Actions in that menu.
Otherwise, it appears under and Adaptive CLI classification.
Description
—A text description of the action.
Ty p e
—Select a type from the pick list (
Configure, External
or
Show Command
).
NOTICE
You can use Dell OpenManage Network Manager’s optional Proscan policies to scan the results of
Adaptive CLI show commands for compliance, and trigger actions (alarms, e-mail, and so on) based on
their contents. See Chapter 12, Change Management / ProScan.
The
External
command refers to a script. Making this an ACLI means Dell OpenManage
Network Manager can schedule such scripts or include them in a workflow. See External
Commands on page 413 for more about these.
Tar g e t Type
—Select a type of target from the pick list (
Card, Equipment and Subcomponents,
Interfaces, Managed Devices, Ports
). Adaptive CLI targets can also be
None
(
Targetless)
. On
execution, if you create an Adaptive CLI type with port target, then the selection view panel
lets you choose ports. When the Adaptive CLI type is
External
then Target Type can be
None
;
otherwise it is not an option
Export File Location
—This is a file name and path (
C:\mypath\myfile.txt
) where you
elect to store the result of an adaptive CLI execution. You must specify an extension for the
file, and may specify the variable
$IPAddress
in the filename for pattern substitution.
Overwrite on Export
—Check to overwrite the result file. This overwrites any existing results file
with new results (if checked). If it is unchecked, any new results append to the exported file,
with a time / date stamp and target-identifying information.
Is Batch Execution Enabled
—Check to allow consolidation of related Adaptive CLI scripts,
provided the associated device driver supports such consolidation when provisioning a service.
Batching is valuable for instances like the following: if an Adaptive CLI-provisioned service
has 10 sub-services, OpenManage Network Manager runs commands for the first service, then
if it’s successful, commits, and logs off. Then OpenManage Network Manager repeats this
procedure nine times more, logging on, committing and logging off for each command. If
batching is turned on, then OpenManage Network Manager sends the 10 Adaptive CLIs to
the device as a single unit before committing and logging off. (This logic does not apply if you
are running a procedure against 10 devices.)
Batching is best practice, since if one line of a command fails, the device rolls back the entire
block of commands. Cisco devices typically skip and do not commit failing lines.
Last Executed On
—Displays the last execution date. This is blank for
New
Adaptive CLIs.
402
Actions Portlet | Actions and Adaptive CLI
Action Associations
Click the
Add
button to add associations to vendors and device models. For example, you can
confine an Adaptive CLI to Dell devices, even to certain Dell models. When you right-click your
discovered Dell device in the Managed Resource portlet, the associated Adaptive CLIs appear
listed among the available actions you can request.
Attributes
Adaptive CLI commands let you configure
modifiable
Attributes
as part of the command you
send to the selected equipment.
Use the radio buttons to select from the following
options:
• Do not use Parameter Schema
• Create a new Parameter Schema
• Use an existing Parameter Schema for this
Adaptive CLI
Sharing a schema rather than creating a new one
with each Adaptive CLI lets you use the same
attributes in complementary scripts. For example
one script may create an entity, while another
removes it. In this case, the valid values, labels, and
so on for the attributes are always going to be the same in both create and delete Adaptive CLIs;
therefore, sharing the same schema is both safe and easy. Either script can mark unused attributes
as “Not applicable.”
Do not use Parameter Schema
This option does not save a set of standard attributes to re-use later. Go directly to the Scripts tab
to create this type of Adaptive CLI.
Actions Portlet | Actions and Adaptive CLI
403
Create a new Parameter Schema
Click the
New
button and the schema screens
appear.
Entity Type Settings
The
Entity Type Settings
tab has the following
fields:
Entity Type Name
—An identifier for the schema.
Description
—A text description for the schema.
Category
—A category for the schema.
Version
—An automatically-created version
number.
Attribute Settings
Click the
New
Attribute
button and
select the attribute type
and open editor panel
and configure the
attribute. Configured
attributes appear in a
tree to the left of the
editor panel. Click a
listed attribute to edit
it after it has been
created.
The editor panel has
the following fields:
Label
—An identifier
for the attribute.
These can have
spaces, but not
underscores.
Description
—A text
description for the attribute.

404
Actions Portlet | Actions and Adaptive CLI
The following tabs may appear, depending on the type of attribute you are configuring (some are
absent). Additional fields may appear, depending on the attribute type you are configuring:
Datatype Settings
Default Value
—An optional default value for the attribute.
Collection Settings
Is Collection?
—Check to classify this attribute as a collection.
Allow Duplicate Values
—Check to enable allowing duplicates.
Allow Reordering
—Check to enable allowing reordering.
Collection Min / Max Length
—Enter the minimum/maximum number of characters in this
attribute.
Properties
Upper / Lower Case
—Check to validate on case.
Case Insensitive
—Validation ignores case.
Multi Line Text
—Check to enable multiline text.
One Way Encrypt
—Check to encrypt.
Truncate
—Truncate the attribute.
Attribute Settings
You can create new attribute schemas. See Attribute Editor Panels below for information about
different datatypes’ fields. Once you create a set of attributes, they remain available for re-use as a
schema, or collection of attributes. To identify schemas, enter the following fields:
Label
—A unique, mandatory identifier for the collection of attributes.
Description
—A text description of the entity.
Click
New
to create or select an attribute in the displayed tree and click
Edit
to open an editor
where you can create or modify attributes. Select an attribute and click
Remove
to delete it from
the list.

Actions Portlet | Actions and Adaptive CLI
405
Attribute Editor Panels
The following panels appears, depending on the attribute type selected from the pick list. The
fields in the editor depend on this selection. Available types include
Boolean, Coded Value, Date,
Decimal, IP Address, Integer, Long, Inventory Reference,
and
String.
The following fields appear
for each of these types (omitting redundant fields):
NOTE:
Configure the data type of an attribute before you save a task. After attributes are in Scripts, you cannot
change the data type.
Boolean
Default Value
—Check for
Tr u e
.
Coded Value
Default Coded Value
—Enter the default coded value. If an attribute a Coded Value then enter
valid values in the format of NUMBER:Display Label. For example:
10:Hello World
20:Hello Moon
Without this pattern a validation error appears. Coded values become a Drop Down (Combo
Selection) at runtime containing the Display labels within it (like Hello World, Hello Moon).
Selecting one gives the script the numeric value (If users select Hello World, the value the
script gets is 10)
The default appears by default in this list of alternatives. Enter any other alternatives below
this field in the
Valid Values
.
Vali d Va l u es
—Enter a valid value in the line above the table of valid values, then click the green +
to add the value entered to the list. Click the
Remove
icon (the red -) to delete a selected
value. These must be formatted like the
Default Coded Value.
Date
Default Value
—Enter a default date, or use date icon to display a calendar where you can select
one. Click off the calendar to make it disappear.
Vali d Va l ue s
—Enter valid date values above the list, and click the green plus to add them to the
list.
Decimal
Default Value
—Enter a single or range of default decimal values.
Constraints
—Enter a range of acceptable numbers separated by a colon. For example, Constraints
= 2:4096. At runtime, a field where you can enter numbers. validates that entered numbers
are between 2 and 4096 when running the Adaptive CLI. If you enter a number outside this

406
Actions Portlet | Actions and Adaptive CLI
range, a validation message appears and the attribute name turns red. You can also include
several numbers or ranges separated by the pipe (|) character. If you specify a range, the
lowest number must be to the left of the highest number. For example 9:99|999:1010.
Vali d Va l ue s
—Enter valid decimal range values, and click the green + (the red - removes them).
You can manage these as described in Coded Value above.
IP Address
See also Validating IP Address Variables on page 407.
Default Value
—Enter a default IP Address.
Vali d Va l ue s
—Enter valid values as described in Coded Value above. Check
IP Mask
,
Subnet,
Allow 32 Bit Mask,
and
Allow Any Valid Ip
in the
Properties
tab if you want the values
entered to be those.
Edi ta b le Va lid Va l u es
—Check to enable editing of default or entered IP addresses.
Integer
Default Value
—Enter a default integer.
Constraints
—Enter a range of acceptable numbers separated by a colon. You can also include
several numbers or ranges separated by the pipe (|) character. If you specify a range, the
lowest number must be to the left of the highest number. For example 9:99|999:1010.
Vali d Va l ue s
—Enter ranges of valid values as described in Decimal above.
Edi ta b le Va lid Va l u es
—Check to enable editing of default or entered integer.
Long
Default Value
—Enter a default long.
Constraints
—Enter a range of acceptable numbers separated by a colon. You can also include
several numbers or ranges separated by the pipe (|) character. If you specify a range, the
lowest number must be to the left of the highest number. For example 9:99|999:1010.
Vali d Va l ue s
—Enter ranges of valid values as described in Decimal above.
Inventory Reference
Select the
Reference Type
entity with the list that appears when you click the green plus (+), then
use the side-by-side widget’s arrows to move available attributes from
Available
to
Selected
. You
can change the
Reference Type
by deleting it with the red minus (-), then selecting a new type with
the green plus.
String
Default String
—Enter a default string.
Vali d Va l ue s
—Enter valid values as described in Coded Value above.

Actions Portlet | Actions and Adaptive CLI
407
Edi ta b le Va lid Va l u es
—Check to enable editing valid values.
Constraint
—Enter the regular expression constraints, if any, on the string attribute.
Constraint Description
—Enter the message to appear if the regular expression constraints are not
met.
Min / Max Length
—Enter the minimum / maximum number of characters in a valid string.
Click
Apply
to accept your edits for the attribute, or
Cancel
to abandon them.
Use an existing Parameter Schema for this Adaptive CLI
Select this, and a
Select Existing
button appears. Clicking this button opens a selector where you
can select from previously-configured attribute schemas (collections of attributes) to use in the
Adaptive CLI you are configuring.
Validating IP Address Variables
Programatically, IP address attributes support four extended properties: IP_MASK, SUBNET,
ALLOW_32_BIT_MASK, and ALLOW_ANY_VALID_IP. The state of the first two largely defines
Dell OpenManage Network Manager’s responses.
IP_MASK
—Determines whether Dell OpenManage Network Manager accepts an IP address OR
a subnet/subnet mask. The value accepted is an IP address attribute when false, subnet/
subnet mask when true.
SUBNET
—This property determines whether a subnet value must be provided or not, and
controls display of the subnet portion of the widget. Valid subnet values are 1-31.
By default, when both of the above are false, the attribute only accepts valid IPv4 addresses. For
example: 10.10.10.4
If IP_MASK is false and SUBNET is true then Dell OpenManage Network Manager accepts any
valid IP address with a subnet specified. The address must be an IP within the specified subnet. For
example, 10.10.10.4/24 is a valid entry whereas 10.10.10.0/24 is invalid since it represents the
subnet id, not an actual address within the subnet.
If IP_MASK is true and SUBNET is false, then OpenManage Network Manager accepts one of the
32 valid subnet masks. The widget displays pick list for user to choose from. For example
255.255.255.0
If IP_MASK is true and SUBNET is true, then OpenManage Network Manager accepts a subnet id
(the first IP address within a subnet). For example 10.10.10.0/24, with 10.10.10.0 as the first
address within the subnet spanning 10.10.10.0 to 10.10.10.254. Entering an IP address within the
subnet, say 10.10.10.4/24, the attribute would convert that to 10.10.10.0/24
ALLOW_32_BIT_MASK
—Valid subnet values are between 1 and 31. To extend this to support a
32-bit subnet, which is essentially a single IP address (10.10.10.4/32), set the
ALLOW_32_BIT_MASK property.
408
Actions Portlet | Actions and Adaptive CLI
ALLOW_ANY_VALID_IP
—To accept either an IP address, IP address and subnet or subnet,
then IP_MASK remains false, SUBNET is true. With the ALLOW_ANY_VALID_IP true, the
subnet field is optional and OpenManage Network Manager disables any requirement that a
subnet id be specified. Basically the only validation is that a valid IP address is entered. For
example, in this configuration, 10.10.10.4, 10.10.10.4/24 and 10.10.10.0/24 would all be valid.
Scripts
This screen manages the Adaptive CLI scripts created to query (show) devices or configure them.
Dell OpenManage Network Manager runs only one script per target.
Notice you can order multiple scripts with the arrow(s) to the right of a listed script. Only one
schema of attributes exists for each Adaptive CLI, so the same attribute(s) appear when you
construct each script.
Dell OpenManage Network Manager uses the script’s filter to match the target. For example,
imagine two scripts for which the first has filter = target.type = SWITCH, and the second has no
filter. Then only SWITCH devices run the first script and quit. All remaining targeted devices do
not run first script. Instead they run the second script since that script has no filter. Only one script
runs on the selected target equipment. The ordering lets you to make the most efficient use of that
one-run-per-target pattern.
Actions Portlet | Actions and Adaptive CLI
409
Script Settings
Click
Add New Script
to create a new item in those listed at the top of this screen, or select and
item and click the
Edit
icon to its right to alter it. When you create a new script, you must select
either
Embedded CLI
or
Perl
. Embedded CLI scripts are command-line interface (CLI)
interactions. See Perl Scripts on page 419 for more about using Perl.
Clicking the
Delete
icon removes a selected item. Notice that the up/down buttons to the right of
the list allow you to re-order selected items (they run from top first to bottom last).
See Attribute Appearance and Validation for a description of what constitutes a valid attribute.
Name
—Enter an identifier for the script you are creating or altering.
Target Filter
—Click the plus (+) to create a filter that describes the target for this script. For
example, this filter could confine the action of the configured script to devices from a certain
vendor, or only devices with an operating system version later than a certain number. Since
you can have several scripts, those Adaptive CLIs with a single label (“Show Users,” for
example) could therefore contain several scripts with syntax appropriate to a variety of devices
and operating systems.
CAUTION:
Adaptive CLI supports only filters that select the Managed Equipment type of device.
Attribute Delimiter
—The delimiter(s) you select from the pick list here surround the attributes
you designate as mandatory. See Adaptive CLI Script Language Syntax on page 418 for more
about these.

410
Actions Portlet | Actions and Adaptive CLI
Optional Attribute Delimiter
—The delimiter(s) you select from the pick list here surround the
attributes you designate as optional. See Adaptive CLI Script Language Syntax on page 418
for more about these.
All but
Delete
open a script editor with the following panels:
•Script Content
• Error Conditions
• Continue Pattern
• Attributes Extraction
Script Content
On the left, you can enter text,
Search
by clicking the magnifying glass, and use
Cut, Copy, Paste
,
Undo, Jump to Line #, reformat
. The
Attributes
appear under
Ta rg e t Para m s
on the right of this
text entry screen. Double-click an attribute to insert it unless you are writing a Perl script; this
feature does not work for Perl. Right-click the previously-configured attributes in this panel to
designate them as
Mandatory, Optional, Not Applicable
or
Non Configuration
in a context menu
that appears when you right-click.
NOTICE
Dell OpenManage Network Manager does not send Non Configuration attributes to the device with the
script. These are comments that can serve to remind users of critical information. For example, you can
make Non Configuration boolean attributes into a checklist for someone executing a script, and the
history of this script can record whether Dell OpenManage Network Manager made these checks when
the script ran.
Notice that the
Search
also permits Regular expressions.
You can also enter two types of script language here. See Adaptive CLI Script Language Syntax on
page 418 for a description of the internal
If
capabilities. If you need more elaborate scripting, you
can also use Perl scripts to send text to devices. See
Perl Scripts on page 419
for a description of
those capabilities.

Actions Portlet | Actions and Adaptive CLI
411
Error Conditions
The error condition lets you configure errors for your script.
Check
Continue on Error
under the Global Condition Options, if you want the script to not stop
when it encounters an error. Click
Add new error conditions
to configure a condition at the bottom
of this screen with the following fields:
Error Pattern
—Enter a regular expression for the error.
Error Type
—Select from the pick list of options (
Error, Warning, Ignore
).
Line checking
—Select from the pick list (
Unlimited, Disabled (Skip error condition), Specific
number of lines
). If you select a specific number of lines, enter the number of lines of the
script output to check for the pattern specified, after each command execution. An error
message is most likely to appear immediately right after the command is invoked.
Continue Pattern
Like Error Conditions, this screen lets
you enter conditions to which script
execution can respond.
The Continue Pattern editor operates
like the Error Conditions editor, but has
slightly different fields.
Continue Pattern—
If you expect the
device output of a script to
prompt to continue, you may add
a
Continue Pattern
with a regular expression to parse.
Answer—
This field specifies the
Answer
to the
Continue Pattern
prompt.
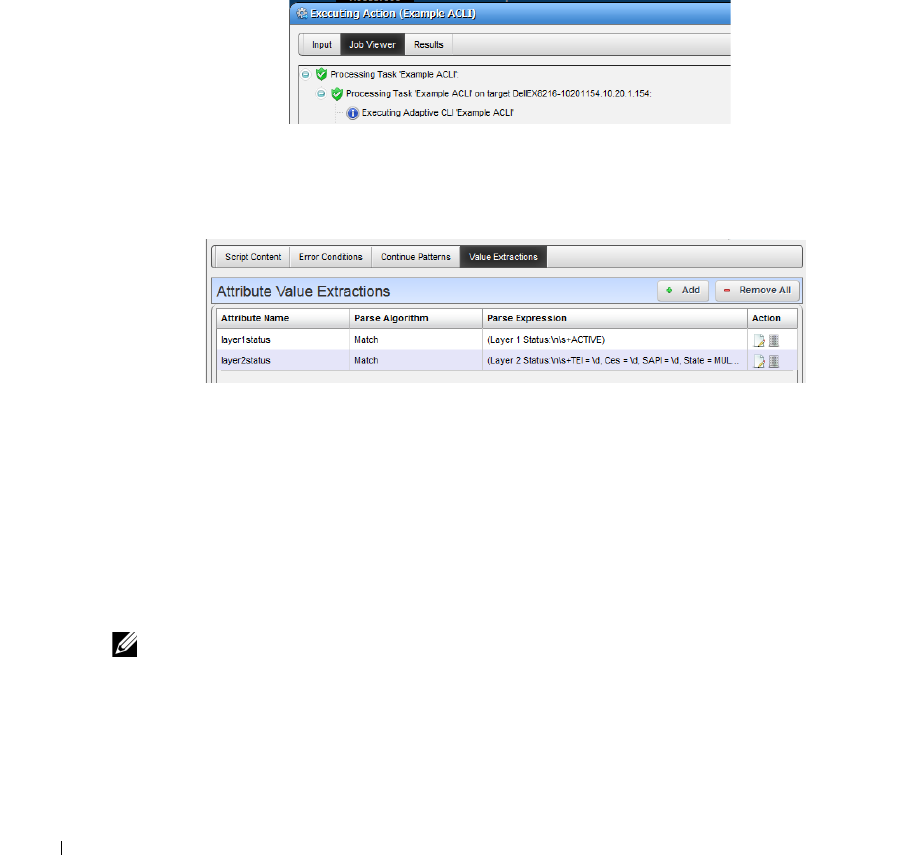
412
Actions Portlet | Actions and Adaptive CLI
Send New Line—
For some devices, a single key response without a new line would be sufficient;
in such cases, you may need to uncheck the
Send New Line
option.
Max Occurrences—
Indicates the maximum number of times respond to a prompt. The default
value zero (0) indicates no limit.
Attributes Extraction
To support Adaptive Service and Active Monitor functions, Adaptive CLI provides a way for the
user to define output schema attributes. This tab is active only if you have configured schema
attributes to store values previously in the Attributes portion of this editor.
This lets you
Add, Edit
or
Delete
extracted attributes, like Error Conditions’s editor. To clarify
configured
Attributes
,
Parse Algorithms
, and
Parse Expressions
accompany scripts, they appear in a
table. Use the
Add
button to create more Value Extractions, and the
Edit
or
Delete
buttons to the
right of listed patterns to alter or remove them.
Configure Value Extractions with the following fields:
Attribute Name—
This field specifies the name of the extracted attribute. To specify the output
value of an attribute, select it from the provided list.
Attribute Type—
The data type of the attribute extracted. Only schema attributes of simple type
String, Integer, Long, Float, Double, and Boolean are available to choose from.
Parse Algorithm—
Select from the pick list (
Extract, Match
). For match algorithm, the result is
either
true
or
false
for the Boolean attribute type, 0 or 1 for numeric types, or
“true”
or
“false”
for String type.
NOTE:
Currently, Active Performance Monitor supports only numeric types.
Parse Expression—
Enter a regular expression for Parse Expression and the Parse Algorithm
(Extract or Match) used when evaluating the device output on a given script execution.
OpenManage Network Manager matches the regular expression for sub-strings, so no need to
provide a leading and trailing “match all” regular expression. (.*).

External Commands | Actions and Adaptive CLI
413
See
Regular Expressions on page 375
for more information about what is these expressions can do.
Click
Apply
to accept your edits, or
Cancel
to abandon them. Click
Add new attribute extraction
to
add more such patterns to your script.
Attribute Appearance and Validation
Invalid schema attribute names appear in the script in red italics. This indicates that you cannot
use such attributes in the script.
Valid attribute names contain alphanumeric characters and underscore (_). They must begin with
either an underscore or a letter [A-Za-z].
All blank space characters in the schema attribute name are converted to underscore (_) by default.
A schema attribute name that is invalid in Adaptive CLI may still be valid in other entities, so you
can specify them in the schema but they are not usable by Adaptive CLI.
Click
Apply
to accept your edits for the script, or
Cancel
to abandon them.
Comparison
Selecting (ctrl+clicking) two Adaptive CLI runs within the
Execution History
portlet lets you
compare the two execution results. Right-click and select
Compare
.
Lines that differ between the two configurations appear highlighted green. Lines that are missing
in one, but that appear in another appear highlighted red. Added lines appear highlighted in yellow.
Use the right/left arrows at the bottom of this screen to page through the side-by-side comparison.
External Commands
External commands are essentially scripts that run in the Dell OpenManage Network Manager
environment. For example, you could run the DOS
dir
command (and schedule its execution).
Make sure you select External Command as the Type of Adaptive CLI in the editor when you
create an Adaptive CLI that refers to an external command. Also, make sure the
Net::Telnet
package is installed with Perl.
You can execute external commands with a device as target, using device attributes as input
parameters to the Adaptive CLI script. See some of the Seeded External Scripts on page 416.
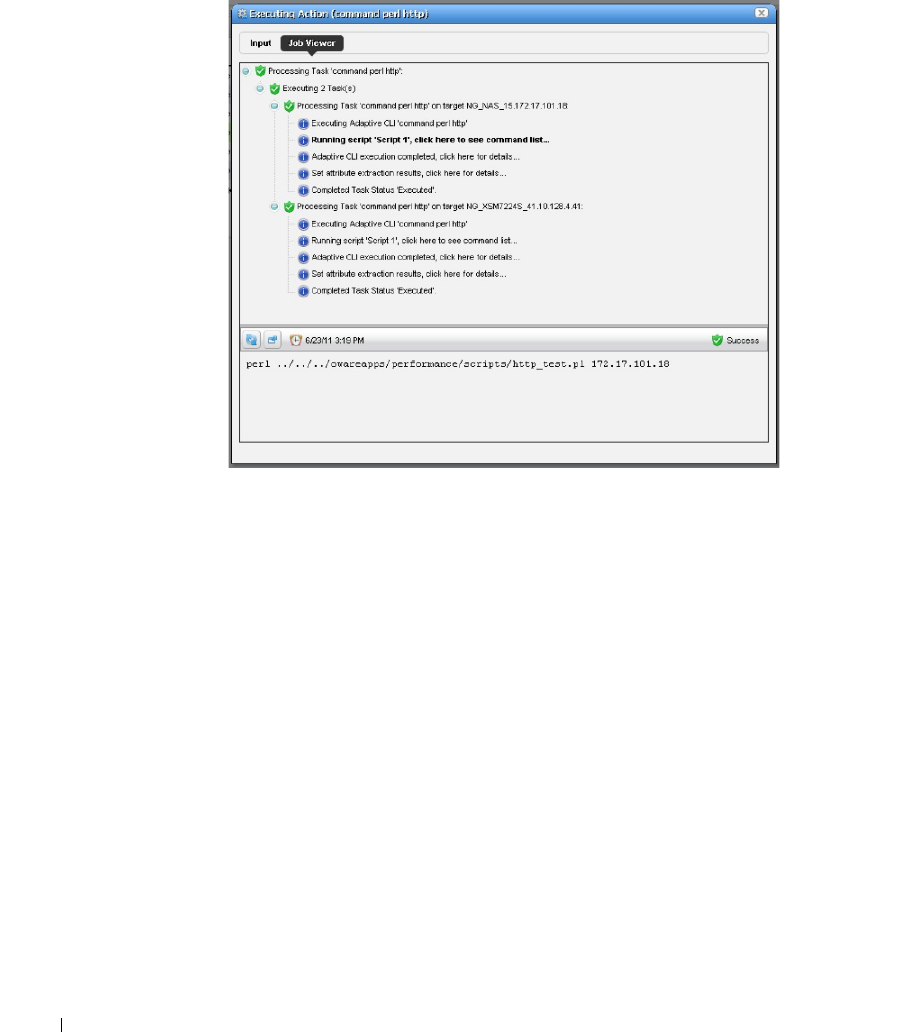
414
External Commands | Actions and Adaptive CLI
Audit Trail
When you execute a script, the audit screen displays information about it.
By default, this screen often conceals the
info
circles in this screen. To see them, click the icon next
to the refresh icon to open the message level selector and check the
info
circle level of reporting,
then click
Refresh
to see those blue circles.
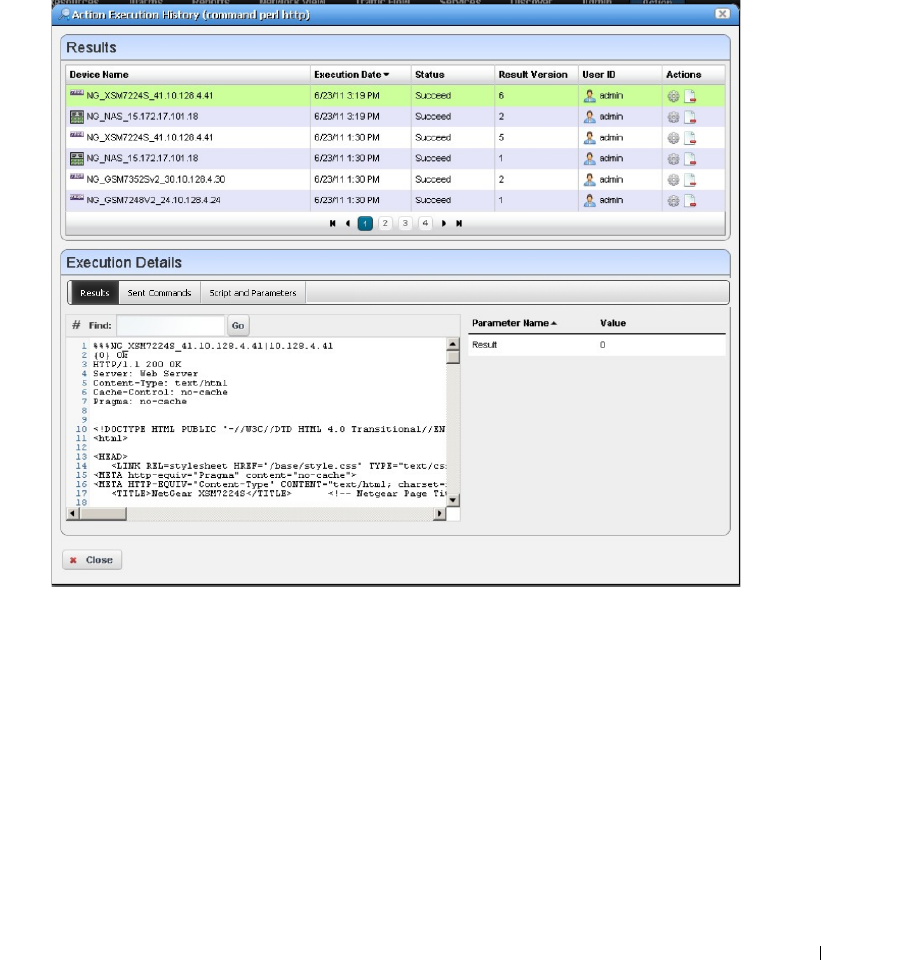
External Commands | Actions and Adaptive CLI
415
Results
Dell OpenManage Network Manager stores the results of running a script as lines the Execution
Details snap panel. Right click the particular command run in the snap panel at the bottom of the
Expanded Actions Portlet. Tabs show the Results, Sent Command, and Script and Parameters.
When viewing a script run the results of running it appear target device-by-device.
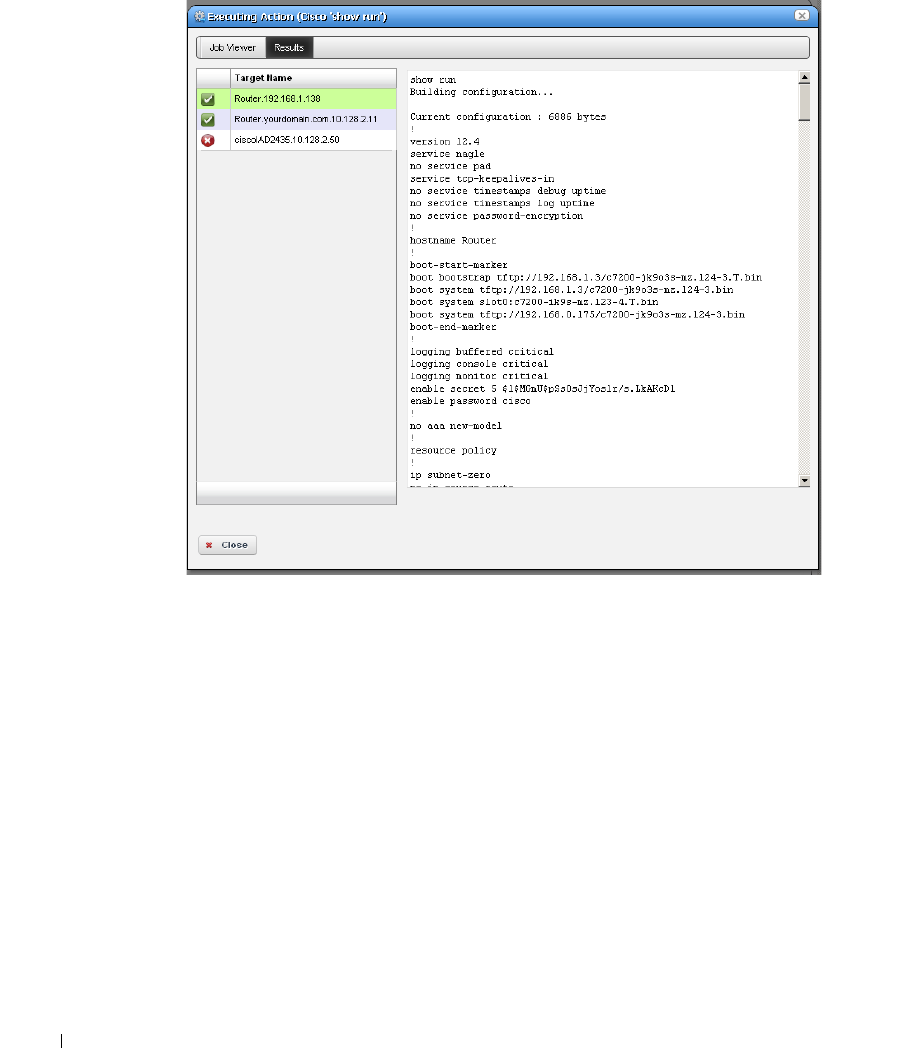
416
External Commands | Actions and Adaptive CLI
Results can also appear in the audit screen messages and in the
Results
panel of the
Action
job
viewer screen.
You can also extract parameters for these external commands as is described in Attributes
Extraction on page 412.
Seeded External Scripts
Several external perl scripts come with Dell OpenManage Network Manager as examples of the
kind of commands you can execute. These are in
\owareapps\performance\scripts
under
the installation root.
To run these, the scripts panel in the Adaptive CLI editor should contain something like the
following:
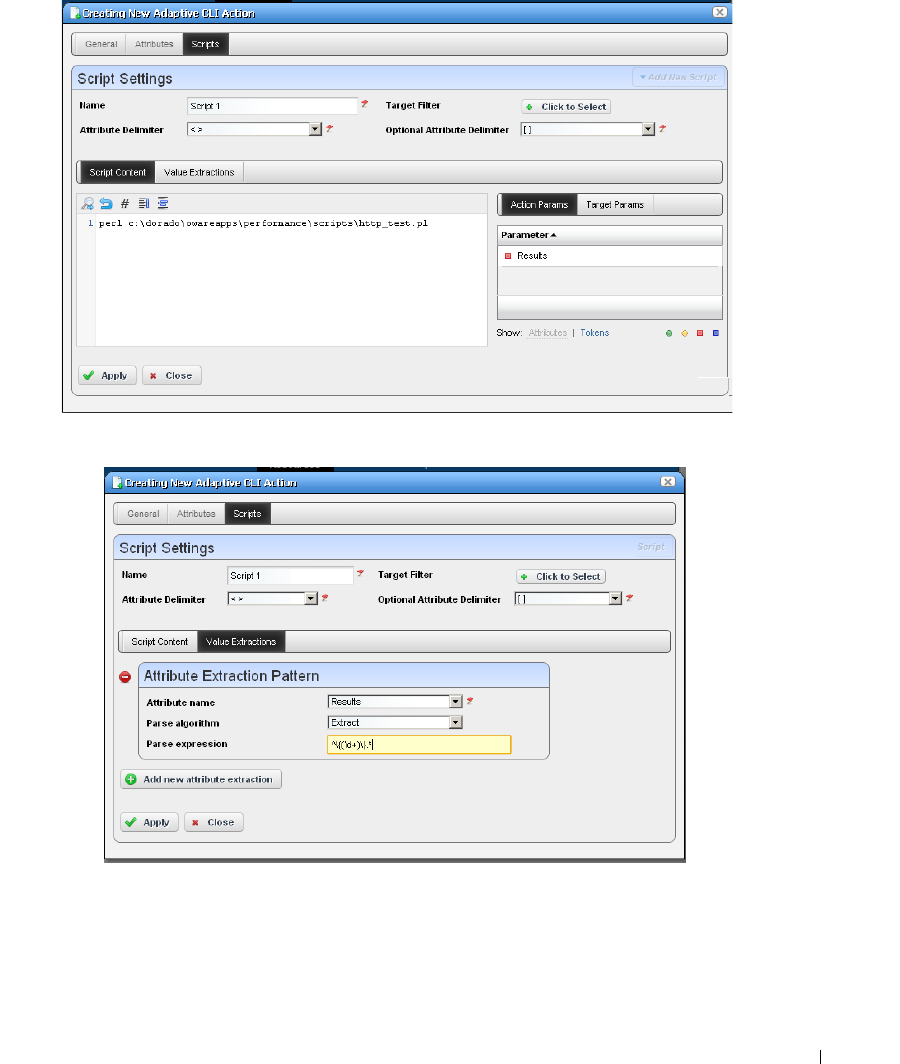
External Commands | Actions and Adaptive CLI
417
perl ../../../owareapps/performance/scripts/http_test.pl
Notice that these also include a parameter (
Result
) that contains values extracted.
Set up attribute extraction in the
Values Extraction
tab of the script editor.
Script Names and Functions
common.pl
—Common functions defined for scripts in this directory.
dns_test.pl
—Check if DNS can resolve the specified host name.

418
Adaptive CLI Script Language Syntax | Actions and Adaptive CLI
finger_test.pl
—Check if the finger service is running on a specified host.
ftp_test.pl
—Check the FTP service is running on a specified host.
http_test.pl
—Check the HTTP service is running on a specified host.
nntp_test.pl
—Check if the NNTP service is running on a specified host. (Public NNTP server to
test: news.aioe.org)
peping_test.pl
—Check if a target is pingable from the specified remote host.
pop3_test.pl
—Check if the POP3 service is running on a specified host.
smtp_test.pl
—Check if the SMTP service is running on a specified host.
telnet_test.pl
—Check if the TELNET service is running on a specified host.
Adaptive CLI Script Language Syntax
Here's the Adaptive CLI scripting language syntax:
• CLI script is a line-based syntax. In other words, each line’s syntax has to be completed.
• CLI script supports primarily two features: Attributes and Conditional Blocks.
Attributes
Each attribute in the script is marked by a delimiter. The following delimiters are supported:
<> [] {} () $ % @ #
Think of Attribute delimiters as a pair of open/close markers surrounding a variable name. For
single character Attribute delimiters, there is no closing marker (the close marker is empty).
Examples of Attributes are:
<var>, [var], {var}, (var), $var, %var, #var, @var
The default mandatory delimiters are
<>
, and the default optional delimiters are
[]
, but you can
change those default settings. That means an Attribute variable like <var> may represent a
mandatory or an optional Attribute depending on what are set as delimiters.
NOTE:
Single delimiter symbols require a space after the attribute. These do allow values immediately before the
symbol. Perl requires a space after the attribute, or the attribute’s closing delimiter, but values immediately
before single delimiters works.
Here is an example of a command line with a mandatory and optional Attribute:
show <mandatory> [optional]
If you set the
<mandatory>
Attribute to
interface
and do not set the
[optional]
one, then the
resulting command would be this:
show interface

Perl Scripts | Actions and Adaptive CLI
419
If you set the
<mandatory>
Attribute to
interface
and set
[optional]
to
brief
then the resulting
command would be:
show interface brief
Conditional Blocks
Every line in the script is presumably a command to be sent to the device, except for lines that
denote either a beginning or ending of a conditional block.
The begin conditional block marker is tied to a Attribute and has the following syntax:
<optional-open-delimiter> IF optional-attribute <optional-close-delimiter>
The end conditional block marker has the following syntax:
<optional-open-delimiter> ENDIF optional-text < optional-close-delimiter>
Here is an example of a conditional block, where the Attribute delimiters are
<>
, optional delimiter
is
[]
, and the conditional Attribute variable is
set
:
[IF set]
execute this command
and execute this command
[ENDIF set]
If the Attribute set has a value then the block is evaluated; otherwise, it is ignored. The text after
ENDIF
., that is
set
or whatever is not required and it is ignored.
Nested conditional blocks are allowed.
Perl Scripts
This section describes the details of using Perl scripts within Adaptive CLI. See Using Perl in
Adaptive CLI on page 394 for more about why to use Perl.
The Perl output goes to the selected target device. Typically, this means creating lines like the
following:
println(“show $param”);
or
print(“show $param\n”);
You must specify parameters within the script (like
$param
) in the screen described in Attributes
on page 402. Unlike its internal scripts, Adaptive CLI does not automatically create attributes. You
must also manually configure created attributes to be
Mandatory,
or
Optional
in that screen.
A few things to remember when using Perl:
• The normal output of your Perl scripts (to stdout) are the commands sent to a device by this
application.

420
Perl Scripts | Actions and Adaptive CLI
• If your script produces an error message (to stderr), the job fails with that message and all
script outputs are ignored. You can validate a script before sending any command to the
device by using die(...) and warn(...) functions in Perl to produce error messages to stderr.
Such messages trigger the script’s failure.
• For such scripts to operate correctly, you must have Perl installed on the directory path for all
OpenManage Network Manager servers.
• Perl does not come with OpenManage Network Manager and must be installed on the server
system independently for it to work with Adaptive CLI.
• You can install your version of Perl and set the PATH environment variable accordingly so that
one can run
perl -v
from the command line (where the OpenManage Network Manager
server is to be started). Adaptive CLI invokes that same
perl
command.
If for some reason Adaptive CLI, fails to invoke the default
perl
command, it reads the
setting of
activeconfig.perl.exe=...
inside
owareapps/activeconfig/lib/
ac.properties
, and uses that alternative command.
Note that the default
activeconfig.perl.prefix=
setting in
ac.properties
is
prepended to every Perl script. It basically forces the script to
use strict
mode and
provides a convenient
println
method for the user. Knowledgeable Perl users can change
this default behavior setting but should be careful about it. Remember, best practice is to
override properties as described in Overriding Properties on page 15.
• The standard output (using
println
) of the Adaptive CLI Perl script represents the
command set that is to be sent to the device. For convenience, a
println
subroutine is
embedded with the script.
• Adaptive CLI with Perl scripts must contain valid Perl under the “strict” pragma (use strict;).
If you import or migrate from a previous version a Perl script that does not pass this “strict”
criterion, you must rewrite it for “strict” compliance before it can be successfully edited or
copied.
NOTE:
When you import a Perl Adaptive CLI that doesn't pass strict, you can execute it without problems.
However, you cannot edit it at all, unless you first edit it to pass strict (or it won't even let you save the
changes).
How To:
Create Adaptive CLI Examples
The following describes the basics of creating and using Adaptive CLIs.
Example 1 - Existing Show Run
uses an existing, seeded Adaptive CLI to show protocols.
Example 2 - New Adaptive CLI
describes making and using a new Adaptive CLI.
Example 3 - Adaptive CLI with Reboot
shows you how to make an Adaptive CLI that requires
rebooting the target device(s).
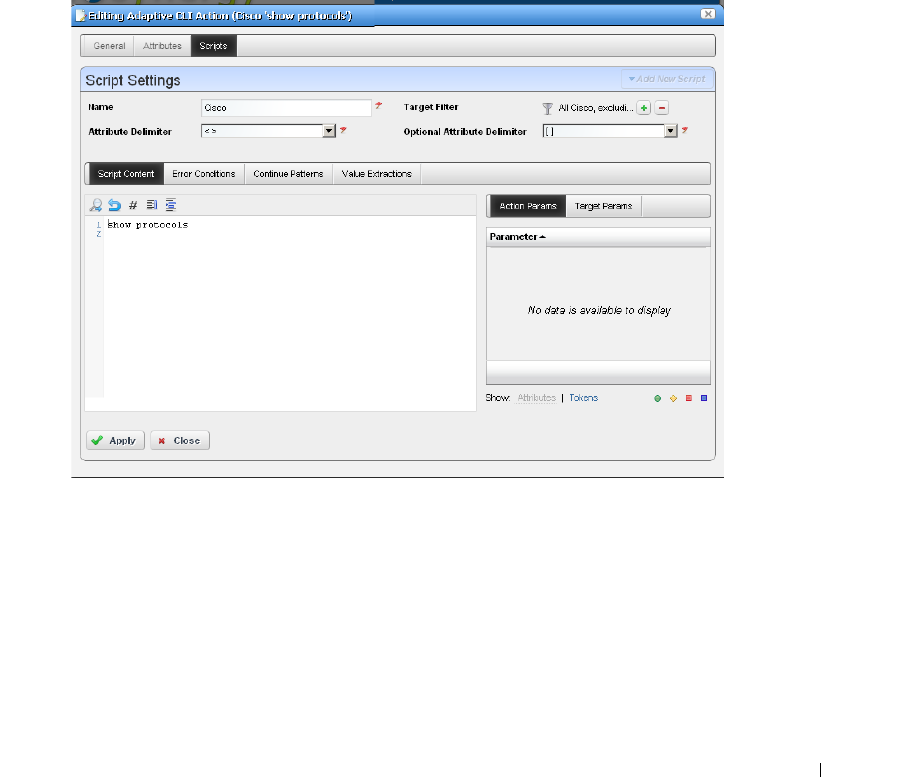
Perl Scripts | Actions and Adaptive CLI
421
Example 4 - Adaptive CLI To Extract Upload / Download Speeds
demonstrates Adaptive CLI
that extracts information from the target device, then displays the results on a dashboard.
Example 5: Monitor Text Values
demonstrates using and Adaptive CLI configured to monitor
attributes with strings that indicate their status.
Some devices do not respond to commands unless they are in the correct state. For example, some
Dell devices must not be in “Simple” mode to respond to Adaptive CLIs. Take account of this as
you create Adaptive CLIs.
Example 1 - Existing Show Run
1
Adaptive CLI Manager has pre-seeded tasks and diagnostic commands based upon the drivers
you have installed. For example: the
Cisco 'show protocols'
command. Right-click and Select
Edit
to view and / or alter this Adaptive CLI.
2
Click the
Edit
icon next to the Cisco script. The
Scripts
tab in this editor appears above,
displaying the
show protocols
command to be sent target devices. Notice (in the upper
right corner) that this Adaptive CLI filters so it applies to all Cisco devices excluding PIX.
3
Close the editor(s), and select this Adaptive CLI.
4
Right click to
Execute,
and select the target equipment for this run in the next screen. The
screen that appears is a standard Dell OpenManage Network Manager equipment selector.
The Adaptive CLI is valid only on devices that pass the Target Filter mentioned in step 2, but
the selection here narrows the target devices for the Adaptive CLI.
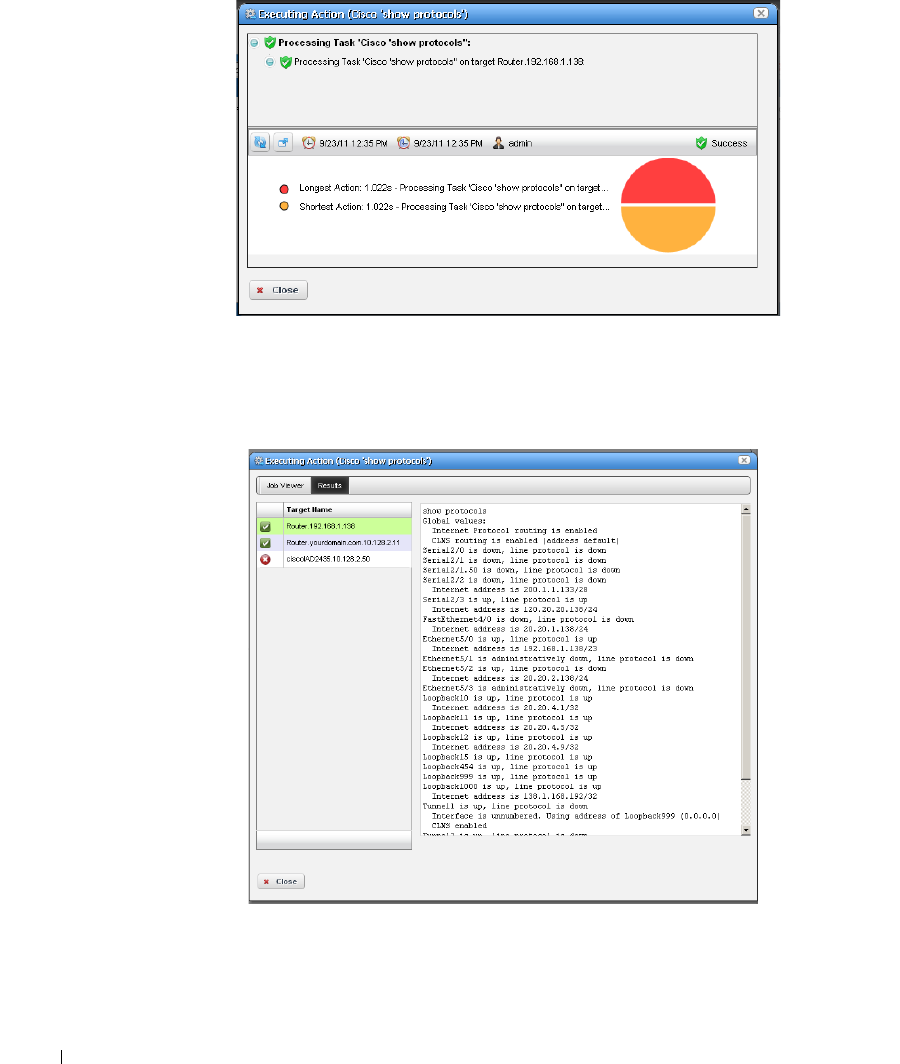
422
Perl Scripts | Actions and Adaptive CLI
5
An Audit trail screen tracks the execution progress
6
Select the Adaptive CLI you ran in the Expanded Portal, and right-click the execution run
that appears in the
Execution History
snap panel at the bottom of the screen.
7
Right-click and select
Execution Details
.
8
View latest results classified by the device you select on the left.
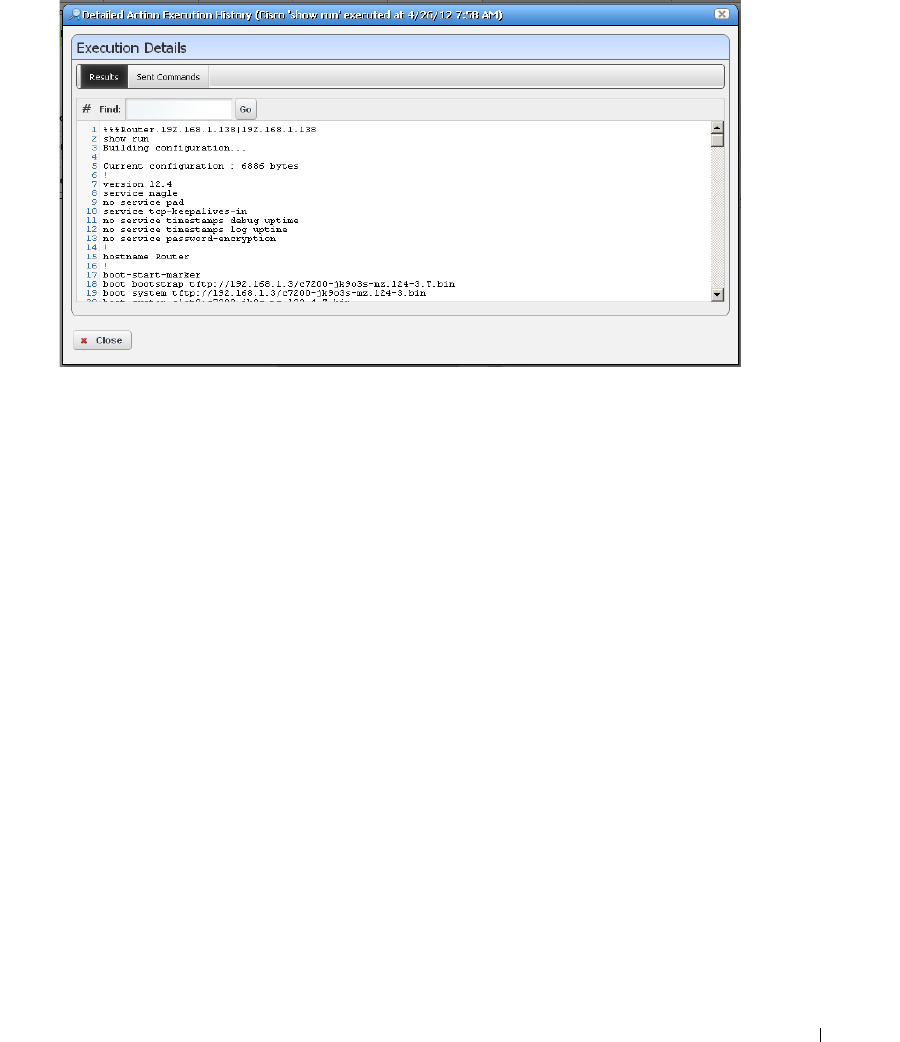
Perl Scripts | Actions and Adaptive CLI
423
9
View latest results by right-clicking in the
Execution History
snap-in of the expanded Action
portlet. You can use the
Find
search box to find matches to strings within the results.
Click
Go
to see the next match.
10
You can also look in the
Sent Commands
tab to see what actually went to the device.
Example 2 - New Adaptive CLI
1
Create a new Adaptive CLI. Right-click and select
New
.
2
Name this (for example “Test ACLI”)
3
In the
Attributes
panel, create string attributes named
required
and
optional
after creating a
new Parameter Schema (for example “test123”).
4
In the
Script
panel define the Attribute Delimiter (< >) and Optional Attributes Delimiter
([ ]) and enter the following three scripts:
show run
show <required>
show [optional]
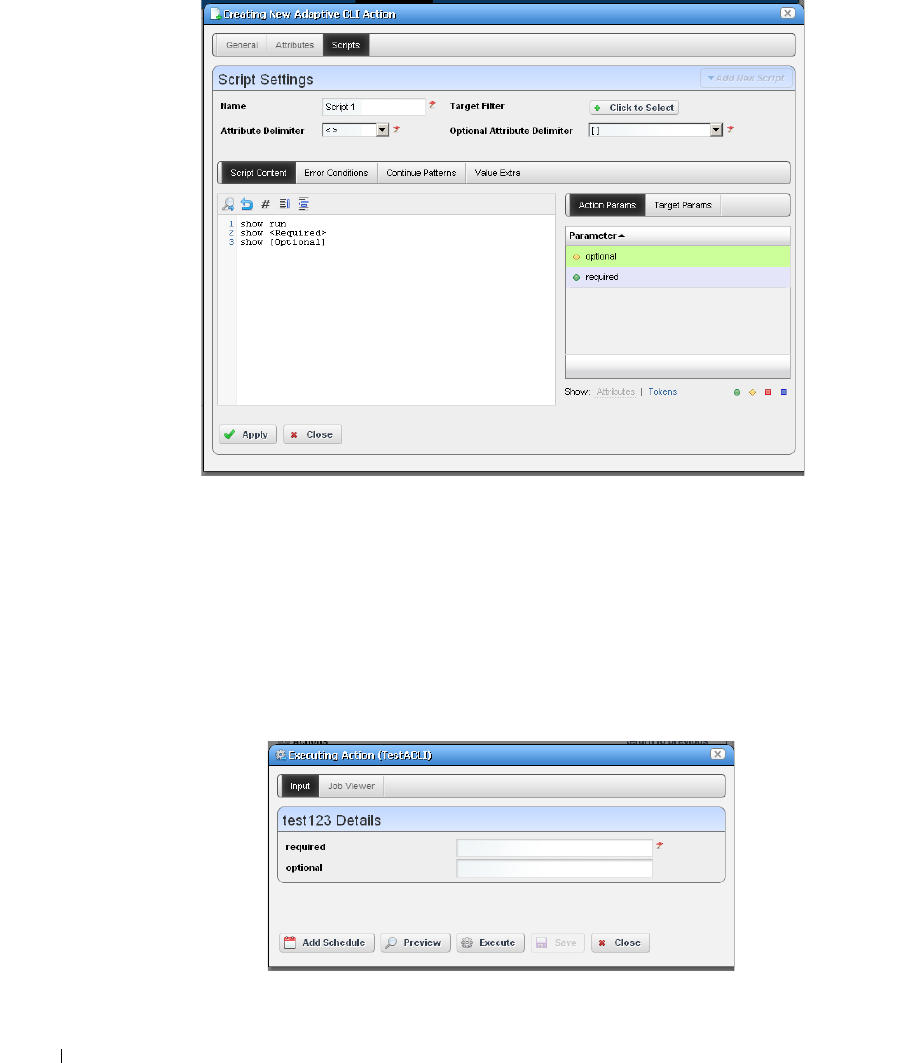
424
Perl Scripts | Actions and Adaptive CLI
Notice that the created attributes appear in the panel on the right of this screen.
5
Select the attribute “required,” then click the
Required
icon (the green circle) in the lower
right corner to of this screen to associate this icon with the Required attribute. Similarly,
associate the
Optional
icon with the attribute “optional.”
Notice that you can double-click the attributes listed in the panel on the right, and they
appear in the script editor at the cursor.
6
Save this Adaptive CLI
7
Execute it with
action > Execute
.
8
Notice that the attributes entered now are visible as inputs.
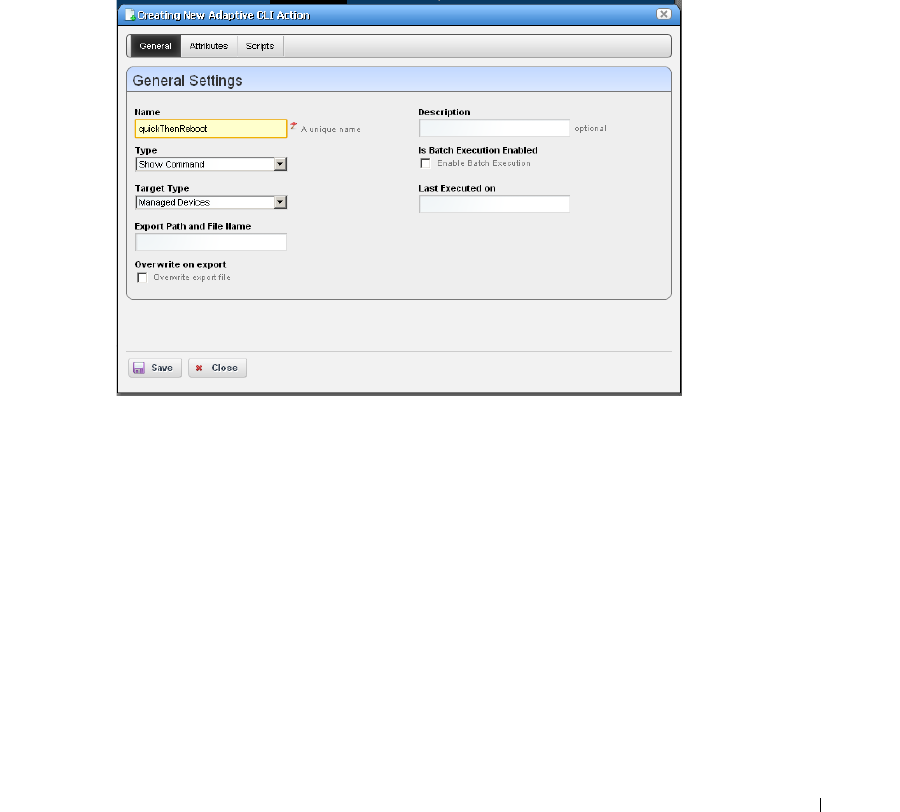
Perl Scripts | Actions and Adaptive CLI
425
When you enter values for these, they accompany the
show run
sent to the target devices.
Notice that you
must
enter the required variable, or execution fails.
9
Select a target.
10
Click
Execute
. The
show run
, and any other required / optional run commands’ results
appear. These are searchable with the results screen.
Example 3 - Adaptive CLI with Reboot
The following describes how to set up multi-line ACLI with error / success tracking for a command
sequence that requires reboot.
1
Create an example configure Adaptive CLI command (here
quickThenReboot
).
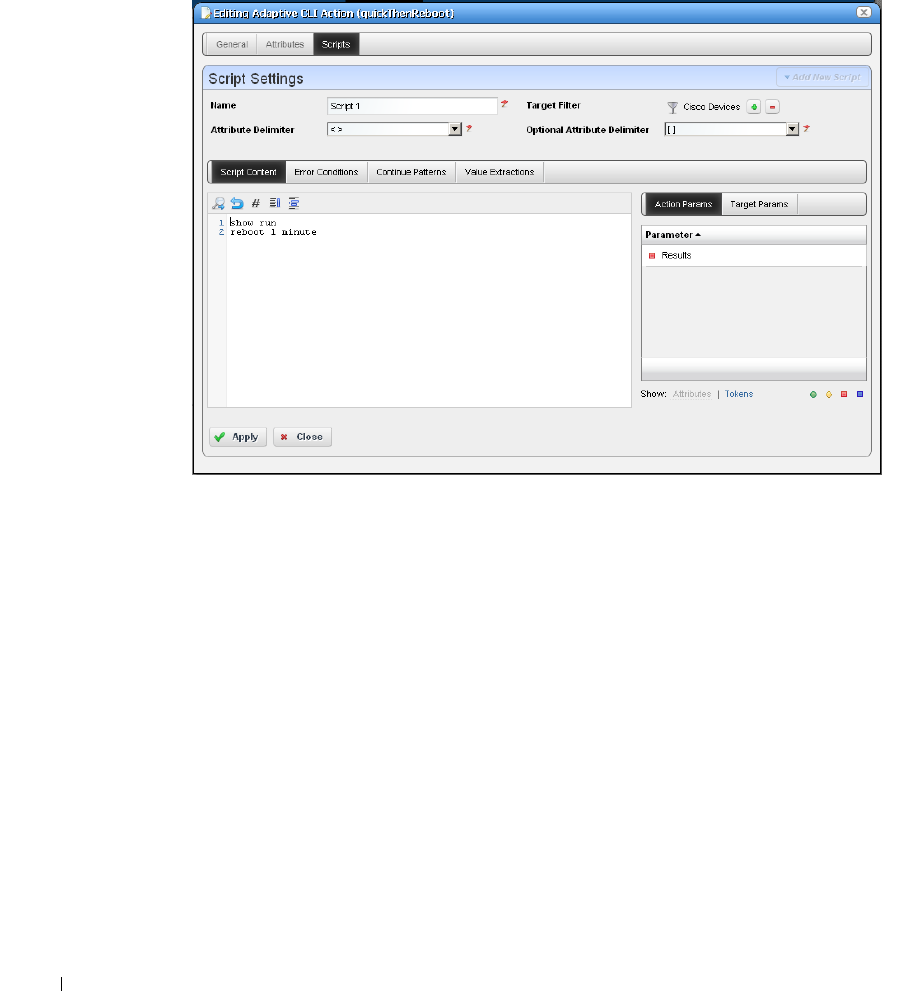
426
Perl Scripts | Actions and Adaptive CLI
2
Separate commands into parts. First issue the command (here
show run
), then issue the
reboot command with a parameter that allows a prompt return before actual reboot (a delay,
for instance). If the first command fails the ACLI doesn't continue, so that makes using the
reboot command second the solution.
In our example:
show run
reboot 1 minute
3
Dell OpenManage Network Manager assumes commands are successful if a prompt appears
without an error return. Default error tracking for most drivers provides all the error pattern
matching you might need (testing the Adaptive CLI lets you know whether the device is
addressed by a driver in “most”).
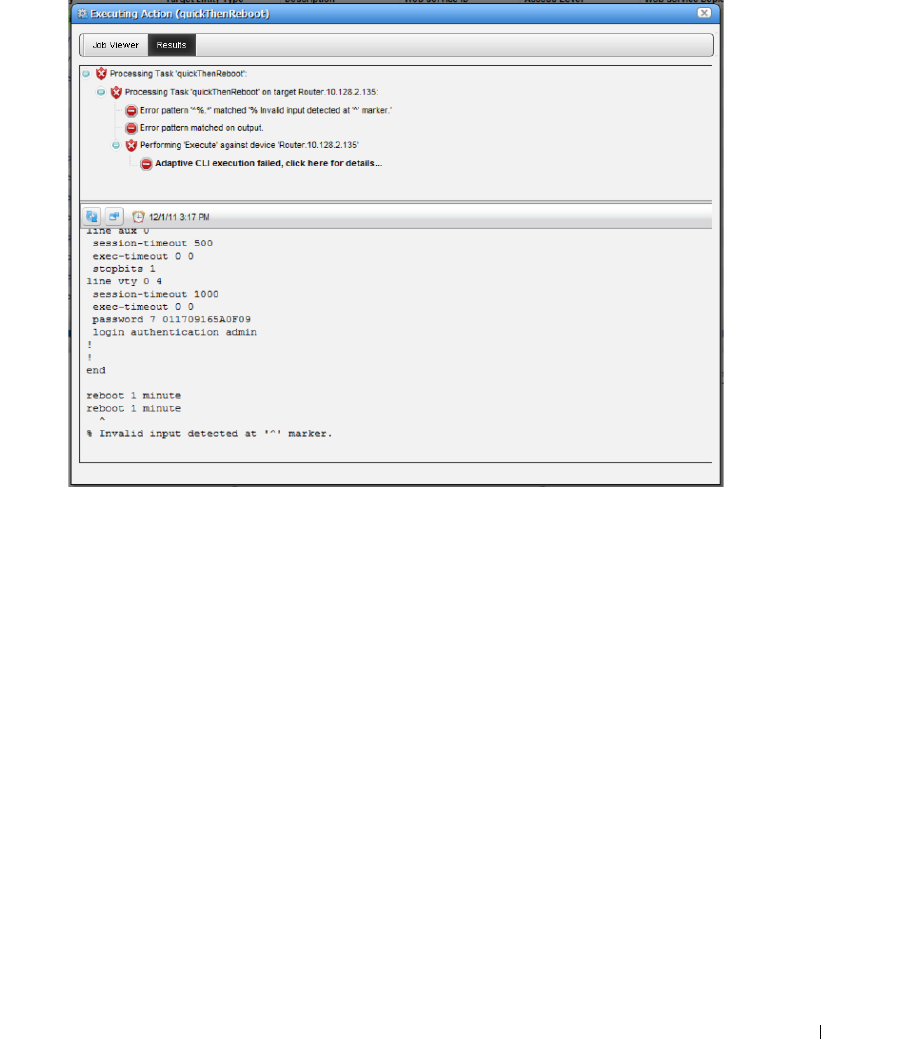
Perl Scripts | Actions and Adaptive CLI
427
Use specific error pattern matching for cases where the driver does not detect the typical
errors by default. , erroneous output appears if the error occurs on the reboot command.
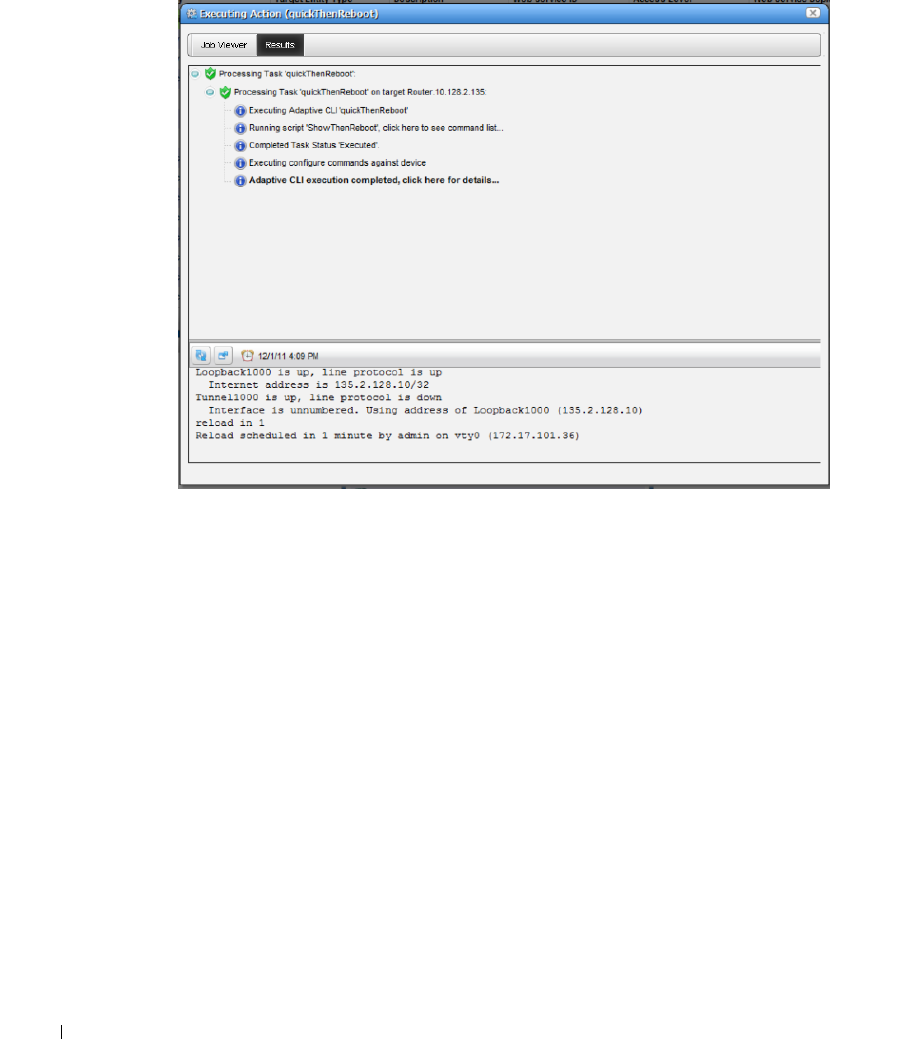
428
Perl Scripts | Actions and Adaptive CLI
4
When reboot is successful with a proper command sequence, the job screen displays the
successful execution.
5
Continue Patterns
—The following Continue Patterns section is an addition to the above
example. It looks for the
Proceed
prompt so the Adaptive CLI can issue a new line to force
the reboot. But the shutdown command follows the next prompt, so the shutdown command
Perl Scripts | Actions and Adaptive CLI
429
must be in another continue pattern to force the last line before a pause in output to be the
router's prompt. The patterns are
.*Proceed.*
and
.*SHUTDOWN in.*
allowing any
characters before and after the keywords to match.
Alternatively, this example could have a third command after
reboot
to force a new router
prompt, but managing this problem with the continuation set seemed more straightforward.
Example 4 - Adaptive CLI To Extract Upload / Download Speeds
The following describes an example Adaptive CLI configured to extract upload and download
ADSL speeds from a Cisco Router. To create this example, follow these steps:
1
Right-click to create a new Adaptive CLI in the Actions portlet.
2
Name it and configure the Adaptive CLI in the General screen. Since these are generic
settings described elsewhere, the details do not appear here.

430
Perl Scripts | Actions and Adaptive CLI
3
Create attributes to extract. In this case, we configure Upload Speed, and Download Speed as
integer attributes, with a name, description, and nothing else.
Notice, however, that you could configure validation for extracted attributes if you liked in
this screen.
4
Create a new schema for these attributes. Schemas are helpful if you are creating several
Adaptive CLIs (create, destroy, update, and so on) with the same set of attributes. With
schemas, you are sure the attributes are configured exactly the same.
5
Save
the configured attributes, click the
Script
panel
6
Enter the script. This extracts upload and download speeds from a Cisco device based on the
output from this command (the script’s contents):
show dsl int atm0 | inc Speed
This command shows dsl, grepping (
inc
) for the unique line beginning with
Speed
. The line
for which this script searches looks like this:
Speed (kbps): 544 0 256 0
Perl Scripts | Actions and Adaptive CLI
431
The attributes configured previously appear beside the script panel, but are not part of the script, even
though that possibility might be useful for another Adaptive CLI. The current attributes are for
extraction from the script results.
NOTICE
The filter at the top of this panel can limit the devices scanned by the Adaptive CLI to extract data. If you
have a specific device or group of devices against which you plan to test this script, it would be a time
saver to create the filter first.
432
Perl Scripts | Actions and Adaptive CLI
7
Click the
Value Extractions
panel within the Scripts screen, and configure an extraction
regular expression for each of the two values.
Click the green plus to add the second attribute.
With the pick lists, select an attribute, and that you want to extract (that is, within which you
plan to store a value), then enter the regular expression to match its target value. Here are
those attribute / regular expression pairs:
• Download Speed (the first integer in the output)
[Speed (kbps):\s+]([0-9]+).
• Upload Speed (the third integer in the output)
[Speed (kbps):\s+][0-9]+\s+[0-9]+\s+([0-9]+).
NOTICE
You can use free regular expression testers to debug these expressions. See Regular Expression Testing
on page 438.
8
Apply the edits you have made to script and extractive regular expressions, then
Save
the
Adaptive CLI.
9
Right-click the Adaptive CLI and
Execute
it.
10
Select the target device(s).
11
Confirm the execution. The screen that appears before you click
Execute
again would have
fields if you had a script with input parameters.
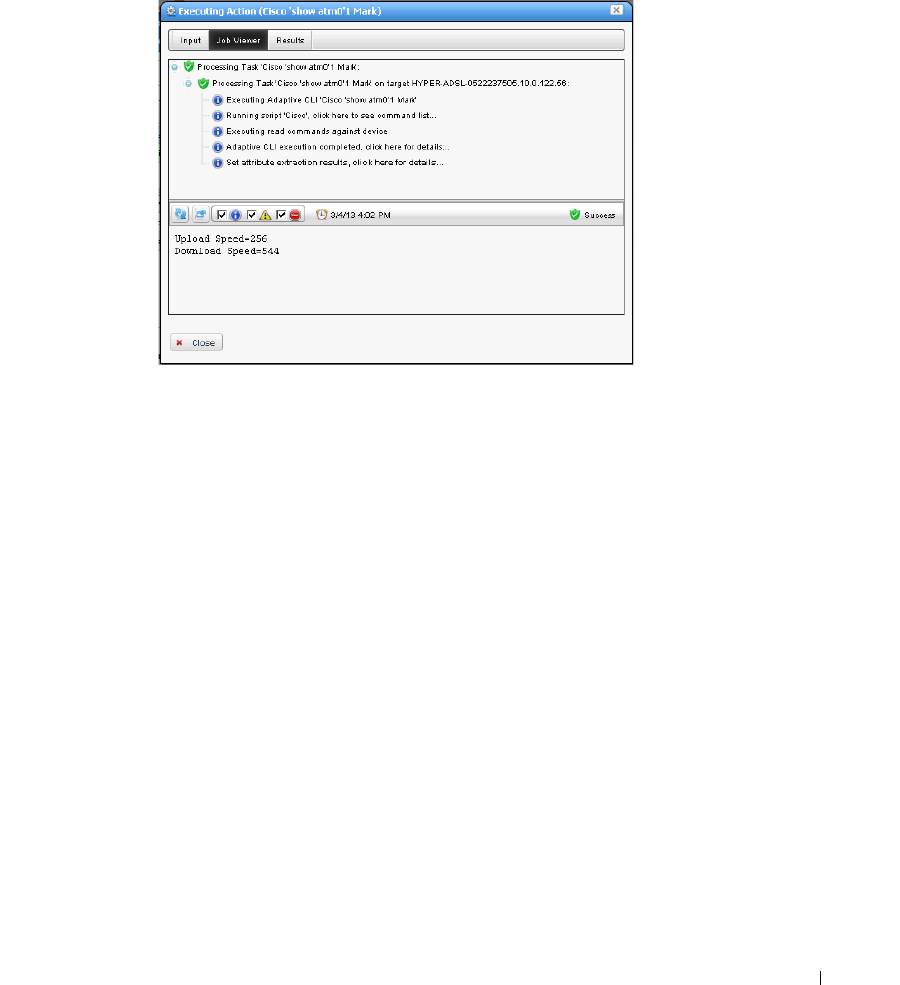
Perl Scripts | Actions and Adaptive CLI
433
12
The
Results
panel appears to advise whether the script ran successfully, displaying its output.
13
Click
Job Viewer
, and arrange that panel so it displays informational messages by clicking the
icon next to the date / time display. Check the checkbox next to the blue informational circle,
and click the
Refresh
icon to the far left.
14
Click the last informational message (
Set attribute extraction results...
) and the extracted
attribute values appear in the data panel at the bottom of the screen.
Example 5: Monitor Text Values
Create an Adaptive CLI with the following to monitor layer 1 and layer 2 status:
• integer attributes: layer1status, layer2status
• Script to produce the output:
show isdn status
Here is the output to match:
Layer 1 Status:
ACTIVE
Layer 2 Status:
TEI = 0, Ces = 1, SAPI = 0, State = MULTIPLE_FRAME_ESTABLISHED
• Attribute Extraction Pattern:
layer1status / Match / (Layer 1 Status:\n\s+ACTIVE)
• For layer2status, the regular expression is like
(Layer 2 Status:\n\s+TEI = \d, Ces = \d, SAPI = \d, State =
MULTIPLE_FRAME_ESTABLISHED)
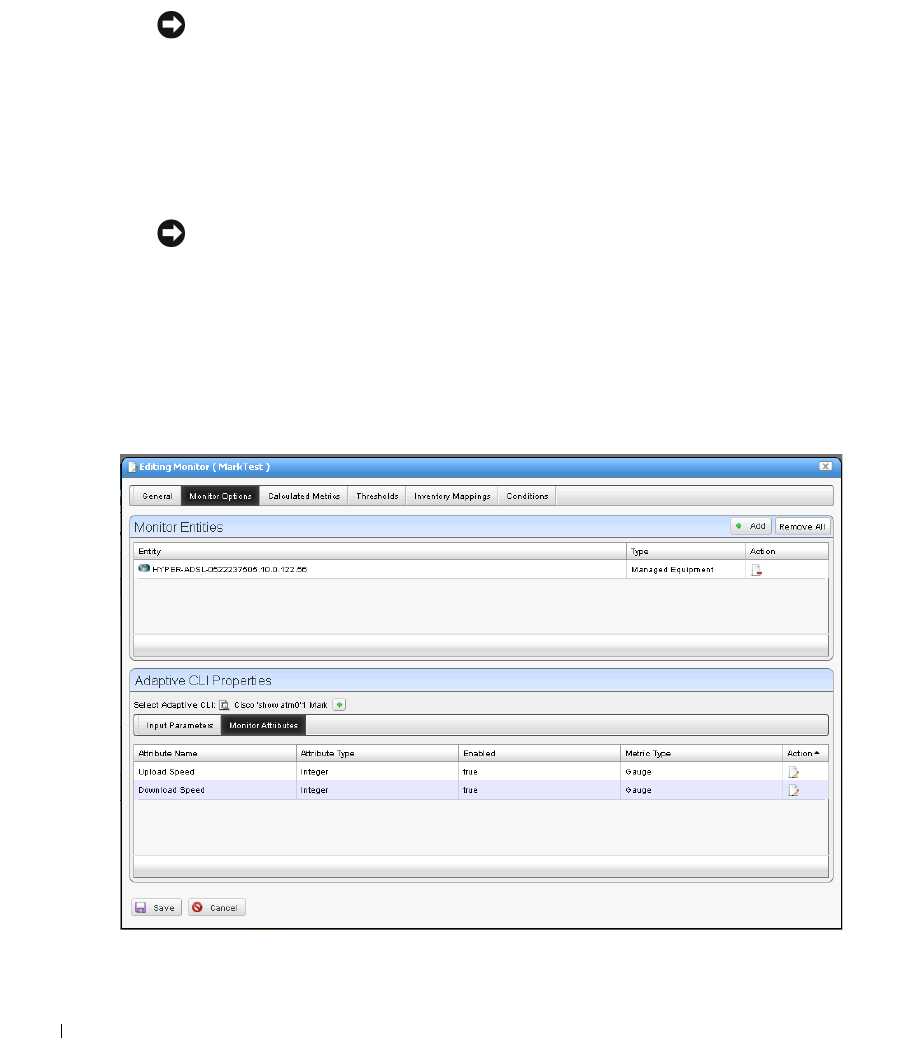
434
Perl Scripts | Actions and Adaptive CLI
Create a monitor to display the result of regularly running this Adaptive CLI on selected targets,
and display its result in a dashboard.
NOTICE
Don’t forget to enable the attributes in the monitor!
Monitoring Upload / Download Speeds
Once you have configured this Adaptive CLI, you can monitor its operation. Follow these steps to
configure the monitor for the How to: Create a Monitor for the External Script Adaptive ACLI:
NOTICE
If you are testing, make the monitoring more frequent than you might in a production system so you can
see if the data is available as expected. You can always change this after you have successfully tested
the monitor.
1
Right-click in the Resource Monitors portlet to create a new monitor.
2
Enter the default name, and interval for the monitor in the
General
panel
.
3
In
Monitor Options,
select the Monitor Entities (target devices) with the green plus, and
subsequent screen.
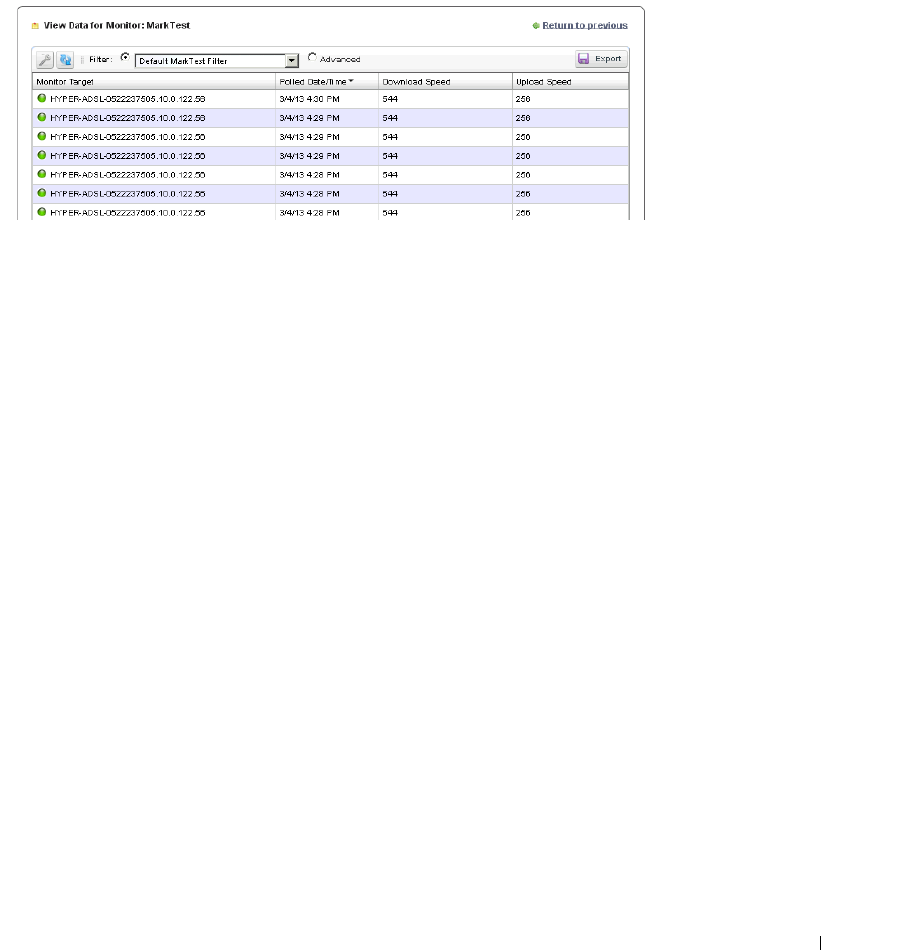
Perl Scripts | Actions and Adaptive CLI
435
4
In the same screen, elect to
Enable
the extracted Monitor Attributes with the editor icon to
the right of the listed attribute. Notice you can also elect to report the attribute as a Gauge,
Counter or Boolean. We selected Gauge.
5
Click
Save
.
6
Right-click the saved monitor to
View Monitor Data
.
You may have to click the wrench icon to configure the columns that appear so this screen
displays the extracted attribute information. You should see the extracted values displayed in
a table.
Configure a Dashboard for Your Monitor
Finally, if you want to configure a dashboard to display your monitored data graphically, follow
these steps:
1
Go to the Dashboard portlet, and right-click to create a Custom dashboard.
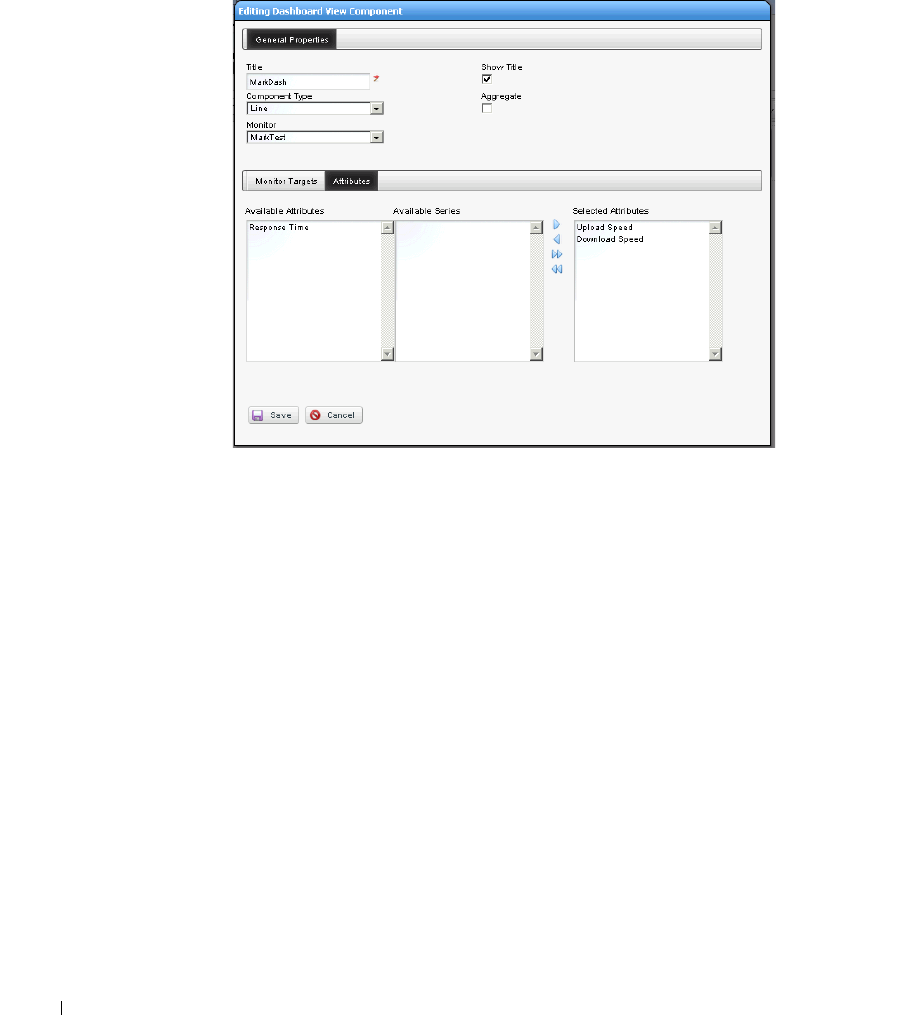
436
Perl Scripts | Actions and Adaptive CLI
2
Enter the default data (name, retention policy, and so on) and configure the device and
monitor selection by editing the panel(s) you want to display with its editor icon in the upper
right corner.
Notice that you can select not only the monitor, but also the target(s) and attribute(s) to
display. Here, we have selected the Upload / Download Speed attributes configured in the
How to: Create a Monitor for the External Script Adaptive ACLI.
3
Save
the configured dashboard.
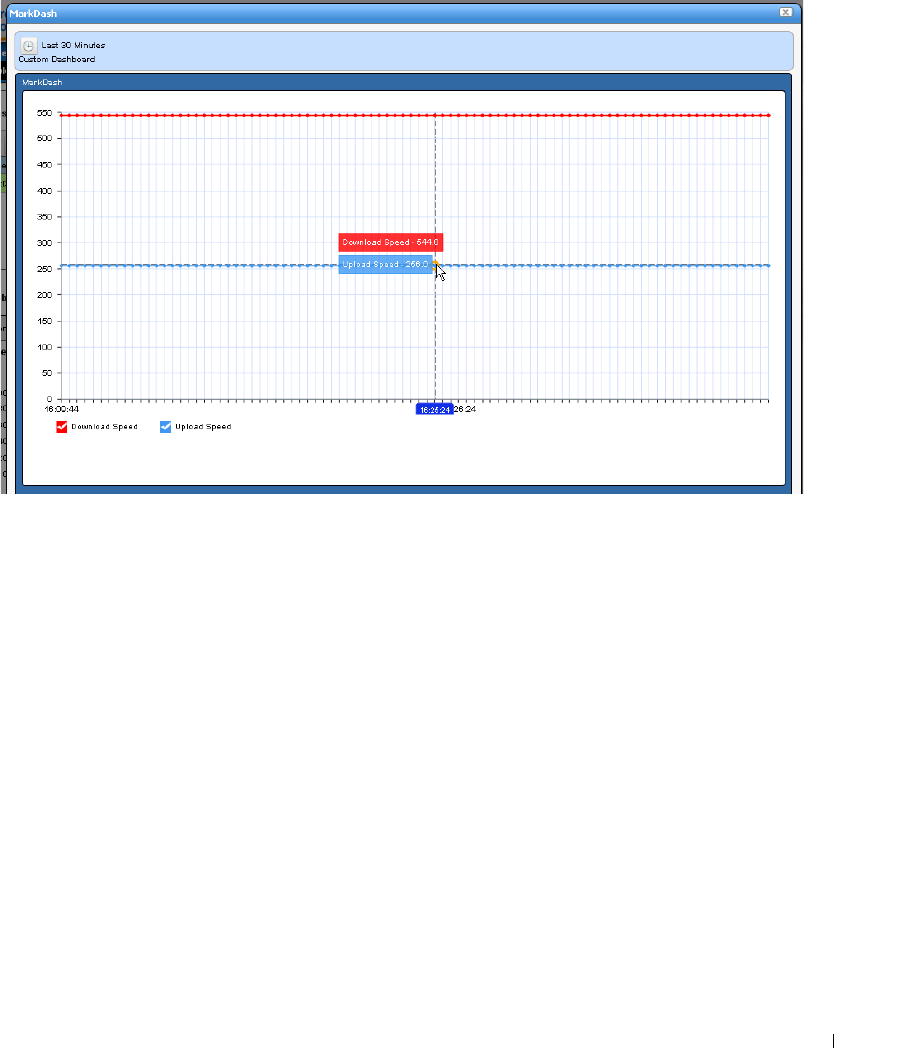
Perl Scripts | Actions and Adaptive CLI
437
4
Right-click the dashboard in the Dashboard Views portlet and view it in one of the options
available (Full Screen / Popup).
Notice that you can hover your cursor over a node in the graph and see all reported values for
that node.
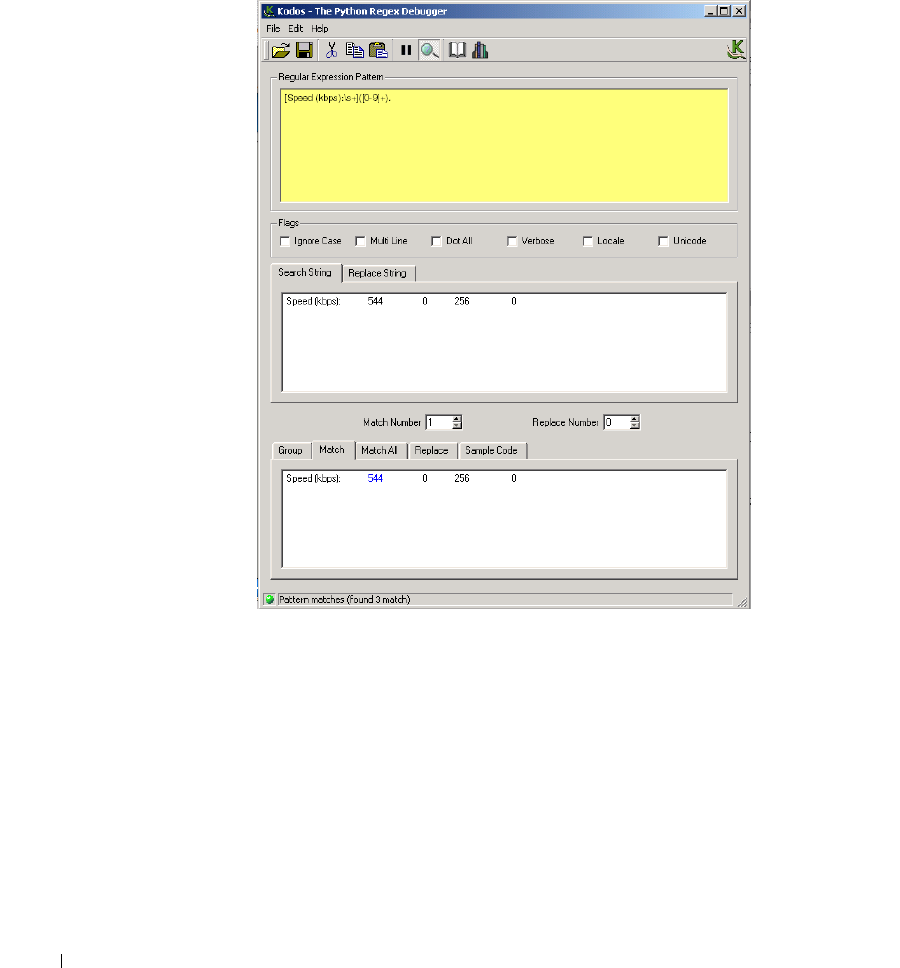
438
Perl Scripts | Actions and Adaptive CLI
Regular Expression Testing
Several applications, some free, are helpful to validate regular expressions. These are helpful when
trying to match a particular number and phrase in the Adaptive CLI and other output. In this
example, we used Kodos to test various iterations of our regular expressions.
Enter the regular expression in the top panel (note the helpful hints from the online help), the
output to scan in the middle panel, and the match appears in the bottom panel.
Regular expressions include metacharacters to instruct the program how to treat characters it
encounters. These include the following: ^, $, . , | , { , } , [ , ] , ( , ), *, +, ? , \. If you want to match
one of these metacharacters, you must prepend a backslash (\). So to match a literal question mark,
rather than instructing regular expression matching to match 0 or 1 of a previous expression, you
must enter \?.
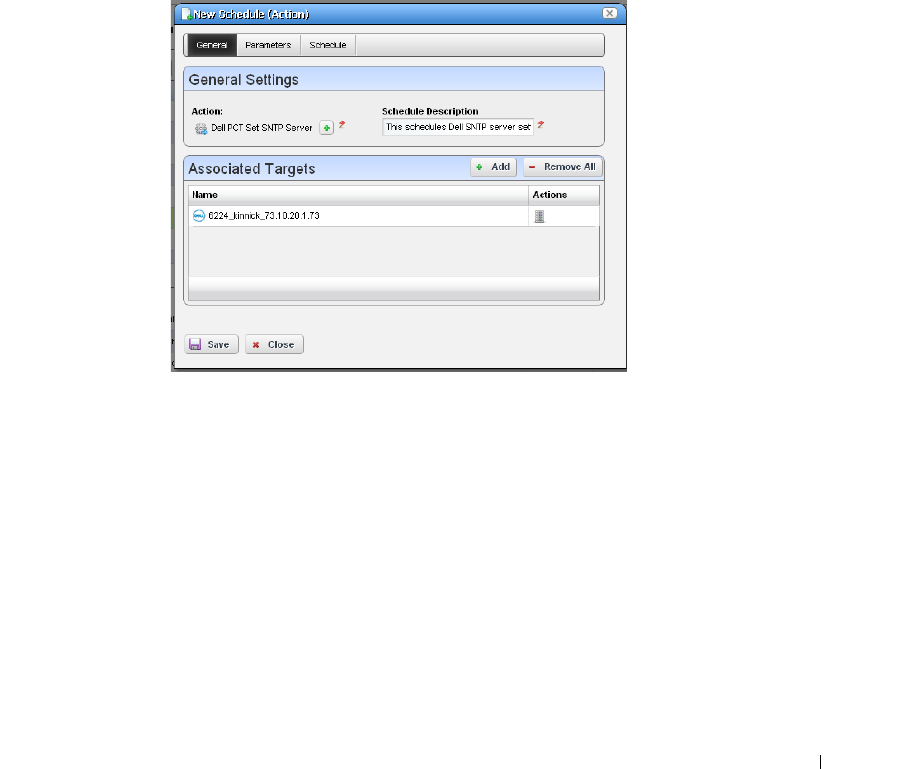
Perl Scripts | Actions and Adaptive CLI
439
Scheduling Actions
You can schedule actions with a right-click in the Actions Portlet or the Schedules Portlet. This
opens an editor with the following screens:
• General
• Parameters
•Schedule
See Schedules Portlet on page 120 for more scheduling actions with that portlet. Schedules created
in the Actions Portlet also appear in the Schedules Portlet.
General
This screen lets you identify the scheduled item and its targets.
This has the following fields:
General Settings
Action
—Identifies the action being scheduled.
Schedule Description
—Identifies the schedule.
Associated Targets
Click the
Add
button to select target equipment. You can remove listed equipment with the icon to
the right of listed items or with the
Remove All
button.
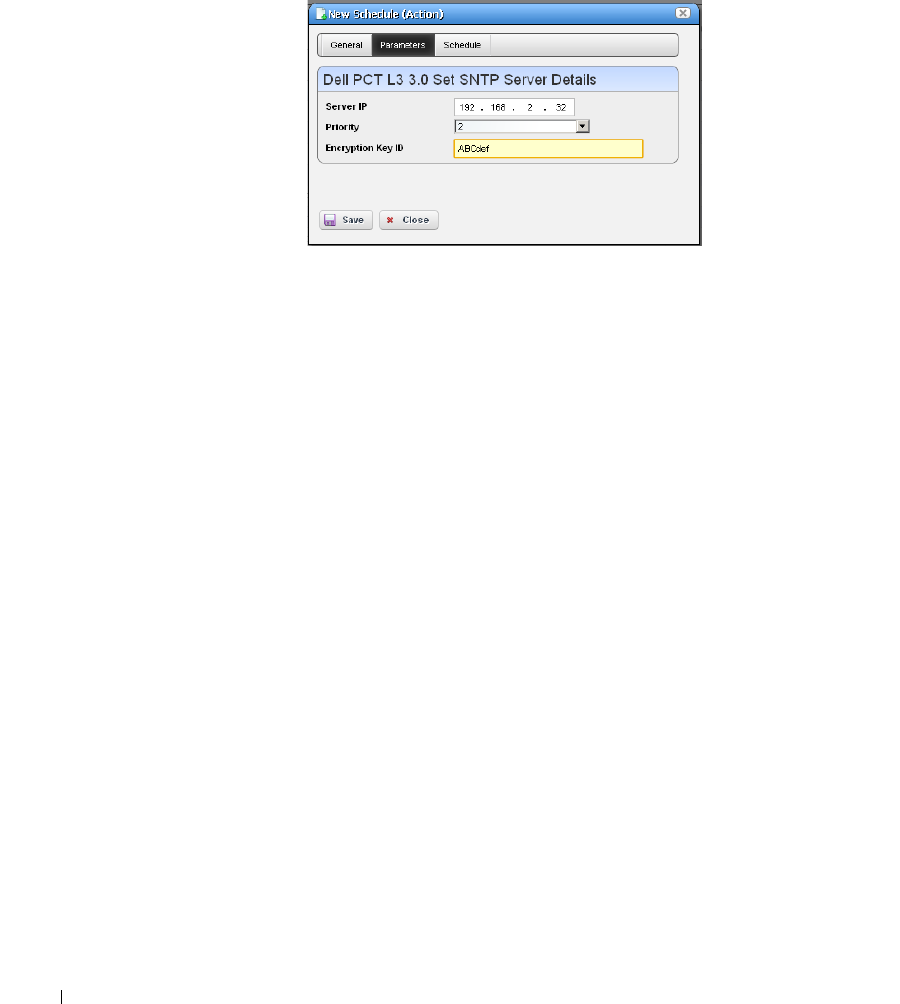
440
Active Performance Monitor Support | Actions and Adaptive CLI
Parameters
This screen’s configuration depends on the selected action you are scheduling. Many actions have
no parameters, so this tab is disabled. Enter the parameters for the action you are scheduling.
Hover the cursor over fields to make their description appear in a tooltip.
Schedule
This screen is a standard scheduler screen, as described in Schedules on page 118.
Active Performance Monitor Support
You can monitor Adaptive CLI execution results with Active Performance Monitor. To do this, you
must select Adaptive CLI as the monitored type when creating a new performance monitor (see
Resource Monitors on page 297), then select a target entities (with the
Add
button in the top
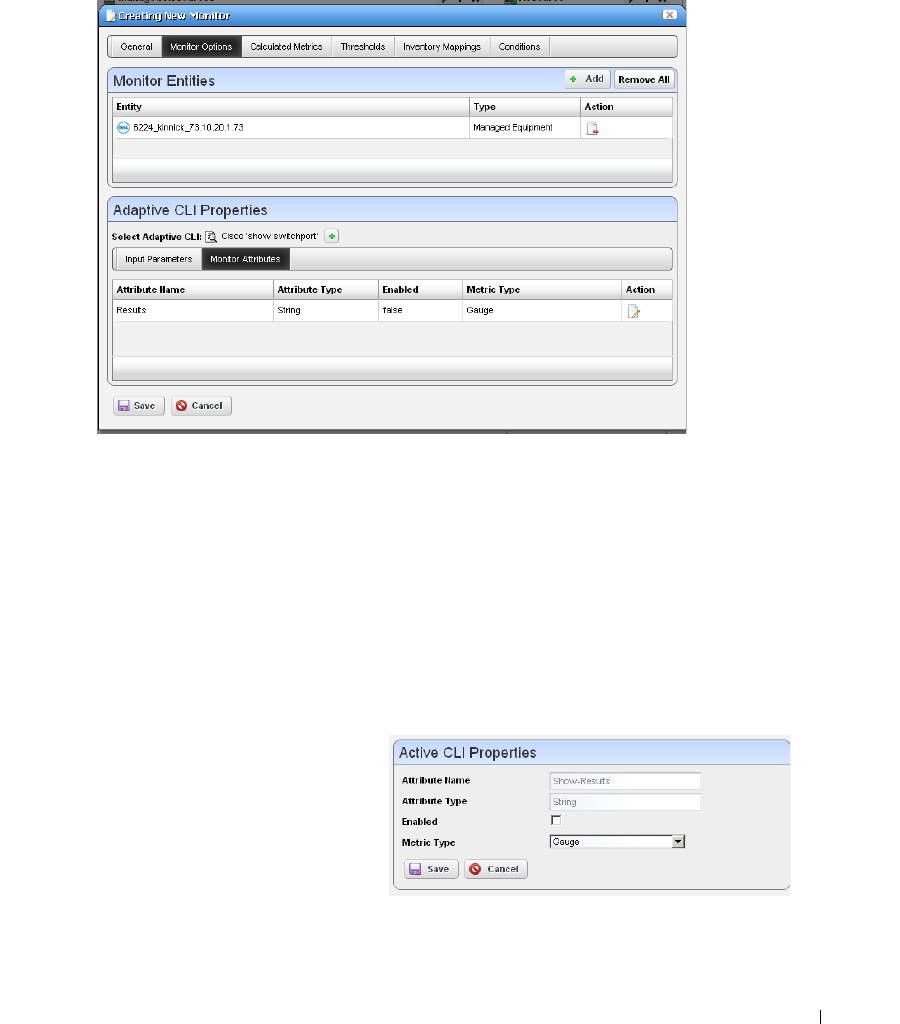
Active Performance Monitor Support | Actions and Adaptive CLI
441
panel) and a particular Adaptive CLI (with the green plus [+] in the Adaptive CLI Properties panel
at the bottom of this screen. Click the
Edit
(page) icon to select the
Input Parameters
to monitor
once you have selected an Adaptive CLI.
The user can choose an Adaptive CLI to monitor and may have to configure both its input values
and metric type for each output attribute. The Input data depends on what is configured in the
Adaptive CLI attributes.
Input Parameters
In Active Monitoring, all attributes of the schema appear in the
Input Data
for user-entered values.
You must enter the data necessary for all selected targets’ scripts. To enter data, click
Edit
and then
enter values. Clicking
Apply
switches the panel back to read-only mode. You must click Save to
preserve input or output data configurations.
Monitor Attributes
Configure Adaptive CLI output attributes for
monitoring in this tab in the lower panel of the
Monitor Editor screen. You can monitor only
exposed attributes of numeric or boolean
types. To change metric type, select the row
and click the
Edit
button to its right.

442
Active Performance Monitor Support | Actions and Adaptive CLI
An Adaptive CLI Properties screen appears that reminds you of the
Attribute Name,
and
Attribute
Ty p e ,
where you can
Enable
the attribute monitoring, and select
Gauge, Counter
or
Boolean
buttons to the right of this panel to configure the metric type of the selected output data.
These attributes default to the metric type
Gauge
. Adaptive CLI is where you define these
attributes, but you must select their metric type settings on this screen if it is something other than
the default.
Click
Save
to preserve your configuration, or
Cancel
to abandon it and close the editor screen.
How To:
Create a Monitor for an External Script
The following steps describe creating a monitor for an external command configured as an
Adaptive CLI (ACLI). Several Perl scripts appear in this performance\scripts directory by default.
You can try others in addition to the
http_test.pl
script in the example.
Create the Adaptive CLI
1
Right click in the Actions portlet, and create a new
External Command
ACLI
2
Make a new attribute schema with attribute: Status (integer)
3
In Scripts, enter the following as Script Content:
perl
"C:\Dorado\owareapps\performance\scripts\http_test.pl"[_EquipmentManage
r_IP_Address]
The variable [_EquipmentManager_IP_Address] provides the target device’s IP address, and
comes from the
Targe t Pa ra m s
tab, where you can find other such variables. If you want to test
this script on an HTTP process on a device not under management, just to see the outcome,
enter a known URL instead of that variable (like www.doradosoftware.com), and run the
script to see its output. (You will still have to select a target managed object to run the script,
even though it is not part of the command line.)
4
In the Value Extraction panel enter the following:
^\{(\d+)\}.*
5
Click Apply
6
Click Save
7
Right click and
Execute
the ACLI to test it.

Active Performance Monitor Support | Actions and Adaptive CLI
443
How To:
Create an Advanced Script Monitor Example
The following monitors an external Adaptive CLI example of setting up a simple process monitor
using ACLI:
1
Make sure Perl is installed (and Windows has restarted after installing it), and check that the
required libraries (
Info.pm
and
WMI.pm
) are in place. Your directory may vary; with 64-bit
Strawberry Perl the locations are:
For Info.pm:
C:\strawberry\perl\vendor\lib\Win32\Process
and for WMI.pm:
C:\strawberry\perl\vendor\lib\Win32\Process\Info
The process folder is attached to this document with proper structure. Put it in
C:\strawberry\perl\vendor\lib\Win32
and you are ready to go.
NOTICE
Here are the URLs where you can download these libraries:
http://search.cpan.org/~wyant/Win32-Process-Info-1.018/lib/Win32/Process/Info.pm
http://search.cpan.org/~wyant/Win32-Process-Info-1.019/lib/Win32/Process/Info/WMI.pm
2
Put
process_check.pl
in the proper directory. For Windows the default is
C:\Dorado\owareapps\performance\scripts.
3
In your actions portlet, import TEST_ACTION.xml.
4
In your monitors portlet, import PROCESS_UPTIME_MONITOR.xml.
5
Even though the monitor and Adaptive CLI do not need one, select any target a dashboard
can track.
6
In your dashboard views portlet, create a new custom Monitor Dashboard for whatever
device(s) you decided to monitor, you will see Status as one of the tracked metrics (1 for up, 0
for down). You can use it as you would any other metric in Dell OpenManage Network
Manager to track, graph, and so on.
By default this script and monitor track whether
notepad.exe
is running, but you can have it
track anything by editing the monitor. Go to Monitor Options > Adaptive CLI Properties, and you
can edit the
Process Name
variable to be any other process.
Extra credit: Modify the script to track multiple applications.
process_check.pl
#!/usr/bin/env perl
use Win32::Process::Info;

444
Active Performance Monitor Support | Actions and Adaptive CLI
$processname=$ARGV[0];
$found = 0;
$pi = Win32::Process::Info->new ();
@info = $pi->GetProcInfo (); # Get the max
@info = grep {
print $_->{Name};
print "\n";
if ($_->{Name})
{
if ($_->{Name} eq $processname)
{
$found = 1;
}
}
} $pi->GetProcInfo ();
if ($found == 1)
{
print "Process " . $processname . " is running! 1";
}
else
{
print "Process " . $processname . " is not running! 0";
}
TEST_ACTION
This action’s name is
TestExternalScript
. It has two attributes,
Process Name
, a string, and
Status
,
an integer. It stores the retrieved process’ status in the
Status
integer, and takes
Process Name
as a
required input. It refers to the process_check.pl script as an external command in its
Scripts
tab.
Here is the syntax:
perl C:\Dorado\owareapps\performance\scripts\process_check.pl
<Process_Name>
In addition to referring to the script, this Adaptive CLI extracts the status from the script’s run.
Essentially it looks for 0 (down) or 1 (up) with the following regular expression in the
Value
Extractions
tab:
(\d)$
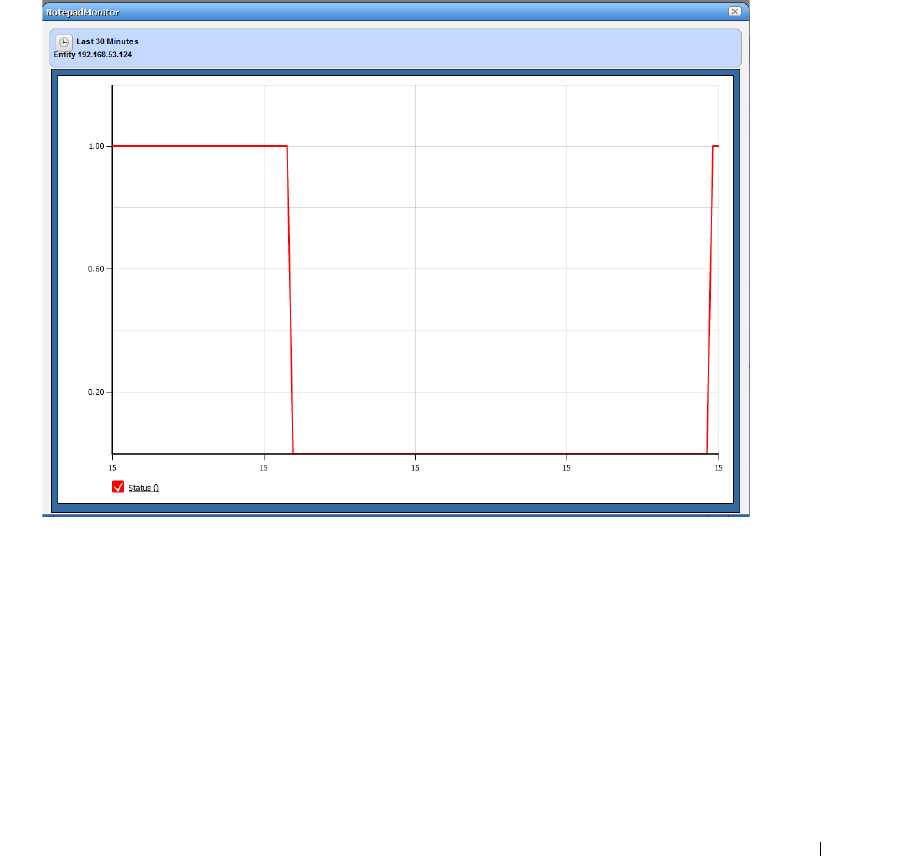
Active Performance Monitor Support | Actions and Adaptive CLI
445
PROCESS_UPTIME_MONITOR
This monitor’s name is
ProcessUptimeMonitor.
It refers to the TestExternalScript
(TEST_ACTION) Adaptive CLI. Notice that the
Process Name
attribute defaults to notepad.exe,
and the Monitor Attributes tab contains the
Status
attribute.
Monitor Dashboard
To see the result of your monitoring, create a custom monitor dashboard with the
PROCESS_UPTIME_MONITOR as its target monitor, and the desired target device as its target
device.
You can then see the process’ activity over time when you launch the dashboard.

446
Active Performance Monitor Support | Actions and Adaptive CLI
7
Look in Job Viewer for the results.
Click
Set attribute extraction results, click here
to see the results appear in the bottom panel.
Notice also that you must check informational messages for all these to appear, and that
several additional sets of messages besides the extraction results appear.
Create a Monitor for the External Script Adaptive ACLI
Now that you have verified the script is working, you can create a monitor to see how this attribute
is doing.
1
In the Monitors portlet, create a new ACLI Monitor
2
Uncheck
Update Network Status
(recommended since the ICMP monitor is already doing
this)
3
You may want to test your monitor, in which case, change the monitoring interval to 30
seconds. Re-edit it to configure it with the interval needed for your production system.
4
In
Monitor Options
select your example monitor configured previously.
5
Confirm that
Monitor Attributes
displays the Status attribute configured previously.
6
In the
Conditions
tab of the Monitor Editor, create “Status Up” condition, with the severity
of
Informational,
and check
Alert
.
7
Create a criterion which is Status = 0.
8
Save this condition
9
Create a new Condition called “Status Down”
10
The criterion is Status = 1
11
Apply and Save
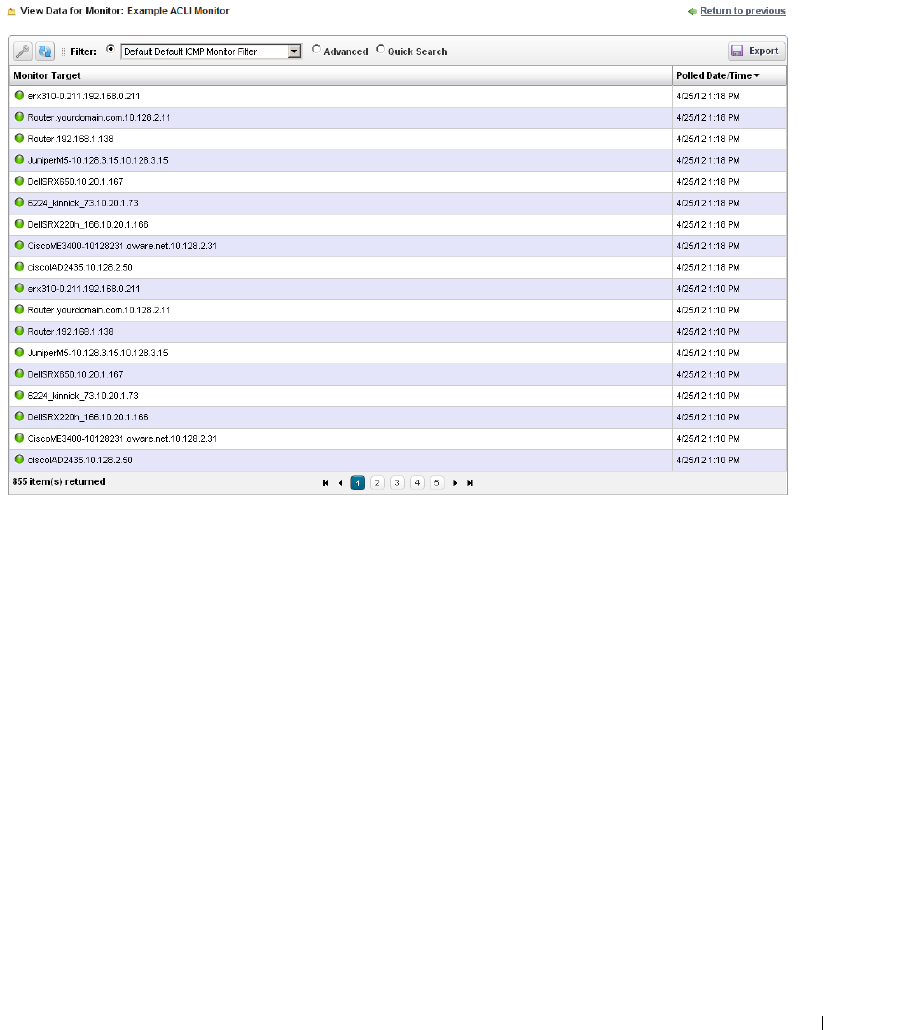
Active Performance Monitor Support | Actions and Adaptive CLI
447
12
Save your monitor.
13
Right-click to select
View Monitor Data
, and you can see the results of your efforts.
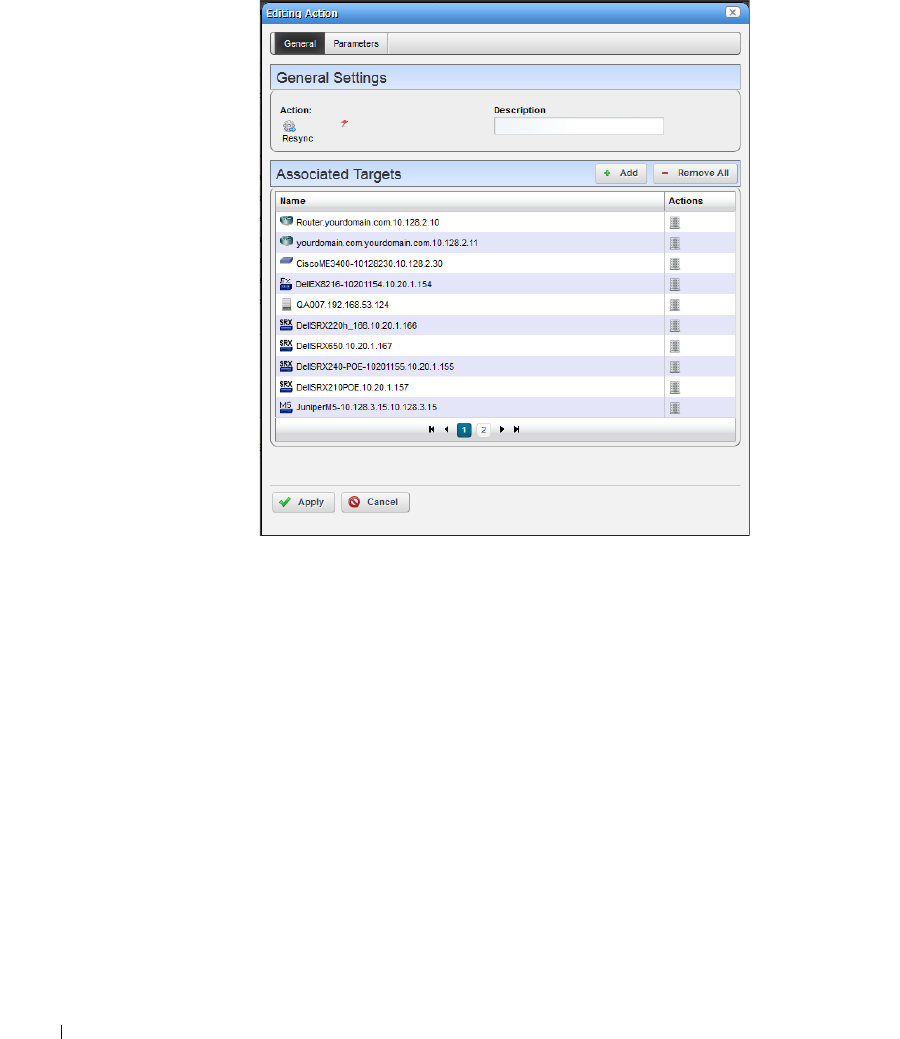
448
Troubleshooting Adaptive CLI | Actions and Adaptive CLI
Add Action
—This opens an Action Editor where you can select the Action that is to be a member
of the group, its Target devices and any Parameters associated with the Action.
Use the
Add
button to add Associated Targets, and the
Delete this entry
icon to delete any
added by mistake. Click
Apply
to accept an added (or edited) Action.
Remove All
—Delete all Actions.
Click
Save
to create the Action Group. Once you have saved the group, you can right-click to
Execute
it manually. You can also click
Add Schedule
to schedule its execution. Clicking
Close
ends
your editor session without saving any new Action Group, or changes you may have made to an
existing one.
Troubleshooting Adaptive CLI
The following issues can prevent the correct completion of Adaptive CLI execution.
Connectivity
—The device can be offline. To detect whether this is true, right-click the device in
the Managed Resources portlet and
Direct Access > Ping
it.

Adaptive CLI Records Aging Policy | Actions and Adaptive CLI
449
Incomplete Discovery
—If the device is online and still does not respond to Adaptive CLI, you
may have only partially discovered it. Right-click the device in the Managed Resources portlet
and select
Direct Access > Telnet
. If that menu option does not exist, it is only partially
discovered. Right-click to edit the device, and add a Telnet Management Interface and
Authentication in those two tabs of the editor.
Adaptive CLI Records Aging Policy
You can use OpenManage Network Manager’s aging feature to preserve Adaptive CLI information.
Click the Redcell > Database Aging Policy (DAP) node of the Control panel, and click the default
Adaptive CLI DAP
and click the edit button on its right.I
After filling in the
General Info
tab, the
Parameters
screen lets you configure the following:
Keep History
—Enter the number of days to retain the history in the database.
Delete history associated with Negate command
—Check to remove archived records associated
with
Negate
(described under General on page 400).
Archive Deleted Records
—Check to have deleted archived records saved as a file (configured in
the
General Info
parameters too).
NOTICE
You can see deployed Axis2 web services listed in the screen at http://[application server IP
address]:8089/axis2/services/listServices. These may take a little time to appear, so be patient. If you
have been patient, and they still do not appear listed, you may have to clear your browser’s cache.
Clicking the Activity link once they appear displays the WSDL.

450
Adaptive CLI Records Aging Policy | Actions and Adaptive CLI

Glossary
451
Glossary
Glossary
A
CCESS
C
ONTROL
—
Refers to mechanisms and policies that restrict access to computer
resources. An access control list (ACL), for example, specifies what operations different users
can perform on specific files and directories.
A
LARM
—
A signal alerting the user to an error or fault. Alarms are produced by events. Alarms
produce a message within the Alarm Window.
API —
Application Programing Interface—A set of routines used by the application to direct
the performance of procedures by the computer’s operating system.
A
UTHENTICATION
—
The process of determining the identity of a user that is attempting to
access a network. Authentication occurs through challenge/response, time-based code
sequences or other techniques. See CHAP and PAP.
A
UTHORIZATION
—
The process of determining what types of activities or access are permitted on
a network. Usually used in the context of authentication: once you have authenticated a user,
they may be authorized to have access to a specific service.
C
O
S—
Class of Service—Describes the level of service provided to a user. Also provides a way of
managing traffic in a network by grouping similar types of traffic.
D
ATABASE
—
An organized collection of Dell OpenManage Network Manager objects.
D
EPLOYMENT
—
The distribution of solution blades throughout the domain.
D
IGITAL
C
ERTIFICATE
—
A digital certificate is an electronic “credit card” that establishes your
credentials when doing business or other transactions on the Web. It is issued by a certification
authority (CA). It contains your name, a serial number, expiration dates, a copy of the certificate
holder's public key (used for encrypting and decrypting messages and digital signatures), and the
digital signature of the certificate-issuing authority so that a recipient can verify that the certifi-
cate is real.
D
OMAIN
—
A goal-oriented environment that can include an industry, company, or department.
You can use Dell OpenManage Network Manager to create solutions within your particular
domain.
E
NCRYPTION
—
Scrambling data in such a way that it can only be unscrambled through the
application of the correct cryptographic key.
E
QUIPMENT
—
A network device managed by the system.
E
THERNET
T
RUNK
—
An Ethernet Trunk service represents a point-to-point connection between
two ports of two devices. Ethernet frames transported by the connection are encapsulated
according to IEEE 802.1Q protocol. The each tag ID value in 802.1Q encapsulated Ethernet
frames distinguishes an Ethernet traffic flow. Thus, an Ethernet trunk can aggregate multiple
Ethernet VLANs through a same connection which is why “trunk” describes these.

452
Glossary
E
THERNET
T
RUNK
P
ORT
—
An Ethernet trunk port is a port that terminates a point-to-point
Ethernet trunk. Since Ethernet trunk is a point-to-point connection, each Ethernet trunk
contains two Ethernet trunk ports.
E
THERNET
S
ERVICE
—
An Ethernet service represents a virtual layer broadcast domain that
transports or transmits Ethernet traffic entering from any one endpoint to all other end-
points.
Often, this is a VLAN service across multiple devices.
An Ethernet service may or may not use Ethernet trunk, depending on the desired connec-
tion between two neighboring devices. If the connection is exclusively used for this Ether-
net service, no Ethernet trunk is needed. On the other hand, if the connection is configured
as an aggregation which can be shared by multiple Ethernet services, an Ethernet trunk
models such a configuration.
Each Ethernet service can have multiple Ethernet Access Ports through which Ethernet
traffic flows get access to the service.
E
THERNET
A
CCESS
S
ERVICE
—
Since an Ethernet trunk can be shared by multiple Ethernet
Services, each Ethernet Service relates to a shared trunk via a unique Ethernet Access com-
ponent.
Because Ethernet trunk is a point-to-point connection, there are two Ethernet Access Ser-
vices per trunk per Ethernet service instance.
E
THERNET
A
CCESS
P
OINT
—
These represent the access points through which Ethernet
frames flow in and out of an Ethernet service.
For an Ethernet Service that uses an Ethernet Trunk Service, an Ethernet Access Port must
be associated with either one of the two Ethernet Access Services.
E
VENT
—
Notification received from the NMS (Network Management System). Notifica-
tions may originate from the traps of network devices or may indicate an occurrence such as
the closing of a form. Events have the potential of becoming alarms.
E
VENT
D
EFINITION
—
Parameters that define what an event does. For example, you can tell
Dell OpenManage Network Manager that the event should be to wait for incoming data
from a remote database, then have the Dell OpenManage Network Manager application
perform a certain action after it receives the data.
E
VENT
I
NSTANCE
—
A notification sent between two Dell OpenManage Network Manager
components. An event instance is the action the event performs per the event definition.
E
VENT
T
EMPLATE
—
Defines how an event is going to be handled.
E
VENT
T
HRESHOLD
—
Number of events within a given tomfooleries that must occur before
an alarm is raised.
E
XPORTING
—
Saving business objects, packages, or solution blades to a file for others to
import.

F
ILTER
—
In network security, a filter is a program or section of code that is designed to
examine each input or output request for certain qualifying criteria and then process or for-
ward it accordingly.
GUI —
Graphical User Interface
K
EY
—
In cryptography, a key is a variable value that is applied using an algorithm to a string
or block of unencrypted text to produce encrypted text. The length of the key generally
determines how difficult it will be to decrypt the text in a given message.
K
EY
M
ANAGEMENT
—
The establishment and enforcement of message encryption and
authentication procedures, in order to provide privacy-enhanced mail (PEM) services for
electronic mail transfer over the Internet.
M
ANAGED
O
BJECT
—
A network device managed by the system.
M
EDIATION
—
Communication between this application and external systems or devices, for
example, printers. Mediation services let this application treat these devices as objects.
M
EDIATION
A
GENT
—
Any communication to and from equipment is handled by the Media-
tion Agent. This communication includes SNMP requests, ASCII requests, and unsolicited
ASCII messages. In addition, the Mediation Agent receives and translates emitted SNMP
traps and converts them into events.
MIB —
Management Information Base. A database (repository) of equipment containing
object characteristics and parameters that can be monitored by the network management
system.
OAM —
Operation, Administration and Maintenance
OID —
Object ID.
OSPF —
Open Shortest Path First routing protocol.
P
OLICY
—
A rule made up of conditions and actions and associated with a profile. Policy
objects contain business rules for performing configuration changes in the network for con-
trolling Quality of Service and Access to network resources. Policy can be extended to per-
form other configuration functions, including routing behavior, VLAN membership, and
VPN security.
P
OLICY
E
NFORCEMENT
P
OINTS
(PEP) —
In a policy enforced network, a policy enforcement
point represents a security appliance used to protect one or more endpoints. PEPs are also
points for monitoring the health and status of a network. PEPs are generally members of a
policy group.
P
OLICY
ROUTING
—
Routing scheme that forwards packets to specific interfaces based on
user-configured policies. Such policies might specify that traffic sent from a particular net-
work should be routed through interface, while all other traffic should be routed through
another interface.
P
OLICY
R
ULES
—
In a policy enforced network (PEN), policy rules determine how the mem-
bers and endpoint groups of a policy group communicate.

454
Glossary
PPTP (P
OINT
-
TO
-P
OINT
T
UNNELING
P
ROTOCOL
)—
Point-to-Point Tunneling Protocol (PPTP)
is a network protocol that enables the secure transfer of data from a remote client to a pri-
vate enterprise server by creating a virtual private network (VPN) across TCP/IP-based data
networks. PPTP supports on-demand, multi-protocol, virtual private networking over public
networks, such as the Internet.
P
RIVATE
K
EY
—
In cryptography, a private or secret key is an encryption/decryption key
known only to the party or parties that exchange secret messages. In traditional secret key
cryptography, a key would be shared by the communicators so that each could encrypt and
decrypt messages. The risk in this system is that if either party loses the key or it is stolen,
the system is broken. A more recent alternative is to use a combination of public and private
keys. In this system, a public key is used together with a private key.
P
ROFILE
—
A profile is an abstract collection of configuration data that is utilized as a tem-
plate to specify configuration parameters to be applied to a device as a result of a policy con-
dition being true.
P
UBLIC
K
EY
—
A public key is a value provided by some designated authority as a key that,
combined with a private key derived from the public key, can be used to effectively encrypt
and decrypt messages and digital signatures. The use of combined public and private keys is
known as asymmetric encryption. A system for using public keys is called a public key infra-
structure (PKI).
Q
O
S—
Quality of Service. In digital circuits, it is a measure of specific error conditions as
compared with a standard. The establishment of QoS levels means that transmission rates,
error rates, and other characteristics can be measured, improved, and, to some extent, guar-
anteed in advance. Often related to Class of Service (CoS).
RADIUS —
RADIUS (Remote Authentication Dial-In User Service) is a client/server proto-
col and software that enables remote access servers to communicate with a central server to
authenticate dial-in users and authorize their access to the requested system or service.
RADIUS allows a company to maintain user profiles in a central database that all remote
servers can share.
RIP —
Routing Information Protocol
S
ELF
-
SIGNED
C
ERTIFICATE
A self-signed certificate uses its own certificate request as a signature rather than the signa-
ture of a CA. A self-signed certificate will not provide the same functionality as a CA-signed
certificate. A self-signed certificate will not be automatically recognized by users' browsers,
and a self-signed certificate does not provide any guarantee concerning the identity of the
organization that is providing the website.
SMTP —
Simple Mail Transfer Protocol.
SNMP —
Simple Network Management Protocol. Network management protocol used
almost exclusively in TCP/IP networks. SNMP provides the means to monitor and control

network devices, and to manage configurations, statistics collection, performance, and secu-
rity.
S
PANNING
T
REE
P
ROTOCOL
(STP) —
The inactivation of links between networks so that infor-
mation packets are channeled along one route and will not search endlessly for a destina-
tion.
SSH (S
ECURE
S
HELL
)—
A protocol which permits secure remote access over a network from
one computer to another. SSH negotiates and establishes an encrypted connection between
an SSH client and an SSH server.
SSL (S
ECURE
S
OCKETS
L
AYER
)—
A program layer created by Netscape for managing the
security of message transmissions in a network. Netscape's idea is that the programming for
keeping your messages confidential ought to be contained in a program layer between an
application (such as your Web browser or HTTP) and the Internet's TCP/IP layers. The
“sockets” part of the term refers to the sockets method of passing data back and forth
between a client and a server program in a network or between program layers in the same
computer.
T
RAP
(SNMP T
RAP
)—
A notification from a network element or device of its status, such as a
server startup. This notification is sent by an SNMP agent to a Network Management Sys-
tem (NMS) where it is translated into an event by the Mediation Agent.
T
RAP
F
ORWARDING
—
The process of re-emitting trap events to remote hosts. Trap Forward-
ing is available from the application through Actions and through the Resource Manager.
VLAN —
A virtual local area network (LAN), commonly known as a VLAN, is a group of
hosts with a common set of requirements that communicate as if they were attached to the
Broadcast domain, regardless of their physical location. A VLAN has the same attributes as
a physical LAN, but it allows for end stations to be grouped together even if they are not
located on the same network switch. Network reconfiguration can be done through software
instead of physically relocating devices.

456
Glossary

457
Index
A
About Box 95
Access Control 451
ACLI needs Perl 38
Acrobat 11
Action Groups 120
Action Job Screen Results
panel 416
Actions 145
Actions in Visualizations
256
Active Directory 68
Active Performance Monitor
291
SNMP Performance Moni-
toring 314
SNMP Performance Moni-
toring Example 314
Active Performance Monitor
Support 440
Adaptive CLI
Actions 395
Attribute Appearance and
Validation 413
Attributes 402
Conditional Blocks 419
Continue Pattern 411
Editor 400
Error Condition 411
General 400
Monitor Attributes 441
Non Configuration at-
tributes 410
Perl Scripts 419
Script Language Syntax
418
Scripts 408
With Reboot 425
Adaptive CLI login limita-
tions 393
Adaptive CLI To Extract
Upload / Download
Speeds 429
Add > Applications menu 73
Additional Products 4
Advanced External Script
Monitor 443
Aging Policies
Editor 61
Options 63
Alarm 451
Alarm archiving 58
Alarm Editor 131
Alarms 123
Alarm State 127
Assigned User 127
Date Assigned 127
Date Closed 127
Date Opened 124
Email 129
Entity Type 125, 131
In Topology 267
Notification Instance 127
Service Effecting 125
Snap Panels 129
Suppression 201
Alarms in Visualizations /
Topologies 267
Amigopod 22
API 451
Application Server Statistics
295
Application Server Status
Monitor 313
Application Settings 57
Archiving data 58
Attributes Extraction 412
Audible Alerts 132
Audible alerts 132
Audit Trail 116
Audit Trail Screen 114
Audit Trail Snap Panels 118
Authentication 17, 451
Editor 178
Portlet 177
Snap Panel 180
Authorization 451
Authorizations 245
B
Back button 94
Background Settings 265
Backups
Configurations 274
Latest Configurations 331
Base Driver 18

458 |
458
Basic Network Consider-
ations 15
Best practice/Web portal
/Multitasking 12
bindobjectdefs.xml 163
Branding Reports 237
Breadcrumb trail 212
Browser Cache 11
C
Cache solutions 11
Change Determination Pro-
cess 384
Change Management / ProS-
can 359
Change Manager
Compliance Policy Viola-
tion report 365
Use paradigms 359
Change the site logo 52
Changing Dashboard Time /
Date Format 333
Changing the Session Time-
out Period 41
Chat / Conferencing 99
Common Menu Items 109
Common Setup Tasks 87
Comparison reports 225
Compliance Policy Summa-
ry 364
Conferences 100
Configuration Files 278
Editor 280
Expanded 279
Configure Alarm E-mail 128
Configuring Audit Trails
116
Configuring Job Viewer 116
Configuring Monitors 291
Configuring Pages and User
Access 71
Configuring Views 255
Contacts Editor 170
Contacts Portlet 169
Container
Authorizations 245
Editor 244
General 244
Membership 245
Portlets filtered 247
Container Editor 244
General 244
Container Manager 242
Expanded 243
Container Manager Expand-
ed 243
Container View 247
Container View in Tenant
Sites 248
Containers and Maps To-
gether 251
Context 242
Continue Pattern 411
Control Panel 43
Control Panel > Server Ad-
ministration > Mail 47, 88
CoS 451
Creating a new label 275
Custom Action 146
Custom attributes 55
Custom Debug 95
Customizing Report Logos
237
D
DAP 58
SubPolicies 62
Viewer 65
Dashboard
Editor 335
View Selection 334
Views 331
Dashboard Time / Date For-
mat 333
Data Configuration 55
Data roll up 301
Data rollup 332
Data summary 301
Database 451
Database Aging
Sub-Policies 63
Database Aging Policies 58
Database Backup 65
date format 83
Default Server Status Moni-
tor 313
Default User Roles 46
Deploy OS 287
Deployment 451
Digital Certificate 451
Direct Access 213
Java Security 217
Direct Access Tool 79
Discovering hostnames 185
Discovery Profile
Editor 183

459
Network 84, 185
Results 86, 189
Discovery Profile Editor 83
Discovery Profiles 181
Actions 187
Expanded 190
General 183
Inspect 85, 188
Display Strategies 262
DNS 15
Dock 96
Domain 451
Name Servers 15
RCSynergy / 44
drvrpt 95
Dynamic Group 194
E
Edit Custom Attributes 112
Email Action 148
Email Action Variables 152
Enabling SSL 39
Enabling Terms of Use 46
Encryption 451
Equipment 451
Equipment Details 210
Equipment Icons 195
Equipment Name 127
Error Condition 411
Ethernet Access Point 452
Ethernet Access Service 452
Ethernet Service 452
Ethernet Trunk 451
Ethernet Trunk Port 452
Event 452
Event and Alarm Lifecycles
164
Event Correlations 163
Event Definition 452
Event Definitions 158
Correlations 162
Editor 158
General 159
Message Template 160
Event History
Portlet 134
Snap Panels 136
Event Instance 452
Event Processing
Filters 141
Rules 136
Event Template 452
Event Threshold 452
eventdefs.xml 163
Expanded
Actions Portlet 396
Alarm Portlet 126
Audit Trail Portlet 117
Authentication Portlet 180
Event History Portlet 135
Location Portlet 172
OS Images portlet. 282
Portlets 106
Reports Portlet 234
Resource Monitor 299
Vendor Portlet 176
Export / Import 109
Exporter Registration 350
Exporting 452
External Script Monitor
Advanced 443
F
FAQ
Portal database backup /
restore 67
File Management 271
File Servers
Editor 270
Port conflict 90
Portlet 269
Filter 4, 453
Management 56
Filter / Settings (Rule Editor)
141
Filters
Visualize portlet 254
Firefox difficulties 11
Firewall 27
Firewall Issues 20
Firewall requirements 31
Fixed IP Address 16
Flash 11
Flash for 64-bit browsers 11
Formatting reports 224
Forward Northbound 150
FTP Protocol Selection 90
FTP Servers 271
Functional permissions 55
G
General (Rule Editor) 140
Getting Started 28
Google maps alternative 253
Graphs 101
Group Operations 274
Group Reports 238

460 |
460
GUI 453
H
Handling Missing Users 9
Hardware 12
Heap 30
Help / Tooltips 93
How to
Add / Remove Columns
107
Add User Roles 50
Add Users 46
Advanced Script Monitor
Example 443
Backup Configurations
274
Configure ProScan Groups
360
Configure Resource Level
Permissions 75
Create a Container for each
Customer 75
Create a Custom Dash-
board View 337
Create a Monitor for an
External Script 442
Create a Monitor Report
316
Create a new Page Tab
(My Resources) 73
Create A Performance
Template 342
Create a Report Template
223
Create a Server Status
Monitor Dashboard 313
Create a Simple Dash-
board View 333
Create a topology view
254
Create a Visualization 254
Create an ICMP Monitor
315
Create an SNMP Interface
Monitor 314
Create Event Processing
Rules 137
Create new users 72
Create Source Group Cri-
teria 371
DAP Workflow 59
Deploy an OS Image 288
Discover Resources 181
Discover Your Network 83
Do Change Management
(Example) 361
Edit Discovery Profiles
183
Filter Expanded Portlet
Displays 108
Register a License 82
Report on Change Deter-
mination 390
Restore a single configura-
tion to many target de-
vices 290
Restore Configurations
276
Restrict Pages for a User
73
Run Change Determina-
tion Process 384
Share a Resource 111
Troubleshoot File Backup,
Restore or Deployment
277
Use “How To” 5
Use Containers 243
Use Traffic Flow Analyzer
349
HowTo
Open an archived file in
dapviewer. 60
HTTPS 39
I
ICMP Monitor 321
Import / Export 109
in Control Panel 44
Incomplete Discovery 86
Install on Linux 32, 41
Installation and Startup 29
Installation Language de-
fault. 29
Installing on Windows 2012
9
Installing Perl 38
Interface Portlet 222
Introducing Display Strate-
gies 241
IP address changes 16
IP Address Search 209
IP or MAC Address Search
209
IPSLA OIDS 318
ISATAP 453

461
J
Java 11
java.exe 27
K
Key 453
Key Features 2
Key Management 453
L
Labels 272
LDAP 67
Portal Settings 70
Legend Tab 266
Level of authentication 179
License 4
License Expiration Warning
Alarms 81
License Viewer 81
Link Discovery 208
Linked View 260
Links in Visualization 267
Localizing Message Files 91
Location Editor 171
Location Manager
Address 172
Parent location 171
Location, updates 173
Locations
Portlets 171
Snap Panels 172
M
MAC Address Search 209
Mail hosts 51
Maintenance Log 199
Managed Object 453
Managed Resource Groups
190
Managed Resources 87
Expanded 204
Portlet 195
Mandatory Fields 105
Map Context 249
Portlets filtered 247
Map Context without Con-
tainers 251
Maps and Containers To-
gether 251
Mass deployments 285
Match Regex for each line
370
Mediation 453
Mediation Agent 453
Mediation Server Status
Monitor 313
Memory Footprint 30
Memory Tuning 17
Menu 128
Menu Bar 100
Menu Options 182
Message files, localizing 91
message URL http
//www.liferay.com/docu-
mentation 92
MIB 453
MIB Browser 214
MIB Browser Tool 79
MIB Browsing undiscovered
devices 323
MIB file locations 79
Migrating heartbeats 304
Migrating Versions 8
Minimum Hardware 12
Minimum hardware 8
Missing Users 9
Monitor Editor 302
Calculated Metrics 305
Conditions 311
Inventory Mappings 310
Monitor Options 305
Thresholds 307
Monitor Graph Background
310
Monitor Options Type Spe-
cific Panels 317
Monitor Reports in Multi-
tenant Environments 316
Monitor Strings 433
Monitor Text Values 433
Monitoring 291
Monitors 330
Monitors and Discovery 291
Multiple indexes in the
SNMP Interface 326
Multiple Performance Tem-
plates 345
Synergy Admin / 44
N
Name Resolution 15
Navigation 93
Netrestore File Servers 90
Network Basics 15
Network Considerations 15
Network Requirements 15

462 |
462
Network Tools 77
Direct Access 79
MIB Browser 79
Ping 78
Network Topology 254
New link creation 207
Non Configuration attributes
410
O
OAM 453
OID 453
OS Image Editor 283
OS Images Portlet 281
OSPF 453
Portal > 52
Overall Compliance 363
P
Page Level Permissions 72
Password Reset 87
PDF 113
Performance and Monitors
291
Performance Dashboard 334
Portlet 334
Performance Note 5
Perl 38
Perl / Java (Groovy) Lan-
guage Policies 377
Permission Manager 52
Permissions 50
Personal pages 71
Ping Tool 78
pmtray 31
Policy 453
Policy Enforcement Points
(PEP) 453
Policy routing 453
Policy Rules 453
Port Assignments 23
Port Details 219
Port Expanded 220
Portal > Portal Settings 51
Portal > Roles 49
Portal > Settings 51
Portal > Users 44
Portal Database Backup 67
Portal Database Restore 67
Portal Memory Settings 17
Portal Overview 93
Portal Settings 51
Portlet Instances 105
Portlet Level Permissions 74
Portlets 102
Ports
Expanded 220
Portlet 218
Ports required 31
Ports Used 22
Ports used 22
Post-processing rules 143
PPTP (Point-to-Point Tun-
neling Protocol) 454
Printing manager contents
110
Private Key 454
Profile 454
Promote 285
ProScan 359
Compliance Reporting 388
Count number of occur-
rences 370
Editor 365
Editor - Compliance 368
Editor - General 366
Java (Groovy) 379
Manager 362
Perl 378
Supported Regular Ex-
pressions 375
Use Cases 359
Use paradigms 359
Proscan
Case Sensitive 371
Criteria Properties 371
Monitor 322
Multi-Line Support 371
ProScan Policy
Creating or Modifying 365
Creating or Modifying
Groups 381
Proscan Policy
Group Editor 381
Protocol flows 26
Protocols Used 15
Public / Private Page Behav-
ior 48
Public Key 454
Q
QoS 454
Quick Navigation 77
Quick Start 28

463
R
RADIUS 454
Recommended Operating
System Versions 9
Recommended Windows
File Servers 271
Recorder / Page turn icons
107
Redcell > Application Set-
tings 57
Refresh 94
Refresh Monitor Targets 328
Regular Expression meta-
characters 375, 438
Regular Expressions 375
re-index 44
Report Templates 223
Editors 224
Reports
Customizing Logos 237
formatting 224
Maximum size 231
Portlet 231
Snap Panels 234
Repositories 64
Resolve DNS Hostnames
Activity 185
Resource Discovery 180
Resource Icons 195
Resource Management
Portlet 177
Resource Monitors
Portlet 297
Snap Panels 299
Restore Configurations 276
Restoring Database 66
Resync alarms 129
Retention Policies 300
Return to previous 94
RIP 454
Roles 49
Rule Editor 139
Actions 145
S
Saving page configurations
71
Schedule Refresh Monitor
Targets 328
Schedules 118
Portlet 120
Scheduling 118
Actions 118
Scheduling Monitor Target
Refresh 328
Scheduling Refresh Monitor
Targets 328
Screen resolution 11
Screen width in pixels 11
Script Monitor Example 443
Search 103
Search in Portlets 105
Search Indexes 43
Search IP or MAC Address
209
Secure Connections 39
Secure WBEM Access 22
Self Management 313
Self Monitoring 313
Self-signed Certificate 454
Server 67
Server monitor 31
Server Sizing 12
Server Statistics 295
Settings 103
Sharing 110
Shift+Click 94
Show Performance Tem-
plates 342
Show Versions 95
Single Server Sizing 12
Site Map portlet 101
Sizing memory 30
Sizing, Standalone Installa-
tions 13
SMTP 454
Configuration 88
Snap Panels 107
SNMP 454
Interface Monitor 325
Interface Monitor Exam-
ple 314
Monitor 323
Performance Monitoring
Example 314
Table Monitor 327
SNMP v3 authentication er-
ror 179
SNMP v3 passwords 179
Sorting 106
Spanning Tree Protocol
(STP) 455
SSH (Secure Shell) 455
SSL 39
SSL (Secure Sockets Layer)
455

464 |
464
Start application server 7
Start web server 7
Starting Web Client 38
Starting Web Server 31
Static Group 193
Status Bar Messaging 98
Stop application server 7
Stop web server. 7
Sub-Policies 63
Supported Flow versions
347
Supported Operating System
Versions 9
Supported PowerConnect
Models 19
Supported Web Browsers 11
Syslog Escalation Criteria
144
System Basics 8
System requirements 8
T
Tenant Reports 316
Terminal 216
TFTP Servers 271
The Back Button 94
Threshold display 310
Threshold Graph Back-
ground 310
Tooltips 93
Top [Asset] Monitors Port-
lets 330
Top Configuration Backups
Portlet 331
Topology 254
Balloon 264
Circular 264
Layout 263
Orthogonal 264
OVERVIEW 262
Radial 265
Topology, saving 261
Traffic Flow Portlet 350
Display registered export-
ers 204
Drill Down 354
Search 355
Traffic Flow Snapshot 356
Trap (SNMP Trap) 455
Trap Forwarding 455
Process 150
Troubleshoot File Backup,
Restore or Deployment
277
Troubleshooting 7
Users and Organizations
43
Troubleshooting Discovery
86
Troubleshooting tip 7
U
Uninstalling 37
Update Location 173
Updating Your License 4
Upgrade licenses from previ-
ous version 4
Upgrading from a Previous
Version 8
User Login Report 239
User Role 45
User Screen Name length 16
Users Missing 9
Using Nokia Maps 253
V
Vendors Portlet 174
Vendors Snap Panel 176
View as PDF 113
Visualization 254
Visualize
Alarms 267
Balloon 264
Circular 264
Circular Layout 264
Configuring Views 255
Design Tools 259
Global Settings 265
Hierarchical-Cyclic 263
Layout 263
Legend Tab 266
Links in Visualization 267
Node alarms 267
Organic 265
Orthogonal 264
Overview 262
Properties and Settings >
Layouts Tab 263
Properties and Settings >
Properties 265
Radial 265
Saving Views 261
Tools 257
Top-Level Nodes Tab 266
View 261

465
Visualize acting as filter 254
Visualize My Network 254
Visualizer Display 246
Visualizer Views 262, 268
VLAN 455
W
WBEM 20
root login 21
WBEM Prerequisites 21
Web Server property over-
rides 15
Web services port 23
Web Services ports 31
Web-Based Enterprise Man-
agement 20
Why share a schema? 402
Windows 2012 9
Windows Management In-
strumentation 28
ports 28
Windows Management In-
terface 19
Windows Server 2008 10
Windows Terminal Server
10
WMI 19, 28
ports 28

466 |
466
