Dell Poweredge 1655Mc Troubleshooting Optimal BIOS Settings For HPC With 12th Generation Servers
2014-11-13
: Dell Dell-Poweredge-1655Mc-Troubleshooting-115295 dell-poweredge-1655mc-troubleshooting-115295 dell pdf
Open the PDF directly: View PDF ![]() .
.
Page Count: 32

Garima Kochhar and Nishanth
Dandapanthula
High Performance Computing
Engineering
July 2012 | Version 1.0
Optimal BIOS settings for HPC with
Dell PowerEdge 12th generation
servers
This Dell technical white paper analyses the various BIOS options
available in Dell PowerEdge 12th generation servers and provides
recommendations for High Performance Computing workloads.
Optimal BIOS settings for HPC with Dell PowerEdge 12th generation servers
ii
This document is for informational purposes only and may contain typographical errors and
technical inaccuracies. The content is provided as is, without express or implied warranties of any
kind.
© 2012 Dell Inc. All rights reserved. Dell and its affiliates cannot be responsible for errors or omissions
in typography or photography. Dell, the Dell logo, and PowerEdge are trademarks of Dell Inc. Intel and
Xeon are registered trademarks of Intel Corporation in the U.S. and other countries. Microsoft,
Windows, and Windows Server are either trademarks or registered trademarks of Microsoft Corporation
in the United States and/or other countries. Other trademarks and trade names may be used in this
document to refer to either the entities claiming the marks and names or their products. Dell disclaims
proprietary interest in the marks and names of others.
July 2012| Rev 1.0
Optimal BIOS settings for HPC with Dell PowerEdge 12th generation servers
iii
Contents
Executive summary ..................................................................................................... 5
1. Introduction ....................................................................................................... 6
2. Dell PowerEdge 12th generation servers and Intel Sandy Bridge-EP architecture ..................... 6
2.1. Intel SandyBridge architecture .......................................................................... 7
3. Overview of BIOS options ....................................................................................... 9
3.1. System Profile .............................................................................................. 9
3.2. Turbo Boost ............................................................................................... 12
3.3. Node interleaving ........................................................................................ 12
3.4. Logical Processor ......................................................................................... 13
3.5. BIOS options specific to latency sensitive applications ........................................... 13
4. Test bed and applications .................................................................................... 14
5. Results and analysis ............................................................................................ 15
5.1. Idle power ................................................................................................. 16
5.2. System Profile ............................................................................................ 17
5.3. Turbo Boost ............................................................................................... 19
5.4. Node Interleaving ........................................................................................ 20
5.5. Logical Processor ......................................................................................... 21
5.6. C States, C1E on remote memory access ............................................................ 22
6. Comparison to Dell PowerEdge 11th generation servers ................................................. 23
7. Conclusion ....................................................................................................... 26
8. References ....................................................................................................... 28
Appendix A – Summary of findings ................................................................................. 29
Appendix B – Dell Deployment Toolkit to modify BIOS options from the command line ................. 31
Tables
Table 1. Dell PowerEdge 12th generation server models ....................................................... 7
Table 2. Intel Sandy Bridge-based servers ........................................................................ 9
Table 3. System Profile options .................................................................................. 10
Table 4. Test bed details .......................................................................................... 14
Table 5. Benchmark and application details ................................................................... 15
Table 6. 11th and 12th generation cluster test bed details ................................................... 24
Table 7. Recommended BIOS setting ............................................................................ 26
Table 8. DTK syscfg options for changing BIOS settings ...................................................... 31
Optimal BIOS settings for HPC with Dell PowerEdge 12th generation servers
iv
Figures
Figure 1. Sandy Bridge-EP architecture for a PowerEdge R620 ................................................ 8
Figure 2. Local, remote and interleaved memory bandwidth ................................................ 13
Figure 3. Idle power usage across different System Profiles ................................................. 16
Figure 4. Impact of power-based BIOS options on idle power ............................................... 17
Figure 5. Performance and Energy Efficiency of System Profiles on applications ........................ 18
Figure 6. Performance and Energy Efficiency of Turbo Boost ................................................ 19
Figure 7. Performance and Energy Efficiency of Node Interleaving ........................................ 20
Figure 8. Performance and Energy Efficiency of Logical Processor ......................................... 21
Figure 9. Impact of C States and C1E on remote memory access ........................................... 23
Figure 10. 11th vs. 12th generation cluster – idle power comparison ......................................... 25
Figure 11. 11th vs. 12th generation cluster – performance and energy efficiency comparison ........... 25

Optimal BIOS settings for HPC with Dell PowerEdge 12th generation servers
5
Executive summary
The latest Dell PowerEdge 12th generation servers provide several BIOS options that can be tuned for
performance and energy efficiency. In this technical white paper, the cluster-level impact of different
BIOS options is quantified and presented for different types of high performance computing (HPC)
workloads. The performance impact and power consumption of various BIOS settings and System
Profiles are compared across several open source and commercial applications, and best practices are
recommended from the measured results.
Comparing these results to the previously published study on Dell’s 11th generation servers, this
document also presents the improvements achieved by Dell’s latest servers for HPC workloads.
Optimal BIOS settings for HPC with Dell PowerEdge 12th generation servers
6
1. Introduction
Dell PowerEdge 12th generation servers1 include the Intel Xeon E5-2600 series processors based on the
Intel microarchitecture codenamed Sandy Bridge. With the new processor and chipset technology, the
new servers support PCI-Gen3 capable PCI slots, memory DIMM speeds up to 1600 MT/s, four memory
channels per socket, and Intel QuickPath Interconnect (QPI) lanes running at 8.0GT/s. Dell PowerEdge
12th generation servers also provide several processor-agnostic enhancements, including improved
energy efficiency, support for more hard drives, support for PCI-E based Solid State Disks, a richer and
simplified BIOS interface, and a choice of Network Daughter Cards.2
High performance computing (HPC) clusters utilize several commodity servers interconnected with a
high-speed network fabric to achieve supercomputer-like performance. Clusters have become the most
popular supercomputer architecture over the last 10 years due to the advantage they provide in terms
of price, performance, and simplicity, over other designs.3 Dell’s dual-socket PowerEdge server line fits
the requirements of the HPC cluster market and is a popular choice for building compute clusters.
This white paper focuses on the impact of the BIOS options available with the latest generation servers
on HPC applications. It first introduces the servers used in this study and describes the Intel Sandy
Bridge architecture. It quantifies the cluster-level impact of the BIOS options on performance and
power consumption across a wide range of HPC applications. Based on measured results it provides
guidelines for tuning the 12th generation BIOS for HPC. It also presents the improvements of the latest
servers over the previous generation in terms of power and performance for various HPC domains.
The guidelines presented here apply to HPC workloads similar to those tested as part of this study. The
recommendations in this document may not be appropriate for general enterprise workloads.
2. Dell PowerEdge 12th generation servers and Intel Sandy
Bridge-EP architecture
Dell PowerEdge 12th generation servers feature a simplified BIOS interface that is different in look and
feel from previous generations. This new interface is in accordance with the Unified Extensible
Firmware Interface (UEFI) specification, but with the option to boot from legacy mode when desired.
The same interface is now used to configure the BIOS, iDRAC, Dell PowerEdge RAID Controller (PERC),
LOM, and other adapter settings. The 12th generation BIOS setup introduces a “System Profiles” menu
that provides a single option to set a group of tuning parameters.4 The BIOS options evaluated in this
study are described in detail in Section 3.
In addition to the richer and simplified BIOS interface, the servers include several technology
enhancements like support for PCI-E based Solid State Disks, a choice of Network Daughter Cards as
opposed to fixed onboard LOMs, hot plug PCIe flash storage, and common power supply modules.
Enhancements to Dell’s iDRAC for systems management provide improved energy efficiencies and
power savings over previous generations.
Dell’s latest server lineup includes many choices. For the two-socket space, Table 1 lists Intel Xeon E5-
2600 based servers that are good candidates for HPC clusters.
All the server models in Table 1 are similar in system architecture and board design. Details of the
architecture are presented in Section 2.1.

Optimal BIOS settings for HPC with Dell PowerEdge 12th generation servers
7
The following features are common to the servers:
Support for processors from the Intel Xeon E5-2600 series.
4 memory channels per socket. The number of DIMM slots per server varies by product line.
o 3 DIMMs per channel for the PowerEdge R and M product line. Total of 12 DIMMs per
socket, 24 DIMMs per server.
o 2 DIMMs per channel for the PowerEdge C product. Total of 8 DIMMs per socket, 16
DIMMs per server.
Support memory speeds of 800 MT/s, 1066 MT/s, 1333 MT/s and 1600 MT/s.
Table 1. Dell PowerEdge 12th generation server models
Server model
Form factor
PowerEdge R620
1U Rack
PowerEdge R720
2U Rack
PowerEdge M620
Half height Blade
PowerEdge C6220
Shared Infrastructure system,
2U Rack with 4 servers.
The servers differ in
Form factor
Number of hard drives supported
Support for hot plug flash storage
Number of onboard NICs
Number and configuration of PCI slots
PERC options for internal and external hard drives
Support for GP GPU and other PCI cards.
This study used the Dell PowerEdge M620 blade servers, but the recommendations contained here apply
to the PowerEdge R and M server models that use the Intel Xeon E5-2600 series processors.
The PowerEdge C product line has a different BIOS interface from the standard PowerEdge products.
The BIOS layout and the options exposed are different and all 12th generation features may not apply.
In general, however, the analysis and recommendations in this document will apply to the PowerEdge
C6220 as well.
2.1. Intel SandyBridge architecture
The Intel microarchitecture codenamed Sandy Bridge is the latest “tock” in Intel’s tick-tock model
of development5. It uses the same 32nm process technology as its predecessor (Intel Xeon 5600
series, codenamed Westmere-EP) but introduces a whole new microarchitecture.
Optimal BIOS settings for HPC with Dell PowerEdge 12th generation servers
8
Like Westmere-EP, Sandy Bridge is also a NUMA-based architecture. Figure 1 shows a block diagram
of the Sandy Bridge-EP architecture. Each processor socket has an integrated memory controller. A
core’s access to the memory attached to its local memory controller is faster and has higher
bandwidth than access to the memory attached to the other, remote socket’s, memory controller.
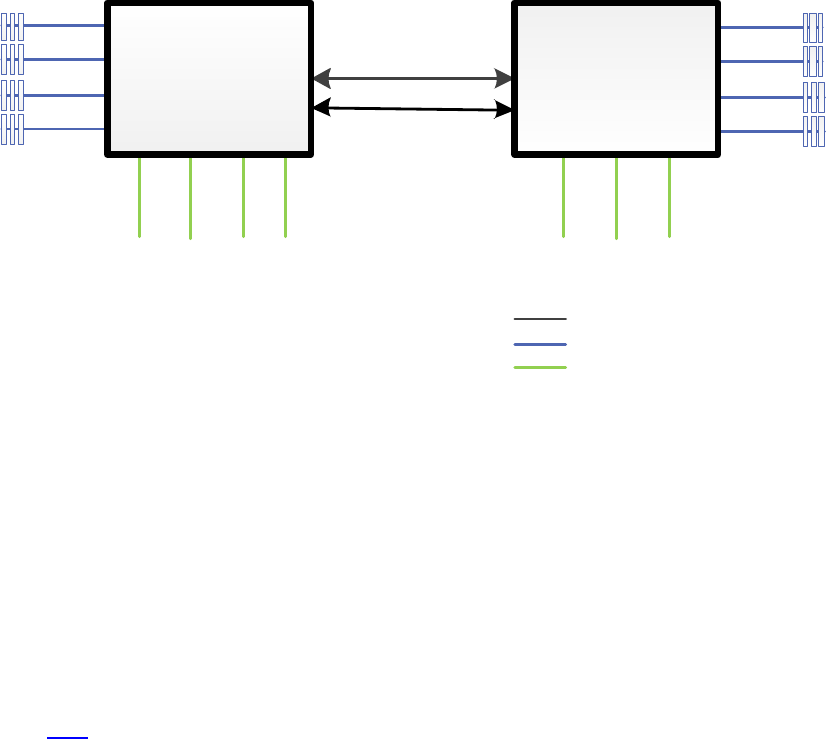
Figure 1. Sandy Bridge-EP architecture for a PowerEdge R620
QPI links
8.0 GT/s
Four memory
channels
Four memory
channels
3 DIMMs
per
channel
3 DIMMs
per
channel
NDC
x8
Left
x16 Center
x8
Storage
x8
Right
x16
Right
x8
Center
x16
QPI
DDR3 memory channel
PCI-Gen3 lanes
ProcessorProcessor
With Westmere-EP, each memory controller had three DDR3 memory channels; Sandy Bridge-EP
increases that to four memory channels per controller. The maximum number of DIMMs per channel
remains three. Sandy Bridge supports up to eight cores per socket as opposed to the six cores per
socket on Westmere-EP.
The QPI links that connect the processors run at up to 8 GT/s with Sandy Bridge. The maximum
speed with Westmere was 6.4 GT/s. Sandy Bridge supports up to two QPI links whereas Westmere
supported only one. Additionally, Sandy Bridge-based processors can support DIMMs at speeds up to
1600 MT/s; Westmere’s limit was 1333MT/s. Sandy Bridge-EP also has a larger L3 cache of up to
20MB compared to Westmere-EP’s 12MB L3 cache. Intel introduced Advanced Vector Extensions
(AVX) 6 with its Sandy Bridge lineup. AVX provides a huge performance boost when compared to
Westmere or Nehalem, as it doubles the number of FLOPS/cycle. A detailed explanation of AVX can
be found here.
Unlike Westmere, Sandy-Bridge-based processors also include an integrated PCI controller. This
makes access to the PCI slots non-uniform. Access to slots that are directly connected to the
socket’s PCI controller will be faster than to slots connected to the remote socket’s PCI controller.
Also new to Sandy-Bridge-based systems is PCI-Gen3 support. This is good news for HPC, as the
Mellanox FDR InfiniBand HCA can utilize this technology enhancement and run at Gen3 speeds.
Sandy Bridge-based servers come in three architectures: Sandy Bridge-EP, Sandy Bridge-EN and
Sandy Bridge-EP 4S. These architectures are compared in Table 2. Additionally Sandy Bridge-EN
processors operate at a lower wattage, with maximum Thermal Design Power (TDP) ranging from
50W to 95W. Sandy Bridge-EP processors have a Maximum TDP of up to 135W7. Other differences
include the number of PCI lanes and number of QPI lanes.

Optimal BIOS settings for HPC with Dell PowerEdge 12th generation servers
9
Table 2. Intel Sandy Bridge-based servers
Architecture
Processor Series
Dell PowerEdge
Server models
Memory channels
Max Memory
DIMMs per
channel (DPC)
Sandy Bridge-EP
Intel Xeon E5-2600
R620, R720,
M620, C6220
4 channels per
socket
3 DPC
Sandy Bridge-EP 4S
Intel Xeon E5-4600
R820, M820
4 channels per
socket
3 DPC
Sandy Bridge-EN
Intel Xeon E5-2400
R420, M420
3 channels per
socket
2 DPC or 1DPC
depending on
server model
This study focuses on the Sandy Bridge-EP based servers. A follow-on study will evaluate the other
architectural variants.
3. Overview of BIOS options
Dell PowerEdge 12th generation servers provide numerous BIOS tunable features. The goal of this white
paper, however, is to examine the impact of only those BIOS options that are relevant in the HPC
domain. This section provides an overview of the specific BIOS settings evaluated in this study. Section
5 presents the impact of these options on performance and energy efficiency across a variety of HPC
applications.
3.1. System Profile
With the latest mainstream PowerEdge server line (i.e., excluding the PowerEdge C products),
several BIOS settings have been grouped into a common “System Profile” section. Predetermined
values for Turbo mode, C States, C1E, Monitor/Mwait, CPU Power Management, Memory Speed,
Memory Patrol Scrub rate, Memory Refresh Rate, and the Memory Operating Voltage can all be set
by selecting a single System Profile value. If these options need to be manipulated independent of
the presets available, a Custom System Profile can be configured.
The available System Profile options are:
Performance Per Watt Optimized (DAPC)
Performance Per Watt Optimized (OS)
Performance Optimized
Dense Configuration Optimized
Custom
The preset BIOS settings for each of these System Profiles are described in Table 3. If a preset
System Profile other than Custom is selected, the following sub-options are selected automatically
and are not individually tunable. The Custom System Profile should be selected to tune each option
in Table 3 individually.

Optimal BIOS settings for HPC with Dell PowerEdge 12th generation servers
10
Details of each of these settings are provided in [4]. A quick overview is provided here.
Table 3. System Profile options
1.
2. Performance
Per Watt
Optimized
(DAPC)
3. Performance
Per Watt
Optimized
(OS)
4. Performance
Optimized
5. Dense
Configuration
Optimized
6. Custom
CPU Power
Management
System DBPM
OS DBPM
Max Performance
System DBPM
System DBPM
Max
Performance
OS DBPM
Memory
Frequency
Max
Performance
Max
Performance
Max Performance
Max Reliability
Max
Performance
Max Reliability
1600 MT/s
1333 MT/s
1067 MT/s
800 MT/s
Turbo Boost
Enabled
Enabled
Enabled
Disabled
Enabled
Disabled
C States
Enabled
Enabled
Disabled
Enabled
Enabled
Disabled
C1E
Enabled
Enabled
Disabled
Enabled
Enabled
Disabled
Memory
Patrol Scrub
Standard
Standard
Standard
Extended
Extended
Standard
Disabled
Memory
Refresh Rate
1x
1x
1x
2x
1x
2x
Memory
Operating
Voltage
Auto
Auto
Auto
1.5V
Auto
1.5V
Monitor/
Mwait
Enabled
Enabled
Enabled
Enabled
Enabled
Disabled
Optimal BIOS settings for HPC with Dell PowerEdge 12th generation servers
11
CPU Power Management determines what controls the power management for the processor.
System DBPM (Demand Based Power Management) is Dell’s Active Power Controller (DAPC) and is
hardware-based control from the iDRAC. OS DBPM hands control to the Operating System. In the
case of Linux, this is controlled by the “cpuspeed” service. Maximum Performance maintains full
voltage to internal components, such as memory and fans, even during periods of inactivity, thus
eliminating the performance penalty associated with phase transitions. This is suitable for
customers whose aim is to extract the highest performance from a server, potentially at the
expense of higher power consumption.
Memory Frequency sets the speed at which the memory will operate. This depends on the actual
DIMMs used and the memory configuration of the system. The Max Performance System Profile will
set the memory speed to run at the maximum supported by the configuration. With BIOS v1.1.2 and
later, Max Reliability picks the speed that is one less than Max Frequency. With the Custom System
Profile, any supported memory speed can be explicitly set. Note that the Memory Frequency does
have a dependency on the operating Memory Voltage. For example 1.35V DIMMs cannot run at
1600MT/s at the time of writing.
Turbo Boost enables or disables the Turbo feature of the Intel Xeon E5-2600 processors. This
option is described in Section 3.2.
The C States and C1E options are used to enable or disable these features. These are power saving
features that allow frequency scaling to individual CPU cores, as opposed to DBPM that functions at
the socket level. This technology is similar to that introduced with Dell’s previous generation
servers
The Memory Patrol Scrub setting determines how often the system memory is checked. Patrol
Scrub searches the memory for errors and repairs correctable errors. This feature prevents
accumulation of errors. The Standard setting specifies that patrol scrubbing will occur at the
standard or default rate of once every 24 hours. Extended sets the scrub to occur every hour.
Disabled turns this feature off.
Memory Refresh Rate This setting determines how often the memory is refreshed. The 2x option
allows the memory to operate more reliably by refreshing the memory data at twice the normal
rate, at the expense of performance.
Monitor/Mwait is a new BIOS option. When this option is disabled, it prevents the OS from using the
MWAIT instructions on the CPU. Use of these instructions can cause C3, C6 or C7 states to be
engaged depending on the silicon. The intel_idle driver in certain newer operating systems can
engage C-states even when C States and C1E are explicitly disabled. Disabling the Monitor/Mwait
setting makes sure that none of these lower sleep states are engaged and the CPU remains fully
turned on. This setting should be disabled only when C States and Logical Processor options are also
set to disabled. An alternative to the BIOS setting is to disable the intel_idle driver in the operating
system. For example, with Red Hat Enterprise Linux 6.2 the kernel string
“intel_idle.max_cstate=0” can be used to disable intel_idle.
Looking back at Table 3, it is now easier to understand what each of the canned System Profiles is
trying to accomplish. The Performance Per Watt Optimized options balance system performance
with energy efficiency. Turbo Boost is enabled, but so are C States and C1E to conserve power. The
Memory options are set to their basic settings. The choice here is between the system-based power
management, DAPC, or OS-based.
Optimal BIOS settings for HPC with Dell PowerEdge 12th generation servers
12
The Performance Optimized System Profile focuses on pure performance. Turbo Boost is enabled;
C States and C1E are disabled.
The Dense Configuration Optimized profile is for systems that have high DIMM count
configurations, where reliability is prioritized over power savings or performance considerations.
Performance options like Turbo Boost are disabled, and memory-based options are prioritized.
The performance and energy efficiency of the four preset System Profiles are discussed in Section
5.2.
The Custom setting is for use cases where the canned profiles do not meet the application
requirements. One example is for low-latency environment like High Frequency Trading. This
option is covered in Section 3.5.
3.2. Turbo Boost
The Turbo boost option can be tuned from the BIOS System Profile menu as described in Section
3.1.
Turbo boost9 is a feature that was introduced in the Intel Xeon 5500 series processor (code named
Nehalem, supported in the Dell’s previous 11th generation servers). When Turbo boost is enabled, it
can provide improved performance by increasing the CPU frequency over the base operating
frequency. However, even when Turbo boost is enabled, it is engaged only when there is available
power headroom and the system is operating below power, current, and temperature specification
limits.
The Sandy Bridge processors use the second generation of this technology, Intel Turbo Boost
technology 2.0. The enhancements made in this generation should improve Turbo residency, i.e.,
how often and how long a core engages in Turbo, when compared to past generations. Within the
Intel Xeon E5-2600 processor family, some SKUs include the Turbo boost technology and some do
not. The exact processor model will determine if Turbo boost technology is available.7, 8
3.3. Node interleaving
As described in Section 2, the Intel Xeon E5-2600 processors are based on the Non-Uniform Memory
Access (NUMA) architecture and have an integrated memory controller. Access to the memory
channels directly connected to the processor is considered local. Access to the memory channels
connected to the other processor is remote access. Local access is faster than remote access
making the memory access non-uniform. Figure 2 shows that memory bandwidth to remote memory
is 43% lower than access to local memory for a single thread since every remote access needs to
traverse the QPI links between the sockets.
The BIOS provides an option to stripe memory access across the two memory controllers in the dual
socket system. This makes the memory equidistant from both memory controllers, making the
access time uniform. This option can be set by enabling Node Interleaving from the BIOS Memory
Settings menu. Figure 2 shows that memory bandwidth to interleaved is 26% lower than access to
local memory for a single thread. This option is useful for cases where the data set needed by a
process will not fit into local memory, or if the application spawns more threads than can fit on the
local socket. With memory interleaved across the two memory controllers, the worst-case scenario
of a remote memory access for every data request can be avoided.

Optimal BIOS settings for HPC with Dell PowerEdge 12th generation servers
13
Figure 2. Local, remote and interleaved memory bandwidth
* Data collected on a PowerEdge R620, Dual Intel Xeon E5-2680 @ 2.7GHz, 8*8GB 1600MT/s memory.
Performance Optimized System Profile, Logical Processor Disabled.
This section focused on memory bandwidth from a memory interleaving point of view. Additional
memory benchmarking results are available in this blog post.
3.4. Logical Processor
Like previous Intel architectures, the Intel Xeon E5-2600 series offers the option of Logical
Processor or Hyper-Threading (HT) or Simultaneous Multi Treading (SMT). When Logical Processor is
enabled, the operating system sees twice as many physical cores. This is accomplished by ascribing
two logical cores to each physical core. SMT can improve performance by assigning threads to each
logical core; however, the logical cores share the physical cores’ resources, and the actual
performance gain can be very application specific.
This option can be set from the BIOS Processor Settings menu.
3.5. BIOS options specific to latency sensitive applications
Latency sensitive applications and industries like High Frequency Trading tend to have very specific
requirements. In almost all cases, performance oriented features are turned on while all power
saving options are turned off to avoid any latency penalties as the system transitions in and out of
low-power sleep states.
Some of the BIOS options that should be tuned for latency sensitive applications are the following:
Turbo Boost – Disabled. This is to ensure stable and repeatable performance. But note that
some applications can benefit from enabling Turbo Boost. It is recommended that the
actual application be tested to determine the benefit of Turbo Boost.
26% lower
43% lower
0
2
4
6
8
10
12
1 thread
Memory Bandwidth in GB/s
Memory Bandwidth - Local, Remote and Interleaved
Local
Interleaved
Remote

Optimal BIOS settings for HPC with Dell PowerEdge 12th generation servers
14
C States, C1E, Monitor/Mwait – Disabled. This is to turn off all power saving features on the
processor.
System Profile – Max Performance. This ensures there is no system level power saving.
Logical Processor – Disabled. This is especially needed when Monitor/Mwait is Disabled
A separate study has covered this topic in great depth. Refer to this link for details.10
4. Test bed and applications
The goal of this paper is to quantify the impact of the different BIOS options available on Dell
PowerEdge 12th generation servers. While Section 3 described what each tuning parameter
accomplishes, this section seeks to quantify each option and determine the actual performance at the
cluster level. Several of the BIOS options studied here increase system performance with a
corresponding increase in power consumption. To evaluate accurately the performance and power
trade-offs, the performance results presented in this study are complemented with power
measurements.
A 16-server cluster was used in the Dell HPC Engineering lab. All results presented in this paper were
derived from this test bed. This section describes the test bed and the applications that were
evaluated as part of this study. Table 4 provides details of the test environment and Table 5 contains
information on the applications and benchmarks used.
Table 4. Test bed details
Component
Description
SERVER
Dell PowerEdge R620 rack server (1)
Dell PowerEdge M620 blade server (16) in a PowerEdge M1000e chassis
SERVER BIOS
1.1.2
SERVER iDRAC
1.06.06 (Build 15)
PROCESSORS
Dual Intel Xeon E5-2680 @ 2.8 GHz
MEMORY
8*8GB 1600 MT/s RDIMMs
STORAGE
146GB 15K SAS PERC H310
INTERCONNECT
Mellanox InfiniBand ConnectX-3 FDR HCAs
INFINIBAND SWITCH
Mellanox M4001F FDR blade chassis I/O switch module
SOFTWARE
Rocks+ 6.0.1 Dell edition
OPERATING SYSTEM
Red Hat Enterprise Linux 6.2 x86_64
INFINIBAND DRIVER
Mellanox OFED 1.5.3-3.0.0

Optimal BIOS settings for HPC with Dell PowerEdge 12th generation servers
15
Table 5. Benchmark and application details
Application
Domain
Version
Benchmark data set
High Performance
Linpack
Floating point CPU intensive
system benchmark
Intel MKL
v10.3.9.293
NA, all problems consumed
90% of total memory.
Stream
Memory Bandwidth micro-
benchmark
v5.9
Array size 160000000
ANSYS Fluent
Computational Fluid Dynamics
application
v14.0.0
truck_poly_14m and
truck_111m
WRF
Weather modeling application
v3.1
Conus 12k
NAMD
Molecular Dynamics application
v2.9
Stmv
MILC
Quantum Chromo dynamics
application
v7.6.3
Input file from Intel Corp.
LU
Lower-upper decomposition,
physical systems
NPB v3.3.1
Class D
As mentioned, this study is focused on a cluster-level evaluation. Some single server results are
available in this blog post.
The applications picked for this study are a mix of synthetic benchmarks and commercial applications
selected to be representative across a range of HPC domains.
For all applications except HPL, performance is measured in terms of “Rating”. Rating determines how
many times the application can run in a day. It is computed as (number of seconds in a 24-hour day/
Time to run in seconds). This allows us to compare the impact to different applications on the same
graph. HPL performance is reported in terms of GFLOPS.
Power consumption was measured by connecting the 16-server blade chassis to a rack power
distribution unit (PDU). The power measurements therefore include the power consumption of the
InfiniBand network infrastructure as well. The PDU recorded current (Ampere) usage over time, and
this value was averaged over the course of the test run to determine the power consumption in Watts.
Energy efficiency is reported as a ratio of Performance per Watt.
5. Results and analysis
This section presents the results of the tests conducted as part of this study. Presented first are results
for idle power usage across the different System Profiles. Each subsequent section discusses the impact
of a specific BIOS option on performance and energy efficiency.
Any BIOS options that were tuned specifically for the study are listed with each section. Options that
are not explicitly mentioned were set to Dell defaults.
Optimal BIOS settings for HPC with Dell PowerEdge 12th generation servers
16
5.1. Idle power
Very few clusters tend to be fully utilized, i.e., running load at all times on all the servers. Most
clusters have some downtime when all or part of the cluster is not being used, and this is where
idle power usage is relevant. If there is anticipated downtime for a cluster, when the load is
expected to be light or close to zero, the cluster can be configured to save power while it is idle.
For this exercise, the power consumption of the 16-node test cluster was measured when the
servers were idle and there was no load on the servers.
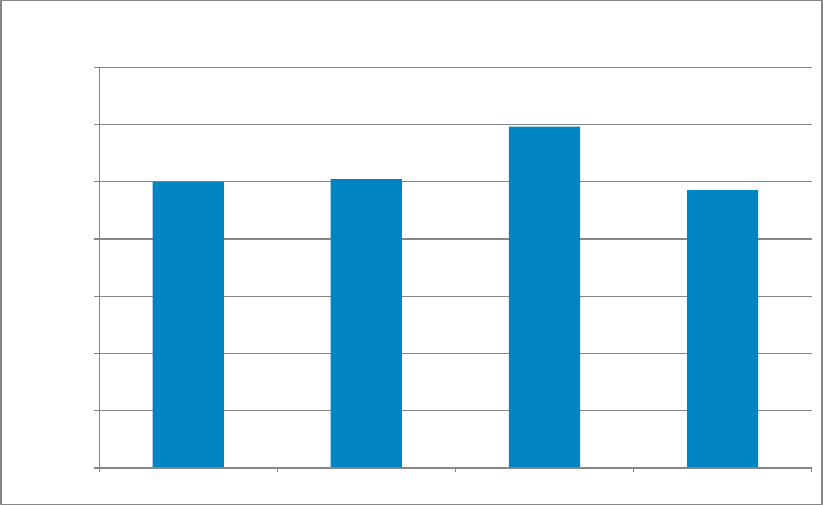
Figure 3. Idle power usage across different System Profiles
* Data collected on a 16-server PowerEdge M620 cluster. Dual Intel Xeon E5-2680 @ 2.7GHz, 8*8GB
1600MT/s memory per server. Mellanox InfiniBand FDR.
Figure 3 presents data for idle power consumption of the four default System Profiles. The baseline
used for the graphs is the power consumption of the DAPC System Profile. From the results it is
seen that the cluster idle power consumption is similar with the DAPC- and OS-based profiles. The
Performance profile consumes 19% more idle power, which is not unusual since this profile disables
C States and C1E, two power savings BIOS options. The Dense profile consumes 3% less power than
DAPC; this is attributed to the memory’s operating at a lower speed. The Dense profile configures
the system memory to run at 1333MT/s, one bin less than the maximum possible of 1600MT/s for
this cluster.
1.00 1.01
1.19
0.97
0.00
0.20
0.40
0.60
0.80
1.00
1.20
1.40
PerfPerWattOptimizedDapc PerfPerWattOptimizedOs Perf Optimzed DenseCfgOptimized
Idle Power Relative to DAPC
Idle Power - default system profiles
Optimal BIOS settings for HPC with Dell PowerEdge 12th generation servers
17
The next graph presents the impact of some BIOS options on idle power consumption. C States, C1E
and Monitor/Mwait are options that reduce power consumption when enabled as described in
Section 3.1. Turbo Boost, when enabled, increases power consumption when the system is under
load. In this test case, these four BIOS options that directly impact power consumption were
evaluated to understand their impact on cluster idle power.
Figure 4. Impact of power-based BIOS options on idle power
* Data collected on a 16-server PowerEdge M620 cluster. Dual Intel Xeon E5-2680 @ 2.7GHz, 8*8GB
1600MT/s memory per server. Mellanox InfiniBand FDR. System profile set to Custom. Power profile set to
Max Performance. Logical Processor and Node Interleaving disabled.
From Figure 4 it is seen that idle power consumption is 72% to 104% more when power saving
options are disabled. The biggest factor appears to be Monitor/Mwait since C States and C1E
contribute to only 17-19% more power consumption when disabled. Latency sensitive applications
will probably need all power saving options disabled, but from this data it is clear that the power
consumption of the associated cluster is likely to be significantly higher, close to a 2x increase.
Recall that C States must be disabled to disable Monitor/Mwait, so there are no tests with C States
enabled and Monitor/Mwait disabled.
Figure 4 also shows that Turbo on versus Turbo off doesn't impact idle power consumption when
power saving options are enabled. This is to be expected since the Turbo Boost feature uses
available power headroom to improve application performance and should not influence the system
when it is idle.
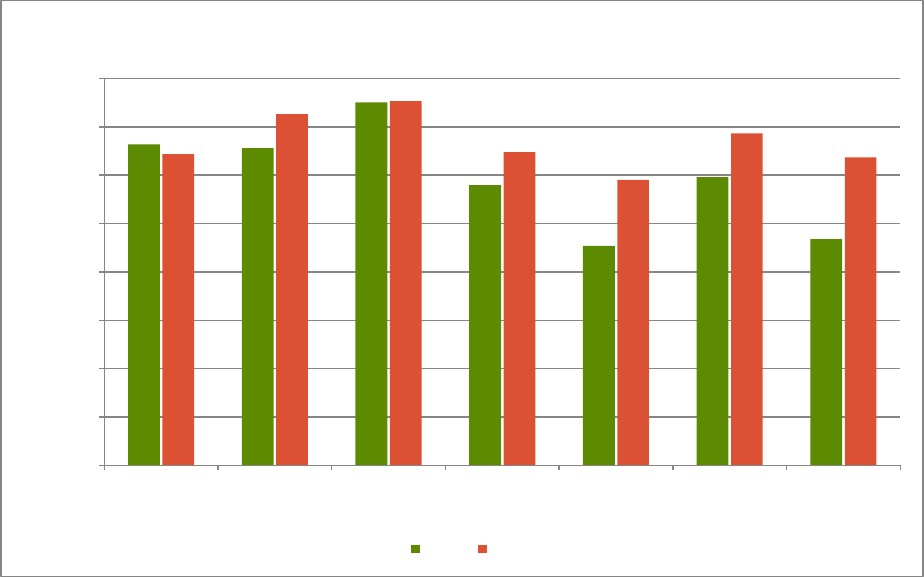
5.2. System Profile
This test case evaluates the performance and energy efficiency of the four System Profiles. For this
test, each application was benchmarked four times, the only change between runs being the
System Profile configured on the cluster servers. These results are shown in Figure 5. The baseline
1.00 1.01
1.19 1.19
2.04
1.72
0.00
0.50
1.00
1.50
2.00
2.50
Turbo on Turbo off
Relative Idle Power
(Baseline is Turbo on. C/C1E/MMw on)
Idle power - power saving options and turbo
C/C1E/MMw on C/C1E off, MMw on C/C1E/MMw off
Optimal BIOS settings for HPC with Dell PowerEdge 12th generation servers
18
used for the chart is the DAPC profile; all results are relative to DAPC. A bar higher than 1.00
indicates that the application’s performance was that much better when compared to its
performance with the DAPC profile.
From the graph, it is seen that MILC performance is significantly impacted by choice of profile for
DAPC, OS, and Performance.
The Dense System Profile significantly reduces performance for all applications by 8 to 35%. This is
because Turbo Boost is disabled and the system memory is running at the lower speed of 1333MT/s
when using the Dense profile. It is interesting to note that ANSYS Fluent is most severely impacted
by this change.
Figure 5. Performance and Energy Efficiency of System Profiles on applications
* Data collected on a 16-server PowerEdge M620 cluster. Dual Intel Xeon E5-2680 @ 2.7GHz, 8*8GB 1600MT/s
memory per server. Mellanox InfiniBand FDR. Logical Processor and Node Interleaving disabled.
Energy efficiency of all profiles is plotted on the secondary y-axis and is again relative to the DAPC
System Profile. For HPL, Fluent, WRF, and LU the first three profiles (DAPC, OS, and Perf) have
similar energy efficiency. Dense profile with HPL shows a 5% improvement in energy efficiency as
the drop in performance is matched by a significant drop in power consumption as well. Fluent
energy efficiency with Dense profile for the truck_111m benchmark is only 83% of that with DAPC,
and Dense profile is not a good choice for this benchmark.
For NAMD, the OS, and Perf profile shows similar performance (both are 2% better than DAPC). The
energy efficiencies of DAPC, OS, and Dense profiles are similar too. Dense profile has lower
performance (12% lower), but balances that with comparable energy efficiency as the power
consumed is correspondingly lower too.
0.00
0.20
0.40
0.60
0.80
1.00
1.20
0.60
0.70
0.80
0.90
1.00
1.10
1.20
1.30
HPL Fluent
truck_poly_14m
Fluent
truck_111m
WRF
conus_12k
NAMD
stmv
MILC
Intel input file
LU
class D
Energy effieincy relative to DAPC (higher is better)
Performance relative to DAPC (higher is better)
Performance and energy efficiency across different profiles
DAPC OS Perf Dense
Optimal BIOS settings for HPC with Dell PowerEdge 12th generation servers
19
The Performance profile significantly improves MILC performance (21%), and energy efficiency is
within 8% of DAPC.
Section 7 concludes with BIOS recommendations that optimize for performance and for
performance/watt based on the test results in this section and those that follow in subsequent
sections.
5.3. Turbo Boost
It is well understood that Turbo Boost improves performance by increasing the processor core
frequency when there is available power and thermal headroom. This section quantifies exactly
how much performance improvement is gained by using Turbo Boost, and at the cost of how much
extra power for each application.
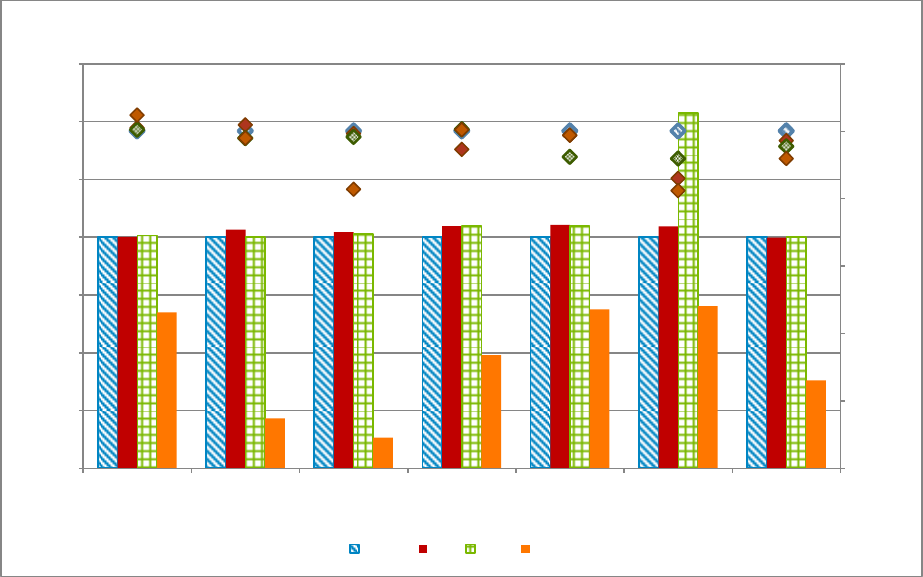
Figure 6. Performance and Energy Efficiency of Turbo Boost
* Data collected on a 16-server PowerEdge M620 cluster. Dual Intel Xeon E5-2680 @ 2.7GHz, 8*8GB 1600MT/s
memory per server. Mellanox InfiniBand FDR. Logical Processor and Node Interleaving disabled. For DAPC, Cstates
and C1E enabled like in the default System Profile. For Perf, C States and C1E disabled like in the default System
Profile.
Figure 6 presents the results of the study. For each application, the energy efficiency of Turbo
disabled is plotted relative to Turbo enabled. Recall from Section 4 that energy efficiency is
calculated as a ratio of Performance to Power consumed in Watts. In Figure 6 a bar higher than
1.00 indicates that the application’s energy efficiency was that much better with Turbo disabled.
From the behavior of Turbo Boost, it is expected that Turbo Boost disabled will reduce the
application’s performance compared to Turbo Boost enabled, but consume correspondingly less
power too. If the decrease in power consumption is more than the decrease in performance, the
-5% Perf +19% Power saving
-8% Perf +22% Power saving
-6% Perf +25 % Power saving
-12% Perf +24 % Power
-11% Perf +16% Power saving
Same Perf +10% Power saving
-15% Perf +21% Pwr saving
-5% Perf +18% Power saving
-7% Perf +26% Power saving
-6% Perf + 26% Power saving
-9% Perf +23% Power saving
-13% Perf +26% Power saving
-4% Perf +20% Power saving
-10% Perf +25% Power saving
0.80
0.85
0.90
0.95
1.00
1.05
1.10
1.15
1.20
HPL Fluent
truck_poly_14m
Fluent
truck_111m
WRF
conus_12k
NAMD
stmv
MILC
Intel input file
LU
class D
Energy efficiency gains with Turbo disabled
(relative to Turbo enabled)
Relative Energy efficiency with Turbo disabled
DAPC Perf
Optimal BIOS settings for HPC with Dell PowerEdge 12th generation servers
20
energy efficiency of Turbo Boost disabled will be better than with Turbo Boost enabled. The text
within the bar quantifies the decrease in performance (-Perf) and power savings (+Power saving)
with Turbo disabled when compared to Turbo enabled. Results are charted for both the DAPC and
the Performance CPU Power Management Profiles.
Figure 6 shows that energy efficiencies are uniformly better with Turbo Boost disabled. The
increase in energy efficiency ranges from 9% to 20% when compared to Turbo Boost enabled. This is
better understood by examining the text details in the graph. For example, consider the case of
WRF with the Perf profile. From the graph the results show that for this application Turbo disabled
provides 12% better energy efficiency. This is because the decrease in performance when Turbo is
disabled is only 9% but the corresponding power savings are 23% when compared to Turbo enabled.
Since the power saving is significantly more than the loss in performance, the resultant energy
efficiency favors Turbo off.
The results in this section indicate that energy efficiency-sensitive clusters should disable Turbo
Boost. It can be enabled in those cases where pure performance is the goal.
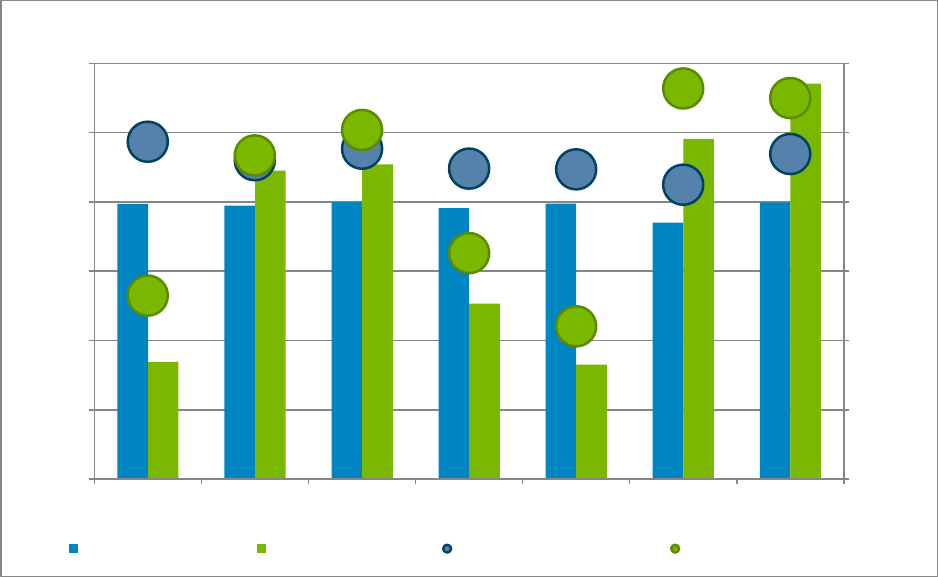
5.4. Node Interleaving
This section examines the impact of the Node Interleaving option on cluster-level application
performance. As described in Section 3.3, the Node Interleaving BIOS option stripes memory across
both memory controllers making the memory access uniform to all processor cores.
Figure 7. Performance and Energy Efficiency of Node Interleaving
* Data collected on a 16-server PowerEdge M620 cluster. Dual Intel Xeon E5-2680 @ 2.7GHz, 8*8GB 1600MT/s
memory per server. Mellanox InfiniBand FDR. Logical Processor disabled. DAPC System Profile.
-1% power
+3% power
Same Power
-1% power
-4% power
+2% power
+1% power
1.01
0.93 0.93
0.91
1.03
0.98
1.00
0.80
0.85
0.90
0.95
1.00
1.05
0.80
0.85
0.90
0.95
1.00
1.05
HPL Fluent
truck_poly_14m
Fluent
truck_111m
WRF
Conus 12km
NAMD
stmv
MILC
Intel input file
LU
class D
Performance/Watt relative to NI off
(higher means NI on is better)
Performance of Node interleaving on relative to NI off
(higher means NI on is better)
Impact of Node Interleaving
Performance Performance/Watt
Optimal BIOS settings for HPC with Dell PowerEdge 12th generation servers
21
Results are shown in Figure 7. The bar graph plots the performance of the application with Node
Interleaving on relative to Node Interleaving off. A value higher than one indicates that the
application performed that much better with Node Interleaving enabled. The text in the bar
indicates the percentage of additional power consumed with Node Interleaving enabled. A value
that is positive indicates that when Node Interleaving was enabled, the cluster consumed more
power than it did when Node Interleaving was disabled. The secondary y-axis plots the associated
energy efficiency. A marker higher than one indicates the energy efficiency of the application was
that much better with Node Interleaving enabled when compared to Node Interleaving disabled.
The results show that enabling Node interleaving does not benefit any of the applications. The
actual impact is application dependent, but all applications do better with Node Interleaving
disabled. LU showed a 1% improvement with Node Interleaving enabled, but that is statistically too
small an improvement to be conclusive.
Based on these results it is recommended that Node Interleaving be set to disabled. However, if
the cluster is running applications that benefit from interleaved memory or if the situation is such
that interleaved memory is beneficial (as described in Section 3.3), then this option should be
tuned as needed.
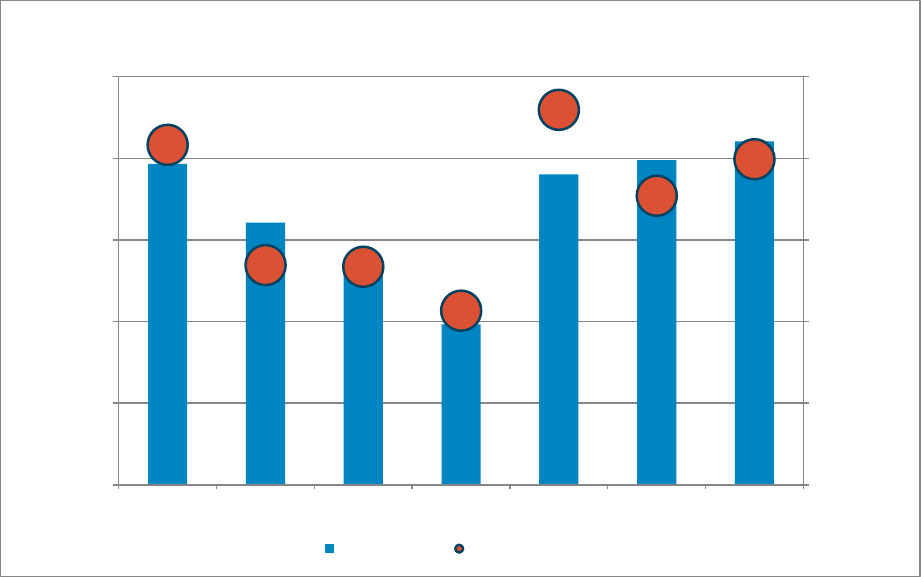
5.5. Logical Processor
The impact of Logical Processor is presented in Figure 8.
Figure 8. Performance and Energy Efficiency of Logical Processor
* Data collected on a 16-server PowerEdge M620 cluster. Dual Intel Xeon E5-2680 @ 2.7GHz, 8*8GB 1600MT/s
memory per server. Mellanox InfiniBand FDR. Node Interleaving disabled. DAPC System Profile.
+2% power
+7% power
+5% power
+10% power
+11% power
+11% power
+6% Power
+2% power
+17% power
+10% power
+8% power
+20% power
+5% power
+22 % Power
0.97
0.92 0.95
0.90 0.89 0.85
0.94
0.53
0.93 1.01
0.65
0.44
1.13 1.10
0.00
0.20
0.40
0.60
0.80
1.00
1.20
0.20
0.40
0.60
0.80
1.00
1.20
1.40
HPL Fluent
truck_poly_14m
Fluent
truck_111m
WRF
conus 12km
NAMD
stmv
MILC
Intel input file
LU
class D
Performance/Watt relative to Logical Processor off
(higher means HT on is better)
Performance with Logical Processor on on relative to off
(higher means HT on is better)
Impact of Logical Processor
Performance-256 thr Performance-512 thr Performance/Watt-256 thr Performance/Watt-512 thr
Optimal BIOS settings for HPC with Dell PowerEdge 12th generation servers
22
The bar graphs plot the performance with Logical Processor enabled when compared to Logical
Processor disabled. The 16-server cluster has a total of 256 physical cores. With Logical Processor
enabled, tests were performed using only 256 cores as well as all the logical 512 cores. The
scheduling of cores was left to the Operating System. The text in the bar indicates the percentage
of additional power consumed with Logical Processor enabled. The secondary y-axis plots the
energy efficiency of Logical Processor enabled relative to disabled. A marker value higher than one
indicates that Logical Processor enabled had better energy efficiency by that much.
From the graph it is seen that the impact of this option is very application specific. For HPL and
WRF, this option should be disabled.
For the benchmark case tested, NAMD performance with Logical Processor enabled and 256 cores is
similar to the performance with Logical Processor disabled; however, the energy efficiency is
better with this setting disabled. Recall that these results are plotted with rating as the
performance metric. NAMD results are typically reported as days/ns. Using rating as the metric as
shown in Figure 8, it appears that the test with 512 cores and Logical Processor enabled does
significantly worse in terms of performance and energy efficiency. However, it was noted that
when the metric used for comparison is days/ns, Logical Processor enabled with 512 cores performs
12% better compared to Logical Processor disabled. As noted in the text in the bar, Logical
Processor enabled at 512 cores consumes 20% more power than when this setting is disabled.
MILC and LU benefit with Logical Processor enabled when all 512 cores are used. With only 256
cores in use, Logical Processor should be disabled for better performance and energy efficiency.
Fluent shows similar performance with 256 cores irrespective of whether Hyper-Threading is
enabled or not; however, the energy efficiency is better with Hyper-Threading disabled. A 9-11%
performance improvement is measured with 512 cores, but the energy efficiency for the
truck_poly_14m case is 7% lower (0.93).
For applications (like Fluent) that have core-based licenses, the increased license costs with more
cores typically outweigh the marginal benefits of Logical Processor. In general it is recommended
that Logical Processor be disabled. The benefit of this feature should be tested for the specific
applications the cluster runs and tuned accordingly.
5.6. C States, C1E on remote memory access
Section 3.1 describes the C States and C1E BIOS options and Figure 4 shows the impact of these
options on power consumption when the system is idle. Options that conserve power tend to have
an associated performance penalty as the system transitions in and out of sleep states.
This section examines the performance impact of C States and C1E on memory bandwidth when all
processor cores are not in use (i.e., some are idle). Idle cores with C States and C1E enabled means
that the cores are likely to be in a sleep state. On Sandy Bridge-EP based systems, when the cores
clock down, the other components on the processor chip, called the uncore, also clock down. This
saves power when the cores are idle but translates into lower memory bandwidth for remote
accesses since the remote memory controller is running at a slower frequency. Figure 9 graphs this
performance impact on remote memory bandwidth.
Optimal BIOS settings for HPC with Dell PowerEdge 12th generation servers
23
Figure 9. Impact of C States and C1E on remote memory access
* Data collected on a single PowerEdge M620, Dual Intel Xeon E5-2680 @ 2.7GHz, 8*8GB 1600MT/s
memory. Logical Processor and Node Interleaving Disabled. Performance CPU Power Management. Turbo
Enabled.
From the chart it is seen that when C States and C1E are disabled, remote memory bandwidth is
24% faster compared to when C States and C1E are enabled. This penalty for remote accesses will
not be incurred if all system cores are active; it is only a factor when the remote cores are idle and
in deep sleep states.
Thus for applications that may not utilize all system cores but are memory sensitive, it is
recommended to disable C States and C1E for best performance. This is in line with the
recommendations for latency sensitive applications in Section 3.5.
6. Comparison to Dell PowerEdge 11th generation servers
A similar study was performed with Dell’s previous generation servers when those servers were first
released.11 Dell’s 11th generation product line includes servers that support the Intel Xeon 5500 series
processor (code named Nehalem-EP). In this section the results of the previous study are compared to
the results presented in this document.
Details of the two test beds are in Table 6. As is obvious from the table, the test clusters are not
identical. However, each cluster was configured with the best choices available at the time. In the
earlier time frame, 1333MT/s memory was the top speed. With three memory channels per socket,
configuring 1 DIMM per channel for a total of 6 DIMMS in the server was considered optimal. With the
current generation, the cluster uses the top speed memory DIMMS, 1600 MT/s, and stays with 1 DIMM
per channel. But with the latest generation, this translates to 8 DIMMS per server.
24%
0
5
10
15
20
25
8 Threads
Remote Memory bandwidth (GB/s)
Impact of C states/C1E on remote bandwidth
C states/C1E Enabled C states/C1E Disabled

Optimal BIOS settings for HPC with Dell PowerEdge 12th generation servers
24
Table 6. 11th and 12th generation cluster test bed details
Component
11th generation cluster10
12th generation cluster
SERVER
Dell PowerEdge R610 rack server (1)
Dell PowerEdge M610 blade server
(16) in a PowerEdge M1000e chassis
Dell PowerEdge R620 rack server (1)
Dell PowerEdge M620 blade server
(16) in a PowerEdge M1000e chassis
PROCESSORS
Dual Intel Xeon X5570 @ 2.93 GHz,
95W
Dual Intel Xeon E5-2680 @ 2.8 GHz,
130W
MEMORY
6 x 4GB 1333 MT/s RDIMM
8 x 8GB 1600 MT/s RDIMMs
INTERCONNECT
Mellanox InfiniBand ConnectX QDR
Mellanox InfiniBand ConnectX-3 FDR
INFINIBAND SWITCH
Mellanox 3601Q QDR blade chassis
I/O switch module
Mellanox M4001F FDR blade chassis
I/O switch module
SOFTWARE
ClusterCorp Rocks+ 5.1 for Dell
StackIQ Rocks+ 6.0.1 Dell edition
OPERATING SYSTEM
Red Hat Enterprise Linux 5.3 x86_64
Red Hat Enterprise Linux 6.2 x86_64
INFINIBAND DRIVER
Mellanox OFED 1.4
Mellanox OFED 1.5.3-3.0.0
The processors used in the previous generation cluster were the top bin SKU that had the maximum
number of cores and would support the 1333MT/s memory speed. With the current cluster, a similar
principle was applied and the processor model chosen supports the 1600 MT/s memory speed.
Similarly the earlier cluster uses QDR InfiniBand, which was the latest technology available at that
time. The latest cluster uses FDR InfiniBand.
Each cluster was configured with the latest operating system, associated cluster management software
and InfiniBand drivers available at the time of the study.
Even though the 11th generation and 12th generation clusters are not identical, they are representative
of the best configurations of their generation as explained above, and that is what makes this
comparison meaningful. The results in this section will prove especially useful if a decision needs to be
made about the application performance and energy efficiency benefits expected by upgrading an
existing 11th generation cluster.
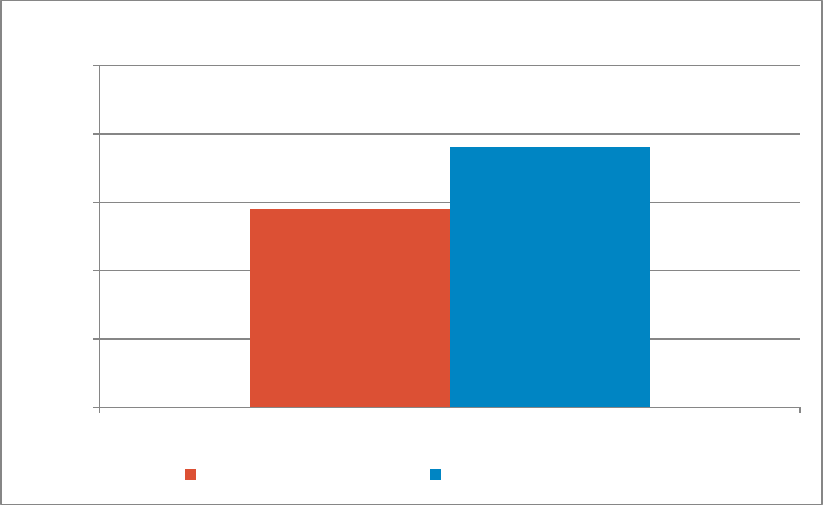
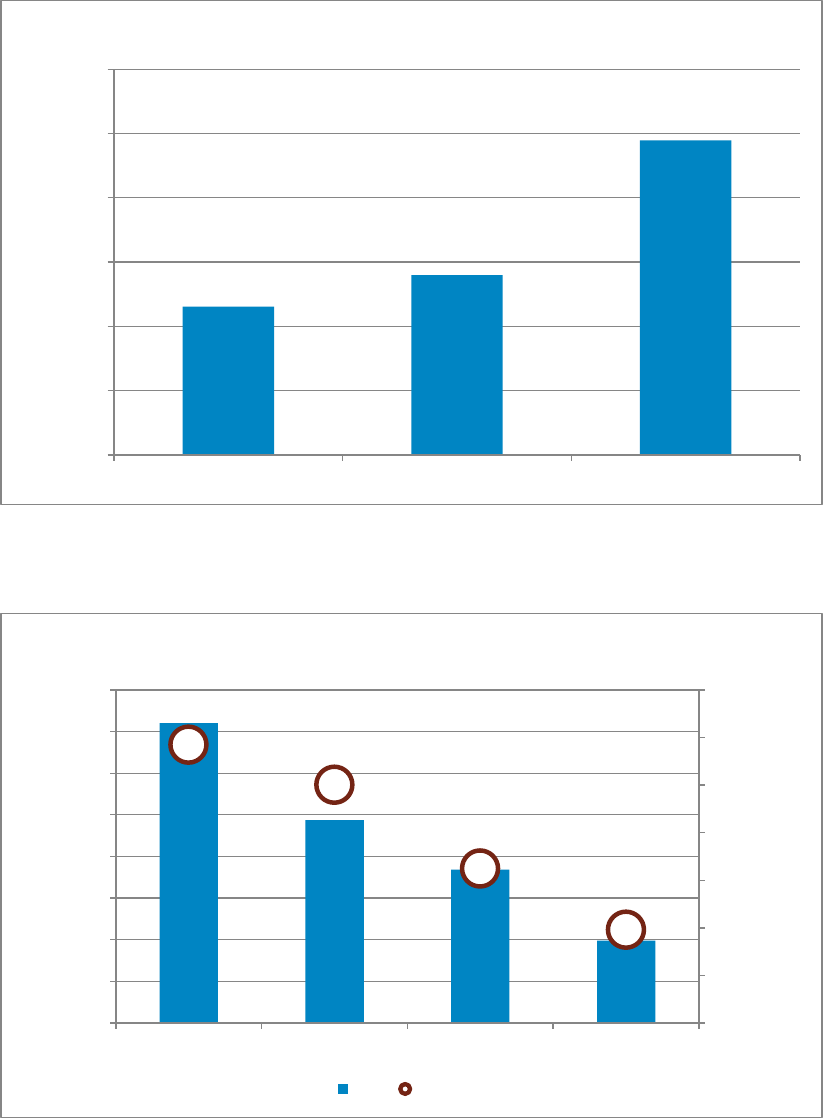
Figure 10 compares the idle power consumption of the 16-server 11th generation blade cluster to the
12th generation blade cluster. The BIOS was configured to be as similar as possible, given that the new
BIOS introduces additional features. From the figure it is observed that a 12th generation cluster that
occupies the same rack space as an 11th generation cluster consumes 11% to 25% less power when idle.
Optimal BIOS settings for HPC with Dell PowerEdge 12th generation servers
25
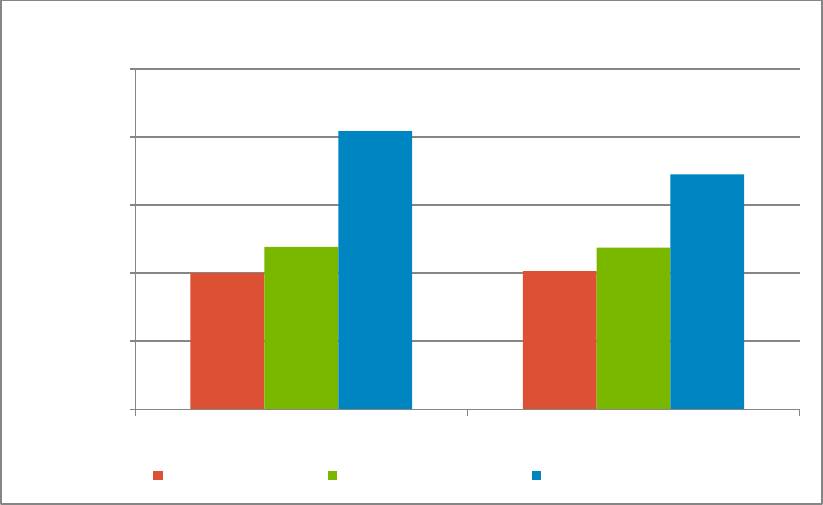
Figure 10. 11th vs. 12th generation cluster – idle power comparison
* Logical Processor and Node Interleaving Disabled. All other options at defaults.
Figure 11. 11th vs. 12th generation cluster – performance and energy efficiency comparison
* Logical Processor and Node Interleaving Disabled. DAPC System Profile. All other options at defaults.
Figure 11 compares the performance and energy efficiency of different applications on the two
clusters. For each test, the cluster is fully subscribed, i.e., all cores are in use. The height of the bar
0%
5%
10%
15%
20%
25%
30%
DAPC OSCtl Perf
Idle power saving with 12th Generation
11th Generation vs 12th Generation - Idle power
2.92
2.50
1.62
0.98
0.00
0.50
1.00
1.50
2.00
2.50
3.00
3.50
0.00
0.50
1.00
1.50
2.00
2.50
3.00
3.50
4.00
HPL Fluent
truck_poly_14m
WRF
conus_12k
LU
class D
Energy efficiency of 12th Generation
relative to 11th Generation
Performance of 12th Generation relative
to 11th Generation
11th Generation vs 12th Generation - Performance and
Energy efficiency
Perf Perf/Watt

Optimal BIOS settings for HPC with Dell PowerEdge 12th generation servers
26
shows the performance improvement with the new cluster relative to the previous generation. The
secondary y-axis plots the energy efficiency of the new cluster relative to the earlier one.
The results are impressive. HPL performance is 3.6 times (3.6x) better with the latest generation and
2.93 times more energy efficient. Fluent and WRF also demonstrate a significant improvement with the
new servers. For applications that are similar to LU, the two generations perform similarly. While
comparing energy efficiency, recall that the 12th generation cluster uses processors that are a higher
wattage than the 11th generation cluster (130W versus 95W).
7. Conclusion
The goal of this white paper is to provide quantitative data on the impact of different PowerEdge BIOS
options on the performance and energy efficiency of HPC applications. Unique to this study is the
emphasis not just on performance but also power consumption and energy efficiency, and the focus on
a cluster-level study as opposed to a single-server evaluation.
Table 7. Recommended BIOS setting
Balanced
configuration
Performance
focused
Energy Efficient
configuration
Latency
sensitive 10
System Profile
Performance Per
Watt Optimized
(DAPC)
Performance
Optimized
Performance Per
Watt Optimized
(DAPC)
Custom
CPU Power
Management
System DBPM
Max
Performance
System DBPM
Max
Performance
Memory
Frequency
Max
Performance
Max
Performance
Max Performance
Max
Performance
Turbo Boost
Enabled
Enabled
Disabled
Disabled
C States
Enabled
Disabled
Enabled
Disabled
C1E
Enabled
Disabled
Enabled
Disabled
Monitor/ Mwait
Enabled
Enabled
Enabled
Disabled
Logical
Processor
Disabled
Disabled
Disabled
Disabled
Node
Interleaving
Disabled
Disabled
Disabled
Disabled
* The text in gray indicates options that are pre-selected by the System Profile and cannot be tuned individually.
Text in black indicates options that should be explicitly configured.
Dell PowerEdge 12th generation servers have an enhanced BIOS that provides several options that can
be tuned to suit specific needs. This white paper evaluates some of these BIOS tuning parameters and
provides specific recommendations on the best settings for HPC applications.
Optimal BIOS settings for HPC with Dell PowerEdge 12th generation servers
27
Table 7 summarizes the different options and the recommended settings for different configuration
goals. Based on studies like this, servers ordered from Dell with the HPC SKU are preconfigured with
the “Balanced configuration” HPC specific BIOS options.
Additionally, this paper includes a performance and energy efficiency comparison to a previous
generation cluster solution.

Optimal BIOS settings for HPC with Dell PowerEdge 12th generation servers
28
8. References
1. Dell PowerEdge 12th generation servers
http://content.dell.com/us/en/enterprise/d/campaigns/poweredge-12th-generation-servers-ple
2. Dell PowerEdge 12th generation features
http://i.dell.com/sites/content/shared-content/data-sheets/en/Documents/dell-poweredge-
m620-technical-guide.pdf
3. Top 500 HPC architectures over time
http://i.top500.org/overtime
4. Dell PowerEdge 12th generation BIOS white paper
http://en.community.dell.com/techcenter/extras/m/white_papers/20132074.aspx
5. Intel’s tick-tock model
http://www.intel.com/content/www/us/en/silicon-innovations/intel-tick-tock-model-
general.html
6. Intel AVX technology
http://software.intel.com/en-us/avx/
7. Intel processor details
http://ark.intel.com
8. Intel E5-2600 Product Brief
http://www.intel.com/content/dam/www/public/us/en/documents/product-briefs/xeon-e5-
brief.pdf
9. Intel Turbo Boost technology
http://www.intel.com/go/turbo
10. Configuring Low-Latency Environments on Dell PowerEdge 12th Generation Servers
http://en.community.dell.com/techcenter/b/techcenter/archive/2012/05/07/configuring-low-
latency-environments-on-dell-poweredge-12th-generation-servers.aspx
11. Optimal BIOS Settings for High Performance Computing with PowerEdge 11G Servers
http://content.dell.com/us/en/enterprise/d/business~solutions~whitepapers~en/Documents~11g-
optimal-bios-settings-poweredge.pdf.aspx

Optimal BIOS settings for HPC with Dell PowerEdge 12th generation servers
29
Appendix A – Summary of findings
This section summarizes results from this white paper.
For readability,
The Performance Per Watt Optimized (DAPC) System Profile is abbreviated to DAPC.
The Performance Per Watt Optimized (OS) System Profile is abbreviated to OS Control.
The Performance Optimized System Profile is abbreviated to Perf.
Idle power
1) Idle power consumption of DAPC and OS Control System Profiles is about the same. Perf System
Profile consumes 19% more power. Dense profile consumed 3% less power.
Reference Figure 3 - Idle power usage across different System Profiles
2) Idle power consumption is 72% to 104% more when power saving options like C States, C1E, and
Monitor/Mwait are disabled when compared to these options enabled. The biggest factor appears
to be Monitor/Mwait since C States and C1E contribute to only 17-19% more power consumption
when disabled.
Reference Figure 4 - Impact of power-based BIOS options on idle power
System Profile
3) For all applications, the performance results with the DAPC and OS Control System Profiles are
within 4% of each other.
The energy efficiency of the two profiles is within 6% of each other for all applications except
MILC. The OS Control profile is 14% less energy efficient than DAPC for MILC.
Reference Figure 5 - Performance and Energy Efficiency of System Profiles on applications
4) The Perf System Profile helps MILC performance by ~21% and NAMD performance by ~7% when
compared to the DAPC System Profile. For the other applications, performance is within 2%
The energy efficiency of the Perf System Profile is 5% lower than DAPC for LU, and 8% lower than
DAPC for NAMD. For all other applications, the energy efficiency is within 2% of DAPC.
Reference Figure 5 - Performance and Energy Efficiency of System Profiles on applications
5) The Dense System Profile reduces application performance by 8% to 35% when compared to the
DAPC profile. The energy efficiency of the Dense System Profile is -18% to +8% depending on the
application.
Reference Figure 5 - Performance and Energy Efficiency of System Profiles on applications

Optimal BIOS settings for HPC with Dell PowerEdge 12th generation servers
30
Turbo Boost
6) Turbo Boost disabled reduces application performance by up to 15% compared to Turbo Boost
enabled. But, at the same time, Turbo Boost disabled consumes 10% to 27% less power. This
translates in to 3% to 20% better energy efficiency with Turbo Boost disabled.
Reference Figure 6 - Performance and Energy Efficiency of Turbo Boost
Node Interleaving
7) Node Interleaving enabled hurts performance by up to 10% compared to this option set to disabled.
It does not benefit any application. Energy efficiency with Node Interleaving enabled is up to 9%
lower.
Reference Figure 7 - Performance and Energy Efficiency of Node Interleaving
Logical Processor
8) The impact of Logical Processor is application specific. Some applications benefit, and some do
not. For applications that have core-based licenses, it is likely that the cost of extra licenses will
significantly outweigh any performance benefits of Logical Processor enabled. For other
applications, it is recommended that this setting be tested to determine the best option.
Reference Figure 8 - Performance and Energy Efficiency of Logical Processor
C States and C1E on remote memory access
9) Disabling C States and C1E can help remote memory bandwidth by ~24% when compared to C States
and C1E enabled on systems where the remote cores are idle.
Reference Figure 9 - Impact of C States and C1E on remote memory access
Latency sensitive applications
10) Recommendations for latency sensitive applications are detailed in this study.
Comparison to Dell PowerEdge 11th generation servers
11) A 16-server 12th generation blade cluster consumes 11% to 25% less power when idle compared to a
similarly configured 11th generation cluster.
Reference Figure 10 - 11th vs. 12th generation cluster – idle power comparison
12) A 16-server 12th generation cluster’s performance was measured to be up to 3.6x that of a similarly
configured 11th generation cluster, with the 12th generation cluster being up to 2.9 times more
energy efficient.
Reference Figure 11 - 11th vs. 12th generation cluster – performance and energy efficiency
comparison

Optimal BIOS settings for HPC with Dell PowerEdge 12th generation servers
31
Appendix B – Dell Deployment Toolkit to modify BIOS options
from the command line
The Dell Deployment Toolkit (DTK) is a component of Dell’s OpenManage suite of products for systems
management. StackIQ Rocks+ includes DTK utilities like syscfg, and this utility is automatically
installed on cluster nodes as part of the Dell roll.
With syscfg, BIOS options can be read and set directly from the Linux command line, simplifying
cluster management. This was especially useful for a study of this nature, where syscfg based
commands were scripted and run in parallel on all servers. The commands used to toggle the BIOS
options described in this white paper are provided below. Note this is not a complete list of syscfg
options but a handy reference. Refer to this link for more details on DTK and syscfg.
Table 8. DTK syscfg options for changing BIOS settings
BIOS OPTION
VIEW current setting
CHANGE the value*
System Profile
–-SysProfile
./syscfg –-SysProfile=PerfPerWattOptimizedDapc
|PerfPerWattOptimizedOs
|PerfOptimized
|DenseCfgOptimized
|Custom
CPU Power
Management
–-ProcPwrPerf
./syscfg –-ProcPwrPerf=SysDbpm
|MaxPerf | OsDbpm
Memory Frequency
--MemFrequency
./syscfg -- MemFrequency =MaxPerf
|MaxReliability
|1600MHz
|1333MHz
|1067MHz
|800MHz
Turbo Boost
--turbomode
./syscfg --turbomode=Enabled|Disabled
C States
--cstates
./syscfg --cstates=Enabled|Disabled
C1E
--cpuc1e
./syscfg --cpuc1e=Enabled|Disabled
Monitor/ Mwait
--MonitorMwait
./syscfg –-MonitorMwait=Enabled|Disabled
Logical Processor
--logicproc
./syscfg –-logicproc=Enabled|Disabled
Node Interleaving
--nodeinterleave
./syscfg –-nodeinterleave=Enabled|Disabled
*Note that any change to BIOS settings needs a system reboot for the change to take effect and for syscfg to
report the new value.
Optimal BIOS settings for HPC with Dell PowerEdge 12th generation servers
32
On StackIQ Rocks+ Dell clusters, syscfg is installed in /opt/dell/toolkit/bin
cd /opt/dell/toolkit/bin and run ./syscfg to see the version and options available.
./syscfg –h <option> shows the detailed help for the particular option.
./syscfg <option> shows the current setting of <option>.
./syscfg <option>=<value> sets the value of <option>.
