Doi HCT 159 00b49527675547a404000000
User Manual: HCT 159
Open the PDF directly: View PDF ![]() .
.
Page Count: 4

Procedia Engineering 47 ( 2012 ) 156 – 159
1877-7058 © 2012 The Authors. Published by Elsevier Ltd. Selection and/or peer-review under responsibility of the Symposium Cracoviense
Sp. z.o.o.
doi: 10.1016/j.proeng.2012.09.108
Proc. Eurosensors XXVI, September 9-12, 2012, Kraków, Poland
Spectroscopic and wireless sensor of hematocrit level
Ernest Krystian, Małgorzata JĊdrzejewska-Szczerska, Michał Sobaszek
Department of Metrology and Optoelectronics, Gdansk University of Technology, Gdansk, Poland
Abstract
An optical method for hematocrit measurement has been presented. The sensor, designed and developed by authors,
consists of spectroscopic set-up controlled by a microcontroller. Measurement results are sent via wireless module.
Experiment has confirmed the ability of the sensor to determine the hematocrit with appropriate measurement
accuracy.
© 2012 Published by Elsevier Ltd.
Keyworlds: hematocrit measurement; spectroscopy; blood analysis
1. Introduction
Nowadays, the necessity to gather information on a wide range of parameters appears crucial in many
fields. It requires a high number of sensors to be connected in a single network to provide easy control and
acquisition of measurement. Sensor networks are widely-used used in medicine, structural health
monitoring and telemedicine. Optical sensors are popular because of their advantages: small weight and
size, as well as their immunity to environmental conditions, such as strong radiation. [1]
The blood hematocrit is routinely determined in the clinic by analysis of blood samples. There are
several methods of measuring the HCT and hemoglobin. Unfortunately, almost all of them require either
blood sampling or catheterization. Therefore, there is a great interest in optical measurement that would
permit simultaneous analysis of multiple components (analytes) in whole blood without the need for
conventional sample processing, such as centrifuging and adding reagents. There are few optical methods
of the hematocrit measurement. Schmitt et al. [2] used the dual-wavelength near IR-
photoplethysmography. Xu et al. applied optical coherence tomography for investigating the HCT value
[3]. Enejder et al. [4] used Raman spectroscopy for simultaneous measurement of concentrations of
multiple analytes in whole blood, including the hematocrit and hemoglobin. Iftimia et al. [5] demonstrated
the use of the spectral domain low coherence interferometry to hematocrit measurement.
Available online at www.sciencedirect.com
© 2012 The Authors. Published by Elsevier Ltd. Selection and/or peer-review under responsibility of the Symposium Cracoviense
Sp. z.o.o.

157
Ernest Krystian et al. / Procedia Engineering 47 ( 2012 ) 156 – 159
Our objective was to design a system for measuring blood parameters of patients at home. Daily
monitoring of changes in the patient gives the possibility of better diagnosis and more rapid response to
threats in the case of high risk groups. The development of cheap and versatile device makes it possible to
prevent the recurrence of the disease early and effective treatment. Sensors of this type will also apply in
the case of successful treatment of cancer. The usefulness of several optical method for measuring
hematocrit in the whole blood were investigated, for example: Raman spectroscopy [6], optical coherent
tomography [7] and low-coherent interferometry [8]. However, authors decided to implement optical
spectroscopy in the designed sensor. The results presented in the paper shows the ability of the method for
measuring blood parameters.
Nomenclature
HCT [%] Hematocrit
V
b
Volume blood in the sample
V
e
Volume erythrocytes in the sample
A
880,570
Absorbance for wavelength 808 nm and 570 nm
c
880,570
Calibration coefficients
Hematocrit is the ratio of volume of blood to the volume of erythrocytes in whole blood (Ve). It is
usually expressed as a percentage or as a fraction. [9]
b
e
V
V
HCT =
(1)
The first figure shows the distribution of blood components in vitro. It can been seen that the blood can
be approximately divided into: plasma and formed elements such as: erythrocytes, leukocytes,
thrombocytes.
Analysis of literature and experimental studies help us to identified two wavelengths as useful for
determining the absorbance of blood sample 570 nm and 880 nm. By the use of optical signals measured
at this wavelengths and using equation (3) it is possible to estimate the hematocrit value.
880880570570
570570
AcAc
Ac
HCT
+
=
(2)
2. Sensor
Figure 2(a) shows a block diagram of develop system. The microcontroller is dedicated to control LED
diode and to receive information from optic sensor by the use of analog to digital converter. The second
microcontroller transmit information to ZigBee module. The value of hematocrit is send in wireless data
transmission format to the host computer. Doctors have the access to the database covered with all
patients’ blood parameters.
In figure 2(b) block diagram of the optic sensor working in transition mode is shown. There is two
LED sources of light 570 nm and 880 nm. Transmitted light through the blood sample is detected by the
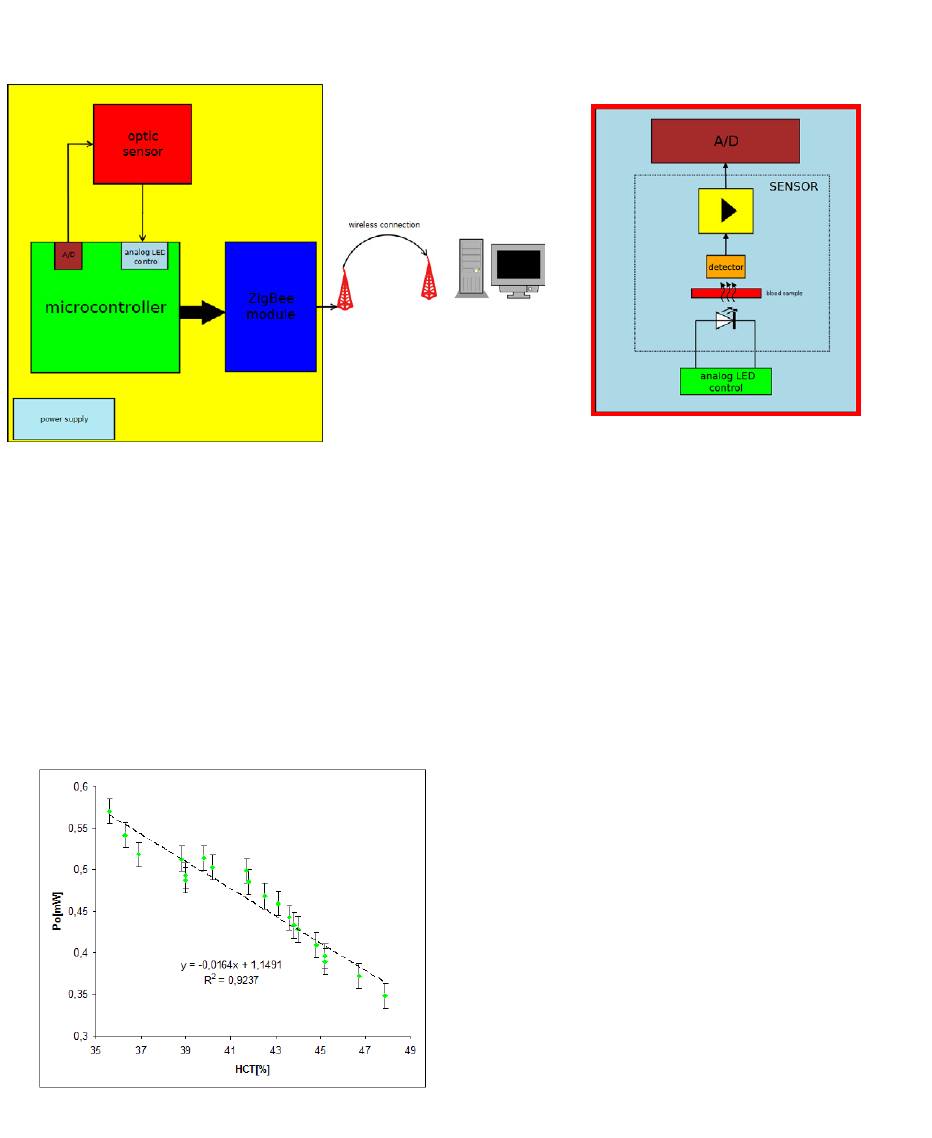
158 Ernest Krystian et al. / Procedia Engineering 47 ( 2012 ) 156 – 159
detector and then the signal from photodiode are amplified. The measurement signal from the sensor is
sampled in microcontroller A/D converter.
(a) (b)
Fig. 2. (a) block diagram of the wireless measurement system; (b) block diagram of the optic sensor.
3. Measurement
In order to find out whether designed sensor sufficient accuracy to monitoring of blood hematrocrit, a
serie of measurements was carried out. During experimental work authors used the whole human blood
for tests. Set of 2 ml blood samples with various hematocrit levels were investigated by the sensor.
Moreover, the hematocrit level of each blood sample was independently measured by standard laboratory
diagnostic method. Samples were obtained from rather healthy volunteers and therefore the measurement
range of the hematocrit level was limited to the range from 30 to 50%. This range was broad enough to
assess resolution and accuracy of the measurement system.
Fig.3. Characteristic of sensor response.

159
Ernest Krystian et al. / Procedia Engineering 47 ( 2012 ) 156 – 159
With the use of developed sensor the hematocrit value of numerous blood sample was measured.
Measurement results with estimated measurement uncertainties are presented in Figure 3. Based on this
data the determination coefficient was calculated. Obtained value is R
2
=0.923.
It can be noted from figure 3 that the measurement system have very good sensitivity. System
accuracy is less than 1.5%, which is a satisfying result.
4. Conclusion
Our motivation was to design the system for measuring human blood parameters of patients, who are
sick or elder and are not able to control this parameter in the ambulatory. The investigation of
spectroscopic method confirms its ability for the hematocrit control in appropriate measurement range
with sufficient accuracy. The analysis of the preliminary results have showed that the measurement
system based on the spectroscopic measurement is the most accurate solution. The designed system is
cheap and accurate. Furthermore, it is easy to use what make it possible to apply this system in practice.
The downside of this system is undoubtedly the measurement speed because one measurement takes from
30 to 60 sec. One can increase the speed of the system, reducing the acquisition time, unfortunately, these
results in a decrease in accuracy. The presented preliminary results can be the base for building sensor
ready for practical applications.
Acknowledgements
This study was partially supported by the National Science Center under the grant titled: “Investigation
of the relationship between the spectrum of optical signal and blood properties” as well as DS Programs
of the Faculty of Electronics, Telecommunications and Informatics, GdaĔsk University of Technology.
References
[1] JĊdrzejewska-Szczerska M., Gnyba M., Kosmowski B. Low-Coherence Fiber-Optic Interferometric Sensors, Acta Physica
Pol.A 2011 4: 621-24.
[2] Schmitt J., Guan-Xiong Z., Miller J. Measurement of blood hematocrit by dual-wavelength near-IR photoplethysmography,
Proc. of SPIE 1992, 1641:150-161.
[3] Xu X., Chen Z. Evaluation of hematocrit measurement using spectral domain optical coherence tomography Proc. Conf. 2008
International Conference on BioMedical Engineering and Informatics Sanya 2008, 615-8.
[4] Enejder A., Koo T., Oh J., Hunter M., Sasic S., Feld M. Blood analysis by Raman spectroscopy, Optics Lett. 2002 27: 2004-6.
[5] Ifitimia N. et al. Toward noninvasive measurement of blood hematocrit using spectral domain low coherence interferometry
and retinal tracking, Optics Expr. 2006 14: 3377-88.
[6] Gnyba M. Smulko J., Kwiatkowski A., Wierzba P. Portable Raman spectrometer – design rules and applications, Bull. Pol.
Acad.Scien Tech. Scien. 2011, 59(3): 325-9.
[7] Strąkowski M., PluciĔski, J., Kosmowski, B. Polarization sensitive optical coherence tomography with spectroscopic analysis,
Acta Physica Pol. A 2011 120 (4):785-788
[8] JĊdrzejewska-Szczerska M., Gnyba M. Optical Investigation of Hematocrit Level in Human Blood, Acta Physica Pol. 2011 4:
642-6.
[9] Traczyk W. Fizjologia człowieka w zarysie. Warszawa Wydawnictwo Lekarskie PZWL; 2007. [in polish]
