01 Driven And Damped Pendulum Experiment Manual
User Manual:
Open the PDF directly: View PDF ![]() .
.
Page Count: 10

Driven and Damped Pendulum (student’s manual) Page 1
Driven and Damped Pendulum
Objectives:
At the end of the activity the student should be able:
1. Identify the effects of driven and damped oscillation
2. Find the frequency in which the pendulum system will experience
resonance for a specific length, l.
3. Differentiate the period of the pendulum swinging in air than the period
of pendulum swinging under water.
Introduction:
An oscillation is a motion that repeats itself over and over. Motion that repeats itself
at regular intervals is called periodic motion. You are most likely familiar with several
examples of periodic motion, such as the oscillations of a block attached to a spring, a child
playing on a swing, the swinging pendulum of a grandfather clock, a car bouncing up and
down on its shock absorber, sound vibrations produced by a musical instrument, etc.
In this experiment, a simple pendulum is attached on a speaker connected in an
amplifier. A function generator was used for the input frequency. The motion detector is then
placed 0.50m away from the equilibrium position of the pendulum and is connected to the
Lab Quest. In this manner, the Lab Quest allows us to measure its displacement as the
pendulum swings.
Theory:
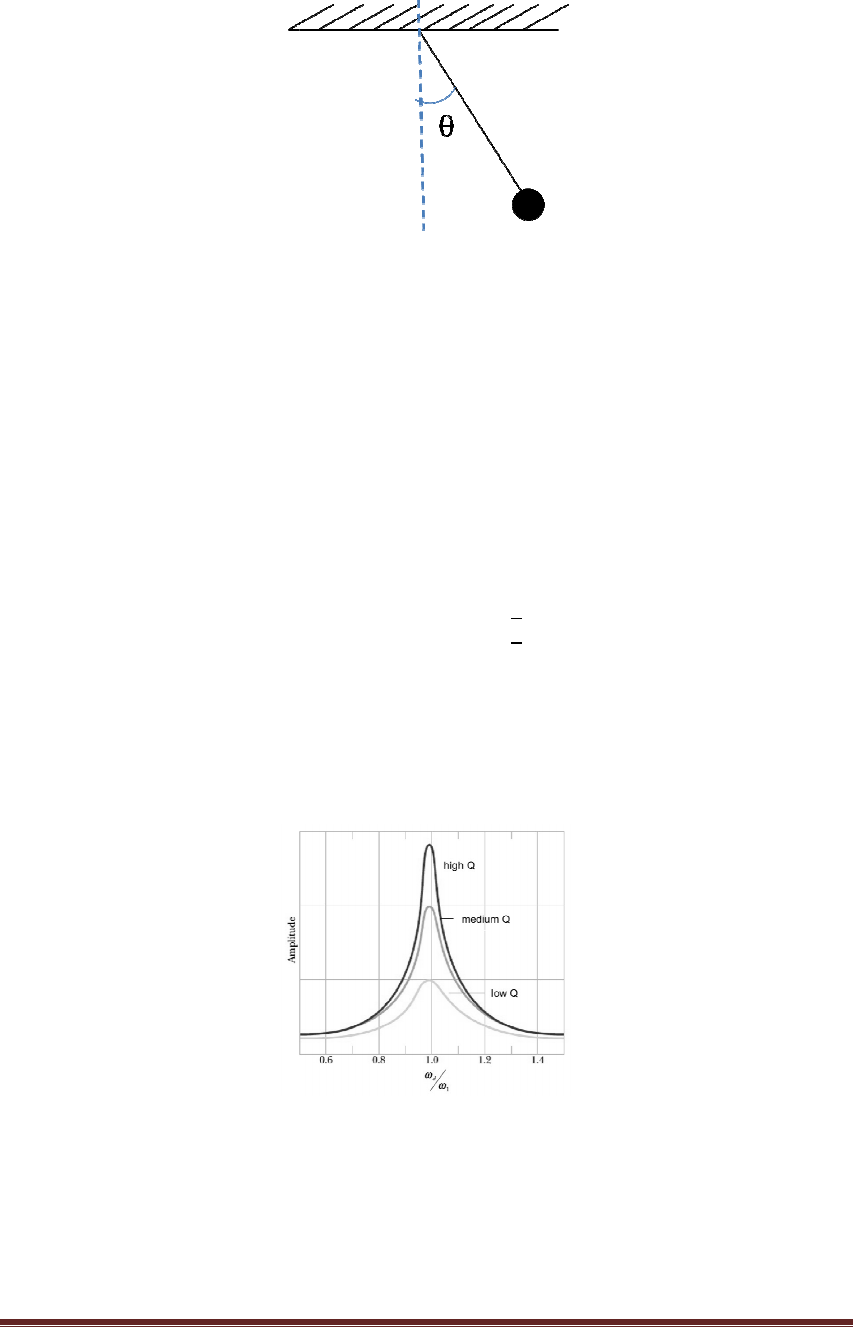
The usual pendulum system consists of a bob and being suspended by a massless
string, this system is free to oscillate back and forth toward the equilibrium position.
For a simple harmonic motion θ < 20°, the time that will complete one cycle is what
we call period, given by:
=
=2
(1)
where l is the length of the string and g is the acceleration due to gravity.
Driven and Damped Pendulum (student’s manual)
In reality, the amplitude of oscillation decreases in time. This decrease in amplitude
called damping, which is caused by the dissipative forces present in a system. The
corresponding motion for such system is called damped oscillations.
External force is usually applied to compensate the decrease in amplitude of
oscillation. A damped os
cillation is said to be driven if an external time dependent force is
present in the system. If we consider a sinusoidal external force characterized by a frequency
ω,
another phenomenon can take place. When the frequency of this driving force matches the
natural frequency of the system given by
the system will exper
ience resonance.
At resonance, the system will have greater amplitude compared to other frequencies.
(
http://umdberg.pbworks.com/w/page/52183487/Driven%20oscillators%3A%20resonance
Reference:
•
Young and Freedman, University Physics 11
Ltd. © 2004.
Driven and Damped Pendulum (student’s manual)
Figure 1: Simple Pendulum
In reality, the amplitude of oscillation decreases in time. This decrease in amplitude
called damping, which is caused by the dissipative forces present in a system. The
corresponding motion for such system is called damped oscillations.
External force is usually applied to compensate the decrease in amplitude of
cillation is said to be driven if an external time dependent force is
present in the system. If we consider a sinusoidal external force characterized by a frequency
another phenomenon can take place. When the frequency of this driving force matches the
natural frequency of the system given by
=2
=
ience resonance.
At resonance, the system will have greater amplitude compared to other frequencies.
Figure 2: Resonance Graph
http://umdberg.pbworks.com/w/page/52183487/Driven%20oscillators%3A%20resonance
Young and Freedman, University Physics 11
th
Ed., Pearson Education South Asia Pte
Page
2
In reality, the amplitude of oscillation decreases in time. This decrease in amplitude
is
called damping, which is caused by the dissipative forces present in a system. The
External force is usually applied to compensate the decrease in amplitude of
cillation is said to be driven if an external time dependent force is
present in the system. If we consider a sinusoidal external force characterized by a frequency
another phenomenon can take place. When the frequency of this driving force matches the
(2)
At resonance, the system will have greater amplitude compared to other frequencies.
http://umdberg.pbworks.com/w/page/52183487/Driven%20oscillators%3A%20resonance
)
Ed., Pearson Education South Asia Pte
Driven and Damped Pendulum (student’s manual)
Page
3
Materials:
Function generator, amplifier, speaker, motion detector, lab quest, container,
stopwatch, meter stick, nylon string and a massive bob.
Procedure:
A. Resonance
1. Tie the pendulum (nylon string of 0.64m tied with mass) on the metal rod
attached on the speaker.
2. Connect the speaker at the back of the amplifier. Insert the wires of the
speaker on the “main speaker”.
3. Connect the function generator to the female jack of the amplifier located at
the back.
4. Connect the Lab Quest into the motion detector (Follow the instructions in
Appendix A illustrating how to setup the Lab Quest).
5. Setup the motion detector 0.50m away from the equilibrium position of the
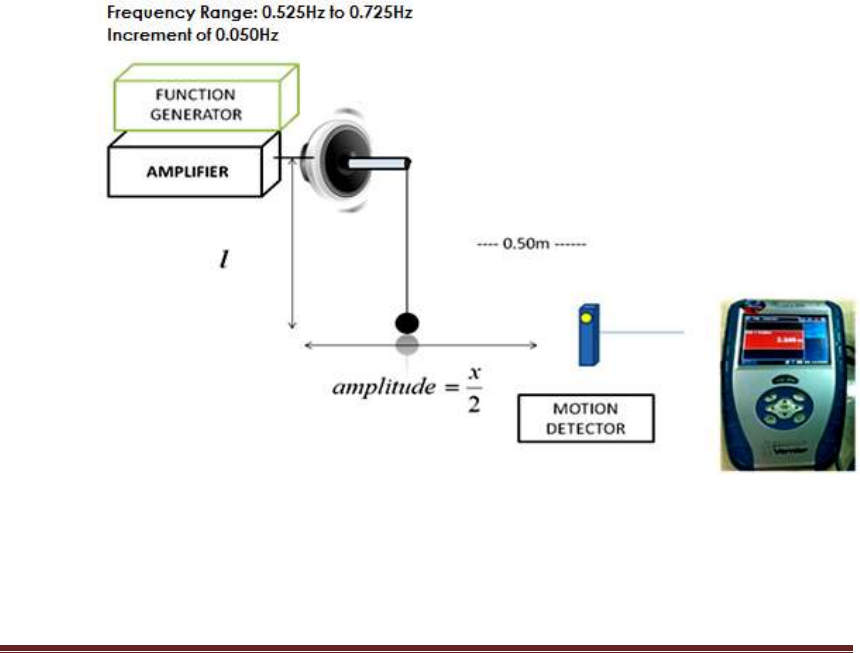
pendulum. The materials should be as shown in the figure.
6. Set the input frequency to 0.525Hz. Measure the pendulum’s displacement
when it reaches its maximum.
Figure
3
: Experimental Set
-
Up for Part A
Driven and Damped Pendulum (student’s manual)
7. Repeat
step 6 but this time put an increment of 0.050Hz. At each increment,
t
he displacement should be measured when the pendulum is at rest. Do this
until you reach 0.725Hz.
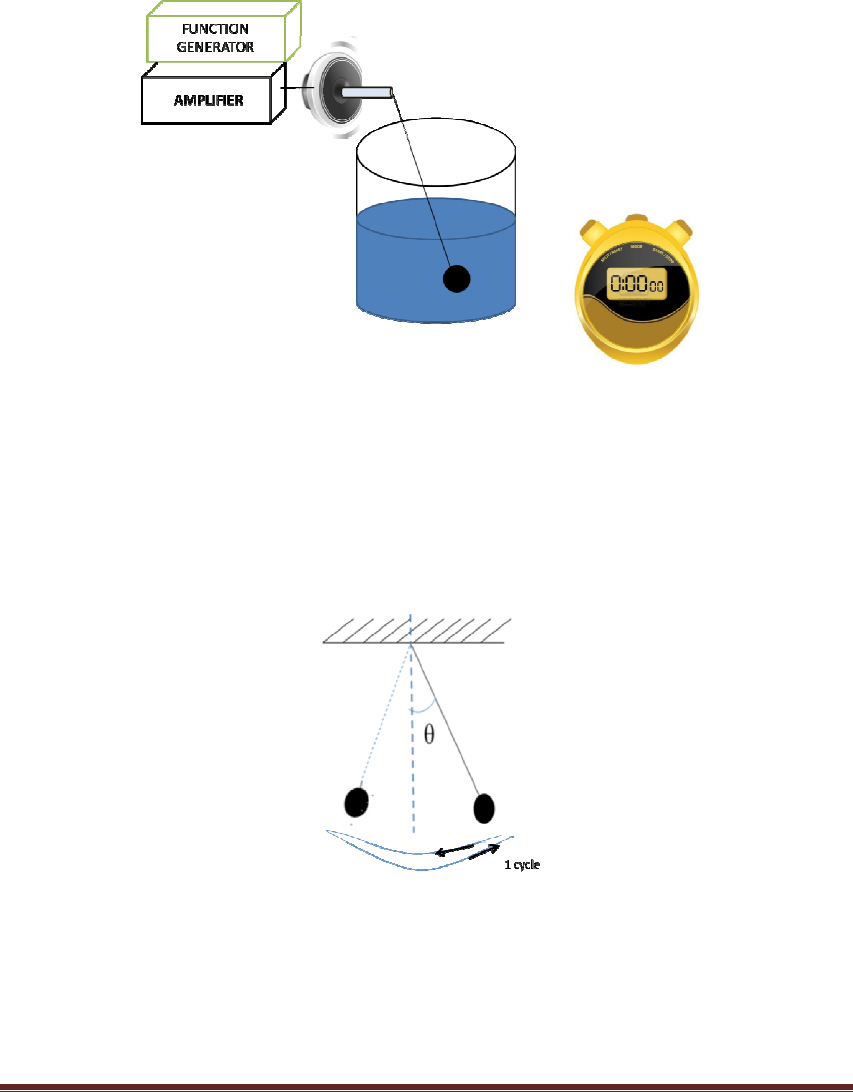
B. Underwater Pendulum
1. Modify the experimental set
Figure
Make sure to use a
circular container to avoid additional uncertainty in the motion of
the water.
2.
Using the resonance frequency from part A,
make at least three
3. Remove the container with water,
pendulum swings in air.
4. Compare your results.
Observe proper significant figures and abso
uncertainty.
Driven and Damped Pendulum (student’s manual)
step 6 but this time put an increment of 0.050Hz. At each increment,
he displacement should be measured when the pendulum is at rest. Do this
until you reach 0.725Hz.
1. Modify the experimental set
-up as follows:
Figure
4: Experimental Set-Up for Part B
circular container to avoid additional uncertainty in the motion of
Using the resonance frequency from part A,
record the
period of oscillation and
trials.
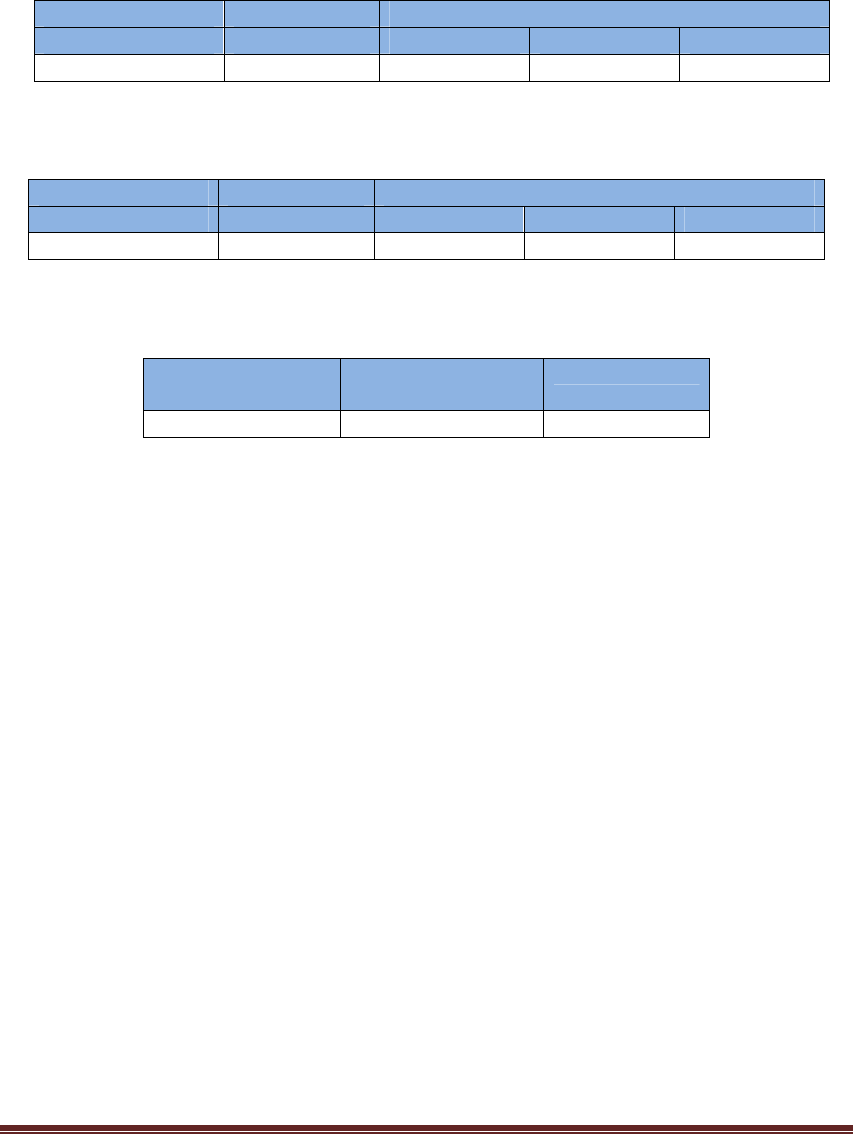
3. Remove the container with water,
this time rec
ord the period of oscillation as the
Observe proper significant figures and abso
lute and
Figure 5: Pendulum cycle
Page
4
step 6 but this time put an increment of 0.050Hz. At each increment,
he displacement should be measured when the pendulum is at rest. Do this
circular container to avoid additional uncertainty in the motion of
period of oscillation and
ord the period of oscillation as the
lute and
relative

Driven and Damped Pendulum (student’s manual) Page 5
Appendix A: Setting up the Lab Quest
1.
Connect the motion detector into DIG1/DIG2 port of the Vernier Lab Quest ®.
2.
In the home screen, click the “sensor” button and find the port where the motion detector
is detected.
3.
If the Lab Quest is connected properly, continuous clicks will be heard from the motion
detector.
4.
Press the play button to collect data and save it by exporting your file using a flash drive.

Driven and Damped Pendulum (student’s manual) Page 6
Name:
Date:
Score:
Group Members:
Section:
Worksheet:
Driven and Damped Pendulum
Data Summary:
I. Identifying the resonance frequency of a pendulum. Let
l
= 0.64 m
Data Table 1:
Frequency, Amplitude, Amplitude
2
Frequency (Hz) Amplitude (m) Amplitude
2
(m
2
)
Solution:
•
What frequency has the highest amplitude?

Driven and Damped Pendulum (student’s manual) Page 7
Graph 1:
Position vs Time (Frequency: _____)
Graph 2:
Position vs Time (Frequency: _____)

Driven and Damped Pendulum (student’s manual) Page 8
Graph 3:
Position vs Time (Frequency: _____)
Graph 4:
Position vs Time (Frequency: _____)

Driven and Damped Pendulum (student’s manual) Page 9
Graph 5:
Position vs Time (Frequency: _____)
•
Compute for the theoretical frequency.
Graph 6:
Resonance (amplitude
2
vs. frequency)
Driven and Damped Pendulum (student’s manual) Page 10
II. Identifying the period of pendulum swinging underwater.
Data Table 1:
Period Underwater
Frequency (Hz) Length (m) Experimental Period (underwater)
Trial 1 Trial 2 Trial 3
Data Table 2:
Period in air
Frequency (Hz) Length (m) Experimental Period (air)
Trial 1 Trial 2 Trial 3
Data Table 3:
Average Period and Percentage error
Average Period
(underwater)
Average Period
(air)
%error
•
What makes the period underwater longer than in air?
•
Calculate the theoretical period and compare it to your results (in air).
