Hanson_Ch14 243677 0170186288
User Manual: 243677
Open the PDF directly: View PDF ![]() .
.
Page Count: 204 [warning: Documents this large are best viewed by clicking the View PDF Link!]

Case studies
Introduction A summary of the case
analysis process C-2
Preparing an effective
case analysis – the full
story C-5
Case 1 Hearing with the aid of
implanted technology: The
case of Cochlear™, an
Australian high-technology
leader C-19
Case 2 The Australian retail wars:
Coles Myer and Woolworths
battle for brand value C-26
Case 3 eBay.com: Profitably
managing growth from
start-up to 2000 C-32
Case 4 Gillette and the men’s
wet-shaving market C-50
Case 5 Gunns and the greens:
Governance issues in
Tasmania C-70
Case 6 Growth at Hubbard’s
Foods? C-79
Case 7 Incat Tasmania’s race for
international success:
Blue-riband strategies C-89
Case 8 The Golden Arches in
India: A case of strategic
adaptation C-95
Case 9 Monsanto: Better
living through genetic
engineering? C-106
Case 10 Nucor Corporation and the
US steel industry C-121
Case 11 Philip Condit and the
Boeing 777: From design and
development to production
and sales C-152
Case 12 Resene Paints C-168
Case 13 Sony Corporation: The vision
of tomorrow C-184

C-2
Introduction
A summary of the case
analysis process
Dallas Hanson
University of Tasmania
Case analysis is an essential part of a strategic man-
agement course and is also perhaps the most enter-
taining part of such a course. The ‘full story’ that
follows this summary gives you considerable detail
about how to go about a case analysis, but for now
here is a brief account.
Before we start, a word about attitude: make it a
real exercise; you have a set of historical facts and use
a rigorous system to work out what strategies should
be followed. All the cases are about real companies,
and one of the entertaining bits of the analysis pro-
cess is to compare what you have said they should do
with what they really have done. So, it is best not to
check the Net to see current strategies until you have
completed your analysis.
What follows is one analytical system, a fairly
tight one that you may want to adapt according to
how much time you have and the style of the case.
External analysis
Step 1 What industry is it?
You must decide on this early. This is an important
step, because it changes the analysis – for example,
your industry analysis will yield different conclusions
depending on what industry you determine.
Step 2 General environment analysis
Analyse the six generic elements – economic, socio-
cultural, global, technological, political/legal and
demographic – and work out what the important
facts are. There may be many issues and facts in each
element, but you put down only the important ones.
It is also important to avoid the common error of over-
emphasis on the firm in question. So, assuming the
firm operates in the Australian ice-cream industry,
the demographic analysis may have this comment: ‘A
large baby boomer generation is now becoming more
health-conscious. This presents opportunities in health
foods and healthy alternatives for conventional foods.
It also presents opportunities for low-fat ice creams.’
Or, in analysing the demographics of the Cochlear™
firm, you may conclude that there is a global market of
1.8 million profoundly deaf people and that this pro-
vides a huge undeveloped market for the implantable
hearing devices industry.
Step 3 The industry environment
Analyse the five forces (that is, supplier power, buyer
power, potential entrants, substitute products and
rivalry among competitors) and explain briefly what
is significant for each. For example, what are the
issues involved in new entrants into the industry? For

Introduction • A summary of the case analysis process C-3
the implantable hearing devices industry, these may
include the need for understanding of intricate new
technology, possession of a reputation in the global
deaf community for safe and effective product devel-
opment, and links to research institutions. This makes
the industry hard to enter. Each force needs a brief dis-
cussion followed by a short conclusion.
One extra consideration before you pull the anal-
ysis together and work out if this is an attractive
industry (the main conclusion) is: Is there a key force
or forces in your industry? Porter argues that there is
a key force in any industry, one that exerts more influ-
ence than the other forces.
Now, is it an attractive industry? You need to
explain, briefly, why or why not. Bear in mind that
it is often not a clear decision because the forces are
mixed – for example, there may be little concern about
new entrants, suppliers or substitutes, but buyers may
be fickle and rivalry high. In such cases, the key force
analysis is very important
Remember: it is the industry you analyse, not the
firm.
Step 4 Competitive environment
Is there a strategic group that you need to take account
of? What is the rivalry like in this group? What capa-
bilities do the relevant firms have? What strategies do
they follow? What threats do they represent?
Step 5 You now have material about
opportunities and threats
It is easy to pull this together from the four steps you
have now completed.
Internal analysis
Step 6 The firm’s resources, tangible and
intangible
List all relevant resources. It is useful to distinguish
between tangible and intangible resources. Remem-
ber: firms have many resources.
At this point, if you have the skills and time, you
can analyse the financial information that almost all
cases provide. This provides material for a financial
resources paragraph.
Step 7 Capabilities identification
Here you make a list of capabilities. Capabilities tell
you what the firm can do.
Remember: each firm may have a dozen or more
capabilities, so include some that are very unlikely to
be core competencies. This is a difficult step, because
you must explain the capabilities carefully to indicate
what the firm really does. For example, Cochlear has
a capability for research in cochlear-related technol-
ogy. It does not have a generic research capability.
Step 8 Core competency analysis
For each capability, indicate which of the four tests
for a core competency it meets. An easy way to do this
is through use of a table. For example:
Rare? Valuable?
Costly to
imitate?
Non-
substitutable
Logistics
management
in cochlear
technologies Yes Y
es No No
Research
knowledge and
skill in cochlear-
related areas Yes Yes Yes Yes
Etc.
This is an important step, because the core compe-
tencies are fundamental in the strategies you suggest
– firms use their core competencies.
Step 9 Weaknesses
What major weaknesses does the firm have – for
example, old technology, very limited finance and poor
cash flow, no succession planning?
Step 10 Pulling it together
You now have all the material for an excellent
SWOT (strengths/weaknesses, opportunities/threats)
analysis. Pull together the earlier identification of
opportunities and threats (step 5) with the internal
analysis you have done. This resources-based, theory-
oriented system gives you a powerful vocabulary
to describe what simpler systems call ‘strengths’,
and the other elements of the system allow you to
systematically identify other significant factors in
the mix.

C-4 Introduction • A summary of the case analysis process
Step 11 Current strategies
Work out the firm’s current strategies.
Step 12 Strategies
Here you take advantage of opportunities and handle
threats. You should be able to make use of core com-
petencies to do this.
You may need strategies at the business level, cor-
porate level and international level (but it depends on
the industry and on whether all are required). Also,
bear in mind that you may need to specify functional-
level strategies to fit the generic strategies at the
business level. For example, if your ice-cream compa-
ny adopts a differentiation strategy, you must specify
how it is differentiated (on what grounds – low fat?)
and there must be associated innovation and market-
ing strategies (or, in the corporate-level strategy, a
supporting acquisition strategy may be used to handle
the innovation issue).
Make a list of alternative possibilities and use
the external and internal analyses that you have con-
ducted to assess them. Choose one set of alternatives.
How do these differ from current strategies?
Make sure the strategies chosen fit in with your
earlier analysis. Use all the conclusions in the earlier
analysis. For example (and bear in mind that this is
simplified to make the idea clearer), if you are in a
rivalrous industry which has good growth prospects
because of useful demographic change and you have
good financial resources, you may argue for expan-
sion into the new segment using available resources.
If the finances were not there, this strategy would be
difficult to support.
Using the Cochlear™ case
as a training case
This case analysis process is easy to use once you have
learned it, and the best way to learn is to try it out. The
Cochlear™ case in this book is designed as a training
case to help you do this. Don’t be concerned if you get
a slightly different analysis to other people: one of the
glories of case analysis is that they are never ‘right’;
some are, however, more plausible than others.

C-5
Preparing an effective case
analysis – the full story
In most strategic management courses, cases are used
extensively as a teaching tool.1 A key reason is that
cases provide active learners with opportunities to
use the strategic management process to identify and
solve organisational problems. Thus, by analysing
situations that are described in cases and presenting
the results, active learners (that is, students) become
skilled at effectively using the tools, techniques and
concepts that combine to form the strategic manage-
ment process.
The cases that follow are concerned with actual
companies. Presented within the cases are problems
and situations that managers and those with whom
they work must analyse and resolve. As you will see,
a strategic management case can focus on an entire
industry, a single organisation, or a business unit of
a large, diversified firm. The strategic management
issues facing not-for-profit organisations also can be
examined using the case analysis method.
Basically, the case analysis method calls for a care-
ful diagnosis of an organisation’s current conditions
(as manifested by its external and internal environ-
ments) so that appropriate strategic actions can be
recommended in light of the firm’s strategic intent and
strategic mission. Strategic actions are taken to devel-
op and then use a firm’s core competencies to select
and implement different strategies, including business-
level, corporate-level, acquisition and restructuring,
international and cooperative strategies. Thus, appro-
priate strategic actions help the firm to survive in the
long run as it creates and uses competitive advantages
as the foundation for achieving strategic competitive-
ness and earning above-average returns. The case
method that we are recommending to you has a rich
heritage as a pedagogical approach to the study and
understanding of managerial effectiveness.2
As an active learner, your preparation is critical
to successful use of the case analysis method. With-
out careful study and analysis, active learners lack the
insights required to participate fully in the discussion
of a firm’s situation and the strategic actions that are
appropriate.
Instructors adopt different approaches in their
application of the case analysis method. Some require
active learners/students to use a specific analytical
procedure to examine an organisation; others pro-
vide less structure, expecting students to learn by
developing their own unique analytical method. Still
other instructors believe that a moderately structured
framework should be used to analyse a firm’s situa-
tion and make appropriate recommendations. Your
lecturer or tutor will determine the specific approach
you take. The approach we are presenting to you is a
moderately structured framework.
We divide our discussion of a moderately struc-
tured case analysis method framework into four
sections. First, we describe the importance of under-
standing the skills active learners can acquire through
effective use of the case analysis method. In the sec-
ond section, we provide you with a process-oriented
framework. This framework can be of value in your
efforts to analyse cases and then present the results of
your work. Using this framework in a classroom set-
ting yields valuable experiences that can, in turn, help
you to successfully complete assignments that you
will receive from your employer. The third section

C-6
is where we describe briefly what you can expect to
occur during in-class case discussions. As this descrip-
tion shows, the relationship and interactions between
instructors and active learners/students during case
discussions are different than they are during lectures.
In the final section, we present a moderately struc-
tured framework that we believe can help you to pre-
pare effective oral and written presentations. Written
and oral communication skills also are valued highly
in many organisational settings; hence, their develop-
ment today can serve you well in the future.
Skills gained through use of
the case analysis method
The case analysis method is based on a philosophy
that combines knowledge acquisition with significant
involvement from students as active learners. In the
words of Alfred North Whitehead, this philosophy
‘rejects the doctrine that students had first learned
passively, and then, having learned should apply
knowledge’.3 In contrast to this philosophy, the case
analysis method is based on principles that were elab-
orated upon by John Dewey:
Only by wrestling with the conditions of this
problem at hand, seeking and finding his own way
out, does [the student] think ... If he cannot devise
his own solution (not, of course, in isolation, but
in correspondence with the teacher and other
pupils) and find his own way out he will not learn,
not even if he can recite some correct answer with
a hundred percent accuracy.4
The case analysis method brings reality into the
classroom. When developed and presented effectively,
with rich and interesting detail, cases keep conceptu-
al discussions grounded in reality. Experience shows
that simple fictional accounts of situations and collec-
tions of actual organisational data and articles from
public sources are not as effective for learning as fully
developed cases. A comprehensive case presents you
with a partial clinical study of a real-life situation that
faced managers as well as other stakeholders, includ-
ing employees. A case presented in narrative form
provides motivation for involvement with and analy-
sis of a specific situation. By framing alternative stra-
tegic actions and by confronting the complexity and
ambiguity of the practical world, case analysis pro-
vides extraordinary power for your involvement with
a personal learning experience. Some of the poten-
tial consequences of using the case method are sum-
marised in Exhibit 1.
As Exhibit 1 suggests, the case analysis meth-
od can assist active learners in the development of
their analytical and judgement skills. Case analy-
sis also helps students to learn how to ask the right
questions. By this we mean questions that focus on
the core strategic issues that are included in a case.
Active learners/students with managerial aspirations
can improve their ability to identify underlying prob-
lems rather than focusing on superficial symptoms as
they develop skills at asking probing, yet appropriate,
questions.
The collection of cases your instructor chooses to
assign can expose you to a wide variety of organisa-
tions and decision situations. This approach vicari-
ously broadens your experience base and provides
insights into many types of managerial situations,
Exhibit 1
1 Case analysis requires students to practise important managerial skills – diagnosing, making decisions, observing, listening and
persuading – while preparing for a case discussion.
2 Cases require students to relate analysis and action, to develop realistic and concrete actions despite the complexity and
partial knowledge characterising the situation being studied.
3 Students must confront the intractability of reality – complete with absence of needed information, an imbalance between
needs and available resources, and conflicts among competing objectives.
4 Students develop a general managerial point of view – where responsibility is sensitive to action in a diverse environmental
context.
Source: C.C. Lundberg and C. Enz, 1993, ‘A framework for student case preparation’, Case Research Journal, 13 (summer), p. 134.
Introduction • Preparing an effective case analysis

C-7
tasks and responsibilities. Such indirect experience
can help you to make a more informed career deci-
sion about the industry and managerial situation
you believe will prove to be challenging and satisfy-
ing. Finally, experience in analysing cases definitely
enhances your problem-solving skills, and research
indicates that the case method for this subject is better
than the lecture method.5
Furthermore, when your instructor requires oral
and written presentations, your communication skills
will be honed through use of the case method. Of
course, these added skills depend on your prepara-
tion as well as your instructor’s facilitation of learn-
ing. However, the primary responsibility for learning
is yours. The quality of case discussion is generally
acknowledged to require, at a minimum, a thorough
mastery of case facts and some independent analysis
of them. The case method therefore first requires that
you read and think carefully about each case. Addi-
tional comments about the preparation you should
complete to successfully discuss a case appear in the
next section.
Student preparation for
case discussion
If you are inexperienced with the case method,
you may need to alter your study habits. A lecture-
oriented course may not require you to do intensive
preparation for each class period. In such a course,
you have the latitude to work through assigned read-
ings and review lecture notes according to your own
schedule. However, an assigned case requires signifi-
cant and conscientious preparation before class. With-
out it, you will be unable to contribute meaningfully
to in-class discussion. Therefore, careful reading and
thinking about case facts, as well as reasoned anal-
yses and the development of alternative solutions to
case problems, are essential. Recommended alterna-
tives should flow logically from core problems iden-
tified through study of the case. Exhibit 2 shows a
set of steps that can help you to familiarise yourself
with a case, identify problems and propose strategic
actions that increase the probability that a firm will
achieve strategic competitiveness and earn above-
average returns.
Exhibit 2
Step 1:
Gaining familiarity
a In general – determine who, what, how, where and when (the critical facts of the case).
b In detail – identify the places, persons, activities and contexts of the situation.
c Recognise the degree of certainty/uncertainty of acquired information.
Step 2:
Recognising symptoms
a List all indicators (including stated ‘problems’) that something is not as expected or as desired.
b Ensure that symptoms are not assumed to be the problem. (Symptoms should lead to
identification of the problem.)
Step 3:
Identifying goals
a Identify critical statements by major parties (e.g. people, groups, the work unit, etc.).
b List all goals of the major parties that exist or can be reasonably inferred.
Step 4:
Conducting the analysis
a Decide which ideas, models and theories seem useful.
b Apply these conceptual tools to the situation.
c As new information is revealed, cycle back to sub-steps (a) and (b).
Step 5:
Making the diagnosis
a Identify predicaments (goal inconsistencies).
b Identify problems (discrepancies between goals and performance).
c Prioritise predicaments/problems regarding timing, importance, etc.
Step 6:
Doing the action planning
a Specify and prioritise the criteria used to choose action alternatives.
b Discover or invent feasible action alternatives.
c Examine the probable consequences of action alternatives.
d Select a course of action.
e Design an implementation plan/schedule.
f Create a plan for assessing the action to be implemented.
Source: C. C. Lundberg and C. Enz, 1993, ‘A framework for student case preparation’, Case Research Journal, 13 (summer), p. 144.
Introduction • Preparing an effective case analysis

C-8
Gaining familiarity
The first step of an effective case analysis process calls
for you to become familiar with the facts featured in
the case and the focal firm’s situation. Initially, you
should become familiar with the focal firm’s general
situation (for example, who, what, how, where and
when). Thorough familiarisation demands apprecia-
tion of the nuances, as well as the major issues, in
the case.
Gaining familiarity with a situation requires you to
study several situational levels, including interactions
between and among individuals within groups, busi-
ness units, the corporate office, the local communi-
ty and the society at large. Recognising relationships
within and among levels facilitates a more thorough
understanding of the specific case situation.
It is also important that you evaluate information
on a continuum of certainty. Information that is
verifiable by several sources and judged along similar
dimensions can be classified as a fact. Information
representing someone’s perceptual judgement of a par-
ticular situation is referred to as an inference. Infor-
mation gleaned from a situation that is not verifiable
is classified as speculation. Finally, information that is
independent of verifiable sources and arises through
individual or group discussion is an assumption.
Obviously, case analysts and organisational decision
makers prefer having access to facts over inferences,
speculations and assumptions.
Personal feelings, judgements and opinions evolve
when you are analysing a case. It is important to be
aware of your own feelings about the case and to
evaluate the accuracy of perceived ‘facts’ to ensure
that the objectivity of your work is maximised.
Recognising symptoms
Recognition of symptoms is the second step of an
effective case analysis process. A symptom is an indi-
cation that something is not as you or someone else
thinks it should be. You may be tempted to correct the
symptoms instead of searching for true problems. True
problems are the conditions or situations requiring
solution before the performance of an organisation,
business unit or individual can improve. Identifying
and listing symptoms early in the case analysis process
tends to reduce the temptation to label symptoms as
problems. The focus of your analysis should be on the
actual causes of a problem, rather than on its symptoms.
Thus, it is important to remember that symptoms are
indicators of problems; subsequent work facilitates
discovery of critical causes of problems that your case
recommendations must address.
Identifying goals
The third step of effective case analysis calls for
you to identify the goals of the major organisations,
business units and/or individuals in a case. As appro-
priate, you should also identify each firm’s strategic
intent and strategic mission. Typically, these direc-
tion-setting statements (goals, strategic intents and
strategic missions) are derived from comments made
by central characters in the organisation, business
unit or top management team as described in the
case and/or from public documents (for example, an
annual report).
Completing this step successfully can sometimes be
difficult. Nonetheless, the outcomes you attain from
this step are essential to an effective case analysis
because identifying goals, intent and mission helps
you to clarify the main problems featured in a case
and to evaluate alternative solutions to those problems.
Direction-setting statements are not always stated
publicly or prepared in written format. When this
occurs, you must infer goals from other available fac-
tual data and information.
Conducting the analysis
The fourth step of effective case analysis is concerned
with acquiring a systematic understanding of a situ-
ation. Occasionally, cases are analysed in a less-than-
thorough manner. Such analyses may be a product of
a busy schedule or of the difficulty and complexity of
the issues described in a particular case. Sometimes
you will face pressures on your limited amounts of
time and may believe that you can understand the sit-
uation described in a case without systematic analy-
sis of all the facts. However, experience shows that
familiarity with a case’s facts is a necessary, but insuf-
ficient, step in the development of effective solutions
– solutions that can enhance a firm’s strategic com-
petitiveness. In fact, a less-than-thorough analysis
typically results in an emphasis on symptoms, rather
than on problems and their causes. To analyse a case
Introduction • Preparing an effective case analysis

C-9
effectively, you should be sceptical of quick or easy
approaches and answers.
A systematic analysis helps you to understand
a situation and determine what can work and prob-
ably what will not work. Key linkages and under-
lying causal networks based on the history of the firm
become apparent. In this way, you can separate causal
networks from symptoms.
Also, because the quality of a case analysis depends
on applying appropriate tools, it is important that you
use the ideas, models and theories that seem to be use-
ful for evaluating and solving individual and unique
situations. As you consider facts and symptoms, a
useful theory may become apparent. Of course, hav-
ing familiarity with conceptual models may be impor-
tant in the effective analysis of a situation. Successful
students and successful organisational strategists add
to their intellectual tool kits on a continual basis.
Making the diagnosis
The fifth step of effective case analysis – diagnosis – is
the process of identifying and clarifying the roots of
the problems by comparing goals with facts. In this
step, it is useful to search for predicaments. Predica-
ments are situations in which goals do not fit with
known facts. When you evaluate the actual perfor-
mance of an organisation, business unit or individual,
you may identify over- or under-achievement (relative
to established goals). Of course, single-problem situa-
tions are rare. Accordingly, you should recognise that
the case situations you study probably will be com-
plex in nature.
Effective diagnosis requires you to determine
the problems affecting longer-term performance and
those requiring immediate handling. Understanding
these issues will aid your efforts to prioritise prob-
lems and predicaments, given available resources and
existing constraints.
Doing the action planning
The final step of an effective case analysis process is
called action planning. Action planning is the process
of identifying appropriate alternative actions. In the
action planning step, you select the criteria you will
use to evaluate the identified alternatives. You may
derive these criteria from the analyses; typically, they
are related to key strategic situations facing the focal
organisation. Furthermore, it is important that you
prioritise these criteria to ensure a rational and effec-
tive evaluation of alternative courses of action.
Typically, managers ‘satisfice’ when selecting
courses of action; that is, they find acceptable courses
of action that meet most of the chosen evaluation
criteria. A rule of thumb that has proved valuable to
strategic decision makers is to select an alternative
that leaves other plausible alternatives available if the
one selected fails.
Once you have selected the best alternative, you
must specify an implementation plan. Developing an
implementation plan serves as a reality check on the
feasibility of your alternatives. Thus, it is important
that you give thoughtful consideration to all issues
associated with the implementation of the selected
alternatives.
What to expect from
in-class case discussions
Classroom discussions of cases differ significantly
from lectures. The case method calls for instructors to
guide the discussion, encourage student participation
and solicit alternative views. When alternative views
are not forthcoming, instructors typically adopt one
view so that students can be challenged to respond
to it thoughtfully. Often students’ work is evaluated
in terms of both the quantity and the quality of their
contributions to in-class case discussions. Students
benefit by having their views judged against those of
their peers and by responding to challenges by other
class members and/or the instructor.
During case discussions, instructors listen, ques-
tion and probe to extend the analysis of case issues.
In the course of these actions, peers or the instructor
may challenge an individual’s views and the validity
of alternative perspectives that have been expressed.
These challenges are offered in a constructive man-
ner; their intent is to help students develop their ana-
lytical and communication skills. Instructors should
encourage students to be innovative and original in
the development and presentation of their ideas. Over
the course of an individual discussion, students can
develop a more complex view of the case, benefiting
from the diverse inputs of their peers and instructor.
Introduction • Preparing an effective case analysis

C-10
Among other benefits, experience with multiple-case
discussions should help students to increase their
knowledge of the advantages and disadvantages of
group decision-making processes.
Student peers as well as the instructor value com-
ments that contribute to the discussion. To offer
relevant contributions, you are encouraged to use
independent thought and, through discussions with
your peers outside of class, to refine your thinking. We
also encourage you to avoid using ‘I think’, ‘I believe’
and ‘I feel’ to discuss your inputs to a case analysis
process. Instead, consider using a less emotion-laden
phrase, such as ‘My analysis shows’. This highlights
the logical nature of the approach you have taken to
complete the six steps of an effective case analysis
process.
When preparing for an in-class case discussion,
you should plan to use the case data to explain your
assessment of the situation. Assume that your peers
and instructor know the case facts. In addition, it is
good practice to prepare notes before class discus-
sions and use them as you explain your view. Effective
notes signal to classmates and the instructor that you
are prepared to engage in a thorough discussion of a
case. Moreover, thorough notes eliminate the need for
you to memorise the facts and figures needed to dis-
cuss a case successfully.
The case analysis process just described can help
you prepare to effectively discuss a case during class
meetings. Adherence to this process results in consid-
eration of the issues required to identify a focal firm’s
problems and to propose strategic actions through
which the firm can increase the probability that it will
achieve strategic competitiveness.
In some instances, your instructor may ask
you to prepare either an oral or a written analysis
of a particular case. Typically, such an assignment
demands even more thorough study and analysis of
the case contents. At your instructor’s discretion, oral
and written analyses may be completed by individuals
or by groups of two or more people. The informat-
ion and insights gained through completing the six
steps shown in Exhibit 2 are often of value in the
development of an oral or written analysis. However,
when preparing an oral or written presentation, you
must consider the overall framework in which your
information and inputs will be presented. Such a
framework is the focus of the next section.
Preparing an oral/written
case strategic plan
Experience shows that two types of thinking are nec-
essary in order to develop an effective oral or written
presentation (see Exhibit 3). The upper part of the
model in Exhibit 3 outlines the analysis stage of case
preparation.
In the analysis stage, you should first analyse the
general external environmental issues affecting the
firm. Next, your environmental analysis should focus
on the particular industry (or industries, in the case
of a diversified company) in which a firm operates.
Finally, you should examine the competitive environ-
ment of the focal firm. Through study of the three
levels of the external environment, you will be able to
identify a firm’s opportunities and threats. Following
the external environmental analysis is the analysis of
the firm’s internal environment, which results in the
identification of the firm’s strengths and weaknesses.
As noted in Exhibit 3, you must then change the
focus from analysis to synthesis. Specifically, you
must synthesise information gained from your analy-
sis of the firm’s internal and external environments.
Synthesising information allows you to generate alter-
natives that can resolve the significant problems or
challenges facing the focal firm. Once you identify a
best alternative, from an evaluation based on prede-
termined criteria and goals, you must explore imple-
mentation actions.
Exhibits 4 and 5 outline the sections that should
be included in either an oral or a written strategic
plan presentation: introduction (strategic intent and
mission), situation analysis, statements of strengths/
weaknesses and opportunities/threats, strategy for-
mulation and implementation plan. These sections,
which can be completed only through use of the two
types of thinking featured in Exhibit 3, are described
in the following discussion. Familiarity with the con-
tents of your textbook’s 13 chapters is helpful because
the general outline for an oral or a written strategic
plan shown in Exhibit 5 is based on an understand-
ing of the strategic management process detailed in
those chapters.
Introduction • Preparing an effective case analysis

C-11
External environment analysis
As shown in Exhibit 5, a general starting place for
completing a situation analysis is the external envi-
ronment. The external environment is composed of
outside conditions that affect a firm’s performance.
Your analysis of the environment should consider the
effects of the general environment on the focal firm.
Following that evaluation, you should analyse the
industry and competitor environmental trends.
These trends or conditions in the external environ-
ment shape the firm’s strategic intent and mission.
The external environment analysis essentially indi-
cates what a firm might choose to do. Often called an
environmental scan, an analysis of the external envi-
ronment allows a firm to identify key conditions that
are beyond its direct control. The purpose of studying
the external environment is to identify a firm’s oppor-
tunities and threats. Opportunities are conditions in
the external environment that appear to have the
potential to contribute to a firm’s success. In essence,
opportunities represent possibilities. Threats are
conditions in the external environment that appear
to have the potential to prevent a firm’s success. In
essence, threats represent potential constraints.
When studying the external environment, the
focus is on trying to predict the future (in terms of
local, regional, and international trends and issues)
and to predict the expected effects on a firm’s oper-
ations. The external environment features conditions
in the broader society and in the industry (area of
competition) that influence the firm’s possibilities
and constraints. Areas to be considered (to identify
opportunities and threats) when studying the general
environment are listed in Exhibit 6. Many of these
issues are explained more fully in Chapter 2.
Once you analyse the general environmental
trends, you should study their effect on the focal indus-
try. Often the same environmental trend may have a
significantly different impact on separate industries,
or it may affect firms within the same industry differ-
ently. For instance, with deregulation of the airline
industry in the United States, older, established air-
lines had a significant decrease in profitability, while
many smaller airlines, such as Southwest Airlines,
Exhibit 3 Types of thinking in case preparation: Analysis and synthesis
ANALYSIS
External environment
General environment
Industry environment
Competitor environment
Internal environment
Statements of
strengths,
weaknesses,
opportunities
and threats
Alternatives
Evaluations of alternatives
Implementation
SYNTHESIS
Introduction • Preparing an effective case analysis

C-12
Exhibit 5 Strategic planning and its parts
• Strategic planning is a process through which a firm determines what it seeks to accomplish and the actions required to
achieve desired outcomes
✓ Strategic planning, then, is a process that we use to determine what (outcomes to be reached) and how (actions to be taken
to reach outcomes)
• The effective strategic plan for a firm would include statements and details about the following:
✓ Opportunities (possibilities) and threats (constraints)
✓ Strengths (what we do especially well) and weaknesses (deficiencies)
✓ Strategic intent (an indication of a firm’s ideal state)
✓ Strategic mission (purpose and scope of a firm’s operations in product and market terms)
✓ Key result areas (KRAs) (categories of activities where efforts must take place to reach the mission and intent)
✓ Strategies (actions for each KRA to be completed within one to five years)
✓ Objectives (specific statements detailing actions for each strategy that are to be completed in one year or less)
✓ Cost linkages (relationships between actions and financial resources)
Exhibit 4 Strategic planning process
Strategic intent
Strategic mission
Strategies
• 1 to 5 years
• Cost linkages
Objectives
• 1 year or less
• Cost linkages
Key result areas
• Required efforts
• Cost linkages
External environment
• Opportunities (possibilities)
• Threats (constraints)
Internal environment
• Strengths
• Weaknesses
Introduction • Preparing an effective case analysis

C-13
with lower cost structures and greater flexibility, were
able to aggressively enter new markets.
Porter’s five forces model is a useful tool for ana-
lysing the specific industry (see Chapter 2). Careful
study of how the five competitive forces (that is, sup-
plier power, buyer power, potential entrants, substi-
tute products and rivalry among competitors) affect
a firm’s strategy is important. These forces may cre-
ate threats or opportunities relative to the specific
business-level strategies (that is, differentiation, cost
leadership, focus) being implemented. Often a stra-
tegic group’s analysis reveals how different environ-
mental trends are affecting industry competitors.
Strategic group analysis is useful for understanding
the industry’s competitive structures and firm con-
straints and possibilities within those structures.
Firms also need to analyse each of their primary
competitors. This analysis should identify their com-
petitors’ current strategies, strategic intent, strategic
mission, capabilities, core competencies and compet-
itive response profile. This information is useful to
the focal firm in formulating an appropriate strategic
intent and mission.
Internal environment analysis
The internal environment is composed of strengths
and weaknesses internal to a firm that influence its
strategic competitiveness. The purpose of completing
an analysis of a firm’s internal environment is to iden-
tify its strengths and weaknesses. The strengths and
weaknesses in a firm’s internal environment shape
the strategic intent and strategic mission. The inter-
nal environment essentially indicates what a firm
Exhibit 6 Sample general environmental categories
Technology • Information technology continues to become cheaper and have more practical
applications
• Database technology allows organisation of complex data and distribution of information
• Telecommunications technology and networks increasingly provide fast transmission of all
sources of data, including voice, written communications and video information
Demographic trends • Computerised design and manufacturing technologies continue to facilitate quality and
flexibility
• Regional changes in population due to migration
• Changing ethnic composition of the population
• Ageing of the population
• Ageing of the baby boomer generation
Economic trends • Interest rates
• Inflation rates
• Savings rates
• Trade deficits
• Budget deficits
• Exchange rates
Political/legal environment • Antitrust enforcement
• Tax policy changes
• Environmental protection laws
• Extent of regulation/deregulation
• Developing countries privatising state monopolies
• State-owned industries
Socio-cultural environment • Increasing proportion of women in the workforce
• Awareness of health and fitness issues
• Concern for the environment
• Concern for customers
Global environment • Currency exchange rates
• Free trade agreements
• Trade deficits
• New or developing markets
Introduction • Preparing an effective case analysis

C-14
can do. Capabilities or skills that allow a firm to do
something that others cannot do or that allow a firm
to do something better than others do it are called
strengths. Strengths can be categorised as something
that a firm does especially well. Strengths help a firm
to take advantage of external opportunities or over-
come external threats. Capabilities or skill deficien-
cies that prevent a firm from completing an important
activity as well as others do it are called weaknesses.
Weaknesses have the potential to prevent a firm from
taking advantage of external opportunities or suc-
ceeding in efforts to overcome external threats. Thus,
weaknesses can be thought of as something the firm
needs to improve.
Analysis of the primary and support activities of
the value chain provides opportunities to understand
how external environmental trends affect the spe-
cific activities of a firm. Such analysis helps to high-
light strengths and weaknesses. (See Chapter 3 for an
explanation of the value chain.) For the purposes of
preparing an oral or written presentation, it is impor-
tant to note that strengths are internal resources and
capabilities that have the potential to be core com-
petencies. Weaknesses, on the other hand, have the
potential to place a firm at a competitive disadvantage
in relation to its rivals.
When evaluating the internal characteristics of
the firm, your analysis of the functional activities
emphasised is critical. For example, if the strategy of
the firm is primarily technology-driven, it is important
to evaluate the firm’s R&D activities. If the strategy
is market-driven, marketing functional activities are
of paramount importance. If a firm has financial diffi-
culties, critical financial ratios would require careful
evaluation. In fact, because of the importance of
financial health, most cases require financial analysis.
The appendix lists and operationally defines several
common financial ratios. Included are exhibits des-
cribing profitability, liquidity, leverage, activity and
shareholders’ return ratios. Other firm characteristics
that should be examined to study the internal environ-
ment effectively include leadership, organisational
culture, structure and control systems.
Identification of strategic intent
and mission
Strategic intent is associated with a mind-set that
managers seek to imbue within the company. Essen-
tially, a mind-set captures how we view the world
and our intended role in it. Strategic intent reflects
or identifies a firm’s ideal state. Strategic intent flows
from a firm’s opportunities, threats, strengths and
weaknesses. However, the main influence on strate-
gic intent is a firm’s strengths. Strategic intent should
reflect a firm’s intended character and a commitment
to ‘stretch’ available resources and strengths in order
to reach strategies and objectives. Examples of strate-
gic intent include:
• The relentless pursuit of perfection (Lexus).
• To be the top performer in everything that we do
(Phillips Petroleum).
• We are dedicated to being the world’s best at
bringing people together (AT&T).
The strategic mission flows from a firm’s strate-
gic intent; it is a statement used to describe a firm’s
unique intent and the scope of its operations in prod-
uct and market terms. In its most basic form, the stra-
tegic mission indicates to stakeholders what a firm
seeks to accomplish. An effective strategic mission
reflects a firm’s individuality and reveals its leader-
ship’s predisposition(s). The useful strategic mission
shows how a firm differs from others and defines
boundaries within which the firm intends to operate.
For example:
• Cochlear’s mission is to have ‘clinical teams and
recipients embrace Cochlear as their partner in
hearing for life’.
• Coca-Cola Amatil’s mission is to have market
leadership in every territory.
Hints for presenting an
effective strategic plan
There may be a temptation to spend most of your
oral or written case analysis on the results from the
analysis. It is important, however, that the analysis
of a case should not be over-emphasised relative to
Introduction • Preparing an effective case analysis

C-15
the synthesis of results gained from your analytical
efforts – what does the analysis mean for the organi-
sation (see Exhibit 3)?
Strategy formulation: Choosing key
result areas
Once you have identified strengths and weaknesses,
determined the firm’s core competencies (if any), and
formulated a strategic intent and mission, you have a
picture of what the firm is and what challenges and
threats it faces.
You can now determine alternative key result
areas (KRAs). Each of these is a category of activi-
ties that helps to accomplish the strategic intent of the
firm. For example, KRAs for Cochlear may include
to remain a leader in hearing implant technology and
to build links with hearing clinicians in Southeast
Asia. Each alternative should be feasible (that is, it
should match the firm’s strengths, capabilities and,
especially, core competencies), and feasibility should
be demonstrated. In addition, you should show how
each alternative takes advantage of the environmental
opportunity or avoids/buffers against environmental
threats. Developing carefully thought-out alternatives
requires synthesis of your analyses and creates greater
credibility in oral and written case presentations.
Once you develop a strong set of alternative
KRAs, you must evaluate the set to choose the best
ones. Your choice should be defensible and provide
benefits over the other alternatives. Thus, it is impor-
tant that both the alternative development and evalu-
ation of alternatives be thorough. The choice of the
best alternative should be explained and defended.
For the two Cochlear KRAs presented earlier, the
strategies are clear and in both cases they take advan-
tage of competencies within the company and oppor-
tunities in the external environment.
Key result area implementation
After selecting the most appropriate KRAs (that is,
those with the highest probability of enhancing a
firm’s strategic competitiveness), you must consider
effective implementation. Effective synthesis is impor-
tant to ensure that you have considered and evaluated
all critical implementation issues. Issues you might
consider include the structural changes necessary to
implement the new strategies and objectives associ-
ated with each KRA. In addition, leadership changes
and new controls or incentives may be necessary to
implement these strategic actions. The implementa-
tion actions you recommend should be explicit and
thoroughly explained. Occasionally, careful evalua-
tion of implementation actions may show the strat-
egy to be less favourable than you originally thought.
(You may find that the capabilities required to imple-
ment the strategy are absent and unobtainable.) A
strategy is only as good as the firm’s ability to imple-
ment it effectively. Therefore, expending the effort to
determine effective implementation is important.
Process issues
You should ensure that your presentation (either oral
or written) has logical consistency throughout. For
example, if your presentation identifies one purpose,
but your analysis focuses on issues that differ from
the stated purpose, the logical inconsistency will be
apparent. Likewise, your alternatives should flow
from the configuration of strengths, weaknesses,
opportunities and threats you identified through the
internal and external analyses.
Thoroughness and clarity also are critical to an
effective presentation. Thoroughness is represented
by the comprehensiveness of the analysis and alterna-
tive generation. Furthermore, clarity in the results of
the analyses, selection of the best alternative KRAs
and strategies, and design of implementation actions
are important. For example, your statement of the
strengths and weaknesses should flow clearly and
logically from the internal analyses presented, and
these should be reflected in KRAs and strategies.
Presentations (oral or written) that show logi-
cal consistency, thoroughness and clarity of purpose,
effective analyses, and feasible recommendations are
more effective and will receive more positive evalua-
tions. Being able to withstand tough questions from
peers after your presentation will build credibility for
your strategic plan presentation. Furthermore, devel-
oping the skills necessary to make such presentations
will enhance your future job performance and career
success.
Introduction • Preparing an effective case analysis

C-16
Appendix: Financial analysis in case studies
Exhibit A-1 Profitability ratios
Ratio Formula What it shows
1 Return on total assets Profits after taxes
Total assets
The net return on total investment
of the firm
or or
Profits after taxes + interest
Total assets
The return on both creditors’ and
shareholders’ investments
2 Return on shareholders’ equity
(or return on net worth)
Profits after taxes
Total shareholders’ equity
How effectively the company is
utilising shareholders’ funds
3 Return on ordinary equity Profit after taxes – preference share dividends
Total shareholders’ equity – par value of
preference shares
The net return to ordinary
shareholders
4 Operating profit margin
(or return on sales)
Profits before taxes and before interest
Sales
The firm’s profitability from
regular operations
5 Net profit margin
(or net return on sales)
Profits after taxes
Sales
The firm’s net profit as a
percentage of total sales
Exhibit A-2 Liquidity ratios
Ratio Formula What it shows
1 Current ratio Current assets
Current liabilities
The firm’s ability to meet its current financial
liabilities
2 Quick ratio (or acid-test ratio) Current assets – inventory
Current liabilities
The firm’s ability to pay off short-term
obligations without relying on sales of
inventory
3 Inventory to net working capital Inventory
Current assets – current liabilities
The extent to which the firm’s working capital
is tied up in inventory
Introduction • Preparing an effective case analysis

C-17
Exhibit A-3 Leverage ratios
Ratio Formula What it shows
1 Debt-to-assets Total debt
Total assets
Total borrowed funds as a percentage of total
assets
2 Debt-to-equity Total debt
Total shareholders’ equity
Borrowed funds versus the funds provided by
shareholders
3 Long-term debt-to-equity Long-term debt
Total shareholders’ equity
Leverage used by the firm
4 Times-interest-earned
(or coverage ratio)
Profits before interest and taxes
Total interest charges
The firm’s ability to meet all interest payments
5 Fixed charge coverage Profits before taxes and interest
+ lease obligations
Total interest charges
+ lease obligations
The firm’s ability to meet all fixed-charge
obligations, including lease payments
Exhibit A-4 Activity ratios
Ratio Formula What it shows
1 Inventory turnover Sales
Inventory of finished goods
The effectiveness of the firm in employing
inventory
2 Fixed assets turnover Sales
Fixed assets
The effectiveness of the firm in utilising plant
and equipment
3 Total assets turnover Sales
Total assets
The effectiveness of the firm in utilising total
assets
4 Accounts receivable turnover Annual credit sales
Accounts receivable
How many times the total receivables have
been collected during the accounting period
5 Average collection period Accounts receivable
Average daily sales
The average length of time the firm waits to
collect payments after sales
Introduction • Preparing an effective case analysis

C-18
Exhibit A-5 Shareholders’ return ratios
Ratio Formula What it shows
1 Dividend yield on ordinary
shares
Annual dividends per share
Current market price per share
A measure of return to ordinary shareholders
in the form of dividends
2 Price–earnings ratio Current market price per share
After-tax earnings per share
An indication of market perception of the firm.
Usually, the faster-growing or less risky firms
tend to have higher PE ratios than the slower-
growing or more risky firms
3 Dividend payout ratio Annual dividends per share
After-tax earnings per share
An indication of dividends paid out as a
percentage of profits
4 Cash flow per share After-tax profits + depreciation
Number of ordinary shares outstanding
A measure of total cash per share available for
use by the firm
Notes
1 M. A. Lundberg, B. B. Levin and H. I. Harrington, 2000, Who
Learns What from Cases and How? The Research Base for Teaching
and Learning with Cases (Englewood Cliffs, NJ: Lawrence Erlbaum
Associates).
2 L. B. Barnes, A. J. Nelson and C. R. Christensen, 1994, Teaching
and the Case Method: Text, Cases and Readings (Boston: Harvard
Business School Press); C. C. Lundberg, 1993, ‘Introduction to
the case method’, in C. M. Vance (ed.), Mastering Management
Education (Newbury Park, Calif.: Sage); C. Christensen, 1989,
Teaching and the Case Method (Boston: Harvard Business School
Publishing Division).
3 C. C. Lundberg and E. Enz, 1993, ‘A framework for student
case preparation’, Case Research Journal, 13 (summer), p. 133.
4 J. Solitis, 1971, ‘John Dewey’, in L. E. Deighton (ed.), Encyclopedia
of Education (New York: Macmillan and The Free Press).
5 F. Bocker, 1987, ‘Is case teaching more effective than lecture
teaching in business administration? An exploratory analysis’,
Interfaces, 17(5), pp. 64–71.
Introduction • Preparing an effective case analysis

C-19
Case 1
Hearing with the aid of
implanted technology:
The case of Cochlear™, an Australian
high-technology leader
Dallas Hanson Mark Wickham
University of Tasmania University of Tasmania
The Cochlear company of
Australia: The situation
Cochlear™ is a leading Australian company specialis-
ing in cochlear devices – that is, implantable hearing
devices. It is the world leader in this market and a pro-
minent innovator in the high-technology niche within
which it operates. Cochlear originated in Australia
but now sells globally in an increasingly competitive
market.
There are several problems currently facing the
company. Within the global deaf community there is
a serious debate about the use of technology to aid
hearing in the profoundly deaf, and this obviously
threatens the market. Second, and more significantly,
in 2002 there was a major issue when the US Food
and Drug Administration (FDA) issued a notification
that it had received news of possible associations
between cochlear implants and meningitis. In late
2003 a new CEO, Chris Roberts, took over. What are
his options?
The Cochlear implant technology
A cochlear implant is a small electronic device that
helps a profoundly (completely) deaf person to have
a sense of sound. It is different from a hearing aid
because it helps to compensate for damaged or non-
functional parts of the ear, while a hearing aid ampli-
fies sound. The implant has four parts:
• a tiny but sensitive microphone that picks up
sound
• a speech processor that selects and arranges
useful sounds
• a transmitter and receiver that turns these
sounds into electrical impulses
• a series of electrodes that are surgically
implanted in the inner ear, which pick up the
receiver’s impulses and transmit them to the
brain. (This process is analogous to how hearing
people hear sounds.)
The cochlear implant technology is getting more
sophisticated all the time. It is a fast-moving technol-
ogy, and changes are further enhancing the capacity

C-20 Case 1 • Hearing with the aid of implanted technology: Cochlear
of the devices as well as making them smaller and
therefore more socially acceptable.
Implanting the devices is a surgical procedure that
has some risks. It is also expensive because it requires
an experienced surgeon. Exhibit 1 is a diagrammatic
representation of the device.
A recent Cochlear company annual report out-
lines the details of this technology and indicates its
intricacy:
Introduction to the Nucleus® 3 system
The unique features of the Nucleus® 3 system
include:
Longest battery life on the market: The ESPrit™
3G speech processor is the only processor on the
market with a battery life that lasts up to three
days. Few interruptions and clear sound means
better hearing.
Unique Whisper setting provides more sound:
The ESPrit 3G is the only speech processor on the
market that features a special Whisper setting
designed to make soft sounds more audible –
like rain falling or a person calling from another
room.
Wireless FM and in-built telecoil: An in-built
telecoil allows you to use the telephone with no
additional attachments. The wireless FM provides
access to sound in a variety of settings including
cinemas, museums, meetings, classrooms, and
wherever an FM system is in place for hearing-
impaired participants. No additional cables are
necessary.
The only pre-curved (contoured) electrode
array on the market: The Nucleus® 24 Contour™
implant is the first implant choice for surgeons.
It features a pre-curved electrode array, which
has two important benefits: 1) The curve of the
array puts the electrodes as close as possible to
the hearing fibers in the cochlea to allow for the
distinct sound. 2) The pre-curved shape of the
array matches the shape of the cochlea, which
helps to protect its delicate structure.
Titanium implant casing for best reliability:
Nucleus® implants are durable and reliable and
are made from Titanium. The Nucleus 24 Contour
has never fractured on impact. Nucleus is built for
a lifetime of use.
Removable magnet for safe MRI: Nucleus is the
first implant to feature the removable magnet for
MRI. This allows recipients to have a full-strength
MRI if they require one.1
Exhibit 1 How the Nucleus® 3 system works
1 A directional microphone picks up sound.
2 Sound is sent from the microphone to the speech processor.
3 The speech processor analyses and digitises the sound into coded
signals.
4 Coded signals are sent to the transmitter via radio frequency.
5 The transmitter sends the code across the skin to the internal
implant.
6 The internal implant converts the code to electrical signals.
7 The signals are sent to the electrodes to stimulate the remaining
nerve fibres.
8 The signals are recognised as sounds by the brain, producing a
hearing sensation.

Case 1 • Hearing with the aid of implanted technology: Cochlear C-21
Cochlear, the company
The history of Cochlear’s Nucleus® device goes back to
1967, when Graeme Clark started research on multi-
channel cochlear implants. In 1978, Professor Clark
implanted Rodney Saunders with a multi-channel
cochlear device, and by 1982 a 22-channel device
was implanted in Graham Carrick. (The more chan-
nels, basically, the better the hearing.) In 1985 the
22-channel Nucleus device was approved by the FDA
for use in adults, and in 1990 for use in children. By
1998, 10 000 children had been implanted, and by
2001 more than 36 000 adults and children had been
implanted.2
Cochlear’s technology has kept improving, and
each component improvement improves the overall
system. In 2003 the company announced a further
significant improvement to its basic product: the
Nucleus® 24 Contour Advance™ was designed to
minimise trauma to the delicate cochlear structures
during implant surgery. It also developed a new Micro-
Link Adaptor for use with the speech processor and
receiver. (This was a product of the alliance Cochlear
has with European technology firm Phonok AG.) In
recent years the company has continually enhanced
the capacity, and further minimised the size, of its
Nucleus devices. Cochlear has won many awards for
innovation – for example, the Medical Design Excel-
lence Award in 2001 (an internationally prestigious
achievement).
The 2002/03 financial year also included a record
result financially. Profit after tax increased by 45 per
cent to A$58.2 million and earnings per share were
up 44 per cent. There were also record unit sales, up
Exhibit 2 Statement of financial performance
Cochlear Limited and its controlled entities for the year ended 30 June 2003
Consolidated Company
2003
$000
2002
$000
2003
$000
2002
$000
Revenue from ordinary activities 290 045 256 201 205 044 187 752
Expenses 209 239 204 021 131 110 136 448
Borrowing costs 796 1 150 153 195
Profit from ordinary activities before related income tax expense 80 010 51 030 73 781 51 109
Income tax expense relating to ordinary activities 21 797 10 920 19 892 11 952
Net profit attributable to members of the parent entity 58 213 40 110 53 889 39 157
Non-owner transaction changes in equity
T
ranslation adjustment in general reserve (8) 3 – –
Net (decrease)/increase in retained profits on the initial adoption of:
Revised AASB 1028, ‘Employee Benefits’ (116) – (90) –
AASB 1044, ‘Provisions, Contingent Liabilities and Contingent Assets’ 311 – 2 411 –
Net exchange difference relating to self-sustaining foreign operations (4 737) 2 507 – –
Total changes in equity from non-owner related transactions
attributable to the members of the parent entity 53 663 42 620 56 210 39 157
Basic earnings per share (cents)
Ordinary shares 110.0 76.6
Diluted earnings per share (cents)
Ordinary shares 110.0 76.6

C-22 Case 1 • Hearing with the aid of implanted technology: Cochlear
19 per cent on the previous year. Sales in the United
States were strong; in Europe they were steady; and
in Asia there was strong growth before the SARS out-
break of 2002 affected the market. Some 9328 devices
were sold during the financial year, and at A$50 000
for lifetime care this indicated a very good year. It
took Cochlear 20 years to sell 30 000 systems, but in
the last couple of years it has sold another 20 000.3
Exhibit 2 shows the statement of financial perfor-
mance for the 2002/03 financial year.
Cochlear’s manufacturing facilities are world class
and have had repeated upgrades in order to maintain
this status.
The firm is very focused on R&D and devotes
15 per cent of total revenue to research. As well as
220 research staff, it has major long-term research
links with the CRC (Co-operative Research Centre)
for Cochlear Implant and Hearing Aid Innovation in
Melbourne, as well as with the University of Melb-
ourne itself. In addition, Cochlear has collaborative
research arrangements with 90 other partners in 35
countries.4
The organisation is very determined to maintain
excellent links with implant recipients and the sur-
geons and audiologists that work with them. In 2002,
70 surgeons attended the Sydney facility through
Cochlear’s ongoing visiting surgeon program.
Cochlear has 630 staff in 70 countries. It has an
excellent training system for new staff. For exam-
ple, in 2002, 43 new staff attended the Sydney head-
quarters for intensive training in the technology of
implants and all aspects of the implantation process,
including surgery. Cochlear is proud of the ethnic
diversity of its staff – the Sydney office includes staff
from 60 nations.
The board is made up of eight independent non-
executive directors, the CEO, and one other execu-
tive director. Cochlear has a great committee system
and all meetings are well documented. In September
2002, Cochlear was named in the top three Australian
companies for best corporate governance by Investor
Relations Magazine.
The external world for the
industry
Hearing impairment
Hearing impairment ranges from mild to profound,
and some people can hear some frequencies but not
others. Mild hearing loss means that people can hear
in quiet, one-to-one, situations but have problems in
noisy environments such as cafés and bars. At the
moderate level of loss, people find difficulty in hear-
ing normal speech at any distance over a metre and
are unlikely to hear well in crowded social situations.
Profound hearing loss means that a person cannot
hear a normal speaking voice or normal sounds. They
may be helped by hearing aids, but tend to rely heav-
ily on speech reading or sign language. Those with
high-frequency loss (often caused by exposure to loud
noises) can hear the person speaking but have diffi-
culty hearing all the sounds. For example, the higher-
pitched consonants such as P, S, F and CH may be
confused, so ‘sun’ may be heard as ‘fun’ or ‘pat’ heard
as ‘sat’.5
The market for cochlear devices is the pro-
foundly deaf. The number of such people is diffi-
cult to determine. The UK National Deaf Children’s
Society (NDCS) suggests that one in 1000 children
are born with severe/profound hearing problems.6
The (Australian) Bionic Ear Institute estimates the
potential market in the West plus Japan as 3 million
devices. In China, there are possibly 35 000 people
born each year who would benefit from the device.7
Even when discounted for unwillingness to risk the
operation or lack of money, the numbers are huge.
The companies competing in the industry concen-
trate on the United States and European markets and
have barely penetrated the wider global market.
The political/legal environment
The cochlear industry is part of the general medical
technology industry. Regulation is therefore signifi-
cant and the US Food and Drug Administration is

Case 1 • Hearing with the aid of implanted technology: Cochlear C-23
the most significant regulator because its findings
have weight worldwide. The FDA must approve new
devices before they can be sold in the United States.
The FDA was also the initiator of the 2002 meningitis
scare, which affected the whole industry.
The global aspect
The cochlear market has gradually expanded beyond
Australia, the United States and Europe. Cochlear
itself established its European offices in 1987 and
an office in Japan and Hong Kong in the 1990s,
while China was a major target in 2001. Cochlear
devices are now sold in more than 60 nations. Given
that profound deafness is a problem globally, it can
be expected that the global market will continue to
expand.
Economics and cochlear devices
Cochlear devices cost around A$50 000 for a life-
time service.8 Demand worldwide therefore comes
from relatively affluent individuals, medical insur-
ance companies and government organisations. It is
possibly limited in poorer nations. However, within
the OECD the middle to upper income groups are
increasingly prosperous and these people are a poten-
tial market without government help. On the other
hand, medical and insurance systems are gradually
coming under increasing pressure as government tax
incomes struggle to cope with competing demands for
health, education and welfare services.9
In 2003 the global economy was expected to take
an upturn, while Australia continued a phase of con-
tinued prosperity and Europe and the United States
were basically stable in economic terms.
The meningitis crisis in the
Cochlear implant industry
On 24 July 2002 the FDA issued a notification that it
had reports of a link between cochlear implants and
bacterial meningitis (a potentially fatal infection of
the lining of the surface of the brain). There were 43
such cases and 11 people died. There were reports that
implants had been withdrawn from sale in Germany,
France and Spain. On 25 July the FDA updated its
warning and said it had now learned of 118 cases.10
Cochlear responded to the crisis quickly. Graeme
Clark claimed that the infection was related to a
design change by their competitor, Advanced Bionics,
that created ‘dead space’ within the ear, thus provid-
ing a home for bacteria. Professor Clark commented
that, ‘It is a very great problem of engineers per se
designing something without due recourse to biolo-
gists and medical people.’11 Advanced Bionics tempo-
rarily withdrew its product from sale.
The neuro-technology industry (the generic
industry for implantable devices) bulletin commented
on this scare: ‘One side benefit of the relative lack
of media exposure that the neural prosthesis industry
receives is that this crisis has not gained the inten-
sive public scrutiny that has greeted other industries
when confronted with unflattering data or allega-
tions.’12 The scare nevertheless received significant
media attention and Cochlear’s share price dropped
sharply. Advanced Bionics advanced a reputation for
crisis management with its suspension from sales and
detailed explanations of problems to its stakeholders.
The meningitis scare has had a long-term ripple
effect on the industry, and doubt remains despite a
climb in share prices to those similar to levels prior
to the scare. The deaf community and the medical
profession have an ongoing debate about cochlear
implants. For example, Blake Papsin, the director of
the Cochlear implant program in Toronto, Canada,
in early 2003, said:
In coming to terms with the relation between
cochlear implants and meningitis, we should not
lose sight of the benefit of this technology. For
many children, the cochlear implant is a marvel
that has allowed them to attain or regain hearing
and speech. The growing number of candidates
for cochlear implants, at least in Canada centres,
reflects a conservative application of this technology
based on the responsible evaluation of outcomes.13
This debate simmers in deaf culture. It is made
more complex by advances in other areas of neuro-
technology that are leading to useful devices such

C-24 Case 1 • Hearing with the aid of implanted technology: Cochlear
as artificial sight. In addition, the increasing accep-
tance of altered body technology may impact on the
cochlear industry: many now feel it is normal to alter
body parts by surgery – for example, with pectoral
enhancement or breast enlargement – and this could
affect the ‘normality’ of a cochlear implant in the
wider (as distinct from deaf) culture.
Debate about the idea of
Cochlear implants in the
deaf community
The background to a vigorous debate about the
active benefits of a cochlear implant is encapsulated
in a 2002 letter from Robert Adam, President of the
Australian Association of the Deaf:
The truth is obvious: a cochlear implant is not a
cure for deafness. Let me expand on this a little.
The Royal Institute for the deaf in the UK has a
fact sheet which mirrors the Australian Association
of the Deaf’s view succinctly: A child with an
implant will still be profoundly deaf when not
wearing the implant. When wearing the implant,
the child will be considered hard of hearing, or
severely deaf, in the sense that a person with a
hearing aid is described as hard of hearing.
The deaf culture is not just about a language
– it is also about community, history and art. Like
many minority cultures, there is a strong tradition
of stories and folklore that is passed on from one
generation to the next. There have been many
captivating and moving stories about the way deaf
people lived in the past and about how deaf culture
has endured despite attempts to ‘cure’ deafness.14
In 2000 in the United States the debate was high-
lighted by a film documentary called Sound and Fury,
which portrayed the Artinian family. The father,
Pete, is deaf and has three deaf children. His family
includes brother Chris and his wife Mari. They had a
deaf baby and decided to have an implant. Pete and his
wife Nita, leading anti-implant campaigners, object-
ed but were then astonished when their own daughter
requested an implant. Pete and Nita were afraid that
their daughter would lose contact with deaf culture if
she had an implant, so they decided to move to a more
deaf-culture-oriented community. This complex fam-
ily drama appealed to the US media, and the idea of a
deaf culture contrasted with the benefits of cochlear
implants became a subject of general debate.
In 2003 the tenor of the debate in the United States
changed with the entry of Miss USA 1995, Heather
Whitestone McCallum. She became profoundly deaf
in infancy and had an implant in 2002. She then
sprang into action, lobbying federal politicians for the
industry, appearing on top-rating television shows,
such as Good Morning America, and appearing in
print media such as the bestselling USA Today. She
has been credited with helping to change the US gov-
ernment’s mind on cochlear support: the government
had been talking in 2002 of reducing funding for the
implant procedure but ended up increasing it.15
Competitors in the
industry
Advanced Bionics is a private US company founded
in 1993, which is dedicated to the development of
neuron-stimulation products – implantable devices
that direct electrical impulses to nerves and muscles.
The chairman, Alfred Mann, says the company aims
to ‘enable the deaf to hear, the blind to see, and the
lame to walk’. The company originated when Dr
Robert Schindler from the University of California’s
San Francisco cochlear program approached Mann
for funding. Mann was already highly successful in
implantable devices, the founder of a major heart
pacemaker company (Pacemaker Systems) and high-
tech wearable insulin-delivering pumps (MiniMed).
In 2003 the Alfred Mann Foundation (Mann’s phil-
anthropic research organisation) was working with
Robert Greenberg, the CEO of Mann’s company
Second Sight, a company devoted to the development
of implants to enable vision. The implants would
enable people with retinal disintegration to see.
Greenberg claimed in 2003 that three people have
been implanted and that the results were ‘pleasing’.16
Advanced Bioniocs has developed and sold the Clar-
ion cochlear implant. This had, in 2002, about 15 per
cent of the US market.

Case 1 • Hearing with the aid of implanted technology: Cochlear C-25
AllHear Inc. Designs
This company manufactures and sells cochlear
implants. The founder, Dr William House, produced
a cochlear device in 1984 in conjunction with the 3M
Corporation, one of the world’s leading innovation-
driven corporations. The AllHear cochlear implant
is unique because it uses a single short electrode that
apparently does not destroy residue of hearing.17 In
2003, AllHear’s cochlear implants were not approved
by the FDA for general sale in the United States.
Med-El
Med-El produces the COMBI-40+ cochlear implant
system. It has collaborative arrangements with a
range of universities. Med-El has eight subsidiaries
and nine service centres throughout the world. It is a
fierce competitor.
Back to Cochlear, the
company
The previous CEO, Jack Mahoney, was a successful
leader after succeeding the well-known Catherine Liv-
ingstone in 2001. He delivered on ambitious growth
and profit targets in 2002/03. He received a pack-
age in 2002 worth $1.8 million, including a $416 845
performance-based bonus and had $100 000 in stock
options, which remained unaffected by the new plan.
In late 2003 he announced his resignation and
a new CEO, Chris Roberts, took over in February
2004. Roberts faced the classic challenges of the new
CEO of a reasonably successful company – how to
continue a record of advancing sales, profits and inno-
vation. In addition, he must cope with the competi-
tion and the social and medical issues that threaten
the industry. Roberts had been CEO of ResMed, an
Australian company that makes and innovates in sleep
apnoea products. (Sleep apnoea is a condition where
a person’s airways become blocked, often as a result
of being overweight, causing them to wake up, some-
times many times a night. It is a good area for busi-
ness, as cases of apnoea are on the increase. ResMed
is number one in Europe for these products.
Soon after Roberts took over at Cochlear, the
share price dropped by 30 per cent. The European
markets were worse than expected, and the American
market was tight because the federal health budget
was tighter, and the major competitor in the United
States, Advanced Bionics, had been rejuvenated.
Cochlear is still the market leader, but its competitors
are coming on strong.18
What strategies do you suggest CEO Chris Roberts
use to achieve his aims?
Notes
1 www.cochlear.com.
2 Ibid.
3 N. Gluyas, ‘Cochlear’, The Australian, 1 December 2003.
4 www.cochlear.com.
5 Australian Association of the Deaf, 2003.
6 NDCS, 2003.
7 Gluyas, ‘Cochlear’.
8 Ibid.
9 OECD, 2002.
10 www.lieffcabrasser.com/cochlear.htm.
11 Quoted in ibid.
12 Neurotech Business Report, August 2003.
13 MAT, accessed on www.cmaj.ca.
14 Herald-Sun, 26 March 2002.
15 Australian Financial Review, 20 August 2003.
16 www.healthyhearing.com.
17 Ibid.; www.allhear.com.
18 B. Foley, 2004, ‘Cochlear needs a good doctor’, Australian
Financial Review, 4 February, p. 21.

C-26
Case 2
The Australian retail wars:
Coles Myer and Woolworths battle for
brand value
Mark Wickham Dallas Hanson
University of Tasmania University of Tasmania
Introduction
Throughout the 1990s, the chronic poor performance
of Australia’s largest ‘food’ and ‘general merchan-
dise’ retail firms, Coles Myer and Woolworths, led
analysts and investors alike to abandon their shares
in droves. Both chains were dogged by underperform-
ing divisions, global economic uncertainty, and a
lack of strategic vision perceived as endemic to the
sector. Since 2000, however, both companies have
managed to implement significant strategic changes
to their business operations, and by 2003 had once
again found favour with the investment community.
The strategic changes have included diversification
into new retailing sectors such as petrol and credit
cards, the restructuring of their supply chain logis-
tics, and the advancement of their information tech-
nology capabilities. Each move has been greeted with
increased earnings and the associated investor opti-
mism, although the question remains as to how Coles
Myer and Woolworths can continue to deliver the
outstanding results of 2003 in an uncertain economic
future.
The Australian ‘food’ and
‘general merchandise’
retail sectors, 1996–2002
Despite the global economic decline experienced since
the Asian financial crisis of 1997/98, and the economic
and social shocks of the World Trade Center attacks in
2001, the Australian retailing sector has experienced
robust year-on-year growth since 1995/96. Exhibit 1
indicates the robust nature of Australian retail spend-
ing during this period. The strength of Australia’s
retail spending has been attributed to relatively high
consumer and business confidence, relatively low offi-
cial interest rates and stable employment levels.1 The
food and general merchandise retail sectors have con-
tributed significantly to Australia’s retailing success
story, and closely reflect the success, and dominance,
of Coles Myer’s and Woolworths’ branding strategies
since 2000. Coles Myer’s and Woolworths’ domina-
tion of the food and general merchandise sectors is
reflected by their combined revenues, which in the
financial year ended 2003 accounted for close to 80
per cent of the sector’s total.2

Case 2 • The Australian retail wars: Coles Myer and Woolworths C-27
Exhibit 1 Australian retail sales figures, 1995/96–2001/02
Food
retailing
General
merchandise
Clothing
and soft
goods
retailing
Household
goods
retailing
Recreational
goods
retailing
Other
retailing
Hospitality
and services Total
$mn $mn $mn $mn $mn $mn $mn $mn
1995/96 57 996 12 315 8 882 12 591 7 623 12 307 25 002 135 885
1996/97 58 406 12 241 8 758 13 795 7 251 12 742 23 603 136 411
1997/98 60 453 12 593 8 989 14 314 7 391 13 835 23 965 141 220
1998 /99 61 482 12 994 10 068 14 717 7 492 14 639 26 007 147 081
1999/00 62 218 13 768 10 781 17 344 7 612 15 863 27 363 154 884
2000 /01 62 004 13 140 10 213 17 972 7 310 17 020 27 563 155 222
2001/02 63 340 13 714 11 005 20 554 7 393 18 785 25 584 163 374
Source: Commsec.
The best of times: A tale of
two retailers
The Australian food retailing industry consists of
a virtual duopoly between Coles Myer and Wool-
worths. The combined sales of the two retail giants
exceed A$55 billion, and provide employment for
some 300 000 workers.3 The Coles Myer empire was
established in 1985 with Coles’ acquisition of Grace
Brothers, and by 2003 consisted of 14 distinct busi-
ness units spanning both the food and general mer-
chandise retailing sectors. In its food division are the
Coles Supermarket chain of stores, its Bi-Lo discount
supermarkets, and the Internet-based Coles Online
and Shopfast Online. In its general merchandise divi-
sion are the Myer’s Grace Brothers department store,
the Megamart chain of electrical and furniture retail-
ers, the Target department stores, Kmart’s cut-price
department store, the OfficeWorks chain and Harris
Technology. Recently, the company also launched its
Coles Express stores, which merchandise a limited
range of grocery items from selected petrol stations
in Victoria.4
In 2003, the Woolworths retailing empire con-
sisted of three food and four general merchandise
businesses. Woolworths’ food businesses included
their Woolworths and Safeway supermarkets, and the
BWS (Beer, Wines and Spirits) chain of liquor outlets.
Its general merchandise businesses include the Big W
chain of discount department stores, the Dick Smith
chain of electronic equipment stores, the Tandy chain
of electrical merchandise stores, and the Plus Petrol
service stations.5
Despite the fact that Coles Myer remains the coun-
try’s largest food retailer, its growth year on year lags
behind that of Woolworths, which has delivered 22
per cent increases in its earnings for the period 2000
to 2002. Coles Myer, on the other hand, has achieved
growth rates that are commensurate with CPI increas-
es, and has tended to play ‘catch-up retailing’ on
everything from supply chain management to fuel dis-
counts. One strategy that Coles Myer uses that acts as
a real point of difference in the supermarket game is
its concentration on the development of house brands
(that is, its Coles, Reliance and Farmland brands).
Currently, house brands account for approximately
8 per cent of Coles Myer’s store-keeping units (SKUs),
with the company planning to increase these to 15
per cent over the next three years. Woolworths, on
the other hand, is concentrating on the promotion of
everyday low price (EDLP) points for well-established
national brands, a strategy that it borrowed heavi-
ly from the success of the Wal-Mart chain of stores
in the United States.6 By taking on the demonstra-
bly successful aspects of Wal-Mart’s EDLP strategy,
Woolworths has turned around its loss-making gen-
eral merchandise operations and has streaked ahead
of its major competitors.7 In particular, Woolworths’
EDLP has worked well in its Big W chain, where it has

C-28 Case 2 • The Australian retail wars: Coles Myer and Woolworths
proven to be a competitive advantage against Coles’
Kmart and Target divisions, which maintained a
‘high–low’ pricing strategy.8
A question of leadership
and strategy
Despite the multi-point competition that exists
between the two companies, their leadership could
not be any more divergent. In September 2001, and
without any prior experience in the industry, John
Fletcher was appointed as the chief executive officer
of Australia’s largest retailer, Coles Myer Ltd. Before
his appointment at Coles Myer, Fletcher spent almost
his entire professional career at Brambles Industries,
a resource sector firm that supplied on- and off-site
logistics for mining companies operating in Austra-
lia.9 Early in his career, Fletcher was charged with
accounting responsibilities at Brambles, but his man-
agerial skills were soon recognised and developed by
the company, who promoted him to CEO in 1993. By
comparison, Roger Corbett, the CEO of Woolworths
Ltd, has been involved in the Australian retail indus-
try for more than 30 years, initially working as a ser-
vice assistant for Grace Brothers in the 1960s, which,
ironically, became part of the Coles Myer empire in
1985. Corbett has also been heavily involved with the
management of the Wal-Mart chain of supermarket
and general merchandise stores in the United States,
where he has attended annual general meetings and
other pivotal strategy meetings. It was from this inter-
action that Corbett adopted the Australian version of
the EDLP strategy that has to date been highly valu-
able for the Woolworths business.10
Fletcher assumed the CEO position at Coles Myer
during a very interesting time for the company. Aside
from its supermarket division, which had experi-
enced strong growth since Dennis Eck took control
in the mid-1990s, the remainder of the group was
dogged by well-documented, and seemingly chronic,
underperformance. In addition, Fletcher’s arrival was
met with a series of boardroom upheavals and the
culmination of years of shareholder discontent.11 The
eight years’ experience at the helm of one of Australia’s
largest resource companies between 1993 and 2001,
however, did little to prepare him for the tumultuous
period that he would endure at Coles Myer during
2002, a year that he was to describe as ‘as tough as
any year that I have had in my professional life’. At the
same time, Roger Corbett was enjoying a third consec-
utive year-on-year profit growth of approximately 10
per cent, and had plans to acquire the Franklins’ chain
of supermarkets to further its growth ambitions. The
source of Woolworths’ much-heralded performance
has been attributed to Corbett’s implementation of
a strategy named ‘Project Refresh’ in 1999. Project
Refresh sought to restructure the company’s supply
chain, and to introduce new technology and the new
EDLP structure to its supermarkets. Added to this
was its successful foray into the petrol-retailing sector
in 1997 (a strategy that drew no competitive response
from Coles Myer at the time), which resulted in Wool-
worths capturing valuable market share points from
Coles Supermarkets between 1999 and 2002. By the
end of 2002, the Australian food and general mer-
chandise retail sectors were valued at approximately
$75 billion, and Woolworths had managed to cap-
ture 40 per cent compared with Coles’ 36 per cent, a
fact reflected in Woolworths’ share price which had
grown from $4.20 in 1999 to $13 in 2002. Coles’
share price during the same period had fallen from
$9 to $6.
2003: The Coles Myer
empire strikes back
After indications that the Coles Myer empire might be
broken into its constituent ‘parts’ due to the chronic
underperformance of a number of its divisions,12 John
Fletcher instead announced a bold plan to confront
Woolworths head-on in the war for corporate brand
value in early 2003. The corporate brand ‘battles’ had
been comprehensively won by Woolworths between
1997 and 2002, with the company achieving 400 per
cent sales growth on their multi-point direct compe-
tition items during this time. Woolworths had also
managed to position itself as The Fresh Food People
during this period, a marketing triumph not matched
by the Coles Myer food retailers. In response to Coles
Myer’s relatively poor performance and its ‘second
mover’ status in the food and general merchandise
sectors, Fletcher promised his shareholders that by

Case 2 • The Australian retail wars: Coles Myer and Woolworths C-29
2007, Coles Myer would become the leaders of retail-
market innovation and value, and double the com-
pany’s profit levels achieved in 2003. The first broad-
side in this ‘battle of the brands’ was to occur early
in 2003 in the liquor segment of the food-retailing
sector.
In April 2003, Coles Myer announced that it had
acquired the Theo’s chain of ‘premium’ liquor out-
lets located in Sydney and Melbourne. Woolworths
had already been in control of the Cheaper Liquor
Company in various states, but had not been involved
with this premium end of the market. Almost imme-
diately, Woolworths undertook a similar acquisition
of the Dan Murphy’s franchise (for a reported $260
million), also located in Sydney and Melbourne.13 The
move almost immediately resulted in the reduction
of prices charged by both outlets. Coles Myer had
acquired Theo’s as a real point of difference between
the two companies’ offerings; however, Woolworths’
implementation of its EDLP strategy forced Coles
Myer to similarly cut its prices as a competitive neces-
sity. Woolworths’ ability to minimise its supply chain
costs (a benefit of the four-year-old Project Refresh
strategy) enabled the company to maintain greater
margins in this price war than Coles Myer could man-
age, a fact reflected in the two companies’ 2002/03
financial reports (see Exhibit 2 later in this case).
In May 2003, some six years after Woolworths’
initial foray into the retail petrol sector had seen it
capture 11 per cent of the market, Coles Myer agreed
to pay $94 million to Shell Petroleum for the right to
operate its own petrol discount chain in 584 of Shell’s
service stations. The alliance between the two compa-
nies was negotiated on the understanding that the
relationship would last for 20 years. Up until this
point, Coles Myer had undertaken a token competi-
tive response to Woolworths’ 1997 Plus Petrol scheme
by offering its customers discount vouchers to the
Mobil chain of petrol retailers. The problem with this
initial response was that, unlike Woolworths’ Plus
Petrol stations, which were located in close proximity
to its stores, the Coles–Mobil discount offer did not
allow the customer to ‘cash in’ on the value-adding
offer at the point of purchase. Of the company’s even-
tual strategic move into retail petrol, Fletcher stated:
‘Coles [does] not want a price war, but will react to
Woolworths’ pricing in this market.’14 In response to
this competitive action, Woolworths reversed its long-
running ‘house-brand’ fuel strategy by unveiling an
equity joint venture with the Caltex franchise of petrol
retailers in August 2003 – a move that closely
mimicked Coles Myer’s alliance with Shell. The equi-
ty joint venture was the company’s response to the
Coles–Shell alliance, a move that the company had
widely criticised at its launch in July 2003.15 In line
with the announcement was a commitment by the
company to wind down its home brand Plus Petrol
service stations in favour of re-branding them as
Caltex service stations.16 The deal with Caltex was to
add an additional 180 retail petrol outlets to Wool-
worths’ existing 287 Plus Petrol outlets. Essentially,
this move ensured that Woolworths would have 450
outlets in head-to-head competition with Coles Myer’s
580 outlets nation-wide.17 Roger Corbett claimed that
the joint venture with Caltex had nothing to do with
Coles Myer’s alliance with Shell, instead stating that
the strategy overcame the difficulties the company
was having in finding new retail outlet sites for its
growing Plus Petrol division.18
The new financial year 2003/04 began with two
important announcements from Fletcher. The first
concerned a Coles Myer alliance with the Nation-
al Australia Bank to revamp the company’s long-
running Fly Buys reward program. The second was
the introduction of a major cost-cutting strategy that
mirrored Woolworths’ Project Refresh launched some
four years earlier. In July 2003, Coles Myer and the
National Australia Bank announced that they had
signed an agreement to revamp the Fly Buys loyalty
program to include a credit card facility. Jon Wood,
a senior Coles Myer executive, said that the enhance-
ment of the Fly Buys card was an important part of
Coles Myer’s strategy to provide a comprehensive and
valuable offer for all of its customers, especially given
the announcement that the company’s famous share-
holder discount card was to be discontinued. Of the
Fly Buys strategy, Wood stated: ‘Fly Buys is Austra-
lia’s largest loyalty program and we are moving to
put more value into the program for our customers.
Together with our partners at the National [Australia
Bank], we will be revamping the program to offer
more points, better rewards and other benefits.’19
The replacement card was to be known as the Source
card, and included a credit facility that represented

C-30 Case 2 • The Australian retail wars: Coles Myer and Woolworths
Exhibit 2 Financial results for Woolworths Limited and Coles Myer Limited, 2001/02 and 2002/03
Woolworths financials
28 Coles Myer financials29
(A$ million) 2001/02 2002/03 2001/02 2002/03
Sales 25 239.4 26 321.4 25 688.7 27 016.6
Pre-tax profit 782.2 (3%) 906.0 (3.4%) 491.0 (1.9%) 617.2 (2.3%)
Net profit 564.4 (2.2%) 650.6 (2.5%) 353.8 (1.4%) 429.5 (1.6%)
EPS 50.2 58.1 26.1 32.2
Dividend 15.0 18.0 25.5 26.0
Sources: Commsec Securities Home Page, www.commsec.com.au.
Coles Myer’s initial foray into Australia’s $100 bil-
lion Capital Card Market (that is, credit cards). Coles
Myer already operates a loyalty card program that con-
sists of 1.7 million Coles Myer Card holders (a chain-
specific line of credit) but did not have the ‘universal
usage capability’. The company’s new Source credit
card meant that Coles Myer could differentiate itself
from Woolworths by offering a full credit card capa-
bility alongside a long-standing and valued rewards
program and a private label store credit card.
Fletcher’s second announcement was his inten-
tion to emulate the success of Woolworths’ Project
Refresh, a plan that would entail major cost-cutting
strategies within the company.20 Fletcher planned to
save up to $1 billion by making its 65 000 suppliers
shoulder more of its supply chain costs in a program
designed to close the performance gap with Wool-
worths. Fletcher intended to change the way Coles
Myer buys its $18 billion of merchandise by cutting
its stock on hand and by forcing its suppliers to move
to a just-in-time approach to delivery. The company
flagged to its employees that it intends to cut the num-
ber of its distribution centres from 41 to 24, and will
use improved technology to reduce costs and stream-
line deliveries to stores.21 Also part of this strategy
are plans to pressure its suppliers to adopt the same
IT systems that it uses in its warehouses and stores so
that it can build a more efficient e-trading platform.
Fletcher said that the company would invest between
$800 million and $900 million over the next five years
as part of this cost-cutting strategy that is expected to
deliver benefits of $425 million a year from 2007/08
onwards.22
By August 2003, there was already some evidence
that Coles Myer’s strategies were bearing fruit for
Fletcher’s shareholders. Sales in the group lifted by
a substantial 6.1 per cent at $27 billion, marginally
ahead of Woolworths’ $26.3 billion. The stock mar-
ket also responded well to Fletcher’s performance,
with Coles Myer shares rising 29 per cent during the
year, while Woolworths’ shares remained steady.23
Still a concern for the company was the food and
liquor sales, which grew by only 1.5 per cent, as
opposed to Woolworths’ 5.4 per cent.24 The statistics
served to underline the competitive advantage that
Woolworths had over the Coles Myer empire. Exhibit
2 presents the economic results for both firms dur-
ing the 2002/03 financial year. Despite the appar-
ent success of Coles Myer’s strategies in address-
ing its performance gap with Woolworths, Corbett
was confident that Woolworths would continue to
achieve its recent double-digit profit growth. Indeed,
despite Coles Myer’s seemingly effective strategis-
ing, the financial year ended 2003 witnessed Wool-
worths notching up its best annual result in five
years. The company’s 16.5 per cent increase in profit
to $610 million was powered by higher margins in
its supermarket, liquor, petrol and general merchan-
dise operations.25 Corbett also revealed that its cost
savings program, Project Refresh, had delivered the
promised savings to the company of some $1.7 billion
over the previous four years.26 Corbett announced
that the company would maintain its profit growth
forecasts of between 10 and 15 per cent for the
2003/04 financial year, despite the uncertain outlook
for the food and liquor divisions, and the increased
competition from Coles and the German outfit,
Aldi.27 Corbett stated that Woolworths’ strategy to
remain differentiated from Coles Myer while adding
greater value to their customers’ shopping experience

Case 2 • The Australian retail wars: Coles Myer and Woolworths C-31
was of utmost importance in Australia’s retailing
industry, and flagged a possible diversification into
the pharmaceutical market. In November 2003,
Corbett solidified this by announcing that Wool-
worths planned to open a number of fully stocked
pharmacies and ‘health and beauty stores’ in its super-
market chain.30
The challenge for both Fletcher and Corbett in
2004 centres on their ability to continue to add value
to their customers’ shopping experience while simul-
taneously maintaining shareholder returns. The ques-
tion, therefore, is how the two men might best strat-
egise for this result given the increasing market power
of the two dominant firms, and the multi-point com-
petitiveness inherent to their operations.
Notes
1 L. Schmidt and S. Lloyd, 2003, ‘Monsters of retail’, Business
Review Weekly, 13–19 November, p. 38.
2 Ibid.
3 P. Switzer, 2003, ‘Call for codes to curb growth of retail giants’,
The Australian, 2 September, p. 29.
4 ‘Our brands’, 2003, Coles Myer Home Page, 10 November,
www.coles.com.au.
5 ‘Our brands’, 2003, Woolworths Home Page, 10 November,
www.woolworths.com.au.
6 ‘Woolies and Coles both forging ahead’, Australian Financial
Review, 15 August, p. 76.
7 S. Mitchell, 2003, ‘Roger Corbett’s other BIG W’, BOSS
Magazine, October.
8 N. Shoebridge, 2003, ‘Woolies stands by its low-price strategy’,
Australian Financial Review, 18 August, p. 45.
9 S. Evans, 2003, ‘Coles targets $1 billion squeeze on suppliers’,
Australian Financial Review, September, p. 1.
10 Mitchell, ’Roger Corbett’s other Big W’.
11 S. Long, 2002, ‘Mayhem in the Coles-Myer boardroom’, ABC
PM, 10 September.
12 R. Gluyas, 2002, ‘Coles Myer break-up looms’, The Australian,
7 June, p. 19.
13 M. Westfield, 2003, ‘Woolies squeezes rivals, suppliers’, The
Australian, 25 March, p. 19.
14 K. Jiminez, 2003, ‘Coles in discount fuel link’, The Australian,
28 May, p. 21.
15 G. Elliott, 2003, ‘Woolies ties up Caltex deal’, The Australian,
22 August, p. 17.
16 T. Hardcourt, 2003, ‘Woolies changes tack – and to Caltex’,
Australian Financial Review, 22 August, p. 56.
17 Elliott, ‘Woolies ties up Caltex deal’.
18 I. Howar th and S. Mitchell, 2003, ‘Corbett defends petrol
strategy’, Australian Financial Review, 25 August, p. 14.
19 ‘Coles Myer and National increase Fly Buys commitment’,
2003, National Australia Bank Home Page, 1 July, 11 November,
www.national.com.au.
20 ‘Woolies and Coles both forging ahead’, p. 76.
21 CNN News Service, 2003, ‘Australia’s biggest retailer Coles
Myer says a transformation of its supply chain will help its
profit goal of Aust. $ 800 million ($536 million) by 2006’,
25 September.
22 Ibid.
23 S. Mitchell, 2003, ‘Woolies vows to beat Coles threat’,
Australian Financial Review, 26 August, p. 1.
24 S. Evans, 2003, ‘Sales rise lifts Coles profit’, Australian Financial
Review, 15 August, p. 55.
25 Mitchell, ‘Woolies vows to beat Coles threat’, p. 1.
26 Ibid.
27 Ibid.
28 Woolworths Home Page, www.woolworths.com.au.
29 ‘Corporate Report 2002–03’, 2003, Coles Myer Home Page,
10 November, http://corporate.colesmyer.com.au.
30 Schmidt and Lloyd, ‘Monsters of retail’, p. 38.

C-32
Case 3
eBay.com*:
Profitably managing growth from
start-up to 2000
Dale Pudney Marius van der Merwe Gary J. Stockport
University of Cape Town University of Cape Town University of Western Australia
* This case study was written by Dale Pudney and Marius van der Merwe, MBA students at the University of Cape Town, under the supervision of
Professor Gary J. Stockport, Graduate School of Management, University of Western Australia. It is intended to be used as the basis for class discussion
rather than to illustrate either effective or ineffective handling of a management situation.
This case was compiled from published sources.
© 2001 G. J. Stockport, University of Western Australia, Perth, Australia.
Introduction
It was 21 November 2000, and Meg Whitman was
considering the events of the last few days. As the
chief executive officer (CEO), she had led eBay.com
to its position as the world’s largest person-to-person
(P2P) trading community, but the share price had just
fallen 20 per cent to US$34.75 when eBay’s share was
downgraded from a ‘buy’ to a ‘neutral’ by Lehman
Brothers, a global investment bank, because of con-
cerns over eBay’s aggressive sales forecasts. The pre-
vious day, eBay had announced the launch of a new
product, application programming interface software
that would enable other web companies to display
eBay auctions on their sites.
The company had experienced explosive growth
from start-up when the founder and current chair-
man, Pierre Omidyar, launched eBay in September
1995. While most e-commerce companies were mak-
ing significant losses by spending aggressively to build
their customer and revenue bases, eBay had remained
profitable since the beginning. In the three-month
period to September 2000, US$1.4 billion worth of
goods were transacted on eBay, with items listed in
more than 4320 categories. The company had 18.9
million registered users at the end of the period and
had captured over 80 per cent of the on-line auction
market with its closest competitors being Yahoo! and
Amazon.com.
Background to eBay
Pierre Omidyar
Pierre Omidyar was born in Paris, France in 1967 and
moved to Washington, DC in the United States with
his parents at the age of six. From an early age he was
interested in computers and he wrote a program to
print catalogue cards for the school library at the age
of 14. In 1988, he graduated with a Bachelor’s degree
in Computer Science from Tufts University. He ini-
tially worked as a developer of consumer application

Case 3 • eBay.com C-33
software such as MacDraw, for Claris, a software
subsidiary of Apple Computer. In 1991, he was one of
the founders of Ink Development, which later became
eShop, an early e-commerce site that was bought by
Microsoft in 1996.
Person-to-person (P2P) trading
prior to 1995
In traditional P2P trading forums, it is sometimes dif-
ficult for buyers to find pricing benchmarks to ensure
that the prices that they pay correspond to the proper
value of the item. It was estimated that in 1995,
US$100 billion was traded annually in the following
forums:
• Newspaper classifieds: Users listed items that
were for sale or wanted, normally in locally
distributed newspapers. The classifieds
typically generated more than 50 per cent of
local newspapers’ revenues from listing fees.
The buyers usually inspected the items before
purchasing and may have collected and paid
for the items in person. As a consequence of the
proximity of buyers and sellers, the items could
have been larger items that were difficult to
transport over long distances.
• Flea markets and garage sales: Sellers stocked
items for sale either at their homes or at
organised markets. Buyers were typically
looking for bargains or interesting artefacts. The
buyers were able to inspect the items and needed
to pay for them before they could collect.
• Auction houses: Sellers took items that were
for sale to auction houses where buyers could
inspect them before the auction. Buyers needed
to pay a registration fee in order to bid and were
required to be at the auction or have a proxy
bidder. The highest bidder won the auction and
normally paid the auction house. The auction
house typically deducted a percentage of the sale
price and paid the balance to the seller.
The opportunity
In the early 1990s, Silicon Valley was quickly turning
its attention away from electronics manufacturers
towards new Internet-based start-ups that married
existing technology to new business models. Internet
usage growth and the provision of the infrastructure
required to ensure acceptable data transmission speeds
were, however, uncertain. Analysts were also unsure
whether people would purchase goods of value from
distant strangers without seeing them beforehand.
Omidyar was writing code for communications-
software maker General Magic in 1995 when he
started to think about the possibility of on-line
auctions. He said the following about his idea:
I had been thinking about how to create an
effi cient marketplace – a level playing field, where
everyone had access to the same information and
could compete on the same terms as everyone else.
Not just a site where big corporations sold stuff
to consumers and bombarded them with ads, but
rather one where people ‘traded’ with each other
… I thought, if you could bring enough people
together and let them pay whatever they thought
something was worth … real values could be
realised and it could ultimately be a fairer system
– a win-win for buyers and sellers.1
Start-up in 1995
eBay (then AuctionWeb) was launched on Labour
Day, 1 September 1995, using a website that was
hosted by Omidyar’s US$30 per month Internet ser-
vice provider (ISP). The site was located at www.ebay.
com. The company operated from Omidyar’s apart-
ment with only the website, a filing cabinet, an old
school desk and a laptop computer. The site was not
much more than a simple marketplace where sellers
listed items and buyers bid for them. Omidyar made
no guarantees about the goods being sold, took no
responsibility and settled no disputes. There were no
fees, no registration, no search engine and, for the
first month, no customers.
Omidyar’s only attempt at marketing was to list
eBay on the National Center for Supercomputing
Applications’ What’s Cool site. Despite this, so many
people visited the site that by February 1996 Omidyar
had to institute a fee of 10 cents per listing to recoup
the ISP costs which by then had risen to US$250 per
month. By the end of March 1996, eBay showed a
profit. Omidyar had kept his day job at General
Magic, but the traffic to the site became so intense
that he had to concentrate on eBay full-time and the

C-34 Case 3 • eBay.com
ISP asked him to take the site elsewhere. He there-
fore bought his own web server and installed it in his
apartment.
Omidyar developed software that was capable
of supporting a robust scalable website and transac-
tion processing system to provide real-time reporting
on the current auctions. The system was scalable to
reduce the initial investment but enabled expansions
when an increasing number of auctions demanded it.
By July 1996, Omidyar needed to move the
operation to a one-room office and hire a part-time
employee. The risks that the business faced at that
stage were substantial and with barriers to entry
being low there was nothing to stop the large Internet
players such as America Online (AOL) (ISP and Inter-
net portal), Amazon.com (on-line book retailer) and
Yahoo! (search engine and Internet portal) from
stealing the opportunity. As the business was based
on collectors’ items, changes in the current fads could
have affected the revenues significantly. At one stage,
trading of Beanie Babies generated 7 per cent of eBay’s
revenues.
The business concept
Omidyar asked one of his friends, Jeff Skoll, to join the
company as its first president in August 1996 and his
role was to turn the concept into a business. He had
a Master’s in Business Administration (MBA) degree
Exhibit 1 Quarterly financial results and statistics
1998 1999 2000
Q1 Q2 Q3 Q4 Q1 Q2 Q3 Q4 Q1 Q2 Q3
Financial data
Revenue
(’000) 13 998 19 480 21 731 30 930 42 801 49 479 58 525 73 919 85 753 97 399 113 377
Gross profit
(’000) 16 194 17 364 24 980 34 824 38 534 41 444 52 334 62 481 73 756 89 465
Gross margin
(%) 83.1 79.9 80.8 81.4 77.9 70.8 72.9 75.7 78.9
Operating
expenses (’000) 11 996 15 504 21 365 27 063 43 166 46 478 51 883 62 029 65 026 75 149
Net income
(’000) 2 279 461 2 639 3 765 816 1 186 4 895 6 288 11 590 15 211
Net profitability
(’000) 14.0 2.1 8.5 8.8 1.6 2.0 6.6 7.3 11.9 13.4
Registered users
(mn) 0.85 1.3 2.2 3.8 5.6 7.7 10.0 12.6 15.8 18.9
No. of auctions
(mn) 6.6 9.2 13.6 22.9 29.3 36.2 41.0 53.6 62.5 68.5
Growth (%)
Revenue (per
quarter) 39 12 42 38 16 18 26 16 14 16
Net income –83 472 43 –78 45 313 28 84 31
Registered users 53 69 73 47 38 30 26 25 20
No. of auctions 39 48 68 28 24 13 31 17 10
Auctions/
registered user 7.1 6.2 6.0 5.2 4.7 4.1 4.3 4.0 3.6
Revenue/auction 2.95 2.36 2.27 1.87 1.69 1.62 1.80 1.60 1.56 1.66
Notes: All figures in US dollars. Source: eBay financial statements.
The registered users figures include everyone who had ever registered on the site and does not reflect currently active users.
Growth figures are growth per quarter.
Revenue figures exclude refunds to sellers due to site outages.

Case 3 • eBay.com C-35
from Stanford University and had wide experience in
managing distribution channels of on-line news infor-
mation, computer consulting and computer rentals.
The business concept was to provide P2P auctions
on the Internet. Using the Internet, buyers and sellers
could access a larger market, which was important for
those collectors who could not find people with simi-
lar interests in their areas. By providing a marketplace
for buyers and sellers to trade their collectibles on the
Internet in an auction format, the buyers set the price
for items based on demand. When more potential
buyers bid on the items, sellers received higher prices.
As the buyers and sellers may be from different parts
of the United States and even the world, the items that
were sold were typically collectibles that were easy to
deliver long distances.
The eBay process was simple and easy to under-
stand. Sellers could list items for sale and pay a small
listing fee, which depended on where and how the
listing was presented and whether the seller required
a reserve price. The seller chose the auction duration
during which buyers could bid for the item. At the
end of the auction, eBay notified the seller and the
winning bidder, following which they made their own
arrangements for payment and delivery of the goods.
The seller was also charged a percentage of the final
value of the transaction. Over time, eBay added ser-
vices to this simple model to improve the user experi-
ence and thereby increase user loyalty and retention.
eBay has been profitable from start-up and although
its business was seasonal with volatile revenues, the
company had maintained high gross margins of about
70–80 per cent (see Exhibit 1). The only costs of goods
sold were computing infrastructure and customer ser-
vice expenses. eBay’s business model did not require
it to keep any inventory, establish an extensive distri-
bution network or have a large staff complement. Its
product range was also determined by the size of its
community and their listings and not by eBay’s prod-
uct development staff.
The listing fees and final value fees charged by
eBay are shown in Exhibits 2 and 3. For example, if
a seller listed a collection of rare stamps on eBay and
the maximum bid is US$24, they would have paid a
50 cent insertion fee when they listed the item, assum-
ing that the listing was not emphasised in any way.
They would also have paid 5 per cent of the final sale
price if the item was sold. eBay would have received
Exhibit 2 Fee to place an item listing
Opening value or reserve price Insertion fee
$0.01 – $9.99 $0.25
$10.00 – $24.99 $0.50
$25.00 – $49.99 $1.00
$50.00 and up $2.00
Real estate and automotive categories $50.00
Reserve price less than $25.00 $0.50
Reserve price of $25.00 or more $1.00
Notes: Source: www.eBay.com, November 2000.
1 All prices in US dollars.
2 Additional fees are charged for enhancing the listing in any way.
Exhibit 3 Additional fee if the item sells
Closing value Final value fee
$0 – $25.00 5% of the closing value
$25.01 – $1000 5% of the initial $25.00 ($1.25), plus 2.5% of the remaining closing balance
Over $1000 5% of the initial $25.00 ($1.25), plus 2.5% of the initial $25 – $1000 ($24.38),
plus 1.25% of the remaining closing value balance
Notes: Source: www.eBay.com, November 2000.
1 All prices in US dollars.
2 There is no final value fee for the real estate and automotive categories.
3 Sellers may have the final value fee refunded if the high bidder does not pay.

C-36 Case 3 • eBay.com
US$1.60 for the listing if the auction closed. If the
seller had a reserve price of US$24.50 on the item, the
auction would not have closed, so eBay would have
received the insertion fee and a 50 cent fee for the
reserve price which was only payable if the item did
not sell.
Building the team
In June 1997, Omidyar and Skoll realised that they
would need capital and management expertise if eBay
was to realise its full potential. They approached
venture capitalists Benchmark Capital who invested
US$5 million for shares and warrants worth 22 per
cent of the company. Bob Kagle, a partner at Bench-
mark Capital, became a board member of eBay.
This money was never used, but the agreement gave
them access to Benchmark’s network of potential
CEOs, marketing gurus, consultants and bankers.
eBay needed this to help them build the business and
recruit talented management. One of the first mem-
bers of the management team was Gary Bengier,
who was hired in November 1997 as the chief finan-
cial officer (CFO). He was responsible for develop-
ing the financial strategy and vision of the company
and maintaining a corporate culture of financial dis-
cipline and prudence, and for equipping eBay for an
eventual public offering of its shares.
Benchmark persuaded Meg Whitman to leave her
job as general manager of Hasbro’s pre-school divi-
sion to become president and CEO of eBay. She was
a strong and decisive executive without the need-to-
dominate personality, which meant that there was a
good fit with eBay’s existing culture of being open
to the voices of customers and employees. Whitman
was impressed by the fact that eBay was doing some-
thing that could not be done effectively off-line and
by the emotional connection between the eBay users
and the service. Whitman brought global marketing
and brand management experience with her when she
joined in February 1998. Her previous work included
being a vice president at Bain & Company and devel-
oping Stride Rite’s Internet strategy. She had an MBA
from Harvard Business School and a BA in Econom-
ics from Princeton.
Whitman recognised the need for other advis-
ers on the board who understood the challenges of
expanding into new markets and could provide advice
and feedback. Again, Benchmark was instrumental
in finding people such as Howard Schultz, chairman
and CEO of Starbucks, and Scott Cook, chairman of
Intuit. Whitman also went on to build her manage-
ment team, and details of the other top-level manage-
ment at eBay are given in Exhibit 4.
Building the community of
users
Many of eBay’s early customers were the result of
referrals. eBay’s loyal customers performed the mar-
keting and sales function through word of mouth to
bring new customers to the community. eBay under-
took limited marketing but had entered into cross-
promotional agreements with the following:
• Banner advertisement on web portals such as
Netscape, Excite and Yahoo!.
• America Online (AOL) – provided an auction
service for AOL’s classified section which gave
eBay access to AOL’s more than 10 million users.
• ZAuction, a vendor-sourced auction site, which
was a leading provider of computer products,
electronic equipment and other brand name
consumer goods.
Omidyar created a platform where ‘anybody could
sell anything’ and did not interfere in the user trans-
actions. Most of eBay’s sellers were serious collectors
and small traders who used eBay as their storefront to
access a large market across the United States and the
world. eBay provided a facility whereby users could
interact with each other through the use of discussion
boards and later through a chat room called the eBay
Café. The eBay Café was similar to a traditional cof-
fee shop where users could relax, catch up on news
and hearsay, and exchange information. It brought
users back to the site every day and they sometimes
communicated directly with each other. One frequent
user of the eBay Café described it as follows:
At the eBay Café you will meet a bunch of caring
and friendly folks talking, helping, laughing, and
at times even complaining about varied subjects. I
have found and met some great folks here. If you
ever need help with almost ANYTHING, if you
have some tips, tricks or a good story or two to
share … the Café is the place.2

Case 3 • eBay.com C-37
When eBay tried to impose changes on users, such
as pricing changes, the users expressed their disap-
pointment through these discussion forums. eBay
trusted its users’ suggestions for improving the site,
and by giving its customers what they wanted, eBay
was improving both customer retention and loyal-
ty. One analyst commented that eBay’s community
was critical for attracting and retaining buyers and
sellers:
eBay has found a natural feedback loop where
creating a critical mass of bidders increases the
price obtained by sellers, which increases the
number of sellers, which attracts more bidders, et
cetera.3
Initially, there was no way to ensure that what
was being bought was real or that the goods would
be paid for. The anonymity and physical distance
between buyers and sellers on the Internet encour-
aged counterfeiting and fraud. In message-board post-
ings to Omidyar, the eBay users suggested that he set
up a system for buyers and sellers to rate each other.
This became known as the Feedback Forum and was
a peer-review reporting system. Buyers and sellers
rate each other and comment on how their business
Exhibit 4 Summary of eBay management at November 2000
Pierre Omidyar (33), founder and chairman, oversees strategic direction and growth, model and site development, and community
advocacy. He has a BS in Computer Science from Tufts University. His previous jobs include founder, Ink Development Corp.,
developer of consumer applications for Claris, a subsidiary of Apple Computer, and General Magic.
Meg Whitman (43), president and CEO, is responsible for building a successful business while delivering on customer needs and
expectations. Her focus is on the user experience, creating a fun, efficient and safe forum for on-line person-to-person trading.
She develops the work ethic and culture of eBay as a fun, open and trusting environment and keeps the organisation focused
on the big picture objectives and key priorities. She has an MBA from Harvard and a BA in Economics from Princeton. Previous
jobs include general manager for Hasbro Inc.’s pre-school division, global marketing of Playskool and Mr. Potato Head brands;
president and CEO of Florists Transworld Delivery; president of Stride Rite and executive vice president at Keds Division; senior
vice president of marketing for the Walt Disney Company’s consumer products; vice president at Bain & Company; and brand
manager at Procter & Gamble.
Gary Bengier (45), chief financial officer, is responsible for developing the financial strategy and vision as well as maintaining a
corporate culture of financial discipline and prudence for eBay. He has an MBA from Harvard and a BBA in Computer Science
and Operations Research, Kent State University. Previous jobs include CFO, Vxtreme, financial officer at Compass Design
Automation, and senior financial posts at Kenetech Corp. and Qume Corp.
Brian Swette (45), chief operating officer, helps to build the eBay community as well as creating an environment for trade by
responding to the community and introducing new categories. He has a BA in Economics from Arizona State University. His
previous jobs include executive vice president and chief marketing officer, Pepsi-Cola Company, responsible for worldwide
marketing and advertising efforts for Pepsi, and brand manager at Procter & Gamble.
Maynard Webb (43), president, eBay Technologies, oversees eBay’s technology strategies, engineering, architecture and site
operations. He has a BA from Florida Atlantic University. Previous jobs include senior vice president and CIO at Gateway, Inc.
Mike Wilson, chief scientist, is responsible for site architecture. Previous jobs include chief architect and project manager at Ink
Development Corp.
Jeff Skoll (35), vice president, strategic planning and analysis, is responsible for competitive analysis, new business planning and
incubation, as well as overall strategic direction. He has an MBA from Stanford University and a BS in Electrical Engineering from
the University of Toronto. His previous jobs include manager of the distribution channels of on-line news information for Knight-
Ridder Information and founder of Skoll Engineering.
Steve Westly, senior vice president, international and general manager of premium services, is responsible for business development,
corporate communications, mergers, acquisitions and partnerships. He has an MBA and a BA from Stanford University. Previous
jobs include vice president, WhoWhere?
Jeff Jordan, vice president and general manager of regionals and services, oversees eBay’s regional business and end-to-end services
which has the goal of making it easier to trade on the site. He has an MBA from Stanford University and a BA in Political Science
and Psychology from Amherst College. Previous jobs include president of Reel.com.
Source: www.eBay.com, November 2000.

C-38 Case 3 • eBay.com
together went. When launching this, Omidyar laid
out eBay’s guiding philosophy:
eBay wouldn’t exist if it wasn’t for our community
… At eBay, our customer experience is based on
how our customers deal with our other customers.
They rarely deal directly with the company. So
how do you control the customer-to-customer
experience? We can’t control how one person
treats another … The only thing we can do is
to influence customer behaviour by encouraging
them to adopt certain values. And those values are
to assume that people are basically good, to give
people the benefit of the doubt, and to treat people
with respect.4
Company values
Omidyar hoped that his auction community would
reflect the values of honesty, openness, equality,
empowerment, trust, mutual respect and mutual
responsibility. eBay’s Mission Statement says:
eBay was founded with the belief that people are
honest and trustworthy. We believe that each
of our customers, whether a buyer or a seller, is
an individual who deserves to be treated with
respect.5
To instil these values into the community, Omidyar
maintained that they had to be embraced by the com-
pany and its employees because everything that the
company did, such as the website, press releases and
strategic partnerships, indirectly influenced the com-
munity. When Meg Whitman joined eBay, her chal-
lenge was to develop the work ethic and culture of
eBay as a fun, open and trusting environment and
keep the organisation focused on the big-picture
objectives and key priorities. eBay had a ‘no penal-
ty’ operating culture where there were no penalties
for making mistakes or being on the wrong side of
an issue which could muzzle employees or suppress
new ideas. Whitman met with all new recruits and
other staff on Mondays to tell them about the culture
and make sure that they knew what was expected of
them. eBay also brought some of its customers to the
head offices regularly to talk to employees about their
experiences.
Coping with customer service
By the end of 1997, more than 3 million items worth
US$94 million had been sold on eBay, resulting in total
revenues of US$5.7 million and US$900 000 profit.
eBay had achieved these results with only 76 employ-
ees. The average value of each item sold was about
US$31, with 6 per cent of this going to eBay’s reve-
nues. The number of auctions per day had increased
from 1500 at the end of 1996 to about 150 000 at the
end of 1997. As the number of users increased, eBay
started to find it difficult to provide customer service
to the members of the community. Simple questions
such as ‘How do I list an item?’ or ‘How do I buy
an item?’ were answered using a self-service on-line
help function which had prominent links from the
eBay home page. Other queries were more difficult
and needed knowledgeable users or service agents to
answer. Users placed queries on bulletin boards dedi-
cated to the discussion of specific issues of the busi-
ness, such as help, registration, listing and shipping,
which were sometimes answered by other members
of the community and at other times by eBay. As part
of building their on-line community, eBay had con-
tracted active, enthusiastic and knowledgeable users
of the site to respond to requests for help. These inde-
pendent contractors worked from home to answer
emailed questions and those that were posted on the
bulletin boards. eBay also decided to employ and
supervise the customer service representatives directly
to better understand customers’ problems and control
the quality of customer service. Nevertheless, not all
of the users were satisfied with the customer service
that eBay offered.
Building trust and loyalty
To work with the community to improve the services
that were offered and develop trust and loyalty, eBay
launched SafeHarbor in February 1998. SafeHarbor
included the following elements:
• Verified User Program: eBay verified user
information during registration and had
partnered with Equifax to provide a higher level
of verification if required.
• Feedback Forum: buyers and sellers rated their
experience with each other as positive, neutral
or negative. The user profile followed the user

Case 3 • eBay.com C-39
everywhere on eBay. Estimates suggested that
users were willing to pay up to 30 per cent more
in certain markets for items sold by someone
with a high feedback rating.
• Insurance: Lloyds of London provided insurance
for users with a net non-negative feedback rating
on their auctions up to US$200 subject to an
excess of US$25.
• Shill Bidding Policy: suspended users who bid
on an item with the intent to drive up the price
without buying it.
• Non-paying Bidder Policy: non-paying bidders
were warned and then suspended.
eBay’s policies and service had helped them to
develop a loyal community of buyers and sellers. One
user described the eBay experience as follows.
I visit eBay to transact auction business because
it has a superior universe of sellers and bidders
and quality and quantity of listings. The people
visiting eBay are generally loyalists, while the
average person visiting Amazon.com is there to
buy a book, but I’d hazard a guess that he isn’t
going to stick around for an hour.6
eBay also provided facilities that users could per-
sonalise, such as the ‘My eBay’ and ‘About Me’ sec-
tions. ‘My eBay’ was a tool that users could person-
alise to keep track of their favourite categories, view
items they were selling or bidding on, check their
recent account balance and feedback, or update their
contact information. An ‘About Me’ page could be set
up by users to tell other eBay users about themselves
and their feedback rating, which helped to improve
the credibility and trust among the users. Not all
users were happy with the services, however, and this
can be seen in the following message taken from the
discussion boards.
Am I the only one that thinks the ‘Watch This
Item’ link in auctions is driving sellers to the
poorhouse? Geez … Bidding is bad enough without
encouraging bidders not to bid.7
Brand building
In a company that had always disdained advertis-
ing, Whitman employed Pepsi’s head of marketing,
Brian Swette, as senior vice president of marketing
in October 1998 to oversee international expansion,
marketing and customer support efforts for eBay. He
had worldwide brand-building experience with both
the Pepsi-Cola Company and Procter & Gamble. His
focus was on increasing brand awareness both nation-
ally and internationally and on making eBay one of
the most accessible and successful e-commerce sites
on the Internet.
eBay found that small traders and serious collec-
tors were the most active site users. Many of the trad-
ers were small businesses who had used eBay as their
storefront or as a supplement to their existing stores.
These users contributed 80 per cent of the total reve-
nues but only constituted 20 per cent of the registered
users. As a result, eBay decided to reduce its presence
in broadband portals and concentrate its marketing
and brand-building resources on these users. This
included advertising in many niche publications read
by serious collectors and exhibiting at collectors’ trade
shows. eBay subsequently launched its first national
print and broadcast advertising campaign in October
1998 in order to increase awareness of the compa-
ny’s brand with The Acme Idea Company, a strategic
and creative consultancy committed exclusively to the
building of brands. The national radio campaign was
aired on more than 12 000 stations across the Unit-
ed States for five weeks. The print campaign includ-
ed adverts in Parade, People, Entertainment Weekly,
Newsweek and Sports Illustrated and over 70 distinct
collecting publications, reaching people who had an
active passion – for example, for coins, stamps, dolls
or photography.
eBay also instituted the PowerSellers program to
benefit the bulk sellers. The program was designed to
meet the needs of users who were running a full-time
on-line trading business on eBay with benefits and
privileges designed to make selling easier and more
profitable. There were three different program levels,
– namely: Bronze, Silver and Gold – which were
achieved with minimum monthly sales on eBay of
US$2000, US$10 000 and US$25 000, respectively.
eBay offered these users additional services depend-
ing upon the level that they had achieved. These ben-
efits included the PowerSellers logo to distinguish
users on the site, dedicated email customer support,
participation in the eBay Success Stories program (to
be profiled for use in press-related events), invitations

C-40 Case 3 • eBay.com
to special events, specialist customer phone support,
dedicated account managers and support hotlines.
A member of the PowerSellers customer-service
program complained that her email and phone calls
regularly went unanswered: ‘I feel like I’m in a co-
dependent relationship. I write to them, I get no
response. I e-mail them, nothing. I’m being abused.’8
On 25 March 1999, eBay and AOL expanded
their existing relationship and announced a four-year
strategic alliance to expand person-to-person com-
merce and community building on AOL and its fam-
ily of brands. The agreement gave eBay prominent
presence across the domestic and international AOL
family of brands, including AOL, AOL.com, Com-
puServe, Netscape’s Netcenter, ICQ and Digital City.
According to the agreement, eBay was to pay AOL
US$75 million over the term of the agreement and
AOL was entitled to all advertising revenues gener-
ated by the co-branded sites and to act as the exclusive
third-party advertising sales force for advertising sold
on eBay’s website. They created customised and co-
branded sites for AOL’s multiple brands that included
comprehensive listings, feedback and ratings, message
boards and select content from eBay. eBay was to pro-
mote AOL as its preferred Internet ISP and enable its
users to download ICQ (communication software that
enables chat, voice, message board, data conferenc-
ing, file transfer or games on the Internet) on its web-
site as well as to integrate AOL’s ‘My News’ feature
into its ‘My eBay’ feature. AOL, in return, undertook
to promote eBay to its member community of over 16
million. As a part of the agreement, the companies
were to work together to facilitate eBay’s expansion
into international markets, and AOL helped to launch
eBay’s expansion into regional markets through the
promotion of eBay on Digital City, a complete guide
to activities in the US’s largest cities.
The challenges of growth
Exhibit 1 contains eBay’s key quarterly financial
results from the beginning of 1998 to the third quar-
ter of 2000, indicating its growth and profitability
during this period. eBay never had any formal plan
to develop the business, but rather took advantage of
opportunities as they arose. Opportunistic behaviour
was bound by a clear goal to be ‘the world’s largest
P2P online auction company’ and a focused strategy
with five elements:
• strengthening the eBay brand
• expanding the user base
• broadening the trading platform by increasing
product categories and promoting new ones
• fostering community affinity
• enhancing site features and functionality.
International expansion
While the Internet was available to users around the
world, trading goods across borders involved diffi-
culties such as currency conversions, different duties,
taxes and regulations, as well as high delivery costs.
To build their user base and access the users in other
countries, eBay needed to open country-specific sites.
It started to expand into the international markets
early in 1999. The company identified the following
possible strategies to enter these new markets:
• building a new user community
• acquiring a company that was already in the
local trading market
• partnering with strong local companies.
eBay started its international expansion in the UK
and Canada (www.ca.ebay.com). eBay’s community
in the UK (www.ebay.co.uk) was built from the grass-
roots by local management with on-line marketing
and local events. eBay rolled this service out to Aus-
tralia (www.ebay.com.au), Japan (www.ebayjapan.
co.jp) and France (www.fr.ebay.com).
In March 1999, some German entrepreneurs cop-
ied eBay’s source code and set up a mirror-image of
the eBay site under the name of Alando.de in Germa-
ny. The site quickly established itself as the leading
on-line trading company among Germany’s 10 mil-
lion Internet users and soon attracted eBay’s atten-
tion. When it acquired Alando on 22 June 1999, it
had 50 000 registered users and 80 000 items listed
in 500 categories. The site was later renamed www.
ebay.de, which gave German users access to eBay’s
worldwide community of active buyers and sellers.
eBay launched its local site in Australia in October
1999 in a joint venture with a leading Internet media
company in Australia, PBL Online. To promote the
launch of the website, eBay Australia waived all list-
ing fees for a limited period and this provided sell-
ers with an even greater reason to list their items on

Case 3 • eBay.com C-41
www.ebay.com.au. In February 2000, eBay Japan
was launched as a joint venture with NEC. The deal
brought together eBay’s unrivalled trading presence
and NEC, one of the world’s most innovative technol-
ogy companies with a commanding presence in the
Japanese market. As part of the agreement, NEC took
an equity stake in eBay Japan and promoted the site
in many ways, including through its BIGLOBE ISP,
personal computer products and off-line marketing
campaigns. The international sites contain:
• country-specific categories and content,
reflecting popular local collectibles
• the ability to trade local items in the local
currency with content in the local language
• access to a worldwide community of traders.
International sellers can list their item so that
it can be viewed from any eBay site, and buyers
can view items listed anywhere in the world,
with items denominated in the local currency
and in US dollars
• local discussion boards that allow the country’s
community to get the most out of the website
and a country-specific chat room.
Amazon.com enters the
on-line auction market
New competitors in the on-line auction market were
surfacing every day, encouraged by the low barriers to
entry and eBay’s success. The first major competitor
was Onsale, which was already an established B2C
site. Yahoo!, Lycos, Excite, Microsoft’s MSN and
many smaller niche competitors followed, but all of
them found that attracting buyers and sellers was dif-
ficult. Exhibit 5 compares a few of the major on-line
auctions sites as at October 2000 by their inventory of
listed items, bidding activity, services and fees, design
and functionality, customer support and the commu-
nity.
In April 1999, Amazon.com launched its auction
site which was remarkably similar to eBay’s and made
it easy for buyers and sellers to move across to Ama-
zon. Amazon did not charge any fees for the first few
months and offered additional services such as cross-
promotion to relevant Amazon retail sites, credit card
payments and buyer guarantees by underwriting the
risks of a seller failing to send an item or where the
item is ‘materially different’ from the description.
Amazon achieved 100 000 auctions per day within a
few months, but the number of listings started to fall
when Amazon introduced charges. While the services
it offered were superior to eBay’s, it was not able to
break into the market that was already dominated by
eBay. One of the sellers summarised his reasons for
staying with eBay:
I’ve posted auctions on just about every site you
can imagine (but) I pretty much stick with eBay.
The buyers are there. I’m established there. My
feedback rating establishes me as an upstanding
member of the community. I don’t have those
ratings on other sites because I don’t do much
business on any of them. I’d rather stay where I’m
known.9
By being the first on-line auction to be able to
scale up and acquire a critical mass of buyers and sell-
ers in its community of users, eBay was able to suc-
cessfully fend off attacks from Internet brands that
were better recognised and offered better services.
eBay’s community of buyers meant that sellers were
less likely to move to competitor sites.
Improved customer service
required
Following Amazon’s launch with superior services,
eBay launched services to assist its community with
shipping (April 1999), credit card payments, escrow
services, electronic stamps and a customer support
centre (May 1999). These services were offered by
entering into alliances with the following:
• iShip.com provided information to e-merchants
and buyers regarding shipping costs and options.
• MBE provided the bricks-and-mortar support
for packing and shipping.
• Billpoint facilitated person-to-person credit card
payments on the Internet.
• iEscrow enabled buyers to pay an escrow service
when they bought an item. This was when a
buyer placed money in the custody of a trusted
escrow service. The money was then paid to the
seller once a specified set of conditions was met,
such as the buyer receiving and approving the
goods.

C-42 Case 3 • eBay.com
Exhibit 5 Auction site competitor comparisons
Auction site Inventory
Bidding
activity
Services &
fees
Customer
support
Design &
functionality Community
321Gone ● ●
Amazon.com ■ ■ ● ■
AuctionAddict.com •● ●
Auctions.com ● ● ● ● •
Bid.com • • ● ● N/A
Bidbay.com •● ●
BoxLot ● ● ●
CityAuction ● ● ●
CNET Auctions ● ● •
Collecting Nation ● ● ●
Comic Exchange ● ● ●
Dell Auction ● ● ● •
eBay ■ ● ● ● ■
edeal ● ● ●
eHammer ● ■ ● ● •
eOrbis.com •● ■ ● •
eRock.net •● ●
eWanted.com ● ● ●
Excite Auctions ■ ● •
First Auction ● ● ● N/A
Gavelnet.com •● ●
GoAuction ● ● ● ● •
Gold’s Auction •■ ● ● ●
Go Network Auction •● ● ●
Haggle Online ●
Lycos Auctions ● ■ ●
MSN Auctions ● ● ●
Musichotbid.com ●•■•
Onsale ● ● ● N/A
Popula ● ● ● ●
Pottery Auction ● ■ ●
Sothebys.com ■ ● ● ● ● N/A
SportsAuction ●N/A ● ● N/A
Teletrade N/A ● ● N/A
uBid ● ● ● ■ ● N/A
Up4Sale ● ●
Wantads.com ● ● ● •
Xoom.com Auctions ● ● ● ●
Yahoo Auctions ■ ● ● •■
Yahoo Store ●N/A ● ■ N/A
ZDNet Auction ●●●
Excellent = ■, good = ●, average = , below average = •. Source: www.auctionwatch.com/awdaily/reviews/ratings.html, November 2000.

Case 3 • eBay.com C-43
• e-Stamp allowed people to buy and print postage
on-line to avoid queues at post offices where
sellers needed to hand letters that weigh more
than 16 ounces directly to a postal clerk.
eBay established its first remote customer support
centre in Salt Lake City in order to stay ahead of the
needs of the on-line community. Its main responsibil-
ity was to interact via email with the eBay community
on a 24-hour basis and provide live customer support
on eBay’s customer support bulletin boards, such as
the ‘Support Q&A Board’, ‘Support Q&A For New
Users’ and ‘Help with Images and HTML’. One user
described his experience of eBay’s customer support.
I think we should spread the word for people to
start using Amazon.com. Maybe then eBay will
increase their customer service and see to it that
their system is working instead of pissing people
off. No wonder they are offering Billpoint for free.
You can’t count on it. eBay is not there to help. At
least not readily. I have sent 3 emails to support
and have heard NOTHING.10
eBay still did not have its customer support up to
the level of its competitors and this remained a prob-
lem for the users.
eBay acquires bricks-and-mortar
businesses
With the on-line auction market being so competitive,
eBay found it difficult to increase its fees. The only
way to increase its revenues was to improve the traffic
volumes by deepening the penetration into the North
American market, expand internationally and raise
the average price of goods sold. On 26 April 1999,
eBay announced that it had agreed to acquire San
Francisco-based Butterfield & Butterfield (B&B), one
of the world’s largest and most prestigious auction
houses. This acquisition enabled eBay to accelerate
its penetration into higher-priced items on a global
basis because of B&B’s expertise in premium mar-
kets and extensive relationships with dealers, auction
houses and individuals throughout North America,
Europe and Asia. B&B had begun providing auctions
over the Internet through its relationship with a local
company, but ended the arrangement three weeks
prior to the announcement in order to work with
eBay. eBay used this acquisition to start its ‘great col-
lections’ speciality site and other antique categories.
Prior to this acquisition, eBay’s average auction closed
at only about US$47, of which eBay’s fee was about
US$3. The average B&B auction closed at US$1400,
of which the house’s fee was almost US$400. Buy-
ing into the high-end auction business might not have
increased the amount of interaction on the discus-
sion boards or chat rooms, but it promised to boost
eBay’s revenues. Shortly afterwards, on 18 May 1999,
eBay announced that it had acquired Kruse Interna-
tional, one of the world’s most respected and well-
established brands in the collector automobile mar-
ket. This strategic acquisition enabled eBay to move
into this market and continue to offer higher-priced
items to its community. Kruse participated in approx-
imately 40 car auctions each year and had held events
in 46 US states, the United Kingdom and Japan. eBay
used expertise gained through this acquisition and
other alliances with CarClub.com and Autotrader.
com to introduce a new automotive section on the
eBay site for collectable and other used cars and offer
users related additional services.
eBay introduces local sites
To further increase eBay’s penetration into higher-
priced goods, eBay accessed the market for goods that
were difficult to ship long distances, such as cars and
large appliances that would have normally been sold
through the local newspaper classifieds owing to their
size or fragile nature. Late in 1999, eBay launched
‘eBay: Go Local’ with a campaign called ‘from our
homepage to your hometown’ whereby eBay toured
30 communities across the United States, and intro-
duced a pilot site in Los Angeles. At the end of 1999,
there was a local site for 63 cities in the US and others
internationally, with a regional flavour in order to
connect local buyers and sellers. Buyers could also
inspect the goods before they bid. The separate local
sites were accessible through the ‘Go Local’ area on
the eBay home page.
eBay Local featured local categories and allowed
members to browse through and trade items of local
interest, such as memorabilia from popular regional
sports teams, political collectibles and antique post-
cards celebrating the region’s heritage. The local site
was completely integrated into eBay’s worldwide

C-44 Case 3 • eBay.com
listings so sellers could list locally while everyone on
eBay could see the item.
Computing infrastructure
The aggressive marketing and expansion during late
1998 and early 1999 resulted in rapid increases in
demand upon the computing infrastructure that sup-
ported the on-line auctions. By the end of June 1999,
eBay had 5.6 million registered users and had con-
ducted 29.4 million auctions (about 250 000 per day)
with gross merchandise sales of US$622 million dur-
ing the previous three-month period. The increas-
ing traffic to the website required constant expan-
sion and upgrading of the technology. Frequent site
outages and downtime for maintenance was a seri-
ous problem for the growing company. A number of
the small traders, who depended on eBay for a living,
attributed the ‘downs’ in their business to site crashes,
pages not loading, system slowdowns and slow end-
of-auction notices. During June 1999, eBay experi-
enced a three-day string of outages because of prob-
lems with its server operating system software which
corrupted their databases. A report of the event even
appeared on the front page of the New York Times
and it was estimated that these outages cost the com-
pany US$3–5 million in refunds to sellers. The share
price fell by 25 per cent and the web page viewing fig-
ures halved for the week after the outage. Other costs
that could not be quantified were the lost revenues
from those customers who got frustrated with the site
and defected to competitors’ sites. eBay instituted an
automatic auction extension policy which meant that
any outage lasting for two hours or more resulted in
an automatic lengthening in the time allowed to place
bids. As a result of the outages, Whitman decided to
build excess capacity, but she decided that the addi-
tional cost would be small when compared to the cost
of outages and poor site performance. She set the goal
of building the infrastructure to 10 times the required
capacity.
In October 1999, eBay outsourced its back-end
Internet technology to AboveNet Communications
and Exodus Communications. It outsourced its web
servers, database servers and Internet routers, and
relied on the companies to provide increased network
bandwidth for its millions of active buyers and sell-
ers. These companies had front-end web servers that
were linked to eBay’s proprietary database and appli-
cation servers and were all located at AboveNet’s and
Exodus’s locations. The servers were located in tem-
perature-controlled facilities with superior fire con-
trol, security and redundant power systems, and were
housed in seismically braced racks. These companies
were also the primary service provider for Yahoo!,
Lycos and other major on-line companies.
Expanding the product range
As of August 1999, eBay’s brand was recognised by
91 million US adults, compared to 118 million for
Amazon.com. eBay’s challenge, however, was to turn
this awareness of its brand into registered users (7.7
million at the time) and revenues. This was becoming
more difficult as new competition was entering the
market all the time. In September 1999, FairMarket.
com announced that it would form an auction net-
work including Microsoft’s MSN, Excite@Home and
Lycos. Alta Vista, Xoom.com, Outpost.com, ZDNet,
CompUSA and Ticketmaster soon joined the net-
work. Each of the networked sites accessed a single
database, so any auction that was listed on one of the
sites was automatically listed on all of the other part-
ner sites which increased the number of buyers that
was available for each member. The FairMarket net-
work was intended to appeal to the big brand names
that did not want their items listed next to collect-
ibles and other ‘junk’. The eBay share price dropped
7 per cent on the news. Amazon had also launched its
zshops whereby merchants could retail their goods in
a fixed-price format which competed with the many
small traders who used eBay as their storefront but
did not require the sale to be in an auction format.
In order to increase its revenues with this increased
competition, eBay acquired Half.com in June 1999,
a fixed-price, person-to-person trading marketplace
to broaden the buying and selling choices for eBay’s
trading community and expand eBay’s trading plat-
form. Half.com had created an efficient, user-friendly
marketplace where buyers and sellers could trade
used books, CDs, movies and video games at fixed
prices that were at least half of the list price. In the
first quarter of 2000, eBay also launched its Business
Exchange site, which was to enable small businesses
to trade with each other in business-related categories
such as computer and industrial equipment, power

Case 3 • eBay.com C-45
tools, office furniture, and consumables such as print-
er toner. While some business-to-business trading had
always taken place on the site, the intention of this site
was to expand this and further increase eBay’s reach
into higher-priced goods.
On 8 February 2000, eBay and the Walt Disney
Corporation announced a comprehensive four-year
agreement in which eBay would ultimately become
the on-line trading service across all of Disney’s Inter-
net properties, including the GO Network portal.
The companies intended to develop, implement and
promote a co-branded person-to-person trading site
for the GO Network at www.ebay.go.com. In addi-
tion, the companies collaborated on the development
of several merchant-to-person trading sites in an auc-
tion format for Disney.com, ESPN.com and ABC.
com that showcase unique, exclusive and authenticat-
ed products, props and memorabilia from throughout
The Walt Disney Company, including Walt Disney
Studios, Disneyland and Walt Disney World, ESPN
Cable Networks and ABC Television.
On 20 November 2000, eBay launched its Appli-
cation Programming Interface (API) that would allow
other companies to display eBay auctions on their
independent websites. Companies would be able to
subscribe to specific auction and fixed-price catego-
ries on the eBay site. eBay had developed the software
itself and the software made it easier for program-
mers to create software applications without having
to write all the code for basic features such as screen
menus and printing capabilities. eBay executives
believed that the syndicated listings would appeal to
other Internet commerce and media sites that wanted
to give users more shopping options without build-
ing their own stores. Websites that wanted eBay list-
ings would not receive any fees of transactions exe-
cuted through their site unless they owned the listed
items. The company believed that it would eventually
be able to persuade some sites that already sold goods
to replace their in-house e-commerce systems with
eBay’s technology.
eBay at the end of 2000
eBay had created a convenient, efficient and enter-
taining marketplace where buyers and sellers could
list, bid for and trade goods. eBay was the intermedi-
ary and only provided the marketspace for buyers and
sellers to trade and did not take any responsibility for
the actual transaction. To attract and retain buyers
and sellers, eBay gave users access to value-added ser-
vices that made the transaction simpler. To improve
loyalty to the site, eBay had also developed an on-line
community where collectors and other users could
interact. The site created excitement for buyers who
searched for and bid on items that they hoped would
be bargain buys. As one customer noted:
I’d recommend eBay Auction services to everyone!
I attend many estate auctions on a regular basis in
the Kentucky area. I have found the same thrills on
eBay as I do at the real estate public auctions.11
Most trading took place in an auction format
where the trade took place between the seller and the
highest bidder, if the bid was above the reserve price
(where applicable). More details of the different auc-
tion formats are contained in Exhibit 6. eBay did not
take any ownership in or agency for the goods. Its
neutrality eliminates some of the concerns that face
other businesses, such as sourcing and supplying
goods, inventory, responsibility, payment collections
or shipping. This was important for eBay to maintain,
as implementing systems to perform these functions
would have significant costs associated with them and
would require additional resources.
Auction aggregators introduce a
new threat
At the end of 1999, auction aggregators such as Auc-
tionWatch.com started to pose a threat to individ-
ual on-line auctions such as eBay. These sites acted
as a portal and they collected data on the auctions
that were available on the individual auction sites
and displayed similar items from the competing sites
together. Buyers could therefore see all of the required
items at one time and compare prices. This was a sig-
nificant threat to eBay, whose success in the past was
due to its established community of buyers and sellers
choosing eBay over other competitors. eBay installed
technical measures to try to block AuctionWatch
servers from accessing its website. This only worked
for about a month, until AuctionWatch designed soft-
ware to get through the security features. eBay con-
sequently threatened legal action, claiming that these

C-46 Case 3 • eBay.com
sites were illegally accessing its site, making unautho-
rised copies of its content, and displaying the content
in incomplete and confusing ways. While the users
provided most of the content on its site, such as item
descriptions and photographs, eBay maintained that
the content that it generated (number of bids, length
of the auction, etc.) was its property.
Counterfeit, illegal and other
questionable listings
While on-line publishers are responsible for the con-
tent of their sites as an on-line venue, eBay was not,
according to the Digital Millennium Copyright Act
(DMCA) of 1998. People were, however, selling ille-
gal items such as human kidneys, marijuana and
counterfeit software, and controversial items such as
Nazi memorabilia and pornographic material. While
eBay had adopted a hands-off approach to what its
customers sold on the site, Shultz advised the board
that these items affected the character of the com-
pany. eBay consequently changed its description to a
‘venue where anybody can sell practically anything on
earth’ and issued a list of items that were restricted on
the site.
eBay had faced several lawsuits questioning the
eBay business model where people claimed that eBay
should take responsibility for the authenticity of items
sold on the site. An example of this was where eBay
was sued by someone who bought a collector’s base-
ball card that turned out to be a fake. Checking every
item that is listed on the site would have required
an army of content checkers, and if eBay had tried
to verify the legality of all of the items it probably
would have been liable for those items that slipped
through its inspections. On 21 November 2000, a
French judge ordered Yahoo! to block French users
from visiting websites that sold Nazi memorabilia.
This ruling meant that all websites would be subject
to the laws and norms of all other countries in the
world, which was a move away from the US-inspired
openness and freedom ethos. Critics suspected that
this ruling may have prompted other governments to
police websites in an attempt to get them to comply
with their local laws.
Exhibit 6 Comparison of auction formats
Dutch auction: The seller places one or more identical items on sale for a minimum price for a set time. When the auction ends,
the highest bidder wins the item(s) at their bid price. Remaining items are sold to other bidders in order of price, quality and
time.
Reserve price: The seller lists a ‘reserve bid price’. Buyers are allowed to place bids for any amount above or below the reserve
price, but the seller has the option to disregard any of the bids below the reserve price. The bidders do not normally know
the reserve price.
Express auction: Short timed auctions generally lasting between one-half to one hour. The quick turn-around offers a heightened
auction experience.
Reverse auction: The seller and not the buyer bears the risk of not being successful. The buyer lists what is required at the
price they are willing to pay for it. Sellers bid for the business. The bidder can remain anonymous, and a maximum price can
be established to maintain the price within a budget. This type of auction format is not offered by eBay. Priceline.com is well
known for offering reverse auctions.
Sealed bid auctions: Bidders are only aware of the reserve price and bid without knowing the amounts of other incoming bids.
All bids are automatically opened at the end date of the auction and the highest bidder wins.
Sniping: Placing a bid in the closing minutes or seconds of an auction. Any bid placed before the auction ends is allowed on eBay
but not on some other sites.
Proxy bidding: Placing a proxy bid at the maximum limit users are willing to bid for an item will result in the system bidding on
the bidder’s behalf each time a new bidder places a bid. The system will ensure that the proxy bidder’s bid is one increment
higher than the previous bid until the user’s maximum limit is reached.
Source: Various.

Case 3 • eBay.com C-47
Exhibit 8 Comparison of financial performance of dotcoms
Performance measure eBay Yahoo! Priceline Amazon
Revenues1 (mn) 113.4 295.5 341.3 637.9
Net income1 (mn) 15.2 47.7 (191.9) (240.5)
Gross margin2 (%) 74.58 85.45 15.40 21.06
Operating margin2 (%) 2.35 27.46 –97.04 –33.08
Profit margin2 (%) 7.50 21.33 –96.18 –35.79
Recent share price336.94 40.88 2.53 28.94
Market capitalisation3 (mn) 9 895.62 22 825.54 426.50 10 306.96
Number of employees4138 1 992 373 7 600
Notes: Source: www.marketguide.com, November 2000.
1 All amounts in US dollars.
2 Revenue and net income for three months to 30 September 2000.
3 Margins for 12 months to 30 September 2000.
4 Share price as at 24 November 2000.
5 Employees as at 31 December 1999.
Exhibit 7 Websites’ audiences and average time per month
Ranking Website Unique audience (’000)
Time per person
(hrs:min:sec)
1 AOL Websites 64 744 00:43:29
2 Yahoo! 63 720 01:41:00
3 MSN 51 424 01:19:37
4 Microsoft 34 614 00:12:31
5 Lycos Network 33 708 00:21:28
6 Excite@Home 32 085 00:35:09
7 Walt Disney Internet Group 27 076 00:33:41
8 Time Warner 23 250 00:24:14
9 About the Human Internet 22 262 00:10:45
10 Amazon 21 837 00:16:06
11 AltaVista 18 560 00:21:41
12 CNET Networks 18 525 00:16:06
13 NBC Internet 18 423 00:14:51
14 eBay 17 010 02:10:49
15 eUniverse Network 16 003 00:18:01
16 LookSmart 15 840 00:07:39
17 Ask Jeeves 14 671 00:10:30
18 Real Network 12 265 00:06:46
19 American Greetings 11 856 00:11:49
20 Earthlink 11 602 00:17:15
21 AT&T 11 196 00:15:45
22 Uproar 11 113 00:42:35
23 The Go2Net Network 10 752 00:13:25
24 GoTo.com 10 564 00:04:15
25 Viacom International 10 178 00:14:21
Source: Nielsen NetRatings.

C-48 Case 3 • eBay.com
The future
In the third quarter of 2000, US$1.4 billion worth
of goods were traded on eBay in 68.5 million auc-
tions, which generated US$113.4 million of revenue
and US$15.2 million in net profit for the company.
At the end of September 2000, eBay had 18.9 million
registered users. When releasing these results, eBay
announced a revenue goal of US$3 billion in 2005,
with sites in 25 countries, representing the majority of
the world’s Internet users. Exhibit 7 gives the Nielsen
NetRatings of the top 25 websites for October 2000
(combined at-home and at-work data), where eBay
received 17 million unique visitors who spent an aver-
age of 2 hours 10 minutes on the site for the month.
What was important to Whitman was the fact that
eBay was making a profit, while many other e-com-
merce companies were making significant losses while
building their user base and establishing distribution
networks (see Exhibit 8).
However, on 20 November 2000, Lehman
Brothers downgraded eBay’s share from a ‘buy’ to a
‘neutral’, citing eBay’s ‘aggressive 2005 sales projec-
tion’ as a concern. The share price fell 20 per cent on
the news. The analyst at Lehman Brothers said that
eBay’s core business was slowing down and that the
new business initiatives were more costly than initial
estimates. The staff complement had increased with
the growth, which meant that the company was being
challenged to maintain the culture and values among
the new recruits. Whitman knew that her greatest
challenge would be to keep eBay focused while grow-
ing the company. Considering the share downgrade,
Whitman was sure that the analyst was over-reacting
on the forecasts. Over the past five years, eBay had
been an example of e-commerce success for Internet
and bricks-and-mortar companies alike. It had trans-
formed the auction business, which had allowed it to
become the world’s largest P2P on-line auction com-
pany, achieving a higher value than many established
Fortune 500 companies. Overcoming challenges was
an everyday part of the environment, for which eBay
had set the example. But the future may bring as many
threats as previously there were opportunities.
Exhibit 9 A brief history of auctions
The auction format of selling emerged almost from the beginning of time, when people first began to barter trade with each
other. The word ‘auction’ is derived from a Latin word, which means a gradual increase.
The earliest record of an organised auction was of the annual marriage market of Babylon in about 500 BC. Once a year the
men of Babylon would gather around while a herald (auctioneer) would accept bids for maidens. The herald would begin the
auction with the most ‘beautiful’ girls and work his way through to the ‘ugliest’. Ancient Romans also auctioned goods. One of
the most astonishing auctions in history occurred in the year AD 193 when no less than the entire Roman Empire was ‘tossed
on the block’ by the Praetorian Guard. First they killed Pertinax, the emperor, and then they announced that the highest
bidder could claim the empire. As the Roman Empire came to an end, there were fewer and fewer auctions.
The earliest reference to the auction as practised in Great Britain is from 1595, but there are no more references until the
end of the 17th century. At that time, auctions were held in taverns and coffee houses to sell art. At the beginning of the 17th
century, four types of auctions developed which shaped how current auctions are conducted today. The four types were:
1 Auctions using a ‘hammer’ as we know it today.
2 Hourglass auctions: Bids were accepted until the last grain of sand was left at the top of the hourglass. The last bid called
before the glass was empty, won.
3 Candle auction: The same idea as the hourglass auction.
4 Dutch auction: This is when the auctioneer begins at a higher price and quotes smaller and smaller bids until there
is a buyer.
Sotheby’s and Christies were founded in 1744 and 1766, respectively.
Sources: www.bendisauctions.com/orgin.htm; http://iml.jou.ufl.edu/projects/Spring2000/McKenzie/History.html; www.webcom.com/agorics/
auctions/auction9.html.

Case 3 • eBay.com C-49
References
The Australian eBay site can be explored at www.ebay.com.au. Users
can search for items in Australia or worldwide, and can set up the
‘My eBay’ function to track auctions.
Alsop. S., 1999, ‘Contemplating eBay’s funeral’, Fortune Magazine,
139(11).
Amazon.com Auctions, 2000, www.amazon.com.
AuctionGuide.com., 2000, www.auctionguide.com.
AuctionWatch, 2000, www.auctionwatch.com.
Bloomberg News, 1999, ‘eBay founders give up billions to repay
loans’, Cnet.com, June, viewed 23 September 2000, www.cnet.
com.
Butterfield & Butterfield, 2000, www.butterfields.com.
CiscoWorld, 2000, Case Study: ‘Keeping outages at bay at eBay’,
5 October, www.ciscoworldmagazine.com.
Clampet, E., 1999, ‘eBay enhances services with acquisitions’, May,
viewed 23 September 2000, www.internews.com.
Cohen, A., 1999, ‘The eBay revolution: How the online auctioneer
triggered a revolution of its own’, Time Magazine, viewed
16 October 2000, www.time.com.
Dayal, S., H. Landesberg and M. Zeisser, 2000, ‘Building digital brands’,
The McKinsey Quarterly 2, pp. 42–51.
eBay Annual Report, 1999, Form 10-K: Annual Report for eBay Inc. for
fiscal year ended December 31, 1998.
eBay Annual Report, 2000, Form 10-K: Annual Report for eBay Inc. for
fiscal year ended December 31, 1999.
eBay Quar terly Financial Statements, 2000, Form 10-Q: Quarterly
Report for eBay Inc. for the quarterly period ended June 30, 2000.
eBay Quarterly Financial Statements, 2000, Form 10-Q: Quarterly Report
for eBay Inc. for the quarterly period ended March 31, 2000.
eBay Quar terly Financial Statements, 2000, Form 10-Q: Quarterly
Report for eBay Inc. for the quarterly period ended September 30,
2000.
eBay.com, 2000, www.ca.ebay.com (Canada).
eBay.com, 2000, www.ebay.co.uk (United Kingdom).
eBay.com, 2000, www.ebay.com.au (Australia).
eBay.com, 2000, www.ebayjapan.co.jp (Japan).
eBay.com, 2000, www.fr.ebay.com (France).
Ellington, D., D. Ficeli, P. Jaturaputpaibul and K. Kellam, 1999, Issues
Facing Consumer-Oriented Online Auctions (MBA, Owen Graduate
School of Management, Vanderbilt University), 17 October
2000, http://mba99.vanderbilt.edu.
Forrester Research, 2000, ‘Forrester findings: Internet commerce’,
17 September, www.forrester.com.
Fortune, 2000, ‘America’s forty under 40’, Fortune Magazine, June,
viewed 23 October, www.fortune.com.
Fortune, 1999, e50, Company Index, 29 September 2000, www.
fortune.com.
Himelstein, L., 1999, ‘Q&A with Meg Whitman: What’s behind the
boom at eBay’, Business Week, www.businessweek.com.
Interagency Government Asset Sales Team (IGAST), 2000, ‘The
vendor pilot asset sales and auction’, US Chief Financial
Officer’s Council Auction White Paper, 13 October, www.
financenet.gov.
InternetNews Staff, 1998, ‘eBay gets personal’, InterNews.com,
October, viewed 23 September 2000, www.internews.com.
InternetNews Staff, 1998, ‘eBay launches national adver tising
campaign’, InterNews.com, October, viewed 23 September
2000, www.internews.com.
Jannarkar, S., 1999, ‘eBay buys Butterfield & Butterfield’, Cnet.com,
April, viewed 26 September 2000, www.cnet.com.
Kruse International, 2000, www.kruseinternational.com.
Lee, J., 1998, ‘Why eBay is flying’, Fortune Magazine, 138(11).
Moran, S., 1999, ‘The pro: Meg Whitman’, Business 2.0, June, viewed
2 October 2000, www.business2.com.
Nielsen/NetRatings Global Internet Index, 2000, ‘Top 25 web sites
by proper ty’, October, viewed 28 November 2000, www.
nielsen-netratings.com.
Reichheld, F. R and P. Schefter, 2000, ‘E-Loyalty: Your secret weapon
on the web’, Harvard Business Review, July–August, pp. 105–13.
Roberts, L., 2000, ‘eBay thinks global, big-time’, 25 September, www.
marketwatch.com.
Roth, D., 1999, ‘Meg muscles eBay uptown’, Fortune Magazine,
140(1).
Sellers, P., 1999, ‘Powerful women: These women rule’, Fortune
Magazine, 140(8).
Silicon Valley, 1999, ‘Return to 1st person: Pierre Omidyar’,
Siliconvalley.com, 23 September 2000, www.sv.com.
Street, D., 1999’, Amazon.com: From start-up to the new millennium
(MBA Research Report, University of Cape Town).
Tedeschi, R., 1999, ‘Using discounts to build a client base’, New York
Times, 31 May.
The Standard, 1999, ‘Profile: Pierre Omidyar’, 15 September 2000,
www.thestandard.com.
Wall Street Journal, 2000, ‘Stocks declined, dragged down by analyst
downgrades, election’, Wall Street Journal, 20 November, www.
wsj.com.
Wingfield, N., 2000, ‘eBay aims to be operating system for all
e-commerce on the Internet’, Wall Street Journal, 20 November,
www.wsj.com.
Yahoo! Auctions, 2000, auctions.yahoo.com.
Notes
1 D. Bunnell, 2000, The eBay Phenomenon: Business Secrets Behind
the World’s Hottest Internet (New York: John Wiley & Sons,
Inc.). Copyright John Wiley & Sons Limited. Reproduced by
permission.
2 Ibid.
3 Ibid.
4 Ibid.
5 Various, 2000, Epinions.com – Reviews of eBay, 21 November,
www.epinions.com.
6 K. Harrod, 1999, ‘Amazon.com vs. eBay’, Letter to Fortune, 5 July
1999, viewed 23 October 2000, www.fortune.com.
7 Bunnell, The eBay Phenomenon.
8 Ibid.
9 Ibid.
10 www.ebay.com.
11 Various, 2000, Epinions.com – Reviews of eBay.

C-50
Case 4
Gillette and the men’s
wet-shaving market
Lew G. Brown Jennifer M. Hart
University of North Carolina at Greensboro University of North Carolina at Greensboro
SAN FRANCISCO
On a spring morning in 1989, Michael Johnson dried
himself and stepped from the shower in his San Fran-
cisco Marina District condominium. He moved to the
sink and started to slide open the drawer in the cabi-
net beneath the sink. Then he remembered that he had
thrown away his last Atra blade yesterday. He heard
his wife, Susan, walk past the bathroom.
‘Hey, Susan, did you remember to pick up some blades
for me yesterday?’
‘Yes, I think I put them in your drawer.’
‘Oh, okay, here they are.’ Michael saw the bottom of
the blade package and pulled the drawer open.
‘Oh, no! These are Trac II blades, Susan, I use an
Atra.’
‘I’m sorry. I looked at all the packages at the drug-
store, but I couldn’t remember which type of razor
you have. Can’t you use the Trac II blades on your
razor?’
‘No. They don’t fit.’
‘Well, I bought some disposable razors. Just use one
of those.’
‘Well, where are they?’
‘Look below the sink. They’re in a big bag.’
‘I see them. Wow, 10 razors for $1.97! Must have been
on sale.’
‘I guess so. I usually look for the best deal. Seems to
me that all those razors are the same, and the drug-
store usually has one brand or another on sale.’
‘Why don’t you buy some of those shavers made for
women?’
‘I’ve tried those, but it seems that they’re just like the
ones made for men, only they’ve dyed the plastic pink
or some pastel colour. Why should I pay more for
colour?’
‘Why don’t you just use disposables?’ Susan contin-
ued. ‘They are simpler to buy, and you just throw
them away. And you can’t beat the price.’
‘Well, the few times I’ve tried them they didn’t seem
to shave as well as a regular razor. Perhaps they’ve
improved. Do they work for you?’
‘Yes, they work fine. And they sure are better than the
heavy razors if you drop one on your foot while you’re
in the shower!’
‘Never thought about that. I see your point. Well, I’ll
give the disposable a try.’

Case 4 • Gillette and the men’s wet-shaving market C-51
History of shaving
Anthropologists do not know exactly when or even
why men began to shave. Researchers do know that
prehistoric cave drawings clearly present men who
were beardless. Apparently these men shaved with
clamshells or sharpened animal teeth. As society
developed, primitive men learned to sharpen flint
implements. Members of the early Egyptian dynas-
ties as far back as 7000 years ago shaved their faces
and heads, probably to deny their enemies anything
to grab during hand-to-hand combat. Egyptians later
fashioned copper razors and, in time, bronze blades.
Craftsmen formed these early razors as crescent-
shaped knife blades, like hatchets or meat cleavers, or
even as circular blades with a handle extending from
the centre. By the Iron Age, craftsmen were able to
fashion blades that were considerably more efficient
than the early flint, copper and bronze versions.
Before the introduction of the safety razor, men
used a straight-edged, hook-type razor and found
shaving a tedious, difficult and time-consuming task.
The typical man struggled through shaving twice a
week at most. The shaver had to sharpen the blade
(a process called stropping) before each use and had
to have an expert cutler hone the blade each month.
As a result, men often cut themselves while shaving;
and few men had the patience and acquired the nec-
essary skill to become good shavers. Most men in the
1800s agreed with the old Russian proverb: ‘It is eas-
ier to bear a child once a year than to shave every
day.’ Only the rich could afford a daily barber shave,
which also often had its disadvantages because many
barbers were unclean.
Before King C. Gillette of Boston invented the
safety razor in 1895, he tinkered with other inventions
in pursuit of a product which, once used, would be
thrown away. The customer would have to buy more,
and the business would build a long-term stream of
sales and profits with each new customer.
‘On one particular morning when I started to
shave,’ wrote Gillette about the dawn of his inven-
tion, ‘I found my razor dull, and it was not only dull
but beyond the point of successful stropping and it
needed honing, for which it must be taken to a bar-
ber or cutler. As I stood there with the razor in my
hand, my eyes resting on it as lightly as a bird settling
down on its nest, the Gillette razor was born.’ Gillette
immediately wrote to his wife, who was visiting rela-
tives, ‘I’ve got it; our fortune is made.’
Gillette had envisioned a ‘permanent’ razor han-
dle on to which the shaver placed a thin, razor ‘blade’
with two sharpened edges. The shaver would place a
top over the blade and attach it to the handle so that
only the sharpened edges of the blade were exposed,
thus producing a ‘safe’ shave. A man would shave
with the blade until it became dull and then would
simply throw the used blade away and replace it. Gil-
lette knew his concept would revolutionise the process
of shaving; however, he had no idea that his creation
would permanently change men’s shaving habits.
Shaving in the 1980s
Following the invention of the safety razor, the men’s
shaving industry in the United States grew slowly but
surely through the First World War. A period of rapid
growth followed, and the industry saw many product
innovations. By 1989, US domestic razor and blade
sales (the wet-shave market) had grown to a US$770
million industry. A man could use three types of wet
shavers to remove facial hair. Most men used the dis-
posable razor – a cheap, plastic-handled razor that
lasted for eight to 10 shaves on average. Permanent
razors, called blade and razor systems, were also pop-
ular. These razors required new blades every 11 to
14 shaves. Customers could purchase razor handles
and blade cartridges together, or they could purchase
packages of blade cartridges as refills. The third cate-
gory of wet shavers included injector and double-edge
razors and accounted for a small share of the razor
market. Between 1980 and 1988, disposable razors
had risen from a 22 per cent to a 41.5 per cent market
share of dollar sales. During the same period, cartridge
systems had fallen from 50 per cent to 45.8 per cent
and injector and double-edge types had fallen from
28 per cent to 12.7 per cent. In addition, the develop-
ment of the electric razor had spawned the dry-shave
market, which accounted for about US$250 million
in sales by 1988.
Despite the popularity of disposable razors,
manufacturers found that the razors were expen-
sive to make and generated very little profit. In 1988,
some industry analysts estimated that manufacturers

C-52 Case 4 • Gillette and the men’s wet-shaving market
earned three times more on a razor and blade system
than on a disposable razor. Also, retailers preferred
to sell razor systems because they took up less room
on display racks and the retailers made more mon-
ey on refill sales. However, retailers liked to promote
disposable razors to generate traffic. As a result, US
retailers allocated 55 per cent of their blade and razor
stock to disposable razors, 40 per cent to systems and
5 per cent to double-edge razors.
Electric razors also posed a threat to razor and
blade systems. Unit sales of electric razors jumped
from 6.2 million in 1981 to 8.8 million in 1987. Low-
priced imports from the Far East drove demand for
electric razors up and prices down during this period.
Nonetheless, fewer than 30 per cent of men used elec-
tric razors, and most of these also used wet-shaving
systems.
Industry analysts predicted that manufacturers’
sales of personal care products would continue to
grow. However, the slowing of the overall US econo-
my in the late 1980s meant that sales increases result-
ing from an expanding market would be minimal and
companies would have to fight for market share to
continue to increase sales.
By 1988 the Gillette Company dominated the wet-
shave market with a 60 per cent share of worldwide
razor market revenue and a 61.9 per cent share of the
US market. Gillette also had a stake in the dry-shave
business through its Braun subsidiary. The other play-
ers in the wet-shave market were Schick with 16.2 per
cent of market revenues, BIC with 9.3 per cent, and
others, including Wilkinson Sword, with the remain-
ing 12.6 per cent.
The Gillette Company
King Gillette took eight years to perfect his safety
razor. In 1903, the first year of marketing, the Amer-
ican Safety Razor Company sold 51 razors and 168
blades. Gillette promoted the safety razor as a saver
of both time and money. Early ads proclaimed that
the razor would save US$52 and 15 days’ shaving
time each year and that the blades required no strop-
ping or honing. During its second year, Gillette sold
90 884 razors and 123 648 blades. By its third year,
razor sales were rising at a rate of 400 per cent per
year, and blade sales were booming at an annual rate
of 1000 per cent. In that year, the company opened its
first overseas branch in London.
Such success attracted much attention, and com-
petition quickly developed. By 1906, consumers had
at least a dozen safety razors from which to choose.
The Gillette razor sold for US$5, as did the Zinn
razor made by the Gem Cutlery Company. Others,
such as the Ever Ready, Gem Junior and Enders, sold
for as little as US$1.
With the benefit of a 17-year patent, Gillette found
himself in a very advantageous position. However, it
was not until the First World War that the safety razor
gained wide consumer acceptance. One day in 1917,
King Gillette had a visionary idea: have the govern-
ment present a Gillette razor to every soldier, sailor
and marine. In this way, millions of men just entering
the shaving age would adopt the self-shaving habit. By
March 1918, Gillette had booked orders from the US
military for 519 750 razors, more than it had sold in
any single year in its history. During the First World
War, the government bought 4 180 000 Gillette razors
as well as smaller quantities of competitive models.
Although King Gillette believed in the quality of
his product, he realised that marketing, especially dis-
tribution and advertising, would be the key to suc-
cess. From the beginning, Gillette set aside 25 cents
per razor for advertising and by 1905 had increased
the amount to 50 cents. Over the years, Gillette used
cartoon ads, radio shows, musical slogans and theme
songs, prizes, contests and cross-promotions to push
its products. Perhaps, however, consumers best remem-
ber Gillette for its Cavalcade of Sports programs that
began in 1939 with the company’s sponsorship of the
World Series. Millions of men soon came to know
Sharpie the Parrot and the tag line, ‘Look Sharp! Feel
Sharp! Be Sharp!’
Gillette had always been an industry innovator.
In 1932, Gillette introduced the Gillette Blue Blade,
which was the premier men’s razor for many years.
In 1938, the company introduced the Gillette Thin
Blade; in 1946, it introduced the first blade dispenser
that eliminated the need to unwrap individual blades;
in 1959, it introduced the first silicone-coated blade,
the Super Blue Blade. The success of the Super Blue
Blade caused Gillette to close 1961 with a command-
ing 70 per cent share of the overall razor and blade

Case 4 • Gillette and the men’s wet-shaving market C-53
market and a 90 per cent share of the double-edge
market, the only market in which it competed.
In 1948, Gillette began to diversity into new mar-
kets through acquisition. The company purchased the
Toni Company to extend its reach into the women’s
grooming-aid market. In 1954, the company bought
Paper Mate, a leading marker of writing instruments.
In 1962, it acquired the Sterilon Corporation, which
manufactured disposable hospital supplies. As a result
of these moves, a marketing survey found that the
public associated Gillette with personal grooming as
much as, or more than, with blades and razors.
In 1988, the Gillette Company was a leading pro-
ducer of men’s and women’s grooming aids. Exhibit 1
lists the company’s major divisions. Exhibits 2 and 3
show the percentages and dollar volumes of net sales
Exhibit 1 Gillette product lines by company division, 1988
Blades and razors Stationery products
Toiletries and
cosmetics Oral B products Braun products
Trac II
Atra
Good News
Paper Mate
Liquid Paper
Flair
Waterman
Write Bros.
Adorn
T
oni
Right Guard
Silkience
Soft and Dri
Foamy
Dry Look
Dry Idea
White Rain
Lustrasilk
Oral B toothbrushes Electric razors
Lady Elegance
Clocks
Coffee grinders and
makers
Exhibit 2 Gillette’s sales and operating profits by product line, 1986–88 (US$mn)
1988 1987 1986
Product line Sales Profits Sales Profits Sales Profits
Blades and razors $1 147 $406 $1 031 $334 $903 $274
Toiletries and cosmetics 1 019 79 926 99 854 69
Stationery products 385 56 320 34 298 11
Braun products 824 85 703 72 657 63
Oral B 202 18 183 7 148 8
Other 5 (0.1) 4 2 48 (1)
Totals $3 582 $643 $3 167 $548 $2 908 $424
Source: Gillette Company Annual Reports, 1985–88.
Exhibit 3 Gillette’s net sales and profit by business, 1984–88 (per cent)
Blades
and razors
Toiletries
and cosmetics
Stationery
products
Braun
products
Oral B
products
Year Sales Profits Sales Profits Sales Profits Sales Profits Sales Profits
1988 32 61 28 14 11 9 23 13 6 3
1987 33 61 29 18 10 6 22 13 6 2
1986 32 64 30 16 11 3 20 15 5 2
1985 33 68 31 15 11 2 17 13 6 3
1984 34 69 30 15 12 3 17 12 3 2
Source: Gillette Company Annual Reports, 1985–88.

C-54 Case 4 • Gillette and the men’s wet-shaving market
and profits from operations for each of the company’s
major business segments. Exhibits 4 and 5 present
income statements and balance sheets for 1986–88.
Despite its diversification, Gillette continued to
realise the importance of blade and razor sales to the
company’s overall health. Gillette had a strong foot-
hold in the razor and blade market, and it intended
to use this dominance to help it achieve the compa-
ny’s goal – ‘sustained profitable growth’. To reach this
goal, Gillette’s mission statement indicated that the
company should pursue ‘strong technical and market-
ing efforts to assure vitality in major existing prod-
uct lines; selective diversification, both internally
and through acquisition; the elimination of product
and business areas with low growth or limited profit
potential; and strict control over product costs, over-
head expenses, and working capital’.
Gillette introduced a number of innovative shav-
ing systems in the 1970s and 1980s as part of its
strategy to sustain growth. Gillette claimed that Trac
II, the first twin-blade shaver, represented the most
revolutionary shaving advance ever. The develop-
ment of the twin-blade razor derived from shaving
researchers’ discovery that shaving causes whiskers to
be briefly lifted up out of the follicle during shaving,
a process called ‘hysteresis’ by technicians. Gillette
invented the twin-blade system so that the first blade
would cut the whisker and the second blade would
cut it again before it receded. This system produced a
closer shave than a traditional one-blade system. Gil-
lette also developed a clog-free, dual-blade cartridge
for the Trac II system.
Because consumer test data showed a 9-to-1
preference for Trac II over panellists’ current razors,
Gillette raced to get the product to market. Gillette
supported Trac II’s 1971 introduction, which was the
largest new product introduction in shaving history,
with a US$10 million advertising and promotion bud-
get. Gillette cut its advertising budgets for its other
brands drastically to support Trac II. The double-
edge portion of the advertising budget decreased from
47 per cent in 1971 to 11 per cent in 1972. Gillette
reasoned that growth must come at the expense of
other brands. Thus, it concentrated its advertising and
promotion on its newest shaving product and reduced
support for its established lines.
Gillette launched Trac II during a World Series
promotion and made it the most frequently advertised
shaving system in America during its introductory
period. Trac II users turned out to be predominantly
young, college-educated men who lived in metropoli-
tan and suburban areas and earned higher incomes.
Exhibit 4 Gillette income statements, 1986–88 (US$mn except for per share and stock price data)
1988 1987 1986
Net sales $3 581.2 $3 166.8 $2 818.3
Cost of sales 1 487.4 1 342.3 1 183.8
Other expenses 1 479.8 1 301.3 1 412.0
Operating income 614.0 523.2 222.5
Other income 37.2 30.9 38.2
Earnings before interest and tax 651.2 545.1 260.7
Interest expense 138.3 112.5 85.2
Non-operating expense 64.3 50.1 124.0
Earnings before tax 448.6 391.5 51.5
Tax 180.1 161.6 35.7
Earnings after tax 268.5 229.9 15.8
Earnings per share 2.45 2.00 0.12
Average common shares outstanding (000) 109 559 115 072 127 344
Dividends paid per share $0.86 $0.785 $0.68
Stock price range
High
Low
$49
$29 1/8
$45 7/8
$17 5/8
$34 1/2
$17 1/8
Source: Gillette Company Annual Reports, 1986–88.

Case 4 • Gillette and the men’s wet-shaving market C-55
As the fastest-growing shaving product on the market
for five years, Trac II drove the switch to twin blades.
The brand reached its peak in 1976 when consumers
purchased 485 million blades and 7 million razors.
Late in 1976, Gillette, apparently in response to
BIC’s pending entrance into the US market, launched
Good News!, the first disposable razor for men sold
in the United States. In 1975, BIC had introduced the
first disposable shaver in Europe; and by 1976 BIC
had begun to sell disposable razors in Canada. Gillette
realised that BIC would move its disposable razor into
the United States after its Canadian introduction, so
it promptly brought out a new blue plastic disposable
shaver with a twin-blade head. By year’s end, Gillette
also made Good News! available in Austria, Canada,
France, Italy, Switzerland, Belgium, Greece, Germany
and Spain.
Unfortunately for Gillette, Good News! was real-
ly bad news. The disposable shaver delivered lower
profit margins than razor and blade systems, and
it undercut sales of other Gillette products. Good
News! sold for much less than the retail price of a
Trac II cartridge. Gillette marketed Good News! on
price and convenience, not performance; but the com-
pany envisioned the product as a step-up item leading
to its traditional high-quality shaving systems.
This contain-and-switch strategy did not succeed.
Consumers liked the price and the convenience of dis-
posable razors, and millions of Trac II razors began
to gather dust in medicine chests across the country.
Many Trac II users figured out that for as little as
25 cents, they could get the same cartridge mounted
on a plastic handle that they had been buying for 56
cents to put on their Trac II handle. Further, dispos-
able razors created an opening for competitors in a
category that Gillette had long dominated.
Gillette felt sure, however, that disposable razors
would never gain more than a 7 per cent share of
the market. The disposable razor market share soon
soared past 10 per cent, forcing Gillette into continu-
al upward revisions of its estimates. In terms of units
sold, disposable razors reached a 22 per cent market
share by 1980 and a 50 per cent share by 1988.
BIC’s and Gillette’s successful introduction of
the disposable razor represented a watershed event in
‘commoditisation’ – the process of converting well-
differentiated products into commodities. Status,
quality and perceived value had always played prima-
ry roles in the marketing of personal care products.
But consumers were now showing that they would
forgo performance and prestige in a shaving product
– about as close and personal as one can get.
Exhibit 5 Gillette balance sheets, 1986–88 (US$mn)
1988 1987 1986
Assets Cash $156.4 $119.1 $94.8
Receivables 729.1 680.1 608.8
Inventories 653.4 594.5 603.1
Other current assets 200.8 184.5 183.0
Total current assets 1 739.7 1 578.2 1 489.7
Fixed assets, net 683.1 664.4 637.3
Other assets 445.1 448.6 412.5
Total assets 2 867.9 2 731.2 2 539.5
Liabilities and equity Current liabilities* 965.4 960.5 900.7
Long-term debt 1 675.2 839.6 915.2
Other long-term liabilities 311.9 331.7 262.8
Equity†$ (84.6) $ 599.4 $ 460.8
* Includes current portion of long-term debt: 1988 = $9.6, 1987 = $41.0, 1986 = $7.6. Source: Gillette Company Annual Reports, 1986–88.
† Includes retained earnings: 1988 = $1261.6, 1987 = $1 083.8, 1986 = $944.3.

C-56 Case 4 • Gillette and the men’s wet-shaving market
In 1977, Gillette introduced a new blade and razor
system at the expense of Trac II. It launched Atra
with a US$7 million advertising campaign and over
50 million US$2 rebate coupons. Atra (which stands
for Automatic Tracking Razor Action) was the first
twin-blade shaving cartridge with a pivoting head.
Engineers had designed the head to follow a man’s
facial contours for a closer shave. Researchers began
developing the product in Gillette’s UK research and
development lab in 1970. They had established a goal
of improving the high-performance standards of twin-
blade shaving and specifically enhancing the Trac II
effect. The company’s scientists discovered that mov-
ing the hand and face was not the most effective way
to achieve the best blade–face shaving angle. The
razor head itself produced a better shave if it pivoted
so as to maintain the most effective shaving angle.
Marketers selected the name ‘Atra’ after two years of
extensive consumer testing.
Atra quickly achieved a 7 per cent share of the
blade market and about one-third of the razor mar-
ket. The company introduced Atra in Europe a year
later under the brand name ‘Contour’. Although Atra
increased Gillette’s share of the razor market, 40
per cent of Trac II users switched to Atra in the first
year.
In the early 1980s, Gillette introduced most of
the new disposable razors and product enhance-
ments. Both Swivel (launched in 1980) and Good
News! Pivot (1984) were disposable razors featur-
ing movable heads. Gillette announced Atra Plus (the
first razor with the patented Lubra-smooth lubricat-
ing strip) in 1985 just as BIC began to move into the
United States from Canada with the BIC shaver for
sensitive skin. A few months later, Gillette ushered in
Micro Trac – the first disposable razor with an ultra-
slim head. Gillette priced the Micro Trac lower than
any other Gillette disposable razor. The company
claimed to have designed a state-of-the-art manufac-
turing process for Micro Trac. The process required
less plastic, thus minimising bulk and reducing man-
ufacturing costs. Analysts claimed that Gillette was
trying to bracket the market with Atra Plus (with a
retail price of US$3.99 to US$4.95) and Micro Trac
(US$0.99), and protect its market share with prod-
ucts on both ends of the price and usage scale. Gillette
also teased Wall Street with hints that, by the end
of 1986, it would be introducing yet another state-
of-the-art shaving system that could revolutionise the
shaving business.
Despite these product innovations and intro-
ductions in the early 1980s, Gillette primarily focused
its energies on its global markets and strategies. By
1985, it was marketing 800 products in more than
200 countries. The company felt a need at this time to
coordinate its marketing efforts, first regionally and
then globally.
Unfortunately for Gillette’s management team,
others noticed its strong international capabilities.
Ronald Perelman, chairman of the Revlon Group,
attempted an unfriendly takeover in November 1986.
To fend off the takeover, Gillette bought back 9.2
million shares of its stock from Perelman and sad-
dled itself with additional long-term debt to finance
the stock repurchase. Gillette’s payment to Perelman
increased the company’s debt load from US$827 mil-
lion to US$1.1 billion, and put its debt-to-equity ratio
at 70 per cent. Gillette and Perelman signed an agree-
ment preventing Perelman from attempting another
takeover until 1996.
In 1988, just as Gillette returned its attention
to new product development and global marketing,
Coniston Partners, after obtaining 6 per cent of Gil-
lette’s stock, engaged the company in a proxy bat-
tle for four seats on its 12-person board. Coniston’s
interest had been piqued by the Gillette–Perelman
US$549 million stock buyback and its payment of
US$9 million in expenses to Perelman. Coniston and
some shareholders felt Gillette’s board and manage-
ment had repeatedly taken actions that prohibited its
shareholders from realising their shares’ full value.
When the balloting concluded, Gillette’s management
won by a narrow margin – 52 to 48 per cent. Coniston
made US$13 million in the stock buyback program
that Gillette offered to all shareholders, but Conis-
ton agreed not to make another run at Gillette until
1991. This second takeover attempt forced Gillette to
increase its debt load to US$2 billion and pushed its
total equity negative to (US$84.6 million).
More importantly, both takeover battles forced
Gillette to ‘wake up’. Gillette closed or sold its Jafra
Cosmetics operations in 11 countries and jettisoned
weak operations such as Misco, Inc. (a computer sup-
plies business), and S.T. Dupont (a luxury lighter,

Case 4 • Gillette and the men’s wet-shaving market C-57
clock and watchmaker). The company also thinned
its workforce in many divisions, such as its 15 per cent
staff reduction at the Paper Mate pen unit. Despite
this pruning, Gillette’s sales for 1988 grew 13 per cent
to US$3.6 billion, and profits soared 17 per cent to
US$268 million.
Despite Gillette’s concentration on fending off
takeover attempts, it continued to enhance its razor
and blade products. In 1986, it introduced the Con-
tour Plus in its first pan-European razor launch. The
company marketed Contour Plus with one identity
and one strategy. In 1988, the company introduced
Trac II Plus, Good News! Pivot Plus and Daisy Plus
– versions of its existing products with the Lubra-
smooth lubricating strip.
Schick
Warner-Lambert’s Schick served as the second major
competitor in the wet-shaving business. Warner-Lam-
bert, incorporated in 1920 under the name William
R. Warner & Company, manufactured chemicals and
pharmaceuticals. Numerous mergers and acquisitions
over 70 years resulted in Warner-Lambert’s involve-
ment in developing, manufacturing and marketing
a widely diversified line of beauty, health and well-
being products. The company also became a major
producer of mints and chewing gums, such as Den-
tyne, Sticklets and Trident. Exhibit 6 presents a list of
Warner-Lambert’s products by division as of 1988.
Warner-Lambert entered the wet-shaving busi-
ness through a merger with Eversharp in 1970. Ever-
sharp, a long-time competitor in the wet-shave indus-
try, owned the Schick trademark and had owned the
Paper Mate Pen Company prior to selling it to Gillette
in 1955. Schick’s razors and blades produced US$180
million in revenue in 1987, or 5.2 per cent of Warner-
Lambert’s worldwide sales. (Refer to Exhibit 7 for
operating results by division, and Exhibits 8 and 9
for income statement and balance sheet data.)
In 1989, Schick held approximately a 16.2 per
cent US market share, down from its 1980 share
of 23.8 per cent. Schick’s market share was broken
down as follows: blade systems, 8.8 per cent; dispos-
able razors, 4.1 per cent; and double-edged blades
and injectors, 3.3 per cent.
Schick’s loss of market share in the 1980s occurred
for two reasons. First, even though Schick pioneered
the injector razor system (it controlled 80 per cent of
this market by 1979), it did not market a disposable
razor until mid-1984 – eight years after the first dis-
posable razors appeared. Second, for years Warner-
Lambert had been channelling Schick’s cash flow to
its research and development in drugs.
In 1986, the company changed its philosophy: it
allocated US$70 million to Schick for a three-year
Exhibit 6 Warner-Lambert product lines by company division, 1988
Ethical pharmaceuticals Gums and mints
Non-prescription
products Other products
Parke-Davis drugs Dentyne
Sticklets
Beemans
Trident
Freshen-up
Bubblicious
Chiclets
Clorets
Certs
Dynamints
Junior Mints
Sugar Daddy
Sugar Babies
Charleston Chew
Rascals
Benadryl
Caladryl
Rolaids
Sinutab
Listerex
Lubraderm
Anusol
Tucks
Halls
Benylin
Listerine
Listermint
Efferdent
Effergrip
Schick razors
Ultrex razors
Personal
Touch
Tetra Aquarium
Source: Moody’s Industrial Manual.

C-58 Case 4 • Gillette and the men’s wet-shaving market
Exhibit 7 Warner-Lambert’s net sales and operating profit by division, 1985–88 (US$mn)
Net sales Operating profit/(loss)
Division 1988 1987 1986 1985 1988 1987 1986 1985
Healthcare Ethical products $1 213 $1 093 $ 964 $ 880 $ 420 $ 351 $ 246 $ 224
Non-prescription
products 1 296 1 195 1 077 992 305 256 176 177
T
otal healthcare 2 509 2 288 2 041 1 872 725 607 422 401
Gums and mints 918 777 678 626 187 173 122 138
Other products* 481 420 384 334 92 86 61 72
Divested businesses (464)
R&D (259) (232) (202) (208)
Net sales and
operating profit 3 908 3 485 3 103 3 200 745 634 599 (61)
* Other products include Schick razors, which accounted for US$180 million in revenue in 1987.
Source: Warner-Lambert Company Annual Report, 1987; Moody’s Industrial Manual.
Exhibit 8 Warner-Lambert income statements, 1986–88 (US$000)
1988 1987 1986
Net sales $3 908 400 $3 484 700 $3 102 918
Cost of sales 1 351 700 1 169 700 1 052 781
Other expenses 2 012 100 1 819 800 1 616 323
Operating income 544 600 495 200 433 814
Other income 61 900 58 500 69 611
Earnings before interest and tax 606 500 553 700 503 425
Interest expense 68 200 60 900 66 544
Earnings before tax 538 300 492 800 436 881
Tax 198 000 197 000 136 297
Non-recurring item – – 8 400
Earnings after tax 340 000 295 800 308 984
Retained earnings 1 577 400 1 384 100 1 023 218
Earnings per share 5.00 4.15 4.18
Average common shares outstanding (000) 68 035 71 355 73 985
Dividends paid per share 2.16 1.77 1.59
Stock price range
High
Low
$79 1/2
$59 7/8
$87 1/2
$48 1/4
$63 1/8
$45
Source: Moody’s Industrial Manual.
period and granted Schick its own sales force. In spite
of Schick’s loss of market share, company execu-
tives felt they had room to play catch-up, especially
by exploiting new technologies. In late 1988, Schick
revealed that it planned to conduct ‘guerrilla war-
fare’ by throwing its marketing resources and efforts
into new technological advances in disposable razors.
As a result, Warner-Lambert planned to allocate the
bulk of its US$8 million razor advertising budget to
marketing its narrow-headed disposable razor, Slim
Twin, which it introduced in August 1988.
Schick believed that the US unit demand for dis-
posable razors would increase to 55 per cent of the
market by the early 1990s from its 50 per cent share
in 1988. Schick executives based this belief on their
feeling that men would rather pay 30 cents for a

Case 4 • Gillette and the men’s wet-shaving market C-59
disposable razor than 75 cents for a refill blade. In
1988, Schick held an estimated 9.9 per cent share of
dollar sales in the disposable razor market.
Schick generated approximately 67 per cent of its
revenues overseas. Also, it earned higher profit mar-
gins on its non-domestic sales – 20 per cent versus
its 15 per cent domestic margin. Europe and Japan
represented the bulk of Schick’s international busi-
ness, accounting for 38 per cent and 52 per cent,
respectively, of 1988’s overseas sales. Schick’s Euro-
pean business consisted of 70 per cent systems and 29
per cent disposable razors, but Gillette’s systems and
disposable razor sales were 4.5 and 6 times larger,
respectively.
However, Schick dominated in Japan. Warner-
Lambert held over 60 per cent of Japan’s wet-shave
market. Although Japan had typically been an electric
shaver market (55 per cent of Japanese shavers use elec-
tric razors), Schick achieved an excellent record and
reputation in Japan. Both Schick and Gillette entered
the Japanese market in 1962; and their vigorous com-
petition eventually drove Japanese competitors from
the industry, which by 1988 generated US$190 mil-
lion in sales. Gillette’s attempt to crack the market
flopped because it tried to sell razors using its own
salespeople, a strategy that failed because Gillette
did not have the distribution network available to
Japanese companies. Schick, meanwhile, chose to
leave the distribution to Seiko Corporation. Seiko
imported razors from the United States and then sold
them to wholesalers nationwide. By 1988, Schick gen-
erated roughly 40 per cent of its sales and 35 per cent
of its profits in Japan. Disposable razors accounted
for almost 80 per cent of those figures.
BIC Corporation
The roots of the BIC Corporation, which was founded
by Marcel Bich in the United States in 1958, were in
France. In 1945, Bich, who had been the production
manager for a French ink manufacturer, bought a
factory outside Paris to produce parts for fountain
pens and mechanical lead pencils. In his new busi-
ness, Bich became one of the first manufacturers
to purchase presses to work with plastics. With his
knowledge of inks and experience with plastics and
moulding machines, Bich set himself up to become
the largest pen manufacturer in the world. In 1949,
Bich introduced his version of the modern ballpoint
pen, originally invented in 1939, which he called
‘BIC’, a shortened, easy-to-remember version of his
own name. He supported the pen with memorable,
effective advertising; and its sales surpassed even his
own expectations.
Realising that a mass-produced disposable
ballpoint pen had universal appeal, Bich turned his
Exhibit 9 Warner-Lambert balance sheets, 1986–88 (US$000)
1988 1987 1986
Assets Cash $176 000 $24 100 $26 791
Receivables 525 200 469 900 445 743
Inventories 381 400 379 000 317 212
Other current assets 181 300 379 600 720 322
Total current assets 1 264 500 1 252 600 1 510 068
Fixed assets, net 1 053 000 959 800 819 291
Other assets 385 300 263 500 186 564
Total assets 2 702 800 2 475 900 2 515 923
Liabilities and equity Current liabilities* 1 025 200 974 300 969 806
Current portion of long-term
debt 7 100 4 200 143 259
Long-term debt 318 200 293 800 342 112
Equity $ 998 600 $ 874 400 $ 907 322
* Includes current portion of long-term debt. Source: Moody’s Industrial Manual.

C-60 Case 4 • Gillette and the men’s wet-shaving market
attention to the US market. In 1958, he purchased
the Waterman Pen Company of Connecticut and then
incorporated as Waterman-BIC Pen Corporation.
The company changed its name to BIC Pen in 1971
and finally adopted the name BIC Corporation for the
publicly owned corporation in 1982.
After establishing itself as the country’s largest
pen maker, BIC attacked another market – the dispos-
able lighter market. When BIC introduced its lighter
in 1973, the total disposable lighter market stood at
only 50 million units. By 1984, BIC had become so
successful at manufacturing and marketing its dis-
posable lighters that Gillette, its primary competitor,
abandoned the lighter market. Gillette sold its Crick-
et division to Swedish Match, Stockholm, the man-
ufacturer of Wilkinson razors. By 1989, the dispos-
able lighter market had grown to nearly 500 million
units, and BIC lighters accounted for 60 per cent of
the market.
Not content to compete just in the writing and
lighting markets, BIC decided to enter the US shav-
ing market in 1976. A year earlier, the company had
launched the BIC Shaver in Europe and Canada.
BIC’s entrance into the US razor market started an
intense rivalry with Gillette. Admittedly, the compa-
nies were not strangers to each other – for years they
had competed for market share in the pen and lighter
industries. Despite the fact that razors were Gillette’s
primary business and an area where the company had
no intention of relinquishing market share, BIC estab-
lished a niche in the US disposable-razor market.
BIC, like Gillette, frequently introduced new razor
products and product enhancements. In January
1985, following a successful Canadian test in 1984,
BIC announced the BIC Shaver for Sensitive Skin. BIC
claimed that 42 per cent of the men surveyed reported
that they had sensitive skin, while 51 per cent of those
who had heavy beards reported that they had sensi-
tive skin. Thus, BIC felt there was a clear need for a
shaver that addressed this special shaving problem.
The US$10 million ad campaign for the BIC Shaver
for Sensitive Skin featured John McEnroe, a highly
ranked and well-known tennis professional, discuss-
ing good and bad backhands and normal and sen-
sitive skin. BIC repositioned the original BIC white
shaver as the shaver men with normal skin should use,
while it promoted the new BIC Orange as the razor
for sensitive skin.
BIC also tried its commodity strategy on sail-
boards, car-top carriers and perfume. In 1982, BIC
introduced a sailboard model at about half the price
of existing products. The product generated nothing
but red ink. In April 1989, the company launched BIC
perfumes with US$15 million in advertising support.
BIC’s foray into fragrances was as disappointing as its
sailboard attempt. Throughout the year, Parfum BIC
lost money, forcing management to concentrate its
efforts on reformulating its selling theme, advertising,
packaging and price points. Many retailers rejected
the product, sticking BIC with expensive manufac-
turing facilities in Europe. BIC found that consumers’
perceptions of commodities did not translate equally
into every category. For example, many women cut
corners elsewhere just to spend lavishly on their per-
fume. The last thing they wanted to see was their
favourite scent being hawked to the masses.
Despite these failures, BIC Corporation was the
undisputed king of the commoditisers. BIC’s success
with pens and razors demonstrated the upside poten-
tial of commoditisation, while its failures with sail-
boards and perfumes illustrated the limitations. BIC
concentrated its efforts on designing, manufacturing
and delivering the ‘best’ quality products at the lowest
possible prices. And although the company produced
large quantities of disposable products (for example,
over 1 million pens a day), it claimed that each prod-
uct was invested with the BIC philosophy: ‘maximum
service, minimum price’.
One of BIC’s greatest assets was its retail distribu-
tion strength. The high profile the company enjoyed at
supermarkets and drugstores enabled it to win loca-
tions in the aisles and display space at the checkout
– the best positioning.
Even though BIC controlled only the number three
spot in the wet-shaving market by 1989, it had exert-
ed quite an influence since its razors first entered the
US market in 1976. In 1988, BIC’s razors generated
US$52 million in sales with a net income of US$9.4
million; BIC held a 22.4 per cent share of dollar sales
in the disposable razor market. Exhibit 10 presents
operating data by product line, and Exhibits 11 and
12 give income statement and balance sheet data.

Case 4 • Gillette and the men’s wet-shaving market C-61
The introduction of the disposable razor revo-
lutionised the industry and cut into system razor
profits. However, despite the low profit margins in
disposable razors and the fact that the industry lead-
er, Gillette, emphasised razor and blade systems, BIC
remained bullish on the disposable razor market. In
1989, a spokesperson for BIC claimed that BIC ‘was
going to stick to what consumers liked’. The com-
pany planned to continue marketing only single-
blade, disposable shavers. BIC stated that it planned
to maintain its strategy of underpricing competi-
tors, but it would also introduce improvements such
as the patented metal guard in its BIC Metal Shaver.
Research revealed that the BIC Metal Shaver provided
some incremental, rather than substitute, sales for its
shaver product line. BIC executives believed that the
BIC Metal Shaver would reach a 5–8 per cent market
share by 1990.
Exhibit 10 BIC Corporation’s net sales and income before taxes, 1986–88 (US$mn)
1988 1987 1986
Net sales Writing instruments $118.5 $106.7 $91.7
Lighters 113.9 120.0 115.0
Shavers 51.9 47.1 49.6
Sport 10.6 16.8 11.3
Total 294.9 290.6 267.6
Profit/(loss) before taxes Writing instruments 16.7 17.5 15.0
Lighters 22.9 28.2 28.5
Shavers 9.4 8.5 8.0
Sport (4.7) (3.5) (3.6)
Totals 44.3 50.7 47.9
Source: BIC Corporation, Annual Reports, 1986–88.
Exhibit 11 BIC Corporation consolidated income statements, 1986–88 (US$000)
1988 1987 1986
Net sales $294 878 $290 616 $267 624
Cost of sales 172 542 165 705 147 602
Other expenses 81 023 73 785 67 697
Operating income 41 313 51 126 52 325
Other income 4 119 1 836 7 534
Earnings before interest and tax 45 432 52 962 59 859
Interest expense 1 097 2 301 11 982
Earnings before tax 44 335 50 661 47 877
Tax 17 573 21 944 24 170
Extraordinary credit – – 2 486*
Utilisation of operating loss carry forward 2 800 – –
Earnings after tax 29 562 28 717 26 193
Retained earnings 159 942 142 501 121 784
Earnings per share 2.44 2.37 2.16
Average common shares outstanding (000) 12 121 12 121 12 121
Dividends paid per share 0.75 0.66 0.48
Stock price range
High
Low
$30 3/8
$24 3/8
$34 7/8
$16 1/2
$35
$23 1/4
* Gain from elimination of debt. Source: Moody’s Industrial Manual; BIC Annual Reports.

C-62 Case 4 • Gillette and the men’s wet-shaving market
Wilkinson Sword
Swedish Match Holding Incorporated’s subsidiary,
Wilkinson Sword, came in as the fourth player in the
US market. Swedish Match Holding was a wholly
owned subsidiary of Swedish Match AB, Stockholm,
Sweden. The parent company owned subsidiaries in
the United States that imported and sold doors, pro-
duced resilient and wood flooring, and manufactured
branded razors, blades, self-sharpening scissors and
gourmet kitchen knives. (Exhibits 13 and 14 present
income statement and balance sheet data on Swedish
Match AB.)
A group of swordsmiths founded Wilkinson in
1772. Soldiers used Wilkinson swords at Waterloo,
at the charge of the Light Brigade and in the Boer
War. However, as the sword declined as a combat
weapon, Wilkinson retreated to producing presen-
tation and ceremonial swords. By 1890, Wilkinson’s
cutlers had begun to produce straight razors, and by
1898 it was producing safety razors similar to King
Gillette’s. When Gillette’s blades became popular in
England, Wilkinson made stroppers to resharpen used
blades. Wilkinson failed in the razor market, however,
and dropped out during the Second World War.
By 1954, Wilkinson decided to look again at the
shaving market. Manufacturers used carbon steel to
make most razor blades at that time, and such blades
lost their serviceability rapidly due to mechanical and
chemical damage. Gillette and other firms had experi-
mented with stainless steel blades; but they had found
that despite their longer-lasting nature, the blades did
not sharpen well. But some men liked the durability;
and a few small companies produced stainless steel
blades.
Wilkinson purchased one small German compa-
ny and put Wilkinson Sword blades on the market in
1956. Wilkinson developed a coating for the stainless
blades (in the same fashion that Gillette had coated
the Super Blue Blade) that masked their rough edges,
allowing the blades to give a comfortable shave and to
last two to five times longer than conventional blades.
Wilkinson called the new blade the Super Sword-
Edge. Wilkinson introduced the blades in England
in 1961 and in the United States in 1962, and they
became a phenomenon. Schick and American Safety
Razor followed a year later with their own stainless
steel blades, the Krona-Plus and Personna. Gillette
finally responded in late 1963 with its own stainless
steel blade; and by early 1964 Gillette’s blades were
outselling Wilkinson, Schick and Personna combined.
Wilkinson, however, had forever changed the nature
of the razor blade.
Exhibit 12 BIC Corporation balance sheets, 1986–88 (US$000)
1988 1987 1986
Assets Cash $5 314 $4 673 $5 047
Certificates of deposit 3 117 803 6 401
Receivables, net 43 629 41 704 32 960
Inventories 70 930 59 779 50 058
Other current assets 37 603 47 385 34 898
Deferred income taxes 7 939 6 691 5 622
Total current assets 168 532 161 035 134 986
Fixed assets, net 74 973 62 797 58 385
Total assets 243 505 223 832 193 371
Liabilities and equity Current liabilities* 55 031 54 034 45 104
Current portion of long-term debt 157 247 287
Long-term debt 1 521 1 511 1 789
Equity $181 194 $164 068 $142 848
* Includes current portion of long-term debt. Source: Moody’s Industrial Manual.

Case 4 • Gillette and the men’s wet-shaving market C-63
In 1988, Wilkinson Sword claimed to have a 4
per cent share of the US wet-shave market; and it was
predicting a 6 per cent share by mid-1990. Industry
analysts, however, did not confirm even the 4 per cent
share; they projected Wilkinson’s share to be closer
to 1 per cent. Wilkinson introduced many new prod-
ucts over the years, but they generally proved to be
short-lived. The company never really developed its
US franchise.
However, in late 1988, Wilkinson boasted that it
was going to challenge the wet-shave category leader
by introducing Ultra-Glide, its first lubricating shav-
ing system. Wilkinson designed Ultra-Glide to go
head-to-head with Gillette’s Atra Plus and Schick’s
Super II Plus and Ultrex Plus. Wilkinson claimed that
Ultra-Glide represented a breakthrough in shaving
technology because of an ingredient, hydromer, in its
patented lubricating strip. According to Wilkinson,
the Ultra-Glide strip left less residue on the face and
provided a smoother, more comfortable shave by cre-
ating a cushion of moisture between the razor and
the skin.
Wilkinson introduced Ultra-Glide in March 1989
and supported it with a US$5 million advertising and
promotional campaign (versus the Atra Plus US$80
million multimedia investment in the United States).
Wilkinson priced Ultra-Glide 5–8 per cent less than
Atra Plus. Wilkinson was undaunted by Gillette’s
heavier advertising investment, and it expected to cash
in on its rival’s strong marketing muscle. Wilkinson
Exhibit 13 Swedish Match AB income statements, 1986–88 (US$000)
1988 1987 1986
Net sales $2 814 662 $2 505 047 $1 529 704
Cost of sales N/A N/A N/A
Operating expenses 2 541 128 2 291 023 1 387 360
Other expenses 108 206 95 420 48 711
Earnings before interest 165 328 118 604 93 633
Interest expense 5 386 19 084 21 618
Earnings before tax 159 942 99 520 72 015
Tax 57 612 29 996 39 165
Earnings after tax 102 330 69 554 32 850
Dividends paid per share 0.53 0.51 1.75
Stock price range
High
Low
22.53
$15.00
19.65
$11.06
66.75
$22.00
Source: Moody’s Industrial Manual.
Exhibit 14 Swedish Match AB balance sheets, 1986–88 (US$000)
1988 1987 1986
Assets Cash and securities $ 159 616 $ 117 027 $323 993
Receivables 611 372 561 479 297 321
Inventories 421 563 415 116 258 858
Total current assets 1 192 551 1 093 622 880 172
Fixed assets, net 707 664 671 409 397 411
Other assets 161 085 132 799 93 211
Total assets 2 061 300 1 897 830 370 794
Liabilities and equity Current liabilities 996 214 905 778 576 534
Current portion long-term debt
Long-term debt 298 505 316 542 244 118
Equity
Source: Moody’s Industrial Manual.

C-64 Case 4 • Gillette and the men’s wet-shaving market
did not expect to overtake Gillette but felt its drive
should help it capture a double-digit US market share
within two to three years.
Many were sceptical about Wilkinson’s self-
predicted market share growth. One industry analyst
stated, ‘Gillette dominates this business. Some upstart
won’t do anything.’ One Gillette official claimed his
company was unfazed by Wilkinson. In fact, he was
quoted as saying, in late 1988, ‘They [Wilkinson]
don’t have a business in the US; they don’t exist.’
Nonetheless, Gillette became enraged and filed
legal challenges when Wilkinson’s television ads for
Ultra-Glide broke in May 1989. The ads stated that
Ultra-Glide’s lubricating strip was six times smoother
than Gillette’s strip and that men preferred it to the
industry leader’s. All three major networks had reser-
vations about continuing to air the comparison com-
mercials. CBS and NBC stated that they were going
to delay airing the company’s ads until Wilkinson
responded to questions they had about its ad claims.
In an 11th-hour counterattack, Wilkinson accused
Gillette of false advertising and of trying to monopo-
lise the wet-shave market.
GILLETTE’S SOUTH BOSTON PLANT
Robert Squires left his work station in the facilities
engineering section of Gillette’s South Boston manu-
facturing facility and headed for the shave test lab. He
entered the lab area and walked down a narrow hall.
On his right were a series of small cubicles Gillette had
designed to resemble the sink area of a typical bath-
room. Robert opened the door of his assigned cubicle
precisely at his scheduled 10 a.m. time. He removed
his dress shirt and tie, hanging them on a hook beside
the sink. Sliding the mirror up as one would a window,
Robert looked into the lab area. Rose McCluskey, a
lab assistant, greeted him.
‘Morning, Robert. See you’re right on time as usual.
I’ve got your things all ready for you.’ Rose reached
into a recessed area on her side of the cubicle’s wall
and handed Robert his razor, shave cream, aftershave
lotion and a clean towel.
‘Thanks, Rose. Hope you’re having a good day. Any-
thing new you’ve got me trying today?’
‘You know I can’t tell you that. It might spoil your
objectivity. Here’s your card.’ Rose handed Robert a
shaving evaluation card (see Exhibit 15).
Robert Squires had been shaving at the South
Boston Plant off and on for all of his 25 years with
Gillette. He was one of 200 men who shaved every
work day at the plant. Gillette used these shavers to
compare its products’ effectiveness with competitors’
products. The shavers also conducted R&D testing of
new products and quality control testing for manu-
facturing. An additional seven to eight panels of 250
Exhibit 15 Gillette shaving evaluation card
NUMB. CODE STA TEST # NAME EMP. # DATE
IN-PLANT SHAVE TEST SCORECARD
INSTRUCTIONS: Please check one box in each column
Overall
evaluation of
shave
Freedom
from nicks
and cuts Caution Closeness Smoothness Comfort
❏ Excellent
❏ Very good
❏ Good
❏ Fair
❏ Poor
❏ Excellent
❏ Very good
❏ Good
❏ Fair
❏ Poor
❏ Exceptionally
safe
❏ Unusually safe
❏ Average
❏ Slight caution
needed
❏ Excessive
caution needed
❏ Exceptionally
close
❏ Very close
❏ Average
❏ Fair
❏ Poor
❏ Exceptionally
smooth
❏ Very smooth
❏ Average
❏ Slight pull
❏ Excessive pull
❏ Exceptionally
comfortable
❏ Very
comfortable
❏ Average comfort
smoothness
❏ Slight irritation
❏ Excessive
irritation
Source: The Gillette Company.

Case 4 • Gillette and the men’s wet-shaving market C-65
men each shaved every day in their homes around the
country, primarily conducting R&D shave testing.
Like Robert, each shaver completed a shave eval-
uation card following every shave. Lab assistants
like Rose entered data from the evaluations to allow
Gillette researchers to analyse the performance of each
shaving device. If a product passed R&D hurdles, it
became the responsibility of the marketing research
staff to conduct consumer-use testing. Such consum-
er testing employed 2000 to 3000 men who tested
products in their homes.
From its research, Gillette had learned that the
average man had 30 000 whiskers on his face that
grew at the rate of half an inch (1.3 centimetres) per
month. He shaved 5.8 times a week and spent three
to four minutes shaving each time. A man with a life
span of 70 years would shave more than 20 000 times,
spending 3350 hours (130 days) removing 27.5 feet
(8.4 metres) of facial hair. Yet, despite all the time
and effort involved in shaving, surveys found that if a
cream were available that would eliminate facial hair
and shaving, most men would not use it.
Robert finished shaving and rinsed his face and shaver.
He glanced at the shaving head. A pretty good shave,
he thought. The cartridge had two blades, but it
seemed different. Robert marked his evaluation card
and slid it across the counter to Rose.
William Mazeroski, manager of the South Boston
shave test lab, walked into the lab area carrying com-
puter printouts with the statistical analysis of last
week’s shave test data.
Noticing Robert, William stopped. ‘Morning, Robert.
How was your shave?’
‘Pretty good. What am I using?’
‘Robert, you are always trying to get me to tell you
what we’re testing! We have control groups and exper-
imental groups. I can’t tell you which you are in, but
I was just looking at last week’s results, and I can tell
you that it looks like we are making progress. We’ve
been testing versions of a new product since 1979, and
I think we’re about to get it right. Of course, I don’t
know if we’ll introduce it or even if we can make it in
large quantities, but it looks good.’
‘Well, that’s interesting. At least I know I’m involved
in progress. And, if we do decide to produce a new
shaver, we’ll have to design and build the machines to
make it ourselves because there is nowhere to go to
purchase blade-making machinery. Well, I’ve got to
get back now; see you tomorrow.’
Thirty-seventh floor,
The Prudential Center
Paul Hankins leaned over the credenza in his 37th-
floor office in Boston’s Prudential Center office build-
ing and admired the beauty of the scene that spread
before him. Paul felt as though he was watching an
impressionistic painting in motion. Beyond the green
treetops and red brick buildings of Boston’s fashion-
able Back Bay area, the Charles River wound its way
towards Boston Harbor. Paul could see the buildings
on the campuses of Harvard, MIT and Boston Uni-
versity scattered along both sides of the river. Soon
the crew teams would be out practising. Paul loved to
watch the precision with which the well-coordinated
teams propelled the boats up and down the river. If
only, he thought, we could be as coordinated as those
crew teams.
Paul had returned to Boston in early 1988 when
Gillette created the North Atlantic Group by com-
bining what had been the North American and the
European operations. Originally from Boston, he had
attended Columbia University and earned an MBA at
Dartmouth’s Tuck School. He had been with Gillette
for 19 years. Prior to 1988, he had served as market-
ing director for Gillette Europe from 1983 to 1984, as
the country manager for Holland from 1985 to 1986,
and finally as manager of Holland and the Scandina-
vian countries.
During this 1983–87 period, Paul had worked for
Jim Pear, vice president of Gillette Europe, to imple-
ment a pan-European strategy. Prior to 1983, Gillette
had organised and managed Europe as a classic
decentralised market. To meet the perceived cultural
nuances within each area, the company had treat-
ed each country as a separate market. For example,
Gillette offered the same products under a variety of
sub-brand names. The company sold its Good News!
disposable razors under the name ‘Blue II’ in the Unit-
ed Kingdom, ‘Parat’ in Germany, ‘Gillette’ in France
and Spain, ‘Radi e Getta’ (shave and throw) in Italy,
and ‘Economy’ in other European markets.

C-66 Case 4 • Gillette and the men’s wet-shaving market
Jim Pear believed that in the future Gillette would
have to organise across country lines, and he had
developed the pan-European idea. He felt that shav-
ing was a universal act and that Gillette’s razors were
a perfect archetype for a ‘global’ product.
Gillette had launched Contour Plus, the European
version of Atra Plus, in 1985/86 and had experienced
greater success than the US launch which took place
at the same time. The pan-European strategy seemed
to be both more efficient and more effective. Colman
Mockler, Gillette’s chairman, noticed the European
success and asked Pear to come to Boston to head the
new North Atlantic Group. Paul had come with him
as vice president of marketing for the Shaving and
Personal Care Group.
Paul turned from the window as he heard people
approaching. Sarah Kale, vice president of marketing
research; Brian Mullins, vice president of marketing,
Shaving and Personal Care Group; and Scott Fried-
man, business director, Blades and Razors, were at
his door.
‘Ready for our meeting?’ Scott asked.
‘Sure, come on in. I was just admiring the view.’
‘The purpose of this meeting,’ Paul began, ‘is to
begin formulating a new strategy for Gillette North
Atlantic, specifically for our shaving products. I’m
interested in your general thoughts and analysis. I
want to begin to identify options and select a strategy
to pursue. What have you found out?’
‘Well, here are the market share numbers you
asked me to develop,’ Scott observed as he handed
each person copies of tables he had produced (see
Exhibits 16 and 17). Like Paul, Scott had earned
an MBA from the Tuck School and had been with
Gillette for 17 years.
‘These are our US share numbers through 1988.
As you can see, Atra blades seem to have levelled off
and Trac II blades are declining. Disposable razors
now account for over 41 per cent of the market, in
dollars, and for over 50 per cent of the market in
terms of units. In fact, our projections indicate that
disposable razors will approach 100 per cent of the
market by the mid- to late 1990s given current trends.
Although we have 56 per cent of the blade market
and 58 per cent of the disposable razor market, our
share of the disposable razor market has fallen. Fur-
ther, you are aware that every 1 per cent switch from
our system razors to our disposable razors represents
a loss of US$10 million on the bottom line.’
‘I don’t think any of this should surprise us,’ Sarah
Kale interjected. Sarah had joined Gillette after grad-
uating from Simmons College in Boston and had been
with the firm for 14 years. ‘If you look back over the
1980s, you’ll see that we helped cause this problem.’
‘What do you mean by that?’ asked Paul.
‘Well, as market leader, we never believed that the
use of disposable razors would grow as it has. We
went along with the trend, but we kept prices low
on our disposable razors, which made profitability
worse for both us and our competition because they
had to take our price into consideration in setting
their prices. Then, to compensate for the impact on
our profitability from the growth of the disposable
razor market, we were raising the prices on our sys-
tem razors. This made disposable razors even more
attractive for price-sensitive users and further fuelled
the growth of disposable razors. This has occurred
despite the fact that our market research shows that
men rate system shavers significantly better than dis-
posable razors. We find that the weight and balance
Exhibit 16 Gillette market share of dollar sales, 1981–88 (per cent)
Product or category 1981 1982 1983 1984 1985 1986 1987 1988
Atra blades 15.4 17.3 19.4 18.7 20.2 20.9 20.0 20.5
Trac II blades 17.5 16.4 15.2 14.6 14.1 13.5 11.8 11.4
Gillette blades 47.3 48.9 52.1 54.2 55.8 57.1 54.1 56.0
Gillette disposables 14.3 15.4 17.4 20.0 21.1 22.7 22.2 24.0
All disposables 23.0 23.2 27.0 30.6 32.7 34.9 38.5 41.1
Gillette disposables as % of
all disposables 67.9 66.9 64.7 65.7 64.6 64.2 57.6 58.4
Gillette razors 50.3 52.5 54.9 58.8 62.2 67.6 64.1 61.0
Source: Prudential-Bache Securities.

Case 4 • Gillette and the men’s wet-shaving market C-67
contributed by the permanent handle used with the
cartridge contributes to a better shave.’
‘Yes, but every time I tell someone that,’ Paul add-
ed, ‘they just look at me as if they wonder if I really
believe that or if it is just Gillette’s party line.’
‘There’s one other thing we’ve done,’ Scott added.
‘Look at this graph of our advertising expenditures in
the US over the 1980s [see Exhibit 18]. In fact, in
constant 1987 dollars, our advertising spending has
fallen from US$61 million in 1975 to about US$15
million in 1987. We seem to have just spent what was
left over on advertising. We are now spending about
one-half of our advertising on Atra and one-half on
Good News!. Tentative plans call for us to increase
the share going to Good News!. Our media budget
for 1988 was about US$43 million. Further, we’ve
tried three or four themes, but we haven’t stuck with
any one for very long. We’re using the current theme,
“The Essence of Shaving”, for both system and dispos-
able products. Our advertising has been about 90 per
cent product-based and 10 per cent image-based.’
‘Well, Scott’s right,’ Sarah noted, ‘but although
share of voice is important, share of mind is what
counts. Our most recent research shows a significant
difference in how we are perceived by male consum-
ers based on their age. Men over 40 still remember
Gillette, despite our reduced advertising, from their
youth. They remember Gillette’s sponsorship of ath-
letic events, like the Saturday Baseball Game of the
Week and the Cavalcade of Sports. They remember
“Look Sharp! Feel Sharp! Be Sharp” and Sharpie the
Parrot. They remember their fathers loaning them
their Gillette razors when they started shaving. There
is still a strong connection between Gillette and the
male image of shaving.’
‘How about with younger men?’ asked Brian.
Brian had joined Gillette in 1975 after graduating
from Washington and Lee University and earning a
master’s degree in administration from George Wash-
ington University.
‘Younger men’s views can be summed up simply
– twin blade, blue and plastic,’ Sarah reported.
‘Just like our disposable razors!’ Paul exclaimed.
‘Precisely,’ Sarah answered. ‘As I say, we’ve done
this to ourselves. We have a “steel” man and “plas-
tic” man. In fact, for males between 15 and 19, BIC
is better known than Gillette with respect to shav-
ing. Younger men in general – those under 30, these
“plastic” men – feel all shavers are the same. Older
men and system users feel there is a difference.’
‘Yes,’ Paul interjected, ‘and I’ve noticed something
else interesting. Look at our logos. We use the Gillette
brand name as our corporate name, and the brand
name is done in thin, block letters. I’m not sure it has
Exhibit 17 Gillette system cartridges, 1971–88 (dollar share of US blade market)
Source: The Gillette Company; Prudential-Bache Securities.
0
5
71
72
73
74
75
76 77
78
Year
TRAC II
ATRA
79
80
81
82 83
84
85
86
87
88
15
20
25
30
Percent share
10

C-68 Case 4 • Gillette and the men’s wet-shaving market
the impact and masculine image we want. On top of
that, look at these razor packages. We have become
so product-focused and brand-manager-driven that
we’ve lost focus on the brand name. Our brands look
tired: there’s nothing special about our retail packag-
ing and display.’
‘Speaking of the male image of shaving, Sarah,
what does your research show about our image with
women?’ asked Brian.
‘Well, we’ve always had a male focus and women
identify the Gillette name with men and shaving, even
those who use our products marketed to women. You
know that there are more women wet-shavers than
men in the US market, about 62 million versus 55
million. However, due to seasonability and lower fre-
quency of women’s shaving, the unit volume used by
women is only about one-third that of the volume
used by men. Women use about eight to 12 blades a
year versus 25 to 30 for men. It is still very consistent
for us to focus on men.’
‘Well, we’ve got plenty of problems on the mar-
keting side, but we also have to remember that we are
part of a larger corporation with its own set of prob-
lems,’ Brian suggested. ‘We’re only 30 per cent or so
of sales but we are 60 per cent of profits. And, given
the takeover battles, there is going to be increased
pressure on the company to maintain and improve
profitability. That pressure has always been on us, but
now it will be more intense. If we want to develop
some bold, new strategy, we are going to have to fig-
ure out where to get the money to finance it. I’m sure
the rest of the corporation will continue to look to us
to throw off cash to support diversification.’
‘This can get depressing,’ Paul muttered as he
looked back at the window. ‘I can sense the low
morale inside the company. People sense the inevita-
bility of disposability. We see BIC as the enemy even
though it is so much smaller than Gillette. We’ve got
to come up with a new strategy. What do you think
our options are, Scott?’
‘Well, I think we’re agreed that the “do-nothing”
option is out. If we simply continue to do business
as usual, we will see the erosion of the shaving mar-
ket’s profitability as disposable razors take more and
more share. We could accept the transition to dispos-
able razors and begin to try to segment the dispos-
able razor market based on performance. You might
call this the “give up” strategy. We would be admit-
ting that disposable razors are the wave of the future.
There will obviously continue to be shavers who buy
based on price only, but there will also be shavers who
will pay more for disposable razors with additional
benefits, such as lubricating strips or movable heads.
In Italy, for example, we have done a lot of image
Exhibit 18 Blade and razor media spending, United States, 1975–87
75 76
61.4
15.1
(Constant 1987 media dollars)
77 78 79 80 81 82 83 84 85 86 87
Year
0
10
SMM
20
30
40
50
60
70
Source: The Gillette Company.

Case 4 • Gillette and the men’s wet-shaving market C-69
building and focused on quality. Now, Italian men
seem to perceive that our disposable razors have val-
ue despite their price. In other words, we could try to
protect the category’s profitability by segmenting the
market and offering value to those segments willing
to pay for it. We would de-emphasise system razors.
‘Or, we could try to turn the whole thing around.
We could develop a strategy to slow the growth of
disposable razors and to reinvigorate the system razor
market.’
‘How does the new razor system fit into all this?’
Paul asked.
‘I’m pleased that we have continued to invest in
R&D despite our problems and the takeover battles,’
Brian answered. ‘Reports from R&D indicate that the
new shaver is doing well in tests. But it will be expen-
sive to take to market and to support with advertising.
Further, it doesn’t make any sense to launch it unless
it fits in with the broader strategy. For example, if
we decide to focus on disposable razors, it makes
no sense to launch a new system razor and devote
resources to that.’
‘What’s the consumer testing indicating?’ asked
Scott.
‘We’re still conducting tests,’ Sarah answered,
‘but so far the results are very positive. Men rate the
shave superior to both Atra or Trac II and superior to
our competition. In fact, I think we’ll see that con-
sumers rate the new shaver as much as 25 per cent
better on average. The independently spring-mount-
ed twin blades deliver a better shave, but you know
we’ve never introduced a product until it was clearly
superior in consumer testing on every dimension.’
‘Okay. Here’s what I’d like to do,’ Paul concluded.
‘I’d like for each of us to devote some time to devel-
oping a broad outline of a strategy to present at our
next meeting. We’ll try to identify and shape a broad
strategy then that we can begin to develop in detail
over the next several months. Let’s get together in a
week, same time. Thanks for your time.’
References
Adams, R. B. Jr, 1978, King Gillette: The Man and His Wonderful Shaving
Device (Boston: Little, Brown).
BIC Annual Report, 1989.
Caminiti, S., 1989, ‘Gillette gets sharp’, Fortune, 8 May, p. 84.
Dewhurst, P., 1981, ‘BICH = BIC’, Made in France International, Spring,
pp. 38–41.
Dunkin, A., L. Baum and L. Therrein, 1986, ‘This takeover artist
wants to be a makeover artist, too’, Business Week, 1 December,
pp. 106, 110.
Dun’s Million Dollar Directory, 1989.
Fahey, A. and P. Sloan, 1988, ‘Gillette: $80M to rebuild image’,
Advertising Age, 31 October, pp. 1, 62.
Fahey, A. and P. Sloan, 1988, ‘Wilkinson cuts in’, Advertising Age,
28 November, p. 48.
Fahey, A. and P. Sloan, 1989, ‘Kiam gets some help: Grey sharpens
Remington ads’, Advertising Age, 13 November, p. 94.
Gillette Annual Corporate Reports, 1985–88.
Hammonds, K., 1987, ‘How Ron Perelman scared Gillette into shape’,
Business Week, 12 October, pp. 40–1.
Hammonds, K., 1989, ‘At Gillette disposable is a dirty word’, Business
Week, 29 May, pp. 54–5.
Jervey, G., 1984, ‘New blade weapons for Gillette-BIC war’, Advertising
Age, 5 November, pp. 1, 96.
Jervey, G., 1985, ‘Gillette and BIC spots taking on sensitive subject’,
Advertising Age, 18 March, p. 53.
Jervey, G., 1985, ‘Gillette, Wilkinson heat up disposable duel’,
Advertising Age, 10 June, p. 12.
Kiam V., 1987, ‘Remington’s marketing and manufacturing strategies’,
Management Review, February, pp. 43–5.
Kiam V., 1989, ‘Growth strategies at Remington’, Journal of Business
Strategy, January/February, pp. 22–6.
Kummel, C. M. and Klompmaker, J. E., 1980, ‘The Gillette Company
– Safety Razor Division’, in D. W. Cravens and C. W. Lamb
(eds), Strategic Marketing: Cases and Applications (Homewood,
Ill.: Irwin), pp. 324–45.
McGeehan, P., 1988, ‘Gillette sharpens its global strategy’, Advertising
Age, 25 April, pp. 2, 93.
Newpor t, J. P., 1988, ‘The stalking of Gillette’, Fortune, 23 May,
pp. 99–101.
North American Philips Corporation Annual Report, 1987.
Pereira, J., 1988, ‘Gillette’s next-generation blade to seek new edge
in flat market’, The Wall Street Journal, 7 April, p. 34.
Raissman, R., 1984, ‘Gillette pitches new throwaway’, Advertising Age,
9 July, p. 12.
‘Razors and blades’, 1989, Consumer Reports, May, pp. 300–4.
Rothman, A., 1988, ‘Gillette, in a shift, to emphasize cartridge blades
over disposables’, The Wall Street Journal, 18 November, p. B6.
Sacharow, S., 1982, Symbols of Trade (New York: Art Direction Book
Company).
Shore, A., 1989, Gillette Report (New York: Shearson Lehman Hutton),
19 October.
Shore, A., 1990, Gillette Company Update (New York: Prudential-
Bache Securities), May 18.
Sloan, P., 1985, ‘Marschalk brains land Braun’, Advertising Age, 18 March,
p. 53.
Sloan, P., 1988, ‘Remington gets the edge on Gillette’, Advertising Age,
16 May, pp. 3, 89.
Sutor, R., 1988, ‘Household personal care products’, Financial World,
27 December.
The Europa World Year Book 1990, vol. II.
Trachtenberg, J. A., 1986, ‘Styling for the masses’, Forbes, 10 March,
pp. 152–3.
Warner-Lambert Annual Corporate Report, 1987.
Weiss, G., 1986, ‘Razor sharp: Gillette to snap back from a dull
stretch’, Barron’s, 25 August, pp. 15, 37.

C-70
Case 5
Gunns and the greens:
Governance issues in Tasmania
Dallas Hanson Colin Winkler
University of Tasmania University of Tasmania
Introduction
Gunns Limited is a listed Australian forestry com-
pany that operates in the tourism-oriented island
state of Tasmania, 40 degrees south of the equator.
In a sluggish economy, Gunns has been a spectacu-
lar performer for a decade. In 2001 the share price
was $3.50 and in late 2003 it was $13. It is the first
Tasmanian company to be worth $1 billion. Despite
this success it remains controversial, a target for green
activists and a common topic for critical discussion
in Tasmanian homes. In September 2003, Gunns
was forced by a section of its shareholding to hold an
extraordinary general meeting (EGM) to discuss for-
estry practices.
This case is about the company and the EGM.
The key issues are these: is it possible for a compa-
ny operating in a hostile social environment to pres-
ent as a good corporate citizen? And, how does such
a company best handle a mix of profit-oriented and
green-oriented investors? Finally, are its practices sus-
tainable? To make sense of these issues requires some
background to be explained, and the first sections of
the case thus provide a brief description of Tasmania
and the ongoing forestry debate. This is followed by
a history of Gunns. The EGM is then described and
the issues discussed.
Tasmania, the island state,
and the forestry debate
Tasmania is the smallest Australian state, just 315
kilometres across its greatest width. The middle of
the island is mountainous and features scattered lakes
and alpine vegetation, while the west faces the Indian
Ocean and is rainswept, with much of it covered in
impenetrable ‘vertical scrub’. The east coast is much
dryer and has golden beaches; the north-west coast
has deep soils and a climate suited to vegetable grow-
ing and dairying; and the south, and a plain next to
the mountains (the midlands), is dry and a wool-
growing area that achieves some of the highest prices
for fine wool in the world. The government branch
of Parks and Wildlife manages 354 reserves covering
over one-third of the state, and the Forestry Commis-
sion, a state government authority, controls still more.
Almost 1.4 million hectares of this is World Heritage
listed. In this small place the world traveller can find
the equivalents of the burnished hills of southern
California, the hills of the grape districts of the South
of France, Wordsworthian English countrysides (both
his Lake District feel and the mannered and pretty
countryside of the green south of England), and the
golden beaches that are stereotypically Australian.
The variety of vegetation and unique wildlife are the
lures that attract tourists.

Case 5 • Gunns and the greens C-71
This is a pleasant land with a temperate climate
first settled by Europeans in 1802. The new settlers
set about clearing the land for agriculture, displacing
the indigenous inhabitants while setting up a wool/
wheat/cattle system modelled on England, complete
with hawthorn, oaks, rabbits and much other exotic
material. There was a thriving timber industry har-
vesting an apparently inexhaustible resource, and
successive Tasmania governments sought to attract
foreign investment into it.
There were occasional outbursts from
conservation-minded people, but the pattern of
cutting/burning/clearing continued relatively quietly
until 1972 when the post-war transition to hydro-
electrification of industry via damming of major
rivers collided with the nascent green movement.
Damming policy was led by the Hydro Electric Corpo-
ration (HEC), at the time a virtual government with-
in the government; one long-time post-war premier
was popularly known as ‘Electric Eric’. The focus of
debate was the damming of the south-west’s Gordon
River and flooding of Lake Pedder, a big remote lake
with an unusual large, sandy beach. This led to the
formation of the United Tasmania Group, the world’s
first formal green party.1 In 1976 the debate heated up
with another major dam proposal and the formation
of the Tasmanian Wilderness Society. A major cam-
paign resulted. This was a world event – ‘No dams’
was the cry in big street marches all over Australia,
and all levels of government and the High Court of
Australia were involved before the HEC was blocked
and the Franklin saved. Green debate was by then a
staple of café conversation.
Meanwhile, export woodchipping had begun,
mainly sourced from ‘charismatic’ old-growth euca-
lypts. Yehudi Menuhin, the great violinist and human-
ist, said of this: ‘I can’t begin to tell you the beauty of
those forests … the forest of Tasmania is yet unsul-
lied and unpolluted by our kind of civilization. That
we should have to defend them is something quite
unbelievable …’2
His sentiments have been shared by a genera-
tion of Tasmanians who continue to contribute to an
ongoing forestry debate on radio, in newspapers and
on the streets. The issue is in the faces of the people of
the capital city because the main log-route to the chip-
ping place is the highway that passes through the city
centre, past the Treasury building. Every day, scores
of trucks go through with apparently excellent build-
ing/furniture timber on board in the form of long,
solid logs. In 2002, a government-sponsored survey
that was part of a ‘Tasmania Together’ process led
by the government found that a significant majority
of Tasmanians wanted an end to old-growth logging:
the opinion crosses conventional political lines.3 The
green side of the debate is led by green parliamen-
tarians, (there are four in the 25-seat lower house),
the Wilderness Society, the Tasmanian Conservation
Trust and the Australian Conservation Foundation.
On the other side, the government is solidly pro-
forestry (it is a conservative union-influenced Labor
government), and the pro-forestry Forest Protection
Society (and there is no evident intention of irony in
the name) is a vocal pressure group.
Gunns: A company with
connections
The two brothers Gunn started a building business in
northern Tasmania in 1877 and soon turned to mill-
ing their own timber. They prospered and quickly
became leading sawmillers. The industry was reli-
ant on ‘crown-logs’, those cut off government land
under licence, and Gunns had good access to this
resource. The industry grew, as did Gunns, which, in
the 1950s, initiated a policy of buying smaller saw-
millers, private forests and rights to crown-logs. This
process gathered pace after 1970 when it became evi-
dent that the supply of crown-logs was limited. From
1982, led by John Gay, Gunns also sought to consoli-
date its existing markets and expand into the growing
export market for hardwood.
In 1986 the company was floated on the Australian
Stock Exchange, with Gay as the CEO. The board
at that time included as chairman Peter Wade, CEO
of the mining and pulp and paper giant, North Bro-
ken Hill; Edmund Rouse, the chair of a northern
Tasmanian media firm; Mr Clements of the Tasma-
nian firm Clements and Marshall; and two mem-
bers from HMA, major investors in Gunns. (In later
moves, Wade was replaced by David McQuestin, a
Rouse connection, and still later, a former premier,
Robin Gray, was appointed.)

C-72 Case 5 • Gunns and the greens
This was an era in which the external environ-
ment of Gunns was also undergoing crucial changes,
especially politically. Liberal premier Robin Gray
called a state election in 1989 only to lose his major-
ity. Labor and the Independents (as the greens had
been identified) combined to become the Labor Green
Accord (LGA) to prevent the Liberals remaining as a
minority government. This upset the forest industry,
which campaigned for a second election before the
LGA could take power. The campaign collapsed when
Edmund Rouse was imprisoned for attempting to
bribe Labor MP Jim Cox to cross the floor to prevent
the LGA from taking power. A Royal Commission
also implicated McQuestin (another latter-day board
member of Gunns), then managing director of Exam-
iner National Television (ENT) of which Rouse was
a substantial shareholder.4 McQuestin was cleared
of being unlawfully involved as a principal offend-
er in Rouse’s bribery charges, though the investiga-
tion acknowledged that his acquiescence with Rouse’s
direction was highly improper. During the investiga-
tion into these bribery charges, it was revealed that
the campaign for a second election actually stemmed
from Gray’s office, although it was funded by the for-
est industry.5
The Labor Green Accord eventually came to
power and, in a (failed) endeavour to settle the forest
industry–conservation debate, the Forest and Forest
Industry Council (FFIC) was established. However,
before long, the FFIC shifted ground to become more
concerned with preserving the forest industry, and
proposed Resource Security legislation that would
give the forest industry guaranteed access to the for-
ests. At the same time, the publicly owned Forestry
Commission became a government business enter-
prise, and was given exemption from freedom of
information legislation. Labor’s attempt to pass the
Resource Security legislation caused the downfall of
the LGA coalition because it outraged the greens, and
Labor was compelled to call an election in 1991 that
returned the Liberals to power under Ray Groom’s
premiership.
Meanwhile, Gunns had positioned itself in the
early 1990s to undertake the bulk of the seasoned
hardwood milling, moulding and veneers in the north
and north-west of the state, leaving only a handful
of significant, independent, locally-owned family
businesses remaining in this sector of the forests
industry in that part of the state. In reaching this posi-
tion, the company defended two High Court appeals
against the issue of licences to cut timber.
This strategic positioning continued through the
late 1990s and beyond, illustrated by Gunns’ buyout
of Boral’s Tasmanian woodchipping interests and the
acquisition (aided by the ANZ Bank) of North Forest
Products – owners of major tree holdings, including a
120 000-hectare tree farm. This saw Gunns become
Tasmania’s only woodchipping company, exporting
5.5 million tonnes of woodchips from the state each
year. A significant proportion of this came from
old-growth forests, including the Styx Valley of the
Giants (as it is called by the Wilderness Society) – the
location of the world’s tallest flowering eucalypts.
During this time, there was an additional pressure
on Gunns and the government over tree plantations.
The movement towards turning agricultural land into
trees had grown over a decade, and the difficulties
of other agricultural practices meant that a growing
number of farmers were selling out to tree farmers
– and Gunns is the biggest. This annoyed the near-
by landowners because of the loss of sun, it annoyed
the greens because the tree farms are usually quick-
growing species that do not provide a habitat for
wildlife, and it annoyed tourism operators because it
presents an ugly face to the world with chemical clear-
ing of sites before planting and clear felling. Gunns
had a direct and highly public dispute over chemi-
cal clearing in 2003 that further hindered its public
image when an organic farmer near a new Gunns tree
farm objected to the land clearing.6
Pressuring the institutional
shareholders
The opening years of the 21st century saw one of
Gunns’ major shareholders, the Commonwealth
Bank, targeted by the Wilderness Society, the soci-
ety exhorting the bank’s shareholders to pressure its
board to use the bank’s shareholding in Gunns (at the
time, just over 17 per cent) to force the company to
move out of the old-growth forests.
Other Australian banks came under pressure
from various quarters, the ANZ Banking Group Ltd
indicating that it did not hold a stake in Gunns but
did have a banking relationship. Charles Goode, the

Case 5 • Gunns and the greens C-73
chairman of ANZ, said that the bank takes environ-
mental issues seriously. ‘We are prepared to enter into
dialogue with community groups such as the Wilder-
ness Society,’ Mr Goode said. In 2003, the board had
a half-day strategy meeting on environmental issues
and, as forecast in The Examiner on 14 December
2002, the chairman and some executives visited the
Gunns forestry sites in Tasmania in February 2003.
Gunns’ managing director, John Gay, contended that
the company had issued invitations to all the major
banking institutions that had been targeted by the
Wilderness Society with what he termed ‘misinfor-
mation’.7
(At this point, an indication of the significance of
these institutionals and some that follow is necessary:
the ANZ, Westpac, Commonwealth and National
Australia banks are Australia’s biggest banks, and the
AMP and Perpetual Trustees are the major insurance
companies in the nation, while Bankers Trust (BT) is
a major investment firm.)
Corporate intransigence
A group of 100 Gunns Ltd shareholders who opposed
the firm’s logging practices took the step of request-
ing an EGM of the company in February 2003. The
group – coordinated by the Wilderness Society, but
including shareholders from outside the society –
relied upon the new Corporations Law governing cor-
porate regulation in Australia which became effective
on 15 July 2001. This scheme provides that the direc-
tors of a company must call and arrange to hold a gen-
eral meeting on the request of:
• members with at least 5 per cent of the votes
that may be cast at the general meeting
or
• at least 100 members who are entitled to vote at
the general meeting.
Gunns Ltd initially refused to hold the special
meeting. Executive chairman John Gay was report-
ed as saying that the directors considered the Wilder-
ness Society’s demand was not valid under existing
regulations, and had decided that convening a special
meeting to consider the issues raised by the society
would be an inappropriate use of company funds.8
(The company maintained that the special meet-
ing sought would cost tens of thousands of dollars.)
The Tasmanian president of the Directors Institute,
Gerald Loughran (who had a business in the north
of the state), said that legislation to change the 100-
person rule to a 5 per cent rule was before the Senate
and he hoped it would soon be resolved.9 However,
Loughran seemingly ignored the fact that the 100-
person rule did apply at the time the request for a
meeting was made.
Gunns maintained that the requisition notic-
es were invalid, and that the shareholders who had
called for an EGM had ‘clearly not abided by the
articles of association of the company’, although the
company did not given the actual reason that the req-
uisition was deemed to be invalid. Executive chair-
man John Gay said that because of the Privacy Act
he could not say exactly what was wrong with the
requisition.10 He objected strongly and the Wilder-
ness Society rethought its tactics.
The Wilderness Society then resubmitted a mod-
ified resolution calling for an EGM of Gunns Ltd.
Campaigner Leanne Minshull indicated that the soci-
ety would take the issue to court if Gunns refused to
call a meeting a second time. The meeting was duly
called.
Extraordinary general
meeting, 29 August 2003
In the lead-up to the August EGM at Gunns, helpful
corporate professionals entered the fray on the green
side:
• Fund managers showed the Wilderness Society
how to draft better resolutions.
• Lawyers gave pro bono advice on procedural
matters, secondary boycotts and defamation
issues.
• Naomi Edwards (retired partner of Deloitte
Touche Tohmatsu and former director of
Trowbridge Consulting) crunched numbers for
the Wilderness Society to back its claim that the
company could refrain from logging old-growth
forests without losing money.
• An international business strategist used by
some of Australia’s biggest companies provided
advice on the campaign in Japan. (Most of
the Gunns woodchips are exported to Japan

C-74 Case 5 • Gunns and the greens
and China, where they are used in paper
production.)
• A 1980s corporate raider gave tips on tactics for
dealing with corporations and hosted private
lunches in Sydney to put activists in touch with
senior executives.
Minshull did not ‘name names’, but she con-
firmed meetings with AMP, BT Financial Group,
Commonwealth Bank, local and federal government
superannuation schemes, National Australia Bank
and Perpetual Trustees. Perpetual’s John Sevior said
it was the first time he had experienced a campaign
of this kind, and that it could be the first of many.
‘The world is getting more determined in a lot of
ways,’ he said.11 One of the Sydney fund managers
with whom Minshull had talks put up a proposal for
a memorandum of understanding between Gunns,
the Wilderness Society and institutional investors.
Minshull believes that such cooperation is feasible,
although the provisos she stipulated were uncompro-
mising ‘… as long as the institutions tell Gunns to
stop developing clear felling, selectively logging, or
accepting product from certain forest areas’.12
The campaign seemed at the time to have had
some effect. Westpac-owned BT Financial Group,
which has a small undisclosed stake in Gunns, indi-
cated its intention to abstain from voting, citing insuf-
ficient information on which to make a decision. The
financial house said it recognised the sensitive nature
of environmental issues, and that it believed there
was a lack of adequate data or information on the
possible effects of adopting the resolution.13 There
was an international dimension to this campaign: as
reported in The Age, Minshull indicated that a loose
coalition of activist organisations around the world,
including Friends of the Earth International, Britain’s
WWF (World Wide Fund for Nature), Greenpeace
and the Rainforest Action Network, helped on the
Gunns campaign by lobbying institutional sharehold-
ers in Britain.14
In the end, no one really expected the Wilderness
Society to get its way at the EGM. Gunns said that the
shareholder activists controlled fewer than 250 000
shares, or about 0.3 per cent of the stock, and Mins-
hull conceded that the resolution was unlikely to get
anywhere near the 75 per cent needed. Gay accused
the environmentalists of wasting shareholders’ money
on what amounted to a protest meeting. ‘That is dis-
gusting,’ he said. ‘They conceded they haven’t got a
hope in hell but they are taking this company through
the pain.’ Gay indicated that there was no prospect
of Gunns working with the activists, because the
company operates within state laws and Tasmania is
a signatory to the 1997 Regional Forest Agreement
between the state and federal governments. ‘If I reject-
ed (the opportunity) to take some logs, they would just
issue them to someone else. They can keep coming but
we don’t make the decisions. They are just damaging
the shareholders of Gunns and the superannuation
funds of Australia by harassing Gunns for a decision
that Gunns doesn’t make. That’s how stupid it is.’15
FIAT (the Forest Industries Association of Tas-
mania) weighed into the EGM issue by publishing
half-page advertisements in all major newspapers, the
text of which ran:
NOTICE TO
GUNNS SHAREHOLDERS
THE GUNNS EXTRAORDINARY GENERAL
MEETING THREATENS THE LIVELIHOOD OF
THOUSANDS OF TASMANIANS EMPLOYED IN
OUR SAWMILL AND VENEER INDUSTRIES
• Closing down more high-yielding forest will
take away the resource needed to supply
our sawmill and veneer industries that add
high value to out timber;
• 40% of our forests are already reserved
– 4 times the international standard;
• mature timbers that supply our higher-
value-adding industries are not available in
regrowth or plantation forests;
• less than 1% of old-growth forest has been
harvested in the last 5 years.
SUPPORT FOR THE WILDERNESS SOCIETY
MOTION IS SUPPORT FOR A LOW-VALUE,
WOODCHIP-DRIVEN FUTURE FOR
TASMANIA’S FOREST INDUSTRY
VOTE NO
TO PROTECT THOUSANDS OF
TASMANIAN JOBS
Forest Industries Association of Tasmania
Source: The Saturday Mercury, 23 August 2003, p. 21.

Case 5 • Gunns and the greens C-75
AMP Henderson indicated that it would vote
against the Wilderness Society resolution at the EGM
for Gunns to cease accessing logged old-growth forest
timber from the so-called Tasmania Together region
under Tasmania’s Regional Forest Agreement. AMP’s
substantial shareholder notice in June 2003 stated that
it owned 7.2 per cent of Gunns shares on issue. AMP
Henderson’s chief investment officer, Merv Peacock,
said that AMP had long discussions with a range of
parties, including Gunns and Forestry Tasmania. He
concluded that the resolution would have a material
negative impact on the company’s profits and believed
that the impact would be greater than that contained
in analysis by actuary and Gunns shareholder, Naomi
Edwards.16
Overall, a trend towards an ‘abstain’ or ‘against’
vote at the EGM emerged, as institutional sharehold-
ers balanced the risk of a consumer backlash with their
fiduciary obligation to investors. UniSuper, the univer-
sity employees’ superannuation fund, announced that
it would abstain, saying that a vote was ‘premature’,17
and the large Commonwealth government employee
fund, PSS/CSS, decided to vote against the resolution.
Perpetual Trustees and Colonial First State would not
disclose their voting intentions, and the SIRIS Proxy
Voting Service also declined to say how it advised its
clients to vote at the meeting. No institutional share-
holder went on record as supporting the Wilderness
Society-led resolution. Dean Paatsch, director of
SIRIS Governance Services Unit, said his consider-
ations varied depending on whether the client had an
environmental policy as part of its investment pro-
cess. Paatsch said he believed that most institutions
would abstain because of their concern for ‘reputa-
tion risk’.
The lead-up to the EGM drew in crusading con-
tributions from both sides of the debate, highlighted
by the Wilderness Society’s own advertisements under
the headline:
Tell Gunns to stop logging
our oldgrowth forests
Join us outside the Gunns
special meeting on oldgrowth
Source: The Examiner, 23 August 2003, p. 37.
The press also carried letters covering aspects
of the situation. The following extracts from The
Examiner on 24 August are representative of the
range of the debate:
Woodchips on a platter
Those who see Paul Lennon as a hard man should
have a look at his Forest Practices Amendment
Bill 2003, currently before Parliament.
For the third time since 1998, the Forest
Practices Board is being given an amnesty for
any previous violations of planning regulations
and its own rules regarding them.
As in FPA Amendment 48 of 1998, there is a
bonus on top of forgiveness … the FPB has been
empowered to overrule the state’s premier appel-
late planning body, the Resource Management
and Planning Appeals Tribunal, when that body
has found forestry to be inappropriate.
Forest system is world class
Tasmania’s Regional Forest Agreement is fast
approaching its sixth anniversary.
This 20-year vision for our forests established
a comprehensive, adequate and representative
reserve system … it is a pity that green activists,
who are a small group, refuse to accept (the)
massive conservation gains from this landmark
agreement.
The campaign also included Timber Communi-
ties Australia’s half-page advertisements in major
newspapers on 27 August under the banner:
We are all proud members
of Tasmania’s forest
industry family.
Our forest industry supports
one in every 20 Tasmanian jobs

C-76 Case 5 • Gunns and the greens
These advertisements, such as that in The Exam-
iner on 27 August 2003, bore testimonials from a
variety of ‘typical Tasmanians’ whose jobs in some
way depended on the forest industry. On the day of
the EGM itself, a large ‘open letter’ on behalf of 3000
employees and contractors of Gunns was published in
The Examiner calling on Gunns’ board to reject out-
right the motion requiring the company ‘to ban pro-
cessing of timber from a significant portion of Tasma-
nia’s multiple use forests’.
The day before the EGM, Gunns released the com-
pany’s financial results, announcing its record $74
million after-tax profit for 2002/03. The 39 per cent
profit increase was a result of strong demand across
each of the company’s key markets. Total group turn-
over rose by 17 per cent to $610 million, with oper-
ating cash flow also up 17 per cent to $104 million.
The meeting: Green fizzer
and fountain of commercial
rationality?
The EGM was held at 10 a.m. on 29 August at 110
Lindsay Street in Launceston, a city of about 60 000
people. More than 200 pro- and anti-logging dem-
onstrators gathered outside Gunns’ offices, and log
trucks lined the street in a show of strength for the
industry. The resolution called on Gunns not to source
any timber from the ‘Tasmania Together’ forests,
which include the Styx, Tarkine, Great Western Tiers,
Southern Forests, Tasman Peninsula, North-East
Highlands, Eastern Tiers and proposed extensions
to the Ben Lomond National Park.18 The Wilderness
Society had encouraged shareholders to attend the
EGM and vote for the resolution, had sought proxy
voting rights, and, in the lead-up to the EGM, had
run stalls outside many Commonwealth Banks pro-
viding information and pro forma letters for people
to send to the bank.
Some 20 speakers addressed the 90-minute meet-
ing, and shareholders voted overwhelmingly against
the resolution calling for Gunns to withdraw from
240 000 hectares of old-growth forest, the resolution
being lost by 54.8 million to 248 000 votes. Institutions
representing some 1.5 million votes abstained.19 Gay
said the vote demonstrated clear support for the
board. ‘This whole action was nothing more than a
publicity stunt by the Wilderness Society, staged for
political purposes in a futile attempt to attack a well-
performing and legitimate Tasmanian business.’20
The resolution was easily defeated with 98 per cent
of votes against. But most disappointing for green
groups and activists was that only 2.6 per cent of
voters abstained – the usual form of protest for insti-
tutional investors. So, Perpetual with 10.17 per cent,
the Commonwealth Bank with 8.6 per cent, and AMP
with 7.21 per cent were effectively saying they were in
favour of logging old-growth forests – a stance that
could cause them some grief at their coming annual
meetings given the high level of activism on the issue.
Despite always having the numbers, John Gay didn’t
want too much debate from the floor. At one point he
told the Wilderness Society’s Leanne Minshull to ‘sit
down, young lady’.21
What does the future hold
for Gunns?
There are some recurring themes in Tasmanian pol-
itics, the latest one of significance being that of a
world-class pulp mill to value add the woodchip
resource. There was a strong sense of déjà vu about
the revelation in June 2003 that Gay and then Deputy
Premier (now Premier) Lennon (the chief government
supporter of forestry industry) discussed the possi-
bility of a pulp mill. Lennon maintained that there
was no pulp mill proposal before the government and
that such a mill was only one of several downstream
processing options discussed with Gay, who him-
self said that while he would like to see a pulp mill
established in Tasmania, it would require a financial
investment of an order of magnitude possibly beyond
Gunns’ resources.

Case 5 • Gunns and the greens C-77
The company is still beset by campaigners. It does
not seem to be able to appear as a good corporate
citizen despite its financial success and despite the
failure of the greens at the EGM. The paper of record
on 14 November 2003 displays the problem: sharing
the front page were Lennon putting forward a pulp
mill and guaranteeing Gunns ‘front running’, and
‘Hector the Protector’, a forest activist who has decid-
ed to go to gaol for 51 days rather than pay a $5000
fine for perching in a tree for 12 days in protest at log-
ging. Hector (his standard name is Smith) was accom-
panied at court by a noisy band of placard-holding
protesters. Perhaps Gunns must face the reality that a
forestry firm, despite being law-abiding and popular
with the institutional shareholders and government,
cannot please the majority of the people. It is well
protected by legislation that guarantees access to the
critical wood resource and has a dedicated workforce,
but it would be nice to be well regarded. And will
the institutional investors continue to support it? The
next phase of activism will not be targeted at Gunns
but at its investors. How much heat will a bank take
for the sake of what is, for it, a minor investment? Is
a concession to green thinking required? But, is that
enough? The green agenda is not about compromise
but full achievement of goals; compromise is for poli-
ticians and corporations. Sustainability of forests in
Tasmania is a hot issue without clear winners so far.
References
Australian Society of Archivists, 2003, ‘North Broken Hill Ltd (1912–
1988)’, Guide to Australian Business Records, www.archivists.org.
Burbury, S. C., 1945, ‘Investigation into alleged irregularities in the
Forestry Department, in Tasmania, 1944–1945, Journals and
Printed Papers of the Parliament of Tasmania, 133(20).
Gee, H., 2001, For the Forests (Hobart: The Wilderness Society).
Graeme-Evans, A., 1995, Against the Odds: Risbys – Tasmanian Timber
Pioneers 1826-1995 (Hobart: Tasbook Publishers).
Kessell, S. L., 1944, ‘Preliminary report on the forests and forestry
administration of Tasmania, in Tasmania, 1944–1945’, Journals
and Printed Papers of the Parliament of Tasmania, 131(45).
Kessell, S. L., 1945, ‘Report on the forests and forestry administration
of Tasmania, in Tasmania, 1944–1945’, Journals and Printed Papers
of the Parliament of Tasmania, 132(42).
Lyons, B., 1998, All Gunns Blazing: J. & T. Gunn and the Development
of Launceston, 1871–1997 (Launceston: self-published). (The
background material in this case study owes much to this source,
quite apart from the attributions in specific references.)
Perrin, G. S., 1898, ‘Forests of Tasmania: Their conservation and
future management’, PP 48/1898. (An earlier report by Perrin
on ‘The systematic conservation of the woods and forests of
Tasmania’ is known to draw attention to the need for more
positive forestry activity; however the whereabouts of this
report are unknown.)
Pritchett, S., 2001, ‘Environmentalism, politicians, Gunns and money’,
1 September, www.aushomepage.com.au.
Rodway, L., 1898–99; ‘Forestry for Tasmania’, in Papers and Proceedings
of the Royal Society of Tasmania.
Steane, S. W., 1947, ‘The evolution of state forest policy and
administration up to 1947’ (a study by a former Conservator
of Forests, in the official records of Forestry Tasmania, File
No. 9633).
Tasmania, 1945–46, ‘Report (Parts I and II) of the Royal Commissioner
on Forestry Administration’, Journals and Printed Papers of the
Parliament of Tasmania, 133(39).
Tasmania, 1946, ‘Report (Par ts III, IV, V, and VI) of the Royal
Commissioner on Forestry Administration’, Journals and Printed
Papers of the Parliament of Tasmania, 135(1).
Tasmania Together, 2002 (Hobart: Tasmanian Government Printer).
Walsh, M., 2003, ‘AMP to vote no at Gunns EGM’, 27 August, www.
ethicalinvestor.com.au.
Wettenhall, R. L., 1968, A Guide to Tasmanian Government Administration
(Hobart: Platypus Press).
Media reference sources
ABC Online
Australian Financial Review
The Advocate
The Age
The Examiner
The Mercury
The Saturday Mercury
The Sunday Examiner
Notes
1 H. Gee, 2001, For the Forests (Hobart: The Wilderness
Society).
2 Ibid.
3 Tasmania Together, 2002 (Hobart: Tasmanian Government
Printer).
4 S. Pritchett, 2001, ‘Environmentalism, politicians, Gunns and
money’, 1 September 2003, www.aushomepage.com.au.
5 Ibid.

C-78 Case 5 • Gunns and the greens
6 www.wilderness.org.au.
7 The Sunday Examiner, 15 December 2002.
8 The Examiner, 19 March 2003.
9 The Advocate, 25 February 2003.
10 The Mercury, 20 March 2003.
11 The Age, 23 August 2003, ‘Business’, p. 1.
12 Ibid.
13 Ibid.
14 Ibid.
15 Ibid.
16 www.ethicalinvestor.com.au.
17 www.investordaily.com.
18 The Age, 30 August 2003, ‘Business’, p. 2.
19
Ibid.
20 The Saturday Mercury, 30 August 2003, p. 9.
21 The Australian Financial Review, 1 September 2003, p. 44.

C-79
Case 6
Growth at Hubbard’s
Foods?*
Jodyanne Kirkwood Diane Ruwhiu
University of Otago University of Otago
Dick Hubbard paused for a minute from the notes
he was writing for his company newsletter to reflect
on the recent changes he had initiated in the com-
pany. He thought back to the early days of the busi-
ness, when he did everything in the company single-
handedly, including making the breakfast cereals. He
looked out into the company car park and saw that it
was almost full. He suddenly realised he was respon-
sible for the livelihoods of many people other than
himself. Should he take the next step and expand
the company further? Dick contemplated the various
scenarios and considered what they would mean for
his business …
Background
Hubbard’s produces a range of 23 breakfast cereals
that are targeted towards the mid–high price ranges
in the cereal market. A recent extension to the prod-
uct range was an organic muesli that is in the very
high price range. Hubbard’s cereals are distinctive due
to their use of New Zealand and tropical fruits and
using fruit flavouring to bake the cereals in. Exhibit
1 provides a schematic that represents the elements
that influence its operation. For a full description of
manufacturing processes and the supply chain, see
the appendix.
Products
Hubbard’s products are aimed at both the high price
range and low end of the cereal market. The high-
end products have such innovative names as ‘Berry
Berry Nice’ and ‘Yours Fruitfully’ (refer to Exhibit 2
for ingredient lists). While the main output from the
operation is high-quality cereals under the Hubbard’s
brand, the company also manufactures some product
lines for a range of supermarket private labels. These
private labels are typically at the lower end of the price
range for cereal, such as rice puffs and cornflakes.
Demand for breakfast cereal products has a slight
seasonal variation. In summer months, consumption
is approximately 10 per cent higher than in win-
ter months. The breakfast cereal industry has been
undergoing rapid change in the past two or three
years, including an increase in the muesli-style cereals
that Hubbard’s popularised, an increase in supermar-
ket own brands, as well as the huge growth in cereal
bars and muesli bars (which Hubbard’s does not
produce). Exact growth figures are not available as
* An earlier version of this case was presented at the North American Case Research Association conference in Banff, Canada, 3–5 October 2002.
This case is part of a series of cases on Hubbard’s Foods. Refer to the reference list for full details of published cases in the series.

C-80 Case 6 • Growth at Hubbard’s Foods?
the cereal industry is highly competitive. In 2000/01,
Hubbard’s exported 14.4 per cent of its production,
mainly to Australia, but a small amount was exported
to the United Kingdom, Singapore and Hong Kong.
Financial information for the company is shown in
Exhibit 3.
Competitors
Hubbard’s has an 18.5 per cent share of the cereal
market in New Zealand, which makes them the third-
largest player in the market. (Exact market share for
the competitors is not known.) There are three strong
direct competitors to Hubbard’s in the New Zealand
market: Sanitarium, Uncle Tobys and Kellogg’s.
Sanitarium is a New Zealand-owned company
that is located in a nearby suburb of Auckland. If
either Sanatarium or Hubbard’s runs out of an ingre-
dient, the other will supply it if they have it available.
A Seventh Day Adventist baker, whose philosophies
were strong on healthy living and vegetarianism,
started Sanitarium Health Foods over 100 years ago.
Sanitarium continues to market their cereals using
these philosophies, and has quite a strong focus on
sponsoring events and charities, as well as promot-
ing healthy living. Sanitarium’s main breakfast cereal
products are Weetbix and Cornflakes, and they have
entered the cereal bar market as well as the breakfast-
in-a-drink market.
Uncle Tobys is part of the Goodman Fielder chain,
which is Australasia’s largest food manufacturer,
employing around 16 000 people. Goodman Fielder
produces such food items as bread, potato crisps,
sauces and baking products. The Uncle Tobys brand
specialises in breakfast cereals and has a strong pres-
ence in the cereal bar market. Cereal products include
Weeties and Fruit Feast.
Kellogg’s is an international brand that was estab-
lished in Australia in the 1920s. Products were export-
ed from the Australian factory to New Zealand, and
Kellogg’s has a strong influence in the New Zealand
market with brands such as Coco Pops, Nutri-Grain
and Special K. Kellogg’s employs around 485 people
in Australia and New Zealand, and also has a pres-
ence in the cereal bar market.
There is also an increasing trend in New Zealand
for individual supermarkets to have their own ‘no
frills’ or ‘budget’ brands which are also in competi-
tion with Hubbard’s. However, the Hubbard’s brand
generally does not compete with this sector of the
market, although it has recently launched a cornflake
product under the Hubbard’s brand name. The mid-
range segment of the market is not an area the com-
pany has chosen to target.
Business start-up
From humble beginnings, Dick has created a success-
ful business. After being turned down for a scholar-
ship to Massey University, he self-financed his degree.
Dick then worked as a food technologist for many
years, gaining valuable experience managing a tropi-
cal fruit factory in Niue for three years. On his return
to New Zealand, he was appointed general manager
of a local food manufacturer. He also went on a team-
work and confidence building course called Outward
Exhibit 1 New Zealand business environment
Economy
LocationTechnology Political/regulatory
Suppliers
Cereal industry Customers
Inputs: ingredients,
equipment, staff,
office equipment
Manufacturing
processes, research
and development
Outputs:
cereal
products
Hubbard's Foods Ltd

Case 6 • Growth at Hubbard’s Foods? C-81
Bound, which Dick attributes with having assisted
him immensely, and he lists the completion of the
course as one of his life successes.
After several years of contemplating what to do
with his life, Dick decided to start his own business.
The company was started in 1988 with the grand total
of four employees, under the name Winner Foods,
changing its name to Hubbard’s two years later. During
the early years of start-up and growth the company
experienced tough times and at one stage was within
three weeks of going into receivership. Dick had to
take the drastic action of asking his employees to go
home on an extended holiday because he could not
afford to pay them. He also made changes in his own
life – for example, on occasion he walked to work to
save petrol.
Those early days of hardship have not been for-
gotten and Hubbard’s is managed under principles of
Exhibit 2 Examples of Hubbard’s products
Product name Description of product Ingredients
‘Berry Berry Nice’ ‘This toasted muesli
is full of berry flavour
– because the oats and
other muesli ingredients
are all soaked in berry
juice before they are baked.
Freeze-dried strawberries
and blackberries, as well
as yoghurt coated raisins
complete the distinctly
Hubbard’s finishing touch.’
rolled oats, raspberry juice,
honey, brown sugar, vegetable
oil, yoghurt raisins (yoghurt
powder, raisins), freeze dried
strawberry pieces, freeze
dried blackberries, sesame
seed, coconut, salt, natural
berryfruit flavour.
‘Yours Fruitfully’ ‘This natural muesli combines
the grains, nuts and seeds
you would expect with some
distinctly New Zealand fruits
– the kiwi and the apricot.
YCR’s, hazelnuts and oatbran
“sticks” give Yours Fruitfully a
distinctly different taste, that
has certainly won favour.’
rolled oats, flaked wheat,
raisins, apricot nuggets,
brown sugar, oatbran, honey,
wheatgerm, yoghurt coated
raisins (raisins, vegetable fat,
yoghurt powder, sugar, milk
powder, lecithin), coconut,
sunflower seeds, hazelnuts,
skim milk powder, sesame
seeds, soya oil, freeze dried
kiwifruit.
Source: www.hubbards.co.nz.
Exhibit 3 Financial information, 1998–2001
April 1998 –
March 1999
April 1999 –
March 2000
April 2000 –
March 2001
Sales $21 297 245 $22 686 163 $24 321 789
Sales increase on previous year 23.05% 6.5% 7.2%
Export sales as % of total sales 7.7% 9.6% 14.4%
Net profit before tax $608 829 $1 029 210 $978 052
Return on shareholders’ funds – after tax 10.26% 20.32% 17.12%
Staff profit share paid N/A N/A $94 172
Company tax paid $240 114 $316 021 $249 373
Hubbard’s Foods market share 17.4% 18.1% 18.5%
Source: Triple Bottom Line (TBL) report, 2000/01.

C-82 Case 6 • Growth at Hubbard’s Foods?
minimum waste and minimum fuss; there is very little
excess at Hubbard’s, with no expensive furniture or
company car fleets to be seen. Dick firmly believes the
early sacrifices made by him and his employees helped
the company to get established.
The business did falter for some time as Dick
diversified into roasting nuts and making items for
bulk bins in supermarkets. The decision to diversi-
fy further into a broader product range was made in
order to generate some cash flow. An oat bran muesli
was launched as an in-house supermarket brand and
was very successful. Dick used this foundation, as
well as the extensive knowledge gained of the cereal
markets, to launch his own brand.
Business growth
By 1993, the business was growing quickly and Dick
realised he had to make changes to the way he man-
aged the company. Until this time, he had managed it
by himself, including tasks such as human resources
management, purchasing, marketing and quality
management. To address the changing situation and
to alleviate some of the day-to-day administrative
decision making required by him, he employed an
assistant and additional office staff to help him man-
age the business.
As a direct result of the strong growth in demand,
decisions were made about the original factory, as it
became too small. A new factory in Mangere, Auck-
land was purpose built for Hubbard’s. Mangere is
on the outskirts of Auckland in a low-income, high-
unemployment area where the population is largely
made up of Maori and Pacific Islanders. This larger
factory operates 24 hours a day, five days a week, and
in busy times it operates seven days a week. Now the
factory is working to almost 100 per cent capacity
and is again becoming too small for the growing
company.
Since Dick established the company, it has grown
steadily in staff numbers. The company is now out-
growing the definition of a small–medium enterprise
(SME), which in New Zealand is a company that
employs fewer than 100 employees. Hubbard’s now
employs approximately 120 staff at any one time.
In response to the positive growth of the company,
Dick and his wife Diana, who were the company’s
owners, appointed a new formal board of directors
in 2001. A primary reason behind this move was to
ensure that all stakeholder interests were being con-
sidered in the company’s growth and the recognition
of the increasing number of stakeholders’ livelihoods
involved.
This has been a total shift for Hubbard’s, from
Dick operating in an owner/CEO role, to a new struc-
ture which gives some of the decision-making respon-
sibility and strategy development to a high-level board
of directors. Dick will remain as CEO of Hubbard’s.
The board consists of six members, and to help main-
tain an objective and effective influence, a profes-
sional company director chairs the board. Exhibit 4
shows the membership of the board.
Company philosophies
and vision
Dick believes there are a number of key stakeholders
who have an interest in the business, including
Exhibit 4 Hubbard’s board of directors
Source: TBL report, 2000/01.
Dick Hubbard
CEO
Diana Hubbard
Wife of CEO
Hubbard’s
operations manager
Hubbard’s
marketing manager
Former CEO
of Watties Ltd
Professional director

Case 6 • Growth at Hubbard’s Foods? C-83
shareholders (Dick and Diana), employees, custom-
ers, suppliers and the community. He has a strong
vision for the business that bears his name and uses a
food metaphor to outline their aim in the Triple Bot-
tom Line (TBL)1 report, which is to ‘provide suste-
nance for the “mind, body and soul”’ of everyone who
has contact with the company (TBL report, 2000/01).
This simple statement exemplifies Hubbard’s commit-
ment to being a socially responsible organisation.
Dick has a distinctive and simple no-nonsense
style of management. Before entering the premises,
you notice a large sign in front of the main doors. It
states:
‘This is a “no nonsense” management zone. No
management excesses, corporate ego trips, committee
decisions, inter-company memos, buck passing, back
stabbing, or any other dubious management decisions
allowed on these premises.’
An illustration of Dick’s no-nonsense approach to
managing staff has become folklore at Hubbard’s. The
story is told of how one employee told Dick she was
intimidated by him wearing a tie. Dick immediately
took off the tie and cut it up. The tie is now framed in
the offices at Hubbard’s and is a strong visual state-
ment of Dick’s commitment to his philosophy of man-
agement.
Dick makes an effort to ensure that he provides a
family culture at the factory. This works well for the
business as the majority of staff at Hubbard’s are Pacific
Islanders, and a significant aspect of many Pacific
Island cultures is based around the importance of the
family. Therefore, Dick’s management style offers an
extension of a family atmosphere into the workplace.
Along similar lines, there is no documented manage-
ment structure at Hubbard’s, illustrating his philoso-
phy of a non-hierarchical business.
Many of the manufacturing processes at Hub-
bard’s are manual, such as mixing of cereals. In con-
trast, a number of the larger competitors manufac-
ture cereal in a more equipment-intensive manner
than Hubbard’s and therefore tend to have a much
lower staffing ratio. However, Dick believes in cre-
ating employment and will not replace people with
machinery unless absolutely necessary.
Key stakeholders
Employees
Staff are a vital stakeholder in the business. Dick sums
up his philosophy to staff as being ‘based around the
concept of “a group of people”. As such, our people
within the company are to be treated with respect,
dignity and an over-riding acknowledgement that,
first and foremost, they are people’ (TBL report,
2000/01). Exhibit 5 outlines figures regarding staff
and remuneration.
Dick fosters an atmosphere of camaraderie among
employees and management. He encourages open
communication and allows for all staff (including
himself) to be on a first-name basis with each other.
A particularly informal approach to communication
allows Dick to practise a hands-on approach to man-
agement by meeting with employees once every three
months. Ten employees at a time visit his office for a
lunch of takeaways to discuss what is happening in
the factory. Also, all managers are expected to be in
the factory on a regular basis, and every six months
spend an entire shift on the factory floor.
Exhibit 5 Employee information
April 2000 – March 2001
Number of souls on board (employees) 116
Remuneration $3 969 603
Average remuneration $31 820
Profit share paid out $94 172
Staff employed from WINZ (Work and Income New Zealand) or employment courses 17 of the 30 new employees
(57% of new employees)
Production personnel 4.65 staff/$million turnover
Source: TBL report, 2000/01.

C-84 Case 6 • Growth at Hubbard’s Foods?
The company experiences very little absentee-
ism and staff turnover is low. This may be indicative
of the way employees embrace and show commit-
ment to Dick’s management philosophy. He strong-
ly believes this approach to running his business is
going to become more popular as employees look
beyond pay rates. Increasingly, potential employees
are taking into account the culture of the company in
their employment decision.
Dick believes in sharing his company’s suc-
cess with his employees and achieves this by taking
employees on trips. Dick is well known for taking all
100 Hubbard’s staff to Samoa, in the South Pacific,
for a long weekend in 1998. At a total cost of approxi-
mately $170 000, Dick chartered a plane to celebrate
Hubbard’s 10-year anniversary. The trip was a trib-
ute to the Pacific Island workforce’s culture and heri-
tage. This added to the family culture at Hubbard’s,
as many of the employees had not been back to their
homeland for years. In subsequent years, other trips
have occurred within New Zealand. In 2000, Dick
and the entire staff met the prime minister, Helen
Clark, to celebrate 10 years of the Hubbard’s brand
being in business. Exhibit 6 shows the trips taken by
staff over the past few years.
Recently the company has implemented a profit-
sharing scheme for employees. The scheme distributes
10 per cent of Hubbard’s pre-tax profit as a ‘dividend’
to employees every six months. This profit-sharing
scheme works according to a formula that is based
entirely on length of service. There is absolutely no
recognition made of seniority or existing salary/wage
rates.
One staff member’s story is illustrated below:
I came to Hubbard’s as a storeman starting rate $9
an hour – I thought, pardon not another one! As I
was picking orders I came across orders saying NO
CHARGE. This surprised me because I have been
a storeman a long time and never come across NO
CHARGE – always money wanted.
One day Dick was in the storeroom so I
approached Dick and I said, ‘Some of the orders
say NO CHARGE.’
He says, ‘Yes.’
‘How do you make money?’ I said.
He said ‘Son’ and touched my arm and told
me he believed that a company needs to make a
profit but he also believes in giving some – you
will reap plenty. He really believes in giving and
sharing. It really touched me. All my life as a
worker I just came to make money. That point was
a turning point. Before Dick talked to me I felt
cheated because I felt I should earn more. Now I
am motivated to work hard. I learned to succeed
you have to go the extra mile.
Now I am deputy supervisor.
Staff at Hubbard’s are paid a relatively mid-
range rate of pay, and this is almost entirely due to
Dick’s desire to be socially responsible. Dick prefers
to hire the long-term unemployed and works with
the Work and Income New Zealand offices to create
Exhibit 6 Staff trips taken by Hubbard’s
1997: Day trip to Rotorua
1998: Long weekend to Samoa
1999: Day trip to Rotorua
2000: Day trip to Waingaro Hot Springs
Source: TBL report, 2000/01.

Case 6 • Growth at Hubbard’s Foods? C-85
employment. The staff survey results show employees’
levels of satisfaction with a range of issues regarding
their employment. Exhibit 7 reports on two of these
issues.
Dick has consistently built a culture around caring
for others, creating employment and being socially
responsible, in addition to the more usual financial
results. However, his philosophy on creating employ-
ment has created some problems. In 2000, an indus-
trial dispute arose that led to a picket over wage and
meal allowances. This dispute was partially due to
pay rates. This industrial issue was resolved quick-
ly by increasing pay and allowances, and through
increased communication between management, the
union and employees.
Shareholders
Although focusing on being a socially responsible
company, financial success is vital to Hubbard’s con-
tinuing success. Dick realises that in order to main-
tain employment levels and achieve his broader social
goals, the company must be financially viable. The
company is founded on Dick’s vision, combined with
commitment and loyalty from employees. There is
great importance placed on running the company in
a fiscally appropriate and responsible manner. The
success and growth of the company has required
financial discipline and sound profitability. Dick
believes this to be important and puts considerable
emphasis on appropriate management practices to
ensure positive growth for the company. Decision
making at Hubbard’s combines both a human-
centred and economic approach to ensure an appro-
priate degree of profitability is maintained to allow
for all stakeholder interests to be looked after.
Community
Dick also believes in sharing his financial success with
those outside the company. For over 10 years, Hub-
bard’s has supported Outward Bound, the outdoor
pursuits organisation. A donation of 50 cents from
every packet of the ‘Outward Bound’ cereal sold is
made to Outward Bound. This results in a donation
of in excess of $100 000 per year, and stems from
Dick’s personal experience of going on an Outward
Bound course. Other sponsorships include World
Vision’s Kids for Kids concert, which is a children’s
charity that benefited by $21 000 from Hubbard’s in
2001. Other local community projects with schools
include support for local high schools of cash scholar-
ships and motivational prizes ($5000). A donation of
$5000 was also made to the New Zealand Businesses
for Social Responsibility, and $1500 was provided for
a student scholarship.
Exhibit 7 Staff satisfaction survey results
Source: TBL report, 2000/01, as at March 2001.
% of respondents
Very
badly
Badly Okay
How Hubbard's rates
(a) Remuneration
Good Very
good
0
10
20
30
40
50
% of respondents
Very
badly
Badly Okay
How Hubbard's rates
(b) Job training
Good Very
good
0
5
10
15
20
25
30
35

C-86 Case 6 • Growth at Hubbard’s Foods?
In addition to sharing his financial success, Dick is
very open to sharing his story with others. His back-
ground shows hardship, and New Zealanders enjoy
hearing about his rise from being a micro-business
into one of the most famous companies and business-
men in New Zealand. Dick was also invited by the
government to help direct New Zealand businesses
towards the future. He is an inspiration to people
starting their own business and is undoubtedly a role
model for many people.
Hubbard’s has also reported on another fac-
tor in their Triple Bottom Line report: ‘influencing’.
Hubbard’s does this by producing the Clipboard
newsletter (refer to Exhibit 8). In order to promote
social responsibility by businesses, Dick founded
the New Zealand Business for Social Responsibility
(NZBSR) in 1998, and membership has now risen to
180 members.
The company is a member of the New Zea-
land Business Council for Sustainable Development
(NZBCSD) and Dick is on its executive board. The
NZBCSD is a branch of the World Business Council
for Sustainable Development, and exists to promote
the concept of sustainable development within New
Zealand. Hubbard’s follows a campaign of reduc-
ing or eliminating waste, informing and educating
customers, and producing innovative products that
conform to the precepts of sustainable development.
Hubbard’s currently recycles paper and cardboard,
plastic shrink wrap which comes on inward pallet,
aluminium and plastic containers, raw material con-
tainers and toner cartridges.
Customers
Traditionally, Hubbard’s has not utilised any forms
of advertising, other than the newsletter, which is
included in each cereal box. Dick is realistic and does
not try to pretend that the business is 100 per cent
trouble-free, and wrote about the past labour dispute.
The Clipboard enables customers to feel they know
Dick, his family and even his dog.
Hubbard’s has never believed in heavy adver-
tising for brand or products. This was not merely a
cost-saving measure, but evidence of Dick’s personal
philosophy regarding the social ‘pollution’ caused by
too much advertising. He preferred to create goodwill
and public knowledge of his products through word-
of-mouth and his many ‘good deeds’ of corporate
Exhibit 8

Case 6 • Growth at Hubbard’s Foods? C-87
responsibility that appeared regularly in national
headlines. This exposure is extremely valuable to the
company and the vast majority of the articles show
the company in a very positive light.
In recent times, however, Dick has released lim-
ited advertising, which uses the following guidelines
that have been presented in the Triple Bottom Line
report.
Our advertising will be aimed to inform and not to
create unrealistic or irrelevant images.
Our advertising will not play on anyone’s con-
science, fear, weakness or worries.
We will not advertise directly to children and we
will not invoke ‘pester-power’.
Our advertising will not use ‘continual repetition’,
or ‘irritation’ as a technique.
Our advertising will not promote the concept of
‘instant gratification’ or ‘instant fix’.
Our advertising will not denigrate our opposition
and we will not undertake ‘comparative advertising’
as seen in the USA and now in Australia.
Our advertising will respect your values and we
recognise that they could be different to ours.
We will spend consumers’ money wisely and
responsibly.
Source: TBL report.
By keeping customers informed (via the Clipboard)
and doing what they say they will do, Hubbard’s has
developed and maintained a good relationship with
customers. The company is not afraid to publish
complaints from customers, and operates as an
honest and socially responsible company with regard
to customers.
The future?
Until now, Hubbard’s has grown with Dick as a hands-
on owner and CEO, while maintaining his strong
desire to operate his company in a socially responsible
way. The result of this socially responsible stance is a
company that is highly respected in New Zealand as
well as being profitable. The question Dick now faces
is whether he should expand the business further and
capture some of the untapped markets he is sure are
out there. Dick now has to weigh up the positives and
negatives associated with growing his business.
Note
1 Triple bottom line reporting aims to extend traditional company
reporting, which focused on financial information, to a more
inclusive reporting system, which adds people and the environment
to the report.
Appendix: Manufacturing
processes
Many of the manufacturing processes are manual,
with mixing of cereals with fruit being done by hand.
Dick acknowledges the company is falling behind on
the information technology front and will be invest-
ing a substantial amount of money into this in the
near future. The production process has become more
complicated, because of the large number of products
and various packaging requirements. One generic
product may need to be packaged in six different ways
for each customer.
Work flow
The factory has expanded as new technology has
been implemented. A production line approach was
not working, so machines have been separated and
redesigned. One product may require to work on
Machines A, D, G and H, and another product may
require D, F, J and S. This means there is no standard
flow through the factory and can mean that work in
process backs up behind machinery while waiting for
spare capacity. This also causes problems for the pro-
duction planner and scheduler.
Schedules
Schedules are based on sales reports from which
trends are able to be gauged. Twelve monthly sales
analyses are viewed, and seasonal patterns are taken
into account. Some areas such as Invercargill (situ-
ated in the lower South Island) experience a much

C-88 Case 6 • Growth at Hubbard’s Foods?
greater drop in sales in winter (up to 50 per cent) than
Auckland does, so the market is very much depen-
dent on climate. However, a seasonal pattern also
emerges because of the Christmas shutdown of many
companies in New Zealand. Therefore, many of Hub-
bard’s customers purchase large volumes of product
in December, resulting in low January sales.
Purchasing
Purchasing is the responsibility of one staff member
and is integrated with production planning, so all pro-
cesses are operating with the same information and
targets. It is considered to be a strategic activity and a
recent analysis was conducted to ensure that the com-
pany is providing adequate resources and support to
purchasing. The purchasing decision is facilitated by
regular stocktakes and visual observation, which is
common practice for a business of this size. Approxi-
mately six weeks’ supply of raw materials is stored in
the on-site warehouse, totalling almost NZ$3 million
in value.
The types of orders range from bulk to small-
sized orders. The bulk orders are for common ingre-
dients, such as sugar or oats where the average order
equates to 1000 tonnes. Bulk orders also tend to have
long lead times, in some cases two to three months,
because they come from overseas suppliers. A domes-
tic supplier usually supplies smaller orders, such as a
few litres of flavouring. Some are delivered on a just-
in-time (JIT) basis, where an order is placed in the
morning, and will be delivered by that afternoon.
Hubbard’s purchases approximately 400 lines of
raw materials, many of which are imported, either
direct from the supplier or through a New Zealand
agent. Purchases are made based on quality as oppos-
ed to cost, because in this industry cheaper sup-
pliers usually mean lower quality. Hubbard’s can-
not afford to purchase inferior raw materials because
it is renowned for being a high-quality producer.
Suppliers are evaluated under Hubbard’s HACCP
(Hazard Analysis Critical Control Point) program.
This requires specifications and inward checks on
raw materials and packaging. A fairly recent activity
encourages key suppliers to evaluate Hubbard’s per-
formance, giving suppliers the opportunity to provide
input into areas for improvement.
Suppliers
Suplliers are important to Hubbard’s and essential
in maintaining the company’s drive for high qual-
ity standards. The nature of the product makes the
quality of raw materials vital and therefore long-term
relationships with key suppliers are viewed as being
essential to success and are actively sought. Packag-
ing is an input into Hubbard’s operation that adds a
great deal of value to the products, as the packaging
adds to the innovative nature of the product. Dick
maintains a collaborative relationship with the main
packaging supplier, as Hubbard’s accounts for 60 per
cent of the total sales of the packaging company. This
supplier visits Hubbard’s regularly to discuss specifi-
cations and any new innovations.

C-89
Case 7
Incat Tasmania’s race for
international success:
Blue-riband strategies
Mark Wickham Dallas Hanson
University of Tasmania University of Tasmania
In 1999, Robert Clifford (aged 56) entered the Busi-
ness Review Weekly’s ‘Richest 200 Australians’ for
the first time, qualifying for the elite group with an
estimated net worth of some $150 million.1 Clifford is
the founder and chairman of Incat Tasmania, a highly
successful catamaran manufacturer in Hobart. His
far-sightedness as a shipbuilder, alongside his ability
to manage innovation, enabled his small boat-build-
ing business (and river-ferry operation) to become
a world force in the high-speed catamaran market,
exporting to Europe, Asia and the Americas. So suc-
cessful has the Incat operation been, that in 2000, it
directly employed over 1000 people, generated $250
million in revenue, and accounted for approximately
23 per cent of Tasmania’s total export earnings.2
Clifford and Clifford
Incorporated: Don’t pay
the ferrymen ...
Despite the worldwide success of their aluminium
catamaran range, the family business did not origi-
nally set out to build state-of-the-art vessels for the
international passenger ferry market. Instead, the
Clifford family business sought to reintroduce a
trans-Derwent ferry service in the early 1970s, one
that would predominantly serve Tasmania’s tourist
population.3 The application to undertake the ferry
operation was granted by the state government of
the day, and in late 1972 the newly formed Sullivan’s
Cove Ferry Company launched the first of its ‘bush-
ranger’ fleet, the Matthew Brady. Business proved to
be good in the early stages, with both tourists and
locals taking advantage of the novel Derwent River
ferry service.
The Clifford family’s decision to begin a ferry ser-
vice across the Derwent River appeared to be rather
fortuitous, given the tragic chance event that occurred
early in 1975. On 5 January, at 9.27 p.m., the bulk ore
carrier Lake Illawarra crashed into the 19th pier of
the Tasman Bridge, claiming 12 lives, and severing
the Eastern Shore’s link with Hobart by knocking
out an 80-metre section of the bridge.4 Many tens of
thousands of motorists and cyclists were now unable
to travel easily to their required destinations, be it
for work or pleasure. Bob Clifford found himself in
the enviable position of being in the right place at the
right time.

C-90 Case 7 • Incat Tasmania’s race for international success
... ’til they get you to the
other side – Transportation
returns to Van Diemen’s
Land
Due to the increase in demand for the ferry service, the
Sullivan’s Cove Ferry Service increased its bushranger
fleet to four with the James McCabe, Martin Cash and
Lawrence Kavanagh. These vessels were built in near
record time, and given the lessons learned from pre-
vious efforts, they were more advanced, being built
‘as the plans were being drawn up’.5 The four bush-
rangers were to serve as the west–east link for some
three years while repairs to the Tasman Bridge were
under way. In this time, Clifford’s ferries transported
in excess of nine million paying passengers.
Despite the successful launch of the additional
bushranger vessels, demand for the ferry service still
outweighed Clifford’s supply. In order to improve
customer service and increase the business’s rev-
enues, Clifford hired a new British-built ‘fast ferry’,
the Michael Howe. The Howe was twice as fast and
twice as comfortable as the bushranger fleet owned
by Clifford, and was an instant success with the
public. Unfortunately, the Michael Howe was also a
maintenance-intensive investment, with 75 per cent
of all company maintenance expenditure spent on
the new ‘hired hand’. Clifford was understandably
unimpressed with the boat’s design and maintenance
requirements, despite the public’s obvious delight with
the faster service. The flaws that Clifford observed in
the boat’s design and structure (the mechanics were
far too complicated and labour-intensive to be viable
in the long term) once again reignited his innovative
flair. ‘If the English can sell 34 heaps of rubbish like
this [around the world], how many properly engi-
neered fast ships could we sell from Tasmania?6 And
with this marketing opportunity well in his grasp, the
Clifford business began its initial foray into the inter-
national fast-ferry industry.
Clifford, Bob Clifford:
Licensed to keel
During the following 20-year period, Bob Clifford
utilised his entrepreneurial flair, and the help of some
of his close shipbuilding friends, to design and build a
succession of innovative catamarans. Of utmost con-
cern for Clifford was the need to lighten the weight
of his new catamaran designs, which had tradition-
ally been built using either steel or iron. A revela-
tion occurred in 1979, when Clifford decided to try
something that no one else had been able to achieve
throughout the history of shipbuilding – the use of
aluminium in the construction of the ship’s hull. Alu-
minium welding had not hitherto been considered a
viable option for ship construction, as the metal is
prone to bursting into flame at the high temperatures
associated with the welding process. After a consider-
able amount of trial-and-error experimentation with
his network of shipbuilding friends, Clifford per-
fected the aluminium welding techniques that were
to propel his brand of fast ferry into the highly lucra-
tive international markets.
Incat Tasmania: Eighty
metres and beyond
By 1995, the world market for high-speed ferries had
grown to generate sales revenues of just under $1.6
billion annually.7 Not surprisingly, a significant num-
ber of businesses had entered the international cat-
amaran industry to gain a share of this substantial
revenue opportunity. By 1995, Clifford was faced
with direct, and intensifying, competition, both from
domestic firms (such as Austal Limited, Sea Wind,
Venturer, Commercial Catamarans and Aussie Cat)
and UK- and US-based firms (such as the ‘US Cat-
amaran’ Company and Prout Catamarans). Each of
the domestic firms, and Austal Limited in particu-
lar, had also perfected the aluminium welding tech-
nologies, and were similarly able to compete in the
same markets as Incat. Over the next five years, for
instance, Austal Limited would mirror Incat’s foray

Case 7 • Incat Tasmania’s race for international success C-91
into passenger and cargo vessels, luxury passenger
vessels, and craft suitable for military operations. The
international competitors, however, were not able to
mirror the Australian success with the aluminium
welding technologies, and still based their vessels on
the traditional steel-based hulls.
Of greatest concern to Incat was the fact that each
of these competitors was also a newly ‘internation-
alising firm’, with access to similar resources (that
is, revenues from international markets, raw materi-
als and trained staff), and had likewise based their
growth on the manufacture of innovative high-speed
vessels. A number of Incat’s competitors had also tar-
geted the potentially lucrative Chinese market for fast
ferries, somewhat threatening Clifford’s most imme-
diate and highly prioritised ‘internationalising strat-
egy’. It would appear that Incat Tasmania no longer
had a monopoly in the world’s high-speed catamaran
market, nor the innovation and expertise required for
success therein.
Clifford was well aware of the need to maintain
Incat’s revenue growth, and protect its market share,
in the face of this increasingly competitive industry.
As had been the case in the past, Clifford once again
returned to the drawing board to design a ‘new and
improved catamaran’ for the world’s markets. The
result was Incat’s (and, indeed, the world’s) first 80-
metre-plus catamaran, the Condor 12. The innova-
tive changes introduced by Clifford this time around
would focus on passenger and crew safety, an impor-
tant point of differentiation, given the spate of ferry
disasters occurring in Europe at the time.8
The Condor 12 was equipped with four of the
world’s most advanced safety systems (known as the
Marine Evacuation System [MES]). The MES ensures
that the entire passenger population of the Condor 12
(some 700 people) can be evacuated in an emergency
in less than 12 minutes, a time significantly less than
that required by the peak international marine safe-
ty body (the International Maritime Organisation).
In addition to the MES, the Condor 12 was also fit-
ted with an advanced and lightweight fire protec-
tion. Also installed upon the vessel were single-leafed
hinged fire doors, single and double sliding fire doors,
engine room fire-dampers, fire hatches and smoke
baffles. These new features, combined with structural
fire protection, formed the best fire protection sys-
tem available for a high-speed aluminium craft. The
safety features were well received by the new owners
of the boat, which in 1996 was to serve as a major
transport vessel for passengers crossing the English
Channel.
The success of the Condor 12 was once again evi-
dent to those in the market that provide a fast ferry
service. In the period 1996 to 1998, Incat was to pro-
duce a number of 80-metre-plus catamarans for the
European market. As was the Incat tradition, the
new catamarans became larger, with greater levels of
comfort and safety, and saw the adoption of new and
innovative technologies. The completed catamarans
during this period are as follows:
Stena Lynx 3 81 metres, English Channel
ferry
Holyman Express 81 metres, England–Belgium
run
Condor Express 86 metres, UK, 800-passenger,
200-car capacity
Sicilia Jet 86 metres, Mediterranean Sea
vessel
Condor Vitesse 86 metres, UK, summer season
ferry carrier
Incat 045 86 metres, Bass Strait carrier
Cat-Link V 91 metres, Scandinavia
Catalonia 91 metres, Spain
During this period, Incat averaged the construc-
tion and launch of one catamaran every 10 weeks.
The most notable boat of the latest generation was
the Catalonia, a 91-metre wave-piercing catama-
ran destined for Spain. Although the Catalonia was
completed over-schedule (due to the inability of the
company to physically perform the tasks required
given the workload), it remained very much the lat-
est ‘showpiece’ of the Incat Empire. Unlike previous
efforts, the Catalonia was fitted out with a duty-free
shop, and a number of extra luxurious features (stair-
cases, plush carpeting, and so on). The more luxuri-
ous fit-out meant that it was noticeably heavier than

C-92 Case 7 • Incat Tasmania’s race for international success
other similarly sized catamarans. However, the Cata-
lonia remained capable of travelling at a respectable
48 knots as a lightship, and at 43 knots fully load-
ed. Despite the Catalonia’s size and weight, Clifford
was confident that the craft was faster than the Hover
Speed Great Britain, with which he had won the Hales
Trophy (a ‘Blue Riband’ award) in 1990. (The ‘Blue
Riband’ Hales Trophy is awarded to the commer-
cial vessel that undertakes the fastest crossing of the
Atlantic Ocean, a record that in 1990 was held by
the liner the SS United States before Clifford won the
trophy and the attention of the world’s media.) With
this thought in mind, as well as the implications for
marketing and sales growth, Clifford decided to use
the Catalonia to secure a second ‘Blue Riband vessel’
for the company.
During the same time, Incat’s major competitor,
Austal Limited, diversified away from its reliance on
luxury aluminium-hulled passenger vessels, in favour
of a multi-domestic-based business focusing on yachts,
pleasure craft and cargo vessels. The company, unlike
Incat, decided to list on the stock exchange and form
alliances with other firms internationally in order
to form an Austal group of companies based in the
United States, Europe and Asia. By 1998, the Austral
group of companies included Austral Limited (based
in Australia), Austal USA (a joint venture partner-
ship with leading US shipbuilder Bender Shipbuilding
& Repair), Oceanfast (a yacht manufacturer), Image
Marine (a pleasure craft manufacturer) and Austal
Service (a maintenance company).9
Incat’s Hales Trophy
Defence: Catalonia and the
Atlantic Ocean crossing
In mid-May of 1998, the Catalonia left Hobart,
bound for New York from where the latest record
attempt would begin. On Saturday, 6 June 6, the Cat-
alonia hauled its anchor and set sail for the UK in an
attempt to set a new record for the Hales Trophy, as
well as a new record for the greatest distance trav-
elled by a ship in a given 24-hour period. Once again,
the mass media were on hand to witness the great
feats undertaken by Clifford and his Incat team. Once
again the media, and the rest of the interested world,
were treated to a triumph. The Catalonia had, in only
its second international voyage, managed to become
the first boat in history to cover in excess of 1000 nau-
tical miles in a 24-hour period. She had also crossed
the Atlantic faster than any commercial vessel before
her, establishing a new world record for Clifford and
Incat.
While this journey was under way, the Incat man-
ufacturing plant was putting the finishing touches on
a new 91-metre catamaran named the Cat-Link V.
Built for the Scandinavian company Scandlines, the
boat was also to undertake a record-breaking attempt
for the Atlantic Ocean crossing. Within weeks of
the Catalonia’s efforts, the Cat-Link V successfully
rewrote the record books and claimed the Hales Tro-
phy and ‘Blue Riband’ certification. What was most
important for Clifford was the fact that now three
Incat vessels had managed to break the speed records
once held by a US vessel for 50 years, and do it in
absolute comfort.
Strong demand for Incat’s wave-piercing catama-
rans resulted in the development of an important joint
venture agreement with Afai Ships of Hong Kong.
The joint venture was important, as it provided Incat
with an initial foray into the high-potential Chinese
market, as well as helped the company to keep up
with the huge global demand for its vessels. The Chi-
nese yard started work on its first vessel early in 1998,
under the supervision of Graeme Freeman, an Incat
manager. Most of the materials for the ships were
supplied through the Tasmanian yard, and a constant
team of Incat personnel and sub-contractors travelled
to Hong Kong to supervise each stage of construc-
tion.10 The joint venture proved successful, with the
first ship completed by May of 1988, with a second
ship’s construction already under way. As with any
licensing agreement, a major risk for Incat lies in the
potential theft of its intellectual property, and there-
fore potentially the company’s core competency of
innovative catamaran design. Perhaps indications of
the innovative drive within the company, Incat man-
agement said of such a concern that: ‘We haven’t real-
ly worried too much about the theft of our intellec-
tual property. We work on the theory that whatever
our licensees are stealing, they are stealing yesterday’s
work anyway.’11

Case 7 • Incat Tasmania’s race for international success C-93
Growth into the future:
Incat and the continued
internationalisation of a
Tasmanian icon
The main issue facing Bob Clifford and his team at
Incat mid-decade is ensuring the continued growth of
the company through innovation, diversification and
globalisation in the face of increasing competition and
‘tough global economic times’. The history of success-
ful marketing exercises, the constant flow of innova-
tion throughout the organisation, and the ability of
Incat to foster international relationships have, at least
to date, seen the company rise from obscurity to a
global leader in boating excellence. While there seems
to be little change to the strength of global demand
for high-speed vessels, cash flow problems did arise in
early 2001 when a number of ships built by the com-
pany remained unsold for an extended period. The
amount of money tied up in the idle ships equated to
a substantial cutting back in employee overtime and
other ‘non-essential company expenditure’.
This cutback in ‘non-essential’ expenditure, unfor-
tunately for Incat’s workforce, apparently extended to
include a 15 per cent pay-rise claim by the two main
unions operating in the shipyard (the Australian Man-
ufacturing Workers Union and the Construction, For-
estry, Mining and Energy Union). Clifford’s response
to the pay claim was to dismiss it entirely, stating that
pay increases at Incat will only result from an increase
in catamaran sales. Given the state of the company’s
sales at the time (having completed, but as yet unsold
vessels on the books), the pay claim appeared to be
doomed to failure. In response to Clifford’s statement
that it would be easier for the union to ‘get blood from
a stone’ than a pay rise based merely upon a ‘cost-of-
living’ adjustment, industrial action was undertaken
by some 650 workers in the form of a 24-hour strike.
Clifford was forewarned of this imminent industrial
action, and acted immediately to release a statement
to this sector of his workforce that branded some as
‘donkeys with not enough brains to make their heads
ache’.12 He continued to suggest that ‘as “intelligent
leaders” in tough economic times, Incat has no choice
but to “cull the donkey population” for the good of
the majority, and in doing so get rid of “the weakest
links”.’13
Unfortunately, the culling of employees was to no
avail, with the firm’s financer, the National Australia
Bank (NAB), appointing a receiver management team
to the company in mid-2001. The receiver managers
were appointed largely to control the firm’s perceived
expenditure issues, and to enforce the cessation of the
continued construction of otherwise unwanted ves-
sels. It was stated by representatives of the NAB that
it had no wish to dismantle the company, but rather
protect its loans to the firm by taking closer control
of its financial management. Again, a tragic event
heralded a new period of growth for the company.
On 11 September 2001, the financial centre of the US
economy, the Twin Towers of the World Trade Cen-
ter, suffered a horrific terrorist attack that destroyed
the capitalist symbols and killed approximately 3000
people. Although the economic damage resulted in
a major share price slump in the short term, it also
sparked a major increase in defence spending around
the globe, spending that would directly benefit the
struggling Incat Tasmania. It was lauded that the US
government had a potential A$20 billion to spend
on new ‘tactical response’ vehicles, vehicles the ser-
vice lacked for quick response to situations of armed
conflict. Incat, rather fortuitously, had provided the
Australian defence force with use of a catamaran (the
HMAS Jervis Bay) for such duties in the East Timor
peacekeeping mission, and was therefore well posi-
tioned to bid for the US contract.
The US government’s response to the ‘9/11’ terror-
ist attacks, the so-called War on Terror in Afghanistan
and Iraq, freed up substantial monetary resources for
the invasion of these countries. During 2002, Incat
managed to win a major US contract that resulted in
the NAB removing its receiver management team. The
contract allowed the company to again innovate its
designs (both in terms of vessels and financial man-
agement strategies) to accommodate the specific needs
of the US military, as well as once again to license out
its manufacturing processes to an overseas construc-
tion company.14
The business of building fast ferries remains a
relatively new one and, as such, there is consider-
able scope for still further market development (con-
tinued catamaran-based construction) and market

C-94 Case 7 • Incat Tasmania’s race for international success
diversification (that is, new product lines). As Clif-
ford himself states:
There are always problems to be solved that will
require the design of both new and innovative
products. It is coming up with ideas that is
essential, and for that you need people with their
brains in gear. Likewise, new markets will emerge
to be served, and our team is constantly working
to ‘improve the breed’. If there is one thing that I’m
proud of, it is [Incat’s] ability to solve problems
and expand our horizons.15
Although this ability seems to have always existed
at Incat under Clifford’s leadership, the question aris-
es as to whether it will provide a continued source of
competitive advantage into the future.
Notes
1 T. Thomas, 1999, ‘ “Dunce” leaves the rest in his wake’, Business
Review Weekly, 28 May.
2 T. Skotnicki, 2000, ‘Exports: Full throttle’, Business Review Weekly,
18 August.
3 R. Clifford, 1998, Incat – The First 40 Years (Victoria: Baird
Publications); Thomas, ‘ “Dunce” leaves the rest in his wake’.
4 Clarence City Home Page, 2001, ‘The Tasman Bridge disaster’,
16 March, www.ccc.tas.gov.au.
5 Clifford, Incat.
6
Ibid., p. 22.
7
Austal Limited information memorandum, 2000.
8
Clifford, Incat.
9
Austal Home Page, 2003, ‘Company overview’, 20 August www.
austal.com.
10 S. L. McCaughey, P. W. Liesch and D. Poulson, 2000, ‘An unconven-
tional approach to intellectual proper ty protection: The case
of an Australian firm transferring shipbuilding technologies to
China’, Journal of World Business, 35(1), pp. 1–22.
11 Ibid.
12 M. Haley, 2001, ‘Incat’s “cull” star ts with strike’, The Mercury,
4 April
13 R. Clifford, 2001, ‘The intelligent worker’: An address to staff at
Incat Tasmania, 3 April.
14 Clifford, Incat.
15 Ibid.

C-95
Case 8
The Golden Arches in India:
A case of strategic adaptation
Nitin Pangarkar Saroja Subrahmanyan
National University of Singapore St Mary’s College
Background
In March 2003, the McDonald’s Corporation’s
Indian operation was at a critical juncture in its evo-
lution. Between 1995 (the year its joint ventures were
formed) and December 2002, the company and its
joint venture partners had opened 46 restaurants.
According to the earlier plans (June 2000), the com-
pany was aiming to have 80 outlets in India by the end
of the year.1 Since the investment to open each out-
let amounted to Rs 20 to 30 million (approximately,
US$417 000 to US$626 000 based on a 1 January
2003 exchange rate of Rs 47.92 = US$1)2 excluding
real-estate costs,3 the rapid expansion would mean
more than doubling of its investments, which (accord-
ing to some estimates) stood at a level of Rs 3.5 bil-
lion in June 2000.4 Some recent reports, however,
had hinted that, due to the recent lacklustre financial
performance of the parent corporation, McDonald’s
might scale back its number of planned outlets by as
much as 20 per cent to 64. The scaling back would be
part of a wider decision to restructure operations in
emerging markets, including closure of 250 outlets.5
Though the management of McDonald’s India had
denied these reports, the pace of expansion seemed to
have slowed down over the past year.6 Since the com-
pany was not required to release its financial figures,
it was not clear whether it was on track to achieve its
original objective of breakeven by the year 2003.7 In
fact, reducing the number of planned outlets would
postpone the date for achieving breakeven since con-
siderable fixed costs had been incurred in developing
a supply chain, creating brand name recognition and
inducing trial among potential customers.
McDonald’s: The global
fast-food powerhouse
McDonald’s was, by far, the world’s biggest marketer
of fast food. In 2003, it operated more than 31 000
restaurants and served 46 million customers each
day in 118 countries. For the financial year 2002, the
company had attained US$41.5 billion in system-wide
sales (out of which US$25.7 billion was accounted for
by franchised restaurants), US$2.1 billion in operat-
ing profits and US$893 million in net profits. It also

C-96 Case 8 • The Golden Arches in India
had US$24.0 billion in assets. (See Exhibit 1 for a
geographic analysis of McDonald’s operations.) It
was also, routinely, cited by the business press as
being a savvy marketer. In June 1999, with a value of
US$26.231 billion, the McDonald’s brand was rated
as being the eighth most valuable brand in the world,
ahead of well-known brands such as Sony, Nokia and
Toyota.8
McDonald’s had a long history in Asia. It entered
the Japanese market in 1971, which was followed
by entry into other newly industrialising economies
(such as Singapore and Hong Kong, among others)
in Asia. Entry into China occurred only in 1990.
McDonald’s entered India in 1996. (See Exhibit 2 for
McDonald’s start-up dates in East Asian and South
Asian countries.) The late entry could be attributed
to several factors, such as the fact that a significant
percentage of India’s population was vegetarian, the
limited purchasing power of the population and the
closed nature of the economy.
The Indian market
India was a vast subcontinent with an area one-fourth
that of the United States, and a population almost
four times that large, at about 1 billion. The per cap-
ita GDP was quite low at US$400 (approximate).
However, after adjusting for purchasing power parity,
India’s economy exhibited a per capita GDP (2002) of
US$2540 and an aggregate GDP of US$2.66 trillion.
On this basis, it was ranked the fifth-largest econ-
omy in the world (ranking above France, Italy, the
UK and Russia) with the third-largest GDP in Asia
behind Japan and China. (See Exhibit 3 for income
distribution in India.9) Among emerging economies,
India was often considered second only to China.
Despite the low per capita income levels, the sheer
size of the ‘eating out’ market in India was substan-
tial. According to one estimate, India’s food expen-
diture amounted to US$77 billion in 2000, out of a
total world food spending of US$4000 billion.10 The
Indian food market was, however, highly fragmented,
Exhibit 1 Geographic analysis of McDonald’s operations and performance (financial year 2002)
Overall
Geographic breakdown
US Europe
Asia-
Pacific
Latin
America Canada
Middle
East &
Africa
Partner
corporate
brands
Revenues (US$mn) 15 405.7 5 422.7 5 136.0 1 236.7 813.9 633.6 1 294 N/A
Operating income
(US$mn) 2 112.9 1 673.3 1 021.8 64.3 (133.4) 125.4 (66.8) (571.7)
Total assets (US$mn) 23 970.5 8 687.4 8 310.6 3 332.0 1 425.3 703.2 780.4 731.6
Capital expenditures
(US$mn) 2 003.8 752.7 579.4 230.4 119.9 111.6 190.4 19.4
Depreciation &
amortisation (US$mn) 1 050.8 383.4 334.9 141.7 59.6 35.6 40.3 55.3
Average annual sales per
restaurant (US$000) N/A 1 628 1 821 1 091 931 1395 N/A N/A
Margins in company-
operated restaurants
(%) 14.4 16.0 15.9 11.3 9.4 13.7 N/A
Margins in franchised
restaurants (%) 78.5 79.1 76.7 85.8 66.9 79.2 N/A N/A
Source: www.mcdonalds.com.

Case 8 • The Golden Arches in India C-97
with millions of roadside stalls collectively account-
ing for a large share of the market.
India’s economic diversity was matched by its
social diversity. There were more than 20 major spo-
ken languages and over 200 dialects. The Indian cur-
rency (Rupee) had its denomination spelt out not only
in English and Hindi (the national language), but also
in three other languages. About 50 per cent of the
population was considered to be illiterate, and adver-
tising reached them via billboards and audio-visual
means. For national launches, at least eight languages
were used. In addition, the country faced poor infra-
structure with frequent power outages even in New
Delhi (the capital city) and Bangalore (India’s Silicon
Valley).
In terms of political system, India was a democ-
racy. Since independence from the British in 1947, the
economic system had historically been modelled on
the socialist style. Under this system, the government
strictly controlled entry and exit of domestic as well
as multinational corporations (MNCs) into different
sectors. Multinational firms also faced a variety of
other restrictions. Since 1991, India had started
deregulating the economy. However, the socialist
mind-set could not be erased overnight. A member of
the parliament had the following comment regarding
the influx of multinational firms in consumer sectors
such as packaged food: ‘We want computer chips and
not potato chips.’
The country also had a few anti-Western factions,
which opposed the entry of MNCs, in general. The
mistrust of MNCs could be at least partially attribut-
ed to the fact that the British rule of India was rooted
in the entry of the British East India Company (for
trading purposes) into the country. There were sev-
eral small but vocal groups of health activists and
environmentalists that were opposed specifically to
the entry of fast-food giants such as McDonald’s and
KFC. When KFC opened its restaurant in Bangalore
in 1995, local officials found that KFC had excessive
levels of monosodium glutamate (MSG) in its food
and closed the outlet. The outlet soon reopened, how-
ever. Vandana Shiva, a vocal exponent of environ-
mental and animal welfare issues, made the following
comment in an audio interview with McSpotlight:
The McDonald’s experience, which is really the
experience of eating junk while thinking you are
in heaven, because of the golden arches, which is
supposed I guess to suggest that you enter heaven,
and the clown Ronald McDonald, are experiences
that the majority of the Indian population would
reject – I think our people are too earthy. First,
of all, it would be too expensive for the ordinary
Indian – for the peasant, or the person in the slums
Exhibit 2 Dates of McDonald’s entry into East and South Asian markets
Year of opening Country Restaurants in 2002 Restaurants in 1997
1971 Japan 3 891 2 437
1975 Hong Kong 216 140
1979 Singapore 130 105
1980 Philippines 236 157
1981 Malaysia 149 110
1984 Taiwan 350 233
1985 Thailand 100 61
1988 South Korea 357 114
1990 China (Shenzhen, Special Economic Zone) – –
1991 Indonesia 105 103
1992 China (Beijing) 546 184
1996 India 46 9
1998 Pakistan 20 0
1998 Sri Lanka 2 0
Sources: For start-up dates: James L. Watson (ed.), 1997, Golden Arches East (Stanford, CA: Stanford University Press), Table 2.
For number of restaurants: McDonald’s Corporation 2002 Annual Report, from www.mcdonalds.com.

C-98 Case 8 • The Golden Arches in India
– it’s an experience that a very tiny elite would
engage in, and most of that elite which knows
what good food is all about – would not fall for it.
McDonald’s is doing no good to people’s health,
and in a country like India where first of all, we
are not a meat culture, and therefore our systems
are ill-adapted to meat in the first place, and where
people are poorer – shifting to a diet like this will
have an enormous impact.11
Since 1991, when the Indian economy began open-
ing up to foreign investments, many multinationals
had rushed in – lured by the attraction of serving a
large middle class, estimated at 300 million. Howev-
er, even some of the well-known global brands failed
with their initial strategies and were forced to repo-
sition, including, in some cases, drastic reduction of
prices. Some multinationals (for example, Peugeot)
even had to close shop. Kellogg’s, which entered with
high-priced cereals (several orders of magnitude more
expensive than the traditional Indian breakfast), faced
a lack of demand. KFC initially failed to realise that
Indians were repulsed by chicken skin, which was vital
for the Colonel’s secret batter to stick. Thus, apart
from a lack of understanding about the local tastes, a
combination of circumstances, including overestima-
tion of the demand potential, rosy assumptions about
the dismantling of bureaucratic hurdles to doing busi-
ness, infrastructural inadequacies and, finally, inap-
propriate firm strategies (for example, pricing), led to
many failures and disappointments.
McDonald’s entry strategy
in India
McDonald’s India was incorporated as a wholly
owned subsidiary – McDonald’s India Pvt Ltd, or
MIPL, in 1993.12 In April 1995, the wholly owned
subsidiary entered into two 50:50 joint ventures: with
Connaught Plaza Restaurants (Mr Vikram Bakshi) to
own and operate the Delhi restaurants, and Hardcas-
tle Restaurants (Mr Amit Jatia) to own and operate
the Mumbai outlets.
Though McDonald’s had done product adapta-
tion to suit local tastes and cultures in several previ-
ous ventures, such as the McPork Burgers served with
Thai Basil in Thailand, the Teriyaki Burger in Japan,
rice dishes in Indonesia, McSpaghetti with Filipino
ham in the Philippines, McTempeh Burgers (ferment-
ed soyabean) in Indonesia and McLox Salmon sand-
wiches in Norway, the degree of adaptation required in
India was significantly greater.13 McDonald’s replaced
its core product, Big Mac, with the Maharaja Mac.
The latter had a mutton patty (instead of the beef
patty in the Big Mac), to avoid offending the sensi-
bilities of Hindus (80 per cent of the population), who
consider killing the cow as sacrilegious, and Muslims
(12 per cent of the population), for whom pork was
taboo. In addition, since 40 per cent of the market
was estimated to be vegetarian, the menu includ-
ed the McAloo Burger (based on potato), a special
salad sandwich for vegetarians and the McChicken
kebab sandwich. It also offered spicier sauces such as
Exhibit 3 Income distribution in India
Classification Number of people (mn) Households (mn) Income in US$
The Deprived 763 131 <600
The Aspirants 120 20 1000–3000
The Climbers 45 8 3000–6000
The Strivers 25 5 6000–12 500
The Rich (total) 2.18 0.3545 >12 500
The Near Rich 1.55 0.25 12 500–25 000
The Clear Rich 0.444 0.074 25 000–50 000
The Sheer Rich 0.144 0.024 50 000–125 000
The Super Rich 0.039 0.0065 >125 000
Income figures are approximate and based on the following two sources: Chaterjee Adite, 1998, ‘Marketing to the superrich’, Business Today, Living Media
India Ltd, 22 April; Warren Berryman and Jenni McManus, 1998, ‘India: Turning the Elephant Economy’, Independent Business Weekly, 24 June.

Case 8 • The Golden Arches in India C-99
McMasala and McImli (made from tamarind). Other
elements of the menu, such as chicken nuggets, fillet
of fish sandwiches, fries, sodas and milk shakes, were
common with the rest of McDonald’s system.
In 1998, McDonald’s India set up a menu develop-
ment team to collect consumer feedback. The results
of the team’s research revealed that while Indian cus-
tomers didn’t want the company to entirely localise its
menu, they wanted a wider product range, more hot
food and lower entry-level prices for products.14 The
company subsequently introduced several new prod-
ucts, such as the Veg Pizza McPuff, that were priced
attractively and became top sellers in the menu. By
2001, almost 75 per cent of the menu in India was
localised versus 33 per cent for a typical Asian coun-
try. (See Exhibit 4 for the complete menu offered in
March 2003.15)
The adaptation of the strategy went well beyond
the menu, encompassing many aspects of the restau-
rant management system. Two different menu boards
were displayed in each restaurant – green for vegetar-
ian products and purple for non-vegetarian products.
Behind the counter, restaurant kitchens had separate,
dedicated preparation areas for the meat and non-meat
Exhibit 4 McDonald’s menu in India
Menu item Price (Rs) Menu item Price (Rs)
Burgers Happy Meals
(burger with regular drink and a toy)
Salad Sandwich 54.00
McAloo Tikki Burger 64.00
Salad Sandwich 18.00 Veg Pizza McPuff 54.00
Veg Pizza McPuff 17.00
McAloo Tikki Burger 28.00 Value Meals (burger with potato wedges/regular fries
McVeggie Burger 34.00 and regular drink)
Veg Surprise 18.00 McAloo Tikki Burger 49.00
Chicken McGrill 24.00 Salad Sandwich 39.00
McChicken Burger 46.00 Veg Surprise 44.00
Filet-O-Fish 46.00 Chicken McGrill 49.00
Chicken Maharaja Mac 55.00
Paneer Salsa Wrap 40.00 Meal combos
Chicken Mexican Wrap 49.00 (burger with medium fries and medium drink)
Fries Extra Cheese 6.50
Regular 20.00 Upsize to Burger with large fries and a large drink 10.00
Medium 26.00 McVeggie Combo 75.00
Large 33.00 McChicken Combo 89.00
Potato Wedges 20.00 Filet-O-Fish Combo 89.00
Beverages Paneer Salsa
Wrap Combo 82.00
Regular Coke/Fanta/Sprite 17.00 Chicken Mexican Wrap Combo 92.00
Medium Coke/Fanta/Sprite 21.00 Chicken Maharaja Mac Combo 94.00
Large Coke/Fanta/Sprite 25.00
Cappuccino 17.00 Desserts
Café Mocha 17.00 Soft serve: Pineapple/Hot Fudge Topping/ Vanilla 19.00
Espresso Black 12.00 Soft Serve: Cone 8.00
Elaichi Tea 17.00 Soft Serve: McSwirl 12.00
Tea 12.00 McShakes: Chocolate/Strawberry/Vanilla 30.00
Mineral Water (500 ml) 14.00 McShakes Regular: Chocolate/Strawberry/Vanilla 25.00
Quick bites McShakes Medium: Chocolate/Strawberry/Vanilla 35.00
Cappuccino + Wedges 25.00 McShakes Large: Chocolate/Strawberry/Vanilla 45.00
Cappuccino + Puff 29.00 Apple Pie 24.00
Source: www.mcdonaldsindia.com.

C-100 Case 8 • The Golden Arches in India
products. The kitchen crew (in charge of cooking) had
different uniforms to distinguish their roles and they
did not work at the vegetarian and non-vegetarian
stations on the same day, thus ensuring clear segrega-
tion.16 The wrapping of vegetarian and non-vegetarian
food took place separately. These extra steps were tak-
en to assure Indian customers of the wholesomeness
of both products and their preparation. To convince
Indian customers that the company would not serve
beef, and respect the culinary habits of its clientele,
McDonald’s printed brochures explaining all these
steps and took customers for kitchen tours.
McDonald’s positioned itself as a family restaur-
ant. The average price of a meal combo, which includ-
ed burger, medium fries and medium drink, varied
from Rs 75 for a vegetarian meal to Rs 94 for a Maha-
raja Mac meal. This could be compared with KFC
meal prices at Rs 59 (Crispy Burger, Regular Fries and
Large Pepsi) and Rs 79 (KFC Chicken, Colonel Burger
and Regular Pepsi). McDonald’s Happy Meal, which
included a complimentary toy, was priced between Rs
54 and Rs 64. The prices in India were lower than
in Sri Lanka or Pakistan, and even the price of the
Maharaja Mac was 50 per cent less than an equiva-
lent product in the United States.17 To fight its premi-
um image among the public, the company undertook
selective price cutting and also ran some periodic
promotions. In March 2003, the company was offer-
ing value meals for as low as Rs 39 and Quick Bites
for as low as Rs 25. The company’s ice-cream offer-
ings were priced extremely attractively – starting at
Rs 8 for a soft serve cone. Apparently, even these low
prices afforded McDonald’s a healthy margin (40 per
cent for cones). As Vikram Bakshi, explained: ‘I will
never become unaffordable, as I will not then be able
to build up volumes.’18 The lower price could be attri-
buted to two key factors. First, pricing strategies of
MNC rivals as well as by mid-range local restaurants
influenced McDonald’s pricing strategies as well as
special promotions. For instance, in February 1999,
several competitors were running special promo-
tions, with KFC offering a meal inclusive of chicken,
rice and gravy for Rs 39. For Rs 350, Pizza Hut was
offering a whole family meal including two medium
pizzas, bread and Pepsi. Wimpy’s was offering mega
meals at Rs 35.19 Some analysts, however, were scep-
tical of McDonald’s loss-leaders (or price cutting on
selective items) strategy since they believed that cus-
tomers attracted purely by these low prices would
not pay repeat visits. The development of a local low-
cost supply chain was a second key enabling factor in
McDonald’s pricing strategy.
Advertising and promotion
Some elements of the McDonald’s promotional strat-
egy remained the same as in other parts of the world
– especially its emphasis on attracting children. A
Happy Meal film had been consistently shown on the
Cartoon Network and Zee (a popular local channel)
Disney Hour. McDonald’s had also teamed up with
Delhi Traffic Police and Delhi Fire service to highlight
safety issues, again trying to create goodwill among
schoolchildren.20 In late 2002, McDonald’s held a
children’s painting competition across all its outlets in
Delhi. As many as 5000 children participated in the
competition and a selection of 12 paintings (screened
by some of India’s noted artists) were printed and sold
as greeting cards. The proceeds from the sale of greet-
ing cards would go towards restoring vision, through
corrective surgeries, for needy children.21 The com-
pany embarked on its first nationwide promotional
campaign in June 2000. The campaign, budgeted at
Rs 100 million, was expected to highlight (in phased
order) the brand (the experience: There is something
special about McDonald’s), food quality and variety.22
The company also ran special promotions during fes-
tivals and vegetarian days, and was even developing
garlic-free sauces to bring in ‘hard-core’ vegetarian
traffic.23
In November 2000, McDonald’s launched a mas-
sive Get Lucky promotional scheme in collaboration
with MTV, Sony Music, Coca-Cola, Hungama.com
and General Motors. Under the scheme, customers
buying a large meal combo, priced at between Rs 69
and Rs 89, would receive a scratch card. Customers
could win giveaways such as caps, T-shirts, audiotapes
and CDs, Internet browsing cards, and free tickets to
a concert by Lucky Ali (a popular local singer). Pur-
chase of a second meal combo within the same month
would make customers eligible for lucky draws whose
prizes included a trip to New Zealand and an Opel
Corsa car. This was the first high-profile program
launched by the company for adults – specifically,

Case 8 • The Golden Arches in India C-101
young parents. In May, the company had launched
a promotional program for children coinciding with
summer vacations.24 The Get Lucky campaign devel-
oped some snags a few months later, since many of the
promised giveaways – such as trips to New Zealand,
Opel Corsa cars and even the Lucky Ali concert – had
not materialised.25
In March 2001, McDonald’s India increased
its advertising expenditure from Rs 150 million to
Rs 200 million. In June 2002, having induced trial
from a number of potential customers, McDonald’s
was aiming to generate repeat visits from customers.
It changed its advertising slogan to Let’s have McDon-
ald’s today (in Hindi: To Aaj McDonald’s ho jaaye)
versus the earlier theme of There is something special
about McDonald’s (in Hindi: McDonald’s main hain
kuch baat) launched in mid-2000. The objective of the
new campaign was to position McDonald’s as a com-
fort zone for young families. The company’s adver-
tising and promotional budget for 2002 was fixed at
Rs 180 million.26
Community involvement
and citizenship behaviour
McDonald’s was involved in a variety of community
welfare projects, including the following:
• It maintained public parks in Delhi and had
taken up the responsibility for the maintenance
and upkeep of two traffic triangles at a busy
traffic junction in Mumbai.
• It was also helping in maintaining heritage
structures of historic importance.
• It was the first fast-food restaurant chain in
Delhi to withdraw the use of polythene bags
in restaurants, replacing them with recyclable
paper bags.
• It was playing a leading role in a campaign to
detoxify one of India’s major rivers by installing
grease traps to separate oil from water before
discharging into the drainage system.
• It treated all effluent material before disposal. It
also segregated plastic, paper and liquid wastes
into recycling versus discharge.
• It had participated in the Pulse Polio Awareness
rally by sponsoring food and drinks for the
volunteers. In 2001, it went a step further and
set up a vaccination booth outside its restaurant
in Pune.
Targeting markets
In terms of selection of cities, McDonald’s followed
the same strategy in India as in the rest of the world.
Its initial focus on Mumbai and Delhi was driven by
the following factors: these were the two largest cities
in India, their citizens enjoyed relatively high income
levels compared to the rest of the country, and they
were exposed to foreign food and culture. After estab-
lishing a presence in leading cities, it then moved to
smaller satellite towns, near the metropolitan cities
(for example, from Delhi to Gurgaon and Noida,
both suburbs of Delhi, and from Mumbai to Pune).
McDonald’s often found that there were positive
spillover effects, in terms of its reputation, from the
metropolitan cities to the satellite towns. In Jaipur,
the company was hoping to attract foreign tourists.
(See Exhibit 5 for a brief profile of the key cities on
McDonald’s radar screen.)
Developing the supply chain
Even before it opened the first restaurant, McDonald’s
spent as much as Rs 500 million (US$12.8 million)
to set up a supply network, distribution centres and
logistics support. By mid-2000, some estimates placed
the total investment in the supply chain at almost
Rs 3 billion.27 Local suppliers, distributors and joint
venture partners and employees had to match the res-
taurant chain’s quality and hygiene standards before
they became part of its system. McDonald’s experi-
ence in identifying and cultivating the supplier of let-
tuce provided an excellent illustration of the difficul-
ties involved. In 1991, hardly any iceberg lettuce was
grown in India, except for a small quantity grown
around Delhi during the winter months. McDonald’s
identified a lettuce supplier (Mr Mangesh Kumar
from Ootacamund in Tamilnadu, a southern state)
and helped him in a broad range of activities from
seed selection to advice on farming practices. For sev-
eral other suppliers, such as Cremica Industries which
supplied the sesame seed buns, McDonald’s helped
them to gain access to foreign technology. In another
instance, it encouraged Dynamix, the supplier for

C-102 Case 8 • The Golden Arches in India
cheese, to establish a program for milk procurement
by investing in bulk milk collection and chilling cen-
tres. This, in turn, led to higher milk yields and over-
all collections, as well as an improvement in milk
quality. McDonald’s ended up with a geographically
diverse sourcing network with buns coming from
North India, chicken and cheese coming from West-
ern India, and lettuce and pickles coming from south-
ern India. By 1999, it was sourcing 98 per cent of
the ingredients and paper products from India. The
only exception was French fries, which were imported
from Indonesia.28 There were as many as 40 suppliers
in the company’s supply chain.29
A dedicated distribution system was established
to match the suppliers’ production and delivery sched-
ules with the restaurants’ needs. The first two cen-
tralised distribution centres were set up near Mumbai
and at Cochin (in the southernmost part of India)
in joint ventures with two local retailers, both of
whom had to learn from international distributors of
McDonald’s products how the restaurant chain han-
dled distribution worldwide and particularly how to
enhance the quality of storage operations. The com-
pany estimated that each distribution centre could
service about 25 outlets.
McDonald’s strove to keep the storage volumes
of products high in order to exploit all possible econ-
omies of scale. The distribution centres were also
expected to maintain inventory records and interact
with suppliers and the logistics firm to make sure that
their freezers were well stocked. McDonald’s Qual-
ity Inspection Programme (QIP) carried out quality
checks at over 20 different points at various stages in
the movement of goods from farms to restaurants. It
Exhibit 5 Profile of the Indian cities targeted by McDonald’s
Place
Population
Remarks State
Annual
per capita
income in Rs
(1997/98)1
Annual
per capita
income in Rs
(1997/98)2
1991 2001
Agra 892 1 076 Tourist attraction; home to
the T
aj Mahal
Uttar Pradesh 7 263 5 890
Jaipur 1 459 1 893 Major tourist attraction Rajasthan 9 356 7 694
Chandigarh 504 790 Capital city of two
northern states, Punjab and
Haryana
Punjab and
Haryana
19 500 14 457
Ahmedabad 2 955 3 823 Major business centre in
western India
Gujarat 16 251 13 709
Vadodara/
Baroda
1 031 1 454 Business centre Gujarat 16 251 13 709
Mumbai 9 926 12 903 Commercial capital of India Maharashtra 18 365 16 217
Pune 1 567 2 004 Satellite town of Mumbai;
manufacturing centre
Maharashtra 18 365 16 217
Ludhiana 1 043 1 482 Textile manufacturing
centre in North India
Punjab 19 500 14 457
Delhi 9 119 13 661 Capital city; seat of the
central government
Delhi 22 687 19 091
Bangalore 2 660 3 637 India’s Silicon Valley Karnataka 11 693 11 153
Notes: 1 Income data from Per Capita Income (State-wise) – Maps of India. The figures refer to the whole state and not the particular cities. Income levels for cities
are likely to be somewhat higher than the figures for the whole states.
2 Income data from The Associated Chambers of Commerce and Industry of India http://203.122.1.245/assocham/prels/04181.asp. The figures refer to the
whole state and not the particular cities. Income levels for cities are likely to be somewhat higher than the figures for the whole states.
Source: Population data from www.world-gazetteer.com/fr/fr_in.htm.

Case 8 • The Golden Arches in India C-103
had adopted Hazard Analysis Critical Control Point
(HACCP) – a systematic approach to food safety that
emphasised prevention within suppliers’ facilities and
restaurants rather than detection through inspection
of illness or presence of microbiological data. Mr
Amit Jatia had the following comment:
The most important part of our operations was
developing a cold chain (the process of procure-
ment, warehousing, transportation and retailing
of food products under controlled temperatures).
There is practically no need of knife in any rest-
aurant. All the chopping and food processing is
done in the plants. Only the actual cooking takes
place in the restaurants.30
Even with the suppliers and distribution system
in place, McDonald’s needed a distribution link to
move raw materials to its restaurants. Logistics
management was contracted out to AFL Logistics
– itself a 50:50 joint venture between Air Freight (a
Mumbai-based firm) and FX Coughlin of the United
States, McDonald’s international logistics provider.
AFL logistics was responsible for the temperature-
controlled movement of all products (by rail, road
or air, as appropriate) from individual suppliers to
regional distribution centres. McDonald’s had to
work extremely hard at inculcating a service orien-
tation in its employees, especially those involved in
physical logistics, since the freshness of the food was
at stake. The truck operators had to be explicitly
and clearly instructed not to switch off the trucks’
refrigeration system to save on fuel or electricity. The
corporation went to the extent of installing tracking
devices, which would show the temperature chart
through the entire journey.31
Since 1999, McDonald’s had started using India
as an export base for cheese, lettuce and other prod-
ucts that went into its burgers. Exports had already
begun to Sri Lanka where it had opened in October
1998, and trial shipments had commenced to Hong
Kong and the Middle East. The company was also
trying to export its products to Europe, Russia and
Southeast Asia. 32 Amit Jatia had the following com-
ment: ‘Things are becoming global in nature. Once
you set up a supply chain in a strategic location it can
service other countries as well.’33
Past performance and
planned strategies
During its first 12 months of operations, McDonald’s
opened seven outlets (four in Delhi and three in Mum-
bai), had 6 million customer visits and had served up
350 000 Maharaja Macs. By the end of 1998, the
number of outlets had increased to 14, and, by mid-
2000, to 25 outlets, with an outlet in Pune and Jai-
pur in addition to 13 in Delhi and 10 in Mumbai. By
December 2000, it had opened another 21 outlets to
bring the total to 46.
McDonald’s success was especially notable in
view of the fact that KFC, which had entered the Indi-
an market at about the same time, had pulled out dur-
ing the year.34
According to one estimate, in June 2002, McDon-
ald’s 38 restaurants (operating at the time) averaged
about 4000 customer visits per day.35 Over the previ-
ous four years, the number of transactions had grown
at a 15 per cent annual rate.36 The spending per cus-
tomer visit at McDonald’s was estimated at around
Rs 45. One gratifying aspect of McDonald’s success
was the fact that, by mid-2000, it derived as much as
50 per cent of its revenues from vegetable food items,
thus disproving its critics – especially those who were
sceptical of its ability to serve food that suited Indi-
an palates. In 1997, McDonald’s food was classi-
fied by consumers as being bland. Within three short
years, however, McDonald’s was being sought for its
unique taste.37 The vegetarian pizza McPuffs, which
combined pizza ingredients with samosas (an Indian
snack), and Chicken McGrill seasoned with mayon-
naise and extra-tangy Indian spices, had proved to
be particularly popular.38 It had also attracted some
loyal customers with its value pricing and localised
menu. One such customer said:
A normal kebab with all the trimmings, at a regular
restaurant would cost more than Rs 25 and if the
new McGrill is giving us a similar satisfaction with
its mint chutney (sauce), then we’d rather eat in a
lively McDonald’s outlet than sitting in a cramped
car on the road.
To exploit the opportunities created due to its
better brand awareness and customer acceptance,

C-104 Case 8 • The Golden Arches in India
McDonald’s was following several different strategies.
First, it was increasing the seating capacity in several
of its restaurants by adding birthday party areas as
well as expanding general seating areas. Initially, four
restaurants in Delhi had been expanded and more
would follow, depending on the results obtained.
The company was also trying to enter new cities
where there might be demand for McDonald’s fast
food. One outlet each had been opened in cities such
as Ludhiana (north India), Ahmedabad and Baroda
(western India). The secondary cities, typically, had
lower per capita income levels as well as population
density than Mumbai or Delhi, and residents were
also likely to be less open to Western food.
In addition to the traditional outlets in busy loca-
tions within key cities, McDonald’s was also trying
to open outlets in new locations including the follow-
ing:
• at the inter-state bus terminal in New Delhi (one
outlet)
• at airports and railway stations (for example, in
Mumbai and Jaipur)
• on busy highways and in petrol stations
• in malls, multiplexes and cinema halls.
One advantage of these outlets was that they
required lower investment per outlet versus a tradi-
tional format. A key concern, however, was wheth-
er the customer profile would be appropriate. For
example, the highway travellers in India tended to be
mostly truck drivers and bus passengers, who were
not likely to go for the McDonald’s type of food. For
several other types of locations (for example, railways
stations), analysts were wondering whether McDon-
ald’s outlets would generate enough traffic. The wide
variety of formats and the dispersed network of out-
lets would accentuate the problems in maintaining
quality and hygiene standards, as well as the infra-
structural inadequacies. As Clair Babrowski, presi-
dent of McDonald’s Asia-Pacific operations, who was
very upbeat about the growth prospects in the Indian
market, had said: ‘Part of opening a store is figuring
out who’s going to fix the equipment and how the
deliveries will get there.’39
Analysts were also wondering whether the com-
pany was hasty in trying to expand too fast before
achieving breakeven. On the other hand, having suc-
ceeded in developing the supply chain and creating a
satisfied customer base, it seemed to be an opportune
time for the company to expand. In summary, the
pace and degree of expansion posed difficult dilem-
mas and would most likely impact the company’s per-
formance over the next several years.
Notes
1 ‘McDonald’s India to invest Rs 7.5 billion’, http://biz.indiainfo.
com.
2 Approximate exchange rates on 31 December of each year
were as follows:
1997: US$1 = Rs 39.246
1998: US$1 = Rs 42.481
1999: US$1 = Rs 43.516
2000: US$1 = Rs 46.664
2001: US$1 = Rs 48.170
2002: US$1 = Rs 47.870
3 ‘Big Mac at a fast clip’, Business Line, 27 June 2002.
4 ‘McDonald’s plans major investments in India’, http://news.
sawaal.com.
5 ‘McDonald’s expansion plans under review’, Business Line,
2 August 2001.
6 For instance, in June 2002, McDonald’s was predicting that it
would have 54 outlets by the end of 2002. The company ended
the year with 46 outlets.
7 ‘Ronald McDonald to relive Indian dream’, Business Line, 9 March
2001.
8 Wall Street Journal, Europe, June 1999; reproduced at www.
branding-kaeuffer.com.
9 www.odci.gov/cia/publications/factbook/geos/in.html#Econ.
10 ‘Long way for India to go on the retail front’, Business Line,
6 December 2000.
11 ‘Vandana Shiva on McDonald’s exploitation and the global
economy’, www.mcspotlight.org.
12 ‘McDonald’s expansion plans under review.’
13 ‘Look who’s going native’, Far Eastern Economic Review, 1 February
2001.
14 ‘McDonald’s shifts to product-focused ads’, Business Line,
8 September 2000.
15 ‘Look who’s going native.’
16 ‘Happy birthday, Maharaja Mac! One year later: McDonald’s in
India’, www.media.mcdonalds.com.
17 ‘Of PPPs, Big Macs and exchange rates’, Business Line, 8 May
1999.
18 ‘McDonald’s reworks its menu’, www.india-today.com.
19 ‘Dinner on discount’, Business Line, 25 February 1999.
20 ‘McDonald’s readies expansion model – restaurants to come up
in Pune, Jaipur and Bangalore’, www.hindubusinessonline.com.
21 ‘Bestowing vision’, Business Line, 18 November 2002.
22 ‘McDonald’s goes for media splash’, Business Line, 3 April 2000.

Case 8 • The Golden Arches in India C-105
23 ‘McDonald’s readies expansion model.’
24 ‘McDonald’s to dish out mega promotions’, Business Line,
2 November 2000.
25 ‘India: Bic Mac: not a lucky promo’, Business Line, 20 March 2001.
26 ‘Big Mac at a fast clip.’
27 ‘McDonald’s readies expansion model.’
28 ‘McJatia tickles Bombay’s tastebuds, builds an empire, all in two
years, The Rediff Business Special’, www.rediff.com.
29 ‘Big Mac sets eyes on south’, Business Line, 24 February 2001.
30 ‘McJatia tickles Bombay’s tastebuds.’
31 ‘Jatia forayed into McDonald’s foodbiz by chance, The Rediff
Business Special’, www.rediff.com.
32 ‘McDonald’s to head south’, Business Line, 21 April 2002.
33 ‘India to be McDonald’s expor t base’, www.indianexpress.
com.
34 ‘Look who’s going native.’
35 Since each restaurant was designed with a seating capacity of
150, this meant a turnover of about 26 times during the course
of the day. ‘Big Mac at a fast clip.’
36 ‘Big Mac at a fast clip.’
37 ‘McDonald’s shifts to product-focused ads.’
38 ‘Look who’s going native’; ‘McDonald’s readies expansion
model.’
39 ‘Risky business’, Chain Leader, 7(11), November 2002,
pp. 63–7.

C-106
Case 9
Monsanto*:
Better living through genetic
engineering?
Seth Brooks Melissa Schilling John Scrofani
Early in the year 2000, Monsanto Company merged
with Pharmacia & Upjohn, forming Pharmacia Cor-
poration, and making Monsanto part of the third-
largest pharmaceutical company in the world. Later
that year, Monsanto raised cash through a partial (15
per cent) initial public offering. As of March 2001,
Monsanto employed 14 700 people, and at the helm
was the president and chief executive officer, Hendrik
Verfaillie.
Verfaillie faced a number of interesting challenges.
Monsanto was a company that had, over the last
decade, dramatically reinvented itself. Throughout
the 20th century, Monsanto had acquired many com-
panies, expanding into a diverse range of business-
es. However, when Bob Shapiro had stepped into the
office of CEO in 1993, he restructured the company
to be more focused on ‘life sciences’ – or the combi-
nation of science and technology to find solutions for
growing global needs. Explosive innovation in bio-
technology had unleased a vast range of new potential
products and offered the allure of tapping new, fast-
growing markets. As of 2001, Monsanto had a new
capital structure, and a new portfolio focused entirely
on applying biotechnology to agriculture.
Though the company had pared down its
corporate portfolio in order to have more strategic
direction, Monsanto’s move towards life sciences was
not without its problems. One of the most successful
applications of biotechnology to Monsanto’s business
had been Roundup® – a popular agricultural herbi-
cide that worked in conjunction with genetically mod-
ified crop seeds. The combination of a powerful her-
bicide and crop seeds that are genetically modified to
resist the herbicide had been a profound innovation,
and had dramatically increased crop yields. By 1996,
Roundup® accounted for 17 per cent of Monsanto’s
total annual sales.1 However, Monsanto’s patents on
Roundup® had begun to expire in several countries
in 1991, and expired in the United States in Septem-
ber 2000. To make matters worse, strong negative
consumer perceptions of genetically modified (GM)
foods began to surface towards the end of the decade,
severely retarding the company’s sales in Europe and
beginning to threaten Monsanto’s American markets
as well.
* This case has been prepared as the basis for class discussion rather than to illustrate either effective or ineffective handling of an administrative
situation.

Case 9 • Monsanto C-107
The science of life
Monsanto is an industry leader in the bioengineer-
ing of foods. ‘The term “biotechnology” refers to the
use of living organisms or their products to modify
human health and the human environment,’ accord-
ing to the National Health Museum’s website.2
For thousands of years, from the time human
communities began to settle in one place, cultivate
crops and farm the land, humans have manipulated
the genetic nature of the crops and animals they
raise. Crops have been bred to improve yields,
enhance taste and extend the growing season.
Each of the 15 major crop plants, which provide 90
percent of the globe’s food and energy intake, has
been extensively manipulated, hybridized, inter-
bred and modified over the millennia by countless
generations of farmers intent on producing crops
in the most effective and efficient ways possible.3
Many scientists argue that genetic engineering is
simply a ‘… refinement of the kinds of genetic modi-
fication that have long been used to enhance plants …
for food’.4 The science of genetics and the understand-
ing of why physical traits are passed from parent
to child began over a century ago. German scien-
tist Gregor Mendel conducted the first experiments
aimed at understanding the science behind genetic
inheritance. Mendel used artificial hybridisation, the
fertilisation of the flower of one species by the pollen
of another species, on thousands of plants, record-
ing the traits of the successive generations. In 1865
he published a paper about his work, ‘Versuche über
Pflanzen-Hybriden’ (Experiments in Plant Hybri-
disation).5 The idea that physical traits are passed
through generations of organisms created the new
field of science focused on genetics.
In 1953, James Watson, a US biologist, and Fran-
cis Crick, an English biophysicist, discovered the
structure of DNA (deoxyribonucleic acid).6 DNA
works like a blueprint to define all characteristics, or
traits, of an organism. A DNA molecule has a double-
helix shape, like a twisting stepladder. DNA strands
are quite similar to a written language. The ‘letters’ of
this genetic language are formed by the DNA nucleo-
tides, which are the ‘steps’ in the DNA stepladder.
The ‘words’ in the genetic language are formed of
codons, each codon consisting of three nucleotides.
The ‘sentences’ in the genetic language are genes,
which are made up of many codons. A ‘book’ in the
genetic language is an entire string of DNA, which
defines all the characteristics of an organism.
Modern understanding of the chemical properties
of DNA allows scientists to ‘cut’ the DNA strand at
a certain point in the stepladder using enzymes that
are produced naturally by some bacteria. With this
enzyme technology, scientists can ‘cut’ away a desir-
able gene from one organism, then ‘paste’ that gene
into another organism, forming what is called a recom-
binant DNA strand (see Exhibit 1). It is through this
cutting and pasting of genes that scientists can give
organisms traits that they previously did not have,
without the use of the longer and more ambiguous
process of cross-fertilisation.
Genetically engineered crops and
herbicide
Without efficient crop protection products, world-
wide yields would fall by an average of 30 to 60
per cent. They would also fluctuate wildly.7
Farmers across the world can either choose to spray
their crops with some form of herbicide, or they can
till their land on a daily basis, drastically decreasing
Exhibit 1 Cutting and pasting DNA
Source: Modified from http://esg-www.mit.edu:8001/bio/rdna/cloning.html.

C-108 Case 9 • Monsanto
their productivity. If they do choose herbicide, they
can go the path of buying very effective and expen-
sive proprietary products such as Roundup®, or they
can buy the cheaper alternative generic brands such as
Squadron, Storm or Post Plus. A 1997 study indicated
that Roundup® clearly outperformed these generic
brands. The results showed that Roundup® led to a
net income per acre of US$235 compared to the oth-
ers, which produced US$209 per acre (see Exhibit 2).
Roundup® cost about US$34 per gallon compared to
generic brands that cost US$15–$20 per gallon.8 In
1998, Monsanto lowered the cost of Roundup® by
US$6 to US$10 per gallon in order to increase sales
volume and to better compete with generic compa-
nies. Generic products were popular in developing
countries where it was difficult for farmers to afford
proprietary products.9 Furthermore, competing with
generic brands had become particularly important as
Roundup’s patents began to expire.
Roundup® herbicide technology
Roundup® is a wide-spectrum herbicide, meaning that
it is toxic to any plants it comes in contact with. As
noted in the Mother Jones environmental journal, ‘…
its main ingredient, glyphosate, breaks down quickly
in soil, so that little or no toxic byproduct accumu-
lates in plant or animal tissue – a detail that Mon-
santo highlights when describing itself as an envi-
ronmentally friendly company.’10 As of March 2001,
Roundup® had been used commercially for more than
20 years and was used in over 100 countries. It was
estimated that in 1998, worldwide use of glyphos-
phate exceeded 112 000 tons, and that 71 per cent
of all genetically engineered crops planted that year
were designed to be resistant to herbicides such as
Monsanto’s Roundup®.11
Roundup Ready® crops
Monsanto markets several agricultural products that
have been genetically modified to tolerate Roundup®
herbicide. These crops, including Roundup Ready®
soybeans, Roundup Ready® canola and Roundup
Ready® cotton, are sold to farmers. Roundup Ready®
soybeans, the first of Monsanto’s Roundup Ready®
genetically modified crops, was approved for com-
mercialisation in 1995.
Roundup® herbicide is a broad-spectrum herbi-
cide which controls a wide range of broadleaf and
grass weeds. Most herbicides used in crops are selec-
tive, and only control certain types of weeds. Farm-
ers using Roundup Ready® soybean seeds can use
Roundup® herbicide to control weeds in their crop.
If Roundup® herbicide were applied over the top of
a conventional soy crop, it would kill the crop as
well as the weeds. Apart from the ability to toler-
ate Roundup®, the crop is klike any other soy crop.
Farmers can still use all the traditional herbicides they
would with a conventional crop, and the composition
of the soybeans produced is equivalent to a conven-
tional soabean crop.
Monsanto enters into agreements with farmers
who grow Roundup Ready® crops. These agreements
Exhibit 2 Roundup® versus generic glyphosate brands
Herbicide treatment SOG Yield BU/A Net income/Acre
Squadron 3 pts PRE 33.6 US$209.20
Storm 1.5 pts + Poast Plus 24 oz 21 DAP + 7 Later 33.6 US$204.70
Roundup Ultra 32 oz 28 DAP 36.8 US$235.80
The Roundup vs. best conventional herbicide alternative study was designed to evaluate the economics of the Roundup Ready
seed/herbicide system versus conventional herbicide programs. Each herbicide program was applied at labelled rates. Net
income is figured by multiplying the yield (Bu/A) by US$7 minus herbicide costs, minus a US$4 fee per herbicide application, and
the US$5 tech fee for Roundup Ready soybeans figured at a bag per acre.
In the systems study herbicide applications were made based on labelled recommendations and no other weed control was
allowed. The systems studies are designed to measure the effectiveness of the herbicide management practices and input costs.
Based on the 1996 trial at Marian AR, the Roundup Ready seed/herbicide system was superior economically to the other two
conventional herbicide programs. These differences can be attributed to advantages in weed control and the removal of crop
stress typically associated with conventional herbicide programs.
Source: www.asgrow.com/gknowled/CRMar96RR5.html, 23 March 1999.

Case 9 • Monsanto C-109
have two main purposes. First, they ensure that grow-
ers are aware of all their regulatory obligations, and
second, they help Monsanto protect their intellectual
property and the investment they have made in Round-
up Ready® technology. Monsanto provides support to
farmers to ensure that they meet their requirements to
be compliant with the law.
Terminal technology
On March 3 1998 the company Delta and Pine Land
Co. (Mississippi, USA) and the U.S. Department
of Agriculture (USDA) announced that they
received US Patent No. 5,723,765 on a new genetic
technology designed to prevent unauthorized seed
saving by farmers.12
The technology enabled the environment to influence
the characteristics a plant exhibits, even if the parents
of the plant do not have those characteristics. With
this technology it was possible to create genetic char-
acteristics in plants that only emerge if they have the
proper external stimulus. For example, two geneti-
cally altered parent plants can thrive in a moist region
and exhibit characteristics of tropical plants, and
their offspring can be moved to a desert region and
exhibit characteristics of a desert plant, even though
neither parent exhibited these desert characteristics.
Monsanto hoped to capitalise on this technology by
using it to prevent farmers from saving their seeds
from year to year (and thus forgoing purchasing them
from Monsanto). Monsanto would have utilised this
technology by altering the plant’s reproductive sys-
tem so that, unless a patented chemical was applied to
the seeds at a certain time during their development,
the seeds would be unable to germinate. This tech-
nology would have further strengthened Monsanto’s
ability to enforce its contracts with farmers, by mak-
ing the farmers unable to use seeds harvested from
the plants they grew using Monsanto’s seeds in the
next season.
Monsanto announced its intention to merge with
Delta and Pine Land Co. in the spring of 1998, in
hopes of acquiring this technology. However, in
response to consumer and farmer outrage, Robert
Shapiro wrote an open letter dated 4 October 1999,
stating that Monsanto was making the public a ‘…
commitment not to commercialize sterile seed tech-
nologies, such as the one dubbed “Terminator”. We
are doing this based on input from … a wide range
of other experts and stakeholders, including our very
important grower constituency.’13 Additionally, Sha-
piro wrote: ‘… though we do not yet own any sterile
seed technology, we think it is important to respond
to those concerns at this time by making clear our
commitment not to commercialize gene protection
systems that render seed sterile.’14 Monsanto with-
drew its Department of Justice filing for a merger with
Delta and Pine Land Co. on 20 December 1999.
History of Monsanto
Monsanto’s germination
Monsanto was founded in 1901 by John Francis
Queeny, a 30-year veteran of the Meyer Brothers
Drug Company, with the goal of producing prod-
ucts for the food and pharmaceutical industries. The
company was named after the founder’s wife, whose
maiden name was Olga Mendez Monsanto. In 1902
the St Louis based company began producing saccha-
rin. For several years after, the entire saccharin out-
put was shipped to Georgia-based Coca-Cola Co. The
company soon began producing caffeine and vanilla
as well. In 1917, Monsanto entered the pharmaceu-
ticals business when it became the first company to
produce Aspirin.
As a result of financial crisis and wartime debt
in the late 1920s, shares were offered to the public in
1927, one year before Edgar Queeny, the son of John
Queeny, succeeded his father as president of the com-
pany. He announced his vision of an era of expansion
into new businesses that would take Monsanto into
the 1930s. This expansion would include immedi-
ate acquisitions that expanded the company into the
rubber, chemicals, textile, paper, leather, soap and
detergents industries. Monsanto also moved into the
plastics and resin industries, the result of which gave
it ownership of the first man-made plastic, celluloid.
During the Second World War years, Monsanto
became involved in uranium research for the Man-
hattan Project. This was done in the Mound Plant in
Dayton, Ohio, which was used as a nuclear facility for
the government for the next 40 years. In the 1950s,
Monsanto began to expand its chemical business.

C-110 Case 9 • Monsanto
Through licensing technology from DuPont, the com-
pany began to produce acrylic fibre and nylon. Mon-
santo also entered into the fertiliser industry, as well
as the plastic bottle industry. During this decade,
Monsanto built a plant to produce ultra-pure sili-
cone, which was used as raw material in the electron-
ics industry.
In the 1960s, Monsanto created a new company
division focused exclusively on agriculture. It intro-
duced Lasso® herbicide, and Roundup® followed a
few years later. In the late 1960s, almost a decade
after establishing the agriculture division, Monsan-
to moved into the seed and hybrid swine business
through an acquisition. The 1972 appointment of
John W. Hanley marked the beginning of an era of
heavy investment in biotechnology research.
The 1980s began with a new president being
named: Richard J. Mahoney. Immediately after
assuming the position, Mahoney sold off the com-
modity chemicals portion of Monsanto’s busi-
ness to DuPont. Monsanto used the money for new
research and development, and created new technolo-
gies, including the artificial sweetener ‘Nutrasweet’
(aspartame). At the beginning of the 1980s, Mon-
santo declared biotechnology as its strategic research
focus. One year after this announcement, scientists
at Monsanto were the first to successfully genetically
modify a plant cell. This led to success in growing
plants with genetically engineered traits. Two years
after this success, a major restructuring of the com-
pany took place. Monsanto divested its non-strategic
businesses to consolidate around its core competency,
high-value-added proprietary products.
The 1990s served as a decade of expanding medi-
cine production for Monsanto. Using new techniques
in bioengineering, it was able to create new medi-
cines at a faster pace than ever before. In the early
1990s, it sold its first Ambien®, an insomnia treat-
ment, and Daypro®, an arthritis treatment. In 1993,
Robert B. Shapiro was named the new CEO of Mon-
santo. He announced that the company would refocus
its strategy and become a life sciences company. In
the mid-1990s, Monsanto’s first genetically modi-
fied crops were approved for commercial sale, includ-
ing Roundup Ready® glyphosate-tolerant soybeans.
Monsanto formed the Solaris Unit, which produced
Ortho®, Greensweep® and Roundup® lawn and gar-
den products.
As part of his effort to restyle Monsanto into an
exclusively life sciences company, in 1997, Shapiro
urged the company to spin off all the chemical parts
of the business into a company called Solutia. Shapiro
saw this as a good way for his company to increase its
profitability by focusing on a key competitive advan-
tage. (See Exhibit 3 for a complete corporate diversi-
fication timeline.)
Monsanto’s evolved form
On 19 December 1999, Monsanto and pharmaceuti-
cal giant Pharmacia & Upjohn, Co. announced their
intention to merge. The merger was approved by shar-
eowners on 23 March 1999, creating a new entity
called Pharmacia Corporation. Monsanto’s phar-
maceutical business was merged with Pharmacia &
Upjohn’s. According to information provided on the
Pharmacia website at the time of the merger,
Monsanto Company is the wholly owned
agricultural subsidiary of Pharmacia Corporation.
Monsanto is committed to finding solutions to
the growing global needs for food and health by
sharing common forms of science and technology
among agriculture, nutrition and health.15
(See Exhibits 4 and 5 for Monsanto’s financial
information valid at time of merger.)
Monsanto’s suppliers
In its move to become a company oriented around life
sciences, Monsanto had spun off its chemical busi-
nesses that made the chemicals necessary to produce
Roundup®. Though in general it was not dependent
on any single supplier for a significant amount of its
raw materials or fuel requirements, certain raw mate-
rials were obtained from a few major suppliers. For
example, Monsanto purchased its North American
supply of elemental phosphorus, a key raw material
for the production of Roundup® herbicide, from P4
Production, LLC, a joint venture between Monsanto
and Solutia Inc.16
On the crop side of the business, Monsanto
had engaged in a spree of mergers and acquisitions,

Case 9 • Monsanto C-111
Exhibit 3 Monsanto’s corporate diversification timeline
1901 John F. Queeny founds the original Monsanto. His wife was Olga Monsanto Queeny. The first product of that
company was saccharine.
1945 The original Monsanto produces and markets agricultural chemicals, including 2,4D.
1960 The Agricultural Division is established.
1964 Ramrod herbicide is introduced, beginning the use of Western theme names for the original Monsanto’s brands of
herbicides.
1968 Commercialization of Lasso herbicide in the U.S. begins the trend toward reduced-tillage farming.
1975 A cell biology research progam is established in the Agricultural Division.
1976 Roundup herbicide is commercialised in the U.S.
1981 A molecular biology group has been set up and biotechnology is firmly established as Monsanto’s strategic research
focus.
1982 Scientists working for the original Monsanto are the first to genetically modify a plant cell.
1982 The original Monsanto acquires the Jacob Hartz Seed Co., known for its soybean seed.
1984 The Life Sciences Research Center opens in Chesterfield.
1987 The original Monsanto conducts the first U.S. field trials of plants with biotechnology traits.
1994 The original Monsanto’s first biotechnology product to win regulatory approval, Polilac, bovine somatotropin (Bst)
for dairy cows, goes on sale in the U.S.
1996 The original Monsanto acquires the plant biotechnology assets of Agracetus and purchases an interest in Calgene,
another biotech research company. (The Calgene acquisition was completed the following year.)
1996 The original Monsanto’s first plant biotechnology product, Roundup Ready soybeans and canola and Bollgard cotton,
are planted commercially.
1997 YieldGard corn, with protection against the European corn borer, is commercialized.
Asgrow agronomics seed business is purchased by the original Monsanto.
1997 The original Monsanto spins off its industrial chemical and fibers business as Solutia Inc.
1998 The original Monsanto completes its purchase of DeKalb Genetics Corp.
1998 Roundup Ready corn is introduced.
2000 The original Monsanto enters into a merger and changes its name to Pharmacia Corporation.
A new Monsanto Company
2000 A new Monsanto company, based on the previous agriculatural division of Pharmacia, is incorporated as a stand-alone
subsidiary of the pharmaceutical company. (Pharmacia itself eventually becomes a subsidiary of Pfizer, in 2003.)
2002 YieldGard Rootworm and YieldGard Plus corn get U.S. approval.
2002 The new Monsanto company is spun off from Pharmacia and is now a separate company.
2003 More than 300 seed companies in the United States have licenses for Monsanto biotechnology traits.
2004 The majority of cotton and soybean seeds planted in the U.S. have at least one biotechnology trait.
Source: www.monsanto.com, 17 August 2004.
expanding its business to incorporate companies
that had previously supplied many of the raw materi-
als that Monsanto used to develop Roundup Ready®
crops. Monsanto acquired or formed long-term
relationships with six seed companies between 1995
and 1997 (see Exhibit 3).
Research and development
Monsanto prides itself on being a company that
develops breakthrough proprietary technology. The
development of Roundup® herbicide in the 1960s
had put Monsanto’s agricultural division into the fore-
front, and scientists in this division were working hard
to develop the next generation of herbicide and seed
systems. In the early 1990s, Bruce Bickner, co-president
of Monsanto’s agribusiness, spent $0.14 per revenue
dollar on R&D compared to the industry average of
$0.09 per revenue dollar.17 However, some felt that
Monsanto’s focus on R&D-based proprietary products
might cause it to miss out on the large global market for

C-112 Case 9 • Monsanto
crop protection. It was estimated that by 2001, 53 per
cent of the world agrochemical market would consist of
generic chemicals (rather than proprietary chemicals).18
In most countires Monsanto’s sales growth was weaker
than sales growth in the United States (see Exhibits 6
and 7).
Human resources
Monsanto placed considerable emphasis on the value
of its employees. It was often reinforced that excel-
lent management of people was crucial to retain Mon-
santo’s foothold in the market. HR managers were
required to have a master’s degree and at least five
years of HR management experience ‘… to ensure
proper staffing skills, change management, coaching
and counseling, project management and organiza-
tional design’.19 The senior staff at Monsanto went to
great effort to place people into the positions that fit
them best, believing that a failure to properly allocate
employees would result in a forfeiture of the compa-
ny’s competitive position.
Marketing
Monsanto targeted professional farmers by advertis-
ing Roundup® in magazines such as Farm & Country,
Farm Journal and High Plains Journal.20 The pri-
mary marketing message for Roundup® was that it
was a safe product to use. The productivity increase
enabled by Roundup® was already clear to farmers
– at least those in the United States. As noted in The
Economist,
Americans in general have a positive perception of
technology and are willing to accept the biological
version of it. They are willing to overlook the
fact that they are growing and eating genetically
modified foods in return for increased yields and
reduced costs.21
Ron Thompson, a corn farmer in Illinois, noted: ‘If
there is a farm that grows corn, canola, soy, or wheat,
then its farmer probably buys Roundup®. It is in his
best interest.’22
Exhibit 4 Monsanto’s statement of consolidated income (loss) (US$mn)
2000 1999 1998
Net sales 5 493 5 248 4 448
Cost of goods sold 2 770 2 556 2 149
Gross profit 2 723 2 692 2 299
Operating expenses:
Selling, general and administrative expenses 1 253 1 237 1 135
Research and development expenses 588 695 536
Acquired in-process research and development 402
Amortisation and adjustment of goodwill 212 128 77
Restructuring – net 103 22 94
Total operating expenses 2 156 2 082 2 244
Income from operations 567 610 55
Interest expense (net of interest income of $30, $26 and $27 in 2000,
1999 and 1998, respectively) (184) (243) (94)
Other expense (income) – net (49) (104) (21)
Income (loss) before income taxes and cumulative effect of accounting
change 334 263 (60)
Income tax provision (159) (113) (65)
Income (loss) before cumulative effect of accounting change 175 150 (125)
Cumulative effect of a change in accounting principle, net of tax benefit of
US$16 million (26)
Net income (loss) 149 150 (125)
Source: Data from Monsanto Annual Report 2000.

Case 9 • Monsanto C-113
Exhibit 5 Monsanto’s statement of consolidated financial position (US$mn)
Assets 2000 1999
Current Assets:
Cash and cash equivalents 131 26
Trade receivables, net of allowances of $171 in 2000 and $151 in 1999 2 515 2 028
Miscellaneous receivables 283 350
Related party loan receivable 205
Related party receivable 261
Deferred tax assets 225 130
Inventories 1 253 1 440
Other Current Assets 100 53
Total Current Assets 4 973 4 027
Property, Plant and Equipment
Land 69 82
Buildings 766 708
Machinery and equipment 2 688 2 187
Computer software 190 155
Construction in progress 746 726
Total property, plant and equipment 4 459 3 858
Less accumulated depreciation 1 800 1 639
Net Property, Plant and Equipment 2 659 2 219
Goodwill (net of accumulated amortisation of $290 in 2000 and $183 in 1999) 2 827 3 081
Other Intangible Assets (net of accumulated amortisation of $506 in 2000 and
$362 in 1999)
779 935
Other Assets 488 839
Total Assets 11 726 11 101
Liabilities and Shareowner’s Equity
Current Liabilities:
Short-term debt 158
Related party short-term loan payable 635
Short-term debt of parent attributable to Monsanto 89
Accounts payable 525 466
Related party payable 162
Accrued compensation and benefits 172 147
Restructuring reserves 38 26
Accrued marketing programs 181 256
Miscellaneous short-term accruals 886 720
Total Current Liabilities 2 757 1 704
Long-term debt 962
Long-term debt of parent attributable to Monsanto 4 278
Postretirement Liabilities 367
Other Liabilities 299 474
Shareowners’ Equity
Common stock (authorised: 1 500 000 000 shares, par value $0.01
Issued: 258 043 000 shares in 2000 3
Additional contributed capital 7 853
Parent company’s net investment 4 926
Retained earnings 2
Accumulated other comprehensive loss (479) (281)
Reserve for ESOP debt retirement – attributable to Monsanto (38)
Total Shareowners’ Equity 7 341 4 645
Total Liabilities and Shareowners’ Equity 11 726 11 101
Source: Data from Monsanto Annual Report 2000.

C-114 Case 9 • Monsanto
Distribution
On 12 July 1999, Monsanto signed an agreement
making Scott’s Company the sole marketing and dis-
tribution agent of Roundup® in the United States.
Scott’s was the most recognised agent of garden
products in the US.23 Prior to this, Monsanto dis-
tributed Roundup® through the Central Garden and
Pet Company, which sold Roundup® to retailers and
sometimes directly to farmers. Global opportunities
had also caught Monsanto’s attention. ‘The interna-
tional potential for our existing biotechnology traits
is roughly double the acreage potential within North
America,’ noted Verfaillie. In July 1998, Monsanto
purchased Cargill Seed Business, an already estab-
lished worldwide seed company with operations and
distribution in 51 countries in Central and South
America, Europe, Asia and Africa, in order to gain
quicker access to these markets.24
As part of its strategy to lessen its reliance on US
sales and increase the acceptance of biotechnology
internationally, Monsanto’s near-term plans includ-
ed: (1) working with the Brazilian government and
other stakeholders to obtain approval for planting
Roundup Ready® soybeans in Brazil; (2) accelerating
Exhibit 6 Monsanto’s sales by region (US$mn)
Year
Sales (US$mn)
0
1995 1996 1997 1998 1999
1
2
3
4
5
6
United States
Europe – Afric
a
Latin America
Asia – Pacific
Canada
Exhibit 7 Monsanto’s trade receivables by region (US$mn)
Year
US$mn
0
1996 1997 1998 1999
100
200
300
400
500
600
700
800
900 US agricultural
product distributors
Customers in Latin
American Southern
Cone Counties
European agricultural
product distributors
Pharmaceutical
distributors worldwid
e
Customers in the
former Soviet Union
Customers in
South-East Asia

Case 9 • Monsanto C-115
the commercialisation of Roundup Ready® corn
by securing a licence to import grain grown from
Roundup Ready® seeds into Europe; and (3) expand-
ing its markets in Asia by securing the approval of
Bollgard insect-protected cotton in India.25
Levelling the field
Monsanto faced several large competitors. One giant
in the market was American Home Products (AHP),
whose agricultural subsidiary, Cynamid Corpora-
tion, competed directly with Monsanto through a
heavy focus on R&D and marketing.26 It had intro-
duced alternative products that had the same chemi-
cal base as Roundup® and thus could be used with it.
DuPont Corporation and Novartis Corporation also
competed with Monsanto and its parent company,
Pharmacia, primarily in the areas of pharmaceuticals,
chemicals and consumer home products. The patent
expiration of glyphosate had further opened opportu-
nities for companies to enter the agribusiness, an area
that had long been dominated by Monsanto.
Patent expiration
Roundup® herbicide was registered for use in 1974.
By 1991 patents protecting it had expired in several
countries, including Australia. Patent protection
for the active ingredient in the herbicide expired in
the United States in September 2000.27 Having had
patent protection on the production and sale of
Roundup® herbicide, Monsanto now stood on the
threshold of competing with other chemical firms that
made glyphosate-based herbicides. Monsanto began
lowering prices on Roundup® in markets where pat-
ent expiration was most likely to impact sales. Mon-
santo hoped to recoup in volume what it would lose
in profit margins.
On 19 January 1999, Dow Chemical Company
subsidiary Dow AgroSciences LLC and Monsanto
announced a multi-year manufacturing agreement
that also licensed the rights to Monsanto’s patent data
for glyphosate herbicide.
The agreement will allow Dow AgroSciences to
register its own brand of glyphosate herbicide for
sale globally. However, Dow AgroSciences will not
be able to reference Monsanto data when registering
its products for use in Japan. Additionally, the
agreement allows Dow AgroSciences to use its
own brand of glyphosate herbicide over the top
of Roundup Ready® soybeans and cotton in the
year 2000 in the United States, and beginning in
2001, over the top of Roundup Ready® corn in the
United States.28
DuPont
DuPont was an extremely large company with US$28
billion in sales in 1999.29 Its business was split fairly
evenly between three divisions: Chemicals (which
DuPont is most widely known for), pharmaceuticals
and life sciences. From 1998 to 2000, its herbicide
share in the soybean market had slipped from 30 per
cent to 12 per cent due to inroads by Roundup®, and
the company was forced to slash 800 jobs in the agri-
cultural division.30 However, in 2000, the company
began producing herbicides similar to Roundup®
under a licensing arrangement from Monsanto.
Novartis
Novartis competed in the areas of consumer health,
healthcare and agribusiness with US$25 billion in
sales in 1999.31 The company was founded in 1758
under the name Ciba Geigy, and began by producing
chemicals, dyes and drugs of all kinds. At the time
of Monsanto’s inception in 1901, Ciba was a market
leader in artificial sweeteners. Like Monsanto and
AHP, it competed worldwide, offering herbicides,
insecticides, plant activators and seed treatment.
While Novartis had not developed any breakthrough
agricultural products in recent years, it did have the
highest capital-spending budget for R&D in crop
protection technologies.32 It also licensed glyphosate
from Monsanto for use in its herbicide products.
American Home Products
As mentioned previously, American Home Products
(AHP) posed a significant threat to Monsanto. Its
acquisition of Cynamid Corporation in 1994 signif-
icantly strengthened the company on a global basis,
placing AHP among the top-tier in sales of agricul-
tural sciences.33 AHP’s sales jumped from US$8.9
billion in 1994 to US$13.3 billion in 1995, due to the
acquisition of Cynamid.34 However, AHP showed a

C-116 Case 9 • Monsanto
net loss of US$1.2 million in 1999, due to the mass
restructuring of the organisation to accommodate the
new agricultural company. In addition, it conducted
a nationwide inventory buyback program of soy-
bean seeds in order to prepare for Cynamid’s future
herbicide products. This reduced 1999 net sales by
US$175 million.35
AHP’s focus on market research and R&D result-
ed in the development of an improved alternative to
Roundup® products, EXTREMETM herbicide and
PURSUIT residual. EXTREMETM used glyphosate,
the same main ingredient used in Roundup®, and com-
bined it with a residual agent PURSUIT, which pre-
vented new weeds from growing up to six days after
application.36 The customer could not get this ben-
efit from using Roundup® alone. When AHP asked
customers how to improve Roundup®, 85 per cent of
them responded, ‘Give it residual control.’37 The two
companies, Cynamid (AHP) and Monsanto, signed a
multi-year agreement in July 1999 in which Cynamid
(AHP) would be allowed to purchase the glyphosate
for use in EXTREMETM.38 Since the product could
be used in conjunction with the glyphosate-immune
seeds sold by Monsanto, AHP was able to benefit by
Monsanto’s large installed base of existing customers
(see Exhibit 8).
Growing concerns
The genetically modified food industry had long
faced opposition in Europe, and was facing increasing
criticism in the United States. In addition, Monsanto
in particular was facing charges of misleading adver-
tising, and that Roundup®’s primary active ingre-
dient, glyphosate, had been linked to illnesses that
included a form of cancer known as non-Hodgkin’s
lymphoma.
Patenting life
Although in the year 2000 the controversy over bio-
engineered foods was only beginning in the United
States, other countries had advocated against the sale
of GM food for years. The use of biotechnology to
create genetically modified food ‘… has set off a fire-
storm among European consumers’.39 In the Euro-
pean Union, a legal and political battle had ensued
over whether or not to allow companies to patent ‘life’
(that is, gene sequences which they have either discov-
ered or engineered).
In 1988, the European Commission first proposed
a patent directive (law) which would have allowed
such patents. Seven years later, in 1995, the
European Parliament (EP) rejected this legislative
proposal because it deemed the patenting of life-
forms unethical. But in 1998, the Parliament
succumbed to pressure from the biotech industry
and adopted the ‘Life Patents Directive’. However,
the Directive is now being challenged before the
European Court of Justice and it is still not certain
whether the industry will get what it wants. In
addition, matters are made even more complicated
by the existence of a parallel patenting system, the
much older European Patent Convention (EPC),
Exhibit 8 Global herbicide sales of American Home Products/Monsanto (US$mn)
1997 1998E 1999E 2000P 2001P 2002P 97–02 ‘CGR
Roundup $2 188 $2 450 $2 650 $2 850 $2 850 $2 850 5%
Pursuit 540 570 600 625 650 675 5%
Prowl/Stomp 314 325 340 360 380 400 5%
Scepter 117 135 165 195 225 250 16%
Lasso/Harness 390 360 360 360 360 360 –2%
BST 160 190 210 230 250 270 11%
Squadron 68 80 95 110 125 140 16%
Other Herbicides 448 490 550 610 660 700 9%
Total Herbicides $4 225 $4 600 $4 970 $5 340 $5 500 $5 645 6%
% Change 15% 9% 8% 7% 3% 3%
Note: E = Estimated, P = Predicted. Source: Pharmaceutical Industry Pulse Part 6, SG Cowen Securities Corporation, 1 October 1998.

Case 9 • Monsanto C-117
Exhibit 9 Greenpeace’s labelling guidelines
Policy Concerning the Labelling and Declaration of Genetically Engineered Food Products
Greenpeace International, November 1997
Greenpeace is opposed to the release of genetically modified organisms (GMOs) into the environment. We also believe that
stream-lining of crops (sometimes referred to as segregation) is essential for the right of consumers to be provided with the
choice of non-genetically manipulated food. For products that do contain or are produced by GMOs all products, seeds, animal
feed, and food products and their components must be very clearly labelled.
Greenpeace has provided an example of how a label for such products could look. We are calling on the EU Commission
to implement a comprehensive and immediate labelling program for its citizens that allows for the choice of non-genetically
modified food for consumers.
Greenpeace Policy on Labelling in the European Union
All food products that have been produced, processed, grown or cultivated under one of the following preconditions have to be
marked with a clear and easily visible label (see Annex 1), to inform consumers about the production process and to allow an
informed choice between genetically engineered and conventional food products.
The label has to be used as a non-removable sticker or as a direct imprint on the product itself or its packaging (whatever
is displayed to the customer). The labelling policy should come into effect immediately as stickers can be used as a phase in for
the interim period when direct imprints should be obligatory.
For the labelling process, the complete chain of production and all components of the final product must be taken into
consideration. All ingredients and components of the final product must be listed. The technical capability to detect GMOs is
not a criteria for labelling.
Additional information on the product must clearly state if the product contains proteins from plants, animals or
microorganisms known to initiate allergies.
A central register of all products on the market in the European Union should be maintained. Information should be
collected and results published for the public by the EU Scientific Food Committee controlling program on the short and long
term effects of genetic engineering in food.
Liability for any health effects caused from food or products derived from GMOs should be the responsibility of the food
processing company or company involved.
(A) Labelled ‘Genetically Manipulated’
Food products must be marked with the label ‘Genetically manipulated’ if one or more of the following preconditions applies to
either the finished product or one or more of its components:
1. Food products and/or their components that consist of or contain genetically modified organisms (according to the
definition set out in the EU-directive 90/220/EEC). This regulation applies both for finished products and their components,
regardless whether the genetical modification can be detected by currently available scientific standards or not.
2. Food products and/or their components that are produced or derived from genetically modified organisms. This regulation
applies both for finished products and their components, regardless of whether the genetical modification can be detected
by currently available scientific standards or not.
3. Food products, if their additives are produced or derived from genetically modified plants or animals.
4. Food products obtained or derived from animals raised and fed with genetically modified animal fodder.
5. Animal fodder must be labelled as genetically manipulated:
if the fodder or its components consist of or contain genetically modified organisms or their parts; if the fodder or its
essential components are produced or derived from genetically modified organisms.
6. Animals that are genetically engineered and sold for food or animal fodder (such as fish meal).
(B) Labelled ‘Produced with Genetic Engineering’
Food products have to be marked ‘Produced with genetic engineering’ (without a label; in written form, placed within the list
of ingredients), if one or more of the following preconditions applies to either the finished product or one or more of its
components:
1. Food products that are produced with the help of production processes that operate with genetically modified organisms or
their derivatives.
2. Food products that contain or are produced with the help of additives (vitamins, enzymes, flavoured substances
(flavourants)) that are produced or derived from genetically modified organisms.
Source: Information taken from www.greenpeace.org/~geneng/.

C-118 Case 9 • Monsanto
which does not allow patents on plants but is
undecided on patents on animals and genes.40
Patents on gene sequences were first allowed in
the United States. If laws banning the patenting of
gene sequences were upheld, Monsanto would be
unable to protect itself from other companies copying
and reselling the technology in which it had invested
so heavily.
The regulation of genetically
modified foods
In the United States, the Food and Drug Administra-
tion (FDA) is responsible for regulating the biotech
industry.
Under FDA policy developers of bioengineered
foods are expected to consult with the agency
before marketing, to ensure that all safety and
regulatory questions have been fully addressed.
FDA’s policy also requires special labeling for
bioengineered foods under certain circumstances.
For example, a bioengineered food would need
to be called by a different or modified name if
its composition were significantly different from
its conventionally grown counterpart, or if its
nutritive value has been significantly altered.
Special labeling would be required if consumers
need to be informed about a safety issue, such as
the possible presence of an allergen that would not
normally be found in the conventionally-grown
product.41
As the FDA policy existed in 2000, most products
that contained genetically modified components did
not need to state this fact on their labels. This raised
heavy criticism from consumer advocacy groups,
which lobbied to have food containing GM prod-
ucts labelled as such. One advocacy group, Green-
peace, released a guideline for labelling GM foods
(see Exhibit 9).
Consumer advocates also criticised the FDA’s
policy that unless a genetically modified food is sig-
nificantly different from its ‘natural’ counterpart, the
agency would not test that food product for safety.
The FDA asserted that GM food is ‘… exempt from
testing because it is “generally recognized as safe”
(GRAS)’.42 However, many scientists, including sci-
entists working for the FDA, insisted that the agency
should test all genetically modified products on the
market.
Herbicide risks
Many of those who were opposed to the use of genet-
ically modified food were also concerned because
companies developing herbicide-resistant crops had
begun requesting permits allowing higher residues of
chemicals in genetically engineered food. For exam-
ple, Monsanto had already received permits enabling
a threefold increase in herbicide residues on geneti-
cally engineered soybeans in Europe and the United
States (up from six parts per million (PPM) to 20
PPM).43 This was particularly alarming because a
study by Swedish oncologists Dr Lennart Hardell and
Dr Mikael Eriksson, published in the 15 March 1999
Journal of American Cancer Society, indicated a link
between glyphosate and non-Hodgkin’s lymphoma
(NHL). The researchers maintained that exposure to
glyphosate increased the risk of contracting this form
of cancer.44
Sadhbh O’Neill, of the European organisation
Genetic Concern, stated that this study reinforces
concerns by environmentalists and health profession-
als that:
… far from reducing herbicide use, glyphosate
resistant crops may result in increased residues to
which we as consumers will be exposed in our food.
Increased residues of glyphosate and its metabolites
are already on sale via genetically engineered soya,
common in processed foods. However no studies
of the effects of GE soya sprayed with Roundup on
health have been carried out either on animals or
humans to date.45
The United States Department of Agriculture
(USDA) statistics from 1997 show that expanded
plantings of Roundup Ready® soybeans (i.e.
soybeans genetically engineered to be tolerant to
the herbicide) resulted in a 72 percent increase in
the use of glyphosate. According to the Pesticides
Action Network, scientists estimate that plants
genetically engineered to be herbicide resistant

Case 9 • Monsanto C-119
will actually triple the amount of herbicides used.
Farmers, knowing that their crop can tolerate or
resist being killed off by the herbicides, will tend
to use them more liberally.46
Misleading advertising
Though Monsanto marketed Roundup® as ‘biode-
gradable’ and ‘environmentally’ friendly, test results
had shown that the main ingredient in Roundup®, gly-
sophate, was the number one cause of illness among
farm workers.47 This brought them under close scru-
tiny by the US Attorney General’s office. As a result,
Monsanto was forced to pay fines up to US$100 000
to compensate the government for the money spent in
the investigation.
To counter the European aversion to genetically
modified foods, Monsanto launched a US$1.6 million
campaign to ease Europeans’ hard feelings about
genetically modified seeds and pesticides. It promised
citizens that genetically modified foods were harm-
less to the environment and to people who eat them.
It also declared that GM potatoes and tomatoes had
been approved for sale in the UK (when in fact the
UK had not yet approved these vegetables for sale).
The European public showed a less-than-welcoming
response to this campaign, complaining on 13 sep-
arate occasions to the UK Advertising Standards
Authority that these ads were false and consumers
were hurt as a result.48
Positioning for the future
The technological innovation embodied in Roundup®
and Roundup Ready® seeds had given Monsanto a
dominant and profitable position in the agricul-
tural market. This product line had come to repre-
sent a significant portion of Monsanto’s revenues and
profits. However, with the impending patent expi-
ration, increasing pressure from groups opposed
to genetically modified foods, and other possi-
ble health concerns, the future of Roundup® – and,
indeed, Monsanto – had become quite murky. Ver-
faillie needed to position his company for the future,
but to do this required addressing some very diffi-
cult questions. Could Monsanto defend its position in
Roundup®? If not, could it develop new markets that
leveraged its biotechnology resources? Would geneti-
cally modified foods gain acceptance, or face increas-
ing opposition and regulation? Was promoting genet-
ically modified foods ethical? How could Monsanto
increase its competitiveness internationally? In sum,
how would Monsanto evolve to face the future?
Notes
The website sources given below were correct at the time of the
merger but may no longer be vlaid.
1 www.monsanto.com/Monsanto/mediacenter/background/
96sep24_Herbicide.html.
2 www.accessexcellence.org/AB/BC/what_is_biotechnology.
html. The National Health Museum is a 501(c)(3) non-profit
corporation, based in Washington DC.
3 www.biotechknowledge.com/primer/primer.html.
4
Henry Miller, MD, Fellow at Stanford University’s Hoover
Institution, 17 June 1999.
5 http://netspace.students.brown.edu/MendelWeb/home.html.
6
http://library.thinkquest.org/10551/web1Eng/biotech2.htm.
7
www.cp.vovartis.com/dframe.htm.
8
Kerri Walsh. 1998, Chemical Week, 9 September.
9
Alice Naude, 1998, Chemical Market Reporter, 253(10), 9 March,
p. FR8.
1 0 Information taken from MOJO Wire, www.mojones.com/
mother_jones/ JF97/brokaw.html.
1 1 www.safe2use.com/pesticidenews/roundup.htm..
1 2 www.greenpeace.org/~geneng/highlights/pat/98_09_20.htm.
1 3 www.monsanto.com/monsanto/gurt/default.htm.
1 4 Ibid.
1 5 www.pharmacia.com/facts_monsanto.html.
1 6 Monsanto’s 1999 10K.
1 7 Anonymous; 1999, ‘Agri marketing’, Skokie, 37(6), June, p. H.
1 8 Naude, Chemical Market Reporter.
19 www.monsanto.com/monsanto/about/careers/default.htm.
20 http://dir.yahoo.com/Science/Agriculture/News_and_Media/
Magazines/Trade_Magazines/.
2 1 Anonymous, 1999, The Economist, 19 June.
2 2 www.farmsource.com/Product_Info/.
23 Scott’s Company news release, Marysville, Ohio, 12 July 1999.
24 Andrew Wood, 1998, Chemical Week, 1 July.
25 Hendrik Verfaille, CEO of Monsanto, Letter to Shareowners,
1 March 2001.
26 www.cynamid.com.
27 www.sec.gov/Archives/edgar/data/67686/0000067686-99-
000050-index.html.
28 www.monsanto.com/monsanto/mediacenter/99/99jan19_dow.
html.
29 www.hoovers.Dupont.htm.
30 Robert Westervelt, 2000, Chemical Week, 19 January.

C-120 Case 9 • Monsanto
31 www.hoovers.novartis.htm.
32 www.cp.novartis.com/d_frame.htm.
33 www.ahp.com/overview.htm.
34 www.ahp.com/netsales.htm.
35 www.hoovers.com.
36 www.extremecontrol.com.
37 Ibid.
38 S. Thompson, Public Affairs, www.cynamid.pressrelease.com.
39 Lucette Lagnado, 2000, ‘Chefs at the biotech barricades’, The
Wall Street Journal, 9 March, p. B1.
40 www.greenpeace.org/~geneng/.
41 www.fda.gov/oc/biotech/default.htm.
42 www.netlink.de/gen/Zeitung/1999/990624b.htm.
43 www.safe2use.com/pesticidenews/roundup.htm.
44 Wendy Prisnitz, 1999, ‘New studies link Monsanto’s Roundup
to cancer’, Natural Life, 68, July, Toronoto, Canada, www.life.
ca/nl/68/cancer.html.
45 Ibid.
46 Ibid.
47 http://jinx.sistm.unsw.edu.au/~greenlft/1997/262/262p13c.
htm.
48 Anonymous, The Economist.

C-121
Case 10
Nucor Corporation and the
US steel industry
Brian K. Boyd Steve Gove
Arizona State University Arizona State University
Darlington, South Carolina, 1969. Making steel is a
technically demanding, complex and dangerous pro-
cess. Nucor Corp.’s initial foray into steel production
was the latter. Instead of staffing the plant with sea-
soned steel veterans, Nucor hired farmers, mechan-
ics and other intelligent, motivated workers. Those
employees along with company executives and digni-
taries in attendance at Nucor’s mill opening fled the
plant as the inaugural pour resulted in molten steel
pouring on to the mill floor and spreading towards
the crowd. Onlookers and employees alike were left
wondering if Nucor would ever successfully produce
steel.1
The steel industry, a classic example of a market in
the late stages of maturity, traces its roots to colonial-
era blacksmiths who forged basic farm and house-
hold equipment. The industry grew (and consolidat-
ed) rapidly in the first half of the 20th century, with
worldwide demand growing throughout the 1960s.
However, a series of shifts in market dynamics led to
dramatic industry-wide declines in growth and prof-
itability. The dominant players faced the same prob-
lems as leaders of other mature industries – Ford and
General Motors, for example: obsolete production
facilities, bureaucratic management systems, heavily
unionised workers and hungry foreign competitors.
Due to its centrality in the economy, the decline of the
steel industry was cited by some observers as evidence
of the decline of the overall US economic system.
While foreign competition played a significant
role in changing the US steel industry, an even larger
factor emerged during the 1970s: minimill technol-
ogy. Traditional ‘integrated mills’ rely on large-scale
vertical integration including integrated coke and
ore production. ‘Minimills’ used a new technology
to recycle scrap steel and quickly stole most of the
commodity steel market away from integrated pro-
ducers. This enabled minimills to enter a geographic
market with a distinct cost advantage: they typically
require a capital investment of US$300 to US$500
million, or 5–10 per cent of that required for an inte-
grated mill. The minimill revolution has resulted in a
dramatic dispersion of the steel manufacturers from
the ‘rust belt’ to the primary population and growth
areas of the United States. The impact of minimills
on the industry is best demonstrated by looking at the
former industry leader US Steel (now USX Corp.). In
1966, US Steel controlled 55 per cent of the American
steel market; in 1986 it controlled only 17 per cent.
Despite its inauspicious foray into steel, Nucor
Corp. has become the benchmark for both the US
steel industry and US industry in general. Nucor is
one of the fastest growing and most efficient steel
producers in the world. Despite declining demand for
steel, Nucor’s growth has been phenomenal. Since

C-122 Case 10 • Nucor Corporation and the US steel industry
pouring its first batch of steel in the 1960s to support
in-house operations, the company has become one of
the top five producers of steel in the United States.
Without an R&D department, Nucor has repeated-
ly achieved technological feats other steel producers
thought impossible. Their hourly pay is among the
lowest in the industry, yet they have the highest pro-
ductivity per worker of any steel producer in the US
and near zero employee turnover. How has Nucor
achieved such phenomenal success? Can it continue
to do so?
US steel industry history
Steel has been a part of the domestic economic system
since the colonial era, when iron (the parent of steel)
was smelted and forged. The early 19th century, with
the advent of steam engines, cotton gins and farming
combines, advanced iron as a commodity of progress.
The addition of carbon to iron yielded a material with
additional strength, elasticity, toughness and malle-
ability at elevated temperatures. The Civil War pro-
vided the impetus for the industry to organise, con-
solidate, expand and modernise to supply the vast
quantities of steel required for warfare.
Following the Civil War, the construction of
new transportation systems, public works projects,
automobiles, bridges, ships and large buildings all
fuelled a torrid expansion of the industry lasting
through the turn of the century. Domestic econom-
ic expansion and two world wars maintained an
unquenchable appetite for steel both in the United
States and around the world in the first half of the
20th century. In the aftermath of the Second World
War, America’s steel industry prospered as it sup-
plied an ever-expanding domestic economy and the
rebuilding of war-ravaged infrastructures. This wind-
fall for the domestic industry was in actuality one of
the root causes for its eventual decline. US plants, left
idle by the end of the war, were reactivated to sup-
port the Marshall Plan and MacArthur’s rebuilding
of Japan. The war-torn nations of the world, however,
rebuilt their industrial facilities from the ground up,
incorporating the latest production technology. Con-
versely, domestic producers were content with older,
formerly inactivated facilities.
Global demand for steel expanded continuously
throughout the 1960s; domestic producers elected
not to meet this demand, choosing only to match
domestic consumption requirements. This present-
ed an opportunity for up-start foreign producers to
rejuvenate and strengthen themselves without direct-
ly competing against US producers. Throughout this
expansion, the relationship between management and
Exhibit 1 Comparative trends: GDP, steel industry output and Nucor output, 1980–96
Note: Information is overall trends; it is not to scale for comparison. GDP is scaled on right axis in trillions of 1992$. Industry is scaled on left axis in million tons. Nucor
is scaled on left axis in million tons, but shown at 10×.
Steel industry GDP
Nucor
1980
0
20
40
60
80
100
120
140
$0
$1
$2
$3
$4
$5
$6
$7
$8
1982
1984
1986
1988
1990
1992
1994
1996

Case 10 • Nucor Corporation and the US steel industry C-123
labour soured. In 1892, Henry Clay Frick’s Pinker-
ton guards attacked striking workers, setting the
stage for a contentious relationship between manage-
ment and labour. Labour, represented by the United
Steel Workers of America (USWA), and management
began negotiating three-year collective bargaining
agreements beginning in 1947. These negotiations
frequently collapsed, and strikes following the third
year of a contract became commonplace. Firms depen-
dent on steel soon initiated a pattern of accumulating
30-day ‘strike hedge’ inventories to feed operations
during strike shutdowns. In 1959, the USWA walked
out for 116 days. In 1964, another strike required
presidential intervention. The impact of these strikes
reverberated throughout the economy. Major cus-
tomers began to look for stable supplies of steel from
foreign producers who, in 1959, met only 3 per cent
of domestic demand. Fuelled by excess capacity and
strike-induced demand, foreign producers were pro-
viding 18 per cent of domestic demand by the time
a long-term labour accord was reached in the early
1970s. Foreign producers currently supply 20–25 per
cent of the steel used in the United States.
The slowdowns and closures of the 1970s set the
stage for the steel industry’s ‘dark ages’ – the period
from 1980 to 1986 when steel output declined from
115 to 80 million tons despite an increase in real GDP.
The energy crisis led to demand for smaller, lighter
cars which require less steel, also resulting in less
required tonnage. R&D in the steel industry led to
stronger blends of steel. New materials, such as petro-
leum-based materials (plastics), organics (wood/pulp)
and synthetic materials (fibreglass, epoxies) became
significant threats in several applications customar-
ily met by steel. Overall employment in steel fell from
535 000 in 1979 to 249 000 in 1986.
Despite this decline, this was also a period of
shakeout and dynamic activity in the industry. Slow-
ly, and with the help of the federal government (pri-
marily in tax and regulatory relief and enforcement
of Uruguay Trade Agreements / Voluntary Restrain-
ing Agreements), some firms were able to revitalise
their operations by streamlining production, select-
ing better markets, focusing production (minimills),
improving facilities, stabilising labour contracts, and
reducing labour content through plant modernisation,
dollar devaluation and a reprieve from the onslaught
of substitute materials. This gave the surviving firms
an opportunity to recover and prosper.
Historically, demand for steel fluctuates in both
the US and international markets due to its close ties to
durable and capital goods, markets which suffer more
acutely during austerity and are more prosperous dur-
ing economic expansions. Economic swings notwith-
standing, there has been little appreciable growth in
steel demand between the 1950s and the 1990s. Cur-
rent domestic production is approximately 100 mil-
lion tons per year, far less than the 120 million tons of
1981. Decline in demand has led to substantial excess
capacity. In 1980, for example, domestic producers
Exhibit 2 World capacity, production and idle capacity, 1970–90
0
200
400
600
800
Capacity
1970
1975
1980
1985
1990
Year % idle
1970 20
1972 22
1974 13
1976 25
1978 24
1980 29
1982 39
1984 29
1986 31
1988 23
1990 23
Production
Millions of tons

C-124 Case 10 • Nucor Corporation and the US steel industry
had 25 per cent idle capacity. While the industry now
operates at 90 per cent of capacity, this has come as a
result of reduced capacity, not increased output; total
domestic capacity declined by 30 per cent between
1980 and 1994. Capacity reduction in the steel indus-
try is expensive, particularly for integrated producers.
USX Corp., for example, eliminated 16 per cent of its
capacity in 1983 at a cost of US$1.2 billion. Still, by
1987, USX had 40 per cent idle capacity.
While large-scale, integrated producers such as
USX were shedding excess capacity, a new type of
competitor, ‘minimills’, was entering the market.
Minimills utilise recycled steel (in the form of junk
cars, scrap, etc.) as a primary ingredient. Unlike
the integrated producers, minimills are less capital-
intensive, smaller and have historically focused on pro-
ducing low-technology, entry-level products. Unlike
integrated mills, which have seen production decline,
minimills have seen explosive growth, with numerous
plants opening in the late 1980s and 1990s.
Overall, the steel industry has all of the char-
acteristics of a highly competitive market: stagnant
demand, excess capacity and numerous global com-
petitors. The ability of the largest firm to use its
power to set prices is gone. Above-average industry
margins are quickly targeted by other firms. These
factors are compounded by a largely commodity-like
product that minimises switching costs and customer
loyalty. Not surprisingly, the profit performance of
the industry has been weak; the industry as a whole
lost money during much of the 1980s. In 1987, the
first (albeit small) industry-wide profit in eight years
was posted. With the exception of the 1990–91 reces-
sion, domestic producers have gradually improved the
return on assets to a value of 6.1 per cent in 1994.
A flurry of exits and Chapter 11 reorganisations led
to an improved profit potential for remaining firms
by the mid-1990s. The success is more pronounced
in the minimill sector, although the integrated pro-
ducers are presently healthy and now represent a new
threat to the minimills.
Emerging industry trend
While in many ways the industry appears to have
stabilised, a number of emerging trends threaten to
cause further disruption within the industry to both
integrateds and minimills.
Minimill over-capacity
Starting in 1989, only one company, Nucor, was
capable of producing flat-rolled steel using minimill
technology. However, competing firms have started
using similar technology and there were expected to
be 10 new flat-roll minimills on-line by 1997, adding
13 million tons of production capacity – about 10 per
cent of 1996 production – to the industry. This new
capacity should become available just as steel con-
sumption is expected to decline.
Scrap prices
Due to growing demand for scrap metal, its cost has
become increasingly volatile in the 1990s. In 1994,
for example, prices climbed as much as US$50/ton
to US$165–170/ton, while 10 million tons of Amer-
ican scrap were exported to offshore customers. In
Exhibit 3 US production, 1974 and 1994
Production in millions of tons
160
140
120
100
80
60
40
20
0
1974
Integrated mills Minimills Other scrap mills Speciality firms
1994

Case 10 • Nucor Corporation and the US steel industry C-125
1996, prices reached US$200/ton, and were expected
to climb, but instead declined to US$170–180/ton by
the end of 1997.
Euro production
While growth has improved in recent years, demand
for steel is still weak in much of Europe, particularly in
Eastern European nations. Western Europe alone had
20 million tons of excess capacity in 1994, and Rus-
sian mills were operating at 65 per cent of capacity.
Additionally, many European mills are state-owned
and subsidised. Faced with weak performance and
idle capacity, many of these mills are aggressively
pursing export opportunities in China and other
parts of Asia. Russian steel exports approached US$4
billion in 1993, double their 1992 level.
Antidumping rulings
US integrated steel producers filed 72 charges of
dumping against foreign competitors – primarily the
Germans and Japanese. In 1993, the International
Trade Commission concluded that there was some
justification for these charges, but not for others, and
ruled that foreign steel caused no harm in 40 of the
72 cases. Stock prices for US producers (in aggregate)
declined US$1.1 billion in the 90 minutes following
the announcement of the ruling.
Industry economic
structure
The domestic steel industry, until recent technological
changes, was essentially composed of two vertically
integrated sectors. The first was the raw steel produc-
tion sector which encompassed steel-making opera-
tions from the unearthing of ores and coke to the basic
ore reduction and smelting. The outcome or product
of this sector was ingots, billets and slabs which are
standard steel shapes. These products were then sent
to finishing mills (the second sector) which conducted
various heat treating and shaping processes to produce
finished steel products such as bars, tubes, castings,
forgings, plates, sheets and structural shapes. These
two sectors were typically housed under a single facil-
ity but as two distinct operations in what was termed
the ‘integrated’ producer. Traditionally, steel manu-
facturers used batch processing, which involved heat-
ing a furnace of steel and pouring the entire furnace
full of molten steel into billets, ingots and slabs. These
intermediate products were then processed and the
process was repeated. The onset of continuous cast-
ing technology (a process in which ores are reduced
and poured into final shapes without the intermediate
production of slabs and ingots) in the late 1970s has
blurred the classical two-sector demarcation. Most
producers today use the continuous casting process
Exhibit 4 Domestic capacity and production, 1980–96
0
50
100
150
200
Millions of tons
1980
1983
1986
1989
1992
1995
Capacity Production

C-126 Case 10 • Nucor Corporation and the US steel industry
for producing isometric shapes, but raw steel must
still be shipped to finishing mills for manufacture of
more complex products.
The suppliers to the steel industry can be broadly
assigned to three major classes: ore, energy and trans-
portation. Since a preponderance of the final produc-
tion cost is tied up in these input items, many producers
have vertically integrated backwards by acquiring ore
and coal/coke mining firms and transportation net-
works (rail and barge). The supply factors of produc-
tion (transformation factors) are labour to operate
plants, capital facilities and land. Recent moderni-
sation has significantly substituted technology for
labour in steel production.
Minimills are a significant force of change in the
industry, as their supplier and customer requirements
differ from the integrated mills. First, ore supplies
are, to differing degrees, replaced by a need for access
to large quantities of scrap steel. Second, minimills,
while still large consumers of electricity, consume
far less power than their integrated mill counter-
parts. This, along with the lower output capacity of
each plant, allows for placement of the mills closer
to the third factor: the changing customer base. This
has resulted in a radical shift in steel production in
recent years from western Pennsylvania and Ohio to a
much broader dispersion of steel mills throughout the
United States. By one estimate, steel mills can now be
found in over half of the US states.
The principal markets and customers for steel are
the classical markets. Some sectors are on the decline,
while others are fairly stable. The automotive sector
was historically the largest consumer of steel in peace-
time. Construction materials is now the largest sector,
followed by the automobile and container industries,
energy equipment, industrial machinery, farming
equipment, car/rail production and various military
applications. The reduced demand by the automo-
bile industry is the result of the lower steel content
in a modern automobiIe, a trend steel producers are
aggressively trying to counter by banding together to
form the Steel Alliance which is running a US$100
million advertising campaign targeted at consumers
and touting the advantages of steel for automobile
design (and house construction).
Service centres are playing an increased role in
the industry, acting as major distributors and whole-
salers for finished steel products to steel consumers
(construction firms, shipbuilders, machine fabrica-
tors, etc.). With the exception of the automobile and
automobile part manufacturers (who contract direct-
ly with producers), most finished steel is delivered to
end users via the steel service centre, moving some of
the inventory management burden to the service cen-
tres for a marginal mark-up to the end user. This pres-
ents a forecasting complication to planners and strat-
egists, as all demand for steel is a derived demand.
The forecaster must be able to look into the macro
forces affecting an economy and project steel’s role in
Exhibit 5 Steel demand by market sector, 1972 and 1998
0
5
10
15
20
25
30 1972
Automotive
Percent of demand
Service centres
Construction
Containers
Industrial machinery
Energy/minerals
Rail/rail vehicles
Farm machinery
Shipbuilding
Other
1998

Case 10 • Nucor Corporation and the US steel industry C-127
the broader economic system from which a consumer
demand pattern could be ascertained.
Steel production
technology
Any attempt to consolidate steel and steel production
technology into a few paragraphs would be doing the
topic a disservice. However, two major issues deserve
additional attention: production factors and substi-
tutes. Automation has improved the competitive posi-
tion of the industry by reducing its exposure to vol-
atile labour markets and labour costs. It has also
increased the flexibility of producers to shift product
output and incorporate the continuous casting pro-
cess. Closely related is the elimination of the old open-
hearth furnace in favour of the blast-oxygen furnace
and electric arc furnaces, which are far more efficient,
more easily automated and require less manpower.
These furnaces also reduce stack emissions, a critical
environmental requirement (and a concern that many
foreign producers do not face). While technology has
been a driver of change, labour agreements and rela-
tions have not always made it possible to fully exploit
the benefits of technological improvements.
The proliferation of substitute materials is an
important issue. It is important to note, however,
that while substitutes have made significant inroads
into steel markets over the last 30 years, they will
likely never replace steel as the commodity of choice
for many applications. Steel will not be displaced
(with very minor exceptions) as a material in strength
applications: plastic is not strong enough; graphite-
reinforced plastics and epoxies lack steel’s thermal
resistance properties; wood is not as strong or envi-
ronmentally resistant as steel; and titanium remains
a rare, expensive, strategically controlled material.
Furthermore, steel comes in many different compo-
sitions (stainless, tool, high-strength, galvanised).
The industry’s R&D efforts have continued to evolve
steel to meet the demands of customers. In short, steel
remains – and is likely to remain – the material of
choice in most applications.
Nucor Corporation
Nucor Corp. began life as the Nuclear Corporation
of America. The latter was a highly diversified and
marginally profitable company; its products included
instruments, semiconductors, rare earths and con-
struction. One of its potential acquisitions was Coast
Metals, a family-owned producer of speciality met-
als. When the acquisition fell through, Nuclear hired
one of Coast’s top engineers as a consultant to recom-
mend other acquisition targets. The engineer – Ken
Iverson – had strong technical skills (including a grad-
uate degree in metallurgy from Purdue University)
and general management experience. Based on Iver-
son’s recommendation, Nuclear acquired a steel joist
company in South Carolina. Subsequently, Iverson
joined Nuclear as a vice president in 1962. Nuclear
built a second joist plant in Nebraska the following
year. Iverson was responsible for supervising the joist
operations as well as the research, chemical and con-
struction segments. By 1965, the diversified company
had experienced another string of losses, although the
joist operations were profitable, and Iverson was pro-
moted to president.
Recognising that its most valuable skills lay in
its joist operations, Nuclear became Nucor Corp.
and divested non-joist operations. New joist plants
soon followed, including one in Alabama in 1967 and
another in Texas in 1968. As a joist company, Nucor
was dependent on American and foreign steel produ-
cers for its key input. Iverson decided to integrate
backwards into steel making in the hopes of stabilising
supply and lowering input costs for the joist business.
So, Nucor began construction of its own steel mill in
Darlington, South Carolina – a location close to an
existing joist operation. The Darlington plant used
the then new minimill technology. When the plant
opened on 12 October 1969, the pouring of the first
batch of steel resulted in molten steel cascading out of
the mould and across the floor of the plant. Despite
the mishap, Nucor quickly became adept at mini-
mill technology. In addition to supplying its own joist
operations, it began competing with integrateds and
other minimills in the commodity steel business. Iver-
son and Nucor soon became recognised as the ‘South-
west Airlines’ of steel: a simple, no-frills organisation,

C-128 Case 10 • Nucor Corporation and the US steel industry
with a unique culture, highly motivated workers and
the lowest cost structure of the industry. Some indica-
tors of Nucor’s success include:
• It is the only major player in the industry that
can boast of 22 years of uninterrupted quarterly
dividends (Nucor began paying quarterly
dividends in 1973) and 30 years of continuous
quarterly profits, despite numerous slumps and
downturns in the industry (see Exhibits 6–14).
• Between 1980 and 1990, Nucor doubled in
size. In comparison, the six main integrated
producers reduced their steel-making capacity
from 108 to 58 million tons during this period.
• In 1990, Nucor had six steel plants and a total
annual capacity of 3 million tons. By 1995,
it had added a seventh plant, and its overall
capacity neared 8 million tons.
• In 1994, Nucor generated US$1.50 in sales for
every dollar in property, plant and equipment.
The industry average was US$0.95 before
depreciation expenses. After depreciation, these
ratios are US$2.18 and US$1.83, respectively.
• Nucor continues to be the industry leader in cost
efficiency. In 1990, it produced 980 tons of steel
per employee each year, at a net cost of US$60/
ton, compared to the industry average of 420
tons per employee at a cost of US$135/ton. In
1994, Nucor’s conversion cost was US$170/ton,
roughly US$50–75 less than its competitors.
Nucor has primary mills located in Arkansas,
Nebraska, Utah, South Carolina, Texas and Indiana.
Additional operating facilities located in Fort Payne,
Alabama; Conway, Arkansas; Saint Joe and Water-
loo, Indiana; Wilson, North Carolina; and Swansea,
South Carolina are all engaged in the manufacture
of steel products. During 1997, the average utilisa-
tion rate of all operating facilities was more than 85
per cent of production capacity. Nucor competes in a
number of distinct product segments, and the empha-
sis on these segments has changed substantially in
recent years. Historically, the largest segment was the
Nucor Steel division, which produces bar and light
structural steel products. In 1991, this was its largest
segment (measured by product volume). However, by
1995, sheet steel, once considered to be an exclusive
product of integrated producers, accounted for the
largest production volume. Heavy structural beams
from a joint venture with Yamato Steel of Japan were
the third-largest segment, followed by the Vulcraft
joist division. Remaining products – including grind-
ing balls, fasteners, ball bearings and prefabricated
steel buildings – each account for relatively small pro-
portions of total output.
While Nucor’s first experience with steel was the
result of backward integration by the Vulcraft joist
division, the manufacture of steel has become the cen-
tral focus of the firm. That focus has broadened to
include sheet steel (1989) and heavy structural beams
(1988). The company has also extended its focus to
several downstream products, including fasteners
and ball bearings (both in 1986) and prefabricated
metal buildings (1988). With the exception of the
ball bearings mill, which was acquired, new business
segments are developed internally. Roughly 15 per
cent of steel output is used internally for downstream
operations. More recently, Nucor has chosen to inte-
grate backwards from steel with a plant in Trinidad.
This backward integration is aimed at lowering pro-
duction costs; the plant produces iron carbide, which
is expected to become an alternative to scrap in the
minimill process.
Nucor’s strategy
Nucor has chosen to avoid the formalised planning
processes that are typically found in Fortune 500
firms. This lack of formalisation also extends to the
company’s mission statement, which is non-existent
but known to all employees. The company does not
have a formal mission statement, as management
believes that most mission statements are developed
in isolation, never seen or conveyed to employees, and
have little in common with what the firm really does
and how it operates. Nonetheless, all Nucor employ-
ees can tell you what their job entails and what the
objective of the organisation is: the production of
high volumes of quality, low-cost steel.2 Nucor and its
employees recognise that all the steel produced must
meet industry standards for quality. In fact, Nucor
frequently exceeds quality standards. High levels of
production per man-hour result in low costs and, sub-
sequently, prices among the lowest in the industry.

Case 10 • Nucor Corporation and the US steel industry C-129
Exhibit 6 Historical data, 1955–96
Earnings Earnings per share Stockholders’ equity Common stock
Year Net sales Operations Other Net Operations Other Net Total assets Amount
Per
share
Shares
outstanding
Per
share Amount
Prior management
1955 415 658 (39 359) – (39 359) Loss – Loss 1 630 644 930 188 0.06 16 355 402 0.48 7 850 593
1956 1 653 007 (355 293) – (355 293) Loss – Loss 1 881 385 848 934 0.04 20 573 241 0.23 4 731 845
1957 1 925 462 (546 270) – (546 270) Loss – Loss 1 908 337 1 052 664 0.03 33 803 241 0.17 5 746 551
1958 2 020 886 (521 827) – (521 827) Loss – Loss 1 717 335 672 638 0.02 35 628 981 0.21 7 482 086
1959 1 859 034 (260 161) – (260 161) Loss – Loss 1 783 598 502 454 0.01 36 532 149 0.28 10 229 002
1960 2 182 204 (367 149) (261 829) (628 978) Loss Loss Loss 1 837 102 647 565 0.01 44 023 275 0.44 19 370 241
1961 4 014 416 379 006 (16 021) 362 985 0.01 Loss 0.01 5 630 178 2 307 566 0.04 55 267 743 0.43 23 765 129
1962 9 100 958 24 095 (683 323) (659 228) – Loss Loss 7 184 395 1 952 764 0.03 56 646 415 0.23 13 028 675
1963 15 374 487 260 710 240 000 500 710 0.01 0.00 0.01 8 324 759 2 453 474 0.04 56 646 415 0.18 10 196 355
1964 17 485 319 33 264 30 000 63 264 – – – 10 337 955 2 796 719 0.05 57 809 552 0.18 10 405 719
1965 22 310 595 (431 013) (1 803 748) (2 234 761) Loss Loss Loss 6 937 251 762 380 0.01 58 695 962 0.26 15 260 950
Present management
1966 23 006 483 698 900 635 000 1 333 900 0.01 0.01 0.02 8 109 190 2 239 882 0.04 59 310 011 0.23 13 641 303
1967 23 600 093 822 424 880 832 1 703 256 0.01 0.02 0.03 11 546 498 6 581 876 0.10 66 836 275 0.64 42 775 216
1968 35 544 913 1 002 954 1 235 982 2 238 936 0.01 0.02 0.03 16 501 866 9 288 771 0.14 68 078 687 0.78 53 101 376
1969 46 321 797 1 210 083 1 125 000 2 335 083 0.02 0.01 0.03 24 655 801 11 938 178 0.17 68 935 656 0.45 31 021 045
1970 50 750 546 1 140 757 – 1 140 757 0.02 – 0.02 28 800 183 13 101 313 0.19 69 001 709 0.27 18 630 461
1971 64 761 634 2 740 694 – 2 740 694 0.04 – 0.04 33 168 014 15 892 357 0.23 69 245 150 0.41 28 390 512
1972 83 576 128 4 668 190 – 4 668 190 0.07 – 0.07 47 537 247 20 929 525 0.30 70 353 577 0.54 37 990 932
1973 113 193 617 6 009 042 – 6 009 042 0.09 – 0.09 67 550 110 26 620 195 0.38 70 302 597 0.41 28 824 065
1974 160 416 931 9 680 083 – 9 680 083 0.14 – 0.14 82 038 748 37 103 939 0.50 73 712 586 0.30 22 113 776
1975 121 467 284 7 581 788 – 7 581 788 0.10 – 0.10 92 639 413 44 549 735 0.59 75 010 113 0.41 30 754 146
1976 175 768 479 8 696 891 – 8 696 891 0.11 – 0.11 119 095 581 54 084 970 0.70 77 790 707 0.74 57 565 123
1977 212 952 829 12 452 592 – 12 452 592 0.16 – 0.16 128 010 982 66 295 405 0.84 78 807 784 1.02 80 383 940
1978 306 939 667 25 848 849 – 25 848 849 0.33 – 0.33 193 454 693 92 129 119 1.15 80 261 028 1.74 139 654 189
1979 428 681 778 42 264 537 – 42 264 537 0.52 – 0.52 243 111 514 133 257 816 1.64 81 046 524 3.32 269 074 460
1980 482 420 363 45 060 198 – 45 060 198 0.55 – 0.55 291 221 867 177 603 690 2.16 82 199 964 5.82 478 403 790
1981 544 820 621 34 728 966 – 34 728 966 0.42 – 0.42 384 782 127 212 376 020 2.54 83 562 084 4.98 416 139 178
1982 486 018 162 22 192 064 – 22 192 064 0.27 – 0.27 371 632 941 232 281 057 2.77 83 951 292 5.21 437 386 231
1983 542 531 431 27 864 308 – 27 864 308 0.33 – 0.33 425 567 052 258 129 694 3.05 84 541 086 7.13 602 777 943
1984 660 259 922 44 548 451 – 44 548 451 0.53 – 0.53 482 188 465 299 602 834 3.53 84 966 474 5.38 457 119 630
1985 758 495 374 58 478 352 – 58 478 352 0.68 – 0.68 560 311 188 357 502 028 4.16 85 890 030 8.98 771 292 469
1986 755 228 939 46 438 888 – 46 438 888 0.54 – 0.54 571 607 644 383 699 454 4.54 84 525 192 7.72 652 534 482
1987 851 022 039 50 534 450 – 50 534 450 0.60 – 0.60 654 090 139 428 009 367 5.05 84 784 352 9.91 840 212 928
1988 1 061 364 009 70 881 020 38 558 822 109 439 842 0.83 0.46 1.29 949 661 710 532 281 449 6.25 85 150 764 11.94 1 016 700 122
1989 1 269 007 472 57 835 844 – 57 835 844 0.68 – 0.68 1 033 831 512 584 445 479 6.83 85 598 480 15.06 1 289 113 109
1990 1 481 630 011 75 065 261 – 75 065 261 0.88 – 0.88 1 035 886 060 652 757 216 7.59 85 950 696 15.50 1 332 235 788
1991 1 465 456 566 64 716 499 – 64 716 499 0.75 – 0.75 1 181 576 798 711 608 991 8.23 86 417 804 22.34 1 930 573 741
1992 1 619 234 876 79 225 703 – 79 225 703 0.92 – 0.92 2 507 382 255 784 230 713 9.04 86 736 700 39.19 3 399 211 273
1993 2 253 738 311 123 509 607 – 123 509 607 1.42 – 1.42 1 829 268 322 902 166 939 10.36 87 073 478 53.00 4 614 894 334
1994 2 975 596 456 226 632 844 – 226 632 844 2.60 – 2.60 2 001 920 165 1 122 610 257 12.85 87 333 313 55.50 4 846 998 872
1995 3 462 045 648 274 534 505 – 274 534 505 3.14 – 3.14 2 296 141 333 1 382 112 159 15.78 87 598 517 57.13 5 004 503 276
1996 3 647 030 387 248 168 948 – 248 168 948 2.83 – 2.83 2 619 533 406 1 609 290 193 18.33 87 795 947 51.00 4 477 593 297
Source: Nucor Corporation Home Page, www.nucor.com/h_historicaldata.htm, 4 September 1998.

C-130 Case 10 • Nucor Corporation and the US steel industry
Exhibit 7 Annual balance sheets, 1977–96
Dec-96 Dec-95 Dec-94 Dec-93 Dec-92 Dec-91 Dec-90 Dec-89 Dec-88 Dec-87 Dec-86 Dec-85 Dec-84 Dec-83 Dec-82 Dec-81 Dec-80 Dec-79 Dec-78 Dec-77
Assets
Cash & equivalents 104.40 201.80 101.93 27.26 25.55 38.30 51.65 32.55 26.38 72.78 128.74 185.14 112.71 79.06 44.89 8.71 21.75 36.65 27.42 7.10
Net receivables 292.64 283.21 258.13 202.18 132.14 109.46 126.75 106.95 97.43 80.08 61.27 70.87 66.87 58.17 38.34 48.70 43.52 40.21 31.90 23.39
Inventories 385.80 306.77 243.03 215.02 206.41 186.08 136.64 139.45 123.22 81.50 105.60 78.64 73.80 56.56 48.83 73.00 49.60 40.01 41.55 30.41
Prepaid expenses 0.00 0.00 0.00 0.00 0.00 0.00 0.00 0.00 0.00 0.00 0.00 0.00 0.00 0.00 0.00 0.00 0.00 0.00 0.00 0.00
Other current assets 45.54 38.97 35.61 23.79 0.52 0.47 0.09 1.08 0.74 0.36 0.14 0.11 0.08 0.11 0.48 0.98 0.49 0.50 0.25 0.26
Total current assets 828.38 830.74 638.70 468.23 364.62 334.29 315.13 280.03 247.76 234.72 295.74 334.77 253.45 193.89 132.54 131.38 115.37 117.36 101.11 61.16
Gross plant property & equipment 2 698.75 2 212.89 1 977.58 1 820.99 1 574.10 1 261.53 1 086.37 1 048.01 942.27 618.54 452.26 376.23 359.97 338.66 322.85 318.86 219.10 160.46 115.25 86.67
Accumulated depreciation 907.60 747.49 614.36 459.95 448.34 414.25 363.12 294.22 240.37 199.16 181.43 150.95 131.87 107.36 83.78 66.25 46.02 35.88 26.72 20.73
Net plant property & equipment 1 791.15 1 465.40 1 363.22 1 361.04 1 125.77 847.28 723.25 753.80 701.90 419.37 270.83 225.28 228.10 231.31 239.07 252.62 173.07 124.58 88.53 65.94
Investments at equity 0.00 0.00 0.00 0.00 0.00 0.00 0.00 0.00 0.00 0.00 0.00 0.00 0.00 0.00 0.00 0.00 0.00 0.00 0.00 0.00
Other investments 0.00 0.00 0.00 0.00 0.00 0.00 0.00 0.00 0.00 0.00 0.00 0.00 0.00 0.00 0.00 0.00 0.00 0.00 0.00 0.00
Intangibles 0.00 0.00 0.00 0.00 0.00 0.00 0.00 0.00 0.00 0.00 0.00 0.00 0.00 0.00 0.00 0.00 0.00 0.00 0.00 0.00
Deferred charges 0.00 0.00 0.00 0.00 0.00 0.00 0.00 0.00 0.00 0.00 0.00 0.00 0.00 0.00 0.00 0.00 0.00 0.00 0.00 0.00
Other assets 0.00 0.00 0.00 0.00 0.00 0.00 0.00 0.00 0.00 0.00 5.04 0.27 0.63 0.37 0.02 0.78 2.78 1.17 3.81 0.92
Total assets 2 619.53 2 296.14 2 001.92 1 829.27 1 490.38 1 181.58 1 038.38 1 033.83 949.66 654.09 571.61 560.31 482.19 425.57 371.63 384.78 291.22 243.11 193.46 128.01
Liabilities
Long-term debt due in one year 0.75 0.15 0.25 0.20 0.20 2.00 2.21 2.27 2.21 2.21 3.05 2.40 2.40 2.40 1.60 1.66 1.70 1.25 0.46 0.44
Notes payable 0.00 0.00 0.00 0.00 0.00 0.00 0.00 0.00 0.00 0.00 0.00 0.00 0.00 0.00 0.00 0.00 0.00 0.00 0.00 0.00
Accounts payable 224.37 214.56 182.85 165.74 119.30 93.76 78.72 89.75 93.17 68.46 53.17 35.47 32.69 37.14 22.95 32.24 36.64 26.42 24.15 12.08
Taxes payable 10.29 11.30 15.51 14.27 10.46 11.07 10.65 13.20 35.80 24.34 14.31 27.60 23.71 14.81 12.54 10.73 4.36 15.91 15.64 4.44
Accrued expenses
Other current liabilities 230.25 221.12 183.86 170.29 142.02 122.34 134.00 88.34 84.92 52.46 47.91 55.78 41.74 34.14 29.02 28.41 23.79 19.96 15.54 13.35
Total current liabilities 465.65 447.14 382.47 350.49 271.97 229.17 225.58 193.56 216.11 147.47 118.44 121.26 100.53 88.49 66.10 73.03 66.49 63.54 55.79 30.30
Long-term debt 152.60 106.85 173.00 352.25 246.75 72.78 28.78 155.98 113.25 35.46 42.15 40.23 43.23 45.73 48.23 83.75 39.61 41.40 41.47 28.13
Deferred taxes 50.00 51.00 63.00 53.00 18.82 21.10 25.82 18.82 15.32 19.32 27.32 41.32 38.82 33.22 25.02 15.62 7.52 4.92 4.02 2.62
Investment tax credit 0.00 0.00 0.00 0.00 0.00 0.00 0.00 0.00 0.00 0.00 0.00 0.00 0.00 0.00 0.00 0.00 0.00 0.00 0.00 0.00
Minority interest 265.71 220.66 175.99 143.09 140.50 124.05 105.44 81.02 72.71 23.83 0.00 0.00 0.00 0.00 0.00 0.00 0.00 0.00 0.00 0.00
Other liabilities 76.28 88.38 84.86 28.27 28.11 22.87 0.00 0.00 0.00 0.00 0.00 0.00 0.00 0.00 0.00 0.00 0.00 0.00 0.04 0.66
Total liabilities 1 010.24 914.03 879.31 927.10 706.15 469.97 385.62 449.39 417.38 226.08 187.91 202.81 182.59 167.44 139.35 172.41 113.62 109.85 101.33 61.72
Equity
Preferred stock – redeemable 0.00 0.00 0.00 0.00 0.00 0.00 0.00 0.00 0.00 0.00 0.00 0.00 0.00 0.00 0.00
Preferred stock – non-redeemable 0.00 0.00 0.00 0.00 0.00 0.00 0.00 0.00 0.00 0.00 0.00 0.00 0.00 0.00 0.00 0.00 0.00 0.00 0.00 0.00
Total preferred stock 0.00 0.00 0.00 0.00 0.00 0.00 0.00 0.00 0.00 0.00 0.00 0.00 0.00 0.00 0.00 0.00 0.00 0.00 0.00 0.00
Common stock 35.95 35.90 35.80 35.70 17.78 8.86 8.82 8.78 8.74 8.70 8.67 5.73 5.67 5.64 2.80 2.79 2.74 2.70 1.78 1.25
Capital surplus 55.05 48.67 39.27 29.91 39.41 42.81 37.67 34.23 30.54 27.38 25.19 24.30 18.99 17.02 17.70 16.24 12.91 10.67 10.41 9.55
Retained earnings 1 535.95 1 315.85 1 065.80 854.86 745.26 678.16 624.66 559.90 511.46 410.51 367.58 327.82 275.04 235.57 211.92 193.36 161.95 119.89 79.94 55.50
Less: treasury stock 17.66 18.30 18.26 18.31 18.23 18.23 18.39 18.46 18.46 18.58 17.73 0.35 0.09 0.10 0.14
Common equity 1 609.29 1 382.11 1 122.61 902.17 784.23 711.61 652.76 584.45 532.28 428.01 383.70 357.50 299.60 258.13 232.28 212.38 177.60 133.26 92.13 66.30
Total equity 1 609.29 1 382.11 1 122.61 902.17 784.23 711.61 652.76 584.45 532.28 428.01 383.70 357.50 299.60 258.13 232.28 212.38 177.60 133.26 92.13 66.30
Total liabilities & equity 2 619.53 2 296.14 2 001.92 1 829.27 1 490.38 1 181.58 1 038.38 1 033.83 949.66 654.09 571.61 560.31 482.19 425.57 371.63 384.78 291.22 243.11 193.46 128.01
Common shares outstanding 87.80 87.60 87.33 87.07 86.74 86.42 85.95 85.60 85.15 84.78 84.52 85.89 84.97 84.54 83.95 83.57 82.20 81.05 80.26 78.80
Note: All US$mn. Source: Compustat.

Case 10 • Nucor Corporation and the US steel industry C-131
Exhibit 7 Annual balance sheets, 1977–96
Dec-96 Dec-95 Dec-94 Dec-93 Dec-92 Dec-91 Dec-90 Dec-89 Dec-88 Dec-87 Dec-86 Dec-85 Dec-84 Dec-83 Dec-82 Dec-81 Dec-80 Dec-79 Dec-78 Dec-77
Assets
Cash & equivalents 104.40 201.80 101.93 27.26 25.55 38.30 51.65 32.55 26.38 72.78 128.74 185.14 112.71 79.06 44.89 8.71 21.75 36.65 27.42 7.10
Net receivables 292.64 283.21 258.13 202.18 132.14 109.46 126.75 106.95 97.43 80.08 61.27 70.87 66.87 58.17 38.34 48.70 43.52 40.21 31.90 23.39
Inventories 385.80 306.77 243.03 215.02 206.41 186.08 136.64 139.45 123.22 81.50 105.60 78.64 73.80 56.56 48.83 73.00 49.60 40.01 41.55 30.41
Prepaid expenses 0.00 0.00 0.00 0.00 0.00 0.00 0.00 0.00 0.00 0.00 0.00 0.00 0.00 0.00 0.00 0.00 0.00 0.00 0.00 0.00
Other current assets 45.54 38.97 35.61 23.79 0.52 0.47 0.09 1.08 0.74 0.36 0.14 0.11 0.08 0.11 0.48 0.98 0.49 0.50 0.25 0.26
Total current assets 828.38 830.74 638.70 468.23 364.62 334.29 315.13 280.03 247.76 234.72 295.74 334.77 253.45 193.89 132.54 131.38 115.37 117.36 101.11 61.16
Gross plant property & equipment 2 698.75 2 212.89 1 977.58 1 820.99 1 574.10 1 261.53 1 086.37 1 048.01 942.27 618.54 452.26 376.23 359.97 338.66 322.85 318.86 219.10 160.46 115.25 86.67
Accumulated depreciation 907.60 747.49 614.36 459.95 448.34 414.25 363.12 294.22 240.37 199.16 181.43 150.95 131.87 107.36 83.78 66.25 46.02 35.88 26.72 20.73
Net plant property & equipment 1 791.15 1 465.40 1 363.22 1 361.04 1 125.77 847.28 723.25 753.80 701.90 419.37 270.83 225.28 228.10 231.31 239.07 252.62 173.07 124.58 88.53 65.94
Investments at equity 0.00 0.00 0.00 0.00 0.00 0.00 0.00 0.00 0.00 0.00 0.00 0.00 0.00 0.00 0.00 0.00 0.00 0.00 0.00 0.00
Other investments 0.00 0.00 0.00 0.00 0.00 0.00 0.00 0.00 0.00 0.00 0.00 0.00 0.00 0.00 0.00 0.00 0.00 0.00 0.00 0.00
Intangibles 0.00 0.00 0.00 0.00 0.00 0.00 0.00 0.00 0.00 0.00 0.00 0.00 0.00 0.00 0.00 0.00 0.00 0.00 0.00 0.00
Deferred charges 0.00 0.00 0.00 0.00 0.00 0.00 0.00 0.00 0.00 0.00 0.00 0.00 0.00 0.00 0.00 0.00 0.00 0.00 0.00 0.00
Other assets 0.00 0.00 0.00 0.00 0.00 0.00 0.00 0.00 0.00 0.00 5.04 0.27 0.63 0.37 0.02 0.78 2.78 1.17 3.81 0.92
Total assets 2 619.53 2 296.14 2 001.92 1 829.27 1 490.38 1 181.58 1 038.38 1 033.83 949.66 654.09 571.61 560.31 482.19 425.57 371.63 384.78 291.22 243.11 193.46 128.01
Liabilities
Long-term debt due in one year 0.75 0.15 0.25 0.20 0.20 2.00 2.21 2.27 2.21 2.21 3.05 2.40 2.40 2.40 1.60 1.66 1.70 1.25 0.46 0.44
Notes payable 0.00 0.00 0.00 0.00 0.00 0.00 0.00 0.00 0.00 0.00 0.00 0.00 0.00 0.00 0.00 0.00 0.00 0.00 0.00 0.00
Accounts payable 224.37 214.56 182.85 165.74 119.30 93.76 78.72 89.75 93.17 68.46 53.17 35.47 32.69 37.14 22.95 32.24 36.64 26.42 24.15 12.08
Taxes payable 10.29 11.30 15.51 14.27 10.46 11.07 10.65 13.20 35.80 24.34 14.31 27.60 23.71 14.81 12.54 10.73 4.36 15.91 15.64 4.44
Accrued expenses
Other current liabilities 230.25 221.12 183.86 170.29 142.02 122.34 134.00 88.34 84.92 52.46 47.91 55.78 41.74 34.14 29.02 28.41 23.79 19.96 15.54 13.35
Total current liabilities 465.65 447.14 382.47 350.49 271.97 229.17 225.58 193.56 216.11 147.47 118.44 121.26 100.53 88.49 66.10 73.03 66.49 63.54 55.79 30.30
Long-term debt 152.60 106.85 173.00 352.25 246.75 72.78 28.78 155.98 113.25 35.46 42.15 40.23 43.23 45.73 48.23 83.75 39.61 41.40 41.47 28.13
Deferred taxes 50.00 51.00 63.00 53.00 18.82 21.10 25.82 18.82 15.32 19.32 27.32 41.32 38.82 33.22 25.02 15.62 7.52 4.92 4.02 2.62
Investment tax credit 0.00 0.00 0.00 0.00 0.00 0.00 0.00 0.00 0.00 0.00 0.00 0.00 0.00 0.00 0.00 0.00 0.00 0.00 0.00 0.00
Minority interest 265.71 220.66 175.99 143.09 140.50 124.05 105.44 81.02 72.71 23.83 0.00 0.00 0.00 0.00 0.00 0.00 0.00 0.00 0.00 0.00
Other liabilities 76.28 88.38 84.86 28.27 28.11 22.87 0.00 0.00 0.00 0.00 0.00 0.00 0.00 0.00 0.00 0.00 0.00 0.00 0.04 0.66
Total liabilities 1 010.24 914.03 879.31 927.10 706.15 469.97 385.62 449.39 417.38 226.08 187.91 202.81 182.59 167.44 139.35 172.41 113.62 109.85 101.33 61.72
Equity
Preferred stock – redeemable 0.00 0.00 0.00 0.00 0.00 0.00 0.00 0.00 0.00 0.00 0.00 0.00 0.00 0.00 0.00
Preferred stock – non-redeemable 0.00 0.00 0.00 0.00 0.00 0.00 0.00 0.00 0.00 0.00 0.00 0.00 0.00 0.00 0.00 0.00 0.00 0.00 0.00 0.00
Total preferred stock 0.00 0.00 0.00 0.00 0.00 0.00 0.00 0.00 0.00 0.00 0.00 0.00 0.00 0.00 0.00 0.00 0.00 0.00 0.00 0.00
Common stock 35.95 35.90 35.80 35.70 17.78 8.86 8.82 8.78 8.74 8.70 8.67 5.73 5.67 5.64 2.80 2.79 2.74 2.70 1.78 1.25
Capital surplus 55.05 48.67 39.27 29.91 39.41 42.81 37.67 34.23 30.54 27.38 25.19 24.30 18.99 17.02 17.70 16.24 12.91 10.67 10.41 9.55
Retained earnings 1 535.95 1 315.85 1 065.80 854.86 745.26 678.16 624.66 559.90 511.46 410.51 367.58 327.82 275.04 235.57 211.92 193.36 161.95 119.89 79.94 55.50
Less: treasury stock 17.66 18.30 18.26 18.31 18.23 18.23 18.39 18.46 18.46 18.58 17.73 0.35 0.09 0.10 0.14
Common equity 1 609.29 1 382.11 1 122.61 902.17 784.23 711.61 652.76 584.45 532.28 428.01 383.70 357.50 299.60 258.13 232.28 212.38 177.60 133.26 92.13 66.30
Total equity 1 609.29 1 382.11 1 122.61 902.17 784.23 711.61 652.76 584.45 532.28 428.01 383.70 357.50 299.60 258.13 232.28 212.38 177.60 133.26 92.13 66.30
Total liabilities & equity 2 619.53 2 296.14 2 001.92 1 829.27 1 490.38 1 181.58 1 038.38 1 033.83 949.66 654.09 571.61 560.31 482.19 425.57 371.63 384.78 291.22 243.11 193.46 128.01
Common shares outstanding 87.80 87.60 87.33 87.07 86.74 86.42 85.95 85.60 85.15 84.78 84.52 85.89 84.97 84.54 83.95 83.57 82.20 81.05 80.26 78.80
Note: All US$mn. Source: Compustat.

C-132 Case 10 • Nucor Corporation and the US steel industry
Exhibit 8 Annual cash flow statement, 1977–96
Dec-96 Dec-95 Dec-94 Dec-93 Dec-92 Dec-91 Dec-90 Dec-89 Dec-88 Dec-87 Dec-86 Dec-85 Dec-84 Dec-83 Dec-82 Dec-81 Dec-80 Dec-79 Dec-78 Dec-77
Indirect operating activities
Income before extraordinary items 248.17 274.54 226.63 123.51 79.23 64.72 75.07 57.84 70.88 50.53 46.44 58.48 44.55 27.86 22.19 34.73 45.06 42.27 25.85 12.45
Depreciation and amortization 182.23 173.89 157.65 122.27 97.78 93.58 84.96 76.57 56.27 41.79 34.93 31.11 28.90 27.11 26.29 21.60 13.30 9.71 7.46 5.93
Extraordinary items and disc. operations 0.00 0.00 0.00 0.00 0.00 0.00 0.00 0.00 0.00 0.00 0.00 0.00 0.00 0.00 0.00 0.00 0.00 0.00 0.00 0.00
Deferred taxes (8.00) (15.00) (2.00) 1.00 (3.00) (4.00) 7.00 3.50 (4.00) (8.00) (14.00) 2.50 5.60 8.20 9.40 8.10 2.60 0.90 1.40 0.80
Equity in net loss (earnings) 0.00 0.00 0.00 0.00 0.00 0.00 0.00 0.00 0.00 0.00 0.00 0.00 0.00 0.00 0.00 0.00 0.00 0.00 0.00 0.00
Sale of property, plant, and equipment and sale of
investments – loss (gain) 0.00 0.00 0.00 0.00 0.00 0.00 0.00
0.00 0.00 0.00 NA NA NA NA NA NA NA NA NA NA
Funds from operations – other 82.57 48.18 17.67 9.75 23.17 26.11 29.71 8.32 0.00 0.00 0.00 0.00 0.00 0.00 0.00 0.00 0.00 0.00 0.00 0.00
Receivables – decrease (increase) (9.43) (25.07) (55.96) (70.03) (22.69) 14.80 (19.80) (9.52) (18.93) NA NA NA NA NA NA NA NA NA NA NA
Inventory – decrease (increase) (79.03) (63.75) (28.01) (8.61) (20.33) (49.43) 2.81 (16.24) (44.65) NA NA NA NA NA NA NA NA NA NA NA
Accounts payable and accrued liabs – inc (Dec) 9.81 31.72 17.11 46.44 25.53 11.54 (11.03) (3.43) 25.36 NA NA NA NA NA NA NA NA NA NA NA
Income taxes – accrued – increase (decrease) (1.01) (4.21) 1.24 3.81 (0.61) 0.42 (2.55) (22.60) (8.54) NA NA NA NA NA NA NA NA NA NA NA
Other assets and liabilities – net change 25.30 26.87 90.60 43.67 26.32 15.66 48.16 3.56 71.33 NA NA NA NA NA NA NA NA NA NA NA
Operating activities – net cash flow 450.61 447.16 424.95 271.79 205.41 173.40 214.33 98.00 147.71 NA NA NA NA NA NA NA NA NA NA NA
Investing activities
Investments – increase 0.00 0.00 0.00 0.00 0.00 0.00 0.00 0.00 0.00 0.00 0.00 0.00 0.00 0.00 0.00 0.00 0.00 0.00 0.00 0.00
Sale of investments 0.00 0.00 0.00 0.00 0.00 0.00 0.00 0.00 0.00 0.00 0.00 0.00 0.00 0.00 0.00 0.00 0.00 0.00 0.00 0.00
Short-term investments – change 0.00 0.00 0.00 0.00 0.00 0.00 0.00 0.00 0.00 NA NA NA NA NA NA NA NA NA NA NA
Capital expenditures 537.44 263.42 185.32 364.16 379.12 217.72 56.75 130.20 345.63 188.99 81.43 29.07 26.08 19.62 14.79 101.52 62.44 45.99 31.59 15.95
Sale of property, plant, and equipment 1.59 0.92 5.22 1.30 2.12 0.55 0.83 1.26 0.40 3.69 0.94 0.79 0.38 0.27 2.05 0.38 0.65 0.23 1.54 0.02
Acquisitions 0.00 0.00 0.00 0.00 0.00 0.00 0.00 0.00 0.00 0.00 0.00 0.00 0.00 0.00 0.00 0.00 0.00 0.00 0.00 0.00
Investing activities – other 0.00 0.00 0.00 0.00 0.00 0.00 0.00 0.00 78.50 NA NA NA NA NA NA NA NA NA NA NA
Investing activities – net cash flow (535.84) (262.50) (180.11) (362.86) (377.00) (217.17) (55.92) (128.95) (266.73) NA NA NA NA NA NA NA NA NA NA NA
Financing activities
Sale of common and preferred stock 7.07 9.67 9.50 8.51 5.60 5.35 3.59 3.86 3.33 2.34 3.96 5.39 2.01 2.20 1.46 3.37 2.29 1.33 1.52 1.02
Purchase of common and preferred stock 0.00 0.22 0.00 0.17 0.08 0.00 0.04 0.14 0.0 0.96 17.52 0.27 0.00 0.00 0.12 0.00 0.00 0.16 0.13 0.22
Cash dividends 28.06 24.49 15.69 13.91 12.13 11.22 10.30 9.40 8.49 7.60 6.68 5.70 5.08 4.22 3.63 3.33 3.00 2.31 1.41 1.04
Long-term debt – issuance 46.50 24.00 0.00 105.70 183.90 46.00 0.00 45.00 80.00 0.00 4.91 0.00 0.00 0.00 7.50 46.40 0.00 1.14 13.90 0.00
Long-term debt – reduction 0.15 90.25 179.20 0.20 11.73 2.20 127.27 2.21 2.21 6.69 3.00 3.00 2.50 2.50 43.02 2.25 1.79 1.21 0.56 3.54
Current debt – changes 0.00 0.84 (0.65) 0.00 NA NA NA NA NA NA NA NA
Financing activities – other (37.52) (3.51) 15.22 (7.16) (6.73) (7.51) (5.29) 0.00 0.00 NA NA NA NA NA NA NA NA NA NA NA
Financing activities – net cash flow (12.16) (84.79) (170.17) 92.77 158.84 30.42 (139.31) 37.11 72.62 NA NA NA NA NA NA NA NA NA NA NA
Exchange rate effect 0.00 0.00 0.00 0.00 0.00 0.00 0.00 0.00 0.00 NA NA NA NA NA NA NA NA NA NA NA
Cash and equivalents – change (97.40) 99.87 74.68 1.71 (12.75) (13.35) 19.10 6.17 (46.40) (55.96) (56.41) 72.43 33.66 CF CF CF CF CF CF CF
Direct operating activities
Interest paid – net 6.95 9.21 16.06 10.74 9.14 3.42 8.58 16.03 3.65 NA NA NA NA NA NA NA NA NA NA NA
Income taxes – paid 152.90 176.50 124.37 57.52 40.82 34.68 31.70 46.90 49.24 NA NA NA NA NA NA NA NA NA NA NA
Note: All US$mn. Source: Compustat.
CF – combined figure.
NA – not available.
NC – not calculable.

Case 10 • Nucor Corporation and the US steel industry C-133
Exhibit 8 Annual cash flow statement, 1977–96
Dec-96 Dec-95 Dec-94 Dec-93 Dec-92 Dec-91 Dec-90 Dec-89 Dec-88 Dec-87 Dec-86 Dec-85 Dec-84 Dec-83 Dec-82 Dec-81 Dec-80 Dec-79 Dec-78 Dec-77
Indirect operating activities
Income before extraordinary items 248.17 274.54 226.63 123.51 79.23 64.72 75.07 57.84 70.88 50.53 46.44 58.48 44.55 27.86 22.19 34.73 45.06 42.27 25.85 12.45
Depreciation and amortization 182.23 173.89 157.65 122.27 97.78 93.58 84.96 76.57 56.27 41.79 34.93 31.11 28.90 27.11 26.29 21.60 13.30 9.71 7.46 5.93
Extraordinary items and disc. operations 0.00 0.00 0.00 0.00 0.00 0.00 0.00 0.00 0.00 0.00 0.00 0.00 0.00 0.00 0.00 0.00 0.00 0.00 0.00 0.00
Deferred taxes (8.00) (15.00) (2.00) 1.00 (3.00) (4.00) 7.00 3.50 (4.00) (8.00) (14.00) 2.50 5.60 8.20 9.40 8.10 2.60 0.90 1.40 0.80
Equity in net loss (earnings) 0.00 0.00 0.00 0.00 0.00 0.00 0.00 0.00 0.00 0.00 0.00 0.00 0.00 0.00 0.00 0.00 0.00 0.00 0.00 0.00
Sale of property, plant, and equipment and sale of
investments – loss (gain) 0.00 0.00 0.00 0.00 0.00 0.00 0.00
0.00 0.00 0.00 NA NA NA NA NA NA NA NA NA NA
Funds from operations – other 82.57 48.18 17.67 9.75 23.17 26.11 29.71 8.32 0.00 0.00 0.00 0.00 0.00 0.00 0.00 0.00 0.00 0.00 0.00 0.00
Receivables – decrease (increase) (9.43) (25.07) (55.96) (70.03) (22.69) 14.80 (19.80) (9.52) (18.93) NA NA NA NA NA NA NA NA NA NA NA
Inventory – decrease (increase) (79.03) (63.75) (28.01) (8.61) (20.33) (49.43) 2.81 (16.24) (44.65) NA NA NA NA NA NA NA NA NA NA NA
Accounts payable and accrued liabs – inc (Dec) 9.81 31.72 17.11 46.44 25.53 11.54 (11.03) (3.43) 25.36 NA NA NA NA NA NA NA NA NA NA NA
Income taxes – accrued – increase (decrease) (1.01) (4.21) 1.24 3.81 (0.61) 0.42 (2.55) (22.60) (8.54) NA NA NA NA NA NA NA NA NA NA NA
Other assets and liabilities – net change 25.30 26.87 90.60 43.67 26.32 15.66 48.16 3.56 71.33 NA NA NA NA NA NA NA NA NA NA NA
Operating activities – net cash flow 450.61 447.16 424.95 271.79 205.41 173.40 214.33 98.00 147.71 NA NA NA NA NA NA NA NA NA NA NA
Investing activities
Investments – increase 0.00 0.00 0.00 0.00 0.00 0.00 0.00 0.00 0.00 0.00 0.00 0.00 0.00 0.00 0.00 0.00 0.00 0.00 0.00 0.00
Sale of investments 0.00 0.00 0.00 0.00 0.00 0.00 0.00 0.00 0.00 0.00 0.00 0.00 0.00 0.00 0.00 0.00 0.00 0.00 0.00 0.00
Short-term investments – change 0.00 0.00 0.00 0.00 0.00 0.00 0.00 0.00 0.00 NA NA NA NA NA NA NA NA NA NA NA
Capital expenditures 537.44 263.42 185.32 364.16 379.12 217.72 56.75 130.20 345.63 188.99 81.43 29.07 26.08 19.62 14.79 101.52 62.44 45.99 31.59 15.95
Sale of property, plant, and equipment 1.59 0.92 5.22 1.30 2.12 0.55 0.83 1.26 0.40 3.69 0.94 0.79 0.38 0.27 2.05 0.38 0.65 0.23 1.54 0.02
Acquisitions 0.00 0.00 0.00 0.00 0.00 0.00 0.00 0.00 0.00 0.00 0.00 0.00 0.00 0.00 0.00 0.00 0.00 0.00 0.00 0.00
Investing activities – other 0.00 0.00 0.00 0.00 0.00 0.00 0.00 0.00 78.50 NA NA NA NA NA NA NA NA NA NA NA
Investing activities – net cash flow (535.84) (262.50) (180.11) (362.86) (377.00) (217.17) (55.92) (128.95) (266.73) NA NA NA NA NA NA NA NA NA NA NA
Financing activities
Sale of common and preferred stock 7.07 9.67 9.50 8.51 5.60 5.35 3.59 3.86 3.33 2.34 3.96 5.39 2.01 2.20 1.46 3.37 2.29 1.33 1.52 1.02
Purchase of common and preferred stock 0.00 0.22 0.00 0.17 0.08 0.00 0.04 0.14 0.0 0.96 17.52 0.27 0.00 0.00 0.12 0.00 0.00 0.16 0.13 0.22
Cash dividends 28.06 24.49 15.69 13.91 12.13 11.22 10.30 9.40 8.49 7.60 6.68 5.70 5.08 4.22 3.63 3.33 3.00 2.31 1.41 1.04
Long-term debt – issuance 46.50 24.00 0.00 105.70 183.90 46.00 0.00 45.00 80.00 0.00 4.91 0.00 0.00 0.00 7.50 46.40 0.00 1.14 13.90 0.00
Long-term debt – reduction 0.15 90.25 179.20 0.20 11.73 2.20 127.27 2.21 2.21 6.69 3.00 3.00 2.50 2.50 43.02 2.25 1.79 1.21 0.56 3.54
Current debt – changes 0.00 0.84 (0.65) 0.00 NA NA NA NA NA NA NA NA
Financing activities – other (37.52) (3.51) 15.22 (7.16) (6.73) (7.51) (5.29) 0.00 0.00 NA NA NA NA NA NA NA NA NA NA NA
Financing activities – net cash flow (12.16) (84.79) (170.17) 92.77 158.84 30.42 (139.31) 37.11 72.62 NA NA NA NA NA NA NA NA NA NA NA
Exchange rate effect 0.00 0.00 0.00 0.00 0.00 0.00 0.00 0.00 0.00 NA NA NA NA NA NA NA NA NA NA NA
Cash and equivalents – change (97.40) 99.87 74.68 1.71 (12.75) (13.35) 19.10 6.17 (46.40) (55.96) (56.41) 72.43 33.66 CF CF CF CF CF CF CF
Direct operating activities
Interest paid – net 6.95 9.21 16.06 10.74 9.14 3.42 8.58 16.03 3.65 NA NA NA NA NA NA NA NA NA NA NA
Income taxes – paid 152.90 176.50 124.37 57.52 40.82 34.68 31.70 46.90 49.24 NA NA NA NA NA NA NA NA NA NA NA
Note: All US$mn. Source: Compustat.
CF – combined figure.
NA – not available.
NC – not calculable.

C-134 Case 10 • Nucor Corporation and the US steel industry
Exhibit 9 Annual income statement, 1977–96
Dec-96 Dec-95 Dec-94 Dec-93 Dec-92 Dec-91 Dec-90 Dec-89 Dec-88 Dec-87 Dec-86 Dec-85 Dec-84 Dec-83 Dec-82 Dec-81 Dec-80 Dec-79 Dec-78 Dec-77
Sales 3 647.03 3 462.05 2 975.60 2 253.74 1 619.24 1 465.46 1 481.63 1 269.01 1 061.36 851.02 755.23 758.50 660.26 542.53 486.02 544.82 482.42 428.68 306.94 212.95
Cost of goods sold 2 956.93 2 726.28 2 334.11 1 843.58 1 319.60 1 209.17 1 208.12 1 028.68 832.88 671.55 575.45 569.69 510.83 434.62 382.32 434.61 356.12 305.98 220.50 162.32
Gross profit 690.11 735.77 641.49 410.16 299.64 256.29 273.51 240.33 228.49 179.47 179.78 188.80 149.43 107.91 103.70 110.21 126.30 122.71 86.44 50.63
Selling general & administrative expense 120.39 130.68 113.39 87.58 76.80 66.99 70.46 66.99 62.08 55.41 65.90 59.08 45.94 33.99 31.72 33.53 38.16 36.72 28.66 19.73
Operating income before deprec. 569.72 605.09 528.10 322.57 222.84 189.30 203.05 173.34 166.40 124.06 113.88 129.72 103.49 73.93 71.98 76.69 88.14 85.98 57.78 30.90
Depreciation depletion & amortization 182.23 173.89 156.65 122.27 97.78 93.58 84.96 76.57 56.27 41.79 34.93 31.11 28.90 27.11 26.29 21.60 13.30 9.71 7.46 5.93
Operating profit 387.49 431.20 370.45 200.31 125.06 95.73 118.09 96.77 110.14 82.27 78.95 98.62 74.59 46.82 45.69 55.09 74.84 76.27 50.33 24.98
Interest expense 7.55 9.28 14.59 14.32 9.03 2.60 8.10 16.88 9.18 3.94 5.32 4.36 4.62 4.80 8.41 10.67 3.53 4.30 2.87 2.82
Non-operating income/expense 7.84 10.41 1.08 1.12 1.30 2.69 1.23 5.74 6.63 4.91 10.61 11.92 8.58 5.55 0.52 0.42 4.75 2.79 1.00 0.10
Special items 0.00 0.00 0.00 0.00 0.00 0.00 0.00 0.00 0.00 0.00 0.00 0.00 0.00 0.00 0.00 0.00 0.00 0.00 0.00 0.00
Pretax income 387.77 432.34 356.93 187.11 117.33 95.82 111.22 85.64 107.58 83.23 84.24 106.18 78.55 47.56 37.79 44.83 76.06 74.77 48.45 22.25
Total income taxes 139.60 157.80 130.30 63.60 38.10 31.10 36.15 27.80 36.70 32.70 37.80 47.70 34.00 19.70 15.60 10.10 31.00 32.50 22.60 9.80
Minority interest
Income before extraordinary items &
discontinued operations
248.17 274.54 226.63 123.51 79.23 64.72 75.07 57.84 70.88 50.53 46.44 58.48 44.55 27.86 22.19 34.73 45.06 42.27 25.85 12.45
Preferred dividends 0.00 0.00 0.00 0.00 0.00 0.00 0.00 0.00 0.00 0.00 0.00 0.00 0.00 0.00 0.00 0.00 0.00 0.00 0.00 0.00
Available for common 248.17 274.54 226.63 123.51 79.23 64.72 75.07 57.84 70.88 50.53 46.44 58.48 44.55 27.86 22.19 34.73 45.06 42.27 25.85 12.45
Savings due to common stock equivalents 0.00 0.00 0.00 0.00 0.00 0.00 0.00 0.00 0.00 0.00 0.00 0.00 0.00 0.00 0.00 0.00 0.00 0.00 0.00 0.00
Adjusted available for common 248.17 274.54 226.63 123.51 79.23 64.72 75.07 57.84 70.88 50.53 46.44 58.48 44.55 27.86 22.19 34.73 45.06 42.27 25.85 12.45
Extraordinary items 0.00 0.00 0.00 0.00 0.00 0.00 0.00 0.00 0.00 0.00 0.00 0.00 0.00 0.00 0.00 0.00 0.00 0.00 0.00 0.00
Discontinued operations 0.00 0.00 0.00 0.00 0.00 0.00 0.00 0.00 38.56 0.00 0.00 0.00 0.00 0.00 0.00 0.00 0.00 0.00 0.00 0.00
Adjusted net income 248.17 274.54 226.63 123.51 79.23 64.72 75.07 57.84 70.88 50.53 46.44 58.48 44.55 27.86 22.19 34.73 45.06 42.27 25.85 12.45
Earnings per share (primary) – excluding
extra items & disc op
2.83 3.14 2.60 1.42 0.92 0.75 0.88 0.68 0.83 0.60 0.54 0.69 0.53 0.33 0.27 0.42 0.55 0.52 0.33 0.16
Earnings per share (primary) – including
extra items & disc op
2.83 3.14 2.60 1.42 0.92 0.75 0.88 0.68 1.29 0.60 0.54 0.69 0.53 0.33 0.27 0.42 0.55 0.52 0.33 0.16
Earnings per share (fully diluted) excluding
extra items & disc op
2.83 3.13 2.59 1.41 0.91 0.75 0.87 0.68 0.83 0.60 0.54 0.68 0.53 0.33 0.27 0.42 0.54 0.52 0.32 0.16
Earnings per share (fully diluted) including
extra items & disc op
2.83 3.13 2.59 1.41 0.91 0.75 0.87 0.68 1.28 0.60 0.54 0.68 0.53 0.33 0.27 0.42 0.54 0.52 0.32 0.16
EP from operations 2.83 3.14 2.60 1.42 0.92 0.75 0.88 0.68 0.83
Dividends per share 0.32 0.28 0.18 0.16 0.14 0.13 0.12 0.11 0.10 0.09 0.08 0.07 0.06 0.05 0.04 0.04 0.04 0.03 0.02 0.01
Note: All US$mn.

Case 10 • Nucor Corporation and the US steel industry C-135
Exhibit 9 Annual income statement, 1977–96
Dec-96 Dec-95 Dec-94 Dec-93 Dec-92 Dec-91 Dec-90 Dec-89 Dec-88 Dec-87 Dec-86 Dec-85 Dec-84 Dec-83 Dec-82 Dec-81 Dec-80 Dec-79 Dec-78 Dec-77
Sales 3 647.03 3 462.05 2 975.60 2 253.74 1 619.24 1 465.46 1 481.63 1 269.01 1 061.36 851.02 755.23 758.50 660.26 542.53 486.02 544.82 482.42 428.68 306.94 212.95
Cost of goods sold 2 956.93 2 726.28 2 334.11 1 843.58 1 319.60 1 209.17 1 208.12 1 028.68 832.88 671.55 575.45 569.69 510.83 434.62 382.32 434.61 356.12 305.98 220.50 162.32
Gross profit 690.11 735.77 641.49 410.16 299.64 256.29 273.51 240.33 228.49 179.47 179.78 188.80 149.43 107.91 103.70 110.21 126.30 122.71 86.44 50.63
Selling general & administrative expense 120.39 130.68 113.39 87.58 76.80 66.99 70.46 66.99 62.08 55.41 65.90 59.08 45.94 33.99 31.72 33.53 38.16 36.72 28.66 19.73
Operating income before deprec. 569.72 605.09 528.10 322.57 222.84 189.30 203.05 173.34 166.40 124.06 113.88 129.72 103.49 73.93 71.98 76.69 88.14 85.98 57.78 30.90
Depreciation depletion & amortization 182.23 173.89 156.65 122.27 97.78 93.58 84.96 76.57 56.27 41.79 34.93 31.11 28.90 27.11 26.29 21.60 13.30 9.71 7.46 5.93
Operating profit 387.49 431.20 370.45 200.31 125.06 95.73 118.09 96.77 110.14 82.27 78.95 98.62 74.59 46.82 45.69 55.09 74.84 76.27 50.33 24.98
Interest expense 7.55 9.28 14.59 14.32 9.03 2.60 8.10 16.88 9.18 3.94 5.32 4.36 4.62 4.80 8.41 10.67 3.53 4.30 2.87 2.82
Non-operating income/expense 7.84 10.41 1.08 1.12 1.30 2.69 1.23 5.74 6.63 4.91 10.61 11.92 8.58 5.55 0.52 0.42 4.75 2.79 1.00 0.10
Special items 0.00 0.00 0.00 0.00 0.00 0.00 0.00 0.00 0.00 0.00 0.00 0.00 0.00 0.00 0.00 0.00 0.00 0.00 0.00 0.00
Pretax income 387.77 432.34 356.93 187.11 117.33 95.82 111.22 85.64 107.58 83.23 84.24 106.18 78.55 47.56 37.79 44.83 76.06 74.77 48.45 22.25
Total income taxes 139.60 157.80 130.30 63.60 38.10 31.10 36.15 27.80 36.70 32.70 37.80 47.70 34.00 19.70 15.60 10.10 31.00 32.50 22.60 9.80
Minority interest
Income before extraordinary items &
discontinued operations
248.17 274.54 226.63 123.51 79.23 64.72 75.07 57.84 70.88 50.53 46.44 58.48 44.55 27.86 22.19 34.73 45.06 42.27 25.85 12.45
Preferred dividends 0.00 0.00 0.00 0.00 0.00 0.00 0.00 0.00 0.00 0.00 0.00 0.00 0.00 0.00 0.00 0.00 0.00 0.00 0.00 0.00
Available for common 248.17 274.54 226.63 123.51 79.23 64.72 75.07 57.84 70.88 50.53 46.44 58.48 44.55 27.86 22.19 34.73 45.06 42.27 25.85 12.45
Savings due to common stock equivalents 0.00 0.00 0.00 0.00 0.00 0.00 0.00 0.00 0.00 0.00 0.00 0.00 0.00 0.00 0.00 0.00 0.00 0.00 0.00 0.00
Adjusted available for common 248.17 274.54 226.63 123.51 79.23 64.72 75.07 57.84 70.88 50.53 46.44 58.48 44.55 27.86 22.19 34.73 45.06 42.27 25.85 12.45
Extraordinary items 0.00 0.00 0.00 0.00 0.00 0.00 0.00 0.00 0.00 0.00 0.00 0.00 0.00 0.00 0.00 0.00 0.00 0.00 0.00 0.00
Discontinued operations 0.00 0.00 0.00 0.00 0.00 0.00 0.00 0.00 38.56 0.00 0.00 0.00 0.00 0.00 0.00 0.00 0.00 0.00 0.00 0.00
Adjusted net income 248.17 274.54 226.63 123.51 79.23 64.72 75.07 57.84 70.88 50.53 46.44 58.48 44.55 27.86 22.19 34.73 45.06 42.27 25.85 12.45
Earnings per share (primary) – excluding
extra items & disc op
2.83 3.14 2.60 1.42 0.92 0.75 0.88 0.68 0.83 0.60 0.54 0.69 0.53 0.33 0.27 0.42 0.55 0.52 0.33 0.16
Earnings per share (primary) – including
extra items & disc op
2.83 3.14 2.60 1.42 0.92 0.75 0.88 0.68 1.29 0.60 0.54 0.69 0.53 0.33 0.27 0.42 0.55 0.52 0.33 0.16
Earnings per share (fully diluted) excluding
extra items & disc op
2.83 3.13 2.59 1.41 0.91 0.75 0.87 0.68 0.83 0.60 0.54 0.68 0.53 0.33 0.27 0.42 0.54 0.52 0.32 0.16
Earnings per share (fully diluted) including
extra items & disc op
2.83 3.13 2.59 1.41 0.91 0.75 0.87 0.68 1.28 0.60 0.54 0.68 0.53 0.33 0.27 0.42 0.54 0.52 0.32 0.16
EP from operations 2.83 3.14 2.60 1.42 0.92 0.75 0.88 0.68 0.83
Dividends per share 0.32 0.28 0.18 0.16 0.14 0.13 0.12 0.11 0.10 0.09 0.08 0.07 0.06 0.05 0.04 0.04 0.04 0.03 0.02 0.01
Note: All US$mn.

C-136 Case 10 • Nucor Corporation and the US steel industry
Exhibit 10 Annual ratios, 1977–96
Dec-96 Dec-95 Dec-94 Dec-93 Dec-92 Dec-91 Dec-90 Dec-89 Dec-88 Dec-87 Dec-86 Dec-85 Dec-84 Dec-83 Dec-82 Dec-81 Dec-80 Dec-79 Dec-78 Dec-77
Liquidity
Current ratio 1.78 1.86 1.67 1.34 1.34 1.46 1.40 1.45 1.15 1.59 2.50 2.76 2.52 2.19 2.01 1.80 1.74 1.85 1.81 2.02
Quick ratio 0.85 1.08 0.94 0.65 0.58 0.64 0.79 0.72 0.57 1.04 1.60 2.11 1.79 1.55 1.26 0.79 0.98 1.21 1.06 1.01
Working capital per share 4.13 4.38 2.93 1.35 1.07 1.22 1.04 1.01 0.37 1.03 2.10 2.49 1.80 1.25 0.79 0.70 0.59 0.66 0.56 0.39
Cash flow per share 4.90 5.12 4.40 2.82 2.04 1.83 1.86 1.57 1.49 1.09 0.96 1.04 0.86 0.65 0.58 0.67 0.71 0.64 0.41 0.23
Activity
Inventory turnover 8.54 9.92 10.19 8.75 6.72 7.49 8.75 7.83 8.14 7.18 6.25 7.47 7.84 8.25 6.28 7.09 7.95 7.50 6.13 NC
Receivables turnover 12.67 12.79 12.93 13.48 13.40 12.41 12.68 12.42 11.96 12.04 11.43 11.01 10.56 11.24 11.17 11.81 11.52 11.89 11.10 NC
Total asset turnover 1.48 1.61 1.55 1.36 1.21 1.32 1.43 1.28 1.32 1.39 1.33 1.46 1.45 1.36 1.29 1.61 1.81 1.96 1.91 NC
Average collection period (days) 28.00 28.00 28.00 27.00 27.00 29.00 28.00 29.00 30.00 30.00 31.00 33.00 34.00 32.00 32.00 30.00 31.00 30.00 32.00 NC
Days to sell inventory 42.00 36.00 35.00 41.00 54.00 48.00 41.00 46.00 44.00 50.00 58.00 48.00 46.00 44.00 57.00 51.00 45.00 48.00 59.00 NC
Operating cycle (days) 71.00 64.00 63.00 68.00 80.00 77.00 70.00 75.00 74.00 80.00 89.00 81.00 80.00 76.00 90.00 81.00 77.00 78.00 91.00 NC
Performance
Sales/net property, plant & equip 2.04 2.36 2.18 1.66 1.44 1.73 2.05 1.68 1.51 2.03 2.79 3.37 2.89 2.35 2.03 2.16 2.79 3.44 3.47 3.23
Sales/stockholder equity 2.27 2.50 2.65 2.50 2.06 2.06 2.27 2.17 1.99 1.99 1.97 2.12 2.20 2.10 2.09 2.57 2.72 3.22 3.33 3.21
Profitability
Operating margin before depr (%) 15.62 17.48 17.75 14.31 13.76 12.92 13.70 13.66 15.68 14.58 15.08 17.10 15.67 13.63 14.81 14.08 18.27 20.06 18.83 14.51
Operating margin after depr (%) 10.62 12.46 12.45 8.89 7.72 6.53 7.97 7.63 10.38 9.67 10.45 13.00 11.30 8.63 9.40 10.11 15.51 17.79 16.40 11.73
Pretax profit margin (%) 10.63 12.49 12.00 8.30 7.25 6.54 7.51 6.75 10.14 9.78 11.15 14.00 11.90 8.77 7.78 8.23 15.77 17.44 15.78 10.45
Net profit margin (%) 6.80 7.93 7.62 5.48 4.89 4.42 5.07 4.56 6.68 5.94 6.15 7.71 6.75 5.14 4.57 6.37 9.34 9.86 8.42 5.85
Return on assets (%) 9.47 11.96 11.32 6.75 5.32 5.48 7.23 5.59 7.46 7.73 8.12 10.44 9.24 6.55 5.97 9.03 15.47 17.38 13.36 9.73
Return on equity (%) 15.42 19.86 20.19 13.69 10.10 9.09 11.50 9.90 13.32 11.81 12.10 16.36 14.87 10.79 9.55 16.35 25.37 31.72 28.06 18.78
Return on investment (%) 12.24 16.06 15.40 8.84 6.76 7.12 9.54 7.04 9.87 10.37 10.91 14.70 12.99 9.17 7.91 11.73 20.74 24.20 19.35 13.19
Return on average assets (%) 10.10 12.77 11.83 7.44 5.93 5.83 7.24 5.83 8.84 8.25 8.21 11.22 9.81 6.99 5.87 10.27 16.87 19.36 16.08 NC
Return on average equity (%) 16.59 21.92 22.39 14.65 10.59 9.49 12.13 10.36 14.76 12.45 12.53 17.80 15.97 11.36 9.98 17.81 28.99 37.50 32.63 NC
Return on average investment (%) 13.28 17.26 15.80 9.62 7.62 7.63 9.33 7.51 11.76 11.07 11.28 15.79 13.78 9.54 7.70 13.53 23.00 27.42 22.67 NC
Leverage
Interest coverage before tax 52.35 47.60 25.46 14.07 13.99 37.85 14.73 6.07 12.72 22.11 16.83 25.35 18.00 10.91 5.49 5.20 22.55 18.40 17.86 8.88
Interest coverage after tax 33.87 30.59 16.53 9.63 9.77 25.89 10.27 4.43 8.72 13.82 9.73 14.41 10.64 6.81 3.64 4.25 13.77 10.84 9.99 5.41
Long-term debt/common equity (%) 9.48 7.73 15.41 39.04 31.46 10.23 4.41 26.69 21.28 8.29 10.98 11.25 14.43 17.72 20.76 39.44 22.30 31.07 45.02 42.44
Long-term debt/shrhldr equity (%) 9.48 7.73 15.41 39.04 31.46 10.23 4.41 26.69 21.28 8.29 10.98 11.25 14.43 17.72 20.76 39.44 22.30 31.07 45.02 42.44
Total debt/invested capital (%) 7.56 6.26 11.77 25.22 21.08 8.23 3.94 19.26 16.08 7.73 10.61 10.72 13.31 15.84 17.77 28.84 19.01 24.42 31.39 30.26
Total debt/total assets (%) 5.85 4.66 8.65 19.27 16.57 6.33 2.98 15.31 12.16 5.76 7.91 7.61 9.46 11.31 13.41 22.20 14.18 17.54 21.68 22.32
Total assets/common equity 1.63 1.66 1.78 2.03 1.90 1.66 1.59 1.77 1.78 1.53 1.49 1.57 1.61 1.65 1.60 1.81 1.64 1.82 2.10 1.93
Dividends
Dividend payout (%) 11.31 8.92 6.92 11.26 15.31 17.34 13.72 16.25 11.98 15.04 14.38 9.74 11.41 15.13 16.34 9.58 6.66 5.46 5.46 8.38
Dividend yield (%) 0.63 0.49 0.33 0.30 0.36 0.58 0.77 0.73 0.84 0.91 1.03 0.74 1.12 0.70 0.83 0.80 0.63 0.86 1.03 1.30
Note: All ratios.
NC – not calculable.

Case 10 • Nucor Corporation and the US steel industry C-137
Exhibit 10 Annual ratios, 1977–96
Dec-96 Dec-95 Dec-94 Dec-93 Dec-92 Dec-91 Dec-90 Dec-89 Dec-88 Dec-87 Dec-86 Dec-85 Dec-84 Dec-83 Dec-82 Dec-81 Dec-80 Dec-79 Dec-78 Dec-77
Liquidity
Current ratio 1.78 1.86 1.67 1.34 1.34 1.46 1.40 1.45 1.15 1.59 2.50 2.76 2.52 2.19 2.01 1.80 1.74 1.85 1.81 2.02
Quick ratio 0.85 1.08 0.94 0.65 0.58 0.64 0.79 0.72 0.57 1.04 1.60 2.11 1.79 1.55 1.26 0.79 0.98 1.21 1.06 1.01
Working capital per share 4.13 4.38 2.93 1.35 1.07 1.22 1.04 1.01 0.37 1.03 2.10 2.49 1.80 1.25 0.79 0.70 0.59 0.66 0.56 0.39
Cash flow per share 4.90 5.12 4.40 2.82 2.04 1.83 1.86 1.57 1.49 1.09 0.96 1.04 0.86 0.65 0.58 0.67 0.71 0.64 0.41 0.23
Activity
Inventory turnover 8.54 9.92 10.19 8.75 6.72 7.49 8.75 7.83 8.14 7.18 6.25 7.47 7.84 8.25 6.28 7.09 7.95 7.50 6.13 NC
Receivables turnover 12.67 12.79 12.93 13.48 13.40 12.41 12.68 12.42 11.96 12.04 11.43 11.01 10.56 11.24 11.17 11.81 11.52 11.89 11.10 NC
Total asset turnover 1.48 1.61 1.55 1.36 1.21 1.32 1.43 1.28 1.32 1.39 1.33 1.46 1.45 1.36 1.29 1.61 1.81 1.96 1.91 NC
Average collection period (days) 28.00 28.00 28.00 27.00 27.00 29.00 28.00 29.00 30.00 30.00 31.00 33.00 34.00 32.00 32.00 30.00 31.00 30.00 32.00 NC
Days to sell inventory 42.00 36.00 35.00 41.00 54.00 48.00 41.00 46.00 44.00 50.00 58.00 48.00 46.00 44.00 57.00 51.00 45.00 48.00 59.00 NC
Operating cycle (days) 71.00 64.00 63.00 68.00 80.00 77.00 70.00 75.00 74.00 80.00 89.00 81.00 80.00 76.00 90.00 81.00 77.00 78.00 91.00 NC
Performance
Sales/net property, plant & equip 2.04 2.36 2.18 1.66 1.44 1.73 2.05 1.68 1.51 2.03 2.79 3.37 2.89 2.35 2.03 2.16 2.79 3.44 3.47 3.23
Sales/stockholder equity 2.27 2.50 2.65 2.50 2.06 2.06 2.27 2.17 1.99 1.99 1.97 2.12 2.20 2.10 2.09 2.57 2.72 3.22 3.33 3.21
Profitability
Operating margin before depr (%) 15.62 17.48 17.75 14.31 13.76 12.92 13.70 13.66 15.68 14.58 15.08 17.10 15.67 13.63 14.81 14.08 18.27 20.06 18.83 14.51
Operating margin after depr (%) 10.62 12.46 12.45 8.89 7.72 6.53 7.97 7.63 10.38 9.67 10.45 13.00 11.30 8.63 9.40 10.11 15.51 17.79 16.40 11.73
Pretax profit margin (%) 10.63 12.49 12.00 8.30 7.25 6.54 7.51 6.75 10.14 9.78 11.15 14.00 11.90 8.77 7.78 8.23 15.77 17.44 15.78 10.45
Net profit margin (%) 6.80 7.93 7.62 5.48 4.89 4.42 5.07 4.56 6.68 5.94 6.15 7.71 6.75 5.14 4.57 6.37 9.34 9.86 8.42 5.85
Return on assets (%) 9.47 11.96 11.32 6.75 5.32 5.48 7.23 5.59 7.46 7.73 8.12 10.44 9.24 6.55 5.97 9.03 15.47 17.38 13.36 9.73
Return on equity (%) 15.42 19.86 20.19 13.69 10.10 9.09 11.50 9.90 13.32 11.81 12.10 16.36 14.87 10.79 9.55 16.35 25.37 31.72 28.06 18.78
Return on investment (%) 12.24 16.06 15.40 8.84 6.76 7.12 9.54 7.04 9.87 10.37 10.91 14.70 12.99 9.17 7.91 11.73 20.74 24.20 19.35 13.19
Return on average assets (%) 10.10 12.77 11.83 7.44 5.93 5.83 7.24 5.83 8.84 8.25 8.21 11.22 9.81 6.99 5.87 10.27 16.87 19.36 16.08 NC
Return on average equity (%) 16.59 21.92 22.39 14.65 10.59 9.49 12.13 10.36 14.76 12.45 12.53 17.80 15.97 11.36 9.98 17.81 28.99 37.50 32.63 NC
Return on average investment (%) 13.28 17.26 15.80 9.62 7.62 7.63 9.33 7.51 11.76 11.07 11.28 15.79 13.78 9.54 7.70 13.53 23.00 27.42 22.67 NC
Leverage
Interest coverage before tax 52.35 47.60 25.46 14.07 13.99 37.85 14.73 6.07 12.72 22.11 16.83 25.35 18.00 10.91 5.49 5.20 22.55 18.40 17.86 8.88
Interest coverage after tax 33.87 30.59 16.53 9.63 9.77 25.89 10.27 4.43 8.72 13.82 9.73 14.41 10.64 6.81 3.64 4.25 13.77 10.84 9.99 5.41
Long-term debt/common equity (%) 9.48 7.73 15.41 39.04 31.46 10.23 4.41 26.69 21.28 8.29 10.98 11.25 14.43 17.72 20.76 39.44 22.30 31.07 45.02 42.44
Long-term debt/shrhldr equity (%) 9.48 7.73 15.41 39.04 31.46 10.23 4.41 26.69 21.28 8.29 10.98 11.25 14.43 17.72 20.76 39.44 22.30 31.07 45.02 42.44
Total debt/invested capital (%) 7.56 6.26 11.77 25.22 21.08 8.23 3.94 19.26 16.08 7.73 10.61 10.72 13.31 15.84 17.77 28.84 19.01 24.42 31.39 30.26
Total debt/total assets (%) 5.85 4.66 8.65 19.27 16.57 6.33 2.98 15.31 12.16 5.76 7.91 7.61 9.46 11.31 13.41 22.20 14.18 17.54 21.68 22.32
Total assets/common equity 1.63 1.66 1.78 2.03 1.90 1.66 1.59 1.77 1.78 1.53 1.49 1.57 1.61 1.65 1.60 1.81 1.64 1.82 2.10 1.93
Dividends
Dividend payout (%) 11.31 8.92 6.92 11.26 15.31 17.34 13.72 16.25 11.98 15.04 14.38 9.74 11.41 15.13 16.34 9.58 6.66 5.46 5.46 8.38
Dividend yield (%) 0.63 0.49 0.33 0.30 0.36 0.58 0.77 0.73 0.84 0.91 1.03 0.74 1.12 0.70 0.83 0.80 0.63 0.86 1.03 1.30
Note: All ratios.
NC – not calculable.

C-138 Case 10 • Nucor Corporation and the US steel industry
Exhibit 11 Comparative income statements – SIC 3312
Nucor
Corp.
Dec-96
Bethlhm
Stl
Dec-96
Birm.
Steel
Jun-96
Carpntr
Tch
Jun-96
Chaparr
Stl
May-96
Inland
Stl
Dec-96
Steel
Dynam
Dec-96
USX-US
Stl
Dec-96
Sales 3 647.0 4 679.0 832.5 865.3 607.7 2 397.3 252.6 6 547.0
Cost of goods sold 2 956.9 4 168.2 730.4 601.6 480.6 2 156.1 201.2 6 005.0
Gross profit 690.1 510.8 102.0 263.8 127.1 241.2 51.5 542.0
Selling general & administrative
expense 120.4 105.5 37.7 112.9 26.1 54.7 13.8 –169.0
Operating income before deprec. 569.7 405.3 64.3 150.9 101.0 186.5 37.6 711.0
Depreciation depletion &
amortization 182.2 268.7 34.7 35.2 29.5 124.6 19.4 292.0
Operating profit 387.5 136.6 29.6 115.6 71.5 61.9 18.2 419.0
Interest expense 7.6 60.3 18.5 19.3 10.0 50.7 23.7 97.0
Non-operating income/
expense 7.8 12.9 10.4 –3.8 4.3 2.5 2.9 51.0
Special items 0.0 –465.0 –23.9 2.7 0.0 –26.3 0.0 –6.0
Pretax income 387.8 –375.8 –2.4 95.2 65.8 –12.6 –2.6 367.0
Total income taxes 139.6 –67.0 –0.2 35.0 23.8 –3.5 0.0 92.0
Minority interest CF CF 0.0 0.0 CF 0.0 0.0 CF
Income before extraordinary
items & discontinued operations 248.2 –308.8 –2.2 60.1 42.0 –9.1 –2.6 275.0
Preferred dividends 0.0 41.9 0.0 1.6 0.0 25.8 0.0 22.0
Available for common 248.2 –350.7 –2.2 58.6 42.0 –34.9 –2.6 253.0
Savings due to common stock
equivalents 0.0 0.0 0.0 0.0 0.2 0.0 0.0 0.0
Adjusted available for common 248.2 –350.7 –2.2 58.6 42.2 –34.9 –2.6 253.0
Extraordinary items 0.0 0.0 0.0 0.0 0.0 –8.8 –7.3 –2.0
Discontinued operations 0.0 0.0 0.0 0.0 0.0 0.0 0.0 0.0
Adjusted net income 248.2 –350.7 –2.2 58.6 42.2 –43.7 –9.8 251.0
Note: All US$mn. Source: Compustat.

Case 10 • Nucor Corporation and the US steel industry C-139
Exhibit 12 Comparative balance sheets – SIC 3312
Nucor
Corp.
Dec-96
Bethlhm
Stl
Dec-96
Birm.
Steel
Jun-96
Carpntr
Tch
Jun-96
Chaparr
Stl
May-96
Inland
Stl
Dec-96
Steel
Dynam
Dec-96
USX-US
Stl
Dec-96
Assets
Cash & equivalents 104.4 136.6 6.7 13.2 20.0 0.0 57.5 23.0
Net receivables 292.6 311.6 111.6 137.1 49.5 225.6 32.5 580.0
Inventories 385.8 1 017.3 196.8 160.5 121.8 182.0 65.9 648.0
Prepaid expenses 0.0 0.0 1.4 0.0 7.8 0.0 0.0 0.0
Other current assets 45.5 22.9 11.6 13.8 0.0 18.6 1.6 177.0
Total current assets 828.4 1 488.4 328.0 324.5 199.1 426.2 157.4 1 428.0
Gross plant property & equip. 2 698.8 6 344.0 678.2 809.7 493.5 4 011.4 356.1 8 347.0
Accumulated depreciation 907.6 3 924.2 134.2 390.2 279.4 2 642.7 16.8 5 796.0
Net plant property & equipment 1 791.2 2 419.8 544.0 419.5 214.1 1 368.7 339.3 2 551.0
Investments at equity 0.0 50.0 0.0 9.8 0.0 221.4 0.0 412.0
Other investments 0.0 NA 0.0 0.0 0.0 0.0 0.0 209.0
Intangibles 0.0 160.0 46.1 18.8 59.2 0.0 0.0 39.0
Deferred charges 0.0 0.0 CF 91.5 2.0 CF 12.4 1 734.0
Other assets 0.0 991.7 9.9 48.0 1.0 326.5 13.2 207.0
TOTAL ASSETS 2 619.5 5 109.0 928.0 912.0 475.3 2 342.8 522.3 6 580.0
Liabilities
Long-term debt due in one year 0.8 49.3 0.0 7.0 12.4 7.7 11.2 73.0
Notes payable 0.0 0.0 0.0 19.0 0.0 272.5 0.0 18.0
Accounts payable 224.4 410.4 83.2 75.8 34.1 217.7 41.2 667.0
Taxes payable 10.3 67.9 0.4 13.7 0.0 69.2 0.0 154.0
Accrued expenses CF 313.3 32.8 56.5 15.9 73.3 9.2 387.0
Other current liabilities 230.2 116.5 0.0 0.0 0.0 3.9 0.0 0.0
Total current liabilities 465.7 957.4 116.4 172.0 62.4 644.3 61.6 1 299.0
Long-term debt 152.6 497.4 307.5 188.0 66.7 307.9 196.2 1 014.0
Deferred taxes 50.0 0.0 50.3 84.5 CF 0.0 0.0 0.0
Investment tax credit 0.0 0.0 0.0 0.0 0.0 0.0 0.0 0.0
Minority interest 265.7 CF 0.0 0.0 CF 0.0
Other liabilities 76.3 2 689.1 5.6 158.4 51.3 1 179.8 0.0 2 637.0
Equity
Preferred stock – redeemable 0.0 0.0 0.0 0.0 0.0 0.0 0.0 0.0
Preferred stock – non-redeemable 0.0 14.1 0.0 5.8 0.0 0.0 0.0 7.0
Total preferred stock 0.0 14.1 0.0 5.8 0.0 0.0 0.0 7.0
Common stock 36.0 113.9 0.3 97.7 3.0 0.0 0.5 85.0
Capital surplus 55.0 1 886.3 331.4 13.5 178.5 1 194.5 303.8 NA
Retained earnings 1 535.9 (988.6) 137.6 256.6 126.9 (983.7) (39.8) NA
Less: treasury stock 17.7 59.7 21.1 64.5 13.4 0.0 0.0 0.0
Common equity 1 609.3 951.9 448.2 303.3 295.0 210.8 264.6 1 559.0
TOTAL EQUITY 1 609.3 66.0 448.2 309.1 295.0 210.8 264.6 1 566.0
TOTAL LIABILITIES & EQUITY 2 619.5 5 109.9 928.0 912.0 475.3 2 342.8 522.3 6 580.0
Note: All US$mn.

C-140 Case 10 • Nucor Corporation and the US steel industry
Exhibit 13 Comparative ratios – SIC 3312
Bethlhm
Stl
Dec-96
Birm.
Steel
Jun-96
Carpntr
Tch
Jun-96
Chaparr
Stl
May-96
Inland
Stl
Dec-96
Ipsco
Inc.
Dec-96
Nucor
Corp.
Dec-96
Steel
Dynam
Dec-96
USX-US
Stl
Dec-96
Weirton
Dec-96
Liquidity
Current ratio 1.55 2.82 1.89 3.19 0.66 2.98 1.78 2.56 1.10 2.14
Quick ratio 0.47 1.02 0.87 1.12 0.35 1.92 0.85 1.46 0.46 0.98
Working capital per share 4.75 7.40 9.18 4.76 –218 099.97 9.48 4.13 2.01 1.52 7.31
Cash flow per share –0.36 1.14 5.74 2.49 115 499.99 2.76 4.90 0.35 6.68 0.32
Activity
Inventory turnover 4.22 3.95 4.78 4.31 11.33 4.17 8.54 5.06 9.62 4.99
Receivables turnover 13.64 7.48 6.76 12.01 10.27 8.18 12.67 15.51 10.97 9.08
Total asset turnover 0.87 0.99 0.99 1.29 1.02 0.62 1.48 0.60 1.00 1.06
Average collection per (days) 26.00 48.00 53.00 30.00 35.00 44.00 28.00 23.00 33.00 40.00
Days to sell inventory 85.00 91.00 75.00 84.00 32.00 86.00 42.00 71.00 37.00 72.00
Operating cycle (days) 112.00 139.00 129.00 114.00 67.00 130.00 71.00 94.00 70.00 112.00
Performance
Sales/net PP&E 1.93 1.53 2.06 2.84 1.75 1.07 2.04 0.74 2.57 2.27
Sales/stockholder equity 4.84 1.86 2.80 2.06 11.37 1.02 2.27 0.95 4.18 8.25
Profitability
Oper. margin before depr (%) 8.66 7.73 17.44 16.61 7.78 15.78 15.62 14.89 10.86 4.24
Oper. margin after depr. (%) 2.92 3.56 13.36 11.76 2.58 13.39 10.62 7.21 6.40 0.05
Pretax profit margin (%) –8.03 –0.28 11.00 10.82 –0.53 15.13 10.63 –1.01 5.61 –4.00
Net profit margin (%) –6.60 –0.26 6.95 6.91 –0.38 10.35 6.80 –1.01 4.20 –3.22
Return on assets (%) –6.86 –0.23 6.42 8.83 –1.49 5.93 9.47 –0.49 3.84 –3.42
Return on equity (%) –36.84 –0.49 19.31 14.23 –16.56 10.53 15.42 –0.97 16.23 –29.83
Return on investment (%) –23.96 –0.29 11.78 11.61 –6.73 7.08 12.24 –0.56 9.57 –7.43
Return on average assets (%) –6.49 –0.26 6.72 8.88 –1.49 6.37 10.10 –0.61 3.86 –3.40
Return on average equity (%) –32.23 –0.48 20.78 14.86 –15.31 11.01 16.59 –1.56 17.47 –25.59
Return on average invest. (%) –21.59 –0.32 12.26 11.78 –5.95 7.62 13.28 –0.69 10.17 –7.29
Leverage
Interest coverage before tax –5.23 0.87 5.92 7.57 0.75 6.27 52.35 0.89 4.78 –0.22
Interest coverage after tax –4.12 0.88 4.11 5.19 0.82 4.60 33.87 0.89 3.84 0.02
Long-term debt/common eq. (%) 52.25 68.61 61.99 22.61 146.06 48.73 9.48 74.15 65.04 288.89
Long-term debt/shrhldr eq. (%) 51.49 68.61 60.83 22.61 146.06 48.73 9.48 74.15 64.75 256.97
Total debt/invested cap. (%) 37.36 40.69 43.05 21.86 113.38 32.89 7.56 45.00 41.79 71.99
Total debt/total assets (%) 10.70 33.14 23.47 16.63 25.10 27.57 5.85 39.70 16.79 33.12
Total assets/common equity 5.37 2.07 3.01 1.61 11.11 1.77 1.63 1.97 4.22 8.72
Dividends
Dividend payout (%) 0.00 –524.80 37.10 13.88 0.00 15.62 11.31 0.00 33.60 0.00
Dividend yield (%) 0.00 2.42 4.13 1.37 NA 1.26 0.63 0.00 3.19 0.00
Note: All ratios. Source: Compustat.

Case 10 • Nucor Corporation and the US steel industry C-141
Exhibit 13 Comparative ratios – SIC 3312
Bethlhm
Stl
Dec-96
Birm.
Steel
Jun-96
Carpntr
Tch
Jun-96
Chaparr
Stl
May-96
Inland
Stl
Dec-96
Ipsco
Inc.
Dec-96
Nucor
Corp.
Dec-96
Steel
Dynam
Dec-96
USX-US
Stl
Dec-96
Weirton
Dec-96
Liquidity
Current ratio 1.55 2.82 1.89 3.19 0.66 2.98 1.78 2.56 1.10 2.14
Quick ratio 0.47 1.02 0.87 1.12 0.35 1.92 0.85 1.46 0.46 0.98
Working capital per share 4.75 7.40 9.18 4.76 –218 099.97 9.48 4.13 2.01 1.52 7.31
Cash flow per share –0.36 1.14 5.74 2.49 115 499.99 2.76 4.90 0.35 6.68 0.32
Activity
Inventory turnover 4.22 3.95 4.78 4.31 11.33 4.17 8.54 5.06 9.62 4.99
Receivables turnover 13.64 7.48 6.76 12.01 10.27 8.18 12.67 15.51 10.97 9.08
Total asset turnover 0.87 0.99 0.99 1.29 1.02 0.62 1.48 0.60 1.00 1.06
Average collection per (days) 26.00 48.00 53.00 30.00 35.00 44.00 28.00 23.00 33.00 40.00
Days to sell inventory 85.00 91.00 75.00 84.00 32.00 86.00 42.00 71.00 37.00 72.00
Operating cycle (days) 112.00 139.00 129.00 114.00 67.00 130.00 71.00 94.00 70.00 112.00
Performance
Sales/net PP&E 1.93 1.53 2.06 2.84 1.75 1.07 2.04 0.74 2.57 2.27
Sales/stockholder equity 4.84 1.86 2.80 2.06 11.37 1.02 2.27 0.95 4.18 8.25
Profitability
Oper. margin before depr (%) 8.66 7.73 17.44 16.61 7.78 15.78 15.62 14.89 10.86 4.24
Oper. margin after depr. (%) 2.92 3.56 13.36 11.76 2.58 13.39 10.62 7.21 6.40 0.05
Pretax profit margin (%) –8.03 –0.28 11.00 10.82 –0.53 15.13 10.63 –1.01 5.61 –4.00
Net profit margin (%) –6.60 –0.26 6.95 6.91 –0.38 10.35 6.80 –1.01 4.20 –3.22
Return on assets (%) –6.86 –0.23 6.42 8.83 –1.49 5.93 9.47 –0.49 3.84 –3.42
Return on equity (%) –36.84 –0.49 19.31 14.23 –16.56 10.53 15.42 –0.97 16.23 –29.83
Return on investment (%) –23.96 –0.29 11.78 11.61 –6.73 7.08 12.24 –0.56 9.57 –7.43
Return on average assets (%) –6.49 –0.26 6.72 8.88 –1.49 6.37 10.10 –0.61 3.86 –3.40
Return on average equity (%) –32.23 –0.48 20.78 14.86 –15.31 11.01 16.59 –1.56 17.47 –25.59
Return on average invest. (%) –21.59 –0.32 12.26 11.78 –5.95 7.62 13.28 –0.69 10.17 –7.29
Leverage
Interest coverage before tax –5.23 0.87 5.92 7.57 0.75 6.27 52.35 0.89 4.78 –0.22
Interest coverage after tax –4.12 0.88 4.11 5.19 0.82 4.60 33.87 0.89 3.84 0.02
Long-term debt/common eq. (%) 52.25 68.61 61.99 22.61 146.06 48.73 9.48 74.15 65.04 288.89
Long-term debt/shrhldr eq. (%) 51.49 68.61 60.83 22.61 146.06 48.73 9.48 74.15 64.75 256.97
Total debt/invested cap. (%) 37.36 40.69 43.05 21.86 113.38 32.89 7.56 45.00 41.79 71.99
Total debt/total assets (%) 10.70 33.14 23.47 16.63 25.10 27.57 5.85 39.70 16.79 33.12
Total assets/common equity 5.37 2.07 3.01 1.61 11.11 1.77 1.63 1.97 4.22 8.72
Dividends
Dividend payout (%) 0.00 –524.80 37.10 13.88 0.00 15.62 11.31 0.00 33.60 0.00
Dividend yield (%) 0.00 2.42 4.13 1.37 NA 1.26 0.63 0.00 3.19 0.00
Note: All ratios. Source: Compustat.
Exhibit 14 Steel companies (SIC 3312) sorted by sales
Company name SIC 1996 Sales 1996 Assets
Broken Hill Proprietary – ADR 3312 $15 260.90 $28 113.50
British Steel PLC – ADR 3312 $11 882.00 $12 939.60
Pohang Iron & Steel Co – ADR 3312 $11 140.60 $18 967.60
USX-US Steel Group 3312 $6 547.00 $6 580.00
Bethlehem Steel Corp 3312 $4 679.00 $5 109.90
LTV Corp 3312 $4 134.50 $5 410.50
Allegheny
T
eledyne Inc 3312 $3 815.60 $2 606.40
Nucor Corp 3312 $3 647.03 $2 619.53
National Steel Corp – CL B 3312 $2 954.03 $2 547.06
Inland Steel Co 3312 $2 397.30 $2 342.80
AK Steel Holding Corp 3312 $2 301.80 $2 650.80
Armco Inc 3312 $1 724.00 $1 867.80
Weirton Steel Corp 3312 $1 383.30 $1 300.62
Rouge Steel Co – CL A 3312 $1 307.40 $681.95
WHX Corp 3312 $1 232.70 $1 718.78
T
exas Industries Inc 3312 $985.67 $847.92
Lukens Inc 3312 $970.32 $888.75
Grupo IMSA SA DE CV – ADS 3312 $953.00 $1 404.00
Algoma Steel Inc 3312 $896.47 $983.47
Quanex Corp 3312 $895.71 $718.21
Carpenter
T
echnology 3312 $865.32 $911.97
Birmingham Steel Corp 3312 $832.49 $927.99
Oregon Steel Mills Inc 3312 $772.82 $913.36
Republic Engnrd Steels Inc 3312 $746.17 $640.58
Geneva Stl Co – CL A 3312 $712.66 $657.39
Highvld Stl & Vanadium – ADR 3312 $695.36 $957.28
Northwestern Stl &
Wire 3312 $661.07 $442.52
Tubos de Acero de Mex – ADR 3312 $645.16 $1 027.85
Titan International Inc 3312 $634.55 $558.59
Florida Steel Corp 3312 $628.40 $554.90
J & L Specialty Steel 3312 $628.02 $771.93
Chaparral Steel Company 3312 $607.66 $475.34
Ipsco Inc 3312 $587.66 $1 025.00
T
alley Industries Inc 3312 $502.70 $280.39
NS Group Inc 3312 $409.38 $300.03
Laclede Steel Co 3312 $335.38 $331.11
Keystone Cons Industries Inc 3312 $331.18 $302.37
Huntco Inc – CL A 3312 $264.09 $222.44
Steel Dynamics Inc 3312 $252.62 $522.29
Roanoke Electric Steel Corp 3312 $246.29 $167.02
Grupo Simec-Spon ADR 3312 $214.64 $509.72
Bayou Steel Corp – CL A 3312 $204.43 $199.27
New Jersey Steel Corp 3312 $145.21 $151.37
China Pacific Inc 3312 $123.50 $114.33
Kentucky Electric Steel Inc 3312 $98.32 $78.43
Steel of West
Virginia 3312 $95.33 $79.30
UNVL Stainless & Alloy Prods 3312 $60.26 $42.10
Consolidated Stainless Inc 3312 $50.82 $51.25
Stelax Industries Ltd 3312 $0.73 $16.76

C-142 Case 10 • Nucor Corporation and the US steel industry
Nucor’s strategic intent is clearly known by
employees, customers and its competitors. Each year,
the business review of the annual report gives this
succinct description of its scope of operations: ‘Nucor
Corporation’s business is the manufacture of steel
products.’ The annual letter to shareholders gives this
picture of the company:
Your management believes that Nucor is among
the nation’s lowest cost steel producers. Nucor
has operated profitably for every quarter since
1966. Nucor’s steel products are competitive with
those of foreign imports. Nucor has a strong sense
of loyalty and responsibility to its employees.
Nucor has not closed a single facility, and has
maintained stability in its work force for many
years ... Productivity is high and labor relations
are good.3
As with the mission, goals at Nucor are equally
streamlined. Iverson has noted that in some compa-
nies planning systems are as much ritual as reality,
resulting in plans and budgets that are inappropri-
ate and unrealistic.4 Nucor has both long- and short-
range goals. However, they are handled differently
than at many firms. Short-term plans focus on bud-
get and production for the current and next fiscal
year. The plans are zero-based – created from actu-
al needs and estimates for specific projects – not an
updated copy of a prior year’s budget. Long-range
plans are a combination of the plans of different divi-
sions and plant – a bottom-up approach to planning.
The long-range plans are seen as guides – not gos-
pel. The plans incorporate relative goals instead of
specific milestones that the firm expects managers to
achieve. Division and plant managers set their target
goals knowing that they will be rewarded for meet-
ing them, but not punished if for unexpected reasons
they are not met.
Similarly, even plans for specific projects are min-
imalist. For example, the company handles new mill
construction largely internally. Many aspects of the
plant design are done ‘on the fly’ to save time. The
company does not create finely detailed construction
plans for new plants. Instead, it uses this experience
as a guide for starting construction. It then fills in
the details as construction proceeds.5 This approach
allows Nucor to construct plants both faster and at
less cost than their competitors. The Hickman, Arkan-
sas mill was completed six months ahead of schedule,
going from groundbreaking to first commercial ship-
ment in a mere 16 months.
By 1995, Nucor had become the fourth-largest
domestic steel producer. CEO John Correnti targets
annual growth at between 15 and 18 per cent – sub-
stantially above the 1–2 per cent rate of growth for
the industry. Given Nucor’s size and the industry’s
maturity, growth for Nucor requires taking mar-
ket share away from the integrated producers. Most
experts agree that Nucor is well positioned to achieve
such growth and sustain profitability, given its indus-
try-leading cost structure. Steel industry analysts
attribute Nucor’s ability to grow in a constricting
market to the firm’s aggressive style of management,
its innovative and revolutionary technologies, and a
Exhibit 15 Nucor annual sales, 1986–97
0
1986
1988
1990
1992
1994
1996
1997
1 000
2 000
3 000
4 000
5 000
Millions of dollars

Case 10 • Nucor Corporation and the US steel industry C-143
solid understanding of the dynamics and cost-drivers
of the steel industry.
Nucor can trace its low-cost position to a com-
bination of three factors: technological innovation,
continuous process refinement and a strong corporate
culture. Investments in any of the three alone is insuf-
ficient; the three elements must work together for the
firm to be productive and successful.
Technological innovation at Nucor
Historically, the main distinction between minimills
and integrated producers has been the range of prod-
ucts offered. While minimill technology is less capital-
intensive, the production process is also limited to
commodity steel products: bars, angles and structural
steel beams. Integrated producers largely retreated
from these commodity products and concentrated on
sheet steel, which was presumably safe from encroach-
ment by the minis. Strategically, though, Nucor more
closely resembles the integrated producers versus other
minimills in terms of product offerings. Innovative use
of technology is key to this strategy.
A prime example of Nucor’s innovation was its
foray into sheet steel. By the mid-1980s, Iverson had
anticipated the coming shake-out among minimills;
the lure of easy pickings from dinosaurs like Beth-
lehem Steel had drawn many firms into the minimill
business, resulting in over-supply. Integrated mills pro-
duce steel sheet by starting with 10-inch-thick slabs of
steel and repeatedly processing the slab through roll-
ers to reduce thickness and increase width. Multiple
rolling machines result in a production line hundreds
of metres long. Conventional wisdom said that it was
impossible to produce the 10-inch-thick steel slabs
needed to roll sheet steel in a minimill; their small
electric arc furnaces simply did not have the same
capability as the blast furnace used by an integrat-
ed mill. Nucor carefully researched emerging tech-
nology. Rather than develop a proprietary system,
they licensed and modified a new German caster and
began a US$270 million experiment. This new plant
– in Crawfordsville, Indiana – started up in 1987. The
process was very different from making sheet steel in
an integrated plant. Nucor’s system involves the high-
ly controlled continuous pouring of molten steel into
a narrow mould and on to a conveyor belt to form a
continuous two-inch-thick ribbon of semi-solid steel
– pouring steel much in the same manner as frost-
ing an endless cake using a pastry tube. The process
requires sophisticated computer technology and mon-
itoring to ensure constant quality and to avert costly
and dangerous spills. This precisely sized ribbon of
steel is then rolled to the specific thickness using a
few smaller-sized rolling machines. This results in a
much smaller and less expensive plant than a tradi-
tional mill for the production of sheet steel.
The technical challenges of producing steel using
this method are the basic requirements of entry
into the minimill market. Profitability, however, is
achieved through efficiency. Labour costs constitute a
large portion of the cost of steel. Integrated producers
can take up to four to five man-hours per ton to pro-
duce sheet steel, with three hours/ton on a productiv-
ity benchmark. In comparison, Nucor’s Crawfords-
ville plant took only 45 man-minutes per ton. Such
efficiency gave Nucor a US$50–75 cost advantage per
ton, a savings of nearly 25 per cent compared to their
competitors. By 1996, Nucor had production time
down to 36 minutes per ton with additional savings
expected. A second sheet plant was added in 1992,
and capacity was expanded at both plants in 1994.
Production capacity was 1 million tons in 1989, and
3.8 million tons in 1995.
Not content with the sheet steel market, Nucor
chose to enter a new strategic segment in 1995: spe-
ciality steel. The Crawfordsville plant was modified to
produce thin slab stainless steel – another ‘impossible’
feat for a minimill. Through experimentation, it was
able to produce two-inch-thick stainless steel slabs.
It shipped 16 000 tons in 1995, 50 000 tons in 1996,
and expects to hit a production capacity of 200 000
tons annually. Coincidentally, perhaps, its projected
capacity mirrors the volume of stainless sheet import-
ed to the United States – about 10 per cent of stainless
steel demand in the United States.
Another example of technological innovation was
Nucor’s entry into the fastener steel segment. Fasten-
ers include hardware such as hex and structural bolts
and socket cap screws, which are used extensively
in an array of applications, including construction,
machine tools, farm implements and military applica-
tions. Dozens of American fastener plants shuttered
their doors in the 1980s, and foreign firms captured
virtually all of this business segment. After a year of

C-144 Case 10 • Nucor Corporation and the US steel industry
studying the fastener market and available technolo-
gy, Nucor built a new fastener plant in Saint Joe, Indi-
ana. Productivity was substantially higher than that
at comparable US plants, and a second fastener plant
came on-line in 1995. The fastener plants receive most
of their steel from the Nucor Steel division. With a
production capacity of 115 000 tons – up substantial-
ly from 50 000 tons in 1991 – Nucor has the capacity
to supply nearly 20 per cent of this market.
A final example of technological innovation con-
cerns upstream diversification. Scrap steel is a critical
input for minimills. Quality differences in scrap types
coupled with insufficient supply have led to large
fluctuations in scrap costs. Frank Stephens, a min-
ing engineer, had developed a technology to improve
the efficiency of steel making through the use of iron
carbide. Stephens had tried – unsuccessfully – to sell
this process to US Steel, National Steel and Armco,
among others.6 In comparison, to Nucor, iron carbide
appeared to be an opportunity to reduce its reliance
on the increasingly volatile scrap steel market. After
speaking with the inventor of the process and touring
an iron carbide pilot plant in Australia, Nucor made
preliminary plans to construct an iron carbide pilot
plant.7 The location selected – Trinidad – would pro-
vide the large quantities of low-cost natural gas need-
ed for iron carbide production. Nucor estimated that
establishing the pilot plant would require US$60 mil-
lion. However, as the process was unproven, Nucor
would, in essence, be making a gamble that would
yield an industry-revolutionising process or be invest-
ing US$60 million in a plant that would be virtual-
ly worthless. To Nucor, the investment constituted
a measured risk; while the investment to determine
the feasibility was significant, if the process failed it
would not cripple the firm. In 1994, Nucor opened
the iron carbide pilot plant at a cost of US$100 mil-
lion – almost double expectations. At the end of
1995, the plant was operating at only 60 per cent of
capacity. Still, Nucor was betting big on this oppor-
tunity. Nucor estimates that the use of iron carbide
would allow them to reduce their steel-making costs
by US$50 per ton – a 20 per cent reduction. Addi-
tionally, Nucor is working on a joint venture with US
Steel to manufacture steel directly from iron carbide,
which could revolutionise the steel industry.
Process refinement at Nucor
Much of the business press focuses on the high-profile
quantum advances made at Nucor, such as the creation
of flat-rolled steel in an electric arc furnace and the
use of iron carbide as a substitute for scrap. However,
an emphasis on continuous innovation is felt through-
out the organisation and is equally important. A man-
ager from Nucor’s Crawfordsville mill observed that
most of the innovation comes not from management,
but from equipment operators and line supervisors.
The job of management, says the manager, is to make
sure the innovations can be implemented.8 For exam-
ple, workers discovered that they could fine-tune sur-
face characteristics of their galvanised steel (a benefit
valued by many customers) simply by making small
adjustments to the air pressure of a coating process.
Changes such as these do not require management
review or approval. Instead, equipment operators and
line supervisors are authorised to innovate and imple-
ment processes that improve production. Such inno-
vation is routine enough at Nucor that management
does not track individual improvements. Rather,
Nucor tracks innovation by looking at the end result
– reductions in the amount of labour required to pro-
duce each ton of steel.
Exhibit 16 Nucor’s principal manufacturing locations, 1997
Location Size (ft2) Products
Blytheville–Hickman, Arkansas 2 880 000 Steel shapes, flat-rolled steel
Norfolk–Stanton, Nebraska 2 28 000 Steel shapes, joists, deck
Brigham City–Plymouth, Utah 1 760 000 Steel shapes, joists
Darlington–Florence, South Carolina 1 610 000 Steel shapes, joists, deck
Grapeland–Jewett, Texas 1 500 000 Steel shapes, joists, deck
Crawfordsville, Indiana 1 410 000 Flat-rolled steel
Berkeley, South Carolina 1 300 000 Flat-rolled steel

Case 10 • Nucor Corporation and the US steel industry C-145
Employee innovation is driven by two factors.
First, the company’s bonus system means that any
substantial improvements to efficiency will contribute
to both the plant’s performance and individual pay
cheques. Second, the corporate culture emphasises
how experiments – even failed ones – keep Nucor as
the perennial benchmark for industry productivity.
Experiments are conducted both at the time of mill
start-up and on an ongoing basis. Typical of most mill
start-ups, the start-up of Nucor’s Hickman plant was
fraught with problems. The high rate of the produc-
tion line resulted in ‘breakouts’ – bad pours – of the
‘ribbon’ of steel for thin-slap casting. Though initial-
ly occurring at the rate of several per day, breakouts
have been declining since the plant became operation-
al. The high rates of production still result in two to
five breakouts per week and Nucor continues to make
modifications to the equipment to reduce this level.
Focusing on clean-steel practices, the melt-shop
people are developing mould powders that can han-
dle the high-speed, thin-slab casting. Mould powders
insulate, lubricate, aid uniform heat transfer, and
absorb inclusions, all of which makes for cleaner steel.
Unfortunately, no existing mould powders can handle
hot steel at the rate Nucor could potentially produce
it: 200 inches a minute. To reduce inclusions (impuri-
ties in the steel), Nucor is working to standardise all
operating practices in the two furnaces and two ladle
furnaces.
The Nucor philosophy towards innovation is that
attempts at improvement will be accompanied by
failures. Tony Kurley, a Nucor plant manager, recalls
Nucor chairman Ken Iverson’s expectation that suc-
cess is making the correct decision 60 per cent of the
time. What’s important isn’t the mistakes that are
made, says Iverson, but the ability to learn from the
20 per cent that are truly mistakes and the 20 per cent
that are sub-optimal decisions.9
This willingness to modify on the fly and ‘shoot
from the hip’, as one melt-shop supervisor puts it,
makes Nucor an exciting place to work. The lean,
flexible workforce is continually trying new things,
doing different jobs. Employees continue to engage in
risk taking because the company rewards success and
does not punish for failures. The result is that employ-
ees, from top managers to hourly personnel, are will-
ing to take risks to achieve innovation and take own-
ership in their jobs.
At Nucor, the tolerance levels for failure are
apparently high. In the 1970s, a Nucor plant man-
ager was considering the replacement of the electric
arc furnace in the plant with an induction furnace. At
Nucor, the plant manager has the authority to select
the type of furnaces used in his plant. There was no
clearly right or wrong answer. A discussion yielded
strong arguments in favour of the switch from some
plant managers and equally enthusiastic arguments
against the switch from others. The plant manager
elected to make the switch at a cost to Nucor of US$10
million. From the start, the new furnaces failed to
live up to expectations and resulted in repeated shut-
downs. Discussion shifted to the pluses and minuses
of removing the furnace and within a year the furnace
was removed. When the manager told Iverson of his
Exhibit 17 Nucor annual worker productivity, 1990–97
0
200
400
600
800
1000
1200
1400
1600
1990
1991
1992
1993
1994
1995
1996
1997
Tons/employee/year

C-146 Case 10 • Nucor Corporation and the US steel industry
decision, Iverson supported him, saying he had made
the right decision – there was no sense in leaving the
reminder of a bad decision laying around.10
Despite the price tag on this particular learn-
ing experience, management was unfazed. Iverson’s
comment on this failure was that the true problem is
people not taking risks. Nucor has a saying: ‘Don’t
study an idea to death in a dozen committee meetings;
try it out and make it work.’
Through incremental advances, employees are
continually able to streamline and refine the steel-
making process. The data suggests that Nucor employ-
ees have not come close to exhausting these enhance-
ments. Productivity, as measured in tons produced
per employee, doubled from 1990 to 1995 (626 tons/
worker and 1269 tons/worker, respectively) and con-
tinues to climb. In 1997, productivity exceeded 1400
tons/worker. How is Nucor able to realise such pro-
ductivity gains in this mature industry? The following
examples highlight incremental innovations.
Preventive maintenance
Preventive maintenance is a crucial but time-
consuming task at a minimill. At Nucor-Yamato, a
joint venture between Nucor and Yamato Kogyo,
a Japanese steel producer, the plant had week-long
shutdowns three times a year. During these periods,
outside contractors would strip, service and replace
worn machinery. The outages could involve as many
as 800 contractor personnel – a difficult task to man-
age. Further exacerbating the situation was the level
of skill and low level of productivity of some contrac-
tor personnel. Aside from the challenges of hunting
down missing contractors, the plant (and employees)
suffered from the three weeks without production.
The company addressed both of these concerns by
eliminating the week-long shutdowns, instead tack-
ling specific areas of the mill in focused, 24-hour
shutdowns. This new process has several advan-
tages, including spreading the maintenance costs over
a wider window and being able to use a smaller in-
house staff that operates continually. Some mainte-
nance jobs are large enough to still require multiple-
day shutdowns, but the number of outside contractors
has been reduced from 800 to 150. Through this pro-
gram, downtime at the plant has fallen from 10 per
cent to near 1 per cent. Some improvements are less
dramatic, but significant nonetheless. A young engi-
neer at a Nucor plant was concerned that too much
was being spent to lubricate and maintain a series of
supporting screws under a rolling line. He had a bet-
ter idea. The screws, part of the original manufactur-
er’s design, were replaced with metal shims, achiev-
ing an annual savings of over US$1 million.
Reduced melt times
At the Crawfordsville plant, workers made a series of
small changes, such as replacing an exhaust pipe and
tinkering with the chemistry of the melt. By doing
so, they reduced the melt time from 72 minutes to 65
minutes. While this may seem a small improvement,
it meant that an additional 25 tons of steel could be
poured in a single shift.
Revitalisation of outdated equipment
When Nucor bought a casting line from a German
supplier, an obsolete reversing mill, which is used to
reduce the thickness of steel, was thrown in as an
afterthought to sweeten the deal. The capacity of the
reducing mill was rated as 325 000 tons a year by
the supplier. Nucor employees immediately began
fiddling with the mill; the following are among the
improvements and results:
• Changing the way the steel was fed into the
machine increased capacity from 360 to 1960
feet per minute.
• Changes reduced the time to thread the machine
from five minutes to 20 seconds.
• Nucor changed the type and grade of lubricating
oil and installed a bigger motor.
With these changes, Nucor processed 650 000
tons of steel during the first year the equipment was
in operation – twice the machine’s capacity as rated
by its manufacturer. Nucor anticipates that an addi-
tional 10 per cent increase can be achieved.11
New galvanising line
At one point, Nucor decided to install a galvanising
line that coats finished steel to enhance its durability.
Engineers from US$17.8-billion USX Corp. visited the
plant before the foundation for the line had even been
poured, and Nucor engineers told them they would
have the line running by year’s end. The USX visitors
laughed because they had started building a similar
line a year earlier and it still wasn’t operational. The

Case 10 • Nucor Corporation and the US steel industry C-147
day after Christmas, USX ran its first coil through
its new galvanising line. Twelve hours later, Nucor’s
US$25 million galvanising line was operational. No
other firm had constructed such a line for less than
US$48 million.12
Continuous production
In most minimills, the conversion of scrap to a fin-
ished product is a discontinuous process. Scrap is con-
verted to ingots, for instance, which are then stock-
piled for further conversion. When building their new
Hickman plant in the early 1990s, Nucor tried an
experiment: continuous production. All steps of the
steel-making process are coordinated, from picking
up the raw scrap, to melting it, forming it and laying
down a finished coil. Continuous production is both
faster (three to four hours from inputs to finished
product) and more efficient. The downside? This just-
in-time approach eliminates all slack or buffers in the
process; problems at any point in the production line
shut the entire operation down. How well has this
new process worked? As with other Nucor plants,
virtually none of the employees had ever worked in
a steel mill before. Still, plant performance within
one year of start-up was competitive with more estab-
lished mills: 0.66 man-hours per ton, and a 91 per
cent yield (percentage of scrap converted to finished
product, a measure of efficiency). In late July 1993,
the Hickman plant shipped 8804 tons, setting a new
Nucor record for the most tons shipped from a single
plant in a day.13
Culture at Nucor
A key ingredient in any effective corporate culture is
people. It is not surprising that many organisations,
especially manufacturing firms, have dysfunctional
cultures given the fear and distrust experienced by
many workers, frequent layoffs and an ‘us versus
them’ mentality. Executives of Bethlehem Steel, for
example, constructed a golf course using corporate
funds, then built a second and third course for mid-
dle managers and employees, respectively. Ken Iver-
son questioned how a company with a culture so
dysfunctional as to require the construction of three
golf courses to maintain the hierarchical distinction
between executives, managers and line employees
could ever expect to improve its operations.14
Nucor differs dramatically from its competitors.
At Nucor, ‘us versus them’ clearly implies manage-
ment and workers united against competitors. One
melt-shop supervisor described a sense of personal
responsibility not only for his own job but also for
the firm. He described his position at Nucor as being
much like running his own company – a typical com-
ment given the entrepreneurial environment Nucor
has created. Decentralised authority and a sense of
individual responsibility are a key part of that struc-
ture. John Correnti explains that he does not want
to micro-manage the firm’s operations. Doing so, he
feels, would result in employees placing blame when
things go wrong instead of taking responsibility
and finding solutions. This, Correnti feels, results
in line personnel having a realistic ability to control
their own job environment, increase productivity and
increase their pay.15
Still, Nucor is anything but a ‘workers’ paradise’.
The standards for employee productivity are extreme-
ly high, and there are a number of painful remind-
ers of this emphasis. For example, the steelworker
who is 15 minutes late loses his production bonus for
the day – as much as half of the day’s pay. Thirty
minutes late and the bonus for the entire week is for-
feited. Workers are not paid for sicknesses less than
three days, or for production downtime due to bro-
ken machinery. However, by most measures, Nucor is
the employer of choice. There is extreme competition
for new positions. The Darlington plant has routinely
received 1000 applications from a single job posting
in the newspaper. Similarly, the new plant in Jewett,
Texas (population 435), received 2000 applications.
Employee turnover rates are among the lowest in the
industry. For example, the Crawfordsville, Indiana,
plant lost a total of four employees between 1988
and 1994: two for drug use and two for poor perfor-
mance. Nucor is a non-union shop with much of the
opposition to unions coming from Nucor employees
who feel that union rules would hurt productivity
and subsequently their pay cheques. According to
company folklore, there has been one labour dispute
outside the mill gates, and plant supervisors had to
protect union pamphleteers from angry employees!
How does Nucor achieve such levels of motiva-
tion and dedication? Iverson suggests that corporate
America has confused the ideas of motivation and

C-148 Case 10 • Nucor Corporation and the US steel industry
manipulation. Manipulation stipulates a one-sided
relationship wherein management convinces employ-
ees to do things in the interest of management. Moti-
vation involves getting employees to do things that are
in the best interest of both parties. In the long term,
Iverson says, motivation yields a strong company
whereas manipulation destroys a company. With this
in mind, Nucor has identified the following elements
as critical to effective employee motivation:
1 Everyone must know what is expected of them,
and goals should not be set too low.
2 Everyone must understand the rewards, which
must be clearly delineated and not subjective.
3 Everyone must know where to go to get help.
The company must have a system that clearly
tells the employee who to talk to when confused
or upset.
4 Employees must have real voices. They must
participate in defining the goals, determining the
working conditions and establishing production
processes.
5 The company must provide a feedback system
so that employees always know how they, their
group and the company are doing.16
The approach appears to work. A long-time
Nucor employee recalls when the Darlington, South
Carolina, plant could produce 30 tons of steel a day.
The same plant now produces 100 tons of steel an
hour. The worker says that, given the can-do attitude
of employees and the focus on constant improvement,
the ‘sky is the limit’ for additional improvements.17
While Nucor is a merit-oriented company, it also
makes it clear that there are no ‘classes’ of employ-
ees. Top managers receive the same benefits as steel-
makers on everything from vacation time to health
insurance. There are no preferred parking spaces, and
the ‘executive dining room’ is the delicatessen across
the street. Incidentally, the corporate headquarters
is located in a dowdy strip mall in Charlotte, North
Carolina. Not surprisingly, there is no corporate jet
or executive retreat in the Caymans. Officers travel
in coach class on business trips, and the organisa-
tion is rife with legends of corporate austerity – such
as Iverson travelling via subway when on business in
New York City (true, incidentally). This emphasis on
egalitarianism is an integral part of the Nucor cul-
ture. Iverson, wanting to eliminate even the smallest
distinctions between personnel, ordered everyone to
wear the same colour hardhat. In many plants, the
colour of your hardhat is a highly visible signal of
your level in the company hierarchy. Even at Nucor,
some managers thought that their authority rested
not in their expertise and management ability, but in
the colour of their hat. This goal of egalitarianism
has not been completely without problems. When it
was brought to Iverson’s attention that workers need-
ed to be able to quickly identify maintenance person-
nel, Iverson admitted his mistake and at Nucor plants
everyone wears green hardhats except maintenance
personnel who wear yellow so that they can be eas-
ily spotted.18
This approach appears transferable and the moti-
vational effects are contagious. Iverson recalls when
Nucor purchased a plant and immediately sold the
limousine and eliminated executive parking spaces
in favour of a first-come, first-served system. Iverson
greeted employees on their way into the plant and
recalls one employee who parked in what was the
boss’s reserved spot and commented that the simple
changes in the parking system made him feel much
better about the company.19
Compensation and bonus system
Leadership by example can only induce so much
behaviour; one of the more visible aspects of Nucor’s
culture is its compensation system, particularly the
prominent bonus system. ‘Gonna make some money
today?’ is a common greeting on the plant floor, and
discussion of company financials is as common in
the lunchroom as basketball scores. The bonus sys-
tem is highly structured, consisting of no special or
discretionary bonuses. The company is divided based
on production teams of 25–50 individuals who are
responsible for a complete task (such as a cold rolled
steel fabrication line). The group includes everyone on
that line, from scrap handlers to furnace operators,
mould and roller operators, and even finish packag-
ers. Managers get together and, based on the equip-
ment being used, set a standard for production. This
standard is known to everyone in advance and doesn’t
change unless the company makes a significant invest-
ment in capital equipment. With the standard in
mind, employees make whatever changes they see fit
to increase production. A bonus is paid for all produc-

Case 10 • Nucor Corporation and the US steel industry C-149
tion over the standard and there is no limit as to how
much bonus can be paid. The only qualifier is that the
production must be good – that is, of sufficient qual-
ity for sale. No bonus is paid for bad production. At
the end of the week, all employees on a particular line
get the same production bonus, which is issued along
with their weekly cheques.20
With bonuses, Nucor employees typically earn as
much as their unionised counterparts in the integrat-
ed plants. Weekly bonuses have, in recent years, aver-
aged 100–200 per cent of base wages. Typical pro-
duction workers earn US$8 to US$9 in base pay plus
an additional US$16 per hour in production bonuses
and averaged US$60 000 in 1996, making them the
highest-paid employees in the industry. Since Nucor
locates its plants in rural locations, employee salaries
are well above the norm for any specific area, making
Nucor jobs highly desirable.
Nucor also offers several other benefits to help
motivate and retain employees. In the 1980s, it shift-
ed to a workweek of four 12-hour days. Workers take
four days off and then resume another intensive shift
– a practice borrowed from the oil industry. While
this practice results in a lot of expensive overtime
– Crawfordsville alone paid out an extra half a mil-
lion dollars in 1995 due to the compressed workweek
– management feels that the ensuing morale and pro-
ductivity gains pay for themselves. The company has
also disbursed special US$500 bonuses (four times in
the last 20 years) in exceptionally good years. They
also provide four years worth of college tuition sup-
port (up to US$2000/year) for each child of each
employee – excluding only the children of corporate
officers.
Job security
Listening to Nucor managers, it is difficult to deter-
mine which fact they are most proud of: 30 years of
uninterrupted quarterly profits or 20 years since they
have last had to lay off an employee. Nucor locates
in rural areas and there are often few other employ-
ment opportunities, let alone other jobs at similar pay
scales, so Nucor feels a strong responsibility for keep-
ing workers employed, even during economic down-
turns.
Popular impressions aside, Iverson is clear to note
that Nucor does not have a no-layoff policy. He cau-
tions that Nucor will lay off employees as a last resort
if the survival of the company is at stake.21 But dur-
ing prior downturns, the company has chosen to ride
out slowdowns with its ‘Share the Pain’ program,
which involves reduced workweeks and plant slow-
downs instead of layoffs. What is most unusual with
the program is that the brunt of poor performance
is felt most heavily at upper parts of the organisa-
tion, particularly as long-term compensation is an
integral part of the executive pay system. During a
period of reduced demand for steel, the plants reduce
their operations. For line personnel and foremen, this
reduces their income by about 20 per cent. For depart-
ment heads, who are covered by a bonus plan based
on the profitability of their plant, slowdowns result in
Exhibit 18 Nucor profitability vs industry, 1981–95
–6%
–4%
–2%
0%
2%
4%
6%
8%
1981
1983
1985
1987
1989
1991
1993
1995
Nucor Industry

C-150 Case 10 • Nucor Corporation and the US steel industry
a reduction of about one-third of their pay. Nucor’s
top managers have their pay based largely on return
on shareholders’ equity – the measure most impor-
tant to shareholders. This is hit the hardest and top
managers see their pay decline the most – as much as
two-thirds or three-quarters of their income is lost.22
This structure serves a number of purposes. First,
the line personnel don’t feel that they are bearing the
brunt of a downturn. Second, there is a great deal of
motivation to further reduce the cost per ton so that
Nucor can underprice any other producer and keep
its mills active even during an economic downturn.
Lastly, while the shareholders may not be happy with
a reduced ROI, they at least know that management
has an incentive to improve company performance.
As an example, Iverson notes that in 1961 – a good
year – he made US$460 000 including bonuses. In
1982, though, Nucor fell shy of its 8 per cent return
on equity and Iverson earned only US$108 000.23
Summary
How important is the corporate culture to Nucor’s
success? Management is free to point out that their
advantage does not stem from proprietary technol-
ogy. After all, most of their innovations – including
thin-slab casting and the use of iron carbide – are
based on technology developed by other firms. While
they pioneered the modifications to make thin-slab
casting possible, numerous other minimills are hot
on their heels in this product segment. Nucor’s plants
are open to firms seeking to benchmark their oper-
ations, including other steel producers. When other
firms tour a plant, they may see the same equipment
as in their plant. Many comment on the culture of the
plant. One visitor from an integrated producer com-
mented that at his plant the culture is adversarial,
management versus employee, with no trust between
the parties. ‘Us versus them’ refers to workers versus
management and production. In contrast, at Nucor,
workers are seen striving together as a team, help-
ing each other and working towards a common goal:
the production of a high volume of low-cost, quality
steel.24
Iverson explains Nucor’s success as being based
on a combination of the technology used and the cul-
ture of the organisation. He is unsure if technology is
20, or 30, or even 40 per cent – but he’s sure it is less
than half of the formula for Nucor’s achievements.
The culture that Nucor instills is focused primar-
ily on the long-term health of the organisation. For
example, debt is avoided, start-up costs are not capi-
talised but rather are expensed in the current peri-
od, and depreciation and write-offs lean towards the
detriment of short-term earnings. Iverson is adamant
about not bowing to short-term pressures to manage
earnings or spread dividends evenly over a quarterly
basis. He refuses to do it. He compares companies
that try endlessly to meet short-term projections at the
expense of a long-term approach to dogs on a leash
– trying to perform a trick to satisfy the stock mar-
ket. He admonishes short-term share speculators to
stay away from the company. He compares Nucor to
an eagle and invites long-term investors to soar with
the company.25
Notes
1 J. L. McCar thy, 1996, ‘Passing the torch at big steel’, Chief
Executive, 111, p. 22.
2 K. Iverson, 1993, ‘Changing the rules of the game’, Planning
Review, 21(5), pp. 9–12.
3 Nucor Corp. Annual Report 1996.
4 K. Iverson, 1993, ‘Effective leaders stay competitive’, Executive
Excellence, 10(4), pp. 18–19.
5
G. McManus, 1992, ‘Scheduling a successful startup’, Iron Age
New Steel, 8(7), pp. 14–18.
6 S. Carey and E. Norton, 1995, ‘Blast from the past: Once
scorned, a man with an idea is wooed by the steel industry’,
Wall Street Journal, 29 December, p. A1.
7 R. S. Ahlbrandt, R. J. Fruehan and F. Giarratani, 1996, The
Renaissance of American Steel (New York: Oxford University
Press).
8 T. Kuster, 1995, ‘How Nucor Crawfordsville works’, Iron Age New
Steel, 11(12), pp. 36–52.
9 B. Berry, 1993, ‘Hot band at 0.66 manhours per ton’, Iron Age
New Steel, 1(1), pp. 20–6.
10 K. Iverson, 1998, Plain Talk: Lessons from a Business Maverick (New
York: John Wiley & Sons).
11 E. O. Welles, 1994, ‘Bootstrapping for billions’, Inc., 16(9),
pp. 78–86.
12 Ibid.
13 Berry, ‘Hot band at 0.66 manhours per ton’.
14 Iverson, Plain Talk.

Case 10 • Nucor Corporation and the US steel industry C-151
15 Ahlbrandt, Fruehan and Giarratani, The Renaissance of American
Steel.
1 6 Iverson, ‘Changing the rules of the game’.
17 Ibid.
18 J. Isenberg, 1992, ‘Hot steel and good common sense’,
Management Review, 81(8), pp. 25–7.
19 Iverson, Plain Talk.
20 Iverson, ‘Changing the rules of the game’.
21 Iverson, Plain Talk.
22 Isenberg, ‘Hot steel and good common sense’.
23 Iverson, ‘Changing the rules of the game’.
24 B. Berry, 1996, ‘The importance of Nucor’, Iron Age New Steel,
12(7), p. 2.
25 Iverson, Plain Talk.

C-152
Case 11
Philip Condit and the
Boeing 777*:
From design and development to
production and sales
Isaac Cohen
San Jose State University
* This case was presented in the October 2000 meeting of the North American Case Research Association at San Antonio, Texas.
© Isaac Cohen, 2000. The author is grateful to the San Jose State University College of Business for its support.
Following his promotion to Boeing CEO in 1988,
Frank Shrontz looked for ways to stretch and upgrade
the Boeing 767 – an eight-year-old wide-body twin
jet – in order to meet Airbus competition. Airbus had
just launched two new 300-seat wide-body models,
the two-engine A330 and the four-engine A340. Boe-
ing had no 300-seat jetliner in service, nor did the
company plan to develop such a jet.
To find out whether Boeing’s customers were
interested in a double-decker 767, Philip Condit, Boe-
ing executive vice president and future CEO (1996),
met with United Airlines vice president Jim Guyette.
Guyette rejected the idea outright, claiming that an
upgraded 767 was no match for Airbus’s new-model
transports. Instead, Guyette urged Boeing to develop
a brand-new commercial jet, the most advanced air-
plane of its generation. Shrontz had heard similar sug-
gestions from other airline carriers. He reconsidered
Boeing’s options, and decided to abandon the 767
idea in favour of a new aircraft program. In Decem-
ber 1989, accordingly, he announced the 777 project
and put Philip Condit in charge of its management.
Boeing had launched the 777 in 1990, delivered the
first jet in 1995, and by February 2001, 325 B-777s
were flying in the services of the major international
and US airlines.1
Condit faced a significant challenge in managing
the 777 project. He wanted to create an airplane that
was preferred by the airlines at a price that was truly
competitive. He sought to attract airline custom-
ers as well as cut production costs, and he did so by
introducing several innovations – both technological
and managerial – in aircraft design, manufacturing
and assembly. He looked for ways to revitalise Boe-
ing’s outmoded engineering production system, and
to update Boeing’s manufacturing strategies. And to
achieve these goals, Condit made continual efforts to
spread the 777 program-innovations company wide.

Case 11 • Philip Condit and the Boeing 777 C-153
Looking back at the 777 program, this case focus-
es on Condit’s efforts. Was the 777 project success-
ful and was it cost-effective? Would the development
of the 777 allow Boeing to diffuse the innovations
in airplane design and production beyond the 777
program? Would the development of the 777 permit
Boeing to revamp and modernise its aircraft manu-
facturing system? Would the making and selling of
the 777 enhance Boeing competitive position relative
to Airbus, its only remaining rival?
The aircraft industry
Commercial aircraft manufacturing was an industry
of enormous risks where failure was the norm, not the
exception. The number of large commercial jet mak-
ers had been reduced from four in the early 1980s
– Boeing, McDonnell Douglas, Airbus and Lockheed
– to two in late 1990s, turning the industry into a
duopoly, and pitting the two survivors – Boeing and
Airbus – one against the other. One reason why air-
craft manufacturers so often failed was the huge cost
of product development.
Developing a new jetliner required an up-front
investment of up to US$15 billion (2001 dollars), a
lead time of five to six years from launch to first deliv-
ery, and the ability to sustain a negative cash flow
throughout the development phase. Typically, to break
even on an entirely new jetliner, aircraft manufactur-
ers needed to sell a minimum of 300 to 400 planes
and at least 50 planes per year. Only a few commer-
cial airplane programs had ever made money.2
The price of an aircraft reflected its high devel-
opment costs. New-model prices were based on the
average cost of producing 300 to 400 planes, not a
single plane. Aircraft pricing embodied the principle
of learning by doing, the so-called learning curve3
workers steadily improved their skills during the
assembly process, and as a result, labour cost fell as
the number of planes produced rose.
The high and increasing cost of product develop-
ment prompted aircraft manufacturers to utilise sub-
contracting as a risk-sharing strategy. For the 747,
the 767 and the 777, the Boeing Company required
subcontractors to share a substantial part of the air-
plane’s development costs. Airbus did the same with
its own latest models. Risk-sharing subcontractors
performed detailed design work and assembled major
subsections of the new plane while airframe integra-
tors (that is, aircraft manufacturers) designed the air-
craft, integrated its systems and equipment, assembled
the entire plane, marketed it, and provided customer
support for 20 to 30 years. Both the airframe integra-
tors and their subcontractors were supplied by thou-
sands of domestic and foreign aircraft components
manufacturers.4
Neither Boeing, nor Airbus, nor any other post-
war commercial aircraft manufacturer produced jet
engines. A risky and costly venture, engine building
had become a highly specialised business. Aircraft
manufacturers worked closely with engine makers –
General Electric, Pratt and Whitney, and Rolls-Royce
– to set engine performance standards. In most cases,
new airplanes were offered with a choice of engines.
Over time, the technology of engine building had
become so complex and demanding that it took lon-
ger to develop an engine than an aircraft. During the
life of a jetliner, the price of the engines and their
replacement parts was equal to the entire price of the
airplane.5
A new-model aircraft was normally designed
around an engine, not the other way around. As
engine performance improved, airframes were rede-
signed to exploit the engine’s new capabilities. The
most practical way to do so was to stretch the fuselage
and add more seats in the cabin. Aircraft manufactur-
ers deliberately designed flexibility into the airplane
so that future engine improvements could facilitate
later stretching. Hence the importance of the ‘family
concept’ in aircraft design, and hence the reason why
aircraft manufacturers introduced families of planes
made up of derivative jetliners built around a basic
model, not single, standardised models.6
The commercial aircraft industry, finally, gained
from technological innovations in two other indus-
tries. More than any other manufacturing indus-
try, aircraft construction benefited from advances in
material applications and electronics. The develop-
ment of metallic and non-metallic composite materi-
als played a key role in improving airframe and engine
performance. On the one hand, composite materials
that combined light weight and great strength were
utilised by aircraft manufacturers; on the other, heat-
resisting alloys that could tolerate temperatures of up

C-154 Case 11 • Philip Condit and the Boeing 777
to 3000 degrees were used by engine makers. Simi-
larly, advances in electronics revolutionised avionics.
The increasing use of semiconductors by aircraft man-
ufacturers facilitated the miniaturisation of cockpit
instruments, and more important, it enhanced the use
of computers for aircraft communication, navigation,
instrumentation and testing.7 The use of computers
contributed, in addition, to the design, manufacture
and assembly of new-model aircraft.
The Boeing Company
The history of the Boeing Company may be divided
into two distinct periods: the piston era and the jet
age. Throughout the piston era, Boeing was essen-
tially a military contractor producing fighter aircraft
in the 1920s and 1930s, and bombers during the Sec-
ond World War. During the jet age, beginning in the
1950s, Boeing had become the world’s largest manu-
facturer of commercial aircraft, deriving most of its
revenues from selling jetliners.
Boeing’s first jet was the 707. The introduction of
the 707 in 1958 represented a major breakthrough in
the history of commercial aviation; it allowed Boeing
to gain a critical technological lead over the Douglas
Aircraft Company, its closer competitor. To benefit
from government assistance in developing the 707,
Boeing produced the first jet in two versions: a mili-
tary tanker for the Air Force (k-135) and a commer-
cial aircraft for the airlines (707-120). The compa-
ny, however, did not recoup its own investment until
1964, six years after it delivered the first 707, and
12 years after it had launched the program. In the
end, the 707 was quite profitable, selling 25 per cent
above its average cost.8 Boeing retained the essential
design of the 707 for all its subsequent narrow-body
single-aisle models (the 727, 737 and 757), introduc-
ing incremental design improvements, one at a time.9
One reason why Boeing used shared design for future
models was the constant pressure experienced by the
company to move down the learning curve and reduce
overall development costs.
Boeing introduced the 747 in 1970. The develop-
ment of the 747 represented another breakthrough;
the 747 wide-body design was one of a kind; it had no
real competition anywhere in the industry. Boeing bet
the entire company on the success of the 747, spend-
ing on the project almost as much as the company’s
total net worth in 1965, the year the project started.10
In the short run, the outcome was disastrous. As Boe-
ing began delivering its 747s, the company was strug-
gling to avoid bankruptcy. Cutbacks in orders as a
result of a deep recession, coupled with production
inefficiencies and escalating costs, created a severe
cash shortage that pushed the company to the brink.
As sales dropped, the 747’s breakeven point moved
further and further into the future.
Yet, in the long run, the 747 program was a tri-
umph. The Jumbo Jet had become Boeing’s most
profitable aircraft and the industry’s most efficient
jetliner. The new plane helped Boeing to solidify its
position as the industry leader for years to come, leav-
ing McDonnell Douglas far behind, and forcing the
Lockheed Corporation to exit the market. The new
plane, furthermore, contributed to Boeing’s manufac-
turing strategy in two ways. First, as Boeing increased
its reliance on outsourcing, six major subcontractors
fabricated 70 per cent of the value of the 747 air-
plane,11 thereby helping Boeing to reduce the proj-
ect’s risks. Second, for the first time, Boeing applied
the family concept in aircraft design to a wide-body
jet, building the 747 with wings large enough to sup-
port a stretched fuselage with bigger engines, and
offering a variety of other modifications in the 747’s
basic design. The 747-400 (1989) is a case in point.
In 1997, Boeing sold the stretched and upgraded 747-
400 in three versions, a standard jet, a freighter, and
a ‘combi’ (a jetliner whose main cabin was divided
between passenger and cargo compartments).12
Boeing developed other successful models. In
1969, it introduced the 737, the company’s narrow-
body flagship, and in 1982 it put into service two
additional jetliners, the 757 (narrow-body) and the
767 (wide-body). By the early 1990s, the 737, 757
and 767 were all selling profitably. Following the
introduction of the 777 in 1995, Boeing’s families of
planes included the 737 for short-range travel, the 757
and 767 for medium-range travel, and the 747 and
777 for medium- to long-range travel (Exhibit 1).
In addition to building jetliners, Boeing also
expanded its defence, space and information busi-
nesses. In 1997, the Boeing Company took a strategic

Case 11 • Philip Condit and the Boeing 777 C-155
gamble, buying the McDonnell Douglas Company in
a US$14 billion stock deal. As a result of the merger,
Boeing had become the world’s largest manufactur-
er of military aircraft, NASA’s largest supplier, and
the Pentagon’s second-largest contractor (after Lock-
heed). Nevertheless, despite the growth in its defence
and space businesses, Boeing still derived most of its
revenues from selling jetliners. Commercial aircraft
revenues accounted for 59 per cent of Boeing’s US$49
billion sales in 1997 and 63 per cent of its US$56 bil-
lion sales in 1998.13
Following its merger with McDonnell, Boeing
had one remaining rival: Airbus Industrie.14 In 1997,
Airbus booked 45 per cent of the worldwide orders
for commercial jetliners15 and delivered close to one-
third of the worldwide industry output. In 2000, Air-
bus shipped nearly two-fifths of the worldwide indus-
try output (Exhibit 2).
Airbus’s success was based on a strategy that
combined cost leadership with technological leader-
ship. First, Airbus distinguished itself from Boeing by
incorporating the most advanced technologies into its
planes. Second, Airbus managed to cut costs by utilis-
ing a flexible, lean production manufacturing system
that stood in a stark contrast to Boeing’s mass pro-
duction system.16
As Airbus prospered, the Boeing Company was
struggling with rising costs, declining productivity,
delays in deliveries and production inefficiencies. Boe-
ing Commercial Aircraft Group lost US$1.8 billion in
1997 and barely generated any profits in 1998.17 All
through the 1990s, the company looked for ways to
revitalise its outdated production manufacturing sys-
tem, on the one hand, and to introduce leading-edge
technologies into its jetliners, on the other. The devel-
opment and production of the 777, first conceived
of in 1989, was an early step undertaken by Boeing
managers to address both problems.
The 777 program
The 777 program was Boeing’s single largest project
since the completion of the 747. The total develop-
ment cost of the 777 was estimated at US$6.3 bil-
lion and the total number of employees assigned to
the project peaked at nearly 10 000. The 777’s twin-
engines were the largest and most powerful ever built
(the diameter of the 777’s engine equalled the 737’s
fuselage), the 777’s construction required 132 000
uniquely engineered parts (compared to 70 000 for
Exhibit 2 Market share of shipments of commercial aircraft: Boeing, McDonnell Douglas and Airbus,
1992–2000 (%)
1992 1993 1994 1995 1996 1997 1998 1999 2000
Boeing 61 61 63 54 55 67 71 68 61
McDonnell Douglas 17 14 9 13 13
Airbus 22 25 28 33 32 33 29 32 39
Sources: Aerospace Facts and Figures, 1997–98, p. 34; Wall Street Journal, 3 December 1998 and 12 January 1999; The Boeing Company Annual Report 1997, p. 19;
Data supplied by Mark Luginbill, Airbus Communication Director, 16 November 1998, 1 February 2000 and 20 March 2001.
Exhibit 1 Total number of commercial jetliners
delivered by the Boeing Company,
1958–2001
Model No. delivered First delivery
B-707 1 010 (retired) 1958
B-727 1 831 (retired) 1963
B-737 3 901 1967
B-747 1 264 1970
B-757 953 1982
B-767 825 1982
B-777 325 1995
B-717 49 2000
T
otal: 10 159
* McDonnell Douglas commercial jetliners (the MD-11, MD-80 and MD-90)
are excluded.
Sources: Boeing Commercial Airplane Group, Announced Orders and
Deliveries as of 12/31/97; The Boeing Company Annual Report 1998, p. 35;
‘Commercial airplanes: Order and delivery summary’, www.Boeing.com,
20 March 2001.

C-156 Case 11 • Philip Condit and the Boeing 777
the 767), the 777’s seat capacity was identical to that
of the first 747 that had gone into service in 1970,
and its manufactured empty weight was 57 per cent
greater than the 767’s. Building the 777 alongside the
747 and 767 at its Everett plant near Seattle, Wash-
ington, Boeing enlarged the plant to cover an area of
76 football fields.18
Boeing’s financial position in 1990 was unusually
strong. With a 21 per cent rate of return on share-
holder equity, a long-term debt of just 15 per cent of
capitalisation and a cash surplus of US$3.6 billion,
Boeing could gamble comfortably.19 There was no
need to bet the company on the new project, as had
been the case with the 747, or to borrow heavily, as
had been the case with the 767. Still, the decision to
develop the 777 was definitely risky; a failure of the
new jet might have triggered an irreversible decline of
the Boeing Company and threatened its future sur-
vival.
The decision to develop the 777 was based on
market assessment – the estimated future needs of
the airlines. During the 14-year period from 1991 to
2005, Boeing market analysts forecasted a 100 per
cent increase in the number of passenger miles trav-
elled worldwide and a need for about 9000 new com-
mercial jets. Of the total value of the jetliners needed
in 1991–2005, Boeing analysts forecasted a US$260
billion market for wide-body jets smaller than the
747. An increasing number of these wide-body jets
were expected to be larger than the 767.20
A consumer-driven product
To manage the risk of developing a new jetliner, air-
craft manufacturers had first sought to obtain a min-
imum number of firm orders from interested carri-
ers, and only then to commit to the project. Boeing
CEO Frank Shrontz had expected to obtain 100 ini-
tial orders of the 777 before asking the Boeing board
to launch the project, but as a result of Boeing’s
financial strength, on the one hand, and the increas-
ing competitiveness of Airbus, on the other, Schrontz
decided to seek the board’s approval earlier. He did
so after securing only one customer: United Airlines.
On 12 October 1990, United had placed an order for
34 of the 777s and an option for an additional 34 air-
craft, and two weeks later, Boeing’s board of direc-
tors approved the project.21
Negotiating the sale, Boeing and United drafted a
handwritten agreement (signed by Philip Condit and
Richard Albrecht, Boeing’s executive vice presidents,
and Jim Guyette, United’s executive vice president)
that granted United a larger role in designing the 777
than the role played by any airline before. The two
companies pledged to cooperate closely in develop-
ing an aircraft with the ‘best dispatch reliability in
the industry’ and the ‘greatest customer appeal in the
industry’. ‘We will endeavor to do it right the first
time with the highest degree of professionalism’ and
with ‘candor, honesty, and respect’ [the agreement
read]. Asked to comment on the agreement, Philip
Condit said: ‘We are going to listen to our customers
and understand what they want. Everybody on the
program has that attitude.’22 Gordon McKinzie, Unit-
ed’s 777 program director, agreed: ‘In the past we’d
get brochures on a new airplane and its options …
wait four years for delivery, and hope we’d get what
we ordered. This time Boeing really listened to us.’23
Condit invited other airline carriers to partici-
pate in the design and development phase of the 777.
Altogether, eight carriers from around the world
(United, Delta, America, British Airways, Qantas,
Japan Airlines, All Nippon Airways and Japan Air
System) sent full-time representatives to Seattle;
British Airways alone assigned 75 people at one time.
To facilitate interaction between its design engineers
and representatives of the eight carriers, Boeing intro-
duced an initiative called ‘Working Together’. ‘If we
have a problem,’ a British Airways production man-
ager explained, ‘we go to the source – design engineers
on the IPT [Integrated Product Teams], not service
engineer(s). One of the frustrations on the 747 was
that we rarely got to talk to the engineers who were
doing the work.’24
‘We have definitely influenced the design of the
aircraft,’ a United 777 manager said, mentioning
changes in the design of the wing panels that made it
easier for airline mechanics to access the slats (slats,
like flaps, increased lift on takeoffs and landings),
and new features in the cabin that made the plane
more attractive to passengers.25 Of the 1500 design
features examined by representatives of the airlines,
Boeing engineers modified 300. Among changes made
by Boeing was a redesigned overhead bin that left
more stand-up headroom for passengers (allowing a

Case 11 • Philip Condit and the Boeing 777 C-157
six-foot-three tall passenger to walk from aisle to
aisle), ‘flattened’ side walls which provided the occu-
pant of the window seat with more room, overhead
bin doors which opened down and made it possible
for shorter passengers to lift baggage into the over-
head compartment, a redesigned reading lamp that
enabled flight attendants to replace light bulbs, a
task formerly performed by mechanics, and a com-
puterised flight deck management system that adjust-
ed cabin temperature, controlled the volume of the
public address system, and monitored food and drink
inventories.26
More important were changes in the interior con-
figuration (layout plan) of the aircraft. To be able to
reconfigure the plane quickly for different markets of
varying travel ranges and passenger loads, Boeing’s
customers sought a flexible plan of the interior. On
a standard commercial jet, kitchen galleys, closets,
lavatories and bars were all removable in the past
but were limited to fixed positions where the interi-
or floor structure was reinforced to accommodate the
‘wet’ load. On the 777, by contrast, such components
as galleys and lavatories could be positioned any-
where within several ‘flexible zones’ designed into the
cabin by the joint efforts of Boeing engineers and rep-
resentatives of the eight airlines. Similarly, the flex-
ible design of the 777’s seat tracks made it possible
for carriers to increase the number of seat combina-
tions as well as reconfigure the seating arrangement
quickly. Flexible configurations resulted, in turn, in
significant cost savings; airlines no longer needed to
take the aircraft out of service for an extended period
of time in order to reconfigure the interior.27
The airline carriers also influenced the way in
which Boeing designed the 777 cockpit. During the
program definition phase, representatives of United
Airlines, British Airways and Qantas – three of
Boeing’s clients whose fleets included a large number
of 747-400s – asked Boeing engineers to model the
777 cockpit on the 747-400’s. In response to these
requests, Boeing introduced a shared 747/777 cock-
pit design that enabled its airline customers to use a
single pool of pilots for both aircraft types at a sig-
nificant cost savings.28
Additionally, the airline carriers urged Boeing
to increase its use of avionics for in-flight entertain-
ment. The 777, as a consequence, was equipped with
a fully computerised cabin. Facing each seat on the
777, and placed on the back of the seat in front, was a
combined computer and video monitor that featured
movies, video programs and interactive computer
games. Passengers were also provided with a digital
sound system comparable to the most advanced home
stereo available, and a telephone. About 40 per cent
of the 777’s total computer capacity was reserved for
passengers in the cabin.29
The 777 was Boeing’s first fly by wire (FBW) air-
craft, an aircraft controlled by a pilot transmitting
commands to the movable surfaces (rudder, flaps,
etc.) electrically, not mechanically. Boeing installed a
state-of-the-art FBW system on the 777 partly to sat-
isfy its airline customers, and partly to challenge Air-
bus’s leadership in flight control technology, a posi-
tion Airbus had held since it introduced the world’s
first FBW aircraft, the A-320, in 1988.
Lastly, Boeing customers were invited to contrib-
ute to the design of the 777’s engine. Both United
Airlines and All Nippon Airlines assigned service
engineers to work with representatives of Pratt and
Whitney (P&W) on problems associated with engine
maintenance. P&W held three specially scheduled
‘airline conferences’. At each conference, some 40
airline representatives clustered around a full-scale
mock-up of the 777 engine and showed Pratt and
Whitney engineers gaps in the design, hard-to-reach
points, visible but inaccessible parts, and accessible
but invisible components. At the initial conference,
Pratt and Whitney picked up 150 airline sugges-
tions, at the second, 50, and at the third, 10 more
suggestions.30
A globally manufactured product
Twelve international companies located in 10 countries,
and 18 more US companies located in 12 states, were
contracted by Boeing to help manufacture the 777.
Together, they supplied structural components as well
as systems and equipment. Among the foreign suppliers
were companies based in Japan, Britain, Australia,
Italy, Korea, Brazil, Singapore and Ireland; among
the major US subcontractors were the Grumman
Corporation, Rockwell (later merged with Boeing),
Honeywell, United Technologies, Bendix and the
Sunstrand Corporation. Of all foreign participants,
the Japanese played the largest role. A consortium

C-158 Case 11 • Philip Condit and the Boeing 777
made up of Fuji Heavy Industries, Kawasaki Heavy
Industries and Mitsubishi Heavy Industries had
worked with Boeing on its wide-body models since
the early days of the 747. Together, the three Japanese
subcontractors produced 20 per cent of the value of
the 777’s airframe (up from 15 per cent of the 767’s).
A group of 250 Japanese engineers had spent a year
in Seattle working on the 777 alongside Boeing
engineers before most of its members went back
home to begin production. The fuselage was built in
sections in Japan and then shipped to Boeing’s huge
plant at Everett, Washington for assembly.31
Boeing used global subcontracting as a market-
ing tool as well. Sharing design work and production
with overseas firms, Boeing required overseas carri-
ers to buy the new aircraft. Again, Japan is a case
in point. In return for the contract signed with the
Mitsubishi, Fuji and Kawasaki consortium – which
was heavily subsidised by the Japanese government
– Boeing sold 46 of the 777 jetliners to three Japanese
air carriers: All Nippon Airways, Japan Airlines and
Japan Air System.32
A family of planes
From the outset, the design of the 777 was flexible
enough to accommodate derivative jetliners. Because
all derivatives of a given model shared maintenance,
training and operating procedures, as well as replace-
ment parts and components, and because such deriv-
atives enabled carriers to serve different markets at
lower costs, Boeing’s clients were seeking a family of
planes built around a basic model, not a single 777.
Condit and his management team, accordingly, urged
Boeing’s engineers to incorporate the maximum flex-
ibility into the design of the 777.
The 777’s design flexibility helped Boeing to man-
age the project’s risks. Offering a family of planes
based on a single design to accommodate future
changes in customers’ preferences, Boeing spread the
777 project’s risks among a number of models all
belonging to the same family.
The key to the 777’s design efficiency was the
wing. The 777 wings, exceptionally long and thin,
were strong enough to support vastly enlarged mod-
els. The first model to go into service, the 777-200,
had a 209-foot-long fuselage, was designed to carry
305 passengers in three class configurations, and had
a travel range of 5900 miles in its original version
(1995), and up to 8900 miles in its extended version
(1997). The second model to be introduced (1998),
the 777-300, had a stretched fuselage of 242 feet (10
feet longer than the 747) was configured for 379 pas-
sengers (three classes), and flew to destinations of up
to 6800 miles away. In the all-tourist class configura-
tion, the stretched 777-300 could carry as many as
550 passengers.33
Digital design
The 777 was the first Boeing jetliner designed entirely
by computers. Historically, Boeing had designed new
planes in two ways: paper drawings and full-size
models called mock-ups. Paper drawings were two-
dimensional and therefore insufficient to account for
the complex construction of the three-dimensional
airplane. Full-scale mock-ups served as a backup to
drawings.
Boeing engineers used three classes of mock-ups.
Made up of plywood or foam, class 1 mock-ups were
used to construct the plane’s large components in
three dimensions, refine the design of these compo-
nents by carving into the wood or foam, and feed the
results back into the drawings. Made partly of metal,
class 2 mock-ups addressed more complex problems
such as the wiring and tubing of the airframe, and
the design of the machine tools necessary to cut and
shape the large components. Class 3 mock-ups gave
the engineers one final opportunity to refine the mod-
el and thereby reduce the need to keep on changing
the design during the actual assembly process or after
delivery.34
Despite the engineers’ efforts, many parts and
components did not fit together on the final assembly
line but rather ‘interfered’ with each other – that is,
they overlapped in space. The problem was both per-
vasive and costly; Boeing engineers needed to rework
and realign all overlapping parts in order to join them
together.
A partial solution to the problem was provided
by the computer. In the last quarter of the 20th
century, computer-aided design was used successfully
in car manufacture, building construction, machine
production and several other industries; its application

Case 11 • Philip Condit and the Boeing 777 C-159
to commercial aircraft manufacturing came later,
both in the United States and in Europe. Speaking
of the 777, Dick Johnson, Boeing chief engineer for
digital design, noted the ‘tremendous advantage’ of
computer application:
With mock-ups, the … engineer had three
opportunities at three levels of detail to check
his parts, and nothing in between. With Catia
[Computer aided three dimensional, interactive
application] he can do it day in and day out over
the whole development of the airplane.35
Catia was a sophisticated computer program
that Boeing bought from Dassault Aviation, a French
fighter plane builder. IBM enhanced the program to
improve image manipulation, supplied Boeing with
eight of its largest mainframe computers, and con-
nected the mainframes to 2200 computer terminals
that Boeing distributed among its 777 design teams.
The software program showed on a screen exactly
how parts and components fit together before the
actual manufacturing process took place.36
A digital design system, Catia had five distinctive
advantages. First, it provided the engineers with 100
per cent visualisation, allowing them to rotate, zoom
and ‘interrogate’ parts geometrically in order to spot-
light interferences. Second, Catia assigned a numeri-
cal value to each drawing on the screen and thereby
helped engineers to locate related drawings of parts
and components, merge them together, and check for
incompatibilities. Third, to help Boeing’s customers
service the 777, the digital design system created a
computer-simulated human – a Catia figure playing
the role of the service mechanic – who climbed into
the three-dimensional images and showed the engi-
neers whether parts were serviceable and entry acces-
sible. Fourth, the use of Catia by all 777 design teams
in the US, Japan, Europe and elsewhere facilitated
instantaneous communication between Boeing and
its subcontractors and ensured the frequent updat-
ing of the design. And fifth, Catia provided the 777
assembly line workers with graphics that enhanced
the narrative work instructions they received, show-
ing explicitly on a screen how a given task should be
performed.37
Design-build teams (DBT)
Teaming was another feature of the 777 program.
About 30 integrated-level teams at the top and more
than 230 design-build teams at the bottom worked
together on the 777.38 All team members were con-
nected by Catia. The integrated-level teams were
organised around large sections of the aircraft; the
DBTs around small parts and components. In both
cases, teams were cross-functional, as Philip Condit
observed:
If you go back … to earlier planes that Boeing
built, the factory was on the bottom floor,
and Engineering was on the upper floor. Both
Manufacturing and Engineering went back and
forth. When there was a problem in the factory,
the engineer went down and looked at it. …
With ten thousand people [working on the
777], that turns out to be really hard. So you
start devising other tools to allow you to achieve
that – the design-build team. You break the
airplane down and bring Manufacturing, Tooling,
Planning, Engineering, Finance, and Materials all
together [in small teams].39
Under the design-build approach, many of the
design decisions were driven by manufacturing con-
cerns. As manufacturing specialists worked alongside
engineers, engineers were less likely to design parts
that were difficult to produce and needed to be rede-
signed. Similarly, under the design-build approach,
customers’ expectations as well as safety and weight
considerations were all incorporated into the design
of the aircraft; engineers no longer needed to ‘chain
saw’40 structural components and systems in order to
replace parts that did not meet customers’ expecta-
tions, were unsafe, or were too heavy.
The design of the 777’s wing provides an exam-
ple. The wing was divided into two integration-lev-
el teams, the ‘leading edge’ (the forward part of the
wing) and the ‘trailing edge’ (the back of the wing)
team. Next, the trailing edge team was further divid-
ed into 10 design-build teams, each named after a
piece of the wing’s trailing edge (Exhibit 3). Mem-
bership in these DBTs extended to two groups of out-
siders: representatives of the customer airlines and

C-160 Case 11 • Philip Condit and the Boeing 777
engineers employed by the foreign subcontractors.
Made up of up to 20 members, each DBT decided
its own mix of insiders and outsiders, and each was
led by a team leader. Each DBT included represen-
tatives from six functional disciplines: engineering,
manufacturing, material, customer support, finance,
and quality assurance. The DBTs met twice a week
for two hours to hear reports from team members,
discuss immediate goals and plans, divide responsibil-
ities, set time lines, and take specific notes of all deci-
sions taken.41 Described by a Boeing official as ‘little
companies’, the DBTs enjoyed a high degree of auton-
omy from management supervision; team members
designed their own tools, developed their own manu-
facturing plans, and wrote their own contracts with
the program management, specifying deliverables,
resources and schedules. John Monroe, a Boeing 777
senior project manager, remarked:
The team is totally responsible. We give them a
lump of money to go and do th[eir] job. They decide
whether to hire a lot of inexpensive people or to
trade numbers for resources. It’s unprecedented.
We have some $100 million plus activities led by
non-managers.42
Exhibit 3 The 10 DBTs (‘little companies’) responsible
for the wing’s trailing edge
Flap Supports Team
Inboard Flap Team
Outboard Flap Team
Outboard Fixed Wing Team
Flaperon* Team
Aileron* Team
Inboard Fixed Wing and Gear Support Team
Main Landing Gear Doors Team
Spoilers** Team
Fairings*** Team
The Flaperon and Aileron were movable hinged sections of the trailing edge that
helped the plane roll in flight. The Flaperon was used at high speed, the Aileron at
low speed.
** The spoilers were the flat surfaces that lay on top of the trailing edge and
extended during landing to slow down the plane.
*** The fairings were the smooth parts attached to the outline of the wing’s
trailing edge. They helped reduce drag.
Source: Karl Sabbagh, 21st Century Jet: The Making and Marketing of the
Boeing 777 (New York: Scribner, 1996), p. 73.
Employees’ empowerment and
culture
An additional aspect of the 777 program was the
empowering of assembly line workers. Boeing man-
agers encouraged factory workers at all levels to
speak up, offer suggestions and participate in deci-
sion making. Boeing managers also paid attention
to a variety of ‘human relations’ problems faced by
workers, problems ranging from childcare and park-
ing to occupational hazards and safety concerns.43
All employees entering the 777 program – man-
agers, engineers, assembly line workers and others –
were expected to attend a special orientation session
devoted to the themes of teamwork and quality con-
trol. Once a quarter, the entire ‘777 team’ of up to
10 000 employees met off-site to hear briefings on the
aircraft status. Dressed casually, the employees were
urged to raise questions, voice complaints and pro-
pose improvements. Under the 777 program, man-
agers met frequently to discuss ways to promote com-
munication with workers. Managers, for example,
‘fire fought’ problems by bringing workers together
and empowering them to offer solutions. In a typi-
cal ‘fire-fight’ session, Boeing 777 project managers
learned from assembly line workers how to improve
the process of wiring and tubing the airframe’s inte-
rior: ‘staffing’ fuselage sections with wires, ducts,
tubes and insulation materials before joining the sec-
tions together was easier than installing the interior
parts all at once in a pre-assembled fuselage.44
Under the 777 program, in addition, Boeing
assembly line workers were empowered to appeal
management decisions. In a case involving middle
managers, a group of Boeing machinists sought to
replace a non-retractable jig (a large device used to
hold parts) with a retractable one in order to ease
and simplify their jobs. Otherwise they had to carry
heavy equipment loads up and down stairs. Again
and again, their supervisors refused to implement the
change. When the machinists eventually approached
a factory manager, he inspected the jig personally and
immediately ordered the change.45
Under the 777 program, work on the shop floor
was ruled by the ‘Bar Chart’. A large display panel
placed at different work areas, the Bar Chart listed
the name of each worker, his or her daily job descrip-

Case 11 • Philip Condit and the Boeing 777 C-161
tion, and the time available to complete specific tasks.
Boeing had utilised the Bar Chart system as a ‘man-
agement visibility system’ in the past, but only under
the 777 program was the system fully computerised.
The chart showed whether assembly line workers
were meeting or missing their production goals. Boe-
ing industrial engineers estimated the time it took to
complete a given task and fed the information back to
the system’s computer. Workers ran a scanner across
their ID badges and supplied the computer with the
data necessary to log their job progress. Each employ-
ee ‘sold’ his/her completed job to an inspector, and
no job was declared acceptable unless ‘bought’ by an
inspector.46
Leadership and management style
The team in charge of the 777 program was led by a
group of five vice presidents, headed by Philip Con-
dit, a gifted engineer who was described by one Wall
Street analyst as ‘a cross between a grizzly bear and
a teddy bear. Good people skills, but furious in the
marketplace.’47 Each of the five vice presidents rose
through the ranks, and each had 25–30 years’ experi-
ence with Boeing. All were men.48
During the 777 design phase, the five VPs met
regularly every Tuesday morning in a small confer-
ence room at Boeing’s headquarters in Seattle in
what was called the ‘Muffin Meeting’. There were
no agendas drafted, no minutes drawn, no overhead
projectors used and no votes taken. The home-made
muffins, served during the meeting, symbolised the
informal tone of the forum. Few people outside the
circle of five had ever attended these weekly sessions.
Acting as an informal chair, Condit led a freewheel-
ing discussion of the 777 project, asking each VP to
say anything he had on his mind.49
The weekly session reflected Boeing’s sweeping
new approach to management. Traditionally, Boeing
had been a highly structured company governed
by engineers. Its culture was secretive, formal and
stiff. Managers seldom interacted, sharing was rare,
divisions kept to themselves, and engineers competed
with each other. Under the 777 program, Boeing
made serious efforts to abandon its secretive manage-
ment style. Condit firmly believed that open com-
munication among top executives, middle managers
and assembly line workers was indispensable for
improving morale and raising productivity. He urged
employees to talk to each other and share informa-
tion, and he used a variety of management tools to do
so: information sheets, orientation sessions, question
and answer sessions, leadership meetings, regular man-
agers’ meetings and ‘all team’ meetings. To empower
shop floor workers as well as middle managers, Condit
introduced a three-way performance review procedure
whereby managers were evaluated by their supervisors,
their peers and their subordinates.50 Most important,
Condit made teamwork the hallmark of the 777 pro-
ject. In an address entitled ‘Working Together: The
777 Story’ and delivered in December 1992 to mem-
bers of the Royal Aeronautics Society in London,51
Condit summed up his team approach:
[T]eam building is … very difficult to do well but
when it works the results are dramatic. Teaming
fosters the excitement of a shared endeavor and
creates an atmosphere that stimulates creativity
and problem solving.
But building team[s] … is hard work. It doesn’t
come naturally. Most of us are taught from an
early age to compete and excel as individuals.
Performance in school and performance on the job
are usually measured by individual achievement.
Sharing your ideas with others, or helping others
to enhance their performance, is often viewed as
contrary to one’s self interest.
This individualistic mentality has its place,
but … it is no longer the most useful attitude
for a workplace to possess in today’s world. To
create a high performance organization, you need
employees who can work together in a way that
promotes continual learning and the free flow of
ideas and information.
The results of the 777
project
The 777 entered revenue service in June 1995. Since
many of the features incorporated into the 777’s
design reflected suggestions made by the airline
carriers, the pilots, mechanics and flight attendants
were quite enthusiastic about the new jet. Three
achievements of the program – in airplane interior,
aircraft design and aircraft manufacturing – stood out.

C-162 Case 11 • Philip Condit and the Boeing 777
Configuration flexibility
The 777 offered carriers enhanced configuration flex-
ibility. A typical configuration change took only 72
hours on the 777 compared to three weeks in com-
peting aircraft. In 1992, the Industrial Design Society
of America granted Boeing its Excellence Award for
building the 777 passenger cabin, honouring an air-
plane interior for the first time.52
Digital design
The original goal of the program was to reduce
‘change, error, and rework’ by 50 per cent, but engi-
neers building the first three 777s managed to reduce
such modification by 60 per cent to 90 per cent. Catia
helped engineers to identify more than 10 000 inter-
ferences that would have otherwise remained unde-
tected until assembly, or until after delivery. The first
777 was only 0.023 inch short of perfect alignment,
compared to as much as 0.5 inch on previous pro-
grams.53 Assembly line workers confirmed the ben-
eficial effects of the digital design system. ‘The parts
snap together like Lego blocks,’ said one mechanic.54
Reducing the need for reengineering, replanning,
retooling and retrofitting, Boeing’s innovative efforts
were recognised yet again. In 1993, the Smithsonian
Institution honoured the Boeing 777 division with its
Annual Computerworld Award for the manufactur-
ing category.55
Empowerment
Boeing 777 assembly line workers expressed a high
level of job satisfaction under the new program. ‘It’s a
whole new world,’ a 14-year Boeing veteran mechanic
said. ‘I even like going to work. It’s bubbly. It’s clean.
Everyone has confidence.’56 ‘We never used to speak
up,’ said another employee, ‘didn’t dare. Now fac-
tory workers are treated better and are encouraged to
offer ideas.’57 Although the Bar Chart system required
Boeing 777 mechanics to work harder and faster as
they moved down the learning curve, their principal
union organisation, the International Association of
Machinists, was pleased with Boeing’s new approach
to labour–management relations. A union spokesman
reported that under the 777 program, managers were
more likely to treat problems as opportunities from
which to learn, rather than as mistakes for which to
lay blame. Under the 777 program, the union rep-
resentative added, managers were more respectful
of workers’ rights under the collective bargaining
agreement.58
Unresolved problems and lessons
learned
Notwithstanding Boeing’s success with the 777 pro-
ject, the cost of the program was very high. Boeing
did not publish figures pertaining to the total cost of
Catia. But a company official reported that under the
777 program, the 3D digital design process required
60 per cent more engineering resources than the older,
2D drawing-based design process. One reason for the
high cost of using digital design was slow computing
tools: Catia’s response time often lasted minutes.
Another was the need to update the design software
repeatedly. Boeing revised Catia’s design software
four times between 1990 and 1996, making the
system easier to learn and use. Still, Catia continued
to experience frequent software problems. Moreover,
several of Boeing’s outside suppliers were unable to
utilise Catia’s digital data in their manufacturing
process.59
Boeing faced training problems as well. One
challenging problem, according to Ron Ostrowski,
director of 777 engineering, was ‘to convert people’s
thinking from 2D to 3D. It took more time than we
thought it would. I came from a paper world and
now I am managing a digital program.’60 Converting
people’s thinking required what another manager
called an ‘unending communication’ coupled with
training and retraining. Under the 777 program,
Ostrowski recalled, ‘engineers had to learn to interact.
Some couldn’t, and they left. The young ones caught
on’ and stayed.61
Learning to work together was a challenge to
managers, too. Some managers were reluctant to
embrace Condit’s open management style, fearing a
decline in their authority. Others were reluctant to
share their mistakes with their superiors, fearing
reprisals. Some other managers, realising that the new
approach would end many managerial jobs, resisted
change when they could, and did not pursue it whole-
heartedly when they could not. Even top executives
were sometimes uncomfortable with Boeing’s open
management style, believing that sharing information

Case 11 • Philip Condit and the Boeing 777 C-163
with employees was likely to help Boeing’s competi-
tors obtain confidential 777 data.62
Teamwork was another problem area. Working
under pressure, some team members did not function
well within teams and had to be moved. Others took
advantage of their new-born freedom to offer sug-
gestions, but were disillusioned and frustrated when
management either ignored these suggestions or did
not act upon them. Managers experienced different
team-related problems. In several cases, managers
kept on meeting with their team members repeatedly
until they arrived at a solution desired by their bosses.
They were unwilling to challenge senior executives,
nor did they trust Boeing’s new approach to team-
ing. In other cases, managers distrusted the new digi-
tal technology. One engineering manager instructed
his team members to draft paper drawings alongside
Catia’s digital designs. When Catia experienced a
problem, he followed the drawing, ignoring the com-
puterised design, and causing unnecessary and costly
delays in his team’s part of the project.63
Extending the 777 revolution
Boeing’s learning pains played a key role in the com-
pany’s decision not to implement the 777 program
company wide. Boeing officials recognised the impor-
tance of teamwork and Catia in reducing change,
error and rework, but they also realised that teaming
required frequent training, continuous reinforcement
and ongoing monitoring, and that the use of Catia was
still too expensive, though its cost was going down.
(In 1997, Catia’s ‘penalty’ was down to 10 per cent.)
Three of Boeing’s derivative programs – the 737 Next
Generation, the 757-300 and the 767-400 – had the
option of implementing the 777’s program innova-
tions, and only one, the 737, did so, adopting a modi-
fied version of the 777’s cross-functional teams.64
Yet the 777’s culture was spreading in other
ways. Senior executives took broader roles as the 777
entered service, and their impact was felt through
the company. Larry Olson, director of information
systems for the 747/767/777 division, was a former
777 manager who believed that Boeing 777 employees
‘won’t tolerate going back to the old ways’. He expected
to fill new positions on Boeing’s next program – the
747X – with former 777 employees in their forties.65
Philip Condit, Boeing CEO, implemented several
of his own 777 innovations, intensifying the use of
meetings among Boeing’s managers, and promoting
the free flow of ideas throughout the company. Under
Condit’s leadership, all mid-level managers assigned
to Boeing Commercial Airplane Group, about 60
people, met once a week to discuss costs, revenues
and production schedules, product by product. By the
end of the meeting – which sometimes ran into the
evening – each manager had to draft a detailed plan of
action dealing with problems in his/her department.66
Under Condit’s leadership, more importantly, Boeing
developed a new ‘vision’ that grew out of the 777
project. Articulating the company’s vision for the
next two decades (1996–2016), Condit singled out
‘Customer satisfaction’, ‘Team leadership’ and ‘A
participatory workplace’ as Boeing’s core corporate
values.67
Conclusion: Boeing, Airbus
and the 777
Looking back at the 777 program 11 years after the
launch and six years after first delivery, it is now
(2001) clear that Boeing produced the most success-
ful commercial jetliner of its kind. Airbus launched
the A330 and A340 in 1987, and McDonnell Douglas
Exhibit 4 Total number of MD11, A330, A340 and 777 airplanes delivered during 1996–2000
1996 1997 1998 1999 2000
McDonnell Douglas/Boeing MD11 15 12 12 8 4
Airbus A330 10 14 23 44 43
Airbus A340 28 33 34 20 19
Boeing 777 32 59 74 83 55
Sources: For Airbus, Mark Luginbill, Airbus Communication Director, 1 February 2000 and 20 March 2001. For Boeing, The Boeing Company Annual Report
1997, p. 35, 1998, p. 35; ‘Commercial airplanes: Order and delivery summary’, www.Boeing.com, 2 February 2000 and 2 February 2001.

C-164 Case 11 • Philip Condit and the Boeing 777
launched a new 300-seat wide-body jet in the mid-
1980s, the three-engine MD11. Coming late to mar-
ket, the Boeing 777 soon outsold both models. The
777 had entered service in 1995, and within a year
Boeing delivered more than twice as many 777s as
the number of MD11s delivered by McDonnell Doug-
las. In 1997, 1998 and 1999, Boeing delivered a larger
number of 777s than the combined number of A330s
and A340s delivered by Airbus, and in 2000 the 777
outsold each of its two Airbus competitors (Exhibit
4). A survey of nearly 6000 European airline passen-
gers who had flown both the 777 and the A330/A340
found that the 777 was preferred by more than three
out of four passengers.68 In the end, a key element in
the 777’s triumph was its popularity with the travel-
ling public.
Appendix A:
Selected features of
the 777
Aerodynamic efficiency
Aircraft operating efficiency depended, in part, on
aerodynamics: the smoother the surface of the plane
and the more aerodynamic the shape of the plane,
the less power was needed to overcome drag during
flight. To reduce aerodynamic drag, Boeing engineers
sought to discover the optimal shape of the plane’s
major components – namely, the wings, fuselage,
nose, tails and nacelles (engine-protective contain-
ers). Speaking of the 777’s ‘airfoil’, the shape of the
wing, Alan Mulally, the 777’s director of engineering
(he later succeeded Condit as the project manager),
explained:
The 777 airfoil is a significant advance in airfoil
design over … past airplanes … We arrived at
this shape by extensive analysis in wind tunnel …
[W]e learned new things by testing the airfoil at
… near flight conditions as far as temperature …
pressures, and air distribution are concerned. And
… we’ve ended up with an airfoil that is a new
standard at maximizing lift versus drag.69
The 777’s advanced wing enhanced its ability
to climb quickly and cruise at high altitudes. It also
enabled the airplane to carry full passenger payloads
out of many high-elevation airfields served by Boeing
customers. Boeing engineers estimated that the design
of the 777 lowered its aerodynamic drag by 5–10 per
cent compared to other advanced jetliners.70
A service-ready aircraft
A two-engine plane needed special permission from
the Federal Aviation Administration (FAA) to fly long
over-water routes. Ordinarily, the FAA first certified
a twin-jet for one hour of flight away from an airport,
then two hours, and only after two years in service,
three hours across water anywhere in the world. For
the 767, Boeing attained the three hours certification,
known as ETOPS (extended range twin-engine oper-
ations) approval, after two years in service. For the
777, Boeing customers sought to obtain an ETOPS
approval right away, from day one of revenue oper-
ations. Boeing 777 customers also expected the new
jet to deliver a high level of schedule reliability from
the start. (Boeing 767 customers experienced frequent
mechanical and computer problems as the 767 entered
service in 1982.71)
To receive an early ETOPS approval, as well
as minimise service disruptions, Boeing engineers
made special efforts to produce a ‘service-ready’
plane. Using advanced computer technology, Boeing
tested the 777 twice as much as the 767, improved
and streamlined the testing procedure, and checked
all systems under simulated flight conditions in a
new US$370 million high-tech lab called Integrated
Aircraft System Laboratory. The Boeing Company, in
addition, conducted flight tests for an extended period
of time, using United pilots as test pilots. Following
a long validation process that included taking off,
flying and landing on one engine, the FAA certified
the 777 in May 1995.72
The 777 proved highly reliable. During the first
three months of its revenue service, United Airlines
experienced a schedule reliability of 98 per cent, a
level the 767 took 18 months to reach. British Air-
ways’ first 777 was in service five days after delivery,
a company record for a new aircraft. The next three
777s to join British Airways fleet went into service a
day after they arrived at Heathrow.73

Case 11 • Philip Condit and the Boeing 777 C-165
The use of composite materials
Advanced composite materials accounted for 9 per
cent of the 777’s total weight; the comparable figure
for Boeing’s other jetliners was 3 per cent. Improved
Alcoa aluminum alloys that saved weight and
reduced corrosion and fatigue were used for the con-
struction of the 777’s upper wing skin; other non-
metallic composites were used for the 777’s rudder,
fines and the tails. To help reduce corrosion around
the lavatories and galleys, Boeing pioneered the use
of composite materials for the construction of the
floor beam structure. Boeing made a larger use of
titanium alloys on the 777 than on any previous air-
craft. Substituting steel with titanium cut weight by
half, and space by one quarter; titanium was also 40
per cent less dense than steel, yet of equal strength.
The use of heat-resisting titanium in the 777’s engine
nacelle saved Boeing 180 pounds per engine, or 360
pounds per plane; the use of titanium rather than
steel for building the 777’s landing gear saved Boeing
600 pounds per plane. Although titanium was more
expensive than steel or aluminum, the choice of its
application was driven by economics: for each pound
of empty weight Boeing engineers squeezed out of the
777, Boeing airline customers saved hundreds of dol-
lars worth of fuel during the lifetime of the plane.74
Appendix B: The
777’s choice of
engines
Pratt and Whitney (P&W), General Electric (GE)
and Rolls-Royce (RR) had all developed the 777 jet
engine, each offering its own make. Boeing required
an engine that was more powerful, more efficient
and quieter than any jet engine in existence; the
777 engine was designed to generate close to 80 000
pounds of thrust (the forward force produced by the
gases escaping backward from the engine) or 40 per
cent more power than the 767’s.75
All three engine makers had been selected by
Boeing airline customers (Exhibit 5). United Airlines
chose the Pratt & Whitney engine. Partly because
P&W supplied engines to United 747 and 767 fleets,
and also because the design of the 777 engine was
an extension of the 747’s and 767’s design, United
management sought to retain P&W as its primary
engine supplier.76 British Airways, on the other hand,
selected the GE engine. A major consideration in Brit-
ish Airways’ choice was aircraft efficiency: fuel con-
sumption of the GE engine was 5 per cent lower than
that of the two competing engines. Other carriers
selected the RR engine for their reasons pertaining to
their own needs and interests.
Exhibit 5 The choice of engines: Boeing 777’s
largest customers
Air France GE
All Nippon Airways P&W
American Airlines RR
British Airways GE
Cathay Pacific Airways RR
Continental Airlines GE
Delta Airlines RR
International Lease Finance Corp. GE
Japan Air System P&W
Japan Airlines P&W
Korea Airlines P&W
Malaysia Airlines RR
Saudi Airlines GE
Singapore Airlines RR
Thai Airways International RR
United Airlines P&W
Source: Boeing Commercial Airplane Group, 777 Announced Order and
Delivery Summary … as of 9/30/99.
Notes
1 Eugene Rodgers, 1991, Flying High: The Story of Boeing (New York:
Atlantic Monthly Press, 1996), pp. 423–15; Michael Dornheim,
‘777 twinjet will grow to replace 747-200’, Aviation Week and
Space Technology, 3 June, p. 43.
2
‘Commercial airplanes: Order and delivery, summary’, 2 February
2000, www.Boeing.com/commercial/ orders/index.html.
3 J. P. Donlon, 1994, ‘Boeing’s big bet’ (an interview with CEO
Frank Shrontz), Chief Executive, November/December, p. 42;
Michael Dertouzos, Richard Lester and Robert Solow, 1990,
Made in America: Regaining the Productive Edge (New York: Harper
Perennial), p. 203.
4 John Newhouse, 1982, The Sporty Game (New York: Alfred
Knopf ), p. 21, but see also pp. 10–20.
5 David C. Mowery and Nathan Rosenberg, 1982, ‘The commercial
aircraft industry’, in Richard R . Nelson (ed.), Government

C-166 Case 11 • Philip Condit and the Boeing 777
and Technological Progress: A Cross Industry Analysis (New York:
Pergamon Press), p. 116; Dertouzos et. al, Made in America,
p. 200.
6 Dertouzos, et. al, Made in America, p. 203.
7 Newhouse, Sporty Game, p. 188; Mowery and Rosenberg, ‘The
commercial aircraft industry’, pp. 124–5.
8 Mowery and Rosenberg, ‘The commercial aircraft industry’,
pp. 102–3, 126–8.
9 John B. Rae, 1968, Climb to Greatness: The American Aircraft Industry,
1920–1960 (Cambridge, MA: MIT Press), pp. 206–7; Rodgers,
Flying High, pp. 197–8.
10 Frank Spadaro, 1992, ‘A transatlantic perspective’, Design
Quarterly, Winter, p. 23.
11 Rodgers, Flying High, p. 279; Newhouse, Sporty Game, Ch. 7.
12 M. S. Hochmuth, 1974, ‘Aerospace’, in Raymond Vernon (ed.),
Big Business and the State (Cambridge: Harvard University Press),
p. 149.
13 Boeing Commercial Airplane Group, Announced Orders and
Deliveries as of 12/31/97, Section A1.
14 The Boeing Company Annual Report 1998, p. 76.
15 Formed in 1970 by several European aerospace firms, the
Airbus Consortium had received generous assistance from the
French, British, German and Spanish governments for a period
of over two decades. In 1992, Airbus had signed an agreement
with Boeing that limited the amount of government funds each
aircraft manufacturer could receive, and in 1995, at long last,
Airbus had become profitable. ‘Airbus 25 years old’, 1997,
Le Figaro, October (reprinted in English by Airbus Industrie);
Rodgers, Flying High, Ch. 12; Business Week, 30 December 1996,
p. 40.
16 Charles Goldsmith, 1998, ‘Re-engineering, after trailing Boeing
for years, Airbus aims for 50 percent of the market’, Wall Street
Journal, 16 March.
17 ‘Hubris at Airbus, Boeing rebuild’, 1998, The Economist,
28 November.
Exhibit 6 Selected financial data (dollars in millions except per share data)
Operation 2000 1999 1998 1997 1996
Sales and revenues
Commercial airplanes 31 171 38 475 36 998 27 479 19 916
Defense and space* 20 236 19 015 19 879 18 125 14 934
Other 758 771 612 746 603
Accounting differences (844) (304) (1 335) (550)
Total 51 321 57 993 56 154 45 800 35 453
Net earnings (loss) 2 128 2 309 1 120 (178) 1818
Earnings (loss) per share 2.48 2.52 1.16 (0.18) 1.88
Cash dividends 504 537 564 557 480
Per share 0.59 0.56 0.56 0.56 0.55
Other income (interest) 386 585 283 428 388
Research and development 1 441 1 341 1 895 1 924 1 633
Capital expenditure 932 1 236 1 665 1 391 971
Depreciation 1 159 1 330 1 386 1 266 1 132
Employee salaries and wages 11 614 11 019 12 074 11 287 9 225
Year-end workforce 198 000 197 000 231 000 238 000 211 000
Financial position at 31 December
Total assets 42 028 36 147 37 024 38 293 37 880
Working capital (2 425) 2 056 2 836 5 111 7 783
Plant and equipment 8 814 8 245 8 589 8 391 8 266
Cash and short-term investments 1 010 3 454 2 462 5 149 6 352
Total debt 8 799 6 732 6 972 6 854 7 489
Customers and commercial financing
assets 6 959 6 004 5 711 4 600 3 888
Shareholders’ equity 11 020 11 462 12 316 12 953 13 502
Per share 13.18 13.16 13.13 13.31 13.96
Contractual backlog
Commercial airplanes 89 780 72 972 86 057 93 788 86 151
Defense and space* 30 820 26 276 26 839 27 852 28 022
Total 120 600 99 248 112 896 121 640 114 173
* Including Information. Source: The Boeing Company Annual Report 2000, pp. 8, 98.
A special note: For additonal financial data, as reported in the company’s annual reports and other financial documents, see Boeing’s website at www.Boeing.com.

Case 11 • Philip Condit and the Boeing 777 C-167
18 The Boeing Company Annual Report 1997, p. 19; The Boeing
Company Annual Report 1998, p. 51.
19 Donlon, ‘Boeing’s big bet’, p. 40; John Mintz, 1995, ‘Betting
it all on 777’, Washington Post, 26 March 26; James Woolsey,
1991, ‘777: A program of new concepts’, Air Transport World, April,
p. 62; Jeremy Main, 1992, ’Corporate performance: Betting on
the 21st century jet’, Fortune, 20 April, p. 104; James Woolsey,
1991, ‘Crossing new transpor t frontiers’, Air Transport World,
March, p. 21; James Woolsey, 1994, ‘777: Boeing’s new large
twinjet’, Air Transport World, April, p. 23; Michael Dornheim, 1991,
‘Computerized design system allows Boeing to skip building 777
mockup’, Aviation Week and Space Technology, 3 June, p. 51; Richard
O’Lone, 1992, ‘Final assembly of 777 nears’, Aviation Week and
Space Technology, 2 October, p. 48.
20 Rodgers, Flying High, p. 42.
21 Air Transport World, March 1991, p. 20; Fortune, 20 April 1992,
pp. 102–3.
22 Rodgers, Flying High, pp. 416, 420–4.
23 Richard O’Lone and James McKenna, 1990, ‘Quality assurance
role was factor in United’s 777 launch order’, Aviation Week and
Space Technology, 29 October, pp. 28–9; Air Transport World, March
1991, p. 20.
24 Quoted in the Washington Post, 25 March 1995.
25 Quoted in Bill Sweetman, 1996, ‘As smooth as silk: 777
customers applaud the aircraft’s first 12 months in service’ Air
Transport World, August, p. 71, but see also Air Transport World,
April 1994, pp. 24, 27.
26 Quoted in Fortune, 20 April 1992, p. 112.
27 Rodgers, Flying High, p. 426; Design Quarterly, Winter 1992, p. 22;
Polly Lane, 1995, ‘Boeing used 777 to make production changes’,
Seattle Times, 7 May.
28 Design Quarterly, Winter 1992, p. 22; The Boeing Company, 1998,
Backgrounder: Pace Setting Design Value-Added Features Boost Boeing
777 Family, 15 May.
29 Boeing, 1998, Backgrounder, 15 May; Sabbagh, 21st Century Jet,
p. 49.
30 Karl Sabbagh, 1996, 21st Century Jet: The Making and Marketing of
the Boeing 777 (New York: Scribner), pp. 264, 266.
31 Sabbagh, 21st Century Jet, pp. 131–2.
32 Air Transport World, April 1994, p. 23; Fortune, 20 April 1992,
p. 116.
33 Washington Post, 26 March 1995; Boeing Commercial Airplane
Group, 777 Announced Order and Delivery Summary . . . as of
9/30/99.
34 Rodgers, Flying High, pp. 420–6; Air Transport World, April 1994,
pp. 27, 31; ‘Leading families of passenger jet airplanes’, Boeing
Commercial Airplane Group, 1998.
35 Sabbagh, 21st Century Jet, p. 58.
36 Quoted in Sabbagh, 21st Century Jet, p. 63.
37 Aviation Week and Space Technology, 3 June 1991, p. 50, 12 October
1992, p. 49; Sabbagh, 21st Century Jet, p. 62.
38 George Taninecz, 1995, ‘Blue sky meets blue sky’, Industry Week,
18 December, pp. 49–52; Paul Proctor, 1992, ‘Boeing rolls out
777 to tentative market’, Aviation Week and Space Technology,
12 October, p. 49.
39 Aviation Week and Space Technology, 11 April 1994, p. 37, and
3 June 1991, p. 35.
40 Quoted in Sabbagh, 21st Century Jet, pp. 68–9.
41 This was the phrase used by Boeing project managers working
on the 777. See Sabbagh, 21st Century Jet, Ch. 4.
42 Fortune, 20 April 1992, p. 116; Sabbagh, 21st Century Jet, pp. 69–
73; Wolf L. Glende, 1997, ‘The Boeing 777: A look back’, The
Boeing Company, p. 4.
43 Quoted in Air Transport World, August 1996, p. 78.
44 Richard O’Lone, 1992, ‘777 revolutionizes Boeing aircraft
development process’, Aviation Week and Space Technology, 3 June
1992, p. 34.
45 O. Casey Corr, 1993, ‘Boeing’s future on the line: Company’s
betting its fortunes not just on a new jet, but on a new way of
making jets’, Seattle Times, 29 August; Polly Lane, 1995, ‘Boeing
used 777 to make production changes, meet desires of its
customers’, Seattle Times, 7 May 1995; Aviation Week and Space
Technology, 3 June 1991, p. 34.
46 Seattle
Times, 29 August 1993.
47 Seattle Times, 7 May 1995 and 29 August 1993.
48 Quoted in Rodgers, Flying High, pp. 419–20.
49 Sabbagh, 21st Century Jet, p. 33.
50 Ibid., p. 99.
51 Dori Jones Young, 1994, ‘When the going gets tough, Boeing
gets touchy-feely’, Business Week, 17 January 1994, pp. 65–7;
Fortune, 20 April 1992, p. 117.
52 Reprinted by The Boeing Company, Executive Communications,
1992.
53 Boeing, 1998, Backgrounder, 15 May.
54 Industry Week, 18 December 1995, pp. 50–1; Air Transport World,
April 1994, p. 24.
55 Aviation Week and Space Technology, 11 April 1994, p. 37.
56 Boeing, Backgrounder, ‘Computing & design/build process help
develop the 777’, undated.
57 Seattle
Times, 29 August 1993.
58 Seattle Times, 7 May 1995.
59 Seattle Times, 29 August 1993.
60 Glende, ‘The Boeing 777: A look back’, p. 10; Air Transport World,
August 1996, p. 78.
61 Air
Transport World, April 1994, p. 23.
62 Washington Post, 26 March 1995.
63 Seattle Times, 7 May 1995; Rodgers, Flying High, p. 441.
64 Ibid., pp. 441–2.
65 Glende, ‘The Boeing 777: A look back’, p. 10.
66 Air Transport World, August 1996, p. 78.
67 ‘A new kind of Boeing’, 2000, The Economist, 22 January, p. 63.
68 ‘Vision 2016’, 1997, The Boeing Company.
69 ‘Study: Passengers voice overwhelming preference for Boeing
777’, 23 November 1999, www.Boeing.com.
70 Quoted in Sabbagh, 21st Century Jet, pp. 46–7.
71 Boeing, 1998, Backgrounder, 25 May; Michael Dornmeim,
1991, ‘777 twinjet will grow to replace 747-200’, Aviation Week
and Space Technology, 3 June, p. 43; Sabbagh, 21st Century Jet,
pp. 286–7.
72 Air Transport World, April 1994, p. 27; Fortune, 20 April 1992,
p. 117; Sabbagh, 21st Century Jet, pp. 139–40.
73 Industry Week, 18 December 1995, p. 52; Aviation
Week and Space
Technology, 11 April 1994, p. 39; Seattle Times, 7 May 1995; Boeing,
1998, Backgrounder, 15 May; Sabbagh, 21st Century Jet, Ch. 24.
74 Industry Week, 18 December 1995, p. 52; Air Transport World,
August 1996, p. 71.
75 Steven Ashley, 1993, ‘Boeing 777 gets a boost from titanium’,
Mechanical Engineering, July, pp. 61, 64–5; Aviation Week and Space
Technology, 3 June 1991, p. 49; Boeing, 1998, Backgrounder, 15
May; Air Transport World, March 1991, pp. 23–4.
76 Boeing, 1998, Backgrounder, 15 May.

C-168
Case 12
Resene Paints
Stephen Bowden
Waikato Management School
This really is a fantastic company to be part of.
Every day presents new opportunities to build on
the great legacy we have.
Nick Nightingale, general manager, Resene Paints
As Nick Nightingale, general manager of Resene
Paints, walked along a corridor between his office
and the manufacturing plant, he looked at the can
of Stipplecote cement-based paint that sat in a dis-
play case. Stipplecote was the original product that
his grandfather, Ted Nightingale, had developed and
based the company on in 1946. In 55 years, Resene
had grown into an integrated manufacturer and
retailer of a wide array of high-quality paints and
surface coatings. Resene operated four manufactur-
ing plants in New Zealand, one in Australia and one
in Fiji. In addition, a chain of 54 company-owned
ColorShops and 19 franchised outlets provided the
retail arm of Resene in New Zealand. A total of 600
employees worked for Resene generating over $100
million in group annual revenue and healthy profits.
(All figures are in New Zealand dollars unless other-
wise stated.) Resene had cultivated a stellar reputa-
tion for innovation throughout its history – especially
from water-based paints, colour development and
environmental awareness.
Still, despite the enormous pride that Nick felt in
the company’s achievements over the last 55 years,
he knew that Resene faced many challenges in the
future. Resene competed against large multination-
als in an industry facing rising research costs. Could
Resene continue to be such an innovator, or did it need
to change in some way? While dominant in the New
Zealand commercial market, overall Resene trailed
the market share of major competitor Dulux. Interna-
tionally, Resene had a small presence in a number of
countries, including Australia, Fiji, Bangladesh and
China. But where should Resene focus its efforts –
what range of products and markets should it be in
and how should it structure the company to best take
advantage of that identity?
Resene Paints
A history of innovation and growth
Ted Nightingale, a builder with no chemical or tech-
nical training, developed Stipplecote, a paint for con-
crete, simply because no such paint existed. (www.
resene.co.nz/pdf/nostalgia.pdf offers a more com-
plete history.) In 1951, Ted also developed New Zea-
land’s first water-based paint under the brand name
Resene and formed the Stipplecote Product Com-
pany in 1952. Ted developed water-based paint after
he heard that the resin he was familiar with through
Stipplecote, PVA, could be used to make other paints.
In an experimental way, with very limited resources,
Ted was able to solve the problem and develop the
water-based paint. In many ways, it was a process
that would be repeated again and again over the his-
tory of Resene as the company continued to innovate
in terms of both paint types and colours. After con-
siderable effort, demand for the company’s water-
based paints grew strongly. The growth necessitated

Case 12 • Resene Paints C-169
expansion and resulted in moves from the original
Kaiwharawhara factory to Seaview in 1967 and then
to the current site in Naenae in 1992. In 1977 the
company changed its name from Stipplecote Products
to the present Resene Paints Ltd.
Paint and protective coatings had long been pro-
duced for a wide range of purposes. Nick Nightingale
viewed Resene as selling to five different markets.
First, there’s a commercial market consisting of
tradespeople, architects and specifiers. While
painters apply the paint, the decision on the paint
to be applied is often made by others. Particularly
on larger jobs an architect, an interior decorator
or even a project manager specifies the paint to
be used. The second market is the retail market
and consists of do-it-yourself (DIY) consumers
who paint their own houses and make occasional
purchases of paint. The combined commercial and
retail markets are referred to as the architectural
and decorative coatings market. Third, is the
specialty finishes market, which mainly involves
textured coatings. The textured coatings are
basically a construction product. Fourth, there’s
a protective coatings market that includes marine
products as well as industrial coatings and some
architectural products like anti-graffiti systems.
Finally, there’s the automotive market for paints.
While Resene began as a manufacturer of basic
paints for buildings and houses, focused mainly on
water-based paints, the company had widened its
range of paints and coatings considerably since to
offer an extensive range of products for each market.
Resene moved into solvent-based paints and had a
specialised plant in Upper Hutt. Resene also operated
two acquired subsidiaries based in New Zealand.
Altex Coatings, with manufacturing facilities both in
Tauranga and Australia, was a manufacturer of pro-
tective coatings for industrial and marine surfaces.
Resene Automotive & Performance Coatings, located
in Auckland, manufactured its own brand of automo-
tive, furniture and industrial paints and a range of car
care products for the New Zealand market. Resene
Automotive was also the distributor in New Zealand
for the world’s leading brand in automotive refinish
paint – DuPont car paints. In addition, Resene oper-
ated two international subsidiaries. Resene Ltd (Aus-
tralia) focused on manufacturing marine coatings
as well as a full range of industrial and architectural
coatings from its factory on the Gold Coast. Resene
Paints Fiji Limited, in Suva, manufactured a full
range of architectural, industrial and marine paints,
as well as furniture lacquers for the commercial and
retail customer. Outside of the paint industry, Resene
owned the Cellier Le Brun Ltd wine-maker in Blen-
heim.
At the same time that Resene had been going
from strength to strength, however, other paint com-
panies had disappeared. In the 1970s a large num-
ber of small independent paint manufacturers exist-
ed – probably 30 or 40 – but the industry was now
dominated by the largest three firms: Orica, Resene
and Wattyl. Both Orica and Wattyl were large Aus-
tralian companies for whom the New Zealand paint
market represented a small part of their operations.
Orica, formerly ICI Australia, operated in New Zea-
land through brands including Dulux, British Paints
and Levenes. Wattyl distributed both Wattyl and
Taubmans branded paints in New Zealand. Resene
was the only paint company still doing research and
development in New Zealand and as a group manu-
factured the most paint in New Zealand.
The Nightingale family
Resene was a very successful privately owned, family
business that was still headed by the Nightingale fam-
ily that founded the business. A significant difference
from competitors that stemmed from the ownership
by the Nightingale family was management tenure.
Resene had been headed by only two people during
its history – the founder Ted Nightingale and his son
Tony. By contrast to the almost 30-year average ten-
ure at Resene, their competitors often viewed New
Zealand as a training ground and turned over senior
management on a two-year cycle.
When Ted Nightingale ran the company, he was
the innovator as well as the marketer and manager
and everything else. In the succession plan that was
implemented with Ted’s retirement, Ted’s son Tony
became managing director, while the recently hired
technical director, Colin Gooch, was given consider-
able autonomy for the technical issues. Tony focused
more on the marketing and managerial issues,
although he always debated other issues with Colin.
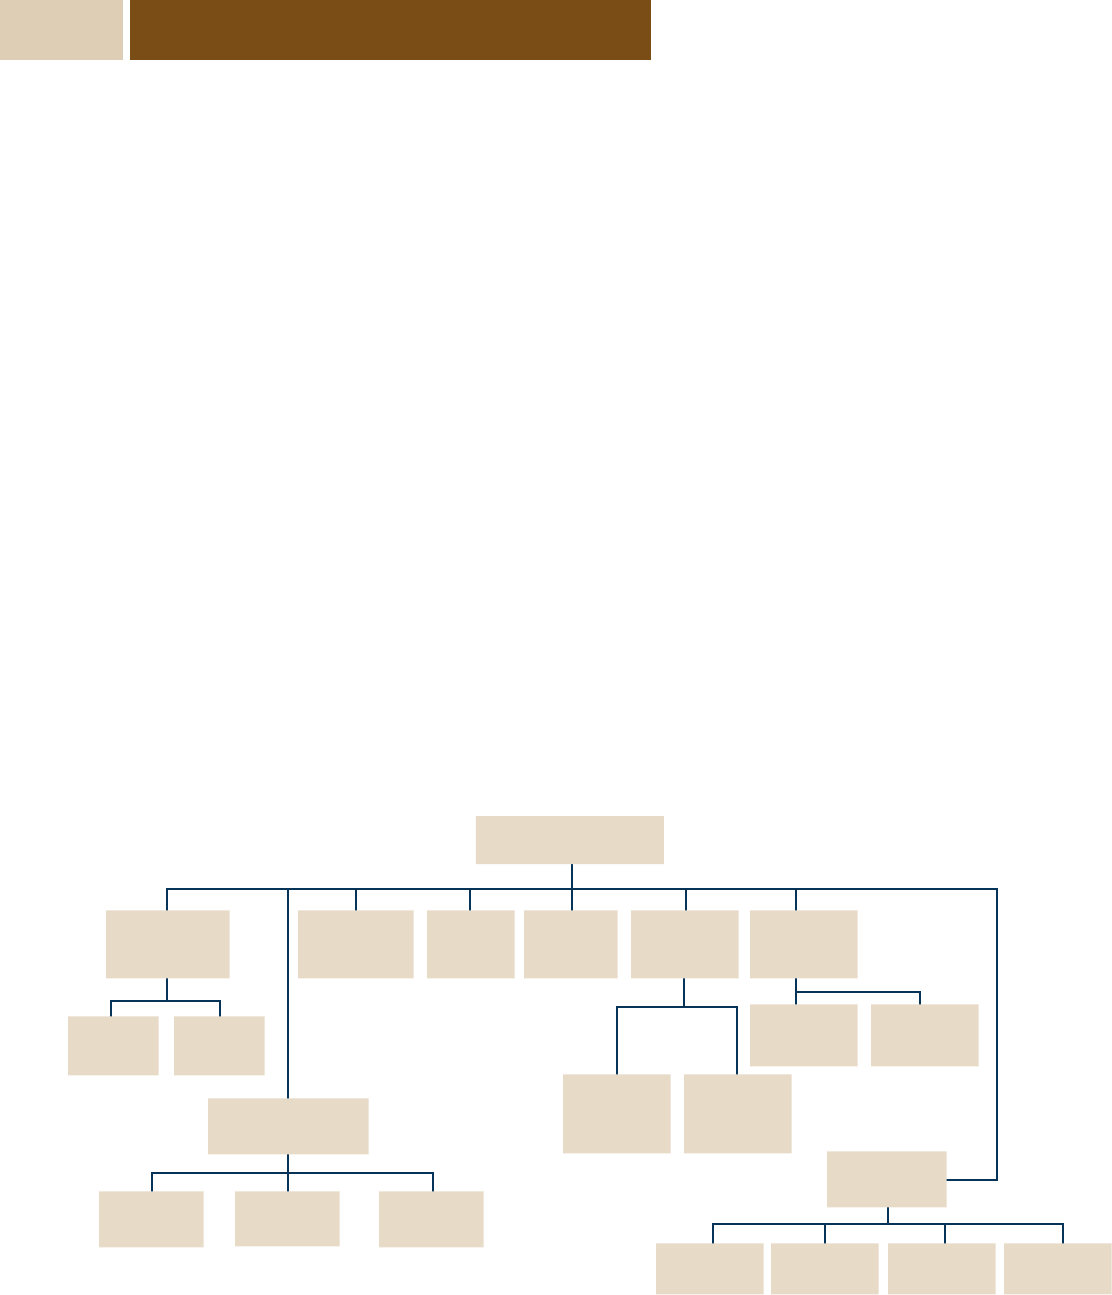
C-170 Case 12 • Resene Paints
Given the importance of technical issues within the
company, one legacy of the succession was that Tony
and Colin were forced to work together and agree on
how to proceed.
Resene was gradually moving through the next
stage in the succession of the company. Tony was still
the managing director, although illness had limited
his involvement over the last few years. Two-and-a-
half years ago, Nick became general manager, direct-
ly under his father, with all other senior managers
reporting to Nick. Of greater concern, however,
Colin Gooch was set to retire in five years’ time and
no obvious successor to Colin was yet apparent.
Top management
Nick had been involved in jobs around the company
since his youth. He was the first person to staff one
of their stores on a Saturday. After completing a com-
merce degree at Victoria University, Nick spent a few
years overseas before returning to New Zealand and
the family business. He had worked on the sales side
since his return as a regional sales manager prior to
becoming general manager. Reporting to Nick were
all the functional managers (see Exhibit 1). In addi-
tion, the heads of each of the subsidiary companies
throughout New Zealand, Australia and Fiji – except
Altex, which reported directly to Tony – were respon-
sible to Nick. According to Nick,
The subsidiary companies operate as separate
companies and we don’t really like to tell them
what to do. We do a little R&D work here in
Naenae for our Australian and Fijian subsidiaries,
but it’s limited due to product differences. We
have just switched a major resin supplier for our
Australian subsidiary to the same supplier that we
use in New Zealand. That switch has led to cost
savings, quality improvement, and meant that our
knowledge base about that resin could be utilised
in Australia.’ Resene Automotive and Altex,
serving different markets with different products,
were treated as stand-alone business units.
‘We require our managers to have a strong ori-
entation to quality at Resene. Frankly, without that
orientation you just would not last here,’ said Nick
Nightingale. Often, the orientation to quality came
at a cost in terms of materials used. For example,
Resene had increased the weight of card they used
as the backing on a colour chart for metallic paints.
This had increased the cost of producing those colour
Exhibit 1 Resene organisational chart*
* Subsidiaries not included.
Production
Manager
Retail
Development
Manager
Logistics &
Purchasing Manager
Marketing
Manager
IT
Manager
Sales
Manager
Finance
Division
Financial
Accountant
General Manager
Plant 1
Manager
Plant 2
Manager
Purchasing Purchasing
Production
Planning
Credit
Control
Southern
Regional
Manager
Northern
Regional
Manager
R&D
Team
Quality
Control
Technical
Services
Colour
Controller
Technical
Director

Case 12 • Resene Paints C-171
charts by 20 cents per card, or 9 per cent, but Nick
felt that the card held up better, looked more attrac-
tive and better supported the quality proposition. The
higher cost structure associated with better-quality
ingredients certainly led to arguments through the
years. ‘Periodically Tony asks me to look at the
cost of producing the paint to see if we can get that
down,’ recalled Colin. ‘Eventually, I would agree to
take a look, but I tended to forget and nothing much
changed. I can honestly say there has never been a
decision to reduce quality over the last 30 years – only
to increase it.’
There was a belief among management, however,
that consumers – even professional painters – did not
always recognise the quality of Resene paints. Colin
Gooch noted that ‘we have always sought standards
for the paint that go far beyond either industry norms
or even customer expectations’. However, the qual-
ity had at least been recognised by the New Zealand
Consumer Institute, identifying Resene as standing
out above all other brands of interior acrylic paints.1
Colin believed that, ‘over time, painters will notice
that they are having less come-backs [repairs] on
Resene paints’.
The board of directors for Resene consisted of
Tony Nightingale, Lindsay Lewer the finance director,
Colin Gooch and Wellington lawyer, Adrian Elling-
ham. At present, particularly since the board was
heavily weighted towards active employees, meetings
of the board were not highly formalised, nor regular.
Important decisions involved consultation between
Nick and Tony. Nick argued that, ‘we bring in specif-
ic expertise as necessary – either within the company
or, occasionally, through consultants. But I do see the
board evolving into a more formalised role with addi-
tional members added such as the manager of Altex
Coatings, myself and perhaps my brother [who did
not work for the company].’
One task that management at Resene had pur-
sued during 2001 was the development of a vision
for the company. Two alternatives had been under
discussion among the management team: Resene
will be an innovative supplier of paint solutions to
the retail and commercial marketplace or Resene will
be a world leader in the provision of paint products,
colour and their technologies. We will be driven by our
successful, world-class New Zealand team which will
celebrate our success. In mid-September, the manage-
ment team chose to go with To be acknowledged as
the leading provider of innovative paint solutions and
technologies.
Human resources
A significant proportion of employees had worked
for Resene for many years. When Resene did recruit
new staff, employees of other paint companies were
generally avoided. For example, the sales force had,
in recent times, recruited only four employees from
competitors. According to Nick, this was because the
philosophy of competitors tended to be more towards
making sales, even at the expense of profits. Resene
preferred to recruit from other industries – people
who had an understanding of selling a quality prod-
uct for a profit. Hiring technical staff, in particular,
was very difficult. Resene had recently had to hire
two scientists from India to obtain suitably qualified
and trained staff. In general, technical recruits from
competitors were more accustomed to a sterile envi-
ronment with well-resourced labs, but less orienta-
tion towards creativity.
Product range
At its most basic level there were two types of paint –
water-based and solvent-based. The difference referred
to the type of solvent used in the paint for thinning
– water or a petroleum derivative. While Resene pio-
neered water-based paints in New Zealand, as noted,
Resene later began producing solvent-based paints as
well. These were produced in their Upper Hutt plant
– separately from the main plant in Naenae. Solvent-
based paints could have certain properties that made
them desirable over water-based paints – particularly
for high-gloss products. However, water-based paints
were not considered dangerous goods because there
was not the fire danger of a petroleum-based prod-
uct. Water-based paints also cleaned up easier, had
less dangerous fumes and were generally more envi-
ronmentally friendly. Because of these advantages,
water-based paints dominated production in Aus-
tralasia. As such, paint companies were always look-
ing to develop water-based versions of paints that
had previously only been available as oil-based. One

C-172 Case 12 • Resene Paints
recent example was where Resene had pioneered the
first truly water-based enamel in the world.
Within these two types of paint, Resene produced
literally hundreds of product types, and thousands of
specific SKUs for use on the huge variety of surfaces
that paint could be applied to. The product range of
Resene included primers, sealers, undercoats and top-
coats for wood, steel, concrete, plaster or any other
building material. The wide product range was sup-
ported by advice on the appropriate product for any
surface. Resene produced award-winning specifica-
tion manuals to aid this, but also worked at a per-
sonal level with clients on specific problems. Both the
decorative and protective functions of paint could be
compromised – no matter how good the paint was
– if the paint was not able to bond with the surface it
was applied to.
Manufacturing
The actual manufacturing of paint involved the mix-
ing together of the basic ingredients of pigment,
binder, solvents and additives. At Resene, like the
vast majority of paint manufacturers in Australasia,
paint was produced in batches. Industry-wide these
batches varied from 200 litres to 20 000 litres at a
time. Resene produced in batches ranging from 200
litres to 10 000 litres. The technology for batch man-
ufacturing was not capital-intensive – particularly for
the production of less complex paint. The technology
for continuous production of particular lines of paint
did exist, but was only economic for the most popular
lines of the largest manufacturers. In 2001, no con-
tinuous manufacturing was done in New Zealand.
As well as demand constraints, the type of product
could limit the size of batch production. Resene had
a product called Zylone Sheen which, if produced in
too large a batch, turned into a jelly-like substance.
The manufacturing facility at Naenae had been
expanded in 2001. An additional 8 per cent capacity
had been built, aiding the manufacture of industrial
tinters and streamlining the manufacturing process.
One outcome of the expansion was that less stock
needed to be carried, as the plant had greater capac-
ity to produce paint as needed. Resene had the space
on their present site to be able to double capacity.
Dulux had recently invested $4 million on upgrading
its plant in Gracefield, Lower Hutt. The introduction
of robot technology enabled increased production, in
addition to improvements in waste treatment, for the
two factories on site. Dulux claimed to produce 12
million litres of paint per year at the site and want-
ed to grow – taking market share from competitors.
Wattyl, on the other hand, had been rationalising its
manufacturing, reducing from three sites to one in
New Zealand.
Raw materials
Resene used approximately 1000 raw materials in the
manufacture of its paints and coatings. For each raw
material, there were many suppliers globally. While
there was variation in the exact type of product and
the quality of products, there was usually a choice of
quality suppliers for each important chemical. Colin
Gooch noted:
For the vast majority of raw materials we pur-
chase there would be at least 10 suppliers. As an
example, there are many suppliers of titanium
dioxide around the world, including DuPont, the
company who developed the chemical, but also
many others who produce just as high quality
titanium dioxide. Quite often, those suppliers
who did not develop particular raw materials will
charge lower prices – because they did not have the
development costs of the innovator. This can create
something of a dilemma for paint companies.
Employees involved in purchasing, whose job it is
to obtain required supplies at the best cost they
can, would often prefer to purchase from these
lower-priced imitators. However, we have always
placed a premium on maintaining relationships
with innovating suppliers like DuPont so that we
can be kept abreast of the latest innovations. Our
competitors don’t have technical people involved in
purchasing so tend to go for the cheaper option.
Colin Gooch felt that he saw more samples of new
products than potentially any competing paint com-
pany. ‘Suppliers know that if they have something
“magic”, then we will be interested,’ Gooch noted.
Suppliers had expressed to Resene the view that there
has been an increasing trend among other paint com-
panies towards price as the dominant concern. The
strong relationships of Resene had enabled it to be the
first company in the world to adopt a number of new

Case 12 • Resene Paints C-173
technologies. In return, Resene provided information
back to the supply companies. This was aided by the
fact that New Zealand was a good test market with
sophisticated customers and harsh conditions. Gooch
commented:
But the relationships are the key – principally the
willingness to share. As an example, we obtained
new pigment dispersion technology from DuPont
that was the best available – which DuPont had
up until that point refused to release to anyone.
However, when I met with the key people at
DuPont I told them about a technology that we
were developing, as well as an idea for how the
DuPont technology might be developed that were
sufficiently valuable to DuPont that they agreed to
allow us access.
For one technology, Resene had commercially
available paint incorporating a new technology for
two months in New Zealand before paint manufac-
turers in the United States were even aware of the
technology.
Product development
Ideas for new products at Resene principally came from
three sources: marketing, usually where Tony Night-
ingale had come up with some ‘wild’ idea; technical
staff, developing a new product; or suppliers, com-
ing up with a new material that allowed new paints
to be developed. New developments could involve
all three elements simultaneously. Colin Gooch had
always enjoyed the problem-solving aspect of R&D
more than anything else, so even Tony’s ‘wild’ ideas
had been treated as challenges by the technical staff.
As Colin noted, ‘If they said to us make paint jump
out of the can and on to the walls itself, then it was
our job to try and get to the guts of the idea behind
that to see what could be done.’
An extremely promising recent innovation had
been the joint development with a Norwegian life-
sciences company, Polymer Systems Ltd, of ‘sphe-
romers’. Spheromers were perfectly spherical parti-
cles that produced an extremely tough, cleanable and
burnish-resistant surface. The dramatic performance
improvements for low-sheen paints were attracting
significant international interest. The problems with
prior low-sheen paints were the stimulus for Resene
to try to find a technology to improve performance.
That search led to contact with Polymer Systems, who
were developing the technology, but unaware of the
potential in paints. Resene developed the base tech-
nology for paints and will receive a share of the future
sales of the spheromers to other paint companies.
There was no such thing as a technician – who
ran experiments and reported back results to more
senior colleagues who decided what experiments to
run – at Resene. All the scientists ran experiments for
themselves. ‘There are subtle observations that are
very difficult to record,’ observed Gooch.
If technicians alone observed these, then key
researchers would not hold valuable information.
Instead, we strongly emphasise technical expertise
at the micro-level – to the point where we have
been said to ‘build paint from the molecules up’.
And actually we take pride in doing just that –
of having an absolutely thorough understanding
of all the constituent parts involved in developing
a great paint. Importantly, one of the constituent
parts is the surface that is to be painted. Therefore,
we go to considerable lengths – far more than our
competitors – to understand potential surfaces.
Colour
Resene has long had a strong reputation in the qual-
ity of its colours. Paint manufacturers typically had a
very large number of colours available for purchase.
However, the factory production of paint in every
colour would be impractical. Instead, the typical
practice was to produce in the factory a base paint,
often white, and add tinting pastes in-store, accord-
ing to preset formulas, to create the final paint colour.
This whole process varied considerably across paint
companies. The variation was in part because tint-
ing pastes varied – not just in their colour, but also
in their concentration. Resene was the first company
in the world to produce multiple base paints from the
factory that allowed less tinting paste to be used to
create final colours. Resene produced 14 different
coloured bases from the Naenae factory.
While Resene had employed its basic colour sys-
tem for many years, only in 2001 did Dulux adopt

C-174 Case 12 • Resene Paints
something similar. The cost of changing a colour sys-
tem is enormous. Colin Gooch explained:
As an example, simply changing the concentration
of one tinting paste without altering the shade
would require the production of probably 30 000
pieces of paper to effect the change. Our blue
tinting paste, for example, is used in approximately
2500 colour formulas of the 10 000 total formulas
that Resene has. Each of those 2500 formulas
would have to be changed because of the change in
concentration. Any change to base paint or tinting
paste will have a major effect on the colour system
because of the scope of colours that need to be
able to be produced and the interdependence of
each aspect of the final paint colour. So it was a
monumental undertaking when we changed from
a system of one base colour to 14 base colours of
paint. But it was less difficult for us to change than
for our competitors because of our smaller size –
particularly then.
Colin Gooch estimated:
Probably 85 per cent of paint manufacturers in
New Zealand, Australia, the United States and
Scandinavia used colour systems involving tinting.
Elsewhere in Europe, penetration rates would be
more like 40 per cent, and even lower throughout
Asia. Really what drives it is the sophistication
of the market and the demand for colours by
customers. It’s just very difficult to compete
with a limited range of colours in more colour-
sophisticated markets like New Zealand.
Customers chose paint based on colour to a sig-
nificant extent. Therefore, customers needed to be
able to see colour and preferably visualise the final
look of any colour on the surface they wanted to
paint. Two critical aspects of colour visualisation
that paint companies used were colour charts and
test pots. Resene has been a leader in many areas of
colour charts. Resene introduced a new system of
colour that included strong colours for the first time
in New Zealand in 1969.
‘We developed the British Standards Regis-
ter system of colours into a series of colour charts
that were the largest available internationally,’ noted
Colin Gooch. The pressure for strong colours came
from a number of prominent Wellington architects
with whom Resene had close relationships. In 1976
the ‘Total Colour Chart’ was launched, having been
completely developed in-house, and replacing previ-
ous charts as the largest available. ‘We’ve continued
to develop our colour ranges and even developed a
fan deck colour chart that allows better isolation of
particular colours on a chart,’ noted Nick.
Resene was also the first company in New Zea-
land to introduce a full range of test pots in 1975. Test
pots enabled customers to try a small amount of paint
on a particular surface before making their full pur-
chase of paint. Even though colour charts and newer
computer programs (such as Resene’s recently intro-
duced ‘Ezypaint’) aided colour choice enormously,
there was no perfect system for taking into account
effects such as lighting, in any given space without
actually painting the surface. Hence, test pots contin-
ued to play a critical part in colour selection and were
complementary to the other colour selection tools.
Test pots were introduced as a promotional device
for architects and interior designers, but in 2001 they
accounted for more than $1 million in sales per year.
Marketing
Resene has always placed great emphasis on the com-
mercial segment of the market and in 2001 continued
to dominate the commercial segment in New Zea-
land. Indeed, the primary phrase that is used in mar-
keting is, ‘Resene: the paint the professionals use.’
Partly, this focus dates back to the origins of the com-
pany and the difficulties in selling to the retail market.
But professionals, particularly architects and specifi-
ers, were also more discerning about the type of paint
to be used. As noted, architects even encouraged the
development of the strong colours that helped Resene
to distinguish itself from competitors. To support
the commercial segment, Resene employed 65 sales
reps – almost twice as many as its nearest competitor,
Dulux, with 35.
Appealing to the commercial market involved
direct marketing, more than mass advertising. Even
with a concerted effort under way to increase its
retail profile, Resene spent approximately the same
amount on direct marketing as wider advertising in
2001. ‘Since I’ve been general manager the database
that we use to target our marketing has grown from

Case 12 • Resene Paints C-175
2500 to 12 000,’ noted Nick Nightingale. ‘And that’s
come from thorough research – including actively
tracking down the owners of buildings throughout
New Zealand. The database is itself segmented and
each person targeted specifically.’ Resene produced
a newsletter that featured new products and services
as well as case studies of recent projects involving
Resene paints. Resene also sent out calendars, coast-
ers and many other promotional items throughout the
year. Additionally, Resene sponsored the Architecture
Awards of the New Zealand Institute of Architects.
Resene traditionally advertised less than the other
major paint companies in New Zealand. However,
this situation was changing, as shown in Exhibit 2.
The trend of increasing advertising continued in 2001
with expenditures up 20 per cent with the introduction
of a new series of three television commercials. Resene
advertising emphasised the brand generally – and the
ColorShops in particular. The competition, especially
Orica, focused on particular products far more in
their advertising. For example, $696 000 of Orica’s
total advertising expenditure was on Dulux Exterior
and Wash & Wear paints alone. Nick explained:
For the retail segment of the market, the key for us
is to get customers inside a ColorShop where those
customers can then be directed to the appropriate
Resene product. For Orica and Wattyl, who
operate through independent retailers, they try
to influence a particular purchase decision prior
to entering a store. The advertising of Orica and
Wattyl is also aimed at fighting for extra shelf-
space from retailers. However, Orica and Wattyl
do benefit from the advertising of the retailers
themselves.
Sales
A major difference between Resene and its two main
competitors was that Resene owned its own retail
outlets. In 2001, Resene operated 54 company-
owned ColorShops as well as 19 franchised outlets
(see Exhibit 3). The franchised outlets tended to oper-
ate in smaller towns, where demand may not justify a
dedicated ColorShop. Nick noted:
We originally opened our own stores because
we couldn’t sell through independent retailers
because the larger paint companies had control
of those channels. We tried using an agent in the
1970s, but he wasn’t overly committed to moving
our paint, it seemed. We’d always sold direct
from the factory, but those sales were limited, of
course. But we bought a hand-made wallpaper
manufacturing operation and with that came a
store in Wellington – so we started selling paint
through that. We were genuinely surprised at how
much we could sell like that.
From that original store had grown the whole
chain. As such, the control of retail distribution
had become a central component of Resene’s overall
approach. That approach had been very successful,
with double-digit growth in retail sales throughout
Exhibit 2 Advertising expenditures, 2000
TV
($000)
Press
($000)
Magazines
($000)
Total
($000)
% change
1999–2000
% change
1998–99
Paint companies
Benjamin Moore 1304 251 68 1623 33.9 12.3
Dulux 1295 17 87 1399 –41.8 20
Resene 1098 123 143 1364 31.2 12.4
Retailers
Mitre 10 4234 2381 138 6753 9.7 38.0
PlaceMakers 2074 1981 4055 4.5 –19.3
Benchmark 2544 640 3184 56.1 19.6
Guthrie Bowron 2739 193 2932 –18.6 62.1
Source: Marketing Magazine, April 2001, p. 23 (based on ratecard only, not actual expenditures).

C-176 Case 12 • Resene Paints
its history. Since Nick became general manager in
1999, nine new stores had been added.
In addition to the growth of the ColorShops
chain, the stores themselves had been gradually
upgraded. A number of stores were relocated to better
locations, and more broadly, significant renovation
had occurred. The new-style stores were larger,
brighter and more sophisticated than their predeces-
sors. The latest ColorShops in Christchurch, Dunedin
and Palmerston North included quiet study spaces,
colour libraries, areas for children and plenty of
parking. Nick explained that, ‘in order to go after the
retail market more aggressively we realised we had
to have a format that was consistent with the high-
quality image of Resene. Our increased advertising
needs to work in concert with better stores and
improved training – I’m determined to only promise
what we can deliver.’ In the ColorShops themselves,
Resene offered a full complement of paint, wallpaper
and accessories. Most of the merchandise in the
ColorShops was sold under the Resene brand name,
but there was also a limited amount of ‘ColorShop’
brand paint that was lower in price and quality, but
also manufactured by Resene. Independent suppliers
manufactured the wallpaper and accessories, such as
brushes.
Exhibit 3 New Zealand retail locations
Region ColorShops (55) Franchises (19)
Northland Whangarei Kaitaia
Kerikeri
Dargaville
Kaikohe
Wellsford
Auckland Wairau Park Ponsonby
Takapuna Devonport
Birkenhead Browns Bay
Orewa
Warkworth
Mt Eden
Newmarket
Onehunga
Parnell
Henderson
New Lynn
Manukau City
Howick
Pukekohe
Albany
Papakura
Waikato Hamilton Thames
Cambridge Gisborne
T
e Awamutu
Tauranga
Mt Maunganui
Whakatane
Matamata
Rotorua
Taupo
Region ColorShops (55) Franchises (19)
Lower Central Napier Dannevirke
Hastings Hawera
New Plymouth Stratford
Palmerston North
Wanganui
Wellington Levin Porirua
Masterton
Paraparaumu
Lower Hutt
Upper Hutt
Naenae
Wellington City
Wellington City
Wellington City
Kilbirnie
Johnsonville
Nelson/
Marlborough
Nelson
Blenheim
Stoke
Canterbury Christchurch
Central
New Brighton
Hagley Park Sydenham
Papanui
Shirley
Timaru
Riccarton
Otago/Southland Oamaru Winton
Dunedin Alexandra
Invercargill
Queenstown

Case 12 • Resene Paints C-177
Both trade and DIY customers were served in the
ColorShops. Competitors Orica (through the Dulux
brand) and Wattyl did operate trade stores through-
out New Zealand, numbering 20 and 12 respectively,
and these were open to the public. However, given
the importance of their other distribution channels
through independent retailers such as Placemakers,
Mitre 10 and Guthrie Bowron, DIY sales were not
targeted by either trade store chain. Benjamin Moore,
a smaller operator, however, did distribute through a
chain of 38 owner-operated retail outlets for its paint
under the Benjamin Moore Colourworks banner. In
addition to selling under their own brands, all the
major paint companies manufactured house brands
for specific stores. Resene sold a very small amount
of paint through The Warehouse retail chain, using
the ‘NZ Paints’ brand. Dulux manufactured house
brands for Mitre 10 and Guthrie Bowron, while
Wattyl manufactured for Placemakers and Carters.
Distribution of paint and other supplies to the
ColorShops was done on a daily basis. However,
information systems to track the movement of paint
through to sale were limited. There was no way of
knowing exactly how much inventory was on hand
at any particular store until a manual stocktake was
undertaken. Relatedly, the profitability of each store
was not known with precision. Resene did purchase
market share data from Neilson, which was broken
Exhibit 4 Price comparison (acrylic exterior house paints – 4 litres)
White Price ($)
Benjamin Moore Benjamin Moore Moorglo 119 93
Orica British Paints 4 Seasons Gloss 65
British Paints Solarscreen Gloss 80
Dulux Weathershield 80
Levene Goldline 100% Acrylic Gloss 80
Resene Resene Enamycryl 87
Resene Hi Glo 87
Wattyl Taubmans All Weather Gloss 56
Wattyl Solagard 80
Others Damar House and Roof Gloss 55
Protec Master Stroke 300 55
Protective Paints Duralon Acrylic 61
House brands Guthrie Bowron Dimensions UVB 60
Hammer Hardware Acrylic High Gloss 40
ITM Supreme Acrylic Gloss 43
Kmart The Performer Acrylic Gloss 60
Mitre 10 Acrylic Gloss 45
The Warehouse NZ Paints 100% Acrylic Gloss 35
Brown Price ($)
Benjamin Moore Benjamin Moore Moorglo 119 93
Orica Dulux Weathershield 100
Levene Goldline 100% Acrylic Gloss 130
Resene Resene Enamacryl 103
Resene Hi Glo 103
Wattyl Wattyl Solagard 85
Others Damar House and Roof Gloss 71
Protective Paints Duralon Acrylic High Gloss 95
House brands Guthrie Bowron Dimensions UVB 80
Source: Consumer Institute of New Zealand, House Paint Test, 6 August 2001. Resene price includes standard 20 per cent ColorShop card discount. Although the
table is accurate for the paint shown, house paint is largely purchased in 10-litre pales and tends to range in price from $100 to $150 approximately.

C-178 Case 12 • Resene Paints
down by region. From that research, Nick was able to
track the company’s performance relative to competi-
tors on a monthly basis. In general, Resene’s weakest
market was Auckland.
Discounting
Paint companies charge different prices to different
customers and also offer a wide variety of discounts.
For example, Resene had a loyalty card that entitled
users to a 20 per cent discount. Resene had in excess
of 100 000 cards on issue. In general, trade prices
were approximately 25 per cent below general retail
prices. While Resene was competitively priced in the
retail segment, relative to other premium paints (see
Exhibit 4), it was able to charge a 10–15 per cent pre-
mium over competitors in the trade segment.
The tradition of discounting in the industry and
the complexity of the pricing systems created chal-
lenges for paint companies. Often the emphasis of
sales staff was on sales rather than profits, and the
result can be excessive discounting. Profitability at
Resene had been improving in part because the level
of discounts was being more closely monitored. There
are two primary reasons why a trade customer may
be offered a discount – volume and visibility. Certain
paint projects – such as the Museum of New Zea-
land, Te Papa – were prestigious and gained publicity
for the paint chosen. In those cases, paint companies
had added incentive to supply the paint, which led to
further discounts. Overall, the highest discounts were
given to Plunket and the IHC – charities to whom
Resene sold basically at cost. In general, major con-
tractors received the second-highest level of discount,
smaller contractors a lower discount, and occasional
trade customers a lower discount still.
Environmental choice
Resene explicitly promoted the environmental friend-
liness of its paint through its Environmental Choice
range. Environmental Choice New Zealand was a
program endorsed by the Ministry for the Environ-
ment and administered by International Accredita-
tion New Zealand (IANZ). It was aimed at improv-
ing the quality of the environment by minimising the
adverse environmental impacts generated by the pro-
duction, distribution, use and disposal of products.
Resene promoted the following pledge to custom-
ers regarding its environmentally friendly products:
With no increase in price, Resene customers will enjoy
safer, less hazardous paints, which are either of the
same quality as before or higher. About 70 per cent of
Resene’s paint products were Environmental Choice
– far ahead of any other manufacturer.
New Zealand subsidiaries
Altex Coatings was a paint and coatings manufac-
turer for the heavy industrial and marine markets,
having been purchased as a going concern by Resene
in 1989. Started over 45 years ago, Altex supplied a
wide range of coatings to almost every major industry
sector. Structures as diverse as petrochemical plants,
commercial ships, electricity pylons – and even the
Auckland Harbour Bridge – had been supplied by
Altex. Complementing its own range of coatings,
Altex had also been a long-standing licensee for
Devoe Coatings. More recently, Altex had obtained
the licence from the US Paint Corporation to pro-
duce its renowned ‘Awlgrip’ and ‘Awlcraft’ range of
high-performance marine coatings. Altex had quickly
established a strong market position in the high-
performance pleasure marine market. When Altex
was acquired, Resene already held licences for some
competing technologies from Ameron Coatings. As
such, the Altex business had to be kept separate from
Resene. The stand-alone nature of Altex was partly a
reflection of that history. However, Nick also believed
that Altex operated better under a separate identity.
Resene had been in the automotive paint market
since 1990, both manufacturing and distributing for
DuPont outside of Auckland. In Auckland, a com-
pany called Santano was the DuPont distributor, but
in 1995, after encouragement from DuPont, Resene
acquired Santano. Originally called Resene Santano,
the subsidiary had changed its name to Resene Auto-
motive & Protective Coatings. The company’s busi-
ness was approximately evenly divided between man-
ufacturing its own paint range, and acting as a local
distributor for other paint companies such as DuPont.
The market for automotive paint involved very low
volumes of paint. The painting of an entire car nor-
mally required a half to one litre of paint. More-
over, since there was no car manufacturing industry
in New Zealand, the market was completely reliant
on repainting vehicles being repaired after accidents.

Case 12 • Resene Paints C-179
Nevertheless, recent changes meant the business did
contribute profits to the group in 2001.
Tony Nightingale decided in 1996 to purchase the
wine company Cellier Le Brun principally because he
had a long-standing interest in wine. Resene used
some of the wine produced for promotional purposes
and the vineyard was painted with Resene paints. The
name Cellier Le Brun had become synonymous with
high-quality methode traditionelle wines. In recent
years, the Terrace Road label had also been devel-
oped for more moderately priced table wines with
some success.
International operations
Resene had a small presence in Australia. The previ-
ously separate Australian manufacturing operations
of Resene and Altex Coatings had been consolidated
down to one plant on the Gold Coast in Queensland.
The Australian manufacturing plant was comple-
mented by a small retail distribution network consist-
ing of four Resene ColorShops and 14 independent
stockists (see Exhibit 5). Nick noted, ‘We haven’t
pushed trade sales in Australia because the competi-
tion has driven prices down to virtually below cost.’
In Fiji, Resene operated one small plant, as did
some Australian competitors. (There was little dif-
ference between paints that worked in Fiji and Aus-
tralia.) The Fijian operation produced a very wide
variety of paints and coatings in small volumes. The
Fijian market had shrunk about 10 per cent after
recent political turmoil. There was a market in Fiji for
up-market paints, but that market was under threat if
more affluent sections of the community left Fiji over
the political problems.
Resene was investigating export opportunities
to Thailand and Japan. In Japan, where prices were
quite high, Resene could cover the cost of transpor-
tation and still be profitable. Nick commented, ‘Tra-
ditionally the emphasis has been on white, some off-
whites and perhaps beige. More recently, though, you
can see European colour influences coming through
in magazines which may signal future growth in the
demand for stronger colours.’
The principal element of Resene’s technology
licensing to date had been a tinting technology sys-
tem. Resene had supplied this technology to South
Africa, Zimbabwe, the Dominican Republic, Malay-
sia, Indonesia and China. According to Nick:
Most international markets tend to have an ‘ICI-
type’ [orica-type] player, a major multinational
paint company who drip-fed technology into
those markets after a lag-time from their primary
markets. Our general approach has been to supply
a local competitor with technology that allows
them to compete better. In China, we’re providing
Exhibit 5 Australian retail locations
State ColorShops (4) Stockists (15)
Queensland Woolloongabba, Brisbane Butcher’s Paint Barn, Townsville
Geebung, Brisbane Cairns Hardware, Atherton
Brisbane Cairns Hardware, Edmonton
Cairns Hardware, Cairns
Cairns Hardware, Cairns
Classic Paint Supplies, Cleveland, Brisbane
Goodfellows Handy Hardware, Kallangur, Brisbane
Innisfail Plumbing and Paint, Innisfail
Paint City Coolum, Coolum Beach
Paint City Currimundi, Currimundi
Paint City Maroochydore, Maroochydore
Paint City Noosa, Noosaville
Goodfellows Handy Hardware, Kallangur, Brisbane
New South Wales North Rocks, Sydney Taree Builders Bargain Centre, Taree South
Victoria Morgans Paint Spot, Moorabbin, Melbourne

C-180 Case 12 • Resene Paints
technology to a major Chinese player who has
been losing market share to multinationals ICI and
Nippon. In Bangladesh, we’ve gone a step further,
and have a 20% stake in Resene Bangladesh with
a local partner. That was really the only way we
could enter the market. The products manufactured
are very basic, but it has the potential to provide
an avenue into the massive Indian market.
The paint industry
In 2001, total sales in the Australasian architectural
and decorative paint market slightly exceeded A$1 bil-
lion, with New Zealand representing approximately
NZ$190 million. Both Australian and New Zealand
markets have shown the same limited growth as other
mature markets for a number of years, at about 1–2
per cent per year. (Resene has been growing at around
6 per cent recently.) The limited amount of residential
and commercial property construction during 2001
had further hindered growth. As shown in Exhib-
its 6 and 7, based on Orica’s own estimates, Dulux
was the market leader in both Australia and New
Zealand. Only 6 per cent of paint sold in Australasia
was imported.
The primary brands in Australia were identical
to New Zealand with the exception of Resene itself
– Dulux, Wattyl and Taubmans. However, while the
Taubmans brand was manufactured by Wattyl in
New Zealand, South African company Barloworld
owned the brand in Australia. There were a rela-
tively large number of independent paint stockists in
Australia, who competed with the massive hardware
chains such as Mitre 10 and BBC Hardware. The
major brands in Australia – Dulux, Wattyl and Taub-
mans – all distributed through those large hardware
chains. The independent paint retailers tried to differ-
entiate themselves from the big chains by greater cus-
tomer service. However, ultimately the customer was
still buying the same paint they could get elsewhere –
probably cheaper. In general, Australian paint shops
were not as upscale as either ColorShops or Guthrie
Bowron in New Zealand.
Throughout Australasia 55 per cent of sales were
to the trade and 45 per cent to the retail DIY market.
The majority of retail paint sales occurred through
independent hardware and decorating outlets. Chains
dominated hardware and decorating retailing in both
New Zealand and Australia. Some of those chains
were owned by single companies, such as Benchmark,
Exhibit 6 New Zealand market shares
Source: Orica.
Others
18%
New Zealand Architectural &
Decorative Coatings Market
A$150mn (25mn litres)
Resene
23%
Wattyl/
Taubman
s
22%
Dulux/
Levenes
37%
Exhibit 7 Australian market shares
Source: Orica.
Others
19%
Australian Architectural &
Decorative Coatings Market
A$850mn (125mn litres)
Dulux (Orica)
35%
Wattyl
25%
Taubmans
(Barloworld)
21%

Case 12 • Resene Paints C-181
while others were cooperatives of independently
owned stores, such as Mitre 10. In Australia, paint
was the highest-margin hardware product sold, gen-
erating gross margins of 35.5 per cent on average for
retailers. Paint was also the single biggest category of
sales for hardware stores – representing approximate-
ly 15 per cent of their retail sales in Australia.
The biggest of the hardware chains in both New
Zealand and Australia was Mitre 10. Under the Mitre
10 and True Value brand names, the group operated
653 stores in Australia and 205 in New Zealand.
When Mitre 10 in Australia switched from Taubmans
to Dulux for the supply of its house brand of paint,
Taubmans lost 7 per cent of its total sales. In gener-
al, price cutting on paint was pervasive in Australia.
‘Discounting, plus the cluttered appearance of most
sales outlets, has encouraged consumers to view paint
as a commodity.’2 One result was that tinting was not
paid for by customers in Australia if done off a white
base, whereas it was in New Zealand.
Competitors
Dulux was the leading paint brand of the Orica
group. Orica was an Australian-headquartered com-
pany formerly known as ICI Australia before the par-
ent company ICI (UK) sold its 64 per cent stake in
1998. A condition of the sale was that the ICI name
be replaced, and so the name Orica was introduced.
Orica was involved in mining services (explosives),
chemicals, agricultural chemicals, and consumer
products such as paint in numerous countries. The
paint business operated only in Australia and New
Zealand, primarily under the brand name Dulux. In
June 2001, a new CEO was hired after recent poor
performance by the group. In New Zealand, the
Dulux name itself has been around since 1939.
The principal paint business for Orica was in
Australia, predominantly through the Dulux brand.
R&D was centralised in Clayton, Victoria at the
A$12 million technology centre for the Consumer
Products division, opened in November 2000. Over-
all within Orica, the Consumer Products division
generated A$638 million (17 per cent) of corporate
sales and 21 per cent of the A$235 million corporate
profits in 2000. The approach of the division was to
emphasise leading brands, established technology,
overlapping customers, and overlapping channels
surrounding a customer focus. Dulux Trade operated
69 Dulux Trade Centres throughout Australasia, had
175 aligned depots and distributorships, and boasted
a customer base of 40 000. Overall, as market lead-
er, Dulux sold 35 per cent of the paint purchased in
Australasia by volume and 38 per cent by value of
what they estimated to be a A$1.1 billion total mar-
ket. Dulux believed its strategy for success was based
around brands, technology, innovation, colour lead-
ership, distribution and customer satisfaction. In
unaided brand awareness tests in Australia, Dulux
trailed only Telstra and McDonald’s for awareness,
beating Coca-Cola and far outstripping any other
paint brand.
Dulux operated three Australian manufacturing
facilities in Queensland, Western Australia, South
Australia plus the New Zealand operation in Wel-
lington. The Rocklea plant in Queensland had com-
pleted a A$17 million upgrade in 2000 that incor-
porated two fully automated and six semi-automated
robotic filling lines and the implementation of flex-
ible manufacturing technology. The Rocklea plant
was the largest paint manufacturer in Australia, the
upgrade increasing the capacity from 40 million litres
per year to over 60 million.
Wattyl was also a multinational competitor head-
quartered in Australia. Wattyl was solely a paint
company with manufacturing operations in Aus-
tralia, New Zealand, the United States, Thailand,
Malaysia and Indonesia. Founded in Sydney in 1915,
Wattyl became a public company in 1959. Since then,
Wattyl’s development has been heavily influenced by
acquisitions, having purchased at least nine other
Australian paint companies. Wattyl has had a pres-
ence in New Zealand since 1970, when it acquired
Solway Products. In 1989 that presence was expand-
ed greatly through the acquisition of Samson Gold-X.
The Taubmans brand in New Zealand was acquired
in 1995, establishing Wattyl as a major player in the
market. Outside Australasia, expansion has been
driven by the acquisition of companies such as the
Dimet Group (Asia) and Coronado Paint (USA).

C-182 Case 12 • Resene Paints
During the financial year to 30 June 2001,
Wattyl had corporate revenues of A$528 million, but
experienced losses of A$22 million. In March 2001,
Wattyl’s managing director resigned. Subsequently,
the management and board of Wattyl instigated a
major strategic review of operations. While Wattyl
had faced a number of one-off costs such as bad debts
in the United States and an Australian strike, it also
believed that it had not re-invested sufficiently in plant
in recent times. While Wattyl was still profitable in
both Australia and New Zealand, 2001 performance
was poor in both the Asian and US markets. As a
result, Wattyl wrote down its investments in Asia
and the United States and was looking to exit Asia
completely. In seeking to remedy the situation in
Australia, Wattyl has reduced the number of plants
from eight to three, established more efficient
warehousing, sold surplus properties, and introduced
a major new premium interior wall paint.
Barloworld is a large South African conglomerate
with interests including cement, lime, laboratory
equipment, lasers and steel tubes. Barloworld has
paint manufacturing operations in South Africa, the
United Kingdom and Australia under different brands.
The Taubmans brand had been in Australia for over
100 years; however, prior to its sale to Barloworld
in 1996, it had begun to flounder, benefiting Wattyl
and Dulux. In 1992, Taubmans had market share of
22 per cent, but that fell to 15 per cent by the time of
the sale. The new ownership had turned that around
and the combined market share of Taubmans and
Barloworld’s other Australian brand, Bristol Paints,
had risen from 23 per cent to 29 per cent since 1998,
taking over the number two spot in the industry.3
Nevertheless profits had been more difficult to come
by and the Taubmans/Bristol group made losses
in 2000 (see Exhibit 8). Speculation existed that
Barloworld would look to exit Taubmans.
The 120-store retail arm of Bristol Paints
was moving towards increased franchising, with
company-owned stores converted into franchisees.
The stores employed 500 staff throughout Australia
and represented the largest chain of retail and trade
stores for paint and wallpaper. In addition, six fran-
chised Bristol decorator centres opened in China in
1999 and a further four in 2000. The entire range
sold in China was produced in Australia. As part of
Barloworld, both Bristol and Taubmans had access
to the Nova Paint Club. The Nova Paint Club was
a worldwide association of 15 paint companies that
provided a framework for the exchange of technical
information, technology and expertise across all their
areas of operation.
Smaller paint companies existed in both Aus-
tralia and New Zealand. Benjamin Moore Pacific in
New Zealand, for example, began as a joint venture
between Benjamin Moore, the large US paint com-
pany, and local owners. However, the local owners
had subsequently taken full ownership and operated
under a licensing agreement from Benjamin Moore
(US). As noted, Benjamin Moore did have a retail
presence through franchised retail outlets around
New Zealand. However, the number of Benjamin
Moore Colourworks stores had been diminishing
as stores switched to competing retail chain Colour
Plus. Colour Plus was associated with Wattyl prod-
ucts, so the switching allegiance was cutting off the
primary outlets that Benjamin Moore had. Retailers
were believed to be switching in order to gain better
brand support.
Most small paint companies did not have chains
of stores associated with them, however. Often they
were specialised firms that had a reputation in a par-
ticular product that allowed them to sell direct to the
trade. In New Zealand, Rotorua-based Damar had an
alliance with Amway that had resulted in the website
Exhibit 8 Barloworld’s regional paint results
(A$mn)
Australia South Africa Other Africa Europe
1999 2000 1999 2000 1999 2000 1999 2000
Sales 192 218 216 220 9 17 19 21
Operating profit 0.8 (2.3) 12 12 0.2 1.2 1.8 2
Assets 104 109 102 101 5 7 9 9
Source: Barloworld Limited Annual Report 2000.

Case 12 • Resene Paints C-183
PaintDirect. Damar concentrated more on the low-
margin road-marking business. Other small competi-
tors tried to sell direct or through any independent
retailers that will stock them.
The future
Throughout its first 55 years in existence, Resene
Paints had shown that it had the capabilities to com-
pete effectively in New Zealand against its larger
multinational competitors. Having traditionally been
strong in the commercial market, Resene had, in
more recent years, made a concerted and successful
push at the retail market through its own chain of
ColorShops. But within New Zealand the prospects
for growth in its current markets were not limitless.
Although there was still room for growth in the
New Zealand market, longer-term growth prospects
appeared to be outside New Zealand. Internation-
ally, Resene had very small operations in Australia
and Fiji. Clearly, Australia was a large opportunity,
but was it the right opportunity for Resene? Were
Asia or elsewhere more desirable regions? Should
Resene itself even look to operate in other countries,
or should it focus on developing technologies in New
Zealand to be licensed overseas, such as the newly
developed spheromer paint flatting agent? Or should
Resene focus its resources on continuing to grow the
New Zealand market for the time being? As Nick
Nightingale stepped off the 18th green at Parapar-
aumu Beach Golf Club, having shot 91 in a losing
effort, he knew he couldn’t afford to be as wayward
in his choice of markets.
Notes
1 Consumer Institute of New Zealand, 1998, ‘Interior Acrylic
Paints’, April.
2 N. Shoebridge, 1997, ‘Taubmans, “with imagination”, tries to paint
its way out of a corner’, Business Review Weekly, 10 November
1997, p. 78.
3 Barloworld Limited Annual Report 2000, p. 32.

C-184
Case 13
Sony Corporation:
The vision of tomorrow
Kulwant Singh Nitin Pangarkar
National University of Singapore National University of Singapore
Loizos Heracleous Abhinav Singh
National University of Singapore National University of Singapore
At the advent of the 21st century, Sony Corporation
was at a crucial juncture in its long and illustrious his-
tory. At the threshold of the much anticipated world
of total digital convergence, the electronics maker
turned media and communications giant seemed to
have it all: next-generation Internet-aware gadgets
and compelling content to pump through them, a
vibrant culture of innovation resulting in cutting-edge
research and development, and a world-class market-
ing acumen that had made Sony a global mega-brand.
Despite having all the arms in its arsenal, some tough
decisions nevertheless lay ahead for the company.
Chief among them were: How to manage the com-
pany’s mix of diverse businesses to achieve inter-unit
coordination and synergies? What paths, in terms of
new product development, to take in the unexplored
realm of total digital convergence? And, above all,
how to communicate and sell the new Sony identity
to the customers, shareholders and employees?
Introduction: It’s a Sony
In 2002, Japan-based Sony Corporation was the
world’s largest consumer electronics company, a sig-
nificant player in the media industry and the fastest-
growing computer and communication equipment
maker. The Sony brand was one of the world’s most
recognisable and trusted brands – thanks to half a
century of relentless innovation, bringing an array of
trend-setting electronics products into the market.
Sony ranked 21st in the BusinessWeek/Interbrand
list of the World’s 100 Most Valuable Brands with
an estimated value of US$14 billion1 – and the first
among its industry peers.
In 1999, for the third year in a row, Sony was
recognised as one of the world’s 100 Best Managed
Companies by Industry Week magazine.2 The Trini-
tron, the Walkman, the Betamax, the Camcorder,
the Compact Disc, the MiniDisc, the venerable Play-
Station and the robot dog Aibo were some of the Sony
innovations that had created all new markets of their
own. It’s a Sony – the company’s tagline for its elec-
tronic audio and video products – was a stamp of
quality, cutting-edge technology and reliability.
The company also had a strong media indus-
try presence, with its record label boasting artists
such as Michael Jackson, Bruce Springsteen, Jenni-
fer Lopez, Celine Dion and Mariah Carey. The film-
making division was behind blockbusters such as
Spiderman, Men in Black, Air Force One, Charlie’s

Case 13 • Sony Corporation C-185
Angels, Stuart Little and many hit television shows
syndicated to various TV and cable channels around
the world. The success of the PlayStation had made
Sony the leader in the console gaming market. Sony
was also the world’s fastest-growing personal com-
puter maker,3 albeit still ranking eighth in worldwide
market share, with its VAIO brand of personal com-
puters and CLIÉ line of hand-helds fast threatening
larger players such as HP-Compaq and Dell. Having
also a presence in semiconductors, electronic com-
ponents, mobile phones and even robots, Sony was
well positioned to compete in the emerging world
of total digital convergence – a vision of the future
where multifunctional devices could seamlessly talk
to each other, and multimedia content was ubiqui-
tous through these networks. But in this uncertain
future world of technology-driven digital entertain-
ment, Sony, like its competitors, wasn’t too sure of
what exactly constituted the winning formula.
Sony’s history: The making
of a dream
The two visionaries
Sony Corporation traced its roots to the Tokyo Tsu-
shin Kogyo (The Tokyo Telecommunications Engi-
neering Corporation), or Totsuko, established on
7 May 1946 by Masaru Ibuka – a gifted engineer,
and Akio Morita – a marketing-savvy innovator.
Both Ibuka and Morita had honed their engineering
skills while serving the government, developing mili-
tary equipment for the Second World War. After the
war, they moved to war-damaged Tokyo and brought
together a small team of trusted war-time engineers
to start a company whose main aim was to create a
stable work environment where engineers who had a
deep and profound appreciation for technology could
realize their societal mission and work to their hearts’
content.4 Seeking to help rebuild post-war Japan with
its engineering know-how but lacking in capital and
infrastructure, the company started out by repairing
radio sets. Its first product was an electric rice cooker,
followed by other innovative appliances such as an
electrically heated cushion and a good-quality record
pick-up. In 1958, the company was renamed Sony – a
term derived from the Latin word sonus, which was
the root of words such as sound and sonic; and also
from sonny which meant little son. Hence, Sony sig-
nified a small group of young people who have the
energy and passion toward unlimited creation.5 The
fact that this name was much simpler to remember
and more marketable to an international consumer
base than Totsuko, of course, helped.
The trailblazers – Sony’s famous
products
In 1950, Sony produced the G-Type, Japan’s first
tape recorder, followed by the P-Type – its portable
version. TR-55, Japan’s first transistor radio, was
launched in 1955, followed by the world’s first pocket
transistor radio in 1957. In 1960, Sony launched the
world’s first direct-view transistor television, and in
1963, the world’s first VCR. In 1968, the legendary
Trinitron colour-TV set the industry standards of pic-
ture quality and design.
In 1975, Sony brought the theatre home by
launching the Betamax – the world’s first home-VCR.
In 1979, Sony launched the Walkman – the world’s
first personal audio tape player – to a sceptical mar-
ket. But the product made history by starting a revo-
lution of personal audio products. The term Walk-
man has even been included in the Oxford English
Dictionary since 1986. In 1982, Sony pioneered the
compact disc, in association with Philips. Apart
from these innovations, Sony also launched the digi-
tal audio tape, the home-use Handycam video cam-
era, the mini-disc, flat-panel and high-definition TVs
(HDTV), and digital cameras.
Sony also played a key role in the development of
the digital versatile disc, or DVD. The market-leading
PlayStation game console was launched in 1994. In
the late 1990s, Sony entered the computer market by
launching its VAIO line of multimedia-capable PCs
in 1996 and the CLIÉ series of handheld computers
in 2000.
In 1999, it launched the world’s first entertain-
ment robot, the dog-like Aibo, which became a run-
away success. Sony engineers were also working on
intelligent humanoid robots, following the success of
Aibo.

C-186 Case 13 • Sony Corporation
Globalisation and diversification
While Sony was launching these innovative prod-
ucts, it was also expanding out of Japan to become a
global player. Ibuka and Morita had earlier visited the
United States and Europe in the early 1950s to study
the latest technologies – for example, the transistor.
There, they discovered a huge market for electronic
products. During his visit to Philips in 1953, Morita
thought, ‘Holland resembles Japan in many ways. If a
company like Philips can succeed in the international
market, there’s no reason why Totsuko can’t.’6 He
thus directed Sony to start concentrating on exports
to the international market, with a goal of earning
at least half of its total revenues from overseas sales.
This was followed by setting up overseas offices to
supervise marketing and sales activities. Sony’s first
major overseas office, the Sony Corporation of Amer-
ica (SONAM), was established in New York City in
February 1960 to do ‘business with Americans like
an American company’.7 With a capital investment
of US$500 000, the office was actually located in a
small warehouse, employing six people. This was fol-
lowed by offices in Hong Kong and Zurich. A radio
factory in Shannon, Ireland was Sony’s first overseas
manufacturing facility. The Sony Technology Centre
in San Diego, established in 1972, was the first con-
sumer electronics manufacturing facility opened by a
Japanese company in the United States.
These initial establishments were followed by
Sony opening offices and plants in many countries.
Sony leveraged on its vast pool of talented engineers
to produce innovative audio and video products, as
well as various electronic components. Under the
leadership of Norio Ohga, who was Sony’s president
from 1982 to 1995, Sony’s view of its business was
transformed from an electronics company to an
entertainment company. Ohga took the bold step of
establishing the music, pictures and gaming businesses
to pioneer Sony’s foray into the content arena. Akio
Morita also wanted Sony to move into the content
business, so that it could have higher market power,
believing that if Sony had controlled the rights to
enough movies, its Beta video format would not
have lost out to Matsushita’s rival VHS format in the
1970s.
This foray into the content business was achieved
by the acquisition of US-based CBS records in 1988
and the Hollywood studio, Columbia Pictures (along
with its television subsidiary Columbia Tristar Tele-
vision Group) in 1989. Hence, Sony Music Enter-
tainment (SME) and Sony Pictures Entertainment –
two of the world’s largest content producers – were
formed. Ohga, being a visionary, was also instrumen-
tal in Sony’s foray into the game business in 1994.
The PlayStation game console directly took on estab-
lished players such as Nintendo and Sega, subse-
quently dominating the market. These moves were
coupled with a renewed and innovative marketing
strategy and product planning, projecting Sony’s new
stylish, modern image. Nobuyuki Idei, who took over
the helm from Ohga in 1995, continued the process of
continuous reinvention at Sony, pushing the compa-
ny into the digital networks and convergence era, by
launching personal and handheld computers, mobile
phones and a host of hybrid devices that herald-
ed the integration of audio-visual and information-
technology products. In 1996, Sony launched So-net,
a broadband network provision service in Japan.
Sony had also diversified into the financial services
business, providing banking and insurance services
in the Japanese market. Sony Bank, an Internet-based
bank for middle-class Japanese investors, was opened
in 2001.
A culture of innovation – the ‘Sony
DNA’
Technical innovation and marketing superiority had
been the two central pillars of the Sony establishment.
These pillars were put in place by the company’s
founders, who, through their complementary skills
and enthusiastic leadership, set the foundations of a
true culture of innovation at Sony. Ibuka was a vision-
ary, adept at imagining applications of emerging tech-
nologies to everyday life. Leading the research and
new product development efforts, he was an inspiring
leader, responsible for shaping much of Sony’s open-
minded corporate culture, and infusing the spirit
of innovation in Sony’s employees. To complement
Ibuka’s skills, Morita was a true marketing pioneer,
and was instrumental in making Sony a household
name worldwide, by searching for new markets and
growth opportunities.

Case 13 • Sony Corporation C-187
The modern corporate culture at Sony was artic-
ulated by the term Sony DNA, a metaphorical refer-
ence to the traits inherited from the two founders and
other leaders. The meaning of the term, and Sony’s
raison d’etre, was summarised by Kunitake Ando,
Sony’s president and chief operating officer, in 2002:
If Sony is going to be different from all the others,
it has to really step ahead. It’s the difference
between originality and a copy machine. We are
not like a Dell. We are trying always to come up
with something new, to create innovative products.
That’s basically Sony’s DNA. The path is not always
smooth. But if you lose your mission, your DNA,
you lose your reason for being. Sony’s reason for
being has always been to create something new, to
create more dreams, to make things fun.8
Sony described itself as follows, on its news and
information website:
Sony is a company devoted to the CELEBRATION
of life. We create things for every kind of
IMAGINATION. Products that stimulate the
SENSES and refresh the spirit. Ideas that always
surprise and never disappoint. INNOVATIONS
that are easy to love, and EFFORTLESS to
use, things that are not essential, yet hard to
live without. We are not here to be logical. Or
predictable. We’re here to pursue INFINITE
possibilities. We allow the BRIGHTEST minds to
interact freely, so the UNEXPECTED can emerge.
We invite new THINKING so even more fantastic
ideas can evolve. CREATIVITY is our essence.
We take chances. We EXCEED expectations. We
help dreamers DREAM.9
The making of a global brand
The term Sony DNA also captured Sony’s extra-
ordinary flair for the design and marketing of its
products. Sony’s successful product launches were
always accompanied by an elaborate marketing and
positioning effort, and doing things differently often
earned it handsome premiums for its products. For
example, one of its devices was a wireless access point
that joined components in a local area network and
provided access to the Internet. Traditional models
of such devices were plain, flat and ugly plastic boxes
with thick antennae jutting out. But Sony’s version
had a glassy, opaque surface, stood vertically and had
cleverly concealed the antennae – giving the product
a smart and very agreeable look.10
These design innovations were backed by zeal-
ous marketing efforts, resulting in the creation of sev-
eral successful sub-brands within the Sony umbrella
such as Trinitron, Walkman, WEGA, VAIO, which
also strengthened the umbrella Sony brand. Sony also
often relied on revitalising its mature brands to repo-
sition them. The Walkman brand was relaunched
in 2000, this time for the mini-disc format, with a
tagline The Walkman Has Landed. The launch was
supported by broadcast, print and on-line advertis-
ing, Internet and dealer events and promotions, and
grassroots public relations campaigns, to target the
Generation Y target market.11
As a result of these efforts, Sony had become one
of the world’s greatest brands, rated the number one
brand in the United States by the 2000 Harris poll,12
and as the world’s 21st most valuable brand in 2002.13
Norio Ohga, Sony’s chairman until 2003, said:
In April of every year a large number of new
employees join the company. And what I always
say to them is that we have many marvelous assets
here. The most valuable asset of all are the four
letters, S, O, N, Y. I tell them, make sure the basis
of your actions is increasing the value of these
four letters. In other words, when you consider
doing something, you must consider whether your
action will increase the value of SONY, or lower
its value.14
Winds of change: Sony
prepares for the future
The modern consumer electronics industry was cre-
ated with the launch of the VCR in the 1970s, but
had changed surprisingly little until the mid-1990s.
Computers and mobile telephones had been launched,
but they had become separate industries in their own
right. During this time, the main players in the con-
sumer electronics industry had remained broadly the
same – dominated by firms such as Sony, Philips and
Matsushita (makers of Panasonic and JVC).15 Each of

C-188 Case 13 • Sony Corporation
these analogue consumer electronic devices had their
own standards and market leaders. Hence, market-
leading VCRs were made by different firms than the
ones that made market-leading audio equipment. But
in the mid-1990s, with the advent of a host of digi-
tal devices with mass market potential, this equation
was changing quickly. These devices were made by
firms outside the consumer electronics world, and
were technically similar to computers – heralding
the digital convergence. They increasingly incorpo-
rated features of consumer electronics devices – for
example, an MP3 personal stereo – but, being digi-
tal, were inherently different in their underlying tech-
nology from their traditional counterparts. The PC
was fast becoming the home’s information and enter-
tainment hub in developed countries. This evolution
of the computer industry towards the consumer elec-
tronics industry promised a profound and long-term
impact on the traditional consumer electronics com-
panies. The message was clear – the wave of digital
convergence was coming as the boundaries between
the computer and other devices blurred, as virtually
all media, from a movie to a telephone call, could be
transmitted and processed as a string of ones and
zeros.16 Consumer electronics companies could ignore
this trend only at their own peril.
The transformation of Sony for this digital age
had started well in time, when Nobuyuki Idei, a
young executive, was surprisingly appointed the CEO
of the company in 1995. Norio Ohga had actually
bypassed about a dozen more senior managers to give
Idei the job, a bold move highlighting the need for the
company to reinvent itself at the end of the analogue
age. Idei had his task cut out: to remake the company
for the network age. He quickly announced his vision
for Sony by coining the phrase ‘Digital Dream Kids’,17
underlining the ambitions of a company that had a
new youthful zeal in the digital era. He summarised
his vision by declaring,
We have to change our culture from the manu-
facturing industry to knowledge-based global
culture. Kind of a reinvention of the business
model itself.18
He knew that Sony had come a long way since the
days of Ibuka and Morita and compared the old Sony
to a prop plane that he was outfitting for jet propul-
sion, by transforming the company that made stand-
alone products shipped in boxes to one that produced
an almost organic swarm of interconnected devices,
services and experiences, all riding on the blurred
pulses of a ubiquitous wide-spectrum network.19
Investors liked Idei’s convergence idea, and Sony’s
market value had tripled by 1999, partly fuelled by
the Internet boom.
Restructuring and cost control
Idei’s appointment was immediately followed by sig-
nificant restructuring. He split the group’s unwieldy
audio/video products company and created a new
division for information technology products. He
also announced that the consumer electronics group
would restructure to become less dependent on
making television sets, video recorders and portable
stereos, due to these products’ commoditisation and
falling margins, and concentrate more on new net-
working opportunities.20 He also started the com-
pany’s drive to convert as many as possible of its
analogue products into digital, since manufacturing
digital products was relatively cheaper and they also
commanded higher margins.21
Traditionally, Sony was a high-cost producer – a
drawback that it used to compensate for by extract-
ing higher premiums on its innovative products and
designs. But its innovations and designs were swift-
ly being replicated by cheap electronics producers
at home (for example, Matsushita) and abroad (for
example, Samsung), pushing down industry margins.
These low-cost producers had even captured a signifi-
cant market share in a number of markets in Asia,
Latin America and Russia, by charging up to 40 per
cent less than Sony’s prices. Cost control was hence
Idei’s top agenda. To cut costs, he shut down 15 of its
manufacturing centres worldwide, leaving Sony with
55 plants by 2003, a workforce reduction of 17 000
workers, 22 and a greater reliance on contract manu-
facturers such as Flextronics and Solectron. Much of
the production was moved overseas to low-cost coun-
tries such as China, and 12 of the company’s Japanese
plants were placed under a rationalised structure to
further control costs.23 Sony’s loss-making low-cost
electronics subsidiary, Aiwa, as well as the music and
movies businesses, were restructured to reduce costs.
Three of the group’s publicly traded subsidiaries –

Case 13 • Sony Corporation C-189
Sony Music Entertainment (Japan), Sony Chemicals
and Sony Precision Technology – were brought back
into the group as wholly owned units, strengthening
the balance sheet to provide the financial muscle for
the company’s digital foray. In 2003, Sony announced
that it would restructure its loss-making music busi-
ness, Sony Music Entertainment, by slashing 1000
jobs, trimming its roster of artists and combining
back office operations to cut costs.24 In 2003, Idei
also announced that Sony would organise itself more
like an American company.25
Focusing on core strengths
CEO Idei knew that Sony’s core strength lay in its abil-
ity to innovate and come up with revolutionary prod-
ucts. Throughout the change process, this was a trait
that had to remain unchanged. It was clear that Sony
did not expect its next breakthrough to come from a
single new electronic device.26 The focus had shifted
from stand-alone devices to networked ones, and the
onus was on Sony’s engineers to realise the digital
dream. Kunitake Ando, Sony’s president and chief
operating officer, also vowed that despite emphasis
on network-based content and services, Sony would
not lose its focus on hardware.27 Sony R&D labs were
continuously working on next-generation wonders
such as paper-thin TV displays, high-definition video
projectors that turned entire walls into film screens
and digital chopsticks – a digital pointer that allowed
a user to freely move a file or an image from a screen
and transfer it to another device, just like a chopstick.
Sony was blurring the lines between these gadgets by
blending their features.
Game for change
One of the most important strategic decisions that
Sony made in the mid-1990s was to enter the video
game market. Norio Ohga envisioned the importance
of the video game consoles in Sony’s digital strat-
egy, and the PlayStation was launched worldwide in
1995. Ken Kutaragi, an engineer atypical to Sony’s
culture of internal cooperation, was the champion of
the PlayStation, developing the new console with his
team of engineers in a relatively independent manner
from the rest of the company. Owing to the domi-
nant position of Sega and Nintendo in the console
market, game developers were initially reluctant to
support Sony’s new format. But Sony pushed forward
with the PlayStation, eventually convincing the devel-
opers of the system’s superior design and capabilities.
By 2000, the PlayStation had dominated the market
to become the world’s largest-selling game console,
with a 70 per cent market share and 80 million units
sold.28 This was followed by the famous launch of
the console’s new avatar, the PlayStation 2, in 2000
– when eager customers tumbled over one another to
obtain the first machines.29 The PlayStation 2 offered
a substantial jump in performance and versatility,
with new features such as Emotion Engine and
Graphics Synthesizer making possible more complex
effects such as facial expressions and clothes flutter-
ing in the wind. Over 10 million units were sold in the
first year, and by 2003, PlayStation 2 accounted for
about half of Sony’s total profits and could be found
in 50 million homes.30 By then, Sega had exited the
console business altogether to concentrate on gaming
software, while Nintendo still held on by launching
its GameCube system. However, Sony’s unexpected
new rival was none other than Microsoft, which had
launched the X-Box, its own gaming console in 2001.
Despite a US$500 million marketing campaign, the
X-Box had sold only 10 million units by 2003, being
a far second in console market share.
Sony had a strong business case to support its foray
into the game business, although its move was met
with scepticism in 1994. Goldman Sachs predicted
the global sales of games to be US$17.5 billion and
consoles to be US$8.7 billion in 2002, the former
equalling the total box office revenues of the film
industry and catching up even with the sales of music
CDs31 (see Exhibit 1). Sales of games were expected
to overtake music CD sales in Europe by 2005.32 A
survey also found that 60 per cent of Americans played
video games, and 61 per cent of these game-buffs were
adults; 43 per cent were women and their average age
was 28, implying that this form of entertainment was
now mainstream.33 Similar trends were observed in
Europe and Japan too. All this was happening while
music and film companies were losing money and the
global economy was facing a slowdown. Due to its
recession-proof nature and lucrative prospects, the
gaming industry was the next big frontier for many
entertainment companies.

C-190 Case 13 • Sony Corporation
However, a presence in the game console market
had far more strategic implications for Sony, and was
indeed an important part of its future digital game
plan. The first, and probably less important, reason
was that the gaming industry was not yet as competi-
tive as the consumer-electronics industry and there
was potential for high margins through product dif-
ferentiation and margins on gaming software. More
importantly, Sony’s vision for the game console was
that it could be the next entertainment hub in homes
of the future, equipped with multimedia capabilities
and connected to other devices with a broadband net-
work. It would then allow players to compete with
other gamers on the network, and would be a gate-
way to a host of multimedia services and content.
The console was thus a centrepiece of Sony’s vision
of digital convergence and a new way to distribute its
content.
The PlayStation 2 was already equipped with
some multimedia and network capabilities, with even
more network awareness expected in future models.
These consoles were thus akin to Trojan Horses,34 a
new breed of consumer electronics products, doubling
up as a television, home computer, game console and
video recorder. The entry of software giant Microsoft
into the game console market was a testimony to the
device’s unlimited potential. An analyst commented,
‘Games are the engine of the next big wave of com-
puting. Kutaragi is the dance master, and Sony is call-
ing the shots.’35
Computers hold the key
Concerned that Silicon Valley was invading its turf,
Sony decided to mount its own assault on the com-
puter industry.36 Idei was aware that an ability to
make information technology products was crucial
to survival in the new era of digital competition, with
the computer as its centrepiece. Being new to the busi-
ness, Sony failed to capitalise upon its powerful brand
in its early attempts to enter the PC market through
the high-margin notebook-PC segment. Collabor-
ating with Intel and former marketers from Apple
Computer, Sony launched its VAIO (Video-Audio
Integration Operation) line of multimedia-capable
notebooks in 1996. Initial adoption was slow, as the
users found the price too steep given the notebook’s
features. But Sony decided to learn from the experi-
ence, saying that it needed PC expertise more than it
needed the profit.37 Idei commented, ‘If you are not
making computers, you can’t keep up.’38 Undaunted
by its initial failures, Sony continued to improve its
line of computers, add new features and slash produc-
tion costs, also launching the CLIÉ range of handheld
computers in 2000. Sony’s persistence finally paid
off, and by 2002, it was the fastest-growing major PC
maker in the world, ranking eighth in overall market
share. Its CLIÉ handheld computers commanded a
Exhibit 1 The growing market for games
Source: ‘Console wars’, The Economist, 20 June 2002.
* Includes games for consoles, PCs and handhelds. Source: Goldman Sachs; Screen Digest; IFPI; Merrill Lynch.
0
2000 2001 2002 2003
Games software*
Global Sales, $bn
Cinema box-office receipts
DVD/video
CDs
10
20
30
40

Case 13 • Sony Corporation C-191
22 per cent market share, second only to Palm.39 An
analyst described Sony’s ascent in the PC market:
They’re borrowing from several of the success
strategies in the PC business. They have a bit of the
operational excellence of Dell, some of the gaga
design of Apple and some of the total solutions
idea from IBM – only targeted at the home retail
market.40
Sony’s latest computer models offered seamless
interconnectivity with its other digital devices. Mark
Hanson, Sony’s vice president in charge of marketing
the VAIO line, concluded:
Our original intent was to figure out how the PC
could help consumer-electronics usage, and (then)
bridge them. And the technology is there where we
can do what many can’t. We’re now better able to
show why we got into the PC business.41
Content with the current content
On the content side, Sony avoided any extravagance
during the mergers and acquisitions boom in the media
industry in the late 1990s, which resulted in under-
performing conglomerates such as AOL Time Warner
and Vivendi Universal. One possible reason was that
Sony still remembered the difficulties it faced when
its acquisition of movie and music businesses was on
the verge of failure and almost brought the whole
company down. Sony had finally recovered through
extensive cost-cutting efforts, but the promised syn-
ergies were not realised. Moreover, the rationale for
the merger wave was the convergence of content and
distribution. In its dream of digital convergence, how-
ever, Sony saw its own networked devices as the dis-
tribution channels for its content. Hence, in a way,
Sony already had what these media giants were trying
to achieve, avoiding the merger wave of the late 1990s
(and the woes that it eventually brought to the merg-
ing conglomerates) and could instead focus on devel-
oping its next-generation gadgets.
Sony’s main weakness in the content business
was its absence in the American TV networks arena,
which were the strongholds of its competitors such
as AOL Time Warner, Viacom and Disney. Being a
Japanese company, Sony was not allowed to set up
broadcast networks in the US, while the difficul-
ties resulting from its acquisitions prevented it from
creating cable networks in the early 1990s.42 Real-
ising that it was rather late to start cable channels
in the fiercely competitive US market, Sony tried to
make up for it by investing in satellite broadcasting in
Japan (through a partnership with Rupert Murdoch’s
News Corp) and many other countries outside the US
and Europe. By globalising production, Sony exploit-
ed a shift in demand in international markets, where
American programming was gradually being replaced
by locally produced programs in the prime-time
slots.43 By 1999, Sony had set up production facili-
ties and TV channels in most of the big countries in
Latin America and Asia, and was making 4000 hours
of foreign-language programs, as compared to 1700
hours of English-language programs.44 This strategy
worked in favour of Sony. By 2003, many of its local
channels were performing extremely well – for exam-
ple, the Sony Entertainment Channel in India, which
consistently scored top viewer ratings in a country of
1 billion viewers.
Sony’s disciplined approach in the media business
had begun to pay dividends. As a result of its cost-
focused operations, its TV series production busi-
ness was posting healthy returns in 2003,45 while its
movies business was the most profitable one in Holly-
wood in 2002, thanks to blockbusters such as Spider-
man.46 Only the music business was a concern, due to
falling sales and widespread piracy. As of 2003, strin-
gent cost-cutting measures were under way to turn
the division around.47
The promise of broadband
One point where Sony was in consensus with its com-
petitors – whether in the media industry or consumer
electronics or information technology – was that
broadband was the next big wave making digital con-
vergence possible. And, like many of its competitors,
Sony staked its future on broadband. This was also
Sony’s chance to justify its costly acquisitions of con-
tent businesses a decade ago, by pushing its content
to consumers through broadband devices. Kunitake
Ando said:
The concept that consumer electronics devices
can access all sorts of content while connected to
a network is the biggest trend, and as broadband

C-192 Case 13 • Sony Corporation
rolls out and becomes more commonly available
– which will happen by 2005 – companies have
to make it happen by introducing more types of
products.48
Broadband networks were next-generation net-
works providing high-speed, high-bandwidth, access
to the Internet, hence enabling the seamless trans-
fer of multimedia-rich content. Thus, broadband
was the main thread running through the trellis of
Sony’s future vision of connected devices with rich
content flowing through them. Broadband was also
the technological prerequisite to such concepts as
on-line music and movie distribution, multi-player
gaming and other interactive services. Kunitake Ando
believed that in 2002, Sony was better positioned
than any other company to make the transition to
the broadband world.49 Its seasoned executives knew
how to design consumer products that were both sexy
and functional; it had a proven global distribution
system and was in constant touch with consumers; it
had a deep understanding of both networking techno-
logy and successful information technology products.
Ando also believed that Sony had finally found the
synergy between the hardware and the content sides
of its business, a point where the other convergence-
seeking conglomerates were struggling.50
Strategic alliances
Sony believed that in the future world of networked
entertainment, size mattered. Although it avoided
jumping on the merger bandwagon, it saw alliances
as a valuable means of growth. The development of
the PlayStation itself was aided by alliances forged
between hardware designers and creative game-
software developers; so were other innovations such
as the compact disc, a result of an alliance with
Philips. Nobuyuki Idei outlined the importance of
alliances to Sony:
We also recognize that the broadband era requires
more resources than the Sony Group alone has.
This is why we began several years ago to promote
‘soft alliances’ with partners sharing the same
vision. Many companies have expressed an interest
in these soft alliances. I believe that this kind of
cooperation with partners having outstanding
technology, content, telecommunication networks
and other key resources is essential.51
He also revealed that Sony was more interested in
forging ‘soft alliances’ than the riskier strategies of
mergers and acquisitions:
The opposite of soft alliances is hard alliances,
which include mergers and acquisitions. Since
purchasing the Music and Pictures businesses,
more than ten years have passed, and we have
experienced many cultural differences between
hardware manufacturing and content businesses.
This experience has taught us that in certain areas
where hard alliances would have taken ten years
to succeed, soft alliances can be created more
easily. Another advantage of soft alliances is the
ability to form partnerships with many different
companies. We aim to provide an open and
easy-to-access environment where anybody can
participate and we are willing to cooperate with
companies that share our vision. Soft alliances
offer many possibilities.52
Mobile phones were an integral element of Sony’s
network strategy. But Sony had never really been suc-
cessful in capturing any substantial market share in
the industry. To quickly overcome this shortcoming,
Sony pooled resources with the Swedish phone maker,
Ericsson, to launch a joint venture – Sony Ericsson
Mobile Communications (SEMC) in October 2001.
Ericsson was a major player in the mobile phone
business, and had introduced several technical inno-
vations over the years. But it had witnessed its mar-
ket share fall against its arch-rival – Finland-based
Nokia. Kunitake Ando summarised the motives of
the alliance:
As one of the originators of GSM, a transmission
standard, Ericsson is known as a company with a
high level of vanguard technology and is the best
in the world when it comes to the technology used
for mobile communication base stations. Sony’s
strength lies in its ability to create new products,
particularly in the crucial product-planning
and design stages. By uniting this strength with
Ericsson’s excellent telecommunications tech-
nology and ability to set standards, SEMC is

Case 13 • Sony Corporation C-193
seeking to become a global market leader in mobile
phones.53
Although Sony Ericsson was still making losses
as of 2003, Sony and Ericsson had both pledged more
resources into the venture. Its phones were highly
regarded by technology enthusiasts and the youth for
their advanced and user-friendly features, and the
company predicted that its next-generation handsets
could finally turn things around.54
Other alliances included PressPlay, an on-line
music distribution site launched by Sony Music in
partnership with Universal Music Group in 2001, and
Sony’s alliance with Palm Corporation to use its oper-
ating system for the CLIÉ handheld. Sony planned to
use the open-source Linux operating system for many
of its other devices, including the CoCoon set-top
box.
These alliances provided Sony an alternative to
Microsoft products, and thus helped to keep its licens-
ing costs down. Although Sony waited for broadband
infrastructure to be widely available in order to realise
the hidden potential for its game consoles, it never-
theless struck another alliance with America Online
(AOL) in 2001. The deal gave the PlayStation 2 users
access to the web, email and other services operated
by AOL, the world’s largest Internet service provider
with 29 million subscribers at the time.55 A special
Internet browser was also developed for the pur-
pose, and Sony designed additional equipment such
as hard disk drives, mouse and keyboard to connect
to the console. This, according to Sony, was just a
glimpse of things to come in the broadband world,
and was ‘an important first step taking PlayStation 2
into the online and broadband environment’, accord-
ing to Kaz Hirai, president of Sony Computer Enter-
tainment.56 Sony was also partnering with IBM and
Toshiba to develop the next-generation cell micro-
processor technology, an extremely fast and network-
capable multipurpose chip that would be the heart
of future Sony devices, including the PlayStation 3.57
Other alliances included a consortium of nine com-
panies – including Sony, Philips, Samsung, Sharp and
Thomson – pushing for the adoption of their Blu-Ray
DVD recording standard over a rival standard from
NEC and Toshiba.58
At the crossroads: Sony in
2002
The year 2002 was a crucial one in the history of Sony.
It was believed that the broadband revolution was just
about to take place and that the world could finally
witness the company’s vision taking shape. The rise
of China as a manufacturing powerhouse was having
important implications for manufacturing-based
companies such as Sony, while Korean competitors
such as Samsung and LG were fiercely challenging
Sony’s innovations in consumer electronics with
low-priced products. Growing digital piracy was
fast eroding the profits of music- and movie-making
companies. Finally, a global economic slowdown,
apprehensions of terrorist attacks and an unstable
geopolitical landscape were set to test Sony’s resilience
as a global corporation.
Sony’s organisation
As a result of Nobuyuki Idei’s restructuring efforts,
the structure of Sony Corporation in 2002 was
designed with cost-effectiveness in mind. The com-
pany was broadly divided into six business areas,
each further divided into smaller business units (see
Exhibit 2).59
1 Electronics Businesses consisted of audio, video,
televisions, information and communications,
semiconductors, components and other
businesses.
2 Game Businesses consisted of game console and
software businesses conducted mainly through
Sony Computer Entertainment Inc.
3 Music Businesses consisted of Sony Music
Entertainment Inc. (SMEI) and Sony Music
Entertainment (Japan) Inc. (SMEJ).
4 Pictures Businesses consisted of motion picture
and television businesses, conducted mainly
through Sony Pictures Entertainment Inc. (SPE).
5 Financial Services Business consisted of Sony Life
Insurance Co. Ltd, Sony Assurance Inc., Sony
Financial International Inc. and Sony Bank Inc.
6 Other Businesses consisted of location-based
entertainment businesses, Internet-related
businesses (So-net), conducted by Sony
Communication Network Corporation,
advertising agency business and other businesses.

C-194 Case 13 • Sony Corporation
Sony’s performance in 2002
In 2000, Sony had reported losses of US$354 mil-
lion in one six-month period – shaking investors’
confidence in its broadband vision. Nobuyuki Idei
declared that grand talk of the long-term future could
wait until Sony showed a better command of the pres-
ent.60 Idei then embarked on a bold restructuring ini-
tiative to cut costs in the electronics and content busi-
nesses. As a result, Sony posted an all-time-high net
sales figure for 2001 of US$53 billion – 3 per cent
above the previous year. But the operating income
of US$1.01 billion – 40 per cent below the previous
year’s income – highlighted Sony’s eroding margins.
Vindicating Sony’s foray into the game business, the
game division strongly boosted Sony’s bottom line,
generating 53 per cent of the total operating income,
despite comprising just 12 per cent of total sales (see
Exhibit 3). Sales of the PlayStation 2, in the second
year since its launch, had risen by 52 per cent. The
profitability of the game business was safeguarded
by a significant drop in manufacturing costs and an
increase in the gross margins on software. Around 18
million PlayStation 2 consoles and 122 million cop-
ies of game software were sold. The game division’s
performance hence more than offset the losses made
in the electronics business, which had suffered a 3 per
cent decrease in sales due to a slump in global demand
for semiconductors and components, reduced sales of
consumer electronics, and losses made in the mobile
phone business due to quality issues. Sony’s VAIO
computers, though, gained global market share faster
than any other computer brand. Despite contraction
of the global music industry, an increase in digital
piracy and terrorist attacks in the US, increased sales
in Japan contributed to sales growth of 5 per cent in
the music business, but a decrease of 2 per cent in
operating income.
The pictures business recorded a 15 per cent
increase in sales and a more than seven-fold increase
in operating income, due to some blockbusters, strong
DVD sales, successful game shows and structural
reforms. The financial services business recorded a 7
per cent increase in revenue and a 27 per cent increase
in operating income, as Sony grew its presence in
the financial industry. The other business segments
recorded a 6 per cent decrease in sales and overall
losses due to losses in advertising business, location-
based entertainment businesses in Japan and the US,
and at Sony Communication Networks Corporation
(SCN). (Appendix A shows Sony’s group financial
results by business segments.)
Exhibit 2 Sony’s organisational units in 2002
Source: Sony Corporation Annual Report 2002.
Games
Music
Pictures
Financial Services
Others
Electronics Audio, Video, Televisions, Information and Communications,
Semiconductors, Components, Other Businesses
Sony Computer Entertainment Inc.
(Playstation and associated software)
Sony Music Entertainment Inc.
Sony Music Entertainment (Japan) Inc.
Sony Pictures Entertainment Inc.
Columbia Tristar Television
Sony Life Assurance Co. Ltd., Sony Assurance Inc.,
Sony Finance International, Sony Bank
Sony Communication Network Corporation (So-net), advertising
and location-based entertainment

Case 13 • Sony Corporation C-195
‘Do you dream in Sony?’:
Sony’s dream of the future
Nobuyuki Idei came out with the tagline Do you
dream in Sony? to spur innovation inside the com-
pany and to prepare consumers for things to come.
Sony strongly believed that its clout in consumer
electronics, combined with its media content, would
allow it to steer digital convergence in its favour.61
With its portfolio of 1000 digitised films, 33 000
hours of TV programming and more than 500 000
hours of songs, Sony was eagerly awaiting this con-
vergence, so that it could provide all this content to
the consumers.62
If everything in the future went Sony’s way, the
consumers could see a whole new world of rich con-
tent delivered anytime, anywhere through broad-
band networks on a spectrum of devices that would
be hybrids of computers and consumer electronics.
Sony identified four categories of gateway products
that would help it to implement its future strategy.
The first would be an intelligent set-top box, called
CoCoon, which could learn its users’ preferences and
could record TV programs of their taste. The CoCoon
would be connected to the DVD player, the TV and,
of course, the Internet. Another gateway product
would be the PlayStation 3, which, apart from being
1000 times faster than its predecessor, would support
movie-like multi-player network games and could
also be used to surf the multimedia-rich Internet in
3-D. It would also simultaneously handle various
tasks – for example, recording a TV show while play-
ing a game. Next-generation VAIO notebooks, CLIÉ
handhelds and Airboard portable wireless TV/Inter-
net display devices would serve as the third gate-
way device, equipped with intelligent software to
learn their user’s preferences and communicate them
to other Sony devices through RoomLink wireless
links. The mobile phone, the fourth gateway device,
would be equipped with cameras and also work in
synch with other devices through the Bluetooth
technology. All these gizmos, including digital still
and movie cameras, would be connected to a home
server device, which would be based on the modular
cell microprocessor technology, and would store and
coordinate all the information in these devices. Each
device would eventually have a certain number of
cells, whose computing power could be harnessed by
other devices on the network, should the need arise.
Sony also planned to make personal robots that
would evolve from their current pet status of Aibos
to become intelligent, humanoid-shaped companions.
They would again communicate with all the other
devices, and also help their master manage his per-
sonal information by remembering appointments, etc.
Toshitada Doi, head of Sony’s Digital Creatures Lab-
oratory, believed that the personal robots would be
Exhibit 3 PlayStation’s contribution to Sony’s income
* Year ending 31 March 2002. Source: ‘The complete home entertainer?’, The Economist, 27 February 2003.
† Calculated as if operating loss in electronics segment were zero.
Winning games
Share by business sector*
Sales and operating
revenue, %
Operating
income†, %
64
814
53
13
20
8
8
12
Electronics
Games
Music
Pictures
Other

C-196 Case 13 • Sony Corporation
Sony’s most profitable line of products and the robot
industry would one day be ‘bigger than the computer
industry’.63 He said, ‘PCs will continue to grow, but
robots will grow faster. When this will happen, I
don’t know – maybe 30 years. But maybe ten years to
15 years.’64 Kunitake Ando also expressed optimism
about the future of robots:
We are hoping that robots will create a new type
of industry. Initially, it will be for entertainment
and for giving comfort, but we think there is a
long-term future for robots, and we are adding
new technology to our robots so they will quickly
become more intelligent and more useful in day-
to-day life.65
Difficult road ahead: Sony’s
future challenges
Sony’s future vision sounded very exciting, but many
real hurdles lay ahead.
All for one
The biggest internal challenge that Sony faced in
achieving its digital convergence ambitions was to
achieve seamless cooperation between its various
subsidiary companies by selling the network vision
internally. This was no easy task, given different sub-
sidiaries’ different expectations and goals.
Traditionally, despite attempts at discovering syn-
ergies, there had been little cooperation between the
content people in the United States and the techni-
cal wizards in Japan. Even the product units used to
work rather independently – the development of Play-
Station under Ken Kutaragi being the prime example.
Kutaragi worked outside the company’s mainstream
and forged his own alliances with various parties.
PlayStation was highly successful, but Sony wondered
if it could enjoy similar luxuries of independence in
the networked future. It also wondered if innovation
could still be maintained by compromising upon this
independence.
To counter the low-cost imitators of its main-
stream products that threatened its profits, Sony
had decided to keep at the forefront of innovation.
Now that Sony was making innovative interconnect-
ed digital multimedia products, the content business,
already plagued by piracy, was even more concerned
about the implications of these new devices for its
copyrighted content. As a producer of both content
and devices, this was a dilemma for Sony that many
other competitors did not have to worry about. As
a result, competitors were already making many de-
vices that Sony ought to have made.66 Sony had, on
the other hand, equipped its MP3 players with unpop-
ular anti-piracy software, greatly affecting their mar-
ket acceptance..67
Nobuyuki Idei was working actively to achieve
organisational integration. In 2002, he started an ini-
tiative called NACSS (Network Application and Con-
tent Service Sector), an effort aimed at bridging the
hardware and content businesses. Masayuki Nozoe,
a veteran with experience in both consumer electron-
ics and movie groups, was appointed to head the ini-
tiative.
Extensive reorganisation was done to change the
organisational mind-set. Such efforts showed promis-
ing results, and by 2003, Sony had witnessed a dra-
matic increase in internal cooperation. When develop-
ing new games, Sony’s developers now kept in mind
not only the PlayStation, but also the CLIÉ and Sony
Ericsson phones. The Walkman was integrated with
VAIO PCs and Sony’s on-line music service, Press-
Play. Engineers always kept the network in mind while
designing new devices. There was also increased coop-
eration between the hardware and content managers
through emails and videoconferences. Nobuyuki Idei
was satisfied by the developments:
It took almost two years for everyone to grasp the
network concept and go in the same direction.
Now we’re all going the same way. The horizontal
and vertical are more balanced.68
Howard Stringer, CEO of Sony USA, said:
The company was built in a vertical silo fashion,
to cultivate the independence that was prized by
Mr. Morita. At the end of the analog age, the
operating companies actually didn’t get along well.
Now everybody in every aspect of the company is
talking to each other. If you keep talking about
networks, you have to practice good networking
in your own company.69

Case 13 • Sony Corporation C-197
Idei had managed to persuade even Kutaragi to
be a team player and cooperate more closely with
everyone, by giving him greater responsibility. About
Kutaragi, Idei said, ‘He’s kind of a symbol for Sony,
how the rule breaker can survive with the rule maker.
And now, the rule breaker has become the rule
maker.’70
The standards war
Being a consumer electronics company, Sony was well
aware of the importance of standards – having learned
its lesson early when its Beta video format had lost a
fiercely fought battle against Matsushita’s VHS for-
mat. But Sony had won more standards battles than
it had lost, the compact disc being one of them. In
the age of digital convergence, it could be a winner-
takes-all situation in a standards war. The number
of companies, including Sony, fighting it out over the
new DVD recording standard was a testimony to the
high stakes involved in modern standards battles.71
Evidently, the age of convergence was expected to
bring with it the fiercest standards battles ever, with
rival players such as Microsoft, Samsung, Nokia, Sun
Microsystems, etc., all pushing their own formats
and protocols for market dominance. Sony’s broad-
band dream could only be a reality if its own stan-
dards prevailed. Joining alliances for joint standard
specification was a good risk-mitigation strategy.
Competition in the 21st century
Sony had traditionally competed with a somewhat
stable set of rivals – the likes of Philips, Matsushita,
Toshiba and Samsung. Competitive issues the com-
pany usually faced were important but less complex,
such as cheap producers of commodity electronics
eroding Sony’s margins. But thanks to the age of con-
vergence, Sony had suddenly found itself up against
an overwhelming set of adversaries, including, but
not limited to, computer makers such as HP and IBM,
PC makers such as Dell, Apple and Palm, network
equipment makers such as Cisco and 3Com, software
makers such as Microsoft and Sun, media companies
such as AOL Time Warner and Vivendi Universal,
game makers such as Nintendo, photographic equip-
ment makers such as Kodak and Fuji, and mobile
phone makers such as Nokia and Motorola. This
complex, multi-dimensional competition was a bitter
reality of the world of digital convergence, where the
boundaries between traditional industry segments
had disappeared. Sony had entered the terrains of
these companies in the media, computer, gaming and
networking markets, and had also witnessed these
very players enter Sony’s traditional fortes. Microsoft
was now making game consoles, Apple was making
personal digital stereos, 3Com was making network
radios, and Nokia was making PDAs. And with most
of its competitors nurturing grand broadband visions
of their own and staking their future on them, Sony’s
digital dream did not seem that unique.
The world of digital convergence also meant that
one company could not do everything on its own,
necessitating selective cooperation with its competi-
tors. An example was Sony’s dependence on Intel
for VAIO chips and Microsoft for its software. This
trend was rather unfamiliar to Sony, which had been
hitherto fiercely independent when it came to launch-
ing new consumer electronics products. The tradi-
tional consumer electronic model also meant com-
panies operating huge manufacturing plants on their
own. But such plants now had to give way to third-
party contract manufacturers such as Flextronics and
Solectron, so that the company could concentrate on
swiftly designing innovative new products, as man-
ufacturing superiority and efficiency were no longer
the basis of competition.72 This outsourcing trend
had significantly reduced the barriers to entry into the
industry.
The scourge of piracy
The proliferation of the Internet and digital gadgets
translated into easier piracy of digitised copyrighted
content. In the 1970s, Sony, as a consumer electronics
company, had fiercely fought in the Supreme Court –
and won – for consumers’ right to make personal cop-
ies of content using its VCRs and tape recorders.73
Now, being one of the world’s biggest owners
of copyrighted content itself, Sony was in a strange
dilemma. Its past attempts to design its devices to pre-
vent copying had resulted in consumer displeasure.
Kunitake Ando thoughtfully rued, ‘When you have a
problem like this, I really wish we were a simple hard-
ware company.’74
Meanwhile, piracy continued unabated, eating
into the revenues in the music business. Despite an

C-198 Case 13 • Sony Corporation
increase in demand, global music sales paradoxically
fell by 9 per cent in 2002.75 Illegal copies and sales in
countries such as Russia, China, Brazil and Ukraine
were estimated to cost movie and music companies
US$7 billion a year.76
With international sales fast becoming major
revenue earners for US-based content producers, the
piracy trend spelled doom to the industry. If this trend
continued, many movie and music producers, includ-
ing Sony’s content divisions, could go out of business
– leaving the digital convergence dreams unfulfilled.
In 2003, Sony teamed up with AOL Time Warner and
Viacom to form an association to urge the US govern-
ment to step up its anti-piracy measures.77
Technology adoption
The most interesting part of Sony’s digital conver-
gence dream was that it was, after all, still a dream.
Despite elaborate preparation for the next genera-
tion of networked entertainment, the networks them-
selves remained conspicuously missing from the pic-
ture. By mid-2003, not a single product from Sony
had yet incorporated any of the features that Idei and
Ando proudly proclaimed in their dreams. Sony had
bet too much on broadband, but there were no elab-
orate broadband networks in place to realise those
dreams.
Although a technical reality for some years, the
broadband networks had not caught on at the pace
that Sony would have liked. Even in the United States,
the traditional trendsetter in network technologies,
broadband was slow to replace the slower dial-
up access networks. Japan, however, showed faster
adoption. By 2005, half of Japan’s households were
expected to have a broadband connection, compared
to just 30 per cent of American households.78 The
prices of such services were not helping either: cost-
ing US$50 per month in the US, compared to US$20
per month in Japan.79 The situation was even worse in
other parts of the world – many developing countries
with high market potential had not even seen the first
wave of the digital transformation. In 2002, about 30
per cent of Sony’s Walkman sales were units that still
used the traditional cassette tape for which the Walk-
man was first launched in 1979.80 A sceptical analyst
wondered:
This is the first time in Sony’s history that they
are producing products that are ahead of the
infrastructure’s ability to use them. When they
came out with the first transistor radios and
Trinitron TVs, the broadcasters were already
there. When they came out with the Walkman,
everyone was already using cassettes. There’s a
huge question mark about broadband networks.81
Sony, having no relationships with telecom and
infrastructure companies, could only wait – but not
forever. An analyst commented:
Even though it’s a chicken-and-egg situation, you
have to have the vision and drive toward it. A
small or even medium-sized company can’t afford
to make that bet. Sony has some insulation from
risk. The company has revenues from so many
other spaces and products that it can fill in the
profit gaps even in the short term.82
Even if broadband networks became mainstream,
the consumers’ acceptance of Sony’s convergence
products could not be taken for granted. Sony’s first
attempt at an Internet appliance, the eVilla, a desk-
top web-browsing device, had miserably failed in
2001.83 Sales of the Airboard, the network Walkman
and third-generation (3G) phones had also been omi-
nously discouraging.
Defining the redefined ‘Sony’
Sony still faced the daunting task of selling its broad-
band vision and new identity to the customers. Sony
had to shed the consumer electronics company image
and explain to users what its new products actually
did. In addition, Sony’s shareholders and employees
had to be part of Sony’s grand vision. Sony had indeed
done quite a lot in the past to successfully change its
image from a pure consumer electronics company to
a total entertainment company, later adding informa-
tion technology products to its portfolio. Nobuyuki
Idei described Sony’s public image in the broadband

Case 13 • Sony Corporation C-199
era as a ‘Global Media and Technology Company’.84
According to Sony:
In essence, Sony, the box manufacturer, is being
replaced by a new Sony – a customer-centric entity
centered around broadband entertainment, yet
driven by the venture spirit of Sony’s founding
days.85
But the task of projecting an image of a player in
the digital convergence industry was much more com-
plex, given that most people still did not understand
what this convergence actually meant. A good exam-
ple of this point was the problem Sony faced in mar-
keting its otherwise highly innovative product – the
Airboard, a combination of TV and PC with an LCD
screen. Kunitake Ando revealed:
People don’t know what it is, whether it’s a PC
or a TV or something else. We try to explain the
concept, but people find it difficult. And dealers
don’t know how to sell it. In the meantime Sharp’s
Aquos, a simple LCD TV, sells so well. But
Airboard is so much more than Aquos!86
He went on to explain:
The biggest hurdle is actually the dealers who may
not be sure how or even where to sell devices. Do
you put something like the Airboard with TVs
or with PCs? We have faced this problem in the
past, and we have managed to educate them. What
we don’t want to do is make it too hard on the
consumer to use the device. We have even created
a user-friendly committee within the company to
make sure that we don’t run into that problem.87
But one thing that Sony did not want to do was
give up. Dreams were an integral part of Sony, and
fervently following them, despite failures, was part of
Sony’s culture. Kenichi Ohmae, a management guru,
pointed out that Sony ‘has failed in the past with its
Beta video format and its purchase of Columbia Pic-
tures. But it has repeatedly displayed the dynamism
to bounce back.’88 Kunitake Ando emphasised his
company’s determination: ‘We don’t want to go back
to being a box company. If we lose our dreams it’s not
Sony at all.’89

C-200 Case 13 • Sony Corporation
Appendix A
Table A1 Sony’s consolidated income statement (for the year ended 31 March 2002)
Consolidated Statements of Income
Sony Corporation and Consolidated Subsidiaries – Year ended 31 March
Yen in millions
Dollars in
millions
2000 2001 2002 2002
Sales and operating revenue:
Net sales ¥6 238 401 ¥6 829 003 ¥7 058 755 $53 073
Financial service revenue 412 988 447 147 483 313 3 634
Other operating revenue 35 272 38 674 36 190 272
6 686 661 7 314 824 7 578 258 56 979
Costs and expenses:
Cost of sales 4 596 086 5 046 694 5 239 592 39 396
Selling, general and administrative 1 478 692 1 613 069 1 742 856 13 104
Financial service expenses 389 679 429 715 461 179 3 468
6 463 457 7 089 478 7 443 627 55 967
Operating income 223 204 225 346 134 631 1 012
Other income:
Interest and dividends 17 700 18 541 16 021 120
Royalty income 21 704 29 302 33 512 252
Foreign exchange gain, net 27 466 – – –
Gain sales of securities investments and
other, net 28 099 41 709 1 398 11
Gain on insurances of stock by equity
investees 727 18 030 503 4
Other 50 603 60 073 44 894 337
146 299 167 654 96 328 724
Other expenses:
Interest 42 030 43 015 36 436 274
Loss on devaluation of securities
investments 2 015 4 230 18 458 139
Foreign exchange loss, net – 15 660 31 736 239
Other 61 148 64 227 51 554 386
105 193 127 132 138 184 1 038
Income before income taxes 264 310 265 868 92 775 698

Case 13 • Sony Corporation C-201
Table A1 Sony’s consolidated income statement (for the year ended 31 March 2002) (continued)
Sales and Operating Revenue by Business Segment
Yen in millions
Dollars in
millions
2000 2001 2002 2002
Current ¥120 803 ¥121 113 ¥114 930 $864
Deferred (26 159) (5 579) (49 719) (374)
94 644 115 534 65 211 490
Income before minority interest, equity
in net losses of affiliated companies and
cumulative effect of accounting changes 169 666 150 334 27 564 208
Minority interest in income (loss) of
consolidated subsidiaries 10 001 (15 348) (16 240) (121)
Equity in net losses of affiliated companies 37 830 44 455 34 472 259
Income before cumulative effect of
accounting changes 121 835 121 227 9 332 70
Cumulative effect of accounting changes
(2001: Including ¥491 million income tax
expense 2002: Net of income taxes of
¥2,975 million) – (104 473) 5 978 45
Net income 121 835 16 754 15 310 115
Electronics –
Customers 4 397 202 4 999 428 4 793 039 36 038
Intersegment 273 800 473 966 517 407 3 890
Total 4 671 002 5 473 394 5 310 446 39 928
Game –
Customers 630 662 646 147 986 529 7 418
Intersegment 24 074 14 769 17 185 129
Total 654 736 660 916 1 003 714 7 547
Music –
Customers 665 047 571 003 588 191 4 422
Intersegment 41 837 41 110 54 649 411
Total 706 884 612 113 642 840 4 833
Pictures –
Customers 494 332 555 227 635 841 4 781
Intersegment 394 0 0 0
Total 494 726 555 227 635 841 4 781
Financial Services –
Customers 412 988 447 147 483 313 3 634
Intersegment 25 774 31 677 28 932 218
Total 438 762 478 824 512 245 3 852
Other –
Customers 86 430 95 872 91 345 686
Intersegment 55&7132 60 526 55 042 414
Total 141 562 156 398 146 387 1 100
Elimination – (421 011) (622 048) (673 215) (5 062)
Consolidated total ¥6 686 661 ¥7 7314 824 ¥7 578 258 $56 979
Note: Electronics intersegment amounts primarily consist of transactions with the game business. Music intersegment amounts primarily consist of transactions with
game and pictures businesses. Other intersegment amounts primarily consist of transactions with the electronics business.

C-202 Case 13 • Sony Corporation
Table A2 Sony’s segment-wise sales information (for the year ended 31 March 2002)
Electronics Sales and Operating Revenue to Customers by Product Category
Yen in millions Dollars in millions
Year ended 31March Y
ear ended 31 March
2000 2001 2002 2002
Audio ¥733 431 ¥756 393 ¥747 469 $5 620
16.7% 15.1% 15.6%
Video 665 429 791 465 806 401 6.063
15.1% 15.8% 16.8%
Televisions 636 213 703 698 747 877 5 623
14.5% 14.1% 15.6%
Information and communications 1 031 661 1 322 818 1 227 685 9 231
23.5% 26.5% 25.6%
Semiconductors 164 196 237 668 182 276 1 371
3.7% 4.7% 3.8%
Components 568 387 612 520 572 465 4 304
12.9% 12.3% 12.0%
Other 597 885 574 866 508 866 3 826
13.6% 11.5% 10.6%
T
otal ¥4 397 202 ¥4 999 428 ¥4 793 039 $36 038
Note: The above table is a breakdown of electronics sales and operating revenue to customers by product category. The electronics business is managed as a single
operating segment by Sony’s management. However, Sony believes that the information in this table is useful to investors in understanding the sales contributions of the
products in the business segment. In addition, commencing with the first quarter ended 30 June 2001. Sony has partly resigned its product category configuration in the
electronics business. In accordance with this change, results of the previous years have been reclassified to conform to the presentation for the year ended 31 March
2002. Sales of mobile phones are no longer recorded in the ‘Information and Communications’ category as of the third quarter of the current fiscal year. From the third
quarter, sales of mobile phones manufactured by Sony Ericsson Mobile Communications are recorded in the ‘Other’ product category.
Table A3 Sony’s profit or loss by business segment (for the year ended 31 March 2002)
Profit or Loss by Business Segment
Yen in millions Dollars in millions
Year ended 31 March Y
ear ended 31 March
2000 2001 2002 2002
Operating income (loss):
Electronics ¥98 573 ¥247 083 ¥(8 237) $(62)
Game 76 935 (51 118) 82 915 623
Music 28 293 20 502 20 175 152
Pictures 35 920 4 315 31 266 235
Financial Services 23 309 17 432 22 134 166
Other (9 648) (9 374) (8 584) (64)
Total 253 204 228 840 139 669 1 050
Elimination 10 520 13 503 16 207 122
Unallocated amounts:
Corporate expenses (40 698) (16 997)
(21 245) (160)
Consolidated operating income 223 204 225 346 134 631 1 012
Other income 146 299 167 654 96 328 724
Other expenses (105 193) (127 132) (138 184) (1 038)
Consolidated income before
income taxes ¥264 310 ¥265 868 ¥92 775 $698

Case 13 • Sony Corporation C-203
Table A4 Sony’s profit or loss by geographic segment (for the year ended 31 March 2002)
Sales and Operating Revenue by Geographic Segment
Yen in millions Dollars in millions
Year ended 31 March Y
ear ended 31 March
2000 2001 2002 2002
Japan ¥2 121 249 ¥2 400 777 ¥2 248 115 $16 903
31.7% 32.8% 29.7%
United States 2 027 129 2 179 833 2 461 523 18 508
30.3% 29.8% 32.5%
Europe 1 470 447 1 473 789 1 609 111 12 098
22.0% 20.2% 21.2%
Other Areas 1 067 836 1 260 434 1 259 509 9 470
16.0% 17.2% 16.6%
Total ¥6 686 661 ¥7 314 824 ¥7 578 258 $56 979
Note: Classification of geographic segment information shows sales and operating revenue recognised by location of customers.
Notes
1 ‘The world’s 100 most valuable brands’, by BusinessWeek/
Interbrand, www.finfacts.com/brands.htm.
2 ‘The Sony Electronics corporate overview’, Sony Electronics News
& Info, http://news.sel.sony.com/corporateinfo/overview.
3 ‘Sony becoming a sleeper PC giant’, CNET News.com,
23 September 2003.
4 ‘The founding prospectus of Tokyo Tsushin Kogyo’, by Masaru
Ibuka, May 1946, www.sony.net/SonyInfo/CorporateInfo/
History/prospectus.html.
5 ‘The Origin of “Sony” ’, www.sony.net/SonyInfo/CorporateInfo/
History/origin.html.
6 Sony Corporation of America, ‘Sony history – Chapter 8’, www.
sony.net/Fun/SH/.
7 Ibid.
8
‘Sony re-dreams its future’, Fortune, 25 November 2002.
9 ‘The Sony brand’, Sony Electronics News & Info, http://news.sel.sony.
com/corporateinfo/sony_brand/.
10 ‘The complete home entertainer?’, The Economist, 27 February
2003.
11 ‘The Sony brand.’
12 Ibid.
13 ‘The world’s 100 most valuable brands.’
14 ‘The Sony brand.’
15 ‘Gadget wars’, The Economist, 8 March 2001.
16 ‘Boot up the television set’, The Economist, 26 June 1997.
17 ‘In their dreams’, The Economist, 24 February 2000.
18 ‘Sony’s new day’, Newsweek, 27 January 2003.
19 Ibid.
20 ‘Multimedia is the message’, The Economist, 11 March 1999.
21 ‘Boot up the television set.’
22 ‘Multimedia is the message.’
23 ‘The complete home entertainer? ’
24 ‘Sony reportedly ready to cut jobs’, MSNBC News, 20 February
2003.
25 ‘The Complete Home Entertainer? ’
26 Ibid.
27 ‘Sony re-dreams its future.’
28 ‘In their dreams.’
29 ‘The gamers come out to play’, The Economist, 17 May 2001.
30 ‘The complete home entertainer? ’
31 ‘Console wars’, The Economist, 20 June 2002.
32 Ibid.
33 Ibid.
34 ‘The gamers come out to play.’
35 ‘Sony takes pioneering direction for video console’, The Seattle
Times, 10 March 2003.
36 ‘Boot up the television set.’
37 Ibid.
38 Ibid.
39 ‘Sony becoming a sleeper PC giant.’
40 Ibid.
41 Ibid.
42 ‘The weakling kicks back’, The Economist, 1 July 1999.
43 Ibid.
44 Ibid.
45 ‘Sony’s push for cable series profits’, Electronic Media, 17 February
2003.
46 ‘Spiderman lifts Sony’s profits’, BBC News, 28 July 2002.
47 ‘Sony reportedly ready to cut jobs.’
48 ‘Vision series: Kunitake Ando’, CNET News.com, 5 December
2002.
49 ‘Sony re-dreams its future.’
50 Ibid.
51 Sony Corporation Annual Report 2002.
52 Ibid.
53 Ibid.
54 ‘The complete home entertainer? ’
55 ‘The gamers come out to play.’
56 Ibid.
57 ‘Sony takes pioneering direction for video console.’
58 ‘Battle of the blues’, The Economist, 12 December 2002.
59 Sony Corporation Annual Report 2002.

C-204 Case 13 • Sony Corporation
60 ‘The complete home entertainer? ’
61 Ibid.
62 ‘Sony re-dreams its future.’
63 ‘Sony’s new day.’
64 ‘Sony re-dreams its future.’
65 ‘Vision series: Kunitake Ando.’
66 ‘The complete home entertainer?.’
67 ‘Gadget wars.’
68 ‘Sony re-dreams its future.’
69 ‘Sony’s new day.’
70 Ibid.
71 ‘Battle of the blues’; ‘Shan’t play’, The Economist, 21 August
1997.
72 ‘Gadget wars.’
73 ‘Sony’s new day.’
74 Ibid.
75 ‘The complete home entertainer? ’
76 ‘AOL, Sony, other companies form anti-piracy group’, The Detroit
News, 14 March 2003.
77 Ibid.
78 ‘Sony re-dreams its future.’
79 Ibid.
80 ‘Sony’s new day.’
81 ‘Sony re-dreams its future.’
82 Ibid.
83 Ibid.
84 Sony Corporation Annual Report 2002.
85 ‘The Sony brand.’
86 ‘Sony re-dreams its future.’
87 ‘Vision series: Kunitake Ando.’
88 ‘Multimedia is the message.’
89 ‘Sony’s new day.’
