33162C 02e7e52db238b91963000000
User Manual: 33162C
Open the PDF directly: View PDF ![]() .
.
Page Count: 6

Diabetologia (2005) 48: 2033–2038
DOI 10.1007/s00125-005-1855-7
ARTICLE
Y. M. Cho .H. D. Shin .B. L. Park .J. H. Kim .
K. S. Park .S. Y. Kim .H. K. Lee
Association between polymorphisms in the nuclear respiratory
factor 1 gene and type 2 diabetes mellitus in the Korean
population
Received: 16 November 2004 / Accepted: 2 April 2005 / Published online: 5 August 2005
#Springer-Verlag 2005
Abstract Aims/hypothesis: Dysfunction in mitochondrial
oxidative phosphorylation plays a central role in insulin
resistance and type 2 diabetes. Nuclear respiratory factor 1
(NRF1) is a transcription factor that acts on nuclear genes
encoding respiratory subunits and components of the mi-
tochondrial transcription and replication machinery. Thus,
we investigated its genetic association with type 2 dia-
betes. Methods: The NRF1 gene was sequenced to iden-
tify polymorphisms in 24 Korean DNA samples and then
common variants were genotyped in 766 patients with
type 2 diabetes and 303 non-diabetic subjects. Results:
Twelve single nucleotide polymorphisms and one inser-
tion/deletion polymorphism were identified. Six common
variants among them were genotyped in a larger study.
Although three individual polymorphisms appeared to be
associated with type 2 diabetes (g.−46350insdel A,g.+ 141G>T
and g.+54529A>G), the effects were only marginal. How-
ever, a haplotype (H2) was associated with a decreased risk
of type 2 diabetes and another haplotype (H4) was associated
with an increased risk of type 2 diabetes (pvalues for the
Haplo.Score test were 0.009 and 0.004, respectively).
Conclusions/interpretation: We demonstrated that two com-
mon haplotypes of NRF1 gene are associated with type 2
diabetes in the Korean population.
Keywords Mitochondria .Nuclear respiratory factor 1 .
Oxidative phosphorylation .Polymorphism .Type 2
diabetes mellitus
Abbreviations FOXC1: fork head-related activator-3 .
LD: linkage disequilibrium .NRF1: nuclear respiratory
factor 1 .OR: odds ratio .PGC1: peroxisome proliferator-
activated receptor γ-coactivator 1 .SNP: single nucleotide
polymorphism .TFAM: mitochondrial transcription factor
A.UTR: untranslated region
Introduction
Insulin resistance in the skeletal muscle of insulin-resistant
offspring of type 2 diabetic patients is associated with
decreased mitochondrial phosphorylation, which might be
an inherited defect in mitochondrial oxidative phosphory-
lation [1]. Furthermore, age-associated insulin resistance
also could be attributable to an age-associated reduction in
mitochondrial oxidative phosphorylation capacity [2].
Therefore, dysfunction in mitochondrial oxidative phos-
phorylation might play an important role in the pathogen-
esis of insulin resistance and type 2 diabetes.
It has been suggested that the oxidative phosphorylation
and electron transport chain system in mitochondria rely on
the functional interplay of gene products expressed from
both nuclear and mitochondrial genomes [3]. Since mito-
chondrial DNA encodes only 13 subunits of ∼100 struc-
tural subunits of respiratory proteins and ATP synthase in
the human mitochondria, the nucleo-mitochondrial inter-
action is essential to maintain normal cellular function [4].
Using microarray data, Patti et al. [5] and Mootha et al. [6]
independently observed that the genes of oxidative metab-
olism regulated by nuclear-encoded proteins are coordi-
nately reduced in the skeletal muscle of human subjects
with insulin resistance or diabetes, which is in line with the
fact that mitochondrial oxidative metabolism is crucial in
maintaining normal insulin sensitivity and normal glucose
metabolism [1,2]. Interestingly, those genes downregu-
lated in insulin resistance or diabetes are under the control
Y. M. Cho .J. H. Kim .K. S. Park .S. Y. Kim .H. K. Lee (*)
Department of Internal Medicine,
Seoul National University College of Medicine,
28 Yongon-dong, Chongno-gu,
Seoul, 110-744, South Korea
e-mail: hkleemd@snu.ac.kr
Tel.: +82-2-20722266
Fax: +82-2-7657966
Y. M. Cho .J. H. Kim .K. S. Park .H. K. Lee
Genome Research Centre for Diabetes and Endocrine Disease,
Clinical Research Institute, Seoul National University Hospital,
Seoul, South Korea
H. D. Shin .B. L. Park
Department of Genetic Epidemiology, SNP Genetics,
Seoul, South Korea

of nuclear respiratory factor 1 (NRF1) and peroxisome pro-
liferator-activated receptor γ-coactivator 1 (PGC1) [5,6].
Among them, NRF1 (Gene map locus 7q32; OMIM#
600879) is a transcription factor that acts on nuclear genes
encoding respiratory subunits and components of mito-
chondrial transcription and replication machinery [7,8].
NRF1 binds to and activates the promoters of many genes
of the mitochondrial electron transport system such as
cytochrome c, NADH dehydrogenase subunit 8, some cy-
tochrome oxidase subunits, some ATP synthase subunits,
mitochondrial transcription factor A (TFAM), and so on
(reviewed in [9]). There is a growing body of evidence that
links NRF1 physiologically to glucose metabolism. Aer-
obic exercise increases NRF1 expression in skeletal muscle
[10] and muscle-specific overexpression of human NRF1
in transgenic mice increases glucose transport capacity in
skeletal muscle by increasing glucose transporter 4 ex-
pression [11]. NRF1 mRNA expression in human skeletal
muscle is decreased in diabetes and inversely correlated
with fasting glucose [5]. In this regard, NRF1 is an at-
tractive candidate gene for type 2 diabetes. However, to the
best of our knowledge, there is no study on the association
between NRF1 polymorphism and type 2 diabetes. Thus, in
this study, we examined the genetic association between
NRF1 and type 2 diabetes.
Subjects and methods
Subjects
For initial sequencing, 24 Koreans were randomly selected
from unrelated local residents without any history of fa-
milial diseases. With 24 samples, one can expect to identify
more than 90% of polymorphisms with a frequency greater
than 0.05 [12]. Subsequently, we studied 766 unrelated
patients with type 2 diabetes from the Diabetes Clinic of
Seoul National University Hospital (age: 59±10 years, 357
men, 409 women) and 303 non-diabetic control subjects
(age: 65±4 years, 139 men, 164 women). The age of onset
of diabetes was 50±10 years. All subjects enrolled in this
study were of Korean ethnicity. Type 2 diabetes was diag-
nosed according to World Health Organization criteria
[13]. Subjects with positive GAD antibodies were ex-
cluded. Selection of the non-diabetic control subjects was
according to the following criteria: 60 years or older, no
past history of diabetes, no diabetes in first-degree rel-
atives, a fasting plasma glucose concentration of less than
6.1 mmol/l, and an HbA
1
c value of less than 5.8%. This
study was carried out in accordance with the Declaration of
Helsinki as revised in 2000 (http://www.wma.net/e/policy/
17cnote.pdf).
The Institutional Review Board of the Clinical Research
Institute in Seoul National University Hospital approved
the study protocol and written informed consent for genetic
analysis was obtained from each subject.
All study subjects were examined in the morning after an
overnight fast. Height, weight, circumferences of waist and
hip and blood pressure were measured. Blood samples were
drawn for biochemical measurements (fasting plasma glu-
cose, fasting plasma insulin, HbA
1
c, total cholesterol, tri-
glyceride and HDL-cholesterol) and DNA extraction.
Sequencing analysis of the human NRF1 gene
We sequenced all exons, including exon–intron boundaries
and promoter region (∼1.5 kb), to discover polymorphisms
in 24 Korean DNA samples using the ABI PRISM 3700
DNA Analyzer (Applied Biosystems, Foster City, CA,
USA). Seventeen primer sets for the amplification and
sequencing analysis were designed based on GenBank
sequences (NM_005011). Information regarding the prim-
ers is available at http://www.snp-genetics.com/reference/
NRF1_add_info.doc. Sequence variants were verified by
chromatograms.
Genotyping with fluorescence polarisation detection
For genotyping of polymorphic sites, amplifying primers
and probes were designed for TaqMan. Primer Express
(Applied Biosystems) was used to design both the PCR
primers and the MGB TaqMan probes. One allelic probe
was labelled with the FAM dye and the other with the
fluorescent VIC dye. PCRs were run in a TaqMan Uni-
versal Master mix without UNG (Applied Biosystems)
with PCR primer concentrations of 900 nmol/l and MGB
TaqMan probe concentrations of 200 nmol/l. Reactions
were performed in a 384-well format in a total reaction
volume of 5 μl using 20 ng genomic DNA. The plates were
then placed in a thermal cycler (PE 9700; Applied Bio-
systems) and heated at 50°C for 2 min and 95°C for
10 min followed by 40 cycles of 95°C for 15 s and 60°C
for 1 min. The TaqMan assay plates were transferred to a
Prism 7900HT instrument (Applied Biosystems) where
the fluorescence intensity in each well of the plate was
read.
Fluorescence data files from each plate were analysed by
automated software (SDS 2.1). Genotyping quality control
was performed in 10% of samples by duplicate checking
(rate of concordance in duplicates >99%). The genotype
success rate was >97.5%. Information regarding the prim-
ers is available on our website http://www.snp-genetics.
com/reference/NRF1_add_info.doc.
Statistical analyses
We used chi-square tests to determine whether individual
polymorphisms were in Hardy–Weinberg equilibrium. Lo-
gistic regression analyses were used for calculating odds
ratio (ORs), 95% CIs and corresponding pvalues, con-
trolling for age, sex and BMI as covariates. Genotypes were
given codes of 0, 1 and 2 and 0, 1 and 1 or 0, 0 and 1 in the
additive, dominant or recessive models, respectively. In the
additive model, the OR was expressed per difference in
number of rare allele. Multiple regressions, whilst adjusting
2034
for age and sex, were used for association analyses of
diabetes-related phenotypes. Haplotype associations were
also estimated using Haplo.Score (http://www.biostat.wustl.
edu/genetics/geneticssoft), which imputes score statistics to
test associations between haplotypes and a wide variety of
traits, including binary, ordinal, quantitative and Poisson
[14]. This software provides several haplotype-specific tests
for association, as well as adjustment for non-genetic covar-
iates and computation of simulation pvalues, using the
assumption that all subjects are unrelated and that hap-
lotypes are ambiguous due to unknown linkage phases of the
genetic markers. To predict putative transcription factor
binding sites, we used MatInspector (http://www.genoma
tix.de/products/MatInspector/index.html)[15]. A pvalue of
less than 0.05 was considered statistically significant.
Results
Identification of polymorphisms in the NRF1 gene
In this study, the NRF1 gene including all exons, ±50 bp
exon–intron boundaries and the −1,500 bp 5′-flanking
region were sequenced in 24 Korean DNA samples and 12
single nucleotide polymorphisms (SNPs) and one insertion/
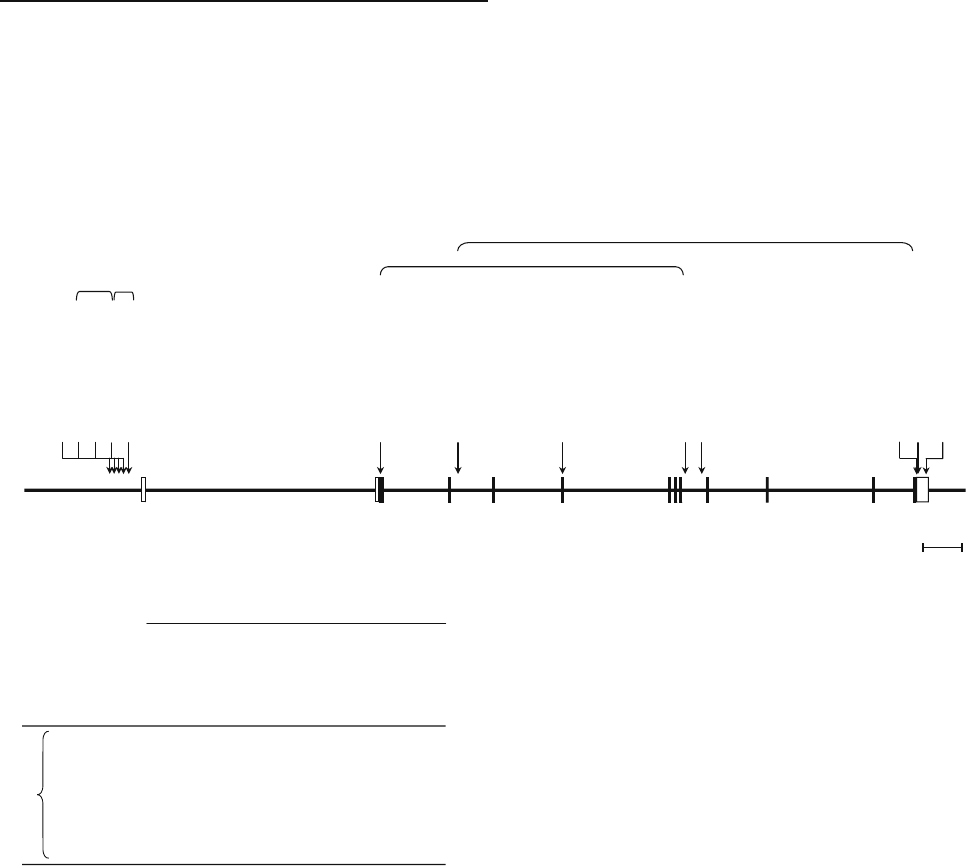
deletion polymorphism were identified (Fig. 1a). Five
variants were in the 5′region: g.−46656G>A,g.−46568G>A,
g.−46350insdel A,g.−46185G>C,andg.−45903C>T.Two
SNPs were found in the exons, where both predicted silent
substitutions: g.+141G>Tin exon 2 encoding 47Ser and
g.+33162C>Tin exon 5 encoding 191Asp. Three SNPs were
in introns: g.+14382T>C,g.+54529A>G,andg.+59745A>G.
And three SNPs were in the 3′-untranslated region (UTR)
(g.+97884G>A,g.+97893G>Tand g.+ 98560A>G). By
pair-wise linkage analysis, we have found that five sets of
SNPs (g.−46568G>A:g.−46185G>C,g.−46568G>A:
g.−45903C>T,g.−46185G>C:g.−45903C>T,g.+141G>T:
g.+54529A>G,g.+14382T>C:g.+97893G>T) were in ab-
solute linkage disequilibrium (LD) (LD D′=1 and r
2
=1) (see
Fig. 1a). Among identified polymorphisms, six common
variants (g.−46568G>A,g.−46350insdel A,g.+ 141G>T,
g.+33162C>T,g.+54529A>Gand g.+59745A>G) were
selected for larger scale genotyping. The LD patterns did
not show a break among SNPs genotyped (all D′s are >0.9,
see Fig. 1b). Genotype distributions of all loci in NRF1 were
in Hardy–Weinberg equilibrium (p>0.05).
Ex1 Ex2 Ex3 Ex4 Ex 5 Ex6,7,8 Ex9 Ex10 Ex11 Ex12
a
g.-46656 G>A (0.021)
g.-46568 G>A (0.13)*
g.-46350 insdelA (0.48)*
g.-46185 G>C (0.125)
g.-45903 C>T (0.125)
g.+141 G>T (S47S) (0.395)*
g.+14382 T>C (0.02)
g.+33162 C>T (D191D) (0.104)*
g.+54529 A>G (0.395)*
g.+59745 A>G (0.083)*
g.+97884 G>A (0.041)
g.+97893 G>T (0.02)
g.+98560 A>G (0.026)
r2=1
r2=1
r2=1
b
5 kb
-0.0570.0080.0530.105
0.007g.+59745A>G
1.000-0.1500.9760.4980.126
g.+54529A>G
1.0001.000-0.1480.068
0.856g.+33162C>T
0.9600.9941.000-0.5130.125
g.+141G>T
0.9300.9450.9010.954-0.074
g.-46350insdelA
1.0000.9780.9840.9781.000-
g.-46568G>A
r2
g.-46568G>A
g.-46350insdelA
g.+141G>T
g.+33162C>T
g.+54529A>G
g.+59745A>G
|D’|
Map of NRF1 on chromosome 7q32
LDs among NRF1 polymorphisms
Fig. 1 Gene map (a) and LD pattern (b)oftheNRF1 gene.
aPolymorphisms identified in NRF1, with coding exons marked
by closed blocks and 5′- and 3′-UTRs by open blocks.*=SNPs that
were genotyped in the larger population. The frequencies of poly-
morphisms were based on sequencing data (n=24). The first
nucleotide of the translation start site is denoted as nucleotide +1.
bLD coefficients (|D′| and r
2
) among polymorphisms in NRF1
2035

Association with type 2 diabetes
We assessed the association of each genotype by logistic
regression analyses adjusting for age, sex and BMI. Three
individual polymorphisms were found to be associated with
the risk of type 2 diabetes (Table 1). The g.−46350insdel A
showed an increased risk of type 2 diabetes when applying a
recessive genetic model (OR=1.631, 95% CI 1.139−2.337,
p=0.008). Also, the nucleotide position −46,350 was pre-
dicted as a 3′-flanking site of the fork head-related activator-3
(FOXC1) consensus sequence. The g.+141G>Tshowed
an increased risk of type 2 diabetes with an additive
model (OR=1.341 [1.075–1.671], p=0.009) and with a
dominant model (OR=1.396 [1.050–1.855], p=0.022).
The g.+54529A>Gpolymorphism, which is in complete
LD with g.+141G>T, showed an increased risk of type 2
diabetes with an additive model (OR=1.302 [1.046–1.619],
p= 0.018) and with a dominant model (OR=1.398 [1.053–
1.857], p=0.021). When Bonferroni’s correction for the
multiple comparisons was strictly applied, no polymor-
phism remained significant in terms of the association with
type 2 diabetes.
Among the six different polymorphisms genotyped, we
identified five common haplotypes (frequency >0.05) that
account for 97.6% of the observed haplotypes (Table 2).
The haplotype H2 was associated with a decreased risk of
type 2 diabetes (pvalue for Haplo.Score=0.009) and the
haplotype H4 was associated with an increased risk of type
2 diabetes (pvalue for Haplo.Score=0.004). Comparing
the elements of the protective haplotype H2 and the sus-
Table 1 Associations between polymorphisms in NRF1 and the risk of type 2 diabetes
SNPs Genotype Number Additive Dominant Recessive Statistical
power
a
Diabetes Control OR (95% CI) pOR (95% CI) pOR (95% CI) p
g.−46568G>AGG 667
(87.5%)
268
(88.7%)
GA 94
(12.3%)
31
(10.3%)
1.04
(0.697–1.595)
0.803 1.154
(0.741–1.795)
0.527 0.144
(0.014–1.493)
0.104 0.034
AA 1 (0.1%) 3 (1.0%)
g.−46350
insdel A
ins/ins 200
(26.8%)
82
(27.4%)
ins/del 364
(48.8%)
164
(54.8%)
1.174
(0.959–1.438)
0.12 0.989
(0.718–1.362)
0.944 1.631
(1.139–2.337)
0.008 0.215
del/del 182
(24.4%)
53
(17.7%)
g.+141G>TGG 306
(40.1%)
143
(47.5%)
GT 371
(48.6%)
134
(44.5%)
1.341
(1.075–1.671)
0.009 1.396
(1.050–1.855)
0.022 1.598
(0.974–2.621)
0.063 0.550
TT 86
(11.3%)
24
(8.0%)
g.+33162C>TCC 652
(85.8%)
261
(87.3%)
CT 107
(14.1%)
35
(11.7%)
1.076
(0.723–1.602)
0.717 1.171
(0.768–1.786)
0.462 0.143
(0.014–1.475)
0.102 0.046
TT 1 (0.1%) 3 (1.0%)
g.+54529A>GAA 310
(40.7%)
145
(48.0%)
AG 368
(48.3%)
130
(43.0%)
1.302
(1.046–1.619)
0.018 1.398
(1.053–1.857)
0.021 1.384
(0.859–1.119)
0.182 0.464
GG 84
(11.0%)
27
(8.9%)
g.+59745A>GAA 613
(80.7%)
245
(80.7%)
AG 141
(18.6%)
57
(18.9%)
1.080
(0.765–1.524)
0.661 1.030
(0.720–1.473)
0.871 ––0.053
GG 6 (0.8%) 0 (0.0%)
Genotype distributions are shown as number (%). Odds ratios (ORs), 95% CI, and pvalues were from logistic regression analyses with
additive, dominant, and recessive models controlling for age, sex and BMI as covariates. In additive models, ORs are expressed per
difference in number of rare alleles. pvalues were not corrected for multiple comparisons (18 tests)
a
Statistical powers calculated with the given OR of additive model, frequency and subject numbers at a significance level of 0.05
2036

ceptible haplotype H4, two polymorphisms (g.+141G>T
and g.+54529A>G) were regarded as the determinants
modifying the risk of type 2 diabetes, although their indi-
vidual effect was modest, as shown in Table 1.
Association with diabetes-related phenotypes
For the association analyses of the diabetes-related phe-
notypes, only non-diabetic subjects were used because, in
diabetic subjects, treatment of diabetes might have affect-
ed those parameters. However, analyses of fasting plasma
glucose, homeostasis model assessment of insulin resis-
tance, waist circumference, BMI, total cholesterol, trigly-
ceride and HDL-cholesterol did not reveal any strong
associations with genotypes or haplotypes when adjusting
for multiple comparisons (data not shown). Also, there
were no strong associations between the diabetes-related
phenotypes and the protective haplotype H2 or the sus-
ceptible haplotype H4 (Table 3).
Discussion
In this study, we demonstrated that two common haplo-
types of the NRF1 gene are associated with type 2 diabetes
in the Korean population. To the best of our knowledge,
this is the first study to demonstrate that NRF1 polymor-
phisms are associated with type 2 diabetes. However, we
did not find any association with diabetes-related pheno-
types. Before concluding that the polymorphisms in NRF1
really are associated with the risk of type 2 diabetes, this
result should be replicated.
At this time, we can only speculate on the mechanism
linking genetic variations of NRF1 to the susceptibility for
type 2 diabetes. Although the nucleotide position −46,350
Table 3 Comparison of diabetes-related phenotypes according to haplotypes in the non-diabetic subjects
Haplotype
combination
Haplotype H2 p value
b
Haplotype H4 p value
b
−/−−/H2 H2/H2 −/−−/H4 H4/H4
Number 264 38 1 –180 109 14 –
Fasting plasma
glucose (mmol/l)
5.1±0.5 5.2±0.5 5.4 0.285 5.1±0.5 5.1±0.4 4.8±0.4 0.360
HOMA-IR
a
1.58 (0.18–5.71) 1.87 (0.69–4.83) 2.25 0.925 1.59 (0.36–4.83) 1.86 (0.18–5.71) 1.72 (0.47–3.01) 0.712
Cholesterol
(mmol/l)
5.02±0.90 5.40±0.85 5.61 0.071 5.05±0.94 5.01±0.80 4.91±0.78 0.931
Triglyceride
(mmol/l)
a
1.36 (0.38–5.94) 1.51 (0.55–2.87) 1.79 0.805 1.44 (0.38–4.63) 1.51 (0.52–5.94) 1.46 (0.75–2.41) 0.330
HDL-cholesterol
(mmol/l)
1.17±0.35 1.19±0.28 1.16 0.380 1.16±0.33 1.19±0.36 1.24±0.34 0.298
BMI (kg/m
2
) 23.5±3.2 25.0±2.4 23.7 0.013 23.6±3.2 23.7±3.2 23.5±2.8 0.517
Waist circumference
(cm)
82.6±8.4 85.9±5.5 86.0 0.348 82.5±7.9 83.7±8.8 81.9±6.1 0.407
Data are shown as means±SD in the case of normal distribution, otherwise as median (range). This table compares diabetes-related
phenotypes according to the additive models with haplotypes H2 and H4, which showed a significant association with type 2 diabetes
a
Homeostasis model assessment of insulin resistance (HOMA-IR) and triglyceride were log-transformed before analyses
b
pvalues of haplotype associations of additive models were calculated by the Haplo.Score algorithm developed by Schaid et al. [14], while
controlling for age, sex and BMI as covariates. They were not corrected for multiple comparisons (seven parameters)
Table 2 Association between haplotypes and the risk of type 2 diabetes
Haplotype Locus Frequency pvalue
a
−46,567 −46,350 141 33,162 54,529 59,745 Diabetes Control
H1 G insA G C A A 0.499 0.533 0.138
H2 G delA G
b
CA
b
A 0.042 0.066 0.009
H3 G delA G C A G 0.097 0.087 0.626
H4 G delA T
b
CG
b
A 0.277 0.226 0.004
H5 A delA T T G A 0.062 0.061 0.880
Each haplotype with a frequency >0.05 is shown
a
pvalues of haplotype associations were calculated by the Haplo.Score algorithm developed by Schaid et al. [14], while controlling for age,
sex and BMI as covariates. They were not corrected for multiple comparisons (five tests)
b
Alleles regarded as the determinants modifying susceptibility to type 2 diabetes after examining the allelic differences between the
protective (H2) and susceptible (H4) haplotypes
2037

was predicted as 3′-flanking site of the FOXC1 consensus
sequence, haplotype analysis revealed that the −46,350A
variant was neutral to the risk of type 2 diabetes in that it
appeared both in protective (H2) and in susceptible (H4)
haplotypes. Similarly, comparing the elements of H2 and H4,
two polymorphisms (g.+141G>Tand g.+54529A>G)were
regarded as the determinants modifying the susceptibility to
type 2 diabetes. However, their individual association with
type 2 diabetes was only modest. Moreover, g.+141G>Tis a
synonymous substitution and g.+54529A>Gis located in
intron. It is possible that these polymorphisms did not reach
a robust association with type 2 diabetes in this study be-
cause the sample size was too small to identify such a modest
genetic effect. Since all genotyped loci were in a single LD
block, it is unlikely that we failed to detect a disease as-
sociation due to any polymorphism within this region that was
not covered in genotyping. However, it is possible that the
polymorphism(s) upstream from the promoter region se-
quenced by us or the gene(s) in the same or nearby locus of
NRF1 could have an influence on susceptibility to type 2
diabetes.
Type 2 diabetes is a multifactorial disease and influenced
by gene–gene and gene–environment interactions [16–18].
Of note, there are interactions among PGC1,NRF1 and
TFAM in the biogenesis and maintenance of normal
function of mitochondria [9,19,20]. Recently, evaluation
of high-order gene–gene interactions has become possible,
thanks to newly developed methods such as multifactor
dimensionality reduction [21–23]. The examination of
gene–gene interactions among PGC1,NRF1 and TFAM
would help reveal the genetic link between mitochondrial
oxidative phosphorylation and type 2 diabetes.
In conclusion, haplotypes of the NRF1 gene, which reg-
ulates mitochondrial oxidative phosphorylation, are asso-
ciated with type 2 diabetes in the Korean population and this
association should be tested in other different populations for
replication.
Acknowledgements Y.M. Cho and H.D. Shin contributed equally
to this work. This work was supported by a grant from the Korea
Health 21 R & D Project, Ministry of Health & Welfare, Republic of
Korea (02-PJ1-PG1-CH04-0001 and 00-PJ3-PG6-GN07-001) and
by an intramural grant of the National Institute of Health, Korea.
References
1. Petersen KF, Dufour S, Befroy D, Garcia R, Shulman GI (2004)
Impaired mitochondrial activity in the insulin-resistant offspring of
patients with type 2 diabetes. N Engl J Med 350:664–671
2. Petersen KF, Befroy D, Dufour S et al (2003) Mitochondrial
dysfunction in the elderly: possible role in insulin resistance.
Science 300:1140–1142
3. Gopalakrishnan L, Scarpulla RC (1995) Structure, expression,
and chromosomal assignment of the human gene encoding
nuclear respiratory factor 1. J Biol Chem 270:18019–18025
4. Poyton RO, McEwen JE (1996) Crosstalk between nuclear and
mitochondrial genomes. Annu Rev Biochem 65:563–607
5. Patti ME, Butte AJ, Crunkhorn S et al (2003) Coordinated
reduction of genes of oxidative metabolism in humans with
insulin resistance and diabetes: potential role of PGC1 and
NRF1. Proc Natl Acad Sci U S A 100:8466–8471
6. Mootha VK, Lindgren CM, Eriksson KF et al (2003) PGC-1
alpha-responsive genes involved in oxidative phosphorylation
are coordinately downregulated in human diabetes. Nat Genet
34:267–273
7. Evans MJ, Scarpulla RC (1989) Interaction of nuclear factors
with multiple sites in the somatic cytochrome c promoter.
Characterization of upstream NRF-1, ATF, and intron Sp1
recognition sequences. J Biol Chem 264:14361–14368
8. Evans MJ, Scarpulla RC (1990) NRF-1: a trans-activator of
nuclear-encoded respiratory genes in animal cells. Genes Dev
4:1023–1034
9. Scarpulla RC (2002) Nuclear activators and coactivators in
mammalian mitochondrial biogenesis. Biochim Biophys Acta
1576:1–14
10. Baar K, Wende AR, Jones TE et al (2002) Adaptations of
skeletal muscle to exercise: rapid increase in the transcriptional
coactivator PGC-1. FASEB J 16:1879–1886
11. Baar K, Song Z, Semenkovich CF et al (2003) Skeletal muscle
overexpression of nuclear respiratory factor 1 increases glucose
transport capacity. FASEB J 17:1666–1673
12. Eberle MA, Kruglyak L (2000) An analysis of strategies for
discovery of single-nucleotide polymorphisms. Genet Epide-
miol 19(Suppl 1):S29–S35
13. Alberti KG, Zimmet PZ (1998) Definition, diagnosis and
classification of diabetes mellitus and its complications part 1:
diagnosis and classification of diabetes mellitus provisional
report of a WHO consultation. Diabet Med 15:539–553
14. Schaid DJ, Rowland CM, Tines DE, Jacobson RM, Poland GA
(2002) Score tests for association between traits and haplotypes
when linkage phase is ambiguous. Am J Hum Genet 70:425–
434
15. Quandt K, Frech K, Karas H, Wingender E, Werner T (1995)
MatInd and MatInspector: new fast and versatile tools for
detection of consensus matches in nucleotide sequence data.
Nucleic Acids Res 23:4878–4884
16. Froguel P, Velho G (2001) Genetic determinants of type 2
diabetes. Recent Prog Horm Res 56:91–105
17. Elbein SC (2002) Perspective: the search for genes for type 2
diabetes in the post-genome era. Endocrinology 143:2012–
2018
18. Gloyn AL, McCarthy MI (2001) The genetics of type 2
diabetes. Best Pract Res Clin Endocrinol Metab 15:293–308
19. Lowell BB, Spiegelman BM (2000) Towards a molecular
understanding of adaptive thermogenesis. Nature 404:652–660
20. Wu Z, Puigserver P, Andersson U et al (1999) Mechanisms
controlling mitochondrial biogenesis and respiration through
the thermogenic coactivator PGC-1. Cell 98:115–124
21. Ritchie MD, Hahn LW, Roodi N et al (2001) Multifactor-
dimensionality reduction reveals high-order interactions among
estrogen-metabolism genes in sporadic breast cancer. Am J
Hum Genet 69:138–147
22. Ritchie MD, Hahn LW, Moore JH (2003) Power of multifactor
dimensionality reduction for detecting gene–gene interactions
in the presence of genotyping error, missing data, phenocopy,
and genetic heterogeneity. Genet Epidemiol 24:150–157
23. Cho YM, Ritchie MD, Moore JH et al (2004) Multifactor-
dimensionality reduction shows a two-locus interaction asso-
ciated with type 2 diabetes mellitus. Diabetologia 47:549–554
2038
