05 Power BI Lab Manual
User Manual:
Open the PDF directly: View PDF ![]() .
.
Page Count: 51

Power platform
App in a Day
Module 5: Power BI
Hands-on Lab Step-by-Step
November 2018
Contents
Power BI ......................................................................................................................................................................................... 1
Lab Prerequisites ............................................................................................................................................................................................................... 1
About Power BI ............................................................................................................................................................................. 1
Exercise 1: Install Power BI Desktop .......................................................................................................................................... 2
Task 1: Download and install Power BI Desktop ................................................................................................................................................... 2
Exercise 2: Import historical data ............................................................................................................................................... 4
Task 1: Import past orders into Common Data Service ....................................................................................................................................... 4
Exercise 3: Connect and reference data .................................................................................................................................. 13
Task 1: Connect Power BI to the CDS Data ........................................................................................................................................................... 13
Task 2: Clean up and Transform ................................................................................................................................................................................ 18
Task 3: Add Device Manufacturer Data .................................................................................................................................................................. 24
Exercise 4: Setup Relationships and Calculated Columns .................................................................................................... 26
Task 1: Manage Relationships .................................................................................................................................................................................... 26
Task 2: Add Link to the Common Data Service (CDS) Record Form ............................................................................................................. 30
Task 3: Add a Calculated Field for approval time ............................................................................................................................................... 35
Exercise 5: Add visuals to the report ....................................................................................................................................... 39
Task 1: Add Stacked Bar Chart of orders ................................................................................................................................................................ 39
Task 2: Add a Slicer on Approval Status ................................................................................................................................................................. 39
Task 3: Add Cards with Device Order statistics .................................................................................................................................................... 40
Task 4: Add a Donut Chart by Manufacture .......................................................................................................................................................... 43
Task 5: Add a Tree Map by Device Name .............................................................................................................................................................. 44
Task 6: Format the Statistics Cards ........................................................................................................................................................................... 45
Task 7: Arrange the visuals on the report page.................................................................................................................................................... 46
Exercise 6: Publish and Share ................................................................................................................................................... 47
Task 1: Publish and Share ............................................................................................................................................................................................ 47
Copyright ..................................................................................................................................................................................... 49

Power platform App in a Day Module 5: Power BI
1 | P a g e ©2018 Microsoft Corporation
Power BI
Lab Prerequisites
This is the fifth lab in a five-part series covering PowerApps, Common Data Service, Flow and Power BI. The assumption is
that you have successfully completed the first four modules, or at least the initial part of setting up an environment as
described in the overview – “00-AppInADay Lab Overview.pdf”.
If you have not completed the previous modules, you can use the completed version of the lab package in the
“\Completed\Module4\Completed Solution” folder. Follow the instructions in the document “Complete Solution” before
proceeding with this module, which will provision the app and the Common Data Service entity into your environment.
About Power BI
Power BI is a suite of business analytics tools that deliver insights throughout your organization. In this lab, we will be
using Power BI to visualize data from the device procurement process. Power BI can connect to hundreds of data sources
and prepare the data for use. In this lab, you will be using the Common Data Service and the Excel connectors.

Power platform App in a Day Module 5: Power BI
©2018 Microsoft Corporation 2 | P a g e
Exercise 1: Install Power BI Desktop
In this exercise you will install the Power BI Desktop application. If you already have the application installed, you
may skip to Exercise 2.
Task 1: Download and install Power BI Desktop
In this task, you will download and install Power BI Desktop.
1. Navigate to https://www.microsoft.com/en-us/download/details.aspx?id=45331 and click Download.
2. Select the appropriate version for your computer and click Next.
Power platform App in a Day Module 5: Power BI
3 | P a g e ©2018 Microsoft Corporation
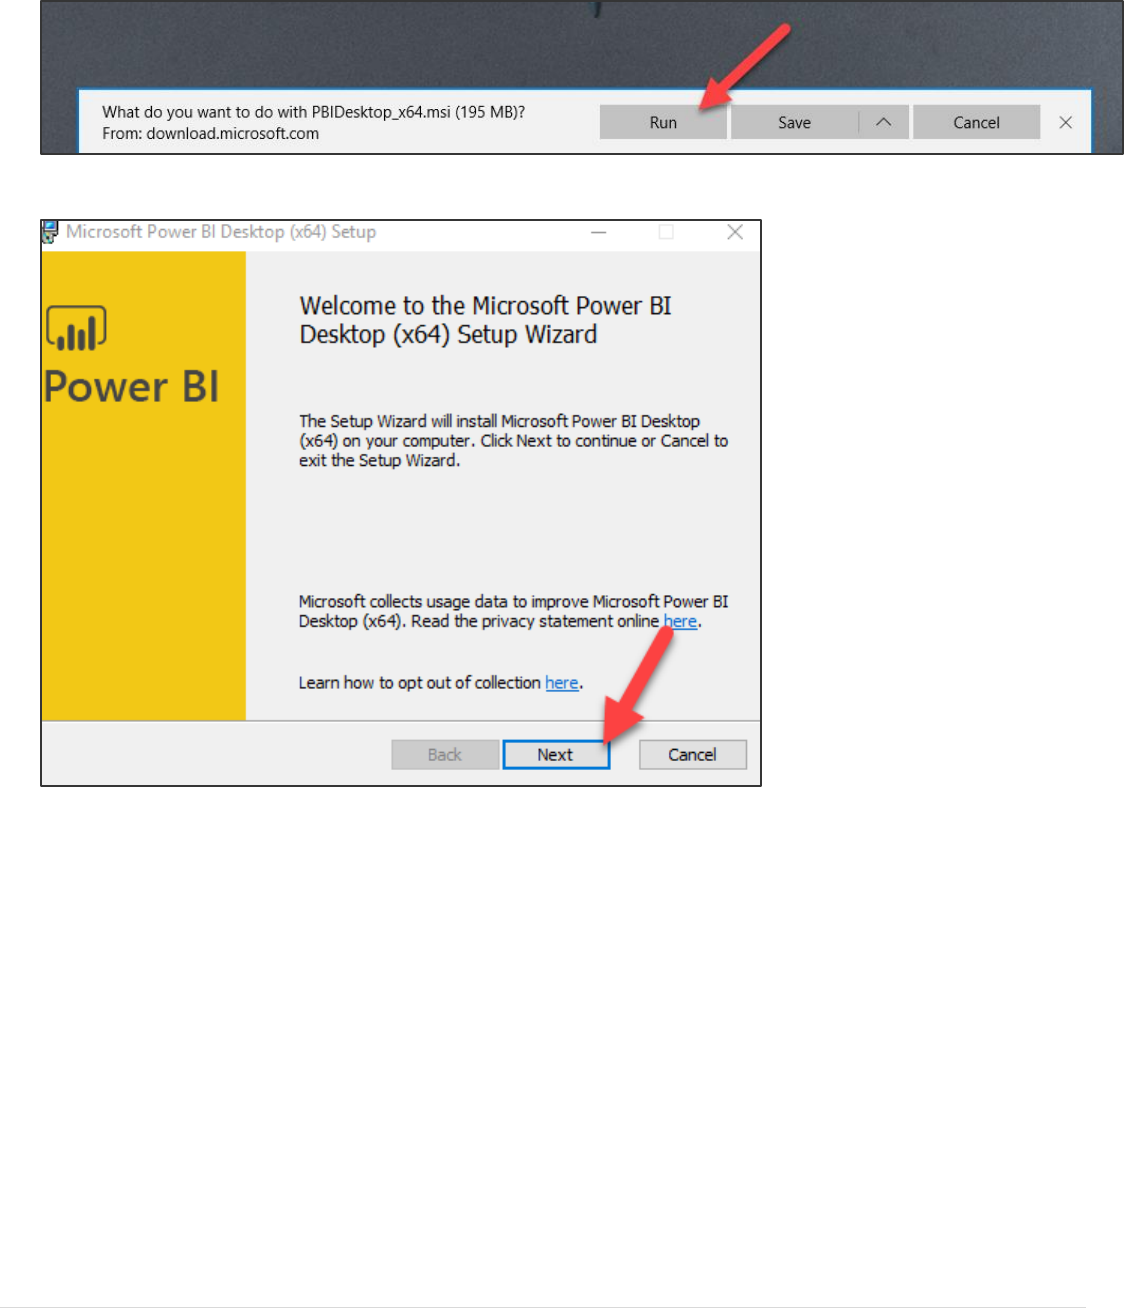
3. Click Run.
4. Click Next.
5. Follow the installation wizard and complete the installation.
Power platform App in a Day Module 5: Power BI
©2018 Microsoft Corporation 4 | P a g e
Exercise 2: Import historical data
Task 1: Import past orders into Common Data Service
Since you probably only input four or five device orders when testing the PowerApp you built in the prior modules we
need more test data to report on. To make the Power BI Analytics more interesting we need some additional data. In this
task you will be importing some historical orders into the CDS Device Orders entity.
1. From https://web.powerapps.com log in to your existing PowerApps Environment that has your CDS data that you
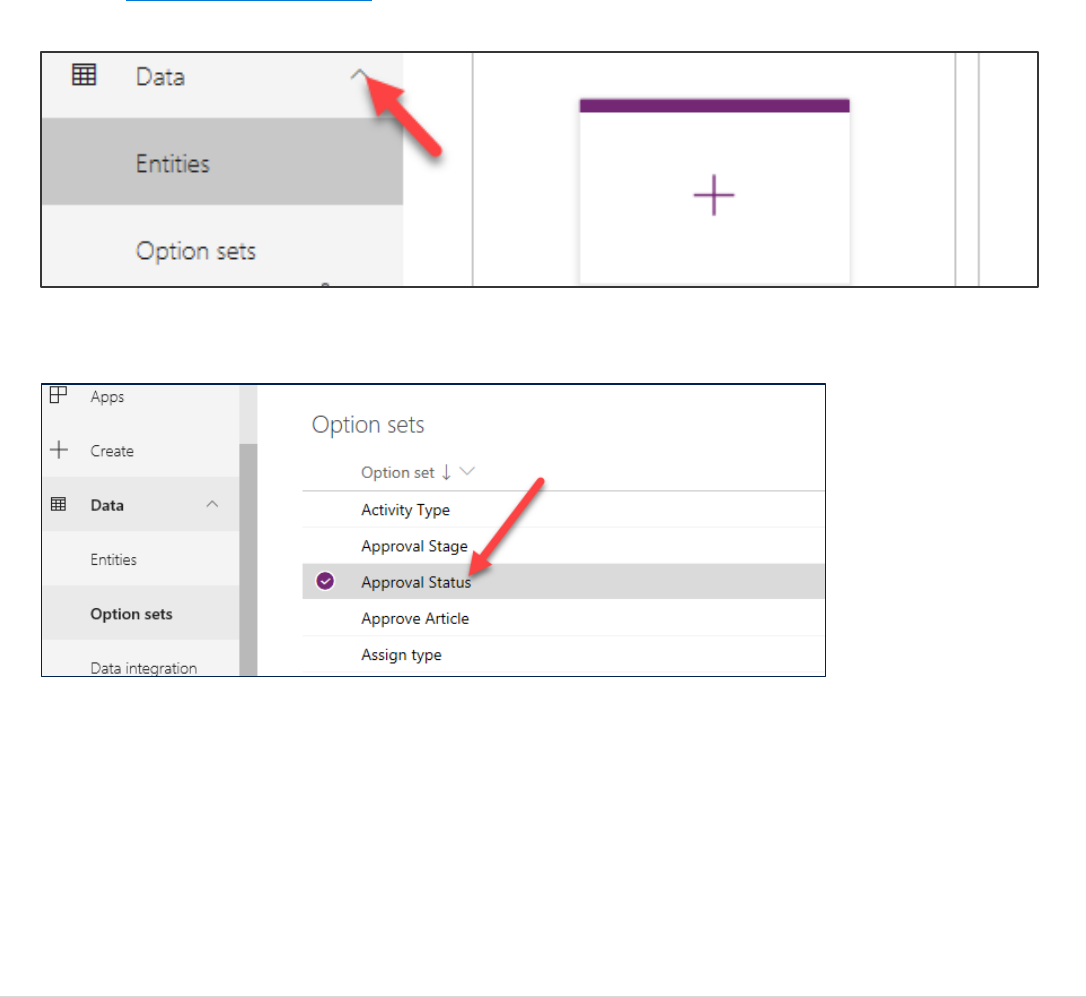
have used for the prior labs. Select your environment and expand Data.
2. Select Option Sets and click on the Approval Status.
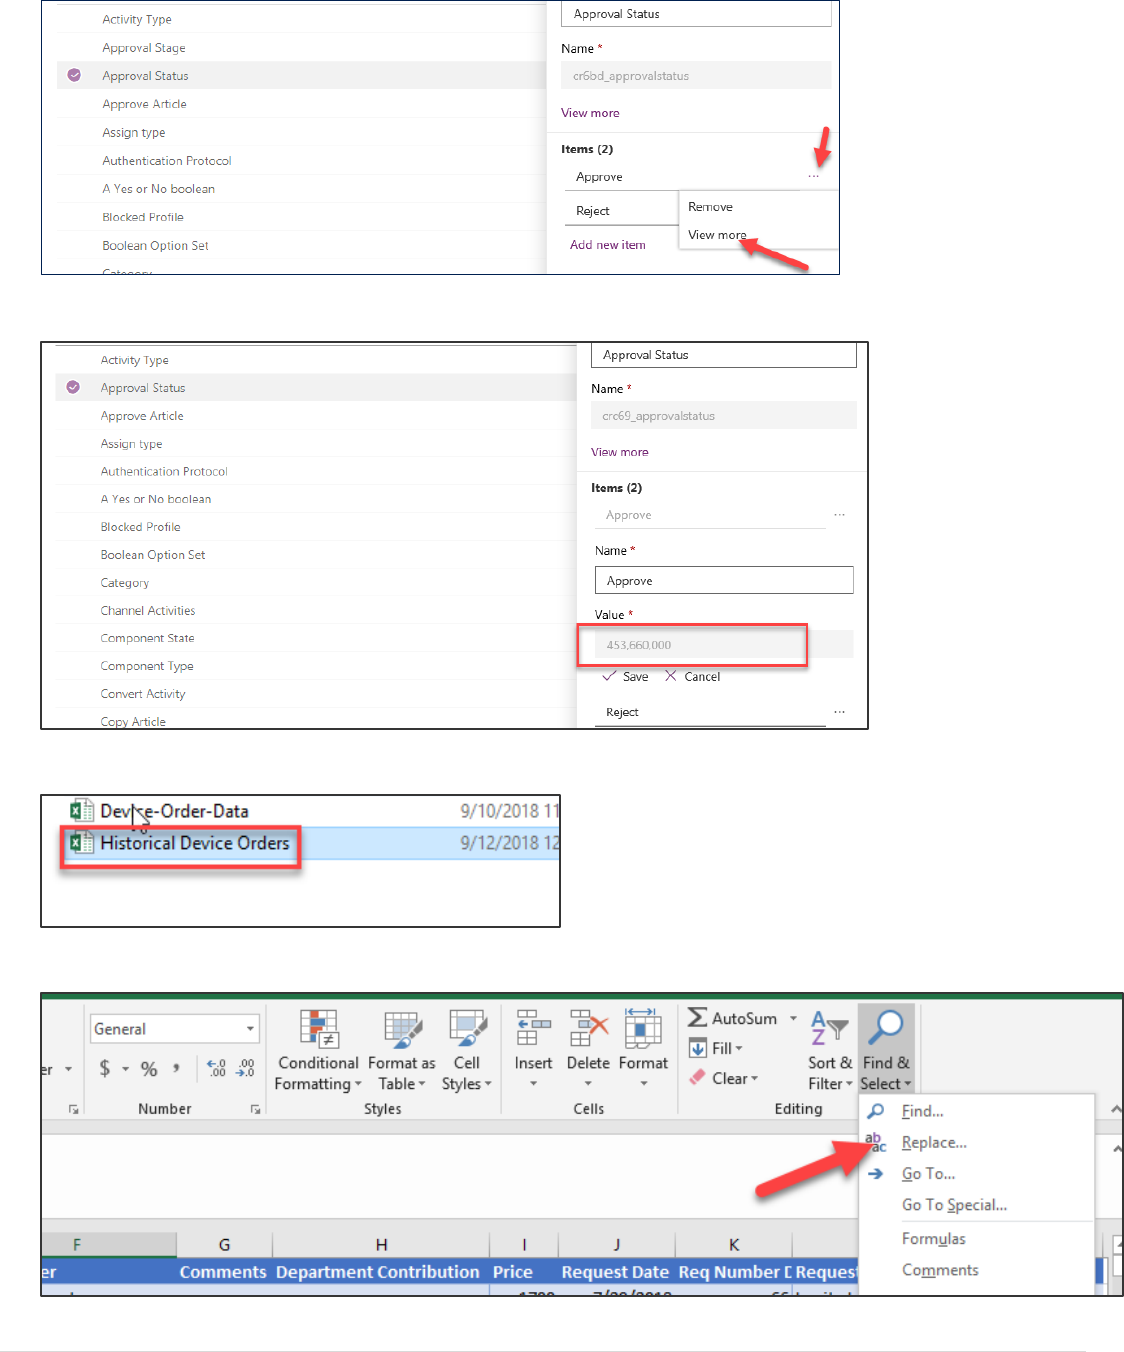
3. Click the … button of the Approve option and select View More.
Power platform App in a Day Module 5: Power BI
5 | P a g e ©2018 Microsoft Corporation
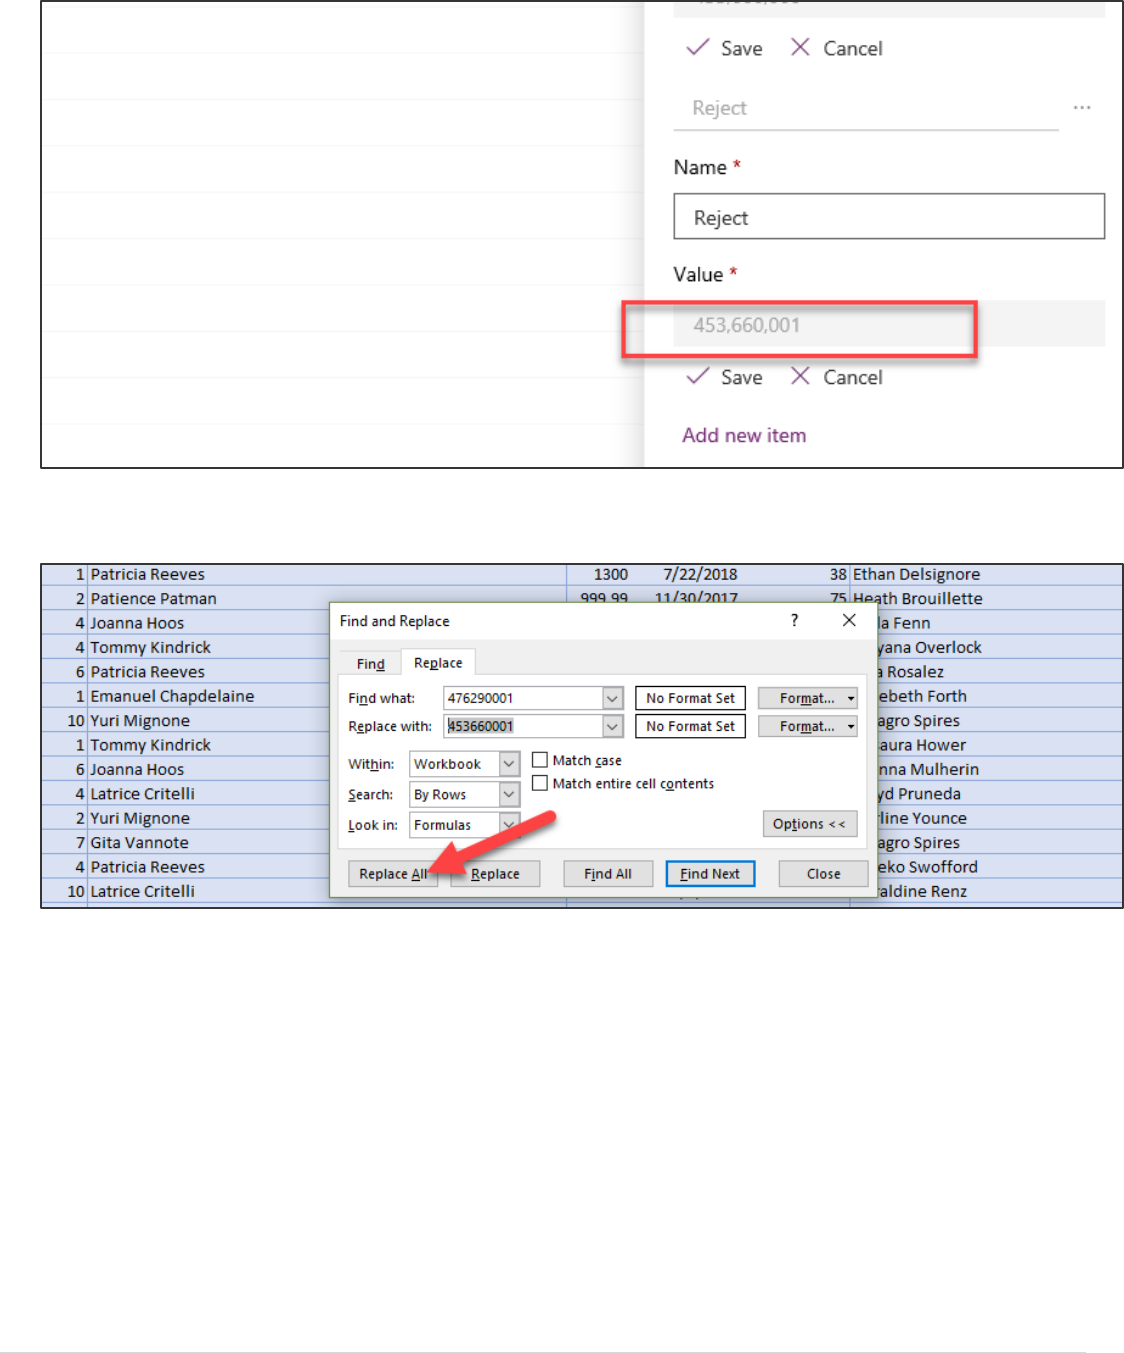
4. Copy the Value.
5. Go to the resources folder of the module and open the Historical Device Order Excel file
6. Click Find and select Replace.
Power platform App in a Day Module 5: Power BI
©2018 Microsoft Corporation 6 | P a g e
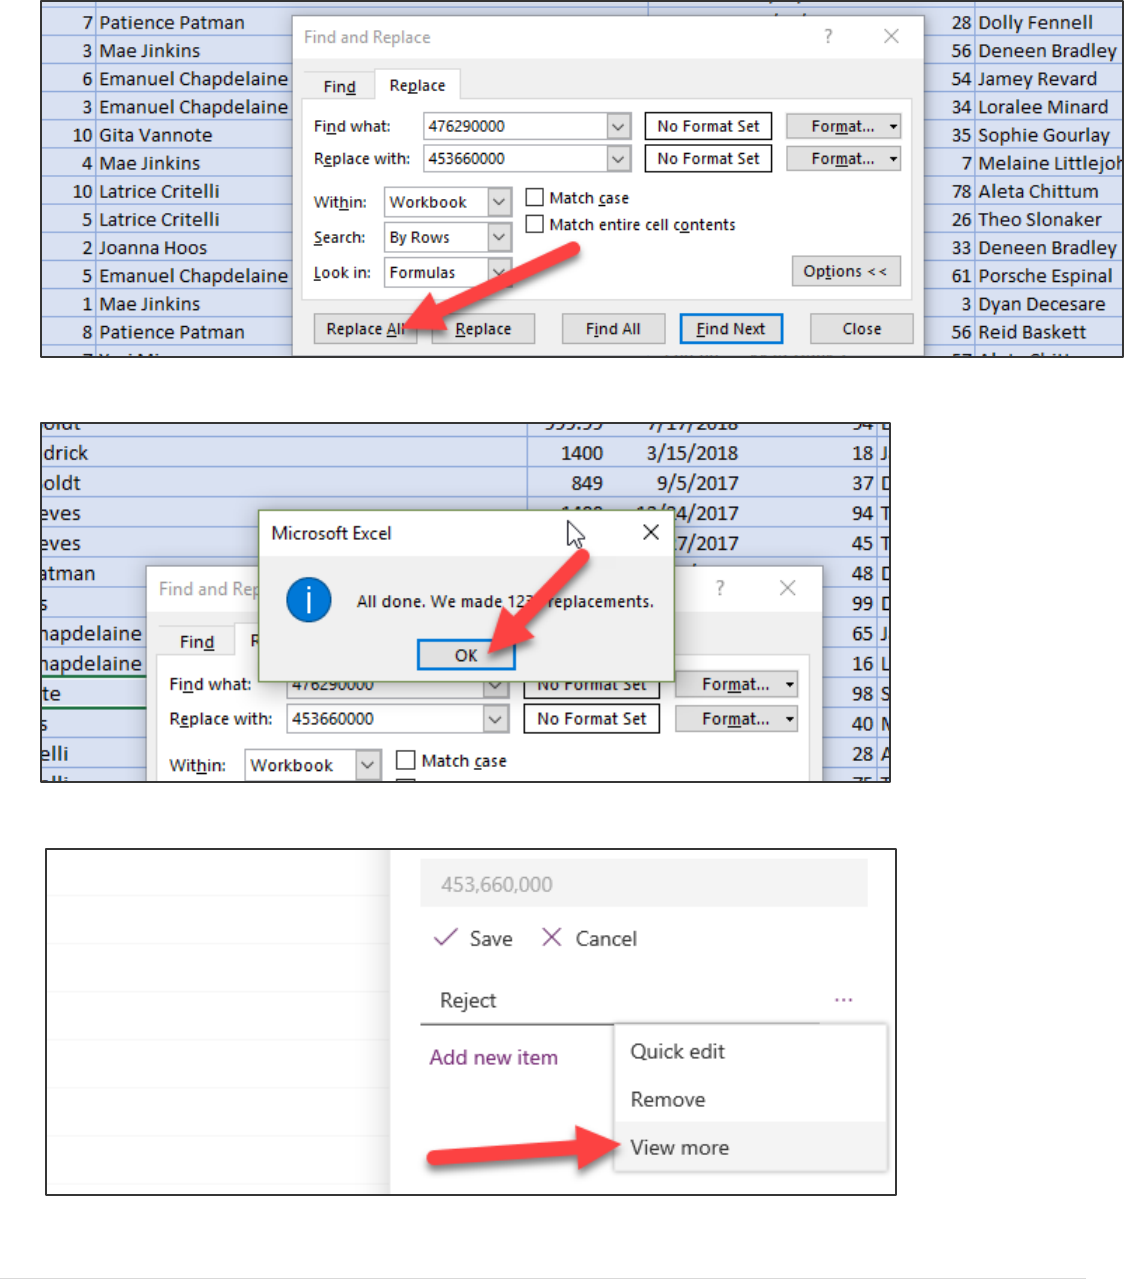
7. Enter 476290000 for Find, type the Value you copied (without the commas) in the Replace field, and click Replace
All.
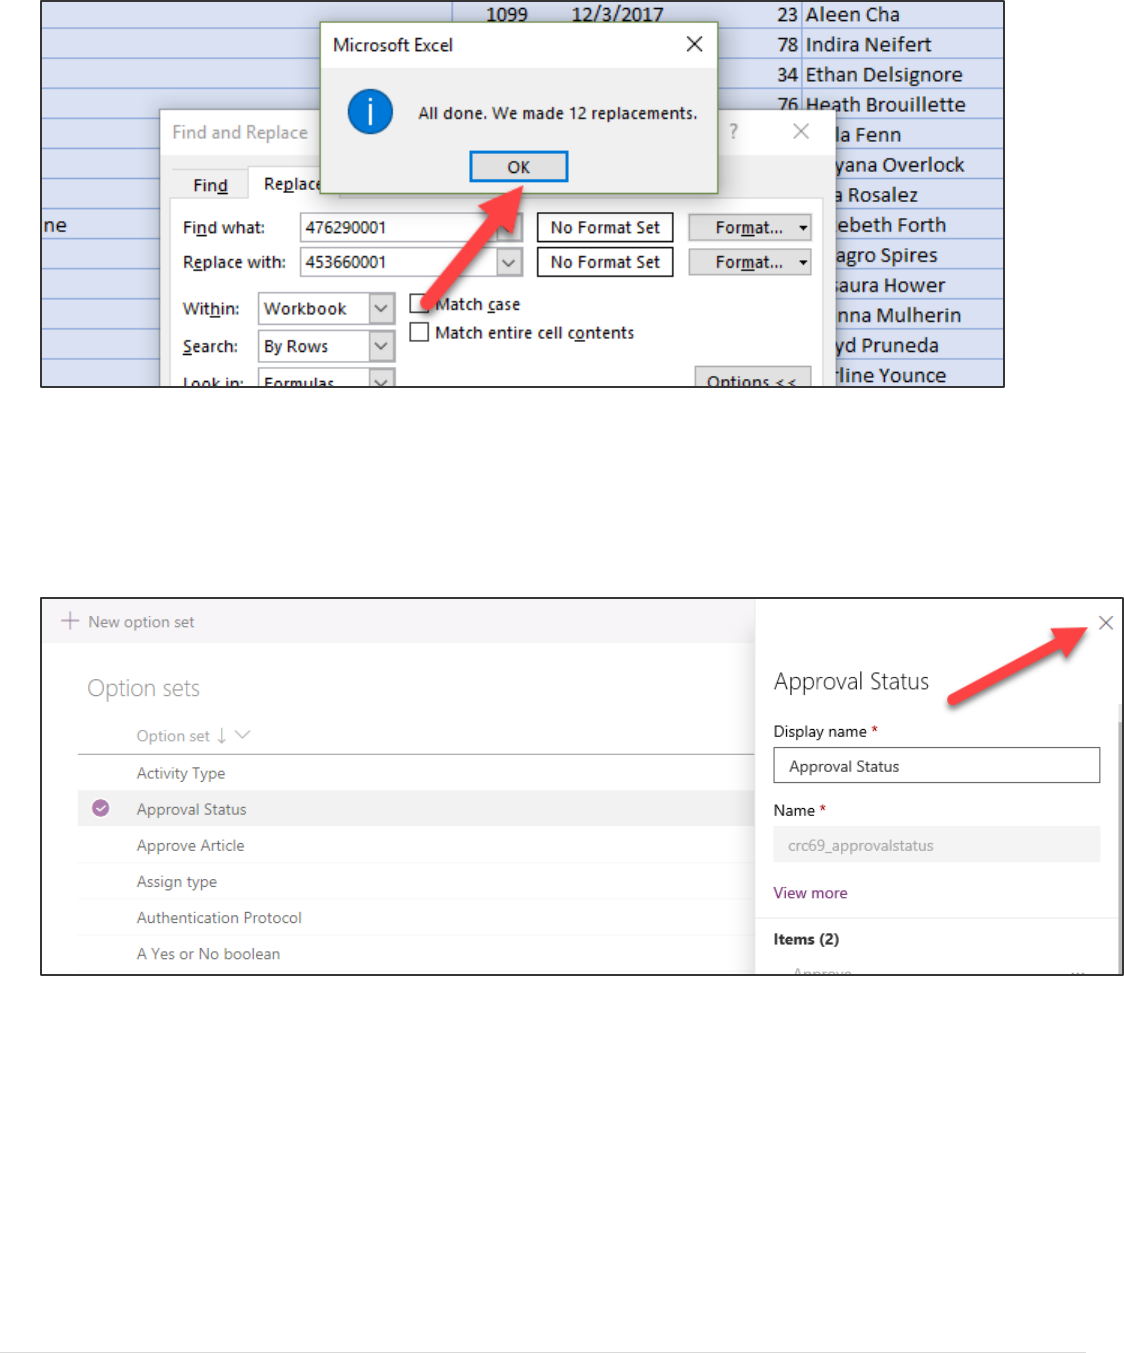
8. Click OK.
9. Go back to PowerApps, click on the ellipses button of the Reject option, and select View More.
10. Copy the Value again.
Power platform App in a Day Module 5: Power BI
7 | P a g e ©2018 Microsoft Corporation
11. Go back to the Excel file, type 476290001 on the find filed, the value you copied (without the commas) in the
replace field, and click Replace All.
12. Click Ok.
Power platform App in a Day Module 5: Power BI
©2018 Microsoft Corporation 8 | P a g e
13. Close the Find and Replace dialog.
14. Save the Excel file and close it.
Note: The reason we are doing this is due to each environment having a unique publisher prefix, when you created
your solution the values of the option set are prefixed based on that value. Currently the import process we are
going to use requires the numeric value and not the label value so it must be adjusted.
15. Go back to the PowerApps and close the Option Set edit window.
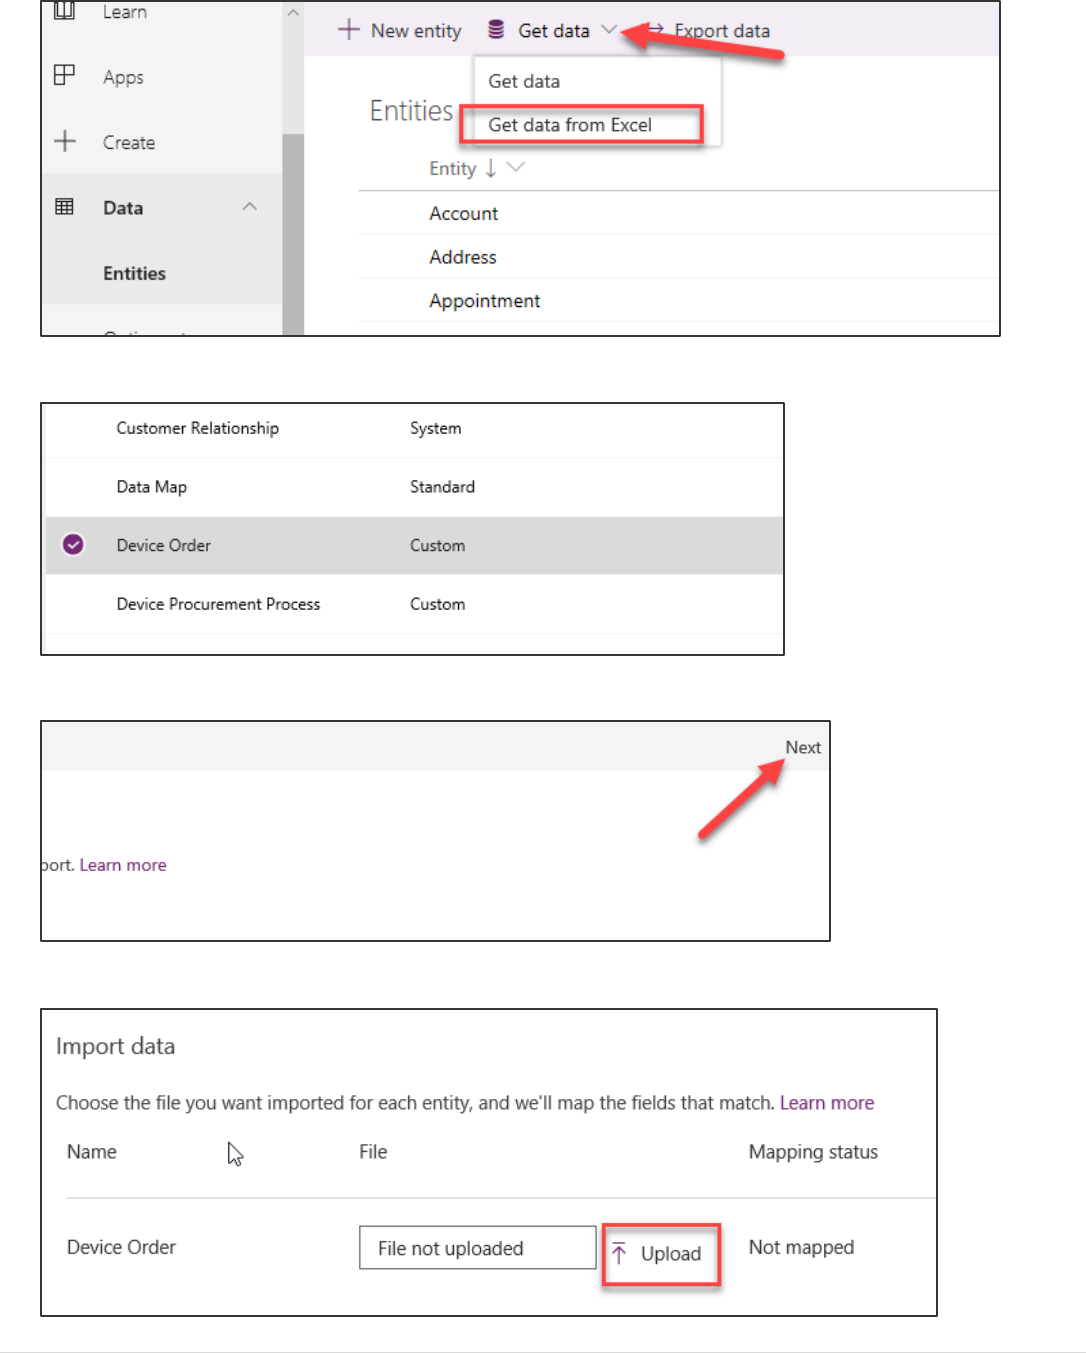
16. There are many options available to get data into CDS. We are going to import from an Excel file. Select Entities
click Get Data and select Get Data From Excel.
Power platform App in a Day Module 5: Power BI
9 | P a g e ©2018 Microsoft Corporation
17. Scroll down the list of entities and choose Device Orders
18. Scroll back up and in the upper right corner click Next
19. Click Upload to open the file browser
Power platform App in a Day Module 5: Power BI
©2018 Microsoft Corporation 10 | P a g e
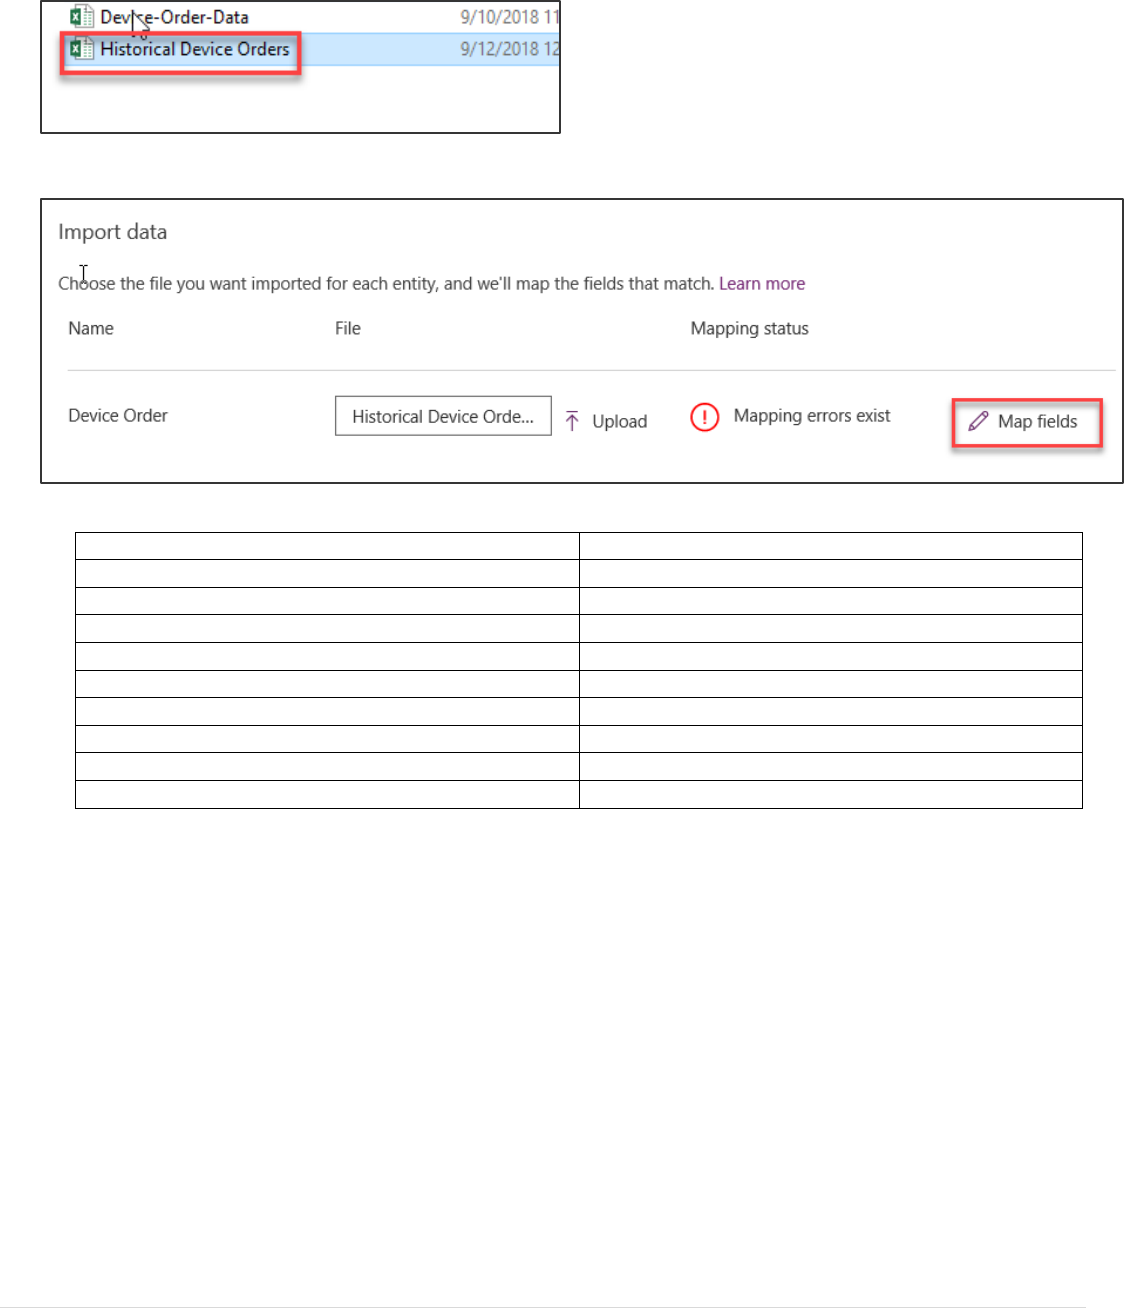
20. Select the Historical Device Orders Excel file.
21. After the file upload is complete it will show mapping errors, Click Map fields
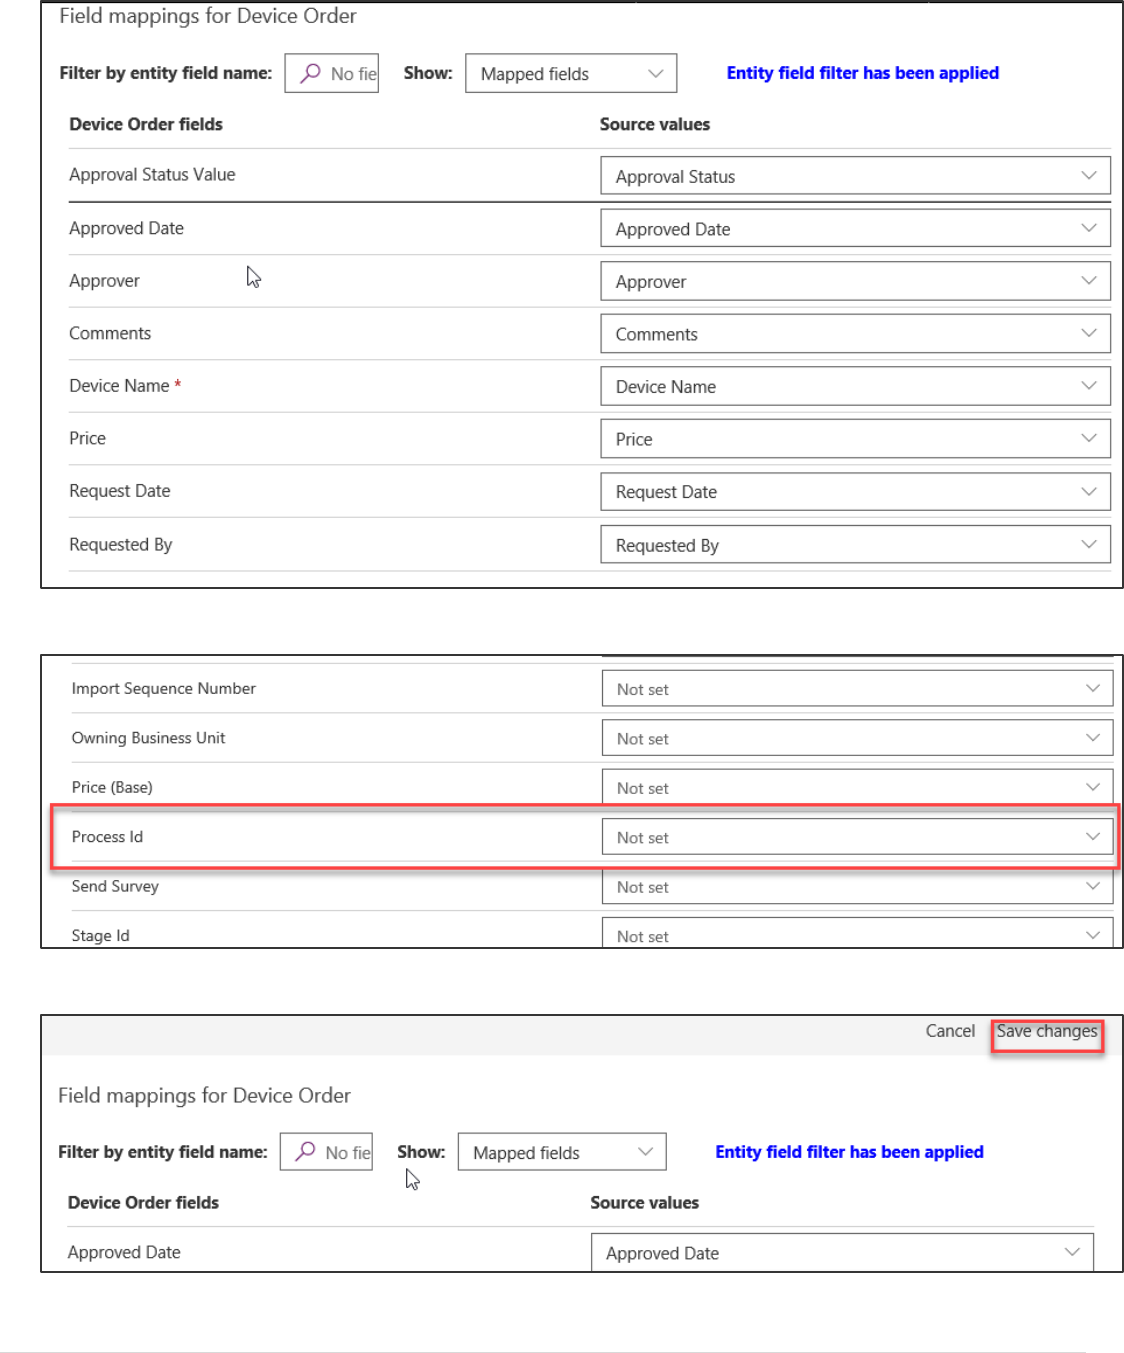
22. Map the following fields
Device Order fields
Source values
Approval Status Value
Approval Status
Approval Date
Approval Date
Approver
Approver
Comments
Comments
Device Name
Device Name
Price
Price
Process ID
Select None to un map
Request Date
Request Date
Request By
Request By
23. Change the Show: dropdown to Mapped fields to show only the fields you have mapped. Confirm your list
matches the list show in the image.
Power platform App in a Day Module 5: Power BI
11 | P a g e ©2018 Microsoft Corporation
24. Confirm that Process Id is not mapped to Approved Date, if it is then un map it by selecting None.
25. Click Save changes to proceed. You may still have an Error and a Warning that is ok
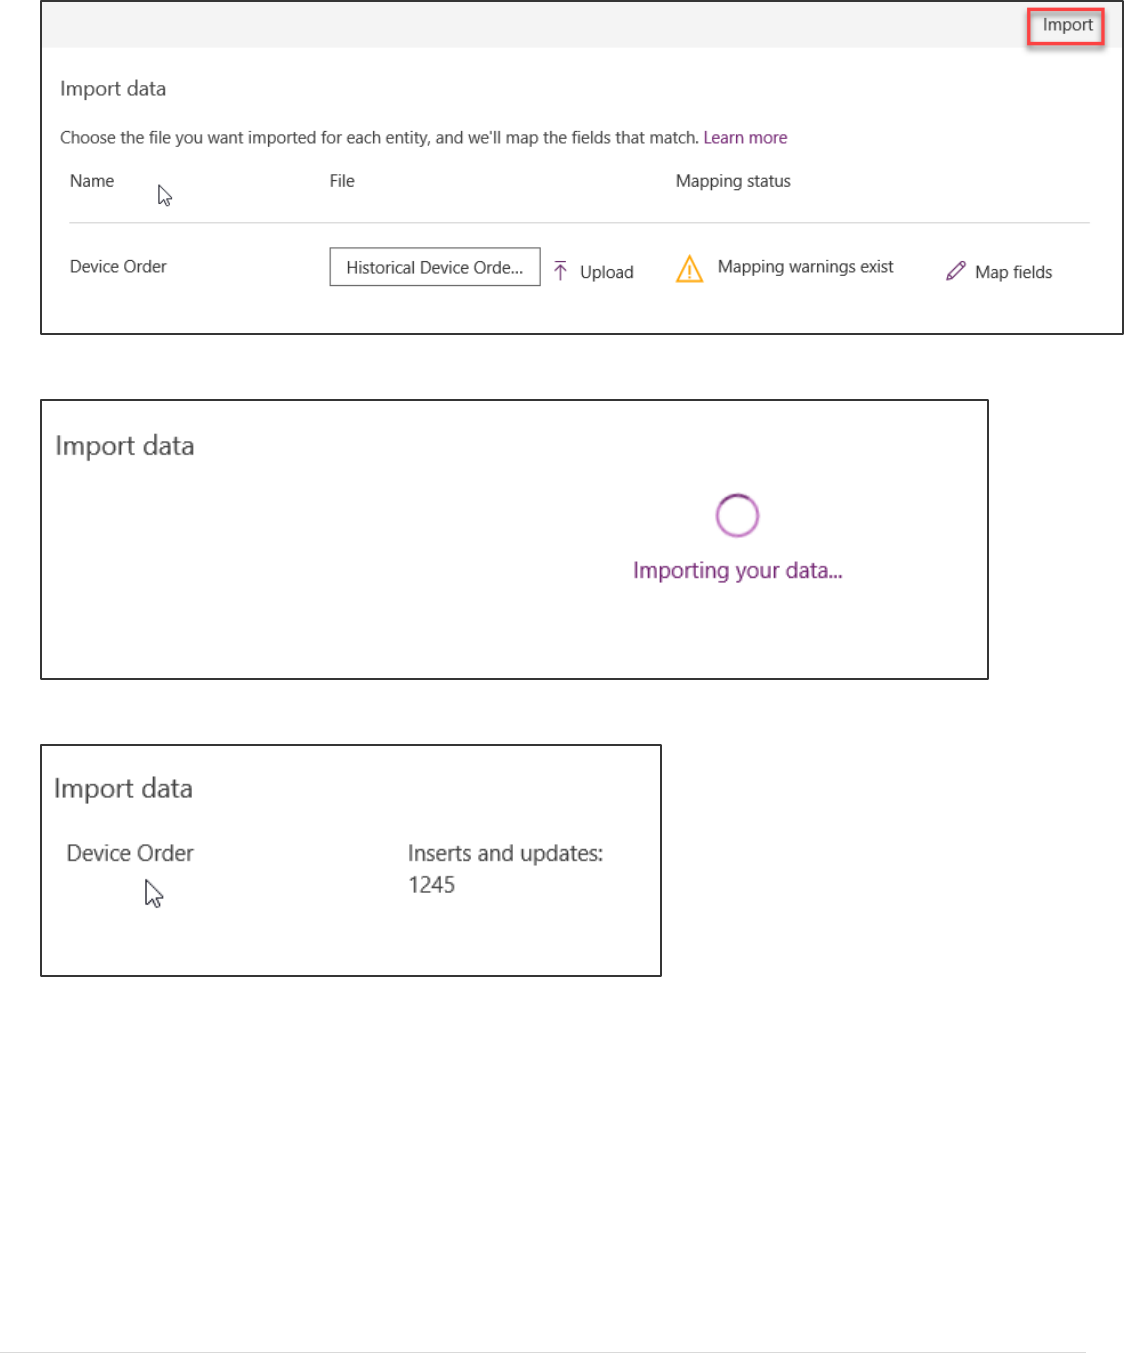
26. Click Import to begin the import of the historical data
Power platform App in a Day Module 5: Power BI
©2018 Microsoft Corporation 12 | P a g e
27. This should take a couple of minutes to complete – while processing you should see the following
28. Once the import has completed you should see the following
29. If for some reason the import wasn’t successful, download the log file and review. Most common cause is an
improper mapping of a field type. If that happens just start this task again as it doesn’t retain your mappings.
Power platform App in a Day Module 5: Power BI
13 | P a g e ©2018 Microsoft Corporation
Exercise 3: Connect and reference data
In this exercise, you will connect to the Common Data Service using a connector. You will then be referencing the data
from the device procurement process that you will use to build the visualizations. This includes selecting only the data
that is useful to help have a easy to use data set to work with.
Task 1: Connect Power BI to the CDS Data
In this task, you will get data from your Common Data Service.
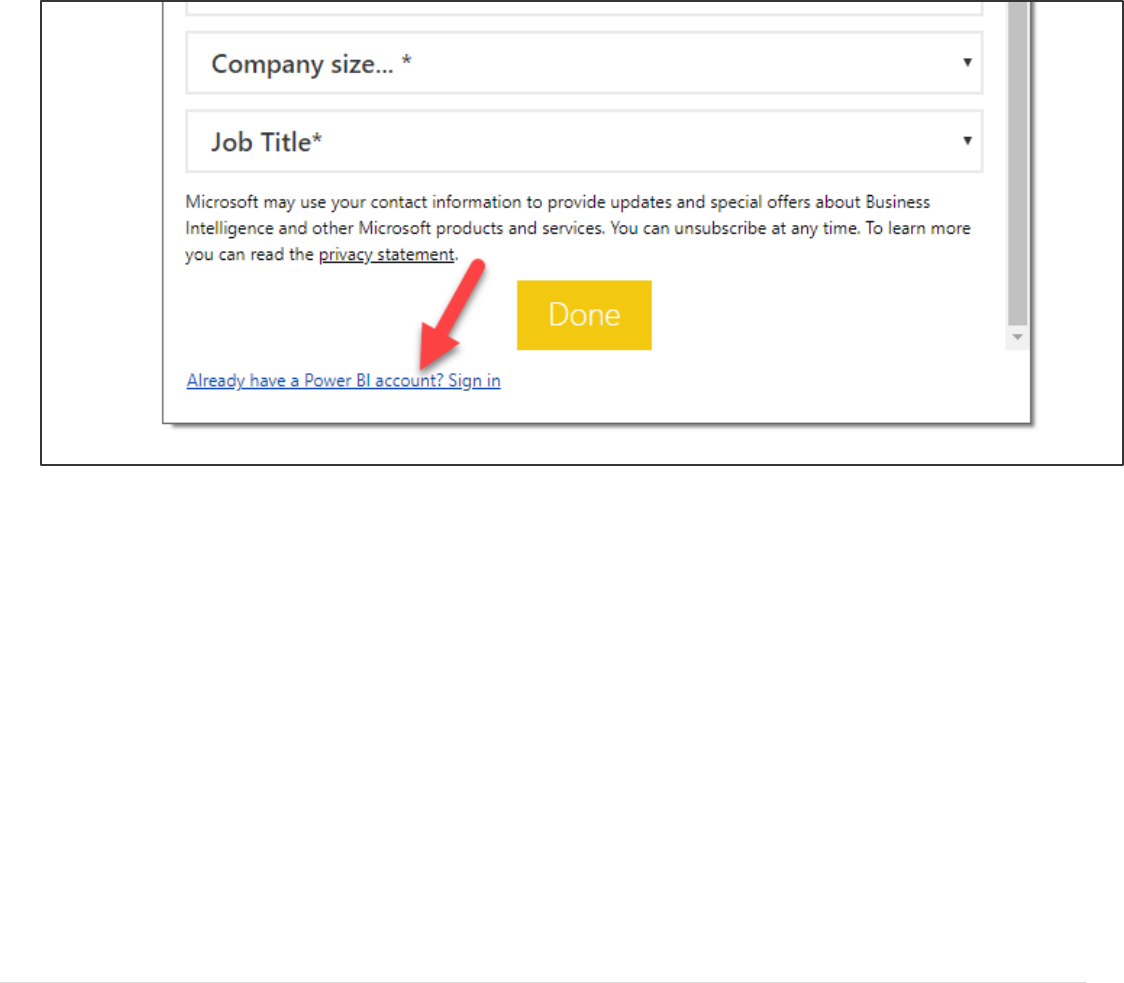
1. Start Power BI Desktop application and click Sign in.
2. Provide your credentials and sign in.
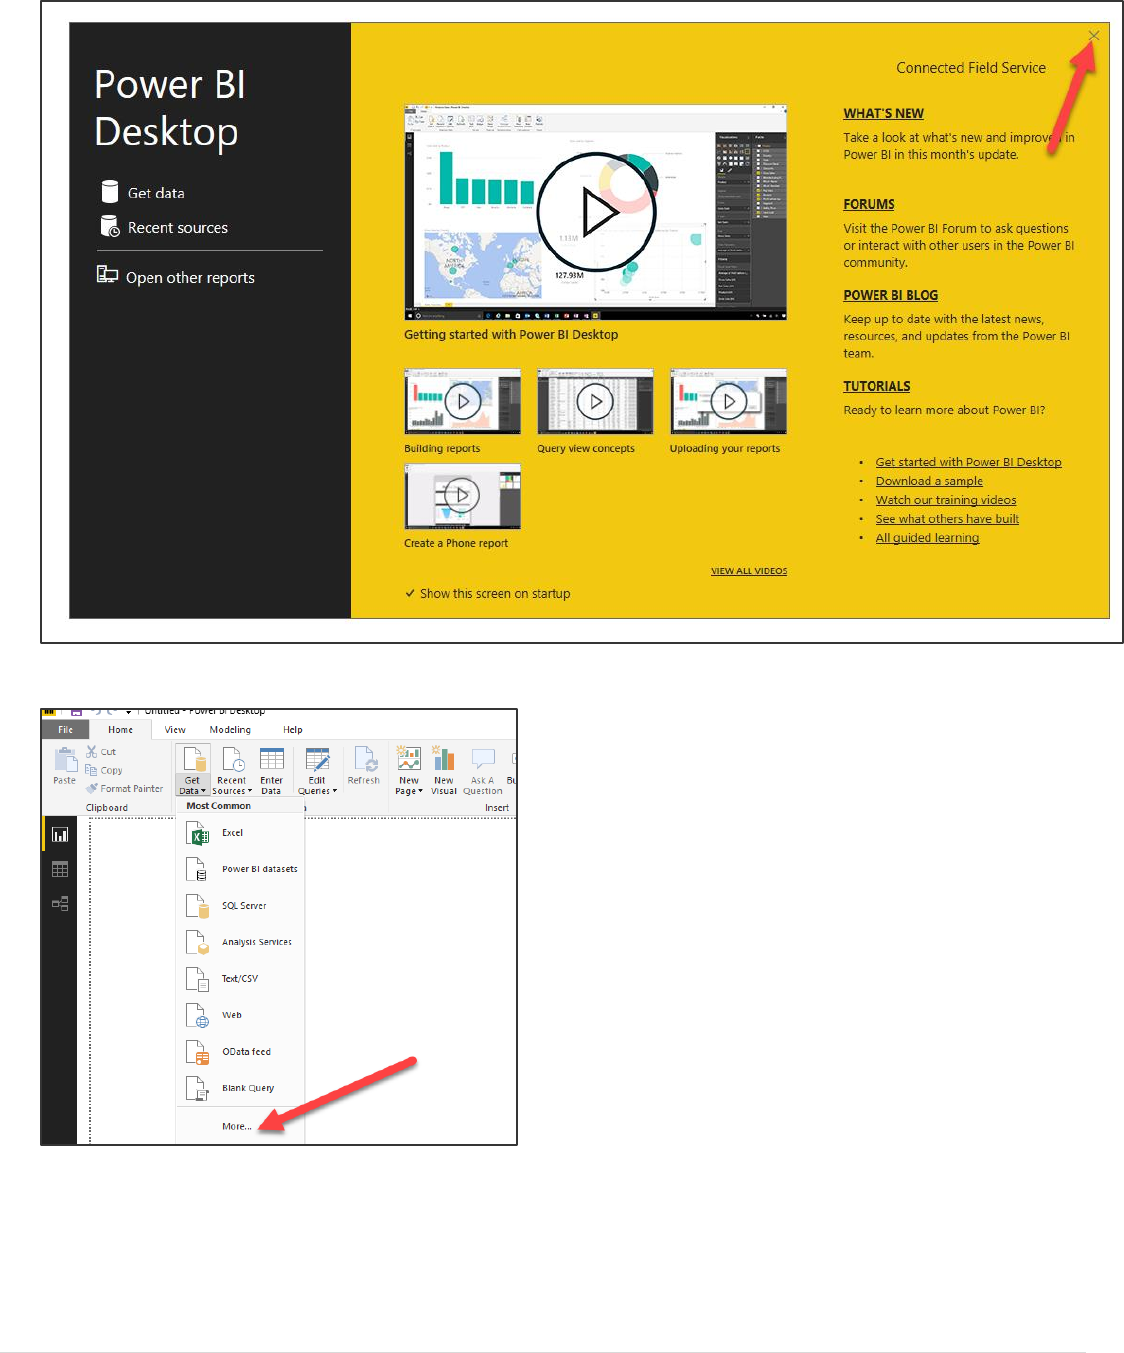
3. Close the splash screen.
Power platform App in a Day Module 5: Power BI
©2018 Microsoft Corporation 14 | P a g e
4. Click Get Data and select More…
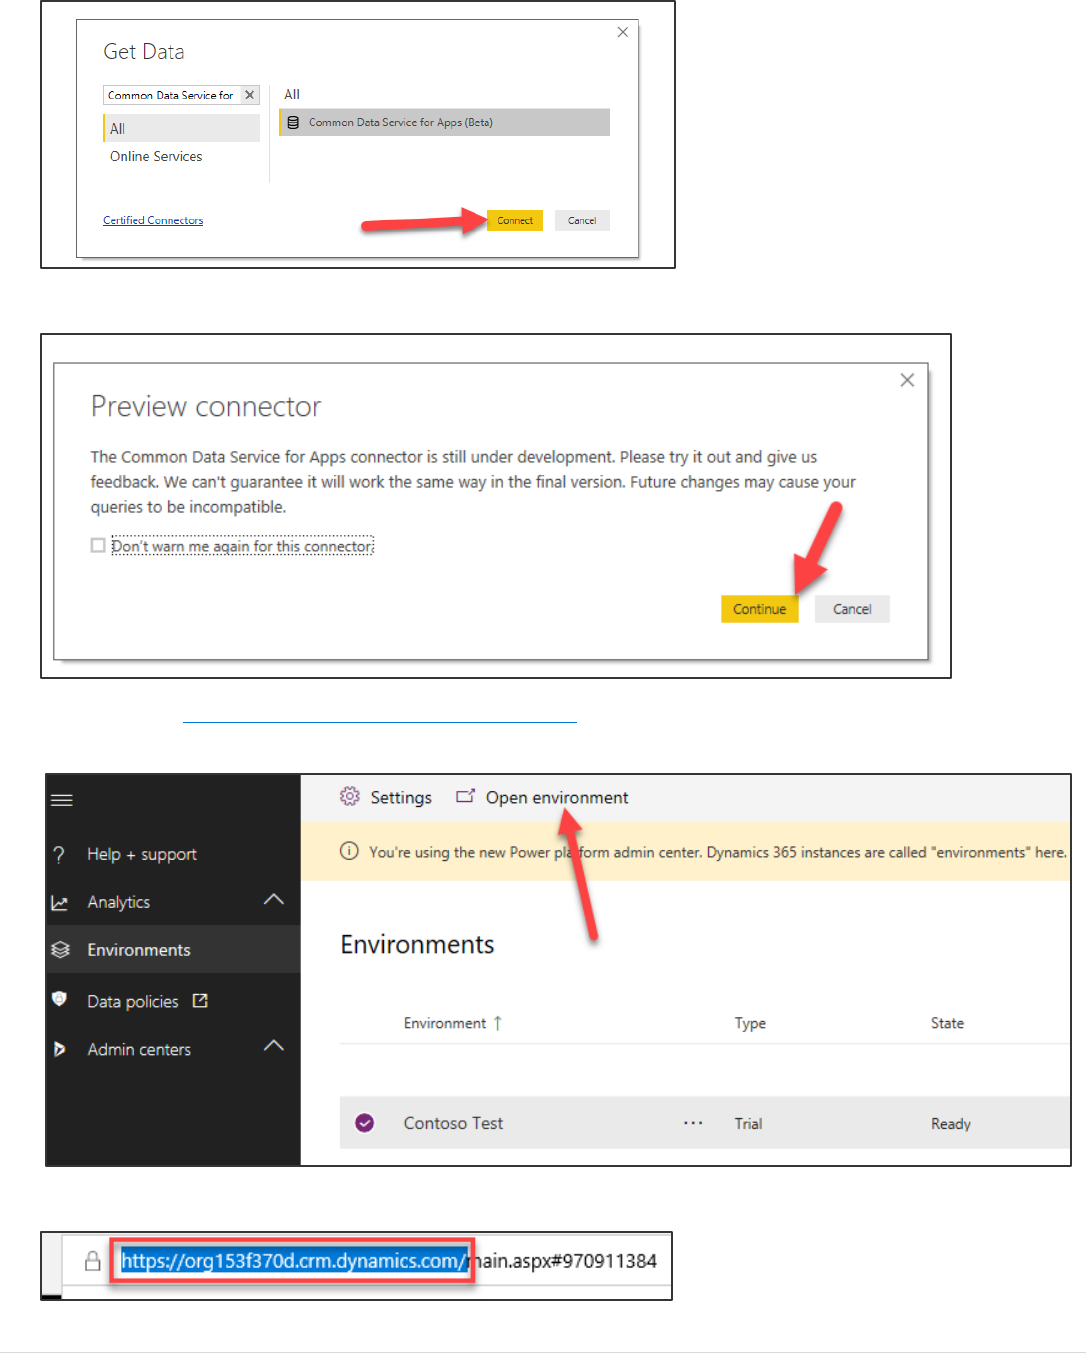
5. Search for Common Data Service for Apps, select it, and click Connect.
Power platform App in a Day Module 5: Power BI
15 | P a g e ©2018 Microsoft Corporation
6. Continue past the connector Preview warning.
7. Navigate to https://admin.powerplatform.microsoft.com/ and select Environments.
8. Select your environment and click Open Environment.
9. Copy the base part of the URL
Power platform App in a Day Module 5: Power BI
©2018 Microsoft Corporation 16 | P a g e
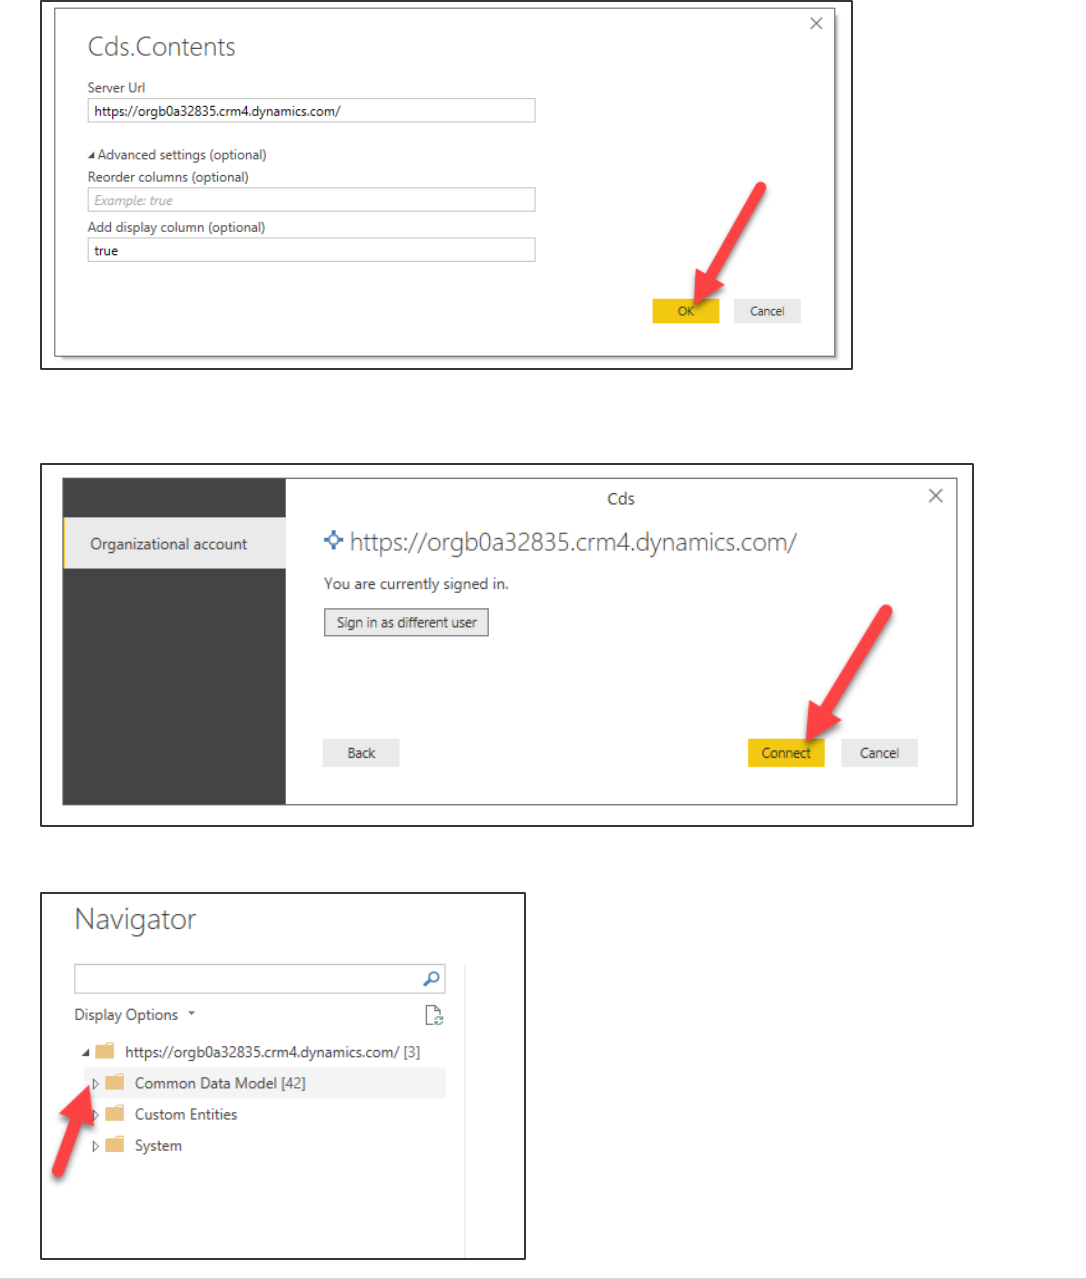
10. Go back to Power BI Desktop, paste the URL you copied into the Server URL field, type true in the Add Display
Column field, and click OK.
11. If you are prompted to sign in, click Sign in and provide your credentials.
12. Click Connect.
13. Expand Entities.
Power platform App in a Day Module 5: Power BI
17 | P a g e ©2018 Microsoft Corporation
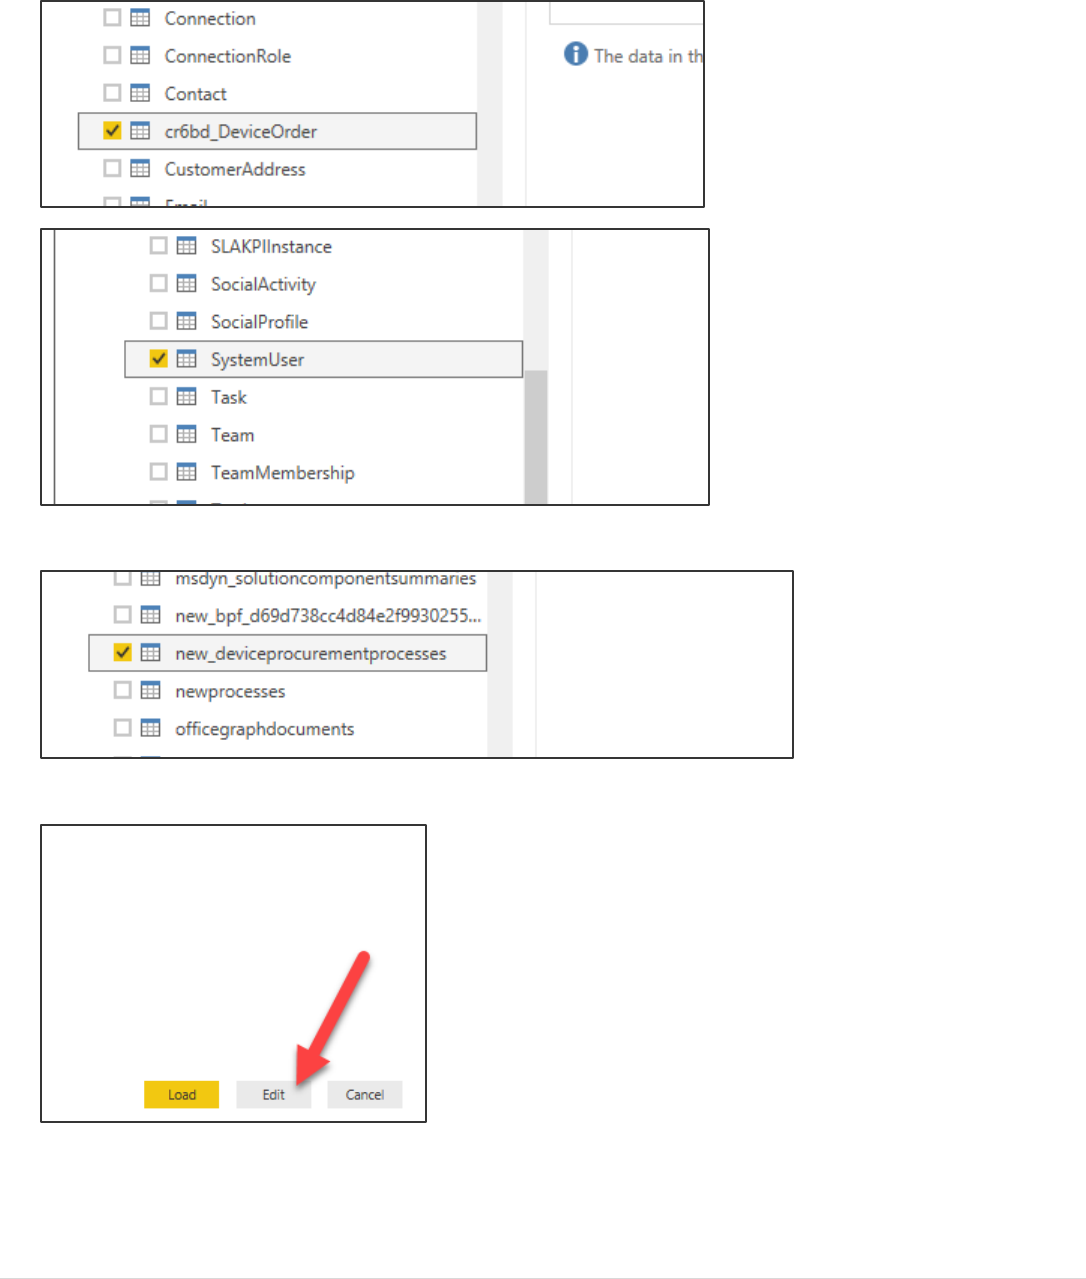
14. Select _DeviceOrder and SystemUser Note: it will be in the format of <prefix>_DeviceOrder where the prefix will
be different in each environment.
15. Expand System and select new_DeviceProcurementProcesses.
16. Click Edit.
17. Your data will now be available in the Power Query Editor.
Power platform App in a Day Module 5: Power BI
©2018 Microsoft Corporation 18 | P a g e
Task 2: Clean up and Transform
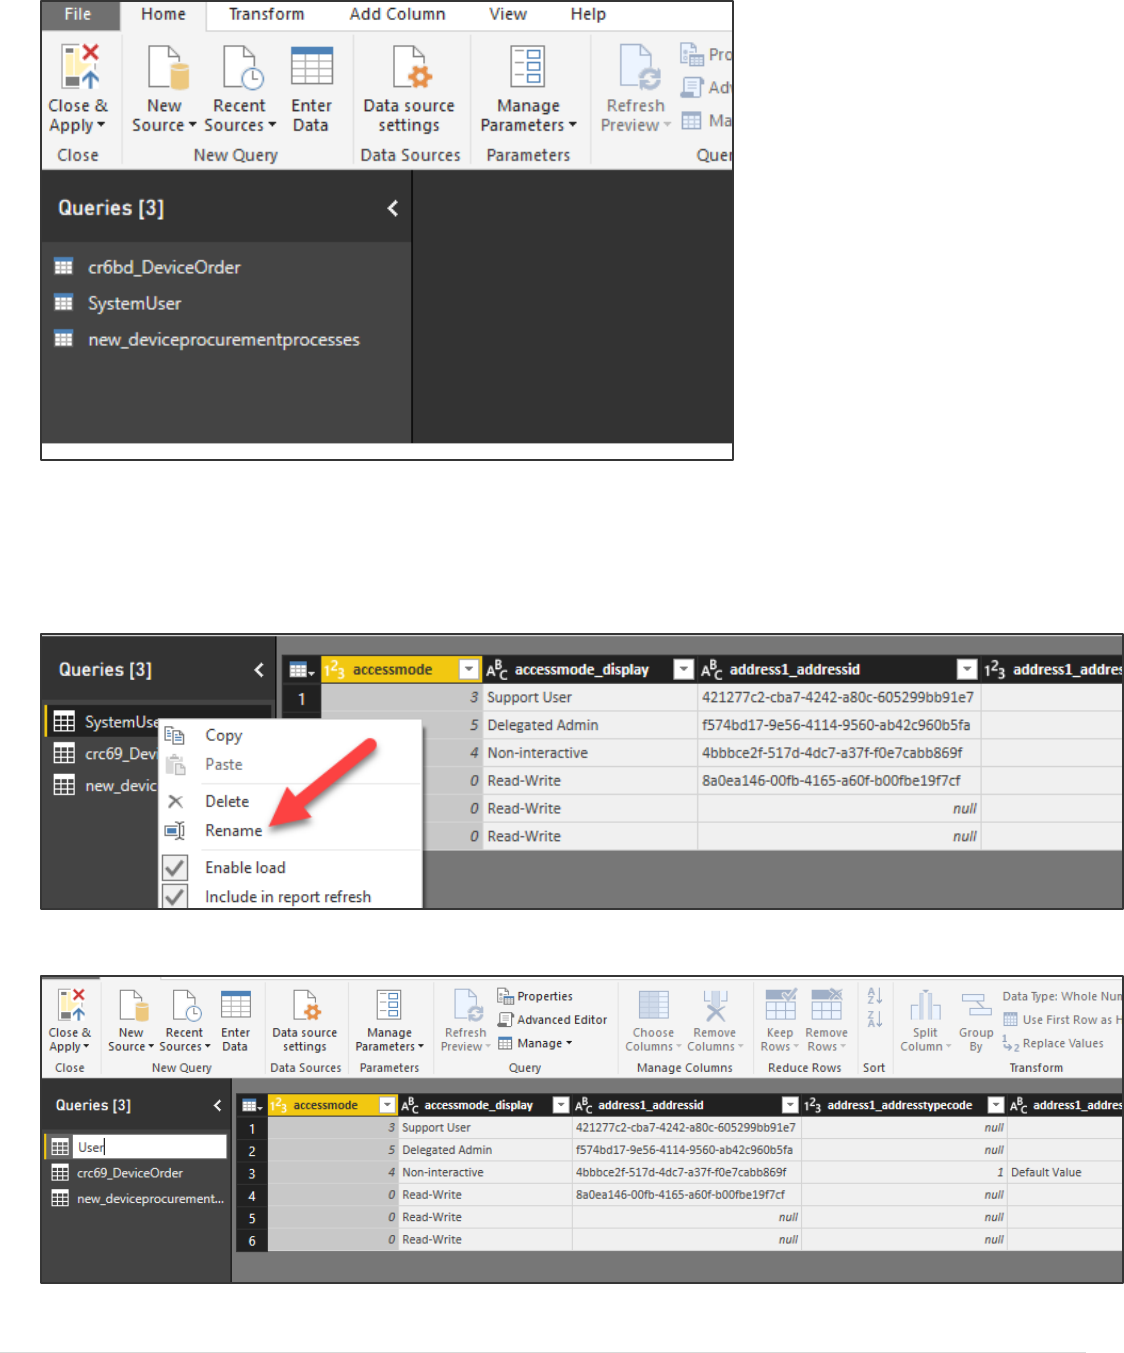
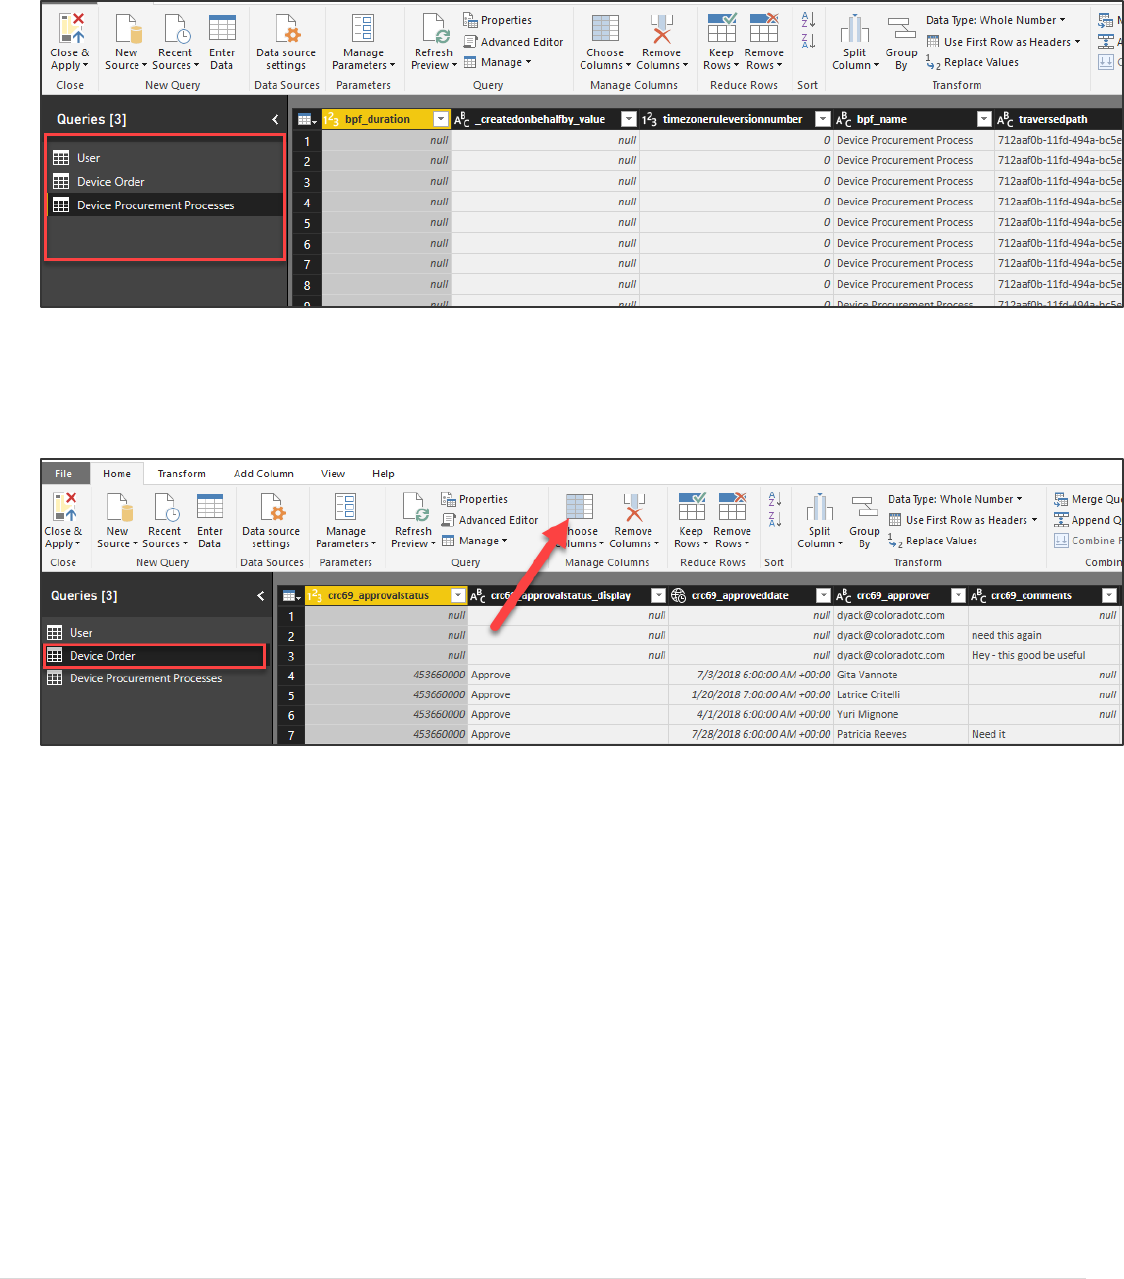
1. Right click on the System User table and click Rename.
2. Rename the table from SystemUser to User.
Power platform App in a Day Module 5: Power BI
19 | P a g e ©2018 Microsoft Corporation
3. Rename the DeviceOrder table to Device Order and the DeviceProcurementProcesses to Device Procurement
Processes. Your table names will now look like the image below.
4. Next, we are going to remove columns from our query on the Device Order entity to make it fewer columns we
need to work with.
5. Select the Device Order table and click Choose Columns. Alternatively, you can also select the column header in
the grid while holding the Ctrl key and then select the columns, then right-click and select Remove Other columns.
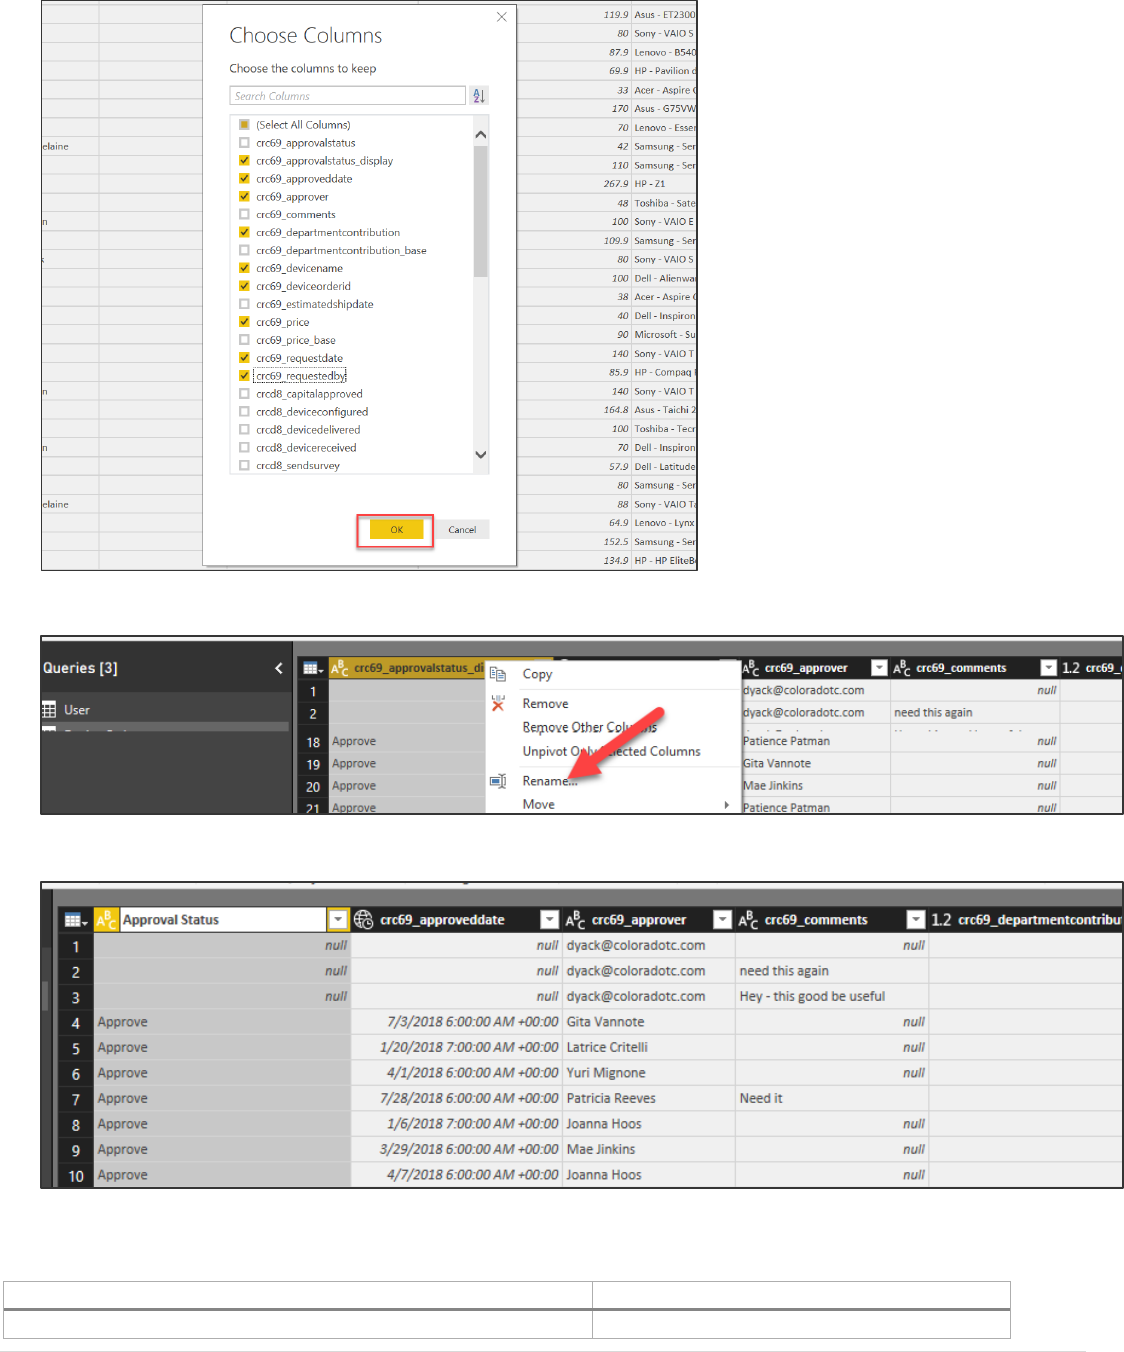
6. Un check the select all columns
7. Select the columns listed below and click OK. Note: the action names will be in the format of <prefix>_<name>.
The following are the names
Approvalstatus_display
Approveddate
Approver
Departmentcontribution
Devicename
Deviceorderid
Price
Requesteddate
Requestedby
Power platform App in a Day Module 5: Power BI
©2018 Microsoft Corporation 20 | P a g e
8. Right click on the Approvalstatus_display and click Rename.
9. Rename the column Approval Status.
10. Rename the rest of the columns as shown below. You may rename other fields if you have time but not required
for the lab.
Current Name
New Name
approveddate
Approved Date
Power platform App in a Day Module 5: Power BI
21 | P a g e ©2018 Microsoft Corporation
approver
Approver
departmentcontribution
Department Contribution
devicename
Device Name
deviceorderid
Device Order
price
Price
requestdate
Requested Date
requestedby
Requested By
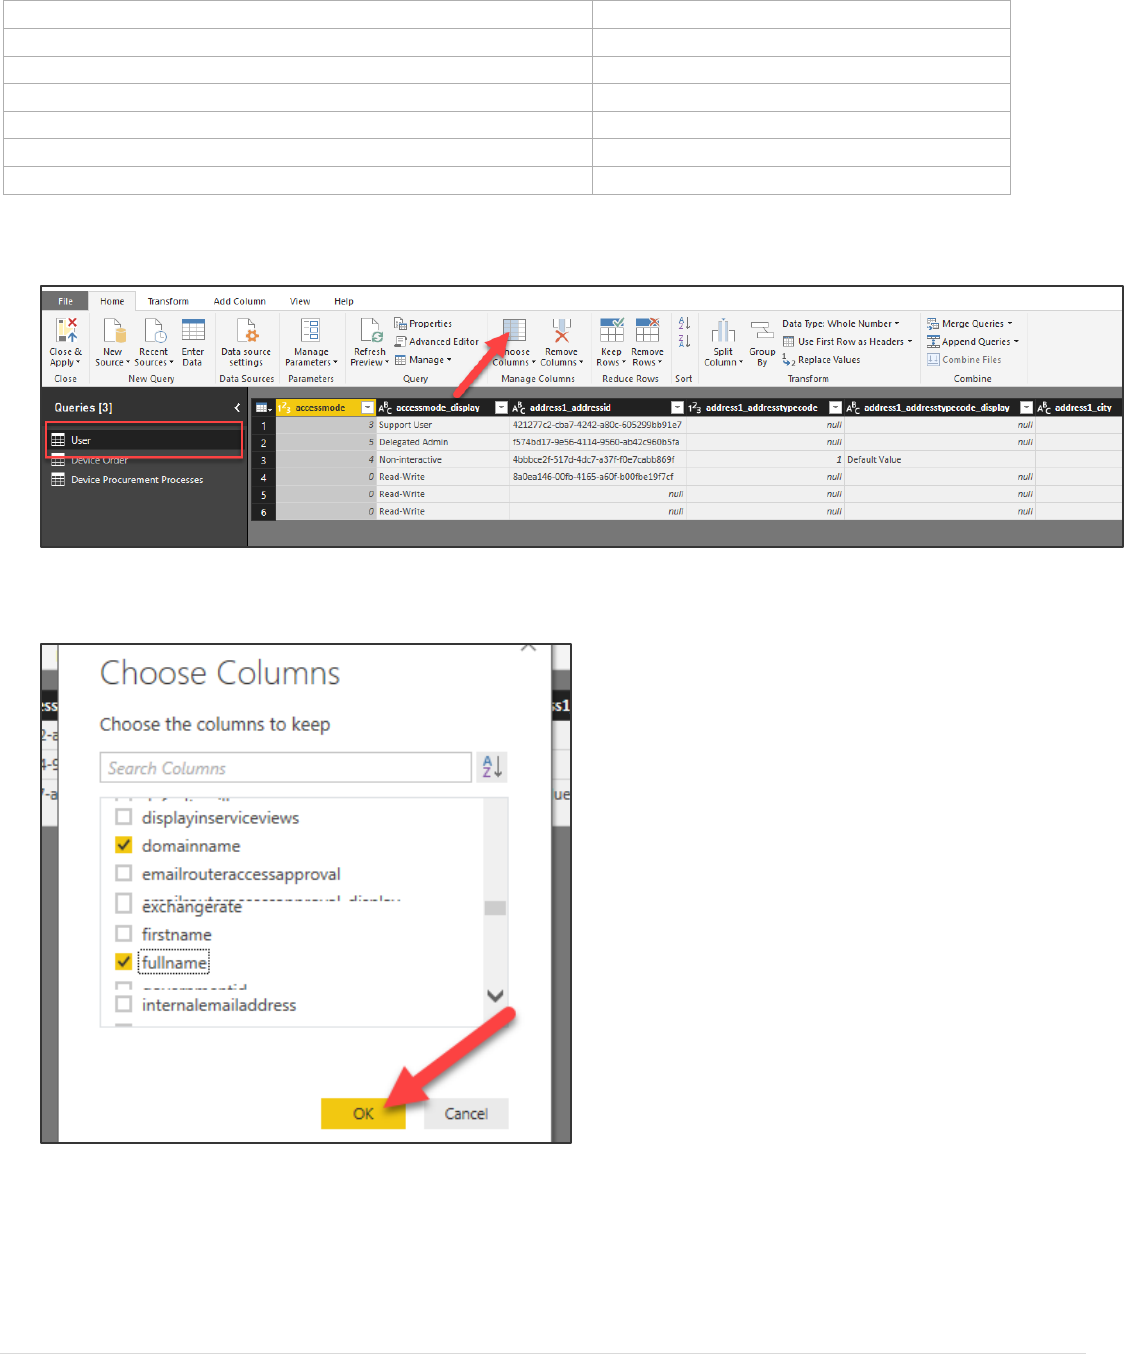
11. Select the User table and click Choose Columns.
12. Uncheck Select All Columns
13. Select domainname, fullname and click OK. Tip: Using Search can speed up finding the columns.
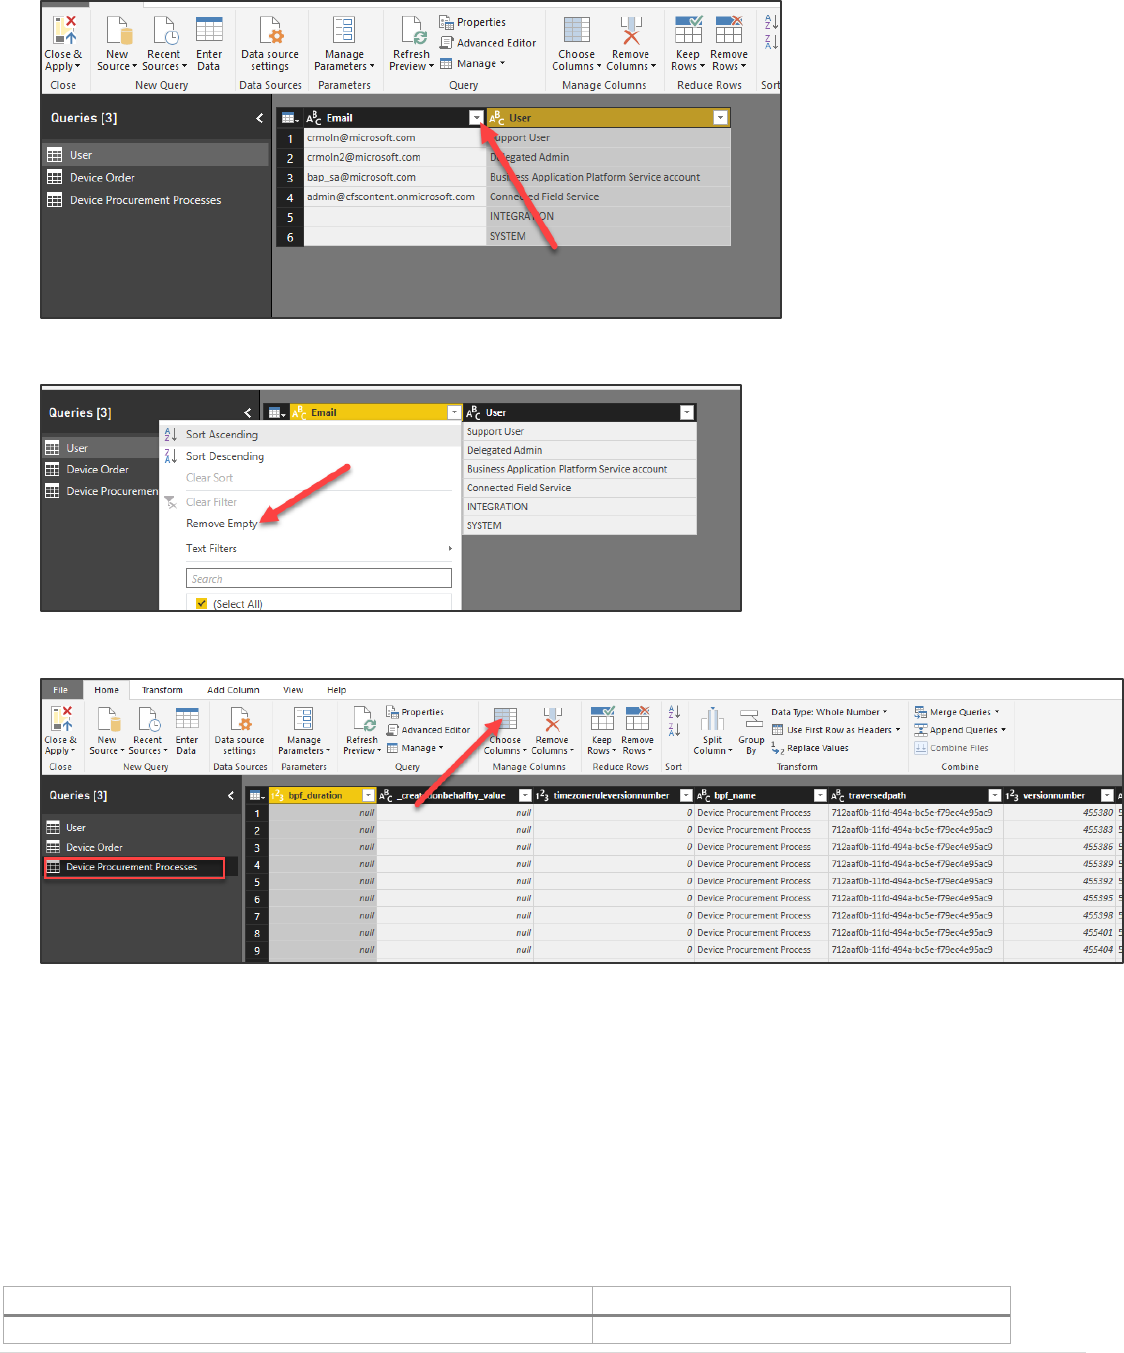
14. Rename the domainname column Email and the fullname column User.
15. Click Sort on the Email column.
Power platform App in a Day Module 5: Power BI
©2018 Microsoft Corporation 22 | P a g e
16. Click Remove Empty.
17. Select the Device Procurement Process table and click Choose Columns.
18. Uncheck the Select All Columns
19. Select the columns listed below and click OK.
Bpf_name
_processid_value
Completedon
Businessprocessflowinstanceid
_bpf__CRC69_deviceorderid_value (Note: the CRC69 might be different in your list)
Activestageid
20. Rename the fields as shown below. You may rename the other fields.
Current Name
New Name
Bpf_name
Name
Power platform App in a Day Module 5: Power BI
23 | P a g e ©2018 Microsoft Corporation
_processid_value
Process
Businessprocessflowinstanceid
Device Procurement Process
_bpf__CRC69_deviceorderid_value (Note: the CRC69 might be
different in your list)
Device Order
Activestageid
Active Stage Id
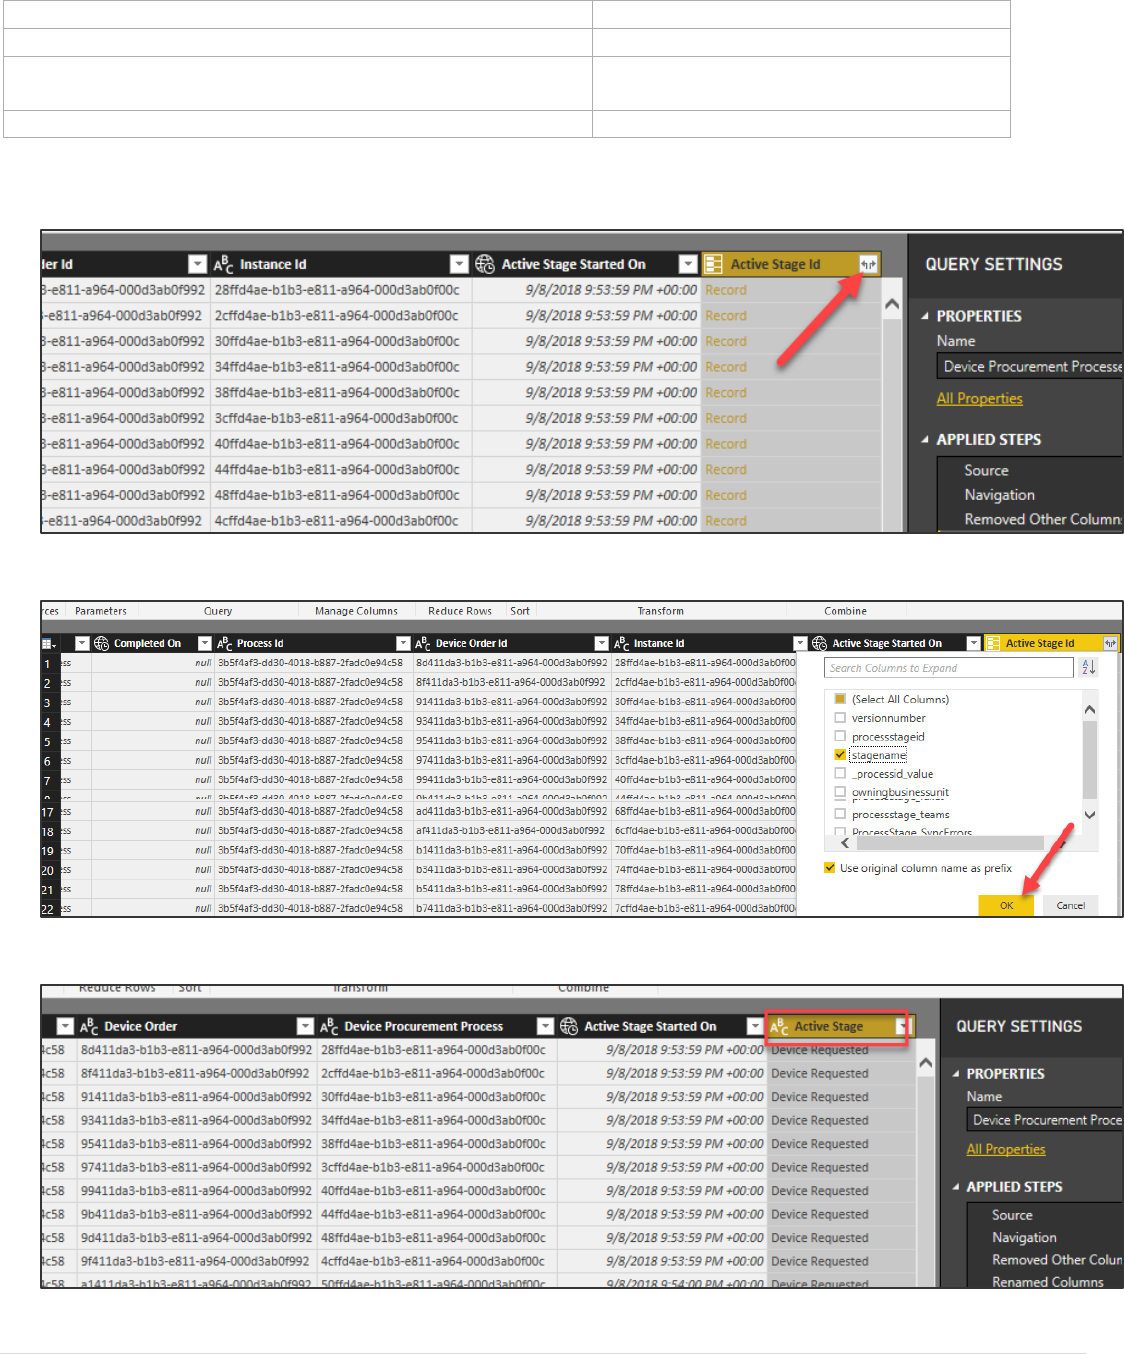
21. Expand the Active Stage column. This will allow us to select one or more values from the related entity.
22. Select stagename and click OK.
23. Rename the column to Active Stage.
Power platform App in a Day Module 5: Power BI
©2018 Microsoft Corporation 24 | P a g e
Task 3: Add Device Manufacturer Data
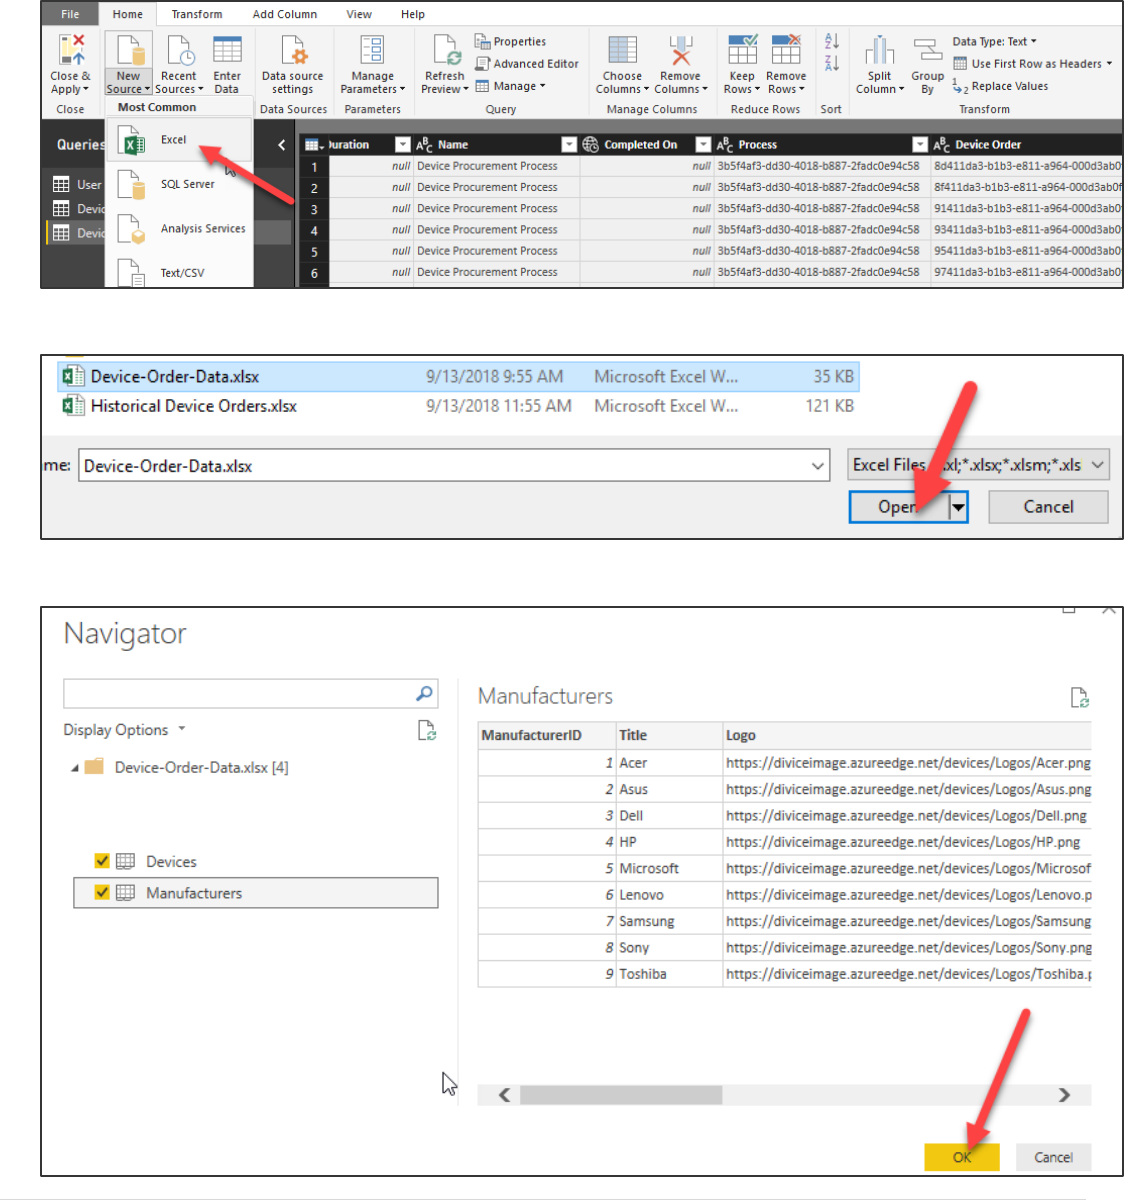
1. Select the Home tab, click New Source, and select Excel.
2. Select the Device Manufacturer Data (Device Order Data.xlsx) file provided to you and click Open.
3. Select the Devices and Manufacturers tables and click OK.
Power platform App in a Day Module 5: Power BI
25 | P a g e ©2018 Microsoft Corporation
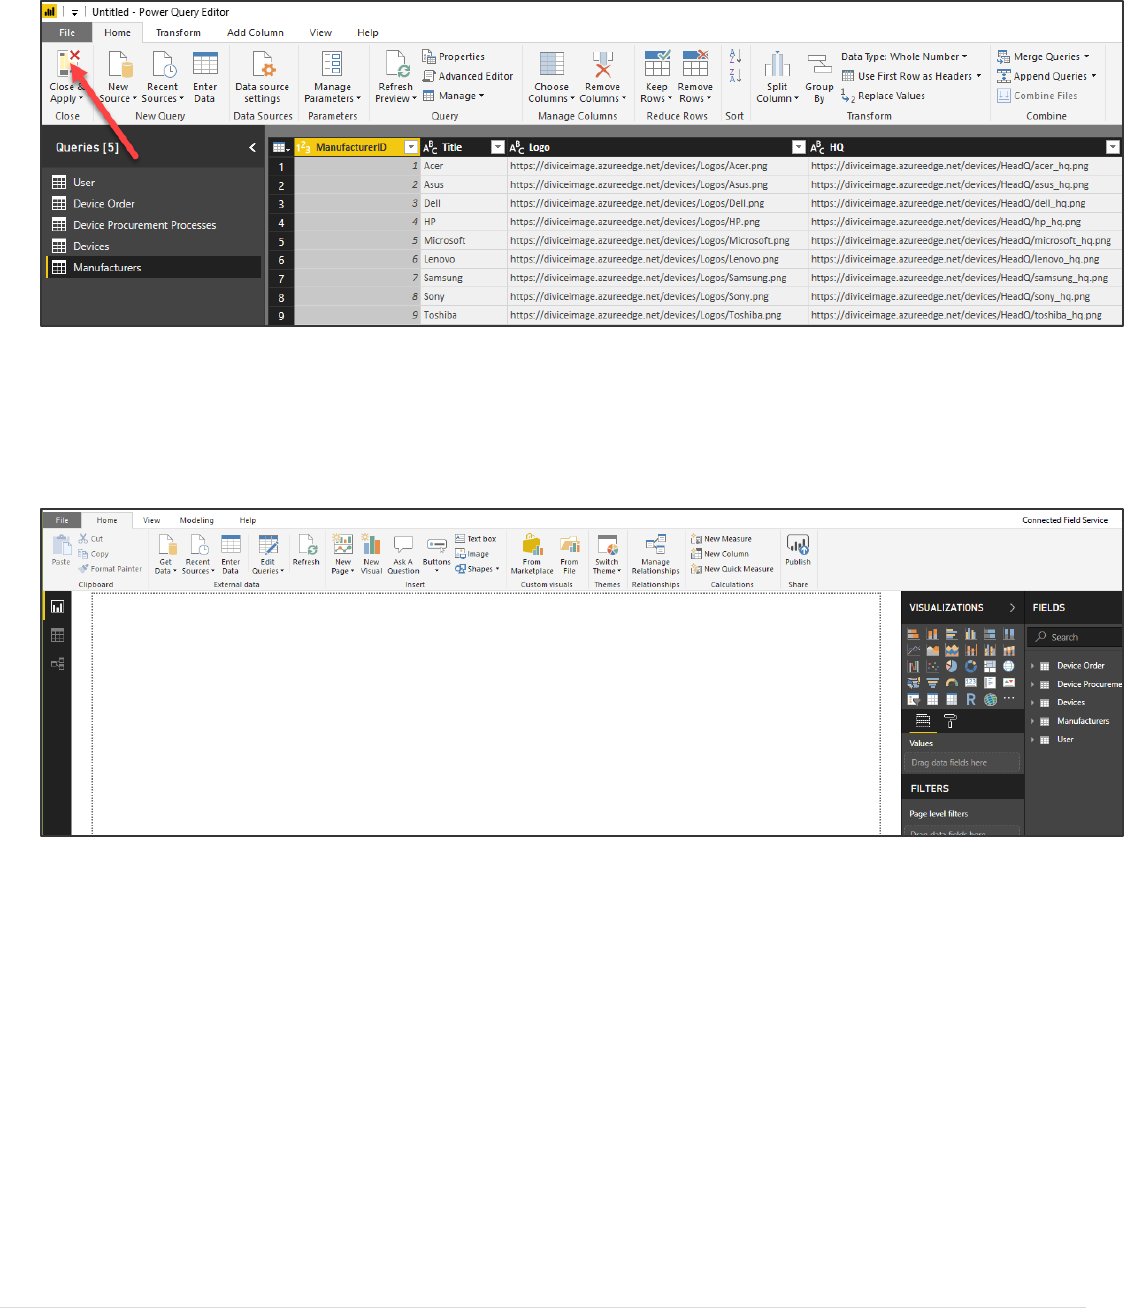
4. Click Close and Apply.
Note: Power Query has a lot of powerful transformations that can be done including trimming, replacing values,
transpose, change data type, and many more. Each of these transformations are built as an M query that is
applied each time you refresh the data. You can see the query that is built by clicking on the Advanced Editor
button.
5. The Power Query editor will close, and you will be back on the Power BI Desktop.
Power platform App in a Day Module 5: Power BI
©2018 Microsoft Corporation 26 | P a g e
Exercise 4: Setup Relationships and Calculated
Columns
Task 1: Manage Relationships
In this task, you will establish the relationships between the data. You will notice auto detection identifies a couple of
relationships within the data. In this task you will be establishing the remaining relationships.
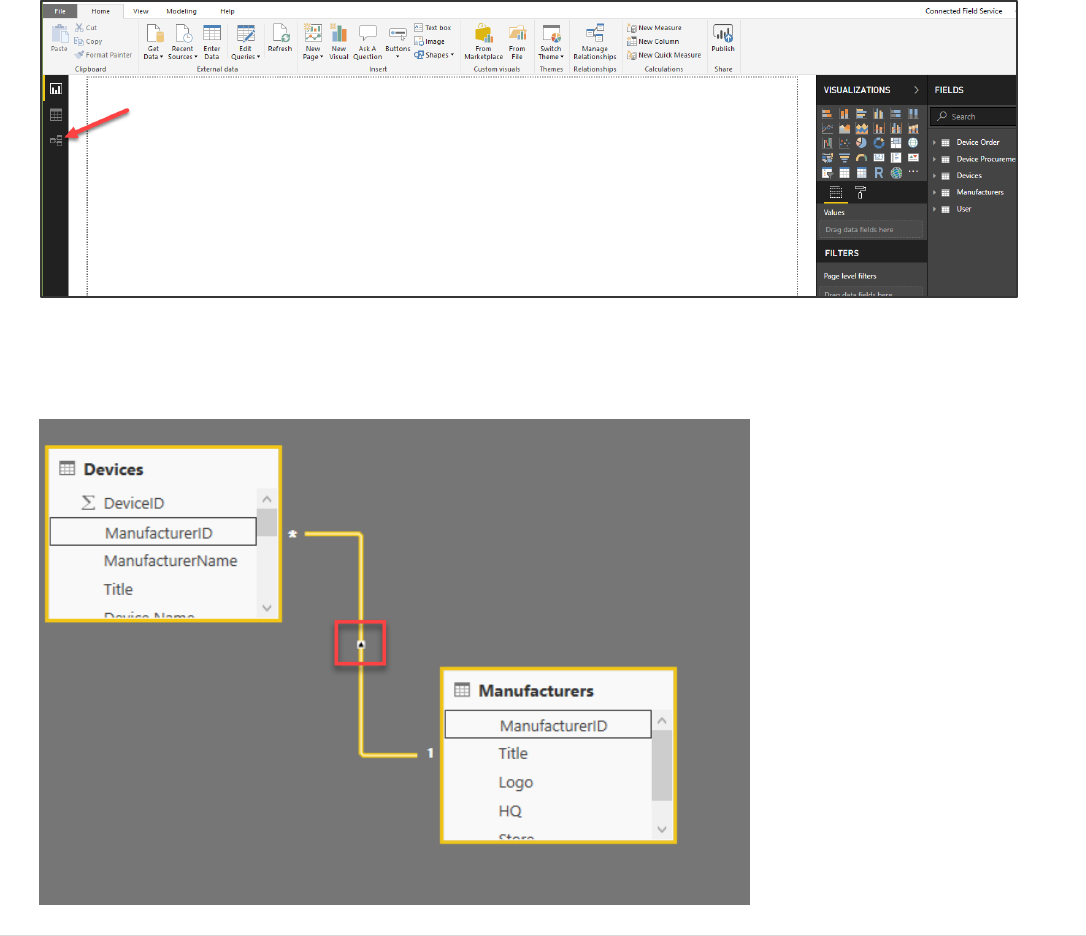
1. Select Relationships from the left side navigation.
2. Double click the Devices to Manufacturers autodetected relationship and it will load the Edit relationship page.
Here you can see the settings on the relationship and make any changes that was required to existing
relationships.
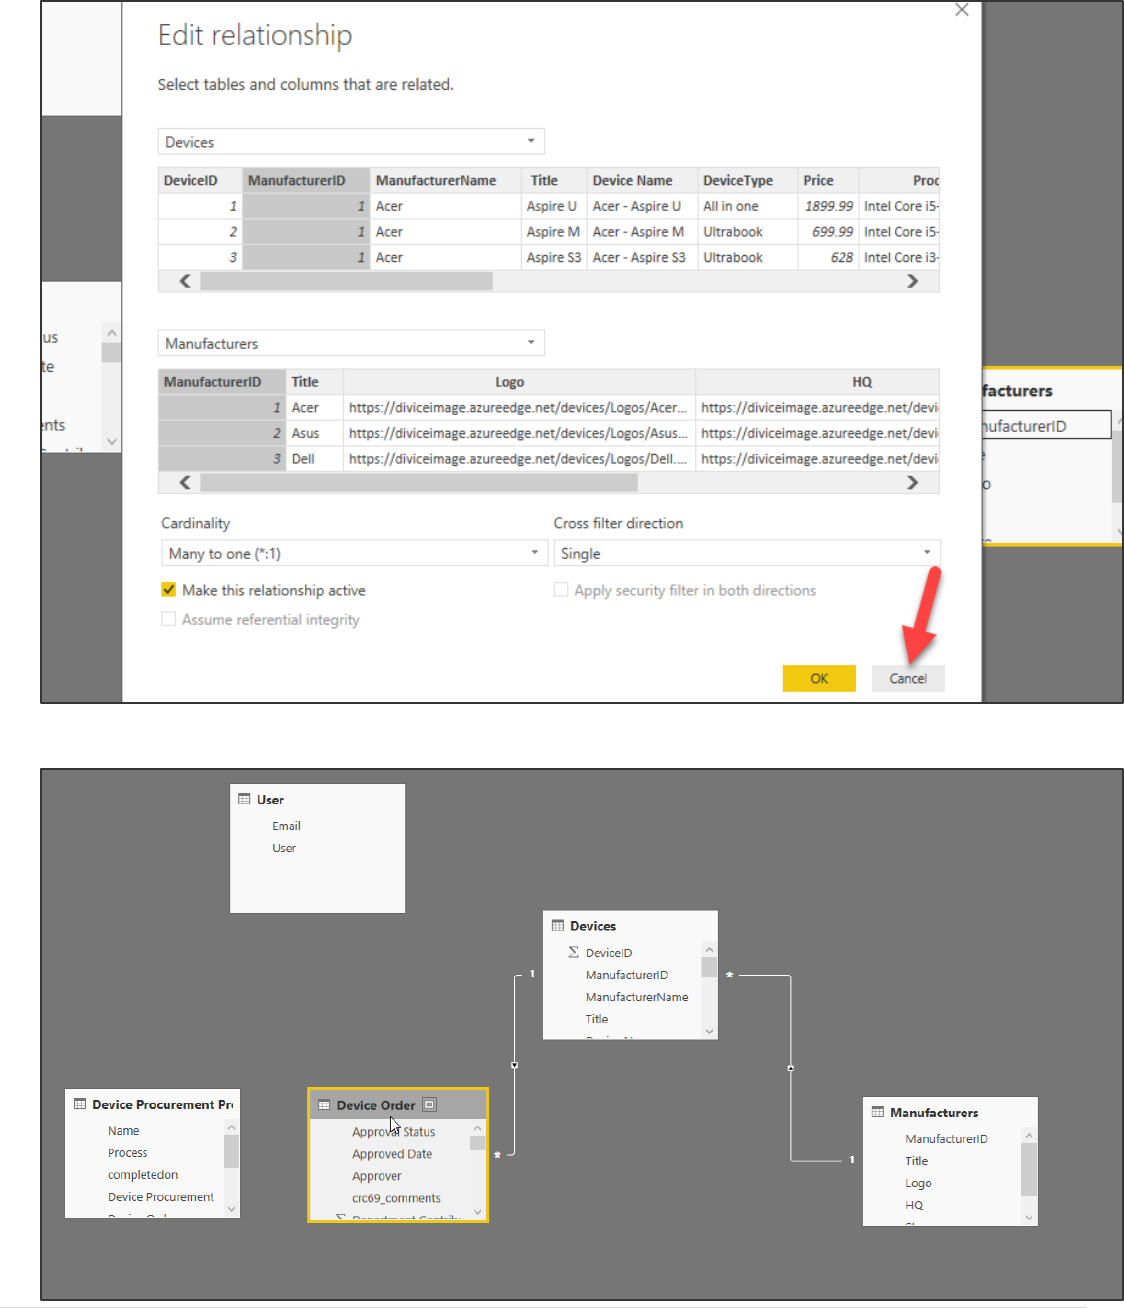
Power platform App in a Day Module 5: Power BI
27 | P a g e ©2018 Microsoft Corporation
3. Click Cancel to close the page.
4. Reposition the table as shown in the image below, so it will be easier to visualize the relationships.
Power platform App in a Day Module 5: Power BI
©2018 Microsoft Corporation 28 | P a g e
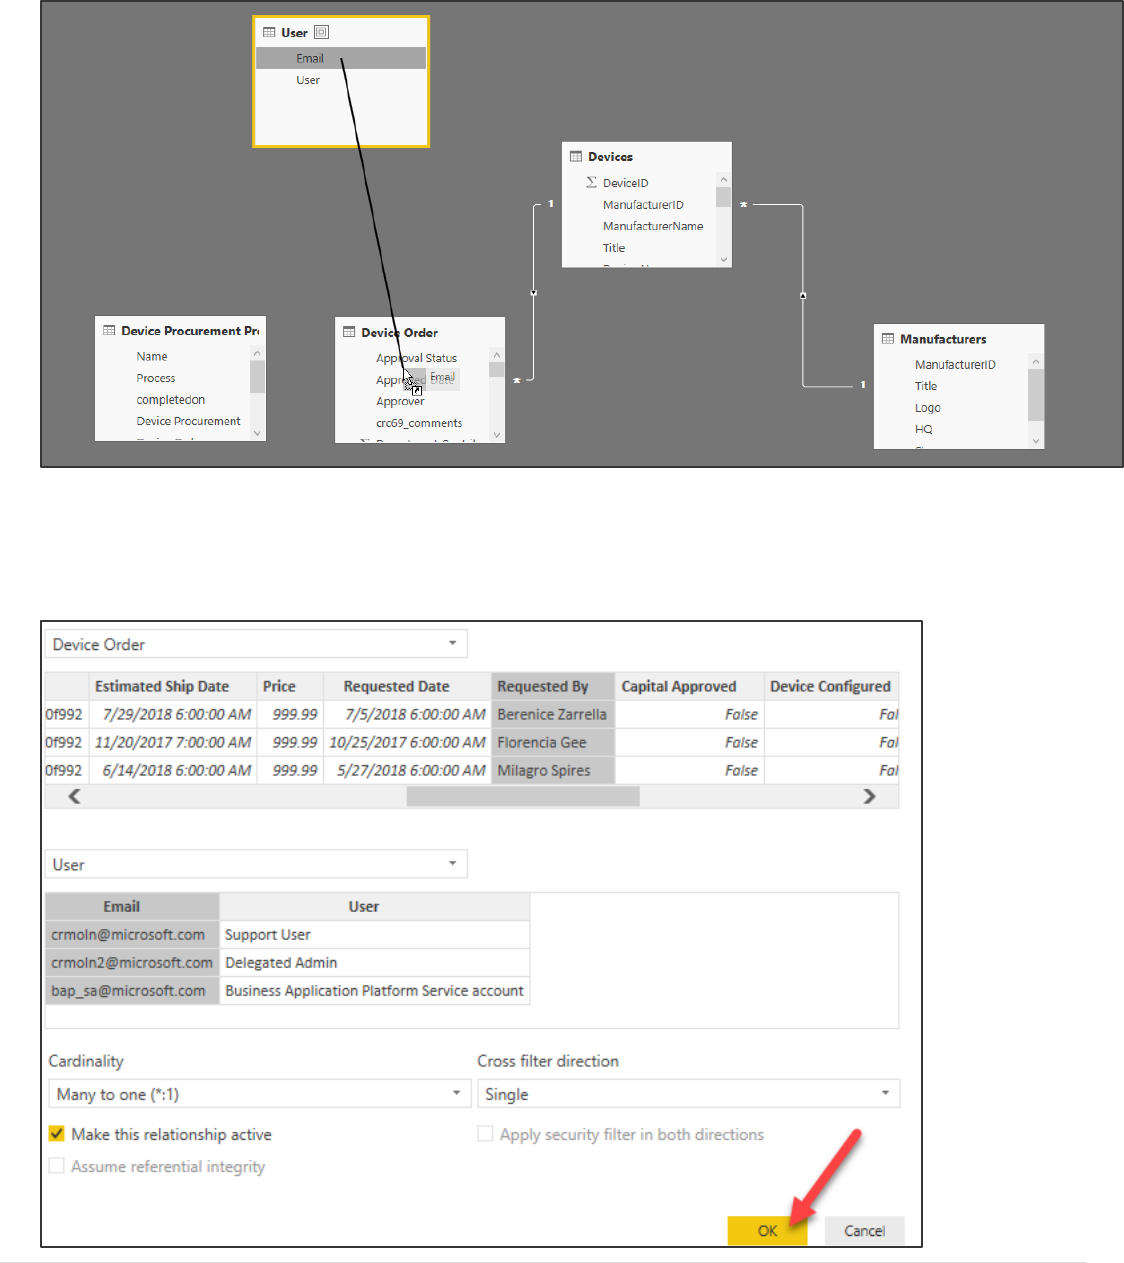
5. Drag the Email column of the User table to the Device Order table and release it.
6. A One to Many relationship will be created. Double click on the new relationship to edit the properties
7. Select Requested By from the Device Order table, Email from User table and click OK. Note: Yes the Requested By
should also have e-mails in order for them to match, this is just different in the historical data you imported and
won’t impact your results in this lab.
Power platform App in a Day Module 5: Power BI
29 | P a g e ©2018 Microsoft Corporation
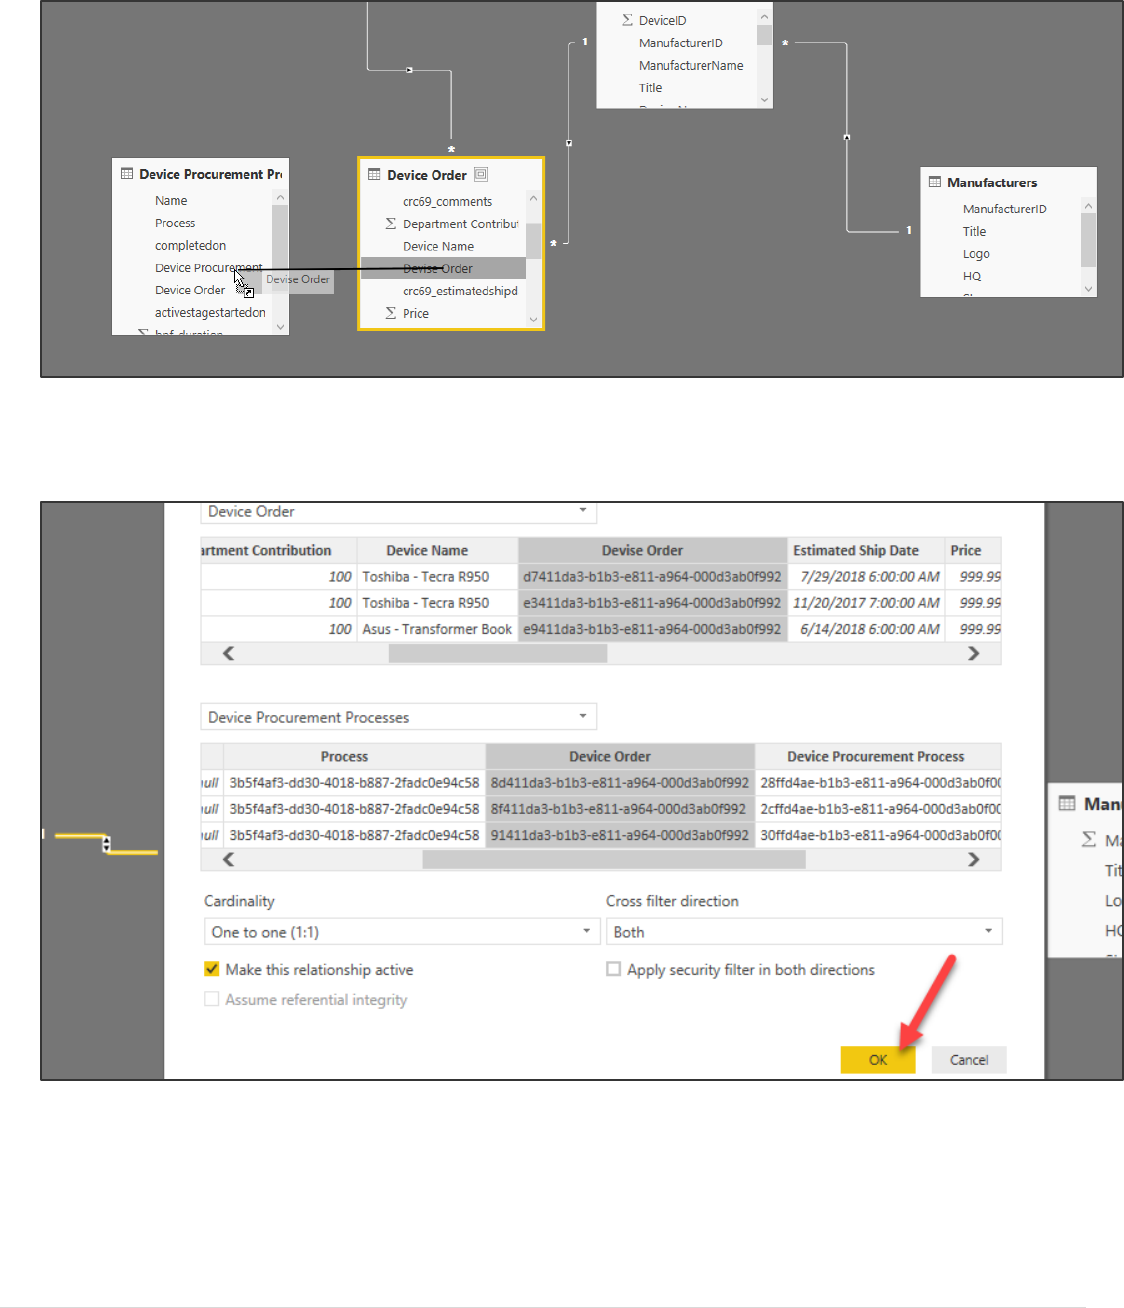
8. Drag Device Order column from the Device Order table and drop it in the Device Procurement Processes table.
9. A new relationship will be created. Double click on the new relationship to edit the properties.
10. Select the Device Order column for both tables.
11. Change the Cardinality to One to one, if it is not already set and then click OK.
12. Your relationships will now look like the image below.
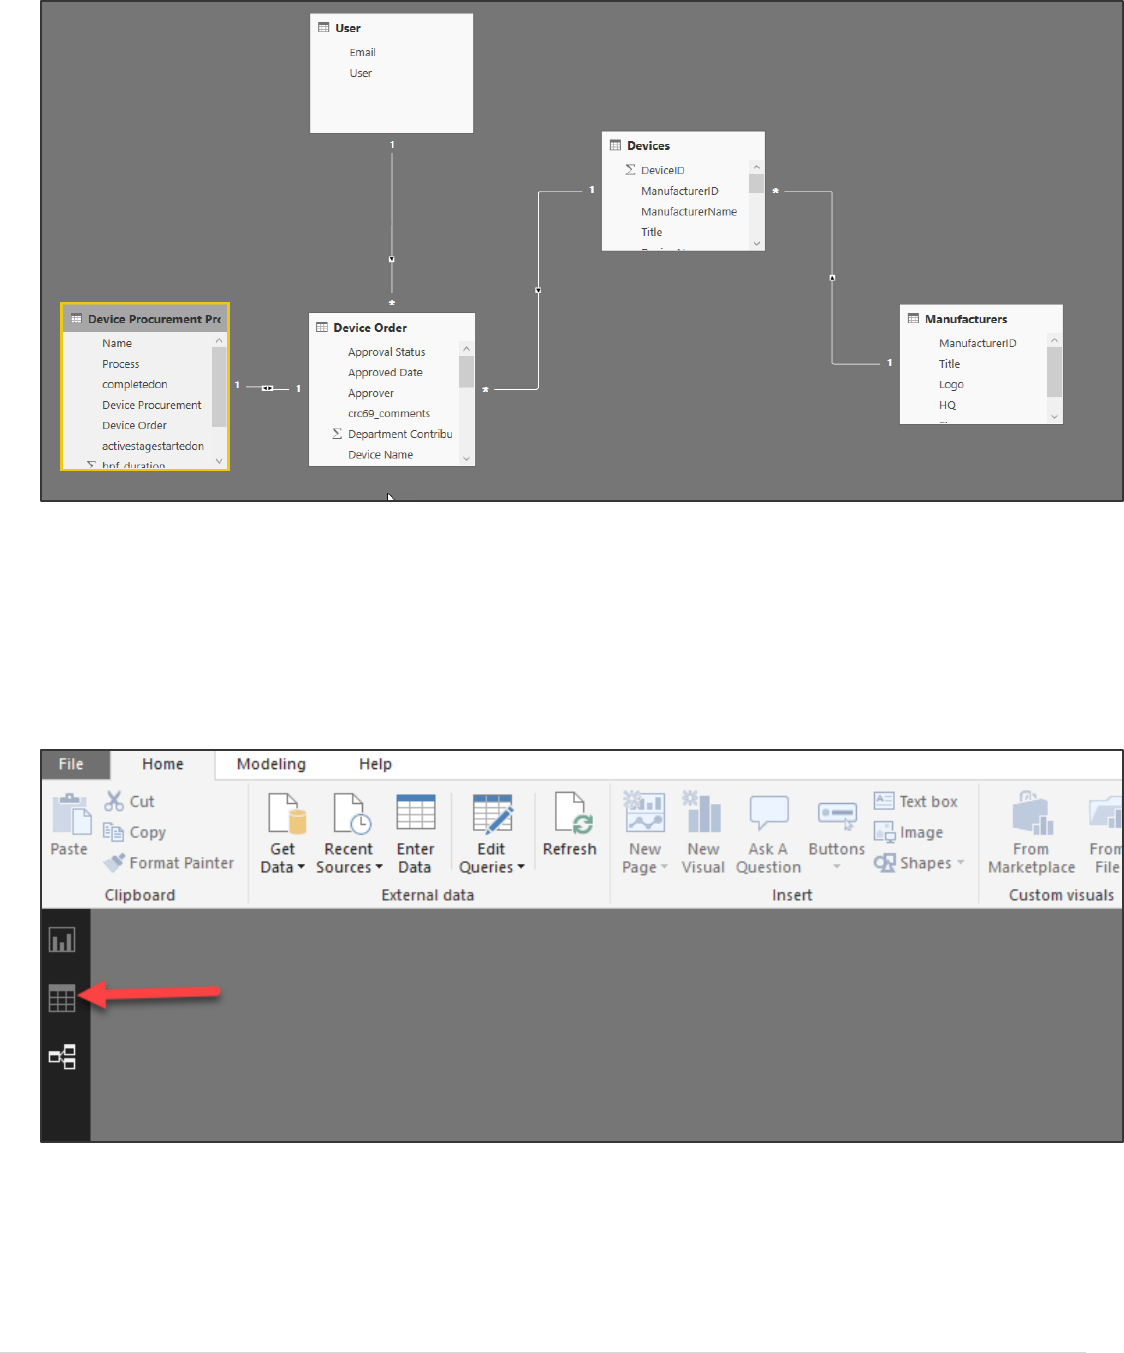
Power platform App in a Day Module 5: Power BI
©2018 Microsoft Corporation 30 | P a g e
Task 2: Add Link to the Common Data Service (CDS) Record Form
A common ask when building a Power BI visual of CDS data is to allow the user to open the record using the CDS form. In
this task you will build a column that will be a link to directly open the record.
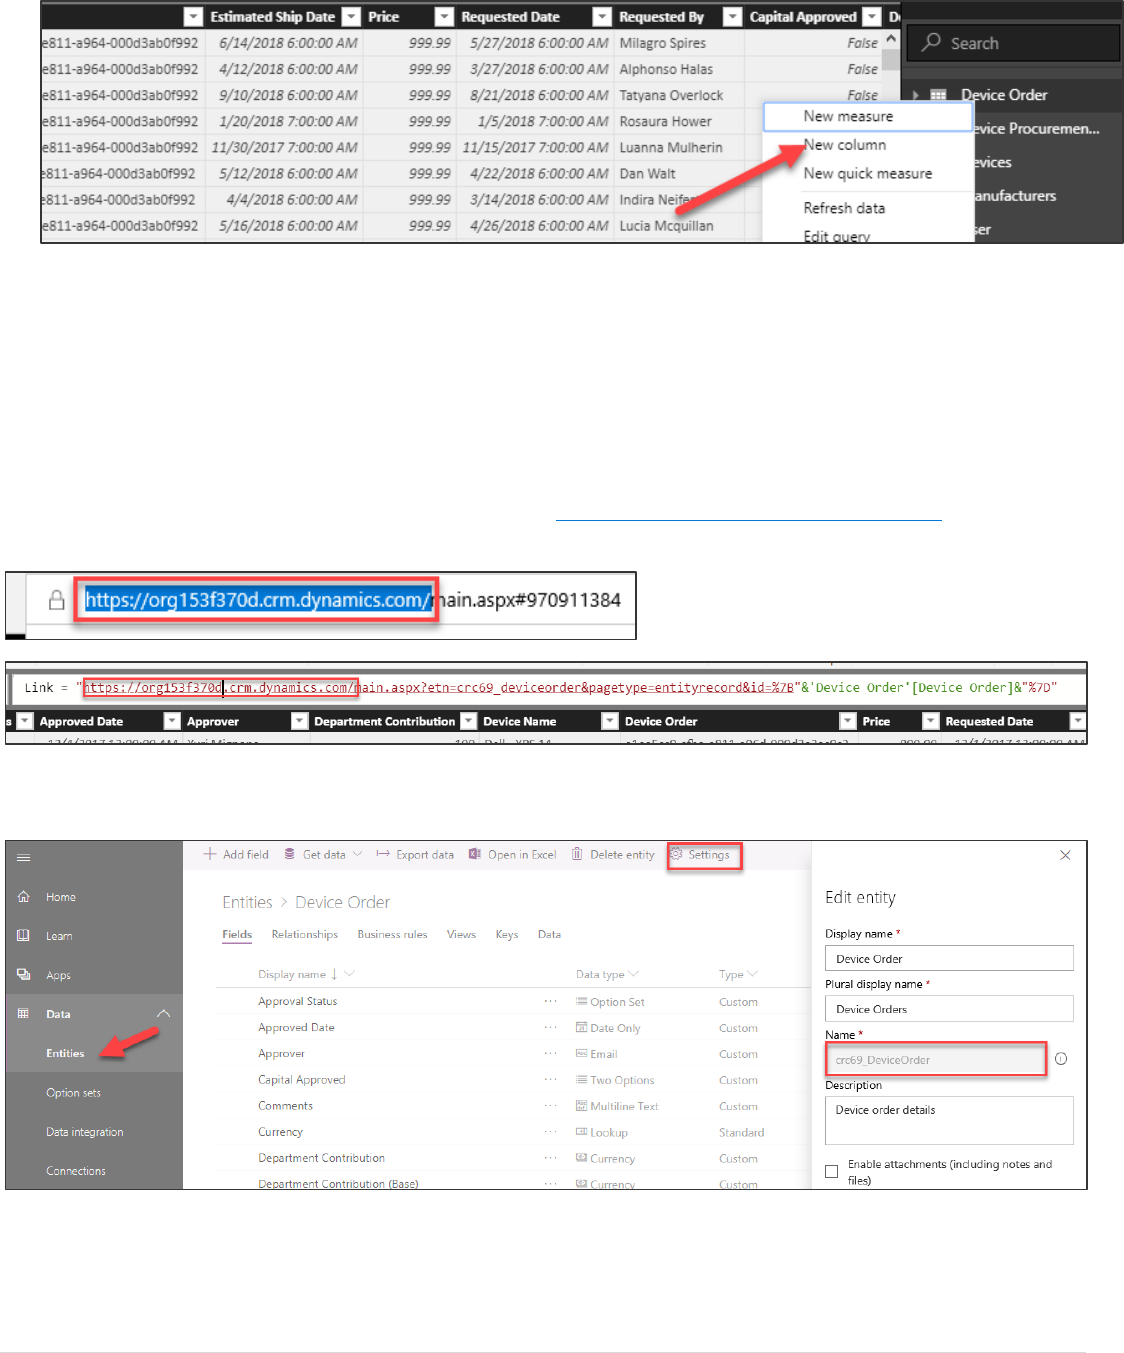
1. Select Data.
2. Right click on the Device Order table and select New Column.
Power platform App in a Day Module 5: Power BI
31 | P a g e ©2018 Microsoft Corporation
3. Provide the function below to build the column value. This needs to be adjusted to match your organization url
and entity type name that can vary from environment to environment, for now paste it in exactly like you have
below
Link =
"https://orgb0a32835.crm.dynamics.com/main.aspx?etn=crc69_deviceorder&pagetype=entityrecord&id=%7B"&'Devi
ce Order'[Device Order]&"%7D"
4. Now get your organization URL, you can get this from https://admin.powerplatform.microsoft.com by selecting
the environments and then … and then open copy the url and replace it in the function
5. Next, we need to get the entity schema name for Device Order. You can get that by going to web.powerapps.com
->Data, select the Device Order entity and click the Settings button
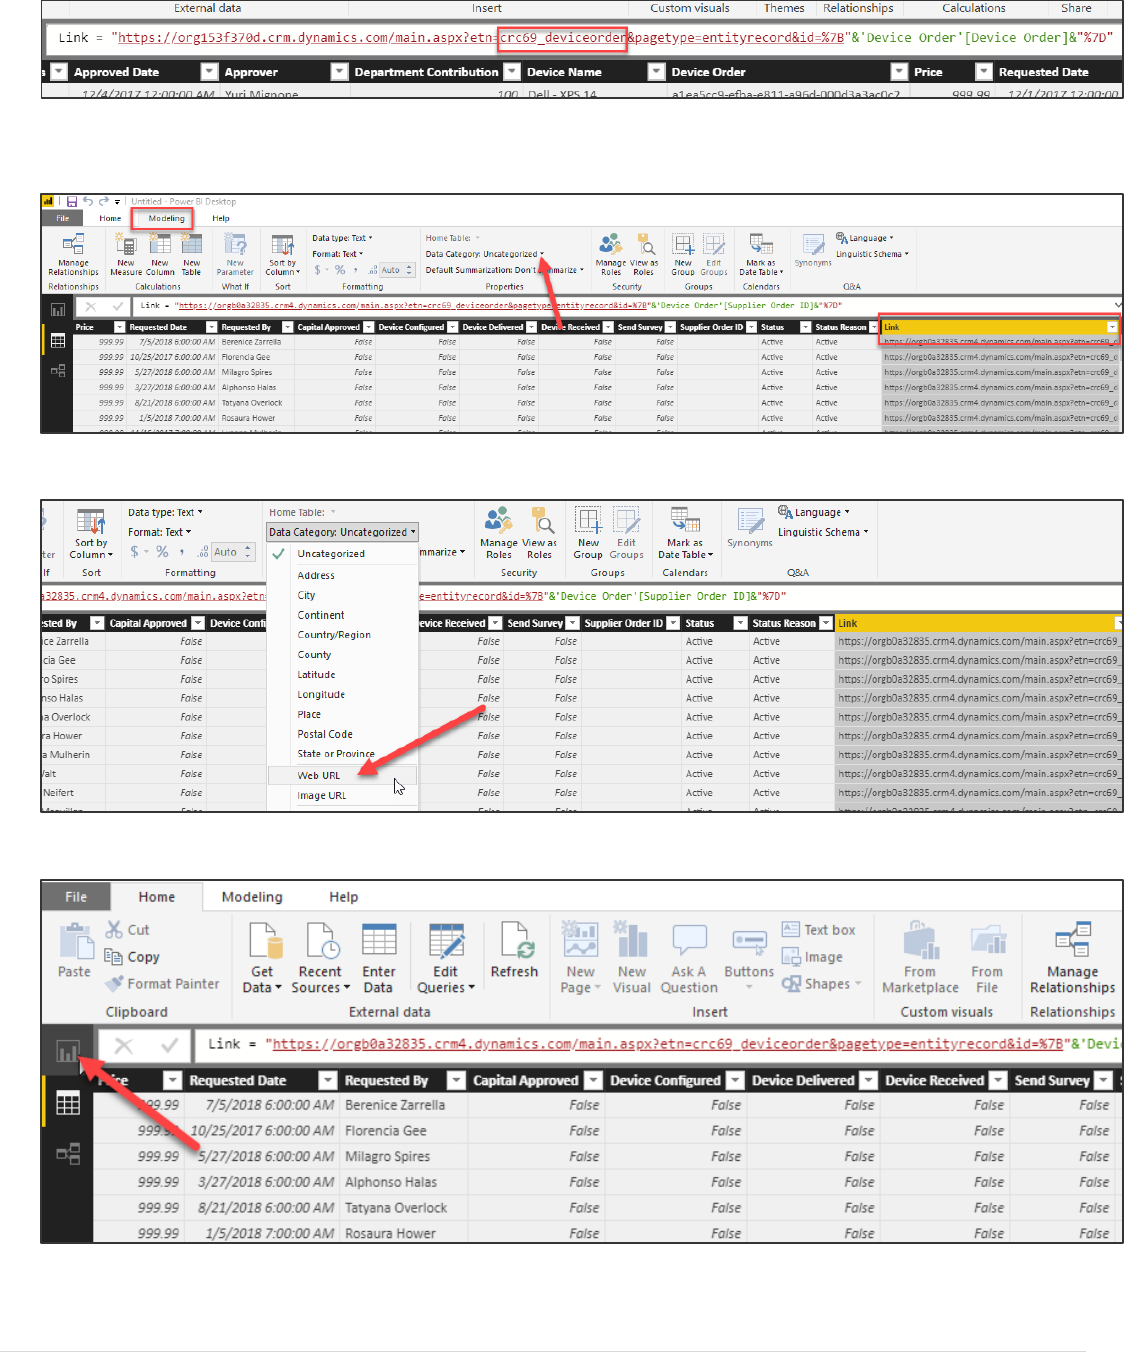
6. If your value is different than what is in the Link function replace that in Power BI. This value can vary from
environment to environment
Power platform App in a Day Module 5: Power BI
©2018 Microsoft Corporation 32 | P a g e
7. Select the new column and from the Modeling tab click Data Category.
8. Select Web URL.
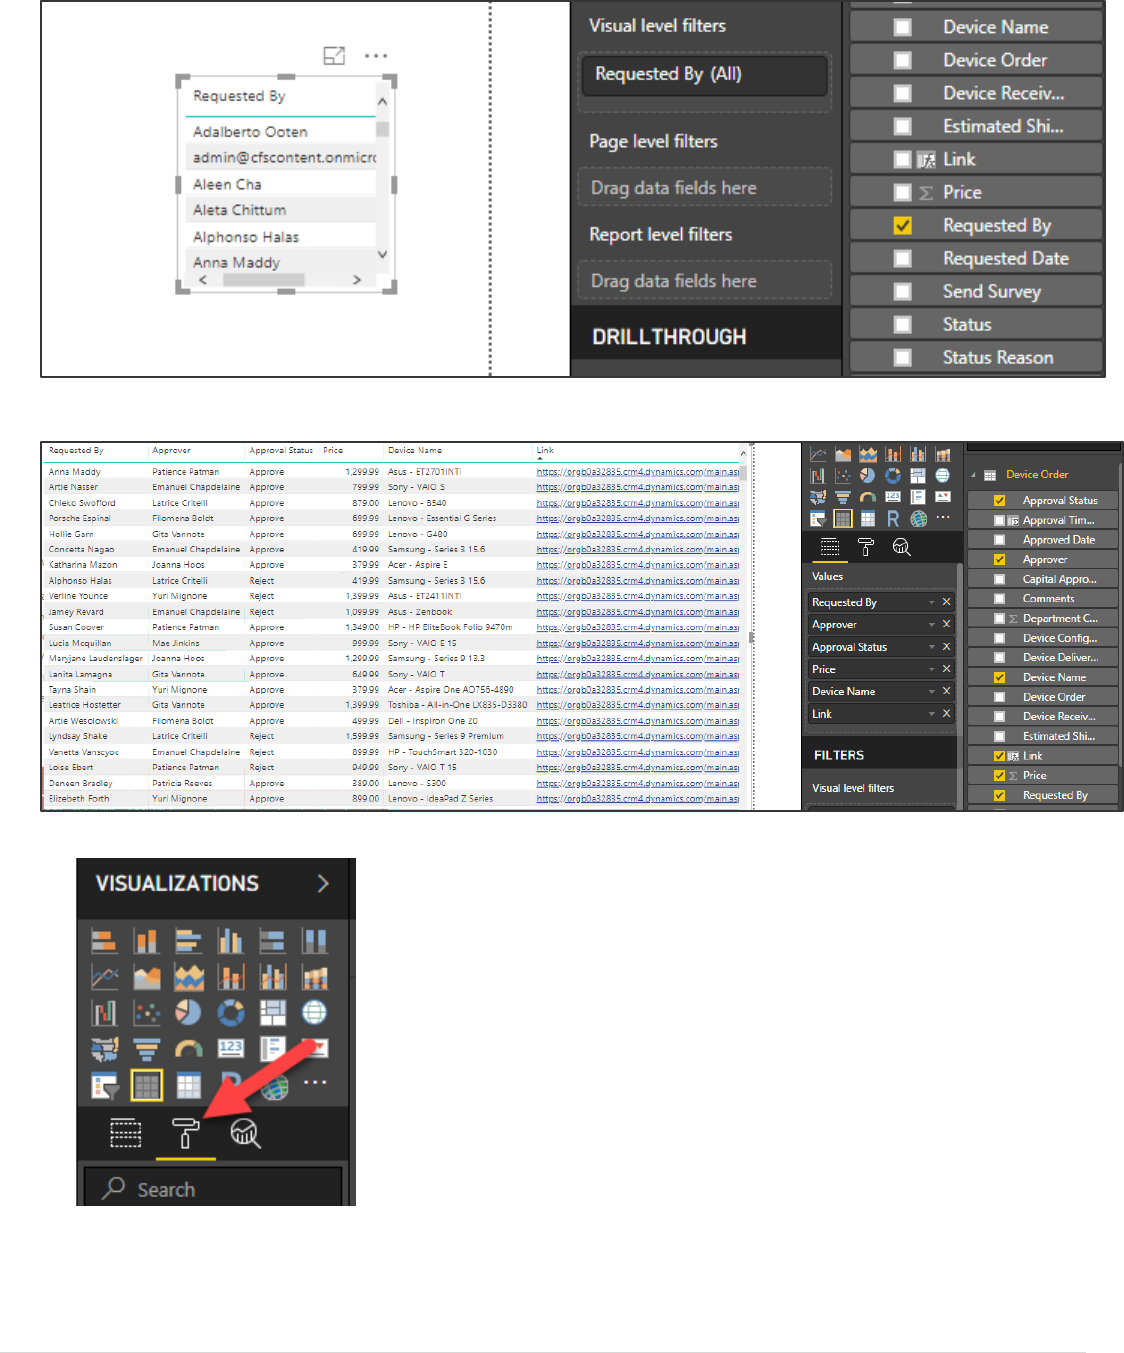
9. Select Reports.
10. Expand the Device Order table and select Requested By.
Power platform App in a Day Module 5: Power BI
33 | P a g e ©2018 Microsoft Corporation
11. Select Approver, Approval Status, Price, Device Name, and Link form the Device Order table.
12. Select the Format tab
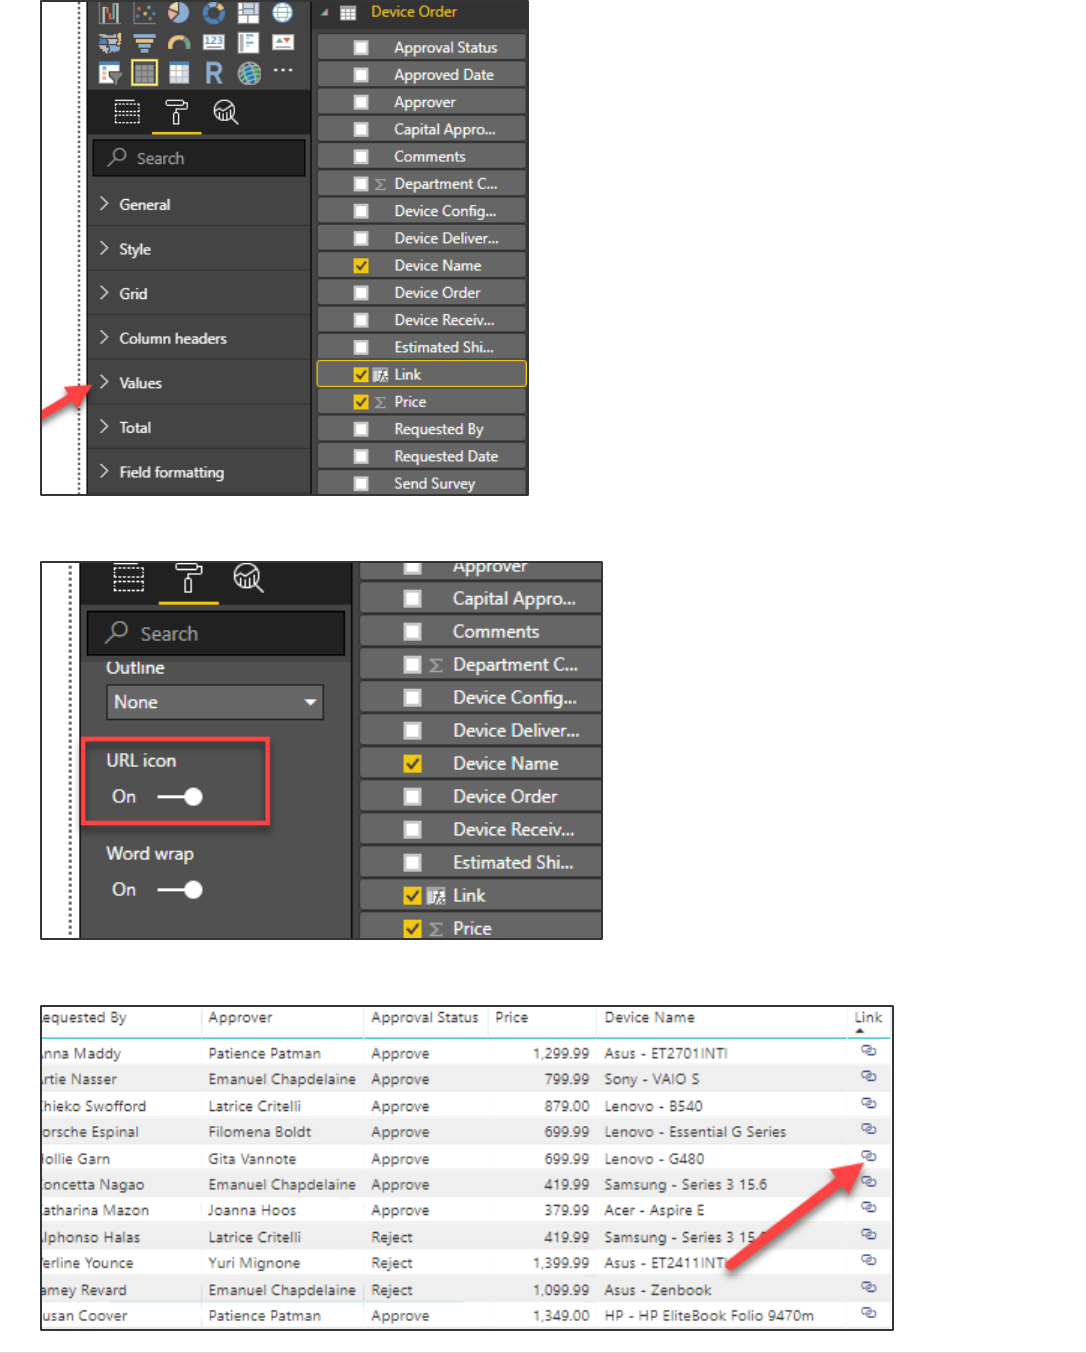
13. Select the Link column and from the Format tab, expand Values.
Power platform App in a Day Module 5: Power BI
©2018 Microsoft Corporation 34 | P a g e
14. Turn on the URL Icon.
15. Click on the link. Your CDS record should open.
Power platform App in a Day Module 5: Power BI
35 | P a g e ©2018 Microsoft Corporation
Task 3: Add a Calculated Field for approval time
In this task, you will add a calculated column with the approval time inn days, you will add a column chart to the report
page.
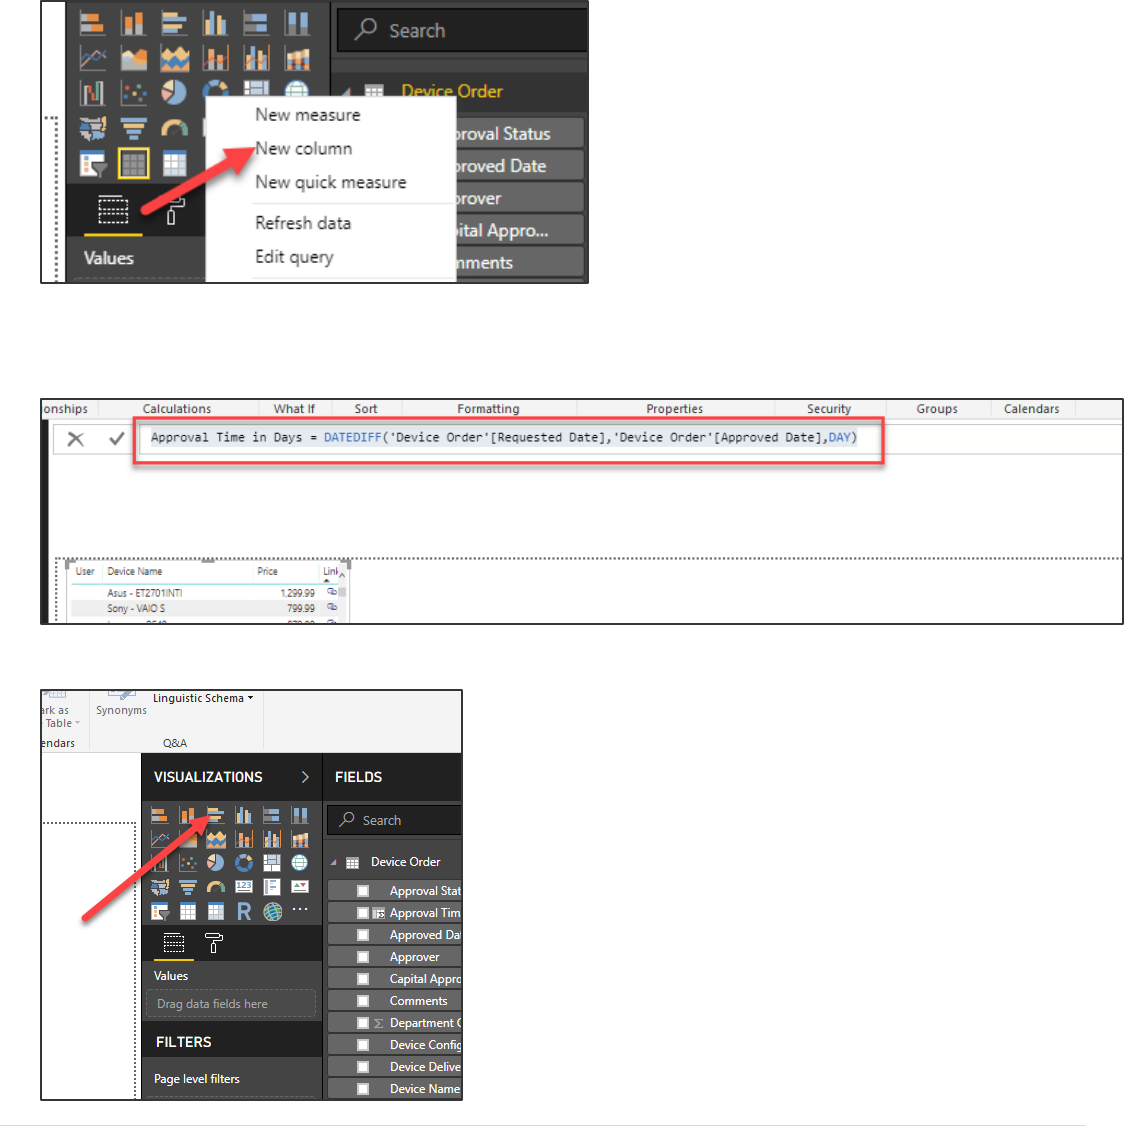
1. Right click on the Device Order table and select New Column.
2. Type in the formula bar.
Approval Time in Days = DATEDIFF('Device Order'[Requested Date],'Device Order'[Approved
Date],DAY)
3. Select the canvas and make sure the list of orders is no longer selected and click Clustered Bar Chart.
Power platform App in a Day Module 5: Power BI
©2018 Microsoft Corporation 36 | P a g e
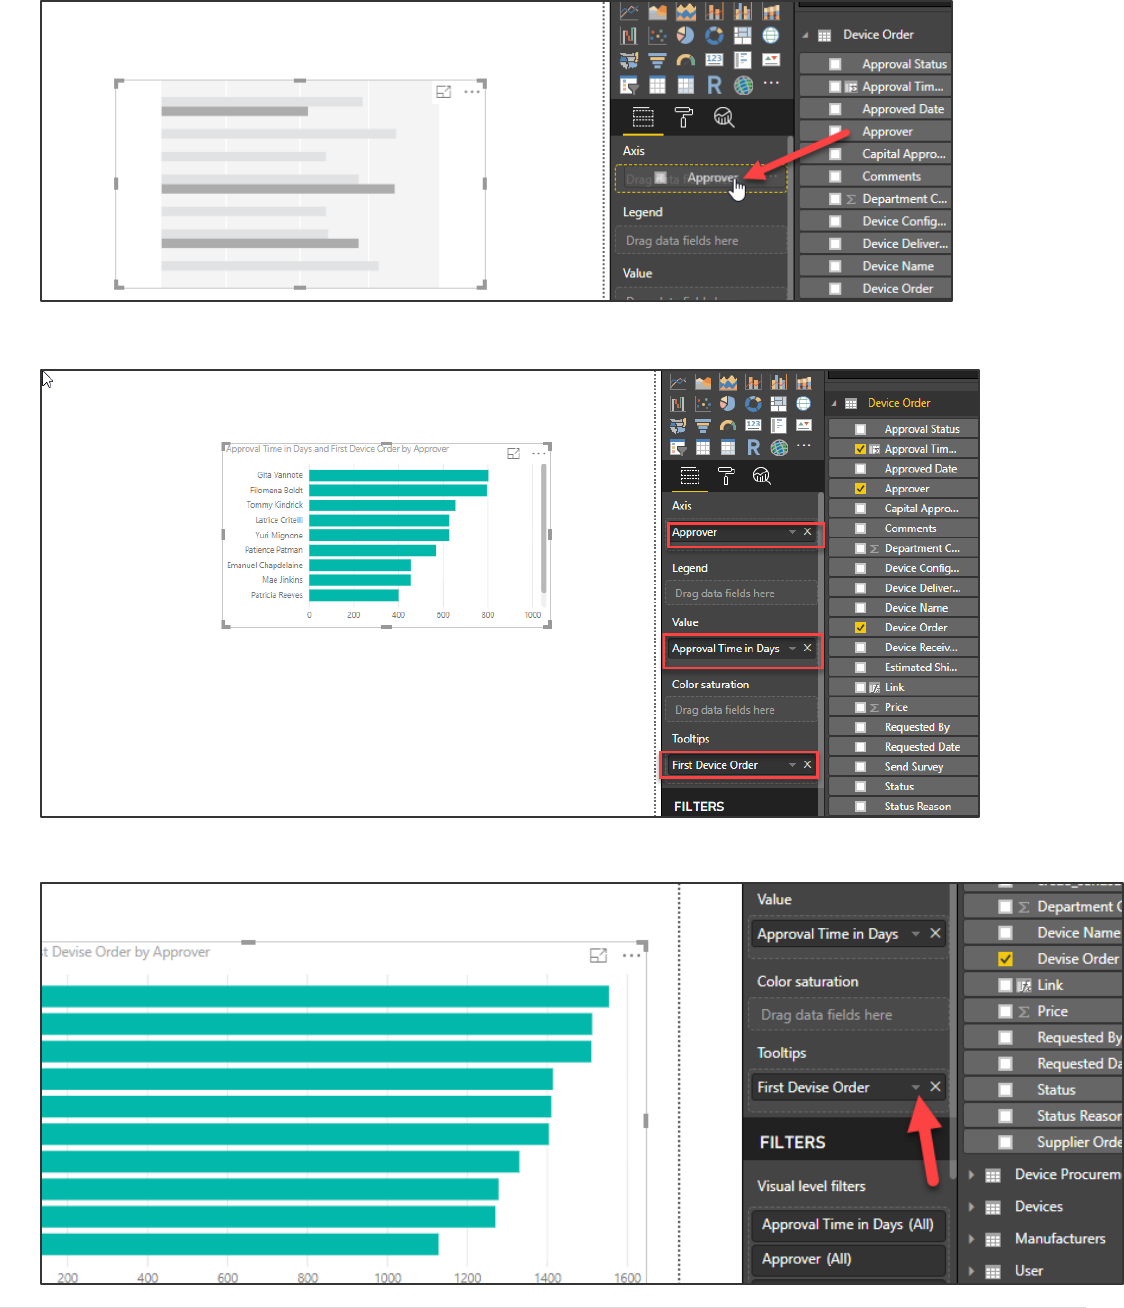
4. Select the chart you added, drag the Approver column and drop it in the Axes target.
5. Drag Approval Time in Days to the Value target and drag Device Order to the Tooltip target.
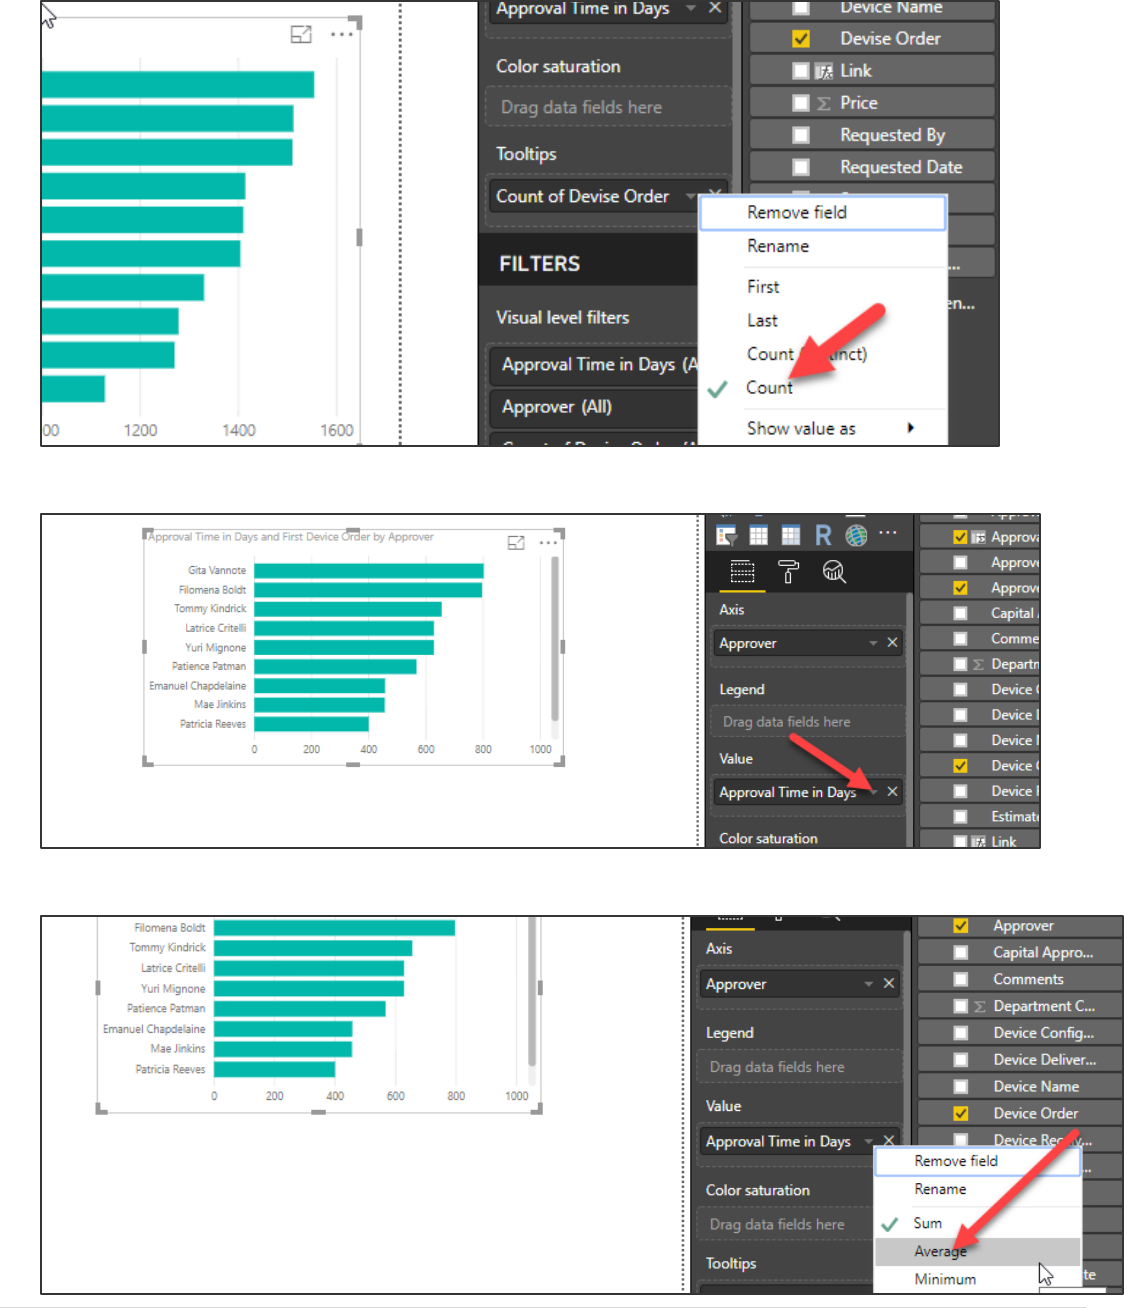
6. Click on the dropdown button next to the First Device Order.
Power platform App in a Day Module 5: Power BI
37 | P a g e ©2018 Microsoft Corporation
7. Select Count.
8. Click on the dropdown button next to the Approval Time in Days.
9. Select Average.
Power platform App in a Day Module 5: Power BI
©2018 Microsoft Corporation 38 | P a g e
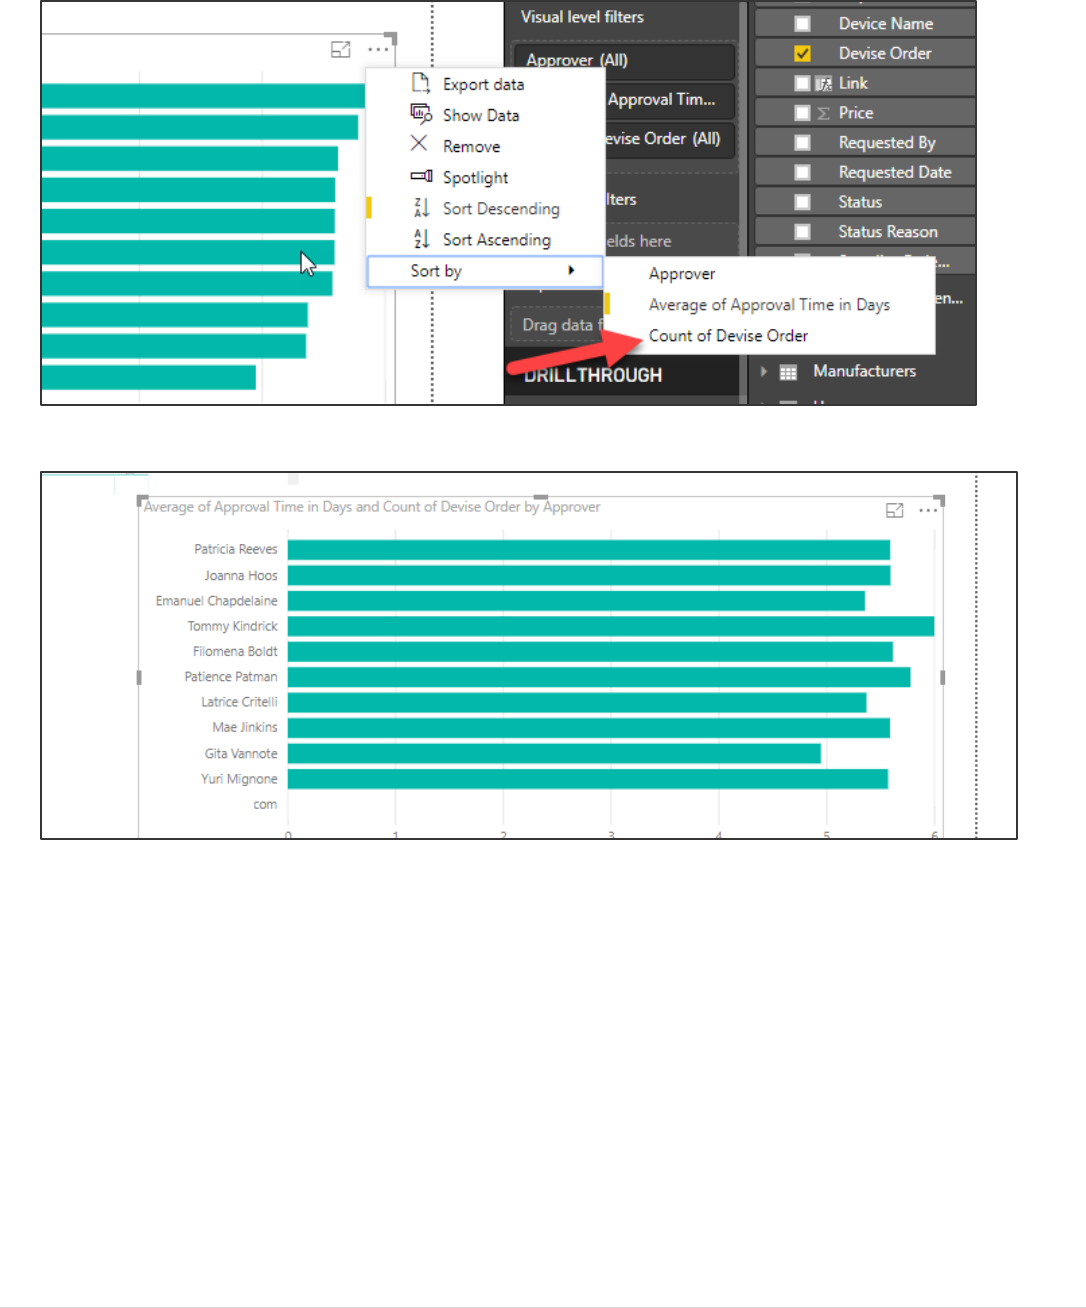
10. Click on the chart ellipses(the …), click Sort By, and select Count of Device Order.
11. Your chart will now look similar to the image below. It may not look exactly like it though…
Power platform App in a Day Module 5: Power BI
39 | P a g e ©2018 Microsoft Corporation
Exercise 5: Add visuals to the report
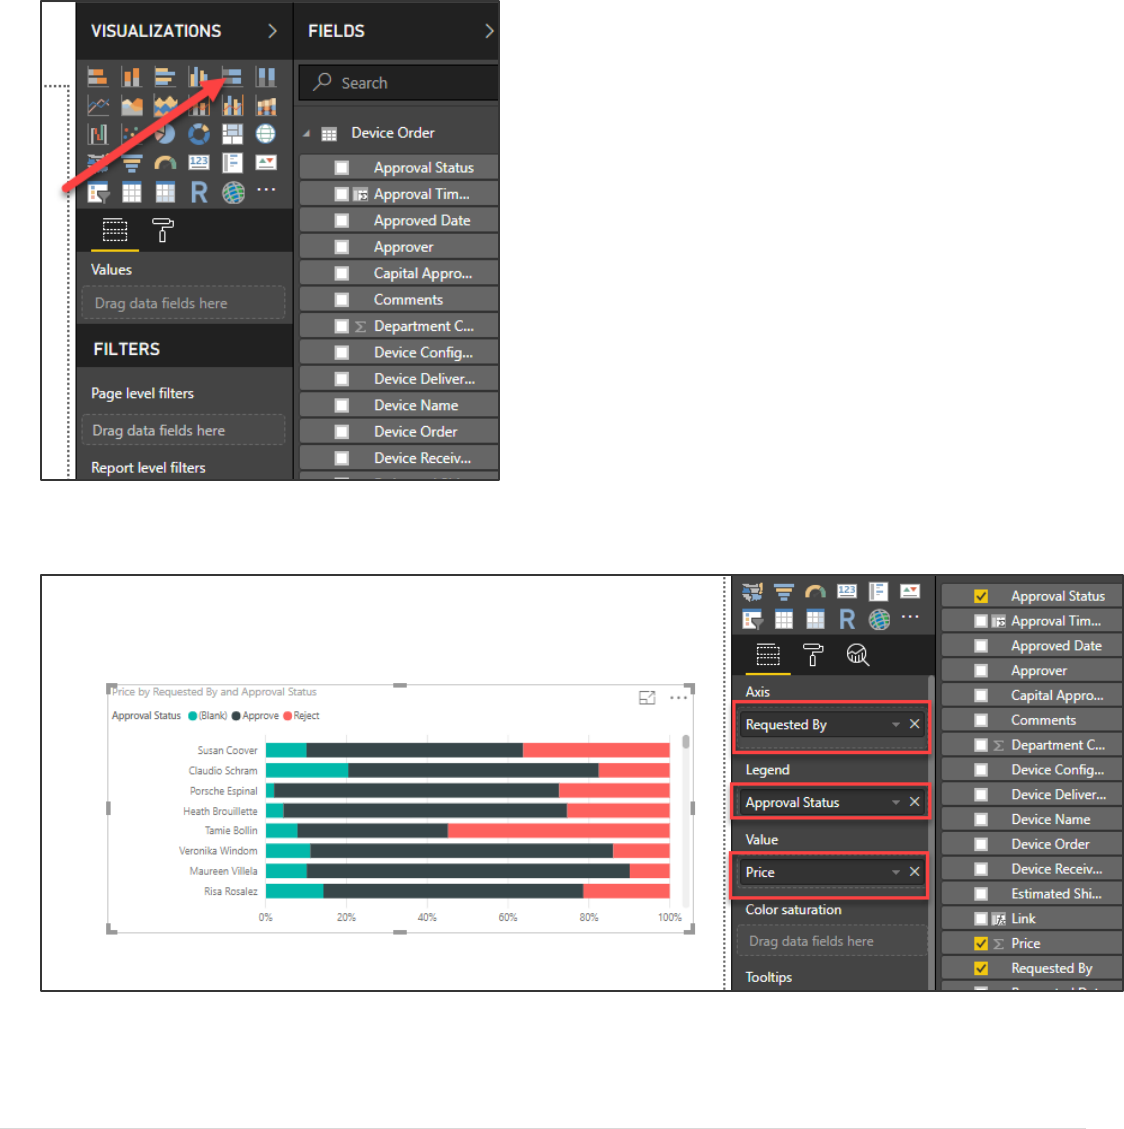
Task 1: Add Stacked Bar Chart of orders
1. Select an empty area of the canvas and click ok the Stacked Bar Chart.
2. Select the columns below for the stacked bar chart. Note: Your chart may not look the same based on how many
rejected you have in your data. You can edit the records in CDS and reject more if you want!
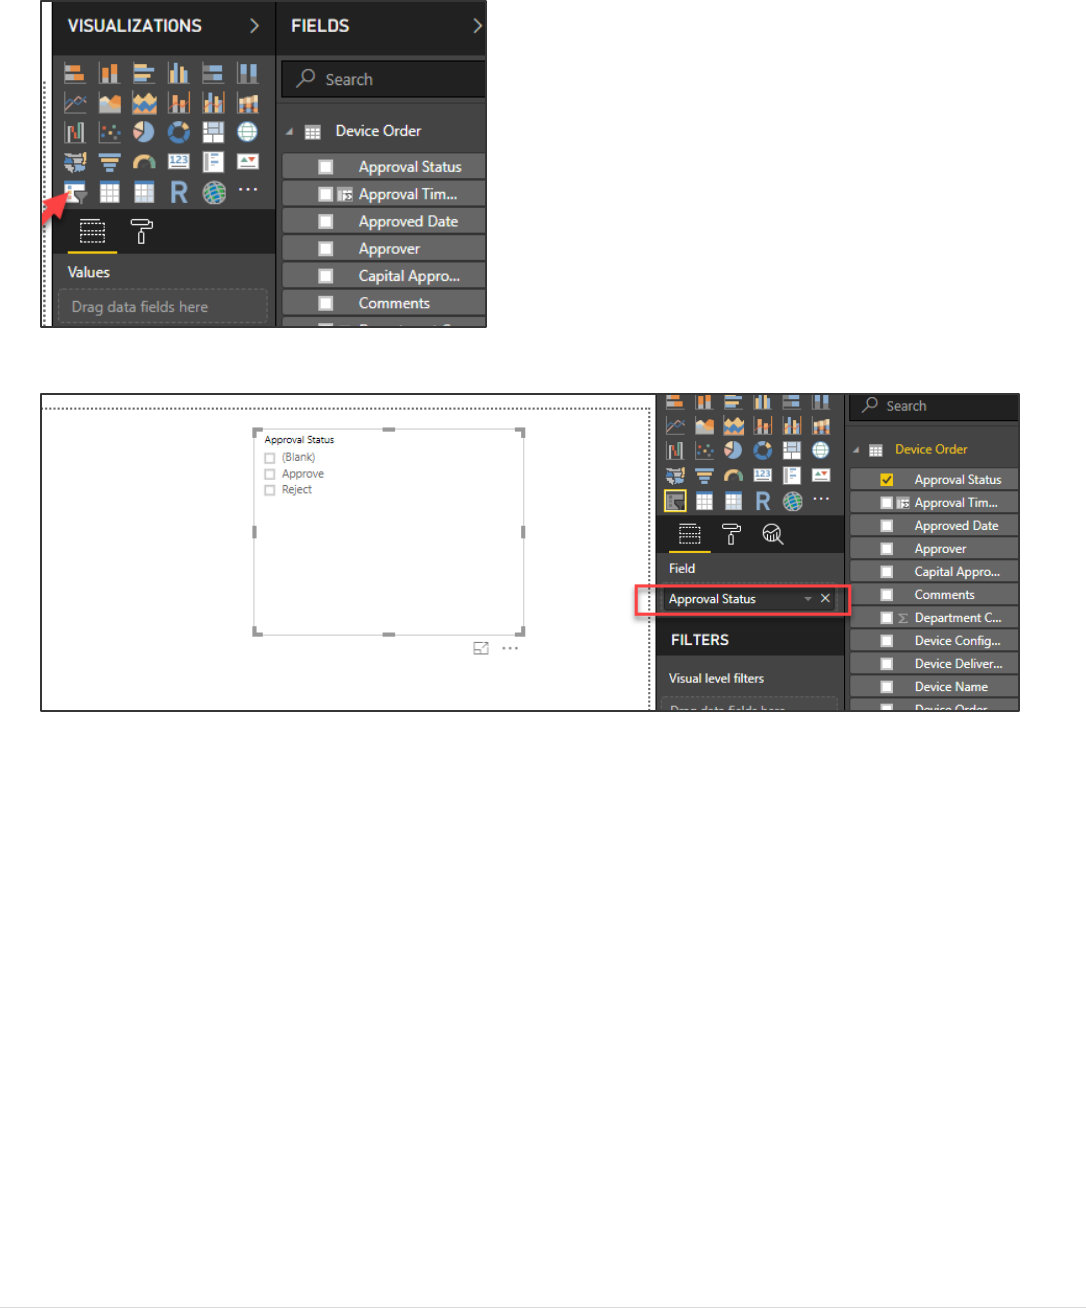
Task 2: Add a Slicer on Approval Status
Power platform App in a Day Module 5: Power BI
©2018 Microsoft Corporation 40 | P a g e
1. Select an empty area of the canvas and click Slicer.
2. Drag the Approval Status to the Field target.
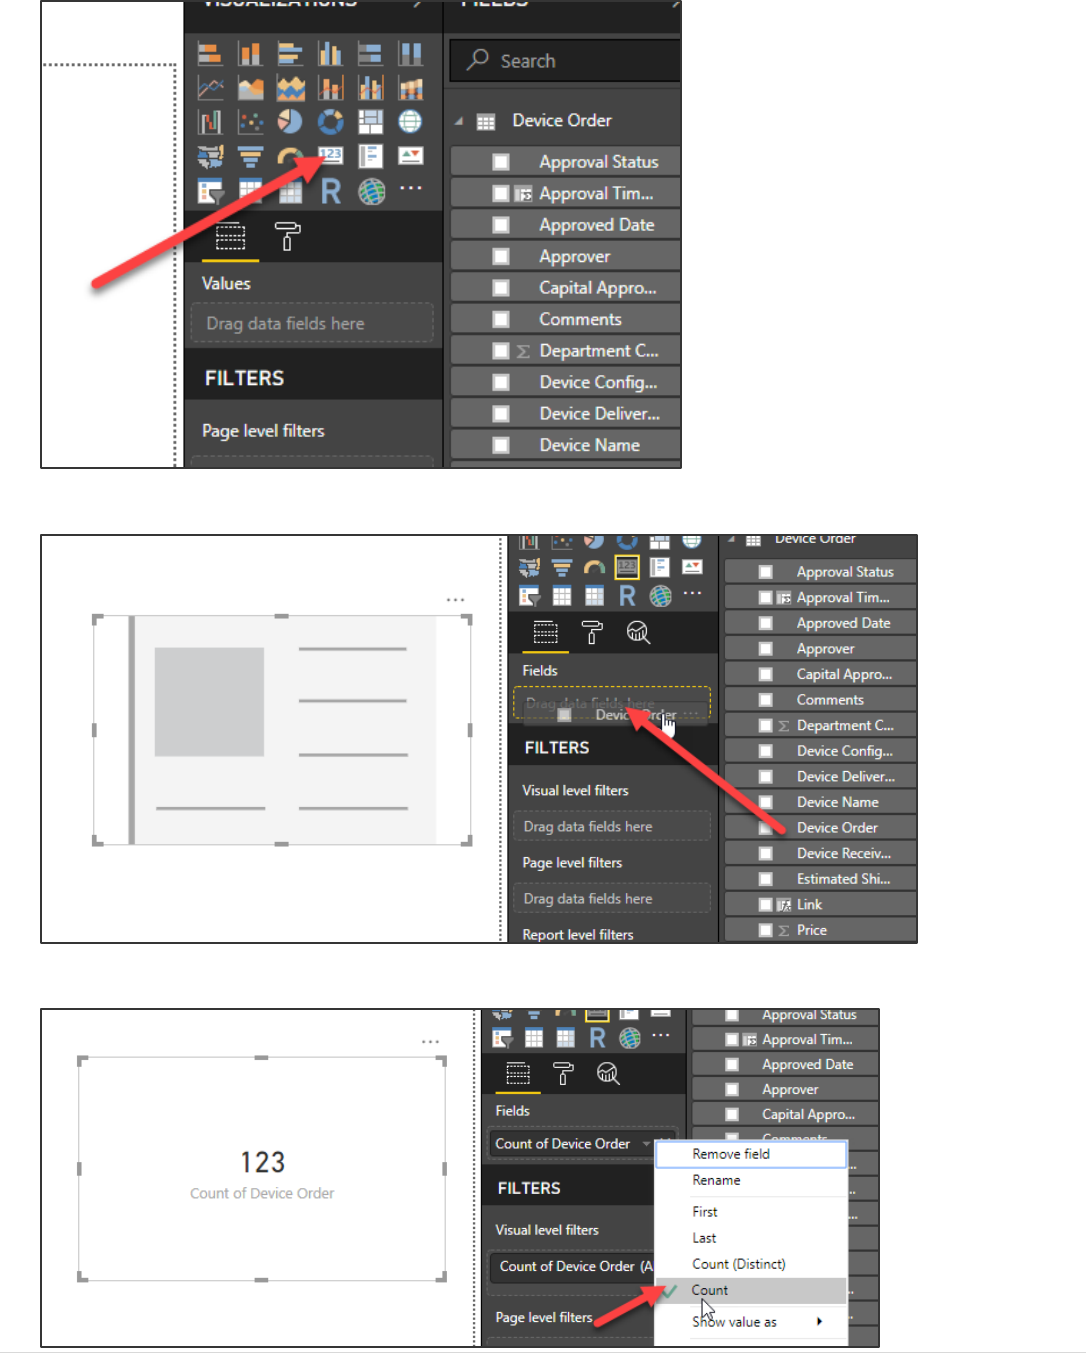
Task 3: Add Cards with Device Order statistics
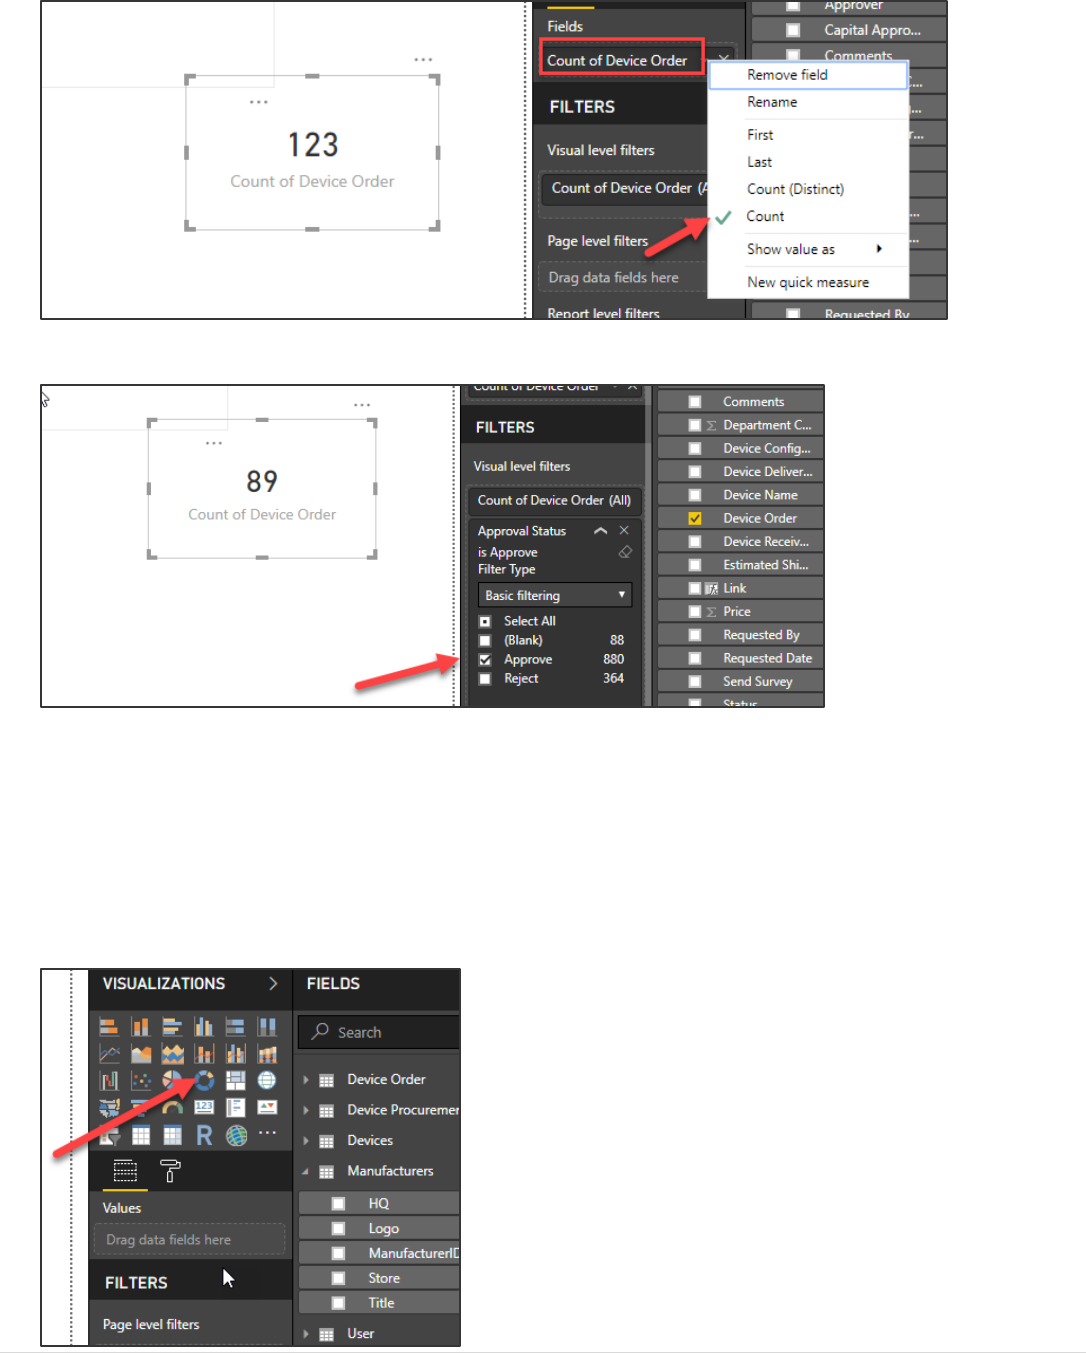
1. Select an empty area of the canvas and click Card.
Power platform App in a Day Module 5: Power BI
41 | P a g e ©2018 Microsoft Corporation
2. This card will show the total count of devices ordered. Select the card and drag Device Order to the Fields target.
3. Select Count.
Power platform App in a Day Module 5: Power BI
©2018 Microsoft Corporation 42 | P a g e
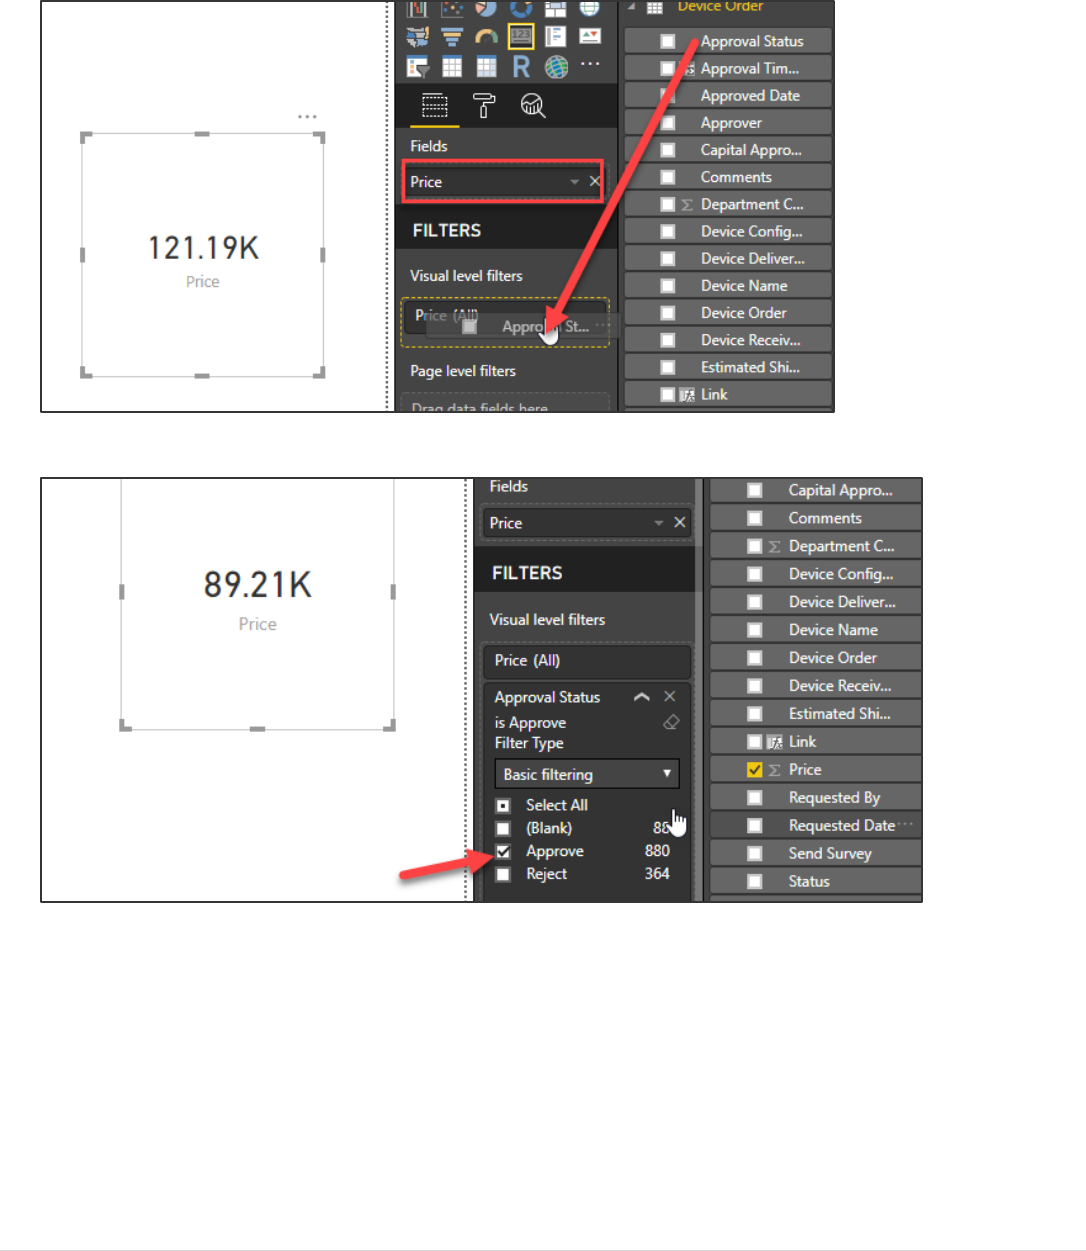
4. Add another Card to the canvas. This card will display total amount spent on approved devices.
5. Drag the Price to the Fields target
6. Drag the Approval Status to the Visual Level target.
7. Select Approve to filter the amount only to those orders that are approved.
8. Add one more Card to the canvas.
9. This card will show total approved devices. Drag Device Order to the Fields target and select Count.
Power platform App in a Day Module 5: Power BI
43 | P a g e ©2018 Microsoft Corporation
10. Drag Approval Status to the Visual Level target and select Approve.
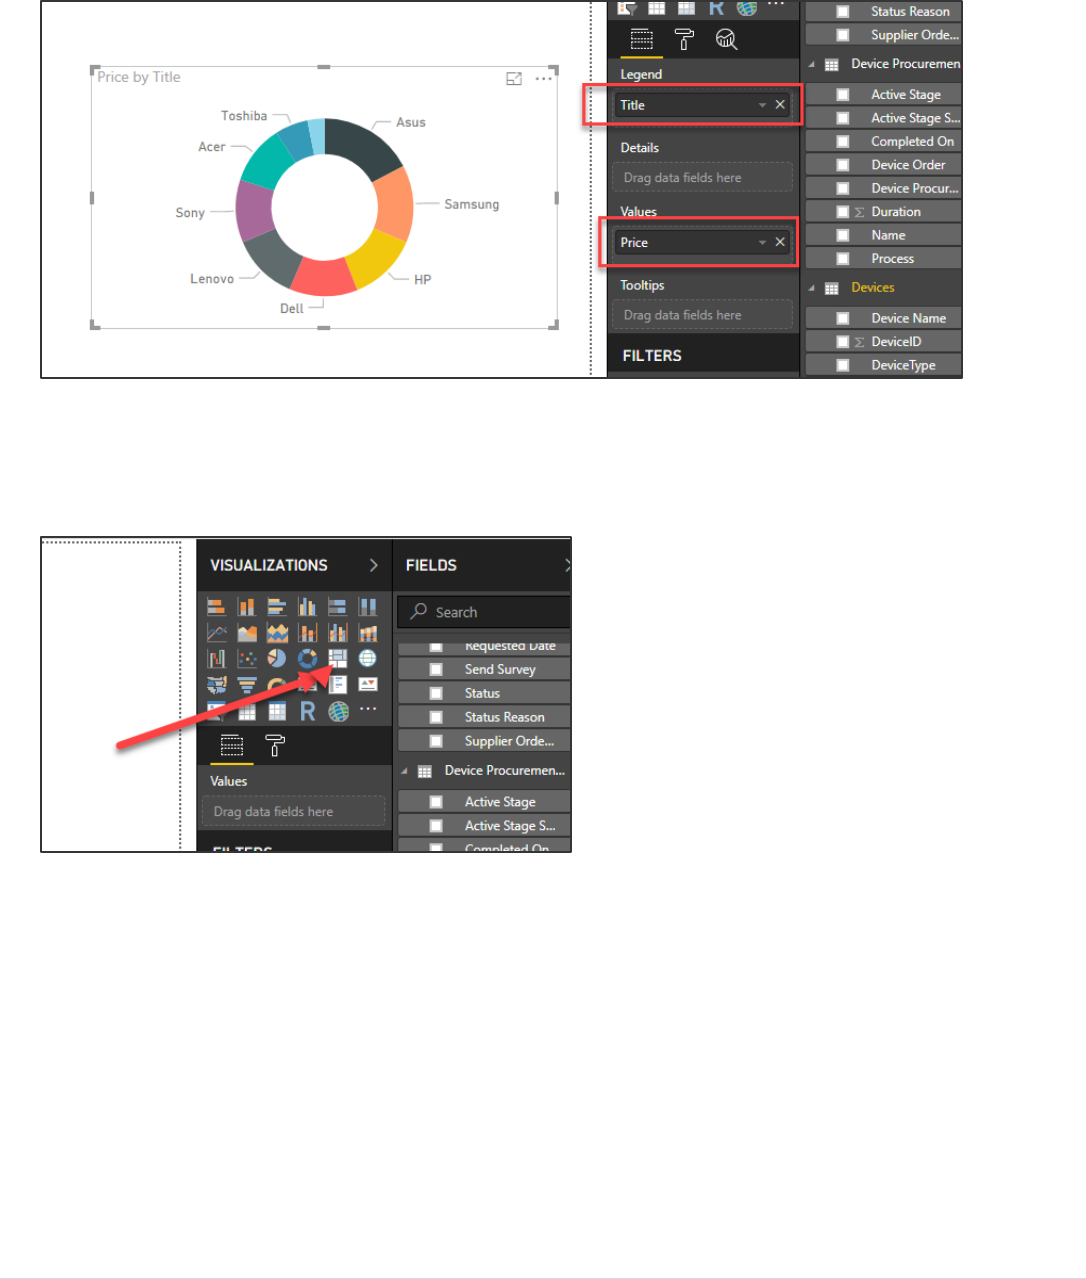
Task 4: Add a Donut Chart by Manufacture
In this task, you will add a Donut to represent the amount spent by manufacture. This can provide a quick visual way of
allowing the CFO or other financial management staff to look at which manufactures they want to negotiate better pricing
with. You can also click on a segment of the donut to filter the rest of the page to just that manufacture.
1. Add a Donut Chart to the canvas.
Power platform App in a Day Module 5: Power BI
©2018 Microsoft Corporation 44 | P a g e
2. Drag Title from the Manufacturers table to the Legend target and Price from the Devices table to the Values
target.
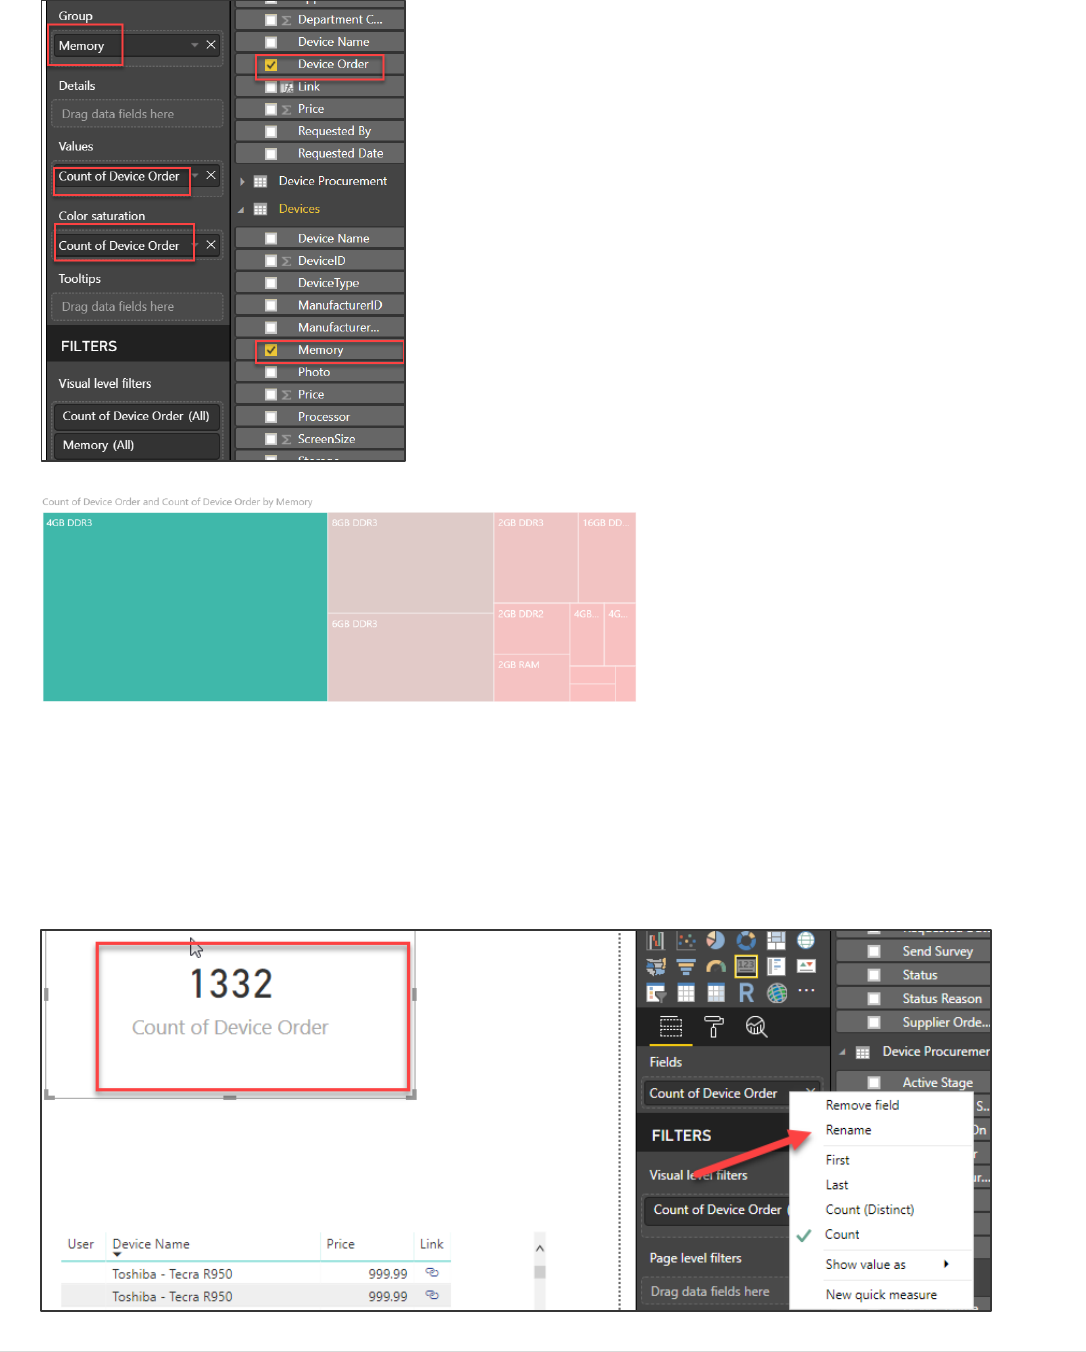
Task 5: Add a Tree Map by Device Name
1. Add Tree Map visual to the canvas.
2. Drag Memory from the Device table to the Group target, Device Order from Device Order table to the Values
target, and Device Order to the Color Saturation.
Power platform App in a Day Module 5: Power BI
45 | P a g e ©2018 Microsoft Corporation
Task 6: Format the Statistics Cards
1. Select the Count of Device Order card and click Rename.
Power platform App in a Day Module 5: Power BI
©2018 Microsoft Corporation 46 | P a g e
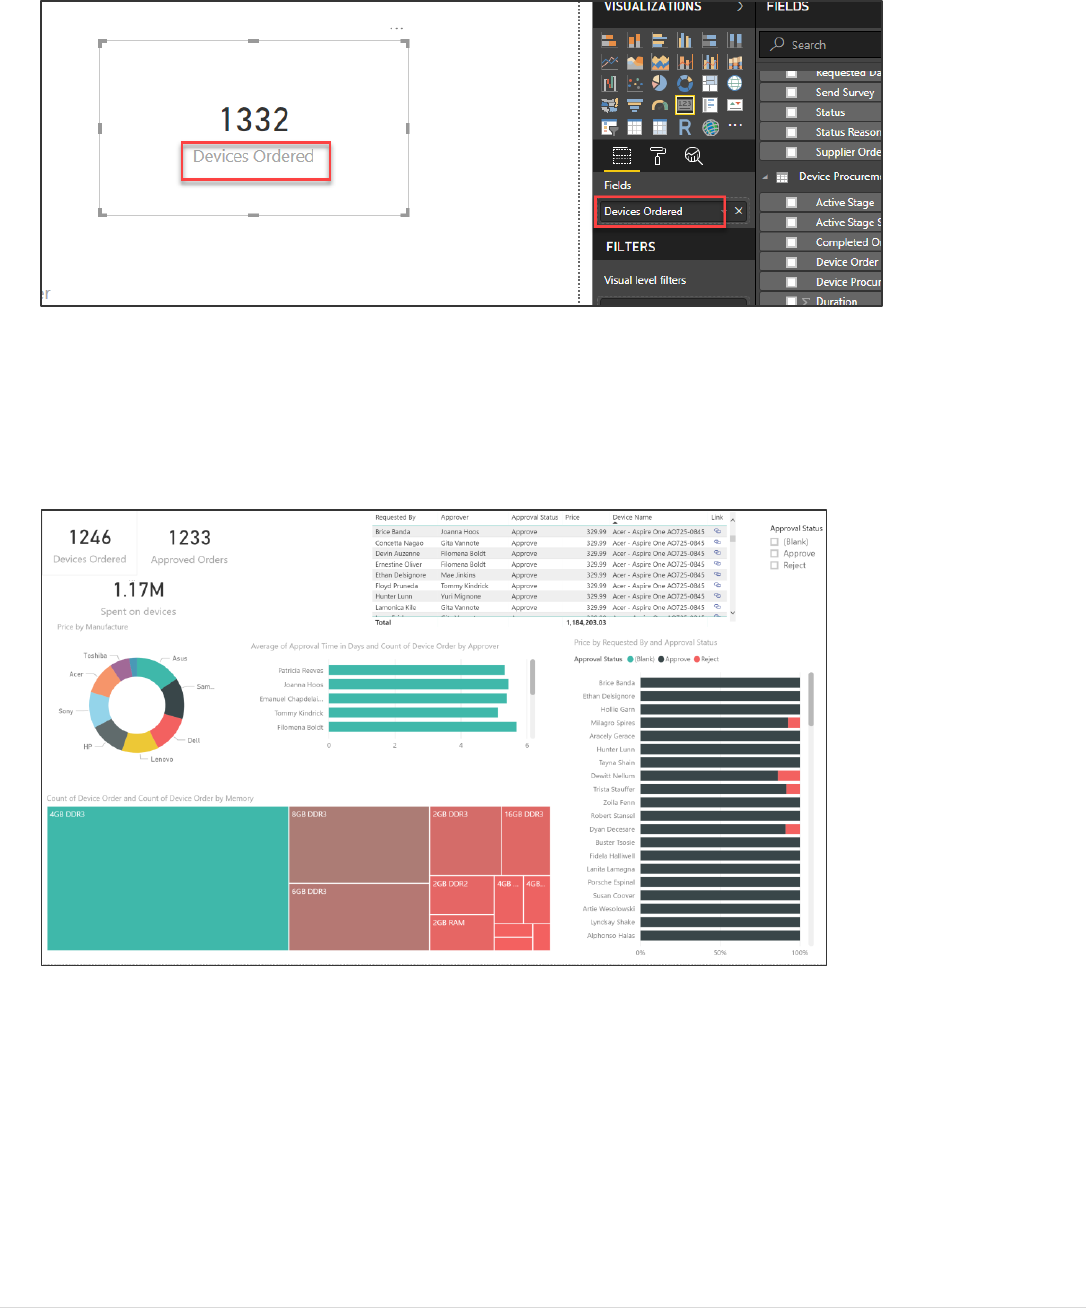
2. Rename it Devices Ordered.
3. You may rename other visuals as you see appropriate.
Task 7: Arrange the visuals on the report page
4. Arrange Visuals on the report page as shown in the image below.
Power platform App in a Day Module 5: Power BI
47 | P a g e ©2018 Microsoft Corporation
Exercise 6: Publish and Share
Task 1: Publish and Share
1. Make sure you are logged in in your environment.
2. Click Save.
3. Name the report Device Order Report and save it on your machine.
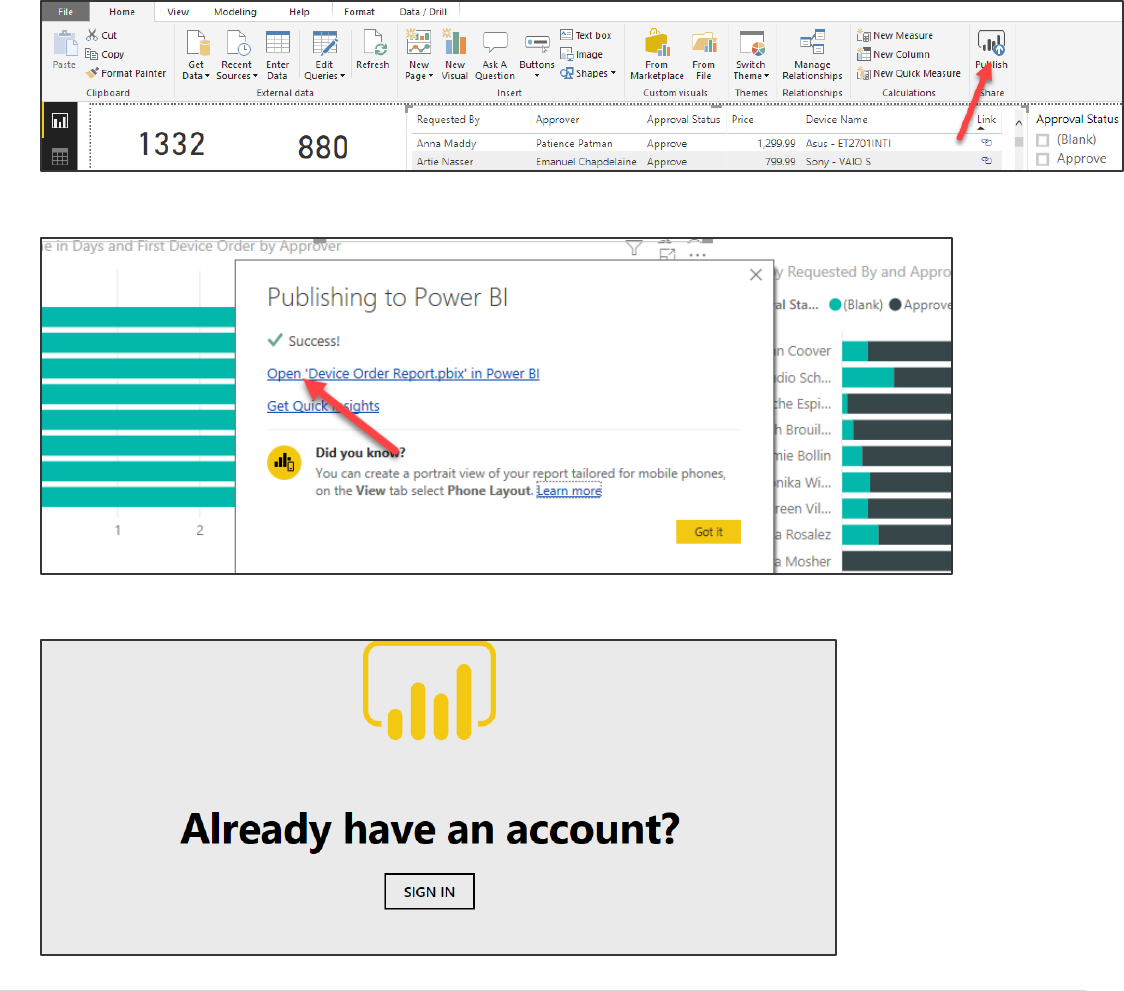
4. Click Publish.
5. Click Open in Power BI.
6. Click Sign in.
Power platform App in a Day Module 5: Power BI
©2018 Microsoft Corporation 48 | P a g e
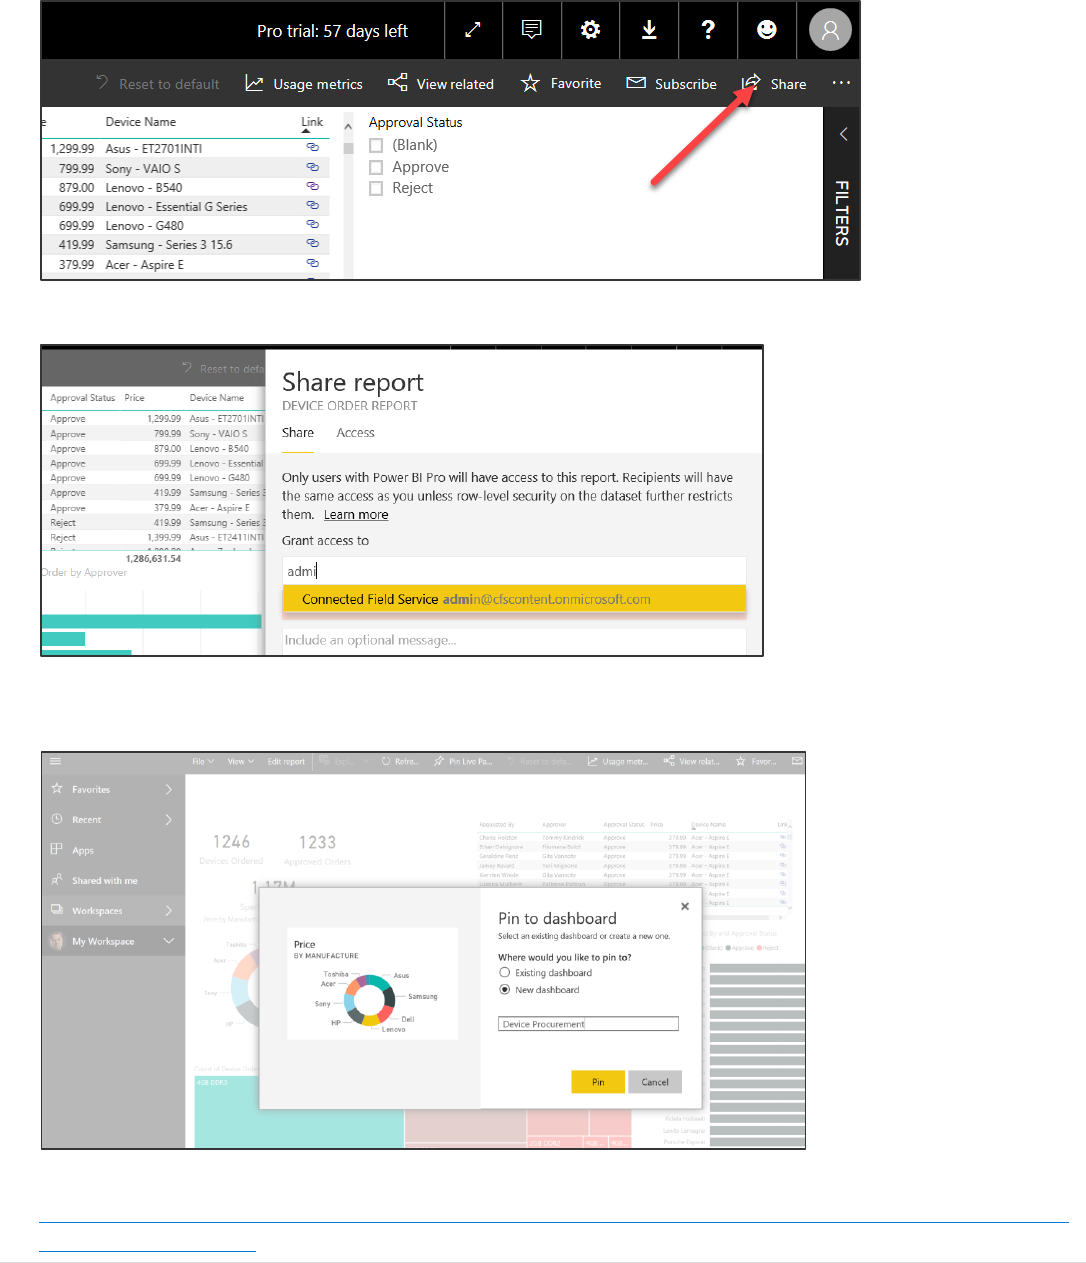
7. Click Share.
8. You can share with any user in your organization.
From with in PowerBI.Com you can also add the report visualizations to an existing dashboard or create a new
dashboard
You can also embed the Power BI Visualizations in a personal dashboard in CDS. You can read more about that here
https://docs.microsoft.com/en-us/dynamics365/customer-engagement/admin/use-power-bi#embed--visualizations-
on-personal-dashboards if you have time give it a try!

Power platform App in a Day Module 5: Power BI
49 | P a g e ©2018 Microsoft Corporation
Copyright
© 2018 Microsoft Corporation. All rights reserved.
By using this demo/lab, you agree to the following terms:
The technology/functionality described in this demo/lab is provided by Microsoft Corporation for purposes of obtaining
your feedback and to provide you with a learning experience. You may only use the demo/lab to evaluate such technology
features and functionality and provide feedback to Microsoft. You may not use it for any other purpose. You may not
modify, copy, distribute, transmit, display, perform, reproduce, publish, license, create derivative works from, transfer, or
sell this demo/lab or any portion thereof.
COPYING OR REPRODUCTION OF THE DEMO/LAB (OR ANY PORTION OF IT) TO ANY OTHER SERVER OR LOCATION FOR
FURTHER REPRODUCTION OR REDISTRIBUTION IS EXPRESSLY PROHIBITED.
THIS DEMO/LAB PROVIDES CERTAIN SOFTWARE TECHNOLOGY/PRODUCT FEATURES AND FUNCTIONALITY, INCLUDING
POTENTIAL NEW FEATURES AND CONCEPTS, IN A SIMULATED ENVIRONMENT WITHOUT COMPLEX SET-UP OR
INSTALLATION FOR THE PURPOSE DESCRIBED ABOVE. THE TECHNOLOGY/CONCEPTS REPRESENTED IN THIS DEMO/LAB
MAY NOT REPRESENT FULL FEATURE FUNCTIONALITY AND MAY NOT WORK THE WAY A FINAL VERSION MAY WORK.
WE ALSO MAY NOT RELEASE A FINAL VERSION OF SUCH FEATURES OR CONCEPTS. YOUR EXPERIENCE WITH USING
SUCH FEATURES AND FUNCTIONALITY IN A PHYSICAL ENVIRONMENT MAY ALSO BE DIFFERENT.
FEEDBACK. If you give feedback about the technology features, functionality and/or concepts described in this demo/lab
to Microsoft, you give to Microsoft, without charge, the right to use, share and commercialize your feedback in any way
and for any purpose. You also give to third parties, without charge, any patent rights needed for their products,
technologies and services to use or interface with any specific parts of a Microsoft software or service that includes the
feedback. You will not give feedback that is subject to a license that requires Microsoft to license its software or
documentation to third parties because we include your feedback in them. These rights survive this agreement.
MICROSOFT CORPORATION HEREBY DISCLAIMS ALL WARRANTIES AND CONDITIONS WITH REGARD TO THE DEMO/LAB,
INCLUDING ALL WARRANTIES AND CONDITIONS OF MERCHANTABILITY, WHETHER EXPRESS, IMPLIED OR STATUTORY,
FITNESS FOR A PARTICULAR PURPOSE, TITLE AND NON-INFRINGEMENT. MICROSOFT DOES NOT MAKE ANY
ASSURANCES OR REPRESENTATIONS WITH REGARD TO THE ACCURACY OF THE RESULTS, OUTPUT THAT DERIVES FROM
USE OF DEMO/ LAB, OR SUITABILITY OF THE INFORMATION CONTAINED IN THE DEMO/LAB FOR ANY PURPOSE.
DISCLAIMER
This demo/lab contains only a portion of new features and enhancements in Microsoft PowerApps. Some of the features
might change in future releases of the product. In this demo/lab, you will learn about some, but not all, new features.
