Twelfth Five Year Plan_vol 2.indb MW 185 12fyp Vol2
User Manual: MW 185
Open the PDF directly: View PDF ![]() .
.
Page Count: 438 [warning: Documents this large are best viewed by clicking the View PDF Link!]

Twelfth Five Year Plan
(2012–2017)
Economic Sectors
Volume II

Copyright © Planning Commission (Government of India) 2013
All rights reserved. No part of this book may be reproduced or utilised in any form or by any means, electronic or mechanical,
including photocopying, recording or by any information storage or retrieval system, without permission in writing from the Planning
Commission, Government of India.
First published in 2013 by
SAGE Publications India Pvt Ltd
B1/I-1 Mohan Cooperative Industrial Area
Mathura Road, New Delhi 110 044, India
www.sagepub.in
SAGE Publications Inc
2455 Teller Road
Thousand Oaks, California 91320, USA
SAGE Publications Ltd
1 Oliver’s Yard, 55 City Road
London EC1Y 1SP, United Kingdom
SAGE Publications Asia-Pacific Pte Ltd
33 Pekin Street
#02-01 Far East Square
Singapore 048763
Published by Vivek Mehra for SAGE Publications India Pvt Ltd, Phototypeset in 11/13pt Minion Pro by RECTO Graphics, Delhi and
printed at Saurabh Printers, New Delhi.
Library of Congress Cataloging-in-Publication Data
India. Planning Commission
Twelfth fi ve year plan (2012/2017)/Planning Commission, Government of India.
Volumes cm
1. India—Economic Policy—1991–92. Finance, Public—India. I. Title.
HC435.3.I39 338.954009’0512—dc23 2013 2013009870
ISBN: 978-81-321-1368-3 (PB)
The SAGE Team: Rudra Narayan, Archita Mandal, Rajib Chatterjee and Dally Verghese

Twelfth Five Year Plan
(2012–2017)
Economic Sectors
Volume II
Planning Commission
Government of India

Thank you for choosing a SAGE product! If you have any comment,
observation or feedback, I would like to personally hear from you.
Please write to me at contactceo@sagepub.in
—Vivek Mehra, Managing Director and CEO,
SAGE Publications India Pvt Ltd, New Delhi
Bulk Sales
SAGE India offers special discounts for purchase of books in bulk.
We also make available special imprints and excerpts from our
books on demand.
For orders and enquiries, write to us at
Marketing Department
SAGE Publications India Pvt Ltd
B1/I-1, Mohan Cooperative Industrial Area
Mathura Road, Post Bag 7
New Delhi 110044, India
E-mail us at marketing@sagepub.in
Get to know more about SAGE, be invited to SAGE events, get on
our mailing list. Write today to marketing@sagepub.in
This book is also available as an e-book.
YZ

Contents
List of Figures vii
List of Tables viii
List of Boxes xii
List of Acronyms xiv
List of Annexures xxv
12. Agriculture 1
13. Industry 51
14. Energy 130
15. Transport 195
16. Communication 258
17. Rural Development 286
18. Urban Development 318
19. Other Priority Sectors 362


Figures
12.1 Growth and Fluctuations in GDP Agriculture and Allied 2
12.2 All India Average Real Daily Wage Rate at 2011–12 Prices (` Per Day) 9
13.1 Contribution of Manufacturing to GDP Very Low in India 52
13.2 India and Global Manufacturing States 52
13.3 New Approach to Industrial Policy 55
13.4 Focus on Sectors as well as Cross-cutting Issues 59
13.5 Strategy for Land Issues 81
13.6 Description of Land Acquisition Process 83
13.7 Two Connected ‘Tracks’ for Implementation and Systems’ Improvement 101
13.8 Capability Map 102
14.1 Exploration Blocks awarded in NELP Rounds 172
14.2 Renewable Power Capacities, Top Five Countries, 2010 183
14.3 Cost of Renewable Energy Technologies Per MW 185
15.1 Existing and Proposed Thermal Power Plants on National Waterways 232
15.2 National Waterway-2 234
15.3 Kaladan Multimodal Transit Transport Project 234
16.1 Telephone Subscribers Growth during 2007–12 259
16.2 Distribution of Urban and Rural Subscribers 260
16.3 Number of Telephone and Broadband Connections 260
16.4 Mobile Tariff Trends V/s Growth in Mobile Subscribers in India (1999–2012) 261
17.1 Access to Household Amenities in Rural India (2001 to 2011) 303
17.2 Households by Type of Latrine Facility in Rural India in 2001 304
17.3 Households by Type of Latrine Facility in Rural India in 2011 304
17.4 PURA Transaction Structure 312
17.5 Institutional Structure for PURA 314
18.1 Sources of Increase in Urban Population 319
18.2 Key Constitutes of India’s Urban Future 324

Tables
12.1 Growth Rate of Agricultural and Allied Sectors 1
12.2 Some Weather Details 3
12.3 Averages and Standard Deviations of Annual Growth Rates of GSDP from Agriculture and
Allied Sectors
4
12.4 Growth of Output, Inputs and Productivity 6
12.5 Gross Capital Formation (GCF) in Agriculture, Forestry and Fishing (2004–05 prices) 8
12.6 Average Annual Growth Rates in Yields Per Hectare 10
12.7 Public Sector Capital Formation and Subsidies to Agriculture (Centre and States) 13
12.8 Real Prices of Agricultural Produce 17
12.9 Demand and Supply of Food Commodities during the Twelfth Plan 18
12.10 Expenditure on Agricultural Research and Education 30
12.11 Outlays and Expenditure of MoA and Its Three Departments (DAC, DAHDF and DARE) 47
12.12 Gross Budgetary Support (Department-wise) 50
12.13 Comparison of States Outlay and Expenditure for Eleventh and Twelfth Plan 50
13.1 Rate of Growth of GDP at Factor Cost at 2004–05 Prices (Per cent) 53
13.2 GCF in Industry 53
13.3 Employment by Sector 54
13.4 Processes that Enable Learning 62
13.5 Manufacturing Ecosystem Infrastructure 62
13.6 Registered MSMEs—Manufacturing 85
13.7 Definition of MSME 85
13.8 Manufacturing GDP by Sector and Employment Projections 96
13.9 Key Variables and Assumptions 105
13.10 Ministry/Department-wise Twelfth Five Year Plan (2012–17) Outlays Industry Sector 129
14.1 Energy Intensity for Total Primary Energy* 130
14.2 Energy Intensity 131
14.3 Household Access (%) 132
14.4 Trends in Supply of Primary Commercial Energy 133
14.5 Share of Each Fuel in Total Energy Production and Consumption 134
14.6 Installed Capacity Addition during the Eleventh Plan (in MW) 136
14.7 Mode-wise/Sector-wise Break-up of Generation 137
14.8 All-India Cumulative Generating Capacity (as on 31 March 2012) (in MW) 137
14.9 Planned Manufacturing Capacity MW Per Annum 139
14.10 Cumulative Achievement of Transmission Lines at the End of the Eleventh Plan 140
14.11 Aggregate Technical and Commercial Los ses of State Power Utilities (within State) 141
14.12 Viability of Major State Utilities Not Improving (Excluding Delhi and Odisha) 142
14.13 Details of Year-wise Progress Achieved on Restructured APDRP (as on 31 March 2012) 142

Tables ix
14.14 Status on RGGVY Progress during the Tenth and the Eleventh Plan 143
14.15 Outlay/Expenditure: Centre, States and UTs (` Crore) 146
14.16 Sector-wise and Mode-wise Capacity Addition (Provisional) during the Twelfth Plan (MW) 146
14.17 Changing Structure of Fuel for Electricity 147
14.18 Status of Hydro Electric Potential Development 148
14.19 Fuel Requirement during 2016–17 149
14.20 Transmission Line at the End of the Twelfth Plan Period 150
14.21 Inter-Regional Flow of Power at the End of Twelfth Plan Period 151
14.22 Details of Coal and Lignite Production 160
14.23 Inventory of Coal and Lignite Reserves as on 1 April 2012 160
14.24 Accretion of Coal Reserves 161
14.25 Coal Washing Capacity by the end of Eleventh Plan Period 162
14.26 Financial Performance of the Coal Sector 165
14.27 Coal Demand during the Twelfth Plan 165
14.28 Coal Production 166
14.29 Share of Underground Production in Total Production 167
14.30 Price Comparison of Domestic Coal with other Countries 167
14.31 Consumption of Petroleum Products 171
14.32 Physical Performance of Petroleum and Natural Gas Sector 172
14.33 Share of Overseas Hydrocarbon Production 173
14.34 Under-Recoveries on Petroleum Products 174
14.35 Demand of Petroleum Products 176
14.36 Projection of Crude Oil Production in the Twelfth Plan 176
14.37 Natural Gas Demand for Twelfth Five Year Plan 176
14.38 Projection of Natural gas production in Twelfth Plan (BCM) 177
14.39 Breakup of the Exploration Programme for the Twelfth Plan 177
14.40 Likely Under-Recoveries on Petroleum* Products 178
14.41 Projected Refining Capacity during Twelfth Plan (MMTPA) 178
14.42 R&D Expenditure by Major Oil and Gas Companies 180
14.43 Eleventh Plan Power Capacity Addition through Grid Interactive Renewable Power 185
14.44 Cost of Power for Various Renewable Energy Sources 186
14.45 Power Capacity Addition through Off Grid Renewable Power 186
14.46 Eleventh Plan Financial Allocations and Expenditure: MNRE 187
14.47 Indicative Twelfth Five Year Plan Outlay for the Various Ministries/Departments in the
Energy Sector
190
15.1 CO2 Emissions from Various Transport Modes 196
15.2 Overview of Financial Position of the Indian Railways 199
15.3 Investment in Railways during Eleventh Plan 200
15.4 Performance of Freight Business during Eleventh Five Year Plan 201
15.5 Performance of Passenger Business during Eleventh Five Year Plan 201
15.6 Losses in Passenger Services 201
15.7 Capacity Creation during Eleventh Plan 202
15.8 Throw Forward of Infrastructure Projects as on 1 April 2012 202
15.9 Rolling Stock Performance during Eleventh Plan 203
15.10 Productivity Performance 203
15.11 Benchmarking Indian Railways with Chinese and Russian Railways 204
15.12 Traffic Projections 206

x Tables
15.13 Passenger Traffic Projections for Twelfth Plan 207
15.14 Projection of Originating PKM for Twelfth Plan 207
15.15 Creation of Fixed Assets during the Twelfth Plan 209
15.16 Rolling Stock Requirement during the Twelfth Plan 210
15.17 Passenger Service Yields in some Major Economies 213
15.18 Freight Yields in some Major Economies 213
15.19 Physical Achievements under NHDP during the Eleventh Five Year Plan 215
15.20 Progress of NHDP up to 30 April 2012 216
15.21 Physical Progress of Non-NHDP NHs during Eleventh Five Year Plan 217
15.22 State Roads Progress during the Eleventh Plan 218
15.23 Physical Progress–PMGSY (as on 31 March 2012) 219
15.24 Financial Progress (as on 31st March, 2012) 219
15.25 Habitation Coverage–Bharat Nirman (as on 31 March 2012) 220
15.26 Cumulative Physical Progress under Bharat Nirman (up to March 2012) 220
15.27 Targets for the Twelfth Plan 223
15.28 Projected Road Freight and Passenger Traffic 225
15.29 Financial Performance of the Shipping Sector in the Eleventh Plan 227
15.30 Estimated Requirements of Additional Vessels and Investment 228
15.31 Eleventh Plan Projection and Achievements of Traffic and Capacity by Major Ports 237
15.32 Commodity Wise Capacity Creation by Major Ports during Eleventh Plan 237
15.33 Traffic Handled at Major and Non-Major Ports during Eleventh Plan 238
15.34 Trend of the Productivity Parameters during Eleventh Plan 238
15.35 Year-wise Awards during Eleventh Plan under PPP 238
15.37 Commodity wise Capacity by the end of Twelfth Plan 239
15.36 Major Ports wise Traffic/Capacity Projections by End of Twelfth Plan 239
15.38 Commodity Wise Traffic by the End of Twelfth Plan (2016–17) 240
15.39 Growth Projections for the Twelfth Five Year Plan: Passenger and Cargo Traffic Forecasts 243
15.40 Investment Requirements during the Twelfth Plan 243
15.41 Comparison of ATF Prices in India with Competing Hubs 245
15.42 Flights/Week 247
15.43 Ministry/Department–wise Twelfth Five Year Plan (2012–17) Outlays for Transport Sectors 251
16.1 Targets and Achievements 267
16.2 Key Targets for the Twelfth Plan for the Electronics and IT-ITeS Industry 268
17.1 Overview of MGNREGA Performance, 2006–12 287
17.2 (A) Average Daily Wage Rates for Agricultural Labour: Male 289
17.2 (B) Seasonality of MGNREGA Employment Provided during 2010–11 290
17.3 Additional List of Permissible Works Under MGNREGA 291
17.4 Wage Payment Cycle under MGNREGA 294
17.5 Accountability Matrix for Delays in Wage Payments under MGNREGA 295
17.6 Phasing of the National Rural Livelihoods Mission 299
17.7 Investments in Rural Drinking Water, 1951–2012 300
17.8 Access to Household Amenities in Worst Performing States in Terms of Toilet Facilities in
Rural India, 2011 (Percentage of Rural Households)
303
17.9 Percentage of Households with No Latrine Facilities in Rural India, 2011 304
17.10 Total Sanitation Campaign, Physical Progress, Eleventh Plan 305
17.11 Total Sanitation Campaign, Financial Progress, Eleventh Plan 305
17.12 Major Increase in Unit Cost Support for IHHLs during the Twelfth Plan 305
17.13 IAY-Financial Performance during Eleventh Plan (2007–08 to 2011–12) 307

Tables xi
17.14 Physical Performance of IAY During Eleventh Plan (2007–08 to 2011–12) 307
17.15 Convergence of IAY with other Rural Infrastructure 308
17.16 Scheme for Purchase of Home Site and Incentive for Additional Target under IAY 308
17.17 Infrastructure and Amenities to be Provided, Operated and Maintained under PURA
Project by Private Developer in the Twelfth Plan
313
17.18 NSAP Progress in the Eleventh Plan 314
17.19 Physical and Financial Progress of NSAP Components, Eleventh Plan 315
18.1 Physical and Financial Progress under JNNURM (March 2012) 323
18.2 Estimates of Urban Transport Investments by HPEC 344
18.3 Requirement of CAPEX 344
18.4 Investments under JNNURM 349
18.5 Investment Requirement Estimates by HPEC 350
18.6 Requirement of CAPEX as per Working Group 350
19.1 Construction Sector-Macro Aggregates 362
19.2 Flow of Bank Credit to Construction Sector 371
19.3 Flow of FDI in Construction Activities (including Roads and Highways) 371
19.4 Alternative growth scenarios of tourism 376
19.5 Performance of Handloom Sector during the Eleventh Plan Period 397
19.6 Performance of Handicrafts Sector during the Eleventh Plan Period 402

Boxes
13.1 Examples of Weak Domestic Standards Leading to Influx of Sub-standard Products in the
Country
61
13.2 Dwindling Indian Capital Goods Industry 68
13.3 Strategies for Highest Overall Impact 98
13.4 Key Recommendations for Manufacturing 99
13.5 Key Recommendations 122
13.6 Key Recommendations 125
14.1 Achievements in Power Sector during the Eleventh Plan 136
14.2 Recommendations of Task Force on Open Access 145
14.3 Perform, Achieve and Trade Mechanism 157
15.1 Containerisation In Railways 207
15.2 Business Models for Passenger and Rail Freight Logistics: The JR East and Deutsche Bahn
Ways
208
15.3 Dedicated Freight Corridors (DFCs) – A Game Change for the Indian Rail Sector 209
15.4 New Generation Locomotives 210
15.5 Public-Private Partnership (PPP) in Railways 212
15.6 Key Message from Reports on Railways: The Need for Organisational Reforms 214
15.7 Financing of National Highway Development Programme (NHDP) 216
15.8 Engineering, Procurement, Construction (EPC) Contract 217
15.9 Innovations by some State Governments 223
15.10 Introduction of Electronic Toll Collection (ETC) 225
15.11 Coal Transport to Farakka through Power Station – A Break through for IWT 233
15.12 Development of Airports During the Eleventh Plan 242
15.13 GAGAN—The Indian Satellite Based Augmentation System (SBAS) for Air Navigation
Services (ANS)
244
16.1 Spectrum Trading 263
16.2 Twelfth Plan Targets for the Telecommunication Sector 264
16.3 Key Achievements (as on 31 March 2012) 267
17.1 New Guidelines Strengthen Demand-driven Character of MGNREGA 293
17.2 Limitations of SGSY 298
18.1 Vision of Our Cities 320
18.2 State of Service Delivery—Key Indicators 321
18.3 Transforming Public Transport in Cities 324
18.4 Harmonising the Role of Parastatals with Elected Municipal Bodies 326
18.5 Strategic Densification—International Examples 330
18.6 Recommendation of Isher Ahluwalia Committee on Financial Devolution to ULBs 332
18.7 PPP in Urban Sector under JNNURM 333

Boxes xiii
18.8 FSI and Coverage Areas Can be Combined to Increase Densities 338
18.9 Metro—A Transformational Approach to Public Transport 341
18.10 Reforms and Desired Outcomes Related to Water Supply and Sanitation 348
18.11 Reforms under JNNURM Comprehensive List of Reforms in Urban Sector 355
18.12 Major Schemes for Urban Renewal at a Glance 358
19.1 Financing Instruments for Affordable Housing 374
19.2 Popular Choice by Design! 399
19.3 Twelfth Plan Interventions for Handlooms 401
19.4 Twelfth Plan Schemes for Handicrafts 404
19.5 Upturn in India’s Sporting Performance 410

Acronyms
2G/3G/4G Second Generation/Third
Generation/Fourth Generation
AAI Airport Authority of India
AAY Antodaya Anna Yojana
ACA Additional Central Assistance
ACC Artisan Credit Card
ACS Average Cost of Supply
ADB Asian Development Bank
ADC Access Deficit Charges
ADDA Asansol Durgapur Development
Authority
AES Acute Encephalitis Syndrome
AI Artificial Insemination
AIBP Accelerated Agriculture Benefit
Programme
AIC Agricultural Insurance Corporation
AIR All India Radio
AIU Association of Indian Universities
AL Arable Land
AML Anti-Money Laundering
AMM Abandoned mine methane
AMPC Automated Mail Processing Centre
ANM Auxiliary Nurse Midwife
AnSI Anthropological Survey of India
AOC Agreement of Collaboration
APL Above Poverty Line
APMC Agriculture Produce Marketing
Committee
APMSS Andhara Pradesh Mahila Samakhya
APO Assistant Programme Officer
ARPU Average Revenue Per User
ARR Average Revenue Realised
ARYA Attracting & Retaining Youth in
Agriculture
ASHA Accredited Social Health Activist
ASI Archaeological Survey of India
ASPIRE Agriculture Science Pursuit for
Inspired Research Excellence
ASSOCHAM Associated Chamber of Commerce
ATC Air Traffic Control
ATF Automatic Transmission Fluid
ATFC Agriculture Technology Forecast
Centre
ATls Administrative Training Institutes
ATMAs Agriculture Technology
Management Agency
ATS Apprentice Training Scheme
B.P.Ed. Bachelor of Physical Education
BAF Batch Annealing Furnace
BC Business Correspondent
BCM Billion cubic metres
BDOs Block Development Officers
BE Budgetary Estimate
BEE Bureau of Energy Efficiency
BEML Bharat Earth Movers Ltd.
BFDAs Brackish water Farmers
Development Agencies
BFO Business Facilitation Officer
BHEL Bharat Heavy Electricals Ltd.
BIPP Biotechnology Industry Partnership
Programme
BIRAP Biotechnology Industry Research
Assistance Programme
BIS Bureau of Indian Standards
BLY Bachat Lamp Yojana
BMPTC Building Material and Technology
Promotion Council
BORL–Bina Bharat Oman Refineries Limited
BOT Build-Operate-Transfer
BPCL Bharat Petroleum Corporation
Limited
BPL Below Poverty Line
BPO Branch Post Office/ Business
Process Outsourcing
BPR Business Process Re-engineering
BRCs Block Resource Centres

Acronyms xv
BRO Border Roads Organisation
BRT Bus Rapid Transit
BSUP Basic Services to the Urban Poor
BTKM Billion Tonne Kilometre
BU Billion Unit
BWA Broadband Wireless Access
C&AG Comptroller & Auditor General
CA Conservation Agriculture
CACP Commission for Agriculture Costs
& Prices
CAG Comptroller and Auditor General
CAGR Compound Annual Growth Rate
Cal/Kg Calorie/ kilogramme
capex Capital expenditure
CBDT Central Board of Direct Taxation
CBM Coal bed Methane
CBOs Community Based Organisations
CBRM Capacity Building and Reform
Management
CCDA Coal Conservation and
Development Act
CCL Central Coalfields Limited
CCRF Code of Conduct for Responsible
Fisheries
C-DAP Comprehensive District Agriculture
Plants
C-DOT Centre for Development of
Telematics
CDP City Development Plans
CEA Central Electricity Authority
CEF Citizen Engagement Framework
CEIG Chief Electrical Inspectorate to
Govt. of India
CERC Central Electricity Regulatory
Commission
CERT Computer Emergency Response
Team
CERT–In Indian Computer Emergency
Response Team
CETP Common Affluent Treatment Plan
CeWiT Centre for Excellence in Wireless
Technology
CFI Construction Federation of India
CFSI Children Film Society of India
CFT Cluster Facilitation Team/
Combating of Financing of
Terrorism
CGD City Gas Distribution
CGP Cluster of Gram Panchayats
CGRF Consumer Grievance Redressal
Forum
CH4. CO Methane, Carbon Monoxide
CHPs Coal Handling Plants
CIDC Construction Industry Development
Council
CII Confederation of Indian Industry
CLCSS Credit Linked Capital Subsidy
Scheme
CM Confederation of Indian Industries
CMA Counter Magnet Area
CMM Coal mine methane
CMPDIL Central Mine Planning and Design
Institute
CMSA Community Managed Sustainable
Agriculture
CNG Compressed natural gas
CPCB Central Pollution Control Board
CPCL Chennai Petroleum Corporation
Limited
CPE Customer Premises Equipment
CPIAL or
CPIIW
Consumer Price Index for
Agricultural Labour/Consumer
Price Index for Industrial Workers
CPIS Coconut Palm Insurance Scheme
CPMG Chief Post Master General
CPPs Captive power plants
CPWD Central Public Works Department
CREDAI Confederation of Real Estate
Developers’ Associations of India
CRPs Community Resource Persons
CRRI Central Road Research Institute
CRRI-In Indian Computer Emergency
Response Team
CSC Cluster Stimulation Cell/Common
Services Centre
CSIR Council for Scientific and Industrial
Research
CSO Central Statistical Office/Civil
Society Organisation
CSR Corporate Social Responsibility
CSS Centrally Sponsored Scheme
CST Central Sales Tax/Concentrating
Solar Technology
CTL Coal to liquid
CUF Capacity Utilisation Factor
CVO Chief Vigilance Officer

xvi Acronyms
C-WET Centre for Wind Energy Technology
CWG Common Wealth Games
DAC Department of Agriculture &
Cooperation
DAE Department of Atomic Energy
DAHDF Department of Animal Husbandry,
Dairying & Fisheries
DALY Disability Adjusted Life Years
DAP Diammonium Phosphate
DARE Department of Agricultural
Research & Education
DAS Digital Addressable System
DAVP Directorate of Advertisement and
Visual Publicity
DBT Department of Bio-technology
DCI Dredging Corporation of India
DD Doordarshan
DeitY Department of Electronics and
Information Technology
DEMU/
MEMU
Diesel-Electric Multiple Unit/
Mainline Electric Multiple Unit
DFC Dedicated Freight Corridor
DFP Directorate of Field Publicity
DGCA Directorate General of Civil Aviation
DGH Director General of Hydrocarbons
DGPS Differential Global Positioning
System
DIPP Department of Industrial Policy and
Promotion
DIPP Department of Industrial Policy and
Promotion
DoP Department of Posts
DoT Department of Telecommunication
DP Development Plan
DPC District Programme Coordinator
DPRs Detailed Project Reports
DPSU Defence Public Sector Undertaking
DRDA District Rural Development Agency
DRDO Defence Research & Development
Organisation
DRI Differential Rate of Interest
DRM Digital Radio Mondiale
DSM Demand side management
DSS Decision Support System
DST Department of Science &
Technology
DTC Direct Tax Code
DTH Direct to Home
DWDM Dense Wavelength Division
Multiplexing
E&P
companies
Exploration and Production
Companies
EBP
Programme
Ethanol Blended Petrol Programme
ECB External Commercial Borrowing
ECBC Energy Conservation Building Code
ECO Local Cable Operators
EDGE Enhanced Data for Global Evolution
EDMC Electronic Design and
Manufacturing Cluster
EDS Electronics Delivery of Services
EEZ Exclusive Economic Zone
EFC Expenditure Finance Committee
eFMS Electronic Fund Management
System
EIAs End Implementing Agencies
EIL Engineers India Limited
EM Entrepreneur’s Memorandum
EMC Electronics Manufacturing Cluster
EMMC Electronic Media Monitoring
Centre
EMSC Environmental Measures and
Subsidence Control scheme
EMU Electric Multiple Unit
EOL Essar Oil Ltd
EPC Engineering Procurement and
Construction
ERP Enterprise resource planning
ESDM Electronics System Design &
Manufacturing
ETP Effluent Treatment Plant
EWS Economically Weaker Sections
EXIM Export Import
FAB Fabrication Unit
FAO Food and Agriculture Organisation
FAR Floor Area Ratio
FDI Foreign Direct investment
FFDAs Fish Farmers Development
Agencies
FICCl Federation of Indian Chamber of
Commerce & Industry
FM Frequency Modulation
FMD Foot & Mouth Disease
FO/LSHS Furnace oil/Low Sulphur Heavy
Stock
FOLD Forum of Load Dispatchers

Acronyms xvii
FoR Forum of Regulators
FPOs Farmer Producer Organisation
FPS Fair Price Shop
FRBM Fiscal Responsibility and Budget
Management Rules
FSA Fuel Supply Agreement
FSI Floor Space Index
FSRU Floating Storage & Regasification
units
FTA Free Trade Agreement
FTII Films and Television Institute of
India
FYP Five Year Plan
GAIL Gas Authority of India Ltd
GBI support Generation based incentive support
GBS Gross Budgetary Support
GCF Gross Capital Formation
GCV Gross calorific value
GDP Gross Domestic Product
GIPCL Gujarat Industries Power Company
Ltd
GIS Geographical Information System
GKMS Gramin Krishi Mausam Seva
GMO Genetically Modified Organisms
GOI Government of India
GoI-UNDP Government of India-United
Nations Development Programme
GPR Ground Penetrating Radar
GPS Global Positioning System
GPs Gram Panchayats
GQ Golden Quadrilateral
GRIHA Green Rating for Integrated Habitat
Assessment
GSDP Gross State Domestic Product
GSI Geological Survey of India
GSM Global System for Mobile
Communication
GST Goods and Services Tax
GT Gross Tonne
GTO/IGBT Gate Turn Off (Thyrister)/lnsulated
Gate Bipolar Transistor
GW GigaWatt
HD High Definition
HDTV High Definition Television
HEC Heavy Engineering Corporation
HEIs Higher Educational Institutions
HEMM Heavy earth moving machinery
HITS Headend In The Sky
HMCP Hardware Manufacturing Cluster
Park
HMEL Hindustan Mittal Energy Limited
HMT Hindustan Machine Tools
HPCL Hindustan Petroleum Corporation
Limited
HPEC High Powered Expert Committee
HPOs Head Post Offices
HPT High Power Transmitter
HRD Human Resource Development
HRSS High Resolution Seismic Survey
HS Herorrhagic Septicemia
HSIL High Surge Impedance Loading
HTLS High Temp. Low Sag
HTREL High-tech Reconnaissance &
Exploration Licences
HUDCO Housing and Urban Development
Corporation
HUMS Indian Institutes of Urban
Management
I&B Information & Broadcasting
IAAS Integrated Agro-Meteorological
Advisory Service
IAASTD International Assessment of
Agricultural Knowledge, Science &
Technology for Development
IAP Integrated Action Plan
IAY Indira Awaas Yojana
IBF Indian Broadcasting Foundation
IBIN India Backbone Implementation
Network
IBM Indian Bureau of Mines
IBP Indian Broadcasting Foundation
IBS In Building Solutions
IC Integrated Circuit
ICAR Indian Council of Agricultural
Research
ICD Inland Container Depot
ICF Integrated Coach Factory
ICMR Indian Council of Medical Research
ICRIS Integrated Coal Resource
Information System
ICT Information and Communication
Technology
ICTE Information, Communication
Technology and Electronics
IDA International Development
Association

xviii Acronyms
IEBR Internal and Extra Budgetary
Resources
IEC Information Education and
Communication
IFFI International Film Festival of India
IGNDPS Indira Gandhi National Disability
Pension Scheme
IGNOAPS Indira Gandhi National Old Age
Pension Scheme
IGNWPS Indira Gandhi National Widow
Pension Scheme
IHHL Individual Household Latrine
IHSDP Integrated Housing & Slum
Development Programme
IIDS Integrated Infrastructural
Development Scheme
IIFCL India Infrastructure Finance
Company Limited
IIHT Indian Institute of Handloom
Technology
IIIT Indian Institute of Information
Technology
IIPA Indian Institute of Public
Administration
IISc Indian Institute of Science
IIT Indian Institute of Technology
IIUMs Indian Institutes of Urban
Managements
ILCS Integrated Low Cost Sanitation
Scheme
ILRIS Integrated Lignite Resource
Information System
IMD Indian Meteorological Department
IMEI International Mobile Equipment
Identity
IMIS Integrated Management
Information System
IMPCC Inter Media Publicity Coordination
Committee
IMT International Mobile
Telecommunications
INDIPEX India International Philatelic
Exhibition
IOCL Indian Oil Corporation Limited
IP Intellectual Property/Internet
Protocol
IPM Integrated Pest Management
IPR Intellectual Property Rights
IPTV Internet Protocol Television
IPV 4/IPV 6 Internet Protocol version 4/Internet
Protocol version 6
IRDA Insurance Regulatory Development
Authority
IRDP Integrated Rural Development
Programme
ISO Indian Standard Organisation
ISPRL Indian Strategic Petroleum Reserve
Ltd
ISRO Indian Space Research Organisation
ISSHUP Interest Subsidy Scheme for
Housing the Urban Poor
IT Information Technology
ITA-1 Information Technology
Agreement-1
ITI Indian Telephone Industries
ITIs Industrial Training Institutes
IT-ITeS Information Technology-and
Information Technology enabled
Service
IVRS Interactive Voice Response System
IWAI Inland Waterways Authority of
India
IWT Inland Waterways Transport
JE Japanese Encephalitis
JLGs Joint Liability Groups
JMP Joint Monitoring Programme
JNNURM Jawaharlal Nehru National Urban
Renewal Mission
JNNUSM Jawaharlal Nehru National Solar
Mission
JRDA Jharia Rehabilitation and
Development Authority
JV Joint Venture
JWGs Joint Working Groups
KCC Kisan Credit Card
Kgoe/US$ Kilograms of Oil Equivalent/US
Dollar
KVIC Khadi & Village Industries
Corporation
KVK Krishi Vigayan Kendra
KVs Kendriya Vidyalayas
kW Kilo Watt
Kwh Kilowatt hour
L. km Line kilometre

Acronyms xix
LAD Least Assured Depth
LARR Land Acquisition and Rehabilitation
and Resettlement Bill, 2011
LBFL Local Bodies Finance List
LCO Local Cable Operators
LDBs Livestock Development Boards
LDC Land Development Corporation
LDO Light Diesel Oil
LEED Leadership in Energy &
Environmental Design
LHB Linke Holfmann Busch
LIGs Low Income Group
LNCPE Laxmibai National College of
Physical Education
LNG Liquefied natural gas
LPG Liquefied Petroleum Gas
LPT Low Power Transmitter
LR Land Readjustment
LTCCS Long Term Cooperative Credit
Structure
LTE Long Term Evolution
LWE Left Wing Extremism
M&A Mergers and Acquisitions
M.P.Ed. Master of Physical Education
MA Moving Average
MANAGE National Institute for Agriculture
Extension and Management
MAT Minimum Alternative Tax
Mbps Megabits per second
MCCL Mahanadi Coalfields Limited
MCS Monitoring, Control and
Surveillance
MDI Management Devolution Index
MDRR Mines and Minerals (Development
and Regulation) Bill, 2011
MEA Ministry of External Affairs
MES Minimum Economic Size
MFIs Microfinance Institutions
MGNREGA Mahatma Gandhi National Rural
Employment Guarantee Act
MGNREGS Mahatma Gandhi National Rural
Employment Guarantee Scheme
MGR Merry-Go-Round
MHz/GHz Mega Hertz/Giga Hertz
MIS Management Information System
MITI Ministry of International Trade and
Industry, Japan
MMBTU Million Metric British Thermal Unit
MM-III Mini Mission III
MMP Mission Mode Project
MMSCMD Million Metric Standard Cubic
Metre Per Day
MMT Million Metric Tonnes
MMTOE Million tones oil equivalent
MMTPA Million Metric Tonne Per Annum
MNAIS Modified National Agricultural
Insurance Scheme
MNRE Ministry of New and Renewable
Energy
MoA Ministry of Agriculture
MoC Ministry of Coal
MoHUPA Ministry of Housing and Urban
Poverty Alleviation
MoP Ministry of Power
MoP&NG Ministry of Petroleum and Natural
Gas
MoRD Ministry of Rural Development
MoRTH Ministry of Roads Transport &
Highways
MoSPI Ministry of Statistics & Programme
Implementation
MOT Multi-organisation Team/ Muriate
of Potash
MoU Memorandum of Understanding
MoUD Ministry of Urban development
MPCs Metropolitan Planning Committees
MRP Maximum Retail Price
MRPL Mangalore Refinery and
Petrochemicals Limited
MS Motor spirit
MSE-CDP Cluster Development Programme of
the M/o MSME
MSEFC Micro & Small Enterprise
Facilitation Councils
MSIPS Modified Special Incentive
Programme Scheme
MSME Micro, Small & Medium Enterprise
MSMED Act MSME Development Act, 2006
MSP Minimum Support Price
MT Million Tonnes
MTA Mid-term Appraisal
MTEE Market Transformation for Energy
Efficiency
MTOE Million tons of oil equivalent
MW Medium Wave/Megawatt
MWe Megawatt electrical

xx Acronyms
MWp. Megawatt Peak
NABARD National Bank for Agriculture and
Rural Development
NABFINS NABARD Financial Services
NAC Non Agricultural use of Land
NADA National Anti-Doping Agency
NAIS National Agricultural Insurance
Scheme
NAPCC National Action Plan on Climate
Change
NARS National Agriculture Research System
NATRIP National Automotive Testing and
R&D Infrastructure Project
NAVA National Audio-Visual Archives
NBA News Broadcasters Association/
Nirmal Bharat Abhiyan
NBECI National Bio Energy Corporation of
India
NBFCs Non-Banking Finance Companies
NBS Nutrient Based Subsidy
NCC National Cadet Corps
NCP National Competition Policy
NCR National Capital Region
NCTE National Council of Teacher
Education
NDDB National Dairy Development Boards
NDP National Dairy Plant
NDTL National Dope Test Laboratory
NE North East
NEF National Electricity Fund
NEGP National e-Governance Plan
NERUDP North Eastern Region Urban
Development Programme
NELP New Exploration Licensing Policy
NER North Eastern Region
NFAP National Frequency Allocation Plan
NFBS National Family Benefit Scheme
NFDB National Fisheries Development
Board
NFDC National Film Development
Corporation
NFSA National Food Security Act
NFSB National Food Security Bill
NFSM National Food Security Mission
NGN Next Generation Network
NGO Non-Governmental Organisation
NGP Nirmal Gram Puraskar
NGRCA National Gender Resources Centre
in Agriculture
NGRI National Geophysical Research
Institute
NHAI National Highway Authority of India
NHB National Horticulture Board/
National Housing Bank
NHDP National Highway Development
Programme
NHM National Horticulture Mission
NIA Net irrigated area
NICRA National Initiative on Climate
Resilient Agriculture
NIMZ National Investment and
Manufacturing Zone
NIPER National Institute of Pharmaceutical
Education & Research
NIS National Institute of Sports
NISC National Institute of Sports
Coaching
NISSM National Institute of Sports Science
and Sports Medicine
NIUA National Institute of Urban Affairs
NKN National Knowledge Network
NLCPR Non-Lapsable Central Pool of
Resources
NLP Natural Language Processing
NMCC National Manufacturing
Competitiveness Council
NMCP National Manufacturing
Competitiveness Programme
NMEEE National Mission for Enhanced
Energy Efficiency
NMSA National Mission for Sustainable
Agriculture
NMSH National Mission on Sustainable
Habitat
NMT Non-Motorised Transport
NOCL Nagarjuna Oil Corporation Limited
NOFN National Optical Fibre Network
NPBB National Programme for Bovine
Breeding
NPBBD National Programme for Bovine
Breeding and Dairy
NPCBB National Project for Cattle & Buffalo
Breeding
NPFAI National Playfields Association of
India

Acronyms xxi
NPFP National Physical Fitness
Programme
NPK Nitrogen Phosphorous & Potash
NPM Non-Pesticidal Management of
Pests
NPMSH&F National Project on Management of
Soil Health & Fertility
NPS New Pension Scheme/ New Pricing
Scheme
NPYAD National Programme for Youth and
Adolescent Development
NRAA National Rained Area Authority
NRDWP National Rural Drinking Water
Programme
NREGS National Rural Employment
Guarantee Scheme
NRL Numaligarh Refinery Limited
NRLM National Rural Livelihood Mission
NSAP National Social Assistance
Programme
NSD National School of Drama
NSDC National Skill Development
Corporation
NSDF National Skill Development Fund
NSF National Sports Federation
NSIC National Small Industry Corporation
NSNIS Netaji Subhas National Institute of
Sports
NSS National Sample Survey/National
Service Scheme
NSSO National Sample Survey Office/
National Sample Survey
Organisation
NTDPC National Transport Development
Policy Committee
NTKM Net Tonne Kilometre
NTP National Telecom Policy
NTPC National Thermal Power
Corporation
NTS National Institute of Sports
NUHHP National Urban Housing and
Habitat Policy
NULM National Urban Livelihoods
Mission
NURTA National Urban Rail Transit
Authority
NUSP National Urban Sanitation Policy
NVG National Voluntary Guidelines on
Soc., Env., & Eco Responsibility for
Business
NVs Navodaya Vidyalayas
NYC National Youth Corps
NYKs Nehru Yuva Kendras
O&M Operation & Maintenance
O+OEG Oil and oil equivalent gas
OBCs Other Backward Classes
ODF Open Defecation Free
OFB Ordinance Factory Board
OIL Oil India Limited
OMCs Oil Marketing Companies
OMS Output per man shift
OMT Operate-Maintain-Transfer
ONGC Oil and Natural Gas Corporation
Limited
OVL ONGC Videsh Ltd
oya Year on Year Average
PACS Primary Agriculture Cooperative
Society
PAPU Pan African Postal Union
PAT Perform, Achieve & Trade
PATM Perform, Achieve and Trade
Mechanism
PCB Pollution Control Board
PCU Policy Coherence Unit
PDAs Pension Distribution Agencies
PEARL Peer Experience and Reflective
Learning
PHPDT Peak Hour Peak Direction Traffic
PIB Public Information Bureau
PIC Public Information Campaign
PKM Passenger Kilometre
PLB Public Land Banks
PLI Postal Life Insurance
PMEGP Pradhan Mantri Employment
Guarantee Programme
PMGSY Pradhan Mantri Grameen Sadak
Yojna
PNG Piped natural gas
PNGRB Petroleum and Natural Gas
Regulatory Board
POL Petroleum, Oil and Lubricants
POLIF Post Office Life Insurance Fund
POs Post Offices
POSOCO Power System Operation
Corporation Limited

xxii Acronyms
PPAC Petroleum Planning and Analysis
Cell
PPAs Power purchase agreement
PPP Public–Private Partnership
PPPP People Private–Public Partnership
PPPIAD Public–Private Partnership
for Integrated Agricultural
Development
PPVFRA Protection of Plant Variety &
Farmers Rights Authority
PRGF Partial Risk Guarantee Fund
PRIs Panchayati Raj Institutions
Provi. Provisional
PSB Public Service Broadcaster
PSCs Production Sharing Contracts
PSUs Public Sector Undertakings
PTA Preferential Trade Agreement
PURA Provision of Urban Amenities in
Rural Areas
PWD Public Works Department
PWSS Piped Water Supply System
PYD Programme for Youth Development
PYKKA Panchayati Yuva Khel aur Krida
Abhiyan
R&D Research and Development
R&M AND LE Renovation & Modernisation and
Life Extension
R&R Rehabilitation and Resettlement
R/P ratios Reserves-to-Production ratio
R–APDRP Restructured Accelerated Power
Development and Reforms
Programme
RAY Rajiv Awas Yojana
RBCs Rural Building Centres
RCUES Regional Centres of Urban and
Environment Studies
RDF Rural Development Flexi-fund
RDSO Research Design and Standards
Organisation
RE bonds Renewable Energy bonds
RE Revised Expenditure
READY Rural Entrepreneurship &
Awareness Development Yojana
REC Renewable Energy Certificate
RFD Result Framework Document
RFID Radio Frequency Identification
RGGVY Rajiv Gandhi Grameen
Vidyutikaran Yojana
RGNIYD Rajiv Gandhi National Institute of
Youth Development
RHF Rural Housing Fund
RIA Regulatory Impact Analysis
RIDF Rural Infrastructure Development
Fund
RIL Reliance Industries Limited
RIL-KG Reliance Industries Limited-Krishna
Godavari Basin
RIS River Information System
RITES Rail India Techno Economic
Services
RKVY Rashtriya Krishi Vikas Yojana
RMSA Rashtriya Madhyamik Shiksha
Abhiyan
ROB/RUB Road Over Bridge/ Road Under
Bridge
RoW Right of Way
RPLI Rural Postal Life Insurance
RPO Renewable Purchase Obligation
RPOLIF Rural Post Office Life Insurance
Fund
RRTS Regional Rapid Transit System
RTE Right to Education
RUDSETIs Rural Development and Self-
Employment Training Institutes
S&DD Song and Drama Division
S&L Standards and Labelling
SAD Special Additional Duty
SAGES Goaf edge supports
SAMETIs State Agriculture Management
Extension & Training Institutions
SARDP-NE Special Accelerated Road
Development Programme for the
North East
SAT Sports Authority of India
SAU/SAUs Social Audit Unit/State Agricultural
Universities
SBD Standard bid documents
SCCL Singareni Collieries Company
Limited
SCs Scheduled Castes
SCSP Scheduled Castes Sub-Plan
SDO Standard Developing Organisations
SDTV Standard Definition Television
SEB State Electricity Board
SEBI Securities & Exchange Board of India
SECC Socio-Economic and Caste Census

Acronyms xxiii
SECF Contribution to State Energy
Conservation Fund
SFAC Small Farmers Agribusiness
Consortium
SFCs State Finance Commissions
SGSY Swarnajayanti Gram Swarozgar
Yojana
SHBs State Housing Boards
SHGs Self-Help Groups
SIBRI Small Industry Business Research
Initiatives
SITP Scheme for Integrated Textile Park
SJSRY Swarna Jayanti Sahari Rozgaar
Yojana
SKO Superior Kerosene Oil
SLNA State-Level Nodal Agency
SLSC State Level Sanctioning Committee
SME Small and Medium Enterprise
SOC Soil Organic Carbon
SOE State Owned Enterprise
SOP Standard Operating Producer
SoRs Schedule of Rates
SPTLs State Pesticide Testing Laboratory
SPV Special Purpose Vehicle
SRFTI Satyajit Ray Film and Television
Institute
SRI System of Rice Intensification
SSA Sarva Shiksha Abhiyan
STB Set Top Box
STL Short term liabilities
STOA Short-Term Open Access
STs Scheduled Tribes
STU/CTU State Transmission Utilities/Central
Transmission Utility
SW Short Wave
SWAN State Wide Area Network
TCF Trillion cubic feet
TCIL Telecommunications Consultants
India Ltd
TCoE Telecom Centres of Excellence
TDB Technology Development Board
TDR Transfer of Development Rights
TDRs Tradable Development Rights
TDSAT Telecom Disputes Settlement
Appellate Tribunal
TEC Telecom Engineering Centre
TFP Total Factor Productivity
TISCO Tata Iron and Steel Company
Limited
TMNE (NE) Technology Mission for North
Eastern Region
TNUDF Tamil Nadu Urban Development
Fund
TOD Time of Day
TOPS Terrestrial Observation &
Prediction System
TPDS Targeted Public Distribution System
TPSs Town Planning Schemes
TQM Total Quality Management
TSC Total Sanitation Campaign
TSDO Telecom Standards Development
Organisation
TSP Telecom Service Provider/Tribal
Sub-Plan
TUFS Technology Upgradation Fund
Scheme
UC Utilization Certificate
UCG Underground Coal Gasification
UGC University Grants Commission
UHV Useful heat value
UID Unique Identification
UID Unique Identification—AADHAR
UIDSSMT Urban Infrastructure Development
for Small & Medium Towns
UIG Urban Infrastructure and
Governance
UK United Kingdom
ULBs Urban Local Bodies
ULIP Unit Linked Insurance Plan
UMPPs Ultra Mega Power Projects
UMTA Unified Metropolitan Transport
Authority
UNICEF United Nations Children’s Fund
UPU Universal Postal Union
USA United States of America
USEPA United States Environment
Protection Agency
USHA Urban Statistics for HR and
Assessments
USIS Urban Sport Infrastructure
USOF Universal Service Obligation Fund
UT Urban Transport
VAS Value Added Services
VAT Value Added Tax
VCFEE Venture Capital Fund for Energy
Efficiency
VFX Visual Effects
VGF Viability Gap Funding

xxiv Acronyms
VLFM Visionary Leadership for
Manufacturing
VLPT Very Low Power Transmitter
VoIP Voice Over Internet Protocol
VUs Vehicle Units
VWSC Village Water and Sanitation
Committee
WBCIS Weather Based Crop Insurance
Scheme
WDM-PON Wavelength Division Multiplexed
Passive Optical Network
WHO World Health Organisation
WiPS Wireless Intrusion Prevention
System
WRDA Warehouse Regulatory &
Development Authority
WSCs Weavers’ Service Centres
WTO World Trade Organisation
XGPON Next Generation Gigabit Passive
Optical Network

Annexures
13.1 Manufacturing GDP by Sector and Employment Projections 105
13.2 Sector-wise Recommendations 106
13.3 Twelfth Five Year Plan (2012–17) Outlays (GBS) for Industry Sector 129
14.1 Eleventh Plan Physical Progress of RGGVY Projects under Implementation 191
14.2 Sectoral Coal Demand/Off-take for Annual Plan 2012–13 192
14.3 Annual Plan 2012–13—Company-wise Production—Ministry of Coal 193
14.4 Physical Targets of Renewable Programme for the Twelfth Plan 194
15.1 Central Road Sector Outlay and Expenditure-At Current Price for Eleventh Plan 252
15.2 Plan-wise Addition to NH Length 254
15.3 Achievement on National Highways 254
15.4 National Highways Development Project Phase I to VII 255
15.5 Physical Performance of Air India Limited during Eleventh Plan Period 256
15.6 Financial Performance of Air India Ltd. during the Eleventh Plan Period 256
15.7 Financial Performance of Airports Authority of India during Eleventh Plan Period 257
15.8 Financial Performance of Pawan Hans Helicopters Ltd. during Eleventh Plan Period 257
16.1 Twelfth Five Year Plan (2012–17) Outlays for the Ministry of Communications and IT and
Ministry of Information and Broadcasting
285


INTRODUCTION
12.1. Although agriculture now accounts for only
14 per cent of Gross Domestic Product (GDP), it
is still the main source of livelihood for the major-
ity of the rural population. As such rapid growth of
agriculture is critical for inclusiveness. Important
structural changes are taking place within the sec-
tor and there are definite signs of improved per-
formance. Agricultural growth has accelerated
compared to the Tenth Plan and diversification
is proceeding (Table 12.1). The National Sample
Survey Organisation (NSSO) data brings out that
rural labourers are shifting to non-agricultural work,
tightening the labour market in agriculture and put-
ting pressure on farm wages. However, dependence
on agriculture remains unchanged among the rural
self-employed whose average farm size continues to
12
Agriculture
decline with population growth. This is also an age-
ing, more feminised population, whose educated
young members are less likely to want to stay in
farming. The viability of farm enterprise, mostly
small farms, must therefore be a special area of
Plan focus in the Twelfth Plan. The Plan must also
focus on other priorities such as resource-use effi-
ciency and technology to ensure sustainability of
natural resources, adaptation to climate change and
improvements in total factor productivity.
RECENT TRENDS: PERFORMANCE AND
POINTERS
GDP Growth
12.2. The average of annual growth rates of GDP in
agriculture and allied sectors during the Eleventh
TABLE 12.1
Growth Rate of Agricultural and Allied Sectors
(in percentage)
Plan Share of Agriculture in the
Economy
Growth Rate of Agriculture
and Allied Sectors
Growth Rate of Total
Economy
(All Figures based on 2004–05 prices)
Ninth Five Year Plan 23.4 2.5 5.7
Tenth Five Year Plan 19.0 2.4 7.6
Eleventh Plan (2007–08 to 2011–12)
2007–08 16.8 5.8 9.3
2008–09 15.8 0.1 6.7
2009–10 14.6 0.8 8.6
2010–11 (2nd RE) 14.5 7.9 9.3
2011–12 (Rev Est.) 14.1 3.6 6.2
Eleventh Plan Average 15.2 3.7 8.0
Source: Central Statistical Office, New Delhi Press Release dated 7th Feb, 2013.
2 Twelfth Five Year Plan
Five Year Plan is now placed at 3.7 per cent. This is
short of the target of 4 per cent but is significantly
better than the achievement of 2.4 per cent in the
Tenth Plan. Failure to reach the target growth is
one reason for the high inflation in prices of food
and other primary commodities that persist despite
the recent slowdown in overall GDP growth.
Consequently, although the overall GDP growth tar-
get of the Twelfth Plan has been revised down since
the Approach Paper, the growth target for agricul-
ture is maintained at 4 per cent.
12.3. A natural question which arises is whether the
target of 4 per cent is attainable in view of past short-
falls. Although growth trends and targets are subject
to high errors due to weather variability (for exam-
ple, the Eleventh Plan average was pulled down by
two successive bad harvests in 2008–09 and 2009–
10), there is reason for cautious optimism because
the turn-around that began after 2004 appears to be
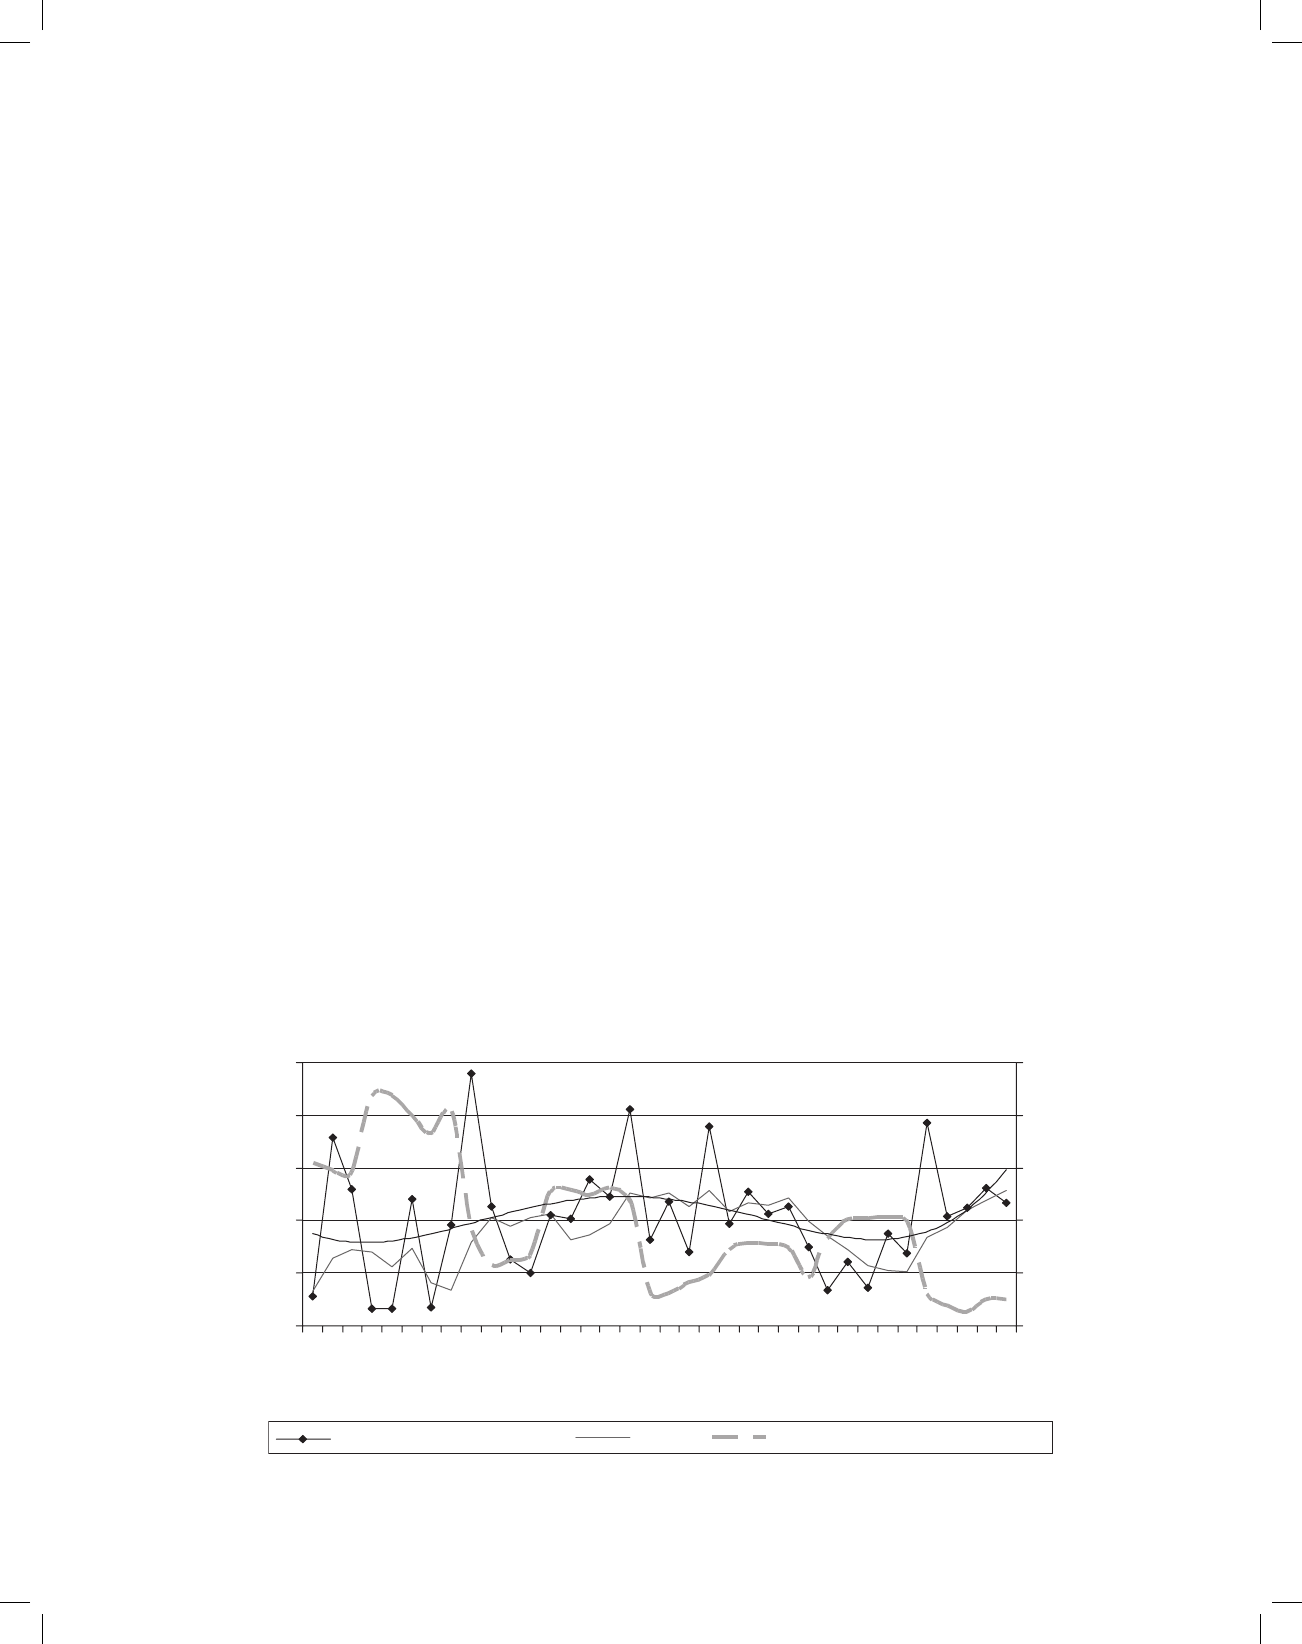
maintaining its momentum. Figure 12.1 plots aver-
ages and standard deviations of annual growth rates
over moving five-year periods, a trend of the growth
averages and also annualised five-year growth rates
based on five-year moving averages. All these show
growth still trending up and variability reducing.
The Eleventh Plan growth rate based on five-year
moving averages is at 3.6 per cent, the highest for any
five-year period ever and, significantly, growth vari-
ability has also reduced to lowest ever.
12.4. The reduction in variability is important since
claims of acceleration or deceleration make sense
only when variability is low. Also, it is a measure
of how well the system is able to cope with inevita-
ble bouts of aberrant weather and yet maintain the
growth momentum. It should be noted that agri-
cultural growth was positive in 2009–10 despite the
worst drought in nearly 40 years. More generally,
whereas earlier periods saw at least one and normally
two years of negative growth in every five year, there
has not been a single year of negative growth of agri-
culture and allied sectors after 2002–03.
12.5. The magnitude of secular decline in growth
variability over the last 30 years is also important.
This is now less than a third of its peak. A major
role must have been played by the increase in irriga-
tion from about 20 per cent of arable area in 1981
to 35 per cent today, based mainly on groundwa-
ter. However, since water tables have fallen and
temperatures risen, the extent of variability decline
is surprisingly large. Even assuming zero variabil-
ity on irrigated land, this implies that variability on
rain-fed land must have reduced very substantially.
Clearly factors such as a more diversified agriculture,
1.0
2.0
3.0
4.0
5.0
6.0
1976–77
1981–82
1986–87
1991–92
1996–97
2001–02
2006–07
2011–12
2.0
4.0
6.0
8.0
10.0
12.0
Average of annual growth rates 5 yr MA Std dev of annual growth rates (axis 2)
FIGURE 12.1: Growth and Fluctuations in GDP Agriculture and Allied

Agriculture 3
extended information reach and investments both
on-farm and in watershed development, appear to
have enabled better responses to depleting natural
resources and weather risk. Although there is con-
siderable scope to improve each of these factors fur-
ther, it is a matter of satisfaction that developments
in these areas are having a positive effect.
The Climate Challenge
12.6. The climate challenge facing agriculture needs
to be taken seriously. Table 12.2 shows a distinct
trend towards both drier and warmer weather, par-
ticularly during the last three Plan periods. Rainfall
in context of agriculture has traditionally been
discussed in terms of the monsoon (that is, June–
September) but annual precipitation is probably
much more relevant now since the dominance of
Kharif crops has reduced. Viewed in this perspec-
tive, it is noteworthy that each of the last three Plan
periods has recorded lower mean rainfall and higher
rainfall variability compared to the immediately pre-
vious period. Three (2008, 2009 and 2011) of the
five Eleventh Plan years had annual rainfall below
95 per cent of long period average, as compared
to only five in the previous 15 years. Temperature
conditions have deteriorated even more. Periods
prior to 1997 can be considered normal, but warm-
ing has increased at an accelerating pace since then.
The Eleventh Plan period contained the two warm-
est years (2010 and 2009) ever recorded since 1900.
Even the coolest year (2008) during these five years
was the thirteenth warmest in the last 110 years.
State-wise performance
12.7. The Mid-term Appraisal of the Eleventh Plan
(MTA) had noted that the recovery in agriculture
after 2004 was associated with clear signs of renewed
dynamism in rain-fed areas. Table 12.3, presents
state-wise averages and standard deviations of
annual growth rates of Gross State Domestic Product
(GSDP) from agriculture and allied activities for four
separate periods since 1981–82. It clearly shows the
following:
1. The all-States average and median growth rates
of GSDP recovered beyond levels before mid-
1990s, to reach near 4 per cent in the period
after 2004–05, this also happened individually in
many states, particularly those with large rain-
fed areas. The states with best performance were
Jharkhand, Chhattisgarh, Manipur, Tripura,
Mizoram, Rajasthan, Gujarat, Maharashtra,
Karnataka and Andhra Pradesh, all with above 5
per cent growth.
2. Despite more difficult weather conditions, all
except few hill states managed substantial reduc-
tion of growth variability (measured by standard
deviation of annual growth rates) during 2005–
12 as compared to the past.
TABLE 12.2
Some Weather Details
1951/52 to
1967/68
1968/69 to
1980/81
1981/82 to
1990/91
1991/92 to
1996/97
1997/98 to
2001/02
2002/03 to
2006/07
2007/08 to
2011/12
Annual Rainfall (cm)
Mean 122.5 118.7 120.1 121.0 118.5 113.7 111.7
Standard Deviation 12.5 10.2 11.5 7.2 8.3 9.4 10.0
Monsoon Rainfall (cm)
Mean 91.9 88.8 88.8 90.0 87.8 83.9 86.6
Standard Deviation 10.1 9.6 11.0 6.5 5.5 7.9 9.7
Annual Temperature anomaly from normal (°C)
Mean 0.04 –0.03 0.09 0.19 0.34 0.56 0.65
Standard Deviation 0.28 0.24 0.03 0.10 0.22 0.11 0.26
Source: Climate bulletins and other publications of the India Meteorological Department.

4 Twelfth Five Year Plan
TABLE 12.3
Averages and Standard Deviations of Annual Growth Rates of GSDP from Agriculture and Allied Sectors
Average of Annual Growth Rates Standard Deviation of Annual Growth Rates
1981–82
to
1993–94
1994–95
to
1999–2000
2000–01
to
2004–05
2005–06
to
2011–12
1981–82
to
1993–94
1994–95
to
1999–2000
2000–01
to
2004–05
2005–06
to
2011–12
Andhra Pradesh 3.9 2.8 4.7 5.0 10.0 13.8 9.7 6.5
Arunachal Pradesh 9.3 –0.8 1.6 5.0 9.7 8.5 7.2 7.8
Assam 2.5 0.2 –0.1 4.1 4.8 2.7 1.4 2.2
Bihar 1.1 3.1 7.4 3.3 12.9 22.7 24.1 11.9
Chhattisgarh 4.9 –2.1 4.6 7.3 10.5 10.5 35.3 9.1
Gujarat 8.8 5.2 9.1 5.5 53.5 27.0 24.2 10.4
Haryana 4.5 2.1 2.7 4.2 12.2 7.0 3.5 5.7
Himachal Pradesh 2.8 0.3 8.0 1.5 12.4 2.1 6.2 9.7
Jammu & Kashmir 1.3 5.2 3.6 0.7 11.2 5.7 3.8 2.9
Jharkhand 1.1 4.3 5.0 8.0 12.9 7.2 19.6 5.1
Karnataka 4.5 4.1 –2.9 5.1 8.7 5.7 15.1 6.8
Kerala 3.2 1.9 1.7 –0.2 6.4 4.9 2.4 3.4
Madhya Pradesh 4.9 1.6 2.2 4.4 10.5 3.4 27.1 4.7
Maharashtra 5.7 3.1 1.6 5.3 17.3 10.1 6.9 11.5
Manipur 2.8 2.1 5.8 5.9 3.6 6.2 6.9 4.4
Meghalaya 1.1 7.2 4.8 3.3 11.2 6.2 2.1 2.2
Mizoram 0.1 5.7 4.8 5.9
Nagaland 14.1 2.5 9.7 2.3
Odisha 2.6 0.0 3.5 3.1 18.6 11.0 16.4 2.5
Punjab 4.9 2.5 1.8 1.8 4.6 4.4 2.6 1.6
Rajasthan 5.9 5.5 10.9 5.5 26.5 14.4 44.9 10.1
Sikkim –1.2 6.5 3.4 11.1 1.0 2.4
Tamilnadu 5.8 1.8 –0.5 4.6 12.7 9.6 14.0 7.0
Tripura 2.5 3.7 4.0 5.7 7.1 5.7 11.4 5.6
Uttar Pradesh 2.8 3.5 1.0 2.8 3.2 5.2 1.8 1.4
Uttarakhand 2.8 2.4 3.3 2.0 3.2 3.5 4.9 4.3
West Bengal 5.3 4.1 2.4 2.6 9.2 4.3 4.0 3.4
Sum of GSDP of:
All above states
3.4
(3.4)
2.5
(3.3)
2.1
(1.7)
3.8
(3.7)
5.8
(5.1)
5.2
(4.6)
6.5
(6.1)
2.8
(2.5)
High irrigation states 3.8 3.2 1.7 2.7 3.1 3.8 2.1 0.9
Medium irrigation states 2.9 1.8 3.1 4.2 9.8 9.1 8.5 3.0
Low irrigation states 3.6 2.8 1.5 4.5 5.6 4.7 9.1 5.3
High productivity states 4.1 2.9 2.5 2.1 3.9 3.1 2.2 0.8
Mid productivity states 3.0 2.4 2.1 3.7 4.0 6.6 4.5 2.3
Low productivity states 3.6 2.6 2.5 5.1 11.0 6.4 16.7 5.4
Across States:
Median 3.6 2.5 3.5 4.2 10.5 6.2 6.9 5.1
Standard deviation 2.2 2.3 3.7 1.9
Note: Figures in brackets use corresponding national GDP agriculture and allied (2004–05 prices) data. High irrigation refers to the
GSDP sum over Haryana, Punjab, Uttar Pradesh and West Bengal (Net irrigated area (NIA)/Arable land (AL) > 55 per cent in 2008–09).
Low irrigation (NIA/AL < 30 per cent) refers to Assam and North-East, Chhattisgarh, Himachal Pradesh, Jharkhand, Karnataka, Kerala,
Maharashtra, Rajasthan and Uttarakhand. Medium refers to the rest. High productivity states (present GSDP/AL > `70,000/hectare
at 2004–05 prices) are Tripura, West Bengal, Kerala, Himachal Pradesh, Punjab, J&K and Haryana. Low productivity (GSDP/AL <
`35,000) states are Rajasthan, Meghalaya, Madhya Pradesh, Chhattisgarh, Maharashtra, Odisha, Jharkhand, Karnataka and Gujarat.
The rest are Middle productivity. The 1980–81 series gives data only for undivided Bihar, MP and UP; these have been split using
1993–94 ratios to get GSDP for new States.

Agriculture 5
3. The variation in performance across States sug-
gests that State-level responses and implementa-
tion play a very significant role in determining
agricultural performance. However, to the extent
that available technology limits potential growth,
it will be difficult to maintain high growth rates
where productivity has increased close to poten-
tial levels. This is relevant because the Eleventh
Plan strategy gave much greater flexibility to
States and focused more on yield gaps within
existing technology, rather than emphasising
new technologies and supporting these. The
growth acceleration since 2005 has therefore
been much stronger in states with lower pro-
ductivity and less irrigation. This suggests that
the strategy may be correcting the past relative
neglect which caused rain-fed farming, covering
over 60 per cent of arable land, to perform well
below potential.
12.8. It is a matter of concern that the recent growth
revival has been weak in areas with high land pro-
ductivity, not only in relatively more irrigated states
such as Punjab, Haryana, Uttar Pradesh and West
Bengal that had green revolution success, but also
in less irrigated states such as Kerala, Himachal
Pradesh and Jammu & Kashmir where high produc-
tivity reflects a high-value cropping pattern based on
horticulture. These States together contribute about
35 per cent of national agricultural output from 20
per cent of arable land, but none of them have been
able to surpass growth rates achieved in the past.
Even Gujarat, a low productivity state that sustained
near 10 per cent growth for almost a decade through
better water use and rapid adoption of Bt cotton
hybrids, slowed down perceptibly in the Eleventh
Plan as Bt adoption saturated and yields reached a
plateau. Clearly, growth is more difficult to acceler-
ate at higher productivity levels without new tech-
nology, particularly if past patterns of growth have
taken a toll on natural resources.
OUTPUTS, INPUTS AND PRODUCTIVITY
12.9. The Eleventh Plan had made four conscious
choices. First, with technology fatigue evident, it
funded research better but emphasised on getting
more from existing technology. Second, since one
size does not fit all, it decentralised plan funds to
encourage initiatives at State and lower levels. Third,
aware of low public investment and food security
needs, it increased Centre’s spending on these, par-
ticularly in disadvantaged regions. Fourth, noting
farmer distress, it tried to focus not just on pro-
duction but also on farm incomes, stressing service
delivery and suggesting encouragement of group
activity with land and tenancy reforms put back on
the agenda. Compared to the original green revo-
lution that built on the best, this strategy sought to
deliver faster growth, that is, more inclusive, more
stable and less concentrated spatially. Nonetheless,
there is a wide demand for a ‘second green revolu-
tion’ with more irrigation and better crop-specific
technologies, with some even claiming that Bt cot-
ton has been the only recent success. The Twelfth
Plan accepts the proposition that a greater techni-
cal thrust is needed, and the strategy for agriculture
should take this into account
12.10. In order to provide a snapshot of the Eleventh
Plan performance and give indication of what the
Twelfth Plan should do differently, long-run data
on growth of output by sub-sector and also rates of
growth of input use and productivity are presented
in Table 12.4. Since performance is almost invari-
ably discussed in the context of well-defined policy
periods, those chosen for this table are same as in the
Eleventh Plan document: (i) Pre-Green Revolution
(1951–52 to 1967–68); (ii) Green Revolution proper
(1968–69 to 1980–81); (iii) Wider technology cover-
age (1981–82 to 1990–91) when focus shifted from
intensification of Green Revolution in best areas
to its spread to new areas; (iv) Early liberalisation
period (1991–92 to 1996–97) when relative prices
became an additional focus, both because agriculture
was expected to gain from reduced trade protection
to industry and also with Minimum Support Prices
(MSP) used for active growth promotion rather than
just passive price support. The other three periods in
the table are subsequent Plan periods: (v) Ninth Plan
(1997–98 to 2001–02); (vi) Tenth Plan (2002–03 to
2006–07) and (vii) Eleventh Plan (2007–08 to 2011–
12). For each of these periods, the average of annual
growth rates is presented for each variable chosen.
12.11. As noted above, growth of agricultural GDP
at 3.3 per cent was short of the 4 per cent target for

6 Twelfth Five Year Plan
TABLE 12.4
Growth of Output, Inputs and Productivity
(period averages of annual growth rates)
Pre-Green
Revolution
Green
Revolution
Wider
Coverage
Early
Liberalisation
Ninth Plan Tenth Plan Eleventh
Plan
1951/52 to
1967/68
1968/69 to
1980/81
1981/82 to
1990/91
1991/92 to
1996/97
1997/98 to
2001/02
2002/03 to
2006/07
2007/08 to
2011/12
I. Value of Output (2004–05 prices)
Cereals 4.2 3.4 3.5 2.4 1.5 1.0 3.0
Pulses 3.0 0.7 3.4 0.8 0.3 1.8 4.2
Oilseeds 3.2 1.8 7.4 4.4 –2.5 7.4 4.5
Sugars 3.3 4.1 4.2 2.4 9.4 1.7 2.2
Fibres 4.4 2.5 5.3 6.5 –5.6 15.1 10.7
Non-horticulture crops 3.2 2.7 3.0 2.1 1.7 2.1 2.8
Horticulture 2.6 4.2 3.1 5.7 3.8 2.6 4.7
All Crops 3.0 3.0 3.0 3.1 2.3 2.1 3.4
Livestock 1.0 3.3 4.8 4.0 3.6 3.6 4.8
Crops and Livestock 2.5 3.0 3.3 3.3 2.6 2.5 3.8
Fishing 4.7 3.1 5.7 7.1 2.7 3.3 3.6
Forestry 1.7 –0.2 0.3 0.3 2.7 1.3 2.3
Agriculture and allied 2.3 2.4 3.0 3.1 2.6 2.4 3.6
II. Value of Intermediate Inputs (2004–05 prices)
Seed 1.5 1.1 2.3 1.6 –0.6 1.4 4.1
Feed of livestock 1.9 4.0 0.1 0.9 3.9 0.7 3.3
Organic manure 0.0 1.3 0.7 0.5 1.6 2.9 3.3
Fertilisers and pesticides 18.2 9.3 8.7 2.0 3.9 4.8 6.7
Diesel oil 26.0 13.1 8.7 4.3 5.1 5.1 5.8
Electricity 18.5 15.2 12.9 14.4 –4.1 2.6 8.0
All inputs crops and
livestock
2.4 4.5 2.2 1.9 3.0 2.5 4.4
Inputs for fishing 4.6 3.3 5.4 6.5 2.7 1.5 3.5
Inputs for forestry 1.7 –0.2 0.1 0.3 2.6 1.3 2.3
All inputs Agriculture and
allied
2.3 3.9 2.1 1.9 3.0 2.4 4.3
III. Gross Value Added (2004–05 prices)
Crops and Livestock 2.7 2.7 3.7 3.7 2.5 2.5 3.5
Fishing 4.7 3.0 5.8 7.2 2.7 3.6 3.7
Forestry 1.7 –0.2 0.4 0.3 2.8 1.3 2.3
Agriculture and allied 2.5 2.4 3.5 3.7 2.5 2.4 3.3
IV. Factor Inputs into Agriculture
Land (Gross cropped area) 1.3 0.4 0.8 0.3 –0.1 0.6 0.3
Labour 1.8 1.1 0.5 2.3 0.3 0.5 –1.5
Net Fixed Capital Stock 2.3 3.6 2.8 3.1 3.4 4.7 6.0
Of which: Public 3.9 2.0 1.4 2.3 3.6
Private 1.4 4.3 5.1 6.6 7.5
V. Partial Factor Productivities (2004–05 prices)
Land productivity 1.2 2.0 2.7 3.3 2.6 1.8 3.1
Labour productivity 0.7 1.4 3.0 1.4 2.2 1.8 4.8
Capital productivity 0.2 –1.1 0.7 0.6 –0.9 –2.4 –2.7
Note: Cropped Area from Ministry of Agriculture, Land use statistics; Labour is agricultural employment from Census till 1971 and
NSSO (weekly status) from 1972–73; all other data are from Central Statistical Office (CSO): National Accounts 2004–05 prices.

Agriculture 7
agricultural GDP but was faster than that in the
Tenth or the Ninth Plan, though lower than the
period from 1981–82 to 1996–97. The growth rates
for individual crops shown in Table 12.4 are for
gross value of output and not value added, but they
present a valid basis for inter-period comparisons.
1. Growth of total value of output in agriculture
proper (crops and livestock) during the Eleventh
Plan averaged 3.8 per cent per year which was
the highest among all seven periods considered.
2. Total non-horticulture crop output grew mar-
ginally faster than target (2.8 per cent against
2.7 per cent target) mainly because of foodgrains
(3.1 per cent actual against 2.3 per cent target),
oilseeds (4.5 per cent against 4 per cent) and
fibres (10.7 per cent against 5 per cent).
3. Horticulture at 4.7 per cent was only marginally
short of the 5 per cent target.
4. Growth of output from livestock (4.8 per cent)
was again highest amongst all the periods consid-
ered but this performance, and even more, so for
fishing (3.6 per cent), fell short of the ambitious
6 per cent target set for these two sub-sectors.
5. Growth of forestry was expectedly slower, pull-
ing down the growth of total value of output in
agriculture and allied to 3.6 per cent, but this
too was the highest among all the seven periods
considered.
12.12. Growth in intermediate inputs has acceler-
ated steadily reaching 4.3 per cent per annum dur-
ing the Eleventh Plan, which was much higher than
growth of output and over twice the growth rate of
intermediate input use during 1981–97. The more
rapid growth in input use explains why despite the
faster growth of the gross value of output during
the Eleventh Plan at 3.6 per cent than in the period
1981–82 to 1996–97 (about 3.0 per cent), GDP in
agriculture (which is a value added concept) grew
more slowly. In other words, agricultural growth
became more input intensive in the Eleventh Plan.
This suggests the need to re-look policies relating to
inputs, especially fertiliser and power.
12.13. Policies towards input use need to distinguish
between traditional inputs such as seed, feed and
organic manure and modern inputs such as chemical
fertiliser, pesticides and farm power. With low seed
replacement, underfed farm animals and soils short
of organic carbon, projections by working groups for
the Twelfth Plan suggest that past growth of these tra-
ditional inputs should be improved upon. However,
these working groups also project lower growth of
‘modern’ inputs than observed during the Eleventh
Plan. For example, 2016–17 requirements of chemi-
cal fertiliser and farm power are placed at levels that
imply annual growth for both fertilisers and ‘mod-
ern’ energy at about 4.5 per cent. These exceed cor-
responding the Eleventh Plan projections but are
much less than the Eleventh Plan actual. Reduced fer-
tiliser and fuel subsidies would be consistent with the
desired moderation in trend of these inputs. Restraint
is also needed on pesticides use which rose sharply in
the Eleventh Plan after years of being subdued.
12.14. In parallel with high growth of intermediate
inputs, there was acceleration in growth of the net
capital stock in agriculture and allied sectors during
the Eleventh Plan. As shown in Table 12.4 (item IV),
Net Fixed Capital Stock in agriculture expanded at
6.0 per cent per year, much faster than in the pre-
vious two Plans. The public component of capi-
tal stock increased by 3.6 per cent while the private
component increased at 7.5 per cent per year, both
showing acceleration compared to the previous
two Plans. However, public investment in agricul-
ture, which was stepped up very substantially in the
last three years of the Tenth Plan, stagnated in the
Eleventh Plan (Table 12.5). This was mainly because
of a large shortfall in planned investment in irriga-
tion. As a result a key part of the Eleventh Plan strat-
egy to achieve 4 per cent agricultural growth which
was to increase public investment in agriculture to
4 per cent of agricultural GDP and thereby achieve
growth of public sector capital stock in agriculture at
least equal to the required 4 per cent growth of total
capital stock has not fructified. Clearly, to attain 4
per cent agricultural growth in the Twelfth Plan will
require firmer commitment to ensure realisation of
this unattained the Eleventh Plan objective.
12.15. Private investment in agriculture has accel-
erated over the past three Plans. Private investment

8 Twelfth Five Year Plan
TABLE 12.5
Gross Capital Formation (GCF) in Agriculture, Forestry and Fishing (2004–05 prices)
Year GDP from Agriculture
and Allied
2004–05 Prices
GCF in Agriculture and Allied at
2004–05 Prices
GCF in Agriculture as Per Cent of
GDP from Agriculture
Public
Sector
Private
Sector
Total Public
Sector
Private
Sector
Total
1 2 345678
Tenth Plan
2002–03 5,17,559 10,299 63,215 73,514 2.0 12.2 14.2
2003–04 5,64,391 12,683 57,238 69,921 2.3 10.1 12.4
2004–05 5,65,426 16,187 59,909 76,096 2.9 10.6 13.4
2005–06 5,94,487 19,940 66,664 86,604 3.5 11.2 14.6
2006–07 6,19,190 22,987 69,070 92,057 3.7 11.2 14.9
Eleventh Plan
2007–08 6,55,080 23,257 82,484 1,05,741 3.6 12.6 16.1
2008–09 6,55,689 20,572 1,06,555 1,27,127 3.1 16.3 19.4
2009–10 6,62,509 22,719 1,08,420 1,31,139 3.4 16.4 19.8
2010–11 7,09,103 21,500 1,20,754 1,42,254 3.0 17.0 20.1
Source: Central Statistical Office National Accounts Division.
averaged 15.6 per cent of agricultural GDP in the first
four years of the Eleventh Plan as against expected
12 per cent. The main driver of this was a large
relative price shift in favour of agriculture, show-
ing that farmers respond to price incentives. If cal-
culated in current price terms rather than constant,
private investment averaged 13 per cent of agri-
cultural GDP—only slightly higher than expected.
Nonetheless, total capital stock in agriculture grew
more than expected. While private investment in
irrigation and water-saving devices did increase, the
largest increase was in labour-saving mechanisation.
This was a natural response to growing labour scar-
city which is reflected in rising wages.
12.16. Table 12.4 also shows growth rates of the two
other factors of production in agriculture: land and
labour. Not unexpectedly, while capital stock has
grown quite rapidly throughout, the other two factors
have not. As far as labour is concerned, the measure
shown is employment in agriculture by usual sta-
tus estimates of the National Sample Survey (NSS),
which is available almost annually since 1987–88 but
requires interpolation for earlier years. Combined
with Census data, these show continuous increase of
agricultural employment till 1994, although at vary-
ing rates of growth and at a particularly sharp rise in
early 1990s when there was slow-down in rural non-
agricultural employment. Agricultural employment
fluctuated in the next decade, but has clearly declined
after 2004–05. NSS employment data for 2007–08
and 2009–10 show clear evidence of an accelerated
shift of rural labourers to non-agricultural work,
which in itself is not an undesirable development.
For land, the measure shown is gross cropped area
which, despite the loss of nearly 3 million hectares of
arable land to non-agricultural uses since 1990–91,
has increased in all periods excepting a slight dip
in the Ninth Plan. This is because cropping inten-
sity has increased almost continuously. However,
cropped area growth which averaged 0.9 per cent per
annum till 1990–91 has averaged only 0.2 per cent
subsequently.
12.17. Table 12.4 also shows growth rates of partial
productivity of land, labour and capital taking GDP
agriculture and allied as numerator. Labour produc-
tivity growth has historically been low, averaging
2per cent per annum or less except during 1981–90
when it reached 3 per cent. Labour productivity
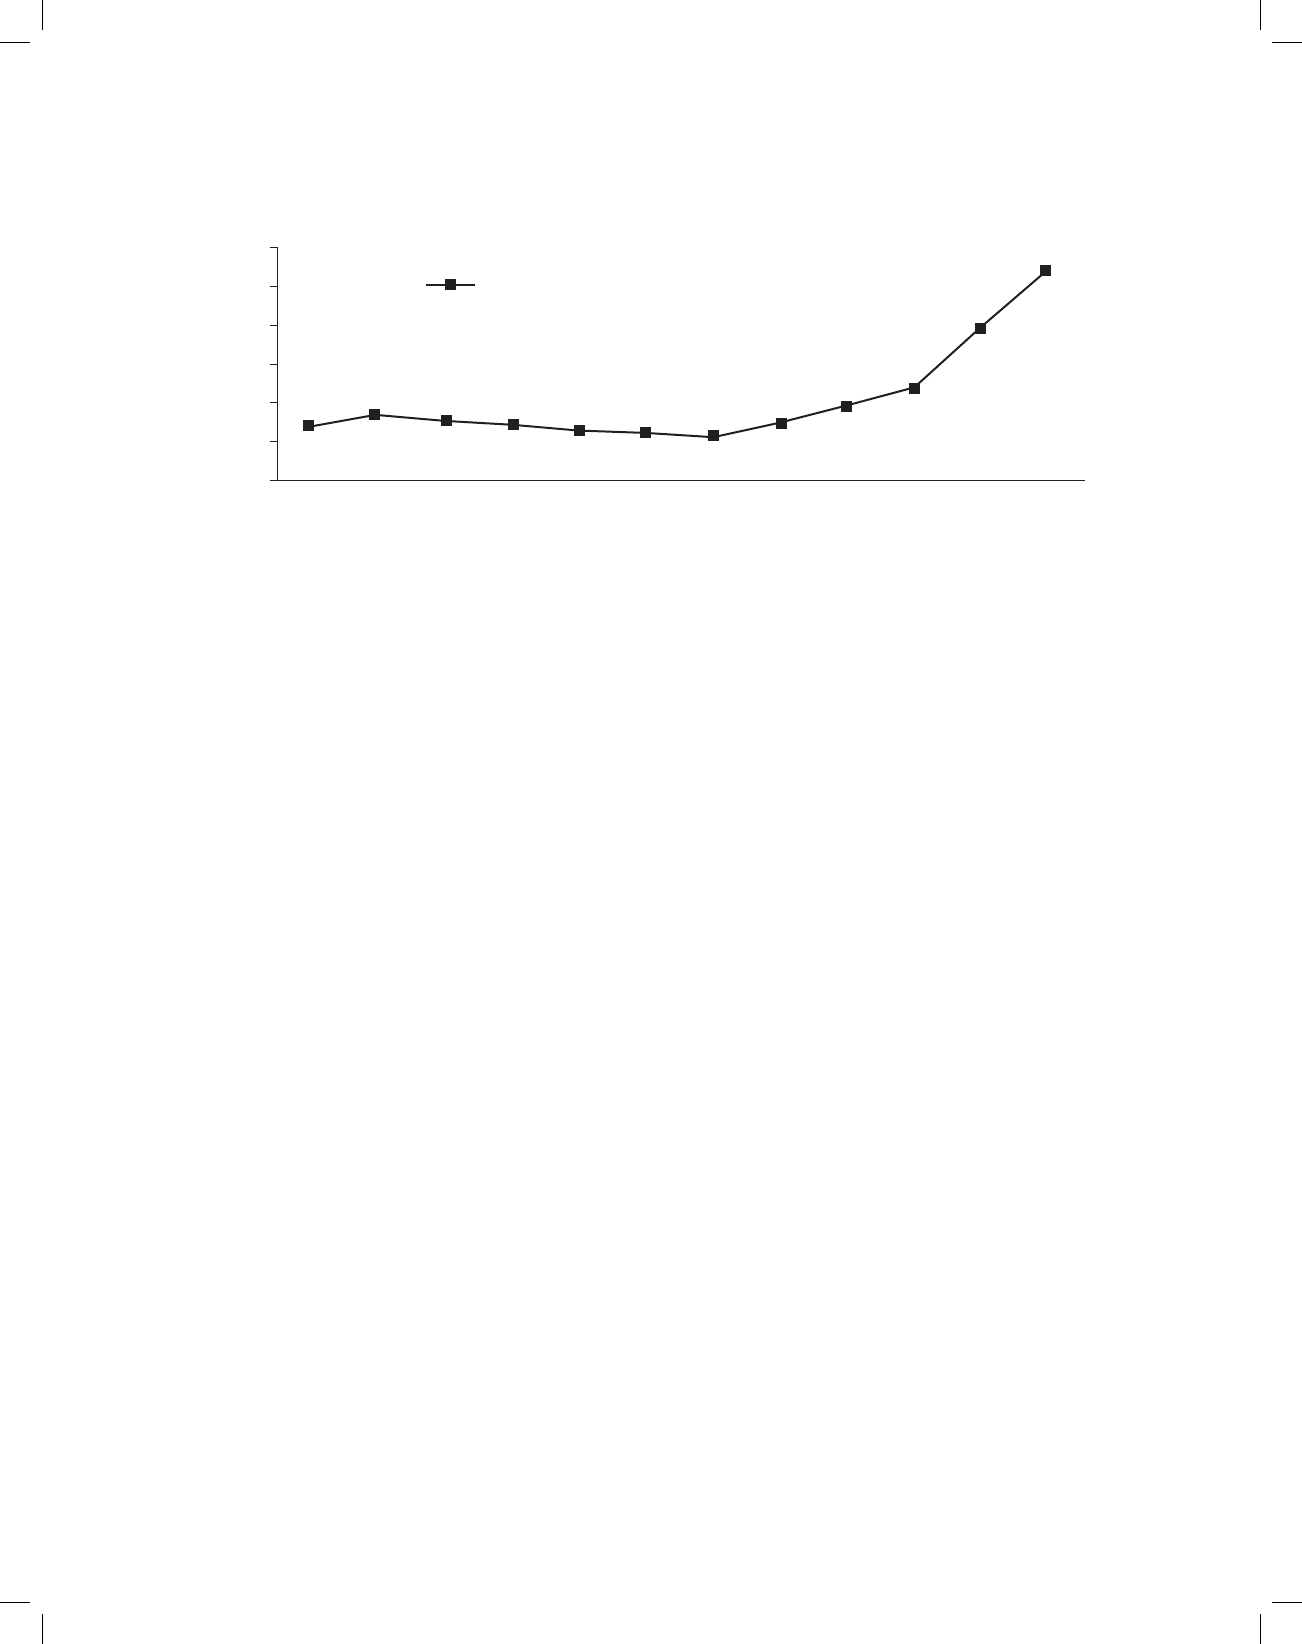
Agriculture 9
jumped to nearly 5 per cent during the Eleventh Plan.
The accelerated shift of rural labour to non-agricul-
ture caused real wages to rise at about 5 per cent
annually between 2004–05 and 2009–10, according
to the NSS, and latest reports of the Commission of
Agricultural Costs and Prices (CACP) suggest even
faster growth of real wages in the last three years of
the Eleventh Plan at almost 8 per cent per year. The
trend in real wages in 2011–12 prices, as estimated
by CACP, is shown in Figure 12.2.
12.18. Labour saving mechanisation, a significant
contributor to the sharp increase of private invest-
ment in the Eleventh Plan period, was a natural
response to tighter labour markets and rising wages.
But, while mechanisation helped farmers to cope
with labour scarcity, it exacerbated a decline in capi-
tal productivity. Private capital stock in agriculture
has increased twice as fast as agricultural GDP since
the Ninth Plan and, although mitigated by terms of
trade gains and a debt write-off, continued invest-
ment with declining capital productivity may not be
sustainable.
12.19. While greater private investment in farm-
ing is desirable where it reflects both an ability to
invest and a desire to increase farm productivity, the
same phenomenon can become a source of distress if
farmers keep investing to cope with shrinking natu-
ral resources, more frequent adverse weather and
less assured labour supply, and do not get adequate
returns for this investment. The Eleventh Plan had
tried to address this in two ways: first, increase pub-
lic investment to lessen the private burden and add
economies of scale; and second, rework architecture
of the Plan spending on agriculture to make it more
decentralised and flexible but also more coordi-
nated locally to improve total productivity of private
resources by better service delivery in all areas from
extension to input supply and marketing. However,
as noted earlier, public investment did not increase.
And, although combined Plan expenditure of Centre
and States in agriculture did increase from 1.9 per
cent of agricultural GDP in the Tenth Plan to 2.9 per
cent in the Eleventh, this was relatively small and left
research, education and extension under-funded,
leaving much to be desired in the quality of service
delivery.
12.20. Nonetheless, growth of land productivity did
increase significantly (Tables 12.4 and 12.6). Having
climbed from about 1 per cent per annum before
Green Revolution to over 3 per cent during 1991–97,
land productivity growth had decelerated to below 2
per cent. This rebounded to over 3 per cent during
the Eleventh Plan.
12.21. Total factor productivity (TFP) improved
during the Eleventh Plan. Individual factor produc-
tivity data in Table 12.4, weighted by a range of factor
shares suggest that TFP growth during the Eleventh
Plan was back to around 1980s level. For example,
160.00
150.00
140.00
130.00
120.00
110.00
100.00
` per day
Year
2000–01
2001–02
2002–03
2003–04
2004–05
2005–06
2006–07
2007–08
2008–09
2009–10
2010–11
2011–12
Average Real Daily Wage Rage at 2011–12 Price (` per day)
FIGURE 12.2: All India Average Real Daily Wage Rate at 2011–12 Prices (` Per Day)

10 Twelfth Five Year Plan
applying factor shares of 30 per cent land, 40 per
cent labour and 30 per cent capital give the following
averages of annual TFP growth: 0.7 per cent in pre-
Green Revolution period, 0.8 per cent during Green
Revolution period, 2.2 per cent during the wider cov-
erage period, 1.8 per cent during early liberalisation,
1.4 per cent during the Ninth Plan, 0.6 per cent dur-
ing the Tenth Plan and 2.0 per cent in the Eleventh
Plan. Although these estimates must be treated as
tentative since data on factor shares is not robust, it
does suggest that the deceleration of TFP in agricul-
ture observed in the previous two Plans, which had
caused widespread apprehension, may have been
reversed in the Eleventh Plan. In other words, the
Eleventh Plan architecture, with the Rashtriya Krishi
Vikas Yojana (RKVY) as core, appears to have deliv-
ered despite adverse weather, a public investment
shortfall and implementation gaps. The strategy of
spreading known technology wider had paid.
SUB-SECTOR-WISE PERFORMANCE AND
ISSUES
Crop Sector
12.22. In addition to above, two indicators worth
highlighting in the crop sector are the pace and pat-
tern of crop area diversification and trends in yields/
hectare of important individual crops. There has
been gradual but sustained shift in cropping pat-
tern away from coarse cereals and pulses towards
other crops over the last four decades. Area under
coarse cereals had declined by 18 million hectares
and that under pulses by nearly 2 million hectares
from earlier peaks to end of the Tenth Plan. During
the Eleventh Plan, there was further decline of 2mil-
lion hectares in area under coarse cereals but area
under pulses reversed earlier decline to reach a
new peak in 2010–11. Noting, that technology and
price policy had neglected pulses earlier despite
their importance as source of protein, special atten-
tion was given to pulses in both the National Food
Security Mission (NFSM) and RKVY, the two major
schemes launched during the Eleventh Plan. Cotton
gained most area, followed by fruits and vegetables,
with rice area steady, an increase in wheat area and
decline in area under oilseeds and sugarcane.
12.23. Although area under coarse cereals and oil-
seeds declined during the Eleventh Plan, both these
crop groups averaged over 4 per cent output growth.
This was because growth of yields per hectare accel-
erated across almost all crop groups, especially those
mainly rain-fed (Table 12.6). Not only did coarse
cereals and oilseeds yields increase faster during the
TABLE 12.6
Average Annual Growth Rates in Yields Per Hectare
Pre-Green
Revolution
Green
Revolution
Wider
Coverage
Early
Liberalisation Ninth Plan Tenth Plan
Eleventh
Plan
1951/52 to
1967/68
1968/69 to
1980/81
1981/82 to
1990/91
1991/92 to
1996/97
1997/98 to
2001/02
2002/03 to
2006/07
2007/08 to
2011/12
Wheat 3.7 3.3 3.6 2.8 0.7 –0.3 3.0
Rice 3.2 2.7 3.0 1.4 2.1 1.2 2.2
Jowar 3.4 2.9 3.2 1.3 0.2 2.1 3.1
Bajra 2.6 6.3 8.8 6.2 4.9 7.3 8.4
Maize 4.8 1.7 4.1 2.6 3.1 –0.2 6.5
Coarse cereals 2.6 1.5 3.1 4.3 1.3 1.7 7.3
Pulses 2.3 –0.2 2.3 1.9 –0.3 0.6 2.7
Oilseeds 1.3 0.8 4.8 3.3 0.4 3.5 5.4
Cotton 3.0 2.6 5.3 3.1 –6.2 19.4 3.9
Sugarcane 1.6 3.1 1.3 0.4 0.3 0.7 0.5
Note: Data is up to fourth advance estimate for 2011–12, Ministry of Agriculture.

Agriculture 11
Eleventh Plan than in any of the earlier periods, so
did pulses yields. Apart from hybrids in case of maize,
and to less extent in bajra, these yield increases came
mainly from better seed quality, higher seed replace-
ment and better practice rather than from new crop
technology or more irrigation.
12.24. Yield growth of cotton, another largely rain-
fed crop, was also respectable although it was down
sharply from a spectacular performance during the
Tenth Plan following adoption of Bt hybrids. With
more than 90 per cent of cotton area now under
Bt hybrids, and cotton yields more than doubling
over the last decade, there is no doubt either about
general farmer acceptance or its being a clear case
of technological transformation unlike other rain-
fed crops. But disagreements continue about the
extent to which Bt contributed to this yield increase
and on wisdom of India’s total dependence on Bt
hybrids rather than the Bt varieties used in the rest
of the world. There are also legitimate complaints
of non-availability of non-Bt seeds, for example in
Vidharbha. Genetically modified organisms (GMOs)
therefore remain controversial, as was evident in case
of Bt Brinjal. Nonetheless, since significant break-
throughs in production technologies are required
to cope with increasing stress, particularly for rain-
fed crops, it is necessary to remain abreast with lat-
est advances in biotechnology. It is, therefore, time
to put in place scientifically impeccable operational
protocols and a regulatory mechanism to permit
GMOs when they meet rigorous tests that can out-
weigh misgivings, while simultaneously noting that
many feasible advances in biotechnology do not in
fact involve GMOs.
12.25. Moreover, the Eleventh Plan experience is that
continuous less-visible efforts by farmers to adapt
and improve can be made effective. The NFSM,
which aimed to reduce gaps between potential and
actual yields, was designed to aid farmers in their
own efforts by demonstrating and supporting a wide
range of interventions. This seems to have worked.
For example, growth in wheat yields nationally was
negligible during the Ninth and the Tenth Plans but
increased to 3 per cent in the Eleventh Plan. Even
in Punjab, where it was believed that wheat yields
had reached a plateau below 4.5 tonnes per hectare,
yields increased steadily during the Eleventh Plan to
reach 4.9 tonnes, accompanied by wider use of con-
servation practices such as laser levelling, zero tillage
and raised beds. Rice yield growth was also higher in
the Eleventh Plan than in any period after 1991, with
Assam, Bihar, Chhattisgarh, East Uttar Pradesh and
West Bengal contributing 80 per cent of this, again
with growing awareness of conservation practices.
For example, many States are now using RKVY to
mainstream the System of Rice Intensification (SRI)
that was not officially accepted till 2004 and was only
small part of NFSM.
Livestock and Fishery
12.26. Livestock contributes 25 per cent of gross
value added in the agriculture sector and provides
self-employment to about 21 million people. Rapid
growth of this sector can be even more egalitarian
and inclusive than growth of the crop sector because
those engaged in it are mainly small holders and the
landless. Growth of livestock output averaged 4.8 per
cent per annum during the Eleventh Plan recovering
from an average of 3.6 per cent in the Ninth and the
Tenth Plans.
12.27. Growth, of dairying, which is the main con-
stituent of livestock sector though slightly higher
than the 4 per cent averaged since 1990, was short of
demand. With over 75 per cent of cattle located in
rain-fed areas, the major issue is access to feed, fodder
and drinking water which is becoming increasingly
scarce. The problems of the sector are compounded
by growing numbers of unproductive male cat-
tle. Developing a strong fodder base needs inten-
sive effort and innovation in institutional aspects of
pasture protection and management and usufruct
sharing. There is little concerted effort in this area at
present as it is too fragmented across various depart-
ments to be able to provide the technical inputs, insti-
tutional designs and adequate investments to make
a meaningful impact. Richer farmers with access
to groundwater irrigation can grow irrigated fod-
der and increase herd size. Poorer livestock owners,
dependent mainly on commons and agriculture resi-
dues, end up underfeeding the animals. This problem
raises questions about the present breeding strategy

12 Twelfth Five Year Plan
that focuses almost exclusively on induction of breeds
that are high yielding, but are much less tolerant to
adverse conditions in extensive livestock systems.
12.28. These issues, which also affect owners of
small ruminants, poultry and even those involved in
inland fishery, came to the fore during the Eleventh
Plan following the drought of 2009. The consequent
high inflation in feed and fodder, that also led to high
inflation in prices of livestock products, revealed
a need for much greater coordination not only
between agencies responsible for livestock and those
responsible for crops that sustain livestock, but also
with other policies, for example, trade policies that
influence feed and livestock product prices. RKVY
provided a window which cut across departments
to allow States to focus on fodder shortages and
restored growth of livestock output much quicker
than in earlier droughts. Nonetheless, underlying
problems remain, as does so called protein inflation.
The Twelfth Plan must address these problems by
involving dairy cooperatives in breed and feed issues,
revisit breeding strategies and make fodder develop-
ment higher priority in both animal husbandry and
crop programmes.
12.29. India produces about 65 billion eggs annually
and production growth has accelerated from around
4 per cent per annum during the 1990s to over 5 per
cent during the Tenth and the Eleventh Plan. This
acceleration has been achieved despite new chal-
lenges such as periodic outbreaks of avian influenza
and the biofuels effect on international prices of
maize, the main poultry feed, which has now transmit
into the domestic economy. One reason for this vital-
ity has been the growth of a large and vibrant com-
mercial poultry sector with adequate economies of
scale and fairly good backward and forward linkages.
Besides eggs, this commercial poultry sector also pro-
duces over 2 million tonnes of broiler meat which is
an increasing part of total meat production of about 5
million tonnes. Meat, with production growth at over
5.5 per cent per annum during the Eleventh Plan, is
the fastest growing segment in the livestock sector.
12.30. The performance of the fisheries sub-sec-
tor has been impressive on the whole, with growth
more than 5 per cent per annum during the 1980s
and 1990s, but growth in this sub-sector has been
decelerating since mid-1990s. The main reason for
this has been stagnation of marine fishery, a phe-
nomenon which is expected to continue. The major
growth in fisheries in recent years has come from
the inland fisheries, with particularly rapid develop-
ment of brackish water aquaculture. This has been
linked to prawn cultivation for export, although
there is also strongly growing domestic demand for
fresh water fish. Fish prices more than doubled dur-
ing the Eleventh Plan, a higher inflation than either
crops or any other livestock segment, despite a small
acceleration in production growth compared to the
Tenth Plan. A problem in this sector is that although
a National Fisheries Development Board was set up,
responsibilities are still not clearly defined between
this and the Department of Animal Husbandry,
Dairying and Fisheries. This has in particular meant
an inability to realise the vast potential of inland fresh
water fishery. Fish production can be enhanced 2 to
4 times in rain-fed water bodies, whether irrigation
reservoirs, natural wetlands or ponds and tanks cre-
ated by watershed development or Mahatma Gandhi
National Rural Employment Guarantee Scheme
(MGNREGS). If fully harnessed, these can secure
over 6 per cent fishery growth in the Twelfth Plan.
EMERGING IMBALANCES
12.31. Although the discussion so far suggests that
agricultural performance did improve during the
Eleventh Plan, experience of the Eleventh Plan also
points to emerging imbalances in agriculture which
call for a long-term strategic reorientation.
Subsidies vs Public Investment
12.32. The Eleventh Plan document had highlighted
that public investment in agriculture as per cent of
agricultural GDP had halved between the 1980s and
in the end of the Ninth Plan while, simultaneously,
budgetary subsidies to agriculture had doubled as
proportion of agricultural GDP. The tendency for
subsidies to increase much faster than public invest-
ment was checked to some extent during the Tenth
Plan, but it reappeared again during the Eleventh
Plan (Table 12.7). Budgetary subsidies to agriculture
(excluding food subsidy, which should be treated as

Agriculture 13
a consumer subsidy) increased from an average of
4.1 per cent of agricultural GDP during the Tenth
Plan to average 8.2 per cent in the first four years
of the Eleventh Plan. Actual subsidies to agriculture
were higher in both periods since CSO books bud-
geted subsidy on domestic urea manufacture entirely
to industry and because part of the power subsidy
received by agriculture is not budgeted but borne by
utilities. Compared to these numbers, public invest-
ment in agriculture averaged only about 3 per cent of
agricultural GDP during both Plan periods.
12.33. The imbalance between subsidy expendi-
ture and expenditure on public investment raises
the issue whether a shift away from subsidies and
towards greater public investment would not be ben-
eficial. The usual argument for reducing subsidies is
that it will improve the fiscal deficit, but that is not
the relevant point in this context, there is a need to
shift from subsidies to public investment aimed at
increasing land productivity on the grounds that
this would produce better agricultural outcomes and
would also be more inclusive. This is particularly
important in the context of strategies for combating
the effect of climate change where public investment
in conservation and management of water resources
will be crucial.
12.34. There are also other uses of resources in agri-
culture which could be promoted if agricultural sub-
sidies are restrained. The Eleventh Plan document
had pointed to trade-offs that subsidies might have
with other non-Plan revenue expenditures, particu-
larly staffing of essential farm support systems such
as extension. Moreover, capacity and skill short-
ages have made upgrading agricultural universi-
ties an urgent need. The Eleventh Plan had aimed
to increase spending on agricultural education and
research from 0.6 to 1 per cent of agricultural GDP,
but this remains less than 0.7 per cent—a large gap in
a very important area that is miniscule in relation to
subsidies.
TABLE 12.7
Public Sector Capital Formation and Subsidies to Agriculture (Centre and States)
(in ` crore and as per cent to GDP from agriculture and allied at current prices)
Public GCF
Agriculture and
Allied
Budgetary
Subsidies (CSO)
Food Subsidy Total Fertiliser
Subsidy
Subsidy on
Indigenous Urea
All other
Agriculture
Subsidies
Tenth Plan
2002–03 9,563 2.0 43,597 9.0 24,176 5.0 11,015 2.3 7,790 1.6 16,196 3.3
2003–04 12,218 2.2 43,765 8.0 25,181 4.6 11,847 2.2 8,521 1.6 15,258 2.8
2004–05 16,187 2.9 47,655 8.4 25,798 4.6 15,879 2.8 10,243 1.8 16,221 2.9
2005-06 20,739 3.3 51,065 8.0 23,077 3.6 18,460 2.9 10,653 1.7 20,181 3.2
2006–07 25,606 3.5 59,510 8.2 24,014 3.3 26,222 3.6 12,650 1.7 21,924 3.0
Eleventh Plan
2007–08 27,638 3.3 85,698 10.2 31,328 3.7 32,490 3.9 12,950 1.5 34,830 4.2
2008–09 26,692 2.8 1,56,823 16.6 43,751 4.6 76,603 8.1 17,969 1.9 54,438 5.8
2009–10 33,237 3.1 1,39,248 12.9 58,443 5.4 61,264 5.7 17,580 1.6 37,121 3.4
2010–11 34,548 2.7 1,50,170 11.8 63,844 5.0 62,301 4.9 15,081 1.2 39,106 3.1
Note: Public sector agricultural GCF and GDP are from CSO, National Accounts Division; budgetary subsidies, are also from CSO
and are based on the economic and purpose classification of Government expenditure. Food and Fertiliser subsidies are from budget
documents of the Central Government. ‘All other agriculture subsidies’ in the table are defined as budgetary subsidies (CSO) plus
subsidy on indigenous urea minus food subsidy. This is because CSO classifies food subsidy as subsidy to agriculture but classifies
subsidies on indigenous urea as subsidy to industry.

14 Twelfth Five Year Plan
12.35. Another, very important reason why subsidies
should be rationalised and restrained is that some
of these subsidies could actually be doing harm. A
case for subsidies exists if there is clear evidence that
some input is being underused. Conversely, when
with there is clear evidence of overuse of a subsidised
input, there is a case to reduce or even eliminate the
subsidy. Today, there is clear evidence of overuse.
Data from all over India, especially from the prime
green revolution areas, show that high use of chemi-
cal fertilisers and power is causing excessive mining
of other soil nutrients and of groundwater, and that
this is also leading to loss of quality of both soil and
water. There is of course about 20–25 per cent of the
country’s arable area, located largely in North-East,
East and Central India, where use of these inputs is
so low that further intensification is desirable per se.
But with nearly 90 per cent of fertilisers and 95 per
cent of farm electricity currently being used outside
this area, there can be no doubt that the present sub-
sidies are actually encouraging practices that need to
be discouraged.
12.36. Any proposal for reducing subsidies will
be opposed by farmers on the grounds that output
will fall if the subsidy cut reduces input use. This is
true unless other investments are made simultane-
ously but such investments would indeed be facili-
tated by the resources released. Efforts were made
in the Eleventh Plan to encourage more efficient
practices without actually reducing the quantum of
subsidy. For example, many States have undertaken
separation of feeders so that electricity supply for
agricultural use can be treated differently from that
for rural non-agricultural use, and stricter schedul-
ing imposed on the former while maintaining its
lower price. Similarly, the Centre introduced a new
scheme, the ‘National Project on Management of Soil
Health & Fertility’ (NPMSH&F) to promote soil test-
ing and issue of soil health cards to farmers, aimed
particularly to spread awareness of micronutrient
deficiencies resulting from excessive and unbalanced
fertiliser use and to encourage balanced and judi-
cious use of chemical fertilisers in conjunction with
organic manures to maintain soil health and fertility.
Moreover, in order to rationalise fertiliser subsidies,
a nutrient-based subsidy (NBS) system was adopted
to subsidise fertiliser products uniformly on basis of
nutrient content, rather than set product-wise sub-
sidies and separate maximum retail prices (MRPs)
for each product. The objective was to reduce dead-
weight of the fertiliser control order, set nutrient-
specific subsidies that maintain desirable NPK
balance, and evolve a subsidy protocol to encourage
both development of new complex fertiliser products
(including micronutrients) and more investment in
the sector.
12.37. These initiatives have had some success in
particular regions, but they do not as yet show up in
national data in terms of higher additional output
per unit additional use of these inputs. Moreover,
NBS roll-out was seriously flawed since urea was
kept out of its ambit. Urea prices remain controlled
with only a 10 per cent rise at the time of adoption
of the NBS in 2010. Meanwhile prices of decon-
trolled products doubled. The fixity of the urea price
naturally worsened the NPK balance. Also, there has
been very little product innovation. The subsidy bill
has increased because resulting higher urea demand
has been met entirely by imports at a unit subsidy
twice that on domestic output, with little incentive to
expand domestic capacity. The NBS as rolled out has
been counterproductive because urea has not been
included.
12.38. As may be seen from Table 12.6, the fertiliser
subsidy is now much higher than all other subsi-
dies to agriculture put together. While this is partly
because fertiliser consumption rose over 30 per
cent during the Eleventh Plan, the main reason is
that world prices of all fertilisers and feedstock have
doubled since 2006. With world fertiliser prices very
sensitive to demand from India, which is not only
the world’s largest importer of fertilisers but also
dependent almost entirely on imports for feedstock,
improving efficiency of fertiliser use must be a the
Twelfth Plan focus, almost as important as the issue
of water use efficiency taken up in another chapter.
A New Road Map for Fertiliser Policy
12.39. A broad idea of what is necessary is evident
from a few key indicators about the price of urea,
the most important and politically sensitive fertiliser

Agriculture 15
in India. At the world level, urea prices had aver-
aged about 80 per cent of world wheat price during
the 25 years before 2005. Since then, they have been
fluctuating wildly at much higher levels and world
urea prices are now over 150 per cent of world wheat
price. In comparison, the price of urea in India has
been declining continuously in relation to wheat
MSP—from over 150 per cent during the 1980s, to 75
per cent in 2005, to only 41 per cent currently. While
MSP of wheat for 2012 was 90 per cent of April–June
average of world reference price of wheat, the MRP
for urea was only 21 per cent of world reference price
of urea.
12.40. Similarly, achieving the recommended
national 4:2:1 NPK balance has proved elusive, again
partly because urea (main source of N) is priced
cheap relative to other fertilisers. World prices of
DAP (main source of P) and MOP (main source of
K) have fluctuated around 150 per cent and 100 per
cent of world urea price over the last 30 years with no
obvious trend. Relative prices of P to N were similar
in India as globally, and K much cheaper, till decon-
trol in 1992 made these more expensive. The MRP
for DAP and MOP in India were 194 per cent and 92
per cent of urea MRP before NBS, after which these
have risen sharply again. Voluntary MRP for these
are now 380 per cent and 230 per cent of urea MRP.
Unless corrected soon, this large distortion in NPK
prices is bound to reduce crop productivity.
12.41. One way out of the present conundrum is to
bring urea into NBS and decontrol its prices. But this
has not been possible so far and fertiliser decontrol
both in 1992 and again in 2010 excluded urea with
counterproductive effect. The reason for this is not
just opposition to rise in urea prices, but also issues
related to domestic urea industry. For example, sub-
sidy provided to N for decontrolled fertilisers in
the present NBS formula is based on the weighted
average of subsidies on imported (around $320/
tonne) and indigenous (around $160/tonne) urea.
Three consequences would follow if urea prices
were decontrolled fully with the subsidy on both
imported and domestic urea equated to this (around
$200/tonne). First, the domestic urea industry as
a whole would get a windfall gain, and there may
be consequent audit objections, since average unit
subsidy on domestic urea is presently half that on
imported. Second, notwithstanding this, that part
of urea industry which uses feedstock other than gas
would complain that they could become unviable
since their present subsidy is more than the weighted
subsidy. Third, since post-subsidy price of urea
would tend to settle at import cost less the weighted
subsidy; this would, with world urea prices now
about $420/tonne, not only double from the present
MRP of `5,310 per tonne but also be subject to the
very large fluctuations in world urea prices that have
been evident since 2005.
12.42. Although political opposition to decontrol is
mainly on the third point above, the other points,
which relate to differences in costs of production
between different Indian producers and between
Indian costs and world prices, have historically been
at least equally important impediments to reform
in this sector. This is unfortunate since India’s fer-
tiliser industry, although at disadvantage on feed-
stock, is largely efficient and can play a key role both
in ensuring future nutrient supply and in the effort
to increase fertiliser-use efficiency. However, with
more than half of its revenues coming from subsidies
and with Government also allocating scarce feed-
stock cheaply, industry effort currently is more to
meet pre-set requirements and lobby, rather than to
either secure long-term feedstock sources or develop
new products and services for its customer base. This
needs to change, and one way that this can be done
is by reducing industry’s dependence on Central
subsidies, allowing greater space for it to set prices.
The industry’s present cost structure is such that no
subsidy would be required on over 70 per cent of
domestic urea production if urea MRP was allowed
to rise to MSP for wheat or paddy. This level of urea
MRP would reduce subsidy by about `15,000 crore
annually and bring domestic NPK price parities in
line with corresponding world parities while still
leaving absolute fertiliser prices in India at about half
international levels.
12.43. Of course, if this were all, urea prices would
more than double with all its negative consequences.
It would be politically unpopular even with the

16 Twelfth Five Year Plan
5–10 per cent extra increase in MSP that would be
required to compensate increases in cost of produc-
tion. There would definitely be some loss of output
as result of lower urea use and farmers unable to avail
MSP increase would suffer loss of income. But these
negatives can be neutralised and a win-win outcome
ensured if the saving in subsidy is ploughed back to
develop suitable location and crop-specific packages
with adequate price incentives so that farmers do
not suffer income loss and yet are encouraged to use
appropriate combinations not only of NPK but also
organic matter and required micronutrients.
12.44. However, for this, the architecture for pub-
lic intervention will need to go well beyond NBS.
Designing and contracting suitable packages will
require stability in prices of basic NPK in relation to
crop MSPs and also considerable location-specific
input, both scientific and operational. The Centre will
need to ensure some insulation of domestic prices of
straight fertilisers from their large world price fluc-
tuations and devolve many functions and most of the
savings from reduced urea subsidy to States. States, in
turn, will need to involve universities and local bodies
to design suitable local packages of products and sub-
sidies and then contract directly with industry.
Cereals Production and Build up of Stocks
12.45. Another major imbalance that emerged dur-
ing the Eleventh Plan was between production and
consumption of cereals, particularly rice and wheat
on the one hand which led to rising stocks and rising
consumption of edible oils and pulses which led to
imports. Cereals production increased by 37 million
tonnes (8 million tonnes coarse cereals, 11 million
tonnes rice and 18 million tonnes wheat) between
2006–07 and 2011–12. This was the result of sev-
eral factors, including the NFSM, an Eleventh Plan
initiative to increase production, combined with
remunerative prices and an expanding and effec-
tive procurement machinery in Madhya Pradesh
for wheat and Chhattisgarh for paddy. However,
although NFSM exceeded targets and per capita
production has bounced back beyond earlier highs,
much of the increase has been absorbed by increase
in Government stocks. There are lessons that need to
be learnt from this for the Twelfth Plan.
12.46. The rapid accretion of stocks between
2006–07 and 2008–09 was because cereals output
responded quickly to policy, both NFSM and MSP,
rising from 203 million tonnes in 2006–07 to 220
million tonnes, accompanied by even larger increase
in procurement, from 36 million tonnes to 59 mil-
lion tonnes, while off-take from public stocks rose
only from 37 to 39 million tonnes. Consequently,
market availability declined during this period,
increasing grain prices, the dominant source of food
inflation till 2009–10 (Table 12.8). Availability con-
tracted further in 2009–10 because of drought which
caused output to fall back to 203 million tonnes.
Rice and wheat relative prices eased somewhat in
the subsequent two years because output increased
even more rapidly than during 2006–09 to reach 240
million tonnes in 2011–12 and because this time rise
in procurement (to nearly 73 million tonnes) was
less than output and off-take increase (to 56 million
tonne) was relatively much more. Nonetheless, pro-
curement exceeded off-take throughout the Eleventh
Plan, even during 2009 drought, and present stocks
are clearly too high. Costing about `5 per kg per year
to store, these are tying up huge resources that could
have been put to better use.
12.47. One important point to emerge is that
although food inflation is usually ascribed to pro-
duction shortfalls, policy decisions on MSP and on
pricing and quantum of PDS and open market sales
can be even more important. This is of course true
of rice and wheat prices that are directly affected by
such policies, but there are indirect effects as well.
For example, milk, eggs, fish and meat had almost no
effect on food inflation from 2004–05 till 2008–09,
but have contributed most to food inflation subse-
quently (Table 12.8). As discussed earlier, much of
this was due to feed and fodder shortages that the
2009 drought exacerbated. But the high build-up of
rice and wheat stocks may in this context have con-
tributed additionally. Substitution effects from lower
availability of rice and wheat appear to have pushed
up real prices of coarse grain to levels that compare
with and most likely influenced inflation in livestock
products. To maintain rapid agricultural growth, it
will be necessary to continuously assess both MSP
and trade policy in light of domestic production

Agriculture 17
trends, paying attention to such wider linkages, so
as to minimise undue production imbalance and the
inflationary pressures resulting from these.
12.48. Another important and related issue is the
likely future demand for food. The Twelfth Plan
Working Group on Crop Husbandry, Demand
and Supply Projections, Agricultural Inputs and
Agricultural Statistics has made projections for
foodgrains and other food items by the terminal year
of the Twelfth Plan, that is, 2016–17 (Table 12.9)
which would suggest that present levels of cereals
production already exceed likely demand at the end
of the Twelfth Plan. These projections are based on
actual past patterns of observed demand and the fact
that cereals consumption per capita has declined
since at least mid-1990s. However, it is also the case
that India has very high levels of malnutrition and,
although there are many reasons for this, deficiencies
in calorie intake remain one of the most important.
With cereals supplying over 50 per cent of total calo-
rie intake even now, falling cereals consumption is
the main reason why per capita calorie intake has not
increased despite rising incomes. It is not just that the
share of cereals in total food expenditure is falling;
even poor people are reducing the share of income
spent on all foods in order to meet other non-food
needs. In such a situation, where there is a disjunction
between such a basic element of human development
as nutrition and other demands in an increasingly
consumerist society, there is need to ensure that min-
imum nutrition requirements are actually met. This
is the goal of the proposed National Food Security
Act (NFSA) under which a majority of the popula-
tion will be entitled to some very cheap cereals. This
is likely to increase cereals demand from those pro-
jected in Table 12.9, but nonetheless cereals demand
is unlikely to rise much faster than population.
12.49. This means that agricultural production
must diversify during Twelfth Plan so as to satisfy
both tastes and nutrition. In particular, MSP policy
should be more restrained for rice and wheat and
made more effective in case of pulses and oilseeds
where India is a net importer. Although MSP for
pulses and oilseeds have been increased substan-
tially in recent years, farmers are still not encouraged
enough to put in the effort and resources required
to substitute for current imports of these commodi-
ties. This is primarily because procurement efforts in
these commodities, which are currently not part of
Public Distribution, simply do not offer farmers the
certainty that they have from procurement effort in
rice and wheat.
TABLE 12.8
Real Prices of Agricultural Produce
(WPI commodity/WPI all commodities, 2004–05 base)
2004–05 2005–06 2006–07 2007–08 2008–09 2009–10 2010–11 2011–12
Rice 100 101 99 105 112 121 117 110
Wheat 100 101 112 115 117 127 120 108
Coarse Cereals 100 107 110 115 113 123 122 136
Pulses 100 108 134 124 124 146 137 129
Vegetables 100 109 103 118 113 124 128 115
Fruits 100 99 99 98 102 104 114 119
Milk 100 97 98 98 98 112 123 124
Eggs, Fish and Meat 100 102 101 100 99 116 133 137
Oilseeds 100 86 85 97 104 103 99 102
Sugarcane 100 96 91 87 80 81 109 107
Fibres 100 92 91 96 109 107 138 140
All Agriculture 100 99 101 104 106 115 123 122
Note: All agriculture comprises food and non-food primary articles.

18 Twelfth Five Year Plan
Public Distribution System
12.50. The Eleventh Plan period witnessed sig-
nificant improvements in administration of the
Targeted Public Distribution System (TPDS). A
nine-point action plan has been useful in elimina-
tion of large number of ghost ration cards, reduction
in leakages and greater transparency in the con-
duct of TPDS operations. While carrying forward
these initiatives with greater vigour, there is a need
for rejuvenated approach towards the TPDS dur-
ing the Twelfth Plan period. The foremost amongst
those is the move towards facilitating rights-based
approach under TPDS by enacting the National
Food Security Bill (NFSB). The Bill has been intro-
duced in the Parliament and is expected to provide
food and nutritional security, in human life-cycle
approach, by ensuring access to adequate quantity of
quality food at affordable prices to people to live a
life with dignity. This would require strengthening of
existing infrastructure and taking up new initiatives
and schemes. Reforms in the TPDS would be crucial
as it would bring about more efficiency in the sys-
tem with enhanced transparency and accountability.
Entitlements of foodgrains are expected to shift from
per household basis to per capita basis. One of the
important challenges for implementation of NFSB
would be proper identification of beneficiaries which
may be based on the ongoing Socio-economic and
Caste Census. Another important initiative required
during the Twelfth Plan is the end-to-end comput-
erisation of the TPDS operations with the help of a
comprehensive Plan scheme. This shouldnot only
address current challenges but also facilitate proper
tracking foodgrains and lifting by consumers using
Aadhaar numbers or adopting innovative methods
like smart cards.
12.51. The up-scaling of the TPDS for proper imple-
mentation of NFSA is an opportunity to expand PDS
coverage to include coarse cereals, pulses and edible
TABLE 12.9
Demand and Supply of Food Commodities during the Twelfth Plan
(in million tonnes)
Crop/Group of Crops Projected Demand (million tonnes) Projected Supply
(million tonnes)
2016–17
Actual Production (million tonnes)
2016–17 2020–21 2006–07 2011–12
Rice 110 117 98–106 93 104*
Wheat 89 98 93–104 76 94*
Maize 19 22 15 22*
Coarse Cereals 36 38 42–48 34 42*
Cereals 235 253 240–251 203 240*
Pulses 22 25 18–21 14 17*
Foodgrains 257 277 258–272 217 257*
Oilseeds/Edible oils 59 71 33–41 24 30*
Sugarcane/Sugar 279 312 365–411 355 358*
Vegetables 161 189 116 147**
Fruits 97 124 59 75**
Milk 141 173 103 122**
Fish 11 14 6.9 8.3**
Meat, other than poultry 3.7 5.0 2.3 2.7**
Poultry Meat 3.3 4.3 2.2@
Source: Twelfth Plan Working Group on Crop Husbandry, Demand and Supply Projections, Agricultural Inputs and Agricultural
Statistics; *4th advance estimate for 2011–12; **Production for the year 2010–11; @Production 2010–11 for only commercial poultry
meat.

Agriculture 19
oils and thereby bring scale and certainty to their
procurement. However, given that consumption and
production patterns vary greatly from state to state,
this is probably something that can be done better
by the States themselves than by any Central agency.
Nonetheless, as part of PDS reform, the Central
Government could moot the idea not only of decen-
tralised procurement but also the innovative meth-
ods of transferring food subsidy. One option could
be that, while the Centre continues to bear respon-
sibility for delivering adequate quantities of cereals
to every State, these may be priced close to market
and food subsidy transferred to the States as recom-
mended by the High Level Committee on Long Term
Grain policy in 2002. Alternatively, subsidy could be
credited directly to the bank accounts of the benefi-
ciaries or the FPS dealers using authentication mech-
anism of Aadhaar numbers. Other option could be
to have a comprehensive electronic benefit trans-
fer system whereby subsidy is loaded on to a smart
card and consumers have a choice of commodities
or fair price shops. These initiatives are expected to
bring down leakages significantly as there would be
little incentive left for intermediaries to divert the
PDS foodgrains into the open market. While imple-
menting these measures, it would be pertinent to
address the issue of viability of FPS and improve
their functioning. The Gross Budgetary Support for
the Department of Food and Public Distribution is
`1,523 crore for the Twelfth Five Year Plan.
Consumer Welfare and Protection
12.52. Consumer welfare has been one of the core
concerns of the Government since the post-Inde-
pendence period. Policies have been designed and
legislations enacted to protect the interests of con-
sumers and grant them the rights of choice, safety,
information and redressal. For the Twelfth Plan
period, it would be apposite to expedite formula-
tion of a comprehensive National Consumer Policy
in conformity with the UN guidelines on consumer
protection. Secondly, there would be a need to revisit
existing legislations administered by the Department
of Consumer Affairs so as to bring the provisions in
line with the changes in the economy, trade, business
and consumer expectations. This, inter alia, includes
amendments in Bureau of Indian Standards Act and
Forward Contracts (Regulation) Act. There is also a
need to conceptualise a National Policy for Quality
Infrastructure covering standardisation, testing and
legal metrology so as to provide the infrastructure
for development of definitive standards, systems
of legal metrology and conformity assessment. The
commodity futures markets need to be strengthened
to enable it to serve the dual purpose of price dis-
covery and risk management. Besides, a structured
system of information, counselling and mediation
need to be put in place with emphasis on rural con-
sumers. The data analysis and price monitoring also
need to be more comprehensive and structured so as
to make informed decisions on market intervention.
The Gross Budgetary Support for the Department
of Consumer Affairs is `1,260 crore for the Twelfth
Five Year Plan.
MAJOR CHALLENGES AND PRIORITIES
DURING THE TWELFTH PLAN
12.53. The main lesson from the performance in
the Eleventh Plan is that while there has been a wel-
come turn-around from the deceleration that was
evident in the decade to 2005, and while several
indicators have shown marked improvement and
potential to build upon, several policy imbalances
exist that can prove to be major handicaps. There
are also other formidable challenges, for example,
a shrinking land base, dwindling water resources,
the adverse impact of climate change, shortage of
farm labour, and increasing costs and uncertainties
associated with volatility in international markets.
The Twelfth Plan will need to face these challenges
boldly.
12.54. The key drivers of growth will remain:
1. viability of farm enterprise and returns to invest-
ment that depend on scale, market access, prices
and risk;
2. availability and dissemination of appropriate
technologies that depend on quality of research
and extent of skill development;
3. Plan expenditure on agriculture and in infra-
structure which together with policy must aim to
improve functioning of markets and more effi-
cient use of natural resources; and

20 Twelfth Five Year Plan
4. governance in terms of institutions that make
possible better delivery of services like credit,
animal health and of quality inputs like seeds,
fertilisers, pesticides and farm machinery.
12.55. In addition, certain regional imbalances
must be clearly addressed. A national priority from
view of both food security and sustainability is to
fully extend Green Revolution to areas of low pro-
ductivity in the eastern region where there is ample
ground water, and thereby help reduce water stress
elsewhere. Rain-fed areas continue to be at a disad-
vantage, and their development still requires some
mindset changes.
FARM VIABILITY: SECURING ECONOMIES OF
SCALE AND BETTER MARKET ACCESS AND
RETURNS
12.56. Farm profitability is central to achieving rapid
and inclusive agricultural growth. Improved agricul-
tural prices (Table 12.8) were an important driver
in success of the Eleventh Plan. But slower growth
of demand in some major sub-sectors (Table 12.9),
combined with higher input costs due to world price
trends, could cause this driver to be more muted in
Twelfth Plan unless offset by increase in productiv-
ity. The reports of the Commission on Agricultural
Costs and Prices show low net farm revenue for
many crops, particularly rain-fed. Diversification
towards higher value crops and livestock remains
the best way not only to improve farm incomes and
accelerate growth, but also to reduce stress on natu-
ral resources which form farmers’ production base.
This needs better infrastructure and emphasis on
integrated farming systems, combining crops and
livestock, including small ruminants, for different
location-specific endowments. This also requires
innovative institutional and contractual arrange-
ments so that smallholders have the requisite tech-
nology and market access.
(A) The Centrality of Smallholdings
12.57. Small farms typify Indian agriculture and this
predominance continues to increase. Agriculture
Census 2005–06 reported the average size of an
operational holding at only 1.23 hectare, with farms
less than 2 hectares comprising 83 per cent of all
holdings and 41 per cent of area. No agricultural
development Plan can be credible unless it is relevant
to this vast majority of farmers. Also, 12 per cent of
rural households are now female headed with even
smaller holding, and the feminisation of agriculture
poses special problem.
12.58. An important step that would help small and
marginal farmers is to reform the tenancy laws. These
were originally meant to help small and marginal
farmers but now operate against them. Even limited
legalisation of agricultural tenancy and freeing the
land lease market with proper record of ownership
and tenancy status will help such farmers. Some small
farmers may lease out land to shift to other occupa-
tions, provided they were assured that they could
resume the land if they wished. Some large farms may
lease in land and even employ the small owner on his
own farm to grow specific crops under supervision.
Moreover, a stark reality of India’s farm situation
today is that while land hunger continues unabated
amongst the poor and uneducated, especially female,
educated young men in richer households are leaving
agriculture. The rapid rise of wages for rural casual
labour during the Eleventh Plan period has further
increased the relative cost of cultivating with hired
labour. Many large and absentee owners are leaving
land under-cultivated which could be leased out if
they were assured of retaining ownership.
12.59. The Eleventh Plan had set out in detail the key
elements necessary to make land policy effective for
equity and efficiency. These are:
1. Modernisation of land records must be both
time-bound and comprehensive. Full digitisa-
tion of land records, including GIS maps, should
be completed with required survey/settlement
by end of the Twelfth Plan, during which pilots
should also be initiated to enable movement
towards a Torrens system in the Thirteenth Plan.
2. Although there is no strong case to change
existing ceiling laws, there are several pending
implementation issues that can and should be
addressed as land records are modernised.
3. Land issues in tribal areas require urgent and
special attention.

Agriculture 21
4. Although no major new redistribution of agri-
cultural land is likely, it is possible to ensure that
all rural households have at least homestead-
cum-garden plots.
5. Tenancy should be legalised in a ‘limited’ man-
ner. Prescribed rents, if any, should allow a band
wide enough for rents to be contracted mutually
over contract periods long enough to encourage
investment by tenants while protecting owner-
ship rights so that landowners have incentive to
lease out land rather than keep this underutilised
or fallow.
6. Small and marginal farmers, particularly women,
lack adequate access to credit, extension, insur-
ance and markets. While every effort should be
made to strengthen delivery of public services in
their favour, the intervention likely to be most
potent is support to group action by farmers
themselves. It was suggested that subsidies in
Government schemes give preference to group
activity.
12.60. Most of these issues, as well as the associ-
ated matter of consolidating fragmented holdings in
course of survey/settlement, are in the State domain
and progress is uneven. Ongoing efforts of Ministry
of Rural Development (particularly, Department of
Land Resources) and Ministry of Tribal Affairs also
address some of these issues, although not necessar-
ily related directly to agriculture. However, there was
little progress during the Eleventh Plan on the sug-
gestion to redesign schemes so that subsidies favour
group activity among small and marginal farmers.
In fact, a criticism of the Eleventh Plan schemes has
been that these diluted earlier specific support for
such farmers.
12.61. Almost all the Twelfth Plan working groups
set up by the Agriculture Division of Planning
Commission have strongly recommended that the
Twelfth Plan should put special focus on building
capacity that encourages group formation and col-
lective effort by small, marginal and women farm-
ers, rather than simply provide additional subsidy to
individuals in these categories. Existing group activ-
ity takes many forms depending on purpose. From
lower tiers of formal cooperative structures in credit,
marketing, dairy and fishery, extending to self-help
groups (SHGs), farmer clubs, joint liability groups
(JLGs) and, more recently, to producer compa-
nies. For simplicity, these can all be termed Farmer
Producer Organisations (FPOs).
12.62. The Twelfth Plan Working Group on Disad-
vantaged Farmers, including women has provided
evidence-based assessment of the ground situation.
New insecurities of tenure from urbanisation and
industrialisation are impacting small farms which
are efficient but lack adequate access. Its main rec-
ommendation is that a collective approach should
be promoted in agriculture for small and women
farmers at all points of the value chain. It cites many
successful examples that stretch from the Gambhira
farmer’s collective in Gujarat, initiated in 1953 and
still going strong, to several initiatives of women’s
group farming in Andhra Pradesh such as one ini-
tiated by Deccan Development Society in 1989 and
another initiated by a UNDP-GoI project in 2001
and sustained since 2005 by the Andhra Pradesh
Mahila Samakhya (APMSS). The most recent suc-
cess story is the collective farming initiative launched
in 2007 under Kudumbashree jointly by Kerala
Government and NABARD. Success of these in
increasing production and empowering women
point to a need for States to experiment with (i)
channelising NGO strength in mobilising people to
encourage small holders to shift from an individual
to a group-oriented approach; and (ii) facilitating
land access by groups of disadvantaged farmers with
appropriate arrangement for provision of inputs,
including credit. Financing such experiments should
be permissible under RKVY.
12.63. Since land access was the most difficult part
in all the above efforts, the Working Group has sug-
gested that, except distribution of homesteads to the
homeless which should have the highest priority,
future Government land distribution should be to
groups of landless and women farmers rather than
to individuals. This could take the form of long-term
lease which would expire if the group broke down,
for which it would be necessary to legalise tenancy
at least for this purpose. Moreover, an innovative
suggestion of both this Working Group and the

22 Twelfth Five Year Plan
Working Group on Marketing is to set up Public
Land Banks (PLB) at Panchayat level. Landowners
could ‘deposit’ uncultivated land and receive regular
payments from the PLB varying by period of deposit
and rents actually obtained with the guarantee that
this ‘deposit’ can be withdrawn with suitable notice.
The PLB could then lease out to small and women
farmers or their collectives. A form of ‘limited’ ten-
ancy aimed at fuller agricultural use of available farm
land and to slow down speculation in such land for
future non-agricultural use, this idea excludes leas-
ing to corporate entities. However, to set up PLBs
will require some initial seed capital and a clear legal
framework. If States provide the legal framework
and the necessary guarantees, the seed capital could
also be permissible under RKVY.
12.64. Access to finance, especially by small hold-
ers, is crucial for improved agricultural performance.
Credit flow doubled in the Eleventh Plan but mainly
by credit deepening, with little increase in farmer
coverage and still leaving 60 per cent of farmers
without institutional credit. There are several ways
in which credit access can be widened. Primary
Agricultural Co-operative Societies (PACS) still have
the widest coverage and must be made more member-
driven and less dependent on higher tiers. Joint
Liability Groups (JLGs) are still the most appropri-
ate mechanisms for farmers and livestock owners
who have productive assets but cannot access credit
because they have no land records, are located too far
from banks or have last mile problems. The SHG-
Bank Linkage programme is still the most appropri-
ate financial mechanism to extend credit to marginal
and dry land farmers as this allows better income
smoothing since SHGs provide space for diversity
in loan purposes and sizes, enabling financing of a
variety of activities that such families select as part of
livelihood strategies when income from agriculture
is low.
12.65. Commercial banks have not supported JLGs
or SHGs as much as they could have, preferring
instead to comply with priority sector requirements
by offering bulk finance through Non-Banking
Financial Companies (NBFC) and Micro-Finance
Institutions (MFI). However, NBFC–MFI lending
is mainly individual and based on standard prod-
ucts imposing short repayment schedules which
did not dovetail with cash flows from agriculture.
This caused multiple borrowings, increased risk
to borrowers and led to a backlash. The solution is
to restore the principle of group decisions by bor-
rowers both in the borrowing process and in use of
borrowed resources. This need not exclude NBFC–
MFI so long as shortcuts are avoided. For example,
NABFINS, a NBFC promoted by NABARD, lends
only to groups and uses a Business Correspondent
(BC) Model that also provides working capital to sec-
ond level institutions like cooperatives and producer
companies which aggregate, add value and market
commodities. The SHGs have a stake in these second
level institutions which help expand their livelihood
base.
12.66. Small and marginal farmers face problems
not only with shrinking land assets and with credit;
they have difficulty in accessing critical inputs for
agriculture such as quality seeds and timely techni-
cal assistance. In this situation, FPOs offer a form
of aggregation that leaves land titles with individual
producers and uses the strength of collective plan-
ning for production, procurement and marketing
to add value to members’ produce through pooled
resources of land and labour, shared storage space,
transportation and marketing facilities. These also
improve bargaining power of small farmers and,
most importantly, reduce transactions costs of banks
and buyers to deal them. Investing in such group
efforts has strong externalities.
12.67. The Twelfth Plan Working Group on Agri-
cultural Marketing, Infrastructure, Secondary
Agriculture and Policy for Internal and External
Trade has in fact suggested that an institutional
development component, along lines of NABARD’s
farmer club scheme, be introduced in all Centrally
sponsored schemes to specifically target FPO for-
mation among small producers, especially tribals,
dalits and women. It notes that a majority of FPOs
that are likely to emerge as a result of such an inter-
vention will remain focused on addressing issues of
crop planning, technology infusion, input supply
and primary marketing. But, with adequate support

Agriculture 23
for business development, about one fourth to a
third would seek to leverage presence further up the
value chain, most likely at the lower end (for exam-
ple, setting up pack houses, grading centres, small
cold stores, drying or quick freezing plants). Larger
FPOs, for example, existing cooperatives could pro-
vide this support and in fact could aim bigger, but
issues may be different. For example, the National
Dairy Development Board’s SAFAL has had only
limited success although the wide network and logis-
tics of milk cooperatives make these obvious incuba-
tors for village-level aggregation of other perishable
products. Therefore, the Twelfth Plan must try to
mainstream support for FPO formation and capac-
ity building using all credible agencies for the pur-
pose: existing cooperatives, NABARD and the Small
Farmers’ Agribusiness Consortium (SFAC).
(B) Issues in Expanding Agricultural
Marketing and Processing
12.68. A major problem facing cultivators is that they
do not get remunerative prices because of uncer-
tainties caused by inadequate market information,
unnecessary controls, lack of physical infrastruc-
ture and price volatility—both domestic and global.
In order to provide adequate incentives to farmers,
the Twelfth Plan will have to focus on leveraging the
required private investment and also policies that
make markets more efficient and competitive.
12.69. Reforming the Agricultural Produce Market-
ing Committee (APMC) Acts should therefore have
priority as emphasised in the Eleventh Plan and the
Mid-term Appraisal. The introduction of the Model
Act in 2003 was directed towards allowing private
market yards, direct buying and selling, and also to
promote and regulate contract farming in high-value
agriculture with a view to boost private sector invest-
ment in developing new regularised markets, logistics
and warehouse receipt systems, and in infrastructure
(such as cold storage facilities). This is particularly
relevant for the high-value segment that is cur-
rently hostage to high post-harvest losses and weak
farm-firm linkages. While many States have moved
towards adoption of the Model Act, actual progress
has been limited. Often the permissions given are
subject to unacceptable restrictions which make
them ineffective. Vested interests in maintaining the
existing mandi system intact are very strong. In view
of the slow progress, the Ministry of Agriculture
set up a Committee of State Ministers in-charge of
agricultural marketing. The Committee submitted
a ‘First Report’ in September 2011 which has been
circulated to all States and UTs. The report calls for
‘speedy reforms’ of Agricultural Produce Market
Committees (APMC) Act across different States
along with ‘time-bound development’ of marketing
infrastructure. Calling for a ten-year perspective plan
to improve infrastructure of backward and forward
linkages for agriculture production and marketing,
the report has suggested that agricultural marketing
be given access to priority sector lending. Thus, the
process to secure necessary amendments in APMC
Acts and thus create the enabling legal environment
is still ongoing. The Twelfth Plan will need to fast-
track modernisation of mandi infrastructure, with
adequate provision of communication and transpor-
tation, and also empower small producers through
their organisations and marketing extension.
12.70. Post-harvest losses, probably average 10 to
25 per cent, being particularly high in horticul-
ture, livestock and fisheries. Very large investments
are required in developing agricultural markets,
grading and standardisation, quality certification,
warehouses, cold storages and other post-harvest
management of produce to address this problem.
Such large investments are possible only with the
participation of the private sector which, in turn,
require freedom from controls on sales/purchase of
agricultural produce, its movement, storage and pro-
cessing. Many new initiatives were taken up during
the Eleventh Plan, including both terminal markets
under Public–Private Partnership (PPP) mode in the
National Horticulture Mission (NHM) and a model
of public sector investment combined with profes-
sional management by stakeholders as exemplified
by NDDB’s fruit and vegetable wholesale market at
Bengaluru and APEDA’s Modern Flower Auction
Houses.
12.71. The Twelfth Plan Working Group on Horti-
culture and Plantations which studied the matter
in detail has observed that participation by traders,

24 Twelfth Five Year Plan
wholesale buyers, exporters and processors has actu-
ally been very low in all these new initiatives because
of reluctance to be subject to transparent operating
procedures. It has come to the conclusion that the
present model of Market Sector Reforms which is
trying to create space for a new set of modern mar-
kets in coexistence with much less transparent pro-
cedures in APMC regulated markets is unlikely to
result in any major private investment in modern
marketing infrastructure. In its view, to break the
barrier of reluctance to participate in business of
modern markets it is necessary as part of marketing
reforms to define and introduce a common Standard
Operating Procedure (SOP) for all markets: both
the new modern markets envisaged as well as exist-
ing regulated markets under APMC Acts. Therefore,
it proposes that managements of existing regulated
markets must be made to adopt the modern market-
ing model: that is, undertake the auction function
themselves and all payments to sellers ensured by the
Market Committee through a system of bank credit
limits of the buyers. This would involve redefining
the role of APMC management with introduction
of SOP and an open policy of registering buyers;
permitting setting up of private markets in APMC
areas; removal of interstate barriers to allow an uni-
fied national market, either by using entry 42 of the
union list or at least for sealed container cargo; and
single point levy at first point of sale.
12.72. While this entire area of regulation of agri-
cultural product markets is thus in some flux and
movement is still slow, an important initiative in
the Eleventh Plan involved setting up a Warehouse
Regulatory and Development Authority (WRDA) to
set standards and modernise warehousing. The aim
is enlarged use of negotiable warehouse receipts that
can be linked to e-trading, both spot and future, so
that farmers have an alternative to mandis. However,
so far less than 300 warehouses have been registered
and there is yet no effective coverage of perishable
products. Cold storages have recently been brought
under WRDA but minimum standards are yet to be
set. This may be as difficult as meeting the require-
ment of cold storage additional capacity estimated
at around 32 million tonnes over the next decade.
Present cold storages are of inadequate quality, most
domestic component manufacturers do not have
certified performance ratings, BIS standards do not
exist for many critical components of cold chain
infrastructure and critical storage conditions pre-
scribed internationally for cold chain structures have
yet to be validated for many Indian agro-climatic
conditions or cultivars.
12.73. Although India ranks second in world pro-
duction of fruits and vegetables, only 6–7 per cent of
this is processed, compared to 65 per cent in US and
23 per cent in China. A well-developed food process-
ing industry is expected to increase farm-gate prices,
reduce wastage, ensure value addition, promote crop
diversification, generate employment opportunities
and boost exports. Further, issues concerning food
processing industry are dealt with in Chapter 9.
12.74. The private sector needs to invest much more
in creation of warehousing capacity, cold storages
and supply chains. In this context, the Planning
Commission had also set up a Committee on
Encouraging Investments in Supply Chains includ-
ing provision for cold storages for more efficient
distribution of farm produce, which submitted its
report in May 2012. The Committee has indicated
that with regard to foodgrains, the Department of
Food and Public Distribution has initiated steps
for creation of 17 million tonnes of additional stor-
age capacity including 2 million tonnes in the form
of silos. This additional capacity is expected to take
care of public sector’s warehousing requirement dur-
ing the Twelfth Plan. The Committee has recom-
mended to exempt perishables from the purview of
APMC, provide freedom to farmers and make direct
sales to aggregators and processors, introduce elec-
tronic auction platforms for all the mandis where
daily transaction is above `10 crore, and replace
licensees of APMC markets with open registration
backed by bank guarantees to ensure wider choice to
growers and to prevent cartelisation by traders. The
Committee has recommended encouraging large-
scale private investments in the cold chain sector
using PPP Model with Viability Gap Funding besides
providing budgetary support and capitalising on
schemes such as Rural Infrastructure Development
Fund (RIDF). An Inter-Ministerial Group on Cold

Agriculture 25
Chain Infrastructure and Allied Sectors has been set
up by the Government to facilitate implementation
of these recommendations.
12.75. There is merit in planning part of such invest-
ment as infrastructure to reduce waste and enlarge
markets rather than wait for corporate investment in
processing or retail. The extent of wastage is not eas-
ily ascertainable and new research suggests that some
of the older estimates were quite likely exaggerated,
especially if quality loss leading to lower prices is not
counted as waste. Also, the experience so far is that
corporate entrants have not fared very well in the
competition with incumbent traders since existing
trading margins, although high, are in fact much less
than, for example, in the USA. However, there is no
doubt that modern storage and logistics do reduce
waste. If such infrastructure also improves farm
shares, social returns could exceed the private and
justify subsidies. Subsidy rates, increased recently
to 25–50 per cent, are now quite high and policy
should be clear on whether the goal is just capacity
targets or wider market access and improved mar-
keting efficiency. If the latter, eligibility criteria need
to be specified and also linked clearly with market-
ing reform. Social returns to subsidy will be more if
access to both the infrastructure and to markets is
more open. The real test is whether these can spawn
and sustain enterprise in aggregation, grading and
processing at the bottom, preferably by FPOs, but
also by lead farmers and even by existing commis-
sion agents.
12.76. The recent decision to open up debate on FDI
in retail must be seen in this context. With multi-
brand retail already open to the domestic corpo-
rate sector, FDI in retail should not be viewed as an
entirely new disruptive factor affecting traditional
retail. It will only add depth and competition to the
present situation. Deeper pockets and technology,
and the compulsions to invest in supply chain devel-
opment which is not there for domestic modern
retail may accelerate investment in logistics, quicken
consolidation of retail trade and create new pro-
prietary supply chains. It must be emphasised that
FDI alone will not resolve back-end issues related
to modernising agricultural markets that have so
far muted the domestic corporate effort and invest-
ment. FDI has an added potential to link farmers to
wider markets by expanding exports. However, the
Eleventh Plan had also noted the legitimate concern
that if front-end investment outpaces backward
linkage, the outcome could instead be more imports
and lower farm prices. The introduction of FDI will
increase, not lessen, the importance of priorities
identified above: marketing reforms, aggregation
at the bottom and public funding of stand-alone
infrastructure.
12.77. With less than 40 per cent of farm produce
presently consumed in urban areas and much less
processed, use of public funds to improve market
efficiency will have a positive effect on farm growth.
There are benefits in coordinating this effort with
other steps to encourage corporate investment in
this area. For example, the NHM was designed
based on a concept of adequately sized area clus-
ters so that processors could plan capacities based
on anticipated future fruit production that would in
turn ensure markets for farmers when trees finally
bore fruit. But processors have preferred to wait and
watch while farmers, not sure of adequate market for
any single crop, have usually chosen to diversify their
production basket. Most clusters have therefore not
developed in the manner intended. A larger thrust to
modernise processing and retail will require bringing
more synergy between corporate actors and farmers,
particularly in infusion of technology and capital at
the farm end.
12.78. The Ministry of Agriculture has proposed a
RKVY window for Public–Private Partnership for
Integrated Agricultural Development (PPPIAD) for
States to facilitate ‘large scale integrated projects led
by private sector players with a view to aggregating
farmers and integrating agricultural supply chains.’
The idea is to leverage corporate interest and mar-
keting solutions to part-finance mobilisation of
expertise to form FPOs and infuse technology and
capital to enhance farm production and value addi-
tion. This is in line with views of various working
groups, and needs to be piloted. But since this will
in effect be public subsidy to contract farming, it
is necessary to be clear on what should and should

26 Twelfth Five Year Plan
not be subsidised. First, project selection should
go beyond where contract farming would normally
occur; that is, give priority to proposals involv-
ing FPOs composed mainly of small and marginal
farmers in less accessible and rain-fed locations.
Second, tangible assets that are property of the cor-
porate partner cannot be subsidised by RKVY. Only
stand-alone assets of farmers or their FPOs should
be subsidised. Third, a transparent project selection
mechanism will be required to rank proposals, for
example, by assigning marks based on States’ priori-
ties to deliverables offered, with outcome indicators
for subsequent monitoring. If this works, it might be
a game changer, not only to form FPOs and widen
farm-industry linkage but also to fast-track desir-
able changes in cropping patterns.
(C) Credit and Cooperatives
12.79. The Twelfth Plan Working Group on
Institutional Finance, Cooperatives and Risk
Management has projected the demand for credit
during Twelfth Plan at between `31,24,624 crore
and `42,08,454 crore, depending on the methodol-
ogy used. At the higher end of these estimates, that
is, assuming agriculture growth at 4 per cent and
ICOR at 4.5, the size of the credit requirement in
the Twelfth Plan period translates into about double
the flow during the Eleventh Plan, that is, `8 lakh
crore per year, as against the level of `4.68 lakh crore
achieved during 2010–11.
12.80. This projected level of credit appears feasible
in view of the Eleventh Plan achievement. As against
credit flow of `2,29,401 crore in agriculture during
2006–07, the total institutional credit flow to agri-
culture in 2011–12 was `5,11,029 crore. But despite
this very robust growth, many issues continue to
confront agricultural credit, particularly in the area
of financial inclusion necessary for ensuring inclu-
sive growth. Agricultural credit continues to neglect
certain sub-sectors, the flow of term lending is dwin-
dling and there is inordinate increase in the share of
indirect finance. Credit dispensation by institutions
to small and marginal farmers has been disappoint-
ing, including by the Cooperative Credit Structure
(CCS) which has traditionally catered to relatively
smaller farmers.
12.81. On these issues, the working group has
pointed to the need for more objective assessment of
credit requirements for direct and indirect financ-
ing of agriculture and also to redefine the priority
lending sectors. It has suggested updating of KCC
databases with priority analysis of KCC percent-
age provided to the small and marginal farmers and
more intensive use of ICT applications to track the
flow of credit and transmission losses, with refer-
ence to such farmers.
12.82. Some ongoing and emerging changes appear
to hold promise of triggering off better financial
inclusion for banking activity:
1. The Core Banking Platform provides seamless
connectivity which, with the telecom infrastruc-
ture, brings a new architecture to access financial
services.
2. The BC model, together with mobile phones, can
along with post offices provide significant last-
mile connectivity.
3. Mandating payments (for example, of wages
under the National Rural Employment
Guarantee Act, pension dues and so on) through
formal channels, including post offices, is help-
ing to reach financial services to those so far not
reached.
4. The enormous economies of scale generated
by SHG Federations (each of 150–200 SHGs) is
enabling banks to give larger loans for housing
and health facilities for their members. A variety
of insurance services are also being made avail-
able, including life, health, livestock and weather
insurance.
5. The UID project of the GoI with biometric
identity may facilitate easier opening of bank
accounts, although this has yet to happen.
12.83. The financial health of the Long-term
Cooperative Credit Structure (LTCCS) continues to
deteriorate with accumulated losses of `5,275 crore
by March 2010, resulting in erosion of 59 per cent in
owned funds. A quick decision is warranted on the
implementation of the revival package for the LTCCS
too on the lines of the Short-term Cooperative Credit
Structure (STCCS).

Agriculture 27
12.84. Notwithstanding, the relatively improved
financial health of the STCCS following implemen-
tation of the revival package, its share in total insti-
tutional credit continues to show a declining trend.
The package for STCCS was conditional to radical
restructuring of coops into autonomous, democratic
and self reliant institutions without intrusion of
politics and bureaucracy. The States have not imple-
mented these recommendations with full serious-
ness. Therefore, Cooperative Sector Reforms should
continue to be insisted upon during the Twelfth
Plan.
12.85. In the interest of strengthening of the ground
level tier, there is also need for considering disci-
plined refinancing of PACS as stand-alone institu-
tions, provided that these are member driven. PACS
still have the widest coverage and the recent develop-
ment of financing PACS through commercial banks
needs to be widened, deepened and strengthened,
especially in cases where higher tiers of the STCCS
are weak and not in a position to fund them.
(D) Farm Income Variability: Managing World
Price Volatility and Climate Risk
12.86. The Eleventh Plan document had noted that
farmers are now subject to much greater risk than
what Indian farmers have been used to in the past.
The frequency and severity of risks in agriculture
have increased on account of climate variability and
this has been accompanied by much greater variabil-
ity of world prices and their quicker transmission
into the domestic economy. On price variability,
it had recommended much greater co-ordination
between MSP and trade policies and for putting
in place a system whereby tariffs on imports and
exports of farm products could be varied quickly
in response to world price movements rather than
having to take recourse to outright bans which hurt
both farmers and trade. On climate variability, it had
recommended going beyond current insurance mea-
sures and to put in place a tertiary mechanism for
management and assessment through climate fore-
casting and mapping of agricultural losses.
12.87. World agricultural prices rose sharply dur-
ing the Eleventh plan period, with inflation about
9 per cent per annum in US dollar terms and price
volatility much higher than before, accompanied by
even higher world inflation in fuels and fertiliser.
It is now generally agreed that among the several
factors that contributed to this were more frequent
weather shocks, policies to promote biofuels and
increased demand on commodity future markets as
a result of speculation and portfolio diversification.
There is also consensus that linkage between agri-
cultural prices and price of oil is now very strong
and may cause high volatility to persist. As com-
pared to this, domestic Indian agricultural prices
were much less volatile and domestic prices of fuel
and fertiliser were increased much less than corre-
sponding international prices. Indian farmers were
thus relatively better protected against both higher
price volatility and higher costs. However, this has
involved repressing inflation in fuel and fertiliser
and required bans on exports during world-price
spikes. Co-ordination between MSP and tariff
policy is still very weak. For example, while other
aspects of a recent CACP suggestion for oil palm
development can be met by ongoing schemes,
the proactive tariff support required is a sticking
point. These will need to be addressed during the
Twelfth plan.
12.88. On the climate side, a number of initiatives
taken by the Indian Space Research Organisation
(ISRO) and the India Meteorological Department
(IMD) during the Eleventh Plan have significantly
improved the scope and quality both of climate data
and of other remote sensing tools. Although IMD’s
long-range forecasts of the monsoon still have a
very large margin of error, its shorter-range prod-
ucts not only have greater accuracy but cover an
array of agro-meteorological variables with fairly
high resolution. There is also much better co-ordi-
nation today between ISRO and IMD on one hand
and the Ministry of Agriculture, corresponding State
departments and NARS on the other. For example,
Department of Agriculture and Cooperation (DAC)
has set up a Mahalanobis National Crop Forecasting
Centre with ISRO collaboration to augment pre-
sent crop forecasts and assessment with regular
remote sensing, GIS and Global positioning System
(GPS) data.

28 Twelfth Five Year Plan
12.89. With better satellite products, an Eleventh Plan
innovation was the Integrated Agro-Meteorological
Advisory Service (IAAS) which now issues regular
weekly Agro-Met Advisory Bulletins up to district
level on field crops, horticulture and livestock. This
involves agricultural universities to collect and organ-
ise soil, crop, pest and disease information and amal-
gamate this with weather forecasts to assist farmers
in their decisions. Though still of very variable qual-
ity from district to district, and limited since dis-
trict is too big a unit for useful advisory, a 2009–10
NCAER study concluded that this brought large sav-
ings to farmers. In the Twelfth Plan, a Gramin Krishi
Mausam Seva (GKMS) will be launched to extend
IAAS to block level, initially on experimental basis.
Also, IMD will implement the Monsoon Mission
aimed at generating better seasonal monsoon rainfall
forecasts in different spatial ranges.
12.90. In a parallel Eleventh Plan initiative, that
took advantage of IMD experience with Automatic
Weather Stations technology, Government launched
a Weather Based Crop Insurance Scheme (WBCIS)
through the Agricultural Insurance Corporation
(AIC). Initiated as a pilot in Kharif 2007 in 70 hob-
lis of Karnataka for 8 rain-fed crops, by 2010–11 the
Scheme was being implemented in 17 States and
covered more than 67 lakh farmers growing crops
on 95 lakh hectares spread over 1,010 blocks in 118
districts.
12.91. At present WBCIS has about one-third the
coverage of the National Agricultural Insurance
Scheme (NAIS), the main crop-insurance vehicle.
Based on results of crop-cutting experiments, this
has been in operation since 1999–2000. Although
a useful device, especially for farmers growing rela-
tively risky crops, the main problem with NAIS is
that it is not actuarial insurance. Premiums for most
important crops are fixed at all-India level irrespec-
tive of risk and Central and State Governments
pay for the entire excess of claims over premium
received. Moreover, being compulsory for all bor-
rowers from banks in States where it is in force, and
with relatively few non-loanee farmers involved,
it mainly insures banks against default following
poor harvest. Further, its popularity with farmers is
limited since crop-cutting experiments delay claims/
payments until well after harvest and risk covered is
only of yield shortfalls at the block level.
12.92. For these reasons AIC is also piloting a
Modified National Agricultural Insurance Scheme
(MNAIS) since 2010 that aims to (i) reduce the insur-
ance unit from block to village panchayat with higher
indemnity as proportion of threshold yield, (ii) move
to actuarial premiums supported by upfront subsi-
dies instead of NAIS practice of Government paying
the entire excess of claims over premium, and (iii)
extend insurance cover to situations such as failed
sowing, cyclonic rains and localised calamities, such
as hailstorms and landslides. The main problem is
lowering insurance unit which although good for
farmers increases the cost and effort on crop-cutting
experiments exponentially.
12.93. As a result, the Government of India is cur-
rently implementing four schemes, that is, NAIS,
MNAIS, WBCIS and another pilot Coconut Palm
Insurance Scheme (CPIS). Only NAIS is being
implemented as a full-fledged scheme and the other
three are being implemented on pilot basis. The
pilot programmes will be evaluated early in the
Twelfth Plan for future revisions/modifications to
evolve a National Agricultural Insurance Programme.
For this, the following will be necessary. First,
define what should be the core programme which
Government should set up and what should be left to
companies to devise their own insurance products.
Second, to examine the trade-off between competi-
tion and benefits of risk pooling, that is, a centralised
reinsurance system. Third, arrive at an optimum mix
between weather-based insurance and those depend-
ent on yield measurements whether by crop-cutting
experiments or remote sensing.
12.94. Some suggestions, based mainly on the
Twelfth Plan Working Group on Institutional
Finance, Cooperatives and Risk Management, are:
1. Taking as core the ongoing NAIS, modifications
being made through the pilot MNAIS should be
continued. The high cost of lowering the insur-
ance unit should be dealt with progressively in

Agriculture 29
consultation with States. Centre may share part
of the cost of crop-cutting experiments in the
short-run but should shift to new technologies
such as satellite imagery in the long run.
2. The issue of private-sector involvement in agri-
cultural insurance can be creatively addressed,
for example, through a system of co-insurance
under which the AIC is lead insurer (with under-
writing responsibilities and contacts with mul-
tiple agencies).
3. Weather-based insurance should continue, again
focused on customisation and innovation such
as double trigger (weather and yield) and index-
plus products, with State Governments choos-
ing what to subsidise. Roll-out of AWS can be
demand-led and private sector also involved
but with mandatory accreditation from a com-
petent third-party designated by Government to
ensure consistent and high-quality weather data.
Further, Terrestrial Observation and Prediction
Systems (TOPS) platforms need to be pilot
tested.
4. Other innovative products such as community-
based mutual insurance, savings-linked insur-
ance, a properly designed product fort contract
farming arrangement and so on can help estab-
lish insurance culture, especially if linked to FPO
formation.
5. Agriculture insurance, being specialty insur-
ance with huge Governmental intervention
should be seen more as a social instrument of the
Government rather than a commercial instru-
ment, hence is unlikely to be effectively adminis-
tered unless backed by a statute.
6. To protect non-insured farmers from extreme
financial distress, Government may con-
sider ‘Catastrophe Protection.’ A blanket Life
Insurance cover could be devised for at least
small/marginal farmers (including tenant farm-
ers) to meet liabilities to banks or other RFIs
in the unfortunate eventuality of death and to
secure some financial support to families of the
deceased. Premia on such group/blanket insur-
ance could be funded by Central/State Govern-
ments and financing banks, in full or in part.
7. Crop losses arising out of natural calamities are
presently compensated by Government funding
or concessions like loan/interest waivers/defer-
ments. This practice is fraught with inefficiency,
besides crippling repayment ethics. It is, there-
fore, necessary that dealing with loan losses
should be internalised within the banking system
through the constitution of Relief and Guarantee
Funds and Stabilisation Funds (set up partly with
Government funding, by diversion of subsidies
for loan repayments and so on).
AGRICULTURE RESEARCH AND EDUCATION
12.95. Agricultural research has played a vital role in
agricultural transformation and in reducing hunger
and poverty and its role in the Twelfth Plan will be
crucial. The Eleventh Five Year Plan had noted that
research in the past had tended to focus mostly on
increasing yield potential by more intensive use of
water and biochemical inputs, paying less attention
to either the long-term environmental impact of this
approach or to methods and practices for efficient
use of inputs and natural resources (Table 12.10). But
now that limitations of this approach were evident,
there appeared to be lack of any clear agricultural
research strategy or to assign definite responsibili-
ties and prioritise the research agenda rationally. It
had proposed that ICAR institutes undertake basic,
strategic and anticipative research, focusing particu-
larly on problems of rain-fed agriculture, while SAUs
concentrate on generating required manpower and
on applied and adaptive research to address local
problems. It had emphasised that research should
shift from a commodity based approach to a farm-
ing systems approach through convergent efforts of
R&D agencies within each agro-climatic region to
address local problems identified by stakeholders,
including development agencies. It had also stressed
the need to enhance spending on NARS and pro-
posed to raise this to 1 per cent of agriculture GDP
by end of the Plan period.
12.96. As it turns out, research spending at 2006–07
prices, although reaching nearly 0.9 per cent in 2010–
11, averaged only 0.7 per cent during the Eleventh
Plan. At current prices, it was even less, averaging
only 0.64 per cent during the Eleventh Plan. Part of
the reason was a shortfall of about 20 per cent in the

30 Twelfth Five Year Plan
Centre’s Plan expenditure from that originally tar-
geted, but the main reason was inadequate spending
by States. While Centre’s expenditure (non-Plan and
Plan, including RKVY) increased 68 per cent in real
terms between the Tenth and the Eleventh Plan peri-
ods, corresponding States expenditures increased
only 22 per cent. In particular, non-Plan spending
on SAUs increased less than 17 per cent, less than
required to meet the pay commission awards in most
States. Consequently, most SAUs are understaffed
and underfinanced. This is undoubtedly the most
serious problem confronting NARS.
12.97. Nonetheless, new SAUs continue to be cre-
ated, especially in animal husbandry, which lack ade-
quate staff, have little infrastructure and are grossly
underfunded. Emphasis has to be laid on arresting
proliferation and improvement, especially in core
disciplines like modern biology, to ensure a steady
supply of quality human resources. ICAR should
specify minimum standards, and meeting these
standards could be an eligibility condition for States
to get RKVY funding.
12.98. Significant contributions of public-sec-
tor research during the last decade have included
breakthroughs in basmati varieties, improved
wheat varieties resistant to rust including race ug99,
improved varieties of soybean, Bengal gram, mus-
tard, chickpea and single cross hybrid maize; which
have led to higher growth in these crops. Similarly,
although most Bt cotton hybrids that are commer-
cially successful are from private producers, these are
based mostly on public material. With respect to nat-
ural resource management, public research claims
significant contribution in developing resource
conservation technologies like integrated farming,
micro-irrigation, laser levelling, zero tillage and agri-
cultural practices to improve efficiency of nutrients
and water, including in situ rain water harvesting.
In fruits and vegetables, better varieties and hybrids,
disease management and multiplication of planting
material and in livestock and fisheries, disease man-
agement technologies (vaccines and diagnostics),
feed and fodder management, improving reproduc-
tive health and production of fisheries seed.
12.99. Broadly, although NARS has yet to respond
to changes suggested in the Eleventh Plan, there are
signs of some new research priorities and agendas.
As example of new collaborative research, ICAR
launched the ‘National Initiative on Climate Resilient
TABLE 12.10
Expenditure on Agricultural Research and Education
(` crore at 2006–07 prices)
Tenth Plan 2007–08 2008–09 2009–10 2010–11 2011–12 Eleventh Plan
States Plan 4,151 694 965 1,070 1,289 1,382 5,401
Non-Plan 6,477 1,464 1,315 1,497 1,755 1,599 7,629
Total 10,629 2,158 2,279 2,567 3,044 2,981 13,030
Centre Plan 4,977 1,210 1,418 1,402 1,909 1,998 7,938
Non-Plan 4,125 852 1,040 1,235 2,168 1,512 6,808
Total 9,102 2,063 2,458 2,636 4,077 3,510 14,745
RKVY Plan 55 197 63 100 160 576
Centre and
States
Plan 9,128 1,961 2,580 2,534 3,298 3,540 13,914
Non-Plan 10,603 2,316 2,355 2,732 3,923 3,111 14,437
Total 19,732 4,277 4,935 5,266 7,221 6,652 28,351
GDP Agriculture and
Allied (2006–07 prices)
33,40,648 7,64,890 7,65,601 7,73,565 8,27,969 8,50,812 39,82,837
Research/Education
as % GDP Ag
0.59% 0.55% 0.61% 0.67% 0.86% 0.76% 0.70%

Agriculture 31
Agriculture (NICRA)’ in February 2011 as a network
project with several collaborating institutions with a
view to enhance resilience of Indian agriculture to
climate vulnerability through strategic research and
technology demonstration. The research on adapta-
tion and mitigation covers crops, livestock, fisher-
ies and natural resource management. The project
aims to enhance resilience through development
and application of improved production and risk-
management technologies. It plans to demonstrate
site-specific technology packages on farmers’ fields
for adapting to current climate risks and to enhance
the capacity of scientists and other stakeholders in
climate resilient agricultural research and its applica-
tion. This will be continued during the Twelfth Plan.
12.100. For the Twelfth Five Year Plan, the ICAR
has proposed a number of new initiatives in its man-
ner of functioning, such as extramural funding for
research, creation of funds for agri-innovations and
agri-incubation and setting up of an Agriculture
Technology Forecast Centre (ATFC). To improve
staff strength and quality it has proposed an Adjunct
Professor Scheme, Agriculture Sciences Pursuit for
Inspired Research Excellence (ASPIRE), e-courses
and more post-doctoral fellowships. Modernisation
of SAU farms is also contemplated. In particular, it
has proposed the following new thrusts:
• Conceived Research Platforms: Research con-
sortia platforms are proposed for focused, time
bound multi-disciplinary research in areas of
‘Agro Biodiversity Management; Genomics;
Seed; Hybrids; GM Foods; Biofortification; Plant
Borers; High Value Compounds/Phytochemicals;
Nanotechnology; Diagnostics and Vaccines;
Conservation Agriculture; Waste Management;
Water Management; Natural Fibre; Health
Foods; Precision Farming, Farm Mechanisation
and Energy; Secondary Agriculture and Agri-
incubators.’ These will involve partnership of
ICAR with R&D organisations inside and out-
side NARS. Inter-departmental platforms for
research in these priority areas and also capacity
building in basic sciences, remote sensing and
medium range agri-advisory services will be fos-
tered involving CSIR, DBT, ICMR, DRDO, DST
research institutes as well as general universities
and Ministries of Environment, Space and Earth
Sciences.
• National Agricultural Education Project: A
National Agricultural Education Project for
Systemic Improvement in Higher Agricultural
Education and Institution Development is pro-
posed to be undertaken as an externally-funded
project to improve education quality in State
Agricultural Universities.
• National Agriculture Entrepreneurship Project:
Another externally-funded project is proposed in
order to build an ecosystem for nurturing entre-
preneurship development through translational
research for technology commercialisation, man-
agement of technologies for commercialisation,
research for breakthrough technologies for accel-
erated growth and higher-economic impact.
• Farmer FIRST: In order to make technology deliv-
ery process more effective through the existing
630 Krishi Vigyan Kendras, this new initiative
will enhance farmers–scientist contact through
multi-stakeholders’ participation to move beyond
production and productivity to privilege the com-
plex, diverse and risk prone reality faced by most
farmers.
• Student READY: A one-year composite pro-
gramme, the Rural Entrepreneurship and
Awareness Development Yojana (READY) is pro-
posed with the objective to develop professional
skills for entrepreneurship: knowledge through
meaningful hands-on experience in project mode;
confidence through end to end approach in prod-
uct development; and enterprise management
capabilities including skills for project develop-
ment and execution, accountancy and national/
international marketing.
• Attracting and Retaining Youth in Agriculture
(ARYA): This initiative will be implemented with
a youth-centric approach, targeting areas of agri-
culture research which can be converted into via-
ble economic enterprises and build capacities to
attract rural youth to agriculture.
12.101. The Twelfth Plan allocation for ICAR is of a
size that will allow spending on NARS to reach 1 per
cent of agriculture GDP by end of the Plan provided

32 Twelfth Five Year Plan
States fund SAUs similarly. The above ICAR propos-
als can have priority if defined in terms of delivera-
bles, rather than areas. Also, NARS should address
the following issues on priority basis during the
Twelfth Five Year Plan:
• Strengthening soil organic carbon (SOC) research,
particularly on the quality of organic matter and
microbial activity, physical properties of SOC,
validation and refinement of models and SOC
dynamics under different land uses and manage-
ment regimes.
• Developing Models and technology interventions
on rational use of inputs, especially nutrients and
irrigation water, under diverse agro-ecologies
through interdisciplinary and farmer participa-
tory mode in order to enhance their use efficiency,
as also farm profits.
• The Expert Group on Pulses has been critical of
NARS. Efforts to enhance the yield potential of
pulses, by analysing physiological and biochemi-
cal limitations of the current crop and designing
more efficient types, is a priority which should
also involve improving the nutritional quality
of pulses and reducing various anti-nutritional
factors.
• Another priority continues to be the development
of heat resistant varieties of wheat.
• Greater thrust needs to be given to post-harvest
management, secondary agriculture and value
addition, along with by-products and waste man-
agement. The agricultural technologies which
have been developed and matured in the Eleventh
Plan should be taken for commercialisation in the
Twelfth Plan. Accordingly, the human resource
development including para-technicians should
be emphasised.
• Private agriculture input and seed companies use
the research products of public system to generate
profits. The public research system should seek a
share in such profits which is possible if the pub-
lic research system takes due care in protecting its
intellectual property rights under the Protection
of Plant Variety and Farmers’ Rights Authority
(PPVFRA). This requires development of an
appropriate pricing mechanism and preparing a
suitable licensing system.
NATIONAL MISSION ON EXTENSION AND
TECHNOLOGY MANAGEMENT
12.102. The extension system of State agricultural
departments is the weakest link in the chain between
research and the farmer. Large number of vacan-
cies of extension workers in the State Agriculture
Department was one of the gravest concerns
expressed by the Eleventh Plan document. During
the Eleventh Plan, efforts were initiated to improve
extension services by extending Central support to
State extension reforms. This has resulted in 604
Agriculture Technology Management Agencies
(ATMAs) to be established across the country with
21,000 new posts sanctioned with Central assistance
at State, district and block levels. Also, since a con-
tinuous problem plaguing extension has been lack
of organic link between the research system and
the extension machinery, R&D linkage guidelines
were jointly brought out by the DAC and ICAR
and sent to all States and SAUs. The basic thrust of
these guidelines were to get ATMAs and KVKs to
work together at the district level and below, keep-
ing in view the priorities reflected in Comprehensive
District Plans. Although neither has delivered full
results, there is now much greater acceptance that
things must be done together.
12.103. Seed is also an area where NARS made much
greater effort than in previous recent Plan periods.
12.104. Along with seeds, farm mechanisation was
also highlighted earlier as a source of the Eleventh
Plan labour productivity gains. In view of emerging
labour shortages in many states, there is demand to
expand custom hiring services, as well as for new
implements. During the Twelfth Five Year Plan it
is proposed to give a co-ordinated thrust on seeds,
farm mechanisation and extension through a new
Mission on Extension and Technology Management.
This should also have a component to fund ICAR
research platforms to find solutions to problems
thrown up by extension and requiring expertise
beyond SAU.
(A) Seeds and Planting Material
12.105. Three major yield successes during the last
decade relate to cotton, maize and basmati rice.

Agriculture 33
These were driven by new seeds of which cotton and
maize hybrids were mainly from private sector while
basmati rice varieties were almost entirely public.
Increased adoption of hybrids in cross-pollinated
crops like cotton, maize, pearl millet and sorghum
has been led largely by the private sector, which
accounts for three-fourths of hybrids developed so
far in the country. But there is discernable change
in role of public sector in development of hybrids
after 2001–02. Till 2001–02, private sector devel-
oped 150 hybrids of cotton compared to 15 by pub-
lic sector; 67 hybrids of maize compared to three in
public sector. In the next seven years, public sector
increased its share from 8 per cent to 19 per cent in
cotton, from 4 per cent to 40 per cent in maize and
from 25 per cent to 58 per cent in rice, with similar
changes in other crops. In parallel, public production
of quality seeds of varieties have increased rapidly
in recent years, expanding the public share in total
seed use. Production of quality seed doubled from
140 lakh quintals in 2004–05 to 280 lakh quintals in
2009–10, contributing significantly to the Eleventh
Plan yield performance. Private sector accounted for
39 per cent of this seed production. Nonetheless, the
ratio of quality seed to total seed use by farmers is
still much lower than norm and there is considerable
scope to raise crop productivity by raising this ratio.
12.106. There are several pending issues regarding
seeds. For example, at present there is no regulatory
mechanism to protect farmers against non-perfor-
mance, say poor seed germination rate. The Seeds
Bill, 2004, introduced in Parliament in 2004, is still
under consideration of the Parliamentary Standing
Committee on Agriculture. It aims to regulate the
quality of seeds and planting material of all agricul-
tural, horticultural and plantation crops to ensure
availability of true to type seeds to Indian farmers;
curb the sale of spurious, poor quality seeds; pro-
tect the rights of farmers; increase private partici-
pation in seed production, distribution and seed
testing; liberalise import of seeds and planting mate-
rials while aligning with World Trade Organization
(WTO) commitments and international standards.
Comprehensive and authentic databases on seed
production and trade in India by public and private
sectors as required under the seed and plant variety
laws need to be built up. The seed chain and the
norms for quality control should be followed with-
out any compromises or shortcuts.
12.107. At present, the public sector is responsi-
ble for most valuable germplasm while private seed
agencies concentrate on more remunerative high
value seed segment. Under the circumstances, clear
protocols need to be developed for sharing precious
germplasm with the private sector on payment of
royalty, while ensuring their conservation and pre-
venting possible erosion of the national interest in
the context of international agreements on plant
variety and intellectual property rights. If this can be
done, there is vast scope to expand linkages between
the private seed industry and public research institu-
tions to take advantage of the positive aspects of both
the segments for the benefit of farmers.
12.108. ICAR needs to revisit procedures for variety
identification, release and notification to cover pri-
vate and farmers’ varieties and also to avoid bias in
favour of varieties evolved by the testing institutions.
The number of seed testing centres in the coun-
try should be expanded rapidly, if necessary in PPP
mode and with third party oversight, to reduce the
time taken in assessment and refinement of varie-
ties and hybrids and technologies for production
and protection of crops. There is also a need for
‘Phytosanitary’ certification, especially for export/
import of seeds. The State Seed Corporations may
establish at least one such certification centre in each
major State.
12.109. The DAC made the present assessment of
seed requirement during the Twelfth Plan for its
proposed Seed Mission with respect to some of the
major crops which brings out that even excluding
requirements arising from possible shift to hybrids,
seed production of varieties will need to increase by
about a third to meet the projected increase in seed
replacement rates. Since seed-production planning
should be done with a long-term perspective (con-
sidering the viability of the seed) and also to keep
buffer stock of seed to meet eventualities of natural
calamities that require replanting, the actual pro-
duction requirements may be higher. To meet the

34 Twelfth Five Year Plan
seed demand for 45 major crops produced within
the country and required under diverse conditions,
seed hubs need to be identified to produce seed and
supply the same to the farmers in each area. This will
save cost of transportation. Public agencies will also
need to strengthen infrastructure for seed process-
ing, storage, transportation and distribution.
12.110. Adequate availability of quality seeds is a par-
ticular challenge for farmers in rain-fed areas where
rainfall risks are high and productivity depends cru-
cially on timely sowing within a short rainfall win-
dow. The seed system must be capable of providing
seeds of contingency or alternative crops during
prolonged dry spells. With protection of crop diver-
sity important in rain-fed areas, strengthening and
improving local-seed systems and linking these to
NARS is a necessity for productivity enhancement.
12.111. An important part of the new Mission will
therefore be to better integrate farmers with produc-
tion and distribution of quality seeds through, for
example, seed village programmes and by encour-
aging NGOs to help FPOs take up seed production.
Therefore, capacity building will be vital to success.
Fodder seeds that are presently neglected and scarce
will need to be emphasised. Equally, the Mission
must be enabled to convey to NARS accurate feed-
back from farmers on seed suitability.
(B) Farm Machinery
12.112. Wages have increased significantly in recent
years and with labour accounting for more than 40
per cent of variable cost, many farm organisations
report that shortage of labour is obstructing opera-
tional efficiency. Animal power is also declining,
with commercial banks reluctant to extend loans
for bullocks. This has naturally led to an increase in
farm mechanisation. However, farm mechanisation
has so far been biased in favour of tractors and been
concentrated in irrigated-command areas paying lit-
tle attention to the needs of farmers in dryland areas
and the scope for introducing small machines that
might be useful to meet their needs.
12.113. Considering the farm sizes and prevailing
skills, farm mechanisation penetration would have
to be enhanced through promotion of custom hir-
ing models as well as individual ownership. While
draft animal power based implements and manual
tools should be owned by individual farmers (with
appropriate financial incentives, for example, off
season employment for animal power by integrat-
ing some services such as ‘manure transport’ with
MGNREGS), expensive machinery should be pro-
moted thorough custom hiring. This could be done
by promoting machinery service centres involving
existing FPOs or by groups of farm youth trained in
machinery operation and maintenance.
12.114. Greater impetus is needed to develop need-
based and regionally differentiated farm machin-
ery. Ongoing efforts by NARS need to be suitably
strengthened with appropriate participation of com-
mercial agricultural machinery manufacturers.
Financial incentives could be linked to require-
ments thrown up by extension experience from dif-
ferent locations or from FPO demand. The Mission
should identify and convey to NARS the critical
mechanisation gaps and, in particular, specific local
requirements related to machinery for soil and water
conservation and gender-friendly implements.
(C) Strengthening Extension
12.115. During the Eleventh Plan, the task of
strengthening and restructuring agricultural exten-
sion was approached through a wide mix of differ-
ent initiatives. The context for this was that while
public sector extension arrangements have weak-
ened, the number and diversity of private exten-
sion service providers have increased in the last two
decades. These include the media, NGOs, producers
associations, input agencies and agri-business com-
panies. Many provide better and improved services
to farmers, but their effective reach is limited and
most poor producers are served neither by public
nor private sector in many distant and remote areas.
Notwithstanding the important role being played
by private sector extension, there are also concerns
with regard to wholesomeness of information, given
equity and long-term implications.
12.116. Although setting up ATMAs in almost all
districts was the single most important achievement,

Agriculture 35
this went hand-in-hand with efforts to enhance qual-
ity through domain experts and regular capacity
building. Other efforts included interactive ways of
information dissemination, public–private partner-
ships and pervasive and innovative use of ICT/Mass
Media. Efforts were also made to involve agri-entre-
preneurs, agri-business companies and NGO experts
to bolster public extension. Most of these efforts will
have to continue in the Twelfth Plan since exten-
sion is a continuous process. But, in view of the ini-
tial broken down condition, there are considerable
gaps even after the subsequent effort. For example,
an evaluation of ATMAs by the Agricultural Finance
Corporation in 2009–10 found that although 52 per
cent of respondent farmers said that they gained
knowledge of new practices and technologies from
this, only 25 per cent felt that this had helped to
increase production. It is perhaps time to conduct
a country-wide extension census to identify exten-
sion resources (manpower, infrastructure, expertise)
available in public and private sectors.
12.117. It is also necessary to continue with experi-
mentation. There are number of models which have
been successfully implemented in several States and
countries which can be tried as pilots by ATMA and
then expanded. Many civil society organisations have
successfully experimented with community managed
extension systems with members of the local com-
munity acting as agents of agricultural extension. In
the Community Managed Sustainable Agriculture
(CMSA) model of Andhra Pradesh, members of the
village community have been trained and developed
as Community Resource Persons (CRPs). CRPs
adopt elements of sustainable and eco-friendly agri-
cultural practices in their own farms and are in a bet-
ter position to motivate and convince other farmers
than normal extension workers. Working with agri-
cultural scientists and extension personnel under the
broad ATMA umbrella, CRPs can help technology
transfer and diffusion.
12.118. Agricultural extension covering crops and
allied sectors is primarily the responsibility of the
States and it is expected that States should drive the
extension reforms process. Any national effort in this
regard can only support States’ efforts. Moreover,
as noted by the Twelfth Plan Working Group on
Agricultural Extension, while public policy in agri-
culture increasingly recognises importance of pub-
lic–private partnership in extension, the experience
so far is that PPPs have been the exception rather
than the rule. States must adopt PPP, but this is not
substitute for strengthening the public extension sys-
tem. Future collaboration between public and pri-
vate players will have to focus more on the public
sector’s ability to set standards and monitor progress
so that these standards are enforced on all players,
including public extension agents, while providing
institutional training and support.
12.119. An important task of the new Mission
should therefore be to consult with States so as to
evolve a standards and regulatory framework for cer-
tifying and validating extension activities by all play-
ers, including public extension agents. MANAGE
and SAMETIs should take the leading role in driv-
ing extension reforms at the National and State levels
respectively. The corporate sector should be encour-
aged to involve itself in this effort and in agricultural
extension in general, if only as part of their Corporate
Social Responsibility (CSR). Even more important
than funding under CSR, the corporate sector can
support by providing adequate extension training
to their extensive promotion network of distributors
and dealers so as to meet required standards.
12.120. The Twelfth Plan Working Group on
Agricultural Extension has noted that although
ATMAs exceeded targets on training, demonstra-
tions and exposure visits, the number of farm schools
set up was well below target and that matters were
lagging also on strengthening and extending Farmer
Advisory Committees at every level. Since active
involvement of farmers in planning and executing
extension reforms was a key ATMA goal, the new
Mission must concentrate on this and on feedback,
particularly on technology and on agricultural plans
at district and lower levels. A critical aspect of this
will be ATMA–KVK coordination and more inten-
sive ICT use.
12.121. Extension services must also be gender-sensi-
tised, and this will require joint efforts, involving the

36 Twelfth Five Year Plan
Mahila Kisan Sashaktikaran Pariyojana component
of the National Rural Livelihood Mission (NRLM)
under MoRD, the Project Directorate for Women in
Agriculture of ICAR and National Gender Resource
Centre in Agriculture (NGRCA) of Ministry of
Agriculture (MoA). Further, since the present exten-
sion system does not pay adequate attention to live-
stock, fishery and fodder and separate extension
machinery for animal husbandry and fishery is not
feasible in many states, this function will need to be
integrated with ATMA with suitable KVK and NGO
backstopping. Indeed, convergence should be a basic
goal of the new Mission, both on the side of technol-
ogy dissemination and feedback as well as for plan-
ning integrated agricultural development.
12.122. The ultimate objective of the Mission should
be to upgrade ATMA from a society operating as an
adjunct to line agricultural departments to an inde-
pendent entity with technical capability to offer local
solutions and deliver feedback to NARS on location-
specific technology needs. The larger trends of pub-
lic policy point towards decentralised governance
of natural resources and the promotion of growth
with increasing emphasis on district (and lower)
level planning. It is necessary to see decentralised
planning as an iterative planning—doing—learn-
ing—planning cycle rather than as simply a one-
time activity. The challenge is to institutionalise this
process and ensure that the agency facilitating plan-
ning also has accountability in the overall outcome.
ATMAs are a natural choice for such an agency in
the present context.
SPECIFIC PLANS AND OBJECTIVES FOR THE
MAJOR SUB-SECTORS
(A) Livestock
12.123. For achieving growth rate of 5–6 per cent
per annum the animal husbandry sector would need
to address important challenges during the Twelfth
Plan. These include delivery of services, short-
age of feed and fodder and frequent occurrence of
deadly diseases. Compared to its contribution in
the economy livestock sector has received much less
resources and institutional support. Livestock exten-
sion remains grossly neglected. The country still lacks
adequate facilities and the infrastructure for disease
diagnosis, reporting, epidemiology, surveillance and
forecasting. Livestock markets are underdeveloped,
which is a significant barrier to commercialisation
of livestock production. Besides, the sector is also
coming under significant pressure of increasing glo-
balisation of agri-food markets. Although there is
demand for Indian meat products in international
markets, lack of international processing standards
is a hindrance. Unfortunately, schemes on moderni-
sation of slaughterhouses and by-product utilisation
have not been effectively implemented. In the animal
husbandry sector, the major priority areas during
Twelfth Five Year Plan will be breed improvement,
enhancing availability of feed and fodder and pro-
vision of better health services, including proper
breeding management. Conservation and perpetua-
tion of diverse local germplasm, which are adaptable
to Indian climate conditions and resistant to various
endemic diseases, will be another important area,
with clearer focus on sub-sectors such as small rumi-
nants that have so far been neglected.
12.124. An important Twelfth Plan initiative is
the National Dairy Plan (NDP), which has already
been launched as a central sector scheme with
credit support from the International Development
Association (IDA). To be implemented by the
National Dairy Development Board (NDDB)
through a network of End Implementing Agencies
(EIAs), mainly dairy cooperatives and producer
companies, this aims to (i) increase productivity of
milch animals and thereby increase milk production
and (ii) provide rural milk producers with greater
access to the organised milk-processing sector. These
objectives would be pursued through adoption of
focused scientific and systematic processes in provi-
sion of technical inputs, supported by appropriate
policy and regulatory measures.
12.125. An important sub-component of (i) above
will be scientific progeny testing and pedigree selec-
tion of bulls for semen required in artificial insemi-
nation (AI) services. It is planned to make available
about 900 high genetic merit bulls for replacement of
bulls maintained at all ‘A’ and ‘B’ graded semen sta-
tions and thereby achieve 100 per cent high genetic

Agriculture 37
merit bull replacement at these semen stations by
end of the Twelfth Plan. It is estimated that this
would produce some 100 million high-quality dis-
ease-free semen doses annually.
12.126. Taking NDP into account and, with RKVY
incentives for States to substantially enhance pub-
lic sector investment in agriculture and allied sector
during the Eleventh Plan, the Department of Animal
Husbandry, Dairying and Fisheries (DAHDF) has
also decided to redesign its schemes. It aims to pro-
vide more flexibility to States while reducing the
number of Centrally Sponsored Schemes (CSS) and
reorientating these to secure better programmatic
focus.
12.127. On genetic improvement in bovines, the
current major programme is the ‘National Project
for Cattle and Buffalo Breeding (NPCBB)’ which
is being implemented since October 2000. Unlike
NDP, which aims to provide breeding services from
the dairy side, NPCBB is administered as part of
States’ veterinary services. DAHDF proposes to con-
tinue NPCBB in this present form since the DAHDF
target is to expand the artificial insemination pro-
gramme from present coverage of about 25 per
cent of breedable population to 50 per cent, which
will require an expansion of AI services beyond the
about 35 per cent coverage planned for under NDP.
This is because NDP will not cover all States and
there are likely to be farmers not covered by dairy-
led breeding services even in States covered by NDP.
Moreover, States have already established Livestock
Development Boards (LDBs) in the present format
to implement bovine breeding programmes with
a stated focus on development and conservation of
important indigenous breeds. The critical require-
ment is that NPCBB and States’ efforts through
LDBs share common standards and protocols with
NDP in progeny testing, pedigree selection and to
improve conception rates. If so, resources are suffi-
cient to achieve 5 per cent growth of milk production
in the Twelfth Plan
12.128. Since standards and protocols will be the key
to success on the breeding side and basic commonal-
ity will have to be brought between NDP, LDBs and
NPCBB, there is need for some architectural rede-
sign during the Twelfth Plan. Therefore, although
NPCBB will continue, this will be as a component
of a new National Programme for Bovine Breeding
and Dairy (NPBBD) which will subsume all DADF
existing schemes on dairy development. Thus,
NPBBD will have two main components, namely
National Programme for Bovine Breeding (NPBB)
and Dairy Development. The component for Dairy
Development will mainly focus on States/areas not
covered under NDP and, in addition to existing
support areas, convergence will be attempted in a
phased manner so that dairy cooperatives which are
not part of NDP also offer breeding and extension
services. It is hoped that such combined activities in
respect of dairying with breeding will be more effec-
tive in extension of artificial insemination services,
feed management and marketing of good quality of
milk which are essential for improving productivity
and income of farmers. In the meantime, NPBB will
continue existing NPCBB functions through LDBs
and the veterinary side with two areas of focus: first,
to harmonise breeding standards and protocols; and,
second, to achieve the so far unrealised stated focus
on development and conservation of important
indigenous breeds.
12.129. The main programme on the veterinary side
will be an expanded scheme for Livestock Health
and Disease Control. Such an expansion is necessary
because occurrence of diseases like foot and mouth
disease (FMD), hemorrhagic septicemia (HS), bru-
cellosis, mastitis, blood protozoon and so on, have
been accentuated with introduction of exotic breeds.
Taking into account the economic losses from these
diseases, and also those of small ruminants (PPR or
peste-des-petits ruminants), particularly to small,
marginal and landless farmers including women
farmers, it is necessary to have a strong focus on
national control programmes for all major animal
diseases, backed by epidemiological analysis and
assessment of the animal diseases in different agro-
climatic regions. Unrestricted movement of live-
stock, as well import of germplasm, and changes
in ecosystems due to climate change are adding to
occurrence of diseases. The availability of improved,
potent and efficacious vaccines meeting international

38 Twelfth Five Year Plan
standards against major prevalent diseases can ena-
ble better management, containment and control of
the diseases. The new programme will associate all
ICAR institutes specialising in animal diseases and,
in consultation with the State Governments, formu-
late and implement more effective strategies for con-
trol of different diseases.
12.130. The third major programme of DADF will
be the National Livestock Mission (NLM). Apart
from bovine breeding, dairying and livestock health
schemes, DADF runs a plethora of other schemes
relating small ruminants, poultry, piggery and fod-
der development which although of extreme impor-
tance, especially to small, marginal, landless and
women farmers, have so far not received focused
attention. The multiplicity of small schemes in these
livestock sectors has been a major constraint since
this limits the capability of states to effectively access
funding under various schemes. In order to provide
greater flexibility to states in formulating and imple-
menting various projects, it is proposed to merge
these schemes with the main objective of achieving
sustainable development and growth of the livestock
sector.
12.131. The NLM will have an important mini-mis-
sion of feed and fodder, with an objective to sub-
stantially reduce the gap between availability and
demand. The deficit of dry fodder (10 per cent),
concentrates (33 per cent) and green fodder (35 per
cent) continues to be high, although availability of
feed resources has improved somewhat. The forage
and fodder seed need varietal and quality improve-
ment alongside better availability. The NLM will
encourage seed companies and SAUs to take up for-
age seed production on a priority basis. Developing
common property resources, including grazing land
and wasteland, and better utilisation and enrichment
of crop residues/agricultural by-products is the other
priority. Ration balancing, which is being promoted
under NDP, will also be promoted under this mini-
mission on feed and fodder.
12.132. The NLM will also have an additional mini-
mission relating particularly to development of
small ruminants, but also covering poultry, piggery
and other minor livestock species. While subsum-
ing some of the existing Central Sector Schemes for
poultry, small animals and fodder development, the
objective will be fuller development of the animal
biodiversity available in our country, which is a rich
treasure of germplasm. NLM will also focus on pre-
dominantly non-descript pig populations, concen-
trated in NE region and eastern region there have
poor productivity. Indian poultry industry is well
equipped and organised to achieve target growth rate
of 11 per cent for commercial broilers and 7 per cent
for layers although it failed to diversify in favour of
duck, quail, turkey and emu production. Need-based
import of grandparent stock of reputed international
brands may be continued with strict enforcement of
bio-security measures. Rural poultry sector however,
needs financial, infrastructure and technological
support to raise the present 2 per cent growth rate
to 3 per cent. All these, including the conservation of
threatened breeds, will be covered by NLM in a flex-
ible but more focused programmatic manner.
12.133. Other issues that NLM will address include
livestock insurance and extension and any innovative
initiative proposed by states for development of the
livestock sector, for example, to deal with unhygienic
slaughtering and processing. If State Governments
notify minor veterinary services accordingly, short-
age of human resources of veterinary staff could also
be supplemented by recruitment of para-vets, similar
to that of ASHA, to provide minor veterinary ser-
vices and supplement the livestock-extension activ-
ity in the States. In this context, it might be noted
that as public-sector spending is enhanced for devel-
opment of livestock, there is need for continuous
assessment of the efficacy of AI and of animal health
programmes in terms of success rates, lactating effi-
ciency and of potential and actual yield per animal.
(B) Fisheries
12.134. Potential of fisheries sector in providing
quality food and nutrition, creating rural livelihoods,
advancing socio-economic development in the rural
and far flung areas is widely demonstrated and glob-
ally recognised as a powerful tool for poverty reduc-
tion and fostering rural development. Annual fish
production has reached to the level of 8.30 million

Agriculture 39
tonnes during 2010–11 (P). Annual export earning
has also touched record US$2.9 billion mark con-
tributing about 17 per cent to national agricultural
export. About 14.5 million people are engaged in
fishing, aquaculture and other allied activities of
which about 75 per cent are in inland fisheries and
the remaining in marine fisheries.
12.135. In marine fisheries, uncontrolled fishing
capacity has led to over-exploitation of the coastal
resources. The estimated potential of the offshore
waters offers opportunities which calls for upgra-
dation of the fleet as well as skills and capacities of
the fishers and incentives to promote diversified
fishing in the offshore waters. Implementation of
Monitoring, Control and Surveillance (MCS) as a
new programme in the ensuing Plan is expected to
bring more discipline and regulate the activities so as
to maintain the growth rate in a sustainable manner.
There is a need of additional infrastructure and also
upgradation of facilities infrastructure for landing
and berthing facilities of marine fishing fleet and for
domestic marketing that have been the main reasons
for post-harvest losses.
12.136. Freshwater aquaculture, which contributed
to the ‘Blue Revolution’ in the country in late 1970s,
is now almost stagnating in terms of species diversi-
fication and yield rates due to less focus on sustain-
able development of inland capture fisheries in past
Plans; increasing pressure on the resources, includ-
ing habitat degradation; and multiple use of inland
water bodies with least priority to fishery require-
ments. Average yield rates are around 1,000 kg/ha/
yr, against potential of 3–4 thousand kg/ha/yr. The
efforts to raise productivity should, however, be
accompanied by formulating guidelines and regula-
tory measures for the judicious use of critical inputs
keeping in view the principles of the FAO Code of
Conduct for Responsible Fisheries.
12.137. Quality fish seed is the most critical input to
enhance the productivity and production of fishes.
But, there are no organised brood-stock production
and management facilities in the country. Therefore,
there is need to set up brood banks in each State with
one at the Central level. There is need to promote
commercial fish feed mills and indigenously formu-
lated fish feeds with locally available ingredients by
supporting the private players with enhanced capi-
tal subsidy especially in the States where there are no
feed mills.
12.138. Adequate infrastructure is not available for
disease diagnosis and treatment for fish disease man-
agement. There is a strong need for capital invest-
ment as well as support for the State Governments
in capacity building and managing the disease diag-
nostic laboratories. There is also a need for creating
a disease surveillance and communication agency/
mechanism at National level along with its wings at
suitable regional locations to build awareness and
send alerts to the stakeholders. This agency shall
have adequate regulatory powers to ensure the dis-
ease control.
12.139. The gradual decline of Freshwater Fish
Farmer’s Development Agencies (FFDAs) and
Brackish water Farmer’s Development Agencies
(BFDAs) and their resultant poor performance
coupled with weak extension services has impacted
the overall growth of aquaculture in the country.
Rejuvenation and consolidation of the two field-level
agencies (FFDA and BFDA) into a single agency—
Fisheries and Aquaculture Development Agency or
can undertake extension of technologies, promote
networking of farmers and fishers (mainly from
reservoirs) and provide effective liaison between
the farmers and developmental and other extension
agencies such as the Krishi Vigyan Kendras and the
ATMAs as well as sourcing the public finance for
fishers.
12.140. An important initiative of Government of
India for development of fisheries sub-sector has
been to launch ‘National Fisheries Development
Board’ (NFDB) as a Special Purpose Vehicle (SPV)
in the year 2006 for implementing fishery develop-
mental schemes in an integrated manner. The scope
of NFDB would be expanded to include manage-
ment of fish diseases and creation of related infra-
structure which is a gap in the present scenario.
During the Twelfth Plan, the existing CSS on inland
and marine fisheries (except welfare of fishers) will

40 Twelfth Five Year Plan
be merged with NFDB to facilitate expansion of fish-
eries through integration of a wide array of activities,
but with its main focus on inland fresh water fishery.
The schemes will be implemented under the aegis
of NFDB removing any duplication or overlap of
efforts. This clear demarcation of work, it is hoped
will enable the growth rate of the sector to rise to 6
per cent during the Twelfth Plan.
12.141. DADF would focus its efforts on policy, reg-
ulation and welfare of fishers, and will implement the
scheme relating to welfare of inland and marine fish-
ers. The DADF will also handle the strengthening of
fisheries data base, implementation of the proposed
scheme on Monitoring, Control and Surveillance
(MCS), all fisheries policy and legal matters, coordi-
nation with the sister Ministries/Departments at the
Centre and the States to make the sector’s founda-
tion more robust and sustainable and build stronger
linkages between research and development. Future
course of fisheries management will have to work
at two fronts—sustainable utilisation of healthy
resources and rehabilitation of threatened resources
by habitat restoration and appropriate conservation
measures. Climate change and its possible impact on
fisheries and fishers is again an additional challenge.
Thus, the future course of management will require
highest level of compliance of acts and regulations,
extensive adoption of BMP and implementation of
CCRF (Code of Conduct for Responsible Fisheries
introduced by FAO) which would be possible only
through the cooperation and active participation of
resource user communities as partner in the devel-
opment and management process.
(C) Horticulture
12.142. With increasing per capita income, Indians
are consuming more of fresh and processed horticul-
tural products indicating growing scope of horticul-
ture by improving crop productivity and efficiency
in the value chains. The initiatives taken in the hor-
ticulture sector during the Tenth Five Year Plan
have helped in achieving high growth in produc-
tion. During the Eleventh Five Year Plan, the growth
rate of horticulture is expected to be 4.7 per annum,
slightly short of the projected 5 per cent. There has
been a marked push to the expansion in area under
horticulture crops since taking up of a number of ini-
tiatives for horticulture development through NHB,
TMNE (NE) and then NHM in 2005–06.
12.143. However, in quest for area-expansion efforts,
the states have neglected due thrust on increasing
productivity of existing orchards through technol-
ogy infusion or by capital investment in fertigation,
input management, plant protection and farm mech-
anisation. The area expansion programmes have
also lacked the proper backward linkage with supply
of quality seed and planting material. Even where
Nursery Act exists, it has not been enforced effec-
tively. A proper system of accreditation and rating of
nurseries, with clearly defined protocols, is the most
important priority and will have to be put in place
during the Twelfth Plan.
12.144. Adequate attention to post-harvest manage-
ment and market development and processing has
yet to pick up and is the weakest aspect of diversifi-
cation towards high-value products resulting in fre-
quent and sharp fluctuations in prices of fruits and
vegetables in domestic market. As discussed earlier,
marketing sector reforms implemented by States
have so far not resulted in efficient marketing of per-
ishables, or put in place transparent system of auc-
tion and price discovery. There are huge logistic gaps
between production clusters and marketing centres,
often at long distance, and private sector investment
in post-harvest management and in marketing infra-
structure has not come forward to the desired extent.
There is also lack of proactive steps to enhance
export competitiveness for high-end export desti-
nations. The availability of adequate regular, unin-
terrupted, affordable power supply for setting up
infrastructure like tissue culture labs, seed process-
ing plants, bio control labs and post-harvest manage-
ment units like cold storages, ripening chambers and
so on is a constraint which needs to be addressed at
least in and around horticulture clusters. Since hor-
ticulture operations are cost intensive and hi-tech,
horticulture growers need to be provided affordable
credit with higher ceiling and insurance against risk.
12.145. The horticulture development missions
depend on a loose set-up of Technology Support

Agriculture 41
Groups for technology inputs. This has proved inad-
equate. Many States do not have adequate techni-
cal trained manpower to implement programmes.
Unless State Governments fill up vacant posts and
create additional posts to provide necessary technical
input, it should be deemed that they are uninterested
and the mission wound up in those States.
12.146. During the Twelfth Five Year Plan the
National Horticulture Mission will integrate the
several existing schemes in this sector and aim at
holistic growth of horticulture sector, including
bamboo, through area-based regionally differenti-
ated strategies, which include research, technology
promotion, extension, post-harvest management,
processing and marketing, in consonance with
comparative advantage of each State/region and its
diverse agro-climatic features. The Mission will also
facilitate marketing reforms discouraging payment
of unnecessary market levies and encouraging pri-
vate investment for setting up horticulture produce
markets. While continuing existing efforts, and aim-
ing at 5 per cent growth of horticulture production
during the Twelfth Plan, the main objective will be
to build required capacities at State level, and assess
their seriousness, so that the horticulture develop-
ment related activities can be transferred fully to
States by end of the Twelfth Plan.
12.147. Another objective will be to improve horti-
culture statistics which continue to be weak, lacking
both a validated methodology for data collection of
horticulture crops and adequate machinery to col-
lect such data. Generation and dissemination of
quality data can also help in averting frequent situ-
ations of gluts and shortages and exploitation of
such situations by the middlemen and speculators.
DAC needs to take up a one-time horticulture cen-
sus with the objective of generating reliable base line
data. Further, as recommended by NSSO commit-
tee on improvement horticulture statistics, there is
need to set up an extensive network of Horticulture
Information Systems (HIS) with proper data units
in all relevant districts and at State and Centre level
covering all relevant aspects. To facilitate this, at least
3 per cent of Mission funds should be earmarked for
this purpose.
(D) Food Grains and Oil Seeds
12.148. Since cultivated land is limited, with poten-
tial for only marginal future increase through higher
cropping intensity or development of cultivable
wasteland, future increase in production will have
to come mainly from yield improvement. Declining
average annual growth of food grains yields from 3.2
per cent in 1980s to 1.6 per cent in 1990s and further
to only 0.6 per cent during the Tenth Plan, taking this
well below population growth, had led to widespread
concern about future food security. The issue was,
therefore, analysed fully with several alternatives
considered and the National Food Security Mission
(NFSM) was formulated for the Eleventh Plan. This
was based on an assessment of yield gap data then
available, and was focused on increasing yields in
low-yield districts using a variety of known interven-
tions, with particular attention to availability of qual-
ity seeds. Although this has paid off, with food grains
yield growth increasing to 3.3 per cent during the
Eleventh Plan, a valid question regards continuation
of NFSM is whether yield gaps are still large?
12.149. A committee set up under Chairmanship of
Chief Minister of Haryana has recently examined the
issue and suggested continuing with the strategy to
bridge the gap between real and potential yields. The
analysis of gap between potential and achieved yields
presented to this committee suggests that there is
considerable potential of increasing yields even in
high productivity irrigated areas with the current
technology. For these areas, the strategies will need
to concentrate on propagation of balanced use of fer-
tilisers and application of micro-nutrients, water and
soil-saving technology. In case of wheat, however,
there is need to step up research to develop varieties
resistant to temperature. The major yield gaps are
due to management practices. Other reasons for this
gap need to be ascertained through specific studies
and addressed through appropriate interventions.
12.150. In addition to enhancing productivity
of food grains in the low productivity areas, it is
equally important to stabilise the productivity gains
in these areas as well as in areas where productivity
levels are comparatively high. With these issues in
mind, the National Food Security Mission (NFSM)

42 Twelfth Five Year Plan
will be revamped during the Twelfth Plan. While
the Eleventh Plan approach of focused attention on
identified districts and crops in a location specific,
target-oriented manner will continue, greater atten-
tion will be put in most areas to shift from exclusive
focus on individual crops to the cropping system/
farming system approach. In particular, the Mission
will be extended to cover coarse cereals and fodder,
in addition to wheat, rice and pulses as at present.
The Mission contemplates that promotion of pack-
age of practices in compact blocks in a hand hold-
ing approach would not only help in enhancing the
production and productivity of a region but also help
in changing mindsets of farmers due to its positive
large-scale impact. This approach will ensure inclu-
sion of all farmers in the compact block irrespec-
tive of their size of holding or social status and will
be compatible with other efforts that encourage
strengthening of institutions, including building of
farmers organisations and FPOs. The Mission will
also build upon the Eleventh Plan experience regard-
ing conservation agriculture.
12.151. However, the main way in which NFSM
will be extended during the Twelfth Plan is through
greater emphasis on strategic-area development.
The two programmes that were started as RKVY
sub-components in the Eleventh Plan namely, the
60,000 pulses village programme and the inten-
sive millets production programme will largely be
shifted into NFSM. On another sub-component of
RKVY—Bringing Green Revolution in Eastern India
(BGREI)—a view will be taken by DAC in consul-
tation with States regarding format of its continua-
tion during the Twelfth Plan. Also, some additional
districts in Himachal Pradesh, Uttarakhand and the
north-eastern region will be included to provide a
specific thrust on foodgrains cultivation in hill areas.
12.152. Such restructuring of RKVY and NFSM will
address the problem of bridging the existing large
gap between potential and realised rice yields in
eastern States and the challenge of increasing pulses
production. Since BGREI allows components which
are not part of NFSM, and since development of the
eastern region requires significant investments in
power and marketing infrastructure, the final design
of how to proceed on the relative contributions of
RKVY and NFSM will need to be decided in con-
sultation with the States. Also, since a counterpart
of expanding rice production in eastern States is to
reduce rice area and resulting groundwater stress
in the North-West, a decision will have to be taken
on what components of the latter effort should be
stressed in NFSM/RKVY.
12.153. Preliminary targets under the NFSM for the
Twelfth Plan are enhancing production by addi-
tional 25 million tonnes of foodgrains consisting of
10 million tonnes of rice, 10 million tonnes of wheat,
3 million tonnes of pulses and 2 million tonnes of
millet. Also it aims to expand fodder production to
meet the demand both of green and dry fodder. In
all probability, the requirement of sufficient quantity
of dual purpose feed and fodder will require rais-
ing this target to 30 million tonnes, with additional
production of coarse cereals put at 7 million tonnes.
All these targets are less than was actually achieved
during the Eleventh Plan and are consistent with
demand forecasts. This would amount to targeting
2–2.5 per cent increase in foodgrains production in
the Twelfth Plan.
12.154. Another consequence of the expanded scope
of NFSM will be to absorb the pulses and maize
components presently in the Integrated Scheme for
Oilseeds, Oil palm, Pulses and Maize Development.
During Twelfth Five Year Plan, it is proposed to
replace this scheme with a new Mission on Oilseeds
and Oil Palm which will be launched with a prelimi-
nary target to increase the production of oilseeds by
at least 4.5 per cent per annum, that is, the same rate
of growth as actually achieved during the Eleventh
Plan. The core of this Mission will therefore be to
continue past efforts with a clearer focus on oil-
seeds. However, since production of oilseeds has not
been able to match the increasing demand of edible
oils, resulting in persistence of a huge gap between
demand and production of edible oils in the country,
the Mission will also aim to expand area under oil
palm to realise the latent potential of the oil palm in
the country. This part of the Mission will fully con-
sider a proposal made recently by CACP and incor-
porate whatever is feasible.

Agriculture 43
NATURAL RESOURCES
(A) Water
12.155. The water resource potential of India is
assessed as 186.9 million hectare meter, mostly from
rainfall. With annual availability still more than
utilisation and with its uneven spatial and tempo-
ral distribution leading to floods/droughts in some
or other parts of the country every year, there is a
strong demand to fully utilise this potential as soon
as possible. The total States proposals on investment
in Irrigation and Flood Control for the Twelfth plan
add up to about `4,00,000 crore, which alone would
amount to over the 4 per cent of cumulative GDP
from agriculture and allied sectors being targeted
as total public investment in this sector during the
plan. Recognising both the criticality of irrigation for
agricultural growth and the potential available, the
Centre’s Twelfth plan gross budgetary support for
development of water resources (including on AIBP)
is being stepped up to `1,09,552 crore from the
Eleventh plan actual expenditure of `41,427 crore.
12.156. However, the performance in respect of
creation and utilisation of irrigation facilities during
the Eleventh Five Year Plan was not satisfactory. The
original Eleventh Five Year Plan target for creating
irrigation potential was 16 million ha. This was sub-
sequently revised to 9.5 million ha, which has been
achieved. However, utilisation out of the created
potential is expected to be only 2.7 million ha. The
ever increasing gap between created potential and
its utilisation is an issue that is a Twelfth Plan prior-
ity, steps to address which are discussed in another
chapter.
12.157. In recent decades irrigation facilities have
increasingly been created through exploitation of
groundwater deployment. However, non-judicious
exploitation of groundwater for irrigation purposes
in India is already showing signs of crisis in many
parts of country. Studies report that more than
26 cubic miles of groundwater has already disap-
peared from underground aquifers in large areas of
Haryana, Punjab, Rajasthan and Delhi, between 2002
and 2008 (NASA 2009). Global Runoff Data Centre,
University of Hampshire and International Earth
Science Information Networks have projected that
around 30 per cent area of India falls in the extreme
water scarce zone having less than 500 m3/person/
year supply of renewable fresh water. The informa-
tion from the Central Ground Water Board reveals
that situation has worsened in most of the states
since 2004. The groundwater level has been declin-
ing annually by about 4 cm during the past decade,
often resulting in drying of rivers and wetlands
and contamination with arsenic, fluoride and other
toxic substances. This requires effective regulatory
framework and participatory watershed develop-
ment, especially because groundwater extraction is
often highly unfavourable to the small farmers who
cannot keep investing to tap deeper aquifers. Apart
from developing appropriate regulatory framework,
and people’s participation, the need of water saving
devices and crop planning cannot be overempha-
sised. Micro-irrigation coverage will be given pri-
ority both in irrigated and rain-fed areas, as part of
comprehensive local planning.
(B) Watershed Development
12.158. Watershed development has long been one
of the major channels directing public investment
to natural resource base and production systems
in rain-fed agriculture. From their earlier empha-
sis on soil and water conservation, the focus in case
of watershed projects is shifting towards livelihood
security and income generation. It is also now gen-
erally accepted that to be effective, the watershed
development and soil conservation investments have
to be complemented with farming systems invest-
ments in a watershed-plus framework that takes into
account the diversity of rain-fed agriculture.
12.159. However, despite considerable emphasis on
this in the Eleventh Plan design and development of
common guidelines, actual performance in regard
to watershed development was poor during the
Eleventh Plan. The details of the Eleventh Plan had
target and achievement may be seen in the Chapter
on Water. Since all watershed development pro-
grammes have been transferred to the Department of
Land Resources, the Ministry of Agriculture has to
redefine its initiatives for rain-fed farming and sus-
tainable agriculture.

44 Twelfth Five Year Plan
12.160. The National Rainfed Area Authority was
constituted with the specific objective of inte-
grating schemes/programmes and activities of
various Departments of the Centre and the State
Governments with regard to dryland farming as
well as providing technical back stopping for water-
shed development in a comprehensive manner.
The authority was expected to play a major role in
training of the officials associated with the water-
shed development projects and also take a lead role
in social mobilisation which is critical in the suc-
cess of the watershed development programmes. It
was also expected to take up studies for evaluation
of the implementation of projects by the States. So
far Departments both at the Central and State level
has not taken much interest in associating NRAA
either in evaluation of the programmes or for pro-
viding technical input for these. NRAA expertise will
be better utilised during the Twelfth Plan.
(C) Land and Soil Health Management
12.161. Land is the prime natural resource of which
140.02 million hectares are net sown area. Since
1990–91 there is gradual but sustained decrease in
net sown area from 143 million hectare to 140 mil-
lion hectares with corresponding increase in fallow
land. The demand from non-agricultural uses like
industrial and urban requirement as well as specula-
tive demand on account of rising land value is put-
ting pressure on availability of land for agricultural
use. There is an urgent need for State Governments
to lay out clear policies to protect productive agricul-
tural land and provide specific guidelines on pres-
ervation of commons and their protection. There
are also other important institutional and policy
issues concerning land: proper recording of land
titles, easing tenancy rigidities, computerisation of
land records as well as addressing declining size of
holdings.
12.162. An important aspect of land is its degrada-
tion in terms of mechanical, chemical and biologi-
cal. Widespread and continuing erosion of country’s
natural resource base is threatening the sustenance
of agriculture sector’s growth rate. Over 120 mil-
lion ha have been declared degraded or problem
soils (NAAS 2010). Conservation agriculture (CA),
integrated nutrient management, carbon sequestra-
tion, erosion control, saline and alkaline soils man-
agement, legislation for soil protection, development
of remote sensing and GPS-based Decision Support
System (DSS) and amelioration of polluted soil are
required to rejuvenate deteriorated soils.
(D) Use of Fertilisers and Pesticides
12.163. Fertiliser consumption in the country has
been increasing over the years and now India is the
second largest consumer of fertilisers in the world,
after China, consuming about 26.5 million tonnes
of NPK. However, imbalanced nutrient use coupled
with neglect of organic matter has resulted in multi-
nutrient deficiencies in Indian soils. These deficien-
cies are becoming more critical for sulphur, zinc
and boron. As nutrient additions do not keep pace
with nutrient removal by crops, the fertility status of
Indian soils has been declining rapidly under inten-
sive agriculture and is now showing signs of fatigue,
especially in the Indo-Gangetic plain. Potassium is
the most mined nutrient. Sulphur deficiencies are
also showing up in all parts of the country especially
in the southern region. In a comprehensive study
carried out by ICAR through their Coordinated
Research Project on Micronutrients, Toxic and
Heavy metals, based on an analysis of 2,51,547 soil
samples from different states, it was found that 48
per cent of these samples were deficient in zinc, 33
per cent in boron, 13 per cent in molybdenum, 12
per cent in iron, 5 per cent in manganese and 3 per
cent in copper. The micronutrient deficiency is a
limiting factor lowering fertiliser response and crop
productivity. As a result of over-emphasis on chemi-
cal fertilisers and imbalanced fertiliser use, efficien-
cies have become abysmally low: hardly 35 per cent
for N, 15–20 per cent for P and only 3–5 per cent for
micronutrients like zinc, resulting not only in high
cost of production but also causing serious environ-
mental hazards. At this rate, the National Academy
of Agricultural Sciences has estimated that for meet-
ing the food needs of the country by 2025, India
may have to increase NPK supply to over 45 million
tonnes from the current level of 26.5 million tonnes
and of organic manures from 4 to 6 million tonnes.
The Twelfth Plan envisages NPK demand at 34–36
million tonnes by 2016–17, but the more important

Agriculture 45
priority should be to give much greater empha-
sis than hitherto on fertiliser use efficiency and soil
health.
12.164. Restoration of soil health requires initiatives
for continuous monitoring of soil health, measures to
arrest decline of soil health, creating adequate facili-
ties for soil testing, fertilisers testing, developing and
upgrading testing protocols, ensuring judicious and
efficient use of fertilisers and pesticides. Judicious
use of fertiliser requires adequate soil testing facili-
ties. By 2010–11 there were 1,049 soil tests labs in the
country with a soil analysis capacity of 106 lakh soil
samples per annum. The State Governments have
issued 40.8 million soil health cards to the farmers
by October 2011. Although a massive achievement in
fairly short time, this remains far below the require-
ment of soil testing capacity. To augment the capac-
ity the State Governments need to utilise resources
from Rashtriya Krishi Vikas Yojana and also engage
State Agricultural Universities, Agricultural Produce
Marketing Committee and other institutions.
There is need for widespread awareness creation
for soil-test–based fertiliser use by involving State
Agricultural Universities and KVKs and NGO and
other stakeholders.
12.165. Measures to soil health improvement need
to be comprehensively centred on addition of soil
organic matter in substantial quantities over time.
The efforts for production and use of available bio-
logical sources of nutrients like bio-fertilisers, organic
manure, bio-compost for sustained soil health and
fertility and improving soil organic carbon and so on
as alternative inputs have been inadequate so far. For
promotion of these inputs in conjunctive use with
chemical fertlisers, and to promote organic farm-
ing we need to formulate and define standards for
unregulated organic and biological inputs and bring
them under quality control mechanism and define/
upgrade standards and testing protocols.
12.166. Similarly, use and availability of safe and
efficacious pesticides and their judicious use by
the farming community is critical to a sustained
increase in agricultural production and productiv-
ity. Quality of pesticides is monitored by the Central
and State insecticide inspectors who draw samples
of insecticides from the market for analysis in the
68 State Pesticide Testing Laboratories (SPTLs)
that have a total annual capacity of 68,110 samples
in 23 States and one Union Territory. However,
sale of low quality/spurious pesticides by dealers is
widespread and is an issue that States need to han-
dle with seriousness. Further, since use of synthetic
pesticides needs to be confined to target control in
the right quantity and at the right time, presence of
pesticides residue in food commodities is becom-
ing a serious food safety matter. DAC implements
a scheme for monitoring pesticide residues and
sharing outcomes of the sample analysis with State
Governments as well as advising States to take nec-
essary action including promotion of the Integrated
Pest Management (IPM) approach, which empha-
sises a safe and judicious use of pesticides. Many
NGOs, however, represent that sporadic promotion
of IPM is not helping in establishment of sustain-
able agriculture practices and that Non-Pesticidal
Management (NPM) of pests is the only sustainable
answer.
NATIONAL MISSION FOR SUSTAINABLE
AGRICULTURE
12.167. A major new mission that will be launched
during the Twelfth Plan is the National Mission for
Sustainable Agriculture (NMSA). Conceived origi-
nally as part of the National Action Plan on Climate
Change (NAPCC), this aims at transforming Indian
Agriculture into a climate-resilient production sys-
tem through adoption and mitigation of appro-
priate measures in the domains of both crops and
animal husbandry. Since a number activities relat-
ing to sustainable agriculture are already parts of
other proposed missions, NMSA as programmatic
intervention, will primarily focus on synergising
resource conservation, improved farm practices
and integrated farming for enhancing agricul-
tural productivity especially in rain-fed areas. Key
deliverables under this mission will be develop-
ing rain-fed agriculture, natural resource manage-
ment, enhancing water and nutrient use efficiency,
improving soil health and promoting conservation
agriculture.

46 Twelfth Five Year Plan
12.168. Nonetheless, since sustaining agricultural
productivity through climate and other challenges
to the natural resources base is the focus of this mis-
sion, it will have to go beyond its programmatic
interventions to bring mind-set changes required in
transiting from the past focus on irrigated, chemi-
cal intensive agriculture. The recent ICAR network
project on National Initiative on Climate Resilient
Agriculture (NICRA) provides some insights on
requirements of adaptation. NMSA can collaborate
with ICAR on specific matters regarding adapta-
tion to climate change. The key to this is a paradigm
shift that moves towards a knowledge-based, farmer
centric and institutionally supported system where
the Government is prime mover and facilitator to
demonstrate at scale the overall strength and impact
of rain-fed agriculture packages that have slowly
emerged through several years of grass-roots work
by Government and civil society organisations and
have shown the strength of combining water and
other interventions at a micro-level. The starting
point of NMSA must be an accurate assessment of
the natural resource, comprising water, land, climate
and biodiversity, which determine the opportunities
for livelihoods of the people.
(E) Design of NMSA
12.169. While the decision to launch the National
Mission for Sustainable Agriculture (NMSA) is quite
historical, there are design issues both in view of the
fact that the Ministry of Agriculture no longer has
a watershed development component in its pro-
grammes and because there are strong differences
on the matter of fertiliser and pesticides use. While
the current National Mission on Micro-Irrigation,
the National Project on Management of Soil Health
and Fertility and the Rainfed Areas Development
Programme (RADP) window in RKVY can be
merged with NMSA, none of these address fully
the issues that have been raised by the Twelfth Plan
Working Group on Natural Resources Management
and Rainfed Farming. Its main recommendation is
to observe the following:
1. Focus on stabilising and securing diverse crop-
ping by bringing a focus on ‘Rainfall Use
Efficiency’ as central to policy as against mere
use efficiency of applied water. This shift calls for
two major focal areas:
a. Promote measures for in-situ conservation
and efficient use of rainwater
b. Invest in shared and protective/supportive
irrigation
2. Harness the inclusive growth potential in the
so far untapped Agronomic and Management
Innovations that are aligned to enhancing sus-
tainability of natural resources, reducing costs,
increasing efficiency of resource use and improv-
ing total factor productivity. System of Rice
Intensification and non-pesticidal management
(NPM) of pests as mentioned in the Approach
Paper and options evolving in conservation agri-
culture are some examples.
3. Strengthen the extensive livestock systems
depending wholly or partly on commons and
agriculture residues through intensive efforts
in improving health care, feed, fodder, drink-
ing water, shelter, institutions and so on. The
domain of public policy and intervention must
shift to these from the present almost exclusive
focus on high yielding breeds.
4. Invest in decentralised and local institutional
capacities that enable a shift away from one-
time Planning to ‘iterative Planning—imple-
mentation—learning cycles’ anchored by local
institutions.
5. Enhance institutional capacities in local gover-
nance and resource management, particularly
related to Commons and strengthen Panchayat
Raj, cooperatives and other stakeholder institu-
tions. Such institutional base is a prerequisite
for evolving location and agro-ecology specific
mechanisms of programme designing, credit
access, filling in infrastructure gaps, marketing
and so on.
12.170. The specific recommendations of this work-
ing group, including the setting up of a National
programme on rain-fed farming, could be another
component of NMSA, financed by resources cur-
rently expended under the scheme of Macro-
management in agriculture which housed the

Agriculture 47
watershed development schemes of DAC and will
now have to be wound up. This component could
mainstream the learning that has emerged from the
International Assessment of Agricultural Knowledge,
Science and Technology for Development (IAASTD)
along with ICAR’s National Initiative on Climate
Resilient Agriculture (NICRA).
PLAN FINANCING
Expenditure on Agriculture and Allied Sectors
12.171. During the Eleventh Five Year Plan, a com-
bined Plan outlay of `1,36,381 crore (at 2006–07
prices) by the Centre, States and UTs was envisaged
for the agriculture and allied sectors. The realisa-
tion is estimated to be `1,30,076 crore at 2006–07
prices, that is, 95 per cent of projected Plan. The
priority to agriculture and allied sectors in alloca-
tion of resources in the combined Plan of Centre,
States and UTs has been around 5.6 per cent in the
Eleventh Plan, an improvement over 3.6 per cent
during the Tenth Plan. At present about 50 per
cent of the agriculture and allied sectors plan in the
country is being financed by the Centre, includ-
ing expenditure on Rashtriya Krishi Vikas Yojana
(RKVY).
FINANCIAL PERFORMANCE OF THE MINISTRY
OF AGRICULTURE
12.172. Table 12.11 gives the outlay and expendi-
tures of the MoA and its three departments, DAC,
DAHDF) and Department of Agricultural Research
and Education (DARE), which implement plans and
programmes for development of agriculture and
allied sectors. The Ministry is likely to realise 88 per
cent of the outlay at current prices. A noticeable fea-
ture is that RKVY, which was initiated in 2007–08,
accounted for 38 per cent of MoA’s total plan expen-
diture in 2011–12(RE).
12.173. DAC with utilisation of around 94 per cent
of projected outlay for Eleventh Plan at current
prices has shown a better performance. The NHM
fell short of targets mainly on account of below par
performance in grounding the Terminal Market
Complexes. The NFSM and horticultural pro-
grammes except NHM have achieved the envisaged
financial targets and expenditure on agricultural
insurance exceeded the Eleventh Plan projection
because of demands arising from the drought of
2009. DAHDF incurred major shortfall in the Plan
expenditure. One of the reasons for this was the
attempt to introduce a large number of schemes
with small outlays during Eleventh Plan which faced
problems in their conceptualisation, formulation
and approval at various stages. Inadequate staff in
the State implementing Departments and resulting
limitations on absorption capacity of the States to
implement the programmes has also been respon-
sible for the shortfall. Both DAC and DAHDF also
transferred increasing amounts through State/
District level autonomous bodies, which will need to
be avoided in future since this limits the capacity of
States to plan comprehensively for agriculture devel-
opment. Plan realisation is expected to be around 77
per cent in the case of DARE.
TABLE 12.11
Outlays and Expenditure of MoA and Its Three Departments (DAC, DAHDF and DARE)
DAC DAHDF DARE RKVY WDPSCA Total
Eleventh Plan proposed (Current Prices) 41,337 8,174 12,588 25,000 240 87,339
2007–08 Actual 5,769 782 1,280 1,247 40 9,118
2008–09 Actual 6,545 865 1,630 2,887 39 11,966
2009–10 Actual 6,827 871 1,707 3,761 40 13,206
2010–11 Actual 10,208 1,096 2,522 6,720 40 20,585
2011–12(RE) 8,654 1,357 2,850 7,811 50 20,722
Total Eleventh Plan Actual 38,003 4,970 9,989 22,426 209 75,597
% utilisation during Eleventh Plan 92 61 79 90 87 87

48 Twelfth Five Year Plan
RASHTRIYA KRISHI VIKAS YOJANA
12.174. The National Development Council (NDC),
in its meeting held on 29 May 2007 resolved to ini-
tiate a special Additional Central Assistance Scheme
viz. Rashtriya Krishi Vikas Yojana (RKVY). The pur-
pose behind this programme was to encourage States
to draw up District and State agricultural plans and
also increase their own spending on the sector so as
to reorient agricultural development strategies for
rejuvenating Indian agriculture during the Eleventh
Plan (2007–12). RKVY is preferred by States for its
inbuilt flexibility in selecting interventions and set-
ting State specific targets.
12.175. One objective of RKVY during the Eleventh
Five Year Plan was incentivising States to increase
expenditure on agriculture and allied sectors. State
plan expenditures (excluding RKVY receipts) as per-
centage of GDP in agricultural and allied increased
from 1.0 per cent in the Tenth Plan to 1.4 per cent
in the Eleventh Plan. State plan expenditures on agri-
culture and allied sectors (excluding RKVY) have
also increased as percentage total plan spending by
States, from about 5 per cent during the Tenth Plan
to over 6 per cent during the Eleventh Plan. RKVY
was therefore successful in motivating States to pay
greater attention to agriculture, besides providing
increased Central assistance for the sector.
12.176. RKVY as assistance was particularly use-
ful for the funds-starved animal husbandry, dairy-
ing and fisheries sectors. Projects amounting to over
`5,000 crore were sanctioned under RKVY for these
sectors during the Eleventh Plan, about 20 per cent of
the total sanctioned RKVY projects, and more than
spending on DAHDF’s schemes. This has provided a
substantial push to these sectors which account for a
significant contribution to the agricultural GDP.
12.177. However, preparation of Comprehensive
District Agriculture Plans (C-DAPs) has been a weak
area in many states, partly due to lack of capacity at
District/State level. Although there are reservations
regarding quality and effective capability of district
level planning and project design, this was an origi-
nal NDC intention and must be fully implemented
during the Twelfth Plan. At least 25 per cent of pro-
jects sanctioned by SLSCs should originate from
the district level, preferably approved by District
Planning Committees. For the purpose, suitable
units will have to be formed involving ATMA/KVK/
SAU and any other technical support unit that States
may specify. As mentioned earlier, it is necessary to
see decentralised planning as an iterative planning—
doing—learning—planning cycle rather than simply
a one-time activity. The challenge is to institutional-
ise this process and ensure that the agency facilitat-
ing planning is also accountable for the outcome.
12.178. Further, while there is very strong anecdo-
tal evidence of the early success of RKVY, a detailed
impact assessment of the scheme is needed for fur-
ther experience and learning. Moreover, two modi-
fications are desirable in the present practice. First,
there should be a proper committee to examine and
vet all projects proposed to the SLSC. Second, that at
least this vetting committee or even the SLSC work
closely with, and preferably be coterminous with,
State level bodies that select MoRD projects, particu-
larly for watershed development. This would permit
better convergence and better project selection.
12.179. Many States have requested changes in the
allocation criteria of RKVY and some have objected
to opening of new windows within the RKVY. A
decision has been taken that no more than 20 per
cent of RKVY funding will be in such windows of
national importance. A decision has also been taken
that at least 40 per cent of RKVY spending should
be on hard infrastructure spending. A meeting of all
States will be held to discuss proposals for changes in
allocation criteria.
12.180. Finally, future RKVY design needs to be
seen in the context of many pending key reforms.
Despite efforts by the Central Government, progress
in agricultural marketing, extension and cooperative
reforms continue to be sluggish. Delivery of services
has not been efficient due to lack of staff at various
levels. State Agricultural Universities (SAUs) need
greater funding support from the State Governments.
Inadequacy of agricultural infrastructure hampers
achievement of growth potential of the agriculture
sector. During the Twelfth Plan RKVY will need
to be reoriented to facilitate such market reforms,
higher expenditure on SAUs and for infrastructure

Agriculture 49
development, besides emphasising effective formu-
lation and implementation of District Agriculture
Plans. These could be incorporated by changing the
current eligibility conditions and allocation formula
for RKVY. The proposed meeting of all States as
mentioned above will need to be held before these
changes in RKVY are proposed to Cabinet.
AGRICULTURAL STATISTICS
12.181. Statistics are the hard input into planning.
There are numerous gaps in agricultural statistics
hampering the agricultural development planning
some of which include reliable and timely avail-
ability of forecasts of agricultural crops especially
foodgrains, reliable statistics for small areas like
blocks and Panchayats, estimates of agricultural
production losses due to pests, diseases, floods and
drought, good estimates of production of minor
crops including spices, condiments, medicinal
plants, floriculture and so on, estimates of require-
ment of foodgrains for seed, feed and industrial use,
harvest and post-harvest losses in agricultural pro-
duction and estimates of meat production. Further,
the available estimates generated through sample
surveys suffer from organisational and operational
problems bringing in inconsistency in these surveys.
12.182. The Vaidyanathan Committee has rec-
ommended setting up a National Centre for Crop
Statistics, independent of the present system, for pro-
viding reliable quick estimates at the National and
State level. This should have high priority since not
only are there strong doubts about quality of present
data among experts, the large increase in number
of crop-cutting experiments for insurance purposes
may further vitiate the system. An independent
source of high-quality data is vital for improving the
quality of agricultural statistics in India.
12.183. The existing database relating to horticul-
ture sector needs to be strengthened as mentioned
earlier in the horticulture section. Cost of produc-
tion data for animal husbandry products also needs
improvement. Development of appropriate meth-
odology for estimation of feed consumed by live-
stock will help in updating ratios currently used
by the National Accounts Division. Similarly, the
existing methodology for generation of fishery statis-
tics needs fine tuning.
12.184. For ascertaining the reliability of land use
statistics in the context of diversion of agriculture
land to other uses for residential, industrial, urbani-
sation, roads and so on, there is a need for conduct-
ing a study for checking the land records through
khasra registers/other records of those villages where
the area have come under diversion of agriculture
land to non-agriculture uses particularly in the vicin-
ity of the metropolitan cities.
12.185. Pilot studies need to be undertaken for per-
fecting remote sensing techniques and GIS/GPS tools
to develop reliable estimates of area under agro-for-
estry area under crop production, land-use planning,
land development and precision farming and so on.
12.186. All in all, the Twelfth Plan objective is to
continue with the decentralisation thrust of RKVY,
while reducing number of Centrally Sponsored
Schemes. As discussed in relevant sections above,
this vision on decentralisation could extend to fer-
tiliser and food subsidies also. While doing this, the
main Twelfth plan foci are:
• Bringing scale through development of Farmer
Producer Organisations
• Emphasising technology, both on the research
and development sides
• Stressing standards and protocols and standard
operating procedures in every scheme
• Improving statistics and evaluation
• Initiating a shift towards sustainable and climate-
resilient agriculture, not only through NMSA but
more generally by laying emphasis on rain-fed
areas and bringing about shifts of water-intensive
rice cultivation from water-stressed North-West
India to Eastern India.
• Preparing for faster growth through a more
diversified agriculture, with investment in the
necessary modern infrastructure required for per-
ishable products.
12.187. As shown in Table 12.13, States have indi-
cated that they will more than double their plan

50 Twelfth Five Year Plan
expenditure on agriculture and allied sectors from
`1,11,824 crore during the Eleventh plan to `2,26,500
crore during the Twelfth Plan. The Centre shall also
more than double its plan expenditure. The alloca-
tion for RKVY is being raised to `63,246 crore for
the Twelfth Plan from actual expenditure of `22,426
during the Eleventh Plan. The indicative Twelfth
Plan Gross Budgetary Support (GBS) for all other
schemes of the MoA is `1,11,232 crore. This is against
corresponding the Eleventh Plan actual expenditure
of `53,171 crore. Refer to Table 12.12 for depart-
ment-wise break-up, excluding RKVY:
TABLE 12.12
Gross Budgetary Support (Department-wise)
Department Gross Budgetary Support (GBS) (` Crore)
Department of Agriculture and Cooperation (DAC) 71,500
Department of Agriculture and Research Education (DARE) 25,553
Department of Animal Husbandry, Dairying and Fisheries (DAHDF) 14,179
TABLE 12.13
Comparison of States Outlay and Expenditure for Eleventh and Twelfth Plan
(` in crore at current prices)
Name of Sate Eleventh Plan Outlay Eleventh Plan Expenditure Twelfth Plan Outlay Increase in
Twelfth Plan
over Eleventh
Plan Expdr. (%)
Agriculture
and Allied
Sector
% of Total
Plan
Agriculture
and Allied
Sector
% of Total
Plan
Agriculture
and Allied
Sector
% of Total
Plan
Andhra Pradesh 3,487.44 2.4 9,510.46 6.0 17,138 5.0 80
Arunachal Pradesh 752 9.5 617.71 5.7 1,114 5.3 80
Assam 877.86 2.1 2,335.56 7.8 3,272 5.9 40
Bihar 3,672.73 4.8 4,805.33 6.3 15,613 6.0 225
Chhattisgarh 4,613 8.6 5,637 12.7 8,284 6.9 47
Goa 211.76 2.5 325.39 3.6 1,046 3.9 221
Gujarat 9,092.94 0.7 8,879.8 6.9 19,712 7.8 122
Haryana 1,638.82 4.7 2,733.02 5.7 6,288 5.4 130
Himachal Pradesh 1,470.08 10.7 1,642.82 12.1 2,174 9.7 32
Jammu & Kashmir 1,818.21 7.0 892.98 3.5 2,843 9.7 218
Jharkhand 3,130.53 7.8 2,319.85 5.9 4,157 3.8 79
Karnataka 8,426.85 8.3 10,484.4 7.7 19,824 8.9 89
Kerala 2,649.11 7.8 2,931.54 7.6 8,831 11.5 201
Madhya Pradesh 3,408.18 4.8 6,057.09 7.3 17,076 8.5 182
Maharashtra 9,507.64 5.9 10,636.4 7.3 19,325 7.03 82
Manipur 386.55 4.7 234.04 3.2 643 3.1 175
Meghalaya 735.52 8.0 845.2 9.8 2,114 10.7 150
Mizoram 536.31 9.6 387.86 7.1 346 2.8
Orissa 1,230.29 3.8 3,580.37 8.2 8,387 7.4 134
Nagaland 434.31 8.3 725.08 11.3 1,795 13.8 148
Punjab 1,309.13 4.5 1,410.77 4.0 1,524 2.9 8
Rajasthan 2,919.07 4.1 5,990.67 6.2 7,255 5.6 21
Sikkim 260.43 6.9 228.27 6.4 469 4.1 106
Tamil Nadu 7,831.57 9.2 8,170.01 8.8 20,680 10.0 153
Tripura 798.51 9.0 858.79 11.3 980 6.8 14
Uttar Pradesh 19,146.37 10.6 14,164.8 7.8 24,354 8.5 72
Uttarakhand 2,478.5 8.4 2,079.25 10.0 2,673 5.9 29
West Bengal 1,846.50 2.9 3,339.26 5.1 8,583 5.5 157
Total States 94,670.21 3.6 1,11,824 7.2 2,26,500 7.1 103

13.1. India has become one of the fastest growing
economies in the world over the last two decades,
undoubtedly aided in this performance by eco-
nomic reforms. The striking aspect of India’s recent
growth has been the dynamism of the service sector,
while, in contrast, manufacturing has been much less
robust, contrary to the experience in other emerging
market countries, where manufacturing has grown
much faster than GDP; this has not happened in
India. Consequently, manufacturing sector’s contri-
bution to the GDP has stagnated at 16 per cent, rais-
ing questions about India’s development strategy,
especially its implications for generating adequate
employment. Additionally, employment in manu-
facturing declined in absolute terms from 55mn to
50mn between 2004 and 2005 and 2009–10, after
having grown by 25 per cent between 1999 and 2000
(44mn) to 2004–05 (55mn).
13.2. The Eleventh Plan period was marked by unfa-
vourable global economic conditions brought on
by the financial sector crisis of 2007–09 followed by
the risks of sovereign debt crisis mid-2011 onwards.
While this led to slackening demand, exchange-rate
volatility and economic uncertainty, domestic dif-
ficulties such as poor implementation and delayed
reforms also slowed the growth of the Indian man-
ufacturing sector. The year 2009–10 witnessed a
fleeting return of manufacturing buoyancy largely
on account of a few sectors such as the automotive
sector along with a revival in cotton textiles, leather
and food products. This brief spurt, however, has
now moderated. The net result is that the share
of the manufacturing sector in the country’s GDP
13
Industry
continued to be stagnant, a trend now observed for
nearly three decades and remained relatively lower
than other emerging and developed economies (refer
to Figure 13.1).
13.3. Further, India was not able to fully leverage the
opportunities provided by the dynamics of globalisa-
tion that resulted in a dramatic shift of manufactur-
ing to developing countries over the last decade. The
increasing gap in both, the sectoral share of manu-
facturing and the competitiveness of the manufac-
turing sector in India, compared with countries, such
as China, is testimony of that (Figure 13.2).
13.4. This shift of manufacturing capacities from
developed nations to rapidly developing economies
(RDEs) is likely to continue. It is estimated that by
2025 RDE production will account for over 55 per
cent of global production compared to 36 per cent
presently. Hence, India’s ability to capitalise on this
by capturing a disproportionate share of such a shift
in global economic setting through an accelerated
growth rate will be imperative.
PERFORMANCE REVIEW OF THE
MANUFACTURING SECTOR
Growth Rate
13.5. The manufacturing sector averaged a growth
of 7.7 per cent (till 2009–10) during the Eleventh
Plan (refer to Table 13.1). Growth peaked at 14.3 per
cent in 2007–08 and then started decelerating. The
decline in manufacturing growth was primarily
responsible for the slowdown in GDP in 2011–12.
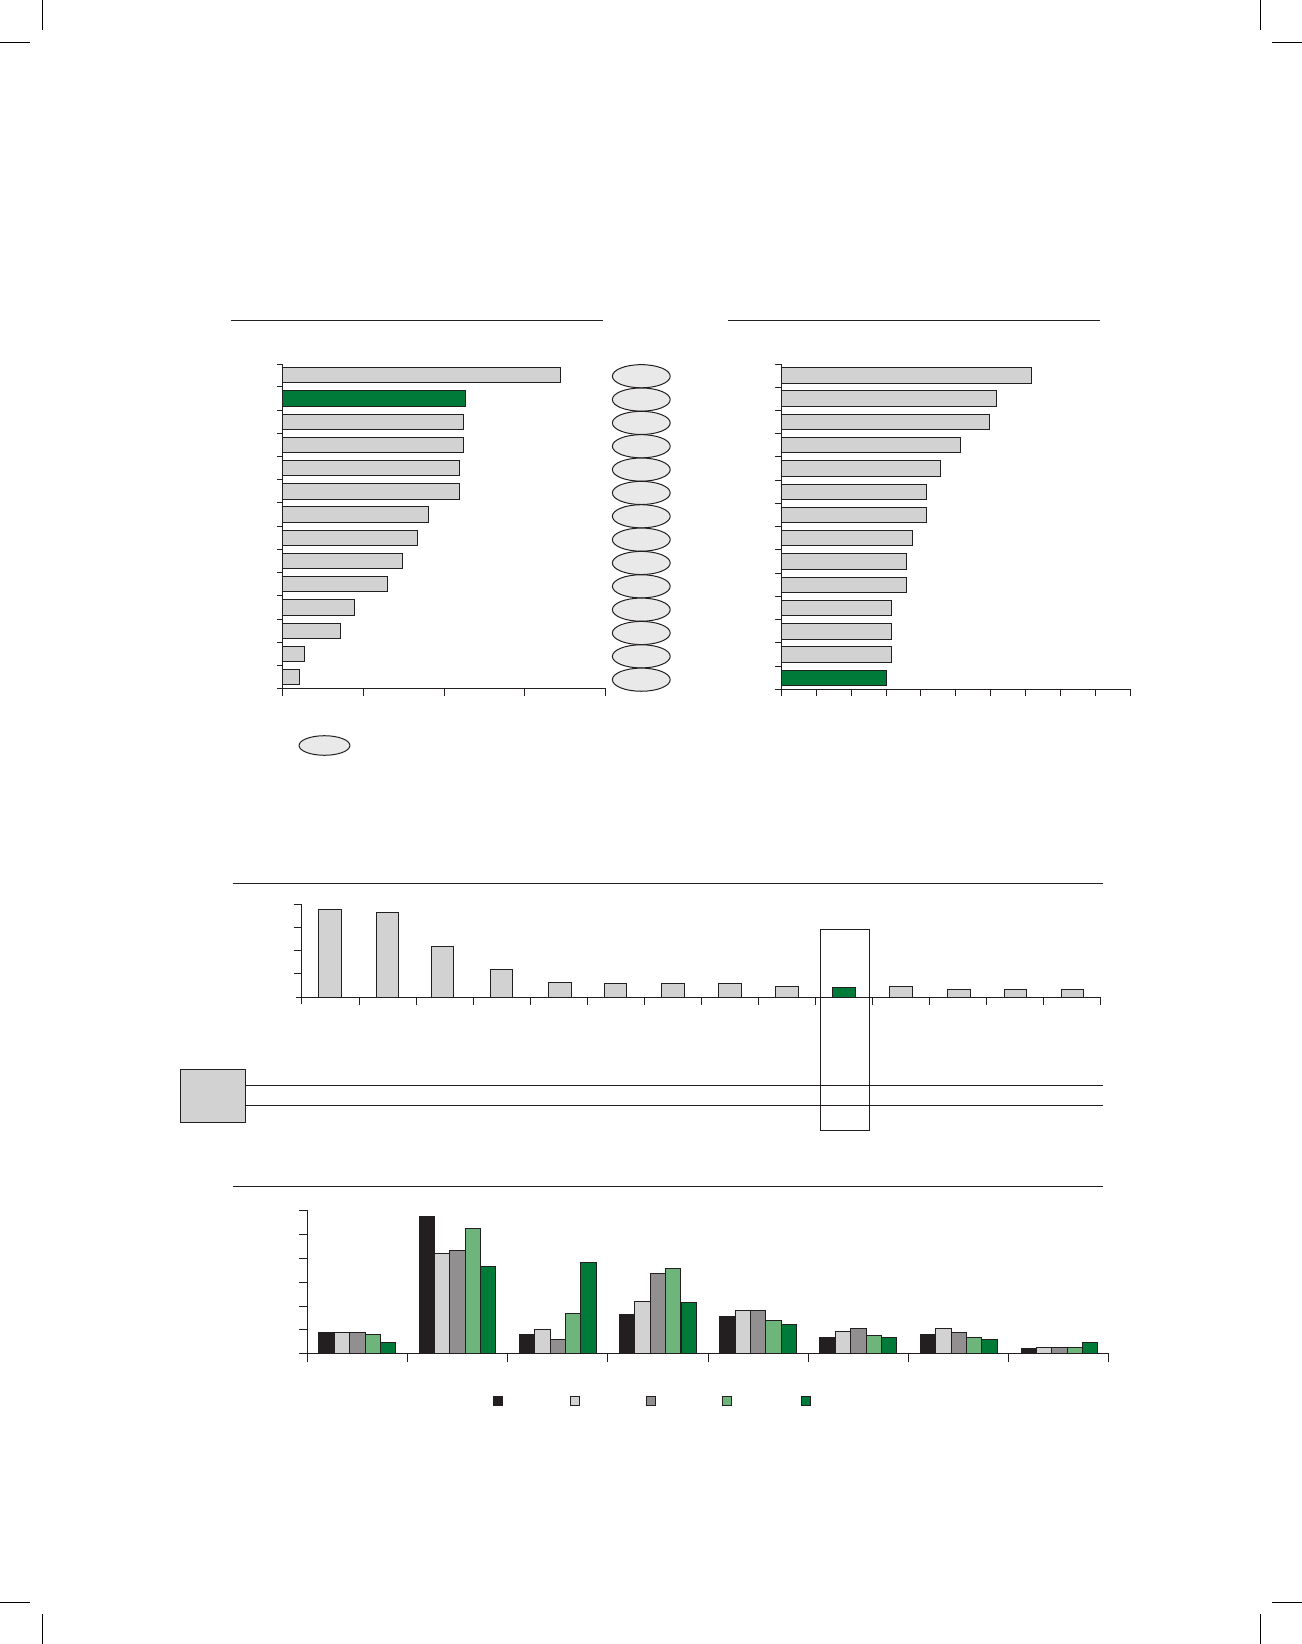
52 Twelfth Five Year Plan
FIGURE 13.1: Contribution of Manufacturing to GDP Very Low in India
Growth rate for ‘99–’09 Share of mfg. GDP
Manufacturing GDP Growth for most
Countries higher than GDP Growth
Share of manufacturing GDP in India is low at
~15% when compared to other economies
x% GDP growth rate for 1999–2009
China Thailand
10.3% 36%
9.9%
7.0%
3.9%
4.8%
5.3%
4.0%
4.9%
2.5%
4.9%
3.6%
3.3%
3.3%
(0.8)%
(1.3)%
6.8% 31%
6.7% 30%
6.7% 26%
6.6% 23%
6.6% 21%
5.4% 21%
5.0% 19%
4.4% 18%
3.9% 18%
2.7% 16%
2.2% 16%
0.8% 16%
0.6% 15%
0% 5% 10% 15% 20% 25% 30% 35% 40% 45% 50%
0% 3% 6% 9% 12%
India South Korea
Poland China
Malaysia Malaysia
Russia Hungary
Thailand Germany
Egypt Argentina
Hungary Japan
South Korea Poland
Turkey Turkey
Brazil Russia
Argentina Brazil
Germany Egypt
Japan India
Manufacturing needs to grow at higher than GDP growth to capture better share of GDP
Source: Economic intelligence Unit, Data Monitor, Euro-monitor, World Bank Work Development Indicators, BCG analysis.
2,000 1,923 1,856
1,084
614 308 282 279 268 231 226 209 179 176 170
1,500
1,000
500
0
China
USA
Japan
Germany
Italy
Brazil
Korea
France
UK
India
Russia
Mexico
Indonesia
Spain
1990
2000
2010
3
1
1
2
2
3
3
4
6
5
12
6
8
7
7
8
5
9
13
10
16
11 12
920
13
11
14
8 1 2 3 4 12 13 7 6 16 9 14 25 10
Global
Rank
Manufacturing Gross Value Added ($bn)
Manufacturing Output as % of World Total
30.0%
25.0%
20.0%
15.0%
10.0%
5.0%
0.0% UK
2.3%
18.2% 18.9%
10.7%
6.0% 3.0% 2.6% 2.2%
USA China Japan Germany Italy France India
1970 1980 1990 2000 2010
FIGURE 13.2: India and Global Manufacturing States
Source: UN National Accounts Main Aggregates Database.

Industry 53
Initial deceleration in industrial growth was largely
on account of the global economic meltdown. Fragile
economic recovery in US and European countries,
and subdued business sentiments affected the growth
of the manufacturing sector. Rising interest rates and
appreciation of the rupee during the Eleventh Plan
period also contributed to this slow down. It is sig-
nificant to note though, that volatility of manufac-
turing growth has become more pronounced over
the last five years. An important implication of this
is the need for greater flexibility both in policy and
non-policy factors which have a bearing on the man-
ufacturing sector.
Investment
13.6. Investment and capacity additions are critical for
sustained industrial growth. National accounts data
clearly indicate a moderation in the growth of gross
capital formation (GCF) in industry (Table 13.2).
The rate of growth of GCF in four broad sectors of
industry comprising mining, manufacturing, elec-
tricity and construction averaged 10.9 per cent dur-
ing 2004–11, almost the same as the rate of growth
of GCF in the economy as a whole. For manufactur-
ing to grow faster than other sectors in the economy,
rate of GCF in manufacturing will have to be higher.
Employment
13.7. Employment in manufacturing increased from
44 million to nearly 56 million between 2000–01 and
2004–05. However, employment in manufacturing
reduced by 5 million between 2004–05 and 2009–10
(Table 13.3). The net increase in employment over
the decade 2000–01 to 2009–10 was around 6 mil-
lion, that is, a 13 per cent increase over 10 years.
Manufacturing in India contributes to only ~11 per
cent of total employment. This compares unfavour-
ably to other emerging economies where the share
of employment in manufacturing range from 15 per
cent to 30 per cent.
TABLE 13.1
Rate of Growth of GDP at Factor Cost at 2004–05 Prices (Per cent)
2007–08 2008–09 2009–10PE 2010–11 QE 2011–12 AE
Agriculture, Forestry and Fishing 5.8 0.1 1 7 2.5
Industry 9.7 4.4 8.4 7.2 3.9
Mining and Quarrying 3.7 2.1 6.3 5 –2.2
Manufacturing 10.3 4.3 9.7 7.6 3.9
Electricity, Gas and Water Supply 8.3 4.6 6.3 3 8.3
Construction 10.8 5.3 7 8 4.8
Services 10.3 10 10.5 9.3 9.4
GDP at Factor Cost 9.3 6.7 8.4 8.4 6.9
Source: CSO.
TABLE 13.2
GCF in Industry
(` Crore at 2004–05 Prices)
2004–05 2005–06 2006–07 2007–08 2008–09 2009–10 2010–11 CAGR
(Eleventh Plan*)
Mining 37,322 52,259 60,456 68,372 57,045 65,984 70,389 3.9%
Manufacturing 3,44,517 4,04,928 4,74,405 6,11,928 4,20,506 5,98,445 6,40,982 7.8%
Construction 54,445 57,531 95,799 1,15,157 88,523 86,290 98,426 0.68%
Total Industry 4,89,584 5,79,391 7,07,029 8,81,464 6,65,067 8,52,999 9,13,051 6.6%
Share of GCF in Industry as
% to Total GCF
48.4 49 51.8 54.9 42.5 49.6 48.3
Source: Economic Survey 2011–12; *CAGR has been calculated for a period of four years.

54 Twelfth Five Year Plan
TABLE 13.3
Employment by Sector
(in Millions)
Sectors 1999–2000 2004–05 2009–10
Agriculture 237.67 258.93 244.85
Manufacturing 44.05 55.77 50.74
Mining 2.17 2.64 2.95
Electricity, Gas
and Water Supply 1.13 1.3 1.25
Construction 17.54 26.02 44.04
Services 94.2 112.81 116.34
Total 396.76 457.46 460.22
Source: Planning Commission.
13.8. One hundred and eighty-three million addi-
tional income seekers are expected to join the work-
force over the next 15 years. Agriculture cannot be
expected to provide more jobs. Manufacturing must
provide a large portion of the additional employment
opportunities required for India’s increasing num-
ber of job seekers. Unless manufacturing becomes
an engine of growth, providing at least 70 million
additional jobs, it will be difficult for India’s growth
to be inclusive. Since the pattern of development of
the manufacturing sector so far has not delivered the
desired growth in output and employment, a change
in strategy is required. This Plan is a description of
the strategy, and the process for its implementation,
without which the national objectives cannot be
achieved.
OBJECTIVES FOR THE TWELFTH PLAN
AND BEYOND
13.9. In order to create a paradigm shift in the
manufacturing sector, it is essential to consider the
objectives over a longer timeframe, such as 15 years.
The National Manufacturing Policy, which was
introduced in 2011, states these objectives and these
are the underlying objectives that the Plan aims to
achieve as well. These objectives are:
1. Increase manufacturing sector growth to 12–14 per
cent over the medium term to make it the engine
of growth for the economy. The 2 to 4 per cent
differential over the medium term growth rate of
the overall economy will enable manufacturing
to contribute at least 25 per cent of the national
GDP by 2025.
2. Increase the rate of job creation in manufactur-
ing to create 100 million additional jobs by 2025.
Emphasis should be given to creation of appro-
priate skill sets among the rural migrant and
urban poor to make growth inclusive.
3. Increase ‘depth’ in manufacturing, with focus on
the level of domestic value addition, to address
the national strategic requirements.
4. Enhance global competitiveness of Indian man-
ufacturing through appropriate policy support.
5. Ensure sustainability of growth, particularly with
regard to the environment.
REALISATION OF OBJECTIVES NEEDS A
PARADIGM SHIFT
13.10. The Eleventh Five Year Plan as well as Plans
that preceded it aimed at establishing a strong manu-
facturing sector but this has not happened. This sug-
gests that a radical change in the policy approach is
needed.
13.11. Comparison with the performance of other
countries shows that the countries that managed to
catch up with the earlier industrialised, high-income
countries were the ones whose governments proac-
tively promoted structural change. Industrial policy,
and with a special focus on manufacturing, is back
on the national agendas of many countries and we
need to consider what lesson we can draw given our
particular circumstances. In other words, the criti-
cal question now is not whether there should be an
industrial policy but what should be the architecture
of the industrial policy.
13.12. Industrial policies, where they have suc-
ceeded, have generally not been an outcome of
Centrally planned economies but of economies that
have had the active involvement of private enter-
prises and other non-governmental stakeholders.
Successful strategies evolve from ongoing produc-
tive interactions between government and produc-
ers. Therefore, the government must improve the
process of interaction, collaboration and learning
amongst producers and itself. This is very differ-
ent from the paradigm of Indian industrial policy

Industry 55
prior to India’s economic reforms commencing in
the 1980s. In that era, industrial planning was a top-
down control activity with Government determining
who should produce what, where and how much and
also what technology they should use. The roadmap
for the Twelfth Plan and beyond can definitely not
be a return to this type of planning.
Nature of Industrial Policy
The Question of ‘Industrial Policy’
13.13. The Government of India needs a strategy to
accelerate the growth of the country’s manufacturing
and industrial sectors to meet the goals and obtain
the outcomes mentioned. The concept of ‘industrial
policy’ has varied across countries and also over time.
In India, industrial policy becomes assaulted under
a stifling system of bureaucratic controls through
licenses and quotas for industrial production. There
is no doubt that these controls were highly dysfunc-
tional and needed to be dismantled but the mere
removal of these controls and reliance on markets
alone was not sufficient. The collapse of the Soviet
Union and the ascendancy of Western free-market
approaches to economic growth which was fash-
ionable for a time in the 1990s implied abandon-
ment of any concept of ‘industrial policy’ altogether.
However, this is not the recipe which delivered rapid
industrial growth for many of the post-war success
stories, whether we think of Japan or Korea or, more
recently, China. In planning a strategy for rapid
growth of industry in India we need to learn from
these success stories and apply them suitably to our
circumstances.
Paradigms of Industrial Policy
13.14. Countries that have succeeded in growing
the competitiveness and scale of their manufactur-
ing sectors have adopted different policy approaches.
However, a common element in their approaches has
been a close coordination between producers and
government policymakers, with Governments play-
ing an active role in providing incentives for domes-
tic industrial growth and in relieving constraints on
industrial competitiveness. The process by which
this coordination has been achieved has differed
according to the political structure of each coun-
try’s economy (Figure 13.3). In Japan the coordina-
tion between Government and industry (and within
Government) was very successfully orchestrated
by MITI in partnership with Japanese industrial
associations. In South Korea, the Chaebol and the
Government collaborated to create world-class and
world-scale winners. In Singapore, the Government
identified industries to be developed and created
ecosystems (skilled human resources, tax regime,
Government incentives and so on) to support growth
of competitive enterprises in the country. In China,
Input–output matrix with
control of investments and
outputs. The Indian approach
prior to the mid 1980s
Big bets on national
champions and
technologies
Leaving it completely to
the ‘market’
No Industrial PolicyPicking WinnersCentrally Planned Economy
Ineffective Models
Rethinking ‘Industrial Policy’ and Our Approach
A national
ecosystem that
facilitates competitive
abilities of enterprises
The three
‘rails’ of
manufacturing
policy
Stakeholder involvement
Implementation
Learning
FIGURE 13.3: New Approach to Industrial Policy

56 Twelfth Five Year Plan
the large State Owned Enterprise (SOE) sector has
enabled the Chinese Government to adopt a very
muscular ‘industrial policy’. Along with preferential
treatment to domestic companies, large investments
in technology development/acquisition, massive
investments in infrastructure and restraints on its
exchange rate, China’s industrial policy has been
remarkably successful. Germany’s manufacturing
sector remains very successful in spite of high labour
costs and a strong currency because collaboration
between stakeholders in the German industrial sys-
tem is deeply embedded in policymaking processes
and also within industrial enterprises.
13.15. A deeper analysis of such successes (Japan,
Korea, China and Germany) of ‘industrial policy’
and also of its failures (India, the Soviet Union and
some instances in Latin America) reveals the essence
of successful industrial policy. Firstly, ‘industrial pol-
icy’ is a web of ongoing changes that facilitates the
growth of a competitive industrial/manufacturing
ecosystem in the country. Secondly, Governments
have a key role in facilitating the process of learning
and collaboration between producers and policy-
makers. Thirdly, and this is key, it is the quality of
this process of collaboration and the speed of learn-
ing and execution in the system that enables the sys-
tem to improve its competitiveness faster than other
countries’ systems. Government policymakers must
have the skills and orientation to facilitate and coor-
dinate, rather than to control. Industrial policy will
not produce a competitive manufacturing ecosystem
if the orientation of the Government and its func-
tionaries is to control and micro-manage. It will also
fail if Government and its functionaries do not mas-
ter the skills and build institutional capabilities for
better coordination within Government, smoother
collaboration with industry (which must be organ-
ised in line with the industrial–political economy
of the country, as mentioned before) and, above all,
faster learning.
13.16. The paradigm we must adopt is to build an
ecosystem for rapid learning and capability building,
which will encourage entrepreneurship and support
innovation, and which will provide the system-wide
processes to support collaboration and build stronger
value chains with depth. This paradigm requires a
change in the mindset of Government functionar-
ies from being ‘controllers’ to ‘facilitators’, from
‘resource allocators’ to ‘knowledge managers’ and
from ‘scheme managers’ to ‘continuous learners’.
Essential Features of a Manufacturing
Ecosystem that Learns
13.17. A dynamic manufacturing ecosystem has
three features that enable it to learn and grow.
1. Firstly, it must have depth (value addition) in
manufacturing processes. A manufacturing sec-
tor, no matter how large, that is composed mostly
of low value addition assembly industries, can-
not create new technological capabilities. It may
compete on low costs on account of scale and low
labour costs, but it can easily lose these advantages
to other countries which have even lower labour
costs. Also, merely having R&D capabilities, with-
out the wherewithal around them to convert ideas
into manufactured products will not enable the
growth of manufacturing industries.
2. Second, it must combine four capabilities:
human skills, embodied technology in hardware,
knowledge (intellectual property) and a large
and demanding customer base. All four compo-
nents grow together to create a productive and
competitive industry.
3. Third, it must have a range of different sized
firms, especially small and medium sized ones.
Small firms provide the first stages for skill devel-
opment. They take up larger numbers of people
into the industrial workforce with less capital
investment, and they provide nurseries for experi-
mentation too. Some of these small firms can
grow into specialised, internationally competitive,
medium sized firms. Such firms are the backbone
of the German industry, and also the strength of
India’s internationally recognised automotive
component, pharmaceutical and IT sectors.
13.18. Firms operating in such an ecosystem would
be able to flourish in an open competitive global
economy. While there is a case for special sup-
port for strategically chosen industries for a limited

Industry 57
period, the only way the industry can demonstrate
competitiveness is to be able to export to global mar-
kets within a defined period.
13.19. In addition to the three features described
above, there are five processes that enable the ecosys-
tem to learn.
• Firstly, learning is accelerated through the interac-
tion of the diverse components of the system: R&D
with producers, both with customers, producers
with institutes for skill development, and inter-
actions amongst adjacent sectors and technolo-
gies that spur new combinations and innovations.
Thus complexity breeds further technological
development and growth. This requirement trans-
lates into the strategies for building clusters, and
linking research and development institutes with
producers.
• Second is the process of Innovation. Innovation
can be spurred by several enablers that create
‘safe-failing’ spaces for experimentation. These
enablers include early stage risk capital, incuba-
tors and quick exit/bankruptcy laws. Analysis
reveals that the Indian industrial ecosystem has
inadequate support systems for experimentation
and innovation.
• Third is a regime of Standards. Standards are an
embodied learning of the ecosystem. They enable
firms, small ones in particular, with a base of
knowledge, and also act as means to reduce trans-
action costs with their customers and suppliers,
domestically and globally.
• Fourth is an IP regime. Like Standards, a good IP
regime provides a base of knowledge for research-
ers and producers to develop upon further with-
out having to reinvent the wheel. An IP regime
also provides incentives for taking risks by assur-
ing rewards.
• The fifth category of processes that enable system-
wide learning and continuing improvement are
a class of processes such as total quality manage-
ment, total productive maintenance, business
excellence and so on. In fact, such processes have
been the foundations for the rapid, country-wide
growth of productivity and competitiveness of
the Japanese and Korean industry. The power of
such processes has been realised by some sectors
of Indian industry too, such as the auto industry,
steel industry and so on.
The Architecture of a Strategy to Accelerate
Growth of Manufacturing
13.20. Manufacturing enterprises, unlike IT and
financial services enterprises, involve the production
and movement of material goods. They, therefore,
require good physical infrastructure to be competitive
and this means improving transportation, uninter-
rupted power and adequate land to build. Moreover,
the materiality of manufacturing activities also results
in more regulations—of safety, pollution, factory
inspections, labour conditions—and hence a more
complex administration structure too. The qual-
ity and efficiency of the physical and administrative
infrastructure is a basic requirement for productive
manufacturing enterprises. This is a major weakness
in India at present. The thrust in Government’s New
Manufacturing Policy (2011) to create good infra-
structure for manufacturing enterprises along trans-
portation corridors is, therefore, overdue.
13.21. Good physical infrastructure and smoothly
functioning administrative infrastructure are
threshold requirements for Twenty-first century
manufacturing enterprises to compete in the inter-
national arena. However, these will not be sufficient.
Competitive manufacturing, requires the develop-
ment of complex capabilities—technologies, skills
and management abilities to coordinate diverse
interactions and processes of learning. Such capa-
bilities can be learned and improved. Continuous
improvement in these capabilities is the key to sus-
tainable competitive advantage, even absent advan-
tages from raw materials required for manufacturing,
as Japan and Korea have demonstrated. Therefore,
the thrust of Government strategy must be on the
enrichment of the composition of these capabilities
in the country’s manufacturing ecosystem.
Three Components of India’s Manufacturing
Strategy and Plan
13.22. India’s Manufacturing Plan strategy in the
Twelfth Plan must be built around three compo-
nents. The first are capabilities and processes that

58 Twelfth Five Year Plan
go across many, if not all sectors of manufacturing,
and that build into the ecosystem the processes for
rapid learning and building of capabilities.
13.23. The second component has to be the plans
to strengthen the performance of selected sectors.
The selection of these sectors is done by a combi-
nation of top-down and bottom-up analysis. From
the top, certain sectors appear more important to
meet the goals of the Plan for more employment, for
example, to produce goods that India needs for its
strategic security. On the other hand, the capabili-
ties created by Indian entrepreneurs in some sectors
provide potential for more growth, and they should
be supported. For example, the pharmaceutical and
auto parts sectors. Thus the Plan, at present, has
identified 18 such sectors.
13.24. India’s sectoral strategy has to be broad-based,
covering many sectors, to achieve the large-scale
growth that India needs in manufacturing. India
cannot achieve its goals by ‘picking winners’. In each
of these sectors, a sector strategy is required to grow
capabilities and relieve constraints. Such sector strat-
egies should be formulated jointly by the associations
of producers in the sector (and other principal stake-
holders too) and the relevant Government depart-
ment. They should describe the opportunity for the
sector and the actions required from the producers
themselves, along with support from Government
policies.
13.25. The third, vital, component of the Strategy is
the institutional ability for effective consultation
and collaboration between producers and public
policymakers and implementers and the systemic
reform of existing systems and processes within the
Government. The strength of this process has been
found to be the common factor in the success sto-
ries of all countries that have built large, competitive
manufacturing sectors.
13.26. Lack of co ordination amongst government
ministries, and the relatively poor quality of inter-
action between business associations and govern-
ment—which is constrained by the competition
amongst associations, and the orientation, by and
large, towards lobbying and financial sops—prevents
improvement in the process of collaborative learning
and capability building that India needs to grow its
manufacturing sector.
13.27. The challenges to developing and implement-
ing a cohesive manufacturing strategy in democratic
India are many. Cohesion can be brought about
through more effective coordination amongst agen-
cies, and more effective consultation amongst stake-
holders. Apart from this, the Government will also
require specialised skills such as consensus build-
ing and programme management to manage this
process. Government should consider a ‘Backbone
Organisation (BBO)’ to facilitate this process.
ISSUE IDENTIFICATION AND STRATEGIES TO
ADDRESS THE VARIOUS CROSS-CUTTING
ISSUES
13.28. The focus of this Plan has specifically been on
transforming the approach to align the varied stake-
holders to a common national goal, instead of having
silo-limited views on individual sectors and individ-
ual goals (Figure 13.4). In order to achieve this coor-
dination between the various sectors, and to identify
the underlying causes of the slow progress of manu-
facturing, a set of thematic ‘cross-cutting’ issues were
identified in addition to the major sectors of manu-
facturing. The ‘cross-cutting’ issues affect the growth
of manufacturing across sectors. They fall into two
categories: one category is those issues that ‘industry’
ministries and industrial enterprises have responsi-
bility to address, albeit in collaboration with other
stakeholders; and the other category is those broader
issues that affect the economy overall in which the
responsibility primarily lies with other ministries.
13.29. In the first category is the weak development of
human resources, of which a vast quantum is essential
to achieve our goals. Another key issue, common to
all sectors, is depth within the country of technology
in the sector’s supply chain. Yet another is a set of the
infrastructural challenges, both physical and adminis-
trative, related to acquisition of land and water man-
agement, and the business regulatory framework, in
which industry has a key role to play in developing
and implementing solutions in consultation with
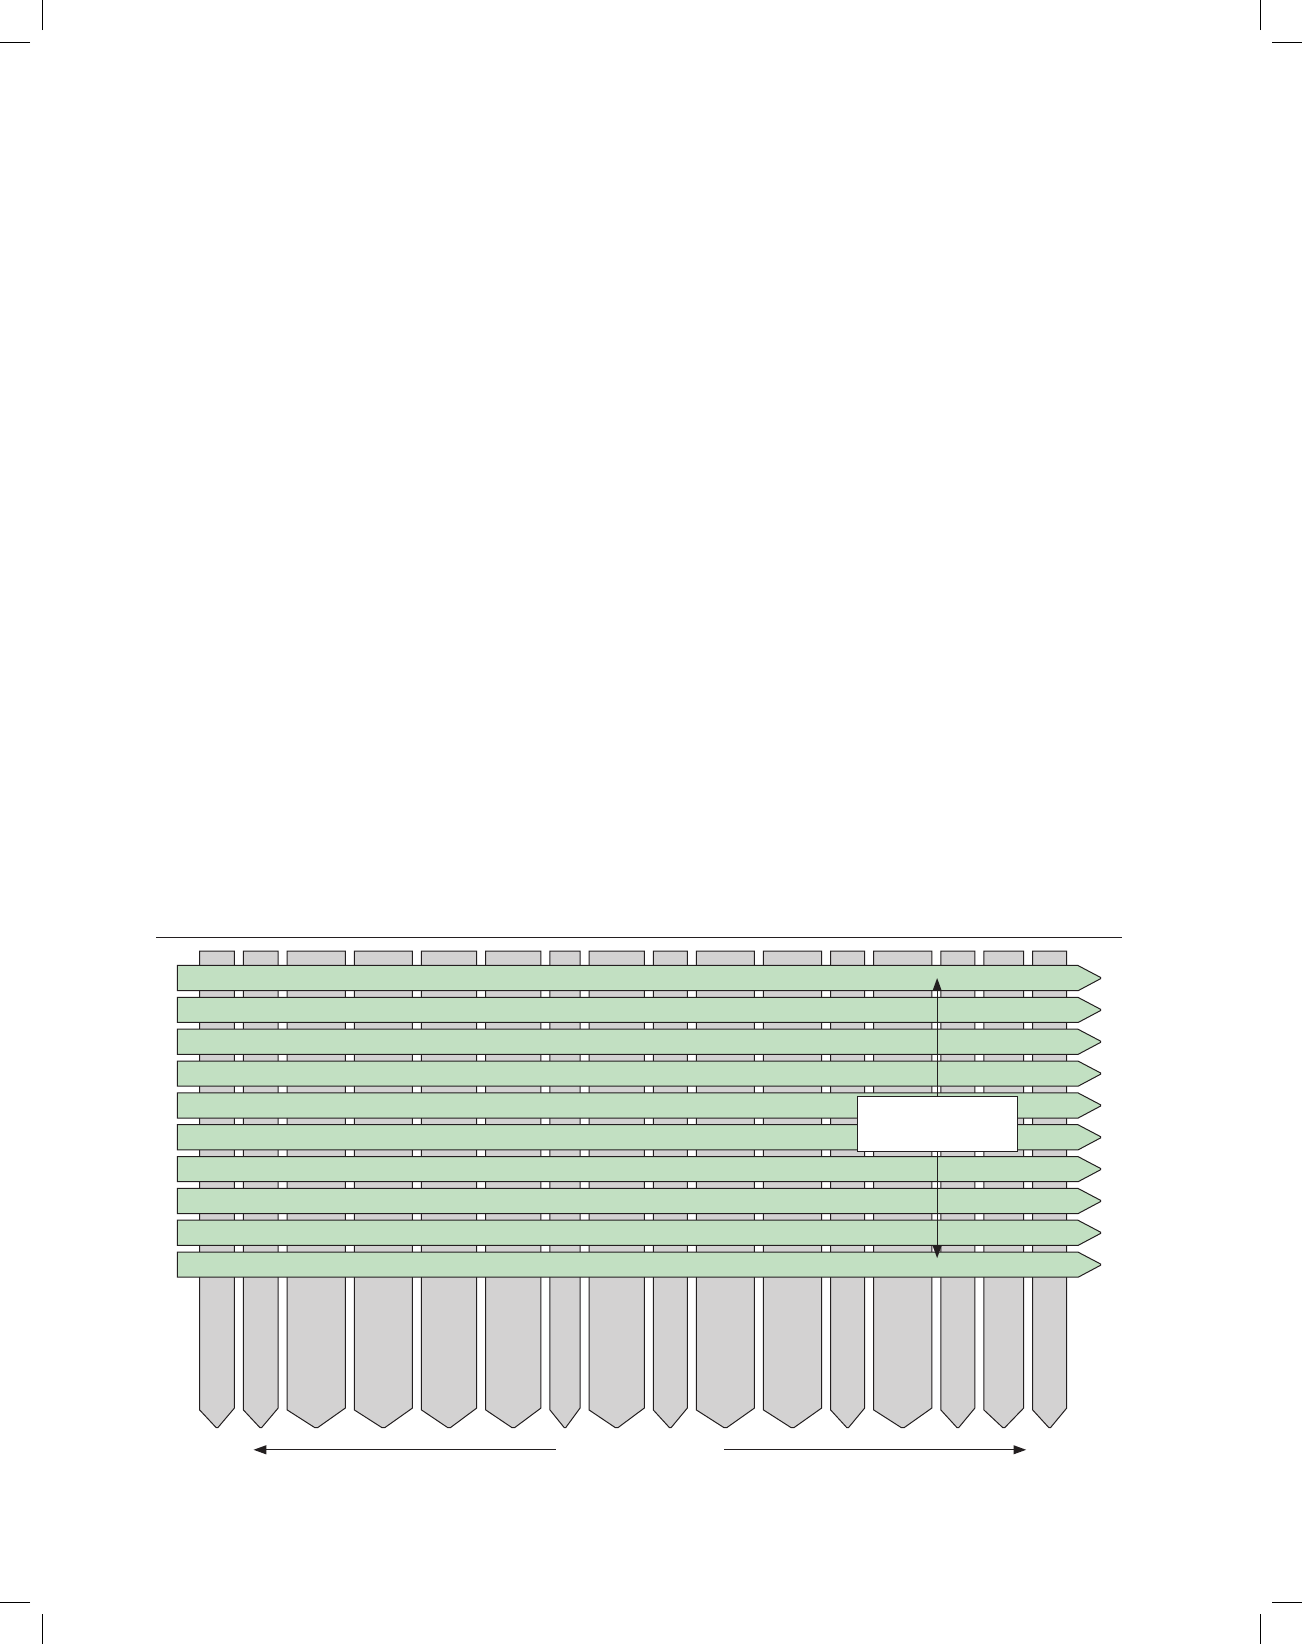
Industry 59
other stakeholders. These cross-cutting issues have
been identified in the National Manufacturing Policy
recently approved by the Cabinet. This Plan describes
the actions to be taken in all these areas and a process
for their implementation and monitoring.
13.30. The second category, that of external inputs to
industry that affect the economy as a whole too, and
which are managed outside industry, includes four
principal constraints on the growth of manufactur-
ing: transport infrastructure, power, cost and avail-
ability of credit, and the exchange rate. Transport
infrastructure and power have a direct bearing on
the competitiveness of manufacturing. Energy and
logistics are critical requirements for competitive
manufacturing operations. While significant invest-
ment were made in transportation infrastructure in
the Eleventh Plan, Indian industries continue to suf-
fer from severe infrastructure handicaps compared
with the infrastructure available to manufacturers
in other countries. Ports are already close to full-
capacity utilisation resulting in extremely inefficient
turnaround times and similarly roads suffer from
congestion resulting in heightened costs. Unreliable
and inadequate power supply continues to be a seri-
ous impediment in India in spite of the considerable
efforts made to enhance power generation capacity
in the country. Improving the supply and quality of
both transport infrastructure and power are essential
requirements for attaining the targeted growth rates
for manufacturing in the Twelfth Plan and beyond.
13.31. Adequate availability of low-cost credit is
a vital requirement for sustainable manufacturing
growth. Continued monetary tightening due to the
recent turn of global events has resulted in a high
cost of capital, adversely impacting manufacturing
investment and growth in India. Cost of capital is key
for ensuring competitiveness, especially of exports,
of the manufacturing sector and needs to be carefully
managed through a more balanced blend of fiscal
and monetary measures. Specifically for MSME’s,
access to credit continues to remain a challenge and
besides a host of measures to facilitate greater flow
of credit to this segment detailed in Section 5, the
overall pool of available capital needs to be enlarged
to include alternate sources of capital such as private
equity, venture capital and so on.
Focus given not only to ‘vertical’ sectors by also to ‘horizontal’ issues that cut across sectors
Automotive
Fertilizer
Petrochemical
& Chemical
Drugs and
Pharmaceuticals
Mineral Expl.
& Development
Ship-building
& Repair
Steel
Textiles & Jute
Cement
Capital Goods
& Engineering
Leather and
Leather Goods
Paper
Food Processing
Industries
Gems & Jewellery
Defence Equip.
Aerospace
Technology & Depth
Human Resource Development
Business Regulatory Framework
Role of PSEs
National Investment and Manufacturing Zones
Boosting India’s Manufacturing Exports
Environment Sustainability
Land and Water
Clustering and Aggregation
MSMEs
Sectoral Groups
Cross-cutting
Groups
FIGURE 13.4: Focus on Sectors as well as Cross-cutting Issues

60 Twelfth Five Year Plan
13.32. Finally, the exchange rate is an enormously
important factor affecting the international com-
petitiveness of a country’s manufacturing sector.
Large fluctuations in exchange rates can disrupt the
management of supply chains. Monetary and fis-
cal authorities need to be cognisant of the impact
that such fluctuations have on the growth of
manufacturing.
TECHNOLOGY AND DEPTH
13.33. A principal objective of the Twelfth Plan must
be to increase ‘depth’ in manufacturing, to increase
domestic value addition, and meet national strategic
requirements. The technological depth of the coun-
try’s manufacturing sector goes up when it becomes
an active player in more parts of the manufacturing
value chain (research, development and production).
Depth defined in these terms increases synergies
across the value chain and also strengthens the over-
all trade position. It may be noted that depth is not
necessarily required in all sectors. There is merit in
being part of a global value chain but substantial part
of industry must have technological depth.
13.34. Depth in technology is extremely important
for a country to sustain its competitive advantage
in a global economy. It is not only important from
the point of view of greater value addition, but it is
also required to attract new industries and maintain
competitive advantage of current industries.
13.35. The key requirements for improving technol-
ogy and depth are to:
• Provide an enabling environment for domes-
tic enterprises to invest in technology creation,
technology absorption and achieve higher value
addition
• Ensure availability of demand for products devel-
oped and/or manufactured indigenously
• Provide enabling environment for foreign enter-
prises to invest in manufacturing and research
activities in the country, in the areas in which the
country needs foreign technology
• Mitigate the risks of MSMEs investing in technol-
ogy development and technology upgradation
Status and Key Challenges
13.36. Lack of depth in technology is one of the
foremost issues affecting the growth of manufac-
turing sector in the country. India’s R&D spend is
0.9 per cent of GDP, whereas China, UK and Israel
spent about 1.2 per cent, 1.7 per cent and 4.3 per
cent, respectively. India needs to increase its R&D
expenditure to improve its depth. The private sec-
tor finances 70 per cent of the total R&D spending
of China, 65 per cent in United States and 75 per
cent in Korea and Japan, while Indian private sector
funds only 25 per cent of the total R&D spend. As
majority of private sector funding of other countries
is towards industrial R&D, Indian corporate sector
needs to increase its spending on industrial R&D
(see chapter on Science and Technology).
13.37. The key challenges faced by Indian industries
are:
• The Indian Industry has not given sufficient
importance to the documentation of knowledge
and creation of IP. As a result, not only were
opportunities lost to create IP, but we lost IPs to
other countries, such as in traditional agricul-
tural products (IPs filed by western countries on
neem, turmeric and basmati rice, which India has
contested). Our regulatory framework, speed of
award of IPs and the enforcement of IP regula-
tions needs improvement. India’s approach on IP,
hence, needs to distinguish between shaping the
framework for IP creation and improving its IP
management processes.
• Though there is an improvement in the indus-
try-academia collaboration in creating pat-
ents/technologies, still there is a large scope for
improvement.
• While FTAs signed with other countries are
favourable for some products, they often create a
distortion in the market in terms of inverted duty
structure for other products.
• Many segments of the industry, especially
MSMEs, have limited information and access to
risk capital for sourcing/developing and internal-
ising new technologies.
• The weak attention to standards not only invites
dumping of sub-standard products by other

Industry 61
countries (refer to Box 13.1), but also makes it dif-
ficult for the industry participants to benefit from
each other’s learning and improve their technol-
ogy depth.
• Absence of national agenda and policy framework
to support innovation.
A Systems Improvement Framework
13.38. It is essential to set the context before mov-
ing to the recommendations. Government support is
essential to enable a country’s industrial ecosystem
to gain depth because technological learning takes
a long time, requires large investments and is risky.
Support to the enterprises should be in such a way
that it motivates and enables enterprises to learn and
develop complex capabilities and not become com-
placent and inefficient, which was the outcome of the
industrial policy adopted by India until the 1980s.
13.39. Table 13.4 and Table 13.5 capture the generic
policy levers that should be moved for faster growth
of manufacturing over the next five years. The spe-
cific policy interventions must be tailored to fit the
requirements of sectors by a process of industry—
Government consultation which, as has been empha-
sised before, will be the key to ‘get it right’. MSMEs
and large enterprises will require different kind of
interventions from Government.
13.40. MSMEs play a critical role in innovation,
thanks to their nimbleness and their ability to
experiment with new technologies on small scales.
However, they often suffer from lack of funds,
inability to take risks associated with technology
developments and the difficulty of attracting skilled
manpower. Policy interventions for MSMEs must be
tailored to their conditions. Government policies for
MSMEs should therefore help them improve their
technological capabilities by focusing on:
• Providing access to risk capital
• Setting up of standards for the industry
• Improving Industry/research institute/academia
interaction, mostly in clusters
• Stimulating demand/providing scale through
preferential treatment in government purchases
Box 13.1
Examples of Weak Domestic Standards Leading to Influx of Sub-standard Products in the Country
A) Absence of standards
In the absence of technical standards, it becomes easy to import poor-quality products into the country. This hurts the domestic
industry as the domestic industry is unable to match the price of these poor-quality products; it also exposes consumers to
the harmful effects of spurious products. In the absence of such standards, it would not be possible to make such technical
regulations which would curb import of poor-quality products. Some of the examples include mobile telephones, batteries for
the mobile telephones, digital blood pressure measuring equipment, decorative lights (imported from China during Diwali
festival), medical equipment and so on.
Mobile telephones: Lack of manufacturing standards and testing/sampling labs are prompting dumping by foreign
manufacturers. For example, till 2009, there was no standard mandating all imported mobile phones to have an IMEI number.
As a result, Chinese handsets without IMEI numbers had a market share of about 13 per cent at that time.
B) Lack of a clear framework for voluntary and mandatory compliances
In some situations, where Indian Standards exist for products or processes, the Central Government has not notified them
for mandatory compliance.
Toys: Standards have been laid out for safety of toys such as quality of plastics and paints, electrical and mechanical hazards,
migration of heavy elements (Lead, Cadmium) and so on. However it is not mandatory to comply with, and hence toys from
other countries are being dumped in the Indian market.
Structural steel: This is used in building damns, bridges and so on. Standards in the manufacturing of structural steel are
voluntary and lack the need to specify end use. The lack of compliance to such voluntary guidelines and the absence of the
need for requisite certification lead to dumping of poor grade structural steel.

62 Twelfth Five Year Plan
competitive products for domestic as well as global
customers. They compete with global manufacturers
in local as well as in global markets. The Government
policies for large enterprises can focus on:
• Improving IP regime
• Ensuring human resource availability by estab-
lishing institutions for technology education and
research, educational institutions and so on
• Ensuring access to critical raw materials
Strategies for Change
13.42. Some high impact strategies for India at this
time to accelerate the development of technological
depth in the manufacturing sector have been anal-
ysed. These should receive special attention in poli-
cymaking and implementation.
13.43. Creation of coherence amongst existing insti-
tutional agencies towards developing national priori-
ties for indigenous technology development.
13.44. Several countries like China and Singapore
have followed a comprehensive approach to iden-
tify critical technologies to be developed indig-
enously and have formulated mechanisms to
TABLE 13.4
Processes That Enable Learning
Process that Enables Learning Policy Levers
1. Interaction between diverse components of
the system—R&D, producers, customers,
Government, institutes of skill development and so
on.
• Cluster development
• FDI and JVs
• Industry/research institute/academia partnership
• Higher education in the country
2. Creating ‘safe-failing’ spaces for experimentation
by firms
• Access to risk capital, technology funds
• Subsidy on interest costs
• PPP model of funding
3. Creating a regime of ‘Standards’ • Setting up a system of National Standards benchmarked to International
Standards
4. IP regime, which helps firms to build on each
other’s innovation
• Effective ‘IP’ regime
• Improving awareness of IP
5. System-wide improvement: Processes such as
‘Total Quality Management’
• Mainly the firm’s role to adopt such tools and increase organisational
learning
• Nation-wide, and State-wide campaigns to improve ‘Total Quality’ in
all enterprises, including MSMEs, should be sponsored by Government
through institutions such as Quality Council of India
Source: Planning Commission.
TABLE 13.5
Manufacturing Ecosystem Infrastructure
Ecosystem
Infrastructure
Policy levers
1. Physical
infrastructure
• Cluster development
• Special manufacturing zones (NIMZ)
2. Improving
capabilities
• Skill development
• Total quality management
• JV, Technology transfer, FDI
3. Creating the
manufacturing
ecosystem
• Developing MSMEs
• Common facilities through clusters
• Developing Standards
• Availability of quality human
resources
• Demand availability for manufactured
products
Source: Planning Commission.
• Modular industrial estates/laboratories near pre-
mier technical institutions with the required plug
and play facilities.
Setting Up of a Technology Acquisition and
Support Fund
13.41. On the other hand, large enterprises handle
complex technologies and manufacture globally

Industry 63
ensure that these technologies were funded and
incubated.
13.45. In India, we have various agencies like the
Department of Science and Technology, NMCC
and the Planning Commission working in this area.
Connections between these agencies remain weak
as they continue to function in silos, resulting in a
cluttered approach to technology development. To
make this process more robust and comprehensive
(including funding and incubating projects), the pre-
sent process/institutional arrangements should be
reviewed and fine-tuned/restructured. The industry,
as key stakeholders, should be involved and con-
sulted in the design of new arrangements.
Create ‘Safe-failing’ Spaces for Companies to
Engage in Innovation
13.46. Government participation in funding of
research through a ‘Technology Fund’ or ‘Tech-
nology Upgradation Fund’ is an important instru-
ment for reducing the risk for firms in investment
in research. The structure of the ‘Technology Fund/
Technology Upgradation Fund’ has to evolve over
a period of time. Traditionally such funds have
been operated in the form of Government grants
or schemes. However, they can be more effective in
producing outcomes if they were managed by pro-
fessionally managed investment entities.
13.47. The ways in which the Government could
provide/redesign fiscal incentives for R&D activities
are:
• Tax credit instead of tax incentives: With the
imposition of Minimum Alternate Tax (MAT)
of 20 per cent, companies are unable to avail full
benefit of weighted deduction. Equivalent benefits
of weighted deduction on R&D spend should be
treated as tax credit and be allowed to be set off
against Tax and/or MAT payable.
• Credit on inputs/capital goods used for R&D out-
side the factory premises: The Cenvat Rules pro-
vide that credit can be availed on inputs and
capital goods if they are used in the factory of the
manufacturer. Enterprises having R&D facility
separately from manufacturing facility will not be
able to claim Cenvat benefits on inputs and capi-
tal goods used for R&D. This anomaly should be
removed and the Cenvat benefits to be available
for inputs and capital goods used in R&D, even if
the R&D is carried out in a different premises, as
long as linkage between manufacturing and R&D
activities can be established. Due to this lacuna,
assesses with sizeable investments in R&D facili-
ties outside their factory of manufacture will not
be entitled to avail Cenvat credit on investments
and certain operating expenses. Consequently,
this forms a disincentive to setting up of R&D
centres by increasing the costs of setting up such
centres.
13.48. The tax incentives should be provided in such
a way that they do not penalise existing enterprises
that do not operate in special economic zones or
particular locations/States. To ensure a ‘level playing
field’ to all domestic manufacturers and to provide
a wider stimulus by the incentives, the tax incen-
tives should be available for all enterprises involved
in a specific activity rather than for a few enterprises
operating in some specific locations. Knowledge
sharing should be improved between the industrial
and financial sectors.
13.49. The financial sector works with many indus-
trial sectors and thus can see patterns and, with
its perspective, obtain insights that are not avail-
able to people within industrial institutions.
There are several programmes like Small Industry
Business Research Initiatives (SIBRI), Technology
Development Board (TBD), Biotechnology Industry
Partnership Programme (BIPP) and Biotechnology
Industry Research Assistance Programme (BIRAP)
which promote early stage innovations and PPPs.
These institutes should work more often and closely
with financial sector institutions to share knowledge
that can improve policies for the manufacturing
sector.

64 Twelfth Five Year Plan
Strengthen the IP Regime and Systems to
Leverage IP
13.50. A strong intellectual property regime is a pre-
requisite for creation of global IP from India. It has
also become a requirement under WTO. While the
importance of IP for creation of innovations in the
industry is well understood, the question is whether
developing countries will get penalised given that
they are starting with a low base compared to devel-
oped countries. Various alternatives like ‘utility
model’ of patents (as China has) to manage this need
to be examined to put in place an efficient model that
can help generation and protection of incremental
innovations in Indian manufacturing.
13.51. Given the need for a strong IP regime from a
long-term point of view, the following steps need to
be taken:
• Improve IP management and protection
mechanisms.
• Develop global information database on IPs
accorded.
• Strengthen and modernise the process of patent
examination and according patents.
13.52. Also, in order to leverage the benefits of IP:
• Build awareness about IP through education and
training.
• Create national IP mission to continually evolve
the IP strategy of the nation.
• Encourage joint IP filings by industry/academia/
research institutes.
• Encourage the formation of companies specialis-
ing in IPs (through tax incentives).
• Exempt income tax for the income generated
from domestic IPs.
Strengthen Partnership between Industry
and Academia/Other Research Institutes to
Create IPs Domestically
13.53. Industry–academia partnerships are relatively
weak in India compared to many other countries.
The partnership should aim for building an eco-
system which can create a virtuous cycle of educa-
tion and research leading to IP creation and its
subsequent commercialisation. Such aspect in turn
will incentivise and inspire further innovation. Some
of the policy measures that Government can use to
accelerate the development of industry–academia
partnership are:
• Joint ownership of IP arising out of these
collaborations.
• Align the goals and annual planning processes of
central research institutions with that of indus-
tries through industry associations.
• Incentivise Central/State Research institutes to
create joint IPs with Industry.
• Tying up a certain percentage of their budget to
the number of collaborative IPs created.
• Incentivise university and industry for forging
successful partnerships in university’s gover-
nance, infrastructure, course curriculum design,
faculty/students development and research.
• Create cluster innovation centres at universities
with the aim to foster a favourable ecosystem and
enforce industry–academia linkage.
• Provide an institutional framework for active
interface between funding agencies, academia and
industry.
Clusters (and NIMZ) Can Provide Enabling
Infrastructure to Improve Technological
Depth
13.54. Clusters play a critical role in propagating
technological depth by facilitating technological
learning and manufacturing through the presence of
the entire ecosystem in the same geographical loca-
tion. The National Manufacturing Policy, which out-
lines creation of NIMZs, was cleared by the Cabinet
in November 2011. It ensures that business is pro-
vided with the ecosystem required for growth, not
only in manufacturing, but also for investments in
research and development. The attractiveness of
NIMZs will be even higher for new high-technology
industries, which will benefit from the localised pres-
ence of the entire value chain of participants. Also,
the benefits of industrial clusters to MSME par-
ticipants are also well understood, and the MSME
Ministry is using the cluster approach to drive the
growth and depth of MSME industries.

Industry 65
Improve Technical Standards, Voluntary
Compliance and Conformity Assessment
13.55. Standards are a form of embodied technical
knowledge accessible to all types of business that
enables more effective product and process devel-
opment. They promote and enable the diffusion of
technology in a form that is readily assimilated by
firms with the complementary capabilities to take up
and use the new methods. Standards, therefore, con-
stitute one of the important foundations for the tech-
nological depth in manufacturing, and are accorded
high importance by the policy planners in the devel-
oped world.
13.56. During the Twelfth Five Year Plan, the focus
on technical regulations should be on:
• Developing a policy on technical regulations.
• Capacity building of regulators (BIS).
• Review of technical regulations to identify the gap
vis-à-vis national standards.
• Sensitising the industry regarding the need to
provide scientific data to regulators to formulate
effective technical regulations.
• Setting up of helpdesks in industry bodies and
export promotion councils for information
dissemination.
13.57. In addition, voluntary compliance initiatives
must be strengthened:
• Promoting and funding a ‘Standards Cell’ in
industry associations and Standards Developing
Organisations (SDO).
• Capacity building of SDOs.
• Capacity-building programmes for the training
of technical staff in the industry for writing com-
pany- and industry-level standards.
13.58. Government should also create a database-
based/software-based system to track the changes in
technical standards/voluntary compliances globally
and alert Indian manufacturers of development.
13.59. While the Standard-setting process sets the
standards to be followed, conformity to the stand-
ards is assessed by conformity assessment agencies.
While many conformity assessment agencies have
sprung up in the last few years, it is important that
these conformity assessment agencies are of world
class and their certificates are acceptable across the
world.
13.60. To achieve these, the following steps are
envisaged during the Twelfth Five Year Plan period:
• Promoting the acceptance of Indian conformity
assessment globally
• Capacity building for inspection bodies/certifica-
tion bodies
• Developing regulation on conformity assessment
13.61. Quality Council of India, set up jointly by the
Government of India and the top industry associa-
tions—CII, FICCI and ASSOCHAM, has been work-
ing to
• Establish and maintain an accreditation structure
in the country
• Help representing India’s interest in International
forums
• Spread the quality movement through the country
13.62. The Twelfth Plan will focus on strengthening
the capabilities and role of the QCI.
Removing Anomalies in Duty Structure
• Remove special schemes that allow import of fin-
ished goods at concessional custom duty: In almost
all promotional schemes where import duties are
reduced (nil duty project imports, certain defence
purchases, SAD exemption under ITA Agreement
for IT products and so on), imports get the ben-
efit of reduced duties/nil duty. This erodes the
level of protection which would have otherwise
been available, thereby, creating a systemic dis-
advantage for local manufacturers. It is therefore
recommended that import of finished goods at
concessional custom duty under special schemes
be discontinued.
• Inverted duty structures (Higher duty on inter-
mediate products vs. final products): For speci-
fied purposes, presently there is higher duty on

66 Twelfth Five Year Plan
intermediate goods (used by the domestic manu-
facturer for assembly/manufacture of goods), as
compared to duty on finished goods. This in turn
leads to higher input cost for the domestic manu-
facturer. It is therefore recommended that duty on
intermediate goods be brought in line or set lower
than applicable for final products.
13.63. The Government has corrected, as best pos-
sible, the issues related to inverted duty structures
(illustrated above) raised by industry. It must review
any new case that is brought to its notice and must
undertake a study of effective rate of protection
across sectors.
13.64. Some issues regarding CST/VAT retention
and VAT/SAD were also analysed:
• CST/VAT Retention: Interstate movement of
goods by domestic manufacturers carries added
cost in the form of central sales tax (on interstate
sales)/retention of input VAT credits (on inter-
state stock transfers). This can be avoided in case
of imports by executing sales in the course of
import or through directly consigning the goods
to the customer’s state. This creates disadvan-
tage to domestic manufacturers. Therefore, CST
on interstate sales and provisions with respect to
retention of input VAT on interstate stock trans-
fers should be abolished.
• VAT vs. SAD: VAT rates have been increased
from 4 per cent to 5 per cent, however there has
been no consequential increase in the rate of SAD
on imported products which is levied in lieu of
VAT. Therefore, SAD should be increased to 5 per
cent to reflect the pan-India based trend of revi-
sion of the VAT/CST rate bracket of 4 per cent to
5 per cent.
13.65. In order to resolve the aforesaid issues, it is
necessary for the Central and State Governments to
quickly build consensus on the design of a compre-
hensive GST and implement the same at the earliest.
Encouraging FDI and Joint Ventures
13.66. FDI (investments by foreign companies
in Indian ventures) and Joint Ventures of Indian
companies with foreign partners can provide access
to technology in areas in which domestic expertise
is inadequate. The Government must identify the
areas, in consultation with the industry, in which
FDI and Joint Ventures can help to bring technol-
ogy. Several problems that are impeding FDI/JVs
need to be addressed. Some these are:
• The ambiguity in the characterisation of income
arising to foreign investor on transfer of tech-
nology from the perspective of direct-tax obli-
gations. This leads to uncertainty with regards
to its taxability in the hands of foreign investor
thereby discouraging the flow of technology from
outside India. The foreign investor is required
to obtain PAN to enable the payer to withhold
taxes at appropriate rates. Also, the foreign inves-
tor is required to file its annual return of income
before the tax authorities in India for the purpose
of claiming credit with respect to the taxes with-
held by the payer in India. Such additional com-
pliances could become quite cumbersome for
the foreign investor in India especially where the
foreign investor does not have any operations in
India.
• The R&D cess paid by the importer cannot be
adjusted against any output taxes paid by the
importer, resulting in additional cost of 5 per cent
for the technology importer.
• Service tax paid on import of technology cannot
be adjusted against taxes paid on output, if the
manufacturing is outsourced.
• Limitation on technology cost as percentage of
total investment available for state tax exemptions.
Preference for Domestic Products in
Government Procurement
13.67. The cost of any manufacturing activity
(excluding raw materials and utilities) depends on
the maturity of manufacturing technology used
and the magnitude of the demand. For a matured
technology, the cost of manufacturing will be
relatively low, due to the learning curve effects.
Similarly, due to scale effects, the unit cost of man-
ufacturing goes down with the increasing demand.
Therefore, a domestic enterprise using new indig-
enous technology will have a cost disadvantage

Industry 67
compared to a global enterprise that has the ben-
efits of matured technology. Unless there is some
incentive provided to domestic enterprises to off-
set this handicap, developing indigenous technol-
ogy will be difficult.
13.68. Therefore, Governments in many countries,
developing as well as developed, provide preference
in Government procurement to domestic enter-
prises. However, to ensure that this policy measure
does not lead to development of substandard qual-
ity products or create inefficiencies in the domestic
enterprises, the preference in procurement can be
made applicable with minimum quality standards;
a cap on the permissible price differential between
domestic and imported products, and also a sunset
clause.
13.69. Some ways in which the preference for indig-
enous products can be provided in Government pur-
chases are:
• In sectors of strategic importance, procurement
should be done only from those vendors, who
have locally established manufacturing base.
• A multi-tier tax structure can be introduced,
which offers concessional tax rates for products
with higher local value addition.
• A certain percentage of Government procure-
ment to be reserved for enterprises using domes-
tic manufacturing/domestic IP; and a certain
percentage of it can be reserved for firms in
MSME Sector.
13.70. However, as a prerequisite to implementing
this procurement strategy, streamlining of procure-
ment functions is essential. Public procurement
organisations must be clear about how national
policy goals should be translated into procurement
practices without compromising quality. ‘Least cost’
is not always the right strategy and needs to be bal-
anced by other guidelines (life-cycle costs such as
service agreements, continuous improvement con-
tracts and so on). A balanced approach should be
taken to determine the weight assigned to price ver-
sus other qualifying criteria.
Aligning Investment Obligations Under
‘Offset Policy’
13.71. Offsets as a policy tool should be encour-
aged for public procurement in sectors where the
Indian industry does not have existing technol-
ogy or capability. The obligations of investments of
foreign companies under ‘Offset Policy’ should be
targeted towards investment in industries in which
the country needs to improve technological depth.
Articulation of clear objectives for an offset pro-
gramme, not just for defence industry but also for
the economy as a whole can become an instrumental
lever to further investment and growth of the coun-
try’s manufacturing sector.
Encouragement of Local Value Addition in
Critical Natural Resources
13.72. Some natural resources like good-quality coal
and iron ore are becoming short in supply in the
global economy with growing demand from devel-
oping economies especially China and now India.
Domestic availability of some of these raw materi-
als provides us a competitive advantage which we
should leverage to build domestic industries that
add value to these resources, thus creating additional
jobs and improving our trade balance. Going further
up the value change Government policies and duty
structure should be designed in a way to incentivise
value addition of steel rather than exporting steel in
raw material form.
13.73. In general the trade-off between export of
inputs which are in demand elsewhere in the world,
and use of those inputs for improving the competi-
tive position of domestic user industries is a tricky
one, while promoting entrepreneurial freedom and
free trade. These trade-offs must be understood
and sensitively managed to ensure competitive and
sustainable growth of domestic manufacturing.
Examples of vulnerabilities that have developed for
Indian industries, when longer term consequences of
policies have not been foreseen, are the virtual disap-
pearance of production of intermediaries for generic
drugs which China is now dominating, and also the
dwindling of Indian capital goods industries (refer to
Box 13.2), where too Chinese industry is becoming a
big international supplier. Chinese industrial policy

68 Twelfth Five Year Plan
has evidently done far better than India’s in building
depth in China’s industries.
HUMAN RESOURCE DEVELOPMENT, JOB
CREATION AND SOCIAL PROTECTION
13.74. One of the primary objectives of the plan is
to increase the competitiveness of Indian manufac-
turing. Human resources are of critical importance
for the growth of knowledge and technology, value
addition and improvement of competitiveness in
manufacturing through processes of continuous
improvement. In fact, the human resource is the only
‘appreciating resource’ in a manufacturing system.
It is the only resource that has the motivation and
ability to increase its value if suitable conditions are
provided, whereas all other resources—machines,
building, materials and so on—depreciate in value
with time. The best enterprises view their people as
their prime asset and the source of their competitive
advantage. Nations that have achieved sustainable
competitiveness in manufacturing even when they do
not have raw materials required, such as Germany,
Japan and South Korea, have created systems for the
continuous improvement of the capabilities of their
human resources.
13.75. India must invest in and build its human
resource capabilities to catch up with other countries
that have moved ahead and thereafter sustain com-
petitive advantages in manufacturing. Indeed the
contentious debate of ‘labour’ versus ‘capital’ in the
enterprise, as well as disputes between the institu-
tions that represent the people working in the enter-
prise and owners of the capital could be reframed if
employees were seen as assets, with value that can
appreciate, rather than as labour costs.
13.76. The purpose of this section is to propose a
set of holistic changes in key areas that require close
involvement and buy-in from various stakeholders.
Box 13.2
Dwindling Indian Capital Goods Industry
The capital goods industry can be considered as the ‘mother’ of all manufacturing industry and is of strategic importance
to national security and economic independence. It is in the interest of User Sectors that the capital goods industry be
strengthened since it is well established that the presence of a strong domestic industry increases competition and helps in
reducing the capital cost of projects. And most importantly, in economical maintenance of plant and machinery. Imported
plants come at lower cost but the foreign suppliers make up for that in their high priced spares and maintenance contracts.
However, Indian capital goods industry is facing severe competition from Chinese companies over the last few years. In the
case of machine tools, imports account for about two-thirds of the domestic requirements and is increasing further. The
import of power-generation equipment from China at much lower cost is also making the domestic industry uncompetitive.
The major factors responsible for increasing Chinese competitiveness are:
• Artificially depreciated Chinese currency
• Tax advantages and Government subsidies given by the Government
• Much lower interest rates
• Simpler labour laws
• Better infrastructure leading to lower cost of power, transportation and cluster approach helping specialisation of labour
and engineering skills
This is further complicated by the absence of level playing field for Indian manufacturers:
• All domestic manufacturers of capital goods are rendered uncompetitive due to additional burden of sales tax, entry tax,
octroi, VAT and other local duties and levies.
• For specified projects (Oil and Gas, mega nuclear/hydel power, fertiliser, refinery and so on) zero/5 per cent customs duty
applies on capital goods.
While it may be preferable from user industry point of view to allow the import of capital goods at lower costs in order to
improve their competitiveness, this will result in over reliance of Indian industry on other countries for key strategic inputs,
exposing itself to vagaries to the policies of these countries. Also, this does not help in building technological depth of the
Indian industry and manufacturing ecosystem.

Industry 69
Consensus about these holistic changes is more
likely to be achieved if, as mentioned before, the pri-
mary challenge was reframed as the development of
human assets to build India’s manufacturing eco-
system and strengthen India’s manufacturing enter-
prises, rather than merely management of costs of
labour.
13.77. Challenges in meeting the objectives lie
broadly in three areas:
• From a skill development perspective, there is
a significant gap between the existing training
capacity and people entering the workforce. A
very small proportion of total manufacturing
workforce is currently skilled.
Moreover, less than 25 per cent of the total
number of graduates are estimated to be employ-
able 1 in manufacturing.
• The total training capacity in the country is about
4.3 million for all sectors including manufactur-
ing.2 The Apprentice Training Scheme (ATS),
which is supposed to provide a bridge from edu-
cation to employment, has very low penetration
and is suffering from significant administrative
issues.
• For entrepreneurs and other employers, the per-
ceived lack of flexibility of changing the size and
nature of the workforce can act as a retardant in
making investments that could lead to greater
employment opportunities. Furthermore, the
complexity of labour laws and the administrative
mechanism of the laws make it harder to do busi-
ness in the country.
• By 2025, an additional 8 million management
workers3 (supervisors and above) are estimated to
be required. Well-trained management/supervi-
sory staff are critical for improving the productiv-
ity and industrial relations in large as well as small
manufacturing enterprises.
Strategy and Key Recommendations
13.78. Human resources should be managed as
a source of sustainable competitive advantage.
Government policy changes should induce and sup-
port such firm level strategies. The key stakeholders
who will need to work together to make the neces-
sary changes to the system in key areas mentioned
above are: Government (at the Centre and State
level), Industrial organisations and the unions.
13.79. The strategies for meeting the objectives are
in the following categories:
• Inducing job creation by reducing the cost of gen-
erating employment.
• Developing a supply of qualified human resources
to meet the demand from additional job creation.
• Enhancing skill levels of current workforce to
improve productivity.
• Improving the state of manufacturing manage-
ment in the country.
• Providing social protection to low-income
workforce.
• Improving industry–workforce relationships.
Inducing Job Creation by Reducing the Cost of
Generating Employment
13.80. There are two major barriers to employment
generation: limited flexibility in managing the work-
force and cost of complying with labour regulations.
Both these barriers must be removed in order for
jobs to be created at a much faster rate.
Limited Flexibility in Managing the Workforce
13.81. The recommendations to increase the level of
flexibility while ensuring fairness are:
• Companies should be allowed to retrench
employees (except categories such as ‘protected
workmen’ and so on) as long as a fair severance
benefit is paid to retrenched employees. This
severance benefit should be higher than what is
currently mandated—and the value should be
arrived at through tripartite dialogue between
Government, employers’ associations and
employees’ associations.
• In order to ensure that there is sufficient liquid-
ity to pay the severance benefit to the retrenched
employees, a mandatory loss-of-job insurance
programme could be put in place. This will espe-
cially be useful in situations where the retrench-
ment is due to bankruptcy or exit of the employer
and will reduce the justification for requiring
prior permission to shut down businesses.

70 Twelfth Five Year Plan
• The threshold level of employment for the
Chapter VB of the Industrial Disputes Act and
the threshold for applicability of the Factories Act
should be raised to at least 300 which was the level
in 1983.
• The process of engaging contract labour should be
reformed—employers should be allowed freer use
of contract labour while ensuring that the rights of
contract workers are protected, which is not the
case at present.
Cost of Complying with Labour Regulations
13.82. The traditional enforcement approach which
is based on inspection—prosecution—conviction
creates incentives for rent-seeking behaviour, espe-
cially if the laws are complex or have provisions that
are contradictory. The complexity of compliance
impacts smaller enterprises much more. They can-
not bear the high administrative costs.
13.83. Recommendations to improve compliance
and also contain the cost of complying with labour
regulations are:
• Simplification of labour laws: The implications of
labour laws should be detailed through a series of
ready reckoners that are easily available and regu-
larly updated so that inspectors and employers
have a common set of rules to look at.
• Improvement of administration: Higher invest-
ment should be made in the training of inspectors
to ensure that they are able to efficiently identify
incidences of actual non-compliance rather than
harass employers.
• Facilitating easier filing: Filing of reports should
be made a once a year activity with an online
option. As far as possible, the interface between
enterprises and Government should be comput-
erised to increase transparency and efficiency and
remove scope for rent seeking.
• Developing a self-certification model: While
ensuring that regulations governing labour wel-
fare must be complied with, a self-certification
model should be developed where appropriate.
• Additionally, fiscal incentives to encourage per-
manent job creation should also be considered,
after evaluating their implications and potential
impact. For example, skill building and train-
ing costs of permanent employees can be con-
sidered for accelerated tax benefits (subject to a
ceiling on percentage of salary paid to permanent
employees).
Developing a Supply of Qualified Human
Resources to Meet Demand from Additional
Job Creation
13.84. The manufacturing sector may need more
than 90 million people by 2022. However, the cur-
rent capacity for skill development is ill equipped to
meet this demand.
13.85. Role of industry: To enable the industry to play
its role in defining the requirement of manpower
both in terms of quality and quantity, Sector Skills
Councils envisaged in the National Skills Policy are
being set up. These councils will identify skill devel-
opment needs in their sector, evaluate the gaps,
create plans for skill development and improve the
quality of the training system. The councils are also
expected to establish sector specific Labour Market
Information Systems (LMIS) to assist in planning
and delivery of training.
13.86. Private sector participation in skill develop-
ment: For the private sector to play a role in aug-
menting the skill-development capacity in the
country, effective PPP models are needed. Existing
ITIs should be clustered together in projects with
total training capacity of at least 1,00,000 each to
allow private sector service providers to leverage
scale benefits leading to long term financial sustain-
ability. For inducing the private sector to partici-
pate in creation of additional capacity, scalable and
sustainable business models with direct linkages to
employment should be deployed. The NSDC has
created such models. They should be implemented
across 20–30 projects specific to manufacturing in
partnership with industry associations and from
funding through NSDF.
13.87. Improving ITIs: We need to improve private-
sector involvement in upgrading existing ITIs and
also improve their curriculum and content through
the sector-skills councils.

Industry 71
13.88. Attracting students: As a long-term strategy, it
is important to make acquisition and improvement
of skills an aspiration for people, especially youth.
This could be achieved by recognising high-skill per-
sons at the national and State levels along with rec-
ognition of other worthy citizens. For example, an
unsecured loan scheme should be created for those
who aspire to undertake vocational training. Large
enterprises could also provide special incentives and
recognition for acquisition of high skills.
13.89. Overall coordination: A number of initiatives
have already been taken by various Government min-
istries to tackle issues related to skill development
both at the Central and the State level. Coordination
between these initiatives should be improved. The role
and performance of the National Skill Development
Coordination Board should be assessed. To ensure
that skill-development activities are aimed towards
areas of maximum impact, it is important to put in
place an information system that provides data on
availability and requirement of skilled resources.
Enhancing Skill Levels of Current Workforce to
Improve Productivity
13.90. Training and skill building of the existing
workforce is an important element of the strategy
for increasing productivity of manufacturing in
India. Training of employees can be incentivised by
allowing tax deductions for expenditure incurred on
training. Currently, skill building is predominantly
achieved by in-house training of workers by each
enterprise. However, clusters and NIMZs provide
opportunities for shared infrastructure to provide
training for skilled and semi-skilled workers.
13.91. A number of existing initiatives are focused
on setting up tool rooms which are necessary for
SMEs. These tool rooms can be made more effective
by periodic performance audits by independent agen-
cies and also by operating them on a PPP model in
collaboration with industry associations. Just as tax
incentives are provided for investments in critically
required infrastructure assets, fiscal measures includ-
ing tax benefits on training expenditure may also be
considered for investment in critical human assets.
MSME Sector alone needs to skill 42 lakh persons in
the Twelfth Plan period, thus, requires to increase its
current training capacity from 4 lakh person per year
to at least 17 lakh persons per year by 2017.
13.92. Apprenticeships can be an effective way of
ensuring that entry-level workers have the skills
required to join the formal workforce. While there
should be no obligation to employ apprentices, the
current apprenticeship model needs to be reformed
by simplifying workflow for engagement of appren-
tices by employers, inclusion of new trades and
recording compliance through e-filing, removing
NOC requirement for out-of-region candidates.
Further, it is proposed to make all graduates eligi-
ble for apprenticeships and the duration of courses
should be reduced to a minimum of three months
and should be converged with MES. Outdated cur-
riculum needs to be updated and outsourcing of
classroom trainings should be allowed.
13.93. Changes in the Apprenticeship Act may have
to be made. In the meantime, a new model of in-
company training should be deployed. In this model,
companies should be allowed to take trainees for a
period of up to six months.
Improving the State of Manufacturing
Management in the Country
13.94. There were a total of approximately 5 million
managers in the manufacturing sector in 2008. If the
manufacturing sector grows at the targeted 12–13
per cent, 8 million more managers will be needed by
2025. Well-trained managers are extremely impor-
tant for improving the productivity of manufacturing
enterprises and maintaining harmonious industrial
relations. Currently, only a very small portion of
graduates from engineering and management insti-
tutes take up careers in manufacturing. Consequently,
there is a significant gap between supply and demand.
13.95. The quantity and the quality of management
in the manufacturing sector can be improved by the
following initiatives:
• Increasing collaboration between manufactur-
ing companies and engineering/management
institutes for joint projects in which staff and

72 Twelfth Five Year Plan
students of the institutes can get some hands-on
experience.
• Encouraging enterprises (especially larger ones)
to run good graduate engineering programmes
which can be a source of management talent for
themselves as well as the manufacturing sector
generally.
• Scaling up programmes such as Visionary
Leadership for Manufacturing (VLFM) at the
national level.
• Setting up centres of excellence for manufactur-
ing management through MoUs between insti-
tutes, government bodies and industry partners.
Business schools that focus only on manufactur-
ing management should also be encouraged.
• Creating a PPP model for engineering and man-
agement colleges with partnership with industry
associations and employers with focus on manu-
facturing management.
• Launching a campaign focused on attracting man-
agement talent to the manufacturing sector.
• A large source of potential managerial/super-
visory staff is the current workforce. Support
should be provided to enable deserving members
of the workforce to be promoted to management
positions.
13.96. Recent reviews with many sectors of industry
reveal a crying need for better supervisors and fore-
men—the first and second levels of supervision—
who are the backbone of productive and harmonious
manufacturing enterprises. Development of super-
visors and foremen, through suitable programmes,
collaboratively designed and managed by industry
and educational and training institutions must be
ensured along with the emphasis on development of
skilled workmen and good managers.
Providing Social Protection to Low-income
Workforce
13.97. Formal sector workers can leverage collec-
tive bargaining to obtain social security; however,
the informal workforce is dependent on govern-
ment actions to improve social protection for them.
A number of social security schemes have been
launched in the recent past. However, the existing
coverage represents a very low percentage of the
total number of workers in the manufacturing sec-
tor. For example, the New Pension Scheme (NPS)
that was launched in May 2009 to increase pension
coverage, particularly to the informal sector, has less
than 2,00,000 voluntary subscribers—this is far less
than the total intended coverage for such a scheme.
Limited access to social security is exacerbated for
those with low or uncertain incomes.
13.98. Unemployment benefits: Low income work-
ers in transitional phases of unemployment are
particularly vulnerable as they are unlikely to have
significant savings. To help overcome the problems
associated with social protection for temporarily
unemployed workers, which include contract work-
ers at the end of their contracts, a solution could be
for these workers to be part of a ‘sump’ as permanent
employees of contract agencies that are provided with
Government support to ensure skill upgradation of
these workers. The focus should be on creating a
pool of workers who can be available to employers
and ensuring that those that are unemployed have
avenues for training as well as financial assistance.
For example, the Automotive Mission Plan has
recommended the formation of a Supplementary
Unemployment Benefits Fund to be created by auto-
motive companies for providing compensation to
laid-off workers. Such funds in other sectors too can
be utilised to finance the creations and sustenance of
the ‘sumps’ that could be the ‘win-win’ solution out
of the ‘fairness–flexibility’ dilemma.
13.99. Increasing penetration of existing schemes: To
ensure that existing schemes reach the entire work-
force, it is important to increase awareness of these
schemes through communication programmes. The
distribution channels for these schemes should be
evaluated and measured regularly and private sector
participation should be encouraged too. Financial lit-
eracy of the workers in the informal sector should also
be improved so that they make better informed deci-
sions about participating in social-security schemes.
Improving Industry Workforce Relationships
13.100. Strong and effective industry relations
can enable managements of enterprises and their

Industry 73
workers to collaborate in increasing the produc-
tivity and competitiveness of the manufacturing
sector. Unions have a critical role to play in ensur-
ing inclusive growth of the manufacturing sector,
especially by working towards social protection for
the workforce. They can also play valuable roles in
other areas such as skill development. The National
Skill Development Policy has recommended that
trade unions contribute in areas such as developing
competency standards, course design, improving
awareness of and promoting participation in skill
development among the workforce. To ensure that
unions can play a broader and more effective role,
it is important to invest in capacity development of
unions through training of their leadership.
13.101. The multiplicity of unions in the same enter-
prise for the same type of workers can lead to inter-
union rivalries and can weaken collective bargaining.
Therefore, legislation that enables one union per
enterprise is strongly recommended. The union
leadership should also be held accountable for any
illegal behaviour by union members during nego-
tiations. The practice of withholding recognition of
unions should be discouraged. Strong gain-sharing
systems can help to improve productivity.
13.102. The Government has a crucial role in
enabling good industrial relations by providing
platforms for the industry and the workforce to par-
ticipate in policy development and implementation.
Since labour figures in the concurrent list in India,
both the Central and State Government’s role in
such platforms should be that of an impartial facilita-
tor focused on creating consensus amongst employ-
ers and employees around solutions. In especially
contentious areas such as changes in labour laws,
the Government should enable the development of
consensus positions between the various interested
parties. The ‘backbone organisation’ described in the
Way Forward Chapter should have the capabilities
to effectively assist in such a process of consensus
creation.
BUSINESS REGULATORY FRAMEWORK
13.103. Countries that have performed better than
the others in terms of thriving business have, to a
great extent, done so on account of the quality of the
business regulatory environment, which is an impor-
tant factor distinguishing better performing coun-
tries from others. The key objectives of streamlining
of business activities through the regulatory frame-
work should be:
• Low compliance cost for doing business in India
• Simple regulatory environment, saving time and
energy for the businesses; and
• Ensuring fair competition
13.104. The country must improve regulations and
implementation in many subjects to make India gen-
erally a more attractive country for doing business.
These include land and environmental regulations,
labour laws and their administration and so on. It
should be noted that, in the context of India’s federal
structure, the ability to mandate specific reforms to
the regulatory framework from any centralised apex
body is fairly constrained. Therefore, while nodal
agencies may be set up to focus attention on matters
that must be attended to across the country, and this
section and others mention some, it is imperative that
the role of such agencies in the process of making
improvements across the country fits the country’s
federal and decentralised political structure. Such
agencies cannot and must not usurp local authority.
Status and Key Challenges
13.105. The present regulatory environment is seri-
ously deficient for the reasons enumerated below:
• Weak institutional architecture for business regu-
lations in the country
– Despite that high priority of the business regu-
latory reform agenda in the country, there is no
dedicated authority that can guide the whole
process of reform in a structured, planned,
cogent and systematic manner, which could
mandate the respective departments of the
Union, State and Local Governments to comply
in a timely, result oriented and predictable way.
• Ambiguous nature and vast scope of business
regulations: there are vast numbers of business
regulations at different levels of Government in
existence in the country. There are instances of

74 Twelfth Five Year Plan
contradictory as well as overlapping business
regulations on account of these being admin-
istered by the different tiers as well as layers of
Government.
• Absence of national repository of business regu-
lations: despite the advancements in Information
and Communication Technology (ICT) and its
ever-growing applications and usage, there is no
dedicated online repository to track all the busi-
ness regulations and procedures.
• Lack of coherence in business regulatory gover-
nance across country; business facilitation is often
mentioned as part of the agenda at the national as
well as State levels. But there is lack of coherence
in all such efforts. There are wide variations in
Government-business transactions taking place in
different locations of the country. It has also been
found that there is a lack of predictability and
standardisation in terms of timelines as well as
process adopted by different State Governments
when it comes to facilitating business.
• Lack of defined mechanism for consultation
between Government and industry: the interface
between Government and the industry is also not
well defined. There are periodic consultations
among various industry collectives and specific
Government departments located at different
levels, but such consultations are not structured
enough to be guided by a well-defined and out-
come-oriented process.
• Inherent limitations of regulatory system in coun-
try: lack of periodic-review clauses in regulations
and Lack of Regulatory Impact Analysis (RIA).
• There have been recommendations for regulatory
reforms earlier as well, but due to absence of any
one dedicated agency accountable for the reforms,
they could not be implemented.
Strategy and Key Recommendations
Follow-up Over Previous Administrative and
Regulatory Reform Endeavours
13.106. Lack of implementation of earlier recom-
mendations on regulatory reforms has contrib-
uted to the current situation of business-regulatory
framework in the country, both at the Central and
State level. All these recommendations need to be
reviewed and a repository of all these documents
needs to be created. After this an enquiry can be
taken up to check the extent to which these recom-
mendations have been implemented or are pending
by the public authority or department.
13.107. There is a need for a process for responding
to the existing recommendations. In such a system
once a certain expert group or commission of enquiry
has submitted its report, the respective departments
are required to prepare a response. That response is
put up in the public domain along with the original
recommendations. This makes it easier for various
stakeholders to understand the extent to which the
recommendations have been accepted along with the
reasons for non-acceptance, if any.
Establishing Enabling Institutional Architecture
• Formulating national policy on business develop-
ment and regulation
– The policy should also provide the principles
of optimal business regulatory governance. It
is recognised that there will be a special role of
the Prime Minister and Chief Ministers in the
aforementioned policy making process because
in the final analysis, the actual adoption of the
policy will entirely be dependent on the politi-
cal leadership.
• Drafting and enacting ‘National Business
Development and Regulation Bill’.
• Building institutional architecture for looking
after the business-regulatory reforms in the coun-
try: a dedicated institution can be set up for this
purpose. The institution should be set up at the
national level as well as at State level.
• Enabling institutional architecture for ensuring
competitiveness in manufacturing. The same is
required in both, Central as well as State level.
– At the Central level the National Manufacturing
Competitiveness Council (NMCC) has been
entrusted with this responsibility.
– Similar institutions may be set up at State level;
to be called State Council on Manufacturing
Competitiveness and Competition Reforms.
• In June 2011, the Ministry of Corporate Affairs
has set up a Committee to draft National

Industry 75
Competition Policy (NCP). In February 2012, the
Drafting Committee submitted a Draft National
Competition Policy and comments of all stake-
holders have been invited. Once this policy is
approved by the Union Cabinet, further steps are
required:
– Building consensus on the policy
– Creating institutional framework for opera-
tionalising the policy, as recommended by the
Committee
– Creating incentive and disincentive mecha-
nisms for States to implement NCP
• Operationalisation of National Manufacturing
Policy and development of State manufacturing
plans in line with National Manufacturing Plan.
Systematisation of Business Regulatory Governance
• Mapping and classification of all existing busi-
ness regulations and procedures and providing
an online one-stop shop—‘National Business
Facilitation Grid’ for all information related to
business regulations and procedures in India.
Design principles of this on line portal can be
finalised through a consultative process. The
Department of Industrial Policy and Promotion is
the nodal agency for the NBFG repository.
• A system of mandatory reviews of existing regu-
lations at periodic intervals should be established
and operationalised. This will achieve the desired
goal of making the regulatory system intrinsically
strong and up to date.
• A decentralised Single Window System should be
established with appropriate geographical spread.
The Single Window System, governed by a com-
mon minimum standard, should, rather than being
a coordination office, be endowed with access to
relevant information and sufficient delegation of
powers from all concerned regulators, including
Central, State, Local and Sector regulators. This
would help reduce the start-up time for businesses
by providing all requisite approvals and licenses, if
any, through the Single Window System.
– Recognising the wide variations with business
procedures at the country level, it is recom-
mended to benchmark the execution timelines
and processes that are undertaken by different
Government entities to facilitate business
requirements.
– A team of Business Facilitiation Officers
(BFOs), in each of the partcipating regula-
tory authorities, may be asked to aid the Single
Window System, and the BFOs could be made
accountable for defaults or deviations result-
ing in aggravated costs of compliance to busi-
nesses. The desirability and feasibility of such
a Single Window System should be determined
through a consultative process.
eBiz Mission Mode Project
13.108. The eBiz Mission Mode Project, under the
National e-Governance Plan, aims to create a busi-
ness and investor-friendly ecosystem in India by
making all business and investment related regula-
tory services across Central, State and Local govern-
ments available on a single portal, obviating the need
for the investors or the business to visit multiple
offices or a plethora of websites. It in envisaged that
the services offered on eBiz will eventually cover the
entire life cycle of a business—right from its estab-
lishment, through its ongoing operations, to even
its possible closure. Once operational, this project
will also create a platform for multiple Government
agencies to cross validate their information.
13.109. The project is being implemented as a
10-year PPP with M/S Infosys. The first-year pilot
includes 8 Central Departments and States (Andhra
Pradesh, Haryana, Maharashtra, Tamil Nadu and
Delhi) covering 29 core services. Five more states
(Punjab, Uttar Pradesh, Odisha, West Bengal and
Rajasthan) and 21 more services will be added during
the next two years of the pilot phase. An end-to-end
solution providing the services under the Andhra
Pradesh Single Window Act will also be provisioned
on the eBiz platform by September 2013 along with
the payment solution gateway.
Adopting Regulatory Impact Assessment (RIA)
• Tool of RIA should be developed for Indian
context through a consultative process and due
research reflecting upon global experiences with
its adoption and usage.

76 Twelfth Five Year Plan
– The parameters of RIA should be clearly spelt
out for evaluation (which should gradually be
expanded to include the following eight ele-
ments: policy coherence; cost of doing business;
competition; innovation; SMEs; consumers;
labour; environment and commons).
• Process of doing RIA should involve a wide stake-
holder consultation.
• RIA has be to be mandated in the country in ex
ante as well as ex post manner.
• It is recommended that Policy Coherence Units
(PCUs), for conducting RIA, be established under
the respective State Planning Boards and at the
national level. Such policy analysis functions can
be connected with the capabilities of the proposed
backbone organisation.
Making Businesses More Responsible Towards
Society
• Considering the importance of the subject, ‘busi-
ness responsibility’ should be included as a sepa-
rate subject under the Government of India
(Allocation of Business) Rules 1961, and Ministry
of Corporate Affairs can be entrusted with the
responsibility of carrying out these activities.
• Redefining the contract of business and society
and developing new rules of the game for corpo-
rate conduct.
– Needs to be done through a widespread consul-
tative process.
• Stronger role of business associations in respon-
sible business.
– Business associations should be encouraged to
develop and impose rules of conduct on their
own members.
– Business associations should be entrusted with
the responsibility of overseeing the compliance
to rules of corporate conduct.
– Such associations should provide their mem-
bers a process for debating and agreeing on
voluntary imposed norms, assistance to mem-
bers to develop capabilities to conform to
these norms and, very necessarily for such
associations to become trusted by stakehold-
ers as effective institutions for self-governance,
internal governance that disciplines errant
members.
• Disclosures on the adoption of ‘National
Voluntary Guidelines on Social, Environmental
and Economic Responsibilities on Business’
(NVG) principles should be made mandatory for
businesses. Adoption of NVG principles can be
made mandatory for all public–private partner-
ship projects by the relevant authority at the time
of project inception. This will help in mainstream-
ing these principles.
• Establishing the required institutional architec-
ture for facilitating adoption of NVG principles.
Awareness and implementation of NVG prin-
ciples is currently the responsibility of the Indian
Institute of Corporate Affairs. The IICA’s abilities
in this respect should be further strengthened.
Developing an Ongoing Process of Stakeholder
Consultation
13.110. For achieving the objectives of a stakeholder
consultation, it is imperative to have capacity, build-
ing both ends: at the Government side as well as at
the industries. A process of productive consultations,
and the roles of representative institutions of employ-
ers and unions in these consultations, in improving
the productivity of the country’s manufacturing eco-
system, and its sustainable competitiveness, cannot
be overemphasised. The competitiveness of German
and Japanese manufacturing industries, in spite of
high-wage costs and expensive currencies, in contrast
to the relative decline of US and UK manufactur-
ing industries, is attributed to the better collabora-
tive processes in the former countries. The following
actions must be taken to achieve this objective:
• Passing a legislation mandating stakeholder con-
sultation and also defining the process that needs
to be followed.
• Measures to strengthen industry associations and
their structure to enable them to convey the view
of industry in a constructive manner.
• Similar capacity building for stakeholders, such as
labour unions.
13.111. Developing a Business Regulatory Governance
Mechanism to choose appropriate regulatory alterna-
tives among self-regulation, co-regulation and public
regulation.

Industry 77
• Currently there is no structured modality explor-
ing various alternatives for achieving regulatory
objectives.
• Detailed analysis should be undertaken to deter-
mine which alternatives to regulations are feasible
as well as beneficial for Indian context.
• As each form of regulation has merits and demer-
its, a desirable combination of all three regulatory
alternatives may be evolved gradually.
• Such mechanism will serve as a ready reference
one-stop shop for the policymakers as well as the
business community while arriving at the choice
of appropriate mode of regulation.
Capacity Building for Carrying Out Regulatory
Reforms
13.112. Since carrying out the aforementioned regu-
latory reforms requires a tremendous effort, capacity
needs to be built in order to implement them. The
capacity-building framework needs to incorporate
the following:
• Developing resources such as modules, guide-
lines, methodologies, reference manuals, check-
lists, case studies and so on as reference material
for regulators.
– These resources should also be available
through an online-knowledge portal.
• Training programmes for regulators need to be
arranged.
• A review may be initiated to determine the fea-
sibility of expanding the roles of institutions
functioning under the aegis of the Ministry of
Corporate Affairs, namely, Indian Institute of
Corporate Affairs, Competition Commission
of India, Institute of Chartered Accountants of
India, Institute of Company Secretaries of India
and Institute of Cost Accountants of India.
ENSURING ENVIRONMENTAL SUSTAINABILITY
WITH INDUSTRIAL GROWTH
13.113. The rise in growth in the resource intensive
manufacturing sector is enabled and facilitated by an
ever-increasing rate of material use leading to mani-
fold impacts to the environment. The contribution
of the manufacturing sector to environmental degra-
dation primarily occurs during the following stages:
• Procurement and use of natural resources
• Industrial processes and activities
• Product use and disposal
13.114. The air, water and land are affected through
the environmental impacts created through the
operations of manufacturing units.
Key Objectives
13.115. Rapid ecologically sustainable industrial
growth with focus on
• Mainstreaming and promoting green business:
an environment has to be created wherein being
green is not viewed as just an obligatory expecta-
tion of a company, but as an area of primary focus
for the company to develop further and be recog-
nised as a leader.
• Protecting natural resources: natural resources
have to be prolonged to their fullest use to main-
tain the aim for continual economic growth and
lessen environmental impacts.
• Addressing funding issues: which act as a con-
straint for movement towards a more sustainable
industrial model.
Status and Key Challenges
13.116. The Central Pollution Control Board has
identified 17 highly polluting industries, the major-
ity of which are manufacturing industries. MSMEs,
in particular, can have a significant impact on the
environment as they are generally liable to be
equipped with obsolete, inefficient and polluting
technologies and processes. Seventy per cent of the
total industrial pollution load of India is attributed
to MSMEs.
13.117. New technologies leading to cleaner pro-
cesses and operations are not being developed at a
fast enough pace to address the urgent need for envi-
ronmental protection.
13.118. The current ecosystem does not encourage
and facilitate the mainstreaming and scaling up of
new technologies for widespread use, mainly due to a
lack of financial support, resources and Government
assistance.

78 Twelfth Five Year Plan
13.119. The waste management and recycling indus-
try in India is currently vast but largely unorganised.
In this space, it is necessary to mainstream the industry
and ensure that the livelihoods of all people depend-
ant on this industry are supported and upgraded.
Strategy and Key Recommendations
Organised Waste Management and Recycling
• Development of a National Waste Management
and Recycling Programme
– This is an overarching framework to create and
mainstream the organised waste management
and recycling industry.
– Structured frameworks and guidelines for recy-
cling industry to be developed to integrate it
with the existing waste management rules and
guidelines.
– Development of industry and sector specific
recycling standards.
• Promotion of PPP model for waste management
and recycling
– Establish facilities for reuse, recycling and
reprocessing of wastes from various sectors
should be encouraged by providing incentives
and ensuring the process for setting up PPP
facilities.
• R&D funding
– Promoting new technologies and processes for
waste management and recycling.
– This should be aligned with the overall technol-
ogy fund as discussed earlier.
• Building institutional capacity
– Local institutional bodies must have their
capacity built on recycling and waste
management.
Creation of a Green Technology Fund
• For usage in three key areas: technology upgrada-
tion, promotion of green entrepreneurs and fund-
ing for R&D.
• This could be disbursed in the form of conces-
sional loans, grants and so on.
• This fund should be a part of the overall tech-
nology fund proposed for improving depth in
manufacturing and must ensure focus on com-
mercialisation of new technology areas.
Promotion of Green Products
• Development of a framework and guidelines for
promotion of green products
– Definition of the specifications
– Creation of/assignment of a new/existing entity
to perform this task on a regular basis
– Identification of top 100 green products (based
on assessment of maximum environmental
impact) and setting of standards for the same
• Promoting green public procurement through
price incentives on Government tenders
• Encourage and develop voluntary rating
programmes
• Creation of centres of excellence to promote green
products and processes
• Incentive programmes for creation of Life Cycle
Inventories
• Incentives for export of green products
Environmental Regulatory Reforms and Market
Based Instruments
• Strengthening regulatory institutions together
with bringing institutional reforms
– Moving towards load-based standards from
concentration based regime.
• Implementing polluters-pay principle, with spe-
cific pollution loads beyond a defined benchmark
should be priced and paid for by industry.
– Reforming the existing environmental clear-
ance process.
– Institutionalise the concept of cumulative
impact assessment of the region.
– Introducing technology assessment while
appraising new projects.
– Process for administering the clearances needs
to be streamlined—should include consider-
ations of decentralisation, requirements and
tenure of clearances.
• Establishing integrated chemical-management
policy and regulatory regime
– Set up a regulatory process to assess all chemi-
cals, register and phase-out toxic chemical
products and replace them with non-toxic/less-
toxic substitutes.
• Market-based instruments and emission trading
– Initial pilot Emissions Trading System to limit
particulate matter emissions.

Industry 79
– Scale up the emissions market to address addi-
tional pollution problems at the State and
national levels.
– Monitoring technology for all types of pol-
lutants be made as affordable as possible for
industry; waiving of applicable taxes and excise
duties, as well as direct subsidies to monitoring
technology wherever their installation is man-
dated by the State pollution boards.
Sustainable Environment Management in MSMEs
• Reconstitution of regulatory bodies
– Inclusion of stakeholders/associations.
– Sector-wise product sub-groups need to be
formed as part of PCBs.
– Grievance Redressal Mechanism should be
established at each PCB.
• Creation of common infrastructure for MSMEs in
clusters
– Central Grant Scheme for soft infrastructure,
unit level technology upgradation assistance,
portion of project cost for Common Effluent
Treatment Plants.
– State Grant Scheme with provision for arrang-
ing land for CETPs, time-bound speedy legal
clearances, provision for equity participation in
SPVs by SPCBs/State agencies.
Disclosure on Performance
• Short-term action to increase voluntary disclosure
of environmental sustainability performance.
– Development of reporting standard-based
on several existing sustainability reporting
initiatives.
– Incentives for voluntary disclosure.
• Long-term steps to compare environmental sus-
tainability performance of organisations with
industry-specific benchmarks.
Development of Environment Sustainability
Benchmark Index, Espeacially for Identified Highly
Polluting Sectors
Organised Waste Management and Recycling
• As covered in the chapter on Environment, the
development of a National Waste Management
and Recycling Programme and the promotion of
PPP model for waste management and recycling
are required.
WATER ISSUES
13.120. With its increasing population and industrial
activity, India is moving towards perennial water
shortages. The current per-capita water availability is
estimated at around 1,720.29 m3 per capita accord-
ing to data from the Central Water Commission
and as per the World Water Development Report—
one of the United Nations, India has been ranked
133 (Out of total of 182 countries) in terms of total
renewable per capita water resources.
13.121. The total water demand is projected to
increase by 22 per cent by 2025, and 32 per cent by
2050. A major part of the additional water demand
will come from the domestic and industrial sectors.
The water demands of the domestic and industrial
sectors will account for 8 per cent and 11 per cent of
the total water demand by 2025.
Key Objectives
• Improve the governance and management of
water in order to ensure availability of water for
all purposes.
• Improve the management of water by industry, in
particular in terms of utilisation and pollution.
Status and Key Challenges
• Inadequate storage capacity
• Governance deficit and fragmented institutional
framework
• Inadequate water management by and for
industry
– Water intensity high as compared to global
benchmarks—to the extent of ~30–50 per cent.
– Recycling water in industry is not common and
its proliferation is not happening at the scale as
required.
Strategy and Key Recommendations
13.122. Strategy on improving overall governance
and management of water has been covered in detail
in the section on Water Resources. The proposed
draft National Water Framework Bill will provide
the broad overarching national legal framework of

80 Twelfth Five Year Plan
general principles on water which will necessitate
the requisite administrative frameworks needed for
greater clarity on demand management, protection
of water resources, improving efficiency of water use
and so on.
13.123. Specifically, strategic measures to ensure
availability for and efficient utilisation of water by
industry have been outlined below.
Water Management in Industry
• Create equity-based and efficiency-based Water
Pricing Regime for industries
– Overcome lack of a clear policy framework
based on cost-recovery principles.
• Current pricing regime is undervalued for all
users.
• This would overcome wide variations in tariff
structure due to current determination by various
States.
• All Indian cities currently operate a mix of mea-
sured/metered or unmeasured/unmetered tariffs.
– Potentially two different pricing regimes in
two-tier tariff system/IBT tariff system.
• Enforce ‘Water returns’
– Annual return to be filed by water users on
similar lines of tax returns—should include
key measures like water utilisation per unit
produce, effluent discharge details, rain water
harvested, water reuse details, fresh water con-
sumption and so on.
– Mandatory for major water using industries
and businesses.
• Promote reuse and recycle of wastewater in
industry
– Regulations and incentives through national
frameworks and a system of water returns
• Industry specific standards
– Promoting rain-water harvesting in industry,
both within and beyond the fence through
incentives and regulation.
LAND ISSUES
13.124. Among all the traditional factors of produc-
tion for any economic activity, land being natural,
immovable and non-renewable, is a distinct resource.
It needs to be looked at from Industry’s perspective
as a tangible resource with supply and demand issues
and the linkage in the form of land acquisition for
industrial demand.
13.125. Land in India has a special significance
because it carries a huge tangible and emotional
value for owners and also for those whose livelihoods
depend on it. This makes it very important to con-
sider the land acquisition process in a critical manner.
Key Objectives
13.126. The key objectives with regard to solving the
various issues and challenges related to land pertain
to:
• Improving the management of land as an asset in
India.
• Setting up a more transparent, fair and effi-
cient process of land acquisition for industry
development.
13.127. By achieving these key objectives, we would
be able to ensure a more productive utilisation of
land, and in particular, be able to spur industrial
development, which has in many instances been hin-
dered as a result of poor land management and land
acquisition processes.
Status and Key Challenges
13.128. India has sufficient land for all uses—agricul-
ture, industry, human dwelling, infrastructure and
other uses—as long as it is used with prudence and
productivity. Currently industry utilises only about
2–4 per cent of all land in India. Even at heightened
industrial activity in the future, it is expected that
there would be sufficient land for all users, including
industry. However, there are some critical issues that
need resolution in order for land to become a well-
managed resource, especially from the point of view
of Industry.
13.129. Land is inherently an imperfect market,
because land is an immobile asset. Hence, no two
pieces of land are alike and can be differentiated.
This gives rise to a monopolistic power with the

Industry 81
landowners. Furthermore, the value of a piece of
land effectively changes when we change its usage
and due to development of surrounding areas. In
addition, the owner is often emotionally attached to
his land. In India, land is considered a very impor-
tant asset from an emotional perspective.
13.130. A major characteristic of land ownership in
India is that the land holdings are typically small.
Typical industrial usage requires development of
large tracts of land. Consequently, industrial devel-
opment has as a prerequisite need to acquire land
from a large number of owners in order to develop a
contiguous piece of land for industrial use.
13.131. Another problem in the land market is the
incomplete, outdated and inaccurate land records,
which give rise to disputes and litigation. Since
industrial projects require large amounts of land and
land holding in India is fragmented, industrialists
have to deal with a large number of landowners and
consequently face substantial risk of litigation.
13.132. In addition, there are some restrictions on
usage of agricultural land for non-agricultural pur-
poses. Non-Agricultural Use Clearance (NAC) from
the local/State Government is necessary before agri-
cultural land can be considered for other uses.
Strategy and Key Recommendations
13.133. A three-pronged approach should be under-
taken for tackling the land issues. This includes the
development of an institutional framework to sup-
port the various actions, a drive to create Land Use
Policies to manage land better, and a reformed pro-
cess of land acquisition (Figure 13.5).
13.134. A National Land Use Policy should be devel-
oped to take care of the growing requirements of land
for sectors other than agriculture. State Governments
should formulate appropriate Land Use Policy in
alignment with the National Land Use Policy. The
main features of this policy should be Land Mapping
(record of types and quanta of land available), Land
zoning and Digitisation of Land Records. The Land
3-part strategy to tackle land issues
Institution Framework
Land development corporations:
independent commercial entity licensed
by the Regulator to acquire and develop
land on behalf of the end-users (industry)
National regulator. lay down
guidelines, monitor the functioning
of the sector and provide oversight
Land Use Policy
National Land Use Policy to be
developed: Land mapping, zoning,
digitization of land records
State Governments should
formulate appropriate Land Use
Policy in alignment with the
National Land Use Policy
Process for Land Acquisition and R&R
Execution of land acquisition by
LDCs through SPVs: based on certain
considerations on
Valuation of land —open-offer price/
multiples of historical price
Compensation for land
R&R programme
FIGURE 13.5: Strategy for Land Issues

82 Twelfth Five Year Plan
Use Policy should also look at measures to opti-
mise utilisation of land by benchmarking current
utilisation efficiency with global benchmarks, and
setting standards and incentives for more efficient
utilisation.
• There is a need to establish an independent and
autonomous regulator which can lay down guide-
lines, monitor the functioning of the sector and
provide oversight. The regulator should
– encourage State and local Governments to
define zoning of land, ear-marking them for
different uses, and encourage digital land
records
– define guidelines for valuing various types of
land for different uses
– Establish norms for setting up and operat-
ing Land Development Corporations (LDCs)
and monitor adherence to the norms by these
institutions
– lay down the guidelines for acquiring land by a
corporate body
– establish norms for process of land acquisition,
compensation and relocation and rehabilita-
tion of various stakeholders for different proj-
ect characteristics
• Value of land can be determined, as per the guide-
lines laid down by the regulator, in the following
ways:
– Open-offer price: Land owners will be asked to
submit their application for sale of land in a
reverse-auction process.
– Multiple of historical price: The regulator can
set a price based on a multiple of the historical
land prices, as mentioned in the land records of
the government.
• The acquiring agent for land should be an inde-
pendent commercial entity—Land Development
Corporation— that has been licensed by the regu-
lator to acquire land. The role of LDC would be
to acquire and develop the land on behalf of its
clients (end users) in exchange of the process and
maintenance fee. A State can have multiple LDCs
and each LDC will execute projects through SPVs.
The operations of the LDC will be under the pur-
view of the regulator.
• The process of land acquisition will be guided by
the regulatory framework applicable for the proj-
ect characteristics as defined by the LDC in its
SPV. The role of local/State Government authori-
ties in supporting the acquisition process should
be laid out clearly by the regulator based on proj-
ect characteristics. The acquisition process may
vary depending upon
– minimum per cent that the SPV needs to
acquire from individual landholders before
regulation mandates compulsory acquisition of
land from other owners
– nature of consent required from different
stakeholders
• Compensation for land needs to factor the
following:
– upfront payment
– annuity income stream
– participation in the future appreciation due to
growth as a result of land development
In addition to the above factors, the land owner
needs to have the flexibility to choose a compen-
sation package
– an owner can choose to take the full value in
upfront compensation or take a part of it as
annuity payouts (determined by prevailing
financial indicators of the time)
– however, every land owner will necessarily
have the component of ‘participation in future
appreciation’ as part of the compensation
• The LDC has to operate a rehabilitation and reset-
tlement programme with combination of different
elements which have been defined by the regu-
lator based on the project characteristics; these
include elements like.
– alternative dwelling, if displaced
– skill development
– assistance in employment/income-generating
opportunities
– community development
• The Industry must be responsible for payment of
cost of land acquisition, including market price,
share of the appreciating value and cost of the
comprehensive R&R.
• There should be a timeframe defined for land
acquisition, and the LDCs must interface
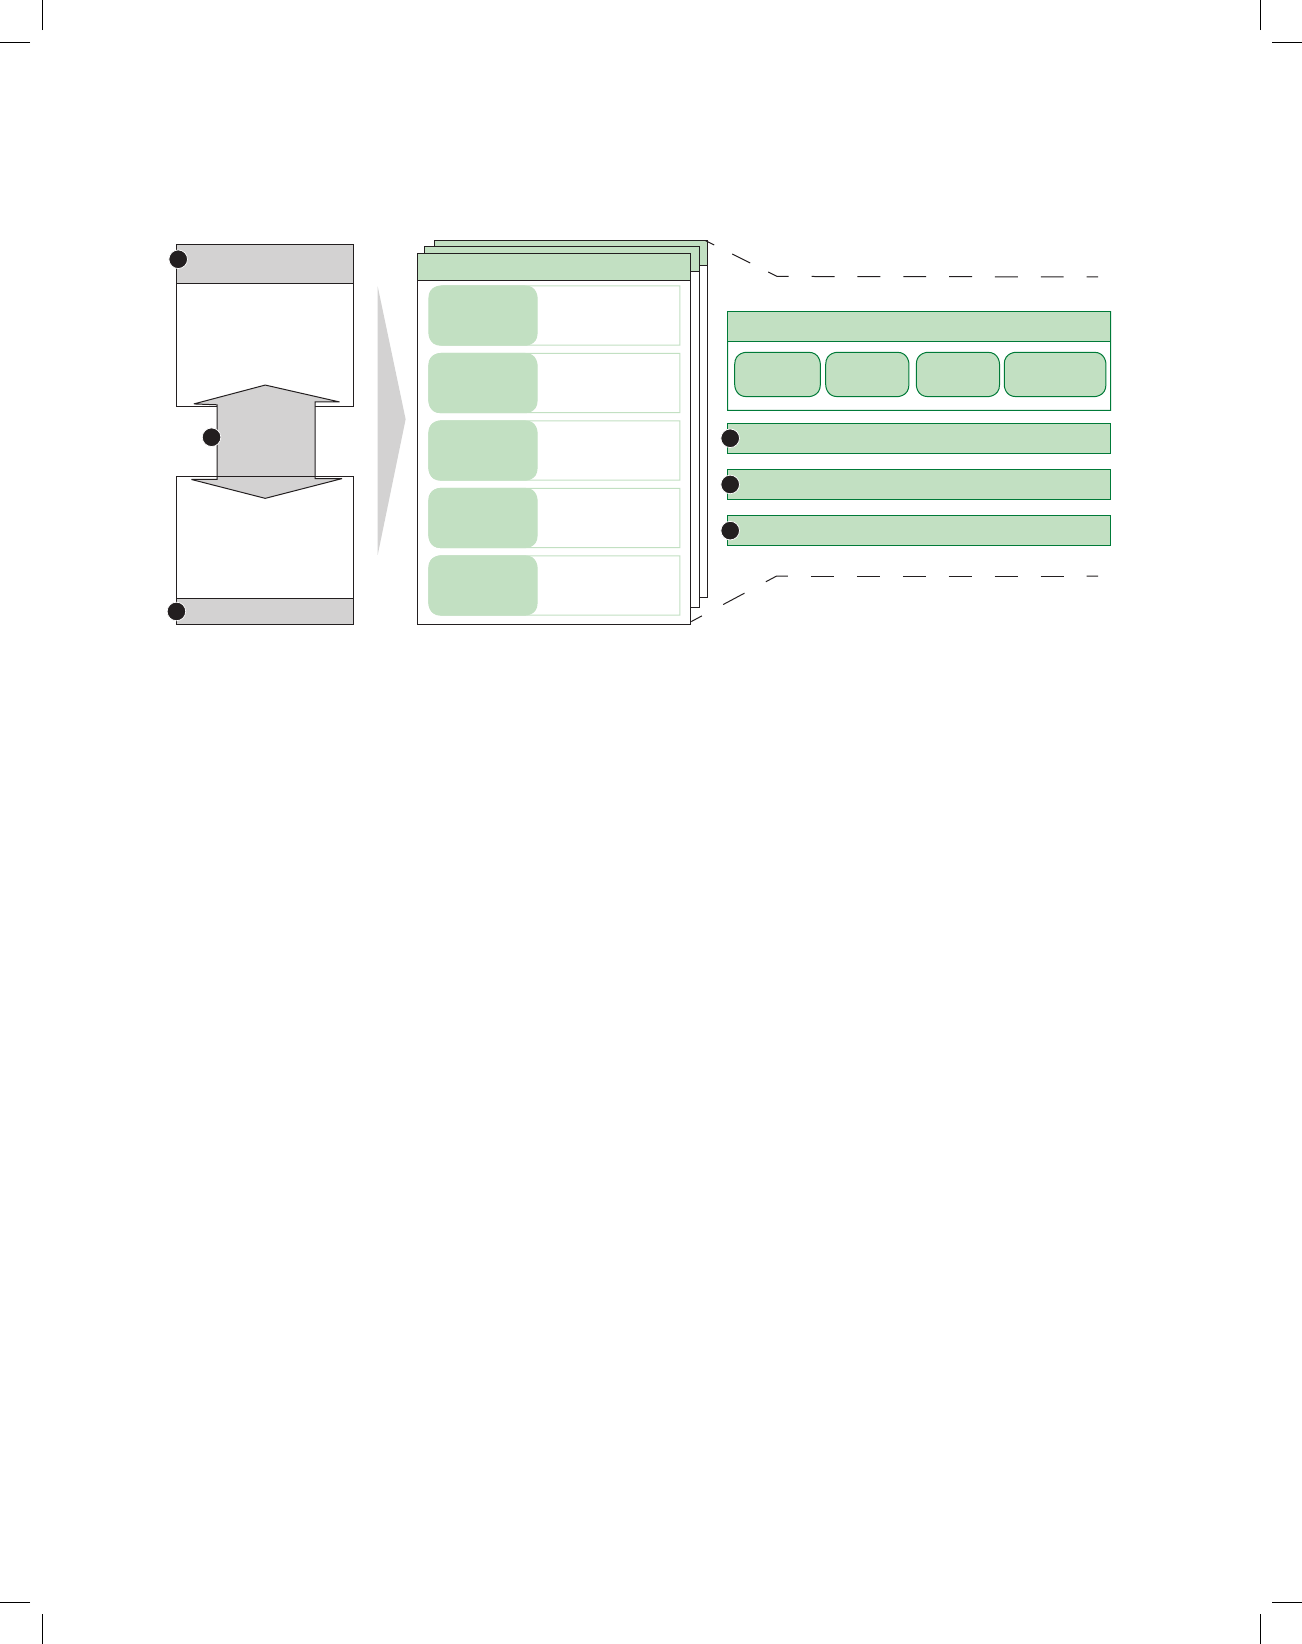
Industry 83
appropriately not only with the local self-
governance bodies, but also other grass-root level
organisations in order to build awareness about
the land acquisition process.
13.135. A description of the process of land acquisi-
tion, the role of the institutional framework and the
other modalities related to land acquisition is pro-
vided in Figure 13.6.
CLUSTERING AND AGGREGATION
Introduction
13.136. Industrial clusters are increasingly recognised
as an effective means of industrial development and
promotion of small and medium-sized enterprises.
Status and Key Challenges
• For MSME participants, clusters play an impor-
tant role in their inclusiveness, technology
absorption, efficiency improvement and availabil-
ity of common resources. Ministries dealing with
MSME enterprises have been using Cluster pro-
gramme as one of the key policy tools in admin-
istering Industrial Policy. There are around 7,000
clusters in traditional handloom, handicrafts and
modern SME industry segments.
• The Ministry of Micro, Small and Medium
Enterprises (MSMEs) adopted the cluster
approach as a key strategy for enhancing the pro-
ductivity and competitiveness as well as capac-
ity building of small enterprises (including small
scale industries and small scale service and busi-
ness entities) and their collectives in the country.
The Ministries have been administering hard and
soft interventions to help the cluster participants.
While hard interventions will include investments
in infrastructure like common facilities, common
testing centres, roads, the soft intervention will
include training, capacity building, skill improve-
ment, marketing inputs, product design and
development and so on.
• In order to assess the level of intervention
required, MSME Ministry has carried out a diag-
nostic study of about 471 clusters. However, the
follow-up on these studies have been weak.
• Today, the cluster programmes are adminis-
tered by various ministries (textiles, leather,
food, MSME, heavy industry [auto]) under vari-
ous names with different terms and conditions.
This apart from putting the cluster participants
through procedural hurdles also makes it very
tough to learn from each other and improve the
efficiency of these schemes.
Zoning
Capital value/
Annuity income/
Emotional/intangible
value
Regulator1
Ownership
Funding
Mandate
Project Characteristics
Land Zoning and
Valuation
Acquiring Agency
3
2
- Public goods
- Social resources
- private business
Purpose
- Short term
- Medium term
- Long term
Development
timeframe
- Agriculture
- Forest
- Barren, tribal
Type of land
- Small
- Medium
- Large
Size of land
- Mild
- Severe
Impact on
community
6
Stakeholders
Owner Tenant Tertiary
user Community
at large
Process of acquisition
Compensation
Rehabilitation and Resettlement
4
5
FIGURE 13.6: Description of Land Acquisition Process

84 Twelfth Five Year Plan
• Though many of the cluster schemes make it
mandatory to have an SPV, a Project Management
Agency and Cluster Associations, the capacity
of these aggregators needs urgent improvement.
These cluster aggregators provide the crucial link
between the Ministry and the cluster participants.
The cluster aggregators also need to have soft skills
required to impart a vision to cluster participants,
and see beyond their immediate requirement.
• The current amount allocated for soft interven-
tions is grossly inadequate.
• The current cluster initiatives are mainly focused
towards MSME Sector. Other industries can also
benefit from cluster programmes as demonstrated
by the automotive industry clusters.
• There is a deficit of trust between the various
participants in clusters today, which needs to be
addressed.
Strategy and Key Recommendations
• It may be desirable to set up a Cluster Stimu-
lation Cell (CSC) at apex level (to be located in
DIPP/NMCC) to monitor the performance of
clusters and share best practices across them.
The CSC should also develop a cluster manual
which may define clusters, development strat-
egies adopted across the clusters, share best
practices and develop a communication chan-
nel. The constitution of a CSC will considerably
reduce the coordination problems across the
clusters and within clusters across different sec-
tors. The CSC should.
• Undertake mapping of clusters to identify the key
bottlenecks and the means for overcoming the
same. It would also enable devising an appropri-
ate strategy and support mechanisms for includ-
ing the clusters in the growth trajectory.
• Maintain information about all the clusters along
with the cluster participant profile, employment
generated and so on.
• Evaluate the performance of these clusters on
predetermined range of various performance
parameters.
• Identify best practices and ensure sharing the best
practices across clusters, in areas like
– Building trust among participants
– Cluster branding
– Building innovation at cluster level
– Suggesting fiscal incentives to provide to
clusters
– Increasing competitiveness of cluster players
– Effectively leveraging the common facilities
13.137. However, the effectiveness of the CSCs
depends entirely on the way they are structured and
run. If CSC is set up as a hierarchical organisation
controlling clusters, it will lead to suboptimal results
as the line ministries are the best agencies for imple-
menting cluster programmes. On the other hand, If
CSC is structured as knowledge organisation, with
the responsibility of enabling clusters to improve
their performance, CSCs can play an effective role
in improving the performance of clusters across the
country.
13.138. Today there are several agencies playing crit-
ical roles in developing and supporting clusters:
• Implementing ministries like MSME, Textiles,
Leather, Food Processing and Heavy Industries
• State Governments
• Department of Science and Technology and
National Innovation Council in the areas of tech-
nology upgradation and innovation
13.139. Normally, clusters, especially for MSMEs,
develop on their own and Government may play a
facilitating role to accelerate their growth. However,
going forward the State Governments should have
devolved powers to create clusters while the Central
Government’s role should be to stimulate learn-
ing across the system. Hence, the CSC is envisaged
as knowledge partner to these agencies. The roles of
CSC will complete a crucial missing link in the clus-
ter support ecosystem.
• Provide assistance to State Governments in the
cluster formation through strengthened DICs at
district level besides NGOs and reputed institu-
tions that have capacity to undertake this type of
work.
• Develop strategies for growing different types of
clusters (for example, hub-and-spoke, MSME,
high tech and so on) for the different sectors.

Industry 85
• The CSC should undertake this exercise and
include details on the approach to be employed
for each type of cluster and sector.
• The scope of soft interventions should be
expanded to include capacity building of Cluster
associations, initiatives aimed at improving mar-
ket linkages, improving product quality, improv-
ing access to credit, encouraging innovation, skill
development and so on.
• The allocation of funds for soft interventions
should be increased accordingly.
PROMOTING MSMEs
13.140. The Micro, Small and Medium Enterprises
(MSME) sector has emerged as a highly vibrant and
dynamic sector of the Indian economy over the last
few decades. It is estimated that this sector con-
tributes about 45 per cent of manufacturing output
and 40 per cent of total exports of the country and
employs about 69 million persons in over 29 million
units throughout the country. Within the MSME
Sector there is a significant concentration of Micro
Enterprises, both in terms of working enterprises
and employment (refer to Table 13.6). There are over
6,000 products ranging from traditional to high-tech
items manufactured by the MSMEs. The sector also
covers the enterprises established in khadi and vil-
lage industries and coir sector (plans for these sec-
tors are detailed in Annexure 13.3).
TABLE 13.6
Registered MSMEs—Manufacturing
Micro Small Medium
Working Enterprises 94.9% 4.9% 0.2%
Employment 69.2% 26% 4.8%
13.141. Recognising the contribution and potential
of the sector, the definitions and coverage of MSE
Sector have been broadened significantly under
Micro Small and Medium Enterprises Development
(MSMED) Act, 2006 (refer to Table 13.7). Service
sector, an important emerging sector, has also been
included under this Act, depending on its category
into Micro, Small and Medium Enterprises. The cri-
teria of investment limit in plant and machinery is
the only parameter, used to categorise the enterprises
in the sector in the country.
TABLE 13.7
Definition of MSME
Nomenclature and
Classification of MSME
(Manufacturing)
Ceiling on Investment in
Plant and Machinery
(in INR)
Micro 25 lacs
Small 5 crore
Medium 10 crore
13.142. It is important to recognise though that
a broad band of differentiation exists within the
MSME Sector across indicators such as turno-
ver, employment and so on. Further discussion on
MSMEs also needs to specifically address organised
and unorganised segments. Classification based on
investment in plant and machinery only superficially
institutes a numeric threshold for describing a funnel
of growth. Schemes and interventions based on such
concretised classifications, however, may not be able
to necessitate real growth as such definitions cre-
ate perverse incentive structures that might thwart
firms from graduating from small to medium, such
as service tax exemptions for firms with less than 10
lac revenue, exemption from central excise duty for
firms with an annual turnover of less than `1.5 crore
and so on.
Key Objectives
13.143. The objectives for the MSME Sector are:
• Promoting competitiveness and productivity in
the MSME space
• Making the MSME Sector innovative, improving
technology and depth
• Enabling environment for promotion and devel-
opment of MSMEs
• Strong presence in exports
• Improved managerial processes in MSMEs
Status and Key Challenges
13.144. MSME Sector has been consistently regis-
tering a higher growth rate than the overall growth
of the industrial sector. During the first four years
of the Eleventh Plan, MSME Sector exhibited a
growth rate of 13 per cent on an average. There
are some inherent challenges faced by the sector
which have a strong impact on its growth. These

86 Twelfth Five Year Plan
relate to (i) availability of credit and institutional
finance (ii) outdated technology and innovation,
(iii) need for skill development and training, (iv)
inadequate industrial infrastructure, (v) marketing
and procurement.
13.145. The Plan explores various aspects of MSME
Sector, relating to the growth of the sector. These
may be classified under six important verticals to
provide theme-based focus, while devising any strat-
egy for the sector. These are (i) finance and credit
(ii) technology (iii) infrastructure (iv) marketing
and procurement (v) skill development and train-
ing (vi) institutional structure, however, keeping in
view of the unique status of the khadi and village
industries and coir sector in the Indian economy, it
was decided that there will be separate recommenda-
tions for these sectors. Similarly, concerns of unor-
ganised sector and special areas and groups would
be given due consideration while formulating any
programmes/schemes under the aforementioned six
major verticals.
Strategy and Key Recommendations
Credit and Finance
13.146. Credit is a crucial input for promoting
growth of MSME Sector, particularly the MSE
Sector, in view of its limited access to alternative
sources of finance. Access to information, simpli-
fication of loan procedures and interest subven-
tion for micro enterprises are enabling features
for timely and affordable credit to MSMEs. The
Plan should provision resources for promoting
e-platforms for information flow and simplification
of procedures. To address the risk perception of
banks, particularly for lending to MSEs, the Credit
Guarantee Scheme needs to be strengthened, with
enhanced budgetary support. There should be sub-
stantial increase in the number of MSEs covered
under the Performance and Credit Rating Scheme
which is a facilitating factor for easy access to credit
with liberal terms.
13.147. The reach of the MSEs to the banking net-
work has to be substantially enhanced through set-
ting up of branches near clusters. While there has
been an effort to facilitate credit to clusters by finan-
cial institutions such as SIDBI, reach and thereby
coverage needs to be increased. In fact, a cluster-
centric approach is the best bet for addressing the
credit needs of the MSME Sector because of reasons
of operational convenience and trust building.
13.148. Access to finance needs to be enlarged
through alternative sources of capital such as private
equity, venture capital and angel funds. This is cru-
cial for facilitating the growth of knowledge-based
enterprises which have high potential in the Indian
context. Further, prospective enterprises in emerging
areas such as nanotechnology, biotechnology, aero-
space and defence applications would also require
such alternative sources of finance since traditional
channels are unable to meet their needs.
13.149. There has to be aggressive market interven-
tion, such as promoting companies for market mak-
ing and ensuring scaling up of operations of SME
exchange. The Plan has to provide resources for such
market interventions.
Technology Upgradation and Support for
Emerging Sectors
13.150. Technology will be the foremost factor for
enhancing the global competitiveness of Indian
MSME Sector. The Prime Minister’s Task Force on
MSMEs has identified low technology, generally
used by the MSME Sector, as a major cause for poor
competitiveness of the sector. Strategies for improv-
ing technological capability of MSMEs have been
previously discussed in the section on improving
technology and depth in domestic manufacturing.
13.151. The main focus needs to be on developing
appropriate technologies for various manufactur-
ing processes to bring down cost, develop collabora-
tions between private and public sector on boosting
R&D, and facilitate absorption of globally competi-
tive technologies. Also, separate schemes of the min-
istry for installation of plants and equipment’s with
advanced technologies viz. CLCSS and NMCP com-
ponents may be merged into one scheme, skill devel-
opment and capacity building.

Industry 87
13.152. Lack of skilled manpower and information
as well as lack of reach to modern technology are
affecting the growth of the MSME Sector. Among
its major recommendations, the Prime Minister’s
Task Force has identified lack of skilled manpower
as a road block for the growth of the MSME Sector.
The Ministry of MSME has been mandated to pro-
vide skill to 42 lakh persons during the Twelfth Plan
period. Strategies for this, including enhancing train-
ing capacities for skilling and industry-led skilling
and training programmes have been covered previ-
ously in the Human Resources Development Section.
Infrastructure Development
13.153. Cluster-based intervention has been
acknowledged as one of the key strategies for com-
prehensive development of Indian industries, partic-
ularly the Micro and Small Enterprises (MSEs). The
Ministry of MSME has adopted the cluster approach
as a key strategy for enhancing the technical and
physical infrastructure as well as capacity-building
of micro and small enterprises and their collec-
tives in the country. Since 1994, Ministry had also
been supporting creation and upgradation of indus-
trial infrastructure in the States under Integrated
Infrastructural Development (IID) Scheme, which
was subsumed under MSE-CDP in October 2007.
13.154. Land and infrastructure constraints are a
major problem, particularly in metros and bigger cit-
ies. As production processes of majority of MSEs can
be accomplished in flatted factories, flatted factory
complexes may be encouraged by providing finan-
cial support likewise. Accommodation problem of
industrial workers may be addressed to a great extent
by supporting dormitories (in or around industrial
estates/areas). SPVs may run the dormitories on sus-
tainable basis.
13.155. Maintenance of industrial estates (mainly
maintenance of roads, drainage, sewage, power dis-
tribution and captive power generation, water sup-
ply, dormitories for workers, common effluent
treatment plants, common facilities, security and so
on) is a critical component for successful functioning
of the industrial enterprises in any industrial estate/
industrial area. It would be appropriate to handover
maintenance of industrial estates to the industry
associations, local bodies, State Government agen-
cies, SPVs on self-sustaining basis. World over high-
tech and innovative enterprises start in Modular
Industrial Estates. To encourage such ventures,
modular industrial estates are proposed to be set up
near centres of excellence like IITs.
13.156. The Cluster Development Programme of the
Ministry of MSME (MSE-CDP) may be continued in
the Twelfth Plan period with streamlining of inter-
ventions and also ensuring the sustainability of clus-
ters developed. The Programme should also address
the requirements of the large unorganised manufac-
turing sector.
Marketing and Procurement
13.157. Marketing and procurement are the other
areas where MSMEs face more challenges than
opportunities. The challenges range from procure-
ment of raw materials to lack of market information.
MSMEs face several constraints in the marketing
and procurement front due to their limited manoeu-
vrability in such wide ranging activities either on
account of lack of finance or on account of lack of
awareness. While marketing of products of MSMEs
mostly depends upon the market forces and indi-
vidual efforts of the enterprises, Government and its
organisations can play the role of a facilitator to help
MSME Sector in these endeavours.
13.158. There are multiplicity of market develop-
ment assistance programmes to support MSMEs,
like participation in domestic and international trade
fairs, bar coding, packaging and standardisation
within the Ministry. There is a need for rationalisa-
tion and consolidation of such programmes under
different broad heads.
13.159. However, schemes especially in areas of
use of ICT for creating cluster-level, State-level and
national-level B2B portals with connectivity to inter-
national markets and marketing infrastructure may
be required in the Twelfth Plan such as setting up of
testing facilities and establishment of information
dissemination centres and display-cum-exhibition
centres.

88 Twelfth Five Year Plan
13.160. The plan allocation for such schemes can be
made under the infrastructure vertical and technol-
ogy vertical (ICT Scheme), respectively. The vacant
land available in the premises of MSME DIs and
DICs can be put to use for construction of display-
cum-exhibition centres and establishment of infor-
mation dissemination centres.
13.161. Setting up of marketing organisations in
clusters in PPP mode through formation of SPVs,
which would form the focal point at the cluster level
for all marketing-related activities, such as e-mar-
keting, branding, advertising, barcoding and so on
could be considered in the Twelfth Plan.
13.162. National Small Industries Corporation
(NSIC), the autonomous outfit of Ministry of MSME
may be the apex organisation to coordinate market
development activities under different schemes.
13.163. The Government has recently introduced
a Public Procurement Policy for the MSME Sector.
Further, there is also need for inclusion of private
sector in the procurement policy for the MSME
Sector. An offset under defence purchases has vast
potential for MSME Sector. There is need for set-
ting up a mechanism in the Ministry of Defence to
ensure that the offsets under defence purchases are
suitably focused to support SMEs in upgrading their
capacities.
13.164. All new and existing schemes should
be merged into one scheme, namely Marketing
Development Assistance Scheme.
Institutional Structure
13.165. The Institutional and legal framework for
promotion and development of Micro, Small and
Medium Enterprise (MSME) Sector of India is
spread both at the National and State level. The pri-
mary responsibility for the development of MSMEs
lies with the State Governments and Government
of India supplements their efforts through a range
of initiatives. The Prime Minister’s Task Force in its
report have made significant recommendations on
liberalising the policy regime for the MSME Sector,
viz. introduction of insolvency act, liberalisation
of labour laws, liberalisation of apprenticeship act,
strengthening of district industry centre and so on.
13.166. The following issues need to be immediately
addressed to unshackle the growth of the MSME
Sector (i) environmental issues, (ii) labour issues,
(iii) exit policy, (iv) amendment of MSMED Act (v)
restructuring of the DICs and MSME-DIs.
13.167. On the environmental issues, it is recom-
mended that policies be made uniform pan-India
with appropriate relaxation of the controls for the
MSMEs. Regarding the labour issues, the immediate
need is to consolidate the plethora of labour laws and
acts into one user-friendly law. The enactment of
Micro, Small and Medium Enterprises Development
(MSMED) Act, 2006 is a harbinger for the growth
of the MSME Sector. However, there is an urgent
need to strengthen the various provisions of the Act
along with enactment of the rules under the various
sections.4
13.168. However, the implementation of the process
of filing of Entrepreneurs’ Memorandum is still very
tardy. Application of e-governance for streamlin-
ing of the procedures and for that purpose setting
up of an information and database network among
the DICs, MSME-DIs and the Ministry may be
considered.
13.169. The provision regarding the delayed pay-
ment under the MSMED Act was another facilita-
tor for ensuring regular cash flow to the micro and
small enterprises against the supplies made. The
Micro and Small Enterprises Facilitation Councils
(MSEFC) stipulated under the Act to be set up at the
State level where foreseen as facilitators to the MSEs.
13.170. However, most of these MSEFCs are not
operating efficiently. In fact, in some States they
are yet to be constituted. The group recommends
immediate action for upscaling the activities of these
MSEFCs and introduction of an information and
communication network for operation and monitor-
ing of these MSEFCs. A budget of `100 crore may be
allotted for ICT enabled upscaling of the EM filing
and MSEFC operations.

Industry 89
THE UNORGANISED SECTOR
13.171. The Prime Minister’s Task Force on MSMEs
have stated that no discussion on MSME can be
completed without a full treatment of the unorgan-
ised sector. More than 94 per cent of MSMEs are
unregistered with most of them being in the infor-
mal/unorganised sector. The Task Force has com-
mented that in addition to the growth potential of
the sector and its critical role in the manufacturing
and value chains, the heterogeneity and the unor-
ganised nature of the Indian MSMEs are important
aspects that need to be factored into policy making
and programme implementation.
13.172. Policies/programmes for the larger sized
MSMEs need to address issues relating to growth,
marketing, access to raw material, credit, develop-
ment and technology upgradation. Programmes for
the micro and small enterprises in the unorganised
sector need to address similar issues for improving
their productivity and competitiveness. In addition,
they must address requirements of social safety nets
for workers in these, more vulnerable enterprises.
The future strategy should focus on providing social
security to the unorganised workers in the MSME
Sector in terms of the mandate under Unorganised
Workers Social Security Act (UWSSA).5
13.173. The policies for the MSME Sector would
have to be devised especially in the areas of skill for-
mation and credit and technology upgradation, and
should meet the special needs of the informal sec-
tor. Instead of consigning these responsibilities to
other departments, the Ministry of MSME will have
to actively provide an enabling environment for the
unorganised sector to flourish and integrate with the
organised sector. Towards this, it is suggested that
separate approaches/schemes for the unorganised
sector be built into the broad verticals—credit, tech-
nology, skill formation and so on. For example, some
of the important suggestions can be incorporated
into the flagship MSE-CDP Scheme as these can be
done on a cluster basis. Apart from this, the Ministry
may work out the modalities of how enterprises in
the sector can be registered.
BOOSTING MANUFACTURING EXPORTS
13.174. In order to achieve the desired growth rate
for the manufacturing sector, it is necessary to have
a high growth rate for the country’s exports as well.
Considering this, the Department of Commerce has
come up with a strategy paper on doubling India’s
exports.
13.175. The recent spiral of exchange rate deprecia-
tion of Rupee, while has exerted pressure on imports,
has made Indian goods more competitive in interna-
tional markets. However, this has not materialised
into a much needed spurt in exports, largely due to
falling global orders and declining domestic demand
on account of rising prices, especially of fuel. Over
time, repricing of Rupee, if sustained, will incentivise
domestic manufacturing. However, it is important
to consider that demand for two of India’s biggest
imports, oil and gold, is not as sensitive to prices.
Exchange rate depreciation will therefore have to
be supported and balanced by fundamental changes
in the ecosystem that can sustainably boost Indian
exports and also overall domestic manufacturing.
Key Objectives
• Accelerating the rate of growth of manufacturing
exports
• Building a brand image for Indian products
• Increasing technology intensity of products being
exported from India
Status and Key Challenges
• Low level of production
– Output is the most important determinant
of exports. Therefore, quantum, quality and
competitiveness of domestic manufacturing is
very important for export performance of the
manufacturing sector. Unfortunately, India’s
manufacturing is growing at a very low rate as
compared to other developing countries.
• Very low share of high tech exports
– High-tech products have better terms of trade
due to high income elasticity. However, India’s
share in the global trade of high tech products
is very low, and has been between 5–8 per cent
during 2003–09.

90 Twelfth Five Year Plan
• Non-tariff barriers being placed by countries
– There is a lack of information and clarity on
procedural norms and regulations of various
countries regarding specification as well as
methods of sampling, inspection and testing.
Several conformity assessment issues also have
the effect of restricting trade.
Strategy and Key Recommendations
13.176. For achieving the above mentioned objec-
tives, a stable and comprehensive policy for promo-
tion of exports is required. Following specific action
points can be considered for achieving the above
mentioned objectives:
Accelerating Rate of Growth of Indian Exports
• Providing world-class infrastructure at ports
and airports. For promoting exports, adequate
infrastructure at all major ports and air ports
is required. Further, deepening of draughts at
berths, anytime working in ports, deployment of
shore mobile cranes for cargo, LPG and CNG con-
nection through pipes, and making them available
in every town are also required.
• Dedicated export berths for automobile industry
at Chennai port and one more port on west coach,
equipped with facilities to handle ~5l vehicles by
2010 and space for parking are required.
• Ranipat, Gurgaon and Unmao should be notified
as town of export excellence as this would enhance
infrastructure development there.
• Providing an enabling mechanism for facilitating
exports is required.
• Reduction of transaction cost for exporters
– Export procedure to be simplified and human
interface with exporters to be reduced
• Addressing non-tariff barriers to ensure fairness
to exporters
– Indian standards need to be in line with inter-
national standards and technical regulations
– Review of our existing standards and their
benchmarking with international standards is
required
– More improved labs with international
accreditation
• Reform of the FTA process to include improved
consultative process with stakeholders
– Include better input taking mechanism from
industries and associations
• Improving fiscal incentives to exporters
• Attracting FDI in country
– Linking FDI investment with market access
and giving preferential incentives for invest-
ment in areas where Indian domestic market is
non-existent
– Reduction of threshold limit for offset obliga-
tion should be considered
• Ensuring availability of funds to exporters
– For example, reduction in ECGC premium,
availability of pre-shipment and post-shipment
credit
• Market strategy to capture unexplored markets
and products
• Move to higher value-added products exported to
traditional markets
• Focus on Asian and African countries
– Market access through quota system should be
negotiated with competing countries
– Conducive trade agreements need to be put in
place
• Focus on globally dynamic products
– Products which are gaining significant share in
global trade
Building a Brand Promotion Strategy to
Coalesce the Brand Values of the Indian
Manufacturing Sector
• Initial survey of existing product-promotion strat-
egy and product perception—through IBEF
• Initiate study to benchmark Indian products
with competitors in terms of quality and price; all
stakeholders should be consulted in this exercise
• A logo and a standard brand kit should be
developed
• Focus required on strong PR initiative
– Participation of Government and industry
should be ensured at major national and inter-
national trade fairs, seminars and exhibitions
Focus on Moving Towards ‘High-tech’ Exports
from Current Low Tech Exports
• Identify the sectors having high technology and
high export growth potential

Industry 91
– Frequent consultations among export promo-
tion councils, industry associations and major
technology agencies required
– CII is already in partnership with many agen-
cies for development of technology. Depart-
ment of Commerce may partner with these
efforts to assist R&D for manufacturing exports
– Need to focus on measures to promote these
identified sectors
REFORMING THE ROLE AND MANAGEMENT
OF PSEs
13.177. Public-sector enterprises occupy an impor-
tant space in manufacturing. While PSEs like SAIL
and BHEL have performed very well in competition
with private-sector enterprises, there are also many
PSEs that have performed very poorly. In an eco-
nomic environment that has changed considerably
since the early days of India’s post- Independence
development journey, the need for PSEs as well
as the systems for their governance and manage-
ment should be re-evaluated. Considering this, the
Roongta Committee was set up to examine a range of
issues of the PSEs and suggest a roadmap for reforms
and further development of these enterprises.
13.178. Major recommendations of the Roongta
Committee are given below
Strategy and Key Recommendations
13.179. A fundamental problem facing CPSEs which
inevitably affect their performance is that they are
expected to compete in the market with private-
sector companies while having much less freedom of
manoeuvre. To deal with this problem it is necessary
to consider some fundamental changes as outlined
below:
Change in Corporate Governance Structure in
CPSEs
• Setting up a strategy and business development com-
mittee by every CPSE Board. The committee needs
to set direction for the company towards diversifica-
tion, acquisition, joint ventures, new business entry
and review of organisational structure and so on.
• Introduce a system of annual self-evaluation for
board of CPSEs.
• Changing the board composition to have 50 per
cent board members as independent directors.
• Role of Government director should be equiva-
lent to independent directors on matters where
Government has no views as Government. These
directors should be paid sitting fees for attend-
ing board committee meetings. Their evaluation
should also be based on their performance as
Directors of board of CPSEs.
• Reform the process of selection of independent
directors to make the process more efficient.
For this DPE/PSEB can formulate a panel of
approved names, out of which independent direc-
tors can be appointed for CPSEs. Full-time CEOs
of successful enterprises should also be eligible to
be appointed as independent directors provided
there is no conflict of interest.
• Streamlining the process of appointment of
CMDs and full-time directors, in particular the
mechanism of obtaining vigilance clearance
Process of selection of CMDs/CEOs of Maharatna
and Navratna Companies to be different from
current process. A separate body may be con-
stituted within PSEB and the selection criteria
should be more focussed on leadership quality,
strategic thinking, capability to manage exter-
nal environment and so on, apart from domain/
sectoral expertise. Selection of CMD should be
made three months before the term of incumbent
CMD. Vigilance-clearance process also needs to
be reformed in line with the previous point.
• Tenure of CMD/Functional director should be
minimum made three years irrespective of the age
of the person.
• Reforming vigilance function in CPSEs.
Change in Human Resource Strategy for CPSEs
• All CPSEs should undertake a comprehensive
manpower planning exercise to identify key skill
and talent requirement across all levels within
an organisation from a medium term and a long
term perspective.
• CPSEs should develop a leadership pipeline for its
key positions and a leadership development strategy.
• To fill the immediate gaps at the higher level in
CPSEs, an extension of two years may be allowed

92 Twelfth Five Year Plan
at DGM and above level, subject to certain
conditions.
• Autonomy in recruitment policy.
• Autonomy in compensation policy.
Review of Memorandum of Understanding for
CPSEs
• Current MOU System to be modified and greatly
linked to the organisation’s approach towards
diversification, acquisition, formation of JVs,
new/strategic business, usage of ICT, R&D initia-
tive, HR development and organisational changes.
• Physical performance parameters, if included
in MOU should be benchmarked with industry
parameters including those in private sectors.
CPSEs should be encouraged to reach to these
standards within a defined timeframe.
Joint Ventures, Public–Private Partnership and
Procurement
• CPSE board should be empowered to select the
partner for JV and companies for acquisition.
• Process of entering into partnership and JVs need
to be simplified. Current restriction of minimum
ownership of 51 per cent in case of JV to be done
away with.
• Disinvestment through privatisation of loss mak-
ing CPSEs may be considered.
• Creation of a Public Sector Land Development
Authority for the purpose of developing surplus
lands with CPSEs and unlocking their real value.
Technology Mapping for CPSEs
• Every CPSE to have a technology policy, clearly
indicating the commitment of the enterprise in
using/sourcing/developing type of technology as
per needs of the organisation.
• A technology committee may be set up in every
CPSE to identify the technology needs and find-
ing alternative ways of developing or finding such
technology.
13.180. There is a need for changing the governance
model for CPSEs in sectors in which private-sector
investments are not forthcoming. Government
should be able to enter or exit from any such
investment in good time. Otherwise, the benefit of
Government investment in the industry is missed or
Government’s investments, when they have outlived
their necessity, become a drag on the performance of
the units and a drain on the public exchequer too.
• For this purpose, a Single Holding Structure
(SHS) for all new government-owned companies
can be established.
– The SHS can be in the form of holding com-
pany owning different stakes in different
Government companies.
– The management can be a mix of senior incum-
bent bureaucrats and members chosen for their
integrity, expertise and domain knowledge in
industry, economic or commerce.
– The SHS can be self-managed like a mutual
fund. The board of the SHS would appoint the
board of the company it has invested into to the
extent of its investment.
– SHS would earn income through dividends
from entities it invested into or through dives-
titure of its stake.
– The performance of the SHS entity could be
monitored by an empowered group of minis-
ters to whom it would be accountable.
13.181. The above mentioned model can be used to
fill gaps where there is not enough Indian presence
in sectors and which the Government considers stra-
tegic and vital to India’s future.
NATIONAL INVESTMENT AND
MANUFACTURING ZONES (NIMZs)
13.182. NIMZ is a new concept which is an inte-
gral part of the recently approved National Manu-
facturing Policy of DIPP. The NMP is a policy
solution for a number of challenges discussed in this
document, and is a policy tool to be applied to select
zones designated for promoting manufacturing.
Key Objectives
13.183. Creation of dedicated zones for manufactur-
ing in the nation to
• Promote investments in manufacturing
• Make the country a hub for both domestic and
international markets

Industry 93
• Promoting ease of development of manufacturing
units
Concept and Approved Strategy
13.184. The National Investment and Manufacturing
Zones (NIMZs) will be developed as integrated
industrial townships with state-of-the art infrastruc-
ture and land use on the basis of zoning; clean and
energy-efficient technology; necessary social infra-
structure; skill development facilities, and so on to
provide a productive environment to persons tran-
sitioning from the primary sector to the secondary
and tertiary sectors. These NIMZs would be man-
aged by SPVs which would ensure master planning
of the zone; pre-clearances for setting up the indus-
trial units to be located within the zone and under-
take such other functions as specified in the various
sections of this policy.
13.185. To enable the NIMZ to function as a self-
governing and autonomous body, it will be declared
by the State Government as an industrial township
under Art 243 Q1(c) of the Constitution. In sum,
the NIMZs would be large areas of developed land,
with the requisite ecosystem for promoting world
class manufacturing activity. They would be differ-
ent from SEZs in terms of size, level of infrastructure
planning, and governance structures related to regu-
latory procedures and exit policies.
13.186. The administrative structure of NIMZ will
comprise of a Special Purpose Vehicle, a developer,
State Government and the Central Government.
The Central Government shall, by notification in the
Official Gazette, notify an NIMZ. An SPV will be con-
stituted to exercise the powers conferred on, and dis-
charge the functions assigned to it under this Policy
to manage the affairs of the NIMZ. Every SPV shall
be a legal entity by the name of the NIMZ. This SPV
can be a company, including a Section 25 company
depending upon the MOU between stakeholders.
Role of Central Government
• Expenditure on master planning for the NIMZ.
• Improve/provide external physical infrastruc-
ture linkages to the NIMZs including—rail, road
(national highways), ports, airports and telecom.
• Viability gap funding through existing schemes
will be provided for internal infrastructure devel-
opment in the zone including infrastructure for
skill development.
• The Central Government, through its institutions
and schemes, will provide institutional infrastruc-
ture for productivity, quality (testing facilities and
so on) and design capabilities, encouraging inno-
vation and skill development within the NIMZ.
• The Central Government will be responsible
for the technology acquisition and development
interventions in the policy.
• The Central Government will put in place a job-
loss policy for units in the NIMZ.
• The Central Government will undertake, along
with the State Government concerned, the pro-
motion of domestic as well as global investments
in NIMZs.
Role of State Governments
13.187. The State Governments would play the lead
role in setting up of the NIMZs. In particular, the
State Government would be responsible for provid-
ing/facilitating the following infrastructure:
• Land
• Power connectivity
• Provision of bulk requirements of water
• Road connectivity (State roads)
• Sewerage and effluent treatment linkages, from
edge of NIMZ, to the final disposal sites
• Appropriate infrastructure to address the health,
safety and environmental concerns
Institutional Framework for Implementing
NIMZs
• The Department of Industry Policy and
Promotion (DIPP) will be the nodal department
of the Government of India for the NIMZs.
• Board of Approval constituted by DIPP will scru-
tinise applications for setting up the NIMZ, and
subsequently monitor and expedite the progress
of implementation.
• The administrative structure of NIMZ will com-
prise of a Special Purpose Vehicle, a developer,
State Government and the Central Government.

94 Twelfth Five Year Plan
• The SPV would be constituted for each NIMZ and
will be responsible for its development and man-
agement. It will also be empowered to issue/expe-
dite approvals and pre-approvals.
The Major Benefits for Units within NIMZ
• Job-loss policy will enable units to pay suit-
able worker compensation in the eventuality of
business losses/closures through insurance and
thereby eliminate the charge on the assets.
• The transfer of assets belonging to a firm which
has been declared sick will be facilitated by the
SPV of the concerned NIMZ.
• Exemption from capital gains tax.
• Skill up gradation programmes for new employ-
ees as well as for the existing employees in coordi-
nation with NSDC.
• Soft loans from multilateral institutions will be
explored for funding infrastructure development.
• The developers of NIMZs will be allowed to raise
ECBs for developing the internal infrastructure.
Special Incentives for Green Technologies in
NIMZs
• Environmental audit will be mandatory
• Water audit will be mandatory
• Exemption from water cess
• Ten per cent one-time capital subsidy for units
practicing zero water discharge
• Rainwater harvesting will be compulsory
• Under renewable energy appropriate incentives
under existing schemes will be available
• Incentive to obtain green rating for buildings
Delhi–Mumbai Industrial Corridor Project
13.188. The DMIC is proposed to be developed
on either side along the alignment of the 1,483 km
long Western Dedicated Rail Freight Corridor
between Dadri (UP) and JNPT (Navi Mumbai).
Running across the six States of Uttar Pradesh,
Haryana, Madhya Pradesh, Rajasthan, Gujarat and
Maharashtra, the project seeks to create a strong eco-
nomic base with a globally competitive environment
and state-of-the-art infrastructure to activate local
commerce, enhance investments and attain sustain-
able development.
13.189. Initially, seven investment nodes/cities have
been taken up for development:
13.190. DMIC is conceived as a model industrial
corridor comprising global manufacturing and com-
mercial hubs, that is, self-contained, state-of-the-art,
industrial cities. These cities will have world-class
physical infrastructure like high speed road and rail
connectivity for freight movement between the ports
and production/consumption centres, logistics hubs,
international air connectivity, reliable power and
water, waste management and recycling.
13.191. With the view to taking the project forward
to the implementation stage, the Cabinet in its meet-
ing held on 15 September 2011 has approved the
financial and institutional structure and financial
assistance for the development of industrial cities
in the DMIC. This inter alia includes creation of the
‘DMIC Project Implementation Fund’ of `17,500
crore over the next five years for the development
of industrial. The Government of Japan has also
announced their financial support for the DMIC
project to an extent of US$ 4.5 billion for projects
with Japanese participation in the first phase of the
project.
STRATEGIES FOR THE VARIOUS
MANUFACTURING SECTORS
13.192. The objectives of the Plan will be met by the
performance of enterprises in select sectors. The
selection of the sectors that are included in the Plan
has been on a ‘bottom-up–cum–top-down’ process.
India’s New Manufacturing Plan is not made on a
blank slate. Manufacturing enterprises are operat-
ing in the country in a large variety of sectors. They
are competing with one another and with enterprises
from abroad too. They understand the constraints in
India on their competitiveness and growth, as well
as opportunities before them. Therefore, associa-
tions of enterprises in various sectors were encour-
aged to prepare plans for their sector’s growth, along
with the central Government ministry/department
responsible for the sector. They have indicated what
the enterprises (and their associations) will them-
selves be responsible for and the support required
from Government.

Industry 95
Sector Coverage
13.193. Some sectors have been identified as critical
in achieving the overall manufacturing goals. The
key characteristics of these sectors are:
Sectors of Strategic Importance
13.194. It is essential for the country to develop
domestic manufacturing capabilities in certain sec-
tors for ensuring national security and self-reliance.
Industries such as Defence Equipment, Aerospace,
Capital Goods, Electronics Systems Design and
Manufacturing (ESDM) and Shipbuilding and Ship
Repair are sectors where greater focus is required to
increase indigenisation in production.
Sectors for Basic Inputs
13.195. Availability of high-quality raw material and
production inputs is essential for ensuring sustained
growth of the manufacturing sector. Industries
which are engaged in the production of steel, cement,
fertilisers, and in the exploration and development of
Minerals, underpin this growth. Significant impetus
is required towards developing production capacities
in these sectors.
Sectors for Depth and Value Addition
13.196. These are knowledge-intensive and technology-
intensive industries with high growth potential.
Developing competitive advantage in them through
increasing depth and value addition in domestic
manufacturing will contribute to long-term sus-
tained economic growth. While India has developed
good technological capability in certain sectors in
this category (automobiles, pharmaceuticals and pet-
rochemicals), it lags behind significantly in others
(electronics, chemicals and paper).
Sectors for Employment Generation
13.197. Industries such as textiles, food processing,
leather goods, and gems and jewellery are less capi-
tal intensive and more labour absorptive in nature.
These are high employment generating industries
that are currently dominated by MSMEs. They lack
the deployment of sophisticated technologies in their
manufacturing processes and instead rely heavily
on manpower. Maximum growth in employment is
likely to come from these industries and hence their
success is imperative for the country to achieve its
job-creation goals.
13.198. The definition of the sectors was influenced
by the way the ministries are organised. However,
most of the growth and employment data available
under NIC classification does not follow this sec-
tor definition. Therefore, we have attempted to cor-
relate the Plans for the sectors (in the way we have
defined in this Plan) to the industrial segments as
per NIC classification to arrive at the likely scenarios
for manufacturing growth rate and employment that
will be achieved if the recommendations suggested
in this Plan are implemented. The Table 13.8 pro-
vides the likely growth rate and employment figures
that would be achieved on a ‘business as is’ basis with
the manufacturing sector growing as per its histori-
cal growth rate (Scenario 1).
13.199. Under Scenario 2, we consider the manu-
facturing growth rate provided the manufacturing
strategy is implemented. Targets for sectoral growth
rates6 in manufacturing were derived by the respec-
tive working groups. This then provided the start-
ing point towards identifying the supporting and
enabling conditions that would need to be effected
to realise the requisite outcomes. One such condi-
tion is that capital investment in the economy needs
to be labour supplementing and not labour displac-
ing; to reflect this we have deflated the growth rate
of labour productivity in Scenario 2. As can be seen
from the following table, in Scenario 2, the creation
of 70 million additional jobs is a possibility, provided
the manufacturing strategy recommendations are
implemented, while a ‘business as usual’ approach
will not create the requisite additional employment
opportunities.
13.200. The Plan is a living process to shape and to
strengthen the productivity and competitiveness
of a large industrial ecosystem so that much faster
growth of industrial output and more employment
can be created across the country. Actions will be
required in all States, and in many industrial sec-
tors, to meet the ambitious national goals for the
country’s industrial sector that this Plan has laid
out. This Plan cannot be ‘the last word’ on all that

TABLE 13.8
Manufacturing GDP by Sector and Employment Projections
Manufacturing Sectors (Excluding Mining) Eleventh Plan* Scenario 1: Manufacturing
Growth as per Historical
Growth Rates
Scenario 2: Growth rate as per
Manufacturing Plan
Contribution to
Manufacturing
GDP
GDP CAGR
11th Plan
Employment
2009–10
Employment
2016–17
Employment
2024–25
GDP CAGR
as per
Manufacturing
Plan
Employment
2016–17
Employment
2024–25
Food products and beverages 8.7% 7.3% 5.5 6.46 6.94 8.8% 7.29 9.50
Tobacco products 1.7% 4.7% 4.1 4.12 3.61 4.7% 4.35 4.17
Textiles 9.2% 3.8% 8.4 8.00 6.56 11.5% 12.07 19.14
Wearing apparel 3.9% 7.3% 7.3 8.57 9.20 11.5% 10.94 17.34
Leather products and others 1.3% 4.6% 0.9 0.90 0.79 24.0% 2.22 8.25
Wood and others 2.2% 12.0% 3.6 5.52 8.34 12.0% 5.82 9.57
Paper, publishing and others 2.7% 5.8% 1.6 1.72 1.64 8.7% 2.08 2.69
Coke, petroleum products, and nuclear fuel,
rubber and plastics
10.6% 7.5% 0.8 0.95 1.03 10.7% 1.16 1.73
Chemicals and chemical products 12.2% 9.0% 1.7 2.20 2.66 12.0% 2.66 4.36
Other non-metallic mineral products 6.8% 13.6% 4.3 7.22 12.22 13.6% 7.61 14.03
Basic metals 9.7% 1.9% 1.4 1.19 0.84 10.3% 1.86 2.71
Machinery and equipment and others 11.1% 8.1% 3.8 4.68 5.33 16.8% 7.25 16.67
Electrical machinery and apparatus, telecom
and others
6.0% 12.8% 1.3 2.09 3.34 12.8% 2.20 3.82
Motor vehicles and other transport
equipment
7.7% 6.0% 1.5 1.63 1.59 13.0% 2.37 4.18
Furniture and other manufacturing 6.3% 6.3% 4.3 4.76 4.47 6.3% 5.02 5.43
Total 50.5 60.01 68.83 74.91 123.59
Note: *Contribution to Manufacturing GDP as per GDP Data series provided by CSO—2009–10. Basis of GDP CAGR Eleventh Plan estimates provided in the Annexure.
Employment figures are in millions. Employment for 2009–10 does not include employment of 0.20 million for recycling and medical, precision and optical instruments,
watches and clocks.
^ The key variables and assumptions are part of Annexure 13.1.

Industry 97
is required to be done. Just as many stakeholders,
many sectors and many industry ministries have
come together to start this comprehensive, col-
laborative process, others are expected to join too.
Thus, the snowball will grow into a larger and faster
movement. Indeed, the preparation of this Plan has
already brought forth demands from sectors that
did not join the first wave to come on board too. In
the directions set by the Plan, they see opportuni-
ties for their growth too. For instance, biotechnol-
ogy, which focuses on industrial enzymes, alternate
energy, seed manufacturing, diagnostics, vaccines,
discovery research and clinical services and biotech
drugs, is emerging as an important focus area for
the country.
13.201. While we have not included this as a sepa-
rate section (this is included in the Drugs and
Pharmaceuticals Section), the policies needed for the
sector would be given due importance in the ongo-
ing planning process. More such sectors are likely to
join the planning process as we go along.
13.202. With this in mind, the process of planning
has been designed as an ongoing activity with peri-
odic reviews to ensure that right policies are pro-
vided to encourage new emerging industrial sectors
and reviewing policies of existing sectors based on
the changing global and domestic economic and
industrial environment.
13.203. While there are certain common challenges
and underlying solutions across sectors, which have
been articulated in the previous section, each sec-
tor also has its unique constraints that need to be
addressed. These sector-wise recommendations
have been attached as an annexure to this document
(Annexure 13.2).
STRATEGIES FOR HIGHEST IMPACT
13.204. The overall manufacturing strategy outlined
in the chapter details many initiatives and actions
that address the key challenges in each sector as well
as focuses on capitalising on the opportunities that
lie within. Also, recommendations have been formu-
lated to relieve the cross-cutting constraints across
sectors. A few high-impact strategies emerge, which
would serve well to further the overall growth of
manufacturing in India (Box 13.3).
13.205. The Central and the State Governments are
responsible for implementing the various policy-
related and institution-related recommendations.
This categorisation can be seen in Box 13.4.
WAY FORWARD
Principles of Policy Implementation
13.206. Research on success of countries that built
effective implementation systems to create sustained
competitive advantage across multiple manufactur-
ing sectors provides some principles for a robust
implementation process.
• Build an implementation system, don’t just do the
task: Explicit attention to the process of policy
development and implementation has been lack-
ing to a large extent in the Indian context. An
effective implementation system is not limited to
the success of a single initiative. It builds broad-
based capabilities across several industries.
• Systemic experimentation and learning help to
progressively and rapidly improve implementa-
tion: Even carefully designed programmes are
likely to face challenges from unforeseen changes
in the environment. Therefore, it is important
to have learning and feedback mechanisms in
place to ensure that implementation effective-
ness improves through successive cycles. Good
policy development (and implementation) should
follow the PDCA cycle (Plan—develop strategy;
Do—implement strategy; Check—diagnose issues
in strategy and its implementation; Act—rectify
issues identified).
• Prioritise, sequence and create momentum through
results: Often it takes time for results of policy rec-
ommendations to become visible. When results
are not visible, the implementation process may
lose momentum. Therefore, to build momentum,
some early wins must be targeted. They build con-
fidence and commitment to the process.
• Performance measures for government pro-
grammes have to be defined consultatively: The old

98 Twelfth Five Year Plan
Box 13.3
Strategies for Highest Overall Impact
Policy and Process Interventions
• Align stakeholders in the process of development and implementation of industrial policies.
• Simplify processes for doing business in India by mandating a ‘Regulatory Impact Assessment’ and operationalising single
window clearance across the country.
• Create a level-playing field for Indian manufacturers through fiscal measures by correcting anomalies in duty structures.
• Boost demand for domestic manufacturing, regardless of ownership of enterprises, through public procurement backed
by minimum threshold quality parameters.
• Bring down the cost of finance.
Technology Upgradation Measures
• Improve Government–industry and industry–academic collaboration.
• Encourage technology transfers through FDI/JVs.
• Improve technical standards and voluntary compliance, across the industry.
• Encourage adoption of ‘green technology’.
• Modernise MSMEs through technology adoption and adequate access to finance.
Infrastructure Creation
• Improve transport and power infrastructure.
• Set up NIMZs (National Investment and Manufacturing Zones).
• Make industrial clusters more effective by creating both, the ‘hard’ physical infrastructure as well as the ‘soft’ infrastructure
for knowledge creation and sharing.
• Design an effective land-acquisition process for industrial development.
Human Capital Formation
• Modernise labour regulations and institutions.
• Improve skill availability through Skill Councils.
• Ensure social protection to all employees in the manufacturing sector by creating ‘sump institutions’ for workers in
transitory phase and develop innovative insurance systems for the informal sector.
• Improve ‘industrial relations’ through streamlining of consultative processes and representative institutions.
• Improve the quality of manufacturing managers/supervisors.
management adage—‘you can’t manage what you
don’t measure’—is especially true with regards to
complex Government programmes. The need for
performance measures is well accepted. However,
it is also very important to define these measures
appropriately. A key difference between pub-
lic sector and private sector programmes is that
the value required to be produced by public pro-
grammes is generally more intangible than in pri-
vate programmes where shareholder value and
profit may be good measures. Outcomes of public
programmes must deliver against expectations of
diverse public stakeholders.
Therefore, it is imperative that time is spent,
upfront, to define outcomes in consultation with
key stakeholders. Failure to do this causes the sys-
tem to adopt simplistic measures of performance
against expenditure targets, which are not good
indicators of the outcomes that were desired.
• Coordination between Government departments
is critical: Given the complexity of policy issues
relating to manufacturing, most solutions are
likely to require coordinated actions between a
number of Government departments. While the
default solution is to create another agency/com-
mittee to oversee this coordination, this is not
always the optimal solution. Before setting up
such an agency/committee, the tasks required to
be performed by such an agency/committee must
be analysed and the existing system of agency/
committees must be mapped to eliminate any
overlaps and redundancies.
Otherwise additional agencies/committees can
increase the clutter in the system rather than

Industry 99
Box 13.4
Key Recommendations for Manufacturing
Category Central Governments State Governments
Policy
recommendations
• Develop National Land Use policy
• Reform the existing environmental clearance processes
• Initiate Reforms in labour laws
• Create a ‘Sump’ for transitory workers and ‘job loss
insurance
• Mandate Regulatory Impact Assessment (RIA) for all
regulatory changes in the country
• Develop functional National Business facilitation and
development policy
• Develop functional competition Act
• Evolve a Single Holding Structure for all PSEs
• Create a National IP Mission
• Develop Policy on technical regulations
• Mandate minimum 30% local value addition for capital goods
• Provide preference to local content in PSE purchases of
capital goods
• Rationalise the import of second hand capital goods
• Make changes in ECB and FDI policy and removal of sectoral
cap for banking sector (Steel)
• Accord ‘deemed exports’ status to Steel Industry
• Prepare policy on fuel usage in Transport sector
• Evolve National Policy on Vehicle Retirement and End-of-
life solution
• Develop integrated chemical management policy and regime
• Passing of MMDR bill
• Reforming the existing
environmental clearance
processes
• Developing State Land Use
policy
• Initiate reforms in labour laws
• Developing State business
facilitation and development
policy
• Developing State Competition
Act
• Mandate Regulatory Impact
Assessment (RIA) for all
regulatory changes in the State
• Mandate minimum 30% local
value addition for capital goods
• Provide preference to local
content in PSE purchases of
capital goods
• Improve the performance
of power generating and
distributing companies in the
States
• Streamlining the administration
of sales tax, VAT and so on
Institution-related
recommendations
(new institutions)
• Create RBOs mandated and empowered for integrated Water
Resource Management
• Establish an independent and autonomous regulator for
Land
• Establish functional National-State Business Facilitation and
Development Commissions
• Establish functional national state institutions for promoting
business responsibilities, competitiveness and competition
reforms
• Establish cluster stimulation cells
• Establish speciality chemical forum
• Constitute domestic council for leather industry
• Create National Aeronautics Commission
• Create National Discovery and Development Center for
Pharma Industry
• Develop institutional mechanisms enabling expert study
of techno-economic policy issues relating to national raw
materials security
• Development of State maritime
policies and boards
• Strengthen land management at
State level
• Establish/strengthen State-level
cluster stimulation cells
Strengthening
of existing
institutions
• Strengthen capabilities of
− Local bodies for recycling and waste management
− Standard developing organisations
− Inspection bodies/certification agencies/regulators in the
areas of Technical Standards
− Scale up of operations of SME exchange
• Strengthen capabilities of
micro and small enterprises
facilitation centers in States

100 Twelfth Five Year Plan
improve its performance. Since coordination is an
essential function to improve system performance,
coordination/oversight should be accountable for
performing its task and its performance must be
measured too.
• Stakeholder consultations are key to improve the
quality of policy development and implementation:
Rather than seeking to a priori design a detailed
plan in an unpredictable environment, it is bet-
ter to create effective forums to identify problems,
and for joint teams to be formed to tackle them.
These forums should be broad-based and inclu-
sive to ensure that all stakeholders can contribute
to the process.
A Two Track Process of Implementation
13.207. The Manufacturing Plan makes many rec-
ommendations developed through a managed, par-
ticipative process with structured involvement from
a diverse set of stakeholders (Figure 13.7). Previous
experiences of implementation in India have shown
that the inability of various stakeholders to work
together is a root cause of failure of policies.
13.208. The conventional response to this has been
to try and create a structure with a chain of com-
mand. However, this becomes untenable when there
are many stakeholders and owners who cannot all be
included within such a structure. The recommended
approach for policy implementation, based on the
principles enunciated before, is characterised by
three ‘L’s: enable local action, create lateral connec-
tions; and focus on learning. Local actions and lateral
connections require a process of implementation that
coordinates multiple entities in a consultative man-
ner. Learning requires a process that systematically
distils lessons from experience to improve the ongo-
ing evolution of policies and their implementation.
13.209. Therefore, a two-track approach for imple-
mentation and learning is recommended: the first
track delineates the steps required to convert the
recommendations of the Plan to implementation
and the second track concentrates on the systemic
changes that need to be undertaken to strengthen the
process of consultation, learning, policy making and
ongoing implementation.
13.210. The ‘third rail’ that provides the power
to accelerate learning and institutional capacity
improvement is an ongoing process of evaluation
and learning, which must be proactively facilitated
through the creation of a ‘backbone’ organisation
and other means. This approach is schematically
represented in Figure 13.7.
Collaboration and Implementation
13.211. Two root causes identified for poor imple-
mentation are: inadequate consensus amongst
stakeholders for policy changes and very poor coor-
dination amongst agencies in execution.
13.212. Wide-spread consensus-building processes,
therefore, need to be institutionalised within the
Indian manufacturing system to ensure successful
implementation of plans.
13.213. This consensus cannot be commanded. We
need another mechanism specifically designed to
bring people with different perspectives together:
to listen to each other, to distil the essence of their
shared aspiration for the country and the critical
principles they will adhere to in the work they have
to do together as partners in progress.
13.214. Hence, there is a need to establish an effective
‘backbone’ capability which will provide strength to
multi-stakeholder policy and implementation processes.
13.215. The ‘backbone’ capability neither requires
an organisation with large amounts of resources and
manpower nor one with the power to command top-
down. The ‘backbone’ capability must essentially
comprise of small catalytic units located in many
parts of the system, which can provide the ‘tools and
techniques’ to the various States and ministries to
effectively coordinate, design and implement their
programmes. The backbone network (and its units)
must rely on ‘learning by doing’ to enhance its own
capacity and to transfer knowledge to other stake-
holders tackling specific systemic issues.
13.216. The India Backbone Implementation
Network will provide these institutions with tools

Industry 101
and assistance to fulfil their coordination functions
more effectively. This has been discussed in detail
in Volume I of the Plan document, in the section on
Collaboration and Implementation, under the chap-
ter on Governance.
A ‘Movement’ of Learning and Improvement
13.217. The distinction between creating yet another
‘organisation’ and stimulating a ‘movement’ is cru-
cial. For widespread acquisition of capabilities, across
a large, diverse, and democratic system, a movement
of learning and change is required.
13.218. Japan was able to improve the quality of all is
enterprises, in the public and private sectors, through
the TQM movement. Relevant principles, techniques
and tools were provided by many persons and organ-
isations, notable amongst them were Professors
Deming and Ishikawa, and Taichi Ohno of Toyota.
These principles and tools were deployed by the
movement. The subjects of the IBIN Movement are
stakeholder collaboration and implementation. IBIN
must play a catalytic role, and it must be designed for
it. Strategic functions such as high-stake partnership
brokering and project management are capabilities
that should rest within IBIN and can be managed
with a compact team. Some amount of time will
have to be invested in identifying staff and partners
with the appropriate skills and character required
for the work of IBIN and its units. Given that India
has never quite had an organisation like the pro-
posed IBIN, the enrolment process of partners will
need to be very deliberate about selecting the right
individuals and organisations for the job, keeping in
mind how these selections will impact stakeholder
perceptions of IBIN and, therefore, willingness to
solicit services of IBIN and its units. Empanelment of
partner organisations should be based on established
guidelines/principles with a rigorous selection pro-
cess whereby partners should expect to be challenged
and evaluated, even being dropped from IBIN’s pan-
els if deemed necessary.
13.219. Further to develop project management and
stakeholder-alignment skills, IBIN needs the sup-
port of quality policy analysis to ensure consistency
in implementation in the present federal structure
(refer to Figure 13.8). Thus, IBIN could be well posi-
tioned to drive policy coherence at the central level
and ensure nation-wide consistency in actions and
Implementation Tracks
Manufacturing
Plan
Process for
Implementation
Implementation
Categorize and Prioritize
Recommendations on
the basis of Impact and
Feasibility
Define, Develop and
Induce the Process for
Implementation
– Inducing State
Consultation
– Ensuring Sectoral
schemes align with
overall strategy
• Ensuring Accountability
• Designing an Effective
Consultation Process
• Developing principles
for key policy actions
such as scheme design
and implementation
• Structuring of
implementation agency
Creating enabling
mechanisms for
Implementation
Identifying and Inducing
Systemic Reform
Learning
ChangingDoing
1
2
FIGURE 13.7: Two Connected ‘Tracks’ for Implementation and Systems’ Improvement

102 Twelfth Five Year Plan
policies. For this IBIN’s units at the Centre and in
the States will use tools such as Business Regulatory
Impact Analysis (BRIA) to analyse the need and rel-
evance of existing as well as new regulations on the
basis of set criteria, developed though a consultative
process, and relevant to the Indian context.
13.220. As mentioned ‘backbone’ units should form
at several nodal points in the institutional struc-
tures of governance in the country where coordina-
tion and management of implementation are key
responsibilities. These will be in State Governments
and they will be within national missions that bring
together several agencies to produce integrated out-
comes. In each of these, the three modules of capa-
bilities described above may be required. Of these,
stakeholder-alignment and programme manage-
ment would be required invariably. The third capa-
bility, policy analysis, may be required in some units,
not all. For example, it would be most likely required
in State level units, but perhaps not in units support-
ing missions.
13.221. A decision will have to be made about where
the central node of the ‘backbone’ capability (which
as mentioned before must grow and be distributed
across the country) will reside, taking into consid-
eration how its location will impact stakeholder
perceptions of its purpose, neutrality and capabili-
ties, and therefore the willingness of stakeholders
to solicit ‘backbone’ services or take part in IBIN
interventions.
Make Systemic Reforms
13.222. In the course of developing the Plan for
manufacturing, through intensive discussions with
stakeholders, ‘root causes’ for present problems in
the country with implementation of such ambitious
and complex programmes were located. Ways to
address some of these have been built into the Way
Forward for the Manufacturing Plan. However,
some root causes require broader institutional
changes. Efforts are being made by Government to
address these. Implementation of those changes by
Government will accelerate the implementation of
the many actions required to achieve the country’s
ambitious goals for its manufacturing sector. These
broader institutional changes, the benefits of which
will be in all sectors of the economy, are described
below.
Improve Architecture of Government
Programmes and Schemes
13.223. Schemes, especially those that aim to provide
financial incentives to encourage specific behaviours
from the private sector, are popular instruments of
manufacturing policy in the country. However, sig-
nificant reforms are required in the architecture of
schemes to ensure that they effectively and efficiently
help to fulfil policy goals:
1. Change the role of the central Government minis-
try from micro-manager to scheme designer and
facilitator: The ministry’s role should be to act
as a knowledge partner and enabler to the proj-
ect implementers (which will typically be in the
States). In order to be able to play this role effec-
tively, the ministry will need to develop capa-
bilities which are focused on scheme design and
creation of learning systems and networks from
which the States and other local implementers
can learn.
2. Establish strategic alignment of schemes: Schemes
should have strategic outcomes defined (such
Program Management Policy Analysis Stakeholder Alignment
Capabilities of the BPO
FIGURE 13.8: Capability Map

Industry 103
as employment generation, number of patents,
output generation and so on) so that measures of
schemes’ performance are not limited to expen-
ditures against targets.
3. Invest in good scheme design: While the Planning
Commission includes schemes in principle dur-
ing the five-year plan process based on the stra-
tegic logic supporting them, the actual monies
should be released only when the scheme design
meets well-defined quality considerations. The
ministry should be provided funds to design the
scheme—which might require hiring consul-
tants/experts or reaching out to numerous stake-
holders—after which they should be provided
funds for the schemes only if the design can
demonstrate that the scheme will deliver on the
desired outcomes.
4. Establish an evaluation and feedback mechanism:
Schemes should be measured on productivity
of the money being spent—this allows various
schemes to be compared with each other. Also,
the ministry should demonstrate how learning
from implementing a scheme is being used in
improving it.
Reform Government Institutions
13.224. The Second Administrative Reforms
Commission has made several important recom-
mendations that will improve the performance of
Government generally and that will substantially
improve Government effectiveness in growing the
country’s manufacturing sector. Since the recom-
mendations are very well developed and explained in
the ARC’s reports, they will not be elaborated here;
however, the following may be highlighted:
• In its Report No. 10, the ARC has recommended
changes in the career structure of the administra-
tive services that will ensure that senior postings
have adequate tenure. It has also recommended
an ‘up or out’ evaluation system so that only the
better officers will stay in service and move to
postings at the top. And it has provided for lateral
entry from outside Government, of suitably quali-
fied personnel for such top positions.
• In its Report No. 13, the ARC has recommended
that policymaking functions of Government and
execution functions be separated and organised
in appropriate structures. For ‘execution’ func-
tions, the ‘agency’ structure has been strongly
recommended. ‘Agency’ structures have enabled
several countries—UK, Sweden, Japan, Australia
and Thailand, to name a few—to substantially
improve Government’s performance.
13.225. The concept of ‘agencification’ is to carve out
of Government departments, ‘executive agencies’ to
carry out, under competitively selected professional
managers on fixed tenures, specific executive func-
tions within a framework of policy and resources.
Each such agency is institutionalised in a framework
document which spells out its mandate, mission
and objectives, structure, accountability, standards
and targets, financial arrangements and so on and is
mandated to release an annual performance report
and accounts. The agency has the freedom to mould
its management style, strategy, operations, systems,
workforce and so on within broad Government
guidelines.
13.226. The advantage of the ‘agency’ structure is
that it leads to clarity about outcomes. It also allows
for an inculcated culture of service delivery, empow-
erment of frontline staff, greater accountability and
openness, improved management, transparency and
so on.
Role of Industry Associations
13.227. Industry associations have a vital role to
play in the evolution and implementation of the
Manufacturing Plan at the Centre and in the States.
They provide platforms for their members to come
together to analyse the constraints in the environ-
ment that must be addressed. Good-quality asso-
ciations, that are democratic in their governance,
transparent in their functioning and represent their
industrial sector, or perhaps all industry, satisfacto-
rily (that is, have large membership) can be invalu-
able partners of Government in the development and
implementation of plans for manufacturing growth.
Associations can also arrange platforms for consul-
tations with Government and other stakeholders on
the lines described above and thus can facilitate the

104 Twelfth Five Year Plan
achievement of the country’s goals for its manufac-
turing sector.
Involve Commercial Banks in the Analysis
Process
13.228. Commercial banks, who provide finance
to manufacturing enterprises, large as well as small
ones, are a valuable (and neutral) source of insight
into constraints of different sectors. They should be
involved, more systematically, in the processes of
evaluation of sectoral performance and for develop-
ing solutions, along with other stakeholders.
Disseminate Information to Public Effectively
13.229. Government must become much more effec-
tive in communicating with the public. Citizens are
not aware of many schemes set up by Central and
State Governments for their benefit. Stakeholders,
who will be affected by new Government poli-
cies, realise only after the policies are announced,
that they have great concerns whereas Government
departments claim that the policies were posted on
their websites and views had been invited. Moreover,
with the ubiquity of electronic communications,
including 24 × 7 TV news, and the advent of social
media, Government’s communication processes
must be modernised, become more proactive, and
reach out to citizens more effectively.
NEXT STEPS
13.230. The immediate next steps for implementing
the Plan are:
• Take the Plan to the States: Much of the imple-
mentation of the Manufacturing Plan will be in
the States. Therefore, State Governments and
stakeholders in the States must be engaged.
• Put the implementation system in place: The
implementation system described in this section
will need to be instituted through the collabora-
tion of various National and State agencies as well
industry associations. The DIPP, NMCC and the
Planning Commission will need to collaborate
to delineate their roles in the implementation
process.
• Ensure sectoral schemes align with overall strat-
egy: The financial outlay of the Plan should be
aligned with the strategies identified in the Plan.
Rather than following the process where budgets
are determined as variances to previous year’s out-
lays, allocations should be designed and reviewed
in accordance to the strategies identified.
• Communicate the Plan to a broader audience:
Communication is critical to the successful imple-
mentation of any major change programme.
Communications must be designed to suit the
audiences for which they are intended. Some can
be delivered in the form of documents or presenta-
tions. Others should be delivered through interac-
tive discussions where clarifications can be given
and even suggestions obtained. Industry associa-
tions can play a very important role in these. The
Planning Commission, DIPP and NMCC would
have to provide leadership and play a major role
in the communications outreach.

Industry 105
ANNEXURE 13.1
Manufacturing GDP by Sector and Employment Projections
TABLE 13.9
Key Variables and Assumptions
Variable Assumption(s)
GDP by Sector (Excluding
Mining)
National Accounts Statistics published by CSO provides GDP data series till 2009–10 for the
manufacturing sector. This data was then extrapolated basis the projected growth rates in the
economic survey report 2010–11 and adjusted for the slowdown in 2011–12 to estimate the overall
growth rate for the Eleventh Plan. The growth rate thus arrived at, has then been used to project GDP
for Scenario 1.
For Scenario 2, growth rates as per sectoral working-group reports have been considered. It is
important to note that NIC classification at the two digit level for capturing data related to individual
sectors under manufacturing does not correspond to the classification of sub-sectors (eighteen) in
the manufacturing strategy. Projected growth rates for the individual sectors as per the respective
working groups have been mapped on a best information basis. The outcome of this approach is an
average growth rate of 12 per cent for manufacturing sector as a whole during the Twelfth Five Year
Plan and till 2025.
GDP GDP growth rate for the country is assumed to be at 9% for the model.
Employment by Sector
(Excluding Mining)
Employment data is quinquennial as published by NSSO. Employment data last available is for
2009–10. This has been used to calculate labour productivity, (GDPt/Employmentt) for 2009–10 for
each sector which is a key input variable towards projecting employment.
Reflecting recent trends in productivity, the labour productivity growth rate has been assumed to
be 6% p.a. under Scenario 1 and 5% p.a. under Scenario 2. Employment in manufacturing declined
between 2004–05 and 2009–10 despite an increase in output. Hence, it is important to consider a
long run view of the trend in labour productivity. As per Papola and Sahu (2012), labour productivity
in India grew by 3.8% p.a. between 1993–94 and 2004–05 and by 6% between 1993–94 and 2009–10.
It is important to note that in the unorganised segment which employs more than 80% of the
workforce, manufacturing sector productivity per worker was estimated to be almost one-twentieth
of that in the organised sector in 2006–07 (Papola et. al., 2011). Hence, a 6% growth rate has been an
outcome of declining employment combined with a concentration of manufacturing output in the
organised sector. This trend is not likely to be sustainable for the Indian economy, especially if the
objective of inclusive growth needs to be realised. The manufacturing strategy for the Twelfth Five
Year Plan aims to address systemic deficiencies in the economy with a clear focus on accelerating
both growth and employment. Hence historical labour productivity growth rates cannot be relied on
to project the likely impact of manufacturing strategy during the Twelfth Five Year Plan and beyond.
The moderate adjustment in labor productivity growth rate from 6% in Scenario 1 to 5% Scenario
2reflects the assumption that with increased focus on employment generation, capital investment will
supplement labour rather than displace it (contrary to the trend that has been observed historically).

106 Twelfth Five Year Plan
ANNEXURE 13.2
Sector-wise Recommendations
1. As indicated earlier, we have included Plans for 17 different industrial sectors, under four categories—sectors of strategic
importance, sectors of basic inputs, sectors of depth and value addition and sectors of employment generation. It is these sec-
tors, which will have to achieve the Plan objectives, that is, growth and employment objectives. Following are the sector-wise
recommendations.
(A) SECTORS OF STRATEGIC IMPORTANCE
DEFENCE EQUIPMENT
Introduction
2. India has been rapidly enhancing its spending on defence. It is expected that India would become the third largest defence
spender after the US and China by 2014. Equipment spending by Ministry of Defence has increased by 15–20 per cent over the
last five years. With several large equipment and modernisation programmes in the pipeline, analysts are projecting an overall
spend of USD 80–100 billion in the next five years. This makes India one of the world’s most lucrative markets for military
products, and defence suppliers are gearing up to compete.
3. The Indian defence equipment market can be divided into four large areas:
• Land Systems
• Naval Systems
• Electronics Systems
• Aerospace
Key Objectives Under the Twelfth Plan
• Progressive increase share of domestic procurement from 30 to 75 per cent in next 10 years.
• Ensure that 8–10 largest weapons programmes in the country have a targeted large percentage of locally manufactured
content.
• Build local IP in critical defence areas.
• Promote and track civilian applications of technologies and material developed during defence research.
• Support local defence manufacturers in building export capabilities.
• Enable creation of one million new direct and indirect jobs in the defence manufacturing space.
• Monitor implementation of Government’s offset policy in letter and spirit for large contracts.
Strategy and Key Recommendations
• Set up a National Defence Manufacturing Council.
• Set up a national defence manufacturing council under the aegis of the Prime Minister’s office to ensure that domestic
manufacturing gets due focus.
• Pass an Executive Order with decision to use Make/Buy and Make (Indian) mandatory for flagship large programmes with
appropriate funding to enforce Make or Buy and Make (Indian) classification for all flagship defence contracts and mandate
that the prime contractor be an Indian entity, which can be a JV between a local entity and relevant global vendors.
• Decide the right financial model for Indian entities working with the Government on these flagship programmes.
• Streamline the defence procurement infrastructure
– Need to streamline at the level of offset implementation, DPSU and OFB procurement and Ministry of Defence cantered
capital procurement.
– Centralisation of procurement systems and infrastructure for DPSU and OFB, creation of a centralised list of defence
vendors and providing guidance to new entrant in the system.
– Provide standardised contractual frameworks and clauses that can be accessed by the multiple contracting agencies to
reduce contract variation and complexity across the system.

Industry 107
– Adopt more professional and specialised approach to enhance the offset facilitation process.
• Increase the FDI limit for foreign participation
– The current upper cap of 26 per cent on FDI in defence production needs to be relaxed to 49 per cent on case to case
basis. Specific technology transfer should be specified and post-contract technology should reside in the JV/country.
• Support for SMEs
– SME-specific support structure for upgradation of defence manufacturing facilities for deeper capability building, achieve
manufacturing certifications like ISO, developing IPs and in establishment of licensed defence units.
• Create enabling infrastructure for capability building
– Mechanisms to provide access to critical technologies available with research agencies or obtained through Transfer of
Technology (TOT) arrangements.
– Creation of a Centre of Excellence for Defence Electronics: to be modelled on a PPP model aimed at generation of indig-
enous IP.
• Vendor development
– Continuous development of vendor base by DPSU.
AEROSPACE
Introduction
4. Aerospace manufacturing is a high-technology industry that produces ‘aircraft, space vehicles, aircraft engines, propulsion
units, and related parts.’ Its value chain is characterised by a long project life cycle spanning R&D, engineering design, manufac-
turing, assembly, maintenance, repair and overhaul. India is one of the fastest growing aerospace markets.
5. The three segments of the Industry are:
• Defence
• Civil Aviation
• Space
Key Objectives Under the Twelfth Plan
• Develop greater design and manufacturing capabilities in the defence space.
• Become a global player in supplying advanced technology in space sector at a fair price in the global space market.
• Drive dedicated technology development for civil aviation, develop greater manufacturing capabilities.
• Become the international hub for maintenance, repair and overhaul needs.
Strategy and Key Recommendations
• Strengthening institutional architecture through a National Aeronautics Commission, if required
– All the knowledge residing in entities like aeronautics organisations, colleges, labs and so on should be synergistically
harnessed.
– Map indigenous capabilities, identify knowledge gaps, direct resources efficiently to address critical technology gaps.
– Formulate a national aeronautics policy to strengthen the aerospace industry.
• Strengthening of certification organisations
– Given the expected increase in the work in the sector, CEMILAC and DGCA must be strengthened.
– The government should facilitate certification of SMEs.
• Promotion of PPP model
– PPP model by forming JVs should be encouraged in order to fully exploit the knowledge base of the government and the
entrepreneurship of the private sector.
• Earmarking special aerospace economic zones may be considered
– Creating clusters to certify and quality test aircraft and system components.
– The growth in offsets could be efficiently utilised in the creation of such SEZs.

108 Twelfth Five Year Plan
SHIP BUILDING AND SHIP REPAIR
Introduction
6. Nearly 95 per cent of India’s foreign trade in terms of volume and more than 65 per cent in terms of value is through sea
routes. Currently, about 10 per cent of our trade is carried by ships with an Indian flag while the ships manufactured in India
carry even less cargo. India’s emergence as a major economic power would mean greater integration in terms of trade with the
rest of the world, requiring huge shipping tonnage. To ensure the safety of our vast coast line, the naval requirement of sophis-
ticated and modern vessels is also growing rapidly. Therefore, shipbuilding is very important from a civilian as well as defence
perspective.
7. While the Indian seaborne trade has been growing rapidly, Indian shipping and shipbuilding sector has been lagging behind
despite their development potential. Indian registered ships form just about 1.1 per cent of the global shipping stock. Indian
EXIM trade is being increasingly serviced by foreign flagged vessels whose share in the Indian shipping market has increased
from 60 per cent in 1980s to about 92 per cent by 2009–2010. This is both a cause of concern and a huge opportunity for India’s
shipping and shipbuilding sector.
Key Objectives Under the Twelfth Plan
• Medium and long term goals have been set for the Indian shipbuilding and ship repair industry. These are:
• To achieve 5 per cent share of the global shipbuilding market and 10 per cent share in the global ship repair industry by 2020.
• To be self-sufficient in ship repair requirements of the country and to emerge as a dominant ship repair centre displacing
Colombo, Dubai, Singapore and Bahrain.
• To develop a strong ancillary base for shipbuilding/ship repair in the country by 2020.
• To generate additional employment for 2.5 million persons (0.5 million direct and 2.0 million indirect) by 2020 in the core
shipbuilding as well as the ancillary and supporting industry sector.
• To develop strong R&D facilities and design capabilities for commercial shipbuilding.
Strategy and Key Recommendations
8. The key recommendations to enable the shipbuilding and ship repair sector to meet its mid-term and long-term goals are:
1. Incentives: In the line of the erstwhile Shipbuilding Subsidy Scheme, some form of adequate financial/fiscal incentive
would need to be considered in order to facilitate the industries to achieve critical mass.
2. Infrastructure status to shipbuilding: Granting infrastructure status would enable the indigenous shipbuilding industry to
enjoy tax benefits and lower interest rates for investment in the technological development and modernisation.
3. Purchase preference for Indian built, Indian flagged vessels and Indian shipyards in Government/Defence purchase: On
the lines of global practice, promotion of the use of locally build vessels by local shipping companies would help To develop
domestic shipbuilding capabilities.
4. Offset scheme for Government procurement: In order to provide impetus to the ancillary industry in India, it should be
mandated that during the purchase of any ship from a foreign yard, the foreign yard would have to source a certain amount
of marine engineering goods from India. This can create a steady stream of orders for domestic marine engineering com-
panies and help develop capabilities in the sector.
5. To examine the issue of incidence of taxes that disadvantages the domestic shipbuilding industry.
CAPITAL GOODS AND ENGINEERING
Introduction
9. The Prime Minister’s Group constituted under Chairman, National Manufacturing Competitiveness Council in its Report
(Prime Minister’s Group Report—PMGR) identified capital goods as one of the sectors that is strategic for strengthening
national capabilities for the long term. The PMGR has recommended support for the following sub-sectors within the capital
goods sector: (i) machine tools, (ii) heavy electrical equipment’s, (iii) heavy transport, earth moving and mining equipment’s,
and (iv) high technology equipment’s like IT, telecommunications and electronics hardware. The PMGR has recommended
that a time-bound action plan should be prepared in each of these areas for building high class modern capacities with R&D
facilities, appropriate programme to encourage growth and development of these areas in the private sector together with

Industry 109
strengthening of the existing public sector and revisiting the existing policies to protect and promote selected capital goods
industries.
10. PMGR has also recommended enunciation of a clear policy to provide incentives for acquisition of advanced technologies
strengthening the country’s technological capabilities in the long term. Need for a dedicated fund for acquiring technology for
tier-2 suppliers of priority sectors and an ‘offset policy’ as one of the means to boost domestic content in the total equipment
imported has been underlined. A review of the current FDI policy from the point of view of transfer of technology as well as
considerations of national security was also recommended. This can be done by giving preference to JVs instead of 100 per cent
foreign-owned companies.
Key Objectives
11. The Plan focuses on the following sectors: machine tools, earth moving, heavy electrical, metallurgical, textile, process plant,
mining, power plant and other industrial machinery and engineering sectors. The key objectives were to make the capital goods
sector globally competitive, reduce overseas dependence in strategic sectors, increase depth in manufacturing and enhance pro-
duction levels, employment, exports and contribution to the national exchequer.
Strategy and Key Recommendations
I. Investment inducement through clusters: Apart from common facilities for product development, design and testing, clus-
ters should include enterprise management development through a common training centre promoted through SPVs.
II. Skill development support: Problem of skill deficit impacting the machine tools, electrical machinery and earth moving
equipment segments should be remedied through a two-pronged approach comprising skill development through public
agencies as well as with the help of private sector on a Public–Private Partnership mode.
The action steps suggested in the different sub-sectors of capital goods include upgradation of selected ITIs, polytechnic
institutions and engineering colleges and to establish centre of excellence for executive development.
III. Fund for Expansion/Modernisation of existing units; fund for technology transfer, acquisition of firms abroad: The industry
is considered high risk and not considered a preferred borrower. Therefore, low-cost funds are required to stimulate cre-
ation of additional capacity and for technology upgradation.
The following major recommendations for policy initiatives are proposed for the capital goods and engineering sector:
• Support for incentivising technology development/transfer and value addition in India
– Modify FDI policy to ensure transfer of technology by giving preference to JVs instead of 100 per cent foreign-
owned companies
– Develop indigenous facilities for design, development and testing of equipment
– Incentivise/mandate foreign players to increase value addition in India
– Preference in PSE/Government purchases for products having higher local content
• Substitute Imports: Calibration of duties and taxes to remove disadvantages for domestic players
– Regulate/ban import of second-hand machinery
– Address adverse tax structure for local manufacturers in India
– Modify Government tender terms to remove disadvantages to Indian firms against imports
• Promote exports by facilitating dedicated line of credit and brand development
12. Though many of the issues constraining the growth of the capital goods sector are common, there are specific sub-sector
issues that would require to be addressed with specific measures. The issues specific to machine tool, heavy electrical and power
plant equipment, earth moving and mining equipment and associated recommendations are as follows:
Machine Tools Industry
13. India’s share of machine tool production is at present only 0.8 per cent of world production. At present, about 70 per cent of
the requirement of machine tools is met through imports. There are 8–10 large companies (turnover above `100 crores), 10–15
medium companies (50–100 crores) and rest are small. HEC and HMT are two CPSEs in the machine tools sector. New invest-
ments have been few, due to low returns on investments. However, the machine tool industry has the potential to grow from
about 12 per cent per annum to 15–20 per cent. To achieve a market share of about 50 per cent by 2020, the industry will require
a set of policy, investment and technology development measures.

110 Twelfth Five Year Plan
14. The recommended measures, in addition to policy support, include Government support for capacity expansion. The mea-
sures include support for technology transfer, common facilities, R&D/incubation centres, business and market development
and cluster parks. Some of the major recommendations are as follows:
1. Define a National Mission for Machine Tools
2. Introduce immediate fiscal incentives
3. Mission to indigenise critical mechanical elements and machine tool electronics
4. Measures to attract investment are a priority
5. Creation of modern state of the art capacities
6. Realise full potential of PSU capacities—currently, capacity in PSUs such as HMT and HEC not optimally utilised
7. Fillip to R&D and technology development is essential
8. Industry–academia–R&D linkages
Heavy Electrical and Power Plant Equipment
15. Heavy electrical and power plant equipment sector is growing at about 14 per cent. Its growth in two distinct segments,
that is, power plant equipment and electrical equipment for power transmission and distribution are being driven by the major
power addition programmes namely, Restructured Accelerated Power Development and Reforms Programme (R-APDRP) and
Rajiv Gandhi Vidyutikaran Yojana (RGGVY) and transmission projects.
16. With increase in the requirements for meeting the planned additions and a shift towards setting up higher efficiency super
critical power plants in the country, the Indian domestic manufacturers have formed joint ventures (JVs) with foreign com-
panies and are focusing on manufacturing higher efficiency equipment’s. The domestic industry has expressed concern about
contract with Chinese suppliers and the lack of capacity utilisation in BTG segment. The ‘Electrical Equipment Manufacturing
Industry’—Industry Report 2010 by IEEMA has highlighted concerns of limited high-voltage testing facilities, varied procure-
ment guidelines of state utilities, persisting gap between Indian and inter national standards. Threat of rising imports issues
of inverted duty structure, critical raw material constraints and absence of appropriate clause to allow preference in domes-
tic procurement on the lines of procurement guidelines of World Bank and ADB. Following are the sector-specific policy
recommendations:
1. Ensuring utilisation of domestic capacity
a. Ensuring sufficient investment in power generation through appropriate Government policies to create adequate
demand potential for heavy electrical and power plant equipment
b. Creation of appropriate conditions enabling full capacity utilisation of domestic manufacturers of heavy electrical and
power plant equipment
c. Constituting a special vehicle for State Electricity Boards (SEB) facilitating replacement of old and ageing power plants
d. Facilitating availability of critical raw materials
2. Standardisation: Adoption of uniform ratings by Central Electricity Authority (CEA)/Ministry of Power (MoP) as stan-
dard ratings to be adopted for the Indian grid.
3. Testing facilities: Strengthening of R&D Infrastructure at national level for type testing of prototypes with a view to mini-
mise development/commercialisation cycle.
Earth Moving and Mining Equipment Sector
17. The earth moving and mining equipment as well as the construction equipment industry (CEI) in India enjoys a positive
long-term outlook. Planned investment in infrastructure (more than US$1 trillion) and growing urbanisation will drive the
construction industry to grow at 16–17 per cent CAGR over the next 10 years. The growth opportunities are accompanied by
increasing competition from equipment’s from countries like Brazil and China.
18. The sector has evolved over the years and is at present in an intermediate stage of development. Some products manu-
factured in India by some of the MNC’s who have set up assembly plants in India are meeting the global standards. It is esti-
mated that the domestic content is nearly 35 per cent in standard equipment whereas the domestic content is about 78 per cent
in high technology equipment’s. Over the years three Chinese companies have emerged as leading construction equipment

Industry 111
manufacturers and have cornered a 12 per cent share of the market. Competition is likely to intensify as many Chinese players
have improved their distribution and after-sale networks in India.
19. Like its global counterpart, the domestic mining sector is now graduating into high-end technology products and is in
demand of transfer of such technology. A recent Industry Report by CII on the Indian Construction Equipment Industry
emphasises for (i) rationalisation of taxes to mitigate impediments for interstate movement of earth moving and construction
equipment, (ii) bridging skill gaps, (iii) prohibiting unregulated import of used equipment, and (iv) removal of ambiguity about
emission and safety standards.
Following are the major recommendations:
• Emission standards must be made applicable to earthmoving equipment’s and so on.
• Initiatives for indigenous development of certain equipments like dredgers are to be taken to achieve self-reliance in this area
• The existing competence and capability of Bharat Earth Movers Ltd (BEML) need to be, inter alia, strengthened by providing
support for transfer of technology
ELECTRONICS SYSTEMS DESIGN AND MANUFACTURING
Introduction
20. Electronics Systems Design and Manufacturing (ESDM) comprises semiconductor design; high-tech manufacturing;
electronics components; electronics systems design telecom products and equipment’s; IT systems and hardware and other
segments. Electronics, along with Information and Communications Technology (ICT), is considered a meta-resource: the
competitiveness of various industries often depends on their ability to integrate ICTE in their business processes. Electronics is
the largest and the fastest growing manufacturing industry in the world. It is expected to reach US$ 2.4 trillion by 2020.
Key Objectives Under the Twelfth Plan
The key objectives for the ESDM Sector are:
• To achieve domestic production of USD 122 Billion by 2017 (growth of 30 per cent)
• To ramp up domestic value addition in ESDM manufacturing
Strategy and Key Recommendations
The strategies and key recommendations are:
Creating a level playing field
• Introduce Modified Special Incentive Package Scheme for improved value-addition
• Provide preferential market access to domestic industry in the ESDM sector and remove trade barriers through effective
negotiations in WTO
• Mandate Indian standards for ESDM to safeguard against substandard items
• Introduce reforms in Government procurement procedure for electronics hardware
Creating an enabling environment
• Set up a national electronics mission
• Promote exports of ESDM by providing appropriate incentives and brand development
• Promote sustainable growth through waste management practices
Providing support across the value chain
• Set up semiconductor fabs in India and encourage innovation, R&D and Indian IP by setting up of Electronics Development
Fund
• Promote the semiconductor chip design, electronics components and strategic electronics industry

112 Twelfth Five Year Plan
STEEL
Introduction
21. Indian iron and steel industry, with its strong forward and backward linkages contributes significantly to the overall growth
and development of the economy. The industry today directly contributes 2 per cent to India’s Gross Domestic Product and its
weightage in the official Index of Industrial Production is 6.2 per cent. India has become the world’s fourth largest producer of
crude steel, preceded only by China, Japan and USA. However, India has been lagging behind other major steel producing coun-
tries in terms of techno-economic efficiency of operations and hence Indian steel industries are not very globally competitive.
22. There is an urgent need to address its basic constraints irrespective of equity size and nature of operations. In 2010, our
per capita consumption of steel was only 51.7 kg, as against the world average of 202.70 kg. There is tremendous potential for
improvement in the domestic steel consumption given the economy’s large untapped markets, especially in rural areas. With a
GDP growth of ~9 per cent, the sector is expected to grow by ~10.3 per cent in terms of steel consumption. This translates to a
need an installed capacity addition of 142.3 MT of steel in the Twelfth Plan.
Key Objectives Under the Twelfth Plan
• Increase capacities to ~142.3 MT in accordance with demand projections
• Ensure raw material security, especially in terms of iron ore and coking/non-coking coal
Strategy and Key Recommendations
Raw Materials
23. Iron ore is the basic raw material used in steel making. Though iron ore is abundantly available in the country, large scale
exports of iron ore have raised serious concerns about the future availability. Side by side, there is an urgent need to address the
problems of degradation of the environment, displaced population, transportation bottleneck and so on.
24. The domestic availability of coking coal, a critical raw material required by steel industry is limited and therefore the Indian
steel industry has to depend heavily on imported coking coal to meet its needs. To ensure raw material security and minimise
the impact of volatility in coal prices, it is desirable to acquire overseas coking coal assets and to increase the domestic produc-
tion of coking coal and upgrade its quality.
Infrastructure
25. Given the rising demand anticipated in the Twelfth Plan period, the already overburdened domestic infrastructure and
more particularly in mineral rich states requires immediate attention. Apart from ensuring adequate rail–road connectivity,
National Investment and Manufacturing Zones (NMIZs) proposed in the National Manufacturing Policy may provide an excel-
lent option for future location for new steel plants due to close proximity to consumers. However, for this to happen, the per-
spective planning for NIMZs has to consider some of the NIMZs in the eastern region of mineral-rich states.
Financial Resources
26. The requirement of financial resources to create an additional capacity during the Twelfth Plan at reasonable costs will be a
challenging task. Softening of norms for external borrowings and having a special purpose long-term financing facility may ease
the situation.
Technology and Research and Development
27. Indian Steel Plants are less efficient in terms of specific consumption of raw material/consumables, energy/power consump-
tion, environmental and pollution norms than those in advanced countries. It is essential to build up indigenous capacity to
develop technologies to suit indigenous raw materials, improve energy inputs norms and meet national emission and comply
with global standards on emissions and carbon foot print and so on. Several small units engaged in manufacturing iron and
steel products need to focus on domestic R&D to improve their technology and performance standards.
28. Improvement in raw materials is to be achieved through selection of appropriate beneficiation process and improvement
in operational practices of ore beneficiation/coal-washing circuit. Coal gasification of non-coking coals and recovery and

Industry 113
utilisation of CBM, are the important steps to address the issues such as coal coke shortage and CO2 emission. To alleviate
the shortages of iron, there is a need to put up pellet plants. Due to increasing demand for high-strength steel, current Batch
Annealing Furnace (BAF) technology may get replaced with Continuous Annealing Technology.
29. The strategies for development of steel sector should not only focus on volume growth but also on quality of growth. It is
necessary to evolve an approximate sustainable development framework which balances the need for rapid growth of the steel
industry and also addresses the concerns on environment and climate change. There is a consensus that there exists a lot of
scope for the Indian steel industry to contribute to the National Mission on Enhanced Energy Efficiency (NMEEE) as well as
National Action Plan on Climate Change (NAPCC) of 2008, which basically aims to reduce the emission intensity. Existing
plants need to evolve short-term and long-term action plan to phase out the old and obsolete facilities by State-of-art, clean and
green technologies with an aim not only to achieve higher standards of productivity but also to harness all waste energy.
30. The Steel Industry needs policy support from the States to achieve the object of the National Steel Policy to make India a
global producer.
Plan Assistance/Allocation for the Steel Industry
31. The Twelfth Plan’s new projects essentially focus promotion of beneficiation and agglomeration of low grade iron ore and
iron-ore fines and improvement of energy efficiency in secondary steel sector.
MINERAL EXPLORATION AND DEVELOPMENT
Introduction
32. India is endowed with ample resources of a number of minerals and has the geological environment for many others. The
metals and minerals sector has a direct bearing on the growth, development, depth and sustainability of the manufacturing and
infrastructure sectors. Hence, its extraction and management have to be integrated into the overall strategy for the country’s
development. Raw material security and the ability to provide the range of metal-based mineral required in terms of quality,
standards and prices are keys to the process.
Key Objectives Under the Twelfth Plan
33. The mining sector is strategically very important for India. The key goals that need to be met for this space are:
• Raw material security: for all the user industries
• Enhanced co-production of by-product metals for Technology Metals and Energy Critical Metals and Rare Earths Elements
• Ensuring sustainability of the environment
Strategy and Key Recommendations
34. The core function of the state in mining needs to be the facilitation and regulation of exploration and mining activities of
investors and entrepreneurs, provision of infrastructure and royalty and tax collection. In order for the State to achieve the key
objectives associated with the sector, a select set of reforms are essential. The major recommendations are as under.
Strengthening of Institutions
• Equip and position public agencies like the Mineral Exploration Corporation Limited, Atomic Minerals Directorate for
Exploration and Research, Indian Rare Earths Limited, Directorates of States and other organisations to conduct detailed
exploration at the State’s expense to enable the State Government to adopt a bidding route for exploration to a larger extent.
• Position GSI to emphasise on geospatial and multi-disciplinary work for the benefit of science, society and the nation, by
placing emphasis. An overarching mechanism to provide policy direction for geosciences is a must.
Encouraging R&D and Technology Development
• Engage IBM to drive process of giving special focus in select areas of mining.
• Strengthen the Mineral Process Laboratories of IBM and other research organisations must before the development of pro-
cesses for beneficiation, elemental analysis of ores and so on.
• Inspire concessionaires to undertake deposit-specific process R&D.

114 Twelfth Five Year Plan
35. Develop an institutional mechanism for the direct lab scale research to commercialisation for the production of materials
of high purity,
• Reorient focus of organisations like Non-Ferrous Technology Development Centre, Jawaharlal Nehru Aluminium Research
Development and Design Centre on process R&D for Technology and Energy Critical Metals.
Creation of Infrastructure
• Special emphasis needs to be given to linking infrastructure in mineral bearing areas.
Skill Development
• Review and upgrade existing training facilities for manpower to meet the requirements of the mining industry.
Ensuring Full and Productive Coverage of Survey and Exploration
• GSI needs to ensure that its regional surveys cover all major geo-scientific datasets
– All pre-competitive data must be available to facilitate entrepreneurs to take investment decisions.
• India’s Exclusive Economic Zone (EEZ) needs to be fully explored and exploited. This requires sea-bed exploration and min-
ing, and the Ministry of Earth Sciences and GSI need to cooperate at an institutionalised level to expedite and complete this
task.
• There is need to address all important aspects of Rare Earths including Mapping the potential sources, enhancing survey and
exploration indigenously as well as in joint collaboration overseas, scaling up R&D in extraction, re-cycling and research for
increase use in other alternative materials in place of Rare Earths.
A Database of Mineral Resources Needs to be Developed
• Consider an efficient IT system in GSI, IBM and State Directorates to ensure availability of a comprehensive and up-to-date
review of exploration data.
• For this purpose, create a National Geophysical Data Repository and a National Drill Core Library.
• Implement the National Tenement Registry and integrated it with the cadastral maps being digitised under the National
Land Records Computerisation Scheme.
Ensuring Availability of Financial Resources
• Access to “risk funds” from capital markets and venture funds needs to be facilitated since prospecting is a high risk venture.
• A suitable scheme for taking full advantage of the HTREL licence must be completed in consultation with the major finan-
cial institutions in India, including SEBI, RBI, CBDT and IVCA.
Ensuring Environmental Sustainability of Mining
• Promote a scientific and efficient process of small scale mining of small deposits
– Regulations related to safeguarding the ecology must be ensured and their compliance strengthened.
– A cluster approach must be adopted with a single lease model for multiple small deposits within a defined area
• Undertake all mining undertaken within the parameters of a comprehensive Sustainable Development Framework
– Under such a framework, no mining lease should be granted without a proper mining plan including an approved envi-
ronment management plan.
– For this purpose, the IBM must acquire the expertise to approve Environment Management Plans and conduct
Environmental Impact Assessments. Thus, the IBM should be able to position itself as the internal environmental regula-
tor as well as the official mining regulator for the sector.
Select Policy Changes in Line with the Overall Strategy
• Adopt an open-sky policy of non-exclusivity for reconnaissance work
• Introduce a new instrument called the High Technology Reconnaissance and Exploration License (HTREL) to attract large
investment and better technology
• Ensure higher value addition in the sector and curb non value-added exports
– Encourage mineral value addition through techniques of beneficiation, pelletisation, agglomeration and processing mak-
ing use of fine.
– Incentivise export of minerals in value added form and develop is a coherent long-term strategy for this

Industry 115
– In line with this, forge long-term relationships with countries with complementary resources, in terms of minerals and
technologies.
– Encourage the user industries to develop long-term linkages with mineral producing units.
• A fair and transparent process for land acquisition must be ensured. This is already under way through the LARR bill
36. The MMDR bill aims at enabling some of these key recommendations, and must be pushed for implementation at the
earliest.
FERTILISER
Introduction
37. The Indian fertiliser industry, given its strategic importance in ensuring the food security in the country has remained
under Government control. Through its impact on agricultural productivity, fertiliser usage directly impacts food security of
the country. Government has been consistently pursuing policies conducive to availability of adequate quantity of quality fertil-
isers throughout the country and their appropriate use. The annual consumption of nutrients (N + P + K), has increased by 62
per cent, from 17.4 million tonne in 2001–02 to 28.1 million tonne in 2010–11. The nutrients N, P and K accounted for 16.6, 8.0
and 3.5 million tonne respectively in 2010–11.
38. In recent years, there has been a significant increase in imports of urea and DAP because there has been hardly any invest-
ment for major capacity additions. Fertiliser consumption in India is highly skewed, with wide inter-regional, interstate, inter-
district and inter-crop variations. The average intensity of fertiliser use in India is much lower than most countries in the world.
39. Government introduced Nutrient Based Subsidy (NBS) for Phosphatic and Potassic (P and K) fertilisers with effect from
1 April 2010 with broad objectives of ensuring balance use of nutrients, introduction, and promotion of innovative and efficient
fertiliser products and allowing market dynamics in pricing of products.
Key Objectives Under the Twelfth Plan
40. The key objective for the fertiliser sector is to ensure national food security by generating sustainable rapid growth in fertil-
iser use to increase agricultural production and productivity at the desired rate. In order to meet the growth targets in fertiliser
use, the following measures are needed:
• Ensuring adequate and timely availability of quality fertilisers to the farmers at fair prices
• Creating an attractive environment for improving indigenous fertiliser
• Rationalisation of the level of fertiliser subsidy disbursed
Strategy and Key Recommendations
Improving Fertiliser Use
41. For continuous rapid growth in fertiliser use to increase agricultural production and productivity, the Fertilisers Monitoring
System (FMS) should be strengthened. There is a need to produce and promote right kind of efficient fertilisers like customised,
water-soluble and fortified fertilisers.
Attracting Investment in the Sector
42. With rising demand and no major domestic capacity addition during the last few years, the industry has been exposed
to volatility of world markets. There is an urgent need to create a conducive environment for new investments in the sector.
Investment for revival of closed units of Fertiliser Corporation of India Ltd (FCIL) and Hindustan Fertiliser Corporation Ltd
(HFCL) will significantly bridge the demand–supply gap of urea.
Availability of Feedstock
43. The Government needs to ensure long-term supply of natural gas at reasonable prices with pipeline connectivity to attract
fresh investment in urea sector. For this, part of future gas finds need to be committed for the new investment in urea units and
incentivising alternative feedstock like coal, CBM and so on to enlarge the choice of raw materials. There is a need to explore the
possibility of investment in R&D for extracting potash from other resources in the country.

116 Twelfth Five Year Plan
Rationalising Subsidy
44. The burden of fertiliser subsidy has increased substantially during the last few years mainly owing to increase in interna-
tional prices of inputs as well as finished fertilisers. A phased approach towards reforming the subsidy disbursement mecha-
nism needs to be developed as under:
• Phase 1: Create information visibility of the movement of fertilisers along the supply chain
• Phase 2: Release subsidy to the retailer through transfer of subsidy directly to the retailer’s bank account on receipt of fertil-
iser from the wholesaler
• Phase 3: In the long run once Aadhaar enabled payments are operational, subsidy disbursement to the farmer can be made
directly into the bank accounts of the intended beneficiary
Joint Ventures Abroad
45. Rising imports of fertilisers are a cause of concern and require urgent attention. India, being one of the largest consumer of
fertilisers in the world, has significant impact in world trade and prices and is exposed to high volatility in prices. There is a need
to ensure long-term supplies of raw materials/intermediates to fertiliser sector by promoting investment and setting up JVs
in mining capacities of the countries with rich reserves of natural gas, rock phosphate and potash with appropriate buy-back
arrangement or long term off-take arrangements.
Setting up R&D Centre
46. R&D centres need to be encouraged especially in the area of catalyst efficiency, retrieval of elements from spent catalyst,
new fertiliser development, improving fertiliser use efficiency and so on.
Fertiliser Prices Regulatory Authority
47. With the implementation of Nutrient Based Subsidy (NBS) regime in non-urea sector and likelihood of extension to urea
sector, the fertiliser sector moved towards a free market system. Therefore, it may be necessary to consider a fertiliser prices
regulatory authority to oversee and regulate fertiliser prices in the interest of the agriculture sector.
Road Map for Sick CPSUs
48. Despite the overall health being fairly satisfactory. Three of the central CPSUs, three units BVFCL, MFL and FACT are
incurring losses due to outdated technology and, high energy consumption. There is a need to explore various possibilities for
their revival and sustainable operation to come up with a holistic revival plan for the sick CPSUs.
CEMENT
Introduction
Key Features of Cement Industry
• Cement production is one of the world’s most energy-intensive industries. Cement industry is in a way a scavenging indus-
try and has been burning alternative fuels such as, residue derived fuel, municipal sewage wastes, agro wastes, plastic and
polythene wastes, paint sludge, shredded tyres and so on in the kiln and conserves fossil fuels.
• Because of low-value high-density product, cement movement is normally restricted to nearby markets and has very limited
international trade.
• Initial investment of setting up a plant is very high.
Production Trends
49. Global cement production has continued to be expanding at an average rate of 6.4 per cent in last five years from 2,568
million tonnes in 2006 to 3,294 million tonnes in 2010. Around 56 per cent of production originates in China. China (with
an average annual growth of 11.4 per cent) and India (with an average annual growth of 9.8 per cent) have been the drivers of
the growth in global cement output, with increase in production in rest of countries remaining virtually stable. Production of
cement in India has increased from 100.1 million tonnes in 2000–01 to 228.3 million tonnes in 2010–11. The demand for the
cement in India has been influenced mainly by the housing, infrastructure and irrigation and so on.

Industry 117
Key Objectives Under the Twelfth Plan
• Reducing environmental impact of industry and encouraging use of fly ash
• Modernisation of plants based on older technology and further improvement of plants
Strategy and Key Recommendations
Measures to Maintain Existing Capabilities
• Allocation of coal of better quality and consistency to cement plants and also speeding up privatisation of collieries for cap-
tive consumption of cement plants should be considered
• To ensure availability of limestone process of limestone mining lease approval/renewal need to be streamlined and simpli-
fied as well as encourage mining of limestone at remote areas
• Rationalising duty structure
– Simplification of excise duty to have specific rate or percentage of sale price with appropriate abatements
– Rationalisation of inverted duty structure to address any inversions
Reducing Environmental Impact of the Industry
• Incentivise non-polluting cement plants adopting newer technologies
• Grant cogeneration of power through waste heat recovery status of renewable energy
• Cement plants should be permitted to move waste from other states with minimum restrictions if they are following standing
guidelines
– Encouraging use of fly ash by ensuring availability of comprehensive data on fly ash generation, disposal, stock and its
pricing, setting standards for making composite cement and so on.
Upgradation of Existing Plants and Research in Further Developed Technologies
• Funding from corpus of clean energy fund for cement sector for development of processes for using alternate fuel and
municipal and solid waste and energy efficient technologies.
• NCCBM, which is primarily an R&D organisation would need support for development of infrastructure.
Development and Adoption of Nanotechnology
• Promoting collaborative research involving national and international laboratories on technologies to produce nanoparticles
and the latest characterisation techniques Establishing a well-equipped Centre of Excellence for development and adoption
of nanotechnology practices to cement and concrete through PPP mode.
Improving the Transportation Facilities for Cement Industry
• Rail transport: Railway should try and attain a share of 50 per cent in total dispatches of cement and clinker.
• Road transport: Load carrying capacity of trucks may be increased to 1 tonne.
• Inland waterways: Sufficient infrastructure need to be provided at IWT terminals/jetties to integrate with other modes of
transportation.
SECTORS FOR DEPTH AND VALUE ADDITION:
AUTOMOTIVE
Introduction
50. The automotive industry is also a key sector for the Indian economy. Owing to its deep forward and backward linkages, it
has a strong multiplier effect and acts as one of the drivers of economic growth. With the gradual liberalisation of the automo-
tive sector in India since 1991, the numbers of manufacturing facilities have grown progressively. It produces a wide variety of
vehicles ranging from passenger cars to heavy commercial vehicles to tractors and other agricultural equipments and so on.
51. The competitive paradigm for the automobile sector world over is rapidly undergoing complete transformation on account
of environmental and energy security concerns. It is estimated that by 2020, electric vehicle (EV) and other green cars will

118 Twelfth Five Year Plan
represent up to one third of total global sales in developed markets and up to 20 per cent in urban areas of emerging markets.
The Indian auto sector which has close linkages with international auto industries will be deeply impacted by the evolving
trends.
Key Objectives Under the Twelfth Plan
52. The Auto Policy of the Government had the following objectives:
1. Exalt the sector as a lever of industrial growth and employment and to achieve a high degree of value addition in the
country
2. Promote a globally competitive automotive industry and emerge as a global source for auto components
3. Establish an international hub for manufacturing small, affordable passenger cars and a key centre for manufacturing trac-
tors and two-wheelers;
4. Ensure a balanced transition to open trade at minimal risk to the Indian economy and local industry
5. Conduce incessant modernisation of the industry and facilitate indigenous design, research and development
6. Steer India’s software industry into automotive technology
7. Assist development of vehicles propelled by alternate energy sources
8. Development of domestic safety and environmental standards at par with international standards
53. The Automotive Mission Plan 2006–16 laid down a 10 year road map for the industry The specific targets set up AMP are
as follows:
• To continue to be the world’s largest tractor and three-wheeler manufacturer in the world.
• To continue as the world’s second largest two-wheeler manufacturers.
• To emerge as the world’s fifth largest car producer (as compared to the seventh largest currently).
• To become world’s fifth largest commercial vehicle manufacturer.
• Automotive sector would double its turnover ratio to India’s GDP in 10 years.
• To export USD 35 billion by 2016.
54. The industry is planning to take a mid-term review of the AMP in 2013 and come up with objectives and targets for beyond
2016.
Government Initiatives
55. Government has also decided to constitute National Council for Electric Mobility (NCEM) and National Board for Electric
Mobility (NBEM) for fast policy and decision making at the apex level for promoting electric mobility and for encouraging
manufacture of electric vehicles in the country. Deliberations at the level of NBEM have been initiated to define short-term and
long-term objectives and to develop short-term/long-term plans.
56. To address the issue of lack of testing infrastructure, a Plan scheme—National Automotive Testing and R&D Infrastructure
Project (NATRIP) was initiated in the Tenth Plan. With the coming up of NATRIP facilities (in the first year of the Twelfth
Plan), the industry would be in a position to adopt higher safety standards. NATRIP implementation Society (NATIS) is over-
seeing the implementation of NATRIP.
Strategy and Key Recommendations
• Providing an enabling environment to the industry to encourage growth, promote domestic competition and stimulate
innovation to achieve operational efficiency.
• Removal of taxation on interstate movement of goods to make the Indian market a genuine ‘free trade area’ domestically.
• A stable import tariff structure consonant with the AMP that encourages investments rather than trade in fully built vehicles.
• Continuation of lower excise duty (in future GST) for manufacture of vehicle types that are a national priority for the
country.
• Ensuring that the Free Trade Agreements being entered into with other countries do not distort markets for Indian automo-
bile and auto component manufacturers.

Industry 119
• Inadequate availability of skilled labour—to be addressed with partnership with NSDC.
• Government to prepare a strategy paper on utilisation of different fuels in the transport sector to meet our national priorities
of emission control, energy security as well as fuel efficiency
• Evolving the emissions and fuel availability road map beyond 2010
• Deepening competence in manufacturing of fuel efficient cars and electric vehicles including the hybrid segment.
• User incentives for adoption of EVs.
• Auto component industry needs to be supported by the Government by easing access to capital, logistic and infrastructure
development in auto component hubs and so on.
• To address the issue of road safety, an appropriate regulatory body would be required.
DRUGS AND PHARMACEUTICALS
Introduction
57. Indian pharmaceutical industry is one of the high performing knowledge-based segments of the Domestic Manufacturing
Sector. The soft patent regime prior to 2005 provided opportunity for this industry to consolidate its position and witness sig-
nificant growth in generic production and exports. Indian pharmaceutical Industry has entered an era in which it has to play a
pivotal role in providing generic medicines to the world and also become a global hub for R&D activities. Despite our success,
we are still at the periphery of a vast unexplored opportunity. At this juncture, it is all the more important to recognise the chal-
lenges and opportunities and realign our strategies along with appropriate policy and institutional frameworks for shaping the
future of the Indian pharmaceutical industry.
Key Objectives Under the Twelfth Plan
• The Indian pharmaceutical sector should grow to US$ 60 billion size in 2017 (CAGR of 18 per cent) and have a 5 per cent
share of the global pharmaceutical industry by the end of the Twelfth Five Year Plan. By 2020, the sector should be at US$
100 billion.
• Exports should be at INR 1,30,000 crores by the end of the Twelfth Five Year Plan.
• The sector should employ 1.5 million people by 2015, 1.898 million people by 2018 and 2.464 million people by 2022.
• Domestic R&D should be internationally competitive.
• Universal access of quality medicine at affordable prices.
• Improve domestic content in medical devices.
• Make all the CPSUs self-sustaining by 2020.
Strategy and Key Recommendations
58. The recommendations are summarised below:
• Capacity building of private sector to meet WHO–GMP standards and other international manufacturing standards.
• Enabling the Indian pharmaceutical industry to develop competence in advanced areas of drug manufacturing like dedi-
cated research facility in bulk drugs , improving processes of manufacturing generics and new APIs.
• Developing common infrastructure in drug discovery and development, such as, manufacturing, distribution, exports, med-
ical devices and so on.
• Appropriate coordination between relevant ministries/departments and stakeholders to build a coordinated strategy s to
tackle non-tariff barriers through counter measures and during signing of FTAs.
• Develop competencies for 2D Bar-coding for SMEs.
• Developing capacity of Central Drug Standards and Control Organisation to ensure timely clearance for new drug trials,
pharmaco-vigilance, and assistance to the willing industry members to shore up their technical capacities for better regula-
tory compliances and adequate number of labour inspectors.
• Developing, evolving and rationalising regulatory frameworks for biosimilar drugs, fixed-drug combinations, clinical trials
and early drug development.
• Developing the ecosystem to take advantage of the opportunity in clinical research and development of Clinical Research
Centres for high-risk trials such as Phase-I.
• Create a level-playing field for domestic manufacturers in the bulk drugs industry.

120 Twelfth Five Year Plan
59. Induce higher levels of research and development:
• Strengthening the NIPERs to boost patent filing from these institutes.
• Improving industry–academia linkages by creating a strong platform for incentivising innovation in producing safe, afford-
able medicine, arranging public–private partnerships with industry and leading academic partners.
• Providing incentives for New Drug Development.
60. Review the regulatory system including expanding tax deduction (to cover activities such as international patenting costs,
regulatory consultants, outsourced R&D services and patent litigation expenses), reducing approval timelines and so on.
• Improving access to quality healthcare promotion of unbranded generics through Jan Aushadhi Stores (JAS) Ministry of
Health needs to bring out legislation for prescription of medicines in generics nomenclature by the doctors on a mandatory
basis.
• Inducing greater level of domestic manufacture of medical devices by creating infrastructure and parks for setting up green-
field medical devices and equipment units and setting up a National Centre for Medical Devices.
• Enabling CPSUs to be self-sustainable by upgrading the existing manufacturing facilities to WHO–GMP compliance.
61. India, with its significant advantage of low cost of innovation, low capital requirements and lower costs in running facili-
ties, well-established manufacturing processes, R&D infrastructure, is strategically well positioned to emerge as a major force to
reckon with in the pharmaceuticals sector.
62. Moving to a higher growth trajectory will require focussed institutional support and incentivise the clusters to foster inno-
vation, encouragement to maximise investments in enhancing manufacturing capacities and aggressive drive for creation of
‘Brand India’ image in select segments including biopharmaceuticals/biosimilars and Indian systems of medicines.
CHEMICAL
Introduction
63. The domestic chemical industry is heterogeneous in nature comprising organic, inorganic, petrochemicals, dyes, paints,
pesticides and specialty chemicals manufactured in the small scale and large units (including MNCs). In the global context, the
industry is increasingly moving eastwards in line with the shift of its key consumer industries (for example, automotive, elec-
tronics and so on) to leverage greater manufacturing competitiveness and share of Asia in the global chemical industry has risen
from 31 per cent in 1999 to 45 per cent in 2009. With the current size of $108 billion, the Indian chemical industry accounts for
~3 per cent of the global chemical industry.
Key Objectives Under the Twelfth Plan
• Ensuring optimal allocation of resources for adequate feed stock (coal, natural gas, naphtha and refinery cuts) to industry.
• Developing new and more energy efficient and environment-friendly/green technologies and processes.
• Clustering and providing common infrastructure to units.
Strategy and Key Recommendations
Ensuring Availability of Feed Stock
• Refinery configuration to focus on optimisation of availability feedstock and source feedstock from feedstock rich countries
through , long term contracts.
• NCL and IICT to take initiative towards development of processes to use bio-based raw material instead of crude-based ones.
Development of Common Infrastructure
• Set up Greenfield PCPIRs and R&D parks through public private partnership.
• Establish a site operator, with the right functional expertise, to market and manage each PCPIR.

Industry 121
Focus on R&D
• Establish chemical sector specific council having representation of stakeholders to develop the innovation road map for
chemical industry.
• Develop dedicated innovation centres in universities for chemical industry.
Focus on Green Technology and Consolidation of Environmental Regulations
• Consolidation of rules governing environment protection for chemical industry.
• Development of green technologies—implementation of the related provisions and fiscal measures of the National
Manufacturing Policy.
• Central and State Government to work together to ensure more rigorous and transparent enforcement of pollution-related
and environment-related regulations in chemical units.
Human Resource Development
• Setting up specialised vocational training centres in the clusters for chemical industry.
Other Strategies
• Fiscal incentives to the chemical sector for tackling the threat from cheap imports.
• Simplifying the process of registration of pesticides to boost export possibilities.
• Better testing mechanisms for tackling the problem of spurious pesticides.
PETROCHEMICALS
Introduction
64. Petrochemicals are chemicals derived from petroleum or natural gas and they form an essential part of the chemical indus-
try today. Due to its very nature, Petrochemicals is an ‘enabler’ industry playing a vital role in the functioning of virtually all key
sectors in the economy including packaging, agriculture, infrastructure, healthcare, textile and consumer goods. Petrochemicals
provide critical inputs which enable other sectors to grow. Even though this industry is capital and technology intensive, the
downstream sector is a major avenue for large-scale employment. The downstream plastic processing industry employs over
3.53 million people who derive their livelihood from this sector.
Key Objectives Under the Twelfth Plan
• Developing new technologies
• Reducing the environmental impact of the sector
• Development of clusters
Strategy and Key Recommendations
Technology Upgradation
• Setting up a petroleum research and development fund under PPP model.
• Augmenting existing testing centres to act as certifying agencies for testing plastic products and raw materials to meet inter-
national as well as BIS standards.
Ensuring Sustainable Growth of the Sector
• Setting up a code of conduct for the industry and permitting certain types of industries, beyond a particular size only if they
can ensure zero discharge.
• Fiscal incentive to encourage use of renewable feedstock, adoption of green processes and build energy-efficient housing.
• Focus on recycling industry.
Creating Infrastructure
• Formation of industrial clusters/plastic parks—benchmarking with similar clusters in China, Singapore, Taiwan and so on,
and other areas which have successfully built such facilities over the years to serve as a blueprint on policy actions.

122 Twelfth Five Year Plan
Human Resource Development
• Specialised programmes for technical training, which can address the specific requirements of plastic industry.
Other Policy Initiatives for Promoting the Sector
• Branding ‘made in India’ products for increasing export competitiveness of the sector.
• Ensure strict and effective enforcement of the ‘Edible Oil Packaging (Regulation) Order’, 1998 by all State Governments.
• Encourage use of plastic packaging in key applications, for example, milk packaging.
• Encourage the use of plastic components in housing to reduce energy requirements.
PAPER
Introduction
65. The Indian Paper industry produces 10.11 million tons of paper per annum and accounts for 2.6 per cent of total world
production. The annual turnover of the Indian paper industry is nearly `30,000 crores and it employs about 3.70 lakh people.
Per capital consumption of paper in India is also very low. Most of the paper mills are in existence for a long time and hence
technologies used by them fall in a wide spectrum ranging from oldest to the modern.
66. As many as 30 large integrated paper mills, accounting for about 31 per cent of total domestic production, use wood-
based/bamboo-based pulp. One hundred and fifty paper mills, contributing 22 per cent of domestic production, use agro-based
(bagasse and straws) and about 473 mills, accounting for 47 per cent of total production, use recycled fibre or waste paper for
paper production.
Key Objectives Under the Twelfth Plan
• Developing new technologies
• Improving availability of raw material
• Development to be environmentally sustainable
Strategy and Key Recommendations
67. The deliberations of the woking group on Pulp and Paper Sector have shown that expected increase in demand of paper
in the country will require considerable increase in the indigenous production base of the paper sector in the next 15 years.
Clearly, this would require in-depth planning to address critical issues like non-availability of fibrous resources, technological
obsolescence and lack of economies of scale. The group has come out with a set of recommendations in respect of areas requir-
ing improvement and focus. The key recommendations are given in the Box 13.5.
Box 13.5
Key Recommendations
• Ensuring availability of basic raw material and power
– Wood: Large scale promotion of agro based plantation and substantial improvement in productivity of agro based
plantation activity; Restoration of degraded forest land
• Bagasse: Review of incentives policy for use of bagasse in sugar mills,
• Identification and promotion of alternate lingo-cellulosic raw materials
• Setting up waste paper collection centres and creation of awareness
• Modernising entire RCF/WP bases industry to adopt state of the art technology
• Technology improvements for better energy efficiency and reduced environmental impact
– Improving energy efficiency of existing and designing of incentives for technology upgradation for paper industry
– Development of indigenous technologies to make agro-based industries competitive and environmentally sustainable
– Development of energy efficient technologies
– R&D institutes like CPPRI to be strengthened with appropriate funding support
• Support for indigenous manufacturing facility for capacity expansion.
• Fiscal measures to support the sector
• Rationalisation of duty structure to address inversions, if any
• Assistance to forestry/plantation

Industry 123
68. The Indian paper and pulp industry has potential and also capabilities to service the growing demand in domestic and inter-
national market. It can also create huge employment avenues in rural India through agro-forestry and can provide direct employ-
ment in production at mills through capacity addition/expansion, provided the competitiveness of the value chain is ensured. This
warrants an enabling policy environment to gear up productive capacity, ensure varied raw material options, induce new technolo-
gies and promote local innovation.
(B) SECTORS FOR EMPLOYMENT GENERATION
TEXTILES
Introduction
69. The strength of the Indian textiles and clothing industry lies in its strong raw-material base, indigenous design capabilities,
presence in the entire value chain, large and growing domestic demand, and the availability of trained manpower at interna-
tionally competitive rates. The Indian Textiles and Clothing Industry consumes a diverse range of fibres and yarns but is pre-
dominantly cotton based.
70. The sector plays a pivotal role in the economy, contributing about 12 per cent of the manufacturing output, 11 per cent of
merchandise exports and employs about 45 million people. It has a major presence in the unorganised sector as compared to
the organised sector, both in terms of the workforce and number of enterprises.
Key Objectives Under the Twelfth Plan
71. The growth of this Sector is crucial to the realisation of targets relating to total output and employment growth. The key
objectives of the Textile sector for the 12th plan period are:
• Achieve an annual average growth rate of 11.5 per cent in volume terms in cloth production and 15 per cent in value of
exports by increasing domestic value addition and technological ‘depth’ and by enhancing the global competitiveness.
• It is expected that training to 35 lakh persons would be provided.
• Additional employment to the tune of 15.81 million by 2016–17 would be created.
Strategy and Key Recommendations
72. Based on the lessons learnt in the Eleventh Plan and continuing with the thrust on technology up gradation and modernisa-
tion, the Twelfth Plan envisages critical interventions in the weaker segments of the textile value chain such as processing and
garmenting. The main elements of the strategy for the Textiles Sector would be as under:
Technology with Focus on Weaving and Processing Sectors
73. The benefits of the Technology Up gradation Fund Scheme (TUFS), have mainly been availed by the Spinning and
Composite Sectors. While investments in the spinning sector may be required to ensure yarn availability and domestic value
addition of cotton, it is also important to promote forward integration. A study by CRISIL has recommended that the inter-
est subsidy for spinning should be allowed only when it is accompanied by matching investments in weaving or knitting.
Investment for technology up gradation in the downstream segments of weaving and processing is necessary to ensure that
maximum quantity of yarn produced in the country is converted into spinning products domestically.
Infrastructure
74. The Scheme for Integrated Textile Parks (SITP) was launched in 2005 to neutralise the weakness of fragmentation in the
various sub-sectors of textiles value chain, and the non-availability of quality infrastructure, with only 9 projects completed of 40
projects sanctioned in the 11th Plan, impact of these Parks is yet to emerge.
75. There is little evidence of vertical integration in these parks, which specifically encourages both forward and backward link-
ages in the entire textile value chain. It would be prudent to focus on consolidation of the gains for existing Parks. The proposed
new scheme of setting up of Integrated Apparel Clusters, activities laid down in the Technology Mission for Knitwear and
Wovenwear should be subsumed in SITP.

124 Twelfth Five Year Plan
Cotton Sector
76. As per the evaluation study carried out by ICRA Management Consultancy Services Limited, trash content in Indian cot-
ton has reduced from high levels of 4–8 per cent during the pre-TMC period to 1.5–3 per cent post modernisation under Mini
Mission-IV of the Technology Mission on cotton. Under Mini Mission-III, up-gradation/improvement in the Market Yards has
arrested the level of contamination. Based on the estimated cotton production of 438 lakh bales by the end of the terminal year
of the Twelfth Five year Plan, MM-III and IV should make efforts for modernisation of G&P factories and Market Yards.
Environmental Concerns
77. The major challenges faced by the textiles processing are availability of water, effluent treatment and disposal of the treated
water and solid effluents. A scheme for Common Effluent Treatment with Marine Outfall for the existing textile processing
clusters on a PPP mode needs consideration.
Jute
78. Dependence of Jute Mills on Government orders the Jute Mandatory Packaging Act is one of the major barriers to mod-
ernisation and product diversification within the industry. The Jute Sector must plan for a gradual phasing out of this order and
achieve more self-reliance through modernisation and diversification.
79. The major focus of interventions during the Twelfth Plan would be on aggressive implementation of Technology Mission
on Technical Textiles which would include implementation of regulatory framework in specified areas, encouraging indig-
enous production of specialty fibres and yarns, encouraging investment in high end technical textiles products, including FDI,
encouraging R&D in technical textiles, formulation and notifications of standards by BIS and ensuring availability of data base.
Silk
80. India is the second largest producer of silk in the world, a distant second to China, with 15.50 per cent share of the world
production.
81. The objectives in the Twelfth Plan would be to facilitate and create conducive conditions for achieving the targeted silk
production of 32,000 M.T. at a CAGR of 7.14 per cent by the terminal year of the Twelfth Plan. This would be done through
intensive efforts in R&D, technology transfer and enterprise development, creating an inbuilt pyramid structure of federated
farmers and farmer associations to synergise and synchronise the production processes. Also, efforts will be directed to develop
3rd Generation multivoltine crossbreeds to increase production and matching quality parameters of bivoltine silk and acceler-
ate the growth in vanya silk production and explore better value realisation in domestic and international markets.
Powerlooms
82. The decentralised powerloom sector plays an important role in the textile economy in terms of fabric production and
employment generation. It contributes 62 per cent to the total fabric production in the country and provides employment to the
tune of 57.2 lakh persons.
83. The interventions required for Powerloom Sector development during Twelfth Plan period include Powerloom Cluster
Development Programme, setting up of Common Facility Centres, Yarn Bank, setting up of Design Development Centres in
the clusters, conducting awareness programmes/seminars/workshops/pilot activities and Distress Relief Fund Scheme for pow-
erloom weavers. An exclusive provision for Powerloom Sector under TUFS for its modernisation and creation of an office of
the Powerloom Commissioner need to be considered.
Wool and Woollens Textiles
84. The woollen industry in the country is of the size of `10,000 crore and broadly divided and scattered between the organised
and decentralised sectors. India has the third largest sheep population in the world, having 6.40 crore sheep producing 43.30
million kgs of raw wool, out of which, about 85 per cent is carpet grade wool,
85. It has been estimated that the raw wool production and imports would double from 114.2 million kg in 2008–09 to 260.8
million kg by 2019–20. During the period 2009–10 and 2014–15, exports of woollen yarn fabrics and made-ups are expected to
record a CAGR of 11.6 per cent.

Industry 125
86. There is a need to have proper data base and action plan to reduce mortality rate of sheep, increasing coverage of shepherds
as well as sheep under insurance, faster development of CFCs, improvement in productivity in wool production. Thrust of the
scheme/programmes has to be oriented accordingly.
Human Resource Development
87. As per the study conducted by National Skill Development Corporation, with the overall growth of 9.5 per cent in the Textiles
and Clothing Sector, its incremental human resource requirement would be about 17.8 million by the end of Twelfth Plan.
FOOD PROCESSING INDUSTRIES
Introduction
88. As a leading producer of food grains, milk, fruits and vegetables, India has the advantage of adequate food at the farm gate
to ensure food security for the nation and to even have a surplus for exports. Food processing industry in India has immense
potential for boosting the rural economy as it brings about synergy between consumers, industry and agriculture. A well-
developed food processing industry is expected to increase farm-gate prices, reduce wastages, ensure value addition, promote
crop diversification, generate employment opportunities and boost export earnings.
Key Objectives Under the Twelfth Plan
89. Following are the main objectives for the Twelfth Plan:
• Develop the food processing sector to enable containment of food inflation and food wastage
• Create 1 million additional jobs during the Twelfth plan period
Strategy and Key Recommendations
90. Based on lessons learnt during Eleventh Plan and keeping in view the priorities of the proposed Manufacturing Plan, the
strategy for 12th Plan has been devised based on three basic principles. Firstly, greater emphasis would be laid on decentralised
process of implementation with greater involvement of states in selection of projects vis-à-vis beneficiaries and monitoring
their implementation.
91. Secondly, instead of project implementation, focus would be on policy making and coordination so as to address criti-
cal issues impacting the value chain in the sector. Lastly, the existing focus on infrastructure development will be continued
with expansion of scope and depth so as to ensure sustainability of the value chains. The major recommendations in regard to
Twelfth Plan activities are in Box 13.6.
92. Adoption of a decentralised approach to instil greater involvement of states and appropriate coordination between states
and stakeholders is a well-conceived idea for development of Food Processing Sector. Launching a National Mission on Food
Processing (NMFP) will be appropriate vehicle to carry forward the idea of decentralisation.
Box 13.6
Key Recommendations
• Setting up of National Mission on Food Processing to improve coordination and implementation of schemes and to
enable greater involvement of state governments.
• Expanding and modifying existing infrastructure development schemes
– Mega Food Parks Scheme, Integrated Cold Chain Scheme
• Setting up and Modernisation of Abattoirs—Establishment of new abattoirs and modernisation of existing abattoirs
• Develop and strengthening of existing and new institutions
• Taking up a nation-wide skill development programme along the lines of special projects for skill development of rural
youths under SGSY of MoRD.
• Putting in place a network of food testing labs (Government/Private) through providing incentives.
• Encouragement for larger participation in Codex deliberations and setting up/strengthening of Codex Cell in FSSAI to
promote, coordinate and monitor related initiatives at the level of stakeholders
• Setting up of an Innovation Fund and Venture Capital Fund for Food Processing to promote innovations and technology
development

126 Twelfth Five Year Plan
93. Likewise shift of focus of the Ministry from project implementation to policy initiative is in right direction towards holistic
development of the sector. The policy to be effective will have to be comprehensive and should evolve through consultation
with the states and the industry.
94. While basic agricultural research has strong and large institutional network in the country, there is inadequate focus on the
food processing sector. There is an urgent need for building a bridge between agricultural universities, premiere technological
and industrial research institute and the private sector to actively undertake collaborative strategic research in this important
sector.
95. Apart from National Institute of Food Technology Entrepreneurship and Management (NIFTEM), the Central Food
Technology Research Institute (CFTRI) should play a more central, pro-active role to strengthen knowledge base of the indus-
try through greater public and private partnership in technology development.
96. Another critical objective should be for the industry to reach international standards of food safety and quality. All efforts
should be made to harmonise Indian Food Standards with Codex. Enactment of the comprehensive legislation, the Food Safety
and Standards Act, 2006 in the recent past has already provided an enabling vista for taking the above aspects forward.
97. Last but not the least; it is required to recalibrate the existing schemes of MFPI for greater effectiveness. The proposed
Centrally Sponsored Scheme of NMFP has to be structured in such a manner so that it is efficiently managed. It may also be
worthwhile for new mega food parks to explore options of identifying one or more anchor industry(ies) to speed up their pace
of implementation.
LEATHER AND LEATHER GOODS
Introduction
98. The leather and leather products industry occupies an important position in the Indian economy in view of its massive
potential for employment generation, potential for growth both in domestic and export markets. The leather industry is spread
in different segments, namely, tanning and finishing, footwear and footwear components, leather garments, leather goods
including saddlery and harness and so on.
Key Objectives Under the Twelfth Plan
• To increase the number of employed in the industry–ensuring the availability of trained/skilled labour
• To improve the export competitiveness of our products and facilitating exports
• Improving the scale of businesses in the sector
• Ensuring clean processes (environmental pollution)
• Improving the social conditions
Strategy and Key Recommendations
Attracting Large Scale Investments through FDI and Domestic Companies
• Promoting the model adopted China and Vietnam to build a strong leather industry, Promotional activities in foreign coun-
tries to be carried out in various formats, print campaign, investment meet, missions for collaborations on raw materials and
so on.
Skill Development Initiatives
• Establishment of new Footwear Design and Development Institutes (FDDI) to skill deficit in the sector.
• Support to Artisans’ scheme—360 degree intervention plan.
• Placement linked Skill Development Programme and Training of Trainers—For providing employment opportunity and to
fill the demand of operators in the footwear sector and improving the quality of training.

Industry 127
Ensuring Environmental Sustainability
• Animal Husbandry Measures, Slaughter and Skin Collection Improvement Measures and Rural Tanning Improvement
Measures.
• Technology Upgradation and Modernisation, environmental impact upgradation and technology benchmarking of
Tanneries.
Improving Export Competitiveness
• Brand Building and Indian Leather Mark
• Constitution of Domestic Council—Footwear and Leather Products Development and Promotion Council (FLPDPC)
Others
• Improving the availability of raw-materials
GEMS AND JEWELLERY
Introduction
99. India’s Gem and Jewellery (G&J) industry is an important foundation of the country’s export-led growth. It is a leading for-
eign exchange earner and one of the fastest growing sectors accounting for 16.67 per cent of India’s total merchandise exports
during FY 2010-11. India now accounts for nearly 55 per cent of world net exports of cut and polished diamonds in value terms,
90 per cent in terms of pieces and 80 per cent by cartage. The industry employs about 2 million highly skilled workforce out of
which one million are exclusively engaged in export production.
100. India is known to be the largest consumer of gold in the world. It is estimated that the current annual demand for gold in
the country is well over 800 tonnes. Naturally India is also the largest fabricator of gold.
101. In the diamond segment, the industry is importing rough diamond from countries such as Belgium, UK, UAE, Israel, Hong
Kong, Switzerland and other mining countries. The polished diamond is exported to countries such as UAE, Hong Kong, USA,
Belgium and Israel.
Key Objectives Under the Twelfth Plan
• To ensure access and availability of raw material to the industry
• To make Indian products attractive at global markets
Strategy and Key Recommendations
Secure Raw Material Sources:
1. Diamond
• Restrict the export of rough diamonds from domestic mines and invest in diamond reserves abroad through PPP to
ensure the sustained availability.
2. Gold
• Explore possibility of free import of precious metal gold for manufacturing exports.
• Examine option of permitting import of gold as per international practice in place of current practice of import by
canalilising agencies to erratic supply and frequent shortages.
3. Coloured Gem Stones
• Commissioning exploration programmes and surveys to ascertain availability of coloured gemstones in India.
Training and Development
• Create Sector Skill Council, under the aegis of NSDC, GJEPC and other critical stakeholders. Develop and administer ‘Train
the Trainer’ programmes, create training infrastructure and roll out the training programmes.

128 Twelfth Five Year Plan
Research and Development and Technological Upgradation
• Documentation of existing tacit knowledge of traditional artists.
• Develop a Design Centre of Excellence and Product Development at Mumbai.
Infrastructure Facilities
• Setting up Gem Bourses, jewellery parks/clusters, Gem trading centres and G&J training centres in some key cities across the
country.
Marketing and Brand Promotion
• Creation of a fund with contribution of industry to promote ‘Made in India’ brand image across the globe.
• Approprite measures by Government of India to have access in the untapped market for G&J products.
• Government should encourage the participation of the industry in international trade forums.
Regulatory and Fiscal
• Introduction of Turnover based taxation system for Indian Gem and Jewellery industry.
• Relaxation in EPC norms for import of machineries from Italy.
• Allowance of External Commercial Borrowings for working capital as well.
• RBI to allow financing for retail jewellery business abroad.
• Create dollar fund to refinance banks to finance industry at competitive international rate.
• Introduction of adequate credit guarantee mechanism for Gem and Jewellery Sector.
• Decrease of transaction cost—Introduction of regulatory control like IRDA to monitor the different transaction charges that
an exporter pays to the different government agencies and financing institutions.
KHADI AND VILLAGE INDUSTRIES
102. The broad targets for development of Khadi and Village industries sector during the 12th Plan period are to achieve at
least 11 per cent growth in Khadi sector and 13 per cent growth in Village Industries. The strategy for achieving targets are to
develop product-wise clusters of Khadi and Village Industries products and develop their domestic as well as export market,
introduce innovations in design and technology, creation of entrepreneurship and growth in manufacturing in rural non-farm
sector to prevent migration by enhanced allocation for PMEGP. The Khadi Reform Programme has been taken up in the 11th
Plan for up scaling marketing of Khadi Products and improving earning of Khadi artisans. The reform also includes introduc-
tion of Khadi mark, strengthening Khadi Institutions, market promotion of Khadi products and participation of private party
in the form of partnership in the existing establishment of Central Silver plants. The process has been slow and needs to be
stepped up in the 12th Plan. Also, outcomes need to be clearly defined.
103. Although the PMEGP is the flagship Programme under KVIC, it is yet to be evaluated in terms of its efficacy. A quick evalu-
ation is warranted before any major up-scaling. Likewise an evaluation of the cluster based initiative by the name of SFURTI
is also necessary to evaluate how shortcomings can be overcome while taking up the proposed expansion and introduction
of Heritage Clusters. Since the Textile Ministry has been implementing such clusters in Handloom and Handicrafts sectors it
would be desirable to ensure convergence whenever possible and avoid duplication.
COIR INDUSTRY
104. Coir Industry is mostly confined in Southern states namely, Kerala, Tamil Nadu and Karnataka. Enterprises in this sector
are usually in Micro and Small sector. At present, products manufactured in the Coir Sector are for limited uses. R&D initia-
tives have been made by the Central Coir Research Institute in Kalavoor and the Central Institute of Technology in Bangalore to
develop innovative products for diverse uses. Under the Prime Minister’s Gram Sadak Yojana (Bharat Nirman), it has already
been decided to use Coir geo-textiles for construction of rural roads in nine States. In future, the project is likely to be extended
to all the 28 States of the country. The coir industry is likely to face problems in catering to the huge requirements. Hence it may
be required to infuse appropriate technology to improve quality and up-scaling manufacturing capacity in the Twelfth Plan to
meet the requirements.
The Twelfth Five Year Plan (2012–17) outlays (GBS) for the sectors discussed above are given in Annexure 13.3.

Industry 129
ANNEXURE 13.3
Twelfth Five Year Plan (2012–17) Outlays (GBS) for Industry Sector
TABLE 13.10
Ministry/Department-wise Twelfth Five Year Plan (2012–17) Outlays Industry Sector
(` Crore)
S. No. S. No. of
Annex. 3.2
Ministry/Department Budgetary
Support
IEBR Outlay
1 34 Department of Chemicals and Petrochemicals 2,890 3.00 2,893.00
2 35 Department of Pharmaceuticals 2,968 127.00 3,095.00
3 36 Department of Fertilisers 1,484 15,437.00 16,921.00
4 40 Department of Industrial Policy and Promotion 12,601 0.00 12,601.00
5 43 Ministry of Corporate Affairs 233 0.00 233.00
6 52 Ministry of Food Processing Industries 5,990 0.00 5,990.00
7 53 Department of Heavy Industry 4,680 17,543.00 22,223.00
8 54 Department of Public Enterprises 50 0.00 50.00
9 27 Ministry of MSME 24,124 1,890.00 26,014.00
10 56 Ministry of Mines 2,332 18,221.00 20,553.00
11 64 Ministry of Steel 200 90,975.00 91,175.00
12 65 Ministry of Textiles 25,931 0.00 25,931.00
NOTES
1. According to NASSCOM—for all graduates (not only related
to manufacturing).
2. Aon Hewitt Survey.
3. ASI 2008–09 data shows ~9 per cent of workforce at super-
visory and above levels. Assumption of 9 per cent continued
for calculating managerial staff requirement in 2025 (organ-
ised and unorganised).
4. Recommended changes include (i) Defined limit of invest-
ment in plant and machinery for classifying the micro, small
and medium enterprises may be deleted from the MSMED
Act, 2006 and should be announced through Notifications.
(ii) The monetary limit of penal provisions of MSMED Act,
2006 should be provided in Rules instead of in the Act. (iii)
Delayed payment of earnest money/security money should be
included for payment of penal interest in case of MSEs as per
provision in Chapter 5 of MSMED Act, 2006. (iv) Amount
of award given by Micro and Small Enterprises Facilitation
Council should be realizable as arrear of land revenue.
5. The UWSSA provides for a National Social Security Board
at the Central level and for welfare schemes to be formulated
by the Central Government on matters relating to (i) health
and disability cover, (ii) health and maternity benefits,
(iii) old age protection, and (iv) any other benefits as may be
determined by the scheme (Indira Gandhi National Old Age
Pension Scheme, National Family Benefit Scheme, Janshri
Bima Yojana, Rashtriya Swasthya Bima Yojana and so on.
are among the welfare schemes notified in Schedule 1 of the
Act under the Central Government). The Act provides a State
Social Security Board at the state level to recommend suit-
able schemes in the State sector and monitor social welfare
schemes for unorganized workers. Schemes relating to (i)
Provident Fund (ii) Employment Injury Benefit (iii) housing
(iv) educational schemes for children (v) skill up gradation of
workers, (vi) funeral assistance and (v) old age homes, is to be
formulated and administered by the State Governments.
6. It is important to note though that the overall condition of
the economy will be a key driver of sectoral growth rates. And
emerging economic realities, especially globally, are likely to
create some restraints in the growth of domestic manufactur-
ing. Hence, deliberate effort is needed to implement the man-
ufacturing strategy to boost the Indian manufacturing sector.

INTRODUCTION
14.1. India is the fourth largest consumer of energy
in the world after USA, China and Russia but it
is not endowed with abundant energy resources.
It must, therefore, meet its development needs by
using all available domestic resources of coal, ura-
nium, oil, hydro and other renewable resources, and
supplementing domestic production by imports.
High reliance on imported energy is costly given
the prevailing energy prices which are not likely to
soften; it also impinges adversely on energy security.
Meeting the energy needs of achieving 8 per cent–
9 per cent economic growth while also meeting
energy requirements of the population at affordable
prices therefore presents a major challenge. It calls
for a sustained effort at increasing energy efficiency
to contain the growth in demand for energy while
increasing domestic production as much as possible
to keep import dependence at a reasonable level.
ENERGY INTENSITY OF GDP
14.2. Energy intensity, defined as the energy input
associated with a unit of gross domestic product
(GDP), is a measure of the energy efficiency of a
nation’s economy. India’s energy intensity has been
declining over the years (See Table 14.1) and is
expected to decline further.
14.3. Falling energy intensity implies that the growth
in energy used is less than the growth of GDP, which
in turn implies that energy elasticity, that is, the ratio
of the growth of energy to the growth of GDP is less
than unity. In fact, this elasticity has been declining
over the years. Total primary energy–GDP elasticity
14
Energy
was around 0.73 during the period 1980–81 to 2000–
01 and it declined to 0.66 in the period 1981–81 to
2010–11. The elasticity of commercial energy is
higher than that of total primary energy because of
the ongoing shift from non-commercial to commer-
cial energy. However, even this elasticity declined
from a level of 1.09 in the period 1980–81 to 2000–
01 and to 0.91 during 2000–01 to 2010–11. The
decline in share of non-commercial energy could
be attributed to increased availability of clean fuels
and replacing traditional fuels such as wood and
cow dung cakes to meet household energy needs.
The Twelfth Plan continues to focus on enhancing
household access to cleaner forms of energy with an
aim to promote sustainable development.
14.4. A National Mission on Energy Efficiency
(NMEE) has been launched to improve energy effi-
ciency in all areas of the economy including power,
transport, urban housing, consumer goods and
TABLE 14.1
Energy Intensity for Total Primary Energy*
Period Energy Intensity
(Kgoe/US$)**
1981 1.09
1991 0.99
2001 0.85
2011 0.62
* Energy intensity indicated is energy required to produce a unit
of GDP.
** kgoe: Kilograms of oil equivalent.
Source: Planning Commission.

Energy 131
industries. As a part of Clean Energy Mechanism,
which is a global initiative, a number of measures are
being planned for improving efficiency in lighting
by use of light-emitting diodes (LEDs) and super-
efficient appliances. A strategy has also been devised
to improve the share of energy-efficient modes of
transport. This improvement in efficiency will lead
to reduced energy intensity of GDP and lower elas-
ticity of energy against GDP. It is estimated that dur-
ing the Plan, the elasticity may further improve by
about 10 per cent by the end of the Plan.
14.5. Table 14.2 shows energy intensity of some
select countries for the year 2010, with GDP meas-
ured in terms of 2010 USD purchasing power par-
ity (PPP). India’s energy intensity using PPP GDP
is 0.191, which is on par with the world average but
higher than most of the European countries. China’s
energy intensity is roughly 1.5 times that of India.
TABLE 14.2
Energy Intensity
S. No Country Energy Intensity
(Kgoe/US$)
1 United Kingdom 0.102
2 Germany 0.121
3 Japan 0.125
4 Brazil 0.134
5 USA 0.173
6 China 0.283
7 South Korea 0.189
8 India 0.191
Source: World Energy Outlook 2011.
EXPANDING ACCESS TO ENERGY
14.6. Higher levels of GDP will obviously require
higher levels of energy as an input but in addition
to this requirement India’s energy planning must
allow for the need to expand access to clean energy
at affordable prices for the bulk of the popula-
tion. Village electrification and connection of rural
households to electric supply under Rajiv Gandhi
Grameen Vidyutikaran Yojana (RGGVY) is a criti-
cal instrument. The supply of kerosene/liquefied
petroleum gas (LPG) at affordable prices is equally
important.
14.7. There is ample evidence of unmet demand
in rural areas indicating the need to expand access
even as we expand total supply. The NSS 66th
Round Survey conducted by National Sample Survey
Organisation (NSSO) for 2009–10 shows improve-
ment in access to cleaner forms of energy by house-
holds for cooking and lighting purposes as compared
to the NSS 61st Round Survey for 2004–05. Access
to electricity in this period increased from 92 per
cent of urban households to 94 per cent and from 55
per cent of rural households to 67.3 per cent. Since
2009–10, 1.40 crore below poverty line (BPL) house-
holds have been provided electricity connection
under RGGVY. If we add only the number of BPL
households connected during last three years to the
NSSO data, the estimated household electrification
level as on 31 March 2012 would be of the order of 75
per cent. However, the availability of electricity sup-
ply continues to remain an area of concern, particu-
larly in rural areas, where consumers get supplies for
less than eight hours a day in certain states. Though
67 per cent of the rural households are reported to
have access to electricity in 2009–10, their per cap-
ita consumption of electricity is only around 8 units
per month, which is just one-third of reported con-
sumption of 24 units in urban areas. This is because
of poor quality of electricity supplies and reflects sig-
nificant unmet demand.
14.8. Achieving universal access to electricity is one
of the most important goals and the Government
plans to provide electricity to each and every
household in the country in the next five years by
extending RGGVY programme to every habita-
tion irrespective of the size of the population. Sub-
transmission, distribution network and renewable
sources will need to be expanded suitably in con-
sultation with the State Governments to realise this
objective. Adequate investments in the distribution
networks will improve the quality of electricity sup-
ply for the existing consumers as well as the targeted
consumers in the next five years
14.9. The percentage of all households using LPG as
cooking fuel increased from 57 per cent of the house-
holds in 2004–05 to around 66 per cent in 2009–10.
Access to LPG supplies in rural areas increased from

132 Twelfth Five Year Plan
8.6 per cent in 2004–05 to around 15.5 per cent in
the year 2009–10. Besides, per capita consumption
reported in rural areas was just 0.3 kg per month as
compared to 1.8 kg in urban areas. Since the dispar-
ity between urban and rural per capita total con-
sumption is much lower it is reasonable to assume
that potential in rural areas is much higher, but is left
unsatisfied because of insufficient access. Women
being the main energy users and primary energy
suppliers are worst affected by restricted LPG sup-
ply. This poses one of the most difficult barriers to
the empowerment of women. Table 14.3 shows the
access levels in 2004-05 and 2009–10.
ENERGY DEMAND AND SUPPLY
14.10. The demand for energy during the Plan will
increase as the economy grows and as access in rural
areas expands. Table 14.4 presents estimates of the
total primary energy demand projected to the end of
the Thirteenth Plan. The annual average growth rate
of the total energy requirement is expected to accel-
erate from 5.1 per cent per year in the Eleventh Plan
to 5.7 per cent per year in the Twelfth Plan and 5.4
per cent per year in the Thirteenth Plan. The faster
growth in supply in the Twelfth Plan is in part a
reflection of the need to meet suppressed demand.
14.11. The demand for non-commercial energy is
expected to decline with increasing expansion of
the network and access to commercial energy. As
shown in Table 14.4, whereas commercial energy is
expected to grow at 6.91 per cent in the five years
up to 2011–12, non-commercial energy is projected
to grow at only 2.6 per cent in the same period. The
growth of non-commercial energy is projected to
decline to around 1.5 per cent in the next 10 years.
14.12. Table 14.5 shows the share of each energy
source in total domestic production and also its
share (including imports) in the total commercial
energy consumption. The most important point
to note is that coal remains the dominant source of
primary energy. Domestic production of coal and
lignite account for two-third of total production of
commercial energy in 2000–01 and is projected to
be about the same in 2021–22. As a percentage of
total consumption of commercial energy, the share
of coal and lignite is projected to increase to 57 per
cent, from a level of 50 per cent in 2000–01. While
share of oil in total commercial energy consumption
is expected to decline from 37.5 per cent in 2000–01
to 23.3 per cent in 2021–22, the share of natural gas
and liquefied natural gas (LNG) is projected to rise
from 8.5 per cent to 13 per cent in the same period.
The combined share of oil and natural gas in energy
consumption was 24.7 per cent in 2011–12 and is
expected to be about the same in 2021–22.
14.13. The supply from renewables is expected
to increase rapidly from 24,503 MW by the end of
the Eleventh Plan to 54,503 MW by the end of the
Twelfth and 99,617 MW by the end of theThirteenth.
This fourfold increase in the next 10 years is expected
to continue in subsequent years as policies provide
a strong incentive for the renewables. Nevertheless
the base is small and the share of renewables in
total commercial energy used will remain small. It
is expected to rise from about 1 per cent in 2011–12
to 1.43 per cent in 2016–17 and just under 2 per
cent in 2021–22. Though small, the share of renew-
able energy in India is comparable with that in
many other countries: USA (1.7 per cent), Indonesia
(1.4 per cent), Thailand (1.0 per cent) and China
TABLE 14.3
Household Access (%)
Energy Source 61st Round 2004–05 66th Round 2009–10
Rural Urban Total Rural Urban Total
Electricity 54.9 92.3 65.2 67.3 93.9 75.5
LPG 8.6 57.1 21.9 15.5 66.2 31.2
Note: Access to energy data for Census 2011 shows primary energy sources for lighting in 2011 as 55.3 per cent rural, 92.7 per cent urban
and 67.2 per cent overall, as against 43.5 per cent rural, 87.6 per cent urban and 55.8 per cent overall in 2001. The difference in NSSO
and Census data is possibly due to differences in questionnaire. It will need to be further looked into.

Energy 133
(0.5 per cent). Brazil at (3.1 per cent) is significantly
higher. We have made a good start but there is need
to do more.
14.14. Even though domestic production of energy
resources is projected to increase, import depend-
ence will continue at a high level. The main area of
import will be crude oil, where nearly 78 per cent of
the demand will have to be met from imports by the
end of the Twelfth Plan. However, import depend-
ence for coal is also estimated to increase from 18.8
per cent in 2011–12 to 22.4 per cent by the end of
the Twelfth Plan and 25.9 per cent by the end of
the Thirteenth Plan. It is estimated that the import
dependence for coal, LNG and crude oil taken
together in the terminal year of the Twelfth Plan
is likely to remain at the Eleventh Plan level of 36
per cent. However, this assumes that we are able to
realise projected domestic production levels of coal,
petroleum and natural gas. If this is not achieved, the
level of import dependence would increase further if
the GDP growth rates projected are to be maintained.
ENERGY PRICING
14.15. Energy pricing is an economically important
but also politically sensitive issue, which will pose
major challenges in the Twelfth Plan. While the
political sensitivity of energy prices is self-evident,
TABLE 14.4
Trends in Supply of Primary Commercial Energy
(in mtoe)*
2000–01
(Actual)
2006–07
(Actual)
2011–12
(Provisional)
2016–17
(Projected)
2021–22
(Projected)
DOMESTIC PRODUCTION
Coal 130.61 177.24 222.16 308.55 400
Lignite 6.43 8.76 10.64 16.80 29
Crude Oil 33.40 33.99 39.23 42.75 43
Natural Gas 25.07 27.71 42.79 76.13 103
Hydro Power 6.40 9.78 11.22 12.90 17
Nuclear Power 4.41 4.91 8.43 16.97 30
Renewable Energy 0.13 0.87 5.25 10.74 20
Total Domestic commercial Energy 206.45 263.28 339.72 481.84 642.00
Non-commercial Energy 1 136.64 153.28
(1.93)
174.20
(2.6 %)
187.66
(1.5 %)
202.16
(1.5 %)
Total 343.09 416.56 513.92 669.50 844.16
IMPORTS
Coal 11.76 24.92 54.00 90.00 150.00
Petroleum Products 77.25 98.41 129.86 152.44 194.00
LNG 0 8.45 12.56 24.80 31.00
Hydro power 0 0.26 0.45 0.52 0.60
Total Net Imports 89.01 132.04 196.87 267.76 375.60
Total Commercial Energy (growth over
the previous five years)
295.46 396.32
(5.01 %)
536.59
(6.25 %)
749.60
(6.91 %)
1017.60
(6.30 %)
Total Primary Energy 432.01 549.60
(4.09 %)
710.79
(5.28 %)
937.26
(5.69 %)
1219.76
(5.41 %)
*mtoe: million tons of oil equivalent.
Source: Planning Commission.
Note: Figures in brackets are annual average growth rates over the previous five years’ period.

134 Twelfth Five Year Plan
the economic role of rational energy pricing is not
adequately appreciated. Rational energy prices help
to balance consumer energy demand with producer
supply, providing incentives to reduce consump-
tion on the one hand and to stimulate production
on the other. As a general rule, energy prices should
be aligned with the global energy prices, especially
when large imports are involved.
14.16. Misalignment of energy prices poses both
microeconomic and macroeconomic problems. At
the microeconomic level, underpricing energy to the
consumer reduces the incentive to be energy-efficient
and also promotes leakage of subsidised products for
sale in open market and also (in case of kerosene)
adulteration. Underpricing to the producer reduces
both the incentive and also the ability to invest in the
sector, depressing production and increasing reli-
ance on imports. This obviously undermines energy
security. At the macroeconomic level, misalignment
either hits producers as stated above, leading to
excessive import dependence with implications for
the balance of payments, or if producers are sought
to be insulated, it necessitates a subsidy, which places
a burden on the budget.
14.17. Over the years, India’s energy prices have
become misaligned, and are now much lower than
global prices for many products. The extent of mis-
alignment is substantial, leading to large un-targeted
subsidies. The implications of price misalignment
are discussed in the individual sections relating to
different sources of energy.
ENERGY SECURITY
14.18. Energy security involves ensuring uninter-
rupted supply of energy to support the economic
and commercial activities necessary for sustained
economic growth. Energy security is obviously
more difficult to ensure if there is large dependence
on imported energy. This calls for action in several
areas.
1. First, and most importantly, the domestic pro-
duction of coal, oil and gas and other energy
sources has to be stepped up. Some of the recent
issues in this regard have been availability of
land, clearances for environment and forest and
implementation of the Scheduled Tribes and
Other Traditional Forest Dwellers (Recognition
of Forest Rights) Act, 2006. Uncertainty about
TABLE 14.5
Share of Each Fuel in Total Energy Production and Consumption
(in percentage)
2000–01
Actual
2006–07
Actual
2011–12
(Provisional)
2016–17
(Projected)
2021–22
(Projected)
Share in Commercial Energy Production
Coal and Lignite 66.38 70.65 68.53 67.52 66.82
Crude Oil 16.18 12.91 11.55 8.87 6.70
Natural Gas 12.14 10.52 12.60 15.80 16.04
Hydro Power 3.10 3.71 3.30 2.68 2.65
Nuclear Power 2.14 1.86 2.48 3.52 4.67
Renewable Energy 0.06 0.33 1.55 2.23 3.12
Share in Total Commercial Energy Supply
Coal and Lignite 50.36 53.22 53.45 55.41 56.90
Crude Oil 37.45 33.41 31.51 26.04 23.29
Natural Gas 8.49 6.99 10.32 13.46 13.17
Hydro Power 2.17 2.53 2.17 1.79 1.73
Nuclear Power 1.49 1.24 1.57 2.26 2.95
Renewable Energy 0.04 0.22 0.98 1.43 1.97

Energy 135
production sharing contracts has also posed
problems. Management strategies and pro-
cedures will have to be devised for ensuring
effective implementation of fuel development
projects while meeting the requirements of
above policies and legislations.
2. Second, a stable and attractive policy regime
has to be provided to ensure substantial private
investment including foreign investment in oil
and natural gas blocks and new capacities for
renewable energy. Producers must have clarity
in the price they will receive and an assurance
of a stable tax regime. Since oil exploration is a
global industry the terms India offers must be
comparable with those offered elsewhere. In this
context the entire structure of New Exploration
Licensing Policy (NELP) contracts for oil and
gas need to be reviewed.
3. Third, investments in renewable energies need
to be strongly emphasised. By present projec-
tions, the share of renewable energy in total
energy consumption will only reach 2 per cent
by 2021.
4. Fourth, investments in energy assets in foreign
countries, especially for coal, oil and gas and
uranium should be stepped up.
5. Fifth, to meet any possible disruption in oil
supplies, on which we are import-dependent
to the extent of more than 80 per cent, storage
capacities need to be created. The Organisation
for Economic Cooperation and Development
(OECD) countries have generally created these
capacities to the extent of 90 days of their domes-
tic demand. We have created the capacity for 5
million tonnes. It has, however, not been fully
utilised so far. There will be a need to increase
this gradually and utilise it fully. Innovative ways
will have to be found to fill up these tankages.
3.2. POWER SECTOR
14.19. The electric power sector consists of a mix of
plants depending on different primary fuels, includ-
ing conventional sources like coal, lignite, natural
gas, oil, hydro and nuclear power; and non-conven-
tional sources like wind and solar power, and agri-
cultural and domestic waste. However, coal remains
the dominant primary energy source used in power
generation accounting for 67 per cent of total gen-
eration. The power sector is currently at a crucial
juncture of its evolution from a dominantly public
sector environment to a more competitive power
sector, with many private producers and greater
reliance on markets, subject to regulation. The per-
formance of the power sector shows many positive
features, especially relating to the pace of addition to
power generation but there are numerous problems
relating to fuel supply which need to be resolved as
also problems relating to the financial viability of the
operation of the distribution companies (Discoms).
REVIEW OF THE ELEVENTH PLAN
14.20. The Eleventh Plan was the period in which
the Electricity Act of 2003, which was enacted dur-
ing the Tenth Plan period was to be fully operation-
alised. The objectives of the Act are “to consolidate
the laws related to generation, transmission, dis-
tribution, trading and use of electricity, and taking
measures conducive for the development of elec-
trical industry, protecting interests of consumers
and supply of electricity to all areas, rationalisation
of electricity tariff, ensuring transparent policies
regarding subsidies, promotion of efficient and envi-
ronmentally benign policies, constitution of regula-
tory commission and establishment of Appellate
Tribunals”. While substantial progress was made in
setting up the institutional structure, there are sev-
eral important areas where reforms have yet to take
place. These are:
1. Open access to consumers, which is mandated
under the Electricity Act, remains ineffective due
to reluctance of state utilities to comply.
2. Trading of power at very high rates and its pur-
chase by utilities even though not willing to pass
on the higher cost in the form of consumer tar-
iffs. This has a distortionary effect and threat-
ens to jeopardise the financial viability of the
Discoms.
3. Energy audit of power utilities has not been
undertaken.
4. Electricity retail tariffs have remained static for
many years because of political pressure, widen-
ing the gap between the average tariff and aver-
age cost of supply.

136 Twelfth Five Year Plan
5. The distribution companies suffer from serious
financial stress. Losses of the distribution utilities
remain high. The annual loss of the State power
utilities (without subsidy) was `33,698 crore dur-
ing 2007–08 and increased to `59,891 crore in the
year 2009–10 (provisional). The State Discoms
cannot sustain such high losses indefinitely.
Physical Achievements
14.21. An important gain in the Eleventh Plan was
the ramping up of the pace of addition to genera-
tion capacity. The Eleventh Plan aimed at a sub-
stantial increase with a target for additional capacity
of 78,700 MW. Actual achievement in the Eleventh
Plan was 54,964 MW. Sector-wise and mode-wise
capacity addition achievements are given in Table
14.6. This is 30 per cent lower than the original tar-
get, but it is more than twice the addition achieved
in the Tenth Plan. More importantly, the pace of
capacity creation picked up in the Eleventh Plan,
and there is at present about 90,000 MW of gen-
eration capacity currently under construction
which would achieve commercial production in the
Twelfth Plan. If these projects proceed to comple-
tion as scheduled, and a strong effort is made to
initiate new projects in the first year of the Twelfth
Plan, we could reasonably expect to achieve addi-
tion to capacity in the Twelfth Plan of the order of
80,000–1,00,000 MW.
14.22. While the pace of addition to generating
capacity is commendable, there has not been compa-
rable progress in delivering fuel and the availability
of both coal and gas to the new power plants is not
assured. Resolution of this problem must have high
priority in the Twelfth Plan.
14.23. The main physical milestones achieved in
the power sector during the Eleventh Plan are sum-
marised in Box 14.1.
TABLE 14.6
Installed Capacity Addition during the Eleventh Plan (in MW)
Type Target Actual
Central State Private Total Central State Private Total
Hydro 8,654 3,482 3,491 15,627 1,550 2,702 1,292 5,544
Thermal 24,840 23,301 11,552 59,693 12,790 14,030 21,720 48,540
Nuclear 3,380 – – 3,380 880 – – 880
Total 36,874 26,783 15,043 78,700 15,220 16,732 23,012 54,964
Source: Central Electricity Authority (CEA).
Box 14.1
Achievements in Power Sector during the Eleventh Plan
• Capacity addition during the Eleventh Plan period has been at 54,964 MW which is 69.8 per cent of the original target and
88.1 per cent of the reduced target of 62,374 MW set in the Mid-term Appraisal (MTA). It is more than 2.5 times that of
any of the earlier Plans.
• Total installed capacity as on 31 March 2012, including renewable energy sources of the country is 1,99,877 MW. The
share of renewable energy capacity is about 12.2 per cent
• Approximately 69,926 circuit km (ckm) of transmission line. 1,50,362 MVA capacity of alternating current (AC) substations
and 1,750 MW capacity of high-voltage, direct current (HVDC) substations were added to the existing transmission systems.
• Total number of villages electrified till March 2012 was about 5.6 lakhs, indicating that more than 93 per cent village
electrification has been achieved. However, a large number of small habitations still remain unconnected.
• Various activities under different schemes of Bureau of Energy Efficiency (BEE) and Ministry of Power (MoP) have
resulted in saving in avoided power capacity of 11,000 MW.
• Works relating to 18 units for life extension aggregating to 1,931 MW and 69 units for repair and maintenance (R&M)
aggregating to 17,435 MW have been completed during the Eleventh Plan.

Energy 137
Electricity Generation
14.24. The Eleventh Plan estimated a terminal year
(2011–12) requirement of electricity generation
from utilities at 1,038 billion units (BU), implying
growth rate of 9.1 per cent (CAGR) per annum over
the gross generation level of 670.65 BU in 2006–07
(the terminal year of the Tenth Plan). As against the
above, the actual generation from utilities in 2011–
12 was 876.88 BU, a shortfall of about 16 per cent,
implying an annual growth rate of only 5.51 per cent
for power from the utilities. The mode-wise and
sector-wise energy generation for 2011–12 is given
in Table 14.7. After allowing for captive generation
of about 110 BU in 2011–12, the growth rate in total
power generation is likely to be 5.7 per cent (CAGR)
over the Eleventh Plan period, against the Plan target
of 9.5 per cent. This has resulted in a demand–sup-
ply gap. On 31 March 2012, it was estimated that the
peak deficit gap was 11.1 per cent and energy deficit
was 8.5 per cent. These deficits are lower than the
corresponding deficits of 13.8 per cent and 9.6 per
cent respectively at the end of the Tenth Plan, but
there is a clear need to step up capacities and energy
availability as the economy grows.
14.25. The actual cumulative capacity as on 31
March 2012 was 1,99,877 MW, including 24,503
MW of renewable sources of energy, the details of
which are given in Table 14.8.
14.26. The Eleventh Plan has clearly succeeded in
creating the precondition for achieving much larger
addition to capacity in future. The performance of
the private sector exceeded targets (see Table 14.6)
whereas the Government sector fell short, with the
shortfall being the generation in the Central sec-
tor. The share of the private sector in the total
installed capacity has risen to about 42 per cent
TABLE 14.7
Mode-wise/Sector-wise Break-up of Generation
(in Billion Units)
Type Central State Private Total
Hydro
(Incl. Bhutan Import)
55.97
(5.28)
71.02 8.81 135.80
(5.28)
Thermal
(a) Coal
(b) Lignite
(c) Gas
281.04
225.18
18.76
37.09
296.93
271.98
2.88
21.27
130.84
87.63
6.45
35.10
708.81
584.79
28.09
93.46
Nuclear 32.29 – – 32.29
Total
(Incl. Bhutan Import)
369.28
(5.28)
367.95 139.65 876.88
(5.28)
Source: CEA.
TABLE 14.8
All-India Cumulative Generating Capacity (as on 31 March 2012) (in MW)
Hydro Thermal Nuclear RES (MNRE)* Total
Centre 9,085.40 45,817.23 4,780.00 0.00 59,682.63
State/UTs 27,380.00 55,024.93 – 3,513.72 85,918.65
Private 2,525.00 30,761.02 – 20,989.73 54,275.75
Total 38,990.40 1,31,603.18 4,780.00 24,503.45 1,99,877.03
* MNRE: Ministry of New and Renewable Energy.
Source: CEA.

138 Twelfth Five Year Plan
of the incremental capacity in the Eleventh Plan.
The capacity addition program has benefited from
increase in the potential of the domestic equip-
ment suppliers like Bharat Heavy Electricals Limited
(BHEL), and also increased imports. BHEL has now
the potential to deliver about 15,000–20,000 MW of
new capacity per year as against 6,000 MW per year
a few years ago. Further, more private-sector equip-
ment manufacturers are also entering the market
and the total capacity may increase to about 40,000
MW per year by 2016–17.
Ultra-Mega Power Projects
14.27. The Ultra Mega Power Projects (UMPPs)
Programme, which brings in private investment
into power generation, was a major initiative of the
Eleventh Plan. So far power purchase agreements
have been signed for four UMPPs of 4,000 MW each
on the basis of competitive tariff-based bidding.
They are based in Sasan (Madhya Pradesh), Mundra
(Gujarat), Krishnapatnam (Andhra Pradesh) and
Tilaiya (Jharkhand). Out of these, one unit of 800
MW of Mundra by Tata Power has been commis-
sioned in March 2012. 12 more supercritical UMPPs
are being planned covering Chhattisgarh, Gujarat,
Tamil Nadu, Andhra Pradesh, Odisha, Maharashtra
and Karnataka. An important element of this pro-
gramme is the induction of supercritical technol-
ogy, which is an important shift towards energy
efficiency. Unfortunately, some of these projects
are plagued with uncertainties regarding fuel sup-
ply because they were based on imported coal and
changes in government policies in the countries
where the coal mines were located have raised the
cost of coal whereas the power tariff is based on a
competitive bid which does not contain a provision
for passing on such increases.
Super Critical Projects under Construction
14.28. Thermal power stations based on present-day
subcritical technology have efficiency of about 38
per cent. To improve energy efficiency further, it was
decided that new thermal power plants should be
based on supercritical technology. Already, eleven
supercritical units with a total capacity of 7,400 MW
have been installed. Large number of supercritical
units are under construction and about 50 per cent
of coal-based capacity addition in the Twelfth Plan
is expected be based on supercritical technology.
For the Thirteenth Plan, it has been decided that all
coal-fired capacity addition shall be through super-
critical units. Higher stream parameters of 565/593
degree centigrade are being adopted for supercriti-
cal units which would lead to design efficiency of
over 40 per cent and lower CO2 emissions by about
5 per cent as compared to a typical 500 MW sub-
critical unit.
14.29. Initiatives have been taken by the Government
for developing indigenous capacity/capability for
manufacturing of supercritical boilers and turbine
generators as indigenous manufacturing capacity is
considered vital to support large-scale induction of
supercritical units envisaged. BHEL has entered into
a technology collaboration with M/s Alstom and
Siemens for supercritical technology for boilers and
turbine generators respectively. BHEL has intimated
that it had augmented its manufacturing capacity to
20,000 MW per year by March 2012. Further, setting
up of joint ventures (JVs)/subsidiary companies by
international manufactures of supercritical boilers
and turbine generators was encouraged. As a result,
several JVs have come up in the country for setting
up manufacturing facilities for supercritical boil-
ers and turbines generators. Manufacturing capaci-
ties which may come up are indicated in Table 14.9.
The Government of India has also approved the
policy of encouraging domestic production of super-
critical plants by bulk-tendering of such units. Two
bulk orders—11 × 660 MW supercritical units for
National Thermal Power Corporation (NTPC) and
Damodar Valley Corporation (DVC) and 9 × 800
MW supercritical units for NTPC—were approved
and being implemented.
Transmission
14.30. A programme for construction of 88,515 ckm
transmission lines for evacuation of power from
generating stations was envisaged at the beginning
of the Eleventh Plan based on the target for capac-
ity addition that was planned. When the capacity
target was scaled down to 62,374 MW at the time of
the Mid-Term Appraisal (MTA), the target for trans-
mission was scaled down to 68,673 ckm. Details of

Energy 139
TABLE 14.9
Planned Manufacturing Capacity MW Per Annum
Joint Venture Boilers Turbine-Generators Remarks
L&T–MHI 4,000 MW 4,000 MW Production for boiler and turbine commenced
Alstom–Bharat Forge – 5,000 MW All manufacturing facilities for manufacture of
turbines to be completed by June 2013
Toshiba–JSW 3,000 MW All manufacturing facilities to be completed by
April 2013
Gammon–Ansaldo 4,000 MW – Probable date of completion of facilities—
December 2012 (2,000 MW) and December 2014
(additional 2,000 MW)
Thermax–Babcock and
Wilcox
3,000 MW All manufacturing facilities to be completed by
September 2012
BGR–Hitachi Boilers
Private Limited
5 Boilers per annum
(~3,000 MW)
All manufacturing facilities to be completed by
January 2013
BGR–Hitachi Turbine
Generator Private Limited
5 Turbine Generators per
annum (~3,000 MW)
All manufacturing facilities to be completed by
July 2014
Doosan Chennai Works
Private Limited
2,200 MW
(Both subcritical and
Supercritical)
DCW Pvt. Ltd. is 100 per cent subsidiary of
Doosan Korea. Company incorporated in India
on 20 July 2000
Existing facility–Chennai Additional facility
acquired at Mannur village, Kancheepuram
district
Production from additional facilities to start by
Sept-2012.
the achievement of transmission lines at the end of
the Eleventh Plan are given in Table 14.10. The addi-
tion achieved during the Eleventh Plan is 69,926 ckm
which is greater than the scaled-down target.
Distribution
14.31. Distribution is the weakest link in the power
system with large losses leading to financial unviabil-
ity. The cash losses of utilities selling power directly
to consumers, after accounting for subsidy from the
State Governments, increased from `17,620 crore
in year 2007–08 to `42,415 crore in year 2009–10.
The cumulative book losses (on accrual basis) of
State Discoms have increased from `79,339 crore
as on 31 March 2009 to `1,06,247 crore at the end
of year 2009–10. The net worth of the Discoms has
decreased from `31,972 crore to `14,786 crore as on
31 March 2010. While some of the States have shown
improvements in the financial health of their utili-
ties, others are yet to demonstrate the impact of the
policy initiatives.
14.32. Distribution companies have not been able to
recover the cost of supply through tariff, and the gap
between Average Cost of Supply (ACS) and Average
Revenue Realised (ARR) has widened and the same
has been increasing over the years. This gap is partly
a reflection of lower tariff, but it also reflects high
aggregate technical and commercial (AT&C) losses
which reduce the average revenue realised. The
trends in AT&C for all States are shown in Table
14.11. The position is especially serious in the spe-
cial category states, which have losses (2010–11,
Provisional) varying between 29.17 per cent in the
case of Uttarakhand to 74.30 per cent in Jammu &
Kashmir. Himachal Pradesh with AT&C loss of
13.53 per cent is an exception. The non-special cat-
egory states have generally performed better, though
the losses are still unacceptably high in several of
these, for example, Jharkhand (45.11 per cent), Bihar
(49.99 per cent), Chhattisgarh (36.41 per cent), Uttar
Pradesh (37.86 per cent), Odisha (44.35 per cent)

140 Twelfth Five Year Plan
and Madhya Pradesh (41.10 per cent). In contrast,
Andhra Pradesh, Gujarat, Punjab, Delhi and Tamil
Nadu show relatively good performance in contain-
ing AT&C losses.
14.33. Due to unsustainable levels of AT&C losses
and other inefficiencies in metering, billing and col-
lection, the utilities are not able recover the cost of
supply resulting in widening of gap between average
cost of supply and tariff. Table 14.12 shows recent
trends in financial parameters of major States.
14.34. The Comptroller and Auditor General (CAG)
of India has carried out a study involving 24 utilities
on issues impacting financial health of power dis-
tribution utilities in India and has pointed out the
need for rationalisation of tariffs charged for vari-
ous consumers. Unless the measures to contain these
inefficiencies are taken, the Discoms will not be able
to break even. Further, default in payments, non-
metering of consumers, inadequate energy auditing,
inadequate investments in upgradation of the distri-
bution system are some of the other issues that need
to be addressed. This situation is a cause of serious
concern and remedial steps need to be taken on pri-
ority basis in the Twelfth Plan to ensure that utilities
generate adequate surpluses to support their ongo-
ing projects.
Restructured Accelerated Power
Development and Reform Programme
(R-APDRP)
14.35. To address the problems of distribution
losses, the Central Government had launched the
APDRP scheme in 2002–03 as an Additional Central
Assistance (ACA) scheme to finance the modernisa-
tion of sub-transmission and distribution networks
with the objective to reduce AT&C losses to 15 per
cent. This programme was not effective in reducing
losses. A Re-structured APDRP was approved as a
Central scheme in 2008 with a total outlay of `51,577
crore over the Eleventh Plan period. The focus of the
programme is on actual, demonstrable performance
in terms of AT&C loss reduction. The coverage of the
programme is for the urban areas—towns and cities
with a population of more than 30,000 (10,000 for
TABLE 14.10
Cumulative Achievement of Transmission Lines at the End of the Eleventh Plan
Transmission System
Type/Voltage Class
Unit At the End of the Tenth Plan
(March 2007)
Addition during the
Eleventh Plan
At the End of the Eleventh Plan
(March 2012)
Transmission Lines
765 kV ckm 1,704 3,546 5,250
HVDC + 500 kV Bi-pole ckm 5,872 3,560 9,432
400 kV ckm 69,174 37,645 1,06,819
230/220 kV ckm 1,10,805 25,175 1,35,980
Total ckm 1,87,555 69,926 2,57,481
Substations
765 kV MVA 0 25,000 25,000
400 kV MVA 92,942 58,085 1,51,027
230/220 kV MVA 1,56,497 67,277 2,23,774
Total MVA 2,49,439 1,50,362 3,99,801
HVDC
Bi-pole link capacity MW 5,000 1,750 6,750
Back-to-back capacity MW 3,000 0 3,000
Total MW 8,000 1,750 9,750
Source: CEA.

Energy 141
special category States). Private distribution utilities
are not covered under the programme which has been
a point of criticism by some States. Projects under the
R-APDRP scheme were to be taken up in two parts.
Part A focused on establishing reliable and automated
system for sustained collection of accurate baseline
data, and the adoption of IT in the areas of energy
accounting and auditing and consumer-based ser-
vices. Part B includes projects to strengthen the dis-
tribution system, including activities like automation
TABLE 14.11
Aggregate Technical and Commercial Losses of State Power Utilities (within State)
(in Percentage)
S. No State 2007–08
(Actual)
2008–09
(Actual)
2009–10
(Actual)
2010–11
(Provisional)
Special Category States
1 Arunachal Pradesh 78.31 74.27 63.14 65.48
2 Assam 36.77 35.37 38.24 45.13
3 Himachal Pradesh 19.52 16.20 17.39 13.53
4 Jammu & Kashmir 73.43 70.69 72.03 74.30
5 Manipur 86.75 83.55 69.23 67.74
6 Meghalaya 39.74 35.27 43.19 37.93
7 Mizoram 38.38 46.43 42.89 42.08
8 Nagaland 51.20 55.85 58.02 55.98
9 Sikkim 46.87 46.81 51.37 46.81
10 Tripura 41.44 40.08 37.52 41.19
11 Uttarakhand 35.37 29.35 28.61 29.17
Non-Special Category States
1 Andhra Pradesh 20.61 19.39 18.32 16.78
2 Bihar 47.60 41.66 42.39 49.99
3 Chhattisgarh 35.17 37.78 46.62 36.41
4 Goa 17.69 17.81 16.18 15.57
5 Gujarat 26.43 25.46 26.87 18.25
6 Haryana 29.01 28.43 29.50 26.72
7 Jharkhand 54.18 54.23 49.07 45.11
8 Karnataka 31.63 24.79 23.69 23.64
9 Kerala 44.80 34.98 28.81 29.72
10 Madhya Pradesh 46.64 45.78 42.93 41.10
11 Maharashtra 30.67 28.75 27.44 23.47
12 Orissa 41.68 42.20 39.71 44.35
13 Punjab 22.36 19.76 19.97 18.35
14 Rajasthan 40.18 32.99 33.06 25.60
15 Tamil Nadu 19.25 20.19 19.11 18.27
16 Uttar Pradesh 38.89 35.29 36.69 37.86
17 West Bengal 20.67 28.81 26.13 28.87
18 Delhi 34.58 17.92 20.78 15.76

142 Twelfth Five Year Plan
and validation of baseline system, project evaluations,
capacity-building and development of franchisees in
the distribution sector and consumer attitude sur-
veys. Projects under Part B would be taken up after
the baseline data is established (Table 14.13).
14.36. The status of R-APDRP at the end of the
Eleventh Plan is as follows:
• Under Part A of R-APDRP, 1,402 projects at
an estimated cost of `5,196.50 crore have been
approved for 29 States/UTs.
• Part A SCADA projects for 63 towns of 15 States
have also been sanctioned at an estimated cost of
`1,443.48 crore.
• Under Part-B of R-APDRP, 1,086 projects at
an estimated cost of `24,776.17 crore have been
approved for 20 States.
• All Part A projects have been awarded except in
one State. These are under implementation and at
a stage of advanced progress in several States.
• Part A of R-APDRP is to be completed by utilities
in three years after its approval. Presently, there
are no projects which have completed three years’
time since they were sanctioned. However, it has
been observed that State procurement policy and
procedures have delayed the appointment of IT
consultants in some of the States.
Rajiv Gandhi Grameen Vidyutikaran Yojana
(RGGVY)
14.37. RGGVY was launched by the Government
of India in April 2005 as a comprehensive scheme
for providing access of electricity to all rural house-
holds. The scheme involved electrification of all
un-electrified villages plus a free connection for
TABLE 14.12
Viability of Major State Utilities Not Improving
(Excluding Delhi and Odisha)
2007–08
Actual
2008–09
Actual
2009–10
Provisional
2010–11
RE
Energy sold/energy available (%) 72.86 74.55 74.33 76.21
Revenue from sale of electricity (` crore) 1,31,220 1,48,605 1,63,475 1,92,827
Total cost of electricity sold (` crore) 1,74,452 2,12,292 2,35,701 2,61,467
Commercial losses without subsidy (` crore) 33,290 52,452 60,172 59,050
Average cost of supply (paise/kWh) 405.86 464.48 480.37 485.67
Average tariff (paise/kWh) 305.29 325.13 333.17 358.18
Gap between the cost of supply and tariff (paise) 100.57 139.35 147.20 127.49
Source: Power Utilities of various States and UTs.
TABLE 14.13
Details of Year-wise Progress Achieved on Restructured APDRP (as on 31 March 2012)
(` Crore)
Year Project Sanctioned Budget Allocation Actual Releases
Part A Part B Total Loan Grant Total Loan Grant Total
2008–09 1,947.70 0.00 1,947.70 0 1 1 0.00 350.00 350.00
2009–10 3,183.00 3,059.28 6,242.28 1,650 80 1,730 1,331.46 1.26 1,332.72
2010–11 715.40 12,915.31 13,630.71 3,600 100 3,700 2,246.42 100.00 2,346.42
2011–12 793.88 8,801.58 9,595.46 1,959 75 2,034 1,600.00 67.87 1,667.87
Total 6,639.98 24,776.17 31,416.15 7,209 256 7,465 5,177.88 519.13 5,697.01
Source: Ministry of Power.

Energy 143
BPL households. The scheme provided a subsidy
of 90 per cent of the total project cost and balance
10 per cent of the project cost was to be provided
by the Rural Electrification Corporation (REC) as
loan. Initially, Phase I of the RGGVY scheme was
approved for implementation with a capital subsidy
of `5,000 crore during the remainder of the Tenth
Plan period. Subsequently, the scheme was approved
to be continued in the Eleventh Plan with a capital
subsidy of `28,000 crore. As on 31 March 2012, out
of the total of 1,12,795 villages to be covered under
RGGVY (including Phase II projects), works in
1,04,496 villages have been completed and only 8,299
un-electrified villages remain; 6,000 villages are
targeted to be electrified during 2012–13. In addi-
tion, about 10,000 remote villages are to be covered
by the MNRE through non-conventional sources.
Overall, by the end of Eleventh Plan, out of the total
5,93,732 villages in India (Census 2001), 5,56,633 vil-
lages (93.8 per cent) have been electrified as per CEA
report. Some of the villages which have been electri-
fied, that is, connected to the grid, have not yet been
energised. The gap is primarily in the States of Bihar,
Jharkhand, Odisha and Assam. Most of the projects
are expected to be completed during 2012 except in
the north-eastern region and in areas involving dif-
ficult terrain.
14.38. The year-wise targets and achievements for
RGGVY during the Tenth and the Eleventh Five
Year Plan are given in Table 14.14.
14.39. Studies were carried out to evaluate the socio-
economic impact of electrification in Odisha. Other
such studies are also underway. The key findings of
the studies are:
1. Electrification has altered the household energy
mix through substitution of traditional kero-
sene-based lighting source by electric light. This
has resulted in energy and financial savings of
households as families would no longer be sub-
ject to exorbitant price of kerosene.
2. Security within the villages as well as the quality
of living of masses have improved.
3. Electrification has enhanced livelihood gen-
eration in the field of agriculture and related
activities, small shops and other entrepreneurial
activities.
4. Availability of electricity during post-sunset
time allowed for extension of study hours for
students.
5. Increased mobility and overall comfort, espe-
cially for women, have enhanced safe spaces and
reduced the drudgery of household chores.
TABLE 14.14
Status on RGGVY Progress during the Tenth and the Eleventh Plan
Year Un-electrified Villages (No.) BPL Households (lakh)
Target Achieved % Achieved Target Achieved %Achieved
Tenth Plan
2005–06 10,000 9,819 98.2 3 0.17 5.7
2006–07 40,000 28,706 71.8 40 6.55 16.4
Eleventh Plan
2007–08 10,500 9,301 88.6 16 16.21 101.3
2008–09 19,000 12,056 63.5 35 30.85 61.7
2009–10 17,500 18,374 105.0 47 47.18 100.4
2010–11 17,500 18,306 104.6 47 58.84 125.1
2011–12 14,500 7,934 54.7 52 34.45 66.2
Cumulative
(as on 31 March 2012)
1,12,795* 1,04,496 92.6 275* 194.25 70.6
* Revised coverage including Phase II projects.
Source: Ministry of Power.

144 Twelfth Five Year Plan
14.40. The RGGVY programme has several defi-
ciencies in implementation. Firstly, nearly 6,000
villages electrified till December 2011 were still not
energised due to lack of supporting network or other
resources. Secondly, access to electricity in rural
areas is still limited, especially in smaller hamlets.
The traditional approach to policy and planning in
power has assumed gender neutrality, thus failing to
recognise that the needs of men and women can dif-
fer. Attention needs to be paid to livelihood activities
of women and to their concerns of safety, security
such as street lighting, healthcare, education and
so on. Thirdly, poor financial health of utilities and
high cost of power act as a disincentive for States to
give new connections. Fourthly, some States do not
have supporting network and are unable to provide
energisation. Fifthly, a viable revenue model is yet
to emerge. This has hindered larger access to new
consumers.
14.41. Some of the other areas of concern are:
1. In certain States, even the minimum required
hours of supply of six hours to eight hours could
not be met.
2. There is a need to upgrade transformer capacity
as the current average demand of BPL and above
poverty line (APL) consumers is in the range
of 300 to 500 watts and 0.5 to 1.15 KW, respec-
tively. There have been several complaints of fre-
quent burning of transformers.
3. The progress of release of APL connections is
slow on account of poor supply of electricity,
long delays in processing of applications and
inadequate transformer capacity.
4. In many States, the distribution company takes
a long time for issuing the first bill which can be
anywhere between three to six months. Because
of this delay, the total bill comes to around
`1,000 to `1,500 which a rural household finds
difficult to pay. This leads to a permanent high
level of outstanding bills.
5. In most of the operating States, no franchisee
was found in any of the surveyed villages and
the Discoms had their own mechanism of meter
reading, billing and so on.
6. As far as project preparation is concerned, it has
been observed that in most cases, the detailed
project reports (DPRs) were prepared in a hur-
ried manner and quality was compromised.
7. As far as the socio-economic impact is con-
cerned, it is found that electrification has so far
not generated substantial employment oppor-
tunities or economic development in the rural
areas except in a few cases.
8. The number of actual BPL families in the villages
in many cases has been higher than the number
indicated in the DPR.
Status on Open Access
14.42. The Electricity Act, 2003, mandates that non-
discriminatory open access for interstate as well as
intra-state transmission and distribution networks
be provided by the utilities. Effective implementation
of open access is crucial for opening up consumer
choices as well as encouraging a healthy trading
function in the country. The open access at interstate
level is fully operational. Starting from 17 BUs of
energy transacted through Short-Term Open Access
(STOA) at the interstate level in 2004–05, the vol-
ume has grown to 55 BUs in 2010–11. While carriage
and content separation at interstate level has been
largely addressed by design, a point of concern has
been the adequacy of carriage. Therefore, adequacy
issues with respect to carriage need to be specified.
Little progress has been made in the implementing
of open access at intra-state transmission and distri-
bution network level.
14.43. An inter-Ministerial Task was constituted
under the chairmanship of Member (Energy),
Planning Commission in February 2008 to exam-
ine the status and make recommendations on the
measures for operationalising the provisions of the
Electricity Act, 2003 in respect of open access. The
Forum of Regulators (FoR) has issued model regu-
lations for intra-state open access in September
2010. Adoption of these model regulations by State
Electricity Regulatory Commissions (SERCs) would
go a long way in successful implementations of intra-
state open access. Further, a Second Task Force was
constituted in February, 2010 to review the prog-
ress made on the recommendations of the previous

Energy 145
Task Force and suggest further course of action on
the issues upon which there was no consensus in the
First Task Force. The report of the second task force
has been received and States have been asked to take
necessary action to implement the recommenda-
tions. Recommendations of the Task forces on open
access are given in Box 14.2.
14.44. At the State level, Discoms need to create dis-
tribution control centres and empower them so that
open access at the distribution level becomes a reality.
The request for open access is given at the State level
to the State distribution control centres. If these can
be empowered to take a quick decision in accordance
with the prescribed guidelines and norms for provid-
ing open access, the decisions will not be delayed.
Such an empowerment of the State distribution cen-
tres is, therefore, is important for the open access.
Financial Performance
14.45. The approved Eleventh Plan power sector
budgetary outlay for the public sector (Central and
State sectors) was `5,72,648 crore which was 15.71
per cent of the total Plan outlay. Summary of the
year-wise investment made during the Eleventh Plan
is shown in Table 14.15.
14.46. The Table indicates major shortfalls in case
of central power sectors. This is primarily because
the pace of capacity addition of NTPC and National
Hydroelectric Power Corporation (NHPC) has
been lower than the expected. The internal and
Box 14.2
Recommendations of Task Force on Open Access
REGULATORY AND SYSTEM CHANGES
1. SERCs to regulate the tariffs of all consumers of 1 MW and above in accordance with the provisions of Sections 42, 49 and
86 of the Act and fix only the wheeling charges (in conformity with section 42, read with section 62 of the Act) and open
access surcharge.
2. Tariff to be charged by the discoms for providing standby supply should not exceed the maximum UI rate for the applicable
hours plus a 5 per cent administrative charge thereon or alternatively, the bulk consumers may directly handle the UI
supplies with the respective State Load Dispatch Centres (SLDCs) and to act as independent entities with financial and
operational autonomy.
3. SLDCs should be upgraded in a time bound manner to enable open access, under section 42.
4. SERCs should ensure enabling arrangements such as metering and settlement.
5. Regulators should meet bulk consumers to take proactive action for encouraging open access. Timelines should be
provided for the same.
6. The trading margin fixed by the Central Electricity Regulatory Commission (CERC) should apply in a seamless manner in
any one transaction emanating from a generating company and terminating with a discom through multiple traders and
should not exceed the maximum margin allowed to a single trader.
CENTRAL GOVERNMENT
7. To earmark a specified proportion, say, 25 per cent of the Centre’s discretionary allocation of 15 per cent of central public
sector undertakings’ (CPSUs’) generating capacity which may be made available for direct sale by CPSUs to open access
consumers. As for new and upcoming capacity of CPSUs, 75 per cent of the discretionary quota may be reserved for sale
to open access consumers and the sale price should determine by bidding. 75 per cent of the profits made by the CPSUs
on this account may be transferred to the respective states where open access consumers are located.
8. Scheme of UI charges should be reviewed to ensure that UI does not become a vehicle for gaming in scheduling. For this
a mechanism should be evolved to facilitate corrective measures against gaming including stiff penalties.
9. Commencing from the Twelfth Five Year Plan, the Central Government should release Accelerated Power Development
and Reforms Programme (APDRP) assistance only to States that comply with the above and enable consumers to exercise
their statutory right to open access. A package of incentives and disincentives should also be formulated by Power Finance
Corporation (PFC) and REC for States to operationalise open access.

146 Twelfth Five Year Plan
TABLE 14.15
Outlay/Expenditure: Centre, States and UTs (` Crore)
Sector Eleventh Plan
Approved
Outlay
2007–08
(Actual)
2008–09
(Actual)
2009–10
(Actual)
2010–11
(RE)
2011–12
(RE)
Eleventh
Plan Likely
Expenditure
Per cent
Utilisation
States and UTs 2,25,385 27,243 31,577 34,059 43,749 48,068 1,84,696 81.95
Central Sector 3,47,263 29,596 42,242 44,528 46,746 70,390 2,33,501 67.24
All India 5,72,648 56,839 73,819 78,587 90,495 1,18,458 4,18,197 73.03
Source: Planning Commission.
extra budgetary resource (IEBR) of the power sector
CPSUs was 63 per cent of the original Plan targets.
TWELFTH PLAN PROGRAMME
Addition to Generation Capacity
14.47. The Working Group on Power has estimated
a capacity addition requirement of 75,785 MW cor-
responding to 9 per cent GDP growth during the
Twelfth Plan period. However, in order to bridge the
gap between peak demand and peak deficit, and pro-
vide for faster retirement of the old energy-inefficient
plants, the target for the Twelfth Plan has been fixed
at 88,537 MW. As shown in Table 14.16, the share of
the private sector in the additional capacity will be 53
per cent, compared to a target of 19 per cent in the
Eleventh Plan. Since the growth rate of GDP for the
Twelfth Plan is likely to be 8.2 per cent and not 9 per
cent, the target for capacity addition contain an ele-
ment of slack of about 10 per cent.
14.48. The share of power based on non-fossil
fuel plants is very low at present and should be
increased over time to promote low carbon growth
strategy. The share of coal and lignite in the addi-
tional capacity being created during the Twelfth
Plan is 79 per cent, up from 76 per cent in the tar-
get from the Eleventh Plan which actually ended
up at 79 per cent. The projected capacity addition
in non-fossil fuel plants covers addition of hydro
capacity of 1,0897 MW and nuclear capacity of
5,300 MW. Besides this, 1,200 MW import of hydro
power from Bhutan has also been considered. In
addition, it is planned to add a grid interactive
renewable capacity addition of about 30,000 MW
comprising of 15,000 MW wind, 10,000 MW solar,
2,100 small hydro, and the balance primarily from
bio mass planned. Details of the projected Twelfth
Plan capacity addition, sector-wise and mode-wise,
are given in Table 14.16.
Power Generation
14.49. The Working Group for the Twelfth Plan has
estimated a requirement of 1,403 BU by the year
2016–17, after taking into account energy conser-
vation measures and demand–supply management.
TABLE 14.16
Sector-wise and Mode-wise Capacity Addition (Provisional) during the Twelfth Plan (MW)
Sector Hydro Total
Thermal
Thermal Breakup Nuclear Total
Coal Lignite Gas/Lng*
Central 6,004 14,878 13,800 250 827.6 5,300 26,181.6
State 1,608 13,922 12,210 0 1,712.0 0 15,530.0
Private 3,285 43,540 43,270 270 0.0 0 46,825.0
Total (Excluding RES) 10,897 72,340 69,280 520 2,539.6 5,300 88,536.6
Renewables – – – – – – 30,000
Total (Including RES) 10,897 72,340 69,280 520 2,539.6 5,300 1,18,536.6
* Addition of gas capacity is provisional and will depend upon the availability of gas. This will be reviewed during the MTA.

Energy 147
Without such measures, the generation requirement
is projected at 1,463 BU. Even if the moderate level
of 1,403 BU is taken as the Twelfth Plan target, the
projected growth rate in power generation will be
9.8 per cent.
14.50. The projected change in the mix of genera-
tion by fuel supply by the end of 2030 is given in
Table 14.17. The share of renewables in electric-
ity generated is expected to rise from around 6 per
cent in 2012 to 9 per cent in 2017 and 16 per cent
in 2030. However, the share of hydro electricity is
expected to fall from 15 per cent in 2012 to 11 per
cent in 2030. The share of nuclear power, another
clean source from a carbon emission perspective is
expected to rise from 3 per cent in 2012 to 5 per cent
in 2017 and to 12 per cent in 2030. Taking all these
clean energy sources together, the share of hydro,
renewables plus nuclear energy is expected to rise
from 26 per cent in 2012 to 39 per cent by 2030.
Renovation and Modernisation and Life
Extension of Thermal Power Plants (R&M
and LE)
14.51. Coal-based thermal plants are the backbone
of the Indian power sector. Most of the old and
smaller size non-reheat type units are on the verge
of retirement. R&M and LE is an economical option
to supplement the capacity addition programme
which was initiated in 1984 as a Centrally Sponsored
Programme during the Seventh Plan. It continued
till the Eleventh Plan and CEA has recommended for
its continuance during the Twelfth Plan also.
R&M of Hydro Plants
14.52. The normal life expectancy of hydro plants is
about 30–35 years after which they need life exten-
sion. Many of the existing hydro power stations
could be modernised to generate reliable and higher
yield by restoration and modernisation schemes.
These involve adopting modern equipments like
static excitation, microprocessor-based controls,
electric microprocessor, high speed static or numeri-
cal relays, data logger, optical instrumentation for
monitoring vibrations, air gaps, and silt contained
in water and so on. These measures would improve
availability of hydro power stations and minimise
outages. Routine maintenance activities are not
included in these schemes. Only activities which aim
at increasing the efficiency of the unit and improve
availability or steps required to meet environmental
norms, or aimed at renovating obsolete equipment
controls and instrumentation, are included in R&M
scheme.
Exploitation of Hydro Electric Potential
14.53. Hydro power plants, particularly storage-
based, are generally planned for their ability to meet
peak power demand. Estimated hydro potential in
India is about 149 GW including the plants of less
than 25 MW capacity. The total capacity devel-
oped and under development put together so far
is about 32 per cent of this potential. A major part
of the unexploited potential is in North-East and
Himalayan regions. With the deployment of latest
technologies we can harness the remaining potential
without damaging the ecology. Table 14.18 shows
TABLE 14.17
Changing Structure of Fuel for Electricity
Capacity (%) Generation (%)
2012 2017 2030 2012 2017 2030
1. Coal 56 57 42 70 69 58
2.Oil 110000
3.Gas 963753
4. Hydro 20 15 13 14 12 11
5. Renewables 12 17 33 6 9 16
6. Nuclear 2493512
Total Clean Energy (4 + 5 + 6) 23 26 39

148 Twelfth Five Year Plan
the status of hydro potential development in the
country (above 25 MW).
Peaking Power and Reserve Plants
14.54. The generation system must be designed to
meet base load as well as peak load of the power sys-
tem and have the ability to respond dynamically and
efficiently to variations in demand within a short
time. Since our system has wide variation in demand
during peak and off-peak periods there is a need
for peaking support with very high ramping rate.
Peaking power can be provided by reservoir-based
hydro plants or gas-based generation. Apart from
the above, an optimal power system should have
adequate reserves to meet the contingency of outage
of certain operating generation capacity. It is impor-
tant to set up these capacities to meet peaking power
demand. It will be necessary to start up 2,000 MW of
peaking gas-based plants, despite the limitations on
availability of gas improvement.
14.55. Since it is expensive to carry unutilised capac-
ity, and power from gas is likely to be especially
expensive, the ability to meet peak loads is critically
dependent on introducing time of day metering with
a sufficient difference between peak and off-peak
tariffs.
Pollution and Ash Utilisation
14.56. An important positive development in
the power sector is that the utilisation of ash has
increased impressively from 9.63 per cent in 1996–97
to 56 per cent in 2010–11. This is the consequence
of deliberative planning to reduce adverse environ-
mental impact as the coal-based capacity expanded.
There are 13 thermal power stations in the country
which have achieved 100 per cent or more ash utili-
sation during the year 2010–11. The ash generation
by coal/lignite-based thermal power stations is esti-
mated to increase to 170 million tons per year by the
end of 2010–11 and reach to a level of about 300 mil-
lion tonnes per year by the end of the Twelfth Plan.
The Ministry of Environment and Forests (MoEF)
has issued notifications for achieving 100 per cent
utilisation of fly ash. The quantity of fly ash which
has to be disposed off in ash ponds shall be reduced
significantly which will help in addressing problems
of pollution. All project developers will have to meet
the stringent requirement of environmental norms
for setting up thermal power plants to minimise air
and water pollution.
Captive Power Plants
14.57. A number of captive power plants (CPPs),
including coal-based power plants of varied type
TABLE 14.18
Status of Hydro Electric Potential Development
(In terms of Installed capacity—above 25 MW)
Region Total potential Capacity developed Capacity Under
development
Total Developed+
Under development
(%)
Capacity yet to be
developed
(%)
Northern 52,263 15,479 5,416 20,895
(40)
31,368
(60)
Western 8,131 5,552 400 5,952
(73)
2,179
(27)
Southern 15,890 9,367 570 9,937
(62.5)
5,953
(37.5)
Eastern 10,680 2,908 2,713 5,621
(52.6)
5,059
(47.4)
North Eastern 58,356 1,200 2,852 4,052
(7)
54,304
(93)
All India 1,45,320 34,506 11,951 46,457
(32)
98,863
(68)

Energy 149
and size, exist in the country. These are either
used in process industries or for in-house power
consumption for large units. Capacity addition of
around 13,000 MW of captive power is likely to be
commissioned during the Twelfth Plan. Surplus
power, if any, from CPPs is fed into the grid. The
tariff for the surplus power is regulated. The captive
power capacity generators find it profitable to sup-
ply electricity to the grid as the fixed cost has already
been recovered by them from the power supplied
for their captive use. The variable costs plus addi-
tional margins which is provided by the utility is
found attractive by them for supplying power sur-
plus to their use.
14.58. The installed capacity of CPPs has increased
from 22,335 MW at the beginning of the Eleventh
Plan to 36,511 MW (provisional) in March 2012,
adding a total of around 14,000 MW addition of cap-
tive capacity during the Plan period.
Fuel Supply Problems
14.59. Although the pace of creation of generation
capacity has picked up considerably, the fuel supply
capability has not kept pace and serious fuel supply
problems have arisen in the last year of the Eleventh
Plan. Since 80 per cent of the additional generating
capacity will be coal-based, resolution of coal supply
to the power plants coming on stream will be crucial.
With 50 per cent of the new capacity being created
in the private sector fuel supply agreements have to
be legally binding with credible penalties to reassure
bankers and other financiers financing the establish-
ment of capacity. The problems of coal supply are
discussed in coal sector.
14.60. Availability of gas is also a problem as gas has
yet to be ensured for 5,156 MW of gas-based proj-
ects commissioned during the Eleventh Plan period
which are currently stranded/operating at a very low
plant load factor (PLF) due to non-supply of gas. In
addition to these projects, at least 2,538 MW of addi-
tional gas based capacity is expected to come up dur-
ing the Twelfth Plan and as mentioned above, there is
need for 2,000 MW of gas-based capacity to deal with
peaking requirements. The requirement for coal, lig-
nite and gas/LNG for power sector at the end of the
Twelfth Plan period has been shown in Table 14.19.
Clearly domestic supply of both coal and gas needs
to be augmented by imports. Since imports will be
at much higher prices, some method must be found
to make the higher priced fuel acceptable to genera-
tors. If domestic prices cannot be fully aligned with
import prices, some resort to price pooling will be
necessary and the scope for such price pooling must
be urgently explored.
Expansion in Transmission System and
Capacity
14.61. The large expansion in production and con-
sumption of electricity has to be supported by a
significant expansion and strengthening of the
transmission network. Technological developments
for transmission lines of 765 KV and 1,000–1,200
KV are of great relevance to reduce land require-
ment and transmission losses. Greater reliance will
have to be placed on gas insulated substations which
need about 20 per cent of the space required for
conventional stations. This is an area where public
investment can be supplemented by private invest-
ment and a good start has been made in the Eleventh
Plan. It is important to build a policy framework
within which more private sector investments will
be forthcoming in the Twelfth Plan. A policy frame-
work for public–private partnership (PPP) and a
standardised documentation is being prepared for
use by the States.
14.62. A total of about 1,07,440 ckm of transmis-
sion lines; 2,70,000 MVA of AC transformer capa city
and 12,750 MW of HVDC systems are estimated as
needed during the Twelfth Plan. Table 14.20 gives
TABLE 14.19
Fuel Requirement during 2016–17
Fuel Requirement Availability
Coal 730 Million Tonnes 550 Million Tonnes
Lignite 46 Million Tonnes 46 Million Tonnes
Gas/LNG 207 MMSCMD* 102 MMSCMD*
Source: Planning Commission estimates based on Working
Group Reports on Power and Petroleum and Natural Gas.
*In addition, about 17,500 MW gas-based capacity is under
various stages of construction for which additional gas require-
ment is about 84 MMSCMD.

150 Twelfth Five Year Plan
the transmission programme to be taken up during
the Twelfth Plan period and also gives the antici-
pated cumulative achievement at the end the year
2016–17.
Creation of a National Grid
14.63. The power system in the country is demar-
cated into five regions. Four regional grids have been
operating in synchronous mode as a single system for
the past few years. Only the southern grid is yet to be
connected to the rest of the system. The high voltage
link to connect southern grid is under construction
and likely to be completed by January 2014. Once
this is achieved, all the five regional grids will operate
as a single system in synchronous mode. This will be
the largest single such system in the world, both in
terms of the grid size and system capacity of around
2,00,000 MW, though, at a given point of time, actual
power flow may be lower than this level.
14.64. The capacity for transfer of power across
regions at the end of the Eleventh Plan is shown in
Table 14.21. The total capacity to transfer power
which is currently about 27,750 MW and this is
expected to increase by 136 per cent to 65,550 MW
by the end of Twelfth Plan. The specific line which
is under construction for connecting the southern
region is the Raichur–Sholapur 765 KV line. In fact,
these are two single circuit lines and the total trans-
mission capacity of these two lines would be about
4,200 MW. Three HVDC systems and a number of
765 KV lines and substations shall be implemented
during Twelfth Plan. The Aurangabad–Wardha 400
KV QUAD DC, line which is part of the transmis-
sion system for evacuation of power from Mundra
Ultra Mega Power Project (UMPP) has been
planned and designed in such a way that the lines
would be converted into a 1,200 KV S/C lines by a
later date.
14.65. There is a three-tier structure for load dis-
patch, namely, State Load Dispatch Centre, Regional
Load Dispatch Centre and the National Load
Dispatch Centre. The Government of India noti-
fied Power System Operation Corporation Limited
(POSOCO) as the designated entity to operate
RLDC/NLDC with effect from 1 October 2010.
A Forum of Load Dispatchers (FOLD) has been
TABLE 14.20
Transmission Line at the End of the Twelfth Plan Period
Transmission System Type/
Voltage Class
Unit At the end of Eleventh
Plan
Expected addition during
Twelfth Plan
Expected by end of
Twelfth Plan
Transmission Line
HVDC Bipole lines ckm 9,432 7,440 16,872
765 kV ckm 5,250 27,000 32,250
400 kV ckm 1,06,819 38,000 1,44,819
220 kV ckm 1,35,980 35,000 1,70,980
Total ckm 2,57,481 1,07,440 3,64,921
Sub-Station
765 kV MVA 2,5000 1,49,000 1,74,000
400 kV MVA 1,51,027 45,000 1,96,027
230/220 kV MVA 2,23,774 76,000 2,99,774
Total MVA 3,99,801 2,70,000 6,69,801
HVDC
Bi-pole link capacity MW 6,750 12,750 19,500
Back-to-back capacity MW 3,000 0 3,000
Total MW 9,750 12,750 22,500

Energy 151
constituted as approved by the Forum of Regulators
(FOR) in January 2009 for harmonising practices
across different load dispatch centres.
Evacuation of Power from the North-East
14.66. The North-East has very large potential for
producing hydro power—close to 50,000 MW—
but the pace of implementation has been poor. The
evacuation of power from the North-East poses a
major challenge for several reasons. First, the entire
capacity has to be evacuated through a narrow strip
of about 25 km in West Bengal. Although no forest
clearance is needed, land acquisition issues could
pose problems, which need to be tackled. Second,
the number of hydro power plants coming up in the
region, especially in Arunachal Pradesh, is expected
to be spread over the Twelfth and Thirteenth Plans
but the transmission system has to be devised as a
onetime operation and may therefore have redun-
dancy initially. This will increase the costs of trans-
mission. Thirdly, a number of States including
Arunachal Pradesh, Tripura and Manipur do not
have adequate 132/220/400 KV systems and this may
cause problems in evacuation of power. Fourthly, the
distribution system is inadequate and consequently
leads to large power losses.
14.67. The road map for the development of power
sector, strengthening of overall transmission system
and sub-transmission system of North-East Region
(NER) and Sikkim was brought out in Pasighat
Summit of North Eastern Council on 17 January
2007. As a follow-up to the recommendations of
the summit, a subgroup under the chairmanship
of Member (Power Systems), CEA was consti-
tuted to suggest the road map for strengthening the
transmission system in the region. Subsequently a
comprehensive review was taken at the Member
(Energy), Planning Commission level to find out
the modalities and source of funding to realise the
objective.
14.68. Based on the recommendation of CEA and
in consultation with each State of NER and Sikkim,
Power Grid has prepared detailed project reports for
comprehensive schemes for strengthening of trans-
mission, sub-transmission and distribution system in
each state of NER and Sikkim and also for interstate
transmission system in NER in June 2010. The esti-
mated cost of the above schemes is about `11,348.50
crore. The schemes were to be implemented in two
phases by 2015–16. Considering the strategic impor-
tance of Arunachal Pradesh and Sikkim, a separate
scheme for strengthening of transmission system for
these two has been formulated at an estimated cost
of about `3,014 crore. The Planning Commission
has conveyed its in-principle approval to this
scheme recently. Funding for this project will be
provided jointly by the Ministry of Development of
North Eastern Region (DoNER) and from the Non-
Lapsable Central Pool of Resources (NLCPR). For the
strengthening of transmission systems in the remain-
ing six states, Ministry of Power is exploring the pos-
sibility of tying up funds from the World Bank.
TABLE 14.21
Inter-Regional Flow of Power at the End of Twelfth Plan Period
Region End of Eleventh Plan End of Twelfth Plan (Tentative)
Eastern/Southern 3,630 3,630
Eastern/Northern 12,130 17,930
Eastern/Western 4,390 12,790
Eastern/North Eastern 1,260 2,860
Northern/Western 4,220 14,420
Western/Southern 1,520 7,920
132/110 KV Lines 600 –
North Eastern/Eastern–Northern/Western – 6,000
Total 27,750 65,550

152 Twelfth Five Year Plan
14.69. Integration of Indian electricity grid with
countries such as Bhutan and Nepal would result in
optimisation of electricity resources on a large scale
and provision of additional benefits and opportu-
nities to the selling and buying countries. This will
enhance hydro-thermal mix in generation, and
reduce carbon emission and dependence on fos-
sil fuels. An electric grid interconnection between
India and Bangladesh through a Berhampur (India)–
Bheramara (Bangladesh) 400 KV DC, 125 km line
along with 1 × 500 MW HVDC back to back asyn-
chronous link at Bheramara is being developed for
facilitating exchange of power up to 500 MW between
the two countries. The capacity of this interconnec-
tion can be upgraded in future. The asynchronous
link ensures that any fluctuations or disturbances on
one side would not affect the other side.
Challenges in Transmission Sector
14.70. The proposed rapid expansion of the capacity
to transfer capacity poses some serious challenges,
viz. right of way, flexibility in line loading and regu-
lation of power and improvement of operational effi-
ciency. Following measures may be implemented to
meet the above challenges:
• Upgradation of transmission lines
• High capacity 400 KV multi, circuit/bundle con-
ductor line
• High Surge Impedance Loading(HSIL) line
• Compact towers
• Increase in current: High Temperature Low Sag
(HTLS)
• Reduction in land for substation
• Regulation in power flow/FACATS devices
• Improvement of operational efficiency with con-
dition based monitoring and private maintenance
• Development of 1,200 KV AC system
• Creating adequate evacuation and transmission
facilities for renewable power including construc-
tion/strengthening of interstate transmission.
The Distribution System
14.71. The distribution segment plays a crucial role
in the overall functioning of the power sector because
it is the part of the system which generates the rev-
enues needed to pay generation and transmission
utilities. The viability of the power sector as a whole
is therefore critically dependent on the health of the
distribution sector. Unfortunately, as the Eleventh
Plan experience amply demonstrates, the financial
viability of the system is under severe strain. Poor
financial health of utilities has resulted in underin-
vestment in the distribution network causing poor
upkeep and maintenance. Consequently the quality
of supply is hampered, leading to customer dissatis-
faction and poor recovery. This, in turn, leads to fur-
ther deterioration of financial health of utilities. This
vicious cycle needs to be broken.
14.72. It is absolutely vital that the distribution sys-
tem is made financially viable during the Twelfth
Plan. The key focus of the Twelfth Plan must be
to strengthen the performance of the distribu-
tion system to achieve improved financial viability
of Discoms and to expand access to power in rural
areas. This calls for concerted attempts at AT&C
loss reduction, introduction of smart grid to allow
effective demand side management (DSM), greater
private sector participation to achieve management
efficiency and so on. Since distribution is entirely
the domain of States, the responsibility for improv-
ing distribution lies almost entirely with State
Governments. The Central Government can incen-
tivise action in a manner which allows the States
leeway for experimenting with different ways of
obtaining better results.
14.73. The Government had constituted the Shunglu
Committee in July 2010 to study issues relating
to the financial viability of the Ds and give recom-
mendations on how to improve the situation. The
Committee has since given its recommendations. In
order to examine these recommendations, and sug-
gest a strategy for the turnaround of the distribution
sector in the Twelfth Plan, an Expert Group under
the chairmanship of Member (Energy), Planning
Commission was set up to look into the problems
being faced by the State Discoms.
Debt Restructuring Policy
14.74. The Expert Group gave extensive recom-
mendations for improving the financial health of
the discoms during the Twelfth Plan. Based on the

Energy 153
recommendations of the Expert Group, the Cabinet
has approved a debt restructuring plan which can be
summarised as follows:
1. a. 50 per cent of the outstanding short term lia-
bilities (STL) as of 31 March 2012 to be taken
over by State Governments by way of bonds
to participating lenders shall be first con-
verted into bonds to be issued by Discoms
duly backed by the State Government guar-
antee. The State Government will take over
the liability during the next two to five years
by issuance of special securities in favour of
participating lenders in a phased manner
keeping in view the fiscal space available till
the entire loan (50 per cent of STL) is taken
over by the State Government.
b. The State Government would provide full
support to the Discoms for repayment of
interest and principal.
2. Balance 50 per cent of the STL will be resched-
uled by lenders and serviced by the Discoms with
a moratorium of three years on principal and
would be backed by a State Government guaran-
tee. The best possible terms are to be extended
for the rescheduled loans to improve viability of
Discoms’ operations.
3. The restructuring/reschedulement of loan is
to be accompanied by concrete and measur-
able action by the Discoms/States to improve
the operational performance of the distribution
utilities. In order to make the effort meaningful,
the State Government/Discoms have to commit
themselves and carry out certain mandatory and
recommendatory conditions contained in part
(c) of the Scheme.
4. To set up a Transitional Finance Mechanism in
support of the restructuring effort of the State
Government for their distribution utilities hav-
ing the following features:
a. For providing liquidity support by way of
a grant equal to the value of the additional
energy saved by way of accelerated AT&C
loss reduction beyond the loss trajectory
specified under Restructured Accelerated
Power Development and Reform Programme
(RAPDRP).
b. The eligibility of grant would arise only if the
gap between ARR and ACS for the year has
been reduced by at least 25 per cent during
the year judged against the benchmark for
the year 2010–11.
c. This scheme would be available only for three
years beginning 2012–13.
d. Incentive by way of capital reimbursement
support of 25 per cent of principal repay-
ment by the State Government on the lia-
bility taken over by the State Government
under the scheme. The amount to be reim-
bursed only in case the State Government
takes over the entire 50 per cent of the short-
term liabilities corresponding to the accu-
mulated losses outstanding as on 31 March
2012. Detailed guidelines for the Transitional
Finance Mechanism as outlined above would
be worked out by the Ministry of Power in
consultation with Ministry of Finance.
5. The Scheme would be applicable to all State
Discoms having accumulated losses and facing
difficulties in financing operational losses.
6. For removal of difficulties in interpreting or
implementing the Scheme, Ministry of Power may
be authorised to issue clarification, after inter-
ministerial consultations, wherever required, with
the approval of the competent authority.
14.75. Effective implementation of the restructuring
package during the Twelfth Plan would send a pow-
erful signal that the power sector is on the path of
financial viability.
Restructured APDRP
14.76. The challenge of providing power to all
involves considerable investment in distribu-
tion. The Working Group for the Twelfth Plan has
assessed a total investment requirement for the dis-
tribution sector at `3.06 lakh crore. Some of the key
initiatives proposed during the Twelfth Plan are:
1. The population norms under R-APDRP for
including a city under R-APDRP may be relaxed

154 Twelfth Five Year Plan
by lowering the existing population threshold.
More extensive coverage will bring uniformity
in billing and customer service of the util-
ity across all its service areas. R-APDRP may
also cover assistance to private distribution
companies.
2. A National Electricity Fund (NEF) had been set
up. This will now be operationalised. It will pro-
vide interest relief to the distribution utilities to
cover loans taken from financial institutions for
development of the distribution sector.
3. Utilities and regulators shall make an action
plan to eliminate the gap between the average
cost of supply and average tariff realised through
improved tariff implementation and adoption of
multi-year tariff framework.
4. Time of Day (TOD) metering shall be taken up
by all the utilities for effective demand side man-
agement (DSM).
5. Load shifting arrangement by regulators and
improvement in energy efficiency and its mea-
surement by BEE in the agriculture sector shall
contribute towards DSM and ease out the pres-
sure on utilities.
6. Open Access shall be provided to consumers
with more than 1 MW load in accordance with
the Electricity Act, 2003. This was mandatory
with effect from 1 January 1 2009 but it has not
been operationalised due to reluctance of State
Governments and the utilities to give the neces-
sary freedom to large customers to choose their
own sources of supply. In fact, under the law, the
State electricity regulator should not set tariffs
for large customers leaving them to be deter-
mined through negotiations.
7. To improve safety, counter theft and improve
aesthetics, underground cabling work shall
be taken up by the utilities for towns under
R-APDRP in selected areas.
8. Moving towards a smart grid in a manner rel-
evant to our needs will be a key focus area in the
distribution sector in the Twelfth Plan. A num-
ber of pilot projects will be taken up.
9. Phased installation of smart metres, extending
SCADA system to 100 more towns, and integra-
tion of renewable into the grid.
The Role of Private Investment and
Participation in Distribution
14.77. The experience of privatisation in Delhi,
Kolkata, Mumbai, Ahmedabad, and Surat shows
that transmission and distribution losses can be
reduced, network efficiency increased, and ser-
vice levels improved. The experiences in Bhiwandi,
Maharashtra of franchising have also indicated
positive gains with network losses going down from
63 per cent to 19 per cent in Bhiwandi and ser-
vice levels improving. The Franchise model is now
being expanded to Nagpur, Aurangabad, Jalgaon in
Maharashtra and Agra in Uttar Pradesh. An alterna-
tive model is public–private partnership (PPP) in the
distribution segment for which necessary concession
agreements are being designed. The Twelfth Plan
will have to place a major emphasis on expansion of
Franchise or PPP or privatisation in different utilities
as a strategy to reduce network losses and improve
efficiency of service and consumer satisfaction.
Separation of Rural Feeders
14.78. An important initiative to improve the avail-
ability of power in the rural areas and have more
effective management of power for the agriculture
sectors where the requirements may be for limited
hours, has been to separate rural feeders for light-
ing and agriculture loads. This was initiated by
Gujarat utilities and has subsequently been taken
up by Rajasthan, Andhra Pradesh, Haryana, Uttar
Pradesh, Chhattisgarh, Madhya Pradesh, Karnataka,
Maharashtra and a number of other States. A World
Bank study on the efficacy of these reforms is under-
way. According to the initial indications, the benefits
have been found to be more in the field of improved
lighting in the villages with varying degree of success
on reducing T&D losses.
Universal Electrification
14.79. The RGGVY was started with an aim to pro-
vide electricity connections to all villages and free
connections to BPL families (Annexure 14.1). It
has certainly provided increased access of power to
a large number of households as indicated in para-
graph 3.1.8. Clearly, there is still a large population
which is not using electricity either because of lack of
network in the villages or absence of connectivity to

Energy 155
the household. There are also a large number of hab-
itations left uncovered. To provide power to all dur-
ing the Twelfth Plan would require dealing with the
large backlog in the States of Uttar Pradesh, Bihar,
Odisha, Assam and some of the North Eastern States.
14.80. Connectivity by itself is only a part of the pro-
gramme. In many States there is also a real shortage
of power. Besides, RGGVY focuses only on house-
hold supply and does not address the needs for
providing electricity for small industries and agricul-
ture, which need three-phase supply. This, in turn,
requires strengthening of the rural network and not
just the last mile connectivity to households, which
is what RGGVY covers. States are often unable to
invest in this. For effective universal access, the
RGGVY programme will be restructured.
Human Resource Development and Capacity
Building
14.81. The present power scenario demands a very
comprehensive and pragmatic approach to attract,
use, develop and conserve valuable human resources.
Technically trained work force comprising of skilled
engineers, supervisors, artisans, managers and so
on are required in every sphere of the power sup-
ply industry. A growing concern over environmen-
tal degradation and depletion of the conventional
energy sources has made the task of electricity gen-
eration even more challenging and therefore, quality
standards of the staff are becoming increasingly vital.
14.82. For a capacity addition of about 1,00,000 MW
(including renewables) in the Twelfth Plan, the addi-
tional work force requirement shall be of the order
of 4 lakh out of which nearly 3 lakh will be techni-
cal. Therefore, all Central sector utilities, State sec-
tor utilities, and IPPs would need to create required
training infrastructure for providing O&M training.
Additional training infrastructure shall be created
by organisations like NPTI and training institutes of
other utilities. These should augment their existing
training institutes for meeting the increased training
requirement of the power sector.
R&D in Power Sector
14.83. The power sector being highly technology-
intensive, R&D plays a major role in its
developmental plans. In the present scenario, R&D
initiatives are particularly required in four different
conventional sectors, viz. generation, transmission,
distribution and environment.
14.84. Thermal, hydro, renewable energy and distrib-
uted generation are the key areas in the generation
sector. Design and development of the equipment,
real-time simulators and controllers, creation of data
bank, automation pilot plant demonstration, devel-
opment of alternative materials, equipment perfor-
mance, biological efforts and exploratory studies are
required in the transmission sector. R&D initiatives
in smart grid and distributed generation are required
for improvement of distribution sector. Major PSUs
involved should be encouraged to do the necessary
R&D. Further clean development mechanism for
bulk utilisation of fly ash, control of SOx, NOx and
mercury in coal-based thermal power plants need
immediate attention for clean and green energy.
14.85. R&D in distribution and rural electrification
needs more thrust. The key research areas may be
AC/DC micro-grid demonstration for improving
reliability and power quality, energy storage scheme
for improving the reliability of sensitive loads, devel-
opment of intra-operable standards and protocol
for energy metering, load research, I.T. applications
in distribution and smart grid and so on. R&D ini-
tiatives are also required for enhancing material
strength and durability and for standardisation on
their specifications. A key initiative for R&D in the
Twelfth Plan may include setting up of a technical
cell in CEA, which will focus on best practices, R&D
in data collection and specific projects and technical
support to States for consultancy and implementa-
tion. The research projects will include support to
universities.
Project Implementation
14.86. Land is increasingly becoming a scarce
resource and availability of land is posing a serious
challenge for future power plants. The optimum util-
isation of land is therefore crucial. Design changes
are required to reduce land requirement. Similarly,
availability of water has become scarce. To meet
future water demand of thermal power, technical

156 Twelfth Five Year Plan
measures for reducing water consumption, creation
of large reservoirs/dams of potential rivers to retain
flood water and encouraging coastal power plants
will be undertaken.
14.87. Achievement of the generation capacity tar-
gets depends critically on supporting infrastructure
in different transport sectors like railway, highways
and roads, inland waterways and gas pipelines.
Railways need to enhance their capacity for coal
evacuation from coal fields by expanding proposed
dedicated freight corridors and also ensure rail con-
nectivity to all ports having coal unloading facili-
ties. Roads and highways need to be augmented for
transportation of over dimensional consignments
and changes in Motor Vehicle Act may be required
to accommodate consignments, with safeguards, of
above 49 million tonnes and also include hydrau-
lic axle trailers. Accordingly, load classification for
roads and bridges may be reviewed and toll plaza
building on highways may be designed keeping these
requirements in view.
14.88. Coal handling arrangements at ports must be
expanded to handle the larger quantities of imported
coal required for power stations. Increase of draft,
creation of roll-on/roll-off berths and mechanisation
shall improve the load handling capabilities of ports.
All these ports must be given priority in effective
road/rail connectivity.
14.89. Adequate manufacturing capacities of main
plant equipment including that for large supercriti-
cal thermal sets shall be available indigenously to
meet the capacity addition requirement of the coun-
try during the Twelfth Plan. Regarding balance of
plants construction agencies and construction equip-
ment/techniques, the capacities and capabilities have
to be further developed and enhanced. There is no
shortage of key material except Cold Rolled Grain
Oriented Steel, higher grade Cold Rolled Non Grain
Oriented Steel and thick boiler steel plates. There is
a need to set up plants to produce Cold Rolled Grain
Oriented Steel, augment indigenous capacity for
tubes and pipes, create short circuit testing facilities
for transformers, augment manufacturing facilities
for gas-insulated substations and create indigenous
capacity for thicker boiler water plates. It should be
possible to set up domestic capacity in these areas
which is internationally competitive.
Management of Energy Demand and Energy
Efficiency
14.90. Improving energy efficiency is an impor-
tant instrument for containing the demand for
energy and several initiatives are possible in this
area. The Bureau of Energy Efficiency (BEE) and
the Ministry of Power (MoP) had introduced a
number of schemes during Eleventh Plan for pro-
motion of energy efficiency in India. The schemes
of BEE include Standards and Labelling (S&L),
Energy Conservation Building Code (ECBC), Energy
Efficiency in Existing Buildings, Bachat Lamp Yojana
(BLY), SDA strengthening, Energy Efficiency in
Small and Medium Enterprises (SMEs), Agriculture
and Municipal Demand Side Management (DSM)
and Contribution to State Energy Conservation
Fund (SECF). Schemes implemented by the Ministry
of Power include Energy Conservation Awards and
National Mission for Enhanced Energy Efficiency
(NMEEE). These schemes are estimated to have
achieved savings equivalent to 11,000 MW of avoided
power capacity during the Plan. Details of savings
projected to be realised through various measures are
given below, along with Plan for the period 2012–17.
Energy Efficiency in Equipment and Appliances
14.91. Large energy inefficiencies exist in consumer
and industrial appliances. The S&L Programme was
quite successful during the Eleventh Plan period and
it is anticipated that by the end of the Eleventh Plan,
total savings in avoided capacity addition would be
7,315 MW. Under this scheme, a large number of
appliances were covered initially under the voluntary
labelling categories, out of which four appliances/
equipment are under the mandatory labelling pro-
gram. The Eleventh Plan has already envisaged cov-
erage of 21 appliances under S&L. This programme
will be continued and expanded during the Twelfth
Plan.
Efficiency in Transport
14.92. As on 2010–11, there were a total of 13.3 mil-
lion passenger cars in India which consumed about

Energy 157
9 mtoe. An additional 1.1 million passenger cars are
added every year. In the transport sector, a label-
ling scheme is envisaged which is aimed at achieving
energy efficiency. This will cover:
• Introduction of fuel economy norms effec-
tive from the first year of the Twelfth Plan. This
will be mandatory from 2015 under the Energy
Conservation Act.
• Technical study for two- and three-wheelers and
commercial vehicles (Trucks and Buses) to final-
ise additional S&L Programme. Norms for these
will be modified.
14.93. The targeted energy saving by the end of the
Twelfth Five Year Plan is 4.3 mtoe in the sector.
Energy Efficiency in Industries
14.94. The total commercial energy consumed by
industry including SMEs stands at about 40–50 per
cent of the total commercial energy consumption
in the country. Hence energy efficiency measures
would yield substantial benefits in this sector. The
projected energy saving potential in the Twelfth Plan
is 13.18 mtoe which consists of a saving of 6.2 mtoe
from the seven energy-intensive industries (DCs),
1.75 mtoe from SME sector and 5.23 mtoe from ther-
mal power stations sector.
National Mission for Enhanced Energy Efficiency
(NMEEE)
14.95. NMEEE is one of the eight Missions created
by India’s National Action Plan for Climate Change
and is based on the Energy Conservation Act, 2001.
The Mission will enable transactions in energy effi-
ciency. Specific initiatives envisaged by the NMEEE
include:
• Perform Achieve and Trade scheme—a market-
based mechanism to enhance energy efficiency
(see Box 14.3 for details). The scheme is expecting
an energy saving of 3.5 million tons of oil equiva-
lent (mtoe) in seven selective industrial sectors
and 3.1 million tons of oil equivalents in thermal
power stations by 2014–15;
• Market Transformation for Energy Efficiency
(MTEE)—CDM roadmap, Standards and
Labelling, ESCO promotion, capacity-building;
• Financing Energy Efficiency—tax exemptions,
revolving fund, Partial Risk Guarantee Fund; and
• Promotion of performance contracting business
model—enabling upgradation of existing build-
ings, streetlights, municipal pumping and so on
through Energy Service Companies which invest
in the upgradation and are paid through sharing
of the resultant savings in the energy bill.
14.96. Fans and Lights are the major users of elec-
tricity in homes and offices across the country.
Energy consumption by fans and lights is expected
to occur rapidly because of increasing incomes and
enhanced access to electricity. During the Twelfth
Plan period the introduction of ‘super-efficient’
lights and fans will be incentivised so as to accelerate
their development and adoption to enable lower the
rate of growth of electricity demand while enhancing
services to households.
Box 14.3
Perform, Achieve and Trade Mechanism
The Perform, Achieve and Trade (PAT) mechanism is a market-based mechanism to incentivise improvements in energy
efficiency in eight energy-intensive industries (including TPS) by setting up standards and certification of energy saving
achieved which can be traded. The vision for PAT scheme during Twelfth Plan covers the following points:
• While implementation of the first cycle of PAT is to achieve the set target of 6.6 mtoe by 2014–15, widening and
deepening the scope of PAT during the second cycle of PAT envisages including other energy-intensive sectors like
efineries, Chemicals, Petrochemicals, Automobile Manufacturing, Sugar, Glass and so on to reduce the threshold energy
consumption limit;
• Fiscal instruments like Partial Risk Guarantee Fund (PRGF) and Venture Capital Fund for Energy Efficiency (VCFEE)
which have been proposed in NMEEE for successful implementation of PAT scheme will be expanded in order to provide
confidence to the financial institutions and to equity investors to invest in energy efficiency products and companies.

158 Twelfth Five Year Plan
14.97. Major R&D programmes may be initiated in
selective areas and selective sectors for developing
new customised energy-efficient technology through
indigenous development of applications of already
available energy efficient technologies/concepts.
14.98. The total projected saving in the year 2016–
17, that is, end of the Twelfth Five Year Plan is of the
tune of 11.43 mtoe in which 10.41 mtoe is contrib-
uted by thermal energy. The rest, which is equivalent
to 11.96 BU of electricity saving is estimated at bus-
bar in 2016–17.
Policy Reforms in the Power Sector
14.99. The Twelfth Plan must push for policy
reforms in several areas, the most important of
which are listed below:
1. Resolution of fuel supply problems related
to availability of coal and gas for the plants
expected to come on stream in the Twelfth Plan
will be critical. These are discussed in the section
on Coal and Gas in this Chapter.
2. The introduction of open access must have top
priority. State Governments, SERCs and Discoms
need to conform to the Electricity Act, which pro-
hibits tariff regulation for consumers of 1 MW
and above. These consumers must be free to pur-
chase electricity through open access in a com-
petitive market. Where cross-subsidy is required,
an open access surcharge may be levied. The Act
requires phased implementation of open access to
all consumers. By the end of the Twelfth Plan, all
consumers up to 0.25 MW may be covered.
3. There is a need to develop ancillary power mar-
kets and CERC should come out with a frame-
work for implementation of such market. To
facilitate further development of power market,
jurisdiction issues regarding forward and future
market products may be clarified in the policy/
Act. Development of markets can be expanded
further by permitting short-term procurement
for three months in advance by the Discoms.
Also, long-term procurement and medium-term
procurement by the Discoms may be encour-
aged and impediments, if any, may be identified
and removed.
4. Strengthening of NLDC/RLDCs/SLDCs is vital
for effective grid management and for imple-
mentation of open access. It is necessary to sepa-
rate the management of POSOCO from PGCIL.
The State Governments must take steps to
upgrade and modernise the SLDCs which must
be made functional and financially independent
in accordance with the Electricity Act.
5. Spinning reserves need to be facilitated for grid
stability at the regional level to accommodate
infirm renewable energy injection into the grid.
The State Governments need to contract addi-
tional capacity for this purpose.
6. Suitable incentives for low-cost transmission,
linking the renewable energy generation sources,
development of smart grid for evacuation and
transmission of renewable power and creation
of spinning reserves may be done through the
National Clean Energy Fund.
7. There is a need to strengthen measures for
increasing share of renewable energy over time.
SERCs should provide long-term trajectory for
renewable purchase obligations and issue rel-
evant regulations within a specified timeframe.
Further, for the procurement of renewable
power, demand of more than one distribu-
tion licensee may be pooled at the State level or
jointly among States and procurement through
competitive bidding route under section 63(a)
of Electricity Act 2003/National Tariff Policy
should be made permissible.
8. Power procurement and allocation of power
must be done in line with the Tariff Policy and the
guidelines/standard bid documents (SBD) issued
by Government of India under the Electricity
Act, 2003. The National Electricity Policy (2005)
may need to be suitably amended to ensure State
Governments abide by these provisions.
9. Consumer Grievance Redressal Forum (CGRF)
should be made a multi-member set-up com-
prising representation from all stakeholders. The
office of Ombudsman should be funded by the
SERCs.
10. Reforms in the distribution sector should include:
a. Prepaid metres to those categories of con-
sumers who are chronic defaulters, 100 per

Energy 159
cent spot billing, spot collection, semi or fully
automatic meter reading and standardisation
of metering protocols for extensive use of
automated meter readings.
b. Institution of Chief Electrical Inspectorate
to Government of India/State Government
(CEIG) to be strengthened and to work out
a scheme for delegation of authority of man-
datory inspection including self-certification
to the CEIG to liberalise it from unnecessary
controls.
c. Separation of rural feeders to control losses
and improve power availability. Dedicated
feeders may be extended to energy-intensive
consumers at their cost.
11. The State Government should clear all the out-
standing dues to the utilities, and ensure timely
payment of subsidy. State Governments with
financially strained Discoms should be encour-
aged to undertake restructuring of the debt as per
the package recently approved by the Cabinet.
This includes restructuring of short-term loans
of Discoms with poor financial health, sharing
by concerned State Governments of the bur-
den of the utilities to the extent of 50 per cent of
such short-term loans, provision of special mar-
ket bonds and relaxation of FRBM norms for
the State Governments. Financial restructuring
should be supported by regular revision of tar-
iff through adoption of regulations suggested by
Forum of Regulators, including automatic tariff
adjustment with change in fuel prices and other
reform measures to ensure regular revision of
tariff and simultaneous investments in reducing
AT&C losses.
12. There is a need for an independent oversight
over programmes like RGGVY and R-APDRP
on a concurrent basis. These should be incorpo-
rated in these schemes for the Twelfth Plan.
3.3. COAL AND LIGNITE SECTOR
14.100. Coal is the mainstay of India’s energy sector
accounting for over 50 per cent of primary commer-
cial energy supply in 2010–11. This share will actu-
ally increase to 57 per cent over the next 10 years.
The gap between the demand and the domestic
supply of coal has made it imperative to augment
domestic production both from the public sector and
the private sector and to expedite the reform pro-
cess for realising efficiency gains through increased
competition in the sector during the Twelfth Plan.
An important feature of the Eleventh Plan was the
attempt to augment domestic coal production from
captive mines. However, the programme has slipped
and expected production from captive blocks fell well
short of the projected target of 104 million tonnes in
the terminal year of the Plan because only 29 captive
blocks could start production out of the 195 blocks
allocated so far. The main impediments in the prog-
ress of captive mining are reported to be similar to
those in other PSU-held blocks like delays in for-
est and environmental clearances, problems of land
acquisition and R&R, allocation of a block to more
than one user and so on. CIL will continue to play a
major role in meeting the coal requirements of the
country but the growth in CIL production will not
be enough to meet the rising demand. Hence, efforts
need to be made to ensure that additional captive
coal blocks start producing in Twelfth Plan to meet
the rising coal demand. It is also necessary to plan
for larger imports of coal.
REVIEW OF THE ELEVENTH PLAN
Coal Demand and Production
14.101. The target for coal production at the end
of the Eleventh Plan was initially set at 680 million
tonnes and revised downwards to 630 million tonnes
at the time of the MTA. The actual achievement was
only 540 million tonnes. Since demand in the termi-
nal year (2011–12) of the Eleventh Plan was around
640 million tonnes there was a large demand–supply
gap of 100 million tonnes which was only partially
met by imports. This has adversely affected the coal
supplies to end consumers, particularly the power
sector. It is estimated that out of capacity addition of
41,894 MW, around 25,000 MW of coal-based capa-
city commissioned is being sub-optimally utilised
because of inadequate availability of domestic coal.
14.102. The widening gap between demand and sup-
ply has to be met by imports because of which the
share of imports in the total coal demand is likely to

160 Twelfth Five Year Plan
increase to around 14.06 per cent in 2011–12 as com-
pared to just 9 per cent in the year 2006–07. Details
of coal imports in Eleventh Plan are given in Table
14.22.
Lignite Production and Demand
14.103. The Eleventh Plan envisaged lignite produc-
tion to reach 54.96 million tonnes in the terminal
year of the Plan (2011–12) from 31.13 million tonnes
in 2006–07 yielding a growth rate of 12 per cent. The
projected production of 54.96 million tonnes was
expected to come from lignite mines spread in three
contributing States with their respective share as
24.23 million tonnes from Tamil Nadu, 22.26 million
tonnes from Gujarat and 8.47 million tonnes from
Rajasthan. However, actual production in 2011–12
was 43.10 million tonnes combined from all the three
states. This shortfall is mainly due to non-starting of
several mines under Private and State Sector and due
to delay in commissioning of lignite-based power
plants and certain mines under the Central Sector.
As far as NLC is concerned, thinning of lignite seam
thickness and the washout zone encountered in Mine
I is the main reason for the shortfall of 2.42 million
tonnes in Tamil Nadu. Similarly, in Barsingsar Mine
under NLC at Rajasthan, though the mine is ready in
all respects to give full production, it was warranted
to limit its production to cope with the demand of its
linked TPS which has certain teething problems. The
lignite based capacity addition in the Eleventh Plan
is 1,490 MW against the target of 2,280 MW.
Coal and Lignite Reserves
14.104. The inventory of geological resources of
India’s coal and lignite reserves as on 1 April 2010
has been shown in Table 14.23. This is 15.09 per cent
higher than the reported reserves level of 255 billion
tonnes in January 2007. Corresponding increase in
lignite reserves level is 9.6 per cent from 38.27 billion
tonnes reported level in 2007. The accretion of coal
resources over the years has been shown in Table
14.24.
Review of the Central Sector Schemes
14.105. The schemes implemented with budget-
ary support from the Ministry’s plan covered
regional/promotional exploration, detailed drilling
in non-CIL blocks, Environmental Measures and
TABLE 14.22
Details of Coal and Lignite Production
Sl. No. Parameter Tenth Plan
2006–07
Eleventh Plan (2011–12) Eleventh Plan % CAGR
Initial MTA Latest Initial MTA Latest
01 234789
1 Coal Demand (million tonnes) 474.18 731.10 713.24 640.00 9.53 8.98 6.98
2 Coal Production (million tonnes) 430.84 680.72 629.91 539.99 9.58 7.89 4.62
3 Imports 43.08 51.00 83.33 90.00 3.43 14.11 15.88
4 Imports as per centage of total demand 9.00 6.98 11.68 14.06
5 Lignite Production (million tonnes) 31.28 54.96 42.59 41.64 12.04 12.04 6.72
Source: Ministry of Coal.
TABLE 14.23
Inventory of Coal and Lignite Reserves as on 1 April 2012
(billion tonnes)
Proved Indicated Inferred Total
Coal 118.145 142.169 33.183 293.497
Lignite 6.18 25.76 10.02 41.96
Source: Ministry of Coal.

Energy 161
Subsidence Control scheme (EMSC), R&D schemes,
Conservation and Safety measures and development
of transport infrastructure in the coal fields and
so on.
Regional/Promotional Exploration
14.106. Exploration for coal and lignite in the coun-
try is taken up in stages. In preliminary exploration,
geological surveys are undertaken by the Geological
Survey of India (GSI) to identify potential coal and
lignite areas. Regional promotional exploration aims
at widespread drilling to establish broad framework
of the deposits to facilitate planning for detailed
exploration and subsequent projectisation and mine
development. While regional exploration drilling
target for Eleventh Plan was 1.94 lakh metres which
was revised to 1.47 lakh metres, promotional drill-
ing target was 4 lakh metres. Against the envisaged
targets, achievement will be 1.14 lakh metres (about
78 per cent) in case of regional drilling, establishing
7.07 Bt of coal and 2.95 lakh metres (74 per cent) in
case of promotional drilling, establishing 20.05 Bt of
coal resources.
14.107. In case of lignite, regional exploration drill-
ing achievement is likely to be 1.32 lakh metres
against a target of 1.48 lakh metres during Eleventh
Plan mainly by NLC and by other agencies, viz.
GMDC and RSMML establishing 1.85 Bt of lignite
resources. Achievement in promotional exploration
is likely to be 2.74 lakh metres (78 per cent) against a
target of 3.50 lakh metres establishing 3.22 Bt of lig-
nite resources.
14.108. 2D HRSS surveys were not a part of the
exploration programme of Eleventh Plan. However,
in view of trends worldwide, these surveys were con-
sidered as a part of regional (promotional) explo-
ration by Subcommittee on Energy Minerals. The
National Geophysical Research Institute (NGRI),
a premier organisation for geophysical studies in
the country, was therefore, inducted to carry out
these surveys in coal and lignite bearing areas. It is
expected that a total of 31 Line kilometre (L.km) in
coal areas and 94 L.km in lignite areas HRSS survey
will have been carried out during the Eleventh Plan.
Detailed Drilling in Non-CIL Blocks
14.109. Detailed exploration surveys focus on
establishing adequate geological resources data for
projectisation and mine development. The blocks
outside the purview of CIL have been proposed to be
explored in detail for reducing the time lag between
offering the blocks to potential entrepreneurs and
starting of the operation by them through budget-
ary support. The cost of exploration, in turn, will be
recovered from entrepreneurs who have been allot-
ted the blocks. CMPDI and its contractual agencies
including MECL have been able to progress well in
detailed exploration activities and are expected to
achieve 8.09 lakh metres against a target of 13.50
lakh metres in non-CIL blocks establishing 5.2 Bt of
private coal reserves.
14.110. Regarding detailed exploration in CIL
blocks as against a target of 5 lakh metres, the actual
achievement has been 11.2 lakh metres (224 per cent)
TABLE 14.24
Accretion of Coal Reserves
(million tonnes)
Reserves
as on
Proved
Category
Accretion in
Proved Category
Inferred
Category
Indicated
Category
Total
Reserves
Reserves
Accretion
1 January 2005 92,960 – 1,17,090 37,797 2,47,847 –
1 January 2007 97,920 4,960 1,18,992 38,260 2,55,172 7,325
1 April 2008 1,01,829 3,909 1,24,216 38,490 2,64,535 9,363
1 April 2009 1,05,720 3,891 1,23,570 37,921 2,67,211 2,676
1 April 2010 1,09,798 4,078 1,30,654 36,359 2,76,810 9,599
1 April 2011 1,14,002 4,204 1,37,471 34,390 2,85,862 9,051
Source: Coal Directory of India.

162 Twelfth Five Year Plan
of exploratory drilling achieved by CMPDIL and by
contractual agencies including MCCL and 9.01 bil-
lion tonnes of coal reserves were proved during the
Eleventh Plan. SCCL has achieved 2.99 lakh metres
of actual drilling against a target of 3.39 lakh metres
and estimated 0.91 billion tonnes of coal reserve
through detailed exploration.
Productivity and Benchmarking
14.111. Traditionally, the output per man shift
(OMS) has been measured as tonnes in coal mines
and it has improved significantly for all the three
PSUs operating in coal and lignite mining. While
overall OMS in case of CIL improved from 3.54
in year 2006–07 to 4.92 in year 2011–12 this was
still lower than the target of 5.54 in the terminal
year of the Eleventh Plan. In case of SCCL this has
improved from a level of 2.39 to 3.80 over the same
period, which is significantly higher than the tar-
get of 2.67. This significant improvement in overall
OMS level is for both opencast and underground
mining operations. This could be due to the out-
sourcing of some of the activities, particularly in
the opencast mining operations. In case of NLC,
the improvement is marginal because lignite pro-
duction level could not increase due to delays in
the completion of lignite-based power plants. One
of the important areas to improve productivity is
benchmarking of operations and equipment pro-
ductivity. Productivity of equipment and machin-
ery used in opencast and underground mining has
significantly improved during the Eleventh Plan
period.
Clean Coal Technologies
14.112. Coal beneficiation is one of the prime clean
coal technologies aimed at supplying washed coal
to the pulverised coal combustion boilers of power
plants. The MoEF’s directive aimed at restricting the
use of coal of not more than 34 per cent ash content
at thermal power stations located far away from pit
heads and load centres and critically polluted areas,
has also contributed to improvement in economics
of operations of such power stations. The CIL envis-
aged building 20 new washeries with a capacity of
111 mt in the Eleventh Plan. However, coal washing
capacity did not grow as planned due to delays in
awarding of contracts to set up washeries by the CIL.
The coal washing capacity at the end of the Eleventh
Plan is as indicated in Table 14.25.
TABLE 14.25
Coal Washing Capacity by the end of
Eleventh Plan Period
(in million tonnes)
Coking
Coal
Non-coking
coal
Public 24.22 17.22
Private 5.66 78.74
Total 29.88 95.96
Washed Coal Production 7.18 40.95
Coal Bed Methane
14.113. The potential of Coal Bed Methane/Coal
Mine Methane was recognised in a new policy of
Government of India in 1997. The Ministry of Coal
(MoC) and the Ministry of Petroleum and Natural
Gas (MoP&NG) are working together for the devel-
opment of Coal Bed Methane and the Government
has offered 33 blocks in four rounds of bidding for
CBM covering 17,416 sq. km of area. One block in
Raniganj coalfield has commenced commercial pro-
duction in 2007 and two blocks are in advanced stage
of commencing production. The Director General
of Hydrocarbons (DGH) is the regulator for CBM
activities in the country. The CBM/CMM clearance
house has been established in CMPDIL, Ranchi,
in collaboration with United States Environment
Protection Agency (USEPA) which will provide
information for development of CBM/CMM in
India. The current level of production, being only 0.2
mmscmd, is confined mostly to the private sector.
There is no separate pricing regime for CBM and the
gas prices are determined by the developer, subject
to Government approval.
Research and Development
14.114. A total of 29 R&D projects were imple-
mented during the Eleventh Plan. Out of these, 16
projects have already been completed by September
2012. Remaining 13 projects are likely to slip into
the Twelfth Plan period. Some of the major projects
under implementation are:

Energy 163
• Development of CMPDI capacity for delineation
of viable coal mine methane (CMM)/abandoned
mine methane (AMM) blocks in the existing and
potential mining areas having partly de-stressed
coal in virgin coal seams.
• Recovery and utilisation of coal methane in Jharia
and Raniganj coalfields.
• Development of immediate roof fall prediction sys-
tem in underground mines using wireless network.
• Demonstration of cost-effective technology for
dry beneficiation of coal by all airjig.
• Demonstration of coal dry beneficiation system
using radiometric technique.
• Assessment of prospect of shale gas in Gondwana
basin with special reference to CIL areas.
• Development of indigenous catalyst through
pilot-scale studies of coal to liquid (CTL) conver-
sion technology.
• High resolution seismic monitoring for early
detection and slope failures in opencast mines.
• Application of Ground Penetrating Radar (GPR).
• Integrated communication system to locate
trapped miners in underground mines.
• Development of self-advancing (mobile) goaf
edge supports (SAGES) for de-pillaring opera-
tions in underground coal mines.
Conservation and Safety in Coal Mines
14.115. Safety of miners and safe mining operations
are of paramount importance in coal mining. These
two schemes are under the statutory provisions of
Coal Conservation and Development Act (CCDA)
and were being implemented as a part of non-Plan
scheme during the Tenth Five Year Plan through
reimbursement of cess collected under CCDA. The
Ministry of Finance has taken a view that cess col-
lected under CCDA is a revenue of the Government
of India, which is reimbursed back to coal compa-
nies for implementation of these schemes. Therefore,
these schemes are treated as Plan schemes during the
Eleventh Plan.
Development of Transport Infrastructure in
Coal Field Areas
14.116. Development of infrastructure in coalfields
is essential to ensure the timely evacuation of coal
produced in mines to the rail heads or railway yards.
Also substantial time is taken by Railways to build the
critical rail links and that is affecting the movement
of coal to the end users. Four critical rail links that
have been pending for years are the Tori–Shivpur–
Katholia rail link in North Karanpura coalfield (CCL
command area), the Bupdevpur Baroud rail link con-
necting coal blocks in Mand Raigarh coalfield, the
Jharsuguda–Barpalli railway line in IB valley coal-
field and the Sattapalli–Bhadrachalam rail link (SCCL
command area). Commissioning of these lines would
facilitate movement of around 125–130 million
tonnes of coal to end users. Construction of Tori–
Shivpuri line was delayed due to delays in getting for-
est clearance. Railways have changed the alignment
of the line to bring down the forest land involved and
MoE&F has cleared the project recently with certain
conditions. Railway Board is yet to approve the imple-
mentation of the Bupdevpur Baround rail link. CIL,
State Government and Railways are in discussion to
implement other critical links in Mand–Raigarh area
in joint venture to facilitate coal movement from the
upcoming mines. The SCCL and Railways were not
able to sort out the differences in the implementation
of Sattapalli–Bhadrachalam link project but this issue
has been resolved recently and SCCL has agreed to
provide funds to the Railways to implement the proj-
ect on turnkey basis.
Environmental Measures And Subsidence
Control
14.117. The purpose of this scheme is to improve
environmental conditions in old mined-out areas,
particularly Jharia and Raniganj coalfields through
implementation of a number of schemes for mitigat-
ing the damage caused by unscientific mining, car-
ried out before nationalisation of coal mines. Under
the scheme, a Master Plan proposal for Jharia–
Raniganj coalfields with a total outlay of `9,773.84
crore was taken up to deal with fire, rehabilitation
of uncontrollable subsidence-prone inhabited areas
and diversification of roads/railway lines within
command area of BCCL and ECL. Recently, the
Cabinet has approved the scheme. For implemen-
tation of the Master Plan, Jharia Rehabilitation and
Development Authority (JRDA) for BCCL areas and
Asansol Durgapur Development Authority (ADDA)
areas have been notified as implementing agencies by

164 Twelfth Five Year Plan
the respective State Governments of Jharkhand and
West Bengal. A High Powered Central Committee
under the Chairmanship of Secretary (Coal) with
representatives from other Ministries/Departments,
State Governments of Jharkhand and West Bengal
and concerned coal companies, has been moni-
toring the implementation of the Master Plan.
Demographic surveys and land acquisition by JRDA
and ADDA are in progress.
Integrated Coal and Lignite Resource
Information System (ICRIS and ILRIS)
14.118. ICRIiS and ILRIS are coal and lignite
resources structured on the UNFC pattern approved
in October 2004 and are under progress at different
data centres in CMPDI/Singareni and NLC. These
projects need to be continued during the Twelfth
Plan with enhanced outlays for successful comple-
tion, maintenance and regular updating.
Application of Information Technology
14.119. Information Technology (IT) has been used
by the coal industry in India for improving produc-
tivity and decision making. Some of the applications
already in use are:
• Enterprise resource planning (ERP).
• Real-time trip counting system at opencast mines
with latest technologies like GPS, GIS, GSM,
RFID, Wi-Fi and so on.
• Proximity warning system for HEMM at opencast
mines.
• Truck movement monitoring system at weigh-
bridges and coal handling plants mines with latest
technologies like GPS, GIS, GSM, RFID, Wi-Fi,
and so on.
• Online underground air and gas monitoring sys-
tems (CH4, CO, Temperature).
• UG communication system and miners’ tracking
with warning system for the miners entering the
unsafe areas.
14.120. An SAP-ERP system in coal mines in the
country has been introduced by SCCL with effect
from July 2008 covering business processes related
to Purchase and Stores, Marketing and Dispatches,
Quality Management, Human Capital Management,
Finance and Accounts, and Costing. The CIL is also
in the process of adopting such a system in the near
future.
Financial Performance of Coal Sector
14.121. The approved Eleventh Plan outlay of
`37,100 crore for MoC was planned to be financed
through an IEBR of `35,774.37 crore, and a GBS of
`1,326.00 crore. The budgetary support sought for
the Ministry’s plan schemes covered regional/pro-
motion exploration, detailed drilling in non-CIL
blocks, Environmental Measures and Subsidence
Control Scheme (EMSC), R&D schemes, conser-
vation and safety measures and development of
transport infrastructure in the coal fields. These
schemes were proposed to be funded by subsidence
excise duty collected under CCDA, IEBR of CIL
and budgetary support. Actual expenditure during
the Eleventh Plan is `26,337.62 crore which is only
63 per cent of the approved outlay. This comprises
`26,374.20 crore of IEBR of three PSUs namely CIL,
SCCL and NLC and balance `1,500 crore GBS for
Ministry of Coal funded schemes. The major short-
falls are in the reported expenditure of CIL and NLC
whereas SCCL is expected to spend `3,707.59 crore
against the approved IEBR of `3,340 crore. The finan-
cial performance of the coal sector is summarised in
Table 14.26.
THE TWELFTH PLAN
Coal Demand
14.122. Total demand for coal grew by around 6.6
per cent during the Eleventh Plan against domestic
production growth of only 4.61 per cent, and the gap
was filled from higher imports. The projected GDP
growth targeted during the Twelfth Plan will lead
to a high demand for coal in the next five years on
a business-as-usual basis. However, increased effi-
ciency measures, including introduction of super-
critical technology in power plants will reduce the
demand for coal. The trend growth for coal demand
during the Twelfth Plan is therefore likely to be simi-
lar to that in the Eleventh Plan.
14.123. Ministry of Coal has projected two scenarios
of coal demand during the Twelfth Plan. Scenario I

Energy 165
projects a demand of 1,204 mt in the terminal year of
the Twelfth Plan and Scenario II projects 980.5 mt.
Scenario I implies 13.5 per cent CAGR and Scenario
II implies a growth rate of 8.9 per cent. Scenario II
is considered realistic, based on specific consump-
tion in each consuming sector observed in the past
few years. From this scenario, total coal demand will
reach 980.50 million tones, an increase of 186 mil-
lion tonnes over the Twelfth Plan period as shown in
Table 14.27.
TABLE 14.27
Coal Demand during the Twelfth Plan
(in million tonnes)
Sector Eleventh Plan
(2011–12)
Annual Plan
Demand Projection
Twelfth Plan
(2016–17)
Demand Projection
Scenario II
Coking Coal 46.67 67.20
Power Utility 412.00 682.08
Power Captive 40.00 56.36
Cement 28.89 47.31
Sponge Iron 30.47 50.33
Others* 81.97 77.22
Total non-coking 593.33 913.30
Grand Total 640.00
(6.6 %)
980.50
(8.9 %)*
* Annual average growth rate during the Twelfth Plan period.
Source: Working Group on Coal and Lignite.
14.124. The total demand by the power sector
including that from captive power plants is expected
to be 75 per cent of the total coal demand during the
terminal year of the Twelfth Plan. The share of the
steel sector is expected to be 6.85 per cent of the pro-
jected demand and the shares of cement and sponge
iron sectors are expected to be 4.8 per cent and 5.1
per cent respectively and balance 7.9 per cent is esti-
mated to be consumed by the brick and others sec-
tors. Cumulative annual growth rate of coal demand
during the Twelfth Plan is projected to be around 8.9
per cent. Coal demand for Eleventh Plan and Twelfth
Plan is given in Annexure 14.2.
14.125. The total addition to electric genera-
tion capacity in the Twelfth Plan is targeted at
88,536.6 MW, which includes 69,280 MW of coal-
based capacity. The estimates for coal requirements
of the power sector have been computed consider-
ing the fact that 40,000 MW of capacity based on
Supercritical technology will be added in the Twelfth
Plan and efficiency measures are also being taken.
Further, power generation capacities were running
at very high PLF so far, in view of high demand–sup-
ply gap. With the planned increase of new capaci-
ties and the pace of setting up new power capacities
getting accelerated, the PLF of the power plants is
likely to go down. Taking all these factors together, it
is estimated that the total demand for coal from the
power sector may be 738.44 mt in the terminal year
of the Twelfth Plan 2016–17. Taking into account
TABLE 14.26
Financial Performance of the Coal Sector
(in ` Crore)
Sl. No. Sector The Eleventh Plan Outlay
Approved MTA Anticipated
1 CIL 17,390.07 16,090.68 13,460.78
2 SCCL 3,340.00 3,802.07 3,707.59
3 NLC–Power 12,051.41 6,140.61 6,246.36
4 NLC–Mines 2,826.00 2,334.39 1,483.67
5 Total NLC 14,877.41 8,475.00 7,730.30
Total IEBR 35,607.48 28,367.75 24,898.40
6 Central Sector Schemes 1,326.01 4,225.80 1,416.19
Total MOC 36,933.49 32,623.55 26,314.59

166 Twelfth Five Year Plan
the requirements of steel, cement and other sectors
of the economy, the total coal demand is estimated
at 980.50 mt. The quality of coal available from the
MCL and IB valley mines has been poor and a large
portion of coal during the Twelfth Plan will be pro-
vided by these mines. If the overall quality of coal
available from domestic mines deteriorates, the total
coal demand may go up.
Coal Production
14.126. The initial years of the Twelfth Plan are
likely to see continuing constraints on coal avail-
ability reflecting the difficulties experienced in
increasing production in the last two years of the
Eleventh Plan. Delays in obtaining E&F clearances,
land acquisition and R&R issues continue to plague
coal production and remedial action is urgently
needed. There is an urgent need to take effective
measures to step up coal production. The Working
Group on Coal in the most optimistic scenario
(Scenario II) has suggested domestic production
for the Twelfth Plan period from various sources as
shown in Table 14.28.
TABLE 14.28
Coal Production
(in million tonnes)
Sector Eleventh Plan
(2011–12)
Twelfth Plan
(2016–17) Projection
Scenario II
CIL 435.84 615.00
SCCL 52.21 57.00
Captive Blocks 36.04 100.00
Others 15.91 23.00
Grand Total 540.00 795.00
Source: Ministry of Coal.
14.127. The incremental production envisaged in the
optimistic Scenario of the Twelfth Plan works out
to 255 million tonnes over the production level of
540 million tonnes during the Eleventh Plan. Major
contribution has to come from the CIL, which is
expected to add incremental production of 185.5 mil-
lion tonnes yielding a cumulative annual growth rate
in coal production of 8 per cent. This is much higher
than the actual growth rate of 4.6 per cent achieved
in the Eleventh Plan. Details of coal production in
the Eleventh Plan and envisaged production during
the Twelfth Plan period are given in Annexure 14.3.
14.128. A number of initiatives are being taken
to promote faster extraction of coal. The policy on
competitive bidding for allocations of captive blocks
has been finalised by the Ministry of Coal and is
expected be made operational during 2012–13. This
should result in allocation of new coal blocks.
Import Requirements
14.129. The level of imports at the end of the Twelfth
Plan is projected to increase from 137 million tonnes
of Indian quality coal at the end of the Eleventh Plan
to 185 million tonnes at the end of the Twelfth Plan
based on total coal demand of 980 million tonnes
and domestic supply of 795 MT. If domestic supply
does not match the target growth rate of 8 per cent
per year, the import demand will be higher. The pro-
jected level of imports of around 185 million tonnes
is large keeping in mind that international trading in
coal is only around 900–1,000 million tonnes (15–16
per cent) of the total consumption of over 6,000 mil-
lion tonnes world over, and there are competing
requirements from other countries like China who
have large coal-based capacities. The international
availability of coal is going to be restricted due to
concerns on climate change. International prices of
coal are also likely to remain high because of taxes
which are being imposed by several coal-producing
countries including Australia and Indonesia.
Underground Mining
14.130. Only 15 per cent of India’s coal production is
from underground mines. The industry aims to reach
a total coal production of 30 per cent from under-
ground mines by 2030. There is a clear trend towards
underground mines as this has positive implications
for the environment. However, the extraction of coal
from the underground mines is lower than that from
the opencast mines. In forest areas, underground
mining is clearly feasible and will sharply reduce
the impact of ecological degradation. It is, however,
feasible only if the pool reserves and the seam thick-
ness permits its exploitation accordingly. The share
of coal production for underground mines in major
coal producing countries is given in Table 14.29.

Energy 167
TABLE 14.29
Share of Underground Production in Total Production
Sl. No. Country Percentage (%)
1 China 90
2 USA 33
3 Australia 20
4 India 10
14.131. Considering the emerging hurdles in for-
est clearance and land acquisition in future, seri-
ous efforts need to be made to increase the share of
underground production considerably by the end of
the Twelfth Plan by focusing on long wall technol-
ogy and productivity in underground mines. Indian
coal companies must accept the challenge of trans-
planting the international best practices with more
effective management. CIL can have joint ventures
or formulate PPP projects with appropriate terms
with renowned international players to shore up the
underground production level in the Twelfth and the
Thirteenth Plans.
Lignite Demand and Production
14.132. The Twelfth Plan envisages lignite demand
of 68.60 million tonnes in the terminal year 2016–17
of the Plan which includes production from Tamil
Nadu, Gujarat and Rajasthan—27.20, 21.60 and
19.80 million tonnes respectively. The additional
lignite-based power generation capacity during the
Twelfth Plan is envisaged as 2,280 MW. It is stated
that projected lignite production of 68.60 million
tonnes would almost be adequate to meet the grow-
ing demand for various sectors consuming lignite.
The projected shortfall would be around 10 million
tonnes which needs to be met by either taking up
new mines or improving the production levels from
the existing mines.
Coal Pricing
14.133. Globally, pricing of coal is based on gross
calorific value (GCV) of coal. The Integrated Energy
Policy which was based on the Integrated Energy
Policy Report of the Planning Commission, and
was approved by the Cabinet in December 2010,
had proposed adoption of this pricing system. This
was finally implemented in January 2012 with the
Ministry of Coal issuing a notification for pricing of
coal on GCV basis with effect from 31 January 2012,
replacing the earlier system of pricing on the basis of
useful heat value (UHV) which takes into account
the heat trapped in ash content also, besides the heat
value of carbon content. The revised GCV system
has 17 bands of calorific values with a bandwidth of
3,000 kilo calorie each instead of the existing seven
grades of A, B, C, D, E, F and G. The revision to
GCV is likely to increase the prices of domestic coal
to some extent. This is desirable adjustment because
domestic thermal coal continues to be underpriced
compared to internationally traded coal prices.
International coal prices of thermal coal are cur-
rently about three to four times higher than domes-
tic coal but this reflects the fact that imported coal
is of higher calorific value and better quality. After
adjusting for these differences, international coal
prices are a little over twice the domestic prices as
shown in Table 14.30. It must also be noted that the
volume of coal traded is small compared to interna-
tional production which makes international prices
a less reliable guide. Table 14.30 compares domestic
coal prices of thermal coal in India with the domes-
tic sale price of thermal coal in other countries. The
comparison shows that Indian coal is underpriced
even on this basis. It is necessary to plan for a steady
upward price adjustment over the Twelfth Plan
period.
TABLE 14.30
Price Comparison of Domestic Coal with other
Countries
Country Calorific
Value K
(Cal/Kg)
Price
(US $ per tonne)
Price
(in `/Mk Cal)
China 5,000–6,000 70 636
USA 5,000–6,000 40 363
India 3,500–4,000 26 342
14.134. The price differential between domestic
and imported coal creates distortions in the power
sector. Since Coal India is not in a position to pro-
vide domestic coal to meet the demand of all power
generating units expected to come on stream in the
Twelfth Plan, increased reliance on coal imports is

168 Twelfth Five Year Plan
necessary. However, power generators supplying
power with PPAs at a regulated tariff will not be
able to pass on the higher cost of imported coal.
There is a need to consider a mechanism of price
pooling under which Coal India undertakes to
meet the full FSA requirement using a combina-
tion of domestic and imported supplies, pooling
the price of its imports with its domestically pro-
duced coal to give coal to power generators at a
uniform price.
Coal Movement Constraints
14.135. Currently the share of rail in movement of
coal in the country is around 52 per cent. The share
of other modes of transportation is 15 per cent by
merry-go-round (MGR), 7 per cent by belt/rope
and 27 per cent by road. Against this, the coal move-
ment matrix in the terminal year of the Twelfth
plan (2016–17) is envisaged to show a 58 per cent
share of rail, 25 per cent share of road, 11 per cent
of MGR and 6 per cent of belt/rope. This includes
planning for movement of 800 million tonnes of
indigenous coal and coal products and 166 mil-
lion tonnes of imported coal which is equivalent to
about 250 million tones of domestic coal. To realise
this objective, average wagon requirement is envis-
aged at 446.4 rakes per day out of which 165.6 rakes
per day will be required for imported coal. The
annualised growth in rail loading is expected to be
7.1 per cent.
14.136. Some of the important identified railway
infrastructure projects are at North Karanpura,
Mand–Raigarh and at Ib Valley coalfields. These
projects were initially proposed during the Eleventh
Plan but could not be implemented due to delays in
land acquisition and clearance from Environment
Ministry. The current status of these projects is given
in paragraph 14.116. In addition to these, a few more
feeder lines have been suggested for improving rail
movement during the Twelfth Plan in potential coal-
fields. Completion of these projects should have top
priority in Railway Planning.
Coal Quality and Beneficiation
14.137. Coal washing is one of the practices being
promoted as a measure to encourage implementation
of clean coal technologies. While coking coal wash-
ing has been in practice for quite some time in the
country, washing of non-coking coal, particularly for
power generation, has come into focus only recently.
Use of washed non-coking coal has increased many-
fold over the last 10 years. Currently coking coal
washing capacity is around 29.88 million tonnes
comprising of washery capacity of 22.18 million
tonnes of CIL, 2.04 million tonnes of SAIL and 5.66
million tonnes of TISCO. However, the actual total
washed coal production from all these washeries is
much below the capacity at 7.03 million tonnes, with
an approximate raw coal feed of 15.5 million tonnes.
It has been observed that performance of CIL man-
aged washeries is not satisfactory and the output of
washed coal from CIL washeries is only 3.89 million
tonnes.
14.138. Non-coking coal washing capacity in the
country is around 96 million tonnes, comprising of
17 million tonnes of CIL and 79 million tonnes of
others. In this case also, the output of washed coal
is below capacity at around 36 million tonnes, with
a raw coal feed of around 52 million tonnes. Thus,
utilisation of existing washery capacity is suboptimal
and suitable measures need to be taken to optimally
use existing capacity. The CIL proposes to set up 20
more washeries with an aggregate capacity of around
111 million tonnes in the Twelfth Plan.
14.139. Considering the need to increase the level
of washed coal, it is proposed to enhance washer-
ies capacity in Twelfth Plan period. Coking coal
washing capacity is likely to increase from the exist-
ing level of around 30 million tonnes in 2011–12 to
49 million tonnes by the end of 2016–17. Similarly
the non-coking coal washing capacity is planned to
increase from about 96 million tonnes by the end of
the Eleventh Plan to around 175 million tonnes by
the end of the Twelfth Plan.
14.140. There has been some progress in dealing with
the problems of oversized coal. Coal companies are
establishing Coal Handling Plants (CHPs) and feeder
breakers. Coal India Ltd. is now supplying almost 99
per cent of crushed coal to the power sector. Further,
deployment of surface miners in different projects

Energy 169
is also helping in producing sized coal for supply to
the consumers. A total of 212 CHPs (74 major CHPs
and 138 mini CHPs/Feeder Breakers) with a total
capacity of about 277 million tonnes per annum are
operating in different subsidiary companies of the
CIL. Further, 50 surface miners deployed at CCL,
SECL and MCL produced about 103 million tonnes
of sized coal in the year 2010–11, which has helped
augment supply of sized coal.
Exploration for Coal and Lignite
14.141. Coal and lignite exploration efforts should
not only aim at expanding the resource base through
regional exploration but also at upgrading the
known resources remaining under ‘Indicated’ and
‘Inferred’ categories through detailed exploration to
facilitate their projectisation for mining. Significant
accretion of resource in coming years is envisaged
in the intermediate and deeper levels (beyond 300m
of depth). As such there is also an emerging need to
fully bring out the potential of coal resources which
are at greater depths, for other forms of exploitation
like CBM, underground gasification (UCG) and so
on to augment the coal resources.
14.142. With ever increasing demand of steel in the
country the requirement of coking coal is projected
to increase from 69.47 million tonnes to 85.06 million
tonnes at the end of the Twelfth and the Thirteenth
Plans. There is a need to focus exploration efforts
on the prime coking coal resources available beyond
300 m of depth to bring them to ‘Proved’ category.
14.143. Against a target of 1.94 lakh metres for
regional exploration during the Eleventh Plan, 1.14
lakh metres (78 per cent) of drilling will be achieved
and 7.07 billion tonnes of coal resources are likely to
be established. In promotional exploration, against
a target of 4 lakh metres of exploratory drilling,
2.72 lakh metres (68 per cent) are expected to be
achieved, establishing 20.05 Bt of coal resources. The
Twelfth Plan envisages taking up 1.05 lakh metre
regional explorations drilling to establish resource
base of around 6.8 billion tonnes. The corresponding
programme under promotional exploration envis-
ages promotional drilling of 4.80 lakh metre cover-
ing an area of 1,204 Sq. Km. to establish resources
of 16.64 billion tonnes. Similarly a drilling target of
54.46 lakh metres is envisaged for detailed drilling in
the Twelfth Plan which includes 19.03 lakh metres
in non-CIL blocks. The envisaged coal resource
establishment under detailed drilling is 76.80 billion
tonnes including 16.22 billion tonnes under detailed
drilling in non-CIL blocks.
Royalty on Coal and Lignite
14.144. According to a decision taken by the
Government, royalty rates have to be revised period-
ically once in every three years. Based on the above
decision, Ministry of Coal had set up a Committee
to suggest revision in royalty rates in 2009. The
Committee suggested ad-valorem royalty on coal and
lignite instead of the earlier system of combination
of specific and ad-valorem duty on various grades of
coal. The Government has accepted the suggestion
and approved the suggested royalty regime based on
ad-valorem basis with effective royalty rates of 14 per
cent on raw coal prices and 6 per cent on lignite with
effect from April 2012.
Amendment to the Coal Mines Act
14.145. The Coal Mines (Nationalisation) Act, 1973
does not allow private companies to mine coal
for sale to third parties though captive mining is
allowed for specified end use sectors. This is a lim-
ited opening which is helpful but unlikely to attract
big investment. Unless large investment and tech-
nology in the sector comes in, mining coal by a host
of small players would not increase production to
desired levels.
14.146. Development of large coal blocks holds the
key to rapidly increase production. There are politi-
cal sensitivities in opening up the coal sector to pri-
vate investment, but it is simply not logical to keep
private investment out of coal, when it is allowed in
petroleum and natural gas. Besides, the energy secu-
rity of the country needs full involvement of all con-
cerned in producing coal. Hence, amendment to the
Coal Mines (Nationalisation) Act is needed. A Bill
to amend the Act for this purpose was introduced
in Parliament in 2001 but has not been pursued.
Allowing private sector mining does not involve pri-
vatisation of Coal India but only entry of new mining

170 Twelfth Five Year Plan
companies. This issue needs to be considered in the
interest of energy security.
New Initiatives to Expand Coal Availability
14.147. Given the importance of coal to India’s
energy security, it is necessary to give priority to a
number of policy initiatives in the Twelfth Plan
which can address obvious weaknesses:
1. Coal exploration must be stepped up to ensure
availability of more coal mining blocks for both
private and public sectors. Either CMPDIL
ought to be made an independent organisation,
or a new independent organisation should be
created to develop and maintain the repository
of all geological information in the country on
the lines of CEA for power sector, or the DGH
for petroleum and natural gas sector.
2. To expedite clearances, a coordination commit-
tee at the Centre and State level may be set up
(single window concept), involving senior rep-
resentation from the concerned departments
for quick environment clearances. Even if statu-
tory clearances can only be given by the relevant
agency, the establishment of a coordinative
mechanism will expedite the decision-making.
3. Enactment of a central legislation to ensure uni-
form R&R policy and speedy land acquisition on
appropriate terms is absolutely necessary.
4. There is a need to incentivise coal availability
from captive coal mining blocks. The decision
to allocate all future coal blocks on the basis of
transparent bidding should be implemented
in the first year of the Twelfth Plan. Further,
we must create an institutional mechanism for
planning and development of common infra-
structural facilities with participation of coal
mining companies and the respective State
Governments.
5. In several cases, development of captive coal
may be in a position to produce coal in excess
of their requirement. At present the terms of
allocation of coal blocks do not permit sale to a
third party except with permission. If they could
be encouraged to produce more than their con-
sumptive use it would avoid the need to import
much more expensive imported coal. This will
be done by making surplus coal available to CIL
subsidiaries at a price which provides adequate
incentive for the captive block owners. The prin-
ciple on which such coal should be priced can be
approved by the Cabinet.
6. Coal companies should develop a comprehen-
sive plan for increasing the share of production
from underground mines and suitable policy ini-
tiatives such as cost plus pricing, fiscal incentives
and so on need to be introduced to improve the
potential returns currently available from under-
ground mining activities. It is suggested that the
share of underground mining be increased from
the existing 10 per cent to a considerable level by
the end of the Twelfth Plan in the next five years.
7. In view of the availability of increased coal
imports for the Twelfth Plan period the Ministry
must ensure that mechanisms are in place which
will be up and appropriate mix of long-term and
sport contracts.
8. A coal sector regulator should be set up on a pri-
ority basis.
9. Finally it is not clear whether the present struc-
ture on which the operating coal companies are
subsidiaries of CIL as the holding company is
desirable. The industry would be better served if
the subsidiaries were spun off as separate public
sector companies encouraged to develop their
own strategies of coal development including
joint venture activity and acquisition of assets
abroad. A High Level Committee should be
appointed to examine this option and submit a
report within six months.
Benchmarking of Productivity
14.148. The Twelfth Plan envisages an improvement
in productivity per person from 4.92 tonnes per
person in CIL to 7 tonnes per person and from 3.8
tonnes per person in SCCL to 4.93 tonnes per person.
This will still leave India well below other produc-
ers, as countries like USA, Australia and China have
productivity levels of about 14 tonnes per person for
combined underground and opencast mines. The
targets set to realise the productivity level mentioned
above envisage productivity levels of 14.0 tonnes
per person for CIL and 14.83 tonnes per person in
SCCL in the terminal year of the Plan for opencast

Energy 171
operations, and only 1.10 and 1.83 tonnes per per-
son for CIL and SCCL, respectively for underground
operations . Thrust would be given on improvement
of operational efficiency of the coal mining compa-
nies by establishing benchmarks for different mining
operations and work force productivity comparable
with international standard. The productivity norms
of different heavy earth moving machinery (HEMM)
benchmarked earlier for both availability and utilisa-
tion in different coal companies would be examined
so that these become comparable with international
standards.
3.4. PETROLEUM AND NATURAL GAS SECTOR
14.149. Managing the petroleum and natural gas sec-
tor will present critical challenges in the Twelfth Plan.
The demand for petroleum products is expected to
expand while the scope for increasing domestic pro-
duction is limited. Oil prices in world markets are
expected to be volatile but generally high. The oil
and gas import bill is likely to be around 6–7 per cent
of GDP during the year 2011–12. Unfortunately,
domestic prices of certain petroleum products have
not been adjusted in line with world prices, with the
result that there is large ‘under-recovery’ by the oil
sector. Important steps were taken in 2012 to adjust
diesel prices and to put a limit on highly subsidised
LPG, but even after these adjustments, under-recov-
eries remain large and the subsidy provided in the
budget covers only a fraction of this. Continuing this
scale of under-recovery is simply not viable. Prices
of sensitive petroleum products like diesel, kerosene
and LPG will therefore have to be adjusted periodi-
cally to reduce the under-recoveries which are cur-
rently borne by the Government and upstream oil
companies. This is not consistent with developing
a healthy petroleum sector capable of investing in
exploration and production.
REVIEW OF THE ELEVENTH PLAN
Demand for Petroleum Products
14.150. Demand for petroleum products grew at an
annual rate of 4.15 per cent during the Eleventh Plan
period which is close to the upper-case scenario that
was envisaged at the start of the Eleventh Plan as
shown in Table 14.31. The elasticity of POL demand
with GDP growth during the Eleventh Plan has been
0.53 which is slightly higher than 0.49 for the Tenth
Plan. The use of FO/LSHS and LDO in power, fertil-
iser and general trade has declined. Also, increased
availability of natural gas has replaced naphtha that
was extensively used in the fertiliser industry. LPG
consumption in India has increased from 10.85 mil-
lion tonnes in the year 2006–07 to 15.36 million
tonnes in the year 2011–12, growing at a rate of 7.21
per cent per annum CAGR.
Exploration, Production and Refining Sector
14.151. Both oil and gas production targets have
slipped by large percentages during the Eleventh Plan
period. Against the crude oil production target of
206.73 MMT in the Eleventh Plan, the actual achieve-
ment is only 177 MMT, that is, 14 per cent below the
target. The actual natural gas production was 212.54
BCM as against the production target of 255.76 BCM,
with a shortfall of about 17 per cent of the Eleventh
Plan targets. The balance recoverable reserve posi-
tion as on 1 April 2011 of O + OEG was about 2015
million tonnes, which has increased by 10.5 per cent
from 1,847 million tonnes as on 1 April 2007.
14.152. In contrast to the large slippage in oil explo-
ration and production, addition to refining capacity
is likely to be 88.42 per cent of the target. Some of the
refinery projects like MRPL expansion and Paradip
refinery projects have also slipped into the Twelfth
TABLE 14.31
Consumption of Petroleum Products
Consumption 2007–08 2008–09 2009–10 2010–11 2011–12 CAGR (%)
Actual 128.95 133.6 137.81 141.75 147.98 4.15
Working Group
Eleventh Plan
Base 116.35 119.1 121.99 126.97 131.77 2.93
Upper 117.56 121.95 127.79 136.59 141.79 4.45
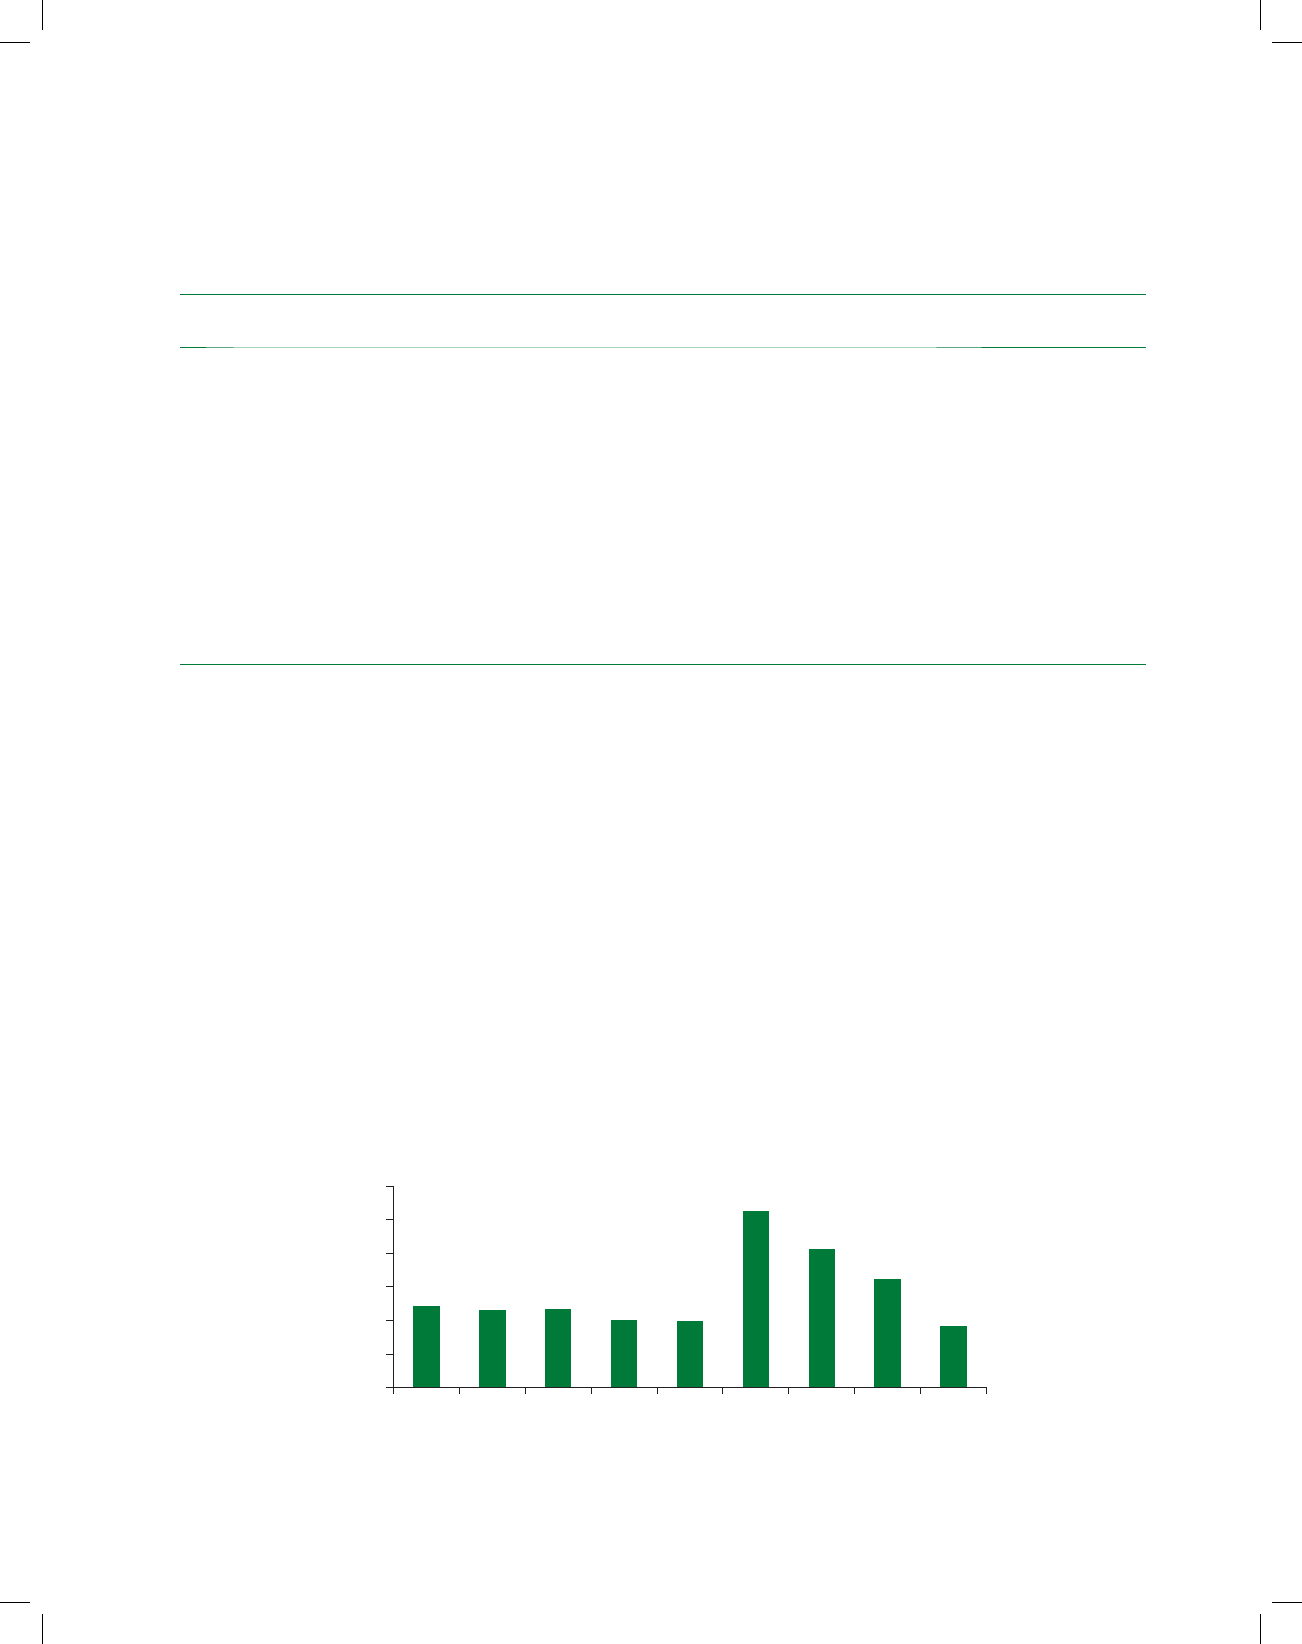
172 Twelfth Five Year Plan
Plan due to delays in providing captive power equip-
ment by BHEL to these refineries. Table 14.32 gives
the target and achievements of various physical
parameters during the Eleventh Plan period.
New Exploration Licensing Policy (NELP)
Programme
14.153. The NELP programme is a major initiative
aimed at attracting private investment into oil and
natural gas. There have been nine rounds of bidding,
starting with a first in 1998, and a total investment of
US$ 15.88 billion has been made by various operators
in E&P sector till 2010–11. Out of 235 Production
Sharing Contracts (PSCs), 73 were signed during
the Eleventh Plan period. To step up the pace of
exploration, in the ninth round of NELP (NELP-IX),
34 exploration blocks were offered in October 2010,
of which 18 PSCs have already been signed with the
awardees. Details of blocks awarded under the nine
NELP rounds are shown in Figure 14.1.
Equity Oil, Gas from Overseas Assets
14.154. Oil PSUs (OVL OIL, GAIL, IOCL, BPCL and
HPCL) have invested `59,108 crore (US$ 13 billion)
up to 31 March 2011 on acquisition of assets abroad,
mainly in oil producing assets. There are nine major
production assets in Russia, Sudan, Brazil, Syria,
Vietnam, Venezuela and Colombia. Production
from overseas oil and gas blocks is presently about
10.22 per cent of India’s domestic production. The
TABLE 14.32
Physical Performance of Petroleum and Natural Gas Sector
Sl.
No.
Item Eleventh
Plan Target
Actual
2007–08
Actual
2008–09
Actual
2009–10
Actual
2010–11
Actual
2011–12
Total in the
Eleventh Plan
1 Crude Oil Production (MMT) 206.73 34.12 33.51 33.69 37.68 38.09 177.09
2 ONGC 140.06 25.94 25.37 24.86 24.42 23.72 124.30
3 OIL 18.99 3.10 3.47 3.57 3.58 3.85 17.57
4 PVT. JVC 47.71 5.08 4.67 5.26 9.68 10.53 35.22
5 Gas Production (BCM) 255.76 32.42 32.85 47.50 52.22 47.56 212.54
6 ONGC 112.39 22.33 22.49 23.10 23.10 23.32 114.33
7 OIL 16.42 2.34 2.27 2.42 2.35 2.63 12.01
8 PVT. JVC 126.95 7.74 8.09 21.99 26.77 21.61 86.20
9 Refining Capacity (MMTPA) 240.96 148.97 177.97 185.39 193.39 213.07 213.07*
10 Hydrocarbon Reserve
Accretion (O + OEG)
1,847 –––– 2,014.81#
* Refining Capacity estimate as on 1 April 2012. # HCRA as on 1 April 2011.
60
50
40
30
20
10
0
No. of PSC signed
I
24 23
II
23
III
20
IV
20
V
52
VI
41
VII
32
VIII
18
IX
NELP rounds
FIGURE 14.1: Exploration Blocks awarded in NELP Rounds

Energy 173
share of overseas vis-à-vis indigenous production of
oil and gas is given in Table 14.33.
Policy Initiatives during the Eleventh Plan
14.155. Various policy initiatives were taken to
address the issues relating to attaining hydrocar-
bon energy security. Major policy initiatives taken
by the Government during the Eleventh Plan are as
follows.
Regulatory Measures
14.156. The Government has set up Petroleum and
Natural Gas Regulatory Board with effect from 1
October 2007 to regulate downstream activities
of oil and gas sector under the PNGRB Act, 2006.
However, the mandate of PNGRB is fairly narrow
and deals largely with pipelines. PNGRB is currently
empowered to give authorisation to entities for lay-
ing, building, operating and expanding any pipeline
as common or contract carrier and expanding city
gas distribution projects.
Allocation of Natural Gas
14.157. Natural gas produced from NELP blocks is
subject to Government-prescribed allocation to dif-
ferent uses and also Government approval of the
pricing formula. The Government has prioritised
allocation of gas produced from NELP blocks in the
following order:
• Fertiliser plants producing subsidised fertilisers
• LPG plants
• Power plants
• City Gas Distribution (CGD) for CNG and
domestic PNG
• Steel, petrochemicals, refinery, captive power
plants and CGD for industrial and commercial
customers
14.158. An Empowered Group of Ministers has allo-
cated 93.336 MMSCMD of gas on a combination of
firm and fallback basis from the blocks producing
gas under NELP.
Strategic Storage of Crude Oil
14.159. The Government is in the process of creat-
ing strategic crude oil storage capacity for 15 days at
Vishakhapatnam (1.33 million tonnes), Mangalore
(1.50 million tonnes) and Padur (2.5 million tonnes)
through a Special Purpose Vehicle, namely, Indian
Strategic Petroleum Reserve Ltd. (ISPRL). The stor-
age would be further upgraded at other suitable
locations by an incremental capacity of 12.5 million
tonnes during the Twelfth Plan period.
Promoting Bio-Fuels
14.160. A programme of 5 per cent blending of
ethanol with petrol is already underway with effect
from November 2006 targeting 20 States and 4 UTs.
Subject to availability, the percentage of blend can
be enhanced to 10 per cent as specification for pet-
rol with 10 per cent ethanol blend is already given
by the BIS. At present, the EBP Programme is suc-
cessfully running in 14 States and three UTs; OMCs
have been able to contract 55.87 crore litres of eth-
anol against the requirement of 105 crore litres of
ethanol for 5 per cent blending in the entire notified
area.
Pricing of Petroleum Products
14.161. In 2002, the Government dismantled the
Administered Pricing Mechanism, and announced
that prices of all petroleum products would be dereg-
ulated. This decision, however, was not fully imple-
mented after the prices of crude oil in international
market rose sharply leading to increase in interna-
tional prices of petrol, diesel, LPG and kerosene.
TABLE 14.33
Share of Overseas Hydrocarbon Production
Year 2007–08 2008–09 2009–10 2010–11 2011–12 #
Total Domestic oil and gas (MMTOE) 66.53 66.35 81.19 89.93 85.64
Overseas production of OVL (MMTOE) 8.8 8.78 8.87 9.43 8.75
Overseas production as a percentage of Domestic (%) 13.23 13.23 10.93 10.49 10.22
Source: Ministry of Petroleum and Natural Gas/ONGC Videsh Ltd. (#) Prov.

174 Twelfth Five Year Plan
On 25 June 2010 the Government announced that
the price of petrol was fully deregulated and the oil
companies were free to fix it periodically. However,
diesel price deregulation was deferred to be imple-
mented later. Prices of LPG and kerosene remained
under price regulation by the Government. The
continuance of price control reflects the political
sensitivity of the issue despite the evident economic
desirability of implementing the Integrated Energy
Policy.
14.162. The under-recovery by oil companies
because of the inability to adjust oil prices is shown
in Table 14.34. The amount of under-recoveries on
sensitive petroleum products was `1,38,541 crores
(excluding the under-recoveries of `4,890 crores
incurred by OMCs on sale of petrol) in the year
2011–12 including the under-recoveries incurred by
OMCs on petrol. The total under-recoveries by the
Government and oil PSUs amount to `4,43,197 crore
during the Eleventh Plan period. That has seriously
affected the profitability and viability of the oil mar-
keting companies. The under-recoveries of the oil
companies in 2012–13 will rise to `1,52,937 crore as
per Refinery Gate price effective from 1 July 2012 if
prices are not adjusted.
Pricing of Natural Gas
14.163. Gas price for NELP Blocks is supposed
to be determined through an arm’s length pro-
cess by contractor, and is subject to approval by
the Government. Accordingly the price of RIL KG
Basin gas was fixed at $4.2/MMBTU ex-Kakinada
in 2007 by EGoM and the price was expected to
be valid till March 2014. The purchase price of
long-term LNG imported from Qatar for Petronet
LNG has been linked to Japanese Crude Cocktail
(JCC) and varies on a monthly basis. It is sold at
prices fixed by resellers. Spot RLNG prices are based
on market conditions, which are currently hovering
around US$12–13/MMBTU. Following the fixation
of the KG basin gas price at US$4.2 per MMBTU,
the administered price of gas from nominated
fields awarded earlier to ONGC/OIL, which var-
ied depending on the field, were raised to US$4.2
per MMBTU, except for the North-East where it is
US$2.52 per MMBTU.
14.164. The NELP of the Government of India pro-
vides freedom to price the gas by the operator at a
market-determined price for gas produced from the
NELP blocks, subject to the Government approving
the pricing formula. However, questions have arisen
regarding the interpretation of various clauses in the
existing contracts. There is a need to review the pro-
vision of pricing under PSC to clarify the extent to
which producers will have the freedom to market the
gas. Clarity is obviously essential if we are to attract
private investment into exploration and production.
Legally, gas as a resource belongs to the Government
and the Government has the right to fix an appro-
priate price. However, if the intention is to attract
private investment into this sector, the Government
should state clearly what degree of pricing freedom
will be given. Ideally, private investors would expect
freedom to price the gas at a level at which there are
willing buyers, which in turn will be determined
by the price at which consumers can import. On
the other hand, the CBM policy envisages a differ-
ent contractual regime. In order to encourage this
TABLE 14.34
Under-Recoveries on Petroleum Products
(` crores)
Petroleum Products 2006–07 2007–08 2008–09 2009–10 2010–11 2011–12
Petrol 2,027 7,332 5,181 5,151 2,227 –
Diesel 18,776 35,166 52,286 9,279 34,706 81,192
Domestic LPG 10,701 15,523 17,600 14,257 21,772 29,997
PDS Kerosene 17,883 19,102 28,225 17,364 19,484 27,352
Total 49,387 77,123 1,03,292 46,051 78,190 1,38,541
Source: PPAC.

Energy 175
emerging source of gas, its pricing should be left
to the market without the need for Government
approval.
14.165. There are a number of other issues regard-
ing existing PSC. First, questions have been raised
regarding investment multiple which determines
the profit share of Government and the investor
after allowing recovery of investment cost. It has
been argued that this incentivises greater capital
intensiveness, and a stronger profit share based
on production would be better. This assessment
needs to be weighed against the argument that the
IM enables Government to insulate the contractor
at higher levels of investment, which increases the
possibility of oil/gas being discovered. There are
also concerns on the need to improve the provisions
under the PSC to make them more transparent and
also fully safeguard the interests of the stakehold-
ers. Second, the existing management system has
not led to an effective supervision over the proj-
ects. There is a need to consider alternate mecha-
nisms. Several other issues have been raised also.
Government has, therefore, appointed a Committee
under the chairmanship of Dr. C. Rangarajan,
Chairman, Economic Advisory Council to the
Prime Minister to review existing PSCs and recom-
mend changes for the future.
14.166. Finally, the Twelfth Plan is likely to see a
continuation of high oil and gas prices in the world
markets and our dependence on imports for both
oil and gas is also likely to increase. There is an
urgent need to align domestic oil and gas price to
market price for sound development of the sec-
tor and to send the right signals to consumers and
producers. This would also enable the oil PSUs to
generate internal resources to fund new projects
and create growth momentum. Price reform along
these lines would also permit entry of private com-
panies for marketing of petroleum products which
would help expand competition. Price adjustment
in the petroleum sector has to be carried out keep-
ing in mind the need for ensuring affordability for
the poor and vulnerable sections. This can be done
in various ways. It does not require generalised
subsidies.
TWELFTH PLAN STRATEGY
Demand of Petroleum Products
14.167. Demand of petroleum products is projected
to increase at an annual rate of 4.7 per cent during the
Twelfth Five Year Plan. This will increase consump-
tion of POL products from 147.98 MMT in 2011–12
to 186.21 MMT by 2016–17. The demand for diesel
will continue to be dominant followed by MS and
LPG. The demand estimates of petroleum products
in Twelfth Plan period are given in Table 14.35.
Supply of Petroleum Products
14.168. Oil production during Twelfth Plan is likely
to increase marginally and then decline by 3.26
per cent by the end of the Plan. As a result, import
dependence in petroleum products is expected
to increase from 76.6 per cent at the end of the
Eleventh Plan to 77.8 per cent by the end of the
Twelfth Plan. The crude oil production profile for
the Twelfth Plan, based on established reserves,
present status of different fields, input implemen-
tation schedules and the health of reservoirs is as
given in Table 14.36.
Natural Gas Demand
14.169. The demand of natural gas during the
Twelfth Plan is likely to grow by about 19.2 per cent
to meet the incremental requirement of power, fer-
tiliser and other industries. The CNG and city gas
sector will also see a quantum growth in natural
gas use. It is expected that by the end of the Twelfth
Plan about 300 cities are likely to be covered under
city gas distribution. Yearly estimates of natural gas
demand are given in Table 14.37.
Natural Gas Production
14.170. Domestic production of natural gas during
the Twelfth Plan will depend upon the output from
gas fields discovered under NELP by various opera-
tors. As majority of new gas prospects are in deep
water, the investments, technology and pricing of
gas for developing these fields would be important.
The estimated gas production by different opera-
tors has been given in Table 14.38. However, the
projected production from Private/JV producers
may need to be reviewed during the Plan period, as

176 Twelfth Five Year Plan
TABLE 14.35
Demand of Petroleum Products
Products 2011–12 2012–13 2013–14 2014–15 2015–16 2016–17 CAGR (%)
1. Petroleum Products (’000MT)
LPG 15,358 16,986 18,363 19,675 20,857 21,831 7.3
MS 14,993 16,091 17,527 19,083 20,766 22,588 8.5
NAPHTHA/NGL 11,105 12,353 11,417 11,417 11,022 11,022 –0.1
ATF 5,536 6,009 6,587 7,202 7,849 8,540 9.1
SKO 8,229 7,949 7,631 7,326 7,033 6,751 –3.9
HSDO 64,742 65,040 68,654 72,589 76,904 81,599 4.7
LDO 415 400 400 400 400 400 –0.7
LUBES 2,745 2,691 2,772 2,857 2,945 3,036 2.0
FO/LSHS 9,232 7,954 7,902 7,899 7,872 7,872 –3.1
BITUMEN 4,628 5,254 5,541 5,732 5,971 6,114 5.7
PET COKE 6,145 6,765 7,514 8,345 9,268 10,294 10.9
OTHERS 4,869 5,445 6,127 6,109 6,085 6,162 4.8
Total POL 1,47,997 1,52,937 1,60,436 1,68,635 1,76,972 1,86,209 4.7
Source: Ministry of Petroleum and Natural Gas.
TABLE 14.36
Projection of Crude Oil Production in the Twelfth Plan
(in MMTPA)
2012–13 2013–14 2014–15 2015–16 2016–17 Total
ONGC 25.045 28.27 28.002 26.286 25.456 133.059
OIL 3.92 4.00 4.06 4.16 4.20 20.34
Pvt./JV 13.34 13.30 12.70 12.10 11.50 62.94
Total 42.305 45.57 44.762 42.546 41.156 216.339
Source: Ministry of Petroleum and Natural Gas.
TABLE 14.37
Natural Gas Demand for Twelfth Five Year Plan
(in MMSCMD)
Sector 2011–12 2012–13 2013–14 2014–15 2015–16 2016–17 CAGR (%)
Power* 91 135 153 171 189 207 17.9
Fertiliser** 43 55 61 106 106 106 19.8
Demand(Price Elastic) – Sub Total 134 190 214 277 295 313 18.5
City Gas 13 15 19 24 39 46 28.8
Industrial 16 20 20 22 25 27 11.0
Petrochemicals / Refineries/Internal Consumption 25 54 61 67 72 72 23.6
Sponge Iron/Steel 6 7 8 8 8 8 5.9
Demand (Relatively price Inelastic) – Sub Total 60 96 108 121 144 153 20.6
Grand Total Demand 194 286 322 398 439 466 19.2
Source: *Ministry of Power, **Ministry of Fertilizers.

Energy 177
the production profile from their exploration acre-
age gets approved by the Directorate General of
Hydrocarbons.
Exploration Activities
14.171. During the Twelfth Plan period, 13,8974
kilometres of 2D seismic and 82,488 square km of
3D seismic are likely to be acquired by ONGC, OIL
and private/JV companies. Also, 1,310 exploratory
wells are likely to be drilled during the Twelfth Plan
period. These exploratory efforts are likely to result
in hydrocarbon reserve accretion of about 727 mil-
lion metric tonnes of oil and oil equivalent gas in the
country. The break-up of exploration programme
by ONGC, OIL and Private/Joint Venture compa-
nies is given in Table 14.39. The role of DGH as the
upstream advisor and supervisor for the Government
is very important. Efforts will be made to increase the
capacity of the DGH, as also efficiency in decision-
making. It can play an important role in obtaining
various clearances for the upstream operators from
multiple agencies of the Government. This has to be
viewed particularly in the light of the fact that a large
number of discoveries made under NELP are yet
to be appraised and developed. The DGH needs to
monitor their evaluation and development quickly.
Pricing and Under Recoveries of Petroleum
Products
14.172. Although important steps have been taken
in the first year of the Twelfth Plan to adjust diesel
prices and to cap the subsidy on LPG, this has not
eliminated the under-recovery of oil companies. The
increase in under-recoveries of OMCs is adversely
affecting the financial position of OMCs and may
affect mobilisation of funds for new projects during
the Twelfth Plan period. Currently, the under-recov-
eries of OMCs are compensated by the Government
from fiscal budget, discount on crude and products
by upstream oil companies and part absorption by
OMCs. The OMCs are expected to incur under-
recoveries of `8,32,737 crore during Twelfth Plan
period. If no further adjustment occurs, and if global
prices stay at present level, the total under-recovery
in the Twelfth Plan period will be over `8.32 lakh
crore which is simply not viable (Table 14.40)
TABLE 14.38
Projection of Natural gas production in Twelfth Plan (BCM)
2012–13 2013–14 2014–15 2015–16 2016–17 Total
ONGC 25.266 25.472 26.669 28.215 38.676 144.298
OIL 3.30 3.80 4.00 4.27 4.45 19.82
Pvt./JV 23.71 32.38 39.4 40.43 41.46 177.38
Total 52.276 61.652 70.069 72.915 84.586 341.498
Total MMSCMD 143.22 168.91 191.97 199.77 231.74 187.12
(Average)
Source: Ministry of Petroleum and Natural Gas.
TABLE 14.39
Breakup of the Exploration Programme for theTwelfth Plan
Activity Unit ONGC OIL Private/JV Total
Seismic Surveys 2D km 28,170 6,850 1,03,954 1,38,974
Seismic Surveys 3D Sq Km 24,163 8,364 49,961 82,488
Exploratory Wells Nos 611 174 525 1,310
Reserves Accretion IIH MMTOE 1,080 78.14 728 1,886.14
Ultimate Hydrocarbon Reserve Accretion MMTOE 360 26 341 727
Source: Ministry of Petroleum and Natural Gas.

178 Twelfth Five Year Plan
TABLE 14.40
Likely Under-Recoveries on Petroleum* Products
(` Crore)
Sensitive Petroleum Products 2012–13 2013–14 2014–15 2015–16 2016–17 Total
Diesel 86,910 90,820 95,053 99,673 1,04,664 4,77,120
PDS Kerosene 28,880 27,725 26,617 25,552 24,528 1,33,301
Domestic LPG 38,182 42,054 44,931 47,531 49,618 2,22,316
Total 1,53,973 1,60,598 1,66,601 1,72,756 1,78,810 8,32,737
* Price of Petrol is made market determined. It assumes oil prices at US$ 100 per barrel with exchange rate of US$ = `55.
Addition to Refining Capacity
14.173. With grass-roots refineries at Bhatinda (9
MMTPA), Paradip (15 MMTPA) and expansion
of some of the existing refineries, the total refining
capacity is projected to be around 218.37 MMTPA
by the year 2012–13 and is expected to touch 313.57
MMTPA by the end of the Twelfth Plan as shown
in Table 14.41. Majority of new refining capacity
would be added from expansion of existing refineries
at low costs.
Alternate Sources of Hydrocarbons
14.174. The development of alternate sources of
hydrocarbons such as coal bed methane, gas hydrate,
shale gas, oil shale and so on are some of the areas
which require greater attention. Oil companies
would also need to focus on development of renew-
able energy sources including biodiesel, ethanol,
wind, solar, biomass and so on to make the hydro-
carbon use for various activities carbon neutral by
the companies.
TABLE 14.41
Projected Refining Capacity during Twelfth Plan (MMTPA)
2012–13 2013–14 2014–15 2015–16 2016–17
IOC 54.2 69.2 69.2 74.0 77.0
BPC (Mumbai) 12.0 12.0 13.5 13.5 13.5
Kochi 9.5 9.5 9.5 15.5 15.5
BORL–Bina 6.0 6.0 7.2 7.2 9.0
HPC (MR + VR) 16.5 17.2 17.2 17.2 23.2
Maharashtra Refinery 0.0 0.0 0.0 0.0 9.0
HMEL (GGSRL) 99999
MRPL 15 15.5 16 16.5 18
ONGC (Tatipaka) 0.066 0.066 0.066 0.066 0.066
CPCL 12.1 12.1 12.1 12.1 18.3
NRL 33338
Sub Total PSU 137.4 153.6 156.8 168.1 200.6
RIL-DTA and SEZ, Jamnagar 60 60 60 60 60
EOL, Jamnagar 19 20 20 30.8 38
NOCL, Cuddalore 2 6 6 6.1 15
Sub Total Private 81 86 86 96.9 113
Total 218.4 239.6 242.8 265.0 313.6
Source: Ministry of Petroleum and Natural Gas.

Energy 179
Coal Bed Methane (CBM)
14.175. The prognosticated CBM resources in the
country are about 92 trillion cubic feet (TCF), out of
which only 8.92 TCF has so far been established. The
Government of India has awarded 33 CBM explo-
ration blocks. Commercial production of CBM has
already commenced in Raniganj (South) in West
Bengal. CBM production by the year 2016–17 is
expected to be around 4 MMSCMD. This is quite
low compared with the resource potential estimated
by the DGH. In spite of the fact that more than a
decade has lapsed since the award of CBM blocks,
the evaluation and development continues to be
behind schedule. Efforts are required to enhance the
production of CBM through suitable policy mea-
sures. There are also delays in approving prices for
CBM projects shortly to go into production. This
needs to be expedited.
Simultaneous Operations of Coal Bed Methane
(CBM) and Oil and Gas
14.176. At present there is no mechanism to work
together simultaneously for the exploration and
exploitation of coal, coal bed methane, shale gas
and oil and gas production in same block/ acreages
due to the fact that both coal and oil and gas sectors
are governed by different administrative ministries.
Regulations and Acts do create conflict of interest
for the simultaneous exploration and exploitation
of coal, CBM, coal mine methane and also under-
ground Coal gasification along with coal and oil and
gas. There is a need for the operators to work under
similar contractual regime for simultaneous opera-
tions of CBM, Coal and shale gas and CBM, oil and
gas and shale gas in the same area. A policy frame-
work for this will need to be developed expeditiously
in the year 2012–13 itself.
Shale Gas Exploration
14.177. The Government has initiated steps for
development of shale oil and shale gas from on
land sedimentary basins. MoU has been signed
between Ministry of Petroleum and Natural Gas
and Department of State, USA on 6 December 2010
for cooperation in resource assessment, regulatory
framework, training and so on. A multi-organisation
team (MOT) has been constituted involving DGH,
ONGC, OIL and GAIL for collection of required
G&G, geochemical and petro-physical data for
assessment of shale oil and shale gas prospects in
Indian on land sedimentary basins. The involvement
of private sector in this initiative will be enhanced as
well. A policy of regulatory framework is to be put
in place for shale oil and shale gas development.
Underground Coal Gasification (UCG)
14.178. ONGC has signed an Agreement of Collab-
oration (AOC) with Skochinsky Institute of Mining,
Russia on 25 November 2004 for implementation of
Underground Coal Gasification (UCG) project in
India. The Vastan Mine block belonging to GIPCL
in Surat district, Gujarat has been selected for UCG
Pilot project. The total financial implication of the
project is about US$ 15.32 million. ONGC will be
asked to complete this pilot at the earliest.
National Gas Hydrate Programme
14.179. An MoU was recently signed in the area of
marine gas hydrate research and technology devel-
opment between the Leibniz Institute of Marine
Sciences, Germany and DGH for research on meth-
ane production from gas hydrate by carbon dioxide
sequestration. The NGHP programme has also been
going on for a long time, with no tangible results so
far. Efforts will be made for better monitoring and
conclusion of this programme at the earliest.
Flaring of Natural Gas
14.180. Currently about 3 per cent of gas produced is
flared by the ONGC and Oil India Limited. The total
volume of gas flared is estimated to be around 3.5–
4.0 MMSCMD. There is a need to stop such flaring
through use of this gas by the local industry and/or
gathering it either through compression or by lique-
faction mode and then re-injecting the gas into pipe-
line. A separate mechanism to reach a zero flaring of
gas and its commercialisation can be developed to
stop such wasteful flaring of gas.
Focus on Research and Development
14.181. The need to develop domestic capability in
the exploration, production, refining and processing
of oil and natural gas has led to the creation of R&D

180 Twelfth Five Year Plan
institutes by oil sector organisations. While in-house
institutions can make a significant contribution
to the activities of their parent PSUs, they are not
subjected to any peer review. They have also been
unable to attract private sector business and have
remained dependent on captive assignments. On the
other hand, the existence of in-house institutions has
restrained the PSUs from outsourcing their assign-
ments to outside institutions/niche area experts. The
objective should be to ensure that R&D centres of
the oil sector PSUs develop into world class institu-
tions, with induction of fresh capital and top scien-
tific personnel.
14.182. Efforts will be intensified to obtain the latest
technology from global centres of excellence while
at the same time strengthening our own capabil-
ity. Several alliances were signed with international
organisations and Governments during the Tenth
and the Eleventh Plan periods. Diplomatic efforts
were also made through JWGs and other forms of
MEA assistance to increase interaction between
Indian and foreign experts. These efforts will be
renewed, and fresh initiatives taken. Some of the key
areas for R&D development to strengthen domestic
capability are in exploration, geo-data processing
and interpretation, drilling technology, reservoir
studies, ocean technology, oil and gas production
technology, well logging technology, biotechnol-
ogy and geotectonic, quality improvements of the
products, improving energy efficiencies of various
processes, and yield maximisation of distillation.
The experience of Brazil in having developed scien-
tific and technical know-how as well as manpower
domestically, tailor-made to suit their geological
requirements is a good example to follow.
14.183. Various oil and gas sector organisations plan
to invest `6,326 crore during the Twelfth Plan period
as R&D of oil and gas sector activities as indicated in
Table 14.42. Some of the focus areas in oil and gas
sector are:
1. Producing waxy crude
2. Smart horizontal well completions
3. 4D Seismic mapping
4. Long heated insulated pipeline for crude
evacuation
5. Improving energy efficiency in refineries
6. Product yield maximisation
7. Exploration of unconventional energy resources,
viz. shale gas, CBM, UCG and so on
8. Oil shale and study of gas hydrates in eastern
and western offshore areas of India
TABLE 14.42
R&D Expenditure by Major Oil and Gas Companies
Company 2009–10 (Actual) Eleventh Plan (Actual) Twelfth Plan (Estimated)
Expenditure
` crore
per cent of R&D
expenditure/Revenues
Expenditure
` crore
Expenditure
` crore
Indian Oil 89.65 0.04 317.83 955
BPCL 26 0.02 155.38 429
HPCL 2.1 0 24.5 315
CPCL 0.3 0 7.4 14
RIL 41 0.02 1,640 2,000
EOL – 12 25
ONGC 219.95 0.34 1,289.32 2,156
OIL 22.49 0.27 108.63 257
GAIL 16.17 0.06 17.23 71
EIL 11 0.54 46 104
Total 428.66 0.06 3,618.29 6,326
Source: Ministry of Petroleum and Natural Gas.

Energy 181
Infrastructure and Capacity Building
• The unlicensed offshore areas and Deccan basins
are technologically challenging due to higher water
depths and sub-basalt sediments, respectively. It is
important to access latest technology from global
centres of excellence to address the specific needs
of these balance areas. The Government would
endeavour to encourage technology alliances with
our upstream companies, and also attract service
industries to set up base in India.
• Strengthen and empower technical and scien-
tific manpower for better decision-making and
capacity-building in oil sector specifically the E&P
companies. Deployment of large qualified work-
force will be necessary during the Twelfth Plan for
exploration and production sector.
• Both ONGC and OIL would step up efforts, to
raise oil and gas production from the near stag-
nant levels of the past one decade or so. These
companies ought to enhance production by reduc-
ing their R/P ratios. They would also be encour-
aged to quickly appraise their entire licensed areas
to enhance reserves. In the offshore nominated
areas, technology is likely to play an important
role. The Government would also encourage them
to induct cutting-edge technology in these acre-
ages, often available only as in-house with global
players, on risk–reward basis.
• The Integrated Energy Policy had laid down that
there is a need for an independent upstream
regulator. The Government needs to distance
itself from routine contract administration, as
well as capex/pricing decisions. As long as the
Government itself is the upstream regulator, the
reasoning that the DGH provides it technical
advice does not lend it independence. Audit issues
and contractor–Government conflicts may get
much reduced if an independent regulator were
to be put in place. Further, in order to make mar-
ginal offshore oil and gas discoveries viable, off-
shore infrastructure needs to be shared between
operators. The DGH would issue regulations to
encourage operators to collaborate on mutually
beneficial terms.
• Development of strategic and commercial gas
storages by the E&P and marketing companies to
address price volatility, balancing of seasonal gas
requirement by various sectors at different loca-
tions in the country.
• Development of strategic crude oil storage beyond
5 MMTPA capacity. The Government would be
open to private sector involvement in building
and operating strategic storage, on the condi-
tion of the crude being available for release, at its
discretion.
• Strategy for refining capacity additions consider-
ing current market situation
• Marketing and distribution infrastructure facili-
ties for the petroleum products
• Additional development of new LNG import and
regasification capacity both on the East and the
West coasts of India.
• Gas Pipeline transportation infrastructure both
on the East and the West coasts and also in south-
ern and northern parts of the country for supply
of gas throughout the country.
• Facilitating development of city gas distribution
in about 300 identified cities in the country.
• Improving efficiency of operations of various
oil and gas sector installations. Benchmarks for
refineries, pipelines process plants, buildings and
any other installations to be developed by all the
organisations and to be monitored periodically.
• Develop capacity building for 5 MMTOE per year
of energy from renewables and unconventional
hydrocarbon resources. This is with an aim to
become carbon neutral for oil sector companies.
• Developing LNG import capacity based on
Floating Storage and Regasification units (FSRU)
in coastal cities of the country which are not con-
nected to gas pipelines to expedite the city gas
supply.
• Deploy the CSR resources for creating health and
education infrastructure. Help communities in
creating opportunities for clean and sustainable
energy supplies for cooking and lighting for bet-
ter quality of life in areas of operations from CSR
funds.
Reforms Required in the Oil and Gas Sector
14.184. Given the challenges in managing the oil and
gas sector, it is necessary to focus on the agenda of
critical reforms needed in this sector in the Twelfth
Plan period. They are listed below:

182 Twelfth Five Year Plan
• Eliminate the uncertainty that has arisen regard-
ing gas pricing from NELP production sharing
contracts by implementing a new design of con-
tracts. The recommendations of the Rangarajan
Committee may be an important input in finalis-
ing this policy. Appropriate steps should be taken
to resolve conflicts in existing contracts where
interpretation of the contract terms is open to
multiple options.
• Operationalise a road map to move petroleum
product prices received by marketing companies
to prices aligned with global prices. This may not
be possible immediately, but it can be achieved by
the end of the Twelfth Plan for diesel and petrol.
• Phasing out subsidies on domestic LPG and PDS
kerosene. Subsidised LPG is now capped at nine
cylinders per household with the rest being avail-
able at market price. Consideration should be
given to converting the subsidised supply to an
equivalent cash transfer targeted to those who
need it.
• Kerosene supplies can be progressively reduced
considering improved electricity access provided
under RGGVY and LPG connections provided in
rural areas.
• Rationalise tax structure in sales of petroleum
products considering thermal value for its use in
transport, industry, power, households and other
sectors. Unified State taxes and removal of tax
anomalies for efficient use of petroleum products.
• Incentivise exploration and production of domes-
tic non-conventional fuels like shale gas, CBM,
coal mine methane, underground coal gasification
and so on.
• Promote development and production of bio-
fuels by the oil sector E&P and marketing com-
panies at commercial level. Appropriate policy
and integration issues facilitating bio-fuels devel-
opment be provided by both the State and the
Central Governments.
• Expand exploration and production of domes-
tic oil and gas sources for which quick decision-
making for awarding and development of NELP
blocks is necessary.
• In order to attract efficient E&P companies glob-
ally to bid for our acreages, it is vital to provide
seismic and other technical data of the acreages
on offer. It is proposed that the entire unlicensed
sedimentary area be surveyed, so that 100 per cent
exploration coverage may be achieved during the
Plan period.
• NELP was launched as a stopgap arrangement
until a National Data Repository was ready to
facilitate an all-year round acreage award policy.
The Government will introduce an Open Acreage
Licensing Policy so that the target of full explora-
tion coverage by the end of Plan period may be
achieved.
• Provide ‘Declared Goods Status’ for natural gas/
LNG so that it is available at uniform price in
most of the States.
• Natural gas prices charged to producers must also
be determined by market forces. There is a need
for clarity on fiscal incentives on exploration of
natural gas under NELP. The concept of uniform
gas price across consuming sectors also needs to
be examined afresh as the desire to keep prices
low for certain sectors tends to distort pricing; it
is inconsistent with the principle that the price of
gas will be determined by market forces.
• Develop a policy framework to exploit shale gas. It
is proposed that a new policy for exploration and
production of shale gas be launched, and acreage
be speedily awarded during the Plan period.
• Coal mining leases acreages often have methane or
even oil/gas deposits. Similarly, oil and gas lease/
PSC acreages have the possibility of coal/methane
production. The Government should put in place
a policy for simultaneous exploitation of CBM,
coal, coal mine methane, oil and gas in a unified
manner wherever such resources are available.
• Acquisition of equity oil and gas abroad including
conventional and shale gas assets.
• Contracting LNG imports both on long- and
short-term basis considering market price
affordability.
3.5. NEW AND RENEWABLE ENERGY
14.185. The need to increase total domestic energy
production in order to reduce import dependence,
combined with the need to move away from fossil
fuels in the longer run in view of climate change con-
siderations, points to the need for stronger efforts
to increase the supply of energy from renewables.
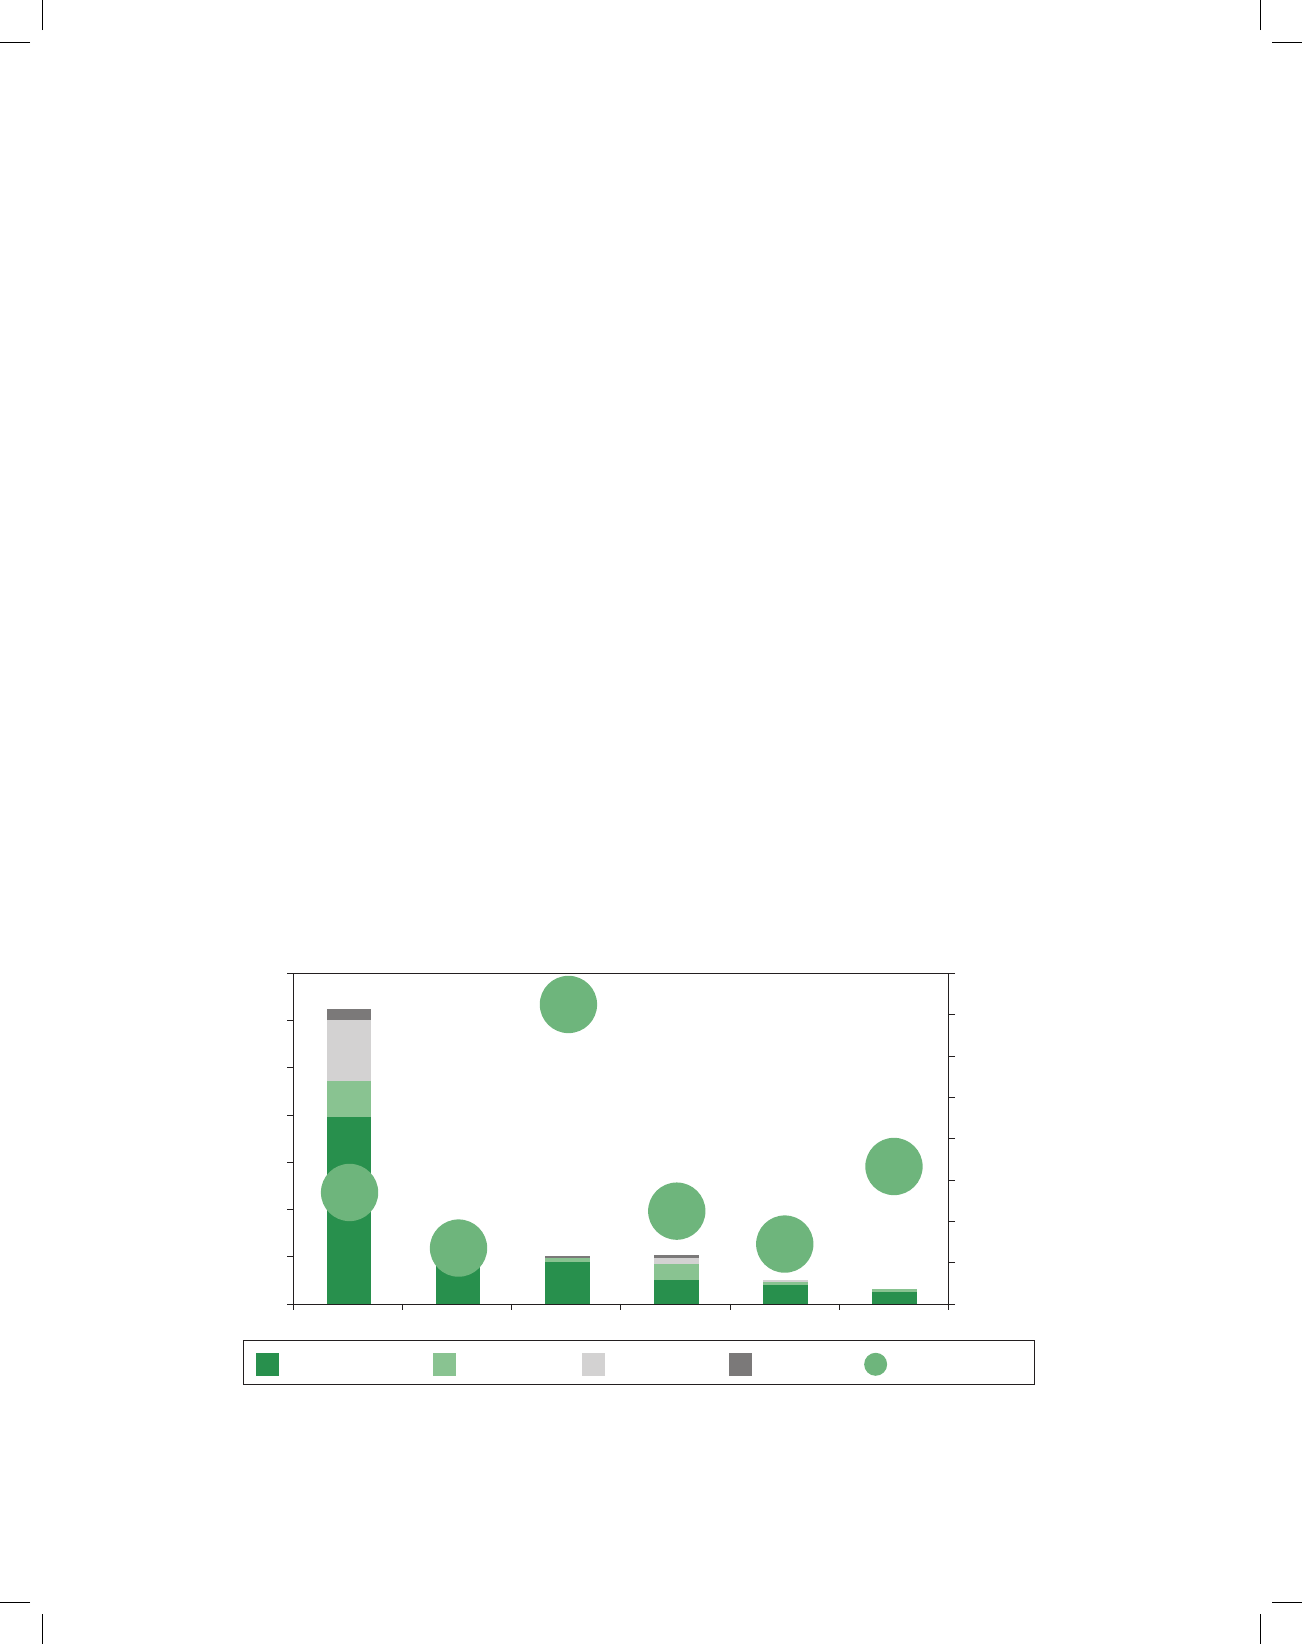
Energy 183
All over the world, investment in renewable power
sources has been increasing. India has been a late
entrant into the field of renewable energy, but it is
beginning to make rapid strides in this sector with
an annual growth rate of 33 per cent in 2010 against
the global growth rate of 26 per cent during the same
period. It must be emphasised however that these
increases are from a very low base since renewables
at present account for about 1 per cent of the total
commercial energy used. Nevertheless, it is impor-
tant to make a start and to gain significant experi-
ence in this important sector keeping in mind its
potential over the longer term.
14.186. An important limitation on the extent to
which we can shift to renewables is the high unit
cost at present, compared with other conventional
sources. However, unit costs of renewable energy,
especially solar energy, are coming down and the
marginal cost of conventional energy based on fossil
fuels is likely to remain high and rise. These trends
suggest that over the next 7 years the unit cost of
energy from renewable sources such as wind and
solar may come close to the unsubsidised cost of
conventional energy. Since India has a large poten-
tial of both wind and solar energy, the exploitation of
this potential should form an important part of our
long-term energy strategy.
14.187. The potential for renewable power has been
revised upward over time. In the early 80s, India
was estimated to have renewable energy potential of
about 85 GW from commercially exploitable sources,
viz. (i) Wind: 50 GW (at 50 m mast height) (ii) Small
Hydro:15 GW (iii) Bio-energy: 20 GW and (iv) solar
radiation sufficient to generate 50 MW/sq. km using
solar photovoltaic and solar thermal energy. These
estimates have since been revised to reflect techno-
logical advancements. Initial estimates from Centre
for Wind Energy Technology (C-WET) suggest that
wind energy potential at 80 metres height (with 2 per
cent land availability) would be over 100 GW. Some
studies have estimated even higher potential ranges
up to 300 GW. The MNRE has initiated an exercise
for realistic reassessment of the wind power poten-
tial, whose results are expected by the end of 2013.
14.188. Some of the key issues facing renewable
power generations are:
1. Regional Concentration of Renewable
Energy Potential: Because renewable energy
13.0%
33.3%
World Total
312
350
300
250
200
150
100
50
0
80.0%
70.0%
60.0%
50.0%
40.0%
30.0%
20.0%
10.0%
0.0%
China
50
Germany
49
India
16
Gigawatts
27.3%
72.4%
US
14.3%
22.5%
56
Spain
26
Wind power Solar PV Biomass Others % Growth in 2010
* Excludes Hydro.
Source: REN21, Global Status Report, 2011.
FIGURE 14.2: Renewable Power Capacities, Top Five Countries, 2010

184 Twelfth Five Year Plan
is location-specific and not evenly distributed
there are problems on scaling up grid connected
renewable power. For instance, wind potential
is mainly confined to the wind resource rich
States of Tamil Nadu, Maharashtra, Gujarat,
Karnataka, Rajasthan, Andhra Pradesh and
Madhya Pradesh. The States of Gujarat and
Rajasthan have excellent solar radiation and the
other suitable states for solar power are Andhra
Pradesh, Tamil Nadu, Karnataka, Madhya
Pradesh, Maharashtra, Orissa and so on.
Similarly, small hydro power potential is mainly
available with the Himalayan States and north-
eastern States. The intermittent nature of Solar
and Wind Power in the absence of an adequate
balancing mechanism limits the flexibility of the
State grid to absorb this power.
2. Insufficiency and High Cost of Evacuation
Infrastructure: Utilisation of variable renewable
energy requires a robust transmission infrastruc-
ture from remotely located generating plants to
the load centres. Further, combining geographi-
cally dispersed renewable energy sources to
reduce variability requires much larger, smarter
and upgraded transmission network. A recent
study conducted by the Power Grid Corporation
Ltd. has identified the requirement for strength-
ening of both intra-state and interstate transmis-
sion system for facilitating transfer of renewable
energy from renewable-energy–rich potential
States to other States as well as for absorption
within the host States. The study has estimated
that for capacity addition plans for the Twelfth
Five Year Plan period, an investment of around
`30,000 crore would be required for creating
renewable power transmission infrastructure.
3. Regulatory Issues: Renewable power, especially
solar, is significantly costlier than conventional
power, thus making its adoption by the cash-
starved utilities difficult unless it is incentiv-
ised through Renewable Purchase Obligation
(RPO) and introduction of Renewable Energy
Certificate (REC). This would enable States to
procure a fixed percentage of their power portfo-
lio from renewable power.
4. Financial Barriers: Renewable energy technolo-
gies require large initial capital investments,
making the levelised cost of generation higher
than it is for many conventional sources. These
technologies need to be supported until technol-
ogy breakthroughs and market volumes gener-
ated are able to bring the tariff down at the grid
parity level. Moreover, high technology and proj-
ect risks perceived by financers for renewable
projects make access to low-cost and long-term
funding difficult. Thus, there is a need to generate
instruments for low-cost and long-term financ-
ing of such projects from both domestic as well as
overseas resources and also banks to adopt sepa-
rate exposure limits for renewable energy sector.
5. Low Penetration of Renewables for Urban and
Industrial Applications: Solar applications for
heating water in urban, industrial and commer-
cial applications is one of the most mature and
viable renewable energy technologies available
worldwide. Better market penetration of such
technologies can lead to better demand side
management for commercial as well as house-
hold usage. With already matured technol-
ogy and rapidly growing industry, solar water
heater installations have witnessed a massive
growth throughout the world but the installa-
tions in India have remained low on account
of poor adoption due to high upfront cost and
poor quality standards of collectors. Moreover,
the binding regulation in building codes that
encourage adoption of such technologies are sel-
dom implemented and only few States have such
regulations.
REVIEW OF ELEVENTH PLAN
14.189. Progress in grid interactive renewable power
generation capacity, especially of wind-based power
was broadly in line with the targets of the Eleventh
Plan. However, actual renewable energy genera-
tion has been substantially lower. Wind-based
power generation has suffered the most partly also
because of the lack of evacuation infrastructure in
the resource rich States and partly because of lack
of enforcing mechanisms and incentives for opera-
tional performance of the wind turbines. Incentives
such as Accelerated Depreciation have not yielded
the desired results and the recommendation now is
to enforce generation-based incentive. Achievement

Energy 185
in capacity addition has been satisfactory for most
sectors except in waste to power. The details of tar-
gets and achievements during the Eleventh Plan for
grid interactive renewable power have been given in
Table 14.43.
14.190. Solar and wind sectors have been facing fol-
lowing key challenges:
1. Globally, development of storage technologies
has not been in line with the technology devel-
opments in wind and solar, due to which capac-
ity utilisation of grid connected solar and wind
has been relatively poor.
2. Though most of the States have come up with
the RPO obligation, proper enforcement and
monitoring is an issue.
14.191. Although private investments in wind
power have increased, technological improvements
and economies of scale have not reduced the costs
in the industry. On the contrary, the cost per MW
of wind power has increased from `4.3 crore/MW
in FY 2003–04 to `5.7 crore/MW in FY 2010–11
(Figure 14.3). Rising land acquisition costs and turn-
key project approach has resulted in the increase of
project cost. Small hydro power, in spite of using
mature and indigenous technology, has witnessed
2002–03 2003–04 2004–05 2005–06 2006–07 2007–08 2008–09 2009–10 2010–11
14
12
10
8
6
4
2
0
` Crore per MW
3.8 3.2
4.3
5.4 6
4.9
4
5
7.6
12
5.7
4.8
6.7
5.0
4.8
Wind energy Biomass energy Small hydro Solar
Source: MNRE.
FIGURE 14.3: Cost of Renewable Energy Technologies Per MW
TABLE 14.43
Eleventh Plan Power Capacity Addition through Grid Interactive Renewable Power
Source Target (MW) Actual (MW) as on 31st March ’2012
Wind 9,000 10,260.00
Small Hydro 1,400 1,419.17
Biomass Power 500 626.00
Waste to Energy 80 46.20
Bagasse Cogeneration 1,200 1,369.70
Solar Power 50 939.74
Total 12,230 14,660.81
Source: MNRE, GoI.

186 Twelfth Five Year Plan
the same trend partly because of the rise in land costs
and partly because of costs associated with delays
for obtaining clearances for the sites where project
development is difficult.
14.192. The cost of renewable power as against vari-
ous sources of renewable energy is given in Table
14.44. The cost of wind power is already quite com-
petitive. Solar power is much more expensive but costs
are coming down. At the time of selection of the first
batch in the Jawaharlal Nehru National Solar Mission
(JNNSM) the tariff for solar P.V. was `17.91 per Kwh
and for solar thermal it was `15.31 per unit. In Batch
II the tariff has come down to `8.77 per unit for solar
P.V. Thus, although renewable power sources are sig-
nificantly costlier than conventional power, the costs
are clearly declining and over the next 5–10 years
renewable energy may well be fully in line with the
cost of new electricity capacity based on conventional
energy sources if no subsidy is involved.
TABLE 14.44
Cost of Power for Various Renewable Energy Sources
Source Estimated
initial
capital cost
(` in crore/MW)
Estimated cost
of electricity
generation
(Financial)
(`/kWh)
Small Hydro Power 5.50–7.70 3.54–4.88
Wind Power 5.75 3.73–5.96
Biomass Power 4.0–4.45 5.12–5.83
Bagasse Cogeneration 4.20 4.61–5.73
Solar Power 10.00–13.00 10.39–12.46
Source: CERC (Terms and Conditions for Tariff Determination
from Renewable Energy Sources) Regulations, 2012 dated 27
March 2012.
Off-Grid Renewable Power
14.193. Off-grid renewable sector has the advantage
that it is potentially much more competitive with
conventional power because it avoids the investment
in transmission to remote locations. Off-grid renew-
able power has made progress during the Eleventh
Plan, but lack of scalable business models and non-
availability of institutional finances have stalled
the pace of its progress. Policy interventions are
required to incentivise creation of financeable busi-
ness models like rice husk gasifiers based electricity
generation. The issue of unwillingness of public sec-
tor banks to finance small scale off grid renewable
based business models need to be addressed. The
detailed overview of targets and achievements for the
Eleventh Plan for off-grid renewable power has been
given in Table 14.45.
TABLE 14.45
Power Capacity Addition through Off Grid Renewable
Power
Source Target
(MW)
Actual
(MW)
Waste to Power (Urban + Industrial) 58.00 85.15
Non-bag Cogen 255.00 336.59
Gasifiers 67.00 63.23
Acro-Gens/Hybrid Systems 1.75 1.14
SPV Systems 20 46.64
Total 401.75 532.75
Source: MNRE.
14.194. Progress of the scheme for electrification of
remote villages/hamlets through renewable genera-
tion has not been satisfactory. Only 57 per cent of the
targeted villages have been electrified so far. Initially
no target was fixed for the grid solar photovoltaic
system during the Eleventh Plan. Under National
Action Plan on Climate Change, Jawaharlal Nehru
National Solar Mission was launched which aims to
install 20GW solar power, 2 GW of off-grid Solar,
20 million sq. metre of solar thermal collector area
and 20 million rural households to have solar light-
ing by 2022. Under off grid solar application scheme
of Jawaharlal Nehru National solar Mission, a total
target of 100 MW of solar photovoltaic system and
power plants for sanctioning was fixed for 2010–11
and 2011–12. Against this the ministry sanctioned
projects aggregating to 118.07 MWp. During the
Eleventh Plan SPV systems of standalone power
projects aggregating to 46.64 MWp capacity were
installed against a target of 20 MWp.
14.195. Another thrust area for the Eleventh Plan
was ‘optimizing energy plantations by raising plants
on degraded forest and community land’. A detailed
analysis for availability of wasteland in India was
carried out based on the information available. IISc,

Energy 187
Bangalore has estimated the waste land available in
the country. Suitability of those areas for high yield-
ing plantation and for Juliflora plantation has been
estimated but policy models along with implementa-
tion guidelines to promote energy plantations have
to be worked out.
14.196. The approved outlay for the Eleventh Plan
for New and Renewable Energy programmes was
`10,598.31 crore comprising of GBS of `4,068 crore
and `6,530.13 crore of IEBR. The likely expendi-
ture at the end of Eleventh Plan is `3,798.36 crore
(Table 14.46).
TWELFTH PLAN STRATEGY
14.197. Renewable energy has to play an expanding
role in achieving energy security and access in the
years ahead. The areas on which attention should be
focussed during the Twelfth Plan are:
• Grid interactive and ff-Grid/Distributed Renew-
able Power
• Renewable Energy for Rural Application
• Renewable Energy for Urban, Industrial and
Commercial Applications
• Research, Design and Development for New and
Renewable Energy
• Strengthening of Institutional Mechanism for
enhanced deployment and creation of public
awareness.
14.198. The National Action Plan for Climate
Change (NAPCC) norms envisage that the share
of renewable electricity in the electricity mix which
was 7 per cent in 2011–12 should reach 12 per cent
by 2016–17. For this the corresponding renewable
power requirement would be 132 BU or 52,000 MW
considering the conservative average capacity utili-
sation factor of 30 per cent. The present installed
capacity of renewable power is around 25,000 MW
and, consequently, the renewable power capacity
addition required for the Twelfth plan would be
about 30,000 MW. The component wise break up
of physical targets for the Twelfth Plan is given in
Annexure 14.4.
14.199. For the Twelfth Five Year Plan, in addition
to reorienting various existing policy initiatives,
several new measures have been identified that are
deemed essential to accelerate the pace of deploy-
ment of renewable energy in the country.
Schemes Spilling from the Eleventh Plan
Grid Connected Renewable Power
14.200. A capacity addition of 30,000 MW of Grid
connected renewable power is proposed of which
15,000 MW is envisaged to come from wind power,
10,000 MW from solar capacity and 5,000 MW
from other types of renewable sources. Institutional
mechanisms to accelerate adoption of Renewable
Power by States in the form of RPOs are sought to
be enforced by bringing in an amendment into the
Electricity Act, 2003. Accelerated depreciation ben-
efit for wind power projects will come to an end at
the end of the Eleventh five year plan. Tariff for Solar
power under JNNSM is expected to continue falling
due to enhanced indigenisation and local manufac-
turing. Further, to ensure volumes GBI support will
be continued in the Twelfth Five Year Plan. It is also
TABLE 14.46
Eleventh Plan Financial Allocations and Expenditure: MNRE
(` in crores)
Programme Component BE Expenditure
Grid-connected and Distributed Renewable Power 1,779 1,839.82
Renewable Energy for Rural Applications 910 910.95
Renewable Energy for Urban, Industrial and Commercial Applications 216 147.28
Research, Design and Development in Renewable Energy 481 340.33
Supporting Programmes 682 559.98
Total 4,068 3,798.36

188 Twelfth Five Year Plan
proposed to restrict the upfront subsidy support for
Small Hydro plants to 10 MW size of hydro plants
from an existing size of 25 MW.
Off-Grid Distributed Renewable Power
14.201. An ambitious capacity addition target of
3,400 MW has been proposed, which is almost five
times the targets of the Eleventh Plan for off-grid
renewables. Cogeneration in non-bagasse industry
is supposed to contribute maximum (2,000 MW) of
the overall ambitious targets proposed by MNRE.
1,000 MW of off-grid solar capacity addition has
been proposed in line with the targets of phase-2 of
Jawaharlal Nehru Solar Mission. The financing for
incentives for such projects would be sourced from
a pool of funds originating out of National Clean
Energy Fund, CSR activities and tax-free donations.
Renewable Energy for Rural Applications for
Cooking
14.202. The biogas technology has now reached
a stage of becoming robust and mature enough
for meeting cooking energy needs with additional
advantages of meeting good organic fertiliser needs
for sustaining crop yield and productivity and soil
health. It is recommended to continue biogas and
solar cooker program. Additionally solar cooking
could be promoted under mid-day meal programme.
Renewable Energy for Rural Electricity Access
14.203. Some of the existing models for providing
off grid electrification have shown notable response.
Consequently, models like Solar home lighting sys-
tems through banking system, entrepreneur based
biomass gasifier models for providing electricity for
lighting, and mini micro hydro systems would con-
tinue to be supported.
14.204. Renewable energy has to be seen as a com-
plementary option to the current conventional
power generation and it has special characteristics
in terms of variability in availability. Solar power is
available only during the day and the availability of
wind power varies depending upon the time of the
year and also intra-day depending on wind con-
ditions. These characteristics imply some special
efforts at balancing with other sources to ensure a
reliable supply to the grid. Fortunately solar power
is at its peak precisely when demand is highest.
However, that may not be the case with wind power.
Effective utilisation of such power will require
focused efforts towards balancing wind power with
other power capacity which can be moderated to sta-
bilise supply and also the development of efficient
storage technologies. For this reason, special empha-
sis needs to be given on pumped water storage hydro
plants. Central Government may consider providing
assistance to the states for creating spinning reserve
at the regional level by setting up of storage tech-
nologies. In the long term, other hybrid technology
options such as gas with solar/wind, which are at a
nascent stage, need to be developed. As the cost of
power through conventional generation rise in the
long term and technological developments in future
increase the commercial viability of hybrid options,
the cumulative financial benefits realised from using
these options to meet peak demand requirements
would outweigh the financial push provided to them
in the present scenario.
Off Grid Solution for Industrial, Commercial and
Buildings Applications
14.205. Existing scheme on solar water heat-
ers will continue with a review of capital subsidy.
Additionally green building programme and solar
city initiative will be expanded to add new cities.
Major New Initiatives
14.206. The following are some of the new initiatives
in the area of renewable energy:
1. National Institute of Solar Energy: The existing
Solar Energy Centre would be converted into an
autonomous institution for undertaking applied
research, demonstration and development in
solar energy including solar hybrid areas.
2. National Bioenergy Corporation of India:
National Bio Energy Corporation of India
(NBECI) will be set up to implement bioenergy
mission including cook stove programme.
3. Renewable Energy Development Fund: In order
to address the financing constraints for the grid
connected as well as the off-grid applications of
renewables, it is proposed to create a Renewable
Energy Development fund. The fund will plug
the gap between the sector financing needs and

Energy 189
the amount that falls short of the banks’ obliga-
tions to their lending to this priority sector.
4. National Bioenergy Mission: Biomass energy
for electricity generation has turned out to be
one of the most attractive source of power which
is scalable, has the largest potential for improving
energy access and which can be linked to gen-
erating additional rural income. In view of the
success of such biomass-based off-grid renew-
able models in rural areas of Bihar, it is proposed
to launch the Biomass Mission with an objec-
tive to create a policy framework for attracting
investment and to facilitate rapid development
of commercial biomass energy market based on
utilisation of surplus agro-residues and develop-
ment of energy plantations.
5. Renewable Power Evacuation Infrastructure:
Special emphasis will be placed on creating
evacuation infrastructure and transmission
facilities for renewable power in a time-bound
manner to support the large expansion in con-
sumption and production of renewable power.
Judicious planning of transmission system,
that is, creating pooling substation for cluster
of renewable power generators and connect-
ing them with receiving station of STU/CTU at
appropriate voltage level, will lead to optimal
utilisation of transmission system.
6. National Biomass Cook Stove Programme: The
proposed initiative plans to universalise access
of improved biomass cook stoves by providing
assistance in exploring a range of technology
deployments, biomass processing and delivery
models leveraging public-private partnerships.
Policy Approach
14.207. The logic of subsidising new initiatives is that
once they gain criticality of mass in terms of manu-
facturing capacity they should be able to survive
without receiving any subsidy or fiscal incentives
from the government. In keeping with this approach
the objective should be to move away to the extent
possible from capital subsidies and fiscal incentives
to performance based incentives. Attaining the pro-
posed higher deployment levels for wind energy,
GBI support will require to be continued during the
Twelfth Plan period.
14.208. To ensure lowest cost procurement of rene-
wable energy, particularly wind and solar power
should be through an open competitive bidding
process. This has proved successful and in line
with the ultimate objective of reaching grid parity
earlier. This is particularly true of solar, which is at
present costly, however it is expected to achieve
grid parity in the Thirteenth Plan period in con-
junction with the objectives of JNNSM. The com-
petitive bidding process adopted for selection of
projects has already resulted in significant reduc-
tions in base tariffs notified by CERC. The tariff
for solar energy is expected to continue falling due
to technological development and focus on indi-
genisation and local manufacturing for future proj-
ects, thus paving way to grid parity in due course
of time.
14.209. There is a need to create a special sectoral
exposure limit for the renewable energy sector by the
banks. Additionally, creation of special instruments
like tax-free RE bonds on the line of infrastructure
bonds would facilitate low cost and long term lend-
ing to the renewable sector. Priority-sector status
may also be granted to the renewable sector in view
of the social and environmental benefits of the proj-
ects. This will act as a major policy push for the off-
grid applications, which face maximum barriers in
receiving low cost finances.
14.210. India’s strategic focus would need to be aug-
menting of decentralised renewable energy capac-
ity in the rural areas where it is having large social
impact. Off-grid renewable energy applications
have significant potential of reducing furnace oil/
diesel/kerosene consumption in the country and
can significantly contribute to oil import substitu-
tion. A cluster based approach for village electrifi-
cation needs to be adopted. Under this approach,
tariff-based bidding mechanism for such clusters
inviting participation from business models would
bring down the tariff by a significant amount.
The difference that the consumers in the clusters
are willing to pay and tariff discovered through
the bidding mechanism can be financed through
annual viability gap funding. The choice of technol-
ogy can be left to the entrepreneurs, which would

190 Twelfth Five Year Plan
TABLE 14.47
Indicative Twelfth Five Year Plan Outlay for the various Ministries/Departments in the Energy Sector
Sl. No. Name of the Ministry/Department Twelfth Plan (2012–17) Projections
GBS IEBR Total Outlay
1. Ministry of Power 54,279 3,86,517 4,40,796
2. Ministry of Coal 4,617 1,08,244 1,12,861
3. Ministry of Petroleum and NG 5,147 4,36,541 4,41,688
4. Ministry of Renewable Sources of Energy 19,113 13,890 33,003
Sub-Total 1-4 83,156 9,45,192 10,28,348
5. Department of Atomic Energy
(Power, Industry and Minerals Sectors) 21,737
R&D 19,878
Sub-Total DAE 41,615 65,572 1,07,187
TOTAL (Energy) 1,24,771 10,10,764 11,35,535
encourage entrepreneurs to constantly innovate
their products and services to bring down the cost
of producing electricity. Such projects would also
be encouraged in the areas with grid availability but
with lack of reliable supply so that power can be
fed into the grid when the grid is energised and can
be supplied to households when the grid is down.
However, proper regulatory framework needs to be
developed which can be adopted at state level, and
has clear cut guidelines on monitoring, evaluation,
multi-year operation and maintenance and ensures
grid compatibility for such projects. Moreover, a
sufficient financing mechanism for meeting out
the viability gap requirement and an institutional
mechanism to create an ecosystem for deployment
of such projects needs to be put into place.
14.211. India is the second largest wind turbine
manufacturer next to China. The installed manu-
facturing capacity in India ranges around 6,000 MW
per year, with large export potential. The manufac-
turing base for wind turbines and its components
has expanded to 16 manufacturers with 43 mod-
els of varying technologies and capacities. Till the
year 2000, most of the machines were of 500 kW
or lower capacity. Today, there are about 14 mod-
els from 5 different manufacturers of capacity 2
MW and above, the largest capacity being 2.5 MW.
Larger machines have resulted in a steady increase
in the Capacity Utilisation Factor (CUF) from 10
per cent–12 per cent in 1998 to 22 per cent–25
per cent in 2012. Technology is moving towards
better aerodynamic design, use of lighter blades,
direct drives, permanent magnet technology, and
variable speed gearless operation using advanced
power electronics. The health monitoring of wind
turbines is now computer-controlled and on real-
time basis.
14.212. Improvements in wind turbine technology
and its installations at higher hub heights are work-
ing towards induction of higher capacity turbines. At
the higher hub heights, wind potential is estimated
to be substantially higher compared to the normal
wind turbines at 40–60 metres hub heights. It is esti-
mated that average capacity factor in USA has grown
by about 25–30 per cent over the last decade. Even
in India, the low capacity, older machines at highly
favourable locations, need to be replaced by newer,
and high capacity ones. Higher hub heights will
enhance wind energy outputs, and will also be cost
efficient.
PLAN OUTLAY
14.213. The indicative Twelfth Five Year Plan outlay
for the various Ministries/Department in the energy
sector is given in the Table 14.47 below:

Energy 191
ANNEXURE 14.1
Eleventh Plan Physical Progress of RGGVY Projects under Implementation
Sl.
No
State/UT Name
(Number of Districts)
Electrification of
Un/De-Electrified Villages
(Achievement)
Intensive Electrification
of Electrified Villages
(Achievement)
No. of Connections to
BPL Households
(Achievement)
1 Andhra Pradesh (22) 0 25,562 27,02,273
2 Arunachal Pradesh (16) 1,313 825 21,646
3 Assam (23) 7,829 11,672 8,07,290
4 Bihar (38) 22,029 4,267 21,49,834
5 Chhattisgarh (14) 857 10,512 9,15,407
6 Gujarat (25) 0 14,457 8,02,818
7 Haryana (18) 0 2,744 1,94,442
8 Himachal Pradesh (12) 78 1,059 10,078
9 Jammu & Kashmir (14) 148 2,380 44,014
10 Jharkhand (22) 1,7905 5,505 12,72,755
11 Karnataka (25) 61 24,575 8,34,196
12 Kerala (7) 0 37 17,238
13 Madhya Pradesh (32) 504 17,942 7,17,394
14 Maharashtra (34) 0 32,528 11,60,732
15 Manipur (9) 616 401 28,814
16 Meghalaya (7) 1,172 1,537 62,768
17 Mizoram (8) 89 338 14,743
18 Nagaland (11) 79 725 28,514
19 Orissa (30) 14,226 21,207 27,48,137
20 Punjab (17) 0 0 53,925
21 Rajasthan (33) 3,999 29,083 10,43,522
22 Sikkim (4) 25 375 9,366
23 Tamil Naidu (26) 0 9,992 5,02,956
24 Tripura (4) 127 463 80,986
25 Uttar Pradesh (65) 27,759 2,982 10,44,494
26 Uttarakhand (13) 1,511 9,028 2,30,558
27 West Bengal (17) 4,169 18,357 19,26,383
Total (546) 1,04,496 2,48,553 1,94,25,283

ANNEXURE 14.2
Sectoral Coal Demand/Off-take for Annual Plan 2012–13
(In Million Tonnes)
Sl. No. Sector 2006–07 2007–08 2008–09 2009–10 2010–11 2011–12 2012–13 2016–17
Actual Actual Actual. Actual Actuals BE Provi. BE
I Coking Coal
Steel/Coke Oven (indigenous) 17.37 16.99 16.58 15.92 16.80 17.23 16.05 22.00 31.70
2 Import 17.88 22.03 21.08 23.47 23.20 29.44 30.62 30.00 35.50
Sub-Total Coking: 35.17 39.02 37.66 39.39 40.00 46.67 46.67 52.30 67.20
II Non Coking
3 (i) Power Utilities (Gen. Req.) 307.92 332.40 362.08 380.13 405.00 460.00 412.00 512.00 682.08
4 Cement 19.74 21.27 20.09 20.80 25.98 28.89 28.89 30.24 47.31
5 Steel DRI 17.47 20.92 19.78 22.89 28.80 30.47 30.47 35.30 50.33
7 Fertilisers 2.96 2.94 3.09 2.63 85.00 90.00 81.97 100.00 77.22
8 LTC/Soft Coke* 51.49 57.50 72.54 77.18
9 Cokeries/Coke oven (NLW)*
10 BRK and Others
11 Captive Power 28.13 29.31 32.94 38.47 40.00 40.00 40.00 43.00 56.36
12 Colly.Consumpt. 0.99 0.93 0.85 0.76 0.73
Sub Total Non-Coking: 428.70 465.27 511.37 542.86 584.78 649.36 593.33 720.54 913.30
Grand Total(I + II): including middlings 463.87 504.29 549.03 582.25 624.78 696.03 640.00 772.84 980.50
Middlings 3.25 3.18 2.61 2.21
Note: (i) *Included in BRK and Others.

ANNEXURE 14.3
Annual Plan 2012–13—Company-wise Production—Ministry of Coal
Company 2006–07 2007–08 2008–09 2009–10 2010–11 2011–12 2012–13 2016–17
Actual Actual Actual Actual Actual Target Provi. Target Target
ECL 30.47 24.06 28.14 30.06 30.81 33.00 31.00 33.00 45.00
BCCL 24.21 25.22 25.51 27.51 29.04 30.00 30.20 31.00 37.00
CCL 41.32 44.15 43.24 47.08 47.52 51.00 49.00 55.00 92.00
NCL 52.16 59.62 63.65 67.67 66.25 68.50 64.50 70.00 82.00
WCL 43.21 43.51 44.70 45.74 43.65 45.50 43.80 45.00 45.00
SECL 88.50 93.79 101.15 108.01 112.71 112.00 113.75 117.00 145.00
MCL 80.00 88.01 96.34 104.08 100.28 106.00 103.00 112.00 167.00
NEC 1.05 1.10 1.01 1.11 1.06 1.00 0.75 1.10 2.00
CIL 360.92 379.46 403.74 431.26 431.32 447.00 436.00 464.10 615.00
SCCL 37.71 40.60 44.54 50.43 51.33 51.00 51.00 53.10 57.00
Other Public Sector 1.77 2.02 1.84 3.30 1.81 3.55 18.00 23.00
Private–TIOSCO 7.04 7.21 7.28 7.21 7.03 8.40 17.75
Captive 17.61 21.17 29.87 35.03 34.60 38.25 36.15 39.80 100.00
Meghalaya 5.79 6.54 5.49 5.77 6.97 5.80
Grand Total 430.84 457.00 492.76 533.00 533.06 554.00 540.00 575.00 795.00

194 Twelfth Five Year Plan
ANNEXURE 14.4
Physical Targets of Renewable Programme for the Twelfth Plan
Programme Proposed Twelfth Plan Targets
1. Grid-interactive Renewable Power(MW)
Grid Interactive Solar
Grid Connected Wind
Other Renewable Sources
30,000
10,000
15,000
5,000
2. Off-grid/Distributed Renewable Power (MWe)
Cogeneration from bagasse
Solar Off-Grid Applications
Waste to Energy
Bio Gas Based Decentralised Power
Others (Biomass Gasifiers, Micro-hydel)
3,400
2,000
1,000
200
50
150
3. Renewables for Rural applications (Cooking)
Biogas Plants (million)
National Biomass Cook stoves Programme (million)
Solar Cookers (Box type + Dish type)
Solar Cooking in schools for mid-day scheme (Schools in lakhs)
0.7
3.5
3.5
5.0
4. Renewable Energy for Urban, Industrial and Commercial Applications
Solar Water Heating Systems (million sq.m of collector area)
Solar Air Heating System (sq m.)
CST based systems for community cooking (sq.m.)
CST based system for air-conditioning
(125 systems, 30TR)
CST based systems for process heat
(225 systems, 250 sq.m. area each)
6
50,000
40,000
37,000
53,750
5. Solar Cities
New Solar Cities in addition to existing target of 60 cities and pending liabilities.
Model and Pilot Solar Cities.
Green Townships.
Tourist/Religious/ Important Places
15
25
150
100
6. Alternate Fuel Vehicles (in numbers) 2,75,000
7. Power Generation from Hydrogen
Stationery Power Generation (KW)
Hydrogen/H-CNG Stations (nos)
Demonstration projects for Hydrogen/H-CNG vehicles
4,000
10
500
8. Power Generation from Fuel Cell
Stationery Power Generation (KW)
Back- up units for telecom towers (MW/nos)
Fuel cell Vehicles
10.0
10/2,000
100
Source: MNRE.

INTRODUCTION
Issues and Challenges
15.1. India’s transport sector is grossly overstretched.
The pace of economic development after the eco-
nomic reforms has imposed a heavy burden on this
sector. To meet the requirements of the economy
during the Twelfth Plan it will have to address sev-
eral challenges.
15.2. First, capacity needs are expected to double
every decade in the medium term. It will conse-
quently require large step-up in investments for
capacity creation. The congestion and shortage of
capacity is exhibited in all transport sectors. The
National Highway network and the rail links along
the North-South East-West corridors have very high
traffic. In spite of expansion of ports capacity to
more than a billion metric tonne by the end of the
Eleventh Plan, a number of major ports have very
high dwell time and are running at more than 90
per cent capacity. Of India’s National Highways, less
than one-third are two- or four-lane and a very large
length of these are not able to support the 10.2 tonne
permissible load per axle trucks are allowed to carry.
While airport capacities have expanded significantly
and kept pace with passenger demand, there is a need
to expand the freight capacities to meet the growing
requirements of the economy. Transportation of key
commodities such as coal, iron ore, iron and steel
and POL put heavy demands on transport system.
Over the next 20 years, the demand for transport
(both domestic and import) of these commodities
15
Transport
could well increase by a factor of four to six which
would require investment in rail capacity and other
modes. Apart from transport, there is severe lack of
capacity in the allied activity of warehousing.
15.3. Second, the transport efficiency is low. The cost
of rail and coastal shipping in the country is higher
than many economies. Even the road costs and tran-
sit time across different modes are large. Partly, it is
because the average speeds of movement of all the
modes: Rail, Road, Coastal Ships is lower than those
in more efficient economies. The average speed
of freight trains is 25 km per hour which is nearly
half that of the U.S. The other nature of inefficien-
cies relate to poor handling equipments at the ports,
inadequate rail infrastructure, absence of modern
technologies in several areas and high handling costs
resulting from a variety of factors including thefts.
15.4. Third, there is an important distortion in the
overall transport movement of goods. A study con-
ducted by RITES indicates that there is a discernible
gap between the way in which the traffic is actually
moving today and the way in which it should move.
A comparative assessment of the impact arising out
of the two different scenarios of modal mix, that is,
Actual and Optimal (applying break-even distances
based on resource cost) on the transport system dur-
ing the base year (2007–08) in terms of flows, cost
and throughput reveals that there is a significant
scope for modal switch from Road to Rail in the case
of miscellaneous/other commodities up to the extent
of 78 per cent.

196 Twelfth Five Year Plan
15.5. The country transports nearly 57 per cent of
the total goods by road, as compared to 22 per cent
in China and 37 per cent in the U.S. In contrast, the
share of rail is only 36 per cent compared to 48 per
cent for the U.S. and 47 per cent for China. Despite
the fact that a large part of India’s freight traffic com-
prises bulk materials and moves over long distances
that can be served efficiently by rail and waterways,
the share of shipping through waterways is nearly 6
per cent as compared to 14 per cent in U.S and 30
per cent in China. This is imposing high cost on the
economy by way of much higher dependence on fos-
sil fuels and high level of green house gas emissions.
On the basis of mode-wise share of originating load-
ings in 2007–08, the indicative CO2 emissions from
the major modes are given in Table 15.1.
TABLE 15.1
CO2 Emissions from Various Transport Modes
Freight Transport
(gm/tkm)
Passenger Transport
(gm/pkm)
Road 160 Passenger Cars 175
Rail 29 Rail 75
Shipping 31 Airways 229
15.6. On environmental considerations, hence, there
is a need to encourage rail and shipping. Added to
this is the lower cost of accidents associated with rail
transport compared with road.
15.7. Fourth, there is a need to provide transport
access to large unserved areas of the country. A num-
ber of States in the North-East have very little rail
network. A number of airstrips in the NE region are
not in use. While there have been efforts to expand
the airlines network and the number of flights to the
North East Region, its intra-regional connectivity is
still low. A programme for development of roads in
the northeast including Trans-Arunachal Highway
has been taken up to improve road connectivity. It
requires large financial and physical resources and
management expertise to complete the projected
network. Similarly, the expansion of rail network in
the North East and several other parts of the country
has been limited in the last six decades. Large areas of
Jharkhand, Orissa, Madhya Pradesh, and Rajasthan
have no access to rail network. In the Himalayan
States of Uttarakhand and Jammu & Kashmir, the
network, particularly in the Hilly areas, is nonexist-
ent. These areas require extensive road and rail net-
work for their integration with the markets.
15.8. Fifth, safety is a major area of concern espe-
cially in the road transport. Over 1.3 lakh people are
known to die annually in road accidents alone and
their number is rising. This is about 10 per cent of
the world figure, though India’s share in number of
vehicles in the world is only 1 per cent. The World
Health Organization has forecasted road traffic inju-
ries to rise and become the fifth leading cause of
death by 2030. Safety levels in railways are also in
need of urgent improvement.
15.9. Sixth, there is a near absence of an integrated
regulatory regime for overseeing tariff setting, cost of
operations, anti-competitive practices and account-
ability to consumers. There is a division of power
between the Central Government and the State
Governments. Some areas are reserved exclusively
for Central Governance, while there are a few sectors
that are subject to joint governance. An examination
of the existing laws, policies and regulations indicate
that they are a result of an ad hoc approach, which is
exacerbated by the overlapping power of the Central
and State Governments. The regulatory framework in
different sectors has been developed without proper
coordination among the sectors. Sometimes only a
set of laws and/or policies govern a particular sector
without a regulatory body to oversee the development
and operations. The absence of a sectoral authority in
the transport sector as a whole has led to fragmented
and ineffective centres of governance.
Strategy
15.10. The challenges in the transport sector need to
be addressed in a comprehensive manner with a set
of policies, laws and regulations. This requires trans-
port reforms. Some of the major initiatives required
are mentioned below.
15.11. First, a more integrated approach is required
to be taken of transport as a whole. Our vision for
transport should be guided by a modal mix that will
lead to an efficient, sustainable, economical, safe,

Transport 197
reliable, environmentally friendly and regionally bal-
anced transportation system. Choices will need to
be made on the priorities to be placed on different
investments. Decisions on road expressways, dedi-
cated rail freight corridors (DFCs), high speed trains
and movement through inland waterways or coastal
shipping must be taken holistically so that the objec-
tive of speed and efficient energy usage is achieved.
Policy decisions should be based on life cycle energy
costs of different transport modes.
15.12. While, pursuing the above objectives, two
important initiatives could be taken:
1. Transportation by containerisation would need
rapid expansion. While a number of initiatives
in this regard have been taken earlier, the share
of container transport is still low. Considering
the international experience, major efforts are
required to expand container traffic including
expansion of the network of dry prots (ICDs).
2. Intermodal connectivity to be given thrust dur-
ing the Twelfth Plan, by developing India’s
Inland Waterways which totals about 14,500
kilometers in length along with coastal shipping.
Strategies, such as setting up coastal terminals at
major ports, providing adequate road and rail
connectivity to inland water and coastal termi-
nals and non-major coastal ports, lowering the
manning scales and vehicle specifications for
coastal ships and other measures would be taken
during the Twelfth Plan.
15.13. Second, the sector requires large increase in
investments. Larger and focused investments will be
able to address the two key issues of rapid increase in
capacity and improvement in efficiency of infrastruc-
ture. The Interim Report of the National Transport
Development Policy Committee (NTDPC) has
strongly focused on need for capacity expansion of
the railways over the next 20 years. All projections
for the growth in demand for both freight and long
distance passenger services suggest that overall eco-
nomic growth could be stymied if appropriate strate-
gic choices are not made now to facilitate significant
capacity expansion of the railways, as has been
done in China over the past decade or so. Such an
expansion will not take place in a business as usual
scenario. If consistent economic growth of 7–10 per
cent per annum is to be achieved over the next 20
years, there is a pressing need for unprecedented
capacity expansion of the Railways for both freight
and passenger traffic in a manner that has not taken
place since independence. It is of utmost importance
that a vision similar to that of NHDP is laid down
for the Railways now so that we may expect a trans-
formed railway network by 2030.
15.14. It is estimated that the infrastructure sector
will need investment of one trillion dollars in the
Twelfth Plan. Of this, major share will be in the trans-
port sector. Given the limitation of public resource,
private investments will have to be emphasised and
expanded. A Public–Private Partnership (PPP)
regime has already been put into operation in road
sector very successfully. While in Ports, Airports,
Railways and Inland Waterways, there have been
efforts in private investments in varying degrees,
there is a need to step up an investment particularly
in the railways. There will be a special focus required
for increased investment in the railways from pub-
lic resources, as well for safety, modernisation and
expansion. It is estimated that the share of private
investments, of the total infrastructure investments
in the economy was nearly 40 per cent by the end of
the Eleventh Plan, the rest being public investments.
This needs to be increased to 50 per cent to 60 per
cent during the Plan.
15.15. Third, transport reforms are needed in pric-
ing and fiscal areas. In several sectors, the transport
pricing policies are unsustainable. The Railways have
not revised their passenger tariffs for several years,
despite sharp increase in fuel prices and other oper-
ating costs. They are further making investments in
uneconomic lines, despite lack of resources. This thin
spreading of the financial resources has delayed com-
pletion of viable projects and thus, led to further dete-
rioration of their finances. There is an urgent need to
undertake a review of projects and prioritise them as
well as to abandon or not to commence work on the
many unremunerative projects which have not made
substantial progress till now. Similarly, the taxation
policies on aviation fuel have led to uneconomic

198 Twelfth Five Year Plan
operations of the airlines. For coastal shipping lines,
similarly, benefits as available in other major econo-
mies to the coastal shipping lines need to be provided.
15.16. Fourth, transport safety has been a neglected
area in the past and credible institutional frame-
work to address these issues at Centre, States and
city level is required. The entire transport system
must be designed to accommodate the individual
who has the worst protection and lowest tolerance
of violence. The Twelfth Plan period would be used
to setting appropriate institutional structures that
create a demand for scientific work in safety issues;
have proper legislation and regulation; monitoring
and measurement by setting up national databases of
relevant information to monitor and assess various
aspects of safety policies, technologies and knowledge
needs. The National Transport Policy Development
Committee (NTDPC) has recommended setting up
institutes for road, railway, water and air safety to
ensure the safety professionals are abreast of inter-
national knowledge and findings as well as provision
for funding and establishment of multidisciplinary
safety research centres at academic institutions. It
has also recommended establishing National Boards
for Road, Railway, Water/Marine and Air Safety.
There is a strong need to put into action the recom-
mendations of the Sundar Committee on Roads and
the Kakodkar Committee on Railways.
15.17. Fifth, transport access is critical for inclusive
growth, economic development, access to markets
and participation in the political process. Develop-
ment of rural roads, expansion of rail infrastructure
in large unserved areas will, therefore, need special
emphasis during the Twelfth Plan. Every minute a
woman dies in child birth, but many of these deaths
could be avoided with timely access to transport.
Gender responsive infrastructure interventions can
free up women’s time by lowering their transaction
costs. This, in turn, will increase girls’ school enroll-
ment and facilitate women’s participation in income
generation and decision making activities.
15.18. Social inclusion requires that needs of the
differently abled are kept in mind while developing
the economy. It will be, therefore, important that
the transport sector makes special arrangements for
their needs, so that they are able to access it conveni-
ently and thus fully participate in our social and eco-
nomic process and contribute to it.
15.19. Sixth, human resource development would
be a key factor in achieving the objective of creat-
ing a well-developed and efficient transport system
in the country. The NTPDC report has pointed to
a severe lack of expertise in the country in almost
every sphere of transportation which makes it nec-
essary for a quantum jump in capacity augmenta-
tion for all modes. The quantitative improvements
to infrastructure need to be made in the context of
more qualitative considerations of safety, emissions,
energy efficiency, climate change impact and social
equity. The Committee has recommended setting up
national institutes for research and statistics, multi-
disciplinary research institutions, State and city level
institutions and centres of excellence in existing aca-
demic institutions. These suggestions will need to be
implemented during the Plan.
15.20. Seventh, connectivity of the North-East, both
within the region and with the far eastern region,
including Myanmar, Bangladesh and Thailand,
would be one of the focus areas for economic devel-
opment of the region and expanding economic activ-
ities including trade and commerce. Inland Water
Transport connectivity with Bangladesh will need to
be specially emphasised. Simultaneously, connectiv-
ity of the North East region through rail, road, air
with the neighboring countries and its rapid expan-
sion within the region would also need special focus
during the Plan.
RAILWAYS
15.21. Indian Railways is the fourth largest railway
network in the world in terms of route kilometers. As
on 31 March 2011, it has a total route length of 64,460
km of which 21,034 km is electrified. The total track
length is 1,13,994 km of which 1,02,680 km is broad
gauge, 8,561 km is meter gauge and 2,753 km is narrow
gauge. Considering the requirements of the economy
and size of the country, the expansion of the railway
network has been inadequate. Indian Railways have
added 11,864 km of new lines since independence.

Transport 199
It has not been able to cover major areas in many
states and has very little presence in the North-East
States and the Himalayan region. However, during
the same period the length of broad gauge route kilo-
meter has been doubled from 25,258 km to 55,188
km through new lines as well as gauge conversion of
21,658 km from meter and narrow gauges to broad
gauge. Gauge Conversion has been instrumental in
adding capacity in the system despite a relatively low
addition of new lines. The network needs extensive
modernisation, increase of speeds, improvement in
safety and modernisation of rolling stock to meet the
needs of a rapidly growing economy.
Review of the Eleventh Plan
Financial Performance
15.22. The Eleventh Plan period has seen steady dete-
rioration in Railway’s financial position (Table 15.2)
which is in sharp contrast with the Tenth Plan
performance when the Railways had achieved a
remarkable turnaround in financial performance.
The Revenue (gross traffic receipts) have gone up by
7.7 per cent (CAGR) during the period 2007–08 to
2011–12 whereas the Total Working Expenses has
gone up by 12.6 per cent (CAGR) during the same
period leading to decline in the net revenue which
has shown a negative growth rate of –17.9 per cent
(CAGR) during the above period. After accounting
for dividend, the net excess has reduced from `13,431
crore in the first year of the Plan to only `1,201
crore in the terminal year of the Plan. In 2009–10,
the balance had reduced to a token figure of less
than a crore. One of the major reasons for increase
in the working expenses during the Eleventh Plan
period has been the increase in wage bills by nearly
`73,000 crore due to the implementation of the Sixth
Pay Commission. However, in the first year of the
Twelfth Plan (2012–13) Indian Railways have tar-
geted a revenue surplus of `15,557 crore and operat-
ing ratio of 85 per cent.
Investments in Eleventh Plan
15.23. Lack of surplus has impacted the capacity
to generate resources for investment in the system
(Table 15.3).
15.24. During the Eleventh Plan period (2007–12),
the Ministry of Railways had an investment target of
`2,33,289 crores comprising of `63,635 crore as GBS,
`90,000 crore as internal generation and `79,654
crore as Extra Budgetary Resources (EBR) through
TABLE 15.2
Overview of Financial Position of the Indian Railways
(in ` Crores at current prices)
Sl.
No.
Description Terminal
Year of Tenth
2006–07
2007–08 2008–09 2009–10 2010–11 2011-12
(RE)
Twelfth
2012–13
(BE)
1 Gross Traffic Receipts 62,731 71,720 79,862 86,964 94,536 1,03,917 1,32,552
2 Net Ordinary Working Expenses 37,432 41,033 54,349 65,810 68,139 75,650 84,400
3 Appropriation to Pension Fund 7,416 7,979 10,490 14,918 15,820 16,800 18,500
4 Appropriation to Depreciation
Reserve Fund
4,198 5,450 7,000 2,187 5,515 6,160 9,500
5 Total Working Expenses 49,047 54,462 71,839 82,195 89,474 98,610 1,12,400
6 Net Revenue 14,453 18,334 9,714 5,544 6,346 7,144 22,233
7 Total Dividend Payable 4,247 4,903 4,718 5,543 4,941 5,652 6,676
8 Excess/Shortfall 10,206 13,431 4,456.78 0.75 1,405 1,492 15,557
9 Operating Ratio (per cent) 78.7 75.9 90.50 95.30 94.60 95 85
10 Ratio of Net Revenue to capital
at charge and investment from
capital fund (per cent)
19.0 20.71 8.80 4.51 4.40 4.43 12.10
Source: Explanatory Memorandum to the Railway Budget for Various Years.

200 Twelfth Five Year Plan
market borrowings. The actual expenditure against
this originally approved outlay for the Eleventh Plan
period comes to `1,92,147 crore—comprising of
GBS of `77,039 crore, internal generation of `66,704
crore and EBR of `48,404 crore. Thus there was a
shortfall of `41,142 crore (17.6 per cent). The antici-
pated utilisation under GBS would be `77,039 crore
against the projected outlay of `63,635 crore which is
an increase of 21 per cent over the estimate whereas
internal generation and EBR components were lower
by 25.9 per cent and 39.2 per cent respectively. It is
evident that the internal generation and borrowings
have not kept pace with the investment requirement.
Physical Targets and Achievements
15.25. The Eleventh Plan targets and achievements
for freight and passenger business are summarised in
Tables 15.4 and 15.5. It will be seen from Table 15.4
that as against the original target of 1,100 MT for the
terminal year of the Eleventh Plan, the actual achieve-
ment is 970 million tonnes which is 11.8 per cent
lower than the original target and 5 per cent lower
than the revised target of 1,020 MT. In NTKM terms,
the achievement has been 639.77 billion which is 8.9
per cent lower than the original target of 702 billion
and 5.1 per cent lower than the revised target of 674
billion. In terms of growth rates of traffic, as against
the projected growth in originating freight traffic of
8.6 per cent, the actual growth was only 5.8 per cent
(CAGR) and in NTKM terms, it was 6.1 per cent as
against a target of 7.8 per cent. The performance in
NTKM is better because of marginal increase in lead.
Growth rate of freight traffic is lower than the growth
rate in GDP during this period. This was contributed
by a sharp drop in exports of iron ore, problems in
mining of iron ore leading to inadequate domestic
movement and poor growth in coal movement due
to slowdown in coal production, particularly in the
last two years of the Plan. The freight basket of rail-
ways needs diversification to include manufactured
goods through containerisation so that slow down in
the core sector of the economy (coal, steel and so on)
can be compensated.
Passenger Business
15.26. The originating passenger traffic achieved in
the terminal year of the Eleventh Plan is 8,139 million
which is 3.2 per cent lower than the original Eleventh
Plan target of 8,400 million but 0.75 per cent higher
than the revised target of the Eleventh Plan. In terms
of growth rates, against the targeted CAGR of 6.2 per
cent, originating passenger traffic grew at the rate
of 5.5 per cent (Table 15.5). In terms of Passenger
Kilometers (PKM), the volume achieved is 1,062 bil-
lion which is higher than the original target but lower
than the revised target. The CAGR of PKM was 8.8
per cent which was much higher than the original
target of 5.9 per cent. This indicated a very signifi-
cant expansion due to higher leads of non-suburban
traffic. It increased from 215.5 km in year 2006–07
to 229.3 km in year 2008–09 and has maintained
the higher level. Railways are making large revenue
losses in passenger traffic both in suburban as well as
non-suburban segments (Table 15.6). Non-revision
TABLE 15.3
Investment in Railways during Eleventh Plan
(In ` Crore at current prices)
Eleventh Plan Approved
Outlay 2007–08 2008–09 2009–10 2010–11 2011–12
(RE)
Total for
Eleventh
Plan
Excess/
Shortfall
2012–13
(BE)
Gross Budgetary
Support
63,635* 8,668 10,110 17,716 19,485 21,060 77,039 13,404 24,000
27.3 % 29.9 % 27.8 % 44.7 % 47.9 % 45.3 % 40.1 % 21.1 % 41.8 %
Internal
Generation
90,000 14,948 18,941 12,196 11,528 9,091 66,704 (–)23,296 18,948
38.6 % 51.6 % 52.1 % 30.7 % 28.3 % 19.4 % 34.7 % (–)25.9 % 31.5 %
Extra Budgetary
Resources
79,654 5,364 7,284 9,760 9,680 16,316 48,404 (–)31,250 16,050
34.1 % 18.5 % 20.0 % 24.6 % 23.8 % 35.1 % 25.2 % (–)39.2 % 26.7 %
Total 2,33,289 28,980 36,336 39,672 40,693 46,467 1,92,147 41,142 60,100
*Includes 13572 crore as additional budgetary support for national projects

Transport 201
of tariff for several years has led to poor financial
health of this segment.
Infrastructure Capacity Creation—Targets and
Achievements
15.27. The Eleventh Plan attempted a paradigm shift
from the earlier incremental approaches to one of
significant infrastructure capacity addition to handle
the quantum increase in traffic levels and to sustain
mobility on the network by setting ambitious targets
as compared to the performance during the Tenth
Plan. The targets in respect of new lines and electri-
fication have been exceeded (Table 15.7). However,
in respect of doubling of lines which is a major
component for improving Railways’ capacity, there
has been a shortfall as compared to original targets
and in case of gauge conversion there has been a
shortfall as compared to the revised targets.
Throw-Forward of Infrastructure Projects
15.28. One of the major problems in the Railways
has been excessive sanctioning of new projects annu-
ally, much beyond the resources available which
only increases the throw-forward (number of proj-
ects under implementation) (Table 15.8). There is an
urgent need for a policy to limit the throw-forward
to a certain proportion of their annual expenditure
on these projects.
TABLE 15.4
Performance of Freight Business during Eleventh Five Year Plan
Item Tenth Plan
Actuals in
Terminal
Year
2006–07
Eleventh
Plan Targets
for Terminal
Year
2011–12
Eleventh Plan
Revised Targets in
Mid-Term Review
for Terminal Year
2011–12
2007–08 2008–09 2009–10 2010–11 2011–12 CAGR
Originating
Tonnage (Million
Tonnes)
728.4 1 100 1 020 794.21 833.31 887.99 921.5 970
Growth ( %) 8.6 7 9.03 4.92 6.56 3.77 5.26 5.8
NTKM (Billion) 475 702 674 511.8 538.23 584.76 605.99 639.77
Growth (%) 7.8 7 7.7 5.16 8.65 3.63 8.67 6.1
TABLE 15.5
Performance of Passenger Business during Eleventh Five Year Plan
Item Tenth Plan
Actuals in
Terminal
Year
2006–07
Eleventh
Plan Targets
for Terminal
Year
2011–12
Eleventh Plan
Revised Targets
in Mid-Term
Review for
Terminal Year
2011–12
2007–08 2008–09 2009–10 2010–11 2011–12 CAGR
Originating
Passengers
(Million)
6,219 8,400
(CAGR
= 6.2 %)
8,200 6,524 6,920 7,246 7,651 8,139 5.5 %
Passenger KM
(Billion)
695 924 (CAGR
= 5.9 %)
1,100 770 838 903 979 1,062 8.8 %
TABLE 15.6
Losses in Passenger Services
Year 2004–05 2005–06 2006–07 2007–08 2008–09 2009–10 2010–11
Losses (`crore) 6,159.41 6,022.66 6,449.22 7,067.67 13,901.22 18,960.67 19,964.03

202 Twelfth Five Year Plan
Rolling Stock Procurement and Production
15.29. During the Plan, acquisition of wagons has
exceeded the target but fallen short in coaches while
in diesel locomotives and electric locomotives the
revised targets have been achieved. The perfor-
mance, however, represents a large jump over the
Tenth Plan achievements (Table 15.9).
15.30. The emphasis in the Eleventh Plan period has
been on manufacturing high horse power electric
and diesel locomotives, EMUs/MEMUs and Metro
coaches based on GTO/IGBT technology.
Track Renewal
15.31. Arrears of track renewal have been brought
down from 6,200 km in the beginning of the Eleventh
Plan to 3,500 km at the end of the Eleventh Plan.
Around 18,000 km of track renewals have been car-
ried out in the Eleventh Plan period.
Productivity
15.32. Table 15.10 gives an assessment of the perfor-
mance of Railways and productivity improvements
during the first four years of the Eleventh Plan.
The improvement in productivity during the Plan
indicates increased congestion on the Railway track
system.
15.33. The productivity of employees and of the
network is important for assessing the operational
efficiency. Table 15.11 gives an international com-
parison. It is clear that the network productivity
of Indian network is good in passengers traffic. In
terms of employees’ productivity in freight Indian
Railways is 1/3rd that of China and about 1/4th that
of Russia
Initiatives Taken During Eleventh Plan
Freight and Passenger Business
15.34. Railways have taken several initiatives dur-
ing the Plan for expanding the share of freight traf-
fic. These include introduction of freight marketing
of select commodities by third parties, introduc-
tion of liberalised wagon investment schemes to
attract private investment in special purpose and
TABLE 15.7
Capacity Creation during Eleventh Plan
Item Tenth Plan
Achievement
(km)
Eleventh Plan
Original Target
(km)
Revised Target for Eleventh
Plan during Mid Term
Appraisal (km)
Eleventh Plan
Achievement
(km)
Improvement over
Tenth Plan (%)
New Lines 920 2,000 2,000 2,205 139.6
Gauge Conversion 4,289 10,000 6,000 5,290 23.4
Doubling 1,300 6,000 2,500 2,756 112
Railway Electrification 1,810 3,500 4,500 4,501 148.7
TABLE 15.8
Throw Forward of Infrastructure Projects as on 1 April 2012
Infrastructure Number of Works
in Progress
Length in km Cost (` crore) Throw Forward 1
April 2012 (` crore)
New Lines 132 14,212 1,23,767 89,792
Gauge conversion 42 9,880 35,051 18,659
Doubling 174 9,015 49,295 38,766
Electrification 39 4,700 4,100 6,229
DFC Project 2 3,338 95,860 93,860
Total 389 41,145 3,08,073 2,47,306

Transport 203
TABLE 15.9
Rolling Stock Performance during Eleventh Plan
Item Tenth Plan
Achievement
Eleventh Plan
Original Target
Revised Target for
Eleventh Plan during Mid
Term Appraisal
Achievement
in the
Eleventh Plan
Improvement
over Tenth Plan
(%)
Wagons 36,222 62,000 62,000 63,481 75
Coaches (including
EMU/MEMU/DEMU
12,202 22,500 19,863 17,085 40
Diesel Loco 622 1,800 1,019 1,288 107
Electric Loco 524 1,800 1,205 1,218 132
Note: This includes acquisition, as well as, railways’ own production.
TABLE 15.10
Productivity Performance
Productivity indicator Tenth Plan
(2006–07)
Eleventh Plan
2007–08 2008–09 2009–10 2010–11
Wagon Utilisation
NTKM/VU/Day (Broad Gauge (BG) 3,238 3,539 8,687 9,022 9,247
Wagon Km/Wagon/Day (BG) 230 248.9 253.7 256.2 262.1
Wagon turnaround in days) (BG) 5.49 5.23 5.19 4.98 4.97
Track Utilisation
NTKM/route Km (million) 9.67 10.19 10.43 11.07 11.34
Passenger Km/route Km (million) 13.47 14.63 15.53 16.35 17.36
NTKM/Engine Day Online (goods-BG)
Diesel 2,68,410 2,64,137 2,70,912 2,85,008 3,02,245
Electric 3,61,543 3,84,981 4,25,329 4,43,386 4,53,960
Human Resources Productivity
NTKM/employee (million) 0.34 0.37 0.39 0.44 0.47
PKM/employee (million) 0.49 0.55 0.60 0.66 0.73
high capacity wagons, freight incentives policies
including dynamic pricing concept and so on. On
the passenger front, during the Eleventh Plan, 323
pairs of new trains have been introduced, services
of 111 trains have been extended and frequency of
63 trains increased. 2,813 coaches have been added
for expanding passenger carrying capacity. High
capacity, air-conditioned double-decker coaches,
low-priced, fast train services such as Garib Rath and
facilities in trains services for ladies, students and
marginalised groups have been introduced.
Traffic Facility Works, Strengthening of High
Density Network (HDN), Augmentation of Terminal
Capacity and Development of Logistics Parks
15.35. A substantial amount of traffic of Indian
Railways moves on the route connecting four metro-
politan cities—Delhi, Mumbai, Chennai and Kolkata.
These 7 main routes along with feeder routes total-
ling 17,383 Route km have been identified as high
density network (HDN). A total of 124 works costing
about `14,000 crore including doubling, third and
fourth lines, bye passes, flyovers, crossing stations,

204 Twelfth Five Year Plan
intermediate block stations, automatic signalling
works, yard remodelling and so on were planned to
augment capacity on the HDN. A total of 128 works
for development and modernisation of freight ter-
minals have been sanctioned since the year 2007–08
and are in progress at different locations.
Information Technology Initiatives
15.36. The Eleventh Plan emphasised the need to
‘use IT for improved customer services’. More than
5,071 locations have been provided with Unreserved
Ticketing System (UTS). The Passenger Reservation
System (PRS) is now available at more than 2,438
locations and is planned further to be expanded to
facilitate the passengers to buy tickets closer to their
homes and work places. Proliferation of e-ticketing
has helped in reducing queue lengths at reservation
offices. To facilitate dispersal of tickets, PRS counters
have been provided at 151 Post Offices. Complete roll
out of Rake Management System (RMS) module has
enabled online monitoring of freight train operations
and improved intra and inter-zonal coordination.
Terminal management system has been introduced
at 1,653 terminals. The e-payment facility is being
availed by 440 freight customers and accounts for
more than 40 per cent of freight earnings. Other IT
initiatives undertaken to improve operational effi-
ciency are Crew Management System, Control Office
Application, e-Procurement and so on.
Energy Management, Energy Efficiency and
Measures to Improve Environmental Friendliness
15.37. Reduction in empty wagon movement by
adopting a new maintenance regime of premium
examination and rationalisation of coaching links
for increased maintenance intervention of 3,500 km
(from the earlier limit of 2,500 km) are some of the
important operational improvements. On fuel effi-
ciency front, increased production of 3 phase electric
locos with 14 per cent to 15 per cent energy regen-
eration feature during braking, fuel efficient 3 phase
diesel locos with 10 per cent higher fuel efficiency
than conventional locos and adoption of 3 phase
EMUs regenerating about 25 per cent to 30 per cent
of energy during braking are some of the important
initiatives taken up during the Plan period. A 10.5
MW capacity wind farm has been commissioned
to provide captive power to Integral Coach Factory
at Chennai and more wind farms are planned in
other states 2.6 million incandescent lamps are
being replaced with CFLs in households to conserve
energy.
15.38. For availing electric power at lower tar-
iff, Indian Railways has set up a 1,000 MW power
plant at Nabi Nagar through a JV with NTPC. It is
expected to be operational by the beginning of the
Twelfth Five Year Plan. This plant will supply 90 per
cent of generated power to 164 substations of Indian
Railways located in Eastern and Western regions and
will result in a saving of `400–600 crores per year to
the Railways due to lower tariffs. Another 1,000 MW
captive power plant is being set up at Adra through a
JV with NTPC.
15.39. To improve sanitation and to prevent dis-
charge from toilets while the train is in Railway
Station premises, speed actuated discharge toilets
TABLE 15.11
Benchmarking Indian Railways with Chinese and Russian Railways
Railways Employee Productivity
(Annual)
Network Productivity Wagon Productivity
(Annual)
NTKM (million)/
Employee
PKM (million)/
Employee
NTKM (million)/
Network Length
PKM (million)/
NetworkLength
NTKM (million)/
Wagon holding
Russia 1.81 0.15 21.87 1.80 5.52
China 1.23 0.38 39.66 12.38 4.31
India 0.44 0.66 9.39 14.12 2.73
Source: UIC Statistics 2009–10.

Transport 205
have been provided in all LHB type coaches and a
select number of ICF coaches. Field trials for bio-
degradable and environment friendly toilets (in col-
laboration with IIT/Kanpur and DRDO) are on. On
successful completion of these trials toilets would be
introduced in passenger coaches in a phased manner.
The Twelfth Plan
Strategies
15.40. The Twelfth Plan aims at faster, more inclu-
sive and sustainable growth. This will require contin-
ued work in several areas and a change in strategy
in others. The expanding requirements of the econ-
omy will need much faster expansion of the freight
network along with its ability to carry larger freight
per wagon, improve efficiency of the Rail system to
deliver it faster and expand the network. There will
also be need to improve the share of the Railways in
the overall national freight market. With increasing
incomes, passenger traffic will increase but plan for
expansion must factor in the fact that demand will be
for better quality services for which passengers will
be willing to pay.
15.41. The rail network will have to develop a strategy
to be part of an effective multi-modal transport sys-
tem to ensure environmental-friendly and economi-
cally efficient transport movement. The Twelfth Plan
will strive towards achieving a gender equal Railway
Transport System designed to meet the needs of
both men and women. Priority will be accorded to
women’s safety and security. Simultaneously, the
network will have to be expanded to other areas
where so far there has been little presence, especially
in the Himalayan region and some of the tribal areas.
One of the most important components of this strat-
egy will be stepping up private investments in the
Railways.
15.42. Investment needs to be prioritised in the
important areas, viz. Dedicated Freight Corridors,
high capacity rolling stock, last mile rail linkages
and port connectivity. Development of logistic parks
would also need to be taken up on priority basis to
create matching terminal and handling capacity,
and facilitate integration of rail with other modes of
transportation. Enhancing project execution capa-
bilities would be critical for speedy capacity creation
and improved returns on investments. Along with
new capacity addition, improving productivity of
existing network and assets would also be crucial to
increase transportation output.
15.43. It has to be clearly realised that the moderni-
sation of Indian Railways cannot be achieved by sim-
ply relying on additional General Budgetary Support
(GBS). Even the norms and methodology of GBS
allotment should be clearly defined. There is a case
for larger GBS but the requirements are so large that
the Railways have to plan for much stronger revenue
growth. Clear Strategies would need to be formu-
lated and executed to identify segments where it can
play low-cost strategy by playing on volumes, taking
advantage of economies of scale and segments where
it can play differentiation strategy by providing high
quality services and command premium prices.
Physical Targets for the Twelfth Plan
Freight Traffic Projections
15.44. Traffic projections for the Twelfth Plan are
given in Table 15.12. It is targeted that during the
Twelfth Plan, the rail share in freight should go up by
at least 2 per cent. The targets for originating freight
tonnage may need to be reviewed on an annual basis
or during the mid-term review to ensure the target
of 2 per cent increase in originating tonnage. Given
that the level of traffic growth achieved in the last
Plan has been 5.8 per cent for originating traffic
and 6.1 per cent for NTKM, it will require a major
increase in efforts and a conscious strategy to move
the road traffic over to the rail. This is going to be a
challenging task.
Technological and Logistical Measures for
Improving Freight Movement Efficiency
15.45. An important component of the strategy
for increasing the freight movement efficiency
will be introduction of new technologies aimed at

206 Twelfth Five Year Plan
improving axle load of wagons, expansion of long
haul, use of GPS and RFID technology for tracking
purposes and technological innovations to improve
efficiency of operations.
1. Proliferation of 25 tonnes axle load running:
Along with this, feasibility of 30 tonnes axle load
running and induction of 30 tonnes axle load
wagon needs to be planned.
2. Raising the current axle load regime from 22.82
tonnes to 23.5 tonnes on selected routes: It is
observed that 98 per cent of Indian Railways
loading comes within a gross weight of wagons
being equivalent to 94 tonnes which translates
to 23.5 tonnes of axle load. The new BOXNHL
wagons primarily designed for coal have suf-
ficient volumetric capacities for loading addi-
tional 2 tonnes of coal.
3. Expansion of Long Haul
4. Use of GPS technology and RFID technology for
tracking purposes and use of Distributed Power
Systems.
4. There is also a need to create multimodal logis-
tics parks to reduce the cost of interfacing and
costs of intermodal transfer and overall produc-
tion. Logistics parks are network hubs, critical
for efficient multimodal transport as they allow
transshipment between modes and consolida-
tion of freight. Earmarking land for logistics
parks at about 15 to 20 key interchange points
around major key urban and industrial centres,
ideally on the proposed rail Dedicated Freight
Corridor (DFC) routes; and providing infra-
structure such as power, utilities, road/DFC
linkages and rail sidings.
5. Containerisation would be a major strategy to
gain share of the freight market (Box 15.1).
Passenger Traffic Projections
15.46. The CAGR of passenger traffic during the
Eleventh Plan has averaged around 5.5 per cent. The
number of passengers travelling annually will thus
increase from 8.9 billion in the first year of the Plan
to 11.7 billion by the end of the Plan (Table 15.13).
The projections for Passenger Kilometers have also
been made based on past trends (Table 15.14). The
growth in PKM is expected to be 10.8 per cent per
annum with an increase to 1,760.4 billion PKM
(2016–17) from 1,195 billion PKM (2012–13).
Measures to Upgrade Quality of Passenger
Services
15.47. To meet the requirements of passenger ser-
vices a number of steps are planned in the Twelfth
Plan. Some of the important areas proposed to be
taken up are mentioned below:
1. Enhancing accommodation in trains: Augment-
ing the load of existing services with popular
timings and on popular routes to 24/26 coaches
would help generating additional capacity and
availability of additional berths/seats for the
traveling public.
2. Enhancing speed of trains: At present, speed
of Mail/Express trains is below 55 kmph.
Segregation of freight and passenger traffic,
enhancing the sectional speeds, and rationali-
sation of stoppages are important measures for
speed enhancement. The speed of passenger
trains is quite low at present primarily because
of the coaching stock in use and due to multi-
plicity of stoppages en-route. There is scope for
speeding up of these services by replacing trains
with conventional stock by fast moving EMUs/
MEMUs/DEMUs. Enhancing the sectional
TABLE 15.12
Traffic Projections
Loading 2012–13 2013–14 2014–15 2015–16 2016–17
MT (million) 1,038 1,119 1,206 1,300 1,405
CAGR 7.8 per cent
NTKM (billion) 690 737 795 857 927
CAGR 7.7 per cent
Lead 665 664 663 661 660

Transport 207
speeds is another enabling factor in speeding
them.
4. Introduction of tailored services: The travel-
ing requirements of various sectors and various
classes of passengers differ. Between major cities
and metros, fast services with very limited stop-
pages are preferred. Introduction of non-stop
services and services with higher accommoda-
tion between popular destinations would better
serve passengers’ requirements.
Box 15.1
Containerisation In Railways
Due to the economic and technological attributes of the railways, it has always been a challenge to attract consignments
which are less than at least a thousand tonnes. Container trains combine the operational efficiency of unit trains with the
commercial flexibility of booking 20 tonnes or even less at a time.. According to the Total Transportation Study (TTS)
conducted by RITES for the Planning Commission, the volume of non-bulk traffic in 2006–07 was 227.17 million tonnes out
of the total traffic of 2,386.97 million tonnes.
Indian Railways set up Container Corporation of India (Concor) in 1988 as a public sector company to spear head
containerisation. It commenced operations in 1989 at which stage Indian Railways transferred all Inland Container Depots
(ICDs) and container related business to Concor. From the 7 ICDs it took over from Indian Railways at inception, Concor has
now expanded the network to more than 44 ICDs and 14 domestic and port side terminals and has 213 rakes of flat wagons.
Using IR’s network and haulage, it has pioneered the concept of multi-modalism through its core activities as a carrier of rail
borne container traffic and terminal operation.
Anticipating higher container traffic at Indian ports, Railways liberalised the entry of private players in the area of rail-based
haulage of containers in 2005. The response has been quite good with 15 new entrants. These 15 new operators have procured
132 rakes and developed 9 new terminals. Sizeable on-track competition has emerged in some of the exim sectors as well as
the domestic sector. Competition also led to an increase in the growth of rail based intermodal traffic at a rate of 15.5 per cent
in the period 2007–08 till 2011–2012 although there has been a negative growth rate in the domestic sector during 2011–12
due to introduction of container class rate for some of the commodities moved normally by conventional wagons. There is
a need to expand containerisation business and improve Railways share in transport sector. Policies in the Twelfth Plan will
aim at this.
TABLE 15.13
Passenger Traffic Projections for Twelfth Plan
Year Projected Passengers Originating (Million)
Suburban Non-Suburban
Nos. Ratio Nos. Ratio Total
2012–13 4,545 51.25 4,323 48.75 8,868
2013–14 4,855 51.07 4,651 48.93 9,506
2014–15 5,186 50.89 5,005 49.11 10,191
2015–16 5,540 50.71 5,385 49.29 10,925
2016–17 5,917 50.53 5,793 49.47 11,710
Note: Originating passenger traffic projections have been made
based on average correlation with GDP calculated for the
preceding 5 years.
TABLE 15.14
Projection of Originating PKM for Twelfth Plan
Year Projected PKMs Originating (Billion)
Suburban Non-Suburban
Nos. Ratio Nos. Ratio Total
2012–13 159 13.32 1,036 86.68 1,195
2013–14 170 12.97 1,146 87.07 1,316
2014–15 182 12.54 1,268 87.46 1,450
2015–16 194 12.15 1,404 87.85 1,598
2016–17 207 11.76 1,553 88.24 1,760
15.48. Strategies for decongesting major passenger
terminals: This would be done through develop-
ment of alternative terminals in suburban areas of
major cities and expeditious operationalisation of
the Dedicated Freight Corridors resulting in seg-
regation of passenger and freight traffic. Spin off
effects in the form of larger number of passenger
services, faster passenger services, quicker freight
movement, and help in decongesting major ter-
minals would be achieved. There are international
examples of efficient passenger and freight opera-
tions which have relevance for Indian Railways
(Box 15.2).

208 Twelfth Five Year Plan
Parcel Business
15.49. One of the important areas to be taken up for
rationalisation and expansion will be the parcel busi-
ness. The annual earnings from parcel services were
`1,377.38 crore (2010–11). These are projected to
grow at a rate of 12.8 per cent during the Plan. The
strategy to expand this will include innovative pric-
ing. Escalation in freight rate for parcel traffic should
be based on the Wholesale Price Index and increase
in the cost of fuel. Concessional pricing based on
marginal costing principle can be tried out for parcel
express trains in empty flow direction. Differential
pricing is needed for different types of parcel ser-
vices, especially for use of passenger trains using par-
cel vans. This will help Railways to shift parcel traffic
from passenger trains to exclusive Parcel Express
trains.
15.50. The Parcel business will be expanded apart
from the other initiatives, with the help of capac-
ity augmentation. This will involve the following:
Increase in rake loading; Introduction of High
Capacity Parcel Vans; Development of dedicated
parcel terminals; Mechanisation of handling;
Provision of end logistics with value added ser-
vices; Introduction of premium super fast parcel
express services between major production and
consumption centres with guaranteed transit and
assured supply on the nominated day of loading; and
Computerisation of Parcel Management System
Expansion of Fixed Assets
15.51. The targets for creation of fixed assets during
the Twelfth Plan have been shown in Table 15.15.
Upgradation of balance 1,575 RKM of Iron Ore
route for 25 tonnes of axle load (5,425 km done in
the Eleventh Plan) and upgradation of Feeder Routes
of DFC to run 25 tonnes of axle load will be the areas
of focus.
15.52. It is planned to undertake 19,000 km of track
renewals including 1,500 km renewal for replacement
Box 15.2
Business Models for Passenger and Rail Freight Logistics: The JR East and Deutsche Bahn Ways
JR East is the largest among the four Japanese railway companies and amongst the most successful operators of rail passenger
business in the world. It operates urban, high speed and regional railways. On a daily basis, JR East handles 17 million
passengers, runs 12,761 trains which cover 7,10,600 Km. per day. Its average delay is less than 1 minute including all kinds of
delays, even those due to snow and typhoons. JR East runs the famous Shinkansen high speed trains. Out of a total operating
Km. of 7,512.6, Shinkasen lines cover 1,134.7 Km. and conventional lines cover 6,377.9 Km. An important aspect of JR East
business is that it earns 30 per cent of its revenues from non-transportation business. This translates to nearly 8.13 billion
dollars from non-transportation business out of its total business of 27.7 billion dollars. Non-transportation business includes
station space utilisation (15.4 per cent), shopping centres and office buildings (8.3 per cent) and other services (8.4 per cent).
The non-transportation business, also called the life-style business is aimed at maximising the values of JR East’s tangible
and non-tangible assets such as railway network and stations. It has renovated a large number of stations in the past two
years including the iconic Tokyo station which is being modernised. It includes building two towers of more than 4,30,000
sq.m of office buildings and hotels, 1,500 sq.m of shopping floors and development of pedestrian decks and restoration and
conservation of the old Tokyo station.
An alternative model of earning revenues and running the business profitably is that of Deutsche Bahn (DB) of Germany.
It consists of 3 divisions and 9 business units including passenger transport which covers long distance, regional and urban
passenger transport; infrastructure which includes track, station and electrification and the third Division being Schenker,
world’s leading logistics service company covering areas of rail freight transport, global logistics services and rail technology
and services. In 2011–12, the total revenue of DB was 37.9 billion Euros with an EBIT of 2.3 billion Euros. Like JR East,
substantial part that is 48 per cent of the revenues of DB comes from non-rail business. DB is increasingly becoming active
in markets outside Germany with 41 per cent of the revenues coming from international operations. It runs 26,000 passenger
trains per day which carry 2.7 billion passengers per year in trains and buses. It is also the fifth largest provider of energy in
Germany. As part of its freight and logistics business, DB is spread to more than 2,000 locations in over 130 countries with
412 million tonnes of freight transported by rail per year, 96 million shipments sent per year via European land transport
and more than 5 million sq.m. of storage space around the world (figures as in December 2011). It is interesting to note that
Germany has 33,600 Km. long rail network which is three times as long as the German Autobahn (Highway) network.

Transport 209
Rolling Stock Requirement
15.54. With the expansion of the freight network
and passengers demand, the requirement of rolling
stock will increase substantially (Table 15.16).
15.55. A range of technological solutions are being
implemented for improving the quality of wagons,
coaches and locomotives. Some of the measures
planned in this regard include transfer of technol-
ogy from USA for track-friendly bogies of advanced
technology capable of carrying enhanced axle loads
of 25 tonnes and higher axle loads while exerting
lesser forces on the track. Keeping the huge demand
for passenger travel in mind, it has been planned
to have a complete switchover to new manufacture
of only LHB design coaches by the end of Twelfth
Plan. This will help in introduction of AC/non-AC
trains at speeds more than 130 kmph by induction of
LHB design coaches and raise the crash worth quo-
tient of coaching stock on Indian Railways through
larger deployment of LHB coaches and incremental
of 52 kg rails with 60 kg rails on Group A routes.
During the Plan, 17,500 km of renewal will become
due apart from 3,500 km which is due at the begin-
ning of the Plan.
Dedicated Freight Corridors (DFCs)
15.53. Two Dedicated Freight Corridors (Box 15.3)
are expected to be commissioned by March 2017.
TABLE 15.15
Creation of Fixed Assets during the Twelfth Plan
Eleventh Plan
Actuals
(Km)
Twelfth Plan
Physical Target
(Km)
New Line 2,205 4,000
Eastern and Western
Dedicated Freight
Corridor
Work in
Progress
3,338
(Double line
except 400 km)
Gauge Conversion 5,290 5,500
Doubling 2,756 7,653
Railway Electrification 4,501 6,500
Box 15.3
Dedicated Freight Corridors (DFCs) – A Game Change for the Indian Rail Sector
The Dedicated Freight Corridors on the Western and the Eastern routes is a strategic capacity augmentation initiative taken
by Railways and involves construction of 3,338 kms of dedicated freight lines to carry predominantly coal and steel on the
Eastern corridor and containers on the estern corridor. The ports in the Western region covering Maharashtra and Gujarat
would be efficiently linked to the Northern hinterland and similarly on the Eastern side, coal would move to the power
plants in the North. The Project completion cost is estimated at `95,860 crore. A major part of the project is being financed
through multilateral/bilateral debt. World Bank funding of part of Eastern DFC is estimated at US $2.73 billion (`13,625
crore) and JICA funding of 504 billion Yen (`31,486 crore). Dankuni–Sonnagar section of Eastern DFC (`10,022 crore) is to
be implemented through PPP. The balance requirement would need to be met through Budgetary Support. Both Eastern and
Western DFCs are targeted for completion in the terminal year of the Twelfth Plan.
Dedicated Freight Corridor can be justifiably called an innovation in rail transport in India because of a number of reasons.
The average speed of freight trains will go up from 25 kmph to 70 kmph which will reduce the transit time by less than half
from the present leves.
Railway technology would get a major up-gradation with the help of heavy hauled freight trains of 15,000 tonnes capacity
and 1,500 meters length. The axle loads of DFC routes will also go up from 25 tonnes to 32.5 tonnes which would enhance
the track loading capacity from 8.67 tonnes per meter to 12 tonnes per meter. Wagons with much better pay load to tare ratio
would also get introduced through this technology. Newer technology in signaling, train communication, track-maintenance
and operations would get introduced in the Indian Railways system. The capacity released by freight trains can be used for
running more passenger trains at higher speeds after upgrading the existing mixed corridors of Indian Railways.
In addition, this initiative is expected to offer significant reduction of Green House Gas (GHG) emissions in transport sector
of India.
Pre-feasibility studies have also been completed on the four new Freight Corridors, viz. North-South, East-West, East-South
and Southern corridors and Preliminary Engineering cum Traffic Survey is being undertaken by RITES. Based on the outcome
of the PETS a beginning would be made in the Twelfth Plan in implementation of the new corridors in a phased manner.

210 Twelfth Five Year Plan
enhancement in ICF coaches. In case of locomotives
higher horsepower capacities and more fuel efficient
technologies are being inducted (see Box 15.4).
15.56. With new sections in BG coming on the
Indian Railways network either due to gauge conver-
sion or due to new lines, need for branch line opera-
tions of passenger trains is increasing. This is best
addressed by DEMUs since they are low cost, do not
require massive infrastructural investments and they
release locos for freight and passenger operations on
main line. With a new factory coming up at Haldia
which is slated to manufacture up to 400 DEMU
coaches per annum, there would be possibility of
large scale deployment of DEMU services in the
North East, North Bihar, Eastern and North Eastern
UP, Gujarat, J&K and many other far-flung areas
of the country. Similarly for the electrified sections,
EMU/MEMU services would be enhanced with
enhancement of technology. A factory is being set
up at Kachrapara for manufacturing EMUs/MEMUs
and Kolkata Metro coaches which will be operational
during the Twelfth Plan.
Signalling and Telecom
15.57. Initiatives in Signalling and Telecom will
include deployment of proven and reliable on-board
train protection system, isolation of run-through line
and provision of complete track circuiting of station
sections, and computerised real time monitoring of
assets and use of conditions based productive main-
tenance system. It is also envisaged to increase Line
Capacity through use of suitable technology options,
viz. Automatic Block Signalling, Intermittent
Block Signalling, Automatic Train Control with
Cab Signalling, Integrating Train Controlling and
TABLE 15.16
Rolling Stock Requirement during the Twelfth Plan
Type of Stock Requirement* on
Additional Account
(2012–13 to 2016–17)
Requirement** on
Replacement Account
(2012–13 to 2016–17)
Total Requirement
(2012–13 to
2016–17)
Anticipated
Acquisition
2012–2017
Coaches 25,440 7,626 33,066 24,000
Diesel Locos 1,500 500 2,000 2,000
Electric Locos 1,800 210 2,010 2010
Wagons (in Vehicle Units) 76,396 29,263 1,05,659 1,05,659
* Requirement of coaches includes EMUs, MEMUs and DEMUs.
** Requirements on replacement account for all rolling stocks are based on actual over age arising and the trend of average condemnation.
Box 15.4
New Generation Locomotives
Ministry of Railways is planning to set up a factory with a foreign partner selected through international competitive bidding
for supply of 12,000 HP Electric Locomotives. This will be a major jump over the current 6,000 HP locomotives. During the
ten-year period of supply programme, the proposed factory at Madhepura will supply 800 electric locomotives with performance
guarantees based on international best practices. This locomotive will have very high energy efficiency and will constitute a part
of India’s response towards mitigation of the emission of green-house gases. Successful execution of this project by the JV route
will usher Indian Railways into a new era of reforms and will provide impetus to PPP funding of railway projects.
Ministry of Railways is also procuring 200 number, 9,000 HP electric locomotives under the JICA loan for Western DFC. These
locomotives would be mainly used forcontainer train operations on the Western DFC.
A factory is also planned at Marowhra for manufacture of diesel locomotives with a capacity of 5,000 HP as against current
usage of 4,000–4,500 HP by the Indian Railways. The Madhepura and Marowhra factories are likely to be awarded during
2012–13.

Transport 211
Signalling System; and switch over to systems and
equipment of higher reliability and safety levels and
built in design redundancy.
New and Renewable Energy Projects
15.58. It is proposed to develop renewable energy
projects and have strategies for more clean energy
in the total consumption basket. Some of the strat-
egies in this regard will include: Grid connected
Solar Panels at major stations; Provision of roof top
Solar Panels on passenger coaches running in Close
Circuits; Provision of solar Panels, Solar Water heat-
ers, Solar Pumps and so on. in Hospitals, Running
Rooms, Rest Houses; and LED based lighting and
Display Systems. In addition to above, it is also pro-
posed to develop wind energy for meeting the above
requirements.
Safety Performance
15.59. There are 14,896 unmanned and 17,839
manned level crossings on Indian Railways network
as on 1April 2011. These level crossings contribute
to 30 per cent of fatalities in Railway mishap and sta-
tistically contribute to about 40 per cent of accidents
of Indian Railways. Accordingly, Indian Railways
Vision: 2020 envisage elimination of all unmanned
level crossings by provision of subway, diverting
road traffic from unmanned level crossing gates to
existing ROB/RUB and manned gates by construct-
ing diversion road, closure of very low Train Vehicle
Units (TVU) gates, manning of unmanned level
crossing gates; upgradation of infrastructure, provi-
sion of interlocking of gates, lifting barrier and so on,
in the next five years. Railways also envisage provi-
sion of ROB/RUB in lieu of manned level crossings
with heavy traffic density (high Train Vehicle Units
that is above one lakh in about 2122 in number and
those level crossings located in station yard/limits
about 842 in number). Railways have also planned
to eliminate level crossings along the Eastern and
Western DFC network. It has been decided to
replace level crossings with TVU>50,000 with ROBs
and TVUs<50,000 with RUBs. Elimination of level
crossings will require General Budgetary Support
to Railways for this work. Above works will help in
achieving zero accidents at level crossings, minimum
detention to road and punctual train operation.
15.60. Railways have prepared a Corporate Safety
Plan, 2003–13. Railways have also appointed a
High Level Safety Review Committee (Kakodkar
Committee) for suggesting measures on Railways
safety which has submitted its report. Their rec-
ommendations will also be considered during the
Plan for strengthening overall safety environment
of the Railways. According to this report, the pre-
sent safety environment on Indian Railways is inad-
equate largely due to poor infrastructure, paucity of
resources and lack of empowerment at the functional
level. The committee has recommended setting up of
a statutory Railway Safety Authority. The Committee
has also recommended adoption of Advance
Signaling System based on continuous track cir-
cuiting and cab signaling similar to European Train
Controlling System Level-II and total elimination of
all level crossings within five years. Following key
areas related to safety will need to be taken up during
the Plan:
1. Development of Train protection and Warning
System (TPWS) and Anti Collision Device
(ACD)/Train Collision Avoidance systems
(TCAS).
2. Provision of improved safety systems with
audio visual warning to road users in advance of
approaching trains.
3. For moving towards a fault tolerant zero defect
regime, computerised real time monitoring of
assets and use of condition based in predictive
maintenance systems shall be necessary.
4. Development of ‘crashworthy’ structural design
capable of absorbing high impact loads in unfor-
tunate case of collision/accidents.
5. All the furnishing materials in the coaches to
have superior fire retardant properties in line
with international norms.
6. Mobile Communication and Train Radio Com-
munication (MCTRC).
7. Replacement of 2,000 km of overhead align-
ment which is an outdated technology for block
and control working.

212 Twelfth Five Year Plan
8. Provision of Biometric VCD (Driver’s Vigilance
Telemetry Control System).
9. Provision of Intelligent fire surveillance and
Extinguishing system of locos.
10. Provision of GPS-based fog safe device
Developing High Speed Rail Corridors and
Upgradation of Speeds
15.61. Ministry of Railways has selected following
six corridors for conducting pre-feasibility stud-
ies for development of High Speed Rail Corridors:
Delhi–Chandigarh–Amritsar (450 km); Pune–
Mumbai–Ahmedabad (650 km); Hyderabad–
Dornakal–Vijaywada–Chennai (664 km);
Chennai–Bangalore–Coimbatore–Ernakulam–
Thiruvananthapuram (849 km); Howrah–Haldia
(135 km); and Delhi–Agra–Lucknow–Varanasi–
Patna (991 km). The viability of each corridor iden-
tified for pre-feasibility study is being examined by
consultants. Efforts are being made to complete all
such studies, undertake at least two Detailed Projects
Reports and develop one corridor of about 500 km
for construction.
15.62. It is also proposed to set up a National High
Speed Rail Authority (NHSRA), an autonomous
body through a Bill in Parliament for implementa-
tion of High Speed Rail Corridor projects of Indian
Railways. This authority will be entrusted with the
work of planning, standard setting, implementing
and monitoring these projects.
15.63. It is planned to undertake civil and signaling
works to support faster movement of trains on few
selected routes. This will enable increase in speed
to 130–140 kmph in certain routes and 160 kmph
in Delhi–Mumbai and Delhi–Howrah to be further
upgraded to 200 kmph.
Public Private Partnerships (PPP)
15.64. Investments in Railways can be stepped up
with the help of PPP. So far, such investments have
been extremely small. Private investment mobilisa-
tion in the Eleventh Plan is likely to be to the tune of
4 per cent of the Plan Outlay. This is far less com-
pared to the Private Capital share in other sectors like
Ports – 80 per cent, Telecom 82 per cent, Electricity
44 per cent, Airports 64 per cent and Roads 16 per
cent. PPP Projects related to rolling stock manufac-
turing units, modernisation of railway stations, multi-
functional complexes, logistics parks, private freight
terminal, freight train operators, liberalised wagon
investment schemes, Dedicate Freight Corridors and
so on which are in pipeline offer excellent opportuni-
ties for private investment. These need to be speedily
executed in the Twelfth Plan (Box 15.5).
Tariff and Prices
Tariff Structure
15.65. The tariff structure in Railways is seriously
distorted because passenger fares are kept very low
and freight fares are increased to cross-subsidise the
low level of passenger tariff. Table 15.17 below indi-
cates Indian passenger fares compared with other
countries and Table 15.18 compares the freight rates.
15.66. Indian passenger tariffs are one-fourth of
China and are one-ninth of Russia. They are nearly
one-twentieth of Japan. Even in Purchase Price
Box 15.5
Public-Private Partnership (PPP) in Railways
As on date, the Indian Railways have a large shelf of on-going projects whose completion would require about `2,25,000
crore. The magnitude of the task is huge and any neglect of the same is bound to lead to severe capacity limitations adversely
affecting the competitiveness and growth of the Indian Railways.
It is estimated that the Indian Railways would not be able to generate sufficient funds internally, through borrowings and
from budgetary support for meeting the investment requirements of the Twelfth Five Year Plan. The shortfall would be
met through private investments in PPP projects. Additional investment from private sector is also expected through
their investments in manufacturing facilities created as a consequence of partnerships with IR. Together it is expected that
investments of about `1 lakh crore would be made by the private sector during the Twelfth Five Year Plan on traffic facilities,
other electrical works; workshops including PSUs, passenger amenities; investment in PSUs/JVs/SPVs, and so on.

Transport 213
Parity terms, the tariffs bear no comparison. In terms
of freight rates, however, the Indian freight rates are
the highest whereas those of China, Russia and the
USA are 58 per cent, 75 per cent and 51 per cent of
the Indian rates adjusted for PPP. Even in nominal
terms, Chinese freight rates are only around 72 per
cent of the Indian fright rates.
15.67. The low passenger fares, which have not been
revised for several years, have led to huge losses in
passenger traffic operations estimated at `22,000
crore in 2011–12. Unless the trend is arrested by
rationally linking passenger fare to input costs, the
Railways will be out priced in the freight market
and would find it unsustainable to run the Railway
operations.
15.68. In the passenger service segment, suburban
services contribute almost 54 per cent in number of
passengers over the IR’s total passenger traffic. Their
earning share is, however, only 7.13 per cent (2009–
10). The losses suffered in the segment during 2008–
09 and 2009–10 were `1,651.19 crore and `2,214.06
crore respectively. In view of the rising input costs,
the suburban fares need to be revised and the level
of subsidies gradually reduced in line with the pro-
posed indexation of lower class fares.
Tariff Regulatory Authority and other reforms
15.69. In the earlier Plans, it had been suggested that
a Tariff Regulatory Authority may be set up to fix up
tariffs both for passenger and freight. It has, however,
so far not been possible. It has to be realised that
with the coming up of more PPP projects, the need
has become more pressing. The Tariff Regulatory
Authority like the regulators in the other sectors will
recommend the tariff structures consistent with the
level of cross-subsidies feasible.
15.70. Numerous reports have mentioned the need
to undertake organisational reforms in the Railways
(see Box 15.6). The current departmental organisa-
tion of the Railways is not conducive to the running
of railways as an economic and business enterprise,
and towards executing the necessary changes to
overhaul the service. The Railway Board should be
re-organised along business lines, in contrast with
the current division between the various disciplines,
electrical, mechanical, traffic and so on. This view
has also been strongly endorsed by the Kakodkar
and Pitroda Committees. Early adoption of stand-
ard business accounting policies will necessitate ade-
quate appropriations to depreciation reserves on a
predictable, systematic and transparent basis.
Financing of the Twelfth Plan
15.71. The Plan will require large investments to
achieve its objectives. The estimated resources
required are `5,19,221 crore including GBS of
`1,94,221 crore, IEBR of `2,25,000 crore and private
sector investment of `1,00,000 crore.
TABLE 15.17
Passenger Service Yields in some Major Economies
Country Passenger Service
Yield US Cents/
Passenger-KM
at nominal prices
Passenger Service Yield
US Cents/Passenger-
KM adjusted for PPP
(India=1)
India 0.6 1.0
China 2.4 2.7
Russia 5.2 6.7
Japan 19.0 9.4
Germany 12.6 6.2
Source: World Bank (2012): Railways International Overview:
Issues for India.
TABLE 15.18
Freight Yields in some Major Economies
Country Freight Yield
US Cents/Total
Tonne-KM at
nominal prices
Freight Yield
US Cents/Total
Tonne -KM adjusted
for PPP (India=1)
India 2.11 1.00
China 1.49 0.58
Russia 2.20 0.75
USA 2.28 0.51
Source: World Bank (2012): Railways International Overview:
Issues for India.

214 Twelfth Five Year Plan
15.72. Some major initiatives in the Twelfth Plan are:
• Twelfth Plan would target to enhance rail share in
freight traffic by at least 2 per cent.
• The Eastern and Western Dedicated Freight
Corridors would be completed during the Twelfth
Plan period and planning for other DFCs—North-
South, East-South, East-West and South-West
may be firmed up during the Twelfth Plan period.
• The Twelfth Plan would focus on five areas—
track, bridges, signalling and telecom, rolling
stock and station and freight terminals which
would lead to safety, decongestion, capacity aug-
mentation and modernisation of system creating
more efficient, faster and safer railways.
• Signalling system would be modernised with pro-
vision of advanced technological features and
development of Train Protection and Warning
System (TPWS), Anti Collision Device (ACD),
Trains Collision Avoidance System (TCAS), GPS-
based Fog Safety Device and Biometric Drivers
Vigilance Elementary Control System.
• Phased elimination of all unmanned level cross-
ings by provision of subway, ROBs/RUBs, con-
structing diversion roads, and so on.
• Expansion of Long Haul trains using distributed
power system.
• Improvement in the design and technology of
wagons, coaches and locos through acquisition as
well as investment in R&D along with induction
of latest technology in rolling stock by encourag-
ing expansion in capacity of manufacturing units
through PPP.
• Developing High Speed Rail corridors and Setting
up National High Speed Rail Authority (NHSRA)
as an autonomous body for planning, standard
setting, implementation and monitoring of high
speed corridors.
• Promoting private investment in special pur-
pose high capacity wagons under the Liberalised
Wagon Investment Scheme (LWIS) and
Encouraging private freight operators to transport
select commodities where railway modal share is
low, that is automobile, un-bagged cement and
fertiliser, fly ash, edible oils, and so on.
• Activity Based Accounting to facilitate managerial
decision making and to establish profit/loss mak-
ing routes/activities.
• Correcting the imbalance between passenger and
freight traffic by setting up a Tariff Regulatory
Authority to suggest tariff structures consistent
with the level of feasible cross-subsidies.
• Resolution of regulatory issues regarding
CONCOR and private players and further expan-
sion of containerisation.
• Reorganisation of Indian Railways on business
lines, hiving off non-transportation tasks and sep-
aration of policy making and operational respon-
sibilities of the Railway Board.
ROADS
15.73. India has one of the largest road networks in
the world, consisting of (i) national highways (NHs),
(ii) state highways (SHs), (iii) major district roads
(MDRs) and (iv) rural roads (RRs) that include other
district roads and village roads. The NHs with a
Box 15.6
Key Message from Reports on Railways: The Need for Organisational Reforms
In the past decade or so, a number of reports have been presented related to the rail sector. The Indian Railways Expert
Committee Report (2001) recommended significant organisational changes including corporatisation of the Indian Railways
and a new investment programme to achieve high traffic and revenue growth along with improvement in safety performance.
Indian Railway’s Vision 2020 (2009) is an aspirational plan which charts out a growth of 10 per cent for the Railways over
the next 10 years by developing a sharper commercial focus with strong social commitment. Recently in February 2012,
two more reports have been submitted. The Expert Group on modernisation of Indian Railways (Pitroda Committee) has
unequivocally stated that Indian Railways are in urgent need of modernisation and generational change to ensure safety,
improve productivity, take advantage of advances in technology and respond to ever increasing demand in order to meet
the inclusive growth aspirations of the country. The High Level Safety Review Committee (Kakodkar Committee) was also
presented in February 2012. All these reports have recommended organisational reforms in the Railways.

Transport 215
length of 76,818 km comprises only 2.0 per cent of
the road network but carry 40 per cent of the road-
based traffic. The SHs and the MDRs together con-
stitute the secondary system of road transportation
which contribute significantly to the development
of the rural economy and industrial growth of the
country. The secondary system also carries about 40
per cent of the total road traffic, although it consti-
tutes about 13 per cent of the total road length. At
the tertiary level are the Other District Roads (ODRs)
and the Rural Roads (RRs). These, once adequately
developed and maintained, hold the potential to pro-
vide rural connectivity vital for generating higher
agricultural incomes and productive employment
opportunities besides promoting access to economic
and social services.
15.74. In recent years special efforts have been
made by the central government to strengthen the
National Highway and also to improve rural road
connectivity. Despite this, the road network remains
grossly inadequate in various respects. It is unable
to handle high traffic density and high speeds at
many places and has poor riding quality. It is nec-
essary to accelerate completion of ongoing projects,
including expressways besides speedy implemen-
tation of the Golden Quadrilateral (GQ) and the
North-South and East-West (NS-EW) corridors and
also to address the deterioration of large stretches of
the NHs.
Review of the Eleventh Plan
15.75. Against an outlay of `1,92,428 crore in the
Eleventh Plan for the road sector, the anticipated
expenditure was `1,58,077 crore (at current prices).
The scheme-wise and year-wise outlay and expendi-
ture are given in Annexure 15.1.
National Highways (NHs)
15.76. At present, out of 76,818 kms of National
Highways about 23 per cent length is of 4-lane (and
above standard), 54 per cent length is of 2-lane stan-
dard and 23 per cent length is of single and inter-
mediate standard. As on March 2012, 30,537 km
length of NHs was entrusted to NHAI, 42,483 km
to State PWDs and 3,798 km to BRO. Plan-wise
details of increase in the NHs network are enclosed
(Annexure 15.2). An overview of the physical tar-
gets and achievements of normal NH works, Border
Roads Development Board (BRDB) works, and
works by the NHAI during the Eleventh Plan period
is enclosed (Annexure 15.3)
15.77. Despite the progress in NHs, only 23 per cent
of their total length is wider than two lanes, lead-
ing to heavy congestion. Shortfall in construction of
bypasses, inadequate capacity, insufficient pavement
thickness, and weak, narrow, and distressed bridges/
culverts as well as ROBs are some of the other
deficiencies.
National Highway Development Programme (NHDP)
15.78. India’s road network has benefited greatly
from the NHDP programme which envisages an
investment of about `2,36,247 crore during the
period 2005–12. Although NHDP envisaged award
of concessions/contracts by the year 2012, the actual
completion of the programme was expected to be
accomplished only by the end of the Twelfth Plan.
Phase- wise progress of NHDP during the Eleventh
Plan is given in Table 15.19 and details of various
phases are given in (Table 15.20). A map showing
these details is given at Annexure 15.4.
Financing of National Highway Development
Programme (NHDP)
15.79. Development and maintenance of National
Highways is financed through various sources.
Details are given in Box 15.7.
TABLE 15.19
Physical Achievements under NHDP during the
Eleventh Five Year Plan
NHDP Total length completed (km)*
NHDP Phase I 639
NHDP Phase II 5,210
NHDP Phase III 3,599
NHDP Phase V 913
NHDP Phase VII 13
Other Projects 235
Total 10,609
* Up to 31 March 2012 (Provisional).

216 Twelfth Five Year Plan
Roads Under SARDP-NE
15.80. To promote the development of road network
in the North-East, a Special Accelerated Programme
for Road Development in North-East (SARDP-NE)
was taken up in two phases. Under Phase ‘A’ of
SARDP-NE approved by the Government, improve-
ment of about 4,099 km length of roads (2,041 km
NHs and 2,058 km State roads) is envisaged. The
SARDP-NE Phase-A was targeted for completion by
March 2014. However, it is expected to be completed
by March, 2015. Under Phase ‘B’ of SARDP-NE
Programme, covering 3,723 km (1,285 km NH and
2,438 km State road), have been approved for DPR
preparation. So far DPRs of about 450 km has been
completed. About 892 km (21.8 per cent) length has
been completed under SARDP-NE Phase-A till end
March 2012.
15.81. Part of SARDP-NE is the Arunachal Pradesh
Package for Road and Highways involving develop-
ment of about 2,319 km length of road (1,472 km
is NHs and 847 km is State/General Staff/Strategic
roads) has also been approved by the Government.
Projects for 776 km are to be taken up on BOT
(Annuity) mode and the balance 1,543 km is to
be developed on EPC basis. The entire Arunachal
Pradesh Package is targeted for completion by June
2016. Out of the BOT (Annuity) Projects, 3 Projects
have been awarded for 369 km costing `3,126 crore;
balance 407 km costing `1,985 crore is in the process
Box 15.7
Financing of National Highway Development Programme (NHDP)
• Gross Budgetary Support (GBS) and Additional Budgetary Support (ABS).
• Dedicated accruals under the Central Road Fund. Present rate of cess is `2.00 per litre on both petrol and diesel. A part of
this cess is allocated to NHAI to fund the NHDP.
• External Assistance through World Bank, ADB, JBIC, and so on.
• Ploughing back of toll revenue including toll collection, negative grant, premium and revenue share deposited by NHAI
into Consolidated Fund of India and equivalent amount to be released to NHAI for ploughing back in its projects.
• Private Sector Investment under Public Private Partnership(PPP) frameworks that is BOT-(Toll) BOT(Annuity), Special
Purpose Vehicle (SPV)- with Equity participation by NHAI.
• Market Borrowings by NHAI as authorised by GOI to bridge the gap between the available resources and funds requirement.
TABLE 15.20
Progress of NHDP up to 30 April 2012
Total length (km) GQ
5,846
NS&EW
7,142
NHDP
Ph.-III
12,109
NHDP
Ph.-IV
14,799
NHDP
Ph.-V
6,500
NHDP
Ph.-VII
700
Other NHs
1,383
Completed Total till date (km) 5,840 6,018 3,798 – 940 14 961
Under Implementation
Length (km)
Contracts (Nos.)
6
8
691
66
2,802
56
3,318
23
1,181
15
27
2
409
5
Letter of Award issued/Agreement
signed and Work to be started
Length (km)
Contracts (Nos.)
12
1
3,669
36
1,866
12
0
0
Total
Length (km)
Contracts (Nos.)
6
8
703
67
6,471
92
3,318
23
30,47
27
27
2
409
5
Length to be awarded
Length (km) 0 421 1,840 1,1481 2,513 659 20

Transport 217
of award. In case of EPC Projects, out of the sanc-
tioned 359 km, 143 km is under process for sanc-
tion andDPRs are under preparation for balance
928 km. Target for award of all civil works is March,
2012. So far during 2011–12, 10 km of road has been
completed.
Roads for LWE Districts
15.82. A programme for development of about
1,202 km of National Highways and 4,362 km of
State Roads in Left Wing Extremism (LWE) affected
areas as a special project costing about `7,300 crore
has been taken up. The programme is slated for
completion by March, 2015. The projects cover 34
districts in eight States, namely Andhra Pradesh,
Bihar, Chhattisgarh, Jharkhand, Madhya Pradesh,
Maharashtra, Orissa and Uttar Pradesh. So far, 178
number of works containing a road length of 4,967
km costing `6,637 crore have been sanctioned. Out of
these, 157 number of works containing a road length
of 4,181 km estimated to cost `5,270 crore have been
awarded and remaining are at various stages.
National Highways Outside NHDP Programme
15.83. Physical progress of Non-NHDP National
High ways during Eleventh Plan is given in
Table 15.21.
15.84. Procurement of public funded projects has
witnessed a paradigm shift and now there is a shift
towards EPC mode of procurement instead of the
traditional mode of item rate contract (Box 15.8).
State Highways (SHs) and Major District
Roads (MDRs)
15.85. Investments including PPP under VGF pro-
gramme of central government have been made by
the State Governments to expand the networks of
roads, especially state highways, which are part of the
secondary and territory network. This has resulted
in expansion of the road network as shown in
Table 15.22.
15.86. It has been found that many State roads suf-
fer from low investment, inadequate width of car-
riageway to meet traffic demand, weak pavement
and bridges, congested stretches passing through
TABLE 15.21
Physical Progress of Non-NHDP NHs during Eleventh Five Year Plan
Sl. No Category Total Completion of Works from
2007–08 to 2010–11
2011–12
(Provisional)
Target Achv. Target Achv. (Up to
March 2012)
1 Missing Link (km) 59.4 55.3 — —
2 Widening to 2-lanes (km) 4,533 4,379 1,070 727
3 Strengthening (km) 3,554 3,950 1,080 672
4 Improvement of Riding Quality (km) 7,769 9,321 1,672 2,367
5 Widening to 4-lanes (km) 301.5 267 104 74
6 Bypasses (No.) 32 13 7 7
7 Bridges /ROBs (No.) 518 388 129 87
Box 15.8
Engineering, Procurement, Construction
(EPC) Contract
The conventional item-rate contracts are generally
prone to time and cost overruns, particularly in the
National Highway sector, resulting in enhanced cost to the
exchequer, as also considerable delays in the completion of
projects. Developed countries have moved to Engineering,
Procurement and Construction (EPC) contracts where
the contractor is responsible for design and construction
on a turnkey basis and for a fixed price. The Planning
Commission has published a model Engineering, Procure-
ment and Construction (EPC) contract for Highways. It is
expected that about 20,000 km of 2 lane National Highways
would be developed under this model. A similar document
is also being prepared for Dedicated Freight Corridor of
the Indian Railways.

218 Twelfth Five Year Plan
cities/towns, poor safety features and road geo-
metrics, and inadequate formation width in hilly
and mountainous regions, missing links and bridges
and several railway level crossings requiring urgent
replacement with ROB/road under bridge (RUB) to
improve safety and faster traffic movement. A broad
assessment shows that over 50 per cent of SHs and
MDRs network have poor riding quality. According
to one assessment, annual losses due to poor condi-
tion of these roads would be around `6,000 crore.
Many policy and implementation deficiencies have
to be redressed. These include: thin spreading of
resources; delay in pre-construction activities due
to delay in land acquisition; delay in environmen-
tal clearance and shifting/removal of utilities; weak
management by contractors due to improper deploy-
ment of human resources and equipment; and poor
implementation capacities of the state Public Works
Departments (PWDs).
Road Maintenance
15.87. The road network built at a huge cost needs
to be maintained properly to prevent disintegration
and deterioration, ensuring its continuous utilisa-
tion in an optimum manner and road safety of its
users. However, maintenance of roads, is treated
as a non-Plan activity and has, therefore, tended
to be neglected because of financial resources con-
straints. The maintenance requirement of the high
density corridors of NHs under construction and
post-implementation is provided by the NHAI.
However, the non-NHDP NH sections, which are
maintained by State PWDs, are poorly managed,
primarily because funds made available to them
for maintenance are well short of the requirement
as per norms. According to an estimate, the NHs
get only 50 per cent of the total funds required for
proper maintenance of NHs. Maintenance of SHs
and MDRs has also been suffering from paucity of
resources made available for the purpose. For rural
roads under PMGSY, there is provision for main-
tenance for five years following the completion of
a project but the long-term issue of maintenance
beyond the initial five year period has not been
addressed so far. Besides inadequacy of resources,
management of roads is unsystematic and inspec-
tions are irregular. There is weak accountability and
poor monitoring of the maintenance activities.
Public–Private Partnership (PPP) Projects
15.88. During the Eleventh Plan, total private-sector
investment on NHDP has been `62,629 crore against
a target of `86,792.00 crore, which is a substantial
jump over the achievement in the Tenth Plan of
`11,032 crore (2011–12 prices) Appropriate policy
and regulatory framework for the PPPs, including
institutional mechanisms are put in place such as
the Model Concession Agreement (MCA) for BOT
projects.
Pradhan Mantri Gram Sadak Yojana (PMGSY)
15.89. Empowering rural India through the strate-
gic provision of all-season road access has emerged
as one of the key priorities for the Government of
India. The Eleventh Five Year Plan (2007–12), and
the Tenth Plan before it, recognised that rural con-
nectivity is a key component of rural development
and poverty alleviation in India. The main mecha-
nism for enhancing rural connectivity in a more
systematic way has been the Pradhan Mantri Gram
Sadak Yojana (PMGSY), a Centrally Sponsored
Scheme (CSS), launched on the 25 December 2000.
The programme seeks to connect all habitations with
a population of 500 persons and above in plain areas
TABLE 15.22
State Roads Progress during the Eleventh Plan
Lane wise Length of SH in 2007 (km) Lane wise Length of SH in 2011 (km)
Total
Length
SL/IL 2 Lane 4 Lane and
above
Total
Length
SL/IL 2 Lane 4 Lane and
above
States 1,50,492 1,11,850 36,349 2,293 1,65,724 1,00,819 60,747 4,157
UTs 221 145 56 20 405 230 63 112
Total 1,50,713 11,995 36,405 2,313 1,66,129 1,01,049 60,811 4,269

Transport 219
and 250 persons and above in Hill States, Tribal
(Schedule V) areas, the Desert Areas (as identified
in Desert Development Programme) and in the
82 Selected and Tribal Backward districts (under
IAP) as identified by the Ministry of Home Affairs/
Planning Commission. The Government of India
has also identified ‘rural roads’ as one of the six com-
ponents of ‘Bharat Nirman’ with a goal to provide
connectivity to all habitations with a population of
1,000 persons and above in plain areas and 500 per-
sons and above in hilly or tribal areas with an all-
weather road.
15.90. The physical and financial progress of
PMGSY upto the end of Eleventh Plan is presented
in Tables 15.23 and 15.24. Although the PMGSY
has achieved only 53 percent of its initial targets—
mainly due to limited implementation capacity—its
achievements have been significant. The length of
the new and improved rural road network under
the program to date has reached 2,09,500 km and
as a result 84,414 habitations have been connected.
The main strength of the PMGSY programme has
been its ability to develop a strong national focus
for rural roads development through the National
Rural Roads Development Agency (NRRDA). The
NRRDA has developed a common set of operating
procedures that are applied nationwide through the
dedicated State Rural Roads Development Agencies
(SRRDAs) and their Program Implementation Units
(PIUs). These operating procedures are set out in a
series of PMGSY manuals covering overall opera-
tions, technical design, quality control and account-
ing. There is a systematic planning process in place
which has included the prioritisation of a 1.5 million
km core rural road network, of which about 750,000
km are eligible for new connectivity and upgrading
under the PMGSY programme. The programme
has also developed a web-based On-line Monitoring
Management and Accounting System (OMMAS)
which is accessible to the public.
15.91. Evidence from several impact evaluation
exercises on PMGSY indicates the multiple benefits
generated in the rural economy in both commercial
and social spheres by improving road connectivity.
A study by Bell (2012)1 examines the contribution
of PMGSY in drawing India’s villages into the main-
stream, in three ways. First, with improved con-
nections to markets, villagers should face more
favourable prices for inputs and outputs. Second,
by reducing the time spent travelling to school and
the days lost due to bad weather, an all-weather road
should improve the attendance, not only of pupils,
but also of their teachers, thus promoting the forma-
tion of human capital and the growth of productivity
over the long run. Third, by improving the villag-
ers’ access to timely treatment, especially in emer-
gencies, the connection should lower mortality and
morbidity.
15.92. Bell (2012) attempts to estimate the relative
sizes of each of these respective contributions to total
benefits from PMGSY. The author finds that pro-
viding backward rural areas with all-weather roads
promotes not only production and trade in what can
be called the ‘commercial’ sphere of life, but also the
formation of human capital and health in the ‘non-
commercial’ one. In a further analysis2, he along
with his co-author undertakes a cross section com-
parison of 30 villages (nine of which benefited from
PMGSY) and ‘before and after’ comparisons in these
nine villages. The authors find that net output prices
TABLE 15.23
Physical Progress–PMGSY (as on 31 March 2012)
Total Eligible Sanctioned Completed
Habitations
(in Nos.)
1,58,891 1,14,963
(72%)
84,414
(53% of
eligible)
New Connectivity
length (km.)
3,67,673 2,79,811
(76%)
2,09,570
(57% of
eligible)
Upgradation
length (UG) (km.)
3,74,844
2,25,111–UG
1,49,733–
Renewal
1,64,096
(73%)
(UG)
1,40,930
(62% of
eligible)
(UG)
TABLE 15.24
Financial Progress (as on 31st March, 2012)
(` crore)
Value of Proposals
Sanctioned
Funds
Released
Expenditure
Incurred
127786 1,00,417 91,498

220 Twelfth Five Year Plan
were 5 per cent or higher; substantially fewer days
of schooling were lost due to bad weather, largely
because teachers had fewer absences. The improve-
ment in the accessibility to education resulted in
increased school enrolment and school attendance.
Importantly, there was an increase in the number of
girls going to schools. The acutely sick received more
timely treatment and were more likely to be treated
in a hospital than in the nearest primary health clinic
in villages connected by PMGSY. Better manage-
ment of infectious diseases and attending to emer-
gencies due to faster access to health facilities and
increase infrequency of visits by health workers were
the other outcomes. Moreover, there was an increase
in the number of institutional deliveries in hospi-
tals outside the village, improvement in ante-natal
and post-natal care and a decline in infant and child
mortality.
15.93. Several independent impact evaluation
exercises commissioned by the Ministry of Rural
Development have also revealed the huge benefits in
terms of agricultural growth, income and employ-
ment generation, access to healthcare and education,
and poverty reduction generated by PMGSY. Better
connectivity resulting in easier access to markets
and improved flow of information led to improve-
ments in agricultural production and incomes of the
farmers inhabiting the connected area. Considerable
change in cropping pattern was observed, with
a shift from food crops to cash crops. Non-farm
opportunities like opening of shops, small business,
cottage industries increased and more avenues for
self-employment emerged. Besides, road connectiv-
ity led to expansion of local industries, which in turn
generated employment opportunities. The construc-
tion of the PMGSY road also led to an increase in
frequency of visits by Government officials. This is
likely to result in better implementation of various
Government schemes and programmes.
Bharat Nirman
15.94. Under Rural Connectivity component of
Bharat Nirman, all habitations having population
of 1,000 or more persons (500 or more in hilly and
tribal areas) are to be provided connectivity with
all-weather roads. Accordingly, the programme
envisages to provide connectivity to 63,940 habi-
tations under above category. Projects to connect
58,387 habitations have been sanctioned and 44,089
habitations connected by constructing 1,41,095 km
of new roads up to 31 March 2012. Also 1,03,471 km
of roads were upgraded (excluding renewals by
States) (Tables15.25 and 15.26).
TABLE 15.25
Habitation Coverage – Bharat Nirman
(as on 31 March 2012)
Total
Eligible
Projects Cleared
(Sanctioned)
Completed
Habitations
(in numbers)
63,940 58,387
(91%)
44,089
(69% of
eligible)
TABLE 15.26
Cumulative Physical Progress under Bharat Nirman
(up to March 2012)
Activity Target (2005–12) Achievement
New Connectivity
(Length in km.)
1,89,897 1,41,096
(74%)
Up-gradation including
renewal (in kms)
1,94,131 2,35,903
(122%)
The Twelfth Plan
15.95. The Twelfth Plan will have to continue the
thrust of upgrading the road infrastructure, with
the objective of improving mobility and accessibility
while reducing the cost of transportation. The main
targets of the Twelfth Plan will be as follows:
1. Completion of on-going works on Golden
Quadrilateral and North–South and East–West
corridors taken up in NHDP Phases I and II of
the programme. The balance works remaining
are marginal and will get completed in the first
two years of the Plan.
2. In respect of the remaining phases of NHDP,
namely NHDP-III for inter-district roads and
other roads taken up under the programme and
NHDP-IV which aims to convert single-lane
roads to double-lane roads, the programmes will
be taken up for completion in the Twelfth Plan.
3. Similarly, NHDP-V which involves conver-
sion of the GQ to six-lane roads now will be

Transport 221
continued in the Twelfth Plan and specific tar-
gets set for completion.
4. National and State Highways would be upgraded
to minimum two lane standard by the end of the
Plan.
5. All villages will be connected with all-weather
roads by the end of the Plan.
6. Work on access controlled expressways has
moved at a slow pace. A comprehensive master
plan for development of 15,600 km of express-
ways would be developed, the alignment deter-
mined and work taken up in phases. It is hoped
that 1,000 km of expressways would be com-
pleted during the Twelfth Plan, while land for
another 6,000 km would be acquired to initiate
work.
7. The Plan will aim to prioritise special links for
feeder roads to important railway routes and ports
which are essential for development of domes-
tic and international trade. The overall effort
will be to integrate with the road development
programme with the other modes of transport
so as to have an integrated transport movement.
Such links which connect important minor and
major ports and developed with minimum two/
four-lane National Highways or State Highways.
Important areas of focus will be development of
way-side amenities and improving capacities of
implementing agencies, including State Public
Works Departments. While undertaking con-
struction of roads, modern technologies which
can help in improvement of energy conservation
and environmental protection will be taken up.
The National Highways had added 10,000 km in
the Eleventh Plan. Another 10,000 kms will be
added during the Twelfth Plan so that the total
length of the highways becomes 91,200 km. This
will require additional resources for maintenance
and improving riding quality. These will be ade-
quately funded.
Road Development in the North-East
15.96. The development of roads in the North-East
had been taken up by special programme under
Special Accelerated Road Development Programme
for North-East (SARDP-NE). It is proposed that
the balance works under these programmes, which
includes connectivity of all State capitals of North-
East with two or four-lane NHs with paved shoul-
ders and connecting all district headquarters with
two-lane NHs will be taken up for completion.
SARDP-NE Phase-B for which work has been
taken up to prepare DPRs would get completed.
It is planned to develop and complete the Trans-
Arunachal Pradesh Highway during the Plan.
15.97. The construction of roads on PPP basis has
gained momentum in the Eleventh Plan and most
of the roads are getting constructed on BOT (Toll)
basis. It is proposed to continue with this pol-
icy in the Twelfth Plan. Simultaneously, a Model
Concession Agreement (MCA) for organisation and
maintenance (OMT) for tollable roads will be taken
up to ensure effective maintenance. The strengthen-
ing and restructuring of the roads in the North East
will be taken up for non-tollable roads. These are
assets which need to be effectively maintained. To
ensure this, modern management techniques and
scientific assessment of maintenance strategies will
be taken up. The capacities of NHAI and BRO would
be further developed for this purpose.
Non-NHDP Road
15.98. The Twelfth Plan will also aim at development
of roads not covered under the NHDP, which have
been taken up by NHAI. It is proposed that 19,200
km of roads will be taken up for conversion of two-
lane roads, including 10,000 km of NHs so declared
during the Eleventh Plan. It is proposed to develop
3,770 km of roads with the help of the World Bank
assistance and another 6,350 km through BOT (Toll)
route. 1,000 km of expressways are planned, in addi-
tion to the NHDP programme. In addition, some
of the other developments, including strengthening
and improvement of riding quality, construction of
bridges/ROBs will be taken up.
Roads in LWE Areas
15.99. The programme for development of roads in
the Left-Wing Extremism (LWE) affected districts
will be continued and works taken up earlier in the
Eleventh Plan be completed during the Plan. It is
expected that 4,426 km of work will get completed by
March 2015 and another 9,615 km by March 2017.

222 Twelfth Five Year Plan
New Schemes During Twelfth Plan
15.100. New Schemes during the Twelfth Plan are as
under:
1. Special Package for development of roads in
the Schedule Areas (under Fifth Schedule)
under Tribal Sub-Plan—1,000 km for total GBS
requirement of `5,000 crore.
2. Development of road corridors in Delhi–
Mumbai industrial corridor project.
3. Special package for development of State roads
in the State of J&K from strategic consider-
ations—complete about 700 km out of total
length of about 1,000 km for total GBS require-
ment of `700 crore.
4. Special package for development of road con-
nectivity for about 50 minor ports—1,000 km for
total GBS requirement of `5,000 crore.
5. Special package for development of road con-
nectivity for 24 Airports—360 km for total GBS
requirement of `1,800 crore.
Rural Roads
15.101. The Twelfth Plan will, aim to connect remain-
ing these habitations by constructing about 1,58,000
km of new roads. 84,181 km of existing roads are
planned to be upgraded during the Twelfth Plan.
15.102. In addition, the funds are required for fol-
lowing activities:
1. NABARD Loan (Principal) and interest
repayment.
2. Provision for left-out bridges on already sanc-
tioned roads.
3. Inclusion of left out habitations due to revision
of core-network permitting to take habitations
(as per guidelines) instead of revenue villages as
units of connectivity in Core-Network.
4. Coverage of new habitations of 250+ in 78 IAP
districts
5. Providing bridges of 75 m length in 78 IAP
districts
6. Additional provisions due to snow fall/ land-
slides in Hill States
7. For providing connectivity to left-out habita-
tions (as per 2001 census) in core-network and
for up gradation of some selected roads in 78
IAP districts
8. For launching of PMGSY-II during Twelfth Five
Year Plan on sharing basis
15.103. During the Tenth and Eleventh Plan periods,
huge investments of over `1,00,000 crore have been
made in expanding the rural roads network. Hence,
it has been proposed to launch PMGSY-II, to consol-
idate the existing rural road network. It would cover
up gradation of existing selected rural roads based
on a criterion to make the road network vibrant, on
sharing basis with the States. The selection of routes
would be with the objective of identification of rural
growth centres and other critical rural hubs.
State Highways
15.104. A programme similar to the NHDP for the
state highways is needed. The States will be encour-
aged to develop a core network. The development of
four-lanes and two-lanes will accordingly be taken
up as part of this Plan. The resources required for the
State’s programme of the above are estimated at `4.9
lakh crore, of which 20 per cent is expected to be pri-
vate sector investment. For this purpose, PPP would
be encouraged through Viability Gap Funding (VGF)
window available with the Central Government.
Targets for Twelfth Plan are mentioned in Table 15.27.
Public-Private Partnerships (PPP) and Other
Initiatives
15.105. The NHDP programme will be funded pri-
marily through PPP, a policy which had been initi-
ated in the Eleventh Plan. For this purpose, a VGF of
40 per cent is provided in the Road Sector, including
20 per cent from the cess on petrol and diesel, which
is available with the NHAI. It is proposed to con-
tinue and further strengthen the PPP construction
and build BOT (Toll) roads. It is also proposed to
strengthen and improve the existing framework, spe-
cifically these will be further expanded for construc-
tion of roads by the State Governments. Some of the
innovations undertaken by the State Government
are given in the (Box 15.9).
15.106. Roads are a major user of construction
material especially of bitumen and asphalt which

Transport 223
are known to emit gases into the atmosphere. Use of
green bitumen materials and specific R&D schemes
for possible adaptation of state-of-the-art innovative
technologies and materials in highway development
and maintenance would be encouraged during the
Twelfth Plan.
15.107. The rapid pace of development of the road
sector has resulted in skill deficit especially among
the technical and engineering staff. Involvement
of contractors and developers in creating skilled
resource pool and encouraging Engineering and
Technical Institutions to attract students in Highway
Engineering profession would be some initiatives
for bridging the skill gap. National Academy of
Construction could be an institution worth emula-
tion by other states.
Regulator for Roads
15.108. There is no independent regulatory author-
ity for India’s Roads and Highways sector. Current
arrangement both at Centre and States (MORTH,
NHAI, MPRDC, PWDs and so on) results in a
potential conflict as the rule making body is also
the implementing body and there is no independent
assessment of its performance across various param-
eters. There is, therefore, a need for a regulator whose
key functions should include tariff setting, regula-
tion of service quality, assessment of concessionaire
claims, collection and dissemination of sector infor-
mation, service-level benchmarks and monitoring
compliance of concession agreements.
Some Major Initiatives in the Twelfth Plan
15.109. Major initiatives in the Twelfth Plan Period
are:
• Earmarking of Plan funds for IRQP and strength-
ening/maintenance of non-tollable roads.
• Development of capacities of NHAI, BRO and
other implementing agencies.
TABLE 15.27
Targets for the Twelfth Plan
State Highways Major District Roads
Kilometres % of Existing/Total Lengths Kilometres % of Existing/Total Lengths
2–Laning 30,000 30 20,000 8.5
4–Laning 5,000 8 1,000 4
Strengthening 41,500 25 66,500 25
IRQP 50,000 30 80,000 30
Box 15.9
Innovations by some State Governments
• Crucial role being played by Madhya Pradesh Road Development Corporation and Gujarat State Road Development
Corporation (GSRDC) in upgrading SRs using Central Government’s VGF which extends subsidy of up to 20 per cent of
total project cost and an additional up to 20 per cent financed by State Government. Contribution to GSRDC is also kept
to defray expenditure on pre-construction activities.
• PPP (Annuity) model adopted by Gujarat since strengthening/widening of SRs does generate a commercially viable return
despite 40 per cent upfront subsidy.
• Adoption of a plan scheme for land acquisition for identified corridors by Punjab to reduce traffic congestion on major
highways, with funds proposed to be released on the condition that these shall be recovered by PWD by imposing a cess
on sale/purchase and any development activity carried out by the private parties on lands adjoining PWD roads.
• Creation of a Rajasthan State Road Development Fund, through a cess on sale of petrol and high speed diesel, towards
extending interest free loan and share capital to the Road Infrastructure Development Company of Rajasthan for projects
to upgrade SHs.

224 Twelfth Five Year Plan
• Prioritisation of special links for feeder roads to
important railway points, ports and areas where
rail link is not possible.
• Special focus on development of roads for Delhi–
Mumbai industrial corridor.
• States to be encouraged to develop core network
for rural connectivity.
• Providing universal connectivity in rural areas
under PMGSY, launch of PMGSY-II and pilots on
PPP in some selected PMGSY roads.
• Focus on implementation of rural road projects in
the LWE districts through the Integrated Action
Plan (IAP).
• Investment in R&D, green technology and design
for better and safer roads.
Road Transport
Issues
15.110. Road transport has emerged as the domi-
nant segment in India’s transportation sector with
a share of 4.7 per cent in India’s GDP in 2009–10
which is higher than Railways that has a 1 per
cent share. Road transport has gained importance
over the years despite significant barriers to inter-
state freight and passenger movement compared
to inland waterways, railways and air which do not
face rigorous en route checks/barriers. Despite the
performance of the road transport sector, it is beset
with slow technological development, low energy
efficiency, pollution and slow movement of freight
and passenger traffic.
Eleventh Plan Review
15.111. The Road Transport policies cover efficient
road movement, road safety and related areas. The
approved outlay for the Eleventh Five Year Plan
for the Transport Sector was `1,131 crore for Road
Safety, National Database Network, Inspection
and Maintenance Centre, Strengthening of Public
Transport, Creation of National Road Safety Board.
Approach to Twelfth Plan
15.112. With the sustained high rates of economic
growth, the growth of passenger and commercial
traffic will be high. An estimate of this was made
by working group making assumptions for various
scenarios (Table 15.28). The Plan will aim at sev-
eral policy interventions to ensure efficient develop-
ment of transport of passenger and freight across the
country.
Development of Database in Road Sector
15.113. The availability of relevant data depends pri-
marily on the efforts of States. Currently, the data-
base on road transport is restricted to number of
registered motor vehicles category-wise as required
by the Motor Vehicle (MV) Act, 1988. There are
serious gaps in Road Transport data such as decen-
tralised generation of data, multiplicity of agencies,
time lag, no data on movement of people, goods
and vehicles, passenger and freight flows measured
in a variety of ways and so on. These issues can be
resolved by a national consensus on data generation
using IT extensively. A group will be set up during
the Plan to resolve the above issues and improve the
national database
Efficiency of Road Transport
15.114. Measures need to be taken to improve road
transport efficiency. Some of the areas which will
be taken up in the Plan include: Integration of tax
administration with inter-state road freight and
passenger movement through online communi-
cation network system at National, Regional and
Local level; Reforms in tax administration including
replacing various road transport related taxes/levies
(road tax, goods tax, passenger tax) and so on by a
single composite tax; Reforms in Motor Vehicles
Act to simplify inter-State movement with simpli-
fied procedures; Automate and Use of IT for Cross
Border Road Freight Transport Management.
Electronic Tolling System
15.115. The Road Transport System needs to be
modernised. For this, there is need to introduce
Electronic Toll Collection (ETC) system in (Box
15.10). At present, there are very few truck terminals
in cities. There is need to create a number of truck
terminals in almost all ‘A’, ‘B’ and ‘C’ class cities and
towns. These truck terminals will ease the traffic
congestion in the city and decrease pollution, facili-
tate emergence of hub spoke system for distribution
of goods and greatly improve the turnaround time

Transport 225
Box 15.10
Introduction of Electronic Toll Collection (ETC)
• A Committee was set up under the Chairmanship of Shri Nandan Nilekani, Chairman, Unique Identification Authority
of India.
• Recommendations of the Committee have been accepted and notified by the Ministry of Road Transport and Highways
for the use of National Highways.
• In the first phase, a pilot project on ETC was inaugurated on 19 April 2012 on a section of NH-5 between Delhi and
Parwanoo. Three Toll Plazas with ETC have been operationalised by the concessionaires at Panipat, DeraBassi and
Parwanoo.
• A second pilot project on the Mumbai and Ahmedabad section of the National Highways has also been initiated. Progress
on the project is being monitored continuously for early completion of the same.
• The other stretches of the NHs on which pilot projects have been undertaken are – Bengaluru–Chennai (State Bank of
India); Kolkata–Dhanbad (IDFC Infra) and Gurgaon–Jaipur–Beawar (Feedback Infra Ltd.).
• The work of implementation of ETC on all stretches of the NHs in the country has been entrusted to NHAI. All the toll
plazas across the country are proposed to be completed by January 2014.
of goods carriages. In these truck terminals there
could be medical facilities, rest room, restaurant and
equipment handling facilities. It is suggested that
while planning SEZ or SER or Industrial Park at least
10per cent of the area should be embarked for logis-
tics and warehousing to support industrial activities
efficiently.
Seamless Passenger Movement
15.116. There is need for promoting seamless pas-
senger across the country. Unfortunately, there are
difficulties in having inter-State agreements particu-
larly on issue of passenger tax. There is a clear need
to resolve these issues and provide the mechanism
for issues arising day to day basis. During the Plan,
efforts will be made to evolve a system for a smooth
interstate passenger transport movement.
Transport Safety
15.117. Transport Safety is an important area, espe-
cially for Road Transport. Annually 1.3 lakh people
die in road accidents. To strengthen the data, there
is need to set minimal road death and injury data
reporting requirements in accordance with stan-
dards set by the International Accident Database
Group (IRTAD) for national level data. Web based
data systems should be established and be made
operational in the Twelfth Plan period. There is need
TABLE 15.28
Projected Road Freight and Passenger Traffic
Years of Twelfth Plan Billion Tonne Kilometre (BTKM) Billion Passenger Kilometre (BPKM)
S I (BAU) S II S III S IV S V S A (BAU) S B
2012–13 1,315 1,337 1,351 1,366 1,381 8,150 8,483
2013–14 1,429 1,465 1,489 1,513 1,538 8,868 9,111
2014–15 1,553 1,605 1,641 1,677 1,714 9,648 9,762
2015–16 1,688 1,760 1,808 1,858 1,909 10,497 10,438
2016–17 1,835 1,928 1,993 2,059 2,126 11,421 11,140
Note: BAU: Business as Usual; S-Scenario; SI-freight traffic assumed to grow at 8.7 per cent per annum in line with the past trend; SII-
GDP growth 8 per cent per annum and elasticity 1.2; SIII-GDP growth 8.5 per cent per annum and elasticity 1.2; SIV-GDP growth 9
per cent per annum and elasticity 1.2; SV GDP growth 9.5 per cent per annum and elasticity 1.2; SA-passenger traffic assumed to grow
at 8.8 per cent per annum; SB-BPKM derived through regression analysis as a function of population growth, urbanisation and per
capita income.

226 Twelfth Five Year Plan
to implement on an urgent basis the key recom-
mendation of the Sundar Committee Report regard-
ing the creation of National Road Safety and Traffic
Management Board.
Awareness, Education and Driver Training
15.118. High level of awareness is required so that
systemic problems get rectified. Awareness should
be spread using all modes of communication: TV,
Newspapers and Radio. ITIs need to be involved in
driver training. MoRTH provides a scheme for set-
ting up IDTR/DTI at state level. Before they start
imparting driving training in driving schools, they
should attend ‘Trainers Training’ in IDTRs/RSIs. To
ensure that the needs are met, driver training schools
should be encouraged to come up in the PPP mode.
Vehicle Safety
15.119. At present, the introduction of new safety
standards is dependent on testing facilities available
in the country including those at NATRIP. Since the
vehicles produced in the next few years will be pres-
ent on the road for about two decades, it is essential
that the provision of testing facilities and introduc-
tion of new standards should be expedited. Impact
standards for vehicles should be implemented on
an early basis. Since a vast majority of those injured
and killed in road accidents comprise of pedestrians,
bicyclists, and motorcyclists, India should take the
lead in introduction of pedestrian impact standards
for all vehicles. India should set up a NCAP India
Programme. In the first phase, cities with significant
transport vehicles (Metros) should introduce a mod-
ern Inspection and Certification regime.
Some Major Initiatives in the Twelfth Plan
15.120. Some major initiatives during the Twelfth
Plan Period are:
• Investment in R&D, technology and design of bet-
ter and safer roads.
• Reforms in Motor Vehicles Act to simplify inter-
State movement with simplified procedures.
• Integration of tax administration with interstate
road freight and passenger movement through
online communication network system at
National, Regional and Local level.
• Reforms in tax administration (road tax, goods
tax, passenger tax) to reduce collection cost and
compliance cost of vehicle owners/operators.
• Creation of truck terminals to ease traffic con-
gestion, decrease pollution, facilitate emergence
of hub spoke system for distribution of goods
and improvement in turnaround time of goods
carriages.
• Creation of National Road Safety and Traffic
Management Board to promote and sustain
improved road safety in India, reflect interna-
tional good practice and provide an informed
basis for effective action.
Outlay for the Twelfth Plan
15.121. The Twelfth Plan budgetary support for
Central Sector Roads is `1,44,769 crore. In addition,
the sector is expected to generate IEBR amounting
to `64,834 crore and private-sector investment of
`2,14,186 crore during this period.
15.122. The Twelfth Plan budgetary support for
Rural Roads (PMGSY) is `1,26,491 crore.
SHIPPING
15.123. There has been a consistent decline in the
share of Indian ships in the carriage of India’s over-
seas trade from 31.5 per cent in 1999–2000 to 13.7 per
cent in 2004–05 and further to 7.95 per cent in
2010–11. There is a need for policy intervention to
arrest this declining trend. Indian shipping fleet is
characterised by the predominance of oil tankers
and bulk carriers. While as on 31.03.12, oil tank-
ers account for 63.76 per cent of the Deadweight
Tonnage (DWT), bulk carriers account for 28.77 per
cent, with all other vessel types such as liner vessels,
OSVs and so on accounting for a mere 7.47 per cent.
Review of the Eleventh Plan
15.124. During the Eleventh Plan, three scenarios
were set with first having a target of 10 million Gross
Tonne (GT). It was further envisaged that with sup-
portive policy measures, acquisition of vessels might
go up to 12 million GT and 15 million GT. During
the Eleventh Plan, shipping tonnage witnessed a rise
from 787 vessels carrying about 8.6 million GT to
1,135 vessels amounting to 11.03 million GT. A total

Transport 227
of 348 vessels of 2.43 million GT were added to the
fleet as against a target of 279 vessels of 4.16 million
GT. The Eleventh Plan is likely to witness a growth
of 6.36 per cent in DWT.
15.125. An outlay of `15,026 crore, including IEBR
of `13,135 crore was provided in the Eleventh Plan
for the Shipping sector. Against this, expenditure
was `9,788.39 crore, accounting for 65.00 per cent of
the total outlay. The scheme-wise details are given in
Table 15.29.
15.126. Ministry of shipping has a number of organi-
sations. This includes Director General of Shipping
(DG (S)), Director General of light houses and light
ships (DGLL) and Shipping Corporation of India.
During the Eleventh Plan, DG Shipping which is a
statutory authority under the Merchant Shipping
Act, 1958 and is responsible for implementing the
Act and thus perform regulatory functions, invested
`230.68 crore for strengthening of mercantile marine
department, procuring modern survey instruments
for minor port survey organisations and setting up of
Indian Maritime University (IMU).
15.127. The DGLL provided Marine aids to naviga-
tion along the Indian Ports and managed 180 light
houses, one light ship, 22 different ships global sys-
tem and 21 deep seas lighted buoys for maritime
navigation. It was able to earn `768.02 crore and
spend `147.98 crore (98.65 per cent) of its outlay.
15.128. The Shipping Corporation of India had
planned for `13,135 crore (IEBR) against which
`8,537.85 crore (65 per cent) has been spent. It
ordered 39 vessels against the acquisition targets of
67 vessels and inducted 20 vessels. The pace of vessel
acquisition is slow during 2011–12, due to fall in the
markets. The SCI profits decreased during the Plan
from `813.9 crore in 2007–08 to a loss of `428 crore
in 2011–12. Its fixed assets increased from `7,086.3
crore to `13,057.3 crore.
Strategies for the Twelfth Plan
15.129. A national shipping fleet commensurate with
our overseas cargo needs would help in reducing the
freight costs of Indian cargo. There is need to develop
our freight policies consistent with efficiency of
transport. A thriving shipping sector encourages the
growth of associated industry and services provid-
ers required for servicing this industry, accounting
to over 75 per cent of the shipping sector’s national
contribution. Most importantly, national tonnage is
decisive in maintaining the supply line of essential
cargo during international emergencies.
15.130. In order to enhance its reach, Director
General of Lighthouses and Lightships plans to
extend the facility for Coastal Surveillance and
avoid environmental pollution under the National
Maritime Domain scheme awareness by providing
Vessel Traffic Service to Non-major Ports.
Increase in Tonnage
15.131. As on 30 June 2012, Indian tonnage stands
at 11.03 million GT and ranks sixteenth in the world.
During the Twelfth Plan it is planned to increase it
to a target of 12.4 million GT if Indian shipping ton-
nage share of 1.16 per cent of global fleet remains
constant in the Plan. However, with more supportive
TABLE 15.29
Financial Performance of the Shipping Sector in the Eleventh Plan
(in ` crore)
Sl. No. Scheme/Programme Financial Performance-Eleventh Plan
Approved Eleventh Plan Outlays Approved Annual Plan Outlays Actual Expenditure
1. SCI 13,135.00 14,283.00 8,537.00
2. DG (Shipping) 366.00 230.68 191.27
3. DG (LL) 150.00 243.60 147.98
4. IWT 615.00 693.00 537.25
Total 15,026.00 16,108.84 9,788.39

228 Twelfth Five Year Plan
policies this could increase to 26.6 Million GT or
even to 53.3 MGT. These scenarios along are given
in the Table 15.30 along with their required invest-
ments. An environment conducive to the growth of
Indian shipping can be fostered by fiscal rationalisa-
tion, strengthening of regulatory mechanism, and
increased focus on maritime training. Supportive
policy measures as detailed below need to be taken to
enable acquisition of vessels up to 26.6M GT.
TABLE 15.30
Estimated Requirements of Additional Vessels and
Investment
Tonnage Target Investment (` in crore)
Scenario 1 11.2—12.4 m GT 2,500
Scenario 2 11.2—26.6 m GT 32,000
Scenario 3 11.2—53.3 m GT 80,000
Fiscal Regime Rationalisation
15.132. The Government had provided Indian ship-
ping a level playing field by introducing tonnage tax
in April 2004. Although tonnage tax regime pro-
vided temporary relief, some changes in direct and
indirect taxation subsequently diluted these benefits.
According to industry estimation, Indian shipping as
against its counterparts is currently subjected to 12
types of taxes. Another aspect which translates itself
into a tax-related disadvantage for the ships with
Indian flags is that national manning is compulsory
for them. The shipping company has to make with-
holding tax payments for Indian seafarers since they
are not exempt from income tax. As this obligation
does not devolve on ships registered in other juris-
dictions employing Indian seafarers, the result is that
the Indian ships have to pay a higher salary. It is crit-
ical for the growth of shipping in India that a level
playing field is created as compared to other regimes
in respect of taxes.
Cargo Support
15.133. The continuation of the policy with respect
to Government owned and controlled cargo to be
imported on FOB basis and shipping arrangements
to be channelised through the Ministry of Shipping’s
Chartering Wing, Trans-chart would be advisable.
Measures to promote use of Indian Flag Ships can
significantly boost the growth of Indian shipping
fleet during the Twelfth Plan. It has been suggested
that a portion of the EXIM trade say, one-third of the
POL and dry bulk cargo can be reserved for Indian
Flag Ships as a condition for availing benefits from
the government for export schemes. This would
enhance cargo availability for Indian ships, and be
a major catalyst to boost the growth of Indian fleet.
This suggestion would need to be examined and an
incentive policy to promote Indian Flag Ships should
be developed.
Maritime Human Resource Development and
Training
15.134. India has positioned herself as a major
human resources–supplying nation to the maritime
industry. As a result of the initiatives taken by the
government in encouraging private participation in
maritime training, the number of maritime train-
ing institutes under the assurance of quality train-
ing by the Directorate General of Shipping DG(S)
rose from 128 in 2005 to 138 in 2012 including seven
Government institutes.
15.135. Global demand for seafarers is estimated to
reach 6,70,000 Officers and 7,20,000 Ratings by 2015.
This will imply an incremental demand of 1,20,000
Officers and 1,25,000 Ratings. Seafarer supplying
countries (for example China, Philippines, Turkey
and Ukraine) are expected to compete for captur-
ing this incremental demand to increase their global
share. Shortage of officers is expected to aggravate due
to high fleet growth. India has an opportunity to sup-
ply more officers in the international maritime sector.
15.136. The target for the maritime training pro-
gramme for the Twelfth Plan is to increase the share
of Indian officers from 6.3 per cent to about 9 per
cent by 2017, whereas for ratings from 7.5 per cent
to about 9 per cent by 2017. Policy initiatives are
required to retain and build talent. Initiatives for this
could include the co-option of the member lines of
the INSA into allocating 10–15 per cent of each ship’s
manning scales exclusively for sea training berths.
15.137. With the objective of providing world class
training opportunity for the shipping sector, the

Transport 229
Government has established an Indian Maritime
University (IMU) in Chennai with campuses in
Kolkata, Mumbai, Visakhapatnam, Kochi, Chennai
and Kandla. The IMU aims to play the role of a cen-
tralised nodal agency to facilitate Maritime studies
and research in emerging areas such as marine sci-
ence and technology and marine environment. The
Indian Maritime University should play the role of a
centralised university in controlling higher maritime
education through academic support processes in its
campuses throughout India.
15.138. There is a need to strengthen the IMU
through induction of high quality faculty.The impor-
tant role presently being played by the Regional
Academic Councils under the Directorate General of
Shipping should be further strengthened by reconsti-
tuting them to form an Advisory Group.
15.139. There should be a strong emphasis on the
need for improving quality of Indian seafarers to
keep up the reputation and credibility of Indian cer-
tifications. For this, not only the number of training
institutes but the quality of such training, examina-
tion and certification of seafarers is to be emphasised.
To achieve this, there is an urgent need of modern-
ising the examination system and strengthening the
pool of qualified examiners.
15.140. It is proposed to form a Research Support
Group to effectively monitor, support and coordi-
nate the activities of Maritime Training Institutes
and to develop proper monitoring and reporting
systems and conduct systems audit on a continu-
ous and sustainable basis. The Research Support
Group would identify the difficulties experienced
by institutes in implementing the quality standards
prescribed by Indian Maritime Administration and
IMU and would serve as a watch dog. The Support
Group will work under the control of the Director
General of Shipping and assisted by technical
administrative officers/Staff meant specifically for
this function.
15.141. For effective implementation of a regula-
tory regime as per the requirements of International
Maritime Organisation (IMO), it is necessary to
strengthen Directorate General of Shipping. A data
base of seafarers should be built. Biometric identity
cum smart card, capable of storing individual’s pro-
fessional record in electronic form must be issued
to every seafarer. There is also a need for capac-
ity building of the DG(S), with greater technologi-
cal tools, training, human resources availability and
greater autonomy for authorising surveyor move-
ment to Indian ships on foreign shores, and in decid-
ing the delegation of powers to Mercantile Marine
Departments. Every port regardless whether it is pri-
vate or non-major, but having target of more than
110 ships a year, (which works out to two ships a
week) should have an office of MMO.
15.142. In order to prevent poor quality foreign flag
ships operating in our waters, Port State Control
inspections have to be strengthened in the years
ahead. The main constraint in the implementation is
the availability of manpower. It is therefore proposed
to create separate divisions in the DG (Shipping
office) and to recruit more surveyors to achieve
10 per cent Port Security Control (PSC) inspections
by the year 2015 as mandated by the IMO. It is also
proposed to carry out 100 per cent FSI inspections of
Indian ships by the year 2020.
15.143. Very often a seafarer’s job is perceived to be
arduous, monotonous, risky and unsafe. This calls
for critical welfare and safety measures. Welfare
measures for seafarers should include a free or sub-
sidized health and insurance policy.
15.144. Indian ships have to mandatorily employ
Indian seafarers, and cannot employ foreign sea-
farers as per the Merchant Shipping Act. In view of
the increasing worldwide shortages of senior offic-
ers, there is inherent disadvantage to the Indian ship
owner as employers. On account of the extra burden
of income tax on Indian seafarers’ income, employ-
ment on a foreign flag is the first choice of an Indian
seafarer, thereby denying the best talent to the local
shipping industry. A positive approach on this issue
for granting freedom for the Indian shipping indus-
try by permitting them to employ foreign seafarers
could be explored.

230 Twelfth Five Year Plan
Other Policy Initiatives
Establishing P&I Club
15.145. In present day scenario, maritime insurance
of ships, wreck removal, dealing with maritime both
for the ship and seafarers are organised by P&I Clubs
of foreign origin. Establishing P&I Club in India
should not only increase trade but would also aug-
ment foreign exchange earnings when these clubs
are used by foreign companies. It is therefore pro-
posed to establish one P&I Club in Indian League by
the year 2015 and one more in the IG League by the
year 2020.
Strengthening Participation in IMO
15.146. The increasing number of International
Codes and Conventions, emanating from the
International Maritime Organisation (IMO), have
changed the maritime trade relationships between
nations and also created a whole new statutory struc-
ture for maritime countries.
Navigational Safety In Port Committee (NSPC)
15.147. The scope of NSPC may be extended to
major as well as non-major ports and the duties
should include port navigational safety issues, cargo
related safety aspects, oversight function of oil pol-
lution response mechanism, reception facilities in
the ports, and so on. For the protection of the envi-
ronment, it may be necessary to develop a ‘Ballast
Water Management System’ in accordance with the
requirements of International Convention for the
Control and Management of Ships as adopted by the
IMO in 2004, along with the development of waste
disposal facilities in ports.
Coastal Shipping
15.148. Out of the total traffic at major ports of
560.90 million tons (MT) in 2009–10, coastal traffic
was 107.94 MT. During 2006–10, the total traffic at
the major ports grew at 7.20 per cent (CAGR) and
that at the non-major ports at 17.20 per cent (CAGR).
However, during 2006–10, coastal traffic at the major
ports grew at 4.5 per cent (CAGR) and the percentage
share of coastal traffic in the total traffic handled at
the major ports was constant between 19 per cent to
21 per cent. During Eleventh Plan period there was a
net increase of about 15 per cent in the total volume
of cargo carried per year meant for coastal shipping.
Coastal shipping in the country is still in its infancy,
with the coastal fleet of 764 vessels accounting for
merely over a million GT as on 31 March 2012. This
period witnessed a remarkable growth in the number
of smaller size vessels (Liner, Passenger-cum-Cargo
and other types viz., Tugs, Ro-Ros, Dredgers and
Pilot/Survey Launches), with the number of coastal
bulk carriers and tanker fleets declining.
15.149. In view of the positive externalities of coastal
shipping, a number of policy interventions would be
required during the Plan. There is a need to consider
fiscal incentives for registered multi-modal trans-
port operators, shippers, trade/industries that prefer
transporting sizeable domestic cargos through coastal
shipping. Unfortunately, despite having the lowest
unit transportation cost for the sea leg, the overall
end-to-end cost of coastal shipping escalates due to
inadequate port and land side infrastructure (capac-
ity and connectivity), resulting in a preference for the
road/rail modes by the industry and trade. The bur-
den of customs duties and the perceived cumbersome
customs/other procedures, low port productivity and
high tariffs, aggravates the problem. There is a need
to remove these bottlenecks.
15.150. Adequate incentives and a level playing
field are required to encourage the growth of the
Indian coastal shipping companies in the face of stiff
competition from the foreign lines. The scope of
coastal shipping needs to be enhanced in the Indian
Merchant Shipping Act, 1958. There is a need to cre-
ate dry-docks and ship repair yards at existing/new
non-major ports to accommodate smaller coastal
vessels. The connectivity for the ports with rail/
road transport needs to be enhanced. Further, the
government may also consider following incentives
for the development of Coastal Shipping: (i) Grant
infrastructure status to Coastal Shipping Industry
for taxation purposes (ii) Allow tax exemption for
the building of coastal ships in India (iii) Confer
‘Declared Goods’ status for the bunker used by
coastal ships (iv) Establish a ‘Coastal Development
Fund’. A separate tariff matrix should be formulated
for coastal vessels.

Transport 231
15.151. To reduce greenhouse gases (GHGs) emis-
sions, the conversion of Indian coastal vessels to
compressed natural gas (CNG) fuel powered, as an
alternate to the extant fossil fuel diesel, in a phased
manner, is necessary.
Promoting Fishing Activity In Indian Seas
15.152. There is a need to promote decent work-
ing conditions for fishermen. The provisions of
the International Labour Organisation Fishing
Convention, 2007 may be implemented for the
Indian fishing boats above 15 meters in length. The
number of such Indian fishing vessels is approxi-
mately 55,000. These improvements would con-
tribute to the decent working conditions of the
fishermen working on these boats.
Multimodal Transportation
15.153. Multimodal transportation system is the
chain that interconnects different links or modes of
transport air, sea, and land into one complete process
that ensures an efficient and cost-effective door-to-
door movement of goods under the responsibility of
a single transport operator, known as a Multimodal
Transport Operator (MTO), on one transport doc-
ument. The multi-modal transportation in India
is governed by the Multimodal Transportation of
Goods Act 1993 which needs to be strengthened to
address issues such as liability regime, setting of ser-
vice standards and registration of service providers,
to provide transparency in operations. In view of
the overall efficiencies associated with this system,
Government would develop policy interventions
encouraging companies to use this.
Strategies for the Twelfth Plan
• Increase in tonnage to meet the growing require-
ments of the Indian Trade and Commerce.
• Fiscal regime rationalisation and cargo support to
expand Indian flag vessels.
• Maritime Human Resource Development for
larger utilisation of Indian technical personnel in
national and international shipping.
• Expansion of Coastal shipping and policies to
promote infrastructure and economic operations.
• Development of strategies for expansion of multi-
modal transport.
INLAND WATERWAYS TRANSPORT (IWT)
Introduction
15.154. With a meager share of 0.4 per cent in the
total cargo handled in the country Inland Waterways
is an under developed mode of transportation in
India. India has a potential of 14,500 km of navi-
gable waterways but so far only 2,716 km have been
developed for commercial transportation. The share
of IWT in transport sector in other countries is far
more significant than that of India. For example, the
shares of IWT as proportion of total tonne-km in
EU, China and the US for the year 2006 were 5.6 per
cent, 8.7 per cent and 8.3 per cent respectively.
15.155. The potential for development of this mode
of transportation is very promising. IWT mode is
best-suited for movement of bulk cargo, over dimen-
sional cargo and hazardous goods. IWT also offers
an environment-friendly economic mode of trans-
port compared to road and rail. According to recent
studies, the total external costs of inland navigation
after accounting for all externalities, including acci-
dents, congestion, noise emissions, air pollution and
other environmental impacts are seven times lower
than that of road transport.
15.156. On Ganga (NW-1) alone there are 10 ther-
mal power plants and at least 10 more are slated to
come up in near future (See Figure 15.1). The trans-
portation of coal to these power plants is considered
to be one of the most challenging tasks. IWT can be
effectively used for this purpose, particularly for the
imported coal since most of these plants would be
importing 10–20 per cent of their coal which can be
transported through NW-1.
Review of the Eleventh Plan
15.157. At present the traffic of IWT is only 5 billion
tonne km (btkm). The target for Eleventh Plan has
been largely achieved, not so much by utilising NW1,
2 and 3 but by increased IWT movement of iron ore
in Goa waterways. In the Eleventh Plan IWAI reached
expenditure level of about `560 crore during the five
years (2007–12) with an average of `112 crore.
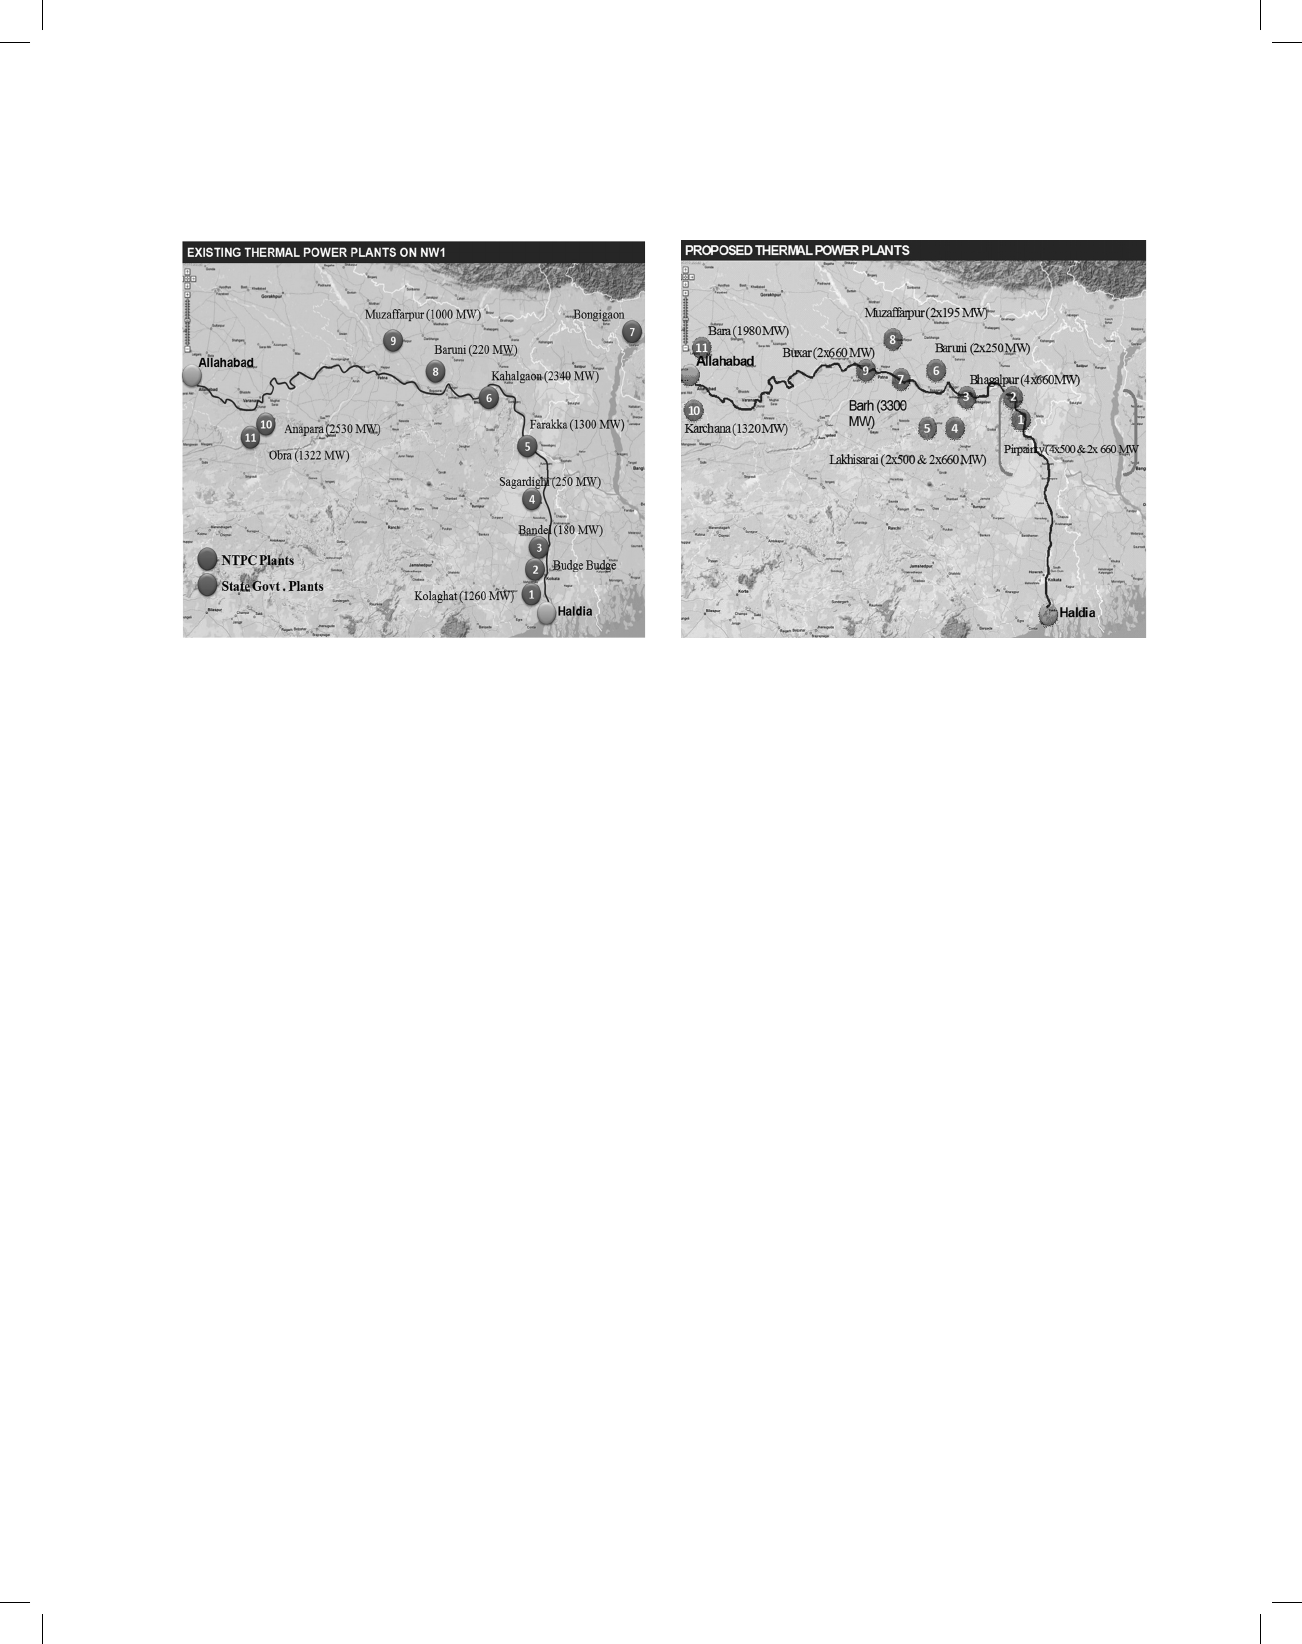
232 Twelfth Five Year Plan
FIGURE 15.1: Existing and Proposed Thermal Power Plants on National Waterways
15.158. The main developments during the Eleventh
Plan were:
1. Two additional waterways were declared as
National Waterways in November 2008. These
were NW-4 and NW-5. As a result of this, the
following waterways totaling 43,82 km have been
declared as National Water Ways (NWWs):
a. Ganga–Bhagirathi–Hoogly river system
(Allahabad Haldia-1,620 km) in the States of
Uttar Pradesh, Bihar, Jharkhand and West
Bengal as NW-1, declared in 1986.
b. River Brahmaputra (Dhubri–Sadiya—891
km) in the State of Assam as NW-2 declared
in 1988.
c. West Coast Canal (Kottapuram–Kollam)
along with Udyogmandal and Champakara
Canals—(205 km) in the State of Kerala as
NW-3 declared in 1993.
d. Kakinada–Puducherry canals along with
Godavari and Krishna rivers (1,078 km)—
in the States of Andhra Pradesh, Tamil
Nadu and Union Territory of Puducherry as
NW-4 declared in 2008.
e. East Coast Canal integrated with Brahmani
river and Mahanadi delta rivers (588 km)
in the states of West Bengal and Odisha as
NW-5 declared in 2008.
2. A major project has been finalised involving
a private agency for developing infrastruc-
ture and transportation of 3 million tonnes per
year of imported coal from Sagar/Sandheads
to Farakka power plant of NTPC Ltd. through
NW-1 for a period of 7 years. A number of Over
Dimentional Cargoes (ODCs) have also been
transported on NW-1 from Haldia/Kolkata to
Barauni, Barh, Ballia, Jamania, and so on for
Barauni refinery, NTPC, BHEL, Power Grid
Corporation, Relianace (Sasan), Tori power
plant, Reghunathpur power project and so on.
ODC also moved from Kolkata to Jogighopa
on NW-2 and to Silchar on Barak river. This
became possible due to enhanced level of infra-
structure on waterways in respect of depth, navi-
gation aids and intermodal terminals.
3. Pandu port in Guwahati is being developed as
an IWT based inter modal hub in the North East
region with broad gauge railway connectivity.
4. Besides 8 terminals at various locations on
NW-3, IWT Ro-Ro/Lo-Lo jetties at Bolghatty
and Willingdon islands in Kochi on NW-3 are to
provide IWT linkage to Vallarpadam Port.
Transportation of Project Cargo for Palatana
Power Project in Tripura
15.159. Another important development in IWT has
been Palatana project. The commissioning of a gas

Transport 233
based power project of ONGC at Palatana in Tripura
was getting delayed due to serious problems in trans-
porting project material from Kolkata/Haldia to the
site by road and railways. However, declaration of
Ashuganj in Bangladesh as a port of call under Indo
Bangladesh Inland Water Transit and Trade Protocol
during the year 2010 opened a new route. With this
route having become operational the new possibilities
of transporting other cargo including food grains to
Tripura and Mizoram by IWT mode have emerged.
Strategic Importance of IWT For North East:
Brahmaputra-Barak Route
15.160. Only in case of IWT there is transit treaty
between India and Bangladesh. All weather IWT
route therefore has strategic significance in the
North East as it helps to avoid the congested West
Bengal–Sikkim narrow corridor. Several North
Eastern States can be reached through IWT routes
(Brahmaputra and Barak). Distance to Tripura,
Mizoram and Southern Assam is also much less
through IWT (Figure 15.2).
Kaladan Multimodal Transport Project
15.161. This project was conceptualised by the
Ministry of External Affairs to provide alternative
connectivity from Mizoram to Haldia/Kolkata ports
through River Kaladan in Myanmar. The project
envisages Coastal Shipping/Maritime Shipping from
Haldia to Sittwe, IWT from Sittwe to Paletwa (in
Myanmar) and thereafter by road from Paletwa to
Mizoram. An Indian contractor has been appointed
for construction of port and IWT components at a
cost `342 crore with a completion period of 3 years.
The construction work of Sittwe port has com-
menced and is in progress (Figure 15.3).
Strategies for the Twelfth Plan
Navigation-Based Infrastructure
15.162. Large parts of Indian Waterways have inad-
equate Least Assured Depth (LAD) for commercial
movement of cargo. Many shippers have expressed
that there is no dearth of cargo if the waterway with
assured depth and 24 hours navigation facility is
provided and there is an adequate number of cargo
vessels.
1. Efforts should be made to develop deeper
stretches of the rivers for IWT/navigational pur-
poses (at least 2.5 m, preferably 3.0 m. LAD for
round the year navigation).
2. Several rivers in India meander resulting in
increase in distance to be travelled on water-
ways as compared to road and rail. Technical
feasibility of reducing the IWT route length by
strengthening the waterway (wherever feasible)
to avoid bends could be studied.
3. There are bridges with low vertical clearance
which impede passage of bigger IWT vessels
on the waterways such as NW-3. Raising these
bridges to at least 5 m or some other technical
solution to make these canal systems navigable
for commercial cargo carriers could be consid-
ered. Alternatively vessels with lower masts can
be used to negotiate the already constructed
major bridges.
4. Lack of IWT terminals including those with
intermodal connectivity of inland waterways
inhibits door to door connectivity to end user.
There are IWT terminals on NW-1, NW-2 and
NW-3 but many of these terminals require better
linkage with road/rail. IWT terminals must have
Box 15.11
Coal Transport to Farakka through Power
Station – A Break through for IWT
NTPC’s power plant at Farakka had been facing shortage
of coal mainly on account of limitation in transportation
capacity of railways and low draft at Haldia dock. Since,
the power plant having been located on the bank of Ganga
(the National Waterway-1), it was felt that transportation
of imported coal from Haldia/Sagar/Sandheads to Farakka
by inland water transport (IWT) mode would be feasible.
In August 2010, NTPC decided for transportation of
3 million tonnes per year (MMTPA) imported coal
for seven years. IWAI and NTPC then developed a
project envisaging an investment of about `650 crore for
setting up (i) trans-shipment facility at Sagar/Sandheads
(ii)barges for 3 MMTPA coal transportation (iii) inland
water terminal at Farakka and (iv) conveyor system from
the terminal to the coal stack yard of Farakka power plant.
IWAI has now guaranteed Least Available Depth (LAD)
of 2.5 m to Farakka along with other navigational aids for
safe 24×7 navigation. A private company is developing
facilities and will maintain these for seven years.

234 Twelfth Five Year Plan
FIGURE 15.2: National Waterway-2
FIGURE 15.3: Kaladan Multimodal Transit Transport Project

Transport 235
good connectivity with road and preferably with
rail for last mile connectivity on lines of bimodal
and tri-modal concept of developed waterways
of other countries. Similar terminal development
is required in NW-4, 5 and proposed NW- 6.
5. Private sector is reluctant to make investment
in barges unless long term cargo commitments
for onward/return trips are made available from
user industry. Eligibility of IWT Vessel building
“Infrastructure Status” could be considered to
help obtain easier credit availability.
6. Developing night navigation infrastructure with
DGPS and RIS in a time bound manner could
help 24 hour navigability.
7. MRO (Maintenance, Repair and Overhaul) facil-
ities which are presently in short supply could
also catalyse the sector.
15.163. Shortage of vessels is perceived to be the
most important factor inhibiting faster growth in
IWT cargo movement. The fleet requirement for 15
btkm of IWT traffic is about 2,500 vessels of aver-
age 1,000 tonne capacity each. At present, there are
just about 600 IWT vessels in the entire country with
nearly 80 per cent vessels being located in Goa alone.
This would call for an investment of `13,000 crore.
There is need to incentivise these investments and
develop a policy framework so that private sector
investments are attracted to vessel building.
Level Playing Field
15.164. There is a transport subsidy for movement of
raw materials and finished goods for the new indus-
tries of NER but this is applicable only for rail and
road modes and not to IWT. Similarly, the transport
subsidy available for movement of fertilisers is also
meant for rail and road modes. The service tax appli-
cable to IWT is more than rail and roads. There is
need for a level playing field and removal of distor-
tions resulting from such policies.
15.165. Development of inland waterways is an eli-
gible sector for Viability Gap Funding and India
Infrastructure Project Development Fund. The usage
of the IWT network for ‘water tourism’ theme has
potential to generate considerable income for the
local economies and additional income from tourist/
luxury taxes for regional and state governments. For
example, in Kerala, over 2,000 people are employed
in houseboats and other motorboats that cruise the
inland waterways filled with tourists. Expanding the
usage of IWT for tourism can be included as one of
the objectives to improve waterways for economic
development.
Human Resource Development
15.166. To meet trained manpower requirements
of the sector, it is necessary that National Inland
Navigation Institute (NINI) is strengthened and net-
worked with Indian Maritime University and at the
same time, a few Regional Crew Training Centres are
also set up. The training should be benchmarked to
the best available standards.
Strengthening of IWT Institutional Set Up in
Riverine States
15.167. In every IWT developed region the impor-
tance of trunk waterways gets significantly enhanced
with development of feeder waterways which are
smaller in length but provide vital ‘last mile connec-
tivity’. In India too, every big waterway has a number
of tributaries which if developed can effectively serve
as feeder routes to the main waterways. But these
waterways will have to be developed by respective
State Governments which do not have the organisa-
tion, the expertise and the resources to even consider
this aspect in their planning. Hence IWT institutions
set up in the States need to be strengthened in a big
way including for checking the safety of vessels to
prevent accidents.
Target for the Twelfth Plan
15.168. At present the share of IWT in terms of
tonne-km is about 5 btkm which is less than 0.5 per
cent of total inland cargo transportation. Given the
distinct advantages of promoting IWT, Twelfth Plan
target to at least triple the tonne-km to 15 btkm and
increase the share of IWT in transport to 1–1.5 per
cent of total inland cargo transportation from the
current level of less than 0.5 per cent.

236 Twelfth Five Year Plan
Strategy For Development of Inland Water
Transport
• Increased public and private investments in infra-
structure of notified Inland Waterways.
• New policies to promote manufacture of Inland
Waterways Vessels for cargo movement by pri-
vate sector.
• Development of National Waterway 4 and 5.
• Development of night infrastructure facilities to
help 24 hours navigation.
• Promoting connectivity with Bangladesh and
strengthening IWT infrastructure.
• Hinterland connectivity through IWT with ports,
both major and non-major having this facility.
PORTS
15.169. Ports constitute inter-modal interface between
maritime and road and rail transport. India has a
coast line of around 7,517 km with 12 major ports and
over 200 non-major ports along the coast line and sea
islands. Almost 95 per cent by volume and 70 per cent
by value of India’s global merchandise trade is carried
through the sea route. In 2011–12 the 12 major ports
handled about 60 per cent of the maritime cargo of the
country. The balance 40 per cent was handled by the
non-major ports. Of the 12 major ports, 11 are admin-
istered by the respective Port Trusts and Ennore Port,
the twelfth major port, which started functioning in
February 2001, is corporatised.
Review of the Eleventh Plan
Capacity Creation in the Eleventh Plan
15.170. The projected capacity creation was 1,001.80
million tonnes for the major port sector but the
achievement was 689.83 MT (Table 15.31) as com-
pared to 504.75 MT in 2006–07 registering a growth
of 37 per cent but below the target by 31 per cent.
Cargo-wise capacity creation details for major ports
are shown in Table 15.32. Capacity of non-major and
Private Ports was envisaged to increase from 228.31
MT to 575 MT. The actual achievement was 544.65
MT, thus registering a growth of 139 per cent.
Traffic Handled by Major and Non-Major Ports
15.171. During the Eleventh Plan, traffic handled by
major ports (Table 15.31) increased from 463.78 MT
in the year 2006–07 to 560.15 MT in the year 2011–
12 against a projection of 708.09 MT, thus register-
ing a growth of 29.48 but 26.55 per cent lower than
the projection. However, non-major ports registered
a cargo growth of 98.81 per cent during the same
period, that is, from 186.11 MT in the year 2006–07
to 370.00 MT in the year 2011–12 which is 23.26
per cent higher than the projection of 300.86 MT.
Commodity wise details are shown in Table 15.33.
Productivity in Major Ports
15.172. The average turnaround time and average
pre-berthing time at major ports have worsened
during the Eleventh Plan (Table 15.34). There is an
improvement of average output per ship berth day
from 9,745 MT in year 2006–07 to 10,967 MT in
year 2011–12. Ports-wise performance shows that
the average turnaround time declined mainly due to
good performance by Paradip, Mormugao, Chennai
and Kolkata ports. Commodity-wise it declined
for other liquid bulk, Iron Ore, FRM and Coal. It
is estimated that 57 per cent of turnaround time of
ships at Indian Ports is caused by delays due to port
related inefficiency. The Pre-berthing detention dur-
ing the Eleventh Plan period has shown an increas-
ing trend. Among the ports, healthy improvement
has been observed in Visakhapatnam, Ennore, New
Mangalore and Mormugao ports, whereas in other
ports the improvement has not been significant pri-
marily due to non-availability of berths meant for the
cargoes like Iron Ore, Coal and Other Miscellaneous
and General Cargo continuously for a long period.
Private Sector Participation
15.173. During the Eleventh Plan, award of PPP
projects commenced only in the year 2009–10 as
first two years of the Plan were spent in finalising
MCA documents. There were, however, projects
awarded to private players based on earlier con-
tracts. Upto 2011–12, 30 PPPs involving an invest-
ment of 9,447.40 crore and capacity addition of
204.65 MT were completed. During Eleventh Plan,
PPP projects with capacity addition of 154.5 MT
were awarded with an investment of `13,195.85
crore. The details of year wise awards during the
Eleventh Plan are given in Table 15.35.

Transport 237
TABLE 15.32
Commodity Wise Capacity Creation by Major Ports
during Eleventh Plan
(Million Metric Tonnes)
Sl.
No.
Capacity 2006–07 2011–12 Increase
(per cent)
1. POL 174.70 228.76 30.94
2. Iron Ore 57.50 79.50 38.26
3. Coal 46.25 65.95 42.59
4. Container 88.08 137.53 56.14
5. Other Cargo 138.22 178.09 28.84
6. Total 504.75 689.83 36.67
TABLE 15.31
Eleventh Plan Projection and Achievements of Traffic and Capacity by Major Ports
Port Traffic in Eleventh Plan (MT) Total Capacity in Eleventh Plan (MT)
(2011–12) (2011–12)
Project Achievement per cent Project Achievement per cent
Kolkata 13.43 12.23 91 31.45 16.35 51
Haldia 44.50 31.01 70 63.40 50.70 79
Paradeep 76.40 54.25 71 106.4 76.50 71
Visakhapatnam 82.20 67.42 82 108.1 72.93 67
Ennore 47.00 14.96 32 64.20 31.00 48
Chennai 57.50 55.71 97 72.30 79.72 110
Tuticorin 31.72 28.10 89 63.98 33.34 52
Cochin 38.17 20.10 53 54.75 40.98 74
NMPT 48.81 32.94 68 60.50 50.97 84
Mormugao 44.55 39.00 88 66.90 41.90 62
Mumbai 71.05 56.18 79 91.91 44.53 48
JNPT 66.04 65.75 100 95.60 64.00 66
Kandla 86.72 82.50 95 122.20 86.91 71
Total 708.09 560.15 79 1,001.80 689.83 69
Dredging
15.174. The requirement of capital dredging in the
Eleventh Plan was envisaged to increase more than
two-fold, to 298.28 million cubic meters (MCuM)
for major ports and 368.59MCuM for non-major
ports, besides maintenance dredging of 380.06
MCuM and 46.41MCuM, respectively. To enable
this, a more liberal dredging policy was brought
into force which allows ports to charter foreign
flag dredgers after granting the Indian companies
the ‘first right of refusal’. Against the targeted Plan,
only 40.02 per cent and 67.92 per cent have been
achieved under the capital and maintenance dredg-
ing respectively.
15.175. The capacity of the DCI, established in 1976,
to provide integrated dredging services to major and
minor ports was 73.60 MCuM of Trailer Suction
Dredgers (TSDs) and 6.25 MCuM of Cutter Suction
Dredgers (CSDs) at the start of the Tenth Plan.
During the Eleventh Plan, DCI was envisaged to
acquire 10 TSDs of 5,000–9,000 CuM hopper capac-
ity and 5 CSDs of 2,000–3,000 CuM hopper capacity
in addition to other auxiliary equipment. However,
against outlay of `2,292 crore, DCI’s anticipated
expenditure by the end of Eleventh Plan is only
`828.35 crore.
Port Connectivity
15.176. The Eleventh Plan envisaged that each major
port should have at least four-lane road and dou-
ble lane rail connectivity. At present, 13 road proj-
ects with combined road length of 360 km at a total
cost of `4,149.66 crore and rail projects at a cost of
`3,903.00 crore are under implementation.

238 Twelfth Five Year Plan
Eleventh Plan Outlay and Expenditure
15.177. An outlay of `30,323.11 crore (at 2006–07
prices) had been approved for the port sector, com-
prising `3,315.00 crore as GBS and `26,574.11 crore
through IEBR of which `17,684.61 crore or 59.62 per
cent is expected to be utilised. In addition, private sec-
tor investment of `36,868.00 crore and a public invest-
ment of `3,627.00 crores is expected in the state sector.
Twelfth Plan
Traffic and Capacity Augmentation
15.178. To meet the overall projected traffic of
1,758.26 million tonnes by 2016–17, the total capac-
ity of the port sector is envisaged to be 2,289.04 mil-
lion tonnes. The traffic forecast by the end of Twelfth
Plan would be 943.06 million tonnes and 815.20 mil-
lion tonnes for the major ports and non-major ports
respectively with the corresponding ports capaci-
ties of 1,229.24 million tonnes and 1,059.80 million
tonnes respectively.
15.179. The details of the traffic/capacity projections
(port wise and commodity wise as well as major and
non-major ports wise) by the end of Twelfth Plan are
given in Tables 15.36, 15.37 and 15.38 respectively.
Issues and Strategies for the Twelfth Plan
Committee on Ports
15.180. The Plan will need to ensure adequate
investments in the Port Sector to meet the grow-
ing capacity needs of our international and coastal
trade, improve efficiency by reducing dwell time and
turnaround time and introduce legislative and insti-
tutional reforms to support these. The Committee
on Ports headed by Shri B.K. Chaturvedi, Member
(Transport), Planning Commission has suggested a
series of reforms to attain the above objectives and
TABLE 15.33
Traffic Handled at Major and Non-Major Ports during Eleventh Plan
Traffic Major Ports Non-Major Ports Major and Non-Major Ports
2006–07 2011–12 % increase 2006–07 2011–12 % Increase 2006–07 2011–12 % Increase
POL 154.34 179.28 16.16 80.37 188.00 133.92 234.71 367.28 56.48
Iron Ore 80.59 60.60 (–)24.80 34.33 51.00 48.56 114.92 111.60 (–)2.89
Fert. and FRM* 14.12 20.42 44.62 4.67 11.00 135.55 18.79 31.42 67.22
Coal 59.98 78.74 31.28 12.92 77.00 495.98 72.90 155.74 113.64
Container 73.44 120.22 63.70 7.87 19.00 141.42 81.31 139.22 71.22
Other Cargo 81.31 100.89 24.08 45.95 24.00 (–)47.77 127.26 124.89 (–)1.86
Total 463.78 560.15 20.78 186.11 370 98.81 649.89 930.15 43.12
* Fertiliser and Fertiliser Raw Material (FRM).
TABLE 15.34
Trend of the Productivity Parameters during
Eleventh Plan
Year Average
Output Per
Ship Berth
Day (Tonnes)
Average
Turnaround
Time (Days)
Average
Pre-berthing
Detention
Time (Hours)
2006–07 9,745 3.62 10.05
2007–08 10,071 3.93 11.40
2008–09 10,473 3.87 9.55
2009–10 10,482 4.42 11.75
2010–11 10,735 4.67 11.76
2011–12 10,967 4.44 11.14
TABLE 15.35
Year-wise Awards during Eleventh Plan under PPP
Years Investment/Awards
(` in crore)
Capacity Addition
(in MMT)
2007–08 703.34 7.50
2008–09 749.43 18.00
2009–10 618.95 19.50
2010–11 3,147.13 30.50
2011–12 7,977.00 79.00
Total 13,195.85 154.50

Transport 239
these will need to be taken up. To support capac-
ity expansion in port sector, necessary measures for
efficient environment clearance and land acquisition
will be taken up. An area, which will need special
attention, is security clearance. The policy on this
needs to be revised and made efficient.
Tariff Regulation
15.181. With the key objective of determining tariffs
for the major ports and also specify the conditionality
governing these tariffs, TAMP was established in 1997
by an amendment in the Major Port Trust’s Act, 1963.
With the increase in port capacities, it is necessary that
in the next five years, the ports move gradually to a
competitive mode of tariff. Already all non-Major Ports
are doing so. A task force under the Chairmanship of
Shri B.K. Chaturvedi to review the draft Port Regulatory
Bill was formed which has finalised its report which will
be of use to review the policy in this area.
Electronic Data Interchange
15.182. Efficient electronic data interchange is
required to improve the efficiency of Ports. It is nec-
essary for Port Community System (PCS) to integrate
the electronic flow of document/information and
function as centralised hub for all the major Ports of
India and also stakeholders like shipping lines/agents,
surveyors, stevedores, banks, container freight sta-
tions, custom house agents, importers and customs.
Further, non-major ports should also gradually inte-
grate with the centralised port community.
TABLE 15.37
Commodity wise Capacity by the end of Twelfth Plan
(Million Tonnes)
Commodity Major ports Non-major ports Total
Existing
(2011–12)
Forecast
(2016–17)
Existing
(2011–12)
Forecast
(2016–17)
Existing
(2011–12)
Forecast
(2016–17)
POL (incl. LNG) 228.76 299.66 276.74 299.90 505.50 599.56
Iron Ore 79.50 143.55 75.07 101.40 154.57 244.95
Coal 65.95 178.65 113.35 365.20 179.30 543.85
Containers 137.53 306.19 27.97 130.00 165.50 436.19
Others including Fert and FRM 178.09 301.19 51.52 163.30 229.61 464.49
Total 689.83 1,229.24 544.65 1,059.80 1,234.48 2,289.04
TABLE 15.36
Major Ports wise Traffic/Capacity Projections by End of
Twelfth Plan
(Million Tonnes)
Port Traffic Capacity
Existing
(2011–12)
Forecast
(2016–17)
Existing
(2011–12)
Forecast
(2016–17)
Kolkata 12.23 22.87 16.35 32.85
Haldia Dock
Complex
31.01 53.20 50.70 71.10
Paradip 54.25 87.70 70.50 125.50
Visakhapatnam 67.42 80.00 72.93 130.23
Ennore 14.96 82.45 31.00 78.00
Chennai 55.71 69.74 79.72 114.72
V.O.
Chidambaranar
28.01 48.84 33.34 81.54
Cochin 20.10 45.50 40.98 57.83
New Mangalore 32.94 53.50 50.97 84.89
Mormugao 39.00 58.25 41.90 72.71
Mumbai 56.18 67.40 44.53 79.13
JNPT 65.75 140.21 64.00 155.61
Kandla 82.50 130.90 86.91 145.13
Port Blair 2.50
Total 560.15 943.06 689.93 1,229.24
Dredging
15.183. Drafts at Indian Ports both in the channel
and at berths need to be improved. It should be a
major objective of the Twelfth Plan that ports in India

240 Twelfth Five Year Plan
increase the draft to at least 14 meters in all Ports by
the end of Twelfth Plan period and achieve 17 meters
in Hub-Ports according to the potential of bigger size
ships calling at these ports. In the Twelfth Plan, the
requirement of capital dredging has been estimated at
221.11 MCuM for major ports and 418.03 MCuM for
non-major ports, besides maintenance dredging of
404.25 MCuM and 125.58 MCuM, respectively.
15.184. The dredging capability of DCI is limited
which needs to be enhanced substantially. The All
India Dredging Cadre scheme needs to be strength-
ened and suitable measures have to be taken to retain
the trained personnel. Suitable measures will need to
be taken to overcome the time overrun experienced
in dry docking of the existing dredgers. Long-term
contracts with ports, which have continuous main-
tenance dredging needs to be developed. Financing
of such ventures could help DCI to acquire new
dredgers with equity support from such ports.
Technological developments and innovations taking
place in this area should be kept in mind and DCI
should go for the latest technology in procuring the
dredgers and in the execution of dredging.
Productivity and Dwell Time
15.185. To improve port efficiency and labour pro-
ductivity, broad strategies like, creation of adequate
port capacity with a gap of 30 per cent between
the installed capacity and the traffic consistent
with international norms, and the drafts of at least
14 meters up to 17 meters according to the poten-
tial of bigger size vessels calling at particular port is
essential. Several Indian ports are unattractive due
to high dwell time on account of customs and port
side constraints like inadequate infrastructure (PH
offer/test laboratories/testing procedures), absence
of seamless connectivity with other modes, and vari-
ous IT related bottlenecks.
Containerisation and Hinterland Connectivity
15.186. Containerised traffic is growing at a faster
pace than other forms of traffic. In India too con-
tainer cargo which formed only 15.8 per cent of total
cargo handled in Major Ports in 2006–07 increased
to 21.5 per cent per cent in 2011–12. The CAGR of
container traffic was 5.2 per cent during the Eleventh
Five Year Plan which was much higher than the
overall growth of traffic of 1.5 per cent for Major
Ports during the same period. The Twelfth Plan will
therefore give due focus on increasing the share of
containerised cargo in ports with a view to capturing
a higher share of international trade. The projects for
rail/road connectivity need to be taken up and moni-
tored closely both for Major and non-Major Ports.
For all these, ports, rail and road investments will be
prioritised. Port traffic within India is carried largely
by railways and road transport, with pipelines carry-
ing crude oil and petroleum products. Railways are
presently carrying considerably less than their opti-
mal share of port traffic and road transport has made
up the deficit partly with many negative externalities.
Private Sector Participation
15.187. The Private Sector participation will play a
major role in realising the anticipated capacity aug-
mentation in the ports during the Twelfth Plan. It
is, therefore, imperative that PPP model is worked
successfully and impediments removed. Specially,
the system for security clearance for ports needs to
be streamlined and made faster. There is also a need
to expand existing framework to attract participation
from the private sector for development of infra-
structure facilities other than container terminals
and berths such as are dredging, road infrastructure,
creation of SEZ and development of integrated park-
ing zones in the port area.
TABLE 15.38
Commodity Wise Traffic by the End of
Twelfth Plan (2016–17)
(Million Tonnes)
Commodity Major Ports Non-Major Ports Total
POL (incl. LNG) 249.49 230.70 480.19
Iron Ore 112.00 78.00 190.00
Fert and FRM 22.57 8.60 31.17
Coal 158.10 280.90 439.00
Containers 268.50 100.00 368.50
Others 132.40 117.00 249.40
Total 943.06 815.20 1,758.26

Transport 241
Non-Major Ports
15.188. An important component of the capac-
ity creation is the development of non-major ports.
The Indian Ports Association has information on
a regular basis only about major ports, but has less
details about progress of works in non-major ports.
Considering the fact that nearly 1/3rd of the traffic is
handled by them and it is likely to increase signifi-
cantly during Twelfth Plan, this gap in the system
needs to be rectified quickly.
Institutional Reforms and Corporatisation
15.189. Presently, Indian Ports Act, 1908 extends
uniformly to all the ports in the country whereas, the
Major Port Trusts Act, 1963 applies only to major
ports. Though both the Acts have undergone piece-
meal revisions to accommodate necessary changes
from time to time, no comprehensive review of the
various provisions of the Act was carried out so far.
There is a need for reform to ensure growth and
meet the international competitive environment.
15.190. The present institutional and regulatory
arrangements are inadequate and deficient to meet
the challenge of efficiency and bringing port services
to world class standards. The ports management
needs to be strengthened so that they work on com-
mercial basis. Corporatisation is one way of achiev-
ing this by conversion of major ports trusts into truly
commercial organisation. It is the process by which
a port trust is converted into legally and financially
independent entity with its own Board of Directors
and governed by the provisions of the Companies
Act. It is equally important that they are given full
autonomy to respond quickly to the requirements of
port development which are very large. We need to
shift to landlord port organisational model quickly.
The role of the state must be confined to setting poli-
cies and evolving strategies. Necessary reforms will be
carried out during the Plan on the above approach.
Outlay for Shipping Sector in Twelfth Plan
15.191. The outlay for Shipping Sector in Twelfth
Plan includes `6,960 crore as GBS and `21,990 crore
as IEBR. In addition the private sector is expressed to
invest nearly 1,70,000 crore in the Port Sector.
Some Major Initiatives in the Twelfth Plan
15.192. Some of the major initiatives for the Ports
Sector is indicated below:
• Re-look at MCA to promote PPP in port sector
• Re-look at port regulation and tariff setting by
TAMP by adopting practices consistent with the
Landlord Port model.
• Capital Dredging to increase the draft of ports
to at least 14 meters in all ports by the end of the
Twelfth Plan and to achieve 17 meters in sub-
ports according to the potential of trade.
• Investment in land infrastructure including mod-
ern cranes, silos/ warehouses, ICDs, connectivity
and so on.
• Move towards greater flexibility for decision mak-
ing by Port Trusts through greater delegation of
powers.
• Landlord port model.
• Corporatisation of major ports in the long run.
CIVIL AVIATION
Overview
15.193. The Civil Aviation services have expanded
rapidly with the opening up of domestic skies to
private carriers in the second half of the Tenth Plan
through PPP investment in the airport infrastruc-
ture. The sector contributes significantly to devel-
opment by generating employment opportunities
directly and indirectly besides facilitating enhance-
ment of productivity and efficiency in the movement
of goods and services.
Review of the Eleventh Plan
15.194. The Eleventh Plan aimed to provide world
class infrastructure for safe, reliable, and affordable
air services so as to encourage growth in passenger
and cargo traffic, and air connectivity to remote and
inaccessible areas with special reference to North-
Eastern part of the country.
15.195. Against an investment target of `49,267.00
crore comprising of `1,900.00 crore as budgetary
support and `47,367.00 crore as IEBR, the antici-
pated expenditure during Eleventh Plan period is

242 Twelfth Five Year Plan
Box 15.12
Development of Airports During the Eleventh Plan
The Private sector played an unprecedented role during the Eleventh Plan in the area of airport development. Five international
airport projects were successfully completed through the public–private partnership (PPP) mode, viz. greenfield development
of Hyderabad and Bengaluru international airports and modernisation of Kochi, Delhi and Mumbai international airports.
Total investment made by private airport operators in the last five years was to the tune of `30,000 crore. Along with the
private sector, Airport Authority of India (AAI) has continued to create airport infrastructure at a rapid pace incurring an
expenditure of `12,500 crores during the Eleventh Plan. AAI is upgrading and modernising 35 non-metro airports in the
country including those at Agra, Ahmedabad, Amritsar, Bhopal, Jaipur, Pune and Goa, at an estimated cost of around `4,500
crore. Of these 35 airports, 26 have already been developed, while the remaining are likely to be completed by end of 2012.
AAI is also enhancing air connectivity in the North-East by way of Greenfield airport at Pakyong (Sikkim).
The Delhi, Mumbai, Bengaluru, Hyderabad and Cochin now have airports that compare very well internationally. A major
achievement during the Eleventh Plan was the commissioning of terminal 3 (T3) and associated infrastructure at Delhi
international airport in a record period of 37 months. The Chennai and Kolkata airports are also being modernised and
expanded by the Airports Authority of India (AAI). These airports handle 60 per cent of the air traffic in the country. The
passenger handling capacity has increased from 13.83 to 60 million at Delhi; 18.50 to 25 million at Mumbai; 3.25 to 9.78
million at Bengaluru; 3.60 to 12 million at Hyderabad; 3.46 to 5 million at Kochi; 7.74 to 23 million at Chennai and 4.06 to
24.06 million at Kolkata during the Eleventh Plan period. Airport capacity in these cities is therefore considered adequate till
the end of the Twelfth Plan period except for the city of Mumbai where the total capacity required at the end of Twelfth Plan
would be 50.27 million against the total capacity creation of 40 million by the end of Twelfth Plan. Since, the capacity required
and the capacity created would not match, there is need for developing another airport at Mumbai.
`44,124.00 crore comprising of IEBR of `39,571.11
crore and budgetary support of `4,552.89 crore.
Thus there would be a shortfall of `5,143.00 crore
(10.44 per cent) in utilisation of the approved outlay.
The anticipated utilisation under budgetary support
would be 239.63 per cent and 83.54 per cent under
IEBR.
15.196. The Indian civil aviation industry managed
to exhibit resilience in face of the recent global eco-
nomic slowdown. Both passenger and cargo traf-
fic have shown robust growth and there has been
modernisation and augmentation of capacities, in a
major way, at various metro and non-metro airports.
Some of the key developments during last five years
include the following:
• India has become the ninth largest civil aviation
market in the world;
• Passenger handling capacity has risen three-
folds from 72 million (FY 06) to over 220 million
(FY11);
• Cargo handling capacity has risen from 0.5 mil-
lion MT (FY 06) to 3.3 million MT (FY 11);
• Connectivity to North Eastern region has risen
from 87 flights per week to 286 flights per week;
• Four international airport projects were success-
fully completed through the public-private part-
nership (PPP) mode, viz. greenfield development
of Hyderabad and Bengaluru international air-
ports and modernisation of Delhi and Mumbai
international airports (Box 15.12);
• The Airport Economic Regulatory Authority
(AERA) was established to safeguard the interests of
users and service providers at Indian airports; and
• As of now five Indian carriers are operating on
international routes.
Twelfth Plan
Objectives
15.197. The Plan aims to propel India among the top
five civil aviation markets in the world by providing
access to safe, secure and affordable air services to
everyone through an appropriate regulatory frame
work and by developing world class infrastructure
facilities (Table 15.39).

Transport 243
Traffic Projections
TABLE 15.39
Growth Projections for the Twelfth Five Year Plan:
Passenger and Cargo Traffic Forecasts
Passenger/Freight 2011 2016–17 Average Annual
Rate of Growth
Passenger (Million)
(i) Domestic 106 209 12 %
(ii) International 38 60 8 %
Cargo (MMTPA)
(i) Domestic 0.9 1.7 12 %
(ii) International 1.5 2.7 10 %
Strategies
15.198. To realise objectives of the Twelfth
Plan, (i) aircraft and airport capacities would
be increased, (ii) airports to be modernised and
upgraded to increase passenger facilities and to
speed up cargo clearance, strengthen security and
safety measures for safe and reliable air services,
(iii) improve air connectivity to NE Region, other
remote areas and tourist destinations, create right
infrastructure for the rapid growth of helicop-
ter operations, (iv) introduce seaplane operations,
(v) to generate employment and to provide better
infrastructure for training to make available quali-
fied human resources, and (vi) strengthening of
regulatory framework on safety and economic regu-
latory aspects of Civil Aviation, by setting up Civil
Aviation Authority.
Airport Infrastructure
15.199. Passenger terminal capacity in all airports
put together is expected to be 230-240 million by
2012 and by 2017 it would be about 370 million as
per the investment plans of the operators. Cargo
growth presently being witnessed will necessitate
investment in specialised cargo terminal and equip-
ment. Independent estimates suggest an additional
requirement of 30 functional airports by 2017 and
about 180 functional airports in all over the next 10
years. Thus, growth in the passenger and cargo traf-
fic requires significant investments for construction
of new airports, expansion and modernisation of
existing airports, improvement in connecting infra-
structure (road, metro, sea link, and so on.) and bet-
ter airspace management.
15.200. Budgetary support from Government for
investment in development of airports in remote areas
and regions which need special consideration from
socio economic and connectivity point of view would
be taken care by the AAI. Regional airport develop-
ment to cater to the emerging air traffic in Tier II and
Tier III towns may initially require budgetary sup-
port during the initial period of its operations and
until such time the operations become viable. Even at
present, there are only 12–13 airports of AAI that are
making profit at current level of operations.
15.201. Indian airports would require to meet the
traffic growth projections an investment of about
`67,500 crores during the Twelfth Plan, of which
around `50,000 crore is likely to be contributed by
the Private Sector (Table 15.40).
TABLE 15.40
Investment Requirements during the Twelfth Plan
Investor Investment Category ` in crore
AAI Airport projects 17,500
Private Investments By Airport Operator 40,000
By Others (Concessionaires,
Third Party, and so on.)
10,000
TOTAL 67,500
Air Navigation Services (ANS)
15.202. Air Space and Air Traffic Management infra-
structure assumes critical importance in the context
of the Indian Air Transport sector transitioning to
the next growth phase. Broadly, it involves deploy-
ment of equipment relating to CNS (Communication
Navigation and Surveillance) and Air Traffic
Management Systems. Presently air navigation ser-
vices in India are provided by the Airport Authority
of India. An important initiative that needs to be
pursued and implemented is separation of Air traf-
fic control (ATC) from airport authority of India
(AAI) in line with the best practices in the world.
It has been suggested that in addition to adequate
investment proposed in ANS infrastructure during

244 Twelfth Five Year Plan
the Twelfth Plan, an independent Air Navigation
Services Corporation should be set up to manage
capacity, safety, congestion and efficiency issues of
air transport.
15.203. The Ministry of Civil Aviation has consti-
tuted a Committee for formulating the next genera-
tion ANS master plan to enhance capacity and safety
levels in the face of higher air traffic movements in
future. The ANS infrastructure would move towards
greater integration and automation with imple-
mentation of state-of-the-art technologies. The sys-
tem would include a centralised Air Traffic Flow
Management with networked VHF and Radars
capable of providing dynamic sectors, which per-
mits alignment with traffic pattern. Existing software
and hardware infrastructure would be upgraded
or replaced. It is estimated that an investment of
`4,400 crore will be made into this sector during the
Twelfth Plan of which `3,700 crore would be in ANS
infrastructure and air safety and `700 crore in the
GAGAN (see Box 15.13) project.
Air Lines
15.204. Anticipating significant growth in traffic,
most Indian carriers have placed orders to augment
their aircraft fleet. According to an estimate, airlines in
India are expected to add around 370 aircrafts worth
`1,50,000 crores to their fleet by 2017. Fleet expansion
at this scale would require airlines to explore multiple
funding options including capital markets, long-term
borrowings and leasing, and so on.
Aviation Turbine Fuel
15.205. A major difficulty being faced by airlines is
the high cost of Aviation Turbine Fuel (ATF), which
is further aggravated by taxes. Viewed in inter-modal
context, it is desirable to rationalise ATF pricing and
to review the tax structure so that Airline operation
becomes viable.The cost of ATF constitutes 40–50
per cent of the total operating cost and thus is a for-
midable challenge for the financial health of airlines.
This has been a long standing issue that requires an
immediate resolution. ATF prices in India are dis-
torted because it is subjected to a multitude of cas-
cading taxes by different government entities despite
being an input fuel (similar to coal and gas); it is sub-
jected to sales tax as high as 30 per cent. It is nearly
60 per cent costlier than competing hubs like Dubai,
Singapore and Kuala Lumpur and hurts India’s
competitiveness. The comparison of ATF prices in
India with competing hubs has been detailed below
(Table 15.41)
Box 15.13
GAGAN—The Indian Satellite Based Augmentation System (SBAS) for
Air Navigation Services (ANS)
GAGAN, the Indian SBAS (Satellite Based Augmentation System) is a project jointly undertaken by the Airport Authority
of India and ISRO to achieve smooth transition to satellite based navigation and seamless air traffic management across
continents. GAGAN is designed to provide additional accuracy, availability, and integrity necessary to enable user to rely on
GPS for all phases of flight, form en route through approach, for all qualified airports within the GAGAN service volume.
GAGAN will provide the capability for increased accuracy in position reporting, thereby making possible high-quality
Air Traffic Management (ATM). GAGAN will provide benefits beyond aviation to all modes of transportation, including
maritime, highways, railways and public services such as defense services, security agencies, and disaster recovery management
by aiding in search and rescue to locate the disaster zone accurately, telecom industry and personal users of position location
applications.
After USA, Japan and Europe, India has taken up the challenge of establishing the regional SBAS that will redefine the
navigation in India and in adjacent regions. The footprint of GAGAN will cover huge area beyond Indian Territory, from
Africa to Australia and can support seamless navigation across the globe. The system is also interoperable with other such
systems of WAAS of USA, EGNOSS of Europe and MSAT of Japan.
The lead taken by the Ministry of Civil Aviation in implementing GAGAN and possible certification by 2014 will propel India
as the only fourth country to have this facility in the world.

Transport 245
TABLE 15.41
Comparison of ATF Prices in India with
Competing Hubs
Location Price/Kilolitre (USD)
India 1,400
Singapore 825
Bangkok 880
Kuala Lumpur 810
Dubai 840
15.206. Due to the distortion in the price structure
caused by the taxation policies, the financial viabil-
ity of airlines is getting strongly affected. Either
ATF should be included in the unified Goods and
Services Tax or ATF should be accorded the status
of “Declared Good” that carries lower and uniform
tax rate.
Multi-Modal Connectivity
15.207. The major airports in India are mostly at a
considerable distance from the city centre. Apart
from causing inconvenience to the passengers, this
also adversely affects the comparative advantage in
terms of saving in time otherwise enjoyed by other
modes of transport. These airports need to be con-
nected to cities by metros and expressways to get
full advantage of air transportation by reducing the
total travel time, as has been done in the case of IGI
Airport, New Delhi.
Foreign Equity Participation
15.208. The Domestic Air Transport Policy
approved by the government provides for foreign
equity participation up to 49 per cent and invest-
ment by non-resident Indians (NRIs) up to 100 per
cent in the domestic air transport services. With a
view to attracting new technology and management
expertise, government has permitted up to 49 per
cent Foreign Direct Investment (FDI) by foreign air-
lines in Indian airline companies.
Air Cargo
15.209. The current share of air-cargo compared to
other modes of cargo-transportation is fairly low in
India. The potential for air-cargo growth in India
can be gauged from the fact that some of the global
airports such as Hong Kong, Dubai and Incheon
(Seoul) handle cargo volumes which are much
more than at Indian airports. The present operating
parameters (daily throughput, dwell times) at most
air-cargo terminals of the country are far from inter-
national best-practices. The following key enablers
would be imperative for growth of India’s air-cargo
industry:
1. Higher Automation: Poor cargo handling infra-
structure at airports leads to spoilage and pilfer-
age, increased turnaround times and degradation
in the quality of items causing perception issues
for Indian exports. There is an urgent need to
facilitate efficiency in air-cargo through IT tools
and automated material handling.
2. India as a Trans-shipment Cargo Hub: Given its
geographic location, India can aspire to become
an international cargo hub. To begin with, India
needs to facilitate trans-shipment of cargo to and
from our neighboring countries, many of whom
do not have regular air services to key markets in
Europe and America.
3. Trans-shipment at Indian airports is currently
negligible. Major bottlenecks are absence of ded-
icated trans-shipment infrastructure at airports
and lack of clarity on the trans-shipment pro-
cedures. Conservative estimates by KPMG indi-
cate that the Indian subcontinent alone can offer
trans-shipment opportunity of 80,000-1,00,000
MT per annum.
4. Dwell Time Reduction: Cargo dwell times for
large Indian airports currently range from 3 to 5
days as compared to an average of 4 to 12 hours
at leading global airports. Reduction in dwell
time and faster clearance of cargo are extremely
critical for India.
5. 24×7 Customs Operation: A review of the cur-
rent customs clearance procedures is extremely
important. There is also a serious need for Indian
Customs to operate in a 24×7 environment. This
would require close and regular interaction
between MoCA, Central Board of Customs and
Excise (CBEC) and the industry.
6. Establishment of Air-Freight Stations (AFS) in
the hinterland: A significant amount of con-
gestion, damage and pilferage is caused by the

246 Twelfth Five Year Plan
current practice of cargo being brought to ter-
minal in loose units which is then unitised into
pallets or containers before being loaded onto
aircrafts. This problem can be alleviated by set-
ting up AFSs’ in the hinterland. Customs check,
X-ray screening and palletisation can take place
at the AFS and airport terminals would only act
as a ‘processing gateway’ between airlines and
cargo carriers. Success of Containers Freight
Stations (CFS) for marine cargo is a clear indica-
tion of the need for a similar concept in the air-
cargo industry.
Maintenance, Repair and Overhaul (MRO)
15.210. Indian MRO industry is expected to triple in
size from `2,250 crore in 2010 to `7,000 crore by 2020.
However, this may still be small compared to the
present MRO industry size of other countries such as
UAE (`8,000 crore per annum) and China (`10,000
crore per annum). India has the potential to be an
MRO hub due to the growing aircraft fleet, locational
advantage and availability of talent. Given the growth
of Indian aviation, it is logical to encourage MRO
infrastructure to support the growth in the sector.
Ground Handling
15.211. By 2017, ground handling market is expected
to double from present `2,000 crore to `3,900 crore.
A number of global ground-handling players have
aggressive expansion plans in India. This would,
however, depend significantly on supportive policies
and requisite airport infrastructure development.
Regional Airlines
15.212. To tap the vast potential of growth of traffic
and to encourage balanced growth of civil aviation,
regional airlines need to be promoted. The promo-
tion of regional airlines would, however, be through
more liberal policy and provision of better infra-
structure facilities. The rules and procedures govern-
ing the entry may also be simplified.
Other Challenges
Route Dispersal Guidelines (RDG)
15.213. In accordance with the Route Dispersal
Guidelines, all routes were divided into three
categories, viz. Category I, II and III. Route categori-
sation was based on traditionally surplus generating
routes (Category I), loss making routes (Category
II) and the remaining routes (Category III). The
Category I routes were largely inter-metro routes
and generated surplus that cross-subsidised losses
largely on Category II routes which served regions
of difficult terrain and destinations in remote areas.
Implementation of Route dispersal guidelines aimed
at ensuring that all players in the liberalised era
would deploy capacity to destinations in remote
areas and would participate equitably in providing
air transportation to remote areas.
Air Connectvity in North Eastern Region and Other
Remote Areas
15.214. North-East Region of India comprises
of eight states viz. Assam, Arunachal Pradesh,
Manipur, Meghalaya, Mizoram, Nagaland, Tripura
and Sikkim. Most of the places in the North-Eastern
states are inaccessible due to inadequate road/rail
facilities. Only viable means of transportation in the
region is by air. At present, air services are available
to/from 11 airports in the North Eastern Region.
During last five years from 2006–2011, total num-
ber of flights operated on domestic network vis-
à-vis flights in North-Eastern Region, Jammu &
Kashmir Region, Andaman & Nicobar Island and
Lakshadweep Island are indicated in Table 15.42.
15.215. The connectivity to NER, J&K, A&N Islands
and Lakshadweep has grown at 43 per cent, 72 per
cent, 75 per cent and 67 per cent respectively which
are higher than growth in total domestic Network of
39 per cent during the period from 2006 to 2011. In
addition to scheduled air services, non-scheduled air
services are being provided by North East Shuttle (a
non-scheduled operator) with small aircraft. Pawan
Hans Helicopters Ltd is also providing helicopter
services in Arunachal Pradesh, Meghalaya, Tripura
and Sikkim with subsidy from Government for car-
riage of passengers, emergency/medical evacuation.
A private Helicopter operator also operates passen-
ger services in Arunachal Pradesh.
15.216. Despite some degree of success of Route
Dispersal Guidelines in ensuring air connectivity to

Transport 247
North-Eastern Region, Jammu & Kashmir and other
places, air connectivity has largely been confined to
few airports in these regions. The air connectivity is
largely concentrated on routes connecting state capi-
tals. Air connectivity has not increased proportion-
ately on routes connecting Island airports. Although
all the scheduled domestic airlines are complying
with mandatory capacity deployment requirements
contained in Route Dispersal Guidelines, however,
some parts of the country still remain unconnected
by air services or partly connected. A sustainable
and durable solution in the long run could be found
only in direct intervention by way of development of
small low cost ‘no-frill‘ airports and regional airlines
through providing direct subsidies in a transparent
manner both for airport operator and for the carrier.
As of now there are 22 airports and civil enclaves in
the NER. Amongst these there are seven fully opera-
tional AAI airports at Agartala, Barapani, Dibrugarh,
Guwahati, Imphal and Lilabari. Besides there are
four civil enclaves at Jorhat, Bagdogra, Silchar and
Tejpur. AAI has plans to develop Guwahati as a
inter-regional hub and Dibrugarh, Imphal and
Agartala as intra-regional hub. As a low cost airport,
to begin with, AAI would be developing Daparizo
Airport in Arunchal Pradesh for 20 seater aircraft
in phase I. Similarly the other airports in the region
could be identified for developing as small airports
suitable for small carriers keeping in view the stra-
tegic and socio-economic development needs of the
areas.
Safety
15.217. With the advancement and growth in aviation
activities in India, the challenges to keep the skies safe
need to be met appropriately. Safety is of paramount
importance. As the number of operations increase, it
is a challenging task to keep the rate of accident and
incident in check. The congestion in the skies also
poses a threat of near-misses and collision warnings.
The increase in number of movements affects runway
safety, ramp safety, incursions and excursions, ramp
congestion, precautionary landings, aborted take
offs, and other serious situations affecting safety. The
implementation of Safety Programme by DGCA and
safety management systems by all stake holders needs
to be ensured. It is proposed to further strengthen
DGCA during the Plan. Dedicated staff for the train-
ing academy has already been sanctioned. As a joint
venture with AAI, the training academy will ensure
technical capability of the highest level to enhance the
skills of officials in various fields
Human Resource Development
15.218. It has been estimated that total manpower
requirement of airlines will rise from 62,000 in FY
2011 to 1,17,000 by FY 2017. This includes number
of pilots, cabin crew, aircrafts engineers and techni-
cians (MRO), ground handling staff, cargo handling
staff, administrative and sales staff. India currently
has over 4,500 pilots, including 400 expatriates. With
the doubling of fleet size expected by 2017, India will
require a total of around 9,000 pilots by 2017. This
implies an average addition of at least 800 pilots per
year for the next five years, not accounting for attri-
tion and replacements of expatriate pilots (about 400),
required to be phased out by end of 2013. Currently
23 out of 40 institutes for pilot training are non-
operational. The remaining 17 institutes offer train-
ing facilities for commercial pilots with an annual
turnover of over 100 pilots. There is acute shortage
of trained pilots/commanders in India. In addi-
tion, many courses of some of the pilot training
institutes are not recognised by DGCA, leading to
TABLE 15.42
Flights/Week
Flight Details 2006 2007 2008 2009 2010 2011
Total on Domestic Network 8,724 10,624 11,048 1,063 11,315 12,107
North-Eastern Region 259 285 298 286 347 370
Jammu & Kashmir 104 116 110 113 120 179
Andaman & Nicobar Island 24 42 42 35 40 42
Lakshadweep Island 06 13 10 07 13 10

248 Twelfth Five Year Plan
high rejection rates. Exams are conducted every
three months compared to weekly exams in devel-
oped countries. It is necessary to meet these gaps in
the Twelfth Plan and increase facilities for human
resource development.
Current Regulatory Environment in Civil
Aviation Sector
15.219. In order to regulate tariff and other charges
for the aeronautical services rendered at airports
and to monitor performance of airports, Airports
Economic Regulatory Authority of India was set up
in 2008 through an Act of Parliament. DGCA per-
forms safety oversight functions of airline industry,
and limited Economic Regulation covering fares,
rates, services affecting such fares and rates.
15.220. Globally, Civil Aviation sector is regulated
by independent regulators. Therefore, creation of a
Civil Aviation Authority as a unified regulator cov-
ering both safety and economic aspects of airline
industry is the need of the hour. Existing Directorate
General of Civil Aviation could be subsumed in the
proposed Civil Aviation Authority as an enforcement
wing. CAA will be the regulatory policy making body
which will also have administrative control over the
enforcement wing (the present DGCA) to ensure the
implementation of its regulatory decisions. Setting up
of independent and autonomous regulatory body is
not only consistent with international best practices
but also essential to meet the challenges of a growing
industry with multiple players from both India and
abroad. Independent Regulators are mandated to
adopt transparent process in decision making, which
is necessary to impart regulatory certainty to inves-
tors current and potential.
National Aviation University
15.221. A skilled and competent workforce is essen-
tial to create a safe and efficient aviation industry.
Without this India cannot join the ranks of the lead-
ing aviation nations. A vibrant, world class educa-
tion and training sector is therefore essential to meet
the rising demand for skilled workforce at all levels.
It is found that there is a near absence of qualitative
and duly recognised formal Educational programme
leading to award of Diploma/Degree/Post Graduate
Degree in the field of Civil Aviation in the country.
As a result of this, all major as well as minor agen-
cies/organisations in the sector have to mostly
recruit persons and invest considerable resources in
post recruitment training. It is therefore necessary
to establish National Aviation University to cater
to the growing educational and training require-
ments of the Civil Aviation Sector on the pattern of
National Maritime University which has been estab-
lished under the Ministry of Shipping, Government
of India for the purpose of development of Human
Resources for Shipping and Ports sector
Development of Areospace Industry
15.222. Considering the growth prospects of Air
Traffic in the country, the potential for large scale
acquisition of aircrafts by the carriers in India, and
the competitive advantages arising out of grow-
ing pool of scientific and technical manpower in
the country it is felt necessary to consider initiat-
ing activities towards development of aerospace
industry. Independent traffic forecasts suggest
that by 2020 or so, the number of aircraft required
in the Indian market would exceed one thousand.
Most of the requirements would be in the nar-
row body segment to cater to the needs of Tier II
and Tier III towns. Also India could capture the
pie of Aerospace outsourcing due to significant
cost advantages. Skilled labour costs are currently
far less than USA and Europe. Therefore, there is
a need to take up Aerospace development pro-
grammes in the country for meeting the needs of
Civilian aircraft.
Establishment of Civil Aviation Museum
15.223. The Civil Aviation Museum shall enshrine
the evolution and development of aviation and
spaceflight in India, and so seek to educate and
inspire the nation by preserving and displaying
aeronautical and spaceflight material and data of
technical and historical interest and significance to
national programmes; developing educational mate-
rial and conducting programmes to enhance public
understanding of and involvement in, the develop-
ment of aviation and spaceflight and conducting

Transport 249
and disseminating new knowledge on aviation and
spaceflight and their related technologies. The aim
is to archive the development of aviation in India,
collect, preserve and display aeronautical equipment
and provide educational material for the study of
aviation and spaceflight sciences.
MOCA Institutions
Air India Limited
15.224. Against the Eleventh Plan approved outlay
of `32,730.71 crore, the anticipated expenditure of
Air India Ltd during Eleventh Plan period would
be `28,203.04 crore including the budgetary sup-
port of `3,200.05 crore in the form of equity infu-
sion. Air India Ltd ordered 93 aircraft comprising of
50 Boeing and 43 Airbus aircrafts. Out of these 93
aircrafts, 85 aircrafts were projected to be received
during the Eleventh Plan period. The physical and
financial performances of Air India Limited are
given at Annexures 15.5 and 15.6.
Airport Authority of India
15.225. The approved Eleventh Plan outlay of
Airports Authority of India was `12,964.21 crore,
including budgetary support of `1,461.68 crore. Out
of `12,964.21 crore, `6,973.40 crore was provided
for non-metro airports and the balance of `5,990.81
crore for metro airports. The anticipated expendi-
ture of Airports Authority of India during Eleventh
Plan period would be `12,547.56 crore including
budgetary support of `850.61 crore. The financial
performance of Airports Authority of India during
Eleventh Plan period is given in Annexure 15.7.
Pawan Hans Helicopters Limited
15.226. The approved Eleventh Plan outlay of Pawan
Hans Helicopters Limited was `603.50 crore includ-
ing budgetary support of `20.00 crore against which
the anticipated expenditure during Eleventh Plan
period would be `797.26 crore including budget-
ary support of `58.00 crore. Major portion of the
Eleventh Plan outlay was earmarked for acquisition
of helicopters. Details of performance is enclosed in
Annexure 15.8.
Hotel Corporation of India Limited
15.227. The Eleventh Plan approved outlay of Hotel
Corporation of India Limited is `75.00 crore, against
which the anticipated expenditure is `43.75 crore.
Directorate General of Civil Aviation
15.228. The anticipated expenditure of Directorate
General of Civil Aviation during Eleventh Plan
period is `210.19 crores against the approved out-
lay of `258.80 crores. The major scheme of the
Directorate envisaged for implementation during
Eleventh Five Year Plan period is ‘New Flying train-
ing Academy in Gondia’ for training of pilots.
15.229. The endeavor of Directorate General of Civil
Aviation (DGCA) during Twelfth Plan period will
be to promote safe and efficient Air Transportation
through regulation and proactive safety oversight
system. Schemes proposed under the Twelfth Plan
are aimed at DGCA’s capacity building.
Bureau of Civil Aviation Security
15.230. During Eleventh Plan period, the Bureau
of Civil Aviation Security (BCAS) is likely to spend
`73.31 crore as against actual allocation of `222
crore. One of the major schemes, namely, setting
up of Civil Aviation Security Training Academy is
at approval stage. Implementation of the restruc-
turing and strengthening of BCAS which includes
creation of infrastructure of office building, acquisi-
tion of some modern equipment including enhanc-
ing the manpower requirement at both the BCAS
Headquarters and regional level is going slowly.
The Bureau of Civil Aviation Security is working
out its future plans of strengthening organisation-
ally and technologically vis-à-vis the current security
scenario.
Indira Gandhi Rashtriya Uran Akademi
15.231. Indira Gandhi Rashtriya Uran Akademi
(IGRUA) is an autonomous body. A management
contract was signed with CAE Flight Training
(India) Private Limited, a wholly owned subsid-
iary of CAE Inc, Canada on 7.2.2008 for an initial
period of 10 years without affecting the legal entity
of IGRUA. IGRUA is provided grants-in-aid to

250 Twelfth Five Year Plan
pursue its plan projects. Against the approved out-
lay of `42.00 crore, the anticipated expenditure of
IGRUA during Eleventh Plan period is `41.00 crore.
Facilities at IGRUA have been upgraded to impart
training to 100 pilots per year. IGRUA has projected
an outlay of `95.00 crore for Twelfth Plan period for
purchase of additional 14 aircrafts, setting up of
MRO hub and AME school at IGRUA and extension
of tarmac at Sultanpur for parking IGRUA aircraft.
Aero Club of India
15.232. Aero Club of India is granted grants-in-aid
for its plan projects. The anticipated expenditure
of Aero Club of India is `31.65 crores against the
Eleventh Plan approved outlay of `35.32 crores.
Major Initiatives to be Taken by Moca in the
Twelfth Plan
• Doubling of passenger handling capacity of
Airports primarily through private investments
(PPP).
• Setting up of Unified Regulatory Agents.
• Up gradation of Air Navigation Services (ANS)
using the latest technology.
• Encouraging emergence of regional airlines to
cater to air transport needs of Tier II and Tier III
towns and promoting low cost carriers for this
purpose.
• New Policy for ATF to improve Airline
competitiveness.
• Policy on increased foreign direct investments,
including by foreign airlines in domestic airlines.
• Policy on MRO to encourage establishment of
dedicated MRO hubs through joint ventures with
MRO service providers and airport companies.
This would also encourage mechanisation and
modern ground handling processes for greater
efficiency.
• Revised policy on Route Dispersal Guidelines
to improve services to far flung and inaccessible
areas.
• Setting up of National Aviation University to
meet critical skill development needs of the avia-
tion Sector.
Investments During Twelfth Five Year Plan for
Civil Aviation
15.233. The projected investment during Twelfth
Five Year Plan from Central sector is expected to
be `33,198 crore of which `16,983 crore is from
GBS and `16,215 crore from IEBR. Out of the GBS
of `16,983 crore, `15,096 crore is earmarked for Air
India and `1,887 crore for all other plan schemes/
programmes for the Ministry. Besides, an investment
of `50,000 crore comprising `40,000 crore from pri-
vate investment and `10,000 crore by others includ-
ing concessioners, third party and so on have been
projected to be made in airport projects during the
Twelfth Five Year Plan.
NORTH EAST REGION
15.234. The North East region has a number of
characteristics that make it imperative for more
organised inter-sectoral planning to be done for
transportation in the region: it is remote from the
rest of India; several areas feature difficult hilly ter-
rain; it also has many rivers, which can permit sig-
nificant inland water transport options, but also
contribute to difficulties in engineering transport
infrastructure; it has a long border with neighbour-
ing countries which increases the importance of
transport infrastructure from a strategic and secu-
rity viewpoint; and it consists of 8 states, each of
which have their own requirements and priorities.
A region-wide transport planning for the four trans-
port sectors – roads, civil aviation, rail, and inland
waterways – in an integrated framework is therefore
required.
Railways
15.235. A decision has already been taken to connect
all the state capitals in the North East with the rest of
the country. The state capitals of Assam and Tripura
are already connected. New lines for connecting state
capitals of Arunachal Pradesh, Manipur, Nagaland,
Mizoram and Meghalaya have been sanctioned and
works are in progress. In the Twelfth Five Year Plan,
the work on these railway lines will be expedited so
that all state capitals in the North East Region are on
the rail map by 2020.

Transport 251
Roads
15.236. A number of programmes such as the
SARDP-NE have been launched for the development
of National Highways, State Highways and other
roads in the North East Region. As a result of these
programmes investments have been increasing. As a
matter of fact, the implementing agencies are unable
to spend the allocated amount and complete the proj-
ects in time. Hence there is a great need for capacity
augmentation and institutional strengthening in the
areas related to evolving of projects, preparation of
project reports, implementation, monitoring and
management of projects in the North East region as
a whole.
Air Connectivity
15.237. Considering the importance of civil aviation
to the development of the NER, a new policy cen-
tred around small aircrafts is required to implement
a hub-and-spoke model. With more frequent flights
in and out of this geographically difficult region,
there may be considerable reduction in the physical
exclusion of the region. The development of exist-
ing airports and operationalisation of non-opera-
tional airports would not only make air links feasible
between the state capitals but also with neighbour-
ing countries. Multi-utility based air services which
enable the movement of high value cargo can also be
instrumental in improving the economic vitality of
the region. However, in order to achieve the objective
of uninterrupted and reliable air services and to pre-
vent accidents, there is a need to develop state of the
art weather and navigation information systems and
human resources together with the actual physical
airport infrastructure. Guwahati Airport should also
be developed as a potential major gateway to South
East Asia, both for passenger and freight traffic.
Inland Water Transport
15.238. IWT has a natural fit with the bulk commod-
ities that the North East Region imports from the
rest of India. Tea, oil, cement and coal are exported,
while food grains, fertilisers and petroleum prod-
ucts are imported. All these items are non-perishable
and transported in high volumes, making them suit-
able for transportation by IWT. Major development
of IWT requires participation by Bangladesh. The
Indo-Bangladesh Protocol on Inland Water Transit
and Trade already exists. Efforts would be made to
extend the validity of this protocol for at least 20
years. This would provide stability to the trading
environment and hence enable appropriate invest-
ment planning in both the public and private sec-
tors. It would also clear the way for the development
of public private partnerships in the development,
management and operation of inland water trans-
port in the region.
TWELFTH PLAN OUTLAY
15.239. The indicative Gross Budgetary Support
and IEBR for Twelfth Five Year Plan for various
Ministries in the Transport Sector is Given below
(Table 15.43):
TABLE 15.43
Ministry/Department – wise Twelfth Five Year Plan (2012–17) Outlays for Transport Sectors
(in ` crore)
Sl. No. Ministry Twelfth Plan (2012–17) GBS Outlays IEBR
1. Ministry of Road Transport and Highways 1,44,769 64,834
2. Ministry of Civil Aviation 16,983 16,215
3. Ministry of Railways 1,94,221 2,25,000
4. Ministry of Shipping 6,960 21,990
5. PMGSY (part of Rural Development Allocation) 1,26,491 –

ANNEXURE 15.1
Central Road Sector Outlay and Expenditure-At Current Price for Eleventh Plan
(` Crore)
S
No
Schemes/Programmes Eleventh
Plan
(2007–12)
Outlay
2007–08 2008–09 2009–10 2010–11 2011–12 Total
Outlay
for the
Eleventh
Plan
(BE)
Total
Expenditure
at Current
Prices
(prov. for
2011–12)
BE Exp. BE Exp. BE Exp. BE Exp. BE Exp.
(Prov.)
1 2 3 4 6 7 9101213151618 19 20
1 External aided projects
(i) External aided (RW) 0.00 0.00 0.00
(ii) Counterpart funds (RW) 0.00 0.00 0.00
EAP Ministry 0.00 0.00 0.00
(iii) Externally aided
(NHAI)
3,563.20 1,788.80 1,776.00 1,515.00 1,515.00 272.00 272.00 320.00 320.00 3,895.80 3,883.00
(iv) Counterpart funds
(NHAI)
0.00 20.00 0.00 20.00 0.00
(v) Loan to NHAI 890.80 447.20 444.00 379.00 379.00 68.00 68.00 80.00 80.00 974.20 971.00
(vi) EAP under RW 100.00 80.00 0.00 180.00 0.00
EAP-NHAI 4,454.00 2,236.00 2,220.00 1,894.00 1,894.00 340.00 340.00 500.00 400.00 100.00 0.00 5,070.00 4,854.00
(vii) Strengthening of PIC 0.00 0.00 0.00
2 Other Schemes-NH (O) 16,500.00 2,079.25 2,011.07 2,142.79 2,852.70 3,342.55 4,298.12 3,958.10 4,496.35 4,964.34 4,519.58 16,487.03 18,177.82
3 Rail cum Road Bridge,
Munger, Bihar
392.00 40.00 40.00 60.00 60.00 100.00 100.00 180.00 72.00 380.00 272.00
4 Development of roads in
LWE affected area
500.00 5.00 1,000.00 718.05 825.00 792.47 2,325.00 1,515.52
5 Development of Vijawada-
Ranchi Road
200.00 0.00 100.00 0.00 100.00 67.25 400.00 67.25
6 Tribal Sub Plan 375.00 374.96 375.00 374.96
7 Mughal Road in Jammu &
Kashmir
127.50 30.00 0.00 20.00 0.00 50.00 0.00
8 Improvement of
Duburi-Brahmanipal-
Harichandanpur-Naranpur
State Road in Orissa
(POSCO)
140.85 40.00 40.00 30.00 0.00 20.00 0.00 33.02 33.02 123.02 73.02

9 Works under BRDB 2,500.00 499.76 623.93 650.00 645.80 600.00 723.49 700.00 693.00 700.00 515.00 3,149.76 3,201.22
10 Travel expenses (domestic) 2.00 1.24 2.00 1.20 2.00 1.31 2.00 1.22 8.00 4.97
11 Other charges 64.00 0.50 0.50 0.50 0.13 0.50 0.00 0.50 0.03 0.50 0.00 2.50 0.66
12 Development of
Information Technology
9.50 0.32 3.50 0.71 3.50 3.05 3.50 1.10 3.50 1.74 23.50 6.92
13 Strategic roads under Roads
Wing
0.00 7.00 6.35 5.00 0.00 12.00 6.35
14 Strategic roads under BRDB 500.00 67.00 61.45 78.00 76.96 60.00 82.17 100.00 72.66 105.00 53.00 410.00 346.24
15 R&D Planning studies 100.00 8.50 0.20 8.50 0.71 5.50 3.84 6.00 0.92 5.50 0.48 34.00 6.15
16 Training 1.50 0.35 1.50 0.16 1.50 0.39 1.50 0.00 1.50 0.11 7.50 1.01
17 Machinery and equipments 10.00 3.07 15.00 0.53 15.00 0.01 5.00 0.00 45.00 3.61
18 Charged expenditure 36.00 6.00 5.93 6.00 2.07 6.00 5.32 6.00 0.21 7.00 0.00 31.00 13.53
19 NHAI (investment) 36,238.00 6,541.06 6,541.06 6,972.47 6,972.47 8,578.45 7,404.70 7,848.98 8,440.94 8,250.00 6,187.00 38,190.96 35,546.17
20 E&I for States from CRF 900.00 264.93 169.70 180.74 175.65 216.97 104.35 195.75 208.23 232.27 173.74 1,090.66 831.67
21 E&I for UTs from CRF 9.00 1.60 10.00 0.00 16.03 0.00 14.67 0.00 17.48 2.04 67.18 3.64
22 NHDP-III, two-laning
expressways and six-laning
0.00 0.00
23 SARDP-NE 9,877.65 710.00 698.02 1,200.00 643.72 1,200.00 658.55 1,500.00 1,044.49 1,600.00 1,939.98 6,210.00 4,984.76
24 Strategic roads in Arunachal
Pradesh under Ministry of
Defense
0.00 0.00
25 NHAI(Toll Remittance) 1,623.00 1,623.00 2,092.89 2,692.89 3,715.89 4,315.89
Total (GBS) 71,830.00 12,440.00 12,340.48 13,270.00 13,349.39 15,198.00 13,690.71 17,700.00 17,800.30 19,600.00 17,426.48 78,158.00 74,607.36
26 IEBR 34,829.00 2,090.00 305.18 4,100.00 1,630.74 5,000.00 1,273.26 7,455.00 2,100.00 17,500.00 12,500.00 36,145.00 17,809.18
Total GBS + IEBR 1,06,659.00 14,530.00 12,645.66 17,370.00 14,980.13 20,198.00 14,963.97 25,155.00 19,900.30 37,100.00 29,926.48 1,14,303.00 92,416.54
Private Sector Investment 86,792.00 7,325.00 7,057.38 13,938.00 8,179.75 16,071.66 8,944.61 21,256.00 15,354.37 23,301.68 25,749.38 81,892.34 65,285.49
Pvt Sec (non-NHDP) 60.00 43.68 142.33 129.49 0.00 375.50
Total Pvt Sect 7,325.00 7,117.38 13,938.00 8,223.43 16,071.66 9,086.94 21,256.00 15,483.86 23,301.68 25,749.38 81,892.34 65,660.99
Total Central Roads Sector 21,855.00 19,763.04 31,308.00 23,203.56 36,269.66 24,050.91 46,411.00 35,384.16 60,401.68 55,675.86 1,96,195.34 1,58,077.53

254 Twelfth Five Year Plan
ANNEXURE 15.2
Plan-wise Addition to NH Length
Plan Length Added (in km) Total Length (in km)
As on 1 April 1947 21,440
Pre First Plan (1947–51) 815 22,255
First Plan (1951–56) 22,255
Second Plan (1956–61) 1,514 23,769
Third Plan (1961–66) 179 23,948
Interregnum (1966–69) 52 24,000
Fourth Plan (1969–74) 4,819 28,819
Fifth Plan (1974–78) 158 28,977
Interregnum (1978–80) 46 29,023
Sixth Plan (1980–85) 2,687 31,710
Seventh Plan (1985–90) 1,902 33,612
Interregnum (1990–92) 77 33,689
Eighth Plan (1992–97) 609 34,298
Ninth Plan (1997–2002) 23,814 58,112
Tenth Plan (2002–07) 9,008 66,590*
Eleventh Plan (2007–12) 10,228 76,818
Eleventh Plan (2007–12)
2007–08 164 66,754
2008–09 3,794 70,548
2009–10 386 70,934
2010–11 0 70,934
2011–12 5,884 76,818**
* 530 km length of National Highways of Madhya Pradesh has been de-notified.
** Includes 1,388 km under notification at present
ANNEXURE 15.3
Achievement on National Highways
Period Total Length#
(km)
Widening to Two
Lanes (km)
Widening to Four
Lanes (km)
Strengthening of
Pavement (km)
Major Bridges
(Nos)
1947–69 24,000 14,000* Nil Nil 169
1969–90 33,612 16,000 267 9,000 302
1990–2002 58,112 3,457 1,276 7,000 87
Tenth Plan (2002–07) 66,590 4,177 6,769** 8,377 611***
Eleventh Plan (2007–12) 75,430 4,892 10,165 4,417 121
Total 75,430 42,526 18,477 28,794 1,290
Note: # Length at the end of the period.
* Includes 6,000 km which were already two-lane at the time of designation as NHs.
** Includes 216.62 km which have been six or eight laned up to Tenth plan.
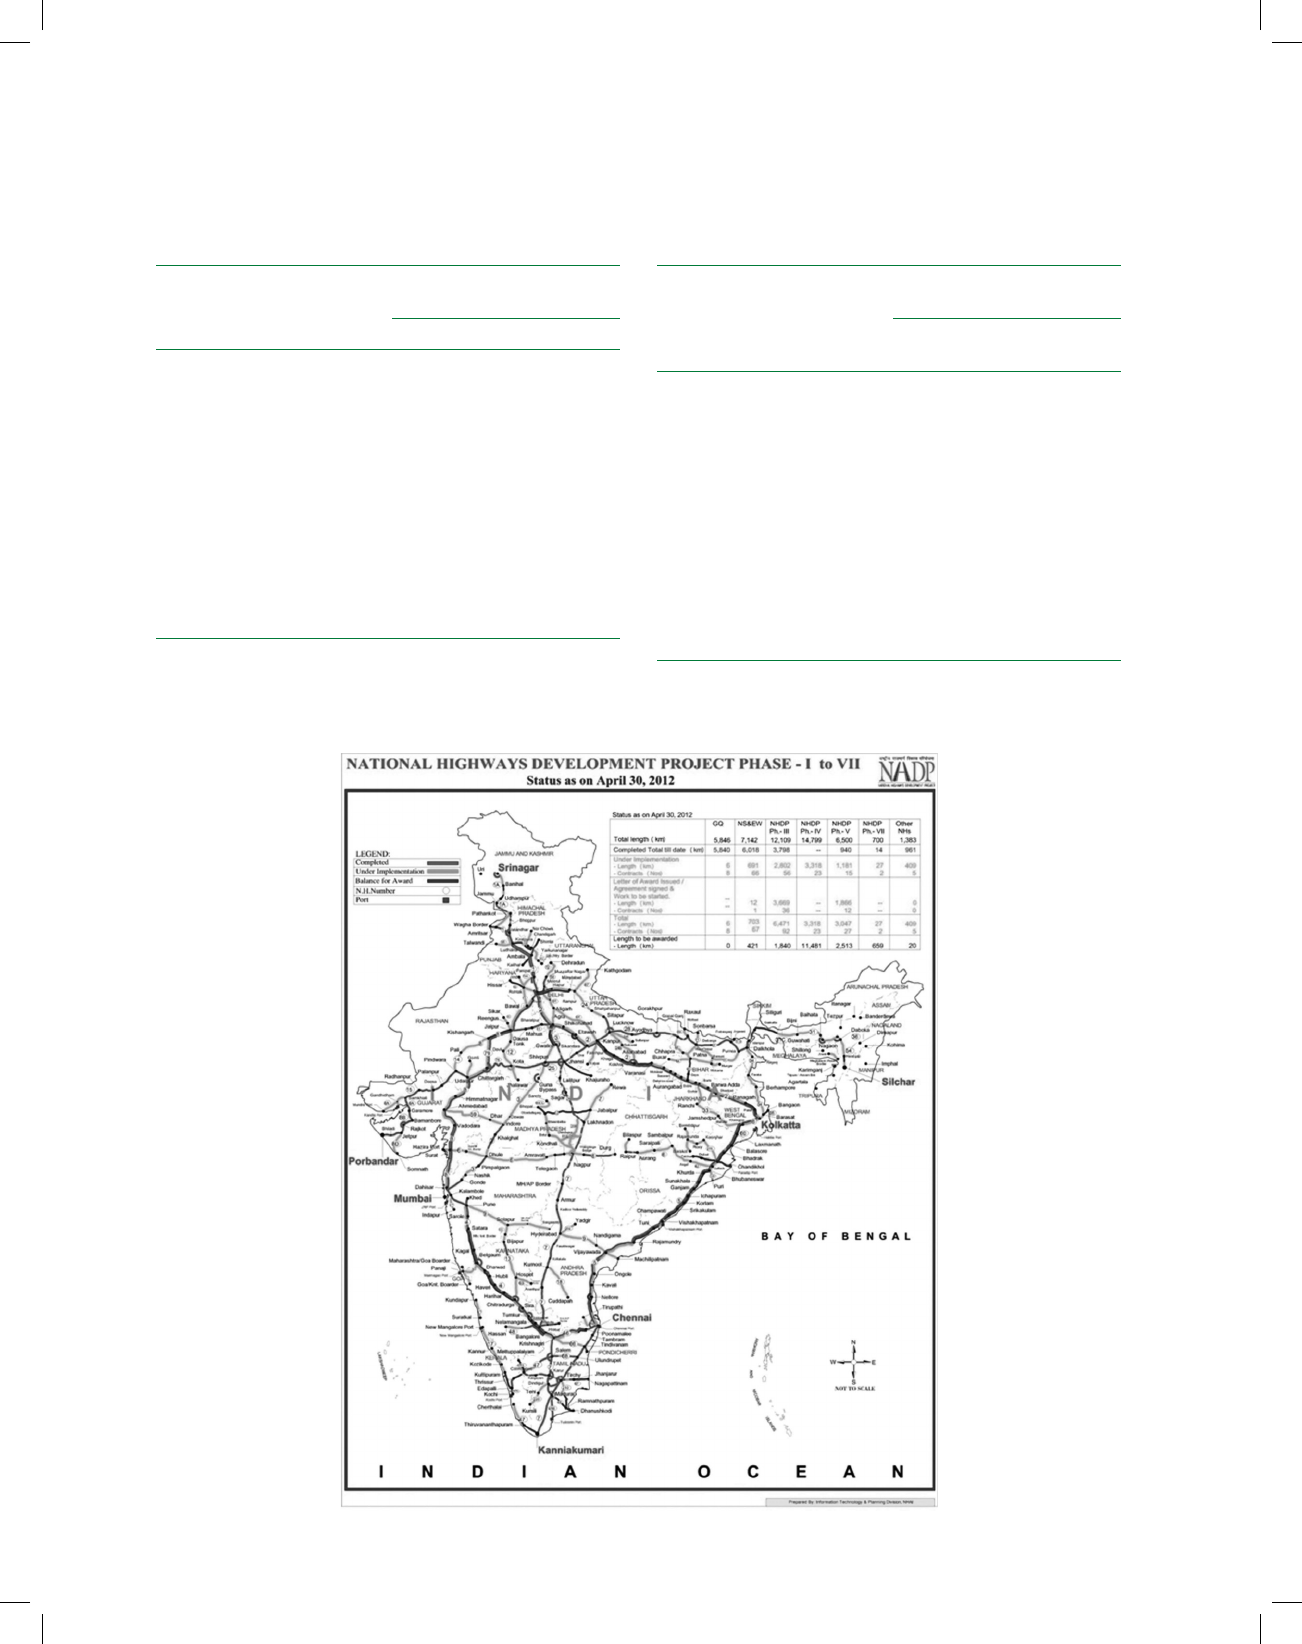
Transport 255
ANNEXURE 15.4
NHAI AND MORTH
S.
No.
Schemes/Programmes Physical Performance
Eleventh Plan
Targets Achievements
1 Widening to two-lanes
(km)
5,603 5,161
2 Widening to four-lanes
(km)
14,975 10,947
3 Strengthening of weak
two-lanes (km)
4,634 4,625
4 Bypasses (nos) 99 29
5 Major bridges /minor
bridges including ROBs
(nos)
660 483
6 IRQP (km) 9,441 11,831
BRDB
S.
No.
Schemes/Programmes
(Normal NH Works)
Physical Performance
Eleventh Plan
Targets Achievements
(Up to Jan 2012)
1 Widening to two-lanes
(km)
1,111 915
2 Widening to four-lanes
(km)
63
3 Strengthening of weak
two-lanes (km)
135 133
4 Bypasses (nos) 18 6
5 Major bridges /minor
bridges including ROBs
(nos)
188 127
6 IRQP 911 811

256 Twelfth Five Year Plan
ANNEXURE 15.5
Physical Performance of Air India Limited during Eleventh Plan Period
Particulars Eleventh
Plan 2007–08 2008–09 2009–10 2010–11 2011–12
Targets Targets Ach. Targets Ach. Targets Ach. Targets Ach. Targets Ach.
1 2 3456789101112
Available TonneKms
(mill.)
54,114 7,180 6,168 8,474 5,602 10,927 6,053 12,811 6,365 14,722 6,482
Revenue TonneKms
(mill.)
38,217 5,160 3,688 6,169 3,191 7,782 3,533 8,921 3,726 10,185 3,620
Overall Load Factor
(per cent)
71 72 60 73 57 71 58 70 58 69 56
Available Seats km
(mill.)
3,74,639 53,411 48,393 61,072 43,591 75,534 44,723 86,230 45,845 98,392 45,803
Rev. Passengers km
(mill)
2,74,075 38,795 30,891 44,691 25,950 55,529 28,965 63,252 30,556 71,808 31,456
Passenger Load
Factor (per cent)
73 73 64 73 60 74 65 73 67 73 69
Source: Air India Limited.
Note: Ach. – Achievement
ANNEXURE 15.6
Financial Performance of Air India Ltd. during the Eleventh Plan Period
Particulars Eleventh Plan 2007–08 2008–09 2009–10 2010–11 2011–12
Targets Targets Ach. Targets Ach. Targets Ach. Targets Ach. Targets Ach.
1 2 3456789101112
Total Revenue 1,13,367 16,541 15,257 19,096 13,479 23,050 13,485 25,682 14,166 28,998 15,383
Total Expenses 1,11,926 16,423 18,556 18,926 20,668 22,839 19,036 25,345 21,160 28,393 23,237
Profit/(Loss)
After Tax
1,441 118 (2,226) 170 (5,548) 211 (5,552) 336 (6,994) 605 (7,854)
Source: Air India Limited.
Note: Ach. – Achievement

Transport 257
ANNEXURE 15.7
Financial Performance of Airports Authority of India during Eleventh Plan Period
Particulars Eleventh Plan 2007–08 2008–09 2009–10 2010–11 2011–12
Targets Targets Ach. Targets Ach. Targets Ach. Targets Ach. Targets Ach.
1 2 3456789101112
Total Revenue 23,783 3,425 4,289 4,117 4,186 4,045 4,615 4,919 5,139 5,382 5,878.66
Total Expenses 14,419 2,187 2,550 2,715 3,070 3,161 3,387 3,758 3,793 4,030 4,514.53
Profit/(Loss)
before Tax
Profit/(Loss)
after Tax
5,150 743 1,082 842 687 530 712 720 846 810 859.01
Note: Ach. – Achievement
ANNEXURE 15.8
Financial Performance of Pawan Hans Helicopters Ltd. during Eleventh Plan Period
Particulars Eleventh Plan 2007–08 2008–09 2009–10 2010–11 2011–12
Targets Targets Ach. Targets Ach. Targets Ach. Targets Ach. Targets Ach.
1 2 3456789101112
Total Revenue 1,810 243 243 239 329 311 396 364 424 446 438.15
Total Expenses 1,602 219 214 226 291 283 349 334 384 419 437.05
Profit/(Loss)
after Tax
210 22 23 14 25 20 36 20 9 2 (10.35)
Note: Ach. – Achievement
NOTES
1. Clive Bell (2012), ‘The Benefits of India’s Rural Roads Program in the Spheres of Goods, Education and Health- Joint Estimation
and Decomposition’, World Bank Policy Research Working Paper 6169, August 2012.
2. Clive Bell and Susanne van Dillen (2012), ‘How Does India’s Rural Roads Program Affect the Grassroots? Findings from a Survey
in Orissa’, World Bank Policy Research Working Paper 6167, August 2012.

INTRODUCTION
16.1. Democratisation of information makes it pos-
sible for ideas, opinions, knowledge and education to
be accessible to everyone, anywhere, anytime. This is
the key to innovation and empowerment of citizens.
In order to enhance access to information emphasis
is laid on building platforms that can leverage broad-
band and create public information infrastructure
and move towards the next generation of governance
to ensure accountability, transparency, informa-
tion sharing and collaboration. The key challenge
now is to build and integrate national platforms
for the Unique Identification (UID-AADHAR),
Geographical Information System (GIS), Cyber
Security and Payment Gateway. Finally, leveraging
the Fourth Screen i.e., the Mobile Phone for reaching
out to citizens is desirable, as it allows a much wider
reach and in a language people can understand.
16.2. The ICT sector is predominantly a service sec-
tor and has redefined service delivery and the way
business houses and common man interact with
Government. Rapid technological developments
over the years have made it possible to provide
services on a single platform due to convergence.
During the Twelfth Plan period, this sector is poised
for substantial growth both in terms of expansion
of carriage (networks) and content (voice, data and
multimedia). Since, ICT infrastructure and services
encompasses all sectors of economy, the next five
years offer a unique opportunity to leverage upon our
strength in all facets of ICT. This chapter deals with
the Telecommunications, Information Technology,
Postal and Information and Broadcasting sectors.
16
Communication
TELECOMMUNICATIONS
Overview
16.3. The telecommunications sector has witnessed
phenomenal growth during the last decade. Growth
of mobile telephony has been the most visible indi-
cator and catalyst to economic growth. Coverage in
terms of number of subscribers has reached 951.34
million in March 2012. The most encouraging fea-
ture has been the growth in coverage and increase in
the number of subscribers in rural areas powered by
low tariffs. More than 5,55,000 villages out of more
than 6,00,000 villages in the country have the benefit
of mobile coverage and the remaining villages are
likely to be covered very soon, either by the Telecom
Service Providers (TSPs) on their own, or with sup-
port from the Universal Service Obligation Fund
(USOF). A worrying feature, however, has been the
slow growth in broadband penetration and usage.
Broadband subscription was only about 14 million in
March 2012, much below what is needed.
16.4. The growth of world-class telecommunication
infrastructure in the country has been driven by pro-
active policy initiatives. The National Telecom Policy
(NTP)-1999 recognised that access to telecommu-
nications is of utmost importance for achieving the
social and economic goals and help in addressing the
developmental challenges of the country. Availability
of affordable and effective communications for the
citizens was at the core of the vision and goal of the
policy makers. Another important objective was to
provide a balance between the provision of univer-
sal service to all uncovered areas, including the rural

Communication 259
areas, and the provision of high-level services capa-
ble of meeting the needs of the country’s economy.
16.5. The sector has shown great resilience during
a period of global downturn and has registered an
annual growth rate of more than 35 per cent during
2008–11. However, the growth has been predomi-
nantly propelled through voice based services. The
Twelfth Plan period needs to leverage the new tech-
nological developments in the sector and provide
affordable value added services.
16.6. Important gains have been made in the R&D
sector and India is being seen as the global desti-
nation for R&D, engineering design and proto-
type development, as well as a manufacturing hub
for high tech products. Generation of Intellectual
Property (IP) and products has, however, been lim-
ited, even though there are numerous instances of IP
and products being registered outside India where
the bulk of R&D has been carried out in India. Now
the aim must be to translate resident R&D capability
into products, patents and IPRs that drive the next
generation of technology innovation. The need to
channelise the capability that exists in the academia
into applied R&D for the Telecom sector cannot be
overemphasised.
REVIEW OF THE ELEVENTH PLAN (2007–12)
16.7. The Eleventh Five Year Plan saw an impres-
sive four and half fold increase in total telephone
connections from 205.86 million in March 2007 to
951.34 million in March 2012 (Figure 16.1). The
Eleventh Plan had envisaged a target of 600 million
connections by March 2012. However, during 2009–
10 the total telephone connections had already
increased to 621.25 million.
16.8. The overall teledensity has also increased from
18.31 per cent to 78.66 per cent during the Eleventh
Plan period. However, the subscriber base for tele-
com services in India is skewed in favour of urban
areas. Urban teledensity is around 4.4 times that of
rural teledensity (Figure 16.2).
16.9. The sector has been dominated by a preference
for wireless phones, as confirmed from the rising
share of wireless phones, which increased from 80.19
per cent (165.09 million) in March 2007 to 96.62 per
cent (919.17 million) in March 2012. On the other
hand, there had been continuous decline in the num-
ber of wireline telephones in the country from 40.77
million in March 2007 to 32.17 million in March
2012 (Figure 16.3). The service providers need to
leverage the wireline infrastructure, and build ser-
vices in new and innovative segments, to address this
decline and salvage the investments made so far.
16.10. While the wireless led penetration appears
impressive, it is dominated by private sector play-
ers and voice telephony services. The mobile broad-
band services also need to keep pace with the voice
telephony growth with the launch of 3G/BWA ser-
vices. The growth of the economy is highly depend-
ent on data services as opposed to voice telephony.
Therefore, a significant challenge remains in mak-
ing the Indian telecom infrastructure accessible and
responsive to this basic requirement.
205.86
300.49
429.72
621.28
846.32
951.34
1000
500
0
Subscribers in Million
Mar 2007 Mar 2008 Mar 2009 Mar 2010 Mar 2011 Mar 2012
Source: TRAI.
FIGURE 16.1: Telephone Subscribers Growth during 2007–12
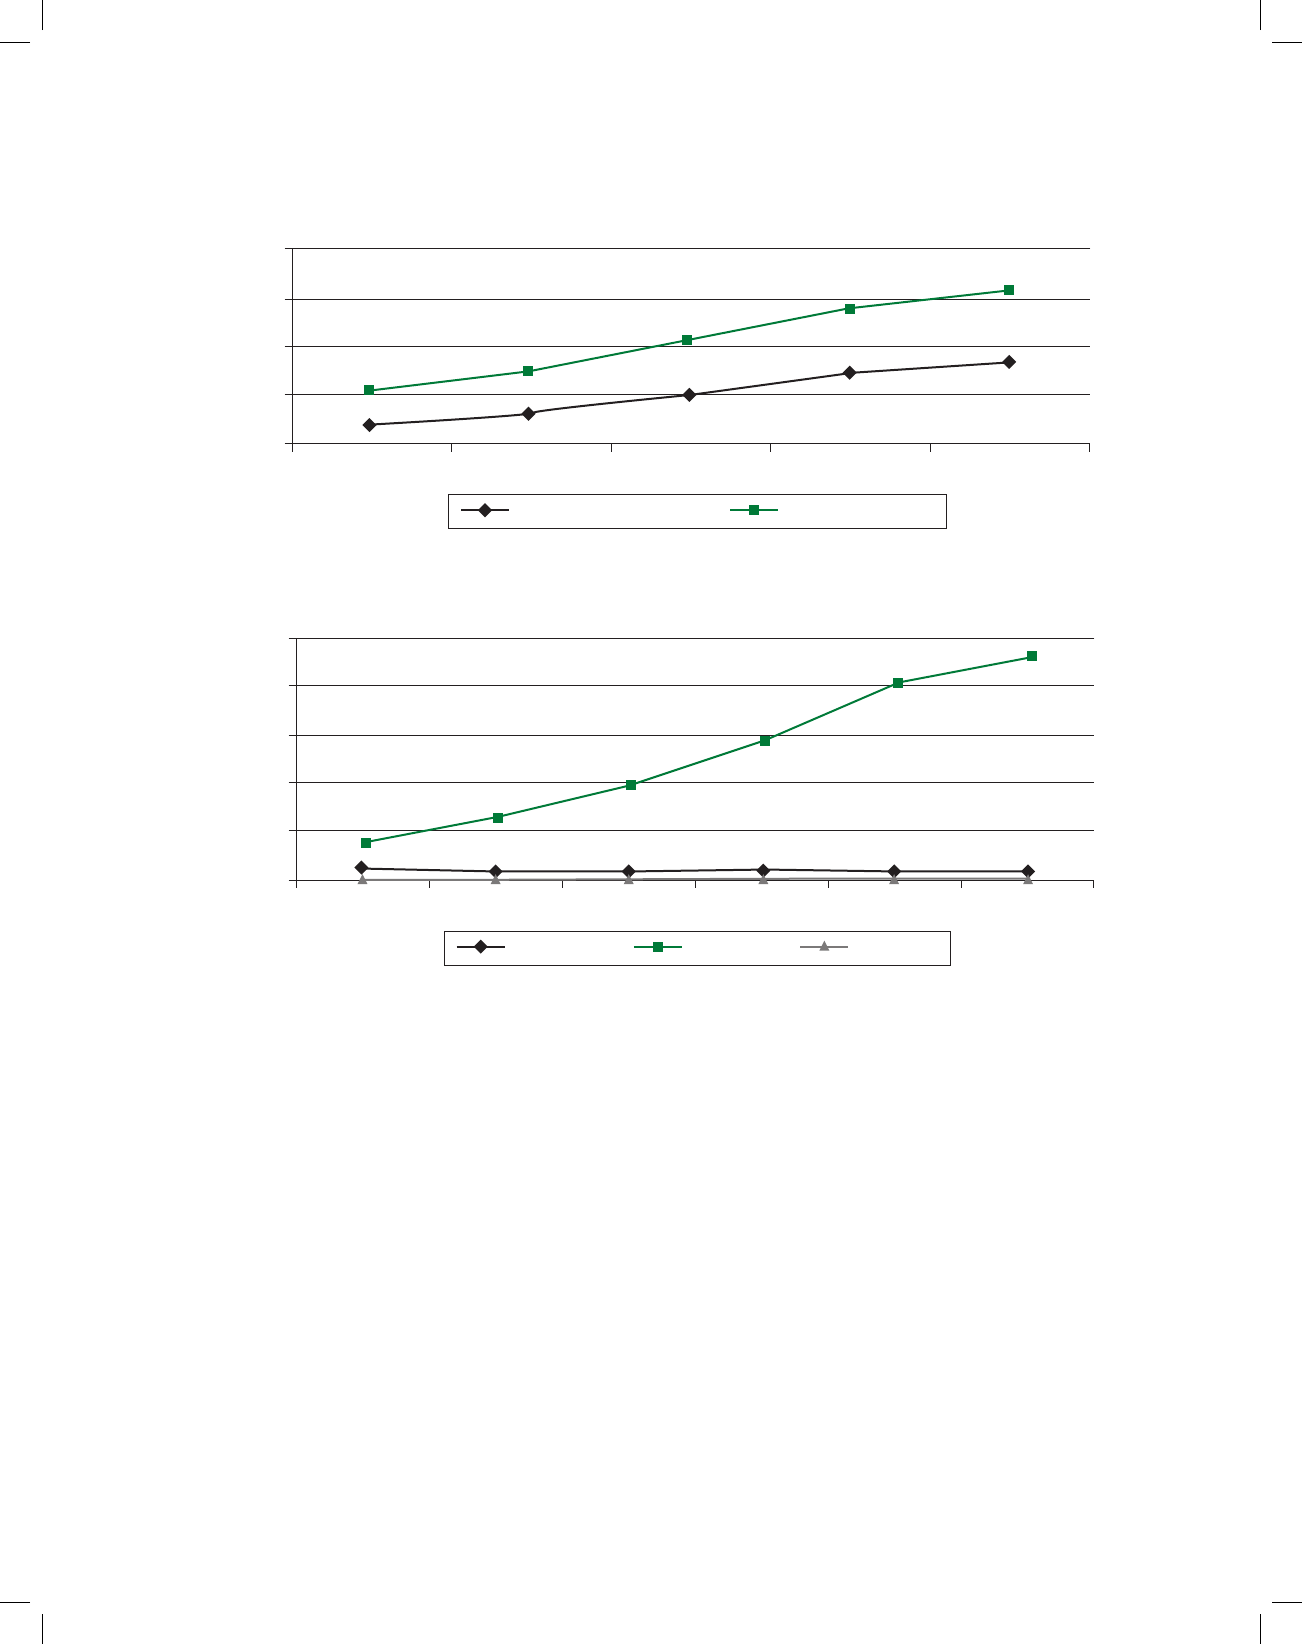
260 Twelfth Five Year Plan
73.92 120.29
282.23
200.81
330.82
420.47
309.43
226.57
564.09
620.52
800
600
400
200
0
Subscribers in Million
2008 2009 2010 2011 2012
Rural Subscribers Urban Subscribers
Source: TRAI.
FIGURE 16.2: Distribution of Urban and Rural Subscribers
1,000
800
600
400
200
0
No. of Subscribers in Million
20082007 2009 2010 2011 2012
Wireline Wireless Broadband
Source: TRAI.
FIGURE 16.3: Number of Telephone and Broadband Connections
16.11. The first wave of initiatives leading to tar-
iff reduction started with the introduction of the
Telecom Tariff Order in 2000 bringing down call
charges to 50 per cent and the introduction of the
3rd and 4th cellular operator. The ‘Calling Party
Pays’ regime further brought down call charges.
During the Eleventh Plan period, further steps were
taken to encourage competition. These include
reduction in tariff for national roaming services;
abolition of Access Deficit Charges (ADC); reduc-
tion of interconnect usage charges and country wide
mobile number portability. These led to a huge boost
to the subscriber base and the average tariff also
came down sharply. Falling tariffs coupled with the
increased number of mobile subscribers, resulted
in increase in overall industry revenues. The sec-
tor is characterized by high subscriber base and
low average tariff per outgoing call as indicated in
Figure 16.4.
Auction of 3G and BWA Spectrum
16.12. The unprecedented growth of voice based
mobile telephony in the country has led to demand
for other value added services that include data com-
munication, video, mobile TV and so on. With a view
to extend the benefit of new technology and for pro-
viding a variety of services to the customers, the gov-
ernment decided to introduce the Third Generation
(3G) systems, which represent the next step in
the evolution of mobile cellular communication.
2G systems focus on voice communication, while
3G systems support increased data communication.
Subsequently, the auction of 3G and BWA Spectrum
was successfully conducted in 2010 and garnered
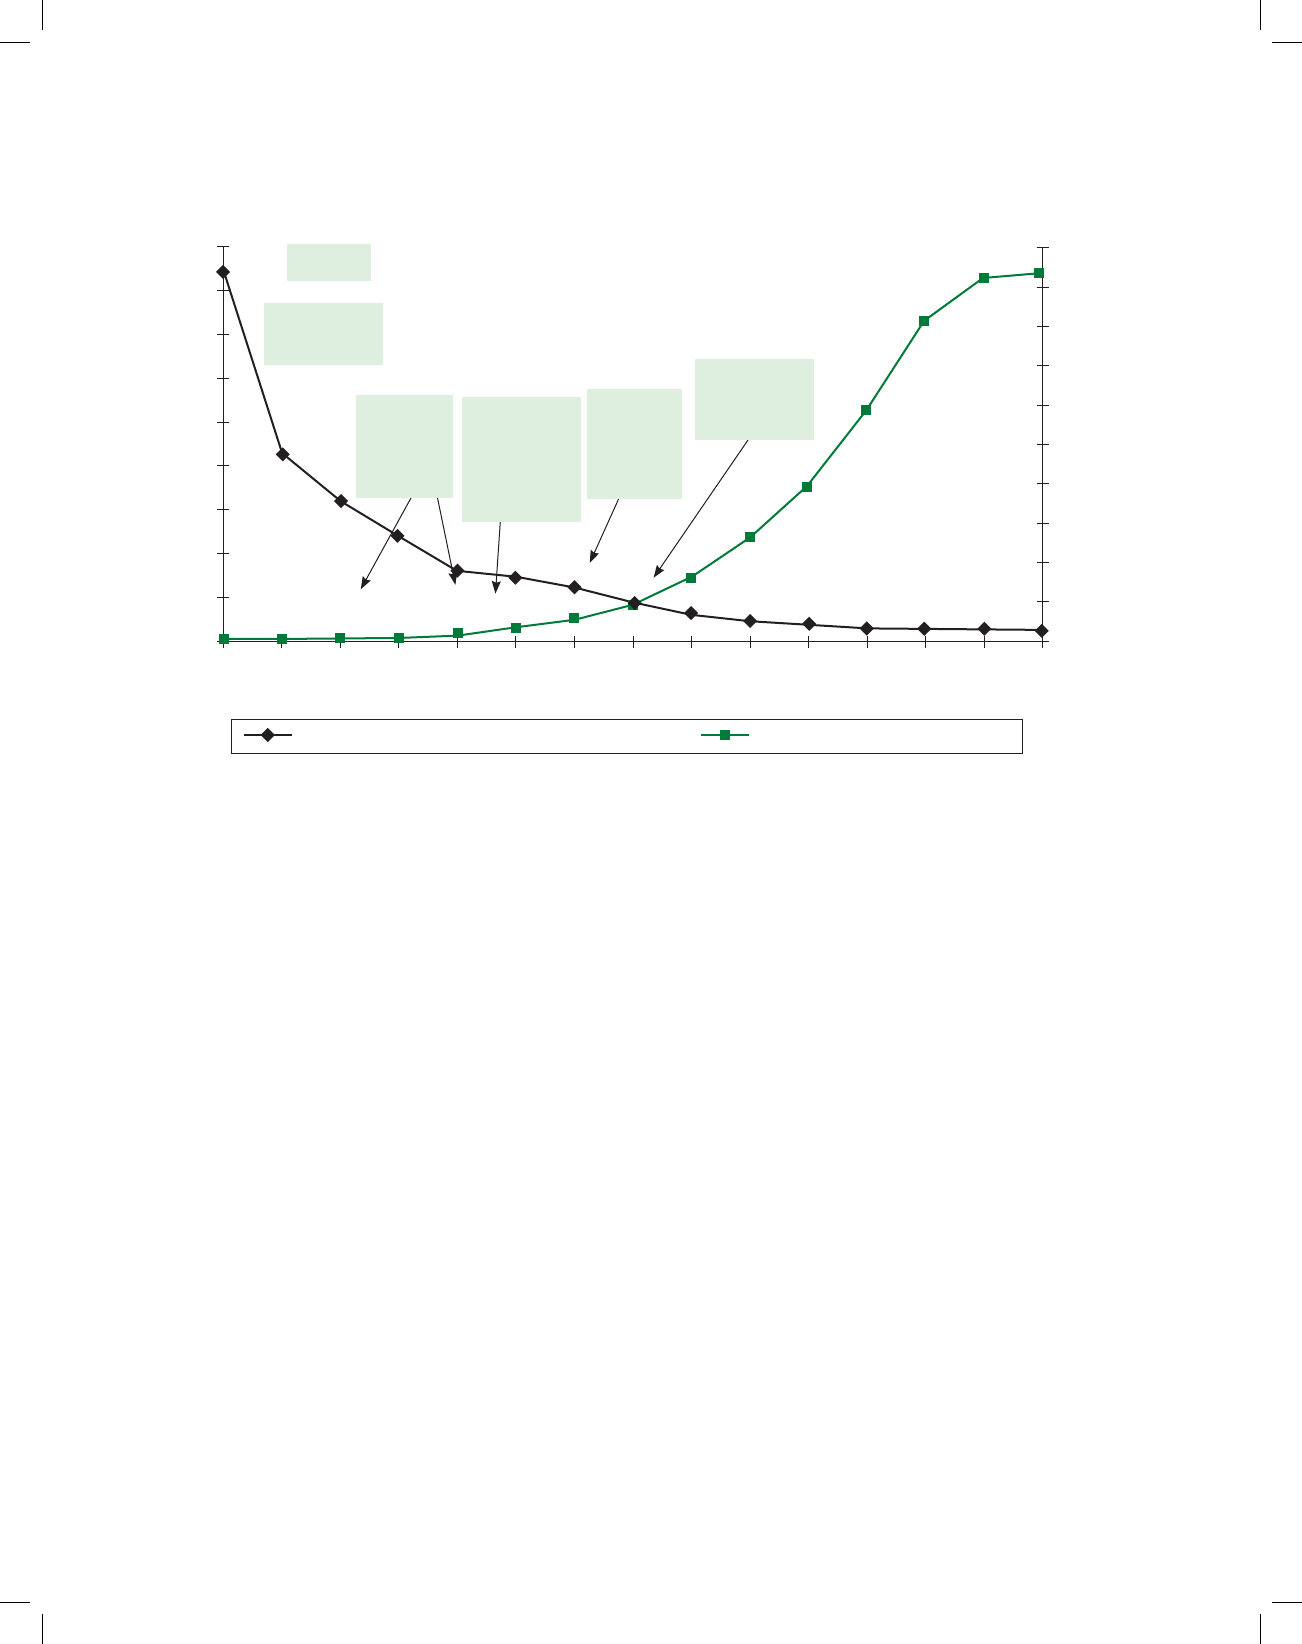
Communication 261
1,000
900
800
700
600
500
400
300
200
100
0
18
16
14
12
10
8
6
4
2
0
Mar 99
Mar 00
Mar 01
Mar 02
Mar 03
Mar 04
Mar 05
Mar 06
Mar 07
Mar 08
Mar 09
Mar 10
Mar 11
Mar 12
Jun 12
934.09
919.17
811.59
584.32
391.76
261.07
165.11
1.77
52.22
33.60
6.50 13.0
3.58
1.88
1.20
16.93
8.55
6.38
4.86 3.24 2.89 2.41 90.14 1.15 0.92 0.76 0.57 0.51 0.49 0.48
Telecom
Tariff Order
NTP ’99
Introduction
of Lifetime
Schemes
United
Access
Licensing
Regime
IUC
Regulation
and
Introduction
of CPP
3rd
and 4th
Cellular
Operator
Average tariff per outgoing minute (GSM Service) Wireless Subscriber base (Millions)
Source: TRAI.
FIGURE 16.4: Mobile Tariff Trends V/s Growth in Mobile Subscribers in India (1999–2012)
`1,06,262 crore. Now, the operators have started roll-
ing out wireless broadband networks in the country
and very soon these services are likely to be available
in the entire country.
Controversies Arising Out of Decisions Taken
in 2008 and Its Fallout
16.13. The policy measures taken so far have paid
rich dividends in terms of expansion and provision
of affordable telecom services. However, problems
arose in the implementation of the First Come First
Served (FCFS) policy framework in 2008. These
led to a legal challenge, and subsequently, in 2012,
quashing of 122 licences by the Supreme Court and
a direction by the Court that the Spectrum thus
released be auctioned. This is being done. With the
completion of the auction in the later months of
2012 it is hoped that there will be a revival of invest-
ment in this important sector.
16.14. During this period, the downturn in the econ-
omy coupled with the financial stress being faced in
the sector, dampened the growth potential of the sec-
tor. The unprecedented expansion during the initial
phase (1994–2003) followed by years of optimism in
an environment of increasing competition and more
choices in technology and services to consumers had
led the industry into an ambitious asset acquisition
mode. The over-leveraging has, partly on account of
the exuberant bidding for 3G spectrum in the auc-
tion held in 2010, led to a downward pressure on
revenues and earning capacities. The cut throat price
competition for adding customers, without adequate
emphasis on provision of value added services, have
further decelerated the industry’s growth and put a
brake on plans for network expansion as well as pro-
visioning for new services.
TELECOM EQUIPMENT MANUFACTURING,
R&D, PRODUCT DEVELOPMENT AND IPR
16.15. The Indian telecommunication industry has
now matured and has started venturing outside the
country and investing abroad. However, the telecom
manufacturing in India is yet to attract investment on
a sustained basis. During the Eleventh Plan period, it
was projected that 75 per cent of telecom equipment
demand would be met from indigenous sources;
however the actual production was much lower.
During this period, mobile handset manufacturing
began, but the production as well as value addition

262 Twelfth Five Year Plan
has been limited. Some of the indigenous brands of
mobile phones have also made their mark, though
their design and manufacturing are still being done
outside India. A number of world renowned manu-
facturers have set up their manufacturing base in the
country. There is concern about low value addition,
lack of R&D and IPR, availability of integrated cir-
cuits, components/piece-parts in the country. Some
indigenous R&D and manufacturing companies
have emerged in the country and demonstrated that
world-class products can indeed be developed indig-
enously. At the same time, some key IPRs have been
created in futuristic wireless technologies by R&D
centers such as Centre for Excellence in Wireless
Technology (CeWiT) and premier academic institu-
tions such as IITs, IISc, IIITs. It is critical to develop
an ecosystem that maintains a sustainable supply
chain from thought to action; from ideas to prod-
ucts; from development to production and actual
deployment to achieve higher value addition.
THE TWELFTH FIVE YEAR PLAN (2012–17):
CHALLENGES AHEAD
16.16. The sector stands at the cross roads of oppor-
tunities as well as challenges at the beginning of the
Twelfth Plan. On the one hand, recent developments
in the sector arising out of aberrations in the licens-
ing and policy implementation have provided an
opportunity for introspection. On the other, there is
a need to sustain the growth momentum in the sec-
tor achieved during the Eleventh Plan to realise the
objective of inclusive growth. The National Telecom
Policy-2012 has been adopted against this backdrop
to address all the key challenges before the sector
in a holistic manner. NTP-2012 seeks to achieve
Broadband on Demand and envisages leveraging
telecom infrastructure to enable all citizens and busi-
nesses, both in rural and urban areas, to participate
in the Internet and web economy thereby, ensuring
equitable and inclusive development. The objective
is to transform the country into an empowered and
inclusive knowledge-based society, using telecom-
munications as a platform. It provides the enabling
framework for enhancing India’s competitiveness in
all spheres of the economy. NTP-2012 envisions sup-
port to platform neutral services in e-governance and
m-governance in key social sectors such as health,
education and agriculture that are at present limited
to a few organisations in isolated pockets. In order to
achieve the objectives laid down in the NTP 2012, we
need to address certain critical constraints and chal-
lenges. Some of these are discussed below.
16.17. Expansion of Reach—Broadband Services:
A key thrust area is to connect all villages with pop-
ulation more than 500 on National Optical Fiber
Network (NOFN) to realise the vision of ‘Broadband
on Demand’. Similarly, ensuring sufficient allocation
of resources like spectrum, ‘Right of Way’ manage-
ment and infrastructure sharing for broadband is
essential. There is a need for national level effort to
harmonise the policies of various state governments/
local bodies to address issues relating to allocation of
land, power supply, grant of right of way and policy/
by-laws for erection of towers and so on. In addition,
there is a need to provide incentives to encourage the
uptake of broadband in sectors like education, health-
care, public safety, government operations, and so on.
16.18. Rollout of 3G/4G: Though the 3G spectrum
was acquired by the Telecom Service Providers
(TSPs) during 2010, the rollout of 3G services is yet to
reach out across the country at affordable rates. This
has affected the introduction of value added services
requiring higher bandwidth. India being a price sen-
sitive market, one of the main reasons for poor rollout
of 3G/4G services is the high cost of smart phones.
There is an urgent need to encourage technologies
and R&D initiatives to pave way for the introduction
of cost effective smart phones for expanding penetra-
tion and out-reach. Provision of funding and sup-
port to encourage the rollout of mobile broadband
on 3G/4G/LTE/BWA spectrum in rural and remote
areas will be crucial for broadband expansion.
16.19. The fulcrum in the sector is the issues sur-
rounding spectrum, its availability, management
and pricing. Telecommunications is characterised by
rapid changes in technology and introduction of new
technologies like Long Term Evolution (LTE), high
bandwidth applications and the demands of an ever
increasing user base requiring additions to the spec-
trum available for non-strategic uses. Since spectrum
is a scarce resource, priority will be on its vacation
from lesser efficient uses and shift to more efficient
use. This will involve intensive policy intervention

Communication 263
to have Government agencies like the Defence and
Railways vacate spectrum bands and reforms in
spectrum management practices. It has already been
decided to allow a liberalised use of spectrum in any
band for any technology. In addition sharing spec-
trum and thereby pooling resources and eventually
move towards a regime that permits spectrum trad-
ing on a trading platform and creating a market
driven mechanism towards its efficient use. Box 16.1
gives the historical perspective of spectrum trading.
Box 16.1
Spectrum Trading
Historically, in most countries, the Regulator has used a
command and control mechanism to decide allocation of
spectrum. But in the last decade, a number of countries have
adopted market mechanisms for spectrum assignment.
However, it is being increasingly felt that this system does not
allow the spectrum licence holders the flexibility to respond
quickly to changes in market demand and technology,
resulting in chunks of spectrum lying underutilised, thereby
creating an artificial scarcity. Therefore, some countries like
Australia, Canada, New Zealand, and some EU countries
have permitted spectrum trading in the secondary market as
an additional means of spectrum distribution. This is likely
to improve spectrum efficiency, boost market competition
and provide incentives to innovation to service providers.
On the other hand it could lead to situations wherein service
providers of less profitable services would prefer to sell their
spectrum instead of continuing to provide services and
which may increase the risk of possibility of concentration
of spectrum and market power. Spectrum Trading requires
implementation of a successful trading platform in the form
of a secondary market requiring creation of an extensive
automated infrastructure in the form of an exchange/online
registry which entails considerable regulatory costs.
16.20. Consolidation in Industry: Presently, there
are six or more TSPs in most of the service areas and
are grappling with reduced ARPUs and high com-
petitive pressures. The future development of cellu-
lar markets is likely to witness consolidation between
the Service Providers to become financially viable.
The revised TRAI recommendations with the relaxa-
tion of M&A norms are expected to act as enablers
for further consolidation in the telecom industry.
16.21. Financial Health of the Sector: The aggres-
sive bidding in 3G/BWA spectrum auction held in
2010 left the industry financially weak. In addition,
expansion into overseas markets, coupled with the
global meltdown and non-availability of funds has
restricted the industry’s expansion plans. This to a
large extent has decelerated network expansion as
well as introduction of new technologies such as 4G/
LTE and value added services.
16.22. Licensing Reforms: For facilitating orderly
growth of the telecom sector, steps such as introduc-
tion of Unified Licensing regime, de-linking license
and spectrum, license renewal terms, technology neu-
trality, rationalisation of licensing regime and enabling
convergence need to be taken on priority basis. In
addition, there is a need to encourage deployment of
Low Power In-Building Solutions (IBS)/In-Campus/
Remote Townships and so on, in tune with the provi-
sions contained in NFAP 2011 and NTP 2012 through
de-licensing of small chunks of spectrum.
16.23. Regulatory Issues: TRAI was established
in 1997 after the sector was thrown open to pri-
vate players. Since then there has been far reaching
changes including number of operators, subscriber
base and range of services being offered. There is a
need to revisit the TRAI Act and revise its provisions
to address the emerging issues. There is also a need
to review the regulatory and executive functions for
instance, the Department of Telecommunication is
involved in activities which are mandatory in nature
such as spectrum allocation, management, audit-
ing and monitoring. For effective and transparent
Spectrum allocation and management and to facili-
tate better coordination amongst various govern-
ment and non-government agencies, the National
Radio Regulatory Authority namely, the Wireless
Planning and Coordination (WPC) wing of DOT,
needs to be repositioned with greater autonomy and
fuller authority.
16.24. Network Security: With rapid expansion of
telecom and IT networks and increased depend-
ence on the networks for delivery of services and
operation of physical and financial infrastructures
has given rise to security concerns. There is an
absolute necessity to ensure security of networks at
all times and adopt effective measures to deal with
cyber threats. For ensuring telecom network secu-
rity there is a need to strengthen the Centre for
Communication Security Research and Monitoring
and Telecom Testing and Security Certification

264 Twelfth Five Year Plan
Centre. Similarly, developing and deploying a Pan
India secure network and network-based services
such as email, VoIP, mobile communication through
survivable and available network architecture for
Government use is also essential.
16.25. Convergence: Convergence of technologies
has thrown open many new challenges and opportu-
nities. This calls for establishment of a proactive and
suitable regulatory framework which would address
issues related to both content and carriage, there by
leading to eventual convergence of IT, Broadcasting
and Telecom.
16.26. Future of PSUs: The poor health of the PSUs
under DOT is a matter of concern. The Department
has under its administration control, not only MTNL
and BSNL, but also the Indian Telephone Industries
(ITI) and Telecom Consultants of India Ltd. (TCIL).
Urgent steps are required to be taken to turn them
around by leveraging upon their strengths and assets
as well as financial reengineering. For ensuring DOT
organisations to effectively flourish in the competi-
tive telecom market there is a need to exploit individ-
ual strengths of these organisations for their mutual
benefit. Efforts should be made by all the PSUs to
reduce their dependence on government support
and become competitive by shedding obsolete tech-
nological and non-profitable product lines and mov-
ing on to more remunerative activities and services.
There is also a need to look for newer markets and
alliances. Government support should be restricted
only for initiatives which address and meet the social
obligations of the government and in areas where the
market is not fully developed.
16.27. Issues of Transition: The telecom sector
faces rapid technological change and concomitantly
issues relating to transition to new technologies and
obsolescence. The phasing out of technologies where
eco-systems are dying, has attendant economic dif-
ficulties. There is therefore, a compelling need for
ensuring minimum quantum of spectrum allocation
for effective harnessing of technology and paving the
way for the entry of new technologies, calling for an
appropriate policy response which helps in the adop-
tion of new technologies and creating appropriate
eco systems for ensuring a smooth transition.
Box 16.2
Twelfth Plan Targets for the
Telecommunication Sector
• Provision of 1,200 million connections by 2017.
• Mobile access to all villages and increase rural tele-
density to 70 per cent by 2017.
• Broadband connection of 175 million by 2017.
• Commissioning of National Optical Fibre Network
(NOFN)
• Make available additional 300 MHz of spectrum for
IMT services
• Making India a hub for telecom equipment manu-
fac turing by incentivising domestic manufacturers
with thrust on IPR, product development and
commercialisation.
• Provide preferential market access for indigenously
manufactured products.
• To increase domestic manufactured products in
telecom network to the extent of 60 per cent with value
addition of 45 per cent by 2017.
• Adoption of green policy in Telecom and incentivise
use of renewable energy sources.
THE PATH AHEAD
16.28. The Twelfth Plan Programmes for the telecom
sector are guided by the NTP-2012. The thrust of
NTP 2012 is on raising the competitiveness of Indian
telecom sector, to make it a world leader, while at the
same time making available a variety of services on a
single platform utilising the technological advance-
ments taking place in the sector. Spectrum, which is
an important input has been a limited and reusable
resource. With the introduction of new technolo-
gies, high bandwidth applications and increasing
user base, there will be a requirement of significant
amount of additional spectrum. While effective spec-
trum planning in this regard needs to be carried out,
the requirement of spectrum in 60 GHz and above
bands for backhaul purposes, audit of spectrum
usage and re-farming of spectrum to ensure the effi-
cient utilisation should also be taken into account
during the Twelfth Plan Period. Twelfth Plan targets
for Telecommunication Sector is given in Box 16.2.
16.29. In view of the situation analysis and the iden-
tified needs of the key stakeholders, the following
approach is suggested for Twelfth Plan period.
(a) USOF Activities: USO fund needs to be lever-
aged for providing incentives for pilot projects,

Communication 265
fixed wireline/wireless phones, use of renewable
energy sources, telecom infrastructure and for
wireline broadband in rural difficult terrain and
LWE areas.
(b) Applications, Value Added Services (VAS) and
Devices: Development of new applications, VAS
and devices would be triggered by e-Governance
projects and growth of Broadband in Rural
Areas. Developing synergies between DoT, DeitY
and I&B to tap the Cable TV segment for prolif-
eration of broadband and broadband access to all
schools for promoting literacy through e-learning
programs will also propel the introduction of
VAS and development of low cost devices.
(c) Telecom Equipment Manufacturing: The large
and growing domestic market for telecom equip-
ment provides an opportunity to leverage this
potential to stimulate domestic manufactur-
ing without financial impact to the government.
Provision has been made to require India manu-
factured products in procurement by the govern-
ment and also in projects funded by government
or under Universal Service Obligation. The pref-
erence is for products which have a specified
domestic manufactured content and the require-
ment is only of manufacture/value addition in
India. Foreign companies manufacturing in
India would be eligible. Telecom Operators also
need to be encouraged to participate in trials of
newly created Indian products and nurture them.
Funding R&D and supporting Indian IPR cre-
ation and driving standards are equally impor-
tant aspects of the promotion of the telecom
equipment manufacturing. Creation of National
Investment and Manufacturing Zones (NIMZs)
as proposed by DIPP and incentivising manu-
facturers in line with Modified Special Incentive
Programme scheme (MSIPs) and Electronic
Design and Manufacturing Cluster (EDMC) of
DeitY are other initiatives that need to be taken
forward for the growth of telecom equipment
manufacturing in India. Setting up of Mega
Fabrication Units (FAB) facility for the manu-
facture of Integrated Circuits (IC), Development
of Hardware Manu facturing Cluster Parks
(HMCPs), Stable fiscal policies, tax structure
that encourages manufacturing, Market pull for
domestic manufacturers, R&D facilities, access
to low cost funds, testing and certification and so
on, also need to be taken up to make India a tele-
com equipment manufacturing hub.
(d) R&D, IPR and Standardisation: There is a
need to create a mechanism for Technology and
Product development forecast and to carryout
periodic updates of the national five year rolling
programme of technology/product development
and its field absorption. The current function-
ing and strengthening of public R&D institu-
tions such as C-DOT also needs to be reviewed
to enable them to collaborate with public as well
as private industry and academia for technology
development. In order to enable creation of IPRs
and progressively mature them into standards,
Telecom Standards Development Organ isation
(TSDO) may be established with participation
from industry, telecom service providers, aca-
demia, R&D centres and government. Academic
R&D, R&D centres and Telecom Centre of Excel-
lence (TCoEs) need to be repositioned towards
IPR generation and creation of telecom stan-
dards, development and commercialisation of
Indian Products. Some of the other major initia-
tives include Strengthening Telecom Engineering
Center; setting up of accredited test facilities for
conformance, performance, inter-operability
and security of the products; creation of live test-
beds for Next Generation technologies; reserving
certain spectrum for indigenous R&D, product
development and field trials (pilots); developing
safety and aesthetic standards for wireless tow-
ers; and ensuring compliance against existing
Electromagnetic (EM) emission standards.
(e) Disaster Management: A Rapidly Deployable
Multi-Protocol Wireless Communication sys-
tem, interoperable across all the services engaged
in disaster management needs to be developed.
A dedicated communication link needs to be
given to disaster management agencies by every
service provider to receive guaranteed service
during disasters.
(f) Capacity Building in Telecom Sector: For
evolving a strategy for capacity building in tele-
com sector there is a need for a comprehensive
repository of all telecom related information/
standards/benchmarks/resources/programme
curriculum, besides setting up of state-of-the-art

266 Twelfth Five Year Plan
telecom labs in all high-end technology areas and
inclusion of Electronics and Telecom as part of
the curriculum at the polytechnic level and in
Industrial Training Institutes for trades specific
to telecom.
(g) Financing of Telecom Sector: The sector
should be allowed to access funding from Indian
Infrastructure Finance Company Ltd. (IIFCL).
Telecom Finance Corporation may be created
as a vehicle to access funds at competitive rates
to facilitate the funding needs of this sector on
requirement. Rationalisation of levies and taxes
in the sector may also be reviewed from time to
time to ensure affordable delivery of services to
the consumers.
(h) Besides the above, several new programmes
like Telecom Promotion Fund, Telecom Entre-
preneurship Promotion Fund, Research Develop-
ment Fund and Human Resource Development
and Skill Development are proposed to be taken
up during the Twelfth Five Year Plan. C-DOT
would take programmes on Next Generation
Mobile Technology, R&D for emerging Wireless
Technologies; Optical Technologies—XGPON-
1/2, WDM-PON, DWDM; Development for a
Secure Mobile Communication Network namely
WiPS based GSM technologies like EDGE and
3G, BWA; Satellite based Technology; R&D for
converged NMS, Software intensive Applications
for new services, service delivery platform to
support multiple applications and Value Added
Services; Power efficient and Green Technologies
for Rural areas and Next Generation security for
Telecom and Data Networks. Major Investment
would be required during the Twelfth Five Year
Plan in the area of network expansion in the rural
and remote areas, network upgradation in cus-
tomer demand cycles, 3G subscriber base, NGN
and IPV6, rural telephony, broadband expansion,
National Optical Fiber Network (NOFN), con-
vergence of technology, Value Added Services
and manufacturing and R&D.
INFORMATION TECHNOLOGY
Overview of the Sector
16.30. The Information Technology sector has
made remarkable progress in the last decade. It has
transformed the world, enabling innovation and
enhancing productivity, connecting people and com-
munities, and improving standards of living and pro-
viding opportunities across the globe. While changing
the way individuals live, interact, and work, IT has
also proven to be a key enabler for enhanced compet-
itiveness and economic and societal modernisation,
as well as an important instrument for bridging eco-
nomic and social divides and reducing poverty.
16.31. The pace of technological advance is accel-
erating and Electronics and ICT is increasingly
becoming a ubiquitous and intrinsic part of peo-
ple’s behaviours and social networks as well as of
business practices and government activities and
service provision. These transformations will con-
tinue to guide human progress forward by further
leveraging IT’s positive social, political, and eco-
nomic impact on government, enterprise, and civil
society alike.
Review of Eleventh Plan
16.32. The following five thrust areas were identified
for the Eleventh Five Year Plan:
• Electronics/IT Hardware Manufacturing
• Exports of Computer Software and Services
• Domestic Computer Software and Services
• Enhancing Cyber Security Capabilities
• Human Resource Development and R&D
16.33. The key targets and achievements with respect
to Electronics/IT Hardware Manufacturing, Exports
of Computer Software and Services and employment
are given in Box 16.3 and Table 16.1.
Broad Objectives, Targets and Thrust Areas
for the Twelfth Five Year Plan
16.34. The vision and mission for Electronics and
IT Sector for the Twelfth Five Year Plan is e-Devel-
opment of India through a multi-pronged strategy.
This includes promotion of e-Infrastructure creation
to facilitate and fast track e-governance, promotion
of software (IT-ITeS) Industry, building knowledge
network and securing India’s cyber space. While
India’s software strengths are recognised globally,
we have not focused on building indigenous hard-
ware, research and manufacturing capabilities. The

Communication 267
Box 16.3
Key Achievements (as on 31 March 2012)
E-Governance
• SWANs rolled out in 30 States/UTs.
• 1,00,086 Common Services Centres rolled out in 33 States/UTs.
• 16 State Data Centres are operational.
• The National Data Centres at Delhi, Pune and Hyderabad are operational.
National Knowledge Network
• 681 links to institutions commissioned and made operational.
• 52 virtual classrooms set up.
Enterprise
• Open Source Software (BOSS) released.
• Param ‘Yuva’ Super computing system commissioned.
E-Security
• The Information Technology (Amendment) Act, 2008 enforced and rules of important sections notified.
• Security Assurance frame work for Govt. developed and validated in Customs Department.
• Resource Centre for Cyber Forensics established.
• CERT-In operates a 24 × 7 Incident Response Help Desk.
Empowerment
• Software tools and fonts for all 22 constitutionally recognised Indian languages released in public domain.
• Various IT projects initiated for empowerment of gender and SC/ST and development of North Eastern region.
Draft National Policy on Electronics—2011 and Draft National Policy on Information Technology, 2011 released.
Policy for Preference to Domestically Manufactured Electronic Goods issued on 10 February 2012.
TABLE 16.1
Targets and Achievements
Targets Achievements (Estimated)
upto 2011–12
Percentage
Achievement (%)
Electronics Hardware
• Electronics production—US$ 67 Billion @ 32 per cent growth
• Exports—US$ 6.7 Billion
US$ 33.0 Billion
US$ 7 Billion
49
104
Software Services
IT-ITES Exports—US$ 86 Billion US$ 69 Billion 80
Employment
• Direct Employment in IT-ITES Exports—3.4 Million 2.8 Million 82
Electronics and ICT strategy for the Twelfth Plan
should aim to focus on promoting domestic man-
ufacturing, including hardware design, building
Semiconductor Wafer Fab manufacturing facilities
and strengthening R&D capabilities.
16.35. Appropriate application of ICT has the poten-
tial to vastly improve productivity and efficiency.
Therefore, there is a need to promote the use of ICT
platforms and convergence of technologies to ensure
better delivery of public services, increased efficiency
in the implementation of the Government’s flagship
programmes and the overall competitiveness of the
economy, since ICT applications will have a perva-
sive effect on the resilience and dynamism of all sec-
tors of the economy.

268 Twelfth Five Year Plan
16.36. India is home to millions of persons with dis-
abilities who are living on the fringes of society due
to their inability to participate in the information
age. There is a need to redefine important areas for
intervention with emphasis on improving the acces-
sibility of ICT to the differently-abled people of the
society as well as promoting its use as an assistive
technology to improve their quality of life.
16.37. In order to achieve the objectives of the
Twelfth Five Year Plan, the following themes have
been identified:
• e-Government
• e-Learning
• e-Security
• e-Industry (Electronics System Design and
Manufacturing)
• e-Industry (IT-ITeS)
• e-Innovation/R&D
• e-Inclusion
16.38. The overall strategy for the sector is to
plan action/programmes/projects for each of these
themes in the Twelfth Five Year Plan, with innova-
tion and inclusion as the fundamental paradigm in
each one of them. The Sub-strategies under each of
these areas have been designed to address suitably
the major challenges facing the sector in the next
five years. The key targets for the Twelfth Plan for
the Electronics and IT-ITeS Industry are given in
Table16.2.
Policy Issues, Programme Reforms and New
Initiatives in the Twelfth Plan
16.39. Some of the Policy issues and new initiatives
proposed in the Twelfth Five Year Plan are given
below:
Policy Issues
• Several new policies have been approved by
Government relating to promotion and develop-
ment of the ESDM sector. A Governance mecha-
nism which would ensure that the benefit of these
and other policies envisaged for the sector reach
the targets in a speedy, fair and transparent man-
ner also needs to be developed. Necessary policy
to mandate standards in electronic goods also
need to be put in place. Policies to induce greater
participation of private sector in human resource
development also need to be ensured.
• Finalisation and implementation of National poli-
cies on Electronics and Information Technology,
spanning the entire spectrum from science to
TABLE 16.2
Key Targets for the Twelfth Plan for the Electronics and IT-ITeS Industry
(Values in USD Billion)
I. Production and Export Targets (Electronics Hardware)
A. High Manufacturing Growth Scenario (Optimistic)
Description FY 2011–12 (E) Target FY 2016–17
Exports (Growth Rate: 22 per cent) 7 20
Production (Growth rate 30 per cent) 33 122
B. Natural Manufacturing Growth Scenario
Exports (Growth Rate: 22 per cent) 7 20
Production (Growth rate 16 per cent) 33 69
II. Revenue and Employment Targets of IT-ITeS Industry
IT-ITES Exports 69 130
IT-ITES Domestic Revenue 19 40
Direct Employment 2.8 million 4.2 million
(E): Estimated.

Communication 269
technology to products, eventually resulting in
mass scale deployment.
• Establish ‘National Electronics Mission’ to help
in synchronised functioning of the industry
through effective coordination across ministries
and government departments at the Centre and
the States.
• Removing barriers of cost, language and acces-
sibility and provide equitable access to Internet
and its benefits to all. Formulate and implement
a national digitisation plan and a digital informa-
tion literacy campaign for enabling the common
man to use ICT optimally.
• Create a comprehensive national IT standards
framework for current and emerging paradigms
like bio-metrics, cloud computing, Green IT and
so on.
• Formulate specific policies to enable public Cloud
Computing for citizens, business verticals and for
government.
• Formulation of governing principles for alloca-
tion, management and sharing of Critical Internet
resources namely Internet Protocol addresses and
Domain Names.
• Bring out Best Practices and Public Policy on
Internet openness, security and privacy in
cyberspace.
• Promote development and deployment of security
standard and practices, which are internationally
accepted for ensuring a secure cyber space.
• Participate globally in standard setting exercise on
Electronics and ICT for business and consumer
applications to ensure competitiveness of Indian
industry.
• Develop strong capabilities in encryption, foren-
sics and establish test labs for testing products
for security and quality; early detection and miti-
gating capabilities of newer threats and vulner-
abilities, which have potential to disrupt the ICT
infrastructure.
• Creation of a separate Electronics Development
Fund with Govt. and Industry bodies as stake-
holders to incentivise R&D in this field.
• Promotion of indigenous R&D and product
development coupled with progressive induction
into strategic defense and civilian space.
• Develop a holistic approach for funding
socially relevant R&D projects in Public Private
Partnership (PPP) modes.
• Define ‘R&D in Services’ specially, R&D in
Electronics and ICT Services to make it broad
based. The present definition of R&D as accepted
by DSIR and Income Tax Department appears
weak to accept R&D in Services.
• Initiation of a comprehensive IPR promotion pro-
gramme covering education, awareness creation,
IP exchange, related technology development and
support to SMEs and start-ups.
• Revamping the procurement cycle for Electronics
and ICT products and services to keep them in
tune with the technology obsolescence and shelf
life of products. Also there is a need to relook at
the 100 per cent pre-dispatch acceptance testing
clause.
• Ensure flexibility in policy to support and adopt
new and emerging technology paradigms in
Electronics and ICT
New Initiatives
• Modified Special Incentive Package Scheme for
improved value addition: Manufacturing base
of electronic products in the country is grossly
inadequate in comparison to demand of such
goods. Even in cases where products are manu-
factured in India, the extent of domestic value
addition is low. This scheme (M-SIPS) has been
introduced to promote large scale manufacturing
in the Electronics System Design Manufacturing
(ESDM) sector by providing a special incentive
package. The incentives would partially offset the
disabilities faced by domestic ESDM industry due
to factors like higher cost of power, finance, logis-
tics, fragmented location of industry and so on,
and thereby reduce the viability gap faced by the
manufacturing units in India.
• Promotion of Electronics Manufacturing Clusters
(EMC): The growth of the Electronics System
Design and Manufacturing (ESDM) industry
in the country is constrained by infrastructure,
power and finance, the three elements of operat-
ing environment which needs to be addressed.
The scheme envisages financial support for devel-
opment of EMCs as they are expected to aid the

270 Twelfth Five Year Plan
growth of ESDM sector, help development of
entrepreneurial ecosystem, drive innovation and
catalyse economic growth. The scheme would
support setting up of both Greenfield (in unde-
veloped/underdeveloped geographical area) and
Brownfield EMCs (where a significant number of
existing ESDM units are located). The focus is on
upgrading infrastructure and providing common
facilities for the ESDM units.
• Semiconductor Fabs: Semiconductor is at the
heart of any electronic system and constitutes at
least 25 per cent of the total value. In case of high-
end equipment and mobile handsets, this content
goes as high as 60 per cent. Presently, while this
is imported, in order to enable manufacturing of
electronic equipment and also push up the value
addition in India, setting up of Semiconductor
wafer fab (full scale as well as proto type) is a pre-
requisite and critical requirement for enhancing
domestic manufacturing capabilities in India.
• Cyber Security R&D and Human Resource
Coordination: The focus would be on supporting
and facilitating basic research, technology dem-
onstration, proof of concept and test bed projects
in thrust areas of cyber security through spon-
sored projects at recognised R&D institutions.
Proactive and collaborative actions in PPP aimed
at cyber security incidents prevention, prediction,
response and recovery actions and cyber security
assurance will be the cornerstone for the cyber
security R&D and human resource coordination.
• Cyber Security Preparedness: In order to ensure
the cyber security preparedness, an improved
interaction and engagement with various key
stakeholders such as Govt., critical infrastructure
sectors, sectorial CERTs, International CERTs,
service providers including ISPs, product and
security vendors, security and law enforcement
agencies, academia, media, NGOs and cyber user
community is essential. Carrying out periodic
cyber security mock drills to assess the prepared-
ness of critical sector organisations to resist cyber-
attacks and improve the security posture are some
other important steps in this regard.
• Green IT: Enhanced deployment and usage of
Green IT in both computing and non-computing
infrastructure (for example, buildings) would be
promoted. Procurement policy needs to incor-
porate guidelines for preference for energy effi-
cient products and to drive Green rating and
stricter regulation and implementation of e-waste
disposal.
• Promote E-Governance cloud: Cloud computing as
a technology paradigm has a tremendous poten-
tial to reduce cost, implementation timelines and
increase reusability. There should be an increased
focus on cloud computing as a mainstream deliv-
ery model by establishing an ‘e-Gov Cloud’ which
can be accessed by various tiers of government to
implement digital public services.
• Promotion of use of ICT by domestic industry for
enhancing productivity in priority sectors like agri-
culture, health, education, retail, automotive, tex-
tile: With the emergence of country-wide high
bandwidth broadband networks, there is a need to
build HR centric applications such as virtual labs,
country wide virtual classrooms, and so on to ride
on these platforms for improving the quality of
students, faculty as well as research. There is also
a need to continue with the programme on devel-
opment of suitable technology/products for mass
applications in these sectors.
• Promote development of SMEs in ICT Sector: The
Software Technology Park scheme has played
a stellar role in the growth story of the IT-ITeS/
BPO sector in the country. To provide competi-
tive edge to small and start-up companies and to
attract investments beyond Metro cities (that is
Tier II and Tier III cities), there is a need for simi-
lar enabling environment.
• Enhancing Supercomputing Capacity in India:
Supercomputing plays an important role in both
scientific advancement and economic com-
petitiveness of a nation. In order to keep pace
with supercomputing developments globally, it
is important that we focus on building super-
computing systems of different sizes match-
ing with the demands of HPC user applications,
Supercomputing applications development,
manpower development and R&D for Exascale
computing by leveraging the already built HPC
capabilities in the country.
• Citizen Engagement Framework for e-Governance
Projects: As the government is incorporating ICT

Communication 271
into delivery of G2C services, there are hardly any
embedded mechanisms to facilitate the voice and
space for citizen participation in e-governance.
It is with this vision that Citizen Engagement
Framework (CEF) for e-Governance projects has
been conceptualised. In addition, Social Media
Framework for the Government of India has been
created to enable government agencies to use
blogs, forums and online social networks more
effectively and reach out to their stakeholders and
understand their concerns and hear their voices.
• HR Policy Framework for e-Governance: There is
an urgent need not only to augment the HR pool
but to create suitable organisational structures
with clear roles and responsibilities for imple-
mentation of e-Governance projects. To supple-
ment the resource pool within the Government,
competencies outside the Government ought
to be leveraged and an enabling framework for
attracting, retaining and optimally utilising such
skilled persons need to be put in place. Setting
up of an e-Governance Academy as a Centre
of Excellence and think tank in this area is also
desirable.
Key Constraints and Challenges
16.40. The sector is facing numerous constraints and
challenges. A list of these constraints and challenges
theme wise is given below:
• e-Government
–Business process re-engineering (BPR):
Implementation of BPR as an integral part of
e-government programmes on the national and
local levels, especially for those involving the
transition to single-window electronic services’
delivery based on integration of information
systems operated by multiple agencies.
– Fast tracking of the Mission Mode Projects
identified under the National e-Governance
Plan for electronic service delivery is a formida-
ble challenge in view of the fact that a number
of actors covering central, State and local gov-
ernments are involved.
– Constraint of internal capacity to manage
large e-Governance Projects and resourcing of
Skilled, experienced manpower across all stage
of Life Cycle.
–Mobile Governance: Providing adequate finan-
cial and institutional support to various agen-
cies to foster creativity and innovation in
developing appropriate applications for mobile
based delivery of public services is very impor-
tant with the involvement of all stakeholders in
the supply chain.
–E-waste management: IT can be a strong enabler
for realising the objectives of India’s National
Action Plan for Climate Change. Sustainable
and environment friendly E-wastage manage-
ment should be a part of these objectives.
–Government procurement: Adoption of stan-
dardised RFPs, Model Contracts, developed by
DeitY, to reduce procurement cycles.
• E-Learning
– Create and leverage Government e-Learning
platform to aid training and skills development
of Government Staff, especially end-users at
junior level for driving adoption of e-Gover-
nance systems.
–Natural Language Processing (NLP) is a com-
plex technology area. Building any language
technology product requires large resources.
There are very few researchers working in the
NLP area and constant efforts are required
to expand the team all over India to address
requirement of all 22 constitutionally recog-
nised languages. Issues related to e-Pedagogy
for content and its delivery on the e platform,
establishment of e-classrooms for delivery of
e-content and e-learning are very important
and the corner stone for the successful imple-
mentation of e-learning module.
• E-Security
–Cyber security: In addition to land, sea and
air, cyber space is a new dimension without
any borders affecting each individual. There
is increasing evidence of espionage, targeted

272 Twelfth Five Year Plan
attacks and lack of traceability in the cyber
world as state and non-state actors are compro-
mising, stealing, changing or destroying infor-
mation and therefore potentially causing risk
to national security, economic growth, pub-
lic safety and competitiveness. Therefore, it is
essential to focus on R&D, Human Resource,
Security Standards and Certification and Cyber
Security coordination in order to overcome
such challenges during the Twelfth Plan.
• E-Industry (Electronics Hardware and IT-ITeS)
–Competition and strong pull from other coun-
tries: China, Philippines, Vietnam, Poland,
Hungary, Mexico, Brazil, Egypt are an indica-
tive list of countries that are emerging as com-
petitive locations for IT-ITeS sector. These are
fast increasing to almost 50 locations which
presents a huge challenge to India’s suc-
cess story. India’s biggest competition in the
Electronics Hardware sector is from China,
which has achieved high economies of scale
and has highly subsidised operating environ-
ment which is largely opaque.
–Reduced competitiveness of the industry: India’s
competitiveness in IT-ITeS Sector is declin-
ing due to high cost of doing business due to
inefficiencies of power, transport, security,
concentration in metros due to inadequate
infrastructure in other towns and so on.
–‘Made in India’ procurement: Indian firms par-
ticularly the SME firms who develop products
find it difficult to sell to the Government as
they lack the sales capacity or they fail to meet
the qualifying procurement criteria, for exam-
ple, annual revenue, number of customer and
so on. As a result the ‘Made in India’ IT prod-
ucts find it difficult to scale up.
–Lack of research capacity: A key weakness of
the Indian IT industry including Government
agencies is the lack of original technology
development. Majority of IT deployed in
India is either imported or IPR resides with
non-Indian entities. Innovation ecosystems in
places like Silicon Valley, which lead in tech-
nology development, have demonstrated that
a key lever for technology development is the
maturity of the post-graduate and doctoral
research programmes. In India, the number
of computer science doctoral research pro-
grammes is very low—both qualitatively and
quantitatively.
–ITA and the WTO: Electronics was the first sec-
tor to be opened up and which accepted zero
duty regime for large number of products. As
a signatory to the Information Technology
Agreement-1 (ITA-1) of the World Trade
Organization (WTO), India has implemented
zero duty regime on 217 product lines. Under
the Free Trade Agreements (FTAs) and
Preferential Trade Agreements (PTAs) with
various countries, the import of electronics
hardware from these countries is allowed at a
duty which is lower than the normal duty rate.
–Disability Costs in local Manufacturing: The
three elements of operating environment which
pose significant challenges to Indian manufac-
turers are: infrastructure, power and finance.
–Lack of support for industry led innovation:
Electronics Sector constituted one of the largest
IP wealth in the world. These IPRs have been
created by industry competing with each other.
However, our efforts have not led to industry
led innovation in the sector. During the Twelfth
Five Year Plan efforts would be to stimulate
provision of risk capital to seed new ideas and
startups in Electronics System Design and
Manufacturing. An Electronic Development
fund is proposed to be set up with industry/
financial institutes’ participation.
Path Ahead
16.41. Widening of R&D base, promoting R&D for
manufacturing and creation/augmentation of R&D
infrastructure in the field of Electronics and IT is
essential for maintaining the competitive edge.
16.42. The Information, Communication
Technology and Electronics (ICTE) has come to
be accepted as a key enabler in development and
is globally being accepted as a ‘Meta-Resource’.
The demand for electronics hardware is increas-
ing and demand supply gap is widening. Moreover,

Communication 273
since the value-addition in domestically produced
electronic goods is very small. Therefore, there is a
need to offset the debility and attract Investments
in ESDM Sector by providing suitable incentives to
the sector.
16.43. To realise the vision of NEGP, there is a need
to reorient the activities for maximising outcome to
the citizens. Electronics Delivery of Services (EDS)
Act needs to be put in place at the earliest in order to
mandate provisioning of all public services compulso-
rily through electronics means from a specified date.
Electronics and ICT are all pervasive today and there
is a dire need to synergise with the important initia-
tives and capabilities in the strategic departments.
INDIA POSTS
Overview of the Sector
16.44. India Posts has been the backbone of India’s
communication and at the core of the country’s
social-economic development for the last 150 years.
It has touched the lives of every citizen. A network of
1.55 lakh (approx.) Post Offices (POs) in the country
with more than 1.39 lakh POs in rural areas is indic-
ative of the commitment of the department towards
its customers. The core activity of the department
is processing, transmission and delivery of mails.
The department has undertaken Mail Network
Optimisation Project to improve the quality and effi-
ciency of mail processing, transmission and delivery.
Considering the vital need for providing benefits of
technology to the customers, the counter operations
are now being progressively computerised.
16.45. The Post Office Savings Bank provides finan-
cial inclusion to people all over the country through
various saving schemes, as its reach and services
are unparalleled by any other banking agency in
the country. Postal Life Insurance (PLI), one of the
oldest life insurance schemes initially meant only
for the Postal employees, now caters to employees
of the Civil and Military Personnel of the Central
and State Governments, local bodies, government
aided educational institutions and so on. Following
the recommendation of Malhotra Committee on
Insurance Sector Reforms, the Department of
Posts (DoP) started the Rural Postal Life Insurance
(RPLI) Scheme for insuring the rural populace with
special emphasis on women and weaker sections of
Society.
16.46. The department is facing twin challenges
posed by increasing competition and continu-
ing advances in communication technologies. The
department has therefore initiated an end to end
IT modernisation project to connect all the 1.55
lakh post offices. The benefits and impact of this IT
project will flow into all the Twelfth Five Year Plan
schemes and activities and the next five year Plan
period will be extensively a period for consolidation
and implementation of the IT project.
Review of the Eleventh Five Year Plan
16.47. The Eleventh Five Year Plan witnessed the
continued drive of computerisation of the post
offices, administrative offices and accounts offices
and completion of the supply of hardware to depart-
mental post offices. Establishment of a strong IT
base has enabled Department of Posts to provide
several value added services, besides providing
the platform for anywhere anytime banking. Mail
Network Optimisation Project and setting up of
Automated Mail Processing Centres were under-
taken to improve the quality of mail operations.
Postal Life Insurance is being transformed into
a commercial business entity with the develop-
ment and operationalisation of software modules
for reporting daily net accretions of POLIF and
RPOLIF by Head Post Offices. The Department of
Posts has steadily expanded the insurance business
during the Eleventh Five Year Plan. As on 31 March
2012, Postal Life Insurance had 5.6 million policies
and Rural Postal Life Insurance had 19.63 million
policies with a total sum assured of `79,183.44 crore
and `82,540.86 crore respectively.
16.48. The department in last few years has also
computerised 24,969 post offices and networked
22,177 post offices (as on 30 June 2012) in urban and
rural areas. The department has also taken up Project
Arrow for modernisation of post offices, as a part
of which, 1,736 post offices have been modernised.
India Post, 2012 Project aims to roll out integrated

274 Twelfth Five Year Plan
software for Postal Banking, Postal Life Insurance,
e-commerce and retailing. In addition, it will also
provide rural ICT solution to more than 1,30,000
POs. With the introduction of ‘One India One Rate’
scheme, speed Post was expanded to cover more than
1,200 towns. The department has also completed
construction of 95 post offices, 13 administrative
offices and 15 staff quarters projects, besides organ-
ising the 6th World Philatelic Exhibition INDIPEX.
Some of the other achievements include introduction
of e-Post Office, opening of 1,008 franchisee outlets
and providing necessary infrastructural equipment to
more than 1 lakh branch post offices (BPOs).
Mails (Including International Mails and Global
Business)
16.49. Department of Posts initiated a number of
projects during the Eleventh Five Year Plan for
modernisation of mails network, which include:
Mail network optimisation; setting up of automated
mail processing centres; deployment of dedicated
freighter aircraft for carriage of mail in North East
as well as metro routes; National Address Database
Management project for building and managing
the address database across the country along with
postal Geographic Information System (GIS) map-
ping of the country; and Mail Motor Vehicles project
for monitoring the movement of mail vans for their
effective management and route optimisation.
Rural Business and Access to Postal Network
16.50. During the Eleventh Five Year Plan, ‘Access
to the Postal Network’ scheme was implemented for
improving access to postal network. Major compon-
ents under the scheme include: opening of new BPOs
in Rural Areas, opening of BPOs by redeployment,
opening of sub post offices by redeployment, open-
ing of franchise outlets in urban areas, rationalisation
of postal network by relocation of branch post offices
and sub post offices and provision of Infrastructural
equipment for extra departmental branch post offices.
Computerisation and Modernisation of Postal
Network
16.51. The department has initiated the programme
of Computerisation of Post Offices, Mail Offices,
Administrative and other offices, establishment
of IT infrastructure and development of software
applications. As a part of this programme, DoP has
engaged M/s. Accenture for providing professional
consultancy to develop a technology strategy and
action plan for process re-engineering total network-
ing and computerisation of post offices, adminis-
trative offices and offices of the accounts wing. A
comprehensive IT roadmap has been developed for
network architecture, integrated software, proper
data management including strengthening/estab-
lishment of National Data Centre(s) and Disaster
Recovery Centre. In addition, the DoP has initiated
projects for (i) Computerisation and Networking
of Departmental Post Offices, and (ii) Upgradation
and modernisation of Postal Accounts Offices and
Postal Accounts Wing of Postal Directorate. Under
the Human Resource Management programme,
multiple training programmes, covering all the cad-
res of employees including Business Orientation
Programmes, Capacity Building, Technology
Training, Standardisation of Training and depart-
mental training for the officers, Postmasters and new
entrants, were conducted.
Vision and Strategy for the Twelfth Five Year
Plan
• To make the Department of Post’s products and
services customer’s first choice and serve its cus-
tomers with a human touch.
• To sustain its position as the largest postal net-
work in the world touching the lives of every citi-
zen in the country.
• To provide mail, parcel, money transfer, bank-
ing, insurance and retail services with speed and
reliability.
• To provide services to the customers on value for
money basis.
• To continue to deliver social security services and
to enable last mile connectivity as a Government
of India platform.
Objectives
16.52. To fulfil the mandate, the department needs
to reinvent itself for providing best in class customer
service and growing its existing businesses by devel-
oping a professional workforce and modernising
and consolidating the network. The department also

Communication 275
needs to come up with new services including finan-
cial Services.
Policy Issues, Programme Reforms and New
Initiatives in the Twelfth Plan
16.53. The India Post has more than 1,50,000 post
offices and its reach in the rural India is unmatched.
This network spread should be leveraged to provide
services to the residents. The department needs to
reinvent itself by embracing technology and redefin-
ing its role by taking up e-commerce, banking and
financial services especially in the rural areas. The
Indian Postal Office Act 1898 needs to be replaced
with a new act keeping in line with the latest trends.
16.54. IT Induction and Modernisation: The major
thrust of the Twelfth Five Year Plan would on imple-
menting the IT Induction and Modernisation pro-
gramme. Implementation of new and improved
processes, enterprise resource planning, integra-
tion and interlinking of applications, greater access,
enhanced productivity, improved functionality and
efficient and cost effective services would be the
hallmark of this programme. The main features of
the project include Supply of mail office hardware,
Development and deployment of rural ICT, Banking
and PLI solutions, Establishment of Data Centre
and Disaster Recovery System, Network Integration,
Development and deployment of Integrated Scalable
Software and change management activities. The
DoP also needs to implement ‘Sevottam’—a Service
Delivery Excellence Model and Quality Certification
as per the corresponding standard IS 15700: 2005
during the Twelfth Five Year Plan. It is also proposed
to attain ISO 9001 Certification for all Head Post
Offices.
16.55. Project Arrow: The Project Arrow envisages
upgradation of POs in urban and rural areas both
in terms of upgrading and enhancing the quality of
service in ‘core areas’ and improving the ‘look and
feel’. So far 1,736 POs have been covered under the
project. This activity has won the Prime Minister
Excellence Award during the year 2009–10. It is pro-
posed to cover more than 2,500 POs under Project
Arrow in a phased manner. It is also proposed to
undertake audit of 1,000 post offices.
16.56. Mails Sector: The Twelfth Five Year Plan aims
at ensuring readiness of the department not only for
the anticipated mail volumes but also to meet ris-
ing customer expectations and competition from
electronic channels of communication and private
couriers. The main focus shall be on the Express
mail segment, bulk mail and parcels which is pres-
ently the most competitive as well as profitable sec-
tor worldwide, as well as in India covering Speed
Post, International Mail, First class mail and second
class mail. While continuing with the Automated
Mail Processing Centre (AMPC) project at Mumbai,
Chennai, Hyderabad and Bangalore, AMPCs would
be established at Ahmedabad, Jaipur, Kochi, Patna,
Lucknow, Bhubaneshwar, Ludhiana and Vashi (Navi
Mumbai). Under the National Address Database
Management Project, GIS maps for the entire coun-
try and address database for 300 million households
is proposed to be developed. The department has
also proposed to replace the existing bag sealing sys-
tem with a new single use self-locking plastic seals
and tag labels to improve environmental conditions
in the POs.
16.57. The department is incurring heavy expendi-
ture on account of payment of haulage charges to
Railways for conveyance of mails and has become
uneconomical as the Railways charges passenger dis-
placement fares for RMS wagons instead of freight
charges. Non-availability of adequate capacity of
wagons also adds to abnormal delay in transmission
of mails and adverse public reaction. The dynamics
of new type of mail flow makes it imperative for the
department to rethink its operational strategy in mail
process and transmission. It is therefore proposed to
replace rail based transportation on short hauls with
road transport network by outsourced/departmen-
tal vehicles wherever feasible. It is also proposed to
upgrade Mail Motor Service vehicles and container-
ised transportation of mail and procure 4-wheeled
vehicles (one tonner), for mechanisation of Business
Mail and Speed Post, two wheeler vehicles for deliv-
ery and collection at Mail Hubs/POs during Twelfth
Five Year Plan. Postman is the key person, in the
postal network and ensuring his mobility is essential
for last mile delivery of mail.

276 Twelfth Five Year Plan
16.58. International Mails, Global Business and
e-Commerce: Quality and efficiency improvement
for Express Mail Service (International) will be one
of the priority programmes during the Twelfth Five
Year Plan. Business process enhancements that
improve the ease of doing business, reduce operating
expenses and improve customer services would be
reinforced. DoP also needs to revamp its mail/par-
cel delivery capabilities. Postal operators across the
world are playing an important role in the develop-
ment of e-Commerce. In the first phase, the entire
range of postal products will be made available to
customers online. In the final phase, the e-Com-
merce business of DoP will evolve into a best-in-
class portal with e-market place functionality. It will
be an online market place selling a variety of non-
postal products.
16.59. A Centre of Excellence for promoting coop-
eration between India Posts and other designated
postal operators of the world is proposed to be
established with focus on evolving modern postal
operations and practices through experience sharing.
The proposed Centre of Excellence could take over
all deliberations with member countries of UPU,
PAPU, African Union and the Asia Pacific on mat-
ters of cooperation in consultancy, Human Resource
and allied areas.
16.60. Financial Services (Savings Bank and
Remittances): During the Twelfth Five Year Plan,
the DoP has envisaged the setting up Post Bank of
India with expansion of IT infrastructure along
with Processing centres and Customer Call centres.
Automatic Teller Machine network of the PO will
be expanded to semi urban and block level POs.
Integrated remittance services, including Mobile
based remittance services will be introduced in order
to exploit the penetration of mobile phones all over
the country. In addition, an Anti-Money Laundering
(AML)/Combating of Financing of Terrorism (CFT)
Compliance Structure will be put in place.
16.61. Postal Life Insurance (PLI): During the Twelfth
Plan period, it is proposed to increase the coverage of
PLI beyond the Government and Semi Government
employees and digitise the records of PLI/RPLI with
the objective to insure 15 million more lives. Several
new products such as ULIPS and Group policies
which will benefit the masses especially in rural areas
will also be introduced. This will go a long way in
providing financial inclusion and risk coverage to
rural population with special emphasis on women
workers and economically weaker sections of the
society. It is also proposed to undertake technology
upgradation to facilitate payment of online premium
of policies through electronic clearance service facil-
ity and use of hand held devices by PLI/RPLI Sales
force and operators.
16.62. Rural Business and Access to Postal Network:
Improving the access to postal network and ration-
alisation of the existing network are important Plan
objectives of the department during the Twelfth
Five Year Plan. As the Panchayats are increasingly
becoming hubs of various kinds of activities in the
villages, it is important that the rural Branch Post
Offices are co-located with Panchayats so that they
are able to provide the required infrastructural sup-
port to all activities of Panchayats in the interest
of rural population and also increase the revenues
of the department. It is recommended that BPOs
should be established at all the Panchayat head-
quarters to ensure efficient delivery of various ser-
vices to the people in such areas and also to improve
financial inclusion of the currently excluded people.
Efforts would also be made to link different local and
community institutions such as Aanganwadis and
people’s collectives including SHGs with the POs.
16.63. Engagement with Social Protection
Programmes: Department of Posts is considered as
the first choice as a delivery channel for various social
protection programmes. Availability of an extensive
postal network with vast experience of delivering
financial and other services offers an opportunity to
the Central/State Governments in India to address
the constraints associated with delivery of various
social protection programmes. The postal network
can also be substantially engaged towards achiev-
ing financial inclusion in rural India. The depart-
ment should collaborate with other Government
and non-Government agencies to implement their
schemes and programmes on financial inclusion.

Communication 277
The BPOs can also be leveraged to transmit informa-
tion like weather, prices, transfer of knowledge on
farm management and facilitate sale/distribution of
farm inputs to the farmer right at his doorstep. This
would call for building capabilities of rural postal
personnel by imparting knowledge and skills on var-
ious Government programmes, banking, insurance,
accounts and finance, entrepreneurship and usage of
computers to Gramin Dak Sewaks in the country.
16.64. Business Development: It is essential for the
department to include logistics as one of its core
activities as development of logistics sector is of par-
amount importance for the economic development
of the country and it offers excellent opportunity for
the department to improve its revenues. The depart-
ment also needs to take a leap forward in express
parcel post service in view of the overall volume of
business being transacted across the country, and
improve the overall efficiency of speed post service
delivery due to increased technological capabilities.
Human resource development and management is
of paramount importance for achieving the goal of
reaching out to all sections of society and providing
efficient services.
16.65. Estates Management: Building requirements
of the DoP have undergone significant changes with
large scale induction of technology. Thrust during
the Twelfth Five Year Plan will be to provide func-
tionally useful modern space for post office opera-
tions; improve the general ambience and aesthetics
of postal buildings and provide modern facilities and
amenities to the users of India Post.
16.66. Philately Operations: Indian philately is
respected internationally for its theme and design
and adherence to good international practices.
Several initiatives are proposed to be taken up during
the Twelfth Five Year Plan to promote the philately
operations, right down to the district level, including
establishment of research wing and consultancy for
marketing.
16.67. Postal Accounts and Finance: As per the deci-
sion of Ministry of Finance, all Government depart-
ments have to migrate to accrual based accounting
system. The department has already initiated action on
this line.
Key Constraints and Challenges
16.68. In the rapidly transforming communica-
tions and financial services sectors and emerg-
ing socio-economic trends within the country and
globally, the DoP is facing challenges posed by glo-
balisation, entry of the private sector, growth of
telephony, focus on inclusive growth, higher level
of delivery standards, developments in other Postal
Administrations and so on in its quest of becoming
self-sustaining. The DoP also has to address issues
relating to multiplicity of application software, co-
existence of manual and computerised processes
and raising productivity norms and demand for
greater accountability and transparency. In the area
of financial services, challenge is to achieve the pro-
jected financial inclusion and rural empowerment.
In addition, enhancing skills and faster genera-
tion of employment in the sector, decentralisation,
empowerment, dissemination of information and
rural transformation with credit facilities by the
postal sector are some of the other challenges faced
by the department.
The Path Ahead
16.69. The total revenue of the DoP increased by
6.6 per cent from 2007–08 to 2008–09, by 11.1 per
cent in 2009–10 to 2010–11 and by 13.75 per cent
in 2010–11 to 2011–12. This trend is indicative of
the fact that incremental improvements in infra-
structure, IT support and quality monitoring dur-
ing Eleventh Plan has taken effect and with the roll
out of all IT induction dependent activities like Core
Banking, Rural ICT, Mail Network Optimisation
and Modernisation, the upward trend will not only
be sustained but will also register a higher percent-
age growth. The objective is to achieve the challenges
with the help of ongoing as well as new schemes like
expansion of Automatic Teller Machine network;
expansion of Mail Processing Centres and Customer
Call centres; Setting up Post Bank of India; e-com-
merce; Integrated remittance services and Mobile
remittance service; and creation of an Anti-Money
Laundering (AML)/Combating of Financing of
Terrorism (CFT) Compliance Structure. Induction

278 Twelfth Five Year Plan
of IT in all post offices will also help in revenue gen-
eration due to the speed and accuracy in transac-
tions, transparency, improved customer grievance
redressal and provision of greater range of services
over a secured network.
INFORMATION AND BROADCASTING
Overview of the Sector
16.70. The Indian Media and Entertainment
Industry has evolved as fastest growing sectors
of the economy over the last few years and it is
expected to grow at an annual average rate on 13.2
per cent in the next five years to reach `1.19 tril-
lion in 2015. Television, Radio and Films are pro-
jected to grow at Compound Annual Growth Rate
(CAGR) of 14.5 per cent, 19.2 per cent and 10 per
cent respectively by 2015. Digitalisation, enhanced
number of channels, increased number of private
stakeholder, momentum in crossover movies and
crossover audience, increasing share in the global
market, domestic demand for animation and special
effect are some of the salient features of this sector.
India today has a large broadcasting and distribu-
tion sector comprising around 800 plus satellite TV
channels, 100 Multi System Operators (MSO), 6,000
Independent Cable operators, around 60,000 Local
Cable Operators (LCO), 7 DTH operators and sev-
eral IPTV service providers. As per industry reports,
out of a total of 138 million TV homes, about 30
million are dependent on Doordarshan’s terrestrial
broadcast services and 74 million are covered by
cable services and the rest by Direct to Home (DTH)
and Internet Protocol Television Services (IPTV)
services. Television industry is more and more get-
ting localised in nature with the spurt of regional
channels over the last few years. Doordarshan (DD)
is the world’s largest terrestrial broadcaster with
over 1,400 terrestrial TV transmitters. The reach
provided by this route is phenomenal with DD cov-
ering 88 per cent of India’s geographical areas and
these transmitters provide coverage to about 92 per
cent population of the country. It is estimated that
Direct to Home (DTH) subscriber base could reach
70 million by 2015. With the widespread adop-
tion of broadband in the country and the grow-
ing techno savvy population, Internet Protocol
Television (IPTV) has a potential to become a huge
success in India. Appropriate policy guidelines have
been adopted in respect of IPTV, Headend in The
Sky (HITS), expansion of FM radio network (Phase
III), and Community Radio Services, and so on FM
Phase-III will extend radio’s reach to 294 towns and
839 stations.
16.71. With convergence of technologies, it is now
possible to provide multiple services on a single plat-
form and on single device. To take full advantage
of the technology, digitisation of broadcasting net-
work needs to be given priority along with archiv-
ing of content and complete switch over to digital
transmission. This would help usher in new value
added services like Internet Protocol TV, Mobile TV
and HDTV. This also calls for a policy to review the
existing regulatory institutions and enactment for
the establishment of a common regulator for content
as well as for carriage.
16.72. The film and entertainment sector needs to
be holistically reviewed in the light of technologi-
cal interventions which have redefined entertain-
ment today. The Cinematographic Act needs to be
relooked to address issues relating to digital cinemas,
piracy concerns. There is also a need to establish low
cost cinema exhibition houses across the country to
make cinema affordable. The film festivals needs to
be more attractive and should be projected as a plat-
form for encouraging film distribution, exhibition
and other related activities.
16.73. There are various issues that revolve around
this sector, these inter-alia include foreign invest-
ments, content regulation, intellectual property rights,
content enrichment, restructuring of PrasarBharati,
digitalisation of network and, content for archival
and dissemination, issues of piracy, spectrum alloca-
tion and maintaining archives of the entire spectrum
of Information and Broadcasting media unit.
Review of Eleventh Five Year Plan
Doordarshan
16.74. Eight new High Power Transmitters (HPTs)
were set up at Port Blair (A&N), Kokrajhar

Communication 279
(Assam), Bikaner (Rajasthan), Dharamshala (H.P.),
Chattarpur (M.P.), Saharsa (Bihar) and Bilaspur
(Chattisgarh), thereby providing coverage especially
to remote, hilly and border areas hitherto uncov-
ered. Six high power transmitters were also commis-
sioned at Kupwara (J&K), Jalgaon (Maharashtra),
Vaodara (Gujarat), Barrmer (Rajasthan), Balurghat
(W.B.) and Kharagpur (West Bengal), which
enabled Doordarshan to provide reliable and
extended service to the people. Two high power
ageing and obsolete transmitters were also replaced
with new transmitters at Chennai for DD1 and DD
News thereby helping to improve the transmission
quality. In addition, 56 Low Power Transmitters
(LPTs) were also installed during the Plan period.
This has increased the reach as well as quality of
the TV services in the targeted areas. Also during
the Plan, 34 new Very Low Power Transmitters
(VLPTs) were installed. Capacity of Doordarshan’s
Direct To Home (DTH) platform ‘DD Direct plus’
was upgraded from 50 to 59 Standard Definition
Television (SDTV) channels and 65,000 Set Top
Boxes (STBs) along with 35,000 TV sets were dis-
tributed in remote and border areas. DTH Service
in C-Band especially for Andaman and Nicobar
(A&N) Islands was commissioned by setting up of a
10 Channel C-Band Earth Station at Delhi. This has
enabled the people of A&N island territory to access
10 channels of Doordarshan.
16.75. Doordarshan as a Host Broadcaster of Com-
monwealth Games—2010, successfully provided
coverage of Commonwealth Games Delhi—2010
in High Definition (HD) format. On the eve of
Commonwealth Games, a new High Definition DD
channel was launched by Doordarshan. Necessary
HD uplinking facility in ‘C’ and ‘Ku’ bands was com-
missioned. There has been some setback in the phys-
ical and financial targets during Eleventh Five Year
Plan period. The main reasons were litigation relat-
ing to procurement of transmitters, delay in approval
of new schemes specially digitalisation scheme of
Doordarshan, lengthy procurement procedure for
machinery and equipment and re-tendering of work
due to non-compliance of the specifications by
bidders.
16.76. Digitalisation of Transmitters and Studios in
DD Network: The Doordarshan network presently
has 1,415 analog transmitters of varying powers pro-
viding coverage to 92 per cent of the population and
81.6 per cent by Area. Doordarshan network also
comprises of 67 studio centres spread all across the
country. Eleventh Five Year Plan scheme of digitali-
sation, which inter alia includes establishment of 40
digital transmitters and full digitalisation of 39 Studio
centres, was approved at a cost of `620.12 crore in
April, 2010. Digitalisation of Doordarshan network
is targeted to be completed by December 2017. For
digitalisation of its terrestrial Network, Doordarshan
has planned to establish a total of 630 digital trans-
mitters (HPTs-230 and LPTs-400) for providing the
present level of coverage as is being provided by 1,415
analog transmitters.
All India Radio (AIR)
16.77. AIR launched digital transmission in DRM
from a 250 kW Short Wave (SW) transmitter in
Delhi. AIR programmes in digital quality are now
available in UK, West Europe, Nepal, Mauritius, East
Africa, Sri Lanka, Russia and NE Asia. Obsolete 1,000
kW Medium Wave (MW) transmitters at Rajkot
and Kolkata (Chinsurah) have been replaced with
state-of-the-art digital (DRM) transmitters. In addi-
tion to the western and eastern parts of India, AIR
programmes to Afghanistan, Iran and Pakistan from
the Rajkot transmitter and to Bangladesh, China and
Nepal from the Kolkata transmitter would now be
available in digital format. Establishment of perma-
nent studios in Leh (J&K) and Tawang (AP) have
been initiated and the studio facilities at Mysore
(Karnataka) have been upgraded. New Studios are
also getting ready at Jaipur and Dehradun, which
will have digital production and transmission facili-
ties. AIR has also commissioned satellite earth sta-
tions at Leh (J&K) and Rohtak (Haryana), enabling
these areas to distribute news and other important
programmes to other AIR stations in the regions.
News-on-Phone Service has been introduced from 5
more stations—Lucknow, Imphal, Simla, Guwahati
and Raipur, making a total of 14 such stations.
Strengthening of radio coverage in the border areas
and Jammu & Kashmir is of strategic importance
for India. Therefore, a programme for strengthening

280 Twelfth Five Year Plan
AIR and Doordarshan coverage in the J&K was
taken.
16.78. Digitalisation Plan: The Eleven Five Year
Plans have given impetus to the growth of broadcast-
ing in India resulting in a phenomenal expansion.
From the six radio stations at the time of independ-
ence, the network has now grown to 279 stations
with 436 transmitters providing coverage to 99.18
per cent of the population and 91.85 per cent area of
the country. AIR FM, which is increasingly becom-
ing popular, provides coverage to about 37 per cent
of population at present. Digitalisation of AIR pro-
duction, transmission and networking infrastructure
is to be completed by December 2017. But it has to
be ensured that till that time, the listeners are not
deprived of the programmes on the existing ana-
logue receivers. During the Eleventh Five Year Plan
a scheme for digitalisation of Transmitters (70 MW
and 9 SW), Studios (98 nos) and Connectivity as well
as augmentation of Training and R&D facilities was
taken up.
Film Sector
16.79. There is a gradual increase in the number of
countries and films participating in the International
Film Festival of India (IFFI). During the 42nd IFFI
which was recently concluded, 255 films from 67
countries participated. IFFI now attracts entries
from all over the world. The participation by Indian
films in various film festivals and in various film
markets has also increased. During the Eleventh Five
Year Plan, National Film Development Corporation
(NFDC) has produced 11 films in different languages
and 8 films are under production. Films Division has
completed production of 183 documentaries and
Children Film Society of India (CFSI) produced 11
feature films during this period. A programme was
also taken up for digitisation and restoration of old
films. Considerable progress has been made towards
setting up of National Museum of Indian Cinema
and is likely to be completed by 2013 to coincide
with the Centenary year of Indian Cinema.
Information Sector
16.80. Directorate of Advertisement and Visual
Publicity (DAVP) is the nodal multi-media
advertising agency of the Government which carries
information on policies, programmes and achieve-
ments of various Ministries and Departments to
masses through various media. It focused on the tech-
nological upgradation of its communication equip-
ment and modernisation of its programme designs.
In order to disseminate information on flagship pro-
grammes of the Government, Public Information
Campaigns (PICs) is the most crucial and important
component of the Media Outreach Strategy organ-
ised by Public Information Bureau (PIB) in joint
collaboration with fellow media units of Ministry of
Information and Broadcasting to raise awareness on
flagship programmes of the Government. Song and
Drama Division (S&DD) mounted a new Sound and
Light Programme titled ‘Jamunia’ based on a Multi
Media Theatrical format, which was well received by
the people.
Broad Objectives, Targets and Thrust Areas
during the Twelfth Five Year Plan
16.81. The growth potential of Media and
Entertainment sector needs to be harnessed in order
to place Broadcasting sector on a higher growth tra-
jectory by taking advantage accrued due to conver-
gence of technologies. In the liberalised economy,
the role of Government has undergone a phenom-
enal change from a services provider to facilitator
and there is a need for creating supportive policy
environment for different stakeholders in the media
and entertainment sector in order to step up the
growth trend. There is a need to promote and facili-
tate the Broadcasting, Films and Print media indus-
try in India to ensure its growth and development
and to generate employment. Media Units need to
be strengthened further to ensure dissemination of
public messages in a more purposeful and efficient
manner. Keeping in view the present day realities
and emerging scenarios, their individual roles also
need to be clearly redefined so as to achieve complete
synergy in delivery mechanism among the media
units. There is a need to ensure free flow of informa-
tion to the public and safeguarding freedom of the
media in general. The Government’s role in mak-
ing information available to people in strategic and
inaccessible areas of the country should continue
to remain paramount. Last but not the least, the

Communication 281
potential of software in film and broadcasting needs
to be exploited internationally to make India a global
soft power and there is a need to review the Acts,
Rules and Regulation as per the contemporary needs
of this sector. During the Twelfth Five Year Plan
thrust would be on the following major programmes:
Broadcasting Sector
1. Digitalisation needs to be given thrust with spe-
cial emphasis on convergence technology. The
digitalisation of AIR, Doordarshan, Cable sector
should be completed as per schedule.
2. Digital content needs to be given push during
Twelfth Plan along with comprehensive pro-
gramme audit of DD and AIR and to improve
the content being telecast by DD/AIR.
3. Restructuring and strengthening of Prasar
Bharati with the twin objectives of (i) enabling
it to perform its primary role of Public Service
Broadcaster (PSB) more purposefully and effi-
ciently; (ii) making the non-PSB component
self-financing within Twelfth Plan period.
4. Enhancing broadcast coverage in boarder areas
and North Eastern areas through expansion of
broadcasting infrastructure and services in the
border areas.
5. Earmarking of some frequencies/channels of DD
and AIR for niche programmes.
6. Expansion of FM coverage in the Twelfth Plan
and dedicating one channel for nationwide news
and current affairs FM channel.
7. Strengthening the capacity of Electronic Media
Monitoring Centre (EMMC) for monitoring
broadcast content including Private FM chan-
nels and Community Radio services.
8. Notification of policy and guidelines for Mobile
TV services.
9. Supporting Community Radio Movement and
Information, Entertainment and Communi-
cation (IEC) activities.
10. Installation of DRM+ transmitters at 50 loca-
tions including all state capitals and some other
major cities in the country.
11. Replacement of 28 MW transmitters by FM and
installation of 330 new FM transmitters (150
at the locations where private FM is coming
in phase III [but AIR does not have FM set up
there], 25 at the locations for which demands
from a number of VIPs are pending, 5 for addi-
tional channels and 150 in the uncovered areas).
12. Broadcasting Infrastructure Network
Development.
13. Special Projects like Auditorium, Global
Coverage of DD International Channel and
Broadcast Museum.
14. IEC activities for promoting Digitalisation,
Automation of Broadcasting wing and Capacity
building of Cable TV industry in Digital wire
line Broadcasting.
Film Sector
1. To devise appropriate policy initiatives for cre-
ating an enabling environment conducive to the
growth and development of film sector includ-
ing preservation and sustenance of the film heri-
tage of India.
2. To devise appropriate policy for simplifying the
procedure for clearance for setting up of film
theatres.
3. To preserve and enhance public access to
the archival wealth of films, video and audio
resources.
4. To devise single window clearance system for
film shooting in India, for both domestic and
international film production houses.
5. To promote India as a film destination in film
market and film festivals.
6. To aggressively pursue for entertainment tax
and services tax to be subsumed in Goods and
Services Tax (GST).
7. Establishment of a National Museum of Indian
Cinema at Mumbai to coincide with the cente-
nary year of Indian cinema in 2013.
8. Infrastructure Development Programme relat-
ing to Film Sector.
9. Development Communication and Dissemina-
tion of Film Content.
10. Anti-Piracy initiatives.
11. Setting up of National Film Heritage Mission.
12. Setting up of National Centre for Animation,
Gaming and VFX.

282 Twelfth Five Year Plan
Information Sector
1. To encourage information dissemination in tra-
ditional media through PPP mode for intensive
campaign at village fairs, festivals and social
gatherings.
2. To create awareness on social issues through
inter-personal and live performance.
3. Media Infrastructure Development Programme.
4. Development Communication and
Dissemination.
5. Human Resource Development.
Key Constraints and Challenges
16.82. Information and Broadcasting sector in the
country will undergo a major facelift Twelfth Five
Year Plan making it comparable with that of devel-
oped world. Some of the game changers and chal-
lenges for the sector are as follows:
1. Going digital in TV and Radio
a. The Government is committed to adhere to
the date-line already notified for Cable TV
digitalisation. HITS is an alternate platform
to the cable sector.
b. Digitalisation of terrestrial transmission,
adding to the digital network capacity in the
country.
c. Digitalisation of All India Radio, particu-
larly MW, SW and FM is another challenge.
PrasarBharati has designed a plan of action to
go digital to replace analogue MW and SW
transmission through adoption of DRM+
technology.
d. Ensuring that PrasarBharati re-gains its
lost position as public service broadcasting
agency and becoming self-financing for non-
PSB component.
2. Community Radio Expansion and Community
Empowerment
a. Provision for adequate availability of fund for
NGOs to initially set up Community Radio
stations and judicious decision in terms of
policy intervention for increasing commer-
cial airtime.
b. Making this sector a vibrant medium of IEC,
spurring content innovation and carrying
message from the Government to the local
people.
3. Film Heritage Mission
a. Film Heritage Mission will not only consoli-
date and add value to the cultural assets but
also will act as a game changer in convert-
ing thousands of films to digital format. This
Mission will help propagate India’s cultural
values to different countries.
Policy Issues and Recent Initiatives
16.83. The Ministry has taken a number of initia-
tives in the recent past with the objective to create an
enabling environment in the information and broad-
casting sector. These include:
1. Broadcasting Sector
a. Policy on Headend in the Sky (HITS): HITS
would provide greater channel capacity and
is capable of bringing down the investments
required at the level of the last mile operator,
thereby enabling deeper penetration of cable
services into rural areas. However, there is
some constraint with regard to availability
of transponder capacities for HITS services.
The implementation of Digital Addressable
System (DAS) in the cable TV sector would
have a great positive impact on HITS services
as it would enable HITS to penetrate and
capture greater market share, particularly in
rural areas.
b. Policy on IPTV Service: IPTV platform is
promising due to its superior quality and
interactive service but the reach is limited to
households having broadband connections.
Once broadband penetration in rural India
improves, IPTV would stand a better chance
of success. However, it is likely to take some
time before the service makes inroads in the
market.

Communication 283
c. Digital Addressable System (DAS) in the Cable
TV Sector: The Ministry has taken a major
decision at reforming the present analogue
cable television networks by digitalising the
same to address the inherent drawbacks in
the analogue networks. DAS will be imple-
mented in a phased time bound manner with
the complete switch off of analog cable TV
service in the country by 31 December 2014.
The implementation of DAS will be a game
changer for the television sector and will take
growth of broadcasting sector to new heights.
It will benefit all stakeholders including cable
operators, broadcasters, customers and the
government.
d. Enhancement of FDI Limits in the Broad-
casting Sector: Rationalisation of Foreign
Investments (FI) limits in various segments
of broadcasting sector needs to be addressed.
There is need for a holistic review of the
existing FI limits for different segments of
broadcasting sector.
e. Content Regulation and Broadcasting
Regulator: Regulation of content of
Television channels and setting up an inde-
pendent regulator for the broadcasting sec-
tor has been a much debated issue. Within
the industry, the preponderant view is that
self-regulation is the best way to regulate
the media and no purpose would be served
by introducing any other measures to reg-
ulate content. The Indian Broadcasting
Foundation (IBF), taking a cue from NBA’s
self-regulation and in consultation with the
Ministry, has set up a mechanism for self-
regulation in case of general entertainment
channels. As part of this, IBF has laid down
Content Code and Certification Rules 2011
covering an entire gamut of content-related
principles and criterion for television broad-
cast. The self-regulation mechanism put in
place by the broadcasters will, however, not
replace the existing regulatory functions of
the Government, arising out of the extant
statute, namely, Cable Television Networks
(Regulation) Act, 1995 and Rules framed
thereunder.
f. Amendment to the Guidelines on Uplinking/
Downlinking of Channels: There is need to
make changes with respect to existing policy
on uplinking/downlinking of Channels and
teleports which, inter-alia, includes uniform
permission period of 10 years for uplink-
ing/downlinking of channels and teleports,
stipulating time frame for operationalisation,
enhancement of permission fee, mandatory
submission of performance Bank Guarantee
for fulfilling the roll out obligations. The
proposed policy also provides for transfer
of permission in case of merger/demerger/
amalgamation with the approval of the
Government.
g. Interoperability of DTH Set-Top-Boxes (STB):
Interoperability of the STBs has been a long
pending issue. Technical interoperability
essentially protects the interest of the sub-
scribers by enabling them to shift from one
operator to another without having to buy a
new STB.
h. License Fee Computation in DTH Sector:
Presently, the license fee collected by the
Ministry of Information and Broadcasting
from DTH operators is based on the Gross
Revenue, as defined in the Article 3 of the
Schedule to the DTH License Agreement. As
per this definition, taxes revenue earned from
the sale of Set Top Box, installation, commis-
sions, content cost, subscription and service
are required to be included for the purpose of
calculation of annual license fee. The TDSAT
has, however, in its orders dated 26 August
2008 and 28 May 2010, applied the principle
of Adjusted Gross Revenue (AGR) for deter-
mination of annual license fee, removing
majority of components such as installation
charges, taxes, commissions, content cost,
sale of STBs and so on. The Government
has filed an appeal in the Supreme Court
against these TDSAT orders. As of now, the
DTH operators are paying license fee as per
adjusted gross revenue which is less than
according to gross revenue computation.
i. Rationalisation of Taxes in Broadcasting
Sector: A long standing demand of the

284 Twelfth Five Year Plan
broadcasting sector has been for DTH, Cable
Services, IPTV services, HITS services and
for similar content distribution services, the
Service Tax, Entertainment Tax and VAT
be subsumed under the proposed Goods
and Services Tax regime (GST) and only a
single/unified GST rate be notified for these
services.
j. Music royalty in FM Radio: Music royalty
issue is a major bone of contention between
radio and music players and the royalty rates
have been one of the problems affecting the
viability of the private FM industry. The
Copyright Board, which was given powers
by the Supreme Court of India to decide in
the matter of radio companies versus music
rights owners on the issue of royalty pay-
ment, has decided to reduce the royalty pay-
ment to two per cent of their net advertising
revenues. This matter is still not settled as
music companies have challenged this order
in court and the industry will need to wait for
a final decision; however no stay has yet been
granted.
k. Promotion of Indigenous Manufacturing
Capacity: A concern has been raised in vari-
ous quarters that there is a lack of indigenous
manufacturing capacities for broadcasting
equipment in India. With digitalisation being
one of the priority agenda for all the stake-
holders, there is a need to enhance domestic
manufacturing capabilities for production of
STBs and other digital equipments.
2. Film Sector
a. The Government has initiated steps for set-
ting up of a mechanism for single window
clearance for film shooting in India.
b. The Ministry has taken up the matter with
the Ministry of Finance for adoption of GST
subsuming all service tax and entertainment
tax under it.
c. To enable expansion of the exhibition sector,
the issue of simplification of regulatory clear-
ances for setting up exhibition outlets needs
to be addressed. State Governments will need
to be asked to explore possibility for grant-
ing exemption from entertainment tax to
low cost theatres for Indian and world award
winning cinema.
d. Revision of the Cinematograph Act, 1952.
e. Declaring SRFTI, FTII as national cen-
tres of excellence enabled by an Act of the
Parliament.
f. There is a need to resolve issues with respect
to high rates of entertainment tax and lack of
uniformity in tax structure, across States.
g. There are issues which need to be addressed
as digital technology and broadband infra-
structure include:
i. Establishment of uniform standards of
technology for theatres;
ii. An effective preservation and archiving
of films in digital formats vis-à-vis tradi-
tional forms of storage; and
iii. internet and web-based piracy of films.
h. Countering Piracy: The film sector faces the
massive challenge of grappling with pirated
software on web-based platforms in the cur-
rent Indian environment. Further, mecha-
nisms for regulation of content on the
Internet are non-existent. Appropriate policy
framework needs to be designed.
3. Information Sector
a. In DAVP, on-line billing has been intro-
duced. This has substantially raised the trans-
parency level of its functioning. There is a
need to take the matter forward by making
DAVP’s operation entirely online.
b. There is a need to periodically review the
pricing of the Government spot in various
channels in order to ensure that Government
spots reach the maximum viewers and par-
ticularly at the regional channels catering to
niche viewers.
c. While the Government has been spending
a large sum of its publicity budget through
DAVP, there is a need for periodical evaluation
of the campaigns to ascertain their impact.

Communication 285
d. There is a need to cover all districts of
the country though Public Information
Campaigns (PICs) during the Plan period
and support for expansion of ‘Jamunia’ in all
regional languages of the country.
e. There is a need to take appropriate steps to
make DFP (Directorate of Field Publicity)
effective.
f. There is need for an integrated approach by
combining all the media units such as PIB,
DAVP, DFP and S&DD engaged in infor-
mation dissemination to ensure maximum
impact of the Government information cam-
paign on the people.
g. Inter Media Publicity Coordination
Committee (IMPCC), at the State capital
level duly constituted by the Ministry needs
to be strengthened and rejuvenated through
appropriate policy direction to regularly
meet, assess and refocus its media campaign.
h. IIMC (Indian Institute of Mass Communi-
cation) needs to be upgraded to an insti-
tute of excellence in media education and
research.
ANNEXURE 16.1
Twelfth Five Year Plan (2012–17) Outlays for the Ministry of Communications and IT and
Ministry of Information and Broadcasting
` in crore
Ministry/Department GBS IEBR Twelfth Plan Outlay
1. Ministry of Communications and IT
• Department of Telecommunications 20,825.00 51,285.40 72,110.40
• Department of Electronics and IT 36,078.00 3,944.29 40,022.29
• Department of Posts 5,527.00 0.00 5,527.00
2. Ministry of I&B 7,583.00 1,000.00 8,583.00
Total 70,013.00 56,229.69 1,26,242.69
Path Ahead
16.84. The Twelfth Five Year Plan would aim at
transforming the information, film and broadcast-
ing sector into a modern, efficient, responsive and
vibrant sector. To achieve this objective, necessary
policy intervention, suitable infrastructure, invest-
ment in traditional as well as modern media unit,
participation of private sector in PPP model, viable
policy environment for facilitating and sustaining
growth and development of media and entertain-
ment sector need to be created. Apart from these,
barriers in the way of investment in infrastructure,
reaching out to rural, remote and inaccessible and
strategic area need to be tackled effectively and
efficiently. For optimal and efficient utilisation of
resources, both manpower and capital, synergy
between various media units of media and entertain-
ment sector is required. Suitable plan/policies/pro-
grammes are needed in this direction.
16.85. The Twelfth Five Year Plan (2012–17) outlays
(GBS) for the Ministry of Communications and IT
and Ministry of Information and Broadcasting are
given in Annexure 16.1.

17.1. The Eleventh Plan period saw major new ini-
tiatives towards inclusive growth in rural India. The
total budgetary allocation for all rural development
programmes by the Government of India in the
Eleventh Plan was `2,91,682 crores which accounted
for 25 per cent of the total Central Budget Plan provi-
sion. Rural development programmes cover employ-
ment through the Mahatma Gandhi National Rural
Employment Guarantee Act and the National Rural
Livelihoods Mission, housing via the Indira Awaas
Yojana and other State schemes and bank support,
sanitation through the Total Sanitation Campaign,
provision of drinking water via the National Rural
Drinking Water Programme, social security through
the National Social Assistance Programme, water-
shed development via the Integrated Watershed
Management Programme (covered in Chapter 5 of
Volume 1), road connectivity through the Pradhan
Mantri Gram Sadak Yojana (described in Chapter
15 of Volume 2) and electrification via the Rajiv
Gandhi Grameen Vidyutikaran Yojana (described in
Chapter 14 of Volume 2).
17.2. Based on a critical review of these programmes
and their performance in the Eleventh Plan, this
chapter outlines the major new initiatives proposed
during the Twelfth Plan period.
MAHATMA GANDHI NATIONAL RURAL
EMPLOYMENT GUARANTEE ACT (MGNREGA)
The Experience So Far
17.3. The most significant rural development initia-
tive of the Eleventh Plan period was the Mahatma
17
Rural Development
Gandhi National Rural Employment Guarantee Act
(MGNREGA). Over the last six years, MGNREGA
has delivered the largest employment programme
in human history, which is unlike any other in its
scale, architecture and thrust. Its bottom-up, people-
centred, demand-driven, self-selecting, rights-based
design is new and unprecedented. Never have in
such a short period so many crores of poor people
benefited from a Government programme.
17.4. In 2011–12, nearly 5.00 crore families were
provided over 211 crore person-days of work under
the programme. Over the last six years, MGNREGA
has generated more than 1,200 crore person-days of
work at a total expenditure of over `1,66,760 crores.
The share of SC/ST families in the work provided
under MGNREGA has been 55 per cent and 45 per
cent of workers are women. Average wages of work-
ers have gone up by 54 per cent over the last five years
and wages have now been so indexed that workers
will be protected from the ravages of inflation. Nearly
10 crore bank/post office accounts of our poorest
people have been opened and around 80 per cent of
MGNREGA payments are made through this route,
an unprecedented step in the direction of financial
inclusion. An overview of MGNREGA performance
from 2006–07 to 2011–12 is given in Table 17.1.
17.5. In many parts of the country, spectacular
successes have been recorded in water harvest-
ing. Distress migration has been arrested in several
areas. Some State Governments have been leaders
in this and the National Consortium of Civil Society
Organisations on MGNREGA has also set up exam-
ples of excellent work.

Rural Development 287
17.6. Many critics and sceptics of MGNREGA who
were extremely vocal during the years leading up to
its passage by Parliament and in the early years of its
implementation have been silenced, especially after
it was recognised that the purchasing power the pro-
gramme created in rural areas and the operation of
the Keynesian multiplier played a crucial role in gen-
erating demand for industry during the dark days of
the recession and assisted in our comparatively faster
emergence out of it.
17.7. However, there is no denying the fact that the
true potential of MGNREGA as an instrument of
rural transformation is yet to be fully realised. Since
the programme marks a radical departure from ear-
lier efforts of a similar kind, there have been many
problems in infusing the system with the new cul-
ture of demand-driven, rights-based, decentralised
decision-making. The MGNREGA provides a his-
toric opportunity for strengthening Panchayati Raj
in India but the experience so far also alerts us to the
need for doing much more in this direction.
17.8. There are problems that arise from the sheer
scale of the programme. At the same time, new
opportunities have arisen because of advances in
TABLE 17.1
Overview of MGNREGA Performance, 2006–12
2006–07
(200 Districts)
2007–08
(330 Districts)
2008–09
(All Districts Hereon)
2009–10 2010–11 2011–12
Households Employed (crore) 2.10 3.39 4.51 5.26 5.49 4.99
Person-days of Employment
generated (crore)
90.5 143.59 216.32 283.59 257.15 211.41
Work Provided per year to
Households who worked (days)
43 42 48 54 47 42
Central Release (` crore) 8,640.85 12,610.39 30,000.19 33,506.61 35,768.95 29,184.85
Total Funds Available (including
Opening Balance) (` crore)
12,073.55 19,305.81 37,397.06 49,579.19 54,172.14 43,273.58
Budget Outlay (` crore) 11,300 12,000 30,000 39,100 40,100 40,100
Expenditure (` crore) 8,823.35 15,856.89 27,250.10 37,905.23 39,377.27 37,548.79
Average Wage per day (`) 65 75 84 90 100 117
Total Works taken up (lakhs) 8.35 17.88 27.75 46.17 50.99 74.13
Works completed (lakhs) 3.87 8.22 12.14 22.59 25.90 15.01
Source: Ministry of Rural Development, GoI.
Information Technology that allow us to get rid of
inefficiencies and corruption in a manner quite
inconceivable in the past. The MIS currently used
by MGNREGA is already the best we have ever had.
More than 8 crore muster rolls and over 12 crore
job cards have been placed online. But there is huge
scope for further improvement in overcoming sys-
temic delays as shown by the software being used, for
example, in Andhra Pradesh.
17.9. We also need to view MGNREGA as a pro-
gramme whose success will, in itself, pave the way for
its downscaling. A large proportion of MGNREGA
workers are small and marginal farmers, the produc-
tivity of whose lands has been so decimated over the
years, that they have been compelled to work under
MGNREGA. The real success of MGNREGA will lie
in raising the agricultural productivity of millions of
these farmers who will then be able to return once
again to farming and will no longer need to depend on
MGNREGA for their survival. Urgent measures are
required to convert MGNREGA into a productivity-
enhancing instrument that will also allay the falsely
perceived conflict between MGNREGA and agricul-
ture—for MGNREGA is the foundation for solving
the problems of the poorest farmers of our country.

288 Twelfth Five Year Plan
Relationship with Agriculture and
Rural Livelihoods
17.10. Ever since work on MGNREGA was launched
in 2006 there have been two divergent perceptions
about its relationship with agriculture—one, as a
relationship of positive synergy and the other, of a
potential source of conflict. The sources of synergy
are many:
17.11. The MGNREGA has led to major increases in
wages of rural workers and when we recognise the
fact (attested by NSSO data on ‘landed labourers’)
that the majority of MGNREGA workers are impov-
erished small and marginal farmers, especially in our
tribal areas, we can see the direct impact MGNREGA
has made on raising incomes of our small and mar-
ginal farmers.
17.12. A comprehensive time series of rural wage
data—both agricultural and non-agricultural—
put together by the Ministry of Statistics and
Programme Implementation indicates that the
advent of MGNREGA has resulted in a significant
structural break in rural wage increases.
1 Between
1999 and 2005, pre-MGNREGA, nominal wages
in the rural economy grew at an average annual
rate of 2.7 per cent (year on year average). Post-
MGNREGA, the rate of average wage increases
almost quadrupled to 9.7 per cent between 2006
and 2009. And between January 2010 and May
2011 (the last date for which this data is available),
annual nominal wage growth averaged almost 18.8
per cent. Since January 2010, agricultural wages
rose 20.2 per cent over year ago while non-agricul-
tural rural wages increased 16.7 per cent over year
ago. Wage growth for men in the agricultural sec-
tor averaged 19.7 per cent over year ago while that
for women 20.8 per cent over year ago. The aver-
age daily wage rates for male agricultural labour are
given in Table 17.2 (A).
17.13. State-wise trends in the wages of casual work-
ers in rural areas compiled by the Labour Bureau,
Shimla indicate that agricultural wages are boom-
ing at the fastest rate ever. The Labour Bureau’s data,
compiled on a monthly basis, are based on primary
information collected from 600 sample villages over
20 States. They cover wage payments both in cash as
well as kind, with the latter valued at the prevailing
local retail prices.
17.14. The tightening of the labour market post-
MGNREGA is a positive indicator of poverty alle-
viation and also signals a pressure for technological
advances that raise farm productivity in areas of rela-
tive labour shortage. This is the process of agrarian
transformation the world over.
17.15. What is more, since a very large proportion
(80 per cent) of the works under MGNREGA are
also focused on soil and water conservation on the
lands of the small and marginal farmers, it is clear
that MGNREGA is making a potential contribu-
tion to raising their incomes through improved
agricultural productivity, and also reducing the
need for small and marginal farmers to continue
to work on MGNREGA sites. Studies conducted
by Indian Institute of Science (IISc), Bangalore;
Indian Institute of Forest Management, Bhopal;
Administrative Staff College of India, Hyderabad
and University of Agricultural Sciences, Bangalore
have all concluded that MGNREGA works have
had a positive impact on agricultural productiv-
ity. In one of the studies conducted in Chitradurga
district of Karnataka, IISc found that MGNREGA
works, besides enhancing agricultural productiv-
ity, successfully reduced water, soil and agricultural
vulnerability.
17.16. As far as the perception of conflict between
MGNREGA and agriculture is concerned, this
is based on a number of misconceptions and
exaggerations.
17.17. Let us first remember that the average annual
person-days of work generated under MGNREGA
since inception has never exceeded 54 days. Surely
this in itself indicates the critical but still small and
supplementary nature of this employment for our
self-selecting poorest people. And if we closely exam-
ine the question of seasonality of this work, an analy-
sis of the quantum of MGNREGA works provided
across the year indicates a powerful seasonal fluctua-
tion, with a disproportionately higher share of works

Rural Development 289
TABLE 17.2 (A)
Average Daily Wage Rates for Agricultural Labour: Male
(in `)
State December % Increase
2008 2009 2010 Dec 09/Dec 08 Dec 10/ Dec 09
Andhra Pradesh 98.31 137.95 176.29 40.32 27.79
Assam 81.19 96.40 114.10 18.73 18.36
Bihar 71.42 86.55 101.85 21.18 17.68
Gujarat 78.72 82.76 91.36 5.13 10.39
Haryana 132.64 168.22 195.02 26.82 15.93
Himachal Pradesh 164.72 180.42 195.22 9.53 8.20
Karnataka 72.90 87.54 111.76 20.08 27.67
Kerala 220.27 250.79 319.13 13.86 27.25
Madhya Pradesh 61.33 69.79 84.43 13.79 20.98
Maharashtra 82.61 95.10 119.36 15.12 25.51
Orissa 68.05 86.70 123.96 27.41 42.98
Punjab 130.63 133.49 176.21 2.19 32.00
Rajasthan 109.84 113.65 145.69 3.47 28.19
Tamil Nadu 113.28 137.98 174.08 21.80 26.16
Uttar Pradesh 81.14 94.89 116.53 16.95 22.81
West Bengal 87.40 99.94 118.47 14.35 18.54
Note: Average rate for five operations (ploughing, sowing, weeding, transplanting and harvesting) has been considered.
being done during the off-season in agriculture. The
month-wise employment data under MGNREGA
during FY 2010–11 (Table 17.2 B) indicates that
it is in the lean agricultural season (January–June),
that around 70 per cent of person-days of work were
generated. And if we were to correct for the fact that
in major MGNREGA States like Tamil Nadu this
is actually not the lean season, the proportion of
MGNREGA work provided in the off-season in agri-
culture would be even higher.
Expanded List of Works
17.18. During the Twelfth Plan we propose to allow
the largest possible number of works which help
strengthen the synergy between MGNREGA and
agriculture without compromising on the funda-
mental features of the Act or its architecture, which
have been celebrated across the globe. The more rural
people feel a sense of resultant ownership and a stake
in the programme, the more efficiency and trans-
parency we will be able to achieve. The list of works
has also been expanded in response to demands of
the States for greater location-specific flexibility in
permissible works, as also to help improve the eco-
logical balance in rural India and provide a cleaner,
healthier environment to its people (Table 17.3). In
response to each of these demands, Schedule I of the
Act has been modified to provide an additional list
of permissible works under MGNREGA. Some of
these works are new but many of them come within
the category of works already permitted under
MGNREGA. This is being provided in response to
demands from States for more elaborate, specific and
unambiguous list of works that could be taken up
under the categories currently permissible.
17.19. Each work indicates the unit cost as also the
labour–material ratio. These unit cost estimates are
indicative and provide a broad order of magnitude.
They may vary depending on local conditions and
more updated SoRs. However, the labour–material
ratio specified for each work must be strictly adhered

290 Twelfth Five Year Plan
TABLE 17.2 (B)
Seasonality of MGNREGA Employment Provided during 2010–11
State April May June July Aug Sep Oct Nov Dec Jan Feb March Total
% % % % % % % % % % % % %
Andhra Pradesh 23.5 33.3 22.5 6.9 2.5 1.1 1.0 0.7 0.7 0.8 1.8 5.2 100.0
Assam 9.8 6.6 4.2 3.3 4.9 6.5 6.7 9.6 13.7 11.8 11.1 11.7 100.0
Bihar 11.2 13.7 11.4 6.2 5.6 6.8 5.4 5.7 8.9 9.5 9.3 6.3 100.0
Chhattisgarh 19.6 27.1 14.2 1.3 0.7 1.0 2.0 1.8 3.2 9.7 10.8 8.7 100.0
Goa 6.9 7.7 7.3 6.8 7.4 4.8 6.5 5.8 10.1 14.5 12.8 9.4 100.0
Gujarat 18.1 26.8 10.7 4.0 2.8 2.3 3.1 4.3 6.3 8.4 7.2 5.9 100.0
Haryana 3.8 3.5 3.1 3.4 5.1 6.0 8.1 10.3 13.5 16.3 13.8 13.2 100.0
Himachal Pradesh 9.7 12.9 12.0 10.1 9.5 9.4 7.2 8.2 5.4 1.9 4.2 9.4 100.0
Jammu And Kashmir 3.7 3.3 3.0 5.6 7.0 8.8 11.2 12.7 14.9 12.4 9.3 8.0 100.0
Jharkhand 11.9 13.2 11.3 7.6 6.8 8.6 6.2 4.8 5.9 7.7 8.6 7.5 100.0
Karnataka 0.5 0.6 1.3 1.6 2.2 3.2 4.7 5.4 7.5 13.3 26.9 32.8 100.0
Kerala 3.0 6.0 7.6 9.8 8.0 10.1 7.1 7.2 8.8 11.3 11.2 9.9 100.0
Madhya Pradesh 15.7 18.0 16.6 7.5 3.8 3.2 3.4 3.8 6.7 8.1 7.6 5.4 100.0
Maharashtra 28.8 25.1 12.9 3.4 1.7 1.3 1.5 1.3 3.4 4.7 7.3 8.6 100.0
Manipur 3.3 11.8 4.7 11.5 13.0 10.9 10.2 5.0 4.3 12.7 8.8 3.9 100.0
Meghalaya 8.7 7.2 8.7 9.1 10.4 11.6 10.2 9.2 6.8 6.6 6.1 5.5 100.0
Mizoram 6.7 6.4 9.8 7.0 7.1 8.9 8.1 8.2 6.3 7.2 14.0 10.4 100.0
Nagaland 14.0 11.6 8.9 7.1 8.6 5.9 7.0 11.1 7.8 7.0 5.5 5.6 100.0
Odisha 16.8 24.6 12.7 3.1 2.8 3.3 4.0 4.7 5.9 6.8 8.2 7.2 100.0
Punjab 7.8 9.6 10.4 6.8 7.4 7.9 7.5 5.7 5.7 5.5 8.2 17.5 100.0
Rajasthan 12.4 22.9 26.5 9.4 2.7 1.5 1.1 1.2 2.9 6.0 7.2 6.1 100.0
Sikkim 6.5 9.0 9.5 8.9 5.0 6.6 3.3 5.9 11.1 15.6 11.5 7.0 100.0
Tamil Nadu 12.4 12.6 12.1 15.9 10.7 7.6 7.7 3.2 3.8 3.6 5.2 5.2 100.0
Tripura 3.7 7.7 9.4 9.5 11.9 13.2 7.2 5.7 5.2 8.6 8.0 9.9 100.0
Uttar Pradesh 8.8 9.8 10.5 9.6 5.9 2.9 1.9 4.5 11.1 13.5 12.2 9.3 100.0
Uttarakhand 8.2 6.0 6.3 6.8 7.7 6.1 6.2 7.6 11.3 14.5 11.3 7.8 100.0
West Bengal 17.0 16.3 14.6 7.4 4.1 4.0 3.2 2.9 4.8 8.3 9.9 7.4 100.0
Andaman and Nicobar 23.7 9.7 11.7 3.7 1.5 0.0 0.8 1.3 1.3 25.3 16.8 4.0 100.0
Lakshadweep 4.5 1.9 11.1 24.0 11.2 10.7 4.8 11.7 9.1 6.5 4.3 0.3 100.0
Puducherry 4.1 12.0 19.6 24.0 16.7 13.6 9.9 0.0 0.0 0.0 0.1 0.0 100.0
All India 13.5 17.3 14.4 8.0 5.0 4.1 3.7 3.7 5.7 7.6 8.7 8.3 100.0
to. Many of these activities entail a higher material
component but it must be ensured that in the final
mix of activities chosen by the Gram Panchayat,
the overall labour–material ratio in each Gram
Panchayat is maintained at 60:40. The selection of
more material-intensive works and their number
must be done within this overall constraint. While
taking up works under MGNREGA, the following
conditions will need to be followed:
• Only those works to be taken up that result in cre-
ation of durable assets
• The order of priority of works will be determined
within the GP

Rural Development 291
TABLE 17.3
Additional List of Permissible Works Under MGNREGA
No Work Standard Dimensions Unit Cost Wage: Material
Cost Ratio
A. WATERSHED RELATED WORKS
1. Contour Trenches Cross section 0.5m*0.5m `11,300 per hectare 100:0
2. Contour Bunds height 0.6m, base width 2.0m and cross-sectional
area of 0.66 sq.m
`13,637 per hectare 100:0
3. Boulder Checks 7m length, maximum height 1m, upstream and
downstream slopes 1:1 and 3:1, top width of 0.5m
`1,600 100:0
4. Farm Bunding height 0.6m, base width 1.7m and cross-section area
0.57 sq.m
`7,729 per hectare 100:0
5. Gabion Structures 2m height, 1m top width and 12m length `45,000 30:70
6. Underground Dykes 12m length, 6m maximum depth and 2m top width `43,000 70:30
7. Earthen Dams 65m length, maximum height 4.65m, upstream and
downstream slopes 2:1 and 2.5:1, top width 2m
`2.63 lakhs 95:5
8. Dugout Farm Ponds 25m*20m*2m `98,470 100:0
9. Stop Dams length 20m, maximum height 2.7m, top width 1.5m
and side slopes 1:1
`5.32 lakhs 25:75
B. WATERSHED RELATED WORKS IN MOUNTAIN REGIONS
10. Springshed Development Various watershed interventions `18,000–`38,000 per
hectare
90:10–60:40
C. AGRICULTURE RELATED WORKS
11. NADEP Composting 3.6m*1.5m*0.9m `8,000 25:75
12. Vermi-Composting 3.6m*1m*0.75m `9,000 25:75
13. BioLiquid Manure Sanjeevak Pit 1m*1m*1m `2,000 30:70
D. LIVESTOCK RELATED WORKS
14. Poultry Shelter 7.5 sq m for 100 birds `40,000 20:80
15. Goat Shelter 7.5 sq m for 10 animals `35,000 25:75
16. Pucca Floor, Urine Tank
and Fodder Trough for
Cattle
Cattle shed floor 26.95 sq.m, 1 cu.m fodder trough
and cattle urine collection tank 250 litres
`35,000 30:70
17. Azolla Cattle-Feed Azolla pit 2m x 2m x 0.2 m `2,000 15:85
E. FISHERIES RELATED WORKS
18. Fisheries in Water Bodies
on Public Land
500 cu.m fish nursery pond, excavation of 15000
cu.m in tank bed, fish drying platform 30 sq.m
`11 lakhs (`75 per
cubic metre)
80:20
F. WORKS IN COASTAL AREAS
19. Fish Drying Yards 10m*10m, 15 cm thick plain cement concrete, brick
protection work 20 cm thickness
`75,000 15:85
20. Belt Vegetation Plant `20 80:20
21. Storm Water Drains 100 m long storm water drain `2.3 lakhs 15:85
G. RURAL DRINKING WATER RELATED WORKS
22. Soak Pits NRDWP specifications `2,000 50:50
23. Recharge Pits NRDWP specifications `5,000 50:50
(Contd.)

292 Twelfth Five Year Plan
No Work Standard Dimensions Unit Cost Wage: Material
Cost Ratio
H. RURAL SANITATION RELATED WORKS
24. Household Toilets TSC specifications `4,500 60:40
25. School Toilets TSC specifications `35,000 25:75
26. Anganwadi Toilets TSC specifications `8,000 25:75
27. Solid Liquid Waste
Management
TSC specifications for 1000 people `5 lakhs 35:65
I. FLOOD RELATED WORKS
28. Deepening and Repair of
Flood Channels
main channels: `180/
metre
field channels: `30/
metre
100:0
100:0
29. Chaur Renovation `4,76,000 per hectare 100:0
J. IRRIGATION COMMAND RELATED WORKS
30 Rehabilitation of Minors,
Sub-Minors and Field Channels
`3,000 per hectare 60:40
Source: Mihir Shah Committee (2012): MGNREGA Operational Guidelines, MoRD, GoI.
• 60:40 ratio for labour:material costs should be
maintained at the GP level
• No contractors/labour-displacing machinery to
be used
Strengthening the Demand-driven Character
of MGNREGA
17.20. The single most important distinguishing fea-
ture of MGNREGA from employment programmes
of the past is that provision of work is triggered by
the demand for work by wage-seekers and provided
as their legal right. All previous employment pro-
grammes provided work when governments decided
to provide work, not when people demanded work.
MGNREGA is to change that. The old practice of jab
kaam khulega, tab kaam milega has to be changed to
jab kaam maangege, tab kaam khulega. This requires
that we pay very close attention to generating aware-
ness among potential wage-seekers and set up systems
that facilitate and rigorously record registration for
work, issuance of job cards and application for work.
17.21. The major weakness so far has been that
States have not set up effective systems of recording
demand. The new MGNREGA Guidelines in opera-
tion from the Twelfth Plan (Box 17.1) take major
steps to overcome this weakness.
Labour Budget
17.22. A unique feature of Mahatma Gandhi
NREGA is its demand-driven character. But before
we begin to record demand we need to make a
prior assessment of the quantum of work likely to
be demanded as also ascertain the timing of this
demand. Concomitantly, we need to prepare a shelf
of projects that would allow us to meet this demand.
This matching of demand and supply of work is the
process of planning under MGNREGA and this is
to be achieved through the preparation of a Labour
Budget, which has two sides—one, assessment of
quantum and timing of demand for work and two,
preparing a shelf of projects to meet this demand in
a timely manner.
17.23. A Labour Budget must, therefore, reflect
1. Anticipated quantum of demand for work
2. Precise timing of the demand for work, and also
3. A plan that outlines the quantum and schedule of
work to be provided to those who demand work
17.24. This is the only way work-providers can
open work in a manner that is synchronised with
the pattern of migration in that area so as to pre-
empt distress migration. It must also be incum-
bent upon work-providers to proactively inform
(Table 17.3 Contd.)

Rural Development 293
Box 17.1
New Guidelines to Strengthen Demand-driven Character of MGNREGA
1. The Gram Panchayat or Programme Officer, as the case may be, shall be bound to accept valid applications and to issue a
dated receipt to the applicant.
2. Refusal to accept applications and provide dated receipts will be treated as a contravention under Section 25 of MGNREGA.
3. The provision for submitting applications for work must be kept available on a continuous basis through multiple channels
so designated by Gram Panchayats who may empower ward members, anganwadi workers, school teachers, self-help
groups, village-level revenue functionaries, common service centres and Mahatma Gandhi NREGA Labour Groups to
receive applications for work and issue dated receipts on their behalf.
4. Provision must also be made (wherever feasible) for workers to register applications for work through mobile telephones
in addition to the MGNREGA website and this should feed in directly into the MIS. In case of mobile telephones, the
system must be made convenient to illiterate workers and may include Interactive Voice Response System (IVRS) and
voice-enabled interactions. This option must automatically issue dated receipts.
5. State Governments will ensure that the MGNREGA MIS will record the demand for work. It will track (for each GP) the
gap between date of application for work and date of opening of work.
6. MGNREGA software will automatically generate the pay order for payment of unemployment allowance to such wage
seekers whose demand for work is not met within 15 days of demand. Reports prepared on this will have to be part of the
essential set of reports to be tracked at the State level.
Source: Mihir Shah Committee (2012): MGNREGA Operational Guidelines, MoRD, GoI.
work-demanders well in advance about the schedule
of work to be provided so that they do not need to
migrate in distress.
17.25. These plans are currently supposed to be pre-
sented for approval only at the Gram Sabha on 2nd
October each year. This is far too late to prevent
distress migration of households because decisions
on migration are normally taken in the monsoon
season. In the absence of a timely work guarantee,
many are likely to migrate after the harvest of the
kharif crop. It is important, therefore, for the GP to
inform potential workers of available employment
and the timing of this employment well in advance
of the kharif harvest. With effect from the Twelfth
Plan, annual plans will be presented by the Gram
Panchayat at a Gram Sabha meeting to be held on
the 15 August.
Planning for an Adequate Shelf of Projects
17.26. As demand gets better recorded, there needs to
be a corresponding increase in supply of work. This
requires strengthening of capacities at the cutting-
edge level of implementation. Unfortunately, the main
implementing agency under MGNREGA, the Gram
Panchayat, is badly lacking in capacities to plan and
implement high quality works under MGNREGA.
This is also the missing ‘F’ (functionaries) which
could galvanise PRIs, especially Gram Panchayats, as
the bedrock of Indian democracy.
17.27. Beginning with the Twelfth Plan, each
Block will appoint a full-time Programme Officer
for Mahatma Gandhi NREGA. It will not be good
enough for BDOs or other block officers to be given
‘additional charge’ for the programme. It has also
been decided that blocks, where either scheduled
castes plus scheduled tribes form greater than or
equal to 30 per cent of the population or the annual
MGNREGA expenditure was more than `12 crores
in any year since the programme started, will man-
datorily have at least three Cluster Facilitation
Teams (CFT), each of which will service a Cluster of
Gram Panchayats (CGP), being accountable to each
GP within their Cluster. Each CGP will cover around
15,000 job cards or an area of about 15,000 ha, broadly
corresponding to the boundaries of a milli-water-
shed and local aquifer. The CFT will comprise a fully
dedicated, three-member professional support team
for MGNREGA. The CFT will be a multidisciplinary
team led by an Assistant Programme Officer (APO)
and will comprise specialists in earthen engineering,
community mobilisation, hydrogeology, agriculture/
allied livelihoods. This will enable more professional
planning based on the watershed approach aimed at
improved land and water productivity.

294 Twelfth Five Year Plan
Reducing Delays in Wage Payments
17.28. Delays in wage payments have emerged as one
of the main weaknesses of MGNREGA over the last
six years. According to section 3(3) MGNREGA, ‘It
is essential to ensure that wages are paid on time.
Workers are entitled to being paid on a weekly basis,
and in any case within a fortnight of the date on
which work was done.’ Thus, MGNREGA 2.0 speci-
fies a payments schedule that will need to be followed
and tracked using a transactions-based MIS.
17.29. States must effectively track delays in pay-
ment so that effective remedial action can be expedi-
tiously taken when delays are spotted. For this States
must develop a customised MIS that enables better
tracking of delays. The best example before us is the
transaction-based MIS along the lines implemented
in Andhra Pradesh. The tightly integrated, end-to-
end computer network in Andhra Pradesh identifies
delay in execution of any work registered online and
takes corrective action immediately. The measure-
ment sheets and muster rolls of the week’s work are
compiled on the sixth day of that week and trans-
mitted to the Mandal (sub-block) computer centre.
The next day, the muster data is fed into the com-
puter and on the eighth day pay orders generated
and cheques prepared. By the tenth day, cheques are
deposited into post office accounts of workers. By
the thirteenth day, workers are able to access wages
from their accounts (Table 17.4). Free availability of
payment information facilitates public scrutiny and
transparency.
17.30. Use of such real-time technologies to enable
online updation of critical data at each stage of the
MGNREGA workflow is now being facilitated by
the Centre for each State. States need to urgently
identify the connectivity and hardware bottlenecks
so that these can be removed. State Governments
should undertake business process re-engineering
of all activities starting from capturing attendance to
the end-point payment of wages in order to improve
efficiency of implementation of MGNREGA. States
should do away with redundant processes/records
which contribute to delay in payments. States should
closely monitor all the critical activities: closure of
muster roll, capturing measurements, generating
pay-order, issuance of cheque and pay-order to pay-
ing agency, transfer of cash to sub-agency (Branch
Post Office/ Business correspondent) and wage
disbursement to workers. Timelines for each activ-
ity should be clearly laid out against the concerned
TABLE 17.4
Wage Payment Cycle under MGNREGA
Activity Day
1
Day
2
Day
3
Day
4
Day
5
Day
6
Day
7
Day
8
Day
9
Day
10
Day
11
Day
12
Day
13
Day
14
Day
15
Executing works
Making and Checking
Measurement
Data Entry at
Computer Centre
Pay Order generation
and Preparation of
Cheques
Handing Over Cheques
to SPO/Banks
Conveyance of Cash
to Paying Agency at
GP Level
Disbursement of
Wages by Paying
Agency

Rural Development 295
MGNREGA staff/agency responsible for meeting
the timelines. Non-adherence to stipulated time-
lines should be penalised and the states should levy
penalties on MGNREGA staff or agency responsible
for any delay in wage payments. An accountability
matrix (Table 17.5) will be used to track the ineffi-
ciencies in delay in wage payments and disciplinary/
punitive actions shall be initiated accordingly.
17.31. An important cause for delay of wage pay-
ments is also non-availability of sufficient funds at
district/block/GP level. In some districts/blocks/GPs
there is shortage of MGNREGA funds, while in oth-
ers there is a surplus. Once the MGNREGA fund is
allotted to a district/block/GP, it is very difficult to
perform transfers of the fund across district/block/
GP. Fund allocation hence becomes an arduous task
in implementation of MGNREGA. To tackle this
problem, MGNREGA 2.0 proposes an integrated
fund management system called e-FMS (Electronic
Fund Management System) which ensures that the
MGNREGA fund is not excess or deficient at any
level. Under e-FMS, the MGNREGA fund is a cen-
trally pooled fund managed at state level. The users,
that is, GP at village level or Programme Officer at
Block level or DPC at district level, all across the State,
are the users of this centralised fund and will have
access to this pooled fund (with certain restrictions).
The users can now undertake only electronic trans-
actions through the centralised fund, for the purpose
of wage/material/administrative payments as per the
actuals (with certain ceilings). All electronic transfers
are realised in a span of 24 hours. Based on this prin-
ciple of centralised fund and decentralised utility, the
e-FMS ensures timely availability of funds at all lev-
els and transparent usage of MGNREGA funds. This
improves efficiency of the programme on the whole
and also has a multiplier effect on timely delivery of
wage payments.
Strengthening Banks and Post Offices
17.32. Another inadvertent source of delays has
been the decision by Government for MGNREGA
payments to be made through banks and post
offices. While this has led to a palpable reduction in
leakages, the lack of sufficient density of banks/POs
and lack of adequate personnel manning them, has
emerged as a major bottleneck, especially in remote,
tribal areas, contributing to delays in wage payments.
The Business Correspondent (BC) model is one way
to overcome these problems. In order to strengthen
the viability of the BC model, the Ministry of Rural
Development (MoRD) has written to all States ask-
ing them to appoint BCs through a transparent pro-
cess of selection with `80 per active account per year
to be absorbed under the 6 per cent administrative
expenditure head of MGNREGA. This is an interim
measure that will help BCs overcome teething prob-
lems before they mature to self-sustaining viability
as their business expands. A major point of delay
has been the crediting of workers’ bank accounts
as this involves physical movement of cheques
and wage lists from the GP to the bank after which
banks are required to feed in details of the bank
TABLE 17.5
Accountability Matrix for Delays in Wage Payments under MGNREGA
Reasons for Delay in Wages Enter the Designation of Personnel/Officer Responsible for Delay in Wage
Payments and Number of Days of Delay
Centre State District Block GP Paying Agency
Delay in making available the MGNREGA funds
Delay in closing of muster rolls
Delay in measurement
Delay in data-entry, generation of pay order
Delay in issuing cheque for wage-payments
Delay in transfer of cash to sub-agency
Delay in end-point wage disbursement

296 Twelfth Five Year Plan
accounts of wage earners once again. To make this
transaction seamless, MoRD has worked with five
banks in four States (Orissa, Gujarat, Rajasthan and
Karnataka) to successfully develop electronic trans-
fer of data files to banks. This solution is now being
taken up in other States also and should be in place
by the second year of the Twelfth Plan in all States.
This will reduce the time taken in crediting accounts
of workers.
17.33. A similar solution is being developed for
transmitting data to Head Post Offices (HPOs)
which will cut down the time required for documents
to travel from Branch Post Offices (BPOs) to HPOs
via Sub-Post Offices. This is being already tried
out in Rajasthan. A major problem faced by BPOs
is that their cash and line limit is very low. States
need to raise the cash and line limit for their BPOs
so that they are not strapped for funds while mak-
ing payments to MGNREGA workers. A provision is
being made that, in consultation with the Chief Post
Master General for the circle, an amount equal to
one month’s wages will be mandatorily required to
be kept with the HPO to avoid delays on account of
clearance of cheques and so on.
Better Social Audits, Vigilance and
Grievance Redressal
17.34. Given the large number of complaints of
corruption, MGNREGA 2.0 pays great attention
to strengthening both preventive and ameliorative
measures to address the issue. Whereas in Andhra
Pradesh, social audits have been institutionalised by
State Governments, they have worked very well. They
have proved a great check on corruption and large
recoveries have also been made. Under MGNREGA
2.0, the MoRD has notified Social Audit Rules that
mandate the establishment of a Social Audit Unit
(SAU) to facilitate conduct of social audit by Gram
Sabhas. This Social Audit Unit can be either a Society
or a Directorate, in each case independent of the
implementing departments/agencies. The Social
Audit Unit shall be responsible for building capaci-
ties of Gram Sabhas for conducting social audit by
identifying, training and deploying suitable resource
persons at village, block, district and State-level draw-
ing from primary stakeholders and other civil society
organisations having knowledge and experience of
working for the rights of the people. The SAU will
create awareness amongst the labourers about their
rights and entitlements under the Act and facilitate
verification of records with primary stakeholders
and work sites. All States have agreed that they will
immediately initiate this process and social audit
will first be completed in all Gram Panchayats in one
selected block in every State.
17.35. States are now required to upload photographs
of works at different stages of execution through the
Ministry’s software NREGASoft. A pilot has been
launched in the Ramgarh district in Jharkhand for
use of the Aadhaar number for biometric based
authentication of payments to MGNREGA work-
ers. The Aadhaar number along with the job card
number will be now part of the MIS to help eliminate
non-genuine and duplicate job cards.
17.36. Complementing social audit will be audit
by the Comptroller and Auditor General (CAG).
All expenditure on all schemes of the Ministries of
Rural Development and Drinking Water Supply
and Sanitation have now been opened up to audit
by the C&AG both at the Centre and in the States.
This will be irrespective of the implementing agency
and will include not only financial audit and compli-
ance audit but also performance audits with regard
to these schemes. To begin with performance audits
of MGNREGA will be taken up in 12 States—Assam,
Andhra Pradesh, Bihar, Chhattisgarh, West Bengal,
Jharkhand, Madhya Pradesh, Rajasthan, Gujarat,
Maharashtra, Orissa and Uttar Pradesh.
17.37. All States will also make an arrangement for a
three-tier vigilance mechanism to proactively detect
irregularities in the implementation of the Act and
to follow up detected irregularities and malfeasance,
including those identified during social audit, and
ensure that the guilty are punished and recover-
ies of misspent funds duly made. At the State level
there will be a Vigilance Cell consisting of a Chief
Vigilance Officer who could be either a senior
Government officer or a retired officer supported by
at least two senior officials (serving or retired), one
engineer and an auditor.

Rural Development 297
17.38. Elaborate steps to institute transparency, pro-
active disclosure and grievance redressal have also
been put into place under MGNREGA 2.0. It has also
been decided that the following will be considered
offences punishable under Section 25 of the Act:
• Job cards found in the possession of any Panchayat
or MGNREGA functionary
• Missing entries or delay in entries in the Job Card
• Refusal to accept applications and provide dated
receipts
• Unreasonable delays in measurement of works
• Unreasonable delays in payment of wages
• Failure to dispose of complaints within seven
days
17.39. Limitations have also been imposed on
administrative expenses, which form a maximum of
6 per cent of expenses under MGNREGA. At least
two-thirds of the expenses admissible under this
head will be spent at the block level and below. The
following items shall under no condition be booked
under the administrative costs of MGNREGA:
• New vehicles
• New buildings
• Air-conditioners
• Salaries/remuneration/honoraria of functionar-
ies who are not exclusively or wholly dedicated to
MGNREGA work
NATIONAL RURAL LIVELIHOODS MISSION
(NRLM-AAJEEVIKA)
17.40. Even as a reformed MGNREGA 2.0 gets
underway, during the Twelfth Plan it is the NRLM
that will emerge as the centrepiece of India’s battle
against rural poverty. NRLM has been designed to
overcome the limitations of SGSY (Box 17.2). The
foundation of water infrastructure and agrarian sta-
bility provided by MGNREGA will be harnessed to
generate sustainable livelihoods for the poor through
the NRLM, which will work simultaneously on five
critical dimensions of rural livelihoods and human
development:
• Strengthening the package of credit-cum-technol-
ogy support to strengthen rural livelihoods
• Empowering institutions of the poor that will
fundamentally alter the balance of power in rural
India
• Facilitating the poor to compete on more equal
terms in the market so that they can derive real
benefits from the new opportunities opening up
in rural India (rather than being at their receiving
end)
• Improving the quality of human development
programmes such as drinking water, sanitation
and housing by making higher private invest-
ments possible through a credit component being
added to the subsidies being currently provided
• Imparting the much needed skills to the rural
population to meet the demands of both the
growing rural and urban economies and ensur-
ing placement of skilled workers in appropriate
jobs
NRLM: New Directions
17.41. Phased Implementation: The SGSY experi-
ence is yet another instance of the ‘universalisation
without quality’ syndrome that has plagued many
rural development initiatives in the recent past.
The NRLM has been designed to be implemented
in a phased manner (Table 17.6) specifically keep-
ing this experience in mind to ensure quality of out-
comes and to avoid spreading resources too thin, too
quickly.
17.42. In each phase, select districts and blocks will
be identified by each state for intensive implementa-
tion of NRLM activities. The ‘intensive blocks’ that
are taken up for NRLM implementation would be
provided a full complement of trained professional
staff to undertake a whole range of activities under
the key components of the Mission:
• Building institutions of the poor
• Promotion of financial inclusion
• Diversification and strengthening of the liveli-
hoods of the poor
• Promotion of convergence and partnerships
between institutions of the poor and the govern-
ment and non-government agencies
• Promotion of skills and placement support
• Support for livelihoods and social innovations

298 Twelfth Five Year Plan
17.43. The rationale behind adopting a phased,
intensive approach is as follows:
• Building sustainable institutions of the poor, pro-
motion of financial literacy and inclusion through
bank linkage and provision of livelihood sup-
port services, skill development and placement,
involves intensive social mobilisation effort and
capacity building.
• All these activities also require a good deal of pro-
fessional support. While the NRLM envisages hir-
ing of services of competent professionals, most
of the States do not have the required capacity,
which can only be built in a phased manner.
• In the long run, institutions of the poor can be
sustained only if leaders from the poor commu-
nities are identified, trained and prepared for
undertaking larger leadership roles. The process
of building local community leaders and resource
persons is by its very nature time-consuming.
• Promotion of livelihoods of the rural poor does
not afford a simple linear solution which all States
and districts can equally adopt. What works in
one state/district may not work equally effec-
tively in another. It is only from learning by doing
and innovating that appropriate solutions can
emerge, as amply demonstrated by the successful
phased expansion adopted in the states of Andhra
Pradesh, Kerala and Tamil Nadu.
• The phased expansion approach will also facilitate
early piloting of key strategies in certain ‘resource
blocks’ which can then provide the ‘proof of con-
cept’ required on the ground for others to adopt
and replicate.
Box 17.2
Limitations of SGSY
The SGSY was launched in 1999 by restructuring the Integrated Rural Development Program (IRDP). The cornerstone of
the SGSY strategy was that the poor need to be organised and their capacities built up systematically so that they can access
self-employment opportunities. In the 10 years of implementing SGSY, there is a widespread acceptance in the country of the
need for poor to be organised into SHGs and SHG federations as a prerequisite for their poverty reduction.
A major problem identified by the Radhakrishna Committee on Credit Related Issues under SGSY (2009) is that most of the
SHGs remain crowded in low productivity, primary sector activities. The success of the programme depended on raising their
abilities to diversify into other high productive activities. Even in the better performing state of Andhra Pradesh, the income
gain to a swarozgari from enterprise activities under SGSY was a mere `1,228 per month. The small income gain was due to
low productive, traditional activities in which they were engaged and due to low absorption of technology.
The Committee argued that nearly two thirds of the total funds were given out as subsidy, thus making the whole programme
subsidy-driven. The subsidy disbursed under SGSY was `12,900 crore, while credit mobilised was `27,800 crore, that is a
credit-subsidy ratio of only 2.15:1, much below the target ratio of 3:1. This was partly due to the failure to strengthen the
demand side by improving the capacity of the poor to absorb credit for income generating activities. But it was also due to
supply side failures. Financial services did not have the systems and procedures suited to the poor.
Only 6 per cent of the total SGSY funds were utilised for training and capacity building during the past decade. Ill-trained
groups under SGSY were a severe handicap in moving towards the Eleventh Plan goal of inclusive growth. Training is of
vital importance in the management aspects of running both SHGs and their federations, as well as in improving existing
livelihood options and also adopting new ones. It is very important to recognise as argued by the Radhakrishna Committee
‘that prior to SHG-Bank Linkage, substantial preparatory work needs to be done for bringing the poor together through
a process of social mobilisation, formation of sustainable SHGs and training them to pool their individual savings into a
common pool for lending it among the needy. It also includes equipping them with skills to manage corpus fund created with
their own savings, interest earned from lending and revolving fund contributed by the government’.
Another defining feature of SGSY was the very uneven distribution of SHGs across regions, with the southern states, which
account for 11 per cent of the rural poor having 33 per cent of the SHGs, while the northern and north-eastern States, which
account for more than 60 per cent of the rural poor having only about 39 per cent SHGs.
It was in the backdrop of these limitations of the SGSY that the Government of India approved restructuring of SGSY as the
National Rural Livelihoods Mission (NRLM) and launched the same in June 2011.

Rural Development 299
• The community-based institutions also require
certain amount of time to internalise new learn-
ing, practices and innovative experiments, before
expanding and scaling up.
• Simultaneous implementation of the intensive
strategy in all blocks and districts would imply a
thin distribution of available resources leading to
sub-optimal and non-sustainable outcomes. The
phased approach will enable States to apply scarce
resources to their priority districts and blocks,
where strong civil society support may also be
available.
Block Level Professional Support
17.44. The lack of quality in SGSY outcomes had a
great deal to do with absence of high quality profes-
sional support at the block and sub-block level for
undertaking intensive social mobilisation, institution
building, capacity building, financial inclusion and
promotion of multiple livelihoods of the poor. Under
NRLM a special provision will be made for this and
the professional support costs incurred at the block/
sub-block levels will be treated as costs of institu-
tion and capacity building and not as administrative
TABLE 17.6
Phasing of the National Rural Livelihoods Mission
2012–13 2013–14 2014–15 2015–16 2016–17 Total
Twelfth
Plan
Total
13th
Plan
Total
Intensive Districts 150 0 150 0 300 600 0 600
Cumulative Intensive Districts 150 150 300 300 600 600 600 600
Intensive Blocks 600 0 1,500 0 2,100 4,200 1,800 6,000
Cumulative Intensive Blocks 600 600 2100 2,100 4,200 4,200 6,000 6,000
Households Covered in Lakh 45 23 60 75 128 330 570 900
Cumulative Households Covered in Lakh 45 68 128 203 330 330 900 900
SHGs in ‘000 360 180 480 600 1,020 2,640 4,560 7,200
Cumulative SHGs in ‘000 360 540 1,020 1,620 2,640 2,640 7,200 7,200
Youth Skilled for and Placed in Jobs in
Lakh
5 10 25 30 30 100 150 250
Cumulative Youth Skilled for and Placed
in Jobs in Lakh
5 15 40 70 100 100 250 250
Self-employed in Lakh 246810306090
Cumulative Self-employed in Lakh 2 6 12 20 30 30 90 90
Note: The figures for 2012–13 include figures of already existing SHGs.
costs. In the phased approach adopted under NRLM,
the block-level professionals will move from one
block to another after promoting and nurturing
community institutions of the poor for a certain
period. Gradually, the trained community resource
persons (CRPs) would take over the responsibility
of the institutions from the professional staff, whose
costs would be progressively absorbed by the insti-
tutions as they grow financially stronger. The pro-
fessional support costs of NRLM will progressively
diminish with the increase in the use of CRPs.
Skill Development and Placement in Jobs
17.45. A major focus of the NRLM is skilling rural
poor youth. This is both for self-employment in
microenterprises and job placement given emerging
widespread employment opportunities at the entry
level in high growth sectors like textiles, construc-
tion, hospitality, retail, security, automobile, health,
services and so on. The services provided by NRLM
in the ‘jobs’ sub-component will include:
• Mapping the demand for jobs;
• Skill development/training;

300 Twelfth Five Year Plan
• Counselling youth by matching their aspirations
and existing skill set with demand;
• Placement and post-placement support.
17.46. NRLM will aim at supporting 1 crore youth in
the Twelfth Plan in this manner. The focus will be on
youth from IAP districts, J&K, North Eastern States,
districts/blocks with high SC population and minor-
ity concentrated districts. The initiative will also aim
at enrolling as many girls as possible.
17.47. The self-employment and microenterprises
sub-component would pursue multiple streams:
• Micro-entrepreneurs and enterprises directly
nurtured by Rural Development and Self-
Employment Training Institutes (RUDSETIs)
• Micro-entrepreneurs through apprenticeship and
nurturing by practicing micro-entrepreneurs (as
under Kudumbasree in Kerala)
• Working with other training partners, including
CBOs, CSOs and so on
17.48. These models envisage transforming unem-
ployed youth into confident self-employed entrepre-
neurs through a short duration experiential learning
program followed by systematic long duration hand
holding support/ apprenticeship. In the Twelfth Plan
it is proposed to nurture 30 lakh entrepreneurs from
among the poor to set up micro-enterprises.
RURAL DRINKING WATER AND SANITATION
Review of National Rural Drinking Water
Programme (NRDWP)
17.49. As against the target of 7,98,967 habitations
for coverage under NRDWP during the Eleventh
Plan, the coverage up to 31 March 2012 was 6,65,034
(83 per cent). States of Jharkhand, Chhattisgarh,
Nagaland, Madhya Pradesh, Odisha, Himachal
Pradesh and Tamil Nadu have exceeded their targets,
whereas Sikkim, Punjab, Assam, Arunachal Pradesh
and Jammu & Kashmir have reported low (less than
50 per cent) achievement against targets. As against
the planned Central outlay of `39,300 crore in the
Eleventh Plan the anticipated expenditure is `39,211
crore. In addition, the States are expected to spend
`49,000 crore. The investments in rural drinking
water (1951–2012) are given in Table 17.7.
TABLE 17.7
Investments in Rural Drinking Water, 1951–2012
Plan Period Investment made (`crore)
Centre State
First (1951–56) 0 3
Second (1956–61) 0 30
Third (1961–66) 0 48
Fourth (1969–74) 34 208
Fifth (1974–79) 157 348
Sixth (1980–85) 895 1,530
Seventh (1985–90) 1,906 2,471
Eighth (1992–97) 4,140 5,084
Ninth (1997–2002) 8,455 10,773
Tenth (2002–07) 16,254 15,102
Eleventh (2007–12) 39,211 49,000
17.50. The difficulty has been that even as cover-
age becomes universal, there is a growing problem
of ‘slipback’, with habitations suffering a fall in the
water table and water quality, especially given the
growing dependence on groundwater. Water quality
has emerged as a growing concern, chemically due to
geogenic leaching (arsenic and fluoride) and biologi-
cally due to bacteriological contamination. The fact
that the same aquifer is being tapped for both irri-
gation and drinking water, without any coordinated
management of the resource, has greatly aggravated
availability of drinking water. Lack of convergence
with sanitation, on the other hand, compromises
water quality, even as it makes provision of improved
sanitation difficult.
17.51. Poor operation and maintenance has resulted
in high rates of attrition and dilapidated facilities.
This has happened mainly because primary stake-
holders do not feel a sense of ownership over the
facility created and in the absence of sufficient sup-
port structures and professional capacities, upkeep
suffers. On the other hand, where people have been
centrally involved, they have both paid for the ser-
vice provided and felt a stake in maintaining the
assets, garnering adequate support for the same

Rural Development 301
through the revenues generated. There are also dis-
turbing reports about social exclusion, with SCs, STs
and minorities being discriminated against. Keeping
this in mind, from 2011–12, earmarking of funds for
expenditure under the SCSP (22 per cent) and the
TSP (10 per cent) has been made mandatory under
NRDWP. Appropriate use of IMIS and GIS maps
in the planning process is being promoted to pre-
vent social exclusion. Provision of drinking water in
minority concentrated districts is one of the activi-
ties monitored under the Prime Minister’s New 15
Point Programme. Implementation of rural water
supply schemes is being closely monitored in the 90
minority concentrated districts.
NRDWP in the Twelfth Plan
17.52. Based on this analysis of what is going wrong
with NRDWP and drawing upon some successes, the
Twelfth Plan envisages a major change in the way
NRDWP projects are to be run:
• While the ultimate goal is to provide households
with safe piped drinking water supply at the rate
of 70 lpcd, considering that 40 lpcd has been the
norm over the last 40 years and there is still a
large population uncovered with this level, as an
interim measure the goal has been kept at 55 lpcd
for the Twelfth Plan.
• By 2017, it is targeted that at least 50 per cent of
rural population in the country (as against 35 per
cent today) will have access to 40 lpcd piped water
supply within their household premises or within
100 metres radius (and within 10 metres elevation
in hilly areas) from their households without barri-
ers of social or financial discrimination. Individual
States can adopt higher quantity norms.
• By 2017, it is targeted that at least 35 per cent of
rural population have individual household con-
nections (as against 13 per cent today).
• Convergence between drinking water supply and
sanitation will be strengthened taking up villages
covered with piped water supply to get open defe-
cation free (ODF) status on priority and vice versa.
• A part of NRDWP outlay will be set apart for inte-
grated Habitat Improvement Projects to provide
housing, water and sanitation facilities in rural
areas at par with urban areas.
• Participation of the beneficiaries, especially
women, in water supply schemes will be ensured
right from the conceptualisation and planning
stage, spanning construction and post-scheme
completion management stages. Capacity building
of members of the Village Water and Sanitation
Committees is of critical importance here.
• The subsidiarity principle will be followed and
decisions made at the lowest level possible espe-
cially on issues like location, implementation,
sustainability, O&M and management of water
supply schemes, while retaining an umbrella
role for the Gram Panchayats for effective
implementation.
• The Ministry of Drinking Water and Sanitation
has devised a Management Devolution Index
(MDI) to track and incentivise more substan-
tive devolution of functions, funds and function-
aries to the Gram Panchayats. While allocating
resources across States, 10 per cent weight is given
to the population of GPs to whom drinking water
supply schemes have been devolved weighted by
the MDI for the State.
• The weakest aspect of rural water supply is
Operation and Maintenance. Allocation for O&M
has been increased from 10 per cent of NRDWP
allocation at present to 15 per cent in the Twelfth
Plan.
• All new drinking water supply schemes will be
designed, estimated and implemented to take into
account life cycle costs and not just per capita cap-
ital costs.
• All Government schools and anganwadis (in
Government or community buildings) will be
provided with water supply for drinking and for
toilets as per relevant quantity norms by conver-
gence of NRDWP for existing schools and SSA for
new schools set up under SSA. For private schools,
supply of water will be ensured by enforcement of
the provisions of the Right to Education Act by
the Education Department.
• All community toilets built with public funds and
maintained for public use will be provided with
running water supply under NRDWP.
• Solar powered pumps will be provided for imple-
mentation in remote, small habitations and those
with irregular power supply, especially in IAP

302 Twelfth Five Year Plan
districts, by converging subsidy available under
Ministry of New and Renewable Energy.
• Waste water treatment and recycling will be an
integral part of every water supply plan or project.
Management of liquid and solid waste will be pro-
moted together with recycling and reuse of grey
water for agriculture and groundwater recharge
and pollution control. This will be done on prior-
ity in NGP villages.
• A holistic aquifer and surface water manage-
ment approach with active community and PRI
participation will converge in a District Water
Vision that includes monitoring and recording of
groundwater levels and rainfall at sub-block level
and Aquifer Management Plans to protect and
recharge drinking water sources.
• Care will be taken to ensure that minimum dis-
tance is maintained between the toilet systems and
water sources, to alleviate the problem of nitrate
contamination.
• Mining activity should only be carried out at a safe
distance from major drinking water sources to
protect the quality and sustainability of the source.
• A progressive tariff with different pricing tiers for
different uses and different classes of consumers
can be considered at various administrative levels,
that is, the Gram Panchayat, district and State as
appropriate. Incentives may be provided to the
GPs for collecting user charges from the benefi-
ciaries. A minimum collection of 50 per cent of
O&M cost (including electricity charges) through
user charges will be the target.
• Given the growing importance of water quality
issues, dedicated funding will be provided to States
with quality affected habitations, over and above
the normal NRDWP allocation to the State. Within
this dedicated funding highest priority will be given
to arsenic and fluoride affected habitations. Part of
the funding would also be made available to tackle
bacteriological contamination in the priority dis-
tricts with high incidence of JE/AES cases as identi-
fied by the Ministry of Health and Family Welfare.
REVIEW OF TOTAL SANITATION CAMPAIGN
(TSC)
17.53. The TSC was launched in 1999 as a demand-
driven, community-led programme with major IEC
inputs to make sanitation a felt need of the people.
The TSC has been able to accelerate sanitation cover-
age from 22 per cent as per the 2001 Census to 31 per
cent in 2011, with over 28,000 PRIs becoming ‘Open
Defecation Free’ (ODF). TSC received a major boost
during the later half of the decade, with the introduc-
tion of the Nirmal Gram Puraskar (NGP) in 2005, an
innovative incentive scheme for Gram Panchayats,
blocks and districts, that have attained 100 per cent
sanitation coverage.
17.54. However, progress remains far from satisfac-
tory. Open defecation by around 600 million people
is our biggest national shame. Since drinking water
and sanitation continue to be treated in separate
silos, both the quality of drinking water and that of
sanitation gets compromised. Latest Census data
reveals that the percentage of households having
access to television and telephones in rural India in
2011 exceeds the percentage of households having
access to toilet facilities and tap water (Figure 17.1).
17.55. Access to household amenities in ten worst
performing States in terms of toilet facilities in rural
India in the year 2011 (percentage of rural house-
holds) is given in Table 17.8.
17.56. The households by type of latrine facility
in rural India as per Census 2001 and Census 2011
are given in Figures 17.2 and 17.3, respectively. The
percentage of households with no latrine facilities in
rural India in 2011; physical progress and financial
progress during the Eleventh Plan of Total Sanitation
Campaign are given in Table 17.9, Table 17.10 and
Table 17.11, respectively.
17.57. Several independent assessments signal the
need for a radical change in approach. The WHO/
UNICEF Joint Monitoring Programme (JMP) for
Water Supply and Sanitation estimates that in 2008
around 638 million people in India still defecated in
the open and the reported usage of sanitation facili-
ties at 30.7 per cent against the TSC sanitation cover-
age figure of 57 per cent for the same year. The JMP
also revealed that 58 per cent of the world’s popu-
lation defecating in the open in 2008 was in India.
A recent impact study by the World Bank’s Water
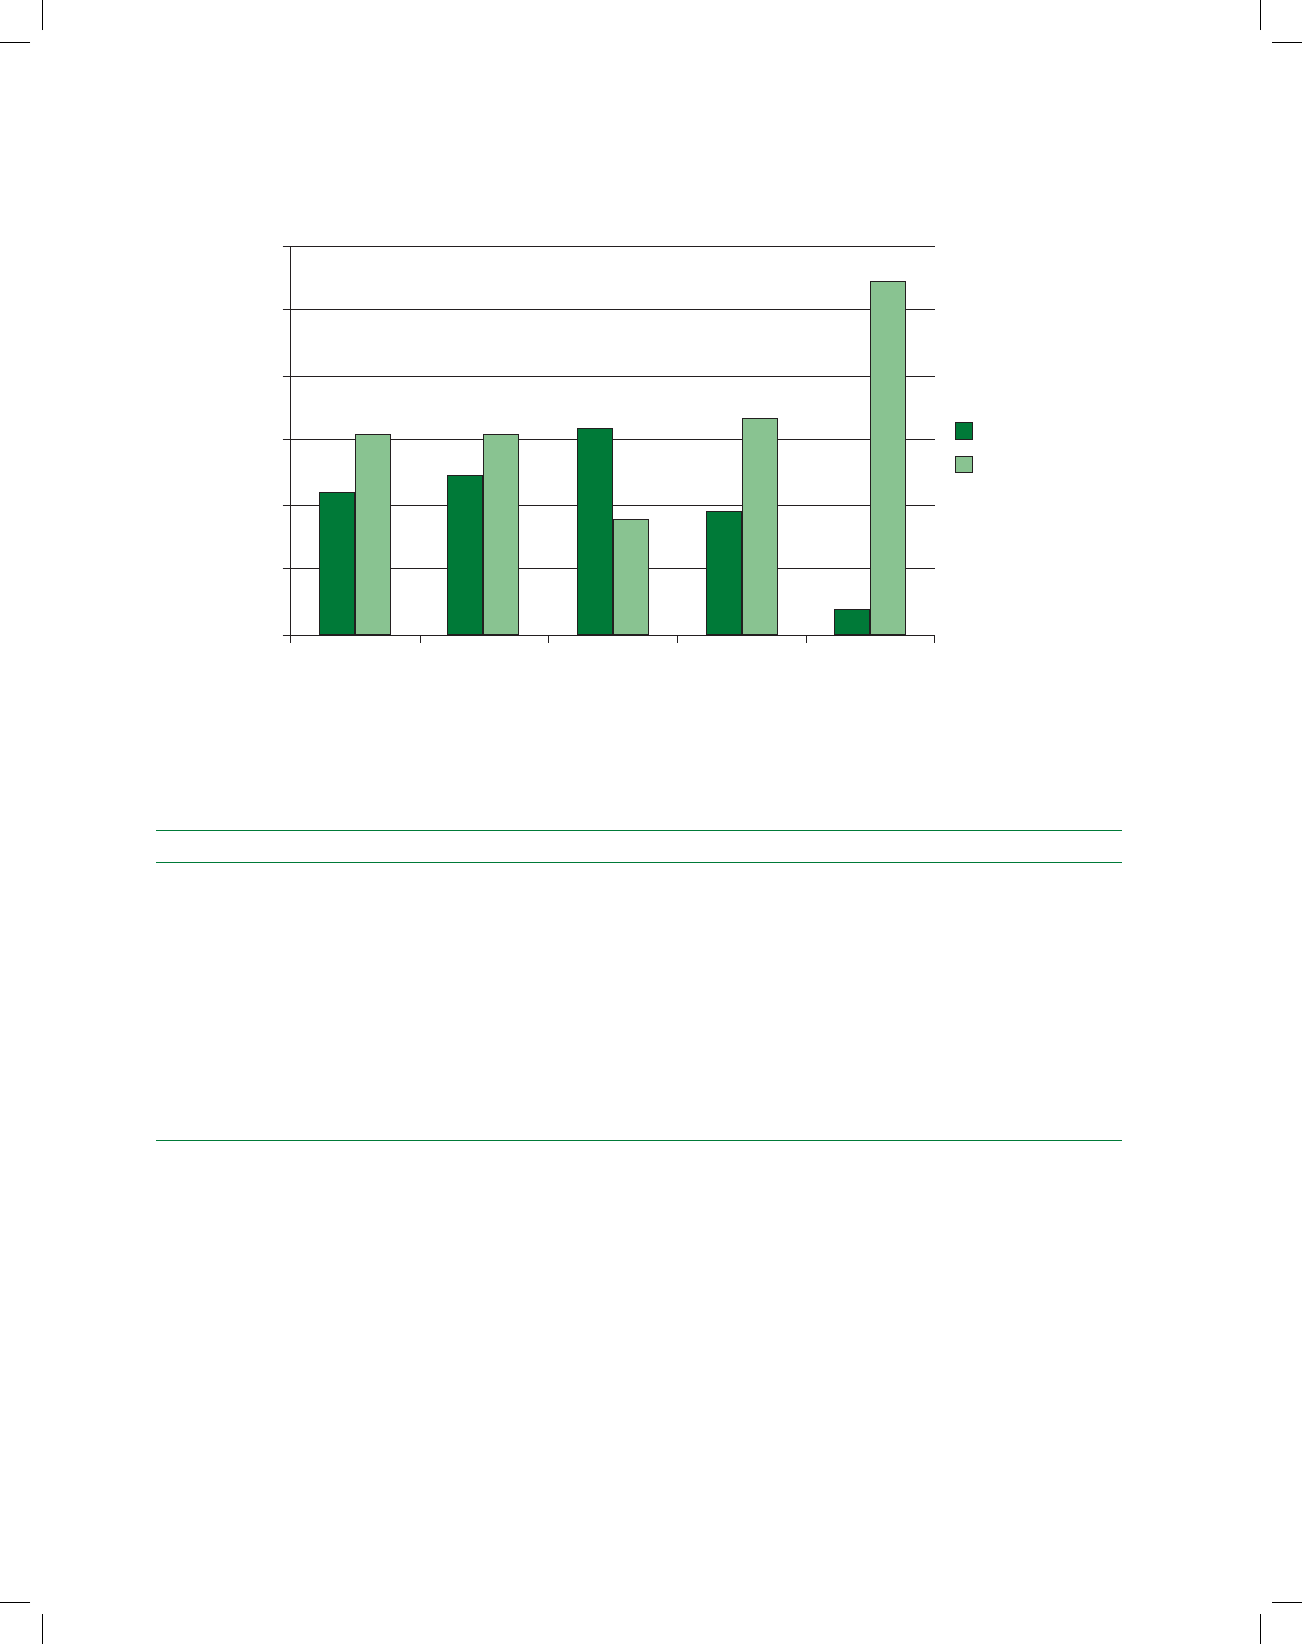
Rural Development 303
and Sanitation Programme in five States reveals that
only 67 per cent of the toilets even in NGP villages
were being used, while this percentage fell to just 46
per cent in non-NGP villages. A study, supported
by UNICEF in 2008 revealed that in 56 per cent of
NGP Gram Panchayats 70 per cent families were still
defecating in the open and only 6 of the 162 NGPs
had been able to sustain the NGP status. In a study
for the Ministry of Drinking Water and Sanitation,
the Centre for Media Studies (2010) found that the
key factors explaining the gap between access to and
usage of sanitation facilities were poor quality of
construction and unfinished toilets, a major reason
for which was the very low incentive provided under
the TSC.
17.58. The Twelfth Plan Working Group is of the
clear view that the APL–BPL distinction and the very
low incentive under the TSC have played havoc with
the programme. Many slip-backs in the NGP villages
have been attributed to non-availability of water,
clearly indicating need to synergise the drinking
60
50
40
30
21.9 24.3
30.7 30.8 31.5
17.3 18.9
3.8
2001
2011
33.4
54.3
20
10
0
Toilet Facilities Tap Water Radio Television Telephone
Source: Census of India, 2001 and 2011.
FIGURE 17.1: Access to Household Amenities in Rural India (2001 to 2011)
TABLE 17.8
Access to Household Amenities in Worst Performing States in Terms of Toilet Facilities in Rural India, 2011
(Percentage of Rural Households)
Rank (worst as 1) State Toilet Facilities Tap Water Radio Television Telephone
1 Jharkhand 7.6 3.7 17.3 13.7 38.7
2 Madhya Pradesh 13.1 9.9 13 18.6 36.4
3 Odisha 14.1 7.5 10.6 19.4 33.6
4 Chhattisgarh 14.5 8.8 9.5 21.1 21.2
5 Bihar 17.6 2.6 25.8 10.2 53.5
6 Rajasthan 19.6 26.9 13.9 25.6 66.2
7 Uttar Pradesh 21.8 20.2 25 23.5 63.6
8 Tamil Nadu 23.2 79.3 18.7 85.3 66.3
9 Karnataka 28.4 56.4 17.6 46.3 62.6
10 Andhra Pradesh 32.2 63.4 6.1 49.3 54.8
Source: Census of India, 2011.

304 Twelfth Five Year Plan
water and sanitation programmes. One of the limita-
tions of the TSC is the narrow range of technology
options offered in a country with such immensely
diverse geographic, hydrologic, climatic and socio-
economic conditions (high water table, flood prone,
rocky ground, desert/water scarce areas and extreme
low temperatures). This has led to many problems,
including non-acceptance by local communities,
water pollution especially in shallow water table
regions, and waste of public funds. There is need
to broaden the ranges of models permissible under
TSC. Finally, the absence of a dedicated implementa-
tion agency at either the State/district or GP level, to
implement TSC has emerged as a major bottleneck
affecting quality of outcomes.
TABLE 17.9
Percentage of Households with No Latrine Facilities in
Rural India, 2011
State 2011 2001
Jharkhand 92.4 93.4
Madhya Pradesh 86.9 91.1
Odisha 85.9 92.3
Chhattisgarh 85.5 94.8
Bihar 82.4 86.1
Rajasthan 80.4 85.4
UP 78.2 80.8
Tamil Nadu 76.8 85.6
D&N Haveli 73.5 82.7
Karnataka 71.6 82.6
Andhra Pradesh 67.8 81.9
Gujarat 67 78.3
Maharashtra 62 81.8
J&K 61.4 58.2
Puducherry 61 78.6
West Bengal 53.3 73.1
Daman & Diu 48.6 68
Arunachal Pradesh 47.3 52.7
Meghalaya 46.2 59.9
Uttarakhand 45.9 68.4
Haryana 43.9 71.3
Assam 40.5 40.4
A&N Islands 39.8 57.7
HP 33.4 72.3
Nagaland 30.8 35.4
Punjab 29.6 59.1
Goa 29.1 51.8
NCT of Delhi 23.7 37.1
Tripura 18.5 22.1
Sikkim 15.9 40.6
Mizoram 15.4 20.3
Manipur 14 22.5
Chandigarh 12 31.5
Kerala 6.8 18.7
Lakshadweep 2 6.9
India 69.2 78.1
Source: Census of India, 2011.
7.1
10.3
4.5
78.1
No Latrine
Other Latrine
Pit LatrineWater Closet
Source: Census of India, 2001.
FIGURE 17.2: Households by Type of Latrine Facility in Rural
India in 2001
No LatrineOther Latrine
Pit LatrineWater Closet
69.3
19.4
10.5
0.8
Source: Census of India, 2011.
FIGURE 17.3: Households by Type of Latrine Facility in Rural
India in 2011

Rural Development 305
Total Sanitation Campaign in the Twelfth Plan
17.59. The Twelfth Plan visualises a major break
from the past under TSC:
• The goal of the Twelfth Plan will be that 50 per
cent of the Gram Panchayats attain Nirmal Gram
status by the year 2017.
• The APL–BPL distinction and the focus on indi-
vidual toilets are to be replaced by a habitation
saturation approach. Rechristened the Nirmal
Bharat Abhiyan (NBA), the programme will
cover SC, ST, physically handicapped, small and
TABLE 17.10
Total Sanitation Campaign, Physical Progress, Eleventh Plan
Financial Year IHHL BPL IHHL APL Total IHHL School Toilets Sanitary
Complexes
Anganwadi
Toilets
2007–2008 57,63,430 57,64,460 1,15,27,890 2,36,259 3,006 86,489
2008–2009 55,70,899 56,94,983 1,12,65,882 2,53,004 3,245 68,995
2009–2010 58,69,608 65,38,170 1,24,07,778 1,44,480 2,230 66,227
2010–2011 61,55,933 60,87,798 1,22,43,731 1,05,509 3,377 50,823
2011–2012 47,34,816 40,64,048 87,98,864 1,22,471 2,547 28,409
TABLE 17.11
Total Sanitation Campaign, Financial Progress,
Eleventh Plan
Financial year Total outlay
(` in crore)
Total expenditure
(` in crore )
2007–08 1,060 996
2008–09 1,200 1,193
2009–10 1,200 1,200
2010–11 1,580 1,580
2011–12 1,500 1,500
Total (in crore) 6,540 6,469
marginal farmers and woman-headed households
in each habitation.
• The idea is not to sacrifice quality and sustainabil-
ity of outcomes in the mad rush to attain targets,
even if this means moving somewhat slower in
reaching universal coverage.
• Through a convergence with MGNREGA, the
unit cost of individual household latrines will rise
to `10,000 as described in Table 17.12.
• Toilet designs will be fine-tuned in accordance
with local social and ecological considerations.
• There will be a specific provision for capacity
building at a rate not exceeding 2 per cent of dis-
trict project outlay.
• In order to focus more centrally on sustainability
of outcomes, the programme shall be taken up in
a phased manner wherein GPs shall be identified,
based on defined criteria of conjoint approach
to sanitation and water supply, for achievement
of NGP status. This would progressively lead
to Nirmal blocks, Nirmal districts and eventu-
ally Nirmal States. The pattern of fund release
will be tweaked with flexibility to the districts to
prioritise funding to GPs identified for Nirmal
Grams. Thus, Nirmal Grams with full access and
usage of toilets, water availability and systems of
TABLE 17.12
Major Increase in Unit Cost Support for IHHLs during the Twelfth Plan
IHHL Centre State Beneficiary Total TSC MGNREGA Total
Total Cost (`) 3,200 1,400 900 5,500 4,500 10,000
Labour Cost (`) 0 2,700 2,700
Material Cost (`) 5,500 1,800 7,300
Labour: Material Cost 0:100 60:40 27:73

306 Twelfth Five Year Plan
waste disposal and drainage, shall be the outcome
ofNBA.
• A new strategy will be devised to facilitate con-
vergence between drinking water and sanitation
projects. NBA will give priority to coverage of
areas with functional piped water supply systems
(PWSS), followed by areas with ongoing PWSS
that are nearest to completion. Next, new PWSS
will be taken up in GPs of districts where IHHL
coverage has reached higher milestones of cov-
erage in a descending order. In all such new and
ongoing PWSS, NBA should be implemented
simultaneously with the planning and execution
of PWSS to ensure that behavioural change for
usage of toilets is generated. Care will be taken
that PWSS are planned and executed covering
entire habitations on a saturation basis, so that
health and other impacts of safe water and sanita-
tion are clearly discernable.
• Running water availability must also be ensured
in all Government school toilets, anganwadi toi-
lets and Community Sanitary Complexes under
NRDWP.
• Child-friendly toilets will be developed in angan-
wadis and schools. This will be accompanied by
capacity building of school teachers, ASHA and
anganwadi workers and ANMs among others on
hygiene and sanitation. Sanitation will be made a
part of the school curriculum so that safe sanita-
tion practices are ingrained in the minds of chil-
dren who would be the torch bearers of sanitation
in their households and the community.
• In order to ensure smooth O&M of toilets, a mas-
sive training campaign will be launched in con-
vergence with the National Rural Livelihoods
Mission in skills such as masonry work, brick-
making, toilet pan making and plumbing. ‘Nirmiti
Kendras’ will be set up for development and
manufacture of cost-effective construction mate-
rials. The existing Production Centres and Rural
Sanitary Marts will also be revitalised and appro-
priate SHGs entrusted with this task.
• Effective hand-holding with adequate IEC must
continue for a period of time even after con-
struction to ensure sustainability of outcomes.
Comprehensive region-specific communication
and information strategy will be deployed for
demand generation and sustainability. Office-
bearers and members of GPs, VWSCs, BRCs,
SHGs, Swachhata doots, women and youth
groups, school committees, and so on will be
involved in dissemination of information and
effective communication. NGOs and CBOs of
repute may be engaged for maximum results for
individual contact, motivation and implementa-
tion. Key Resource Centres must also be identified
within State/district for training of State/district
level functionaries in IEC.
• NBA will be implemented at the GP level through
VWSCs who could receive technical support from
NGOs/CBOs identified by the District authorities.
The VWSC must be mandatorily made a Standing
Committee of the GP to ensure community par-
ticipation in planning, construction, operation
and management with the GP providing overall
guidance to the VWSCs. A sense of ownership will
be created through owner-driven construction
through self labour and hiring of skilled labour.
• Solid and liquid waste management will be taken
up in Nirmal Grams on a priority basis for which
an assistance of `5,00,000 will be additionally
available per 1,000 people from the redesigned
MGNREGA 2.0.
17.60. Justification for the huge jump in outlays for
sanitation and drinking water is provided by recent
scholarly work on the relationship between sanita-
tion and health. A recent article in Lancet2 suggests
that the impact of sanitation and hygiene interven-
tions on child under-nutrition has been seriously
undervalued in the existing research as this effect
has been modelled entirely through diarrhoea. The
study argues that a key cause of child under-nutri-
tion is a subclinical disorder of the small intestine
known as tropical enteropathy. This is caused by
faecal bacteria ingested in large quantities by young
children living in conditions of poor sanitation and
hygiene. The study finds that provision of toilets
and promotion of hand-washing after faecal contact
could reduce or prevent tropical enteropathy and
its adverse effects on growth; and that the primary
causal pathway from poor sanitation and hygiene
to under-nutrition is tropical enteropathy and not
diarrhoea. Though based on field studies conducted

Rural Development 307
in Africa, This study has important policy implica-
tions for India. Accelerating provision of toilets and
improved drinking water quality will prevent tropi-
cal enteropathy, which in turn will yield improve-
ments in child growth, health and survival.
17.61. A study of the TSC completed in July 2012,3
finds that at mean program intensity, infant mortal-
ity decreased by four per thousand and children’s
height increased by 0.2 standard deviations. Relative
to other children born in the same districts or in the
same years, rural children exposed to better sanitation
in their first year of life were more likely to survive
infancy. Districts in which more latrines were con-
structed over this period saw a greater decline in rural
infant mortality rates, controlling for other changes.
Rural children born in years and districts with more
TSC latrines available in the first year of their lives are
taller than children born in other years or districts.
RURAL HOUSING
17.62. Allied to these initiatives on rural livelihoods,
are significant steps towards improving basic ame-
nities in rural India, the most important of which
is housing. Under the Indira Awaas Yojana (IAY),
since 1985, nearly 285 lakh houses have been con-
structed with an expenditure of about `84,234 crore.
IAY during the Eleventh Plan Period
17.63. The summary of the financial and physical
progress of IAY during the Eleventh Plan period is
given in Tables 17.13 and 17.14.
17.64. Over the years, there have been important
revisions in the scheme and related institutional pro-
cesses for making IAY accessible to the poorest in
rural India:
1. IAY waitlists have been prepared Gram
Panchayat–wise by the States/UTs on the basis of
their housing and poverty status as per the BPL
list. In order to introduce transparency in the
selection of beneficiaries, permanent waitlists are
supposed to be displayed in all Gram Panchayats.
2. IAY houses are allotted (in this order of pref-
erence) in the name of the woman or jointly
between the husband and the wife.
3. Financial assistance provided under IAY was
raised twice during the Eleventh Plan, on 1 April
2008 from `25,000 in plain areas and `27,500
for hilly/difficult areas to `35,000 and `37,500
respectively and to `45,000 in plain areas and
`48,500 in hilly/difficult areas on 1 April 2010.
The higher assistance is also provided to districts
under the Integrated Action Plan (IAP) for select
backward and tribal districts. IAY beneficiaries
are also covered under the Differential Rate of
Interest (DRI) scheme for lending up to `20,000
per housing unit at 4 per cent interest.
4. Sanitary latrine and smokeless chullah are
required to be constructed along with each IAY
house. For construction of the sanitary latrine,
financial assistance is made available from the
Total Sanitation Campaign (TSC) funds in addi-
tion to IAY assistance.
5. There is a provision for making available home-
stead sites to those rural BPL households whose
TABLE 17.13
IAY-Financial Performance during Eleventh Plan
(2007–08 to 2011–12)
Year Total Available Fund*
(`crore)
Utilisation (`crore)
2007–2008 6,527.17 5,464.54 (83.72)
2008–2009 14,460.35 8,348.34 (57.73)
2009–2010 15,852.35 13,292.46 (83.85)
2010–2011 17,956.54 13,465.73 (74.99)
2011–2012 18,982.69 12,451.12 (65.59)
Notes: (i) *Includes Opening Balance and Centre and State
Releases.
(ii) Figures in the parentheses are per cent utilisation to
total available fund.
TABLE 17.14
Physical Performance of IAY During Eleventh Plan
(2007–08 to 2011–12)
Year IAY Houses (in lakh)
Target Constructed
2007–2008 21.27 19.92 (93.66)
2008–2009 21.27 21.34 (100.32)
2009–2010 40.52 33.85 (83.55)
2010–2011 29.09 27.15 (93.36)
2011–2012 27.27 22.30 (81.80)
Note: Figures in the parentheses are per cent achievement of total
target.

308 Twelfth Five Year Plan
names are included in the permanent IAY wait-
lists but do not have a house site. `10,000 per
homestead site is currently provided, this fund-
ing being equally shared by the Centre and the
States. States are also incentivised by allocating
additional IAY houses equal to the number of
homestead sites provided through any of the
stipulated means—regularisation of existing
occupied land, allotment of government land
or purchase/acquisition of land. If the amount
per beneficiary falls short, the balance amount
is contributed by the State Government. BPL
families allotted land through purchase are, to
the extent feasible, provided assistance for house
construction in the same year.
17.65. Progress on some of these innovative fea-
tures has been slow. For instance, Table 17.15 shows
that the drive towards convergence with other rural
infrastructure schemes has not been up to the mark.
17.66. Again, only a few States such as Bihar,
Karnataka, Kerala, Rajasthan, Andhra Pradesh,
Maharashtra, UP and Sikkim have so far requested
for funds for purchase of homestead land under this
scheme. Progress is summarised in Table 17.16.
TABLE 17.15
Convergence of IAY with other Rural Infrastructure
S. No. Convergence (per cent of IAY houses)
Period TSC Smokeless
Chullahs
Bio-Gas
Plant
RGGVY Kitchen
Garden
Life Insurance
Scheme
Health Insurance
Scheme
1 2008–09 5.91 5.17 0.00 0.11 0.29 0.74 0.29
2 2009–10 26.50 22.70 0.12 0.65 0.64 4.21 1.00
3 2010–11 26.85 24.05 0.07 1.10 0.95 6.18 2.07
TABLE 17.16
Scheme for Purchase of Home Site and Incentive for Additional Target under IAY
S. No. State/UT 2009–10 2010–11
Purchase of Homesite Incentive Purchase of Homesite Incentive
Amount
Released
(` Lakh)
No. of
Sites to be
Purchased
Additional
Houses
Sanctioned
Amount
Released
(` Lakh)
No. of
Sites to be
Purchased
Additional
Houses
Sanctioned
1 Andhra Pradesh 10,228 2,04,568
2 Bihar 5,334 1,06,674
3 Gujarat 33,154 18,342
4 Karnataka 5,400 1,08,000 6,082 1,21,634 31,806
5 Kerala 3,209 64,189
6 Madhya Pradesh 1,05,200
7 Maharashtra 2,500 50,000
8 Rajasthan 1,721 34,412 95,702
9 Sikkim 83 1,666
10 Tripura 15,050
11 Uttar Pradesh 190 3,790
Total 15,747 3,14,941 33,154 19,000 3,79,992 2,66,100

Rural Development 309
Rural Housing through other Sources
17.67. During the Eleventh Plan period, rural hous-
ing was also facilitated by assistance from State
Governments and financial institutions/banks. This
has been through both supplementing IAY grant
assistance as well as via State-level schemes for rural
housing. For instance, Government of Kerala pro-
vides additional resources to enhance the unit cost to
`75,000 for general category households, `1,00,000
for SC households as well physically and mentally
handicapped persons and `1,25,000 for ST house-
holds and destitute families. Government of Andhra
Pradesh provides additional `20,000 to SC/ST ben-
eficiaries of IAY. Around 15 States/UTs have their
own schemes. During the Eleventh Plan, about 30
lakh houses were constructed under various rural
housing schemes of State Governments.
17.68. National Housing Bank (NHB), National
Bank for Agriculture and Rural Development
(NABARD) and Housing and Urban Development
Corporation (HUDCO) also provide support for
rural housing. The NHB is the apex financial insti-
tution for housing in the country. It runs schemes
such as the Rural Housing Fund (RHF), Golden
Jubilee Rural Housing Refinance Scheme (GJRHFS)
and Productive Housing in Rural Areas (PHIRA).
NABARD made refinancing for rural housing as an
eligible activity in the year 2001–02. Under the Rural
Housing Scheme, NABARD extends refinance to
banks for provision of loans to individuals/coopera-
tive housing societies. HUDCO has been supporting
Housing Boards, Panchayati Raj Institutions (PRIs),
Development Authorities and other para-statals by
extending loan assistance for weaker sections at 8
per cent to 8.5 per cent against its borrowing rate of
10.25 per cent. Of the total 1.5 crore housing units
supported by HUDCO till date, over 89 lakh units
(60 per cent) have been constructed in rural areas.
Rural Housing in the Twelfth Plan
Need for Greater Financial Support
17.69. One of the major reasons for continued shel-
terlessness in rural India is shortage of financial
resources. According to the NSSO, about 66 per
cent financing of new construction in rural areas
in 2010–11 was done by rural families with their
own resources; about 27 per cent construction had
some amount financed from non-institutional agen-
cies such as moneylenders, family and friends while
only 9 per cent of new construction was financed by
institutional channels such as Government schemes,
banks and so on. A Committee constituted by the
Ministry of Rural Development for formulation
of Concrete Bankable Schemes for Rural Housing
(2011) found that although credit flow to the hous-
ing sector witnessed a growth of about 30 per cent
over the last five years, lending to rural areas grew
only about 10 per cent.
17.70. Quality of housing has also suffered due to
inadequate financial support. It is, therefore, pro-
posed to increase the unit assistance for house con-
struction under IAY to `65,000 in plain areas and
to `70,000 in hilly/difficult areas during the Twelfth
Plan, with an increase each year to absorb ris-
ing cost of material and labour’. Given the overall
financial constraint this may lead to a slowing down
of achievement of targets but a conscious decision
is being taken to ensure that good quality housing
becomes possible through an increase in unit cost
assistance provided. At the same time, DRI loans
for IAY families will be enhanced up to `50,000
at 4 per cent rate of interest, along with extended
repayment tenure up to 15 years. Provision of DRI
loans for IAY beneficiaries will be made obligatory
on the part of the banks given the investment that
the government commits when sanctioning an IAY
house. Approval of DRI loans will be included as an
indicator of financial inclusion by the banks. Banks
will develop standard processes that are simple and
hassle-free to enable easier access to DRI loans by
beneficiaries.
Smoother Transfer of Funds
17.71. The process of fund transfer from the Centre
to the States is being simplified to facilitate con-
vergence as well as enhance effectiveness and effi-
ciency in the implementation of various rural
habitat schemes. Funds will now be released to the
States through a fund to be created by the State on
the lines of MGNREGA or TSC. Central releases as
well as State contribution will be credited to the State

310 Twelfth Five Year Plan
Fund and the States are expected to release funds
to DRDAs on the basis of predetermined criteria as
defined in the guidelines. It is expected that these
modifications in the administration of the scheme
would help in reaching out to the targeted popu-
lation effectively and in a manner that facilitates
smooth functioning across departments.
Abolition of the APL–BPL Distinction
17.72. The Socio-economic and Caste Census
(SECC) will be complete in time for the Twelfth Plan
implementation. This Census will provide lists of
households that are homeless as well as those who
live in poor quality houses. There will be no refer-
ence made to any BPL list. Assistance under IAY will
be provided to these households in order of priority
to be determined on the basis of the other indicators
of deprivation thrown up by the SECC.
Enhancing Access of the Poor to Land
17.73. The unit cost for purchase of homestead plots
under IAY will be increased to `20,000 on IAY assis-
tance pattern, that is, 75:25 contributions by the
Centre and the State, respectively. A dedicated officer
at the district level will be designated by the state gov-
ernment to address various bottlenecks faced by the
beneficiaries in accessing homestead sites. A cluster
approach will be adopted for developing homestead
lands for groups of homeless families.
Improving Quality of IAY Houses
17.74. The most important change the Twelfth Plan
seeks to bring is an improvement in quality of hous-
ing. Raising the financial assistance is certainly a
necessary condition for improved quality but it is
not sufficient in itself. IAY guidelines recommend
that State Government and implementing agencies
should facilitate access to information on innova-
tive technologies, materials, designs and methods,
but most States do not have any mechanism to do
so. There is a clear need for developing and popula-
rising appropriate technology through a network of
institutions, which could result in low-cost, environ-
ment-friendly and disaster-resistant houses as per
local cultural preferences. Developing a menu of spe-
cific designs and technology options for each region
reflecting variations in environmental and cultural
conditions would be the way to go forward.
Rural Building Centres (RBCs)
17.75. RBCs at the district level could play an impor-
tant role as a single window solution for guidance
on quality construction, supply of alternative mate-
rials, skill building of artisans and development and
dissemination of innovative, location-appropriate
technologies that minimise the use of high-energy
construction materials. They could also carry out
special skill upgradation programmes intended to
impart both skills and organisational abilities, effec-
tive monitoring of housing construction, knowl-
edge building and awareness creation on quality and
safety features
17.76. The RBCs would provide a platform for devel-
oping comprehensive knowledge and experience
of application of common alternative technologies
for various geo-climatic zones of India needs to be
developed. A network of RBCs would serve to link
research institutions with rural habitat practitioners
for dissemination of technical know-how. It would
also facilitate further development of knowledge on
alternate materials and technologies for different
geo-climatic zones.
17.77. Proven alternative technologies that are
cost-effective and environment-friendly need to be
included in the State Schedule of Rates. Towards
this end, partnerships need to be forged by the States
with specialised research and development institu-
tions, academic institutions and NGOs that have
worked on alternate technologies. For instance, the
National Mission on Bamboo Applications can pro-
vide advice on treatment, use and costing of bamboo
based building elements for use in areas that have
bamboo in abundance and have used the material
traditionally due to its appropriateness in the specific
geo-climatic context.
Emphasis on Disaster Risk Reduction
17.78. Along with concerted efforts to demystify
and enable access to technical knowledge and skills
for good quality construction, it is important that
disaster risk in various locations be considered and
analysed. Technical guidelines for house construc-
tion need to be modified suitably. Under the GoI–
UNDP Disaster Risk Management Programme, the
Ministry of Home Affairs has developed ‘Guidelines

Rural Development 311
for Development and Building Construction includ-
ing Safety Provisions for Natural Hazards in Rural
Areas’. The guidelines provide detailed understand-
ing of the role and responsibility of various institu-
tions including PRIs for addressing disaster risk of
buildings in rural areas. In addition, there is detailed
guidance on construction details that can make a dif-
ference to the safety of a building. There is a need
to include such considerations for reducing disaster
risk of housing stock in rural India irrespective of
the source of funding. There is a need to pay special
attention to ‘multi-hazard’–prone areas spelt out in
the Vulnerability Atlas of India through incorpora-
tion of disaster resistant designs in house construc-
tion. These areas will be designated as ‘difficult areas’
and provided higher unit assistance under IAY. In
addition, all new houses will be insured through
group insurance to spread the risk of losses due to
natural disasters and other calamities such as fires.
Training of Masons, Artisans and Others
17.79. A large pool of skilled workers like masons,
bar benders, plumbers, carpenters and other con-
struction-related artisans trained in safe and sustain-
able construction practices needs to be developed for
all construction activity in the future. Five per cent
of the IAY budget in the Twelfth Plan is being dedi-
cated to capacity building of these personnel
Partnerships with Civil Society and PRIs
17.80. Given the scale of shelterlessness and the
need for improving quality, it is important that local
stakeholders are able to effectively participate in
housing delivery. PRIs are central to effective habi-
tat development in rural areas. They need to take
a lead in micro-planning and prioritising habitat
development needs. Services of trained local groups
and enterprises to take up innovative implemen-
tation of housing and habitat schemes should be
made available to PRIs by the State Governments.
SHGs could be an important vehicle for production
of building materials and provision of construction
services. NGOs have been playing an important
role in facilitating rural housing through promo-
tion of innovations in architectural design, hous-
ing finance, alternative technology, supervision
of construction and promotion of an eco-habitat
approach. NGOs could be professionally engaged
to support PRIs to facilitate safe and sustainable
habitat development.
PROVISION OF URBAN AMENITIES IN RURAL
AREAS (PURA)
17.81. PURA aims to provide urban amenities and
livelihood opportunities in rural areas to bridge the
rural–urban divide in the Indian society. The pilot
phase of PURA was implemented from 2004–05 to
2006–07, with a total budget of `30 crores. There
were seven clusters selected in seven States, with
budgets of `4–5 crores per cluster. The implemen-
tation of the pilot phase did not yield the desired
results as it faced the following issues:
• The pilot projects lacked a detailed business plan
and there was limited participation by the private
sector.
• The pilot projects were predominantly infrastruc-
ture-oriented projects, with limited attention
being given to the implementation of economic
activities.
• The criteria for selection of the clusters did not
factor the growth potential for that area.
• There was no ownership at the State Government
level and the entire implementation lacked an
appropriate institutional structure with dedicated
professional support.
• There was no convergence with other schemes of
rural development or other departments.
17.82. Given the experience of the pilot projects, a
restructured PURA was launched in the Eleventh
Plan as a demand-driven programme through
Public–Private Partnership (PPP) between Gram
Panchayats and private sector partners. Core fund-
ing is sourced from the convergence of Central
Government schemes and complemented by addi-
tional support through the PURA Scheme. The pri-
vate sector brings on board its share of investment
besides operational expertise. The PURA Scheme is
implemented and managed by the private sector on
considerations of economic viability but designed in
a manner whereby it is fully aligned with the overall
objective of rural development. To attract the pri-
vate sector, the Scheme has a ‘project based’ design
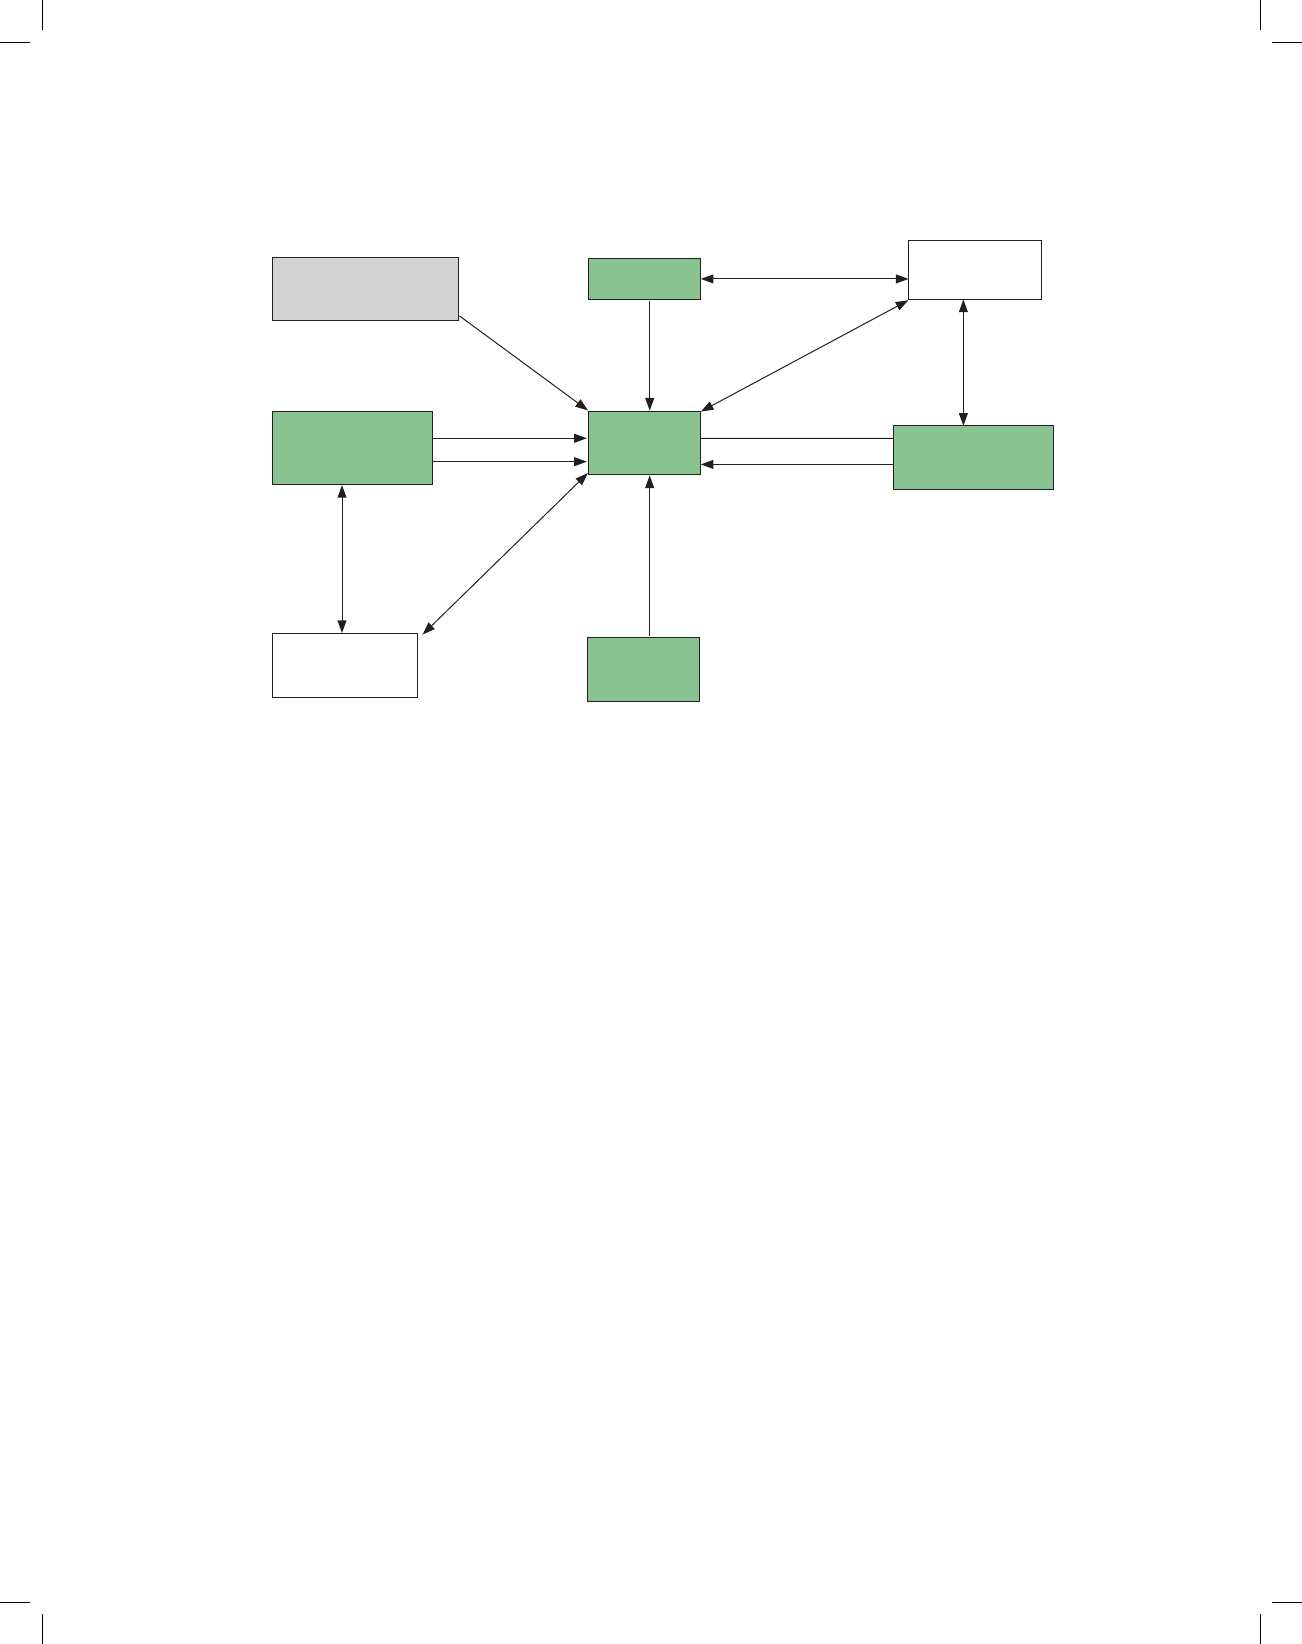
312 Twelfth Five Year Plan
• In many PURA projects it became evident that
bidders had not adopted a consensus-building
process and hence failed to incorporate many of
the demands of the villagers. A proactive consen-
sus building approach will be a basic guideline
to the bidders with each step being documented.
Each demand should be documented and if the
same is not accommodated by the bidder, then
this should be transparently shared with the pri-
mary stakeholders.
• Due to the multiple activities involved in a PURA
project, the selected concessionaire is required to
approach various departments within the State
Government. This process can be time-consum-
ing. Hence a project-level coordination committee
must be constituted at the State Government level
to grant various approvals or take decisions on the
implementation challenges associated with PURA
projects. An example is the committee constituted
by the Government of Kerala to address issues
relating to PURA projects.
• A Project Implementation Unit also needs to be
established at MoRD to undertake the monitoring
role for all PURA projects within the country.
• There is an imperative need for undertaking
capacity-building activities for officials of Gram
Panchayats and the District Administration. This
with well-defined risks, identified measures for risk
mitigation and risks sharing among the sponsoring
authority (Gram Panchayat), Central Government,
State Government and the selected bidder.
17.83. The transaction structure conceived to imple-
ment the project is shown in Figure 17.4.
17.84. MoRD issues Letters of Award to only those
projects whose DPRs have been approved by an
Inter-Ministerial Empowered Committee (EC)
constituted for PURA. Post the issue of the Letter
of Award, the concession and State support agree-
ments are executed. Based on an understanding
of challenges that have emerged through the brief
experience of these pilot projects, the following
improvements will be made in PURA going into the
Twelfth Plan:
• There will be a better coordination procedure for
granting the approvals to projects under non-
MoRD schemes to ensure a single window clear-
ance for the bidders. Guidelines will be issued to
future bidders regarding the potential non-MoRD
schemes that could be integrated within PURA
projects, which could act as a useful databank for
bidders.
Private
Developer
DRDA
SPV
MoRD Through
DRDA Gram
Panchayat(s)
State
Govt
State Support
Agreement
Equity
PURA Grant
Set-up and operate a dedicated
bank account for each PURA project
Access, Land, Core facilities,
Clearances/approvals
Release of State govt share in funds under
MoRD and non-MoRD schemes through DRDA
Amenities and
Add-on projects
Concession
Agreement
Release of MoRD share
under MoRD Schemes
Facilitate release of GOI
share in funds sanctioned
under non-MoRD schemes
FIGURE 17.4: PURA Transaction Structure

Rural Development 313
capacity-building would be aimed at providing
officials with necessary skill sets to meet their
obligations under the Concession Agreement and
State Support Agreement. Handholding by the
MoRD in the pilot phase would be required to
achieve smooth implementation of the projects.
• An accurate baseline survey is crucial in deter-
mining the PURA grant for the project. The broad
contents of the baseline survey needs to be pro-
vided to bidders as a standard document.
• Given the diverse backgrounds of the bidders,
standard technical solutions (like sample designs
of various structures) may be provided as a man-
ual to the bidders. Such a reference document
would enable standardisation of the DPRs and
enable a smoother approval process for MoRD.
• A manual of various innovative cost-effective
technologies may also be provided that could be
adopted by the bidders in their projects.
17.85. Table 17.17 shows the infrastructure and
amenities to be provided, operated and maintained
under a PURA project by the private developer dur-
ing the Twelfth Plan.
17.86. In order to ensure scaling of the PURA
Scheme, it would necessary for State Governments
to lead the entire process of managing PURA
projects. The key activities would involve under-
taking the procurement process for selection of
private developers, facilitating/interacting with
the private players in the course of preparation of
Concept Plans and DPRs and undertaking its obli-
gations under the Concession and State Support
Agreements. Further the State Governments would
need to identify their nodal departments and build
capacities of these nodal departments to handle
PURA Projects. In addition, a funding pattern
for PURA Grant in the ratio of 80:20, with 80 per
cent of the funding for PURA Grant coming from
MoRD and 20 per cent from the concerned State
Government will be adopted. The role of MoRD
will be that of a facilitator and the final approving
and monitoring authority of the PURA Projects. An
institutional structure on the lines of the PMGSY
Scheme of the MoRD is suggested for upscaling
PURA (Figure 17.5).
NATIONAL SOCIAL ASSISTANCE
PROGRAMME (NSAP)
17.87. An integral element of India’s battle with
poverty and distress is to provide succour to
senior citizens, differently abled people and oth-
ers who have suffered due to mishaps in life
through unconditional cash transfers. The NSAP
refers to a basket of welfare schemes that provide
social assistance to a wide range of people in need
in both rural and urban India. At the beginning
of the Eleventh Plan, the NSAP comprised the
Indira Gandhi National Old Age Pension Scheme
(IGNOAPS), the Annapurna Scheme and National
Family Benefit Scheme (NFBS). In February 2009,
two more schemes were added under NSAP—the
Indira Gandhi National Widow Pension Scheme
(IGNWPS) and the Indira Gandhi National
Disability Pension Scheme (IGNDPS). Although
they are small, these pensions have been described
as a veritable lifeline for the millions of widows,
TABLE 17.17
Infrastructure and Amenities to be Provided, Operated and Maintained under PURA Project by Private Developer
in the Twelfth Plan
Mandatory-under
MoRD schemes
Under non-MoRD schemes
as local conditions permit
(Illustrative list)
Add-on projects to generate economic
and livelihood opportunities*
(Illustrative list)
• Water and sewerage • Village street lighting • Village linked tourism
• Village streets • Telecom • Integrated rural hub, Rural market
• Drainage • Electricity generation, and so on • Agri—common service centre and warehousing
• Solid waste management • Any other rural economy based project
• Skill development
• Development of economic activities
At least one such activity would be included in the project.
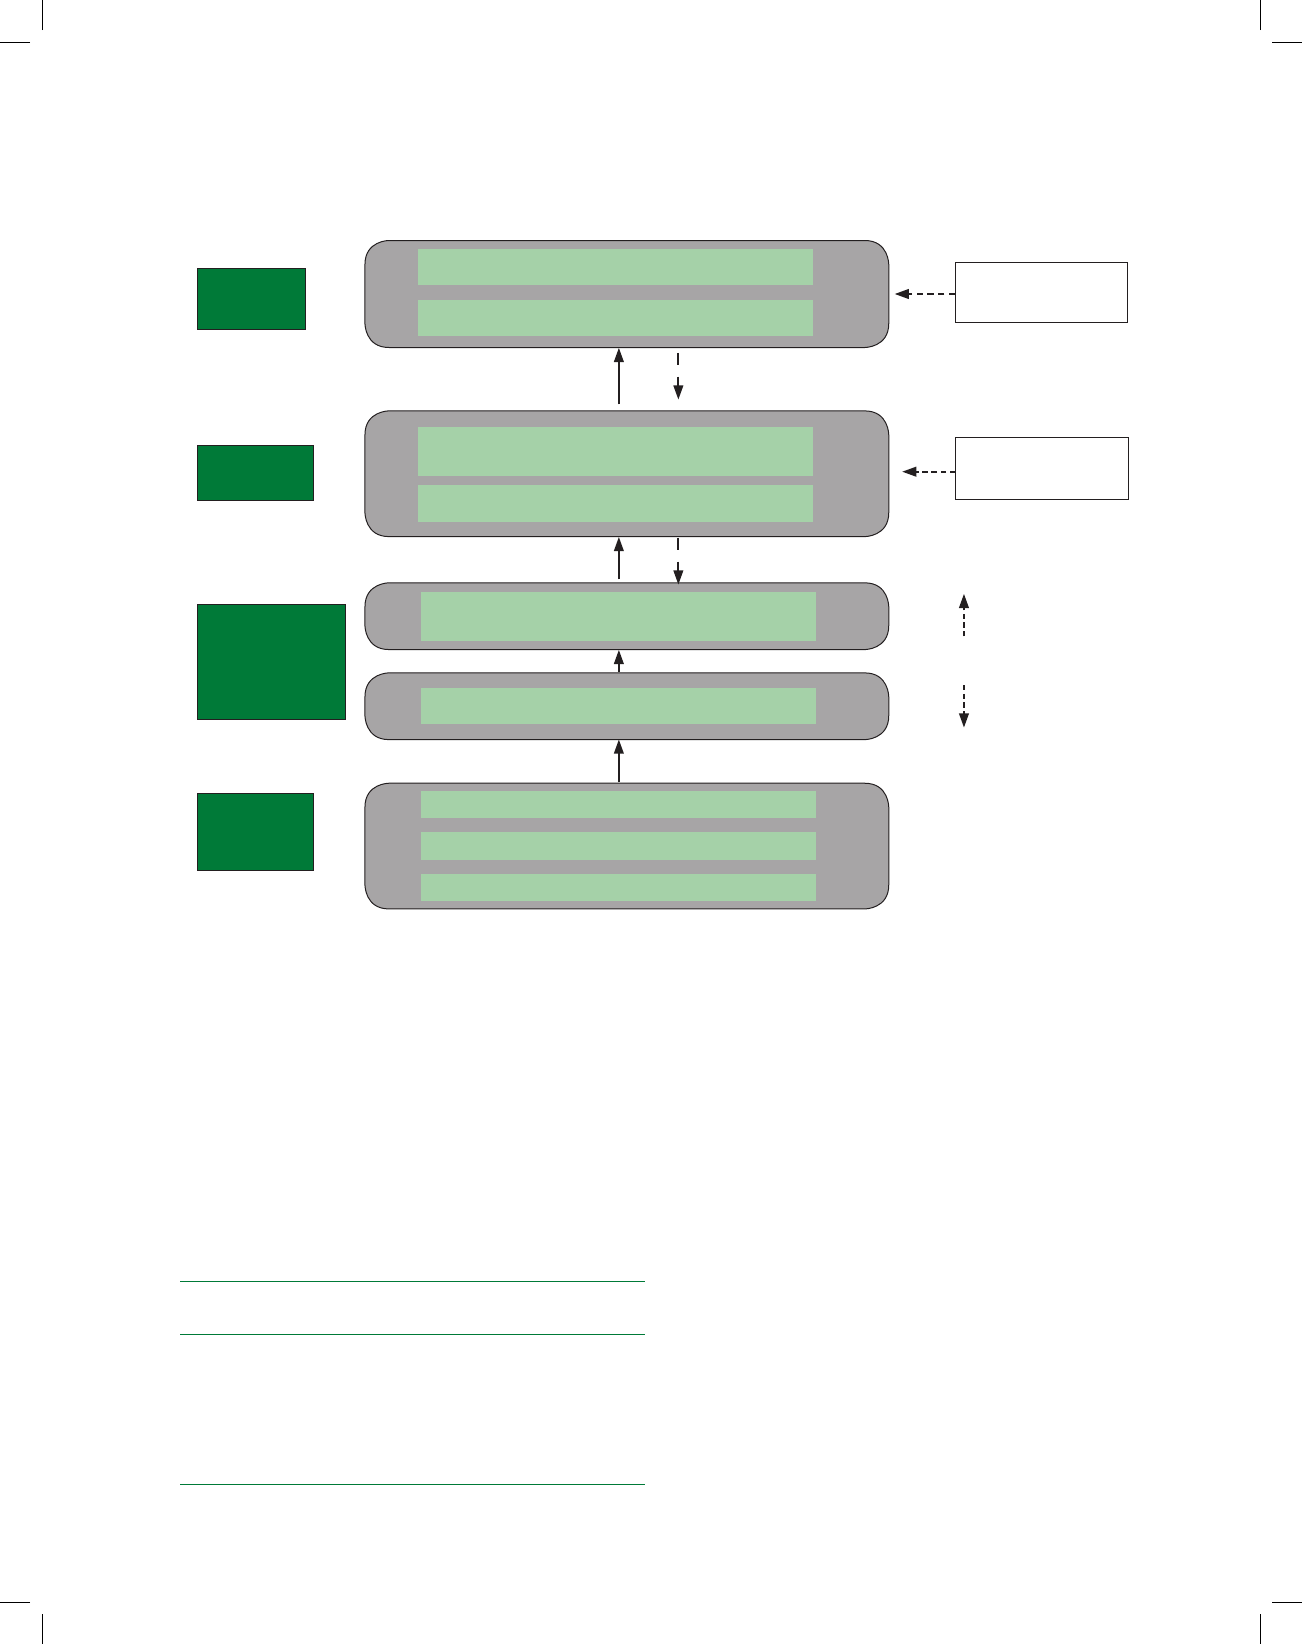
314 Twelfth Five Year Plan
elderly and disabled people who receive them.4
NSAP allocation has increased eight-fold since
2002–03. IGNOAPS is the largest scheme within
NSAP. In 2011–12, 82 per cent of the total NSAP
expenditure was on IGNOAPS followed by the
IGNWPS at 9.7 per cent. The physical and finan-
cial progress of NSAP during the Eleventh Plan is
given in Table 17.18.
TABLE 17.18
NSAP Progress in the Eleventh Plan
Year Expenditure Reported
(` crore)
Beneficiaries
(in lakh)
2007–08 3,110.99 128.89
2008–09 3,875.31 167.63
2009–10 4,718.83 216.06
2010–11 5,480.60 231.12
2011–12 5,121.95 253.64
17.88. While NSAP started as a Centrally Sponsored
Scheme (CSS) in 1995, it was transferred to State Plans
in 2002–03 and funds are now released as Additional
Central Assistance to the States. Guidelines are issued
by the MoRD at the Centre and the MoRD monitors
expenditures under the ACA, but it is the responsi-
bility of State Governments to identify beneficiaries,
sanction benefits and disburse payments.
17.89. Under IGNOAPS, since 2006–07, old age
pension of `200 per month was being provided to
persons of 65 years and above who are destitute
(BPL with effect from 19 November 2007). With
effect from 1 April 2011, the age limit has been low-
ered to 60 years and for persons above 80 years, the
pension has been enhanced to `500 per month. It is
estimated that this change will benefit an additional
7.2 million persons in the age group of 60–64 years
and 2.6 million persons above the age of 80 years.
Central
Level
State Level
Private Player
with consultation
with Gram
Panchayat
State
Government
Selection of Private Developer
Submission of Request for Proposal (RfP)
Expression of Interest (EoI)
Project Management
Unit at MoRD level
Project Management
Unit at State Level
Project
Proposal
Flow
Policy
Directive
Flow
Empowered Committee
Project Sanctioning and Monitoring Committee
State Level Project Sanctioning and Monitoring
Committee (SPSMC)
State Level Nodal Department
Preparation of Concept Plan and
Preparation of DPRS
Identification of PURA Cluster
FIGURE 17.5: Institutional Structure for PURA

Rural Development 315
Currently, 19 States/UTs are providing an addition-
ality of `200 to `800 per month. Another 11 States/
UTs are providing additional pension of between
`50 to `200.
17.90. The NFBS provides a lump sum family benefit
of `10,000 to the bereaved household in case of the
death (natural or accidental) of the primary bread-
winner (male or female) whose earnings contribute
substantially to the total household income. This
scheme is applicable to all the eligible persons in the
age group 18 to 64. The bereaved household should
belong to BPL families to qualify for this benefit.
This sum has been raised to `20,000 with effect from
18 October 2012 with eligibility criteria of age group
18 to 59 years.
17.91. In February 2009, the IGNWPS was started
to provide pension to BPL widows in the age group
40–64 years at the rate of `200 pm per beneficiary.
The estimated number of beneficiaries under Indira
Gandhi National Widow Pension Scheme (IGNWPS)
is 45 lakhs. IGNDPS was also started in the same
month for BPL persons with severe or multiple dis-
abilities5 (in the age group of 18–64 years) at the rate
of `200 per month per beneficiary. It is estimated that
15 lakh beneficiaries will be covered under IGNDPS.
As a result of change in the eligibility criteria for
receiving old age pension in April 2011, eligibil-
ity criteria for widow pension under IGNWPS and
disability pension under IGNDPS got revised from
40–64 years to 40–59 years and from 18–64 years to
18–59 years, respectively. 36.05 lakh beneficiaries
have been covered so far under IGNWPS and 7.69
lakh under IGNDPS. With effect from 1 October
2012, the widow and disability pensions have been
raised to `300 per month and eligibility criteria to age
group 40–79 years for IGNWPS and 18–79 years for
IGNDPS. The component-wise physical and financial
progress of NSAP during the Eleventh Plan is given
in Table 17.19.
17.92. NSAP faces several types of implementation
challenges: logistical (application and sanctioning
process, funds flow management), bureaucratic (low
incentives, weak capacity), and management (MIS,
reporting systems, verification). In the execution of
NSAP, greater professional support is needed for
ensuring quality, delivery and for suitable monitoring
and evaluation, both at the Centre and State levels.
Technical support groups comprising professionals
and voluntary organisations will be set up at Central,
State and district levels for continuous review of
policy and performance of NSAP during the Twelfth
Plan. Documentary requirements for proving eligi-
bility and identity have proved extremely onerous
for the beneficiaries who are among the most vul-
nerable. It is hoped that the use of UID (once avail-
able) will ease some of these pressures. Many States
have devised somewhat arbitrary and harsh exclu-
sion criteria which have been applied in a mechani-
cal manner that discriminate against some of the
most vulnerable. Even having a living adult son has
meant exclusion in some cases. Such practices must
be stopped. Shifting to payment through post offices
or banks is a significant step in ensuring transpar-
ency. But as under MGNREGA, where density of
banks/POs is low or because of lack of adequate staff,
people have had to suffer great hardships in the tran-
sition period. Aged and disabled people may not be
able to reach the POs or banks. The banking corre-
spondent model with UID biometrics could be a way
out as it would provide payments at the doorstep in a
transparent manner.
TABLE 17.19
Physical and Financial Progress of NSAP Components, Eleventh Plan
Year IGNOAPS IGNWPS IGNDPS NFBS Annapurna
`Crore Lakh `Crore Lakh `Crore Lakh `Crore Lakh `Crore Lakh
2007–08 2,896 115.14 176 3.34 40 10.76
2008–09 3,422 150.21 329 4.23 47 10.41
2009–10 4,354 163.34 152 32.13 29 7.00 154 3.44 30 10.16
2010–11 3,528 170.60 524 34.25 134 7.28 324 3.35 45 9.58
2011–12 4,214 199.55 496 36.55 105 7.77 282 2.48 25 7.28

316 Twelfth Five Year Plan
17.93. IT solutions need to be seen as central to
scheme implementation and not just as a periph-
eral MIS system. Use of IT can help reduce discre-
tion, stem leakages through duplication, enhance
efficiency by reducing time taken between steps,
reduce the need for reporting at multiple levels,
and facilitate accounting, particularly in States with
lower human resources capacity. To be most effec-
tive, IT needs to be an end-to-end solution. This
means not only that the solution encompasses the
entire process cycle—from application to pension
payment—but that it links each of the functional
processes to each other. The solution needs to be
transaction-based in the sense that it must involve
no or extremely limited opportunity for original
transaction data entry. An electronic registry of ben-
eficiaries will require digitisation of legacy data and
continuous entry of new beneficiaries. Digitisation
will need a robust data migration process (for exam-
ple, minimise duplicates, reduce risk of missing
records) to ensure accuracy. Mechanisms should be
built in to cross-check the registry with other data-
bases such as the SECC, UID or ration cards for
verification. A robust electronic registry is the base
on which application management can be built to
record, acknowledge and check compliance with eli-
gibility norms while minimising the burden of proof
of documentation that is presently placed on the
applicant.
17.94. In order to streamline the processes of com-
munication of information of actual transfers to
programme managers at the State level, an elec-
tronic fund management system (as described for
MGNREGA above) could make a big difference. The
NSAP guidelines do not require any formal fiduci-
ary assurance from the States in terms of end-use
of funds other than the annual utilisation certifi-
cate (UC). The basis for recognition of programme
expenditure for the purpose of the UC is not clear,
which may result in States adopting varying yard-
sticks for what is expenditure. Third party review of
the payment processes and enforcement of plough-
back of unspent balances with pension distribution
agencies (PDAs) must be introduced so that the pos-
sibility of ‘ghost beneficiaries’ and unspent balances
lying with PDAs is reduced.
17.95. At present, there is no mechanism for sys-
tematic revision of pension payments in line with
inflation. A case can be made during the Twelfth
Plan to adopt an approach similar to that adopted
for MGNREGA wages, whereby an index such as
the CPIAL or CPIIW could be adopted to tie pen-
sion payments to inflation, allowing for cost of living
differences across States. The periodicity of revision
could be aligned with preparation of annual budget
estimates.
17.96. The use of BPL lists has led to large errors
of inclusion and exclusion. Eligibility and coverage
rates will need to be reassessed after the SECC pro-
cess is completed.
FLEXI-FUND FOR RURAL DEVELOPMENT
17.97. There is an increasing demand to give States
much greater flexibility in spending decisions with
respect to Government schemes. The demand is jus-
tified on the basis that States have differing needs,
priorities and levels of development and the ‘one size
fits all’ model of Centrally Sponsored Schemes (CSS)
does not allow these interstate variations to be ade-
quately reflected. The BK Chaturvedi Committee has
addressed this issue and proposed a new framework
for introducing much greater flexibility as described
in Chapter 10 of Volume 1 on Governance.
17.98. The Ministry of Rural Development has
proposed going even further by setting up a Rural
Development Flexi-fund (RDF) of `40,000 crores
(of which 70 per cent would be the Central share of
`28,000 crore) with the intent to devolve a significant
share of Central funds related to Rural Development
to the States over the Twelfth Plan period directly
though this Fund. This would ensure better targeting
and focused projects on state-specific priorities. It
would also send a powerful signal about the Central
Government’s deep commitment to cooperative
federalism.
17.99. The RDF will be a separate line item in
the Budget of the Ministry of Rural Development
(MoRD). It would be available as an additional
amount that can be spent either on existing Centrally
Sponsored Schemes of the MoRD and Ministry of

Rural Development 317
Drinking Water and Sanitation, or on new pro-
jects proposed by the respective States. Thus the
RDF would provide inter-scheme flexibility to
States among the Centrally Sponsored Schemes of
the Ministry of Rural Development and Ministry
of Drinking Water and Sanitation.6 This will be in
addition to the intra-scheme flexibility made possible
by the BK Chaturvedi Committee for all Centrally
Sponsored Schemes. The MoRD will lay out broad
guidelines on what the RDF can be used for. In order
to avoid inter-district distortions, the flexi-fund will
be essentially a fund to incentivise: (i) innovation in
service delivery, (ii) building sustainable rural infra-
structure (iii) ‘Greening’ of rural development and
(iv) devolution to and empowerment of PRIs.
17.100. With these provisos the RDF will be avail-
able for use under any CSS and even for work not
currently covered under any of the CSS. In order to
be eligible to use the fund, States will have to pro-
pose projects that merit support based on the above
four criteria. The project reports (DPRs) prepared
by the States will be discussed and approved by a
Central Committee under the Chairmanship of
Member (RD) Planning Commission, and com-
prising Secretary (RD), GoI and 2–3 eminent Rural
Development experts.
PLAN OUTLAY
17.101. The tentative Gross Budgetary Support
(GBS) for the Ministry of Rural Development for the
Twelfth Five Year Plan (2012–17) is `4,43,261 crore.
Out of this, about 85 per cent is for the flagship pro-
grammess implemented by the Department of Rural
Development, that is, Mahatma Gandhi National
Rural Employment Guarantee Act (`1,65,500 crore),
Indira Awas Yojana (`59,585 crore), Pradhan Mantri
Gram Sadak Yojana (`1,24,013 crore) and National
Rural Livelihood Mission (`29,006 crore).
17.102. The Twelfth Plan Central Sector Tentative
Gross Budgetary Support for Rural Drinking Water
Supply and Sanitation is `98,015 crore. 100 per cent
of this outlay is for flagship programmes, namely
National Rural Drinking Water Programme and
Nirmal Bharat Abhiyan, administered by Ministry
of Drinking Water and Sanitation. This provision
will draw matching provisions from the States to
the tune of `1,32,393 crore. Thus, the total outlays
in the Twelfth Five Year Plan for Rural Drinking
Water Supply and Sanitation sector would be about
`2,30,408 crore.
NOTES
1. JP Morgan (2011): India: Rural Wages Surge, India Equity
Research Reports.
2. Jean H Humphrey (2009): ‘Child Undernutrition, Tropical
Enteropathy, Toilets and Hand Washing’, Lancet, 374:
1032–35.
3. Dean Spears (2012): Effects of Rural Sanitation on Infant
Mortality and Human Capital: Evidence from India’s Total
Sanitation Campaign. This study uses administrative records
on implementation of TSC and data from the third round of
the District Level Household Survey (DLHS-3) and bulletins
of the 2010–11 Annual Household Survey.
4. Dutta, P., S. Howes, and R. Murgai (2010): ‘Small but
Effective: India’s Targeted Unconditional Cash Transfers.’
Economic and Political Weekly, XLV(52) pp. 63–70.
5. Disability is legally defined as (i) blindness, (ii) low vision,
(iii) leprosy cured, (iv) hearing impaired, (v) loco motor disa-
bility, (vi) mental retardation and (vii) mental illness. Persons
with disability are persons suffering from not less than 40 per
cent of any of the above disabilities as certified by a medi-
cal authority. Persons with severe disability are persons with
80 per cent or more of one or more disabilities. Multiple dis-
abilities are combination of two or more disabilities.
6. Mahatma Gandhi NREGA is excluded from this list as it a
special demand driven scheme based on a legal entitlement
under the MGNREGA Act, 2005.

INTRODUCTION
18.1. About 377 million Indians comprising of
about 31 per cent of the country’s population, live
in urban areas according to Census 2011. This is a
smaller proportion compared to other large develop-
ing countries, for example, 45 per cent in China, 54
per cent in Indonesia, 78 per cent in Mexico and 87
per cent in Brazil. With the more rapid growth of the
Indian economy in recent years, which is expected
to continue, the rate of urbanisation will increase.
Projections are that by 2031, about 600 million
Indians will reside in urban areas, an increase of over
200 million in just 20 years.
18.2. Urban areas are engines of economic growth.
Data on the urban share of the gross domestic prod-
uct (GDP) for the Indian economy is not available
on a regular and consistent basis but estimates by
the Central Statistical Office (CSO), available for a
few years, indicate that this share increased from
37.7 per cent in 1970–71 to 52 per cent in 2004–05.
The mid term appraisal of the Eleventh Plan pro-
jected the urban share of GDP at 62–63 per cent in
2009–10.
18.3. Urbanisation will be central to India’s strat-
egy of achieving faster and more inclusive growth
because agglomeration and densification of eco-
nomic activ ities (and habitations) in urban con-
glomerations stimulates economic efficiencies and
provides more opportunities for earning liveli-
hoods. Thus urbanisation increases avenues for
18
Urban Development
entrepreneurship and employment compared to
what is possible in dispersed rural areas. It, thereby,
enables faster inclusion of more people in the pro-
cess of economic growth.
18.4. Although the theme of a ‘rural–urban divide’
still colours some policy discourse in India, there is
a growing recognition that urbanisation is necessary
to realise India’s growth potential, and that rural–
urban linkages must be strengthened. Indeed this
will accelerate growth of the rural sector also.
18.5. The High Powered Expert Committee (HPEC)
under the chairpersonship of Dr. Isher Judge
Ahluwalia that was constituted by the Ministry of
Urban Development for estimating the investment
requirements for urban infrastructure services has
observed that the fortunes of the agricultural sector
are crucially linked to the manner in which growth
in the industry and services sectors unfolds. People
living in rural areas typically tap the opportunities
that cities provide for employment, entrepreneur-
ial avenues, and education. As urbanisation grows,
demand for food items other than food-grains,
that is, vegetables, lentils, milk, eggs and so on, also
grows. This leads to investments in infrastructure,
logistics, processing and packaging in rural and peri-
urban areas. Such investments and other economic
inter-linkages connect and build synergy between
rural and urban centres. Thus the rural sector also
benefits from good management of neighbouring
urban conglomerations.
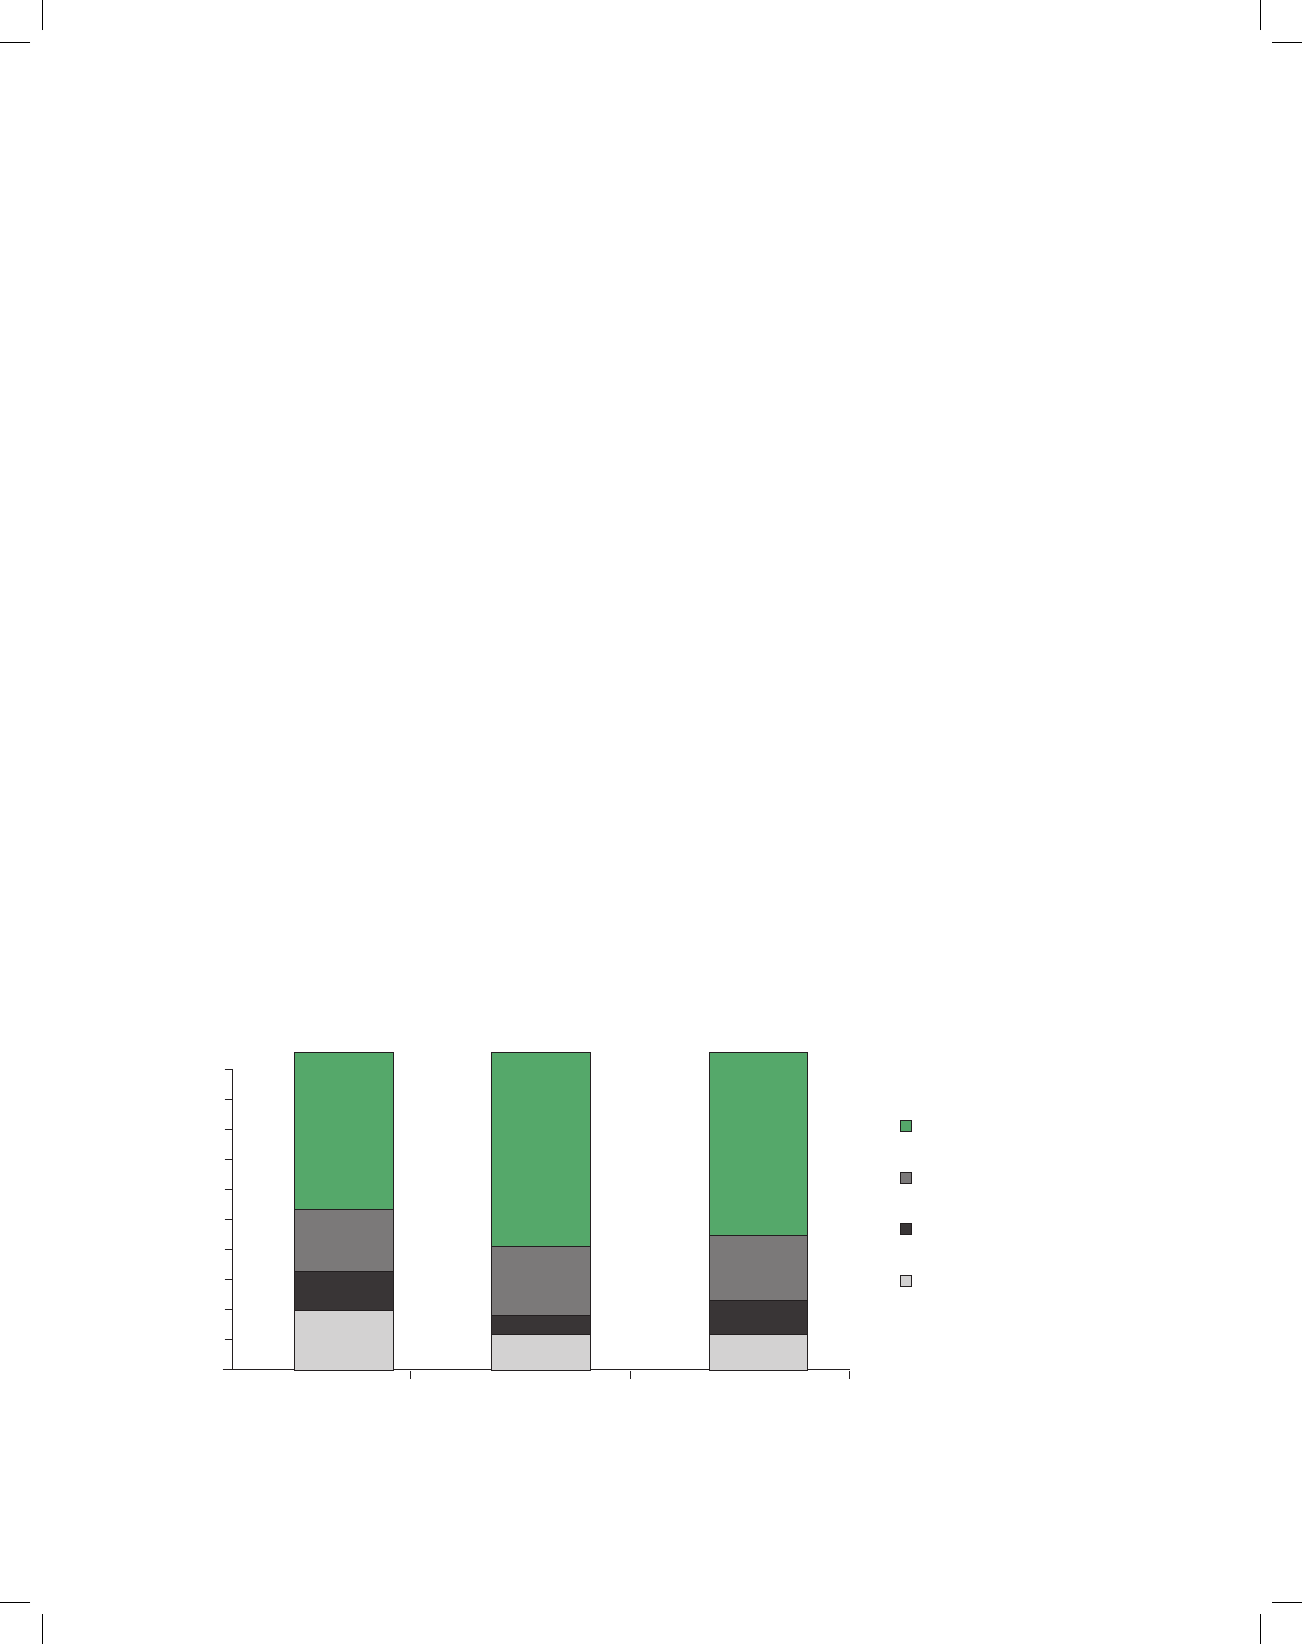
Urban Development 319
Urbanisation Trends and Their Implications
18.6. As mentioned above, the degree of urbanisa-
tion at 31 per cent of the population is one of the
lowest in the world though it is accelerating. The
share of persons living in urban areas rose by 3.35
per cent in the decade 2001 to 2011 while it had risen
by only 2.10 per cent in the decade 1991 to 2001. The
sources of increase in urban population are shown in
Figure 18.1.
18.7. About 60 per cent of the growth in the urban
population is due to natural increase. Rural–urban
migration has contributed to only about 20 per cent
of increase in urban population. In this regard, the
Isher Ahluwalia HPEC has observed that notwith-
standing three decades of rapid economic growth,
rural urban migration has remained relatively low as
industrialisation has been capital intensive and the
services boom fuelled by the knowledge economy has
also been skill intensive. This has prevented Indian
cities from realising their full potential of generating
employment opportunities and consequently mak-
ing the development process more inclusive.
18.8. There is a concentration of the urban popula-
tion in large cities and existing urban agglomerations.
As per census 2011, there are 53 million plus cities
accounting for about 43 per cent of India’s urban
population. Class-I cities with population over 3 lakh
accounted for about 56 per cent of the urban popu-
lation and with a population ranging from 1 lakh to
3 lakh accounted for another 14 per cent. This pattern
of population concentration in large cities reflects
spatial polarisation of the employment opportuni-
ties. While it is expected that gains from an agglom-
eration economy would lead to some polarisation of
economic activities, there is a need for developing an
optimal portfolio of cities by drawing regional devel-
opment plans and promoting growth centres that are
employment intensive and consistent with the eco-
nomic potential including the natural endowment of
cities and regions. The availability of water to pro-
vide for the needs of a large urban population must
be a critical factor in plans for urban development.
18.9. Though the proportion of urban population
concentrated in larger cities continue to remain
high, there is some evidence that other urban
growth nodes are emerging underscoring the need
for adequate policy attention to smaller cities and
peri-urban areas as against the narrow focus of con-
centrating on large ‘Mission Cities’ as was followed
in the Eleventh Plan period. Census 2011 notes that
the number of towns in India increased from 5,161
in 2001 to as many as 7935 in 2011. It points out
that almost all of this increase was in the growth of
‘census’ towns (which increased by 2,532) rather
than ‘statutory’ towns (which increased by only 242).
Natural increases
Net Rural-Urban migration
Expansion of boundaries
Net reclassification
100
90
80
70
60
50
40
30
20
10
1971–81 1981–91 1991–2001
0
51.7 62.7 59.2
21.1
9.9
9.7
22.6
2.1
12.6
19.9
11.9
16.6
Per cent
Source: Reproduced from Isher Ahluwalia Hpec Report (2011).
FIGURE 18.1: Sources of Increase in Urban Population

320 Twelfth Five Year Plan
‘Statutory’ towns are towns with municipalities or
corporations. Whereas, ‘census’ towns are agglomer-
ations that grow in rural and peri-urban areas, with
densification of population that do not have an effec-
tive urban governance structure or requisite urban
infrastructure, for example, sanitation, roads and so
on in place.
18.10. An accelerated pace of urbanisation would
imply significant spill over of existing cities into
peri-urban areas. As borne out by a recent study
by the World Bank—India Urbanisation Review:
Urbanisation beyond Municipalities (2012) already
there are evidences that peri-urban areas in the vicin-
ity of large cities are centres of intense economic
activities. A large number of new towns are ‘born’
in the vicinity of existing cities with million plus
population. If these trends are any indication of how
the future will unfold, much of India’s urbanisation
challenge will be to transform land-use and expand
infrastructure in its largest cities and neighbouring
Box 18.1
Vision of Our Cities
The objective of the Twelfth Plan is faster, more inclusive and more sustainable growth. The vision of India’s urban growth
must be aligned with the objectives of inclusion and sustainability.
Urbanisation should be guided towards inclusive, equitable and sustainable growth of towns and cities with proper civic
amenities. Good urbanisation would ensure that towns and cities are free from slums and provides adequate opportunities
for productive employment and a decent quality of life to all their inhabitants including the poor.
The smart cities of our vision would be engines of growth as they would increasingly compete for investments nationally
and internationally too. Therefore, cities must provide world class infrastructure and services at affordable costs to give
a competitive edge to the economic activities they host. Besides, cities should be able to provide basic services to migrant
workers, their families and other vulnerable sections of society including women and children. The future renewal of our
cities should facilitate transition from ‘informality’ of large number of workers towards more formal livelihoods in line with
their aspirations. They should address various vulnerabilities including residential, occupational and social vulnerabilities,
associated with urban poverty. As an overriding principle, ‘people’ should be brought to the heart of the urban agenda,
for both, deciding the vision of their city and for choosing the process of reaching that goal. This implies that all citizens
have access to basic services of clean water, sanitation, sewage, solid waste management, urban roads, safe and affordable
public transport systems, affordable housing, and a clean and healthy environment. Besides creating avenues for gainful
employment, Indian cities should also meet the rising aspirations of people for a better quality of life. Citizens should be
proud of their towns and cities and take responsibility for their cleanliness, safety and hospitality.
Environmental sustainability of Indian cities is another integral part of the vision. Future growth should be consistent with
cities’ natural endowments and the economic potential of the region in which they are situated. All cities should be efficient
in using available resources particularly energy, water and land.
Our cities must also preserve and foster their cultural and historical heritage and benefit from the tourism potential of their
heritage and natural endowments.
suburbs—places that are not pristine or green field,
but already support 9 per cent of the country’s popu-
lation and provide 18 per cent of the employment on
1 per cent of the country’s land area. Jobs and people
are flowing from metropolitan cores to nearby set-
tlements—regardless of whether they are classified as
urban or rural often giving rise to haphazard urbani-
sation in the peri-urban areas. The challenge is to
ensure that new cities and existing metropolises are
connected and land-use change is coordinated with
infrastructure development to accommodate urban
redevelopment and urban spatial expansion (refer to
Box 18.1). Failure to do so would eventually neces-
sitate expensive ‘retrofits’ in future.
The Country’s Urban Conditions and
Challenges
18.11. Broadly, the urban sector in India faces two
distinct but mutually linked sets of challenges. Based
on NSSO Report No. 508 (2004–05) it is estimated
that the number of urban poor had increased by

Urban Development 321
34.4 per cent from 1973 to 2004. The NSSO (66th
round) has estimated that during the period 2004–05
and 2009–10, the unemployment rate in terms of the
usual status decrease by 1 percentage point for both,
urban male and females notwithstanding an impres-
sive growth registered by the economy in this period.
Hence, the first challenge is to significantly step up
the rate of creation of jobs in the urban sector
18.12. The second set of challenges before the Gov-
ernment is to guide the process of urbanisation and
ensure that basic services, for example, sanitation,
water supply, and basic housing are provided to urban
citizens expected to be around 600 million within 20
years. If these challenges are not tackled expressly,
not only would India’s cities get increasingly chaotic
and choked, rural poverty will be converted to urban
poverty with no gains to improvement of livelihoods
of India’s burgeoning population.
Box 18.2
State of Service Delivery—Key Indicators
Water supply: As per 2011 census 70.6 per cent of urban population is covered by individual connections, compared with
91 per cent in China, 86 per cent in South Africa and 80 per cent in Brazil. Duration of water supply in Indian cities ranges
from 1 hour to 6 hours, compared with 24 hours in Brazil and China and 22 hours in Vietnam. Per capita supply of water
in Indian cities ranges from 37 lpcpd to 298 lpcpd for a limited duration, while Paris supplies 150 lpcpd continuously and
Mexico 171 lpcpd for 21 hours a day. Most Indian cities do not have metering for residential water connections. Seventy per
cent of water leakages occur from consumer connections and due to malfunctioning of water meters. Non-revenue water
(NRW) accounts for 50 per cent of water production compared with 5 per cent in Singapore.
Sanitation: Even a partial sewerage network is absent in 4861 cities and towns in India. Almost 50 per cent of households
in cities like Bangalore and Hyderabad do not have sewerage connections. As per 2011 census, about 13 per cent of urban
households do not have access to any form of latrine facility and defecate in the open. Census 2011 also revealed that about
37 per cent of urban households are connected with open drainage and another 18 per cent are not connected at all. Less than
20 per cent of the road network is covered by storm water drains. As per the report of the Central Pollution Control Board
(CPCB) 2009, only about 20 per cent sewage generated was treated before disposal in Class I cities and Class II towns (as per
2001 census). As per CPCB report brought out in 2005, about 1,15,000 MT of Municipal Solid Waste is generated daily in the
country. However, scientific disposal of the waste generated is almost non-existent.
Public transport: Public transport accounts for only 27 per cent of urban transport in India. Share of the public transport
fleet has decreased from 11 per cent in 1951 to 1.1 per cent in 2001. In 2009, only 20 out of 85 Indian cities with a population
of 0.5 million had bus services.
Source: As compiled in Isher Ahluwalia HPEC report (2011) and Census of India and MoUD
Affordable housing: The Technical Group on the Estimation of Housing Shortage projects the total shortage of dwelling
units in urban areas in 2012 to be 18.78 million units. The projected slum population in India is 94.98 million in 2012. As
against this, the number of dwelling units sanctioned under JNNURM in 7 year Mission period was 1.6 million units. The
supply of decent affordable housing by private sector has remained woefully inadequate.
Source: Ministry of Housing and Urban Poverty Alleviation and Report of the Pronab Sen Committee on Slum Statistics (2010).
18.13. Already, cities and towns of India are visibly
deficient in the quality of services they provide, even
to the existing population. A recent compilation of
key indicators of the present state of urban service
delivery is given in Box 18.2.
18.14. The high coping cost of deficient infrastruc-
ture especially to the urban poor has been reported in
several studies. For example, due to the intermittent
and inadequate supply of water, it has been estimated
that the urban poor pays significantly more than the
average price for water, often tenfold higher. In a city
sanitation study, conducted by the MoUD (2010)
none of the 423 cities where the study was conducted
were found to be ‘healthy and clean’. The Water and
Sanitation Programme of the World Bank, using data
for 2006, suggested that per capita economic cost of
inadequate sanitation in India is `2,180. The cost in
terms of Disability Adjusted Life Years (DALY) of

322 Twelfth Five Year Plan
diarrhoeal disease for children from poor sanitation
is estimated at `500 crore (HPEC 2011).
18.15. Many studies have demonstrated that there
is considerable positive impact on health status after
having adequate access to water and sanitation, both
in terms of hygiene related behaviour as well as
reduction in water borne diseases and skin diseases.
There is a very strong gender dimension to safe
water and sanitation. Women bear the maximum
brunt in their absence. They are forced to spend
time and energy collecting water for the household
use and by that are forced to give up on income gen-
erating opportunities and leisure time. There are
severe health consequences of such work on women.
In absence of sanitation they have to go out in dark
only for defecation which has adverse health conse-
quences on them besides increasing risks of sexual
violence. Higher morbidity rates within the fami-
lies because of lack of these services forces them to
spend time on caring for the sick within the family
and thereby increasing their burden. This also leads
to poor health status of women and lower incomes in
their hands.
18.16. The scenario in urban transport is equally
alarming. Current urban transport trends in Indian
cities are leading to broader sustainability chal-
lenges for people and the environment in terms of
lost man-hours due to long commute times, greater
reliance on expensive private transport, increasing
emissions and road fatalities. A MoUD study in 2010
based on sample of 87 cities estimated than under a
business-as-usual scenario, in about 20 years time,
the expected average journey speeds on major cor-
ridors in many cities would fall from 26–17 kmph to
8–6 kmph.
18.17. Air quality has also deteriorated sharply car-
rying with it concomitant health costs. For instance,
per capita emission levels in India’s seven largest cit-
ies have been estimated (Palanivel 2002) to be at least
three times higher than the WHO standards. Air pol-
lution levels were low in only three cities of the 127
cities monitored by the Central Pollution Control
Board under the National Air Quality Monitoring
Programme (2009).
18.18. To conclude, urbanisation is increasing at a
faster rate than earlier. Since urbanisation is ‘efficient’
and could be job-creating, it must be planned and
properly guided. An accelerated pace of urbanisation
would also result in significant spill over in peri-urban
areas and therefore, these areas need to be included in
urban planning and provided for. While India needs
to plan for its urban expansion, the conditions of
delivery of services in existing cities and decent hous-
ing even for the current level of urban population is
highly deficient. There is a pressing requirement to
address the problem of urban poverty. The task enu-
merated above calls for a renewed thrust towards
improvement in governance structure especially at
the level of urban local bodies and a major improve-
ment in delivery of urban services in cities.
REVIEW OF MAJOR INITIATIVES TAKEN UNDER
THE ELEVENTH PLAN
JNNURM
18.19. The Jawaharlal Nehru National Urban
Renewal Mission (JNNURM) was launched in
December 2005 for a period of seven years with an
outlay of `66,085 crore. The objectives of the scheme
included empowerment of Urban Local Bodies
(ULBs), planned and holistic development of cities
and making them inclusive. The scheme mandated
preparation of City Development Plans (CDP) and
a set of urban reforms at State and Municipal levels.
18.20. JNNURM renewed the focus on urban
renewal and gave impetus to many urban reforms.
Central allocation of `66,085 crore led to overall
commitment of investment of `1,23,711 crore under
the scheme (refer to Table 18.1).
18.21. Some of the key inadequacies noted during
implementation of the programme included failure
to mainstream urban planning, incomplete reforms
and slow progress in project implementation. Delay
in securing land for projects and obtaining approval
from various regulatory authorities also led to delay
in implementation of some of the projects.
18.22. Despite the stress on urban planning, in many
cities the planning process is yet to be strengthened

Urban Development 323
and made participatory. Invariably peri–urban
areas around cities’ limits have grown haphazardly.
Lack of participatory planning has resulted in pro-
grammes suffering from ‘lack of ownership’.
18.23. A significant interstate variation in comple-
tion of reform underscores the need for their careful
calibration on the basis of city size and capabilities.
In many States, incomplete governance and finan-
cial reforms prevented emergence of the municipal
entities as viable and financially sustainable enti-
ties. Lack of capacity has further emerged as a seri-
ous constraint. Thus, despite some good examples
in some cities, the overall progress in improving
service delivery standards has been unsatisfactory.
Another major shortcoming was the limited success
in leveraging of JNNURM fund by locating non-
budgetary financial resources including funds under
PPP framework.
Other Initiatives in the Urban Sector in the
Eleventh Plan
18.24. Swarna Jayanti Sahari Rozgaar Yojana
(SJSRY) is designed to enable urban poor to get gain-
ful employment. Under this scheme 3,941 towns have
been covered and an assistance of `3,360 crore has
been released. Since inception, about 12.3 lakh per-
sons have been imparted training under the scheme.
For making India slum free, pilot phase of Rajiv
Awas Yojana was launched in 2011. The scheme has
a progressive architecture which includes in-situ
rehabilitation of slums and legislation to provide
property rights to slum dwellers. Another thrust has
been implementation of the Employment of Manual
Scavengers and Construction of Dry Latrines (pro-
hibition) Act 1993. Under the Integrated Low Cost
Sanitation Scheme (ILCS) 2.5 lakh dry latrines have
been converted into sanitary ones and about 1.55
lakh new toilets have been sanctioned.
Urban Transport
18.25. A major achievement leading to transforma-
tional change in public transport has been a signifi-
cant extension of Metro rail network in large cities.
Delhi metro phase-II has been successfully completed
and phase-III involving an investment of `35,242
crore is under implementation. Metro rail projects in
Bangalore, Chennai and Kolkata involving an invest-
ment of `31,084 crore are under implementation In
addition, metro projects in Hyderabad and Mumbai
involving investment of more than `22,000 crore are
being developed on a Public–Private Partnership
basis. Under JNNURM, 21 projects including Bus
Rapid Transit (BRT) System with an approved cost
of `5,211 crore were sanctioned. Besides, purchase of
15,260 buses gave a major boost to public transport.
Another 123 projects like roads, flyovers, ROBs and
parking projects with an approved cost of `10,162
crore were sanctioned for traffic improvement and
parking (refer Box 18.3).
TABLE 18.1
Physical and Financial Progress under JNNURM (March 2012)
UIG UIDSSMT BSUP IHSDP Total
7 year Allocation (in ` crore) 31,500 11,400 16,357 6,828 66,085
No. of Projects sanctioned 559 808 528 1,078 2,973
Total cost of project (in ` crore) 67,275 14,039 30,416 11,981 1,23,711
Total ACA Committed ( in ` crore) 30,971 11,372 15,092 7,704 65,139
Total ACA released (in ` crore) 18,479 8,469 8,642 4,905 40,495
Per cent of ACA released to ACA sanctioned 60% 74% 57% 64% 62%
No. of DU approved in lakh (BSUP and
IHSDP)
10.3 5.7 16.0
No. of projects completed (UIG and
UIDSSMT)
127 142 269
No. of Dwelling units completed (in lakh)
(BSUP and IHSDP)
4.4 1.8 6.2

324 Twelfth Five Year Plan
Conclusion
18.26. JNNURM has led to a significant step up in
investment in urban sector. However, urban sector
continues to suffer from low-level of service deliv-
ery, structural problems, grossly inadequate avail-
ability of resources and lack of capacity at different
levels of the government. Successful management of
India’s urbanisation would not only require a signifi-
cant step up in investments for urban improvements
under the Twelfth Plan period, but also emphasis on
measures to address the glaring weaknesses in urban
governance and management. In addition, reducing
urban poverty has emerged as a major thrust area in
managing our cities.
THE STRATEGY FOR URBANISATION
Enablers for effective urbanisation
18.27. The strategy for the Twelfth Five Year Plan
will be focused on strengthening the five enablers
for urbanisation—governance, planning, financing,
capacity building and innovation (Figure 18.2).
Strengthen Urban Governance
18.28. Despite the 74th Constitutional Amendment,
which required States to transfer eighteen functions
to the ULBs, there is significant variation in devolu-
tion of functions, functionaries and funds across the
States. City mayors lack the powers and tenure to
be truly accountable for delivery of urban services.
At the metropolitan level, Metropolitan Planning
Committees (MPCs) are yet to evolve and District
Planning Committees must function not only in
letter but in the intended spirit too. In most States
either State agencies or parastatals are in-charge of
urban service delivery rather than ULBs. This maze-
like structure of management and accountability
hampers good urban management.
18.29. To strengthen the urban governance frame-
work, it is proposed to adopt the following strategies
during the Twelfth Five Year Plan period:
Box 18.3
Transforming Public Transport in Cities
Under UIG component of JNNURM, 15,260 low-floor and semi–low-floor buses enabled with intelligent transport system
were sanctioned to 65 Mission cities with admissible central assistance of `2,089 crore. As a result of the scheme, 34 cities
across India have organised city bus services for the first time.
Sustainable
livelihood
and enterprises
2
Affordable
housing
1
Universal
access to water
and sanitation
3
Quality and
affordable public
transport
4
Clean and healthy
environment
5
Planned, inclusive and sustainable urban development
Strengthen local governance systems
6
Integrate planning organisations and processes
Build capacity across all levels
Financially empower ULBs
Promote innovation in urban management
7
8
9
10
Necessary enables Desired outcomes
FIGURE 18.2: Key Constitutes of India’s Urban Future

Urban Development 325
Achieve Convergence at the Central
Government Level
18.30. Urban development, housing and poverty
alleviation are inter-related subjects. Various expert
bodies including Isher Ahluwalia led HPEC have
recommended the merger of the Ministry of Urban
Development with that of the Housing and Urban
Poverty Alleviation. Their merger would improve
the effectiveness and the efficiency of urban manage-
ment in India. Till this is achieved, a concerted effort
must be made for convergence of the programmes
and initiatives of both the Ministries and merger of
both the Ministries deserves a careful consideration.
Ultimately all schemes run by different Ministries
of the States and the Central Government must
converge on ground at the municipal level. This
must be an overarching guiding principle for the
Twelfth Plan.
Set Up Municipal Services Regulators
18.31. An independent utility regulator should be
set up at the State level to monitor service levels and
adjudicate disputes related to delivery and pricing of
services. The regulator would facilitate transparency
by regular publication of service level benchmarks,
and help set the vision for ULBs. Therefore, setting
up of a suitable urban regulator at the State level
must be a priority.
Empower and Extend the Term of the Mayor
18.32. Eminence of elected bodies in decision mak-
ing is a prerequisite for participatory develop-
ment processes. JNNURM pushed for elections to
municipal bodies. The stage has come where the
heads of such elected bodies should be adequately
empowered. With the objective of establishing sin-
gle point accountability the Mayor should be the
executive head of the city. Also the Mayor should
be vested with appropriate authority, for exam-
ple, in a Metropolitan Area the Mayor of the larg-
est ULB should be the Chair of the Metropolitan
Planning Committee. While local conditions should
determine whether cities should adopt a Mayor-in-
Council or an Executive Mayor system, in either
scenario, the Mayor’s term should be extended to
five years. The Isher Ahluwalia HPEC has also rec-
ommended that the executive head of the city will
need to be empowered to run an efficient system of
delivering urban services in a manner which har-
nesses agglomeration economies, minimises con-
gestion diseconomies and creates a socio-economic
environment that attracts investment and generates
livelihoods whilst adhering to the constitutional
requirements of a duly elected legislative body, the
third-tier of Government. Hence suitable empower-
ment of mayors should be mandated as a key gover-
nance reform under JNNURM.
Strengthen the Unified Metropolitan Transport
Authority (UMTA)
18.33. As recommended by the Second Administrative
Reforms Commission, all the million plus metro-
politan areas should set up an UMTA to develop and
implement city level transportation plans. These must
be integrated with spatial and land use plans of cities.
Introduce Citizen Charters
18.34. Every municipality should publish a citizen’s
charter. The charter should contain comprehensive
information on service levels for all urban services,
including the same for basic services for the urban
poor at ward level and specification of time limits
for approvals relating to regulatory services such as
licenses and permits. The charter should also spec-
ify the relief available to the citizens in case of non-
adherence as prescribed in the report of the Second
Administrative Reforms Commission.
Increase Adoption of Information Technology at
the ULB Level
18.35. Information Technology (IT) can play an
important role in improving governance. With
municipal administration becoming increasingly
complex, the benefits of IT adoption are becom-
ing more visible across several municipalities.
E-governance must be a mandatory reform under the
renewed JNNURM and its implementation should
be required in all cities receiving assistance under
the capacity building component of the Mission.
A major constraint in full fledged transition to
e-governance is lack of a suitable national level archi-
tecture. This has led to States and ULBs indepen-
dently developing e-governance platforms which are
often mutually incompatible. This has also prevented

326 Twelfth Five Year Plan
States from replicating successful architecture devel-
oped in other States leading to avoidable expendi-
ture. To address this problem, the Ministry of Urban
Development should finalise a suitable national level
architecture with sufficient flexibility for customisa-
tion at the State and ULB level within the first year of
the Twelfth Plan.
Clarification of Roles of ULBs and Parastatals
18.36. In large metropolitan areas and cities, dedi-
cated Government agencies with operational
autonomy should be carved out to provide services
like water supply, solid waste management, sewer-
age, sanitation, primary health services, primary
education, roads and urban transport. The elected
municipal bodies may procure services from these
agencies by entering into suitable MoUs with them
with clearly specified and mutually agreed upon
output parameters/deliverables. This arrangement
would make delivery of services more accountable
to people while the expert knowledge available with
parastatals will be available in conceptualisation and
implementation of projects (refer Box 18.4).
Set Up Area Sabhas and Ward Committees to
Decentralise Urban Governance
18.37. Ward Committees and Area Sabhas should be
set up for institutionalising participatory develop-
ment process for effectively carrying out the func-
tions devolved to ULBs under the Twelfth schedule
of the Constitution. For this purpose, Area Sabhas
would be constituted by comprising all citizens in
one or two polling station areas who should elect,
once in a five year, a small Committee of represen-
tatives. Further, Ward Committees should be set
up in every electoral ward of Municipalities and
Panchayats by drawing representatives from Area
Sabhas. Together, these institutions will ensure that
executive power is located at the ULB level, while
the deliberative powers are vested with the Ward
Committee. These structures will institutionalise
participatory and accountability mechanisms. These
structures should be further empowered through
enactment of Community Participation Act and
Public Disclosure Law. Enactment of these laws
would be part of the mandatory reforms under the
renewed JNNURM.
Box 18.4
Harmonising the Role of Parastatals with Elected Municipal Bodies
A frequently expressed criticism of JNNURM has been that large numbers of projects were executed through parastatals.
As a result, ULBs, which are the main institution under the constitutions for participatory governance at ground level,
have remained marginalised. Lack of participatory process has reduced ownership of programmes by people. At the same
time, planning and execution of urban service delivery like water supply, sanitation, urban transport and so on are highly
interdependent and complex in nature and require technical inputs. Thus, a key challenge is harmonising the role of experts
dominated parastatals with the elected municipal bodies representing people for whom the Plan is drawn.
The roles and responsibilities of different institutions in such situations should be clarified along five principal dimensions:
• Unique Purpose: Each institution should have a clearly defined ‘unique’ purpose for itself, in line with people’s aspirations.
Typically it should not overlap with any other institution at the same federal level
• Measure of Effectiveness: In line with the unique purpose, relevant measures of effectiveness should be put in place. These
will not only help in creating external accountability for the institution as a whole, but will also provide guidance to the
individual employees to discharge their duties.
• Exclusive Decision Rights: The decisions which the institution is empowered to take and which others are required to
follow must be specified. These decisions rights must be reconciled with decision rights granted to other institutions.
• Expertise and Capabilities: Empowering any institution with certain decision rights alone is not enough. The critically
necessary capabilities/expertise required by the institution to perform its functions and fulfil its purpose must be defined,
along with processes for ensuring it will have these capabilities.
• Inter-linkages within the Ecosystem: Lastly, it is critical to understand the inter-linkages with other institutions in a
complex, multi-institutional environment. A particular institution may have different types of relationships with other
institutions. These could range from being a regulator, to having a contractual arrangement or serving as a technical advisor.

Urban Development 327
Put In Place a Fiscal Responsibility Framework
for ULBs
18.38. Adoption and monitoring of prudent finan-
cial management in ULBs should be institutionalised
through appropriate legislation. ULBs should prepare
a medium term (10 years) fiscal Plan, fix a ceiling for
revenue expenditures and perform regular audits.
Adopt an Outcome Based Approach and
Put Up a Robust Monitoring Mechanism
18.39. A significant change would be to shift to out-
come-based monitorable milestones as a measure of
performance instead of exclusively relying on expen-
diture. The implementing ministries should suitably
draw their Result Framework Document (RFD) for
better implementation of programmes aligned to the
needs of people. For instance, Ministry of Housing
and Urban Poverty Alleviation may draw a quan-
titative target of reduction of households staying
in slum. Ministry of Urban development may draw
target of increase in share of public transport; cover-
age of access to water and sanitation and so on. This
robust system of monitoring of the implementation
of the Plan would also require frequent consultations
with all stakeholders including elected representa-
tives, citizens groups, civil societies and experts. All
the schemes drawn under the Twelfth Plan must con-
tain these provisions for monitoring and for receiv-
ing feedback so that plans are owned by the people
for whom and progressively by whom, they are made.
Set up Lokayuktas/Ombudsman at State and
City Level
18.40. In line with the recommendations of the
Thirteenth Finance Commission, it is essential to
bring local office bearers, councillors and other office
bearers under the purview of an Ombudsman or the
Lokayukta. The role of the Ombudsman would be to
mediate conflicts between citizens and various urban
authorities.
Urban Planning
18.41. A key weakness of India’s urbanisation efforts
is that the agenda is being implemented through
disjointed projects/activities with inadequate or no
planning for the urban area as a whole. The ‘Master
Plan’ approach generally focuses on only the core
area of the city, has little linkages to any financial and
operating strategy and, in many cases has been used
as a regulatory tool instead of being a blue print for
development of dynamic and smart cities. A master
plan typically freezes the land use pattern and build-
ing bye-laws and so on determines the permissible
limits of Floor Space Index (FSI) and minimum set-
back areas. Often these provisions do not take into
account the potential of the city to grow, especially
where trunk infrastructure has been laid. This results
in sub-optimal use of land as well as the infrastruc-
ture. Though JNNURM mandated preparation of
City Development Plans (CDP) before taking up
any projects, in many cases, the CDPs became hast-
ily put-up documents with limited consideration
of socio-economic aspects. Exclusion of peri-urban
areas where fast growth is taking place has further
limited the adequacy of such planning for guiding
the emergent needs of a city.
18.42. Absence of any long-term plan prevents
development of ‘good cities’ in which all the parts of
the system—urban services, transportation, housing,
commercial activities—fit together harmoniously.
Planning must be holistic before it is detailed, for
example, urban housing and urban poverty issues
cannot be separated from other aspects of urban
planning. A whole-city–approach is required and,
therefore, there is a need for both Central Ministries
which provide assistance under JNNURM for urban
renewal to work very closely together. Holistic plan-
ning, even if not detailed, is required at the local
urban level, at the metropolitan level and at State and
national levels too.
18.43. The concept of ‘Master Plan’ to guide a city’s
long-term development has evolved in many coun-
tries to increase the quality of participation of all
sections of citizenry in the preparation and endorse-
ment of the plan. Earlier master plans used to be
prepared mostly by experts in urban planning to
engineer the physical layout of the city which often
excluded the needs of citizens, especially the poorest
whose requirements thus became peripheral to the
Plan. Best practice master planning today is a core
participatory process and addresses the needs of citi-
zens more holistically.

328 Twelfth Five Year Plan
City Development Plan and Financial Plan
18.44. Every city/town should mandatorily draw a
Development Plan (DP) by taking at least a 10-years
perspective. The plan should take into account a
city’s natural endowment, and its economic potential
and should promote clean and green city It should
specifically provide for the following:
1. Strategic densification especially along mass
transit corridors with mixed land use
2. City mobility plan with special emphasis of mak-
ing cities safe for vulnerable groups including
women and children, pedestrian and cyclists
3. City sewerage and sanitation plan
4. City water plan
5. Economic and commercial activity plan
6. Infrastructure plan
7. Affordable housing plan
8. Environment conservation plan
9. Urban poverty reduction strategy and inclusion-
ary zoning (old age homes, orphanages, working
hostels, night shelters and so on)
10. Plan for peri-urban area
18.45. Financial plans that indicate the sources of
funds required for the holistic urban development
of a city must also be prepared. Performance against
the agreed upon targets indicated in the Financial
Plan should not only be used to monitor the efficacy
of financial reforms being implemented across the
State and city but also form the criteria of release of
central assistance to the ULBs.
18.46. Drawing of DP and FP should be a neces-
sary precondition for receiving assistance under the
renewed JNNURM.
18.47. To ensure planned development of cities, a
series of policy and institutional strategies should be
adopted during the Plan period:
Ensuring Citizens’ Participation at the
Planning Stage
18.48. Success of any Plan depends on the extent it
is owned by the people. This in turn would depend
on what the Plan does for a common person. Since,
in an emerging economy, every sector makes a claim
for available resources, it is necessary that scarce
resources made available for the urban sector are
utilised efficiently and spent in the manner that is
relevant for the people. Therefore, in accordance
with the spirit of the 74th CAA, it is necessary that
‘people’ should be brought to the heart of the urban
agenda, both, for deciding the vision of their city
and for choosing the process of reaching the goal.
Thus, involvement of people through Area Sabha
and Ward Committees in the Planning Stage must
be a necessary prerequisite for implementation of all
schemes for urban development including schemes
for slum improvement.
Constitute/Strengthen the Metropolitan Planning
Committees (MPC) and District Planning
Committees and Restructure the Role of the
Metropolitan Development Authority
18.49. As per the 73rd and 74th CAA, a minimum
of 2/3rd of the MPC shall be constituted of elected
representatives from the metropolitan region, and
a minimum of 4/5th of the DPC shall be elected
by, and from amongst, the elected members of the
District Panchayat and Municipalities in the district
in proportion to the ratio between the population of
the rural areas and of the urban areas in the district.
Currently, DPCs are dysfunctional in most States.
18.50. Once constituted, the MPC/DPC should
create the spatial development Plan for the region
including any rural areas that may lie within the dis-
trict boundary but outside the municipal limits of
an urban area. Such Plans should take a longer 20+
year perspective with a formal review every 5 years.
The broad Spatial Development Plan should then be
used by the ULBs as a guiding framework to create
the second level detailed plans for the city. The time-
line of the Metropolitan Development Plans and the
District Development Plans should be synchronised
with ULB Spatial Plans.
18.51. The Metropolitan Development Authority
under the aegis of the Metropolitan Planning
Com mittee should be vested with the responsibil-
ity of enforcing and regulating the metropolitan

Urban Development 329
development Plan. It should be the appellate
authority for conflict resolutions on spatial plans
for all Local Planning Authorities in the metro
region, in keeping with the letter and spirit of the
Constitutional Amendment Act.
18.52. Given the revised mandate of the Develop-
ment Authority it should be relieved from respon-
sibilities related to project implementation and land
development so as to avoid any conflict of interest
between the roles of planner/regulator, and that of
project implementer or developer. Finally, it is rec-
ommended that the Chief Planning Officer and his
establishment in the district ought to become part of
the technical support system of the DPC.
ULBs must Prepare Municipal Plans while
Utilities, Environmental Bodies and Parastatals
should Provide Technical Inputs
18.53. Each municipality must mandatorily fulfil its
obligation to produce a spatial plan within a speci-
fied time period. The Spatial Development Plans
prepared by a municipality should be submitted to
the MPC/DPC. Any directions given by the MPC/
DPC from the point of view of ensuring the fulfil-
ment of requirements and imperatives of the notified
Metropolitan/District SDP should be complied with
and these should be binding on the municipality. The
spatial plan which fully complies with such direc-
tions (if any) shall be approved by the concerned
municipal corporation/council. This will not only
ensure compliance with the requirements of regional
planning, but will also safeguard the power of the
individual ULBs to approve the SDPs prepared by
them without submitting it to the State Government
for final approval.
Modify State Town Planning Acts, Municipal Laws,
Building Byelaws and Land-Use Conversion Norms
18.54. These legislations need to be reviewed and
revised to address the current challenges of urbanisa-
tion as well as to reflect recent policy recommenda-
tions to allow regional decentralisation and citizen
participation. Metropolitan plans should be binding
on municipal plans and should integrate top-down
and bottom-up plans, reinforcing the concept of
‘urban development regions’ around the municipal
boundaries.
Provide Incentives for Strategic Densification of
Cities/New Towns on Growth Corridors
18.55. Strategic densification as a planning strategy
should be pursued to accommodate future urbanisa-
tion needs. In addition, mandating inclusionary zon-
ing and providing higher FSI to make the economics
of affordable housing viable should be considered.
Similarly, new cities may be planned to nurture
emerging growth nodes in the urban landscape.
However, as international experience indicates, the
success of new cities is dependent on factors like their
proximity to, as well as connectivity linkages with an
existing metropolitan city. An effective regulatory
regime which allows ease in conversion of land use
while cities and their peri-urban areas are developing
is critical. As a long-term strategy, the Ministry of
Urban Development should identify such corridors
and nodes with urban growth potential and facilitate
their development (refer Box 18.5).
Consider Land Readjustment
18.56. Land readjustment (LR) is gaining acceptance
as an alternative to land acquisition as it has many
advantages for land assembly. Under this process, a
compact area is selected in consultation with the land
owners for urban expansion/renewal. The municipal
authorities provide infrastructure which is funded by
exploiting a part of land. The remaining land, whose
value has increased due to provision of infrastruc-
ture, is reallocated back to participating private land-
owners. In essence a participatory tool, LR avoids
public discontent and protests to a great extent. It
also reduces the need for raising large amounts of
money for acquiring land. However, successful LR is
grounded in three main enablers:
• Fairly well-defined property rights
• Streamlined, independent and transparent evalu-
ation processes
• Strong judicial system to address public concerns
Financing Urban Infrastructure
18.57. The Isher Ahluwalia Committee on Urban
Infrastructure and Services (2011) estimated the

330 Twelfth Five Year Plan
Box 18.5
Strategic Densification—International Examples
Large Indian cities have high population density. However, FSI in these cities are low compared to many smart cities in
the world. This results in low per capita availability of urban space. Strategic densification of cities through higher FSI has
numerous advantages: it makes the cities compact and efficient and frees space for accommodating more people as well as for
providing urban amenities. Pricing of higher FSI also generates resources for funding urban infrastructure projects.
In Manhattan, as well as in other international best practice examples, FSIs vary by location and land use Density zones are
typically small and are determined by street width and capacity as well as land use patterns. Commercial and office districts
typically have higher FSIs than residential districts FSIs are set in conjunction with the formulation of development and
strategic plans. Optimising infrastructure and density is a central element of urban planning.
Singapore makes highly effective use of FSI with variations by location and type of use. FAR is higher near metro stations
because transport system can accommodate increased density. As higher FSIs will require more infrastructure investments,
they can be financed by suitable instruments like development fees or pricing of Tradeable Development Rights (TDRs) and
so on.
Source: India Urbanisation Review: Urbanisation beyond Municipalities (2012), World Bank.

Urban Development 331
total capital investments in urban infrastructure at
about `39 lakh crores over the next 20 years. To meet
this requirement, ULBs will need to identify robust
revenue streams. In addition, both central and State
Governments will also have to increase their com-
mitment to the urban sector.
18.58. Working on the 20 year estimate provided by
the Ahluwalia Committee, three alternative scenarios
of covering the backlog of service deficits in 10 year,
15 years and 20 years respectively were developed for
projecting investment. The aforesaid 15-years sce-
nario up-fronted investment in water and sanitation
sectors as well as investment in capacity building in
view of the huge externalities and also moderated its
projection on the basis of capacity constraint. Unless
stated otherwise, the estimates so derived have been
used in the chapter.
18.59. The share of ULBs’ own revenues has declined
significantly from 63 per cent in 2002–03 to 53 per
cent in 2007–08. Property Tax collection is ham-
pered by poor assessment methods, limited cover-
age, weak collection efficiency, loss on account of
exemptions and poor enforcement. User charges
also remain low, most often lower than the opera-
tional costs for ULBs. Most States have also not fully
implemented the recommendations of State Finance
Commissions, leaving ULBs with unpredictable
funds’ transfers from State Governments.
18.60. During the Twelfth Plan period, the finances
of ULBs should be strengthened with a three-
pronged approach
• create robust tax and non-tax based revenue
streams for ULBs;
• attract private capital to the urban sector; and
• systematically monetise land.
18.61. A major strategy under the Twelfth Plan
would be to strengthen the municipal finances and
make them predictable through suitable reforms
under JNNURM. This is necessary for attracting pri-
vate funds for urban infrastructure. To this end, the
following initiatives must be undertaken by the cen-
tral and State Governments.
Institutionalise the Revenue Streams for ULBs
18.62. The Ministry of Urban Development should
facilitate the process of making a Constitutional
Amendment that clearly outlines the various tax
and non-tax revenue streams for ULBs through the
incorporation of a Local Bodies Finance List in the
Constitution. In addition to property, entertain-
ment, professional, motor vehicle, advertising tax
and stamp duty, the amendment should also entitle
the ULBs to collect appropriate user charges, trade
license fees and use land-based instruments to aug-
ment their revenues. It must ensure that all taxes are
regularly revised using scientific principles such that
they serve as relevant sources of funds for ULBs.
Ensure Revenue Sharing from States to ULBs
18.63. According to HPEC, States should share 25 per
cent of the GST equivalent with urban and rural
local bodies, and this should be enforced through
an appropriate constitutional mechanism. HPEC’s
recommendations in this regard are given in the
Box 18.6.
Ensure Generation of Non-budgetary Revenues
through Innovative Measures Including
Monetisation of Land
18.64. Additional FSI that is given beyond what
is normally prescribed should be charged for ade-
quately. Such charges should be a part of the balanced
strategy for expanding the effective supply of prime
land going hand-in-hand with the strategy for creat-
ing ‘virtual land’ in the required location by building
tall. The charges for additional FSI and land-use con-
versions should be determined professionally and
should be at least 50 per cent of the actual land value
in the concerned area. Apart from FSI, ULBs should
also use various other land value-based instruments
like betterment fee, land use conversion charges,
impact fees and development charges that should be
parked in a ring fenced city development fund and
used for developing the required urban infrastruc-
ture in the city.
18.65. To enable land monetisation, a comprehen-
sive and transparent framework should be put in
place with the following features:

332 Twelfth Five Year Plan
• Development Plans should be prepared using a
standardised approach on a regular basis
• Land-use patterns must be maintained as per
approved Master Plans
• The process of land development should be strate-
gically sequenced to generate resources for infra-
structure creation
• Roles and responsibilities of Urban Development
Authorities and ULBs in the land management
process must be clearly delineated
Increase User Charge Collection
18.66. ULBs should levy user charges for all mea-
surable services where beneficiaries are easily iden-
tifiable. Appropriate level of user charges should be
determined based on actual service use, and regulated
by the proposed municipal services regulator. These
charges should not only cover the O&M costs, debt
servicing costs and depreciation, but also provide a
minimal profit to the ULBs to facilitate creation of an
equity base for ULBs over time. Also, there should be
a tiered structure of user charges, where higher levels
of consumption should be charged a higher tariff.
Establish a Comprehensive Approach to Facilitate
PPPPs
18.67. As much as 13–23 per cent of investments
in urban infrastructure in the Twelfth FYP can be
raised through public private and people partner-
ships. This should be done under an extended ‘4P’
framework—People–Private–Public Partnerships as
experience across the world indicates that in urban
renewal and management, the role of ‘People’ in
design of projects and partnerships is crucial, much
more so than in large infrastructure projects such as
highways, airports, power, power plants and so on,
in which ‘People’ have a relatively limited role in the
ongoing governance of the projects and their out-
comes. Therefore, best practices and model docu-
ments for ‘PPPP’ must be evolved and deployed for
India’s urban management agenda to succeed. This
would improve the ownership of these projects and
would facilitate an effective R&R component of the
project. These PPPP projects may become more via-
ble if a subvention from property and other urban
taxes is imaginatively used to meet any financial gap
in the projects where felt necessary (refer Box 18.7).
Box 18.6
Recommendation of Isher Ahluwalia Committee on Financial Devolution to ULBs
The Committee recommends more broad-based revenue sharing by States with ULBs through appropriate amendments of
the Constitution/other measures so as to:
• Insert a ‘Local Bodies Finance List’ (LBFL) along the lines of the Union and State Lists
• Empower ULBs to exclusively levy property tax, profession tax, entertainment tax and advertisement tax and retain the
whole of their proceeds (hereinafter referred to as ‘exclusive taxes’). In case States continue to levy and collect profession
tax or entertainment tax, then the entire revenues, net of collection cost, should be passed on to the ULBs
• Constitutionally ensure sharing of a pre-specified percentage of revenues from all taxes on goods and services (including
motor vehicle tax and stamp duty) which are levied by States to enable ULBs to meet their functional responsibilities
assigned to them by the 74th Amendment (hereinafter collectively referred to as ‘revenue-shared taxes’)
• Provide for formula-based sharing of the divisible pool with the ULBs and also grants-in-aid to ULBs from the divisible
pool for bridging, wherever necessary, horizontal fiscal imbalance;
• Provide that the devolution in (c) above shall be on the basis of a formula designed by the SFC, taking into account the
level of economic activity, population levels, extent of poverty, capacity to mobilise resources and other factors as may be
necessary over time.
The Committee also recommends that States should strengthen SFCs by improving their capacity, following the
recommendations of the thirteenth CFC. They must also ensure that the recommendations of SFCs are given the same level
of consideration as the recommendations of the CFC to the Government of India.
Source: HPEC Report (2011).

Urban Development 333
Box 18.7
PPP in Urban Sector under JNNURM
It has been estimated that about 13–23 per cent of the total investment requirement in urban sector can potentially come
through PPPs including annuity model. This would roughly translate to about 250–300 PPP projects in urban sector each
year.
JNNURM-I was the first major initiative which encouraged PPP in urban sector. Forty-nine projects involving total project
cost of about `5,458 cr were taken up under PPP framework in sectors likes solid waste, water supply, sewage and urban
transport in which private concessionaire brought in investment of `1,066 crore.
A major factor that has prevented mainstreaming of PPP framework in urban sector is that given low user charges, very few
projects are financially free standing and sustainable on the basis of user fee alone. PPP projects in urban sector would require
relatively higher degree of government support and may be broadly classified as follows:
• Projects which are free standing, usually based on user charges, sometimes combined with Viability Gap Funding (VGF)
or revenue streams from real estate
• Revenue linked to a performance based unitary charge (tipping fee for instance) with a minimum throughput assurance
• Revenue linked to a performance based periodical payment (annuity payment)
• Projects having little or no capital investment from private sector but designed to bring in efficiency improvements: for
instance management contracts
Experience in other infrastructure sectors especially highways have shown that beside enabling environment, standardisation
of bidding documents is key to encourage PPP projects. Such standardisation leads to greater certainty, broad public
acceptability, reduction in transaction costs and time besides addressing the issue of capacity constraint.
Under the Twelfth Plan, there is need to develop such model documents for PPP projects in urban sector including:
• Water supply
• Urban waste management including solid waste and sewerage
• Urban transport
• Social sectors like Health care and education
• Affordable housing
Another important aspect in designing a PPP project is to ensure participation of people so that the project has the requisite
ownership.
Set up a ‘Ring-Fenced’ City/State-level
Development Fund
18.68. Set up a city/State-level development fund:
Proceeds accruing to ULBs from innovative sources
like land monetisation and other land based instru-
ments should be pooled into a ‘ring fenced’ city
development fund and then used only for urban
infrastructure projects and projects for providing
shelters to the urban poor in respective cities and not
for any other purpose. In view of the capital inten-
sity of transport projects, it is suggested that the fund
may have two parts—(i) Fund marked for urban
transport projects and (ii) fund for other infrastruc-
ture and shelter related projects. To start with, such
funds may be created in metropolitan cities. To meet
the demands of smaller ULBs, each State should set
up a State Financial Intermediary, on the lines of
Tamil Nadu Urban Development Fund (TNUDF),
which can then pool funding requirements of the
ULBs in the State and provide economies of scale.
Empower ULBs to Leverage Municipal Bonds
Including Pooled Financing
18.69. A handbook should be created based on con-
sultation with key stakeholders that specifies regu-
lations relating to lenders and lending instruments,
mixed or shared authority and responsibility between
the Central and State Government and the ex ante
borrowing activities of municipalities and ex post pro-
cedures relating to municipal default and insolvency.
Bolster State Finance Commissions
18.70. The State Finance Commissions (SFCs) need
to be further strengthened for financial devolution

334 Twelfth Five Year Plan
and imparting predictability to the municipal
finances. For efficient functioning of the SFCs, there
is a need for revamping MIS at municipal level.
Suitable assistance for strengthening of SFCs and
creation of municipal level MIS should be admissible
under capacity building component of JNNURM.
Building Capacity for Managing India’s
Urbanisation
18.71. Lack of sufficient capacity across all levels of
Government is a root cause of India’s urban devel-
opment challenges. The Mid-term Appraisal of the
Eleventh Plan highlighted that many States have
lagged in programme utilisation due to inadequate
capabilities of governance and management. Trad-
itionally, capacity building, though critical, has been
given low priority, which is evident in the absence
of dedicated municipal cadres and robust urban
management structures. Substantial skill gaps exist
across almost all areas of urban management. This
is driven as much by the lack of credible and special-
ised supply side institutions as it is by poor demand
from those responsible for urban management in
cities. Addressing the capacity deficit must be a key
endeavour during the Twelfth FYP and the following
strategies should be adopted to achieve this:
Create a Comprehensive Capacity Building Strategy
18.72. The Central Government should create a
comprehensive framework that addresses issues
such as staffing, training and skill development and
finances. This framework should then be used by the
States to evolve a capacity building strategy for all
their ULBs detailing staffing norms, cadre rules that
reflect service delivery and governance norms to be
met by ULBs. This strategy should dynamically meet
future needs, incentivise knowledge and skill devel-
opment and provide an environment for using the
acquired skills. State strategies should translate into
ULB level implementation plans for capacity build-
ing. In view of its centrality to India’s urban agenda,
a separate sub-mission for capacity building, with 10
per cent of the overall funds should be created under
the renewed JNNURM.
18.73. The wide-spread need and extreme urgency
for urban management capabilities to catch up with
the relentless process of India’s urbanisation, makes
a ‘Just-in-Time and Task-Aligned’ approach impera-
tive to build capabilities. In a ‘Just-in-Time and
Task-Aligned’ approach, functionaries are provided
requisite tools and skills as they get to do the tasks,
rather than acquiring these only through ‘remote’
training programmes not synchronised with action
requirements. Therefore, the training process must
be flexible and accessible. IT-based training systems
enable this.
18.74. Key elements of capacity building could be as
follows:
Institutionalisation and Professionalisation of
Municipal Cadre
18.75. Every State should institutionalise a dedicated
municipal cadre with necessary technical skills. The
cadre should cover the key areas of urban gover-
nance and be equipped for increasing complexities
of modern city management. State Governments
should suitably frame the recruitment rules includ-
ing norms for direct recruitment to ensure that
the cadre attracts top-quality talent. A career path
should also be put in place by allowing functionar-
ies to move to higher levels of local bodies based on
their experience and should ensure that employees
are continuously motivated and recognised.
Leverage Private Sector Expertise
18.76. To meet the skill deficit in the short to
medium term, policies should enable recruitment
from the private sector and hiring of external con-
sultants through a fast-track process. States can con-
sider creating a list of ‘empanelled urban practice
professional institutions’ to streamline the procure-
ment process and enable ULBs to access external tal-
ent in a timely manner.
Establish a Reforms and Performance Cell at the
Central Level
18.77. A dedicated unit to address issues such
as implementation of reforms, dissemination of
best practices across urban issues should be set up
under the Capacity Building Mission structure of
JNNURM. This unit should comprise urban plan-
ners, municipal finance experts, IT personnel, public

Urban Development 335
health engineers’ and others from required disci-
plines in addition to programme managers.
Launch Five Indian Institutes of Urban
Management (IIUMs)
18.78. The Government of India in partnership with
State Governments and the private sector should
set up five Indian Institutes of Urban Management
(IIUMs) over next two Plan periods and at least two
in the Twelfth Plan to help prepare future genera-
tion of urban managers/regulators with world-class
training in urban issues. It is also of utmost impor-
tance that these institutions are professionally man-
aged by a joint board of stakeholders having required
autonomy.
Facilitate Information Sharing Between
Urban Managers
18.79. Strengthen the Urban Resource Link Project,
designed by the Administrative Staff College of
India in partnership with the World Bank Institute,
to provide timely, relevant and quality information
related to urban issues to urban managers across cit-
ies. Existing city manager associations should also be
strengthened and networking opportunities should
be created for urban managers to interact and learn.
Use ICT and e-Governance
18.80. e-governance initiatives including Online
Pro ject Management Information System should be
implemented across all ULBs. There should be a State
level nodal agency for implementation and monitor-
ing of all e-governance initiatives within the State.
It should also identify the training needs and coordi-
nate with relevant agencies to conduct trainings.
Strengthen Institutions to Cater to Dynamic Urban
Needs
18.81. The Ministry of Urban Development and
Ministry of Housing and Urban Poverty Alleviation
should bolster existing institutions and set up new
ones to assist with policy research, design, and imple-
mentation as well as to train municipal officials, and
elected representatives. Of these at least one to two
institutions should have investments and involve-
ment of the private sector.
Reorient the Activities of Existing Organisations
namely IIPA, NIUA, RCUES
18.82. The Indian Institute of Public Administration
(IIPA) along with the Administrative Training
Institutes (ATIs) should be tasked with the prepa-
ration of standardised training modules and testing
of training modules before they are circulated across
the country to ensure they are in synchronisation
with current requirements. The National Institute of
Urban Affairs (NIUA) focus should be renewed such
that it is capable of assisting the MoUD with policy
formulation, providing advisory services to States
on a variety of urban governance dimensions, and
implementing high end capacity building activities
for policymakers. The Regional Centres of Urban
and Environment Studies (RCUES) should conduct
active research related to policy support to cities and
also disseminate various policies and programmes of
Government of India and State Governments. These
centres should carry out capacity building pro-
grammes in respect of new initiatives and priorities
identified by the MoUD.
Enter into PPP Arrangements for Capacity
Building
18.83. The Government’s network of 1,817 Industrial
Training Institutes (ITIs) and the 3,338 Industrial
Training Centres run by the private sector could be
roped in to up-skill and re-skill ULB personnel.
18.84. In conclusion, it must be reiterated that a
modern ‘Just-in-Time and Task-Aligned’ approach is
required to ensure that supply-side capability build-
ing institutions meet the demand side needs rapidly
and effectively. India’s urbanisation is unstoppable.
Urban managers will have to learn while doing.
Leveraging Innovation to Solve the
Challenges of Urbanisation
18.85. Managing India’s ongoing urbanisation will
place huge requirements on financial as well as
human resources in the country. Given the scarcity
of resources in the medium term, innovation will
have a significant role to play. In the Twelfth Five
Year Plan period, it is critical to promote innovation
and research in several ways :

336 Twelfth Five Year Plan
Provide Support and Incentives for Innovation
18.86. Given the huge requirement of funds, it is
critical to incentivise cost reducing innovations in
the fields of materials and processes. The support
can be in the form of incubation assistance and low
cost funds. Incentives could be in the form of recog-
nition and rewards.
Use Technology Extensively in Urban
Management
18.87. Technology can unlock significant potential
in building capacity across the ULBs. Innovative uses
like, self learning packages which simulate real life
situations relating to operations and maintenance
can be developed in areas like water supply and sani-
tation, solid waste management and urban planning.
Recognise and Replicate Innovation
18.88. Creating innovative solutions is not enough.
These solutions need to be spread across the country
to maximise impact. Various approaches to identify,
and spread the use of innovations should be insti-
tutionalised. These would include ‘innovation and
best practices’ portals. The portals created by the
national Innovation Commission can provide a plat-
form. The Peer Experience and Reflective Learning
(PEARL), platform created by the Ministry of Urban
Development under JNNURM whereby cities can
learn from each other, will also propagate solutions
and its use and coverage should be dramatically
scaled up.
SECTOR SPECIFIC APPROACH
Affordable Housing
18.89. The Technical Group on the Estimation of
Urban Housing Shortage has estimated the current
shortage of 18.78 million dwelling units. Further,
the Group has also estimated that 73 per cent of the
shortage in self occupied housing is in bottom 40
per cent of the urban households. The proportion of
slum dwellers in large metropolitan areas is higher.
18.90. As against this huge requirement, during the
seven years of implementation of the BSUP and
the IHSDP component of JNNURM, only about
1.6 million dwelling units have been sanctioned.
Given the huge investment required to bridge the
gap between demand for affordable housing and
its availability, all the costs cannot be borne by the
Government and hence the key would be to attract
private investment and to enable the beneficiary
to increase his/her contribution. A multi-pronged
strategy is required to meet the need for housing
of the urban poor. First, a facilitative environment
must be created by reviewing the regulatory pro-
cesses governing land use to augment the supply
of affordable housing with private capital. Second,
encouraging contributions from beneficiaries of
the slum—rehabilitation schemes are required for
increasing the ownership of the programme. For
this, the flow of institutional credit to the urban poor
should be ensured. Third, they should be organ-
ised in suitable societies and self-help groups. These
measures would improve the capacity of urban poor
to afford a decent shelter either through incremental
improvement of their existing dwelling units or take
up shelter on rental basis or new units on ownership
basis. Fourth, the Government should continue to
undertake and expand the slum rehabilitation pro-
gramme under the overall umbrella scheme of Rajiv
Awas Yojana. Fifth, innovative approaches to facili-
tate the creation and maintenance of rental hous-
ing stock including dormitories should be expressly
undertaken to serve the needs of the floating and
migrant urban poor. And lastly innovations aimed at
low cost housing must be encouraged.
18.91. Availability of land for affordable housing is
perhaps the most crucial issue. Progress in imple-
mentation of BSUP and IHSDP and now RAY has
been hampered by non-availability of suitable land
for in-situ slum rehabilitation. The scarcity of land
is the result of sub-optimal land-use patterns largely
induced by the regulatory regime in place, lack of
long term urban planning and lack of participatory
planning process to determine the most efficient use
of a parcel of land.
18.92. Several strategies can improve land availabil-
ity for affordable housing and monetise land values
for infrastructure. They are as follows:

Urban Development 337
1. Instead of relying on public land acquisition
using the power of eminent domain under the
current 1894 Law, which often give rise to dis-
content, the use of Land Readjustment meth-
ods must be extended for land assembly and
infrastructure development to the extent possi-
ble. India has already been experimenting with
a variant of LR in Gujarat’s Town Planning
Schemes (TPSs). Another ongoing experiment is
the improvement of the C-ward in Mumbai that
showcases the promises of participatory pro-
cesses in urban renewal. There is need for scaling
such experiments.
2. Adopting mixed land use and subsequently
modifying regulations governing land use and
removing deficiencies in the urban land market
need to be given high priority. In many parts of
the country, urban land planning limits redevel-
opment, modernisation and the repurposing of
older inefficient areas. Weak institutional and
information foundations still govern land mar-
kets. In many cases, urban plans seek to preserve
status quo by limiting land assembly and freezing
the density of developments by using very low
Floor Space Indexes (FSI), and limited coordina-
tion with infrastructure development. Under the
Eleventh Plan, JNNURM sought to address these
issues by incentivising several urban reforms.
Completion of reforms mandated by JNNURM
must be given priority.
3. Simplification of procedures for conversion of
land use and change in building bye-laws have
been mandated under JNNURM. These reforms
should be completed.
4. JNNURM mandated earmarking at least 20–25
per cent of developed land for housing projects
for EWS/LIG category with a system of cross
subsidisation. This reform should be completed
on priority.
5. As mentioned in paragraph 18.55 above, there is
an urgent need for strategic densification of our
cities, especially along trunk transport networks
and around zones of intense economic activi-
ties. Densification would make space available
for affordable housing and generate resources
for affordable housing. An argument in favour
of keeping the densities low is that the existing
infrastructure systems in cities would collapse
if urban densities were increased. While cities
do have severe infrastructure limitations, these
arguments ignore the opportunities of using
increases in land values by strategic densifica-
tion to finance higher-capacity and higher-qual-
ity infrastructure networks and also affordable
housing for low-income and moderate-income
groups. In addition, compact development fos-
ters increase in agglomeration economies and
increased productivity which in turn leads to
additional livelihood opportunities. However,
care should be taken that the valuation of FARs
required for strategic densification is not ‘given
away’. It has been observed that high FARs are
‘given away’ in the name of densification, cluster
development and redevelopment. These ‘givea-
ways’ should be properly valued and put in a
dedicated City Development Fund.
18.93. Since land and housing are State subjects, both
JNNURM-II and RAY should continue to provide
incentives to States to professionalise urban planning
and undertake tenuous land-related reforms that
reduce distortions in land markets.
Estimation of Budgetary Support for Slum
Rehabilitation Programme
18.94. The Isher Ahluwalia HPEC has estimated
a requirement of about `4.1 lakh crore over the 20
years for the purpose of slum rehabilitation. In addi-
tion, noting that about 25 per cent of urban popu-
lation live in slum, the HPEC recommended that
for inclusive growth, out of the estimated CAPEX
of 34.1 lakh crore over a period of 20 years, 25 per
cent, that is, about `8.5 lakh crore should be for
slum population, assuming universal standards
for all as well as universal provision for access and
mobility. However, an objective estimation of the
budgetary requirement from Central Government
for the Twelfth Plan is difficult because this is cru-
cially linked to the extent of innovation in low cost
housing, the flow of private capital for such dwell-
ing units and the extent of contribution from other
stakeholders like the State Government, ULBs and
the beneficiaries.
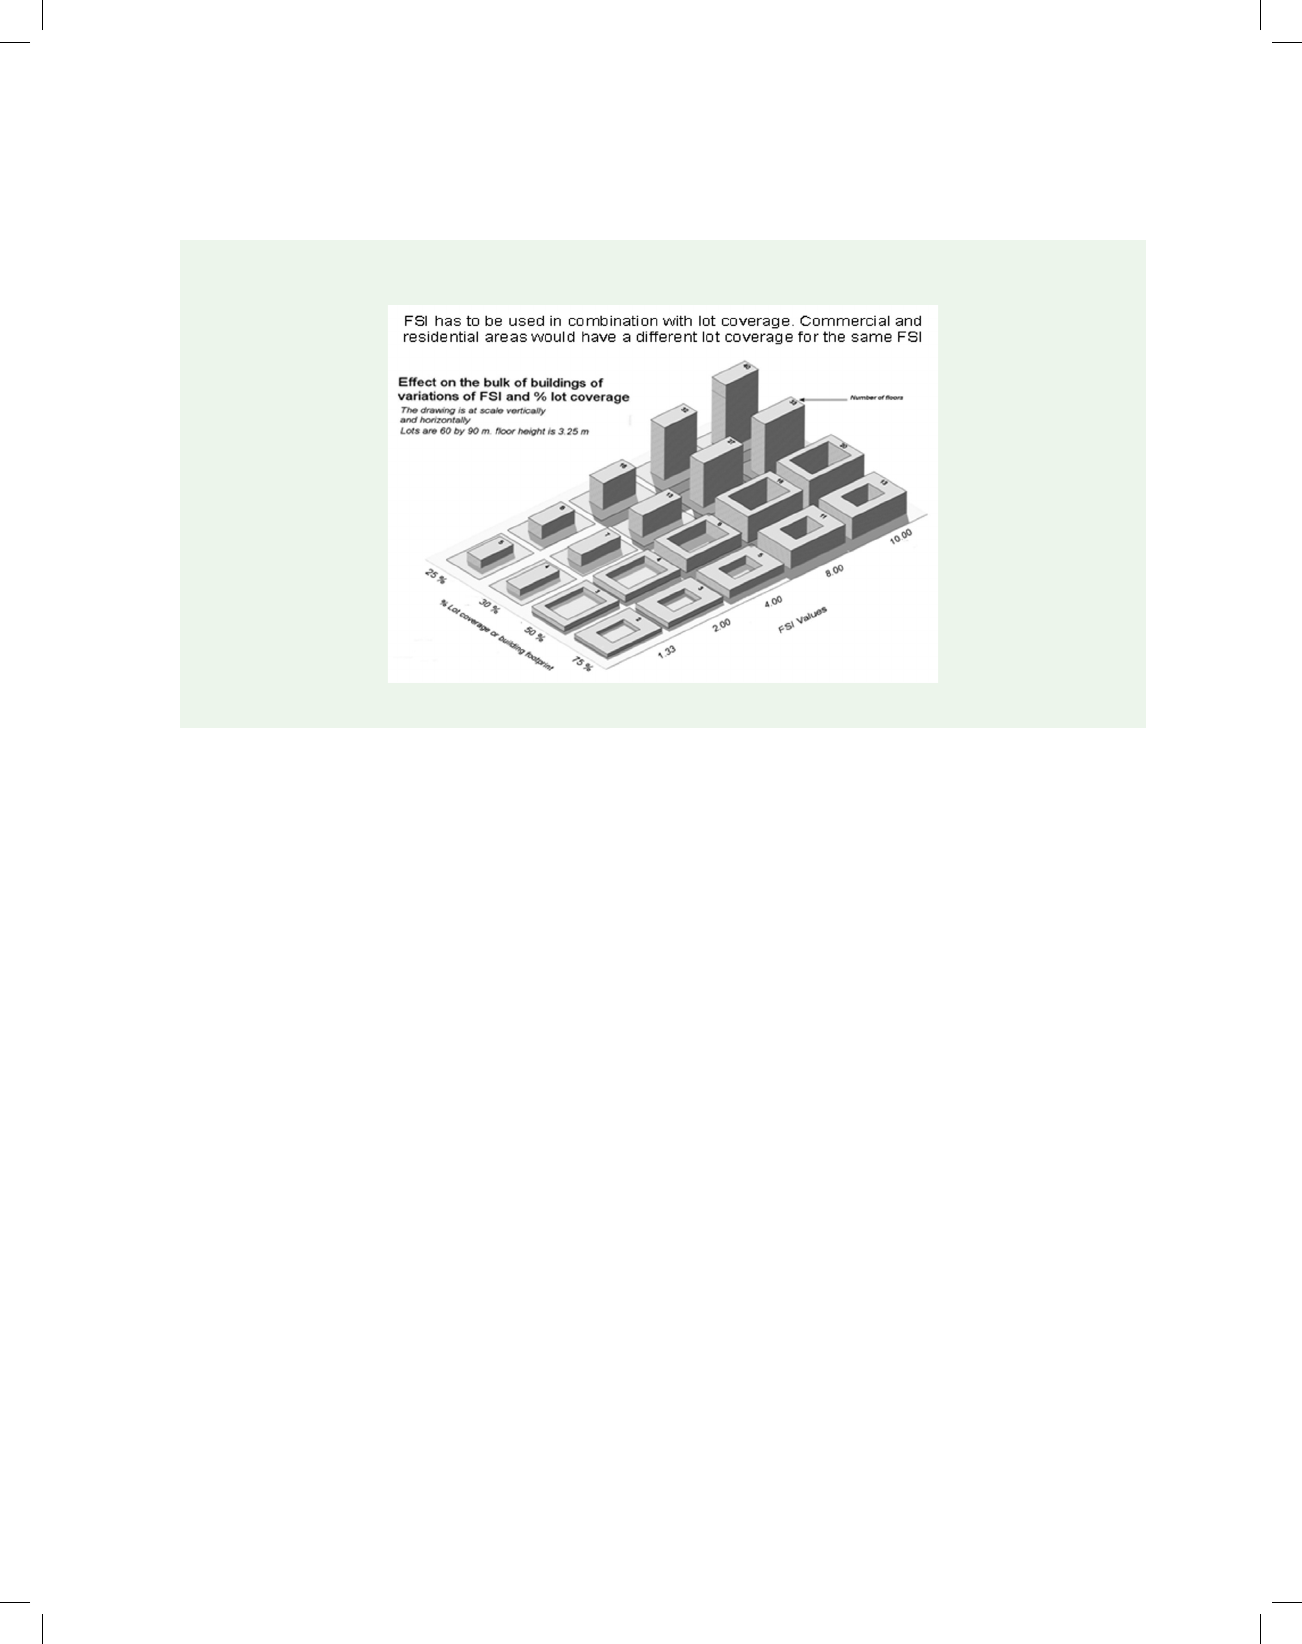
338 Twelfth Five Year Plan
18.95. Besides availability of resources, an important
element that determines provision of central budget
is the capacity available with different level of gov-
ernments to undertake the activities required. Under
the BSUP and IHSDP components of JNNURM,
the cumulative expenditure across seven years has
been approximately `13,000 crore. Despite its supe-
rior architecture, RAY has not evoked immediate
response from the ULBs or the State Governments.
Schemes for Slum Rehabilitation and Affordable
Housing in the Twelfth Plan Period
18.96. The schemes under the Twelfth Plan would be
as follows:
1. Rajiv Awas Yojana: Phase-II of the Rajiv Awas
Yojana would be launched. Ministry of Housing
and Urban Poverty Alleviation should constitute
a suitable committee to recommend the design
of second phase of RAY by incorporating the
learnings from the pilot phase. Phase II of the
scheme should retain the principal architectural
feature of phase-I of Rajiv Awas Yojana which
are as follows:
a. It is based on a holistic approach: Before
seeking assistance under the scheme, all
participating cities are required to make a
city wide plan for rehabilitation of ‘all’ slums.
b. It mandates in-situ rehabilitation of slums
so that the livelihood opportunities of their
dwellers are not disrupted. In case such
slums have to be relocated because the sites
at which they are situated are ‘untenable’,
this should be done through a transparent
process and the rehabilitations should be
planned in close vicinity of the existing slum.
c. It mandates giving ‘property rights’ to slum
dwellers by suitable enactment within a year
of the project being sanctioned. Besides,
during this period it also mandates enact-
ment of legislations to earmark 20–25 per
cent of developed land for housing projects
for EWS/LIG category and earmarking of at
least 25 per cent of budget of municipal and
other such body which provide basic urban
services for urban poor. It also requires the
participating States to draw specific time-
lines for legislations like modification of the
Rent Control Act.
d. Central assistance is up to 50 per cent of the
project cost.
e. The scheme provides for measures to
improve the flow of institutional credit to
Box 18. 8
FSI and Coverage Areas Can be Combined to Increase Densities
Source: India Urbanisation Review: Urbanisation beyond Municipalities (2012), World Bank.

Urban Development 339
the beneficiary. These measures are expected
to incentivise banks and other lending insti-
tutions to provide credit to slum dwellers.
2. Phase-II of RAY would also emphasise following:
a. Creation of social/rental housing: The focus
of RAY on provision of rental/social housing
stock for the migrant population is a critical
element of a long-term preventive strategy.
Of the total stock created under RAY, at
least 30 per cent should be rental, and 5 per
cent should be dormitories. Dormitories
can be set up in industrial and commercial
areas that see a significant influx of migrant
workers.
b. Slum-upgradation as the solution of choice
and transparent process for determining the
tenability of slum rehabilitation: Resettle-
ment or relocation should be seen as an alter-
native option only in exceptional situations.
A clear policy for in-situ slum upgradation
including redevelopment and resettlement/
relocation should be evolved by the GoI and
implemented in the State as broad guide-
lines with State-specific amendments as per
individual contexts. While evaluating the
city wide slum rehabilitation plan, tenability
of slums should be clearly identified by the
Central Government in consultation with
the State Government.
c. Building affordable housing stock in peri-
urban areas: RAY should also make provi-
sions for affordable housing for the urban
poor in peri-urban areas. The provision of
affordable housing in peri-urban areas must
be accompanied by the provision of basic
services as well as functional transport link-
ages into the city.
d. Encouraging community participation to
develop customised approaches for slum
rehabilitation related to local needs: Since a
large number of slums are located on prime
urban land which has multiple socially pro-
ductive uses, every effort should be made
to economise on land use through higher
FSI. But in doing so it is vital to involve the
community in designing slum rehabilitation
plans. This should include the involvement
of the community in planning, execution,
and analysis/feedback of various schemes.
Schemes should encourage the creation of
Community Based Organisations in slums,
federated at a higher level into an association/
federation, eventually working to the admin-
istrative level of the ULBs with clear-cut,
institutionalised frameworks mandating dia-
logue between ULB level functionaries and
the community. The involvement of NGOs
in programmes and schemes may be encour-
aged wherever appropriate to the aims of the
scheme. Community-based organisations
should be accredited and enabled to play a
meaningful role in initiatives such as RAY.
This will help such organisations to build on
the community mobilisation, participation
and social audit, and evaluations guidelines
provided for in RAY. Guiding principles for
designing slum improvement could include
exploring the possibility of channelising
community savings, reuse of building mate-
rials and other innovative method of reduc-
ing the cost of new dwelling units. In those
cases where slums are not on prime urban
land, incremental improvement in existing
dwelling units along with provision of basic
services like water supply, sanitation, power
connection and so on may be adopted.
For ensuring convergence with other
schemes in the urban sector, RAY should be
implemented within the overall umbrella of
JNNURM-II. However, the funding pattern
of RAY may be different. It should be run in
project mode as project-wise involvement of
centre in slum rehabilitation is desirable.
e. Slum rehabilitation scheme for smaller towns
under JNNURM-II: For the cities not cov-
ered under RAY, slum rehabilitation would
be taken up under JNNURM-II. This scheme
should have the flexibility to undertake new

340 Twelfth Five Year Plan
construction while its thrust should be on
incremental slum rehabilitation though
new constructions as in the case of IHSDP
of JNNURM-I would also be an admissible
component. The budgetary provision for the
scheme would come from the overall alloca-
tion made under JNNURM-II.
f. Affordable Housing in Partnership: While
under the Twelfth Plan, this scheme may
continue to remain dovetailed with RAY, it
needs to be completely revamped. Its thrust
should be to incentivise the private sector
to augment supply of affordable housing in
line with the strategy envisaged under the
National Urban Housing and Habitat Policy
(NUHHP) of 2007.
3. In addition to launching of the aforesaid
schemes, following activities should also be
undertaken to augment provision of affordable
housing:
a. Revitalise and reorient the role of State
Housing Boards: Efforts should be made to
reorient the role of State Housing Boards
(SHBs) and Development Authorities. They
should be encouraged to develop multiple
partnerships with the private sector for
construction of affordable housing. State
Governments should provide the necessary
impetus by preparing State housing plans
that are integrated into the overall metropol-
itan/city master plan and outline the roles
of the SHBs. They should provide a larger
quantum of guarantee to social housing pro-
grammes to enable SHBs to access a larger
quantum of loan assistance from Housing
Finance Institutions. SHBs should also work
with the State Governments to acquire land
at appropriate locations that can be used for
the creation of affordable housing stock. The
activities of SHBs can be broad based so that
cross-subsidisation opportunities may be
made available to them.
b. Promote a corporatised agency for delivery of
affordable housing under the Metropolitan
Development Authority:
At the metropolitan level there is no spe-
cific agency that is responsible for the deliv-
ery of affordable housing stock. The State
Government may constitute a corporatised
agency that functions with an empowered
board and steers the development and deliv-
ery of such stock in the top 20 to 30 metro-
politan areas.
c. Accredit community-based organisations:
Community-based organisations should be
accredited and enabled to play a meaningful
role in initiatives such as RAY. This will help
such organisations to build on the commu-
nity mobilisation, participation and social
audit, and evaluations guidelines provided
for in RAY.
d. Promote PPPP for affordable housing: Further
measures to facilitate private sector partici-
pation should be introduced. This should
include capacity building and legislative
arrangement for rolling out PPP projects for
providing affordable housing. Additional
FAR grant and the provision of using some
part of the developed area for commercial
purposes could be provided to developers
interested in slum redevelopment projects
targeted at the EWS and LIG segments. The
ISSHUP scheme which provides interest
subsidy on housing loans to EWS sections
should also be reoriented to facilitate PPP
models.
e. Increase the corpus of the Credit Risk Gua-
rantee Fund: The credit mortgage fund
launched under RAY should also be
extended to cover any slum rehabilita-
tion schemes undertaken by the Central
Government. The corpus should be suitably
enhanced and the policy should be fine-
tuned such that allocated funds are used to
underwrite similar funds created for this
purpose by the private sector. This will gen-
erate significant additional capital for the
sector and stimulate on-the-ground demand
for affordable housing stock.
f. Simplification of the process of approval
for projects of affordable housing: Delay
in approval process not only acts as a

Urban Development 341
disincentive for the flow of private capital,
it makes assembly of land more difficult
besides time and cost overrun.
Urban Transport
18.97. Importance of an efficient urban transport
system which is cheap, safe and reliable can hardly
be overemphasised. The National Urban Transport
Policy 2006 calls for increasing the share of public
transport in our cities from 22 per cent to 60 per
cent. The achievements under the Eleventh Plan
especially in terms of an extension of metro rail
network and provision of projects as well as buses
under JNNURM to improve public transport need
to be further built up under the Twelfth Plan (refer
Box 18.9).
Box 18.9
Metro—A Transformational Approach to Public Transport
High capacity Metro rails are already in use in India and are proving to be successful in addressing the issues of public
transport. However, it is a highly capital intensive mode of transport and hence should be first deployed in large metropolitan
areas.
When to Deploy a Metro Based System?
Given the high capital costs, high ridership is a must for a metro system to become economically viable. Ridership is a multi-
determinant variant that includes population, disposable income per capita, city densification, availability and opportunity
cost of land, morphology of the city, and more importantly, the aspirations of people revealed through political demand.
A metro rail project is recommended in cities which ordinarily have:
• Peak hour peak direction traffic (PHPDT) of more than 20,000 for at least 5 kms of continuous length by 2021
• Total population of more than 2 million as per 2011 census
• Average trip length of more than 7–8 kms for motorised trips
• At least 1 million ridership per day on organised public transport
These criteria are in the nature of guidelines and are not to be construed as entitlement for a metro project. As huge public
money is involved in construction of these projects, in all such cases, in the first instance, feasibility of relatively cheaper
options should be examined.
However, it is recognised that in some cases, especially along busy corridors, difficulty and cost involved in acquisition of
land may make metro rail projects a better option. In addition, surface vehicular transport system in general are less energy
efficient and cause pollution especially along busy corridors where rail based systems are the best option. Hence, there is a
need for a thorough cost-benefit analysis to choose an optimum mode of transport to ensure value-for-money.
Funding the Investments for Metro Systems
Global experiences suggest that metro rail transit systems have largely been developed by the public sector (an analysis of 132
cities worldwide shows that 113 cities (~88 per cent) have metros which are developed and operated in public sector mode).
As MRTS alignment usually result in a significant rise in value of the real estate along its zone of influence, Government
entities promoting metro rail have used this resource to fund other urban infrastructure. The efficiency gains through PPP
have been brought in at the O&M stage. However, given the huge requirement of capital and willingness as well as capability
of the private capital to undertake such projects, in high-density corridors, projects which are viable on their own (with
admissible Viability Gap Funding and commercial utilisation of land ordinarily required for the project ) may be encouraged
under PPP mode. However, projects which are financially unviable without providing additional real-estate development
rights and so on, should primarily be funded by Government. The central Government may suitably contribute in funding
such projects preferably by way of making grants. Appropriate arrangements however need to be placed for densification
across such corridors and use of the enhanced value of the real estate for funding other infrastructure projects. Wherever
projects are to be developed under public sector, apart from grant, long-tenured debt financing should be facilitated through
Government guarantee.

342 Twelfth Five Year Plan
Quality and Affordable Public Transport
18.98. A study (2008) conducted by Ministry of
Urban Development estimated that public transport
had accounted for only 27 per cent of urban transport
in India. The same study also estimated that in cit-
ies having population more than 1 million, the share
of public transport is even lower. Promoting public
transport in a big way with an approach of trans-
porting people rather than vehicles is therefore not
an option but is central to any strategy to make cities
sustainable and efficient. Hence under the Twelfth
Plan, the aim must be to raise the share of public
transport to at least 50 per cent of all motorised trips.
18.99. This would require appropriate legislative,
institutional and financial arrangements under the
plan. Besides incentives for promoting public trans-
port, effective measures are needed to disincentivise
the use of private transport, along with creation of
an affordable and efficient public transport network.
18.100. The measures recommended for the urban
transport sector are:
1. Strengthen UT Wing in MoUD
18.101. Being capital intensive by nature, urban
transport will attract the highest share of invest-
ment in the urban sector in the coming years. A key
challenge is to generate non-budgetary resources
to fund these projects, especially through land-
based instruments. To manage this scale and com-
plexity, it is recommended that the UT wing of the
MoUD is appropriately strengthened with a full time
Additional Secretary in-charge to exclusively focus
on urban transport issues and drive its implementa-
tion across the country. MoUD should suitably initi-
ate a proposal in this regard.
2. Constitution of National Urban Rail Transit
Authority
18.102. Currently the Metro Act 1978 provides for
formations of a Metro Advisory Board for every
Metro project to assist the Government in imple-
mentation and running the project. In view of the
growing importance of rail-based mass urban tran-
sit, there is a requirement of a national level organ-
isation for research, drawing of specifications and
standards, developing appropriate financing model
of MRTS projects and so on. The Ministry of Urban
Development should initiate a proposal for setting
up an apex institution namely the National Urban
Rail Transit Authority (NURTA) to promote rail-
based mass urban transport in the country. The
major functions of the Authority would include:
a. Advisory services to centre, States and Urban
local bodies by emerging as the knowledge and
resource centre for rail-based urban transport
excluding the sub-urban railways which are
under the Ministry of Railways
b. To draw specification and standards for rail-
based mass transport system and determine the
service level benchmarks for these systems
c. To develop alternative financial models for fund-
ing the rail-based projects
d. To develop capacity across different levels of
government to roll out rail-based urban trans-
port project on PPP basis. In this regard, to
develop model bid documents
e. To promote research and innovation in rail
based urban transport system
3. Setting up of a Research Centre for Rail-based
Urban Mass Transport System
18.103. The Ministry of Urban development should
initiate a proposal for setting up a Centre of excel-
lence for rail based mass transit system which should
promote research in all the major components of
such system viz. civil network, rolling stock, tracks
and signalling. Fostering innovation in such capi-
tal intensive systems would reduce dependence on
imports for projects in the country and would help
India emerge as an exporter of these equipments.
The aforesaid research centre may also become a
resource centre for the proposed National Urban
Rail Transit Authority.
4. Promote High Speed Urban Rail and the
Regional Rapid Transit System
18.104. Linking the core of large cities with their
periphery through a fast and efficient transport sys-
tem has the potential to unlock significant gains and
reduce the transport related bottlenecks. As the dis-
posable income rises, citizens value their time and

Urban Development 343
are likely to be willing to pay higher fare. This also
offers the opportunity for transit oriented devel-
opment and promotes efficient land use. Besides
inducing growth in satellite towns and peri-urban
areas which are zones of intense economic activities,
this also reduces congestion in the core of the city.
As the experience of metro rail in India has shown,
such transport networks are safe and have enabled
the citizenry, especially women to participate more
effectively in the economic activities of a city. The
Ministry of Urban Development should explore
such possibilities of developing rapid transport sys-
tem and develop financial models for funding these
projects through capture of value of the real estate
along the alignment with an aim to reduce budgetary
requirements.
5. Intelligent Transport System and Seamless
Integration of Different Modes through Smart
Card
18.105. Use of IT based applications for making
public transport more efficient should be an integral
part of any urban transport project. Already, in the
Eleventh Plan, significant progress has been made
in drawing City Mobility Plans and integrating vari-
ous modes of transport. This initiative should be
expanded in the Twelfth Plan to have a Common
Mobility Card across all operators and all modes
including parking.
6. Policy to Disincentivise Usage of Private Vehicles
18.106. Based on the ‘polluter pays principle’ it is
recommended that an additional urban transport
tax may be considered on private vehicles. This tax
can be levied on an annual basis and can be collected
through insurance companies for existing vehicles
and directly on the purchase of new private vehi-
cles. As the coverage of public transport improves
in Indian cities, suitable disincentive to private cars
may be introduced. Congestion pricing may also
be explored as a means to reduce or stagger traffic
on busy corridors and generate revenue for further
expansion of public transport.
7. Social and Gender Auditing of Transport Projects
18.107. It is necessary that the benefits of urban
transport projects are shared by all. Hence, choice of
alignment and timing of running the trains or buses
should be carefully done so that poorer sections of
the society and workers in the informal sector are
given priority as these sections are wholly dependent
on public transport unlike the relatively richer sec-
tions which have other options. Besides, the safety
and security of public transport is of prime impor-
tance. The Ministry of Urban development would
issue detail guidelines for social and gender auditing
of the outcomes of urban transport project.
8. Promote Non-motorised Transport (NMT)
18.108. NMT such as bicycles, pedal rickshaws and
pedestrianism are affordable, environment friendly
and promote healthy living. They are particularly
suitable for short trips, especially for last mile con-
nectivity. Despite these obvious advantages, these
modes have suffered from policy neglect. Urban
planning in many cities has not made any provision
for dedicated tracks for these modes. Consequently,
safety concerns have prevented many citizens from
switching over to NMT. MoUD should bring out a
comprehensive set of guidelines to incentivise NMT
under JNNURM-II. For instance, while renovat-
ing arterial roads or new road projects, it should
be ensured that the project provides for pedestrian
path and bicycle lanes, wherever the space permits.
Innovations in improving designs of NMT like pedal
rickshaw should be suitably incentivised.
9. Create New Departments of UT in State Urban
Development Ministries
18.109. States should institute a dedicated depart-
ment for urban transport within the Municipal
Administration and Urban Development ministry.
This will help bring focus on the urban transport
agenda for the State at large and key cities in particu-
lar. Ministry of Urban Development could suitably
take up the matter with State Governments.
10. Institute a Safety Commission for Rail/
Guided and Road Transport
18.110. Safety is a critical issue in urban transport.
For rail based mass rapid system, the Central Safety
Commission should be appropriately strengthened.
For road based system, State-level commissions may
be set up for performing safety audits.

344 Twelfth Five Year Plan
11. Promote PPP Arrangements, where
Appropriate
18.111. Given the huge requirement of capital and
willingness as well as capability of the private capi-
tal to undertake urban transport project, promoting
PPP could be a key priority. All metro projects which
are in high density corridors, and are viable on their
own (with admissible Viability Gap Funding and real
estate development on land ordinarily required for
the project) may be encouraged under PPP mode.
However, projects which are financially not viable
without providing additional real-estate develop-
ment rights and so on, should primarily be funded
by Government. The central Government may suit-
ably contribute in funding such projects preferably
by way of grants. Similarly PPP arrangements in
bus transport systems based on a gross cost model
should be encouraged. The O&M of metro rail proj-
ects as well as BRT projects should also be entrusted
to the PPP concessionaire to bring in the efficiency
gain. For successful implementation of the PPP proj-
ects, specification of the service standards, outcomes
and its monitoring would be the necessary prerequi-
site to ensure value for money.
Schemes and Projects for Urban Transport in the
Twelfth Plan Period
Requirement of overall Capex Investment
18.112. For 20 years period beginning the first year
of the Twelfth Plan, the requirement of Capex (at
2009–10 prices) estimated by the Isher Ahluwalia
HPEC for urban transport from all sources are given
in the Table 18.2.
18.113. For the Twelfth Plan period, the working
group constituted by the Planning Commission on
financing urbanisation worked out the requirement
of investment for the urban transport sectors (refer
to Table 18.3).
Schemes/Projects
18.114. In view of the importance of the urban trans-
port, schemes/projects under the Twelfth Plan would
be as follows:
1. JNNURM-II: as described in para 18.143 to
18.167, the assistance under JNNURM would
be released to the city through concerned State
TABLE 18.2
Estimates of Urban Transport Investments by HPEC
Sector Investment from all sources (in ` Cr)
over 20 year period
% share in investment in urban sector
Urban Roads 17,28,941 55.8%
Urban Transport 449,426 14.5%
Traffic support infrastructure 97,985 3.2%
Street lighting 18,580 0.6%
Total 22,94,932 74.1
TABLE 18.3
Requirement of CAPEX
Annual Cap Ex (` Crore) Requirement of CAPEX across different sectors in urban area
2012 2013 2014 2015 2016 Total
Urban Roads 29,842 35,214 41,552 49,032 57,858 2,13,498
Mass Transit 7,757 9,154 10,801 12,745 15,040 55,497
Traffic Managements Systems 1,691 1,996 2,355 2,779 3,279 12,100
Street Lighting 321 378 447 527 622 2,294
Capacity Building ( urban transport) 1,000 1,000 1,000 1,000 1,000 5,000
Total 40,611 47,742 56,155 66,083 77,799 2,88,389

Urban Development 345
Governments as long as they adhere to the
approved development plans, meet the reform
related conditionality as well as mutually agreed
financial parameters. Hence all urban transport
projects and related activities including provi-
sion of buses, which improves public transport
are admissible components under JNNURM-II.
2. Urban road projects: Of the overall capex esti-
mation for 20 years for the urban sector, HPEC
estimated that about 55.8 per cent would be
required for urban roads. Since assistance under
JNNURM is proposed to be fungible, urban road
projects should be admissible under the scheme.
3. Provision for metro rail projects and RRTS:
Success of the Delhi metro in transforming the
public transport system in NCR region has led
to demand of metro rail projects from many
cities. Considering the long gestation period of
conceptualising a metro rail project and arrang-
ing funds for it, following is recommended as
a guideline for making a city eligible to receive
central assistance for metro rail project:
• Peak hour peak direction traffic (PHPDT) of
more than 20,000 for at least 5 kms of contin-
uous length by 2021
• Total population of more than 2 million as
per 2011 census
• Average trip length of more than 7–8 kms for
motorised trips
• At least 1 million ridership per day on organ-
ised public transport
18.115. These criteria are in the nature of guide-
lines and are not to be construed as entitlement for a
metro rail project. As huge public money is involved
in construction of these projects, a thorough cost-
benefit analysis across available mode of transport is
to be ensured in case of every project.
Water Supply, Sewerage, Storm Water
Drainage, Solid Waste Management and
Environment Sustainability of the Cities
18.116. Safe water and sanitation are public goods
as they have very large positive externalities. While
access to water supply and sanitation is important
for all the urban residents, for the poor, it becomes a
question of basic survival. Lack of safe water and san-
itation cause outbreaks of epidemics and Indian cities
are every year affected by this. The impact of epidem-
ics on the poor is much larger than on the non-poor
for many reasons; firstly epidemics break out in areas
where the poor live, their access to safe water and
sanitation is far lower than non-poor and their nutri-
tional status being poor they easily succumb to the
epidemics than the non-poor. Thus, lack of safe water
and sanitation cause health disorders and keep the
mortality rates high in general and among the poor
in particular. On the other hand, it has been esti-
mated that access to water increases the productive
working hours of the urban poor in general and the
poor women in particular by 1.5 to 2 hours. Access
to water and sanitation has positive impact on overall
health and decline in disease burden reduces house-
hold expenditure on health and that itself has positive
impact on household income. It is well known that
higher incidence of morbidity pushes low income
households below the poverty line.
18.117. The central assistance to States and ULBs for
improving these services would be within the overall
umbrella scheme of JNNURM-II. Besides, the focus
of the Plan should be to bring about structural and
governance change at ULB levels and to build capac-
ity so that these services are provided on a sustained
basis. This would be incentivised through a set of
reforms related to water and sanitation and provid-
ing assistance to the cities conditional to progress in
achieving reforms.
Water Supply
18.118. Following should be the target for the
Twelfth Plan period:
1. Universalisation of water and sanitation to urban
areas: This involves the universal coverage of
all urban population for the minimum levels of
safe drinking and household-use water along
with a clean toilet, sewerage, storm water drain-
age and solid waste management. The provi-
sioning of basic water and sanitation should be
de-linked from issues of land tenure and legal
status. These services should be provided on the
clear understanding that this provision does not

346 Twelfth Five Year Plan
automatically translate into legal entitlements in
other spheres, especially as regards legal rights
to the land and/or dwelling space. Further any
decisions as to whether the slums are to be legal-
ised or not should be made irrespective of the
provision of basic services.
2. Reduction in unaccounted for water: A system-
atic approach for identification and reduction
of leakage and preventive maintenance would
be promoted as an integral part of the operation
and maintenance of the water supply system on
a regular basis. This would help save precious
quantities of treated water and increase revenues
to make systems self-sustaining. Such measures
can often obviate the need for immediate aug-
mentation of capacities of the existing schemes,
which are very often quite capital intensive,
while triggering significant improvements in
service delivery.
3. Hundred per cent metering of water supply:
Metering is essential for recovery of reasonable
user charges and conservation. It acts as an incen-
tive for those who wish to conserve water and a
disincentive to those who waste water. Metering
helps increasing the total quantum of water avail-
able and consequently increases the quantum of
water available for supply and increases the over-
all revenue. Metering also leads to reduction of
wasteful use of water and increases efficiency and
sustainability of the water supply system that is
an important O&M function.
4. Ensure 24 × 7 water supply: Yet another prior-
ity is to move towards continuous water supply.
Intermittent supply leads to sucking of external
pollution into the system during non-supply
hours due to inadequate pressure, causing health
hazards.
5. Address structural dysfunctionalities through
reforms mentioned in Box 18.10: For meeting
the aforesaid target, it is necessary that struc-
tural issues facing the sectors are addressed
through completion of reforms mandated under
JNNURM. These issues include high levels of
non-revenue water, low level of metering, inter-
mittent supply, inadequate quality, low sustain-
ability and so on. The poor, particularly those
living in slums and squatter settlements, are
generally deprived of potable water. The imple-
menting Ministry would work with States and
ULBs to introduce operational, financial and
institutional reforms related to water sector and
these reforms under JNNURM-II.
18.119. Water is an extremely valuable but scarce
resource and should be treated as such. In this con-
nection following are recommended:
1. The issue of allocation of water resource between
rural and urban India needs to be addressed in
ways that reduce intra-national tension: In many
instances, growth of urban and industrial sec-
tors increases consumption of water which may
give rise to conflicting claims on allocation of
water across different sectors. It is imperative
that while all efforts are made to conserve water
for augmenting its availability, Indian cities and
industries reinvent their water strategy with an
aim to grow with minimal water and minimal
waste generation.
2. To cut the costs of water supply and distribution
losses, focus on building, renewing and replenish-
ing local water sources, including groundwater: As
cities expand their water footprint which implies
sourcing water from distance sources, the cost of
water supply as well as transportation losses and
leakages rise. Committing a larger capital invest-
ment in creating such infrastructure also leaves
utilities with very little money to maintain these
networks which further compounds the problem.
It is necessary therefore that all efforts should be
made to develop a source of water close to where
people need supply. The city sources are it water
bodies, which capture rain or floodwaters from
rivers as well as its underground water aquifers.
There is an urgent need to protect and nurture
these sources. Such measures may include bring-
ing specific legislations apart from taking up
specific projects under JNNURM-II.
3. Include ground water in water supply calcula-
tions: While preservation and recharging of
ground water are increasingly receiving atten-
tion of city planners, there is a tendency to
exclude this source from urban water planning.

Urban Development 347
In absence of universal access to piped water
supply, people are forced to rely on ground water
extraction. Another problem is perverse incenti-
visation for substitution of piped water supply
by ground water extraction in case the water
tariff is perceived to be high. There is therefore
an urgent need to map groundwater and include
this resource in water planning of a city for its
sustainable utilisation.
4. Take an integrated view of water supply and
sanitation: Investment in sewage should be a
function of investment in water supply as any
augmentation of water supply also leads to
increase in sewage generation. It is, therefore,
necessary that planning of a water supply project
should also include provision for treatment of
sewage. Discharge of untreated sewage, besides
making cities and our water bodies unhygienic
also significantly raises the cost of treatment of
water. The guiding principle should be to incen-
tivise cost saving innovations in building sewage
network, reducing the length of sewage network
and treating waste water as resource by turning
it into water for irrigation or use in the industry.
5. Set real and hard targets for affordable recycling
and reuse of treated waste water: Recycling and
reuse of waste water is already in practice. This is
required to be scaled up in a planned way. Reuse
of waste water after its treatment in agriculture
and other sectors should be properly planned for
optimal utilisation of this scarce resource (refer
Box 18.10).
Sewerage, Drainage and Solid Waste
Management
18.120. The Ministry of Urban Development should
work towards the implementation of the National
Urban Sanitation Policy. Cities should be encour-
aged to formulate city-wide sanitation plans and
all the States shall be encouraged to adopt State
Sanitation Strategies. These activities should be sup-
ported under JNNURM-II.
Reuse Treated Sewage for Industrial Applications
18.121. Cities should be encouraged to meet part
of their water supply, at least for industrial use, by
reusing/recycling waste water. Incentives may be
provided to users (through water tariff, property tax
and so on) to recycle and reuse treated wastewater.
These should also be incorporated in building bye-
laws for new constructions.
18.122. Ministry of Urban Development should sup-
port these activities through financial and policy
support through various schemes. While the major
intervention would be under the JNNURM-II for
preventing manual handling of human excreta, a
separate sub-scheme for achieving the goals of the
National Urban Sanitation Policy (NUSP) shall be
formulated in the Twelfth Plan.
Solid Waste Management
18.123. Some of the major issues concerning solid
waste management are:
1. Absence of segregation of waste at source
2. Lack of funds for waste management at ULBs
3. Lack of technical expertise and appropriate insti-
tutional arrangement
4. Unwillingness of ULBs to introduce proper col-
lection, segregation, transportation and treat-
ment/disposal systems
5. Indifference of citizens towards waste manage-
ment due to lack of awareness
6. Lack of community participation towards waste
management and hygienic conditions
18.124. As a general approach, Ministry of Urban
Development should work with the States to explore
the following strategies:
• The recovery of recyclables is presently being
done in an unorganised manner. This needs to be
replaced with informal arrangements of rag pick-
ers and NGOs/CBOs who could also be involved
for facilitating effective door-to-door collection.
• Acquisition/earmarking of land required for the
project should be facilitated by proactive guide-
lines/direction from the State. A Master Plan pro-
cess should actively address this requirement.
• The concept of regional solid waste management
solutions needs to be encouraged. This has been
taken up in Gujarat with a view to achieving econ-
omies of scale.

348 Twelfth Five Year Plan
• Waste characterisation has to be done properly
taking representative samples from the city for
various types of wastes and the treatment process
should be selected accordingly.
• Appropriate technology options for treatment of
the organic content of the wastes should be cho-
sen based on the physical and chemical character-
istics of the wastes and local conditions and so on.
Box 18.10
Reforms and Desired Outcomes Related to Water Supply and Sanitation
Reforms (water and sanitation sector)
• Enact bylaws for reuse of recycled water
• ULBs to ensure accountability of the water supply utility by drawing service level agreements with them
• Have road map for bringing down wastage
• Prepare a detailed database for the city relating to water supply and regularly update it
• Draw up a roadmap, that is, city sanitation plan in accordance with the Urban Sanitation Policy
• Prepare a sewage master plan for the city
• Draw-up a roadmap for achieving Service Level Benchmark
• Set tariffs on a scientific basis with cross subsidised* tariffs for the economically weaker sections
• Have an effective grievance redressal mechanism
• Draw-up demand management measures
• Formulate ground water use by laws and enforce effectivelyenergy conservation measures especially in pumping
* In general, since the charge can be only for water and one time sanitation connection charge, the charge for water must
therefore cover O&M + Capex for water and sanitation for all categories. For both water and sewerage, subsidy can be in
terms of low charges for the first x litres of water and higher than normal for the rest.
State level reforms
• Set up a regulator for the sector
• Introduce policies to augment bulk water and resource allocation plans in alignment with the basic requirements of the
city
• Transfer the water supply function fully to the cities
• Follow the three ‘Rs’—Reuse, Reduce, Recycle policy for waste management based on the quantum generated
• Provide incentives for waste water recycling policy incentives
• Increase resource provision for augmentation of sewage system/toilets for weaker sections
• Prepare a regional solid waste management arrangements (to have larger aggregation and economies of scale)
• Prepare implementable PPP policy for cities
Desired outcome
• Universal Access to Water and Sanitation
• Hundred per cent Metering of water supply
• Opt for 24 × 7 water supply wherever possible and feasible
• Provide for step by step improvement in the operations of the water utility
• Steadily bring down distribution inefficiencies by bring down wastage of water closer to international best practice.
Successful examples of utilities such as Phnom Penh, Manila (East Zone) demonstrate that reduction in NRW levels to
below 20 per cent is possible even in developing country contexts
• Commit to given hours of supply and be accountable for it through citizen charters
• Commit to quality of water to be supplied
• Ensure that the cities are free from open defecation and measures for providing toilets
• Community toilets especially in areas that are home to the economically weaker section
• Provide sufficient no of public toilets/urinals in city
• Hundred per cent collection of garbage from houses/establishments and straight transportation for disposal
• Conversion of waste to energy/other forms

Urban Development 349
• IEC (Information, Education and Communica-
tion) in order to educate households, municipal
staff as well as personnel engaged in collection
and management of waste about need for segrega-
tion at source and improved sanitation is the most
important element in success of a SWM project.
This must be accorded due and adequate priority.
• Polluter Pay Principle should be implemented in a
calibrated manner in order to instil a sense of dis-
cipline with respect to throwing of litter by people
without any concern for cleanliness.
• In the area of solid waste management, a gen-
eral approach should be to pursue the concept of
‘waste to wealth’. PPP may also be explored/intro-
duced for functions such as door-to-door collec-
tion, street sweeping, transportation, treatment
and so on.
Storm Water Drainage
18.125. Lack of storm water drainage often exacer-
bates the sanitation problem in many Indian cities
especially during the monsoon months. The prob-
lem has its genesis in illegal, unplanned develop-
ment and encroachment often on natural areas and
drainage systems/ways. As the cities develop and
grow, benefits from important environmental func-
tions (natural water ways/areas) are often ignored
and overlooked as a result of which natural areas are
degraded and damaged. This along with the increase
in built-up area results in increased incidences of
flooding and accompanied ill effects. The densifi-
cation of cities is leading to construction of roads,
buildings which has resulted in increase in imper-
meable areas. As a result often permanent changes
to the catchment are caused, leading to changes in
runoff patterns, which affect the magnitude, fre-
quency and occurrence of flooding.
18.126. Lack of storm water drains lead to water log-
ging every monsoon and outbreak of vector diseases
such as malaria, dengue and so on, that afflict the
poor the most as the poor live in settlements that are
in low-lying and un-serviced areas. However, such
epidemics rarely remain confined and easily spread
throughout the city.
18.127. The core of sustainable storm water man-
agement is to consider storm water as a potential
resource rather than as a liability or a waste product.
This shift can only be initiated by a visionary storm
water management approach which combines the
preventive measures with the traditional curative
and reactive measures in appropriate sum so as to
minimise negative impacts on human, property and
environmental health. In this respect, environmental
health would include preserving and maintaining the
natural hydrological cycle, groundwater recharge,
natural drainage system and so on.
18.128. Urban water supply, sanitation and storm
water drainage were accorded priority under the
Eleventh Plan. Number of projects sanctioned and
level of investment in these services under JNNURM
are given in Table 18.4.
18.129. At present, a large number of these projects
are under various sages of implementation hence
their full benefit are yet to be felt. However, given
the level of deficit in these essential services and their
importance in making a city liveable, they would
TABLE 18.4
Investments under JNNURM
Particulars UIG UIDSSMT Total
No. of
projects
Cost
(in ` cr)
No. of
projects
Cost
(in ` cr)
No. of
projects
Cost
(in ` cr)
Water supply 158 20,562 453 8,901 611 29,463
Sewerage 112 14,992 89 2,833 201 17,826
Drainage 73 8,404 67 790 140 9,193
Solid waste management 45 2,091 56 342 101 2,433
Total 388 46,050 665 12,865 1,053 58,915

350 Twelfth Five Year Plan
continue to receive top most priority under the
Twelfth Plan.
National Urban Sanitation Policy
18.130. This policy aims at creating cities free from
open defecation practices. Under the policy, annual
ratings of cities on select sanitation-related param-
eters shall be carried out and the best performing cit-
ies will be recognised. The policy seeks to improve
the status of sanitation in the country through for-
mulation of State sanitation strategies, city sanitation
plans, and a national awareness generation cam-
paign. The Ministry of Urban Development and the
Ministries of Housing and Urban Poverty Alleviation
should continue to operationalise the policy under
the Twelfth Plan period.
Projected Requirement of Investment
18.131. The Isher Ahluwalia Committee estimated
the 20 years investment requirement from different
sources as given in Table 18.5.
18.132. The requirement of Capex from all sources
for these sectors under the Twelfth Plan as estimated
by the Working Group on financing urbanisation is
as given in Table 18.6.
18.133. Adopting mixed land use and subsequently
modifying regulations governing land use and
removing deficiencies in the urban land market need
to be given high priority. In many parts of the coun-
try, urban land planning limits redevelopment, mod-
ernisation and the repurposing of older inefficient
areas. Weak institutional and information foun-
dations still govern land markets. In many cases,
urban plans seek to preserve status quo by limiting
land assembly and freezing the density of develop-
ments by using very low Floor Space Indexes (FSI),
and limited coordination with infrastructure devel-
opment. Under the Eleventh Plan, JNNURM sought
to address these issues by incentivising several
urban reforms. Completion of reforms mandated by
JNNURM must be given priority.
Schemes
18.134. Following schemes should be launched
under the Twelfth Plan for assisting the States and
ULBs to improve service delivery:
1. JNNURM-II: The broad principle on which the
scheme is to be launched is given in paragraph
18.143 to 18.167.
2. National Mission on Sustainable Habitat
(NMSH): The National Mission on Sustainable
Habitat (2010) is one of the eight missions under
the National Climate Change Action Plan. The
Mission should be implemented in the Twelfth
TABLE 18.6
Requirement of CAPEX as per Working Group
Annual CAPEx (` Crores) Requirement of CAPEX
2012 2013 2014 2015 2016 Total
Water Supply 5,539 6,536 7,713 9,101 10,739 39,628
Sewerage 4,189 4,943 5,833 6,883 8,121 29,969
Solid Waste 839 989 1,168 1,378 1,626 6,000
Storm Water Drains 3,297 3,891 4,591 5,418 6,393 23,590
Total 13,864 16,359 19,305 22,780 26,879 99,187
TABLE 18.5
Investment Requirement Estimates by HPEC
Sector Requirement
of investment
from all sources
(in ` cr)
per cent share
in required
investment in
urban sector
Water supply 3,20,908 10.4%
Sewerage 2,42,688 7.8%
Solid waste management 48,582 1.6%
Storm water drains 1,91,031 6.2%

Urban Development 351
Plan period with the aim to make cities sustain-
able through improvements in energy efficiency
of buildings, management of solid waste, and
shift to public transport.
The Mission should broadly cover:
a. Extension of the energy conservation build-
ing code, which addresses the design of new
and large commercial buildings to optimise
their energy demands
b. Better urban planning and modal shift to
public transport, that is, making long-term
transport plans to facilitate the growth of
medium and small cities in such a way that
ensures efficient and convenient public
transport. These plans should be in sync
with the city’s overall development plan and
be a part of it
c. Recycling of material and urban waste man-
agement, a special area of focus being the
development of technology for producing
power from waste
d. The National Mission will include a major
R&D programme, focusing on biochemi-
cal conversion, waste-water use, sewage
utilisation, and recycling options, wherever
possible
e. As JNNURM-II would be launched as an
umbrella scheme for urban renewal and as
environment sustainability is an important
feature, many of the activities envisaged
under the NMSH should be taken under
JNNURM-II to ensure convergence. Hence,
NMSH should essentially be a scheme for
taking up pilot and demonstrational projects
in cities to promote environmental sustain-
ability. Close involvement of the Central
Ministry in such projects is desirable. Hence,
the scheme would be run on project mode
3. Scheme for mechanical cleaning of septic tanks
and so on:
Implementation of Employment of Manual
Scavengers and Construction of Dry Latrines
(Prohibition) Act 1993 is required to be attached
priority as this addresses the age old abomi-
nable practice of manually handling the human
excreta. The Ministry of Urban Development
should take up this activity within the overall
framework of JNNURM in which one-time pro-
curement of the equipments for the purpose is
supported.
Alleviating Urban Poverty: Creating
Sustainable Livelihoods and Enterprises
18.135. Based on NSSO Report No. 508 (2004–05),
it is estimated that the number of urban poor had
increased by 34.4 per cent from 1973 to 2004.
Approximately 81 million, that is, 26 per cent of the
estimated 310 million urban dwellers were below the
monthly consumption of `539 in 2004–05.
18.136. An important feature of urbanisation in India
during the period 1981–2001 was the relatively small
contribution of migration to the increase in urban
population in India. The HPEC has noted that the
evidence in India suggests that the rural–urban differ-
entials in productivity have widened since 1993–94,
indicating that there is considerable scope for migr-
ants to take advantage of the higher-productivity
non-agricultural sectors if they can be equipped with
the skills and education relevant for employment in
urban areas.
18.137. At the same time, the poor who are already
living in cities are largely employed in the informal
sector. Even though they contribute significantly to
the economy of the cities, they suffer from multiple
deprivations and vulnerabilities that include lack of
access to basic amenities such as water supply, sani-
tation, health care, education, social security and
decent housing.
18.138. If cities have to emerge as engines of inclu-
sive growth, the country is required to address the
basic needs of the urban poor by equipping them
with necessary skills to take advantage of the growth
process and at the same time reducing institutional
dysfunctionalities which have been pointed to earlier
that hamper inclusive and sustainable development
of our urban conglomerations. A multi-pronged
strategy is required to meet the following objectives:
1. Accelerate the rate of job creation in urban areas

352 Twelfth Five Year Plan
2. Impart relevant skills to urban poor
3. Facilitate self-employment for urban poor wher-
ever this viable
4. Proactive and mandatory creation/allocation of
spaces within city boundaries to ensure liveli-
hood opportunities to the urban poor.
5. Provide basic services to the urban poor, espe-
cially through rehabilitation of slums
6. Ensure financial inclusion of urban poor
7. Ensure legislative inclusion of urban poor
8. Facilitate the transition of the urban poor from
the informal sector to the formal one and extend
the provisions of social security
18.139. For making our cities engines of inclusive
growth, in addition to launching of an improved
JNNURM-II and RAY, the following schemes would
be taken up under the Twelfth Plan:
18.140. The National Urban Livelihood Mission
NULM. This entails revamping the guidelines
of SJSRY and enhancing its scope. Its basic thrust
would be to build capacities and skills in sectors that
have growing employment opportunities and are
relevant to local socio-economic conditions. In its
design NULM should deal with important issues like
financial exclusion, policy and legal exclusion, and
lack of access to information and technology, raw
materials and markets. It should also develop link-
ages with the organisations like the National Skills
Development Corporation and other private sector
organisations including vocational training institu-
tions that can actually train and hire the urban poor
to meet their growing capacity needs.
18.141. In addition, within the umbrella of NULM,
following two sub-components would be launched.
1. Sub-component for National scheme for support
to street vendors
2. Sub-component for assistance to the States for
provision of shelters
18.142. To make the scheme more effective, the
Ministry of Housing and Urban Poverty Alleviation
should initiate proposals to undertake following pol-
icy changes:
a. Enactment and implementation of a suitable
Act on livelihood promotion of street vendors
and adoption of a no-eviction strategy by State
Governments: This will enable the creation of
physical legal spaces for the informal economy
and recognise and support natural markets of
street vendors with a non-eviction guarantee.
For this, a no-eviction policy should be put in
place in combination with a land policy aiming
at the provision of developed lands for the urban
poor. This strategy should be implemented with
the caveat that evictions for the purpose of the
common social good may occur, but with provi-
sions for resettlement and rehabilitation of proj-
ect affected persons. The strategy should also
cover Central Government and private lands.
1. Formalisation of participation of informal
workers in the economy: Informal sector
workers should be organised as associations
or federations such as trade unions, coop-
eratives, and must be formally recognised.
Similarly workers guilds and self-help
groups should be recognised as fee paying
organisations and must have the capacity to
negotiate with utilities like DISCOMs and
water supply boards to provide services at
specified locations by paying user charges.
2. Design of new financial strategies and prod-
ucts to meet the needs of the urban poor:
Typically poor cash flow hinders the success
of micro-enterprises, women, children and
also those belonging to minorities or SC/
ST caste groups. Thus, innovative products
and services that help meet the needs of the
informal economy, for example, branch-
less banking, business correspondents and
micro-finance should be created. Workers
guilds and self help groups should be pro-
vided with a package of financial services
including micro-credit for working capital
and assets, micro-insurance for life, health
and livelihoods.
3. Convergence of schemes for social protec-
tion of the urban poor: A large number of
programmes are being implemented by
the Government to help uplift poor in the

Urban Development 353
country. At present, multiple ministries (for
example, health and education) are driv-
ing separate initiatives aimed at the poor
across rural and urban areas. To increase
their effectiveness, convergence across
these efforts is essential. In addition, ULBs
have the potential to emerge as an inter-
face between the citizenry on one hand and
the State and national Government on the
other for ensuring better outcomes of these
initiatives.
JNNURM UNDER THE TWELFTH FIVE YEAR PLAN
18.143. JNNURM which was launched in December
2005 is co-terminus with the Eleventh Plan. Under
the Twelfth Plan period, JNNURM-II would be
launched as a State sector ACA scheme. The scheme
will have a focused approach on urban reforms,
capacity building and helping achieve fiscal pru-
dence across ULBs. The salient feature of the scheme
and budgetary provisions under the Twelfth Plan
period would be as follows:
Objective
18.144. The objectives of JNNURM-II would be as
follows:
• Alleviating urban poverty
• Improving service delivery standards in urban
areas including basic services for urban poor
• Empowering urban local bodies
• Facilitating participatory governance
• Effectively managing land resources
• Fostering sustainable, inclusive and faster growth
Strategies of JNNURM-II
18.145. To realise these objectives, the key strategies
of the programme would be as follows:
• Build adequate capacity including dedicated
municipal cadre
• Planned urbanisation by preparing a Development
Plan through a participatory process
• Remove distortions in land market
• Establish efficient governance structures
• Promote financial sustainability and accountabil-
ity of ULBs
• Attract more private investment, in particular,
through PPPP
• Adoption of service level benchmarks and social
and gender audit of the outcomes of programme
• Slum rehabilitation and creation of affordable
housing
• Planned development of smaller towns and peri-
urban areas
• Incentivising innovation and rapid learnings
across urban systems
Components of JNNURM
18.146. The programme should have following
components:
1. Urban Infrastructure and Governance (UIG)
2. Rajiv Awas Yojana (RAY)
3. Slum rehabilitation in cities not covered under
RAY
4. Capacity building
18.147. The scheme for Urban Infrastructure
Develop ment in Satellite Towns should be merged
with the sub-mission on UIG under JNNURM-II.
Further, while BSUP and IHSDP should be discontin-
ued, RAY should be a sub-mission under JNNURM-II
for the purposes of achieving convergence.
Coverage of JNNURM-II
18.148. Under JNNURM-I, a ‘Mission city’ approach
was followed. About 70 per cent of the central assis-
tance was provided to 65 Mission cities. In the
Twelfth Plan, adequate attention should also be
paid to encourage the medium and small town to
realise their full economic potential. Hence under
JNNURM-II, the limiting concept of ‘Mission cities’
should be dispensed with and while all cities should
be eligible to participate, a fair system of selection of
cities to be covered under the programme should be
put in place.
Outlay for JNNURM-II and its Division
18.149. The five year budgetary outlay for
JNNURM-II is given in paragraph 18.184. This out-
lay should be divided between the following:
• Base Fund (80 per cent of the total outlay of
JNNURM-II)

354 Twelfth Five Year Plan
• Capacity Building Fund (10 per cent of the total
outlay of JNNURM-II)
• Incentive Fund (10 per cent of the total outlay of
JNNURM-II)
Capacity Building under JNNURM-II
18.150. Capacity building at different levels of gov-
ernment would be a key focus area under the pro-
gramme. For this purpose:
• A separate Mission Directorate for Capacity
Building and Reform Management should be
established.
• Ten per cent of the overall JNNURM fund should
be earmarked for capacity building.
• MoUD and MoHUPA should prepare a road map
for operationalising the recommendations made
by HPEC and the Working Group on capacity
building.
• All capacity building efforts currently undertaken
by the MoUD and MoHUPA in urban sector may
be brought under the umbrella of JNNURM-II.
However, capacity building efforts for highly
specialised sectors like urban transport (Metro
Rail) or for proposed National Urban Livelihood
Mission could be run independently though the
Ministries should ensure their convergence with
the efforts taken under JNNURM-II.
18.151. The main thrust of capacity-building activi-
ties would be:
• Creation and professionalisation of the Municipal
Cadre
• Identifying the gap in capacity at different levels
to establish the demand
• Strengthening the supply side of capacity building
• Opening of suitable institutions in case the exist-
ing ones are unable to meet current requirements
• Support to opening of a apex level institutions
that have involvement from the private sector and
centres of excellence in specific sectors like water
supply and sanitation, housing and so on
• Creation of a dedicated PPPP cell for developing
model bid documents
• Creation of cell on municipal finance and frame-
work for land monetisation and other innovative
method of generating finances and so on
• Dissemination of national and international best
practices in urban governance
• Conducting annual reform audits to monitor the
progress of reforms across participating States
and cities
Planned and Holistic Development of Cities
under JNNURM-II
18.152. Every town and city participating in the pro-
gramme would prepare a Development and Financial
Plan as provided in paragraph 18.44 and 18.45.
Reforms under JNNURM-II
18.153. Since the engagement of Government of
India in the urban sector is largely to incentivise the
State Governments and ULBs to bring about struc-
tural transformation in cities, reforms must remain
at the heart of the JNNURM. In addition a robust
system of evaluation of reforms should be put in
place.
18.154. JNNURM-I has set the stage for attempt-
ing second generation reforms. Secondly, since
JNNURM-II takes a relatively longer time horizon of
10 years, it provides sufficient opportunity to achieve
reforms to even those States which have struggled to
make any significant progress.
18.155. All pending reforms under JNNURM-I
should become base reforms for JNNURM-II. A
few second generation reforms including reforms
in water and sanitation sector should be introduced
and made mandatory. In view of different level of
preparedness for achieving the reforms across cit-
ies of different sizes, the required milestones to be
achieved in a particular reform should be calibrated
according to the size of cities. Besides, since some
of the reforms mentioned in the comprehensive list
are difficult ones but are transformational in nature,
it is desirable to introduce additional incentives for
fast tracking such difficult reforms. Their comple-
tion should entitle States/ULBs to get additional
allocation from the Incentive Fund which is pro-
posed to be 10 per cent of the outlay of JNNURM-II
(refer to Box 18.11).

Urban Development 355
Box 18.11
Reforms under JNNURM Comprehensive List of Reforms in Urban Sector
ULB Level Reforms (cities having population more than 5 lakh)
1. Introduce and enhance e-governance system
2. Adoption of accrual based double entry system of accounting
3. Collection of property tax
4. Rationalisation of user charges collection
5. Create a ring-fenced development fund
6. Put in place transparent FAR policies and market value based FAR charges
7. Earmarking of 20–25 per cent of developed land for housing projects for EWS/LIG category with a system of cross
subsidisation
8. Internal earmarking within local body budgets for basic service to the urban poor
9. Sector specific reforms of water and sanitation that includes:
• Enact bylaws for reuse of recycled water
• Ensure accountability of the water supply utility through service level agreements with ULBs
• Draw road map for bringing down wastage
• Prepare a detailed database for the city relating to water supply and regularly update it
• Draw up a roadmap, that is, City sanitation plan in accordance with the Urban Sanitation Policy
• Prepare a sewage master plan for the city
• Draw-up a roadmap for achieving Service Level Benchmark
• Have an effective grievance redressal mechanism
• Draw-up demand management measures
Reforms for Metropolitan Areas
1. Institute the Metropolitan Planning Committee (MPC)
2. All metropolitan areas (UAs) with population above 4 million, should set up an UMTA to facilitate integration of multi-
modal transport systems and ensure it works with the MPC and has the MDA as the secretariat
State Level Reforms
1. Create and establish the Municipal Cadre
2. Set up a Municipal Regulator at the State/city level to
• advise and monitor the service delivery levels;
• regulate the pricing of services; and
• ensure equitable access to all urban citizens, including urban poor.
3. Revise town planning act, development control regulations, municipal laws and building bye-laws with a view to promote
strategic densification, single window clearance process, to promote conservation of environment and so on
4. Simplification of legal and procedural frameworks for conversion of agricultural land for non-agricultural purposes
within a time bound period
5. Repeal of Urban land Ceiling and Regulation Act
6. Amendment of Rent Control Laws
7. Rationalisation of Stamp Duty to bring it down to 5 per cent or lower
8. Introduction of computerised process of registration of land and property
9. Provide security of tenure at affordable prices to urban poor
10. To facilitate public–private partnerships, and market borrowing (through provisions in the Municipal Act)
11. Transfer 18 functions to ULB as per 74th CAA
12. Strengthen the State Finance Commissions and act on the existing recommendations of previous SFCs
13. Set up a State Property Tax Board
14. Extending the term of Mayor to five years and adopt a Mayor-in-Council or Executive Mayor system
15. Enactment of community participation law
16. Enactment of Public Disclosure Law

356 Twelfth Five Year Plan
Addressing Operational and Organisational
Issues through JNNURM-II
18.156. The need to adopt a unified approach to
achieve planned, inclusive and sustainable urban
development has long been recognised. Hence one
of the objectives of JNNURM-II which has been
envisaged as the umbrella programme should be to
facilitate convergence of the initiatives at central and
State-level for guided urbanisation.
18.157. To this end, at the central level it is proposed
that the reform agenda for the Urban Infrastructure
and Governance (UIG) sub-mission and Ray
Awas Yojana (RAY) and the programme on slum
rehabilitation for others cities outside of RAY is
strengthened. Similarly to effectively assist States
with reform management and implementation, and
capacity building initiatives it is proposed that a
separate sub-mission, that is, Capacity Building and
Reform Management (CBRM) is launched under
JNNURM-II. This approach would facilitate con-
vergence across the two ministries at the centre, and
enable the Central Government to collectively pro-
vide State and city Governments with adequate sup-
port to implement reforms and projects. In addition,
it would also systematically monitor the progress
on reform implementation across States and assist
them with strategic capacity-building initiatives, for
example, revitalising existing institutions, setting up
a municipal cadre and so on.
18.158. To facilitate convergence at the State-level,
a single State-level nodal agency (SLNA) should
be set up for implementing all centrally sponsored
17. State-level reforms pertaining to water and sanitation sector which includes:
• Prepare a regional water supply, sanitation and solid waste management plan. (to have larger aggregation,
development of watershed and economies of scale)
• Transfer the water supply function ( distribution within the city) fully to the cities
• Introduce policies to augment bulk water and resource allocation plans in alignment with the basic requirements
of the city
• Follow the three ‘Rs’—Reuse, Reduce, Recycle policy for waste management based on the quantum generated
• Provide incentives for waste water recycling policy incentives.
• Increase resource provision for augmentation of sewage system/toilets for weaker sections
• Prepare implementable PPP policy for cities
• Formulate ground-water use by laws and enforce effectively energy conservation measures especially in
pumping
Incentive Reforms and Conditionalities
• Create and establish the Municipal Cadre
• Set up a Municipal Regulator at the State/city level
• Extending the term of Mayor to 5 years and adopt a Mayor–in–Council or Executive Mayor system
• Revise Town Planning Act and so on
• Simplification of legal and procedural frameworks for conversion of agricultural land for non-agricultural purposes
• Amendment of Rent Control Laws
• Provide Security of Tenure at affordable prices to urban poor
• Amend Municipal Laws to include Fiscal Responsibility and Budget Management principles for ULBs
• Release the land under ULCRA for development of affordable housing
• Introduction of Property Title Certification System in ULBs
• Transfer 18 functions to ULB as per 74th CAA
• Any substantial innovation in the area of urban governance or financing
• Take up projects under PPPP
• Leverage fund through non-budgetary resources
Incentive Reforms for Metropolitan areas
• Adoption of an agency model, for example, BEST model of service
• Exceptional performance in the area of service delivery, collection of user charges and property tax.

Urban Development 357
urban programmes in the State. This agency would
have project management and implementation units
for UIG, RAY, National Urban Livelihoods Mission
(NULM), other housing programmes and capacity
building, and the would be led by either the Secretary
Urban Development or Housing depending on their
seniority.
18.159. The SLNA could be the nodal contact for all
participating ULBs. It would also help strengthen the
District Urban Development Authorities to assist
smaller cities with project development and finance
and reform implementation. In addition, it would
technically appraise projects submitted by ULBs,
and forward them onto the competent authority for
sanction, transfer money to ULBs as per the pro-
ject implementation phase and provide ULBs with
the requisite technical support, and enable pooled
finance development through the setting up of State-
level financial intermediaries, in order to provide
financial assistance to smaller ULBs.
Providing Operational Flexibility
18.160. In keeping with the recommendations of
the Second Administrative Reforms Commission,
JNNURM-II should encourage agencification to
provide operational flexibility, essential for the mis-
sions to discharge their duties effectively.
18.161. In line with this, all the four sub-missions
envisaged under JNNURM-II could be set up as
agencies, that is, organisation with a board, and
the board could be chaired by the Secretary of the
respective ministries at the central level. Other board
members could include senior representatives from
the Department of Expenditure, Urban Transport,
Mission Director—RAY, Planning Commission,
Mission Director—Capacity Building and Mission
Director of the programme for slum rehabilitation
in smaller cities. In addition, to further the spirit of
participatory governance, a few eminent individu-
als should also be co-opted as board members. The
board of the sub-mission, CBRM could be chaired
by eminent individual as it seeks to facilitate conver-
gence across the two ministries.
18.162. It is important to note that all decisions with
regard to capacity building should ultimately be
approved by the CBRM board after gathering mus-
ter with the Council on Capacity Building, that is,
a three-member council chaired by the Additional
Secretary heading this unit with Mission Director,
JNNURM-I and Mission Director—RAY as mem-
bers. Similarly, the SLNA should also be set up as an
agency whose board should chaired by the nominee
of the Chief Secretary of the State and include senior
representatives from the State Government’s depart-
ment on finance, housing, parastatals, for example,
housing Boards, transport and local self-govern-
ment, depending on the governance structure of the
State. In addition it should have also co-opt a few
eminent civil society representatives.
Preparing for JNNURM-II
18.163. Significant preparatory work is required to
be undertaken by the centre and States in the areas
of planning, capacity building and preparation of
model legislations, and policies. During the initial
two years of JNNURM-II the following should be
accomplished:
• The projects sanctioned under JNNURM-I and
pending reforms should be completed
• The implementing ministries through CSMC may
sanction projects based on the allocation provided
for basic services
• The Centre, State and the ULBs should undertake
extensive capacity building programme and for-
mulate State-level strategies for a 10-year horizon
• Municipal cadres should be established and pro-
fessionalised in States in which they have been
established. This would include clear guidelines
on roles, career progression, and recruitment
rules to ensure these cadres fructify into high
quality capacity on the ground.
• DP and FP should be prepared based on the
guidelines proposed by the MOUD
Fund Flow Mechanism
18.164. The cities receiving assistance under the pro-
gramme would be selected as per the mechanism
designed for the programme.

358 Twelfth Five Year Plan
• Once the DP and the FP are approved, the
annual allocation of the city are recommended
to be released in two instalments by the Ministry
of Finance, that is, in April and October of the
year. The release should be made to the ULBs by
Ministry of Finance through the State Government.
• In the second year, the Mission Directorate should
examine the financial and reform related param-
eters made in the DP, FP and RFD. In the initial
year of Plans, while releasing funds, progress in
approved project would be taken into account. As
projects would start maturing, by the Thirteenth
Plan the release should be linked to the outcome
of the projects in terms of service delivery. As long
as these parameters are met, the annual alloca-
tion for the second year should be released in two
instalments. In the subsequent years, the Mission
Directorate will follow the same procedure for
release of funds.
• Under this arrangement, JNNURM funds should
be fungible across various approved projects in a
city.
• The fund flow mechanism of Rajiv Awas Yojana
should continue to be governed by the current
approved mechanism and may be reviewed at the
time of review of RAY.
Leveraging Funds under JNNURM-II
18.165. As brought out by the HPEC Report and
the Report of the Working Group on Financing
Urbanisation, there is a huge gap between the funds
required for successful urbanisation and the funds
available with ULBs. In view of the severe budget-
ary constraint, this gap can only be partly filled by
contribution from the Centre and States. Therefore,
the ULBs must leverage such contributions from
the Centre and States to attract private investment
besides generating their own revenues through com-
prehensive reforms. One of the key focus areas of
the scheme would be to leverage central assistance
under JNNURM so that investment in urban sector
is augmented.
Share of the State Government
18.166. JNNURM-II would incentivise the State
Governments for financial devolution to ULBs for
improving their financial sustainability. Till this is
done, the State should contribute 50 per cent of the
amount of grant provided to a ULB by the Centre
under JNNURM-II or the amount recommended by
the State Finance Commission, whichever is higher.
Incentive Fund
18.167. For incentivising completion of second
generation urban reforms 10 per cent of JNNURM
funds would be earmarked as Incentive Funds. These
funds are envisaged to be disbursed to States and
metropolitan cities once the CRBM certifies that the
reforms have been implemented in letter and spirit
(refer to Box 18.12).
MISCELLANEOUS SCHEMES
18.168. In accordance with the recommendations
of the Chaturvedi Committee, a guiding principle
in the Twelfth pan is to run umbrella schemes hav-
ing different components. In the preceding sections,
major scheme for urban renewal for the Twelfth Plan
period have been described. In addition, following
schemes/projects would also continue in the Twelfth
Plan period.
General Pool Accommodation (Residential
and Non-residential)
18.169. This scheme provides for office and resi-
dential accommodation for Central Government
Box 18.12
Major Schemes for Urban Renewal at a Glance
State sector ACA scheme: Jawaharlal Nehru
National Urban Renewal Mission (JNNURM)
having following components:
• Urban Infrastructure and Governance (UIG)
• Rajiv Awas Yojana (RAY)
• Slum rehabilitation in cities not covered under RAY
• Capacity building
Centrally Sponsored Schemes
National Urban Livelihood Mission having two additional
components:
• Scheme for support to street vendors
• Scheme for assistance to the States for provision of
shelters.
1) National Mission on sustainable Habitat

Urban Development 359
departments and employees through CPWD. As
land parcels available with the Ministry are mostly
in prime locations they have significant potential to
generate resources, embarking on PPPs towards this
end would be an effective route to pursue, given the
thrust of the Twelfth Plan on such arrangements.
North Eastern Region Urban Development
Programme (NERUDP)
18.170. Launched with the assistance of the Asian
Development Bank (ADB) to encourage develop-
ment in the North Eastern Region as well as increase
support through multilateral agencies, the pro-
gramme provides support for priority urban services
viz. (i) Water Supply, (ii) Sewerage and Sanitation
and (iii) Solid Waste Management in the capital cities
of five North-Eastern States viz. Agartala (Tripura),
Aizawl (Mizoram), Gangtok (Sikkim), Kohima
(Nagaland) and Shillong (Meghalaya). Under the
Twelfth Plan, this programme would be recast and
taken under the overall framework of JNNURM.
National Capital Region Planning Board
18.171. The NCR Planning Board is providing
financial assistance to create civic amenities in the
National Capital Region (NCR). The assistance is
in the form of soft long-term loans to the partici-
pating State Governments and other parastatals for
infrastructure development projects in the constitu-
ent NCR States and identified Counter Magnet Area
(CMA) towns. The activities of the NCRPB would be
expanded in the Twelfth Plan period.
Other Schemes/Projects
Ministry of Urban Development
Urban Transport Planning and Capacity Building
in Urban Sector
18.172. The scheme provides assistance upto 80 per
cent of cost of city specific comprehensive traffic
and transportation studies and builds capability to
undertake comprehensive urban transport planning.
The scheme should be subsumed under the renewed
JNNURM in the Twelfth Plan period.
Research and Capacity Building in Urban and
Regional Planning
18.173. The scheme was launched to build capac-
ity building for urban regional planning at the ULB
level. While capacity building for regional planning
is a prerequisite for sound urban development, the
scheme should be subsumed under the renewed
JNNURM.
Capacity Building Scheme for Urban Local Bodies
18.174. A scheme for capacity building for ULBs
was initiated for supporting implementation of vari-
ous reforms. This was supported by the creation of
nine Centres of Excellence in reputed institutes like
IIT Chennai, IIT Guwahati, IIM Bangalore, ASCI
Hyderabad, Centre for Science and Environment,
Lal Bahadur Shastri National Academy of Adminis-
tration, Mussoorie and so on. Under the Twelfth
Plan, the scheme should be subsumed under the
Capacity Building sub-component of JNNURM.
National Mission Mode Project for E-Governance
in Municipalities
18.175. This scheme was launched under the UIG
component of JNNURM for providing ‘single win-
dow’ services to the citizens. Since e-governance is
not only a reform in itself, it is an enabler for other
reforms, a major emphasis has been recommended
under the improved JNNURM. Hence, the scheme
would be subsumed under the capacity building sub-
mission of JNNURM under the Twelfth Plan.
Scheme for Urban Infrastructure Development in
Satellite Towns/Counter Magnets of Million Plus
Cities
18.176. Under the renewed JNNURM, special
emphasis has been laid on development of satellite
towns, especially by developing their transport and
communication linkages with the mega city. Hence
the scheme would be subsumed under the JNNURM.
Pooled Finance Development Fund
18.177. The Pooled Finance Development Fund was
approved in 2006 to help ULBs to raise funds from
capital markets for urban infrastructure projects.
An amount of `2,500 crore was provided for the

360 Twelfth Five Year Plan
Eleventh Plan. However, the scheme could not pick
up during the Eleventh Plan period. Since raising
finances at municipal level is one of the main thrust
under JNNURM, for which several interconnected
recommendations have been made to boost inves-
tors’ confidence, the scheme would be subsumed
under the new JNNURM.
Ministry of Housing and Urban Poverty Alleviation
Interest Subsidy Scheme for Housing the Urban
Poor (ISSHUP)
18.178. The scheme was launched to provide interest
subsidy of 5 per cent per annum for housing purpose
for lending to the EWS and LIG segments of urban
areas. Since slum rehabilitation requires a holistic
approach the scheme has been subsumed under the
Rajiv Awas Yojana.
Grant to Building Material and Technology
Promotion Council (BMPTC)
18.179. Under the Eleventh Plan, grant has been
provided to the BMPTC to meet multiple objectives
of promoting innovation in building material, main-
streaming disaster management and to work as a
resource centre for capacity building and skill devel-
opment. As these objectives are critical to success of
any housing related scheme, there is a need for their
continuation as well as convergence with the other
programmes being implemented by the Government
in housing sector. Encouragement to the innova-
tive practices should be funded under the overall
umbrella scheme of the Rajiv Awas Yojana rather
than taking up these activities on stand alone basis.
Hence, the assistance to BMPTC should be done
under the capacity building component of the Rajiv
Awas Yojana.
Urban Statistics for HR and Assessment (USHA)
Scheme
18.180. The scheme has been launched to develop
and maintain a data base, MIS and knowledge repos-
itory relating to urban poverty, slums housing, con-
struction and other urbanisation related statistics.
Creation of a Municipal level MIS system has been
recommended under the new JNNURM. Hence the
scheme should be subsumed under the renewed
JNNURM.
Externally Aided Capacity Building Schemes
MOUD
1. Capacity building for urban development
(JNNURM)—assistance from the World Bank:
2. Capacity building for Urban Transport—
Assistance from the World Bank
MOHUPA
1. World Bank Capacity Building Project for urban
development
2. Technical assistance from DFID for support to
National Policies for urban poor
18.181. It is recommended that all Capacity Building
activities should be taken under the overall frame-
work of JNNURM.
EXPECTED OUTCOMES IN IMPROVEMENT IN
SERVICE DELIVERY
18.182. The urban sector is predominantly a State
subject. The nature of engagement by the Central
Government would be to primarily incentivise urban
reforms and assist the States/ULBs in improving the
delivery of urban services at affordable costs. Such
measures would not only improve the financial
health of ULBs, but also dismantle structural barriers
and in turn make cities more inclusive. These would
constitute broad outcomes of the schemes under the
Twelfth Plan period.
18.183. As regard specific outcomes in terms of
improvement in service delivery, the Ministry of
Urban Development has developed detailed ser-
vice level benchmarks for a number of urban ser-
vices. Such benchmarks include 24 × 7 water supply,
water consumption norms of 135 lpcd for all cities,
100 per cent individual piped water supply, 100 per
cent collection and treatment of solid and liquid
waste, underground sewerage system for all cities.
Similarly, benchmarks have also been developed for
storm water drainage, urban transport, urban roads,
traffic support infrastructure, urban transport and

Urban Development 361
street lighting. As observed by the Isher Ahluwalia
Committee, these benchmark norms are consist-
ent with the economic and social aspirations arising
from India’s GDP growth target of 8 to 9 per cent per
annum. Since different States and cities are at differ-
ent stage of development, it will be essential for the
Central Government to undertake an audit during
the preparatory phase of JNNURM-II to determine
the service levels across States and set outcome-based
targets for services admissible under JNNURM-II
for individual states. In the longer term, all state and
cities should aspire to achieve the aforesaid service-
level norms.
OVERALL BUDGETARY OUTLAYS FOR URBAN
SECTOR
18.184. An indicative outlay of `1,20,557 crore
for Ministry of Urban Development (MoUD) and
`43,521 crore for Ministry of Housing and Urban
Poverty Alleviation (MoHUPA) has been made. This
includes provision of `1,01,917 crore for the Flagship
Scheme of JNNURM which is a State sector ACA
scheme and is implemented jointly by both the afore-
said Ministries. The share of MoUD in JNNURM is
`66,246 crore and of MoHUPA is `35,671 crore.

CONSTRUCTION SECTOR
BACKGROUND
19.1. Construction activity creates physical assets in
a number of sectors of the economy. Construction
sector has two key segments: (i) Buildings, fall-
ing into one of the following categories: residen-
tial, commercial, institutional and industrial; and
(ii) Infrastructure such as road, rail, dams, canals,
airports, power systems, telecommunication sys-
tems, urban infrastructure including water supply,
sewerage, and drainage and rural infrastructure.
Assets once created also need to be maintained.
Many upstream economic activities depend upon
the construction sector. It is roughly estimated that
40–45 per cent of steel; 85 per cent of paint; 65–70 per
cent of glass and significant portions of the output
from automotive, mining and excavation equipment
industries are used in the construction industry.
19.2. Construction accounts for nearly 60–80 per
cent of the of project cost of roads and housing and
a significant portion in case of other infrastructure
sectors. Construction materials such as cement and
steel, bricks and tiles, sands and aggregates, fixtures
19
Other Priority Sectors
and fittings, paints and chemicals, petrol and other
petro-products, timber, minerals, aluminium, glass
and plastics account for nearly two-third of the con-
struction costs. The forward and backward multiplier
impact of the construction industry is significant.
CONSTRUCTION SECTOR AND THE INDIAN
ECONOMY
19.3. The Construction sector has been contributing
around 8 per cent to the nation’s GDP (at constant
prices) in the last five years (2006–07 to 2010–11).
As indicated by Table 19.1, GDP from Construction
at factor cost (at constant prices) increased to `3.85
lakh crore (7.9 per cent of the total GDP) in 2010–11
from `2.85 lakh crore (8 per cent of the total GDP) in
2006–07. The growth in construction sector in GDP
has primarily been on account of increased spend-
ing on physical infrastructure in the last few years
through programmes such as National Highway
Development (NHDP) and PMGSY/Bharat Nirman.
EMPLOYMENT IN THE CONSTRUCTION
INDUSTRY
19.4. With around 31,000 enterprises involved in
the construction industry in 2011, the industry is the
TABLE 19.1
Construction Sector-Macro Aggregates
Macro-variable 2006–07 2007–08 2008–09 2009–10 2010–11
GDP from Construction (lakh crore) 2.85 3.15 3.33 3.56 3.85
Share of GDP (%) 8.0 8.1 8.0 7.9 7.9
Growth rate for GDP in Construction (%) 10.3 10.7 5.4 7.0 8.1
Source: Handbook of Statistics, RBI 2010–11.

Other Priority Sectors 363
second largest employer in the country after agricul-
ture. Over 95 per cent of the enterprises numbering
around 29,600 employ less than 200 persons; over
3 per cent or around 1,050 enterprises employ
between 200 and 500 persons and only a little over
1 per cent or 350 enterprises have more than 500
employees. The employment figures have shown a
steady rise from 14.5 million in 1995, 31.5 million
in 2005 to 41 million in 2011. Between 1995 and
2005, there was a substantial drop in the proportion
of skilled engineers in the workforce from 4.71 per
cent to 2.65 per cent. This trend seems to have been
arrested if not reversed with the number of engi-
neers in 2011 at 2.56 per cent, that is, 1.05 million.
The number of technicians and foremen is 1.12 mil-
lion which represents 2.74 per cent of the workforce
which shows an improvement over the 2005 when
their proportion was 1.85 per cent. The number of
skilled workers at 3.73 million constitutes 9.1 per
cent of the total workforce which is marginally lower
than their proportion of 10.57 per cent in 2005. Apart
from clerical staff of 0.93 million, that is, 2.26 per
cent, the rest of the workforce of 41 million in 2011 is
comprised of unskilled workers whose number stood
at 34.2 million representing 83.3 per cent which is
almost at par with the proportion of 82.45 per cent in
2005. A large part of the industry remains unorgan-
ised which negatively impacts on the quality of deliv-
ery. Amongst the workforce, there is predominance
of migrant labour which increases their vulnerabili-
ties. There is a need to go in for state-centric surveys
to capture the flow and pattern of migration rather
than depending upon macro level data.
DEVELOPMENTS DURING THE TENTH AND
ELEVENTH PLANS
19.5. Some notable achievements during the previ-
ous plan periods have been:
• Construction Sector was declared as an industrial
concern under the IDBI Act in March 2000 in
order to increase the flow of institutional credit to
the sector.
• Implementation of national Human Resource
Development (HRD) initiatives in the non-formal
sector, including the workers’ level to the upper
levels of engineering and managerial categories
• Setting up of the Arbitral Institutions for resolu-
tion of business disputes in construction industry
• Setting up of disaster identification and mitigation
centres which helped in development of a cadre of
professionals well-trained to take disaster mitiga-
tion activities
• Development of institutions and implementation
plans for safety and quality related issues
• Obtaining state-of-the-art global technology
through strategic association between industry,
government and international bodies
• Effective dissemination of information, regard-
ing good work practices, and development of an
action frame work for quality and safety audits,
assessment and certification as well as training of
man-power both for practice and research
• Improvement in procurement practices for the
public sector, and also development of regulatory
manuals to ensure quick and effective procure-
ment procedures
• Electronic tendering process, online publishing of
tender notices and related procedures are becom-
ing more and more common.
• Setting up of models of public-private partnership
in construction activity
• Development of consultancy and advisory ser-
vices in the areas of project and construction
management, procurement services, regulatory
issues, and technology. Institutional Arbitration
has taken firm root with the operationalisation
of Construction Industry Arbitration Council.
Nineteen cases have been undertaken so far.
• Specialised institution (Construction Industry
Vocational Training Council) was set up at the
national level to provide training to vocational and
supervisory trades of the construction industry.
• Safety record of the industry has shown improve-
ment. The accident frequency rate in 2011
declined to 0.006 accidents per million man-hours
worked from 0.009 in 2007. This is due to profes-
sionalisation of big contractors.
• On account of better training opportunities and
enhanced mechanisation, productivity per person

364 Twelfth Five Year Plan
in the industry has increased from `78,440 in 2007
to `98,620 in 2011.
• A national level comprehensive Green Rating
Initiative has been made ready and is ready to be
launched.
• National level awards (Vishwakarma Awards)
instituted by Construction Industry Development
Council (CIDC) for outstanding performance have
received good response. The awards cover all lev-
els from artisans to life-time achievement awards
for industry captains. Awards are also given for
projects, with categories including Safety, Health,
Environment, Special Features and so on.
• Construction cost indices, sponsored by MOSPI
have received good response from project owners.
CONSTRAINTS IN THE CONSTRUCTION
INDUSTRY
19.6. Despite the achievements during the previous
plans, construction industry faces many constraints.
Although 41 million people are employed in this sec-
tor, less than 6 per cent has the benefit of structured
training and skill building. Skill upgradation schemes
launched by the state and Central Governments are
not adequate and only a handful of large firms orga-
nise training programmes. Construction firms are
regulated under multiple laws and there is no uni-
fied regulatory framework. There is lack of efficient
and stable regime for dispute resolution in con-
tracts leading to costly and time-consuming disputes
between the promoters of the project and contrac-
tors. Although the flow of bank credit has improved
to the construction industry, institutional finance
still remains inadequate. High cost of finance trans-
lates into high costs for the industry and the econ-
omy. Presently construction industry suffers from
poor state of technology leading to inefficiencies,
wastage and low value added. Investment in R&D
is 0.03–0.05 per cent of the investment in construc-
tion as against 1.5–2 per cent in South East Asian
countries and 4–6 per cent in developed economies.
These and other constraints require to be redressed
during the Twelfth Plan period.
STRATEGIES FOR THE TWELFTH PLAN PERIOD
Key drivers of growth of construction industry
19.7. Forecasts for the market size of construc-
tion industry for the Twelfth Plan period indicate
that that the aggregate output of the industry dur-
ing the period 2012–13 to 2016–2017 is likely to be
52.31 lakh crores increasing from 7.67 lakh crores in
2012–13 to 13.59 lakh crores in 2016–17. As noted
earlier, growth in construction industry is linked to
the growth in the infrastructure sector and the build-
ing industry. The output of the industry is likely to
be contributed almost equally by the buildings and
infrastructure segments respectively. The thrust on
capacity expansion in the infrastructure sector will
continue in the Twelfth Plan. Apart from steady
growth in construction related to industrial build-
ings, the industry catering to commercial real estate
in the non-residential sector is likely to grow at an
accelerated pace due to a vibrant and growing service
industry such as IT and related sectors, hospitality
and tourism industry and logistics services. The real
estate sector faces challenges despite strong growth
in the past. The current trend in real estate market
is that after making investments in land, the proj-
ect construction is mainly retail financed, that is,
through advances or milestone based payments from
owners. In affordable housing projects retail financ-
ing would be a challenge as the ability of the retail
investors would be very limited. This issue becomes
more significant in the category of affordable hous-
ing for low income group and economically and
weaker segments of the society.
HUMAN RESOURCE STRATEGIES FOR THE
TWELFTH PLAN
19.8. Construction industry faces acute shortage of
skilled workers especially in mechanised trades. Even
in the case of engineers, there is reduction of share
of new trainees in Construction Engineering Streams
(Civil, Electrical, and Mechanical Engineering). This
is due to reduced intake by colleges following the lack
of placement opportunities for civil engineers. The
trend has started reversing but needs stepping up
considerably. On account of natural attrition and the
need of skills of contemporary trades, Construction
Industry needs infusion of at least 6 million persons

Other Priority Sectors 365
per year. The total training capacity is woefully
inadequate. Against a requirement of over 3.5 mil-
lion trained tested and certified workers, the capac-
ity available is about 0.5 million per annum. The
ITIs, both in private and public sector are not able to
offer many trades relevant to construction Industry.
Schemes such as NREGS have further reduced the
state of fresh entrants since the unskilled or semi-
skilled workforce is no more desirous of migrating
as they are able to source employment locally. Skill
upgradation schemes launched by the Governments
both at State and Central Government level are inad-
equate and industry sponsored apprenticeship is not
easily available. Only a handful of large firms orga-
nise training programmes. NSKDF (National Skill
Development Fund) schemes are not attractive since
the funds are provided to training providers as loan
which have to be recovered from recipients who
are generally too poor to be able to pay for training.
Apart from shortage of workers, the industry is fac-
ing shortage of contractors, especially in specialised
areas. Most of the construction materials continue to
be manufactured in the informal sector which makes
it difficult to induct modern technology.
19.9. Construction Industry Development Council
(CIDC)—an industry association formed with the
initiative of the Planning Commission—is actively
involved in imparting training and skill up-gradation
of the workers in the industry. It has taken steps
in association with a few states such as Madhya
Pradesh, Rajasthan, Bihar and Haryana for train-
ing and certification of construction workers. These
states have made available the physical infrastructure
of the ITIs situated in their States, where training in
self-financing mode is being conducted by CIDC
and skill certification is given by CIDC. This scheme
needs to be extended to other states after auditing
the scheme and removing any deficiencies. Ministry
of Labour and DG (ET), NCVT (National Council of
Vocational Training), have taken measures to launch
skill certification initiatives through CIDC and also
under MES/SDI schemes. Resources from the SDI
(Skill Development Initiative) Scheme can be used
for training the workers in construction industry.
Some firms in the construction industry such as L&T
have undertaken their captive training programmes.
More firms should be encouraged to do so. These
efforts need to be up-scaled and accelerated. One
source of funds for doing this can come from The
Building and other Construction Workers Welfare
Cess Act, 1996 which aims to garner resources,
through a cess but does not lay down specific norms
for expenditure of the sums, thus collected. It is
proposed that a portion of this fund could be uti-
lised to meet the financing requirements of workers
training through a nominated and authorised nodal
agency. A dedicated fund for human resource devel-
opment in the construction industry could be set
up for taking these ideas forward. This fund known
as Construction Skill Development Fund (CSDF)
could be set up with `200 crores per year from above
source and a matching amount from the industry to
facilitate training of at least 2,00,000 workers per year.
19.10. The next major issue needing attention is
continuous skill upgradation and reversing the attri-
tion of engineers from the Construction Industry.
Engineering Council of India, the apex body, hav-
ing representation of several engineering profes-
sional organisations has made several proposals to
the Government of India, in this context, which may
be studied and acted upon. It is proposed that an
Engineers Bill be enacted to look into issues of pro-
fessional development of practicing engineers and
Industry be encouraged through some tax incentives,
which could be availed for HRD initiatives launched
by them. Curriculum for Construction should be
developed and harmonised. Steps must be taken to
establish Department of Construction Engineering
in Colleges and Universities. As per a CIDC sur-
vey, nearly 85 per cent of engineering graduates
are unemployable on graduation. This position can
be improved by internship after or during gradu-
ation. A pilot project undertaken by CIDC with an
Engineering University saw employability going up
significantly. A continuing programme for industry
orientation and experience for teachers is essential
for improving employability further. Workshops are
needed at every state capital in collaboration with
engineering institutions to evolve a mechanism to
improve the engineering curricula and also introduce

366 Twelfth Five Year Plan
apprenticeship. A structured interface is required
between the industry bodies and the Ministry of
HRD, UGC and AICTE on these issues.
SAFETY AND RELATED ISSUES OF
CONSTRUCTION WORKERS
19.11. Apart from training, welfare for work-
ers should be a major area of action during the
Twelfth Plan. Workers in the construction indus-
try are vulnerable to inherent risks to their life and
limbs. Temporary relationships between employer
and employee, uncertain working hours, lack of
basic amenities and inadequacy of welfare facilities
are some of the difficulties faced by the employ-
ees. The Building and other Construction Workers
(Regulation of Employment and Conditions of
Service) Act 1996 was enacted recognising the need
for a comprehensive Central legislation for regulat-
ing the safety, health, welfare, and other conditions
of service for construction workers. However, only
a few states have implemented the provisions of the
Act, such as setting up welfare boards. Twelfth Plan
will aim at accelerating this process of implementa-
tion of the provisions of the Act. As a substantial seg-
ment of the construction industry workforce, women
workers need to be accorded special focus in both
skill training as well as stipulated social benefits.
19.12. A major issue concerns with the Provident
Fund for Construction Workers. It has been pointed
out by the industry representatives that although
large sums of monies are being deposited with the PF
Trust every year, use and withdrawal of these mon-
ies by the beneficiaries, is near absent. Proceeds of
this deposit are estimated at about `25,000 crores by
industry bodies but would require official authenti-
cation. Such unutilised funds need to be distributed
amongst the beneficiaries and used for the welfare of
the workers. Industry representatives have suggested
that a sub-trust for construction industry should be
created. Another source of funds is The Building and
other Construction Workers Welfare Cess Act, 1996
through which since 1996, a cess amounting to 2 per
cent of the contract value being executed by any con-
tractor is being deducted as the mandatory workers
welfare cess. It is believed by industry bodies that
sums with various State Governments now aggregate
to `22,500 crores and are reportedly lying unutilised.
These funds could be used for skill upgradation and
improving the living conditions of the workers.
REGULATORY FRAMEWORK IN THE
CONSTRUCTION INDUSTRY
19.13. Construction has been declared as an indus-
try but has presently no regulatory framework on an
all India basis. For example, although the National
Building Code and Common General Conditions of
Contract have been evolved, they have not been man-
dated as applicable either by the Central Government
or any of the states. Presently no common construc-
tion law exists and the construction activities are
administered through 32 different laws, rules and
statutes. For example, there are 27 different statutes
dealing with labour alone, starting with the Children
(Pledging of Labour) Act, 1938 to the Employees
Provident Fund and going to the Miscellaneous
Provisions (Amendment) Act, 1996. To deal with
the multiplicity of laws, it has been suggested by
the construction industry to have a Common Con-
struction Law which would harmonise the existing
statutes related to construction sector. It has also
been suggested that a nodal regulatory authority
in the shape of Central Construction Authority at
the national level and State Authorities at the state
levels should be formed to administer and moni-
tor the Construction Law. The proposed authority
could act as a nodal agency of the Government on all
issues related to the construction sector. It has also
been suggested that the related statutes of Japan and
Singapore could be studied for adoption in India.
These suggestions would need to be discussed widely
and debated before a firm view could be taken on
them. This exercise would be taken up during the
Twelfth Plan period.
19.14. Apart from the actions to be taken by the
Government, the Industry itself should adhere to
the principles of self-regulation with the help of
industry associations such as Builders Association
of India, CREDAI, CFI and others. The focus of self-
regulation should be labour welfare measures, adher-
ence to environment norms, ethical work practices,
joint apprenticeship programmes.

Other Priority Sectors 367
CONTRACTING SYSTEMS AND DISPUTE
RESOLUTION
19.15. There are shortcomings in the present con-
tracting procedures as pointed out by various
industry bodies. The procedures are costly and cum-
bersome for both the project owners as well as the
contractors. It has been estimated that the total cost
of procuring, supervising and monitoring incurred
by the project owner comes to about 22 per cent
of the cost of asset created. Lack of standardisation
of contract procedures and evaluation criteria is
another difficulty associated with contracting pro-
cess. Whereas the special conditions could vary, core
conditions could be standardised to avoid subjective
interpretation of clauses leading to disputes. In this
connection, it would be useful to study the Uniform
Contract Conditions and a model bidding document
for domestic contracts finalised by the Ministry of
Statistics and Programme Implementation, Govern-
ment of India and promote a wider adoption of the
same. There is also a prevailing view that the contract
conditions are not equitable. Elements such as per-
formance guarantees and other requirements lead to
an increase in the cost of the project. Time and cost
over-runs are often caused by ambiguities in condi-
tions governing damages to contractors due to delays
by project owners, resource mobilisation through
advances and cost escalations. In case of PPP con-
tracts for the road sector, Planning Commission has
come out with standardised model concession agree-
ments which have facilitated the implementation of
these projects.
19.16. It has been suggested that the criteria of
awarding works to the lowest cost bidder adopted
by the procuring agencies in the public sector hin-
ders in the process of adoption of better technol-
ogy, best practices and quality. It might result in
cost cutting practices by contractors and prevent-
ing passing on the benefits to the workers. In this
respect, it has been suggested that ‘Effective Lowest
Price’ rather than the ‘Lowest Price’ as adopted by
the Ministry of National Development, Government
of Singapore may be considered for adoption.
Technology capacity of contractors should be made
part of contract requirement for different categories
of projects—based on their value and it should also
be part of pre-qualification process. Efforts could
be made to include contractors’ proposals as part of
contract conditions. Availability of some minimum
percentage of skilled and certified manpower with
Contractors should be made part of contract require-
ment for different categories of projects based on
value. Incentive for better efficiency should be made
part of the contract requirements. A system of incen-
tives for timely completion and better performance
needs to be integrated in procurement procedures
by all public agencies. Instead of pre-qualifying the
agencies time and again, departments desirous of
engaging the contractors can resort to choosing con-
tractors on the basis of their grading, followed by a
periodical surveillance. Intensification and univer-
salisation of the e-tendering system is also required
to be undertaken.
ARBITRATION AND DISPUTE RESOLUTION
19.17. The enactment of Arbitration and Concilia-
tion Act 1996 provided for an effective framework
for resolution of disputes without depending on the
overburdened judicial system of the country. Despite
these improvements, the arbitration process contin-
ues to be predominantly ad-hoc leading to a situation
where according to a CIDC survey, `1,35,000 crores
remains blocked in the construction sector over dis-
putes. There is an increasing tendency to appeal on
grounds of ‘misconduct’ on the part of arbitrators
particularly taking the view that they are not being
approved by any responsible organisation. There is
no provision for a neutral body to administer and
supervise arbitration. Besides, there is no quality
control of arbitrator’s qualifications and expertise,
no assistance is available in managing arbitrator’s
fees and there is lack of close supervision of arbitra-
tor’s progress. A solution to the above problems is to
use the Institutional Arbitration system according to
which appointment of arbitrators is done from inter-
national, national or regional panels. Other features
of this system are: having a code of ethics which
binds the arbitrators and a pre-determined level of
fees. This system is hoped to improve the quality of
arbitrators, manage arbitral fees and maintain close
supervision and monitoring of arbitrator’s progress.
During the Twelfth Plan, steps would be taken to
operationalise these recommendations.

368 Twelfth Five Year Plan
ENVIRONMENT AND ENERGY
19.18. Construction sector is one of the highest con-
sumers of natural resources and energy amongst the
various industries. The industry needs to give par-
ticular attention to the following aspects: manage-
ment of water resources and amelioration of water
pollution; efficient use of materials and energy and
environmental management during implementa-
tion phase and post completion phase. All construc-
tion projects undertake mandatory Environment
Impact Assessment as per the guidelines of Ministry
of Environment and Forest and the concerned State
Governments. It is now being increasingly realised
in the construction industry that sustainable devel-
opment concepts, applied to the design, construc-
tion and operation of buildings, can enhance both
the economic well-being and environmental health
of communities. If sustainable design principles are
incorporated into building projects, benefits include
resource and energy efficiency, healthy buildings
and materials, ecologically and socially sensitive
land use, transportation efficiency, and strengthened
local economics and communities. Under National
Bankers Mission, for example, the Government
is funding establishment of bamboo mat-making
centres and giving training to local women work-
ers in bamboo growing areas of the North-eastern
States of India. These centres will supply the bam-
boo mats for further processing at industrial units
for production of bamboo mat corrugated sheets
for roofing of buildings. With a view to promote
green building materials, the Government of India
in their successive budgets after 1993 have been
providing excise duty concessions on the materi-
als manufactured from recycling of agro-industrial
wastes and by-products. It has also set up an inter-
disciplinary organisation. Building Materials and
Technology Promotion Council was set up in the
Urban Development Ministry to address the issues
of environment friendly and energy efficient build-
ing materials and technologies.
19.19. Construction Industry needs to work in uni-
son with Bureau of Energy Efficiency to develop
Green Building Guidelines based on energy efficiency
and use of renewable energy; direct and indirect
environmental impact; resource conservation and
recycling; minimisation of waste; water-harvesting;
indoor environmental quality and community and
site related issues. Construction industry should
develop typical green building guidelines for dif-
ferent geo-climatic regions. Energy Consumption
Indices should be developed for different types of
building occupancies, site conditions, and climatic
zones. Governments at Central, State and Local lev-
els should also encourage use of green construction.
CIDC is now taking an initiative along with a few
states to facilitate development of technologies and
building guidelines and promoting practice of green
construction. CIDC is also interacting with inter-
national agencies which have expertise in concepts
and technologies relating to green building materi-
als and construction systems. CIDC is collaborating
with Building Construction Authority of Singapore
to evolve a Green Mark for Buildings. This aims at
assessing buildings in five key areas of environment
energy efficiency, water efficiency, site development
and building management, indoor environmen-
tal quality and environmental innovations. Green
Marking will provide a meaningful differentiation of
buildings in the real estate market. The Government
may also consider giving fiscal incentives for use
of building materials produced from recycling of
wastes and by-products from agricultural, forestry
and industrial operations. Concrete steps will be
taken during the Twelfth Plan period to promote the
concept of green building.
TECHNOLOGY AND PRODUCTIVITY
19.20. Bulk of the construction industry suffers from
poor state of technology. Inefficiency, wastage and
low value added arise at two fronts: first, due to low
technology used in the manufacturing of construc-
tion material and second due to low technology used
during construction itself. It is important that pro-
ductivity enhancement of construction industry is
driven both by a demand for high quality as well as
supply for the same. In order to reduce cost of works
in rural roads sector, it is important to develop and
use ‘marginal materials’ instead of traditional costly
materials. As part of technology up gradation, there is
need to enhance the use of IT and IT-based solutions
for the construction industry. It is proposed that a

Other Priority Sectors 369
National Construction Research and Development
Fund be created with a grant from the Government
and matching contribution from the industry.
19.21. The productivity of the industry has shown
a positive trend in recent years as seen from
Table 19.3 earlier on account of better training and
higher mechanisation. However, compared to other
countries, for example, China, US, Europe, on an
average, it is 35–45 per cent lower after factoring in
purchase power parity. With rapid advances in tech-
nology and much better training especially at the
lower and middle levels, productivity is expected to
rise substantially.
QUALITY AND STANDARDS
19.22. Quality of construction has been recog-
nised by the industry as a weakness. In recent years,
some companies by actively supporting training
and certification of workers, supervisors and man-
agers have tried to improve on the quality dimen-
sion. The skill upgradation programme by CIDC
is also a sustained effort in that direction. Use of
technology like Ready Mixed Concrete and pre-fab
techniques along with more intensive use of infor-
mation technology has also helped. Many construc-
tion companies are working to obtain ISO 9000
series certification. Bureau of Indian Standards has
started formulating performance standards which
will gradually supercede prescriptive standards.
There are two good global examples for quality cer-
tification in the construction sector from Singapore
and UK respectively. Singapore has introduced a
scheme called The Construction Quality Assessment
System or CONQUAS which was developed by the
Building and Construction Authority (BCA) in co-
operation with major public sector agencies and
various leading industry professional bodies to mea-
sure workmanship quality in a completed building.
Since the launch of CONQUAS in 1989, more than
1,500 public and private building projects have been
assessed by BCA. The contract value of these proj-
ects exceeded US$50 billion.The scheme covers three
main aspects of the general building works: struc-
tural, architectural and mechanical and electrical.
Developers are using CONQUAS increasingly to
promote and market their property developments.
For instance, it is common for promoters to specify
target CONQUAS Score in the tender contracts as
targets for contractors. Similarly, contractors that are
capable of delivering a consistently high CONQUAS
Score would be in demand and command a higher
premium. The other international scheme is the
Agreement Certi ficates which is a Quality Appraisal
Scheme of the British Board of Agreement (BBA).
BBA’s Agree ment Certificate Scheme provides
authoritative and independent information on per-
formance of building products. The main focus of the
Agreement process is the evaluation of the extent to
which the product allows compliance with relevant
Building Regulations and other statutory require-
ments. These two examples are very relevant for
the industry in India to consider and adopt. During
the Twelfth Plan period steps would be initiated to
launch such schemes.
19.23. In the area of standards, Bureau of Indian
Standards (BIS), is the statutory and apex organi-
sation for laying down of standards and their
adherence, but does not having any mandate for
enforcement. Even the standards are recommenda-
tory in nature, which prevent stake holders to strictly
conform and follow. BIS needs to be granted neces-
sary authority and powers to ensure serious adher-
ence to Indian standards. The issue of shifting from
Prescriptive to Performance Standards as well as for-
mulation of standards on green and intelligent build-
ing design should be given high priority
R&D IN CONSTRUCTION SECTOR
19.24. R&D in construction sector needs to be
built around a vision of delivering inclusive growth
supported by collaboration between the research
providers and the research users. In the field of
construction sector in India the principal institu-
tions involved in research include Central Building
Research Institute (CBRI), Building Materials and
Technology Promotion Council (BMTPC), Institute
of Steel Development and Growth (INSDAG),
Central Institute of Plastics Engineering and Tech-
nology (CIPET), National Council for Cement and
Building Materials (NCB), Central Road Research

370 Twelfth Five Year Plan
Institute (CRRI) and Research Designs and Stand-
ards Organisation (RDSO). The challenge for the
construction industry in the coming years is to
establish a framework which supports innovation,
research, development, demonstration and use of
knowledge for benefits to society at large. Such a
framework would be built around integration of var-
ious technologies into viable assets; develop designs
and practices for meeting the needs of climate con-
trol; develop new materials and construction tech-
niques; asset management deploying ICT right from
conceptualisation to construction; automation in
design, construction and operation and risk mitiga-
tion. Apart from R&D in construction technology,
adequate focus is required on construction materi-
als to help answer questions like: which alternatives
have the lowest resource inputs and environmental
emissions and wastes throughout their life cycle?
19.25. R&D vision shall motivate towards an inno-
vative sustainable and productive construction
industry and shall ensure collaboration and align-
ment amongst policymakers and all sections of the
construction industry supply chain. A clear objec-
tive and identification of well-defined research pro-
jects would accelerate development of an innovative
mind-set and in time should cause users to demand
change. Since the country has a variety of geophysi-
cal conditions with varying materials available
locally, technology should be adaptable to local con-
ditions. To enable that, regional technology centres
with autonomous functioning coupled with account-
ability are required under a national level umbrella
organisation which in turn should also be account-
able. One of the aforementioned organisations,
along with the participation of policymakers, asso-
ciations, academic institutions and industry be man-
dated to spearhead the collaborative effort needed to
drive the R&D initiatives in Construction Industry.
Industrially advanced countries too depend on col-
laboration amongst all stakeholders to decide on pol-
icies and their implementation framework. It is also
suggested that spending on research for construction
industry, require special incentives (for example,
150 per cent tax exemption) to encourage such
research.
CONSTRUCTION MACHINERY AND
TECHNIQUES
19.26. Construction equipment accounts for 21–23
per cent of the total project cost and as such, varia-
tions in equipment pricing have a huge impact on
the project costs. The prices of construction equip-
ment vary according to the product. As per estimates
by Off-Highway research, the sale of construction
equipment is expected to reach 84,000 units by
2014, of which infrastructure and real estate sectors
will account for 70 per cent. This translates into a
CAGR of about 20 per cent over the next five years
(2009–14) in sales of construction equipment. Over
the years, the equipment used in construction has
improved significantly to provide better productivity,
safety and accuracy. Mechanisation ensures greater
efficiency and reduces the need for skilled labour. It
also enables access to hazardous areas where man-
ual intervention is not possible. Developments in
this area include: evolving sustainable construction
practices; enhanced usage of precast products; close
proximity radiography; concrete production and
placement; earth moving and mining; automation to
enhance productivity and safety; facilitate availability
and deployment of construction equipment through
incentives and penetration of good practices into
rural construction sector and low cost housing.
PROJECT EXPORT IN CONSTRUCTION
INDUSTRY
19.27. Indian Construction Industry had been very
active in the overseas market, especially the Gulf in
the decades of seventies and eighties, when Indian
companies ventured out to fill the demand for con-
struction activities, fuelled by oil boom. Between
1975 and 1980, Indian companies handled construc-
tion work worth nearly US$ 5 billion. Out of this
nearly US$ 1.5 billion was repatriated back to India,
mainly in the form of profits, wages and construc-
tion material exported abroad. But this trend did
not last, and by mid and late 1980s the volume of
contracts secured, fell down sharply. From US$443
million in 1986–87 the contracts came down to
just US$98 million in 1995–96. Though this was
mostly due to the prevalent political situation in the
Gulf region, even then it was a major drop for the
industry. There is a strong need to reverse this trend

Other Priority Sectors 371
through strong government support in aggressively
marketing Indian products and services in construc-
tion in the overseas market. In order to boost export
of both services and goods from Indian Construction
Sector it is important to evolve and set up an insti-
tutional mechanism for maintaining operational and
effective linkages with Indian Missions abroad. In
selected countries with a high potential for project
export the commercial sections of the missions may
be strengthened by placing a representative of the
Construction Industry to create awareness and pro-
vide strengthening of Indian Construction Industry
and to facilitate industry constituents from India to
participate in bidding process of selected projects
and also explore possibilities of promoting joint ven-
tures in India and abroad. This would also attract
greater FDI and new technologies in the domestic
construction sector.
FINANCE AND RELATED ISSUES IN THE
CONSTRUCTION SECTOR
Flow of Funds into the Construction Sector
19.28. Even though the construction sector is attract-
ing both domestic (gross bank credit) as well as for-
eign direct investment, more resources are needed
for the sector to fulfil the ever rising pressures of
enhancing the housing and infrastructure sectors in
the country. Institutional financing of construction
sector still remains an underdeveloped area. Table 19.2
shows the flow of bank credit to construction sector
during 2006–07 to 2010–11. In the year, 2010–11,
around `50,135 were lent by banks to the construc-
tion industry which was 1.4 per cent of the gross bank
non-food credit disbursed during the year. Table 19.3
depicts the year wise and cumulative FDI flows into
construction activities including roads and highways
sector. The cumulative FDI inflows from April 2000
to August 2011 into construction activities stood at
around US$ 9,417 million or `42,072 crore, which is
nearly 6 per cent of the total cumulative FDI inflow
into the country during same period.
EXISTING SHORTCOMINGS IN INSTITUTIONAL
FINANCING FOR CONSTRUCTION INDUSTRY
19.29. The Indian construction industry is faced with
high operation, maintenance, and financial costs. As
the magnitude of housing shortage in the country
is huge requiring substantial investments in hous-
ing and related infrastructure, the Banks, Financial
Institutions and Housing Finance Companies have
not lent to the poorer segments of the population
for affordable housing segments. The priority sector
lending by Banks for affordable housing loans up to
`5 lakh constitutes only 22.75 per cent, of the total
lending to housing sector according to the housing
loan data received from the 26 leading public sector
banks including SBI for the year 2010–11. Further,
TABLE 19.2
Flow of Bank Credit to Construction Sector
(in ` ’000 Crore)
2006–07 2007–08 2008–09 2009–10 2010–11
Gross Bank Non-Food Credit 1,801 2,205 2,602 3,040 3,667
Bank Credit to Construction Industry 20 28 39 44 50
Percentage share (%) 1.1. 1.3 1.5 1.5 1.4
Source: Annual Reports, RBI.
TABLE 19.3
Flow of FDI in Construction Activities (including Roads and Highways)
2007–08 2008–09 2009–10 2010–11 Cumulative(April 2000–August 2011)
In ` Crore 6,989 8,792 13,469 4,979 42,072
In USD million 1,743 2,028 2,852 1,103 9,417 (6% of total FDI inflows)
Source: DIPP, MoC&I.

372 Twelfth Five Year Plan
as per latest BSR report of RBI for the period ended
March 2010, loan sizes up to `5 lakh constitutes 24.16
per cent of the total outstanding housing loans of
`3,06,307 crore. It can thus be safely concluded that
a very low proportion of the low ticket loans have
actually gone to the EWS/LIG individuals. Mortgage
penetration is already low in India and mechanisms
are only now developing to maintain credit histories.
Informal sector workers in particular have variable
income streams and in some cases, might not have
access to a bank account.
19.30. Key reasons for the reluctance on the part
of banks/FIs to lend to the construction industry
include: (i) lenders do not understand the work-
ing dynamics of the construction industry; (ii) lack
of adequate safeguarding mechanisms to assure
the banks about the credibility of the industry and
(iii) banks have better options to lend their precious
money to sectors with assured returns at much lower
risks. There is no appropriate institutional set up to
absorb the flow of funds to the construction sector.
Apart from non-availability of credit for the sec-
tor, non-availability of bankable DPRs in the con-
struction sector and huge time and cost overruns
of the construction projects are some of the reasons
for projects in the construction sector not taking
off in a sustainable manner. Another shortcoming
in the construction sector in India is that the State
Governments do not make funds available after they
approve the projects. There is no law to ensure that
a contract cannot be awarded unless finances are
arranged. A programmatic approach for large con-
struction programmes at the State level requiring a
planned approach with resources tied up needs to be
encouraged.
STRATEGIES TO IMPROVE FLOW OF FUNDS
TO CONSTRUCTION INDUSTRY
19.31. Although the industry is not fixed capital
intensive, it is working capital-intensive in terms
of gross working capital requirements with high
payment receivable risk. Five types of financing
requirements can be identified in respect of the
Construction Industry: (i) working capital require-
ments; (ii) Capital requirements for modernisa-
tion of equipments and/or expansion of industry;
(iii) Project specific bridge loans; (iv) Loans for BOT
projects; and (v) Equity for BOT and real estate
project. The funds requirement of the construction
industry is approximately USD 1 trillion with the
modernisation requirements of the construction
industry estimated to be to the tune of US$150–200
billion. Further, as per the High Powered Expert
Committee (HPEC) Report for estimating the invest-
ment requirement for urban infrastructure services,
the investment requirement for urban infrastructure
over the 20year period (2012–31) is estimated at
`39.2 lakh crore at 2009–10 prices.
19.32. The construction sector remains in need of
financial support while sizable funds available with
Banks and Financial Institutions remain unutilised.
Lenders do not have a reasonably sound and reliable
system for risk assessment in the construction sec-
tor. In order to have a sustained and enhanced flow
of credit to the construction sector, greater trans-
parency, better corporate governance, sharing of
experiences and specific regulations are required.
Innovative financing methods or instruments are
required to enhance the flow of funds and insti-
tutional credit to the construction sector. Various
strategies for this are:
• Enhancing flow of finance through grading of
construction companies
• Construction industry-specific lending norms
• Credit enhancement product or agency which
would provide bridge finance to the construction
sector on lines of the `300 crores partial guarantee
facility launched recently by IIFCL for the infra-
structure sector
• Setting up of a Mortgage Refinance Company
which would be a financial institution owned by
the banks with the sole purpose of supporting
banks to do construction mortgage lending by
refinancing banks’ mortgage portfolios
• Setting up of a Construction Bank especially dedi-
cated to suit the sector’s financial needs on lines of
countries like China, Singapore and Ethiopia
• Indian Infrastructure Equipment Bank which
would make use of construction equipment
owned by Companies by putting them to produc-
tive use when they are unutilised

Other Priority Sectors 373
• Compulsory Escrow accounting for Construction
Projects in order to provide credit cushion to the
investors
• Letter of Credit may be opened in the name of the
contractor at the time of award of project by the
Client to ensure that the payment is made as soon
as the project milestone approval is received
• Working capital advance may be provided to con-
tractors in order to kick-start the construction
project
• ‘Delayed Payment Act’ for Construction Projects
which would make it mandatory for the clients or
big contractors to pay the small contractors the
money along with the prevailing interest rate, the
cases where contractors are not paid by the clients
in time
• Lending and Non-Performing Assets (NPA)
norms for construction sector may be reviewed
and reformed
• Sector-specific (for example, housing, real estate,
Power, Roads, Ports, and so on) innovative financ-
ing instruments may be developed to enhance the
flow of funds to the specific sectors
• Innovative financing instruments/products like
‘Insurance Product’, ‘Housing Warranty’ and
‘green construction finance’ (and green rating
other than LEED and GRIHA) may be explored
for enhanced and orderly flow of institutional
credit to the construction sector
• The possible credit enablement mechanisms/
financial instruments for affordable housing are
given the Box 19.1
• Developing Housing Warranty Scheme as being
offered to the consumers in the Developed Coun-
tries, (for example, Japan, North America and so
on) could be a potent instrument for covering risk
elements at micro level for houses and buildings/
structures
• Developing Insurance Products to mitigate con-
struction business risks to cover the risk elements
Bidding Indemnity Policy (BIP); Delay in meet-
ing obligation by client policy (DIMO Policy);
Settlement of Claims Policy (SOC Policy); Loss
of Profit Policy (LOP Policy); Transit Insurance
Policy (TI Policy); Loss of Performance of Con-
struction Equipment (LOPCE Policy); Force
Majeure Loss Policy (FML Policy); Financial Risk
Coverage Policy (FRC Policy)
• Fiscal incentives such as allowing resource mobili-
sation through tax-free bonds
• Accessing International Financial Markets
through External Commercial Borrowings (ECB),
Infrastructure Debt Funds (IDFs), Global Depo-
sitory Ratios (GDR) and other debt instruments
• Infrastructure Debt Funds (IDFs) to deepen the
corporate bond market to make it attractive for
these investors
• Foreign Private Equity and Venture Capital Funds
• Regulatory reforms required for PE and VC for
fulfilling their role as growth enablers a host of
regulatory changes
• Builders and Real Estate Developers involved in
construction sector may be incentivised to take up
affordable housing construction through grant of
additional FAR/FSI/TDR and appropriate fiscal
incentives
• State Plan Document should have a Chapter on
construction sector which would clearly mention
the construction financing requirements in the
state
• Single Window Clearance to reduce the hassles
and delays in the approval process resulting in
delay in completion of projects
19.33. Obviously, such a vast financial requirement
cannot be addressed by a single enterprise or institu-
tion. Government initiatives must be in coordination
with all the constituents of the construction industry
for dedicated flow of credit to the sector. Workable
Action Plans incorporating the above suggestions
would be made during the Twelfth Plan period.
TOURISM
TOURISM AS A MEANS TO FASTER, MORE
INCLUSIVE AND SUSTAINABLE GROWTH
19.34. The tourism sector has a major role to play
to promote faster, sustainable and more inclusive
economic growth—the goal of the Twelfth Five
Year Plan. It has better prospects for promoting
pro-poor growth than many other sectors. This is
because tourism involves a collection of activities,
services and industries comprising transportation,

374 Twelfth Five Year Plan
accommodation, eating and drinking establish-
ments, retail shops, entertainment businesses and
other hospitality services provided to individuals or
groups traveling away from home for leisure, busi-
ness or other purposes. The broad scope of economic
activities involved enables wide participation in its
growth, including participation by the informal sec-
tor. Tourism is also highly dependent upon natural
capital (for example, forest, wildlife) and culture and
these are assets that some of the poor have, even if
they have no financial resources. For all these rea-
sons, across the world, the tourism industry is one of
the largest generators of employment. In India, the
travel and tourism sector is estimated to create 78
jobs per million rupees of investment as compared to
45 in the manufacturing sector. The role of tourism
in promoting inclusive growth was also recognised
in the meeting of Heads of States of G-20 countries
held in June 2012 in Mexico.1
19.35. While Tourism is important for both growth
and employment generation, it must also be sustain-
able. The World Tourism Organization (WTO) has
defined sustainable tourism as ‘leading to manage-
ment of all resources in such a way that economic,
social and aesthetic needs can be fulfilled while
Box 19.1
Financing Instruments for Affordable Housing
1. Credit enhancement mechanisms like Setting up of ‘Credit Risk Guarantee Fund’ need to be expedited.
2. A city level dedicated fund for financing urban infrastructure/amenities including affordable housing need to be created
which may finance affordable housing including slum housing programmes. Resources can be pooled to this Fund
through land monetisation and other innovative sources of funds, contributions from Federal/State/Local Governments,
HFCs, Banks, Financial Institutions/Corporate Bodies, levy of labour cess/slum upgradation cess/service tax on
construction; and Multi-lateral/bi-lateral bodies. There is a need to look at workable models for Social Rental housing
which can be driven through private sector with conducive legal/regulatory environment. In this context, the options of
issuing ‘Rental Housing Voucher’ may be explored.
3. Set up Apex Institution by Government of India for Financing/re-financing Housing Micro finance by MFIs. Development
of a robust micro-mortgage market for mitigating risk of providing institutional credit in EWS/LIG segment may be
explored.
4. Banks lending for affordable housing upto certain limit should be provided with 1 per cent of the loan amount as incentive
for covering their operational costs.
5. Banks/HFCs may be permitted to float tax-free infrastructure bonds to raise cheaper funds and reserve for affordable
housing so that they can reduce the lending rates for EWS/LIG housing loans.
6. Interest Subsidy may be enhanced and targeted for affordable housing. Other Subsidy methods like interest-cum-capital
subsidy may also be worked out Incentives to private builders for creation of affordable/ rental housing stock through
appropriate tax incentives, low cost credit and other incentives like additional FAR/FSI/TDR and so on may be provided.
7. Pre-finance and start-up capital may be provided to NGOs/CBOs for taking up affordable housing programme for the
poor.
8. Substantial enhancement of transfer of funds from Federal/State Govts to Local Governments. To avoid time and cost over
runs, there should be no delay in transferring Land required for projects of affordable housing and slum rehabilitation
programme to ULBs.
9. Enable Municipal Bodies to raise resources through tax-free bonds and transfer of Government land.
10. Municipal Governments should be given a part of the profit earned by the Development Authorities/Improvement
Trusts as suggested by the 2nd Administrative Reforms Commission and Thirteenth Finance Commission to create a
revolving fund for affordable housing.
11. Specific dispensation for affordable housing at municipal level should be considered in the forthcoming Goods and
Services Tax (GST).
12. Initiatives under service level benchmark for water, sanitation and solid waste, as per Thirteenth CFC recommendations,
should include specific coverage of affordable housing.
13. Short-term construction finance should be made available to municipal bodies to meet the immediate shortfall of funds
due to delayed transfer of funds and receipt of beneficiary contribution.

Other Priority Sectors 375
maintaining cultural integrity, essential ecological
processes, biological diversity and life support sys-
tems.’ In 1992, the ‘Earth Summit’ in Rio established
the triple principles of environmental, economic and
social sustainability. Since then, the principles of sus-
tainable tourism have been adopted by the tourism
industry worldwide. In India, the tourism sector is
based on exploiting its unique endowments of bio-
diversity, forests, rivers, and its rich culture and heri-
tage. The challenges in this sector lie in successfully
preserving these in their original form, and making
them accessible to domestic and international trav-
ellers. Tourism in India has the potential to create
economic interest of local communities in the pro-
tection of its natural and cultural endowments lead-
ing to a more sustainable growth.
19.36. The Twelfth Plan envisages a growth rate of
4 per cent in the agricultural sector, 8 per cent in the
manufacturing sector and 9.1 per cent in the services
sector. The annual growth of the Tourism sector is
estimated to be 8.1 per cent during the last five years,
which is marginally higher than the overall economic
growth of 7.9 per cent expected to be achieved dur-
ing the Eleventh Five Year Plan. Under the business-
as-usual scenario, the tourism sector is forecasted to
grow by 8.8 per cent per annum during the period
2011–21 even though, according to the World Travel
and Tourism Council (WTTC), tourism in India has
the highest 10-year growth potential in the World
during 2009–18. The expected growth of the tour-
ism sector is, therefore, inadequate both in terms of
its contribution to the overall economic growth and
its potential. The approach to tourism in the Twelfth
Plan must focus on achieving a substantially higher
growth rate than the aggregate growth rate envisaged
so as to provide a cushion against any shortfall in
other sectors.
19.37. In view of the above, the Twelfth Plan must
evolve a strategy based on the ability of tourism to pro-
mote a more inclusive, sustainable and faster growth
in the face of resource constraints. Tourism should be
accorded a priority status to enable the Government
to achieve its planned growth and employment objec-
tives and foster national integration.
REVIEW OF ELEVENTH PLAN
19.38. For the Eleventh Five Year Plan (FYP), the
vision for the tourism sector was ‘to achieve a supe-
rior quality of life through development and promo-
tion of tourism through a multi-pronged strategy,
that is, (i) Position and maintain tourism devel-
opment as a national priority. In spite of this, the
global ranking of India in respect of ‘Government
Prioritization of the Travel and Tourism Industry’
declined from 59 in 2006 to 80 in 2010.2 (ii) Improve
and expand the development of product and infra-
structure for destination/circuits. This was sought
to be achieved through the centrally-sponsored
scheme ‘Product/Infrastructure Development for
Desti nation and Circuits’ (PIDDC). In spite of these
initiatives, the global ranking of the level of tourism
infrastructure in India (measured by the number of
hotel rooms, number of ATMs accepting visa cards
and the presence of major car rental companies)
improved only marginally from 96 in 2006 to 89 in
2010.3 (iii) Develop and implement an effective pro-
gramme for marketing of brand ‘Incredible India’.
While both central and State Governments allocated
a significantly large proportion of their plan out-
lay on tourism on marketing and social awareness
campaigns, the effectiveness of the marketing strat-
egy is questionable. The global ranking of India in
respect of ‘Effectiveness of Marketing and Branding’
declined from 59 in 2006 to 63 in 2010.4 (iv) Build
capacity of service providers in the tourism sector.
The Central Government launched a scheme to cre-
ate and upgrade adequate institutional infrastructure
for training and certification of manpower resources;
and (v) To enhance and maintain India’s competitive-
ness as a tourism destination. During the Eleventh
Plan period, the global ranking of India in the Travel
and Tourism Competitiveness Index improved from
65 in 2006 to 62 in 2008 and thereafter fell to 68 in
2010 due to increase in out-bound Indian tourists
from 8.34 million in 2006 to 12.07 million in 2010.
TARGET FOR TWELFTH PLAN
19.39. Under the business-as-usual scenario, the
tourism sector is forecasted to grow by 8.1 per cent
per annum only during the period 2011–21 even
though, according to the World Travel and Tourism

376 Twelfth Five Year Plan
Council (WTTC), tourism in India has the high-
est ten-year growth potential in the World during
2009–18. The currently projected growth of the tour-
ism sector is, therefore, inadequate both in terms of
its contribution to the overall economic growth and
its potential, and the Twelfth Plan must target a sig-
nificant improvement.
19.40. The direct employment in the tourism sector
has registered an annual growth rate of 2.04 per cent
during the six-year period 2004–05 to 2010–11. The
employment elasticity with respect to value-addition
in the tourism sector is estimated to be 0.28 during
the same period. This is substantially lower than the
estimated world-wide employment elasticity of 0.65
in the tourism sector. Therefore, there is significant
potential for the tourism sector in India to absorb a
substantially larger workforce.
19.41. In the aforesaid context, three alternative sce-
narios are presented in Table 19.4.
TABLE 19.4
Alternative growth scenarios of tourism
Scenario Growth in
Value-
addition
Growth in
employment
Creation of
New Jobs
over
Plan period
Scenario—I 10 per cent 4.0 per cent 5.5 million
Scenario—II 11 per cent 4.4 per cent 6.1 million
Scenario—III 12 per cent 4.8 per cent 6.7 million
19.42. The growth in direct employment is estimated
on the assumption that in the medium term it may
not be feasible to sharply raise the employment elas-
ticity to the international level but will increase to 0.4
during the Twelfth Five Year Plan.
19.43. The T&T Competitiveness Report5 ranks
India at 12th in the Asia Pacific region and 68th
overall, out of 139 countries in the Travel and
Tourism Competitiveness Index for 2011 down six
places since the Index of 2009. India is well assessed
for its natural resources (ranked 8th) and cultural
resources (24th), with many World Heritage sites,
both natural and cultural, rich fauna, many fairs and
exhibitions, and strong creative industries. India also
has quite good air transport (ranked 39th), particu-
larly given the country’s stage of development, and
reasonable ground transport infrastructure (ranked
43rd). However, some aspects of its tourism infra-
structure remain underdeveloped (ranked 89th),
with very few hotel rooms per capita by international
comparison and low ATM penetration. Another area
of concern is the policy environment, which is now
ranked 128th, with much time and cost for starting
a business, bilateral Air Service Agreements that are
not assessed as open, and visas required for most vis-
itors. Other areas requiring attention are health and
hygiene standards (112th) and the country’s human
resources base (96th). It is imperative to point out
that India has the advantage of a strong domestic
tourism base which is likely to further grow on the
back of a rapidly rising middle class with increased
disposable incomes and awareness. However, much
of the domestic tourism is ‘low end’ and the chal-
lenge is to persuade ‘high end’ domestic tourists to
substitute domestic tourism for foreign tourism by
upgrading the tourism related infrastructure and the
quality of tourism services.
19.44. In spite of low rankings on the Competitive-
ness scale, India can leverage its higher ranking in
certain categories to exploit its tourism potential
over the next decade with proper planning. This
potential, exploited in an intelligent and sustain-
able manner, can prove to be the proverbial engine
of growth for India. This can be achieved only with
active cooperation from the States/UTs.
19.45. The approach to tourism in the Twelfth Plan
must focus on achieving a substantially higher annual
growth rate of 12 per cent in the value addition in
the tourism sector during the Twelfth Five Year
Plan. The strategy for promoting tourism should be
re-oriented to increase the employment elasticity in
the tourism sector to the international level. Further,
India should strive to be amongst the top 50 coun-
tries in the Travel and Tourism Competitiveness
Rankings by the terminal year of the Twelfth Five
Year Plan and increase the share of India to 1 per
cent in Global foreign tourist arrivals.

Other Priority Sectors 377
STRATEGY FOR DEVELOPMENT OF TOURISM
DURING TWELFTH PLAN
19.46. Tourism in India has the potential to pro-
mote faster, sustainable and more inclusive growth.
However, during the Eleventh Plan period this
potential could only be partially realised. In the
Twelfth Five Year Plan period, it is necessary to re-
orient the strategy so as to achieve the targets set-out
in the earlier section.
19.47. The traditional approach to tourism devel-
opment is a direct result of an extremely open and
deregulated world economic environment. This
approach is characterised by inequity in redistribu-
tion of economic benefits. Over the last two decades,
new non-traditional approaches like eco-tourism6
which are concerned more with ecological and cul-
tural conservation than poverty reduction have
become popular. The aim is more on minimising
costs on people’s lives rather than bringing benefits
to them. The approach for development of tourism
in the Twelfth Five Year Plan should be re-oriented
to eliminate poverty.
19.48. The Approach Paper to the Twelfth Plan
released by the Planning Commission lays down
the overall strategy for enabling tourism to realise
its potential. It emphasises the need to adopt a ‘pro
poor tourism’ approach aimed at increasing the net
benefits to the poor from tourism and ensure that
tourism growth contributes to poverty reduction.
The benefits may be economic, social, environmen-
tal or cultural. For this purpose, the Approach Paper
identified the need for developing a comprehensive
set of strategies for a diversity of actions, from micro
to macro level, including product and infrastructure
development, marketing, branding and promo-
tion, planning, policy and investment and increas-
ing the spread of benefits to the weaker sections. It
also prescribes that the ‘principal strategy’ to realise
the tourism potential of India’s enormous assets,
namely historical sites, places of religious signifi-
cance, and its vast range of national attractions, must
be to focus on developing clusters or circuits around
such assets. The development of these clusters/cir-
cuits requires collaboration between many agen-
cies at the local level to create an attractive and safe
transit experience. Therefore, development of tour-
ism requires that States take a leading role in devel-
oping their own tourism potential to obtain growth
in employment as well as State Domestic Product.
19.49. Pro-poor tourism is increasingly becoming
popular but there are not many places in the world
where this initiative has been effectively imple-
mented in line with pro-poor tourism principles. In
2006, the Kerala Department of Tourism proactively
decided to make the state tourism policies more ‘pro-
poor’ through the framework of Responsible Tourism
(RT) Initiative. Under this initiative, development
of tourism in Kumarakom was taken up as a pilot
destination. The initial phase was characterised by
local farm land being converted into tourism infra-
structure, reduction in agricultural production and
increase in wage income of the local workers from
the hectic pace of construction activity. However, it
soon became apparent that the gap between the tour-
ism industry and the local population was rapidly
widening. Most villagers eventually got into financial
difficulties after losing their land and no meaningful
skills with which to operate tourism activities.
19.50. Eventually it became apparent that the local
people in Kumarakom were not benefitting from
the new tourism businesses. While many job oppor-
tunities were created with the opening of hotels and
restaurants, they could not be availed by the local
people since the local wages were substantially higher
than those in other parts of the country. Over 80 per
cent of the hotels’ staff was recruited from outside
Kumarakom; a significant number of them were
from Northeast India, the poorest part of the coun-
try. Further, the working conditions in the tourism
sector were very poor: workers had no job security,
there were many cases of broken contracts without
sufficient reasons and employees were poorly paid.
19.51. Besides, the locals in Kumarakom became
victims of the tourism industry in many other dif-
ferent ways. Villagers’ lifestyle and occupations were
closely related to the canals, bays, lakes and shores
in the area that have been using for fishing, collect-
ing shells, or as a mean of transportation. However,
many resort-owners closed the access to lakes and

378 Twelfth Five Year Plan
canals for the local community in order to satisfy the
tourists’ need for privacy and tranquillity. In addi-
tion, resorts increasingly operated tourist cruises in
the backwaters by motorboats, which have consid-
erably damaged the fishing nets used by local fish-
ermen. A survey conducted by Equations in 2002
among 140 households in the village shows that
tourism expansion has not meaningfully contributed
to infrastructure development and improvement of
the living standards of people of the community.
Responding to the query whether development of
tourism in Kumarakom has improved the overall
development of the region, 62 households responded
that tourism had not made any significant contribu-
tion to improving roads or transportation system.
Similarly, 87 households responded in the negative
regarding the supply and quality of water, 90 house-
holds responded in the negative for the electricity,
and 99 responded in the negative on the possibility
of getting an employment.
19.52. The Department of Tourism of Kerala dec-
lared the place as a pilot destination for Respon sible
Tourism in 2007 but it was extremely difficult to
commence work on the project due to local resist-
ance. It was possible to start the implementation of
the initiative only after the Panchayat representatives
and officials from the Kerala Department of Tourism
organised a mass meeting in May 2007 to explain the
schedule, the means, aims and objectives of the RT
initiative and the key players involved.
19.53. The first objective was to revive the agricul-
tural sector in Kumarakom. The Department of
Tourism sought the help of Kudumbashree, the Pan-
chayat and Kerala Institute of Travel and Tourism
Studies (KITTS) to conduct a survey and analysis of
the possibility of linking the local population with
the tourism businesses and market. For this pur-
pose, first, KITTS identified the most vulnerable
groups, that is, families of farmers living below the
poverty line and the local producers who had diffi-
culty in accessing the market to sell their produce.
In addition, KITTS researchers conducted a survey
of the hotels and restaurants to establish their exact
requirement for fruits and vegetables. Based on the
survey results, the Destination Level Responsible
Tourism Committee (DLRTC) cell prepared an agri-
cultural calendar for the supply of produce to the
hotels, that is, what should be cultivated and when,
and the overall amount that will be needed by the
hotels. This process made it possible for the local
self-government to establish the link between the
local farmers and the hotels. Consequently, 18 hotels
and resorts agreed to purchase their vegetables,
fruits, and so on, exclusively from local producers.
19.54. In spite of the agreement, the hotels and
resorts refused to buy the local produce when all the
crops were ready for harvest in February 2008. Most
of them argued that Kumarakom produce were too
expensive relative to neighbouring Tamil Nadu. The
crisis was averted only with the firm intervention of
the State Government; the hoteliers and resort own-
ers were firmly requested to co-operate with the initi-
ative and respect the agreement. Two weeks later, 15
hotels, among them the luxury Taj Resort and Lake
Resort, made a written and formal agreement with
DLRTC and the Panchayat to purchase the produce
from the local farmers. The first sales of the produce
were made to the hotels and resorts on 18 March
2008. The farmers and tourism business owners now
enjoy a healthy working relation. The RT initiative
in Kumarakom has reached 1,350 direct beneficiaries
through this agricultural project.
19.55. The RT initiative has produced several real
and quantifiable results within one year of its imple-
mentation. Some of the important outcomes are
significant increase in local agricultural production,
creation of a cultivation calendar, creation of sys-
tems for steady prices to avoid inflation and market
fluctuations, creation of 10 Karshakasamity (farm-
ers groups), with a total of 460 people, creation of 20
Kudumbashree units, with a total of 250 women, cre-
ation of five Micro Enterprises focused on women,
one women fish processing unit, one women chicken
processing unit; one women Chapathy (local bread)
processing unit and two coconut supply units.
19.56. One year after the initiation of the RT in
Kumarakom, new projects were developed to enable
local people to access the tourism market and ben-
efit from it. A link between several tourist hotels

Other Priority Sectors 379
and some local artists was established whereby, the
hotels agreed to buy products, services or perfor-
mances from two handicraft units, one women’s cul-
tural group performing Thiruvathirakaly (traditional
Kerala dance art), and one women’s painting group.
Besides providing additional income for the art per-
formers, this project also enables the promotion and
conservation of the traditional art forms from Kerala,
and avoids the usual cultural breakdown that hap-
pens when tourism is developing in a destination.
19.57. In July, 2009, a new initiative called the ‘Vil-
lage Life Experience @ Kumarakom’ was launched.
Under this initiative, the tourists are taken around
villages to have a real experience of the village life
where they can enjoy a visit to a fish farm; vegetables
and fruits farm, duck farm, paddy fields, and can also
learn a bit about the traditional fishing techniques.
The cost for a half-day trip is about `1,000 and the
amount of money earned is equally divided among
the villagers who participate in the tour.
19.58. Further, there is also a very special role for
women in the Responsible Tourism initiatives and
projects. In co-operation with Kudumbashree, 760
women are included in the cultivation programme,
35 in retail activities, 30 in art and cultural groups,
and 45 in the village tour group. This is an important
step toward women empowerment in Kumarakom;
these groups of women are now participants in deci-
sion making for the programme. In such a way, a
carefully managed tourism industry can help the
poor rural women to become increasingly empow-
ered, improve their status in their families and within
the society.
19.59. The learning experience from the implemen-
tation of the pilot project in Kumarakom, Kerala
provides a successful pro-poor tourism model for
replication across the country with such localisation
as may be necessary.
19.60. In view of the above, a ‘pro-poor tourism’
approach should be adopted for development of
tourism and furthering the objectives of the Twelfth
Plan. The goal of ‘pro-poor tourism’ is to bring
net benefit to the poor and marginalised through
tourism activities thereby, eliminating poverty. The
means to achieve this goal is to expand the opportu-
nities for them through capacity building and trans-
fer of skills in close co-operation with the education
and training sector and microfinance institutions.
‘Pro-poor tourism’ has a holistic notion of poverty
alleviation. Non-economic benefits are as impor-
tant as economic gains. An improved management
approach of the tourism industry can provide new
skills, better access to education and health care,
improving access to clean water and transportation
networks. Intangible benefits may also be provided
such as access to information, opportunities to com-
municate with the outside world, increased access to
market opportunities, strengthening the community
institutions and structures, and enhancing commu-
nity pride.
19.61. ‘Pro-poor Tourism’ is essentially about redis-
tribution of resources and opportunities and not just
the creation of a new tourism product. Therefore, a
proactive interventionist approach is needed from
the governments in order to effectively realise the
objective of the concept. Since the poor and margin-
alised communities do not have the avenues to nego-
tiate with tourism companies, the authorities have
the responsibility to advocate for and promote their
interests. Governments need to change their poli-
cies and create new ones that cater for the needs of
the marginalised within the tourism industry frame-
work. Without such actions at the macro level, ‘pro-
poor tourism’ may remain a niche market without
addressing the larger picture of poverty reduction
objective.
19.62. The ‘pro-poor tourism’ approach comprises
of practical strategies based on the principles under-
lying the approach. These practical strategies essen-
tially focus on three core areas: increased economic
benefits, positive non-economic impacts, and policy/
process reform. In each area three distinct (but often
overlapping) methods can be identified.
19.63. The increased economic benefits can be
achieved by (i) expanding business opportunities for
the poor; (ii) expanding employment opportunities
for the poor; and (iii) enhancing collective benefits.

380 Twelfth Five Year Plan
Business opportunities for the poor can be expanded
by enabling them to set up small enterprises, partic-
ularly in the informal sector. The main activities in
this area should be enterprise support, expansion of
markets and development of complementary tour-
ism enterprises, such as craft initiatives and cultural
displays. Local enterprises need to be developed to
supply the tourism industry itself (for example, with
accommodation, food and materials). A wide range
of measures will have to be used to overcome the
multiple barriers to economic participation (such
as lack of credit, inappropriate social organisation,
insecure tenure and remote location). Since local
entre preneurs generally lack entrepreneurial skills
to engage with private operators in the formal tour-
ism sector, training will need to be a key interven-
tion. Further, there is a need to combine supply side
measures (developing products and skills directly
with the poor) with measures to expand demand for
the products and services of the poor amongst tour-
ists and operators. Supportive NGO-type organisa-
tions dedicated to supporting small enterprises need
to be encouraged to assist them. The employment
opportunities for the poor can be expanded by ensur-
ing that the investors and operators in the formal
tourism sector are committed to source employment
locally thereby, also benefitting from low staff turn-
over. However, the jobs should not be concentrated
among few families and the better off in the local
community. Further, focus must also be placed on
pursuing skills development to enable local commu-
nity to take up skilled jobs which may be created. The
collective community income can be enhanced, inter
alia, through levies on tourists and operators; equity
partnerships in which the community holds a stake;
lease fees paid by private operators; and donations
from tourists. However, it is necessary to develop
strong, accountable and transparent community
organisations to ensure that the collective income is
not misused. The enhanced collective benefits can
spread benefits well beyond the direct earners.
19.64. The non-economic benefits can be increased
by (i) Capacity building, training and empowerment;
(ii) Mitigating the environmental impact of tourism
on the poor; and (iii) Addressing social and cultural
impact of tourism. Capacity building is central to the
strategy in increasing non-economic benefits since
the poor often lack the skills and knowledge to take
advantage of opportunities in tourism. Investment in
capacity building is essential but a long-term process.
The main focus should be on increasing poor peo-
ple’s basic understanding of tourists and the tour-
ism industry; training in business skills; and local
institutional capacity building for empowerment.
Environmental sustainability is an important ele-
ment of ‘pro-poor tourism’ since tourism can lead to
displacement of the poor from their land and/or deg-
radation of the natural resources on which the poor
depend. Therefore, tourism should be integrated
with broader rural development work that includes
natural resource management activity. The social
and cultural impact of tourism can be addressed by
promoting cultural tourism which allows for capi-
talising on cultural assets which are predominantly
owned by the poor. Similarly strategies should be
designed to improve local infrastructure, health care
and access to information and communication.
19.65. The policy/process reform should focus on
(i) promoting participation; (ii) bringing the private
sector in the formal tourism sector into business
partnerships with small local entrepreneurs; and
(iii) building a more supportive policy and plan-
ning framework. Participation can be promoted by
enhancing the participation of the local community7
in decision-making. Tourism should be integrated
into the participatory district planning process as one
of a range of opportunities for local economic devel-
opment. The private sector in the formal tourism sec-
tor should promote business partnerships by acting as
an important market for the products of small entre-
preneurs (for example, goods and services purchased
for a lodge). Private companies, particularly tour
operators and agents, should also channelise their
own clients to small enterprises of the local com-
munity. The formal tourism sector will need to take
responsibility for developing local, skills marketing
links, and commercial expertise of locally driven
tourism enterprises. The policy and planning frame-
work can be a strong enabler of ‘pro-poor tourism’.
Therefore, there is a strong case for reform. Some of
the most influencing strategies include promoting
participatory planning; increasing communication

Other Priority Sectors 381
with Government and establishing a voice for small
producers; lobbying government for supportive
policies and legislation—both within tourism and in
other sectors (for example, land tenure, infrastruc-
ture, local planning); lobbying the local conserva-
tion authority to invest in destination marketing and
infrastructural development and to lift restrictions
on development; promoting inter-departmental ini-
tiatives and coordination; linking with the national
tourism authority; and using Government’s power to
allocate concessions to influence investors.
19.66. In general, tourism provides better opportuni-
ties for women’s participation in the workforce, wom-
en’s entrepreneurship, and women’s leadership than
other sectors of the economy. Women in tourism are
still underpaid, under-utilised, under-educated, and
under-represented; tourism offers pathways to suc-
cess. The ‘pro-poor tourism’ approach should be a
vehicle for furthering the advancement and empow-
erment of women who constitute a large proportion
of the most vulnerable in the local community. The
Global Report on Women in Tourism 2010 has made
a set of recommendations for increasing the par-
ticipation of women in tourism which should form
the agenda for increasing participation of women
in tourism. These recommendations need to be
integrated into the ‘pro-poor tourism’ approach to
enhance the ‘inclusive’ agenda for the Twelfth Plan.
19.67. The implementation of various strategies for
development of tourism would involve developing
formal and informal links between all stakeholders
and coordination across all levels of Government.
It would be necessary to establish a ‘whole govern-
ment’ agenda for tourism development between
departments at national level and between national
and local government so as to create convergence
and synergy across programmes. This requires that
awareness is created amongst all stakeholders and
across Government about the contribution of tour-
ism to local livelihoods and engage them in joint
initiatives to increase the local economic develop-
ment and impact on poverty reduction. The National
Tourism Policy should reflect clear progress in ‘tilting’
tourism to unlock more opportunities for the poor.
It should form an integral part of the poverty reduc-
tion strategy during the Twelfth Five Year Plan.
19.68. The realisation of the country’s huge, barely
tapped, tourism potential is contingent upon simul-
taneously addressing the multiple challenges thrown
up by capacity constraints and inadequate policies.
These constraints include inadequate transportation
infrastructure; accommodation; land; multiple taxes
and an overall high tax burden; inadequate financial
resources for enterprises; skills; safety and hygiene
conditions around tourist attractions; and conver-
gence of actions by multiple agencies. The challenges
are further magnified in the context of a federal
structure where the responsibilities for policymaking
and implementation fragmented across levels of gov-
ernment and coordination between them is often
lacking.
DEVELOPMENT OF TOURISM INFRASTRUCTURE
19.69. Availability of good infrastructure is one of
the essential requirements at selected tourist destina-
tions. The infrastructure for tourism includes travel
infrastructure networks like airports, railways, roads,
waterways, telecommunications; amenities like elec-
tricity, water supply, drainage sewerage, solid waste
disposal systems and tourism facilities, services and
amenities like accommodation, restaurants, recre-
ational facilities and shopping facilities. The opera-
tion of tourism facilities, services and amenities are
often dependent on a number of travel infrastructure
networks. The most usual case in tourism develop-
ment is for infrastructure development to precede
the completion of the tourism facilities. This means
that the installation of the infrastructure becomes a
public sector responsibility. The case for infrastruc-
ture services being a public sector responsibility is
based on the consideration that the network of ser-
vices is available to both tourists and residents of
the area and the construction of an integrated sys-
tem would also facilitate non-tourism development
within the region.
19.70. In terms of the federal framework of the
Constitution, the responsibilities of the Union
Government and the State/UT Governments are
elaborated in separate schedules to the Constitution.

382 Twelfth Five Year Plan
The Central Government is responsible for mat-
ters such as external affairs, visa regulations, foreign
exchange regulations and import/export procedures,
while the State/UT Governments are responsible,
inter alia, for law and order, land use, civic ameni-
ties, shops and establishments. These Governments
have separate agencies for dealing with specific sub-
jects and regulations. For example, the Ministry of
Tourism in the Union Government is concerned
with the over-all coordination and planning of tour-
ism development in the country and for undertaking
tourism promotion and publicity in the interna-
tional market. However, the State/UT Governments
control all factors of production including land in
their territories. Further, there is empirical evidence
to suggest that a significant proportion of their tax
revenues is attributable to consumption by tour-
ists. Therefore, the State/UT Governments have the
responsibility and the incentive for facilitating the
creation of infrastructure for tourism. The role of
the Union Government is restricted to establishing a
policy and regulatory framework, creating the appro-
priate incentive structure and synergising the activi-
ties of different infrastructure sectors across levels
of government and supplementing these efforts by
financial assistance.
19.71. The strategy for development of tourism
infrastructure should essentially focus on identi-
fying clusters of habitations/destinations having
unique craft, ethnic art form, culture and heritage,
natural spots for development as tourism products
and develop tourist circuits/destinations around
them on a Mission Mode with the active participa-
tion of local communities. As part of this strategy,
State Governments should be expected to identify
at least one integrated tourist circuit, map all the tan-
gible and intangible natural and cultural assets along
the circuit, estimate the sustainable destination car-
rying capacity and undertake a gap analysis of the
travel infrastructure network and tourism facilities,
services and amenities. Based on this, a comprehen-
sive integrated physical and financial plan should be
prepared through a community participatory pro-
cess. The Plan should identify, inter alia, the win-
ners and losers, agencies responsible for executing
the sub-components of the plan and the timelines
for achieving the milestones. The integrated plan
should be approved and monitored by the Ministry
of Tourism as part of the Product/Infrastructure
Development of Destination and Circuits Scheme
(PIDDCS). To the extent there is shortfall in the
financing of the plan, the same may be considered for
financing under the PIDDC subject to a ceiling there
under. The PIDDC scheme should also be modified
along the lines recommended in the Report of the
Steering Committee to the extent they are not incon-
sistent with the recommendations in this Chapter.
19.72. Easy access to tourism destinations in terms of
international transport and facilities for easy move-
ment within the destinations are prerequisites for the
development of tourism. India ranks 39th and 43rd
in the Travel and Tourism Competitiveness Index
2011 for Air Transport Infrastructure and Ground
Transport Infrastructure respectively. However, its
rank in respect of Airport density is as low as 135
from amongst 139 countries and 90 in respect of
quality of roads. India’s ability to open up new areas
and properly service emerging tourism resorts, while
also providing access to natural tourism attractions
and circuits for tours will significantly depend upon
its ability to quickly improve the airport density
and quality of rail and roads. The existing Pradhan
Mantri Gram Sadak Yojana (PMGSY) and other
schemes of the Central Government could be used to
improve the quality of transport infrastructure.
19.73. In terms of investment, especially private
investment, tourist accommodation represents the
most expensive facility in tourist resorts. In the past
few decades, the character and composition of tour-
ist accommodation has undergone considerable
change. New types of accommodation, such as self-
catering units, home stay, budget hotel accommoda-
tion and camping sites, have evolved to meet market
demands for increased levels of independence, self-
sufficiency, informality, economy and convenience.
Such changes have been influenced by the emer-
gence of the new types of travellers and the tourists
who invest in a holiday home or unit in a preferred
tourism destination. As the spectrum of travellers
has undergone transformation, there have also been

Other Priority Sectors 383
changes in the requirements for traditional hotel
accommodation.
19.74. The availability of hotel rooms in India is
extremely limited; it ranks 136th from amongst 139
countries ranked on the basis of the number of hotel
rooms. Further, there is acute shortage of land in
urban areas particularly in cities due to land mar-
ket distortions discussed separately in Chapter 4.
Therefore, the prospect of large-scale new tradi-
tional hotel accommodation is extremely limited. It
is imperative to expand the number of registrations
under the home stay scheme in various stays so as to
significantly augment hotel room capacity in India.
This will open up new livelihood opportunities for
local people.
HUMAN RESOURCE DEVELOPMENT AND
CAPACITY BUILDING
19.75. Tourism is a labour-intensive industry and
a major source of employment. Therefore, issues
of human resources development and capacity
building are extremely important. The problem of
human resource is identified as a shortage of trained
labour; lack of trainers; inadequate training materi-
als and lack of tourism education strategies as part of
national tourism planning. Other issues concerning
human resources development in the tourism indus-
try include: working conditions, availability of edu-
cation and training, policy issues, information and
technology and cultural issues.
19.76. Developing human resources in the tourism
sector faces unique challenges because customer
preferences, travel patterns, information technology
and conditions at destinations are changing rapidly.
As a result, strong and flexible human resources
development strategies are needed. The strategy
should mirror human resources needs and the cor-
responding recruitment, employment and training
requirements.
19.77. Training programmes need to articulate well
with employment creation, for maximum synergy.
Training should be strictly need-based and demand-
led. Thus, it is necessary to establish linkages with
various labour market institutions and processes:
labour market information, employment services,
public works, credit and other support to small enter-
prises, unemployment and social support services
and so on. Training services for existing enterprises
to upgrade and re-orient technical skills or develop
management capacity can help stimulate their labour
absorption, avoid retrenchments and facilitate rede-
ployment of retrenched workers. Therefore, the tour-
ism training strategy should focus on employability,
sustainability and promotion of decent work culture
especially to safeguard foreign tourists. In the light of
the above, the following initiatives need to be under-
taken during the Twelfth Plan period to expand the
tourism related human resource base:
a. Setting up new SIHMs: Government will need to
accord permission to set-up new SIHMs which
will also implement the craft courses, short dura-
tion skill development courses and skill certifica-
tion programme.
b. Setting up of new Food Crafts Institutes (FCIs):
Government will need to sanction new FCIs to
increase the number of turn-outs with hospital-
ity skills and ensuring sustainable operations.
c. Setting up of a Hospitality University: Presently,
an IHM affiliated to the NCHMCT awards a B.Sc.
(Hotel and Hospitality Administration) degree
of Indira Gandhi National Open University
(IGNOU). It is felt that hospitality education
course will be pursued as part of the mainstream
academic effort only if it is part of a regular
University. Accordingly, IHMs will be affiliated
to local or Central Universities for awarding a
B.Sc. (Hotel and Hospitality Administration).
d. Revamping NCHMCT: Hospitality education,
especially at the degree level, needs to be posi-
tioned as a mainstream discipline
e. Preserving and promoting Indian Cuisine—
Setting up of a Indian Culinary Institute (ICI):
The proposed Indian Culinary Institute (ICI),
would be set up with headquarters in the
National Capital Region, and six regional cen-
tres located in four metropolitan cities, one in
Central India and one in the North East. The
Institute should be set-up under a PPP mode so
that industry expertise from the private sector
could be used to build quality and brand value.

384 Twelfth Five Year Plan
f. Expansion of Indian Institute of Tourism and
Travel Management (IITTM): This initiative will
include setting up of a North-Eastern Centre of
the IITTM; seeking Deemed University/Institute
of National Importance status for the IITTM;
and developing Simulation Labs at IITTM
Centres for hands on training.
g. Reorganising the Indian Institute of Skiing and
Mountaineering, Gulmarg: IISM is presently a
subordinate office of the MOT. The possibility of
its being incorporated in the IITTM as a centre
would be explored. The financial assistance for
infrastructure upgradation of IISM under the
Plan Scheme may also be extended.
h. Modifications in the Scheme of Assistance to IHM/
FCI: The Scheme of Assistance to IHMs/FCIs
and so on, under the Ministry of Tourism, intro-
duced in 2008, enables the Central Government
to establish institutional infrastructure necessary
for supporting hospitality and tourism related
training and education. Based on the experience,
appropriate amendments to the Scheme should
be made to enhance its effectiveness and impact.
i. Expand the scope and size of the Hunar-se-
Rozgar program.
j. Promotion of excellence in institutes: promotion
of research and specialisation in tourism; aca-
demic audit of the hospitality institutes; curricula
review; faculty development; students’ exchange
programme; and attached applied training cen-
tres/training hotels.
k. Merits-cum-scholarships: Introduce a scheme to
provide financial support to meritorious students
on merit-cum-means scholarship to encourage
students to opt for tourism-related courses.
19.78. Market Pulse has estimated a total additional
requirement of 77,000 trainers during the Eleventh
Plan period. Train-the-trainers strategies can often
ensure that a critical mass of experts and experience
is made available on a larger scale. A significant posi-
tive impact can be created over time on the indus-
try as a whole if a small number of participants are
equipped with the skills to train, educate, and service
workshops. As of now, there is no dedicated teach-
ers’ training institute. Therefore, the following mea-
sures are recommended to meet the gap:
a. Setting up of dedicated teachers’ training insti-
tutes: The MOT will set up need based autono-
mous training institutes catering to the needs of
the hospitality and tourism sectors both at skill
and diploma/degree levels.
b. Designating some IHMs as teachers’ training
institutes with need-based infrastructural and
faculty strengthening.
c. Setting up of Training Institutes in Rural
Areas: In collaboration with Ministry of Rural
Development, attempts would be made to
explore the possibilities of setting up of training
institutes in rural areas to conduct training for
forest guards, handicraft workers and so on.
19.79. In 2011, Ministry of Tourism commis-
sioned a study by Market Pulse, which estimated a
requirement of 36.18 lakh skilled manpower in the
hospitality sector. However the Institutional capaci-
ties (including the National Skill Development
Corporation) created by the end of Eleventh Plan
would be able to fulfil only 10 per cent of the esti-
mated additional requirement of manpower in hos-
pitality and tourism sector (inclusive of supply from
Non-MOT sources). Thus, there is need to give a
major boost to the initiatives through convergence
with the other ministries of GOI, States/UT admin-
istration and the Private Sector. In governments,
it is essential to involve all relevant ministries and
agencies, not only in environment but also tour-
ism/economy, education, foreign affairs, planning,
regional affairs and finance/budgeting. At times,
it may be important to institutionalise these multi-
stakeholder and inter-institutional boards by estab-
lishing a national committee or council for tourism
education and training, so that initiatives can survive
beyond short political mandates and/or circum-
stances. Such a committee or council could be advi-
sory and consultative and should bring together the
various ministries; workers’ organisations (unions);
professional and trade associations (employers), the
national association of hotel and tourism schools and
all other parts of the tourism sector. Similarly, since
almost all tourism employment will be in the private
sector, it is crucial that the private sector participates,
provides support and resources and gives consulta-
tion. The private sector must ensure that it benefits

Other Priority Sectors 385
from national objectives, strategies and policies for
human resources development in the tourism indus-
try. Trade associations need to play an important
role to encourage the private sector’s direct contribu-
tion to tourism human resources development.
19.80. With a view to ensuring the successful imple-
mentation of the various initiatives relating to human
resource development, it is necessary to establish
separate institutional structures for developing,
implementing, monitoring and evaluating the pro-
grammes. For this purpose, it is recommended that:
a. Separate divisions should be established in the
Ministry of Tourism to deal with degree and
higher level tourism education and skill training
programmes.
b. The institutional infrastructure envisaged in the
Twelfth Plan, and the carry over work from the
Eleventh Plan, is a means to providing trained
manpower to the Industry. Timely completion
of the projects sanctioned is, therefore, of para-
mount importance. A Programme Monitoring
Unit (PMU) with adequate staffing should be
set-up for projects sanctioned under the Scheme
of Assistance to IHMs and so on.
c. The various initiatives relating to human
resource development for the tourism sector
will enable the Ministry of Tourism to annually
train 2.5 lakh persons for employment in the
tourism sector and partially meet the human
resource gap.
CAMPAIGN CLEAN INDIA
19.81. A study conducted by MoT at important
tourist destinations revealed that cleanliness and
hygiene at these places was much below the accept-
able level. This not only inconvenienced the tourists,
both domestic and foreign, but also had a pull-down
impact on image-India. Government should launch a
Clean India Campaign by adopting a multi-pronged
strategy comprising of persuasion, education, sensi-
tisation, training, demonstration and regulation. The
Campaign should involve every strata of the society,
the NGOs and the Corporate Sector. For steering
and monitoring the Campaign, a dedicated Cell in
the MoT should be set up. As a first step, top 50 most
popular monuments and tourist sites may be identi-
fied for setting-up pay toilets with separate facilities
for women and the physically challenged.
PUBLICITY, PROMOTION AND MARKETING
19.82. In order to promote and market brand India
and increase India’s share in global tourists’ arrival to
1 per cent, it is imperative to adopt a multi-pronged
tourism marketing strategy. Some of the important
elements of the strategy are discussed below:
a. Establish overseas tourism offices/information
centres in the target markets
19.83. Ministry of Tourism should enhance the reach
of brand ‘Incredible India’ and increase inbound
tourism from established source markets and new
potential markets which increasingly contribute to
global traffic like Spain, Russia, South America, and
Scandinavian nations, Thailand, Malaysia and Korea
and so on. The existing scheme of opening tourist
marketing offices of the Ministry of Tourism should
be supplemented by appointing ‘India Tourism
Marketing Representatives (ITMR)’. The ITMRs
would be private firms and companies who would
represent and undertake required promotional activ-
ities in the desired markets in the local language on
behalf of the Ministry of Tourism. They will have
the necessary market intelligence to work with the
local trade in their language on increasing aware-
ness, undertaking publicity and branding, facilitat-
ing travel trade, printing of collaterals and so on. The
ITMRs will be paid performance related charges for
the services rendered by them.
b. Produce effective marketing and promotional
materials
19.84. The medium of ‘Cinema and TV’ is a power-
ful tool for the development and promotion of des-
tinations. Several destinations have indeed gained
by being the venue/location of popular cinema and
TV. Ministry of Tourism should extend support for
the production of films (international and domes-
tic) showcasing tourism destinations in the country.
Details of the scheme for extending such support
may be worked out in collaboration with the stake-
holders. To further leverage the medium of cinema

386 Twelfth Five Year Plan
and TV, the Ministry may also partner with major
cinema and TV-related events.
c. Promote travel festivals
19.85. An annual National Travel Mart under the
title ‘Global Travel Mart, India’ should be organised
every year with the main objective of attracting buy-
ers to an event which offers them the entire range of
Travel and Tourism products and services in India,
in one location. The scope of the fair should include
Travel trade. Government should also organise ‘India
Festivals’ in important overseas markets to showcase
and promote the tourism destinations, culture, cui-
sine, handicrafts, textiles and costumes, and so on,
of the country. These events should be organised by
the Indian tourist industry in collaboration with all
the stakeholders but the cost should be borne by the
Central and State Governments. Similarly, business
meetings may be organised between tour operators
from India and the Festivals hosting country.
d. Develop a specialised website for tourism products
19.86. During the Eleventh Plan, there was a greater
focus on print, television and outdoor advertising.
However, with the growing importance of informa-
tion technology and internet as a powerful tool for
communication, greater emphasis need to be placed
on online campaigns, interactive/social media and
other modern and innovative technology spheres
(for example, i-pad). E-learning online programmes
like ‘Know India’ with video walk-in and multiple
languages may be undertaken in overseas markets to
educate and equip the tour operators.
e. Arrange more familiarisation trips for travel
agencies abroad
19.87. Road Shows should be organised in over-
seas markets, in collaboration with all stakeholders
for promoting tourism destinations, products and
tour packages in the country. These Road Shows
may include business meetings. Government may
also host ‘Mega Familiarization Tours’ inviting tour
operators, travel agents, trade partners and famous
travel writers to India to obtain first-hand knowledge
of Indian tourism products. Similarly, sub-national
governments should be encouraged to organise road
shows in other States/Union Territories to promote
their tourist destinations and products.
f. Arrange international meetings in the region
where delegates can be exposed to tourist attrac-
tions and activities
19.88. International Buddhist Conclave should be
organised every two years with the objective of pro-
moting Buddhist circuits and sites in the country.
The conclaves may host eminent scholars, tour oper-
ators, media and opinion makers from India and
abroad. Similarly, conclaves could be held for other
religious and cultural groups.
g. Advertorial campaigns to promote and provide
information about new and niche tourism prod-
ucts and destinations
19.89. The Incredible India campaigns have been
generic in nature and have effectively generated
general awareness about India as a tourism destina-
tion. The campaigns should be more focused and
niche tourism products of the country like Heritage
Home Tourism, Religious Tourism, Rural Tourism,
Wellness and Medical Tourism, MICE Tourism,
Adventure Tourism, Golf, Polo, and so on, should
be promoted aggressively through the Campaigns.
Specific Road Shows focusing on these Niche
Products may also be organised overseas, in asso-
ciation with stakeholders from the relevant fields.
The Himalayas and the Sayadhris can be promoted
aggressively as destinations for adventure tour-
ism, wildlife and indigenous culture and heritage.
Similarly, other physical features of the country need
to be exploited.
h. Undertake social awareness campaigns
19.90. The ‘Atithidevo Bhava’ campaign should be
re-enforced to generate wide-spread awareness on
issues related to good behaviour towards tourists,
civic responsibilities, security and comfort of tourists
and so on. It will also help to train local policemen to
bring about an attitudinal change towards tourists.
i. Public–Private Co-operation
19.91. Cooperation among public and private sec-
tors is essential in the development of hospitality and
tourism marketing mix. The NTO and the private

Other Priority Sectors 387
sector should put more efforts in searching and shar-
ing tourism promotional funds, product develop-
ment, raising awareness of the destination.
PROMOTING SUSTAINABLE TOURISM
19.92. India provides enormous experiential oppor-
tunities for tourists based on the wide variety of all-
season attractions available throughout the country.
It is imperative that these attractions get developed
for the socio-economic benefit of the local com-
munities, especially in order to strengthen inclu-
sive economic growth. It is equally important to
ensure that increased socio-economic well-being
does not cause permanent or long-term damage to
the country’s physical, cultural and environmental
heritage. The use of existing resources, both tangible
and intangible, has to be undertaken judiciously for
the well-being of the present generation but not at
the cost of depriving future generations of any part
of our inheritance. Promoting sustainable tourism
will enable the country to take full advantage of the
potential of tourism for inclusive growth with live-
lihoods support to the poor, most disadvantaged,
women and youth. Therefore, growth of tourism
needs to be sustainable to meet the overall objective
of the Twelfth Plan.
19.93. Against this background, it is necessary to
define the Sustainable Tourism Criteria for India
(STCI) and the indicators. The STCI system should
be evolved to address the issues relating to the modus
operandi of the STCI certification mechanism;
incentivising STCI certification; capacity building in
industry and the Government; creating governance
coefficients using contemporary technology; griev-
ance redressal and review of the certification process.
19.94. STCI needs to be immediately operation-
alised. In the initial years, the adoption of STCI by
individual tourism establishments will have to be
voluntary. For implementation of STCI, a system
of rating/certification of establishments would have
to be evolved. Such a system would need to address
key issues like type of rating; incentive for rated/cer-
tified establishments; logo for rated/certified estab-
lishments; process and institutional mechanism
for certification, validity of certification; audit and
capacity building.
19.95. The Working Group on Tourism set-up by
the Planning Commission has made a number of
recommendations on promotion of sustainable tour-
ism which should be fully implemented. Similarly,
the recommendations on eco-tourism, rural tour-
ism and heritage tourism by the Working Group also
needs to be implemented to provide an impetus to
such form of tourism.
‘NICHE’ TOURISM PRODUCTS
19.96. During the Eleventh Plan period, the
Government took the initiative of identifying, diver-
sifying, developing and promoting the nascent/
upcoming ‘niche’ products of the tourism industry
so as to overcome ‘seasonality’ and promote India
as a 365 days destination, attract tourists with spe-
cific interests and ensure repeat visits for the unique
products in which India has comparative advan-
tage. This endeavour of the Government needs to
be pursued with greater vigour during the Twelfth
Plan period. Some of the ‘niche’ tourism products
identified for development and promotion include
Adventure; Meetings Incentives Conferences and
Exhibitions (MICE); Cruise; Medical; Wellness; Golf;
Polo; Pilgrimage/spiritual travel; Film; Tea/Coffee;
Wild Life; and Caravan. Identifying niche products
is a dynamic exercise wherein new products may be
added in due course. Further, the recommendations
on various ‘niche’ tourism products in Chapter 8 of
the Report of the Working Group on Tourism in the
Twelfth Plan should be implemented to provide an
impetus to ‘niche’ products.
VERTICAL AND HORIZONTAL
CO-ORDINATION
19.97. Tourism is a multi-sectoral activity tran-
scending multiple services provided by a range of
suppliers. The related sectors include airlines, sur-
face transport, hotels, basic infrastructure and facili-
tation systems, external affairs, sanitation, health,
internal security and so on. Growth of tourism
cannot be attained unless policy and implementa-
tion issues across all the sectors are coordinated
and addressed simultaneously. For its development,

388 Twelfth Five Year Plan
active involvement of all vertically and horizontally
placed agencies is required. Since the tourism proj-
ects are implemented at the State/UT level, conver-
gence among various Ministries/Organisations is
required at Central and State level.
19.98. At present, there is a lack of horizontal and
vertical coordination among the many actors that
intervene, directly or indirectly, in the tourism devel-
opment process. This lack of coordination is observed
at the national level, firstly among different govern-
ment departments that make decisions on tourism
related issues, for instance concerning transport
infrastructure, or natural protected areas, or educa-
tion, without considering the implications these deci-
sions may have on the tourism sector. The lack of
coordination results in dispersed sector-specific pol-
icy orientations and concomitant difficulties in try-
ing to harmonise diverse national, local and sectoral
interests. Secondly, there is often a lack of coopera-
tion and coordination between the public institutions
concerned with tourism and the traditional tourism
private sector for establishing the requirements for
tourism investments and operations
19.99. Therefore, it is necessary to establish a mech-
anism to facilitate horizontal and vertical coordi-
nation to optimise tourism induced outcome. In
order to achieve this goal, a Tourism Development
Authority under the chairmanship of the Prime
Minister may be created with multi-sectoral rep-
resentation from Government (both Centre and
States) and other stakeholders to ensure that differ-
ent interests and viewpoints are considered before a
given policy is designed to accomplish national goals
and build consensus on differences between stake-
holders. The Authority would need to be supported
by a Standing Committee.
TAXATION
19.100. Basically, the tourism sector can be taxed
either by taxing the businesses in the tourism sector
or by taxing the tourists directly. In practice, tour-
ism can be taxed in two ways: through the general
tax system, particularly profits and sales taxes, and
through special taxes imposed on ‘tourist’ activi-
ties, particularly entry and exit taxes and taxes on
hotels. Most important taxes on tourism in almost
every developing country are taxes on hotel services,
whether levied as part of a general sales tax or as spe-
cial ‘excise’ taxes.
19.101. In general, developing countries do not
seem to obtain much revenue from levying income
and profits taxes on the tourist industry. In prin-
ciple, there are no special problems in applying the
normal income tax system to the tourist industry.
Corporations engaged in providing tourist services
should be taxed like any other corporations. The
case for any exemption from income tax is extremely
weak with the caveat that there should be no bias
against the tourism industry under the income
tax. Similarly, the individuals they employ and the
self-employed tourist operators should be sub-
ject to income tax in the same manner as any other
employed individual and any other self-employed
persons, respectively.
19.102. In countries with general sales taxes, par-
ticularly value-added taxes, these taxes are usually
extended to hotel accommodation and other tourist
activities, although sometimes at reduced rates for
competitive reasons. In developing countries, how-
ever, as a rule only a limited range of services are
subjected to so-called ‘general’ sales taxes. Instead,
special taxes (also referred to as ‘tourist’ taxes) tend
to be applied to such services as those provided by
tourist hotels. Since the special taxes applied to tour-
ist services as hotel accommodation, rental cars,
entertainment and restaurants may often be intended
to approximate to the general level of sales taxation/
VAT, they do not, in substance, really constitute
industry-specific taxation.
19.103. The most important tourist tax is invariably
that on accommodation (and related catering). Hotel
accommodation in India is subject to luxury tax by
the States at rates ranging from 4 per cent to 20 per
cent of the tariff above a threshold limit. With a view
to preventing mis-declaration of actual tariff, the
levy is imposed on printed tariff with a low threshold
limit. Since the actual tariff in lean seasons is substan-
tially lower than the printed tariff, the effective tax
rate increases to 30 per cent. Further, the disparity in

Other Priority Sectors 389
the rates of luxury tax across states adds to the dis-
satisfaction of tourists and compliance cost by tour
operators. In addition, the Central Government
has, in the Union Budget 2011–12, introduced ser-
vice tax on the tariff value of hotel accommodation
with an abatement of 50 per cent. Similarly, food
and beverages is also subject to State-VAT at varying
rates. VAT on food items range from 5 per cent to
16.84 per cent and on liquor from 13 per cent to 58
per cent. In addition, service tax on air conditioned
restaurants has been imposed in the Union Budget
2011–12, with an abatement of 70 per cent.
19.104. Many of the popular tourist circuits require
inter-state movements. Tourist coaches/cars moving
along inter-state circuits are liable to road and pas-
senger taxes. To illustrate, the golden triangle cir-
cuit of Agra-Delhi-Jaipur cover four states of Delhi,
Haryana, Uttar Pradesh and Rajasthan. While mov-
ing across these states, tourist vehicles are liable to
pay road and passenger taxes which varies across
states. According to estimates made by Indian
Tourist Transport Association (ITTA), for a three
day package between Delhi, Agra and Jaipur, the
total road and passenger tax paid accounts for 23 per
cent of the cost of a three-day package for the Delhi-
Agra-Jaipur circuit. In the absence of a centralised
tax payment facility, the problem is further aggra-
vated by collection of the tax at each entry/state
border. This causes harassment, undue delay in itin-
erary resulting in dissatisfaction of the tourists and
encourages rent seeking behaviour.
19.105. Air travel in India is subject to the multiple
levies, thereby undermining the competitiveness of
Indian destinations. These are fuel surcharge varying
from `1,850 to `2,500/-; transaction charge varying
across sector; new service tax of `185/-; passenger
service tax; Airport Tax/User development fee which
varied from `200 to `400/- depending on port of
departure; Service tax (0.62 per cent of basic fare
charged from the travel agents/tour operator ser-
vices); and Tax on Air Turbine Fuel (ATF) (ranging
from 20 per cent to 38 per cent across States).
19.106. Some of the levies are in the nature of user
charges and need to be continued. However those in
the nature of taxes are cascading in nature thereby
substantially increasing the incidence of tax. Further,
there is lack of transparency in collection of these
taxes since they vary across airlines. This leads to dis-
satisfaction amongst the customers.
19.107. The Central Government has introduced a
constitutional amendment to enable the introduc-
tion of a comprehensive, dual, harmonised and a
VAT-type Goods and Services Tax (GST) at the
Central and State Government levels. The final con-
tours of the GST regime are under discussion and
the new regime is expected to be operationalised
from 1 April 2013. The new regime is expected to
subsume all Central taxes on goods and services and
a number of taxes levied on goods and services at the
State level.8 The rationalisation of the multiple lev-
ies on goods and services consumed in the course of
tourism should be consistent with the GST regime.
Towards this objective, the tax regime for goods and
services relating to the tourism industry should be
restructured in the following manner:
a. The taxes on hotel accommodation, food and
beverages levied both by the Centre and the
States should be subsumed in the GST. Since
GST rates will be uniform across states, the
tax incidence will be transparent and reduce
compliance burden for tour operators. It will
also resolve disputes regarding taxation of self-
supply. However, liquor being a ‘sin’ good,
should continue to be subject to a non-vatable
type ‘excise’.
b. The goods and passengers tax levied by the States
should be subsumed in the GST and the revenue
loss may be recouped by suitably adjusting the
revenue neutral rate for State GST.
c. Since the purpose of collecting taxes is to enable
the Government to provide public goods like
roads, the case for a separate levy like the motor
vehicle tax which is in the nature of a user charge
for use of roads, is extremely weak. Therefore,
Motor vehicles tax/road tax should be subsumed
in the GST and the rates adjusted suitable to
recoup the revenue loss. The State level registra-
tion charges for vehicles should be replaced by
an annual Central registration fee for all vehicles

390 Twelfth Five Year Plan
so as to enable them to move unhindered across
inter-state borders. It will help establish seamless
movement of people across States and eliminate
the requirement for tourist permits. The col-
lection from registration charges may be fully
devolved to the States in the ratio of their road
density.
d. The aviation sector, like the road transport sec-
tor, should be brought under the GST regime
and the ATF, fuel surcharge, and service tax
should be subsumed. This will ensure that the
tax on ATF is fully vatable and therefore do not
add to the tax incidence on aviation services.9
The other levies like transaction charge, new ser-
vice tax, airport tax, user development fee, and
passenger service tax are in the nature of user
charges and therefore may be rationalised to
reflect the level and quality of service.
e. As GST stabilises, consumption of goods and
services by foreign tourists should be treated as
exports and GST paid by them refunded when
they leave the country, in line with best interna-
tional practice.
VISA FACILITATION
19.108. Smooth and speedy issue of Visa is catalytic
to the growth of tourism to any destination. The
prompt delivery of visas to inbound tourists is one
of the key contributors to sustainable development
of tourism. As a policy, Ministry of External Affairs
is committed to issuing visas within three days of the
receipt of an application. However, in practice, there
are inordinate delays.
19.109. The Government should, therefore, set-up
a High-Powered Committee comprising of offi-
cers from the Ministries of Home, External Affairs,
Tourism, and Planning Commission and trade rep-
resentatives to re-engineer the procedure for issuing
of visa within 48 hours of receipt of the application,
enabling the online filling of visa applications in
local language in the non-English speaking countries
(especially in Europe); a single window clearance
system for conference and medical visa applications
and extending the facility for issuing visa on Tatkal
(emergency) basis on the payment of higher fee as in
the case of passports. Similarly, the fee for Medical
Visa needs to be rationalised and the facility of col-
lective landing permit should be introduced.
19.110. Another aspect of visa which needs to be
reviewed relates to issuance of Tourist Visa on
Arrival (TVOA). An evaluation conducted by
Ministry of Tourism shows that the decision to travel
to India is significantly influenced by TVOA. Hence,
it is necessary to further extend the TVOA facility to
European countries (for example, Germany, France,
Spain) for which multiple entry visa is allowed;
CIS countries like Russia, Kazakhstan, and so on;
ASEAN countries—Thailand, Malaysia, Brunei;
and other International Airports of the country like
Panaji, Bengaluru, Bodh Gaya, Trivandrum, Kochi
and Hyderabad. Further, in order to enrich the expe-
rience of tourists with the TVOA facility, immigra-
tion Officials dealing with TVOA facility need to be
trained to create an awareness of the tourism indus-
try among the immigration officers.
19.111. A number of grievances arising from imple-
mentation of the visa system can be resolved through
inter-ministerial coordination. A permanent task
force of Joint Secretary level officers from Ministries
of Tourism, Home and External Affairs may be
formed under the chairmanship of Joint Secretary
from Ministry of Home Affairs to expeditiously
resolve visa related problems brought to their notice.
SAFETY AND SECURITY
19.112. Safety and the security of the tourists is
a worldwide concern. Any adverse perception
about safety and security of the tourists has seri-
ous implications for tourist arrivals to the country
and its tourist destinations. Accordingly, based on
experience, the scheme for constitution of Tourist
Facilitation and Security Organization(s) (TFSOs)
in States/UTs employing ex-servicemen introduced
during the Eleventh Plan may be extended during
the Twelfth Plan. Similarly, the Government should
undertake awareness campaigns for spreading a mes-
sage for adoption of Code of Conduct for ‘Safe and
Honourable Tourism’ among the stakeholders, ser-
vice providers and State level Tourism Departments.
The Code is a set of guidelines primarily intended to

Other Priority Sectors 391
encourage tourism activities to be undertaken with-
out compromising the basic rights like dignity, safety
and freedom from exploitation of both tourists and
local residents, in particular, women and children.
MARKET RESEARCH AND TOURISM STATISTICS
19.113. Tourism statistics are extremely vital for pol-
icy formulation on demand and supply of tourism
services at national, regional and local levels. The key
tourism statistics which need to be compiled on a
regular basis should relate to visitor arrival informa-
tion; tourism expenditure estimates; visitor surveys
(expenditure, motivation, satisfaction and so on);
accommodation and tourism establishment surveys
and tourism satellite account (TSA). Effort should
be to establish an internationally consistent system
of tourism statistics and harmonise the method and
conceptual basis of collection, collation and dissemi-
nation of tourism related information at all levels in
the country. In this regard, the recommendations
made by the Working Group on Tourism should be
fully implemented.
CONCLUSION
19.114. Tourism has the potential to help achieve the
objectives of the Twelfth Plan for faster, more inclu-
sive, and sustainable growth. More importantly, it is
a powerful antidote to poverty. It eliminates the dis-
advantage of market inaccessibility suffered by the
poor in respect of their goods and services by bring-
ing the consumer to their doorstep. This reduces the
need for intermediation thereby improving recovery.
However, the potential can be fully realised only if
the international competitiveness of the Indian tour-
ism sector improves significantly by removing both
the supply and demand constraints.
19.115. India has a large domestic tourism market
too, in addition to international travellers. A variety
of products and price points required to realise the
country’s large domestic tourism potential must be
developed. Standard, international products will not
be able to open up this market. Indeed even foreign
tourists to India come for a variety of experiences,
from the luxurious to the simple and spiritual. This
would require innovations in products. Therefore,
on the supply side, it is necessary to identify new
tourism products and create destinations and cir-
cuits around them through a comprehensive physical
and financial plan through a community participa-
tory process. This would have to be complemented
by building the necessary human resource skills for
servicing the tourist. Similarly, on the demand side,
a multi-pronged effective tourism marketing strat-
egy would need to be adopted to eliminate infor-
mation asymmetry and create brand India. Since
pricing is an important determinant in the choice of
an international destination, the tourists cannot be
excessively burdened with statutory levies and taxes.
Therefore, taxation of tourism should be rationalised
in conformity with best international practice.
19.116. The responsibilities for implementing the
comprehensive plan for development of tourist cir-
cuits and building brand India is fragmented verti-
cally across levels of governments and horizontally
across the private and public sector. Hence, it is
imperative to establish a transparent and effective
policy and regulatory framework; create the appro-
priate incentive structure; and institute a coordi-
nation mechanism to synergise the activities of
different stakeholders.
19.117. The Gross Budgetary Support for the Twelfth
Five Year Plan (2012–17) for the Ministry of Tourism
is `15,190 crores that excludes IEBR of 155 crore.
ARTS AND CULTURE
19.118. India has a long, rich and diverse cultural
heritage that is deeply rooted in its pluralistic ethos
providing a creative expression to thousands of com-
munities that make contemporary Indian society.
The expression of this rich cultural tradition by indi-
viduals and groups not only creates a vibrant society
but also provides livelihood to a large section of peo-
ple contributing to the country’s economy. With its
rich cultural tradition, India occupies an important
place on the cultural map of the world. This is also
an expression of its ‘soft power’. A variety of cultural
traditions and diverse historical legacies of differ-
ent regions join together to provide India its unique
identity as a ‘nation state’. Thus, culture should not
be seen as a mere ‘fringe’ activity, but is now at the

392 Twelfth Five Year Plan
‘core’ of the holistic development strategy of the
country and its people.
19.119. The Government through its network of
institutions and a slew of grants-in-aid schemes has
been supporting preservation, popularisation and
promotion of the rich cultural heritage of the coun-
try. Different activities create a link between the
past and present and lay the foundation for future
development of the country’s tangible and intan-
gible cultural heritage. This is done through muse-
ums, archives, libraries, the performing arts and so
on and by organising a variety of events and festi-
vals. Government efforts create an environment and
sensitivity for sustenance of the country’s cultural
heritage and promotion of cultural activities in all
its variety. Thus, activities and institutions under the
Ministry of Culture are important pillars for inclu-
sive development of the country.
STRATEGIC SHIFT IN THE TWELFTH PLAN
19.120. During the Twelfth Plan, we need to adopt a
new approach and appropriate policies which are less
dependent on Government financing and catalyse
local partnerships. The programmes must be inte-
grated into strategies for sustainable development at
every level and take into account the needs and aspi-
rations of the community where cultural assets are
found. Sustainable heritage conservation depends
upon the commitment and involvement of local
communities. Conservation policies, to be success-
ful, need to promote local community stewardship
of the heritage as well as provide socio-economic
benefits for local communities. Therefore, a direct
link must be made between safeguarding the heri-
tage and socio-economic development. This calls for
the deliberate recasting of heritage conservation as a
development activity that brings economic opportu-
nities, creates jobs, and generates income based on
traditional technologies and knowhow. This new
programme is aimed at complementing and extend-
ing those efforts by moving heritage conservation
beyond the exclusive sphere of high technology and
elite specialisation and to become the concern and
responsibility of every citizen and transform heritage
conservation into a grassroots movement which will
return the heritage to the communities that created it
and who rely on it as the foundation for their future
development.
19.121. While ongoing professional and institutional
efforts at heritage conservation would be strength-
ened, participatory approach would be used to
catalyse engagement of local community and various
interest groups. They would assess the unique char-
acteristics, strengths and economic potential of the
elements making up their physical as well as intan-
gible cultural heritage, and then design a community
action plan to self-develop these elements in a way
which is both profitable and sustainable. Through
the programme assistance should be provided in
the form of practical, technical, and small “start-
up” grants to the local communities and NGOs. At
least some part of the annual plan outlay for culture
should be used for these “local” grants.
TANGIBLE CULTURAL HERITAGE
19.122. The Archaeological Survey of India (ASI)
would be strengthened during the Twelfth Plan for
proper conservation, preservation and maintenance
of the built heritage of the country. For this, it would
be necessary to prepare a comprehensive coordi-
nated plan for conservation and development of
monuments and archaeological sites by the Central
and State governments and academic and research
institutions. They could also be involved in archae-
ological exploration and excavation. UNESCO
Category-2 Regional Centres would be established.
Efforts would be stepped up for conservation of
unprotected heritage buildings, monuments, archae-
ological sites, and historic buildings. Fellowships
for visiting scholars would be instituted. Cultural
Heritage Management Council would be created.
And, finally, mapping of cultural heritage resources
would be taken up. Schools would be engaged in
mapping of local history, ecology and cultural heri-
tage of the area where they are located.
19.123. Museums play an important role in society.
They preserve and promote art, culture and scientific
learning. They are the learning centres for children
during their formative years. They help in building
public awareness of the wealth of the nation as well

Other Priority Sectors 393
as scientific temper in the population. Compared
to its size and vast heritage, the country has a small
number of museums and these are not all properly
managed. There is a need to set up modern muse-
ums of arts and science all over the country that use
advanced technology to showcase Indian art, culture
and science (including science cities and science
centres) as used in day-to-day life. The museums
should be interactive and help in learning. These
should provide an experience for children and pub-
lic at large and should also provide information in
the local and regional languages. A large number of
Science museums in partnership with the Ministry of
Science and Technology and Ministry of HRD also
be established. These could have three parts—peda-
gogy centre for school/college teachers, science activ-
ity centre for students, and science Exploratorium
for general public.
19.124. During the Eleventh Plan, various measures
were taken for up-gradation/modernisation, and
improvement in functioning, of the national-level
museums directly funded by the Government of
India and a large number of local-level museums run
by State Governments, trusts, foundations and so on.
Academic and research institutions should be sup-
ported to set up more museums across the country.
These measures have helped in furthering the cause
of the ‘museum movement’ and the pace of mod-
ernisation should be accelerated during the Twelfth
Plan period. For this purpose, it is imperative to
adopt a multi-pronged strategy comprising the pro-
vision of financial assistance for establishment and
up-gradation of local and regional museums through
the revision of the existing scheme; modernising of
State and national level museums; establishing larger
scale museums in State capitals through partnership
with State Governments/Civil Society; digitisation
of collections in all museums to facilitate accessibil-
ity through a virtual museum portals including 3D
exhibits and virtual 3D tours; making museum web-
sites more dynamic, interactive and social-media
enabled to attract online participation; creation of
innovation spaces in museums based on frame-
work provided by the National Innovation Council
and capacity building and training of existing staff
of Museums. Role of museums in education, infor-
mal as well as formal learning aligned to curriculum
would be strengthened in the Twelfth Plan.
INTANGIBLE CULTURAL HERITAGE
19.125. At present, Anthropological Survey of India
(AnSI) is involved in collaborating scientific work
relating to anthropology with scientific institutions.
However, there is no scheme for providing finan-
cial assistance for such scientific work. Therefore, a
mechanism should be established to enable AnSI to
provide financial assistance to projects proposed by
the scientific organisations of State Governments,
departments of anthropology in universities, NGOs
involved in anthropological studies and similar bod-
ies. Further, assistance to State Governments, insti-
tutions and organisations should also be provided
for documentation and dissemination of research
results in the field of anthropology.
19.126. A large amount of cultural wealth is stored
in the form of audio-visual materials available with
various government and non-governmental insti-
tutions and private individuals. In the absence of a
systematic organisation and periodic up-gradation,
these materials are fast deteriorating. To digitise
them and to provide the wider public an easy access
to these and to the new audio-visual resources being
constantly generated, appropriate technological and
institutional framework is urgently required.
19.127. For this purpose, a separate National Audio-
Visual Archives (NAVA) should be established as a
virtual network of cultural resources in audio-visual
form. NAVA will be engaged in instituting state-of-
the-art digitisation and storage system for indepen-
dent repositories of audio-visual resources; setting
up a virtual network of these repositories and offer-
ing interactive online access to their resources; and
standardising and periodically upgrading the meth-
ods and technologies used in production, storage
and retrieval of audio-visual resources. The design of
data-retrieval systems, being the point-of-access for
users of the database, must be given adequate atten-
tion and must provide for relevant interactive tools
to be used. The genres to be covered will include

394 Twelfth Five Year Plan
oral traditions, traditional crafts and textiles, dance,
music and theatrical practices, cultural practices and
traditional knowledge.
19.128. Dissemination of India’s traditional and
contemporary cultural expressions is an important
means for preservation of culture. For this, high
quality programmes on art and culture could be
supported. Such programmes may be telecast on all
public and private channels. All this video content
could also be made available in the public domain.
Competitions can be launched inviting short films,
documentaries and short videos on specified themes
to capture the cultural diversity and expressions
across the country.
19.129. Unlike most capital cities of the world, Delhi
does not have a world class integrated infrastructural
facility for culture and performing arts. This gap
needs to be filled up by setting up a National Centre
of Performing Arts at New Delhi. The Centre will
be a state-of-the-art “cultural multiplex” housing a
set of auditoria/performance spaces of varying sizes
and specifications and present, round the year, world
class productions of India’s varied arts from across
the country. It will also develop its own repertoire
and be a vibrant cultural hub. This would require
about 15–20 acre land in Central Delhi. Similar
centres may also be set-up in Kolkata, Chennai and
other major cities in due course. In Kolkata, the area
encompassing Rabindra Sadan Cultural Complex and
Central Cultural Institute has a potential to be devel-
oped into such a Centre. New and innovative institu-
tional arrangements and partnerships may be needed
to create and manage such integrated complexes.
19.130. National School of Drama (NSD) has
emerged as a foremost theatre training institution
in the world and the only one of its kind in India. It
has played an important role in shaping contempo-
rary theatre in all its variety in the country. Need for
more such schools were recognised in the Eleventh
Plan. During the Twelfth Plan, five Regional Schools
of Drama at Bengaluru, Kolkata, Maharashtra/Goa,
J&K, and the North-East region will be set up by the
Ministry of Culture as independent, autonomous
Schools of Drama having their own repertory com-
panies. These Schools will be free to draw upon the
experience of NSD, New Delhi and grow on their
own. In addition, the States will be encouraged to
set-up their own language-based versions of NSD.
KNOWLEDGE RESOURCE HERITAGE
19.131. During the Twelfth Plan, public library sys-
tem in the country should be rejuvenated by taking
advantage of the technological developments that
have transformative potential to change the public
libraries. Existing public libraries must modernise
their collections, services and facilities and become
pro-active in resource sharing, professional devel-
opment of staff, extending library facilities right up
to the grassroots through the Panchayats. Based on
the recommendation of the National Knowledge
Commission, a National Mission on Libraries has
already been established. The mission should now be
enabled to undertake specific activities as per NKC
recommendations and could pave way for setting
up of an independent and financially autonomous
National Commission on Libraries.
19.132. Archival system including National Archives
would also be strengthened. The process of acquisi-
tion and accession of public and private records at
the National Archives of India would be stepped up.
Digitisation and security microfilm making would
also be done expeditiously. Old public institutions
including academic and research institutions and pri-
vate archives should be supported to conserve, pre-
serve, digitise and archive valuable Indian heritage.
19.133. India has unique and unparalleled living and
diverse cultural traditions of an unimaginable magni-
tude. To provide sustenance to, and showcase the rich-
ness of living and diverse cultural traditions of India,
an overarching mechanism in the form of a National
Network Centre on India’s Intangible Cultural
Heritage should be set up for mapping and document-
ing India’s valuable tangible and intangible cultural
assets in different eco-cultural zones. It should pro-
vide for coordinated identification, documentation
and preservation of the extensive and diverse range
of India’s traditional knowledge system and integrate

Other Priority Sectors 395
its various dimensions. For this purpose, Government
may seek international technical assistance for design-
ing a system based on best international practice.
19.134. Ideas, ideals and values promoted by
Mahatma Gandhi have become more relevant today
than before—not only for India but for the entire
world. Thus, a Gandhi Heritage Mission would be
taken up to conserve, preserve and promote Gandhi’s
physical and the intellectual heritage. Further, his
ideas and values would be promoted across the
world through conference and seminars on Gandhi’s
intellectual heritage.
19.135. Indian writing is unique in its pluralistic,
multilingual traditions and has an incredible heritage
of rich literary diversity. During the Eleventh Plan,
the Government had initiated a pilot project, ‘Indian
Literature Abroad’, to promote and showcase Indian
literature to a larger international audience. This was
meant to support and facilitate translation and pro-
motion of literary heritage and contemporary litera-
ture of various Indian languages into major foreign
languages. This project has been widely appreciated
and would be continued during the Twelfth Plan.
EDUCATION, RESEARCH AND INTERNATIONAL
CULTURAL RELATIONS
19.136. The existing schemes under the Education
and Research Section should be modified to be more
effective. With a view to preserving and promoting
Buddhist Culture the setting up of Bodh Darshan
Higher Study School, Tabo (Himachal Pradesh)
will get priority during the Twelfth Plan period.
Similarly, the existing schemes for promoting inter-
national cultural relations need to be rationalised to
effectively foster friendly relations and project Indian
culture in the countries concerned.
19.137. Further, it is also necessary to put in place
a mechanism for providing financial assistance for
artists and cultural professionals going abroad for
seminars, festivals and exhibitions on cultural sub-
jects and for providing financial assistance to for-
eign artists desiring to study and/or learn Indian
culture in any form like dance, music and drama for
supporting Indian artistes to go abroad or foreign
artistes to take up study in the field of Indian culture.
This assistance does not have to be entirely through
Government support, but should bring together pri-
vate donors and corporate entities. The Government
should provide matching grants.
19.138. During the Twelfth Plan, India should
explore the possibility of having a permanent pres-
ence at the prestigious Venice Biennale of Art. The
space could be used not only for the Art Biennale
but also for the equally prestigious Venice Biennale
of Architecture and in the lean months for any other
cultural activities.
GOVERNANCE AND PARTNERSHIPS
19.139. India’s traditional and contemporary cul-
tural expressions are extremely diverse and spread
out and therefore no centralised academy or agency
can do full justice with the demands of the sector.
For various reasons, many of the State Academies
set up by various State Governments are in disar-
ray. Central Government needs to partner with the
State Governments in making the State Academies
play an important role in preserving and promot-
ing performing, visual and literary arts of each State.
For this purposes, Ministry of Culture will introduce
scheme for rejuvenating both central and the State
Academies working in the field of performing, visual
and literary arts by providing financial assistance
subject to professionalisation of the management of
these bodies.
19.140. In order to leverage professional expertise
and capacity from outside in specific disciplines,
Government could enter into partnership with
selected universities, institutions of national impor-
tance, research institutions and cultural organisa-
tions to undertake a mutually agreed programme
and function as Centre of Excellence in the specified
fields. While autonomy of these organisations will
be respected, deliverables will be closely monitored.
This partnership could be with well-established the-
atre groups and professional repertory companies
with high standard of excellence, cultural research
centres and repositories of archives on a particular
subject, and centres of excellence in cultural texts,

396 Twelfth Five Year Plan
stagecraft, cross translations, interactive documen-
tation, teaching and learning of traditional arts,
conservation and preservation of both tangible and
intangible heritage of the country.
19.141. Ministry of Culture and its autonomous
organisations have a large number of grants-in-
aid schemes meant to provide financial support to
individuals and organisations in the area of culture.
Several steps like electronic payments, online appli-
cations and minutes of expert committees available
online have been introduced to bring about trans-
parency. During the Twelfth Plan, greater objectiv-
ity and transparency would be infused by developing
a comprehensive management information system
with online filing and tracking of all applications and
IT solutions for back-end operations in a seamless
manner.
19.142. Capacity-building and training of person-
nel to work in various Cultural Organisations is
a critical requirement. Presently, some training is
being imparted, but in a limited and distributed
manner with various institutes under the aegis of
the Government. Coordination and expansion of
training research should be undertaken through an
apex institutional mechanism or a Central Cultural
University for the purpose.
CONCLUSION
19.143. The conservation of culture is extremely vital
for inclusive growth. In general, cultural assets are
owned by the relatively poorer section of the society.
Any erosion in these assets will further aggravate the
asset ownership pattern to the detriment of the poor.
The problem is further aggravated by the fact that
often these assets are also income generating. These
assets cannot be protected by individuals and there-
fore Government must step in to provide technical
and financial support. Such efforts should essentially
complement the new programme for conservation,
which should usher a paradigm shift in our hitherto
conservation efforts, by integrating it into the overall
development strategy for local communities.
19.144. The Plan allocation for the Twelfth Five Year
Plan (2012–17) for Ministry of Culture is `7,275 crores.
HANDLOOMS AND HANDICRAFTS
INTRODUCTION
19.145. The handloom and handicrafts sectors have
their roots in the rich traditional, historical and
cultural diversity that distinguishes India from the
rest of the world. The two sectors are also particu-
larly significant as they provide low-cost and green
livelihood opportunities to lakhs of families, besides
supplementing incomes in times of agrarian distress,
checking migration and preserving the traditional
economic relationships between different sections
of the society. As on June 2011, the handloom and
handicraft sectors employed 43.32 lakh weavers/
workers and 68.86 lakh craftspersons respectively,
resulting in total employment of 112.18 lakh per-
sons. With women contributing a majority (85 per
cent) of the pre- and post-loom labour and account-
ing for over 50 per cent of weavers/artisans in the
country, and a significant mass of weavers/artisans
consisting of Scheduled Castes (SCs), Scheduled
Tribes (STs), other backward classes (OBCs) and
religious minorities, these two sectors also represent
the economic lifeline of the most vulnerable sections
of the population. Owing to their cultural and eco-
nomic importance in India’s development process,
various policies along with programmatic interven-
tions, are proposed to be implemented in the Twelfth
Plan, aimed at generating sustained and productive
employment with suitable working conditions for
the entire weaver, artisanal and ancillary worker
population, and also to ensure that the crafts and
their products continue to flourish across the coun-
try as well as abroad.
HANDLOOMS
19.146. Indian handlooms are characterised by an
infinite variety of weaves, textures and designs spun
on the handloom, ranging from the finest muslins
to heavy bedspreads, from delicate pastels to earthy
hues, and from appealingly simple to amazingly
intricate compositions, which are known through-
out the world since ancient times. This sector can
meet every need, from exquisite fabrics, which take
months to weave, to popular items of mass produc-
tion for daily use. Handloom, being a State subject,
its development is primarily the responsibility of

Other Priority Sectors 397
the State Governments. However, the Government
of India has been supplementing the efforts of the
States with its policy of promoting and encouraging
the sector through suitable interventions.
Current Situation
19.147. As per the latest (3rd) Handloom Census
of 2009–10, there are 23.77 lakh handlooms in the
country, providing employment to 43.32 lakh han-
dloom weavers and ancillary workers which include
38.47 lakh adult handloom weavers and ancillary
workers. Of the latter, 77.90 per cent are women,
10.13 per cent belong to the SCs, 18.12 per cent to the
STs and 45.18 per cent to OBCs. A total of 27.83 lakh
handloom households are engaged in weaving and
allied activities, of which 87 per cent are located in
rural areas and remaining 13 per cent in urban areas.
Most of the handloom households live in kutcha
(54 per cent) or semi-pucca (31 per cent) houses;
only 15 per cent households live in pucca houses.
However, 53 per cent of the handloom households
weave only for commercial purposes, and nearly
16 per cent households undertake a mix of domes-
tic and commercial production. In the North Eastern
Region (NER), 90 per cent of handloom worker
households are weaver households and account for
63.4 per cent of total handloom worker households
in the country. The Approach Paper for the Twelfth
Plan has identified handlooms as one of the prior-
ity sectors that will create large scale employment
opportunities.
19.148. The performance of the handloom sec-
tor during the Eleventh Plan period is indicated in
Table 19.5 which shows that total handloom cloth
production was 6,947 million square meters during
the first year of the Eleventh Plan (2007–08), but it
declined by 3.89 per cent in the following year (2008–
09) which was marked by global recession. However,
since then, production has consistently risen in the
third and fourth years of the Eleventh Plan, to reach
a production level of 6,930 million square meters
during 2011–12, which accounts for over 14 per cent
of total cloth/textile production, comprising han-
dloom, mill-made and powerloom, in the country.
Exports rose by 26 per cent in 2010–11 to `1,574.95
crore as compared to the previous year and further
to `2,653.95 crore, registering a growth of 68 per cent
over the previous year.
Challenges for the Twelfth Plan for Handlooms
19.149. While considerable progress has been made
in the handloom sector during the Eleventh Plan as
depicted in Table 19.5, a lot still remains to be done
as the sector continues to face several daunting chal-
lenges and uncertainties.
Welfare and Livelihood of Weavers
19.150. Nearly 47 per cent of all handloom weav-
ers belong to BPL families and 10 per cent fall in
the Antodaya Anna Yojana (AAY) category. About
29.4 per cent of all handloom workers have never
attended school and 12.7 per cent are educated only
up to the primary school level. Poverty and illiter-
acy among weaver families is accompanied by poor
access to basic necessities including health, water,
sanitation, housing and livelihood facilities. The
contribution of women is largely unacknowledged,
although women constitute nearly 70 per cent of
total handloom weavers/workers.
TABLE 19.5
Performance of Handloom Sector during the Eleventh Plan Period
Item 2007–08 2008–09 2009–10 2010–11 2011–12 CAGR (%)
Cloth Production
(million square meters)
6,947 6,677 6,806 6,903 6,930
(Prov.)
1.25
(base: ’08–’09)
Employment (lakh persons) NA NA 43.32 43.32 43.32 –
Export (`crore) NA* NA* 1,252.81 1,574.95 2,653.95 45.55
Source: Office of Development Commissioner (Handlooms), Ministry of Textiles.
Note: *Not available due to absence of ITC (HS) codes for handloom products.

398 Twelfth Five Year Plan
Rising Input Costs
19.151. Despite more than 700 yarn depots being
operated, the issue of easy sourcing of raw materi-
als, both yarn and dyes and chemicals, at reason-
able prices has been a key problem across centres of
handloom production, particularly in the NER, as
in recent period, there has been a sharp rise in yarn
prices. The problem is more acute for individual
weavers who need smaller quantities of yarn which
are not readily available.
Sparse Credit Coverage and High Cost
19.152. Weavers are prone to diverting credit
towards consumption needs, and lack of even rudi-
mentary financial literacy aggravates the existing
credit-related obstacles faced by them. Further, a
majority of the weavers continue to operate outside
the fold of institutionalised financing, with nearly
44.6 per cent being dependent on Master Weavers,
13.4 per cent on moneylenders and only 14.8 per
cent having access to institutionalised sources of
credit. For rural households, access to institutional
financing was far lower at 7.7 per cent revealing the
extent to which weavers are trapped in the vicious
cycle of debt and resultant poverty.
Marketing Bottlenecks and Lack of Opportunities
19.153. Dearth of innovation and limited dynamism
in the handloom sector, particularly in the field of
marketing, is a matter of concern, which is imped-
ing its expansion and growth. As 61.1 per cent of the
total weaver workforce (24 per cent for non-North
Eastern States) comprise of independent workers, a
majority of the weavers necessarily bear all the risks
associated with the business of procurement, mar-
keting and sale, with obvious consequences. Certain
State Governments have undertaken innovative
measures to popularise the use of handloom prod-
ucts (Box 19.2). Such innovative measures for pro-
moting handloom products need to be replicated by
other States.
Poor Institutional Coverage and Management
19.154. About 85 per cent of weavers are outside the
cooperative fold, as they either work under Master
Weavers/traders or independently. Further, sev-
eral Apex/Handloom Corporations have become
dormant due to a host of reasons such as financial
losses, lack of professional management, over-staff-
ing and poor marketing and distribution channels,
which have, in turn, affected the health of about
50 per cent of the Primary Weavers’ Cooperative
Societies.
Poor Policy Dissemination and Information Gaps
19.155. Lack of information to weavers regard-
ing various Government policies/schemes under
implementation, is a significant cause for deteriorat-
ing conditions of the weavers. Sometimes even the
implementing agencies may not possess complete
information, resulting in critical gaps in implemen-
tation. Also, major institutions providing critical
inputs like credit, research, technology, manage-
ment, and market development, are largely central-
ised and hence unable to reach the dispersed and
largely home-based weavers.
Infrastructure Gaps
19.156. Infrastructure in the handloom sector con-
tinues to be inadequate, with substantial gaps, par-
ticularly in the NER. Facilities such as clean drinking
water, sanitation, effluent treatment plants and elec-
tricity, are yet to be universally provided in all hubs
of handloom production. Systems that ensure effi-
cient supply chain management from the stage of
availability of raw materials up to sale of finished
goods are yet to be set up.
Monitoring and Evaluation
19.157. There is a need for a strong Web-based
monit oring and evaluation system to promote trans-
parency and accountability and facilitate regular
tracking of physical and financial performance of
individual programmes/projects, particularly the
ongoing clusters.
Education, Skills, Research and Training
19.158. The formal education system, including
research institutes, has not included teaching, train-
ing and skill development for handlooms into its
mainstream curricula. Hence, the onus of introduc-
ing innovation in design and techniques, and pass-
ing the traditions to younger generations, is left to

Other Priority Sectors 399
weaver families who usually have no resources to
devote to this critical field.
Limited Role of Private Enterprise
19.159. The success of project interventions is lim-
ited by the capacity of NGOs/implementing agen-
cies which often have weak linkages with the market,
thereby limiting the sustainability of their opera-
tions. Also, implementing agencies are often unable
to sustain operations after funding support under
the concerned Schemes has stopped. Greater private
participation for promoting professional manage-
ment and handholding support, inter alia, through
adoption of the PPP model, is required to supple-
ment Government resources and bring about greater
efficiencies and ensure attainment of project targets.
Consolidation
19.160. The existing clusters need consolidation
for converting the Self-Help Groups (SHGs) into
self-sustainable community-based enterprises.
Hence, adequate measures are necessary to ensure
consolidation of all existing clusters introduced in the
earlier Plans. At the same time, for equitable growth
of the sector, the remaining clusters/areas also need
coverage in a phased manner. As such, cluster devel-
opment needs to be given continued emphasis for
achieving integrated and holistic development of the
weavers. Consolidation of all efforts introduced in the
earlier Plans is a big challenge for the Twelfth Plan.
The Vision and Strategies for the Twelfth
Plan for Handlooms
19.161. The vision for the handloom sector for the
Twelfth Plan is to develop a strong, competitive
and vibrant sector in order to provide sustainable
employment to the weavers and ancillary workers,
particularly belonging to the disadvantaged sections
of the population and to ensure faster, more inclu-
sive growth of the sector. To achieve the vision, the
emphasis in the Twelfth Plan will be on consolida-
tion of past gains and strengthening of marketing
systems. Effort will continue over the next five years
to promote supply of yarn/dyes and chemicals in
Box 19.2
Popular Choice by Design!
• The Jharkand Silk, Textile and Handicraft Development Corporation (Jharcraft) has adopted an innovative method to
implement the weavers’ credit card scheme, involving a tripartite agreement between the weaver, Jharcraft and Dena
Bank, under which three different accounts are maintained by the Bank—savings account of weaver, loan account of
weaver and Jharcraft’s account. The price of raw material issued to the weaver is deducted from loan account of the weaver
and deposited into Jharcraft’s account. When the latter gets the finished product, weaver’s dues are credited into savings
account of weaver. After the finished product is sold, the sale proceeds are deposited into the loan account of the weaver.
In view of the success of this pilot, it is now being scaled up by the State. Jharcraft has also, after making sustained efforts,
revived two unique tribal paint forms—Jadopatia of Dumka and Pyathar of Singhbhum which had almost become extinct.
Under a project named ‘HARSH’, more than 50,000 Self-Help Groups have been organised, mainly consisting of women.
In addition, bamboo-based low cost houses and toilets are being developed for weavers and artisans. Jharcraft is now
operating 25 emporia across the country, with its initiatives having resulted in an incredible jump in turnover from `50
lakh in 2007–08 to `70 crore in 2011–12!
• For creating sustainable jobs for weavers/artisans, upgrading skills/product quality, raising earnings and creating market
linkages, Government of Odisha has signed an MOU with a subsidiary of Fabindia under which a Community Owned
Company was set up in October 2010. In 2011–12, the Company has inducted 300 artisans as shareholders; total sale of
products during this period was `1.4 crore; another project by Boyanika (Orissa State Handloom Weavers’ Cooperative
Society) is aimed at improving designs and creating a market for the State’s handloom and textile products; leading
designers such as Rta Kapur Chishti, Bibhu Mohapatra, Rajesh Pratap Singh, and Rakesh Thakore are associated with it.
• Lepakshi of Andhra Pradesh has launched a major ICT initiative through a web-based service for online sale of craft items
produced in the State. Now, markets are just a click away, besides keeping the intermediaries away!
• In Madhya Pradesh, handloom angvastrams/stoles are, inter alia, presented to dignitaries and guests at State functions,
providing visibility to the products both domestically and internationally, besides creating a growing, captive market for
such products. Presentation of ‘Chanderi’ angvastrams was a major highlight at the Commonwealth Games!

400 Twelfth Five Year Plan
smaller quantities/sachets and allocation of more
depots; achieving universal financial inclusion of
weavers/ancillary workers with margin money and
credit guarantee support, interest subvention, greater
coverage of Weaver Credit Cards and linking SHGs
with banks, Microfinance Institutions (MFIs) and
others for greater access to credit; expanding cover-
age under weaver welfare programmes; restructuring
the cluster development approach for more efficient
management and increased sustainability of exist-
ing clusters and taking up new clusters where none
have been assisted so far; broadening the eligibility
of implementing agencies to include NGOs, associa-
tions, design institutes, management institutes and
other institutions of repute which have local and
regional experience and relevant expertise; enumer-
ating women’s contribution in mapping/diagnostic
exercises; and establishing robust monitoring and
evaluation systems, along with defined goalposts.
19.162. The Twelfth Plan will also encourage greater
environmental compliance and occupational health
and safety by adoption of measures such as quanti-
fying environmental impact in planning for cluster
development, mandatorily installing effluent treat-
ment plant (ETP) in all the dyeing units in PPP
mode, promoting solar lighting and supporting
adoption of improved looms with better ergonom-
ics to reduce drudgery of weavers. To overcome the
exiting training and skill gaps, the Weavers’ Service
Centres (WSCs) and Indian Institutes of Handloom
Technology (IIHTs) will be strengthened and further
consolidated. Formal crafts education will be intro-
duced through establishment of Textiles chairs in
leading regional and national universities to inspire
and draw young people into joining the sector.
A Textile Museum/Observatory/Resource centre/
Hastkala Academy to support preservation, revival,
archiving and documentation of languishing hand-
loom crafts (including handicrafts) will also be set
up under PPP. Design and product diversity, includ-
ing development of niche products will be directed
towards strengthening marketing and brand build-
ing. The brand of ‘Handmade in India’ will be pro-
moted domestically as well as abroad, and since the
handlooms, handicrafts, and khadi and the village
industry sectors are distinct but have threads of
commonality, greater synergy will be encouraged
between them to achieve more efficient utilisation
of resources. The coverage of ‘Handloom Mark’
is proposed to be enlarged to cover all handloom
products within a definite time frame. States will
be encouraged to leverage the rich tradition of the
handloom sector to develop tourism potential by
showcasing the unique skills/products by setting up
permanent establishments where live demonstration
of the crafts along with sales counters could be pro-
vided for, at strategic locations, which could serve
as captive marketing channels for weavers. To boost
exports, besides participation in fairs and exhibitions
abroad, ‘India Weaves Week’ will be organised at the
Indian Embassies/High Commissions.
19.163. Special Assistance to NER will be extended
through focus on up gradation of looms, dye houses
and work-sheds after in-depth evaluation and review
of existing infrastructure. SHGs will be formed
and training facilities upgraded to arrive at 100 per
cent coverage of handloom workers. An Apparel
Designing and Training Institute is proposed to
be set up, linked with one Special Weavers’ Service
Centre. A new umbrella scheme that gives space for
framing projects for NER within the objectives for
the handloom sector with flexibilities in guidelines to
suit their peculiar difficulties is proposed. One of the
projects within the scheme would be conversion of
domestic handloom units into Minimum Economic
Size (MES) commercial units aimed at creating com-
mercial areas with infrastructure including work-
sheds, equipment and common facility centres for
making the handloom industry in NER more market
responsive and professionally oriented.
19.164. Major interventions proposed for the hand-
loom sector during the Twelfth Plan are given in
Box 19.3.
HANDICRAFTS
19.165. Handicrafts are items made by hand with
the use of simple tools, generally artistic and/or
traditional in nature, which are used for decorative
purposes, including as gifts and souvenirs as well as
for utility purposes. Handicrafts activity is predomi-
nantly carried out in the unorganised household

Other Priority Sectors 401
sector, and in India as well as in many other regions
of the world, the handicrafts sector is identified as the
largest sector of rural employment after agriculture.
As in the case of handlooms, the handicrafts industry
has also been identified in the Approach Paper for
the Twelfth Plan as one of the priority sectors that
will create large-scale employment opportunities.
Current Situation
19.166. The Handicrafts Census is yet to be com-
pleted, which will indicate the precise extent and
nature of the sector. As per latest available estimates,
employment in this sector has risen from 47.61 lakh
in 2005–06 to 68.86 lakh crafts persons in 2010–11;
20.80 per cent belong to the SCs, 7.50 per cent to the
STs, 52.40 per cent to OBCs and 56.0 per cent are
women. It is proposed to include Handicrafts in the
Sixth Economic Census scheduled to be conducted
during 2012–13.
19.167. The performance of the handicrafts sector
during the Eleventh Plan period is given in Table 19.6.
It is to be noted that towards the beginning of the
Eleventh Plan, exports of handicrafts (inclusive of
carpets) suffered a severe setback due to the global
economic recession in 2008. Thus, exports declined
by 37.89 per cent in the second year of the Eleventh
Plan (2008–09) to `10,891.85 crore. However, steps
taken by the Government led to total handicraft
exports increasing by 3.05 per cent in 2009–10, fol-
lowed by a 20.51 per cent increase during 2010–11
and further by 24.58 per cent during the last year
(2011–12) of the Eleventh Plan, to reach a level of
`16,851.27 crore. The revival of the industry has now
led to the return of many artisans who had left the
sector earlier. However, India’s share in total world
handicrafts exports is estimated to be less than
2 per cent, indicating the potential for raising handi-
crafts exports in the largely unexplored international
market.
Challenges for the Twelfth Plan for Handicrafts
19.168. Like handlooms, the handicrafts sector,
being a State subject, is also primarily the respon-
sibility of the State Governments, and assistance is
provided by Government of India to supplement the
States’ resources. However, while measures taken
in the Eleventh Plan have helped in the revival of
the sector, it remains beset with several constraints,
many of which are common to the handloom sector
already brought out in the previous section. Other
challenges specifically faced by the handicrafts sector
are indicated below.
Box 19.3
Twelfth Plan Interventions for Handlooms
Marketing, Exports, Brand Building and Promotion of Handloom Products—Marketing Events; Urban Haats; Retail Outlets;
Strengthening of Handloom Organisations; Marketing Incentive Component; International Fairs and Exhibitions; and
Export Projects.
Infrastructure and Cluster Model—Consolidation of existing Clusters; New Clusters/Projects; Will include Group Projects/
State-specific Projects and Innovative ideas; New component of Margin Money support.
Raw Material Availability—Yarn to be supplied, including supplies under 10 per cent Hank Yarn Price Subsidy and increased
freight/depot charges for NE States; Depots to take up distribution of dyes and chemicals also; Depot-cum-Warehouse for
supply of smaller quantities of yarn.
Credit Availability—Credit Guarantee and Interest Subvention to weavers against targeted credit.
Social Welfare Measures/Environmental Compliance—Health Insurance Scheme and Mahatma Gandhi Bunkar Bima Yojana;
Environmental Compliance Projects; Solar lighting; Looms improvement and better ergonomics.
Training, HRD, R&D and Technical Processes—Improvement in infrastructure and machinery in existing WSCs and IIHTs;
Introduction of degree courses; R&D Projects; Revival and documentation of languishing handloom crafts.
North Eastern Region—Umbrella scheme for greater flexibility; conversion of domestic handloom units into Minimum
Economic Size (MES) commercial units

402 Twelfth Five Year Plan
Resource Mapping and Data Base
19.169. Several crafts are languishing and slowly
dying due to prolonged neglect and lack of aware-
ness, and inadequate appreciation of the intricacies
and skills involved. Lack of proper processes and sys-
tems for identification, documentation and mapping
of all crafts in India is still a major challenge. Data on
craftspersons, including their socio-economic status,
livelihood and family details, and scientific map-
ping of market trends and consumer profiles is also
inadequate.
Infrastructural and Technological Gaps
19.170. The availability of infrastructure, includ-
ing formal institutions/organisations for produc-
tion, marketing and distribution of handicrafts
in an organised manner is lacking and often non-
functioning. Artisans do not have direct access to
markets within the country and abroad. Lack of
technological up gradation has aggravated the situ-
ation as age-old technology/methods of production
are utilised, leading to inefficient operations and low
quality of output.
Technical Resource Gaps
19.171. There is a lack of comprehensive data on
equipments used by various crafts, apart from lack
of concentrated efforts to develop good quality,
low-cost tools for artisans. Several design banks
are outdated and redundant, as they fail to under-
take continuous revision through, inter alia, use of
internet. Designers often lack requisite knowledge
on practical application of crafts, and training pro-
grammes introduced to upgrade skills of artisans are
treated as a one-time activity, with no mechanism to
institutionalise learning.
Regional Imbalances
19.172. Regional imbalances continue to prevail with
visible gaps in production and consumption (sales),
as the northern and central regions account for bulk
of the exports.
Programmatic Issues
19.173. Various programmatic issues, such as eli-
gibility criteria, financial aspects and fund release
pattern need to be reviewed to facilitate greater effi-
ciency in implementation.
The Vision and Strategies for THE Twelfth
plan for Handicrafts
19.174. The vision for the handicrafts sector for the
Twelfth Plan is to create an equitable, world-class
globally competitive and enabling environment,
and provide sustainable livelihood opportunities
to the artisans through innovative product designs,
improvement in product quality, introduction of
appropriate technology including modern tech-
nology, wherever required, and preserving tradi-
tions, thereby resulting in balanced socio-economic
development and inclusive growth of the sector. In
line with the vision, focus will be on consolidation
of existing infrastructure including measures to
ensure sustainability; institutionalisation of systems
of implementation and scientific evaluation and con-
tinuous monitoring of all existing programmes; and
compulsory scientific mapping of crafts, artisanal
communities, market trends and consumer profiles
and using this as basis for introducing new schemes
or programmes, where necessary. For this purpose,
the existing programmes/schemes in the Eleventh
Plan will be continued with suitable modifica-
tions and consolidation and, in addition, some new
TABLE 19.6
Performance of Handicrafts Sector during the Eleventh Plan Period
Item 2007–08 2008–09 2009–10 2010–11 2011–12 CAGR (%)
(base: ’08–’09)
Production (` crore) 31,940.36 19,375.88 20,221.58 24,393.14 30,257.18 16.01
Employment (lakh persons) NA 58.50 62.60 68.86 72.30 7.3
Export (` crore) 17,536.78 10,891.85 11,224.27 13,526.66 16,851.27 15.70
Source: Office of Development Commissioner (Handicrafts), Ministry of Textiles.

Other Priority Sectors 403
initiatives will be introduced. Existing clusters will
be consolidated through design development efforts,
intensifying forward and backward linkages, and fos-
tering compliance and quality control, so that they
become sustainable, vibrant and resourceful centres
of craftsmanship. Core issues of water and energy
management, sanitation facilities for workers, and
crèche facilities for women artisans will be included
mainly through convergence with other pro-
grammes, and details on raw material availability and
related information will be placed in public domain.
New clusters will be demand and need-driven, and
set up under the PPP mode wherever possible. MFIs
and Non-Banking Finance Companies (NBFCs)
will be tapped as additional sources of credit, and
banks will be encouraged to ensure that lending to
artisans which falls under priority lending, is at least
10 per cent of such lending, and give due thrust to the
Scheme of Artisan Credit Card (ACC). Technological
interventions will be promoted to enhance competi-
tiveness of handicraft products. Awards/scholarships
will be introduced to encourage young generation
craftspersons, and Shilp Gurus/National Awardees
will be conferred honours at par with other National
honours.
19.175. The marketing strategy will involve sus-
tained focus on brand building and promotion
of ‘Handcrafted in India’ brand through a dedi-
cated campaign to promote domestic sales as well
as exports, including a new consumer awareness
scheme for domestic markets, introduction of
national level events on the lines of National Hand-
looms Expo, and greater involvement of the private
sector including the civil society. PPP mode will be
encouraged at all levels in marketing promotion.
Steps will be taken for adherence to compliance
issues so that products meet the acceptable inter-
national quality standards and also convey their
historical, cultural and traditional significance. As
proposed for handlooms, States will be encouraged
to leverage the unique skills and products of the
handicrafts sector to develop tourism potential in
individual States through suitable linkages with the
tourism industry. Efforts will be made to conceive
or upgrade craft training programmes to cover core
areas such as craft design, technology, marketing
and management through recognised institutions
and universities. Social welfare measures will be
modified to provide for improved delivery, moni-
toring and grievance redressal mechanisms. A new
Scheme called the ‘Infrastructure and Technology
Development Scheme’ will be introduced by shifting
the infrastructure components of existing schemes
for developing infrastructure with focus on technol-
ogy. Emphasis will also be placed on establishment
of Handicrafts Museums/Conservatories/Resource
Centres for preservation, revival, archiving and docu-
mentation of languishing crafts. Another new initia-
tive called the ‘North Eastern Regional Development
Scheme’ is proposed, to tap the potential of handi-
crafts in NER, by facilitating access to markets, pro-
viding infrastructure support for improved quality
and productivity and introducing an institutional
framework of development.
19.176. Major interventions proposed for the handi-
crafts sector during the Twelfth Plan are given in
Box 19.4.
THE WAY FORWARD
19.177. In the Twelfth Plan, the overall policy frame-
work for the handloom and handicrafts sectors will
be to focus on consolidation of gains achieved from
the existing schemes/programmes, along with impact
evaluation and suitable modifications in the schemes
to improve their efficacy and delivery. Special focus
will be placed on promoting a unified ‘Handmade in
India’ brand for Indian hand-crafted products and
encouraging greater synergy between handlooms,
handicrafts and khadi and village industry sectors
to achieve more efficient utilisation of resources and
improved performance of the sectors, with as much
emphasis on domestic markets as for exports. There
will also be a focus on supporting private entre-
preneurship and professionalism along with insti-
tutionalisation of e-governance and leveraging of
innovations for achieving sustainable growth of the
sectors. Special efforts will be made towards pres-
ervation, revival and documentation of languishing
crafts, and harnessing the rich tradition of handlooms
and handicrafts in the country to develop tourism
potential. State Governments will be encouraged to
adopt innovative measures to popularise handlooms

404 Twelfth Five Year Plan
and handicrafts within their States as well as in other
parts of the country. Policy will also focus on pro-
motion of financial inclusion and financial literacy
support programmes, addressing environmental and
occupational health and safety concerns, recognis-
ing the contribution of women in their own individ-
ual capacities, and giving arts and crafts education
its due place in mainstream educational systems.
Mechanisms will be put in place to define goalposts
and provide for periodic reviews to ensure compli-
ance of policy directives. The proposals included in
the Twelfth Plan, spanning institutional, financial,
administrative and strategic reforms, are aimed at
raising the production and productivity of the han-
dloom and handicrafts sectors, so as to provide bet-
ter prospects for the crafts and the crafts persons as
well as to fully tap the potential inherent in the two
sectors to contribute towards national development
through higher production and exports. The outlay
for these sectors is included in the overall outlay of
the Ministry of Textiles.
YOUTH AFFAIRS AND SPORTS
19.178. The youth play a crucial role in shaping a
country’s destiny. The Twelfth Plan would focus
on all round development of youth by empowering
them with attitudes, skills and competencies so that
they can fulfil their legitimate aspirations and engage
more effectively in the process of nation build-
ing. In the area of sports, the vision is to broad base
participation in sports and games, particularly par-
ticipation of students in schools and institutions of
higher education and to excel in national and inter-
national competitive sports to bring glory and pride
to the nation. With a view to provide special focus to
the activities of youth affairs and sports, these were
bifurcated into two Departments in 2008. These are
discussed below one after the other.
19.179. Even though public spending on youth
affairs and sports has risen from a meagre `1,146
crore in the Eighth Plan to `14,764 crore during the
Eleventh Plan, it remains very small, just about 2
per cent of the public spending on education. This
should progressively be increased to 5 per cent over
the years. More so, the relative share of the States
has continuously gone down from 62 per cent in the
Eighth Plan to 43 per cent during the Eleventh Plan.
This needs to be enhanced.
Box 19.4
Twelfth Plan Schemes for Handicrafts
Babasheb Ambedker Hastshilp Vikas Yojna: Consolidation of clusters by strengthening existing skills, harnessing design
development efforts; New clusters preferably in PPP mode.
Design and Technology Up-gradation Scheme: Introduction and dissemination of new Designs; Development of Innovative
Technologies/Technical Processes; Showcasing of Prototypes in Exhibitions as well as online.
Marketing Support and Services Scheme: Initiation of new consumer awareness scheme for increasing domestic sales;
Introduction of national level events; Brand promotion; Domestic Exhibitions and International Exhibitions/events.
Human Resource Development Scheme: Introduction of Craft Training Programmes in design, technology, marketing and
management through recognised institutions and universities.
Handicrafts Artisans Comprehensive Welfare Scheme: Modified Rajiv Gandhi Shilpi Swasthya Bima and Janashree Bima
Yojana; Credit Guarantee/Interest Subvention; Cards to new Artisans.
Research and Development Scheme: Completion of Handicrafts Census; Studies on languishing crafts; Occupational Health
and Safety Issues; Special advocacy efforts for benefit of artisans.
Infrastructure and Technology Development Scheme (New): Strengthening of Raw Material Depots/CFCs as well as opening of
new ones; establishment of Mini Haats/Urban Haats; Construction of warehouses; Handicraft Museums.
Special Package for NER (New): Capacity development; Setting up State Initiative Design Centre/International Craft Complex;
Raw Material and Design Banks; Marketing Extension activities.

Other Priority Sectors 405
YOUTH AFFAIRS
19.180. The total youth population (10–35 years)
in the country was 563 million as per Census 2011
with about 70 per cent living in the rural areas. With
a view to bring greater focus and better targeting,
youth is being redefined to cover people in the age
group of 15 to 30 years in place of 15 to 35 years. A
youth development index to serve as a ready reckoner
for educators and policymakers is proposed. There
would be focus on developing qualities of good citi-
zenship and community service amongst the youth
and inculcating in them the spirit of volunteerism.
They would be provided training and research sup-
port and encouraged to take up sports and adven-
ture activities. Youth travel would be promoted and
initiatives would be taken to create an international
perspective amongst them. All this would be done
by building on synergies with the activities of other
ministries, departments and agencies. Special focus
would be on the rural youth. These efforts would aim
at channelising youth energy in productive activi-
ties and engaging them in nation-building activities.
Aligned with this thinking, a National Youth Policy
would be formulated through a consultative process.
19.181. The above objectives are currently being met
by implementing various schemes such as National
Service Scheme (NSS) in collaboration with State/UT
Governments and expansion of activities of Nehru
Yuva Kendra(s), National Youth Corps, scheme of
youth hostels and so on. In addition, several minis-
tries and departments like Health, Women and Child
Development, Education, and Rural Development are
also implementing various programmes for youth.
REVIEW OF THE ELEVENTH PLAN
19.182. Currently, there are 12 schemes/pro-
grammes that either support youth-based organisa-
tions and/or support youth development activities.
The pro gress under these various schemes during
the Eleventh Plan has been uneven. The NSS has not
been able to keep pace with the expansion of the uni-
versity, college and +2 school networks. The NYKs
could extend its activities much beyond the dis-
tricts already covered. Linkages between NYKs and
grass-roots youth organisations such as youth clubs,
sports clubs, Mahila Mandals continues to be weak.
Although NYKs have about 3 lakh youth clubs with
membership of over 80 lakh, only about 1 lakh youth
clubs were active at the grass root level as per recent
survey. Female participation in youth development
activities has been low. In States with large youth
population the visibility of National Schemes like
NYKs and NSS is poor. Coordination of the NYKs
with the schemes run by other ministries/agencies
continues to be a challenge.
TWELFTH PLAN STRATEGY AND INITIATIVES
19.183. The Twelfth Plan would look de novo at the
existing policies, instruments and institutions, and
suggest innovative policies, efficient and effective
instruments and creative ways to rejuvenate insti-
tutions in order to utilise and channelise the youth
energy in nation-building and economic develop-
ment of society. Convergence in approach and syn-
ergy in action would be the key elements. NSS/NCC
may be treated as compulsory co-curricular activity
in educational institutions. Popular Village adoption
activities for health and literacy should be expanded
and training component for NSS volunteers strength-
ened and volunteers’ services should be recognised
with certification. The NYKs should set target for
female membership and achievement should have
weightage in grading of youth clubs. The NYKs
should be evaluated before expansion. Convergence
for optimal utilisation of NYKs/National Youth
Corps is possible only with proper coordination
between Centre and States in implementing various
youth development programmes. A new National
Youth Policy with focus on youth empowerment and
employability will be unveiled.
19.184. Although most of these activities are funded
under various schemes and programmes, there is a
need for coordination and synergy for supplement-
ing their efforts towards the development of youth in
the following areas:
1. Utilising extensive youth network for implemen-
tation of programmes and for monitoring, over-
sight, social audit and so on.
2. Using the youth network for extension and
awareness campaign for issues relating to
girls’ nutrition, dowry, female foeticide, voter

406 Twelfth Five Year Plan
awareness, drug abuse, alcoholism and so on;
Capacity building of youth clubs for social
empowerment under MGNREGA.
3. Training of youth leaders and formation of
supervisory committees at village level under
Pradhan Mantri Grameen Sadak Yojana
(PMGSY).
4. Prevention, education and awareness generation
programme against Alcoholism and Substance
Abuse in the States under Ministry of Social
Justice and Empowerment.
5. Promoting youth employability through provi-
sion of a variety of skill based training courses.
TWELFTH PLAN INITIATIVES
Rajiv Gandhi National Institute of Youth
Development (RGNIYD)
19.185. During the Twelfth Plan, RGNIYD would
be upgraded as an ‘Institute of National Importance’
and ultimately become an international institute of
repute, meeting the requirement of youth develop-
ment/leadership programmes of South East Asian
and South Asian countries. The Institute would
have strong research support by creating several
self-sustaining Centres of Excellence in the areas of
adolescent and youth development with knowledge
capital infusion. The Institute would establish link-
ages with other national, State and regional institu-
tions, including open university system, and create a
network of institutions for carrying out its activities.
The Institute would lay special focus on youth lead-
ers from PRIs and on issues relating to youth and
local governance.
National Programme for Youth Development
19.186. During the Twelfth Plan, an umbrella pro-
gramme for youth development would be launched.
It will bring activities under the ongoing pro-
grammes under one umbrella for better coordina-
tion. This would include:
a. Strengthening of the network of Nehru Yuva
Kendra(s)
b. Expansion of National Youth Corps
c. Support to organisations for activities related to
youth development
d. International youth exchange programmes
Nehru Yuva Kendra(s)
19.187. In the Twelfth Plan, the thrust of the Nehru
Yuva Kendra(s)—NYKs—would be on consoli-
dating, expanding and energising the youth club
movement for engaging the rural youth in various
socio-economic and community activities. NYKs
services would be utilised for fostering national unity
and secular values and stemming the tide of extrem-
ism, essentially through programmes like national
integration camps, inter-state youth exchange, cul-
ture and sports activities and celebration of days and
weeks of national importance. The reach of NYKs
would be extended from existing 501 to all districts
in the country with emphasis on increasing female
membership. NYKs in collaboration with National
Skill Development Corporation (NSDC) have taken
up the initiative for providing young people with
knowledge, new skills, insight and ideas to raise
employability in the North East Region through
‘Train the Trainers’ Centres. Such activities would
be replicated in other disadvantaged areas including
left-wing extremist areas. Success of NYKs depends
upon quality of coordinators and volunteers and 80
per cent of the operational cost is on salaries. Thus,
it is necessary that the process of selecting District
Youth Coordinators should be reviewed with a view
to attract better talent.
National Youth Corps (NYC)
19.188. The NYC envisaged enrolment of 20,000
volunteers in the 18–25 age group to serve up to two
years in nation building activities in lieu of fixed
honorarium. In 2011–12, the enrolment strength
was 18,808 and about 12,300 volunteers have been
deployed in various Kendras across the country @ 2
volunteers per Block. However, keeping in view spe-
cial circumstances in LWE districts and NER, there
is a need to deploy additional volunteers. Expansion
should be considered on evaluation of the scheme,
both in terms of process and impact. The monthly
honorarium of NYC volunteers would be enhanced
to cover mobility and connectivity expenses. The
NYC volunteers would be provided training in two
phases, namely 15 days induction training and 5
days refresher training.

Other Priority Sectors 407
Support for Activities for Youth Development
19.189. The guidelines for National Programme for
Youth and Adolescent Development (NPYAD) has
been revised enabling financial assistance to State
Governments, NYKs, NSS, and NGOs to participate
in youth development activities such as vocational
training, entrepreneurship development, national
and state level exhibitions, camps and festivals,
life-skills education, counselling and career guid-
ance and so on. In the Twelfth Plan, the NPYAD
would be modified and renamed as Programme for
Youth Development (PYD). Promotion of Scouting
and Guiding would be continued with expansion
in membership and a renewed focus on inculcat-
ing in the youth a spirit of patriotism, social service
and communal harmony. The membership would
expand from 50 lakh to 55 lakh during the Twelfth
Plan. Integration and coordination among NSS,
NCC, and Scouts and Guides is also desired. Since
the programme is centred on students, it is prefer-
able to implement it in close coordination with the
Ministry of HRD.
National Service Scheme (NSS)
19.190. The NSS would be revamped and strength-
ened with its coverage expanding from the existing
33 lakh by 5 lakh per annum over the next five years.
The special focus would be on areas where the enrol-
ment of volunteers so far has been low. It is planned to
train about 10,000 programme officers, per annum,
so that about 30,000 of them get training in a cycle
of three years. Priority would be accorded to extend
NSS to uncovered Universities, Colleges, Technical
Institutes and +2 Schools under Higher Secondary
Councils/Boards, particularly in low representa-
tion States like Bihar, Jharkhand, Chhattisgarh, J&K
and all NE states. Enrolment of women volunteers
would be encouraged through a targeted special
drive. Village adoption activities such as under the
Samarth Bharat Abhiyaan of University of Pune have
been most successful in solving problems of sanita-
tion, water management, tree planting and so on.
Similarly, Soft-Skills Development Programme and
‘Each One Teach One’ literacy programme of Pune
University are also success stories that could be rep-
licated. NSS should have training programmes for
disaster management and crowd management. The
existing funding pattern between the Centre and the
States would be revised to 75:25 with special dispen-
sation to NE states in the ratio of 90:10.
Youth Hostels and Youth Resource Centres
19.191. These would be strengthened by develop-
ing them as youth resource centres and making
them vibrant with a lot of activities. The construc-
tion/operations of new hostels could be in franchis-
ing/PPP mode for addressing issues of site selection,
construction, occupancy for other purposes and so
on. Some existing hostels in tourist locations deserve
one time grant for upgradation of facilities and infra-
structure. Part of hostel could be run on competitive
market rates so as to cross-subsidise and meet opera-
tion and maintenance expenses.
19.192. During the Twelfth Plan, a National Youth
Centre at Delhi and five regional centres including
one for the North Eastern Region would be estab-
lished. These could be co-located with the existing
youth hostels with additional investment for infra-
structure and capacity building. The National and
Regional Centres would become the hub of youth
camp activities.
SPORTS AND PHYSICAL EDUCATION
19.193. After India hosted the Ninth Asian Games in
1982, Sports began to receive attention. This led to
the creation of the Sports Authority of India (SAI)
and the formulation of the National Sports Policy.
This helped in generating awareness about the mul-
tidimensional character of sports and emphasised
the need for making sports and physical education
an integral part of the educational curriculum.
19.194. In 2010, the country successfully hosted the
Commonwealth Games and created a world class
sports infrastructure, achieving an impressive medals
tally in swimming, gymnastics and athletics by over-
shadowing major sporting nations like South Africa
and Australia. Also, the performance of Indians in
recent Olympics has been quite good. A good begin-
ning has also been made in strengthening and cre-
ating of sports competition structures at Sub-State
levels. Broad basing of sports and mass participation
is being pursued through Panchayat Yuva Khel aur

408 Twelfth Five Year Plan
Krida Abhiyan (PYKKA) in a decentralised manner.
Further, an opening has been made for development
of school sports and in many States school play-
grounds are being developed with assistance from
PYKKA. The RTE Act 2009 mandates school sports
facilities and provision of sports instructors. The
Rashtriya Madhyamik Shiksha Abhiyan (RMSA) too
provides for physical education instructors in every
secondary school.
19.195. The conduct of National Games has been
gaining importance and States are showing keen
interest in developing sports infrastructure. National
Playfields Association of India has been formed at
National level and Sports Playfields Associations
have been formed at state level in some of the States.
Draft National Sports Development Bill has been
formulated, which includes aspects such as partici-
pation of athletes in the management/decision mak-
ing of the concerned National Sports Federations
and the Indian Olympic Association through the
Athletes Advisory Council, ensuring fair and trans-
parent functioning of autonomous sports bodies and
promotion of welfare measures for sportspersons
and ethical practices in sports and games.
REVIEW OF THE ELEVENTH PLAN
19.196. There was twofold thrust in the Eleventh
Plan. One was to broad base games and sports
through PYKKA and secondly to promote excel-
lence in national and international competitions.
Under the PYKKA, 51,759 villages and 1,538 block
panchayats were covered during the Eleventh Plan
in the rural areas. This is however only 21 per cent
of the total number of village and block panchayats.
For the urban areas, a scheme of assistance for cre-
ation of Urban Sports Infrastructure (USIS) on pilot
basis was started in the year 2010–11. This aimed at
addressing the entire ‘sports eco-system’ in a holistic
manner and included players’ training, coaching and
developmental needs and sports infrastructure.
19.197. The Sports Authority of India (SAI) contin-
ued its activities of promoting sports excellence, broad
basing sports, talent identification and development
through Netaji Subhas National Institute of Sports
(NSNIS), Patiala and LNCPE, Thiruvanthapuram,
and its Training centres. In order to create a dope-
free sports environment in the country, two separate
autonomous entities, namely National Anti-Doping
Agency (NADA) and National Dope Test Laboratory
(NDTL) were established.
TWELFTH PLAN STRATEGY
19.198. The twin planks of Government policy of
broad-basing of sports and achieving excellence in
sports will continue to be pursued in the Twelfth
Plan. While the primary responsibility for pro-
moting sports culture will remain with the State
Governments with active support from the Central
Government through various schemes and pro-
grammes, achieving excellence in competitive events
at the national and international levels will be the
responsibility of various autonomous National
Sports Federations. The role of the Government
would be to create basic infrastructure as well as
build capacity through training and resource sup-
port that will enable sportspersons to excel in various
national and international sporting events.
19.199. Setting up of State Sports Authorities will be
encouraged and Sports Complex Stadia, playfields
and so on will be treated as ‘Infrastructure’ enabling
viability gap funding (VGF) for encouraging invest-
ment through public private partnership and link-
ages with corporate social responsibility (CSR) of the
corporate houses for Sports Infrastructure develop-
ment at State and Sub-State levels.
TWELFTH PLAN INITIATIVES
19.200. Nurturing and promoting excellence in
sports requires a long-term strategy. During the
Twelfth Plan, a long-term plan would be drawn up
by building on initiatives already underway and
taking into consideration the shortcomings of the
actions taken so far.
Sarva Krida Abhiyan
19.201. For broad basing sports and games and con-
necting them to the schools and colleges on one hand
and local bodies on the other, Sarva Krida Abhiyan
would be launched during the Twelfth Plan. This
would bring all ongoing programmes under one
umbrella for better coordination. This would include:

Other Priority Sectors 409
1. Panchayat Yuva Krida aur Khel Abhiyan
(PYKKA)
2. National physical fitness programme
3. Support for sports in institutions of higher
education
4. Support for sports infrastructure
Panchayat Yuva Krida Aur Khel Abhiyan
19.202. Under the Panchayat Yuva Krida aur Khel
Abhiyan (PYKKA), the need now is to capitalise
on the enthusiastic response that the scheme has
evoked in the States and to enhance its coverage to
all village and block panchayats during the Twelfth
Plan period, as originally envisaged. School play-
grounds will be developed by converging PYKKA
with MGNREGA and State schemes. The NVs and
KVs will also open up their playgrounds for neigh-
bourhood schools. Local bodies will be persuaded
to earmark open spaces and community parks for
neighbourhood schools in urban areas. School
adoption by national/international sports stars and
corporate bodies will be promoted along with tax
incentives for investment in school sports infrastruc-
ture. In consultation with all stakeholders, a national
sporting calendar would be developed so that sports
become an integral part of the annual calendar and
parents do not view it as distraction from studies.
Holding of state-level age group specific ‘low-cost’
sports would be promoted with a view to encourage
continued excellence from school to higher educa-
tion level. School-based investment as a part of SSA/
RMSA will strengthen school sports and games. A
full time sports teacher will be made available under
RMSA and SSA will provide part-time sports instruc-
tor. Scholarships/stipends would be introduced for
students excelling in sports.
National Physical Fitness Programme
19.203. Recognising physical fitness as crucial for
social and economic well-being of the nation, a
National Physical Fitness Programme (NPFP) for
school children would be launched in the Twelfth
Plan. Physical education, games and sports will be
made an integral part of school curriculum. To be
implemented along with the Ministry of HRD and
the State governments, the scheme would encourage
school children to be physically fit and concurrently
evaluate their fitness. This would be motivational.
Students’ scores/grades for physical fitness would
be given adequate weightage and added to their
academic scores/grades. Under this programme, all
students of class 5 and above would be evaluated on
six parameters of physical fitness, namely (i) cardio
respiratory endurance, (ii) muscular strength,
(iii) muscular endurance, (iv) flexibility, (v) explo-
sive strength, and (vii) body composition (percent-
age of body fat).
Support for Sports in Institutions of Higher
Education
19.204. An initiative to promote sports and wellness
in the higher education institutions (HEIs) would be
taken up in partnership with the Ministry of HRD
and the Association of Indian Universities (AIU).
Activities under this initiative would include—start
fitness and wellness programme for all students,
encourage HEIs to include physical education as
general institutional requirement, raise participation
in competitive sports from current 2 per cent stu-
dents to 10 per cent, create and support departments
and units for physical education in all HEIs with
adequate staff, support creation of adequate sports
infrastructure, encourage sports club system in
HEIs, establish inter-disciplinary research centres on
sports technology, sports medicine and sports man-
agement, and finally create an information network
on sports. In view of increased demand for physical
education teachers/Instructors, there is a need for
expansion of Physical Education in universities/col-
leges in Western, Northern and Eastern Zones and
NCTE should relax restrictions on B.P.Ed./M.P.Ed
to expand intake capacity.
Sports Infrastructure
19.205. The Urban Sports Infrastructure Scheme
(USIS) would be dovetailed with JNNURM project
funds to benefit from synergy in the urban areas. Due
to pressures of urbanisation, playfields are under
serious threat. They need to be protected. All States
should establish State Playing Fields Associations
and take necessary steps for preservation, protec-
tion and development of playfields. The National
Play Fields Association of India (NPFAI), as an apex
body, would provide requisite support to the State

410 Twelfth Five Year Plan
Associations with financial assistance provided by
the Central and State Governments.
19.206. State-of-the-art sports infrastructure for
competition and training for mega sporting events
is created at various locations at considerable costs.
Such sports infrastructure should be put to opti-
mal use after the main events are over. For this, the
concerned agencies would be encouraged to have
viable plans for utilisation. Such sports infrastruc-
ture should be made available to District/State Sports
Federations for preparation and training of sub-
junior and junior level athletes as well as to the local
community/schools. Possibility for setting up a sepa-
rate company (possibly under the Sports Authority
of India) for this purpose could also be explored. This
could tentatively be called Sports Asset Management
Ltd., whose job would be to develop plans for each
asset and then to bid them out under transparent cri-
teria. There should be efforts for intense use of sports
infrastructure, particularly the expensive ones, in the
evenings and night. Finally, public-private partner-
ships (PPP) in creation and operation of expensive
sports facilities could be explored.
Promotion of Excellence in Sports
19.207. The country’s performance in mega sport-
ing events such as Olympic Games, Asian Games
and Commonwealth Games has consistently
improved over the years (see Box 19.5). Focused
attention and improved funding along with bet-
ter sports infrastructure and facilities and coach-
ing through ‘Operation Excellence’ launched in
April 2011 has helped in achieving this. As a mat-
ter of strategy, besides providing generalised train-
ing through national camps, individualised training
was also provided to the players, tailor-made to their
specific needs, including training in foreign training
institutes. The country should aim to get at least 20
Medals in Olympics 2016 and 30 Medals in Olympics
2020 and be amongst the top 10 sporting countries.
In the Asian Games 2014, the country could aim to
get 75 Medals and then 100 medals in Asian Games
2019 and be amongst the top 3 countries. With a
view to achieve these targets, there would be a clear
and well-funded strategy to build on past perfor-
mance and further improve country’s performance
in international events during the Twelfth Plan.
19.208. ‘Operation Excellence’ so far is structured
with short-term objectives. In order to build on
this, a long-term vision for identification and nur-
turing of talent would be needed. The pool from
which the elite sports persons are drawn has to be
significantly enlarged. The skill sets of our sports
persons has to be augmented through better coach-
ing, more dependent sports medicines, better
sports services and enhanced participation in com-
petitions of higher standards, both in India and
abroad. Focused attention is required in respect of
10 Olympic sports disciplines, namely athletics,
wrestling, shooting, weightlifting, boxing, archery,
badminton, field hockey, judo and taekwondo, row-
ing, sailing, kayaking and canoeing, in which India
has greater potential for excellence and winning
medals. For enlarging the pool, there is a need for
identifying talent through grass-root competition,
particularly in rural areas and nurturing sports tal-
ents through special sports schools, separate from
mainstream schools with greater emphasis on sports
training and coaching support. Early identification
of skill sets of individual sports persons on a scien-
tific basis—at least partly based on bio-medical and
other scientific evidence—would be helpful.
Box 19.5
Upturn in India’s Sporting Performance
The Country had won a total of 50 medals in the Commonwealth Games—2006 and the tally went up to 101 in the
Commonwealth Games—2010. Similarly, India had won 53 medals in Asian Games—2006 that improved to 64 medals in
the Asian Games—2010. India’s performance in the London Olympics—2012 has been the best ever performance by the
Indian contingent in the Olympic Games with six medals, up from three medals in Beijing Olympics—2008. In addition,
12 of the country’s athletes secured 4th to 12th positions, while until then only 5 Indian athletes had secured such positions
in all previous Olympic Games taken together. This shows the growing sporting potential of the country. India also had the
largest contingent of 81 sports persons that qualified for participation in London Olympics.

Other Priority Sectors 411
Preparation of Teams/Athletes
19.209. The scheme for preparation of Indian team
for mega sporting events with clearly defined roles/
responsibilities for each agency/authority will be
continued and supported with adequate budget dur-
ing the Twelfth Plan. This would be linked to the
scheme to support identified sportspersons who
have attained a certain level of achievement. There
is a need for greater convergence of all such initia-
tive including support through National Sports
Development Fund. Corpus for this fund would also
be enhanced. There is a need for further enhancing
the award money for these championships as well
as introducing, during the Twelfth Plan, a system
of giving cash awards to personal coaches, who may
not fulfil the eligibility criteria of imparting 240 days
training preceding the medal winning performance
of their trainees, but who have trained the athletes
for a substantial period of time.
Assistance to National Championships and
National Games
19.210. The Scheme of Assistance to NSFs should
be recast to provide financial assistance for conduct
of National Games and national championships at
senior, junior and sub-junior levels for both men
and women. The level of financial assistance for con-
duct of national championships would also be raised
substantially. The Twelfth Plan will encourage each
State Government to have its own State-level games
every four years—with teams from each district.
This would be in parallel to the national games. State
Games will spread the spirit of competitive sports to
each district.
Pension to Meritorious Sportspersons
19.211. As regards meritorious sportspersons from
Para-sports category, winners of gold, silver and
bronze medals in Para-Olympics alone are eligi-
ble for pension. Now, since physically challenged
sportspersons are taking part in CWG and Para-
Asian Games, they should also be included in the
scheme of Pension to Meritorious Sportspersons
and given pension at par with able-bodied sportsper-
sons. The scheme should be transferred to SAI and
its funding could be included in the block grant
of SAI.
Coaching Upgradation
19.212. The availability of well qualified coaches is
a critical area for the promotion of sports excellence
and requires focused attention in the Indian con-
text. There is a need for producing quality coaches
of international standards and developing a holistic
system for imparting coaching within the country.
Therefore, it has been decided to de-merge National
Institute of Sports (NIS, Patiala) from SAI to form a
new society, the National Institute of Sports Coaching
(NISC). The establishment of NISC would go a long
way in producing quality coaches of international
standards to meet the requirements of our athletes
and teams. There is also a need for keeping our
coaches updated with latest techniques and methods
of coaching in competitive sports and, for this, they
should be sent abroad for short and medium-term
courses in specific disciplines. Institutes and Sports
Universities offering such courses in countries such
as Cuba, Hungary, Belarus, UK, Australia, China,
New Zealand and so on, would be identified.
Establishment of Network of Sports Training/
Advanced Training Centres
19.213. With a view to nurture sports talent, a net-
work of district sports centres and advanced train-
ing centres at the regional level would be established.
To begin with, districts having high potential for
sports talent would be identified and taken up. This
would enable identification of sports talent from
the grassroots level and nurture them over a long
period of time and create bench strength of sports
persons in various disciplines. These fully residen-
tial training centres catering to sports talent in age
group of 8 to 17 years would preferably be co-located
with Navodaya Vidyalayas, Kendriya Vidyalayas,
Sarvodaya Vidyalayas, Schools under the armed
forces or even well-established State Government
schools. Possibility of setting up such schools even
with the private schools subject to proper checks and
balances could also be explored. These centres would
have high quality sports infrastructure.
Sports Authority of India (SAI)
19.214. The SAI, as the apex body for promotion
of excellence in sports, would be strengthened dur-
ing the Twelfth Plan. Existing twelve (12) centres

412 Twelfth Five Year Plan
of excellence catering to training requirements of
national level athletes preparing for participation in
international events would continue to be supported
and more such centres with state-of-the-art facili-
ties and international standard equipment would
be established, particularly in sports disciplines
where India has a higher medal potential. These
centres should be given flexibility to engage the best
National/International coaches and technical sup-
port staff to provide their services to National Teams
and other players. The SAI would set up National
level Institutes in their five major sports complexes
in Delhi, such as National Institute of Hockey at
Dhyan Chand National Stadium. These would
become centres of excellence, training and research
for these specific sports.
Sports Science and Sports Medicine
19.215. During the Twelfth Plan, existing sports
science and medicine facilities at SAI Centres
would be upgraded to prepare the country for the
Commonwealth Games and the Asian Games in
2014. In addition, a National Institute of Sports
Science and Sports Medicine (NISSM) would be set
up to provide integrated and quality-assured test-
ing services and for training and capacity building
of leading experts to drive innovation and share
knowledge that will have positive impact on sporting
performance.
19.216. In order to address the fundamental weak-
ness in the sports sector in the country, there is a
need for focused and coordinated approach. There
has to be a space for sports in the overall economic
activity in the country. This would entail provid-
ing better employment opportunities to promising
sports persons including better opportunities for
career progression, commercialising and developing
certain aspects of sports development and marketing
so as to attract private sector participation and capi-
tal investment in sports.
19.217. The indicative Gross Budgetary Support for
the Twelfth Five Year Plan for the Ministry of Youth
Affairs and Sports is `6,648 crore.
NOTES
1. The resolution read as:
We recognize the role of travel and tourism as a vehicle
for job creation, economic growth and development, and,
while recognizing the sovereign right of States to con-
trol the entry of foreign nationals, we will work towards
developing travel facilitation initiatives in support of
job creation, quality work, poverty reduction and global
growth.
2. Travel and Tourism Competitiveness Reports for various
years published by World Economic Forum which ranks
139 countries on various parameters which effect travel
and tourism competitiveness. The global ranking of India
in respect of ‘Government Prioritization of the Travel and
Tourism Industry’ is a reflection on the priority accorded by
the Government and not on the actual performance.
3. Travel and Tourism Competitiveness Reports for various
years published by World Economic Forum.
4. Ibid.
5. The Travel and Tourism Competitiveness Report 2011,
World Economic Forum.
6. Eco-tourism is a comprehensive idea encompassing numer-
ous concepts such as Nature Tourism, which aims at dis-
covering natural wonders by minimising the impacts of
people on the environment; Adventure Tourism and Ethnic
Tourism, which takes the tourists into a cultural immersion
within local indigenous communities.
7. The emphasis should be on decision making through the
gram sabha rather than through the gram panchayat.
8. The electricity duty, tax on goods and passengers, motor
vehicle tax and stamp duty levied by the States will not be
subsumed in the GST at the time of its introduction.
9. In the case of the transport sector, credit for input tax
is allowed by way of abatement on a presumptive basis.
However, in the case of aviation services, credit for input tax
including tax on ATF should be allowed on actual basis.
10. Travel and Tourism Competitiveness Reports for various
years published by World Economic Forum which ranks
139 countries on various parameters which effect travel
and tourism competitiveness. The global ranking of India
in respect of ‘Government Prioritization of the Travel and
Tourism Industry’ is a reflection on the priority accorded by
the Government and not on the actual performance.
11. Travel and Tourism Competitiveness Reports for various
years published by World Economic Forum.
12. Ibid.
