14638_TDL_Web 14638 TDL Web
User Manual: 14638_TDL_Web
Open the PDF directly: View PDF ![]() .
.
Page Count: 105 [warning: Documents this large are best viewed by clicking the View PDF Link!]
- Introduction
- About AquaLab
- Water Activity Theory
- Getting Started
- Menus
- Cleaning and Maintenance
- Verification and Calibration
- Sample Preparation
- Taking a Reading
- Moisture Content Measurement
- Computer Interface
- Troubleshooting
- Support and Repair
- Further Reading
- Appendix A
- Appendix B
- Appendix C
- Declaration of Conformity
- Certificate of Traceability
Operator’s Manual
METER Group, Inc.
Version: July 18, 2017 — 14:18:47

AquaLab TDL
METER Group, Inc.
2365 NE Hopkins Court
Pullman WA 99163
Phone: 509-332-5601
Fax: 509-332-5158
Website: www.metergroup.com
Email: support.food@metergroup.com or
sales.food@metergroup.com
Trademarks
AquaLab is a registered trademark of METER Group, Inc.
c
2017 METER Group, Inc.
ii

AquaLab TDL CONTENTS
Contents
1 Introduction 1
1.1 Customer Support . . . . . . . . . . . . . . . . . . . . 1
1.2 About This Manual . . . . . . . . . . . . . . . . . . . 1
1.3 Warranty ......................... 2
1.4 Seller’s Liability . . . . . . . . . . . . . . . . . . . . . . 2
1.5 General Safety Information . . . . . . . . . . . . . . . 3
2 About AquaLab 4
2.1 AquaLab TDL Instrument Specifications . . . . . . . . 4
2.2 AquaLab and Water Activity . . . . . . . . . . . . . . 5
2.3 HowTDLWorks ..................... 5
2.4 AquaLab and Temperature . . . . . . . . . . . . . . . 6
3 Water Activity Theory 7
3.1 Moisture Content . . . . . . . . . . . . . . . . . . . . . 7
3.2 WaterActivity ...................... 7
3.3 Water Potential . . . . . . . . . . . . . . . . . . . . . . 9
3.4 Sorption Isotherms . . . . . . . . . . . . . . . . . . . . 12
4 Getting Started 13
4.1 Components of your AquaLab . . . . . . . . . . . . . . 13
4.2 Choosing a Location . . . . . . . . . . . . . . . . . . . 13
4.3 Preparing AquaLab for Operation . . . . . . . . . . . 14
5 Menus 16
5.1 Measurement Tab . . . . . . . . . . . . . . . . . . . . 16
5.2 Configuration Tab . . . . . . . . . . . . . . . . . . . . 17
5.3 Admin Settings . . . . . . . . . . . . . . . . . . . . . . 23
5.4 DataTab ......................... 27
6 Cleaning and Maintenance 29
6.1 Cleaning the Block Sensors . . . . . . . . . . . . . . . 30
6.2 Cleaning an AquaLab TDL . . . . . . . . . . . . . . . 31
6.3 Cleaning Procedure: . . . . . . . . . . . . . . . . . . . 31
6.4 Verification of Calibration . . . . . . . . . . . . . . . . 33
7 Verification and Calibration 34
7.1 Water Activity Verification . . . . . . . . . . . . . . . 34
iii

CONTENTS AquaLab TDL
7.2 Verification of Calibration . . . . . . . . . . . . . . . . 35
8 Sample Preparation 47
8.1 Preparing the Sample . . . . . . . . . . . . . . . . . . 47
8.2 Samples Needing Special Preparation . . . . . . . . . . 48
8.3 Slow Water-Emitting Samples . . . . . . . . . . . . . . 49
8.4 Samples Not at Room Temperature . . . . . . . . . . . 49
9 Taking a Reading 51
9.1 Measurement Steps . . . . . . . . . . . . . . . . . . . . 51
9.2 How AquaLab Takes Readings . . . . . . . . . . . . . 51
10 Moisture Content Measurement 54
11 Computer Interface 55
11.1 AquaLink 4 Software . . . . . . . . . . . . . . . . . . . 55
11.2 AquaLink 4 Part 11 Compatible Software . . . . . . . 56
11.3 Using a Communication Program . . . . . . . . . . . . 56
12 Troubleshooting 58
13 Support and Repair 66
13.1RepairCosts ....................... 67
13.2 Loaner Service . . . . . . . . . . . . . . . . . . . . . . 67
14 Further Reading 68
14.1 Water Activity Theory & Measurement . . . . . . . . 68
15 Appendix A 90
15.1 Preparing Salt Solution . . . . . . . . . . . . . . . . . 90
16 Appendix B 92
17 Appendix C 93
18 Declaration of Conformity 98
19 Certificate of Traceability 99
iv

AquaLab TDL 1 INTRODUCTION
1 Introduction
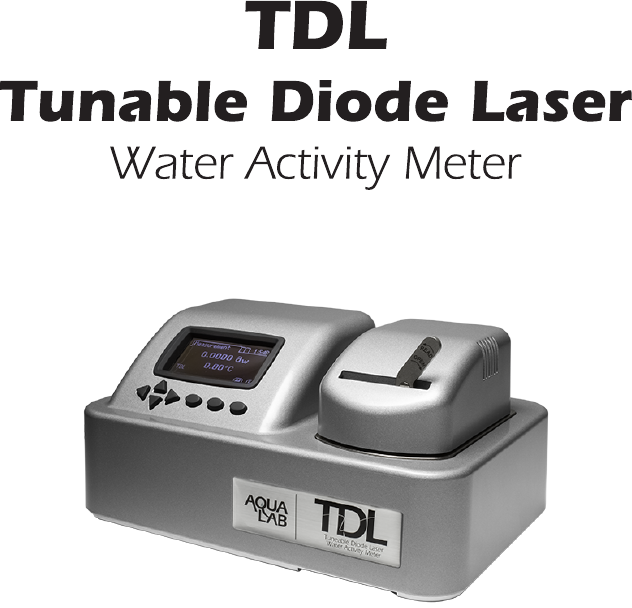
Welcome to your AquaLab Tunable Diode Laser (TDL). AquaLab is
the quickest, most accurate, and most reliable instrument available
for measuring water activity. Whether you are researching or working
on the production line, the TDL suits your needs. It is easy to use
and provides accurate and timely results.
1.1 Customer Support
If you ever need assistance with your AquaLab, have any questions
or feedback, there are several ways to contact us. METER has Cus-
tomer Service Representatives available to speak with you Monday
through Friday, between 7 am and 5 pm Pacific time.
Note: If you purchased your AquaLab through a distributor, please
contact them for assistance.
Email:
support.food@metergroup.com or sales.food@metergroup.com
Phone:
1-509-332-5601
Fax:
1-509-332-5158
If contacting us by email or fax, please include as part of your mes-
sage your instrument serial number, your name, address, phone, fax
number, and a description of your problem or question.
1.2 About This Manual
This manual includes instructions for setting up your AquaLab, veri-
fying the calibration of the instrument, preparing samples, and main-
taining and caring for your instrument. Please read these instructions
1

1 INTRODUCTION AquaLab TDL
before operating AquaLab to ensure that the instrument performs to
its full potential.
1.3 Warranty
AquaLab has a 30-day satisfaction guarantee and a one year warranty
on parts and labor. Your warranty is automatically validated upon
receipt of the instrument. We contact you within the first 90 days of
your purchase to see how the TDL is working for you.
1.4 Seller’s Liability
Seller warrants new equipment of its own manufacture against de-
fective workmanship and materials for a period of one year from the
date of receipt of equipment.
Note: We do not consider the results of ordinary wear and tear,
neglect, misuse, accident and excessive deterioration due to corro-
sion from any cause as defects.
The Seller’s liability for defective parts shall in no event exceed the
furnishing of replacement parts Freight On Board the factory where
originally manufactured. Material and equipment covered hereby
which is not manufactured by Seller shall be covered only by the
warranty of its manufacturer. Seller shall not be liable to Buyer for
loss, damage or injuries to persons (including death), or to property
or things of whatsoever kind (including, but not without limitation,
loss of anticipated profits), occasioned by or arising out of the instal-
lation, operation, use, misuse, nonuse, repair, or replacement of said
material and equipment, or out of the use of any method or process
for which the same may be employed. The use of this equipment
constitutes the buyer’s acceptance of the terms set forth in this war-
ranty. There are no understandings, representations, or warranties
of any kind, express, implied, statutory or otherwise (including, but
without limitation, the implied warranties of merchantability and
fitness for a particular purpose), not expressly set forth herein.
2

AquaLab TDL 1 INTRODUCTION
1.5 General Safety Information
Please read through this documentation carefully before putting the
instrument into operation. The documentation contains information
and warnings which the user must follow in order to ensure safe op-
eration. This instrument may only be operated in accordance with
the specifications in this documentation.
This instrument has left the factory in a flawless state in terms of
technical and electrical safety. To maintain this state and ensure
non-hazardous operation of the instrument, the following instruc-
tions must be observed carefully.
1. Only personnel qualified by METER are authorized to carry
out service work on the electrical components. When work is
required a Certificate of Calibration will be issued upon com-
pletion of the work.
2. Never remove the housing of the instrument. The instrument
could be damaged by this. There is also a risk of serious injury
if the live components are touched. There are no parts inside
the housing which can be serviced or replaced by the user.
3. An incorrect main power voltage can damage the instrument.
Only operate this instrument with a main power voltage spec-
ified for it (see rear label).
4. This product is grounded through the grounding conductor of
the power cord. To avoid electric shock, the grounding conduc-
tor must be connected to earth ground.
5. Should a fuse need to be replaced. Use only the fuse type and
rating specified for this instrument.
6. If the instrument is used in a manner not specified by the man-
ufacturer, the protection provided by the equipment may be
impaired.
3

2 ABOUT AQUALAB AquaLab TDL
2 About AquaLab
AquaLab is the fastest and most accurate instrument for measuring
water activity, giving readings in five minutes or less. Its readings
are reliable, providing ±0.005 awaccuracy. The instrument is easy
to clean and checking calibration is simple.
Note: UL has listed this product to applicable UL Standards and
Requirements.
2.1 AquaLab TDL Instrument Specifications
Sensor Type: Tunable Diode Laser and Infrared Temperature
Water Activity Accuracy: ±0.005 @ 25 ◦C
Water Activity Resolution: 0.0001 aw
Water Activity Range: 0.000 to 1.000 aw
Water Activity Repeatability: ±0.001 aw
Read Time1:≤5 min.
Sample Temperature Control: 25 ◦C 15 to 50 ◦C (with calibration)
Sample Temperature Adjustment Increment: 1 ◦C
Sample Temperature Accuracy: ±0.2◦C
Sample Temperature Resolution: 0.01 ◦C
Sample Dish Capacity: 15 mL full
Operating Environment: 4 to 50 ◦C; 0 to 90% Humidity non-condensing
Case Dimensions: 26.7 x 17.8 x 12.7 cm
Weight: 3.1 kg
Case Material: POLYLAC PA-765 (ABS) with fire retardant
Display: 64 x 128 Graphical
1On samples with no significant impedance to vapor loss.
4

AquaLab TDL 2 ABOUT AQUALAB
Data Communications: USB
Power: 110 to 220 VAC, 50/60 Hz
Warranty: One year parts and labor
2.2 AquaLab and Water Activity
Water activity (aw) is a measurement of the energy status of the
water in a system. The value indicates how tightly water is bound,
structurally or chemically, within a substance. Water activity is the
relative humidity of air in equilibrium with a sample in a sealed
measurement chamber. The concept of water activity is of partic-
ular importance in determining product quality and safety. Water
activity influences color, odor, flavor, texture and shelf-life of many
products. It predicts safety and stability with respect to microbial
growth, chemical and biochemical reaction rates, and physical prop-
erties. For a more detailed description of water activity as it pertains
to products, please refer to Section 3 of this manual, titled “Water
Activity Theory.”
2.3 How TDL Works
The TDL uses a tunable diode laser to measure the water activity of
a sample. The sample is equilibrated with the head-space of a sealed
chamber containing a tunable laser that shines light of a controlled
wavelength at a detector that receives the light from the laser. At
equilibrium, the relative humidity of the air in the chamber is the
same as the water activity of the sample. In the TDL, the vapor
pressure of the headspace in equilibrium is determined by the loss of
signal strength from the laser caused by the presence of water vapor
in the headspace. This vapor pressure is divided by the saturated
vapor pressure at the sample temperature, which is measured us-
ing an IR sensor, to give water activity. AquaLab then signals you
by beeping and displays the final water activity. Since the sample
temperature is directly measured and no sensor is being used to de-
tect humidity, all that is needed to make a measurement is vapor
equilibrium, which can happen in as little as two to three minutes.
5

2 ABOUT AQUALAB AquaLab TDL
2.4 AquaLab and Temperature
Samples not read at room temperature during the read cycle equi-
librate with the TDL temperature before the water activity is dis-
played. Large temperature differences cause longer reading times,
since TDL cannot make a complete and accurate reading until the
sample and the instrument equilibrate to within ±4◦C. There are
several advantages in having a temperature-controlled water activity
meter. A few major reasons are:
1. Research purposes. Researchers can use temperature con-
trol to study the effects of temperature on the water activity of
a sample, make a comparison of the water activity of different
samples independent of temperature, and conduct accelerated
shelf-life studies or other water activity studies where temper-
ature control is critical. There are many shelf-life, packaging,
and isotherm studies in which temperature control would be
very beneficial. (See Section 14. Further Reading for more
information)
2. Compliance with government or internal regulations for
specific products. Though the water activity of most products
varies by less than ±0.002 per ◦C, some regulations require
measurement at a specific temperature. The most common
specification is 25 ◦C, though 20 ◦C is sometimes indicated.
3. Minimization of extreme ambient temperature fluctu-
ations. If the environmental and AquaLab temperatures fluc-
tuate by as much as ±5◦C daily, water activity readings vary
by ±0.01 aw. Temperature control eliminates variations due to
changes in ambient conditions.
6

AquaLab TDL 3 WATER ACTIVITY THEORY
3 Water Activity Theory
Water is a major component of foods, pharmaceuticals, and cosmet-
ics. Water influences the texture, appearance, taste and spoilage of
these products. There are two basic types of water analysis: moisture
content and water activity.
3.1 Moisture Content
The meaning of the term moisture content is familiar to most people.
It implies a quantitative analysis to determine the total amount of
water present in a sample. There are two primary methods for deter-
mining moisture content: loss on drying and Karl Fisher titration,
but you can also use secondary methods such as infrared and NMR.
Moisture content determination is essential in meeting product nu-
tritional labeling regulations, specifying recipes and monitoring pro-
cesses. However, moisture content alone is not a reliable indicator for
predicting microbial responses and chemical reactions in materials.
The limitations of moisture content measurement are attributed to
differences in the intensity with which water associates with other
components.
3.2 Water Activity
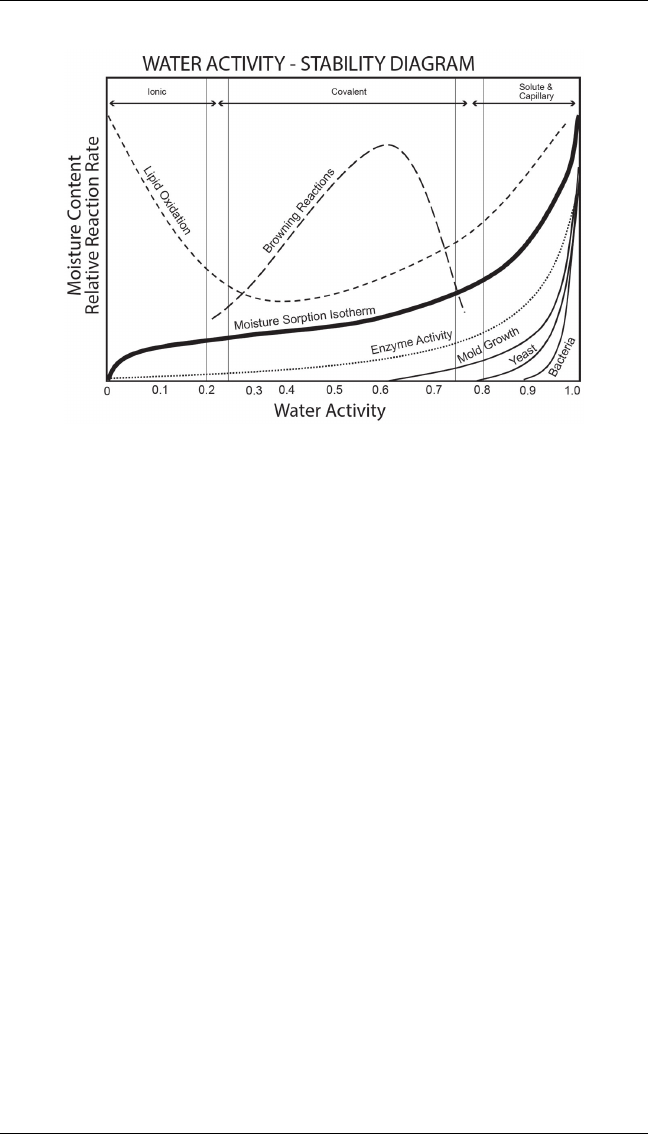
Water activity is a measure of the energy status of the water in a
system, and thus is a far better indicator of perishability than water
content. Figure 1 shows how the relative activity of microorganisms,
lipids and enzymes relate to water activity. While other factors, such
as nutrient availability and temperature, can affect the relationships,
water activity is the best single measure of how water affects these
processes. Researchers measure the water activity of a system by
equilibrating the liquid phase water in the sample with the vapor
phase water in the headspace and measuring the relative humidity
of the head-space. First place a sample in a sample cup that seals
inside the TDL sample chamber. Inside the sample chamber is a tun-
able diode laser and an infrared thermometer. The TDL determines
the vapor pressure in the headspace and the infrared thermometer
7
3 WATER ACTIVITY THEORY AquaLab TDL
Figure 1: Water Activity Diagram adapted from Labuza
measures the sample temperature. From these measurements, the
relative humidity of the head-space is computed as the ratio of the
partial pressure measured by TDL to saturation vapor pressure at
the sample temperature. When the water activity of the sample and
the relative humidity of the air are in equilibrium, the measurement
of the head-space humidity gives the water activity of the sample.
In addition to equilibrium between the liquid phase water in the
sample and the vapor phase, the internal equilibrium of the sample
is important. If a system is not at internal equilibrium, one might
measure a steady vapor pressure (over the period of measurement)
which is not the true water activity of the system. An example of this
might be a baked good or a multi-component food. Initially out of
the oven, a baked good is not at internal equilibrium; the outer sur-
face is at a lower water activity than the center of the baked good.
One must wait a period of time in order for the water to migrate
and the system to come to internal equilibrium. It is important to
remember the restriction of the definition of water activity to equi-
librium.
8

AquaLab TDL 3 WATER ACTIVITY THEORY
Temperature Effects
Temperature plays a critical role in water activity determination.
The AquaLab infrared thermometer measures the difference in tem-
perature between the sample and the block. It is carefully calibrated
to minimize temperature errors, but when temperature differences
are large water activity can change during testing. Best accuracy is
therefore obtained when the sample is near chamber temperature.
Another effect of temperature on water activity occurs when sam-
ples are near saturation. A sample that is close to 1.0 awand is
only slightly warmer than the sensor block condenses water within
the block. Condensation causes errors in the measurement, and in
subsequent measurements until it evaporates. A sample at 0.75 aw
needs to be approximately 4 ◦C above the chamber temperature to
cause condensation. The AquaLab warns the user if a sample is more
than 4 ◦C above the chamber temperature, but for high water ac-
tivity samples the operator needs to be aware that condensation can
occur if a sample that is warmer than the block is put in the TDL.
3.3 Water Potential
Some additional information may be useful for understanding what
water activity is and why it is such a useful measure of moisture
status in products. Water activity is closely related to a thermody-
namic property called the water potential, or chemical potential (µ)
of water, which is the change in Gibbs free energy (∆G) when water
concentration changes. Equilibrium occurs in a system when (µ) is
the same everywhere in the system. Equilibrium between the liquid
and the vapor phases implies that (µ) is the same in both phases. It
is this fact that allows us to measure the water potential of the va-
por phase and use that to determine the water potential of the liquid
phase. Gradients in (µ) are driving forces for moisture movement.
Thus, in an isothermal system, water tends to move from regions of
high water potential (high aw) to regions of low water potential (low
aw). Water content is not a driving force for water movement, and
therefore can not be used to predict the direction of water movement,
except in homogeneous materials.
9

3 WATER ACTIVITY THEORY AquaLab TDL
10

AquaLab TDL 3 WATER ACTIVITY THEORY
Factors In Determining Water Activity
The water activity of the water in a system is influenced by factors
that effect the binding of water. They include osmotic, matric, and
pressure effects. Typically water activity is measured at atmospheric
pressure, so only the osmotic and matric effects are important.
Osmotic Effects: Osmotic effects are well known from biology and
physical chemistry. Water is diluted when a solute is added. If
this diluted water is separated from pure water by a semi-permeable
membrane, water tends to move from the pure water side through
the membrane to the side with the added solute. If sufficient pressure
is applied to the solute-water mixture to just stop the flow, this pres-
sure is a measure of the osmotic potential of the solution. Addition
of one mole of an ideal solute to a kilogram of water produces an
osmotic pressure of 22.4 atm. This lowers the water activity of the
solution from 1.0 to 0.98 aw. For a given amount of solute, increasing
the water content of the systems dilutes the solute, decreasing the
osmotic pressure, and increasing the water activity. Since microbial
cells are high concentrations of solute surrounded by semi-permeable
membranes, the osmotic effect on the free energy of the water is im-
portant for determining microbial water relations and therefore their
activity.
Matric Effects: The sample matrix affects water activity by phys-
ically binding water within its structure through adhesive and cohe-
sive forces that hold water in pores and capillaries, and to particle
surfaces. If cellulose or protein were added to water, the energy sta-
tus of the water would be reduced. Work would need to be done to
extract the water from this matrix. This reduction in energy status
of the water is not osmotic, because the cellulose or protein concen-
trations are far too low to produce any significant dilution of water.
The reduction in energy is the result of direct physical binding of
water to the cellulose or protein matrix by hydrogen bonding and
van der Waals forces. At higher water activity levels, capillary forces
and surface tension can also play a role.
11

3 WATER ACTIVITY THEORY AquaLab TDL
3.4 Sorption Isotherms
Relating Water Activity to Water Content
Changes in water content affect both the osmotic and matric binding
of water in a product. Thus a relationship exists between the water
activity and water content of a product. This relationship is called
the sorption isotherm, and is unique for each product. Besides being
unique to each product, the isotherm changes depending on whether
it was obtained by drying or wetting the sample. These factors need
to be kept in mind if one tries to use water content to infer the
stability or safety of a product. Typically, large safety margins are
built into water content specifications to allow for these uncertainties.
While the sorption isotherm is often used to infer water activity
from water content, one could easily go the other direction and use
the water activity to infer the water content. This is particularly at-
tractive because water activity is much more quickly measured than
water content. This method gives particularly good precision in the
center of the isotherm. In order to infer water content from water
activity, one needs an isotherm for the particular product. METER
sells an Isotherm Generator called the AquaLab Vapor Sorption Ana-
lyzer (VSA) or you can also have METER run the isotherm for a fee.
For example, if you were using the AquaLab to monitor the water
content of dried potato flakes, you would measure the water activity
and water content of potato flakes dried to varying degrees using the
standard drying process for those flakes. You could then use that
data to construct an isotherm and infer the water content using the
measured water activity of samples and that isotherm.
We cannot overemphasize the importance of the concept of water
activity for foods, pharmaceuticals, and cosmetics. Water activity
is a measure of the energy status of the water in a system. More
importantly, the usefulness of water activity in relation to microbial
growth, chemical reactivity, and stability over water content has been
shown.
12

AquaLab TDL 4 GETTING STARTED
4 Getting Started
4.1 Components of your AquaLab
Your AquaLab should have been shipped with the following items:
•AquaLab water activity meter
•Calibration certificate
•Power cord
•USB interface cable
•50 disposable sample cups
•Operator’s Manual
•Quick Start Guide
•Cleaning kit
•Two vials each of the following verification solutions:
1.00 awUSP Purified Water
0.984 aw0.50 mol/kg KCL
0.920 aw2.33 mol/kg NaCl
0.760 aw6.00 mol/kg NaCl
0.500 aw8.57 mol/kg LiCl
0.250 aw13.41 mol/kg LiCl
•AquaLink 4 Software Package
4.2 Choosing a Location
To ensure that your AquaLab operates correctly and consistently,
place it on a level surface. This reduces the chance of sample mate-
rial spillage or sample chamber contaminate. Also select a location
where the temperature remains fairly stable to avoid temperature
changes that can affect accuracy. This location should be well away
from air conditioner and heater vents, open windows, etc. Place
the AquaLab in a location where cleanliness can be maintained to
prevent contamination of the sample chamber.
13
4 GETTING STARTED AquaLab TDL
4.3 Preparing AquaLab for Operation
After finding a good location for your AquaLab, plug the power cord
into the back of the unit. The ON/OFF switch is located on the
lower left corner of the AquaLab back panel. When the AquaLab
is turned on, you should see a model name/number screen and then
the main Measurement screen.
Warning: Only use the supplied power cord or one rated for your
AquaLab 4 and certified for the country of use. The cord must be
minimum of 18 AWG and have a rating for 10 Amps or greater.
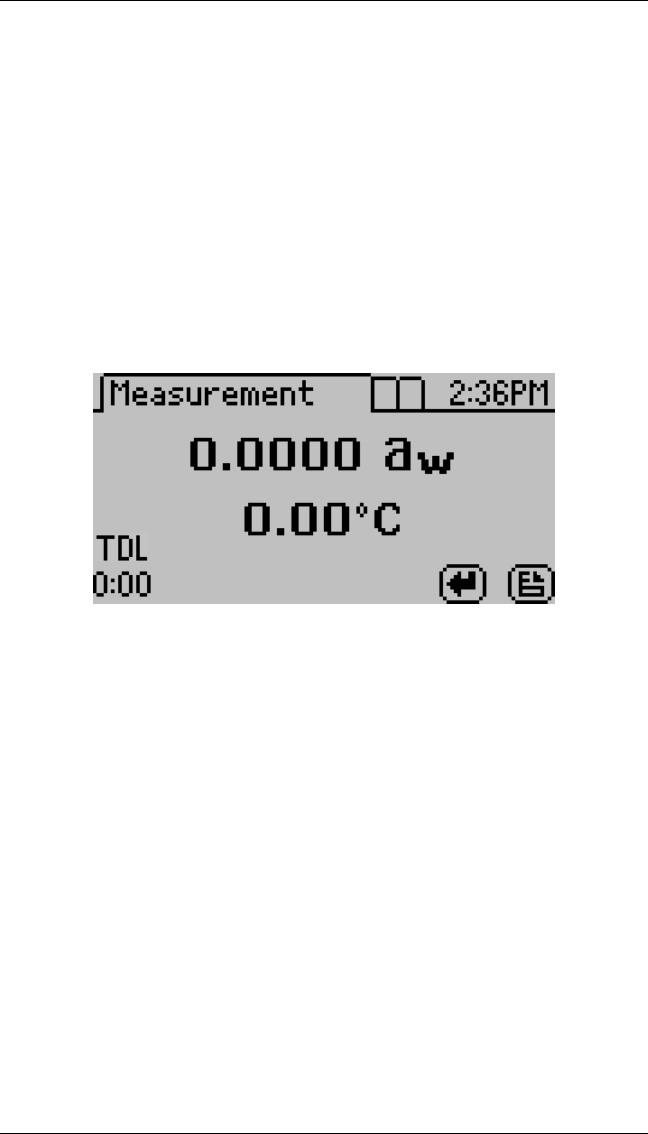
The Measurement screen shows the water activity (aw) in the middle
of the screen, directly above the sample temperature.
Note: Allow your AquaLab a 15 minute warm-up period to ensure
the most accurate readings.
If you have users set up, the User screen appears instead of the
Measurement screen. (See Section 5 for more information on ad-
ministrative settings and user setup.) Select the appropriate user to
begin.
14

AquaLab TDL 4 GETTING STARTED
15
5 MENUS AquaLab TDL
5 Menus
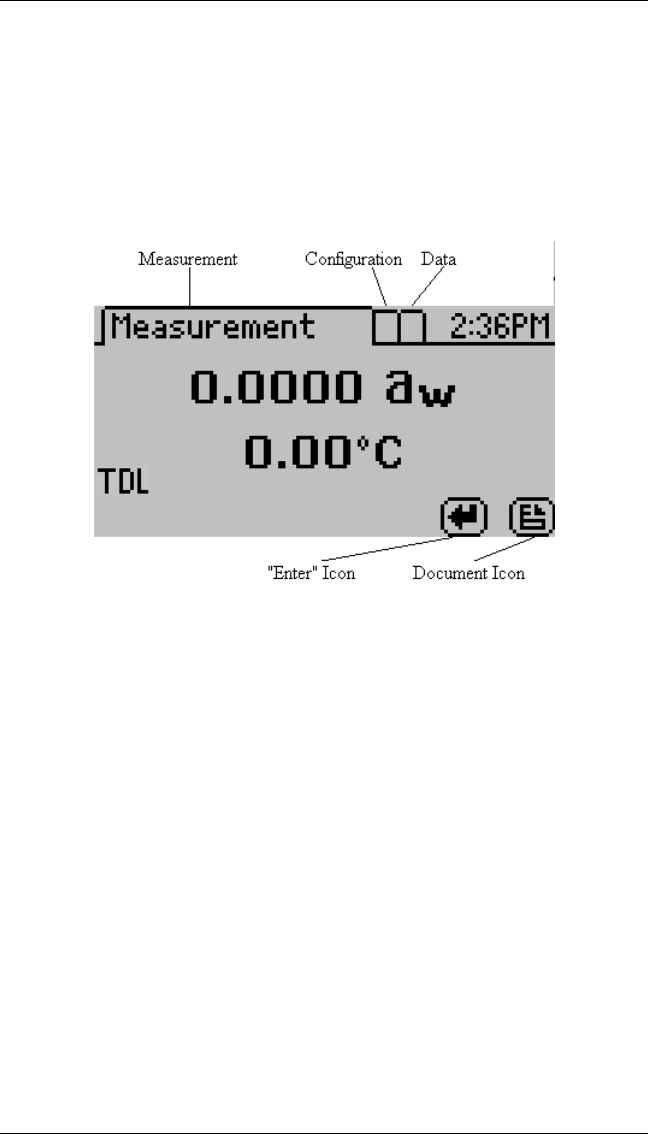
At the top of the display screen there are three tabs: Measurement,
Configuration, and Data. These tabs indicate the three menus you
can access. To change between the tabs press the right most button
below the document icon.
The enter icon is the Read or Enter button. Once the latch is set
to the Read position, the document icon switches to an “X” icon,
which allows the user to stop the current reading. During a reading,
pressing Enter again restarts the reading.
5.1 Measurement Tab
The Measurement tab, as seen above, is the main screen which dis-
plays each time you turn on your AquaLab. If this screen does not
appear, refer to Section 12 for troubleshooting instructions. As men-
tioned earlier, the water activity and sample temperature are dis-
played on the screen.
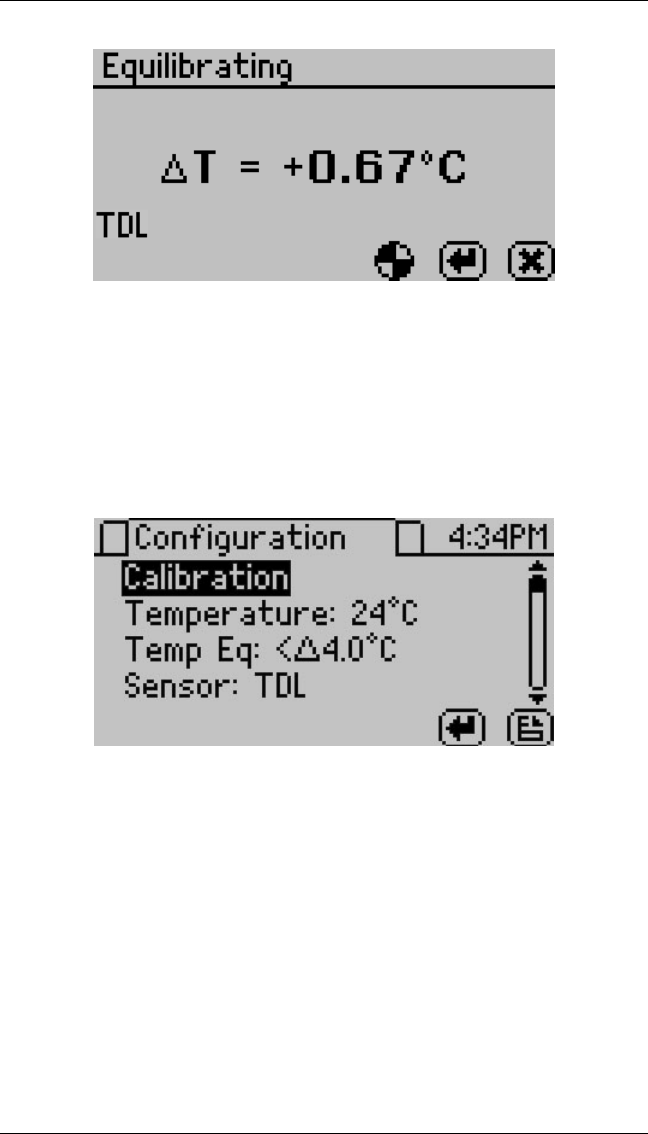
Pushing the right or left arrow keys changes the display to a tem-
perature Equilibrating screen. This screen shows the temperature
difference between the sample temperature and the lid temperature.
16
AquaLab TDL 5 MENUS
5.2 Configuration Tab
When at the configuration screen, pressing the up and down arrow
keys moves the cursor through the various configuration options.
Press the left and right arrows to page through the options. The
Enter button allows you to change the highlighted setting.
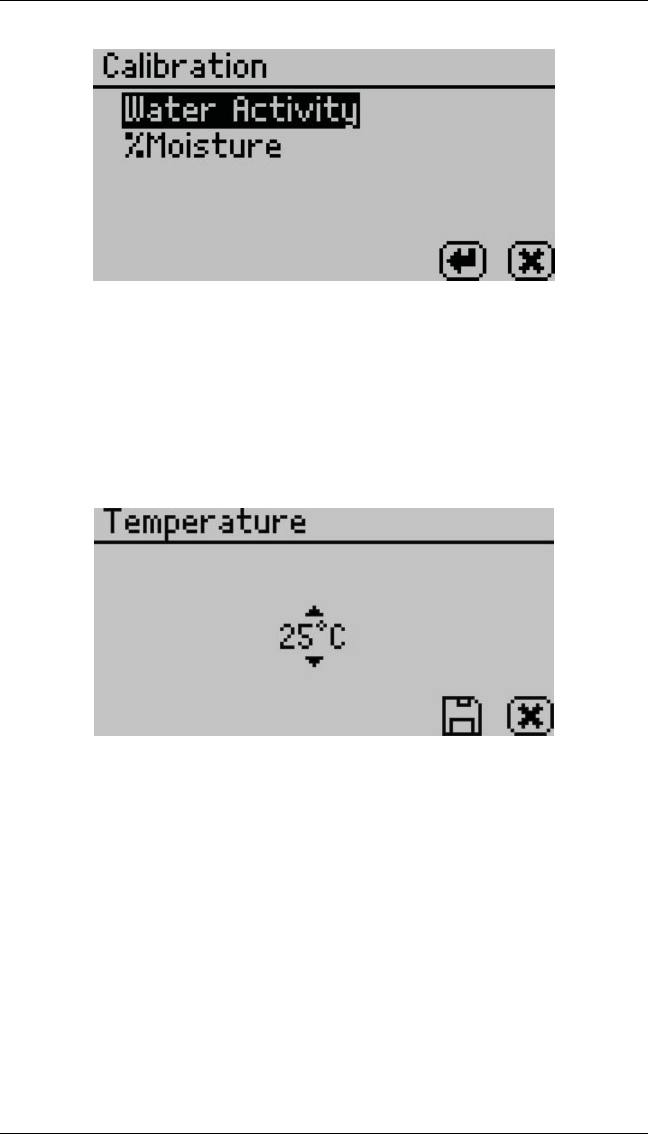
Calibration
Pressing the Enter button with Calibration highlighted starts the
calibration process. For more details on the water activity verifica-
tion and calibration procedures refer to Section 7. You may also reset
the calibration to the factory defaults by highlighting the Defaults
option and pressing Enter. This resets all options to the way they
were when the instrument arrived at your location.
17
5 MENUS AquaLab TDL
Temperature
The default temperature is 25 ◦C. Press the Enter button to change
the temperature setting. The AquaLab may be set between 15 and
50 ◦C by 1.0 ◦C intervals. Using the up and down arrows, set the
AquaLab to your desired temperature and press the save button.
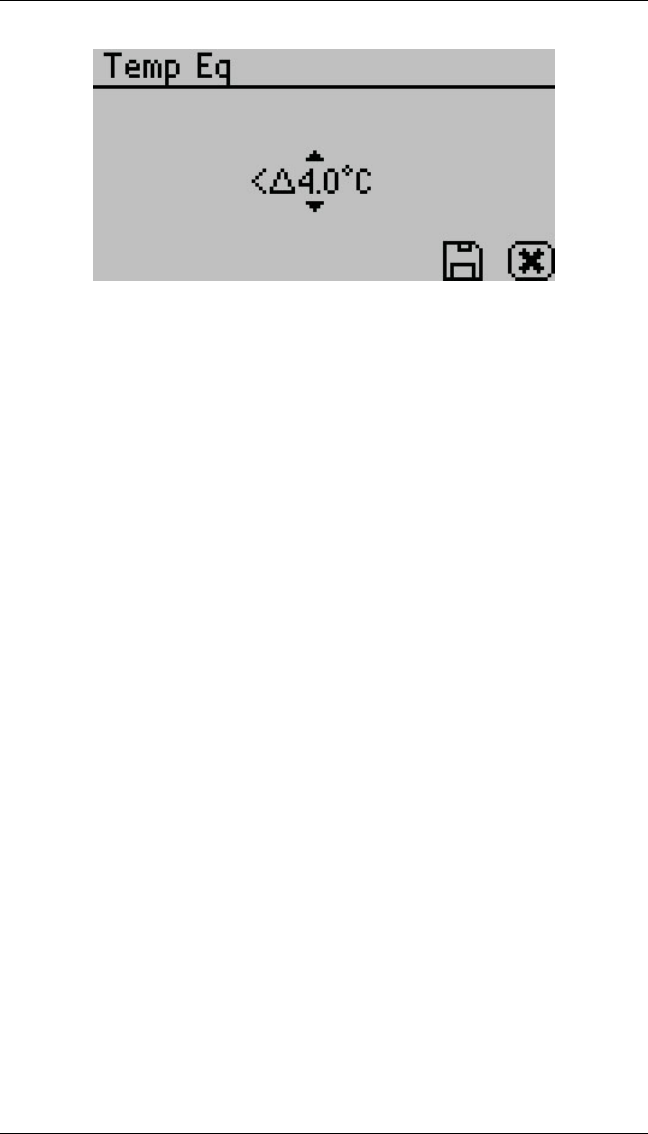
Temp Eq
The Temperature Equilibration option allows you to set the level
of temperature equilibration desired before the water activity mea-
surement begins. The range is 0.5 to 4.0 ◦C. A setting of 4.0 ◦C
begins the measurement immediately (assuming the sample is not >
4.0 ◦C above or below the block temperature). A setting of 0.5 ◦C
causes the instrument to wait until the sample temperature is within
<0.5 ◦C of the block temperature before starting the water activity
measurement.
18
AquaLab TDL 5 MENUS
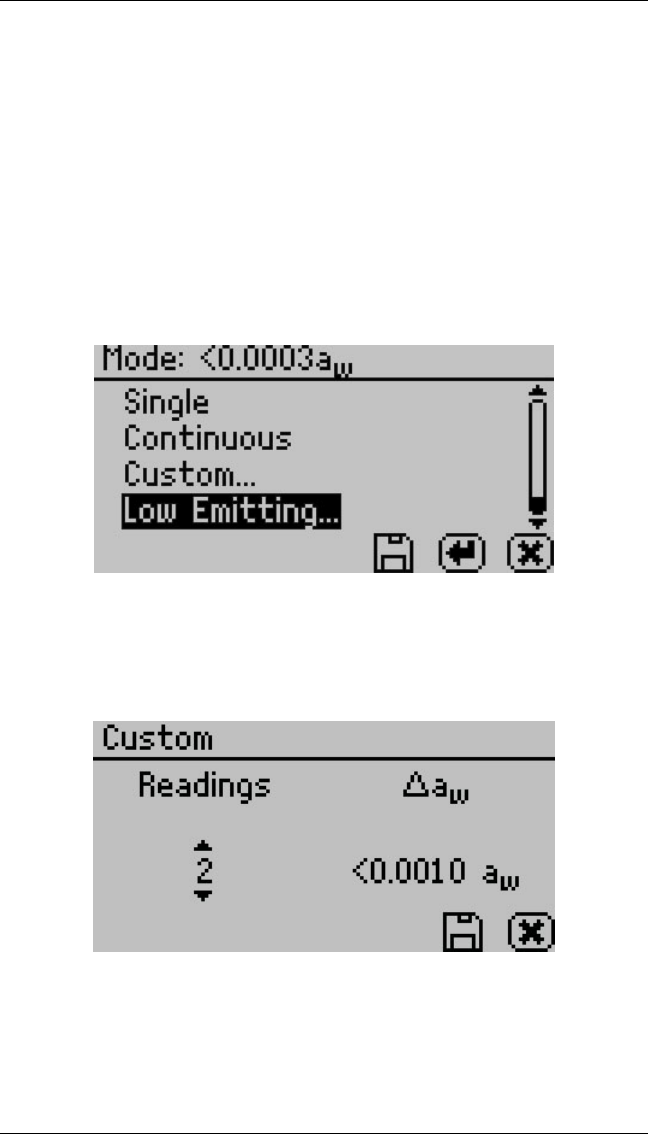
Mode
Users may choose between single, continuous, custom, or low emit-
ting mode by pushing the save button.
Single Mode: Single mode reads the sample once, after which the
instrument notifies you that it is finished and the water activity and
temperature display on the screen.
Continuous Mode: Continuous mode reads your sample until you
open the chamber lid or stop the test using the stop button. AquaLab
reads the sample, displays the water activity and temperature, then
begins another read cycle without further input from the user. Be-
tween samples, the machine signals you with beeps. This mode elimi-
nates the possibility of moisture exchange with the environment out-
side the chamber in between readings. A time on the bottom left of
the screen tracks the cumulative read time. All readings taken dur-
ing continuous mode are saved on the instrument memory if the auto
save feature is selected (see Auto Save below). If AquaLab is con-
nected to a computer using AquaLink 4 (See Section 11), all readings
taken during continuous mode download to the AquaLink 4 software.
Custom Mode: Custom mode allows a sample to be read mul-
tiple times until a desired level of stability is achieved. The user
determines how many consecutive tests they want to be within a
given water activity stability setting. For instance, the customer can
choose to have four consecutive tests be within ±0.001 aw. The in-
strument continues to run tests until it records four consecutive tests
within ±0.001 aw, then it stops and reports the value of the final test.
19
5 MENUS AquaLab TDL
If you turn auto save on, all test readings save to the instruments
memory, but only the final reading appears on the main Measure-
ment screen. If you keep the TDL connected to a computer using
AquaLink 4 (See Section 11: Computer Interface), all readings taken
during a custom mode test download to the AquaLink 4 software.
On the Mode screen at the top of the page is the current mode
settings with the number of tests appearing first, followed by the sta-
bility value (∆aw). Pressing Enter with the custom mode highlighted
allows you to change the number of tests and stability settings.
To change the number of readings, use the right/left arrow buttons
to highlight the number under Readings, and then use the up and
down buttons to change to any value between 2 and 9.
To change the stability setting, use the right/left arrow buttons to
highlight the number under (∆aw), and then use the up and down
buttons to change to any value between 0.0005 and 0.0200. To save
the settings and finish, press the save button (to exit without updat-
20
AquaLab TDL 5 MENUS
ing, press the cancel button). The Mode screen now has the updated
custom settings at the top of the screen. Press the Save button to
return to the Configuration screen and begin using the custom mode
(To exit without updating, press the Cancel button).
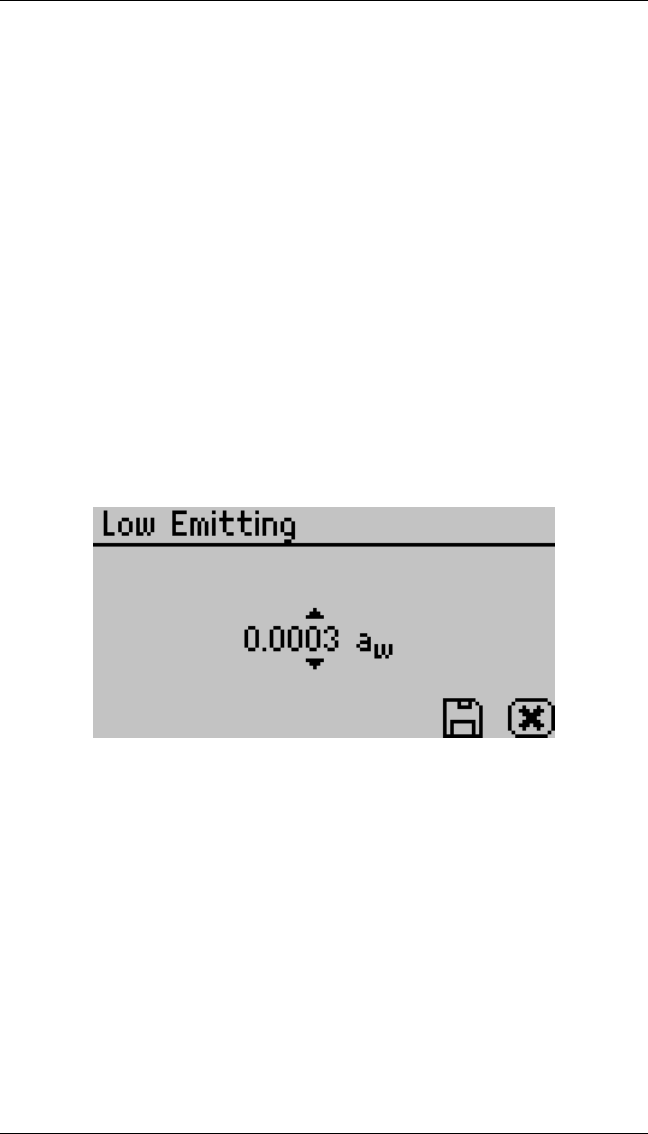
Low Emitting Mode: This mode is for samples that are slow to
equilibrate such as vegetable oils, high fat samples, and high viscosity
samples. AquaLab determines vapor equilibrium at the end of a test
by comparing sequential water activity values, looking for a trigger
value difference less than 0.0005 aw. This very strict requirement is
needed to ensure that the instrument provides the necessary accu-
racy. The low emitting mode gives the option of speeding up test
time by adjusting the equilibrium trigger value. The typical setting
is two water activity values that are within ±0.0005 awof each other.
This value can be adjusted to any value between 0.0003 and 0.0030
aw.
Increasing the trigger value causes a subsequent reduction in instru-
ment accuracy and precision, but results in a shorter test time. In
certain cases, this loss in performance may be acceptable in order to
speed up the analysis time. We recommend using using high trigger
only after careful consideration of the impact on test results.
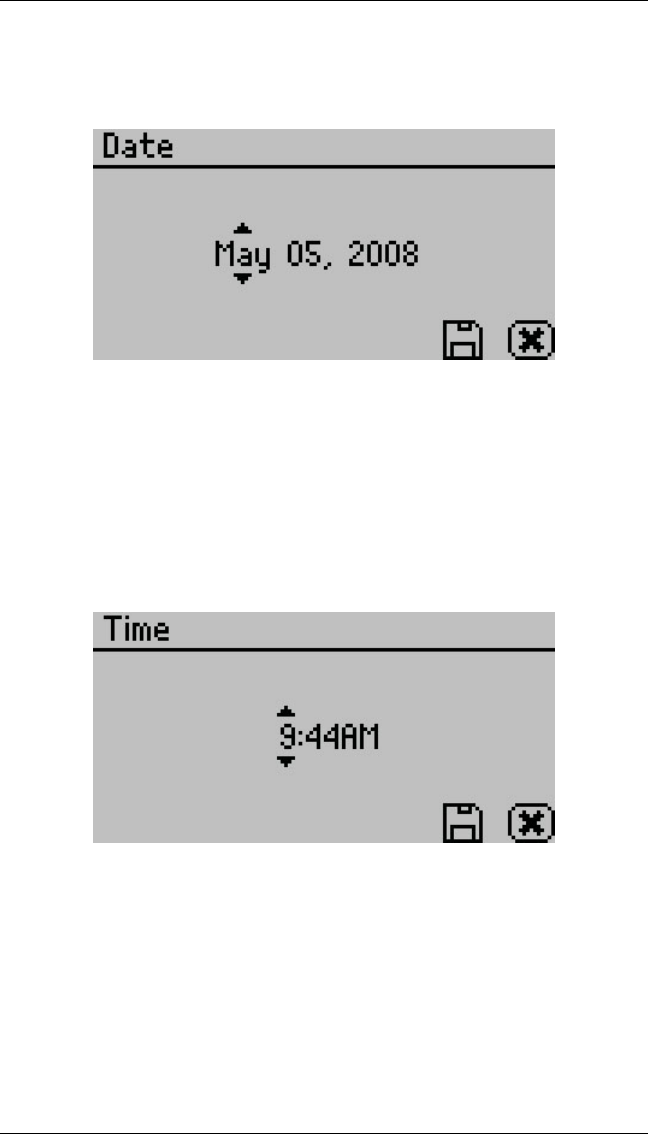
Date
AquaLab TDL models have an internal calendar and clock. The
time and date are recorded with each water activity reading. Press-
ing Enter when the Date option is highlighted allows you to set the
date in the instrument. Press the left and right arrows to change
21
5 MENUS AquaLab TDL
between the month, day and year. Press the up or down arrows to
change any of the individual values.
Time
Pressing Enter with the Time option highlighted allows you to set
the current local time. Press the up or down arrows to change any
of the individual values. Press the left or right buttons to change
between hour and minutes. The hour setting automatically changes
between AM and PM.
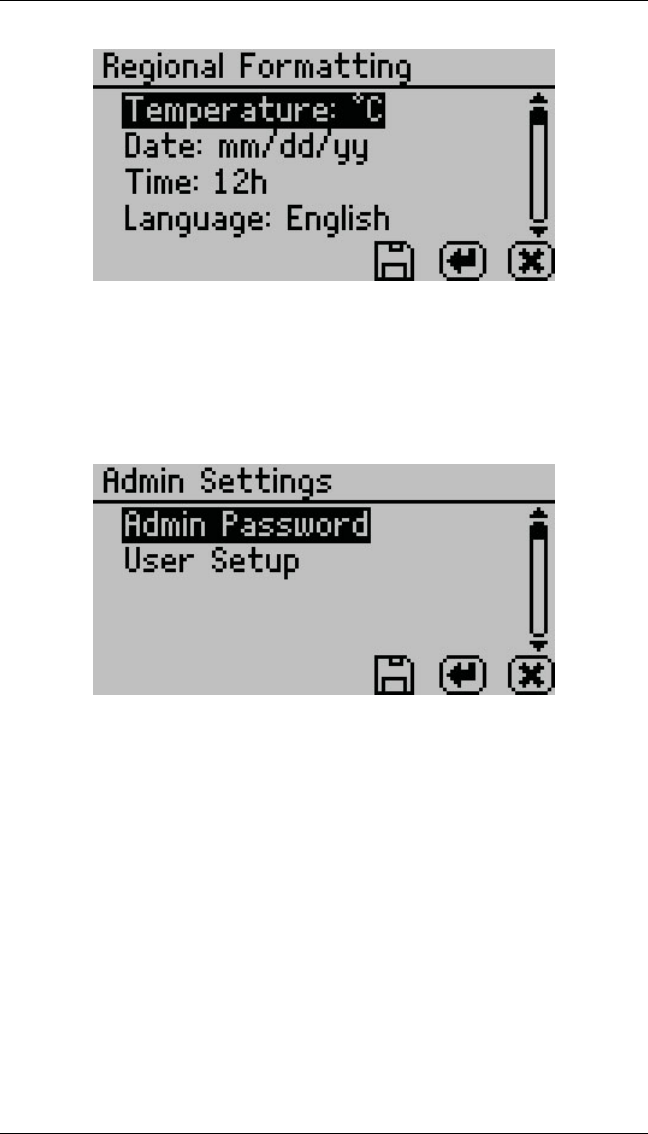
Regional Formatting
Allows you to configure how AquaLab TDL displays information.
You may choose the temperature scale (Celsius vs Fahrenheit), the
date display (mm/dd/yy vs. dd/mm/yy), the hour format (12 vs 24
hour) and the language.
22
AquaLab TDL 5 MENUS
5.3 Admin Settings
Allows you to create an administrator password as well as create,
edit, and delete additional users.
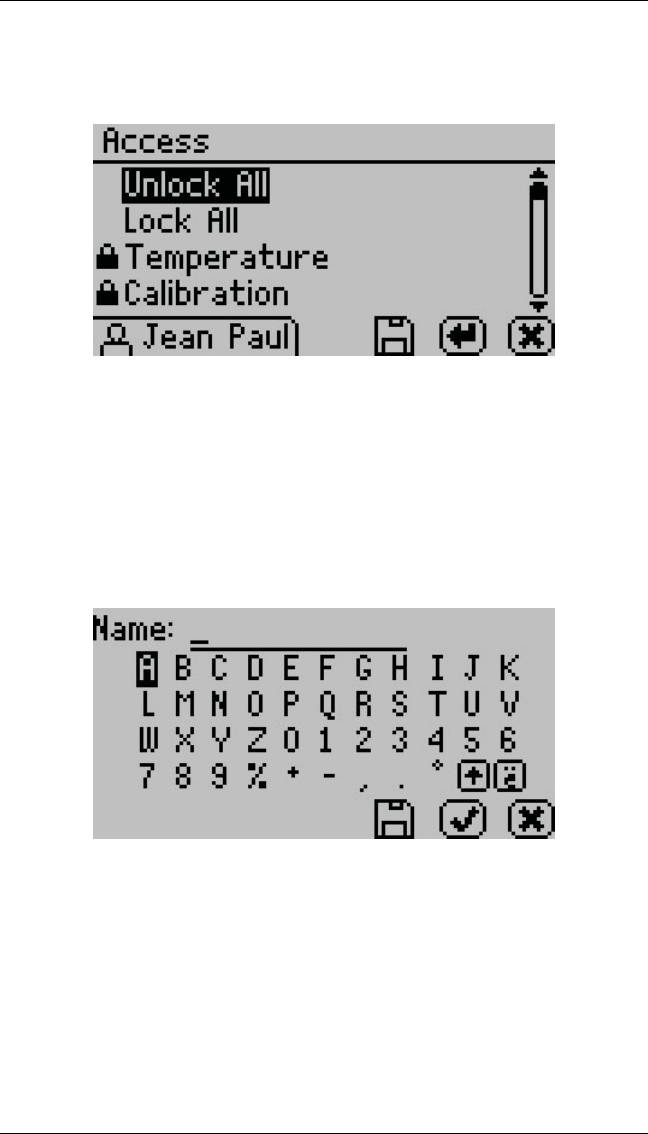
The Admin settings allow the administrator to grant or block ac-
cess to some or all of the configuration options for all AquaLab TDL
models. For example: If the administrator wanted to make sure that
all samples were read at 25 ◦C the administrator would set their
temperature to 25 ◦C and then lock all other users out of that con-
figuration screen. Administrators may lock out users by entering
the Access function and selecting the desired option to toggle it on
and off. You can also lock and unlock all of them at once. (For
example, if you do not want an individual changing the instruments
measurement temperature, the administrator can lock that function
for only certain individuals.) The areas that you can lock are calibra-
tion, temperature, temperature equilibration, sensor selection, mode,
date/time, region, password, auto-save, number of beeps, contrast,
23
5 MENUS AquaLab TDL
and delete functions.
User Setup
Administrators can add, edit, or delete users from this screen. An
alphabet screen appears where you can enter a name using lower
case, upper case and accents.
Note: User setup is not required for instrument operation. It is in
place for users wanting to be compliant with 21 CFR Part 11 or who
want to maintain the settings they have selected.
Auto Save
AquaLab TDL models have the ability to store water activity read-
ings within the instrument. By selecting Auto Save “On,” the instru-
24

AquaLab TDL 5 MENUS
ment automatically stores every water activity reading in the inter-
nal memory. AquaLab TDL can store up to 8,000 records before the
memory is full. If you turn Auto Save “off” then the instrument does
not store data automatically, although you may store any individual
reading manually right after completing the test and before starting
the next test.
To manually store a water activity or append an annotation to the
active reading that has been autosaved, press the save icon button
after the water activity measurement is completed. Pressing the icon
opens a “Name” screen. You may give this reading a name by press-
ing the arrow buttons to highlight the letter and then pressing the
“Check” icon button. Press the save icon to save this data record
with the name you have specified.
Note: Pressing the save icon button without giving it a name saves
the reading without a name. If you do not press the save icon after
a reading, and the reading is autosaved, you cannot give it an anno-
tation later.
Beeps
Allows you to set the reading finished notification from four beeps
to continuous beeps. You may also turn the audible notification off.
Contrast
Allows you to set the contrast of the screen to your liking. Viewing
the screen from a sitting versus a standing position may require con-
trast adjustment for the best visibility in that position.
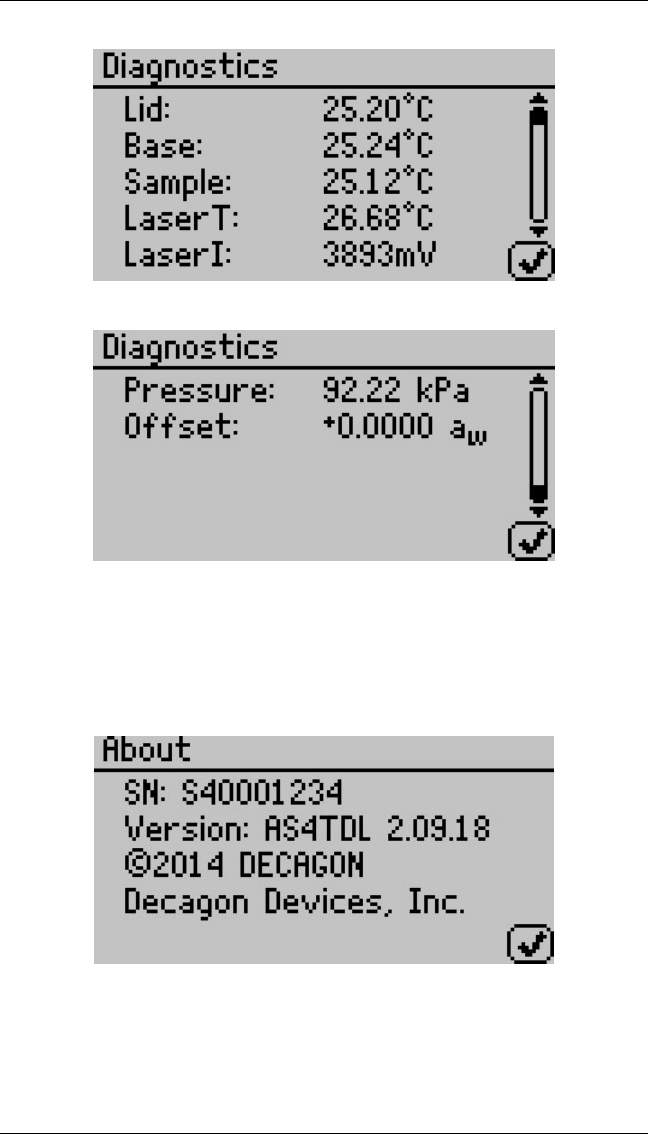
Diagnostics
For the TDL water activity meter, the diagnostics screens provide
you with an updated lid, base, sample, and laser temperature, as well
as laser intensity, atmospheric pressure and water activity offset.
25
5 MENUS AquaLab TDL
About
This screen provides important information including the serial num-
ber and code version of your instrument.
26
AquaLab TDL 5 MENUS
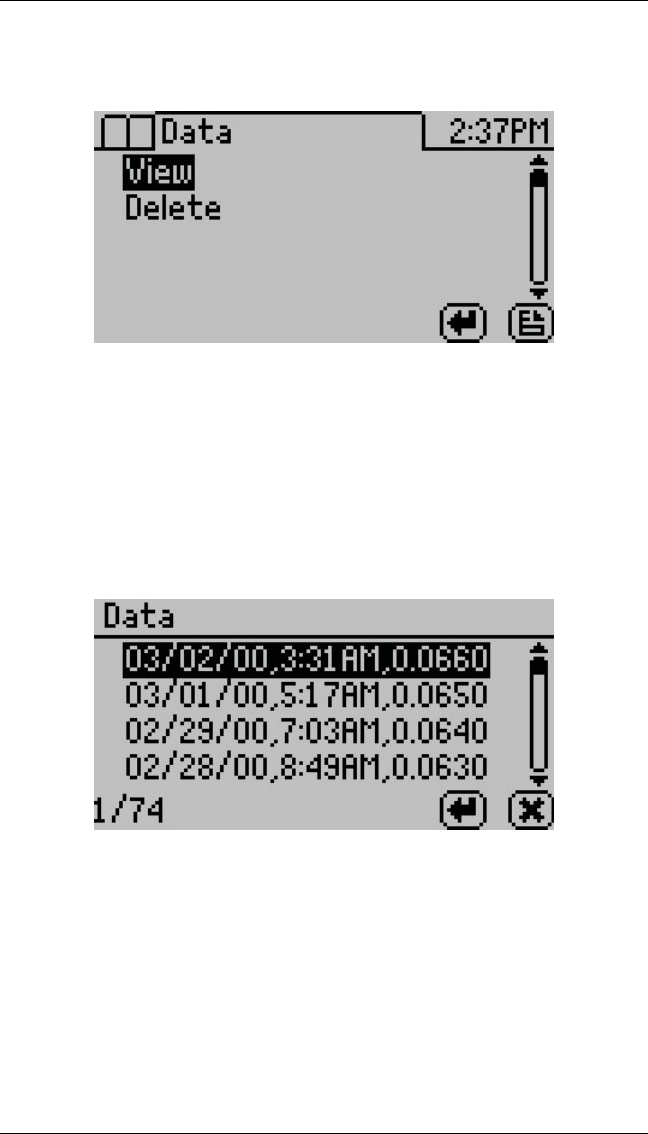
5.4 Data Tab
View
This selection allows you to view your stored measurements. The
up/down arrows move you through the stored data with the most
recent measurements at the top of the table. You may also press the
left and right arrows to page quickly through the data. See Section
11 for information about downloading these readings to a computer.
When you are viewing the summary screen, you may press the Enter
button on a highlighted reading to get detailed information on the
reading as the Data - Sample screen shows.
27
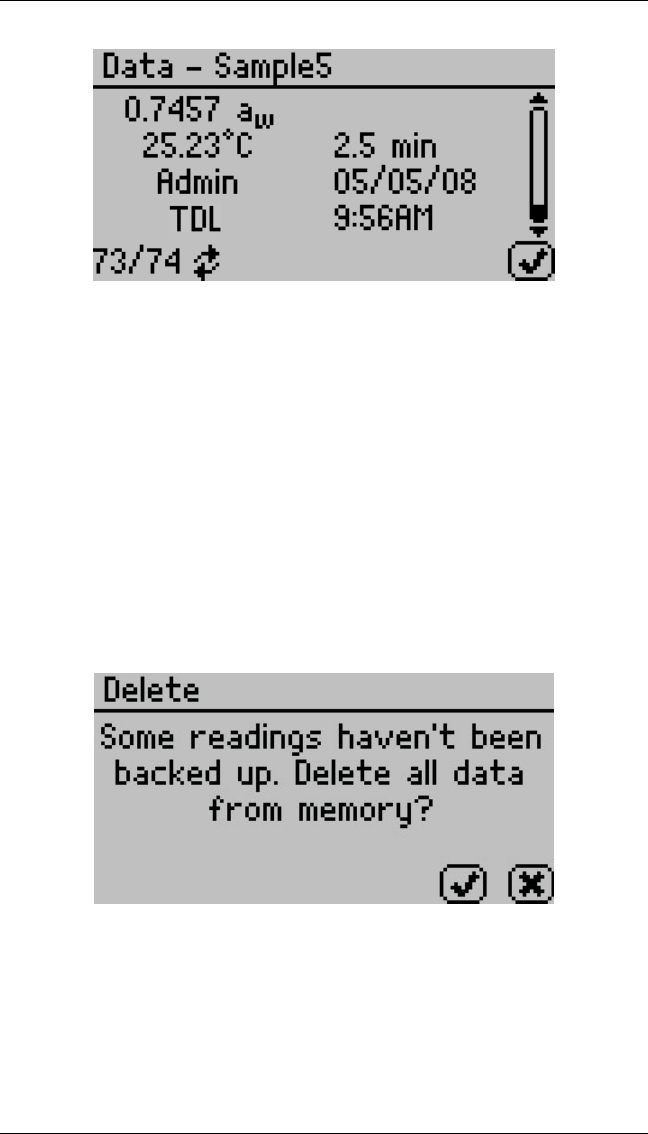
5 MENUS AquaLab TDL
The information shown is the water activity of the sample, the tem-
perature, the test time, the user who ran the test (if setup), the date
of the reading, the time the reading was taken, and the sequence num-
ber of the stored reading. The up and down arrows scroll through
readings.
Delete
Selecting this option deletes all of the information currently stored
in the instrument. If you have not backed up this information with
AquaLink 4, TDL reminds you in the delete screen.
Note: It is impossible to recover deleted data.
28
AquaLab TDL 6 CLEANING AND MAINTENANCE
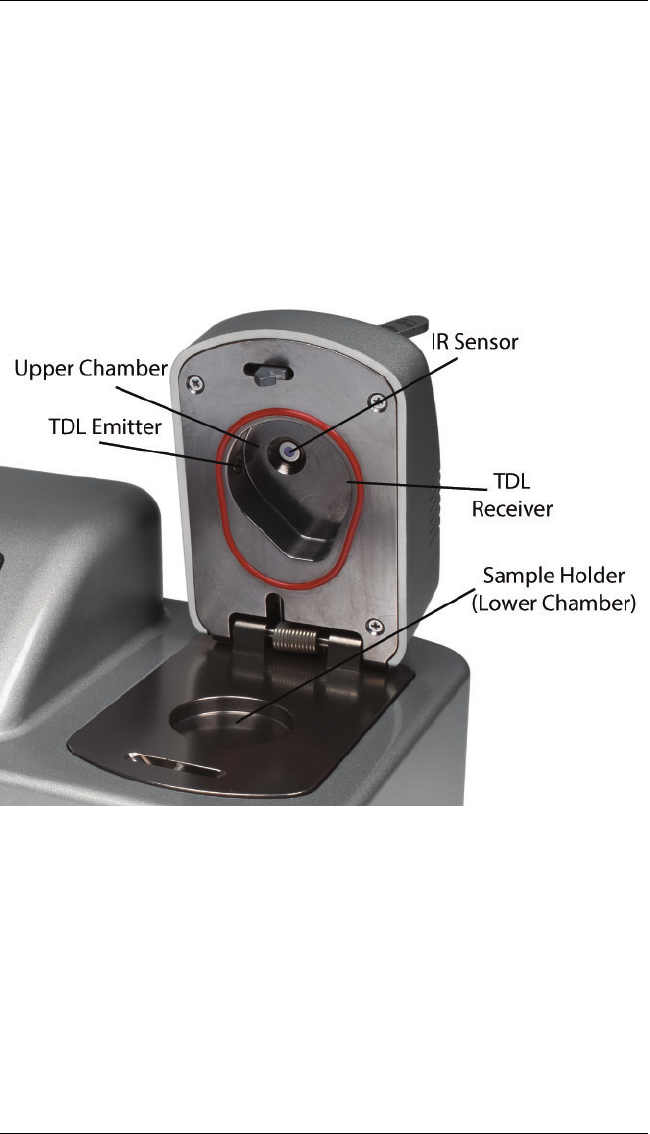
6 Cleaning and Maintenance
Keeping your AquaLab clean is vital to maintaining the accuracy
of your instrument. Dust and sampling debris can contaminate the
sampling chamber, so you must regularly clean your instrument. To
clean your instrument, carefully follow these instructions and refer
to the labeled diagram in Figure 2. METER also recommends you
send your TDL in for annual factory calibration.
Figure 2: AquaLab Instrument Diagram
29

6 CLEANING AND MAINTENANCE AquaLab TDL
Purpose
The purpose for the cleaning procedure is to remove grease, dirt
and other soluble substances which can absorb or release water dur-
ing verification, calibration, and/or sample testing. For the TDL
and the IR sensor to perform well, they must be clean and free from
contaminants (e.g. fingerprints).
When to Clean
The instrument should be cleaned if visual inspection indicates the
chamber is dirty or as instructed in Table 1 on page 35.
Cleaning Supplies
Your new instrument comes with the AquaLab Cleaning Kit. The
AquaLab Cleaning Kit comes with all the materials needed to clean
the instrument for about a year. Every time you send in your instru-
ment for the annual calibration service, you receive a new cleaning
kit. The AquaLab Cleaning Kit contains the following supplies.
•Spatula (a thin plastic rod)
•Deionized Water
•Cleaning Solution
•Kimwipes R
Note: Wash your hands with soap and water and use clean lab gloves
before starting the cleaning procedure. This prevents oils from con-
taminating the cleaning materials, the sample chamber, or the sen-
sors.
Note: You can substitute isopropyl alcohol for cleaning solution.
6.1 Cleaning the Block Sensors
Accessing the Sample Chamber
Turn the power off on your AquaLab. If latched, move the lever
over to the open position. Lift the chamber cover to expose the sam-
30

AquaLab TDL 6 CLEANING AND MAINTENANCE
ple chamber and sensors. The sample chamber consists of all surfaces
inside the orange o-ring when the lid is closed.
6.2 Cleaning an AquaLab TDL
Follow the cleaning procedures listed below. If you run out of solu-
tion, you can use isopropyl alcohol (IPA) instead.
6.3 Cleaning Procedure:
Cleaning your AquaLab is a multi-step procedure which involves
washing, rinsing, and drying for each specific area as outlined be-
low. (Refer to Figure 2 at the beginning of this section to identify
component locations for cleaning.)
1. Cleaning the Sample Chamber
(a) Remove any debris that may have collected within or
around the sample chamber.
(b) Wrap a NEW Kimwipe around the end of the spatula
(thin plastic rod) and moisten it with cleaning solution.
Note: Do NOT dip a used Kimwipe into your cleaning
solution (the cleaning solution becomes contaminated).
(c) WASH — Clean upper chamber, o-ring, and all surfaces
of the block within the o-ring. You may need to replace
the Kimwipe if it becomes too dirty during this process.
(d) Clean lower block with a fresh Kimwipe. Be sure to clean
the entire block surface.
(e) RINSE — Repeat steps b through d using new Kimwipes
with deionized water.
(f) DRY — Repeat steps b through d using new, dry Kimwipes
to help remove any moisture remaining from the cleaning.
Note: Do not reuse Kimwipes.
31

6 CLEANING AND MAINTENANCE AquaLab TDL
2. Clean the TDL
(a) Wrap a NEW Kimwipe around the end of the spatula and
moisten it with cleaning solution.
(b) WASH — Swipe the moistened Kimwipe across the TDL
emitter and detector lense once. (A single swipe is usually
sufficient to remove contaminants.)
(c) RINSE — Repeat steps a through b using new Kimwipes
moistened with deionized water instead of cleaning solu-
tion.
(d) DRY — Repeat steps a through b using a new, dry Kimwipes
to help remove any moisture remaining from the cleaning.
(e) Visually inspect the components for cleanliness. Clean
again if necessary.
3. Clean the IR Sensor
(a) Wrap a new Kimwipe around the end of the spatula and
moisten it with cleaning solution.
(b) WASH — Swipe the moistened Kimwipe across IR Sensor.
(A single swipe across the sensor is usually sufficient to
remove contaminants.)
(c) RINSE — Repeat steps a through b using new Kimwipes
moistened with deionized water instead of cleaning solu-
tion.
(d) DRY — Repeat steps a through b but use a new, dry
Kimwipe to help remove any moisture remaining from the
cleaning.
(e) Visually inspect the IR Sensor for cleanliness. Clean again
if necessary.
4. Additional Drying Time
(a) Visually inspect the sample chamber and sensors for con-
taminants, including moisture. If necessary, repeat the
cleaning process using new Kimwipes.
(b) Let stand for at least five minutes to ensure the sample
chamber is dry.
32

AquaLab TDL 6 CLEANING AND MAINTENANCE
6.4 Verification of Calibration
After you have cleaned the chamber and other parts of your AquaLab,
it is important to check the instrument performance in order to cor-
rect for any linear offset that may have occurred during the cleaning
process.
Before you check the instrument we recommend that you run a sam-
ple of the activated charcoal pellets provided in your AquaLab Clean-
ing Kit. This cleans the air inside the chamber, helping it come back
to a stable sampling environment.
Verify the linear offset against known verification standards accord-
ing to the procedure described in the next section. If a linear offset
has occurred, refer to “adjust for linear offset” in Section 7 for direc-
tions on how to correct for linear offset. If, after adjusting for linear
offset, your instrument is still not reading samples correctly, it may
be time for an annual factory calibration. Contact Aqualab at sup-
port.foods@metergroup.com or 509-332-5601 for annual calibration.
33

7 VERIFICATION AND CALIBRATION AquaLab TDL
7 Verification and Calibration
It is important to verify AquaLab water activity calibration against
known standards to guarantee optimal performance and accuracy.
METER recommends verification daily, once per shift or before each
use. METER also recommends annual factory calibration to main-
tain optimal performance.
Note: To avoid inaccurate water activity readings, verification stan-
dards should be used once immediately after opening and not stored
in sample cups for repeated use.
7.1 Water Activity Verification
AquaLab uses the TDL technique to determine water activity. Be-
cause this is a primary measurement of relative humidity, no calibra-
tion is necessary; but we recommend periodic verification for linear
offset. The components used by the instrument to measure water
activity are subject to contamination which may affect the AquaLab
performance. When this occurs, it changes the accuracy of the in-
strument. This is what is called a “linear offset.” Therefore, frequent
verification assures you that your AquaLab is performing correctly.
Linear offset is checked by using two different verification standards.
Verification Standards
Verification standards are specially prepared unsaturated salt solu-
tions having a specific molality and water activity value which are
accurately measurable. The verification standards that were sent
with your initial shipment are very accurate and readily available
from METER. Using verification standards to verify accuracy can
greatly reduce preparation errors. For these reasons, we recommend
using standards available through METER for the most accurate
verification of your AquaLab performance. Performance Verifica-
tion Standards come in six water activity levels: 1.000, 0.984, 0.920,
0.760, 0.500, 0.250, and 0.150 aw. The standards are produced un-
der a strict quality assurance regime. Please contact METER to
34

AquaLab TDL 7 VERIFICATION AND CALIBRATION
order additional standards via sales.food@metergroup.com or 509-
332-5601.
Table 1: Verification Flowchart
Verification Standard @ 25 ◦C Water Activity
17.18 mol/kg LiCl 0.150 ±0.005
13.41 mol/kg LiCl 0.250 ±0.005
8.57 mol/kg LiCl 0.500 ±0.005
6.00 mol/kg NaCl 0.760 ±0.005
2.33 mol/kg NaCl 0.920 ±0.005
0.50 mol/kg KCl 0.984 ±0.005
USP Purified Water 1.000 ±0.005
Note: If you need to obtain a Safety Data Sheet (SDS) for any of
these standards, a printable version is available on our website at
http://sds.metergroup.com/.
To use a verification standard, remove the twist top and pour the
contents into an AquaLab sample cup. Information about the stan-
dard value and molality can be found printed on the outside of the
plastic vial. If for some reason you cannot obtain METER’s ver-
ification standards and need to make a saturated salt solution for
verification, refer to Appendix A.
7.2 Verification of Calibration
When to Verify for Linear Offset
Linear offset should be checked against two known verification stan-
dards daily, either once per shift or before each use. Linear offset
should never be verified solely against steam distilled water, since
it does not give an accurate representation of the linear offset. For
batch processing, the instrument should be checked regularly against
a known standard of similar water activity. It is also a good idea to
check the offset with a standard of similar water activity when the
general water activity range of your sample is changing. Checking
the water activity of a standard solution alerts you to the possibility
35

7 VERIFICATION AND CALIBRATION AquaLab TDL
of unit contamination or shifts in the linear offset from other causes.
Follow steps 1 through 8 to verify for linear offset of your AquaLab.
(Refer to Figure 3: the Verification Standard Flowchart for a quick
overview.)
1. Choose a verification standard that is close to the water activ-
ity of the sample you are measuring.
Note: The AquaLab needs to warm up for approximately 15
minutes to make accurate readings.
2. Empty a vial of solution into a sample cup and place it in the
TDL testing chamber. Make sure that your standard is as close
to the instrument temperature as possible. See Section 8 for
detailed instructions.
Note: Make sure the rim and outside of the sample cup are
clean and the standard covers the bottom.
3. Carefully close the lid and move the lever to the Read position.
4. Take two readings. The water activity readings should be
within ±0.005 awof the given value for the verification stan-
dard. See Appendix B for the correct water activity value of
METER’s standards at temperatures other than 25 ◦C.
5. If your AquaLab is reading within ±0.005 awof the verification
standard, choose a second verification standard that would bor-
der the range of water activity you plan to test. For example,
if you plan to test for water activity readings ranging between
0.713 and 0.621 you should use the 8.57 mol/kg LiCl (0.50 aw)
standard for your first verification and the 6.00 mol/kg, NaCl
(0.76 aw) for the second verification.
6. Prepare a sample cup of the second verification standard and
take two readings. The second water activity reading for the
second verification standard should be within ±0.005 aw.
7. If either of the verification standards is not correct, it is prob-
ably due to contamination of the sensor chamber. For cleaning
36
AquaLab TDL 7 VERIFICATION AND CALIBRATION
instructions, see Section 6. After cleaning, repeat verification
from step two.
8. If you are consistently getting readings outside the water ac-
tivity of your first verification standard by more than ±0.005
aw, a linear offset has probably occurred. In this case, adjust
the reading to match the correct verification standard value as
outlined in the next section.
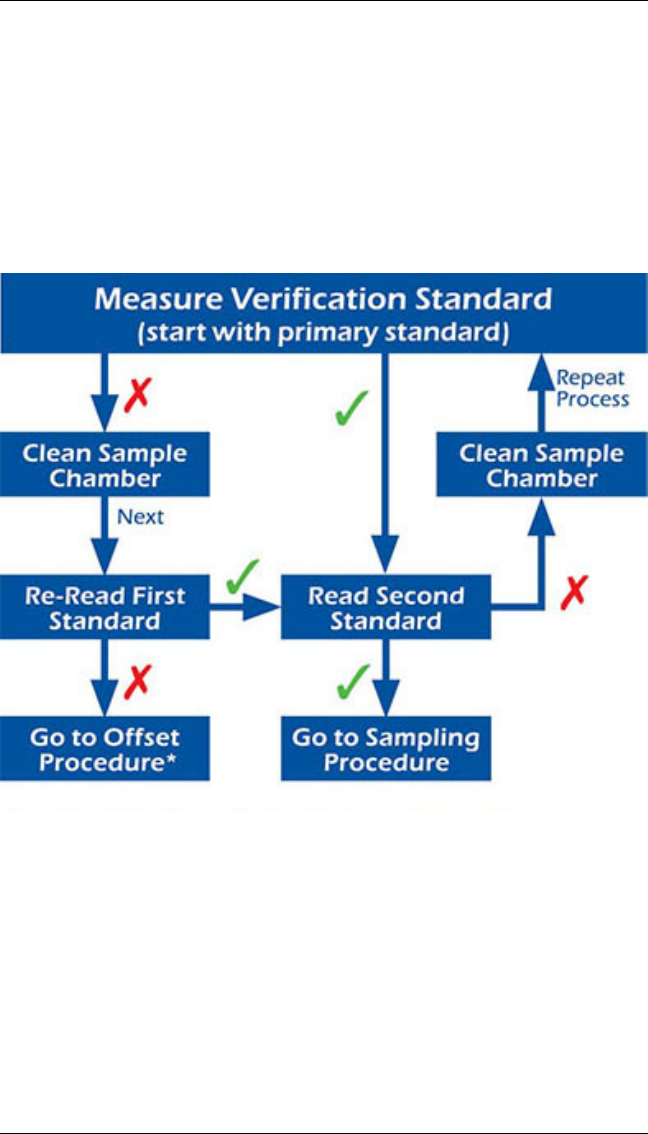
Figure 3: Verification Standard Flowchart
Note: The Measure Verification Standard flowchart is a graphical
representation of the Verification of Calibration directions.
Adjust for Linear Offset
1. Once you are certain a linear offset has occurred, toggle to the
Configuration tab by pressing the Document icon button. Cal-
37
7 VERIFICATION AND CALIBRATION AquaLab TDL
ibration is the first option highlighted in the Configuration tab.
Press the Enter icon button to begin the verification process.
The on screen commands guide you through the linear offset
routine. The Calibration screen prompts you to start.
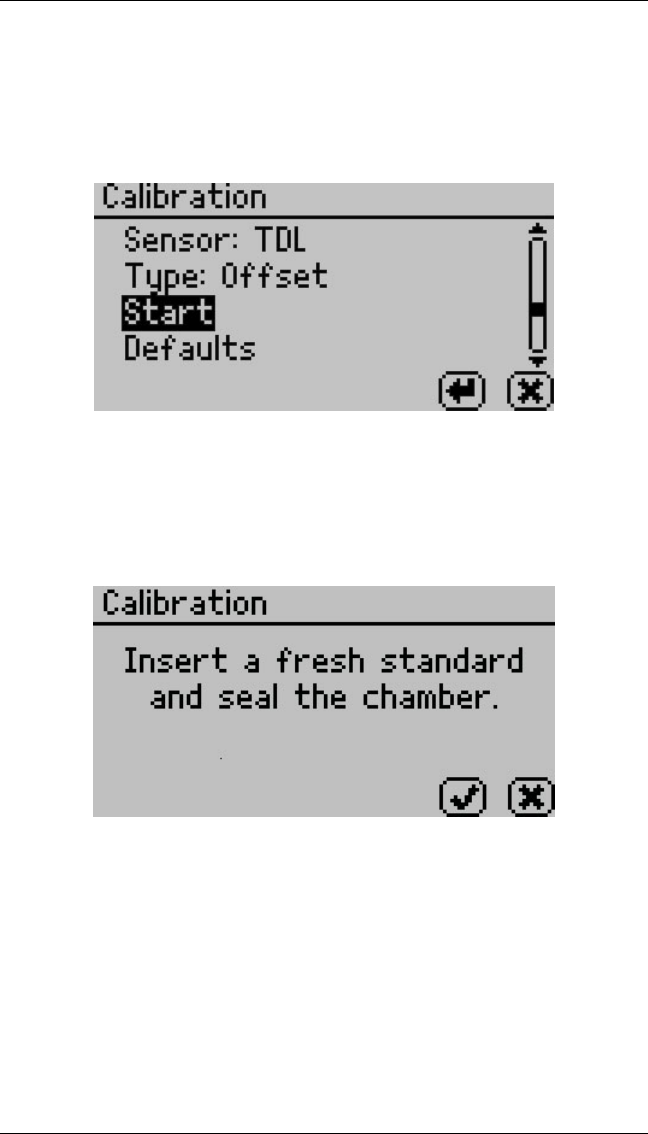
2. Press the Enter button to start the linear offset process. To re-
turn to the Configuration Screen, press the Cancel button. Af-
ter pressing the Enter button, the Calibration screen prompts
you to insert a fresh standard and seal the chamber.
3. Empty the whole vial of solution into a sample cup. We rec-
ommend using the 6.00 NaCl (0.76 aw). Do not adjust for the
offset using steam distilled water. Ensure the rim and outside
of the cup are clean. Place the sample cup in the TDL sample
chamber.
Note: You may use the same verification standard to verify
and adjust the linear offset.
38
AquaLab TDL 7 VERIFICATION AND CALIBRATION
4. Carefully close the lid and move the lever to the Read position.
Press the Check icon button to begin testing.
Note: If you decide at this point not to continue with the linear
offset program, just return the lever to the Open position or
press the cancel button to return to the previous screen.
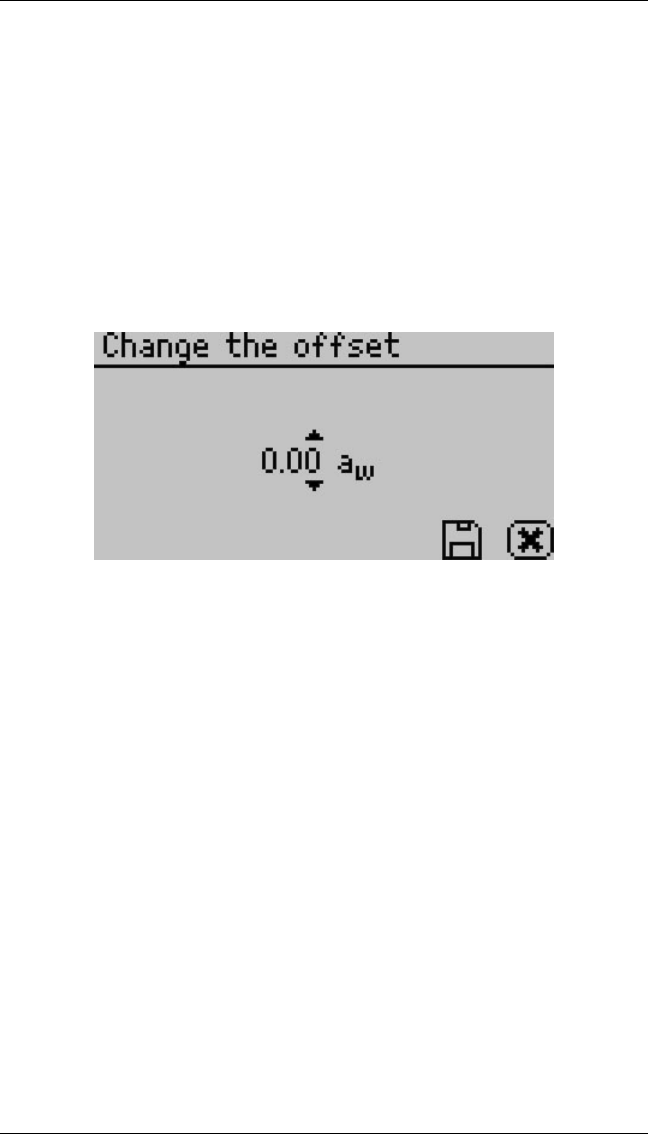
5. After your AquaLab has finished measuring the verification
standard, it displays a Change the Offset screen.
6. Press the up and down arrows to adjust the water activity read-
ing to its proper value for the particular verification standard
you are measuring. When the correct value is displayed, press
the Save icon button to store this new value. To cancel without
saving changes and return to the main menu, press the Cancel
button.
7. Re-measure the verification standard again in normal sampling
mode. It should read the proper value (within ±0.005 aw) at a
given temperature for your particular standard. (See Appendix
B for temperatures other than 25 ◦C.)
Measure the water activity of a second verification standard accord-
ing to the verification procedure described above. If both verification
readings are within ±0.005 awthen the instrument is ready to be-
gin testing. If you still have incorrect verification standard readings
after cleaning the chamber and adjusting for linear offset, contact
METER by email at support.food@metergroup.com or by phone at
509-332-5601 for further instructions. If you purchased your METER
39
7 VERIFICATION AND CALIBRATION AquaLab TDL
instrument from one of our international distributors, please contact
them for local service and support.
Note: A linear offset does not adjust the calibration for all water
activity levels and should only be used if the user intends to measure
water activity in a very small range.
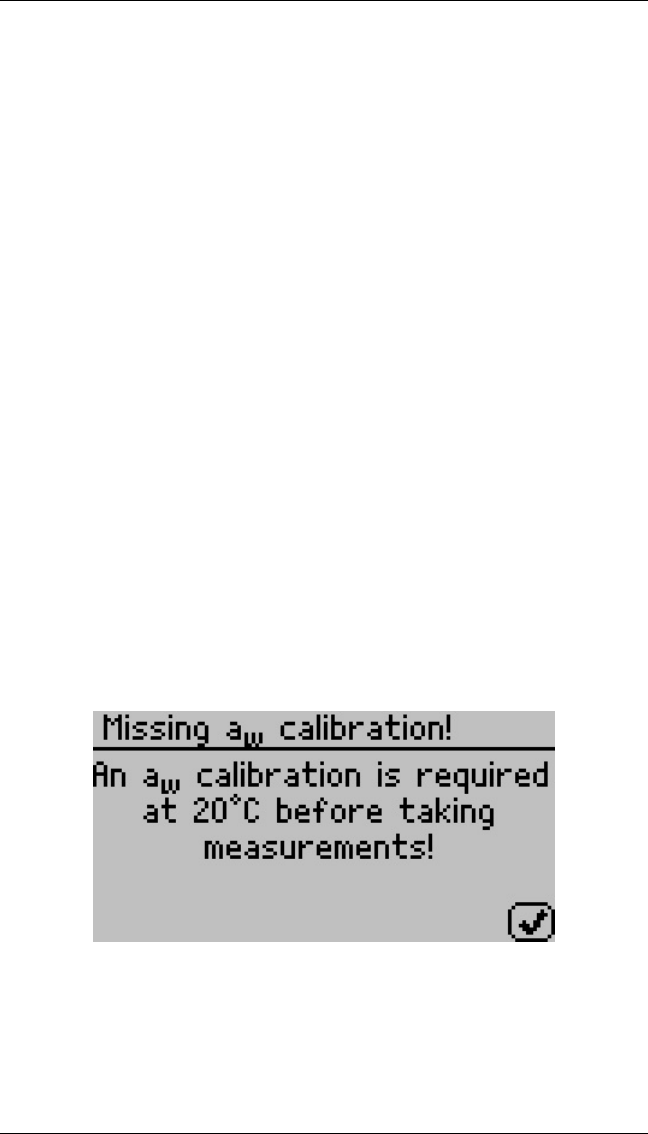
Multi-Point Calibration for New Temperatures
1. The AquaLab TDL is optimized for performance at specific
temperatures. If testing is to be conducted at new tempera-
tures, an updated calibration will be needed. If a temperature
setting that has not been used previously is chosen, an error
message will appear instructing the user that the calibration
needs to be updated.
Note: Factory calibrations performed by METER are locked
and cannot be updated with a multipoint calibration, only with
a linear offset as outlined above.
This update can be either a 1 point linear offset (see instruction
for adjusting for linear offset) or a multi-point update, which
requires reading multiple water activity standards.
2. Change instrument temperature setting to desired testing tem-
perature.
3. You will need 0.25 aw, 0.50 aw, 0.76 awand 1.00 awunsatu-
rated salt standards from METER to proceed with multi-point
40
AquaLab TDL 7 VERIFICATION AND CALIBRATION
calibration.
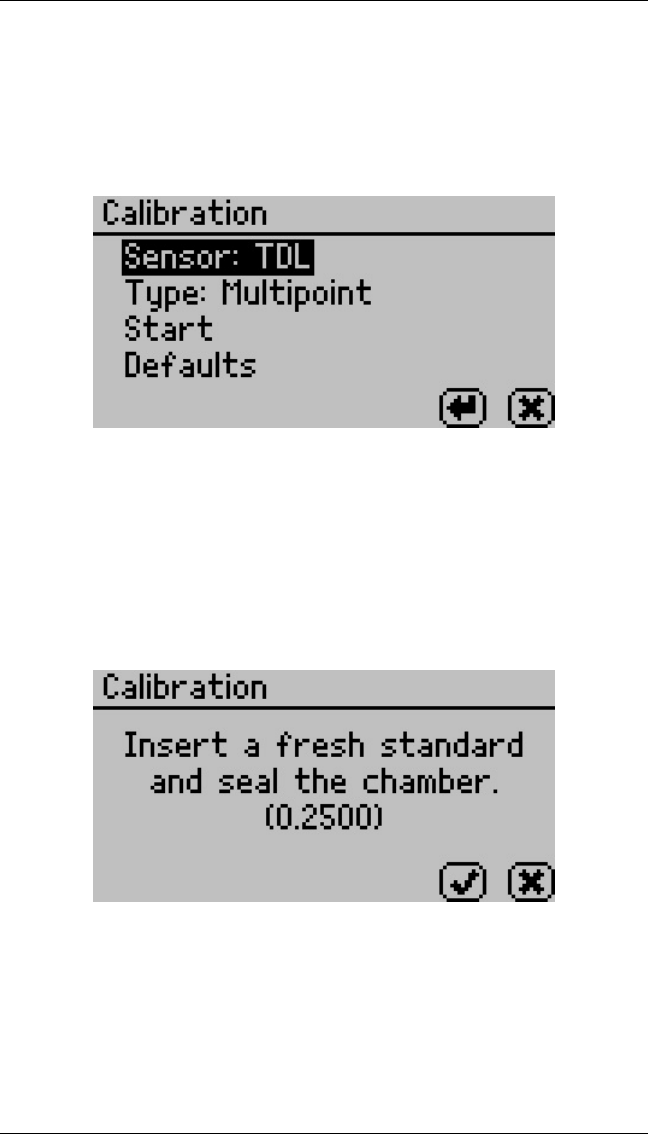
4. To perform a multi-point calibration, select Calibration from
the Configuration tab. The Calibration screen will prompt you
with options.
5. Highlight Type and select Enter to toggle to multi-point. You
will be guided through the multi-point calibration routine through
on screen commands.
6. Toggle to the Start button and press Enter to begin the multi-
point calibration. Once you press Enter, the Calibration screen
will prompt you to insert a fresh standard and seal the chamber.
7. Empty the whole vial of 0.25 awstandard solution into a sample
cup. Ensure the rim and outside of the cup are clean. Place
the sample cup in the AquaLab sample chamber.
8. Carefully close the lid and move the lever to the Read position.
Press the Check icon button to begin testing.
41
7 VERIFICATION AND CALIBRATION AquaLab TDL
9. After your AquaLab has finished measuring the verification
standard, a new screen will appear requesting that a 0.50 aw
standard be placed in the chamber. Repeat steps 6 through 7
for 0.50, 0.76, and 1.00 awstandards.
Note: If you decide at this point not to continue with the linear
offset program, just return the lever to the Open position or
press the cancel button and you will be returned to the previous
screen.
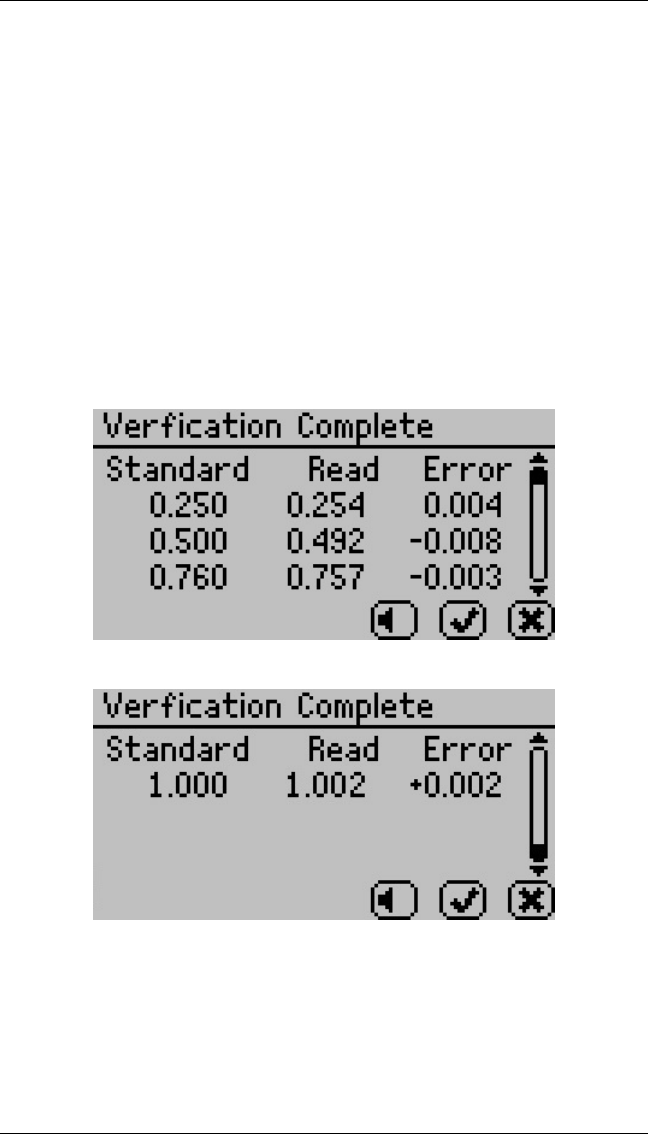
10. When measurements are complete on all four standards, a ver-
ification complete screen appears showing the testing results
for each standard.
11. Pressing the X button will cancel the calibration process while
selecting the Check Mark will bring up the optimize prompt.
You can toggle the audio icon to turn beeping on and off.
42
AquaLab TDL 7 VERIFICATION AND CALIBRATION
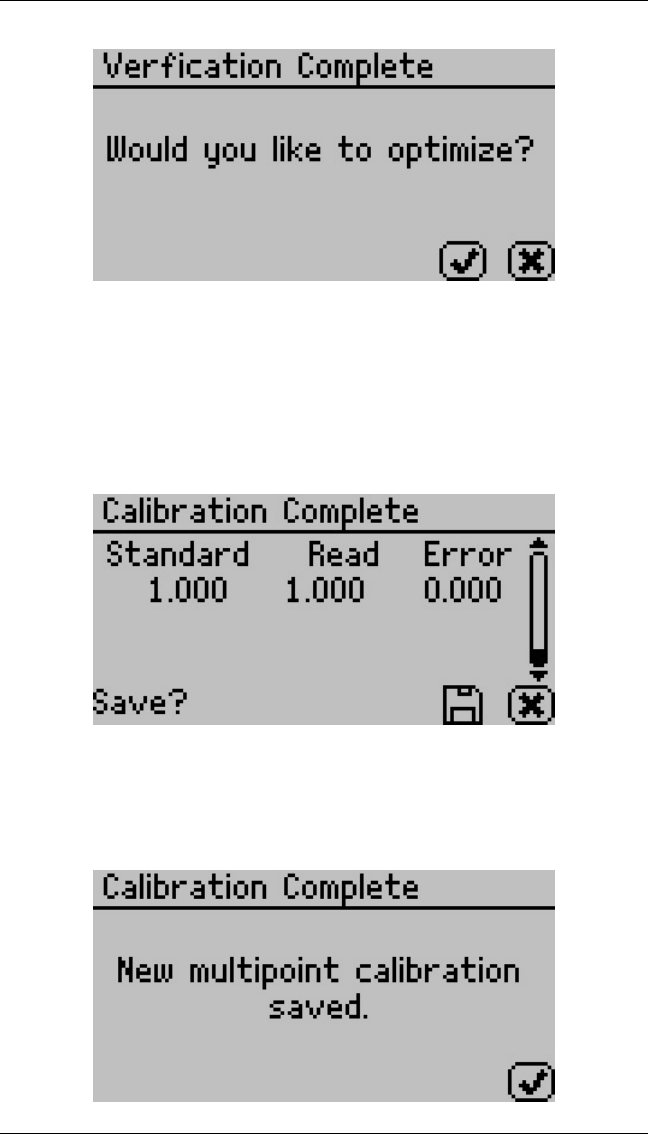
12. To make adjustments to the calibration, select the check mark
or select the X button to cancel without adjusting the calibra-
tion.
13. After optimizing the new calibration, the Calibration Complete
screen will appear.
14. To save the new calibration changes, select the Save icon and
the calibration screen will verify that the AquaLab saved your
new multi-point calibration.
43
7 VERIFICATION AND CALIBRATION AquaLab TDL
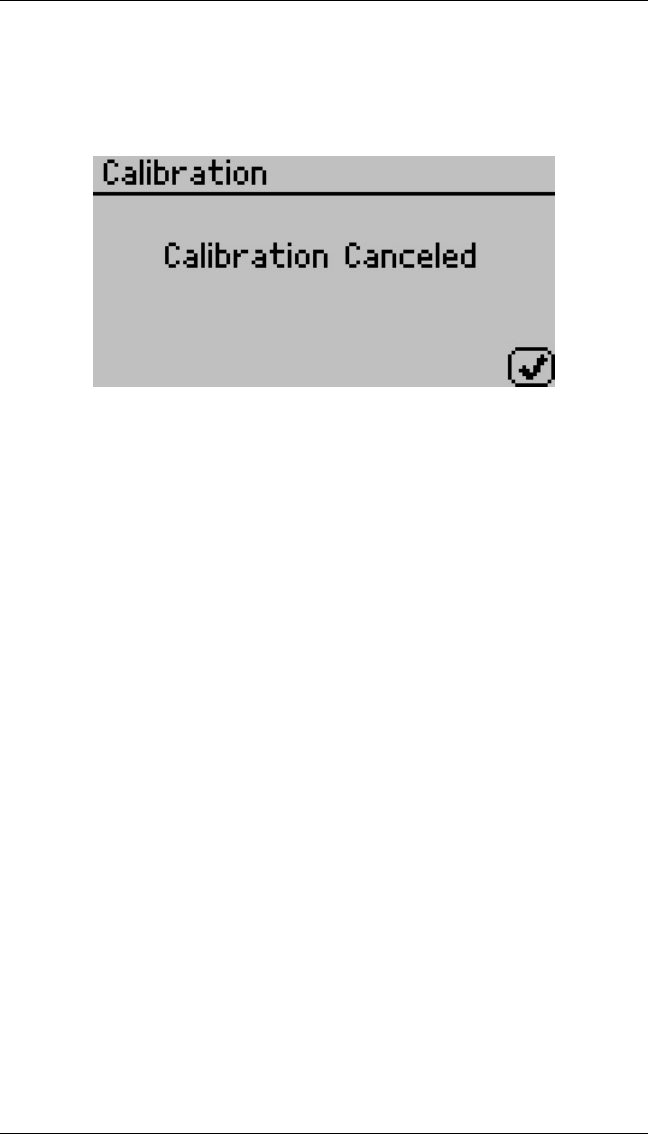
15. To discard the calibration changes and exit without saving,
press the X button and the system will return a calibration
canceled message.
16. Measure a 0.76 awverification standard again in normal sam-
pling mode. It should read the proper value (within ±0.005 aw)
at a given temperature (see Appendix B of a second verification
standard (0.25 or 0.50 aw) according to the verification proce-
dure described above. If both verification readings are within
±0.005 awthen the instrument is ready to begin testing.
17. If you have trouble reading the water activity of standards at
temperatures other than 25 ◦C after performing a multi-point
calibration, contact METER by email at
support.food@metergroup.com or by phone at 509-332-5601 for
further instructions. If you purchased your METER instru-
ment from one of our international distributors, please contact
them for local service and support.
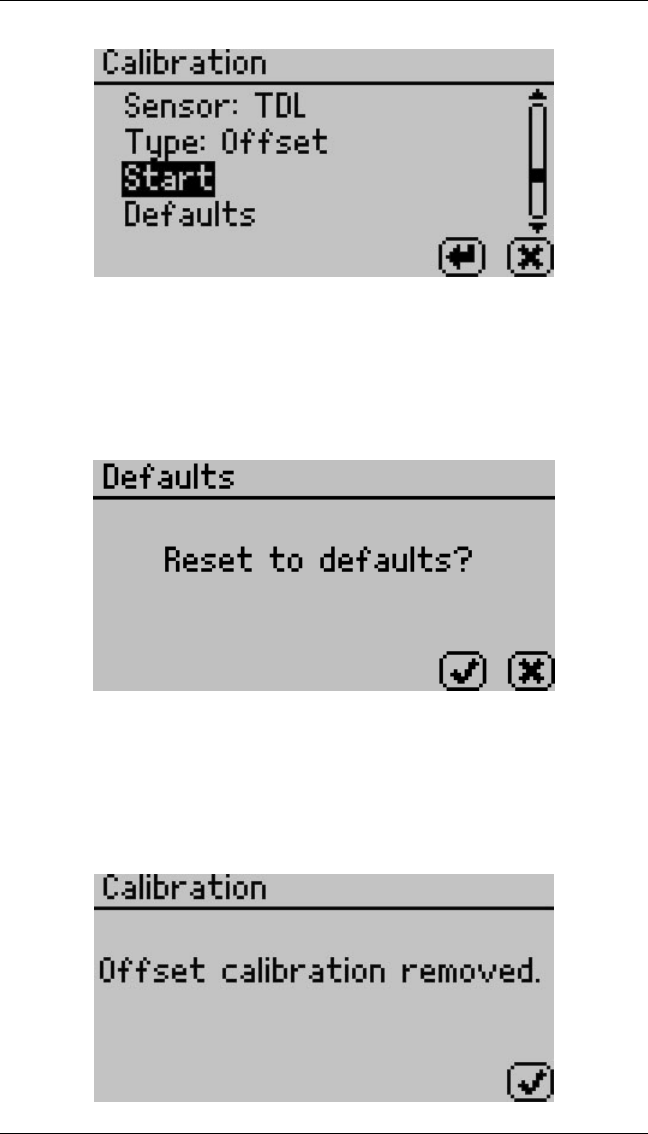
How to Restore Factory Defaults
To restore original calibration settings, do the following:
1. Toggle to the Configuration tab by pressing the Document icon
button. Select Calibration and press the Enter button.
44
AquaLab TDL 7 VERIFICATION AND CALIBRATION
2. Scroll down to Defaults and press the Enter icon button to
access the Restore Factory Defaults routine. To cancel and
return to the main menu, press the Cancel icon button. After
pushing the Enter icon button, the Default screen prompts you
to reset defaults.
3. To restore the factory calibration values, select the Check icon.
To cancel and return to the main menu, choose the Cancel
button. After pressing the Check icon, the Calibration screen
verifies restoration of factory calibration.
45

7 VERIFICATION AND CALIBRATION AquaLab TDL
4. To return to the Main menu screen, select the Check icon.
46

AquaLab TDL 8 SAMPLE PREPARATION
8 Sample Preparation
Proper sample preparation is an important step in keeping your
AquaLab clean and achieving repeatable results. Careful prepara-
tion and loading of samples lengthens time between cleanings and
helps you avoid downtime.
8.1 Preparing the Sample
1. Make sure the sample to be measured is homogeneous.
Multicomponent samples (e.g., muffins with raisins) or samples
that have outside coatings (like deep-fried, breaded foods) can
be measured, but may take longer to equilibrate. For samples
like these, AquaLab may take more than five minutes to give
an accurate reading, or may require multiple readings of the
same sample. Measuring the water activity of these types of
products is discussed in detail later in this section (see Samples
Needing Special Preparation).
2. Place the sample in a disposable sample cup, com-
pletely covering the bottom of the cup, if possible.
AquaLab is able to accurately measure a sample that does not
(or cannot) cover the bottom of the cup. For example, raisins
only need to be placed in the cup and not flattened to cover the
bottom. A larger sample surface area increases instrument effi-
ciency by providing more stable infrared sample temperatures.
It also speeds up the reading by shortening the time needed to
reach vapor equilibrium.
3. Do not fill the sample cup more than half full. Over-
filled cups contaminate the sensors in the sensor cham-
ber. Filling the sample cup does not make the readings faster
or more accurate. There only needs to be enough sample in
the cup to allow the water in the sample to equilibrate with
the water in the vapor phase and not change the moisture con-
tent of the sample. Covering the bottom of the sample cup
provides enough sample to get an accurate reading.
47

8 SAMPLE PREPARATION AquaLab TDL
4. Make sure the rim and outside of the sample cup are
clean. Wipe any excess sample material from the rim of the
cup with a clean Kimwipe. Material left on the rim or the
outside of the cup can contaminate the sensor chamber and be
transferred to subsequent samples.
5. If you want to save a sample for later, put the dis-
posable sample cup lid on the cup to restrict water
transfer. For longterm storage, seal the lid by placing tape or
Parafilm R
completely around the cup/lid junction.
6. Be consistent in sample preparation practices. If you
crush, grind, or slice your sample, be consistent in the method
you use in order to obtain reproducible results.
8.2 Samples Needing Special Preparation
AquaLab reads most materials in five minutes or less. However,
the nature of some samples necessitates longer reading times. These
materials need additional preparation to ensure quick, accurate read-
ings. To find out whether special sample preparation is necessary,
take several readings to see if readings (awand time) stabilize. If
continued readings take longer than six minutes, remove the sam-
ple and take a reading of a verification standard. This ensures the
sample itself is causing the long read time, and that there is not a
problem with your instrument. If the verification standard also takes
longer than six minutes to test, the chamber may be dirty. Refer to
Section 6 for cleaning procedures.
Coated and Dried Samples
Samples with high sugar or fat coatings often require multiple read-
ings, because it takes longer for them to equilibrate. If this is the
case for your samples, it is not a problem with your instrument; it
simply means that your particular sample takes longer than most to
equilibrate.
To reduce the time needed to take a water activity reading for coated
or dried samples, you can crush or slice the sample before sampling.
48

AquaLab TDL 8 SAMPLE PREPARATION
This increases the surface area of the sample, thus decreasing read-
ing times. However, keep in mind that modifying some samples may
alter their water activity readings.
For example, a candy may have a soft chocolate center and a hard
outer coating. The water activity reading for the center and the outer
coating are different, so one would need to evaluate which part of the
sample needed to be measured before crushing it. When the candy
is crushed, the water activity represents the average water activity of
the entire sample; whereas leaving the candy whole gives a reading
for the coating, which may act as a barrier to the center.
8.3 Slow Water-Emitting Samples
Some extremely dry, dehydrated, highly viscous water-in-oil (but-
ter), high fat, or glassy compositions may require multiple tests due
to their slow water-emitting properties. This is because the slow
emission of water decreases the change in water activity sufficiently
that the instrument determines the test to be complete, even though
changes in water activity are still occurring. The most effective way
to test these types of samples is to run them in the TDL using the
continuous or custom mode and wait for the water activity readings
to stabilize.
For faster reading, it is important to have the water activity of the
chamber at or below the water activity of these type of samples. This
causes the sample to release water to the vapor phase and equilibrate
with the chamber. If the water activity of the head-space is greater
than this type of sample, reaching equilibrium takes a longer period
of time and it may affect the water activity of your sample.
8.4 Samples Not at Room Temperature
Samples that are 4 ◦C colder or warmer than the instrument (cham-
ber) temperature need to equilibrate to instrument temperature be-
fore you can make a fast and accurate reading. Rapid changes in tem-
perature over short periods of time cause the water activity readings
49

8 SAMPLE PREPARATION AquaLab TDL
to rise or fall until the temperature stabilizes. When the tempera-
ture stabilizes within an optimal one or two degrees of the chamber
temperature, you can proceed with normal measurements.
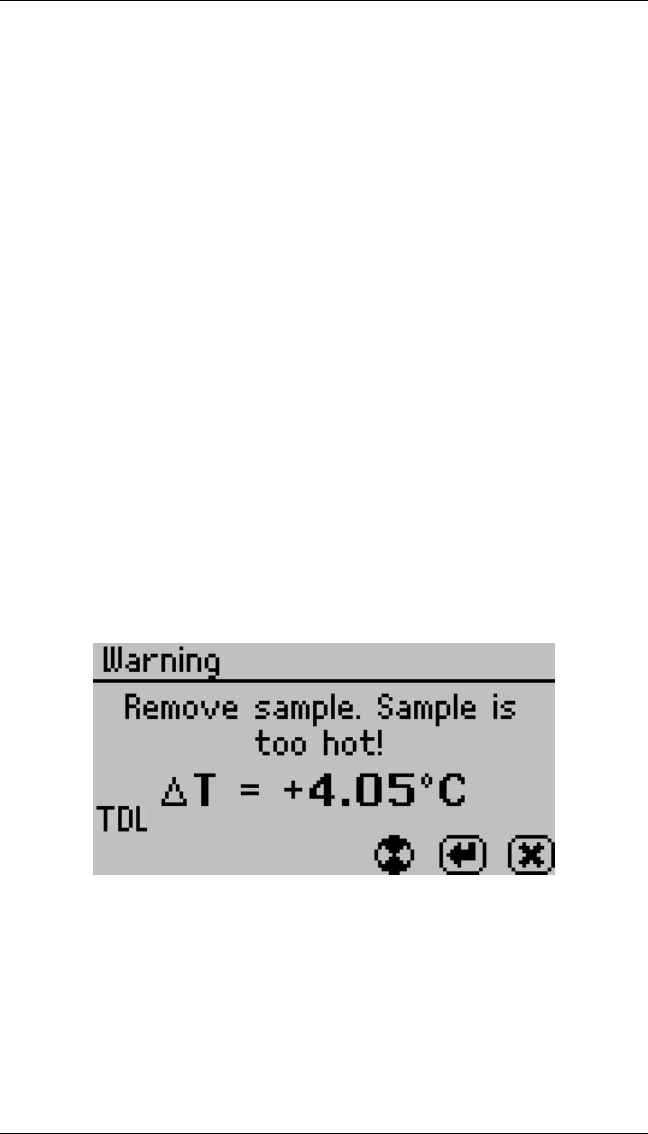
High-water activity samples that are warmer than the chamber tem-
perature can cause condensation inside the measuring chamber, which
adversely affect subsequent readings. A warning message appears
(Sample too hot) if the sample temperature is more than 4 ◦C above
chamber temperature. If this message appears, immediately remove
the sample from the instrument, place a lid on the cup, and allow
the sample to cool to within 4 ◦C of the instrument before measuring.
Samples that are lower than 4 ◦C of the instrument temperature
cause longer read times. The sample temperature must be within
one or two degrees of the chamber temperature before you can take
fast and accurate readings.
50

AquaLab TDL 9 TAKING A READING
9 Taking a Reading
9.1 Measurement Steps
Once you have verified for cleanliness, calibration, and prepared your
sample, you are ready to take readings. Follow steps 1 through 4.
1. Move the chamber lever to the Open position and lift the cham-
ber lid.
2. Check the top lip and outside of the sample cup to make sure
they are free from sample residue and that the sample cup is
not overfilled.
Note: Over-filling the sample cup may contaminate the cham-
ber sensors.
3. Place your prepared sample cup in the chamber. The sam-
ple cup lid must be removed while in the testing chamber for
correct functionality.
4. Close the chamber lid and move the lever to the Read position.
This seals the chamber and starts the reading.
In one to two minutes, the first water activity measurement displays
on the LCD (this is an intermediate reading and not the final water
activity). Length of read times may vary depending on tempera-
ture differences between the chamber and your sample, and other
properties of your sample.
9.2 How AquaLab Takes Readings
The AquaLab reading cycle continues until the rate of change of three
consecutive readings are less than 0.0005 awof each other. The in-
strument continually tracks the strength of the TDL signal to ensure
equilibrium and the accuracy of readings. When the instrument has
finished its read cycle, the water activity is displayed, the read time
is displayed, the Save icon replaces the spinning measurement icon,
51
9 TAKING A READING AquaLab TDL
and, if enabled, you hear a series of beeps.
Cautions
•Never leave a sample in your AquaLab after a reading
has been taken. The sample may spill and contaminate
the instrument chamber if the instrument is acciden-
tally moved or jolted.
•Never try to move your instrument after a sample has
been loaded. Movement may cause the sample mate-
rial to spill and contaminate the sample chamber.
•If a sample has a temperature that is 4 ◦C higher
(or more) than the AquaLab chamber, the instrument
beeps and displays a warning that the sample is too
hot. Remove the sample until it is at room tempera-
ture.
Note: To check the differences in temperature between the sample and
the chamber prior to beginning a read, set the sample in the chamber,
close the lid without latching it, and press the right arrow button.
Although the instrument can measure warmer samples, the readings
may be inaccurate. Warm samples can cause condensation in the
chamber if they have a high water activity. It is best to remove the
sample from the instrument, place a lid on the cup and allow the
sample to cool before reading.
The physical temperature of the instrument should be between 15
52

AquaLab TDL 9 TAKING A READING
and 50 ◦C. The TDL can measure samples between these ambient
temperatures quickly and accurately. The AquaLab TDL has tem-
perature control capabilities that enable it to read samples at tem-
peratures different from ambient temperature, but no higher than
50 ◦C.
53
10 MOISTURE CONTENT MEASUREMENT AquaLab TDL
10 Moisture Content Measurement
Previously, measuring moisture content and water activity required
different instruments. Now it is possible to determine both moisture
content and water activity with one machine.
To calculate moisture content using water activity requires an un-
derstanding of the relationship between the two parameters. This
relationship, referred to as the moisture sorption isotherm, is com-
plex and unique to each product type. Customers can use the prod-
uct isotherm to calculate moisture content based on a water activity
measurement. This is most easily accomplished using a model that
characterizes the isotherm. For additional information about sorp-
tion isotherms and models, please refer to Section 3.
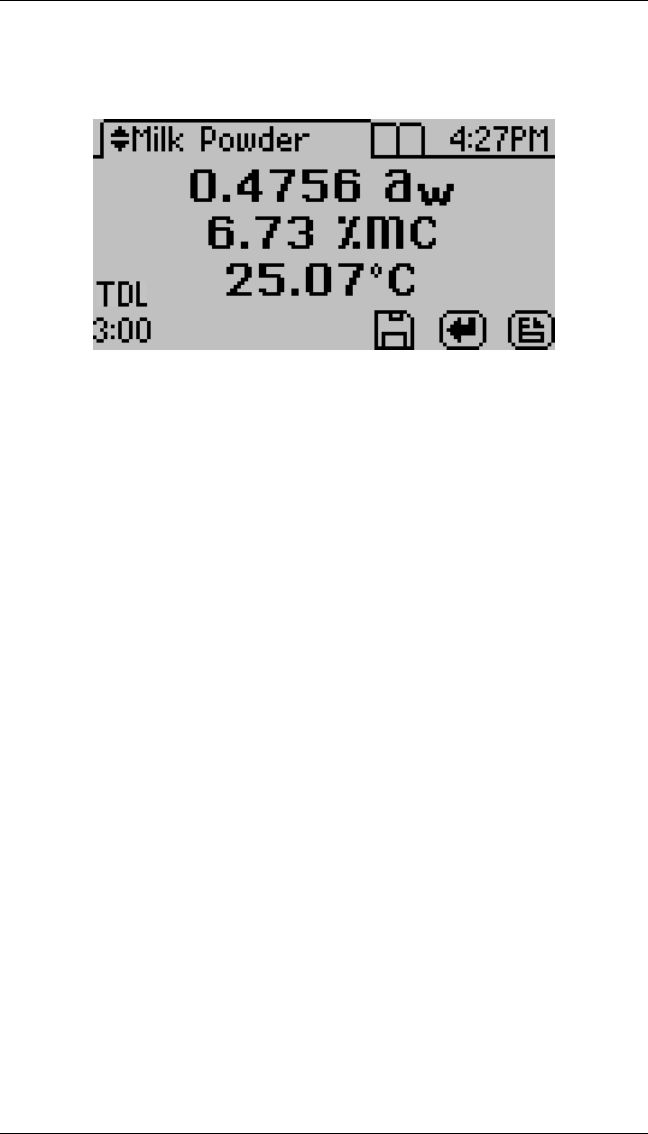
The TDL generates water activity values and then uses preloaded
product specific isotherm models to calculate moisture content and
present it on the screen with the water activity.
Obtaining Product Isotherm Models
Since the isotherm relationship for each product is unique, each prod-
uct isotherm model must be determined experimentally. This only
needs to be done once, but must be done prior to testing moisture
content with the TDL.
54

AquaLab TDL 11 COMPUTER INTERFACE
11 Computer Interface
Your AquaLab may connect to your computer using USB or RS232.
Your AquaLab was shipped to you with a standard USB cable. Using
this cable, you can send water activity data to a computer for further
analysis and storage. The interface is run through the AquaLink 4
Software or a terminal communication program.
Note: You must install the USB driver before connecting the USB
Cable to your computer. You can install from the USB included with
your AquaLab or download here: www.aqualab.com/aqualink.
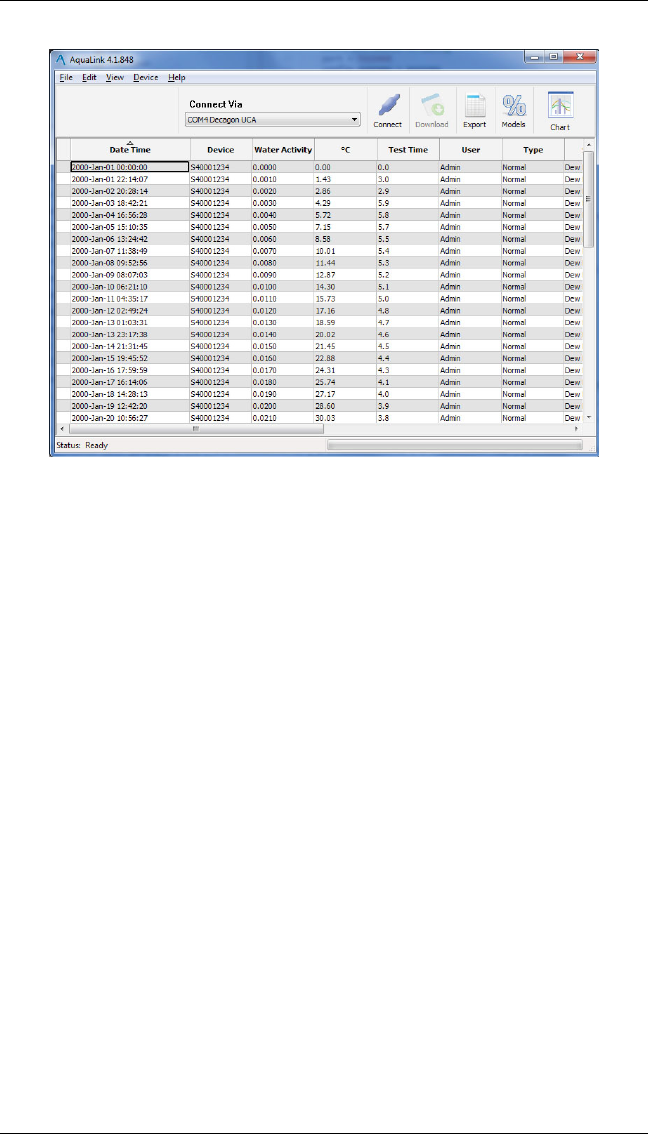
11.1 AquaLink 4 Software
AquaLink 4 is available for use with your AquaLab. AquaLink 4 is a
Windows based program designed for data collection and customized
report generation for all AquaLab models. AquaLink 4 logs water
activity, temperature, time of measurement, and date stamps along
with other information. AquaLink 4 also has sample identification
and comment fields that you can use to help annotate the data your
AquaLab is gathering.
A USB of this program was included with your instrument. Fig-
ure 4 shows a screen shot of the AquaLink 4 program.
55
11 COMPUTER INTERFACE AquaLab TDL
Figure 4: AquaLink 4 Screen Shot
11.2 AquaLink 4 Part 11 Compatible Software
This version of AquaLink 4 is available for customers needing to be
CFR Part 11 compliant. The software contains the required elements
to be used in a Part 11 compliance system.
11.3 Using a Communication Program
There are several terminal program options. METER has its own
terminal program (DecaTerm) which can be downloaded from
http://software.metergroup.com/DecaTerm.zip. Two other options
are TeraTerm, which is a free program that can be found on the In-
ternet and Hyperterminal which came standard with Microsoft Win-
dows prior to Windows 7.
To use any of these terminal programs with your AquaLab, follow
the instructions for the program with the following settings. Be sure
to power on the AquaLab prior to connecting the USB interface cable
to your computer.
56

AquaLab TDL 11 COMPUTER INTERFACE
•Choose correct Com port
•Set/Verify Com Properties
Bits per second 9600
8 Databits
No parity
1 stop bit
Flow control set to none
After successfully connecting the AquaLab to your computer and
upon completion of a water activity reading, the data displays in
the terminal program in the format as follows: measurement time
(minutes), sample temperature, and water activity. Table 2 shows
an example data return.
Table 2: Terminal Data
Time since chamber
was closed Temperature (◦C) aw
3.1, 24.3, 0.862
57

12 TROUBLESHOOTING AquaLab TDL
12 Troubleshooting
AquaLab is a high performance, low maintenance instrument, de-
signed to have few problems if used with care. Unfortunately, some-
times even the best operators using the best instruments encounter
technical difficulties. Below is quick reference guide that directs you
to detailed solutions of some problems that may occur. If these reme-
dies still do not resolve your problem, then please contact METER
for help (see Customer Support in Section 1). Here is a list of some
problems that may occur.
Note: If you purchased your METER instrument from one of our
international distributors, please contact them for local service and
support.
Table 3: Troubleshooting Quick Guide
If this problem occurs: Refer to:
AquaLab does not turn on Problem #1
Readings are slow or inconsistent Problem #2
Awreadings on solutions are too high/low to ad-
just
Problem #3
Screen displays “Sample too hot” Problem #4
Verification is not correct Problem #5
Screen displays “Crystal failure” Problem #6
Screen displays “Pressure Sensor failure” Problem #7
Screen displays “Firmware is corrupted” Problem #8
Screen displays “Readings are disabled” Problem #9
Test was run with wrong model Problem #10
%Moisture Content displayed is not correct Problem #11
%Moisture Content is not shown on screen Problem #12
Returns no moisture content reading Problem #13
1. PROBLEM:
AquaLab does not turn on.
SOLUTIONS:
1. Check to make sure your power cord is securely attached to the
58

AquaLab TDL 12 TROUBLESHOOTING
back of the instrument and it is plugged into the power outlet.
2. A power surge may have caused a fuse to blow. To change the
fuses, follow instructions a through d.
(a) Unplug the power cord.
(b) Locate the panel where the power cord plugs in. The fuse
box is on the right side of that panel. Press in on the
release tab and pull the fuse-holder out. Pull the broken
fuse(s) out and replace with a 1.25-A 250-V fuse.
Caution: Do not use any other kind of fuse or you
risk damage to your instrument as well as void
your warranty.
(c) Replace the fuse-holder and push it into the fuse-well until
the release tab snaps in place.
(d) Connect the power cord and turn your instrument on. If
the fuse blows again, a failed component may be causing
the problem. Contact METER to make arrangements for
repairs. (See Section 13)
2. PROBLEM:
Readings are slow or inconsistent.
SOLUTIONS:
1. The sample chamber may be dirty. Refer to Section 6 for di-
rections on cleaning the sample chamber.
2. The temperature difference between the sample and the block
chamber may be too great. The sample must equilibrate to
instrument temperature before a making a fast and accurate
reading. (Refer to Section 8)
3. Some products absorb or desorb moisture very slowly, causing
measurements to take longer than usual, and nothing can be
done to speed up the process. Refer to Section 8 for further
59
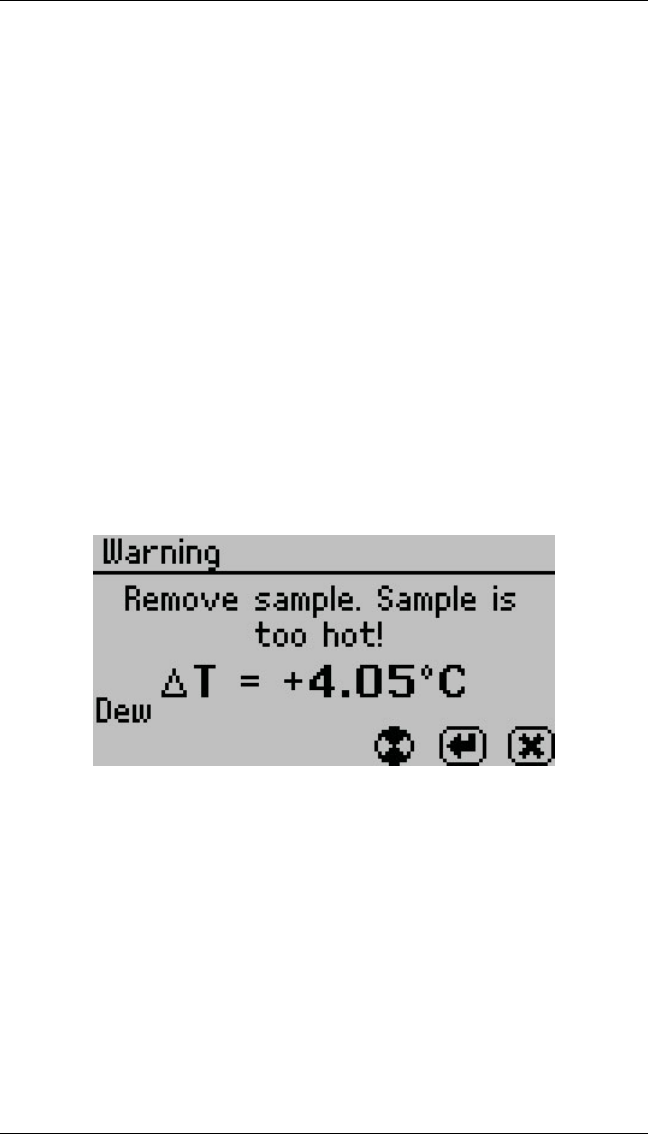
12 TROUBLESHOOTING AquaLab TDL
explanation.
3. PROBLEM:
Water activity readings on verification standards are too high/low
and a linear offset adjustment cannot be made any higher/lower.
SOLUTIONS:
1. The IR Sensor in your chamber, which measures sample tem-
perature, may have become contaminated. Refer to Section 6
for directions on cleaning.
2. The TDL lenses may be dirty. Refer to Section 6 for directions
on cleaning.
4. PROBLEM:
Message on screen displays a warning that the sample is too hot.
SOLUTION:
Your sample temperature is too high for the instrument to equili-
brate with it in a reasonable amount of time. The instrument and
sample need to be in temperature equilibrium before accurate mea-
surements can be made. Therefore, very cold samples take a very
long time to measure for the same reason. To avoid this problem,
make sure to only measure samples that are at the same temperature
as the instrument.
60
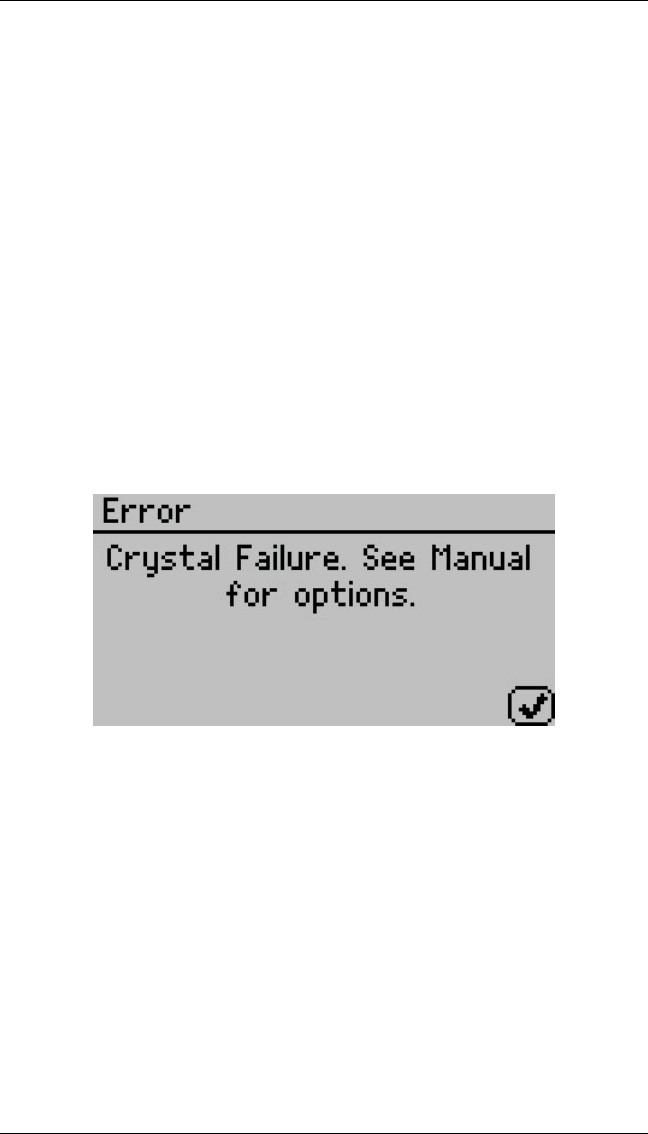
AquaLab TDL 12 TROUBLESHOOTING
5. PROBLEM:
Verification is not correct.
SOLUTION:
1. The sample chamber and components need to be cleaned. See
Section 6 for detailed cleaning instructions. If verification is
still not correct, then linear offset has occurred.
2. Verify and Adjust for Linear offset. After you have cleaned the
sample chamber and components you need to use a Verifica-
tion Standard to verify and adjust for Linear offset as Section
7 describes.
6. PROBLEM:
Message on screen displays the following:
SOLUTION:
The crystal that runs the firmware is having trouble starting. Oc-
casionally, cycling the power solves the problem. If this message
continues to appear, METER needs to service the instrument. See
Section 13 for detailed instructions.
7. PROBLEM:
Message on screen displays the following:
61
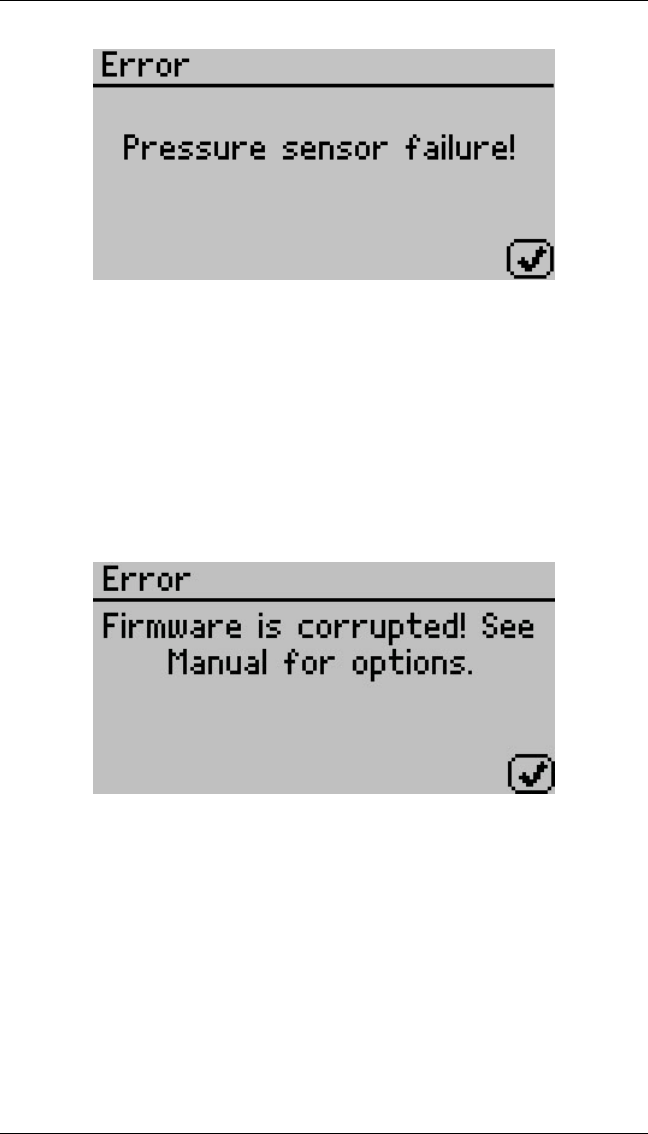
12 TROUBLESHOOTING AquaLab TDL
SOLUTION:
The pressure sensor used during water activity measurements is not
functioning correctly and needs to be replaced. METER needs to
service the instrument. See Section 13 for detailed instructions.
8. PROBLEM:
Message on screen displays the error “Firmware is corrupted.”
SOLUTION:
The firmware on the instrument is corrupted and needs to be reloaded.
To download new firmware to the AquaLab TDL, the instrument
must be serviced by METER.
11. PROBLEM:
Ran test with wrong model.
62

AquaLab TDL 12 TROUBLESHOOTING
SOLUTION:
1. On the measurement screen, toggle to the correct model us-
ing the up and down arrow keys. The moisture content value
updates to correspond with the model you select.
2. If the correct model is not available, the model may not be
loaded on the instrument.
(a) To determine which models are loaded on the instrument,
cycle to the Configurtation tab, select %Moisture and then
the loaded models appear.
3. If the correct model is not available, load the appropriate model
using AquaLink 4 Software. The AquaLab TDL can hold a
total of 100 models at any one time. You may need to re-
move a model using the Software or use the delete option in
the %Moisture Calibration menu before you can add a new
one. Any model that you remove from the instrument with
AquaLink 4 stores in the software to use later.
12. PROBLEM:
Moisture Content displayed is not correct.
SOLUTION:
1. Model selected may not be correct for the product being tested.
(a) Toggle through the available models to find a more appro-
priate model.
(b) If the model is correct but not giving correct moisture con-
tent values it may be necessary to generate a new model
for the product or update an existing model. For infor-
mation about generating a model, contact METER for
updating a model.
13. PROBLEM:
Moisture content does not show up on the screen.
SOLUTION:
63
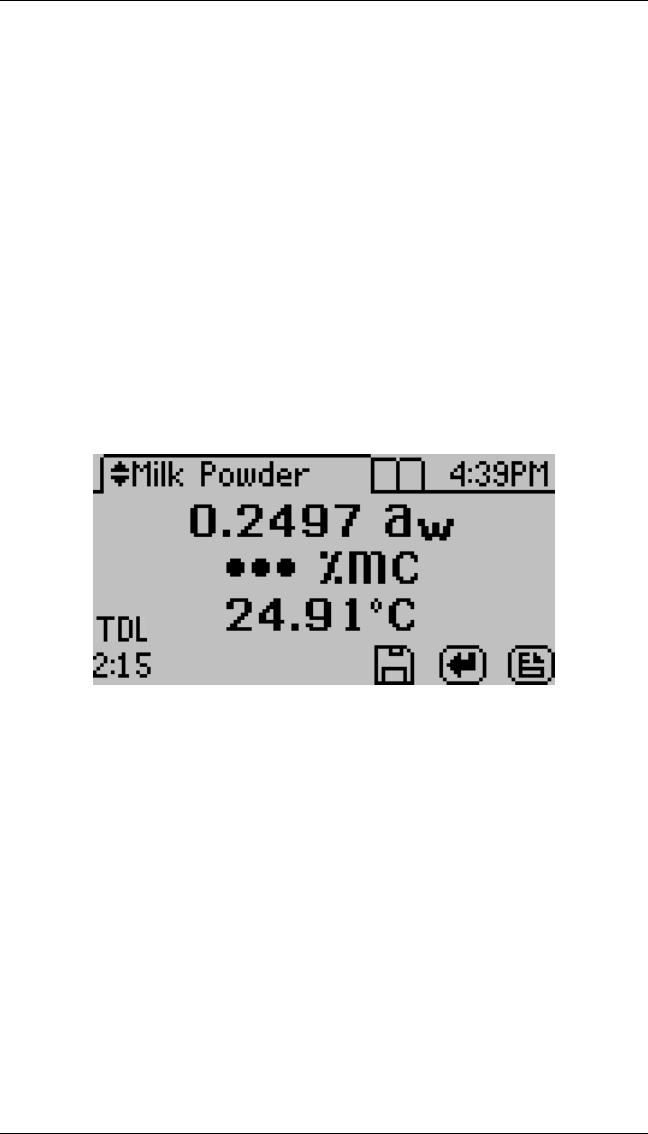
12 TROUBLESHOOTING AquaLab TDL
Moisture content has not been activated.
1. Toggle to Configuration tab, select %Moisture, and select the
appropriate model.
(a) If no models appear in moisture content screen, reload
them using AquaLink 4 software.
(b) If moisture content is not an active selection, the model
feature may not be active. Content METER to learn how
to activate the model feature.
14. PROBLEM:
Message on the screen displays no moisture content reading.
SOLUTION:
1. When a moisture content reading is not shown, the water ac-
tivity or temperature for that reading is beyond the scope of
the moisture sorption isotherm. This can happen under the
conditions a or b.
(a) The isotherm equation calculates a moisture content that
is less than 0% or greater than 100% with the given water
activity.
(b) The control temperature is significantly different than the
isotherm temperature. Make sure that the sample wa-
ter activity and the instrument controlling temperature
64
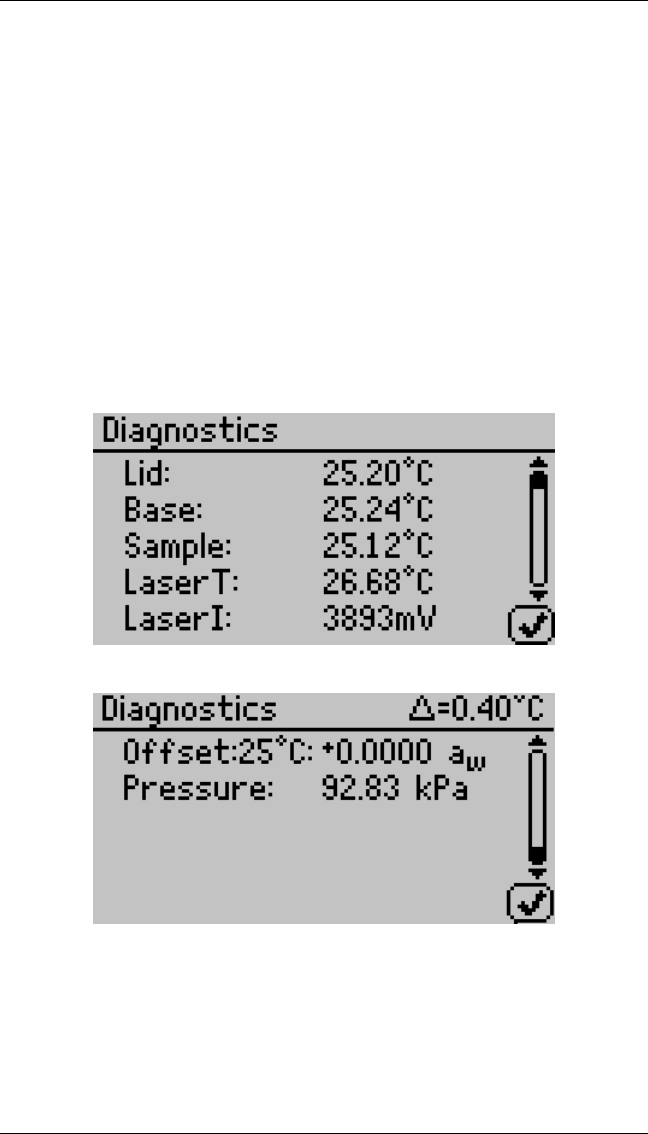
AquaLab TDL 12 TROUBLESHOOTING
are within the scope of the selected moisture sorption
isotherm model.
Diagnostic Screen
If, after cleaning your instrument and reading the other troubleshoot-
ing hints, you have reason to believe that one of the components of
your AquaLab may be causing measurement error, you may access a
screen that displays values for component performance. Customers
can access this Diagnostics screen by navigating to the Configura-
tion tab and then by scrolling down to the diagnostics option. Press
Enter and the TDL gives you a list of components and their values.
65

13 SUPPORT AND REPAIR AquaLab TDL
13 Support and Repair
Note: If you purchased your AquaLab from one of our international
distributors, please contact them. They are able to provide you with
local support and service.
When encountering problems with your AquaLab (that you unable
to resolve with the help of this manual), please contact METER
Customer Support at support.food@metergroup.com, 509-332-5601
or fax us at 509-332-5158. Please have the serial number and model
of the instrument ready.
AquaLab annual calibration is available. For details on sending your
AquaLab to METER or your distributor in for calibration, contact
us by phone or email at support.food@metergroup.com.
All AquaLabs returning to METER for servicing must be accom-
panied with a Return Material Authorization (RMA) number. Prior
to shipping the instrument, please contact a METER customer sup-
port representative to obtain an RMA.
Shipping Directions
The following steps help to ensure the safe shipping and processing
of your AquaLab.
1. Ship your AquaLab in its original cardboard box with suspen-
sion packaging. If this is not possible, use a box that has at
least four inches of space between your instrument and each
wall of the box.
2. Place the AquaLab in a plastic bag to avoid disfiguring marks
from the packaging.
3. Do not ship the power cord or serial cable.
4. If the original packaging is not available, pack the box mod-
erately tight with packing material (e.g. styrofoam peanuts
or bubble wrap), ensuring the instrument is suspended in the
packing material.
66

AquaLab TDL 13 SUPPORT AND REPAIR
5. On the RMA form, please verify the ship to and bill to infor-
mation, contact name, and problem description. If anything is
incorrect please contact a METER representative.
6. Tape the box in both directions for added support.
7. Include the RMA number in the attention line on the shipping
label.
Ship to:
METER Group, Inc.
ATTN: RMA (insert your RMA #)
2365 NE Hopkins Court
Pullman, WA 99163
13.1 Repair Costs
METER repairs manufacturer defects and instruments within the
one year warranty at no charge. We bill non-warranty repair charges
for parts, labor and shipping to you and may charge an extra fee
for rush work. METER can provide an estimated repair cost, if
requested.
13.2 Loaner Service
METER has loaner instruments available to keep you measuring wa-
ter activity while your instrument is being serviced. Please contact
customer support for pricing and availability of loaners. If your
AquaLab is being serviced under warranty, you qualify for a free
loaner.
67

14 FURTHER READING AquaLab TDL
14 Further Reading
14.1 Water Activity Theory & Measurement
Bousquet-Ricard, M., G. Qualyle, T. Pharm, and J. C. Cheftel. 1980.
Comparative study of three methods of determining water activity
in intermediate moisture foods. Lebensm Wiss Technol 13:169-173.
Cazier, J.B., and V. Gekas. 2001. Water activity and its predic-
tion: a review. International Journal of Food properties 4(1):35-43.
Chirife, J., G. Favetto, C. Ferro-Fontn, and S.L.Resnik. 1983. The
water activity of standard saturated salt solutions in the range of
intermediate moisture foods. Lebensm Wiss Technol 16:36-38.
Duckworth, R. 1975. Water relations of foods. Academic Press,
New York.
Gmez, R., and J. Fernandez-Salguero. 1992. Water activity and
chemical composition of some food emulsions. Food Chem 45:91-93.
Greenspan, L. 1977. Humidity fixed points of binary saturated aque-
ous solutions. J Res Nat Bur Stand - A Phys Chem 81A:89-96.
Karmas, E. 1981. Measurement of moisture content. Cereal Foods
World 26:332-334.
Kitic, D., D.C. Pereira-Jardim, G.J. Favetto, S.L. Resnik, and J.
Chirife. 1986. Theoretical prediction of the water activity of stan-
dard saturated salt solutions at various temperatures. Journal of
Food Science 51:1037-1042.
Labuza, T.P., and R. Contreras-Medellin. 1981. Prediction of mois-
ture protection requirements for foods. Cereal Foods World 26:335-
343.
Labuza, T.P., K. Acott, S.R.Tatini, R.Y. Lee, J. Flink, and W. Mc-
Call. 1976. Water activity determination: A collaborative study of
68

AquaLab TDL 14 FURTHER READING
different methods. Journal of Food Science 41:910-917.
Marcolli, C., and Th . Peter. 2005. Water activity in polyol/water
systems: new UNIFAC parameterization. Atmospheric Chemistry
and Physics 5:1545-1555.
Ninni, L., M.S. Camargo, and A.J.A. Meirelles. 2000. Water ac-
tivity in polyol systems. Journal of Chemical and Engineering Data
45:654-660.
Prior, B.A. 1979. Measurement of water activity in foods: A re-
view. Journal of Food Protection 42:668-674.
Rahman, M.S. and S.S. Sablani. 2001. Measurement of water ac-
tivity by electronic sensors. P. A2.5.1-A2.5.4 In R.E.Wrolstad (ed.)
Current Protocols In Food Analytical Chemistry. John Wiley &
Sons, Inc., New York.
Rahman, M.S., S.S. Sablani, N. Guizani, T.P. Labuza, and P.P.
Lewicki. 2001. Direct manometic determination of vapor pressure.
P. A2.4.1-A2.4.6. In R.E. Wrolstad (ed.) Current Protocols In Food
Analytical Chemistry. John Wiley & Sons, Inc., New York.
Reid, D.S., A.J. Fontana, M.S. Rahman, S.S. Sablani, T.P. Labuza,
N. Guizani, and P.P. Lewicki. 2001. Vapor pressure measurements
of water p. A2.1.1-A2.5.4. In R.E. Wrolstad (ed.) Current Protocols
In Food Analytical Chemistry. John Wiley & Sons, Inc., New York.
Reid, D.S. 1976. Water activity concepts in intermediate moisture
foods. p. 54-65. In R.Davies, G.G.Birch, and K.J.Parker (ed.) In-
termediate Moisture Foods. Applied Science Publishers, London.
Richard, J., and T.P. Labuza. 1990. Rapid determination of the
water activity of some reference solutions, culture media and cheese
using a dew point method. Sci. des Aliments 10:57-64.
Roa,V., and M.S.Tapia de Daza. 1991. Evaluation of water activity
measurements with a dew point electronic humidity meter. Lebensm
69

14 FURTHER READING AquaLab TDL
Wiss Technol 24:208-213.
Rodel, W. 2001. Water activity and its measurement in food. P.
453-483. In E. Kress-Rogers, and C.B. Brimelow (ed.) Instrumenta-
tion and sensors for the food industry. CRC Press LLC, Boca Raton,
FL.
Roos, K.D. 1975. Estimation of water activity in intermediate mois-
ture foods. Food Tech 29:26-30.
Scott, V.N., and D.T. Bernard. 1983. Influence of temperature on
the measurement of water activity of food and salt systems. Journal
of Food Science 48:552-554.
Snavely, M.J., J.C. Price, and H.W. Jun. 1990. A comparison of
three equilibrium relative humidity measuring devices. Drug Dev.
Ind. Pharm. 16:1399-1409.
Stamp, J.A., S. Linscott, C. Lomauro, and T.P. Labuza. 1984. Mea-
surement of water activity of salt solutions and foods by several elec-
tronic methods as compared to direct vapor pressure measurement.
Journal of Food Science 49:1139-1142.
Stoloff, L. 1978. Calibration of water activity measuring instruments
and devices: Collaborative study. Journal of the Association of Of-
ficial Analytical Chemists 61:1166-1178.
Troller, J.A. 1983. Methods to measure water activity. Journal of
Food Protection 46:129-134.
Troller, J.A., and J.H.B Christian. 1978. Water Activity and Food.
Academic Press, New York.
Troller, J.A., and V.N. Scott. 1992. Measurement of water activity(aw)
and acidity. p. 135-151. In C. Vanderzant, and D.F. Splittstoesser
(ed.) Compendium of Methods for the Microbiological Examination
of Foods. American Public Health Association, Washington, D.C.
70

AquaLab TDL 14 FURTHER READING
Van den Berg, C. 1986. Water activity. p. 11-36. In D. MacCarthy
(ed.) Concentration and drying of foods. Elsevier Applied Science
Publishers, London.
Van den Berg, C. 1991. Food-water relations: Progress and inte-
gration, comments and thoughts. In H. Levine, and L. Slade (ed.)
Water Relationships in Foods. Plenum Press, New York.
Van den Berg, C., and S. Bruin. 1981. Water activity and its estima-
tion in food systems: Theoretical aspects. p. 1-61. In L.B. Rockland,
and G.F. Stewart (ed.) Water Activity: Influences on Food Quality.
Academic Press, New York.
Vega-Mercado, H., andG.V. Barbosa-Canovas. 1994. Prediction of
water activity in food systems: A review on theoretical models. Re-
vista Espanola De Ciencia Y Tecnologia De Alimentos 34:368-388.
Vega-Mercado, H., B. Romanach, and G.V. Barbosa-Canovas. 1994.
Prediction of water activity in food systems: A computer program
for predicting water activity in multicomponent foods. Revista Es-
panola De Ciencia Y Tecnologia De Alimentos 34:427-440.
Vos, P.T., and T.P. Labuza. 1974. Technique for measurements of
water activity in the high awrange. J. Agric. Food Chem. 22:326-
327.
Voysey, P. 1993. An evaluation of the AquaLab CX-2 system for
measuring water activity. F. M. B. R. A. Digest No. 124, 24-25.
Food Safety and Microbiology
Bei, Z.H., and R.-M.J. Nout. 2000. Effects of temperature, wa-
ter activity and gas atmosphere on mycelial growth of tempe fungi
Rhizopus microsporus var. microcporus and R. microsporus var.
oligosporus. World Journal of Microbiology and Biotechnology 16:853-
858.
Beuchat, L.R. 1981. Microbial stability as affected by water activity.
71

14 FURTHER READING AquaLab TDL
Cereal Foods World 26:345-349.
Brandt, L. 1996. Bound for success. Controlling water activity gives
technologists the edge in developing safe, shelf-stable foods. Food
Formulating 2:41-48.
Chirife, J., and M.P. Buera. 1994. Water activity, glass transi-
tion and microbial stability in concentrated/semimoist food systems.
Journal of Food Science 59:921-927.
Chirife, J., and M.P. Buera. 1995. A critical review of some nonequi-
librium situations and glass transitions on water activity values of
foods in the microbiological growth range. Journal of Food Engi-
neering 25:531-552.
Chirife, J., and M.P. Buera. 1996. Water activity, water glass dy-
namics, and the control of microbiological growth in foods. Critical
Rev. in Food Sci. Nutr. 36:465-513.
Farberm, J.M., F. Coates, and E. Daley. 1992. Minimum water ac-
tivity requirements for the growth of Listeria monocytogenes. Lett
Appl Microbiol 15:103-105.
Franks, F. 1991. Water activity: a credible measure of food safety
and quality? Trends Food Sci Technol March:68-72.
Garcia de Fernando, G.D., O. Diaz, M. Fernandez, and J.A. Or-
donez. 1992. Changes in water activity of selected solid culture
media throughout incubation. Food Microbiology 9:77-82.
Gibson, A.M., J. Baranyi, J.I. Pitt, M.J. Eyles, and T.A. Roberts.
1994. Predicting fungal growth: The effect of water activity on As-
pergillus flavus and related species. International Journal of Food
Microbiology 23:419-431.
Goaleni, N., J.E. Smith, J. Lacey, and G. Gettinby. 1997. Effects of
temperature, water activity, and incubation time on production of
aflatoxins and cyclopiazonic acid by an isolate of Aspergillus flavus
72

AquaLab TDL 14 FURTHER READING
in surface agar culture. Appl Environ Microbiol 63:1048-1053.
Hardman, T.M. 1988. Water and food quality. Elseiver Press, Lon-
don.
Hocking, A.D., and B.F. Miscamble. 1995. Water relations of some
Zygomycetes isolated from food. Mycological Research 99:1113-1118.
Hocking, A.D., B.F. Miscamble, and J.I. Pitt. 1994. Water re-
lations of Alternaria alternata, Cladosporium cladosporioides, Cla-
dosporium sphaerospermum, Curvulario lunata and Curvulario pallescens.
Mycological Research 98:91-94.
Houtsma, P.C., A. Heuvelink, J. Dufrenne, and S. Notermans. 1994.
Effect of sodium lactate on toxin production, spore germination and
heat resistance of proteolytic Clostridium botulinum strains. Journal
of Food Protection 57:327-330.
Kress-Rogers, E. 1993. Food quality measurement. Food Industry
News September:23-26.
Kuntz, L.A. 1992. Keeping microorganisms in control. Food Prod-
uct Design August:44-51.
Levine, H., and L. Slade. 1991. Water Relationships in Foods.
Plenum Press, New York.
Li, K.Y., and J.A. Torres. 1993. Water activity relationships for
selected mesophiles and psychrotrophs at refrigeration temperature
Journal of Food Protection 56:612-615.
Lopez-Malo, A., S. Guerrero, and S.M. Alzamora. 2000. Proba-
bilistic modeling of Saccharomyces cerevisiae inhibition under the
effects of water activity, pH, and potassium sorbate concentration.
Journal of Food Protection 63:91-95.
Mannheim,C.H., J.X. Liu, and S.G. Gilbert. 1994. Control of water
in foods during storage. Journal of Food Engineering 22:509-532.
73

14 FURTHER READING AquaLab TDL
Marauska, M., A. Vigants, A. Klincare, D. Upite, E. Kaminska, and
M. Bekers. 1996. Influence of water activity and medium osmolality
on the growth and acid production of Lactobacillus casei var. alac-
tosus. Proceedings of the Latvian Academy of Sciences Section B
Natural Exact and Applied Sciences 50:144-146.
Masana, M.O., and J. Baranyi. 2000. Growth/no growth interface of
Brochothrix thermosphacta as a function of pH and water activity.
Food Microbiology 17:485-858.
Mattick, K. L., F. Jorgensen, J.D. Legan, M.B. Cole, J. Porter, H.M.
Lappin-Scott, and T.J. Humphrey. 2000. Survival and filamentation
of Salmonella enterica serovar Enteritidis PT4 and Salmonella enter-
ica serovar Typhimurium DT104 at low water activity. Appl Environ
Microbiol 66:1274-1279.
Mattick, K.L., F. Jorgensen, J.D. Legan, H.M. Lappin-Scott, and
T.J. Humphrey. 2000. Habituation of Salmonella spp. at reduced
water activity and its effect on heat tolerance. Appl Environ Micro-
biol 66:4921-4925.
Mattick, K.L., F. Jorgensen, J.D. Legan, H.M. Lappin-Scott, and
T.J. Humphrey. 2001. Improving recovery of Salmonella enterica
Serovar Typhimurium DT104 cells injured by heating at different
water activity values. Journal of Food Protection 64:1472-1476.
McMeekin, T.A., and T. Ross. 1996. Shelf life prediction: Status
and future possibilities. International Journal of Food Microbiology
33:65-83.
Miller, A.J. 1992. Combined water activity and solute effects on
growth and survival of Listeria monocytogenes. Journal of Food
Protection 55:414-418.
Nakajo, M., and Y. Moriyama. 1993. Effect of pH and water ac-
tivity on heat resistance of spores of Bacillus coagulans. Journal of
the Japanese Society for Food Science and Technology 40:268-271.
74

AquaLab TDL 14 FURTHER READING
Nelson, K.A., and T.P. Labuza. 1994. Water activity and food poly-
mer science: Implications of state on arrhenius and WLF models in
predicting shelf life. Journal of Food Engineering 22:271-289.
Nesci, A., M. Rodrigues, and M. Etcheverry. 2003. Control of
Aspergillus growth and aflatoxin production using antioxidants at
different conditions of water activity and pH. Journal of Applied Mi-
crobiology 95:279-287.
Nolan, D.A., D.C .Chamblin, and J.A. Troller. 1992. Minimal wa-
ter activity levels for growth and survival of Listeria monocytogenes
and Listeria innocua. International Journal of Food Microbiology
16:323-335.
Noorlidah, A., A. Nawawi, and I. Othman. 2000. Fungal spoilage of
starch-based foods in relation to its water activity (aw). Journal of
Stored Products Research 36:47-54.
Park, C.M., and L.R.Beuchat. 2000. Survival of Escherichia coli
O157:H7 in potato starch as affected by water activity, pH and tem-
perature. Lett Appl Microbiol 31(5):364-367.
Petersson, S., and J. Schnuerer. 1995. Biocontrol of mold growth
in high-moisture wheat stored under airtight conditions by Pichia
anomala, Pichia guilliermondii, and Saccharomyces cerevisiae. Appl
Environ Microbiol 61:1027-1032.
Pitt, J.I., and B.F. Miscamble. 1995. Water relations of Aspergillus
flavus and closely related species. Journal of Food Protection 58:86-
90.
Plaza, P., J. Usall, N. Teixido, and I. Vinas. 2003 Effect of water
activity and temperature on germination and growth of Penicillium
digitatum, P. italicum and Geoteichum candidum. Journal of Ap-
plied Microbiology 94:549-554.
Quintavalla, S., and G. Parolari. 1993. Effects of temperature, water
75

14 FURTHER READING AquaLab TDL
activity and pH on the growth of Bacillus cells and spore: A response
surface methodology study. International Journal of Food Microbi-
ology 19:207-216.
Rockland, L.B., and G.F. Stewart. 1981. Water activity: Influ-
ences on food quality. Academic Press, New York.
Rockland, L.B., and S.K. Nishi. 1980. Influence of water activity
on food product quality and stability. Food Tech 34:42-59.
Saad, R.R. 1992. Effect of water activity on growth and lipids of
xerophilic fungi, Aspergillus repens and Aspergillus amstelodami.
Zentralblatt Fuer Mikrobiologie 147:61-64.
Salter, M.A., D.A. Ratkowsky, T. Ross, and T.A. McMeekin. 2000.
Modelling the combined temperature and salt (NaCl) limits for growth
of a pathogenic Escherichia coli strain using nonlinear logistic regres-
sion. International Journal of Food Microbiology 61:159-167.
Santos, J., T.M.Lopez-Diaz, M.C.Garcia-Lopez, M.C.Garcia-Fernandez,
and A.Otero. 1994. Minimum water activity for the growth of
Aeromonas hydrophila as affected by strain, temperature and humec-
tant. Lett Appl Microbiol 19:76-78.
Sautour, M., A. Rouget, P. Dantigny, C. Divies, and M. Bennsoussan.
2001. Prediction of conidial germination of Penicillium chrysogenum
as influenced by temperature, water activity and pH. Lett Appl Mi-
crobiol 32:131-134.
Seow, C.C., T.T. Teng, and C.H. Quah. 1988. Food preservation
by moisture control. Elsevier, New York.
Shebuski, J.R., O. Vilhelmsson, and K.J. Miller. 2000. Effects of
growth at low water activity on the thermal tolerance of Staphylo-
coccus aureus. Journal of Food Protection 63:1277-1281.
Taoukis, P., W. Breene, and T.P. Labuza. 1988. Intermediate mois-
ture foods. Adv Cereal Sci Technol 9:91-128.
76

AquaLab TDL 14 FURTHER READING
Tapia de Daza, M.S., Y. Villegas, and A. Martinez. 1991. Mini-
mal water activity for growth of Listeria monocytogenes as affected
by solute and temperature. International Journal of Food Microbi-
ology 14:333-337.
Tokuoka, K., and T. Ishitani. 1991. Minimum water activities for
the growth of yeasts isolated from high-sugar foods. Journal of Gen-
eral and Appied Microbiology 37:111-119.
Torres, R., J. Usall, N. Teixido, M. Abadias, and I. Vinas. 2003.
Liquid formulation of the biocontrol agent Candida sake by modify-
ing water activity or adding protectants. Journal of Applied Micro-
biology 94:330-339.
Ucar, F., and I. Guneri. 1996. The effect of water activity, pH
and temperature on the growth of osmophilic yeasts. Turkish Jour-
nal of Biology 20:37-46.
Wijtzes, T., P.J. Mcclure, M.H. Zwietering, and T.A. Roberts. 1993.
Modelling bacterial growth of Listeria monocytogenes as a function
of water activity, pH and temperature. International Journal of Food
Microbiology 18:139-149.
Zwietering, M.H., T. Wijtzes, J.C. de Wit, and K.Van’T Riet. 1992.
A decision support system for prediction of the microbial spoilage in
foods. Journal of Food Protection 55:973-979.
Meat and Seafood
Allen, K., D. Cornforth, D. Whittier, M. Vasavada, and B. Num-
mer. 2007. Evaluation of high humidity and wet marinade methods
for pasteurization of jerky. Journal of Food Science. 72:C351-C355.
Chen, H.C. 1995. Seafood microorganisms and seafood safety. Jour-
nal of Food and Drug Analysis 3:133-144.
Clavero, M.R.S., and L.R.Beuchat. 1996. Survival of Escherichia
77

14 FURTHER READING AquaLab TDL
coli O157:H7 in broth and processed salami as influenced by pH, wa-
ter activity, and temperature and suitability of media for its recovery.
Appl Environ Microbiol 62:2735-2740.
Duffy, L.L., P.B. Vanderlinde, and F.H. Grau. 1994. Growth of
Listeria monocytogenes on vacuum-packed cooked meats: Effects of
pH, aw, nitrite and ascorbate. International Journal of Food Micro-
biology 23:377-390.
Elgasim, E.A., and M.S. Al Wesali. 2000. Water activity and Hunter
colour values of beef patties extended with samh (Mesembryanthe-
mum forsskalei Hochst) flour. Food Chem 69(2):181-185.
Gmez, R., and J. Fernandez-Salguero. 1993. Note: Water activity of
Spanish intermediate moisture fish products. Revista Espanola De
Ciencia Y Tecnologia De Alimentos 33:651-656.
Hand, L. 1994. Controlling water activity and pH in snack sticks.
Meat Marketing and Technology May:55-56.
Lee, M.B., and S. Styliadis. 1996. A survey of pH and water ac-
tivity levels in processed salamis and sausages in Metro Toronto.
Journal of Food Protection 59:1007-1010.
Luecke, F.K. 1994. Fermented meat products. Food Res Intl 27:299-
307. Minegishi, Y., Y. Tsukamasa, K. Miake, T. Shimasaki, C. Imai,
M.
Sugiyama, and H. Shinano. 1995. Water activity and microflora
in commercial vacuum-packed smoked salmons. Journal of the Food
Hygienic Society of Japan 36:442-446.
Nunez, F., M.C. Diaz, M. Rodriguez, E. Aranda, A. Martin, and
M.A. Asensio. 2000. Effects of substrate, water activity, and temper-
ature on growth and verrucosidin production by Penicillium polonicum
isolated from dry-cured ham. Journal of Food Protection 63:231-236.
Placido, M. and M.P. Aleman. 2002. Rapid hygrometric method for
78

AquaLab TDL 14 FURTHER READING
determing water activity. Ciencia y Tecnologia Alimentaria 3(4):229-
235.
Rocha-Garza, A.E., and J.F. Zayas. 1996. Quality of broiled beef
patties supplemented with wheat germ protein flour. Journal of Food
Science 61:418-421
Sabadini, E., M.D. Hubinger, P.-J.d.Sobral, and B.C. Carvalho, Jr.
2001. Change of water activity and meat colour in the elaboration
process of dehydrated salted meat. Ciencia e Tecnologia de Alimen-
tos 21(1):14-19.
Shimasaki, T., K. Miake, Y. Tsukamasa, M.A. Sugiyama, Y. Minegishi,
and H. Shinano. 1994. Effect of water activity and storage tempera-
ture on the quality and microflora of smoked salmon. Nippon Suisan
Gakkaishi 60:569-576.
Untermann, F., and C. Muller. 1992. Influence of awvalue and
storage temperature on the multiplication and enterotoxin forma-
tion of staphylococci in dry-cured raw hams. International Journal
of Food Microbiology 16:109-115.
Williams, S.K., G.E. Rodrick, and R.L. West. 1995. Sodium lactate
affects shelf life and consumer acceptance of fresh Catfish (Ictalu-
rus nebulosus, marmoratus) fillets under simulated retail conditions.
Journal of Food Science 60:636-639.
Dairy Products
Clavero, M.R.S., and L.R. Beuchat. 1996. Survival of Escherichia
coli O157:H7 in broth and processed salami as influenced by pH, wa-
ter activity, and temperature and suitability of media for its recovery.
Appl Environ Microbiol 62:2735-2740.
Correia, R., M. Magalhaes, M. Pedrini, A. da Cruz, and I. Clementino.
2008. Ice cream made from cow and goat milk: chemical composi-
tion and melting point characteristics. Revista Ciencia Agronomica
39:251-256.
79

14 FURTHER READING AquaLab TDL
Duffy, L.L., P.B.Vanderlinde, and F.H. Grau. 1994. Growth of Lis-
teria monocytogenes on vacuum-packed cooked meats: Effects of pH,
aw, nitrite and ascorbate. International Journal of Food Microbiol-
ogy 23:377-390.
Gmez, R., and J. Fernandez-Salguero. 1993. Note: Water activity of
Spanish intermediate moisture fish products. Revista Espanola De
Ciencia Y Tecnologia De Alimentos 33:651-656.
Hand, L. 1994. Controlling water activity and pH in snack sticks.
Meat Marketing and Technology May:55-56.
Hardy, J., J. Scher, and S. Banon. 2002. Water activity and hy-
dration of dairy powders. Lait 82:441-442.
Lee, M.B., and S. Styliadis. 1996. A survey of pH and water ac-
tivity levels in processed salamis and sausages in Metro Toronto.
Journal of Food Protection 59:1007-1010.
Luecke, F.K. 1994. Fermented meat products. Food Res Intl 27:299-
307.
Malec, L.S., A.S. Pereyra-Gonzales, G.B. Naranjo, and M.S. Vigo.
2002. Influence of water activity and storage temperature on lysine
availability of a milk like system. Food Res Intl 35(9):849-853.
Minegishi, Y., Y. Tsukamasa, K. Miake, T. Shimasaki, C. Imai, M.
Sugiyama, and H. Shinano. 1995. Water activity and microflora in
commercial vacuum-packed smoked salmons. Journal of the Food
Hygienic Society of Japan 36:442-446.
Rocha-Garza, A.E., and J.F. Zayas. 1996. Quality of broiled beef
patties supplemented with wheat germ protein flour. Journal of Food
Science 61:418-421.
Shah, N.P., and R.R. Ravula. 2000. Influence of water activity on
fermentation, organic acids production and viability of yoghurt and
80

AquaLab TDL 14 FURTHER READING
probiotic bacteria. Australian Journal of Dairy Technology 55(3):127-
131.
Shimasaki, T., K. Miake, Y. Tsukamasa, M.A. Sugiyama, Y. Minegishi,
and H. Shinano. 1994. Effect of water activity and storage tempera-
ture on the quality and microflora of smoked salmon. Nippon Suisan
Gakkaishi 60:569-576.
Untermann, F., and C. Muller. 1992. Influence of awvalue and
storage temperature on the multiplication and enterotoxin forma-
tion of staphylococci in dry-cured raw hams. International Journal
of Food Microbiology 16:109-115.
Williams, S.K., G.E. Rodrick, and R.L. West. 1995. Sodium lactate
affects shelf life and consumer acceptance of fresh Catfish (Ictalu-
rus nebulosus, marmoratus) fillets under simulated retail conditions.
Journal of Food Science 60:636-639.
Fruits and Vegetables
Ayub, M., R. Khan, S. Wahab, A. Zeb, and J. Muhammad. 1995.
Effect of crystalline sweeteners on the water activity and shelf stabil-
ity of osmotically dehydrated guava. Sarhad Journal of Agriculture
11:755-761.
Beveridge, T., and S.E. Weintraub. 1995. Effect of blanching pre-
treatment on color and texture of apple slices at various water activ-
ities. Food Res Intl 28:83-86.
Clavero, M.R.S., R.E. Brackett, L.R. Beuchat, and M.P. Doyle. 2000.
Influence of water activity and storage conditions on survival and
growth of proteolytic Clostridium botulinum in peanut spread. Food
Microbiology 17(1):53-61.
Fouskaki, M., K. Karametsi, and N.A. Chaniotakis. 2003. Method
for the determination of water content in sultana raisins using a wa-
ter activity probe. Food Chem 82:133-1337.
81

14 FURTHER READING AquaLab TDL
Gogus, F., C. Cuzdemir, and S. Eren. 2000. Effects of some hydro-
colloids and water activity on nonenzymic browning of concentrated
orange juice. Nahrung 44(6):438-442.
Hubinger, M., F.C. Menegalli, R.J. Aguerre, and C. Suarez. 1992.
Water vapor adsorption isotherms of guava, mango and pineapple.
Journal of Food Science 57:1405-1407.
Jimenez, M., M. Manez, and E. Hernandez. 1996. Influence of water
activity and temperature on the production of zearalenone in corn by
three Fusarium species. International Journal of Food Microbiology
29:417-421.
Khalloufi, S., J. Giasson, and C. Ratti. 2000. Water activity of
freeze dried mushrooms and berries. Canadian Agricultural Engi-
neering 42(1):51-56.
Kiranoudis, C.T., Z.B. Maroulis, E. Tsami, and D. Marinos-Kouris.
1993. Equilibrium moisture content and heat of desorption of some
vegetables. Journal of Food Engineering 20:55-74.
Lopez-Malo, A., and E. Palou. 2000. Modeling the growth/nogrowth
interface of Zygosaccharomyces bailii in Mango puree. Journal of
Food Science: 65:516-520.
Makower, B., and S. Myers. 1943. A new method for the determina-
tion of moisture in dehydrated vegetables. Proceedings of Institute
of Food Technologists, 4th Conference 156.
Maltini, E., D. Torreggiani, B.R. Brovetto, and G. Bertolo. 1993.
Functional properties of reduced moisture fruits as ingredients in
food systems. Food Res Intl 26:413-419.
Marin, S., N. Magan, M. Abellana, R. Canela, A.J. Ramos, and
V. Sanchis. 2000. Selective effect of propionates and water activ-
ity on maize mycoflora and impact on fumonisin B1 accumulation.
Journal of Stored Products Research 36:203-214.
82

AquaLab TDL 14 FURTHER READING
Marin, S., V. Sanchis, I. Vinas, R. Canela, and N. Magan. 1995.
Effect of water activity and temperature on growth and fumonisin
B-1 and B-2 production by Fusarium proliferatum and F. monili-
forme on maize grain. Lett Appl Microbiol 21:298-301.
Monsalve-Gonzalez, A., G.V. Barbosa-Canovas, and R.P. Cavalieri.
1993. Mass transfer and textural changes during processing of apples
by combined methods. Journal of Food Science 58:1118-1124.
Pinsirodom, P., and K.L. Parkin. 2000. Selectivity of Celite-immobilized
patatin (lipid acyl hydrolase) from potato (Solanum tuberosum L.)
tubers in esterification reactions as influenced by water activity and
glycerol analogues as alcohol acceptors. J. Agric. Food Chem.
48(2):155-160.
Tapia de Daza, M.S., C.E. Aguilar, V. Roa, and R.V. Diaz de Tablante.
1995. Combined stress effects on growth of Zygosaccharomyces rouxii
from an intermediate moisture papaya product. Journal of Food Sci-
ence 60:356-359.
Zeb, A., R. Khan, A. Khan, M. Saeed, and S.A. Manan. 1994. Influ-
ence of crystalline sucrose and chemical preservatives on the water
activity and shelf stability of intermediate banana chips. Sarhad
Journal of Agriculture 10:721-726.
Zhang, X.W., X. Liu, D.X. Gu, W. Zhou, R.L. Wang, and P. Liu.
1996. Desorption isotherms of some vegetables. Journal of the Sci-
ence of Food and Agriculture 70:303-306.
Baked Goods and Cereals
Abellana, M., A.J. Ramos, V. Sanchis, and P.V. Nielsen. 2000. Ef-
fect of modified atmosphere packaging and water activity on growth
of Eurotium amstelodami, E. chevalieri and E. herbariorum on a
sponge cake analogue. Journal of Applied Microbiology 88:606-616.
Aramouni, F.M., K.K. Kone, J.A. Craig, and D.Y.C. Fung. 1994.
Growth of Clostridium sporogenes PA 3679 in home-style canned
83

14 FURTHER READING AquaLab TDL
quick breads. Journal of Food Protection 57:882-886.
Cahagnier, B., L. Lesage, and D. Richard-Molard. 1993. Mould
growth and conidiation in cereal grains as affected by water activity
and temperature. Lett Appl Microbiol 17:7-13.
Clawson, A.R., and A.J.Taylor. 1993. Chemical changes during
cooking of wheat. Food Chem 47:337-343.
Fleurat-Lessard, F. 2002. Qualitative reasoning and integrated man-
agement of the quality of stored grain: a promising new approach.
Journal of Stored Products Research 38:191-218.
Gmez, R., J. Fernandez-Salguero, M.A. Carmona, and D. Sanchez.
1993. Water activity in foods with intermediate moisture levels: Bak-
ery and confectionery products: Miscellany. Alimentaria 30:55-57.
Guynot, M.E., A.J. Ramos, L. Seto, P. Purroy, V. Sanchis, and S.
Marin. 2003. Antifungal activity of volatile compounds generated by
essential oils against fungi commonly causing deterioration of bakery
products.
Harris, M., and M. Peleg. 1996. Patterns of textural changes in brit-
tle cellular cereal foods caused by moisture sorption. Cereal Chem
73:225-231.
Hope, R., and N. Magan. 2003. Two-dimensional environmental pro-
files of growth, deoxynivalenol and nivalenol production by Fusarium
culmorum on wheat-based substrate. Lett Appl Microbiol 37:70-74.
Michniewicz, J., C.G. Biliaderis, and W. Bushuk. 1992. Effect of
added pentosans on some properties of wheat bread. Food Chem
43:251-257.
Moreno-Contreras, M.D., A.J. Martinez-Yepez, and R.R. Martinez.
2000. Determination of deoxynivalenol (DON) in wheat, barley and
corn and its relationship with the levels of total molds, Fusarium spp.,
infestation percentage, and water activity. Archivos Latinoameri-
84

AquaLab TDL 14 FURTHER READING
canos de Mutricion. 50(2):183-186.
Phoungchandang, S., and J.L. Woods. 2000. Moisture diffusion and
desorption isotherms for banana. Journal of Food Science 65:651-657.
Ramanathan, S., and S. Cenkowski. 1995. Sorption isotherms of
flour and flow behaviour of dough as influenced by flour compaction.
Canadian Agricultural Engineering 37:119-124.
Roessler, P.F., and M.C. Ballenger. 1996. Contamination of an un-
preserved semisoft baked cookie with a Xerophilic Aspergillus species.
Journal of Food Protection 59:1055-1060.
Schebor, C., and J. Chirife. 2000. A survey of water activity and
pH values in fresh pasta packed under modified atmosphere man-
ufactured in Argentina and Uruguay. Journal of Food Protection
63:965-969.
Seiler, D.A.L. 1979. The mould-free shelf life of bakery products.
FMBRA Bulletin April:71-74.
Sumner, S.S., J.A. Albrecht, and D.L. Peters. 1993. Occurrence
of enterotoxigenic strains of Staphylococcus aureus and enterotoxin
production in bakery products. Journal of Food Protection 56:722-
724.
Tesch, R., M.D. Normand, and M. Peleg. 1996. Comparison of
the acoustic and mechanical signatures of two cellular crunchy cereal
foods at various water activity levels. Journal of the Science of Food
and Agriculture 70:347-354.
Weegels, P.L., J.A. Verhoek, A.M.G. de Groot, and R.J. Hamer.
1994. Effects of gluten of heating at different moisture contents: I.
Changes in functional properties. Journal of Cereal Science 19:31-38.
Beverages/Soups/Sauces/Preserves
Cardelli, C., and T.P. Labuza. 2001. Application of Weibull Hazard
85

14 FURTHER READING AquaLab TDL
Analysis to the determination of shelf life of roasted and ground cof-
fee. Lebensm Wiss Technol 34:273-278.
Carson, K.J., J.L. Collins, and M.P. Penfield. 1994. Unrefined,
dried apple pomace as a potential food ingredient. Journal of Food
Science 59:1213-1215.
Cavia, M.M., M.A. Fernandez-Muio, J.F. Huidobro, and M.T. San-
cho. 2004. Correlation between Moisture and Water Activity of
Honeys Harvested in Different Years. Journal of Food Science 69:C-
368-370.
Durrani, M.J., R. Khan, M. Saeed, and A. Khan. 1992. Devel-
opment of concentrated beverages from Anna apples with or without
added preservatives by controlling activity of water for shelf stability.
Sarhad Journal of Agriculture 8:23-28.
Ferragut, V., J.A. Salazar, and A. Chiralt. 1993. Stability in the
conservation of emulsified sauces low in oil content. Alimentaria
30:67-69.
Gleiter, R.A., H. Horn, and H.-D. Isengard. 2006. Influence of type
and state of crystallization on the water activity of honey. Food
Chem 96:441-445.
Hajmeer, M.N., F.M. Aramouni, and E.A.E.Boyle. 2000. Shelf-
life of lite syrup after opening and storage at room or refrigerated
temperature. Journal of Food Quality 23:529-540.
Ibarz, A., J. Pagan, and R. Miguelsanz. 1992. Rheology of clarified
fruit juices: II. Blackcurrant juices. Journal of Food Engineering
15:63-74.
Khalloufi, S., Y. El-Maslouhi, and C. Ratti. 2000. Mathematical
model for prediction of glass transition temperature of fruit pow-
ders. Journal of Food Science 65:842-848.
Kusumegi, K., T.Takahashi, and M.Miyagi. 1996. Effects of ad-
86

AquaLab TDL 14 FURTHER READING
dition of sodium citrate on the pasteurizing conditions in “Tuyu,”
Japanese noodle soup. Journal of the Japanese Society for Food Sci-
ence and Technology 43:740-747.
Perera, C.O. 2005. Selected quality attributes of dried foods. Drying
Technology 23:717-730.
Sa, M.M., and A.M. Sereno. 1993. Effect of temperature on sorption
isotherms and heats of sorption of quince jam. International Journal
of Food Science & Technology 28:241-248.
Shafi ur-Rahman, M. 2005. Dried food properties: challenges ahead.
Drying Technology 23:695-715.
Pharmaceuticals/Cosmetics
Ahlneck, C., and G. Zografi . 1990. The Molecular basis of moisture
effects on the physical and chemical stabilty of drugs in the solid
state. International Journal of Pharmaceutics 62:87-95.
Bell, L.N., and K.L. White. 2000. Thiamin Stability in Solids as
Affected by the Glass Transition. Journal of Food Science 65:498-
501.
Cochet, N., and A.L. Demain. 1996. Effect of water activity on
production of beta-lactam antibiolics by Streptomyces clavuligerus
in submerged culture. Journal of Applied Bacteriology 80:333-337.
Constantino, H.R., R. Langer, and A.M. Klibanov. 1994. Solid-
Phase Aggregation of Proteins under Pharmaceutically Relevant Con-
ditions. Journal of Pharmaceutical Science 83:1662-1669.
Enigl, D.C. 2001. Pharmaceutical stability testing using water ac-
tivity. European Pharmaceutical Review 6:46-49.
Enigl, D.C., and K.M.Sorrel. 1997. Water Activity and Self-Preserving
Formulas. p. 45-73. In J.J. Kabara, and D.S. Orth (ed.) Preservative-
Free and Self-Preserving Cosmetics and Drugs: Principles and Prac-
87

14 FURTHER READING AquaLab TDL
tice. Marcel Dekker.
Hageman, M.J. 1988. The Role of Moisture in Protein Stability.
Drug Dev. Ind. Pharm. 14:2047-2070.
Heidemann, D.R., and P.J. Jarosz. 1991. Preformulation Studies
Involving Moisture Uptake in Solid Dosage Forms. Pharmaceutical
Research 8:292-297.
Kontny, M.J. 1988. Distribution of Water in Solid Pharmaceuti-
cal Systems. Drug Dev. Ind. Pharm. 14:1991-2027.
Sablani, S.S., K. Al-Belushi, I. Al-Marhubi, and R. Al-Belushi. 2007.
Evaluating Stability of Vitamin C in Fortified Formula Using Water
Activity and Glass Transition. International Journal of Food Prop-
erties 10:61-71.
Zografi, G. 1988. States of Water Associated with Solids. Drug
Dev. Ind. Pharm. 14:1905-1926.
Zografi, G., and M.J. Kontny. 1986. The interactions of water with
cellulose and starch-derived pharmaceutical excipients. Pharmaceu-
tical Research 3:187-193.
Miscellaneous
Bell, L.N. 1995. Kinetics of non-enzymatic browning in amorphous
solid systems: Distinguishing the effects of water activity and the
glass transition. Food Res Intl 28:591-597.
Bell, L.N., and T.P. Labuza. 1992. Compositional influence on the
pH of reduced-moisture solutions. Journal of Food Science 57:732-
734.
Bell, L.N., and T.P. Labuza. 1994. Influence of the low-moisture
state on pH and its implication for reaction kinetics. Journal of
Food Engineering 22:291-312.
88

AquaLab TDL 14 FURTHER READING
Bhandari, B., and I. Bareyre, 2003. Estimarion of crystalline phase
present in glucose crystal-solution mixture by water activity mea-
surement. Lebensm Wiss Technol 36:729-733(5).
Brake, N.C., and O.R. Fennema. 1993. Edible coatings to inhibit
lipid migration in a confectionery product. Journal of Food Science
58:1422-1425.
Dole, M., and L. Faller. 1950. Water sorption by synthetic high
polymers. Journal of the American Chemical Society 12:414-419.
Fernandez-Salguero, J., R. Gmez, and M.A. Carmona. 1993. Water
activity in selected high-moisture foods. Journal of Food Composi-
tion and Analysis 6:364-369.
Juhan, K., and G.K. Byung. 2000. Lipase-catalyzed synthesis of
lysophosphatidylcholine using organic cosolvent for in situ water ac-
tivity control. Journal of American Oil Chemists’ Society 77(7):701-
797.
Lima, J.R., S.D.S. Campos, and L.-A.G. Goncalves. 2000. Rela-
tionship between water activity and texture of roasted and salted
cashew kernel. Journal of Food Science and Technology 37(5):512-
513.
Lomauro, C.J., A.S. Bakshi, and T.P.Labuza. 1985a. Evaluation
of food moisture sorption isotherm equations. Part II: Milk, coffee,
tea, nuts, oilseeds, spices and starchy foods. Lebensm Wiss Technol
18:118-124.
Lomauro, C.J., A.S. Bakshi, and T.P. Labuza. 1985b. Evaluation of
food moisture sorption isotherm equations. Part I: Fruit, vegetable
and meat products. Lebensm Wiss Technol 18:111-117.
89

15 APPENDIX A AquaLab TDL
15 Appendix A
15.1 Preparing Salt Solution
If you choose to mix a saturated salt solution for use as a verification
standard, we recommend that you use the approved AOAC method.
Steps 1 through 4 detail the AOAC method.
1. Select a reagent-grade salt and place it in a test container to
a depth of about 4 cm for more soluble salts (lower aw), to a
depth of about 1.5 cm for less soluble salts (high aw), and to
an intermediate depth for intermediate salts.
2. Add distilled water in increments of about 2 mL, stirring con-
stantly.
3. Add water until the salt can absorb no more water, evidenced
by the presence of free liquid. Keep the amount of free liquid to
the minimum needed to keep the solution saturated with water.
If you plan on using this solution over a long term period, seal
the solution well to prevent losses from evaporation. Table 4
shows saturated salt solutions and their respective water ac-
tivities at various temperatures. Please note that these values
are based on averaged published data, and the standard errors
shown reflect Greenspan’s standard error for each salt solution,
not the AquaLab accuracy in measuring the salt. AquaLab
TDL measures all samples with an accuracy of ±0.005 aw.
90

AquaLab TDL 15 APPENDIX A
Table 4: Water Activity of Selected Salt Solutions
Saturated Solution awat 20◦Cawat 25◦C
Lithium Chloride 0.113 ±0.003 0.113 ±0.003
Magnesium Chloride 0.331 ±0.002 0.328 ±0.002
Potassium Carbonate 0.432 ±0.003 0.432 ±0.004
Magnesium Nitrate 0.544 ±0.002 0.529 ±0.002
Sodium Chloride 0.755 ±0.001 0.753 ±0.001
Potassium Chloride 0.851 ±0.003 0.843 ±0.003
Potassium Sulfate 0.976 ±0.005 0.973 ±0.005
Note: Table 4 adapted from Greenspan (1977). Rounded to
nearest thousandth.
4. Saturated salt solutions are very temperature-sensitive and their
values are not as accurate as the verification standards offered
by METER.
91

16 APPENDIX B AquaLab TDL
16 Appendix B
Temperature Correction
of METER’s Verification Standards
Table 5: Water Activity of Selected Salt Solutions
Temp. H2O
0.50 2.33 6.00 8.57 13.41 17.18
(◦C)
mol/kg mol/kg mol/kg mol/kg mol/kg mol/kg
KCL NaCL NaCL LiCl LiCl LiCl
15.0 1.000 0.984 0.923 0.761 0.492 0.238 0.140
20.0 1.000 0.984 0.922 0.760 0.496 0.245 0.145
25.0 1.000 0.984 0.920 0.760 0.500 0.250 0.150
30.0 1.000 0.984 0.920 0.760 0.504 0.255 0.155
35.0 1.000 0.984 0.920 0.760 0.508 0.261 0.160
40.0 1.000 0.984 0.921 0.760 0.512 0.266 0.165
50.0 1.000 0.984 0.894 0.740 0.517 0.275 0.172
Note: AquaLab TDL measures these verification standards to ±0.005
aw.
92

AquaLab TDL 17 APPENDIX C
17 Appendix C
AquaLab Verification Standards
Application Note
Using AquaLab is easier then ever. Pre-packaged standard salt solu-
tions are immediately available for performance verification, saving
you time and money. Validation and documentation for GMP and
GLP has also become easier. Operate your instrument with cer-
tainty and insure the quality of your food product by using low cost
precision salt solutions.
•No need to purchase and store reagent grade salts.
•No additional laboratory equipment necessary.
•Avoid solution handling and mixing errors.
•Save technician time.
The AquaLab should be verified against a known salt standard daily.
For high use or batch processing, the instrument should be checked
regularly against a known salt standard of similar water activity.
Checking the water activity of a standard solution alerts the oper-
ator to the possibility of contamination of the unit or shifts in the
linear offset from other causes.
Now, you can verify AquaLab performance with confidence. Per-
formance Verification Standards come in seven water activity levels:
1.000, 0.984, 0.920, 0.760, 0.500, 0.250, and 0.150 aw. The standards
are produced under a strict quality assurance regime by an indepen-
dent third party that verifies the standards and they are shelf stable
for one year. Order your calibration salt standard of similar water
activity today.
Uncertainties Using Saturated Salt Solutions
The water activity values listed in our operator’s manual for sat-
urated salts were reprinted from Greenspan (1977). His method for
determining water activity was to combine all of the available data
from tests by other researchers. He did not set up any experiments of
93

17 APPENDIX C AquaLab TDL
his own. The uncertainty he published is due to variation among the
results from the different methods. There are, therefore, limitations
to the accuracy of these values. The instrumentation available for
making water activity measurements is much better now than it was
in 1977, so improved standards are needed.
Saturated salt solutions can be prepared by several methods. The
AOAC method involves starting with salt and adding water in small
increments, stirring well with a spatula after each addition, until
salt can absorb no more water as evidenced by free liquid (where it
takes on the shape of the container but does not easily pour). This
method gives the most accurate readings, but only for a short time
unless great care is taken to prevent water gain or loss. When a
salt standard is prepared so that it consists mostly of liquid with a
few crystals in the bottom, it can result in a layer of less than sat-
urated solution at the surface which produces a higher reading than
anticipated. Conversely, solid crystals protruding above the surface
of the liquid can lower the readings. To comply with Good Labo-
ratory Practices (GLP), a saturated salt solution must read within
reasonable analytical error of the accepted published value for a given
temperature.
Why AquaLab Verification Standards are Superior
Our research indicates that unsaturated salt solutions make much
better standards than saturated salts. Robinson and Stokes (1965)
give activity coefficients for various salt solutions. Customers can use
these activity coefficients to the water potential, or partial specific
Gibbs free energy, of the water in the solution using;
Ψ = −φγcRT (1)
where Ψ is the water potential, φis the number of active particles
per molecule of solute (i.e. 2 for NaCl), γis the activity coefficient,
cis the concentration of the solute (mol/kg1), R is the gas constant
(8.314 J mol/kg−1K−1), T is the Kelvin temperature. Water poten-
tial is related to water activity by the equation;
aw= exp ΨMw
RT (2)
94

AquaLab TDL 17 APPENDIX C
where Mwis the molecular weight of water (0.018 mol/kg−1). When
equations 1 and 2 are combined a simplified equation for water ac-
tivity is obtained;
aw= exp(−φγcMw) (3)
For example, equation 3 gives the awin a 6 mol/kg NaCl solution,
(Mw= 0.018 kg mol−1,φ2, and = 1.271; from tables in Robinson
and Stokes, 1965) as
aw= exp(−2×1.271 ×6×0.018) = 0.760 (4)
It is important to note that equation 3 has no explicit temperature
dependence. Available data on temperature dependence of γindi-
cates variation is less than ±2% over the range 0 to 50 ◦C for NaCl
(Lang, 1967) and KCl (Campbell and Gardner, 1971) and no other
terms have any temperature dependence.
A further advantage of unsaturated salts is that there is no solid
phase present to affect the water activity of the solution. Salt in sat-
urated solutions can exist in different states and result in uncertainty
in the water activity values.
Instructions for Using METER’s Verification Standards
Simply empty one vial of standard solution into a sample dish and
place the dish immediately into the AquaLab for measurement. Each
vial fills a sample dish to just less than half full. Table 6 shows the
expected values.
Note: If you need to obtain a Safety Data Sheet (SDS) for any of
these standards, a printable version is available on our website at
http://sds.metergroup.com/.
95

17 APPENDIX C AquaLab TDL
Table 6: Verification Standard Expected Values
Verification Standard Distilled H2O
Water Activity 1.000 ±0.005
0.50 mol/kg KCl 0.984 ±0.005
2.33 mol/kg NaCl 0.920 ±0.005
6 mol/kg NaCl 0.760 ±0.005
8.5 mol/kg LiCl 0.500 ±0.005
13.4 mol/kg LiCl 0.250 ±0.005
17.18 mol/kg LiCl 0.150 ±0.005
Verify the AquaLab is functioning properly with any two of these
solutions. We recommended that you choose a standard from the
range in which you are measuring and distilled water (or another
solution from the table).
1. Place the verification standard (do not start with water) in
AquaLab for measuring. When you reach a final reading, check
it against the values in Table 6. If it is within ±0.005, place
your second solution in the drawer for testing. It should read
the value ±0.005 listed in the table above. If the readings are
within the expected values your verification is complete.
2. If the first solution does not read within ±0.005 of the ex-
pected value, then you need to adjust the linear offset so that
the solution reads correctly (see Section 7). When you are fin-
ished measuring both standards, the readings should be within
±0.005 of the predicted values.
References
AOAC, Method 978.18D Preparation of Reference Salt Slushes. 1995.
Official Methods of Analysis of AOAC International. 16th Ed. AOAC
International, Arlington VA.
Campbell, G.S. and W.H. Gardner. 1971. Psychrometric measure-
ment of soil water potential: temperature and bulk density effects.
Soil Sci. Soc. Am. Proc. 35:8-12.
Greenspan, L. 1977. Humidity fixed points of binary saturated aque-
96

AquaLab TDL 17 APPENDIX C
ous solutions. J. Res. National Bureau of Stds. A. Physics and
Chem. 81A:89-96.
Lang, A.R.G. 1967. Osmotic coefficients and water potentials of
sodium chloride solutions from 0 to 40 ◦C. Aust. J. Chem. 20:2017-
2023.
Robinson, R.A. and R.H. Stokes. 1965. Electrolyte Solutions. But-
terworths, London.
97

18 DECLARATION OF CONFORMITY AquaLab TDL
18 Declaration of Conformity
Application of Council Directive: 2004/108/EC and 2011/65/EU
Standards to which conformity is
declared: EN 61326-1:2013 and
EN 50581:2012
Manufacturer’s Name: METER Group, Inc 2365 NE
Hopkins Ct. Pullman, WA 99163
USA
Type of Equipment: AquaLab water activity meter.
Model Number: AquaLab Tunable Diode Laser
(TDL)
Year of First Manufacture: 2015
Laser Type: Class 1
(Class 1 Lasers are safe under all conditions of normal use. Do
not exceed maximum permissible exposure (MPE) when viewing
a laser with the naked eye or with the aid of typical magnifying
optics (e.g. telescope or microscope).)
The undersigned hereby declares on behalf of METER Group, Inc.
that the above referenced products, to which this declaration relates,
fully conform to the provisions of the Council Directives and stan-
dards referenced above.
Michael Wadsworth
Engineering Director
7-9-2015
98

AquaLab TDL 19 CERTIFICATE OF TRACEABILITY
19 Certificate of Traceability
METER Group, Inc.
2365 NE Hopkins Court
Pullman WA 99163 USA
Tel: 509-332-5601
Fax: 509-332-5158
support.food@metergroup.com
METER Group, Inc. manufactures all AquaLab water activity me-
ters according to accepted international temperature standards with
traceable calibration.
99
Index
Accuracy, 52
Activated Charcoal Pellets, 33
Admin Settings, 23
Administrator Password, 23
Annual Calibration Service, 30,
33, 34, 66
Auto Save, 24
Barrier, 48
Beeps, 23, 25, 52
Binding, 11, 12
Calibration, 17, 33
Multi-Point, 40
Restore Factory Defaults, 44
Capillaries, 11
Cautions, 52
Certificate of Traceability, 99
Cleaning, 29
Coatings, 48
Computer Interface, 55
Condensation, 9, 50, 52
Configuration, 17, 38
Contamination, 36, 93
Continuous Mode, 19
Contrast, 25
Cooler, Peltier thermoelectric, 5
Cosmetics, 7, 12
Custom Mode, 19
Customer Support, 1, 66
Declaration of Conformity, 98
Dehydrated, 49
Delete, 28
Diagnostics, 25, 65
Email, 1, 39, 66, 99
Equilibrate, 48, 49
Equilibrium, 8
Fuse, 59
Gibbs Free Energy, 9, 94
Homogeneous, 9, 47
Infrared Thermometer, 8
Isotherm Model, 54
Isotherm, Moisture Sorption, 54,
64
LCD, 51
Linear Offset, 33, 35, 37
Liquid Phase, 7
Location, 13
Loss on Drying, 7
Low Emitting Mode, 21
Matrix, 11
Measurement Tab, 16
Menus, 16
Microbial Growth, 12
Moisture Content, 54
Multi-Component Food, 8
Notification, 25
Operation, 14
Osmotic, 11
Part 11 Compliance, 56
Performance, 34
Perishability, 7
Pharmaceuticals, 7, 12
Phone, 35, 39
100

AquaLab TDL INDEX
Physical Temperature, 52
Pressure Effects, 11
Quantitative Analysis, 7
Regulations, 6, 7
Research, 94
Research Purposes, 6
RS232, 55
Salt Standard, 35
Sample Preparation, 47
Saturation, 8
Seller’s Liability, 2
Single Mode, 19
Sorption Isotherm, 12
Specifications, 4
Technical Difficulties, 58
Temperature, 6, 18
Effects, 9
Fluctuations, 6
Thermodynamic Property, 9
Time, 22
Troubleshooting, 16, 58
USB, 55
Users, 14, 24
Vapor Equilibrium, 21, 47
Vapor Phase, 7, 9, 47, 49
Verification, 33
Verification Standards, 33, 34
View, 27
Warranty, 2, 67
Water Activity, 7
Water Content, 12
Water Potential, 9, 94
101
