Page 2009 Monitoring Landfill !! Report
Preview ! 2009_Landfill_Report Aoc Lawn Mower Manuals - Lawn Mower Manuals – The Best Lawn Mower Manuals Collection
User Manual: !! Aoc Lawn Mower Manuals - Lawn Mower Manuals – The Best Lawn Mower Manuals Collection
Open the PDF directly: View PDF ![]() .
.
Page Count: 147 [warning: Documents this large are best viewed by clicking the View PDF Link!]
- 2009 Environmental Monitoring Report - Current and Former Landfill Areas
- Executive Summary
- Table of Contents
- Acronyms
- 1.0 Introduction
- 2.0 Groundwater Monitoring
- 3.0 Wooded Wetland Monitoring
- 4.0 Soil-Gas Monitoring
- 5.0 Maintenance and Repair
- 6.0 Conclusions and Recommendations
- 7.0 References
- Tables
- Figures
- Appendices
BROOKHAVEN NATIONAL LABORATORY
2009 ENVIRONMENTAL MONITORING
REPORT
CURRENT AND FORMER LANDFILL AREAS
Prepared by
Brookhaven National Laboratory
Environmental Protection Division
Upton, New York
March 11, 2010
i
BROOKHAVEN NATIONAL LABORATOR
2009 ENVIRONMENTAL MONITORING REPORT
CURRENT AND FORMER LANDFILL AREAS
Executive Summary
This report documents the Operations and Maintenance activities undertaken during the calendar
year 2009 for the Current Landfill (AOC 3) and the Former Landfill Areas (Former Landfill AOC
2A, Interim Landfill AOC 2D, and Slit Trench AOC 2E). Brookhaven National Laboratory is
responsible for performing this work to comply with the post-closure O&M requirements specified
in 6 New York State Code of Rules and Regulations (NYCRR) Part 360, Solid Waste Management
Facilities, effective December 31, 1988. The landfill caps are functioning as designed and the 2009
results are consistent with results from previous years.
GROUNDWATER QUALITY
The groundwater quality at both the Current and Former Landfill Areas remains relatively
unchanged from 2008. Volatile organic compounds (VOCs) and metals continue to be detected
downgradient of the Current Landfill. The most prevalent VOCs detected above standards are
chloroethane and benzene, at maximum concentrations of 27 μg/L and 2 μg/L, respectively. As with
previous years, iron, manganese, and arsenic were detected downgradient from the Current Landfill
at concentrations above applicable standards. Concentrations of these metals were similar to those
detected in 2008. Maximum concentrations of iron, manganese, and arsenic in downgradient wells
were 68,900 μg/L, 6,650 μg/L, and 23 μg/L, respectively. These results are an indicator of continued
low level leachate generation at this landfill.
Concentrations of parameters detected in wells downgradient of the Former Landfill Area do not
indicate the presence of leachate. VOCs were not detected above standards in Former Landfill Area
monitoring wells. Leachate indicator parameters and metals concentrations were generally the same
when comparing downgradient monitoring wells to upgradient monitoring wells.
The groundwater monitoring well network and sampling frequencies for both the Current Landfill
and the Former Landfill are adequate at this time.
SOIL-GAS MONITORING
Soil-gas monitoring at the Current Landfill indicates that decomposition is still occurring. However,
as with prior years, there is no indication that the vapors are migrating beyond the monitoring well
network. Therefore, there is no potential risk to the nearby National Weather Service building. Soil-
gas monitoring at the Former Landfill Area indicates that there are only minimal detects of hydrogen
sulfide, with no detectable levels of methane present. The soil gas monitoring well networks are
sufficient to monitor both landfill areas.
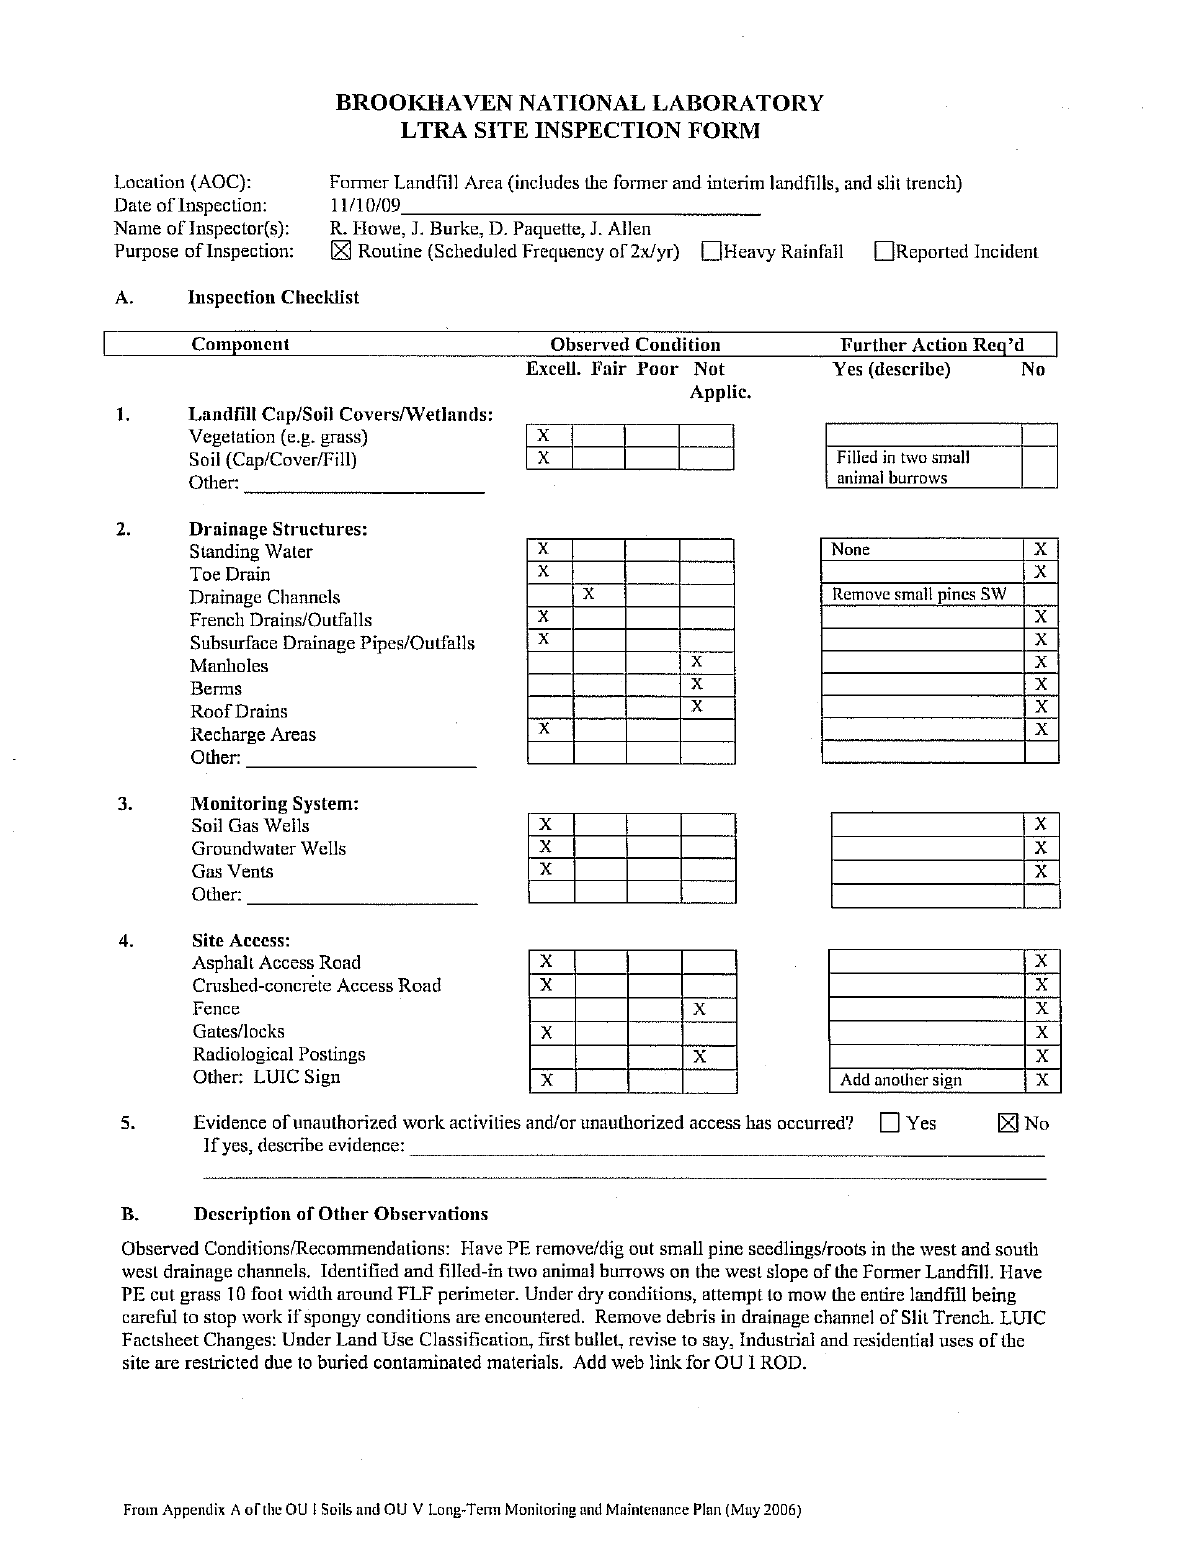
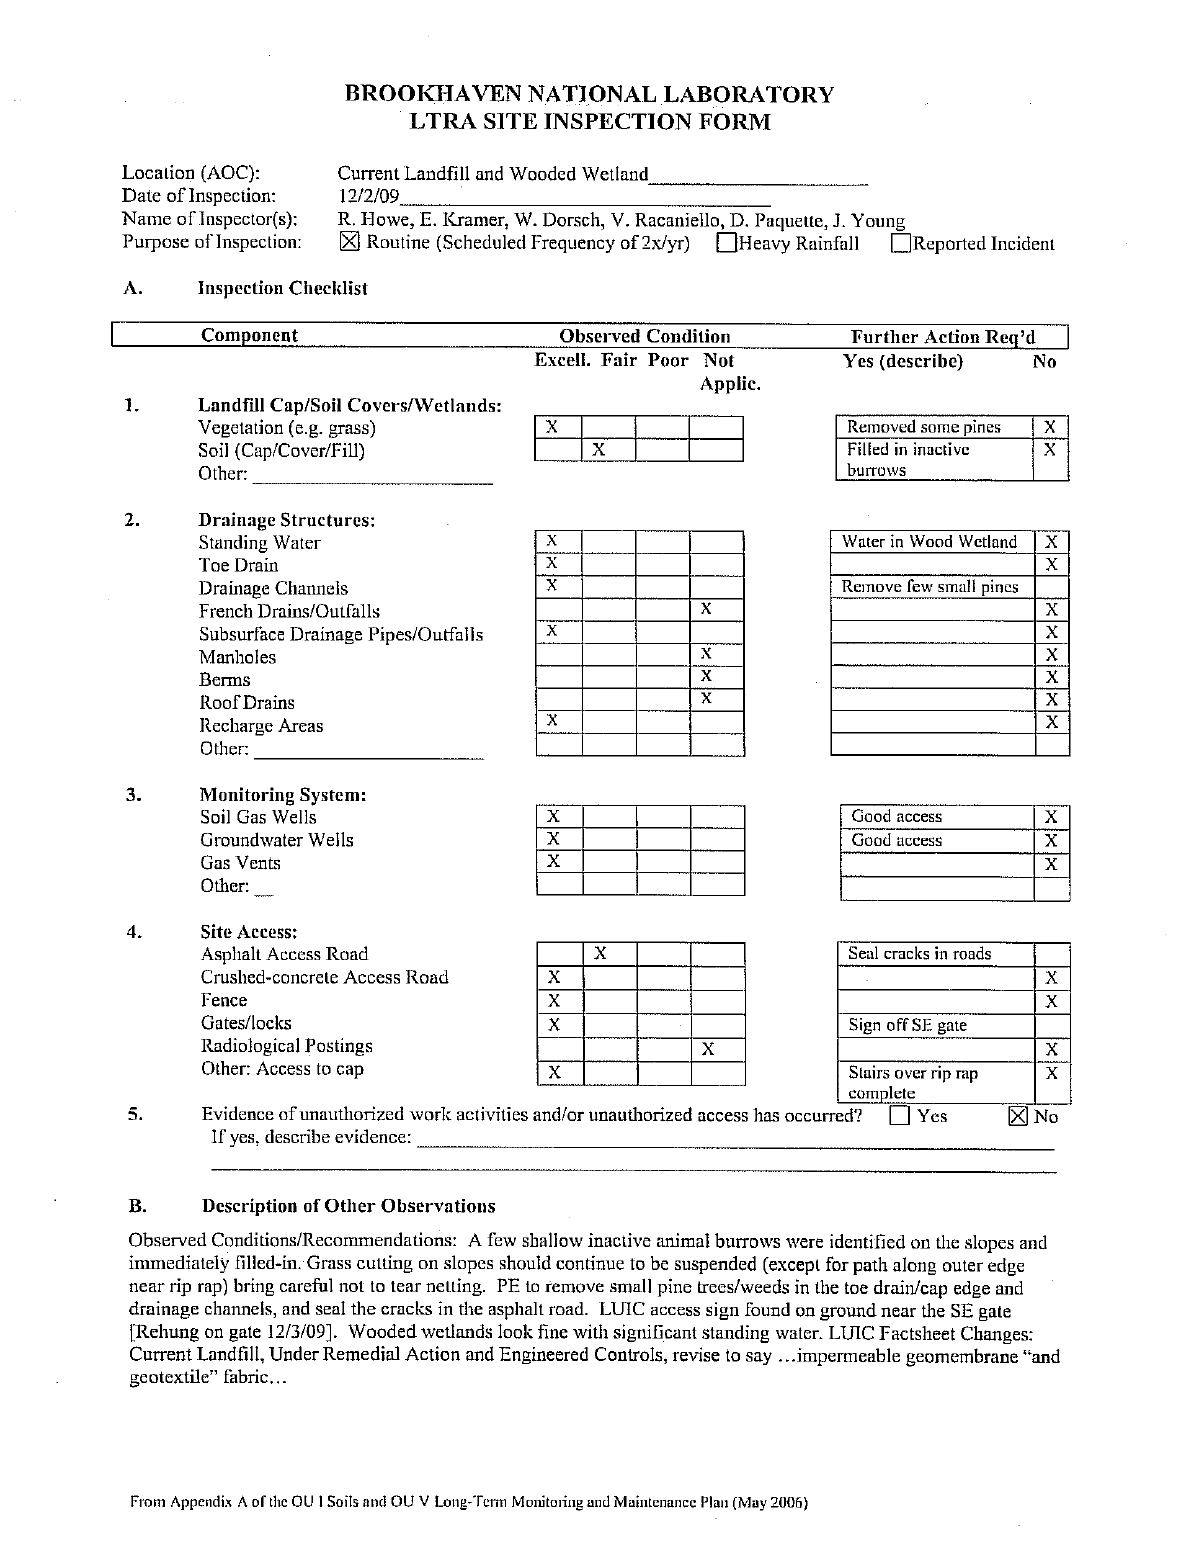
MAINTENANCE AND REPAIR
Monthly inspections and maintenance continued throughout 2009. To prevent ruts in the landfills
caused by the weight of the lawn mowers and a significant amount of precipitation, the cutting of the
grass only occurs when optimal soil conditions are evident. This pattern of vegetation control will
continue. Small animal burrows were noted during the biannual LTRA inspections. Also vegetation
was noted growing in the drainage channels. Work orders were placed to fill in the animal burrows
and the vegetation was removed in June 2009.
T:\LTRA\Landfills\2009 Report\Text\2009_text_v1.doc I
TABLE OF CONTENTS
Executive Summary………………………………………………………………………………..i
1.0 INTRODUCTION............................................................................................................................1
1.1 Site Description and Project Background..........................................................................1
1.2 Overview of the Monitoring Program................................................................................3
Groundwater Monitoring ........................................................................................... 3
2.0 GROUNDWATER MONITORING...............................................................................................4
2.1 Monitoring Well Networks..................................................................................................4
2.1.1 Current Landfill ............................................................................................. 4
2.1.2 Former Landfill.............................................................................................. 5
2.1.3 Sampling Frequency and Analytical Parameters ........................................... 6
2.1.4 Quality Assurance / Quality Control ............................................................. 7
2.2 Landfill Groundwater Monitoring Results........................................................................8
2.2.1 Current Landfill ............................................................................................. 9
2.2.1.1 Volatile Organic Compounds (VOCs)................................................................................................9
2.2.1.2 Water Chemistry Parameters...........................................................................................................10
2.2.1.3 Metals ..............................................................................................................................................11
2.2.1.4 Radionuclides...................................................................................................................................12
2.2.2 Former Landfill............................................................................................ 12
2.2.2.1 VOCs................................................................................................................................................12
2.2.2.2 Water Chemistry Parameters...........................................................................................................13
2.2.2.3 Metals ..............................................................................................................................................13
2.2.2.4 Pesticides/PCBs...............................................................................................................................14
2.2.2.5 Radionuclides...................................................................................................................................14
3.0 WOODED WETLAND MONITORING.....................................................................................14
4.0 SOIL-GAS MONITORING ..........................................................................................................14
4.1 Soil-gas Monitoring Networks ..........................................................................................14
4.1.1 Current Landfill ........................................................................................... 15
4.1.2 Former Landfill Area ................................................................................... 15
4.1.3 Sampling Frequency .................................................................................... 15
4.2 Results of Soil-Gas Monitoring.........................................................................................15
4.2.1 Current Landfill ........................................................................................... 16
4.2.1.1 Trend in Soil-Gas Data....................................................................................................................17
4.2.2 Former Landfill Area ................................................................................... 17
4.2.2.1 Trends in Soil-Gas Data ..................................................................................................................17
5.0 MAINTENANCE AND REPAIR .................................................................................................18
5.1 Landfill Cap and Gas Vents..............................................................................................18
5.2 Drainage Structures...........................................................................................................18
5.3 Environmental Monitoring System ..................................................................................18
5.4 Related Structures..............................................................................................................19
6.0 CONCLUSIONS AND RECOMMENDATIONS .......................................................................19
6.1 Groundwater Monitoring..................................................................................................19
6.1.1 Conclusions for the Current Landfill ........................................................... 19
6.1.2 Recommendations for the Current Landfill ................................................. 20
6.1.3 Conclusions for the Former Landfill Area................................................... 20
6.1.4 Recommendations for the Former Landfill Area......................................... 20
T:\LTRA\Landfills\2009 Report\Text\2009_text_v1.doc II
6.2 Soil-Gas Monitoring...........................................................................................................20
6.2.1 Conclusions for the Current Landfill ........................................................... 20
6.2.2 Recommendations for the Current Landfill ................................................. 21
6.2.3 Conclusions for the Former Landfill Area................................................... 21
6.2.4 Recommendations for the Former Landfill Area......................................... 21
6.3 Maintenance and Repair ...................................................................................................21
6.3.1 Current Landfill ........................................................................................... 21
6.3.2 Former Landfill Area ................................................................................... 21
7.0 REFERENCES...............................................................................................................................21
LIST OF TABLES
1. Analytical Requirements For Groundwater Samples
2. Current Landfill – Summary of 2009 VOC Data
3. Current Landfill – Summary of 2009 Water Chemistry Data
4. Current Landfill – Summary of 2009 Metals Data
5. Current Landfill – Summary of 2009 Radionuclide Data
6. Former Landfill – Summary of 2009 VOC Data
7. Former Landfill Area – Summary of 2009 Water Chemistry Data
8. Former Landfill Area – Summary of 2009 Metals Data
9. Former Landfill Area – Summary of 2009 Pesticide/PCB Data
10. Former Landfill Area – Summary of 2009 Radionuclide Data
11. Soil-gas Monitoring Well Description
12. 2009 Current Landfill Soil-gas Monitoring Summary
13. 2009 Former Landfill Area Soil-gas Monitoring Summary
LIST OF FIGURES
1. Site Location Map
2. Current Landfill Monitoring Well Locations
3. Water Table Contour Map
4. Former Landfill Area Monitoring Well Locations
5. Current Landfill VOC Trend Plots
6. Current Landfill Alkalinity and Chloride Trend Plots
7. Current Landfill Iron Trend Plots
8. Current Landfill Tritium and Strontium-90 Trend Plots
9. Former Landfill Area VOC Trend Plots
10. Former Landfill Area Alkalinity and Chloride Trend Plots
T:\LTRA\Landfills\2009 Report\Text\2009_text_v1.doc III
11. Former Landfill Area Iron Trend Plots
12. Former Landfill Area Tritium and Strontium-90 Trend Plots
13. Current Landfill Soil-Gas Monitor Location Map
14. Former Landfill Area Soil-Gas Monitor Location Map
T:\LTRA\Landfills\2009 Report\Text\2009_text_v1.doc IV
LIST OF APPENDICES
A. Soil-Gas Sampling Field Notes
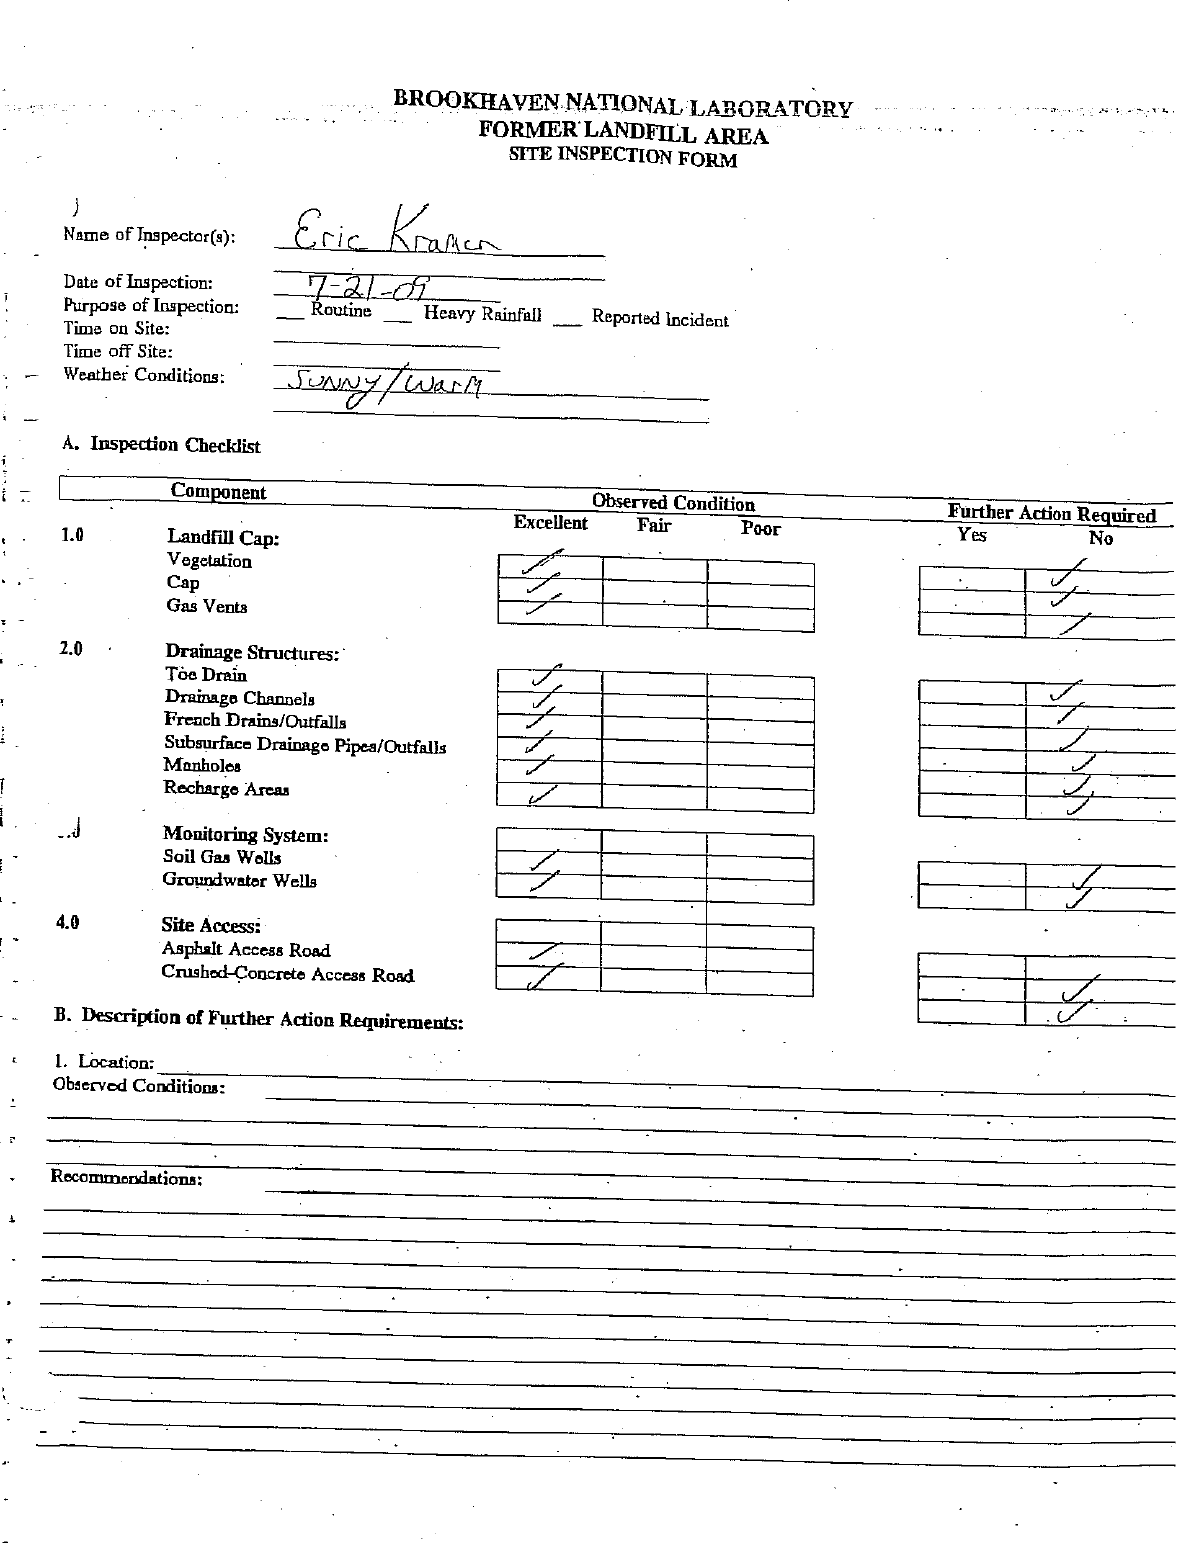
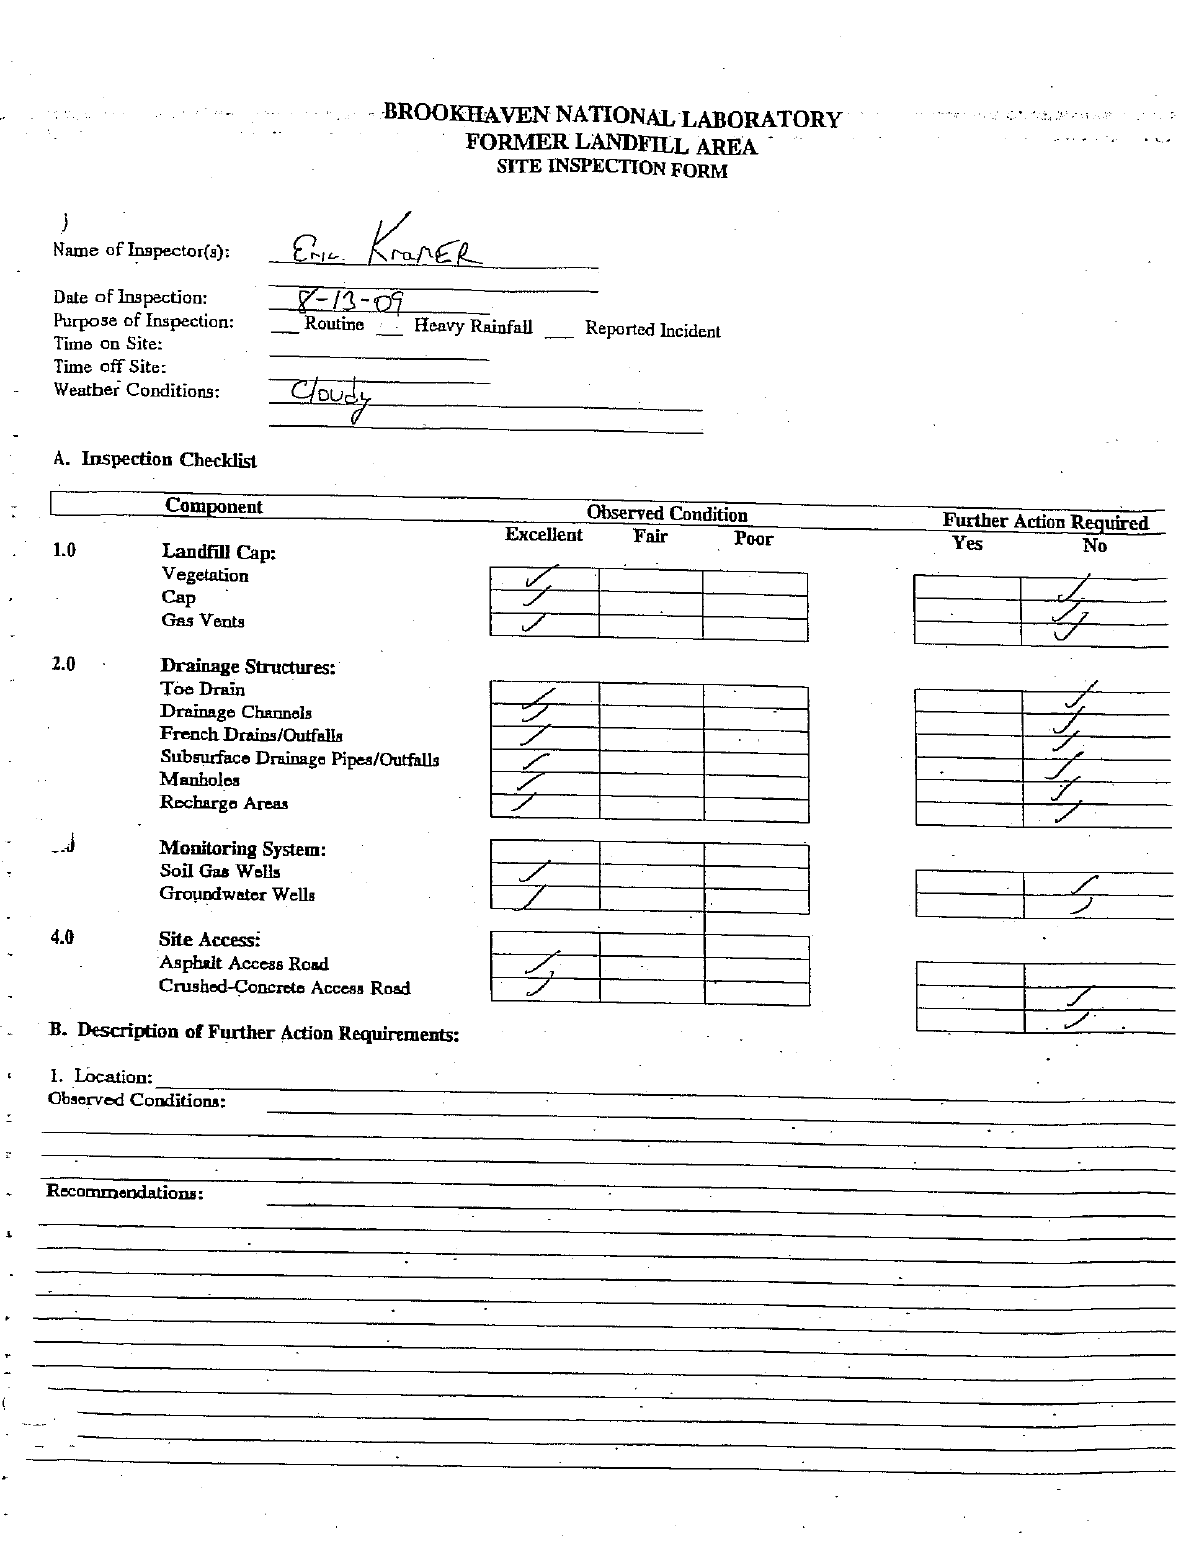
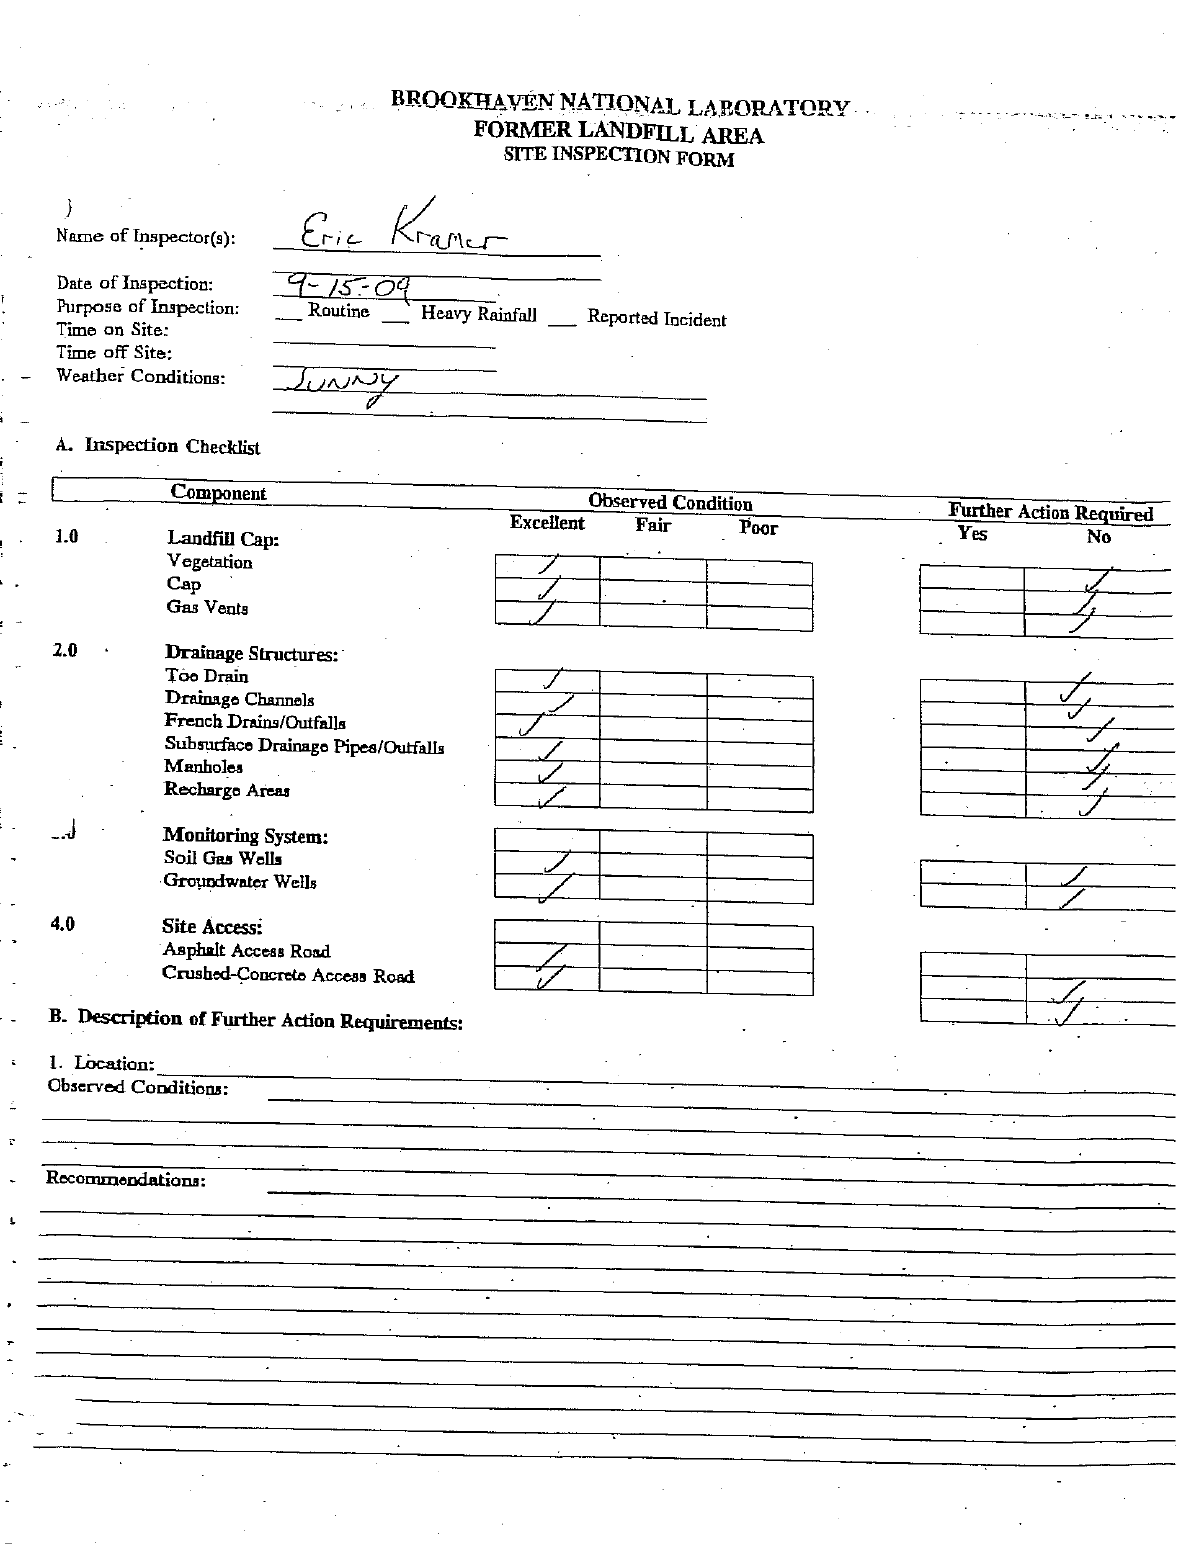
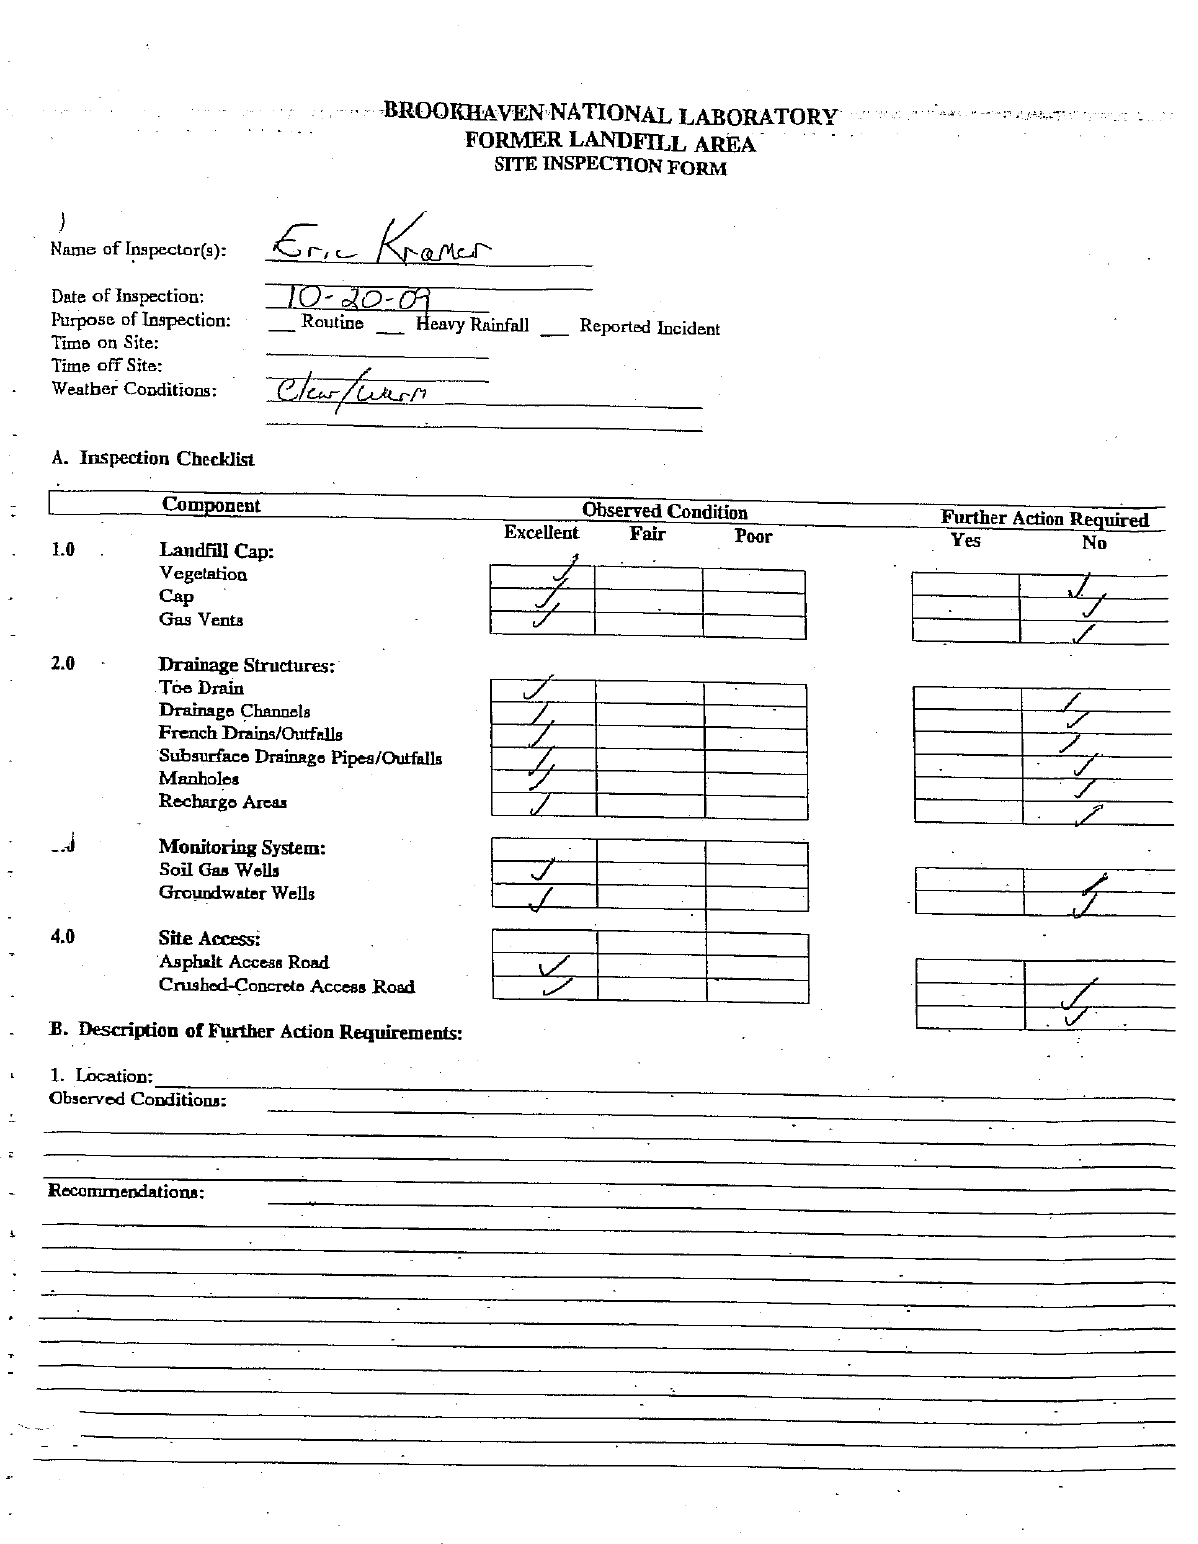
B. Monthly Site Landfill Inspection Forms
C. Historical Soil-Gas Monitoring Data
ACRONYMS
BNL Brookhaven National Laboratory
BSA Brookhaven Science Associates
CERCLA Comprehensive Environmental
Response, Compensation and
Liability Act
CLF Current Landfill
DCG Derived concentration guides
DOE U.S. Department of Energy
DQOs Data quality objectives
EIMS Environmental Info. Mgmt. System
FLF Former Landfill
HWMF Former Hazardous Waste
Management Facility
LEL Lower explosive limit
MS/MSDs Matrix spike/matrix spike duplicates
NPL National Priorities List
NYSDEC NY State Dept. of Environmental
Conservation
NYSDOH NY State Dept. of Health
O&M Operations and Maintenance
OU Operable Unit
PCBs polychlorinated biphenyls
QA/QC Quality Assurance/Quality Control
QAPP Quality Assurance Project Plan
Sr-90 Strontium 90
TDS Total dissolved solids
TKN Total Kjeldahl nitrogen
TSS Total suspended solids
TVOCs Total volatile organic compounds
UEL Upper explosive limit
VOCs Volatile organic compounds
T:\LTRA\Landfills\2009 Report\Text\2009_text_v1.doc 1
1.0 INTRODUCTION
This report documents the Operation and Maintenance (O&M) activities conducted during calendar
year 2009 for the Current Landfill (AOC 3) and the Former Landfill Areas (Former Landfill AOC
2A, Interim Landfill AOC 2D, and Slit Trench AOC 2E). Brookhaven National Laboratory (BNL)
is responsible for performing this work to comply with the post-closure O&M requirements
specified in the 6 New York State Code of Rules and Regulations (6NYCRR) Part 360, Solid Waste
Management Facilities, effective December 31, 1988. The details of the O&M programs are
described in the Final Operations and Maintenance Manuals for the Current Landfill (CDM Federal,
1996a) and the Former Landfill Areas (CDM Federal, 1996b).
The following are the primary objectives of the O&M program:
Monitor the effectiveness of the impermeable caps in protecting groundwater quality;
Monitor the potential generation and migration of soil-gas; and
Maintain and monitor the various components of the closure system (landfill caps, drainage
structure, and environmental monitoring systems).
This is the fourteenth year of O&M for the Current Landfill, the thirteenth year for the Former
Landfill and Slit Trench, and the twelfth year for the Interim Landfill.
1.1 Site Description and Project Background
BNL is a 5,265-acre site located in central eastern Long Island, New York. The facility is a federally
owned and funded international research and learning center managed, by Brookhaven Science
Associates (BSA) under contract with the United States Department of Energy (DOE). On December
21, 1989, the site was placed on the United States Environmental Protection Agency’s (USEPA’s)
National Priorities List (NPL), a ranking of hazardous waste sites compiled by the federal
government as part of the Comprehensive Environmental Response, Compensation and Liability Act
(CERCLA). Placing BNL on the NPL resulted in the establishment of a remediation-task list for

T:\LTRA\Landfills\2009 Report\Text\2009_text_v1.doc 2
various locations around the facility. The site subsequently was divided into seven separate
remediation work areas known as Operable Units (OU). The Current Landfill and Former Landfill
Areas are located in OU I, near the south central portion of the BNL site (see Figure 1).
Current Landfill. The Current Landfill consists of one unlined waste-cell that operated from the late
1960s until 1990 for disposing of waste generated at the Laboratory. An impermeable cap covering
the cell was completed in November 1995. Additional information about the cap’s construction can
be obtained from the Construction Certification Report for the Current Landfill (CDM Federal,
1996b). Following the installation of the cap, the post-closure groundwater-monitoring program was
implemented in December 1996, in accordance with 6 NYCRR Part 360 Section 2.15, Solid Waste
Management Facilities (effective December 31, 1988).
Groundwater quality near the Current Landfill is monitored under the O&M program for a wide
variety of volatile organic compounds (VOCs), metals, radiological, and water chemistry (landfill
leachate) parameters. Monitoring in this vicinity was expanded in 1999 to include a wetland area
adjacent to the landfill’s eastern boundary. This area, known as the Wooded Wetland area, is a two-
acre wetland located between the Former Hazardous Waste Management Facility (HWMF) and the
Current Landfill. The wetland receives surface runoff from the Current Landfill and usually is
flooded during the spring/early summer and dry in late summer/fall. Monitoring of the Wooded
Wetland area has been incorporated into the Current Landfill Monitoring Program and consists of
sampling and analyzing surface water and sediment to evaluate the potential for leachate migrating
into this area, as originally performed under the OU I Ecological Risk Assessment (CDM Federal,
1999).
As required under 6 NYCRR Part 360, groundwater quality must be monitored for a minimum of
five years, after which the permittee may request modification of the sampling and analysis
requirements. In October 2001, BNL submitted the Five-Year Evaluation Report for the Current
Landfill (BNL, 2001). This report assessed groundwater trends over the five years after capping, and
proposed changes to the sampling program. These changes were implemented in CY02. In July
2006, BNL issued the Final Five-Year Review Report which discussed all remediation areas at the
site. Review of the Current Landfill was included in this report.

T:\LTRA\Landfills\2009 Report\Text\2009_text_v1.doc 3
FormerLandfill Area The Former Landfill Area encompasses three closely located landfill units; the
Former Landfill, the Slit Trench, and the Interim Landfill. The Former Landfill is an unlined waste-
disposal area originally used by the United States Army in the 1940s. Waste disposal operations
ceased in 1966, and the landfill was covered with soil. The Interim Landfill also is unlined, and was
reportedly used for approximately one year between the time the Former Landfill was closed and the
Current Landfill was opened. The Slit Trench is unlined as well, and is believed to have operated
between 1960 and 1967 for disposal of construction and demolition debris (CDM Federal, 1996).
The Former Landfill and Slit Trench were capped in November 1996 and the Interim Landfill was
capped in October 1997. Additional information about the construction of the caps can be found in
the Construction Certification Report for the Former Landfill (Roy F. Weston, 1997) and
Construction Certification Report for the Interim Landfill Capping (PW Grosser, 1997). BNL started
O&M activities in December 1996 at the Former Landfill and Slit Trench, and in November 1997 at
the Interim Landfill. Under this O&M program, groundwater quality in downgradient wells in the
vicinity of the Former Landfill is monitored for VOCs, metals, radionuclides, and landfill-leachate
parameters.
In March 2002, BNL submitted a Five-Year Evaluation Report for the Former Landfill (P.W.
Grosser, 2002), which assessed trends in groundwater quality over the five-year period following
capping and proposed changes to the sampling program. These changes were implemented in CY03.
In July 2006, BNL issued the Final Five-Year Review Report which discussed all remediation areas
at the site. Review of the Former Landfill Area was included in this report.
1.2 Overview of the Monitoring Program
Groundwater Monitoring
Data quality objectives for each of BNL’s groundwater monitoring programs are presented in the
BNL Environmental Monitoring Plan (BNL, 2009). The design of the data collection network was
optimized as part of the process. Such optimization continues annually as part of the O&M program
and is based on the interpretation of new data as well as historical trends. The primary decision

T:\LTRA\Landfills\2009 Report\Text\2009_text_v1.doc 4
identified for the landfill monitoring programs is “Are the controls effectively improving
groundwater quality below and downgradient of the landfill?”
Groundwater samples are collected from monitoring wells positioned upgradient and downgradient
of each landfill area. Analytical data are reviewed, and determinations are made regarding the
effectiveness of landfill controls.
The additional monitoring programs for the landfill areas consists of:
Soil-gas Monitoring. Measurements of methane, Lower Explosive Limit (LEL), and hydrogen
sulfide are taken quarterly from monitoring locations surrounding the landfills to evaluate the
movement of soil-gas from the landfills.
Wooded Wetland Monitoring. Surface waters and sediments in the wooded wetland adjacent to
the eastern boundary of the Current Landfill are sampled every two years to evaluate possible
effects of landfill leachate on Tiger Salamander habitats. Samples were last collected in 2008
and are scheduled for collection again in 2010.
Routine Visual Inspection, Maintenance, and Repair. Monthly inspections are performed to
monitor the structural and/or operational status of the landfill caps, drainage structures, and
environmental monitoring systems.
Leachate Discharge. Visual inspections of the landfills are performed monthly to monitor for
signs of leachate discharge. If observed, samples of the leachate are collected and analyzed.
These activities are discussed in greater detail in Sections 2 through 5 of this report. Section 6
contains the conclusions and recommendations. References are included in Section 7.
2.0 GROUNDWATER MONITORING
2.1 Monitoring Well Networks
2.1.1 Current Landfill
Since February 1996, groundwater quality at the Current Landfill has been monitored using ten
downgradient wells and one background monitoring well. Figure 2 depicts the location of the

T:\LTRA\Landfills\2009 Report\Text\2009_text_v1.doc 5
monitoring wells. Figure 3 shows the water table contours for this area in June 2009. The depths of
the screen intervals for the Current Landfill wells are listed below.
Well ID Screen Interval (ft BLS) Screen Zone
087-09* 24–34 Shallow Glacial
087-11 11–21 Shallow Glacial
087-23 25–40 Shallow Glacial
087-24 70–80 Intermediate
087-26 70–80 Intermediate
087-27 5–20 Shallow Glacial
088-109 6–21 Shallow Glacial
088-110 10–25 Shallow Glacial
088-21 5–20 Shallow Glacial
088-22 70–80 Intermediate
088-23 120–130 Deep Glacial
BLS = Below Land Surface
*Background well
Screen zones were determined based on the following characteristics:
Shallow Zone: typical water table within 10 ft of the screen zone.
Intermediate Zone: typical water table between 10 ft and 100 ft above the screen zone.
Deep Zone: typical water table >100 ft above the screen zone.
2.1.2 Former Landfill
Since January 1997, groundwater quality at the Former Landfill area has been monitored using
eight shallow monitoring wells (three background and five downgradient). The locations of the
eight monitoring wells are presented in Figure 4. In addition, six wells, 106-20, 106-21, 106-43,
106-44, 106-45 and 106-64 were moved from the Chemical/Animal Holes project to the Former
Landfill Area project. This move was made since the analyte of interest detected in these wells
(strontium-90) originated from the Former Landfill. The direction of groundwater flow in the
OU I area of the site is generally to the south-southeast. Figure 3 shows the June 2009 water
table
T:\LTRA\Landfills\2009 Report\Text\2009_text_v1.doc 6
contours for the area. The screen zones for Former Landfill Area wells are summarized below.
Well ID Screen Interval (ft BLS) Screen Zone
086-42* 65–75 Intermediate
086-72* 41.5–56.5 Shallow Glacial
087-22* 43–53 Shallow Glacial
097-17 29–39 Shallow Glacial
097-64 29–44 Shallow Glacial
097-277 40–55 Shallow Glacial
106-02 55–65 Intermediate
106-30 29–44 Shallow Glacial
106-20 85-95 Intermediate
106-21 55-65 Shallow Glacial
106-43 43-53 Shallow Glacial
106-44 44-54 Shallow Glacial
106-45 44-55 Shallow Glacial
106-64 30-40 Shallow Glacial
BLS = Below Land Surface
*Background well
Screen zones were determined based on the following characteristics:
Shallow Zone: typical water table within 10 ft of the screen zone.
Intermediate Zone: typical water table between 10 ft and 100 ft above the screen zone.
2.1.3 Sampling Frequency and Analytical Parameters
Monitoring wells at the Current Landfill were sampled in 2009 during the following periods:
Sampling Event Sampling Dates
Round 1 March 12 - 13
Round 2 June 4
Round 3 August 26
Round 4 December 1
Based on the recommendation in the 2008 Landfill Report, the sampling frequency was reduced
from quarterly to semiannual for all organic and inorganic parameters. The routine sampling
schedule was changed to collect samples during the 2nd and 4th quarters. Since the recommendation
was approved after the 1st quarter round was collected, there were three complete sampling rounds
collected during 2009. As of 2010, only 2 rounds will be collected. As per the schedule listed on

T:\LTRA\Landfills\2009 Report\Text\2009_text_v1.doc 7
Table 1, during the August round, only well 088-109 was sampled.
Monitoring wells at the Former Landfill were sampled in 2009 during the following periods:
Sampling Event Sampling Dates
Round 1 June 3
Round 2 December 2-3
As per the schedule listed on Table 1, during the June round, only wells 106-20, 106-21, 106-43,
106-44, 106-45, and 106-64 were sampled.
R&C Formation, Ltd. of Bellmore, New York conducted the groundwater sampling, and Test
America, St. Louis Missouri analyzed the samples. See Table 1 for a summary of analyses
performed, by well and sampling round.
2.1.4 Quality Assurance / Quality Control
The groundwater samples were collected and analyzed in accordance with strict quality assurance,
quality control (QA/QC) requirements as described in the BNL Groundwater Monitoring Program
Quality Assurance Project Plan (QAPP) (BNL, 1999). The analytical results for groundwater
samples collected during 2009 satisfied the data-quality objectives. The sampling team personnel are
responsible for assuring that a master calibration/maintenance log is maintained for each field-
measuring device (e.g., pH conductivity, turbidity meters). The sample coordinator provided a
calibration/maintenance log for equipment supplied to the contractor’s sampling teams.
The analytical results of samples collected for the Current and Former Landfill Area projects
underwent data verification, using BNL standard operating procedures EM-SOP-203, Chemical Data
Verification, and EM-SOP-204, Radiochemical Data Verification. These procedures are designed to
verify the accuracy and/or completeness of analytical data. The data verification process is
implemented to detect the most common analytical problems that affect the quality of the results. To
accomplish this task, QA/QC items such as the following were checked: holding times, matrix
spikes, laboratory and field blanks, and field logs. If items are found that can affect the use and
interpretation of the data, they are either corrected, as in the case of unreadable information on the
T:\LTRA\Landfills\2009 Report\Text\2009_text_v1.doc 8
field logs, or the data are “qualified,” as in the case of contamination of the blanks or violations of
the holding time.
Guidance on the collection of QA/QC samples is contained in the QAPP, and in BNL procedure
EM-SOP-200, “Collection and Frequency of Field Quality Control Samples.” The QA/QC samples
collected included trip blanks, field blanks, matrix spike/matrix spike duplicate (MS/MSDs), and
blind duplicates.
Trip blanks were analyzed for aqueous VOCs only. One trip blank was shipped to the analytical
laboratory with each set of samples submitted for VOC analyses. One duplicate sample was
collected from the Current Landfill during the second and fourth quarters, and one duplicate sample
was collected during the quarter from the Former Landfill. No errors were detected in the duplicate
analyses. MS/MSD samples were collected at the same frequency as the duplicates. Chloromethane
and bromomethane were detected in various method and trip blanks during 2009. Sample results
with concentrations of these compounds within five times the associated blank value were declared
non-detect. The amount of qualified data was within acceptable limits and did not adversely impact
the review of the groundwater quality.
2.2 Landfill Groundwater Monitoring Results
This section summarizes the results for VOCs, metals, water-chemistry parameters, and
radionuclides detected for both the Current Landfill and Former Landfill Area in CY09. The
historical trends in concentrations of key contaminants are assessed and shown graphically in
Figures 5 through 12. Summary tables of all 2009 landfill groundwater data are presented in Tables
2 through 10. Detections that exceed groundwater standards are in bold text. The tables include
groundwater standards, laboratory results, minimum detection limits, and laboratory data qualifiers.
The groundwater standards used for evaluating groundwater data include those contained in the
NYSDEC Ambient Water Quality Standards and Guidance Values (June 1998, with addendums
April 2000 and June 2004). Groundwater standards for radiological compounds were supplemented
with New York State Department of Health’s (NYSDOH’s) standards for drinking water when a
NYSDEC groundwater standard was not available. When there were no groundwater standards for a
T:\LTRA\Landfills\2009 Report\Text\2009_text_v1.doc 9
radiological compound, a Groundwater Screening Level was used. This value is based on a dose
equivalent of 4 mrem/year and was calculated as 4% of the DOE Derived Concentration Guides
(DCG) (DOE Order 5400.5) for the isotope of concern. These values are listed under the
“groundwater standards” column in the summary tables and annotated where appropriate.
Laboratory results that exceed the lower of the groundwater standards or the Selected Cleanup Goals
listed in the ROD are highlighted in the data summary tables to facilitate review of the information.
The laboratory data qualifiers included in the tables vary for the different analyses. Explanations for
the data qualifiers are included in the notes in each table. Complete 2009 laboratory data reports,
chain of custody forms, and well-sampling logs for both landfills are archived and available upon
request. In addition, analytical results are stored in the BNL Environmental Information
Management System (EIMS) database.
2.2.1 Current Landfill
2.2.1.1 Volatile Organic Compounds (VOCs)
Benzene, and/or chloroethane, were detected above their respective groundwater standards in three
of the 10 downgradient monitoring wells during 2009 (Table 2). 1,1-Dichloroethane was also
detected above the groundwater standard in one well. These VOCs have historically been the
primary groundwater contaminants detected downgradient of the Current Landfill. No other VOCs
were detected above groundwater standards during 2009.
Figure 5 plots the concentration trends of total VOCs (TVOC), benzene, and chloroethane. As
shown, VOCs remained relatively stable at low concentrations. Overall, the trend plots also show a
distinct decrease in VOC concentrations from the high concentrations seen prior to the installation of
the cap. This reflects the positive effects of the capping on the groundwater quality downgradient.
Several chloroethane results were slightly elevated during the 2008 monitoring events in wells 088-
109, 088-110, and 087-11. The chloroethane concentrations for samples collected during 2009 have
returned to previous levels.
Benzene exceeded the 1 μg/L standard in well 087-11. Chloroethane exceeded the 5 μg/L standard in
wells 087-11, 087-23, and 088-109. The maximum chloroethane concentration was 26.9 μg/L in well
T:\LTRA\Landfills\2009 Report\Text\2009_text_v1.doc 10
088-109; which is a decrease from the high of 80.8 μg /L in 2008. Benzene was detected at a
maximum of 2 μg/L in well 087-11. There have been no detections of VOCs exceeding groundwater
standards in wells 087-24, 088-22, and 088-23 since 1998. These downgradient wells are screened in
the mid to deep Upper Glacial Aquifer as perimeter wells to monitor the vertical extent of
contamination from the Current Landfill.
2.2.1.2 Water Chemistry Parameters
Groundwater samples near the Current Landfill were analyzed for ammonia, total kjeldahl nitrogen
(TKN) cyanide, sulfate, nitrite, nitrate, total nitrogen, chloride, alkalinity, total dissolved solids
(TDS or residue, nonfilterable), and total suspended solids (TSS or residue, filterable) during 2009
(Table 1). The results are provided in Table 3. Elevated levels of these parameters can be indicative
of the presence of landfill leachate. During 2009, ammonia and chloride were the only water
chemistry parameters detected above standards.
Ammonia was detected above the standard of 2 mg/L, with exceedances in three downgradient wells
(087-11, 087-27, and 088-110) during three sampling events, as shown in Table 3. The highest
concentration of 7.03 mg/L was reported for well 088-110 in June. The levels of ammonia detected
are consistent with historic data.
Chloride was detected in one well above the standard of 250 mg/L. Well 088-21 had a concentration
of chloride at 270 mg/L in March. The concentration decreased each subsequent round to a low of
72.7 mg/L in December. Figure 6 plots these trends. With the exception of well 088-21, the trends
for downgradient wells show the low and stable nature of chloride concentrations in the vicinity of
the Current Landfill.
During 2009, all sulfate concentrations remained below the groundwater standard of 250 mg/L. The
highest sulfate value reported for 2009 was detected in the December sample from monitoring well
088-110 at a concentration of 20.2 mg/L. This is consistent with historic background levels at the
Current Landfill.
Alkalinity, in the form of bicarbonate, is the concentration of anions available to neutralize acid, and
is often used as an indicator of leachate contamination. The alkalinity in background well 087-09
ranged from 17.4 mg/L to 22.9 mg/L during 2009. The highest alkalinity concentration during 2009
T:\LTRA\Landfills\2009 Report\Text\2009_text_v1.doc 11
was detected in downgradient, shallow Glacial Aquifer well 087-11, at 192 mg/L in December.
There is no groundwater standard for alkalinity. The concentration trends plotted in Figure 6 show
an overall decrease in alkalinity following the capping of the landfill. Alkalinity levels in the
background well remained stable during this period.
Total dissolved solids and TSS results were similar to those from previous years. TDS and TSS
concentrations in background well 087-09 ranged from 156 mg/L to 194 mg/L, and 7.1 mg/L to 10.4
mg/L, respectively. The maximum concentrations observed in downgradient wells were 565 mg/L
and 70.8 mg/L of TDS and TSS, respectively.
No water chemistry parameters have exceeded groundwater standards in downgradient wells 087-24,
088-22, and 088-23, since 1998. These wells are all screened in the mid to deep-Upper Glacial
Aquifer to monitor the vertical extent of contamination from the Current Landfill. A comparison of
downgradient and background wells shows that leachate continues to be generated from the Current
Landfill, albeit at low concentrations. Decreasing trends in concentration indicate that the capping is
effectively reducing the generation and migration of leachate.
2.2.1.3 Metals
Historically, iron is detected consistently above groundwater standards in the majority of wells
surrounding the landfill. Precipitated iron from the BNL Water Treatment Plant was disposed of at
the Current Landfill during past operations. Concentrations in upgradient well 87-09 are still lower
than in the downgradient wells, suggesting continued leachate migration from the landfill.
During 2009, aluminum, antimony, chromium, iron, nickel, sodium, and thallium in the background
well and antimony, arsenic, iron, manganese, and sodium, in downgradient wells were detected
above their respective groundwater standards (Table 4). Iron in the downgradient wells peaked at a
maximum of 68,900 μg/L in well 088-110 during March. In contrast to background concentrations,
in well 87-09, iron ranged from 2,100 μg/L to 3,860 μg/L.
T:\LTRA\Landfills\2009 Report\Text\2009_text_v1.doc 12
Manganese ranged from 75.2 μg/L to 146 μg/L in background well 087-09, and up to 6,650 μg/L in
the downgradient wells. Background sodium levels ranged from 32,800 to 52,900 μg/L; whereas
downgradient levels reached a high of 181,000 μg/L.
Arsenic was reported above the standard of 10 μg/L in wells 087-23 and 088-110 at a
concentrations of 11.9 μg/L and 23.2 μg/L, respectively. Arsenic detections have historically been
observed at similar levels in Current Landfill wells. Antimony was detected above the standard of 3
μg/L in downgradient wells 087-11, and 088-21 at concentrations ranging from 3.4 μg/L to 7.2
μg/L. Thallium was detected in background well, 087-09, above the standard of 0.5 μg/L ranging
from 0.5 μg/L to 0.8 μg/L. Nickel and chromium were detected above the standard of 100 μg/L and
50 μg/L, respectively, in background well 087-09. However, neither was detected above standards
in any of the downgradient wells.
2.2.1.4 Radionuclides
No radionuclides were detected above groundwater standards during 2009 (Table 5). Strontium-90
(Sr-90), and tritium were the only radionuclides detected during 2009.
Sr-90 was detected in wells 087-09 and 088-21 at concentrations of 1.28 pCi/L and 3.45 pCi/L,
respectively, during December. These are well below the standard of 8 pCi/L.
Tritium was detected significantly below the groundwater standard of 20,000 pCi/L with a maximum
value of 622 pCi/L in well 087-11 (Figure 8). Tritium and Sr-90 concentrations have not exceeded
groundwater standards in any wells since 1998.
2.2.2 Former Landfill
2.2.2.1 VOCs
During 2009, there were no detections of VOCs above groundwater standards in wells in the Former
Landfill Area (Table 6). The compounds consistently found in the Former Landfill Area monitoring
wells include 1,1,1-trichloroethane, and chloroform. Chloroform was reported in several wells
during the year at concentrations ranging from 0.27 μg/L to 2.1 μg/L, well below the groundwater
standard of 7 μg/L. 1,1,1-Trichloroethane detections ranged from 0.3 μg/L to 1.9 μg/L. These
concentrations are well below the standard of 5 μg/L. Figure 9 shows plots of the historical VOC
detections for the Former Landfill Area monitoring wells. During 2009, VOCs were detected at the
T:\LTRA\Landfills\2009 Report\Text\2009_text_v1.doc 13
Former Landfill Area in several wells, but only at trace concentrations, indicating that the cap on the
landfill is operating as intended.
2.2.2.2 Water Chemistry Parameters
Groundwater samples from monitoring wells in the Former Landfill Area were analyzed for sulfate,
nitrite, nitrate, total nitrogen, chloride, alkalinity, TDS (TDS or residue, non-filterable) and TSS
(TSS or residue, filterable). During 2009, none of the of water chemistry parameters exceeded
applicable groundwater standards (Table 7). In general, all of the landfill leachate indicator
parameter concentrations in the downgradient wells were indistinguishable from concentrations in
the upgradient wells in 2009. These trends indicate that the landfill cap is effective.
Sulfate concentrations ranged from 8.6 mg/L to 9.6 mg/L in the background wells, and from 5.7
mg/L to 23.7 mg/L in downgradient wells, significantly below the standard of 250 mg/L.
Nitrogen in the form of nitrate (NO3), and chloride were consistently low with concentrations up to
1.2 mg/L and 38.4 mg/L, respectively in the background wells and concentrations up to 1.2 mg/L
and 12.8 mg/L, respectively in the downgradient wells. The trends plotted in Figure 10 indicate
chloride concentrations are stable over time.
Alkalinity concentrations ranged from 5.5 mg/L to 33.2 mg/L in background wells and from 5 mg/L
to 21.8 mg/L in downgradient wells. The trends plotted in Figure 10 demonstrate that the alkalinity
concentrations in 2009 continue to be at background levels.
TDS concentrations ranged from 32 mg/L to 146 mg/L in the background wells, and from 28 mg/L
to 59 mg/L in the downgradient wells. TSS concentrations were nondetect in the background wells,
and ranged from nondetect to 10.4 mg/L in the downgradient wells.
TKN concentrations ranged from 0.05 mg/L to 0.09 mg/L in the background wells. TKN
concentrations in the downgradient wells ranged from nondetect to 0.16 mg/L.
2.2.2.3 Metals
The sampling results are summarized in Table 8, and concentration trend plots for iron are shown on
Figure 11. Iron was the only metal detected that exceeded the groundwater standards in
T:\LTRA\Landfills\2009 Report\Text\2009_text_v1.doc 14
downgradient wells during 2009. Downgradient well 106-02 had a concentration of 956 μg/L in
December. This is above the standard of 300 μg/L.
2.2.2.4 Pesticides/PCBs
There were no detections of pesticides or polychlorinated biphenyls (PCBs) during 2009. The
sampling results are summarized in Table 9.
2.2.2.5 Radionuclides
Tritium was not detected in any wells during 2009. Strontium-90 was detected in five wells in 2009
below the groundwater standard of 8 pCi/L. Detects ranged from 1.07 pCi/L to 4.62 pCi/L in well
106-44. The sampling results are summarized in Table 10, and concentration trend plots are shown
on Figure 12.
3.0 WOODED WETLAND MONITORING
Sampling at the Wooded Wetland is performed as part of the compliance monitoring for the Current
Landfill. Prior to the capping of the Current Landfill, leachate was periodically observed in the
wetland. The monitoring is focused on metal concentrations in the sediment and surface water to
evaluate potential risks to the local Tiger Salamander population. Samples are collected every two
years. Samples were last collected in 2008 and are scheduled for collection again in 2010.
4.0 SOIL-GAS MONITORING
4.1 Soil-gas Monitoring Networks
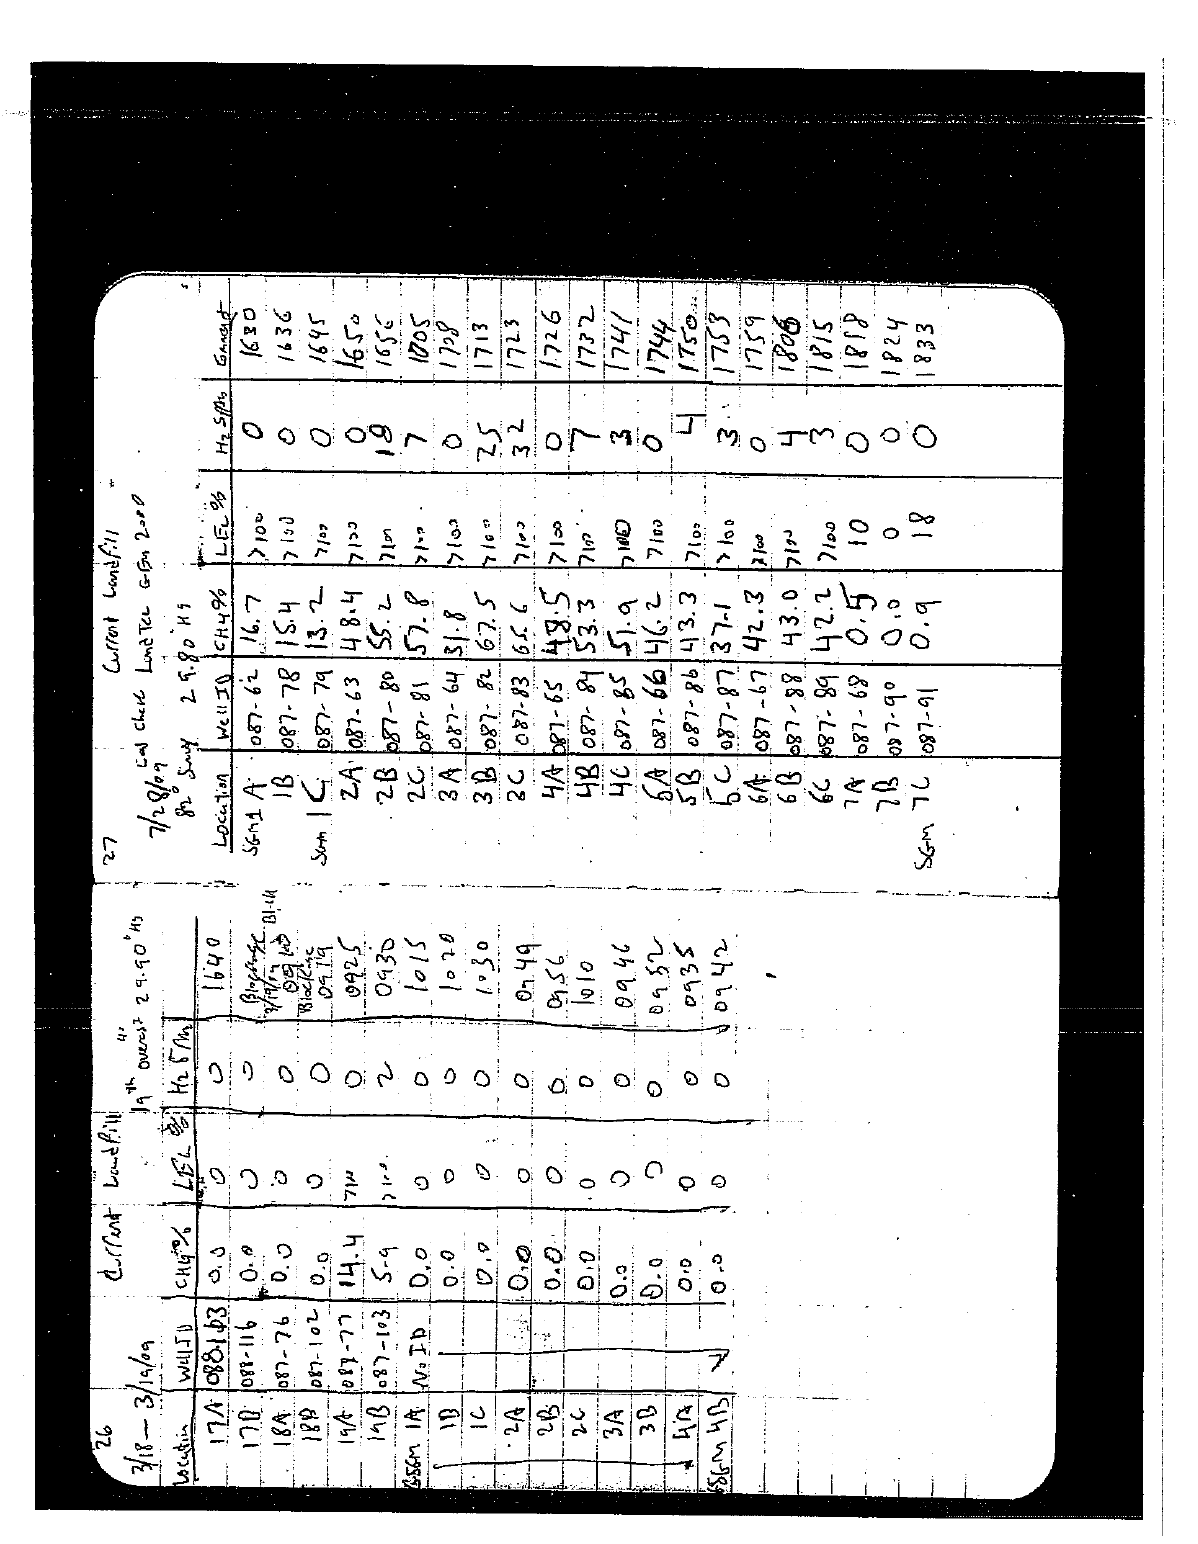
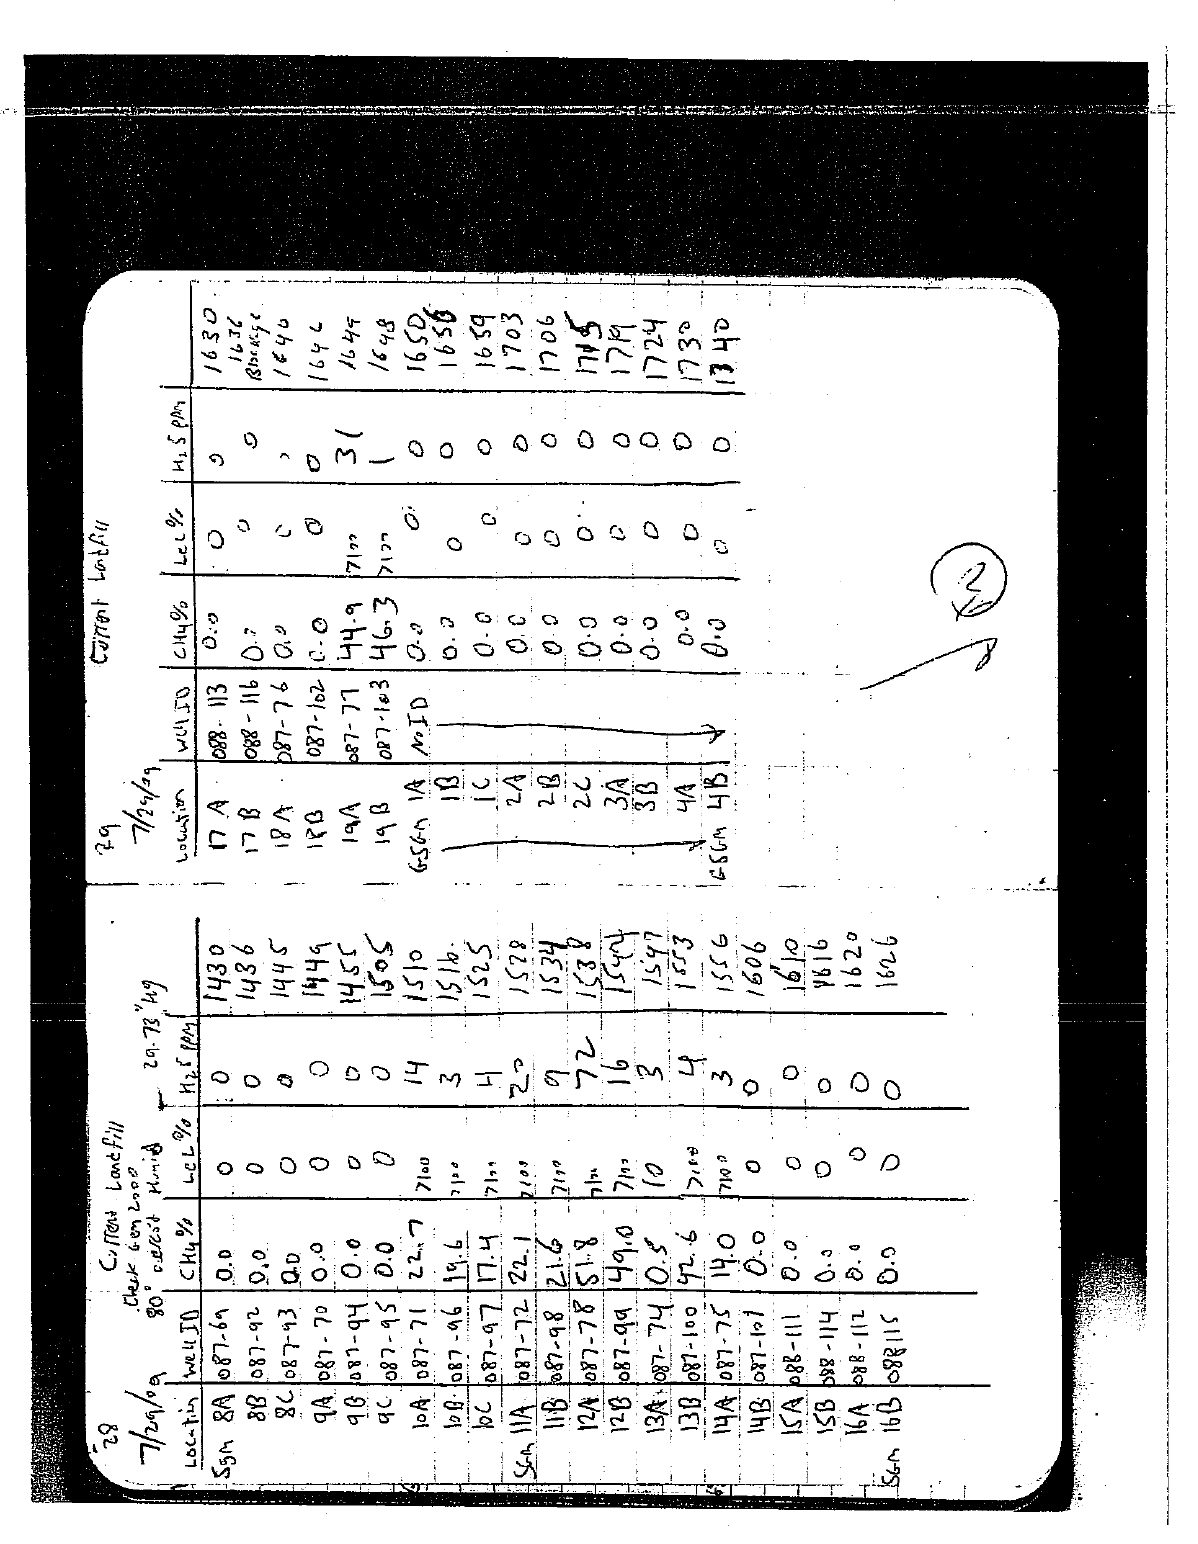
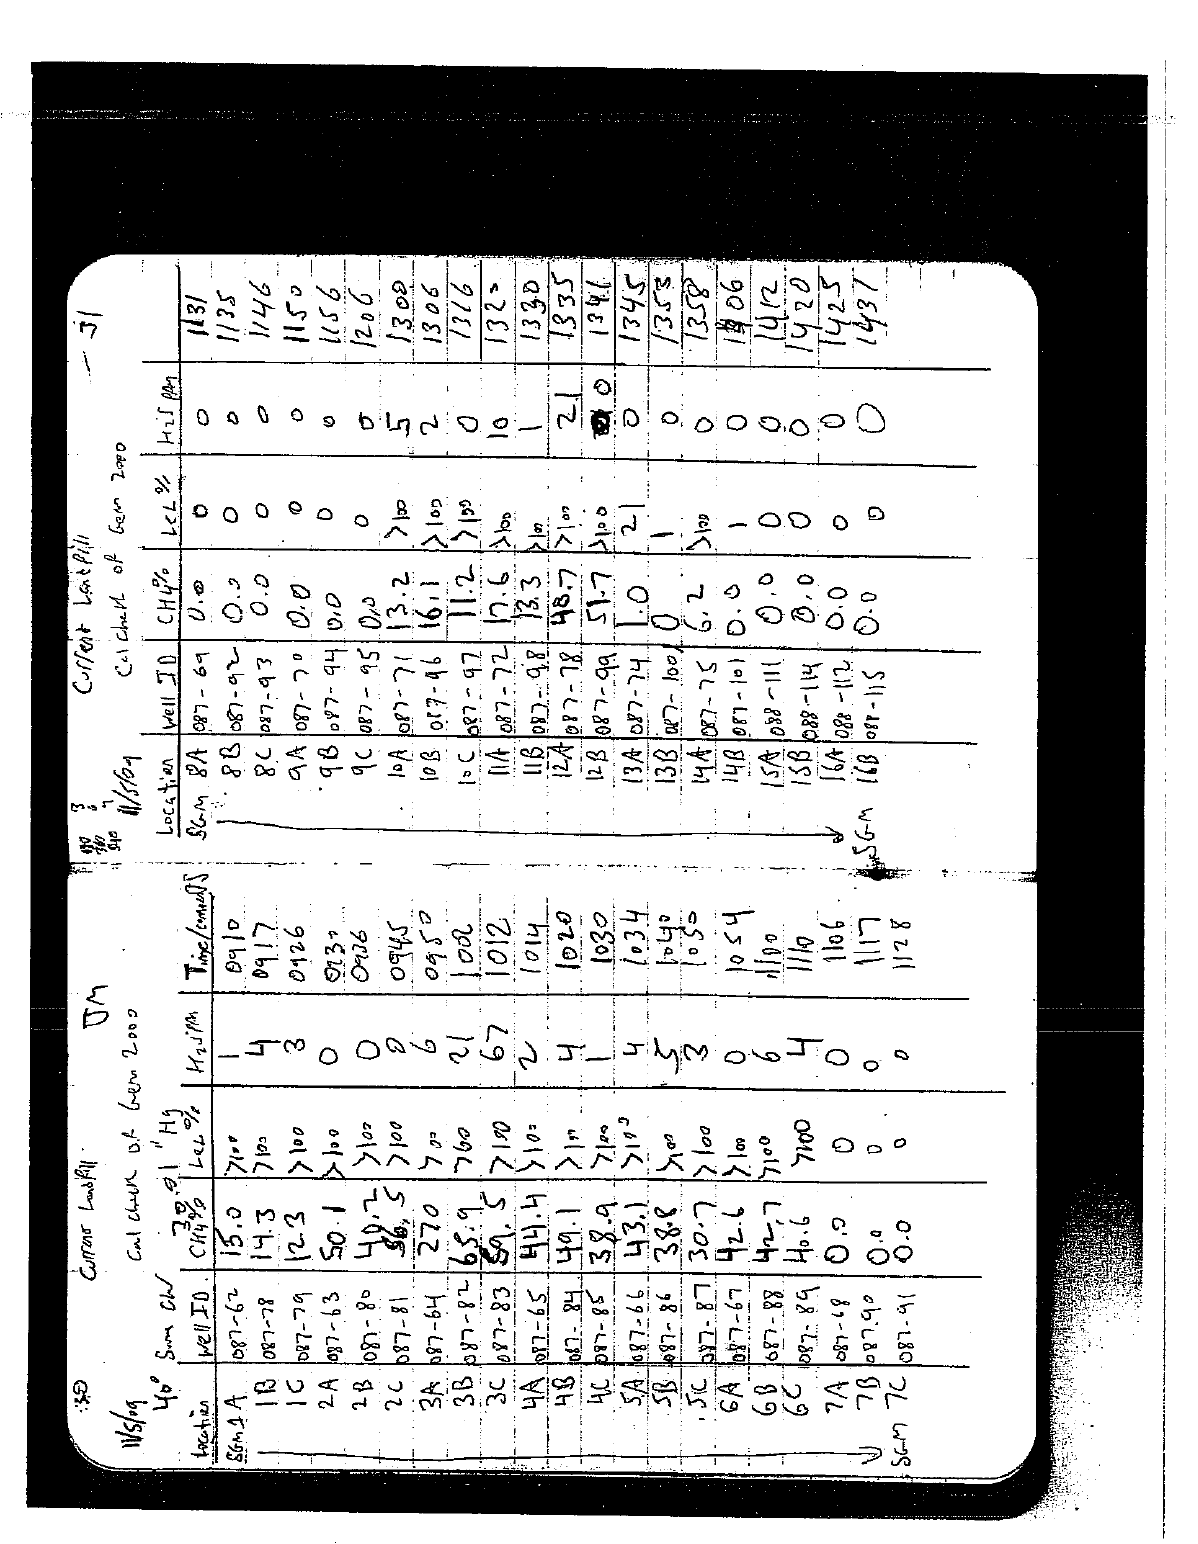
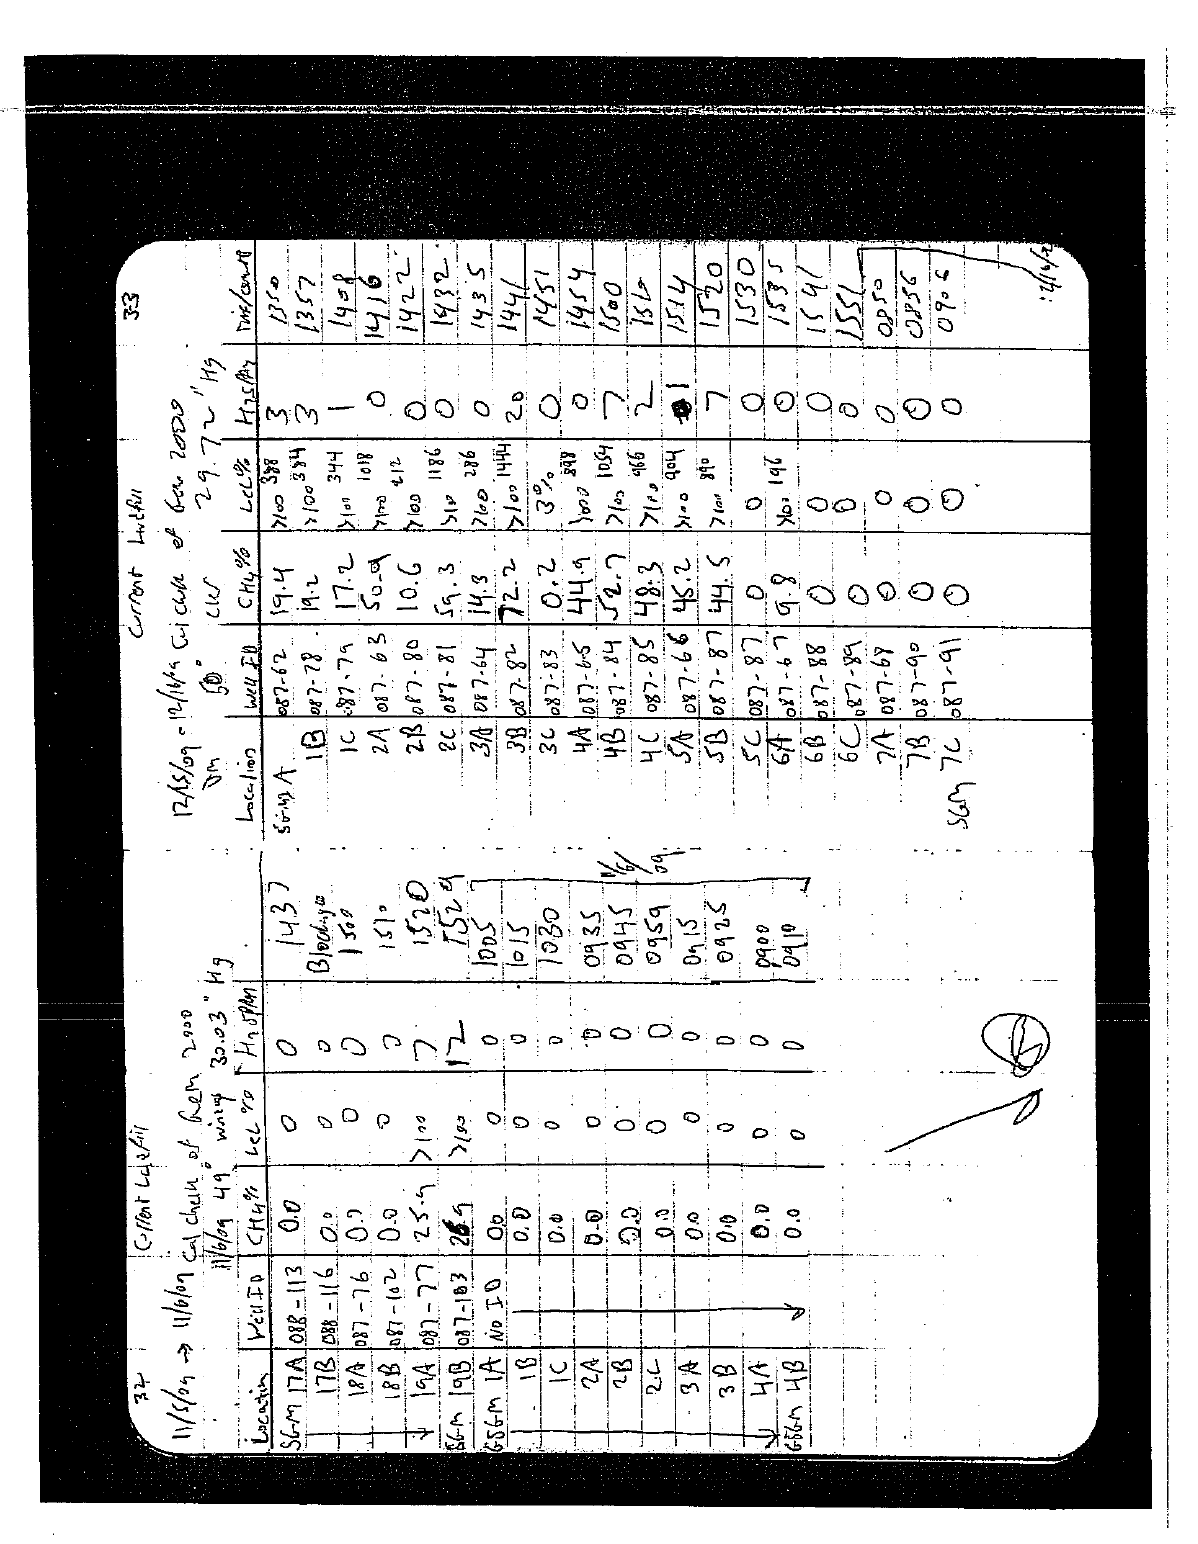
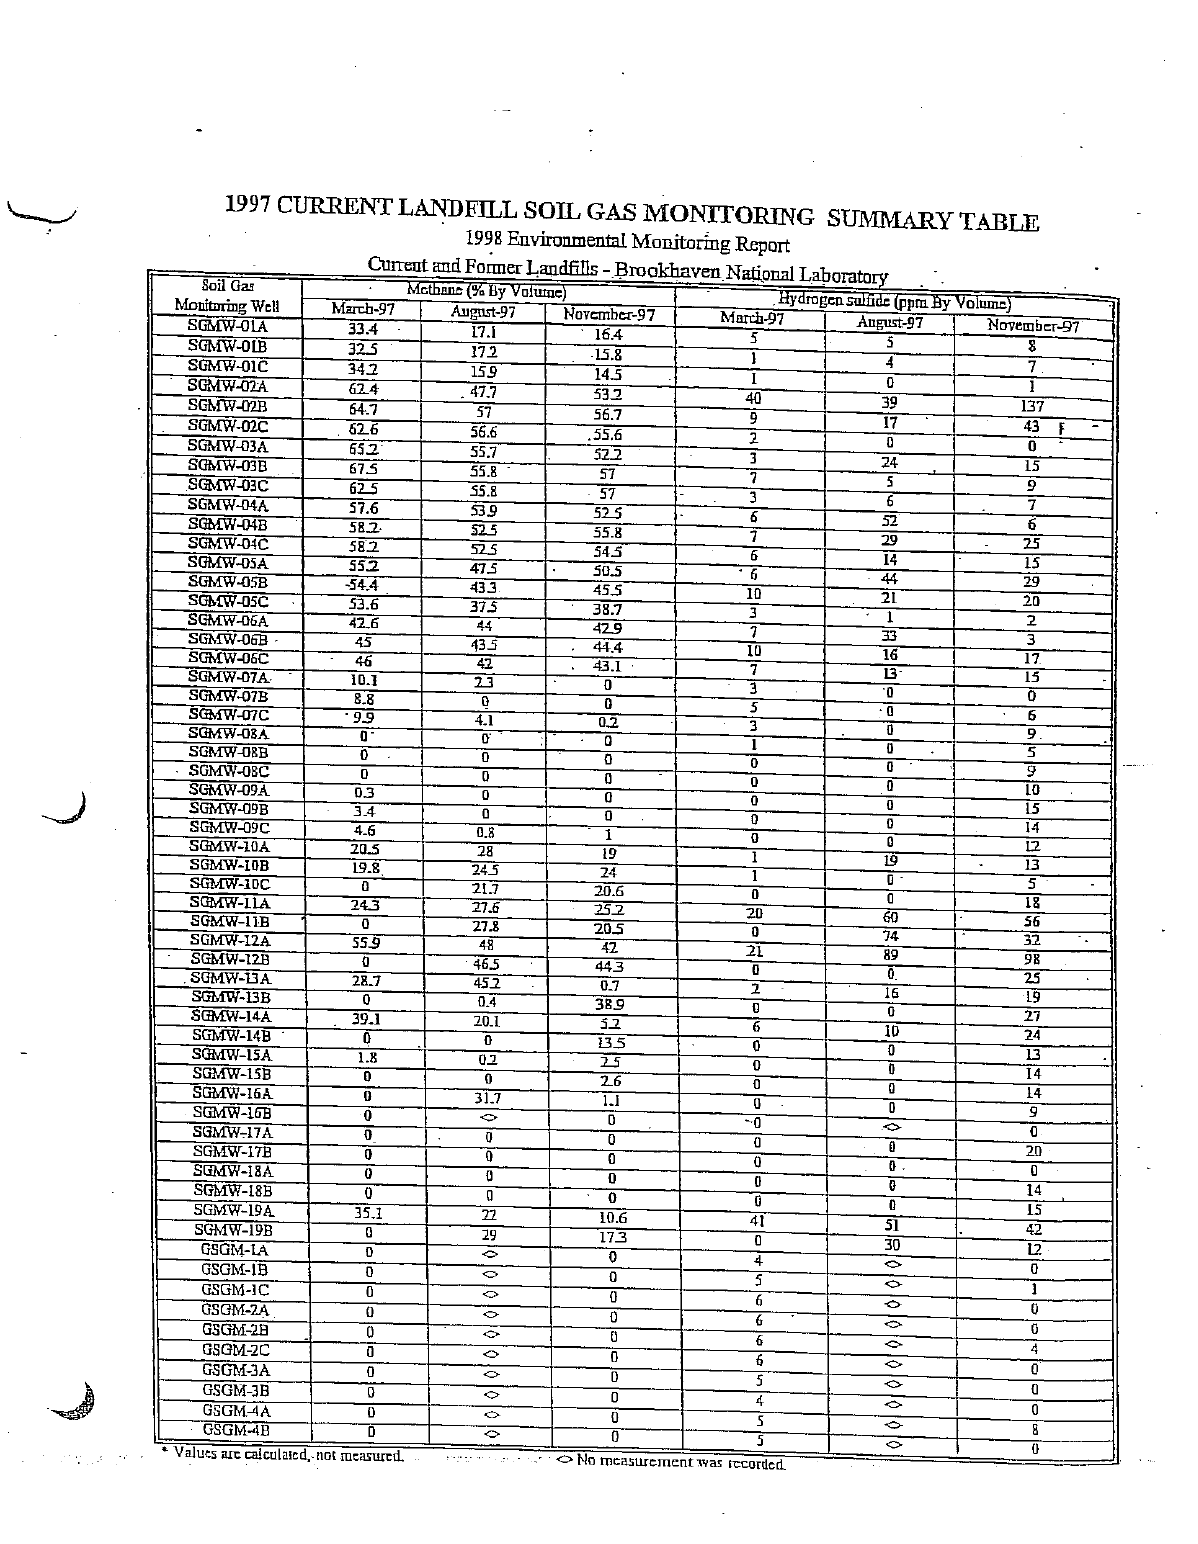
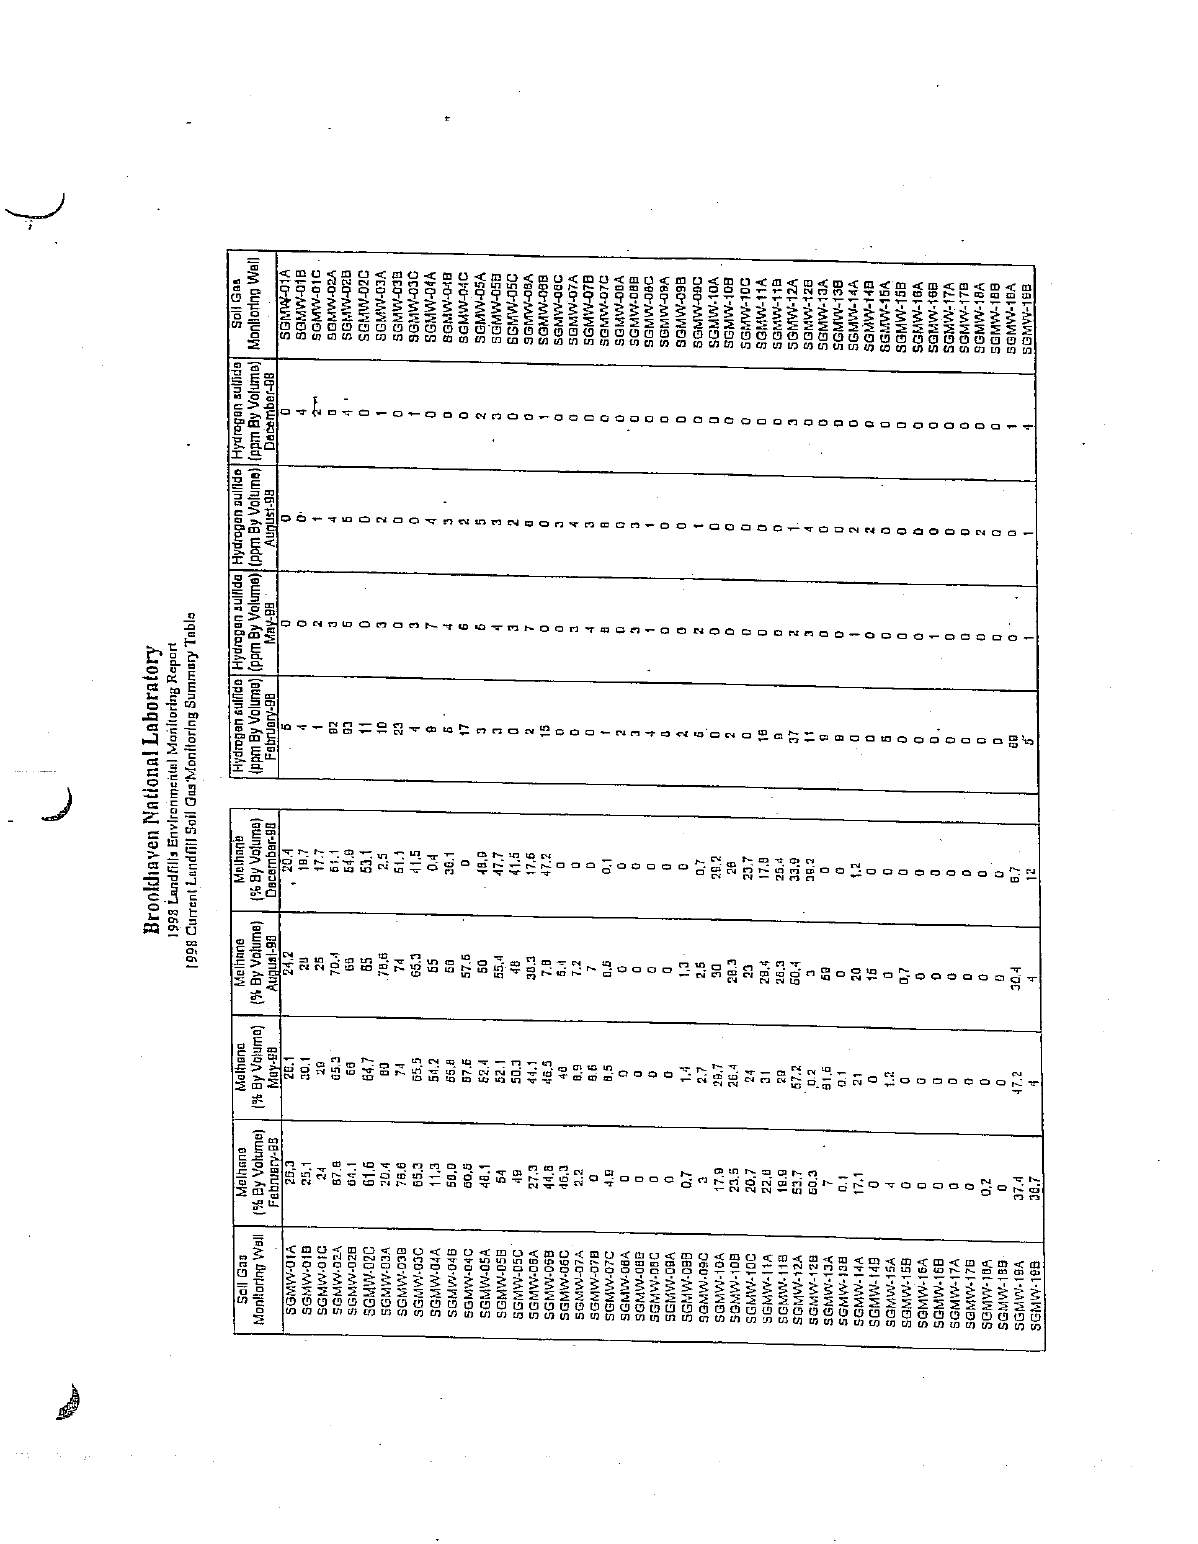
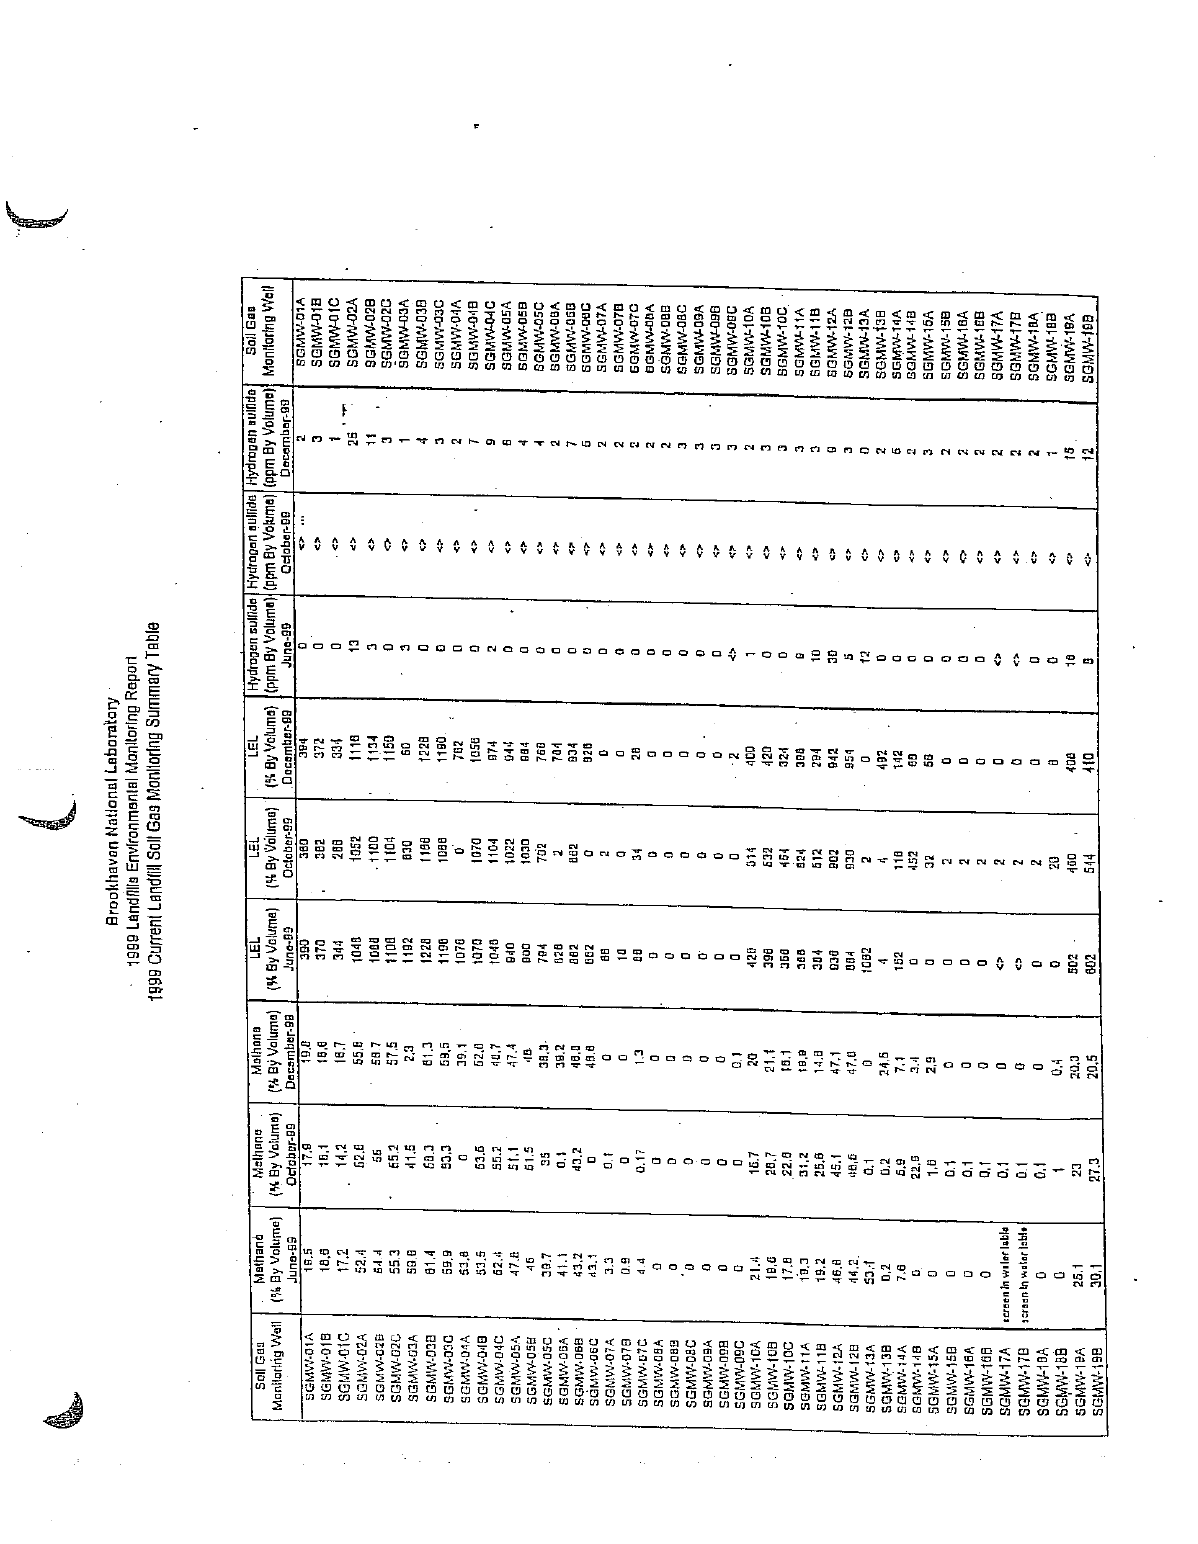
Soil-gas readings were collected from wells surrounding the Current Landfill in March, July,
November, and December 2009 and from the Former Landfill in March, July, and December 2009.
For the Former Landfill, the soil-gas monitoring schedule was changed to collect samples during the
2nd and 4th quarters based on a recommendation in the 2008 Landfill Report. Since the
recommendation was approved after the 1st quarter round was collected, there were three complete
soil-gas rounds collected during 2009. Methane, lower explosive limit (LEL), and hydrogen sulfide
were measured using a Landtec GA-90 (Serial # 690). The LEL for methane is 5.3% and the upper
explosive limit (UEL) is 15%.

T:\LTRA\Landfills\2009 Report\Text\2009_text_v1.doc 15
4.1.1 Current Landfill
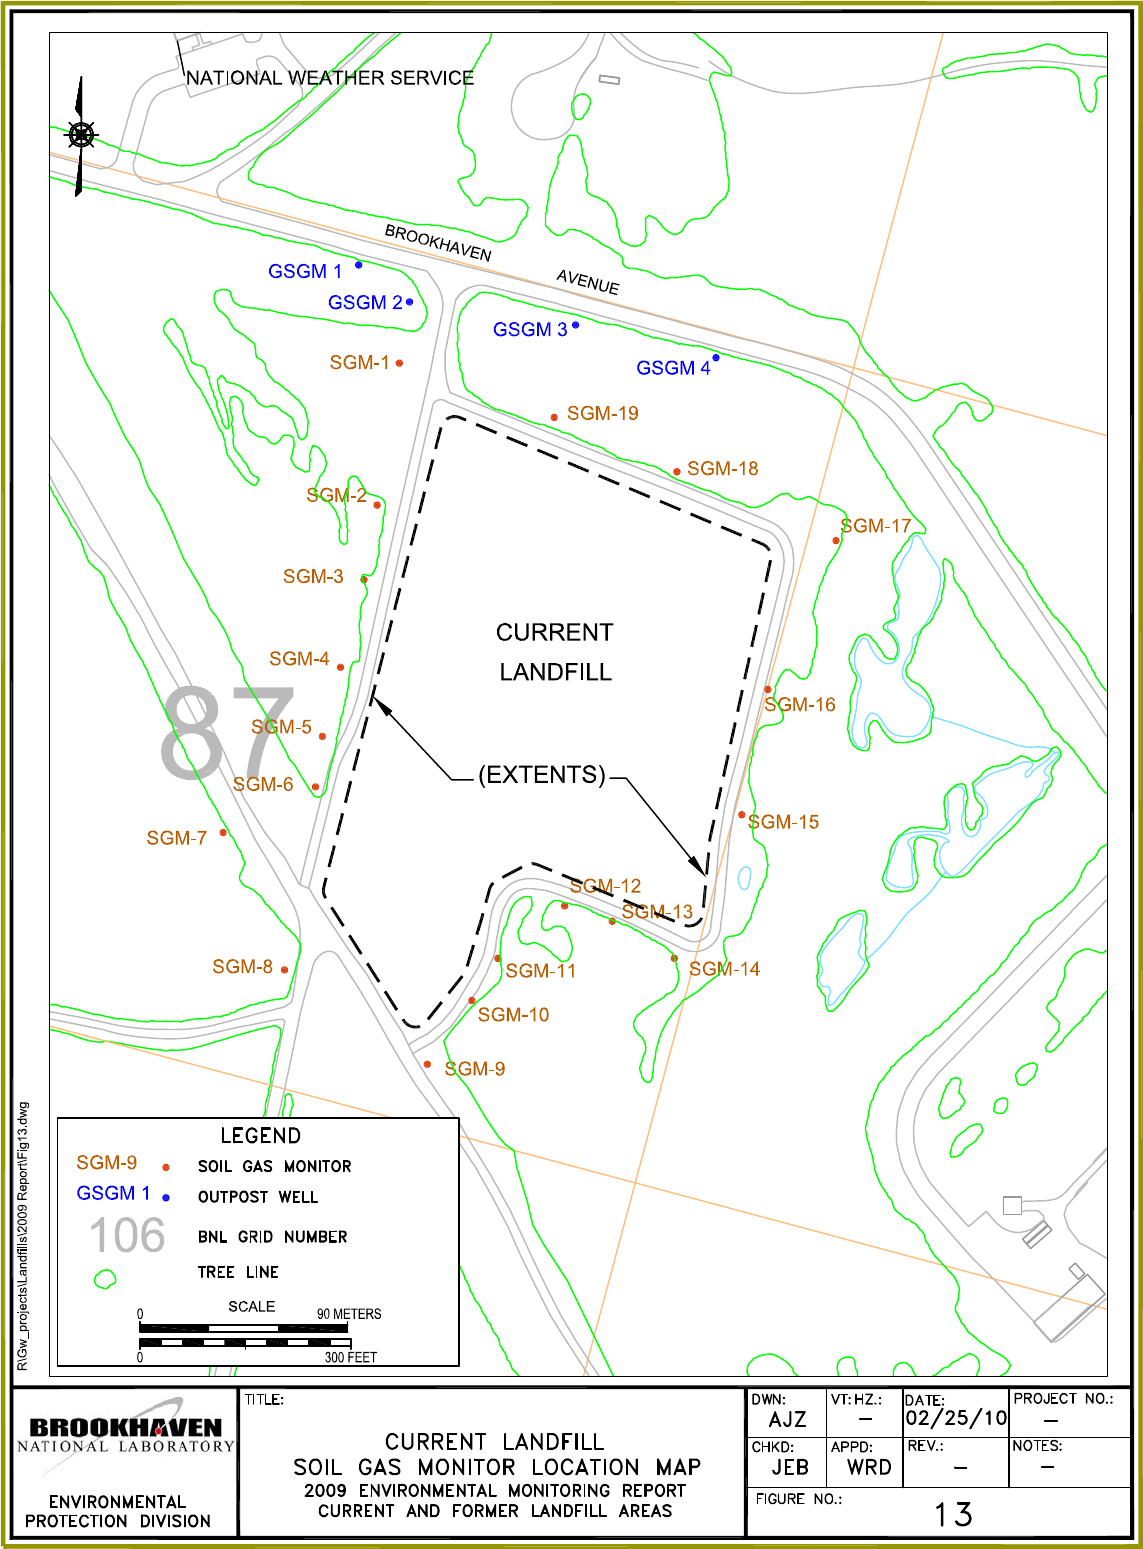
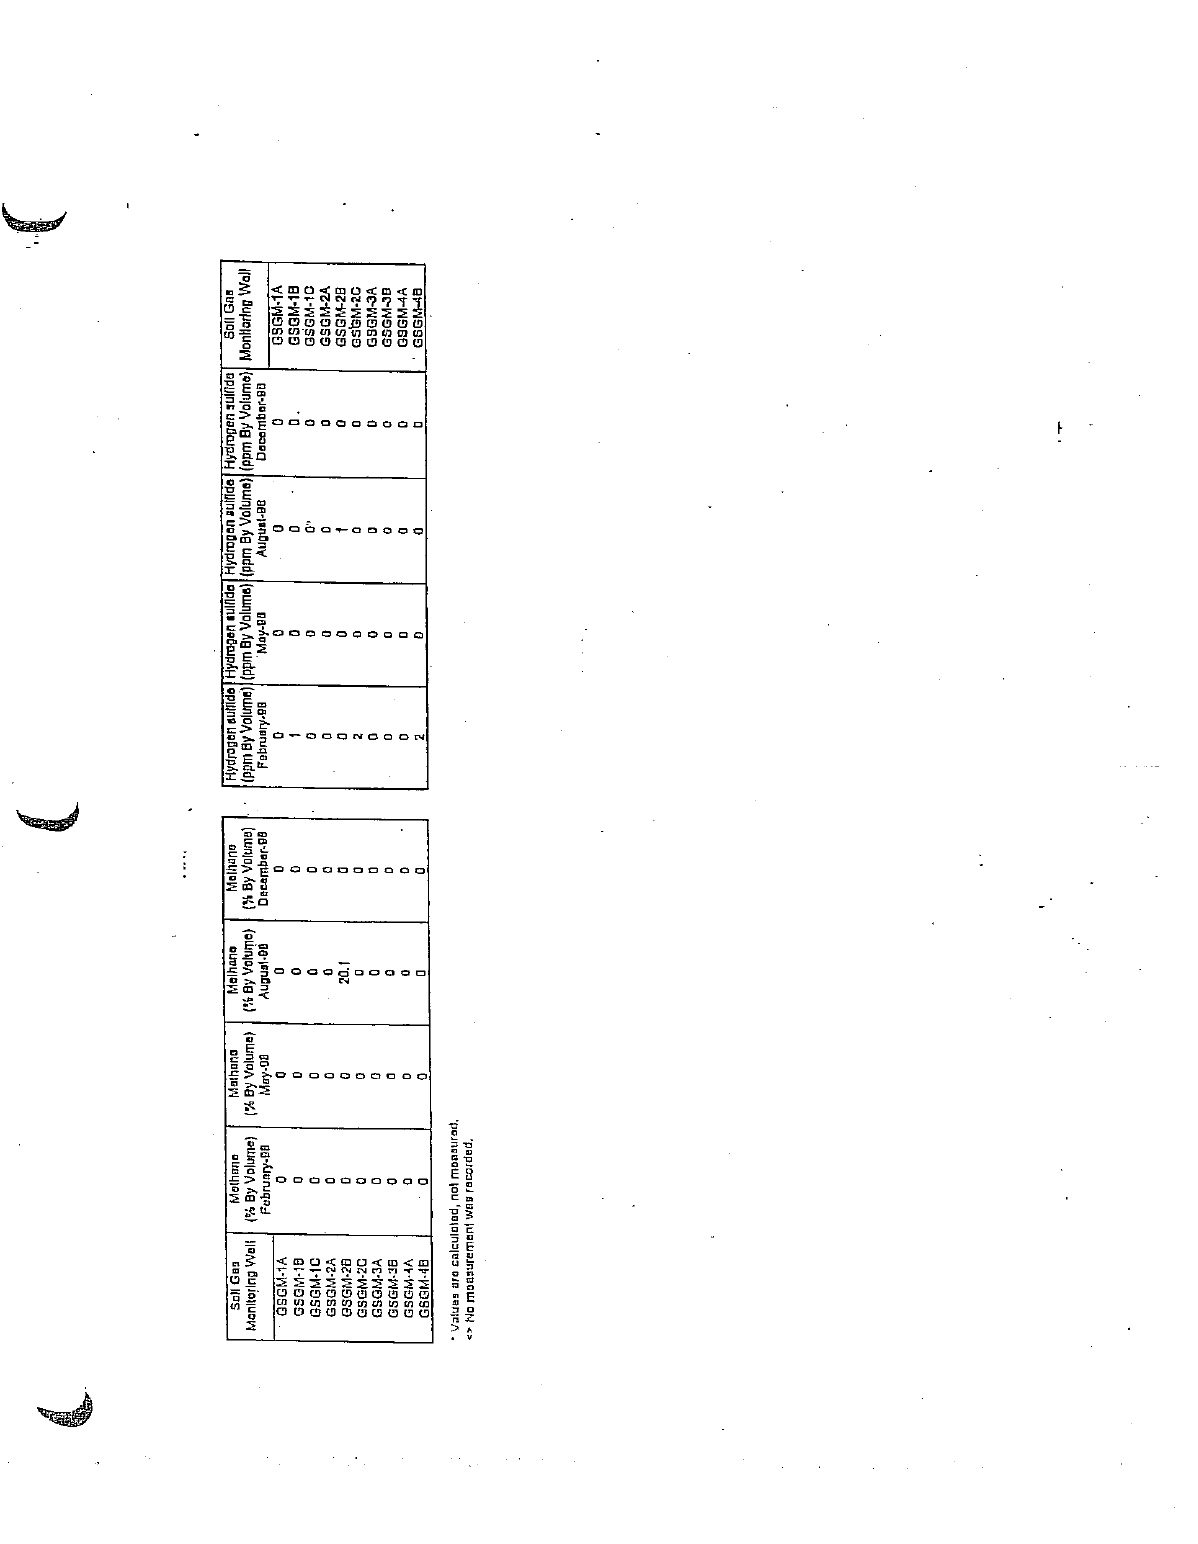
Along the perimeter of the Current Landfill, 58 points were sampled for soil-gas, which includes
four outpost soil-gas well clusters, GSGM-1 to GSGM-4, located along the south side of
Brookhaven Avenue. The sampling points include 12 soil-gas well clusters consisting of three
sampling intervals per cluster, and 11 soil-gas well couplets consisting of two sampling intervals per
couplet. Table 11 describes each soil-gas well. Their locations are illustrated on Figure 13.
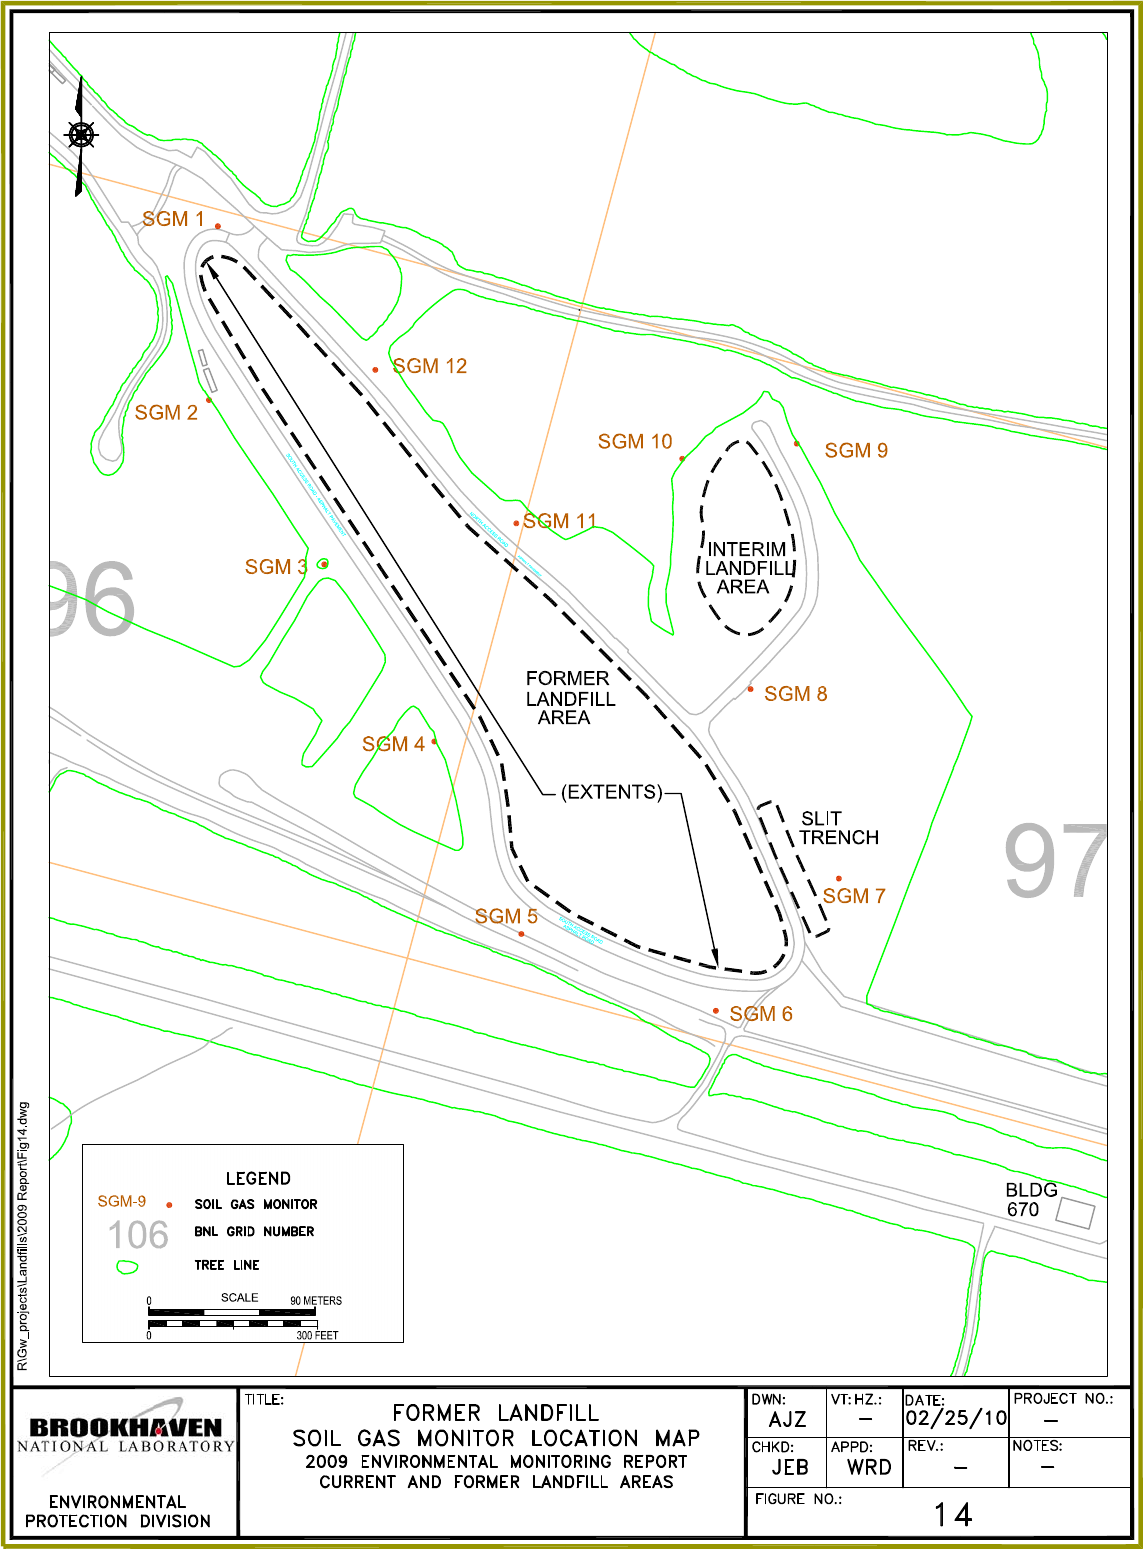
4.1.2 Former Landfill Area
Twenty-four sampling points were monitored for the Former Landfill Area. These points include 12
well couplets consisting of two sampling points per couplet. Details of each soil-gas well are given
in Table 11 and their locations shown in Figure 14.
4.1.3 Sampling Frequency
Soil-gas was monitored for each landfill in the following months.
Sampling Event Current Landfill Former Landfill
Round 1 March 2009 March 2009
Round 2 July 2009 July 2009
Round 3 November 2009 December 2009
Round 4 December 2009 None
4.2 Results of Soil-Gas Monitoring
Action levels for soil-gas are specified in 6 NYCRR Part 360-2.17(f) in terms of percent LEL, which
is primarily related to the amount of methane present. This discussion focuses primarily on the
methane levels detected during quarterly monitoring. Hydrogen sulfide is monitored, but has no
regulatory action level. 6 NYCRR Part 360-2.17(f) specifies that active measures to control
decomposition gases are required when the concentration of methane or other explosive gases
exceeds 25 percent of the LEL (or 1.3% methane) in facility structures, or 100 percent (%) of the
LEL (or 5.3% methane) at the site boundary.
T:\LTRA\Landfills\2009 Report\Text\2009_text_v1.doc 16
4.2.1 Current Landfill
A total of 23 soil-gas monitoring well clusters are positioned around the Current Landfill (Figure
13). Potential receptors, or areas where methane can accumulate in the vicinity of the Current
Landfill, include the National Weather Service building located 480 ft north northwest of the Current
Landfill on the north side of Brookhaven Avenue. Should methane extend to the south side of
Brookhaven Avenue, active measures will be required to control its migration. The four outpost soil-
gas wells, GSGM-1 to GSGM-4, located along the south side of Brookhaven Avenue, are used to
monitor the northern extent of the migration of landfill gas.
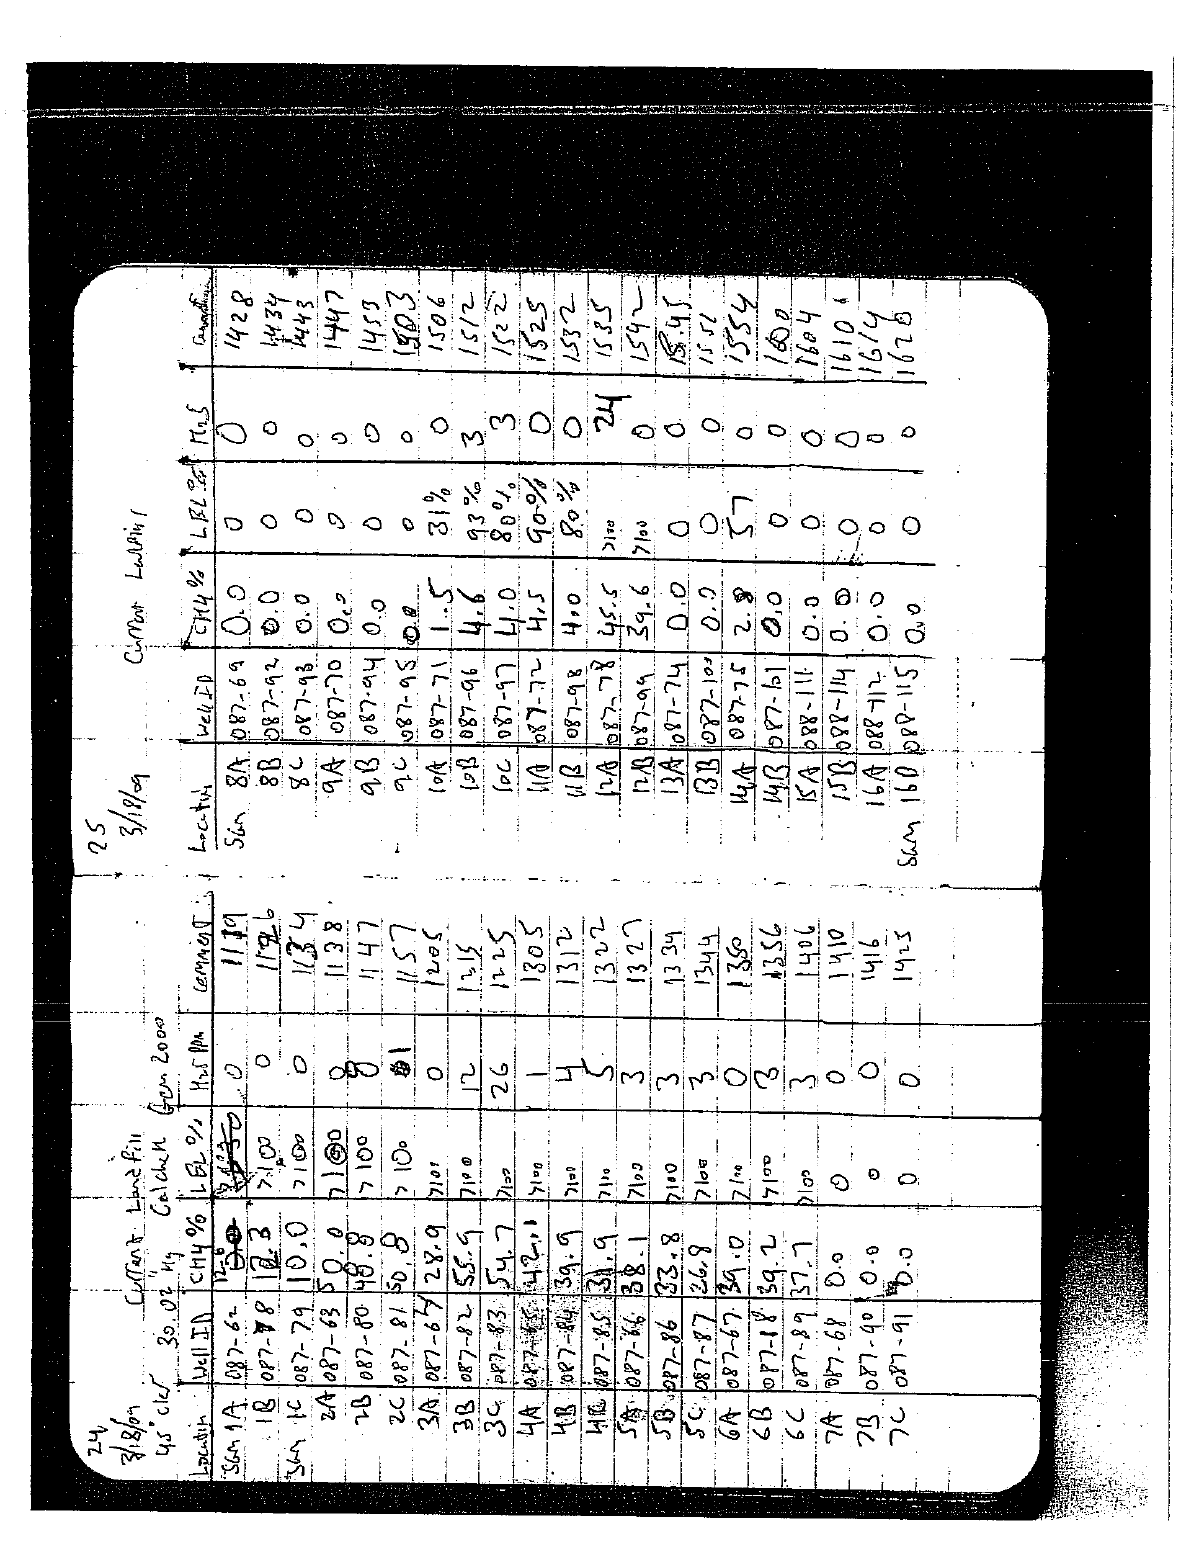
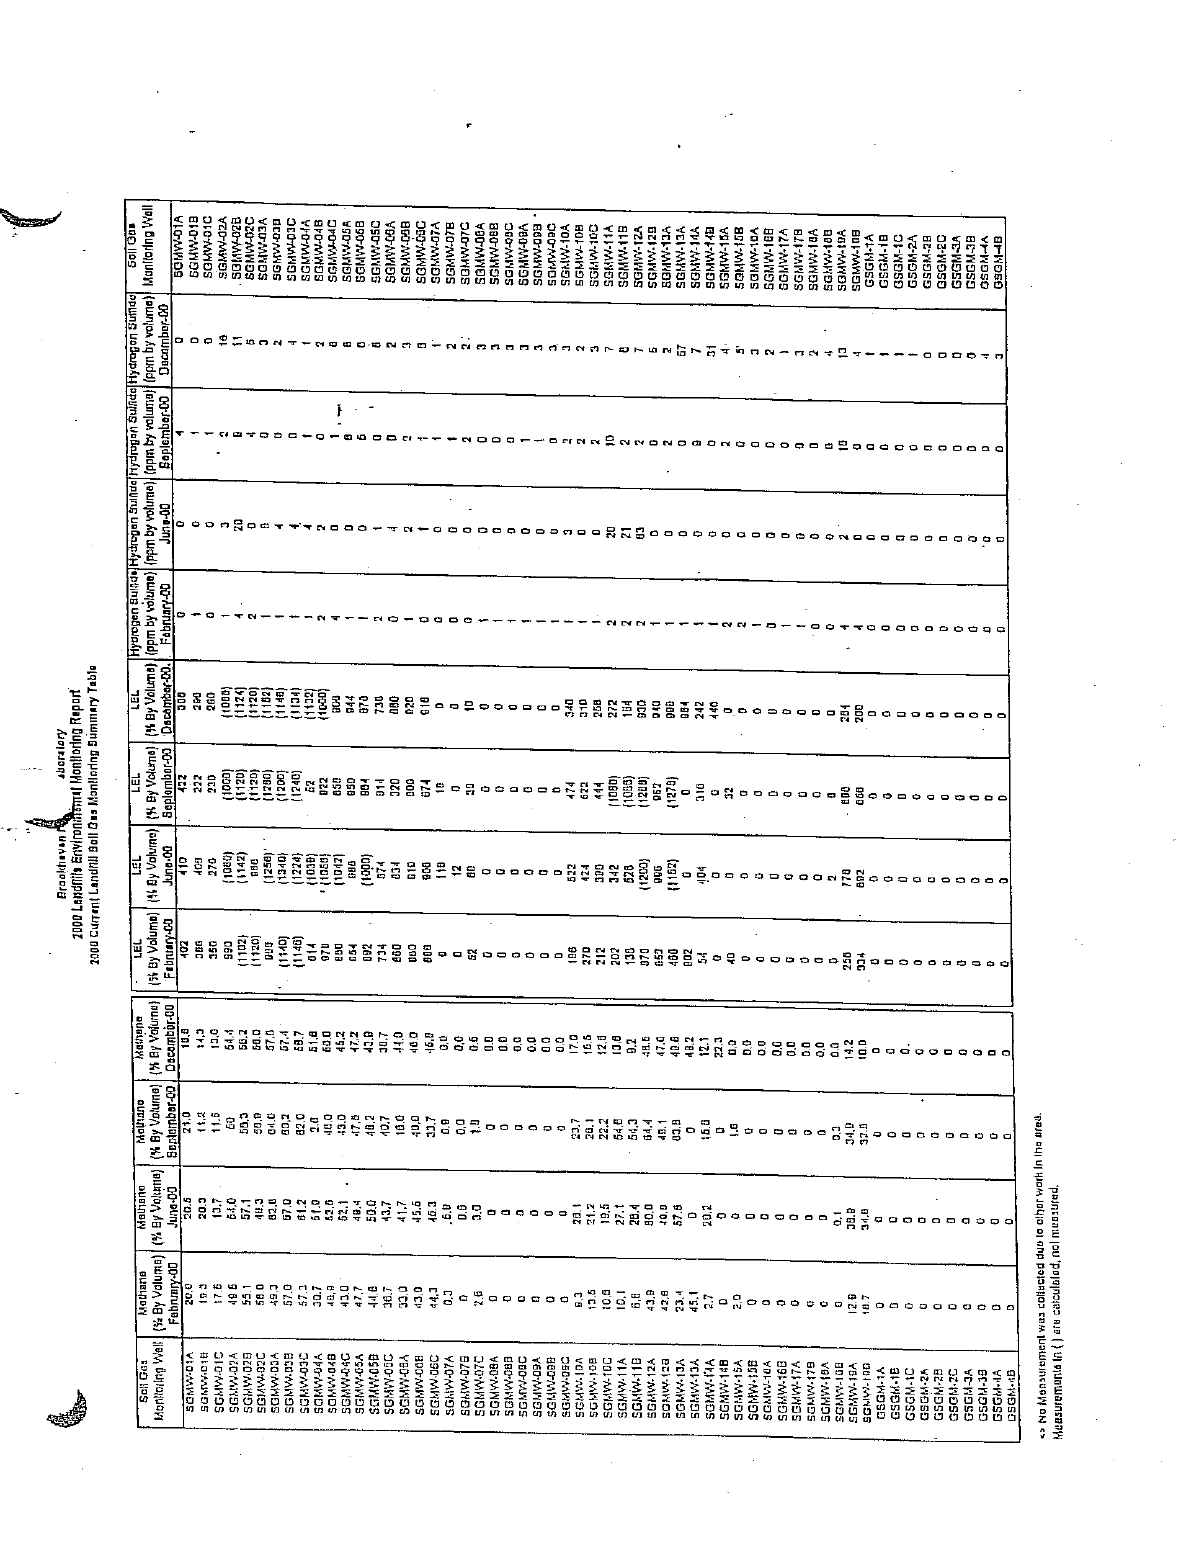
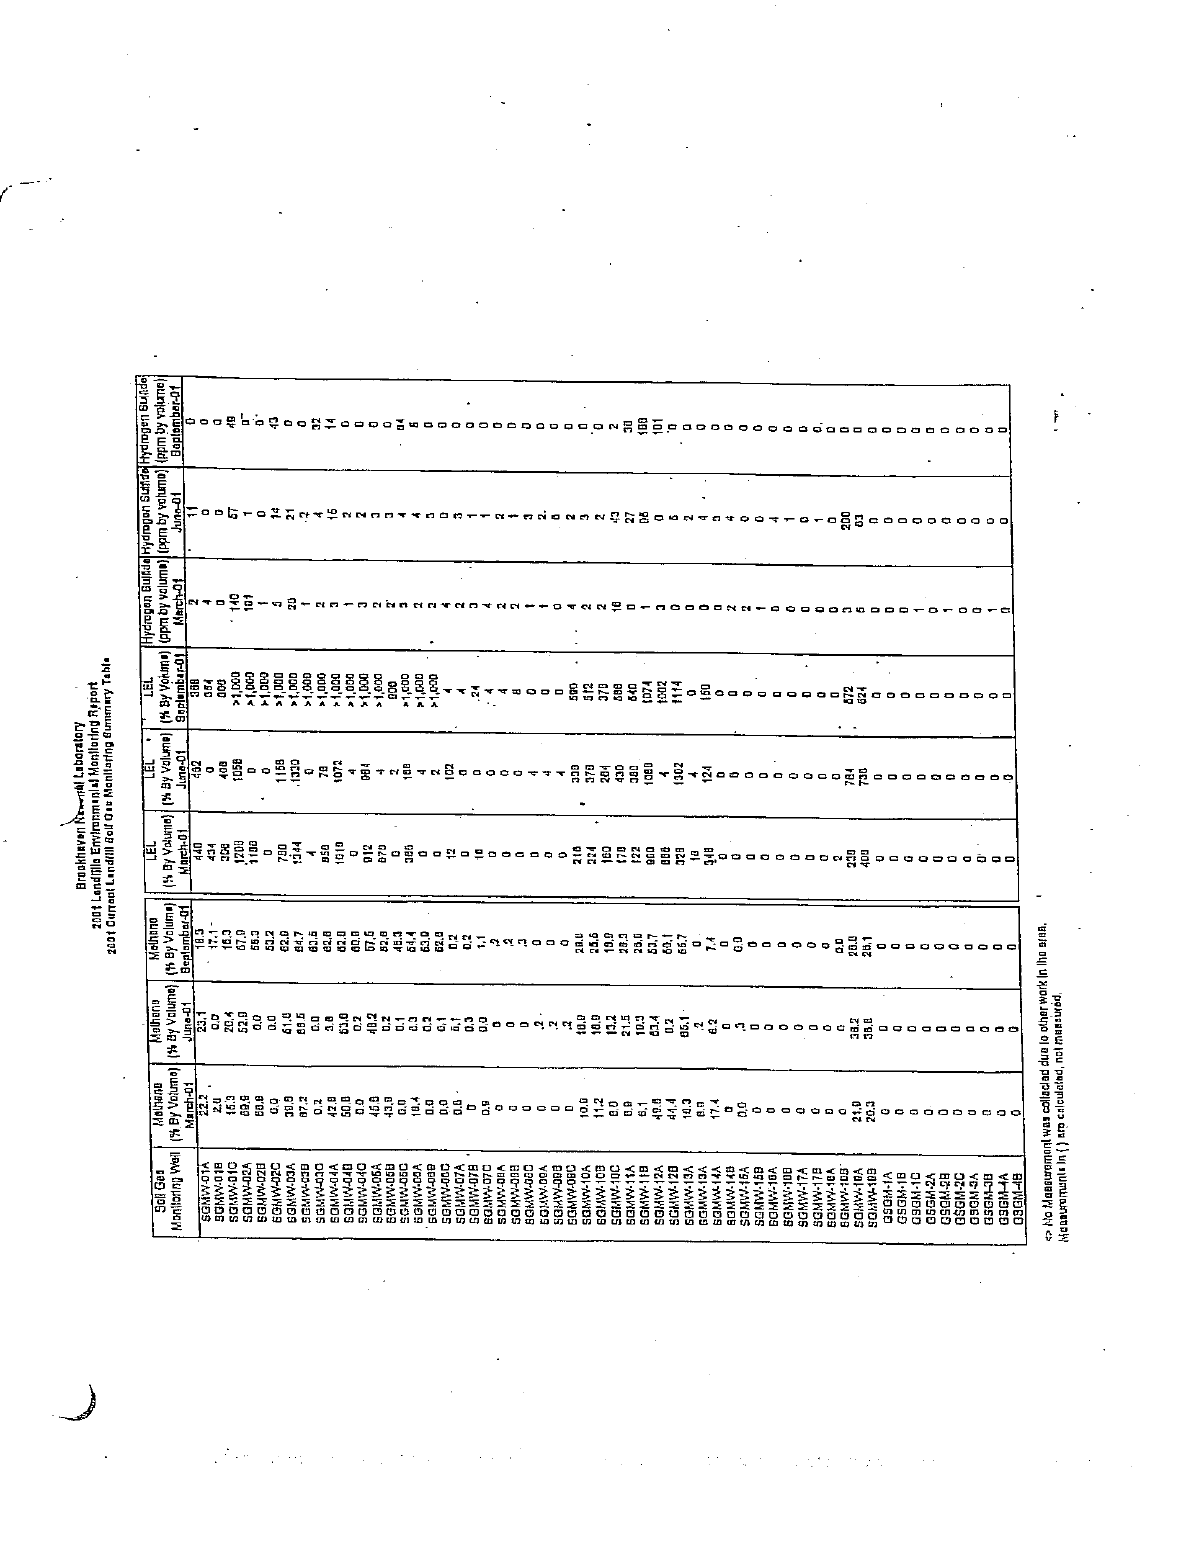
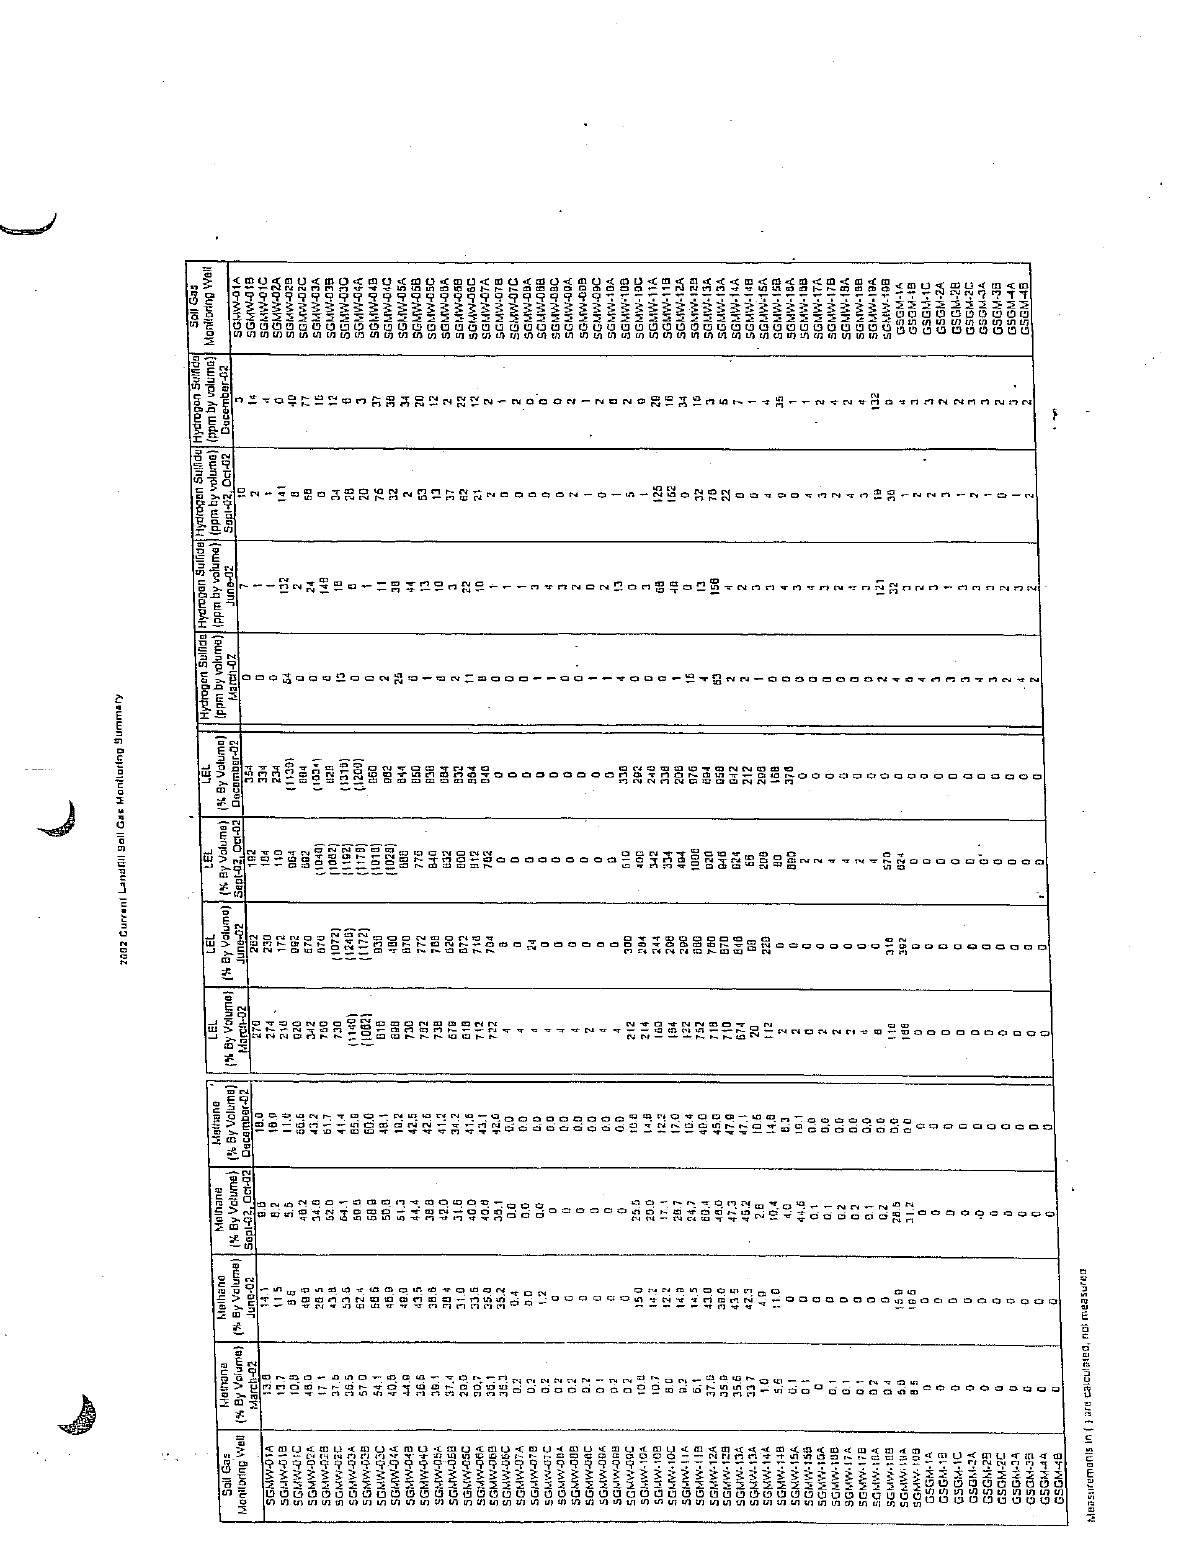
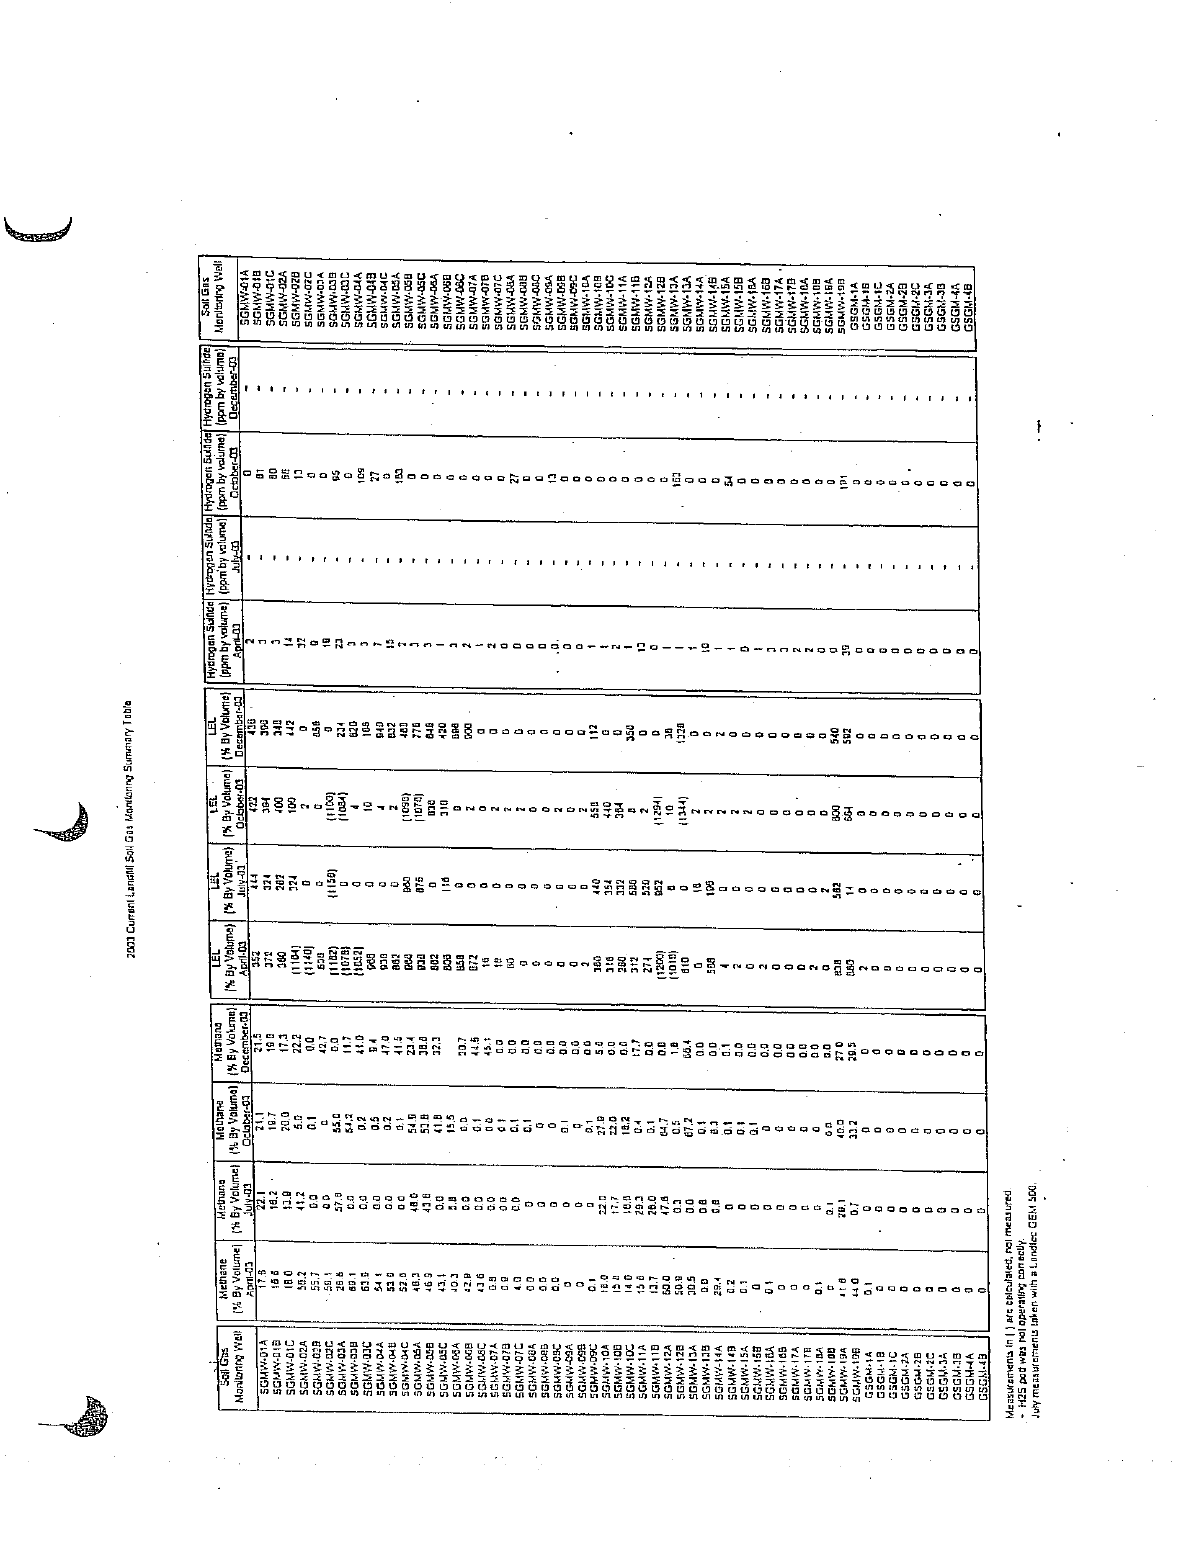
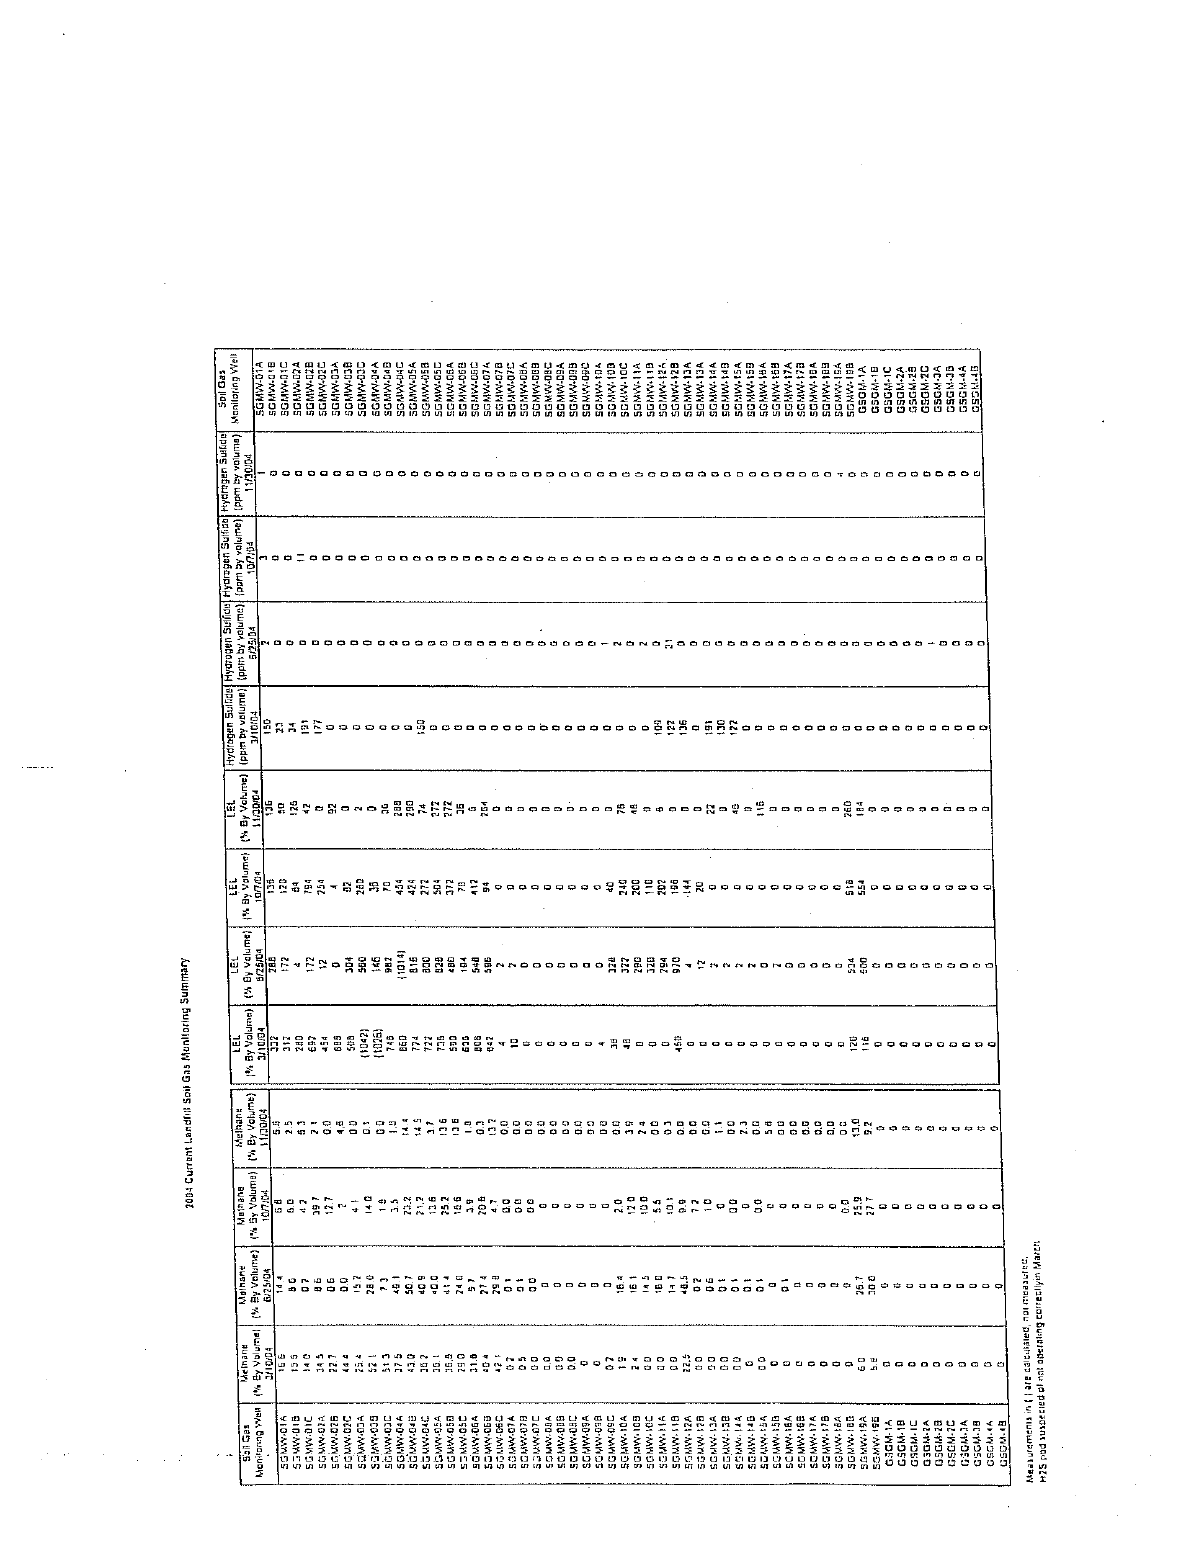
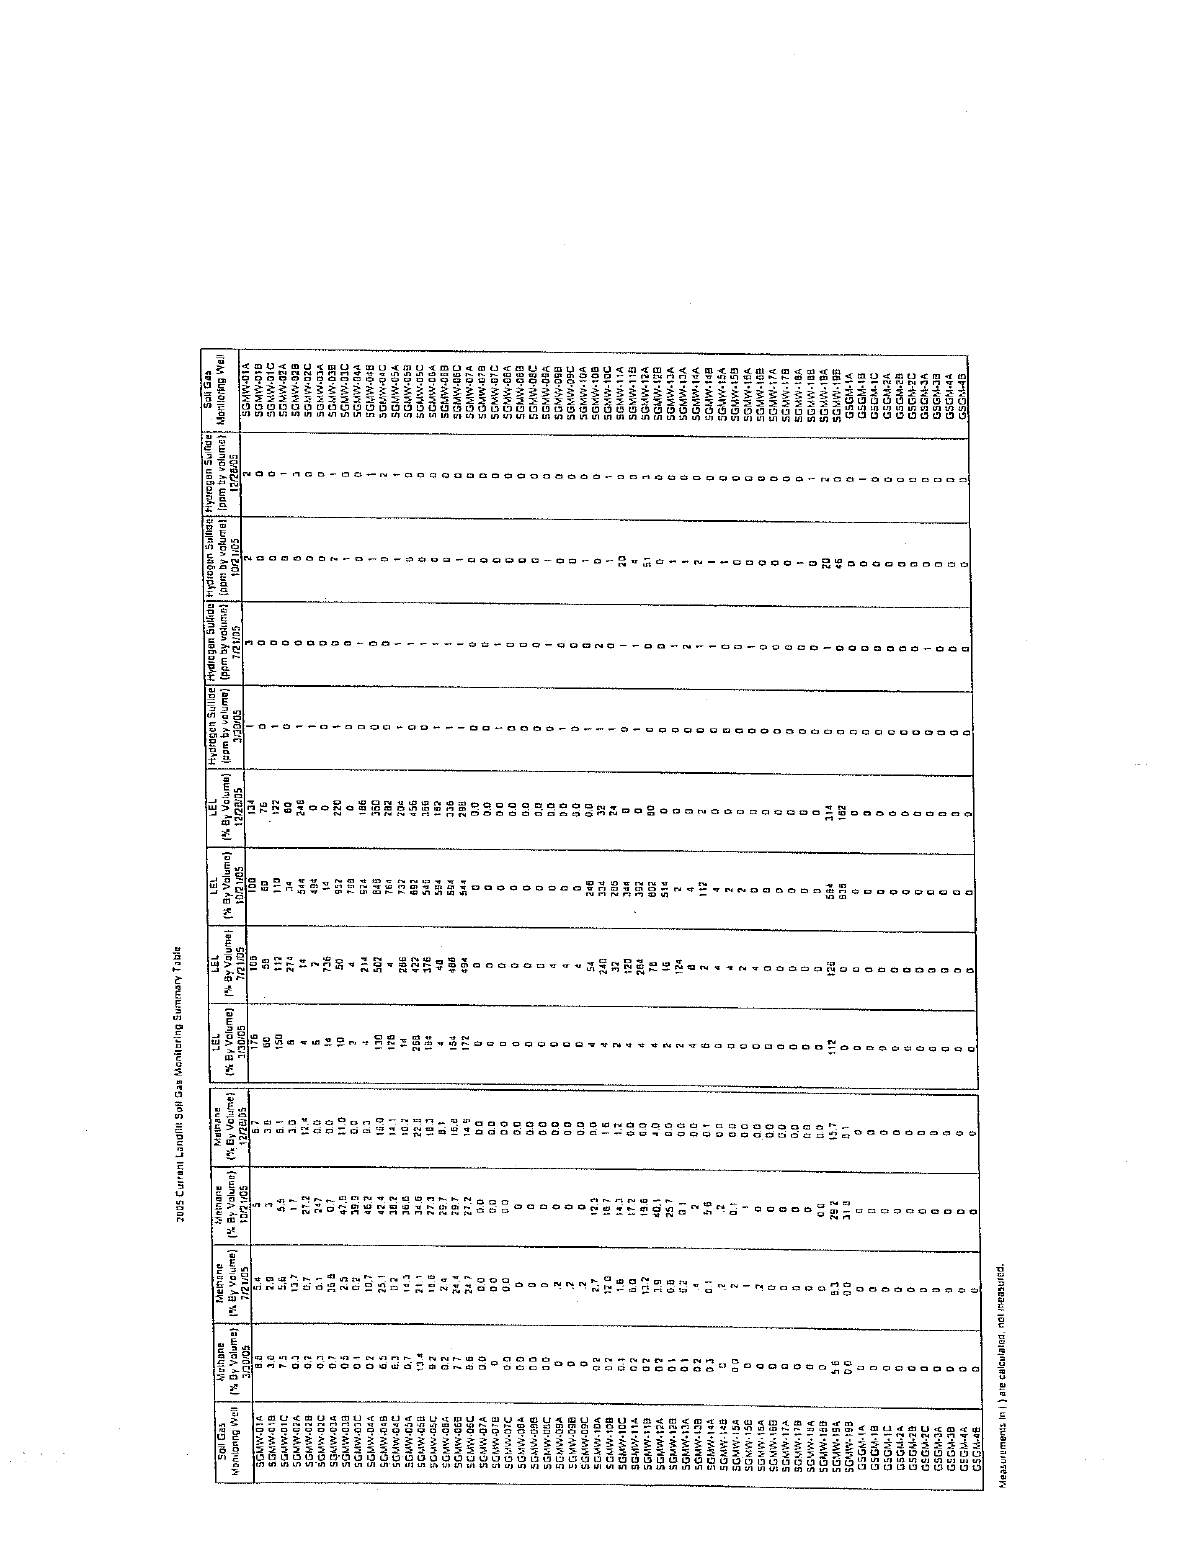
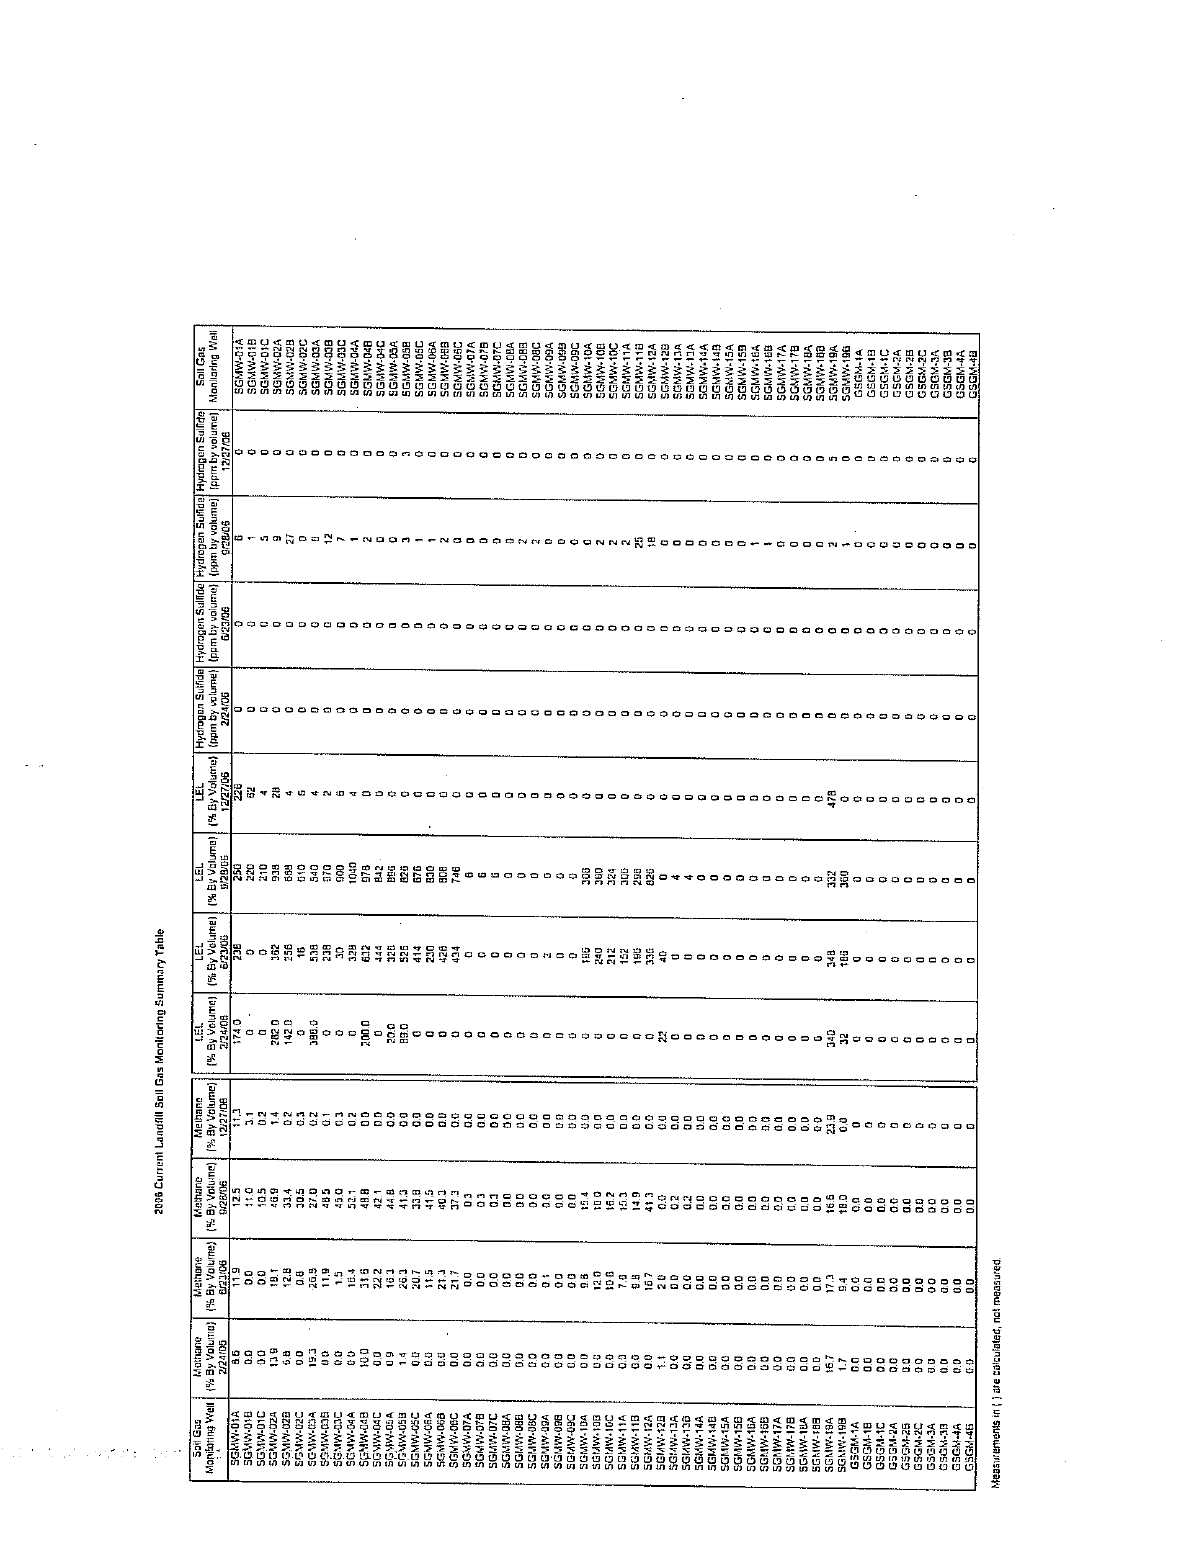
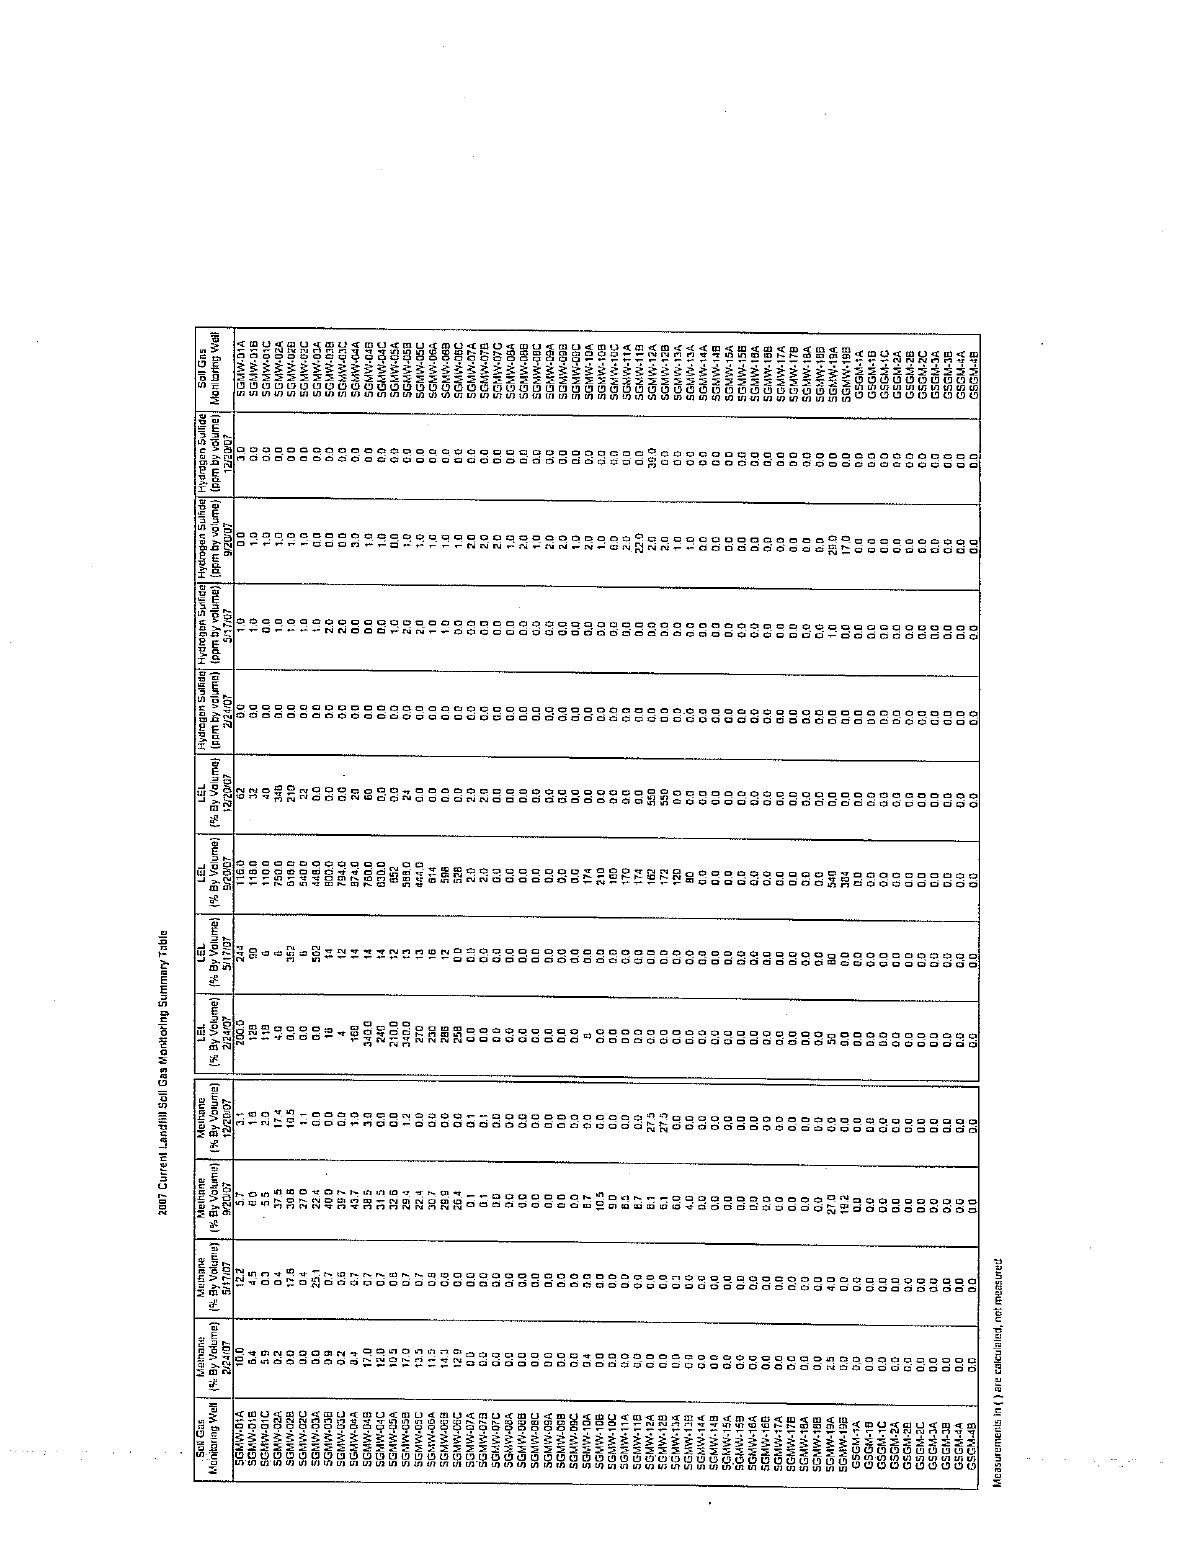
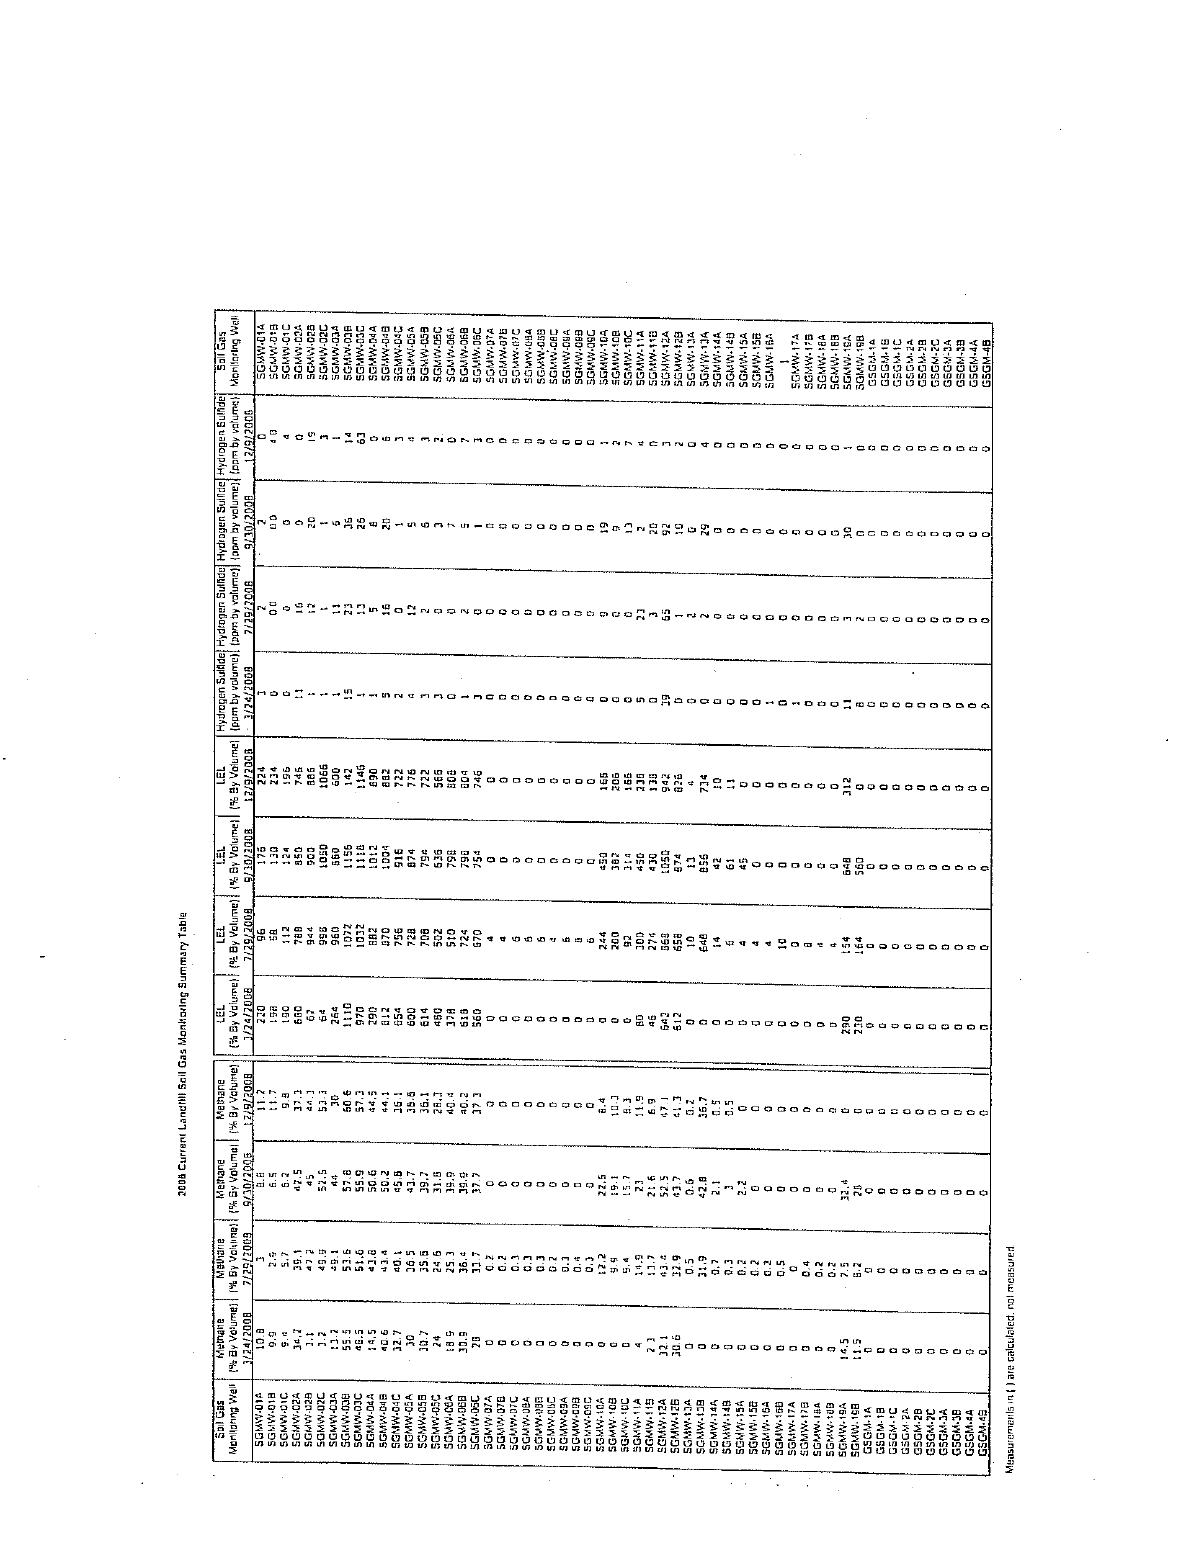
The results of the soil-gas monitoring for 2009 are summarized in Table 12. Appendix A contains
the field notes recorded during the sampling events. Instrument measurements show that methane
continues to be generated in several areas of the landfill. The percent of the LEL is elevated along
the western side and the southeast boundary of the Current Landfill. In addition, one point, SGM-19,
along the northern side of the Current Landfill had elevated LEL readings. These levels have
remained stable since 1996 when monitoring began and the current gas venting system appears to be
controlling gas accumulation. These data are consistent with previous years (see Appendix C).
Outpost wells, GSGM-1 to GSGM-4, located along the south side of Brookhaven Avenue showed no
methane during 2009, indicating that the methane accumulation and migration does not extend to
this area. Should methane extend to these outpost wells on the south side of Brookhaven Avenue,
active measures will be required to control its migration.
Hydrogen sulfide is a product of anaerobic decay in landfills and can produce an odor like rotten
eggs. It is a nuisance, but rarely a toxicity problem. For reference, the National Institute of
Occupational Safety and Health sets an exposure limit of 10 parts per million (ppm) hydrogen
sulfide in the breathing zone for an 8-hour period.
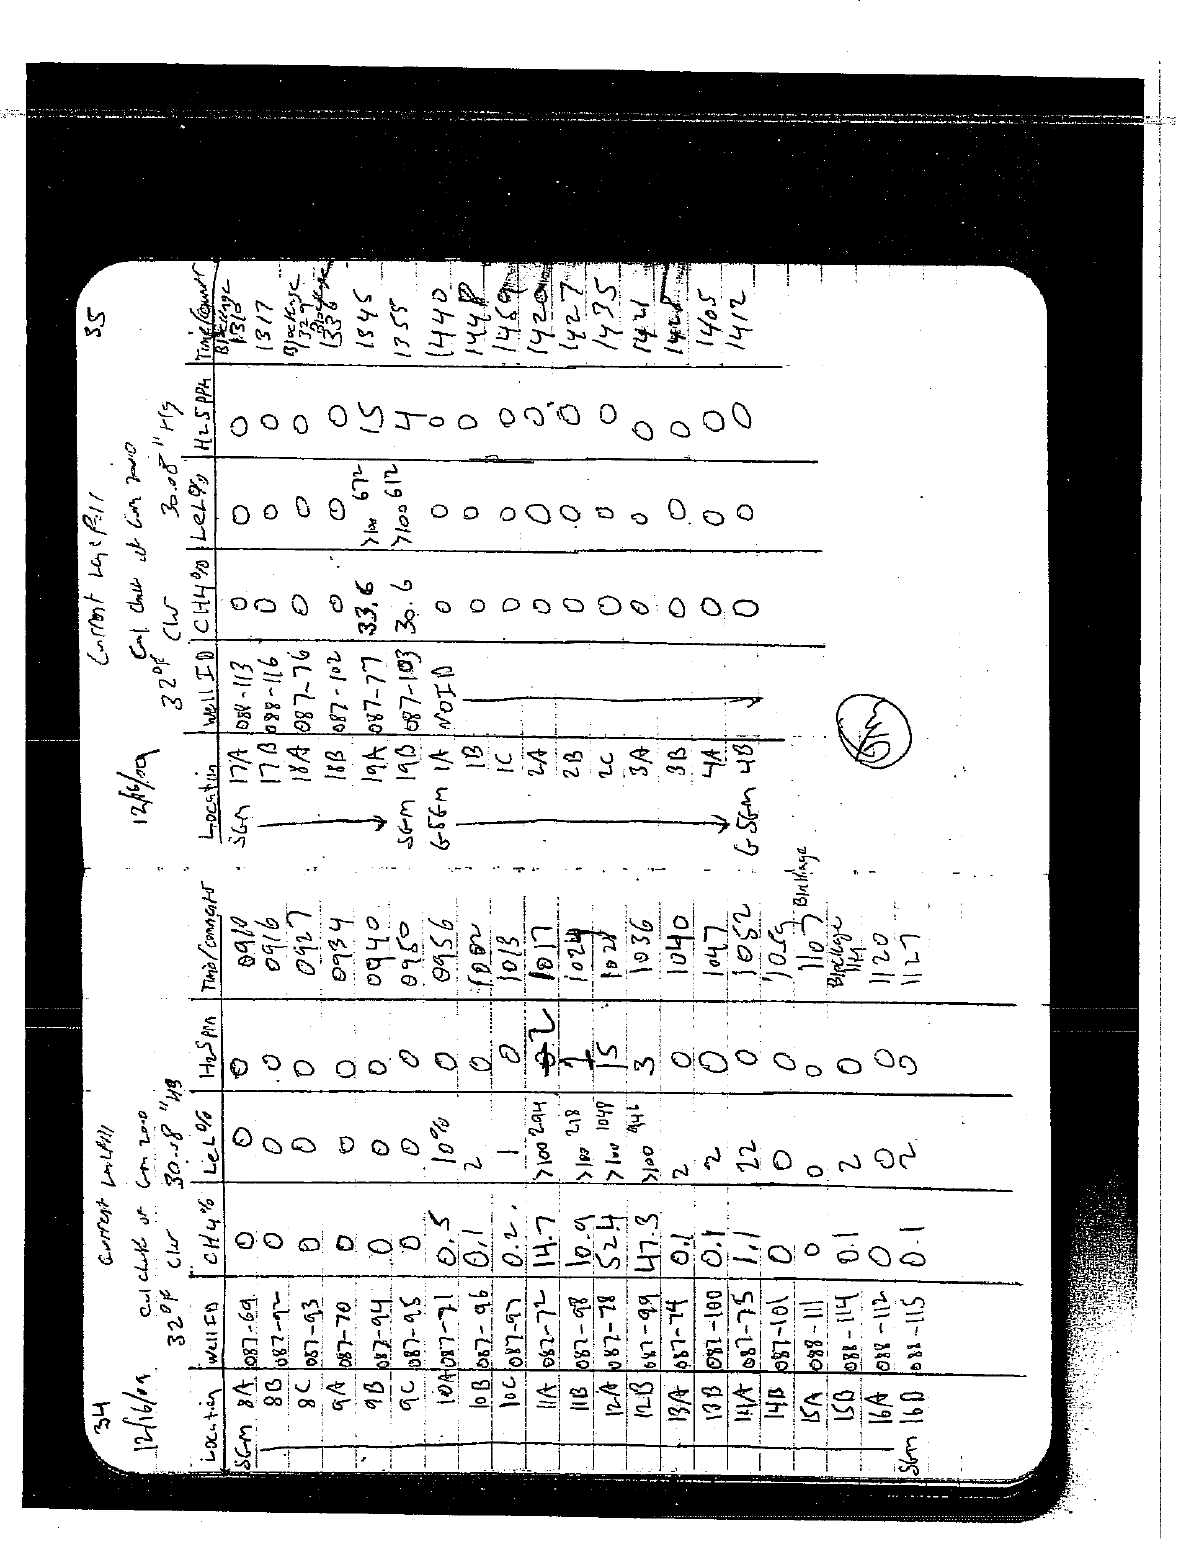
Hydrogen sulfide measurements collected from the soil-gas monitoring wells ranged from 0 ppm to
72 ppm. Well SGM-12A located near the south-eastern section of the landfill, had the highest
hydrogen-sulfide concentration, which was above the 10 ppm exposure limit; however it was taken
from a vapor point screened 2.5 - 7.5 ft below the surface and not from the ambient breathing zone.
Like methane, receptors to hydrogen sulfide are considered to be in areas such as basements where
T:\LTRA\Landfills\2009 Report\Text\2009_text_v1.doc 17
the gas can accumulate. Based upon the readings obtained from the outpost soil-gas wells along the
south side of Brookhaven Avenue (GSGM-1 – GSGM-4), there is no evidence that hydrogen sulfide
is migrating toward the National Weather Service building.
4.2.1.1 Trend in Soil-Gas Data
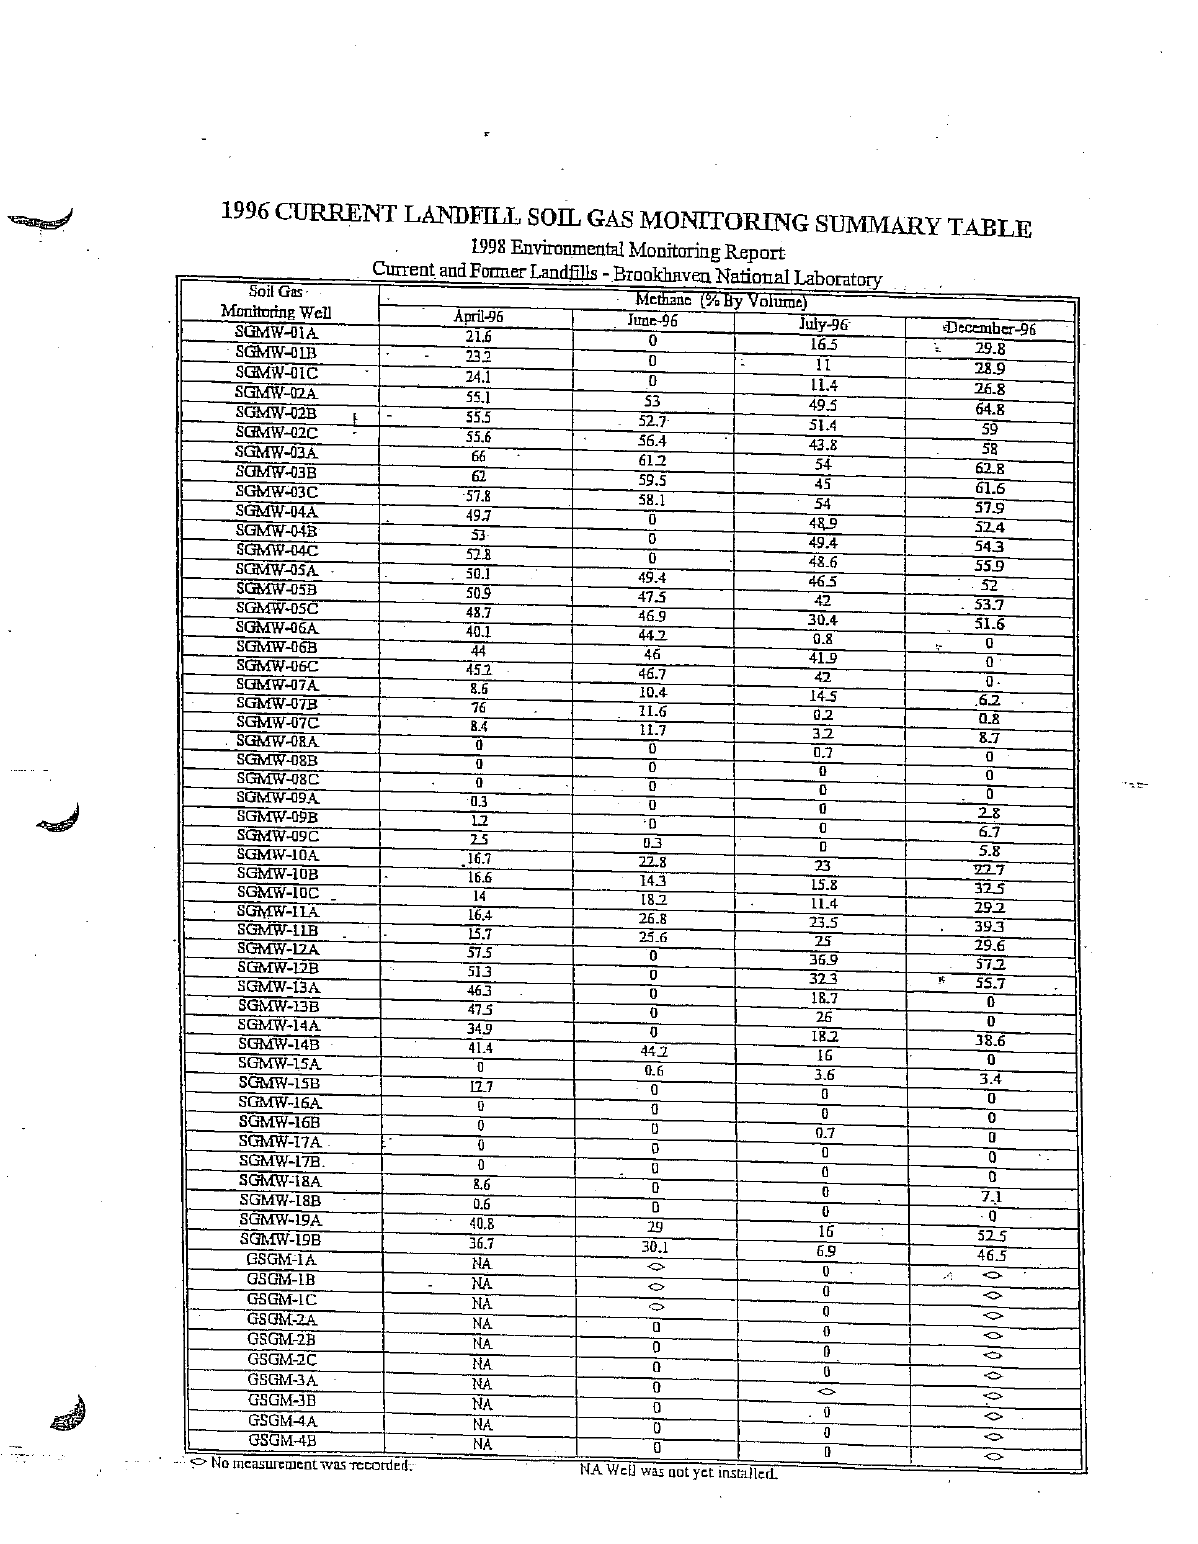
Appendix C contains the results of methane monitoring for the Current Landfill from 1996 through
2008. Generally the levels of methane and hydrogen sulfide in the wells along the northwest landfill
boundary and southeast corner have remained stable.
4.2.2 Former Landfill Area
A total of 12 soil-gas monitoring well clusters are positioned around the Former Landfill Area.
During 2009, the well clusters were monitored three times. The only existing operating facility
within the immediate vicinity of the Former Landfill Area is Building 670, located approximately
650 feet to the southeast. This building houses the Chemical/Animal Holes Sr-90 groundwater
treatment system. Because this facility does not have a basement, there is minimal potential for
hazardous levels of landfill gases to accumulate in this structure.
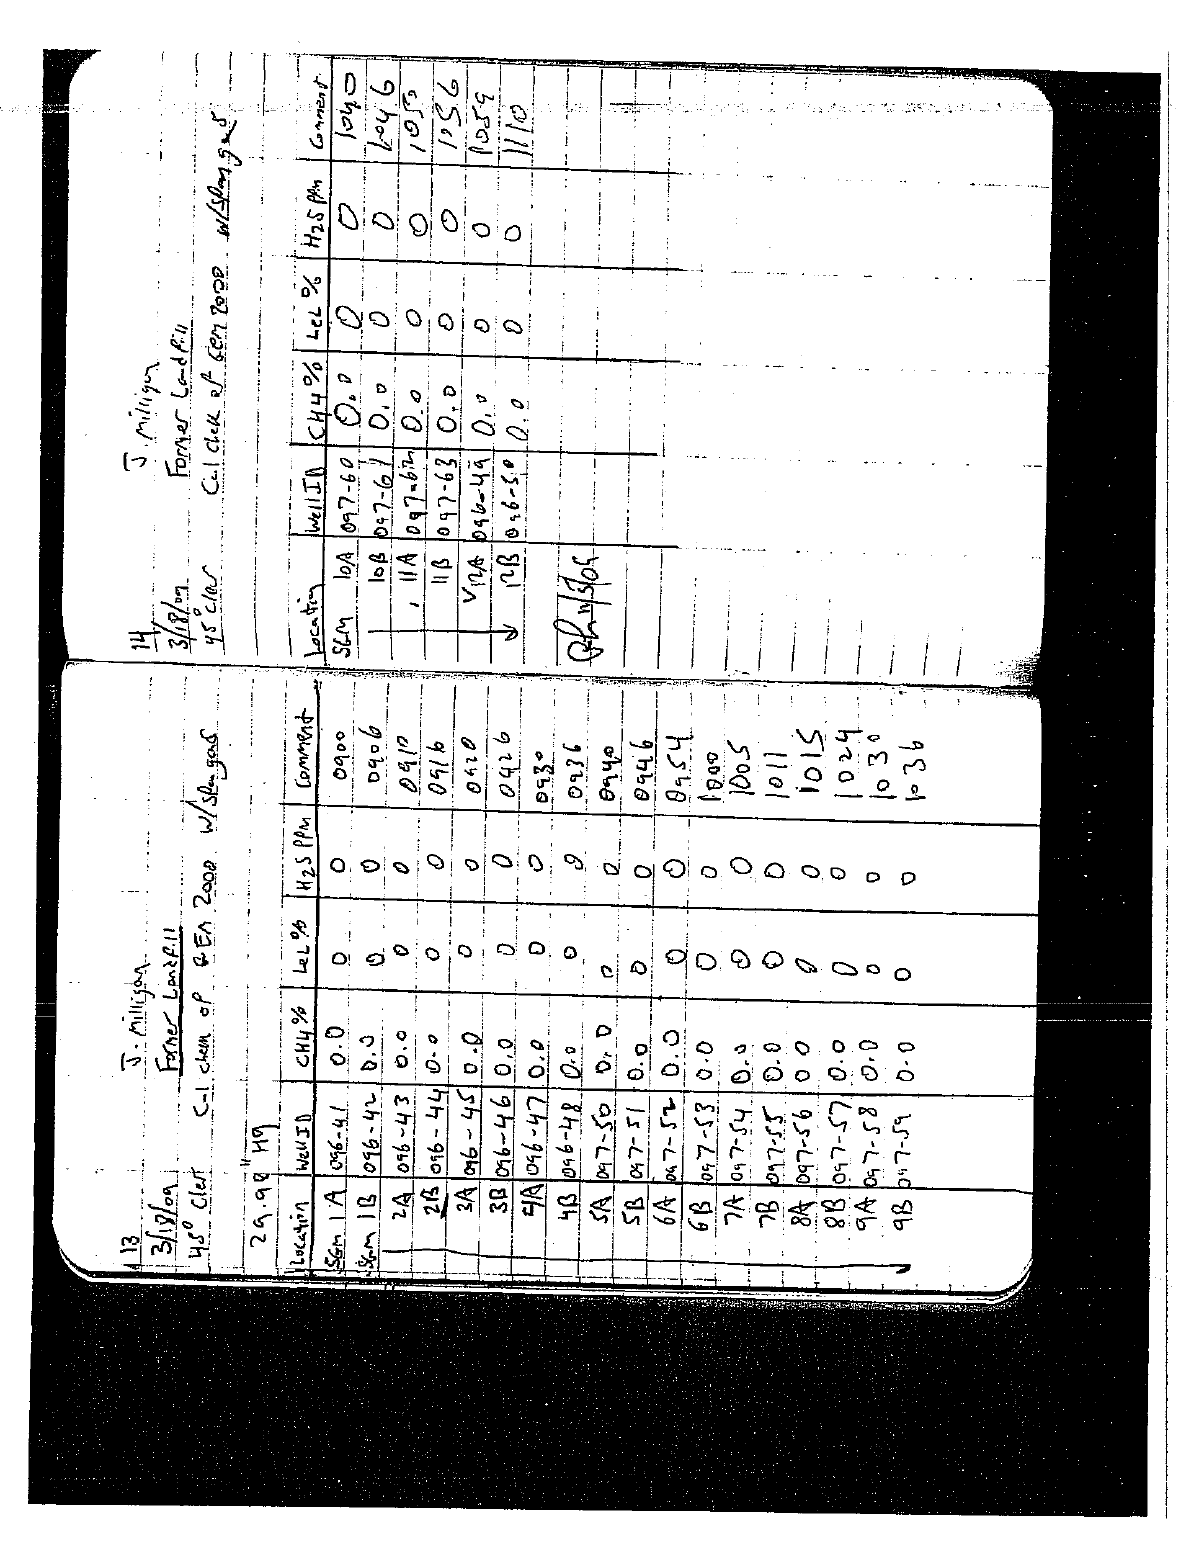
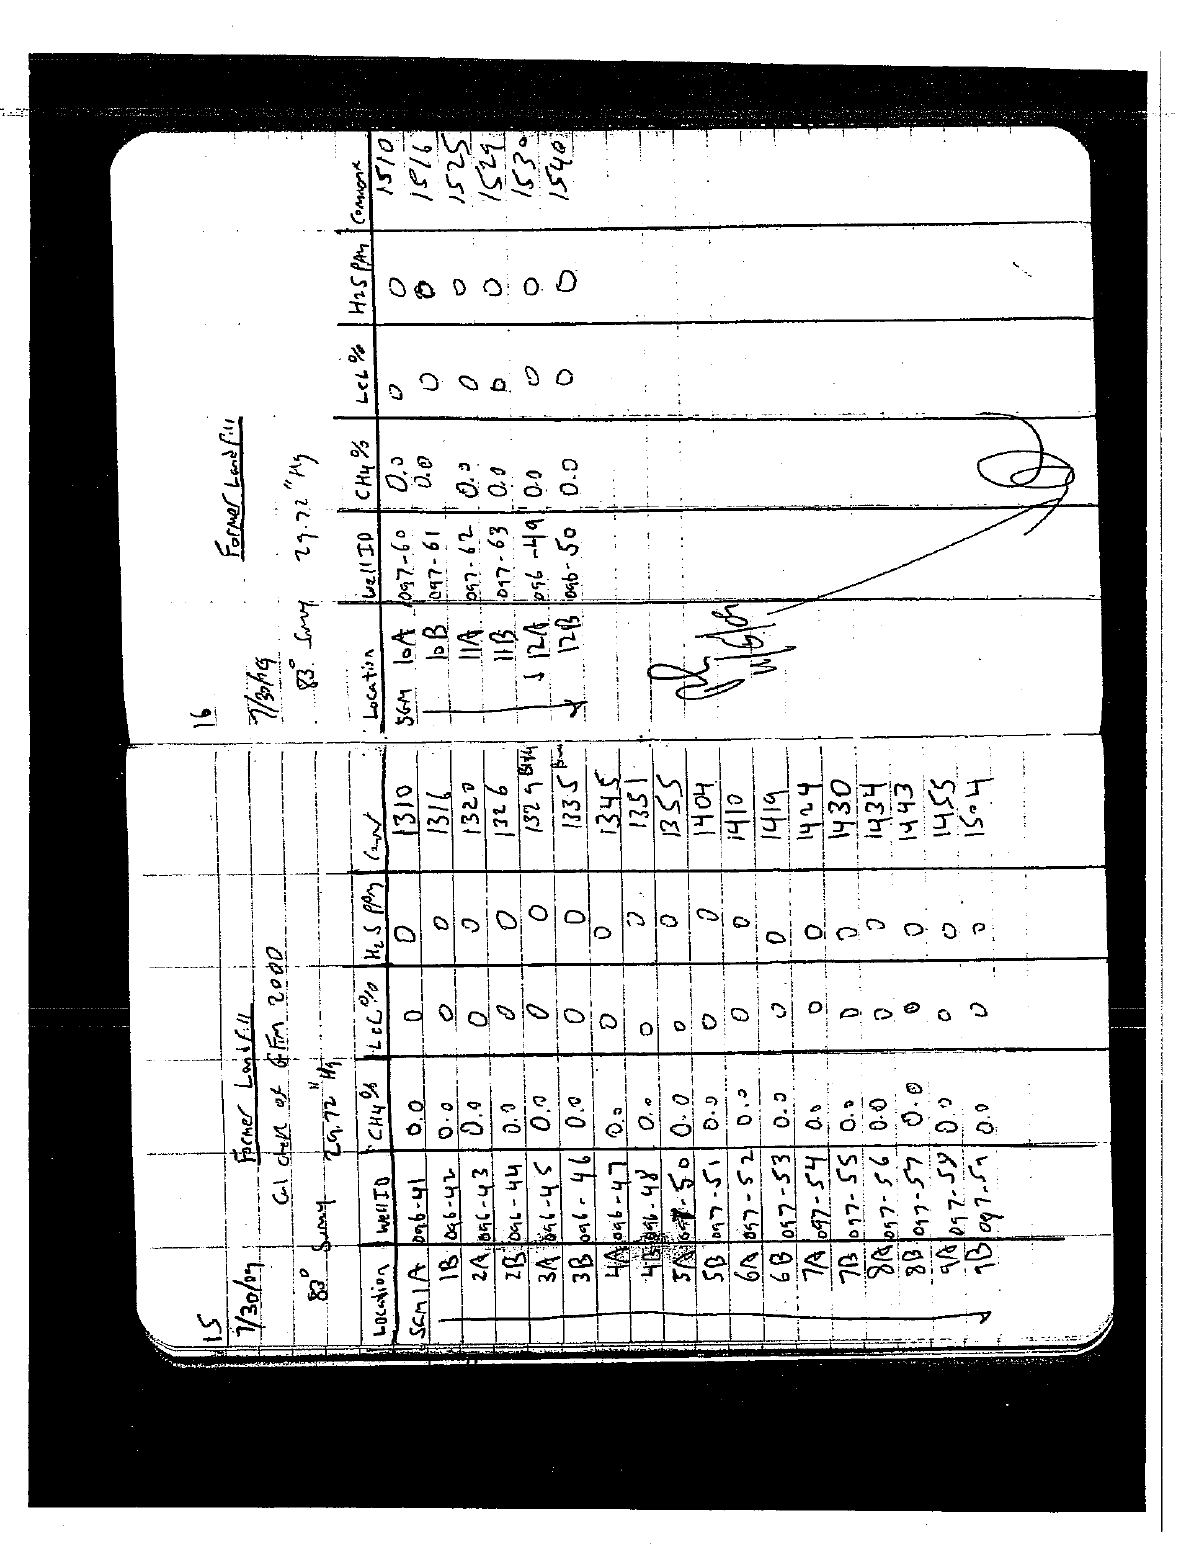
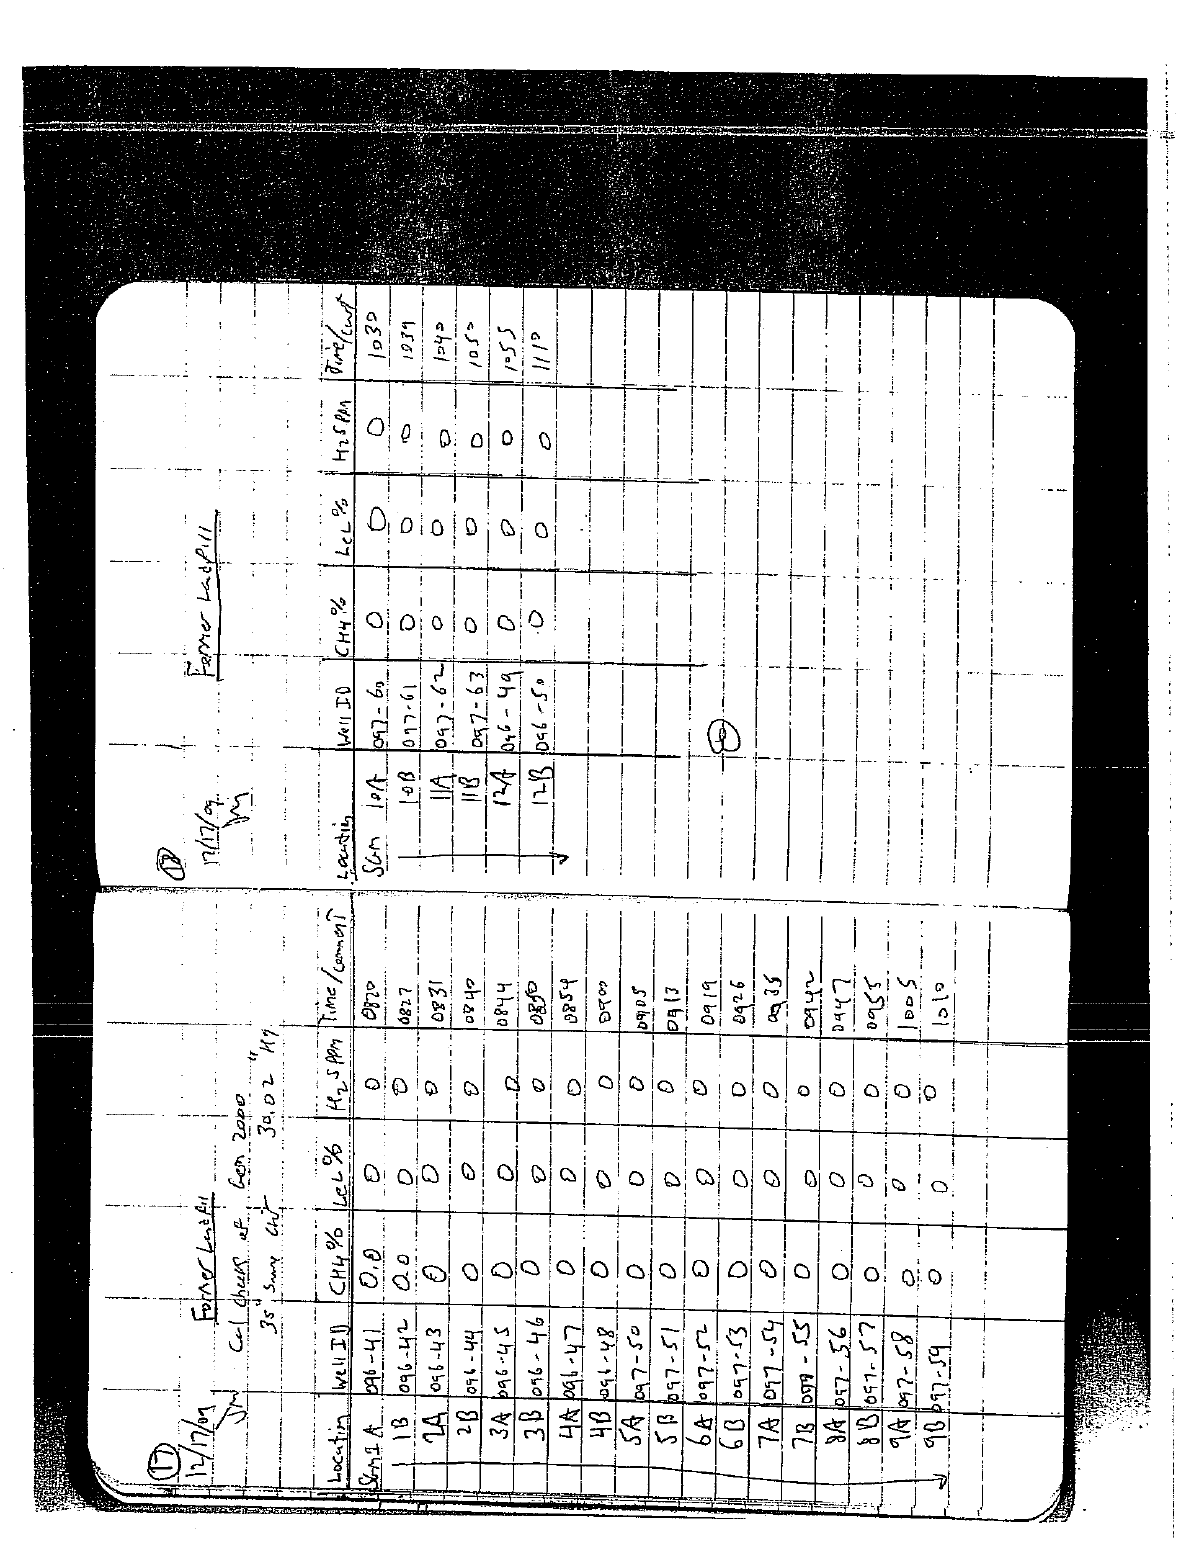
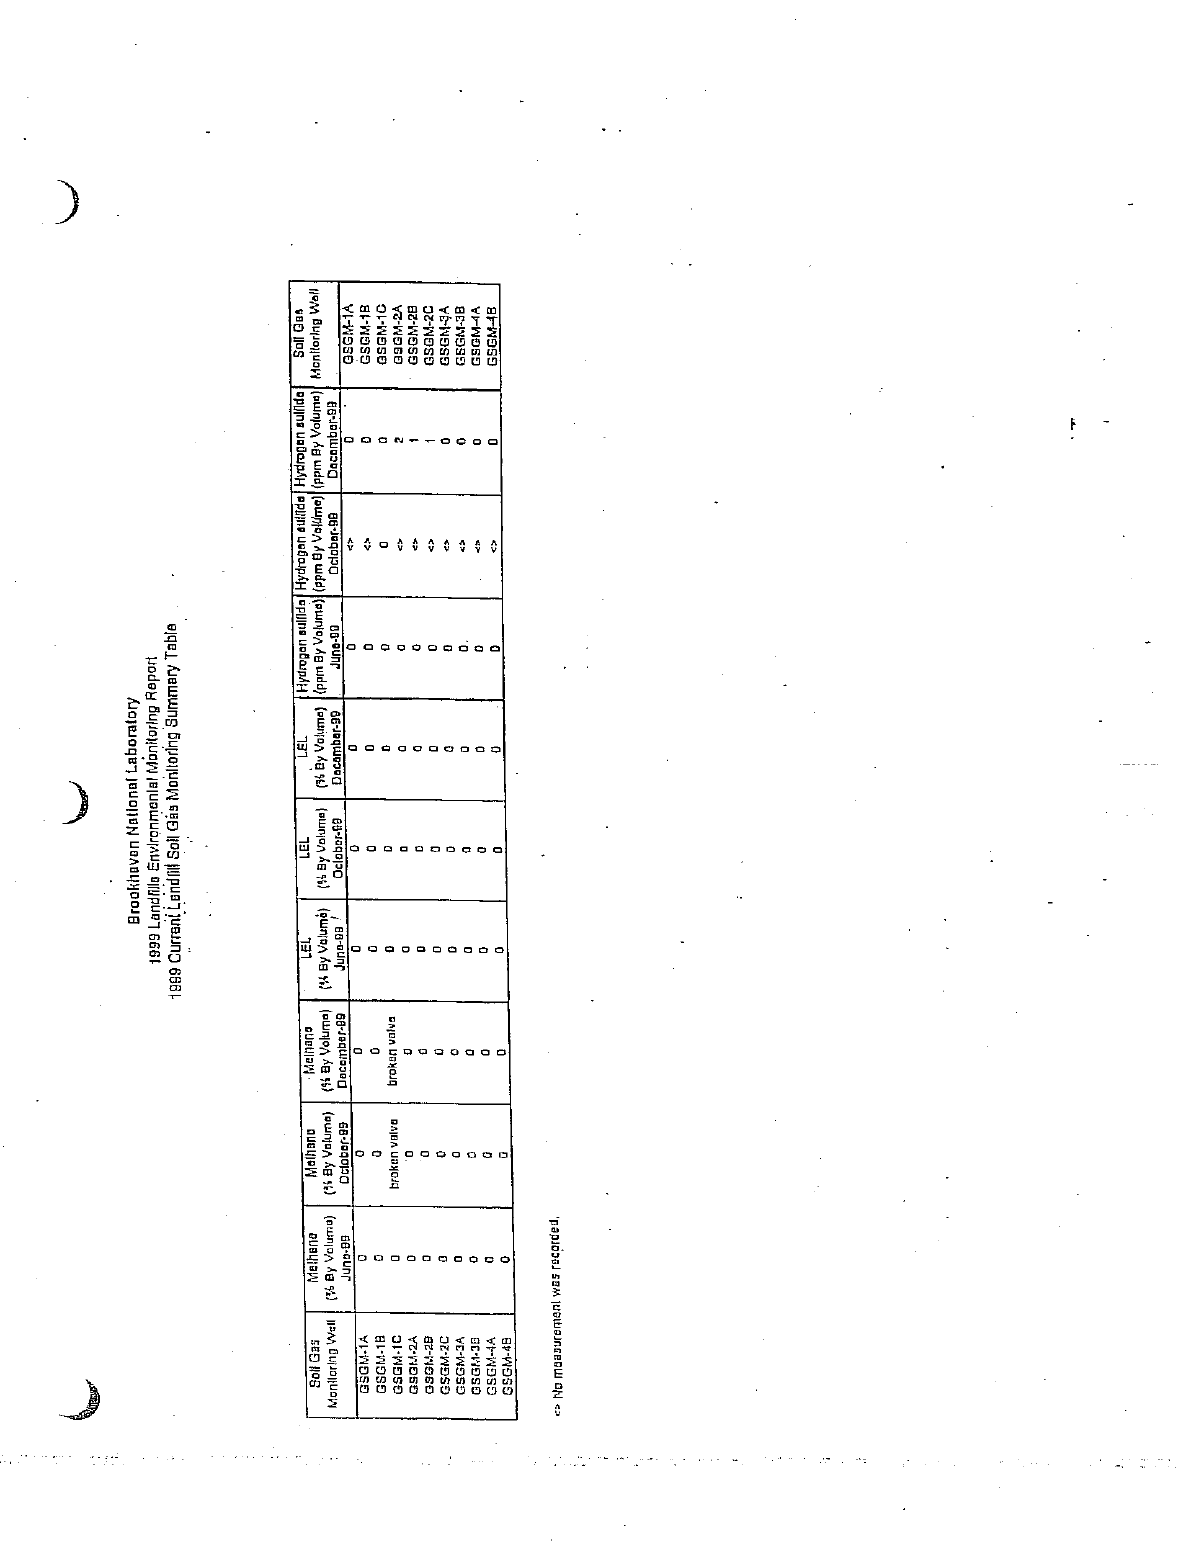
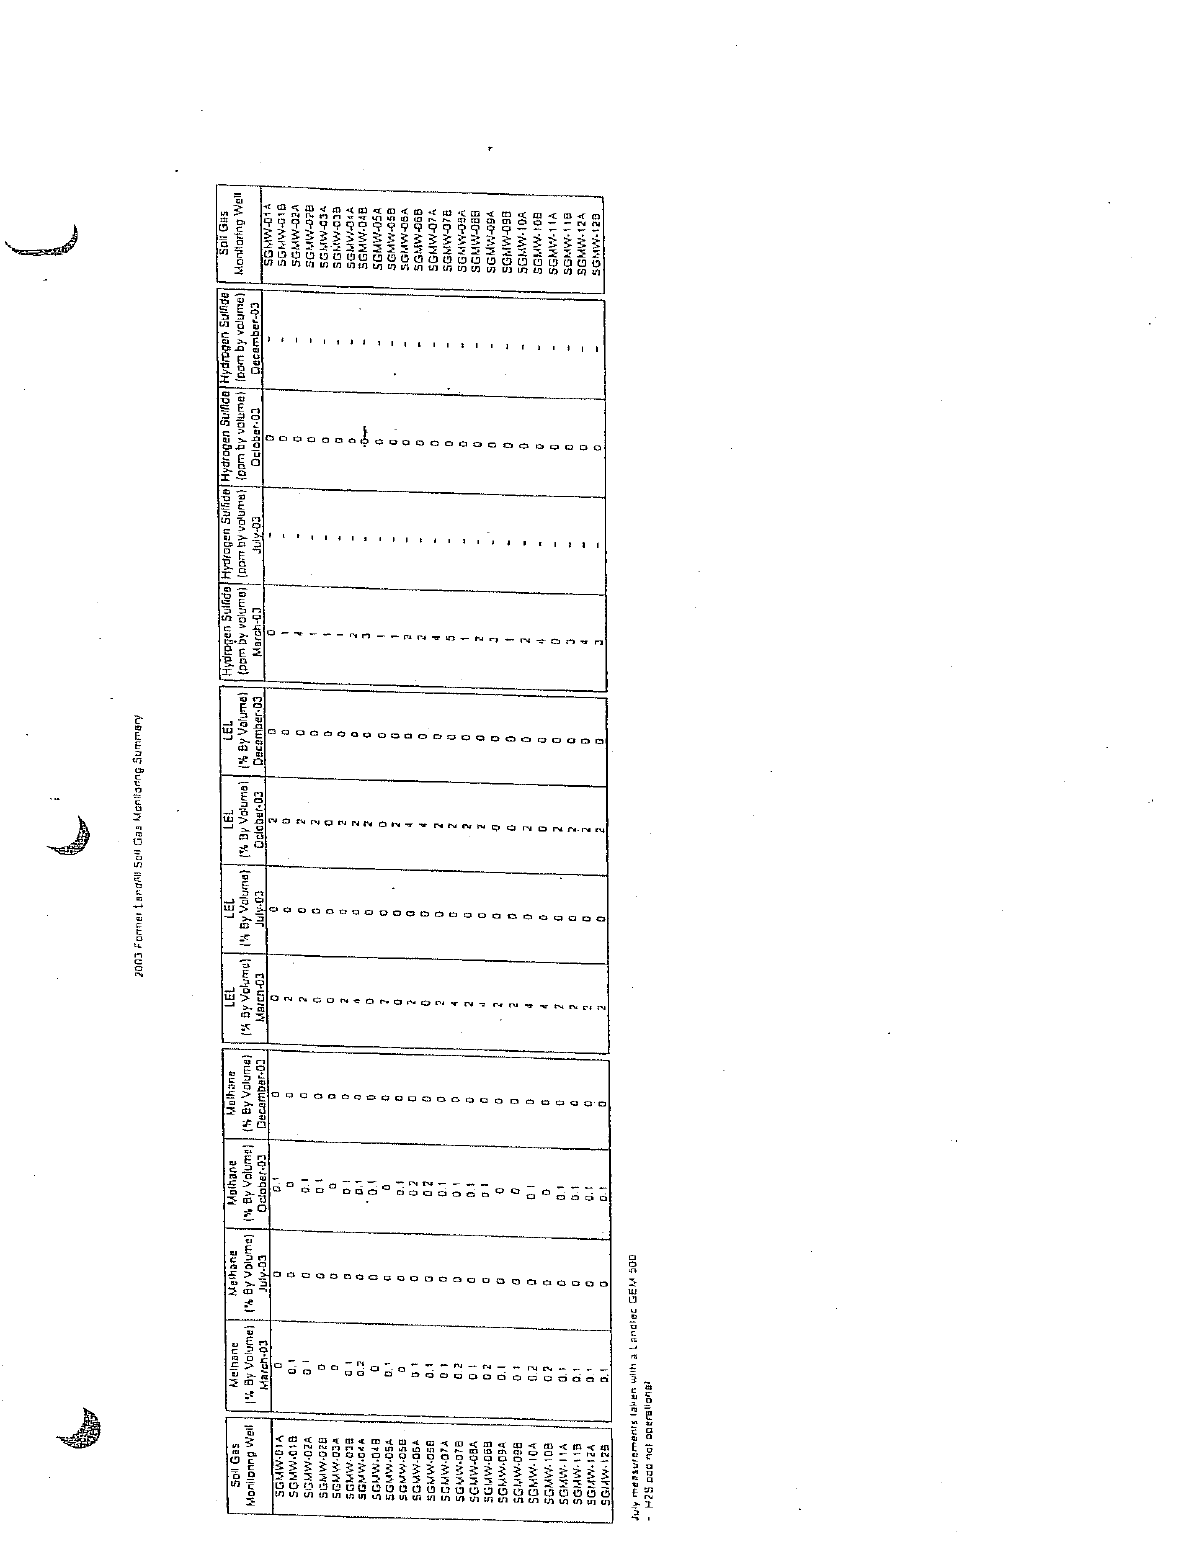
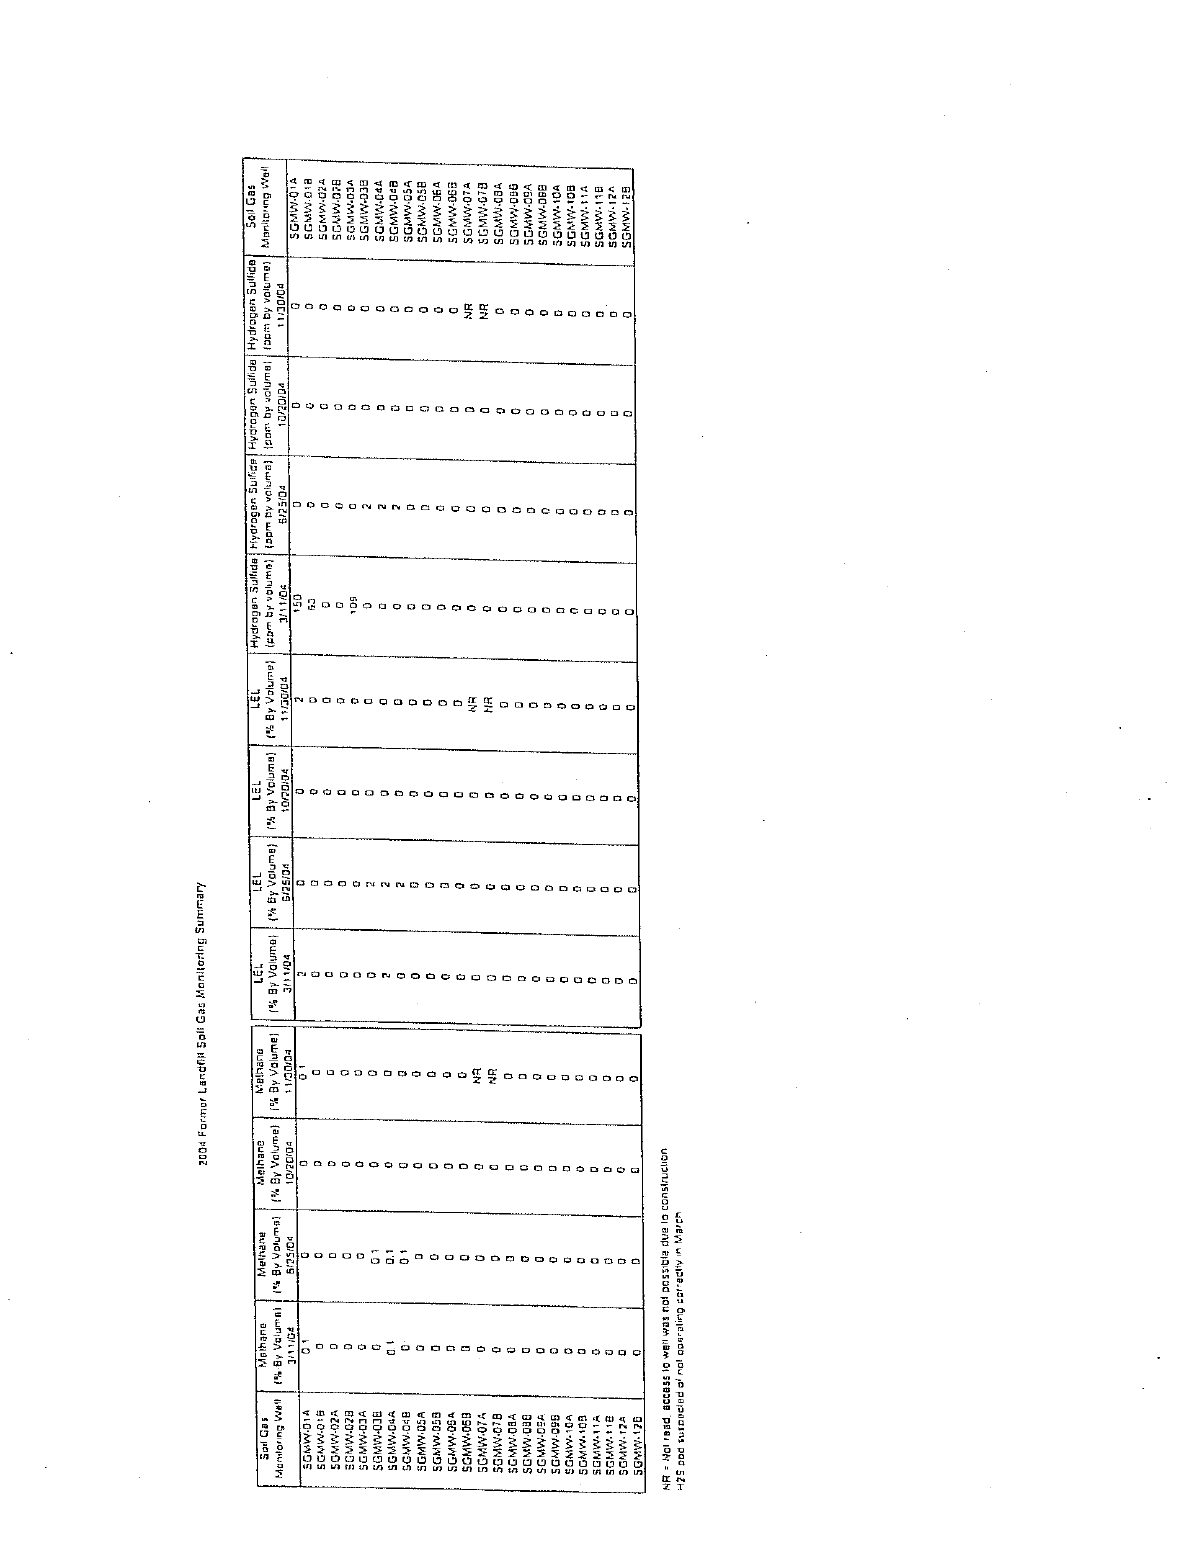
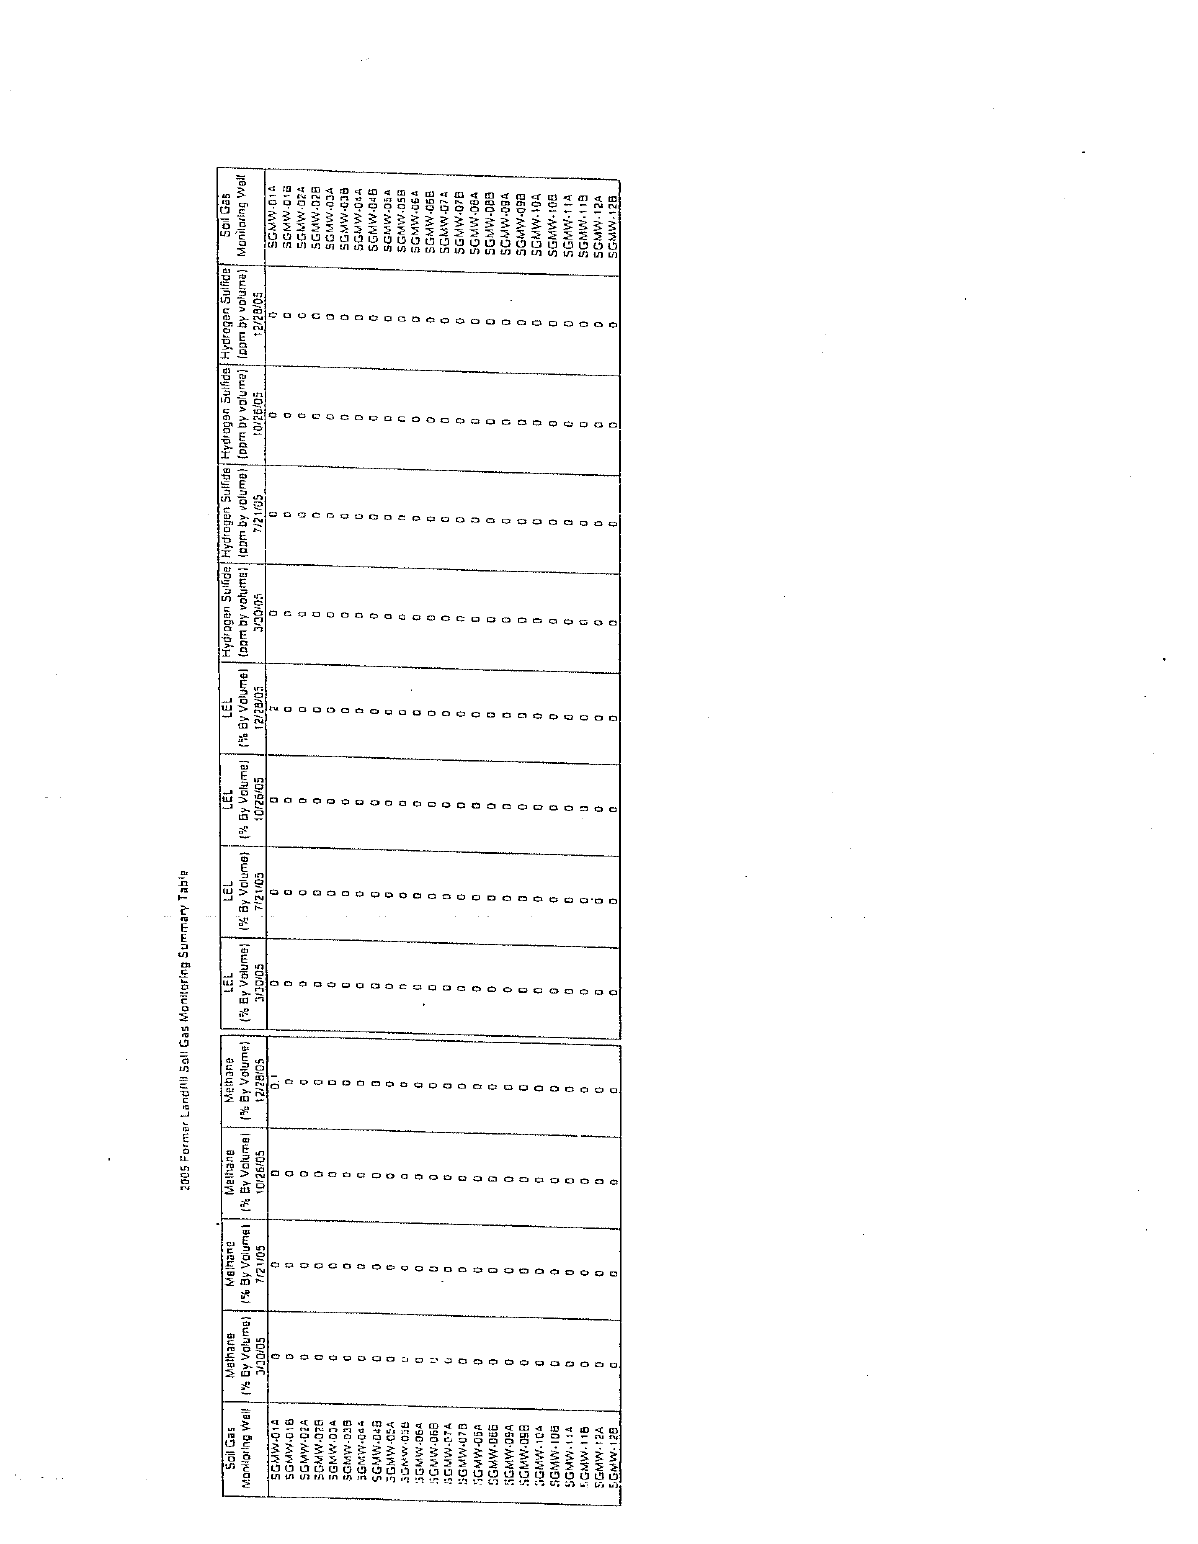
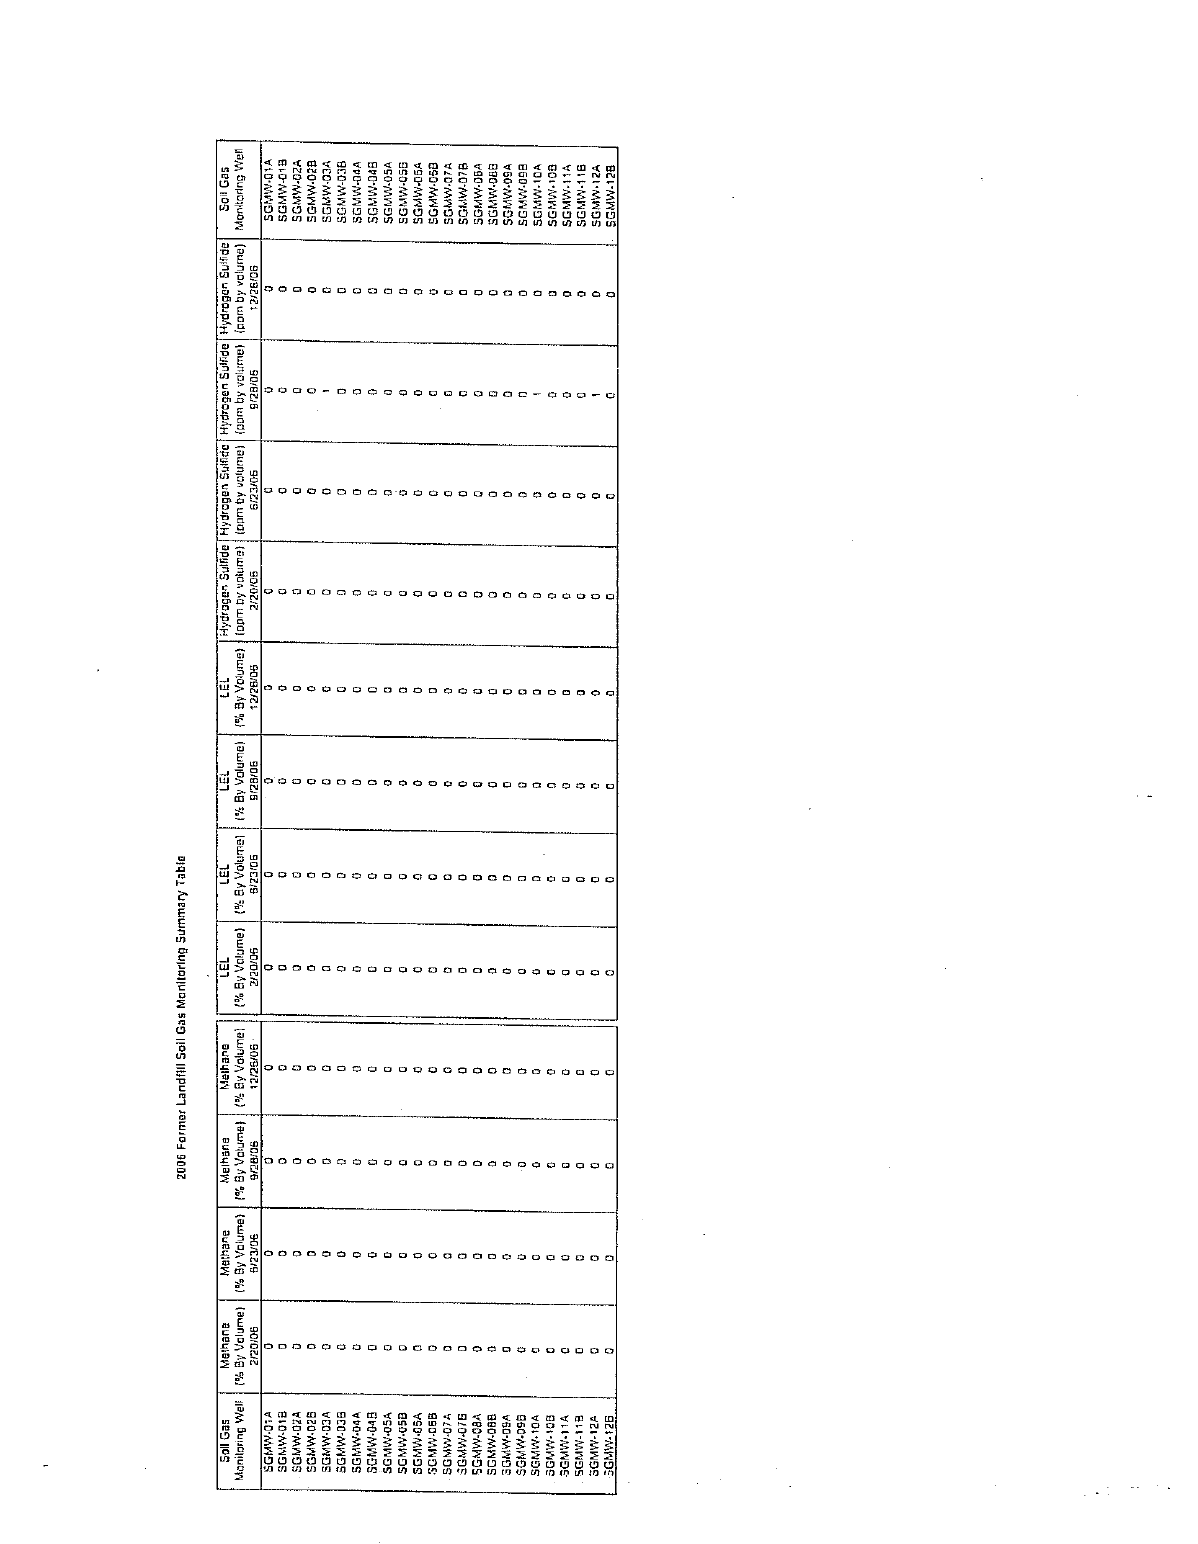
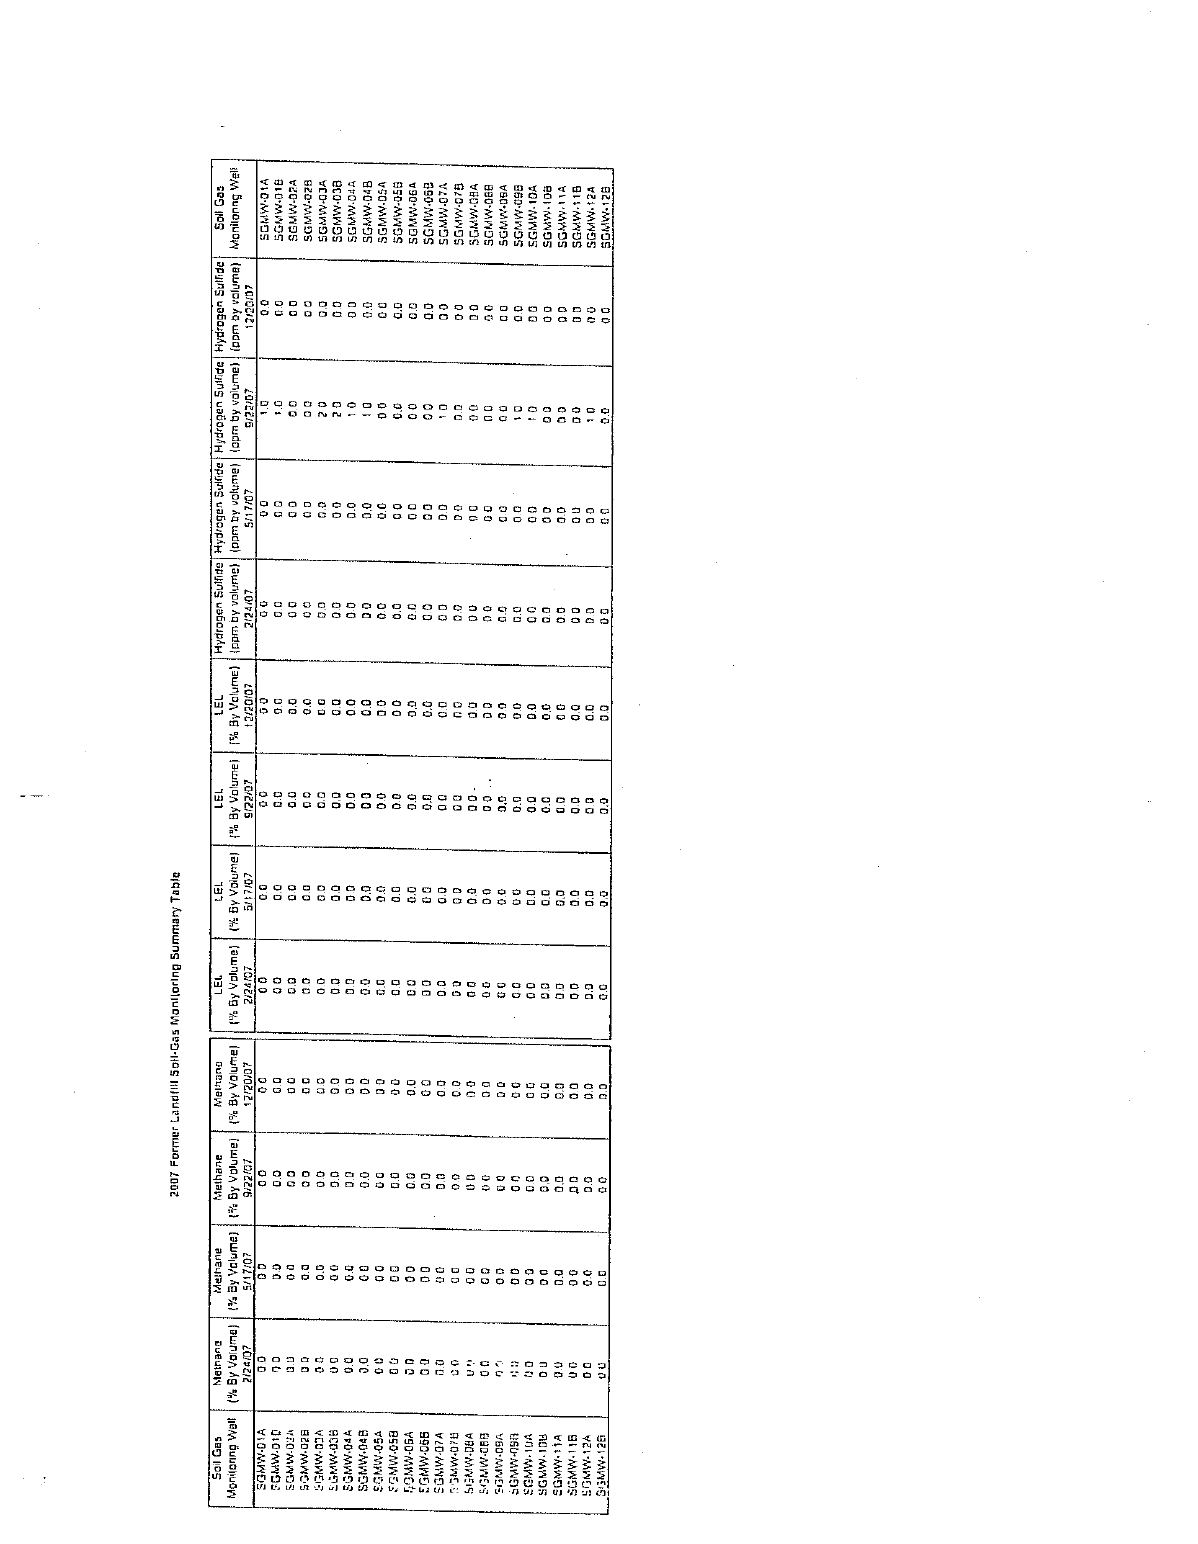
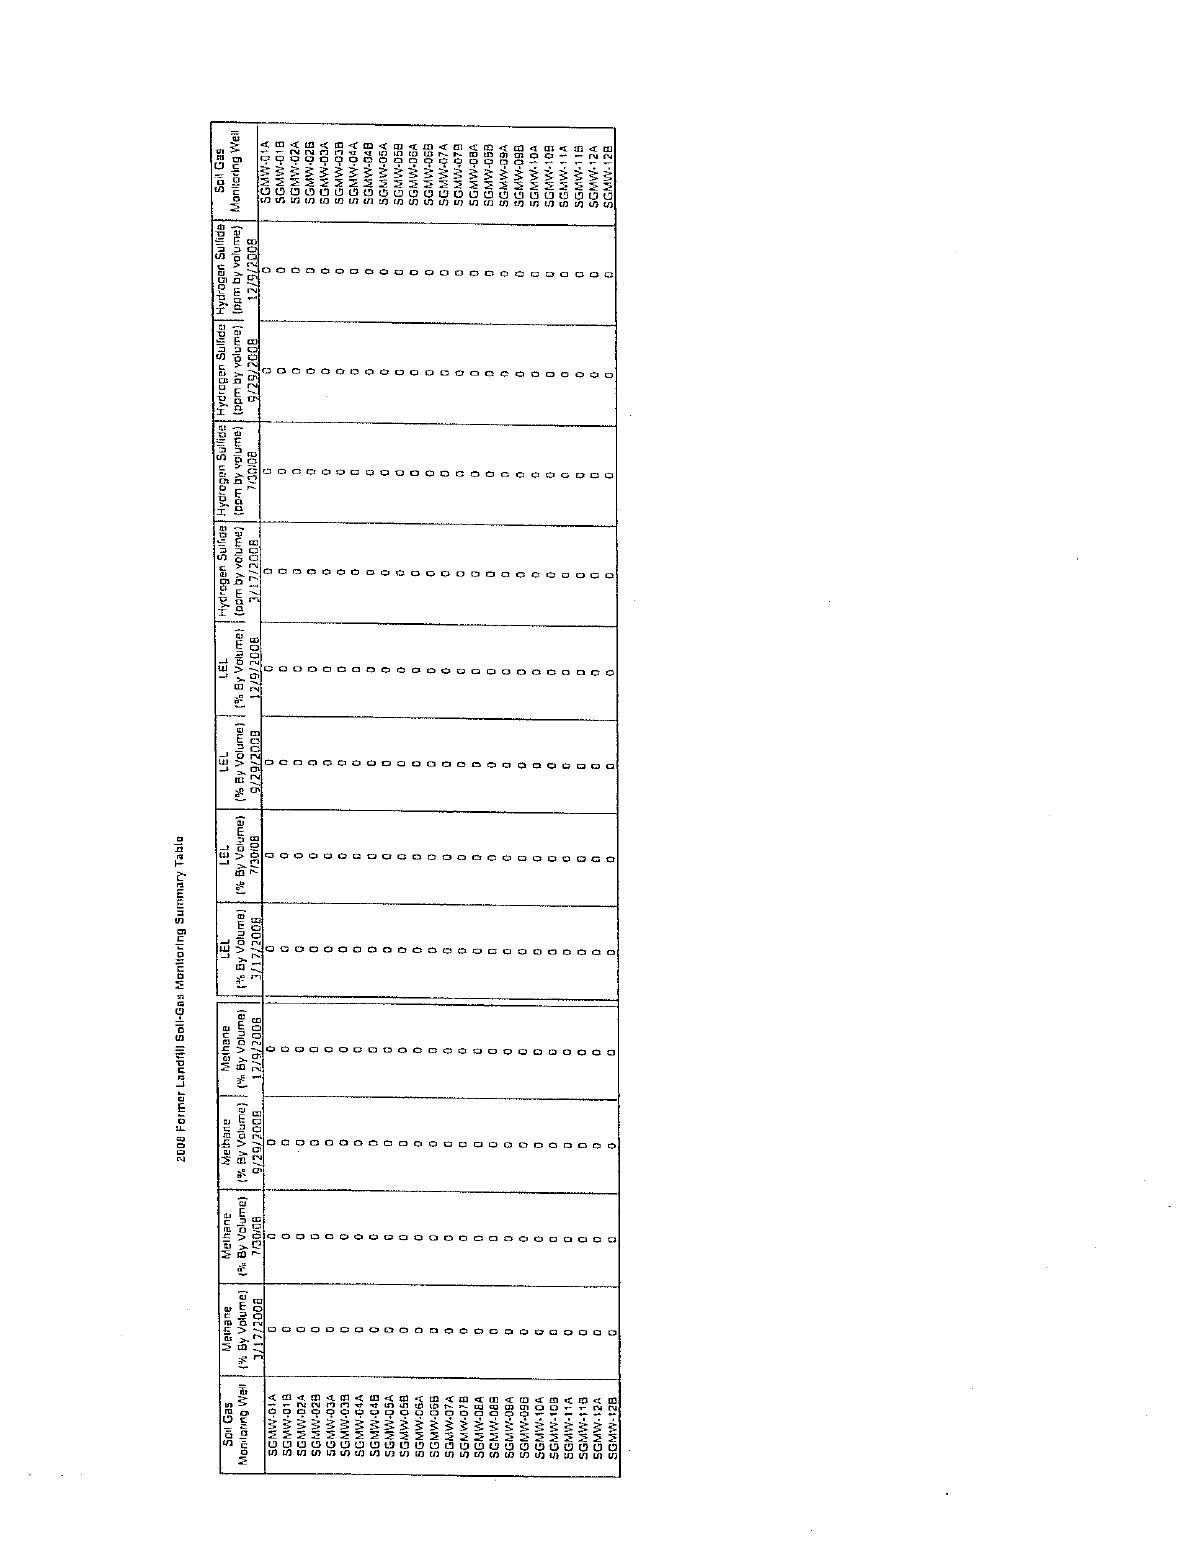
Based upon the three sampling events, there was no methane or hydrogen sulfide detected. Table 13
details the 2009 soil-gas monitoring results for the Former Landfill Area. Appendix A contains the
field notes recorded during the sampling events.
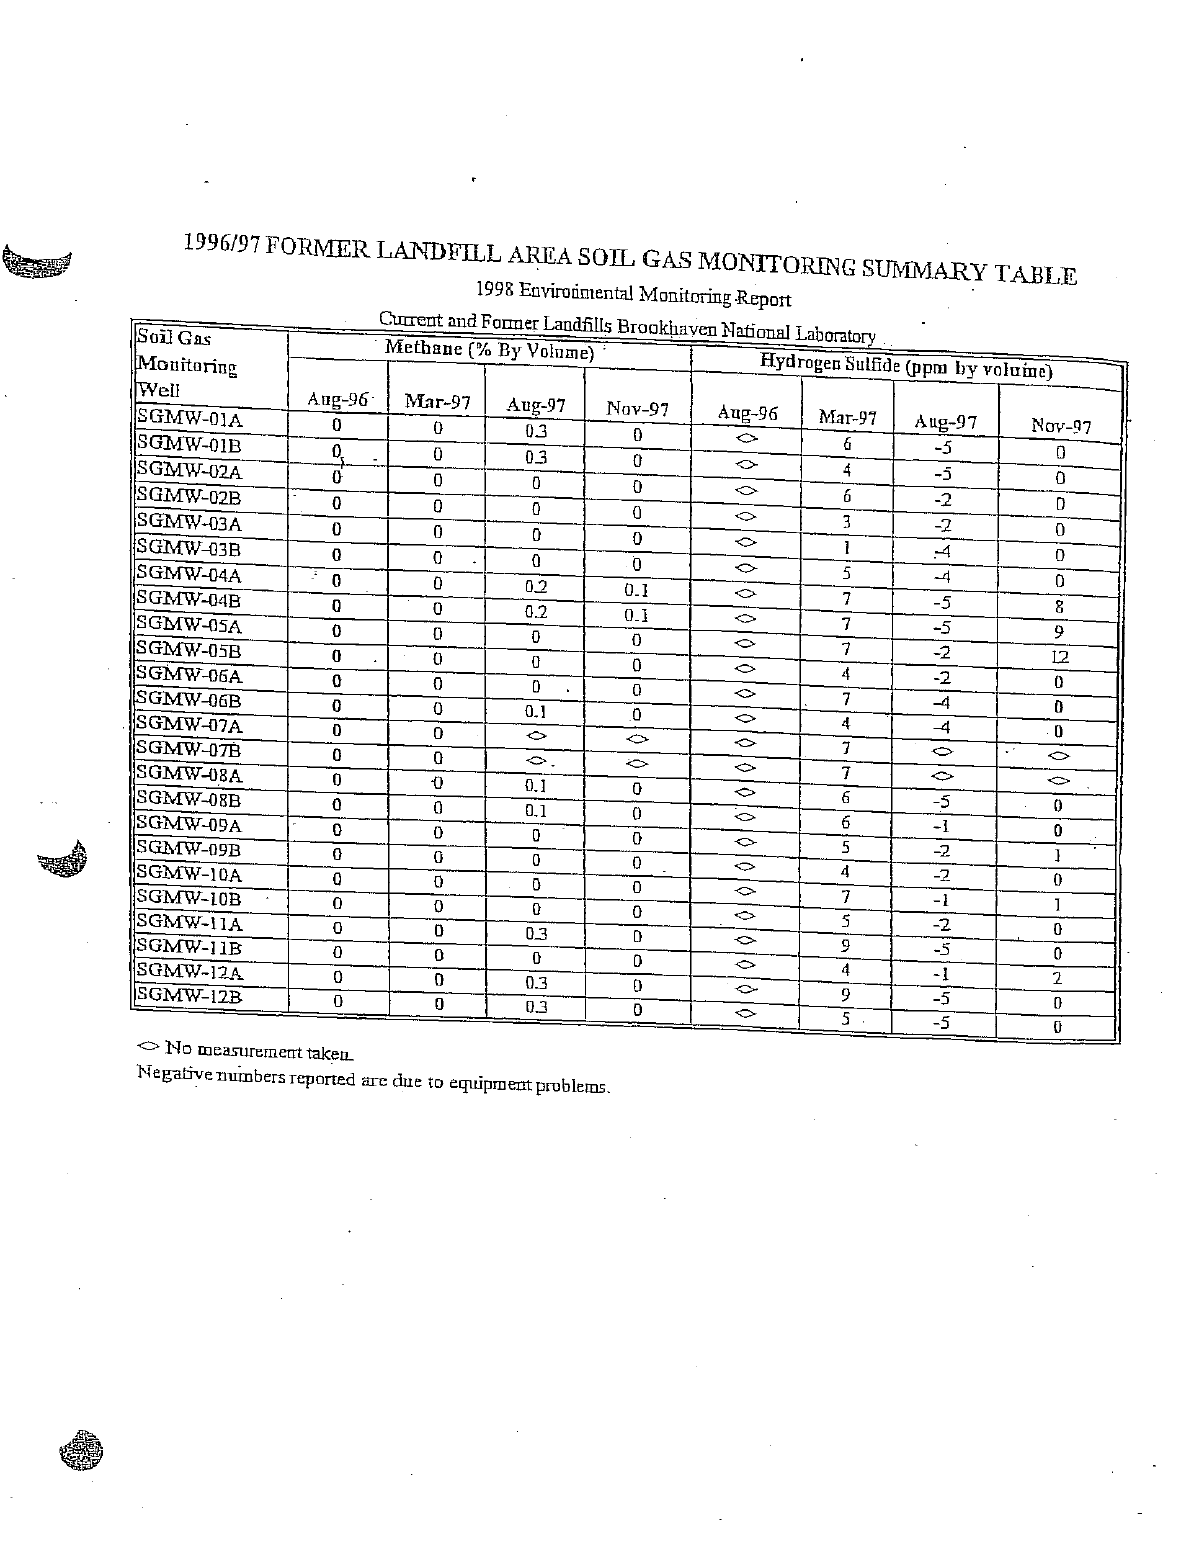
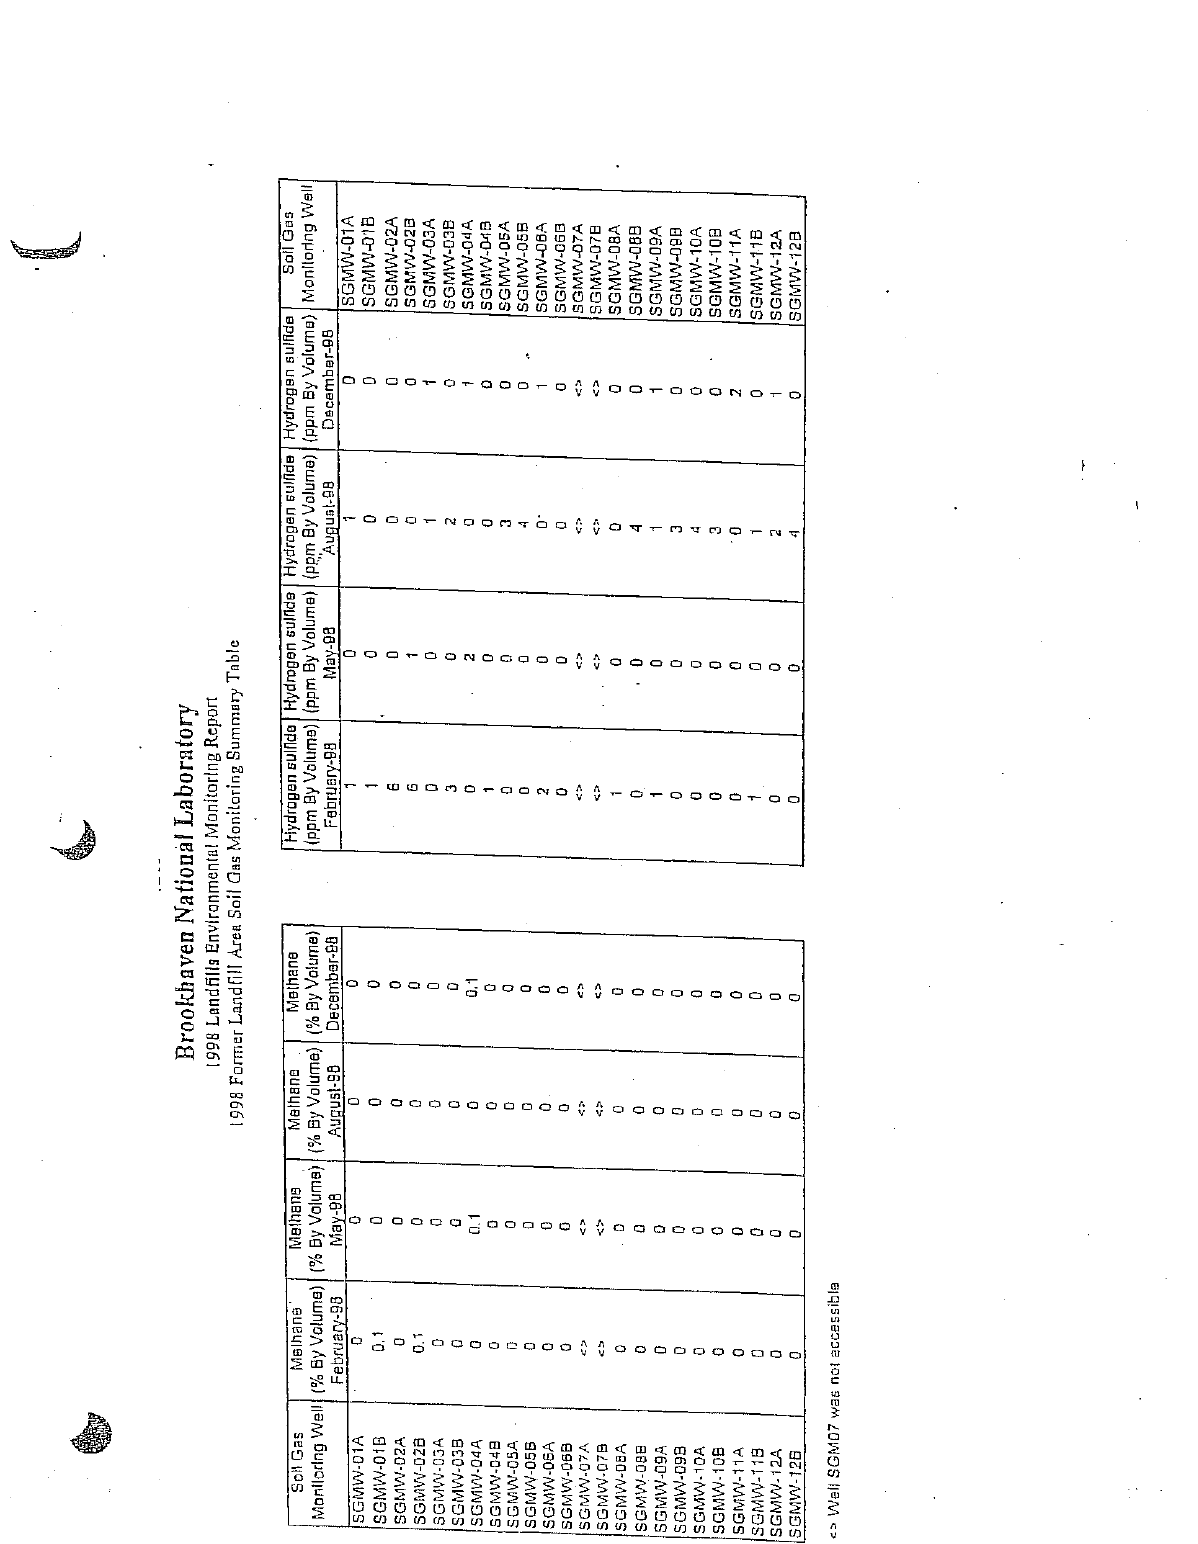
4.2.2.1 Trends in Soil-Gas Data
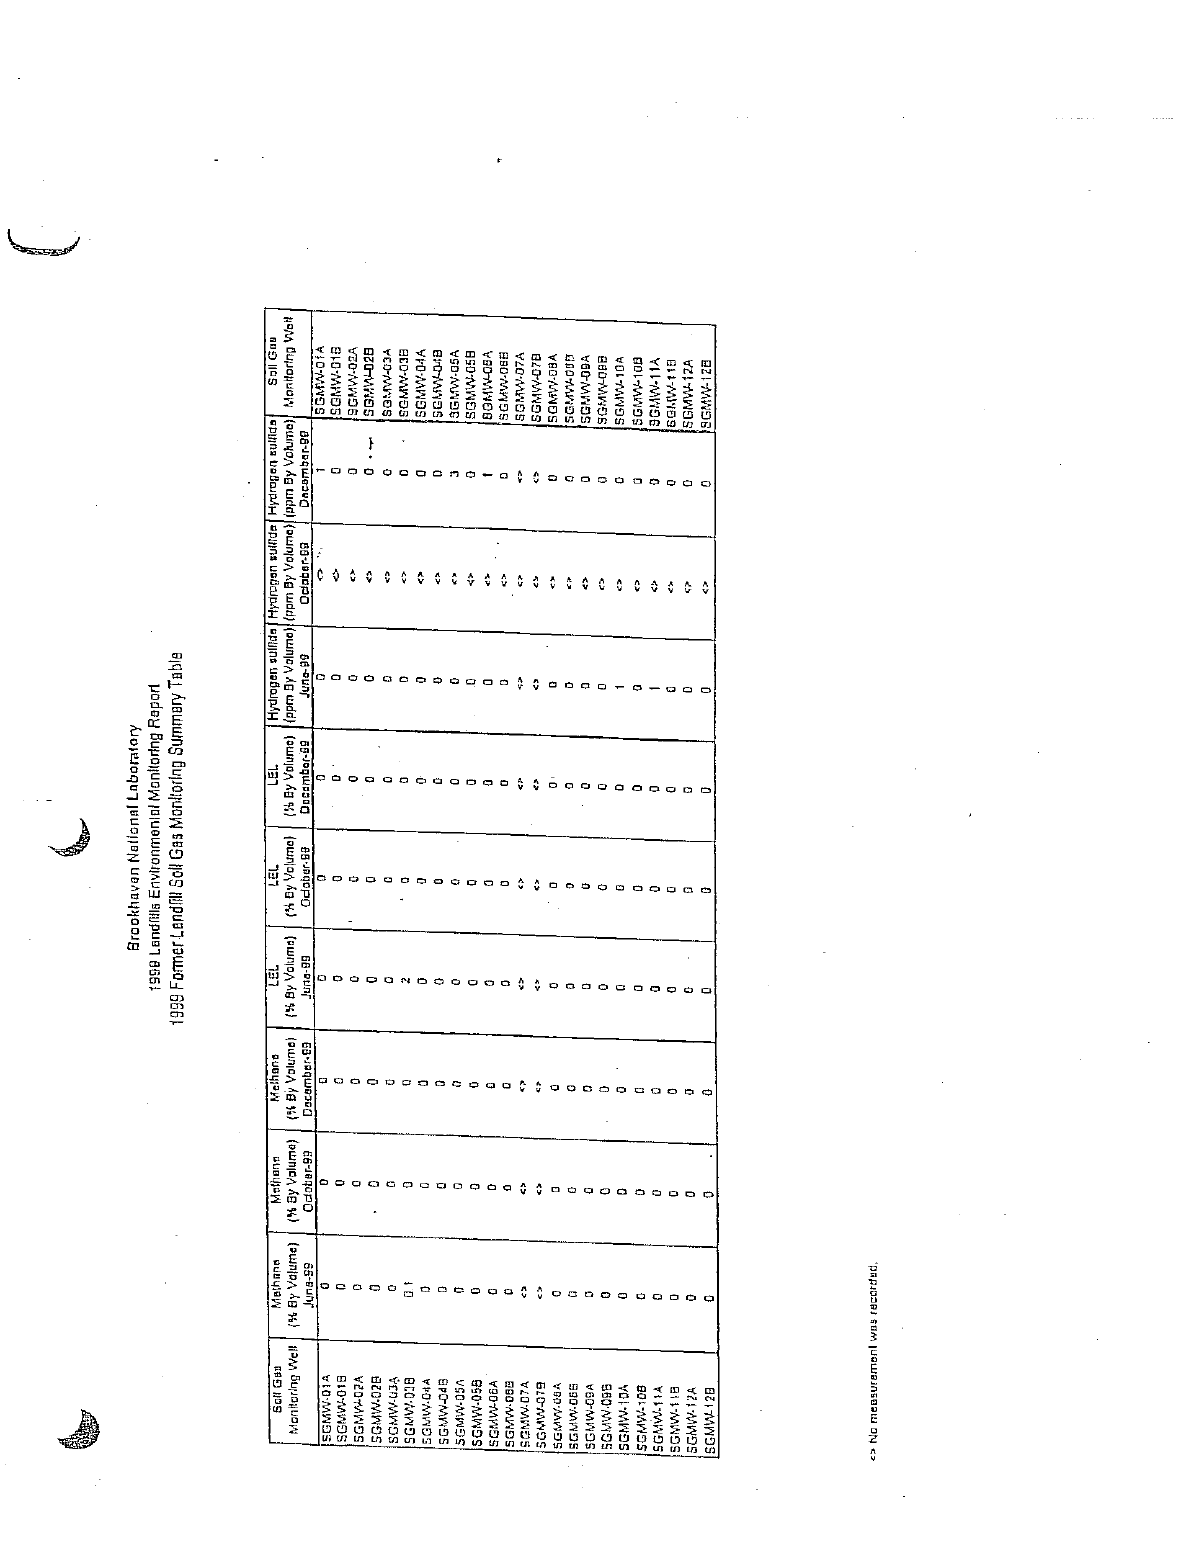
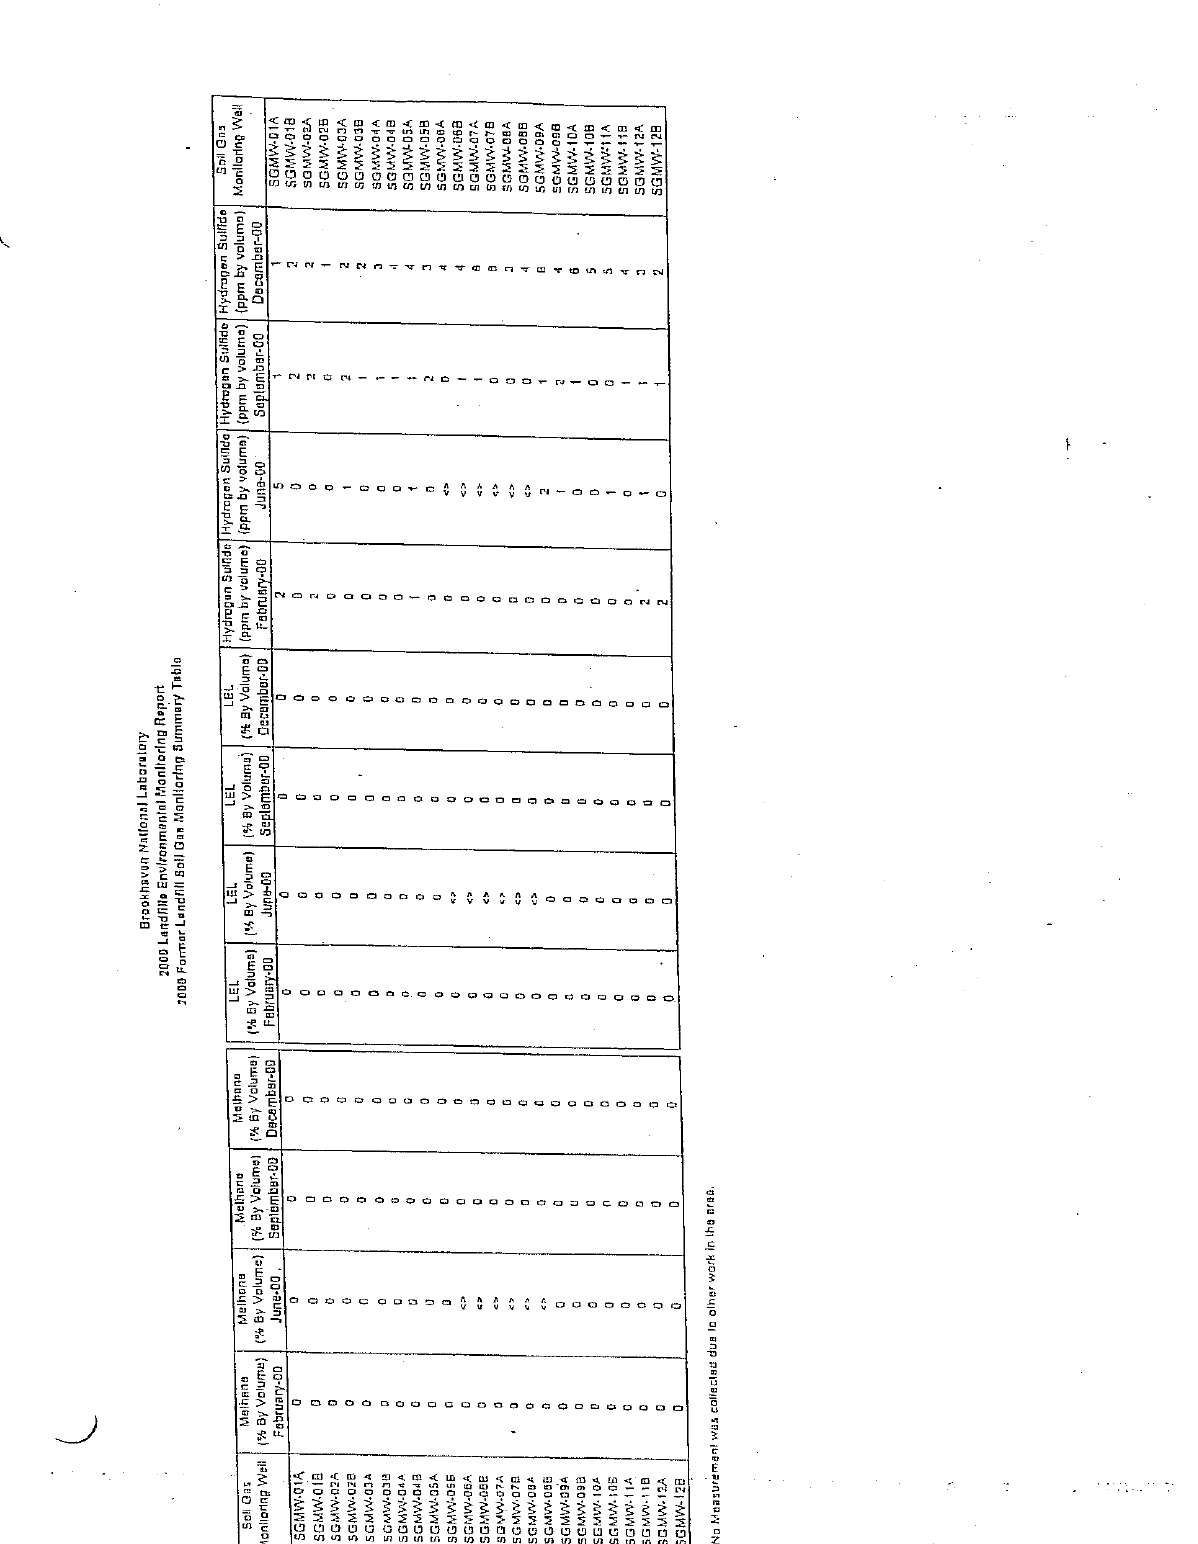
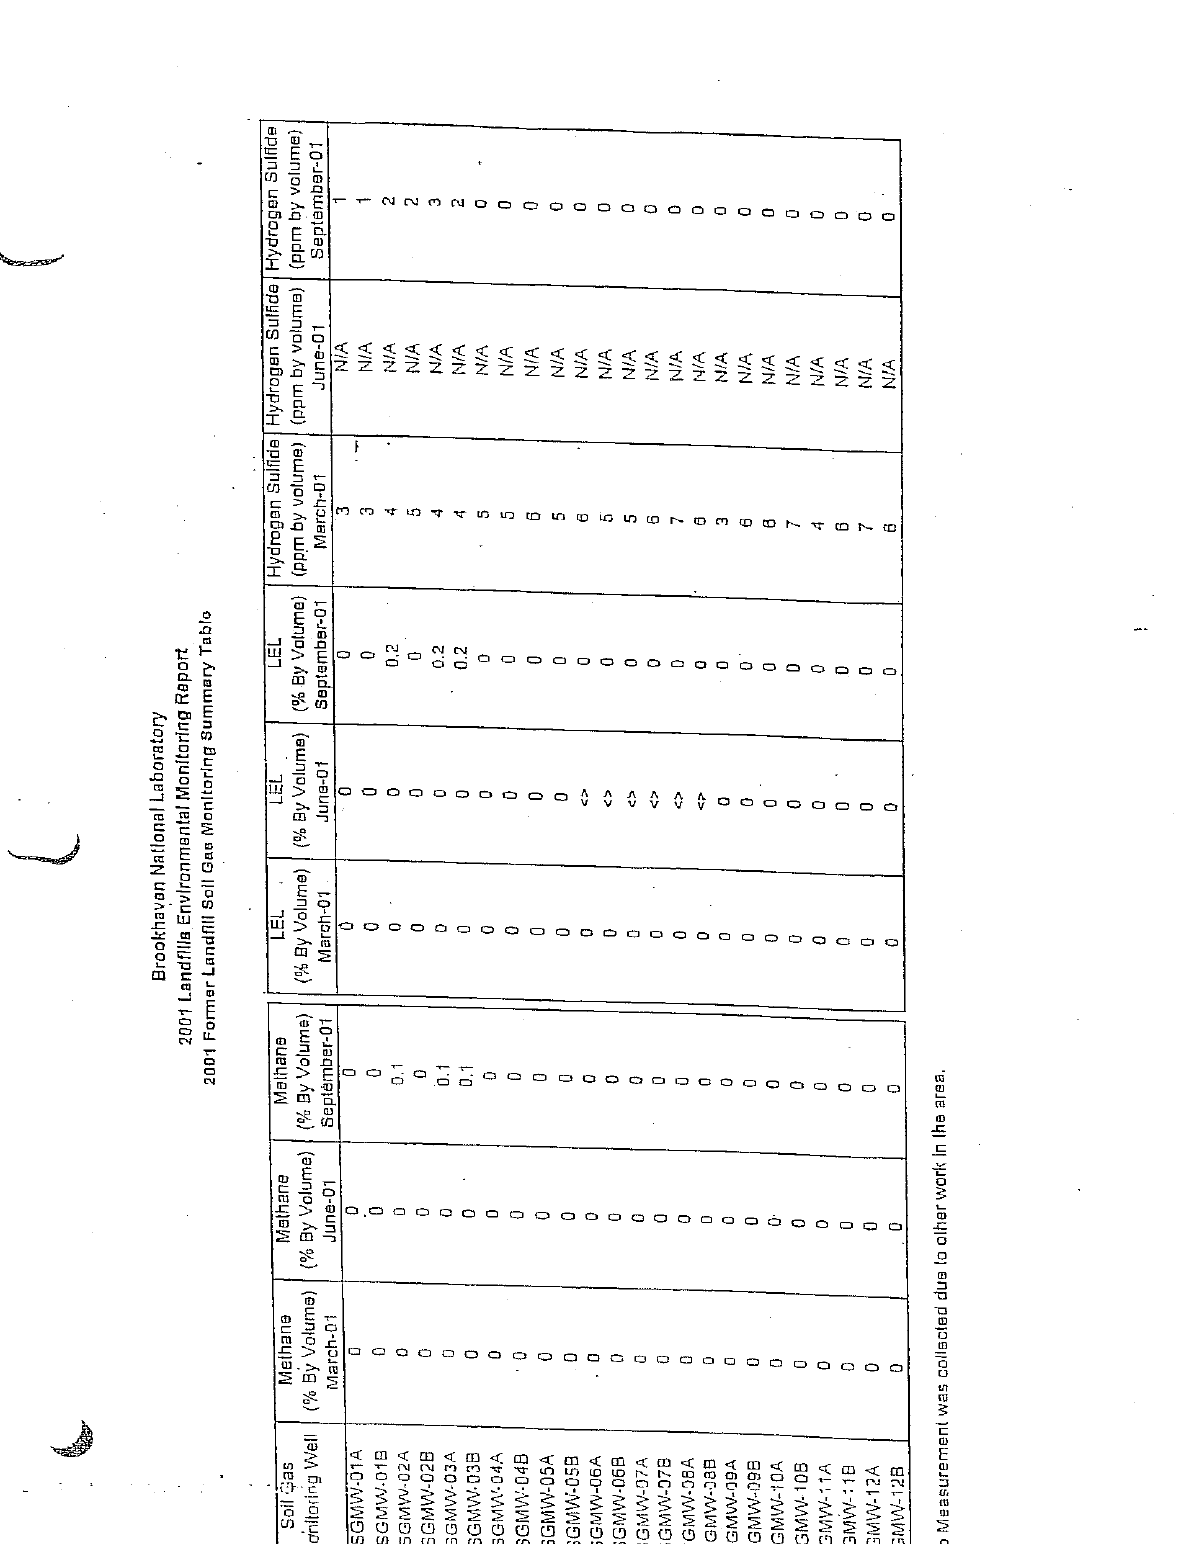
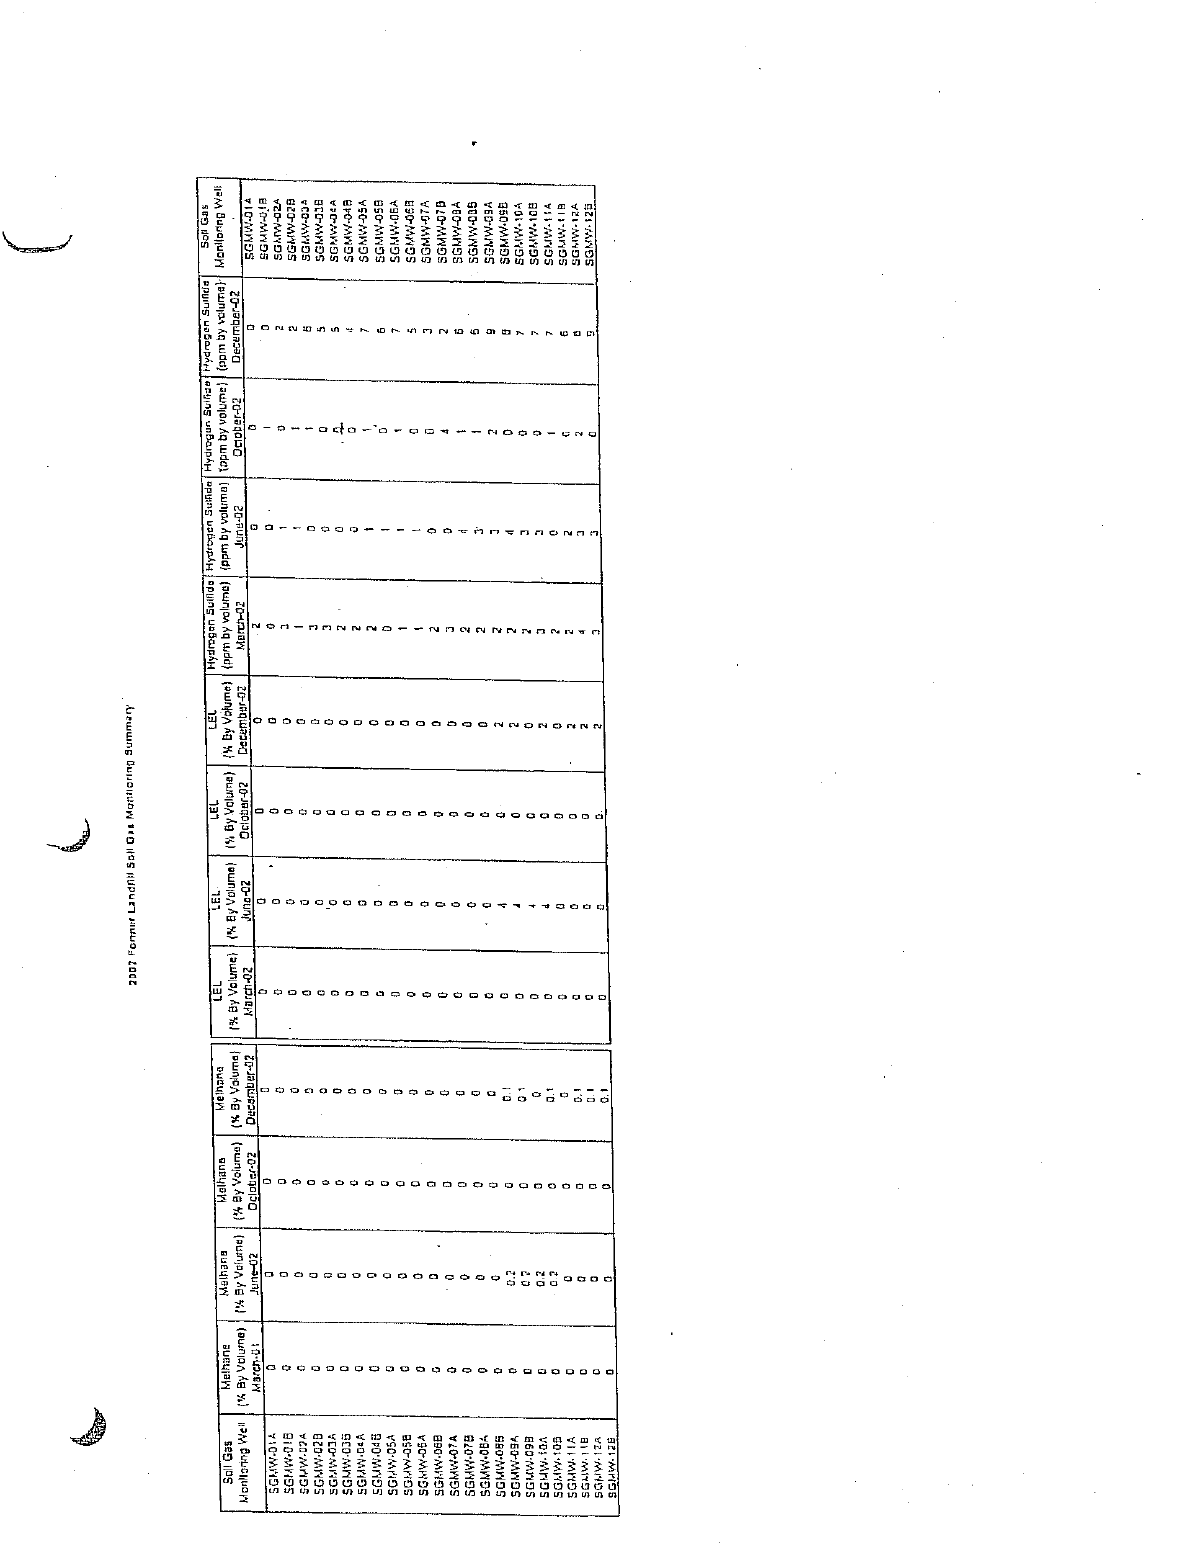
The results of monitoring the Former Landfill Area continue to be consistent with the initial survey
of the methane- gas migration conducted in 1995, during which concentrations between 0% to 0.1%
methane were recorded. Hydrogen-sulfide gas also was measured during this survey. The hydrogen
sulfide results indicate there were no detectable levels during 2009. Appendix D includes the results
of monitoring methane in the Former Landfill Area for 1996 through 2008.
Presently, there is no measured pathway for methane-gas migration, nor do the concentrations
represent an explosive hazard as shown by the nondetect readings on the LEL meter. The age of the
Former Landfill Area and the types of materials disposed of would likely result in the low levels or
absence of methane or hydrogen sulfide.
T:\LTRA\Landfills\2009 Report\Text\2009_text_v1.doc 18
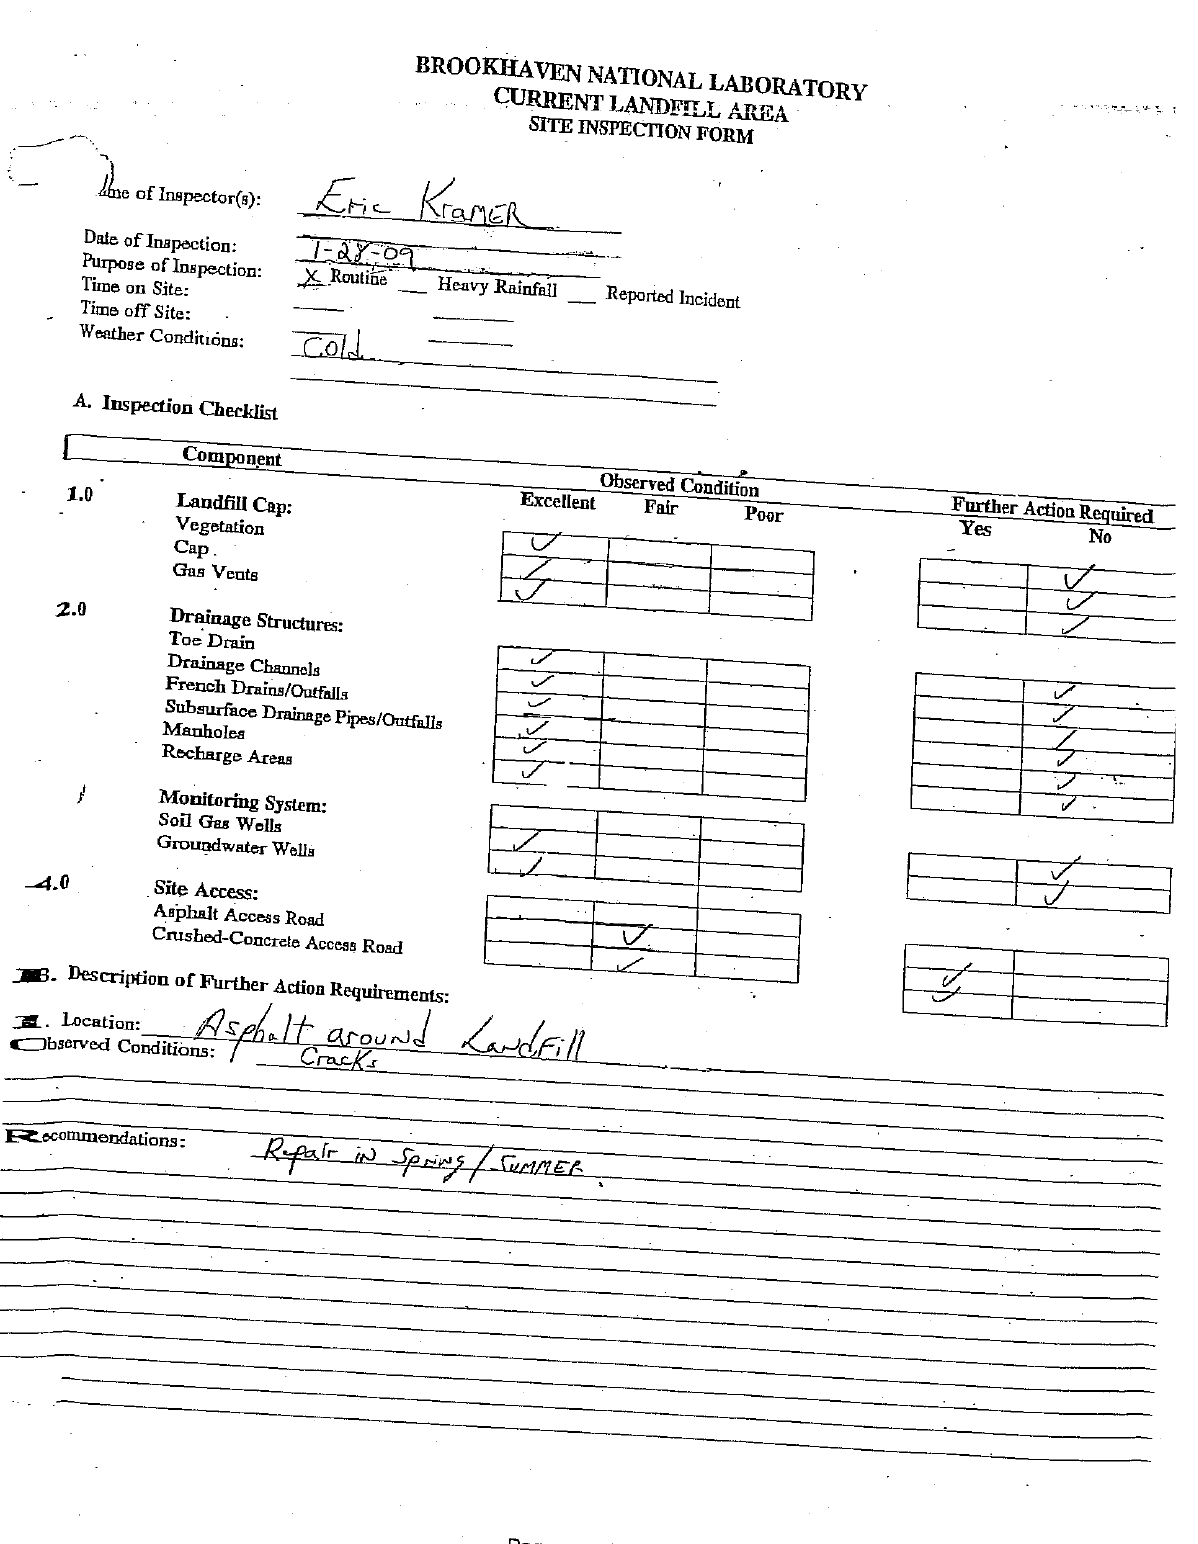
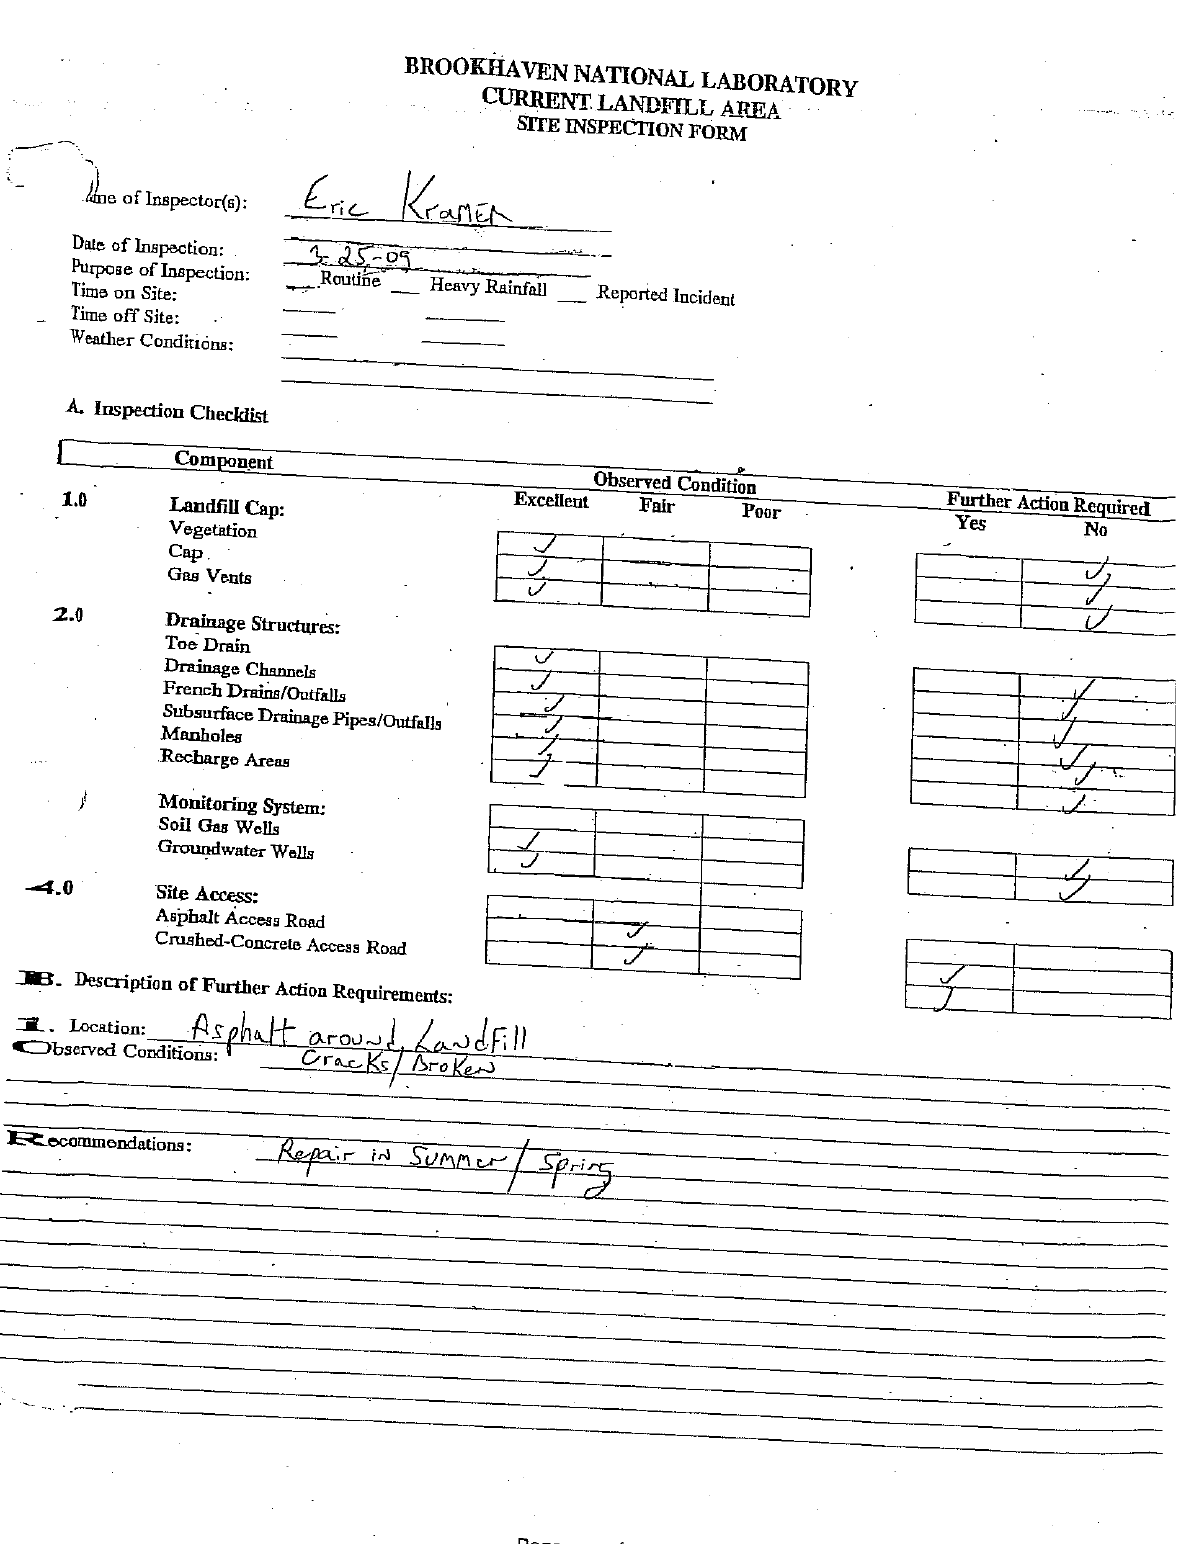
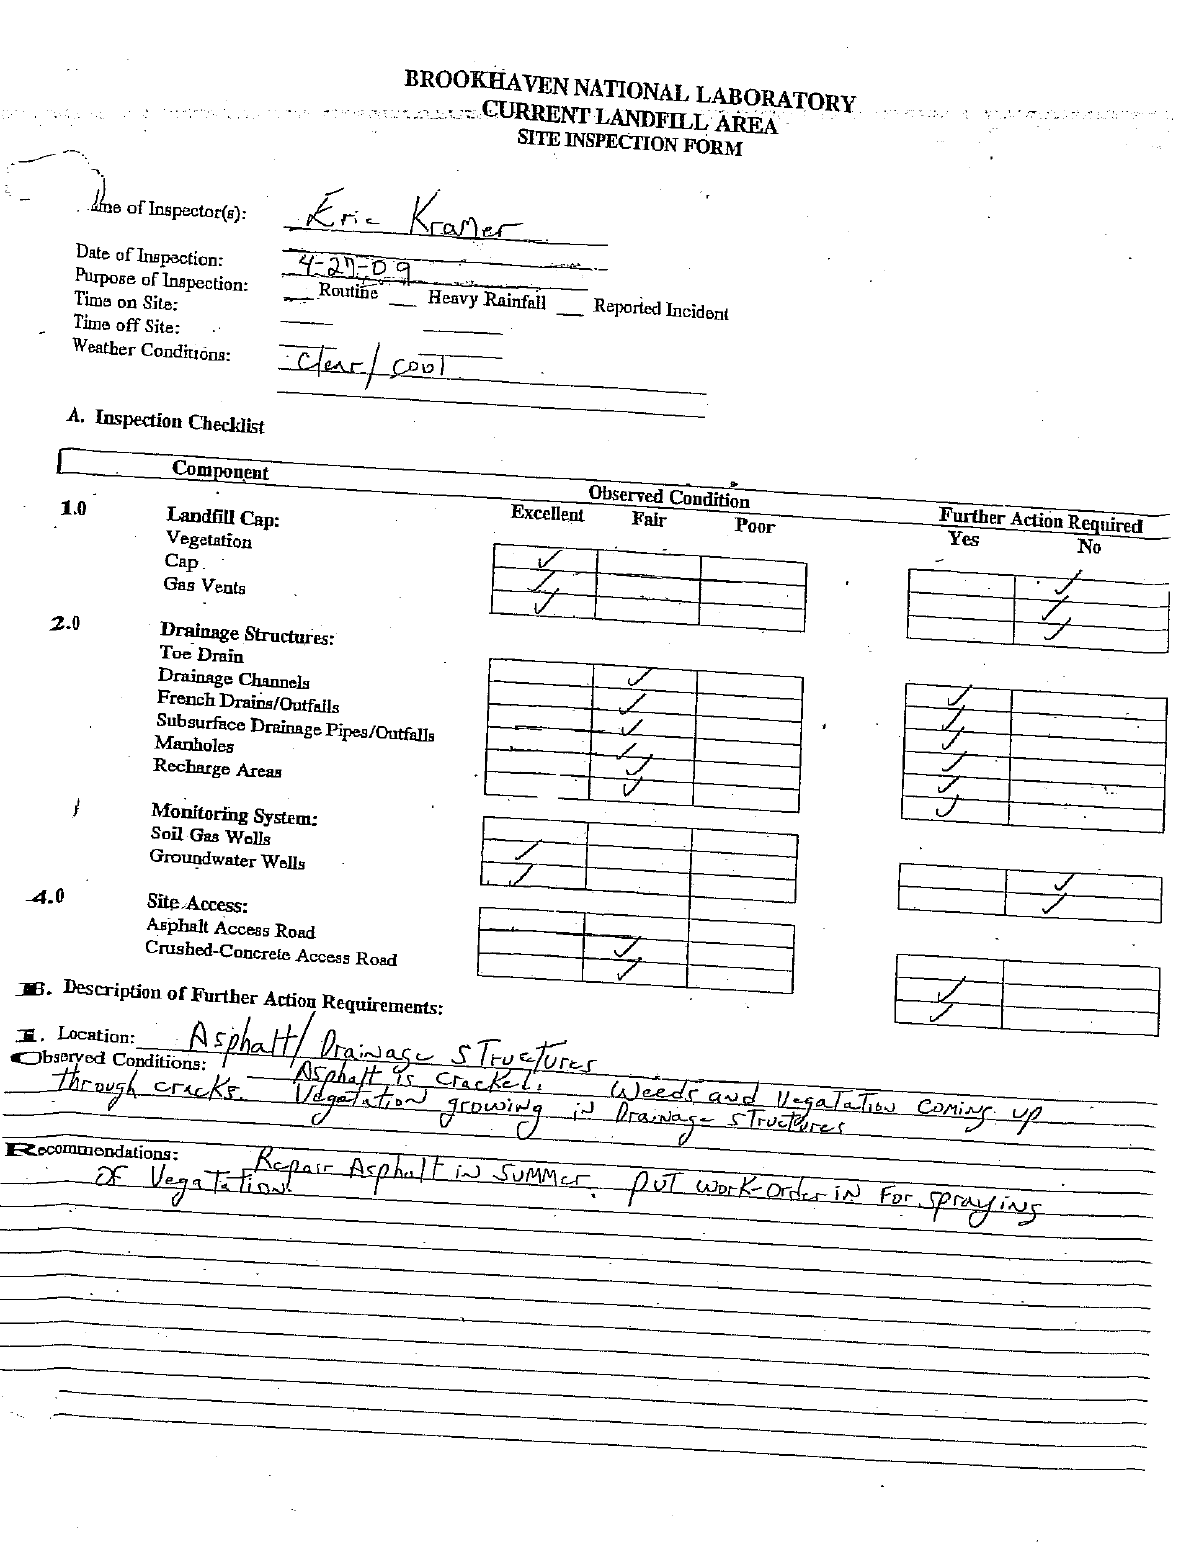
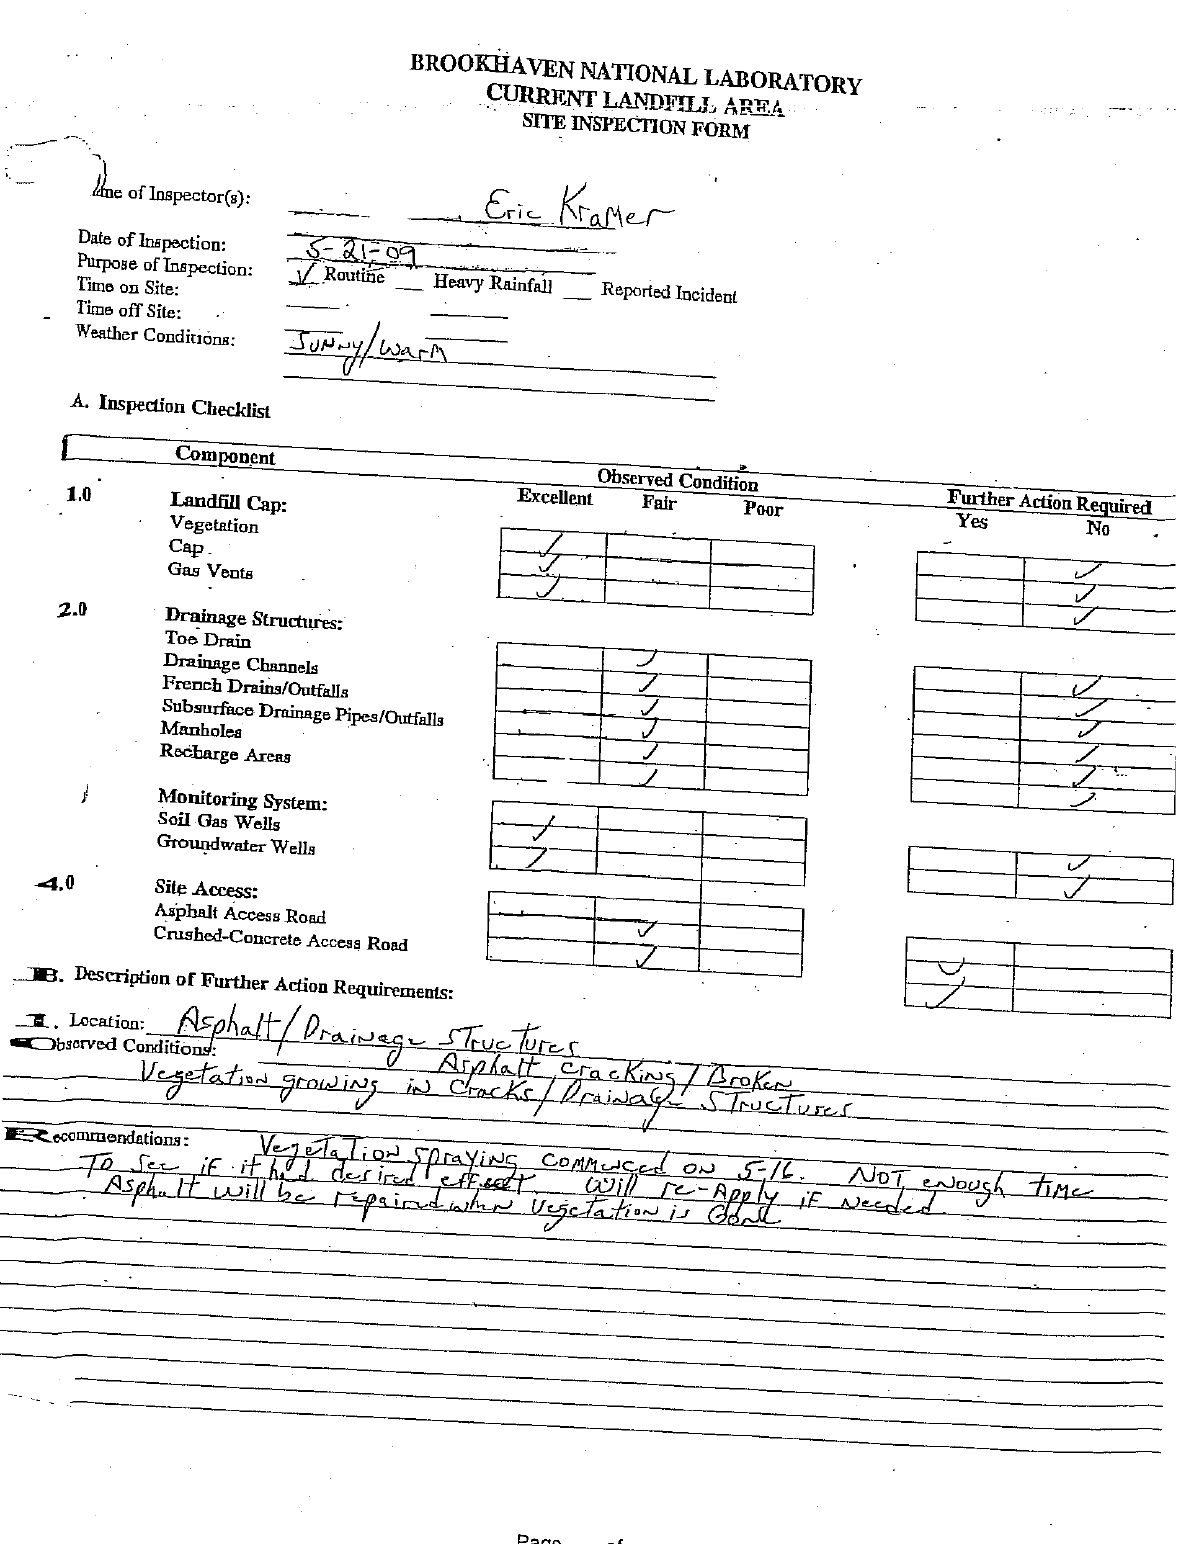
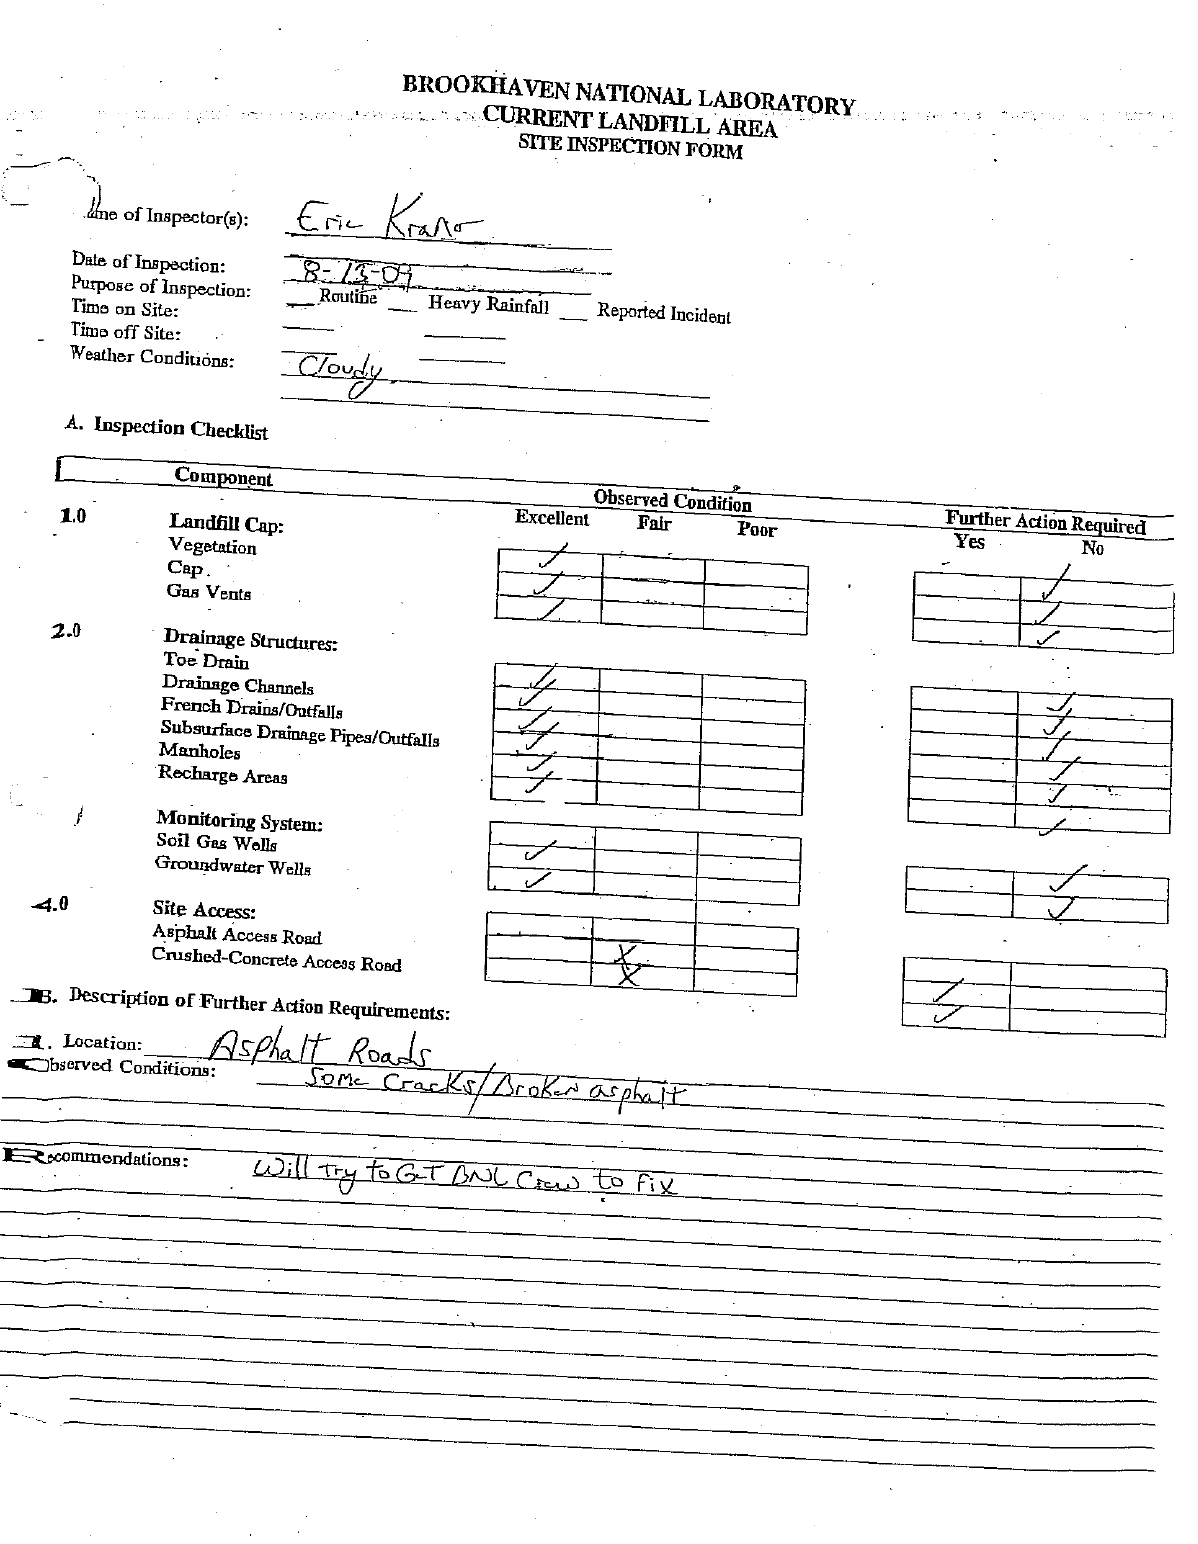
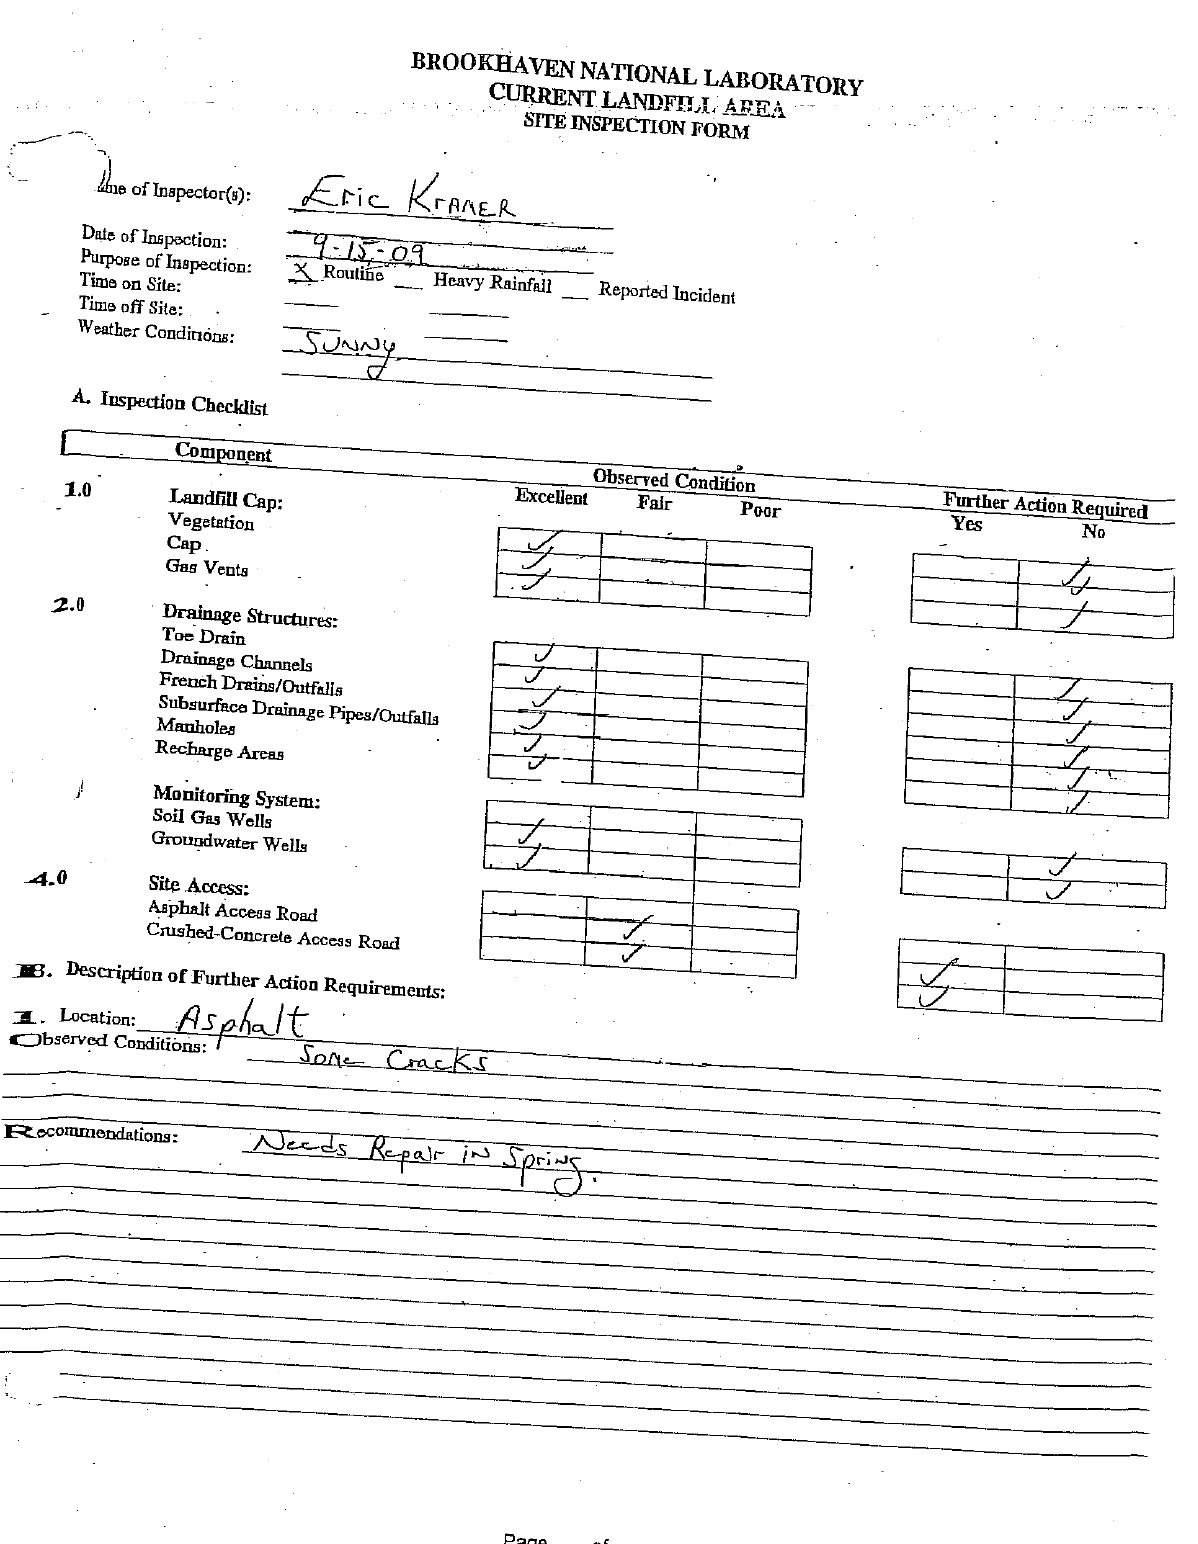
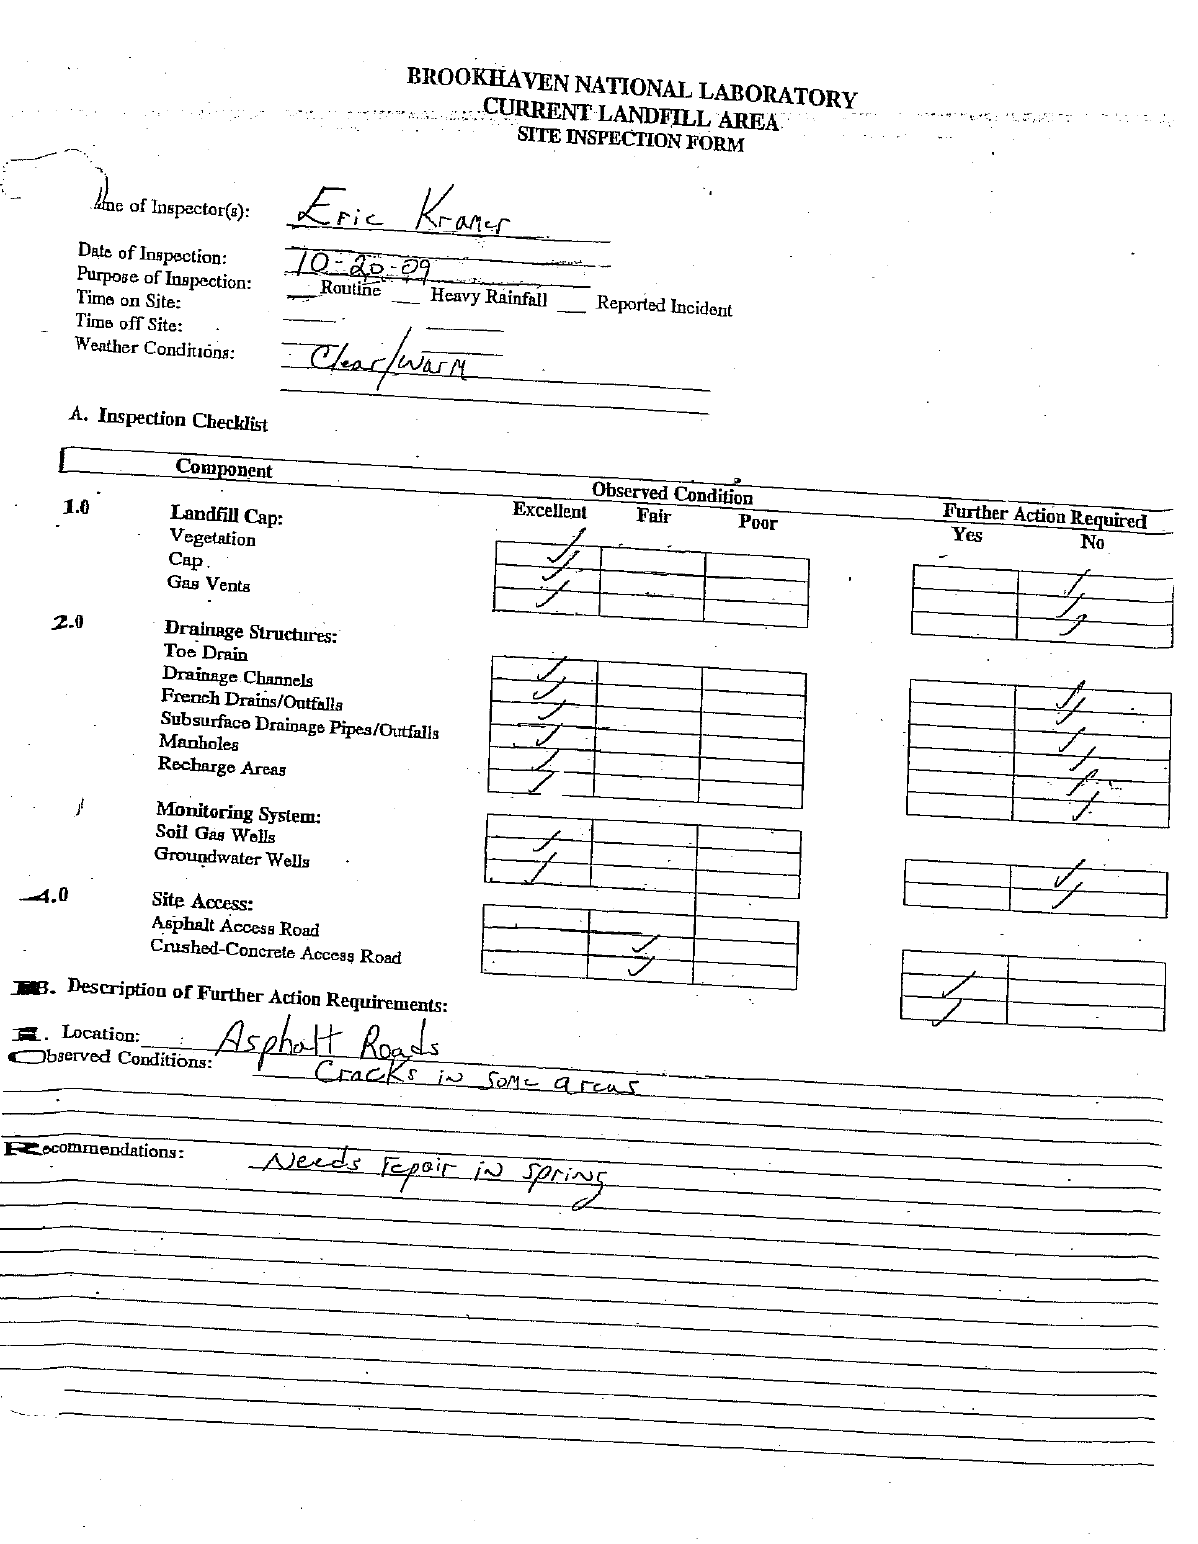
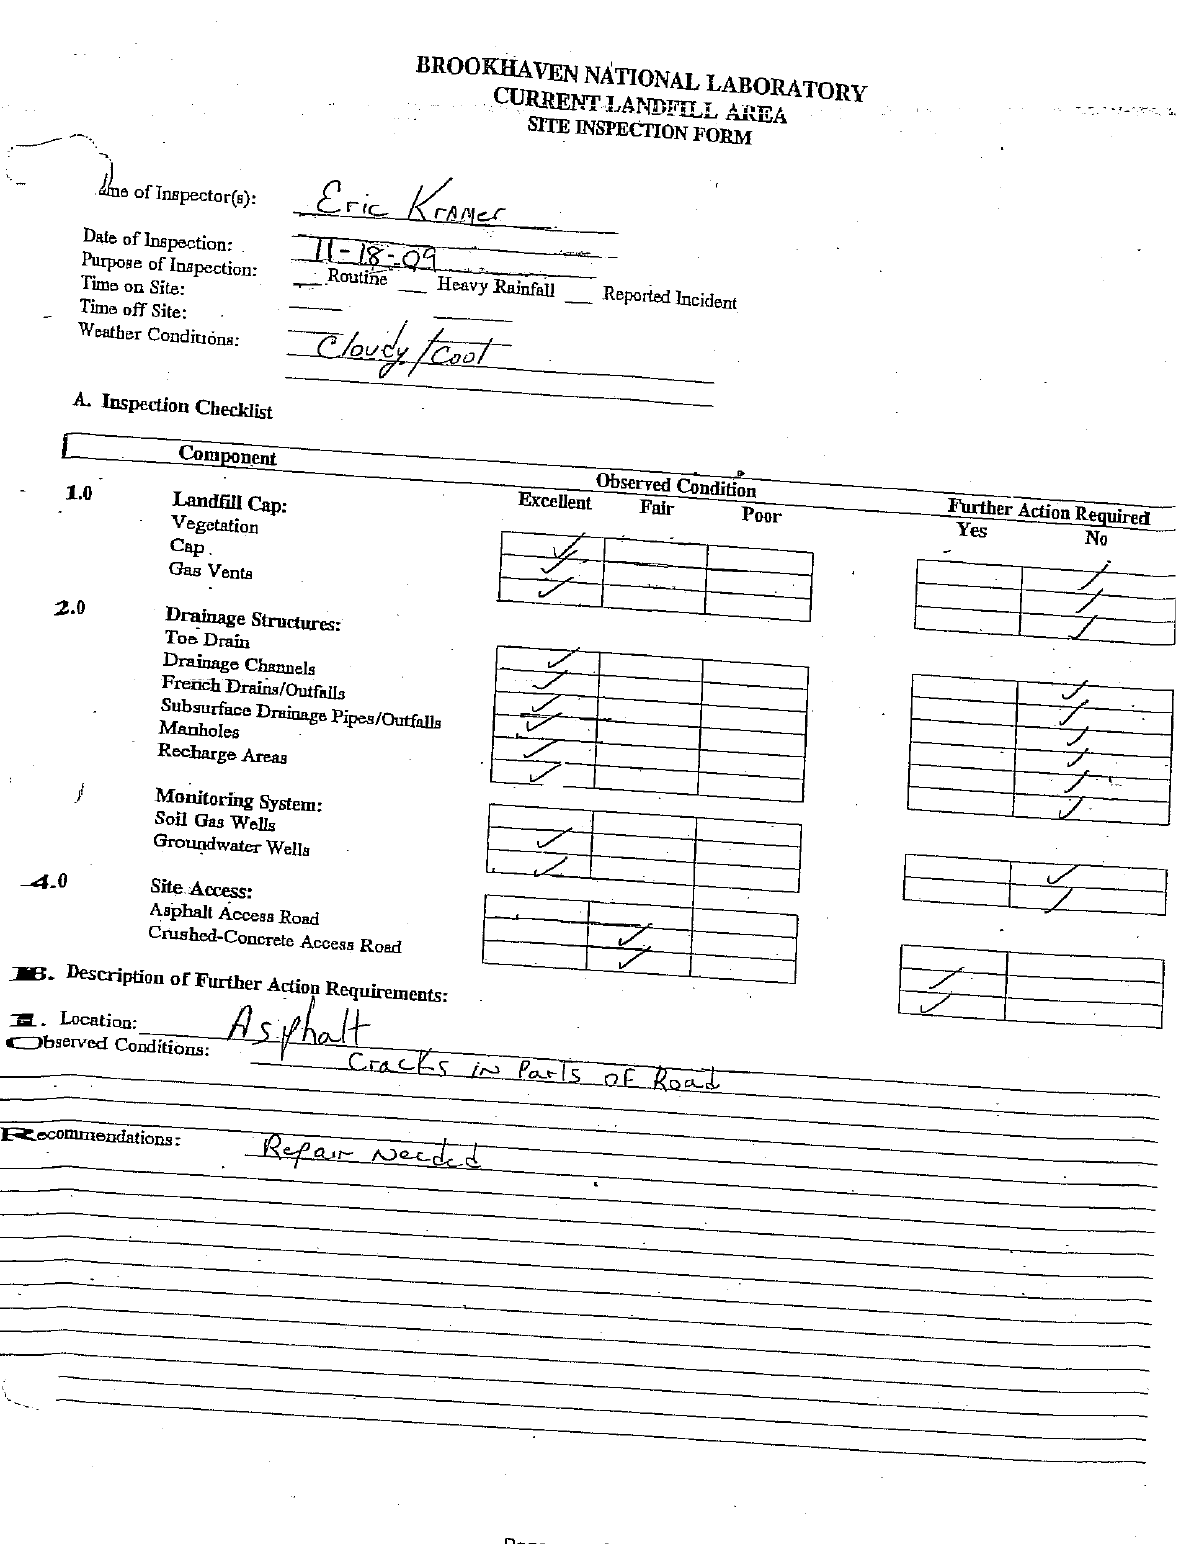
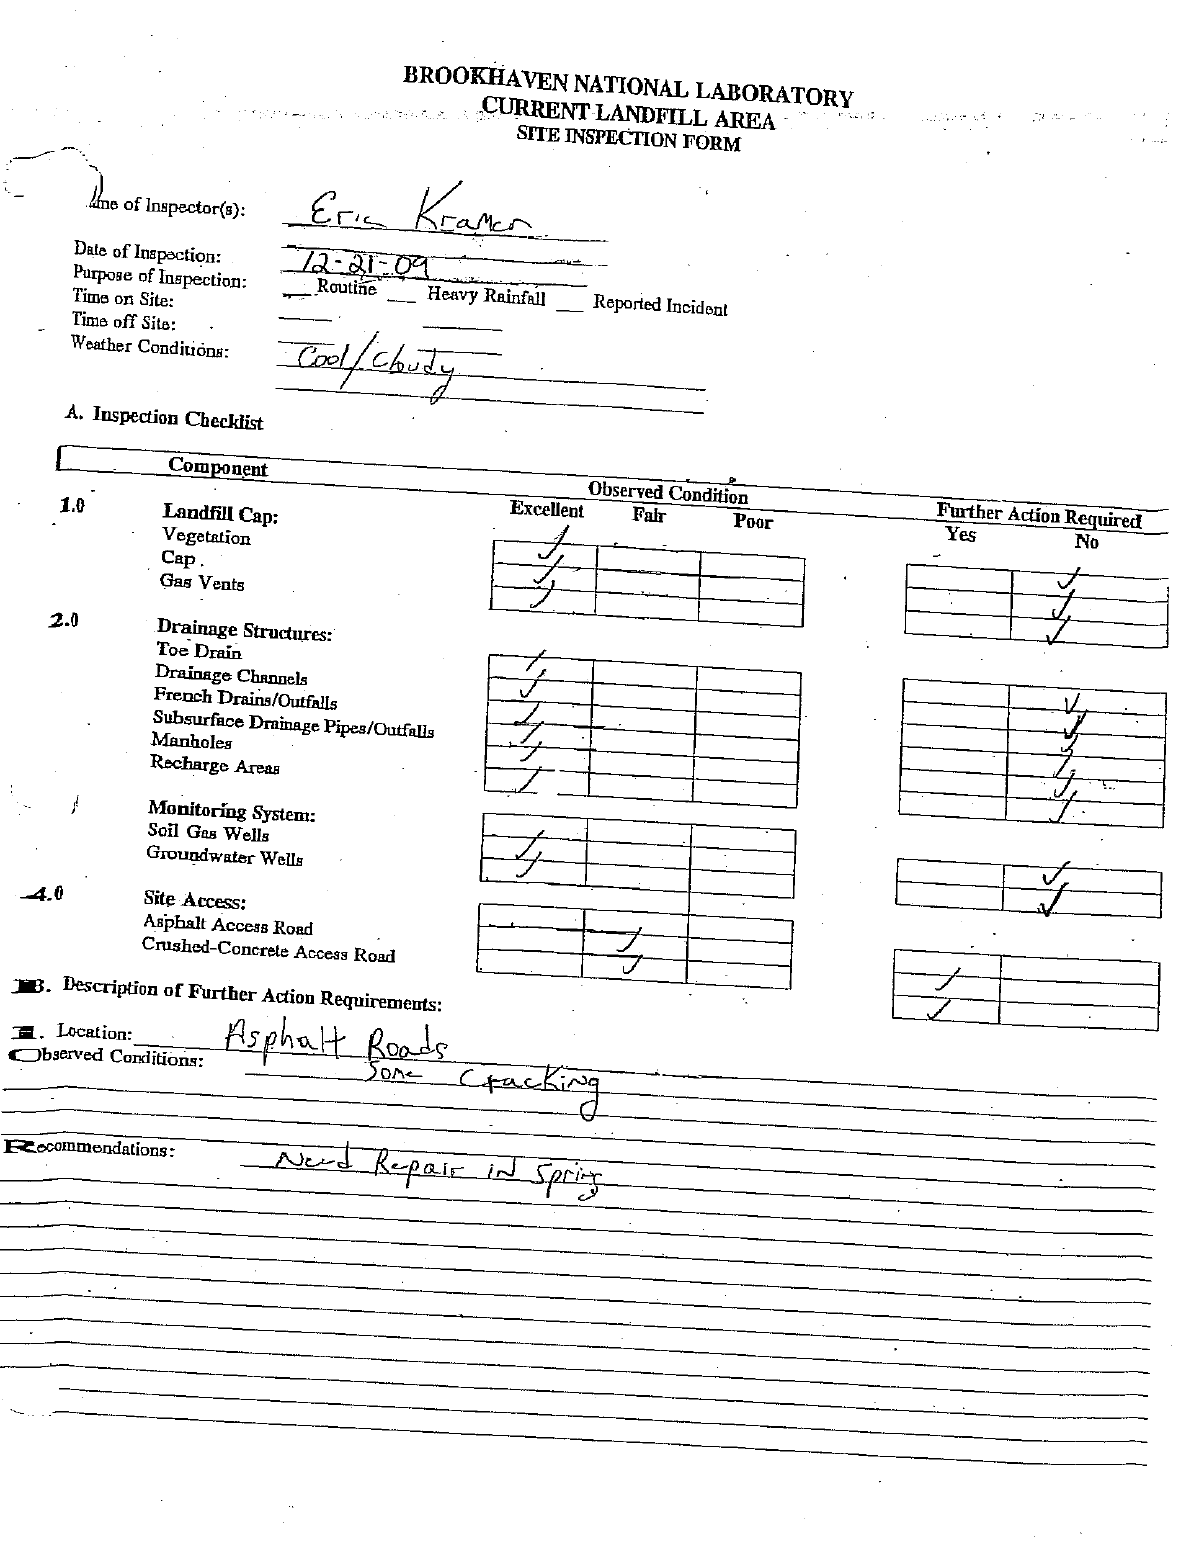
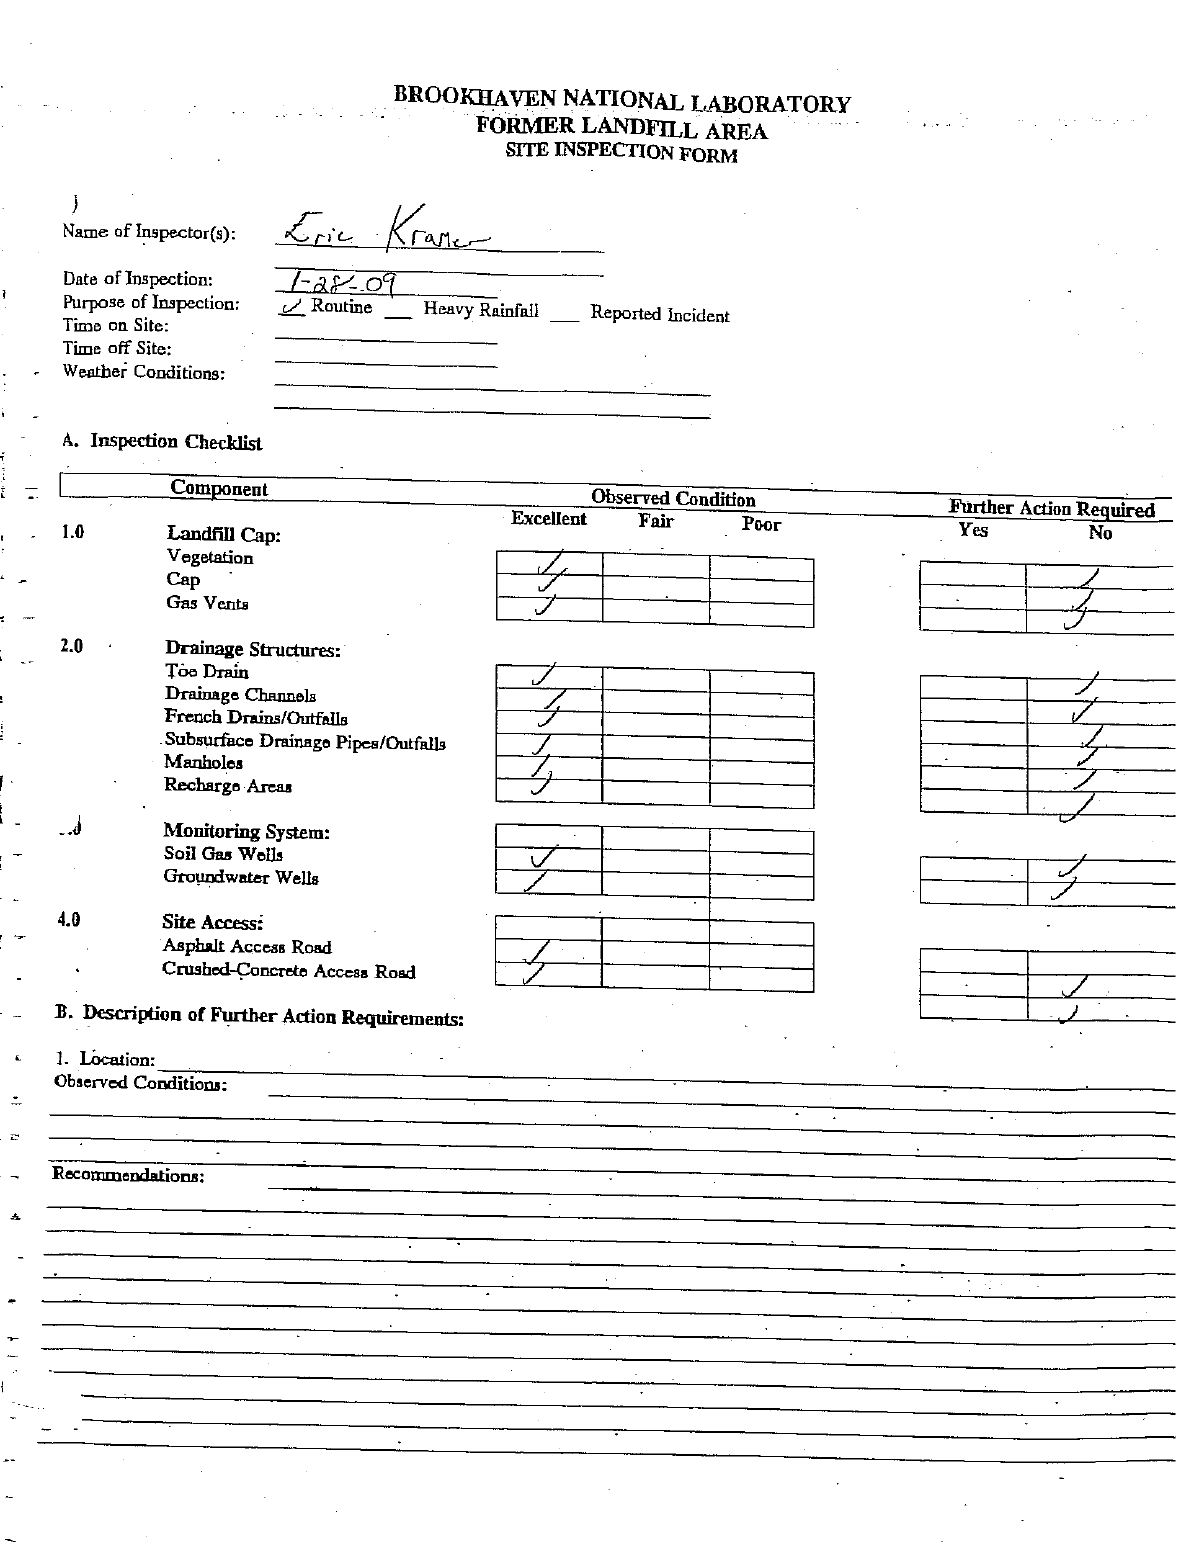
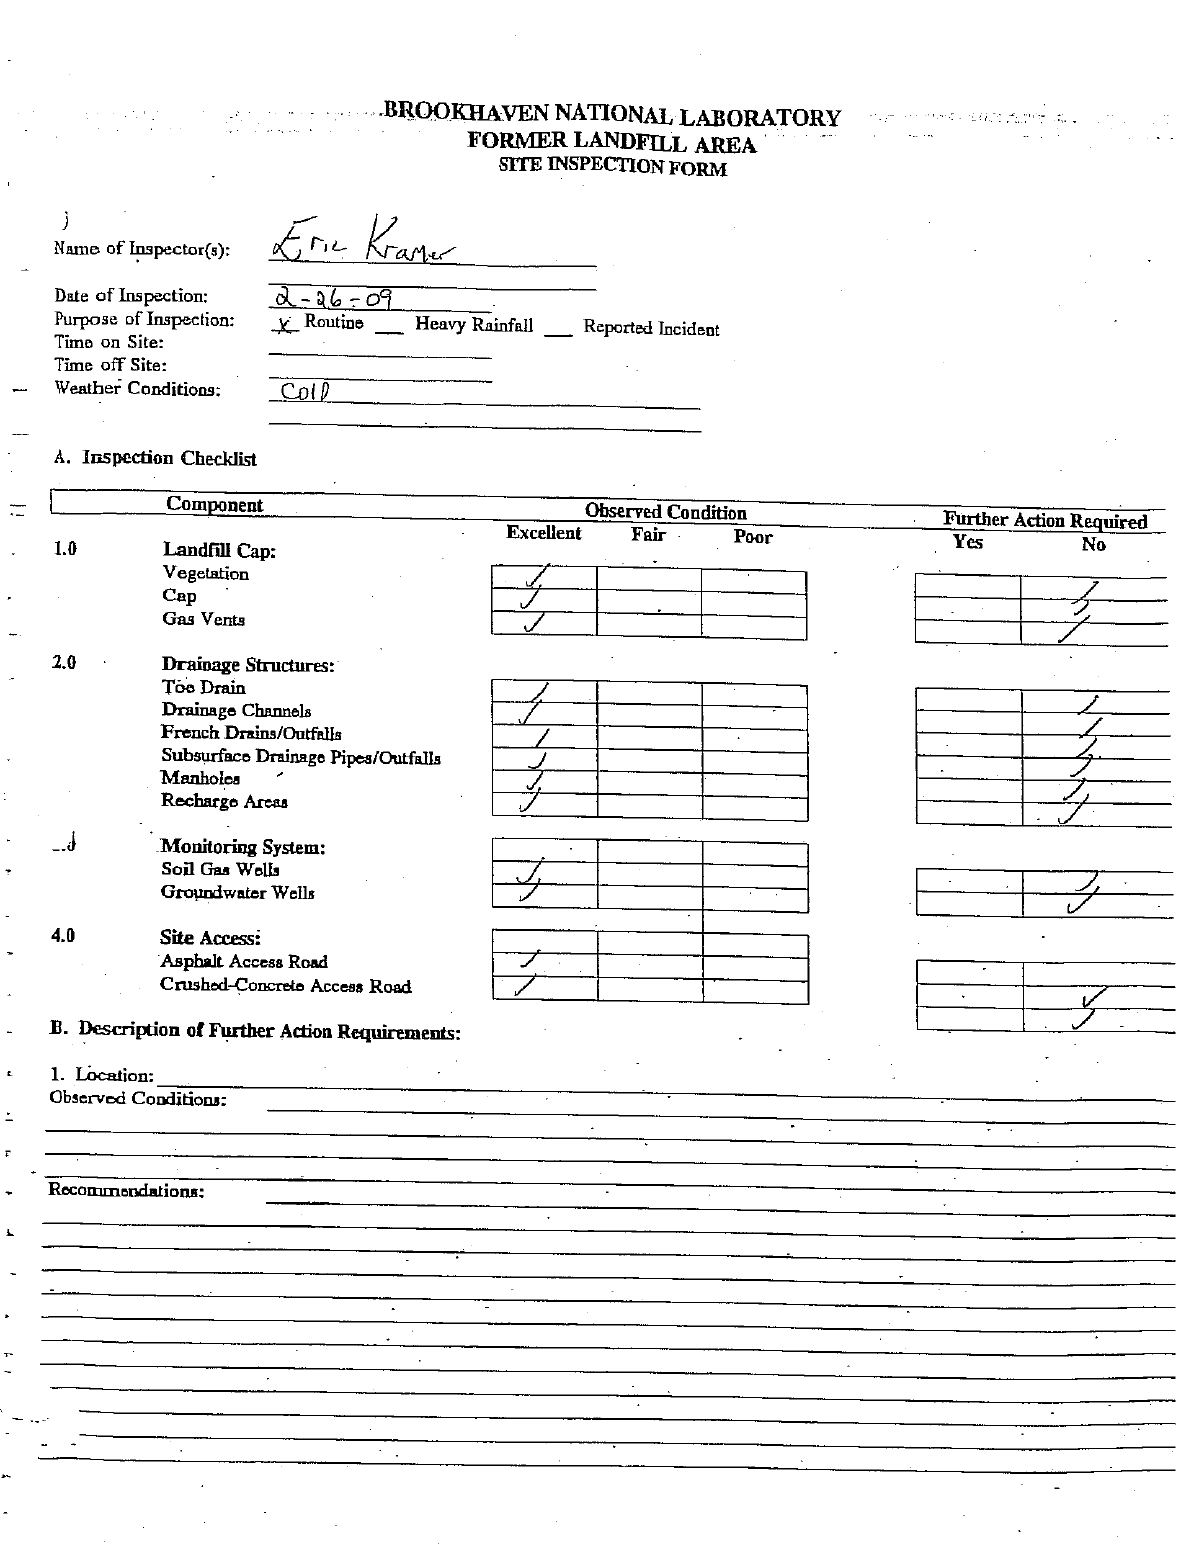
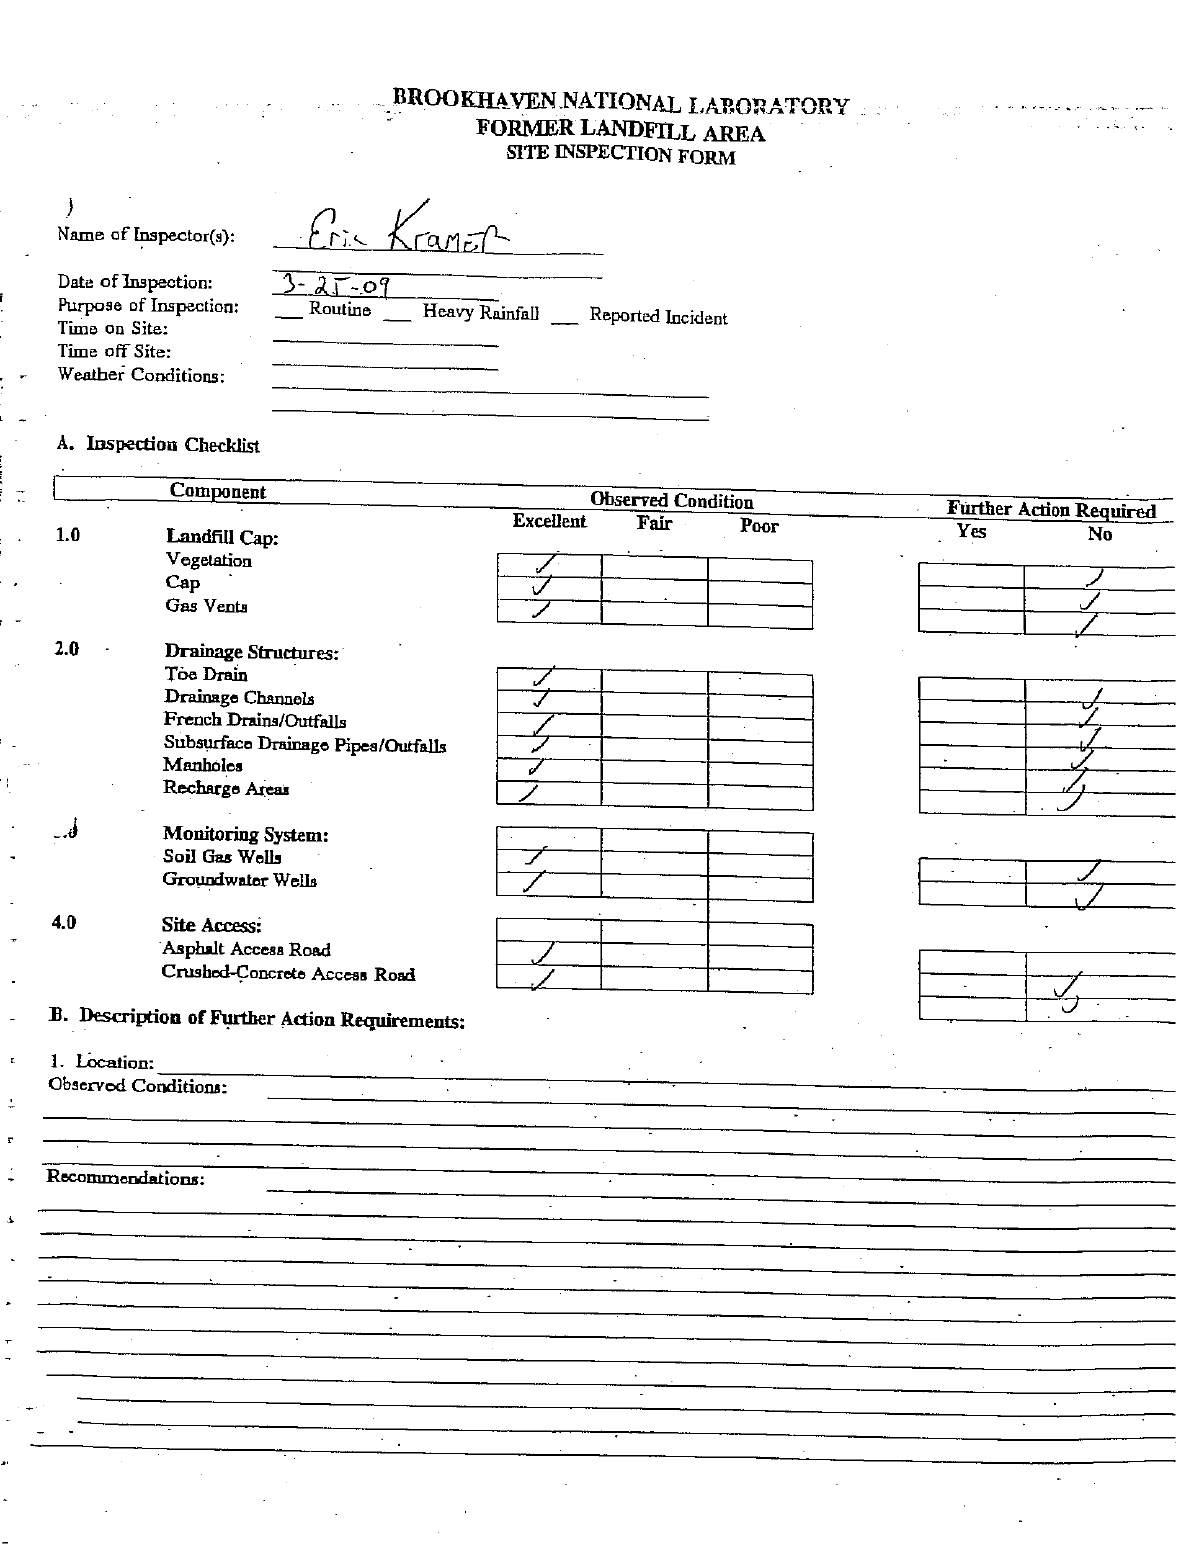
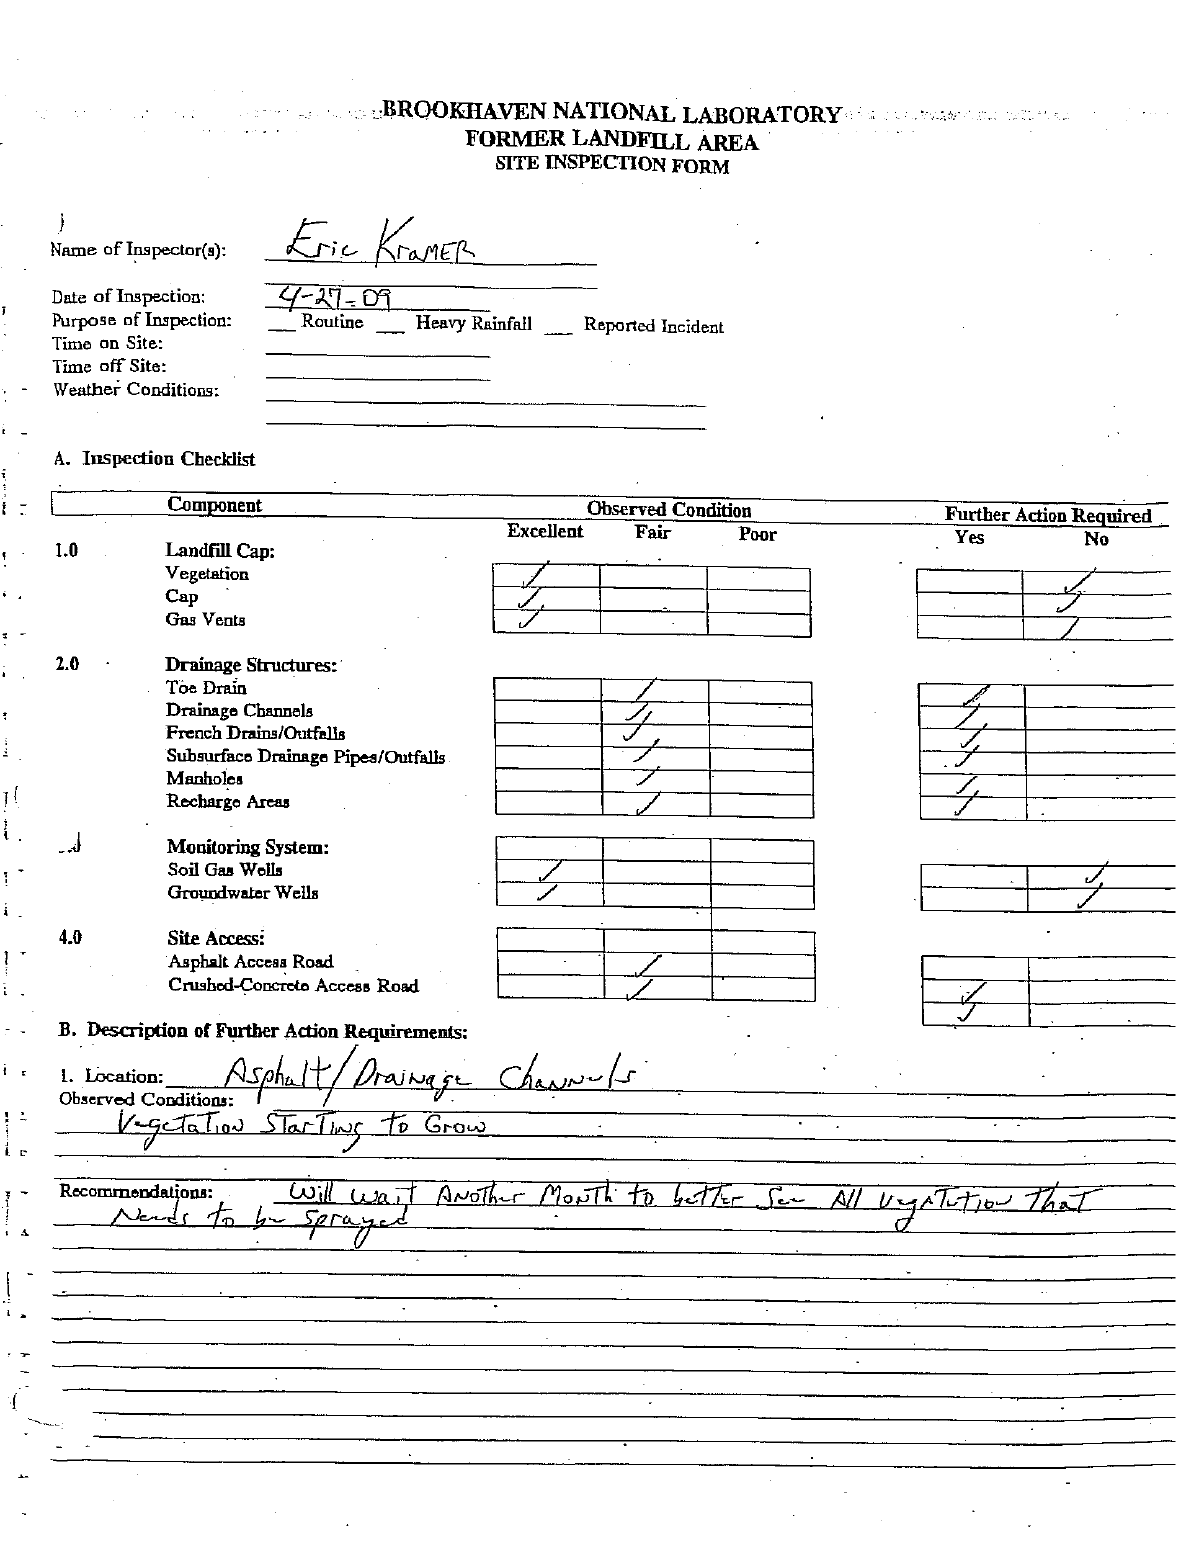
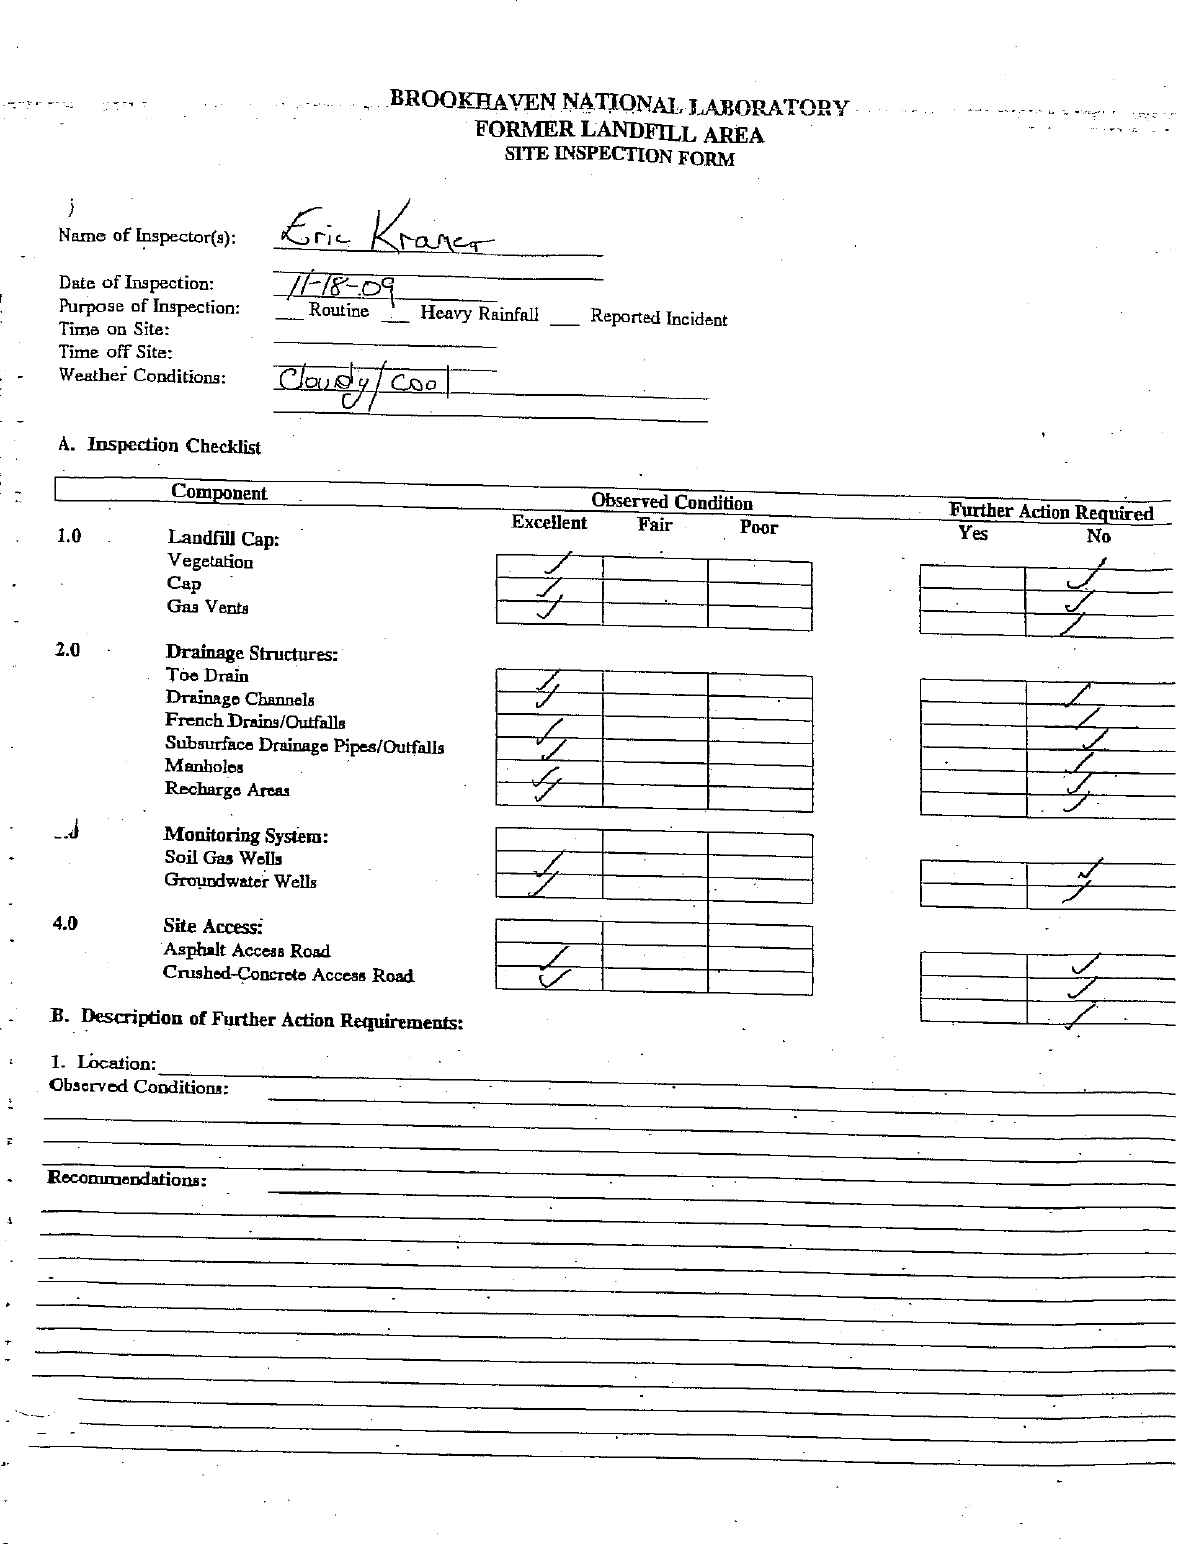
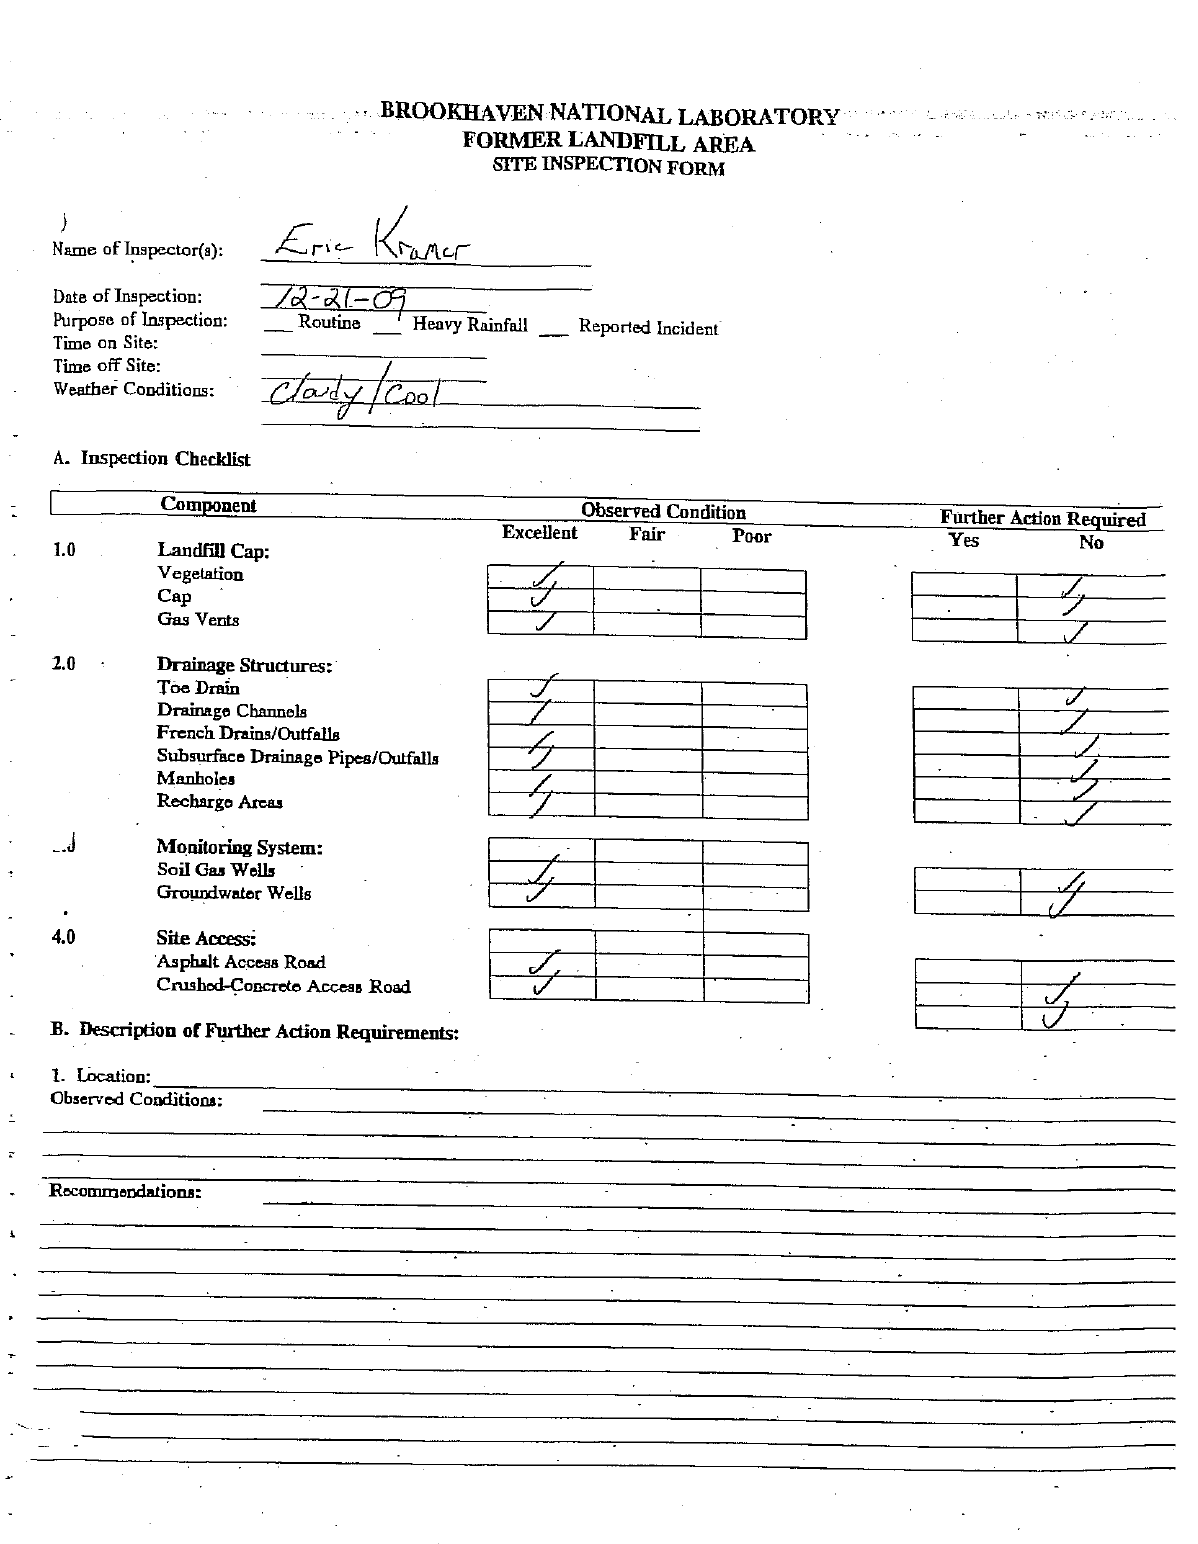
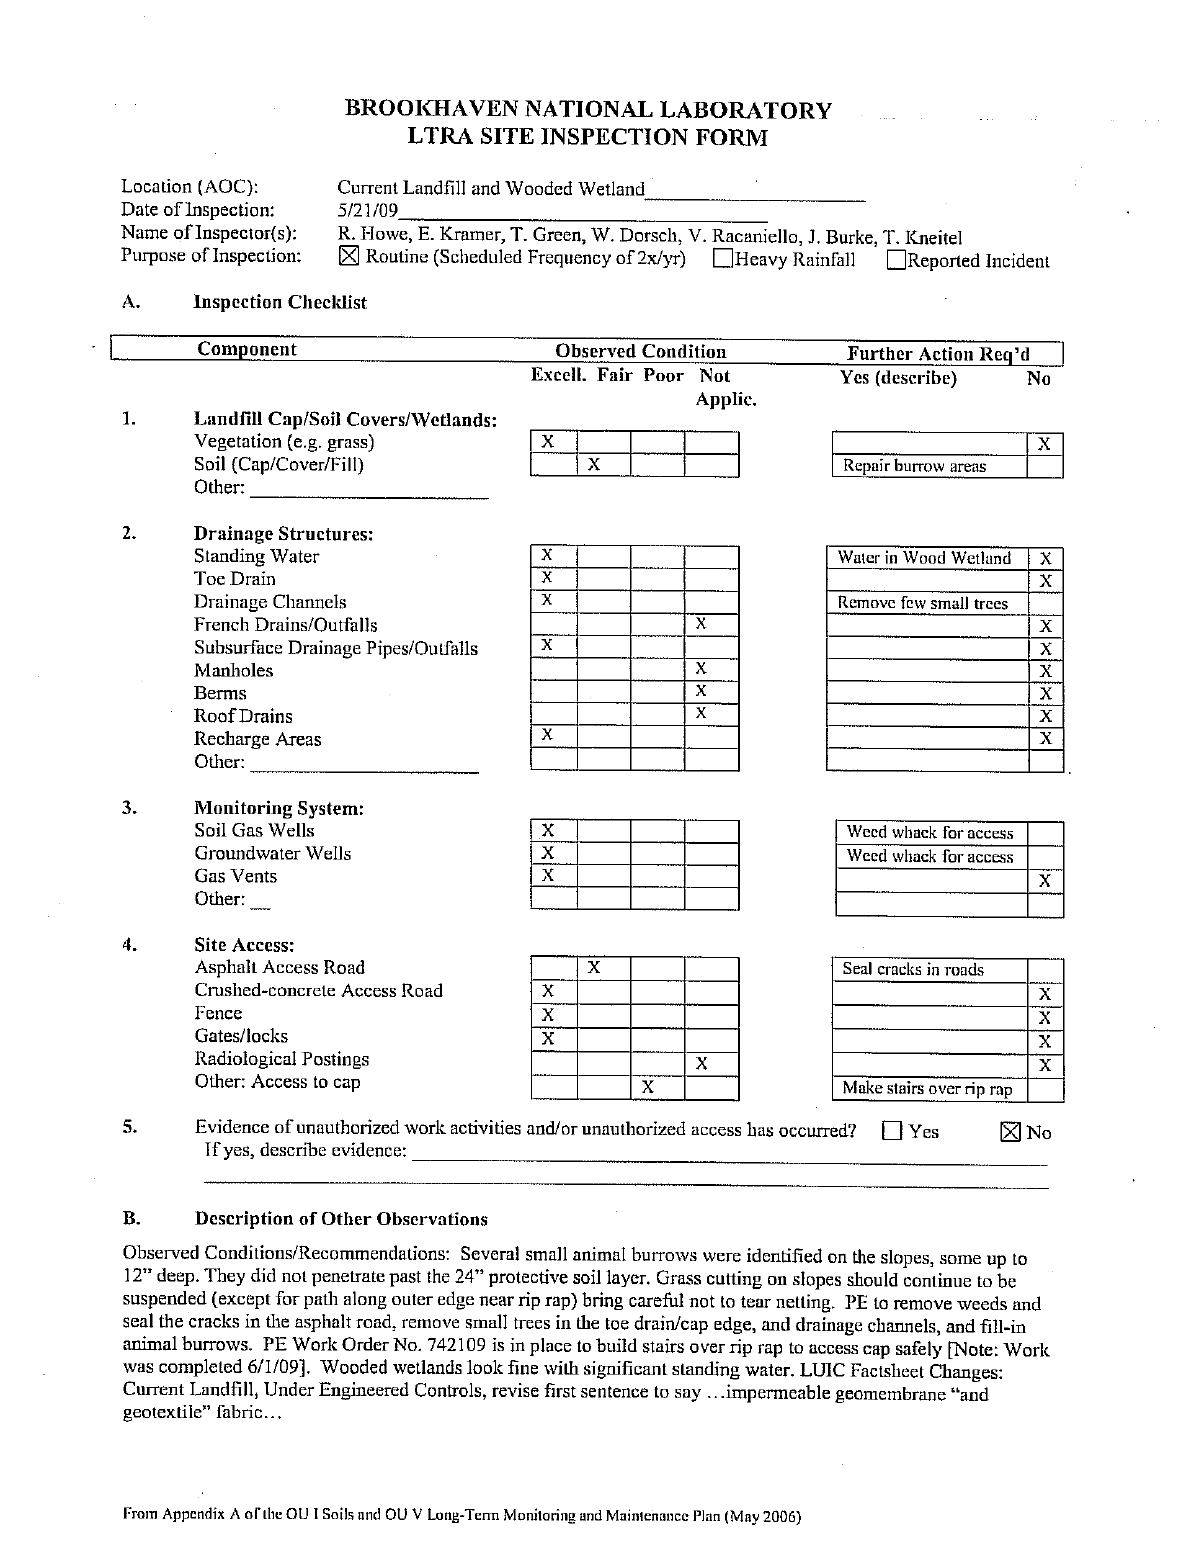
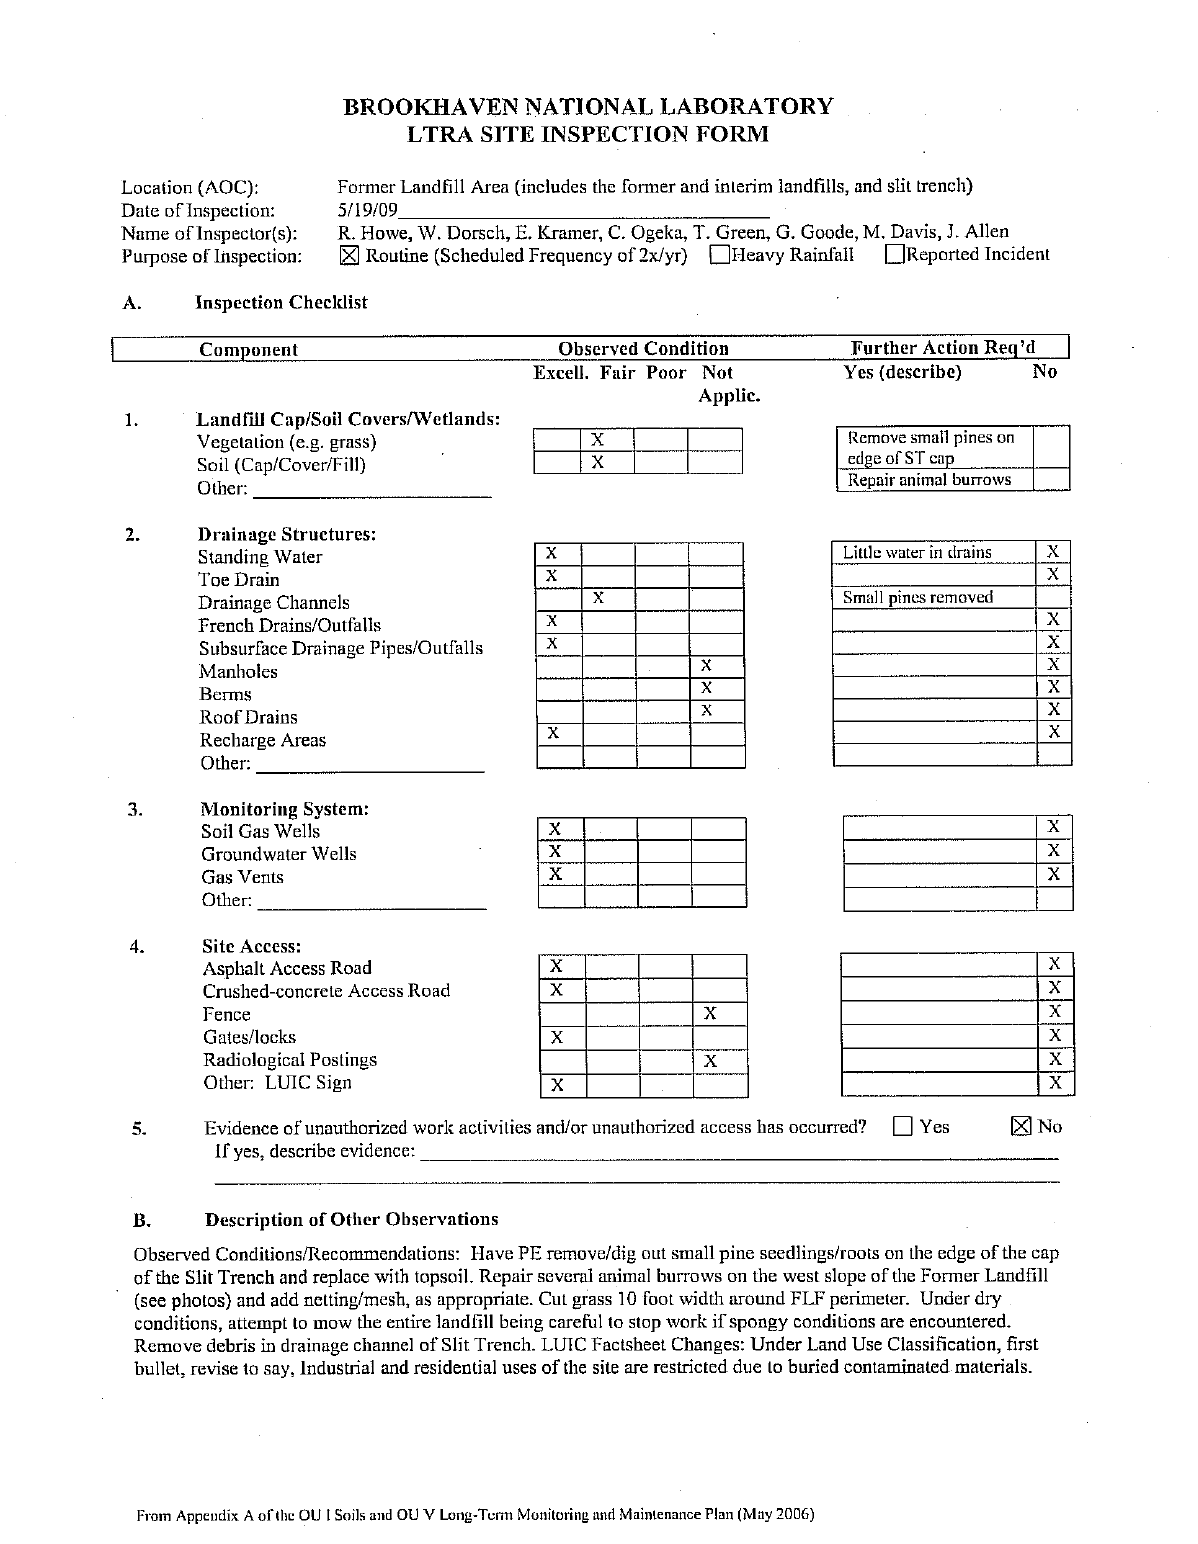
5.0 MAINTENANCE AND REPAIR
Monthly site inspections were performed by BNL at the Current and Former Landfill areas to
monitor the structural and/or operational status of the landfill cap, gas vents, drainage structure,
fences and environmental monitoring system (groundwater wells, soil-gas wells) in accordance with
the O&M Manuals. A copy of the inspection reports is included in Appendix B. Maintenance and
repair work completed or required by BNL is discussed below.
5.1 Landfill Cap and Gas Vents
To prevent ruts in the landfills caused by the weight of the lawn mowers during periods of above
normal precipitation, the cutting of the grass is only conducted when optimal soil conditions are
evident. Small cracks in the asphalt road next to the Current Landfill were noted on the inspection
logs. The cracks do not impact the structural integrity of the road. Small animal burrows were noted
during the biannual LTRA inspections. Also small pine seedlings were noted growing around the
edge of the landfill. Maintenance is scheduled for the Spring 2010 which will include removing the
seedlings and filling all remaining animal burrows.
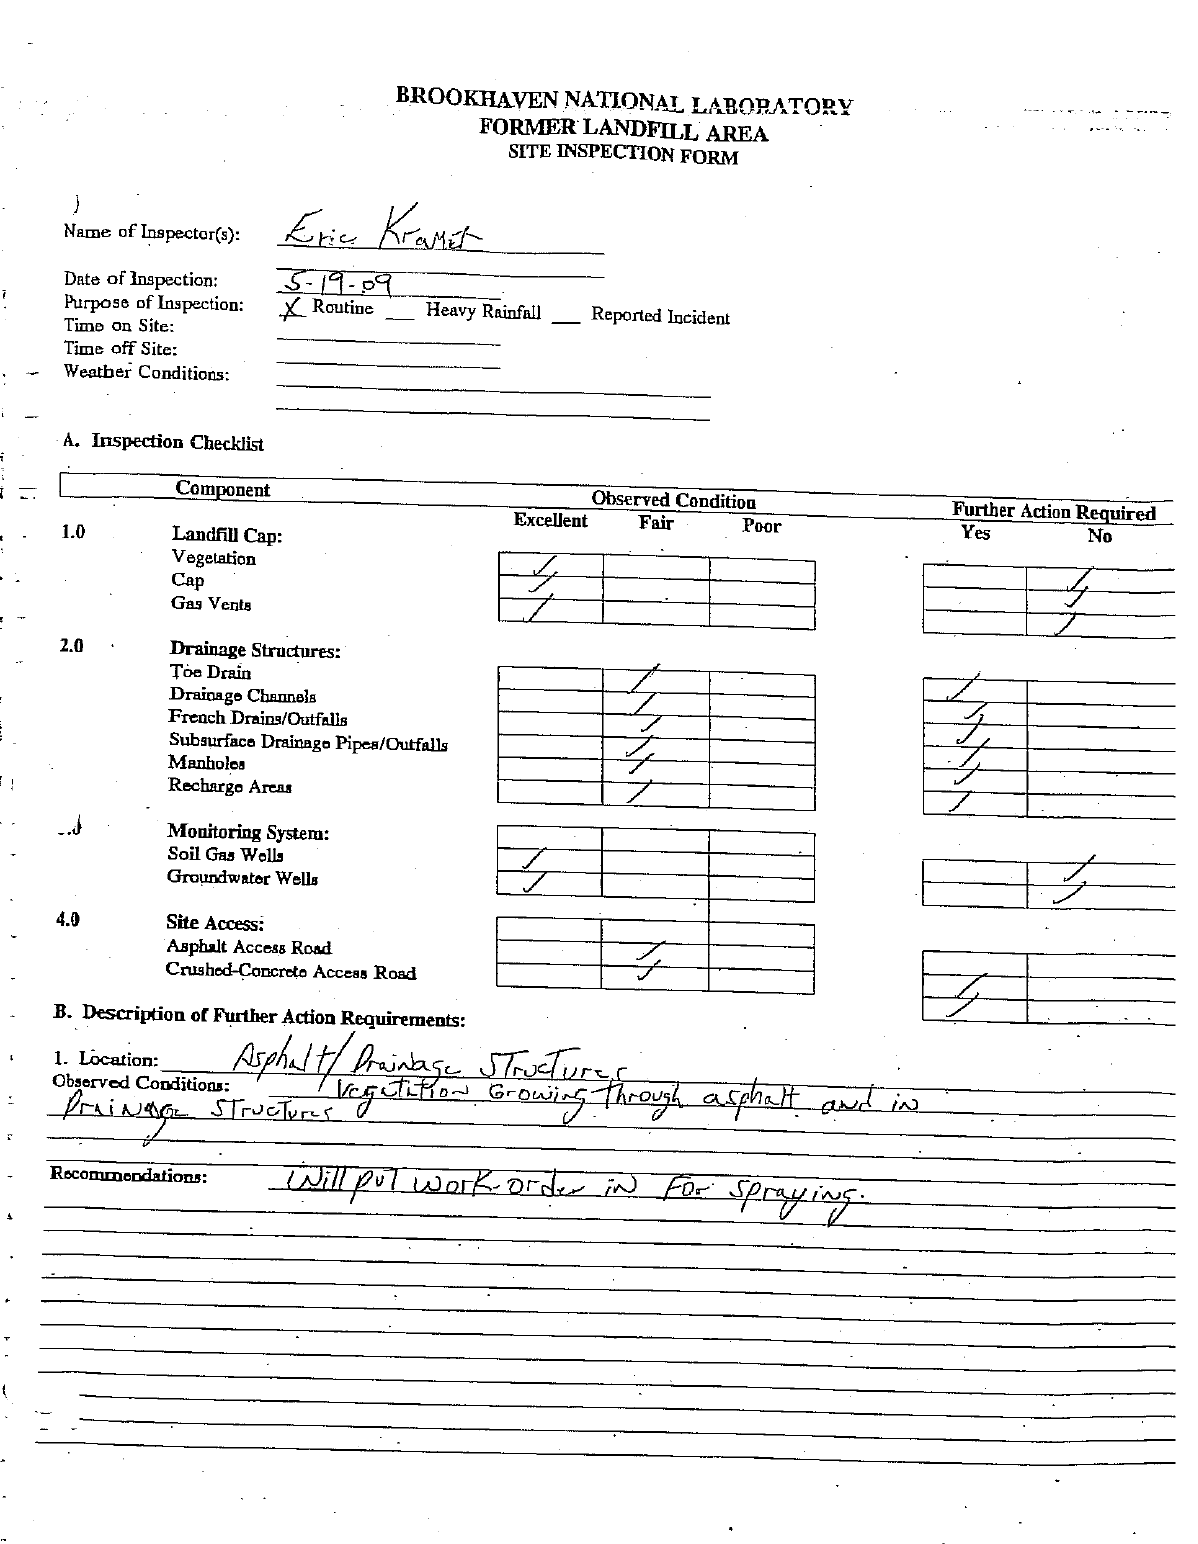
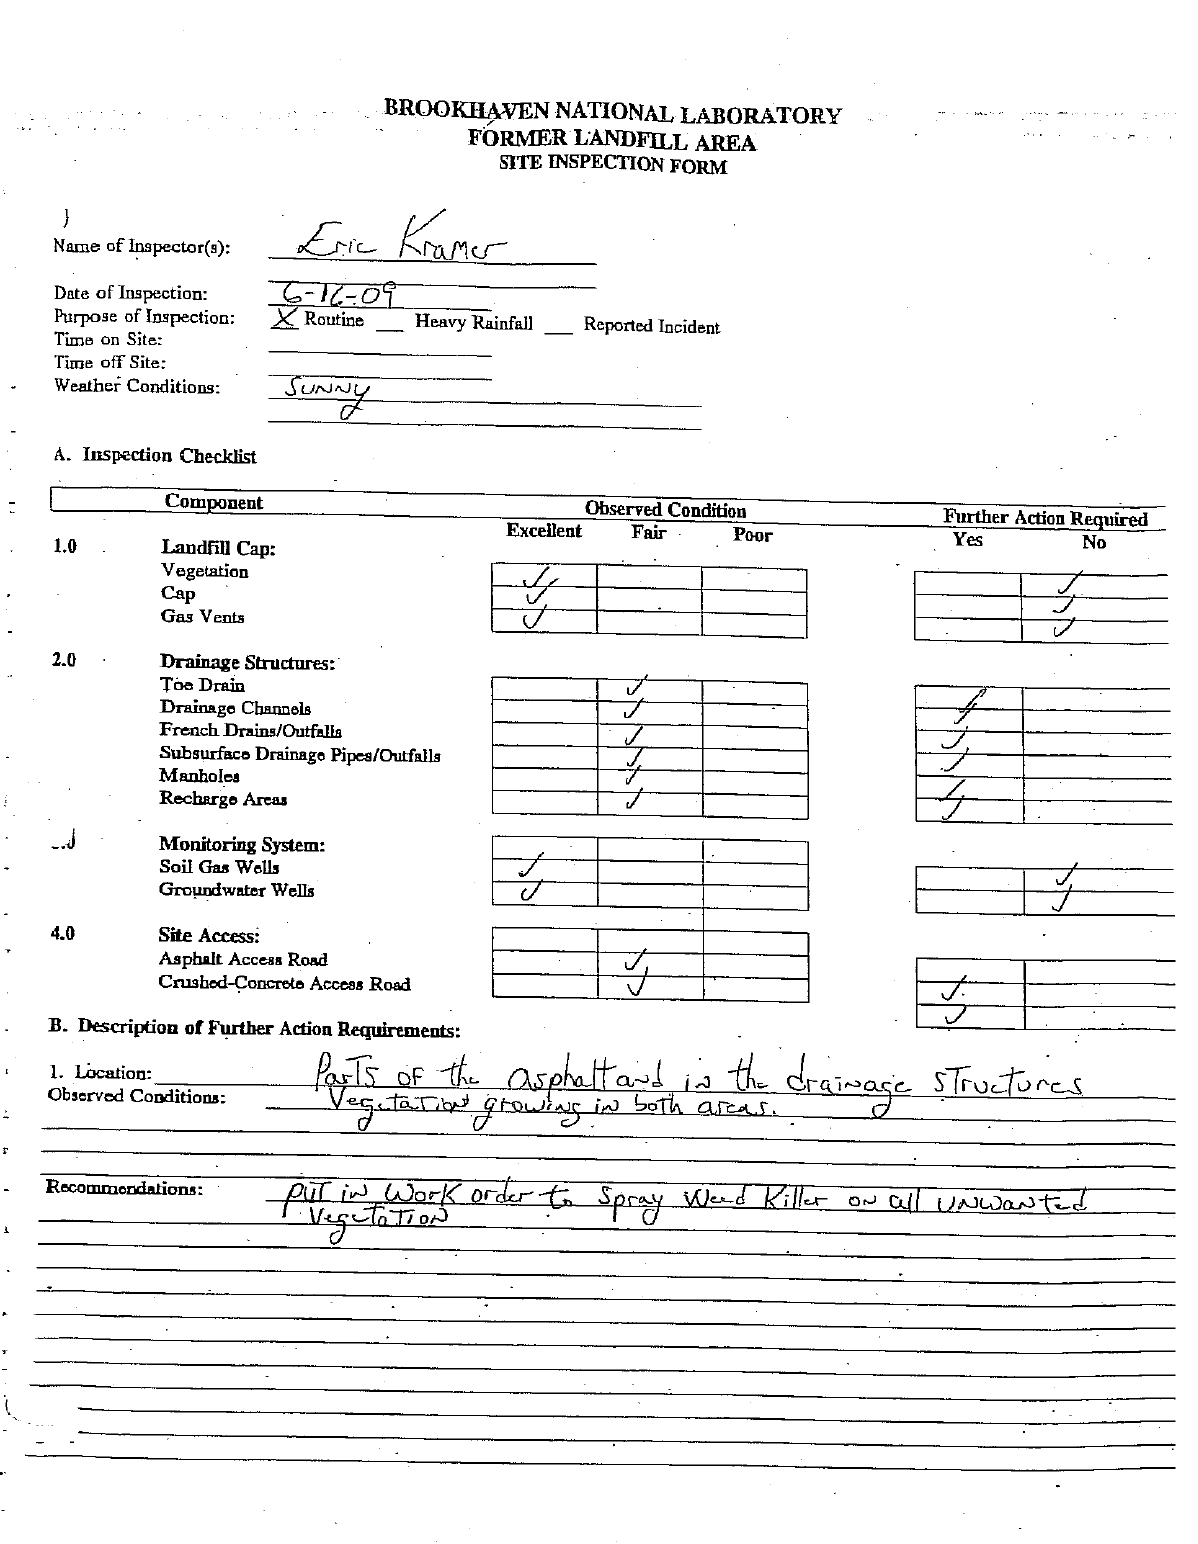
5.2 Drainage Structures
The drainage structures at both the Current and Former Landfill areas were maintained and any
obstructions removed. They were observed to be operational and structurally sound during the site
inspections. From April through June 2009, vegetation was noted growing in the drainage channels
of the Current Landfill and Former Landfill Area. A combination of weed whacking and herbicide
was used and the vegetation was not noted in subsequent inspections.
5.3 Environmental Monitoring System
The monitoring wells and soil-gas monitoring wells associated with the landfills required no
significant maintenance. During 2009, the groundwater monitoring wells were repainted to minimize
the affects of weather on the steel casings. Access to the soil-gas monitoring wells was cleared via
mechanical weed whacking
T:\LTRA\Landfills\2009 Report\Text\2009_text_v1.doc 19
5.4 Related Structures
During routine inspections of both landfills it was noted that access to the landfill caps required
walking on the unstable rip rap. Therefore, wooden staircases were installed in May 2009 at the
northeast corners of both the Current and Former Landfills to allow safer access to the cap areas.
The footings on the cap side of the stairs were secured to cement slabs placed on top of the cap.
6.0 CONCLUSIONS AND RECOMMENDATIONS
6.1 Groundwater Monitoring
6.1.1 Conclusions for the Current Landfill
VOCs such as benzene, and/or chloroethane continue to be detected in downgradient wells
087-11, 087-23, and 088-109 at concentrations above groundwater standards. The maximum
chloroethane concentration was 26.9 μg/L in well 088-109. Benzene was detected at a
maximum of 2 μg/L in well 088-11. During 2009, TVOC concentrations in these three wells
ranged up to 28.7 μg/L indicating that low level VOCs continue to emanate from the landfill.
However, an analysis of the trends of VOCs indicated the concentrations are stable to
decreasing.
Landfill water chemistry parameters and metals evaluated during the year suggest that
leachate continues to emanate from the landfill, but at low levels.
Tritium and Sr-90 continue to be detected in the wells downgradient of the Current Landfill,
but at concentrations well below groundwater standards. These concentrations were
consistent with historical observations.
Since 1998, there have been no detections of VOCs, water chemistry parameters or
radionuclides exceeding groundwater standards in wells 087-24, 088-22, and 088-23. These
wells are all screened in the mid-to deep-Upper Glacial Aquifer to monitor the vertical extent
of contamination from the Current Landfill.
Although low levels of contaminants continue to be detected, the landfill controls are
effective as evidenced by the improving quality of groundwater downgradient of the landfill.
T:\LTRA\Landfills\2009 Report\Text\2009_text_v1.doc 20
6.1.2 Recommendations for the Current Landfill
The groundwater monitoring well network is adequate at this time. No changes to the monitoring
frequency are recommended.
6.1.3 Conclusions for the Former Landfill Area
The Former Landfill Area is not a significant source of VOC contamination. No VOCs were
detected above groundwater standards in 2009. VOC concentrations in the downgradient
wells were at or near the minimum detectable limits.
Landfill-leachate indicators in downgradient wells were detected at concentrations
approximating those in the background monitoring wells, indicating that leachate generation
is minimal to nonexistent.
The Former Landfill Area no longer appears to be a source of Sr-90 contamination. Only
trace amounts of Sr-90 were detected near the Former Landfill Area (Well 097-64). The Sr-
90 detected in wells 106-43, 106-44, 106-45 and 106-64 has been decreasing with time and
is currently not above groundwater standards.
The implemented landfill controls are effective, as evidenced by the improving quality of
groundwater downgradient of the landfill.
6.1.4 Recommendations for the Former Landfill Area
The groundwater monitoring well network is adequate at this time. No changes to the monitoring
frequency are recommended.
6.2 Soil-Gas Monitoring
6.2.1 Conclusions for the Current Landfill
Methane and hydrogen sulfide levels in wells located along the west landfill boundary and southeast
corner have remained stable and have not shown any significant increases or decreases over time.
No gas migration has been observed this year at the outpost soil-gas wells along Brookhaven
Avenue.
T:\LTRA\Landfills\2009 Report\Text\2009_text_v1.doc 21
6.2.2 Recommendations for the Current Landfill
The soil-gas monitoring program is adequate at this time, since methane gas is still being produced
and leachate is continuing to discharge from the landfill.
6.2.3 Conclusions for the Former Landfill Area
Methane and hydrogen sulfide levels at the Former Landfill Area continue to show little to no
landfill gas.
6.2.4 Recommendations for the Former Landfill Area
The soil-gas monitoring program is adequate at this time. No changes to the monitoring frequency
are recommended.
6.3 Maintenance and Repair
Maintenance of the landfill caps will continue in accordance with the O&M requirements.
6.3.1 Current Landfill
Monthly inspections and maintenance will continue in accordance with the O&M requirements. To
prevent ruts in the landfills caused by the weight of the lawn mowers and moist surface conditions,
the cutting of the grass is only conducted when optimal soil conditions are evident. Access to the
soil-gas monitoring wells are cleared via mechanical weed whacking.
6.3.2 Former Landfill Area
Monthly inspections and maintenance will continue in accordance with the O&M requirements. To
prevent ruts in the landfills caused by the weight of the lawn mowers during periods of above normal
precipitation, the cutting of the grass is only conducted when optimal soil conditions are evident.
Access to the soil-gas monitoring wells are cleared via mechanical weed whacking.
7.0 REFERENCES
Brookhaven National Laboratory, 1999, BNL Groundwater Monitoring Program Quality
Assurance/Quality Control Project Plan, BNL, August 1999.
Brookhaven National Laboratory, 2001a, Groundwater Monitoring Data Quality Objectives Project,
BNL, September 2001.
T:\LTRA\Landfills\2009 Report\Text\2009_text_v1.doc 22
Brookhaven National Laboratory, 2001b, Current Landfill Area Five-Year Evaluation Report. BNL
Environmental Services Division, October 29,2001.
Brookhaven National Laboratory. 2009. Environmental Monitoring Plan CY 2009 Update.
Brookhaven National Laboratory, Upton, NY. January 2009.
CDM Federal, 1995a, Final Design Specifications for the Current Landfill, Brookhaven National
Laboratory, CDM Federal Programs Corporation, February 1995.
CDM Federal, 1995b, Engineering Evaluation/Cost Analysis for Groundwater: Operable Unit I,
Brookhaven National Laboratory, CDM Federal Programs Corporation, September 1995.
CDM Federal, 1995c, Final Closure/Design Report for the Former Landfill Area, Brookhaven
National Laboratory, CDM Federal Programs Corporation, November 1995.
CDM Federal, 1996a, Final Operations and Maintenance Manual for the Current Landfill,
Brookhaven National Laboratory, CDM Federal Programs Corporation, March 1996.
CDM Federal, 1996b, Final Construction Certification Report for Current Landfill Capping,
Brookhaven National Laboratory, CDM Federal Programs Corporation, May 1996.
CDM Federal, 1996c, Final Operations and Maintenance Manual for the Former Landfill Area,
Brookhaven National Laboratory, CDM Federal Programs Corporation, May 1996.
CDM Federal, 1997, Environmental Monitoring Report for Current Landfill, Brookhaven National
Laboratory, CDM Federal Programs Corporation January 1997.
CDM Federal, 1999, Focused Ecological Risk Assessment, Appendix L., Final Feasibility Study
Report OU I, CDM Federal Programs Corporation March 31, 1999.
EM-SOP-200, Collection and Frequency of Field Quality Control Samples, Brookhaven National
Laboratory, Environmental Monitoring Standard Operating Procedure
EM-SOP-203, Chemical Data Verification, Brookhaven National Laboratory Environmental
Monitoring, Standard Operating Procedure.
EM-SOP-204, Radiochemical Data Verification, Brookhaven National Laboratory Environmental
Monitoring, Standard Operating Procedure
6NYCRR Part 360, Solid Waste Management Facilities, New York State Department of
Environmental Conservation, Division of Solid & Hazardous Waste.
PW Grosser Consulting, 1997, Construction Certification Report for the Interim Landfill Capping,
Brookhaven National Laboratory, October 1997
T:\LTRA\Landfills\2009 Report\Text\2009_text_v1.doc 23
PW Grosser Consulting, 2001, Current Landfill Area Five-Year Evaluation Report, October 29,
2001.
PW Grosser Consulting, 2002, Former Landfill Area Five-Year Evaluation Report, March 8, 2002.
Roy F. Weston, 1997, Final Construction Certification Report for Former Landfill Capping,
Brookhaven National Laboratory, March 1997.
OER, 1997, Statement of Work For Hazardous Chemical and Radiochemical Data Validation,
Brookhaven National Laboratory, April, 1997.
United States Department of Energy Order 5400.5, Radiation Protection of the Public and the
Environment. Washington D.C., February 8, 1990.
T:\LTRA\Landfills\2009 Report\Text\2009_text_v1.doc 24
Appendix A
Soil-gas Sampling Field Notes
T:\LTRA\Landfills\2009 Report\Text\2009_text_v1.doc 25
Appendix B
Monthly Landfill Site Inspection Forms
T:\LTRA\Landfills\2009 Report\Text\2009_text_v1.doc 26
Appendix C
Historical Soil-gas Monitoring Data

Table 1. Analytical Requirements for Groundwater Samples
Well ID Project 1 Decision Subunit
EPA 524.2 VOCs
Pesticides Method 608
PCBs Method 608
TSS/TDS
Sufates/Chloride/Alkalinity
TK Nitrogen
Total Nitrogen
Nitrates
Nitrites
Ammonia
TAL Metals
Cyanide
EPA 900 Gross Alpha/Beta
EPA 901 Gamma Spec
EPA 906 Tritium
EPA 905 Sr 90
Blind Duplicate/MS/MSD
Frequency (events/year)
087-09 CLF Background X
f
Xbf Xbf Xbf Xbf Xbf Xbf Xbf Xbf Xbf XaXaXa3bf
087-11 CLF Downgradient X
f
Xbf Xbf Xbf Xbf Xbf Xbf Xbf Xbf Xbf XaXaXa3bf
087-23 CLF Downgradient X
f
Xbf Xbf Xbf Xbf Xbf Xbf Xbf Xbf Xbf XaXaXa3bf
087-24 CLF Downgradient XaXbf Xbf Xbf Xbf Xbf Xbf Xbf Xbf Xbf XaXaXa3bf
087-26 CLF Downgradient X
f
Xbf Xbf Xbf Xbf Xbf Xbf Xbf Xbf Xbf XaXaXa3bf
087-27 CLF Downgradient X
f
Xbf Xbf Xbf Xbf Xbf Xbf Xbf Xbf Xbf XaXaXa3bf
088-109 CLF Downgradient XXbf Xbf Xbf Xbf Xbf Xbf Xbf Xbf Xbf XaXaXaX4
088-110 CLF Downgradient X
f
Xbf Xbf Xbf Xbf Xbf Xbf Xbf Xbf Xbf XaXaXa3bf
088-21 CLF Downgradient X
f
Xbf Xbf Xbf Xbf Xbf Xbf Xbf Xbf Xbf XaXaXa3bf
088-22 CLF Downgradient XaXbf Xbf Xbf Xbf Xbf Xbf Xbf Xbf Xbf XaXaXa3bf
088-23 CLF Downgradient XaXbf Xbf Xbf Xbf Xbf Xbf Xbf Xbf Xbf XaXaXa3bf
086-42 FLF Background XaXaXaXaXaXaXaXaXaXaXaXaXaXaXXa1a
086-72 FLF Background XaXaXaXaXaXaXaXaXaXaXaXaXaXaXaXa1a
087-22 FLF Background XaXaXaXaXaXaXaXaXaXaXaXaXaXaXaXa1a
097-17 FLF Downgradient XaXaXaXaXaXaXaXaXaXaXaXaXaXaXaXa1a
097-277 FLF Downgradient XaXaXaXaXaXaXaXaXaXaXaXaXaXaXaXa1a
097-64 FLF Downgradient XaXaXaXaXaXaXaXaXaXaXaXaXaXaXaXa1a
106-02 FLF Downgradient XaXaXaXaXaXaXaXaXaXaXaXaXaXaXaXa1a
106-30 FLF Downgradient XaXaXaXaXaXaXaXaXaXaXaXaXaXaXaXaX1a
106-20 FLF Downgradient Xf 2f
106-21 FLF Downgradient Xf 2f
106-43 FLF Downgradient Xf 2f
106-44 FLF Downgradient Xf 2f
106-45 FLF Downgradient Xf 2f
106-64 FLF Downgradient Xf 2f
NOTES:
a: Collect in 4th Quarter only.
b: Collect 1st Quarter only.
3/16/2010

Table 1. Analytical Requirements for Groundwater Samples
Well ID Project 1 Decision Subunit
EPA 524.2 VOCs
Pesticides Method 608
PCBs Method 608
TSS/TDS
Sufates/Chloride/Alkalinity
TK Nitrogen
Total Nitrogen
Nitrates
Nitrites
Ammonia
TAL Metals
Cyanide
EPA 900 Gross Alpha/Beta
EPA 901 Gamma Spec
EPA 906 Tritium
EPA 905 Sr 90
Blind Duplicate/MS/MSD
Frequency (events/year)
f: Collect in 2nd and 4th Quarters.
3/16/2010

Table 2. Current Landfill - Summary of 2009 VOC Data
Groundwater
Standards
Analtye (ug/L)
1,1,1,2-Tetrachloroethane 5 0.5 U 0.5 U 0.5 U 0.5 U 0.5 U 0.5 U 0.5 U 0.5 U
1,1,1-Trichloroethane 5 0.5 U 0.5 U 0.5 U 0.5 U 0.5 U 0.5 U 0.5 U 0.5 U
1,1,2,2-Tetrachloroethane 5 0.5 U 0.5 U 0.5 U 0.5 U 0.5 U 0.5 U 0.5 U 0.5 U
1,1,2-Trichloroethane 1 0.5 U 0.5 U 0.5 U 0.5 U 0.5 U 0.5 U 0.5 U 0.5 U
1,1-Dichloroethane 5 0.5 U 0.5 U 0.5 U 0.5 U 0.297 J 0.303 J 0.5 U 0.5 U
1,1-Dichloroethylene 5 0.5 U 0.5 U 0.5 U 0.5 U 0.5 U 0.5 U 0.5 U 0.5 U
1,1-Dichloropropene 5 0.5 U 0.5 U 0.5 U 0.5 U 0.5 U 0.5 U 0.5 U 0.5 U
1,2,3-Trichlorobenzene 5 0.5 U 0.5 U 0.5 U 0.5 U 0.5 U 0.5 U 0.5 U 0.5 U
1,2,3-Trichloropropane 0.04 0.5 U 0.5 U 0.5 U 0.5 U 0.5 U 0.5 U 0.5 U 0.5 U
1,2,4-Trichlorobenzene 5 0.5 U 0.5 U 0.5 U 0.5 U 0.5 U 0.5 U 0.5 U 0.5 U
1,2-Dichloroethane 0.6 0.5 U 0.5 U 0.5 U 0.5 U 0.5 U 0.5 U 0.5 U 0.5 U
1,2-Dichloropropane 1 0.5 U 0.5 U 0.5 U 0.5 U 0.5 U 0.5 U 0.5 U 0.5 U
1,3-Dichloropropane 5 0.5 U 0.5 U 0.5 U 0.5 U 0.5 U 0.5 U 0.5 U 0.5 U
2,2-Dichloropropane 5 0.5 U 0.5 U 0.5 U 0.5 U 0.5 U 0.5 U 0.5 U 0.5 U
Benzene 1 0.5 U 0.5 U 1.22 1.99 1.07 0.971 0.5 U 0.5 U
Benzene, 1,2,4-trimethyl 5 0.5 U 0.5 U 0.5 U 0.5 U 0.5 U 0.5 U 0.5 U 0.5 U
Benzene, 1,3,5-trimethyl- 5 0.5 U 0.5 U 0.5 U 0.5 U 0.5 U 0.5 U 0.5 U 0.5 U
Benzene, 1-methylethyl- -- 0.5 U 0.5 U 0.5 U 0.5 U 0.5 U 0.5 U 0.5 U 0.5 U
Bromobenzene 5 0.5 U 0.5 U 0.5 U 0.5 U 0.5 U 0.5 U 0.5 U 0.5 U
Bromodichloromethane 50 0.5 U 0.5 U 0.5 U 0.5 U 0.5 U 0.5 U 0.5 U 0.5 U
Bromoform 50 0.5 U 0.5 U 0.5 U 0.5 U 0.5 U 0.5 U 0.5 U 0.5 U
Carbon tetrachloride 5 0.5 U 0.5 U 0.5 U 0.5 U 0.5 U 0.5 U 0.5 U 0.5 U
Chlorobenzene 5 0.5 U 0.5 U 0.276 J 0.447 J 0.833 0.995 0.5 U 0.5 U
Chlorobromomethane 5 0.5 U 0.5 U 0.5 U 0.5 U 0.5 U 0.5 U 0.5 U 0.5 U
Chloroethane 5 0.5 U 0.5 U 3.39 5.19 4.64 5.21 0.5 U 0.5 U
Chloroform 7 0.5 U 0.198 J 0.5 U 0.5 U 0.5 U 0.5 U 0.5 U 0.5 U
cis-1,2-Dichloroethylene 5 0.5 U 0.5 U 0.145 J 0.195 J 0.5 U 0.5 U 0.5 U 0.5 U
cis-1,3-Dichloropropene 0.4 0.5 U 0.5 U 0.5 U 0.5 U 0.5 U 0.5 U 0.5 U 0.5 U
Cymene 5 0.5 U 0.5 U 0.5 U 0.5 U 0.5 U 0.5 U 0.5 U 0.5 U
DBCP 0.04 0.5 U 0.5 U 0.5 U 0.5 U 0.5 U 0.5 U 0.5 U 0.5 U
Dibromochloromethane 5 0.5 U 0.5 U 0.5 U 0.5 U 0.5 U 0.5 U 0.5 U 0.5 U
Dibromomethane 5 0.5 U 0.5 U 0.5 U 0.5 U 0.5 U 0.5 U 0.5 U 0.5 U
Dichlorodifluoromethane 5 0.5 U 0.5 U 0.5 U 0.5 U 0.5 U 0.5 U 0.5 U 0.5 U
EDB 0.05 0.5 U 0.5 U 0.5 U 0.5 U 0.5 U 0.5 U 0.5 U 0.5 U
Ethene, 1,2-dichloro-, (E)- 5 0.5 U 0.5 U 0.5 U 0.5 U 0.5 U 0.5 U 0.5 U 0.5 U
Ethylbenzene 5 0.5 U 0.5 U 0.5 U 0.5 U 0.5 U 0.5 U 0.5 U 0.5 U
Hexachlorobutadiene 0.5 0.5 U 0.5 U 0.5 U 0.5 U 0.5 U 0.5 U 0.5 U 0.5 U
m-Dichlorobenzene 3 0.5 U 0.5 U 0.5 U 0.5 U 0.5 U 0.5 U 0.5 U 0.5 U
m/p xylene 5 0.5 U 0.5 U 0.5 U 0.5 U 0.5 U 0.5 U 0.5 U 0.5 U
Methyl bromide 5 0.5 U 0.5 U 0.5 U 0.5 U 0.5 U 0.5 U 0.5 U 0.5 U
Methyl chloride 5 0.5 U 0.5 U 0.5 U 0.5 U 0.5 U 0.5 U 0.5 U 0.5 U
Methyl tert-butyl ether 10 0.5 U 0.5 U 0.5 U 0.5 U 0.5 U 0.5 U 0.5 U 0.5 U
Methylene chloride 5 0.5 U 0.5 U 0.5 U 0.5 U 0.5 U 0.5 U 0.5 U 0.5 U
n-Butylbenzene 5 0.5 U 0.5 U 0.5 U 0.5 U 0.5 U 0.5 U 0.5 U 0.5 U
n-Propylbenzene 5 0.5 U 0.5 U 0.5 U 0.5 U 0.5 U 0.5 U 0.5 U 0.5 U
Naphthalene 10 0.5 U 0.5 U 0.5 U 0.5 U 0.5 U 0.5 U 0.5 U 0.5 U
o-Chlorotoluene 5 0.5 U 0.5 U 0.5 U 0.5 U 0.321 J 0.484 J 0.5 U 0.5 U
o-Dichlorobenzene 3 0.5 U 0.5 U 0.5 U 0.5 U 0.5 U 0.5 U 0.5 U 0.5 U
o-Xylene 5 0.5 U 0.5 U 0.5 U 0.5 U 0.5 U 0.5 U 0.5 U 0.5 U
p-Chlorotoluene 5 0.5 U 0.5 U 0.5 U 0.5 U 0.5 U 0.5 U 0.5 U 0.5 U
p-Dichlorobenzene 3 0.5 U 0.5 U 0.367 J 0.469 J 0.361 J 0.483 J 0.5 U 0.5 U
sec-Butylbenzene 5 0.5 U 0.5 U 0.5 U 0.5 U 0.5 U 0.5 U 0.5 U 0.5 U
Styrene 5 0.5 U 0.5 U 0.5 U 0.5 U 0.5 U 0.5 U 0.5 U 0.5 U
tert-Butylbenzene 5 0.5 U 0.5 U 0.5 U 0.5 U 0.5 U 0.5 U 0.5 U 0.5 U
Tetrachloroethylene 5 0.5 U 0.5 U 0.5 U 0.5 U 0.5 U 0.5 U 0.5 U 0.5 U
Toluene 5 0.5 U 0.5 U 0.5 U 0.111 J 0.5 U 0.5 U 0.5 U 0.5 U
trans-1,3-Dichloropropene 0.4 0.5 U 0.5 U 0.5 U 0.5 U 0.5 U 0.5 U 0.5 U 0.5 U
Trichloroethylene 5 0.5 U 0.5 U 0.5 U 0.5 U 0.5 U 0.5 U 0.5 U 0.5 U
Trichlorofluoromethane 5 0.5 U 0.5 U 0.5 U 0.5 U 0.5 U 0.5 U 0.5 U 0.5 U
Vinyl chloride 2 0.5 U 0.5 U 0.5 U 0.5 U 0.5 U 0.5 U 0.5 U 0.5 U
524.2 TVOC -- 0 0.198 5.398 8.402 7.522 8.446 0 0
U - Not Detected
J - Estimated Value
(ug/L) (ug/L) (ug/L) (ug/L)(ug/L) (ug/L) (ug/L) (ug/L)
6/4/2009 12/1/2009 6/4/2009 12/1/2009 6/4/2009 12/1/2009 12/1/2009 6/4/2009
087-23 087-23 087-24 087-26087-09 087-09 087-11 087-11
Page 1 of 3

Table 2. Current Landfill - Summary of 2009 VOC Data
Groundwater
Standards
Analtye (ug/L)
1,1,1,2-Tetrachloroethane 5
1,1,1-Trichloroethane 5
1,1,2,2-Tetrachloroethane 5
1,1,2-Trichloroethane 1
1,1-Dichloroethane 5
1,1-Dichloroethylene 5
1,1-Dichloropropene 5
1,2,3-Trichlorobenzene 5
1,2,3-Trichloropropane 0.04
1,2,4-Trichlorobenzene 5
1,2-Dichloroethane 0.6
1,2-Dichloropropane 1
1,3-Dichloropropane 5
2,2-Dichloropropane 5
Benzene 1
Benzene, 1,2,4-trimethyl 5
Benzene, 1,3,5-trimethyl- 5
Benzene, 1-methylethyl- --
Bromobenzene 5
Bromodichloromethane 50
Bromoform 50
Carbon tetrachloride 5
Chlorobenzene 5
Chlorobromomethane 5
Chloroethane 5
Chloroform 7
cis-1,2-Dichloroethylene 5
cis-1,3-Dichloropropene 0.4
Cymene 5
DBCP 0.04
Dibromochloromethane 5
Dibromomethane 5
Dichlorodifluoromethane 5
EDB 0.05
Ethene, 1,2-dichloro-, (E)- 5
Ethylbenzene 5
Hexachlorobutadiene 0.5
m-Dichlorobenzene 3
m/p xylene 5
Methyl bromide 5
Methyl chloride 5
Methyl tert-butyl ether 10
Methylene chloride 5
n-Butylbenzene 5
n-Propylbenzene 5
Naphthalene 10
o-Chlorotoluene 5
o-Dichlorobenzene 3
o-Xylene 5
p-Chlorotoluene 5
p-Dichlorobenzene 3
sec-Butylbenzene 5
Styrene 5
tert-Butylbenzene 5
Tetrachloroethylene 5
Toluene 5
trans-1,3-Dichloropropene 0.4
Trichloroethylene 5
Trichlorofluoromethane 5
Vinyl chloride 2
524.2 TVOC --
U - Not Detected
J - Estimated Value
0.5 U 0.5 U 0.5 U 0.5 U 0.5 U 0.5 U 0.5 U 0.5 U
0.5 U 0.5 U 0.5 U 0.5 U 0.5 U 0.5 U 0.5 U 0.5 U
0.5 U 0.5 U 0.5 U 0.5 U 0.5 U 0.5 U 0.5 U 0.5 U
0.5 U 0.5 U 0.5 U 0.5 U 0.5 U 0.5 U 0.5 U 0.5 U
0.5 U 0.5 U 0.5 U 1.76 1.31 0.811 0.391 J 0.661
0.5 U 0.5 U 0.5 U 0.5 U 0.5 U 0.5 U 0.5 U 0.5 U
0.5 U 0.5 U 0.5 U 0.5 U 0.5 U 0.5 U 0.5 U 0.5 U
0.5 U 0.5 U 0.5 U 0.5 U 0.5 U 0.5 U 0.5 U 0.5 U
0.5 U 0.5 U 0.5 U 0.5 U 0.5 U 0.5 U 0.5 U 0.5 U
0.5 U 0.5 U 0.5 U 0.5 U 0.5 U 0.5 U 0.5 U 0.5 U
0.5 U 0.5 U 0.5 U 0.5 U 0.5 U 0.5 U 0.5 U 0.5 U
0.5 U 0.5 U 0.5 U 0.5 U 0.5 U 0.5 U 0.5 U 0.5 U
0.5 U 0.5 U 0.5 U 0.5 U 0.5 U 0.5 U 0.5 U 0.5 U
0.5 U 0.5 U 0.5 U 0.5 U 0.5 U 0.5 U 0.5 U 0.5 U
0.5 U 0.421 J 0.822 0.107 J 0.177 J 0.5 U 0.121 J 0.43 J
0.5 U 0.5 U 0.5 U 0.5 U 0.5 U 0.5 U 0.5 U 0.5 U
0.5 U 0.5 U 0.5 U 0.5 U 0.5 U 0.5 U 0.5 U 0.5 U
0.5 U 0.5 U 0.5 U 0.5 U 0.5 U 0.5 U 0.5 U 0.5 U
0.5 U 0.5 U 0.5 U 0.5 U 0.5 U 0.5 U 0.5 U 0.5 U
0.5 U 0.5 U 0.5 U 0.5 U 0.5 U 0.5 U 0.5 U 0.5 U
0.5 U 0.5 U 0.5 U 0.5 U 0.5 U 0.5 U 0.5 U 0.5 U
0.5 U 0.5 U 0.5 U 0.5 U 0.5 U 0.5 U 0.5 U 0.5 U
0.5 U 0.193 J 1.49 0.5 U 0.5 U 0.5 U 0.5 U 0.104 J
0.5 U 0.5 U 0.5 U 0.5 U 0.5 U 0.5 U 0.5 U 0.5 U
0.5 U 1.1 1.58 26.1 26.9 13.2 9.86 1.98
0.5 U 0.272 J 0.5 U 0.288 J 0.27 J 0.5 U 0.257 J 0.5 U
0.5 U 0.5 U 0.5 U 0.5 U 0.5 U 0.5 U 0.5 U 0.5 U
0.5 U 0.5 U 0.5 U 0.5 U 0.5 U 0.5 U 0.5 U 0.5 U
0.5 U 0.5 U 0.5 U 0.5 U 0.5 U 0.5 U 0.5 U 0.5 U
0.5 U 0.5 U 0.5 U 0.5 U 0.5 U 0.5 U 0.5 U 0.5 U
0.5 U 0.5 U 0.5 U 0.5 U 0.5 U 0.5 U 0.5 U 0.5 U
0.5 U 0.5 U 0.5 U 0.5 U 0.5 U 0.5 U 0.5 U 0.5 U
0.5 U 0.5 U 0.5 U 0.5 U 0.5 U 0.5 U 0.5 U 0.5 U
0.5 U 0.5 U 0.5 U 0.5 U 0.5 U 0.5 U 0.5 U 0.5 U
0.5 U 0.5 U 0.5 U 0.5 U 0.5 U 0.5 U 0.5 U 0.5 U
0.5 U 0.5 U 0.5 U 0.5 U 0.5 U 0.5 U 0.5 U 0.116 J
0.5 U 0.5 U 0.5 U 0.5 U 0.5 U 0.5 U 0.5 U 0.5 U
0.5 U 0.5 U 0.5 U 0.5 U 0.5 U 0.5 U 0.5 U 0.5 U
0.5 U 0.5 U 0.5 U 0.5 U 0.5 U 0.5 U 0.5 U 0.5 U
0.5 U 0.5 U 0.5 U 0.5 U 0.5 U 0.5 U 0.5 U 0.5 U
0.5 U 0.5 U 0.5 U 0.5 U 0.5 U 0.5 U 0.5 U 0.5 U
0.5 U 0.5 U 0.5 U 0.5 U 0.5 U 0.5 U 0.5 U 0.5 U
0.5 U 0.5 U 0.5 U 0.5 U 0.5 U 0.5 U 0.5 U 0.5 U
0.5 U 0.5 U 0.5 U 0.5 U 0.5 U 0.5 U 0.5 U 0.5 U
0.5 U 0.5 U 0.5 U 0.5 U 0.5 U 0.5 U 0.5 U 0.5 U
0.5 U 0.5 U 0.5 U 0.5 U 0.5 U 0.5 U 0.5 U 0.5 U
0.5 U 0.5 U 0.5 U 0.5 U 0.5 U 0.5 U 0.5 U 0.5 U
0.5 U 0.5 U 0.5 U 0.5 U 0.5 U 0.5 U 0.5 U 0.5 U
0.5 U 0.5 U 0.5 U 0.5 U 0.5 U 0.5 U 0.5 U 0.5 U
0.5 U 0.5 U 0.5 U 0.5 U 0.5 U 0.5 U 0.5 U 0.5 U
0.5 U 0.5 U 0.261 J 0.5 U 0.5 U 0.5 U 0.5 U 0.234 J
0.5 U 0.5 U 0.5 U 0.5 U 0.5 U 0.5 U 0.5 U 0.5 U
0.5 U 0.5 U 0.5 U 0.5 U 0.5 U 0.5 U 0.5 U 0.5 U
0.5 U 0.5 U 0.5 U 0.5 U 0.5 U 0.5 U 0.5 U 0.5 U
0.5 U 0.5 U 0.5 U 0.5 U 0.5 U 0.5 U 0.5 U 0.5 U
0.5 U 0.5 U 0.5 U 0.5 U 0.5 U 0.5 U 0.5 U 0.5 U
0.5 U 0.5 U 0.5 U 0.5 U 0.5 U 0.5 U 0.5 U 0.5 U
0.5 U 0.5 U 0.5 U 0.5 U 0.5 U 0.5 U 0.5 U 0.5 U
0.5 U 0.5 U 0.5 U 0.5 U 0.5 U 0.5 U 0.5 U 0.5 U
0.5 U 0.5 U 0.5 U 0.5 U 0.5 U 0.5 U 0.5 U 0.5 U
0 1.986 4.153 28.25
5
28.657 14.011 10.629 3.525
(ug/L) (ug/L) (ug/L) (ug/L)(ug/L) (ug/L) (ug/L) (ug/L) 8/26/2009 12/1/2009 6/4/20096/4/2009 12/1/2009 3/12/2009 6/4/200912/1/2009 088-109 088-109 088-109 088-110087-26 087-27 087-27 088-109
Page 2 of 3
Table 2. Current Landfill - Summary of 2009 VOC Data
Groundwater
Standards
Analtye (ug/L)
1,1,1,2-Tetrachloroethane 5
1,1,1-Trichloroethane 5
1,1,2,2-Tetrachloroethane 5
1,1,2-Trichloroethane 1
1,1-Dichloroethane 5
1,1-Dichloroethylene 5
1,1-Dichloropropene 5
1,2,3-Trichlorobenzene 5
1,2,3-Trichloropropane 0.04
1,2,4-Trichlorobenzene 5
1,2-Dichloroethane 0.6
1,2-Dichloropropane 1
1,3-Dichloropropane 5
2,2-Dichloropropane 5
Benzene 1
Benzene, 1,2,4-trimethyl 5
Benzene, 1,3,5-trimethyl- 5
Benzene, 1-methylethyl- --
Bromobenzene 5
Bromodichloromethane 50
Bromoform 50
Carbon tetrachloride 5
Chlorobenzene 5
Chlorobromomethane 5
Chloroethane 5
Chloroform 7
cis-1,2-Dichloroethylene 5
cis-1,3-Dichloropropene 0.4
Cymene 5
DBCP 0.04
Dibromochloromethane 5
Dibromomethane 5
Dichlorodifluoromethane 5
EDB 0.05
Ethene, 1,2-dichloro-, (E)- 5
Ethylbenzene 5
Hexachlorobutadiene 0.5
m-Dichlorobenzene 3
m/p xylene 5
Methyl bromide 5
Methyl chloride 5
Methyl tert-butyl ether 10
Methylene chloride 5
n-Butylbenzene 5
n-Propylbenzene 5
Naphthalene 10
o-Chlorotoluene 5
o-Dichlorobenzene 3
o-Xylene 5
p-Chlorotoluene 5
p-Dichlorobenzene 3
sec-Butylbenzene 5
Styrene 5
tert-Butylbenzene 5
Tetrachloroethylene 5
Toluene 5
trans-1,3-Dichloropropene 0.4
Trichloroethylene 5
Trichlorofluoromethane 5
Vinyl chloride 2
524.2 TVOC --
U - Not Detected
J - Estimated Value
0.5 U 0.5 U 0.5 U 0.5 U 0.5 U
0.5 U 0.5 U 0.5 U 0.5 U 0.5 U
0.5 U 0.5 U 0.5 U 0.5 U 0.5 U
0.5 U 0.5 U 0.5 U 0.5 U 0.5 U
0.865 0.5 U 0.5 U 0.5 U 0.5 U
0.5 U 0.5 U 0.5 U 0.5 U 0.5 U
0.5 U 0.5 U 0.5 U 0.5 U 0.5 U
0.5 U 0.5 U 0.5 U 0.5 U 0.5 U
0.5 U 0.5 U 0.5 U 0.5 U 0.5 U
0.5 U 0.5 U 0.5 U 0.5 U 0.5 U
0.5 U 0.5 U 0.5 U 0.5 U 0.5 U
0.5 U 0.5 U 0.5 U 0.5 U 0.5 U
0.5 U 0.5 U 0.5 U 0.5 U 0.5 U
0.5 U 0.5 U 0.5 U 0.5 U 0.5 U
0.536 0.5 U 0.5 U 0.5 U 0.5 U
0.5 U 0.5 U 0.5 U 0.5 U 0.5 U
0.5 U 0.5 U 0.5 U 0.5 U 0.5 U
0.5 U 0.5 U 0.5 U 0.5 U 0.5 U
0.5 U 0.5 U 0.5 U 0.5 U 0.5 U
0.5 U 0.5 U 0.5 U 0.5 U 0.5 U
0.5 U 0.5 U 0.5 U 0.5 U 0.5 U
0.5 U 0.5 U 0.5 U 0.5 U 0.5 U
0.34 J 0.5 U 0.5 U 0.5 U 0.5 U
0.5 U 0.5 U 0.5 U 0.5 U 0.5 U
3.1 0.5 U 0.5 U 0.5 U 0.5 U
0.5 U 0.5 U 0.5 U 0.5 U 0.5 U
0.5 U 0.5 U 0.5 U 0.5 U 0.5 U
0.5 U 0.5 U 0.5 U 0.5 U 0.5 U
0.5 U 0.5 U 0.5 U 0.5 U 0.5 U
0.5 U 0.5 U 0.5 U 0.5 U 0.5 U
0.5 U 0.5 U 0.5 U 0.5 U 0.5 U
0.5 U 0.5 U 0.5 U 0.5 U 0.5 U
0.5 U 0.5 U 0.5 U 0.5 U 0.5 U
0.5 U 0.5 U 0.5 U 0.5 U 0.5 U
0.5 U 0.5 U 0.5 U 0.5 U 0.5 U
0.514 0.5 U 0.5 U 0.5 U 0.5 U
0.5 U 0.5 U 0.5 U 0.5 U 0.5 U
0.5 U 0.5 U 0.5 U 0.5 U 0.5 U
0.5 U 0.5 U 0.5 U 0.5 U 0.5 U
0.5 U 0.5 U 0.5 U 0.5 U 0.5 U
0.5 U 0.5 U 0.5 U 0.5 U 0.5 U
0.5 U 0.5 U 0.5 U 0.5 U 0.5 U
0.5 U 0.5 U 0.5 U 0.5 U 0.5 U
0.5 U 0.5 U 0.5 U 0.5 U 0.5 U
0.5 U 0.5 U 0.5 U 0.5 U 0.5 U
0.5 U 0.5 U 0.5 U 0.5 U 0.5 U
0.5 U 0.5 U 0.5 U 0.5 U 0.5 U
0.5 U 0.5 U 0.5 U 0.5 U 0.5 U
0.5 U 0.5 U 0.5 U 0.5 U 0.5 U
0.5 U 0.5 U 0.5 U 0.5 U 0.5 U
0.326 J 0.5 U 0.5 U 0.5 U 0.5 U
0.5 U 0.5 U 0.5 U 0.5 U 0.5 U
0.5 U 0.5 U 0.5 U 0.5 U 0.5 U
0.5 U 0.5 U 0.5 U 0.5 U 0.5 U
0.5 U 0.5 U 0.5 U 0.5 U 0.5 U
0.5 U 0.5 U 0.5 U 0.5 U 0.5 U
0.5 U 0.5 U 0.5 U 0.5 U 0.5 U
0.5 U 0.5 U 0.5 U 0.5 U 0.5 U
0.5 U 0.5 U 0.5 U 0.5 U 0.5 U
0.5 U 0.5 U 0.5 U 0.5 U 0.5 U
5.681 0 0 0 0
(ug/L)
(ug/L) (ug/L) (ug/L) (ug/L)
6/4/2009 12/1/2009 12/1/2009 12/1/200912/1/2009 088-23088-110 088-21 088-21 088-22
Page 3 of 3
Table 3. Current Landfill - Summary of 2009 Water Chemistry Data
Groundwater Standards
A
naltye (mg/L)
Alkalinity (as CaCO3) -- 19.2 22.9 17.4 86.7 131 192 32.2 115
Ammonia (as N) 2 0.03 U 0.016 U 0.016 U 4.2 3.15 3.1 0.46 0.53
Chloride 250 56.9 49.7 90.7 15.2 16.3 18.5 12.7 7.58
Cyanide 0.2 0.002 U 0.002 U 0.002 U 0.002 U 0.0017 U 0.002 U 0.002 U 0.0017 U
Nitrate (as N) 10 0.696 0.692 0.403 0.033 U 0.033 U 0.033 U 0.033 U 0.033 U
Nitrite (as N) 1 0.033 U 0.033 U 0.033 U 0.033 U 0.033 U 0.033 U 0.033 U 0.033 U
Nitrite + Nitrate-N 10 0.83 0.152 0.386 0.01 U 0.0323 J 0.081 J 0.01 U 0.0326 J
Nitrogen -- 0.909 0.348 0.401 4.12 2.63 3.66 0.615 1.22
Sulfate 250 17.6 12 10.9 2.15 J 3.92 J 2.4 J 10.3 5.54
TDS -- 161 156 194 153 173 194 81 144
Total Kjeldahl Nitrogen -- 0.079 J 0.196 0.033 U 4.11 2.6 3.57 0.615 1.19
TSS -- 7.05 10.4 8 25 18.3 70.8 5.9 14.7
U - Not Detected
J - Estimated Value
(mg/L) (mg/L) (mg/L) (mg/L) (mg/L) (mg/L) (mg/L) (mg/L)
3/12/2009 6/4/2009 12/1/2009 3/12/2009 6/4/2009 12/1/2009 3/12/2009 6/4/2009
087-11 087-11 087-23 087-23087-09 087-09 087-09 087-11
Page 1 of 4
Table 3. Current Landfill - Summary of 2009 Water Chemistry Data
Groundwater Standards
A
naltye (mg/L)
Alkalinity (as CaCO3) --
Ammonia (as N) 2
Chloride 250
Cyanide 0.2
Nitrate (as N) 10
Nitrite (as N) 1
Nitrite + Nitrate-N 10
Nitrogen --
Sulfate 250
TDS --
Total Kjeldahl Nitrogen --
TSS --
U - Not Detected
J - Estimated Value
114 16.6 18.4 17.7 17.1 17.4 145 112
0.322 0.016 U 0.016 U 0.03 U 0.016 U 0.016 U 3.7 2.41
9.22 17.9 18.1 15.7 17.2 19 23.7 26.3
0.002 U 0.002 U 0.002 U 0.0015 U 0.0017 U 0.002 U 0.0015 U 0.0017 U
0.033 U 0.472 0.492 0.438 0.453 0.508 0.033 U 0.033 U
0.033 U 0.033 U 0.033 U 0.0365 J 0.0531 J 0.033 U 0.0349 J 0.033 U
0.08 J 0.478 0.487 0.475 0.456 0.496 0.01 U 0.0346 J
0.548 0.478 0.622 0.475 0.456 0.641 3.26 3.14
6.55 12.4 12.5 11.9 12.2 12.3 6.53 12.3
141 73 74 76 78 73 222 180
0.468 0.033 U 0.135 0.029 U 0.033 U 0.145 3.26 3.1
8.6 0.69 J 1.14 U 0.57 U 3.45 1.14 U 27.6 17.1
(mg/L) (mg/L) (mg/L) (mg/L)(mg/L) (mg/L) (mg/L) (mg/L) 6/4/2009 12/1/2009 3/12/2009 6/4/200912/1/2009 6/4/2009 12/1/2009 3/12/2009 087-26 087-26 087-27 087-27087-23 087-24 087-24 087-26
Page 2 of 4
Table 3. Current Landfill - Summary of 2009 Water Chemistry Data
Groundwater Standards
A
naltye (mg/L)
Alkalinity (as CaCO3) --
Ammonia (as N) 2
Chloride 250
Cyanide 0.2
Nitrate (as N) 10
Nitrite (as N) 1
Nitrite + Nitrate-N 10
Nitrogen --
Sulfate 250
TDS --
Total Kjeldahl Nitrogen --
TSS --
U - Not Detected
J - Estimated Value
163 52.4 36.4 78.9 105 124 133 16.6
1.5 1.59 0.836 0.891 3 7.03 2.11 0.03 U
26.2 12.6 10.9 13.9 30.8 26.4 35.4 270
0.002 U 0.0015 U 0.002 U 0.002 U 0.0015 U 0.0017 U 0.0017 U 0.002 U
0.033 U 0.0754 J 0.033 U 0.033 JU 0.033 U 0.033 U 0.033 JU 0.291
0.033 U 0.033 U 0.033 U 0.033 JU 0.0372 J 0.0528 J 0.033 JU 0.033 U
0.073 J 0.05 U 0.05 U 0.065 J 0.01 U 0.0345 J 0.0745 J 0.295
1.87 1.61 1.02 1.23 2.86 6.28 2.49 0.442
14.2 14.2 17.7 12.7 13.5 14.8 20.2 2.99 J
211 106 82 136 220 241 222 565
1.8 1.59 0.996 1.17 2.86 6.25 2.41 0.147
17.2 1.8 J 0.875 J 3 J 42.2 27.8 12 6
(mg/L) (mg/L) (mg/L) (mg/L)(mg/L) (mg/L) (mg/L) (mg/L) 3/12/2009 6/4/2009 12/1/2009 3/12/200912/1/2009 3/12/2009 6/4/2009 12/1/2009 088-110 088-110 088-110 088-21087-27 088-109 088-109 088-109
Page 3 of 4
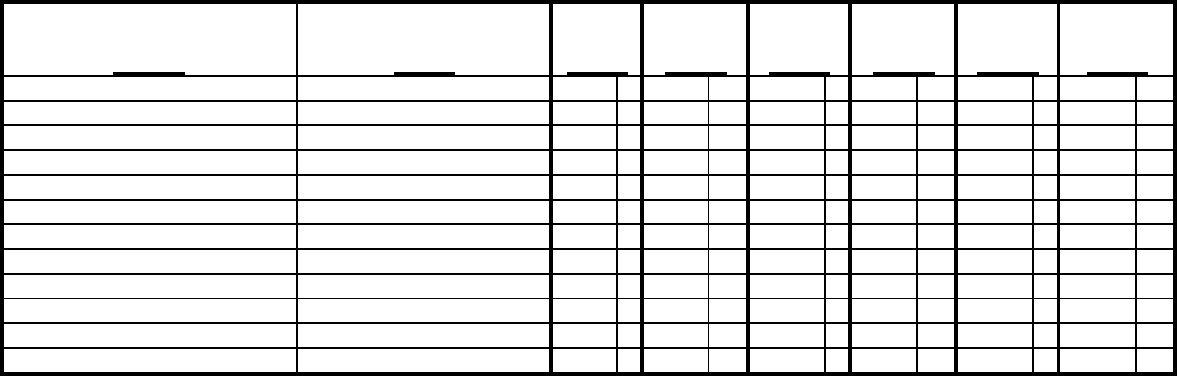
Table 3. Current Landfill - Summary of 2009 Water Chemistry Data
Groundwater Standards
A
naltye (mg/L)
Alkalinity (as CaCO3) --
Ammonia (as N) 2
Chloride 250
Cyanide 0.2
Nitrate (as N) 10
Nitrite (as N) 1
Nitrite + Nitrate-N 10
Nitrogen --
Sulfate 250
TDS --
Total Kjeldahl Nitrogen --
TSS --
U - Not Detected
J - Estimated Value
14.5 23.8 14.5 15.4 27 22.3
0.048 J 0.021 J 0.016 U 0.016 U 0.04 U 0.016 J
162 72.7 17.3 17.1 16 16.1
0.002 U 0.002 U 0.0017 U 0.002 U 0.0017 U 0.0017 U
0.162 0.281 J 0.465 0.486 J 0.033 U 0.033 JU
0.033 U 0.033 JU 0.0538 J 0.033 JU 0.0549 J 0.033 JU
0.116 0.257 0.432 0.495 0.0113 J 0.0525 J
0.122 0.269 0.432 0.496 0.033 U 0.204 J
3.39 J 4.05 J 11.4 11.5 11.2 10.8
351 172 69 62 84 67
0.033 U 0.033 U 0.033 U 0.033 U 0.033 U 0.151
6.99 1.14 U 10.1 2.4 J 3.41 9.6
(mg/L) (mg/L)(mg/L) (mg/L) (mg/L) (mg/L) 6/4/2009 12/1/20096/4/2009 12/1/2009 6/4/2009 12/1/2009 088-23 088-23088-21 088-21 088-22 088-22
Page 4 of 4
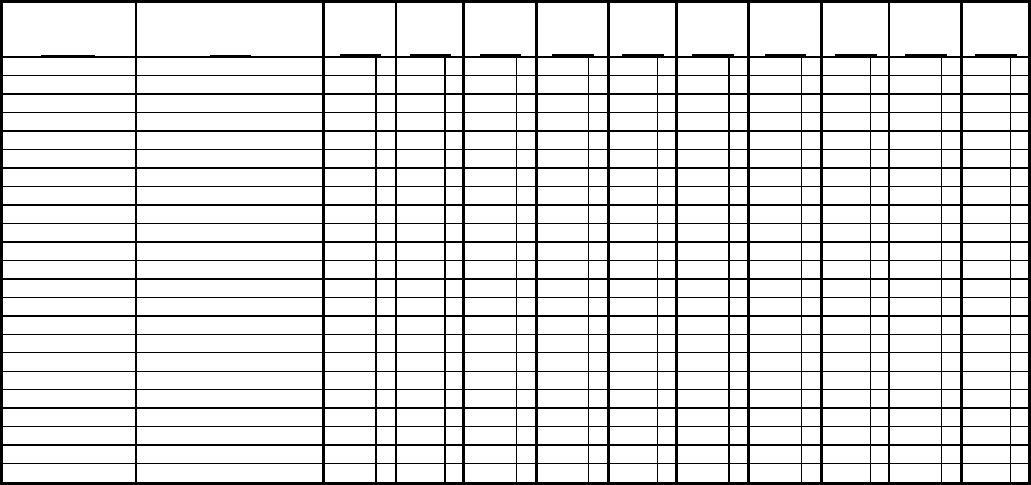
Table 4. Current Landfill - Summary of 2009 Metals Data
Groundwater Standards
Analtye (ug/L)
Aluminum 200 941 336 240 164 B 76.4 B 69.4 B 68 U 68 U 68 U 68 U
Antimony 33.4 B7.96 B3U3.4 B7.19 B3U3U3U3U3U
Arsenic 10 1.5 U 4.24 B 2.32 B 5.4 5.46 6.26 9.7 11.9 11.8 1.5 U
Barium 1000 45.9 B 41.5 B 49.6 B 35.3 B 23.7 B 35.5 B 23.1 B 30.4 B 33.2 B 9.98 B
Beryllium 3 1U1U1U1U1U1U1U1U1U1U
Cadmium 5 1U1U1U1U1U1U1U1U1U1U
Calcium -- 10700 9840 8780 18000 15200 19700 4080 B 4940 B 6710 5590
Chromium 50 794 607 515 2 U 2 U 2.18 B 2 U 2 U 2.99 B 2 U
Cobalt -- 2.9 B 3.13 B 3.42 B 1 U 1 U 1 U 2 B 3.12 B 2.9 B 1 U
Copper 200 13.4 B 13.2 B 11.5 B 3 U 3 U 3 U 3 U 3 U 3 U 3 U
Iron 300 3860 3440 2100 59100 53500 65000 32900 61400 55800 25 U
Lead 15* 0.78 B 0.5 U 0.5 U 0.5 U 0.5 U 0.5 U 0.5 U 0.5 U 0.5 U 0.5 U
Magnesium 35000 4420 B 4180 B 4200 B 4100 B 3200 B 4750 B 1450 B 1430 B 1890 B 3650 B
Manganese 300 84.6 146 75.2 1120 943 1250 3940 6120 6650 2U
Mercury 0.7 0.067 U 0.067 U 0.066 U 0.067 U 0.067 U 0.066 U 0.067 U 0.067 U 0.066 U 0.067 U
Nickel 100 413 405 454 1 U 1 U 1.5 U 1 U 1 U 1.5 U 1 U
Potassium -- 1430 B 1870 B 1280 B 5780 3640 B 5670 1000 B 1150 B 1140 B 1130 B
Selenium 10 1U1U1U1U1U1U1U1U1U1U
Silver 50 1 U 1 U 1 U 1 U 1.46 B 1.27 B 1 U 3 B 2.53 B 1 U
Sodium 20000 43900 32800 52900 10700 8750 12700 9360 5190 6730 11100
Thallium 0.5 0.58 B0.531 B0.761 B 0.3 U 0.3 U 0.305 B 0.3 U 0.3 U 0.3 U 0.3 U
Vanadium -- 3.8 B 2.57 B 2.1 B 1.1 B 1 U 1 U 1 U 1 U 1 U 1 U
Zinc 2000 6.4 B 5.54 B 3.3 U 7.3 B 4.2 B 3.3 U 9.6 B 6.58 B 5.52 B 2 U
U - Not Detected
B - Value between contract reporting
limit and instrument detection limit.
* Listed value is the Selected Cleanup
Goal stated in the ROD.
(ug/L) (ug/L)(ug/L) (ug/L) (ug/L) (ug/L) (ug/L) (ug/L) (ug/L) (ug/L) 12/1/2009 6/4/20093/12/2009 6/4/2009 12/1/2009 3/12/2009 6/4/2009 12/1/2009 3/12/2009 6/4/2009 087-23 087-24087-11 087-11 087-23 087-23087-09 087-09 087-09 087-11
Page 1 of 3
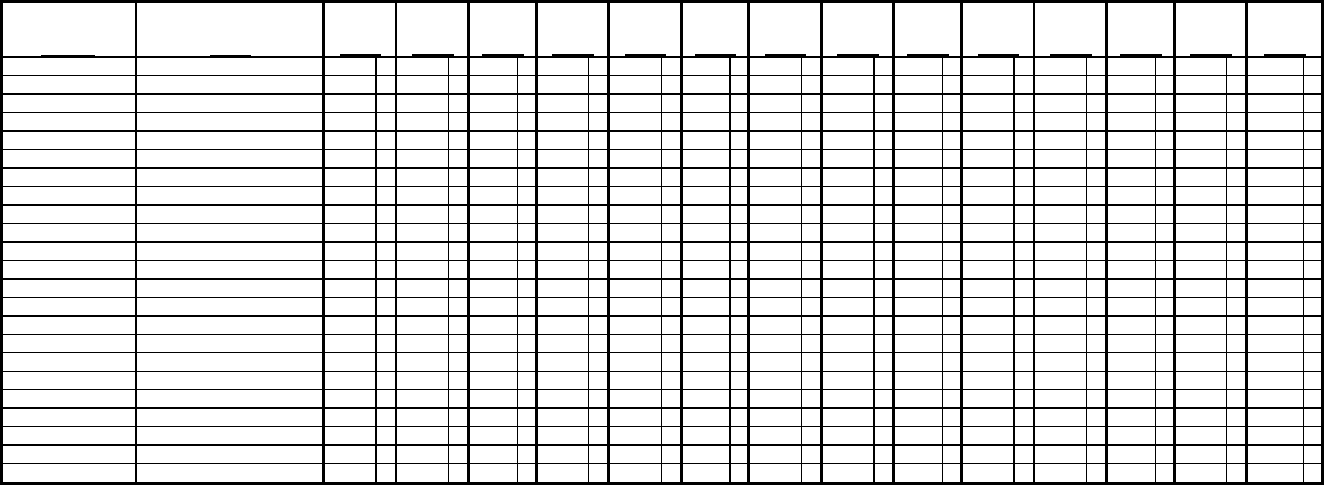
Table 4. Current Landfill - Summary of 2009 Metals Data
Groundwater Standards
Analtye (ug/L)
Aluminum 200
Antimony 3
Arsenic 10
Barium 1000
Beryllium 3
Cadmium 5
Calcium --
Chromium 50
Cobalt --
Copper 200
Iron 300
Lead 15*
Magnesium 35000
Manganese 300
Mercury 0.7
Nickel 100
Potassium --
Selenium 10
Silver 50
Sodium 20000
Thallium 0.5
Vanadium --
Zinc 2000
U - Not Detected
B - Value between contract reporting
limit and instrument detection limit.
* Listed value is the Selected Cleanup
Goal stated in the ROD.
68 U 68 U 68 U 68 U 189 B 68 U 138 B 68 U 68 U 68 U 68 U 68 U 68 U 181 B
3U3U3U3U3U3U3U3U3U3U3U3U3U4.1 B
1.6 U 1.5 U 2.41 B 1.88 B 10.5 5.55 9.68 1.5 U 1.5 U 2.33 B 23.2 15 11.3 1.5 U
10.7 B 21.9 B 22.1 B 22.5 B 57.8 B 41.6 B 41.8 B 38.4 B 24 B 35.4 B 54.4 B 37.7 B 39.9 B 64.6 B
1U1U1U1U1U1U1U1U1U1U1U1U1U 1U
1U1U1U1U1U1U1U1U1U1U1U1U1U 1U
5920 5650 5540 5920 39700 26700 24800 19500 13600 17700 25900 19200 18800 22700
1 U 2 U 2 U 1 U 2 U 2 U 1.28 B 2 U 2 U 1 U 2 U 2 U 1.19 B 2 U
1.38 B 1.5 B 1.15 B 1.37 B 3.6 B 2.85 B 3.3 B 1 U 1 U 1 U 5.9 B 4.36 B 4.6 B 1 U
3 U 4.2 B 3.94 B 3 U 3 U 3 U 3 U 3 U 3 U 3 U 3 U 3 U 3 U 3 U
30 U 126 2810 185 63700 29000 45800 2160 800 7040 68900 55200 49400 3880
0.5 U 0.5 U 0.5 U 0.5 U 0.5 U 0.5 U 0.5 U 0.5 U 0.5 U 0.5 U 0.5 U 0.5 U 0.5 U 0.5 U
4080 B 3760 B 3720 B 4010 B 9120 6550 5670 5780 5030 4710 B 7050 5140 5530 10400
2 U 2 U 10.7 B 2.11 B 3100 1180 1800 563 181 411 3300 2680 2230 143
0.066 U 0.067 U 0.067 U 0.066 U 0.067 U 0.067 U 0.066 U 0.067 U 0.067 U 0.066 U 0.067 U 0.067 U 0.066 U 0.067 U
1.5 U 1 U 1 U 1.5 U 1.5 B 1 U 1.5 U 1 U 1 U 1.5 U 1 U 1 U 1.5 U 1 B
1200 B 1020 B 1090 B 1050 B 7140 4920 B 4850 B 3570 B 1670 B 3530 B 5010 3800 B 4340 B 3140 B
1U1U1U1U1U1U1U1U1U1U1U1U1U 1U
1 U 1 U 1 U 1 U 1 U 1 U 1.16 B 1 U 1 U 1 U 1 U 1.64 B 1.98 B 1 U
13100 12800 11800 12700 19700 13500 19300 8580 7350 8360 25400 19400 25400 181000
0.3 U 0.3 U 0.3 U 0.3 U 0.3 U 0.3 U 0.3 U 0.3 U 0.3 U 0.3 U 0.3 U 0.3 U 0.3 U 0.3 U
1 U 1 U 1.72 B 1 U 1 U 1 U 1 U 1 U 1 U 1 U 1 U 1 U 1 U 8.4 B
3.3 U 4.5 B 3.36 B 3.3 U 12.7 B 5.08 B 3.3 U 5.9 B 2.54 B 3.3 U 6.5 B 3.61 B 3.3 U 6.3 B
(ug/L) (ug/L) (ug/L) (ug/L)(ug/L) (ug/L) (ug/L) (ug/L)(ug/L) (ug/L) (ug/L) (ug/L)(ug/L) (ug/L) 3/12/2009 6/4/2009 12/1/2009 3/12/200912/1/2009 3/12/2009 6/4/2009 12/1/20096/4/2009 12/1/2009 3/12/2009 6/4/200912/1/2009 3/12/2009 088-110 088-110 088-110 088-21087-27 088-109 088-109 088-109087-26 087-26 087-27 087-27087-24 087-26
Page 2 of 3
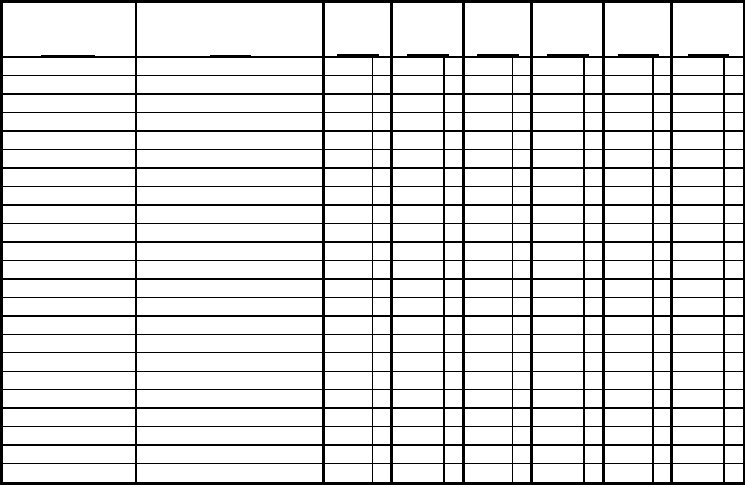
Table 4. Current Landfill - Summary of 2009 Metals Data
Groundwater Standards
Analtye (ug/L)
Aluminum 200
Antimony 3
Arsenic 10
Barium 1000
Beryllium 3
Cadmium 5
Calcium --
Chromium 50
Cobalt --
Copper 200
Iron 300
Lead 15*
Magnesium 35000
Manganese 300
Mercury 0.7
Nickel 100
Potassium --
Selenium 10
Silver 50
Sodium 20000
Thallium 0.5
Vanadium --
Zinc 2000
U - Not Detected
B - Value between contract reporting
limit and instrument detection limit.
* Listed value is the Selected Cleanup
Goal stated in the ROD.
144 B 68 U 68 U 68 U 68 U 68 U
3U3 U3U 3 U3U 3 U
1.7 B 1.6 U 4.29 B 2.38 B 3.25 B 3.23 B
43.5 B 30.4 B 31 B 23.6 B 3.49 B 3.6 B
1U1 U1U 1 U1U 1 U
1U1 U1U 1 U1U 1 U
12800 6610 6740 6810 8850 6020
2 U 1 U 2 U 1 U 2 U 1.12 B
1 U 1 U 4.5 B 2.76 B 1 U 1 U
3U3 U3U 3 U3U 3 U
2940 68.3 B 5800 741 1870 2360
0.5 U 0.5 U 0.5 U 0.5 U 0.5 U 0.5 U
6070 3430 B 2160 B 2160 B 2140 B 1770 B
120 35.5 835 92.2 1750 2170
0.067 U 0.066 U 0.067 U 0.066 U 0.067 U 0.066 U
1 U 1.5 U 1 U 1.5 U 1 U 1.5 U
2870 B 2220 B 1040 B 1000 B 722 B 751 B
1U1 U1U 1 U1U 1 U
1U1 U1U 1 U1U 1 U
83400 51100 12100 12600 12700 13900
0.3 U 0.3 U 0.3 U 0.3 U 0.3 U 0.3 U
5.65 B 1 U 1 U 1 U 1 U 1 U
4.88 B 3.3 U 2 U 3.3 U 3.39 B 3.3 U
(ug/L) (ug/L)(ug/L) (ug/L) (ug/L) (ug/L) 6/4/2009 12/1/20096/4/2009 12/1/2009 6/4/2009 12/1/2009 088-23 088-23088-21 088-21 088-22 088-22
Page 3 of 3
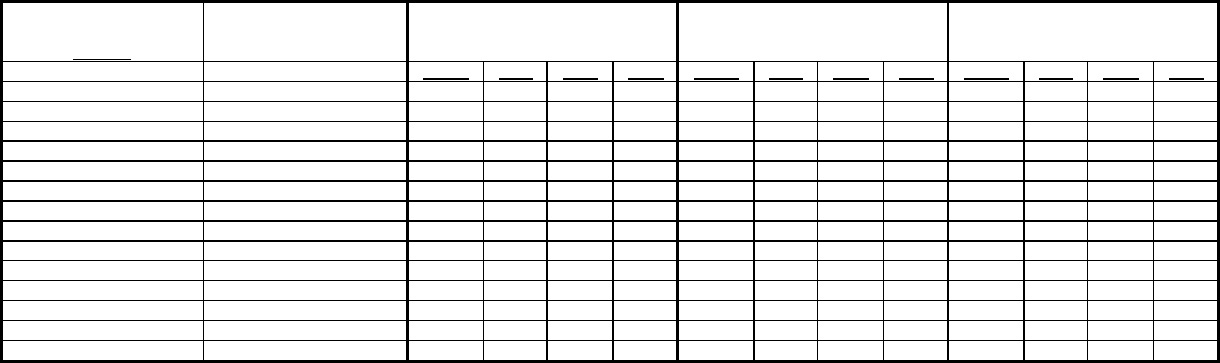
Table 5. Current Landfill - Summary of 2009 Radionuclide Data
Groundwater
Standards
Analtye pCi/L Result Qual MDA Error Result Qual MDA Error Result Qual MDA Error
Americium-241 1.2 6.89 U 14.6 9.6 8.56 U 15.9 9.82 2.42 U 7.66 5
Beryllium-7 40000 6.06 U 18.3 10.9 1.35 U 16.1 9.56 3.91 U 13.8 7.91
Cesium-134 80 -0.463 U 2.33 1.42 -0.406 U 2.14 1.37 0.367 U 2.02 1.21
Cesium-137 120 -0.281 U 2.14 1.28 0.252 U 1.88 2.54 0.614 U 1.89 1.1
Co-60 200 -0.322 U 2.43 1.62 0.792 U 2.24 1.25 1.97 J-UI 1.96 1.03
Cobalt-57 4000 0.503 U 2.02 1.23 0.176 U 1.65 0.976 -0.531 U 1.34 0.789
Europium-152 841 3.26 U 6.98 4.07 -0.835 U 5.32 3.27 0.643 U 4.88 2.97
Europium-154 573 0.958 U 6.26 3.59 -2.4 U 5.39 3.37 -0.462 U 4.34 2.65
Europium-155 4000 -5.35 U 8.63 5.45 -3.4 U 7.11 4.31 -0.615 U 5.95 3.42
Manganese-54 2000 -2.29 U 1.76 1.61 0.103 U 1.72 1.01 -0.77 U 1.53 0.937
Sodium-22 400 0.321 U 2.23 1.28 -0.369 U 1.95 1.17 -0.165 U 1.55 0.946
Strontium-90 8 1.28 0.442 0.395 0.449 U 0.467 0.289 0.131 U 0.51 0.296
Tritium 20000 23.7 U 221 127 622 222 155 273 J 221 139
Zinc-65 360 -8.16 U 4.18 3.19 1.06 U 3.92 2.61 1.89 U 3.33 2.06
J - Estimated Value.
U - Not detected.
I - Interference detected.
pCi/L pCi/L pCi/L
12/1/2009 12/1/2009 12/1/2009
087-09 087-11 087-23
Page 1 of 4

Table 5. Current Landfill - Summary of 2009 Radionuclide Data
Groundwater
Standards
Analtye pCi/L
Americium-241 1.2
Beryllium-7 40000
Cesium-134 80
Cesium-137 120
Co-60 200
Cobalt-57 4000
Europium-152 841
Europium-154 573
Europium-155 4000
Manganese-54 2000
Sodium-22 400
Strontium-90 8
Tritium 20000
Zinc-65 360
J - Estimated Value.
U - Not detected.
I - Interference detected.
Result Qual MDA Error Result Qual MDA Error Result Qual MDA Error
-1.16 U 3.89 3.36 1.18 U 3.35 2.18 2.3 U 11.8 7.45
-0.571 U 17.2 10.2 -8.83 U 15.7 9.92 -6.69 U 15 9.39
0.911 U 2.77 1.55 1.02 U 2.48 1.41 0.259 U 2.02 1.19
1.63 U 2.49 1.41 -1.37 U 3.29 2.42 0.505 U 1.88 1.08
0.755 U 2.73 1.6 -0.529 U 2.1 1.3 1.25 U 1.79 0.984
-0.352 U 1.35 0.803 0.298 U 1.33 0.76 -0.0236 U 1.54 0.915
-2.13 U 5.4 3.22 0.46 U 5.35 3.11 2.05 U 5.24 3.04
-1.8 U 5.64 3.61 1.66 U 6.38 3.67 -1.34 U 4.91 3.01
1.2 U 5.59 3.21 1.24 U 5.49 3.12 -1.99 U 6.56 3.91
-0.902 U 2.22 1.35 -0.433 U 1.84 1.13 0.0713 U 1.69 1.01
-0.652 U 2.01 1.29 0.601 U 2.28 1.31 -0.485 U 1.75 1.07
0.0102 U 0.437 0.248 -0.197 U 0.357 0.184 0.482 U 0.787 0.473
318 222 141 272 J 221 139 359 222 143
-4.36 U 5.15 4.01 1.15 U 4.52 2.96 1.62 U 3.69 2.38
pCi/L pCi/LpCi/L
12/1/2009 12/1/2009 12/1/2009
087-26 087-27087-24
Page 2 of 4
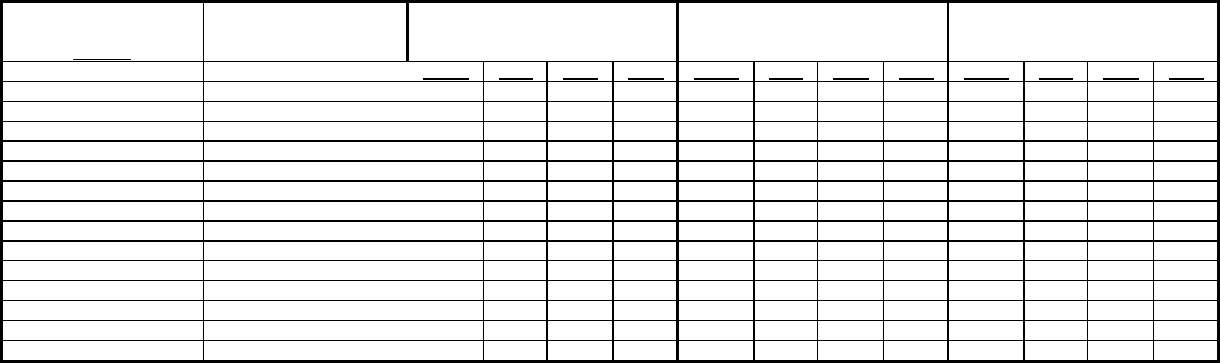
Table 5. Current Landfill - Summary of 2009 Radionuclide Data
Groundwater
Standards
Analtye pCi/L
Americium-241 1.2
Beryllium-7 40000
Cesium-134 80
Cesium-137 120
Co-60 200
Cobalt-57 4000
Europium-152 841
Europium-154 573
Europium-155 4000
Manganese-54 2000
Sodium-22 400
Strontium-90 8
Tritium 20000
Zinc-65 360
J - Estimated Value.
U - Not detected.
I - Interference detected.
Result Qual MDA Error Result Qual MDA Error Result Qual MDA Error
0.364 U 11 6.56 0.235 U 2.83 1.87 -1.17 U 6.31 3.76
3.74 U 15.7 9.41 -1.1 U 14.7 8.88 1.51 U 15 9.08
1.24 U 1.88 1.05 0.213 U 2.13 1.25 0.817 U 1.95 1.12
0.618 U 1.79 1.03 -1.78 U 2.82 2.29 0.0468 U 1.7 0.998
-0.378 U 1.69 1.02 0.341 U 1.98 1.16 -0.505 U 1.65 1.02
-0.212 U 1.49 0.92 0.562 U 1.15 0.652 -0.1 U 1.4 0.852
-3.07 U 4.74 2.96 -2.29 U 4.39 2.65 -0.502 U 4.76 2.86
0.741 U 4.89 2.82 0.0315 U 4.7 2.79 1.12 U 4.87 2.81
2.37 U 6.57 3.96 0.206 U 4.39 2.52 -0.992 U 5.52 3.36
0.573 U 1.72 0.994 -0.617 U 1.69 1.04 -0.155 U 1.56 0.945
-0.294 U 1.74 1.04 -0.324 U 1.67 1.02 0.255 U 1.74 1.02
0.0413 U 0.524 0.304 0.299 U 0.446 0.27 3.45 0.472 0.581
-8.64 U 222 126 106 U 221 131 -17.2 U 221 125
1.34 U 3.62 2.43 -3.1 U 3.52 2.27 -1.11 U 3.3 2.34
pCi/LpCi/L pCi/L
12/1/2009 12/1/2009
088-21
12/1/2009
088-109 088-110
Page 3 of 4
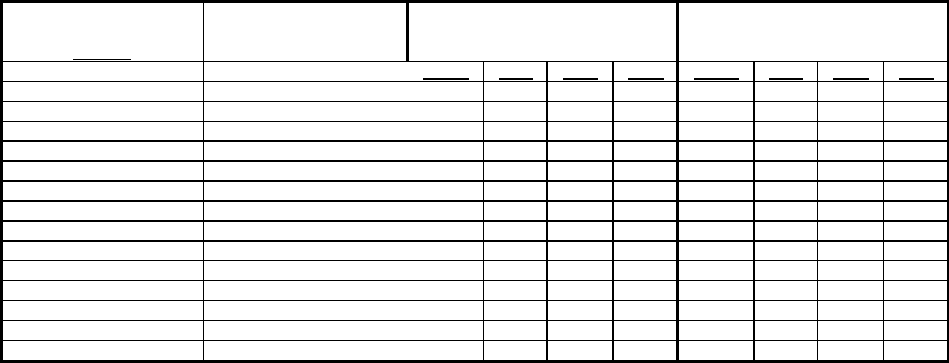
Table 5. Current Landfill - Summary of 2009 Radionuclide Data
Groundwater
Standards
Analtye pCi/L
Americium-241 1.2
Beryllium-7 40000
Cesium-134 80
Cesium-137 120
Co-60 200
Cobalt-57 4000
Europium-152 841
Europium-154 573
Europium-155 4000
Manganese-54 2000
Sodium-22 400
Strontium-90 8
Tritium 20000
Zinc-65 360
J - Estimated Value.
U - Not detected.
I - Interference detected.
Result Qual MDA Error Result Qual MDA Error
1.95 U 10.3 6.87 -0.0397 U 6.4 4.27
-6.31 U 14.6 9.23 1.32 U 12.8 7.42
0.24 U 2 1.18 -0.43 U 1.57 0.99
0.414 U 1.68 0.965 0.366 U 1.48 0.869
0.0944 U 1.65 0.967 -0.213 U 1.54 1.1
0.419 U 1.48 0.898 0.283 U 1.18 0.672
-0.0627 U 4.9 2.94 0.0909 U 4.01 2.46
1.69 U 5.11 2.89 0.694 U 4.07 2.4
-3 U 6.11 3.82 0.79 U 4.98 2.83
-0.0424 U 1.6 0.955 0.133 U 1.35 0.778
0.757 U 1.83 1.03 0.242 U 1.46 0.857
0.163 U 0.414 0.243 -0.325 U 0.576 0.318
511 222 150 461 220 147
0.58 U 3.37 2.32 -0.195 U 2.79 1.94
pCi/L pCi/L
12/1/2009 12/1/2009
088-22 088-23
Page 4 of 4

Table 6. Former Landfill - Summary of 2008 VOC Data
Groundwater
Standards
Analtye (ug/L)
1,1,1,2-Tetrachloroethane 5 0.5 U 0.5 U 0.5 U 0.5 U 0.5 U 0.5 U 0.5 U 0.5 U
1,1,1-Trichloroethane 5 0.5 U 0.5 U 0.5 U 0.5 U 0.5 U 0.29 J 0.5 U 1.89
1,1,2,2-Tetrachloroethane 5 0.5 U 0.5 U 0.5 U 0.5 U 0.5 U 0.5 U 0.5 U 0.619
1,1,2-Trichloroethane 1 0.5 U 0.5 U 0.5 U 0.5 U 0.5 U 0.5 U 0.5 U 0.5 U
1,1-Dichloroethane 5 0.5 U 0.5 U 0.5 U 0.5 U 0.5 U 0.5 U 0.5 U 1.88
1,1-Dichloroethylene 5 0.5 U 0.5 U 0.5 U 0.5 U 0.5 U 0.5 U 0.5 U 0.5 U
1,1-Dichloropropene 5 0.5 U 0.5 U 0.5 U 0.5 U 0.5 U 0.5 U 0.5 U 0.5 U
1,2,3-Trichlorobenzene 5 0.5 U 0.5 U 0.5 U 0.5 U 0.5 U 0.5 U 0.5 U 0.5 U
1,2,3-Trichloropropane 0.04 0.5 U 0.5 U 0.5 U 0.5 U 0.5 U 0.5 U 0.5 U 0.5 U
1,2,4-Trichlorobenzene 5 0.5 U 0.5 U 0.5 U 0.5 U 0.5 U 0.5 U 0.5 U 0.5 U
1,2-Dichloroethane 0.6 0.5 U 0.5 U 0.5 U 0.5 U 0.5 U 0.5 U 0.5 U 0.5 U
1,2-Dichloropropane 1 0.5 U 0.5 U 0.5 U 0.5 U 0.5 U 0.5 U 0.5 U 0.5 U
1,3-Dichloropropane 5 0.5 U 0.5 U 0.5 U 0.5 U 0.5 U 0.5 U 0.5 U 0.5 U
2,2-Dichloropropane 5 0.5 U 0.5 U 0.5 U 0.5 U 0.5 U 0.5 U 0.5 U 0.5 U
Benzene 1 0.5 U 0.5 U 0.5 U 0.5 U 0.5 U 0.5 U 0.5 U 0.5 U
Benzene, 1,2,4-trimethyl 5 0.5 U 0.5 U 0.5 U 0.5 U 0.5 U 0.5 U 0.5 U 0.5 U
Benzene, 1,3,5-trimethyl- 5 0.5 U 0.5 U 0.5 U 0.5 U 0.5 U 0.5 U 0.5 U 0.5 U
Benzene, 1-methylethyl- -- 0.5 U 0.5 U 0.5 U 0.5 U 0.5 U 0.5 U 0.5 U 0.5 U
Bromobenzene 5 0.5 U 0.5 U 0.5 U 0.5 U 0.5 U 0.5 U 0.5 U 0.5 U
Bromodichloromethane 50 0.5 U 0.5 U 0.5 U 0.5 U 0.5 U 0.5 U 0.5 U 0.5 U
Bromoform 50 0.5 U 0.5 U 0.5 U 0.5 U 0.5 U 0.5 U 0.5 U 0.5 U
Carbon tetrachloride 5 0.5 U 0.5 U 0.5 U 0.5 U 0.5 U 0.5 U 0.5 U 0.5 U
Chlorobenzene 5 0.5 U 0.5 U 0.5 U 0.5 U 0.5 U 0.5 U 0.5 U 0.5 U
Chlorobromomethane 5 0.5 U 0.5 U 0.5 U 0.5 U 0.5 U 0.5 U 0.5 U 0.5 U
Chloroethane 5 0.5 U 0.5 U 0.5 U 0.5 U 0.5 U 0.5 U 0.5 U 0.5 U
Chloroform 7 0.5 U 2.09 0.535 0.936 0.537 0.5 U 0.123 J 0.265 J
cis-1,2-Dichloroethylene 5 0.5 U 0.5 U 0.5 U 0.5 U 0.5 U 0.5 U 0.5 U 0.5 U
cis-1,3-Dichloropropene 0.4 0.5 U 0.5 U 0.5 U 0.5 U 0.5 U 0.5 U 0.5 U 0.5 U
Cymene 5 0.5 U 0.5 U 0.5 U 0.5 U 0.5 U 0.5 U 0.5 U 0.5 U
DBCP 0.04 0.5 U 0.5 U 0.5 U 0.5 U 0.5 U 0.5 U 0.5 U 0.5 U
Dibromochloromethane 5 0.5 U 0.5 U 0.5 U 0.5 U 0.5 U 0.5 U 0.5 U 0.5 U
Dibromomethane 5 0.5 U 0.5 U 0.5 U 0.5 U 0.5 U 0.5 U 0.5 U 0.5 U
Dichlorodifluoromethane 5 0.5 U 0.5 U 0.5 U 0.5 U 0.5 U 0.5 U 0.5 U 0.5 U
EDB 0.05 0.5 U 0.5 U 0.5 U 0.5 U 0.5 U 0.5 U 0.5 U 0.5 U
Ethene, 1,2-dichloro-, (E)- 5 0.5 U 0.5 U 0.5 U 0.5 U 0.5 U 0.5 U 0.5 U 0.5 U
Ethylbenzene 5 0.5 U 0.5 U 0.5 U 0.5 U 0.5 U 0.5 U 0.5 U 0.5 U
Hexachlorobutadiene 0.5 0.5 U 0.5 U 0.5 U 0.5 U 0.5 U 0.5 U 0.5 U 0.5 U
m-Dichlorobenzene 3 0.5 U 0.5 U 0.5 U 0.5 U 0.5 U 0.5 U 0.5 U 0.5 U
m/p xylene 5 0.5 U 0.5 U 0.5 U 0.5 U 0.5 U 0.5 U 0.5 U 0.5 U
Methyl bromide 5 0.5 U 0.5 U 0.5 U 0.5 U 0.5 U 0.5 U 0.5 U 0.5 U
Methyl chloride 5 0.5 U 0.5 U 0.5 U 0.5 U 0.5 U 0.5 U 0.5 U 0.5 U
Methyl tert-butyl ether 10 0.5 U 0.5 U 0.5 U 0.5 U 0.5 U 0.5 U 0.5 U 0.5 U
Methylene chloride 5 0.5 U 0.5 U 0.5 U 0.5 U 0.5 U 0.5 U 0.5 U 0.5 U
n-Butylbenzene 5 0.5 U 0.5 U 0.5 U 0.5 U 0.5 U 0.5 U 0.5 U 0.5 U
n-Propylbenzene 5 0.5 U 0.5 U 0.5 U 0.5 U 0.5 U 0.5 U 0.5 U 0.5 U
Naphthalene 10 0.5 U 0.5 U 0.5 U 0.5 U 0.5 U 0.5 U 0.5 U 0.5 U
o-Chlorotoluene 5 0.5 U 0.5 U 0.5 U 0.5 U 0.5 U 0.5 U 0.5 U 0.5 U
o-Dichlorobenzene 3 0.5 U 0.5 U 0.5 U 0.5 U 0.5 U 0.5 U 0.5 U 0.5 U
o-Xylene 5 0.5 U 0.5 U 0.5 U 0.5 U 0.5 U 0.5 U 0.5 U 0.5 U
p-Chlorotoluene 5 0.5 U 0.5 U 0.5 U 0.5 U 0.5 U 0.5 U 0.5 U 0.5 U
p-Dichlorobenzene 3 0.5 U 0.5 U 0.5 U 0.5 U 0.5 U 0.5 U 0.5 U 0.5 U
sec-Butylbenzene 5 0.5 U 0.5 U 0.5 U 0.5 U 0.5 U 0.5 U 0.5 U 0.5 U
Styrene 5 0.5 U 0.5 U 0.5 U 0.5 U 0.5 U 0.5 U 0.5 U 0.5 U
tert-Butylbenzene 5 0.5 U 0.5 U 0.5 U 0.5 U 0.5 U 0.5 U 0.5 U 0.5 U
Tetrachloroethylene 5 0.5 U 0.5 U 0.5 U 0.5 U 0.5 U 0.5 U 0.5 U 0.5 U
Toluene 5 0.5 U 0.5 U 0.5 U 0.5 U 0.5 U 0.5 U 0.5 U 0.5 U
trans-1,3-Dichloropropene 0.4 0.5 U 0.5 U 0.5 U 0.5 U 0.5 U 0.5 U 0.5 U 0.5 U
Trichloroethylene 5 0.5 U 0.5 U 0.5 U 0.5 U 0.5 U 0.195 J 0.5 U 0.575
Trichlorofluoromethane 5 0.5 U 0.5 U 0.5 U 0.5 U 0.5 U 0.5 U 0.5 U 0.5 U
Vinyl chloride 2 0.5 U 0.5 U 0.5 U 0.5 U 0.5 U 0.5 U 0.5 U 0.5 U
524.2 TVOC -- 0 2.09 0.535 0.936 0.537 0.485 0.123 5.229
J - Estimated value.
U - Not detected.
(ug/L) (ug/L) (ug/L) (ug/L)(ug/L) (ug/L) (ug/L) (ug/L) 12/3/2009 12/3/2009 12/3/2009 12/3/200912/3/2009 12/3/2009 12/3/2009 12/3/2009 097-277 097-64 106-02 106-30086-42 086-72 087-22 097-17
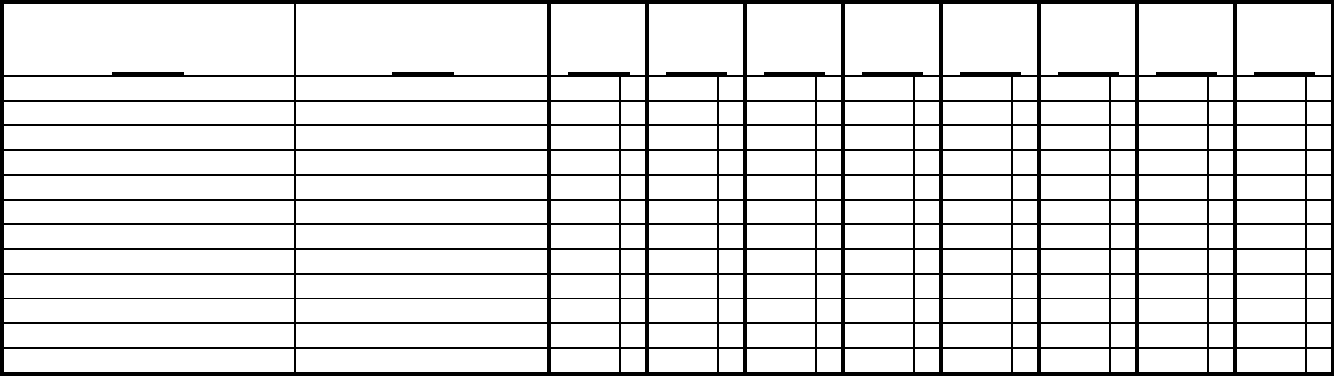
Table 7. Former landfill - Summary of 2009 Water Chemistry Data
Groundwater Standards
A
naltye (mg/L)
Alkalinity (as CaCO3) -- 33.2 5.46 5.46 9.43 4.96 21.8 14.9 15.4
Ammonia (as N) 2 0.016 U 0.016 U 0.016 U 0.016 U 0.016 U 0.157 0.016 U 0.016 U
Chloride 250 38.4 8.3 6.28 8.35 12.8 4.77 4.6 6.71
Cyanide 0.2 0.002 U 0.002 U 0.002 U 0.002 U 0.005 J0.004 J 0.002 U 0.002 U
Nitrate (as N) 10 1.16 0.23 0.572 0.209 0.3 1.02 0.558 1.25
Nitrite (as N) 1 0.033 U 0.033 U 0.033 U 0.033 U 0.033 U 0.033 U 0.033 U 0.033 U
Nitrite + Nitrate-N 10 1.13 0.164 J 0.57 0.18 J 0.26 1.02 0.535 1.25
Nitrogen -- 1.13 0.253 0.621 0.241 J 0.347 1.18 0.698 1.32
Sulfate 250 23.7 9.57 8.6 5.67 14 11.7 10.4 9.93
TDS -- 146 33 32 28 59 55 36 57
Total Kjeldahl Nitrogen -- 0.033 U 0.089 J 0.051 J 0.061 J 0.087 J 0.159 0.163 0.068 J
TSS -- 1.14 U 0.62 U 0.606 U 0.606 U 0.597 U 0.745 J 10.4 0.57 U
J - Estimated value.
U - Not detected.
(mg/L) (mg/L) (mg/L) (mg/L)(mg/L) (mg/L) (mg/L) (mg/L) 12/3/2009 12/3/2009 12/3/2009 12/3/200912/3/2009 12/3/2009 12/3/2009 12/3/2009 097-277 097-64 106-02 106-30086-42 086-72 087-22 097-17
Page 1 of 1
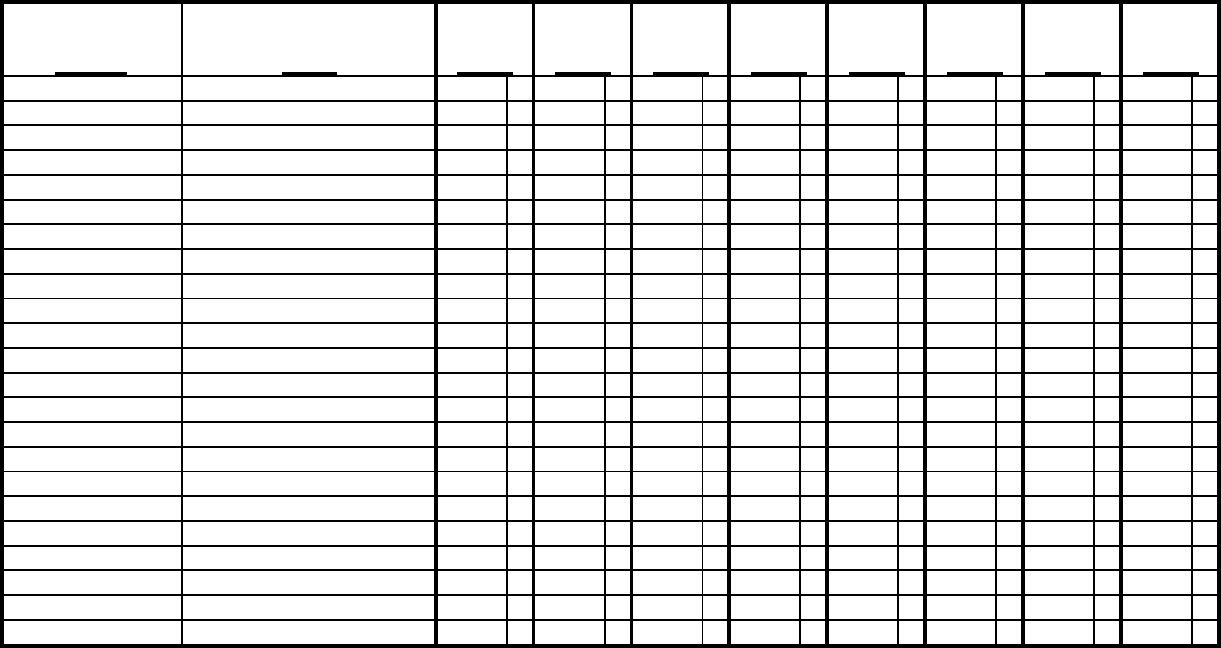
Table 8. Former landfill - Summary of Metals Data
Groundwater Standards
A
naltye (ug/L)
Aluminum 200 68 U 68 U 68 U 68 U 68 U 68 U 185 B 103 B
Antimon
y
3 3U3U3U3U3U3U3U3U
Arseni
c
10 1.6 U 1.6 U 1.6 U 1.6 U 1.6 U 1.6 U 1.6 U 1.6 U
Barium 1000 23.4 B 13.7 B 16.2 B 10.9 B 11.1 B 17.5 B 9.23 B 13.5 B
Beryllium 3 1U1U1U1U1U1U1U1U
Cadmium 5 1U1U1U1U1U1U1U1U
Calcium -- 12500 2440 B 3180 B 4160 B 4140 B 9370 7360 9060
Chromium 50 1U1U1U1U1U1U1.8B1U
Cobalt -- 1U1U1U1U1U1U1U1U
Copper 200 3U3U3U3U3U3U3U3U
Iron 300 30 U 30 U 30 U 30 U 30 U 30 U 956 38.7 B
Lead 15* 0.5 U 0.5 U 0.5 U 0.5 U 0.5 U 0.5 U 0.761 B 0.5 U
Magnesium 35000 4100 B 1980 B 2170 B 1890 B 2280 B 1710 B 1530 B 2340 B
Manganese 300 2 U 4.23 B 2.88 B 13.6 B 13.8 B 5.89 B 11.6 B 11.8 B
Mercury 0.7 0.066 U 0.066 U 0.066 U 0.066 U 0.066 U 0.066 U 0.066 U 0.066 U
Nickel 100 1.5 U 1.5 U 1.5 U 1.5 U 1.5 U 1.5 U 1.5 U 1.5 U
Potassium -- 1960 B 785 B 1200 B 803 B 1170 B 1450 B 1130 B 1170 B
Selenium 10 1U1U1U1U1U1U1U1U
Silve
r
50 1U1U1U1U1U1U1U1U
Sodium 20000 32700 5900 3570 B 4490 B 9760 4500 B 4120 B 4120 B
Thallium 0.5 0.611 B 0.3 U 0.3 U 0.3 U 0.3 U 0.3 U 0.3 U 0.3 U
V
anadium -- 1 U 1 U 1 U 1 U 1 U 1 U 1.04 B 1 U
Zinc 2000 3.3 U 3.3 U 3.3 U 3.3 U 3.3 U 3.3 U 3.32 B 3.3 U
U - Not Detected
B - Value between contract reporting
limit and instrument detection limit.
* Listed value is the Selected Cleanup
Goal stated in the ROD.
(ug/L) (ug/L) (ug/L) (ug/L)(ug/L) (ug/L) (ug/L) (ug/L) 12/3/2009 12/3/2009 12/3/2009 12/3/200912/3/2009 12/3/2009 12/3/2009 12/3/2009 097-277 097-64 106-02 106-30086-42 086-72 087-22 097-17
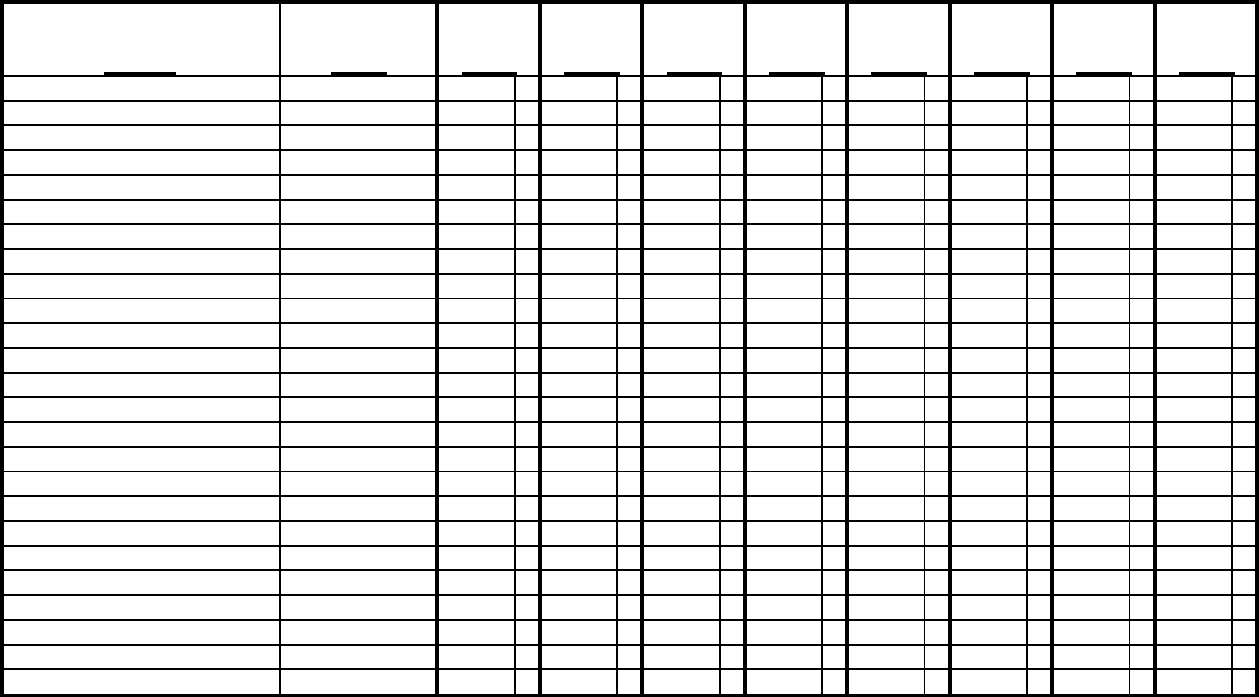
Table 9. Former Landfill - Summary of 2009 Pesticide/PCB Data
Groundwater
Standards
A
naltye (ug/L)
4,4''-DDD 0.3 0.061 U 0.061 U 0.0604 U 0.0604 U 0.0627 U 0.0615 U 0.0604 U 0.0615 U
4,4''-DDE 0.2 0.061 U 0.061 U 0.0604 U 0.0604 U 0.0627 U 0.0615 U 0.0604 U 0.0615 U
4,4''-DDT 0.2 0.061 U 0.061 U 0.0604 U 0.0604 U 0.0627 U 0.0615 U 0.0604 U 0.0615 U
Aldrin 0 0.0305 U 0.0305 U 0.0302 U 0.0302 U 0.0314 U 0.0308 U 0.0302 U 0.0308 U
alpha-BHC 0.01 0.0305 U 0.0305 U 0.0302 U 0.0302 U 0.0314 U 0.0308 U 0.0302 U 0.0308 U
Aroclor 101
6
0.09 0.762 U 0.762 U 0.755 U 0.755 U 0.784 U 0.769 U 0.755 U 0.769 U
Aroclor 1221 0.09 0.762 U 0.762 U 0.755 U 0.755 U 0.784 U 0.769 U 0.755 U 0.769 U
Aroclor 1232 0.09 0.762 U 0.762 U 0.755 U 0.755 U 0.784 U 0.769 U 0.755 U 0.769 U
Aroclor 1242 0.09 0.762 U 0.762 U 0.755 U 0.755 U 0.784 U 0.769 U 0.755 U 0.769 U
Aroclor 124
8
0.09 0.762 U 0.762 U 0.755 U 0.755 U 0.784 U 0.769 U 0.755 U 0.769 U
Aroclor 125
4
0.09 0.762 U 0.762 U 0.755 U 0.755 U 0.784 U 0.769 U 0.755 U 0.769 U
Aroclor 1260 0.09 0.762 U 0.762 U 0.755 U 0.755 U 0.784 U 0.769 U 0.755 U 0.769 U
beta-BHC 0.01 0.0305 U 0.0305 U 0.0302 U 0.0302 U 0.0314 U 0.0308 U 0.0302 U 0.0308 U
Chlordane 0.05 0.381 U 0.381 U 0.377 U 0.377 U 0.392 U 0.385 U 0.377 U 0.385 U
delta-BHC 0.04 0.0305 U 0.0305 U 0.0302 U 0.0302 U 0.0314 U 0.0308 U 0.0302 U 0.0308 U
Dieldrin 0.004 0.061 U 0.061 U 0.0604 U 0.0604 U 0.0627 U 0.0615 U 0.0604 U 0.0615 U
Endosulfan I 0.009 0.0305 U 0.0305 U 0.0302 U 0.0302 U 0.0314 U 0.0308 U 0.0302 U 0.0308 U
Endosulfan II -- 0.061 U 0.061 U 0.0604 U 0.0604 U 0.0627 U 0.0615 U 0.0604 U 0.0615 U
Endosulfan sulfate -- 0.061 U 0.061 U 0.0604 U 0.0604 U 0.0627 U 0.0615 U 0.0604 U 0.0615 U
Endrin 0 0.061 U 0.061 U 0.0604 U 0.0604 U 0.0627 U 0.0615 U 0.0604 U 0.0615 U
Endrin aldehyde 5 0.061 U 0.061 U 0.0604 U 0.0604 U 0.0627 U 0.0615 U 0.0604 U 0.0615 U
Heptachlor 0.04 0.0305 U 0.0305 U 0.0302 U 0.0302 U 0.0314 U 0.0308 U 0.0302 U 0.0308 U
Heptachlor epoxide 0.03 0.0305 U 0.0305 U 0.0302 U 0.0302 U 0.0314 U 0.0308 U 0.0302 U 0.0308 U
Lindane 0.05 0.0305 U 0.0305 U 0.0302 U 0.0302 U 0.0314 U 0.0308 U 0.0302 U 0.0308 U
Toxaphene 0.06 0.762 U 0.762 U 0.755 U 0.755 U 0.784 U 0.769 U 0.755 U 0.769 U
U - Not detected.
(ug/L) (ug/L) (ug/L) (ug/L)(ug/L) (ug/L) (ug/L) (ug/L) 12/3/2009 12/3/2009 12/3/2009 12/3/200912/3/2009 12/3/2009 12/3/2009 12/3/2009 097-277 097-64 106-02 106-30086-42 086-72 087-22 097-17
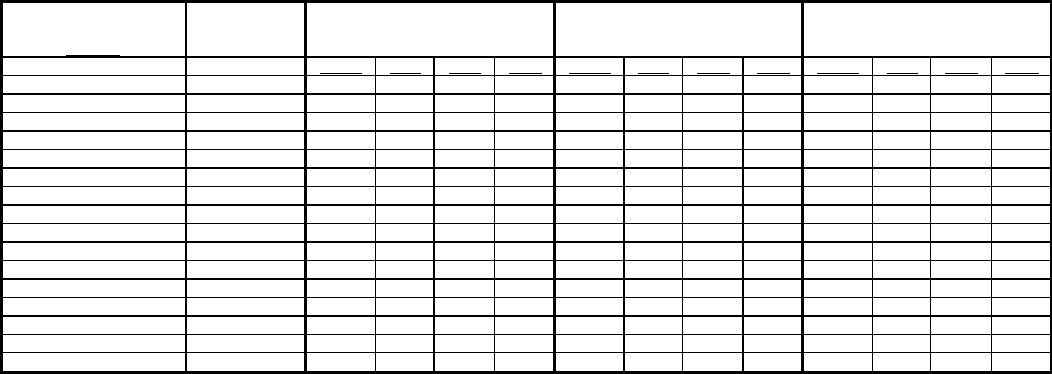
Table 10. Former Landfill - Summary of 2009 Radionuclide Data
Groundwater
Standards
Analtye pCi/L Result Qual MDA Error Result Qual MDA Error Result Qual MDA Error
Americium-241 1.2 -3.42 U 7.48 5.15 3.74 U 13.1 7.74 7.82 U 13.7 8.43
Beryllium-7 40000 3.21 U 16.6 9.55 7.61 U 20.5 12.1 -4.69 U 20.1 12.4
Cesium-134 80 -0.882 U 2.05 1.32 0.774 U 2.44 1.4 -0.238 U 2.42 1.46
Cesium-137 120 -0.378 U 1.66 1.02 1.23 U 2.12 1.18 0.076 U 2.14 1.25
Co-60 200 0.265 U 1.56 0.913 0.165 U 2.16 1.26 1.58 U 2.32 1.27
Cobalt-57 4000 -0.0669 U 1.44 0.832 -0.0992 U 1.8 1.11 -0.659 U 1.85 1.12
Europium-152 841 2.73 U 4.97 2.94 1.83 U 5.72 3.35 0.664 U 6.18 6.32
Europium-154 573 -2.99 U 4.18 2.83 -2.28 U 5.03 3.17 -1.93 U 5.1 3.21
Europium-155 4000 -0.0326 U 5.73 3.28 1.85 U 7.47 4.51 1.39 U 7.97 4.66
Gross Alpha 15 0.771 U 1.75 1.04 -0.322 U 1.21 0.354 -0.134 U 1.32 0.365
Gross Beta 50* 2.53 J 1.95 1.29 0.1 U 2.14 1.19 1.1 U 1.58 0.988
Manganese-54 2000 -0.0361 U 1.59 0.922 0.552 U 1.94 1.12 -0.209 U 2.02 1.23
Sodium-22 400 -1.06 U 1.51 1.01 -0.719 U 1.82 1.13 -0.728 U 1.82 1.15
Strontium-90 8 -0.0825 U 0.552 0.272 0.0451 U 0.538 0.281 0.00354 U 0.511 0.26
Tritium 20000 64.7 U 211 124 38.1 U 212 123 34.3 U 211 122
Zinc-65 360 -1.08 U 3.63 2.24 1.63 U 4.22 2.79 -3.5 U 4.14 2.68
J - Estimated value.
U - Not detected.
* Listed value is the Selected Cleanup
Goal stated in the ROD.
pCi/L pCi/L pCi/L
12/3/2009 12/3/2009 12/3/2009
086-42 086-72 087-22
Page 1 of 5

Table 10. Former Landfill - Summary of 2009 Radionuclide Data
Groundwater
Standards
Analtye pCi/L
Americium-241 1.2
Beryllium-7 40000
Cesium-134 80
Cesium-137 120
Co-60 200
Cobalt-57 4000
Europium-152 841
Europium-154 573
Europium-155 4000
Gross Alpha 15
Gross Beta 50*
Manganese-54 2000
Sodium-22 400
Strontium-90 8
Tritium 20000
Zinc-65 360
J - Estimated value.
U - Not detected.
* Listed value is the Selected Cleanup
Goal stated in the ROD.
Result Qual MDA Error Result Qual MDA Error Result Qual MDA Error Result Qual MDA Error
3.36 U 9.82 6.51 4.14 U 6.89 4.44 -1.84 U 18 11.8 1.74 U 7.3 4.79
0.397 U 18.2 10.7 -2 U 15.1 9.22 0.00962 U 19.3 11.7 -3.36 U 15.8 9.44
-1.22 U 2 1.29 0.289 U 1.98 1.15 -1.34 U 2.17 1.38 0.489 U 2 1.18
-0.691 U 1.96 1.55 0.4 U 1.75 0.996 0.755 U 1.99 1.12 0.233 U 1.73 1.02
-0.859 U 2.12 1.84 1.08 U 1.81 1.01 -0.262 U 1.87 1.13 -0.262 U 1.67 1.03
-0.262 U 1.62 0.978 -0.612 U 1.36 0.851 0.171 U 1.78 1.07 1.14 U 1.49 0.834
-0.829 U 5.46 3.71 1.48 U 4.63 2.77 4.37 U 5.98 3.38 0.204 U 4.83 2.96
2.08 U 5.8 3.28 -1.03 U 4.45 2.8 0.57 U 5.46 3.16 0.832 U 4.83 2.83
-0.695 U 6.77 4.08 2.29 U 5.78 3.43 -0.97 U 7.61 4.59 0.15 U 5.7 3.25
0.186 U 1.67 0.755 0.135 U 1.78 0.78 -0.544 U 2.19 0.755 0.0183 U 2.3 1.03
0.199 U 1.66 0.882 0.987 U 2.69 1.56 4.43 2.23 1.68 1.35 U 1.79 1.14
-0.225 U 1.82 1.11 -0.429 U 1.59 0.966 -0.661 U 1.72 1.07 0.256 U 1.66 0.946
0.753 U 2.08 1.17 -0.68 U 1.59 1.03 0.158 U 1.95 1.13 0.29 U 1.73 1.02
-0.0889 U 0.534 0.26 0.226 U 0.574 0.333 1.37 0.819 0.562 -0.131 U 0.532 0.248
76.2 U 211 124 -38.1 U 211 119 -43.9 U 212 119 85.9 U 212 125
0.917 U 3.94 2.25 0.107 U 3.71 2.22 1.02 U 4.1 2.41 -1.4 U 3.36 2.11
pCi/L pCi/L pCi/LpCi/L
12/3/2009 12/3/2009 12/3/2009 12/3/2009
097-277 097-64 106-02097-17
Page 2 of 5

Table 10. Former Landfill - Summary of 2009 Radionuclide Data
Groundwater
Standards
Analtye pCi/L
Americium-241 1.2
Beryllium-7 40000
Cesium-134 80
Cesium-137 120
Co-60 200
Cobalt-57 4000
Europium-152 841
Europium-154 573
Europium-155 4000
Gross Alpha 15
Gross Beta 50*
Manganese-54 2000
Sodium-22 400
Strontium-90 8
Tritium 20000
Zinc-65 360
J - Estimated value.
U - Not detected.
* Listed value is the Selected Cleanup
Goal stated in the ROD.
Result Qual MDA Error Result Qual MDA Error Result Qual MDA Error Result Qual MDA Error
0.021 U 13.1 7.87
-8.21 U 19.2 12.2
0.179 U 2.33 1.38
-0.0253 U 1.96 1.15
-0.0836 U 2.1 1.24
0.561 U 1.76 1.07
1.24 U 5.89 3.47
1.19 U 5.58 3.18
-2.29 U 7.27 4.52
0.136 U 1.36 0.652
0.896 U 1.47 0.893
-0.387 U 1.75 1.07
-0.111 U 1.99 1.18
0.0375 U 0.794 0.439 -0.161 U 0.441 0.182 0.0878 U 0.508 0.29 0.0013 U 0.48 0.251
49.6 U 212 123
-0.946 U 4.17 3.06
pCi/L pCi/L pCi/LpCi/L
6/3/2009 12/2/2009 12/2/2009 12/3/2009
106-20 106-21 106-30106-20
Page 3 of 5

Table 10. Former Landfill - Summary of 2009 Radionuclide Data
Groundwater
Standards
Analtye pCi/L
Americium-241 1.2
Beryllium-7 40000
Cesium-134 80
Cesium-137 120
Co-60 200
Cobalt-57 4000
Europium-152 841
Europium-154 573
Europium-155 4000
Gross Alpha 15
Gross Beta 50*
Manganese-54 2000
Sodium-22 400
Strontium-90 8
Tritium 20000
Zinc-65 360
J - Estimated value.
U - Not detected.
* Listed value is the Selected Cleanup
Goal stated in the ROD.
Result Qual MDA Error Result Qual MDA Error Result Qual MDA Error Result Qual MDA Error
1.07 0.612 0.417 1.04 0.72 0.486 4.62 0.51 0.571 2.53 0.694 0.57
pCi/L pCi/L pCi/LpCi/L
6/3/2009 12/2/2009 6/3/2009 12/2/2009
106-43 106-44 106-44106-43
Page 4 of 5
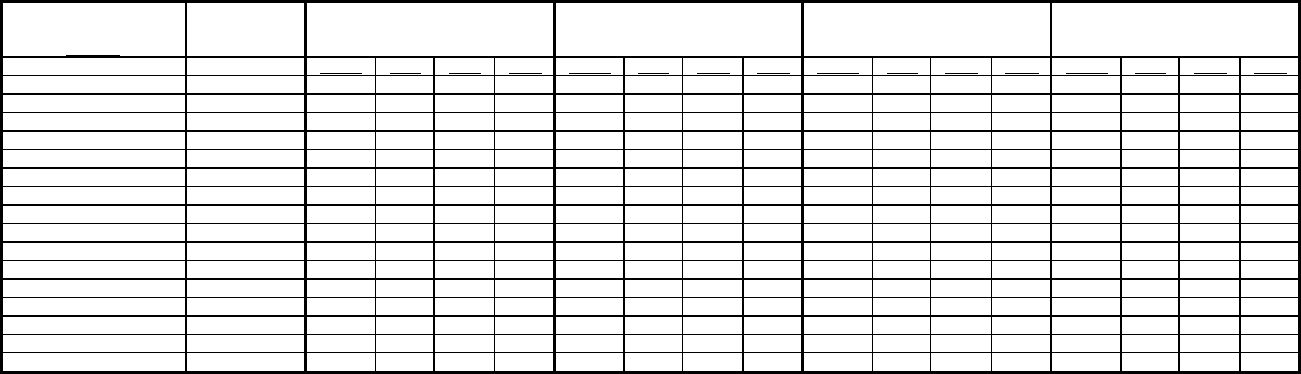
Table 10. Former Landfill - Summary of 2009 Radionuclide Data
Groundwater
Standards
Analtye pCi/L
Americium-241 1.2
Beryllium-7 40000
Cesium-134 80
Cesium-137 120
Co-60 200
Cobalt-57 4000
Europium-152 841
Europium-154 573
Europium-155 4000
Gross Alpha 15
Gross Beta 50*
Manganese-54 2000
Sodium-22 400
Strontium-90 8
Tritium 20000
Zinc-65 360
J - Estimated value.
U - Not detected.
* Listed value is the Selected Cleanup
Goal stated in the ROD.
Result Qual MDA Error Result Qual MDA Error Result Qual MDA Error Result Qual MDA Error
3.07 0.647 0.543 1.5 0.76 0.535 2.34 0.558 0.471 2.23 0.774 0.59
pCi/L pCi/L pCi/LpCi/L
6/3/2009 12/2/2009 6/3/2009 12/2/2009
106-45 106-64 106-64106-45
Page 5 of 5

Table 11
Soil Gas Monitoring Well Description
Current Landfill
Soil Gas
Monitoring Well Screen
Location Top of Screen
(Feet BLS) Bottom Screen
(Feet BLS)
SGM-1 PROBE A Shallow 2.5 7.5
SGM-1 PROBE B Intermediate 10.5 17.5
SGM-1 PROBE C Deep 20 29.5
SGM-2 PROBE A Shallow 2.5 7.5
SGM-2 PROBE B Intermediate 10.5 16
SGM-2 PROBE C Deep 19 28
SGM-3 PROBE A Shallow 2.5 7.5
SGM-3 PROBE B Intermediate 10.5 17
SGM-3 PROBE C Deep 20 29
SGM-4 PROBE A Shallow 2.5 7.5
SGM-4 PROBE B Intermediate 10.5 20
SGM-4 PROBE C Deep 23 32
SGM-5 PROBE A Shallow 2.5 7.5
SGM-5 PROBE B Intermediate 10.5 22
SGM-5 PROBE C Deep 25 34
SGM-6 PROBE A Shallow 2.5 7.5
SGM-6 PROBE B Intermediate 10.5 18.5
SGM-6 PROBE C Deep 21.5 30.5
SGM-7 PROBE A Shallow 2.5 7.5
SGM-7 PROBE B Intermediate 10.5 16
SGM-7 PROBE C Deep 19 26
SGM-8 PROBE A Shallow 2.5 7.5
SGM-8 PROBE B Intermediate 10.5 16.5
SGM-8 PROBE C Deep 19.5 28.5
SGM-9 PROBE A Shallow 2.5 7.5
SGM-9 PROBE B Intermediate 10.5 20.5
SGM-9 PROBE C Deep 23.5 32.5
SGM-10 PROBE A Shallow 2.5 7.5
SGM-10 PROBE B Intermediate 10.5 15.5
SGM-10 PROBE C Deep 18.5 27.5
SGM-11 PROBE A Shallow 2.5 7.5
SGM-11 PROBE B Intermediate 10.5 16
SGM-12 PROBE A Shallow 2.5 7.5
SGM-12 PROBE B Intermediate 10.5 15
SGM-13 PROBE A Shallow 2.5 7.5
SGM-13 PROBE B Intermediate 10.5 13
SGM-14 PROBE A Shallow 2.5 7.5
SGM-14 PROBE B Intermediate 10.5 13
SGM-15 PROBE A Shallow 2.5 5.5
SGM-15 PROBE B Intermediate 8.5 11.5
SGM-16 PROBE A Shallow 2.5 5.5
SGM-16 PROBE B Intermediate 8.5 11
SGM-17 PROBE A Shallow 2.5 5.5
SGM-17 PROBE B Intermediate 8.5 11
Table 11
Soil Gas Monitoring Well Description
Current Landfill
SGM-18 PROBE A Shallow 2.5 7.5
SGM-18 PROBE B Intermediate 10.5 13.5
SGM-19 PROBE A Shallow 2.5 7.5
SGM-19 PROBE B Intermediate 10.5 17
BLS – Below Land Surface
Former Landfill
Soil Gas
Monitoring Well Screen
Location Top of Screen
(Feet BLS) Bottom Screen
(Feet BLS)
SGM-1 PROBE A Shallow 2.5 10
SGM-1 PROBE B Intermediate 15 43
SGM-2PROBE A Shallow 2.5 10
SGM-2 PROBE B Intermediate 15 40
SGM-3 PROBE A Shallow 2 9.5
SGM-3 PROBE B Intermediate 14.5 36
SGM-4 PROBE A Shallow 2.5 10
SGM-4 PROBE B Intermediate 15 35.5
SGM-5 PROBE A Shallow 2.5 10
SGM-5 PROBE B Intermediate 15 37
SGM-6 PROBE A Shallow 2.7 10.2
SGM-6 PROBE B Intermediate 22 37.2
SGM-7 PROBE A Shallow 2.8 10.3
SGM-7 PROBE B Intermediate 15 42
SGM-8 PROBE A Shallow 2.5 10
SGM-8 PROBE B Intermediate 15 47
SGM-9 PROBE A Shallow 2.5 10
SGM-9 PROBE B Intermediate 15 52
SGM-10 PROBE A Shallow 2.5 10
SGM-10 PROBE B Intermediate 15 52
SGM-11 PROBE A Shallow 2.5 10
SGM-11 PROBE B Intermediate 15 46
SGM-12 PROBE A Shallow 2.5 10
SGM-12 PROBE B Intermediate 15 43.5
BLS – Below Land Surface
Table 12
2009 Current Landfill Soil Gas Monitoring Summary Table
Soil Gas Methane Methane Methane Methane LEL LEL LEL LEL Hydrogen Sulfide Hydrogen Sulfide Hydrogen Sulfide Hydrogen Sulfide Soil Gas
Monitoring Well (% By Volume) (% By Volume) (% By Volume) (% By Volume) (% By Volume) (% By Volume) (% By Volume) (% By Volume) (ppm by volume) (ppm by volume) (ppm by volume) (ppm by volume) Monitoring Well
3/18/2009 7/28/2009 11/5/2009 12/15/2009 3/18/2009 7/28/2009 11/5/2009 12/15/2009 3/18/2009 7/28/2009 11/5/2009 12/15/2009
SGMW-01A 12.6 16.7 15 19.4 >100 >100 >100 >100 0 0 1 3 SGMW-01A
SGMW-01B 12.3 15.4 14.3 19.2 >100 >100 >100 >100 0 0.0 4.0 3.0 SGMW-01B
SGMW-01C 10 13.2 12.3 17.2 >100 >100 >100 >100 0 0 3 1 SGMW-01C
SGMW-02A 50 48.4 50.1 50.9 >100 >100 >100 >100 0 0 0 0 SGMW-02A
SGMW-02B 48.8 55.2 40.2 10.6 >100 >100 >100 >100 8 18 0 0 SGMW-02B
SGMW-02C 50.8 57.8 56.5 59.3 >100 >100 >100 >100 1 7 0 0 SGMW-02C
SGMW-03A 28.9 31.8 270 14.3 >100 >100 >100 >100 0 0 6 0 SGMW-03A
SGMW-03B 55.9 67.5 65.9 72.2 >100 >100 >100 >100 12 25 21 20 SGMW-03B
SGMW-03C 54.7 65.6 59.5 0.2 >100 >100 >100 3 26 32 67 0 SGMW-03C
SGMW-04A 42.1 48.5 44.4 44.9 >100 >100 >100 >100 1 0 2 0 SGMW-04A
SGMW-04B 39.9 53.3 49.1 52.7 >100 >100 >100 >100 4 7 4 7 SGMW-04B
SGMW-04C 31.9 51.9 38.9 48.3 >100 >100 >100 >100 5 3 1 2 SGMW-04C
SGMW-05A 38.1 46.2 43.1 45.2 >100 >100 >100 >100 3 0 4 1 SGMW-05A
SGMW-05B 33.8 43.3 38.8 44.5 >100 >100 >100 >100 3 4 5 7 SGMW-05B
SGMW-05C 26.8 37.1 30.7 0 >100 >100 >100 0 3 3 3 0 SGMW-05C
SGMW-06A 39 42.3 42.6 9.8 >100 >100 >100 >100 0 0 0 0 SGMW-06A
SGMW-06B 39.2 43 42.7 0 >100 >100 >100 0 3 4 6 0 SGMW-06B
SGMW-06C 37.7 42.2 40.6 0 >100 >100 >100 0 3 3 4 0 SGMW-06C
SGMW-07A 0 0.5 0 0 0 10 0 0 0000SGMW-07A
SGMW-07B 0000 0000 0000SGMW-07B
SGMW-07C 0 0.9 0 0 0 18 0 0 0000SGMW-07C
SGMW-08A 0000 0000 0000SGMW-08A
SGMW-08B 0000 0000 0000SGMW-08B
SGMW-08C 0000 0000 0000SGMW-08C
SGMW-09A 0000 0000 0000SGMW-09A
SGMW-09B 0000 0000 0000SGMW-09B
SGMW-09C 0000 0000 0000SGMW-09C
SGMW-10A 1.5 22.7 13.2 0.5 31 >100 >100 10 0 14 5 0 SGMW-10A
SGMW-10B 4.6 19.6 16.1 0.1 93 >100 >100 2 3 3 2 0 SGMW-10B
SGMW-10C 4 17.4 11.2 0.2 80 >100 >100 1 3 4 0 0 SGMW-10C
SGMW-11A 4.5 22.1 17.6 14.7 90 >100 >100 >100 0 20 10 2 SGMW-11A
SGMW-11B 4 21.6 13.3 10.9 80 >100 >100 >100 0 9 1 1 SGMW-11B
SGMW-12A 45.5 51.8 48.7 52.4 >100 >100 >100 >100 24 72 21 15 SGMW-12A
SGMW-12B 39.6 49 51.7 47.3 >100 >100 >100 >100 0 16 0 3 SGMW-12B
SGMW-13A 0 0.5 1 0.1 0 10 21 2 0 3 0 0 SGMW-13A
SGMW-13B 0 42.6 0 0.1 0 >100 1 2 0 4 0 0 SGMW-13A
SGMW-14A 2.8 14 6.2 1.1 57 >100 >100 22 0 3 0 0 SGMW-14A
SGMW-14B 0000 0010 0 0 0 0
SGMW-14B
SGMW-15A 0000 0000 0 0 0 0
SGMW-15A
SGMW-15B 0000.10002 0 0 0 0
SGMW-15B
SGMW-16A 0000 0000 0 0 0 0
SGMW-16A
SGMW-16B 0000.10002 0 0 0 0
SGMW-16B
SGMW-17A 0000 0000 0 0 0 0
SGMW-17A
SGMW-17B 0000 0000 0 0 0 0
SGMW-17B
SGMW-18A 0000 0000 0 0 0 0
SGMW-18A
SGMW-18B 0000 0000 0 0 0 0
SGMW-18B
SGMW-19A 14.4 44.9 25.9 33.6 >100 >100 >100 >100 0 31 7 15 SGMW-19A
SGMW-19B 5.9 46.3 26.9 30.6 >100 >100 >100 >100 2 1 12 4 SGMW-19B
GSGM-1A 0000 0000 0000GSGM-1A
GSGM-1B 0000 0000 0000GSGM-1B
GSGM-1C 0000 0000 0000GSGM-1C
GSGM-2A 0000 0000 0000GSGM-2A
GSGM-2B 0000 0000 0000GSGM-2B
GSGM-2C 0000 0000 0000GSGM-2C
GSGM-3A 0000 0000 0000GSGM-3A
GSGM-3B 0000 0000 0000GSGM-3B
GSGM-4A 0000 0000 0000GSGM-4A
GSGM-4B 0000 0000 0000GSGM-4B

Table 13
2009 Former Landfill Soil-Gas Monitoring Summary Table
Soil Gas Methane Methane Methane LEL LEL LEL Hydrogen Sulfide Hydrogen Sulfide Hydrogen Sulfide Soil Gas
Monitoring Well (% By Volume) (% By Volume) (% By Volume) (% By Volume) (% By Volume) (% By Volume) (ppm by volume) (ppm by volume) (ppm by volume) Monitoring Well
3/18/2009 7/30/2009 12/17/2009 3/18/2009 7/30/2009 12/17/2009 3/18/2009 7/30/2009 12/17/2009
SGMW-01A 000000 0 0 0SGMW-01A
SGMW-01B 000000 0 0 0SGMW-01B
SGMW-02A 000000 0 0 0SGMW-02A
SGMW-02B 000000 0 0 0SGMW-02B
SGMW-03A 000000 0 0 0SGMW-03A
SGMW-03B 000000 0 0 0SGMW-03B
SGMW-04A 000000 0 0 0SGMW-04A
SGMW-04B 000000 0 0 0SGMW-04B
SGMW-05A 000000 0 0 0SGMW-05A
SGMW-05B 000000 0 0 0SGMW-05B
SGMW-06A 000000 0 0 0SGMW-06A
SGMW-06B 000000 0 0 0SGMW-06B
SGMW-07A 000000 0 0 0SGMW-07A
SGMW-07B 000000 0 0 0SGMW-07B
SGMW-08A 000000 0 0 0SGMW-08A
SGMW-08B 000000 0 0 0SGMW-08B
SGMW-09A 000000 0 0 0SGMW-09A
SGMW-09B 000000 0 0 0SGMW-09B
SGMW-10A 000000 0 0 0SGMW-10A
SGMW-10B 000000 0 0 0SGMW-10B
SGMW-11A 000000 0 0 0SGMW-11A
SGMW-11B 000000 0 0 0SGMW-11B
SGMW-12A 000000 0 0 0SGMW-12A
SGMW-12B 000000 0 0 0SGMW-12B
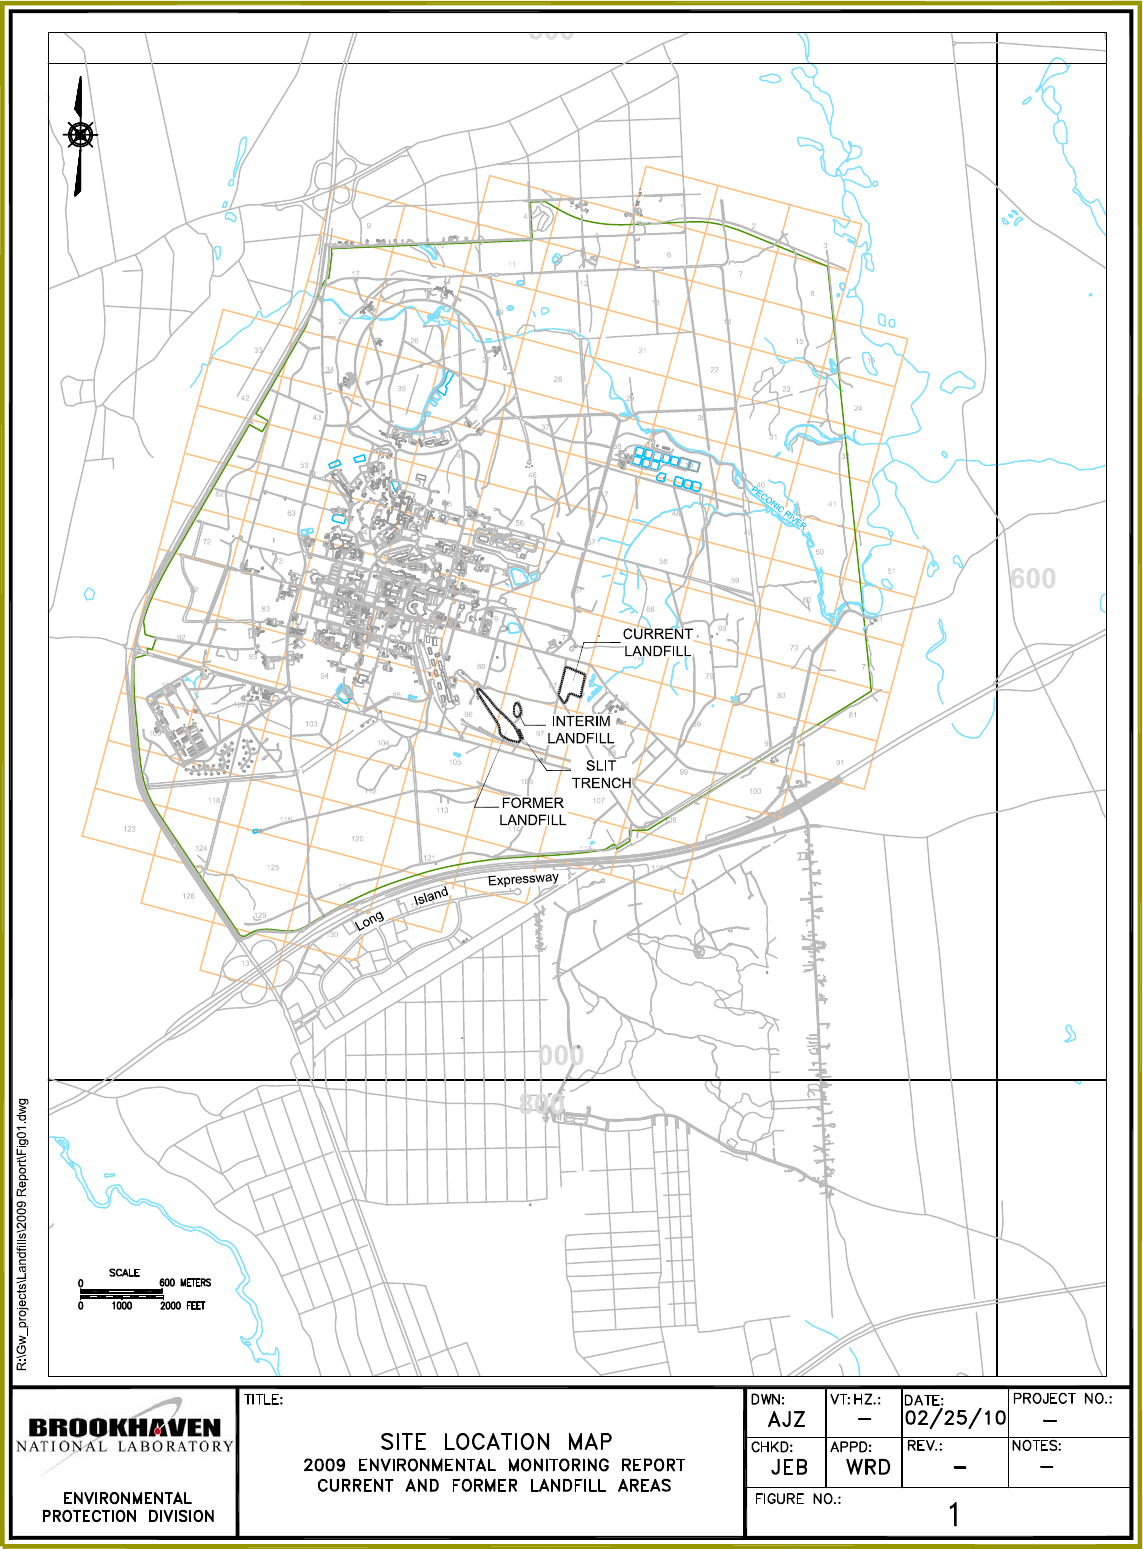
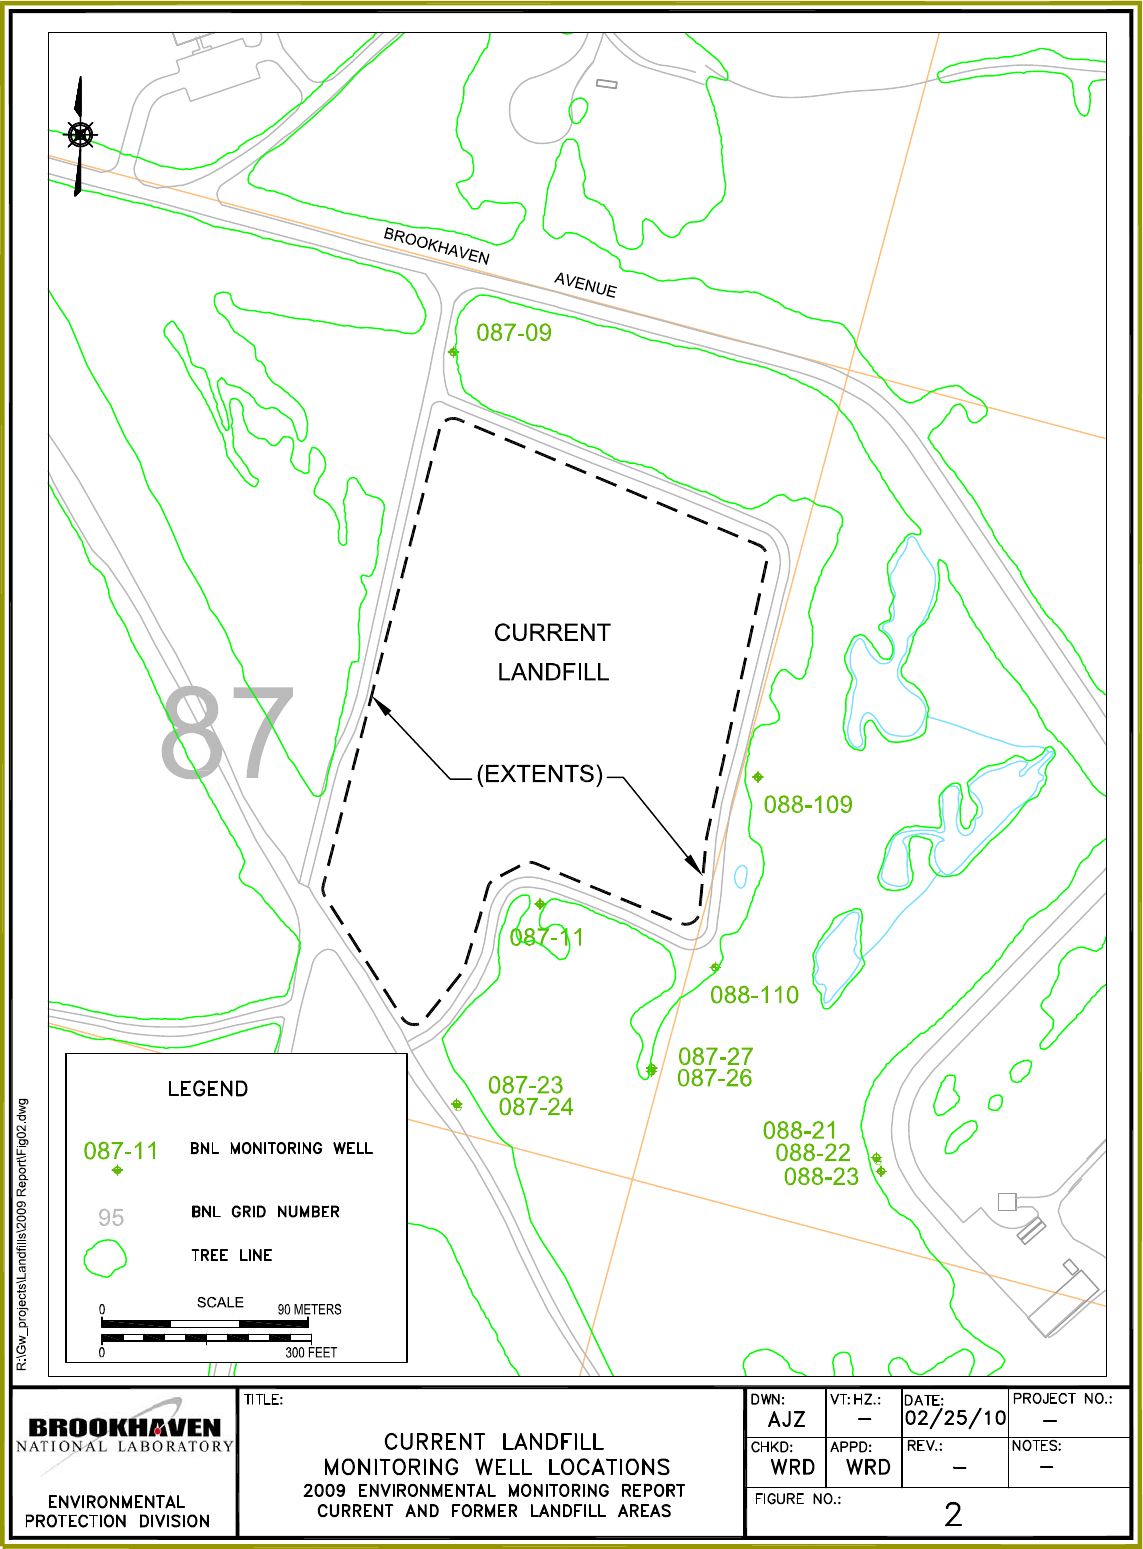
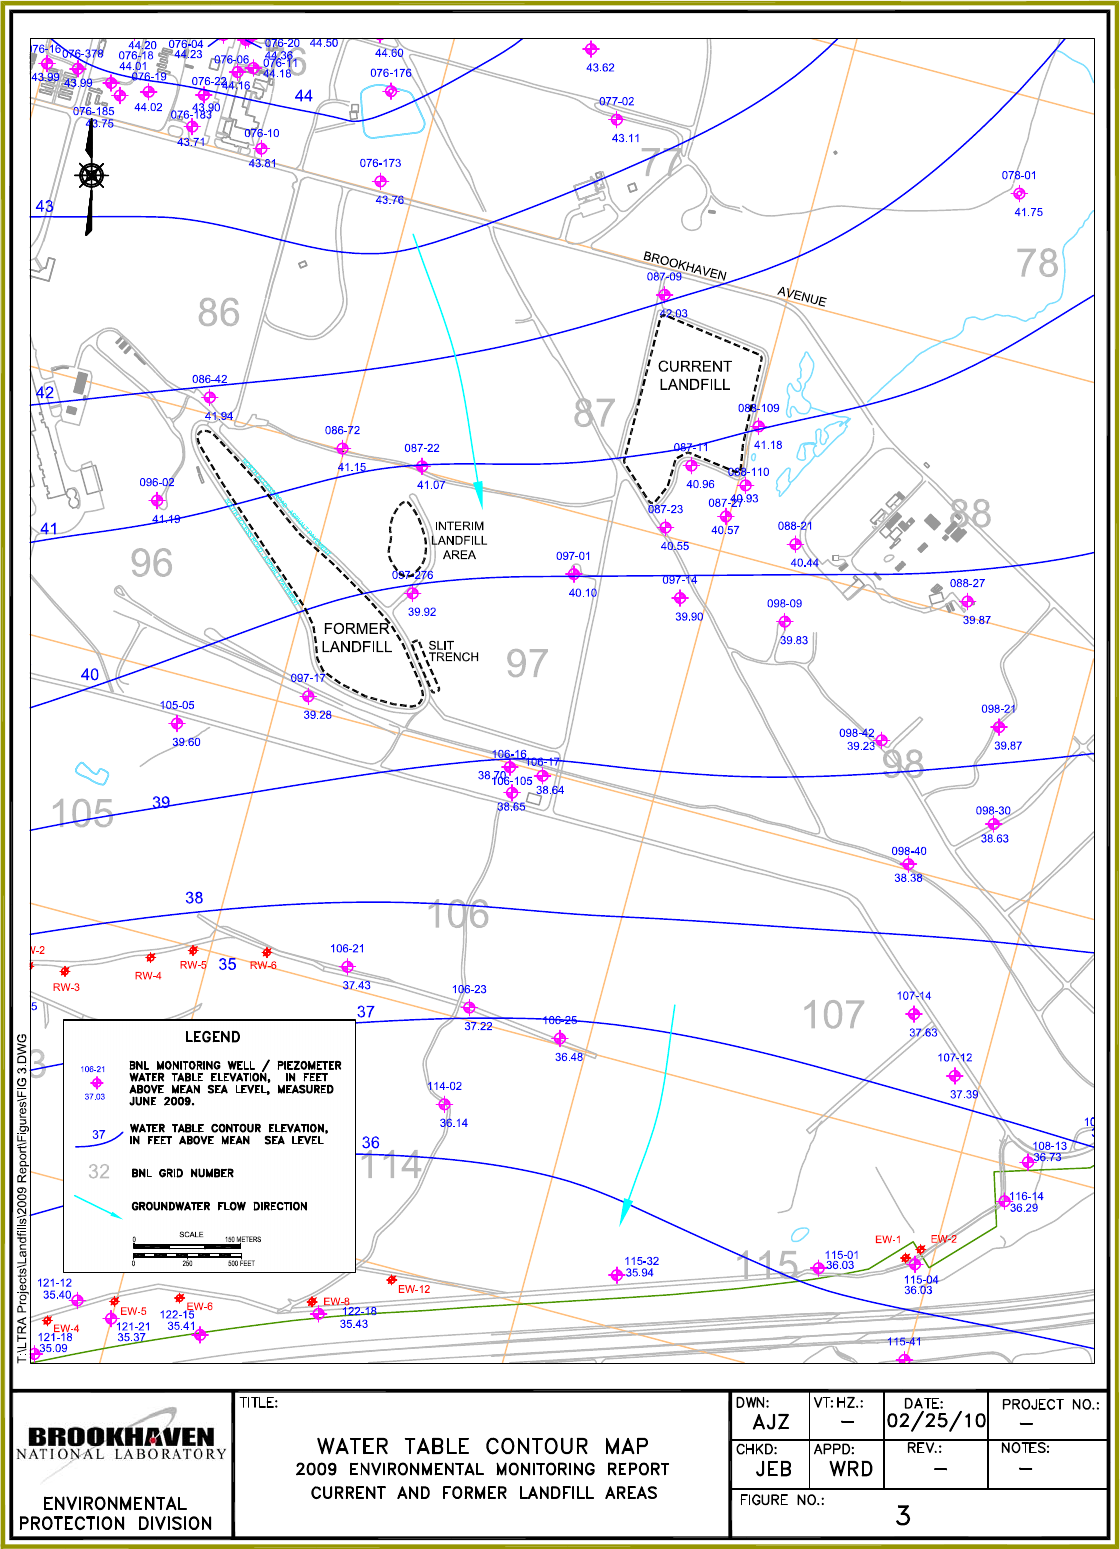
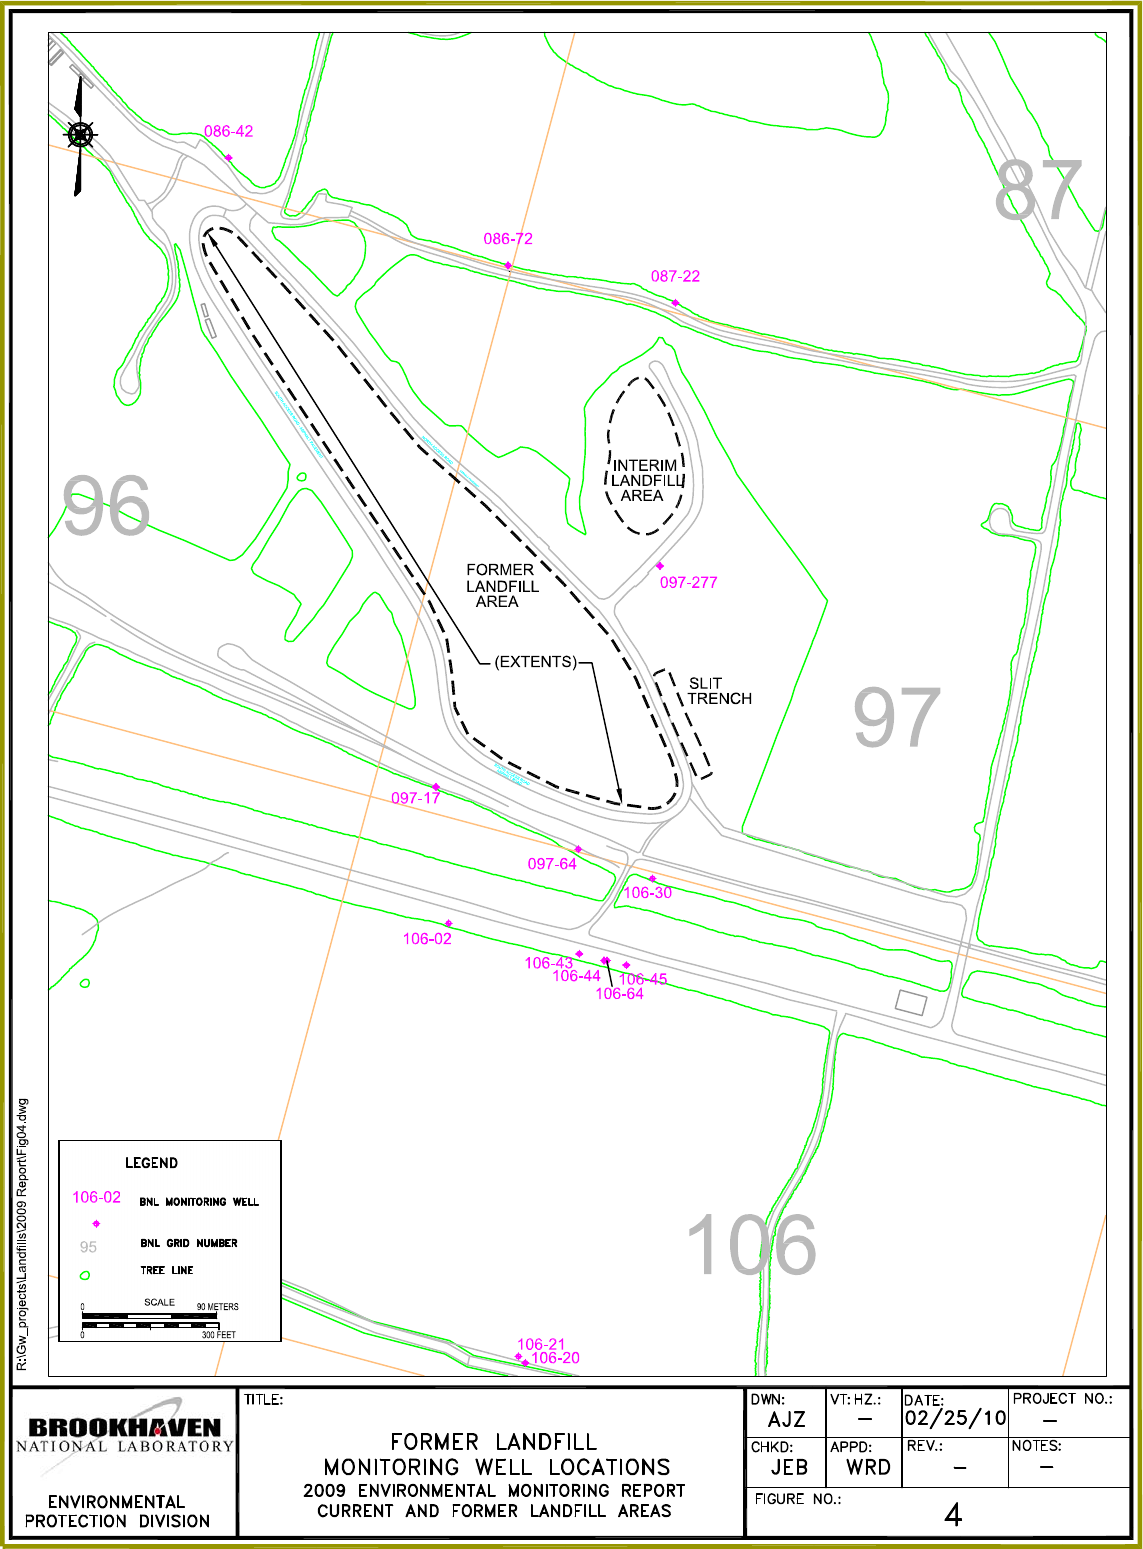
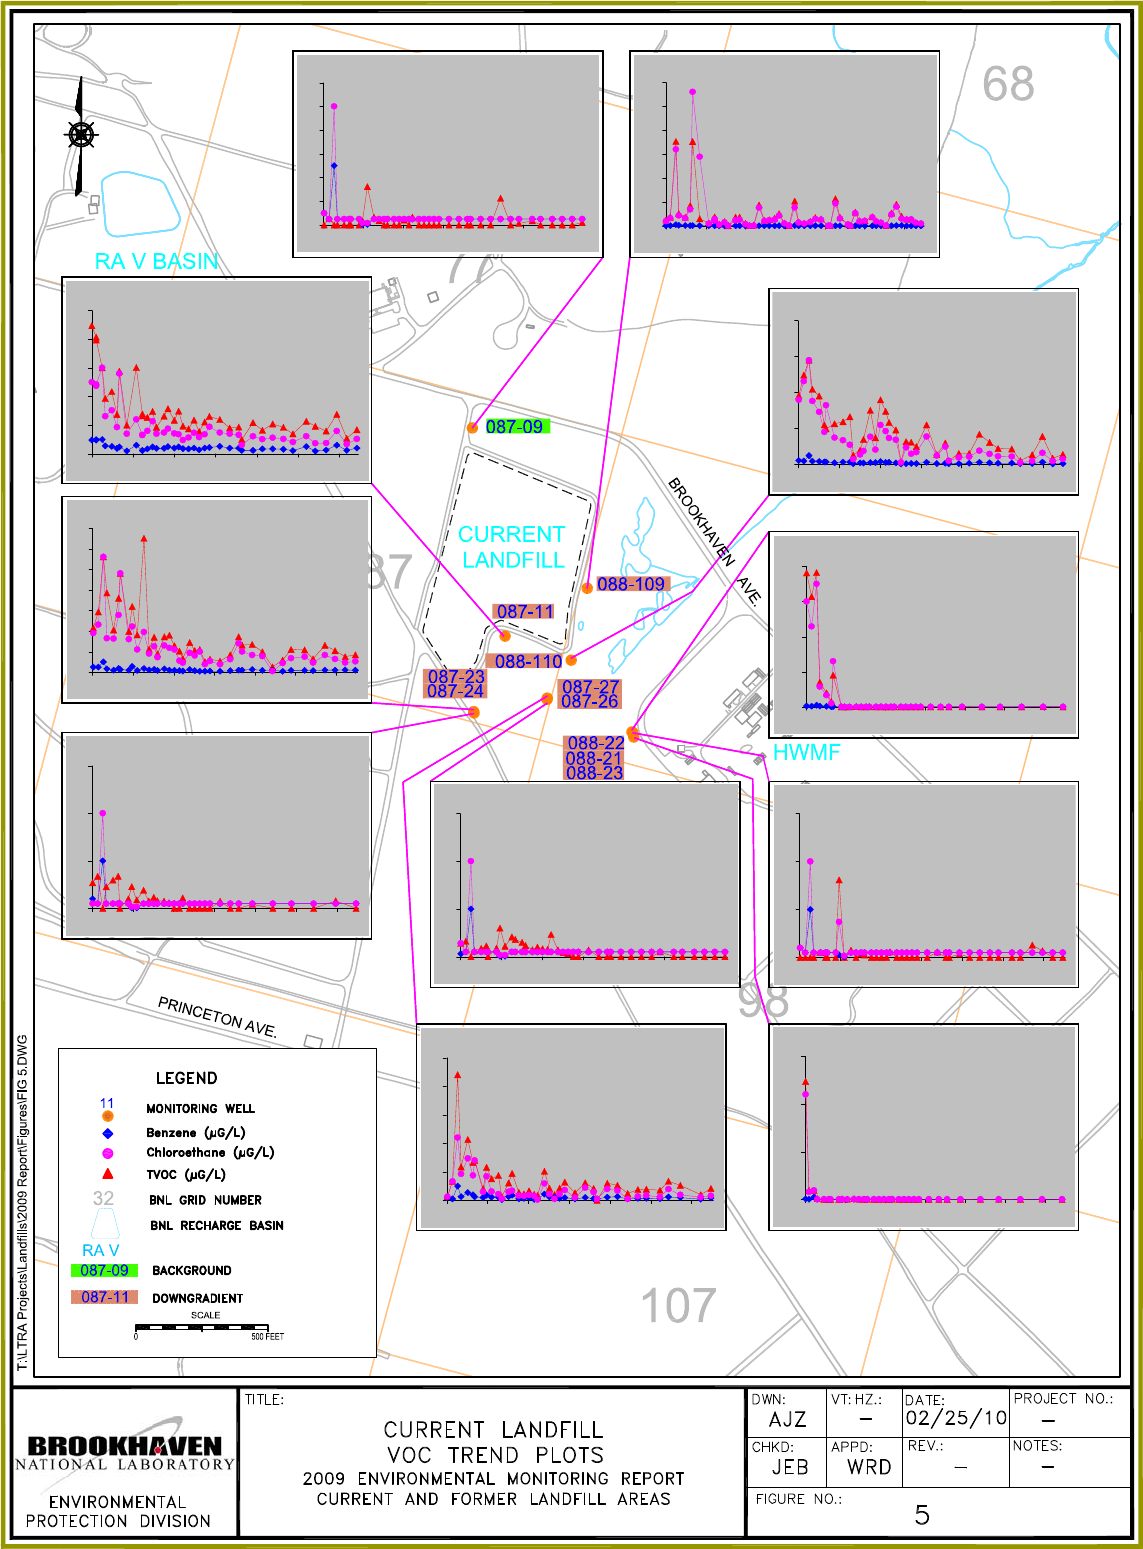
087-09
0
2
4
6
8
10
12
1/97 1/99 1/01 1/03 1/05 1/07 1/09
088-109
0
100
200
300
400
500
600
1/97 1/99 1/01 1/03 1/05 1/07 1/09
088-110
0
20
40
60
80
1/97 1/99 1/01 1/03 1/05 1/07 1/09
088-22
0
100
200
300
400
1/97 1/99 1/01 1/03 1/05 1/07 1/09
088-21
0
5
10
15
1/97 1/99 1/01 1/03 1/05 1/07 1/09
087-26
0
5
10
15
1/97 1/99 1/01 1/03 1/05 1/07 1/09
087-27
0
10
20
30
40
50
1/97 1/99 1/01 1/03 1/05 1/07 1/09
088-23
0
100
200
300
2/97 2/99 2/01 2/03 2/05 2/07 2/09
087-24
0
5
10
15
1/97 1/99 1/01 1/03 1/05 1/07 1/09
087-23
0
10
20
30
40
50
60
70
1/97 1/99 1/01 1/03 1/05 1/07 1/09
087-11
0
10
20
30
40
50
1/97 1/99 1/01 1/03 1/05 1/07 1/09
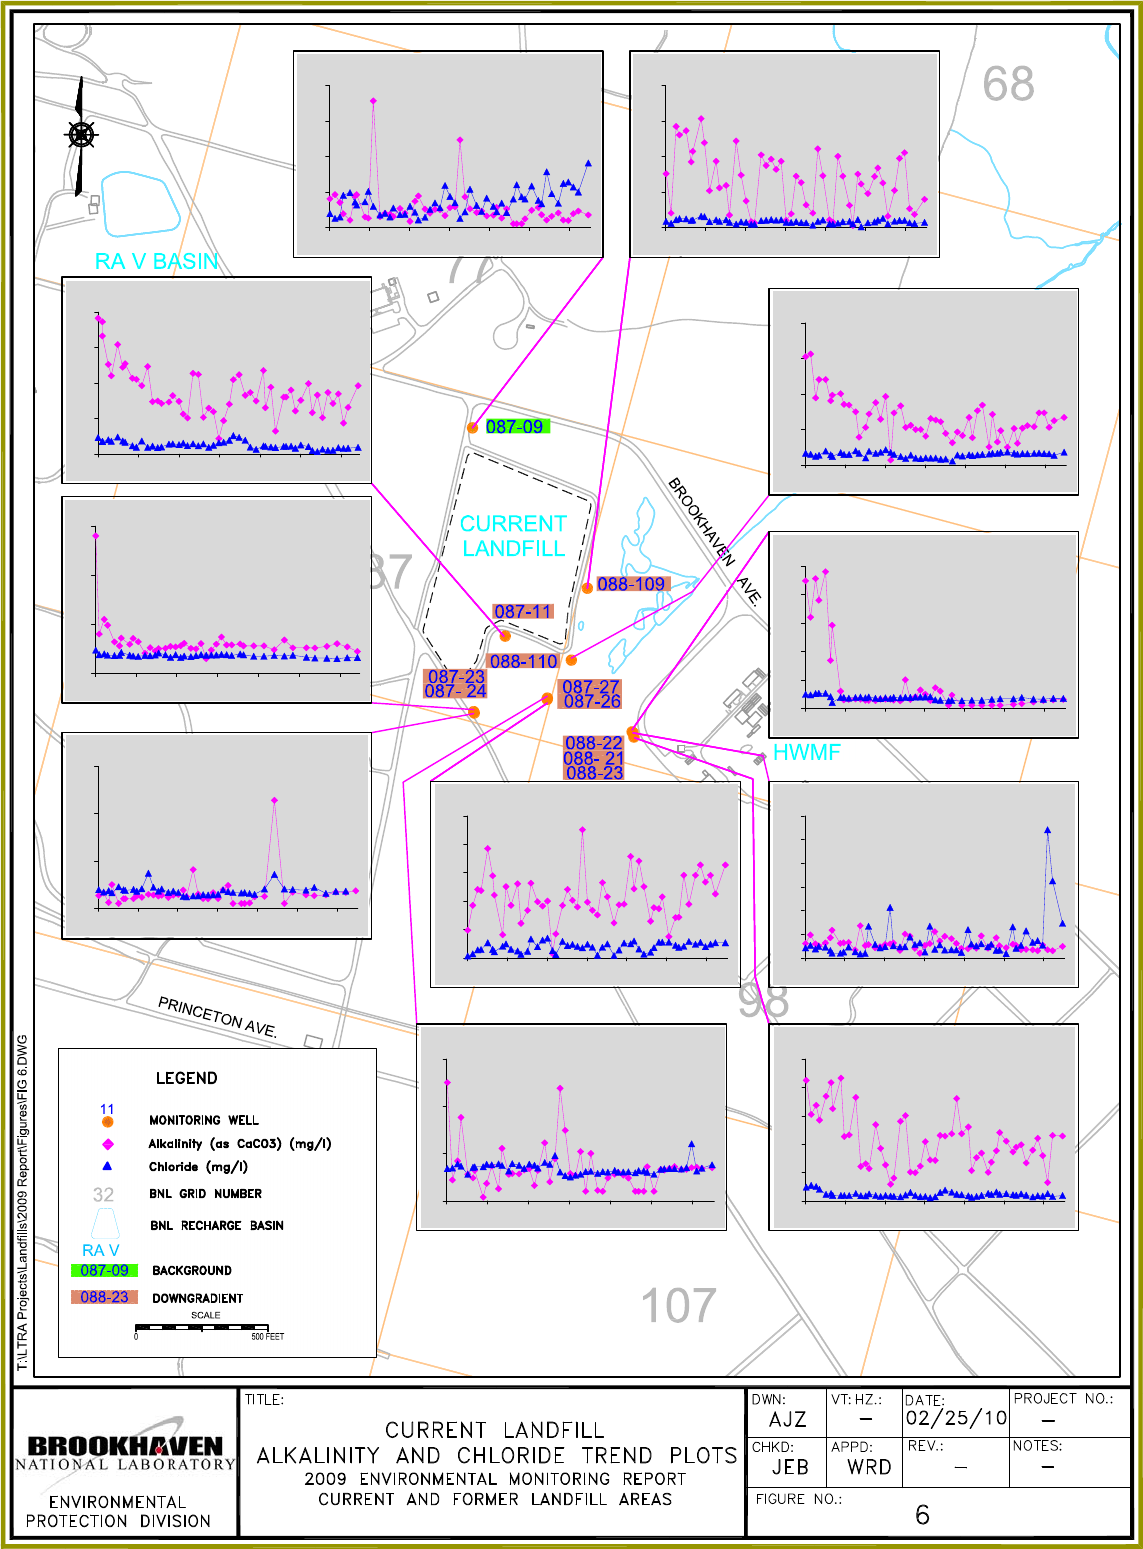
087-09
0
50
100
150
200
1/97 1/99 1/01 1/03 1/05 1/07 1/09
088-109
0
100
200
300
400
1/97 1/99 1/01 1/03 1/05 1/07 1/09
088-110
0
100
200
300
400
1/97 1/99 1/01 1/03 1/05 1/07 1/09
088-22
0
50
100
150
200
250
1/97 1/99 1/01 1/03 1/05 1/07 1/09
088-21
0
50
100
150
200
250
300
1/97 1/99 1/01 1/03 1/05 1/07 1/09
087-23
0
50
100
150
200
250
1/97 1/99 1/01 1/03 1/05 1/07 1/09
087-27
0
50
100
150
200
250
1/97 1/99 1/01 1/03 1/05 1/07 1/09
087-26
0
25
50
75
1/97 1/99 1/01 1/03 1/05 1/07 1/09
087-24
0
50
100
150
1/97 1/99 1/01 1/03 1/05 1/07 1/09
088-23
0
50
100
150
2/97 2/99 2/01 2/03 2/05 2/07 2/09
087-11
0
100
200
300
400
1/97 1/99 1/01 1/03 1/05 1/07 1/09
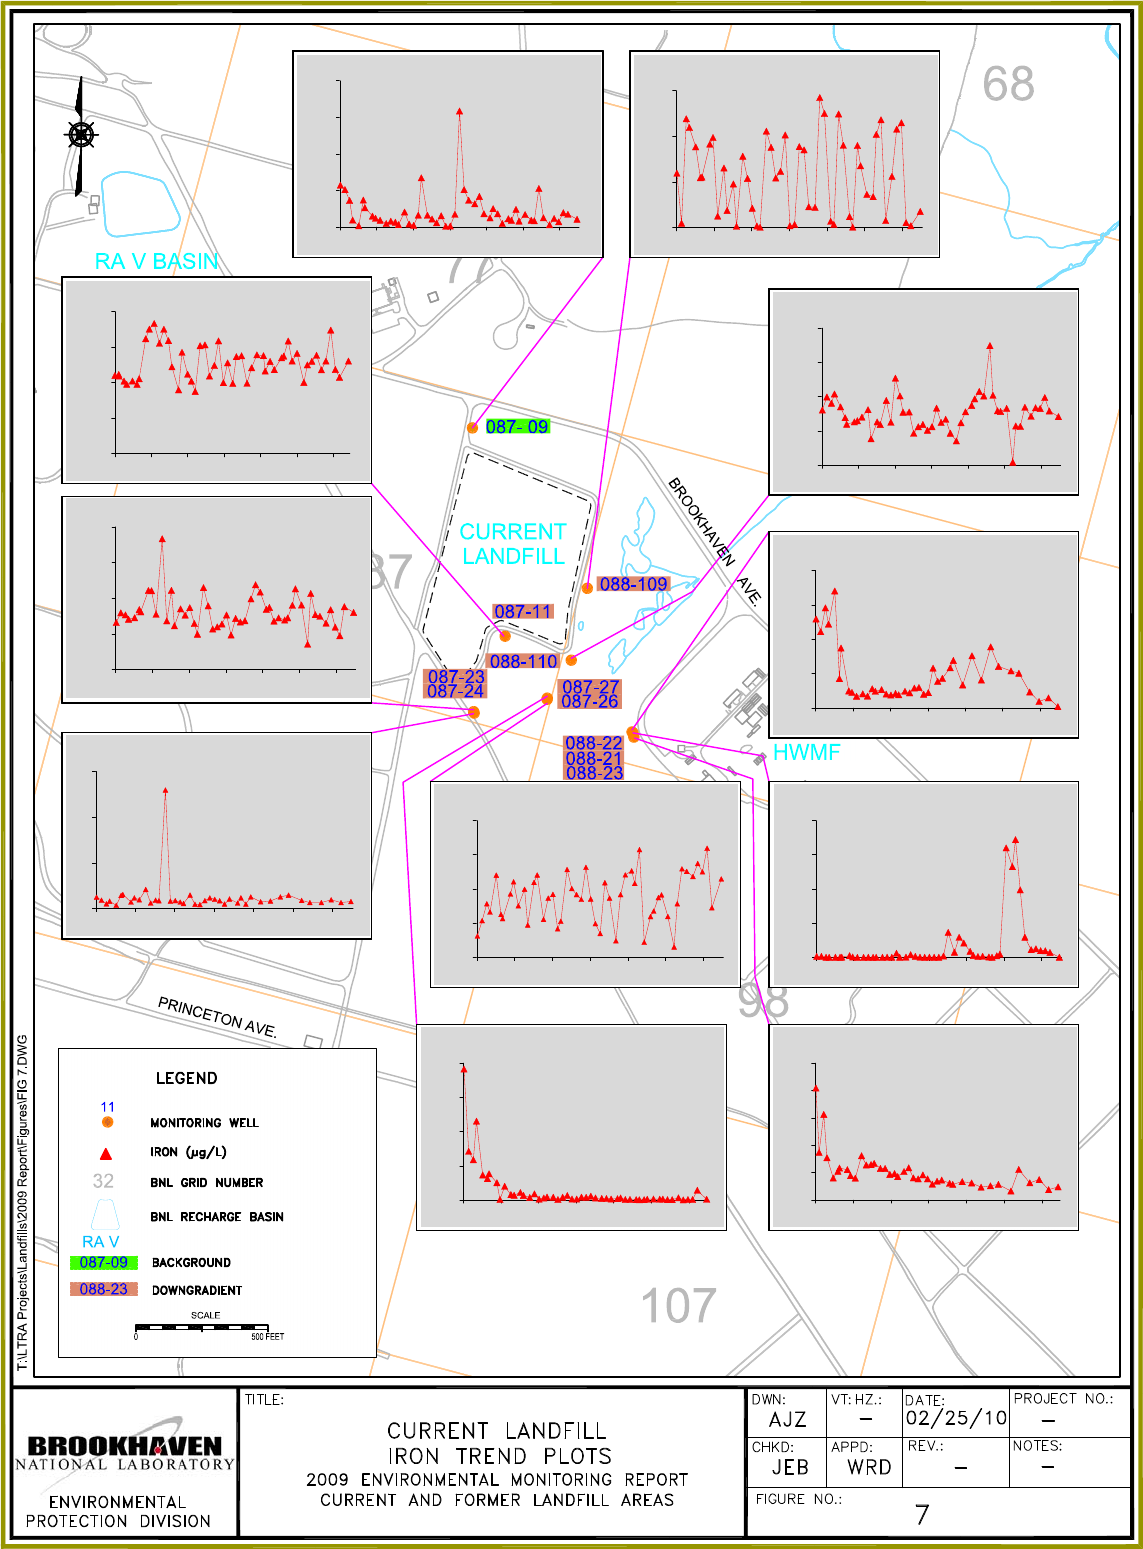
087-11
0
25000
50000
75000
100000
1/97 1/99 1/01 1/03 1/05 1/07 1/09
087-09
0
10000
20000
30000
40000
1/97 1/99 1/01 1/03 1/05 1/07 1/09
087-23
0
35000
70000
105000
140000
1/97 1/99 1/01 1/03 1/05 1/07 1/09
088-109
0
20000
40000
60000
1/97 1/99 1/01 1/03 1/05 1/07 1/09
088-110
0
35000
70000
105000
140000
1/97 1/99 1/01 1/03 1/05 1/07 1/09
088-22
0
20000
40000
60000
80000
1/97 1/99 1/01 1/03 1/05 1/07 1/09
088-21
0
20000
40000
60000
80000
1/97 1/99 1/01 1/03 1/05 1/07 1/09
088-23
0
5000
10000
15000
20000
25000
2/97 2/99 2/01 2/03 2/05 2/07 2/09
087-26
0
10000
20000
30000
40000
1/97 1/99 1/01 1/03 1/05 1/07 1/09
087-27
0
20000
40000
60000
80000
1/97 1/99 1/01 1/03 1/05 1/07 1/09
087-24
0
200
400
600
1/97 1/99 1/01 1/03 1/05 1/07 1/09
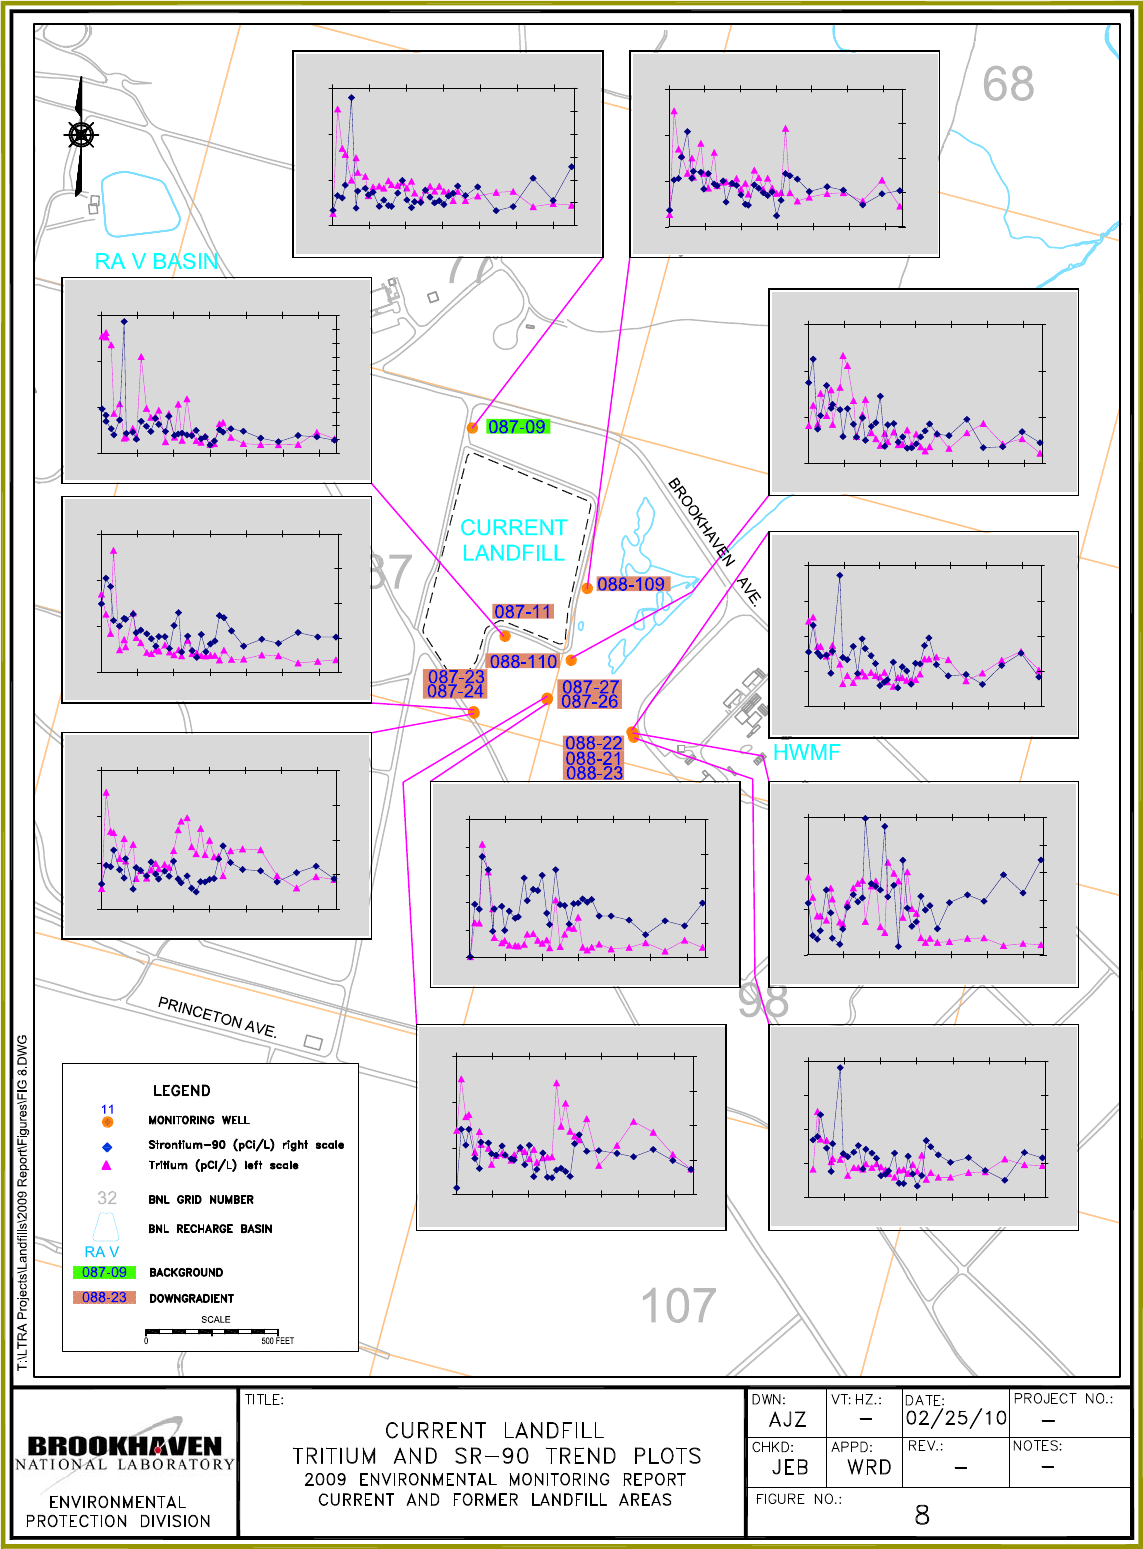
088-23
0
500
1000
1500
2000
0.00
0.50
1.00
1.50
2.00
1/97 1/99 1/01 1/03 1/05 1/07 1/09
088-21
0
1000
2000
3000
0.00
1.00
2.00
3.00
4.00
5.00
1/97 1/99 1/01 1/03 1/05 1/07 1/09
088-22
0
500
1000
1500
2000
0.00
0.50
1.00
1.50
2.00
1/97 1/99 1/01 1/03 1/05 1/07 1/09
088-110
0
1000
2000
3000
0.00
1.00
2.00
3.00
1/97 1/99 1/01 1/03 1/05 1/07 1/09
088-109
0
500
1000
1500
0.00
0.50
1.00
1.50
2.00
1/97 1/99 1/01 1/03 1/05 1/07 1/09
087-09
0
500
1000
1500
0
0.5
1
1.5
2
2.5
3
1/97 1/99 1/01 1/03 1/05 1/07 1/09
087-11
0
2000
4000
6000
0
0.5
1
1.5
2
2.5
3
3.5
4
4.5
5
1/97 1/99 1/01 1/03 1/05 1/07 1/09
087-23
0
1000
2000
3000
0.00
0.50
1.00
1.50
2.00
1/97 1/99 1/01 1/03 1/05 1/07 1/09
087-24
0
500
1000
1500
0.00
0.50
1.00
1.50
2.00
1/97 1/99 1/01 1/03 1/05 1/07 1/09
087-27
0
1000
2000
3000
4000
5000
0.00
0.50
1.00
1.50
2.00
1/97 1/99 1/01 1/03 1/05 1/07 1/09
087-26
0
500
1000
1500
0.00
0.50
1.00
1.50
2.00
1/97 1/99 1/01 1/03 1/05 1/07 1/09
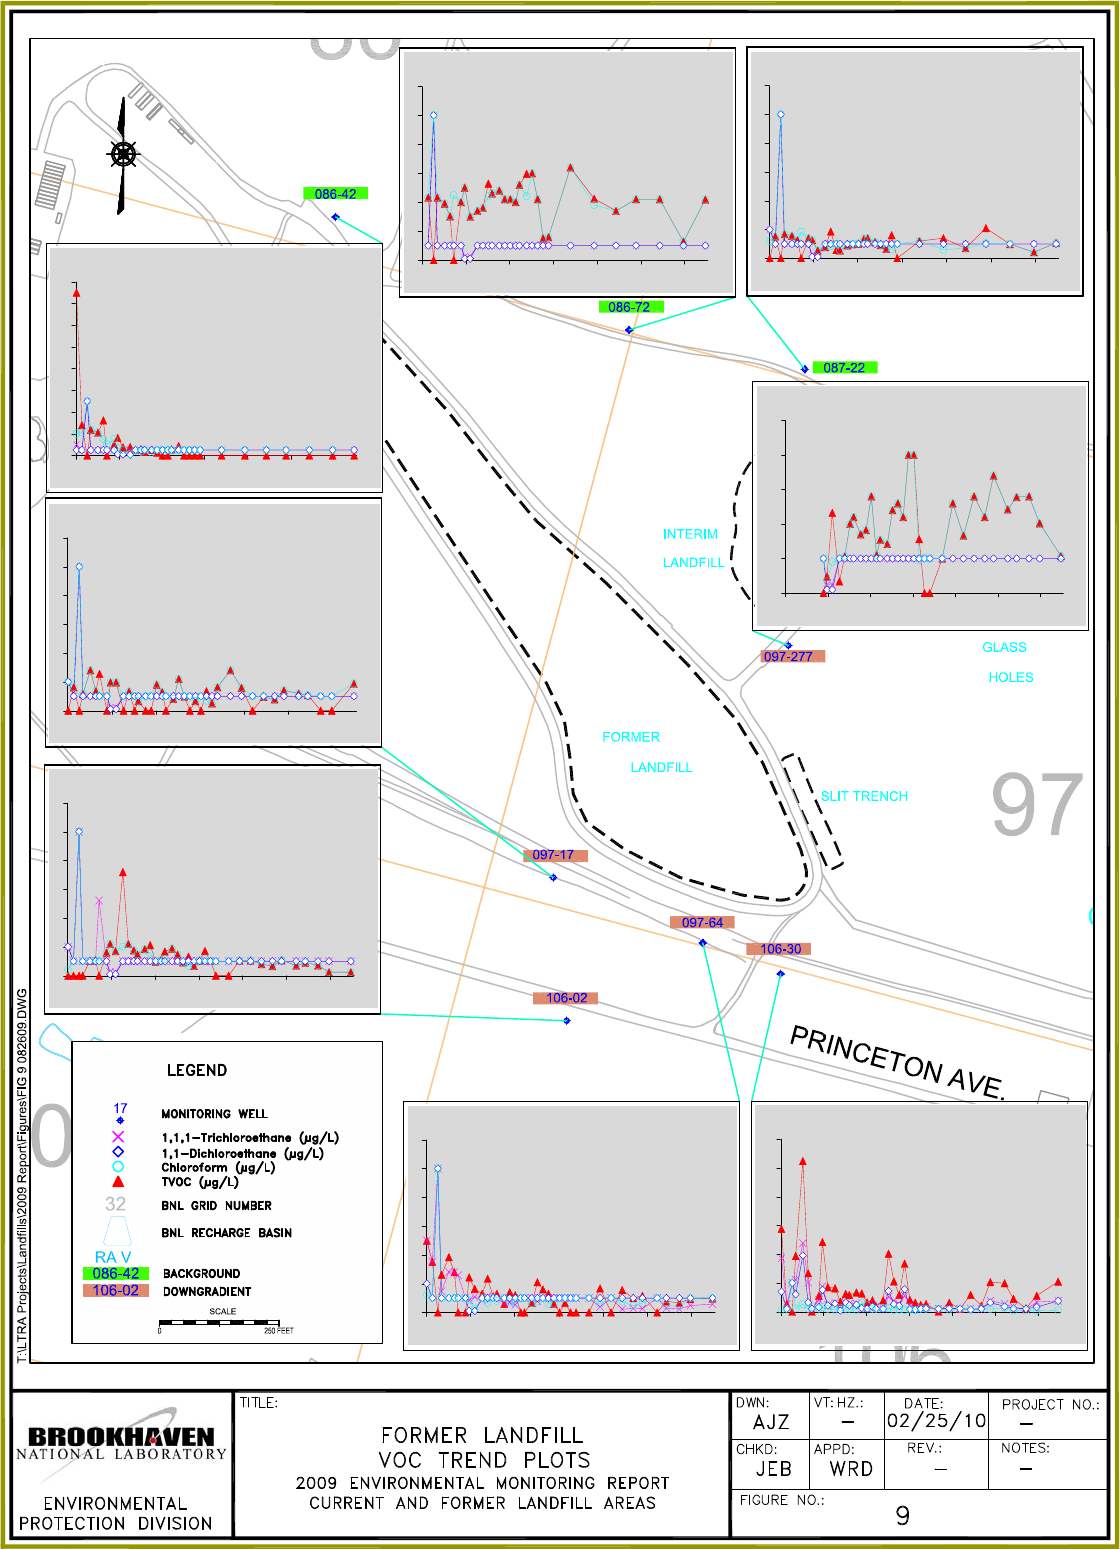
086-42
0
2
4
6
8
10
12
14
16
1/97 1/99 1/01 1/03 1/05 1/07 1/09
086-72
0
1
2
3
4
5
6
1/97 1/99 1/01 1/03 1/05 1/07 1/09
087-22
0
1
2
3
4
5
6
1/97 1/99 1/01 1/03 1/05 1/07 1/09
097-277
0
0.5
1
1.5
2
2.5
1/97 1/99 1/01 1/03 1/05 1/07 1/09
106-30
0
5
10
15
20
25
30
1/97 1/99 1/01 1/03 1/05 1/07 1/09
097-64
0
1
2
3
4
5
6
1/97 1/99 1/01 1/03 1/05 1/07 1/09
106-02
0
1
2
3
4
5
6
1/97 1/99 1/01 1/03 1/05 1/07 1/09
097-17
0
1
2
3
4
5
6
1/97 1/99 1/01 1/03 1/05 1/07 1/09
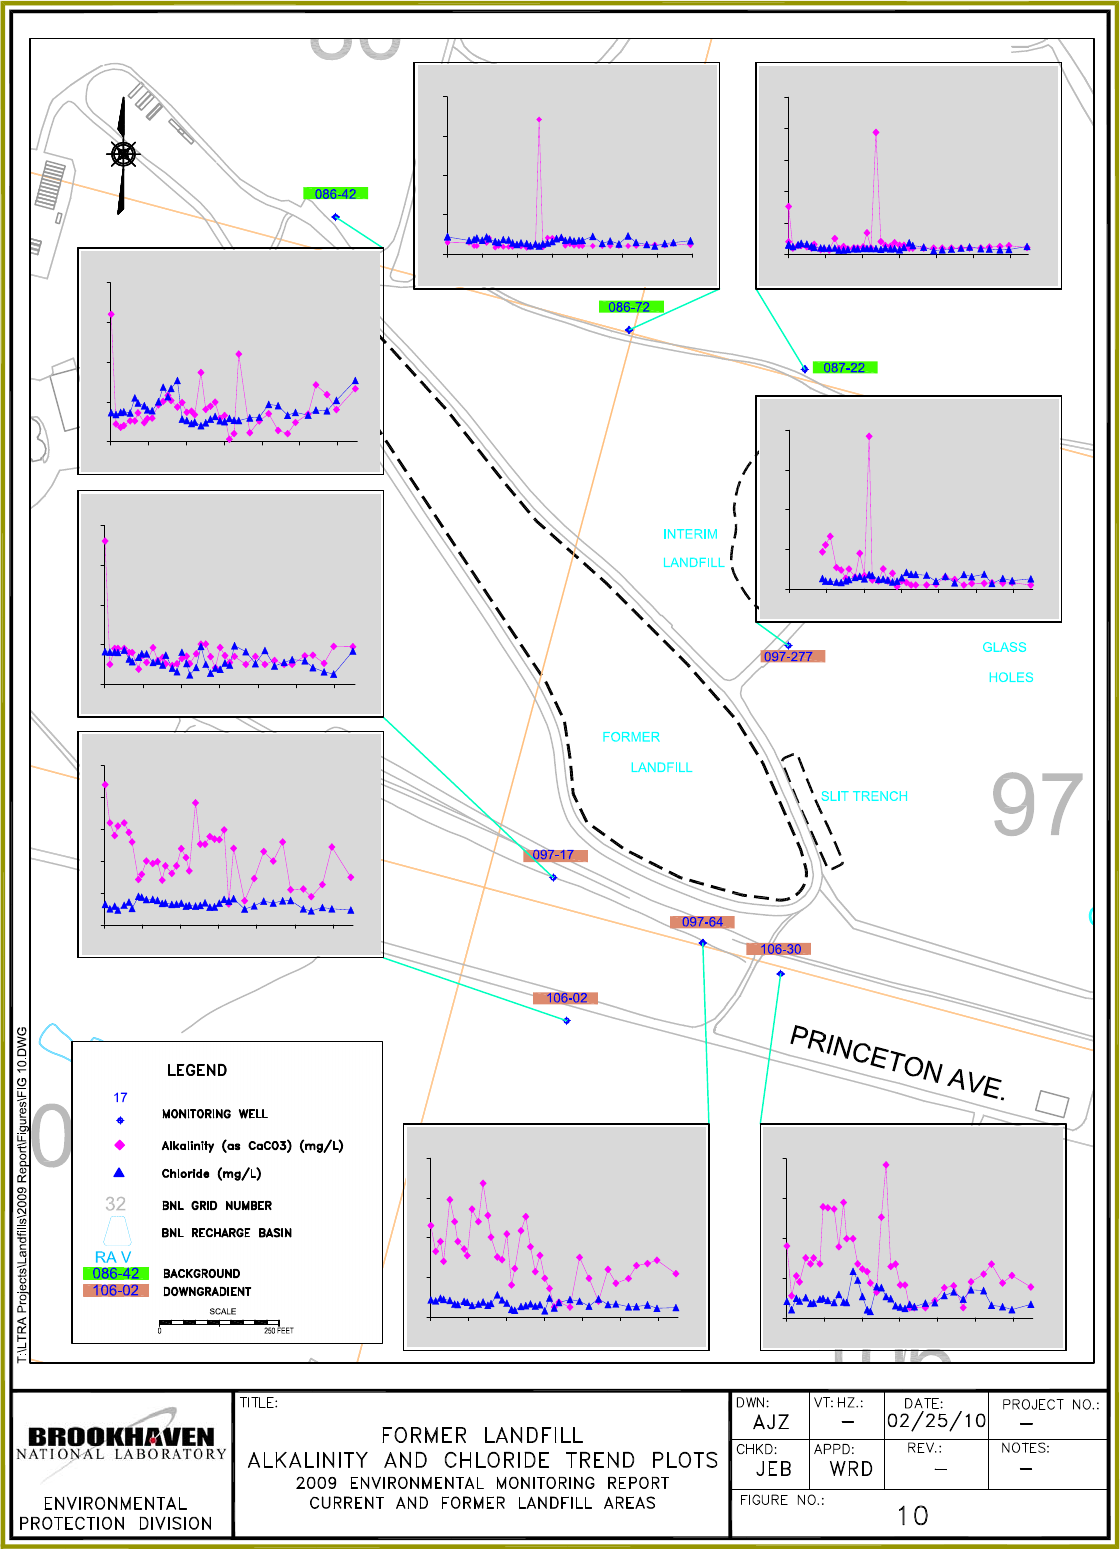
086-42
0
25
50
75
100
1/97 1/99 1/01 1/03 1/05 1/07 1/09
086-72
0
25
50
75
100
1/96 1/98 1/00 1/02 1/04 1/06 1/08 1/10
087-22
0
25
50
75
100
125
1/97 1/99 1/01 1/03 1/05 1/07 1/09
097-277
0
50
100
150
200
1/97 1/99 1/01 1/03 1/05 1/07 1/09
106-30
0
20
40
60
80
1/97 1/99 1/01 1/03 1/05 1/07 1/09
097-64
0
20
40
60
80
1/97 1/99 1/01 1/03 1/05 1/07 1/09
106-02
0
10
20
30
40
50
1/97 1/99 1/01 1/03 1/05 1/07 1/09
097-17
0
10
20
30
40
1/97 1/99 1/01 1/03 1/05 1/07 1/09
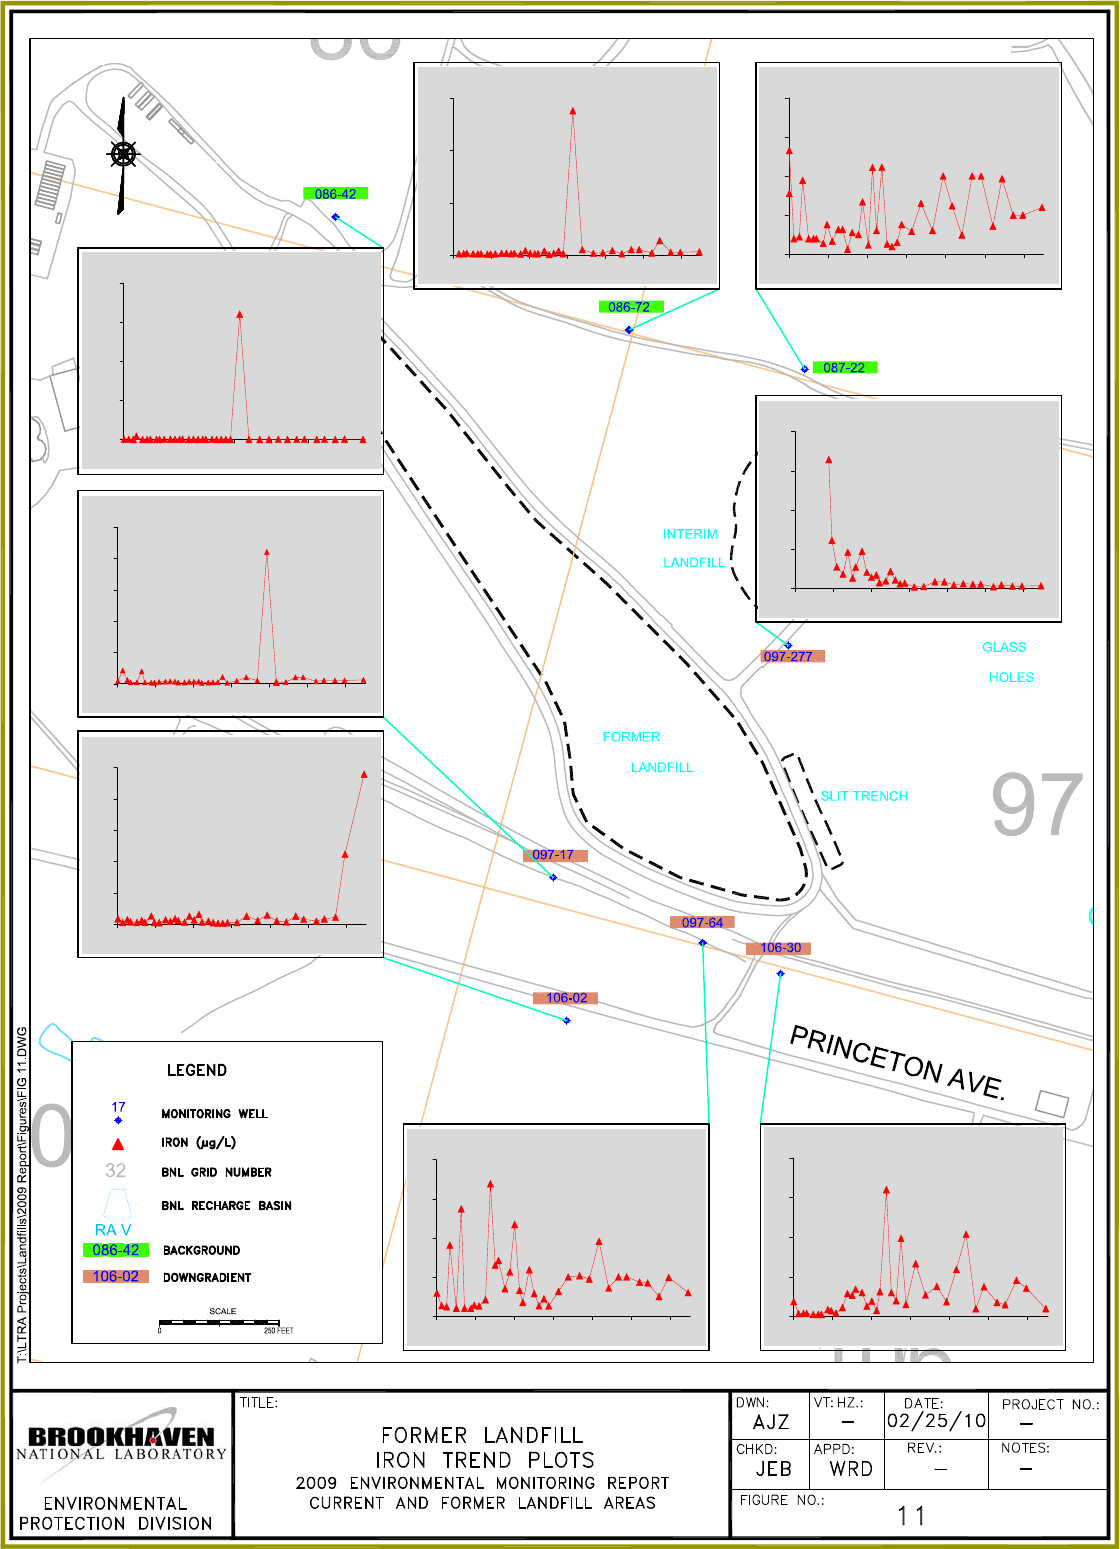
106-30
0
200
400
600
800
1/97 1/99 1/01 1/03 1/05 1/07 1/09
097-64
0
50
100
150
200
1/97 1/99 1/01 1/03 1/05 1/07 1/09
106-02
0
200
400
600
800
1000
1/97 1/99 1/01 1/03 1/05 1/07 1/09
097-17
0
250
500
750
1000
1250
1/97 1/99 1/01 1/03 1/05 1/07 1/09
086-42
0
10000
20000
30000
40000
1/97 1/99 1/01 1/03 1/05 1/07 1/09
086-72
0
500
1000
1500
1/97 1/99 1/01 1/03 1/05 1/07 1/09
087-22
0
25
50
75
100
1/97 1/99 1/01 1/03 1/05 1/07 1/09
097-277
0
500
1000
1500
2000
1/97 1/99 1/01 1/03 1/05 1/07 1/09
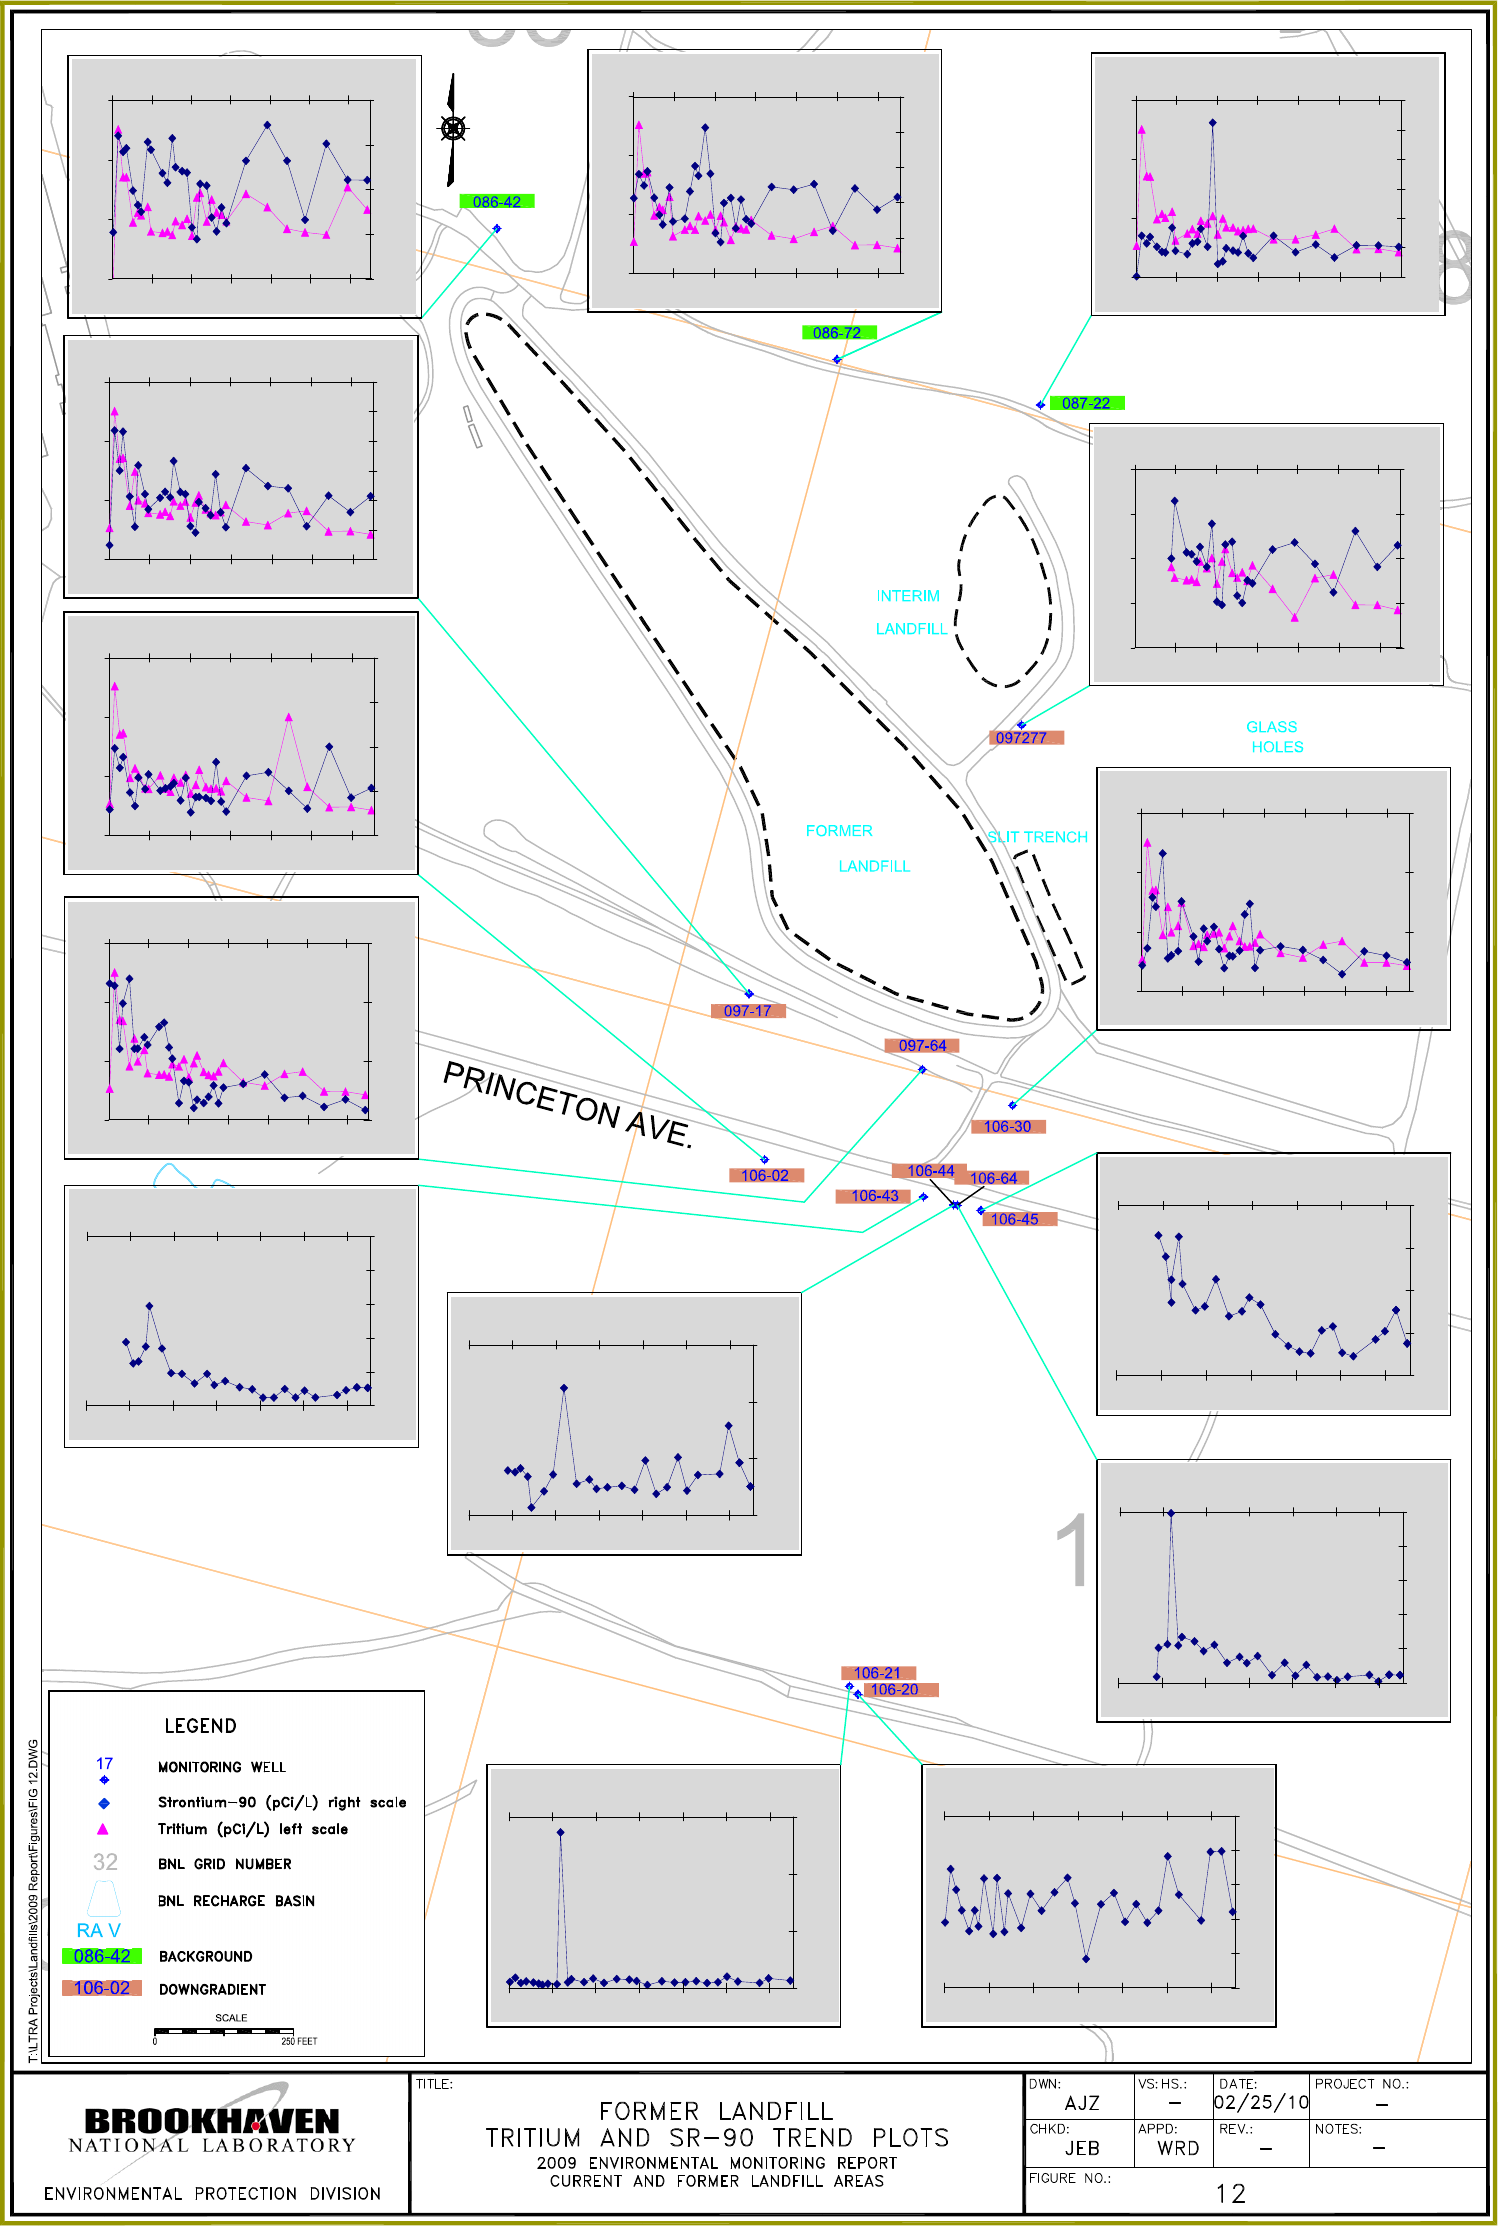
086-42
0
500
1000
1500
0.00
0.25
0.50
0.75
1.00
1/97 1/99 1/01 1/03 1/05 1/07 1/09
106-30
0
500
1000
1500
0.00
1.00
2.00
3.00
1/97 1/99 1/01 1/03 1/05 1/07 1/09
097-64
0
500
1000
1500
0.00
5.00
10.00
15.00
1/97 1/99 1/01 1/03 1/05 1/07 1/09
106-02
0
500
1000
1500
0.00
0.50
1.00
1.50
2.00
1/97 1/99 1/01 1/03 1/05 1/07 1/09
097-277
0
250
500
750
1000
0.00
0.25
0.50
0.75
1.00
1/97 1/99 1/01 1/03 1/05 1/07 1/09
087-22
0
500
1000
1500
0.00
0.50
1.00
1.50
2.00
2.50
3.00
1/97 1/99 1/01 1/03 1/05 1/07 1/09
086-72
0
500
1000
1500
0.00
0.25
0.50
0.75
1.00
1.25
1/97 1/99 1/01 1/03 1/05 1/07 1/09
097-17
0
500
1000
1500
0.00
0.25
0.50
0.75
1.00
1.25
1.50
1/97 1/99 1/01 1/03 1/05 1/07 1/09
106-43
0.00
2.00
4.00
6.00
8.00
10.00
1/97 1/99 1/01 1/03 1/05 1/07 1/09
106-44
0.00
5.00
10.00
15.00
1/97 1/99 1/01 1/03 1/05 1/07 1/09
106-45
0.00
2.00
4.00
6.00
8.00
1/97 1/99 1/01 1/03 1/05 1/07 1/09
106-64
0.00
10.00
20.00
30.00
40.00
50.00
1/97 1/99 1/01 1/03 1/05 1/07 1/09
106-20
0.00
0.20
0.40
0.60
0.80
1.00
1/97 1/99 1/01 1/03 1/05 1/07 1/09
106-21
0.00
4.00
8.00
12.00
1/97 1/99 1/01 1/03 1/05 1/07 1/09