2016 Surveytech Guide X Dec
User Manual:
Open the PDF directly: View PDF  .
.
Page Count: 17

DIGITALENGAGEMENTRESEARCHWORKINGGROUP
SurveyTechnicalGuidance:Samples,DesignandAnalysis
November2015
Paperauthoredby
DrGrantBlank,OxfordInternetInstitute,UniversityofOxford
Withsupportfromthe
DigitalEngagementResearchWorkingGroup
page1

TableofContents
Executivesummary……………………………………………………….………………….3
Technicalguidance…………………………………………………………………………...4
Sampling…………………………………………………………………………………….4
Samplesizeandsampleerror…………………………………………………………….4
Totalsurveyerror…………...……………………………………………………………...6
Questionwording…………………………………………………………………………...7
Questionorder……………………………………………………………………………...8
Instructionsforrespondents………………………………………………………………9
Responserates…………………………………………………………………………...10
Pretestingyourquestionnaire…………………………………………………………...10
Administeringthesurvey………………………………………………………………....11
Checkingyourdata……………………………………………………………………….12
Weights…………………………………………………………………………………….12
Analysis…………………………………………………………………………………….13
Reportingyourmethodology…………………………………………………………….16
Foradditionalinformation………………………………………………………………….17
page2

Executivesummary
A simple survey can be done relatively easily and it can produce persuasive, informative results.
There are, however, a number of technical considerations that will improve the quality and
reliability of the results. High quality surveys produce evidence that stands up to scrutiny and can
inform policy. It follows the principles of ethics, transparency, accountability and auditability. This
document briefly outlines many of the key issues and supplies guidance on how to deal with
them.
Samplingandquestionwording
Ensure that the sample is randomly selected so that it is representative of the population that
youwanttostudy.
If you want do statistical analysis, make the sample size large enough. This probably means
aminimumof400respondentsandaminimumof800ismuchbetter.
Writesimple,easilyunderstoodquestionstoavoidbiasedresults.
If you use questions that have been used in other surveys, you can compare your results to
theirs.Thisisvaluableifyouwanttocompareyourresultstoanationalsurvey.
Pretestyourquestionswithasmallnumberofpeoplefromthepopulationofinterest.
In your cover letter, tell respondents who is conducting the survey, why, and give contact
detailsiftheywantfurtherinformation.
Analysisandreporting
Know how large the difference between percentages must be in order to say that it is
statistical significant given your sample size. Do not claim that smaller differences are
important.
Do not confuse correlation with causation (e.g. if higher Internet use is associated with lower
marksthismaynotmeanthatInternetusereducesmarks).
Clearly label all graphs and tables, as well as all axes on graphs. To the extent possible,
graphsandtablesshouldbeselfexplanatory.
Report percentages with a clear statement of the sample or subsample they refer to (e.g.
Internet users age 16 and over; Users of social network sites age 2534). This should be part
ofthelabelofeachtableorgraph.
Accountability
Reportfundingsourcesandanypotentialconflictsofinterest.
Explainhowtherespondentswereselected.
Reporttheexactwordingofthequestionsandpossibleresponses.
Report what organization conducted the survey along with the dates and circumstances of
datacollection.
If you summarize results for the press, provide access to the percentage tables from which
youdrewyourreportedfindings.
Ensure the full research report is available or provide contact details so that interested
peoplecanaskresearchersaboutthedataortheanalysis
page3

Technicalguidance
Surveys have been conducted, in their modern form, for at least 75 years, and many
books have been written about them. This brief document can’t hope to duplicate the
detail you would get from any one of a number of good books. This document is an
overview. The goal of this document is to introduce you to crucial issues and give you
relatively straightforward suggestions. It is not a substitute for indepth knowledge and,
at the end of the document, I suggest some books you can turn to for more detailed
information.
Sampling
Collecting data on whole populations is often too expensive and it is not necessary. You
can answer almost all questions by selecting a sample, and it will be faster and
cheaper. A sample is just a collection of people from the population that you wish to
learn about. How these people are selected matters a great deal. A sample is valuable
when it accurately represents the underlying population. To do this people in the
sample must be selected randomly
. “Random” has a very specific meaning: the
selection is designed so that each person in the population has an equal chance of
being selected. These samples are called “probability samples” because each member
of the population has an equal probability of selection. The payoff from a probability
sample is that the sample will be representative of the underlying population; that is,
that the results you get from the sample can be generalized to the population. Random
selection is the most important single element in the success of your survey. If you don’t
do this well, the rest doesn’t matter because the results from the sample can’t be
generalized.
Results from nonprobability samples cannot be generalized. Nonprobability samples
include selfselected or “convenience samples”, including Internet optin surveys, callin
samples, person in the street surveys, and nonprobability mailin or telephone
samples.
Samplesizeandsampleerror
Probability samples depend on two mathematical axioms: the law of large numbers and
the central limit theorem. The central limit theorem says that if we draw a sample to
measure something, say Internet use, the measurements will fall in a predictable, stable
pattern around the true value in the population. This predictable pattern is the familiar
bellshaped curve, which is called a “normal distribution”. The centre of a normal
page4
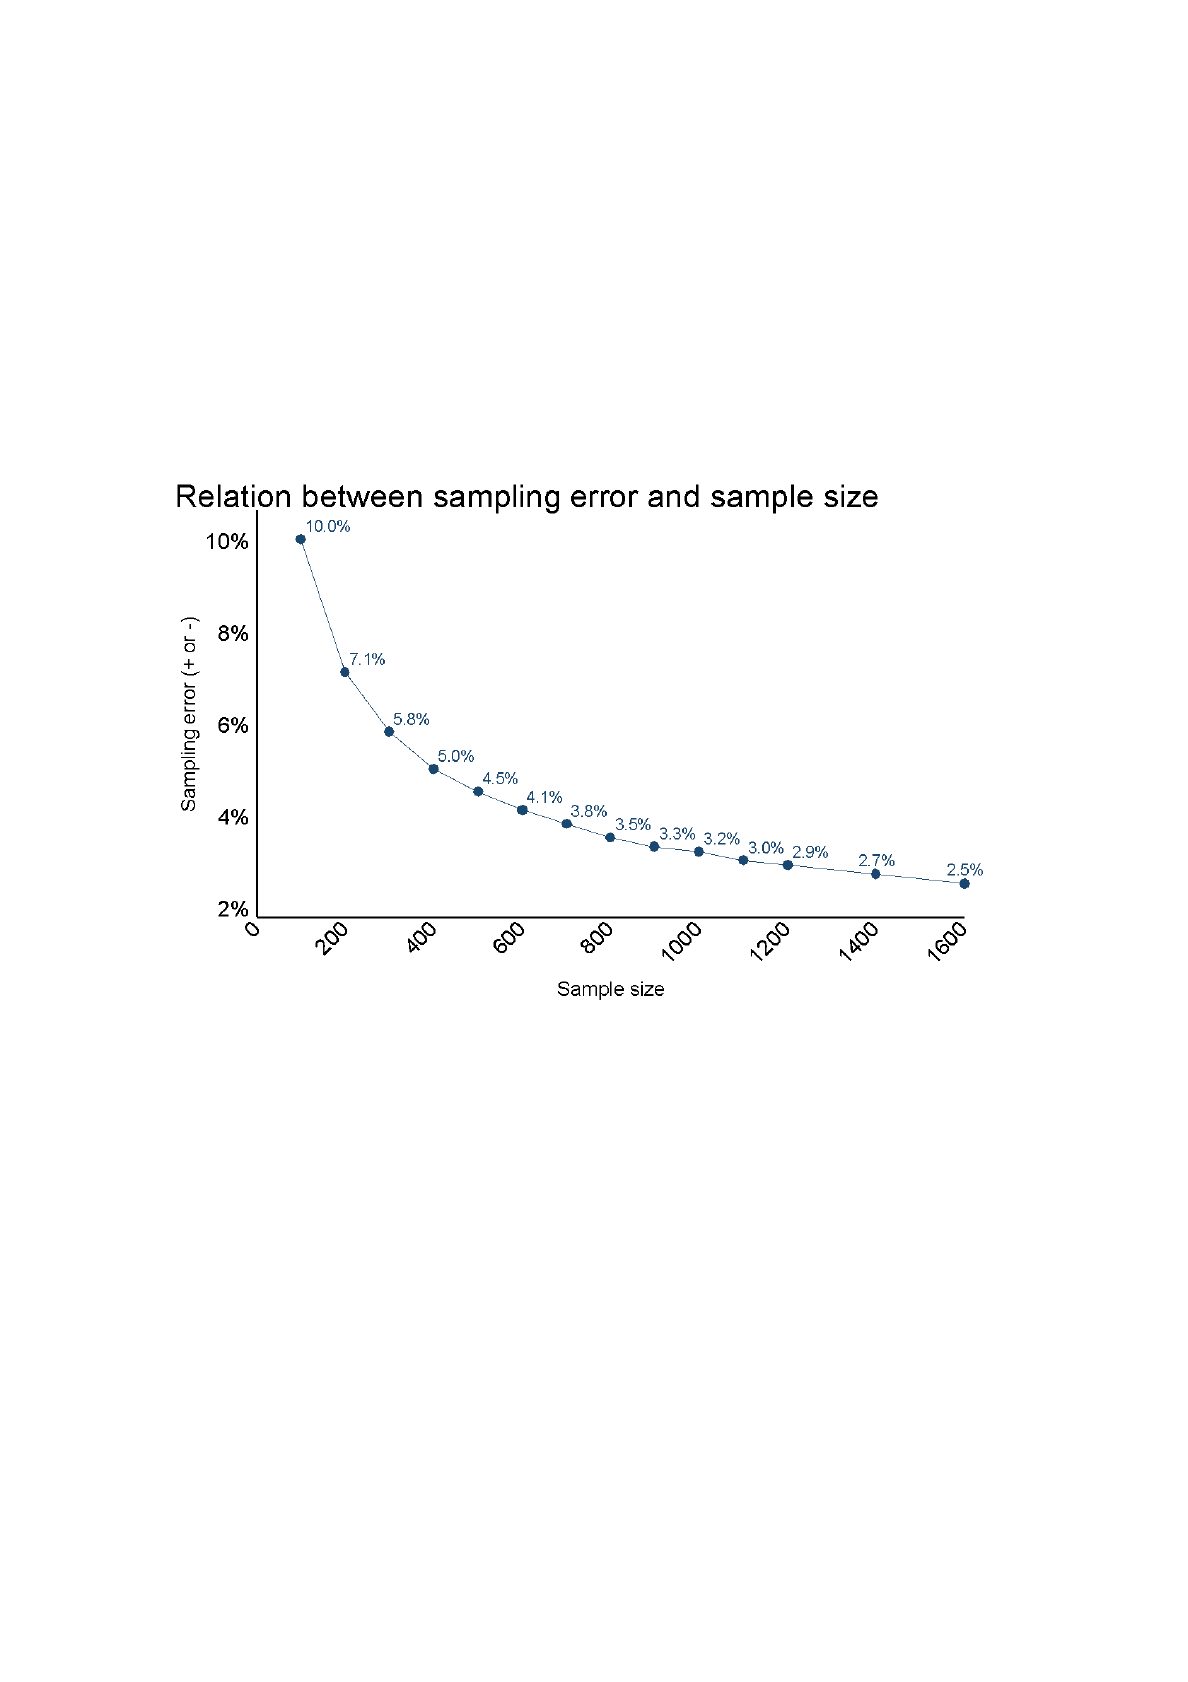
distribution is likely to be at the true value in the population. The law of large numbers
says that the more people you have in the sample the closer your distribution will be to
a bellshaped curve. That is with a large sample, your results will be very close to the
underlying population. How close your results come to the population is called the error
in the sample or the “sampling error”. Sampling error has a simple relationship to
sample size: as sample size goes up, sampling error gets smaller. The relationship
between sample size and sampling error can be described mathematically, as shown in
thefigurebelow.
The figure shows the size of the sampling error in percent for sample sizes between
100 and 1600 respondents. For example, it says that a sample of 400 respondents will
have a sampling error of 5%. If you took a sample of 400 and found that 80% of them
were Internet users, this says that the proportion of Internet users in the population
would be 80% ±5%. Another way to say this is that your survey shows the proportion of
Internet users is between 75% and 85%. The figure shows why the typical national poll
samplesabout11001200people:Forthatsamplesizethemarginoferroris±3%.
Sampling error has several characteristics that you should know to help understand it.
First, it is a theoretical minimum. It assumes that you have drawn a truly random
sample, where all members of the population had an equal probability of being
included. Second, it is only one kind of error, but it is quantifiable and so it is often
reported. Other errors will be discussed below. Third, it is not possible to calculate the
page5

sampling error of a nonprobability sample. It is worth emphasizing again that all
InternetpollsinBritainarenonprobabilitysamples.
Finally, you often want to compare percentages; for example, voter preferences
between Conservative and Labour in a political poll. In these cases it is important to
remember that sampling error applies not to the gap between estimated percentages
but to each estimate
. Below is an example from the 2009 OxIS survey. This was a
survey of 2,013 respondents, which had a margin of error of 2.2%. The table below
shows that 71% of men are likely to use the Internet compared to 68% of women, a
difference of three percentage points. This is outside the 2.2% margin of error.
However, the possible range for men is 69% to 73%; for women it is 66% to 70%. Since
the minimum estimate for men, 69%, is less than maximum estimate for women, 70%,
these two ranges overlap. This says that men and women have about the same Internet
use. Two groups are only different from each other if the difference between them is
morethantwicethesamplingerror
.
Internetusebygender
2009OxfordInternetSurvey
Men71%
Women68%
Men71%±2.2%
Women68%±2.2%
Men69%73%
Women66%70%
Totalsurveyerror
Samplingerrorisonesourceoferror.Totalsurveyerror
comprisesfoursources:
● Samplingerror.Thesamplemaydifferfromthepopulation.
● Coverageerror.Thesamplemaynotmaptothepopulation.
● Nonresponseerror.Manyrefusetobesurveyed.
● Measurementerror.Questionwordingandorderproblems.
I have already discussed sampling error. I will discuss the other three in succession.
The “sampling frame” is the name for list of all the people in the population from which
you intend to draw the sample. The sampling frame should include every person in the
population. Coverage error occurs when some people in the population were not
included in the sampling frame. Because they were not included in the sampling frame
they could not have been included in the sample. The problem with coverage error is
that people excluded from sampling frame are almost never a random selection from
page6

the population. Instead they are typically people who are more marginal and harder to
reach. In national samples they are poorer, less welleducated, possibly homeless or
without a permanent address. People excluded from the sampling frame have zero
probability of being included in the sample, thus the sample will not be a true reflection
of the population. To the extent that the sample deviates from the population, the
sampleissaidtobe“biased”.
A second source of bias is nonresponse error. People may refuse to participate in the
survey for many reasons; the problem is that typically they do not refuse at random.
The people who refuse are systematically different from the people who agree to
participate. For example, most surveys are biased toward people who have more free
timetoanswerquestions:oftenhousewives,unemployed,retired,orstudents.
The ratio of the number of people who participate in the survey over to the number who
were asked is called the “response rate”. The response rate is an important measure of
the quality of the survey. Response rates vary a lot depending on the mode of the
survey. Typical response rates for inhome interviews are around 50%; for telephone
polls,1020%,forInternetsurveys14%.
Questionwording
Finally, there are errors due to measurement problems. This is a complex subject that
will not be covered in detail. One source of measurement problems is badly worded
questions. For example, if you want to know how people felt about a training
programme don’t ask “Was the training programme useful?,” instead ask “Was the
training useful or not useful?” because you don’t want to emphasize one answer or the
other. You want to offer options that represent the basic choice: useful or not useful;
approval or disapproval. Sometimes it could be a range, like “How confident are you
that you will use the training?” You can be extremely confident, you can be not
confident at all, or you can be somewhere in the middle. Second, consider the question:
“Do you want to see less money spent on defence and more on the NHS?” The
problem is that regardless of whether a respondent agrees or disagrees it is not clear
what they are agreeing/disagreeing to. They may want to spend more on the NHS but
that doesn’t mean that they want less spent on defense, and vice versa. These are
called “doublebarreled questions” because they are really two separate questions.
Another example of a bad question is: “Do you favor killing unborn babies?” This sort of
question is loaded with emotional or red flag words that make it very hard to disagree
with, regardless of the respondent’s true feelings about abortion. None of these types of
questionswillproduceaccurateanswers.
page7

Finally, questions need to be understood by everybody who is answering the survey.
They need to be understood by people who have a Ph.D. and people who have no
educationalqualifications.Goodquestions:
● Areconcise,short,simpleandavoidjargon
● Areeasilyunderstoodbyallrespondents
● Don’tpresumeinformation
● Don’ttaxarespondent’smemoryorcognitiveability
● Usebalanced,neutralwordingtoavoidbias
● Askaboutonlyonething
● Avoidnegativetermslike“not”,“none”or“no”
Question wording matters a lot. It is important to provide the complete text of questions
and responses so that readers can judge for themselves whether you have avoided
these problems. The questions we provide to measure digital engagement have been
professional written to avoid these and other problems. It is very important that you
keep the exact wording and do not change a single word. This ensures that your results
arecomparabletoothersurveysusingthesamequestions.
Questionorder
The context of the questions matters a lot. This is an issue of questionnaire design and
format.Severalsuggestionsforthequestionnaireare:
● Start with simple and interesting questions. You want to grab respondents
at the beginning with something that they know and enjoy thinking about.
Possiblypleasurable,enjoyableexperiencesonline.
● After several warm up questions, ask the most important questions in the
survey. This is the place where respondents are least likely to be affected
byrespondentfatigue.
● End with sensitive questions like age, qualifications, marital status,
gender, employment status, and ethnicity. In many countries, income is
among these questions, but the British people are very sensitive to talking
about their income so you may want to omit it. If you do include it be
preparedforahighrateofnonresponse.
● Include the date and time when the survey was distributed as well as a
respondent ID number. To help protect confidentiality the respondent’s
nameshouldnotappearonthequestionnaire.
page8

Pay attention to the order of the questions. People respond to questions by telling you
aboutwhatisontopoftheirheads.Considerthefollowingsequenceoffourquestions:
1. HowimportantistheNHStoyou?
2. AreyouworriedaboutpossibleprivatizationofpartoftheNHS?
3. Do you think that high quality NHS care will be available to you when you
needit?
4. WhatisthemostimportantproblemfacingtheUnitedKingdom?
The first three questions will prompt people to think about the NHS. These questions
push the NHS to the top of their minds. When respondents reach the fourth question
and need to retrieve from their minds the most important problem facing Britain, the
NHS will be easy to retrieve. A much higher proportion of people would say the NHS is
an important problem than they would if the question about the most important problem
had been placed first instead of last. The point is that the answers are influenced by
preceding questions. If you want accurate, unbiased results you need to be careful
aboutquestionorder.
Instructionsforrespondents
You need a cover letter, email or instruction sheet for any survey. There are usually four
importantpiecesofinformationtoincludeintheinstructions.
1. The purpose of the survey. This is very important. The more respondents see
the survey as personally important to them, the more likely they are to
completeit.
2. Whoissponsoringthesurveyandwhoisadministeringit.
3. How confidentiality will be protected. A strong assurance of anonymity is an
importantwaytoincreasethelikelihoodofhonestresponses.
4. Who the respondent can call, write or email if they have questions, concerns,
orwantacopyofthesurveyresults.
If possible, the instructions, email or cover letter should be personalized with the
respondent’sname.Thiswillimproveyourresponserate.
page9

Responserates
Response rates to survey vary enormously. There are a number of actions that you can
taketoimproveresponserates.
Salience refers to the significance or value of a topic to the respondent. Salient
questionnaires receive much higher response rates than nonsalient surveys. Your
cover letter should always explain how the respondent will benefit personally from
completing the questionnaire. One approach is for the cover letter to be signed by a
person who the respondent knows, either personally, by reputation or by affiliation (like
a CEO), a politician, or another wellknown person. Salience is usually the single most
important factor in improving your response rate. Public health surveys can achieve
responseratesofover80%.Marketingsurveysoftenget20%
Followup contacts. When potential respondents don’t respond to your initial contact,
what is the effect of followup contacts? The first followup adds about 1520% more
respondents; the second followup adds another 1015%; the third followup adds
perhaps5%.Thefourthandlaterfollowupsseemtoaddlittle.
Reachable population. If the population is easily reachable, for example, students,
employees or clients, they are more likely to return the questionnaire than if the survey
isofthegeneralpopulation.
Adding a monetary incentive increases the response rate. Typical incentives include
£5or£10orinclusioninadrawingforaprize.
Advance contact, such as sending a letter or an email telling respondents that the
questionnaireiscoming,seemstohaveaboutthesameeffectasfollowup.
Length does not seem to have a big effect. It only appears when salience and followup
are controlled. Obviously at some point length matters, but not for moderately long
questionnairesof1020minutes.
Pretestingyourquestionnaire
By the time you have written the questionnaire you may be too close to it to see
potential problems. You may want to ask several people to critique it before you pretest
it.
page10

Pretesting is important because you may find that your understanding of the questions
differs from that of potential respondents. To pretest, choose a small sample of people
who are similar to the people you will be surveying. You may want to include people
with different qualifications or different income, with or without children, different ages,
different marital status, depending on what factors you think will affect a respondent’s
ability and willingness to complete the survey. If possible time how long the pretesters
need to complete the survey. Encourage pretest respondents to make comments on
each question, as well as on the order and format of the questions. This is often best
done by interviewing them immediately after they complete the questionnaire. If several
peoplecompletethesurveyatonce,thendiscussingitinasmallgroupmaybehelpful.
Pay close attention to any questions that pretesters refuse to answer, misunderstand or
answer incorrectly. These questions may be poorly worded, too difficult to answer, or
too sensitive to answer. These questions should be revised, and pretested again, if
possible.
Administeringthesurvey
There are usually seasonal differences in availability of willing respondents. You want to
avoid times like August and December because they will produce higher nonresponse
rates. School term breaks may also be bad times if your population includes large
numbersofhouseholdswithchildren.
If you are conducting the survey yourself, there are several administrative issues to
consider. Keep lists of all people contacted for the survey (including addresses, email
addresses, and phone numbers) and when they completed the survey. For respondents
who refuse to complete the survey, try to learn why and record the reasons. This may
help you understand ways you can modify your data collection methods. Keep track of
any additional contacts, like follow up phone calls or emails. Make sure that all
personally identifiable information like names and addresses are kept strictly
confidential. Tabulate the number of people contacted and the number who actually
completed the survey so you can calculate a response rate. This is an important
numberthatyoushouldreportwheneveryoureportanyresultsfromthesurvey.
page11

Checkingyourdata
Once you have data, the first step is to check it for errors. For example if the possible
codes for gender are 0 = Male and 1 = Female, then be sure that you don’t have any 3s
or 4s. This is a check for impossible codes. You need to do this check for every single
question in your questionnaire. A related check is for unusually large or small values,
for example a respondent who claims to spend over 100 hours per week on the
Internet. You need to decide what to do when you encounter implausible values like
this. There are many possibilities. Some respondents may have special characteristics
that make an unusually large or small number plausible, or they may have
misunderstood the question, or this may be evidence they are not taking your survey
seriously. You should check to see if this is a data entry error that you can fix. If this
occurs in a small number of instances you may want to remove it from the dataset. If
you remove data, you need to report it in the methodological section of the results. You
mayalsowanttoreportthedatawithandwithoutthesecases.
You will need special codes for nonresponse. There are many kinds of nonresponses,
such as people who were never asked certain questions. For example, in a survey of
Internet use, people who don’t use social media would not be asked social media
questions. People who don’t own smartphones would not be asked smartphone
questions. Households without children would not be asked questions about their
children’s Internet use. Because these questions were skipped they are called “legitimate
skips”. They could be coded 1. Also, some people will refuse to answer certain
questions. In Britain questions about income have high rates of refusal. Refusals can be
coded as 2. Some people may be asked questions but they don’t know the answers.
Peoplewhorespond“don’tknow”canbecodedas3.
Weights
If your survey is for a local project you don’t need to use weights and you don’t need to
read this. However, all national surveys need to be weighted. Weighting corrects for the
problem of not including groups in the sample in the correct proportion to their size in
the population. This is called “poststratification” weighting. It is one way to correct for
samplingerrorandnonresponseerror.Thetablebelowcontainsasimpleexample:
page12

Qualifications
Population%
Sample%
Weight
Noqualifications
10
5
2.0
GCSE
25
10
2.5
Furthereducation
35
35
1.0
Universitygraduate
30
50
0.6
The second column in the table shows the percent of the population who have four
educational qualifications. The third column shows hypothetical survey results. The
survey received responses from too few people with no qualifications or GCSEs and too
many university graduates. We can correct for this by weighting each respondent.
Respondents who report no qualifications receive a weight of 2.0. Respondents
reporting GCSEs will be weighted 2.5. Further education respondents will be weighted
1.0anduniversitygraduateswillbegivenaweightof0.6.
The software you use to analyze the survey has to be able to use weights correctly. Any
standard statistical software will be able to handle weights. Look in the documentation
or help files for “weights” or “poststratification weights” or “probability weights”.
Spreadsheets like Excel and most database software will not handle weights and this is
agoodreasontoavoidthemforstatisticalanalysis.
What the software will do is count the respondent in the results in proportion to the
weight. Thus a person with no qualifications and a weight of 2.0 will be counted twice as
heavily in the results compared to a person who has further education and a weight of
1.0. The value of weighting is that it adjusts the results from the sample so that they
morecloselyreflecttheresultsfromthepopulationasawhole.
Weights have an important limit that you should know. You can only weight to known
population values. In national samples this usually means the population values
reported by the British census. Although the census collects data on everyone, it does
not collect very much data. Weights will probably be limited to gender, age, region,
urbanruralstatusandafewothers.
Analysis
Once you have collected your data they have to be analyzed. Analysis of survey data is
a very large topic. I will just touch on a few central issues; for further information, see
thesuggestedreadingsattheend.
page13

The oldest and still most common method of analysis is percentage tables. They remain
an excellent technique for gaining insights into your data. You are unlikely to need
anything more sophisticated. Simple frequency tables are an excellent way to describe
your data. Below is a frequency table of the social grade of respondents from the 2013
waveoftheOxfordInternetSurvey:
SocialGradeofRespondents
Frequency
Percent
Valid%
Valid
AUppermiddle
25
0.9
1.1
BMiddleclass
332
12.5
14.6
C1Lowermiddle
720
27.1
31.6
C2Skilledworking
427
16.1
18.7
DWorkingclass
504
19.0
22.9
ESubsistence
274
20.3
12.0
Totalvalid
2,282
85.9
100
Missing
Legitimateskip
365
13.7
Refused
10
0.4
Total
375
14.1
Total
2,657
100
The table has three columns of data: the frequency in each category, the percent in
each category and the valid percent in each category. Looking first at the column titled
“Frequency”, the bottom row, labelled “Total” shows that there were 2,657 respondents
in the survey, but the “Total valid” rows indicates that only 2,282 have valid data on
social grade. Among the 375 missing, 365 were missing because they were not asked
(social grade is based, in part, on occupation, so these would be students, unemployed
or retired) and 10 refused to give the information. The “percent” column contains
percents of all respondents, regardless of whether they have data on social grade. The
“valid %” column contains percents of only those cases where there are valid
responses. In general, the valid % column is the one you want to pay attention to. You
can see in the first row of the table that 25 respondents, or 1.1%, were in social grade
A,comparedto274respondents,or12.0%,insocialgradeE.
The graph below shows the same percentage table in a more visual form. This form is
probablybetterforpresentationtomostaudiences.
page14

Twoway percentage tables tell you how different variables are related to each other.
For example, to show how social grade is related to Internet use, we crosstabulate
social grade and Internet use. We put social grade in the rows and Internet use in the
columnsandaskforrowpercents.Theresultisbelow:
SocialGradebyInternetUse
Non
user
User
Total
Frequenc
y
AUppermiddle
0.0%
100.0
100
21
BMiddleclass
6.3
93.8
100
314
C1Lowermiddle
12.6
87
100
676
C2Skilledworking
28.7
71.4
100
465
DWorkingclass
30.8
69.2
100
478
ESubsistence
51.8
48.2
100
239
Total
23.2
76.8
100
2,195
For each category of social grade the table contains four data columns. The first data
column is the percentage of nonInternet users in that social grade. The second column
is the percentage of Internet users in that social grade. These two columns add to
100%, which is the third column. The final column on the right gives the number of
respondents in each row. Analysis consists of comparing the percentages down the
columns. For example, looking at the percentage of users, we notice that 100% of
social grade A are Internet users. As we go down the list of social grades the
percentage of Internet users declines steadily. At the lowest level, only 48.2% of the
people social grade E are Internet users. From this analysis we would conclude that
page15

social grade has a major impact on Internet use. You could do the same analysis of the
nonuser column, but since the percent nonusers plus the percent users adds up to
100% an analysis of nonusers would just be a mirror image of the analysis we just did
onusers.
Since we are looking at the influence of social grade on Internet use, we are thinking of
social grade as a causal variable. It causes (some of the) variation in Internet use. We
say that the proportion of Internet users depends (in part) on social grade. When we
think about causes and effects in this way we have a simple rule for setting up a
twoway table: Ask for percentages in the direction of the causal variable. If the causal
variable is in the rows, calculate row percents. Then do your comparisons down the
columns, like we did in the previous paragraph. This rule can be stated concisely: For a
twoway table, calculate percentages in the direction of the causal variable and
compareintheotherdirection.
Reportingyourmethodology
There are minimum standards for reporting the methodology you use in your survey.
Reporting this information allows readers to judge the quality of your work. This
information can be on a web page and it should be included as a “Methodological
Appendix”inanyreport.Theminimumstandardinformationis:
● Nameofthesurveysponsor
● Nameoftheorganizationthatconductedthesurvey
● The exact wording of the questions being analyzed and the possible
responses
● Thedefinitionofthepopulationunderstudy.
● A description of the sampling frame used to represent the population
understudy
● Anexplanationofhowrespondentswereselected
● Total number of potential respondents contacted, total completed surveys
returnedandtheresponserate.
● The mode of data collection; e.g. paper, telephone, Internetbased, email,
etc.
● Thedatesandlocation(s)ofdatacollection
page16

● Estimatesofsamplingerror
● Adescriptionoftheweightingprocedure(ifused)
Foradditionalinformation
Many books have been written about the conduct and analysis of surveys. Textbooks
aremostaccessibleforanovice.Twogoodchoicesare:
Babbie, Earl. (2010) The practice of social research
. 12
th ed. Wadsworth. This has
excellentchaptersonsampling,writingquestions,andanalysisofsurveys.
De Vaus, David. (2014) Surveys in social research
. 6
th ed. Routledge. Has excellent
chaptersonallphasesofthesurveyprocess.
page17
