28280.Covered Calls And LEAPS A Wealth Option Guide For Generating Extraordinary Monthly Income
User Manual:
Open the PDF directly: View PDF ![]() .
.
Page Count: 241 [warning: Documents this large are best viewed by clicking the View PDF Link!]

Covered Calls
and LEAPS—
A Wealth
Option
ffirs.qxd 10/23/06 1:31 PM Page i
Founded in 1807, John Wiley & Sons is the oldest independent publishing
company in the United States. With offices in North America, Europe, Aus-
tralia, and Asia, Wiley is globally committed to developing and marketing
print and electronic products and services for our customers’ professional
and personal knowledge and understanding.
The Wiley Trading series features books by traders who have survived
the market’s ever changing temperament and have prospered—some by
reinventing systems, others by getting back to basics. Whether a novice
trader, professional, or somewhere in-between, these books will provide
the advice and strategies needed to prosper today and well into the future.
For a list of available titles, visit our web site at www.WileyFinance.com.
ffirs.qxd 10/23/06 1:31 PM Page ii

Covered Calls
and LEAPS—
A Wealth
Option
A Guide for Generating
Extraordinary Monthly Income
JOSEPH HOOPER
AARON ZALEWSKI
John Wiley & Sons, Inc.
ffirs.qxd 10/23/06 1:31 PM Page iii
Copyright © 2007 by Compound Stock Earnings Seminars, Inc. All rights reserved.
Published by John Wiley & Sons, Inc., Hoboken, New Jersey.
Published simultaneously in Canada.
No part of this publication may be reproduced, stored in a retrieval system, or
transmitted in any form or by any means, electronic, mechanical, photocopying,
recording, scanning, or otherwise, except as permitted under Section 107 or 108 of
the 1976 United States Copyright Act, without either the prior written permission of
the Publisher, or authorization through payment of the appropriate per-copy fee to
the Copyright Clearance Center, Inc., 222 Rosewood Drive, Danvers, MA 01923,
(978) 750-8400, fax (978)646-8600, or on the web at www.copyright.com. Requests
to the Publisher for permission should be addressed to the Permissions Department,
John Wiley & Sons, Inc., 111 River Street, Hoboken, NJ 07030, (201) 748-6011,
fax (201) 748-6008, or online at http://www.wiley.com/go/permissions.
Limit of Liability/Disclaimer of Warranty: While the publisher and author have used
their best efforts in preparing this book, they make no representations or warranties
with respect to the accuracy or completeness of the contents of this book and specifi-
cally disclaim any implied warranties of merchantability or fitness for a particular pur-
pose. No warranty may be created or extended by sales representatives or written sales
materials. The advice and strategies contained herein may not be suitable for your situ-
ation. You should consult with a professional where appropriate. Neither the publisher
nor author shall be liable for any loss of profit or any other commercial damages, includ-
ing but not limited to special, incidental, consequential, or other damages.
Designations used by companies to distinguish their products are often claimed as
trademarks. In all instances where John Wiley & Sons, Inc., is aware of a claim, the
product names appear in initial capital or all capital letters. Readers, however, should
contact the appropriate companies for more complete information regarding trade-
marks and registration.
For general information on our other products and services or for technical
support, please contact our Customer Care Department within the United States
at (800) 762-2974, outside the United States at (317) 572-3993 or fax (317) 572-4002.
Wiley also publishes its books in a variety of electronic formats. Some content that
appears in print may not be available in electronic books. For more information
about Wiley products, visit our web site at www.wiley.com.
Library of Congress Cataloging-in-Publication Data:
Hooper, Joseph, 1943–
Covered calls—A wealth option : a guide for generating extraordinary
monthly income / Joseph Hooper And Aaron Zalewski.
p. cm.
Includes bibliographical references and index.
ISBN-13 978-0-470-04470-4 (cloth/dvd : alk. paper)
ISBN-10 0-470-04470-5 (cloth/dvd : alk. paper)
1. Options (Finance) 2. Stock options. I. Zalewski, Aaron, 1980–
II. Title. III. Title: Covered calls.
HG6024.A3H66 2006
332.63'2283—dc22
2006015461
Printed in the United States of America.
10987654321
ffirs.qxd 10/23/06 1:31 PM Page iv
v
Contents
Foreword vii
Preface ix
CHAPTER 1 An Introduction to Options 1
PART I Covered Calls 21
CHAPTER 2 An Introduction to Covered Calls 23
CHAPTER 3 Entering New Covered Call Positions 33
CHAPTER 4 Management Rules 59
CHAPTER 5 Defensive Techniques 75
PART II Calendar LEAPS Spreads 115
CHAPTER 6 An Introduction to Calendar
LEAPS Spreads 117
CHAPTER 7 Entering New LEAPS Positions 123
CHAPTER 8 Management Rules 147
CHAPTER 9 Defensive Techniques 165
ftoc.qxd 10/23/06 1:29 PM Page v
CONCLUSION How to Move Forward 177
APPENDIX A Quick Reference Guide 179
APPENDIX B Foreign Exchange Risk 197
APPENDIX C Brokerages and Order Types 201
APPENDIX D Using ETFs and HOLDRs for
Diversification 205
APPENDIX E Compound Stock Earnings
Support Services 207
Glossary 211
Disclaimer and Legal Information 217
About the DVD 221
Index 223
vi Contents
ftoc.qxd 10/23/06 1:29 PM Page vi

vii
Foreword
Brilliant book. Anyone who has read any of my work knows that I be-
lieve buying, holding, and praying is not an optimal financial strategy.
Joseph Hooper and Aaron Zalewski have done an excellent job mak-
ing a complex subject simple enough for someone like me to understand.
As most of us know, investors invest for two basic things: capital gains
and cash flow. Most people invest for capital gains, which is simply buying
something and hoping the price goes up. Investing for cash flow is invest-
ing for a steady stream of income. Of the two, investing for cash flow re-
quires the most skill. Anyone can deceive themselves by thinking, “The
price will go up in the future.” Or anyone can be suckered into a sales pitch
that goes: “Prices have gone up over the past five years...so you better
buy now.”
The reason I love this book is because the authors have made investing
for cash flow simple. I like the analogy in their Preface of planting trees and
growing a forest to be cut down as an example of investing for capital
gains versus planting fruit trees to harvest and replenish on a regular basis
as the example of investing for cash flow. Obviously, the more savvy in-
vestors invest for both capital gains and cash flow. They want a forest and
the fruit. They want money today and tomorrow.
Regardless, even if you never plan on investing in stocks or covered
calls, this is an excellent book for anyone who wants to look into the mind
of a professional investor. You see, the investment strategy discussed in
this book does not apply only to stocks. This investment strategy works for
real estate as well. Rarely do I buy a stock or piece of real estate without
first knowing that I will receive cash flow and capital gains. In other words,
this book is not about an asset class but more about a class of investor that
likes to win, not gamble.
R
OBERT
K
IYOSAKI
Author of Rich Dad, Poor Dad
fmatter.qxd 10/23/06 1:26 PM Page vii
fmatter.qxd 10/23/06 1:26 PM Page viii

ix
Preface
One can think of the accumulation of a stock portfolio through time as
the cultivation of a forest full of trees. Traditional Street mentality
encourages investors to plant trees throughout their working lives
and rely on appreciating markets to grow the forest over the long term.
Once our working lives are finished and active income ceases, the
Street then encourages investors to begin cutting down the forest to pro-
vide income in retirement. The hope is that the forest has grown large
enough over time to withstand the depletion in retirement. In our experi-
ence, this level of growth is a rarity for the average American.
What the Street has overlooked is that simple and very conservative
cultivation can transform the forest into an orchard of fruit-bearing trees.
Fruit-bearing trees generate cash income on a monthly basis. For investors
who want to grow their assets, rather than eating the fruit each month, the
fruit can be left to fall on fertile soils to grow more trees and thus to com-
pound the growth of the forest through time. For investors who are in re-
tirement, the fruit can be picked each month as cash income for living
expenses—without liquidating stocks in the portfolio and destroying the
forest that they depend on to live.
Correct application of the covered call technique is the vehicle by
which stocks are converted to cash flow generating assets.
OPTIONS ARE NOT JUST A
HIGH RISK/HIGH RETURN INSTRUMENT
Options are without doubt the most misunderstood, misrepresented, and
poorly implemented financial tool in the world. When asked about options,
most people (including those “in the know” like financial planners, stock-
brokers, and accountants) will tell you that “they’re high-risk, high-return
instruments.”
It is astonishing that even those who are financially educated seem un-
aware that options can be used to minimize or even eliminate risk in a
fpref.qxd 10/23/06 1:23 PM Page ix
stock portfolio. In fact, options were originally not devised for use as a
speculative instrument. They were originally used in the agricultural indus-
try to reduce risk by locking in future sales prices before harvest. Regard-
less of this original intent, options maintain the label of “high risk, high
return.”
The high-risk, high-return label derives its origins from the speculative
use of options. Speculators use options to bet on the direction of the mar-
kets for the potential of very high returns. However, with these high returns
come very high risk, and the vast majority of speculators fail over the long
term. If you ever attempt to speculate with options, there is a very high
chance that you, too, will be unsuccessful over the long term.
What evidence do we have that the vast majority of speculators fail over
the long term? Well, if just 10 percent of the world’s speculators were mak-
ing regular 50–100 percent returns per trade over the long term (as is the goal
of a speculator), then the world would be full of multi, multimillionaires who
made overnight fortunes trading options. Clearly, this is not the reality. How-
ever, this get-rich-quick ideal continues to be perpetuated by the endless
hope of investors seeking a quick and easy solution to their financial woes.
Options markets are a zero-sum game. Someone wins only when some-
one else loses. If most speculators lose in the long run, who are the win-
ners? Apart from the market makers and the small portion of speculators
who win over the long term, money flows each and every month into the
hands of option writers. Option writers are the people who are selling op-
tion contracts to the speculators.
What we want to teach you has nothing to do with the risky practice of
speculating with options—this is not high-risk, high-return trading. In fact,
covered calls are almost the complete opposite. In this book we show you
a way to use options to make consistent, steady profits that you can rely on
to pay your mortgage and put food on your table or to compound your in-
vestment capital through time into significant accumulations of wealth.
J
OSEPH
H
OOPER
A
ARON
Z
ALEWSKI
xPreface
fpref.qxd 10/23/06 1:23 PM Page x
1
CHAPTER 1
MARKET BASICS
This section is written specifically for the stock market novice. It is aimed
at those who have never bought a stock before or those who have very lit-
tle understanding of the most basic functions of stock and option markets.
What Is the Stock Market?
From the perspective of a private investor, the stock market provides a
venue for the buying and selling of stock of publicly listed companies. If
you want to buy fruit, you go to the fruit market. If you want to buy stocks,
you buy them through the stock market—it is as simple as that. Other com-
mon terms for the stock market include:
• Share market
• Equity market
• Simply “the market”
From the perspective of a company, listing on the stock market pro-
vides access to a large amount of investment capital that would not other-
wise be available to an unlisted company. The market provides companies
with the ability to seek investment funds from retail investors as well as in-
stitutional investors (fund managers, banks, etc.) who invest on behalf of
others. Access to this public market capital enables a listed company to sig-
nificantly extend its potential funding base upon which it can expand and
grow its business in the future.
An Introduction
to Options
c01.qxd 10/23/06 2:22 PM Page 1
What Is a Share?
A share represents a portion of ownership of a company. Public companies
are very large and, in most instances, are not owned by just one person or
entity. Many thousands of different people or entities own stock in large
listed public companies.
A share literally entitles its owner to a portion of a company’s earnings
(as dividends) and a claim on the company’s assets in the event of bank-
ruptcy (priority given to creditors). Through the election of company di-
rectors, stockowners are also entitled to participate in deciding the future
direction of the company.
Most adults are already stockowners. Some of these stockowners are
active investors who buy and sell stocks based on their own research or on
the advice of their peers or professional advisers such as a stockbroker.
Other stockowners gain exposure to the stock market through mutual
funds where money is pooled and invested by a professional fund manager.
How Are Stocks Bought and Sold
on the Stock Market?
Think of the stock market like a fruit market. Let’s assume you want to buy
10 bananas. You need to go to the fruit market and see who is selling ba-
nanas and at what price. Store owners are entitled to sell their bananas at
whatever price they see fit. Obviously they don’t want to make the price too
high or their fruit won’t sell, or too low because then they are not making
as much money as they could.
You find three different stores selling bananas:
Asking Price, 10 Bananas
Store 1 $1.40
Store 2 $1.47
Store 3 $1.60
You obviously want to buy your bananas as cheaply as possible. If you
think $1.40 is reasonable, you might simply buy them from store 1 at that
price. If you are only prepared to pay $1.35, then you might “bid” to buy them
at $1.35. The manager at store 1 may agree to this price as it’s not far away
from his asking price. If you both agree on a price, the bananas will sell.
Buying stocks on the stock market works exactly the same way! Let’s
assume you want to buy 100 shares of General Electric (GE). You look up
the price at the stock market by calling your stockbroker (or going to your
broker’s online site). You are presented with the market for GE stock. It
looks Table 1.1.
2AN INTRODUCTION TO OPTIONS
c01.qxd 10/23/06 2:22 PM Page 2

If you want to buy 100 shares, you need to buy them by reaching an
agreement on price from someone who wants to sell them. The sellers put
into the market how many shares they want to sell and at what price (the
“ask” price). You obviously want to buy the stock as cheaply as possible, so
the seller asking the lowest price is always at the top of the list. He or she
is offering 5,000 shares for sale at a price of $25.20.
You now have two options:
1. If you think $25.20 is a reasonable price, you can simply put in a bid to
buy 100 shares of GE at $25.20 and your order will be filled.
2. If you think $25.20 is not a reasonable price, you can put in a bid for less.
Let’s assume you think $25.10 is a reasonable price. You enter this bid
price into the market and the market will then look like Table 1.2. Your bid
is now at the top of the column because you are the current highest bidder.
If the seller at $25.20 (or any other seller) thinks that $25.10 is a reasonable
price, he or she may change the order to $25.10 and the stock will trade. Or
a new seller might come into the market enticed by your bid of $25.10 and
your stock may trade.
What Is a Stock Code or Symbol?
All stocks that trade on public markets are represented by an individual
stock code or symbol. No two stocks have the same stock code.
An Introduction to Options 3
TABLE 1.1 The Market for GE Stock
Buyers (Bid) Sellers (Ask)
Number of Shares Bid Price Ask Price Number of Shares
2,000 $25.00 $25.20 5,000
5,000 $24.80 $25.40 400
400 $24.20 $26.00 1,000
TABLE 1.2 Entering a Bid into the Market
Buyers (Bid) Sellers (Ask)
Number of Shares Bid Price Ask Price Number of Shares
100 $25.10 $25.20 5,000
2,000 $25.00 $25.40 400
5,000 $24.80 $26.00 1,000
400 $24.20
c01.qxd 10/23/06 2:22 PM Page 3
While these terms can be used interchangeably, in the United States,
the term symbol is used. U.S. stock symbols consist of one letter to five
letters. For example, Citigroup is represented by the symbol C, Wal-Mart is
represented by the symbol WMT, and Shire Pharmaceuticals is represented
by the symbol SHPGY.
Option contracts in the United States are also represented by symbols/
tickers, which are generally five letters long. As with stocks, no two option
contracts have the same symbol.
What Makes Stock Prices Go Up and Down?
Many factors influence the price at which a company’s stock trades, the
most important factor being a company’s future earnings. Various funda-
mental factors combine to influence a company’s future earnings. You will
become very familiar with fundamental factors as they are of particular
interest to financial analysts and also gain significant exposure in the fi-
nancial press. Common fundamental factors that affect the future earnings
potential of a company include:
• Company-related issues such as increases or decreases in sales, in-
creases or decreases in the cost of doing business, and changes in asset
position, management team, business model, or perceived business risk.
• Industry-related issues such as the financial performance of competi-
tors or introduction of significant legislation.
• Economic-related issues such as the economic growth rate of econo-
mies in which the business operates, currency fluctuations, and inter-
est rate or inflation rate changes.
If a fundamental factor changes and causes the market to think that a com-
pany’s future earnings will be higher (lower) than previously expected, the
stock price will adjust upward (downward) accordingly.
Other influences on stock prices that you should be aware of are techni-
cal factors. Technical analysis is the study of stock price charts through time.
There are many investors and traders in the financial markets who make buy
and sell decisions based solely on technical analysis because they believe
that all fundamental factors are represented in the price charts they analyze.
We discuss both fundamental and technical factors in more depth later
in this book.
What Is a Stockbroker?
Stockbrokers provide access to the stock market by entering buy and sell
orders into the market on behalf of investors. Stockbrokers also hold ac-
counts on behalf of investors where electronic records of stocks, options,
and cash held are kept.
4AN INTRODUCTION TO OPTIONS
c01.qxd 10/23/06 2:22 PM Page 4
A brokerage account is just like a bank account except it holds stocks
and options as well as cash. To set up a brokerage account, contact a bro-
ker (via phone or online), fill out the paperwork, and deposit money into
your account. For the type of investing you are going to be doing, it is best
to use a discount broker with the lowest possible transaction costs and fast
executions.
Do not use a boutique broker (one who provides advice), even if you cur-
rently use one. They are expensive and, from this point on, you will not need
their advice. You will make your own decisions and the returns you will gen-
erate may be many times what the best broker can do for you in the best year!
The brokerage industry is constantly evolving with new online players
entering the market and existing brokerage houses regularly making
changes to trading platforms and commission structures. The current in-
dustry best brokers for using the covered call technique can be found at
www.compoundstockearnings.com/brokers. We strongly advise you to use
one of these recommended brokers because trading platforms and trans-
action costs have a very dramatic effect on profitability.
What Are the Dow Jones Industrial Average,
S&P 500, and NASDAQ?
The Dow Jones Industrial Average (the Dow), S&P 500, and NASDAQ are
stock market indexes. A stock market index is used to represent the per-
formance of a group of stocks rather than just a single stock. Apart from
some exceptions (such as the Dow), indexes are generally constructed on
a market value weighted basis. Consequently, the movements of larger
companies have a greater impact on the performance of the index than do
movements of smaller companies.
Some of the world’s most significant stock market indexes are listed in
Table 1.3.
An Introduction to Options 5
TABLE 1.3 Major Stock Market Indexes
Index Name Market Composition
Dow Jones Industrial U.S.—NYSE 30 stocks on New York Stock Exchange
(Dow) (NYSE)
NASDAQ Composite U.S.—NASDAQ All NASDAQ stocks; heavy in technology
S&P/ASX 200 Australia 200 largest and most liquid companies
Financial Times Stock London 100 largest companies; often called
Exchange (FTSE) “Footsie”
DAX Germany 30 major companies
Hang Seng Hong Kong 33 largest companies
Nikkei Tokyo 225 largest companies
c01.qxd 10/23/06 2:22 PM Page 5

OPTIONS BASICS
What Are Options and How Do They Trade?
An option is a financial instrument and contract. An option gives the holder
the right, but not the obligation, to buy or sell a financial asset at a certain
price up to a certain date. An important distinction is “the right, but not the
obligation.” The holder of the option does not have to exercise the right
under the contract if it is not in his or her favor to do so.
Options (like futures) are known as derivative securities simply be-
cause their value is derived from the value of other more basic variables.
For example, an IBM stock option is a derivative security because its value
depends on the price of IBM stock. The derivative asset is also referred to
as the underlying asset. In this case, the underlying asset is IBM stock.
Options are available on many financial assets including stocks, fu-
tures, and commodities. Most options are exchange traded, meaning they
are traded on public markets, just like stocks are traded on stock exchanges.
There are two basic types of stock options:
1. A call option gives the holder the right, but not the obligation, to buy a
stock at a certain price up to a certain date. Call options are used by
speculators who expect an increase in the price of the underlying
asset.
2. A put option gives the holder the right, but not the obligation, to sell a
stock at a certain price up to a certain date. Put options are used by
speculators who expect a decrease in the price of the underlying asset.
The covered call technique involves the use of call options only.
Options trade exactly the same way that stocks do. There are investors
who want to buy options and there are investors who want to sell, or write,
options. When these two investors reach an agreement on price, the con-
tract trades. This trade happens in exactly the same way as previously de-
scribed in the section on “how stocks are bought and sold on the stock
market.”
All exchange-traded options have certain standard characteristics.
Take this description of a contract as an example:
General Electric September 2005 $30.00 Call Option
Company name All exchange-traded options relate to a specific
publicly listed company (or financial asset). In
this case the contract relates to stock in Gen-
eral Electric (GE).
6AN INTRODUCTION TO OPTIONS
c01.qxd 10/23/06 2:22 PM Page 6
Expiration date All options have an expiration date. In this case
the option expires in September 2005.
Strike or exercise All options have a specific strike or exercise
price price. These two terms are used interchange-
ably. If you own this contract you have the
right to buy GE stock at a price of $30.00.
Type All options are either a call option or a put
option. A call option provides the right to buy
the stock. A put option provides the right to
sell the stock. This contract is a call option.
If you owned the GE September 2005 $30.00 call option, you would have the
right, but not the obligation, to buy GE stock at $30.00 per share up to the
expiration date of September 2005.
Unlike stocks, options are referred to as contracts. In the United States,
a standard contract relates to 100 shares in the underlying stock—this num-
ber changes depending on which country the option is listed in. Thus, if you
buy four GE September 2005 $30 calls, you own four contracts. Each con-
tract relates to 100 shares, so in this instance, you own the right to buy 400
shares.
What Basic Options Terminology Do You
Need to Know?
Long and Short Positions An investor who has an overall buy posi-
tion in a stock or option contract is said to be long. If you currently do not
own GE stock and you purchase 500 GE shares, you are long 500 GE
shares. If you purchase four GE September 2005 $30 calls and have no
existing position in that contract, you are long four GE September 2005
$30 calls.
Conversely, an investor who has an overall sell position in an option
contract is said to be short. If you currently do not own GE stock and you
sell 400 GE shares, you are short 400 shares. If you sell three GE September
2005 $30 calls and have no existing position in that contract, you are said to
be short three September 2005 $30 calls.
Table 1.4 shows each position classified as either long or short. It
assumes that the investor has no existing position in any stock or option
contract.
Opening and Closing Transactions An opening transaction is one
where an option buyer or seller establishes a new position or increases an
existing position as either a buyer or a seller. For example, if John buys one
An Introduction to Options 7
c01.qxd 10/23/06 2:22 PM Page 7

GE September 2005 $30 call, he is said to be “buying to open”—he has
opened a new position. John may also elect to sell one GE September 2005
$30 call. In this case he would be “selling to open” if he was not already long
in the identical contract. The effect of an opening transaction is that the
number of contracts the investor is exposed to is increased.
A closing transaction is one where an option buyer makes an offset-
ting sale of an identical option or an option seller makes an offsetting pur-
chase of an identical option. For example, if John is long one GE September
2005 $30 call and then sells one GE September 2005 $30 call, he would be
“selling to close” because he has now closed out his position in that option
contract and has no further rights or obligations under the contract. The ef-
fect of a closing transaction is that the number of contracts the investor is
exposed to is decreased.
Alternatively, if John holds a short position of one GE September 2005
$30 call and then buys one GE September 2005 $30 call, he would likewise
be “buying to close” because he has now closed out his position in that op-
tion contract and has no further rights or obligations under the contract.
Again, the effect of a closing transaction is that the number of contracts the
investor is exposed to is decreased.
Table 1.5 shows transactions categorized as either an opening or
closing.
The important concept to understand is that an option buyer or seller
can, at any time, close an open position by performing an equal and oppo-
site transaction with the identical contract. Whether the transaction is
closed for a profit or loss depends on the option’s price at the time that the
closing transaction is executed. This action is very similar to closing a tra-
ditional stock investment—the investor can sell the stock and close the po-
sition at any time, but whether the stock can be sold for a profit or loss
depends on the current market price at the time.
8AN INTRODUCTION TO OPTIONS
TABLE 1.4 Comparison of Long and
Short Positions
Position Long Short
Buy 300 GE shares X
Sell 12 WMT calls X
Buy 4 HD calls X
Buy 8 JPM calls X
Sell 1 CD call X
c01.qxd 10/23/06 2:22 PM Page 8
In the Money, Out of the Money, and At the Money Option market
participants have coined the phrases in, out, and at the money to describe
an option’s strike price in relation to the stock price.
An in-the-money option is one that has intrinsic value, where the
owner of the option stands to profit by exercising his or her right under the
contract. For a call option to be in the money, the stock price must be
higher than the strike price. For example, a $15.00 call option is in the
money when the stock price is greater than $15.00.
An out-of-the-money option is one that has no intrinsic value, where
the owner of the option does not stand to profit by exercising his or her
right under the contract. For a call option to be out of the money, the stock
price must be lower than the strike price. For example, a $15.00 call option
is out of the money when the stock price is below $15.00.
An at-the-money option is one where the stock price is trading at or
very close to the exercise price. For example, a $15.00 call option would be
considered at the money if the stock price was $15.00. In practical terms,
market participants also describe an option as at the money when the stock
price is close to the exercise price of the option. So, if an option’s strike
price was $15.00 and the stock price was $14.80 to $15.20, it would be
deemed as being at the money.
Table 1.6 shows options classified as being either in, at, or out of the
money.
Physical Settlement Versus Cash Settlement There are two types
of settlement styles for exchange-traded options: physical settlement and
cash settlement. Physical-settlement options give the owner the right to re-
ceive physical delivery of the underlying asset when the option is exercised.
An Introduction to Options 9
TABLE 1.5 Classification of Transactions
Buy to Buy to Sell to Sell to
Current Position Next Transaction Open Close Open Close
Long 100 GE shares Buy 100 GE shares X
Long 100 GE shares Sell 100 GE shares X
Long 300 GE shares Buy 100 GE shares X
Short 200 GE shares Buy 200 GE shares X
No position Buy 2 GE calls X
No position Sell 2 GE calls X
Short 2 GE calls Buy 2 GE calls X
Long 2 GE calls Sell 2 GE calls X
c01.qxd 10/23/06 2:22 PM Page 9

Cash-settlement options give the owner the right to receive a cash payment
based on the difference between the underlying asset price at the time of the
option’s exercise and the exercise price of the option. The majority of stock
options are physically settled while index options are cash settled.
American Versus European Expiration An American-style option
may be exercised at any time prior to its expiration. A European-style option
may be exercised only on its expiration date. The majority of stock options
traded on U.S. and international options exchanges are American-style
options. Our covered call technique involves the use of American-style op-
tions only.
Option Expiration Dates In the U.S. market, virtually all standardized
option contracts expire on the third Friday of each month; they do not ex-
pire on the last day of the month. For example, if you hold a November op-
tion contract, this contract will expire on the third Friday of November, not
at the end of November.
The Options Clearing Corporation The Options Clearing Corpora-
tion (OCC) guarantees that all market participants fulfill their obligations
under the terms of options contracts. This is a very important function of an
options market, particularly in terms of guaranteeing that options writers
are capable of fulfilling their potentially large exposures.
Apart from keeping a record of all short and long positions, the OCC
ensures that when purchasing an option the buyer must pay for it in full and
the writer of an option must maintain an adequately funded margin account
to cover his or her exposure at all times.
The clearinghouse allows the options market to function. Without it,
the risk of counterparties defaulting on their obligations under an option
contract would stifle the market.
Standardized Options and Option Chain Exchange-traded options
are almost always standardized. Standardized options have set parameters
10 AN INTRODUCTION TO OPTIONS
TABLE 1.6 Classification as In, At, or Out of the Money
Contract Stock Price In At Out
GE Jan 07 $35 Call $35.75 X
WMT Sep 05 $45 Call $48.20 X
C Jan 06 $50 Call $50.02 X
JPM Aug 05 $30 Call $24.10 X
HON Jan 07 $50 Call $40.45 X
ABT Sep 05 $45 Call $44.90 X
c01.qxd 10/23/06 2:22 PM Page 10
in terms of the amount of an underlying asset a contract relates to, the ex-
piration date, the exercise price, the multiplier, and the option style. In-
vestors cannot alter the standardized characteristics of an exchange-traded
option to suit their own needs—they must work within the standardized pa-
rameters provided by the options exchange. The most important function
of standardization is to assist in the formation of liquid secondary markets
where buyers of options can close out positions by selling an identical con-
tract and sellers/writers can close out positions by buying an identical
contract.
An option chain is a list of all standardized options available for a par-
ticular stock or index. Table 1.7 shows an option chain for the U.S.-listed
banking group JP Morgan. Take a moment to study it and note the different
strike prices and expiration dates available.
If you wanted to buy or sell a call option on JP Morgan, you would have
to select an option contract from this option chain. You are not able to se-
lect contract specifications that do not appear in the standardized option
chain. Note that for simplicity only call options appear on this option chain;
the same option chain is also available for put options.
How Do Speculators Use Options
to Trade the Market?
While we don’t use options to speculate on the future direction of a stock
or market, many investors do use options for this purpose. It is essential
that you understand how a speculative trade works in order for you to un-
derstand options markets.
Example of Using a Call Option to Speculate GE stock is cur-
rently trading at $30.00. John thinks GE stock is going to go up in the next
three months. It’s now June, so John decides to buy a September $30.00 call
option (note that he does not have to choose a strike price equal to the cur-
rent stock price). John now has the right, but not the obligation, to buy GE
stock at a price of $30.00 up to September. For this right John pays the pre-
mium of $1.00 per share. The premium is the price the option buyer pays
to the option seller.
So let’s assume John’s hunch is right. It’s now July and GE stock is
$35.00. John has the right to buy GE stock for only $30.00. He can exercise
this right, buy the stock at $30.00, and immediately sell it in the market for
$35.00 (the current stock price). John has paid a premium of $1.00 per share
for this right. His profit appears as follows:
Share sell price – Share buy price – Option price = Profit per share
$35.00 – $30.00 – $1.00 = $4.00
An Introduction to Options 11
c01.qxd 10/23/06 2:22 PM Page 11

12 AN INTRODUCTION TO OPTIONS
TABLE 1.7 JP Morgan Option Chain Example—Stock Price, $39.38
Bid Ask Bid Ask
Strike Symbol Price Price Delta Strike Symbol Price Price Delta
September Mar-05
27.50 JPMIY 11.80 12.00 1.00 27.50 JPMCY 11.90 12.10 0.98
30.00 JPMIF 9.30 9.50 1.00 30.00 JPMCF 9.50 9.70 0.97
32.50 JPMIZ 6.80 7.00 1.00 32.50 JPMCZ 7.20 7.40 0.92
35.00 JPMIG 4.40 4.50 1.00 35.00 JPMCG 5.20 5.30 0.81
37.50 JPMIU 1.95 2.05 0.91 37.50 JPMCU 3.30 3.50 0.63
40.00 JPMIH 0.30 0.35 0.33 40.00 JPMCH 1.90 2.05 0.44
42.50 JPMIV 0.00 0.05 — 42.50 JPMCV 0.90 1.05 0.26
45.00 JPMII 0.00 0.05 — 45.00 JPMCI 0.35 0.45 0.14
47.50 JPMIW 0.00 0.05 — 47.50 JPMCW 0.10 0.20 0.06
50.00 JPMIJ 0.00 0.05 — 50.00 JPMCJ 0.00 0.10 —
October Jan-06
27.50 JPMJY 11.90 12.00 1.00 20.00 WJPAD 19.30 19.50 0.95
30.00 JPMJF 9.40 9.50 1.00 25.00 WJPAE 14.40 14.60 0.94
32.50 JPMJZ 6.90 7.00 1.00 30.00 WJPAF 10.10 10.20 0.87
35.00 JPMJG 4.40 4.60 0.97 35.00 WJPAG 6.30 6.50 0.68
37.50 JPMJU 2.20 2.25 0.79 37.50 WJPAU 4.80 4.90 0.56
40.00 JPMJH 0.55 0.65 0.39 40.00 WJPAH 3.40 3.60 0.44
42.50 JPMJV 0.05 0.10 0.10 42.50 WJPAV 2.40 2.55 0.33
45.00 JPMJI 0.00 0.05 — 45.00 WJPAI 1.55 1.70 0.23
47.50 JPMJW 0.00 0.05 — 47.50 WJPAW 1.00 1.10 0.16
50.00 JPMJJ 0.00 0.05 — 50.00 WJPAJ 0.60 0.70 0.11
December Jan-07
30.00 JPMLF 9.40 9.60 0.99 25.00 VJPAE 14.40 14.90 0.88
32.50 JPMLZ 7.00 7.20 0.97 30.00 VJPAF 10.60 10.80 0.78
35.00 JPMLG 4.80 4.90 0.89 35.00 VJPAG 7.20 7.30 0.61
37.50 JPMLU 2.80 2.95 0.69 40.00 VJPAH 4.60 4.80 0.43
40.00 JPMLH 1.30 1.40 0.42 45.00 VJPAI 2.70 2.90 0.27
42.50 JPMLV 0.50 0.55 0.20 50.00 VJPAJ 1.50 1.60 0.16
45.00 JPMLI 0.10 0.15 0.07
47.50 JPMLW 0.00 0.10 —
Jan-05
25.00 JPMAE 14.30 14.50 0.99
30.00 JPMAF 9.40 9.60 0.98
32.50 JPMAZ 7.10 7.30 0.95
35.00 JPMAG 4.90 5.10 0.85
37.50 JPMAU 3.00 3.20 0.66
40.00 JPMAH 1.55 1.65 0.43
42.50 JPMAV 0.60 0.70 0.23
45.00 JPMAI 0.15 0.25 0.10
47.50 JPMAW 0.05 0.10 0.04
50.00 JPMAJ 0.00 0.05 —
c01.qxd 10/23/06 2:22 PM Page 12

So what would have happened if John’s hunch were wrong and GE
stock actually fell? John has the right, but not the obligation, to buy GE
stock at $30.00. If the stock is less than $30.00, he would not exercise this
right and would just let the option expire. If this were the case, he would
lose the $1.00 premium he paid for the contract. It is important to realize
that this $1.00 is the most John could possibly lose on this trade.
The maximum loss of an option buyer is the premium paid (the cost of
the option).
Example of Using a Put Option to Speculate A put option works
very similarly to a call option; however, investors buy a put option when
they think the price of a stock is going to fall. Let’s look at an example.
It’s now September and GE is trading at $35.00. John thinks that the
price of GE stock is going to fall. So he decides to buy a December $35.00
put option. He now has the right, but not the obligation, to sell GE stock at
a price of $35.00 up to December. For this right John pays, for example,
$1.00 per share.
The price of GE stock then falls to $30.00 per share. John has the right
to sell GE stock at $35.00. He would, therefore, go into the market and buy
GE stock for $30.00 and then exercise his right to sell GE stock at $35.00.
His profit would look like this:
Share sell price – Share buy price – Option price = Profit per share
$35.00 $30.00 $1.00 = $4.00
So what would have happened if John’s hunch were wrong and GE
stock actually rose? John has the right, but not the obligation, to sell GE
stock at $35.00. If the stock is more than $35.00, he would not take up this
right to sell and would just let the option expire. If this were the case, he
would lose the $1.00 he paid for the contract. It is important to realize that
this $1.00 is the most John could possibly lose on this trade.
Again, the maximum loss of an option buyer is the premium paid (the
cost of the option).
Options Trading in the Real World Now you understand the ratio-
nale and logic behind an options trade, but trading in the real world is a lit-
tle different!
In the real world, speculators very rarely exercise their option con-
tracts in order to take profits from a trade. Take the first example where
John has the right to buy GE stock at $30.00 and the stock is trading at
Premium: The price of an option; the amount of money the buyer pays for
the rights and the seller receives for the obligations granted by the contract.
Expressed on a per share basis.
An Introduction to Options 13
c01.qxd 10/23/06 2:22 PM Page 13

$35.00. If John wants to realize a profit on this trade, it is highly unlikely
that he would exercise this option. It is more profitable for John to just sell
his call option to someone else in the market (sell to close).
Remember, John paid $1.00 per share for the right to buy GE stock at
$30.00. If GE stock quickly jumped up to $35.00, he would actually be able
to sell his call option for around $6.00. This $6.00 market value comprises
$5.00 exercisable value and $1.00 of remaining time value. Both exercisable
(intrinsic) value and time value are discussed in detail later in “How Are
Option Prices Determined?”
John’s profit would look like this:
Option sell price – Option buy price = Profit per share
$6.00 – $1.00 = $5.00
So John would make $5.00 per share by selling the call option, compared to
only $4.00 per share if he exercised the call option, because exercising op-
tions results in a loss of time value (discussed in “How Are Option Prices
Determined?”). By exercising the option, John will realize the $5.00 exer-
cisable value in the contract ($35.00 stock price minus $30.00 strike price),
but will forgo the remaining time value in the contract ($1.00).
Due to this loss of time value, option traders very rarely exercise op-
tions in order to take profits from a trade! Options are traded just like
stocks, and profits and losses are made, for the most part, by buying and
selling the option itself, not by exercising it. So, it is important to remember:
Option traders very rarely exercise their options more than two
weeks before expiration. In practicality, the vast, vast majority of op-
tion contracts are exercised on the third Friday of expiration. Exer-
cising options early results in a loss of time value to the option buyer.
Instead, option traders simply buy and sell the option contract just
like buying and selling stocks.
Why Speculate with an Option Instead
of a Stock?
Why speculate with an option instead of a stock? The simple answer is
leverage. Options provide a much greater return potential than investing in
the stock itself (albeit with higher risk). If a stock moves up 5 percent, an
Time Value: The portion of an option’s price that exceeds the exercisable
value.
14 AN INTRODUCTION TO OPTIONS
c01.qxd 10/23/06 2:22 PM Page 14
investor will make more money if he has $10,000 invested in call options
rather than if he has $10,000 invested in stock itself.
Here’s an example. John thinks GE stock is going to rise by $2.00 and
wishes to invest $10,000 on his hunch. He has two alternatives:
1. Buy GE stock.
2. Buy call options on GE stock.
Let’s look at the two scenarios.
Scenario 1 GE stock is currently trading at $30.00. With his $10,000
John can buy 333 shares ($10,000/$30.00 per share). If GE goes up to $32.00
as he expects, John will make $2.00 per share profit, or a total of $666 on his
$10,000 investment. This is a return of 6.7 percent. Not bad.
Scenario 2 GE stock is currently trading at $30.00. With his $10,000
John decides to buy GE call options. He buys the $30.00 call option for
$1.00 per share. In the United States, each contract relates to 100 shares so
he can buy 100 contracts [$10,000/($1.00 per share ×100 shares per con-
tract)]. If GE stock increases by $2.00, his call option contract is likely to be
worth around $1.80 per share. John will make $0.80 per share ×100 shares
per contract ×100 contracts = $8,000. This is a return of 80 percent.
Table 1.8 gives a comparison of the two scenarios.
The preceding example shows that with the same dollar investment in
the same company and the same move in the stock price, John made an
extra 73 percent return on his investment and an extra $7,333 by buying GE
options rather than GE stock. This extra bang for your buck, known as
leverage, attracts speculators to the use of option contracts. Options are
leveraged instruments. But beware! The leverage works both ways. John
could have lost most, if not all, of his money if the stock price went down
$2.00 rather than up!
Leverage is why options are regarded by the vast majority as risky. Op-
tions are, without doubt, very risky when used to speculate. After all, can
An Introduction to Options 15
TABLE 1.8 Comparison of Investing in Stocks Versus Options
Type of Stock Total Number Sell
Scenario Investment Price Invested Price of Units Price Profit
A Shares $30.00 $10,000 $30.00 333 $32.00 $667
or 7%
B Options $30.00 $10,000 $ 1.00 100 $ 1.80 $8,000
or 80%
c01.qxd 10/23/06 2:22 PM Page 15

John, or you, or I see into the future and know which way a stock is going
to go? The answer is obviously no. GE could just as easily have gone down
and John could have lost most, if not all, of his $10,000 investment. We
never use an option for speculative purposes. Covered call writers sell op-
tions, rather than buy them.
How Are Option Prices Determined?
As with determining the price at which a stock sells in the market, it is sup-
ply and demand that influence the price at which an option trades. An in-
vestor attempting to buy an option must do so from an investor wanting to
sell/write an option contract. Option market participants do, however, as-
sess distinct and constantly changing variables in order to determine the
price at which an option trades—its market value.
The liquidity of the options market is a significant contributor to the
consistency of bid and ask prices representing fair market value. In less liq-
uid markets—those with fewer participants, fewer market makers, and a
lower volume of options trades—it is more likely that bid and ask spreads
will be larger and that investors need to take more caution in assessing bid
and ask prices for fair market value. Your covered call activity will likely be
conducted in the options market of the United States, which is the world’s
largest and most liquid options market. As such, the bid and ask prices or
the market for contracts you trade will generally represent a reasonable ap-
proximation of fair market value.
Mathematical formulas such as the Black-Scholes and binomial pricing
models have been developed to calculate an option’s theoretical value. The
shortcomings of these models in terms of encompassing the scope of vari-
ables and uncertain outcomes of financial markets and their resulting de-
tachment from market reality have been well documented. Stock options’
market prices will inconsistently resemble the theoretical value as deter-
mined by models such as the Black-Scholes. As such, option traders and in-
vestors generally do not spend time calculating academic values for
contracts—the market is the primary driver of value determination.
What it all boils down to is this: If you’re investing in the U.S. market
(or a developed overseas market), it is highly likely that the prices at the bid
and ask are reasonable approximations of fair value.
That being said, six independent factors are very important when de-
termining the value of a stock option. It is essential for you to understand
these factors and how they interact and influence the price of an option
Liquidity: Market liquidity refers to the ability to quickly buy or sell a stock
or option without causing a significant movement in the price.
16 AN INTRODUCTION TO OPTIONS
c01.qxd 10/23/06 2:22 PM Page 16
contract. This knowledge will allow you to understand how the price of the
contract will change with changes in the underlying stock price, with lapses
in time, and so on. These six important factors are:
1. The current stock price.
2. The exercise price of the contract.
3. The time to expiration.
4. The volatility of the stock price.
5. Risk-free rate (interest rates).
6. Dividends expected on the stock during the life of the option.
To be successful in the business of writing covered calls, you need to
have a good understanding of factors 1, 2, and 3 and to a lesser extent, fac-
tor 4. Be aware of points 5 and 6; however, an in-depth understanding of
these factors is very academic and not essential to your success as an op-
tion writer.
Factor 1: The Current Stock Price As discussed previously, an in-
vestor who purchases a call option is speculating that the price of the un-
derlying stock is going to increase. The payoff to this investor will be the
difference between the exercise price and the stock price. This difference
is known as intrinsic value, which is simply what the option owner can
make if he or she exercises the option and sells the stock in the market.
That is, if he or she has the right to buy the stock at $35.00, and the stock
price is $40.00, the intrinsic value is $5.00. If the stock price moves up again
to $45.00, the intrinsic value is $10.00. It makes sense that an option con-
tract with $10.00 of intrinsic value should be worth more than a contract
with only $5.00 of intrinsic value.
Thus, call option prices increase as the stock price increases and more
intrinsic value is added to the contract. Put options are the opposite, so put
option prices increase as the stock price decreases. Table 1.9 shows the re-
lationship between option price and intrinsic value.
An Introduction to Options 17
TABLE 1.9 Intrinsic Value
Call Strike $35.00
Stock price $35.00 $40.00 $45.00
Call value $ 1.00 $ 5.60 $10.20
Put Strike $35.00
Stock price $25.00 $30.00 $35.00
Put value $10.20 $ 5.40 $ 1.10
c01.qxd 10/23/06 2:22 PM Page 17

Factor 2: The Exercise Price of the Contract The exercise price
of the contract has an influence on intrinsic value similar to changes in the
stock price. Let’s assume an investor has a $35.00 call option and the stock
price is currently $40.00. We now know that this contract has $5.00 worth
of intrinsic value. Let’s assume the same investor also has a $30.00 call op-
tion on the same stock. The $30.00 call option has $10.00 of intrinsic value
and obviously, then, it has to be worth more!
Thus, call options increase in price the lower the exercise price is. Put
options are the opposite, so they increase in price the higher the exercise
price is. Table 1.10 shows the relationship between option price and exer-
cise price.
Factor 3: The Time to Expiration Up to this point, we have dis-
cussed only intrinsic value. Hopefully, you have been looking at the pricing
examples provided for factors 1 and 2 and wondering why the option price
is greater than the intrinsic value. The option price is greater because the
other portion of value in an option contract is time value.
Intrinsic value + Time value = Option value
The longer an option has to expiration, the greater its time value. John
thinks GE stock is going to rise from the current price of $35.00. He decides
to buy a $35.00 strike call. Remember, John wants GE to increase in price
so that the intrinsic value of his contract will increase. If John has six
months until his contract expires, that gives him a lot of time for GE stock
to increase. However, if John purchases a contract with only one month to
expiration, he does not have much time for GE stock to move in his favor.
Thus, the more time a contract has to expiration, the more it is worth.
Each day that goes by, the price/value of each and every option contract de-
creases because there is less time to expiration. Options are, therefore,
known as decaying assets.
18 AN INTRODUCTION TO OPTIONS
TABLE 1.10 Exercise Price
Stock Price $35.00
Call strike price $35.00 $30.00 $25.00
Call value $ 1.10 $ 6.00 $10.40
Stock Price $35.00
Put strike price $35.00 $40.00 $45.00
Put value $ 1.00 $ 5.70 $10.60
c01.qxd 10/23/06 2:22 PM Page 18
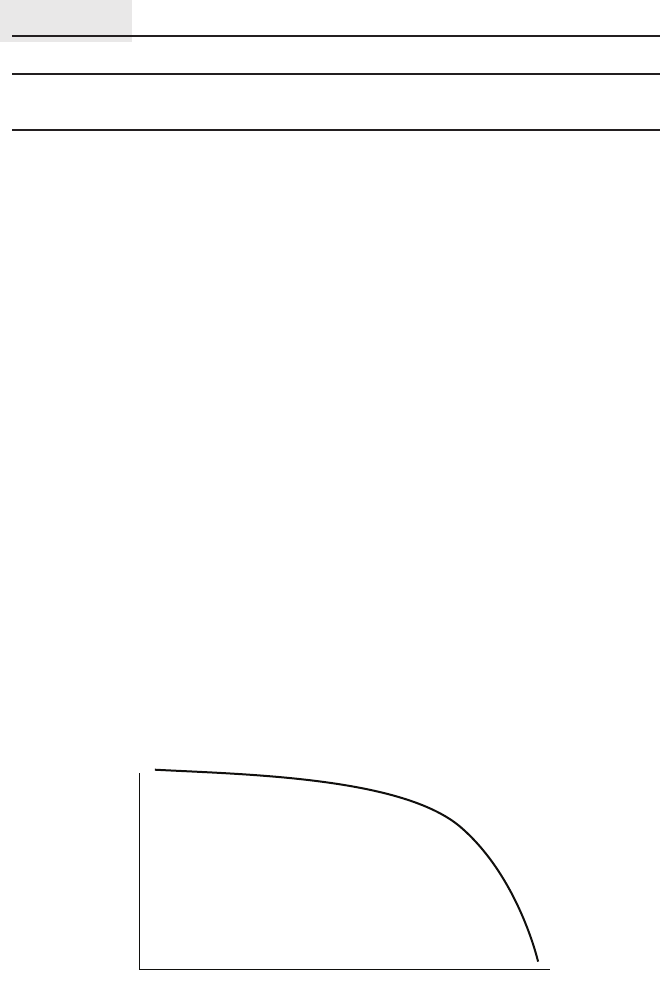
Table 1.11 shows how time affects an option’s price (assume it is early
June).
A very important point to understand in options pricing is that time
decay is not linear! (See Figure 1.1.) Contracts that expire in one or two
months have a significantly higher level of time decay than contracts that
expire in one or two years. The majority of an option’s time value is lost
in the weeks leading up to expiration.
The covered-call method of investing actually utilizes the decay in time
value to your advantage. You will make money from the decay in the spec-
ulators’ assets.
Factor 4: The Volatility of the Stock Price Option contracts are
worth more on a stock that is volatile than on a stock that is less volatile.
Volatility is technically defined in terms of standard deviation; however,
for our purposes volatility can be thought of simply as a measure of how un-
certain we are about a stock’s future price movements. As volatility in-
creases, the chance that a stock will make a significant move upward or
downward increases.
If you were the owner of stock in a company, these two extreme out-
comes tend to offset one another. However, if you are the owner of a call or
a put, while your potential loss is limited to the amount invested, your po-
tential profit can be many times over your original investment from signifi-
cant price swings in the appropriate direction.
An Introduction to Options 19
TABLE 1.11 How Time Value Affects Options Price
Strike $35.00
Expiration date June July Sep Dec
Option price $0.50 $1.00 $1.30 $1.50
Price
Time
FIGURE 1.1 Example of the rapid decay of time value toward the end of an
option’s life.
c01.qxd 10/23/06 2:22 PM Page 19
So, all else being equal, a more volatile stock will have higher option
prices (see Table 1.12). Additionally, options prices will adjust upward or
downward to significant changes in a stock’s volatility levels.
Factor 5: Risk-Free Rate (Interest Rates) The effect of interest
rates on option prices is very academic and perhaps only meaningfully no-
ticeable over the longer term where significant interest rate changes occur.
Therefore, this brief discussion of that effect is included for completeness
rather than necessity. Understanding this effect will not have any signifi-
cant influence on your success as an option writer.
As interest rates increase, (1) the present value of future cash flows re-
ceived by the holder of the option decreases and (2) the expected growth
rate of stock prices tend to increase. In the case of calls, effect (1) tends to
decrease option prices and effect (2) tends to increase prices. In the case of
puts, both (1) and (2) have negative effects on prices.
Factor 6: Dividends Expected on the Stock During the Life of
the Option Dividends have the effect of reducing the stock price on the
ex-dividend date (the date the dividend on a stock is paid). The price re-
duction, in turn, decreases the value of call options and increases the value
of put options. A high proportion of companies you are likely to invest in
will pay dividends. Worrying about insignificant pricing influences such as
dividends creates headaches, not better returns. So forget about them, and
leave the squabbling to the academics.
20 AN INTRODUCTION TO OPTIONS
TABLE 1.12 Effect of Volatility on Price
Stock Price Call Strike Expiration Option Price
Stable stock $30.00 $30.00 Mar-06 $1.00
Volatile stock $30.00 $30.00 Mar-06 $1.30
c01.qxd 10/23/06 2:22 PM Page 20

PART I
Covered Calls
c02.qxd 10/23/06 2:21 PM Page 21
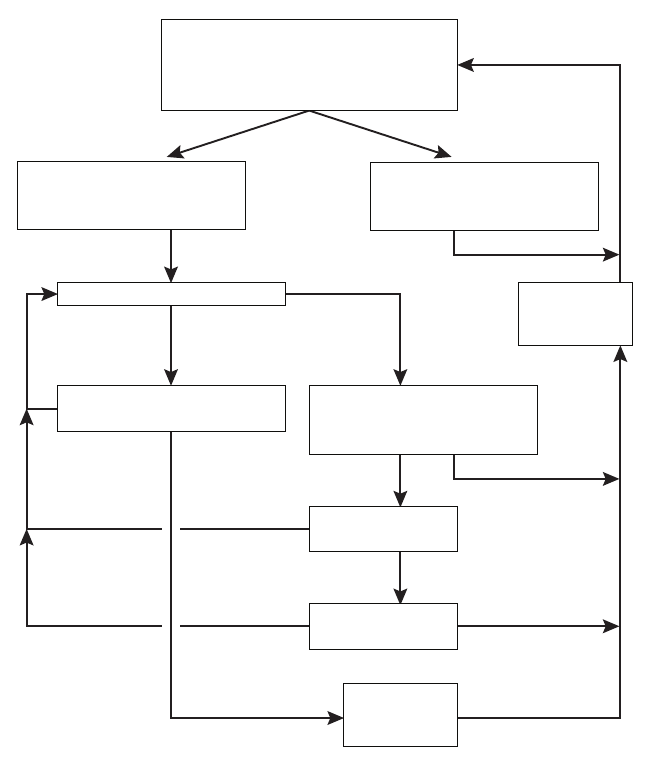
COVERED CALL PROCESS FLOWCHART
Enter New Position
1. Filter with CSE Screener
2. Upward or sideways current cycle
3. Bottom 25% of current cycle
Stock Decreases
1. Mid-month buyback rule or
2. Allow call to expire
Can we favorably CPR?
Wait for expiration of CPR
1. Were we called out?
Profitable buyback
on TSS call?
1. Close on delta or
2. Apply SSR
Reinvest and
compound
proceeds
Reinvest and
compound
proceeds
Stock Increases
1. Close on delta effect or
2. Get called out
Secondary Call Sales Rules
1. Near month call or
2. TSS For income
Yes
Yes
Yes
No Exit
No
No
TSS
No
Exit
Called Out
Near Month
Each step in the covered call investing process is shown in the flowchart
above—from entering new positions, to managing positions for income, to
advanced defensive techniques. Investors familiar with our covered call
method know that there is a specific technique to address every situation
that may occur in the markets. Each situation that can be presented to a
covered call investor can be handled through the use of a specific man-
agement technique. Part I of this book will elaborate, expand on, and
provide an example of each step presented in the covered call process
flowchart. You may wish to revisit the flowchart at the beginning of each
new topic so you can gain an understanding of where a particular rule or
technique is applied in the overall investment process.
c02.qxd 10/23/06 2:21 PM Page 22

23
CHAPTER 2
OPTION SELLERS/WRITERS
In Chapter 1 we discussed only the intentions of speculators who are buy-
ing options to bet on the movement of the market, buyers of calls who are
anticipating an upward move in the stock price, and buyers of puts who are
anticipating a downward move in the stock price. We also stated that for
every buyer of an option contract, there is also a seller/writer of that con-
tract (the terms seller and writer can be used interchangeably). So who are
the sellers of options and what are their objectives?
There are basically three types of sellers of options:
1. Sellers who are closing existing long positions.
2. Sellers who are opening short uncovered positions.
3. Sellers who are opening short covered positions.
Short Position: An overall sell position in a stock or option.
Long Position: An overall buy position in a stock or option.
An Introduction
to Covered Calls
c02.qxd 10/23/06 2:21 PM Page 23

Sellers Who Are Closing Existing Long Positions
Sellers who are closing existing long positions are generally traders who
are speculating in the market. Closing a long position is exactly the same
as someone who has bought stock and is now trying to sell it for a profit
or loss. The seller holds a long position (has bought an option) and is
now hoping to realize a profit or loss on the position by selling the option
to close.
For example, when GE stock was trading at $34.00, a speculator bought
to open a GE $35.00 call option for $1.00 in anticipation of the stock price
rising. Let’s assume the speculator correctly picked the direction of the
market and the stock price is now $36.00. This speculator can sell to close
the GE $35.00 call at $1.50 and realize a $0.50 profit. Alternatively, if the
price of GE stock declined, the speculator could sell this contract for some-
thing less than $1.00 and would realize a loss.
Sellers Who Are Opening Short Uncovered Positions
In most financial markets, you can sell something that you don’t already
own. Such a transaction is possible through short selling. The objective of
short selling is to buy the share or contract back (buy to close) at a lower
price than you sold it for. Let’s look at an example.
John sells a GE $35.00 call option for $1.20. He will immediately get the
$1.20 premium of the contract deposited in his brokerage account by the
option buyer. John wants the stock price to drop so that the call price also
drops and he can buy the contract back (buy to close) and make a profit.
Let’s assume the stock price drops and John buys the contract back (buy to
close) for $1.00. He has made the difference of $0.20.
This transaction is an example of selling an uncovered call. Selling an
uncovered call is simply selling a call option without owning the underlying
stock or another covering option, which prevents a loss if the stock price
increases (we discuss this in the following section, “Sellers Who Are Open-
ing Short Covered Positions”). If you sell a call option without owning the
underlying stock or another covering option you are said to be “uncovered”
or “naked.” Selling naked calls is one of the most risky activities any in-
vestor can do in the markets—the profit and loss potential is simply not
Buying to Close: Closing a short stock or option position.
Selling to Close: Closing a long stock or option position.
24 COVERED CALLS
c02.qxd 10/23/06 2:21 PM Page 24
stacked in the naked seller’s favor. Let’s look at the example of John selling
a GE $35.00 call option for $1.20 and see what his profit and loss potential
looks like.
Profit Remember, John sold this option, so someone has the right, but
not the obligation, to buy GE stock from John for $35.00. When he sold the
contract, John received the premium of $1.20 from the option buyer. The
maximum possible profit that John can make from this trade is restricted to
the price he received for selling the option, which is $1.20. The best out-
come for John is that the stock price plummets, the call is way out of the
money, and the contract expires worthless. In this instance, he would keep
the $1.20 he sold the contract for. However, it is more likely that John will
buy the contract back at some time in the future for something less than he
sold it for. Remember, John has to buy the option back in order to close his
position. Otherwise, if the contract finishes in the money, the buyer will ex-
ercise his option and John may need to deliver GE stock.
Loss We understand now that the most John can make from this trade is
$1.20. But, believe it or not, he has the potential to lose an unlimited
amount of money, because the stock price can theoretically go up to
any value. Let’s assume GE stock goes up to $45.00. There are two scenar-
ios here:
1. The buyer of the option may exercise his or her contract and John will
need to deliver GE stock at $35.00. GE stock is available in the market
at $45.00. So John will have to take the $10.00 loss.
2. John sees the share price soaring and decides to cut his losses. He will
buy to close the contract so that he has no further obligation under the
contract. If the stock is at $45.00, he’ll have to pay around $11.00 to buy
back the call. In this case he would lose $1.20 – $11.00 = $9.80.
Summary In any case, John stands to make a maximum of $1.20 and lose
a potentially unlimited amount on this trade. Business and markets are all
about risk and return. You should now understand that selling naked calls
is a very bad business proposition. Even though people still sell naked calls,
our advice is that you do not ever, under any circumstances, sell naked
calls. Doing so is categorically the quickest and easiest way to lose your
money in the options markets.
Sellers Who Are Opening Short Covered Positions
Sellers who open short covered positions are executing covered calls.
These are the smart sellers and this is the sort of selling that will regularly
An Introduction to Covered Calls 25
c02.qxd 10/23/06 2:21 PM Page 25
put money into your account with very, very low risk. These types of sell-
ers are also selling option positions to open. However, the distinction is that
these sellers also own the underlying stock (or another option contract)
and are thus covered in the event the stock price increases.
Remember in the preceding example where John sold a $35.00 call op-
tion for $1.20? He made money when the stock price declined, as the option
expired worthless and he kept the premium. However, the problem with
this transaction was that, in the event the stock price increased, John stood
to experience a substantial loss. In the event the stock price increased to,
for example, $45.00, the speculator would exercise the call. John would be
forced to buy the stock at the current market price of $45.00, only to im-
mediately deliver the stock to the speculator at a price of $35.00—a $10.00
loss. This problem of suffering a large loss in the event the stock price in-
creases can be easily remedied by owning the underlying stock before sell-
ing the call option.
If John already owned GE stock before selling the call, he would not be
concerned about the stock price rising as he could simply deliver the stock
he already owned. John is therefore covered in the event the stock price
increases after selling the call—he will not be forced to buy the stock at
a higher price in the market and then immediately sell it at a loss to the
speculator.
So if John already owned the stock before selling the call, he would
make money if the stock price goes up, he would also keep the premium if
the stock price goes down. This is an example of selling a covered call,
which is discussed at length later in this book.
Selling or writing covered calls is perhaps the safest and most consis-
tent way to make money in the financial markets and also involves less risk
than owning stock. If you’re not convinced, here’s another example. Let’s
assume it is June and GE stock is trading at $34.50. John decides he’d like
to buy GE stock and sell a covered call against it. Let’s assume he elects to
sell the June $35.00 call and receives a premium of, for example, $0.70
straight into his brokerage account. There are two possible things that can
now happen to John.
1. He gets called out. Remember, John has sold a GE June $35.00 call. So
someone else has the right to buy his GE stock for $35.00 up until the
third Friday of June (remember that the third Friday of the month is the
expiration date for U.S. option contracts). Getting called out means
that the person who bought the GE June $35.00 contract has decided to
exercise the contract and wants to buy John’s stock, because GE stock
has gone up and it is worth more than $35.00. John is contractually ob-
ligated to oblige.
26 COVERED CALLS
c02.qxd 10/23/06 2:21 PM Page 26

So John delivers (or sells) his stock at a price of $35.00 to the op-
tion buyer and this money gets deposited into his account. This trans-
action is good, because John only paid $34.50 for his stock and thus has
made $0.50 per share on the call out. John has also received a premium
of $0.70 from the option buyer, which he also gets to keep. So he’s
made a total of $1.20 per share in just one month! Based on a share
price of $34.50, that’s a monthly return of around 3.5 percent. If he
makes that return each month, he’ll make 41 percent on his money per
year (uncompounded). If he’s really smart and reinvests his earnings
and uses the power of compounding, his 3.5 percent per month turns
into an amazing 51 percent per year!
2. He doesn’t get called out. Again, John’s fate rests in the hands of the in-
vestor who bought the option he sold. If the stock price at the end of
the month is below the $35.00 strike price of the option, then it is not in
the option buyer’s interest to exercise the contract, so John won’t get
called out. In this situation, the contract would simply expire and John
would keep the $0.70 he received for selling the option. That’s a return
of 2.0 percent in a month or 24 percent per year (uncompounded).
John would be left with his GE stock at the end of June and would
simply sell another call for July and start all over again.
You should now be starting to realize the power of covered calls. You
should also be starting to understand that selling covered calls actually de-
creases the risk of stock ownership because you are continually generating
cash flow from your stock investment and effectively lowering your cost in
the stock.
Think of selling covered calls as investing in real estate. You are liter-
ally renting your stock out each month and getting cash flow in return.
Would you buy an investment property and not rent it out while you wait to
sell it? Of course not! You would be leaving thousands of dollars on the
table each month for no reason. Similarly, if you own stocks (which almost
everyone does) and are not selling covered calls against these stocks, you
are also leaving thousands of dollars on the table each month!
COVERED CALLS: THE RIGHT MIND-SET
To be a successful covered call writer, you must recognize from the out-
set what your objectives are and the mind-set you require in order to
achieve them.
An Introduction to Covered Calls 27
c02.qxd 10/23/06 2:21 PM Page 27

Compound Interest
Our objective is to generate consistent monthly cash flow from our assets.
We can then reinvest this cash flow each month to compound our invest-
ment capital and generate extraordinary long-term returns.
Compound interest is the way to accumulate wealth. Whether in busi-
ness, real estate, financial markets, or any other financial pursuit, com-
pounding your assets is the fastest way to make them grow. Don’t take our
word for it. Many years ago Albert Einstein was asked what he thought was
the human race’s greatest invention. His reply was “compound interest.” He
also regarded compounded interest as “the eighth wonder of the world.”
If you are not aware, there are two types of interest: simple and com-
pound. Simple interest allows you to earn money on your principal. Com-
pound interest allows you to earn money on your principal and your
interest. Table 2.1 gives the example of two bank accounts, each with a
starting balance of $10,000 and each earning 5 percent interest per year.
However, one account earns simple interest and the other, compound in-
terest. As you can see, the account that pays compound interest is worth
significantly more at the end of the 10-year period.
Now, in the context of covered calls, compounding is many times more
powerful. Remember, our objective is not to make 5 percent per year; our
objective is to generate monthly returns of 3–6 percent for covered call
transactions. We will then reinvest this return into new positions and com-
pound our returns on a monthly, not a yearly, basis. Let’s look at the
$10,000 bank account again, but this time let’s compound that account at a
28 COVERED CALLS
TABLE 2.1 Simple Versus Compound
Interest at 5 Percent Per Year
Simple Compound
Time Interest Interest
Start $10,000 $10,000
Year 1 10,500 10,500
Year 2 11,000 11,025
Year 3 11,500 11,576
Year 4 12,000 12,155
Year 5 12,500 12,763
Year 6 13,000 13,401
Year 7 13,500 14,071
Year 8 14,000 14,775
Year 9 14,500 15,513
Year 10 15,000 16,289
c02.qxd 10/23/06 2:21 PM Page 28

return of just 4 percent per month and see what it looks like after 10 years.
See Table 2.2
Wow, a $10,000 account has grown to over $1.1 million in 10 years! If
you had started with $50,000, you would have $5.5 million at the end of 10
years. This is the power of covered calls: We are compounding returns that
most investors get in a year on a monthly basis. Now, is this enough moti-
vation for you to gradually take control of your own financial future? We
should hope so!
Cash Flow Focus
We have established that generating monthly cash flow and compounding
this cash flow into much larger sums of money is our objective. To achieve
this objective as a covered call writer we prioritize cash flow over account
market value. To be successful in this technique, you must let go of the tra-
ditional benchmarks for measuring equity portfolio performance—particu-
larly in the short term.
The traditional benchmark that is used by the brokers and fund man-
agers to measure a portfolio’s performance is market value. Brokers and
fund managers report to you the market value of your portfolio on a regu-
lar basis. For instance, you may have started with $100,000, and the broker
bought you stock of this value. Now the combined value of your stocks has
gone up and your portfolio is worth $120,000. So the broker says you have
made $20,000 based on a current market valuation. While this valuation is
fine if you sell today, it is just a paper gain and, if the market turns down,
these gains can be easily lost because they have not been realized as cash.
An Introduction to Covered Calls 29
TABLE 2.2 Compound Interest at
4 Percent Per Month
Time Account Value
Start $ 10,000
Year 1 16,010
Year 2 25,633
Year 3 41,039
Year 4 65,705
Year 5 105,196
Year 6 168,423
Year 7 269,650
Year 8 431,718
Year 9 691,195
Year 10 1,106,626
c02.qxd 10/23/06 2:21 PM Page 29
A covered call writer should only be interested in cash. We do not care
if the stock we purchased for $10.00 is now worth only $8.00 or $5.00 in the
market. We understand and accept that stock prices of good companies go
up and down.
We do not care.
We care only about how much cash (premium income) we are able to
generate from a position. If you purchase a good company with real earn-
ings at a reasonable valuation and the stock falls, it is likely that eventually
the stock price will go back to where it was when you purchased it. Even if
it doesn’t, eventually we will make back all the money we invested in the
stock by selling calls against it. We never, ever, sell a stock for a loss.
This advice goes against all traditional measures of portfolio perfor-
mance and the “loser mentality” of “cutting your losses” that is instilled in
us by brokers to increase their own revenues. We look at stock investments
as you would an investment property. If you buy good property in a good
position, are you afraid of not getting your money back over the long term?
Do you get a weekly valuation of the property and stress if that valuation is
less than what you paid for the property? No. You take a long-term view, let
time run its course, and collect your rent each month. That is the mind-set
of a successful covered call writer.
The stock market is the only market in the world where investors have
developed a mind-set that it is acceptable, even advantageous, to sell a gen-
erally appreciating asset for a loss. You do not run out and sell your house
or an investment property for a loss because, at some point in time, the
market value happens to be down. You will only sell your investment prop-
erty because, at some point in time, it happens to be up in value and you are
getting a good price. We reiterate: The stock market is the only market in
the world where people voluntarily sell generally appreciating assets for a
loss because the market value just happens to be down at a particular point
in time. This is a destructive financial mentality based on ignorance and
fear, and it is perpetuated by the brokerage community to increase its own
revenues. We never sell a stock for a loss, and neither should you!
History indicates that the U.S. stock market (as measured by the S&P
500) has never failed to make new highs over the long term. Figure 2.1 is a
chart of the S&P 500, which measures the performance of the top 500 U.S.-
listed companies, from 1930 through 2004. It is clear that good companies
have historically increased in value over the long run. Over the short term,
however, stocks go up and down—that’s what they do. Accept this fact and
do not concern yourself with the daily or monthly fluctuations in the mar-
ket value of your portfolio. You must concern yourself only with generating
cash flow and compounding this cash flow. This is a concept that will take
time for you to gain confidence in. But history, and our experience, indi-
cates that it works.
30 COVERED CALLS
c02.qxd 10/23/06 2:21 PM Page 30
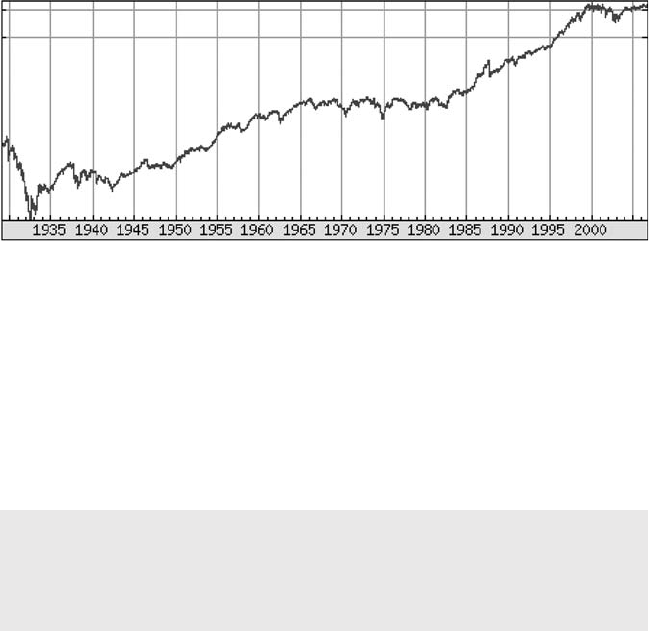
Growth Through Cash Flow Correct application of the covered call
technique provides portfolio growth through cash flow rather than specu-
lative appreciation. A cash return of 4 percent per month equates to 48 per-
cent cash return per year (uncompounded) or nearly 100 percent over two
years (uncompounded).
The initial capital investment can be entirely liquidated by premium in-
come in just two years. If the stocks have any value at all after two years,
the investor will be ahead. It is more likely that the stocks are around
breakeven, leaving the investor with his or her original capital investment
plus the premium income. Growth through cash flow, then, is another crit-
ical mind-set for the covered call writer.
The Impact of Cash Flow Focus on Short-Term Portfolio Market
Value Understanding the impact of cash flow–focused covered call in-
vesting on short-term portfolio market value is vitally important. Investors
new to the covered call technique often become discouraged when after the
first several months of covered call investing, the market value of their
portfolios remains relatively unchanged. Short-term stagnation of portfolio
market value is the nature of this technique and should be expected by all
investors.
Dozens of client testimonials and recorded interviews can be found at
www.compoundstockearnings.com/testimonials attesting to achieving con-
sistent cash returns between 4 percent and 6 percent per month using the
techniques outlined in this book.
An Introduction to Covered Calls 31
FIGURE 2.1 Value of the S&P 500 index from 1930 through 2004.
c02.qxd 10/23/06 2:21 PM Page 31

When using the covered call technique, growth in portfolio value
should not be expected in the initial months of the investment. In the early
stage of the investment, the “winning” stocks in the portfolio are capped at
around a 5 percent return (monthly), yet the “losing” stocks in the portfolio
(those that decrease in value) are held and can fall by more than that
amount. This condition initially has a negative effect on the portfolio’s mar-
ket value. It is then that the management and defensive techniques out-
lined in Chapters 4 and 5 of this book are applied to continue to generate
cash flow on these fallen positions. The overall portfolio market value then
begins to increase after a period of months when the cash flow generated
from all positions accumulates, compounds, and then outweighs the mar-
ket value losses of particular stocks in the portfolio.
The traditional use of the covered call technique does not generally
lead to portfolio growth as fallen stock positions become dormant and un-
productive due to a lack of management and defensive techniques (an in-
ability to continue to generate income on fallen stocks). The management
and defensive techniques outlined in this book are the difference between
great success and complete mediocrity in the business of covered calls.
We cannot overemphasize that it is important for investors to under-
stand and expect a lack of portfolio market value growth in the initial
months of using the technique. This initial lack of growth is the norm and
should not be a reason for discouragement. In our experience, portfolio
market value growth comes after a period of months when the cash flow
generated from all positions accumulates and begins to compound. Under-
standing this characteristic of the technique is essential so that we can re-
main focused on the long-term objective of consistently generating and
compounding cash flow.
Market Value: The value of the portfolio if it were immediately liquidated for
cash at current market prices.
32 COVERED CALLS
c02.qxd 10/23/06 2:21 PM Page 32
33
CHAPTER 3
This chapter details the actual process of establishing covered call
positions.
SOME BASICS
Markets to Invest In
Choosing a market to invest in depends on your own personal objectives
and your country of residence. If you are a non-U.S. resident and have ex-
isting stock holdings in non-U.S. stocks or would like to invest only in your
country of residence for whatever reason (familiarity, etc.), then you are
able to write covered calls on your non-U.S. stocks. If, however, you have
new funds to commit to the market or you want to make a serious commit-
ment to the growth of your investment capital, you should invest in the U.S.
market.
Base your decision on what makes you more comfortable. Even if you
are a non-U.S. resident and decide to initially invest only in stocks listed in
your home country, it is likely (and advisable) that you will eventually move
all your covered call activity to the U.S. market. The U.S. market is incred-
ibly large and provides significantly more opportunity, lower transaction
costs, and much higher covered call returns. If you are committing new
capital to the market, it is strongly advisable to invest in the U.S. market.
Entering New
Covered Calls
Positions
c03.qxd 10/23/06 2:20 PM Page 33
Some advantages of writing covered calls in the United States include:
•More stocks to choose from. The United States boasts the largest and
most liquid stock and options market in the world. This allows U.S.
covered call investors to be very selective in their investment and stock
selection process, which, in turn, leads to a higher likelihood of posi-
tive investment outcomes.
•Higher monthly covered call yields. The U.S. market is significantly
more volatile than the majority of other developed foreign markets. As
volatile markets are positive for option prices, U.S. covered call in-
vestors will normally receive higher percentage returns (yields) on call
sales compared to other international markets.
•Access to information. There are some excellent information services
that allow U.S. covered call investors to research and filter all covered
call opportunities for the U.S. market. These services significantly as-
sist you in selecting companies based on the fundamental and technical
criteria you should use to select companies in which to invest (dis-
cussed later).
•U.S. option contracts relate to only 100 shares. Generally U.S. option
contracts relate to only 100 shares, whereas international option con-
tracts may relate to more than 100 shares. During your learning period,
you can invest a lot less money in a U.S. covered call transaction than
in some international markets (discussed in detail later).
•Lower transaction costs. Due to the size of the U.S. market and the
number of brokerage houses competing for your business, transaction
costs are significantly less in the United States compared to most de-
veloped overseas markets. You will, therefore, be able to invest at a
much lower rate of commission in the United States compared to most
international markets. Saving on commissions equates to higher profits.
Disadvantages of writing covered calls in the United States include:
•Limited market hours. While your covered call activity should only oc-
cupy a few hours of your time per month, if you choose to invest in the
United States you will need to work the hours when the U.S. market is
open. If you are outside the United States, the time difference between
your home country and the United States is a disadvantage for most
investors.
•Foreign exchange risk. If your country of residence is outside the
United States, it is likely that you will also need to manage foreign ex-
change risk as your profits will be made in U.S. dollars. While there are
techniques to use that will help manage this risk (see Appendix B), it is
an added consideration.
34 COVERED CALLS
c03.qxd 10/23/06 2:20 PM Page 34
Option Contract Sizes
It is important for you to understand that, in the United States, option con-
tracts generally relate to just 100 shares, while in foreign markets, option
contracts may relate to a different number of shares. For example, in Aus-
tralia, option contracts relate to 1,000 shares. The more shares an option
contract relates to, the more difficult it becomes for an investor to diversify
a portfolio with a smaller capital resource.
Using the example of Australia, because one option contract relates to
1,000 shares, an investor must have 1,000 shares to sell one covered call
contract. This requirement makes it very difficult for covered call writers in
Australia to build a diversified covered call portfolio with a smaller capital
resource. Let’s look at an example of one $0.50 call option sold on a $10.00
stock in both the U.S. and Australian markets.
Table 3.1 shows that if an investor wishes to write one covered call
contract on a $10.00 stock in the United States, the investor need only com-
mit US$1,000 to the stock purchase. However, if an investor wishes to write
one covered call contract on a $10.00 stock in Australia, the investor needs
to commit AU$10,000 (approximately US$7,500) to the stock purchase.
Thus there is a significant advantage of investing in the U.S. market,
particularly in terms of the following:
• Minimizing capital investment when learning the covered call technique.
• Gaining adequate levels of diversification with limited capital resources.
• Reinvesting monthly earnings into new covered call opportunities.
The Importance of Diversification
While you might start off with just one or two stocks during the learning pe-
riod, your eventual goal is to have a diversified portfolio of optionable
Entering New Covered Calls Positions 35
TABLE 3.1 Comparison of Option Contract Sizes
U.S. Australia
Shares bought 100 1,000
Stock price $10 $10
Capital invested $1,000 $10,000
Call contracts sold 1 1
Call sale price $0.50 $0.50
Cash inflow from call $50 $500
Uncalled return 5% 5%
c03.qxd 10/23/06 2:20 PM Page 35
stocks that you have selected because of high-yielding covered call oppor-
tunities. Investors should construct portfolios of between 10 and 20 stocks
regardless of which market they choose to invest in.
The importance of diversification cannot be stressed enough. Investors
must diversify their portfolios between different stocks and different in-
dustries—you must not find one or two or three high-yielding covered call
opportunities and put all your money into just a few positions. You must
spread risk across many different stocks in many different sectors. Diver-
sification is particularly easy to achieve in the U.S. market due to its size,
but is also achievable in foreign markets.
THE RULES FOR ENTERING NEW COVERED CALL
POSITIONS IN THE U.S. MARKET
If you have decided to invest in the U.S. market, you should invest a small
amount of money into two or three stocks while learning. To begin with,
only buy 100–200 shares and concentrate on stocks with relatively low
stock prices. By following these guidelines, investors can begin learning the
covered call technique with a capital commitment of as little as US$1,000 to
US$3,000. Once comfort is gained with the technique, investors can build a
diversified portfolio of U.S. covered calls with as little as US$10,000 to
US$15,000. The sky is the limit in terms of how much capital you can have
effectively invested in covered calls as the U.S. market is tremendously
large and liquid. And because of the large variety, investors can be very se-
lective when entering into new covered call positions.
The eight rules, then, for entering new covered call positions in the
U.S. market are:
1. You can only establish new positions on down market days. A down
market day is any time when the Dow and the NASDAQ are in the red
(trading lower than the close of the previous day).
2. You must always only sell the near month call when entering a
transaction.
3. Use the CSE Screener (discussed in the following section) to filter
through all available covered call opportunities on the U.S. market.
4. Select the highest-yielding opportunities presented by the CSE
Screener.
5. Ensure that the stock is an upward moving or sideways moving stock
(discussed in a later section, “Assessing Chart Positions for New Cov-
ered Call Positions”).
36 COVERED CALLS
c03.qxd 10/23/06 2:20 PM Page 36
6. Ensure that the stock adheres to the buying low rule for covered calls
(discussed later in this chapter).
7. Always give priority to maintaining acceptable levels of diversification
between stocks and industries—even if a stock you are already in-
vested in presents an excellent covered call opportunity.
8. Buy the stock first and then immediately sell the call. Do not hesitate.
If you buy the stock and wait for a better price for the call, you are no
better than a speculator, and you will get burned!
USING THE CSE SCREENER TO SELECT
U.S. COVERED CALLS
The CSE Screener is a proprietary covered call search and filter tool de-
signed, developed, and maintained by Compound Stock Earnings. The CSE
Screener allows investors to quickly and easily search the stock market
for the highest-returning covered call positions that meet specific funda-
mental and technical requirements. The tool is tailored to accommodate
the criteria and rules established in this book for selecting covered call
positions.
Anyone who purchases Covered Calls and LEAPS—A Wealth Option is
entitled to one month’s complimentary access to the Covered Call Toolbox
(which includes the CSE Screener) by going to www.compoundstock
earnings.com/freemonth. Thus readers can actually use the tools while
learning about them in this book.
Selection Parameters
Because the U.S. market is extremely large, you can be very selective in
terms of the quality of the companies in which you invest. You should use
the following eight parameters to filter U.S. covered call opportunities:
1. Uncalled return of minimum 4 percent.
2. Called return of minimum 4 percent.
3. Price-earnings ratio (PE) of 35 or less.
4. Market capitalization of US$500 million or more.
5. Average broker recommendation of 2.5 or less.
6. An aggregate of the brokers recommending the stock as “Strong Buy”
and “Buy” greater than the number of brokers recommending the stock
as “Hold.”
Entering New Covered Calls Positions 37
c03.qxd 10/23/06 2:20 PM Page 37
7. A consensus earnings per share (EPS) estimate for “Next Fiscal Year”
forecast to be greater than the consensus EPS estimate for “This Fiscal
Year.”
8. Stock trading less than 75 percent of its 52-week trading range.
Rationale Behind CSE Screener Filters
The return filters ensure that acceptable covered call yields are realized on
entering the transaction. A 4 percent uncalled and called return is the min-
imum acceptable return when entering a new covered call transaction. In
most instances, the CSE Screener will present transactions that yield re-
turns of 4–8 percent. You should select the transaction(s) with the highest
uncalled and called return.
Uncalled and Called Returns There are two separate return calcula-
tions that you must compute and be aware of for every covered call trans-
action: the uncalled return and the called return.
The uncalled return is also known as the “percentage return” or “yield”
and is simply the premium you received on the call sale divided by the cost
of the stock. So if you sell a call for $1.00 and you paid $20.00 for the stock,
your uncalled return is 5 percent ($1.00/$20.00). The uncalled return is the
most important return in a covered call transaction because it represents
your return in the worst-case scenario and is the cash return in your hand
as soon as you sell the call.
The called return is the sum of the uncalled return plus the profit or
loss you make if your call is exercised (called out) divided by your cost in
the stock. If you are called out, you have to deliver the stock you own at the
exercise price of the call. For example, if you own a $19.50 stock and sell a
$20.00 call for $0.70 and are called out, your profit would look like this:
• You will deliver (sell) the stock at $20.00. You bought the stock for
$19.50. So you make $0.50.
• You also keep the $0.70 that you sold the call for.
• In total you make $0.50 + $0.70 = $1.20.
• Called return = $1.20/$19.50 = 6.15 percent.
PE Ratio A PE ratio of 35 or less ensures that the company you are in-
vesting in is historically profitable and its stock is not overly expensive
relative to the market. You want to be investing in solid, low-PE stocks.
High-PE stocks are often “priced to perfection” and their stock prices have
a long way to fall if the company does not perform as expected by the
market.
38 COVERED CALLS
c03.qxd 10/23/06 2:20 PM Page 38

Market Capitalization Market capitalization is a measure of the value
and size of a company. It is calculated by multiplying a company’s stock
price by the number of shares it has on issue. A market capitalization of $500
million or more ensures that the company is of a reasonable size. Investors
should give preference to companies with higher market capitalization.
Broker Recommendations An average broker recommendation of 2.5
or less ensures that the stock is rated at least an average of “buy” by the an-
alysts who cover it. This statement does not imply that we value or follow
the opinions of brokers. However, the brokerage community will be in the
markets promoting the stock and the masses will be providing buying sup-
port for the stock. More importantly, the stock is not likely to go out of busi-
ness in the short term.
The aggregate of the brokers recommending the stock as Strong Buy
and Buy must be greater than the number of brokers recommending the
stock as Hold. This criterion simply ensures that more brokers are positive
on the stock than are neutral.
Earnings per Share A forecast consensus EPS estimate for “Next Fis-
cal Year” greater than the consensus EPS estimate for “This Fiscal Year”
simply ensures that the brokers covering the stock believe that the com-
pany’s earnings will grow next fiscal year and helps prevent investors from
buying stocks that are going into a period of contracting earnings.
52-Week Trading Range Buying the stock at less than 75 percent of its
52-week range simply ensures that you are not paying a historically high
price for the stock.
52-Week Range: Refers to the lowest and highest price a company’s stock
has traded for during the past year.
Earnings per Share: A company’s earnings divided by the number of ordi-
nary shares.
Broker recommendations range from Strong Buy (1) to Strong Sell (5).
PE Ratio: A stock’s market price divided by its earnings per share. A PE ratio
of a stock is used to measure how cheap or expensive the stock price is.
Entering New Covered Calls Positions 39
c03.qxd 10/23/06 2:20 PM Page 39
Remember, you are a cash generator and compounder. All you are try-
ing to do when selecting a covered call opportunity is to make sure you get
a high uncalled and called return and that the company you invest in isn’t
going out of business in the near future. While it is nice if the stock goes up
and you are called out at the end of each month, you do not really care if it
goes down. You own stock in a fundamentally sound, profitable company
with a reasonable PE and significant broker support, and you have not paid
top dollar for the stock. Just worry about generating cash flow and let time
take care of the rest.
You should be concerned only with generating and compounding cash
flow. Compounding of the monthly cash return leads to portfolio growth.
Directions for Using the CSE Screener
To access the covered call search tools, you need to establish a username
and password from www.compoundstockearnings.com/freemonth. Then
do the following:
1. Go to www.compoundstockearnings.com/cctoolbox.
2. Enter your username and password.
3. Click Log On.
4. Click CSE Screener—Covered Calls.
The CSE Screener will automatically run the search for the best cov-
ered call positions using the eight criteria listed previously. It will then
search the entire market to find all the stocks that meet the stipulated fun-
damental and technical criteria. It examines the option chains on these
stocks to find positions with near month calls that provide both an uncalled
and called return of 4 percent or more. The CSE Screener then presents the
results of the search to the investor (see Figure 3.1).
The criteria for selecting covered call positions have remained sub-
stantially the same for many years. However, from time to time, the criteria
have been modified to adapt to the current conditions of the market. It is
very important for investors to understand that the objective of the criteria
will always remain the same: to find a low PE company of reasonable size
and with high broker support and forecast earnings growth that is not trad-
ing at yearly highs and that presents a very good covered call return in the
near month.
While this objective never changes, the market does. The market is not
static. PE ratios expand and contract with the performance of the market,
volatility increases and decreases affecting covered call premiums, strong
40 COVERED CALLS
c03.qxd 10/23/06 2:20 PM Page 40
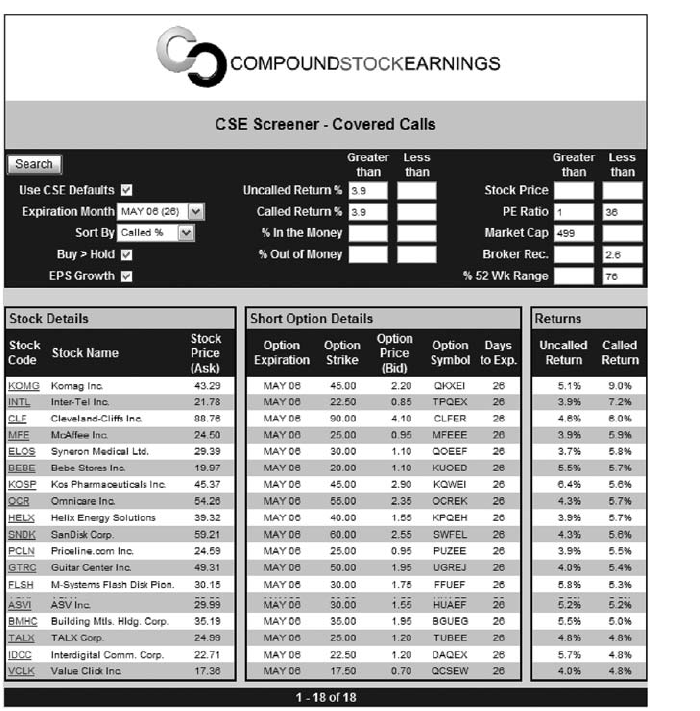
market periods reduce the number of stocks trading below 75 percent of
the 52-week range, and so on. The market is constantly evolving, and occa-
sionally the criteria need to evolve to stay relevant to the condition of the
market. When such a change is needed, the authors adapt the default cri-
teria of the CSE Screener to keep investors in step with the current condi-
tions of the markets. Therefore, it is highly recommended that investors
simply use the default criteria of the CSE Screener when searching for new
positions.
Entering New Covered Calls Positions 41
FIGURE 3.1 Sample screenshot of the CSE Screener for covered calls.
c03.qxd 10/23/06 2:20 PM Page 41

USING PRICE CHARTS
Simply because the CSE Screener has presented a position does not auto-
matically qualify it as an acceptable investment. Revisit the “Rules for En-
tering New Covered Call Positions in the U.S. Market.” The present section
addresses in significant detail the two rules that relate to price charts:
• Ensure that the stock is an upward moving or sideways moving stock.
• Ensure that the stock adheres to the buying low rule for covered calls.
Judicious assessment of a stock’s price cycle is critical before a new cov-
ered call position is entered into. Investors who get caught up in hype and
buy when markets are going up or who panic and sell when markets are
going down are categorically the losing investors in the markets. You must
buy low and sell high: You must buy when markets are falling and sell when
markets are rising. If you were selling any product as a business venture,
you would be attempting to buy the product low and to sell it high. Finan-
cial markets are no different. The importance of these rules cannot be
stressed enough.
Identifying and Assessing Price Cycles
To implement these rules, you will need to recognize that virtually all
stocks move in distinct price cycles. Movements between parallel lines
characterize these cycles. What you want to do is identify a price channel
or a price cycle (these terms are used interchangeably). The way to identify
a price channel is to draw two lines (preferably parallel) connecting the
bottoms and the tops of a chart. The best source for free charts on the In-
ternet is www.bigcharts.com. If you select “Java Chart” and then check
“Draw Trendlines,” you will be able to draw cycles on the chart similar to
those in the following illustrations. You should always assess a stock using
a 12-month chart.
Figure 3.2 shows how stocks move. Almost all stocks cycle between
parallel lines. Perhaps the most costly misunderstanding among unedu-
cated investors is that stocks do not go straight up or straight down. A
stock that is cycling upwards or downwards also has upward and down-
ward movements within that cycle. Look at Figure 3.2. Regardless of the
trend of the stock, the stock is moving upwards and downwards within a
cycle. We repeat: Understanding this characteristic is vitally important.
Price Channel or Cycle: The price trend that a stock is trading in. Identified
by the trading range between two parallel lines.
42 COVERED CALLS
c03.qxd 10/23/06 2:20 PM Page 42
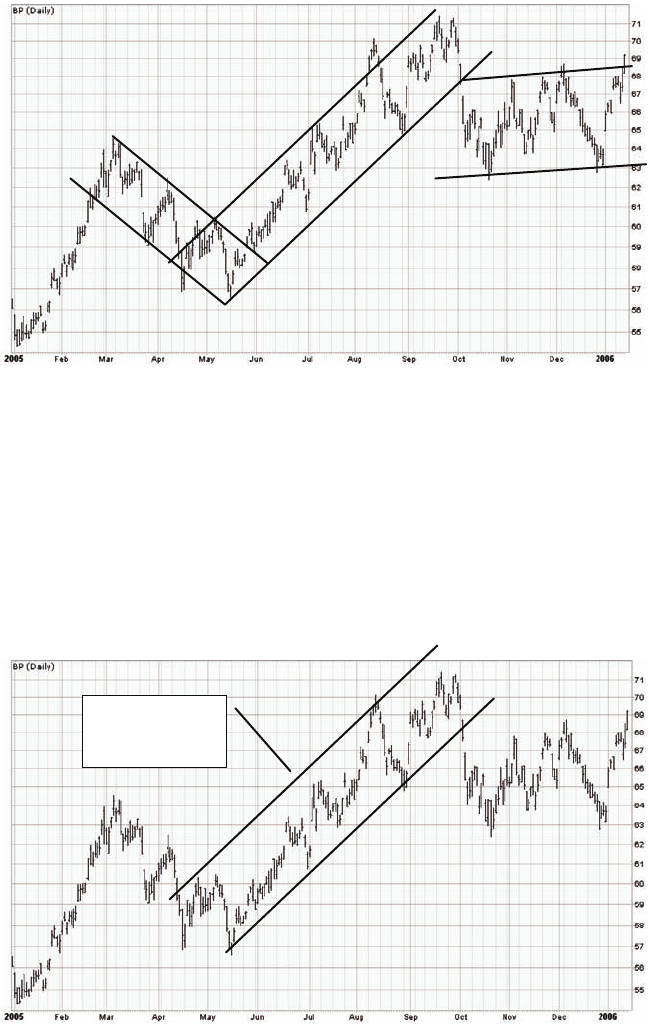
Stocks do not go straight up or straight down—they move up and down
within cycles characterized by parallel lines.
Upward Cycles In an upward cycle, the tops of the cycle are getting
higher and the bottoms are also getting higher. An upward cycle has higher
tops and higher bottoms. See Figure 3.3.
When we have an upward cycle, start by drawing a line connecting the
bottoms on the chart, because the buyers are in control of the market and
Entering New Covered Calls Positions 43
FIGURE 3.2 Example of how stocks cycle between parallel lines.
Upward cycle:
higher tops and
higher bottoms
FIGURE 3.3 Example of an upward cycle.
c03.qxd 10/23/06 2:20 PM Page 43
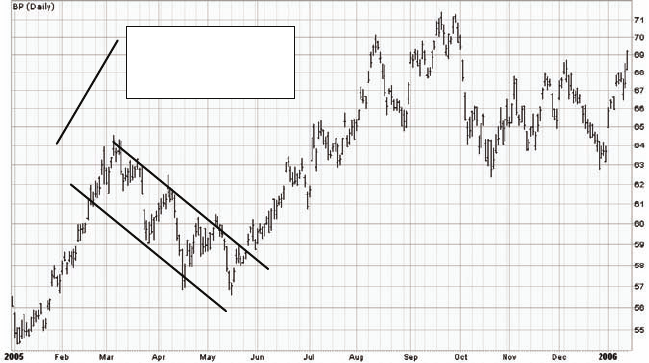
driving prices higher. Then attempt to identify the top of the cycle by draw-
ing a line that is parallel to the bottoms. Note: Assessing cycles is not an
exact science and absolute accuracy is not a contributing factor to the suc-
cess of our covered call technique.
Downward Cycles In a downward cycle, the tops of the cycle are get-
ting lower and the bottoms are also getting lower. A downward cycle has
lower tops and lower bottoms. See Figure 3.4.
When we have a downward cycle, start by drawing a line connecting
the tops on the chart, because the sellers are in control of the market and
driving prices lower. Then attempt to identify the bottom of the cycle by
drawing a line that is parallel to the tops. Again note that assessing cycles
is not an exact science and absolute accuracy is not a contributing factor to
the success of our covered call technique.
Horizontal Cycles In a horizontal cycle, the tops and bottoms are not
getting substantially higher or lower. A horizontal cycle has relatively sta-
ble tops and bottoms. The cycle highlighted in Figure 3.5 is a general hori-
zontal cycle (although it does have slight upward bias).
In a horizontal cycle, the market is in consolidation and it is not im-
portant which line is drawn first. Simply try to make the two lines parallel
remembering that assessing cycles is not an exact science and absolute
accuracy is not a contributing factor to the success of the covered call
technique.
44 COVERED CALLS
Downward cycle:
lower tops and
lower bottoms
FIGURE 3.4 Example of a downward cycle.
c03.qxd 10/23/06 2:20 PM Page 44
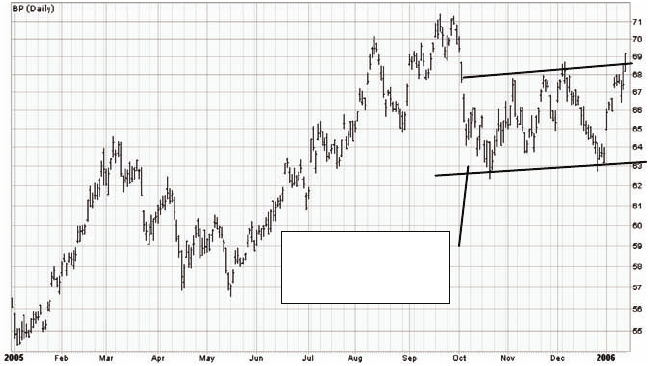
How to Look at a Price Chart
When an investor assesses a price chart, he or she must be able to answer
the following four questions:
1. What is the overall trend: upwards, downwards, or sideways?
2. What are the past cycles: upwards, downwards, or sideways?
3. What is the current cycle: upwards, downwards, or sideways?
4. Where are we in the current cycle: the bottom, middle, or top?
Step 1: Identify the Overall Trend A first glance at Figure 3.6 shows
that the overall trend for this stock is upward. We know this because in a
broad sense prices are increasing—significant tops and bottoms are getting
higher, so the chart is generally upward moving.
Step 2: Identify the Individual Cycles After identifying the overall
trend, we are then looking to identify the individual cycles. There is nor-
mally more than one cycle on any given chart of six months’ duration or
greater. Remember, cycles are characterized by movements between par-
allel lines. See Figure 3.7.
Step 3: Identify the Current Cycle After identifying the individual
cycles, we then want to classify the current cycle, that is, the cycle the
Entering New Covered Calls Positions 45
Horizontal cycle:
stable tops and
bottoms
FIGURE 3.5 Example of a horizontal cycle.
c03.qxd 10/23/06 2:20 PM Page 45
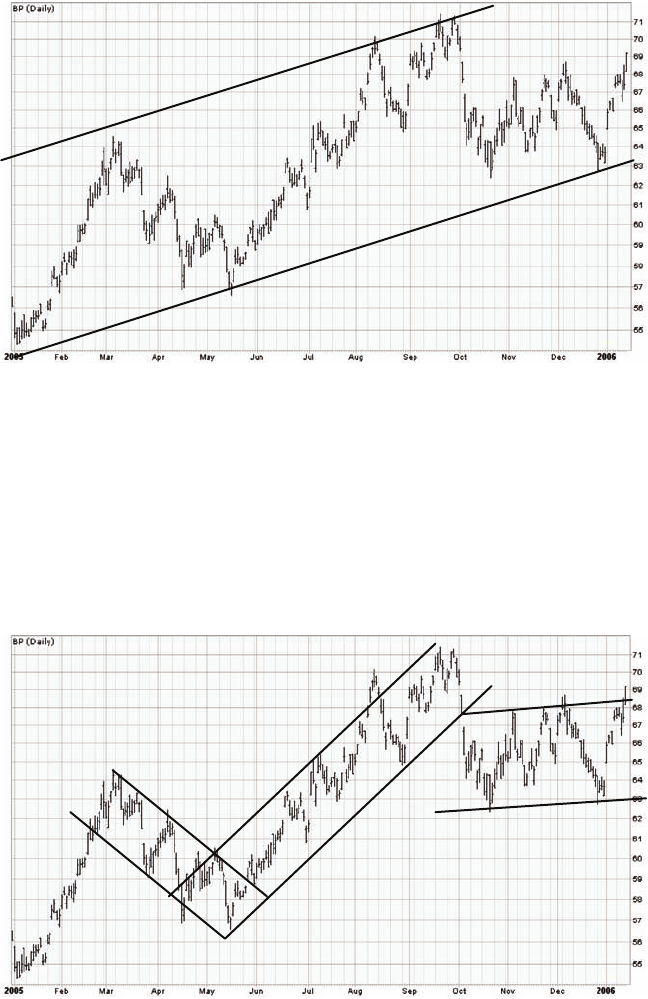
stock is trading in now. To do so we need to determine if the tops and bot-
toms of the current cycle are getting:
• Higher (upward cycle)
• Lower (downward cycle)
• Relatively stable (horizontal cycle)
46 COVERED CALLS
FIGURE 3.6 Identify this trend.
FIGURE 3.7 Identify the cycles.
c03.qxd 10/23/06 2:20 PM Page 46
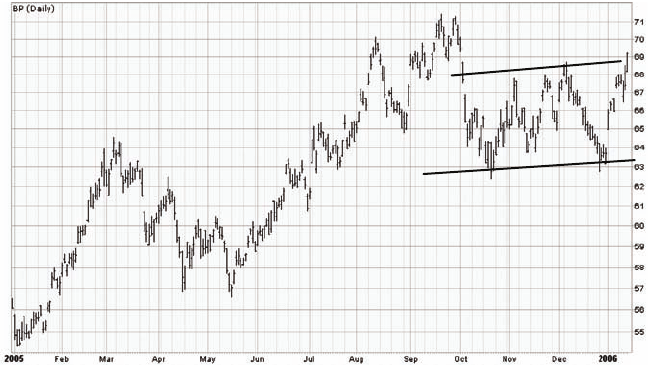
Figure 3.8 shows that the current cycle of BP is horizontal with slight
upward bias. Understanding the direction of the current cycle is critical.
Step 4: Identify the Position in the Current Cycle After we have
identified the current cycle, in Figure 3.8 it is horizontal with slight upward
bias, we then want to understand the position of the stock in relation to the
current cycle. Is the stock at the top, middle, or bottom of the current
cycle? Where is the stock price in relation to the top and bottom lines of the
current cycle? In Figure 3.9 we can see that the stock price is at the top of
the current cycle.
Utilizing the Information So we now understand this chart of BP
(Figures 3.6 through 3.9). We know that BP is (1) in an overall upward
trend, (2) currently in a horizontal cycle with slight upward bias, and (3) at
the top of the current cycle.
The stock is at the top of the cycle—its bias is to head back down.
When a stock is in the high point of the current cycle, its bias is to go down.
When a stock is in the low point of the current cycle, its bias is to go up.
These facts are so basic and fundamental, yet they are ignored by most in-
vestors and that ignorance is the single biggest reason that investors lose in
the market. They are constantly on the wrong end of the cycle. They are
constantly chasing the trend and having it reverse on them. The mind-set of
a losing investor is to buy this stock right now, after all “it’s increased from
$60 to almost $70 in just one month and it’s in the press as a top performer
Entering New Covered Calls Positions 47
FIGURE 3.8 Identify the current cycle.
c03.qxd 10/23/06 2:20 PM Page 47
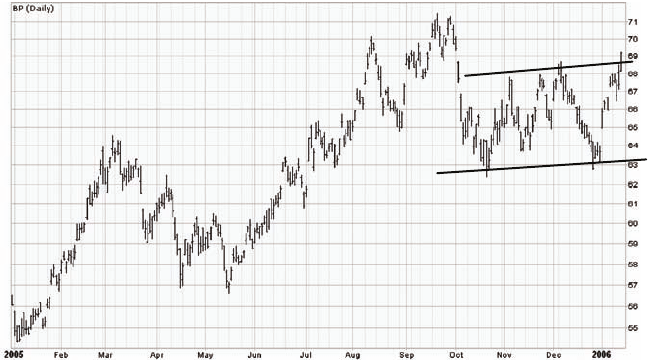
last month, it’s having a great run, so there must be further to go.” This is
the mind-set of the average losing investor. It should be abundantly clear
why this investor is an expert at picking stocks that then fall in the ensuing
weeks. This investor’s stock selection mentality always leads to purchasing
stocks at the top of the current cycle. The investor then panics when the
stock starts cycling down and sells out for a loss, only to see the stock go
back up a month later. The investor is completely ignorant to the fact that
stocks go up and down—that is what they do.
Let’s look at another example in Figure 3.10. We can quickly identify
that there is no distinct overall trend. However, we can identify three dis-
tinct price cycles. The stock is currently in an upward cycle and it is at the
very top of that cycle. The stock’s likely move over the short term is to head
back to the bottom of the rising cycle. The short-term bias for this stock
is down.
On occasion, you will find charts that are harder to identify and classify
in this fashion. If you do not understand a chart, do not invest in the stock.
Assessing Chart Positions for New
Covered Call Positions
The optimal outcome for covered call investors is that the stock price rises
after entering the transaction, they are called out at the end of the month,
48 COVERED CALLS
FIGURE 3.9 Identify the stock’s position in the current cycle.
c03.qxd 10/23/06 2:20 PM Page 48
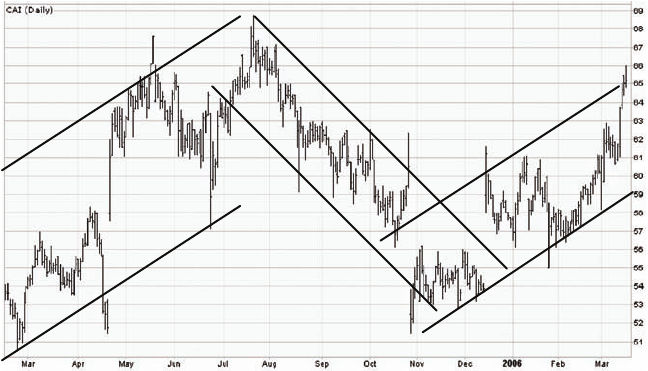
and they then reinvest and compound their capital the following month. To
increase the likelihood of this outcome, investors should only invest in up-
ward moving or sideways moving stocks.
The CSE Screener filters stipulate that investments can only be made in
stocks that are trading less than 75 percent of their 52-week trading range.
This criterion commonly leads to stocks being presented by the CSE
Screener with three distinct stock price chart types:
1. Upward moving stocks
2. Downward moving stocks
3. Sideways moving stocks
Upward Moving Stocks In the context of covered calls, upward mov-
ing stocks can be of two types:
1. Stocks in a generally rising cycle.
2. Stocks that have had significant price declines in the preceding months
and are currently in an upward cycle. A stock is currently in an up-
ward cycle if it has (a) substantially broken through the upper line of
the declining price cycle and (b) established a new rising price cycle (a
cycle with higher tops and higher bottoms).
Entering New Covered Calls Positions 49
FIGURE 3.10 Assess this chart.
c03.qxd 10/23/06 2:20 PM Page 49
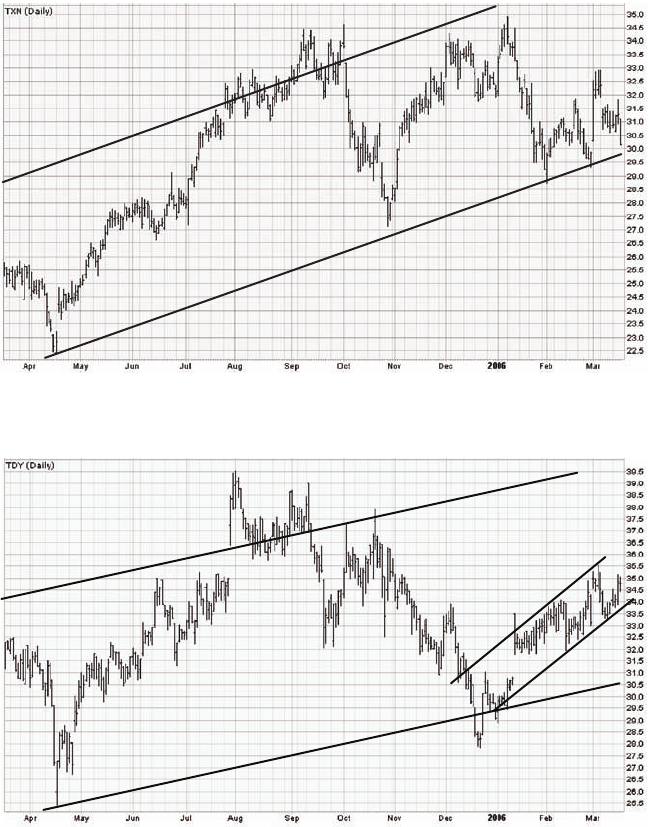
Type 1 upward moving stocks are generally upward moving within an
upward cycle. However, they are not trading at or near their highs for the
year. See Figures 3.11, 3.12, and 3.13 for examples.
Type 2 upward moving stocks have had significant price declines in the
preceding months and are now rising. The most important factors in
50 COVERED CALLS
FIGURE 3.11 Generally upward moving stock.
FIGURE 3.12 Generally upward moving stock.
c03.qxd 10/23/06 2:20 PM Page 50
determining whether the stock is now rising are if it has (a) substantially
broken through the upper line of the declining price cycle and (b) estab-
lished a new rising price cycle (a cycle with higher tops and higher bot-
toms). See Figures 3.14, 3.15, and 3.16 for examples.
Entering New Covered Calls Positions 51
FIGURE 3.13 Generally upward moving stock.
FIGURE 3.14 Current rising cycle outside of a declining cycle.
c03.qxd 10/23/06 2:20 PM Page 51
Downward Moving Stocks In the context of covered calls, downward
moving stocks are those that have had significant price declines in the pre-
ceding months and are continuing to decline. These stocks should be
avoided. They have not substantially broken through the upper line of the
declining price cycle and established a new rising price cycle (a cycle with
52 COVERED CALLS
FIGURE 3.15 Current rising cycle outside of a declining cycle.
FIGURE 3.16 Current rising cycle outside of a declining cycle.
c03.qxd 10/23/06 2:20 PM Page 52
Entering New Covered Calls Positions 53
FIGURE 3.17 Downward moving stock.
FIGURE 3.18 Downward moving stock.
higher tops and higher bottoms). See Figures 3.17 and 3.18 for examples of
downward moving stocks.
Sideways Moving Stocks Sideways moving stocks are suitable for
covered call investment and are characterized by predominantly stable
c03.qxd 10/23/06 2:20 PM Page 53
bottoms and tops; that is, the tops and bottoms of the cycle are getting nei-
ther higher nor lower. When a stock is sideways moving, the market is in
consolidation. See Figures 3.19 and 3.20 for examples.
54 COVERED CALLS
FIGURE 3.19 Sideways moving stock.
FIGURE 3.20 Sideways moving stock.
c03.qxd 10/23/06 2:20 PM Page 54
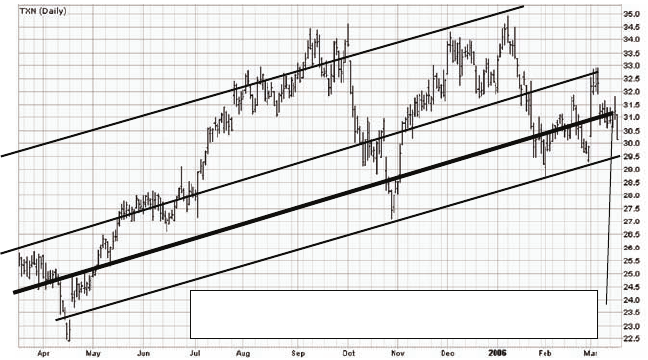
The Buying Low Rule for Covered Calls
The buying low rule for covered calls exists to ensure that new covered call
positions are only entered into in the lower portion of a stock’s current
price cycle. Investing in stocks that are in the lower portion of the current
price cycle increases the likelihood that the stock price will increase after
entering into a new position and, therefore, increases the likelihood of
being called out at the end of the option month. Being called out at the end
of the option month is a primary objective of covered call investing.
The buying low rule for covered calls includes two stipulations:
1. Invest in stocks that are upward moving or sideways moving.
2. Only invest in a stock when it is in the lower 25 percent of the current
price cycle. Investing in the lower 25 percent of the cycle makes it more
likely that the stock will move up after entering the transaction and,
therefore, increases the likelihood of being called out.
See Figures 3.21 and 3.22 for examples.
Entering New Covered Calls Positions 55
Only invest in new positions when the stock is trading at
or below 25% of the current price cycle.
FIGURE 3.21 Satisfying the buying low rule.
c03.qxd 10/23/06 2:20 PM Page 55
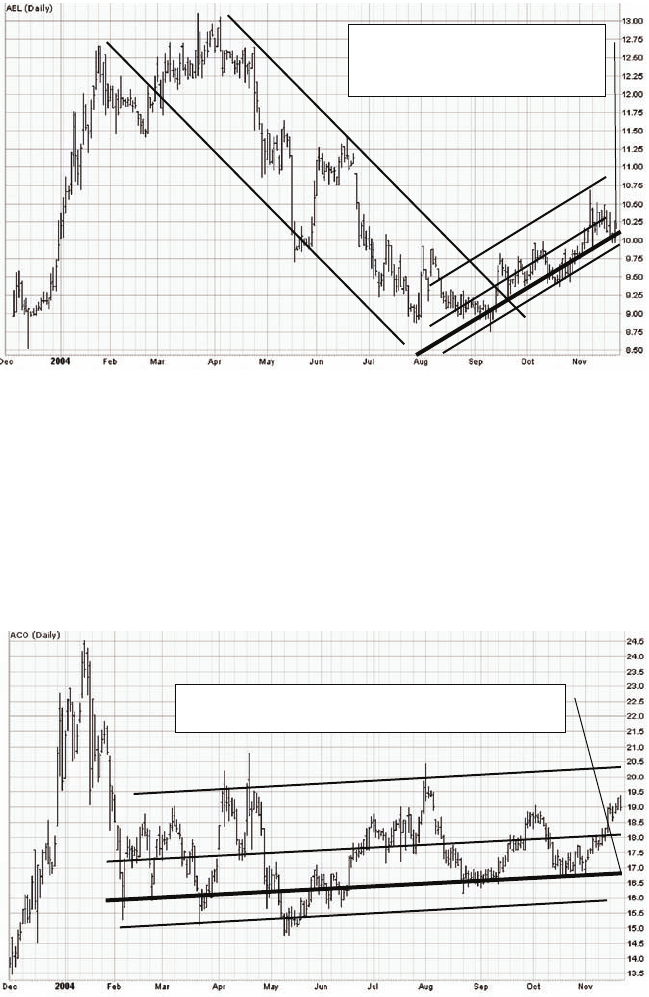
In contrast, the stock shown in Figure 3.23 does not qualify for invest-
ment. The current cycle is horizontal with upward bias, but the stock is
trading at about 75 percent of the cycle. The near-term bias is down. This
stock does not meet the buying low rule.
56 COVERED CALLS
Only invest in new positions when
the stock is trading at or below
25% of the current price cycle.
FIGURE 3.22 Satisfying the buying low rule.
Only invest in new positions when the stock is trading
at or below 25% of the current price cycle.
FIGURE 3.23 Buying low rule not satisfied.
c03.qxd 10/23/06 2:20 PM Page 56

INVESTING IN NON-U.S. MARKETS
Those electing to invest in non-U.S. markets must be aware of the limita-
tions of these markets compared to the U.S. markets. The primary draw-
backs of investing in markets outside the United States are the significantly
smaller numbers of optionable stocks in foreign markets, the lower option
premiums due to lower volatility levels, and the lack of tools such as the
CSE Screener to assist in finding and analyzing potential covered call
opportunities.
It is highly advisable that investors wanting to commit new funds to the
covered call technique do so in the U.S. market. However, if you already
own stocks in foreign markets and want to continue holding these stocks,
see if they are optionable and then start selling covered calls on them! You
are in a win-win situation; you have already assumed the risk of owning the
stock and can only benefit from selling the covered call.
If you don’t own any existing stocks and would like to start investing in
covered calls in a foreign market, the stocks you should focus on are those
with the most liquid options markets, those that provide consistent near
month call expirations, and those that provide superior yields.
A near month call is a call that expires in the current month—for ex-
ample, if we are in March, a near month call would expire at the end of
March. It is optimal for covered call writing that a stock always has a near
month call.
As the CSE Screener does not extend its services to foreign markets, if
you would like to start investing in covered calls in a foreign market, you
will need to conduct a reasonable amount of research before doing so. You
will need to understand:
• What stocks in the foreign market are optionable.
• What stocks in the foreign market have consistent near month call ex-
pirations.
• Which stocks have adequate volatility levels and, therefore, reasonable
covered call yields.
• How many shares each option contract relates to in the foreign market.
You must also recognize that it is unlikely that you will be able to find
covered call opportunities in foreign markets that meet the U.S. covered
call search criteria as previously discussed, because foreign markets are
smaller than the U.S. market and provide less variety and opportunity. You
may need to relax or even eliminate the fundamental and technical search
criteria discussed. Doing without these criteria is further reason why new
funds committed to the covered call technique should be committed in the
U.S. market.
Entering New Covered Calls Positions 57
c03.qxd 10/23/06 2:20 PM Page 57
If you still want to invest in covered calls in a foreign market, to begin
with, buy only enough stock to sell one covered option contract and con-
centrate on stocks with relatively low stock prices—this will minimize your
initial capital investment. Sell covered calls on just one or two stocks until
you have the confidence to commit more capital to the market.
If you find that the minimum investment in stock to sell one option con-
tract makes you uncomfortable due to its dollar value, or if this amount rep-
resents more than 10 percent of the capital you would like to ideally have
invested in covered calls (once you are comfortable with the technique),
then you should invest in the U.S. market because doing so will allow you
to gain acceptable levels of diversification with a smaller capital base (U.S.
option contracts generally relate to only 100 shares).
This being said, then, the six rules for entering new covered call posi-
tions in foreign markets are:
1. You can establish new positions only on down market days. A down mar-
ket day is a day when the major market average index for that market is
in the red (trading lower than the close of the previous trading day).
2. You must always only sell the near month call when entering a new
covered call position.
3. You should assess the universe of optionable stocks for the fundamen-
tal and technical data outlined in the U.S. covered call search criteria.
Preference should be given to stocks that more fully meet these criteria.
4. You should assess the universe of optionable stocks in the chosen
market for both uncalled and called returns and invest in the highest
yielding opportunities.
5. Always give priority to maintaining acceptable levels of diversifica-
tion—never have more than 10 percent of your investment capital in
any one stock. Preferably construct a portfolio of between 10 and 20
stocks.
6. Buy the stock first and then immediately sell the call. Do not hesitate.
If you buy the stock and wait for a better price for the call, you are no
better than a speculator, and you will get burned!
58 COVERED CALLS
c03.qxd 10/23/06 2:20 PM Page 58

59
CHAPTER 4
The difference between great success and complete mediocrity in the
business of writing covered calls is how well you can profitably man-
age your way out of a position that is not performing as you would
like. It would be fantastic if every time you entered into a transaction, you
were called out at the end of the month, got all your money back, and
started again. It would even be great if you didn’t get called out and were
able to sell the same strike price again in the near month and to maintain
both a good called and uncalled return. Unfortunately, such is not the real-
ity of this business.
Covered calls require management. You must manage positions for
consistent monthly income, regardless of market direction, to achieve port-
folio growth and compounding using this technique. This chapter highlights
the management techniques needed to achieve consistent monthly income
from a stock investment, regardless of market direction.
CLOSING POSITIONS ON THE DELTA EFFECT
Occasionally a stock’s price may increase significantly after a covered call
position has been established. This increase may allow investors to close
out the position for an overall transaction profit by buying back the short
call and selling the stock. The investor is able to achieve this profit because
the stock price generally increases more than the call price on a dollar-to-
dollar basis. This is known as the delta effect.
The delta of a stock option is the rate of change of the option price with
respect to the price of the underlying stock. It is a measure of how much an
Management
Rules
c04.qxd 10/23/06 2:18 PM Page 59

option’s price will increase or decrease for an incremental increase or de-
crease in the stock price.
Let’s look at an example of a call that has a delta of 0.60. This number
means that when the stock price changes by an amount, the option price
will change by 60 percent of that amount. For example, if the stock price in-
creases by $1.00, then the option will increase in price by $0.60 (60 percent
of the stock price’s increase). If the stock price increased just $0.50, then
the option price would increase by only $0.30 (60 percent of the stock price
increase).
The delta of the stock is always 1 or 100 percent; for a $1.00 move in the
stock price, the stock moves up, obviously, $1.00 or 100 percent of that
move. So, when a new covered call position is entered into and the stock
price increases significantly, the profit the investor can make by selling the
stock will almost always be larger than the loss realized by buying back the
call. Consequently, if the stock price moves up far enough after entering a
transaction, investors can close the position immediately with a profit and
then reinvest and compound the proceeds.
Let’s look at an example. John buys MDR stock at $20.00 and sells the
June $20.00 call for $1.00. You should understand that the delta of the stock
is always 1 and the delta of the call for the purposes of this example is 0.50.
If the stock price jumps up by, for example, $2.00 after entering this posi-
tion, the option price will only increase by $1.00 (50 percent of $2.00).
John’s position would look like this:
Profit on stock sale = $22.00 – $20.00 = $2.00
Loss on call buyback = $ 1.00 – $ 2.00 = –$1.00
Net Profit on transaction close = $ 2.00 – $ 1.00 = $1.00, or 5%
In this instance, it would be wise for John to simply close the transaction
and then reinvest and compound the proceeds. He would do so by simply
buying back the short call and then immediately selling the stock.
New covered call positions should be monitored for an opportunity to
close the position on the delta effect. Closing positions on the delta effect
occurs regularly when the stock price increases significantly after entering
a new position.
THE MID-MONTH RULE
Once you have entered into the covered call position, all you need to do is
have patience and wait for the option’s expiration at the end of the month.
However, you can decide to be a little more proactive during the month and
60 COVERED CALLS
c04.qxd 10/23/06 2:18 PM Page 60

utilize the mid-month rule, which can have the effect of significantly in-
creasing your returns on the position.
The mid-month technique involves buying back the short call for a
profit in the first two weeks of the month. The five rules for implementing
this technique are:
1. If you have sold a call for a 5 percent uncalled return or more, the mid-
month technique may be considered.
2. If within the first two weeks of the month you are able to buy back the
call and lock in an uncalled return of 4 percent for the month, then do so.
3. You then put in a good til canceled (GTC) order to sell the same call for
more than you bought it back for.
4. If the GTC order executes, wait until the end of the month to see if you
will be called out.
5. If the GTC order does not execute, or if the position is uncalled at ex-
piration, move to the secondary call sales rule.
Here’s an example of utilizing the mid-month rule. John selects a new
covered call position on MDR. He purchases the stock for $19.75 and sells
the one-month out $20.00 call option for $1.00. This transaction has gener-
ated a 5.1 percent uncalled return ($1.00/$19.75).
In assessing the chart, John has identified that the stock is an upward
moving stock and is in the lower 25 percent of the rising price cycle. If the
stock price falls after entering the position, he may be able to implement
the mid-month rule to enhance yield. John calculates that a 4 percent return
on this position would equate to about $0.80 (0.04 ×$19.75). So for John to
make a net 4 percent or $0.80 uncalled return on this position, he would
need to buy back the call at a price of $0.20 ($1.00 – $0.80).
John would then attempt to sell the same call again at a value greater
than what he bought it back for sometime before the end of the month. The
price at which he would resell the call depends on (1) the time left in the
option month and (2) the position of the stock in relation to its current
price cycle.
The price at which the call should be resold is based on judgment and
is a skill investors develop with time and experience. Less active investors
should simply put in a GTC order to resell the call for a price higher than
they bought it back for. More active investors should wait until the stock
Good til Canceled (GTC): An order to buy or sell a stock or option that re-
mains in effect until it is executed or canceled by the investor who placed it.
Management Rules 61
c04.qxd 10/23/06 2:18 PM Page 61

reaches 75 percent of the price cycle and then resell the call. This explana-
tion will be become more clear in the following section on secondary call
sales rules.
Remember, John would only buy back the call in the first two weeks of
the month. If he buys the call back later than this, then there is less than
two weeks left until the option expires. Due to accelerating time decay in
the last two weeks of an option’s life, it is unlikely that the price of the op-
tion will increase enough to make it worthwhile for John to sell it again.
By buying back the call, you are locking in a fantastic 4 percent return
for the month, but you are leaving a little bit of money on the table, in this
example, $0.20 or 1 percent. You are doing this because it is likely that,
sometime in the next two or three weeks before the option’s expiration, the
stock will jump up a little and allow you to resell the call for a greater value
than you bought it back for. Practitioners of this technique understand that
this is a regular occurrence. Remember, the covered call position was en-
tered into at the bottom 25 percent of a rising or sideways price cycle, and
the stock has obviously fallen further to allow the buyback of the call for a
profit. It is therefore highly likely that the stock price will then increase
back into its regular cycle, thus allowing the resale of the same call for
higher premium.
SECONDARY CALL SALES
A secondary call sale is any call sale that occurs after you have bought back
the original call or the original call has expired. At the end of the first
month, you either got called out or you didn’t. If you got called out, you now
have all your money back in your account and you are ready to start again.
Go back to the rules for entering new covered call positions provided in
Chapter 3. Enter these positions as quickly as possible. The longer you wait,
the more time value is eroding in the next month’s option contracts and the
lower your covered call yield will be. You need to assess how much cash
you have made during the month and try to reinvest it all so your money can
start compounding. Remember, compounding is the key.
If you didn’t get called out and you are investing in the U.S. market, you
have a nice 4–8 percent cash return sitting in your brokerage account in one
month. A 7 percent return would be a very good return for a mutual fund in
a year, and you have made that return in just one month! And if you have
several positions, your returns for the month may represent enough
cash for you to enter a whole new position and really have your money
compounding.
62 COVERED CALLS
c04.qxd 10/23/06 2:18 PM Page 62
The Rules for Secondary Call Sales
If you were not called out, that means the call has expired worthless. You
now have a stock without a call and are ready to sell a call for the next
month. The rules for selling secondary calls are significantly different from
the rules for entering new covered call transactions. The six rules for sec-
ondary call sales are:
1. Secondary calls can only be sold when the markets are in the green
(higher than the close of the previous day). For the United States, the
markets are in the green when both the Dow Jones Industrial Average
and the NASDAQ are trading above the close of the previous day. For-
eign markets are in the green when the major market index for that
market is trading above the close of the previous day.
2. For the U.S. market, if you can sell a near month call where the un-
called and called returns are both greater than 4 percent, then do so.
For foreign markets, if you can sell a near month call where the un-
called and called returns are both greater than 1.5 percent, then do so.
3. If rule 2 isn’t applicable, you should use the TSS for income while being
sure to adhere to the selling high rule (both discussed in detail in the
following section). Move the expiration of the call out to the second to
last expiration and sell a call that provides an uncalled return of mini-
mum 10 percent. Do not sell the last expiration of the option series.
This must be kept in reserve for defensive techniques.
4. The minimum uncalled return of 10 percent for a TSS for income call
sale is based on your purchase price of the stock or the current market
value, whichever is higher.
5. The greater the uncalled return generated on the TSS for income call
sale, the quicker the call will be bought back as the stock price de-
clines. You may select a lower strike price to allow an easier buyback
to the extent the strike price of the call selected plus the call’s bid price
is greater than the current price of the stock.
6. Once a TSS for income call is sold, it should be bought to close at any
time a 5 percent net return can be realized or when the stock reaches
25 percent of the current cycle, whichever occurs first.
Implementing the Secondary Call Sales Rules
While the objective with covered calls is generally to sell a near month call
and have the time decay factor working strongly in your favor, this is often
not practically achievable. In situations where new covered call positions
Management Rules 63
c04.qxd 10/23/06 2:18 PM Page 63
are entered into and are not called out, it is often not possible to sell a near
month call where the uncalled and called returns are both greater than 4
percent (the preceding rule 2). For example, let’s assume it’s early May and
John selects a new covered call position on MDR. He purchases the stock
for $19.75 and sells the May $20.00 call for $1.00. If the stock finishes the op-
tion month at $18.00, the position will not be called out. John will keep
the $1.00 in premium and will be left to reassess a secondary call sale on
MDR. It’s now June and the near month option chain appears as shown in
Table 4.1.
We can see from Table 4.1 that John will not be able to sell the June
(near month) $20.00 call for an uncalled and called return of 4 percent or
greater (the preceding rule 2) as the premium for this call is just $0.20 or a
1 percent uncalled return. John could sell the June $17.50 call for an un-
called return of 6.1 percent, but the called return would be –5.3 percent
[($17.50 – $19.75 + $1.20)/$19.75]. That sale would violate rule 2, which stip-
ulates both the uncalled and called returns must be 4 percent or greater in
order to sell a near month call.
In this situation, John must use the TSS for income while being sure to
adhere to the selling high rule (the preceding rule 3).
64 COVERED CALLS
TABLE 4.1 MDR Near Month Option Chain
Strike Ticker Bid Price Ask Price Delta
June
7.50 JPMIY 10.60 10.70 1.00
10.00 JPMIF 8.10 8.20 1.00
12.50 JPMIZ 5.60 5.70 1.00
15.00 JPMIG 3.20 3.40 1.00
17.50 JPMIU 1.20 1.35 0.91
20.00 JPMIH 0.20 0.30 0.33
22.50 JPMIV 0.00 0.05 —
25.00 JPMII 0.00 0.05 —
27.50 JPMIW 0.00 0.05 —
30.00 JPMIJ 0.00 0.05 —
c04.qxd 10/23/06 2:18 PM Page 64

THE TETHERED SLINGSHOT FOR INCOME
AND THE SELLING HIGH RULE
The tethered slingshot (TSS) for income and the selling high rule are very
important techniques for the covered call writer as they allow consistent
generation of income in situations where the stock price is trading below
an investor’s cost in the stock.
The rules for the TSS for income are embedded in the preceding rules
for secondary call sales. These rules state that when a call cannot be sold
in the near month that provides both an uncalled and called return of 4 per-
cent or greater, the investor must use the TSS for income. The investor
should select the second to last expiration and sell a strike price call that re-
sults in an uncalled return of minimum 10 percent. Before this call can be
sold, the investor must ensure that the selling high rule has been satisfied.
The selling high rule relates to the timing of the TSS for income call sale—
it is very important that TSS for income calls are sold at the high point of
the price cycle.
The Selling High Rule
The selling high rule states that secondary call sales using the TSS for in-
come can only be made when a stock is in the upper 75 percent of its cur-
rent price cycle.
When a secondary call is sold using the TSS for income, the investor’s
objective must be to generate income and buy back the call (buy the call to
close) as soon as possible for a positive net return. To achieve a positive net
return on a buyback, one or both of the following circumstances must
occur: (1) The stock price must decrease in value and/or (2) time value
must diminish.
The selling high rule draws on point 1 by assisting the investor to iden-
tify when the stock is trading at the high point of its current price cycle.
This rule is essentially the opposite of the buying low rule for covered calls,
which ensures that you are buying into new positions when the market is
down and the stock is in the lower 25 percent of its price cycle. Conversely,
the selling high rule ensures that you are selling a secondary call when the
market is up and the stock is in the upper 75 percent of its price cycle. This
condition greatly increases the chances that the stock will fall and you will
be able to buy back the call for a profit.
TSS for Income: A covered call management technique used to generate in-
come when the stock price has declined after entry.
Management Rules 65
c04.qxd 10/23/06 2:18 PM Page 65
Remember, too, that decay in time value is also working significantly in
the covered call writer’s favor. This factor also greatly increases the op-
portunity for a profitable call buyback.
It is important to make the distinction that our objective is not specu-
lation when using the TSS for income and selling high rule. What we are
trying to do is sell in the vicinity of the top of the cycle and buy the call
back for a profit at lower stock prices in the near future. If you sell a call
and the stock keeps moving up, you do not take a loss on the call. Rather,
investors should have patience and wait for the stock price to come back
to the bottom of the cycle. Stocks cycle up and down—they do not go
straight up and they do not go straight down. If the stock doesn’t come
down to allow a profitable call buyback we can use other management
and defensive techniques, primarily exiting on the delta effect (see
earlier in this chapter) or the surrogate stock replacement (covered in
Chapter 5).
Patience and management are critical factors for success. You must
have patience to wait for the stock price to meet the selling high rule before
selling a TSS for income call. You must also have patience to wait for the
stock price to cycle down after selling a TSS for income call to allow a prof-
itable buyback. Patience is key.
It is very rare that a call will be sold and the very next day the stock cy-
cles down. It is not possible to pick the absolute top of the market and have
the call immediately fall in price—this is an unrealistic expectation. It is
much more common that over a period of one to four weeks after selling a
TSS for income call, the stock cycles down and allows a profitable buy-
back. During the period of waiting, patience is required. Novice investors
often panic when a TSS for income call cannot be immediately bought
back for a profit. Such immediacy is against the nature of this technique.
Again, when using the TSS for income and the selling high rule, patience
is key.
But what if we sell a TSS for income call at what we believe is the top
of the price cycle and the stock breaks cycle, shoots straight up, and never
trades at a lower price? This scenario is common and simply requires in-
vestors to implement one of many management strategies:
• Closing the position on the delta effect (discussed previously).
• Buying back the call profitably at higher stock prices due to the decay
in time value.
• Using the surrogate stock replacement to exit the position (discussed
in Chapter 5)
• Using the 20¢ rule or TSS for defense (Chapter 5).
66 COVERED CALLS
c04.qxd 10/23/06 2:18 PM Page 66
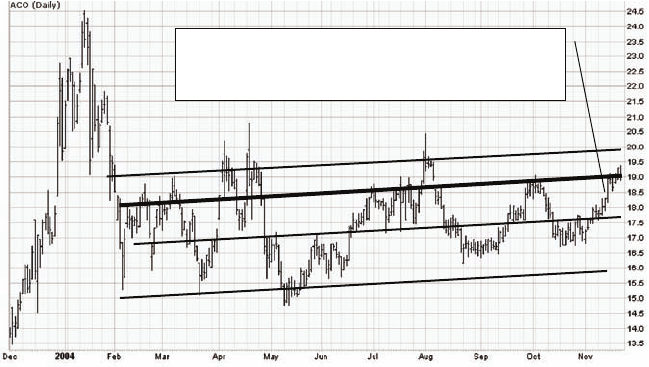
Applying the TSS for Income and
Selling High Rule
Remember, the selling high rule identifies the timing of a TSS for income
call sale. It identifies the point on the chart where a TSS for income call can
be sold. The selling high rule instructs to only sell a TSS for income call
when the stock price is in the upper 75 percent of the current price cycle.
Interpretation of the chart is vitally important. The figures in this section
show some examples of applying the TSS for income and the selling high
rule on various stocks.
Experience indicates that the selling high rule will be satisfied on
most stocks approximately once or twice a month over the long-term—
particularly when we assess shorter-term cycles (discussed in the next sec-
tion, “Safely Maximizing TSS for Income Call Sale Opportunities”). Look at
Figure 4.1. Assume we bought this stock some time in the past and it is cur-
rently trading below our cost. If we were assessing this chart today, it
would qualify under the selling high rule. At this point, we would immedi-
ately sell the TSS for income call. We do not care if it appears that the
stock has further to increase before it reaches the absolute top of the
cycle—this is speculation. We are not attempting to “pick the top.” We just
want to sell the TSS for income call in the high region of the price cycle.
Picking the absolute top is not reliably achievable and, further, does not
contribute to the success of this technique.
Management Rules 67
When the stock reaches 75% of the cycle, the selling
high rule has been satisfied. Sell TSS for income
call and wait for the stock to cycle down.
FIGURE 4.1 Satisfying the selling high rule.
c04.qxd 10/23/06 2:18 PM Page 67
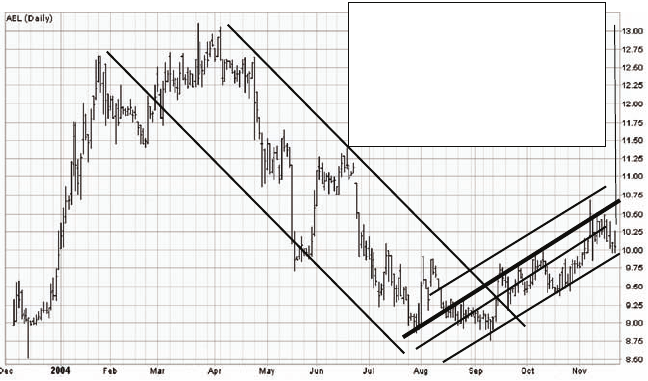
Once the TSS for income call is sold, the investor then needs to have
patience and wait for the stock to cycle down. During this period of wait-
ing, the call may be unprofitable to buy back, as the stock price may in-
crease further. The investor must have patience and allow the stock to
cycle down or time value to erode in order to profitably buy back the call.
If the stock shoots straight up we may be able to exit on the delta effect
(discussed earlier in this chapter) or will use defensive techniques such as
the surrogate stock replacement (discussed in Chapter 5).
We can see from Figure 4.2 that there are always opportunities to con-
tinue generating net cash flow using the TSS for income—regardless of the
trend of the stock. However, patience is required to wait for the correct
point in the price cycle to sell the call. In the preceding example, we would
be waiting for the stock to reach 75 percent of the cycle before selling a TSS
for income call. As soon as the stock reaches 75 percent of the cycle, we
will immediately sell the call.
Safely Maximizing TSS for Income Call Sale
Opportunities—Understanding Cycles Within Cycles
When managing fallen positions using the TSS for income, it is important to
maximize call sale opportunities. Maximizing call sale opportunities
means taking advantage of as many movements within the price cycle as
possible. In the examples illustrated by Figures 4.1 and 4.2, we assessed the
selling high rule based on a 12-month chart. However, depending on the na-
68 COVERED CALLS
Selling high rule not satisfied. Have
patience and wait for the stock to
move back to the top of the cycle.
When the stock reaches 75% of
the cycle, immediately sell the
TSS for income call.
FIGURE 4.2 The selling high rule is not satisfied.
c04.qxd 10/23/06 2:18 PM Page 68
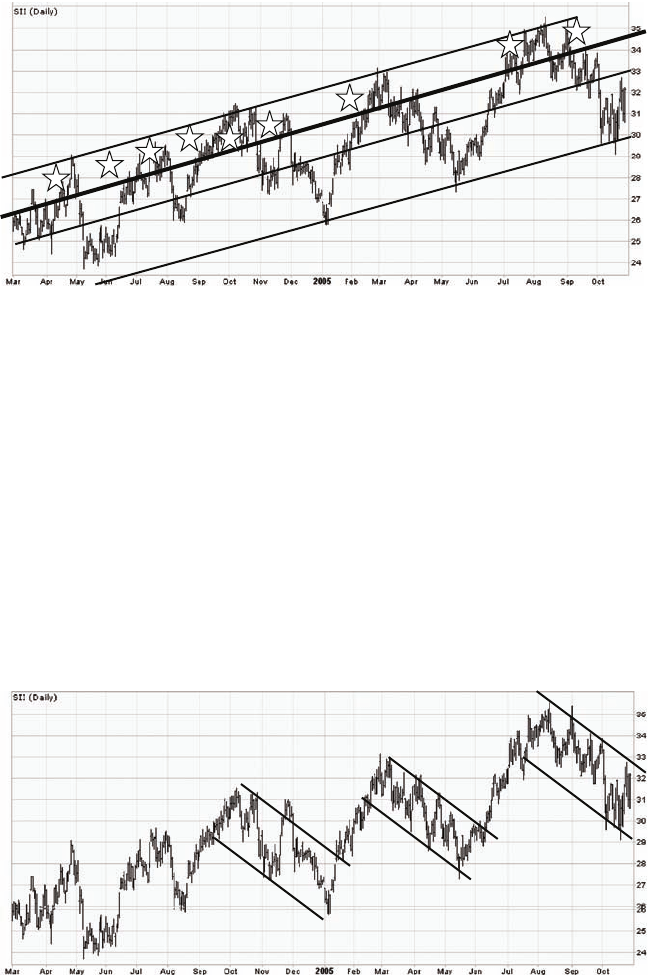
ture of the stock, it is sometimes necessary to assess the selling high rule
based on shorter-term cycles. We can see in Figure 4.3, that if assessing the
cycles on a 12-month chart, only at approximately nine points would the
selling high rule be satisfied.
In order to maximize call sale opportunities when using the TSS for in-
come and selling high rule, investors must be cognizant of shorter-term cy-
cles. We can see from the chart in Figure 4.4 that this stock is cycling
upwards over the long-term; however, there are shorter-term cycles within
the long-term cycle—both upward and downward. Some (not all) of the
cycles are highlighted in Figure 4.4 for illustration purposes.
We can see in Figure 4.4 that many more opportunities exist to imple-
ment the TSS for income while adhering to the selling high rule when
Management Rules 69
FIGURE 4.3 Maximizing sale call opportunities.
FIGURE 4.4 Many points on the short-term downward cycle qualify under the
selling high rule.
c04.qxd 10/23/06 2:18 PM Page 69
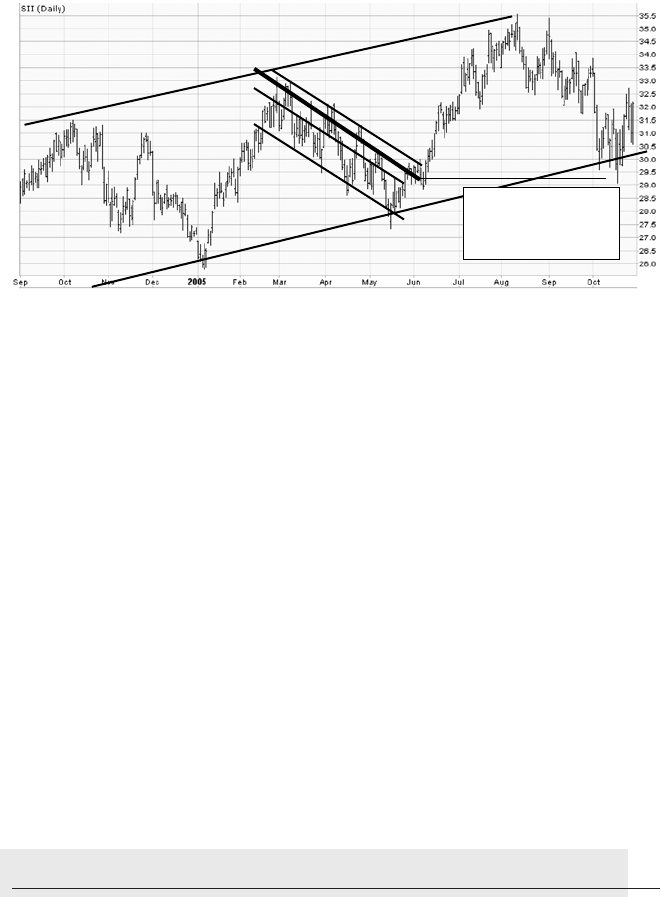
assessing shorter-term cycles. There are many points on the short-term
downward cycle that qualify under the selling high rule. However, it is most
important to always understand the longer-term cycle and the position of
the stock in relation to that cycle.
We can see in the short-term downward cycle illustrated in Figure 4.5
that the top of this cycle is actually the bottom of the longer-term upward
cycle. This is a very common occurrence. In this instance a call should not
be sold because, in actuality, the stock is at the bottom of the longer-term
upward cycle. Its bias is, therefore, up.
In summary, maximizing call sale opportunities means taking advan-
tage of as many movements within the price cycle as possible. To do this,
investors must take advantage of short-term cycles while assessing the sell-
ing high rule. However, investors must not ignore the long-term cycle when
using the TSS for income and selling high rule. Do not sell a call at the bot-
tom of the long-term cycle. Always view the stock initially over a 12-month
time frame to understand the long-term cycle. Shorter-term cycles can then
be assessed. The top of a short-term cycle is often the bottom of the long-
term cycle.
SELLING CALLS ON EXISTING STOCK HOLDINGS
Investors new to the covered call technique often express concern about
being forced to profitably sell their stock in the event of a call out. This con-
70 COVERED CALLS
Top of short-term
cycle, but bottom of
long-term cycle.
FIGURE 4.5 A stock at the bottom of a longer-term upward cycle.
c04.qxd 10/23/06 2:18 PM Page 70
cern is particularly common with investors who are considering making
their first covered call transactions on existing stock holdings that have sig-
nificant unrealized capital gains.
If an investor wishes to be successful in the business of covered calls,
emotional attachments cannot be held toward any particular stock holding;
decisions must be made purely on economic considerations. However,
when learning the covered call technique, it is also important that investors
are comfortable with their level of financial commitment to the technique,
including the commitment to the taxman if significant unrealized capital
gains are realized through a call out.
This situation arises if you bought a stock for $15.00 and the stock is
now trading at, for example, $30.00. If you were not inclined to continue
holding the stock, the rules for selling covered calls on existing stock hold-
ings (detailed later in this section) would instruct you to sell a near month
call that will provide a good uncalled and called return. For purposes of il-
lustration, let’s assume you sold a $32.50 call. If you were then called out,
you would realize a capital gain of $17.50 ($32.50 – $15.00) on the stock.
Even though you can simply repurchase the stock after being called out for
around the same price as you sold it for and then resell another call, this re-
alization of capital gains liability understandably makes some investors ner-
vous when first starting to use the covered call technique.
One alternative for investors not wishing to risk being called out of a
particular stock holding is to not sell near month calls. Instead, simply use
the TSS for income and selling high rule. This strategy will dramatically de-
crease (but can never completely eliminate) the risk of being called out. It
is the preferred strategy for investors wishing not to be called out of a par-
ticular stock position. Investors following this technique should still make
themselves familiar with the defensive techniques for preventing a call out
(discussed in Chapter 5).
Once experience and comfort are gained with the technique, it is likely
that you will realize that the merits of consistent monthly cash flow out-
weigh the very small chance of a possible realization of a large capital gain
on a particular stock when using the TSS for income. However, if this does
concern you and if you wish to initiate selling covered calls on your exist-
ing portfolio, simply choose stocks in your portfolio that will not result in
significant tax liabilities in the event of a call out. It would also be advisable
that while familiarizing yourself with the technique, you do not sell calls on
stocks that will result in a negative called return. Instead, while learning the
technique, choose stocks in your portfolio that are trading close to or
slightly above the price you paid for them.
Management Rules 71
c04.qxd 10/23/06 2:18 PM Page 71
The Rules for Selling Calls on Existing
Stock Holdings
The four rules for selling covered calls on existing stock holdings are:
1. New calls may only be sold on up market days. For the U.S. market, an
up market day is when the Dow Jones Industrial Average and the NAS-
DAQ are in the green (trading higher than the close of the previous
day). For foreign markets, an up market day is when the major market
average index for that country is in the green (trading higher than the
close of the previous day).
2. If the market price of the stock is higher than your cost in the stock,
both the called and uncalled return calculations should be based on the
current market price of the stock. If the market price of the stock is
lower than your cost in the stock, all return calculations should be
based on your cost in the stock.
3. If you have no desire to keep the stock, your objective should be to sell
a near month call that will provide a satisfactory uncalled and called
return. If you can sell a near month call with a resulting uncalled and
called return of minimum 2.0 percent for the U.S. market or minimum
1.0 percent for foreign markets, then do so. This minimum return re-
quirement is highly dependant on the volatility of the individual stock.
With experience, you will gain a greater understanding of what is a rea-
sonable uncalled and called return for your particular stock holdings.
4. If you cannot satisfy rule 3 or you do not want to be called out of the
stock holding, then use the TSS for income while being sure to adhere
to the selling high rule. These rules are detailed in the rules for sec-
ondary call sales listed earlier in the chapter.
What to Do When Called Out
If you plan to implement a covered call strategy over existing stock hold-
ings, the situation will arise when you are called out of such holdings and
left with excess capital to invest back into the market. If you wish to con-
tinue holding the stock you were called out of, you may simply construct a
new covered call position on that stock. When doing so, be sure that you
satisfy the buying low rule for covered calls. You must not construct a cov-
ered call position at the top end of the price cycle, even if it is on a stock
that you have just been called out of.
72 COVERED CALLS
c04.qxd 10/23/06 2:18 PM Page 72

IMPLEMENTING A COVERED CALL STRATEGY
USING OTHER STOCK SELECTION METHODS
Many investors choose to implement a covered call strategy on stocks that
have been selected by a professional fund manager or broker. For example,
a fund manager or broker may suggest a diversified portfolio of stocks as an
attractive long-term investment. The investor educated in the covered call
technique may then simply choose to invest in these stocks yet add the
covered call strategy to enhance yield and reduce risk in the portfolio. The
most common strategy to implement in this instance is the TSS for income
while adhering to the selling high rule to allow yield enhancement to the
portfolio without having stocks called out on a regular basis.
While this is generally a very conservative strategy, investors should
understand that the covered call yields realized using this stock selection
method would be lower than the yields realized using the stock selection
methods outlined in this book. That being said, utilizing the covered call
strategy over a diversified portfolio of blue-chip stocks selected by a value-
(not growth) orientated broker or professional fund manager is the most
conservative and low-risk equity strategy available to investors.
It is important for those choosing to implement a covered call strategy
over such a portfolio that after being called out of a particular stock, in-
vestors do not construct a new covered call position on that particular
stock until the buying low rule for covered calls has been satisfied.
Management Rules 73
c04.qxd 10/23/06 2:18 PM Page 73
c04.qxd 10/23/06 2:18 PM Page 74

75
CHAPTER 5
We have established that the difference between great success and
complete mediocrity in the business of writing covered calls is
management. Management primarily involves generating consis-
tent monthly income from a stock investment regardless of the direction or
trend of the stock.
With this chapter, we move on to defensive techniques, which are as
important as management techniques but used more sparingly. Defensive
techniques serve several very important functions, including:
• Identifying if a position is in danger of being unprofitably called out.
• Preventing an unprofitable call out while maintaining positive cash
flow.
• Remedying a TSS for income call sale that is not able to be bought back
for a profit.
• Reducing the profitable exit price of an underperforming position.
• Generating income on deeply depressed stock positions.
The defensive techniques presented in this chapter cover the entire
scope of worst-case scenarios that may be encountered by the covered call
investor. These techniques provide a so-called “light at the end of the tun-
nel” for poorly performing covered call positions and, when properly un-
derstood, provide investors with the confidence to implement the mind-set
of never selling a stock for a loss.
Defensive
Techniques
c05.qxd 10/23/06 2:15 PM Page 75

76 COVERED CALLS
BASIC DEFENSIVE TECHNIQUES
The 20¢ Rule
You should recall that option contracts are rarely exercised until the last
two weeks before expiration because doing so results in a loss of time value
to the option buyer. In practically, the vast majority of option contracts are
exercised on the third Friday of expiration.
It is very rare that an option contract will be exercised before the last
two weeks of the option month, even if it is in the money. As such, defen-
sive measures to avoid an unprofitable call out need only be taken when the
option contract is within its last two weeks before expiration. If someone
does exercise on you early, you are unlucky and it will probably never hap-
pen again.
The 20¢ rule provides investors with a method to determine whether an
investment is in danger of being called out and if it is, therefore, necessary
to implement the tethered slingshot (TSS) for defense to prevent being
called out.
The 20¢ rule states that if you have a negative called return when an op-
tion contract has two weeks or less to expiration, take the strike price of
your call, add the cost of buying back that call (the ask price) and subtract
the market price of the stock. So:
20¢ rule = Call strike price + Call buyback price (ask) – Stock price
If the 20¢ rule value is equal to $0.20 or less, you are in the danger zone of
being called out and you need to take defensive action using the TSS for
defense.
The need for the 20¢ rule also arises when an investor has lowered the
strike price on a call sale and has a negative called return on a position.
While this situation arises very rarely when using the covered call tech-
niques presented in this book, it happens quite often when adopting tradi-
tional covered call methods, which instruct to sell near month calls with
lower strike prices in order to maintain yield. Regardless, awareness of
how to avoid an unprofitable call out is very important.
Let’s look at an example. Assume an investor buys a stock for $14.75
and sells the June $15.00 call for $0.80. In this example the return calcula-
tions would be:
Uncalled return = $0.80/$14.75 = 5.4%
Called return = ($0.80 + $15.00 – $14.75)/$14.75 = 7.1%
c05.qxd 10/23/06 2:15 PM Page 76
Defensive Techniques 77
The stock price then falls to $12.50 and the call expires worthless leav-
ing the investor with a return of 5.4 percent for the month. This investor
then elects to sell the July $12.50 strike. (Note that this would not be the
course of action if correctly following the secondary call sales rules—this
is for illustration purposes only. The correct course of action would be to
use the TSS for income [sell the second to last expiration of the option
chain and a call that allows for a minimum of 10 percent uncalled return
while adhering to the selling high rule].)
Let’s assume that the stock price now rises and the investor is unable
to buy back the near month $12.50 strike call back for a profit. The stock
price is now $13.30. As the stock price is now above the strike price of the
call sold, it may be in the interest of the option buyer to exercise his or her
option. The covered call writer may have to sell the stock at a loss. This in-
vestor may be in danger of being called out for a loss and needs to use the
20¢ rule for guidance. Thus:
20¢ rule = $12.50 + $0.85 (trading near intrinsic value) – $13.30
= $0.05
Since the 20¢ rule value is less than $0.20, this position is likely to be called
out and defensive action is necessary.
Remember, the 20¢ rule is only used in the last two weeks of the op-
tion month and only on positions with negative called return. You must
monitor such positions carefully during the last two weeks of the option
month to make sure you are not in danger of being called out unprof-
itably. If at any time during the last two weeks of the option month you
have sold a call that results in a negative called return and the 20¢ rule
equals $0.20 or less, you must immediately take defensive action using the
TSS for defense.
Tethered Slingshot for Defense
You should implement the TSS for defense immediately if the 20¢ rule has
indicated that you are in danger of being called out and that this call out will
be unprofitable.
The functions of the TSS are:
• Preventing an unprofitable call out.
• Generating additional covered call income.
• Allowing the investor to move the strike price of the call back to where
the called return is positive.
c05.qxd 10/23/06 2:15 PM Page 77

78 COVERED CALLS
The eight rules for using this technique are:
1. Implement the TSS for defense if the 20¢ rule indicates that you are in
danger of being called out and that this call out will be unprofitable.
2. Immediately buy back the existing call (this results in a temporary
loss).
3. Select the same call strike price but move the expiration date out to the
second to last expiration.
4. You have now generated additional covered call income, as the price
you received for selling the TSS for defense call is always higher than
the cost of buying back the near month. You no longer have a tempo-
rary loss.
5. Buy back this new call when the net gain is at least equal to the tempo-
rary loss generated in rule 2.
6. You now have a stock with no call obligation, did not get called out, and
made additional income every step of the way.
7. You should now be patient and wait for an upswing in the stock price
that will allow you to sell a near month call for a minimum of 4 percent
uncalled and called return for the U.S. market and 1.5 percent for for-
eign markets that will allow a positive called return.
8. If the stock reaches 75 percent of the price cycle and does not allow for
application of rule 7, go back to the rules for secondary call sales given
in Chapter 4.
ADVANCED DEFENSIVE TECHNIQUES
The defensive techniques presented in this section are considered ad-
vanced because they draw on the use of debit spreads. A debit spread in-
volves selling a call option while using another long call option for cover,
rather than the stock. The general technique of using debit spreads is dis-
cussed in detail in Part II on calendar LEAPS spreads. Here we discuss how
to use debit spreads as a specific defensive tool for covered call investors.
These advanced defensive techniques are indispensable when using the
covered call technique.
Many brokers do not allow the use of debit spreads in a retirement ac-
count such as an IRA or 401k. It is important for investors to understand
that this is a software-related issue at the particular brokerage house rather
c05.qxd 10/23/06 2:15 PM Page 78
Defensive Techniques 79
than a legal requirement that prevents the use of debit spreads in a retire-
ment account. To keep your business, many brokerage firms will tell you
debit spreads are “not allowed in a retirement account.” This is a mislead-
ing statement. Debit spreads are allowed in a retirement account; however,
most brokerage houses do not have the software to cater for them. For a
list of Compound Stock Earnings recommended brokers, including those
that allow debit spreads in a retirement account, go to www.compound
stockearnings.com/brokers.
Surrogate Stock Replacement
Surrogate stock replacement (SSR) is an invaluable covered call defensive
technique. The function of the SSR is to expedite the profitable close-out of
a covered call transaction where the following three conditions apply:
1. An investor has used the TSS for income on the position.
2. The stock has continued to move up after selling the TSS for income
call. The investor is therefore unable to buy back the TSS for income
call due to this buyback being unprofitable.
3. The investor now has a profit in the stock position, but is prevented
from closing the entire transaction (buying back the call and selling the
stock) because doing so would result in an overall transaction loss. In
all instances this is due to the loss on buyback of the TSS for income
call exceeding the potential profit from selling the stock.
See, for example, the position shown in Table 5.1. This investor has a
$2.00 profit in the stock position; however, the position cannot be closed
due to a $4.50 loss on the TSS for income call. Closing the position would
result in an overall transaction loss of $2.50.
Given this scenario, if the investor does not implement the SSR, the
strategy going forward with this position would be to take one of the fol-
lowing two actions:
TABLE 5.1 Example Position Appropriate for Use of SSR
Entry Current Profit/
Position Price Price Loss
Long GE stock $35.00 $37.00 $2.00
Short Jan 2007 $30 call $ 5.00 $ 9.50 –$4.50
c05.qxd 10/23/06 2:15 PM Page 79

80 COVERED CALLS
1. Wait for the stock price to move down or for time value to erode so the
investor can profitably buy back the TSS for income call.
2. Wait for a large increase in the stock price, which, in most cases, will
eventually lead to the position becoming profitable due to the delta
ratio.
The SSR serves the function of expediting the closeout of a TSS for in-
come call sale that has gone bad. This function is highly valuable to the
covered call investor because waiting for the conditions to arise to permit
either action (1) or (2) can, in many instances, take several months. During
this period of waiting for the position to improve through either a large in-
crease or decrease in the stock price, the capital invested in the position be-
comes dormant and unproductive. This period of waiting represents an
opportunity cost to the investor—the cost of returns that could have been
made if that capital were invested in productive positions.
When using the SSR, the objective is to restructure the position through
the following three actions:
1. Closing out the existing position by buying back the call and selling the
stock. In every case, this creates a temporary loss (the restructure
cost).
2. Purchasing a LEAPS or a longer-term call in place of the stock.
3. Selling a near month or two month out call that will provide a positive
called return on the entire transaction (including recuperating the re-
structure cost).
The ten rules for using the SSR technique are:
1. The SSR is to be used on a covered call position where an investor has
an open TSS for income call.
2. The investor has a profit in the stock position.
3. The position cannot be closed for a profit, as the loss on buyback of the
call is greater than the potential profit from selling the stock. There-
fore, if the position is closed out, a net loss for the investor would be
created.
LEAPS: Acronym for long-term equity anticipation securities. They are simply
long-term options. They have exactly the same standardized characteristics
as a normal option but with a long-term expiration. Contracts with one year
or more to expiration and a January 200x expiration are known as LEAPS.
c05.qxd 10/23/06 2:15 PM Page 80
Defensive Techniques 81
4. Use the SSR Worksheet to calculate the net loss in closing the transac-
tion (the SSR Worksheet is part of the Covered Call Toolbox, one
month’s complementary access to which is available by going to
www.compoundstockearnings.com/freemonth). This net loss is the re-
structure cost.
5. Input various LEAPS contracts into the SSR Worksheet. The SSR usu-
ally works better when using the second to last expiration LEAPS,
rather than the furthest out LEAPS contract. Start one strike price out
of the money and move into the money three or four contracts.
6. Input various near month and two month out call contracts into the
SSR Worksheet. Start two strikes out of the money and move into the
money two contracts.
7. The SSR should be executed if the SSR Worksheet presents a transac-
tion that has both an uncalled and called return of greater than 2 per-
cent. Preference should be given to the SSR transaction with the
highest returns. Preference should also be given to selling the near
month call.
8. It is also preferable that the SSR be cash flow positive. Investors with
excess capital may still choose to execute the SSR if it is cash flow neg-
ative. Optimally, the transaction should generate net cash.
9. If the transactions presented by the SSR Worksheet do not meet the re-
turn requirements or cash flow requirements in items (7) and (8), more
aggressive investors may choose to enter shorter-term calls into the
SSR Worksheet as an alternative to using a LEAPS. Aggressive in-
vestors may buy a shorter-term call to construct a SSR if the shorter-
term call provides an SSR that meets rules (7) and (8). If buying a
shorter-term call:
(a) Preference must be given to the longest-term call that meets rules
(7) and (8).
(b) An investor must not purchase a call when that call’s price consists
of more than 15 percent time value. This limit ensures that the in-
vestor is purchasing primarily intrinsic value (exercisable value)
and will not be affected greatly by time decay in the event that the
position is not exited quickly.
(c) When purchasing a shorter-term call, investors must be aware that
in the event the stock begins trading down, the call will need to be
rolled out.
10. In the event the call that was shorted in the SSR restructure expires
worthless (the position was not called out), the position should be
managed like a regular LEAPS position (discussed in depth in Chapter
8) with the following exception:
c05.qxd 10/23/06 2:15 PM Page 81
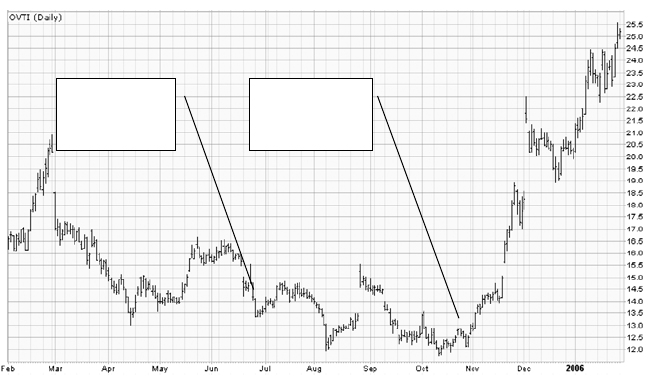
82 COVERED CALLS
(a) The investor should always give preference to selling a near
month call if that call will provide a positive called and uncalled
return. Remember, the objective of the SSR is not to manage the
position for income, but to exit the unproductive position as soon
as possible.
An Example of Implementing SSR Figure 5.1 shows the entry of a
covered call position on OVTI, at a price of $15.13, in the middle of June.
The stock then proceeded to fall, and the TSS for income was applied on
several occasions to maintain return on the position even though it was
depressed. In late October, a TSS for income call was sold in accordance
with the selling high rule. The call sold was the January 07 $12.50 at a price
of $2.85.
The stock then broke to the top of the declining price cycle and in-
creased strongly over the following month. During this time, the position
could not be closed for a profit, as the loss on buyback of the TSS for in-
come call was always in excess of the realizable profit on the stock. As is
sometimes the case, the delta ratio on the position was not acting as it
should. The position was then as depicted in Table 5.2.
It is clear that this position could not be closed for a profit, as the loss
on call buyback was greater than the profit when selling the stock. Without
using the SSR restructuring, the strategy going forward on this position
would be either to wait for a further increase in the stock price and an
Stock
purchased
here at $15.13.
Problem TSS for
income call
sold here.
FIGURE 5.1 History of a covered call position.
c05.qxd 10/23/06 2:15 PM Page 82
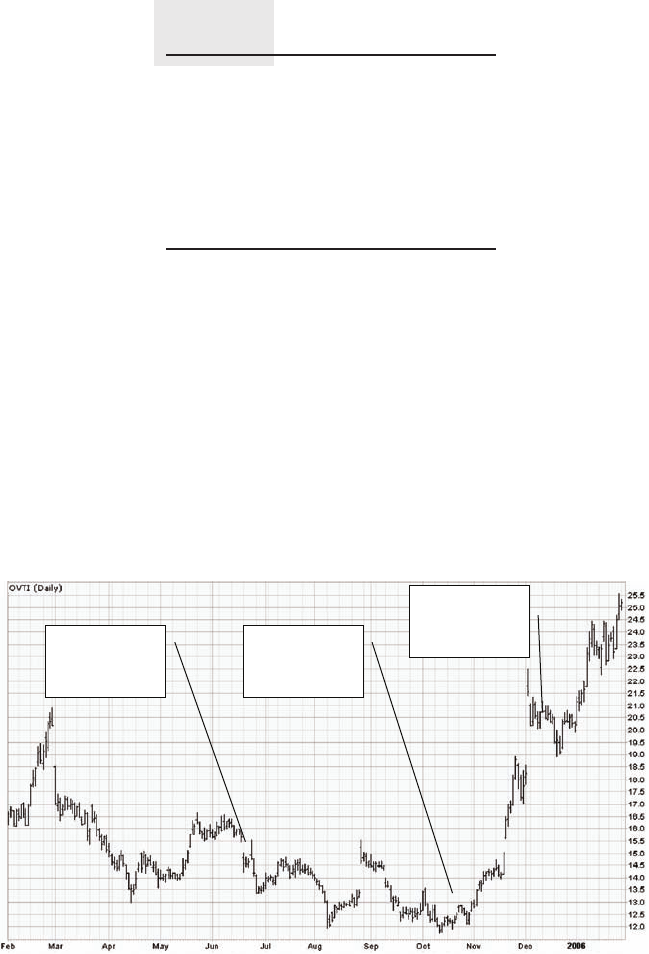
Defensive Techniques 83
eventual exit on the delta effect (this would be difficult given that the call
is now very deep in the money and the delta is near 1) or to wait for a de-
cline in the stock price to allow a profitable buyback of the TSS for income
call. This position (Figure 5.2) is, therefore, an ideal candidate for the SSR
technique to be applied according to the following steps.
Step 1: Assess the restructure cost. The restructure cost is the tempo-
rary loss generated when the unproductive position is closed out or “re-
structured.” It is the same as the loss if the position is closed. In this
instance, the restructure cost is –$1.12. See Table 5.3.
TABLE 5.2 Data for Position Shown in
Figure 5.1
Current stock price $21.66
Cost in stock 15.13
–———
Profit on sale $ 6.53
Call sell price $ 2.85
Current call price 10.50
—–——
Loss on buyback –$ 7.65
Loss if position closed –$ 1.12
Stock
purchased
here at $15.13.
Problem TSS
for income call
sold here.
SSR
restructure
applied here.
FIGURE 5.2 Application of the SSR technique to the covered call position
depicted in Figure 5.1.
c05.qxd 10/23/06 2:15 PM Page 83

84 COVERED CALLS
Step 2: Assess the option chain for an appropriate SSR. In this step,
we look at the at-the-money and in-the-money LEAPS contracts (second to
last expiration is the most likely to provide an acceptable transaction) and
match these contracts with a near month (ideally) or a two month out call.
This creates a LEAPS transaction with a short-term call sold against it.
The objective is to select a transaction that:
• Provides a positive called return—including recuperation of the re-
structure cost.
• Provides an acceptable uncalled return of greater than 3 percent.
• Is cash positive—meaning that the SSR will free up cash when exe-
cuted. This cash can then be reinvested into new positions.
To achieve these objectives, investors should use the SSR Worksheet
(part of the Covered Call Toolbox, one month’s complementary access
to which is available by going to www.compoundstockearnings.com/
freemonth). The SSR Worksheet allows investors to enter various LEAPS
and call combinations to find the optimal SSR for a position. It is very im-
portant that the position is constructed to provide a positive called return
including recuperation of the restructure cost. Otherwise, the call out will
be at a loss. The calculation of uncalled and called returns, including recu-
peration of the restructure cost, is performed by the SSR Worksheet.
Looking at the option chain and entering the appropriate LEAPS and
call contracts into the SSR Worksheet as instructed in the SSR rules pro-
duces the results as shown in Table 5.4. The SSR restructure that is optimal
for this particular transaction is highlighted. After closing out the existing
stock and TSS for income call position, the investor should immediately
buy the $15.00 January 2007 call for $8.60 and immediately sell the $25.00
January 2006 call for $0.60. This is the transaction that provides the best
TABLE 5.3 Assessing Restructure Cost
Current stock price $21.66
Cost in stock 15.13
–———
Profit on sale $ 6.53
Call sell price $ 2.85
Current call price 10.50
–———
Loss on buyback –$ 7.65
Restructure cost –$ 1.12
c05.qxd 10/23/06 2:15 PM Page 84

85
TABLE 5.4 Potential SSR Combinations
Ask Cash Bid Uncalled Called Bid Uncalled Called Bid Uncalled Called
Exp Strike Price Free Up Price Return Return Price Return Return Price Return Return
2007 $12.50 $10.40 5.0% 1.30 12.5% –2.1% 0.60 5.8% 15.2% 0.20 1.9% 35.4%
2007 15.00 8.60 16.9 1.30 15.1 –10.7 0.60 7.0 10.2 0.20 2.3 34.7
2007 17.50 7.00 27.5 1.30 18.6 –26.0 0.60 –8.6 –0.3 0.20 2.9 29.7
2007 20.00 5.60 36.7 1.30 23.2 –52.1 0.60 –10.7 –20.0 0.20 3.6 17.5
Sell Call Jan-06 $22.50 Sell Call Jan-06 $25.00 Sell Call Jan-06 $27.50Long Call Candidate
c05.qxd 10/23/06 2:15 PM Page 85
86 COVERED CALLS
uncalled and called return and also frees up a high percentage of cash from
the position.
Shorting the $22.50 strike is not acceptable as doing so leads to nega-
tive called returns. Shorting the $27.50 strike is not optimal because it
would require a very large movement in the stock price to be called out. Ad-
ditionally, the uncalled return is very low (which is what the investor is
likely to receive at January expiration given the very out-of-the-money
$27.50 strike).
In regard to the long call selected, the optimal selection is to long the
January 07 $15.00 strike rather than the $12.50 strike as this frees up more
cash and provides a higher uncalled return when matched with the January
06 $25.00 strike.
Step 3: Execute the SSR. In this instance, the investor should close the
existing position, generating a restructure cost of –$1.12. The investor
should then long the January 2007 $15.00 at $8.60 and short the January
2006 (one month to expiration at time of execution) $25.00 at $0.60.
Executing this transaction will free 16.9 percent of the capital from the
position.
Note: The SSR Worksheet is designed to carry forward the restructure
cost when calculating the called return. The called return presented by the
SSR Worksheet includes recuperation of the restructure cost. This function
is very important to the success of the SSR. If the called return and re-
structure cost are not correctly accounted for, the position will be called
out at a loss.
If uncalled, the return on this position will be 7.0 percent (see Table
5.4), and if called the return will be 10.2 percent (see Table 5.4). The in-
vestor is now back into productive management of this position and has a
very high likelihood of exiting the entire position in one month’s time
through a call out. Remember, the cycle is now up, and that is why we are
unable to buy back the TSS for income call profitably.
If the stock price continues up and does not reach the strike of the
short call, the investor will keep the premium of the short call at expiration
and also benefit from capital appreciation of the LEAPS. This situation
often results in the investor being able to sell the LEAPS for an overall
transaction profit immediately following worthless expiration of the short
call. Exiting the position profitably does not specifically require a call out.
This is a very important characteristic of the SSR technique.
Step 4: Close the SSR and complete the transaction. In this particular
instance, the $25.00 January 2006 call expired worthless and the $15.00 Jan-
uary 2007 LEAPS was sold on the Monday following the third Friday. The
transaction was closed for an overall profit (Figure 5.3).
c05.qxd 10/23/06 2:15 PM Page 86
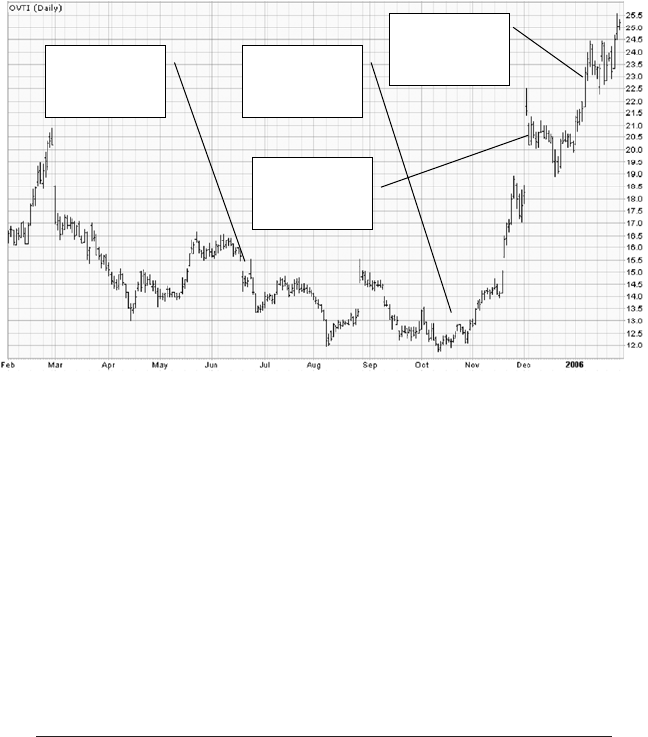
Defensive Techniques 87
The profit on the transaction was as follows:
Profit from TSS for income call sales and buybacks
prior to SSR $1.80
Loss on restructure –$1.12
Profit from SSR $25.00 January 2006 call at expiration $0.60
Profit from sale of LEAPS on Monday following
January 2006 expiration $1.17
Total OVTI transaction profit at closeout $2.45
Profit on original $15.13 investment 16.2%
What if the SSR is uncalled and the LEAPS cannot be sold for an over-
all transaction profit? If the position is uncalled at January expiration and
the transaction still cannot be closed for an overall profit, the investor
should just resell the February 2006 $25.00 call provided that doing so re-
sults in a satisfactory uncalled return of 3 percent or more. If not, the posi-
tion should be managed to exit like a regular LEAPS transaction. The
process of managing a LEAPS transaction is discussed in Chapter 8.
Stock
purchased
here at $15.13.
Problem TSS
for income call
sold here.
SSR
restructure
applied here.
Transaction
profitably
closed here.
FIGURE 5.3 Completing the SSR transaction for the covered call position
depicted in Figure 5.1.
c05.qxd 10/23/06 2:15 PM Page 87
88 COVERED CALLS
Cardiopulmonary Resuscitation
Cardiopulmonary resuscitation (CPR) is an advanced covered call defen-
sive technique that is used to literally resuscitate a fallen stock. The CPR
has two typical applications:
1. To dramatically expedite the closing of a new covered call position
where the stock price has suffered an immediate decline after entering
the transaction. The CPR provides this ability as, in many cases, it al-
lows the investor to lower the strike price of the short call in the near
month, yet continue to maintain a positive called return.
2. To generate income and reduce the cost basis in a deeply depressed po-
sition. The CPR can effectively be applied where an underperforming
stock is now in an upward cycle but the cycle’s depth is too shallow to
effectively use the TSS for income.
The Structure of a CPR For any given stock position, the construction
of a CPR is accomplished as follows:
1. An investor holds a long position of 100 shares of stock.
2. The investor buys one near month (or two month out) call.
3. The investor sells two near month (or two month out) calls with a
higher strike price than the call selected in step 2.
In the preceding example, the investor owns 100 shares of stock,
yet has sold two calls against the position. The stock holding covers
one of these calls and the second call is covered by the purchase of the
long call.
The CPR always follows this structure: The investor will always pur-
chase the number of call options that relates to his or her stock holding and
will always sell two times the number of call options that relates to his or
her stock holding. For example, (1) an investor holds a long position of 300
shares of stock; (2) the investor buys three near month (or two month out)
calls; and (3) the investor sells six near month (or two month out) calls with
a higher strike price than the call selected in (2).
This structure of selling two times the number of calls than the investor
purchases predominantly finances the purchase of the long call. This is an
important structural aspect of the technique and limits the downside of the
strategy in the event of an unfavorable stock price at expiration (discussed
later in this section).
c05.qxd 10/23/06 2:15 PM Page 88
Defensive Techniques 89
Let’s look at the construction of a typical CPR on the stock FMD. The
objective of this example is to illustrate the structure of the CPR. The rules
for selecting expirations and strikes, timing, and pay-off scenarios are dis-
cussed later in this section.
Let’s assume it’s early January and John owns 100 shares of FMD at a
cost of $32.50. A typical CPR construction as previously described would
appear as follows:
1. John owns 100 shares of FMD at a cost of $32.50.
2. John buys one $25.00 January 06 call at $4.00.
3. John then sells two $30.00 January 06 calls at $1.50.
Understanding the Net Debit of a CPR Using the prices in the pre-
ceding example, John has outlaid $4.00 to purchase the $25.00 call, yet has
received $3.00 by the sale of two $30.00 calls. The net cash cost of this CPR
to John is $1.00 [$4.00 – (2 ×$1.50)]. This $1.00 net cost when constructing
a CPR is known as the net debit. The net debit should always be expressed
on a per share basis:
Net debit = Price of long call – (2 ×Price of short call)
It should now be clear that when an investor places a CPR, he or she is,
in effect, purchasing a near-term call to take advantage of a rising stock
price. This call, however, is being predominantly financed through the sale
of two calls at a higher strike price. This financing limits the downside in
case the stock price does not increase. If the stock price goes down signif-
icantly, the loss to the investor will be the $1.00 per share net debit rather
than the $4.00 per share cost of buying the short-term call on its own.
The net debit of the CPR is the maximum loss to the investor. How-
ever, the cost of this limited downside to the investor is that the investor’s
upside is now capped at the strike price of the short call ($30.00 in this
case). In the event that the stock price increases above the strike price of
the short call, the investor will be called out of the position (both the stock
position and the long option position) at the strike price of the short call.
In summary, the CPR provides very small downside to the investor. This
downside is equal to the net debit. However, this small downside comes at
a cost: The investor’s upside is capped at the strike price of the short call.
Understanding the Payoff from a CPR Now that the structure of the
CPR is understood, let’s examine the payoff from the strategy. The rules for
selecting expirations and strikes and timing are discussed later in this
c05.qxd 10/23/06 2:15 PM Page 89
90 COVERED CALLS
section. Continuing with the preceding example of John owning 100 shares
of FMD at a cost of $32.50, a CPR would be constructed as follows:
1. John owns 100 shares of FMD at a cost of $32.50.
2. John buys one $25.00 January 06 call at $4.00 (near month).
3. John then sells two $30.00 January 06 calls at $1.50 (near month).
We now use the CPR Worksheet (part of the Covered Call Toolbox, one
month’s complementary access to which is available by going to www
.compoundstockearnings.com/freemonth) to understand the payoff from
the strategy at expiration of the long and short call options.
Table 5.5 shows the profit to the investor at various stock prices at ex-
piration. A CPR is an expiration-based strategy meaning that once a CPR
is constructed, it is generally held until expiration of the contracts. The
highlighted line in the table shows the payoff of the strategy at various
stock prices at expiration, represented as a percentage of the $32.50 in-
vestment in the stock.
CPR Is Unprofitable at Expiration We can see from Table 5.5 that if the
stock price finishes at $25.00 or below on the third Friday of January 2006,
the CPR will lose the investor 3.1 percent of his or her $32.50 investment in
the stock (a loss of $1.00). This loss is equal to the net debit and is com-
puted as follows:
Long $25.00 strike call:
• Cost is $4.00
• Expired worthless
• Loss of $4.00
Short 2 ×$30.00 strike call:
• Premium received is $3.00 ($1.50 ×2)
• Expired worthless
• Profit of $3.00
CPR return:
• Loss of $4.00 on long call
• Profit of $3.00 on short calls
• Net loss of $1.00
This $1.00 loss represents 3.1 percent of the $32.50 investment in the stock.
Regardless of how low the stock price goes, the investor’s maximum loss
for this CPR is capped at the net debit of $1.00 or 3.1 percent.
The maximum loss of all CPRs is equal to the net debit of the
transaction.
c05.qxd 10/23/06 2:15 PM Page 90
91
TABLE 5.5 Profit at Various Stock Prices at Expiration
Stock Price at Expiration
$24.00 $25.00 $26.00 $27.00 $28.00 $29.00 $30.00 $31.00 $32.00
Long $25 and Short $30
Will I get called out? No No No No No No Yes Yes Yes
Profit (loss) if called based on cost $ 1.50 $ 1.50 $ 1.50
How much did I get all up when called? $34.00 $34.00 $34.00
Current market price to repurchase $30.00 $31.00 $32.00
Cash return or called return % –3.1% –3.1% 0.0% 3.1% 6.2% 9.2% 4.6% 4.6% 4.6%
c05.qxd 10/23/06 2:15 PM Page 91
92 COVERED CALLS
CPR Is Profitable at Expiration but Not Called Out We can also see from
Table 5.5 that this strategy becomes profitable at stock prices of $27.00 or
greater at expiration. If the stock finishes the option month at $27.00, the
profit from the CPR will be $1.00 or 3.1 percent of the $32.50 investment in
the stock. This profit is computed as follows:
Long $25.00 strike call:
• Cost is $4.00
• Sell for intrinsic value of $2.00 on third Friday
• Loss of $2.00
Short 2 ×$30.00 strike call:
• Premium received is $3.00 ($1.50 ×2)
• Expired worthless
• Profit of $3.00
CPR return:
• Loss of $2.00 on long call
• Profit of $3.00 on short calls
• Net profit of $1.00
This $1.00 profit represents 3.1 percent of the $32.50 investment in the
stock. In order to realize this profit, the investor must take the following
steps on the third Friday of expiration:
1. Buy back one of the short $30.00 calls. This buyback can normally be
executed for $0.05, as the call will expire worthless at the end of the
trading day. This buyback frees the long $25.00 call for sale, as it is no
longer needed to cover one of the short calls.
2. Sell the long $25.00 call. The sale price will be around the intrinsic
value of $2.00.
3. Allow the second call to expire worthless at the end of the trading day.
These three steps must be executed on the third Friday of expiration in
all CPRs when (a) the long call is in the money and (b) the short call is out
of the money (the CPR will not be called out). Following these steps allows
the investor to salvage the intrinsic value in the long call before that call ex-
pires worthless or the broker automatically exercises it.
CPR Is Called Out at Expiration In the event that the stock price finishes
above the strike price of the short call, the short calls will be exercised and
the position will be called out. This situation will generally occur only on
c05.qxd 10/23/06 2:15 PM Page 92
Defensive Techniques 93
the third Friday of expiration. Using the preceding FMD example, if the
stock price is above $30.00 on the third Friday of January, the position will
be called out. John will be required to deliver 200 shares of FMD stock at a
price of $30.00. The following transactions will automatically occur in his
account as a result of the call out:
• John’s holding of 100 shares of FMD will be sold at the short call exer-
cise price of $30.00. John’s cost in FMD stock is $32.50, so he has sold
the stock for a loss of $2.50 per share.
• John will keep the $3.00 premium received for the short calls.
• John has an obligation to deliver an additional 100 shares of FMD stock
at $30.00 as he has sold two $30.00 calls. His broker will thus automat-
ically exercise John’s $25.00 strike call and he will buy 100 shares at
this price. The broker will then automatically sell this stock at the short
strike price of $30.00 to deliver John’s obligations from the $30.00 short
call. John has, therefore, purchased 100 FMD shares at $25.00 and im-
mediately sold these at the short strike price of $30.00. He has made
$5.00 profit per share on these 100 shares.
• John will then lose the $4.00 premium he paid for the long call option,
as this call has now been exercised.
• Adding these figures, John’s overall profit on call out is $1.50 or 4.6 per-
cent of his $32.50 investment in the stock. This profit is computed as
follows:
(a) Loss of $2.50 per share on the stock sale plus
(b) Profit of $3.00 per share from short call premium plus
(c) Profit of $5.00 per share from buying the stock at $25.00 and selling
at $30.00 plus
(d) Loss of $4.00 per share from the exercised long option equals
(e) Overall transaction return of $1.50 per share or 4.6 percent of the
$32.50 investment in the stock.
We now understand that this CPR will be called out for a return of 4.6
percent if the stock price is above $30.00 at expiration. Importantly, re-
gardless of how high the stock price is at expiration, John’s called return is
capped at 4.6 percent. He will receive the same called return regardless of
how high above $30.00 the stock price is at expiration because his upside in
the transaction has been capped by the sale of the $30.00 call option.
Understanding the CPR Worksheet Now that we understand the
basic structure of the CPR, let’s look at entering this particular transaction
into the CPR Worksheet. The CPR Worksheet is part of the Covered Call
Toolbox (one month’s complementary access to which is available by going
c05.qxd 10/23/06 2:15 PM Page 93
94 COVERED CALLS
to www.compoundstockearnings.com/freemonth). The CPR Worksheet al-
lows investors to quickly and accurately perform the following three tasks
automatically:
1. Assess various strike prices and expirations to find the optimal CPR for
a given position.
2. Calculate the net debit of the transaction.
3. Understand the profit and loss of the CPR at various stock prices at
expiration.
We continue with the preceding example of assessing a CPR on FMD
stock, which an investor owns at a cost of $32.50. The first step in assess-
ing a CPR on this position is to enter the position details into the CPR Work-
sheet as indicated by the highlighted cells thereon.
CPR Worksheet Inputs The inputs for our example as shown in Table 5.6
are:
• The stock code is FMD.
• The purchase price is the investor’s cost of 32.50.
• The net premium to date is $0.00. For simplicity, we have assumed the
investor has not made any income from call sales and buybacks. Im-
portantly this figure is net premium. Net premium is cumulative call
premium from closed positions only. When assessing a CPR you must
not include the premium from an open call position. If an investor
wishes to construct a CPR, the stock must not have an open call posi-
tion. Any open call positions will first need to be closed. The profit or
TABLE 5.6 CPR Worksheet Inputs
Inputs
Stock FMD
Purchase price $32.50
Net premium to date $ 0.00 0.0%
P&L analysis—start price $24.00
P&L analysis—$ increment $ 1.00
CPR potential strikes $25.00 $30.00 $35.00
Bid or ask Ask Bid Ask Bid
Option price $ 4.00 $1.50 $1.65 $ 0.30
Net debit CPR with $25 and $30 $ 1.00 3.6%
Net debit CPR with $30 and $35 $ 1.05 3.2%
Ask Bid Ask Bid
c05.qxd 10/23/06 2:15 PM Page 94
Defensive Techniques 95
loss on closure should be included in total net premium to date on the
position.
• The P&L analysis—start price is $24.00.
• The P&L analysis—$ increment is $1.00.
• The CPR potential strikes are $25.00, $30.00, and $35.00. The potential
strikes were selected arbitrarily from the option chain. In general, the
strikes that most often construct effective CPRs are in the range of two
strikes in the money to two strikes out of the money. This is explained
in more detail later in this chapter.
• The option prices entered are the relevant bid and the ask prices for the
near month or near month + 1 contract. The CPR should always be con-
structed with the near month call if this call provides the desired return
outcome. If it does not, the CPR can be constructed with near month +
1 contracts. This, again, is discussed in more detail later in this chapter.
Using the inputs provided, the CPR Worksheet then calculates the net debit
for the two possible CPRs on this position.
Understanding the CPR Worksheet Outputs Once the details of a partic-
ular position and the potential CPR strikes and market prices have been
entered, the CPR Worksheet will produce the profit and loss from the par-
ticular CPR at various stock prices at expiration.
Table 5.7 shows the profit and loss scenarios for two different CPRs
that have been generated by the CPR worksheet:
1. Long $25.00 and short $30.00
2. Long $30.00 and short $35.00
The investor then needs to assess both potential CPRs to select the best
construction for the position. We achieve this by looking in Table 5.7 and
comparing the rows “Cash Return or Called Return %” for each CPR. We
can see that the $25.00 and $30.00 CPR becomes profitable with stock
prices at expiration above $27.00 and that a profitable call out of 4.6 percent
will occur at stock prices at expiration (one or two months away) of $30.00
and above (remember, the cost in the stock is $32.50). The maximum loss
on this CPR is the net debit, which is 3.1 percent.
Alternatively, if the $30.00 and $35.00 strike CPR is selected, the CPR
will become profitable at stock prices at expiration of $32.00 and above,
and a positive called return of 19.8 percent will result with stock prices
greater than $35.00 at expiration. We can see that this CPR needs a greater
increase in the stock price in order to become profitable and provides more
upside to the investor due to the higher strike price. Again, the maximum
loss of this CPR is the net debit, which is 3.2 percent.
c05.qxd 10/23/06 2:15 PM Page 95
96
TABLE 5.7 Stock Breakeven Analysis
Stock Price at Expiration
$25.00 $26.00 $27.00 $28.00 $29.00 $30.00 $31.00 $32.00 $33.00 $34.00 $35.00
Long $25 and Short $30
Will I get called out? No No No No No Yes Yes Yes Yes Yes Yes
Profit (loss) if called based on adj. cost $ 1.50 $ 1.50 $ 1.50 $ 1.50 $ 1.50 $ 1.50
Do I need to rebuy stock? No No No No No No No No No No No
How much did I get all up when called? $34.00 $34.00 $34.00 $34.00 $34.00 $34.00
Current market price to repurchase $30.00 $31.00 $32.00 $33.00 $34.00 $35.00
Reduction in cost/cash return $ 1.50 $ 1.50 $ 1.50 $ 1.50 $ 1.50 $ 1.50
Cash return or called return $ –$ 1.00 $ 0.00 $ 1.00 $ 2.00 $ 3.00
Cash return or called return $ –$ 1.00 $ 0.00 $ 1.00 $ 2.00 $ 3.00 $ 1.50 $ 1.50 $ 1.50 $ 1.50 $ 1.50 $ 1.50
Cash return or called return % –3.1% 0.0% 3.1% 6.2% 9.2% 4.6% 4.6% 4.6% 4.6% 4.6% 4.6%
Adjusted cost $33.50 $32.50 $31.50 $30.50 $29.50 $28.50 $29.50 $30.50 $31.50 $32.50 $33.50
Profit or loss if immediately sell stock –$ 8.50 –$ 6.50 –$ 4.50 –$ 2.50 –$ 0.50 $ 1.50 $ 1.50 $ 1.50 $ 1.50 $ 1.50 $ 1.50
Long $30 and Short $35
Will I get called out? No No No No No No No No No No Yes
Profit (loss) if called based on adj. cost $ 6.45
Do I need to rebuy stock? No No No No No No No No No No No
How much did I get all up when called? $38.95
Current market price to repurchase $35.00
Reduction in cost/cash return $ 6.45
Cash return or called return $ –$ 1.05 –$ 1.05 –$ 1.05 –$ 1.05 –$ 1.05 –$ 1.05 –$ 0.05 $ 0.95 $ 1.95 $ 2.95
Cash return or called return $ –$ 1.05 –$ 1.05 –$ 1.05 –$ 1.05 –$ 1.05 –$ 1.05 –$ 0.05 $ 0.95 $ 1.95 $ 2.95 $ 6.45
Cash return or called return % –3.2% –3.2% –3.2% –3.2% –3.2% –3.2% –0.2% 2.9% 6.0% 9.1% 19.8%
Adjusted cost $33.55 $33.55 $33.55 $33.55 $33.55 $33.55 $32.55 $31.55 $30.55 $29.55 $28.55
Profit or loss if immediately sell stock –$ 8.55 –$ 7.55 –$ 6.55 –$ 5.55 –$ 4.55 –$ 3.55 –$ 1.55 $ 0.45 $ 2.45 $ 4.45 $ 6.45
c05.qxd 10/23/06 2:15 PM Page 96
Defensive Techniques 97
For this particular position, at this moment in time, the CPR should be
constructed using the $25.00 and $30.00 strike. While both positions will
provide a positive called return, the $25.00 and $30.00 strike CPR:
• Becomes profitable at stock prices above $27.00 versus $32.00 for the
higher strike CPR. (See the “Cash Return or Called Return %” row in
Table 5.7.)
• Will allow the investor to exit the position through a call out at a price
of $30.00 versus an exit price of $32.00 for the higher strike CPR. Note:
A call out will occur for the $30.00 and $35.00 CPR at a price of $35.00;
however, the position will be able to be profitably closed at a stock
price at expiration of $32.00 or greater because the CPR, at a stock
price of $32.00 at expiration, generates uncalled return of $0.95. This
uncalled return lowers the investor’s cost in the stock to $31.55
($32.50 – $0.95). The investor can then sell the stock at the current mar-
ket price of $32.00 to realize a net return of $0.45 ($32.00 – $31.55) or
2.9 percent.
• Provides much lower likelihood of losing the net debit of the transac-
tion as this occurs at stock price of $25.00 and below versus $30.00 and
below for the higher strike CPR.
To summarize, the $25.00 and $30.00 CPR is superior as it will pro-
vide higher levels of profit at lower stock prices; will allow the investor
to exit the entire position at a significantly lower stock price at expiration;
and provides less likelihood of the investor realizing a loss equal to the
net debit.
In all instances where both potential CPRs provide a positive called re-
turn, the CPR that provides the lowest profitable exit price should be used.
The objective of a CPR that has a positive called return is to exit the posi-
tion profitably at the lowest possible stock price at expiration. We discuss
later in this chapter the objectives of a CPR that does not provide a prof-
itable called return.
Applying the CPR Technique The CPR has two typical applications:
1. To dramatically expedite the closing of a new covered call position where
the stock price has suffered a decline after entering the transaction.
2. To generate income and reduce the cost basis in a depressed position
where the cycle of the stock is now increasing but this cycle is too
shallow to effectively use the TSS for income.
Using the CPR to Expedite the Close of a New Covered Call Position
Using the CPR to expedite the close of a new covered call position is its
c05.qxd 10/23/06 2:15 PM Page 97
98 COVERED CALLS
most significant function. When the stock price falls after entering a new
covered call position, correct use of the CPR allows an investor, in most in-
stances, to lower the strike price of the near month call yet maintain a pos-
itive called return. This stance greatly increases the likelihood that the
position will be called out for a profit. Take the following simplified exam-
ple for illustration of this function:
• Stock is purchased in January at $34.00 and the January $35.00 strike
call is sold for $1.50.
• Stock price falls sharply to $30.00 and the call can now be bought to
close for $0.80, leaving a profit of $0.70, or 2.0 percent.
• Immediately apply CPR with January expirations at strikes of $25.00
and $30.00.
• Yield enhancement in the form of uncalled return will occur at stock
prices greater than $27.00 at expiration.
• Profitable call out will now occur at a stock price of $30.00 rather than
the original call sale strike of $35.00, resulting in a 15 percent reduction
in the profitable call out price. This reduction is very significant.
We can see, then, that the CPR was used as a defensive measure on a
new covered call position immediately following a large decline in the
stock price. The CPR had the effect of enhancing uncalled return at stock
prices higher than $27.00 and, more important, lowering the profitable call
out price from a $35.00 strike to $30.00. This defensive outcome is regularly
achievable using the CPR technique on newly established covered call po-
sitions that fall.
The following example illustrates the complete process of using the
CPR to expedite the close of a covered call position on a fallen stock.
Step 1: Enter a new covered call position. In mid-December (Figure
5.4), a new covered call position was identified and executed as follows:
• BTO 500 FMD @ $33.33
• STO 5 FMD $35.00 Jan 06 calls @ $1.35
The stock met the fundamental requirements for investment, was an up-
ward moving stock, and was in the bottom 25 percent of the rising price
cycle. A few days after entering the position, the stock fell 16 percent to
$28.00. This is an ideal time to assess a potential CPR to expedite the close
of this fallen position (Figure 5.5).
Step 2: Assess the potential CPR and execute if acceptable. We now
hold a covered call position on FMD, which, in all likelihood, will not be
called out at the end of the month due to the call being sold at a strike of
c05.qxd 10/23/06 2:15 PM Page 98
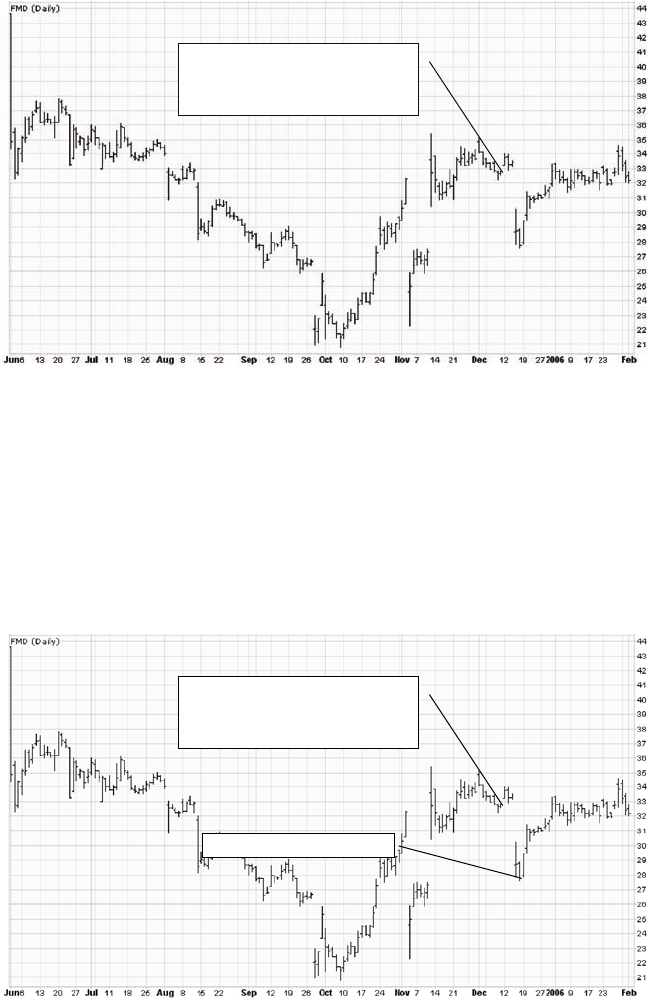
$35.00 and the current stock price being around $28.00. However, we do
have a profit in the call due to the fall in the stock. This profit is significantly
to our advantage when we construct the CPR. Without the profit in the buy-
back of the call, the CPR may not be able to be structured with a positive
called return.
We then enter the details of the position and the option contracts we
may use into the CPR Worksheet as shown in Table 5.8.
Defensive Techniques 99
Positioned constructed here:
BTO FMD @ $33.33
STO Jan 06 $35.00 @ $1.35
Assess potential CPR.
FIGURE 5.5 When to assess the need for CPR.
Positioned constructed here:
BTO FMD @ $33.33
STO Jan 06 $35.00 @ $1.35
FIGURE 5.4 Entering a covered call on FMD.
c05.qxd 10/23/06 2:15 PM Page 99

100 COVERED CALLS
In this instance, the option expiration selected is January. January is the
same month as the original call sold when entering the position. It is our pref-
erence to use the January expiration; however, February can be used in the
event that a CPR cannot be favorably constructed with January expirations.
Favorable construction in this regard is a CPR with a positive called return.
You will also notice that net premium to date has been entered into the
CPR Worksheet as $0.95. If we wish to construct this CPR, we will need to
buy to close the open January 06 $35 call, which we originally sold for
$1.35. The ask price for this contract when assessing the CPR was $0.40.
Buying back the call at this price will realize net premium of $0.95. The net
premium we receive when buying back the call is critical to the CPR con-
struction having adequate called return.
The CPR Worksheet produces the output as shown in Table 5.9. We can
see that both CPRs will provide a positive called return. From previous dis-
cussion, we know that when assessing two CPRs that both have positive
called returns, the CPR with the lowest strike prices should always be se-
lected. The reasons for this choice have been explained previously and are
not repeated here. As such, we will immediately apply the CPR with $25.00
and $30.00 strikes to this stock. The process is as follows:
• Buy back five January 06 $35.00 calls at $0.40 for a gain of $0.95, or 2.9
percent.
• BTO 5 Jan 06 $25.00 calls at $4.00.
• STO 10 Jan 06 $30.00 calls at $1.40.
• The net debit is $1.20, or 3.6 percent.
We have now executed the CPR (see Figure 5.6).
TABLE 5.8 CPR Worksheet Inputs Pertaining to Figure 5.5
Inputs
Stock FMD
Purchase price $33.33
Net premium to date $ 0.95 2.9%
P&L analysis—start price $25.00
P&L analysis—$ increment $ 1.00
CPR potential strikes $25.00 $30.00 $35.00
Bid or ask Ask Bid Ask Bid
Option price $ 4.00 $1.40 $1.45 $ 0.30
Net debit CPR with $25 and $30 $ 1.20 3.6%
Net debit CPR with $30 and $35 $ 0.85 2.6%
Ask Bid Ask Bid
c05.qxd 10/23/06 2:15 PM Page 100
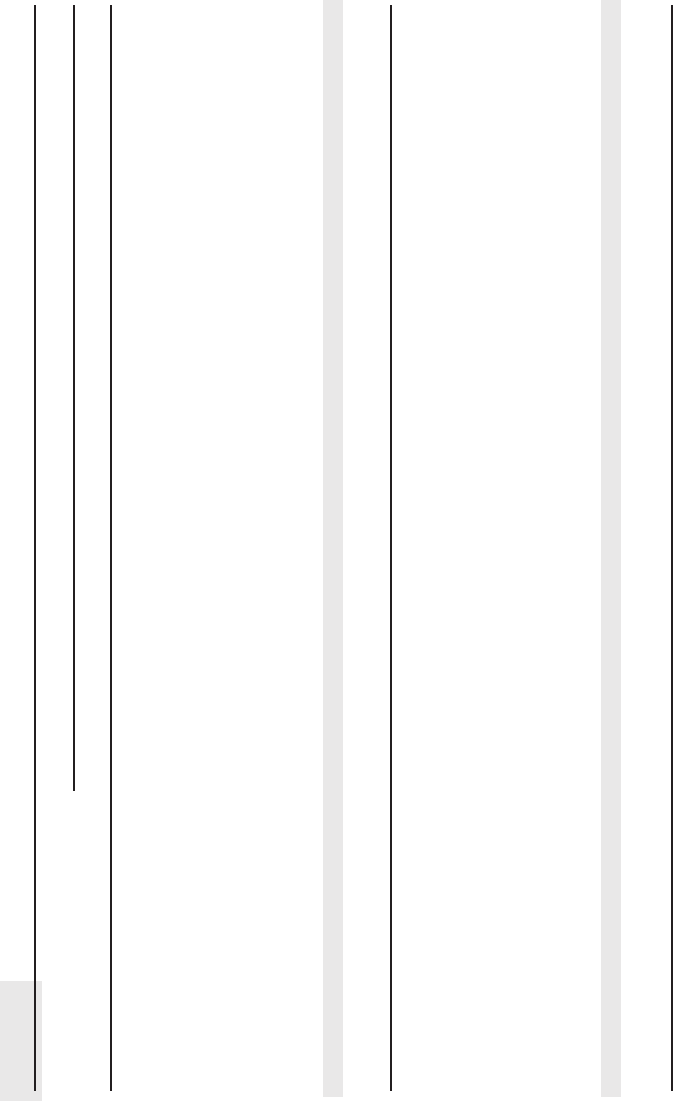
101
TABLE 5.9 Stock Breakeven Analysis Pertaining to Figure 5.5
Stock Price at Expiration
$25.00 $26.00 $27.00 $28.00 $29.00 $30.00 $31.00 $32.00 $33.00 $34.00 $35.00
Long $25 and Short $30
Will I get called out? No No No No No Yes Yes Yes Yes Yes Yes
Profit (loss) if called based on adj. cost $ 1.42 $ 1.42 $ 1.42 $ 1.42 $ 1.42 $ 1.42
Do I need to rebuy stock? No No No No No No No No No No No
How much did I get all up when called? $33.80 $33.80 $33.80 $33.80 $33.80 $33.80
Current market price to repurchase $30.00 $31.00 $32.00 $33.00 $34.00 $35.00
Called return $ 1.42 $ 1.42 $ 1.42 $ 1.42 $ 1.42 $ 1.42
Uncalled return $ –$ 0.25 $ 0.75 $ 1.75 $ 2.75 $ 3.75
Uncalled or called return $ –$ 0.25 $ 0.75 $ 1.75 $ 2.75 $ 3.75 $ 1.42 $ 1.42 $ 1.42 $ 1.42 $ 1.42 $ 1.42
Uncalled or called return % –0.8% 2.3% 5.3% 8.3% 11.3% 4.3% 4.3% 4.3% 4.3% 4.3% 4.3%
Adjusted cost $33.58 $32.58 $31.58 $30.58 $29.58 $28.58 $29.58 $30.58 $31.58 $32.58 $33.58
Profit or loss if immediately sell stock –$ 8.58 –$ 6.58 –$ 4.58 –$ 2.58 –$ 0.58 $ 1.42 $ 1.42 $ 1.42 $ 1.42 $ 1.42 $ 1.42
Long $30 and Short $35
Will I get called out? No No No No No No No No No No Yes
Profit (loss) if called based on adj. cost $ 6.77
Do I need to rebuy stock? No No No No No No No No No No No
How much did I get all up when called? $39.15
Current market price to repurchase $35.00
Called return $ 6.77
Uncalled return $ $ 0.10 $ 0.10 $ 0.10 $ 0.10 $ 0.10 $ 0.10 $ 1.10 $ 2.10 $ 3.10 $ 4.10
Uncalled or called return $ $ 0.10 $ 0.10 $ 0.10 $ 0.10 $ 0.10 $ 0.10 $ 1.10 $ 2.10 $ 3.10 $ 4.10 $ 6.77
Uncalled or called return % 0.3% 0.3% 0.3% 0.3% 0.3% 0.3% 3.3% 6.3% 9.3% 12.3% 20.3%
Adjusted cost $33.23 $33.23 $33.23 $33.23 $33.23 $33.23 $32.23 $31.23 $30.23 $29.23 $28.23
Profit or loss if immediately sell stock –$ 8.23 –$ 7.23 –$ 6.23 –$ 5.23 –$ 4.23 –$ 3.23 –$ 1.23 $ 0.77 $ 2.77 $ 4.77 $ 6.77
c05.qxd 10/23/06 2:15 PM Page 101
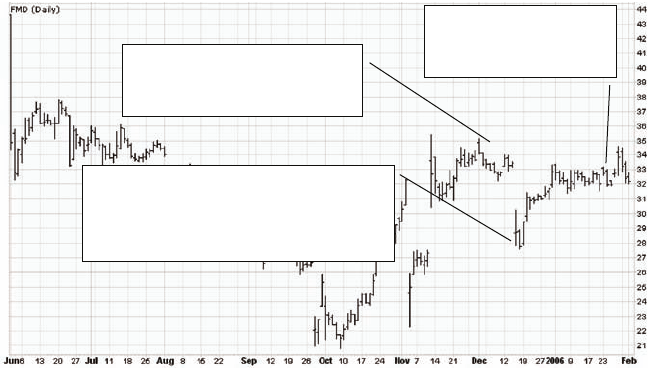
102 COVERED CALLS
Step 3: Wait for expiration Friday of the calls. Our profit and loss on
the position at January expiration is shown in Table 5.10.
It is very important to understand that the returns presented by the
CPR Worksheet include the net premium to date. Therefore, all cash re-
turns and called returns in the Worksheet include the $0.95 already made in
net premium.
For example, this position will be called out at stock prices above
$30.00. The return on call out will be a total transaction return of 4.3 per-
cent. The called return is not 4.3 percent plus the 2.9 percent already real-
ized in net premium. Additionally, at a stock price at expiration of $27.00,
the cash return will be 5.3 percent. This is the total transaction cash return
and includes the net premium to date of 2.9 percent. All returns presented
by the CPR Worksheet are overall transaction returns and include any net
premium to date.
If the stock finishes the option month above $30.00, we will be called
out for an overall transaction return of 4.3 percent. Originally, our prof-
itable call out strike was $35.00 so we have drastically lowered the prof-
itable exit price of this position. This is the most important aspect of the
CPR technique. The technique is designed to profitably expedite the close
out of an underperforming covered call position through lowering of the
strike price while maintaining a positive transaction called return.
If the stock finishes the option month between $25.00 and $30.00, the
position will not be called out, yet the investor will be left with a cash return
Positioned constructed here:
BTO FMD @ $33.33
STO Jan 06 $35.00 @ $1.35
Position called out at
$30.00 on the third Friday
for a return of 4.3%.
BTC call and execute CPR.
BTC FMD Jan 06 $35.00 calls @ $0.40
BTO FMD Jan 06 $25.00 calls @ $4.00
STO 2 ¥ FMD Jan 06 $30.00 calls @ $1.40
FIGURE 5.6 Using CPR to profitably close out of an underperforming covered
call position.
c05.qxd 10/23/06 2:15 PM Page 102
103
Stock Price at Expiration
$25.50 $26.00 $26.50 $27.00 $27.50 $28.00 $28.50 $29.00 $29.50 $30.00 $30.50
Long $25 and Short $30
Will I get called out? No No No No No No No No No Yes Yes
Profit (loss) if called based on adj. cost $ 1.42 $ 1.42
Do I need to rebuy stock? No No No No No No No No No No No
How much did I get all up when called? $33.80 $33.80
Current market price to repurchase $30.00 $30.50
Called return $ 1.42 $ 1.42
Uncalled return $ $ 0.25 $ 0.75 $ 1.25 $ 1.75 $ 2.25 $ 2.75 $ 3.25 $ 3.75 $ 4.25
Uncalled or called return $ $ 0.25 $ 0.75 $ 1.25 $ 1.75 $ 2.25 $ 2.75 $ 3.25 $ 3.75 $ 4.25 $ 1.42 $ 1.42
Uncalled or called return % 0.8% 2.3% 3.8% 5.3% 6.8% 8.3% 9.8% 11.3% 12.8% 4.3% 4.3%
Adjusted cost $33.08 $32.58 $32.08 $31.58 $31.08 $30.58 $30.08 $29.58 $29.08 $28.58 $28.08
Profit or loss if immediately sell stock –$ 7.58 –$ 6.58 –$ 5.58 –$ 4.58 –$ 3.58 –$ 2.58 –$ 1.58 –$ 0.58 $ 0.42 $ 1.42 $ 1.42
TABLE 5.10 Stock Breakeven Analysis
Inputs
Stock FMD
Purchase price $33.33
Net premium to date $ 0.95 2.9%
P&L analysis—start price $25.50
P&L analysis—$ increment $ 1.00
CPR potential strikes $25.00 $30.00 $35.00
Bid or ask Ask Bid Ask Bid
Option price $ 4.00 $1.40 $1.45 $ 0.30
Net debit CPR with $25 and $30 $ 1.20 3.6%
Net debit CPR with $30 and $35 $ 0.85 2.6%
Ask Bid Ask Bid
c05.qxd 10/23/06 2:15 PM Page 103
104 COVERED CALLS
from the CPR. To realize this return, on the third Friday, the investor will
need to buy back 5 of the 10 short $30.00 calls and then sell all 5 long $25.00
calls. This process will allow the investor to realize the intrinsic value in the
long option before it expires or is exercised automatically by the broker.
This process is discussed in detail in the earlier section, “CPR Is Profitable
at Expiration but Not Called Out.”
If the stock finishes the option month below $25.00, we will lose the
net debit of the transaction or 3.6 percent. This loss will be compensated
for by the 2.9 percent profit realized from net premium to date. As such, the
maximum negative net cash return for the month will be just 0.8 percent. As
you can see, there is very small downside to the correct application of the
CPR technique. See Table 5.11.
What if the CPR Worksheet does not produce a CPR with a positive
called return? If the CPR Worksheet does not produce a transaction with a
positive called return using near month or near month + 1 expirations or, in
assessing the cycle of the stock, the higher strike price CPR seems to re-
quire an unrealistically large movement in the stock price to become prof-
itable, we will simply wait for a further increase in the stock price, which
will improve the profitability of the potential CPRs.
If at any time an investor is waiting for an improvement in a CPR return
before executing the CPR and a call can be sold that meets the secondary
call sale rules such as a TSS for income, then these rules should be imme-
diately followed.
Using the CPR Where the Called Return Is Negative Another useful func-
tion of the CPR technique is to generate income and reduce the cost basis
on a deeply depressed position. The CPR can effectively be applied where
a stock is now in an upward cycle but the cycle’s depth is too shallow to ef-
fectively use the TSS for income. A cycle with such characteristics is often
evident in a stock that has suffered one of the following fates:
• A quick and sharp price decline that is normally the result of a negative
news or earnings announcement causing the stock to consolidate in a
gradual upward moving or sideways moving cycle.
• A long and protracted decline over a period of months and the stock is
now upward moving or sideways moving.
In most instances where the CPR is applied on a deeply depressed
stock, an effective CPR cannot be constructed with a positive called return.
The investor will, therefore, construct a CPR with a profitable range of
stock prices at expiration. If the stock price is below this range at expira-
tion, the investor will lose the net debit. If the stock breaks cycle, begins a
more aggressive upward cycle, and is above the profitable range, this action
can result in the CPR being unprofitable.
c05.qxd 10/23/06 2:15 PM Page 104
105
TABLE 5.11 Stock Breakeven Analysis
Stock Price at Expiration
$24.00 $24.50 $25.00 $25.50 $26.00 $26.50 $27.00 $27.50 $28.00 $28.50 $29.00
Long $25 and Short $30
Will I get called out? No No No No No No No No No No No
Profit (loss) if called based on adj. cost
Do I need to rebuy stock? No No No No No No No No No No No
How much did I get all up when called?
Current market price to repurchase
Called return
Uncalled return $ –$ 0.25 –$ 0.25 –$ 0.25 $ 0.25 $ 0.75 $ 1.25 $ 1.75 $ 2.25 $ 2.75 $ 3.25 $ 3.75
Uncalled or called return $ –$ 0.25 –$ 0.25 –$ 0.25 $ 0.25 $ 0.75 $ 1.25 $ 1.75 $ 2.25 $ 2.75 $ 3.25 $ 3.75
Uncalled or called return % –0.8% –0.8% –0.8% 0.8% 2.3% 3.8% 5.3% 6.8% 8.3% 9.8% 11.3%
Adjusted cost $33.58 $33.58 $33.58 $33.08 $32.58 $32.08 $31.58 $31.08 $30.58 $30.08 $29.58
Profit or loss if immediately sell stock –$ 9.58 –$ 9.08 –$ 8.58 –$ 7.58 –$ 6.58 –$ 5.58 –$ 4.58 –$ 3.58 –$ 2.58 –$ 1.58 –$ 0.58
c05.qxd 10/23/06 2:15 PM Page 105
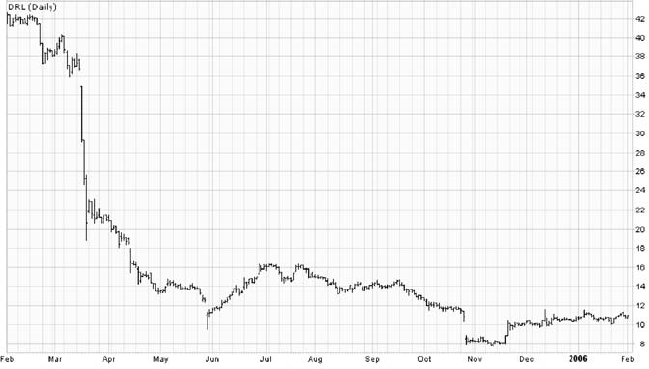
106 COVERED CALLS
Let’s look at an example of implementing the CPR on a deeply de-
pressed stock. Let’s assume we own 500 shares of DRL at a cost of $20.00.
Step 1: Assess the cycle of the stock you wish to CPR. When a stock is
trading deeply below an investor’s cost, it is unlikely that a CPR can be con-
structed using near month or near month + 1 expirations that has a positive
called return. If a CPR has a negative called return, it can only be con-
structed when (1) the stock is in a current upward cycle and (2) the distance
between the upper and lower lines of the price cycle is $1.50 or less. If the
cycle of the stock does not comply with both (1) and (2), then it is more ad-
vantageous for the investor to use the TSS for income on the position.
We can see from Figure 5.7 that DRL is currently stabilizing from se-
vere price declines in the preceding months. DRL qualifies for CPR as it is
both an up cycling stock (the bottoms and tops of the current cycle are get-
ting higher) and the current cycle has less than $1.50 of price depth. We
can, therefore, assume that the CPR technique can be used on this stock at
this point in time rather than the TSS for income.
Step 2: Input the position data into the CPR Worksheet. For the pur-
pose of this example, the January 06 expirations were used. At the time of
writing, the January contract had 40 days to expiration. See Table 5.12.
Note that in this instance, the net premium to date is set at $0.00.
When assessing a CPR that will not result in a positive called return, the
net premium should always be set to $0.00 regardless of the income earned
on the position in the past. We use $0.00 because we are attempting to
generate additional income on the position and need to understand the
FIGURE 5.7 A depressed stock that qualifies for CPR.
c05.qxd 10/23/06 2:15 PM Page 106

Defensive Techniques 107
profitability of the CPR as an independent strategy. We are not looking to
the CPR as a tool to lower the exit price of the stock, as we would if the
called return were positive.
Step 3: Assess the CPR Worksheet outputs. The CPR worksheet pro-
vides the profit and loss of the two potential CPRs. See Table 5.13. The
stock price at time of writing was $11.60. The optimal CPR for this position
is the $10.00 and $12.50 CPR. This CPR will provide an enhancement to re-
turn at stock prices between $11.00 and $14.00 at expiration. This result
compares to the $12.50 and $15.00 CPR that does not become profitable
until the stock price reaches $13.00—a required increase of 12.1 percent in
a month.
If the stock finishes the option month above $12.50 but less than
$14.00, the investor will be called out. This call out will be at a loss, but will
still result in the investor earning an uncalled return on the position.
We see from Table 5.14 that if the investor is called out, the loss on call
out will be $5.90. This loss on call out is calculated as the total capital re-
ceived on call out ($14.10) minus the cost in the stock ($20.00).
In situations where the investor is called out in a CPR and that call out
will be unprofitable, the investor will need to rebuy the stock on the Mon-
day following expiration as the position is yet to be closed for an overall
transaction profit. The difference between the total capital received on call
out and the current market price to repurchase is the called return in a CPR
where the call out is unprofitable versus the investor’s overall cost.
Let’s look at an example using Table 5.14 and assuming a stock price at
expiration of $13.00. In this scenario, the investor will be called out on the
third Friday. Total capital received will be $14.10. If the stock price at ex-
piration is $13.00, the investor will be able to repurchase the stock on the
TABLE 5.12 CPR Worksheet Inputs
Inputs
Stock FMD
Purchase price $20.00
Net premium to date $ 0.00 0.0%
P&L analysis—start price $ 9.50
P&L analysis—$ increment $ 0.50
CPR potential strikes $10.00 $12.50 $15.00
Bid or ask Ask Bid Ask Bid
Option price $ 2.00 $0.55 $0.60 $ 0.10
Net debit CPR with $10 and $12.50 $ 0.90 4.5%
Net debit CPR with $12.50 and $15 $ 0.40 2.0%
Ask Bid Ask Bid
c05.qxd 10/23/06 2:15 PM Page 107
108
TABLE 5.13 Stock Breakeven Analysis
Stock Price at Expiration
$ 9.50 $10.00 $10.50 $11.00 $11.50 $12.00 $12.50 $13.00 $13.50 $14.00 $14.50 $15.00
Long $10 and Short $12.50
Will I get called out? No No No No No No Yes Yes Yes Yes Yes Yes
Profit (loss) if called based
on adj. cost –$ 5.90 –$ 5.90 –$ 5.90 –$ 5.90 –$ 5.90 –$ 5.90
Do I need to rebuy stock? No No No No No No Yes Yes Yes Yes Yes Yes
How much did I get all up
when called? $14.10 $14.10 $14.10 $14.10 $14.10 $14.10
Current market price to
repurchase $12.50 $13.00 $13.50 $14.00 $14.50 $15.00
Called return $ 1.60 $ 1.10 $ 0.60 $ 0.10 –$ 0.40 –$ 0.90
Uncalled return $ –$ 0.90 –$ 0.90 –$ 0.40 $ 0.10 $ 0.60 $ 1.10
Uncalled or called
return $ –$ 0.90 –$ 0.90 –$ 0.40 $ 0.10 $ 0.60 $ 1.10 $ 1.60 $ 1.10 $ 0.60 $ 0.10 –$ 0.40 –$ 0.90
Uncalled or called
return % –4.5% –4.5% –2.0% 0.5% 3.0% 5.5% 8.0% 5.5% 3.0% 0.5% –2.0% –4.5%
Adjusted cost $20.90 $20.90 $20.40 $19.90 $19.40 $18.90 $18.40 $18.90 $19.40 $19.90 $20.40 $20.90
Profit or loss if
immediately sell
stock –$11.40 –$10.90 –$ 9.90 –$ 8.90 –$ 7.90 –$ 6.90 –$ 5.90 –$ 5.90 –$ 5.90 –$ 5.90 –$ 5.90 –$ 5.90
c05.qxd 10/23/06 2:15 PM Page 108

109
Long $12.50 and Short $15
Will I get called out? No No No No No No No No No No No Yes
Profit (loss) if called based
on adj. cost –$ 2.90
Do I need to rebuy stock? No No No No No No No No No No No Yes
How much did I get all up
when called? $17.10
Current market price to
repurchase $15.00
Called return $ 2.10
Uncalled return $ –$ 0.40 –$ 0.40 –$ 0.40 –$ 0.40 –$ 0.40 –$ 0.40 –$ 0.40 $ 0.10 $ 0.60 $ 1.10 $ 1.60
Uncalled or called
return $ –$ 0.40 –$ 0.40 –$ 0.40 –$ 0.40 –$ 0.40 –$ 0.40 –$ 0.40 $ 0.10 $ 0.60 $ 1.10 $ 1.60 $ 2.10
Uncalled or called
return % –2.0% –2.0% –2.0% –2.0% –2.0% –2.0% –2.0% 0.5% 3.0% 5.5% 8.0% 10.5%
Adjusted cost $20.40 $20.40 $20.40 $20.40 $20.40 $20.40 $20.40 $19.90 $19.40 $18.90 $18.40 $17.90
Profit or loss if
immediately sell
stock –$10.90 –$10.40 –$ 9.90 –$ 9.40 –$ 8.90 –$ 8.40 –$ 7.90 –$ 6.90 –$ 5.90 –$ 4.90 –$ 3.90 –$ 2.90
c05.qxd 10/23/06 2:15 PM Page 109
110
TABLE 5.14 Stock Breakeven Analysis
Stock Price at Expiration
$12.00 $12.50 $13.00 $13.50 $14.00 $14.50 $15.00 $15.50 $16.00
Long $10 and Short $12.50
Will I get called out? No Yes Yes Yes Yes Yes Yes Yes Yes
Profit (loss) if called based on adj. cost –$ 5.90 –$ 5.90 –$ 5.90 –$ 5.90 –$ 5.90 –$ 5.90 –$ 5.90 –$ 5.90
Do I need to rebuy stock? No Yes Yes Yes Yes Yes Yes Yes Yes
How much did I get all up when called? $14.10 $14.10 $14.10 $14.10 $14.10 $14.10 $14.10 $14.10
Current market price to repurchase $12.50 $13.00 $13.50 $14.00 $14.50 $15.00 $15.50 $16.00
Called return $ 1.60 $ 1.10 $ 0.60 $ 0.10 –$ 0.40 –$ 0.90 –$ 1.40 –$ 1.90
Uncalled return $ $ 1.10
Uncalled or called return $ $ 1.10 $ 1.60 $ 1.10 $ 0.60 $ 0.10 –$ 0.40 –$ 0.90 –$ 1.40 –$ 1.90
Uncalled or called return % 5.5% 8.0% 5.5% 3.0% 0.5% –2.0% –4.5% –7.0% –9.5%
Adjusted cost $18.90 $18.40 $18.90 $19.40 $19.90 $20.40 $20.90 $21.40 $21.90
Profit or loss if immediately sell stock –$ 6.90 –$ 5.90 –$ 5.90 –$ 5.90 –$ 5.90 –$ 5.90 –$ 5.90 –$ 5.90 –$ 5.90
c05.qxd 10/23/06 2:15 PM Page 110
Defensive Techniques 111
Monday following the third Friday for around the $13.00. This $13.00
amount is less than the $14.10 total capital received on call out. In this in-
stance, the investor will repurchase the stock for $13.00, yet the investor
has just been called out for a total of $14.10, which is a $1.10 difference.
The investor has generated a return of $14.10 – $13.00 = $1.10, or 5.5
percent. This $1.10 return is, in effect, uncalled return, or “free net cash re-
turn”; it is the same as the uncalled return received on a profitable call buy-
back or call expiration. It can be used to invest in other positions or to
reduce the cost basis or amortize the investment in the stock.
If the stock finishes the option month between $10.00 and $12.50, the
position will not be called out. The investor will need to take action to re-
alize the uncalled return or minimize the loss of the CPR. See Table 5.15.
As previously outlined, when the long call of the CPR finishes in the
money and the short call finishes out of the money, the investor must take
action on the third Friday of expiration to realize the intrinsic value in the
contract before it expires or is automatically exercised by the broker. This
process is discussed in detail in the preceding material and will involve the
investor taking the following steps on the third Friday of expiration:
1. Buy back half the short calls at around to $0.05 (they will expire worth-
less at the end of the day).
2. Sell the entire holding of long calls. This price realized will be around
intrinsic value.
3. Allow the other half of the short calls to expire worthless at the end of
the trading day.
Following this process when there is intrinsic value in the long call yet the
short calls are out of the money ensures that the uncalled return will be re-
alized or the loss on the CPR will be minimized.
We can see from Table 5.15 that any stock price at expiration greater
than $10.00 and less than $12.50 will require this action. Importantly, at a
stock price of $10.50 at expiration, this action will still need to be taken.
The result will be a loss on the CPR of 2.0 percent, rather than a loss of the
entire net debit of 4.5 percent.
If the stock finishes the option month below $10.00, then both calls
will expire worthless leaving the investor with a loss equal to the net debit
of 4.5 percent. Regardless of how low the stock price goes, this is the max-
imum loss of the CPR.
If the stock finishes the option month above $14.00, the investor will
be called out for a loss and will not be able to repurchase the stock for less
than the $14.10 received at call out. See Table 5.16. In this instance, the in-
vestor will need to repurchase the stock at the higher market price and add
c05.qxd 10/23/06 2:15 PM Page 111

112
TABLE 5.15 Stock Breakeven Analysis
Stock Price at Expiration
$10.00 $10.50 $11.00 $11.50 $12.00 $12.50 $13.00 $13.50 $14.00
Long $10 and Short $12.50
Will I get called out? No No No No No Yes Yes Yes Yes
Profit (loss) if called based on adj. cost –$ 5.90 –$ 5.90 –$ 5.90 –$ 5.90
Do I need to rebuy stock? No No No No No Yes Yes Yes Yes
How much did I get all up when called? $14.10 $14.10 $14.10 $14.10
Current market price to repurchase $12.50 $13.00 $13.50 $14.00
Called return $ 1.60 $ 1.10 $ 0.60 $ 0.10
Uncalled return $ –$ 0.90 –$ 0.40 $ 0.10 $ 0.60 $ 1.10
Uncalled or called return $ –$ 0.90 –$ 0.40 $ 0.10 $ 0.60 $ 1.10 $ 1.60 $ 1.10 $ 0.60 $ 0.10
Uncalled or called return % –4.5% –2.0% 0.5% 3.0% 5.5% 8.0% 5.5% 3.0% 0.5%
Adjusted cost $20.90 $20.40 $19.90 $19.40 $18.90 $18.40 $18.90 $19.40 $19.90
Profit or loss if immediately sell stock –$10.90 –$ 9.90 –$ 8.90 –$ 7.90 –$ 6.90 –$ 5.90 –$ 5.90 –$ 5.90 –$ 5.90
c05.qxd 10/23/06 2:16 PM Page 112
113
TABLE 5.16 Stock Breakeven Analysis
Stock Price at Expiration
$13.00 $13.50 $14.00 $14.50 $15.00 $15.50 $16.00 $16.50 $17.00
Long $10 and Short $12.50
Will I get called out? Yes Yes Yes Yes Yes Yes Yes Yes Yes
Profit (loss) if called based on adj.
cost –$ 5.90 –$ 5.90 –$ 5.90 –$ 5.90 –$ 5.90 –$ 5.90 –$ 5.90 –$ 5.90 –$ 5.90
Do I need to rebuy stock? Yes Yes Yes Yes Yes Yes Yes Yes Yes
How much did I get all up when
called? $14.10 $14.10 $14.10 $14.10 $14.10 $14.10 $14.10 $14.10 $14.10
Current market price to repurchase $13.00 $13.50 $14.00 $14.50 $15.00 $15.50 $16.00 $16.50 $17.00
Called return $ 1.10 $ 0.60 $ 0.10 –$ 0.40 –$ 0.90 –$ 1.40 –$ 1.90 –$ 2.40 –$ 2.90
Uncalled return $
Uncalled or called return $ $ 1.10 $ 0.60 $ 0.10 –$ 0.40 –$ 0.90 –$ 1.40 –$ 1.90 –$ 2.40 –$ 2.90
Uncalled or called return % 5.5% 3.0% 0.5% –2.0% –4.5% –7.0% –9.5% –12.0% –14.5%
Adjusted cost $18.90 $19.40 $19.90 $20.40 $20.90 $21.40 $21.90 $22.40 $22.90
Profit or loss if immediately sell stock –$ 5.90 –$ 5.90 –$ 5.90 –$ 5.90 –$ 5.90 –$ 5.90 –$ 5.90 –$ 5.90 –$ 5.90
c05.qxd 10/23/06 2:16 PM Page 113
114 COVERED CALLS
this expense to the overall cost of the position. Importantly, CPRs are con-
structed with near month or near month + 1 expirations and on stocks with
very little depth in the cycle. Extremely dramatic stock price movements are
unlikely. In the preceding example, DRL’s stock price at execution of the
CPR was $11.60. The CPR becomes unprofitable at stock price of $14.00
and higher and thus would require an increase of 20.7 percent [($14.00 –
$11.60)/$11.60)] in one month for the CPR to become profitable. This is a
very dramatic and highly improbable increase given the cycle of the stock.
More importantly, an increase in the stock price of this magnitude (20+
percent) in such a short period (one month) would normally indicate that
some fundamental changes have occurred that have increased the market’s
forecast for the company’s future earnings. It is therefore likely that the
stock price will continue to increase, and the position will no longer be
underperforming.
c05.qxd 10/23/06 2:16 PM Page 114
PART II
Calendar LEAPS
Spreads
c06.qxd 10/23/06 2:14 PM Page 115
CALENDAR LEAPS SPREAD PROCESS FLOWCHART
Enter New LEAPS Position
1. CSE Screener filter
2. Satisfy buying low rule
3. Construct LEAPS position
Buy Back Call and Set GTC on LEAPS
1. 10¢ Buyback rule or
2. 5% Buyback rule
Close Transaction or Buy Back Call
1. 5% Close on delta or
2. 5% Buyback rule
Did LEAPS sell for cost + 5%? Reinvest and
compound
proceeds
Managing LEAPS That Have Not Sold for Profit
1. Secondary call sale rules
2. Formalized seven-day rule
3. Delta effect
Defensive Techniques
1. SLR
2. Average down
3. Reposition
4. Close on delta
5. Roll out
No
Yes
10¢ Rule DLB
Buy Back Buy Back
Close
Each step in the calendar LEAPS spread investing process is shown in the
flowchart above—from entering new positions, to managing positions for in-
come, to LEAPS defensive techniques. As with covered calls, investors who
are accomplished with our LEAPS method understand that there is a specific
technique to address every situation that may occur in the markets. However,
when contrasted to covered calls, there are significantly more management
and defensive techniques in LEAPS investing. Further, the addition of leverage
to the strategy makes LEAPS much more responsive to management when
compared to traditional covered calls. Part II of this book will elaborate on,
expand on, and provide an example of each step presented in the calendar
LEAPS spread process flowchart. You may wish to revisit this flowchart at the
beginning of each new topic so you can gain an understanding of where a par-
ticular rule or technique is applied in the overall investment process.
c06.qxd 10/23/06 2:14 PM Page 116

117
CHAPTER 6
As noted in Chapter 5, LEAPS stands for long-term equity anticipation
security. Despite this complicated name, LEAPS are just long-term
options. They are exactly the same as normal options, but allow in-
vestors to establish positions with expirations of up to three years.
The use of calendar LEAPS spreads is a technique similar to, yet more
sophisticated than, traditional covered calls. The mind-set for using the
technique remains the same as for using covered calls (see Chapter 2).
However, it is a technique to be used only by investors who have developed
a consistent track record of success with the covered call technique. The
LEAPS technique requires a greater time commitment than covered calls,
but provides the potential for higher returns because the compounding ef-
fect is magnified many times over. It is, therefore, ideally suited to those
who aspire to eventually make a full-time career out of the markets or those
who have more time to commit to their investments.
Calendar LEAPS spreads are most easily performed in the U.S. market.
If you wish to use them from outside the United States, you will have to sac-
rifice by adapting to working for reasonable lengths of time at unusual
hours. However, the potential returns from this technique for experienced
investors certainly justify such a sacrifice.
In our experience, portfolio growth is much more quickly achieved
using the LEAPS technique when compared to traditional covered calls.
An Introduction
to Calendar
LEAPS Spreads
c06.qxd 10/23/06 2:14 PM Page 117

ADVANTAGES OF THE LEAPS TECHNIQUE
In a calendar LEAPS spread, we buy a LEAPS for cover rather than buying
a stock. The advantages of this technique over writing covered calls are nu-
merous and include the following:
• Investors are able to use higher-priced stocks (many of which are the
bluest of blue chip). Investors would not normally be able to use these
higher-priced stocks with the covered call technique because the un-
called and called returns would not be high enough.
• Investors are able to utilize the leverage offered by options, as they can
control stock using LEAPS with a much lower capital outlay and at
much lower prices compared to investing in the stock. Thus the ability
to completely amortize (reduce) the cost of a position is dramatically
increased when using the calendar LEAPS technique because, rather
than paying, for example, $30.00 for a stock, an investor will purchase
a LEAPS contract for $10.00 or less (when following the rules outlined
in this book). When the same calls are sold against this much cheaper
LEAPS, the cost is amortized to zero many times faster.
• Investors are able to much more directly take advantage of upward
movements in the stock price. Where they would normally have to wait
for the end of the month to be called out, calendar LEAPS spreads
allow investors to close out the transaction immediately if the stock
price increases, thus allowing much greater compounding of the asset
base.
• Investors are able to be much more proactive in the management
process when the position is not performing well. This ability assists in
maintaining high returns regardless of the direction of the market.
• Because of leverage, investors are effectively able to have the benefits
of investing on margin without the detractions of margin (margin calls,
etc).
The most significant advantage of LEAPS over covered calls is that
they enable experienced investors to close out a transaction potentially
many times per month. This capability allows much higher returns and far
superior compounding of an investor’s asset base.
Growth Through Cash Flow
Correct application of the LEAPS technique provides portfolio growth
through cash flow rather than speculative appreciation. When using cov-
118 CALENDAR LEAPS SPREADS
c06.qxd 10/23/06 2:14 PM Page 118
ered calls, our objective is a cash return of around 4 percent per month,
which equates to 48 percent cash return per year (uncompounded) or
nearly 100 percent over two years (uncompounded). When using the
LEAPS technique, our return objectives are much higher; we aim to achieve
consistent monthly cash returns in the high single digits to low teens.
Being Prepared for Extreme Fluctuations
in Position Market Value
As previously stated, the calendar LEAPS spreads technique is an advanced
covered call technique. Only investors who have developed a consistent
track record of success with the covered call technique should use LEAPS.
Having such a track record is necessary because of the extreme fluctuation
in position market value while managing calendar LEAPS spread positions
for cash flow until a profitable exit is realized. Investors must understand
that LEAPS are leveraged instruments and their market value fluctuates sig-
nificantly on a daily basis.
Take the two positions shown in Table 6.1 as an example of leverage.
Investors A and B both create a position in JPM at the same time. Investor
A purchases the stock at $30.00, while investor B purchases a JPM LEAPS
for $6.00. Remember, these two purchases are made at the same time—the
JPM stock price is $30.00. The stock then declines 10 percent. Investor A
has suffered a 10 percent market value decline in the value of his position.
However, investor B, who purchased a JPM LEAPS, has suffered a 35 per-
cent market value decline in the value of his position. This is a significant
market value decline and is the result of leverage.
Experienced investors who are familiar with the covered call technique
understand the mind-set required to never sell a position for a loss and, in-
stead, to continue to generate and compound cash flow from a fallen posi-
tion. Those experienced with the correct application of the covered call
technique understand that stock prices of good companies go up and down
and that cash flow can be consistently generated regardless of market
An Introduction to Calendar LEAPS Spreads 119
TABLE 6.1 An Example of Leverage
Asset Asset Stock Asset Asset
Investor Purchased Price Declines Price Decline
A JPM Stock $30.00 10% $27.00 10%
B JPM LEAPS $ 6.00 10% $ 3.90 35%
c06.qxd 10/23/06 2:14 PM Page 119

direction. For those unaccustomed to the technique, “never selling a posi-
tion for a loss” is merely a catch phrase, and many investors find this tem-
porary market value loss too large a psychological hurdle. Experienced
LEAPS investors understand that correct management of a position leads
to the complete amortization of the position, in most instances, in less than
one year. Investors using the LEAPS technique must understand and accept
market value fluctuations. They must remain focused on the primary ob-
jective: consistently generating and compounding cash flow.
USING LEAPS FOR COVER
A covered call is defined as selling a call when holding the underlying stock
or another covering option on the same stock. In Chapter 2, “An Introduc-
tion to Covered Calls,” we explained selling a covered call and being cov-
ered by the stock. This section explains how to be covered by owning a
long-term option (LEAPS).
The rules for constructing and managing LEAPS positions are dis-
cussed in subsequent chapters, but, for now, let’s gain an understanding of
how to be covered by a LEAPS instead of a stock. Here is an example.
Citigroup stock is currently trading at $46.00. Let’s assume we purchase
a Citigroup January 2007 $40.00 LEAPS for $8.00 (remember, this is just a
normal option with a very long expiration). We then go ahead and sell a
December 2004 $47.50 call for $1.40. Our position is as follows.
Long Jan 2007 $40.00 Call at $8.00
Short Dec 2004 $47.50 Call at $1.40
There are two separate return calculations that you must compute and
be aware of for every LEAPS transaction: the uncalled return and the called
return.
The uncalled return is also known as the “percentage return,” “down-
side protection,” or “yield” and is simply the premium you received on the
call sale divided by the cost of the LEAPS. So in our example we purchased
a LEAPS for $8.00 and sold a call for $1.40. The uncalled return in this in-
stance is $1.40/$8.00 = 17.50 percent, which is a very large return and is the
result of leverage working in our favor.
The called return is the return the investor realizes in the event that the
short call is exercised or called out. The formula for calculating the called
return is:
Called return = Strike call – Strike LEAPS – LEAPS price + Call price
120 CALENDAR LEAPS SPREADS
c06.qxd 10/23/06 2:14 PM Page 120
To calculate the called return, you must understand what happens in the
event of a call out. Using our example:
• If we are called out, we have the obligation to deliver Citigroup stock at
a price of $47.50. As we own the LEAPS, we have the right to buy Citi-
group stock at a price of $40.00.
• In the event of a call out, our broker will automatically exercise the
LEAPS on our behalf. We will thus automatically buy the stock at a
price of $40.00 and sell the stock at a price of $47.50. We have recov-
ered $7.50 of our capital investment on the stock sale.
• As with covered calls, we get to keep the $1.40 that we sold the call for.
Our total return of capital would, therefore, be:
Return of capital = Strike call – Strike LEAPS + Call price
= $47.50 – $40.00 + $1.40
= $8.90
Remember, we invested $8.00 in this transaction, so the called return would
be $8.90 - $8.00 = $0.90 or 11.3 percent ($0.90/$8.00)
Again, the formula for calculating the called return is:
Called return = Strike call – Strike LEAPS – LEAPS price + Call price
In this instance, then:
Called return = $47.50 – $40.00 – $8.00 + $1.40
= $0.90, or 11.3% ($0.90/$8.00)
So we now know how we can substitute the stock with a LEAPS and
still sell a covered call.
An Introduction to Calendar LEAPS Spreads 121
c06.qxd 10/23/06 2:14 PM Page 121
c06.qxd 10/23/06 2:14 PM Page 122
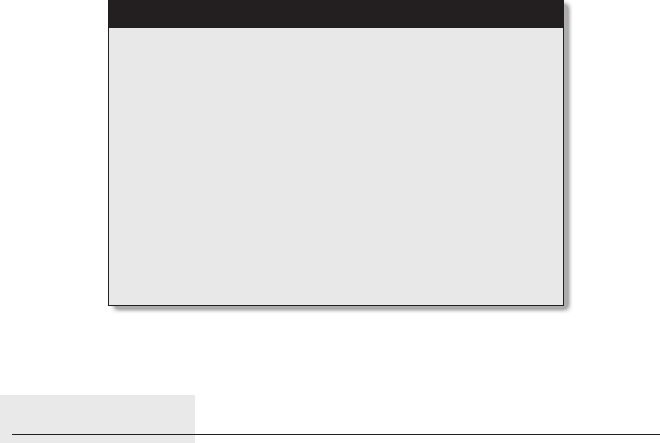
123
CHAPTER 7
SOME BASICS
Markets to Invest In
Unlike traditional covered calls, LEAPS investors are restricted to the U.S.
market. Only the U.S. option market has adequate size and liquidity to ef-
fectively implement a calendar LEAPS strategy.
If you wish to utilize these techniques from outside the U.S., you will
have to adapt to working for reasonable lengths of time at unusual hours.
This is a sacrifice; however, the potential returns from this technique for
experienced investors certainly justify such a sacrifice. You will also need
to be cognizant of foreign exchange risk (see Appendix B).
The Importance of Diversification
Our objective with LEAPS is to construct a well-diversified portfolio of 15
to 20 positions. One significant advantage of LEAPS over conventional cov-
ered calls is that you are able to invest in the bluest of blue-chip stocks—
including those that are generally excluded to covered call investors due to
their high stock prices and subsequent low yields.
You must construct a portfolio with a broad representation of indus-
tries. You should also construct your portfolio using only large capitaliza-
tion stocks (those with a market capitalization greater than US$5 billion)
from the Dow Jones Industrial Average, the S&P 500, and the NASDAQ.
These are the bluest of blue-chip companies available for public invest-
ment anywhere in the world. Apart from rare instances (Enron, WorldCom,
Entering New
LEAPS Positions
c07.qxd 10/23/06 2:12 PM Page 123

etc.) it is very uncommon for these companies go out of business—and
that is the only time we ever lose money on a properly constructed position.
Your portfolio should include companies from the industries listed in
Table 7.1. As you can see, there are eleven individual sectors. You should
try to include about two stocks from each of these sectors in the construc-
tion of your LEAPS portfolio.
The importance of diversification cannot be stressed enough. Investors
must spread risk between various stocks in different industries. Given the
low price of LEAPS contracts (the contracts that investors will purchase
following the rules in this book are usually priced between $4.00 and
$10.00), a portfolio of 15 LEAPS positions can be constructed with as little
as $6,000.
THE RULES FOR ENTERING
NEW LEAPS POSITIONS
A new calendar LEAPS position involves buying a LEAPS and selling a call.
The six rules for entering into new LEAPS positions are:
1. You can only establish new positions on down market days. A down
market day is any time when the Dow and the NASDAQ are in the red
(trading lower than the close of the previous day).
124 CALENDAR LEAPS SPREADS
TABLE 7.1 Industries Suitable for LEAPS Investing
Sector Example of Industry
Financial Banks, insurance companies, investment services
Health care Biotechnology and drugs, health care facilities, major
drugs
Consumer noncyclical Beverages, food, household products
Consumer cyclical Apparel, footwear, autos
Basic materials Chemical manufacturing, paper products, plastic and
rubber
Technology Computer equipment, semiconductors, software
Transportation Air, railroads, trucking
Capital goods Aerospace and defense, construction services and
machinery
Utilities Electrical, natural gas, water
Energy Coal, oil and gas, services and equipment
Services Advertising, broadcasting and cable, retail
c07.qxd 10/23/06 2:12 PM Page 124

2. Use the CSE Screener to filter all stocks in the market for the funda-
mental criteria (see the following section) for LEAPS investments.
3. You must follow the rules for correctly constructing a LEAPS position
(discussed later in this chapter). These rules are imbedded in the CSE
Screener.
4. Ensure that the stock adheres to the buying low rule for LEAPS (dis-
cussed later in this chapter).
5. Always give priority to maintaining acceptable levels of diversification
between stocks and industries—even if a stock you are already in-
vested in presents an excellent opportunity.
6. Buy the LEAPS first and then immediately sell the call. Do not hesitate.
If you buy the LEAPS and wait for a better price for the call, you are no
better than a speculator, and you will get burned!
USING THE CSE SCREENER TO FILTER
LEAPS INVESTMENTS
The first step in the LEAPS process investment flowchart (Figure A.2 on
page 190) is to use the CSE Screener to identify a potential LEAPS invest-
ment. The CSE Screener is a proprietary covered call and LEAPS search
and filter tool designed, developed, and maintained by Compound Stock
Earnings. The CSE Screener allows investors to quickly and easily search
the stock market for the highest returning covered call or LEAPS positions
that meet specific fundamental, technical, and construction requirements.
The tool is tailored to accommodate the criteria and rules established in
this book for selecting LEAPS positions.
Anyone who purchases Covered Calls and LEAPS—A Wealth Option is
entitled to one month’s complimentary access to the Covered Call Toolbox
(which includes the CSE Screener) by going to www.compoundstockearn
ings.com/freemonth. Thus readers can actually use the tools while learning
about them in this book.
Selection Parameters
The eight parameters you should use to filter LEAPS positions are:
1. Uncalled return of minimum 10 percent.
2. Called return of greater than 0 percent
3. Price-earnings ratio (PE) of 70 or less.
4. Market capitalization of US$5 billion or more.
Entering New LEAPS Positions 125
c07.qxd 10/23/06 2:12 PM Page 125
5. Stock price between $25.00 and $100.00.
6. Average broker recommendation of 2.5 or less.
7. An aggregate of the brokers recommending the stock as “Strong Buy”
and “Buy” greater than the number of brokers recommending the stock
as “Hold.”
8. A consensus earnings per share (EPS) estimate for “Next Fiscal Year”
forecast to be greater than the consensus EPS estimate for “This Fiscal
Year.”
Rationale Behind CSE Screener LEAPS Filters
The fundamental filters for LEAPS and covered calls are slightly different.
The LEAPS technique provides the opportunity to exit positions much
faster than traditional covered calls, and the companies in which we invest
are inherently lower risk due to their larger size, established positions in
the market place, very high levels of broker coverage, and increased visi-
bility of earnings. As such, it is necessary to alter the selection criteria for
LEAPS investments.
Uncalled and Called Returns The uncalled return filter of 10 percent
or greater ensures we are entering a transaction with adequate return to
correctly manage the position. The uncalled return is vitally important as it
affects our ability to buy back the call for a profit under a scenario of a
small stock price decline after entering the transaction. This scenario is dis-
cussed in Chapter 8.
The called return filter of 0 percent or greater simply ensures we are en-
tering a transaction that will provide a positive return if called out. While our
objective when entering a LEAPS position is not to be called out, and the
calls sold are not near month, which all but eliminates the chance of a call
out, a position should never be constructed where a loss will be realized on
call out. When assessing two positions with different called returns, in-
vestors should not view the position with a higher called return more favor-
ably. The only consideration is if the position has a positive called return.
PE Ratio The PE ratio filter of 70 or less reflects the fact that with
LEAPS investing, we are dealing with the bluest of blue-chip companies.
We thus allow a higher PE ratio than with traditional covered calls. Unlike
covered calls, LEAPS allow investment in much higher priced stocks due to
the leverage offered by buying the LEAPS rather than the stock itself.
126 CALENDAR LEAPS SPREADS
c07.qxd 10/23/06 2:13 PM Page 126
Market Capitalization The market capitalization filter of $5 billion or
greater ensures that we are investing in a company of significant size, with
substantial earnings. A company is generally considered blue chip when it
has a market capitalization of $5 billion or greater. LEAPS investors should
construct positions on qualifying companies from the Dow Jones Industrial
Average, the S&P 500, and the NASDAQ. These are the bluest of blue-chip
companies available for public investment anywhere in the world.
Stock Price We also now only select stocks that are priced between
$25.00 and $100.00. We do not invest in stocks under $25.00 as lower priced
stocks limit leverage in the LEAPS position and also the application of the
formalized seven-day rule, which is discussed in Chapter 8. Stocks with
prices over $100.00 are also excluded because they are inherently more
risky for this technique due to limiting the application of the formalized
seven-day rule.
Broker Recommendations An average broker recommendation of 2.5
or less ensures that the stock is rated at least an average of “buy” by the an-
alysts who cover it. This statement does not imply that we value or follow
the opinions of brokers. However, the brokerage community will be in the
markets promoting the stock and the masses will be providing buying sup-
port for the stock. More importantly, the stock is not likely to go out of busi-
ness in the short term.
The aggregate of the brokers recommending the stock as Strong Buy
and Buy must be greater than the number of brokers recommending the
stock as Hold. This criterion simply ensures that more brokers are positive
on the stock than are neutral.
Earnings per Share A forecast consensus EPS estimate for “Next Fis-
cal Year” greater than the consensus EPS estimate for “This Fiscal Year”
simply ensures that the brokers covering the stock believe that the com-
pany’s earnings will grow next fiscal year and helps prevent investors from
buying stocks that are going into a period of contracting earnings.
Readers familiar with the traditional covered call technique will notice
that with LEAPS investing, we drop the 75 percent of the 52-week trading
range. This omission reflects the more short-term nature of LEAPS invest-
ments compared to covered calls. It is not necessary to hold a LEAPS in-
vestment to wait for a call out at the end of the month. A LEAPS position
can be quickly and profitably closed out with a very small increase in the
underlying stock price.
Entering New LEAPS Positions 127
c07.qxd 10/23/06 2:13 PM Page 127
Directions for Using the CSE Screener
To access the covered call search tools, you need to establish a username
and password from www.compoundstockearnings.com/freemonth. Then
do the following:
1. Go to www.compoundstockearnings.com/cctoolbox.
2. Enter your username and password.
3. Click Log On.
4. Click CSE Screener—LEAPS.
The CSE Screener will search the entire market to find all the stocks
that meet the stipulated fundamental and technical criteria. It then looks
at the option chains on these stocks and correctly constructs LEAPS
positions using the position construction rules outlined later in this
chapter.
Correct construction is absolutely critical. Without correct construc-
tion, it is highly unlikely that the investor will be able to exit the position
quickly and profitably with a small increase in the stock price. Additionally,
management for cash flow will be very difficult if the entry position is in-
correctly constructed.
The CSE Screener then presents a list of potential positions to the in-
vestor. All positions meet the fundamental requirements listed previously
(PE ratio, market capitalization, broker rating, etc.) and are correctly con-
structed to expedite a profitable close out and assist management for cash
flow.
Figure 7.1 is a typical screenshot of the CSE Screener for LEAPS trans-
actions. Each position presented by the screener meets both the funda-
mental and construction criteria outlined in this book.
Remember, The CSE Screener only filters for fundamental criteria and
correctly constructs the position. You must ensure that companies meet the
technical criteria (upward or sideways moving stock and adherence to the
buying low rule discussed in the next section) before entering the position.
The fundamental and construction criteria for selecting LEAPS posi-
tions have remained substantially the same for many years. However, from
time to time, the criteria have been modified to adapt to the current condi-
tions of the market. When such a change is needed, the authors adapt the
default criteria of the CSE Screener to keep investors in step with the cur-
rent conditions of the markets. Therefore, it is highly recommended that in-
vestors simply use the default criteria of the CSE Screener when searching
for new positions.
128 CALENDAR LEAPS SPREADS
c07.qxd 10/23/06 2:13 PM Page 128
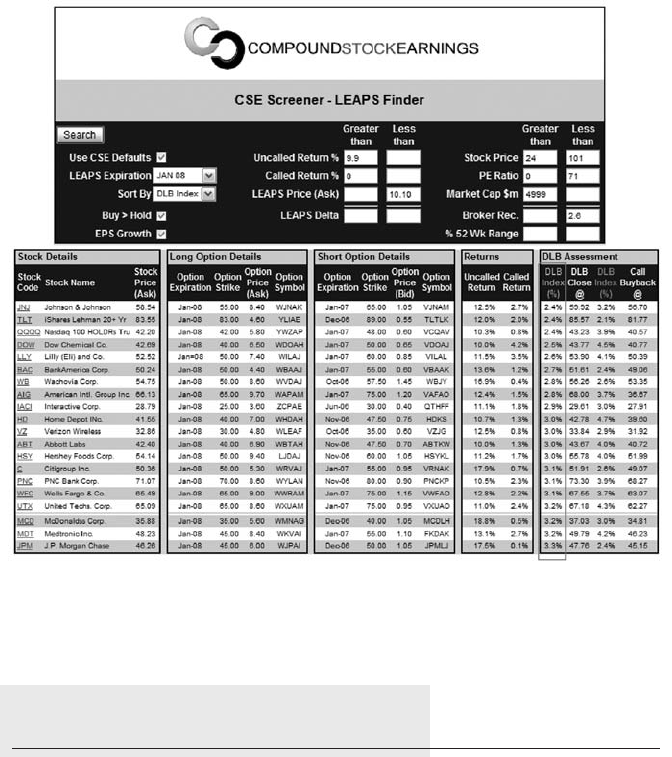
USING PRICE CHARTS WITH THE
LEAPS TECHNIQUE
Simply because the CSE Screener has presented a position does not auto-
matically qualify it as an acceptable investment. Revisit the “Rules for En-
tering New LEAPS Positions” listed earlier. At this point we just want to
emphasize the rule that relates to price charts:
• Ensure that the stock adheres to the buying low rule for LEAPS.
Before entering a new LEAPS position, investors must assess the stock’s
chart. Correct assessment of the price chart is absolutely critical to opti-
mizing returns when using the LEAPS technique. Investors who get caught
up in hype and buy when markets are going up or who panic and sell when
Entering New LEAPS Positions 129
FIGURE 7.1 Sample screenshot of the CSE Screener for LEAPS transactions.
c07.qxd 10/23/06 2:13 PM Page 129

markets are going down are categorically the losing investors in the mar-
kets. You must buy low and sell high: You must buy when markets are
falling and sell when markets are rising. If you were selling any product as
a business venture, you would be attempting to buy the product low and to
sell it high. Financial markets are no different. The importance of this rule
cannot be stressed enough.
The detailed information provided in the “Using Price Charts” section
in Chapter 3 also applies to entering a LEAPS position. Review the mater-
ial therein about identifying and assessing price cycles and how to look at
a price chart. And remember: If you do not understand a chart, do not invest
in the stock.
THE BUYING LOW RULE FOR LEAPS
The second step in the LEAPS investment process flowchart (Figure A.2 on
page 190) is to satisfy the buying low rule. The buying low rule defines the
point in the stock’s price cycle at which an investor can enter into new po-
sitions. It attempts to ensure that investors are buying when prices are low.
The three components of the rule are:
1. Investment in new LEAPS positions can only be made when a stock’s
overall or current cycle is increasing or horizontal.
2. Investment in new LEAPS positions can only be made when a stock is
in the lower 25 percent of its overall or current price cycle.
3. A stock’s current price cycle must have at minimum $1.50 of price
between the upper and lower lines for a position to be eligible for
investment. This third rule ensures that there is enough potential up-
ward movement in the stock price to exit the position.
By ensuring that you enter into new positions on stocks whose general
or current cycle is either increasing or horizontal and the stock is trading in
the lower end of the cycle, the buying low rule provides you with greater
probability that the stock price will increase and allow you to close out the
transaction.
Implementing the Buying Low Rule
Figures 7.2 through 7.14 provide examples of implementing the buying low
rule. Study each of these carefully. Turnover of capital (meaning the quick
and profitable exit of positions) is critical to your success as a LEAPS in-
vestor. Correct assessment of the price chart expedites the profitable exit
130 CALENDAR LEAPS SPREADS
c07.qxd 10/23/06 2:13 PM Page 130
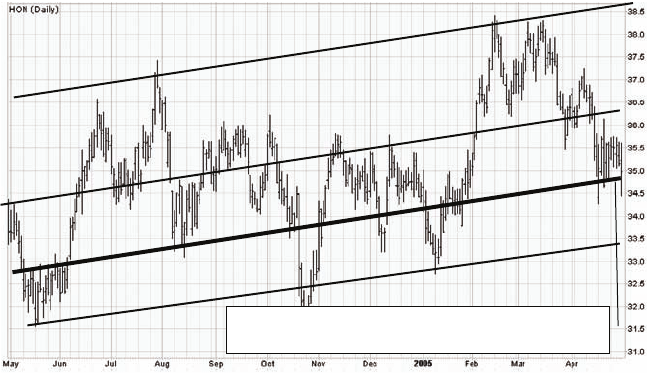
of LEAPS positions. Incorrect assessment of the price chart leads to in-
creasing the number of positions that require management for income.
Bottom 25 Percent of an Overall Rising or Horizontal Cycle
We can see in Figure 7.2 that the overall trend for HON is rising because
the significant bottoms and tops on the chart are getting higher. We can
also see that there is around $5.00 of price depth in the cycle (~$38.50 –
~$33.50). HON is also reaching the bottom 25 percent of the overall rising
cycle (indicated by the stock’s movement below the bold line drawn on the
chart). This is the safest and most profitable chart position for a new
LEAPS investment. Given the position on the chart, it would be ideal to con-
struct a LEAPS position on HON now.
Investing at or below the bottom 25 percent of an overall rising or hor-
izontal cycle is ideal for LEAPS positions.
Let’s look at another example in Figure 7.3. To assist us in identifying
when the stock is trading in the lower 25 percent of its price cycle, we draw
in a 50 percent line directly in the middle of the upper and lower lines
(should be parallel). We can see from the chart in Figure 7.3 that the over-
all trend for PG is horizontal with slight upward bias, because the signifi-
cant bottoms and tops on the chart are generally stable with slight upward
bias. We can also see that there is around $7.00 of price depth in the cycle
(~$58.00 – ~$51.00). Again, this is the safest and most profitable chart po-
sition for a new LEAPS investment. Given the position on the chart, it
would be ideal to construct a LEAPS position on PG now.
Entering New LEAPS Positions 131
Only invest in new positions when the stock is trading
at or below 25% of the generally rising price cycle.
FIGURE 7.2 Identifying the bottom 25 percent of an overall rising cycle.
c07.qxd 10/23/06 2:13 PM Page 131
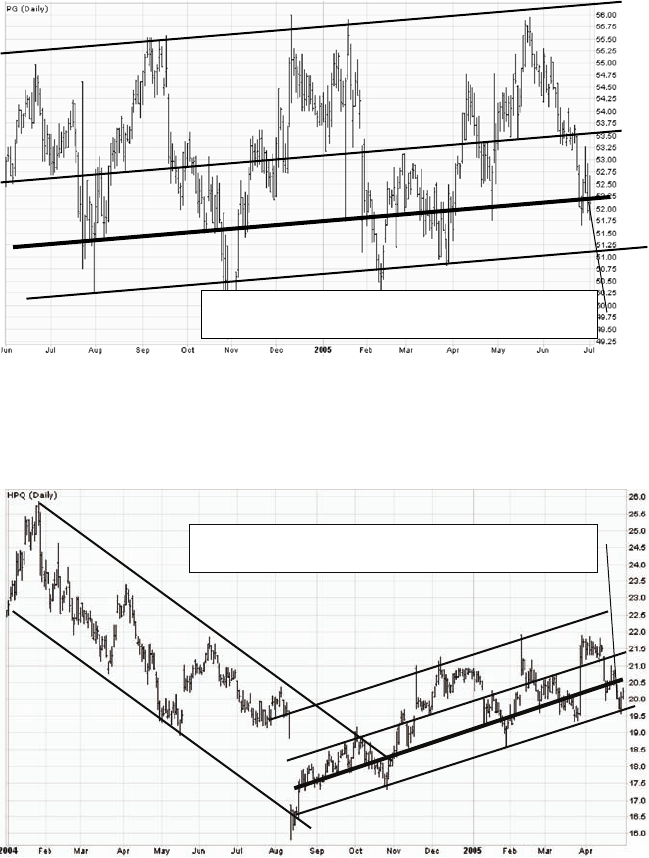
132 CALENDAR LEAPS SPREADS
Only invest in new positions when the stock is trading at
or below 25% of a current rising or horizontal price cycle.
FIGURE 7.4 Identifying the bottom 25 percent of a current rising cycle.
Only invest in new positions when the stock is trading
at or below 25% of a generally horizontal price cycle.
FIGURE 7.3 Identifying the bottom 25 percent of a horizontal cycle.
c07.qxd 10/23/06 2:13 PM Page 132
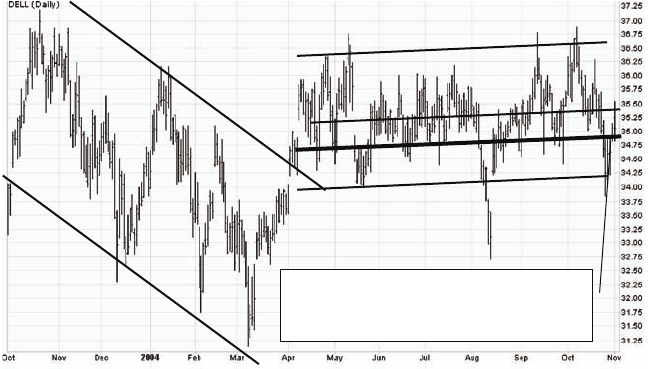
Entering New LEAPS Positions 133
Investing at or below the bottom 25 percent of an overall rising or hor-
izontal cycle is ideal for LEAPS positions.
Bottom 25 Percent of a Current Rising Cycle When the stock
drops into the lower 25 percent of the price channel (below the bolded
line), it qualifies under the buying low rule. We can see that Figure 7.4 dif-
fers significantly from the preceding examples. In contrast, this stock is not
in an overall rising cycle, but the current cycle is rising. This chart is also
optimal for constructing new LEAPS positions.
Investing at or below the bottom 25 percent of a current rising cycle is
ideal for LEAPS positions.
We can see that Figure 7.5 also differs significantly from the preceding
examples. In this case, the current cycle is horizontal with slight upward
bias. Again, this chart is optimal for constructing new LEAPs positions.
When Constructing a Position at the Bottom 25 Percent
of a Current Rising or Horizontal Cycle Is a Poor Choice
There are two distinct occasions when the bottom 25 percent of a current
rising or horizontal cycle is, in fact, a very poor place to construct a posi-
tion. The following examples apply to chart interpretation for both cov-
ered call and LEAPS positions.
Only invest in new positions when the
stock is trading at or below 25% of a
current rising or horizontal price cycle.
FIGURE 7.5 Identifying the bottom 25 percent of a current cycle that is
horizontal with a slight upward bias.
c07.qxd 10/23/06 2:13 PM Page 133
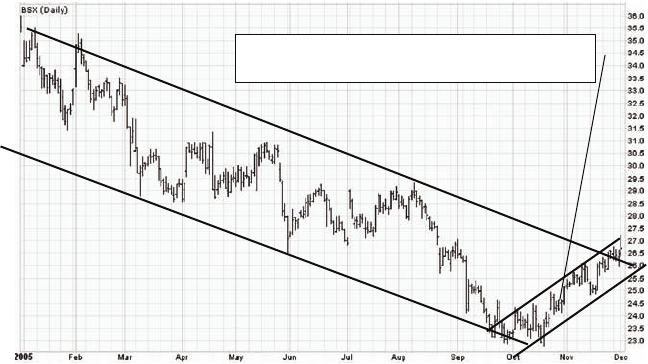
1. Bottom of a Current Rising Cycle That Is Part of a Longer-
Term Downward Cycle Perhaps the most common chart misinterpre-
tation made by novice investors is not recognizing that a current rising
cycle is part of a longer-term downward cycle. This is the result of an in-
vestor ignoring the longer-term cycle of the stock. This shortsightedness
leads investors to construct positions in a short-term upward cycle that is
merely the continuation of a longer-term downward cycle.
Study Figure 7.6. We can see that while BSX is in a current rising cycle,
the overall cycle is down. Now compare Figure 7.6 to Figure 7.7. Notice in
Figure 7.7 that the top of the declining price cycle has been substantially
broken by the current rising cycle. This differs from Figure 7.6 where the
current rising cycle was still trading within the declining price cycle.
Do not invest in a stock where the current rising cycle has not sub-
stantially broken through the top of the overall declining price cycle. This
occurrence is critically important to prevent misinterpretation of the cur-
rent cycle of the stock.
Let’s look at another example. Study Figure 7.8. Again, we can see that
the current rising cycle is actually a part of the long-term declining cycle.
LEAPS positions should not be constructed at the bottom of such a cycle.
2. Current Cycles That Are Close to the Yearly High Another
common chart misinterpretation by novice investors is investing at the bot-
tom of current cycles that are very close the yearly high for the stock. This
134 CALENDAR LEAPS SPREADS
The rising current price cycle is actually a part
of the declining longer-term price cycle.
FIGURE 7.6 A rising current cycle that is part of a long-term downward cycle.
c07.qxd 10/23/06 2:13 PM Page 134
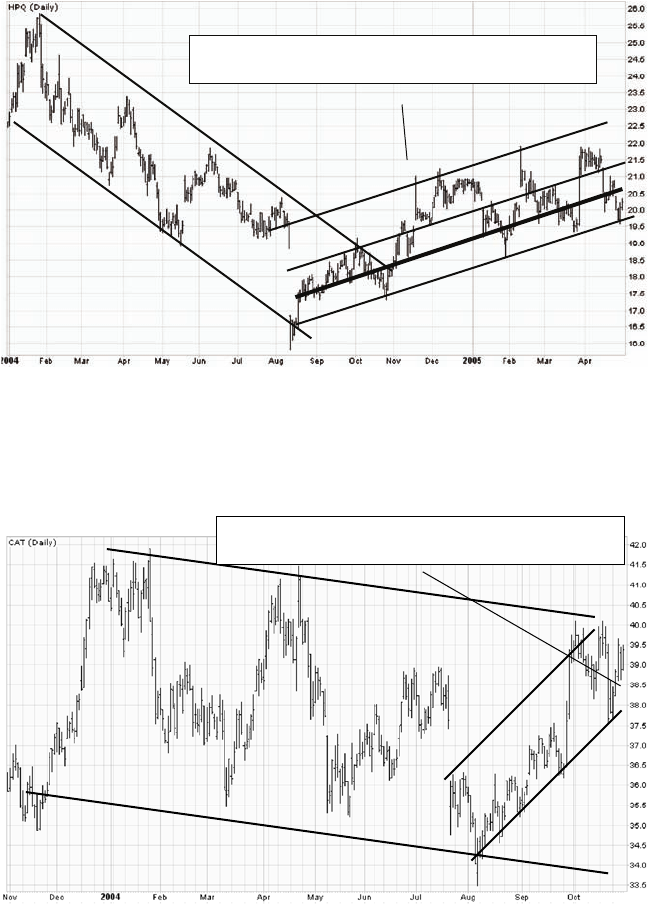
Entering New LEAPS Positions 135
The current rising cycle has substantially broken
through the top of the declining price cycle.
FIGURE 7.7 Evidence that the overall cycle is increasing.
The rising current cycle is actually a part of the
declining longer-term price cycle.
FIGURE 7.8 Another rising current cycle that is part of a long-term
declining cycle.
c07.qxd 10/23/06 2:13 PM Page 135
point, in many instances, is a “greed trap,” where investors see a stock con-
tinually rising over a yearly time frame and they are entering into new po-
sitions very near to the yearly high for a stock. While this strategy is fine if
the stock continues its strength, eventually it will turn around. Investors
who consistently enter new positions near the yearly high will accumulate
a portfolio of underperforming positions that require management for in-
come. When a stock breaks cycle after making a yearly high, it may be
months or even years before the stock price ever trades higher than this
major yearly high. Very few stocks can consistently make yearly highs
month after month. All stocks eventually cycle down.
Remember, our objective when using the buying low rule is to buy
when markets are falling and to enter a position at the lower point of the
market. We do not want to be caught up in the hype of the losing investors
who consistently buy stocks at the high end of the market. At this point, it
is important to think about what the term “buying low” actually means.
“Buying low” means entering into a position at an inexpensive price relative
to the market. Relativity is the key word. We want to enter into new posi-
tions at a relatively inexpensive price compared to what other investors
have recently paid for the stock. Relativity is the key.
See, for example, Figures 7.9 and 7.10. Figure 7.9 shows entering a new
position in the lower 25 percent of an overall rising cycle. Figure 7.10 high-
lights the entry point from Figure 7.9, the point where we are comfortable
constructing a new LEAPS position if we were assessing this chart today.
This point is the lower 25 percent of the overall rising cycle. Notice that
many investors have recently paid prices significantly higher than our entry
price. Relatively speaking, our entry price is inexpensive.
Similarly, Figure 7.11, on Dell, shows entering a new position under the
buying low rule at the bottom of a current horizontal cycle. Notice in Figure
7.12 that the vast majority of investors have recently paid prices signifi-
cantly higher than our entry price. Again, relatively speaking, our entry
price is inexpensive.
Now that we more fully understand the concept of buying low, let’s ad-
dress the common mistake of investing at the bottom of a current rising
cycle that is very close to the yearly high for a stock. Take Figure 7.13 as an
example. It is clear that this stock is both in an overall upward cycle and
within the bottom 25 percent of this cycle. Why then, is this a very poor
place to construct a new LEAPS position? See Figure 7.14 for the answer.
We can see very clearly from Figure 7.14 that while the stock is gener-
ally rising over a yearly time frame and is at the bottom of a current rising
cycle, we are paying almost the yearly high for the stock. Very few investors
136 CALENDAR LEAPS SPREADS
c07.qxd 10/23/06 2:13 PM Page 136
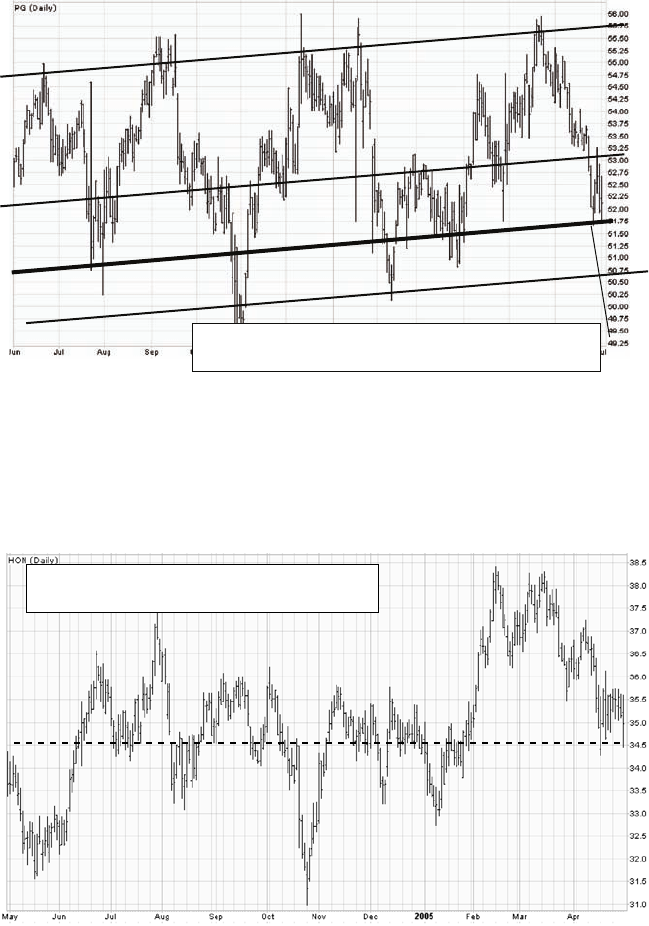
Entering New LEAPS Positions 137
Only invest in new positions when the stock is trading at
or below 25% of a generally horizontal price cycle.
FIGURE 7.9 Entering a new position in the lower 25 percent of an overall
rising cycle.
Many investors have paid higher prices for the
stock compared to our entry price.
FIGURE 7.10 Relative entry price.
c07.qxd 10/23/06 2:13 PM Page 137
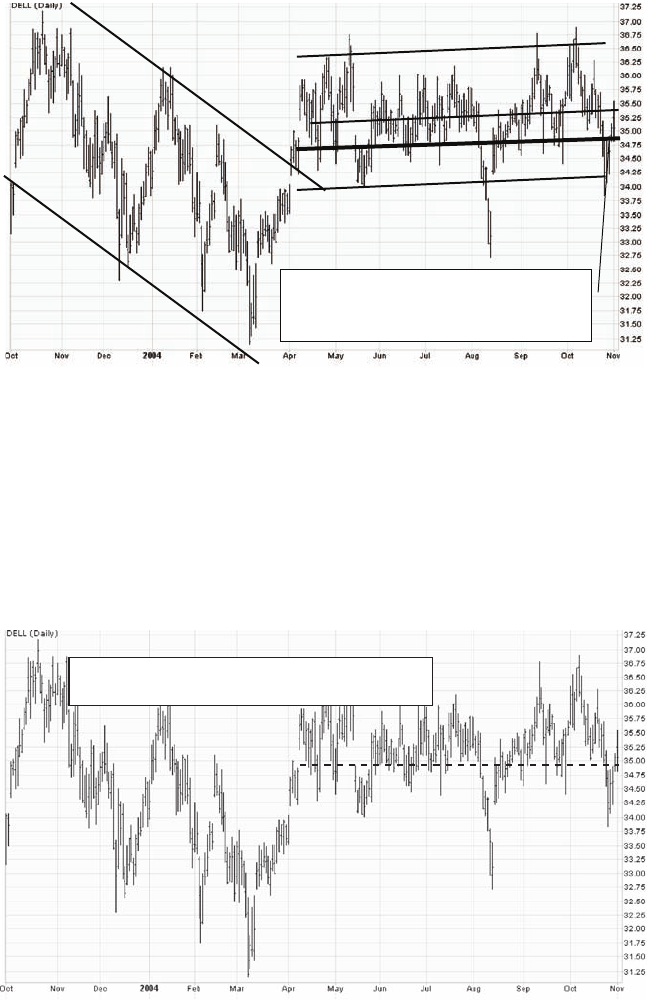
have recently purchased the stock at higher prices. We are, in actuality,
buying high, rather than low. We are getting caught up in the hype and ex-
uberance of a strongly appreciating stock price.
This is a very poor place to construct a LEAPS position. Sure, the stock
may continue its strong run upwards and we may quickly exit the position.
However, in the event that the stock does turn around and makes a signifi-
138 CALENDAR LEAPS SPREADS
Only invest in new positions when the
stock is trading at or below 25% of a
current horizontal price cycle.
FIGURE 7.11 Entering a new position at the bottom of a current
horizontal cycle.
The majority of investors have paid higher prices
for the stock compared to our entry price.
FIGURE 7.12 Relative entry price.
c07.qxd 10/23/06 2:13 PM Page 138
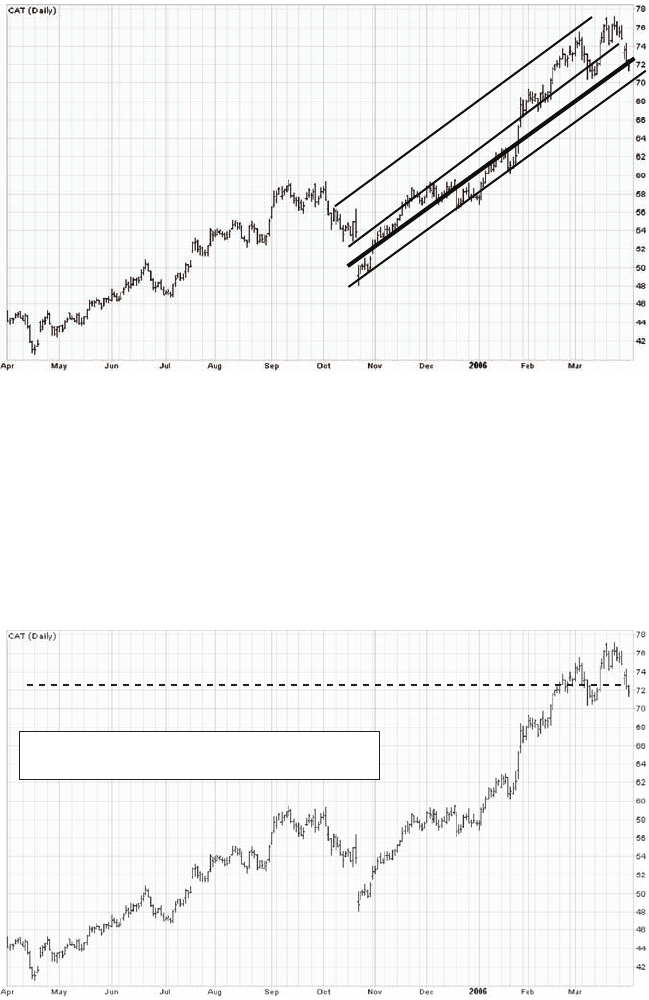
cant change in trend, it is very unlikely that there will be higher prices for
the stock for months, if not years. As such, we will be forced into a pro-
tracted period of management for income on this position (management for
income is discussed in depth in Chapter 8). While there are numerous man-
agement rules and techniques that allow the continued generation of in-
come from a position regardless of market direction, having to rely on
Entering New LEAPS Positions 139
FIGURE 7.13 A stock in an upward cycle and within the bottom 25 percent of
the cycle.
The vast majority of investors have paid lower
prices for the stock compared to our entry price.
FIGURE 7.14 A current rising cycle that is actually very close to the yearly high.
c07.qxd 10/23/06 2:13 PM Page 139
management for cash flow is not the optimal outcome. The optimal out-
come for LEAPS investors is to quickly enter and exit LEAPS transactions.
The regular reinvestment of capital plus cash returns allows for fast and
dramatic compounding of the asset base.
Whenever entering a new position, investors should ask themselves:
“Am I paying a relatively cheap or expensive price? Have many investors
recently purchased the stock at a higher price than my entry price?” As
we have just seen, the answers will reveal the suitability of entering the
position.
Identifying a Change in the Cycle and the
First Buy Point
We now understand that new LEAPS positions can only be constructed at
the bottom 25 percent of an overall or currently rising or horizontal cycle.
Therefore, two very important skills are needed:
1. Knowing how to identify a change in cycle.
2. Knowing how to identify the first buy point of a new price cycle.
How to Identify a Change in Cycle This topic applies equally to cov-
ered call and LEAPS techniques. However, it is discussed in this section
rather than in Part I, Covered Calls, since it is an advanced charting tech-
nique. Investors using both techniques can use this to understand a change
in cycle from declining to rising and to, consequently, identify the first
buy point of a new rising cycle. In each and every change in cycle from de-
clining to rising, two chart events occur. These events do not necessarily
occur in the same order for each individual change in cycle and they do
not guarantee a change in cycle; however, both events do occur each and
every time a cycle actually changes direction. Therefore, investors should
be watching cycles for these events—and when they unfold, they warn of a
potential change in cycle. Because we are talking about entering into new
positions, we are assessing a change from a declining to a rising cycle.
The two chart events that occur in each and every change of trend
from a declining to a rising cycle are:
1. A higher bottom or bottoms, which may occur within the declining
price cycle.
2. A break through of the top line of the declining price cycle.
Without these two events occurring, a change of cycle direction cannot
take place. Therefore, watching for and identifying these events as they
140 CALENDAR LEAPS SPREADS
c07.qxd 10/23/06 2:13 PM Page 140
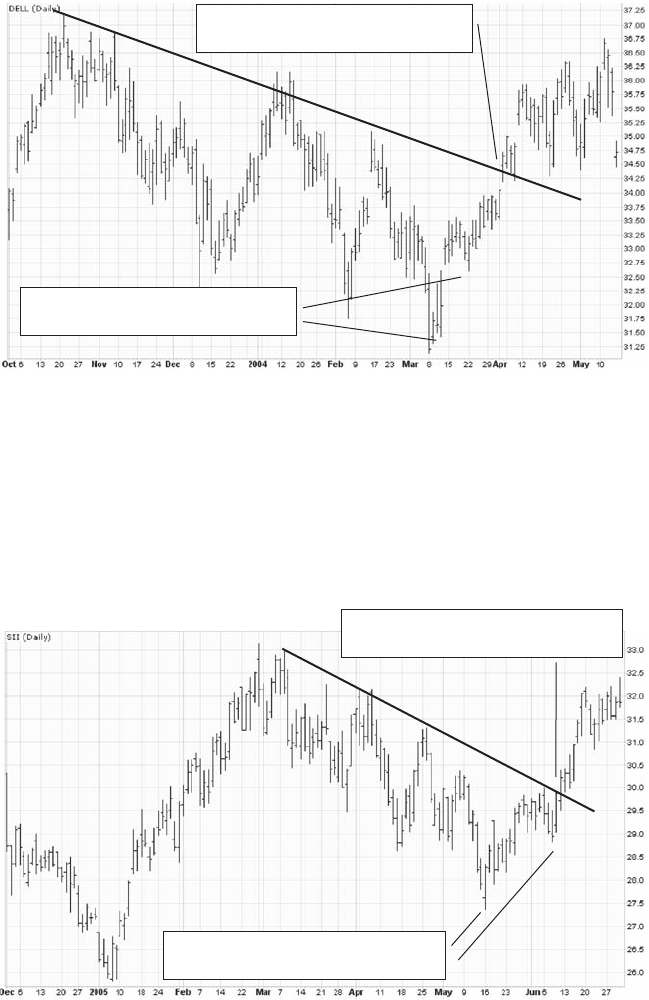
occur is an excellent early warning to watch for a change of cycle direction.
See the examples in Figures 7.15 and 7.16.
Now that we know that when following a declining cycle, higher bot-
toms and a break to the top of the declining cycle provide a red flag that the
cycle may, in fact, be about the change, we need to know how to identify
the first buy point of a new, rising cycle.
Entering New LEAPS Positions 141
1. Higher bottom; in this instance,
within the declining price cycle
2. Break through the top of the
declining price cycle
FIGURE 7.15 Identifying a change in cycle.
1. Higher bottoms; in this instance,
within the declining price cycle
2. Break through the top of the
declining price cycle
FIGURE 7.16 Another example of identifying a change in cycle.
c07.qxd 10/23/06 2:13 PM Page 141
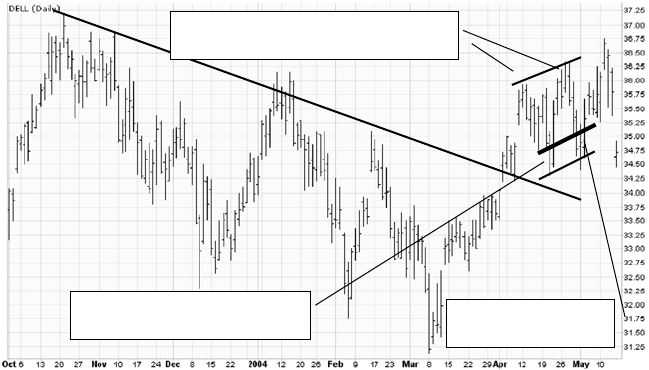
How to Identify the First Buy Point of a New Price Cycle The
most difficult part of the buying low rule for LEAPS is identifying the first
buy point of a new price cycle. The first buy point of a new price cycle is lit-
erally the first point in a new cycle at which the buying low rule is satisfied.
This definition does not mean that new positions can only be constructed
at the first buy point; however, the first buy point provides confirmation of
a new rising cycle.
The first buy point of a new cycle is always preceded by a minimum of
two tops and a minimum of one bottom. The second top must be higher than
the first; otherwise the cycle is declining and is ineligible for investment.
Study Figure 7.17. We can see that the first buy point of a new cycle is
always preceeded by a mimimum of two tops (the second top being higher
than the first) and a minimum of one bottom. The first buy point can then
easily be estimated by first connecting the higher tops, identifiying the first
bottom of the cycle, and then extrapolating a bottom parallel line from this
bottom. Remember, when attempting to identify the first buy point, the sec-
ond bottom of the cycle is yet to form—the bottom line must be estimated
by drawing a parallel line from the first bottom.
Remember, this technique is only a tool for identifying the first buy
point of a new cycle. It is not necessary to only enter new positions at the
first buy point. It is completely reasonsable to enter into new positions
after the current rising cycle is well established (after it has made several
higher bottoms and tops).
142 CALENDAR LEAPS SPREADS
2. Minimum of one bottom.
Draw bottom line parallel to tops. 3. First buy point; 25%
of current rising cycle.
1. Minimum of two tops. Second top is
a higher top. Draw top trend line.
FIGURE 7.17 Identifying the first buy point of a new price cycle.
c07.qxd 10/23/06 2:13 PM Page 142

CONSTRUCTING A LEAPS POSITION
Now that we understand how to use the CSE Screener to identify a poten-
tial LEAPS position and how to qualify a stock using the buying low rule,
we are ready to discuss position construction. The CSE Screener only pre-
sents positions that follow the correct construction rules as outlined in this
section, which is a significant advantage to investors, as position construc-
tion has already been performed. However, it is essential that investors un-
derstand the fundamental rules and reasoning behind the construction of a
position. So let’s look at the rules for constructing a LEAPS position.
Selecting a LEAPS
• You must select a LEAPS that is one strike price in the money. The rea-
son for this requirement relates to the delta ratio, which is discussed
later in this chapter.
• You may not select a LEAPS that costs more than $10.00; the less it
costs, the better. Low cost is necessary to generate leverage. Also, the
higher the cost of your LEAPS, the more difficult the position will be to
manage in a market downturn.
• The LEAPS selected must have at minimum 12 months to expiration,
with the longest-term LEAPS available always given preference.
Selecting the Call
• You must sell a call as soon as you buy a LEAPS. If you wait to get a
higher price for the call, you are no better than a speculator and you
will get burned!
• You must select a call that results in a positive called return. To make
this selection, take the LEAPS strike price and add the cost of the
LEAPS and you will arrive at an approximate strike price for the call.
• The call expiration that you select must not be equal to the expiration
of the LEAPS. The shortest-term call that meets the requirements for a
correct construction should be selected to allow management depth
(discussed later).
• The call selected must combine with the LEAPS selected to have a
delta ratio (see next section) of 1.90 or more.
Let’s look at an example of constructing a calendar LEAPS Spread on
JP Morgan (JPM). For the purpose of this example, assume that the fun-
damental and buying low rule requirements have been met and that the
CSE Screener is not being used. Remember, the CSE Screener will not
present a position for investment unless it meets the construction rules.
However, it is essential that investors understand these rules and the logic
behind them.
Entering New LEAPS Positions 143
c07.qxd 10/23/06 2:13 PM Page 143
Refer back to Table 1.7 (on page 12), which shows an option chain for
JPM. (Option chains on U.S. stock are available as part of the Compound
Stock Earnings Covered Call Toolbox.) An option chain is just a list of all
available option contracts on a particular stock and the prices the contracts
are trading in the market.
To construct a LEAPS Position on JPM according to the rules, we need
to select a LEAPS that is (1) one strike price in the money; (2) not more
than $10.00 in value; and (3) the longest-term LEAPS available in the option
chain.
The first step is to go out to the longest-term LEAPS available. From
the option chain shown as Table 1.7, the longest-term LEAPS available is
the January 2007. We then need to find the January 2007 LEAPS that is
one strike price in the money. As JPM is trading at $39.38, the $35.00
strike is one strike price in the money. We need to invest in a LEAPS that
costs no more than $10.00. We can buy the January 2007 $35.00 for $7.30.
(If the January 2007 $35.00 were more than $10.00, we would simply disre-
gard this position and identify a new stock for investment. However, it is
not necessary to do so in this instance, as we have met the selection crite-
ria.) We will try to construct a spread using the January 2007 $35.00 for
$7.30.
We now need to select a call to sell against this LEAPS. From the rules
we know that we must select a call that (1) results in a positive called re-
turn and (2) a minimum uncalled return of 10 percent; (3) whose expiration
is not equal to the expiration of the LEAPS selected (the shortest-term call
that allows a correct construction should be selected); and (4) has a delta
ratio of 1.90 at a minimum.
Next we need to select the call strike price. Remember, our goal is to
ensure that we create a position with a positive called return and an
uncalled return of minimum 10 percent. We estimate the correct call strike
price that will provide a positive called return by adding the LEAPS
strike price of $35.00 to the cost of the LEAPS. So we add $35.00 to $7.30 for
a total of $42.30. We should thus attempt to sell a $42.50 call for a mini-
mum uncalled return of 10 percent. The cost of the LEAPS is $7.30, so we
need to sell a call for $0.73 or more (10 percent or more). We look at the op-
tion chain (Table 1.7) for a $42.50 strike call that we can sell for $0.73 or
more.
We see that the shortest-term $42.50 strike call that we can sell for
$0.73 or more is the March 2005. This call would meet the rules previously
outlined because (1) it results in a positive called return; (2) it is the near-
est month that allows for a minimum 10 percent uncalled return (the Janu-
ary 2005 $42.50 is trading at $0.60 and will not provide a 10 percent return);
and (3) the call expiration that we selected is not equal to the expiration of
the LEAPS selected.
144 CALENDAR LEAPS SPREADS
c07.qxd 10/23/06 2:13 PM Page 144
Finally, we need to assess the delta ratio. The rationale and importance
of the delta ratio is discussed in the following section, but for now you only
need to know how to calculate it per the following equation:
Delta ratio = LEAPS delta/Call delta
So for our example:
Delta ratio = 0.61/0.26
= 2.34
Now have met all criteria for entering into a new position, which is as
follows:
Buy LEAPS Jan 07 $35.00 for $7.30 delta of 0.61
Sell call Mar 05 $42.50 for $0.90 delta of 0.26
Uncalled return $0.90/$7.30 = 12.3%
Called return $42.50 – $35.00 – $7.30 + $0.90
= $1.10 or 15.1%
The Delta Ratio
As noted earlier in the book, the delta of a stock option is the rate of change
of the option price with respect to the price of the underlying stock. It is a
measure of how much an option’s price will increase or decrease for an in-
cremental increase or decrease in the stock price.
Let’s look at an example of a call that has a delta of 0.60. This number
means that when the stock price changes by an amount, the option price
will change by 60 percent of that amount. For example, if the stock price in-
creases by $1.00, then the option will increase in price by $0.60 (60 percent
of the stock price’s increase). If the stock price increased just $0.50, then
the option price would increase by only $0.30 (60 percent of the stock price
increase).
The delta ratio is a measure of the interaction between the LEAPS delta
and the call delta and is represented by the following formula:
Delta ratio = LEAPS delta/Call delta
A position with a delta ratio of 1.90 or more ensures that, when the stock
price rises, the LEAPS price increases much faster than the cost of buying
back the call. This high delta ratio will assist greatly in the closing of a
transaction when the stock price continues to rise after entering a new po-
sition. The delta ratio also assists in closing positions on the delta effect
when performing a secondary call sale. (Secondary call sales are discussed
in Chapter 8.)
Entering New LEAPS Positions 145
c07.qxd 10/23/06 2:13 PM Page 145
Completing the Construction
Remember, the CSE Screener will only present positions that meet the pre-
ceding construction rules. Consequently, we needn’t go through the con-
struction process on each position. We only need to do the following three
things:
1. Use the CSE Screener to identify positions that meet the fundamental
criteria and can be correctly constructed.
2. Ensure that the position is on a stock with an overall or current upward
or horizontal cycle.
3. Ensure the position meets the buying low rule.
Assuming that the portfolio diversification rules are also met, we can
then enter the position.
146 CALENDAR LEAPS SPREADS
c07.qxd 10/23/06 2:13 PM Page 146
147
CHAPTER 8
After entering new LEAPS positions, you need to know the rules for
managing these positions in the event that the stock price initially in-
creases or decreases. You also need to know how to manage a po-
sition for cash flow until you completely amortize the cost of the LEAPS in
the event the stock price never increases to a point where you can exit the
transaction (refer to Figure A.2 on page 190). Correct management is the
difference between great success and complete mediocrity in the business
of both covered calls and LEAPS.
THE 10¢ AND 5% BUYBACK RULES
With an established position in the LEAPS and the call, there are two
possibilities:
1. The stock price increases and triggers the 10¢ buyback rule.
2. The stock price decreases and triggers the 5% buyback rule.
These rules are intended to expedite the closing of the transaction so you
can get your capital back and reinvest it to compound your assets.
You must understand that your objective with LEAPS spreads is not the
same as with covered calls. With LEAPS spreads your objective is always to
exit the entire spread as soon as possible for a 5 percent profit on the whole
Management
Rules
c08.qxd 10/23/06 2:11 PM Page 147
transaction. Unlike covered calls, it is not necessary to hold the position
until the expiration of the short call. The position can be very quickly
closed for a profit if the stock price increases by a small amount after en-
tering the transaction.
The 10¢ Buyback Rule
The objective of the 10¢ buyback rule is to allow the buyback of the call if
the stock price moves up after entering the position and then to sell the
LEAPS for a profit if the stock price continues to move up. Application of
this rule facilitates the timely close of the transaction by preventing the call
price from increasing as the LEAPS price is increasing. Remember, the
LEAPS position is constructed at the bottom 25 percent of a rising or hori-
zontal cycle where the bias for the stock is to move up after entering the
transaction.
The 10¢ buyback rule instructs investors to do two things:
1. Buy back the call at market if the bid price of the LEAPS moves to 10¢
above your cost in the LEAPS.
2. Then add the cost of the call buyback to your cost in the LEAPS, add 5
percent to that total, and put in a good til canceled (GTC) order to sell
the LEAPS at this price.
For example, if your cost in a LEAPS is $7.30, you would buy back the call
if the market bid price of the LEAPS reaches $7.40. This is a very important
point: We are referring to the market bid price of the LEAPS, not the ask
price or the last price.
When you buy back a call under the 10¢ buyback rule, it usually in-
volves a loss on buyback of $0.20 to $0.40. Let’s assume the call buyback
creates a loss of $0.30. Continuing with our example, you would calculate
your GTC sell order for the LEAPS as follows:
GTC sell order = (LEAPS cost + Loss on buyback) ×1.05
= ($7.30 + $0.30) ×1.05
= $7.98
So you would set your GTC order at $8.00. If this stock moves up a lit-
tle further, this order will execute, you will have your money back in your
account plus your 5 percent return, and you will be ready to reinvest your
money and compound your assets. If the order does not execute, you will
148 CALENDAR LEAPS SPREADS
c08.qxd 10/23/06 2:11 PM Page 148
have the option of selling another call. This option is discussed in the later
section on secondary call sales.
The 5% Buyback Rule
The 10¢ buyback rule applies in the event the stock price initially increases
after entering the transaction. Conversely, the 5% buyback rule allows you
to take advantage of a downward movement in the stock price after estab-
lishing a new position by taking the following two steps:
1. Buy back the call for a net uncalled return of 5 percent if market prices
decline.
2. Then add 5 percent to the cost of the LEAPS and place a GTC order to
sell the LEAPS at this price.
Let’s continue with the preceding example in which you have a LEAPS
that cost $7.30 and a call you sold for $0.90. If there were a drop in the stock
price, you would buy back the call at a price of $0.55 to leave a net return
of $0.35, or a 4.8 percent gain ($0.35/$7.30). You would then put in a GTC to
sell the LEAPS at a price of $7.70 ($7.30 x 1.05) for an additional gain of 5.5
percent. If this stock went back up and this order executed, a total net gain
of 10.3 percent would result.
Based on the example given here, if the 10¢ buyback rule were trig-
gered, you would attempt to sell the LEAPS for $8.00 for a total transaction
gain of 5 percent. However, if the 5% buyback rule were triggered, you
would sell the LEAPS for $7.70 for a total transaction gain of 10 percent.
Thus you can see that it is often more advantageous for the stock price to
drop after initially entering a transaction! This advantage is another unique
aspect of the LEAPS technique. It is the reason why we do not attempt to
pick the bottom of the market. Entering a position at or around 25 percent
of the cycle often leads to the stock initially falling before it cycles back up.
An initial fall is a significant advantage in a LEAPS position as it can result
in double the return and a lower exit price.
If you buy back the call for a profit and your order to sell the LEAPS at
cost plus 5 percent does not execute, then what? Well, you have locked in
a great 5 percent return over just a few days and you then assess the possi-
bility of selling another call. This activity is discussed in detail in the later
section on secondary call sales rules.
Management Rules 149
c08.qxd 10/23/06 2:11 PM Page 149

150 CALENDAR LEAPS SPREADS
THE DELTA LOW BRIDGE
The delta low bridge (DLB) is an alternative technique to the 10¢ rule LEAPS
technique. The primary difference between the two techniques is:
• DLB investors do not buy back the short call under the 10¢ rule if the
stock price rises after entering a transaction.
Instead, if the stock price rises after entering the transaction, DLB investors
exit the entire transaction on the delta effect. Exiting the transaction on the
delta effect involves buying back the call and immediately selling the
LEAPS when a 5 percent net return can be realized. This technique thus
provides DLB investors with greater downside protection because they are
not exposed to a downturn in the market after buying back the call and
waiting for the stock price to increase and the LEAPS to sell.
If the stock price declines after entering the transaction, as with 10¢
rule transactions, DLB investors will also buy back the initial call for a
profit of 5 percent and then sell the LEAPS for cost plus 5 percent.
Closing a Transaction Using the Delta Effect
As previously discussed (in Chapter 7), the delta of a stock option is the
rate of change of the option price with respect to the price of the underly-
ing stock. It is a measure of how much an option’s price will increase or de-
crease for an incremental increase or decrease in the stock price.
Recall from the position construction rules that LEAPS transactions
must be established with a minimum delta ratio of 1.90. In a correctly con-
structed LEAPS position, the LEAPS delta is always significantly higher
than the call delta. As such the value of the LEAPS increases much faster
than the buyback cost of the call. This is a critical factor for DLB investors
who rely on the LEAPS increasing in value much faster than the buyback
cost of the call in order to exit the transaction.
Closing a transaction on the delta effect means waiting for a point
where the buyback cost of the call is exceeded by the profit available when
selling the LEAPS. Take the following position as an example:
• BTO GE $35.00 Jan 2007 LEAPS @ $5.00; delta of 0.60
• STO GE $40.00 Dec 2005 Call @ $0.50; delta of 0.30
Closing this position on the delta effect when the stock price increases
would involve immediately buying back the call and selling the LEAPS
when a 5 percent net return could be realized. For example, suppose the
c08.qxd 10/23/06 2:11 PM Page 150
stock price increases after entering this transaction and the current market
prices of the LEAPS and call are as follows:
• GE $35.00 Jan 2007 LEAPS @ $5.00; current bid price $5.60
• GE $40.00 Dec 2005 Call @ $0.50; current ask price $0.80
This position could be closed on the delta effect to realize a $0.60 profit on
the LEAPS and a $0.30 loss on the call. The overall profit would therefore
be $0.30, or 6.0 percent ($0.30/$5.00) of the invested value of the LEAPS.
Such a situation is common for the LEAPS investor using the DLB tech-
nique. The call is never bought back for a loss under the 10¢ rule; rather, the
delta effect is relied on to provide a profitable exit.
The DLB Rules
The process of investing with the DLB technique is similar to that for nor-
mal LEAPS transactions. Investors still go through the regular LEAPS in-
vestment process previously outlined in Chapter 7, including:
• Using The CSE Screener to meet fundamental and construction
requirements.
• Ensuring the stock is in an overall or current rising or horizontal cycle.
• Ensuring the stock meets the buying low rule.
Once these actions have been accomplished, DLB investors must perform
one additional activity to ensure a realistic position is being entered into:
• Assessing the stock chart for the upward price move required to exit
the DLB transaction.
As DLB transactions require exit on the delta effect, they generally need a
larger movement in the stock price to close the transaction for cost plus 5
percent than is required for 10¢ rule transactions.
When assessing a particular position as a DLB, it is important to look at
the “DLB Close @” column of the CSE Screener. This column tells the in-
vestor at what stock price a particular LEAPS construction will close on the
delta effect for a 5 percent return. This is a very valuable component of the
tool and allows a realistic position to be entered into. The “DLB Close @”
column is highlighted in Figure 8.1.
The position shown on HD in Figure 8.1 would close out on the delta ef-
fect for a 5 percent return when the stock price increases to $42.78, which is
a 2.4 percent increase from the current stock price of $41.55. Remember,
all LEAPS positions are constructed at the lower 25 percent of an overall or
Management Rules 151
c08.qxd 10/23/06 2:11 PM Page 151
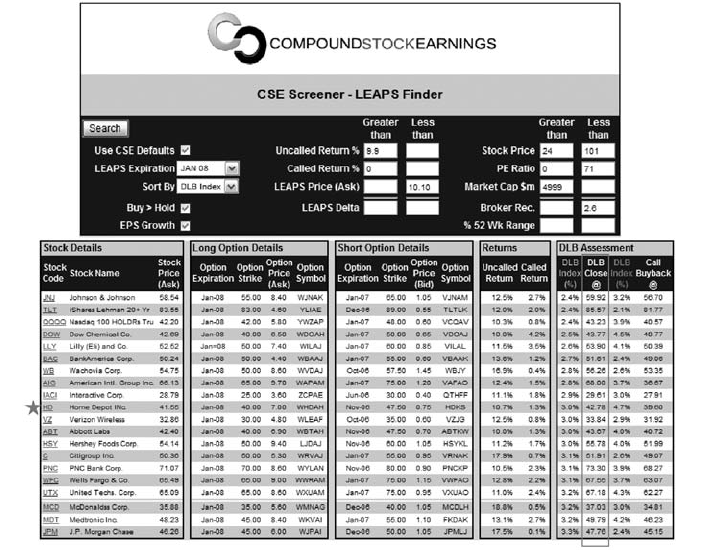
current rising or horizontal cycle, so the bias is the for the stock price to in-
crease in the short term. However, investors must ensure that a particular
DLB position will close out on the delta effect by the time the stock reaches
75 percent of the cycle. The assessment of the stock price at which the posi-
tion will close is critical to the timely exit of the position. Let’s assess the
HD price chart shown as Figure 8.2 and make a judgment on this particular
position.
We can see from the “DLB Close @” column in Figure 8.1 that this par-
ticular position will close out on the delta effect for a 5 percent return when
the stock price reaches $42.78. This point is well before the stock reaches
75 percent of the current rising cycle; actually, the position will close out
before the stock reaches 50 percent of the cycle. As such, this position
meets the requirements and is an acceptable investment. If the stock price
needs to increase more than 75 percent of the current cycle, the position is
152 CALENDAR LEAPS SPREADS
FIGURE 8.1 The “DLB Close @” column tells the investor at what stock price a
particular LEAPS construction will close on the delta effect for a 5 percent return.
c08.qxd 10/23/06 2:11 PM Page 152
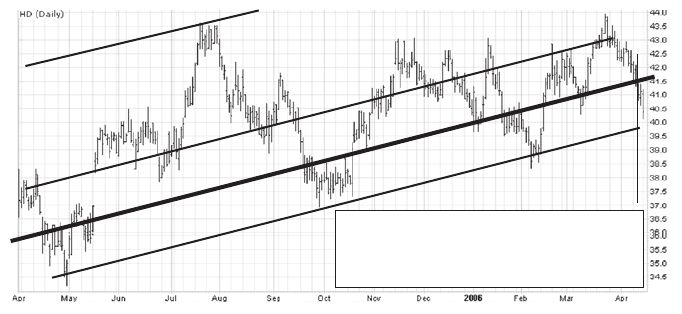
Management Rules 153
This DLB position will close out at $42.78,
a price that is actually below 50% of the
cycle. This is an acceptable DLB position.
FIGURE 8.2 Price chart showing an acceptable DLB position.
not optimal, and we would simply select and qualify another position. As an
alternative, we may choose to enter this position as a 10¢ rule transaction,
which does not depend on the delta effect to exit.
Understanding the DLB Index
Another very important function of the CSE Screener is the ability to filter
the market for LEAPS investments that have a high DLB index. The DLB
index is a calculation for any given LEAPS position of the percentage the
stock price must rise in order for the position to exit on the delta effect with
a 5 percent return. For example, a position with a DLB index of 3.5 percent
will close out on the delta effect for a 5 percent return when the underlying
stock price increases by 3.5 percent. A position with a DLB index of 2.0 per-
cent will close out on the delta effect for a 5 percent return when the un-
derlying stock price increases by 2.0 percent.
Obviously, the most desirable DLB transactions are those that close out
with the smallest increase in the underlying stock price. The CSE Screener
can be used to effectively identify the best DLB positions (those with the
lowest DLB index). See Figure 8.3. The default search criteria of the CSE
Screener automatically ranks the positions in relation to their DLB index.
The positions with the lowest DLB index are presented at the top of the re-
sults table. Investors choosing to use the DLB technique can simply start at
the top of the list to identify positions with the lowest DLB index, qualify
positions under the buying low rule, and then, finally, ensure that the re-
quired stock price increase is within 75 percent of the cycle.
c08.qxd 10/23/06 2:11 PM Page 153
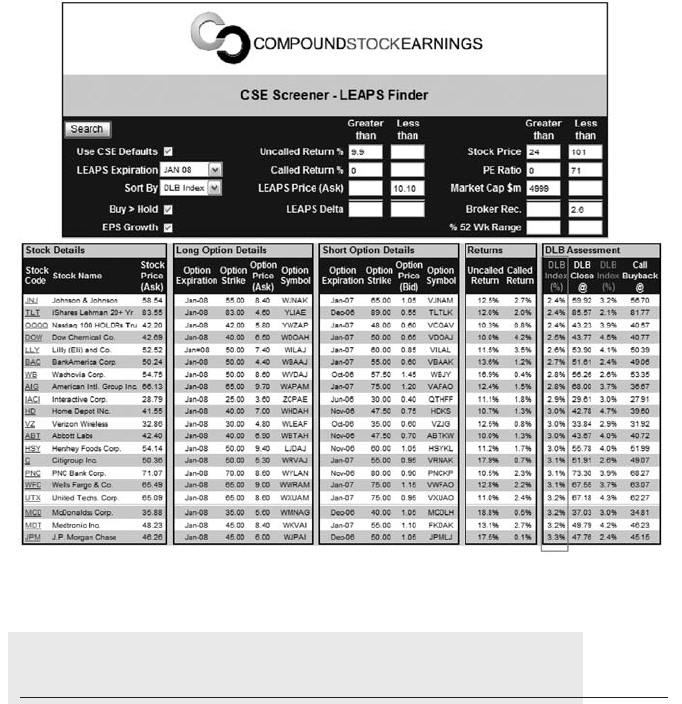
SECONDARY CALL SALES: MANAGING LEAPS
THAT HAVE NOT SOLD FOR A PROFIT
Remember, the objective is to consistently generate and compound cash
flow regardless of the direction of the market. This section explains how
we accomplish this objective through secondary call sales. A secondary call
sale is any call sale that occurs after you have bought back the original
call you sold when constructing a position. You need to use the secondary
call sale rules on positions where the stock price has not increased enough
to sell your LEAPS for cost plus 5 percent after buying back the short call.
LEAPS Secondary Call Sales Rules
The objective when selling a secondary call on a LEAPS is to buy back that
call as soon as possible for at least a 5 percent net return. The methods and
timing of secondary call sales are discussed in depth later in this section,
154 CALENDAR LEAPS SPREADS
FIGURE 8.3 CSE Screener ranks positions by DLB index.
c08.qxd 10/23/06 2:11 PM Page 154
but for now you must gain an understanding of the rules for selecting strike
prices and expirations for secondary call sales—this function is not per-
formed buy the CSE Screener.
The underlying function of the rules for selecting strike prices and ex-
pirations on a secondary call sale is to ensure, if possible, that you sell a
secondary call that is both (1) the same strike price as the original call se-
lected when constructing the position and (2) the shortest expiration pos-
sible that allows the minimum required return. The eleven rules are:
1. A secondary call can only be sold when the markets are in the green
(trading higher than the close of the previous day). The markets are in
the green any time when both the Dow Jones Industrial Average and
the NASDAQ are trading above the close of the previous day.
2. A secondary call can only be sold after implementing either the 10¢ or
5% buyback rule.
3. A secondary call cannot be sold if the market bid price of the LEAPS is
within 10 percent of your GTC sale price.
4. A secondary call can only be sold when the formalized seven-day rule
has been satisfied (discussed in depth later in this section).
5. A secondary call sale should generate a minimum 10 percent uncalled
return.
6. The aim is to buy back the call for a net uncalled return of 5 percent.
7. It is preferable to select the same call strike price as the strike price
used when the position was established. Simply move the expiration
date out in order to maintain a minimum 10 percent uncalled return
using the same strike price. This move ensures that the delta ratio re-
mains intact. A call may be sold up to but not exceeding the expiration
date of the LEAPS.
8. Preference should always be given to a shorter-term call if this call pro-
vides the minimum uncalled return requirement of 10 percent (time
value erodes more quickly in the investor’s favor).
9. If a minimum 10 percent uncalled return with the same strike price
cannot be maintained, drop the strike price one increment toward in
the money. Preference should always be given to a shorter-term call if
this provides the minimum uncalled return requirement of 10 percent.
10. Continue to drop the strike price to generate yield up to the point that
the call strike price is equal to the LEAPS strike price. Do not sell a call
with a strike price lower than the strike of the LEAPS.
11. In the event that a 10 percent uncalled return cannot be generated with-
out violating rule 10, the LEAPS should be repositioned (discussed in
Chapter 9).
Management Rules 155
c08.qxd 10/23/06 2:11 PM Page 155
Example of Selecting a Strike and Expiration for a Secondary
Call Sale Let’s assume some time ago you entered into the following
position on JP Morgan (JPM):
• BTO Jan 2007 $45.00 @ $6.50
• STO Jan 2006 $50.00 @ $1.50
After entering the position, the stock price declined and the call was bought
back for $1.20 for an uncalled return of 4.6 percent. Subsequently, the stock
price broke cycle and began cycling down. You are thus unable to sell the
LEAPS for cost plus 5 percent and are now assessing a secondary call sale.
When selecting a call from the option chain, the LEAPS secondary call
sales rules stipulate that:
• The bid price of the LEAPS must not be within 10 percent of the GTC
sale price of the LEAPS.
• The call selected must generate a minimum 10 percent uncalled return.
• It is preferable to select the same call strike price as the strike price
used when the position was established. If this call will not generate
the uncalled return requirement, move the expiration date out to a
maximum of the expiration of the LEAPS contract. Preference is al-
ways given to the shorter-term contract that provides the minimum un-
called return of 10 percent.
• If a minimum 10 percent uncalled return with the same strike price
cannot be maintained, drop the strike price one increment toward in
the money. Preference is always to sell the shortest-term call that pro-
vides the minimum uncalled return requirement of 10 percent.
Assume that the market is in the green and that the formalized seven-
day rule (FSDR) has been met. (The FSDR governs the point in the price
cycle where a secondary call can be sold and is covered in detail in the next
section). Let’s assess the option chain for JPM (Table 8.1) to find a call that
meets the preceding requirements.
Because the stock price has declined since entering the position, the
LEAPS originally purchased for $6.50 is now trading for $2.70 to $2.90. The
original call sold was the January 2006 $50.00 at $1.50. This call is now trad-
ing for $0.60 to $0.70.
The first preference is to sell the original call sold when entering the
transaction, if this call will provide a minimum 10 percent uncalled return
on the position, or a minimum $0.65. We can see from the option chain that
this call can only be sold for $0.60, which is less than the required minimum
uncalled return of $0.65. You need to increase yield on the call sale. The
preference is to maintain the same strike price, yet move the expiration of
156 CALENDAR LEAPS SPREADS
c08.qxd 10/23/06 2:11 PM Page 156
Management Rules 157
TABLE 8.1 JP Morgan Option Chain Example
Bid Ask Bid Ask
Strike Ticker Price Price Delta Strike Ticker Price Price Delta
September Mar-05
27.50 JPMIY 11.80 12.00 1.00 27.50 JPMCY 11.90 12.10 0.98
30.00 JPMIF 9.30 9.50 1.00 30.00 JPMCF 9.50 9.70 0.97
32.50 JPMIZ 6.80 7.00 1.00 32.50 JPMCZ 7.20 7.40 0.92
35.00 JPMIG 4.40 4.50 1.00 35.00 JPMCG 5.20 5.30 0.81
37.50 JPMIU 1.95 2.05 0.91 37.50 JPMCU 3.30 3.50 0.63
40.00 JPMIH 0.30 0.35 0.33 40.00 JPMCH 1.90 2.05 0.44
42.50 JPMIV 0.00 0.05 — 42.50 JPMCV 0.90 1.05 0.26
45.00 JPMII 0.00 0.05 — 45.00 JPMCI 0.35 0.45 0.14
47.50 JPMIW 0.00 0.05 — 47.50 JPMCW 0.10 0.20 0.06
50.00 JPMIJ 0.00 0.05 — 50.00 JPMCJ 0.00 0.10 —
October Jan-06
27.50 JPMJY 11.90 12.00 1.00 20.00 WJPAD 19.30 19.50 0.95
30.00 JPMJF 9.40 9.50 1.00 25.00 WJPAE 14.40 14.60 0.94
32.50 JPMJZ 6.90 7.00 1.00 30.00 WJPAF 10.10 10.20 0.87
35.00 JPMJG 4.40 4.60 0.97 35.00 WJPAG 6.30 6.50 0.68
37.50 JPMJU 2.20 2.25 0.79 37.50 WJPAU 4.80 4.90 0.56
40.00 JPMJH 0.55 0.65 0.39 40.00 WJPAH 3.40 3.60 0.44
42.50 JPMJV 0.05 0.10 0.10 42.50 WJPAV 2.40 2.55 0.33
45.00 JPMJI 0.00 0.05 — 45.00 WJPAI 1.55 1.70 0.23
47.50 JPMJW 0.00 0.05 — 47.50 WJPAW 1.00 1.10 0.16
50.00 JPMJJ 0.00 0.05 — 50.00 WJPAJ 0.60 0.70 0.11
December Jan-07
30.00 JPMLF 9.40 9.60 0.99 25.00 VJPAE 14.40 14.90 0.88
32.50 JPMLZ 7.00 7.20 0.97 30.00 VJPAF 10.60 10.80 0.78
35.00 JPMLG 4.80 4.90 0.89 35.00 VJPAG 7.20 7.30 0.61
37.50 JPMLU 2.80 2.95 0.69 40.00 VJPAH 4.60 4.80 0.43
40.00 JPMLH 1.30 1.40 0.42 45.00 VJPAI 2.70 2.90 0.27
42.50 JPMLV 0.50 0.55 0.20 50.00 VJPAJ 1.50 1.60 0.16
45.00 JPMLI 0.10 0.15 0.07
47.50 JPMLW 0.00 0.10 —
Jan-05
25.00 JPMAE 14.30 14.50 0.99
30.00 JPMAF 9.40 9.60 0.98
32.50 JPMAZ 7.10 7.30 0.95
35.00 JPMAG 4.90 5.10 0.85
37.50 JPMAU 3.00 3.20 0.66
40.00 JPMAH 1.55 1.65 0.43
42.50 JPMAV 0.60 0.70 0.23
45.00 JPMAI 0.15 0.25 0.10
47.50 JPMAW 0.05 0.10 0.04
50.00 JPMAJ 0.00 0.05 —
c08.qxd 10/23/06 2:11 PM Page 157
the call out to generate yield. In this instance, the only option is to move to
the January 2007 expiration. We know that you must attempt to sell a call
with the same strike price as the original call sold, if this call provides the
minimum uncalled return of 10 percent. In this instance the January 2007
$50.00 is selling for $1.50, well in excess of your minimum uncalled return
requirement of $0.65. This is the call you would sell.
In the event that the January 2007 $50.00 did not provide an uncalled re-
turn of minimum 10 percent, you would drop the strike price one increment
and sell the shortest-term call that provides an uncalled return of 10 percent
or greater. This process can be continued up to, but not exceeding, the
strike price of the LEAPS. If, in order to generate an uncalled return of min-
imum 10 percent, you need to sell a call with a strike less than the strike of
the LEAPS, the LEAPS needs to be repositioned. Repositioning of a LEAPS
is discussed in detail in Chapter 9.
The Formalized Seven-Day Rule
Now that we have covered how to select the strike price and expiration for
a secondary call sale, in this section we discuss an equally important aspect
of secondary call sales: timing. Timing relates to where on the price chart a
secondary call sale is executed. Timing is critical to the ability of an in-
vestor to continually generate cash flow from a position, regardless of mar-
ket direction.
Readers familiar with covered calls will realize that the FSDR is essen-
tially the selling high rule for covered calls applied to the LEAPS technique.
While the concept remains the same, the one very significant advantage of
applying this technique to a LEAPS position compared to a traditional stock
position is leverage. When applying the FSDR on LEAPS, buyback returns
can be realized with much smaller movements in the underlying stock
price, because the profitable buyback amount is so much smaller due to a
smaller dollar investment in the LEAPS contract versus the stock. For ex-
ample, a 5 percent net return on a $5.00 LEAPS is just $0.25, whereas a 5
percent net return on a $30.00 stock is $1.50. Much smaller movements in
the underlying stock price allow for profitable call sales and buybacks. It
follows, then, that very small cycles of the stock price can and should be
utilized to sell and profitably buy back a call when managing a LEAPS po-
sition. The need to pay close attention to stock price cycles is part of the
reason why LEAPS require a much greater time commitment to manage-
ment than do covered calls. However, the greater time commitment is com-
pensated for by much higher returns when used by experienced investors.
To achieve a profitable buyback on a call using the FSDR technique we
need one or both of the following to occur: (1) The stock price must drop
sometime in the future or (2) time value must diminish.
158 CALENDAR LEAPS SPREADS
c08.qxd 10/23/06 2:11 PM Page 158
The FSDR concentrates on point 1 by identifying when a stock is in the
high region of its price cycle. This rule is essentially the opposite of the buy-
ing low rule that ensures you are buying into new positions when the mar-
ket is down and a stock is in the lower 25 percent of its cycle. Conversely,
the FSDR ensures that you are selling a secondary call when the market is
up and the stock is in the upper 75 percent of its current cycle. This condi-
tion greatly increases the chances that the stock will fall and you will be
able to buy back the call for a profit.
It is important to make the distinction that our objective is not specu-
lation. What we are trying to do is simply buy low and sell high or sell high
and buy low, as the case may be. If you sell a call and the stock keeps mov-
ing up, you may be able to close the position on the delta effect (previously
discussed) or implement other defensive strategies such as the surrogate
LEAPS replacement technique (see Chapter 9).
The FSDR encompasses two components:
1. Secondary call sales can only be made when a stock is in the upper 75
percent of its current price cycle.
2. A rising price cycle must have a minimum of $1.50 of price between the
upper and lower lines of its price cycle.
By ensuring that you sell secondary calls at the high end of the price cycle,
it is more likely that the stock will decline and you will be able to buy the
call back for a profit. Remember, the decay in time value is also working
significantly in the covered call writer’s favor. This factor also greatly in-
creases the opportunity for a profitable call buyback.
It is important to make the distinction that our objective is not specu-
lation when using the FSDR. What we are trying to do is sell in the vicinity
of the top of the cycle and buy the call back for a profit at lower stock
prices in the near future. If you sell a call and the stock keeps moving up,
you do not take a loss on the call. Rather, investors should have patience
and wait for the stock price to come back to the bottom of the cycle. Stocks
cycle up and down—they do not go straight up and they do not go straight
down. If the stock doesn’t come down to allow a profitable call buyback we
can use other management and defensive techniques (see Chapter 9).
Patience and management are critical factors for success. You must have
patience to wait for the stock price to meet the FSDR before selling the sec-
ondary call. You must also have patience to wait for the stock price to cycle
down after selling the call to allow a profitable buyback. Patience is key.
It is very rare that a call will be sold and the very next day the stock cycles
down. It is not possible to pick the absolute top of the market and have the call
immediately fall in price—this is an unrealistic expectation. It is much more
common that over a period of one to four weeks after selling a secondary call,
Management Rules 159
c08.qxd 10/23/06 2:11 PM Page 159
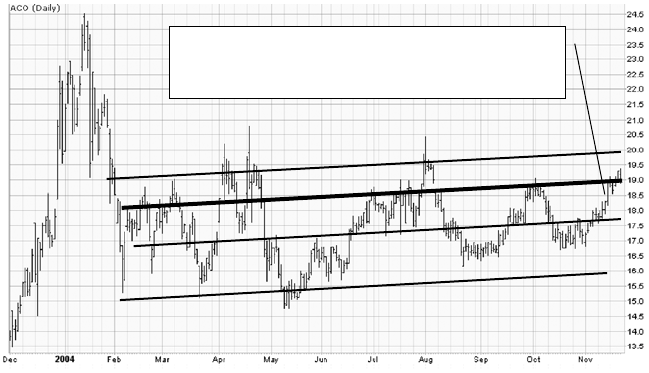
the stock cycles down and allows a profitable buyback. During the period of
waiting, patience is required. Novice investors often panic when an FSDR call
cannot be immediately bought back for a profit. Such immediacy is against the
nature of this technique. Again, when using the FSDR, patience is key.
But what if we sell an FSDR call at what we believe is the top of the
price cycle and the stock breaks cycle, shoots straight up, and never trades
at a lower price? This scenario is common and simply requires investors to
implement one of many management strategies:
• Closing the position on the delta effect.
• Buying back the call profitably at higher stock prices due to the decay
in time value.
• Using the surrogate LEAPS replacement to exit the position (discussed
in Chapter 9).
Applying the FSDR Remember, the FSDR identifies the timing of a sec-
ondary call sale. It identifies the point on the chart where a secondary call
can be sold. The FSDR instructs to only sell a secondary call when the
stock price is in the upper 75 percent of the price cycle (Figure 8.4). This
section illustrates the practical application of this technique. Interpretation
of the chart is vitally important.
160 CALENDAR LEAPS SPREADS
When the stock reaches 75% of the cycle, the FSDR
has been satisfied. We will sell a secondary call and
wait for the stock to cycle down.
FIGURE 8.4 The FSDR instructs to only sell a secondary call when the stock
price is in the upper 75 percent of the price cycle.
c08.qxd 10/23/06 2:11 PM Page 160
Readers should revisit “Using Price Charts,” discussed in Chapter 3.
The FSDR is essentially the selling high rule for covered calls when applied
to LEAPS. The commentary and examples provided for the selling high rule
apply equally to the FSDR.
Identifying the First Sell Point of a New Price Cycle This topic
applies equally to covered call and LEAPS techniques. However, it is dis-
cussed in this section rather than in Part I, Covered Calls, since it is an ad-
vanced technique for optimizing the management of positions. This level of
optimization is not critical to the success of the covered call strategy, yet it
will most definitely increase returns of that strategy. When using the LEAPS
technique, however, we are leveraged, and aggressive management of un-
derperforming positions is critical to the success of the strategy.
The most difficult task regarding the FSDR is identifying the first sell
point of a new price cycle. While it is not critical to enter new positions at
the first buy point, identifying the first sell point of a new cycle is much
more important. The reason for its importance is that when assessing an
FSDR, the investor is already in a management situation on the particular
position and needs to maximize call sales to maximize the cash flow from
that position. Consistently missing the first sell point of a new cycle means
an investor is consistently missing an opportunity to generate cash flow, re-
duce cost base in the position, and compound the asset base.
When assessing the first buy point, we do so from the perspective of
entering into new positions after the current cycle has changed from de-
clining to increasing. In identifying the first sell point, many of the princi-
pals of identifying a change in cycle remain the same as those for
identifying the first buy point, so now is a good time to revisit the section
“Identifying the First Buy Point” in Chapter 7. In using the FSDR, however,
we are discussing management of positions in any cycle and how to iden-
tify the first sell point of a new cycle, whether it is increasing or declining.
When managing a position for income where the current cycle is de-
clining, we should be watching for higher bottoms and a break to the top of
the declining cycle to indicate a potential change of cycle direction, as
shown in Figure 8.5. When managing a position for income where the cur-
rent cycle is rising, we should be watching for lower tops and a break to the
bottom of the declining cycle to indicate a potential change of cycle direc-
tion, as shown in Figure 8.6.
Once we have spotted a potential change in cycle, whether increasing
or declining, we can identify the first sell point of a new cycle as follows:
• The first sell point of a new cycle is always preceded by a minimum of
two bottoms and one top.
Management Rules 161
c08.qxd 10/23/06 2:12 PM Page 161
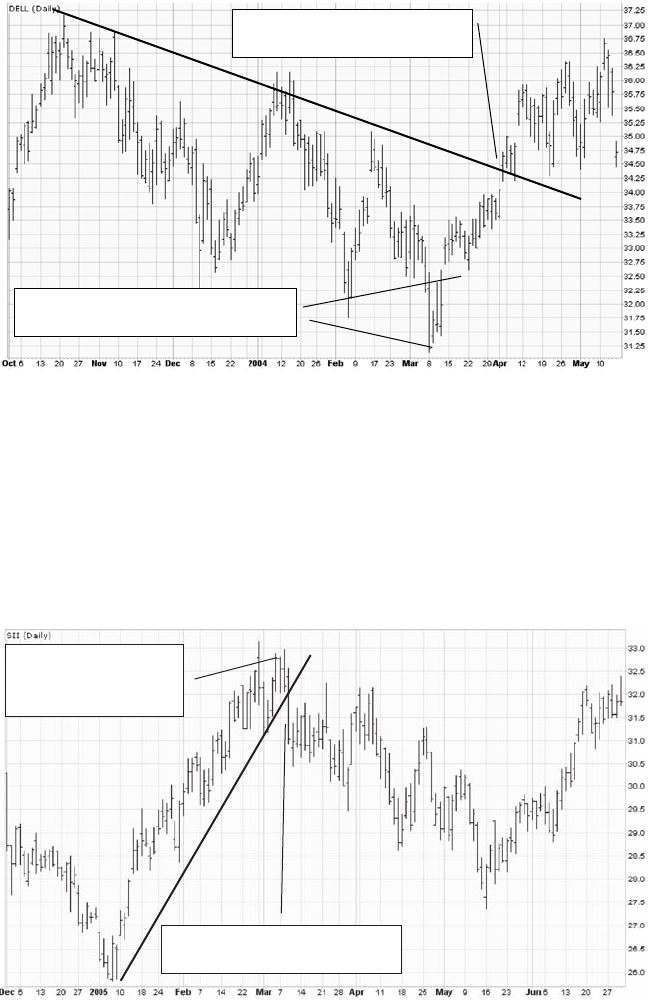
See Figure 8.7 for an example of identifying the first sell point of a new
rising cycle. As previously noted, the first sell point of a new cycle is always
preceeded by a mimimum of two bottoms and a minimum of one top. So we
first connect the two bottoms, then identifiy the first top of the cycle, and
then extrapolate a top parallel line from this top. Remember, when at-
tempting to identify the first sell point, the second top of the cycle is yet to
162 CALENDAR LEAPS SPREADS
1. Lower top; in this
instance, within the
rising price cycle
2. Break through the bottom of
the rising price cycle
FIGURE 8.6 Break through bottom of a rising cycle.
1. Higher bottom; in this instance,
within the declining price cycle
2. Break through the top of the
declining price cycle
FIGURE 8.5 Break through top of a declining cycle.
c08.qxd 10/23/06 2:12 PM Page 162
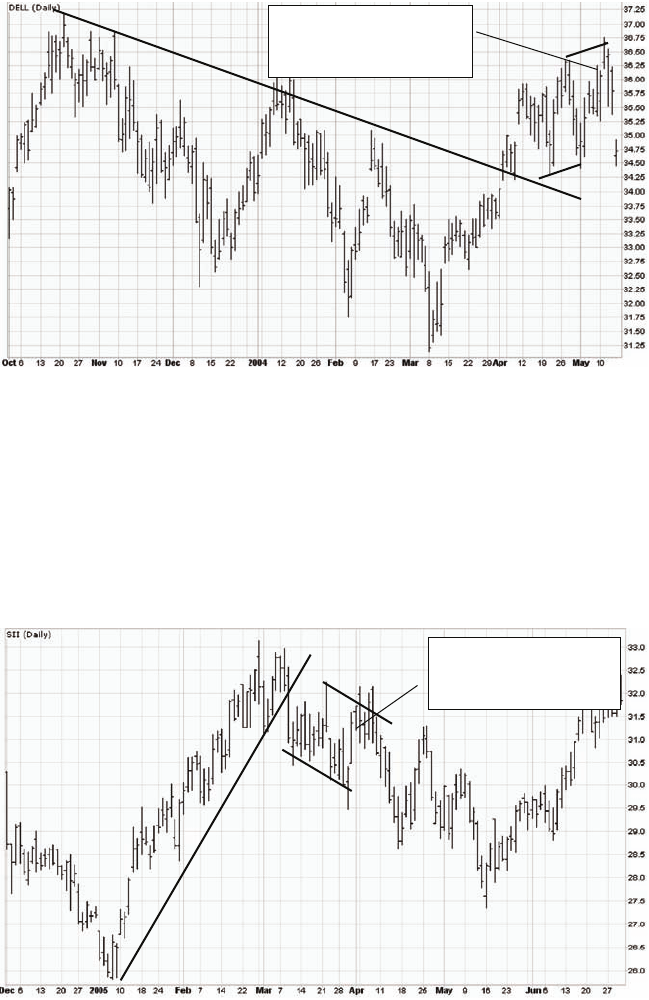
form—the top line must be estimated by drawing a parallel line from the
first top.
An example of identifying the first sell point of a new declining cycle is
shown in Figure 8.8. Since the first sell point of a new cycle is always pre-
ceeded by a mimimum of two bottoms and a minimum of one top we first
connect the two bottoms, then identifiy the first top of the cycle, and then
Management Rules 163
First sell point is preceded
by minimum of two
bottoms and one top.
FIGURE 8.7 Identifying the first sell point of a new rising cycle.
First sell point is preceded
by minimum of two
bottoms and one top.
FIGURE 8.8 Identifying the first sell point of a new declining cycle.
c08.qxd 10/23/06 2:12 PM Page 163
extrapolate a top parallel line from this top. Remember, when attempting to
identify the first sell point, the second top of the cycle is yet to form—the
top line must be estimated by drawing a parallel line from the first top.
Exception to FSDR—Declining Cycles The FSDR is applicable to
stocks regardless of whether the stock price is rising, falling, or going side-
ways. The rules for applying the FSDR remain substantially the same re-
gardless of the direction of the cycle. However, one very important
exception to the FSDR exists for falling stocks, and it is known as the 25%
buyback rule.
When implementing the FSDR on a declining cycle, investors should
not aim for a net buyback return of 5 percent. Instead, for larger buyback
returns, investors should only buy back the call when the stock reaches the
bottom 25 percent of the cycle. The 25% buyback rule leverages off the fact
that the current cycle is declining. As such, it is wise to take full advantage
of this declining stock price in order to enhance returns.
164 CALENDAR LEAPS SPREADS
c08.qxd 10/23/06 2:12 PM Page 164

165
CHAPTER 9
In the preceding chapters we discuss in detail the process of entering
new LEAPS positions, the buyback and close out rules, and managing
unproductive positions for consistent cash flow regardless of market di-
rection. Now we present the defensive techniques available to LEAPS in-
vestors (refer to Figure A.2).
The flexibility of LEAPS allows investors a significant array of defen-
sive techniques. These techniques can be used to effectively manage any
poorly performing LEAPS position to an eventual profitable exit. They vary
in nature and are used for the following purposes:
• To prevent an unprofitable callout.
• To reduce capital in an underperforming position.
• To reduce the average LEAPS cost in an underperforming position.
• To allow continued call sales on a LEAPS that has fallen significantly.
• To prevent high levels of time decay in a LEAPS.
When learning the defensive techniques, it is important to remember
the three primary objectives of LEAPS investing:
1. Closing the transaction as quickly as possible for a profit.
2. Generating consistent income on underperforming positions.
3. Reinvesting and compounding these proceeds.
The defensive techniques exist to quicken the realization of these objec-
tives and allow faster compounding of the asset base.
Defensive
Techniques
c09.qxd 10/23/06 2:10 PM Page 165

SURROGATE LEAPS REPLACEMENT
The surrogate LEAPS replacement (SLR) is a highly valuable defensive
technique that is very regularly applied by LEAPS investors. The SLR is
used when an investor sells a call under the FSDR and the stock price con-
tinues to move up, preventing a profitable call buyback. It allows investors
to reduce capital in the position and realize profits on a LEAPS by taking
advantage of a rising stock price—without unprofitably buying back the
short call.
The SLR is very effective when the stock price has not moved up
enough to exit the entire position on the delta effect or the position has a
poor delta ratio due to incorrect construction. Thus, it is to be used when
the following three conditions exist:
1. An investor has sold a secondary call and the stock price has moved up,
not allowing that call to be bought back for a profit.
2. The investor can sell the LEAPS for a 5 percent or better profit but is
prevented from closing the transaction as doing so would result in an
overall negative return due to the buyback cost of the call.
3. The stock is in the upper 75 percent of its current cycle.
Take the position shown in Table 9.1 as an example. We can see that
this investor has a LEAPS with a cost of $5.00 and has sold a call for $1.00.
Since selling the call, the underlying stock price has increased. As such, the
call has not been able to be bought back for a profit and is now trading at
$3.00. As the stock price has increased, so has the value of the investor’s
LEAPS. The investor now has a $1.50 profit in the LEAPS but is prevented
from realizing this profit because of the larger loss on the call. The loss on
the call is preventing the transaction from being closed out; even through
the investor has a large profit in the LEAPS. This is an ideal situation in
which to use the SLR.
166 CALENDAR LEAPS SPREADS
TABLE 9.1 Sample Position Suitable for SLR
Contract Entry Price Current Price Profit (Loss)
LEAPS $5.00 $6.50 $1.50
Call $1.00 $3.00 ($2.00)
c09.qxd 10/23/06 2:10 PM Page 166
The SLR Rules
There are two basic rules for using the SLR:
1. If the stock price is in the upper 75 percent of the cycle and you are
able to sell the original LEAPS for a return of 5 percent or more, then
the SLR can be considered.
2. Select the same expiration date; however, move the strike price up one
or two increments (preferably not equal to the strike price of the call).
Buy this LEAPS and then immediately sell the LEAPS you own.
Once you have taken action based on these rules, there are two distinct
scenarios:
1. Stock price continues up. In this scenario you should take advantage of
the rising stock price. If you are able to sell the SLR LEAPS for a 5 per-
cent profit, then do so. After selling this LEAPS, you must immediately
buy another LEAPS. Simply move the strike price up one increment.
You have now performed a second SLR. Continue to take 5 percent
profits and SLR the LEAPS to the extent that the strike price of your
LEAPS is not higher than the strike price of the call. You can SLR up to
the point that the LEAPS and the call have an identical strike price.
2. Stock price declines. In this scenario you should buy back the prob-
lematic call, but only when you can exit the call at approximately the
cost you sold it for. Once you have bought back the call, go back to the
FSDR.
Following the rules for this technique achieves several important
objectives:
• Investors can take advantage of the high point of the price cycle and re-
alize a profit on the LEAPS.
• Investors can continually reduce the capital invested in the position by
selecting a higher strike price LEAPS. Excess capital can then be rein-
vested into new positions.
• If the stock price rises, investors can profit from continued strength in
the stock by selling LEAPS for 5 percent profits.
• If the stock price declines, investors can exit a problematic call.
• After buying back the call, investors have the potential to exit the entire
position on the next high point of the price cycle.
Defensive Techniques 167
c09.qxd 10/23/06 2:10 PM Page 167
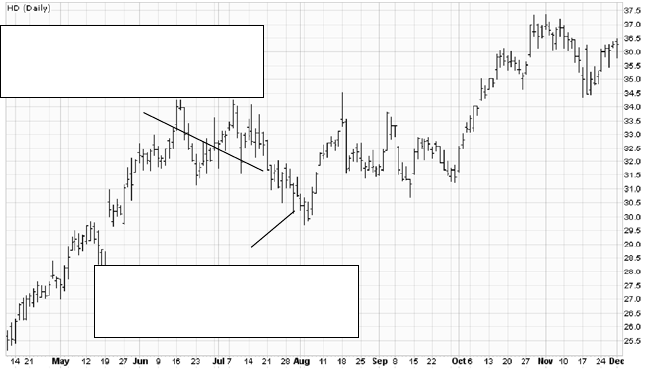
Applying the SLR
Here is a detailed example of implementing the SLR in five steps.
Step 1: Enter new position. Figure 9.1 shows the entry into a new po-
sition at the bottom of a current horizontal cycle. The stock then broke
cycle, allowing the call to be bought back to lock in a 5 percent uncalled
return.
Step 2: Sell a call at top of cycle, which then becomes problematic.
After buying back the initial call, our interpretation of the chart as shown in
Figure 9.2 is that the stock was in a current declining cycle. A secondary
call was sold at the top of this declining cycle. The stock immediately broke
to the top of the declining cycle. The call could not be bought back for a
profit.
Step 3: LEAPS becomes profitable, so perform an SLR. The stock
price continues to increase after selling the call, as shown in Figure 9.3. It
increases to a point where we have a 5 percent or greater return if we sold
the LEAPS. At this point, we immediately SLR. We move the strike up one
or two increments (two in this case) and buy the Jan 2007 $35.00 @ $3.00.
We then sell the current LEAPS to take a profit of $0.40. We have taken
profits and reduced capital in the underperforming position by over 50 per-
cent. This capital should be immediately invested elsewhere. We would
then generally place a GTC to buy back the problematic call at cost ($0.80).
Step 4: Stock price declines and the GTC to buy back the call executes.
The GTC order to buy the call at cost executes (see Figure 9.4). In this in-
168 CALENDAR LEAPS SPREADS
1. Position constructed here:
BTO Jan 2007 $30.00 @ $6.00
STO Jan 2006 $37.50 @ $1.20
2. BTC call here:
BTC Jan 2006 $37.50 @ $0.90
5% Uncalled return realized
FIGURE 9.1 Entering a new position at the bottom of a current horizontal cycle.
c09.qxd 10/23/06 2:10 PM Page 168
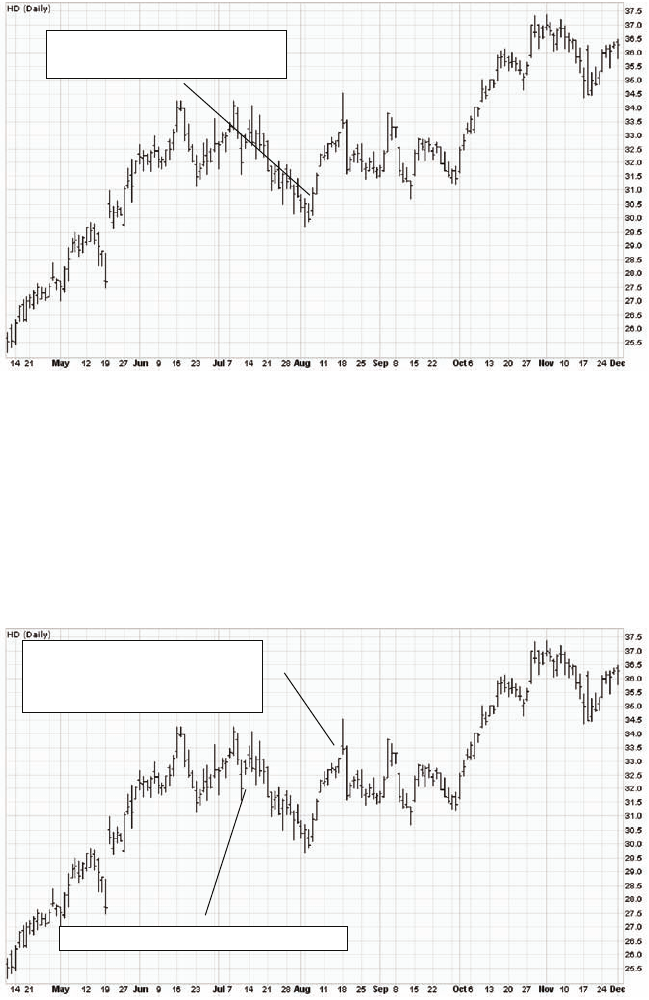
stance, the call was held for a period of approximately three weeks. It is im-
portant during this time to have patience and wait for time to take its
course and for the stock price to fluctuate, allowing the buyback.
Most importantly, during this period of waiting, the SLR has freed the
majority of our capital from the position. This capital is now invested in
Defensive Techniques 169
2. Problem call sold here:
STO Jan 2007 $37.50 @ $0.80
FIGURE 9.2 A problematic secondary call sale.
3. SLR here:
STC Jan 2007 $30.00 @ $6.40
BTO Jan 2007 $35.00 @ $3.00
LEAPS was purchased here for $6.00.
FIGURE 9.3 Performing an SLR when the LEAPS becomes profitable.
c09.qxd 10/23/06 2:10 PM Page 169
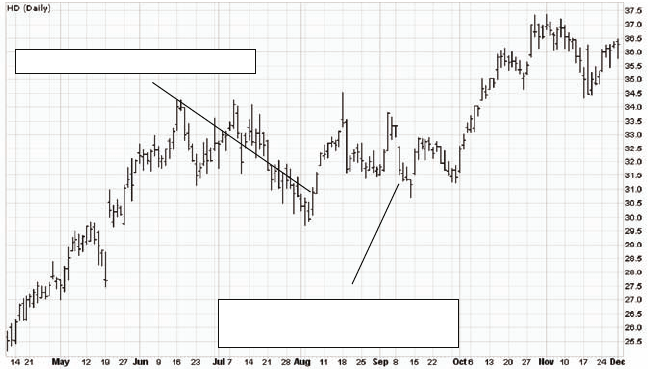
new productive positions and has been reinvested many times over during
the three-week period.
If the stock price continues to move up and does not allow a profitable
call buyback, when we are able to sell the current LEAPS for a 5 percent or
greater return and the stock is at 75 percent of the current cycle, we will
SLR again. We will continue to SLR until the strike price of the LEAPS is
equal to the strike price of the call. When the strike prices are equal, we are
“against the wall” and can no longer SLR. By this time, we have taken sev-
eral profits from the LEAPS and have taken out the vast majority of the cap-
ital from the position. We will then simply wait for the stock price to
decline and time value to erode the buyback cost of the call until it can be
bought back at breakeven. Stocks go up and down, but they do not go
straight up or straight down.
Step 5: Sell SLR LEAPS for cost plus 5 percent. As shown in Figure 9.5,
we complete the transaction by selling the SLR LEAPS for cost plus 5 per-
cent. The total profit on the transaction is as follows:
• $0.30 from buyback of original call.
• $0.40 from sale of original LEAPS.
• $0.15 from sale of SLR LEAPS.
• Total = $0.85, or 14.1 percent on original cost of $6.00.
Remember, $3.40 or 57 percent of the $6.00 of capital committed to this
position was removed by the SLR. The entire position was open for ap-
170 CALENDAR LEAPS SPREADS
4. BTC call here:
BTC Jan 2007 $37.50 @ $0.80
Call was sold here for $0.80.
FIGURE 9.4 Stock price declines and the GTC to buy back the call executes.
c09.qxd 10/23/06 2:10 PM Page 170
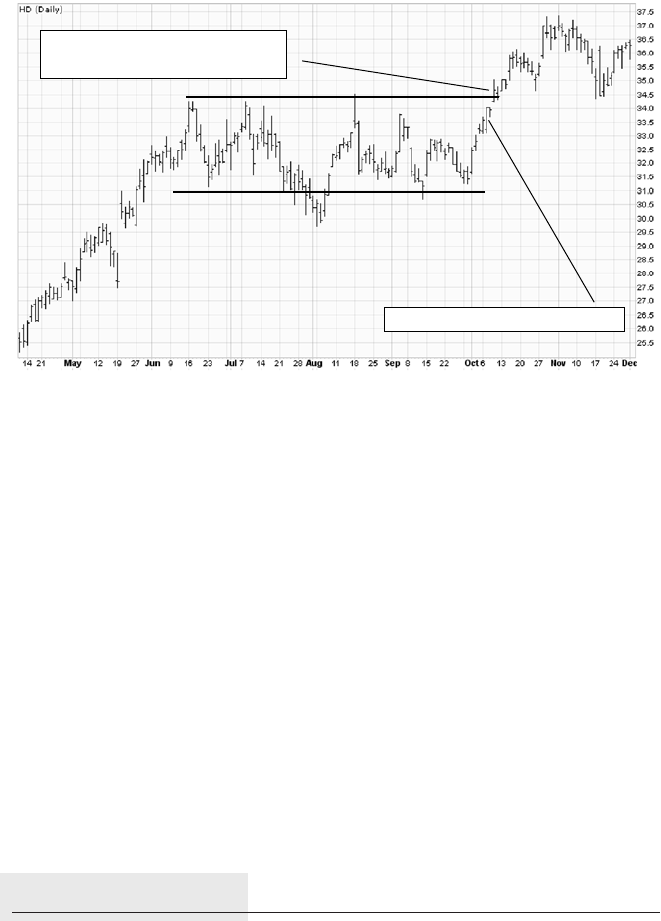
proximately one month; however, for three weeks of this month, only $3.00
of capital was committed. This figure effectively brings the return up to
around 30 percent on the committed capital of $3.00. This adjustment high-
lights the value of the SLR technique: Capital can be effectively removed
from an underperforming position and committed elsewhere into new, pro-
ductive positions.
One significant point of note is the secondary call sale that may have
been executed at the top of the current horizontal cycle. If this call were ex-
ecuted, the position would not be able to be closed, and we would have ap-
plied the SLR again. However, this call should not have been sold.
According to the LEAPS secondary call sales rules, a secondary call cannot
be sold if the market bid price of the LEAPS is within 10 percent of the GTC
sell price. This limitation prevents calls from being sold against positions
that are close to an exit. As it is impossible to pick the absolute top of the
market, when a call is sold on a position that is close to exit, more often
than not, it becomes a hindrance to the position being profitably closed out.
AVERAGING DOWN
Many investment methodologies promote the technique of dollar cost aver-
aging. Dollar cost averaging involves purchasing a certain amount of a stock
or fund at regular intervals over time. For example, instead of investing
$10,000 in a stock today, invest $2,500 at the end of each quarter over a year.
Defensive Techniques 171
Sell secondary call here?
5. Sell SLR LEAPS for cost +5%.
STC Jan 2007 $30.00 @ $3.15
FIGURE 9.5 Completing the SLR LEAPS transaction.
c09.qxd 10/23/06 2:10 PM Page 171
A modified version of this technique is a valuable defensive technique
for LEAPS investors. Occasionally, a LEAPS price will drop significantly
over a long period of time. These circumstances may allow you to take ad-
vantage of a highly depressed LEAPS price by averaging down.
The four rules for averaging down a LEAPS position are:
1. If the market price of a LEAPS drops significantly to a point where you
are able to buy the same LEAPS contract you already own for 15 per-
cent or less of the price you paid for it, then do so. For example, if you
own a LEAPS at a cost of $5.00, you would average that position down
if you could buy additional contracts at a price of $0.75 (the “average
down price”).
2. You should buy the number of contracts that brings your average cost
(see explanation in “Calculating Adjusted Cost and Average Cost” in
the section on rolling out that follows) to a price equal to two times the
average down price. For example, if you own a LEAPS at a cost of
$5.00, you would average that position down if you could buy addi-
tional contracts at a price of $0.75 (the average down price). You
should buy the number of contracts that brings your average cost to a
value of $1.50 (two times the average down price of $0.75).
3. The 5 percent return calculation for subsequent secondary call sales
should be based on the original contract cost, not on the average cost
of contracts. So, for a buyback on a secondary call sale on a $5.00
LEAPS, you should still attempt to realize a net return of $0.25.
4. Sell the LEAPS at the new average cost plus 5 percent, not the original
cost. So, for the preceding example, you should sell the LEAPS for
$1.50 plus 5 percent.
Averaging down allows investors to do the following:
• Significantly reduce their average cost in the LEAPS for a relatively
small additional capital outlay.
• Significantly increase their LEAPS contracts for a relatively small ad-
ditional capital outlay.
• Generate significantly higher percentage returns on secondary call
sales.
• Exit the position at average cost rather than original cost. This feature
has the effect of enabling investors to exit the position at much lower
stock prices and, therefore, much quicker.
172 CALENDAR LEAPS SPREADS
c09.qxd 10/23/06 2:10 PM Page 172

REPOSITIONING A LEAPS
In the rules for selling secondary calls we established that (1) you cannot
sell a call on a LEAPS with a strike price less than the LEAPS and (2) you
cannot sell a call on a LEAPS with an expiration longer than the LEAPS.
On rare occasions, a stock may decline significantly to a level where
you can no longer sell a call on a position for a minimum 10 percent return
without breaching the preceding two rules. If this situation occurs, you
must reposition your LEAPS in order to continue generating cash flow from
this position.
Repositioning a LEAPS simply means selling the LEAPS you currently
own and purchasing a LEAPS with the same expiration one or two strike
prices deeper in the money.
Again, you must try not to violate the $10.00 adjusted cost rule; how-
ever, on some occasions it may be necessary to do so. If you do violate the
$10.00 rule, managing the position with secondary call sales will be more
difficult.
Repositioning a LEAPS has the effect of creating more management
depth by allowing you to sell lower strike prices that previously would have
violated the rule regarding not selling a call on a LEAPS with a strike price
less than the LEAPS.
ROLLING OUT
One great advantage of the LEAPS technique is that time is always working
more for you than against you. You always sell a call that has a far greater
theta, or rate of time decay, than the LEAPS you own. To keep time on
your side, it is imperative that each year you go through a process called
rolling out.
As a guide, a one strike price in the money LEAPS with about two years
to expiration has a theta value of around –0.003, which means that the
LEAPS loses $0.0030 in value each day, or $0.09 per month.
A one strike price in the money LEAPS with a half a year to expiration
has a theta value of around –.0042, meaning that the LEAPS loses $0.0042 in
value each day, or $0.13 per month.
The objective is to always keep time decay of your LEAPS to a mini-
mum. Rolling out allows you to accomplish this objective by ensuring that
there is always at least one year of time value left in the LEAPS.
Defensive Techniques 173
c09.qxd 10/23/06 2:10 PM Page 173
The Rollout Rules
If an investor is holding a LEAPS that has less than one year to expiration,
he or she must sell it and buy another LEAPS relating to the same company.
Three guidelines must be followed:
1. A rollout must be conducted on a down day.
2. If your capital position allows, select the same strike price and the fur-
thest out date possible providing that the adjusted cost (discussed later
in this section) does not exceed $10.00.
3. If this LEAPS leads to an adjusted cost of more than $10.00 (or if your
capital position does not allow you to select the same strike), select the
next highest strike price. Continue to raise the strike price until the ad-
justed cost does not exceed $10.00. Preference is always given to main-
taining the lowest strike price possible.
Note that if you raise the strike price of the LEAPS, you will generally
have a lower delta value on the LEAPS. This causes a lower delta ratio
when selling calls against the LEAPS and also means the stock price must
travel higher for you to exit the position at cost plus 5 percent.
Calculating Adjusted Cost and Average Cost
Adjusted cost is a measure of the new cost of your LEAPS after you have
rolled out. As an example of how it is calculated, suppose the following
conditions exist:
• You hold a Jan 2006 $35.00 LEAPS on JPM at a cost of $5.00.
• You have not been able to exit the position for cost plus 5 percent, but
you have been selling and buying back calls to generate cash flow.
• It is now January 2005, and you need to roll out the LEAPS.
• You sell your Jan 2006 $35 LEAPS on JPM for $3.50.
• You buy the Jan 2007 $35 LEAPS on JPM for $8.00.
You figure the adjusted cost as follows:
Adjusted cost = Cost of original – Sell price of original + Cost of new LEAPS
= $5.00 – $3.50 + $8.00
= $9.50
You now must use the adjusted cost of $9.50 for all return calculations.
A net 5 percent return on a secondary call sales and buyback is now $9.50
×0.05 = $0.48. Do not use the original cost of your LEAPS as you now have
174 CALENDAR LEAPS SPREADS
c09.qxd 10/23/06 2:10 PM Page 174
more capital invested in the position! When selling the LEAPS, also use the
adjusted cost of $9.50 plus 5 percent.
Average cost is a measure of new cost of your LEAPS after you have av-
eraged down. Let’s use another example to show how this factor is calcu-
lated. Suppose the following:
• You hold 10 Jan 2006 $35.00 LEAPS at a cost of $5.00.
• You have not been able to exit the position for cost plus 5 percent, but
you have been selling and buying back calls to generate cash flow.
• Following the averaging down rules, you purchase another 46 contracts
of the Jan 2006 $35.00 LEAPS on JPM. You purchase this number of
contracts as this is the number that will allow you to reduce your aver-
age cost down to $1.50 (two times the average down price).
The number of contracts needed to be purchased to reduce the average
cost to two times the average down price varies for each position. The
number needs to be estimated at first, and then investors can use the fol-
lowing formula to test the accuracy of the estimate. Adjust the number of
contracts upwards or downwards as appropriate, until the result of the fol-
lowing formula equals two times the average down price.
Adjusted cost = [(No. original contracts ×Cost of original contracts)
+ (No. new contracts ×Cost of new contracts)]/(# Original contracts
+ No. new contracts)
= [(10 ×$5.00) + (46 ×$0.75)]/(10 + 46)
= $1.50
When selling the LEAPS, use the adjusted cost of $1.50 plus 5 percent.
However, when performing a secondary call sale, use the original cost of
$5.00 when calculating net buyback amounts. For example, a call buyback
for a secondary call sale will net a minimum $0.25 or (5 percent of the $5.00
original cost) even though the adjusted cost in this position is now only
$1.50. Just one management move with a net buyback return of $0.25 will
now allow you to net a return of 16.70 percent.
Thus you can see how averaging down allows realization of much
higher returns on an underperforming position.
Defensive Techniques 175
c09.qxd 10/23/06 2:10 PM Page 175
c09.qxd 10/23/06 2:10 PM Page 176

177
CONCLUSION
Since Compound Stock Earnings was founded in 1999, thousands of in-
vestors have been taught the techniques outlined in this book and are
now successfully managing their own investments using covered
calls. Once comfort and familiarity are gained with the technique, these in-
vestors consistently generate monthly returns from their stock investments
equivalent to an annual mutual fund return.
This chapter is intended to provide some guidance to those who wish
to follow the path of thousands of successful Compound Stock Earnings
clients who are now safely and very successfully managing their own stock
portfolios.
1. Reread this book until you are confident in your full and compre-
hensive understanding of the concepts and techniques of covered call in-
vesting described herein. You should not consider beginning investing if
there are any gaps or uncertainties in your understanding. You must be
comfortable and confident with every concept before placing your hard-
earned money at risk.
2. Investigate the support services offered by Compound Stock Earn-
ings such as the 2-Day Intensive Seminar or Covered Call/LEAPS Selec-
tions (see Appendix E) and decide which, if any, will enhance your learning
and progression. We have found that most investors do not require any sup-
port services over the long term, but these services are invaluable to those
who are learning the technique.
3. The importance of capital management cannot be overstated for
learning investors. Do not invest a significant amount of money while learn-
How to Move
Forward
bafter.qxd 10/23/06 2:28 PM Page 177
ing the covered call technique. A “significant amount” of money varies for
each individual investor. A good “learning stake” is 10–20 percent of the
value of your current stock portfolio; or if you do not have a stock portfo-
lio, 10–20 percent of your annual salary. If an investor is gripped with the
fear of losing money, it is very difficult to make rational and logical deci-
sions. The learning process is greatly assisted when a smaller amount of
capital is at stake.
4. When you are ready to commit funds to the technique, we strongly
recommended that all investors begin investing with covered calls and not
LEAPS. Covered call investing is a superior technique for the learning in-
vestor as it is far less complicated and inherently less risky than LEAPS.
5. Invest using the covered call technique with a small learning stake
for a minimum of six months before considering progressing to LEAPS.
This period will allow you to accumulate some profits in your account, be-
come proficient in both up and down markets, learn from a few mistakes
(you cannot develop a new skill without making them), gain some confi-
dence, and gain greater insight into the operation of the markets.
6. Once you have developed a consistent track record of generating re-
turns over a six-month period with covered calls, you are then ready to con-
sider progressing to LEAPS if you wish. Investors should understand that
LEAPS investing is a higher risk/higher return strategy when compared to
covered calls, and it requires much greater time commitment. A good way
to start learning the practical application of the technique is to follow the
transactions, management moves, and close-outs being executed by the au-
thors in the Compound Stock Earnings Covered Call/LEAPS Selections ser-
vice by going to www.compoundstockearnings.com/services.htm.
7. Many investors choose to continue solely with covered call invest-
ing, as they are happy with the returns generated and the low time input re-
quired. If you would like to progress to LEAPS investing, do so gradually.
Take 10 percent of your portfolio and place these funds into LEAPS invest-
ments for a month or two. Then move another 10 percent to LEAPS invest-
ments if you achieve acceptable returns.
8. Do not move more than 20 percent of your portfolio into LEAPS in-
vestments until you have a consistent track record over six months of gen-
erating returns higher than those realized with your covered call investing.
9. Remember, investing is a long-term wealth-building proposition.
Treating it as such and taking the time to learn will greatly increase the like-
lihood of achieving the desired successful outcomes. Any endeavor worth
succeeding in requires aptitude, patience, and perseverance. Investing is no
different!
178 Conclusion
bafter.qxd 10/23/06 2:28 PM Page 178
179
APPENDIX A
This appendix is best used as a reference. It should not be read to the
exclusion of the rest of the book.
COVERED CALLS
Refer to the accompanying flowchart (Figure A.1) that depicts each step in
the covered call investment process.
The Rules for Entering New Covered Call
Positions in the U.S. Market
A new covered call position involves buying a stock and selling a covered
call. The U.S. market has thousands of optionable stocks; therefore in-
vestors can be very selective when entering into new covered call posi-
tions. The eight rules are as follows:
1. You can only establish new positions on down market days. A down
market day is any time when the Dow and the NASDAQ are in the red
(trading lower than the close of the previous day).
2. You must always only sell the near month call when entering a
transaction.
3. Use the CSE Screener to filter through all available covered call op-
portunities on the U.S. market.
Quick Reference
Guide
bapp.qxd 10/23/06 2:26 PM Page 179
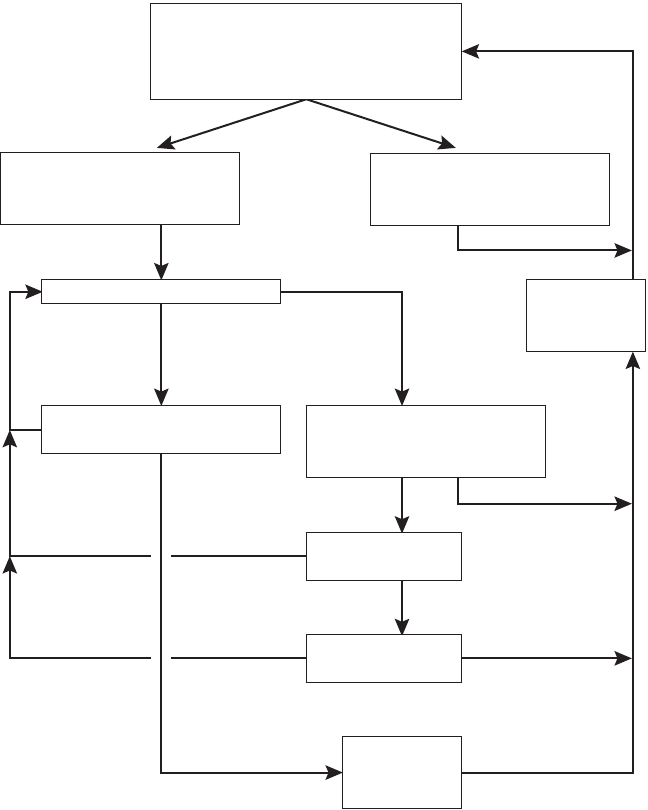
180 Appendix A
Enter New Position
1. Filter with CSE Screener
2. Upward or sideways current cycle
3. Bottom 25% of current cycle
Stock Decreases
1. Mid-month buyback rule or
2. Allow call to expire
Can we favorably CPR?
Wait for expiration of CPR
1. Were we called out?
Profitable buyback
on TSS call?
1. Close on delta or
2. Apply SSR
Reinvest and
compound
proceeds
Reinvest and
compound
proceeds
Stock Increases
1. Close on delta effect or
2. Get called out
Secondary Call Sales Rules
1. Near month call or
2. TSS For income
Yes
Yes
Yes
No Exit
No
No
TSS
No
Exit
Called Out
Near Month
FIGURE A.1 Covered call process flowchart.
bapp.qxd 10/23/06 2:26 PM Page 180
4. Select the highest-yielding opportunities presented by the CSE Screener.
5. Ensure that the stock is an upward moving or sideways moving stock.
6. Ensure that the stock adheres to the buying low rule for covered calls.
7. Always give priority to maintaining acceptable levels of diversification
between stocks and industries—even if a stock you are already in-
vested in presents an excellent covered call opportunity.
8. Buy the stock first and then immediately sell the call. Do not hesitate.
If you buy the stock and wait for a better price for the call, you are no
better than a speculator, and you will get burned!
Using the CSE Screener to Select
U.S. Covered Calls
The CSE Screener is a proprietary covered call search and filter tool de-
signed, developed, and maintained by Compound Stock Earnings. The CSE
Screener allows investors to quickly and easily search the stock market for
the highest returning covered call positions that meet specific fundamental
and technical requirements. The tool is tailored to accommodate the criteria
and rules established in this book for selecting covered call positions.
Anyone who purchases Covered Calls and LEAPS—A Wealth Option is
entitled to one month’s complimentary access to the Covered Call Toolbox
(which includes the CSE Screener) by going to www.compoundstockearn
ings.com/freemonth. Thus readers can actually use the tools while learning
about them in this book.
Because the U.S. market is extremely large, you can be very selective in
terms of the quality of the companies in which you invest. You should use
the following eight parameters to filter U.S. covered call opportunities:
1. Uncalled return of minimum 4 percent.
2. Called return of minimum 4 percent.
3. Price-earnings ratio (PE) of 35 or less.
4. Market capitalization of US$500 million or more.
5. Average broker recommendation of 2.5 or less.
6. An aggregate of the brokers recommending the stock as “Strong Buy”
and “Buy” greater than the number of brokers recommending the stock
as “Hold.”
7. A consensus earnings per share (EPS) estimate for “Next Fiscal Year”
forecast to be greater than the consensus EPS estimate for “This Fiscal
Year.”
8. Stock trading less than 75 percent of its 52-week trading range.
Appendix A 181
bapp.qxd 10/23/06 2:26 PM Page 181
How to Look at a Price Chart
When an investor assesses a price chart, he or she must be able to answer
the following four questions:
1. What is the overall trend: upwards, downwards, or sideways?
2. What are the past cycles: upwards, downwards, or sideways?
3. What is the current cycle: upwards, downwards, or sideways?
4. Where are we in the current cycle: the bottom, middle, or top?
Identifying Upward, Downward, and Sideways
Moving Stocks in the Context of Covered Calls
Upward moving stocks can be of two types:
1. Stocks in a generally rising cycle.
2. Stocks that have had significant price declines in the preceding months
and are currently in an upward cycle. A stock is currently in an up-
ward cycle if it has (a) substantially broken through the upper line of
the declining price cycle and (b) established a new rising price cycle (a
cycle with higher tops and higher bottoms).
Downward moving stocks are those that have had significant price de-
clines in the preceding months and are continuing to decline. These stocks
should be avoided. They have not substantially broken through the upper
line of the declining price cycle and established a new rising price cycle (a
cycle with higher tops and higher bottoms).
Sideways moving stocks are suitable for covered call investment and
are characterized by predominantly stable bottoms and tops; that is, the
tops and bottoms of the cycle are getting neither higher nor lower.
The Buying Low Rule for Covered Calls
The buying low rule for covered calls exists to ensure that new covered call
positions are only entered into in the lower portion of a stock’s current
price cycle. Investing in stocks that are in the lower portion of the current
price cycle increases the likelihood that the stock price will increase after
entering into a new position, and therefore, increases the likelihood of
being called out at the end of the option month. Being called out at the end
of the option month is a primary objective of covered call investing.
The buying low rule for covered calls includes two stipulations:
1. Invest in stocks that are upward moving or sideways moving.
182 Appendix A
bapp.qxd 10/23/06 2:26 PM Page 182
2. Only invest in a stock when it is in the lower 25 percent of the current
price cycle. Investing in the lower 25 percent of the cycle makes it more
likely that the stock will move up after entering the transaction and,
therefore, increases the likelihood of being called out.
The Rules for Investing in Non-U.S. Markets
1. You can establish new positions only on down market days. A down mar-
ket day is a day when the major market average index for that market is
in the red (trading lower than the close of the previous trading day).
2. You must always only sell the near month call when entering a new
covered call position.
3. You should assess the universe of optionable stocks for the fundamen-
tal and technical data outlined in the U.S. covered call search criteria.
Preference should be given to stocks that more fully meet these
criteria.
4. You should assess the universe of optionable stocks in the chosen mar-
ket for both uncalled and called returns and invest in the highest yield-
ing opportunities.
5. Always give priority to maintaining acceptable levels of diversifica-
tion—never have more than 10 percent of your investment capital in any
one stock. Preferably construct a portfolio of between 10 and 20 stocks.
6. Buy the stock first and then immediately sell the call. Do not hesitate.
If you buy the stock and wait for a better price for the call, you are no
better than a speculator, and you will get burned!
The Mid-Month Rule
Once you have entered into the covered call position or sold a secondary
call, all you need to do is have patience and wait for the option’s expiration
at the end of the month. However, you can decide to be a little more proac-
tive during the month and utilize the mid-month rule, which can have the ef-
fect of significantly increasing your returns on the position.
The mid-month technique involves buying back the short call for a
profit in the first two weeks of the month. The five rules for implementing
this technique are:
1. If you have sold a call for a 5 percent uncalled return or more, the mid-
month technique may be considered.
2. If within the first two weeks of the month you are able to buy back the
call and lock in an uncalled return of 4 percent for the month, then do so.
Appendix A 183
bapp.qxd 10/23/06 2:26 PM Page 183
3. You then put in a good til canceled (GTC) order to sell the same call for
more than you bought it back for.
4. If the GTC order executes, wait until the end of the month to see if you
will be called out.
5. If the GTC order does not execute, or if the position is uncalled at ex-
piration, move to the secondary call sales rule.
The Rules for Secondary Call Sales
A secondary call sale is any call sale that occurs after you have bought
back the original call or the original call has expired. The six applicable
rules are:
1. Secondary calls can only be sold when the markets are in the green
(higher than the close of the previous day). For the United States,
the markets are in the green when both the Dow Jones Industrial
Average and the NASDAQ are trading above the close of the previous
day. Foreign markets are in the green when the major market index for
that market is trading above the close of the previous day.
2. For the U.S. market, if you can sell a near month call where the un-
called and called returns are both greater than 4 percent, then do
so. For foreign markets, if you can sell a near month call where the
uncalled and called returns are both greater than 1.5 percent, then do
so.
3. If rule 2 isn’t applicable, you should use the TSS for income while
being sure to adhere to the selling high rule. Move the expiration of
the call out to the second to last expiration and sell a call that provides
an uncalled return of minimum 10 percent. Do not sell the last expira-
tion of the option series. This must be kept in reserve for defensive
techniques.
4. The minimum uncalled return of 10 percent for a TSS for income call
sale is based on your purchase price of the stock or the current market
value, whichever is higher.
5. The greater the uncalled return generated on the TSS for income call
sale, the quicker the call will be bought back as the stock price de-
clines. You may select a lower strike price to allow an easier buyback
to the extent the strike price of the call selected plus the call’s bid price
is greater than the current price of the stock.
6. Once a TSS for income call is sold, it should be bought to close at any
time a 5 percent net return can be realized or when the stock reaches
25 percent of the current cycle, whichever occurs first.
184 Appendix A
bapp.qxd 10/23/06 2:26 PM Page 184
The Tethered Slingshot for Income
and the Selling High Rule
The tethered slingshot (TSS) for income and the selling high rule are very
important techniques for the covered call writer as they allow consistent
generation of income in situations where the stock price is trading below
an investor’s cost in the stock.
The rules for the TSS for income are embedded in the preceding rules
for secondary call sales. These rules state that when a call cannot be sold in
the near month that provides both an uncalled and called return of 4 percent
or greater, the investor must use the TSS for income. The investor should se-
lect the second to last expiration and a strike price call that results in an un-
called return of minimum 10 percent. Before this call can be sold, the
investor must ensure that the selling high rule has been satisfied. The selling
high rule relates to the timing of the TSS for income call sale—it is very im-
portant that TSS for income calls are sold at the high point of the price cycle.
The selling high rule states that secondary call sales using the TSS for
income can only be made when a stock is in the upper 75 percent of its cur-
rent price cycle.
Safely Maximizing TSS for Income Call Sale Opportunities—
Understanding Cycles Within Cycles
Maximizing call sale opportunities means taking advantage of as many
movements within the price cycle as possible. To do this, investors must
take advantage of short-term cycles while assessing the selling high rule.
However, investors must not ignore the long-term cycle when using the TSS
for income and selling high rule. Do not sell a call at the bottom of the long-
term cycle. Always view the stock initially over a 12-month time frame to un-
derstand the long-term cycle. Shorter-term cycles can then be assessed. The
top of a short-term cycle is often the bottom of the long-term cycle.
The Rules for Selling Calls on Existing
Stock Holdings
1. New calls may only be sold on up market days. For the U.S. market,
an up market day is when the Dow Jones Industrial Average and the
NASDAQ are in the green (trading higher than the close of the previous
day). For foreign markets, an up market day is when the major market
average index for that country is in the green (trading higher than the
close of the previous day).
2. If the market price of the stock is higher than your cost in the stock,
both the called and uncalled return calculations should be based on the
current market price of the stock. If the market price of the stock is
Appendix A 185
bapp.qxd 10/23/06 2:26 PM Page 185
lower than your cost in the stock, all return calculations should be
based on your cost in the stock.
3. If you have no desire to keep the stock, your objective should be to sell
a near month call that will provide a satisfactory uncalled and called
return. If you can sell a near month call with a resulting uncalled and
called return of minimum 2.0 percent for the U.S. market or minimum
1.0 percent for foreign markets, then do so. This minimum return re-
quirement is highly dependant on the volatility of the individual stock.
With experience, you will gain a greater understanding of what is a rea-
sonable uncalled and called return for your particular stock holdings.
4. If you cannot satisfy rule 3 or you do not want to be called out of the
stock holding, then use the TSS for income while being sure to adhere
to the selling high rule.
The 20¢ Rule
If you have a negative called return when an option contract has two weeks
to expiration, take the strike price of your call, add the cost of buying back
that call (the ask price) and subtract the market price of the stock. So:
20¢ rule = Call strike price + Call buyback price (ask) – Stock price
If the 20¢ rule value is equal to $0.20 or less, you are in the danger zone of
being called out and you need to take defensive action using the TSS for
defense.
Remember, the 20¢ rule is only used in the last two weeks of the option
month and only on positions with negative called return. You must monitor
such positions carefully during the last two weeks of the option month to
make sure you are not in danger of being called out unprofitably. If at any
time during the last two weeks of the option month you have sold a call that
results in a negative called return and the 20¢ rule equals $0.20 or less, you
must immediately take defensive action using the TSS for defense.
Tethered Slingshot for Defense
You should implement the TSS for defense immediately if the 20¢ rule has
indicated that you are in danger of being called out and that this call out will
be unprofitable. The eight rules for using this technique are:
1. Implement the TSS for defense if the 20¢ rule indicates that you are in
danger of being called out and that this call out will be unprofitable.
186 Appendix A
bapp.qxd 10/23/06 2:26 PM Page 186
2. Immediately buy back the existing call (this results in a temporary loss).
3. Select the same call strike price but move the expiration date out to the
second to last expiration.
4. You have now generated additional covered call income, as the price
you received for selling the TSS for defense call is always higher than
the cost of buying back the near month. You no longer have a tempo-
rary loss.
5. Buy back this new call when the net gain is at least equal to the tempo-
rary loss generated in rule 2.
6. You now have a stock with no call obligation, did not get called out, and
made additional income every step of the way.
7. You should now be patient and wait for an upswing in the stock price
that will allow you to sell a near month call for a minimum of 4 percent
uncalled and called return for the U.S. market and 1.5 percent for for-
eign markets that will allow a positive called return.
8. If the stock reaches 75 percent of the price cycle and does not allow for
application of rule 7, go back to the rules for secondary call sales.
Surrogate Stock Replacement
Surrogate stock replacement (SSR) is an invaluable covered call defensive
technique. The function of the SSR is to expedite the profitable close-out of
a covered call transaction where the following three conditions apply:
1. An investor has used the TSS for income on the position.
2. The stock has continued to move up after selling the TSS for income
call. The investor is therefore unable to buy back the TSS for income
call due to this buyback being unprofitable.
3. The investor now has a profit in the stock position, but is prevented
from closing the entire transaction (buying back the call and selling the
stock) because doing so would result in an overall transaction loss. In
all instances this is due to the loss on buyback of the TSS for income
call exceeding the potential profit from selling the stock.
The ten rules for using the SSR technique are:
1. The SSR is to be used on a covered call position where an investor has
an open TSS for income call.
2. The investor has a profit in the stock position.
Appendix A 187
bapp.qxd 10/23/06 2:26 PM Page 187
3. The position cannot be closed for a profit, as the loss on buyback of the
call is greater than the potential profit from selling the stock. There-
fore, if the position is closed out, a net loss for the investor would be
created.
4. Use the SSR Worksheet to calculate the net loss in closing the transac-
tion (the SSR Worksheet is part of the Covered Call Toolbox, one
month’s complementary access to which is available by going to
www.compoundstockearnings.com/freemonth). This net loss is the re-
structure cost.
5. Input various LEAPS contracts into the SSR Worksheet. The SSR usu-
ally works better when using the second to last expiration LEAPS,
rather than the furthest out LEAPS contract. Start one strike price out
of the money and move into the money three or four contracts.
6. Input various near month and two month out call contracts into the
SSR Worksheet. Start two strikes out of the money and move into the
money two contracts.
7. The SSR should be executed if the SSR Worksheet presents a transac-
tion that has both an uncalled and called return of greater than 2 per-
cent. Preference should be given to the SSR transaction with the
highest returns. Preference should also be given to selling the near
month call.
8. It is also preferable that the SSR be cash flow positive. Investors with
excess capital may still choose to execute the SSR if it is cash flow neg-
ative. Optimally, the transaction should generate net cash.
9. If the transactions presented by the SSR Worksheet do not meet the re-
turn requirements or cash flow requirements in items (7) and (8), more
aggressive investors may choose to enter shorter-term calls into the
SSR Worksheet as an alternative to using a LEAPS. Aggressive in-
vestors may buy a shorter-term call to construct a SSR if the shorter-
term call provides an SSR that meets rules (7) and (8). If buying a
shorter-term call:
(a) Preference must be given to the longest-term call that meets rules
(7) and (8).
(b) An investor must not purchase a call when that call’s price consists
of more than 15 percent time value. This limit ensures that the in-
vestor is purchasing primarily intrinsic value (exercisable value)
and will not be affected greatly by time decay in the event that the
position is not exited quickly.
(c) When purchasing a shorter-term call, investors must be aware that
in the event the stock begins trading down, the call will need to be
rolled out.
188 Appendix A
bapp.qxd 10/23/06 2:26 PM Page 188

10. In the event the call that was shorted in the SSR restructure expires
worthless (the position was not called out), the position should be
managed like a regular LEAPS position with the following exception:
(a) The investor should always give preference to selling a near month
call if that call will provide a positive called and uncalled return. Re-
member, the objective of the SSR is not to manage the position for
income, but to exit the unproductive position as soon as possible.
Cardiopulmonary Resuscitation
Cardiopulmonary resuscitation (CPR) is an advanced covered call defen-
sive technique that is used to literally resuscitate a fallen stock. The CPR
has two typical applications:
1. To dramatically expedite the closing of a new covered call position
where the stock price has suffered an immediate decline after entering
the transaction. The CPR provides this ability as, in many cases, it al-
lows the investor to lower the strike price of the short call in the near
month, yet continue to maintain a positive called return.
2. To generate income and reduce the cost basis in a deeply depressed po-
sition. The CPR can effectively be applied where an underperforming
stock is now in an upward cycle but the cycle’s depth is too shallow to
effectively use the TSS for income.
For any given stock position, the construction of a CPR is accom-
plished as follows:
1. An investor holds a long position of 100 shares of stock.
2. The investor buys one near month (or two month out) call.
3. The investor sells two near month (or two month out) calls with a
higher strike price than the call selected in step (2).
CALENDAR LEAPS SPREADS
Refer to Figure A.2, the flowchart that depicts each step in the LEAPS in-
vestment process
Calculating the Called Return
The formula for calculating the called return is:
Called return = Strike call – Strike LEAPS – LEAPS price + Call price
Appendix A 189
bapp.qxd 10/23/06 2:26 PM Page 189
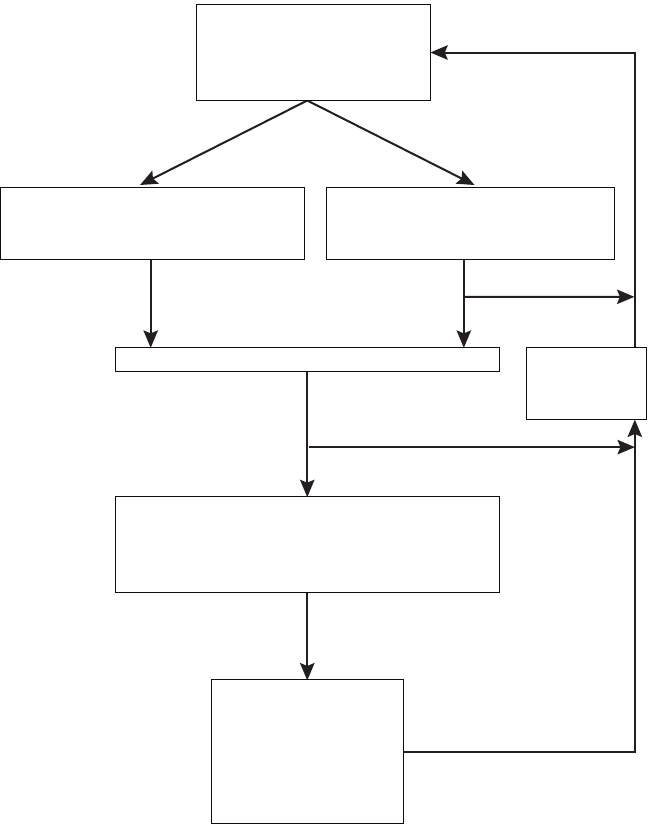
190 Appendix A
Enter New LEAPS Position
1. CSE Screener filter
2. Satisfy buying low rule
3. Construct LEAPS position
Buy Back Call and Set GTC on LEAPS
1. 10¢ Buyback rule or
2. 5% Buyback rule
Close Transaction or Buy Back Call
1. 5% Close on delta or
2. 5% Buyback rule
Did LEAPS sell for cost + 5%? Reinvest and
compound
proceeds
Managing LEAPS That Have Not Sold for Profit
1. Secondary call sale rules
2. Formalized seven-day rule
3. Delta effect
Defensive Techniques
1. SLR
2. Average down
3. Reposition
4. Close on delta
5. Roll out
No
Yes
10¢ Rule DLB
Buy Back Buy Back
Close
FIGURE A.2 Calendar LEAPS spread process flowchart.
bapp.qxd 10/23/06 2:26 PM Page 190
The Rules for Entering New LEAPS Positions
A new calendar LEAPS position involves buying a LEAPS and selling a call.
The six rules for entering into new LEAPS positions are:
1. You can only establish new positions on down market days. A down
market day is any time when the Dow and the NASDAQ are in the red
(trading lower than the close of the previous day).
2. Use the CSE Screener to filter all stocks in the market for the funda-
mental criteria for LEAPS investments.
3. You must follow the rules for correctly constructing a LEAPS position
These rules are imbedded in the CSE Screener.
4. Ensure that the stock adheres to the buying low rule for LEAPS.
5. Always give priority to maintaining acceptable levels of diversification
between stocks and industries—even if a stock you are already in-
vested in presents an excellent opportunity.
6. Buy the LEAPS first and then immediately sell the call. Do not hesitate.
If you buy the LEAPS and wait for a better price for the call, you are no
better than a speculator, and you will get burned!
Parameters for Filtering LEAPS Positions
The eight parameters you should use to filter LEAPS positions are:
1. Uncalled return of minimum 10 percent.
2. Called return of minimum 0 percent.
3. Price-earnings ratio (PE) of 70 or less.
4. Market capitalization of US$5 billion or more.
5. Stock price between $25.00 and $100.00.
6. Average broker recommendation of 2.5 or less.
7. An aggregate of the brokers recommending the stock as “Strong Buy”
and “Buy” greater than the number of brokers recommending the stock
as “Hold.”
8. A consensus earnings per share (EPS) estimate for “Next Fiscal Year”
forecast to be greater than the consensus EPS estimate for “This Fiscal
Year.”
Appendix A 191
bapp.qxd 10/23/06 2:26 PM Page 191
Using Price Charts with the LEAPS Technique
Before entering a new LEAPS position, investors must assess the stock’s
chart. Correct assessment of the price chart is absolutely critical to opti-
mizing returns when using the LEAPS technique. The detailed information
provided in the “Using Price Charts” section in Chapter 3 also applies en-
tering a LEAPS position. Remember: If you do not understand a chart, do
not invest in the stock.
The Buying Low Rule for LEAPS
The buying low rule defines the point in the stock’s price cycle at which an
investor can enter into new positions or sell secondary calls. It exists to en-
sure that new LEAPS positions are only constructed on a stock that is in the
low point of its price cycle. The three rules are:
1. Investment in new LEAPS positions can only be made when a stock’s
overall or current cycle is increasing or horizontal.
2. Investment in new LEAPS positions can only be made when a stock is
in the lower 25 percent of its overall or current price cycle.
3. A stock’s price cycle must have at minimum $1.50 of price between the
upper and lower lines for a position to be eligible for investment. This
third rule ensures that there is enough potential upward movement in
the stock price to exit the position.
Constructing a Leaps Position
Selecting a LEAPS
• Because of the delta ratio, you must select a LEAPS that is one strike
price in the money.
• You may not select a LEAPS that costs more than $10.00; the less it
costs, the better. Low cost is necessary to generate leverage. Also, the
higher the cost of your LEAPS, the more difficult the position will be to
manage in a market downturn.
• The LEAPS selected must have at minimum 12 months to expiration,
with the longest-term LEAPS available always given preference.
Selecting the Call
• You must sell a call as soon as you buy a LEAPS. If you wait to get a
higher price for the call, you are no better than a speculator and you
will get burned!
• You must select a call that results in a positive called return. To make
this selection, take the LEAPS strike price and add the cost of the
LEAPS and you will arrive at an approximate strike price for the call.
192 Appendix A
bapp.qxd 10/23/06 2:26 PM Page 192
• The call expiration that you select must not be equal to the expiration
of the LEAPS. The shortest-term call that meets the requirements
for a correct construction should be selected to allow management
depth.
• The call selected must combine with the LEAPS selected to have a
delta ratio of 1.90 or more.
The Delta Ratio
Delta ratio = LEAPS delta/Call delta
The 10¢ Buyback Rule
The 10¢ buyback rule instructs investors to do two things:
1. Buy back the call at market if the bid price of the LEAPS moves to 10¢
above your cost in the LEAPS.
2. Then add the cost of the call buyback to your cost in the LEAPS, add 5
percent to that total, and put in a good til canceled (GTC) order to sell
the LEAPS at this price.
The 5% Buyback Rule
The 10¢ buyback rule applies in the event the stock price increases after en-
tering the transaction. Conversely, the 5% buyback rule allows you to take
advantage of a downward movement in the stock price after establishing a
new position by taking the following two steps:
1. Buy back the call for a net uncalled return of 5 percent if market prices
decline.
2. Then add 5 percent to the cost of the LEAPS and place a GTC order to
sell the LEAPS at this price.
LEAPS Secondary Call Sales Rules
The eleven rules for selling a secondary call on a LEAPS are as follows:
1. A secondary call can only be sold when the markets are in the green
(trading higher than the close of the previous day). The markets are in
the green any time when both the Dow Jones Industrial Average and
the NASDAQ are trading above the close of the previous day.
2. A secondary call can only be sold after implementing either the 10¢ or
5% buyback rule.
Appendix A 193
bapp.qxd 10/23/06 2:26 PM Page 193
3. A secondary call cannot be sold if the market bid price of the LEAPS is
within 10 percent of your GTC sale price.
4. A secondary call can only be sold when the formalized seven-day rule
has been satisfied.
5. A secondary call sale should generate a minimum 10 percent uncalled
return.
6. The aim is to buy back the call for a net uncalled return of 5 percent.
7. It is preferable to select the same call strike price as the strike price
used when the position was established. Simply move the expiration
date out in order to maintain a minimum 10 percent uncalled return
using the same strike price. This move ensures that the delta ratio re-
mains intact. A call may be sold up to but not exceeding the expiration
date of the LEAPS.
8. Preference should always be given to a shorter term call if this call pro-
vides the minimum uncalled return requirement of 10 percent (time
value erodes more quickly in the investor’s favor).
9. If a minimum 10 percent uncalled return with the same strike price
cannot be maintained, drop the strike price one increment toward in
the money. Preference should always be given to a shorter-term call if
this provides the minimum uncalled return requirement of 10 percent.
10. Continue to drop the strike price to generate yield up to the point that
the call strike price is equal to the LEAPS strike price. Do not sell a call
with a strike price lower than the strike of the LEAPS.
11. In the event that a 10 percent uncalled return cannot be generated with-
out violating rule (10), the LEAPS should be repositioned.
The Formalized Seven-Day Rule
The FSDR encompasses two components:
1. Secondary call sales can only be made when a stock is in the upper 75
percent of its current price cycle.
2. A rising price cycle must have a minimum of $1.50 of price between the
upper and lower lines of its price cycle.
The 25 Percent Buyback Rule Exception to FSDR—Declining
Cycles When implementing the FSDR on a declining cycle, investors
should not aim for a net buyback return of 5 percent. Instead, for larger
buyback returns, investors should only buy back the call when the stock
reaches the bottom 25 percent of the cycle. The 25% buyback rule leverages
194 Appendix A
bapp.qxd 10/23/06 2:26 PM Page 194
off the fact that the current cycle is declining. As such, it is wise to take full
advantage of this declining stock price in order to enhance returns.
The Surrogate Leaps Replacement Rules
There are two basic rules for using the surrogate LEAPS replacement (SLR):
1. If the stock price is in the upper 75 percent of the cycle and you are
able to sell the original LEAPS for a return of 5 percent or more, then
the SLR can be considered.
2. Select the same expiration date; however, move the strike price up one
or two increments (preferably not equal to the strike price of the call).
Buy this LEAPS and then immediately sell the LEAPS you own.
Once you have taken action based on the rules, there are two distinct
scenarios:
1. Stock price continues up. In this scenario you should take advantage of
the rising stock price. If you are able to sell the SLR LEAPS for a 5 per-
cent profit, then do so. After selling this LEAPS, you must immediately
buy another LEAPS. Simply move the strike price up one increment.
You have now performed a second SLR. Continue to take 5 percent
profits and SLR the LEAPS to the extent that the strike price of your
LEAPS is not higher than the strike price of the call. You can SLR up to
the point that the LEAPS and the call have an identical strike price.
2. Stock price declines. In this scenario you should buy back the prob-
lematic call, but only when you can exit the call at approximately the
cost you sold it for. Once you have bought back the call, go back to the
FSDR.
The Averaging Down Rules
The four rules for averaging down a LEAPS position are:
1. If the market price of a LEAPS drops significantly to a point where you
are able to buy the same LEAPS contract you already own for 15 per-
cent or less of the price you paid for it, then do so. For example, if you
own a LEAPS at a cost of $5.00, you would average that position down
if you could buy additional contracts at a price of $0.75 (the “average
down price”).
2. You should buy the number of contracts that brings your average cost
to a price equal to two times the average down price. For example, if
Appendix A 195
bapp.qxd 10/23/06 2:26 PM Page 195
you own a LEAPS at a cost of $5.00, you would average that position
down if you could buy additional contracts at a price of $0.75 (the av-
erage down price). You should buy the number of contracts that brings
your average cost to a value of $1.50 (two times the average down price
of $0.75).
3. The 5 percent return calculation for subsequent secondary call sales
should be based on the original contract cost, not on the average cost
of contracts. So, for a buyback on a secondary call sale on a $5.00
LEAPS, you should still attempt to realize a net return of $0.25.
4. Sell the LEAPS at the new average cost plus 5 percent, not the original
cost. So, for the preceding example, you should sell the LEAPS for
$1.50 plus 5 percent.
The Rollout Rules
If an investor is holding a LEAPS that has less than one year to expiration,
he or she must sell it and buy another LEAPS relating to the same company.
Three guidelines must be followed:
1. A rollout must be conducted on a down day.
2. If your capital position allows, select the same strike price and the fur-
thest out date possible providing that the adjusted cost does not exceed
$10.00.
3. If this LEAPS leads to an adjusted cost of more than $10.00 (or if your
capital position does not allow you to select the same strike), select the
next highest strike price. Continue to raise the strike price until the ad-
justed cost does not exceed $10.00. Preference is always given to main-
taining the lowest strike price possible.
196 Appendix A
bapp.qxd 10/23/06 2:26 PM Page 196
197
APPENDIX B
This appendix is intended solely for investors residing outside of the
United States. U.S. investors can disregard this material.
DEFINING FOREIGN EXCHANGE RISK
Transactions involving international stock and options generally introduce
foreign exchange risk. Foreign exchange risk is the risk that the exchange
rate between currencies will change and adversely affect the earnings or
value of your portfolio as denominated in your home currency. Foreign ex-
change risk occurs because instruments listed on foreign markets are gen-
erally traded in the home currency of that market. For example, if you wish
to purchase a U.S. stock or option, you must do so in United States dollars
(USD or US$).
The foreign exchange market facilitates the buying and selling of for-
eign currencies by generally allowing any individual or entity to purchase
units of a foreign currency in exchange for the home currency. The ex-
change rate is the market price of one currency against another. For ex-
ample, 1 USD equals 0.75 Australian dollars (AUD or AU$). Like stock and
option prices, exchange rates are generally determined by market forces
and are constantly changing.
If you decide to invest in the U.S. markets and you are not based in the
United States, you will need to be aware of foreign exchange risk. If you in-
vest in the U.S. market and are a U.S. resident you are not exposed to for-
eign exchange risk.
Foreign
Exchange Risk
bapp.qxd 10/23/06 2:26 PM Page 197
An example of a non-U.S. investor who invests in the U.S. markets
being adversely affected by foreign exchange risk on a simple U.S. stock
transaction is given in Table B.1. Notice that the investor bought 500 shares
at US$20.00 and sold them at US$20.50, realizing a US$250 profit. However,
if the investor converted AUD in order to buy the 500 shares and then con-
verted the USD proceeds of the stock sale back to AUD, he or she may be
adversely affected by foreign exchange translation. Because the investor
converted AUD to USD at a rate of $0.75 to buy the stock and then con-
verted the USD proceeds to AUD at a rate of $0.77, he or she would actually
lose AU$22.00 on the entire transaction.
MANAGING FOREIGN EXCHANGE RISK
Investors using the covered call or LEAPS techniques who are not located in
the United States are exposed to foreign exchange risk. Given the long-term
compounding focus of the covered call and LEAPS techniques, experience
tells us that foreign exchange risk should be viewed more as a potential
cost of doing business rather than as a risk of going out of business.
Depending on the level of foreign exchange risk mitigation required by
covered call and LEAPS investors, there are four alternative strategies that
can be implemented to manage foreign exchange risk.
1. Implement Forward Hedging Strategy
The most comprehensive of all foreign exchange risk management meth-
ods, implementing forward hedging leads to the virtual elimination of for-
198 Appendix B
TABLE B.1 Effect of Foreign Exchange Risk
Buy Transaction
Shares USD Total AUD/USD AUD
Bought Price USD Rate Total
500 $20.00 $10,000 $0.75 $13,333
Sell Transaction
Shares USD Total USD AUD/USD AUD AUD
Sold Price USD Profit Rate Total Profit
500 $20.50 $10,250 $250 $0.77 $13,312 –$22
bapp.qxd 10/23/06 2:26 PM Page 198
eign exchange risk. This method involves the use of future or option con-
tracts to hedge foreign exchange conversions.
Experience indicates that such a strategy is highly complicated to im-
plement with the covered call and LEAPS techniques due to the uncertainty
in the timing of future USD capital and earnings flows. Forecasting future
earnings and capital flows and constructing complicated hedging strate-
gies to accommodate these flows only serves to detract from what should
be an investor’s primary focus: generating and compounding cash flow. A
forward hedging strategy is simply not appropriate for this type of investing
as its benefits do not outweigh its costs.
2. Convert to USD and Back to Home Currency
for Each Transaction
A second method simply involves converting your home currency as re-
quired when purchasing new positions. Investors would then convert back
to the home currency when profits are realized or capital is freed up by ex-
iting an existing position.
This method has proven ineffective for the covered call and LEAPS
technique. Both covered call and LEAPS investors aim to generate returns
of around 5 percent per transaction. This small return target can easily be
eroded by relatively minor foreign exchange movements. For example, a 5
percent USD return can easily be eroded to just a 1 percent or 2 percent
home currency return due to a small movement in the USD/home currency
exchange rate.
Additionally, investors using this risk management technique find them-
selves regularly buying and selling currency—possibly numerous times a
day for LEAPS investors. Apart from detracting from the investor’s primary
focus of generating and compounding cash flow, this technique also serves
to significantly increase transaction costs.
3. Use Home Currency as Collateral for USD
A third method involves using deposited home currency as collateral for
borrowed USD. For example, if an investor deposited AU$10,000 and the
AUD/USD exchange rate was 0.75, then this investor would be able to in-
vest in U.S. stocks or options to a value of US$7,500. Investors then receive
interest at the prevailing AUD cash rate on the Australian dollar balance
over a predetermined sum by the broker (see broker’s web site for current
balance limits) and pay interest on the borrowed USD balance at the pre-
vailing U.S. interest rate.
Along with method 4, using home currency as collateral for USD is one
of two preferred methods for managing foreign exchange risk. It allows
Appendix B 199
bapp.qxd 10/23/06 2:26 PM Page 199
investors to realize profits in USD and accumulate and compound these
profits in USD. This method is also particularly beneficial when the interest
rate differential between the home currency and the USD is significant.
This method results in a profit to the investor when credit interest paid by
the broker is greater than debit interest charged by the broker.
One disadvantage of this technique is the need for investors to provi-
sion for the potential of decreased buying power resulting from a devalua-
tion of the home currency against the USD. Under the conditions of a
devaluating home currency, a fully invested portfolio may be subject to
margin calls due to a lack of collateral to fund the negative USD balance. In
a climate of a devaluing home currency, investors should instead consider
using method 4.
4. Convert to USD and Remain in USD
A fourth method involves converting your home currency to USD as you in-
vest your capital in the U.S. market. Investors would then simply accumu-
late profits in USD and use these USD to invest in more positions to
compound the asset base. The accumulated USD balance is only translated
back to the home currency when an investor wishes to remove money from
the account.
Along with method 3, converting to and remaining in USD is one of the
preferred methods for managing foreign exchange risk.
200 Appendix B
bapp.qxd 10/23/06 2:26 PM Page 200
201
APPENDIX C
SELECTING A BROKERAGE HOUSE
The significance of brokerage commissions should not be ignored. An in-
vestor’s choice of brokerage house has a large impact on overall profitability.
Whether you are investing in covered calls or LEAPS, you must use a
discount broker. Discount brokers have cheaper rates of brokerage/com-
mission because they provide an execution only service (they do not pro-
vide research or advice). Both covered call and LEAPS investors make a
significant number of transactions each month and realize small profits on
each of these transactions. Therefore, transaction costs have a very high
bearing on profitability with this method of investing.
Again, the impact of different commission structures at various bro-
kerage houses is very significant and should not be ignored. Not selecting
a competitively priced broker is no different than ignoring the operating ex-
penses in a traditional business.
If you are investing in the U.S. market, there are several discount bro-
kers very suitable for this type of investing. Deep discount brokers are even
better, as they have extremely cheap commissions, so small that commis-
sions needn’t be accounted for when considering profits on trades. For ex-
ample, one industry-leading deep discount broker charges commissions of
just $0.75 per 100 shares and $0.75 per option contract—with no minimum
trade size! If an investor buys 100 shares of a $30.00 stock, this is a $3,000
investment. The commission for this stock purchase and the sale of one op-
tion contract would total just $1.50, or 0.05 percent of the invested capital.
This is a remarkable rate of commission, and, for all intents and purposes,
the trade is practically commission free.
Brokerages and
Order Types
bapp.qxd 10/23/06 2:26 PM Page 201

The brokerage industry is constantly evolving with new online players
entering the market and existing brokerage houses regularly making
changes to trading platforms and commission structures. The current
industry best brokers for using this technique can be found at www
.compoundstockearnings.com/brokers. We highly recommend that in-
vestors use one of these brokers because trading platforms and transaction
costs have a dramatic effect on profitability.
COMMON ORDERS USED IN ONLINE
BROKERAGE PLATFORMS
There are four basic kinds of orders that investors can use with the covered
call and LEAPS techniques. The first two of the following relate to price ex-
ecution and the second two pertain to order duration.
1. Limit (LMT). A limit order is one that is price specific, for example, buy
100 C shares at $45.00. The order will not be filled unless it can be filled
at a price of $45.00 or less. Limit orders are the safest way to buy or sell
a stock or option, and they should be used as often as possible.
2. Market (MKT). A market order is one that is not price specific, for ex-
ample, buy 100 C shares at market. The order will be filled at the best
price available in the market; a price is not guaranteed.
3. Good til Canceled (GTC). A GTC order will sit in the market until the
investor who placed it cancels it or it executes. For example, a GTC
limit order to buy 100 C shares at $45.00 will sit in the market until the
shares can be bought at $45.00 or the investor cancels the order.
4. Day Order (DAY). A day order will only sit in the market until the end
of the trading day it was transmitted. For example, a day order to buy
100 C shares at limit of $45.00 will be purged from the market at the end
of the day if it has not executed.
CONDITIONAL ORDERS AND
THE 10¢ AND 5% RULES
Conditional orders are an invaluable tool for LEAPS investors utilizing the
10¢ rule who are not able to monitor the market continuously throughout
the trading day. These orders allow investors to place an order into the
market that is conditional on certain events occurring, for example a stock
or option trading at a certain price.
202 Appendix C
bapp.qxd 10/23/06 2:26 PM Page 202

LEAPS investors can use conditional orders to automate the process of
buying back a call under the 10¢ and 5% buyback rules. Thus they can con-
duct their LEAPS investing for only a few hours a day, rather than being at
the computer for the entire day waiting for situations to arise. Take the fol-
lowing new position for example:
• Long 2 JPM Jan 2007 $35.00 LEAPS @ $5.00
• Short 2 JPM Dec 2005 $40.00 Calls @ $1.00
Conditional orders allow investors to place an order to take care of the 10¢
buyback rule as follows:
• Buy back Dec 2005 $40.00 call at market if bid price of Jan 2007 $35.00
LEAPS reaches $5.10.
A simple limit order also allows investors to take care of the 5% buy-
back rule as follows:
• Buy back Dec 2005 $40.00 call at limit of $0.75.
By using the conditional order format, investors can ensure the rules
are being followed without sitting at the computer all day. Compound Stock
Earnings recommended brokers accommodate conditional orders.
CREDIT SPREADS AND THE DELTA LOW BRIDGE
Credit spreads are an invaluable tool for delta low bridge (DLB) investors
who are not able to monitor the market continuously throughout the trad-
ing day. These orders allow investors to place an order into the market that
will execute when a certain price spread can be realized on the sale and
buyback of two option contracts.
For example, take the following DLB investment:
• Long 2 JPM Jan 2007 $35.00 LEAPS @ $5.00
• Short 2 JPM Dec 2005 $40.00 Calls @ $1.00
Credit spread orders allow an investor to place an order into the market
that will allow the call to be bought back and the LEAPS to be simultane-
ously sold when the investor can realize a predetermined profit. In this
case, the predetermined profit would be the LEAPS cost plus 5 percent,
or $5.00 ×0.05 = $0.25. The credit spread order system will execute the
Appendix C 203
bapp.qxd 10/23/06 2:26 PM Page 203
buyback of the call and the simultaneous sale of the LEAPS if a credit dif-
ference of $0.25 can be realized in the market.
Investors can also place a limit order into the market to take care of the
5 percent profitable buyback of the call if the market price drops.
As with conditional orders, credit spread orders can allow the DLB in-
vestor to follow the rules without being at the computer throughout the en-
tire trading day.
204 Appendix C
bapp.qxd 10/23/06 2:26 PM Page 204

205
APPENDIX D
For all intents and purposes exchange-traded funds (ETFs) and Hold-
ing Company Depositary Receipts (HOLDRs) trade and operate just
like normal stocks. However, they differ from normal stocks as they
represent the performance of an industry or an index. This feature is an ad-
vantage in that it makes ETFs and HOLDRs great tools for diversification.
For example, you can construct a LEAPS spread on a stock called the
“DIA” that tracks the price of the Dow Jones Industrial Average. For all in-
tents and purposes, if you buy the DIA you are actually investing in the Dow
Jones Index. The Dow is an index of the most significant companies listed
on the New York Stock Exchange. Alternatively, you can buy a stock called
the “XLF,” which provides you with exposure to U.S. companies in the fi-
nancial sector. Thus, if you want to add a financial company to your port-
folio you may elect to invest directly in JP Morgan, or, alternatively, you
may wish to invest in the XLF, which will give you exposure to JP Morgan
and a whole host of other financial companies. This diversification will de-
crease your portfolio risk.
The disadvantage, however, is that you will not have the liberty of
screening the finance companies within the Dow and the S&P 500 and se-
lecting a company that has a low PE and a very high broker rating.
ETFs and HOLDRs are particularly helpful for investors using the
LEAPS technique with limited capital resources as they allow diversifica-
tion between different companies and industries with the purchase of only
a few positions. Be sure to remember that you need to treat them as just an-
other stock.
Using ETFs and
HOLDRs for
Diversification
bapp.qxd 10/23/06 2:26 PM Page 205
Here are some ETFs and HOLDRs that you may wish to use with the
LEAPS technique:
DIA Dow Jones Industrial Average tracking stock
QQQQ NASDAQ 100 tracking stock
XLB Material Select Sector SPDR
XLE Energy Select Sector SPDR
XLF Financial Select Sector SPDR
XLI Industrial Select Sector SPDR
XLK Technology Select Sector SPDR
XLP Consumer Staples Select Sector SPDR
XLU Utilities Select Sector SPDR
XLV Health Care Sector SPDR
HLY Consumer Discretionary Select Sector SPDR
BDH Broadband HOLDRs Trust
HHH Internet HOLDRs Trust
IAH Internet Architect HOLDRs Trust
OIH Oil Services HOLDRs Trust
PPH Pharmaceutical HOLDRs Trust
RKH Regional Bank HOLDRs Trust
RTH Retail HOLDRs Trust
SMH Semiconductor HOLDRs Trust
SWH Software HOLDRs Trust
TTH Telecom HOLDRs Trust
UTH Utilities HOLDRs Trust
WMH Wireless HOLDRs Trust
The LEAPS technique works very well using both individual stocks and
also ETFs and HOLDRs.
206 Appendix D
bapp.qxd 10/23/06 2:26 PM Page 206
207
APPENDIX E
Compound Stock Earnings is an investment education resource op-
erated by the authors of this book, Joseph Hooper and Aaron
Zalewski. Since its inception in 1999, Compound Stock Earnings has
grown to become the definitive education and information resource for the
covered call technique.
Through its web site, www.compoundstockearnings.com, Compound
Stock Earnings provides a host of services ranging from search and filter
tools like the CSE Screener, to daily covered call and LEAPS selections sent
by e-mail to clients, to the 2-Day Intensive Seminar. The impetuses of the
services are to provide investors with the critical information and educa-
tion needed to be successful in the business of writing covered calls.
Details of Compound Stock Earnings support services can be found at
http://www.compoundstockearnings.com/services.htm. Services offered at
the time of writing include the following.
COVERED CALL TOOLBOX
All investors who purchase Covered Calls and LEAPS—A Wealth Option
are entitled to one month’s complimentary access to the Covered Call Tool-
box by going to www.compoundstockearnings.com/freemonth. This access
provides investors with an opportunity to actually use the tools while learn-
ing about them in this book.
Compound Stock
Earnings Support
Services
www.compoundstockearnings.com
bapp.qxd 10/23/06 2:26 PM Page 207

The Covered Call Toolbox includes the CSE Screener for both covered
calls and LEAPS, the SSR and CPR Worksheets, and the Option Chains
tools that have been discussed in this book. These tools are indispensable
to the covered call and LEAPS investor. The CSE Screener is particularly
essential because it dramatically improves the ability of covered calls and
LEAPS investors to quickly find, qualify, and construct positions. Given the
many thousands of stocks in the market, it is almost impossible for in-
vestors to manually filter stocks to find the best positions. The CSE Screener
performs this function quickly and accurately with real time prices.
COVERED CALL/LEAPS SELECTIONS
Covered Call/LEAPS Selections subscribers receive real time, covered call
and LEAPS transactions e-mailed directly to them. The service is unique in
that the selections are generally trades we are executing in our own ac-
counts or funds. They are not broker-style recommendations where we
have no financial interest in the transaction performing well.
A Covered Call/LEAPS Selections subscription is an ideal way for
clients to see firsthand the practical application of the covered call and
LEAPS technique in terms of timing, position construction, and man-
agement.
THE 2-DAY INTENSIVE SEMINAR
The 2-Day Intensive Seminar is held at selected times in selected cities
throughout the country. It is also offered online through an audiovisual link
over the Internet to allow investors to attend the seminar without the in-
convenience and expense of travel.
The most vital function of the 2-Day Intensive Seminar is to illustrate
the practical application of the rules and techniques for covered call/LEAPS
investing. It explains, elaborates on, and provides examples of every topic
contained in Covered Calls and LEAPS—A Wealth Option. The seminar
also covers new techniques or adaptations of rules that come about due to
the ever-changing conditions of the market.
For investors who need hands-on classroom-style explanation and in-
struction on the covered call and LEAPS technique, the 2-Day Intensive
Seminar is invaluable.
208 Appendix E
bapp.qxd 10/23/06 2:26 PM Page 208

THE MASTER CLASS DVD
The Master Class was an advanced two-day seminar on both covered calls
and LEAPS. It was a unique seminar in that it was taught by four of the most
successful, long-term Compound Stock Earnings clients, each of whom
uses advanced adaptations and interpretations of the techniques presented
in this book—developed through years of their own individual use of the
technique. The four client presenters each taught half a day of the two-day
seminar, covering exactly what they do to produce superior returns using
the covered call or LEAPS technique. The topics included covered calls on
blue-chip stocks, covered call selection and management strategies (in-
cluding the advanced SSR and CPR techniques), and adaptations of the
LEAPS technique.
The presenters’ backgrounds are diverse, including a professional fund
manager using the covered call technique, an ex-investment banker who is
now a full-time investor using the covered call technique, and two retired
investors who have built their accounts using covered calls and now use
the technique as their sole source of income in retirement.
The Master Class was recorded in its entirety in high-definition DVD.
For those who want to be taught advanced techniques from actual Com-
pound Stock Earnings clients who have consistently returned in excess of
60 percent annually in their accounts, the Master Class DVD is the ultimate
resource.
THE COW REPORT
Every Saturday morning, our covered call experts sift through all of the
week’s e-mail correspondence from Compound Stock Earnings clients
across the world and compile the most interesting questions and comments
into a weekly e-newsletter, the Compound Stock Earnings Cow Report. All
investors who purchase Covered Calls and LEAPS—A Wealth Option are
entitled to lifetime access to the Cow Report by going to www.compound
stockearnings.com/cowreport.
WHERE TO FIND SERVICES
All services are available through our web site at www.compoundstock
earnings.com/services.htm.
Appendix E 209
bapp.qxd 10/23/06 2:26 PM Page 209
bapp.qxd 10/23/06 2:26 PM Page 210

211
Glossary
American option (or expiration) An option that may be exercised at any
time prior to its expiration. The majority of stock options traded on American and
international options exchanges are American-style options. The covered call tech-
nique involves the use of American style-options only.
at the money An option where the stock price is trading at the exercise price.
For example, a $15.00 call option would be considered at the money if the stock
price is $15.00. In practical terms, market participants also describe an option as at
the money when the stock price is close to the exercise price of the option. So if an
option’s strike price is $15.00 and the stock price is, for example, $14.90 or $15.10,
it would be deemed as being at the money.
averaging down A modified version of the traditional dollar cost averaging
technique. Used to significantly reduce the average cost of a LEAPS position.
buying to close Closing a short stock or option position.
calendar LEAPS Selling a call option and owning a LEAPS on the same un-
derlying stock for cover. See also LEAPS.
called return The sum of the uncalled return plus the profit or loss you make if
your call is exercised (called out) divided by your cost in the stock. If you are called
out, you have to deliver the stock you own at the exercise price of the call. See also
uncalled return.
call option An option that gives the holder the right, but not the obligation, to
buy a stock at a certain price up to a certain date. Call options are used by specula-
tors who expect an increase in the price of the underlying asset.
call out (or called out) The result of an option that an investor has sold
being exercised by an option buyer. In the case of stock options, results in the op-
tion seller being required to deliver the underlying stock at the exercise price of the
option.
cardiopulmonary resuscitation (CPR) An advanced covered call defen-
sive technique used to expedite the close of a fallen covered call position or to gen-
erate income on deeply depressed stock.
bgloss.qxd 10/23/06 2:25 PM Page 211
cash settlement There are two types of settlement styles for exchange-traded
options—physical settlement and cash settlement. Cash settled options give the
owner the right to receive a cash payment based on the difference between the un-
derlying asset price at the time of the option’s exercise and the exercise price of the
option. The majority of stock options are physically settled while the majority of
index options are cash settled. See also physical settlement.
closing transaction A transaction where an option buyer makes an offsetting
sale of an identical option or an option seller makes an offsetting purchase of an
identical option. The effect of the transaction is that the number of contracts the in-
vestor is exposed to is decreased.
conditional orders Orders placed into the market on the condition that certain
events occur, for example, a stock or option trading at a specified price.
covered call Selling a call option and owning the underlying stock for cover.
calendar LEAPS A technique for selling a call option while owning a LEAPS on
the same underlying stock for cover. See also LEAPS.
credit spread A closing order that executes when a predetermined price spread
can be realized on the sale and buyback of two option contracts on the same un-
derlying security. Most commonly used with the DLB technique. See also delta low
bridge.
CSE Screener A proprietary online search engine used to assist in identifying
the best covered call and calendar LEAPS transactions in the U.S. market.
delta The rate of change of the option price with respect to the price of the un-
derlying stock. It is a measure of how much an option’s price will increase or de-
crease for an incremental increase or decrease in the stock price. For example, an
option with a delta of 0.60 means that when the stock price changes by an amount,
the option price will change by 60 percent of that amount. Thus, if the stock price
increases by $1.00, then the option will increase in price by $0.60 (60 percent of the
stock price’s increase).
delta low bridge (DLB) An alternative LEAPS technique similar to the 10¢
rule LEAPS technique. The primary difference between the two techniques is DLB
investors do not buy back the short call under the 10¢ rule if the stock price rises
after entering a transaction. Instead DLB investors exit the entire transaction on the
delta effect. See also DLB index; 10¢ buyback rule.
delta ratio A measure of the interaction between the LEAPS delta and the call
delta: Delta ratio = LEAPS delta/Call delta.
derivative A financial instrument whose price depends directly on the value
of an underlying security, index, debt instrument, commodity, or other financial
instrument.
dividend A distribution of earnings to shareholders usually paid quarterly in the
form of cash.
212 Glossary
bgloss.qxd 10/23/06 2:25 PM Page 212
DLB index A calculation for any given LEAPS position of the percentage a stock
price must rise in order for the position to exit on the delta effect with the desired
minimum 5 percent return.
Dow (the) Short for the Dow Jones Industrial Average, which is a stock index.
It is the price of a collection of 30 blue-chip industrial companies listed on the New
York Stock Exchange (NYSE). It provides a measure of how the blue-chip stock
market is performing.
downward moving stock A stock whose upper line of the price channel is at
a gradient less than horizontal; a stock making lower tops and lower bottoms. A
downward trending stock.
earnings per share A company’s earnings divided by the number of ordinary
shares.
European option (or expiration) An option that may be exercised only on
its expiration date. The majority of stock options traded on American and interna-
tional options exchanges are American-style options. The covered call technique in-
volves the use of American-style options only.
exchange-traded fund (ETF) A basket of stocks that is bought and sold on
the stock exchange as if it were a single stock. An ETF typically represents a par-
ticular sector of the economy or a particular index.
exercise See call out.
52-week range Refers to the lowest and highest price a company’s stock has
traded for during the past year.
foreign exchange risk The risk that the exchange rate between currencies
will change and adversely affect the earnings or value of a portfolio as denomi-
nated in an investor’s home currency.
formalized seven-day rule (FSDR) A technique used to assist in identifying
the timing of secondary call sales on a LEAPS position. See also secondary call.
good til canceled (GTC) An order to buy or sell a stock or option that re-
mains in effect until it is executed or canceled by the investor who placed it.
HOLDRs Acronym for Holding Company Depositary Receipts. Listed on the
American Stock Exchange (AMEX), HOLDRs are securities that represent an in-
vestor’s ownership in the common stock or American Depositary Receipt of speci-
fied companies in a particular industry. Similar to an ETF.
in the money An option that has intrinsic value, where the owner of the option
stands to profit by exercising his or her right under the contract. For a call option
to be in the money, the stock price must be higher than the strike price. For exam-
ple, a $15.00 call option is in the money when the stock price is greater than $15.00.
See also intrinsic value.
Glossary 213
bgloss.qxd 10/23/06 2:25 PM Page 213
intrinsic value The exercisable value of an option, which is the difference be-
tween the stock price and the exercise price. The value an option owner could re-
alize by exercising an option and selling the stock in the market at the current
market price. Intrinsic value cannot be negative.
LEAPS Acronym for long-term equity anticipation securities. They are simply
long-term options. They have exactly the same standardized characteristics as a
normal option but with a long-term expiration. Contracts with one year or more of
time value and a January 200x expiration are known as LEAPS.
limit order An order designed to fill only at a specified price or better.
liquidity Market liquidity refers to the ability to quickly buy or sell a stock or op-
tion without causing a significant movement in the price.
long position An overall buy position in a stock or option.
market order An order designed to fill at the best price currently available in
the market.
market value The value of the portfolio if it were immediately liquidated for
cash at current market prices.
NASDAQ A U.S. stock market that lists approximately 3,300 companies; heavily
weighted with technology companies.
opening transaction A transaction where an option buyer or seller establishes
a new position or increases an existing position as either a buyer or a seller. The ef-
fect of the transaction is that the number of contracts/shares the investor is exposed
to is increased.
option A financial instrument and contract that gives the holder the right, but not
the obligation, to buy or sell a financial asset at a certain price up to a certain date.
option chain A list of all standardized options available for a particular stock or
index.
option contract Unlike stocks, options are referred to in contracts. Each con-
tract relates to a certain number of shares in the underlying asset—this number
changes depending on which exchange the option trades on. In the United States,
option contracts generally relate to 100 shares.
out of the money An option that has no intrinsic value, where the owner of the
option does not stand to profit by exercising his or her right under the contract. For
a call option to be out of the money, the stock price must be lower than the strike
price. For example, a $15.00 call option is out of the money when the stock price is
below $15.00.
PE (price-earnings) ratio A stock’s market price divided by its earnings per
share. A PE ratio of a stock is used to measure how cheap or expensive the stock
price is.
214 Glossary
bgloss.qxd 10/23/06 2:25 PM Page 214
physical settlement There are two types of settlement styles for exchange-
traded options—physical settlement and cash settlement. Physical settlement op-
tions give the owner the right to receive physical delivery of the underlying asset
when the option is exercised. The majority of stock options are physically settled
while the majority of index options are cash settled. See also cash settlement.
put option An option that gives the holder the right, but not the obligation, to
sell a stock at a certain price up to a certain date. Put options are used by specula-
tors who expect a decrease in the price of the underlying asset.
premium The price of an option; the amount of money the buyer pays for the
rights and the seller receives for the obligations granted by the contract. Expressed
on a per share basis.
price channel or cycle The price trend that a stock is trading in. Identified by
the trading range between two parallel lines.
rollout A technique used in LEAPS investing in which the investor sells an ex-
isting contract and repurchases another contract on the same underlying security
with greater time to expiration.
S&P 500 Short for the Standard & Poor’s 500, which is an index of the 500
largest publicly traded U.S. corporations and is often considered representative of
the stock market in general. The majority of the companies included in the index are
listed on the New York Stock Exchange (NYSE).
secondary call Any call that is sold subsequent to the call that was originally
sold when entering a covered call or LEAPS position.
short position An overall sell position in a stock or option.
sideways moving stock A stock whose lower line of the price channel is at a
gradient approximately equal to horizontal; a stock making relatively equal tops and
bottoms. A sideways trending stock.
surrogate LEAPS replacement (SLR) A LEAPS technique used when an
investor sells a call under the FSDR and the stock price continues to move up, pre-
venting a profitable call buyback. It allows investors to reduce capital in the posi-
tion and realize profits on a LEAPS by taking advantage of a rising stock
price—without unprofitably buying back the short call.
surrogate stock replacement (SSR) An advanced covered call defensive
technique used to remedy a TSS for income call that cannot be bought back for a
profit. See also tethered slingshot for defense; TSS for income.
10¢ buyback rule A means for LEAPS investors to expedite the buyback of the
call if the stock price is moving up and then to sell the LEAPS for a profit if the stock
price continues up. This rule facilitates the close of the transaction.
tethered slingshot for defense (TSS) A covered call defensive technique
used to prevent an unprofitable call out.
Glossary 215
bgloss.qxd 10/23/06 2:25 PM Page 215
time value The portion of an option’s price that exceeds the exercisable value.
TSS for income A covered call management technique used to generate in-
come when the stock price has declined after entry.
20¢ rule A means for investors to determine whether an investment is in danger
of being called out and if it is, therefore, necessary to implement the TSS for defense
to prevent being called out. The 20¢ rule value = Call strike price + Call buyback
price (ask) – Stock price. If the 20¢ rule value is equal to $0.20 or less, the danger
zone of being called out exists and defensive action using the TSS for defense must
be taken.
uncalled return Also known as the “percentage return” or “yield,” it is simply
the premium received on the call sale divided by the cost of the stock or LEAPS. See
also called return.
underlying asset The asset that an option (or other derivative security) derives
its value from. For example, the underlying asset of an IBM stock option is IBM
stock.
upward moving stock A stock whose lower line of the price channel is at a
gradient greater than horizontal; a stock making higher tops and higher bottoms. An
upward trending stock.
216 Glossary
bgloss.qxd 10/23/06 2:25 PM Page 216

217
Disclaimers
All information presented by Compound Stock Earnings, Inc., and/or Compound
Stock Earnings Seminars, Inc., by its directors, employees, contractors, and con-
sultants in seminars, Web sites, literature, verbal opinion or e-mail or through any
other medium provides general information only. All references to international
and USA securities are made using historical data and are for educational purposes
only. No trading suggestions of any kind are made nor should be implied. In pre-
senting the material, neither Compound Stock Earnings, Inc., and/or Compound
Stock Earnings Seminars, Inc., nor its directors, employees, contractors, and con-
sultants has taken into consideration any individual’s investment objectives, finan-
cial situation, or particular needs. All recipients of general information furnished by
Compound Stock Earnings, Inc., and/or Compound Stock Earnings Seminars, Inc.,
should seek independent professional advice as to the suitability of any investment
strategy to their personal financial profile and goals.
Compound Stock Earnings, Inc., and/or Compound Stock Earnings Seminars,
Inc., seminars, Web sites, literature, or e-mail or any other communications are pro-
vided by Compound Stock Earnings, Inc., and/or Compound Stock Earnings Semi-
nars, Inc., on an “as is” basis. Compound Stock Earnings, Inc., and/or Compound
Stock Earnings Seminars, Inc., makes no representations or warranties of any kind,
express or implied, as to the operation of the Web site or the information, content,
materials, or products included in seminars, Web sites, literature, verbal opinion or
e-mail or in any other communication. To the full extent permissible by law, Com-
pound Stock Earnings, Inc., and/or Compound Stock Earnings Seminars, Inc.,
disclaims all warranties, express or implied, including, but not limited to, implied
warranties of merchantability and fitness for a particular purpose. Compound Stock
Earnings, Inc., and/or Compound Stock Earnings Seminars, Inc., will not be liable
for any damages of any kind arising from the use of information furnished through
seminars, Web sites, or literature or through any other medium, including, but not
limited to, direct, indirect, incidental, punitive, and consequential damages.
While content is based on information from sources that are considered reli-
able, Compound Stock Earnings, Inc., and/or Compound Stock Earnings Seminars,
Disclaimer and
Legal Information
bmeddis.qxd 10/23/06 2:24 PM Page 217
Inc., its directors, employees, contractors, and consultants do not represent, war-
rant, or guarantee, expressly or implied, that the information presented is complete
or accurate. Additionally, no responsibility is accepted to inform you of any matter
that subsequently comes to its notice, which may affect any of the information con-
tained in this document. Compound Stock Earnings, Inc., and/or Compound Stock
Earnings Seminars, Inc., their officers or employees may at any time have a posi-
tion, either long, short, or in a derivative, in any of the financial instruments dis-
cussed herein.
Risk and Liability
Compound Stock Earnings, Inc., and/or Compound Stock Earnings Seminars, Inc.,
its directors, employees, contractors, and consultants specifically disclaim any lia-
bility, whether based in contract, tort, strict liability, or otherwise, for any direct, in-
direct, incidental, consequential, or special damages arising out of or in any way
connected with seminars, Web sites, literature, verbal opinion, or e-mail or any
other communications or the information or material available from or through it
even if Compound Stock Earnings, Inc., and/or Compound Stock Earnings Semi-
nars, Inc., has been advised of the possibility of such damages, including liability in
connection with mistakes or omissions in, or delays in transmission of, information
to or from the user, interruptions in telecommunications connections to the site, or
viruses.
Compound Stock Earnings, Inc., and/or Compound Stock Earnings Seminars,
Inc., limits any liability that cannot be excluded to restoring the service, resupply-
ing the material, or refunding any amount paid to Compound Stock Earnings, Inc.,
and/or Compound Stock Earnings Seminars, Inc., for the service or material. Any or
all products or services provided by Compound Stock Earnings, Inc., and/or Com-
pound Stock Earnings Seminars, Inc., may be modified over time.
All financial instruments including equity and derivative securities involve risk.
Financial market participants must satisfy suitability requirements outlined by rel-
evant brokers in order to trade financial instruments. Transacting in financial in-
struments is inherently risky and uncertain. Past results are not indicative of future
performance.
None of the information and data contained in or communicated by seminars,
Web sites, literature, e-mail, verbal opinion or through any other medium, consti-
tutes a recommendation to purchase or sell a security, or to provide investment
advice.
The information presented by Compound Stock Earnings, Inc., and/or Com-
pound Stock Earnings Seminars, Inc., its directors, employees, contractors, and
consultants in seminars, Web sites, literature, or verbal opinion or through any
other medium is provided for general informational purposes. The materials are not
a substitute for obtaining professional advice from a qualified person, firm, or cor-
poration. Consult the appropriate professional advisor for more complete and
current information. Compound Stock Earnings, Inc., and/or Compound Stock
Earnings Seminars, Inc., is not engaged in rendering any legal, taxation, or other
professional service by furnishing these general information materials.
218 Disclaimer and Legal Information
bmeddis.qxd 10/23/06 2:24 PM Page 218
Compound Stock Earnings, Inc., and/or Compound Stock Earnings Seminars,
Inc., makes no representations or warranties about the accuracy or completeness of
the information contained on this Web site or associated literature or through any
other medium. Any links provided to other server sites are offered as a matter of
convenience and in no way are meant to imply that Compound Stock Earnings,
Inc., and/or Compound Stock Earnings Seminars, Inc., endorses, sponsors, promotes,
or is affiliated with the owners of or participants in those sites, or endorses any in-
formation contained on those sites, unless expressly stated.
Use of Information
Compound Stock Earnings, Inc., and/or Compound Stock Earnings Seminars, Inc.,
is the copyright owner of all text and graphics contained on or in Compound Stock
Earnings, Inc., and/or Compound Stock Earnings Seminars, Inc.’s Web sites, e-mails,
seminar materials, or any other associated literature except as otherwise indicated.
Other parties’ trademarks and service marks that may be referred to herein are the
property of their respective owners. You may print a copy of the information fur-
nished on the Compound Stock Earnings, Inc., and/or Compound Stock Earnings
Seminars, Inc., Web site or e-mails for your personal use only, but you may not
reproduce or distribute the text or graphics to others or substantially copy the
information on your own server, or link to this Web site, without prior written per-
mission of Compound Stock Earnings, Inc., and/or Compound Stock Earnings Sem-
inars, Inc.
Permission to use and reproduce documents and related graphics available from
seminars, Web sites, or literature or through any other medium can only be granted by
Compound Stock Earnings, Inc., and/or Compound Stock Earnings Seminars, Inc., in
writing and if so will only be granted provided that: 1. the copyright notice appears in
all copies and that both the copyright and this permission notice appear; 2. use and re-
production of documents and related graphics is limited to personal, noncommercial
use; 3. no documents or related graphics, including logos, are modified in any way;
and 4. no graphics, including logos, are used separate from accompanying text. Use or
reproduction for any other purpose without the prior written consent of Compound
Stock Earnings, Inc., is expressly prohibited by law, and may result in civil and crim-
inal penalties. Compound Stock Earnings, Inc., and/or Compound Stock Earnings
Seminars, Inc., reserves the right to revoke any given authorization at any time in writ-
ing, at which point any such use must be discontinued immediately.
Violators will be prosecuted to the maximum extent possible.
Applicable Law
The Compound Stock Earnings, Inc., Web site is created and controlled by Com-
pound Stock Earnings, Inc., and Compound Stock Earnings Seminars, Inc., in
Texas, United States of America. As such, the laws of Texas and the United States
of America will govern these disclaimers, and terms and conditions, without giving
effect to any principles of conflicts of laws. We reserve the right to make changes to
our site and these disclaimers, and terms and conditions at any time.
Disclaimer and Legal Information 219
bmeddis.qxd 10/23/06 2:24 PM Page 219
Privacy Policy
Compound Stock Earnings, Inc., and/or Compound Stock Earnings Seminars, Inc.,
is committed to safeguarding your privacy. Please read the following statement to
understand how your personal information will be treated while using the Com-
pound Stock Earnings, Inc., and Compound Stock Earnings Seminars, Inc., Web
site.
If you have any questions regarding our privacy statement, please feel free to
contact us by e-mail at sylvia@compoundstockearnings.com.
Gathering of Information
Voluntary Submission
Compound Stock Earnings, Inc., and/or Compound Stock Earnings Seminars, Inc.,
does not collect personally identifying information about any individual Compound
Stock Earnings, Inc., Web site user except when knowingly provided by such indi-
vidual. For example, we may ask you for information when you register to receive
information or to book attendance at a seminar. You always have the option not to
provide the information we request. If you choose not to provide the information we
request, you can still visit most of the Compound Stock Earnings, Inc., Web site, but
you may be unable to access certain options and services.
A cookie is a data file that certain Web sites write to your computer’s hard drive
when you visit such sites. A cookie file can contain information, such as a user iden-
tification code, that the site uses to track the pages you have visited. Compound-
stockearnings.com uses cookies solely to track user traffic patterns throughout the
Compoundstockearnings.com Web site and to allow you access to “member only”
sections of the site. We use this data on an anonymous basis and we do not corre-
late this information with personal data of any user.
Most Web site browsers automatically accept cookies, but you can usually
change your browser settings to display a warning before accepting a cookie, or to
refuse all cookies. However, if you choose to disable the receipt of cookies from our
Web site, you may not be able to use certain features of the site.
Compoundstockearnings.com Web servers automatically collect information
about a site user’s IP address, browser type, and referrer by reading this information
from the user’s browser (information provided by every user’s browser). This in-
formation is collected in a database and used—in an aggregated, anonymous
manner—in our internal analysis of traffic patterns within our Web site. This infor-
mation is automatically logged by most Web sites.
220 Disclaimer and Legal Information
bmeddis.qxd 10/23/06 2:24 PM Page 220
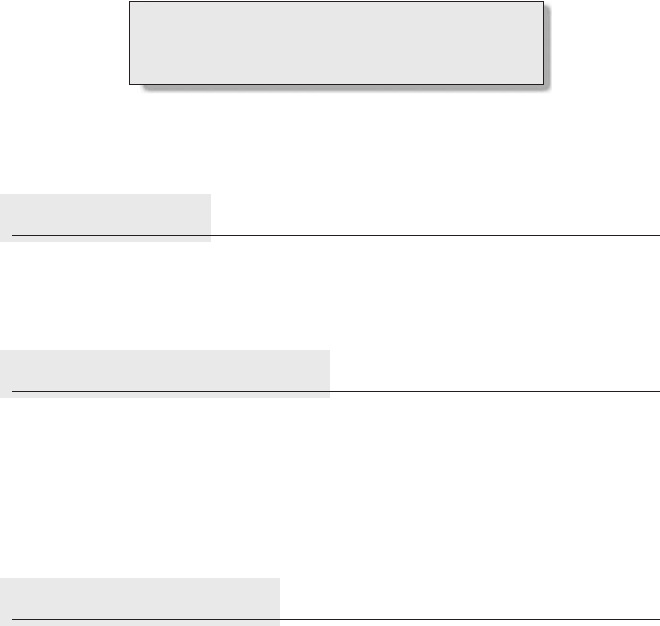
221
About the DVD
INTRODUCTION
This appendix provides you with information on the contents of the DVD
that accompanies this book.
SYSTEM REQUIREMENTS
• A computer with DVD player and appropriate software installed
OR
• A stand-alone DVD player attached to a television monitor
Note: the DVD is compatible with all NTSC DVD players
WHAT’S ON THE DVD
The following sections provide a summary of the software and other mate-
rials you’ll find on the DVD.
Content
This companion DVD contains two video presentations on executing cov-
ered calls and LEAPS transactions.
Playing the DVD on a PC
In the event the DVD does not automatically load on your PC:
• Open My Computer.
• With your mouse, right click on the DVD drive.
bmedinst.qxd 10/23/06 2:23 PM Page 221

• Open Properties.
• Open the AutoPlay tab.
• Using the drop down menu, select Video Files.
• Select the DVD player.
• Click on Apply.
• Put the Covered Calls and LEAPS DVD into the disc drive.
The video should now load automatically.
CUSTOMER CARE
If you have trouble with the DVD, please call the Wiley Product Technical
Support phone number at (800) 762-2974. Outside the United States, call
(317) 572-3994. You can also contact Wiley Product Technical Support at
http://support.wiley.com. John Wiley & Sons will provide technical sup-
port only for installation and other general quality control items. For tech-
nical support on the applications themselves, consult the program’s vendor
or author.
To place additional orders or to request information about other Wiley
products, please call (877) 762-2974.
222 About the DVD
bmedinst.qxd 10/23/06 2:23 PM Page 222

223
Index
Accelerating time decay, 62
Access to information, 34
Active investors, 2, 61
Adjusted cost, 173, 174–175
Advanced defensive techniques
cardiopulmonary resuscitation (CPR),
88–114, 189
surrogate stock replacement (SSR), 79–87,
196
Aggressive investors, 81, 188
American Stock Exchange (AMEX), 213
American-style option, 10, 213
Amortization, 111, 118
Ask price, 3, 16, 76, 100, 216
At-the-money
LEAPS contracts, 84
options, 9, 211
Australian dollar (AUD), foreign exchange
risk, 197–200
Average cost, calculating, 174–175, 195–196
Averaging down, 171–172, 195–196, 211
Bid and ask spreads, 16
Bid price, 3, 16, 216
bigcharts.com, 42
Binomial option pricing model, 16
Black-Scholes option pricing model, 16
Blue-chip stocks, 73, 127, 213
Board of directors, 2
Bottoms, of price cycle, 44–48, 131, 136,
138–139, 142, 159, 161–163, 185
Breakeven, 170. See also Stock breakeven
analysis
Broker(s)
boutique, 5
debit spreads and, 78
recommendations, 37, 39, 127, 181, 191
Brokerage/brokerage firms
characteristics of, 78–79
debit spreads, 78
online, 202
selection factors, 201–202
Buyback
characteristics of, 65–66, 78–79, 82–83, 92,
100, 111, 211, 215
existing call, 187
5% rule, 147, 149, 196
price, 76
profitable, 83, 158–160
returns, 158
rolling out, 174–175
rules, 195, 215
surrogate LEAPS replacement, 169, 195
10¢ rule, 148, 150, 215
Buying low rule, 37, 55–56, 73, 130–142, 146,
153, 159, 181–183, 192
Buying to close, 24, 211
Buy low, sell high, 42, 159
Calendar LEAPS, defined, 211, 212. See also
Calendar LEAPS spread
Calendar LEAPS spread
advantages of, 118–120
buying low rule, 153
called return calculations, 189
characteristics of, 117–118
defensive techniques, 165–175
investment process, 190
management rules, 147–164
new LEAPS positions, see New LEAPS
positions
process flowchart, 116, 190
using for cover, 120–121
Called returns, 37–38, 58, 65, 78, 82, 120–121,
125–126, 144–145, 181, 191–192, 194, 211
Call options
defined, 6, 211
price determination, 17, 20
bindex.qxd 10/23/06 2:24 PM Page 223
Call options (cont.)
selection factors, 192
selling guidelines, 14, 143, 183
speculation example, 11–13
Call out/callout, 26–27, 55, 70–72, 75–78, 98,
86, 107, 165, 183, 187–188, 211, 216
Call returns, 72
Call sale opportunities, maximizing, 68–70
Capital, generally
appreciation, 86
forecasting, 199
gains tax, 71
investment, 31, 33, 80, 174–175, 183
management, 177–178
surrogate LEAPS replacement (SLR)
strategy and, 168–169
Cardiopulmonary resuscitation (CPR)
applications, 97–114, 189
call outs at expiration, 92–93
construction of, 99–100
defined, 88, 211
maximum loss, 90
net debit of, 89, 95, 97
payoff of, 89–93
profitable, 90
structure of, 88–89
Worksheet, 90, 93–97, 100, 102, 104, 107,
208
Cash flow
compound interest, 28–29
generation of, 40, 68
growth through, 31–32, 118–119
maximization of, 161
negative, 81
positive, 81, 188
significance of, 140
Cash return, 102, 104, 119
Cash settlement, defined, 212
Cash-settlement options, 9–10
Citigroup, 120–121
Clearinghouse, see Options Clearing
Corporation (OCC)
Close of position, 59–60, 79–80, 83, 97–98, 177
Closing the transaction, 8, 165, 212
Commissions, brokers, 5, 201
Commodities, 6
Compounding/compound interest, 28–29, 62,
165
Compound Stock Earnings, Inc.
Covered Call/LEAPS Selections service,
177–178
Cow Report e-newsletter, 209
disclaimers, 217–218
functions of, 79
information gathering, 220
legal information, 220
privacy policy, 220
support services, 207–209
web site, see
compoundstockearnings.com
compoundstockearnings.com, 5, 31, 40–41,
79, 84, 94, 177–178, 181, 207–209
Conditional orders, 202–203, 212
Consensus estimate, 38–39, 126, 181, 191
Contract, 7, 35
Cost basis, 97
Covered call(s)
applications, 6
buying low rule, 182–183
high-yielding, 36
learning guidelines, 177–178
loss, 25
mindset, 27–32
new positions, see New covered call
positions
portfolio growth, 32
profit, 25
process flowchart, 22, 180
selection factors, 208
sellers/writers, 23–27, 77
selling, 26–27
writing, see Writing covered calls
Covered Call/LEAPS, Selections, 208
Covered call techniques, 181, 207–208, 212
Covered short position, 25–27
Cow Report, 209
Creditors, 2
Credit spreads, 203–204, 212
CSE Screener
applications, generally, 36, 146, 207–208
buying low rule, 144, 146
defined, 212
directions for using, 40–41, 128
filters, see CSE Screener filter
selecting U.S. covered calls, 181
selection parameters, 37–38
CSE Screener filter
characteristics of, 38–40, 126
covered call options, 179, 181
new LEAPS positions, 125–128, 191
Current cycle, 45–48, 56, 158, 166
Current market price, 186
224 Index
bindex.qxd 10/23/06 2:24 PM Page 224
Current rising cycle, 133–140, 143, 151–152,
161
Cutting your losses, 30
Debit spreads, 78–79
Decaying assets, 18–19
Declining price cycle, 82, 134, 140–141, 161,
164, 168, 170, 182, 194–195
Deep-in-the-money calls, 173
Defensive techniques
advanced, 78–114
characteristics of, 75
tethered slingshot, 77–78
20¢ rule, 76–77
Delta
defined, 212
effect, 59–60, 66, 68, 83, 150–151, 159–160
low bridge, see Delta low bridge (DLB)
ratio, 143, 145, 174, 192–193, 212
Delta low bridge (DLB)
characteristics of, 150, 203–204, 212
closing transaction using delta effect,
150–151
defined, 212, 213
Index, understanding of, 153, 213
rules, 151–153
Depressed stock positions, 75, 97, 106, 211
Derivative securities, 6, 212, 216
Disclaimers, 217–218
Diversification, 35–37, 58, 73, 123–124, 181,
183
Dividends, 2, 17, 212
DLB index, 153, 213
Dollar cost averaging, 171
Dow Jones Industrial Average, 5, 36, 63, 72,
123–124, 127, 155, 179, 184–185, 195,
205, 213
Down market day, 36, 58, 196
Downside protection, 120
Downward cycles, 44, 46, 69, 134
Downward moving stock, 49, 52–53, 182, 213
Earnings, 2, 35
Earnings per share (EPS), 38–39, 126–128,
181, 191, 213
Emotional control, 71
Equal and opposite transaction, 8
Equity market, 1
European-style options, 10, 213
Exchange-traded funds (ETFs), 205–206,
213
Exchange-traded options, 6, 10–11
Exercisable value, 81
Exercise price, 17–19, 212, 214
Exercising options, 9, 13–14, 25, 38, 215
Existing stock holdings, selling calls on,
185–186
Exit price, 102
Exit strategy, 172, 175, 213
Expected growth rate, 20
Expiration date, 10, 14, 65, 78, 184, 192–194
Fair value, 16
Fallen positions, 68, 211
Fallen stocks/falling stocks, 33, 164
Fear, 30, 178
52–week range, 39, 41, 181, 213
First buy point, identification in new price
cycle, 142–143, 161–163
5% buyback rule, 147, 149, 193, 195–196,
202–203
Foreign exchange risk
characteristics of, 34, 123
defined, 197, 213
elimination of, 199
implications of, 198
management, 198–200
Foreign market investments, 57–58, 183
Foreign markets
characteristics of, 34, 78
investment, see Foreign market
investments
selling calls rules, 186
up market days, 72
Formalized seven-day rule (FSDR)
applications, 159–164, 194–195, 215
characteristics of, 158–161, 164
defined, 213
Forward hedging strategy, 198–199
Free net cash return, 111
Fundamental factors, 4, 183
Future cash flow, 20
Futures, 6
General Electric (GE), 2, 6–8, 11–13
Good til canceled (GTC) order, 61, 149, 155,
168–170, 184, 193–194, 213
High-PE stocks, 38
High-yielding covered calls, 181, 183
Holding Company Depositary Receipts
(HOLDRS), 205–206, 213
Index 225
bindex.qxd 10/23/06 2:24 PM Page 225
Holding period, 169
Home currency
as collateral of U.S. dollar, 199–200
conversion to U.S. dollar and back to, 199
conversion to U.S. dollar and remain in
USD, 200
devalued, 200
foreign exchange risk and, 213
Horizontal cycle, 44, 46, 131–133, 138, 146,
151, 168, 171
IBM, 6, 216
In-the-money
LEAPS contracts, 84
options, 9, 143, 155, 213
Individual investors, 178
Inexpensive entry price, 136
Institutional investors, 1
Interest rates, 17
Intrinsic value, 17–18, 81, 111, 188, 214
JP Morgan (JPM)
LEAPS, 119, 143–144, 174–175
option chain, 11–12, 156–157
Large capitalization stocks, 123
LEAPS, see Calendar LEAPS spreads; New
LEAPS positions
averaging down, 195–196
characteristics of, 78, 80, 86–87
contracts, 81, 84
defined, 80, 214
filtering parameters, 191–192
repositioning, 173
risk management, 178
secondary call sales rules, 154–158,
193–194
selection factors, 192
techniques, see LEAPS techniques
LEAPS techniques
buying guidelines, 191
buying low rules, 153, 192
position construction, 194–195
using price charts, 194
Learning stake, 177–178
Leverage, 14–15, 118, 143, 158, 161, 164, 194
Limit order, 214
Liquidity, 16, 214
Long calls, 111
Long position, 7, 23–24, 88, 214
Long strike call, 90, 92
Long-term cycles, 69–70, 185
Long-term objectives, 32
Long-term options, see LEAPS
Loser mentality, 30
Losing investors, characteristics of, 47–48
Low-PE stocks, 38
Low-risk equity strategy, 73
Management rules
buybacks, 66, 147–149
closing position on delta effect, 59–60, 66,
68
delta low bridge (DLB), 150–153
5% buyback rule, 147, 149
implementing covered call strategy, 73
mid-month rule, 60–62, 183–184
secondary call sales, 62–64, 148–149,
154–164
selling calls on existing stock holdings,
70–72
10¢ rule, 147–148
tethered slingshot (TSS) for income,
selling high rule, 65–70
Margin account, 10
Market basics, 1–6
Market capitalization, 37, 39, 125, 127, 181,
191
Market downturn, 143
Market hours, 34
Market order, 214
Market value
defined, 33, 214
fluctuation in, 30, 119–120
implications of, 5, 16, 29
short-term portfolio, 31–32
Master Class seminar, 209
Mid-month rule, 60–62, 183–184
Mind-set, 47–48
Minimum return requirement, 72, 186
Monthly cash flow, 29
Monthly yields, 34
Naked calls, 24–25
NASDAQ, 5, 37, 63, 72, 123–124, 127, 155,
179, 184–185, 195, 214
Near month call, 37, 57, 63–64, 71–72, 76,
80–82, 88, 179, 183, 186
Negative called return, 77, 104, 106
Net buyback, 175
Net debit, 89, 95, 97, 104
Net premium, 100, 102
New covered call positions
buying low rule, 55–56
226 Index
bindex.qxd 10/23/06 2:24 PM Page 226
characteristics of, 96
chart position assessments, 48–54
contract sizes, 35–58
diversification, 35–37, 58
entry rules, 36–37, 179, 181
new capital invested, 33–34
non-U.S. market investments, 57–58
selection using price charts, 42–48
selection using CSE Screener, 37–41, 49, 57
selling, 37
New LEAPS positions
buying first, 125
buying low rule, 125, 130–142
construction of, 125, 128, 133–140,
143–146
using CSE Screener filter, 125–128, 191
diversification, 123–125
entry rules, 124–125, 191
markets to invest in, 123
New price cycle, first sell point, 161–164
New York Stock Exchange (NYSE), 205,
213, 215
Non-U.S. markets, investment rules, 183
Non-U.S. stocks, 33
Novice investors, 66, 136
100 shares, 34
Online broker/brokerage firms, 5, 202
Opening transaction, 7–8, 214
Option chain, 10–12, 84, 155–157, 208, 214
Options
basics of, 6–16
contract, defined, 214
defined, 214
price determination, 16–20
real world example, 13–14
sample contract, 6–7
symbols, 4
terminology, 7–14
trading process, 6
types of, 6
Options Clearing Corporation (OCC), 10
Out-of-the-money options, 9, 86, 111, 214
Panic sell-offs, 129–130
Paper gain, 29
Payoff, 17, 89–93
Percentage return, 38, 120
Percentage yield, 216
Physical settlement, defined, 215
Physical-settlement options, 9–10
Picking the top, 67
Position construction, 123–124
Positive called return, 77–78, 95, 97–98, 100,
102, 126, 144–145, 194
Premium, 11, 13, 40, 215
Present value, 20
Price channel, 42, 215
Price charts
applications, 161, 182
assessment of, see Price chart assessment
characteristics, 129–130, 182, 194
LEAPS techniques, see Price charts,
LEAPS techniques
Price charts assessment, 45–48
Price charts, LEAPS techniques
applications, 129–130
optimal positions for LEAPS investments,
130–131
Price cycle
bottoms, 44–48, 131, 136, 138–139, 142,
159, 161–163, 185, 213
characteristics of, 42, 78, 106, 114, 130
changes, identification of, 140–142
defined, 215
identification of, 45
management rules and, 158
secondary calls, 65
tops, 44–47, 72, 131, 142, 161–163
types of, 48
Price declines, 167. See also Declining price
cycle
Price-earnings (PE) ratio, 37–40, 125–126,
181, 191, 214
Profitable buybacks, 83, 158–160
Profitable call out, 98
Profitable close out, 102
Profitable LEAPS, 168–169
Put options
defined, 6, 215
price determination, 17, 20
speculation example, 11–13
Reference Guide, 179–196
Reinvestment, 84, 165, 170
Relativity, 136
Reselling calls, 61
Restructure cost, 80, 83–84, 86
Restructuring, 189
Retirement accounts, 78
Returns, 33. See also specific types of
returns
Rising price cycle, 49, 51–52, 62, 131–133,
136–140, 159, 167, 182, 194
Index 227
bindex.qxd 10/23/06 2:24 PM Page 227
Risk-free rate, 17, 20
Risk management, 34, 178
Risk reduction, 73
Rolling out
adjusted cost/average cost calculations,
174–175
applications, 188
defined, 173, 215
rules, 174, 196
Secondary call, defined, 215. See also
Secondary call sales
Secondary call sales
adjusted cost calculation, 175
characteristics of, 62, 78, 145
LEAPS rules, 154–164
management rules, 148–149
problematic, 168–169
returns on, 174
rules for, 63–64, 154–164, 184–185
selling guidelines, 183, 194
selling high rule, 185
Sellers, types of, 23–24
Selling call, see Selling covered calls
guidelines for, 37, 181
on existing stock holdings, 70–72
strategies, 168, 175
Selling covered calls, 57–58
Selling high rule, 65–70, 82, 161, 184–185
Selling to close, 24
Seminars, 209
Seven-day rule, 127, 155, 194
Share
defined, 2
market, 1
number of, 34
Shire Pharmaceuticals, 4
Short calls, 89, 111
Short position
covered, 25–27
defined, 23, 215
implications of, 7
uncovered positions, 24–25
Short strike call, 90, 92
Short-term calls, 81, 155–156, 158, 188,
195–194
Short-term cycle, 70, 185
Short-term portfolio market value, 31–32
Sideways moving cycle, 104
Sideways moving stock, 36, 49, 53–54, 62,
181–182, 215
Simple interest, 28
Speculation/speculators
call options, 11–13, 26, 211
covered calls, 26
put options, 14, 215
options vs. stock, 14–16
Standard & Poor’s 500 (S&P 500), 5, 30–31,
123, 127, 215
Standardized options, 10–11
Stock breakeven analysis, 96–97, 101, 105,
108–110, 112–113
Stockbroker, functions of, 4–5. See also
Broker(s)/brokerage firms
Stock code/symbol, 3–4
Stock indexes, 213
Stock market
buying stock, 2–3, 181, 183
defined, 1
indexes, 5–6
selling stock, 2–3
share, 2
Stock price
cycle, 158
current, 17–18
declining, see Declining position
implications of, 127
movement, influence factors, 4
Stock purchases, guidelines for, 2–3, 181,
183
Stock repurchase, 107
Stock selection, 34, 48, 73
Strike LEAPS, 120–121
Strike price, 9, 17, 65, 76–77, 81, 86, 88–89,
155–156, 158, 167–168, 170, 173, 174,
184, 192, 194, 196, 213
Successful traders, characteristics of, 66, 68,
161, 169
Support services, 177
Surrogate LEAPS replacement (SLR)
applications, 160, 168–171, 195
characteristics of, 166
defined, 215
rules, 167
suitable positions, sample, 166
Surrogate stock replacement (SSR)
characteristics of, 66, 68, 79–82, 187
defined, 215
implementation, example of, 82
restructure, 189
rules for, 187–189
Worksheet, 81, 84, 86, 188, 208
228 Index
bindex.qxd 10/23/06 2:24 PM Page 228
Taxation/tax liabilities, 71
Technical analysis, 4, 183
Temporary loss, 77–78
10¢ buyback rule, 147–148, 193, 202–203, 215
10 percent uncalled return, 155–156
Tethered slingshot for defense, 186–187,
215–216
Tethered slingshot (TSS) for income
call sale opportunities, maximizing, 68–70,
185
closeout of, 80
defined, 215–216
implementation of, 76
secondary call sales, 63
selling high rule, 65–70, 185
Theta, 173
Tickers, 4
Time decay, 62, 66, 81, 160, 165
Time to expiration, 17
Time value, 14, 18–19, 65–66, 160, 170, 173,
194, 216
Tops
price cycle, 44–47, 72, 131, 142, 161–163
surrogate LEAPS replacement (SLR) and,
168
Trading day, 111
Trading range, 39, 41, 181, 215
Transaction(s), 9, 33–34
Trendlines, 42
20¢ rule, 66, 76–77, 186–187, 216
25 percent buyback rule, 194–195
Two month out call, 80–81
Uncalled return, 37–38, 58, 65, 72, 78, 82, 97,
111, 120–121, 125–126, 144–145,
155–156, 158, 181, 187, 191, 194, 211, 216
Underlying assets, 6, 9, 11, 211, 214, 216
Underlying stock, 7, 27, 127, 211–212
Underperforming position, 75, 102, 161, 165,
168, 171, 175
U.S. dollar (USD), foreign exchange risk,
197–200
Unprofitable call outs, 76–78, 107, 165
Up market days, 72
Upswing price, 187
Upward cycle, 43–44, 46, 48, 69–70, 104,
138–140, 146
Upward moving cycle, 104
Upward moving stock, 36, 49–50, 181–182,
216
Upward price movement, 151
Value-oriented brokers, 73
Volatility, 17, 19–20, 72, 186
Wal-Mart, 4
Wealth-building guidelines, 178
Winning stocks, 32
Writer(s)
functions of, 10, 16, 23–24
selling options, 16
success factors, 30
Writing covered calls, see Covered call
options
advantages, 34
characteristics of, 27
disadvantages of, 34–35
Yield, 34, 38, 73, 98, 120, 216
Index 229
bindex.qxd 10/23/06 2:24 PM Page 229

For more information regarding the DVD, see the
About the DVD section on page 221.
CUSTOMER NOTE: IF THIS BOOK IS ACCOMPANIED BY
SOFTWARE, PLEASE READ THE FOLLOWING BEFORE
OPENING THE PACKAGE.
This software contains files to help you utilize the models described
in the accompanying book. By opening the package, you are agreeing
to be bound by the following agreement:
This software product is protected by copyright and all rights are
reserved by the author, John Wiley & Sons, Inc., or their licensors.
You are licensed to use this software on a single computer. Copying
the software to another medium or format for use on a single com-
puter does not violate the U.S. Copyright Law. Copying the software
for any other purpose is a violation of the U.S. Copyright Law.
This software product is sold as is without warranty of any kind,
either express or implied, including but not limited to the implied
warranty of merchantability and fitness for a particular purpose. Nei-
ther Wiley nor its dealers or distributors assumes any liability for any
alleged or actual damages arising from the use of or the inability to
use this software. (Some states do not allow the exclusion of implied
warranties, so the exclusion may not apply to you.)
John Wiley & Sons, Inc.
bindex.qxd 10/23/06 2:24 PM Page 230
