41821800 7A New Jersey Charts And Graphs
User Manual: 41821800
Open the PDF directly: View PDF ![]() .
.
Page Count: 35
- ToolkitGlossary
- Synod7A11
- Size of All ELCA Congregations
- Congregation Size Type by Synod
- 7AEthnicityBySynodAndConference2011
- Congregation Growth Decline by Synod
- Largest Attendance Congregations by Synod45
- Fastest Growing Congregations by Synod45
- Racially Diverse Congregations by Synod45
- Congregations with Most Baptisms by Synod45
- 2013 Mission Support Plans by Synod
- Synod Demographics
- emphasis7A
- Syn7AAge
- NewJerseyMap
Synod Bishop Election Toolkit Glossary
1. Synod11 - Synod Trend Report showing the baptized membership, average attendance
and giving and many other statistics for the synod from 2005 to 2011.
2. Size of all ELCA congregations – Distribution of all ELCA congregations based on average
attendance
3. Congregation Size/Type by Synod – Distribution of congregations by average attendance
for each synod.
4. Ethnicity by Synod/Conference – The percentage of people of color within a synod and
conference.
5. Congregation Growth/Decline by Synod – Congregations growing, declining, or
remaining stable based on changes in average attendance from 2006 to 2011 for each
synod.
6. Largest Attendance Congregations by Synod – Ranking of congregations based on
average attendance.
7. Fastest Growing Congregations by Synod – Ranking of congregations growing fastest
between 2006 and 2011, based on average attendance.
8. Racially Diverse Congregations by Synod – Congregations showing the most racial/ethnic
diversity, especially with congregations with no racial/ethnic community in the majority.
9. Congregations with Most Baptisms by Synod – Ranking of congregations based on child
and adult baptisms.
10. 2013 Mission Support Plans by Synod – Intended and Actual Mission Support from
Synods for 2011 to 2013.
11. Synod Demographics – Includes population projections and many characteristics for the
synod’s territory.
12. Emphasis – Congregations reporting which programs and activities they consider their
‘specialty’ (based on the parochial forms).
13. Age – Chart comparing the age of clergy serving congregations in the synod to the age
of clergy in the ELCA.
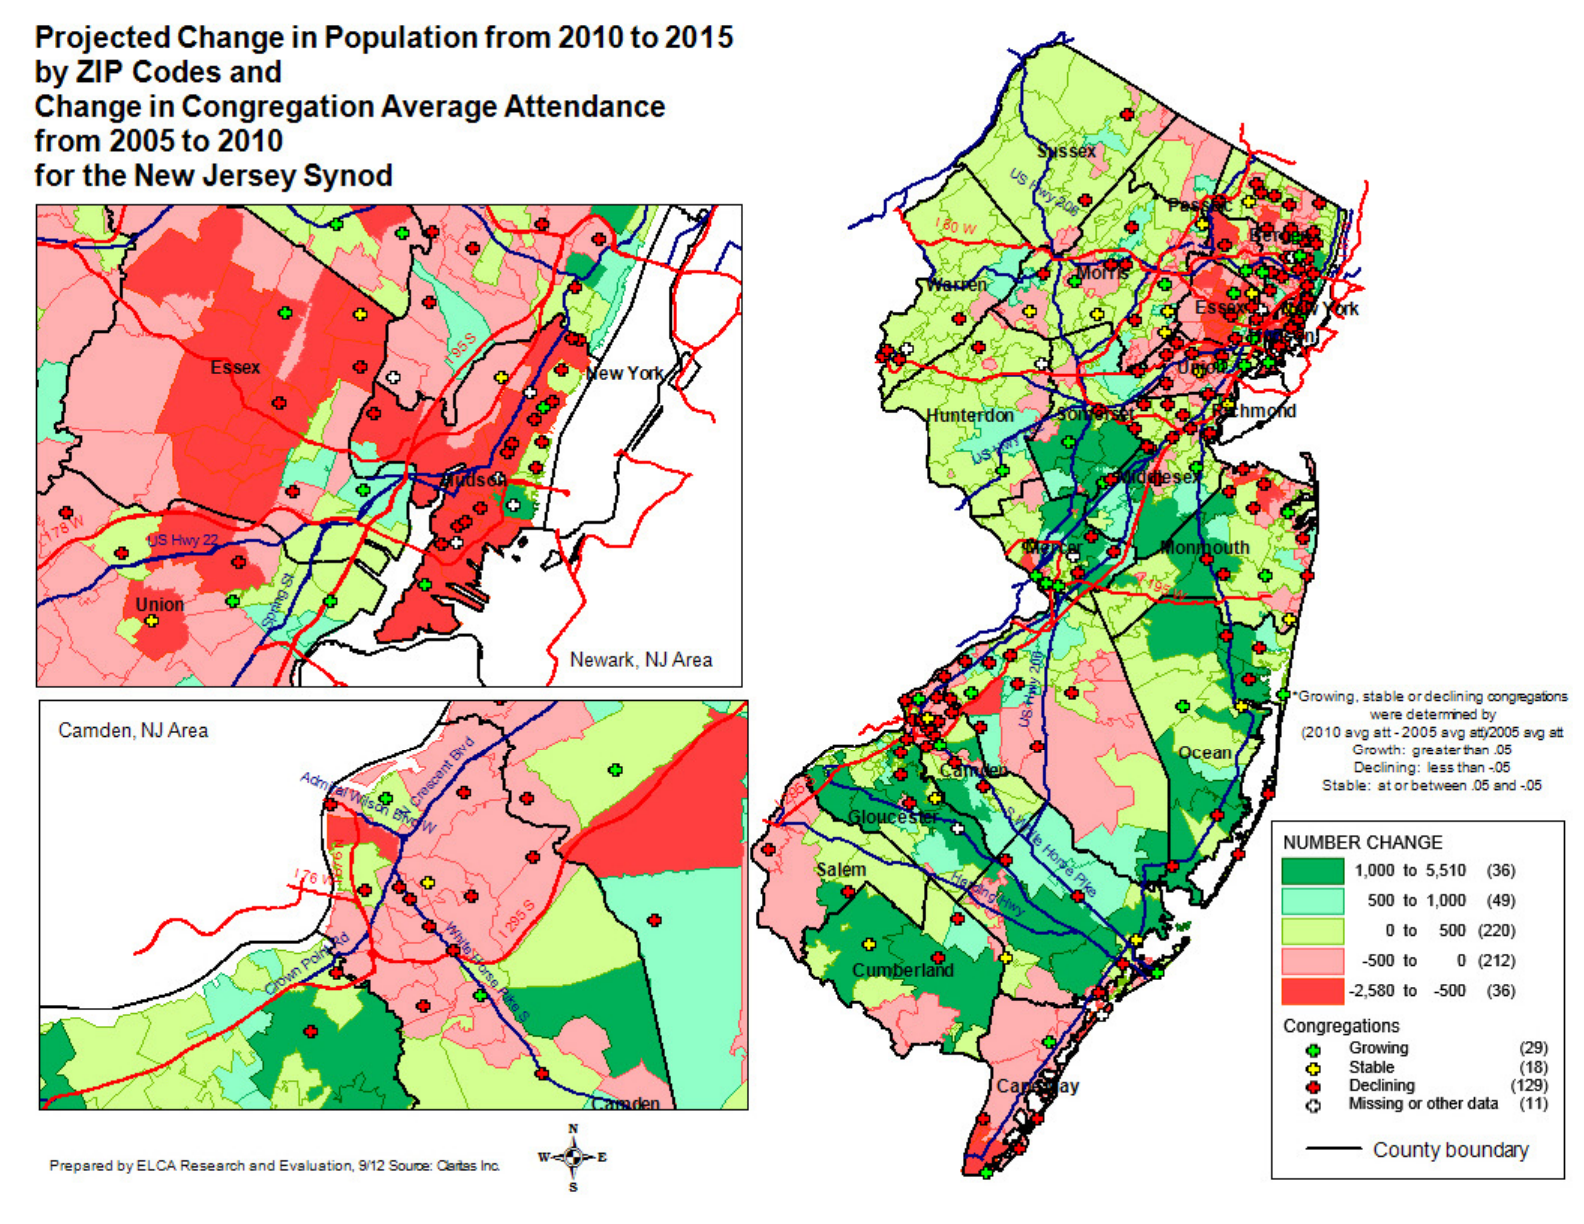
14. Map - Map of Projected Change in Population by ZIP Code and Change in Congregation
Average Attendance for the synod.

Evangelical Lutheran Church in America
ELCA Research and Evaluation
Source: Congregational Report Forms
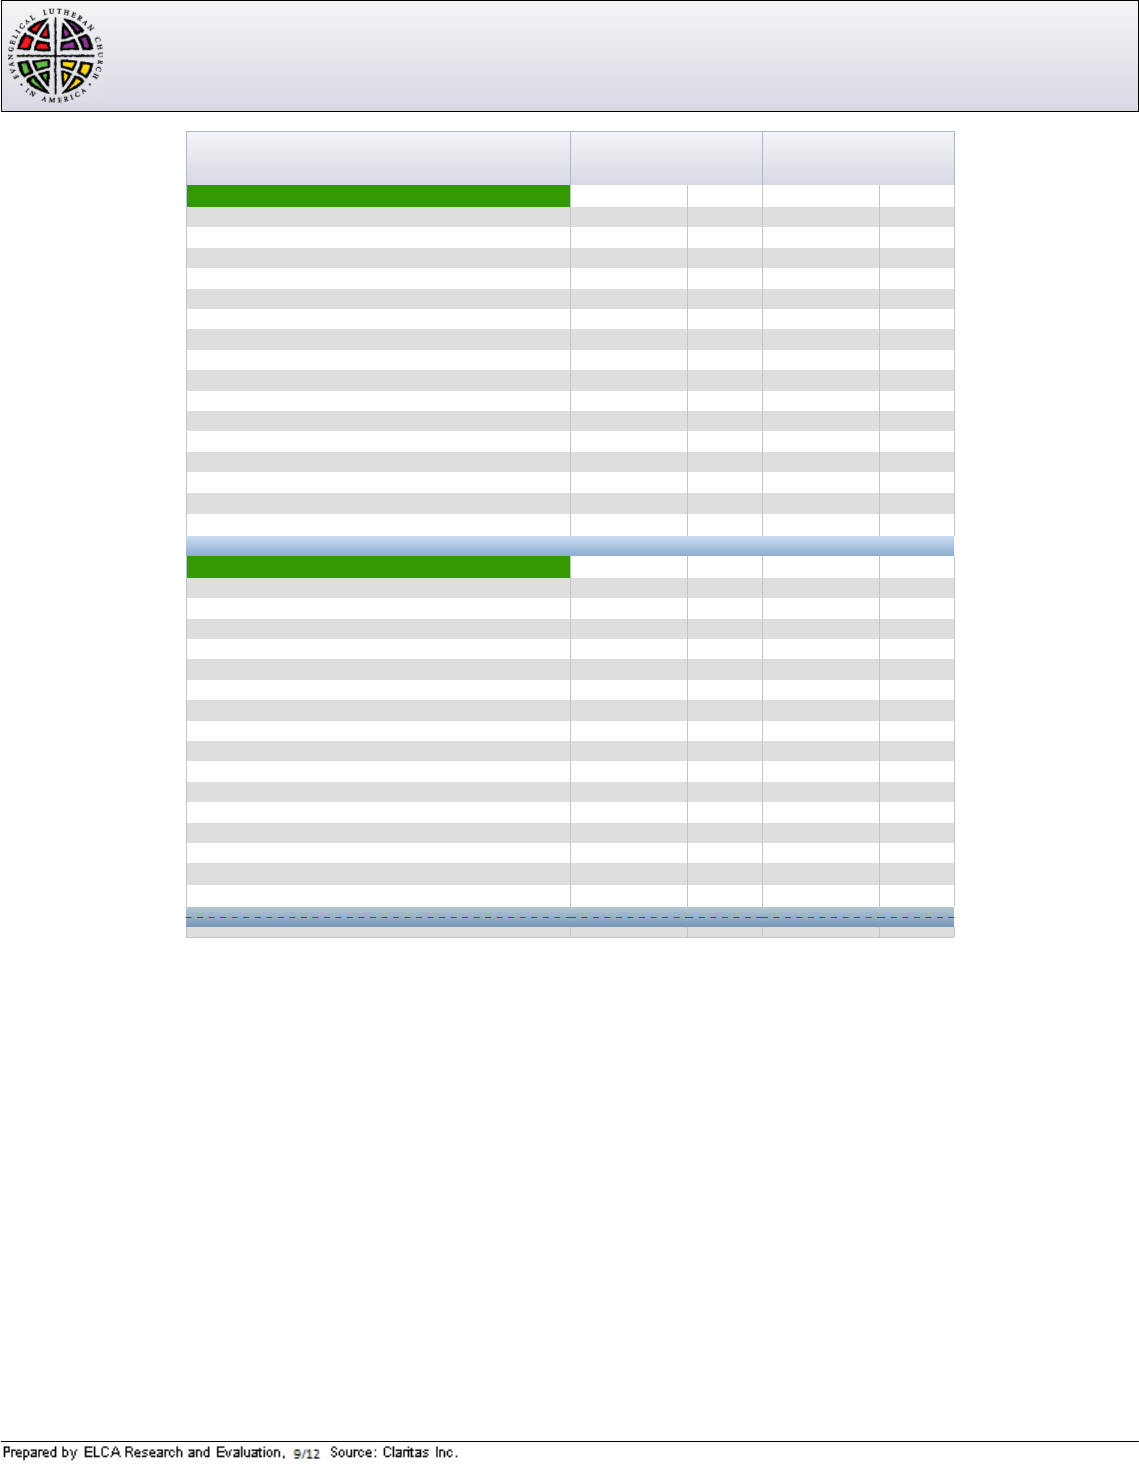
From 2005 to 2011 2005 2006 2007 2008 2009 2010 2011 2005-11
% Change
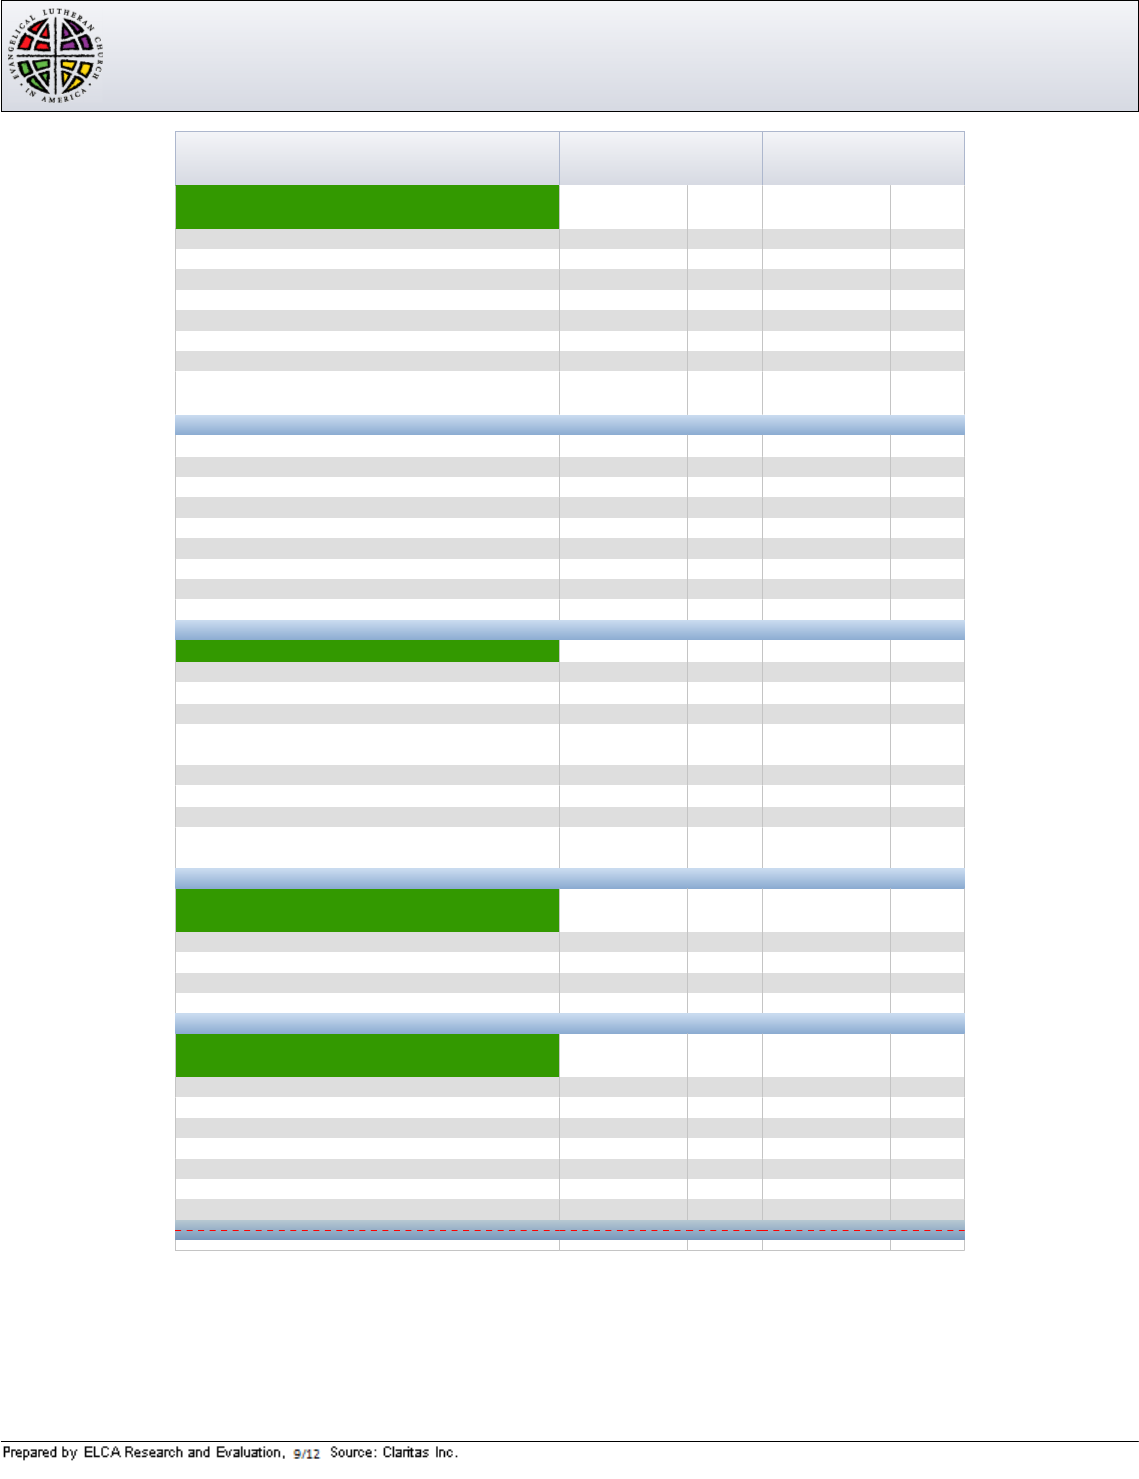
Congregation Totals for New Jersey Synod 7A
Number of Congregations
221 141 142 141 569 267 242
190 189 185 186 185 187 184 %-3.16
Baptized Membership 60,85462,85564,84366,77068,20670,76574,630 %-18.46
Members Received by
a. Baptism: Children 1,186 1,147 1,088 1,031 943 894 850
b. Baptism: Adult 62 67 67 73 136 88 125
c. Affirmation of Faith 1,266 1,207 1,233 1,035 933 939 927
d. Transfer 896 743 668 774 536 511 485
e. Other & Stat. Adjustment
Total Members Added 3,198 3,054 3,117 2,699 2,6293,631 3,305
Members Removed By:
a. Death 658 635 607 605 545 513 558
b. Transfer 1,073 840 829 737 514 380 392
c. Other & Stat. Adjustment 4,092 6,356 5,326 4,844 5,515 3,165 3,451
4,4014,0586,5746,1866,7627,8315,823
Total Members Removed
Total Membership Change -2,192 -4,526 -3,564 -3,132 -3,457 -1,359 -1,772
Baptized Youth Confirmed 855 809 712 668 723 730 702 %-17.89
39,437 39,34040,652
Active Participants (New in 2009)
%25.71%25.99%26.20%26.54%27.06%27.25%26.43
Percent Attending Worship %-20.6715,64716,33516,99117,72718,45719,28619,723
Average Weekly Worship Attendance %-13.2544,84944,83645,93147,08448,00949,15151,699
Confirmed Members
%11.94%11.51%11.27%7.71%7.41%7.31%6.99
% of Total Baptized/Active Participants 4,8104,7964,8945,1475,0555,1715,213
Total Membership of Color/Language 1641342261,652314311375
Other 540498542479399299229
Multi Racial 1,4711,4671,5361,6521,6711,7151,811
Latino/Latina (All Races) 546572570539505536506
Asian/Pacific Islander 65696439394023
Arab/Middle Eastern 19151521171821
American Indian/Alaska Native 279318
African National/African Caribbean (New in 2010) 1,7261,7231,9412,1072,1102,2522,248
African American/Black
Racial/Ethnic Composition of Baptized Members (2005-2008) and Active Participants (2009-2011)
%-3.314,326,6723,393,2949,831,0264,794,5024,115,0634,183,1634,474,801
Other Receipts %13.22667,902527,5571,254,384596,165492,567440,459589,896
Grants & Partnership Suport
%-14.982,794,0514,550,7763,750,7993,344,0733,498,2953,515,7263,286,349Earned Income (any source)
%-22.134,579,8043,860,3264,180,9564,334,7704,077,8644,253,0385,881,296
Designated Giving by Members %-0.9928,056,48528,097,49028,152,99628,943,28328,913,50629,193,63828,338,357
Regular Giving by Members
544.56 %-0.91543.13561.28557.98
557.62567.25575.37
Regular Giving Per Confirmed
Member in 2005 Dollars
548.14 593.96 614.72602.25 612.94 625.58626.67 %14.13
Regular Giving Per Confirmed
Member
%-7.34
40,424,91440,444,44343,658,016 47,170,16141
,
821
,
80042,262,838
Total Receipts 43,627,106

Evangelical Lutheran Church in America
ELCA Research and Evaluation
Source: Congregational Report Forms
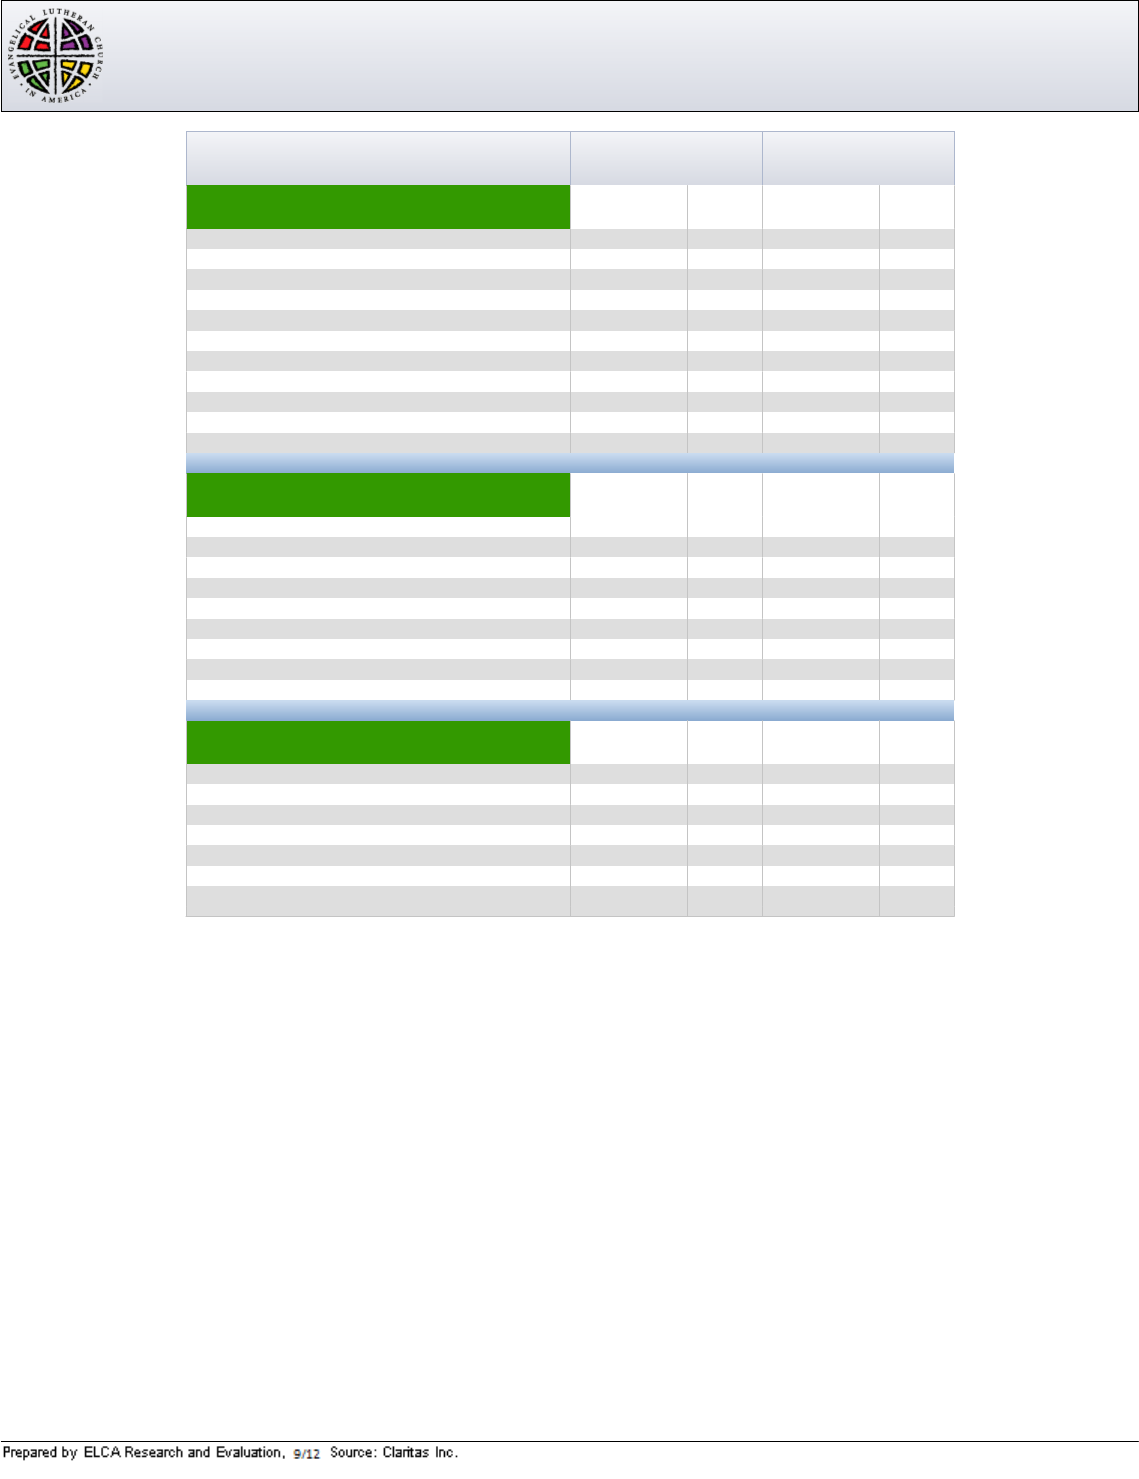
From 2005 to 2011 2005 2006 2007 2008 2009 2010 2011 2005-11
% Change
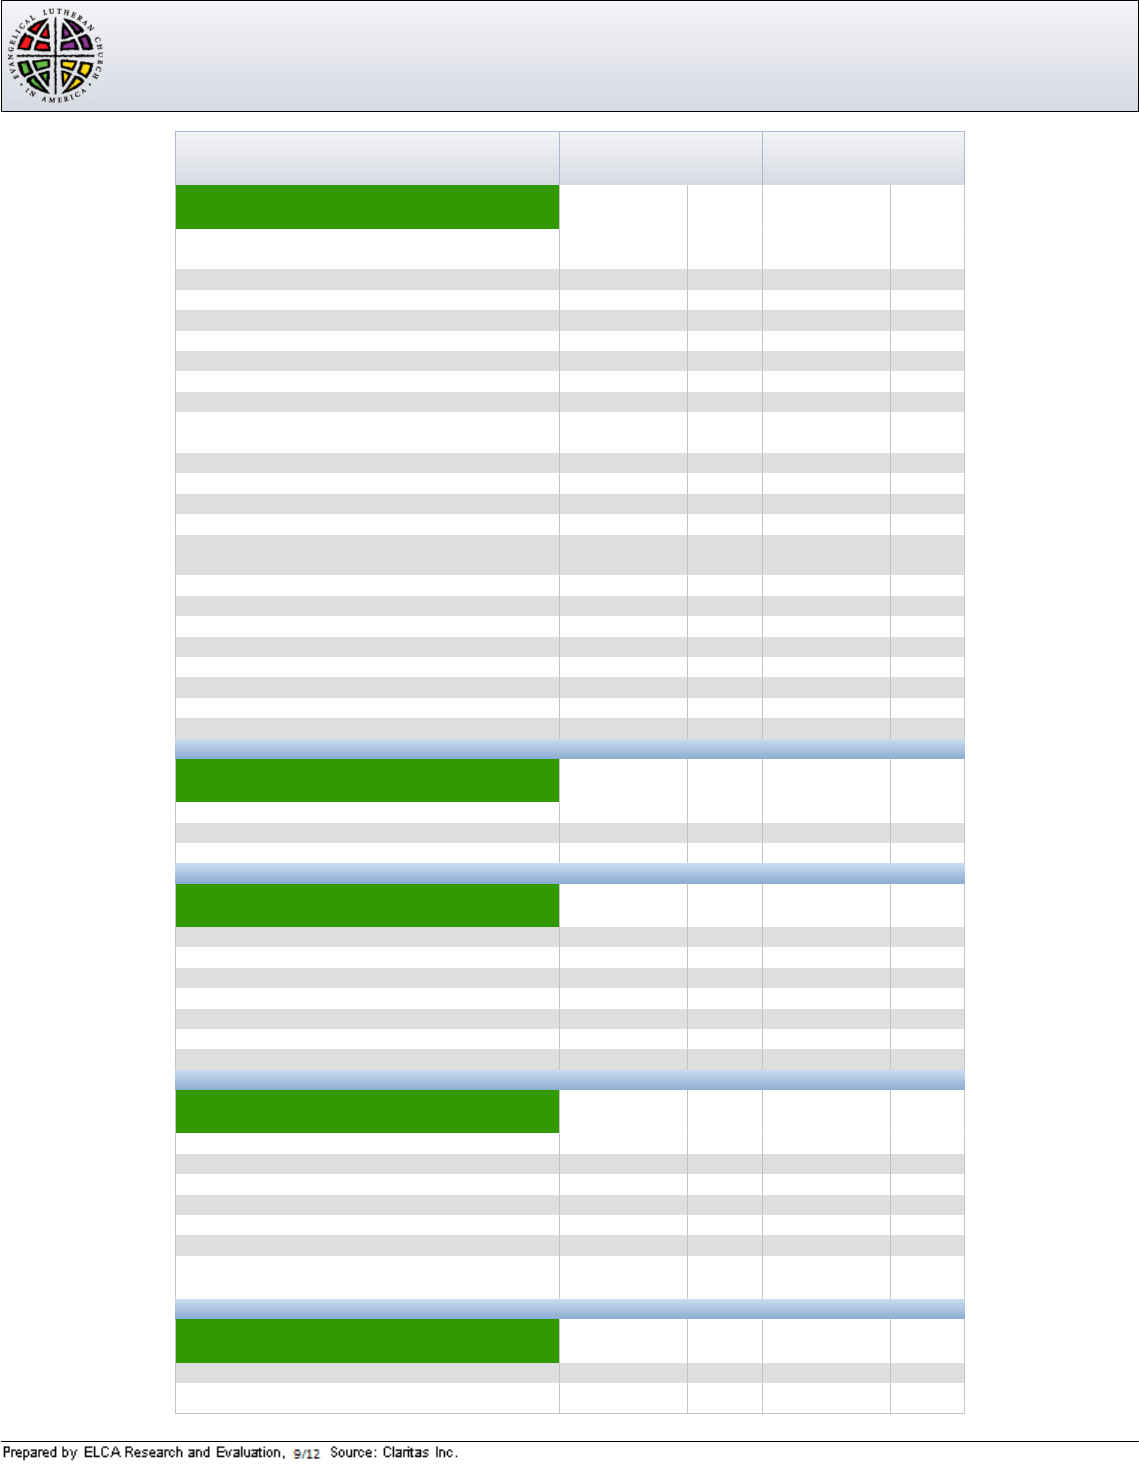
Congregation Totals for New Jersey Synod 7A
%-0.05
42,902,50243,710,12745,879,23044,947,74743,023,10243,989,45642,925,006Total Expenses
%-39.18669,101833,4261,472,8901,556,6421,215,3391,446,4141,100,171
Other Expenses
%-27.231,461,9081,566,2411,718,4181,620,5501,839,0161,614,8202,008,901
All Other Benevolences
%7.93
%7.90%8.24%8.75%9.34%9.28%9.39
Misn Supt % of Regular Giving %5.08 %5.18%5.06%5.63%6.28%6.16%6.20
Misn Supt % of Total Expenses
%-16.462,223,3632,220,0132,320,6792,531,9132,699,7212,710,5292,661,505
Mission Suport %-6.422,057,1712,685,5293,887,0532,048,2302,416,4032,886,8592,198,405
Payments on Debt
%47.645,045,6733,969,7273,984,4224,458,4652,422,3643,012,5493,417,630Capital Improvements
%-0.3031,445,28632,435,19132,495,76832,731,94732,430,25932,318,28531,538,394
Current Operating Expenses
Endowment & Memorial Funds
Cash, Savings, Bonds etc.
Other Assets
Total Indetedness
Number of Bequests Received
Value of Bequests Received
Intended Mission Support
21,328,063
14,259,997
5,977,221
20,072,541
107
2,825,628
2,852,142
27,395,579
12,427,027
18,292,904
5,022,068
69
1,971,163
2,726,727 2,627,927
27,337,708
14,554,355
5,308,122
17,222,193
47
438,793
2,567,696
21,960,673
15,370,650
5,495,817
17,413,162
70
1,152,008
2,517,674
24,265,450
13,478,317
4,725,752
20,046,828
48
1,322,622
25,128,768
13,307,292
3,993,508
18,041,081
52
1,524,339
2,259,670
24,083,196
12,626,562
3,391,359
18,128,810
39
1,463,485
2,330,939
%-11.45
%-43.26
%-9.68
%-18.27
%12.92

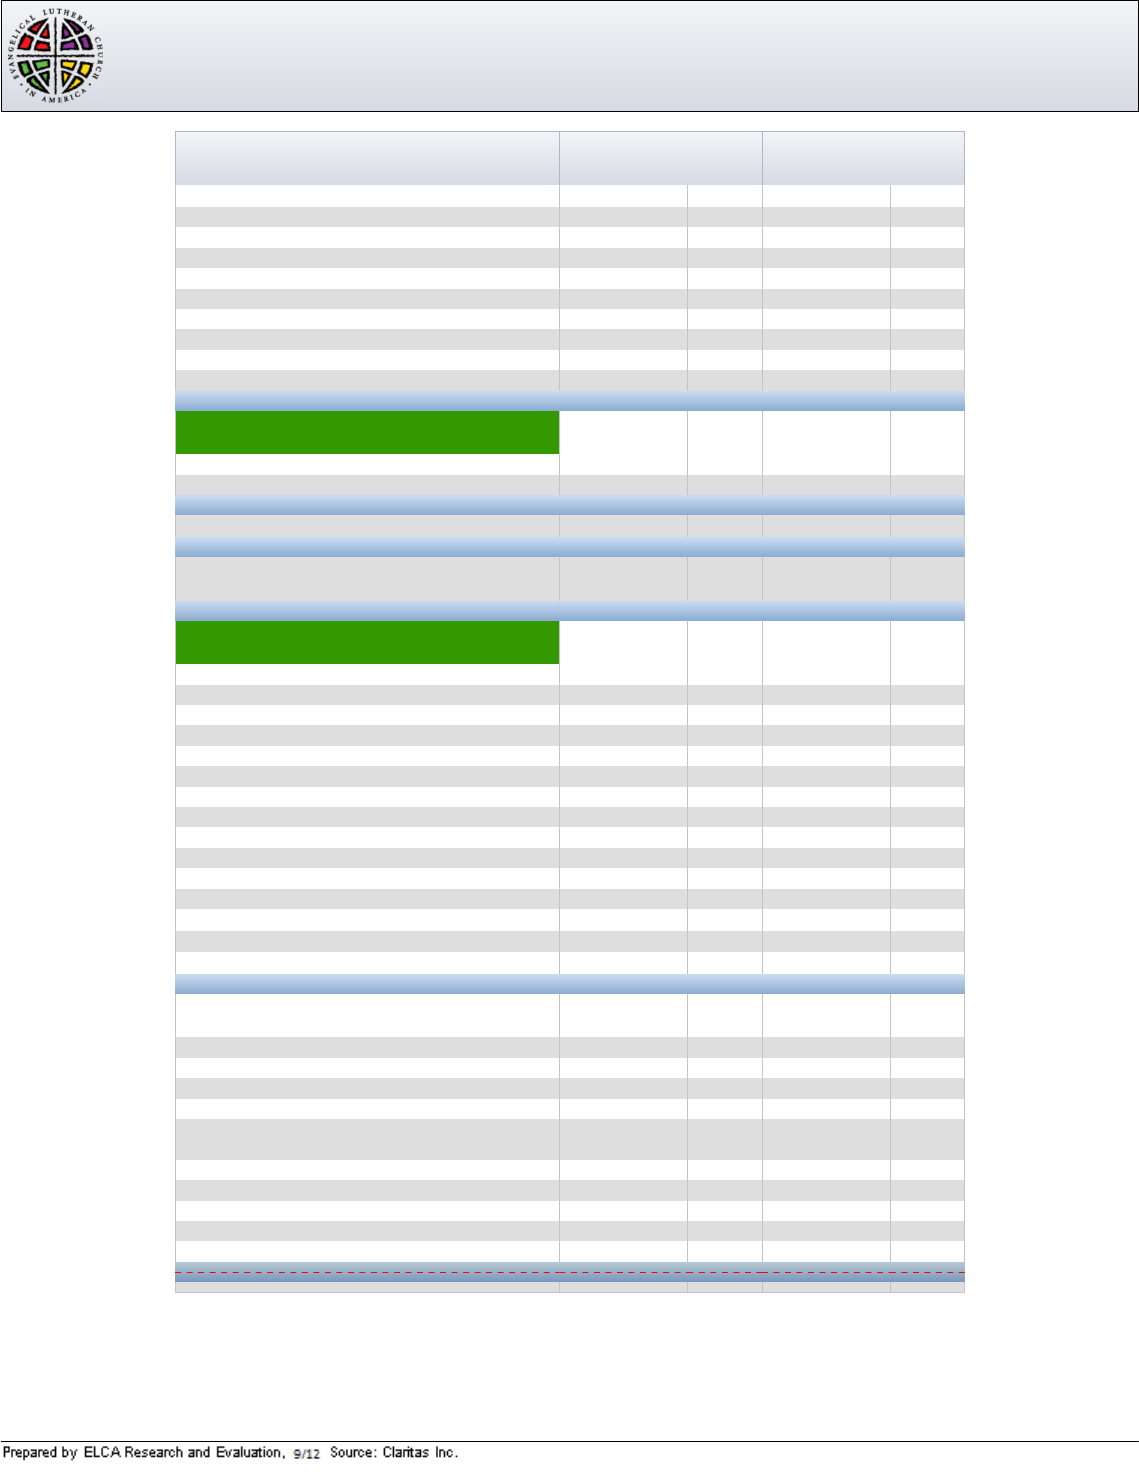
Size of All ELCA Congregations
Size in Number Percent
Average of of
Attendance Congs Congs Percentile
1001+ 28 0.3% 100.0%
751 to 1000 40 0.4% 99.7%
501 to 750 119 1.2% 99.3%
351 to 500 250 2.6% 98.0%
251 to 350 443 4.6% 95.4%
201 to 250 466 4.9% 90.8%
151 to 200 804 8.4% 85.9%
101 to 150 1,423 14.9% 77.6%
76 to 100 1,242 13.0% 62.7%
51 to 75 1,712 17.9% 49.7%
36 to 50 1,260 13.2% 31.9%
21 to 35 1,164 12.2% 18.7%
1 to 20 629 6.6% 6.6%
Total 9,580 100.0%
Source: Annual Congregational Report Forms. Prepared by ELCA Research and Evaluation.

Average Attendance of Congregations in ELCA Synods
Mission Small Pastoral Program Corporate Mega
Synod 0 1-50 51-150 151-350 351-800 801+ Total
1A Alaska Synod 2 13 14 4 0 0 33
6.1% 39.4% 42.4% 12.1% 0.0% 0.0% 100.0%
1B Northwest Washington Synod 1 19 54 23 7 0 104
1.0% 18.3% 51.9% 22.1% 6.7% 0.0% 100.0%
1C Southwestern Washington Synod 0 10 50 21 6 0 87
0.0% 11.5% 57.5% 24.1% 6.9% 0.0% 100.0%
1D Eastern Washington-Idaho Synod 1 29 48 12 2 0 92
1.1% 31.5% 52.2% 13.0% 2.2% 0.0% 100.0%
1E Oregon Synod 1 34 59 20 2 0 116
0.9% 29.3% 50.9% 17.2% 1.7% 0.0% 100.0%
1F Montana Synod 0 63 53 12 1 0 129
0.0% 48.8% 41.1% 9.3% 0.8% 0.0% 100.0%
2A Sierra Pacific Synod 4 54 97 24 8 0 187
2.1% 28.9% 51.9% 12.8% 4.3% 0.0% 100.0%
2B Southwest California Synod 1 39 63 21 2 0 126
0.8% 31.0% 50.0% 16.7% 1.6% 0.0% 100.0%
2C Pacifica Synod 1 38 48 26 4 0 117
0.9% 32.5% 41.0% 22.2% 3.4% 0.0% 100.0%
2D Grand Canyon Synod 3 5 34 30 15 5 92
3.3% 5.4% 37.0% 32.6% 16.3% 5.4% 100.0%
2E Rocky Mountain Synod 4 29 72 47 4 3 159
2.5% 18.2% 45.3% 29.6% 2.5% 1.9% 100.0%
3A Western North Dakota Synod 0 119 46 13 6 1 185
0.0% 64.3% 24.9% 7.0% 3.2% 0.5% 100.0%
3B Eastern North Dakota Synod 3 127 59 19 7 3 218
1.4% 58.3% 27.1% 8.7% 3.2% 1.4% 100.0%
3C South Dakota Synod 3 73 91 28 12 6 213
1.4% 34.3% 42.7% 13.1% 5.6% 2.8% 100.0%
3D Northwestern Minnesota Synod 0 113 92 28 7 1 241
0.0% 46.9% 38.2% 11.6% 2.9% 0.4% 100.0%
3E Northeastern Minnesota Synod 1 39 65 26 7 0 138
0.7% 28.3% 47.1% 18.8% 5.1% 0.0% 100.0%
3F Southwestern Minnesota Synod 1 87 105 43 11 0 247
0.4% 35.2% 42.5% 17.4% 4.5% 0.0% 100.0%
3G Minneapolis Area Synod 1 10 53 48 30 10 152
0.7% 6.6% 34.9% 31.6% 19.7% 6.6% 100.0%
3H Saint Paul Area Synod 0 4 44 39 17 8 112
0.0% 3.6% 39.3% 34.8% 15.2% 7.1% 100.0%
3I Southeastern Minnesota Synod 0 47 67 40 20 2 176
0.0% 26.7% 38.1% 22.7% 11.4% 1.1% 100.0%
4A Nebraska Synod 0 79 114 35 15 3 246
0.0% 32.1% 46.3% 14.2% 6.1% 1.2% 100.0%
4B Central States Synod 2 76 74 26 7 0 185
1.1% 41.1% 40.0% 14.1% 3.8% 0.0% 100.0%
4C Arkansas-Oklahoma Synod 1 25 20 6 1 0 53
1.9% 47.2% 37.7% 11.3% 1.9% 0.0% 100.0%
4D N. Texas-N. Louisiana Synod 0 44 42 14 4 1 105
0.0% 41.9% 40.0% 13.3% 3.8% 1.0% 100.0%
4E Southwestern Texas Synod 2 41 68 24 4 0 139
1.4% 29.5% 48.9% 17.3% 2.9% 0.0% 100.0%
Source: Congregational Report Form Data. Prepared by ELCA Research and Evaluation.10/23/2012$" "&[Page]

Average Attendance of Congregations in ELCA Synods
Mission Small Pastoral Program Corporate Mega
Synod 0 1-50 51-150 151-350 351-800 801+ Total
4F Texas-Louisiana Gulf Coast Synod 0 30 53 27 4 0 114
0.0% 26.3% 46.5% 23.7% 3.5% 0.0% 100.0%
5A Metropolitan Chicago Synod 0 46 85 49 10 3 193
0.0% 23.8% 44.0% 25.4% 5.2% 1.6% 100.0%
5B Northern Illinois Synod 1 29 81 29 10 0 150
0.7% 19.3% 54.0% 19.3% 6.7% 0.0% 100.0%
5C Central/Southern Illinois Synod 0 50 64 15 3 0 132
0.0% 37.9% 48.5% 11.4% 2.3% 0.0% 100.0%
5D Southeastern Iowa Synod 0 32 65 32 8 2 139
0.0% 23.0% 46.8% 23.0% 5.8% 1.4% 100.0%
5E Western Iowa Synod 0 41 73 17 3 0 134
0.0% 30.6% 54.5% 12.7% 2.2% 0.0% 100.0%
5F Northeastern Iowa Synod 0 43 80 25 6 1 155
0.0% 27.7% 51.6% 16.1% 3.9% 0.6% 100.0%
5G Northern Great Lakes Synod 0 30 42 9 1 0 82
0.0% 36.6% 51.2% 11.0% 1.2% 0.0% 100.0%
5H Northwest Synod of Wisconsin 0 64 96 34 6 0 200
0.0% 32.0% 48.0% 17.0% 3.0% 0.0% 100.0%
5I East-Central Synod of Wisconsin 1 13 56 47 9 0 126
0.8% 10.3% 44.4% 37.3% 7.1% 0.0% 100.0%
5J Greater Milwaukee Synod 0 17 63 38 14 0 132
0.0% 12.9% 47.7% 28.8% 10.6% 0.0% 100.0%
5K South-Central Synod of Wisconsin 1 32 55 45 9 2 144
0.7% 22.2% 38.2% 31.3% 6.3% 1.4% 100.0%
5L LaCrosse Area Synod 0 27 31 13 3 0 74
0.0% 36.5% 41.9% 17.6% 4.1% 0.0% 100.0%
6A Southeast Michigan Synod 1 27 62 34 4 0 128
0.8% 21.1% 48.4% 26.6% 3.1% 0.0% 100.0%
6B North/West Lower Michigan Synod 0 26 68 23 2 0 119
0.0% 21.8% 57.1% 19.3% 1.7% 0.0% 100.0%
6C Indiana-Kentucky Synod 1 67 92 29 5 0 194
0.5% 34.5% 47.4% 14.9% 2.6% 0.0% 100.0%
6D Northwestern Ohio Synod 1 35 84 42 3 0 165
0.6% 21.2% 50.9% 25.5% 1.8% 0.0% 100.0%
6E Northeastern Ohio Synod 1 54 89 39 1 0 184
0.5% 29.3% 48.4% 21.2% 0.5% 0.0% 100.0%
6F Southern Ohio Synod 3 70 92 28 12 0 205
1.5% 34.1% 44.9% 13.7% 5.9% 0.0% 100.0%
7A New Jersey Synod 2 55 103 19 1 0 180
1.1% 30.6% 57.2% 10.6% 0.6% 0.0% 100.0%
7B New England Synod 3 46 117 23 0 0 189
1.6% 24.3% 61.9% 12.2% 0.0% 0.0% 100.0%
7C Metropolitan New York Synod 3 73 100 21 5 0 202
1.5% 36.1% 49.5% 10.4% 2.5% 0.0% 100.0%
7D Upstate New York Synod 1 71 86 18 0 0 176
0.6% 40.3% 48.9% 10.2% 0.0% 0.0% 100.0%
7E Northeastern Pennsylvania Synod 2 83 153 41 4 0 283
0.7% 29.3% 54.1% 14.5% 1.4% 0.0% 100.0%
7F Southeastern Pennsylvania Synod 2 31 80 42 4 0 159
1.3% 19.5% 50.3% 26.4% 2.5% 0.0% 100.0%
Source: Congregational Report Form Data. Prepared by ELCA Research and Evaluation.10/23/2012$" "&[Page]

Average Attendance of Congregations in ELCA Synods
Mission Small Pastoral Program Corporate Mega
Synod 0 1-50 51-150 151-350 351-800 801+ Total
7G Slovak Zion Synod 0 13 10 0 0 0 23
0.0% 56.5% 43.5% 0.0% 0.0% 0.0% 100.0%
8A Northwestern Pennsylvania Synod 0 54 27 5 0 0 86
0.0% 62.8% 31.4% 5.8% 0.0% 0.0% 100.0%
8B Southwestern Pennsylvania Synod 0 73 82 21 2 0 178
0.0% 41.0% 46.1% 11.8% 1.1% 0.0% 100.0%
8C Allegheny Synod 0 71 41 9 1 0 122
0.0% 58.2% 33.6% 7.4% 0.8% 0.0% 100.0%
8D Lower Susquehanna Synod 0 67 124 41 7 0 239
0.0% 28.0% 51.9% 17.2% 2.9% 0.0% 100.0%
8E Upper Susquehanna Synod 0 67 55 9 0 0 131
0.0% 51.1% 42.0% 6.9% 0.0% 0.0% 100.0%
8F Delaware-Maryland Synod 4 55 78 32 6 0 175
2.3% 31.4% 44.6% 18.3% 3.4% 0.0% 100.0%
8G Metro. Washington, D.C. Synod 1 13 37 18 6 0 75
1.3% 17.3% 49.3% 24.0% 8.0% 0.0% 100.0%
8H West Virginia-W. Maryland Synod 0 41 19 3 0 0 63
0.0% 65.1% 30.2% 4.8% 0.0% 0.0% 100.0%
9A Virginia Synod 1 71 59 19 5 0 155
0.6% 45.8% 38.1% 12.3% 3.2% 0.0% 100.0%
9B North Carolina Synod 0 54 92 44 8 1 199
0.0% 27.1% 46.2% 22.1% 4.0% 0.5% 100.0%
9C South Carolina Synod 3 42 63 47 2 0 157
1.9% 26.8% 40.1% 29.9% 1.3% 0.0% 100.0%
9D Southeastern Synod 4 41 77 27 7 0 156
2.6% 26.3% 49.4% 17.3% 4.5% 0.0% 100.0%
9E Florida-Bahamas Synod 3 34 79 61 11 1 189
1.6% 18.0% 41.8% 32.3% 5.8% 0.5% 100.0%
9F Caribbean Synod 0 16 14 3 0 0 33
0.0% 48.5% 42.4% 9.1% 0.0% 0.0% 100.0%
Total 71 3021 4359 1707 381 53 9592
0.7% 31.5% 45.4% 17.8% 4.0% 0.6% 100.0%
Source: Congregational Report Form Data. Prepared by ELCA Research and Evaluation.10/23/2012$" "&[Page]

AmericanAfrican
AsianIndianAfrican
Racial/Ethnic Active Participants by Conference for
National Arab
MultiLatinoPacificMiddleAlaskaAmerican African
Racial
OtherWhiteHispanicIslanderEasternNativeBlack
New Jersey Synod, ELCA
Caribbean
Total
Not Provided
0000000000
Bergen
10 6 0 5 53 50 3,038 0 42 3,204
Burlington
69 13 3 0 19 46 5,045 0 29 5,224
Camden
212 1 1 11 14 189 2,576 17 99 3,120
Central
32 6 0 5 35 23 2,438 0 41 2,580
Central Shore
26 1 1 0 17 59 2,634 1 10 2,749
Hudson
280 59 0 8 63 515 657 48 104 1,734
Meadowlands
80 6 2 12 27 32 1,188 5 18 1,370
Mercer
637 14 0 2 95 94 1,845 8 16 2,711
North Shore
35 7 7 1 31 37 2,275 0 29 2,422
Northwest
23 3 2 8 32 35 3,063 0 35 3,201
Passaic/Essex
84 59 0 0 23 169 725 82 19 1,161
Raritan
87 51 1 7 91 113 1,504 3 25 1,882
South Shore
21 2 0 0 21 17 2,774 0 21 2,856
Southwestern
58 0 2 0 12 36 2,410 0 19 2,537
Union
37 51 0 0 3 45 337 0 13 486
Western
35 0 0 6 10 11 2,961 0 20 3,043
40,28054016435,4701,47154665192791,726
Synod Totals
Source: Annual Congregational Report Forms. Prepared by ELCA Research and Evaluation. 10/ 9/2012

Growing, Stable and Declining ELCA Congregations by Synod
Using Average Worship Attendance*
Synod Declining Stable Growing Total
1A Alaska Synod 25 80.6% 1 3.2% 5 16.1% 31
1B Northwest Washington Synod 78 75.7% 7 6.8% 18 17.5% 103
1C Southwestern Washington Synod 51 58.6% 12 13.8% 24 27.6% 87
1D Eastern Washington-Idaho Synod 59 64.8% 12 13.2% 20 22.0% 91
1E Oregon Synod 87 75.7% 9 7.8% 19 16.5% 115
1F Montana Synod 87 67.4% 19 14.7% 23 17.8% 129
2A Sierra Pacific Synod 112 61.5% 32 17.6% 38 20.9% 182
2B Southwest California Synod 74 59.2% 16 12.8% 35 28.0% 125
2C Pacifica Synod 81 70.4% 10 8.7% 24 20.9% 115
2D Grand Canyon Synod 53 59.6% 10 11.2% 26 29.2% 89
2E Rocky Mountain Synod 103 66.5% 21 13.5% 31 20.0% 155
3A Western North Dakota Synod 107 57.8% 40 21.6% 38 20.5% 185
3B Eastern North Dakota Synod 136 63.3% 37 17.2% 42 19.5% 215
3C South Dakota Synod 134 63.5% 35 16.6% 42 19.9% 211
3D Northwestern Minnesota Synod 161 67.1% 35 14.6% 44 18.3% 240
3E Northeastern Minnesota Synod 95 69.3% 22 16.1% 20 14.6% 137
3F Southwestern Minnesota Synod 174 70.7% 34 13.8% 38 15.4% 246
3G Minneapolis Area Synod 101 66.9% 18 11.9% 32 21.2% 151
3H Saint Paul Area Synod 83 74.1% 12 10.7% 17 15.2% 112
3I Southeastern Minnesota Synod 129 73.3% 15 8.5% 32 18.2% 176
4A Nebraska Synod 179 72.8% 31 12.6% 36 14.6% 246
4B Central States Synod 131 72.0% 23 12.6% 28 15.4% 182
4C Arkansas-Oklahoma Synod 39 75.0% 5 9.6% 8 15.4% 52
4D Northern Texas-Northern Louisiana Synod 78 74.3% 8 7.6% 19 18.1% 105
4E Southwestern Texas Synod 93 68.4% 16 11.8% 27 19.9% 136
4F Texas-Louisiana Gulf Coast Synod 80 69.6% 15 13.0% 20 17.4% 115
5A Metropolitan Chicago Synod 124 64.9% 30 15.7% 37 19.4% 191
5B Northern Illinois Synod 117 78.5% 15 10.1% 17 11.4% 149
5C Central/Southern Illinois Synod 100 75.8% 10 7.6% 22 16.7% 132
5D Southeastern Iowa Synod 102 73.4% 13 9.4% 24 17.3% 139
5E Western Iowa Synod 99 73.9% 21 15.7% 14 10.4% 134
5F Northeastern Iowa Synod 124 80.0% 11 7.1% 20 12.9% 155
5G Northern Great Lakes Synod 64 78.0% 4 4.9% 14 17.1% 82
5H Northwest Synod of Wisconsin 152 76.0% 13 6.5% 35 17.5% 200
5I East-Central Synod of Wisconsin 93 74.4% 15 12.0% 17 13.6% 125
5J Greater Milwaukee Synod 95 72.0% 10 7.6% 27 20.5% 132
5K South-Central Synod of Wisconsin 105 73.4% 16 11.2% 22 15.4% 143
5L LaCrosse Area Synod 47 63.5% 9 12.2% 18 24.3% 74
6A Southeast Michigan Synod 91 71.7% 20 15.7% 16 12.6% 127
6B North/West Lower Michigan Synod 89 74.8% 13 10.9% 17 14.3% 119
6C Indiana-Kentucky Synod 131 67.9% 36 18.7% 26 13.5% 193
6D Northwestern Ohio Synod 130 79.3% 17 10.4% 17 10.4% 164
6E Northeastern Ohio Synod 137 74.9% 21 11.5% 25 13.7% 183
6F Southern Ohio Synod 124 61.4% 43 21.3% 35 17.3% 202
7A New Jersey Synod 131 73.6% 16 9.0% 31 17.4% 178
7B New England Synod 132 71.0% 24 12.9% 30 16.1% 186
7C Metropolitan New York Synod 123 61.8% 30 15.1% 46 23.1% 199
7D Upstate New York Synod 114 65.5% 41 23.6% 19 10.9% 174
7E Northeastern Pennsylvania Synod 185 65.8% 63 22.4% 33 11.7% 281
7F Southeastern Pennsylvania Synod 114 72.6% 21 13.4% 22 14.0% 157
7G Slovak Zion Synod 14 60.9% 5 21.7% 4 17.4% 23
Source: ELCA Congregational Report Forms. Prepared by ELCA Research and Evaluatiuon. 10/22/2012

Growing, Stable and Declining ELCA Congregations by Synod
Using Average Worship Attendance*
Synod Declining Stable Growing Total
8A Northwestern Pennsylvania Synod 66 76.7% 12 14.0% 8 9.3% 86
8B Southwestern Pennsylvania Synod 131 73.6% 22 12.4% 25 14.0% 178
8C Allegheny Synod 85 69.7% 24 19.7% 13 10.7% 122
8D Lower Susquehanna Synod 183 76.6% 24 10.0% 32 13.4% 239
8E Upper Susquehanna Synod 92 70.2% 13 9.9% 26 19.8% 131
8F Delaware-Maryland Synod 118 69.0% 24 14.0% 29 17.0% 171
8G Metropolitan Washington, D.C. Synod 54 73.0% 10 13.5% 10 13.5% 74
8H West Virginia-Western Maryland Synod 46 73.0% 4 6.3% 13 20.6% 63
9A Virginia Synod 95 61.7% 38 24.7% 21 13.6% 154
9B North Carolina Synod 132 66.3% 26 13.1% 41 20.6% 199
9C South Carolina Synod 102 66.7% 25 16.3% 26 17.0% 153
9D Southeastern Synod 106 69.7% 18 11.8% 28 18.4% 152
9E Florida-Bahamas Synod 120 64.5% 27 14.5% 39 21.0% 186
9F Caribbean Synod 13 39.4% 16 48.5% 4 12.1% 33
6,610 69.5% 1,295 13.6% 1,609 16.9% 9514
*Growing means attendance grew by more than 3% from 2006 to 2011; declining means a decline in attendance
of more than 3%, stable means a change between -3% and +3%.
Source: ELCA Congregational Report Forms. Prepared by ELCA Research and Evaluatiuon. 10/22/2012

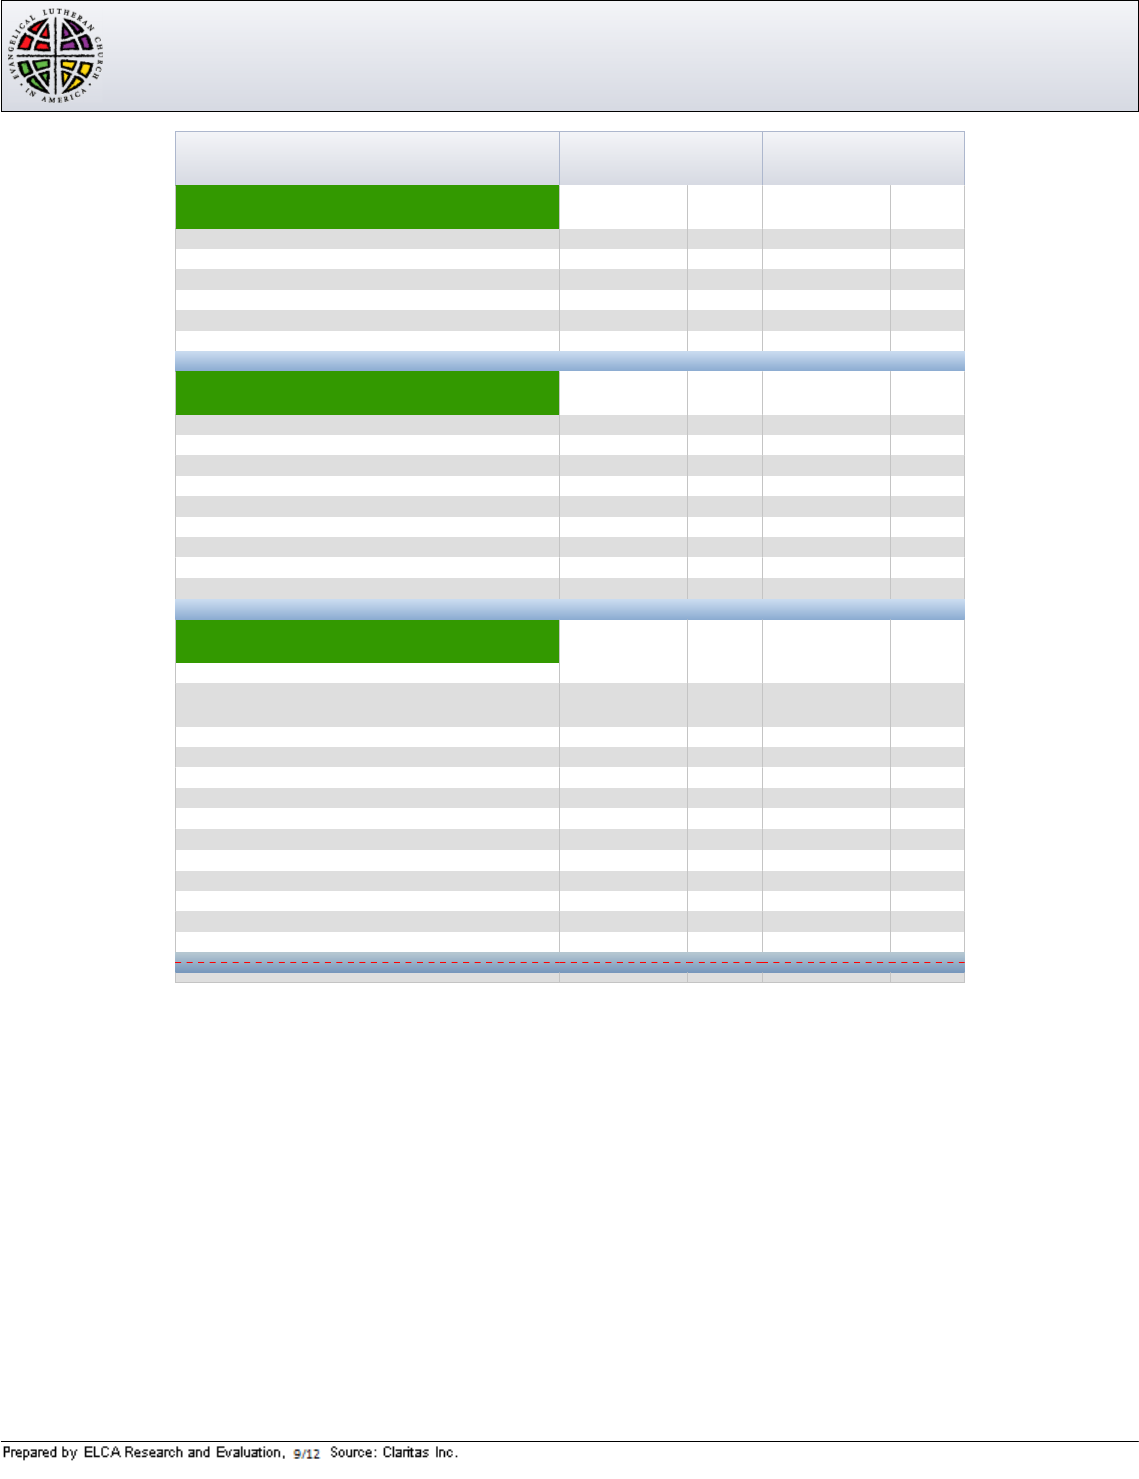
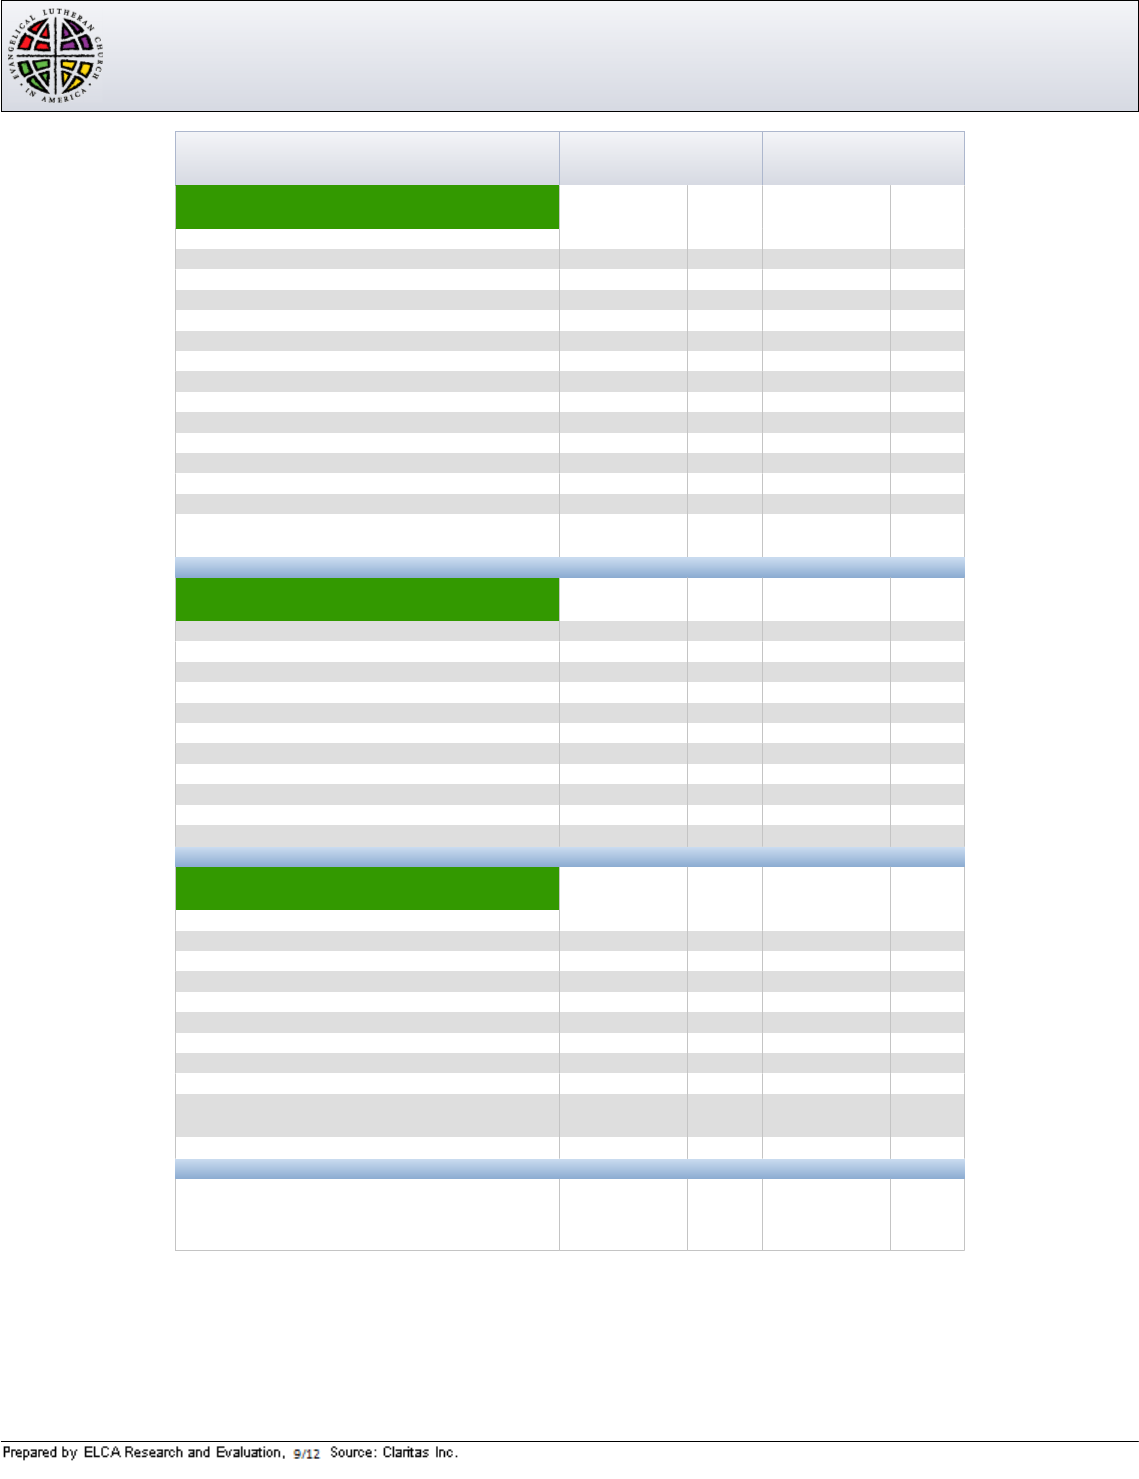
The Congregations with the Largest Average Attendance in
New Jersey Synod7A
Average
Attendance
358 03760 St Paul's - Hainesport,
N
J Pastor David B. Jost
294 03734 Holy Cross - Toms River,
N
J Senior Pastor Bruce T. Ewen
290 07779 Lord of Life - Tabernacle,
N
J Pastor David W. Jones
252 10520 Redeemer - Succasunna,
N
J Senior Pastor Thomas J. Kildea
251 03720 Holy Trinity - Manasquan,
N
J Pastor Mary V. Farnham
Source: Annual Congregational Report Forms. Prepared by ELCA Research and Evaluation.

The Congregations with the Largest Growth in Average Attendance in
New Jersey Synod7A
2006-2011 Average
Attendance Growth
65 30752 Elect Saints Lutheran Chapel - Hamilton,
N
J Pastor Agnes B. Gbardoe
54 30863 St Stephan's Grace Community -
N
ewark,
N
J Pastor Maristela L. Freiberg
47 30745 Pilgrim Journey - Elizabeth,
N
J Pastor Developer Gomes Pedro
33 30846 St Isabel - Elizabeth,
N
J Pastor Developer Ramon A. Collazo
21 03675 Faith - Hillsborough,
N
J Pastor William E. Zimmermann
Source: Annual Congregational Report Forms. Prepared by ELCA Research and Evaluation.

The Most Racially/Ethnically Diverse Congregations in
New Jersey Synod7A
African
National/ Amer Ind/ Arab/Midl Asian/ Latino/ White/ Multi-Af Amer/
Black OtherRacialHispanicPac IslandEasternCaribbean Alaska Nat Caucasian
03612 Bethany - Belleville,
N
J Pastor
N
ancy S. Moore
06574630411
03626 St Matthew - Jersey City,
N
J
01153610003222
03627 St Paul - Jersey City,
N
J Pastor Jessica D. Lambert
03366210084
03629 Zion - Jersey City,
N
J
0012030012
03636 Good Shepherd - Weehawken,
N
J Pastor Birgit Solano-Richante
00689660009
03658 Grace - Perth Amboy,
N
J Pastor H W. Brady
34444631108
03694 St John - Passaic,
N
J Pastor Josechu I. Unzaga
00306000000
03729 St Bartholomew - Trenton,
N
J Pastor Jon A. Richter
0790362600816
03742 Christus Evangelical - Camden,
N
J Pastor Carol J. Book
0344085000140
07456 Christ Our Saviour - Jersey City,
N
J Pastor Divendra R. Etwaroo
36040000060
07477 Holy Trinity - East Orange,
N
J Pastor Rodwell G. Thom
490701005728
20288 Grace - Jersey City,
N
J Pastor Glenn L. Boisclair
0011340002
30512 Bridge of Peace Community Church - Camden,
N
J Pastor Giselle C. Coutinho
0443139001062
Source: Annual Congregational Report Forms. Prepared by ELCA Research and Evaluation.
10/25/201
2

The Congregations with the Most Child & Adult Baptisms in
New Jersey Synod7A
Total
Baptisms
42 03734 Holy Cross - Toms River,
N
J Senior Pastor Bruce T. Ewen
40 03766 Trinity - Runnemede,
N
J Pastor George A. Engelhart
34 07161 Lutheran Church of the Redeemer - Trenton,
N
J
33 30752 Elect Saints Lutheran Chapel - Hamilton,
N
J Pastor Agnes B. Gbardoe
26 03720 Holy Trinity - Manasquan,
N
J Pastor Mary V. Farnham
26 03721 King of Kings - Middletown,
N
J Interim Pastor James H. Reeb
Source: Annual Congregational Report Forms. Prepared by ELCA Research and Evaluation.

EVANGELICAL LUTHERAN CHURCH IN AMERICA
CHURCH COUNCIL
November 9-11, 2012
Exhibit F, Part 5b
Page 1
2013 Synod Mission Support Plans
With 2011 Actual and 2012 Plans
SYNOD NAME # ACTUAL MS % AMOUNT MS %
ALASKA 1A 163,377 39.50% 160,370 39.50% 171,035 39.50%
N.W. WASH 1B 578,855 45.50% 568,750 45.50% 598,000 46.00%
S.W. WASH 1C 339,873 39.00% 359,450 39.50% 376,000 40.00%
E.WASH/ID 1D 247,053 31.00% 265,650 33.00% 267,960 33.00%
OREGON 1E 361,817 39.00% 355,875 36.50% 385,200 40.00%
MONTANA 1F 373,578 39.50% 382,000 40.00% 394,065 40.50%
SIERRA-PACIFIC
2A 921,487 51.50% 910,000 52.00% 984,373 52.50%
SW CALIFORNIA
2B 495,474 49.00% 526,750 49.00% 530,519 50.00%
PACIFICA 2C 720,189 51.00% 739,500 51.00% 747,150 51.00%
GRAND CANYON
2D 876,501 50.00% 875,000 50.00% 875,000 50.00%
ROCKY MTN 2E 1,240,827 50.00% 1,237,500 50.00% 1,250,000 50.00%
W. NO.DAK 3A 384,420 43.00% 393,240 43.50% 400,400 44.00%
E. NO.DAK 3B 393,228 40.00% 428,000 40.00% 420,000 40.00%
SO. DAK. 3C 679,481 44.00% 731,114 44.50% 769,970 45.50%
NW. MINN. 3D 677,897 51.00% 655,350 51.00% 685,950 51.00%
NE. MINN. 3E 583,253 49.00% 590,450 49.00% 617,400 49.00%
SW. MINN. 3F 1,054,345 52.50% 1,064,569 52.50% 1,075,215 52.50%
MINPLS. AREA 3G 1,722,647 55.00% 1,732,500 55.00% 1,787,500 55.00%
ST PAUL (M) 3H 982,489 50.00% 1,050,000 50.00% 1,050,000
SE. MINN. 3I 977,919 52.50% 979,650 52.50% 1,010,625 52.50%
NEBRASKA 4A 1,988,922 57.00% 1,907,500 54.50% 1,907,500 54.50%
CENTRAL STATES
4B 886,407 50.00% 902,567 50.00% 912,567 50.00%
ARK/OK 4C 190,173 40.50% 220,170 41.00% 207,872 40.60%
N.TEX/N.LOU 4D 560,320 47.00% 576,777 47.50% 602,298 48.00%
S.W.TEXAS 4E 665,787 50.00% 792,000 50.00% 714,000 51.00%
GULF COAST 4F 623,397 50.00% 667,500 50.00% 600,000 50.00%
METRO CHGO 5A 1,698,450 54.00% 1,670,000 53.00% 1,700,504 53.00%
NO. ILL 5B 1,269,984 55.00% 1,315,600 55.00% 1,348,050 55.00%
CEN.SO. ILL 5C 794,453 56.00% 795,200 56.00% 798,000 56.00%
SE IOWA 5D 1,385,061 53.50% 1,385,062 53.50% 1,385,062 53.50%
WEST IOWA 5E 335,909 36.10% 326,747 37.10% 338,910 38.10%
NE IOWA 5F 544,081 40.00% 570,000 40.00% 560,000 40.00%
N GRT LKES 5G 407,663 50.00% 425,000 50.00% 426,725 50.50%
NW.SYN (W) 5H 731,749 55.00% 775,500 55.00% 775,500 55.00%
EC WISC 5I 867,380 55.00% 907,500 55.00% 907,500 55.00%
GRTR MILWKEE
5J 1,250,348 57.00% 1,182,500 55.00% 1,155,000 55.00%
SO.-CENT (W) 5K 815,917 55.00% 839,731 55.00% 858,000 55.00%
LACROSSE (W) 5L 424,808 55.00% 441,900 55.00% 451,000 55.00%
SE. MICH 6A 532,973 43.00% 546,000 42.00% 559,000 43.00%
N/W LOWER MICH
6B 702,935 50.00% 718,400 50.00% 718,400 50.00%
IND/KY 6C 919,126 51.50% 962,000 52.00% 988,000 52.00%
NW OHIO 6D 911,314 51.00% 875,262 51.00% 888,012 51.00%
NE OHIO 6E 811,692 49.00% 827,812 49.00% 833,000 49.00%
S. OHIO 6F 723,067 39.27% 589,875 32.50% * 737,000 40.00%
* Est. Average for year
NEW JERSEY 7A 1,109,027 50.00% 1,100,000 50.00% 1,100,000 50.00%
NEW ENGLAND
7B 1,059,528 54.00% 1,068,268 54.20% 1,096,425 54.40%
METRO NY 7C 572,404 48.50% 612,500 49.00% 618,750 49.50%
UPSTATE NY 7D 567,461 47.20% 492,733 40.04% 523,556 42.03%
NE PENN 7E 1,341,235 53.00% 1,104,000 46.00% 1,104,000 46.00%
2011 2013
SYNOD PLANS
2012
SYNOD PLANS
Shaded areas reflect notification of plan changes received since the April 2012 Church Council meeting.

EVANGELICAL LUTHERAN CHURCH IN AMERICA
CHURCH COUNCIL
November 9-11, 2012
Exhibit F, Part 5b
Page 2
2013 Synod Mission Support Plans
With 2011 Actual and 2012 Plans
SYNOD NAME # ACTUAL MS % AMOUNT MS %
2011 2013
SYNOD PLANS
2012
SYNOD PLANS
SE PENN 7F 1,236,550 53.50% 1,203,750 53.50% 1,209,100 53.50%
SLOVAK ZION 7G 18,324 30.00% 21,000 30.00% 20,000 30.25%
NW PENN 8A 429,488 50.00% 418,473 50.00% 411,615 50.00%
SW PENN 8B 836,575 50.00% 800,000 50.00% 785,650 47.50%
ALLEGHENY 8C 371,172 50.00% 405,000 50.00% 382,500 50.00%
LOW SUSQ 8D 1,407,389 46.00% 1,627,500 46.50% 1,534,500 46.50%
UPP SUSQ 8E 521,590 50.00% 525,000 50.00% 512,500 50.00%
DEL-MRYLND 8F 1,122,860 53.00% 1,150,250 53.50% 1,188,000 54.00%
METRO DC 8G 889,428 50.00% 900,000 50.00% 850,000 50.00%
W. VA/W.MYLD 8H 209,380 45.00% 229,500 45.00% 191,484 37.50%
VIRGINIA 9A 600,866 37.34% 660,910 38.00% 682,500 39.00%
NO. CAROLINA 9B 1,218,582 42.06% 1,123,423 38.74% 1,123,423 38.27%
SO. CAROLINA 9C 1,049,898 41.00% 1,050,780 41.50% 1,085,500 41.75%
SOUTHEASTERN
9D 1,066,767 50.00% 1,076,250 50.00% 1,103,150 50.00%
FLORIDA-BAHAMAS
9E 948,015 44.00% 995,583 46.00% 1,019,900 47.00%
CARIBBEAN 9F 30,000 12.79% 40,000 17.22% 40,000 17.22%
TOTAL REMITTANCES $50,423,160 49.06% $50,831,241 48.67% $51,350,815 49.69%
Shaded areas reflect notification of plan changes received since the April 2012 Church Council meeting.
New Jersey Synod
Pop Facts: Demographic Snapshot (Part 1)
Pop Facts:
Demographic Snapshot (Part 1)
Population
2015 Projection
2010 Estimate
2000 Census
1990 Census
Growth 2010-2015
Growth 2000-2010
Growth 1990-2000
2010 Estimated Population by Single Race
Classification
White Alone
Black or African American Alone
American Indian and Alaska Native Alone
Asian Alone
Native Hawaiian and Other Pacific Islander
Alone
Some Other Race Alone
Two or More Races
2010 Estimated Population Hispanic or
Latino by Origin
Not Hispanic or Latino
Hispanic or Latino
Hispanic or Latino by Origin
Mexican
Puerto Rican
Cuban
All Other Hispanic or Latino
2010 Estimated Hispanic or Latino by
Single Race Classification
White Alone
Black or African American Alone
American Indian and Alaska Native Alone
Asian Alone
Native Hawaiian and Other Pacific Islander
Alone
Some Other Race Alone
Two or More Races
New Jersey Synod
8,781,077
8,711,870
8,414,350
7,730,188
0.79%
3.54%
8.85%
8,711,870
68.77%5,990,848
13.51%1,177,175
0.26%23,040
7.64%665,287
0.04%3,875
6.55%570,702
3.22%280,943
8,711,870
83.34%7,260,833
16.66%1,451,037
1,451,037
13.43%194,916
28.61%415,120
5.74%83,325
52.22%757,676
1,451,037
49.66%720,561
4.08%59,174
0.70%10,154
0.27%3,906
0.07%1,039
38.06%552,201
7.17%104,002
The United States
321,675,005
309,038,974
281,421,906
248,709,873
4.09%
9.81%
13.15%
309,038,974
72.32%223,493,067
12.39%38,292,279
0.94%2,892,875
4.40%13,589,995
0.15%472,946
6.80%21,013,929
3.00%9,283,883
309,038,974
84.18%260,146,564
15.82%48,892,410
48,892,410
65.18%31,867,641
8.96%4,380,979
3.47%1,696,896
22.39%10,946,894
48,892,410
48.12%23,528,698
1.97%963,343
1.14%556,908
0.31%153,094
0.10%51,131
42.01%20,541,428
6.34%3,097,808
© 2010, The Nielsen Company. All Rights Reserved
New Jersey Synod
Pop Facts: Demographic Snapshot (Part 1)
Pop Facts:
Demographic Snapshot (Part 1)
2010 Estimated Population, Asian Alone
Race by Category
Chinese, except Taiwanese
Filipino
Japanese
Asian Indian
Korean
Vietnamese
Cambodian
Hmong
Laotian
Thai
All other Asian Races, including 2 or more
2010 Estimated Population by Ancestry
Arab
Czech
Danish
Dutch
English
French (except Basque)
French Canadian
German
Greek
Hungarian
Irish
Italian
Lithuanian
Norwegian
Polish
Portuguese
Russian
Scottish
Scotch-Irish
Slovak
Subsaharan African
Swedish
Swiss
Ukrainian
United States of America
Welsh
West Indian (exc Hisp groups)
Other
Ancestry Unclassified
2010 Estimated Population Age 5+ by
Language Spoken At Home
Speak only English
Speak Asian or Pacific Island Language
Speak IndoEuropean Language
Speak Spanish
Speak Other Language
New Jersey Synod
665,287
20.22%134,525
16.94%112,701
3.00%19,931
35.52%236,282
13.82%91,940
3.00%19,941
0.13%848
0.00%24
0.10%658
0.41%2,740
6.87%45,697
8,711,870
0.81%70,893
0.19%16,798
0.13%11,222
0.66%57,739
3.40%295,998
0.64%56,079
0.17%15,058
7.07%615,765
0.60%52,659
0.71%61,436
10.56%919,690
14.64%1,275,822
0.24%21,037
0.30%26,520
4.38%381,605
0.72%62,656
1.61%140,157
0.74%64,087
0.52%44,961
0.28%24,060
1.01%87,587
0.34%29,844
0.10%9,105
0.59%51,082
3.07%267,636
0.19%16,638
1.64%143,199
38.58%3,361,435
6.10%531,102
8,154,377
72.22%5,889,487
4.20%342,721
8.24%672,224
13.95%1,137,907
1.37%112,038
The United States
13,589,995
22.53%3,062,270
17.59%2,391,074
7.33%996,064
17.65%2,399,195
10.80%1,467,580
10.69%1,452,794
1.52%207,188
1.46%198,368
1.59%216,124
1.11%150,526
7.72%1,048,812
309,038,974
0.43%1,328,977
0.31%949,357
0.29%882,451
0.92%2,828,187
6.20%19,146,089
1.83%5,656,205
0.52%1,597,249
11.58%35,792,719
0.36%1,109,629
0.31%952,102
7.43%22,966,724
4.51%13,938,249
0.14%433,703
1.02%3,163,666
2.19%6,767,413
0.34%1,061,320
0.73%2,246,441
1.23%3,805,029
1.09%3,376,759
0.16%495,143
0.88%2,710,723
0.85%2,636,482
0.19%590,825
0.23%718,734
6.14%18,970,369
0.32%983,700
0.74%2,298,540
38.22%118,124,937
10.84%33,507,252
287,713,408
80.25%230,898,554
2.96%8,521,991
3.63%10,448,191
12.28%35,338,770
0.87%2,505,902
© 2010, The Nielsen Company. All Rights Reserved
New Jersey Synod
Pop Facts: Demographic Snapshot (Part 1)
Pop Facts:
Demographic Snapshot (Part 1)
2010 Estimated Population by Sex
Male
Female
2010 Estimated Population by Age
Age 0 to 4
Age 5 to 9
Age 10 to 14
Age 15 to 17
Age 18 to 20
Age 21 to 24
Age 25 to 34
Age 35 to 44
Age 45 to 54
Age 55 to 64
Age 65 to 74
Age 75 to 84
Age 85 and over
Age 16 and over
Age 18 and over
Age 21 and over
Age 65 and over
2010 Estimated Median Age
2010 Estimated Average Age
New Jersey Synod
8,711,870
48.98%4,267,065
51.02%4,444,805
8,711,870
6.40%557,493
6.38%555,739
6.51%567,424
4.25%370,198
3.76%327,867
5.05%440,042
12.13%1,056,571
14.51%1,264,435
15.63%1,361,282
11.74%1,022,361
7.13%620,944
4.46%388,558
2.05%178,956
79.28%6,906,596
76.46%6,661,016
72.70%6,333,149
13.64%1,188,458
38.80
38.68
The United States
309,038,974
49.31%152,401,520
50.69%156,637,454
309,038,974
6.90%21,325,566
6.61%20,432,517
6.55%20,238,234
4.20%12,986,580
4.28%13,235,896
5.43%16,772,012
13.33%41,191,523
13.65%42,170,028
14.42%44,548,066
11.47%35,459,583
6.98%21,580,358
4.26%13,167,556
1.92%5,931,055
78.53%242,681,142
75.74%234,056,077
71.45%220,820,181
13.16%40,678,969
36.98
37.75
© 2010, The Nielsen Company. All Rights Reserved
New Jersey Synod
Pop Facts: Demographic Snapshot (Part 1)
Pop Facts:
Demographic Snapshot (Part 1)
2010 Estimated Male Population by Age
Age 0 to 4
Age 5 to 9
Age 10 to 14
Age 15 to 17
Age 18 to 20
Age 21 to 24
Age 25 to 34
Age 35 to 44
Age 45 to 54
Age 55 to 64
Age 65 to 74
Age 75 to 84
Age 85 and over
2010 Estimated Median Age, Male
2010 Estimated Average Age, Male
2010 Estimated Female Population by Age
Age 0 to 4
Age 5 to 9
Age 10 to 14
Age 15 to 17
Age 18 to 20
Age 21 to 24
Age 25 to 34
Age 35 to 44
Age 45 to 54
Age 55 to 64
Age 65 to 74
Age 75 to 84
Age 85 and over
2010 Estimated Median Age, Female
2010 Estimated Average Age, Female
New Jersey Synod
4,267,065
6.69%285,653
6.68%284,830
6.81%290,655
4.45%189,719
3.97%169,358
5.30%225,972
12.66%540,061
14.74%629,095
15.69%669,498
11.47%489,587
6.60%281,533
3.63%154,892
1.32%56,212
37.34
37.30
4,444,805
6.12%271,840
6.09%270,909
6.23%276,769
4.06%180,479
3.57%158,509
4.82%214,070
11.62%516,510
14.29%635,340
15.56%691,784
11.99%532,774
7.64%339,411
5.26%233,666
2.76%122,744
40.25
40.01
The United States
152,401,520
7.16%10,908,777
6.86%10,451,485
6.80%10,358,522
4.37%6,658,868
4.47%6,810,523
5.68%8,651,309
13.80%21,036,821
13.89%21,171,854
14.40%21,949,394
11.23%17,108,975
6.53%9,955,030
3.55%5,409,454
1.27%1,930,508
35.63
36.54
156,637,454
6.65%10,416,789
6.37%9,981,032
6.31%9,879,712
4.04%6,327,712
4.10%6,425,373
5.18%8,120,703
12.87%20,154,702
13.41%20,998,174
14.43%22,598,672
11.72%18,350,608
7.42%11,625,328
4.95%7,758,102
2.55%4,000,547
38.34
38.93
© 2010, The Nielsen Company. All Rights Reserved
New Jersey Synod
Pop Facts: Demographic Snapshot (Part 1)
Pop Facts:
Demographic Snapshot (Part 1)
2010 Estimated Population Age 15 and
Over by Marital Status
Total, Never Married
Males, Never Married
Females, Never Married
Married, Spouse present
Married, Spouse absent
Widowed
Males, Widowed
Females, Widowed
Divorced
Males, Divorced
Females, Divorced
2010 Estimated Population Age 25 and
Over by Educational Attainment
Less than 9th grade
Some High School, no diploma
High School Graduate (or GED)
Some College, no degree
Associate Degree
Bachelor's Degree
Master's Degree
Professional School Degree
Doctorate Degree
2010 Est. Pop. Age 25+ by Educational
Attainment, Hispanic or Latino
Less than 9th grade
Some High School, no diploma
High School Graduate (or GED)
Some College, no degree
Associate Degree
Bachelor's Degree
Graduate or Professional Degree
New Jersey Synod
7,031,214
32.24%2,267,166
17.19%1,208,753
15.05%1,058,413
47.97%3,373,223
4.95%347,800
6.62%465,683
1.28%90,039
5.34%375,644
8.21%577,342
3.23%227,321
4.98%350,021
5,893,107
5.52%325,451
7.36%433,573
29.89%1,761,253
16.84%992,640
6.20%365,622
21.44%1,263,594
9.03%532,013
2.41%141,794
1.31%77,167
868,592
18.55%161,136
12.04%104,593
32.11%278,873
16.30%141,604
4.88%42,384
11.09%96,299
5.03%43,703
The United States
247,042,657
31.01%76,606,923
16.78%41,441,576
14.23%35,165,347
47.15%116,470,525
4.98%12,308,149
6.25%15,438,809
1.23%3,044,260
5.02%12,394,549
10.61%26,218,251
4.56%11,276,834
6.05%14,941,417
204,048,169
6.40%13,058,518
8.88%18,109,334
29.00%59,184,106
20.71%42,257,481
7.47%15,247,439
17.42%35,553,709
7.04%14,355,422
1.93%3,942,133
1.15%2,340,027
26,698,693
23.65%6,313,368
15.65%4,177,423
26.02%6,947,141
16.56%4,422,491
5.26%1,403,832
8.84%2,361,139
4.02%1,073,299
© 2010, The Nielsen Company. All Rights Reserved
New Jersey Synod
Pop Facts: Demographic Snapshot (Part 2)
Pop Facts:
Demographic Snapshot (Part 2)
Households
2015 Projection
2010 Estimate
2000 Census
1990 Census
Growth 2010-2015
Growth 2000-2010
Growth 1990-2000
2010 Estimated Households by Household
Type
Family Households
Non-family Households
2010 Estimated Group Quarters Population
2010 Households by Ethnicity: Hispanic or
Latino
2010 Estimated Households by Household
Income
Less than $15,000
$15,000 to $24,999
$25,000 to $34,999
$35,000 to $49,999
$50,000 to $74,999
$75,000 to $99,999
$100,000 to $124,999
$125,000 to $149,999
$150,000 to $199,999
$200,000 to $499,999
$500,000 or more
2010 Estimated Average Household Income
2010 Estimated Median Household Income
2010 Estimated Per Capita Income
2010 Median Household Income by Single
Race Classification or Ethnicity
White Alone
Black or African American Alone
American Indian and Alaska Native Alone
Asian Alone
Native Hawaiian and Other Pacific Islander
Alone
Some Other Race Alone
Two or More Races
Hispanic or Latino
Not Hispanic or Latino
New Jersey Synod
3,201,516
3,175,894
3,064,645
2,794,711
0.81%
3.63%
9.66%
3,175,894
70.37%2,234,814
29.63%941,080
197,808
12.85%408,171
3,175,894
8.67%275,392
7.38%234,352
7.67%243,711
11.80%374,864
17.76%564,054
14.21%451,284
10.62%337,377
6.85%217,674
7.22%229,307
6.37%202,265
1.44%45,614
$ 93,603
$ 70,372
$ 34,425
$ 74,903
$ 49,768
$ 55,051
$ 93,448
$ 68,801
$ 47,725
$ 54,128
$ 50,826
$ 73,662
The United States
120,947,177
116,136,617
105,480,101
91,947,410
4.14%
10.10%
14.72%
116,136,617
68.28%79,298,160
31.72%36,838,457
8,381,717
11.23%13,040,715
116,136,617
12.10%14,054,103
10.18%11,818,043
10.56%12,262,660
14.98%17,397,307
19.53%22,683,566
12.52%14,536,895
7.77%9,019,575
4.37%5,075,576
3.91%4,545,299
3.34%3,875,867
0.75%867,726
$ 71,071
$ 52,795
$ 27,034
$ 56,240
$ 37,307
$ 39,541
$ 67,283
$ 55,855
$ 42,424
$ 45,418
$ 43,247
$ 54,382
© 2010, The Nielsen Company. All Rights Reserved
New Jersey Synod
Pop Facts: Demographic Snapshot (Part 2)
Pop Facts:
Demographic Snapshot (Part 2)
2010 Estimated Households by Type and
Presence of Own Children
Married-Couple Family, own children
Married-Couple Family, no own children
Male Householder, own children
Male Householder, no own children
Female Householder, own children
Female Householder, no own children
2010 Estimated Households by Household
Size
1-person household
2-person household
3-person household
4-person household
5-person household
6-person household
7 or more person household
2010 Estimated Average Household Size
2010 Estimated Households by Presence of
People
Households with 1 or more People under
Age 18
Married-Couple Family
Other Family, Male Householder
Other Family, Female Householder
Nonfamily, Male Householder
Nonfamily, Female Householder
Households no People under Age 18
Married-Couple Family
Other Family, Male Householder
Other Family, Female Householder
Nonfamily, Male Householder
Nonfamily, Female Householder
New Jersey Synod
2,234,814
35.02%782,564
39.92%892,157
2.74%61,312
3.91%87,404
9.90%221,271
8.51%190,106
3,175,894
24.72%785,214
30.11%956,177
17.53%556,653
15.68%498,011
7.46%236,805
2.79%88,492
1.72%54,542
2.68
3,175,894
35.70%1,133,884
25.22%800,992
2.30%72,920
7.93%251,878
0.19%6,107
0.06%1,987
64.30%2,042,010
26.47%840,654
2.30%72,932
4.76%151,326
13.63%432,818
17.14%544,280
The United States
79,298,160
31.93%25,318,442
42.36%33,593,758
3.40%2,692,941
3.49%2,770,774
11.11%8,809,489
7.71%6,112,756
116,136,617
26.03%30,234,773
32.44%37,671,657
16.82%19,531,669
13.95%16,199,670
6.49%7,536,732
2.56%2,974,127
1.71%1,987,989
2.59
116,136,617
34.11%39,608,472
22.54%26,182,984
2.64%3,068,427
8.60%9,983,169
0.24%281,766
0.08%92,126
65.89%76,528,145
26.85%31,187,620
1.94%2,254,797
3.91%4,545,883
15.32%17,788,040
17.87%20,751,805
© 2010, The Nielsen Company. All Rights Reserved
New Jersey Synod
Pop Facts: Demographic Snapshot (Part 2)
Pop Facts:
Demographic Snapshot (Part 2)
2010 Estimated Households by Number of
Vehicles
No Vehicles
1 Vehicle
2 Vehicles
3 Vehicles
4 Vehicles
5 or more Vehicles
2010 Estimated Average Number of
Vehicles
Family Households
2015 Projection
2010 Estimate
2000 Census
1990 Census
Growth 2010-2015
Growth 2000-2010
Growth 1990-2000
2010 Estimated Families by Poverty Status
Income At or Above Poverty Level
Current Year Families at or Above Poverty
Current Year Families at or Above Poverty
with Children
Income Below Poverty Level
Current Year Families Below Poverty
Current Year Families Below Poverty with
Children
2010 Estimated Population Age 16 and
Over by Employment
In Armed Forces
Civilian - Employed
Civilian - Unemployed
Not in Labor Force
2010 Estimated Employed Population Age
16 and Over by Class of Worker
For-Profit Private Workers
Non-Profit Private Workers
Local Government Workers
State Government Workers
Federal Government Workers
Self-Employed Workers
Unpaid Family Workers
New Jersey Synod
3,175,894
11.50%365,143
34.28%1,088,725
36.88%1,171,382
12.22%388,201
3.87%122,753
1.25%39,690
1.68
2,254,292
2,234,814
2,154,539
2,021,346
0.87%
3.73%
6.59%
2,234,814
93.76%2,095,402
46.37%1,036,241
6.24%139,412
4.85%108,475
6,906,596
0.15%10,385
63.18%4,363,397
4.01%277,171
32.66%2,255,643
4,183,923
73.81%3,088,284
6.93%289,971
8.35%349,411
3.98%166,381
1.89%79,036
4.89%204,443
0.15%6,397
The United States
116,136,617
8.79%10,205,780
33.32%38,701,884
37.87%43,982,732
14.08%16,352,602
4.29%4,980,041
1.65%1,913,578
1.78
82,789,506
79,298,160
71,787,347
64,517,947
4.40%
10.46%
11.27%
79,298,160
90.34%71,638,374
43.01%34,105,901
9.66%7,659,786
7.58%6,014,125
242,681,142
0.48%1,176,827
60.96%147,944,385
4.14%10,049,245
34.41%83,510,685
146,063,511
71.35%104,209,460
7.54%11,009,866
7.63%11,141,460
4.37%6,379,751
2.45%3,574,091
6.49%9,483,088
0.18%265,795
© 2010, The Nielsen Company. All Rights Reserved
New Jersey Synod
Pop Facts: Demographic Snapshot (Part 2)
Pop Facts:
Demographic Snapshot (Part 2)
2010 Estimated Employed Population Age
16 and Over by Occupation
Management , Including Farmers and Farm
Managers
Business and Financial Operations
Computer and Mathematical
Architecture and Engineering
Life, Physical, and Social Science
Community and Social Services
Legal
Education, Training, and Library
Arts, Design, Entertainment, Sports, and
Media
Healthcare Practitioners and Technical
Healthcare Support
Protective Service
Food Preparation and Serving Related
Building and Grounds Cleaning, and
Maintenance
Service : Personal Care and Service
Sales and Related Occupations
Office and Administrative Support
Farming, Fishing, and Forestry
Construction and Extraction
Installation, Maintenance, and Repair
Production
Transportation and Material Moving
2010 Estimated Employed Population Age
16 and Over by Occupation Classification
Blue Collar
White Collar
Service & Farm
2010 Estimated Workers Age 16 and Over
by Transportation To Work
Drove Alone
Car Pooled
Public Transportation
Walked
Bicycle
Other Means
Worked at Home
2010 Estimated Workers Age 16 and Over
by Travel Time to Work
Less than 15 minutes
15 to 29 Minutes
30 to 44 Minutes
45 to 59 Minutes
60 or more Minutes
2010 Estimated Average Travel Time to
Work in Minutes
2010 Estimated Tenure of Occupied
Housing Units
Owner-Occupied
New Jersey Synod
4,183,923
10.51%439,936
5.33%222,951
3.48%145,439
1.72%72,137
1.20%50,382
1.60%66,988
1.41%59,013
6.56%274,364
1.96%82,105
5.27%220,317
1.96%81,895
2.44%101,942
4.53%189,371
3.43%143,626
3.30%138,253
11.94%499,379
14.92%624,348
0.16%6,597
4.94%206,660
3.00%125,509
4.43%185,409
5.91%247,302
4,183,923
18.28%764,880
65.90%2,757,359
15.81%661,684
4,106,309
71.81%2,948,536
9.17%376,671
10.31%423,545
3.31%136,060
0.30%12,430
1.78%73,280
3.31%135,787
3,991,771
24.38%973,143
31.98%1,276,554
20.45%816,291
9.41%375,639
13.78%550,144
32.59
3,175,894
67.16%2,132,838
The United States
146,063,511
9.61%14,037,627
4.38%6,395,567
2.35%3,438,688
1.94%2,835,737
0.93%1,354,972
1.60%2,337,123
1.13%1,651,016
5.79%8,451,241
1.87%2,728,179
5.10%7,445,369
2.26%3,304,996
2.15%3,147,387
5.37%7,840,983
3.86%5,636,844
3.31%4,835,210
11.34%16,557,258
14.21%20,760,906
0.69%1,007,703
6.05%8,833,560
3.44%5,023,137
6.49%9,485,894
6.13%8,954,114
146,063,511
22.11%32,296,705
60.24%87,993,683
17.65%25,773,123
144,447,112
75.83%109,539,612
10.67%15,405,565
4.84%6,985,703
2.81%4,060,088
0.52%744,534
1.27%1,834,009
4.07%5,877,601
139,652,532
28.58%39,911,501
36.13%50,462,298
19.69%27,499,999
7.50%10,471,977
8.10%11,306,757
27.75
116,136,617
66.83%77,609,497
© 2010, The Nielsen Company. All Rights Reserved

New Jersey Synod
Pop Facts: Demographic Snapshot (Part 2)
Pop Facts:
Demographic Snapshot (Part 2)
Renter-Occupied
2010 Occupied Housing Units, Average
Length of Residence
Owner-Occupied
Renter-Occupied
New Jersey Synod
32.84%1,043,056
17
8
The United States
33.17%38,527,120
16
7
© 2010, The Nielsen Company. All Rights Reserved
New Jersey Synod
Pop Facts: Demographic Snapshot (Part 2)
Pop Facts:
Demographic Snapshot (Part 2)
2010 Estimated All Owner-Occupied
Housing Units by Value
Less than $20,000
$20,000 to $39,999
$40,000 to $59,999
$60,000 to $79,999
$80,000 to $99,999
$100,000 to $149,999
$150,000 to $199,999
$200,000 to $299,999
$300,000 to $399,999
$400,000 to $499,999
$500,000 to $749,999
$750,000 to $999,999
$1,000,000 or more
2010 Estimated Median Owner-Occupied
Housing Unit Value
2010 Estimated Housing Units by Units in
Structure
1 Unit Attached
1 Unit Detached
2 Units
3 or 4 Units
5 to 19 Units
20 to 49 Units
50 or More Units
Mobile Home or Trailer
Boat, RV, Van, etc.
Dominant structure type
2010 Estimated Housing Units by Year
Structure Built
2000 or Later
1990 to 1999
1980 to 1989
1970 to 1979
1960 to 1969
1950 to 1959
1940 to 1949
1939 or Earlier
2010 Estimated Median Year Structure
Built**
Dominant Year Structure Built
** Median Year Built will be unreliable if more
than half of the Housing Units in this report
area were built in 1939 or earlier.
New Jersey Synod
2,132,838
0.22%4,785
0.54%11,616
0.69%14,822
0.93%19,821
1.17%24,865
6.07%129,434
11.85%252,694
27.07%577,419
20.46%436,388
11.45%244,265
12.20%260,288
4.25%90,653
3.08%65,788
$ 307,095
3,482,408
9.02%314,061
54.09%1,883,494
9.35%325,510
6.64%231,385
10.09%351,235
3.93%136,904
5.86%203,969
1.01%35,124
0.02%726
1 Unit Detac...
3,482,408
8.47%294,976
9.19%320,140
11.55%402,073
12.80%445,856
14.54%506,412
15.90%553,826
8.85%308,274
18.69%650,851
1965
1939 or Earl...
The United States
77,609,497
2.65%2,056,011
3.76%2,919,328
4.99%3,876,113
6.01%4,664,635
7.27%5,645,872
19.24%14,934,245
14.67%11,386,772
18.09%14,040,285
9.14%7,095,378
4.94%3,832,669
5.42%4,206,841
2.03%1,578,415
1.77%1,372,933
$ 170,676
129,573,942
5.69%7,368,026
61.76%80,028,787
3.94%5,106,385
4.49%5,817,881
9.36%12,122,571
3.40%4,407,504
4.56%5,911,377
6.72%8,708,220
0.08%103,191
1 Unit Detac...
129,573,942
13.71%17,761,158
14.31%18,541,780
13.87%17,970,290
16.17%20,954,467
11.70%15,153,685
11.08%14,353,052
6.02%7,800,957
13.15%17,038,553
1975
1970 to 1979
© 2010, The Nielsen Company. All Rights Reserved
ELCA Congregations Reporting Programs and Activities That Are a Specialty in
New Jersey Synod, ELCA7A
Bible study/adult Christian ed
Holy Communion - 442 S Route 73 Berlin,
N
J Pastor Cynthia J. Fazzini
Holy Trinity - 59th St & Long Beach Blvd Brant Beach,
N
J Pastor James F. Jacob
Cape May Evangelical - 509 Pittsburg Ave Cape May,
N
J Pastor Jeffrey W. Elliott
St Michael - 601 Kings Hwy
N
Cherry Hill,
N
J Pastor Michael C. Gebhart
Holy Trinity - 92 Burton Ave Hasbrouck Heights,
N
J Pastor Susan P.
N
elson-Colaneri
Holy Trinity - 6 Osborn Ave Manasquan,
N
J Pastor Mary V. Farnham
Grace - 65 E Main St Mendham,
N
J Pastor Carol A. Petersen
King of Kings - 250 Harmony Rd Middletown,
N
J Interim Pastor James H. Reeb
Redeemer Church - 3531 State Highway 33
N
eptune,
N
J Pastor Randall J. Steinman
Faith - 524 South St
N
ew Providence,
N
J Pastor Murdoch MacPherson
Temple - 5600
N
Route 130 Pennsauken,
N
J Pastor Margaret M. Marks
Lutheran Church of St Ambrose - 443 S Broadway Pennsville,
N
J Pastor Daniel A. Congleton
St James - 400 Columbia Ave Pitman,
N
J
Redeemer - 55 Wyckoff Ave Ramsey,
N
J Pastor Michael C. Linderman
Grace - 925 5th Ave River Edge,
N
J Pastor Stephen E. Sweet
St Stephen - 3145 Park Ave South Plainfield,
N
J Pastor Christopher L. Halverson
Our Saviour - 9212 3rd Ave Stone Harbor,
N
J Pastor Glenn F. Schoenberger
Grace Evangelical - 1200 River Rd Teaneck,
N
J Pastor Clemens I. Reinke
St John - 3511 Palisade Ave Union City,
N
J Pastor Horst G. Kugler
Holy Spirit - Bayshore at Washington Villas,
N
J Pastor Leah L. Lavelle
St Luke - 214 State Route 31
N
Washington,
N
J Pastor Karol L. Van Wulfen
Christ - 40 Schoolhouse Rd Whiting,
N
J Pastor Joseph F. Watson
St Luke - 2 Salem Rd Willingboro,
N
J Pastor Michael D. Edwards-Ronning
Christian ed age 15 or younger
Christus Evangelical - 909
N
26th St Camden,
N
J Pastor Carol J. Book
Gloria Dei - 300 Shunpike Rd Chatham,
N
J
Trinity - 123 E Blackwell St Dover,
N
J Pastor Cheryl L. Johnson
Zion - 312 Philadelphia Ave Egg Harbor City,
N
J Interim Pastor Glenn A. Englehardt
Good Shepherd - Rock Rd & Ackerman Ave Glen Rock,
N
J Pastor Roger W. Spencer
Zion - 11 Schooleys Mountain Rd Long Valley,
N
J Pastor Peter H. Froehlke
Holy Trinity - 6 Osborn Ave Manasquan,
N
J Pastor Mary V. Farnham
Prince of Peace - 61 E Route 70 Marlton,
N
J Pastor Richard W. Overcash
Lutheran Church of the Redeemer - 471 Maywood Ave Maywood,
N
J Pastor Susan P.
N
elson-Colaneri
St Stephan's Grace Community - 7 Wilson Ave
N
ewark,
N
J Pastor Maristela L. Freiberg
Messiah - 3091 Bordentown Ave Parlin,
N
J Pastor
N
ancy A.
N
ardi
Temple - 5600
N
Route 130 Pennsauken,
N
J Pastor Margaret M. Marks
Lutheran Church of St Ambrose - 443 S Broadway Pennsville,
N
J Pastor Daniel A. Congleton
St James - 400 Columbia Ave Pitman,
N
J
Grace - 925 5th Ave River Edge,
N
J Pastor Stephen E. Sweet
Prince of Peace - 10 Knoll Dr Rockaway,
N
J Pastor Sharon L. Eckhardt
St John - 145 Mortimer Ave Rutherford,
N
J Pastor Jeffrey L. Walters
Holy Cross - 639 Mountain Ave Springfield,
N
J Pastor Jon D. Knecht
Holy Cross - 1500 Hooper Ave Toms River,
N
J Senior Pastor Bruce T. Ewen
St John - 3511 Palisade Ave Union City,
N
J Pastor Horst G. Kugler
St Timothy - 395 Valley Rd Wayne,
N
J Pastor Robert M. Mountenay
Christian ed. for age 16-19
Christus Evangelical - 909
N
26th St Camden,
N
J Pastor Carol J. Book
St James - 400 Columbia Ave Pitman,
N
J
Holy Cross - 1500 Hooper Ave Toms River,
N
J Senior Pastor Bruce T. Ewen
Community service activities
Atonement - 308 1st Ave Asbury Park,
N
J Pastor Jennifer L. Sweitzer
St Paul - 130 Cable Ave Beachwood,
N
J Pastor Peter M. Hartney
Source: 2011 Congregational Report Form A. Prepared by ELCA Research and Evaluatio
n
10/19/201
2
ELCA Congregations Reporting Programs and Activities That Are a Specialty in
New Jersey Synod, ELCA7A
Holy Communion - 442 S Route 73 Berlin,
N
J Pastor Cynthia J. Fazzini
Bridge of Peace Community Church - 2755 Tuckahoe Rd Camden,
N
J Pastor Giselle C. Coutinho
Christus Evangelical - 909
N
26th St Camden,
N
J Pastor Carol J. Book
Cape May Evangelical - 509 Pittsburg Ave Cape May,
N
J Pastor Jeffrey W. Elliott
Zion - 712 Roosevelt Ave Carteret,
N
J Pastor Christine A. Bridge
St Michael - 601 Kings Hwy
N
Cherry Hill,
N
J Pastor Michael C. Gebhart
St Paul - 832 Park Ave Collingswood,
N
J Pastor Andrew T. Gordon
St Paul - 79 One Mile Rd Ext East Windsor,
N
J Pastor James R. Egan
Good Shepherd - 160 Ridgedale Ave Florham Park,
N
J Pastor Wendy L. Abrahamson
Hope - Adelphia Rd & US Route 9 Freehold,
N
J Pastor Patricia A. Medley
Good Shepherd - Rock Rd & Ackerman Ave Glen Rock,
N
J Pastor Roger W. Spencer
St Matthew Trinity - 57 8th St Hoboken,
N
J Pastor Mary E. Forell-Davis
Zion - 11 Schooleys Mountain Rd Long Valley,
N
J Pastor Peter H. Froehlke
Prince of Peace - 61 E Route 70 Marlton,
N
J Pastor Richard W. Overcash
Lutheran Church of the Redeemer - 471 Maywood Ave Maywood,
N
J Pastor Susan P.
N
elson-Colaneri
Grace - 65 E Main St Mendham,
N
J Pastor Carol A. Petersen
St Mark - 100 Harter Rd Morristown,
N
J Pastor Mary Jane Hastings
Ascension - 247 Somerset St
N
ew Brunswick,
N
J Interim Pastor Sue A. Riley
Faith - 524 South St
N
ew Providence,
N
J Pastor Murdoch MacPherson
Zion - 56 Old Tpke. Oldwick,
N
J Pastor Mark R. Summer
Temple - 5600
N
Route 130 Pennsauken,
N
J Pastor Margaret M. Marks
St James - 400 Columbia Ave Pitman,
N
J
Prince of Peace - 177 Princeton Hightstown Rd Princeton Junction,
N
J
Holy Trinity - 150 River Rd Red Bank,
N
J Pastor Dean R. Brown
Grace - 925 5th Ave River Edge,
N
J Pastor Stephen E. Sweet
Lord of Life - 1 Winchester Ct Tabernacle,
N
J Pastor David W. Jones
Holy Cross - 1500 Hooper Ave Toms River,
N
J Senior Pastor Bruce T. Ewen
St John - 3511 Palisade Ave Union City,
N
J Pastor Horst G. Kugler
Good Shepherd - 98 Columbia Ter Weehawken,
N
J Pastor Birgit Solano-Richante
Holy
N
ativity - 3 Lenape Trl Wenonah,
N
J Pastor Kenneth L. Regan
Reformation - 992 Broadway West Long Branch,
N
J Pastor Matthew Cimorelli
Christ - 40 Schoolhouse Rd Whiting,
N
J Pastor Joseph F. Watson
St John - 1002 S Main St Williamstown,
N
J
St Stephen's - 230
N
Evergreen Ave Woodbury,
N
J Pastor Christine R. Regan
Confirmation ministry
St Thomas - 135 Salmon St Brick,
N
J Pastor John M. Anderson
Trinity - 123 E Blackwell St Dover,
N
J Pastor Cheryl L. Johnson
Grace - 200 Park Ave Freehold,
N
J
Good Shepherd - Rock Rd & Ackerman Ave Glen Rock,
N
J Pastor Roger W. Spencer
Zion - 11 Schooleys Mountain Rd Long Valley,
N
J Pastor Peter H. Froehlke
Holy Trinity - 6 Osborn Ave Manasquan,
N
J Pastor Mary V. Farnham
Lutheran Church of St Ambrose - 443 S Broadway Pennsville,
N
J Pastor Daniel A. Congleton
St James - 400 Columbia Ave Pitman,
N
J
Holy Trinity - 150 River Rd Red Bank,
N
J Pastor Dean R. Brown
St John - 145 Mortimer Ave Rutherford,
N
J Pastor Jeffrey L. Walters
Grace - Shore Rd & Dawes Ave 11 E Dawes Ave Somers Point,
N
J Pastor Jeffrey H. Rickards
Holy Cross - 639 Mountain Ave Springfield,
N
J Pastor Jon D. Knecht
Holy Cross - 1500 Hooper Ave Toms River,
N
J Senior Pastor Bruce T. Ewen
St Luke - 214 State Route 31
N
Washington,
N
J Pastor Karol L. Van Wulfen
St Timothy - 395 Valley Rd Wayne,
N
J Pastor Robert M. Mountenay
Evangelism activities
Bridge of Peace Community Church - 2755 Tuckahoe Rd Camden,
N
J Pastor Giselle C. Coutinho
Cape May Evangelical - 509 Pittsburg Ave Cape May,
N
J Pastor Jeffrey W. Elliott
St Matthew Trinity - 57 8th St Hoboken,
N
J Pastor Mary E. Forell-Davis
Source: 2011 Congregational Report Form A. Prepared by ELCA Research and Evaluatio
n
10/19/201
2
ELCA Congregations Reporting Programs and Activities That Are a Specialty in
New Jersey Synod, ELCA7A
St Stephan's Grace Community - 7 Wilson Ave
N
ewark,
N
J Pastor Maristela L. Freiberg
Fellowship & social activities
Zion Evangelical - 18th St & Central Barnegat Light,
N
J Pastor Jocelyn Johnston
Cape May Evangelical - 509 Pittsburg Ave Cape May,
N
J Pastor Jeffrey W. Elliott
St Isabel - C/O San Marcos Lutheran Church 908 E. Jersey St. Elizabeth,
N
J Pastor Developer Ramon A. Collazo
St James - 1341 Mays Landing Rd Hammonton,
N
J Pastor Pamela J. Werner
Faith - 1801 Grand Central Ave Lavallette,
N
J Pastor John T. Collins
Holy Trinity - 26 S Forklanding Rd Maple Shade,
N
J Pastor Annemarie Cook
St Andrew - 335 Reynolds Ave Parsippany,
N
J Pastor Frederick L. Lentz
Lutheran Church of St Ambrose - 443 S Broadway Pennsville,
N
J Pastor Daniel A. Congleton
St James - 400 Columbia Ave Pitman,
N
J
Zion - 215 Elm Ave Rahway,
N
J Pastor Margay J. Whitlock
Holy Trinity - 150 River Rd Red Bank,
N
J Pastor Dean R. Brown
Grace - 925 5th Ave River Edge,
N
J Pastor Stephen E. Sweet
Prince of Peace - 10 Knoll Dr Rockaway,
N
J Pastor Sharon L. Eckhardt
St John - 145 Mortimer Ave Rutherford,
N
J Pastor Jeffrey L. Walters
Grace - Shore Rd & Dawes Ave 11 E Dawes Ave Somers Point,
N
J Pastor Jeffrey H. Rickards
St John - 3511 Palisade Ave Union City,
N
J Pastor Horst G. Kugler
Christ - 40 Schoolhouse Rd Whiting,
N
J Pastor Joseph F. Watson
Identify/use spiritual gifts
Christus Evangelical - 909
N
26th St Camden,
N
J Pastor Carol J. Book
Prince of Peace - 177 Princeton Hightstown Rd Princeton Junction,
N
J
Zion - 215 Elm Ave Rahway,
N
J Pastor Margay J. Whitlock
St John - 3511 Palisade Ave Union City,
N
J Pastor Horst G. Kugler
Music
St Paul - 130 Cable Ave Beachwood,
N
J Pastor Peter M. Hartney
Bethany - 262 Joralemon St Belleville,
N
J Pastor
N
ancy S. Moore
Holy Communion - 442 S Route 73 Berlin,
N
J Pastor Cynthia J. Fazzini
Bridge of Peace Community Church - 2755 Tuckahoe Rd Camden,
N
J Pastor Giselle C. Coutinho
St Paul - 832 Park Ave Collingswood,
N
J Pastor Andrew T. Gordon
St Paul - 79 One Mile Rd Ext East Windsor,
N
J Pastor James R. Egan
Zion - 312 Philadelphia Ave Egg Harbor City,
N
J Interim Pastor Glenn A. Englehardt
Abiding Presence - 2220 Pennington Rd Ewing,
N
J Pastor Boyce D. Whitener
Good Shepherd - Rock Rd & Ackerman Ave Glen Rock,
N
J Pastor Roger W. Spencer
Lutheran Church of Our Savior - 204 Wayne Ave Haddonfield,
N
J Senior Pastor P W. Zschech
St John the Baptist - 300 Bloomfield St Hoboken,
N
J Pastor Triffel L. Felske
St Paul - 440 Hoboken Ave Jersey City,
N
J Pastor Jessica D. Lambert
Holy Trinity - 6 Osborn Ave Manasquan,
N
J Pastor Mary V. Farnham
Prince of Peace - 61 E Route 70 Marlton,
N
J Pastor Richard W. Overcash
Grace - 65 E Main St Mendham,
N
J Pastor Carol A. Petersen
Redeemer Church - 3531 State Highway 33
N
eptune,
N
J Pastor Randall J. Steinman
Faith - 524 South St
N
ew Providence,
N
J Pastor Murdoch MacPherson
Bethany - 1301 Kennedy Blvd
N
orth Bergen,
N
J Pastor Carlos W. Jarvis
Lutheran Church of St Ambrose - 443 S Broadway Pennsville,
N
J Pastor Daniel A. Congleton
St James - 400 Columbia Ave Pitman,
N
J
Prince of Peace - 177 Princeton Hightstown Rd Princeton Junction,
N
J
Grace - 925 5th Ave River Edge,
N
J Pastor Stephen E. Sweet
St John - 145 Mortimer Ave Rutherford,
N
J Pastor Jeffrey L. Walters
Grace - Shore Rd & Dawes Ave 11 E Dawes Ave Somers Point,
N
J Pastor Jeffrey H. Rickards
Holy Cross - 639 Mountain Ave Springfield,
N
J Pastor Jon D. Knecht
St John's - 587 Springfield Ave Summit,
N
J Pastor Andrea L. Walker
Grace Evangelical - 1200 River Rd Teaneck,
N
J Pastor Clemens I. Reinke
Holy Cross - 1500 Hooper Ave Toms River,
N
J Senior Pastor Bruce T. Ewen
Source: 2011 Congregational Report Form A. Prepared by ELCA Research and Evaluatio
n
10/19/201
2
ELCA Congregations Reporting Programs and Activities That Are a Specialty in
New Jersey Synod, ELCA7A
St John - 3511 Palisade Ave Union City,
N
J Pastor Horst G. Kugler
Christ - 40 Schoolhouse Rd Whiting,
N
J Pastor Joseph F. Watson
St Stephen's - 230
N
Evergreen Ave Woodbury,
N
J Pastor Christine R. Regan
Other activities age 16-19
Calvary - 165 W Crescent Ave Allendale,
N
J Pastor Bruce W. Bassett
Christus Evangelical - 909
N
26th St Camden,
N
J Pastor Carol J. Book
Lutheran Church of St Ambrose - 443 S Broadway Pennsville,
N
J Pastor Daniel A. Congleton
St James - 400 Columbia Ave Pitman,
N
J
Other activities for children
Christus Evangelical - 909
N
26th St Camden,
N
J Pastor Carol J. Book
Zion - 11 Schooleys Mountain Rd Long Valley,
N
J Pastor Peter H. Froehlke
Lutheran Church of the Redeemer - 471 Maywood Ave Maywood,
N
J Pastor Susan P.
N
elson-Colaneri
St Mark - 409 White Horse Pike Oaklyn,
N
J Pastor Jeffrey D. May
St James - 400 Columbia Ave Pitman,
N
J
Zion - 941 Slocum Ave Ridgefield,
N
J Pastor Janet E. Blair
Holy Cross - 639 Mountain Ave Springfield,
N
J Pastor Jon D. Knecht
Lord of Life - 1 Winchester Ct Tabernacle,
N
J Pastor David W. Jones
Prayer, meditation, spirit dev
Bridge of Peace Community Church - 2755 Tuckahoe Rd Camden,
N
J Pastor Giselle C. Coutinho
Redeemer Church - 3531 State Highway 33
N
eptune,
N
J Pastor Randall J. Steinman
Lutheran Church of St Ambrose - 443 S Broadway Pennsville,
N
J Pastor Daniel A. Congleton
St John - 145 Mortimer Ave Rutherford,
N
J Pastor Jeffrey L. Walters
St John - 3511 Palisade Ave Union City,
N
J Pastor Horst G. Kugler
Christ - 40 Schoolhouse Rd Whiting,
N
J Pastor Joseph F. Watson
Social justice activities
Bridge of Peace Community Church - 2755 Tuckahoe Rd Camden,
N
J Pastor Giselle C. Coutinho
Cape May Evangelical - 509 Pittsburg Ave Cape May,
N
J Pastor Jeffrey W. Elliott
St Paul - 832 Park Ave Collingswood,
N
J Pastor Andrew T. Gordon
St Isabel - C/O San Marcos Lutheran Church 908 E. Jersey St. Elizabeth,
N
J Pastor Developer Ramon A. Collazo
Good Shepherd - 160 Ridgedale Ave Florham Park,
N
J Pastor Wendy L. Abrahamson
St Matthew Trinity - 57 8th St Hoboken,
N
J Pastor Mary E. Forell-Davis
Bethany - 2015 John F Kennedy Blvd Jersey City,
N
J Pastor Hans R. Arnesen
Lutheran Church of the Redeemer - 471 Maywood Ave Maywood,
N
J Pastor Susan P.
N
elson-Colaneri
Grace - 65 E Main St Mendham,
N
J Pastor Carol A. Petersen
Faith - 524 South St
N
ew Providence,
N
J Pastor Murdoch MacPherson
St Stephan's Grace Community - 7 Wilson Ave
N
ewark,
N
J Pastor Maristela L. Freiberg
Temple - 5600
N
Route 130 Pennsauken,
N
J Pastor Margaret M. Marks
Grace Evangelical - 1200 River Rd Teaneck,
N
J Pastor Clemens I. Reinke
St John - 3511 Palisade Ave Union City,
N
J Pastor Horst G. Kugler
Good Shepherd - 98 Columbia Ter Weehawken,
N
J Pastor Birgit Solano-Richante
Christ - 40 Schoolhouse Rd Whiting,
N
J Pastor Joseph F. Watson
St John - 1002 S Main St Williamstown,
N
J
Stewardship
Cape May Evangelical - 509 Pittsburg Ave Cape May,
N
J Pastor Jeffrey W. Elliott
Trinity - 123 E Blackwell St Dover,
N
J Pastor Cheryl L. Johnson
N
ativity - 552 Ryders Ln East Brunswick,
N
J Pastor Jill E. Collict
Abiding Presence - 2220 Pennington Rd Ewing,
N
J Pastor Boyce D. Whitener
Good Shepherd - Rock Rd & Ackerman Ave Glen Rock,
N
J Pastor Roger W. Spencer
Zion - 11 Schooleys Mountain Rd Long Valley,
N
J Pastor Peter H. Froehlke
Lutheran Church of St Ambrose - 443 S Broadway Pennsville,
N
J Pastor Daniel A. Congleton
St James - 400 Columbia Ave Pitman,
N
J
Source: 2011 Congregational Report Form A. Prepared by ELCA Research and Evaluatio
n
10/19/201
2
ELCA Congregations Reporting Programs and Activities That Are a Specialty in
New Jersey Synod, ELCA7A
Good Shepherd - 300 Union Ave Somerville,
N
J Pastor Christine A. Stiger
Support Groups
Cross of Glory - 95 Cambridge Dr Aberdeen,
N
J Pastor Gary E. Costa
Holy Trinity - 59th St & Long Beach Blvd Brant Beach,
N
J Pastor James F. Jacob
Zion - 712 Roosevelt Ave Carteret,
N
J Pastor Christine A. Bridge
N
ativity - 552 Ryders Ln East Brunswick,
N
J Pastor Jill E. Collict
Faith - 524 South St
N
ew Providence,
N
J Pastor Murdoch MacPherson
Holy Trinity - 150 River Rd Red Bank,
N
J Pastor Dean R. Brown
Grace - Shore Rd & Dawes Ave 11 E Dawes Ave Somers Point,
N
J Pastor Jeffrey H. Rickards
St Luke - 2 Salem Rd Willingboro,
N
J Pastor Michael D. Edwards-Ronning
Worship
Cross of Glory - 95 Cambridge Dr Aberdeen,
N
J Pastor Gary E. Costa
Atonement - 308 1st Ave Asbury Park,
N
J Pastor Jennifer L. Sweitzer
Zion Evangelical - 18th St & Central Barnegat Light,
N
J Pastor Jocelyn Johnston
St Paul - 130 Cable Ave Beachwood,
N
J Pastor Peter M. Hartney
Holy Communion - 442 S Route 73 Berlin,
N
J Pastor Cynthia J. Fazzini
Bridge of Peace Community Church - 2755 Tuckahoe Rd Camden,
N
J Pastor Giselle C. Coutinho
Messiah - 2298
N
Route 9 Cape May Court House,
N
J Pastor Bernard R. Kelly
Gloria Dei - 300 Shunpike Rd Chatham,
N
J
St Paul - 832 Park Ave Collingswood,
N
J Pastor Andrew T. Gordon
Calvary - 108 Eastman St Cranford,
N
J Pastor Carol A. Lindsay
Bethlehem - 12th Ave Dorothy,
N
J
Zion - 312 Philadelphia Ave Egg Harbor City,
N
J Interim Pastor Glenn A. Englehardt
Pilgrim Journey - 83 Galloping Hill Rd Elizabeth,
N
J Pastor Developer Gomes Pedro
Spruce Run Evangelical Lutheran Zion Church - 442 W Hill Rd Glen Gardner,
N
J Pastor Gary V. Ettlemyer
Good Shepherd - Rock Rd & Ackerman Ave Glen Rock,
N
J Pastor Roger W. Spencer
Lutheran Church of Our Savior - 204 Wayne Ave Haddonfield,
N
J Senior Pastor P W. Zschech
St Mark - 350 White Horse Ave Hamilton,
N
J Pastor Linda J. Thurston
Holy Trinity - 92 Burton Ave Hasbrouck Heights,
N
J Pastor Susan P.
N
elson-Colaneri
St John the Baptist - 300 Bloomfield St Hoboken,
N
J Pastor Triffel L. Felske
Good Shepherd - 112 Middletown Rd Holmdel,
N
J
Grace - 982 Summit Ave Jersey City,
N
J Pastor Glenn L. Boisclair
St Paul - 440 Hoboken Ave Jersey City,
N
J Pastor Jessica D. Lambert
Zion - 1799 Kennedy Blvd Jersey City,
N
J
First - 65 Oakwood Ave Kearny,
N
J
Holy Trinity - 201
N
Warwick Rd Magnolia,
N
J
Holy Trinity - 6 Osborn Ave Manasquan,
N
J Pastor Mary V. Farnham
Prince of Peace - 61 E Route 70 Marlton,
N
J Pastor Richard W. Overcash
Grace - 65 E Main St Mendham,
N
J Pastor Carol A. Petersen
St Matthew - 318 Chester Ave Moorestown,
N
J Pastor Ingrid A. Wengert
Redeemer Church - 3531 State Highway 33
N
eptune,
N
J Pastor Randall J. Steinman
Faith - 524 South St
N
ew Providence,
N
J Pastor Murdoch MacPherson
St Stephan's Grace Community - 7 Wilson Ave
N
ewark,
N
J Pastor Maristela L. Freiberg
Bethany - 1301 Kennedy Blvd
N
orth Bergen,
N
J Pastor Carlos W. Jarvis
Zion - 56 Old Tpke. Oldwick,
N
J Pastor Mark R. Summer
St Andrew - 335 Reynolds Ave Parsippany,
N
J Pastor Frederick L. Lentz
Lutheran Church of St Ambrose - 443 S Broadway Pennsville,
N
J Pastor Daniel A. Congleton
Grace - 300 Roseberry St Phillipsburg,
N
J Pastor Robert E. Weber
St James - 1213 US Highway 22 Phillipsburg,
N
J Pastor John H. Van Haneghan
St James - 400 Columbia Ave Pitman,
N
J
Epiphany - 306 S. Franklin Blvd. Pleasantville,
N
J
Prince of Peace - 177 Princeton Hightstown Rd Princeton Junction,
N
J
Zion - 215 Elm Ave Rahway,
N
J Pastor Margay J. Whitlock
Redeemer - 55 Wyckoff Ave Ramsey,
N
J Pastor Michael C. Linderman
Source: 2011 Congregational Report Form A. Prepared by ELCA Research and Evaluatio
n
10/19/201
2
ELCA Congregations Reporting Programs and Activities That Are a Specialty in
New Jersey Synod, ELCA7A
Grace - 925 5th Ave River Edge,
N
J Pastor Stephen E. Sweet
St John - 145 Mortimer Ave Rutherford,
N
J Pastor Jeffrey L. Walters
Grace - Shore Rd & Dawes Ave 11 E Dawes Ave Somers Point,
N
J Pastor Jeffrey H. Rickards
Good Shepherd - 300 Union Ave Somerville,
N
J Pastor Christine A. Stiger
Holy Cross - 639 Mountain Ave Springfield,
N
J Pastor Jon D. Knecht
St John's - 587 Springfield Ave Summit,
N
J Pastor Andrea L. Walker
Lord of Life - 1 Winchester Ct Tabernacle,
N
J Pastor David W. Jones
Grace Evangelical - 1200 River Rd Teaneck,
N
J Pastor Clemens I. Reinke
Holy Cross - 1500 Hooper Ave Toms River,
N
J Senior Pastor Bruce T. Ewen
Lutheran Church of St Matthew - 2201
N
ew York Ave Union City,
N
J
St John - 3511 Palisade Ave Union City,
N
J Pastor Horst G. Kugler
Redeemer - 2384 E Landis Ave Vineland,
N
J Senior Pastor Gary
N
. Stiegler
Advent - 128 Stirling Rd Warren,
N
J
Holy
N
ativity - 3 Lenape Trl Wenonah,
N
J Pastor Kenneth L. Regan
Christ - 40 Schoolhouse Rd Whiting,
N
J Pastor Joseph F. Watson
St Luke - 2 Salem Rd Willingboro,
N
J Pastor Michael D. Edwards-Ronning
Source: 2011 Congregational Report Form A. Prepared by ELCA Research and Evaluatio
n
10/19/201
2
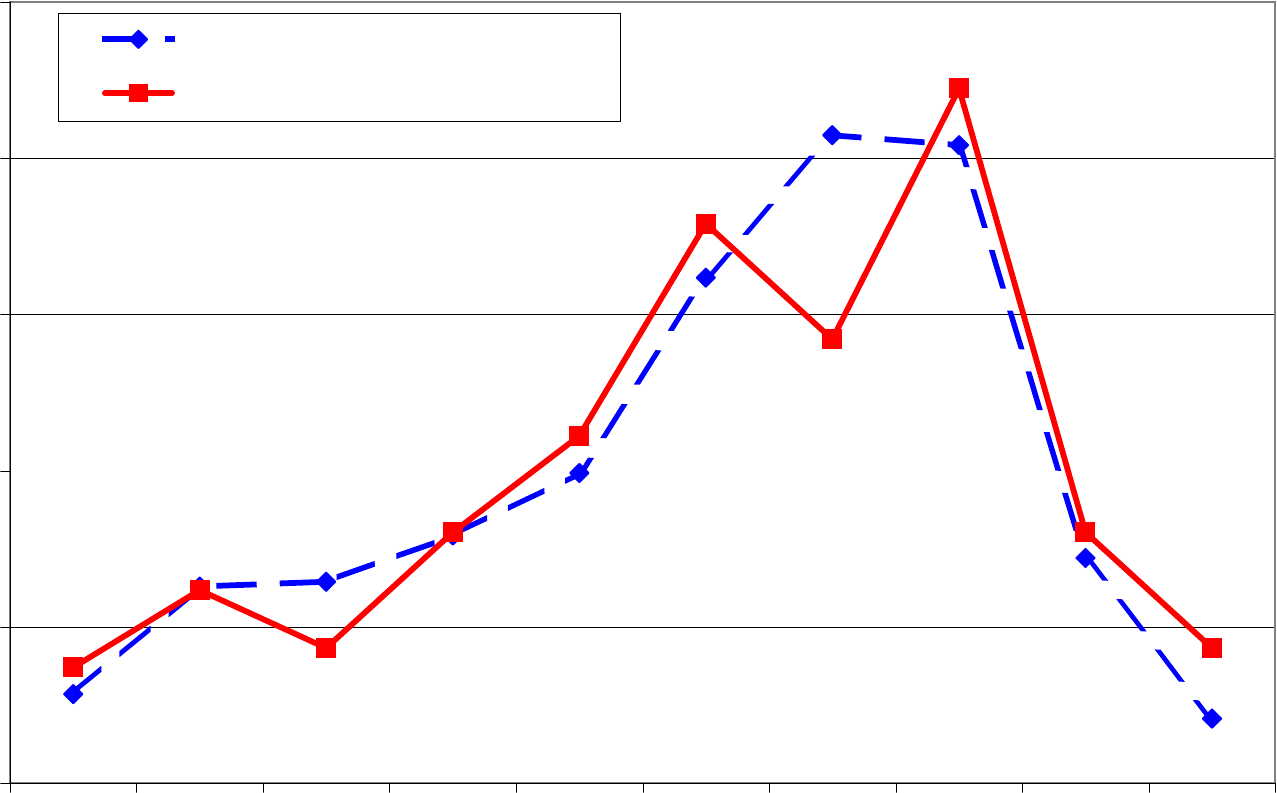
Source: ELCA Roster Database. Prepared by ELCA Research and Evaluation. 10/22/2012
Comparing the Age of All ELCA Clergy Serving Congregations With Clergy in
0%
5%
10%
15%
20%
25%
<30 30-34 35-39 40-44 45-49 50-54 55-59 60-64 65-69 70+
Age Category on February 1, 2012
Percent in Age Group
All ELCA Congregational Clergy
New Jersey Synod
New Jersey Synod