Granville Phillps 835 VQM User Manual (835000) (manual)
User Manual:
Open the PDF directly: View PDF ![]() .
.
Page Count: 284 [warning: Documents this large are best viewed by clicking the View PDF Link!]
- 835000_Rev H_Instruction Manual.pdf
- Table of Contents
- Safety Instructions
- Introduction & Specifications
- 2.1 General Description
- 2.2 Receiving Inspection
- 2.3 Glossary of Terms
- 2.4 Specifications
- 2.4.1 Dimensional Illustrations
- 2.4.2 VQM Controller Specifications
- 2.4.3 Mass Spectrometer Gauge Specifications
- 2.4.4 Viewer Software Specifications
- 2.4.5 Host/PC Requirements
- 2.4.6 Trigger Input/Output Specifications
- 2.4.7 Analog Input/Output Specifications
- 2.5 Compliance
- 2.6 Warranty Information
- Hardware Installation
- 3.1 Introduction
- 3.2 Terms used in this chapter
- 3.3 Unpacking the Components
- 3.3.1 Before Opening the Boxes
- 3.3.2 Checklist of Components
- 3.4 MS Gauge Installation
- 3.4.1 Introduction
- 3.4.2 Installation Requirements
- 3.4.3 Operational Requirements
- 3.4.4 Mounting Procedure
- 3.5 Micro-Ion Gauge Installation
- 3.5.1 Introduction
- 3.5.2 Installation Requirements
- 3.5.3 Mounting Procedure
- 3.6 VQM Controller, MS Gauge & Micro-Ion Gauge Connections
- 3.6.1 Introduction
- 3.6.2 Connection Requirements
- 3.6.3 MS Gauge Connection Procedure
- 3.6.4 Micro-Ion Gauge Connection Procedure
- 3.7 VQM Controller - 24 Vdc Power Connection
- 3.7.1 Introduction
- 3.7.2 Connection Requirements
- 3.7.3 Connection Procedure
- 3.8 System Grounding Procedure
- 3.8.1 VQM Controller Ground Connections
- 3.8.2 System Ground Test Procedure
- 3.9 VQM Controller - Signal Input/Output Connections
- 3.9.1 Trigger Input
- 3.9.2 Trigger Output
- 3.9.3 Analog Input / External Total Pressure
- 3.9.4 Analog Output
- 3.9.5 VQM Controller to Host/PC Connection
- 3.10 Initial Startup
- Software Installation
- 4.1 Introduction to the Software Installation
- 4.1.1 Installation Issues
- 4.2 Install the Viewer Application Software
- 4.3 Install the USB Driver
- 4.3.1 Installing the 835 Driver from the CD
- 4.3.2 Installing the GP Device Driver after a Software Installation
- 4.4 Troubleshooting
- 4.4.1 Installation Does Not Complete
- VQM Controller Overview
- 5.1 Introduction
- 5.2 Terms used in this chapter
- 5.3 VQM Controller Overview
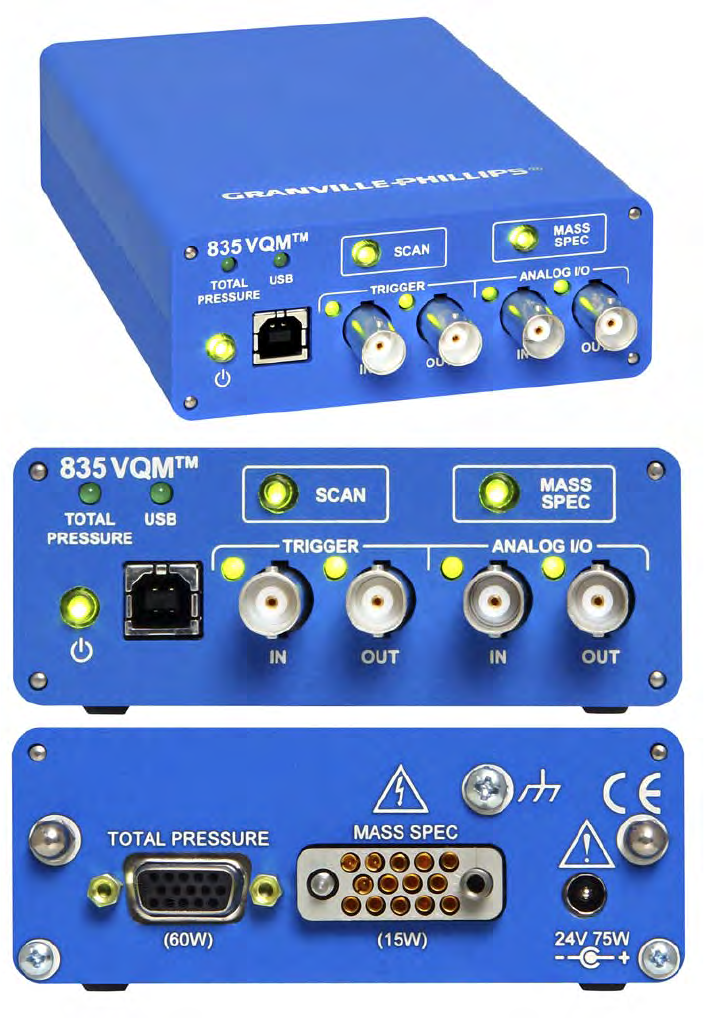
- 5.4 Front Panel Controls, Interconnects, and LEDs
- 5.4.1 Buttons
- 5.4.2 Power Button/LED
- 5.4.3 SCAN Button/LED
- 5.4.4 MASS SPEC Button/LED
- 5.5 Front Panel Connectors
- 5.5.1 Trigger IN BNC Connector / LED
- 5.5.2 Trigger OUT BNC Connector / LED
- 5.5.3 Analog IN BNC Connector / LED
- 5.5.4 Analog OUT BNC Connector / LED
- 5.5.5 USB Port / LED
- 5.5.6 External Total Pressure Connector / LED
- 5.6 Rear Panel Controls and Interconnects
- 5.6.1 TOTAL PRESSURE Connector
- 5.6.2 MASS SPEC Connector
- 5.6.3 24 Vdc, 75 W Connector
- 5.6.4 Grounding Lug
- 5.7 MS Gauge Ion Trap Power Supply Settings
- 5.7.1 Filament Overpower Detection
- 5.7.2 RF Signal Generator
- 5.7.3 Electrometer
- 5.8 Power Modes
- 5.9 Power ON/OFF Sequence
- 5.9.1 Power ON Sequence
- 5.9.2 Standby Power Sequence
- 5.9.3 Power-On Self-Test
- 5.10 Micro-Ion Gauge Operation
- 5.10.1 Autopressure Mode
- 5.10.2 Overpressure Protection
- 5.11 Mass Spectrometry Scan Control
- 5.11.1 Manual Scan Control
- 5.11.2 External Trigger Scan Control
- 5.11.3 Remote Scan Control
- 5.11.4 Mass Spectrometry Scan Count
- 5.11.5 Single Scan
- 5.11.6 Continuous Scans
- 5.12 Typical System Configurations
- 5.12.1 Standard Setup
- 5.12.2 Standard Setup with External Trigger Pulses
- 5.12.3 Stand Alone Setup
- 5.12.4 Stand Alone Setup with External Pulses
- 5.13 Timing Diagrams for MS Scan Control
- 5.13.1 Immediate Trigger Mode
- 5.13.2 Internal Trigger with No USB Data
- 5.13.3 Internal Trigger with USB Data
- 5.13.4 Buffer Overwrite
- Ion Trap Mass Spectrometer Gauge
- 6.1 Introduction to the MS Gauge
- 6.2 Terms used in this chapter
- 6.3 MS Gauge Overview
- 6.4 MS Gauge Principles of Operation
- 6.5 Construction Materials
- 6.6 Ionizer
- 6.7 Ion Trap Mass Separator
- 6.8 Ion Detector Assembly
- 6.9 MS Gauge Advanced User Settings
- 6.9.1 Electron Multiplier Bias
- 6.9.2 RF Amplitude Peak-to-Peak
- 6.9.3 Filament Emission
- 6.9.4 Repeller Plate Bias
- 6.9.5 Exit Plate Bias
- 6.9.6 Electron Multiplier Shield Bias
- 6.9.7 Filament Bias
- 6.9.8 Entry Plate Bias
- 6.9.9 Pressure Plate Bias
- 6.9.10 Cup Bias
- 6.9.11 Transition Bias
- 6.10 Superharmonics
- MS Gauge Maintenance
- 7.1 Introduction
- 7.2 Unpacking, Handling, and Long-Term Storage
- 7.2.1 Storage Recommendations
- 7.3 Bakeout Procedure
- 7.4 Environmental Requirements
- 7.4.1 Pressure Ranges
- 7.4.2 Temperature Range
- 7.4.3 Humidity Range
- 7.4.4 Warm-up Periods
- 7.5 Filament Assembly
- 7.5.1 Introduction
- 7.5.2 Filament Assembly Replacement
- 7.5.3 Repeller Voltage Optimization
- 7.5.4 Filament Operation
- 7.6 Electron Multiplier Detector
- 7.6.1 Introduction
- 7.6.2 Best-Known Practices
- 7.6.3 Operating Pressure
- 7.6.4 Operating Temperature
- 7.6.5 Bakeout Temperature
- 7.6.6 Operating Voltage
- 7.6.7 Contamination
- 7.6.8 Initial Operation
- 7.6.9 Gain Adjustment
- 7.6.10 Electron Multiplier Replacement
- 7.7 Cleaning a VQM Gauge
- Initial Operation & Viewer Software
- 8.1 VQM® Viewer Application Software for the VQM System
- 8.1.1 Software VIs, Services, and Driver
- 8.2 VQM Viewer Application Icons and Screen Displays
- 8.2.1 Viewer Application Icons
- 8.2.1.1 Connect See Section 8.4.1
- 8.2.1.2 Multi-function Mass Spec Control See Section 8.4.2.
- 8.2.1.3 Auto Tune See Section 8.4.3
- 8.2.1.4 Summary See Section 8.4.4
- 8.2.1.5 Trend See Section 8.4.5
- 8.2.1.6 Leak See Section 8.4.6
- 8.2.1.7 Settings See Section 8.4.7
- 8.2.1.8 Tune See Section 8.4.8
- 8.2.1.9 Log Data See Section 8.4.8.4 and Section 8.4.9
- 8.2.1.10 Save See Section 8.4.10
- 8.2.1.11 VQI® (Vacuum Quality IndexTM) See Section 8.4.11
- 8.2.1.12 VQI Status See Section 8.4.12
- 8.3 Initial Operation Procedure
- 8.3.1 Connect the USB Cable
- 8.3.2 Initial Pump Down
- 8.3.3 Abbreviated Initial Startup/Setup Procedure.
- 8.3.4 Filament Outgassing
- 8.3.5 Electron Multiplier Preconditioning
- 8.3.6 Auto Tune
- 8.3.7 Manual Electron Multiplier Bias Voltage Adjustment (optional)
- 8.3.8 Mass Axis Calibration
- 8.3.9 Storing the Gauge Settings
- 8.4 Using the Viewer Application
- 8.4.1 Connect
- 8.4.2 Gauge Operating Mode
- 8.4.3 Auto Tune
- 8.4.4 Summary
- 8.4.5 Trend
- 8.4.6 Leak
- 8.4.7 Settings (preferences)
- 8.4.8 Tune
- 8.4.9 Log Data
- 8.4.10 Save
- 8.4.11 VQI® (Vacuum Quality IndexTM)
- 8.4.12 VQI Status
- 8.4.13 Status/Error Reporting and Contextual Help
- 8.4.14 Adding Pressure Sources
- 8.4.15 Customizing Data Analysis Peak Fitting
- 8.4.16 Adding Gases or Customizing Gas Coefficients
- 8.5 Troubleshooting
- 8.5.1 Viewer Application Does Not Open
- 8.5.2 Viewer Application Does Not List Any VQM Controllers
- 8.5.3 Viewer Application Does Not Connect to a Listed Controller
- 8.5.4 Service is not Responding
- 8.5.5 .Net Error when attempting to connect Viewer Application to Controller
- 8.5.6 Viewer Application displays Generic Error 42 or Error 74 when connecting to a Controller.
- 8.5.7 Loss of Communication
- 8.5.8 Mass Spec Light Red or Gauge Won't Turn On
- 8.5.9 System Stopped Scanning or Won't Scan
- 8.5.10 Auto Tune Failures
- 8.5.11 Auto Tune Errors
- 8.5.12 835 VQM Controller Errors
- 8.5.13 Low Signal
- 8.5.14 Missing Peaks
- 8.5.15 Noisy Signal
- 8.5.16 Timeouts, etc.
- 8.5.17 Where are the Logs?
- 8.5.18 Error 5013 - Not able to create Raw Logs
- 8.6 VQM Utility Application
- 8.6.1 File Menu
- 8.6.2 Diagnostics Tab
- 8.6.3 Cable Power Limit Tab
- 8.6.4 Firmware Upgrade Tab
- 8.6.5 SCPI Command Tab
- VQM Command Set
- 9.1 Introduction
- 9.1.1 USB Driver Installation
- 9.1.2 Logical Instruments
- 9.1.3 Command Format
- 9.2 SCPI Command Tables
- 9.2.1 Input Format
- 9.2.2 Response Format
- 9.3 IEEE 488.2 Required Commands
- 9.3.1 CALibration Subsystem
- 9.3.2 CONFigure Subsystem
- 9.3.3 FETCh Subsystem
- 9.3.4 FORMat Subsystem
- 9.3.5 INPut Subsystem
- 9.3.6 INSTrument Subsystem
- 9.3.7 MEASure Subsystem
- 9.3.8 MEMory Subsystem
- 9.3.9 OUTPut Subsystem
- 9.3.10 SENSe Subsystem
- 9.3.11 SOURce Subsystem
- 9.3.12 STATus Subsystem
- 9.3.13 SYSTem Subsystem
- 9.3.14 TEST Subsystem
- 9.4 Test Report
- 9.4.1 TRIGger Subsystem
- 9.4.2 Reset State
- 9.4.3 Error/Event Codes
- 9.4.4 Data Interchange Format
- 9.5 Simplified Programming Overview and Examples
- 9.5.1 Bias Voltages
- 9.5.2 Filament Power
- 9.5.3 Emission Current and Filament Bias Voltage
- 9.5.4 Formatting Fetch data
- 9.5.5 Partial Pressure Measurement
- 9.5.6 External Total Pressure
- 9.5.7 Store/Load Ion Trap and Controller Settings
- 9.5.8 Change or Calibrate Electrometer Gain/Sensitivity
- 9.5.9 Real-Time Clock
- 9.5.10 Manual Control of the Digital Output on the BNC
- 9.5.11 Fatal Errors
- 9.5.12 Reading Controller Status/Clearing Status Registers
- 9.6 Using a Terminal to Communicate with the VQM System
- 9.6.1 Using HyperTerminal
- Service & Maintenance
- Index

Instruction manual part number 835000
Revision H - November 2016
Series 835
Instruction Manual
Granville-Phillips® Series 835
Vacuum Quality MonitorTM

This Instruction Manual is for use with all Series 835
Vacuum Quality Monitors. A list of applicable catalog
numbers is provided on the following page.
This product is RoHS compliant.
Granville-Phillips® Series 835
Vacuum Quality MonitorTM
Series 835
Instruction Manual
© 2016 MKS Instruments, Inc. All rights reserved.
Granville-Phillips®, VQM®, VQI®, and Micro-Ion® are registered trademarks, and mksinstTM, Vacuum
Quality IndexTM, and Vacuum Quality MonitorTM are trademarks of MKS Instruments, Inc.
All other trademarks and registered trademarks are the properties of their respective owners.
Customer Service / Technical Support:
MKS Pressure and Vacuum Measurement Solutions
MKS Instruments, Inc., Granville-Phillips® Division
6450 Dry Creek Parkway
Longmont, Colorado 80503 USA
Tel: 303-652-4400
Fax: 303-652-2844
Email: mks@mksinst.com
MKS Corporate Headquarters
MKS Instruments, Inc.
2 Tech Drive, Suite 201
Andover, MA 01810 USA
Tel: 978-645-5500
Fax: 978-557-5100
Email: mks@mksinst.com

Catalog numbers for Series 835 VQM® Controllers, Gauges, and Accessories
Product/Description Catalog Number
VQM Controller for one MS Gauge, benchtop mount . . . . . . . . . . 835500-U#-#(*)
USB 2.0, 1-145 or 1-300 amu, with power supply & cord.
1 = 1 - 145 amu (120 resolution)
3 = 1 - 300 amu (180 resolution)
Cables, VQM Controller to Mass Spectrometer Gauge: . . . . . . . 835300-##M(**)
835 Software Suite (Viewer Application, LabVIEW VI). . . . . . . . . . . . . . . 835400
835 MS Gauge, Channel Electron Multiplier Detector . . . . . . . . . . 835100-YG-# X
Y = Yttria-coated Iridium filament
G = 2.75inch (NW35CF) flange
1 = 1 - 145 amu
3 = 1 - 300 amu
N = Nude
D = In demountable envelope
Total Pressure Measurement Micro-Ion ATM Module. . . . . . . . . . . 390802-2-YG-T
Absolute & Ratiometric Pressure, 10-9 to ATM, RS-485,
gauge filament protection, digital display, dual Yttria-coated Iridium
ion gauge filaments, 2.75-inch (NW35CF) ConFlat-type flange, Torr
Cables - 835 VQM Controller to Micro-Ion ATM Module: . . . . 802301-##M(***)
Accessories
Field Replaceable Filament Assembly Kit:. . . . . . . . . . . . . . . . . . . . . .830105-Y-K
For use with Series 830 & 835 Gauges.
Field Replaceable Electron Multiplier Kit: . . . . . . . . . . . . . . . . . . . . . . 835110-K
For use with Series 835 Gauges only.
Cable for log/linear analog output (1/8" miniature phone jack) . . . . . .801202-10M
Interconnect from a G-P Series 370 Ion Gauge Controller
to the analog input on the VQM Controller, 10 meters long
Demountable Envelope (4-inch nipple) for Nude Gauge . . . . . . . . . . . . . 801270
T-Flange, 2.75 inch (NW35CF) flanges . . . . . . . . . . . . . . . . . . . . . . . . . . . 801272
Hardware/Bolt Kit: . . . . . . . . . . . . . . . . . . . . . . . . . . . . . . . . . . . . . . . . 801274-1
Includes 6 flange bolts and washers, 3 plate nuts, and 1 copper gasket
Wrench, 1/4", 12 pt. . . . . . . . . . . . . . . . . . . . . . . . . . . . . . . . . . . . . . . . . . . 801275
Heater Jacket, 120 VAC, for the 835 Gauge:. . . . . . . . . . . . . . . . . . . . . . . 801203-1
Heater Jacket, 240 VAC, for the 835 Gauge:. . . . . . . . . . . . . . . . . . . . . 801204-#(*)
(*) # -1 = North American 115 VAC & Japan 100 VAC, -2 = North American 240 VAC,
-3 = Universal European 220 VAC, -4 = United Kingdom 240 VAC
(**) # -01 = 1 meter (3.28 ft), -03 = 3 meters (9.84 ft), -20 = 20 meters (65.6 ft)
(***) # -01 = 1 meter (3.28 ft), -03 = 3 meters (9.84 ft)
Windows, Windows XP, and Windows 7 are registered trademarks of Microsoft Corporation.
LabVIEW is a registered trademark of National Instruments Corporation.
SIMION is a registered trademark of Scientific Instrument Services, Inc.
5
Series 835 Vacuum Quality Monitor
Instruction Manual - 835000
Chapter 1 Safety Instructions . . . . . . . . . . . . . . . . . . . . . . . . . . . . . . . . . . . . . . . . . . . . . . . . . . . . . . . . . . . . . . . . . 13
1.1 Safety Introduction . . . . . . . . . . . . . . . . . . . . . . . . . . . . . . . . . . . . . . . . . . . . . . . . . . . . . . . . . . . . . . . . . . 13
1.2 Equipment Grounding . . . . . . . . . . . . . . . . . . . . . . . . . . . . . . . . . . . . . . . . . . . . . . . . . . . . . . . . . . . . . . . 16
1.3 Implosion / Explosion . . . . . . . . . . . . . . . . . . . . . . . . . . . . . . . . . . . . . . . . . . . . . . . . . . . . . . . . . . . . . . . . 17
1.4 User’s Responsibility . . . . . . . . . . . . . . . . . . . . . . . . . . . . . . . . . . . . . . . . . . . . . . . . . . . . . . . . . . . . . . . . . 18
1.5 Damage Requiring Service . . . . . . . . . . . . . . . . . . . . . . . . . . . . . . . . . . . . . . . . . . . . . . . . . . . . . . . . . . . . . 18
1.6 Service Guidelines . . . . . . . . . . . . . . . . . . . . . . . . . . . . . . . . . . . . . . . . . . . . . . . . . . . . . . . . . . . . . . . . . . . 19
1.7 FCC Verification . . . . . . . . . . . . . . . . . . . . . . . . . . . . . . . . . . . . . . . . . . . . . . . . . . . . . . . . . . . . . . . . . . . . 19
Chapter 2 Introduction & Specifications . . . . . . . . . . . . . . . . . . . . . . . . . . . . . . . . . . . . . . . . . . . . . . . . . . . . . . . . 21
2.1 General Description . . . . . . . . . . . . . . . . . . . . . . . . . . . . . . . . . . . . . . . . . . . . . . . . . . . . . . . . . . . . . . . . . 21
2.2 Receiving Inspection . . . . . . . . . . . . . . . . . . . . . . . . . . . . . . . . . . . . . . . . . . . . . . . . . . . . . . . . . . . . . . . . . 23
2.3 Glossary of Terms . . . . . . . . . . . . . . . . . . . . . . . . . . . . . . . . . . . . . . . . . . . . . . . . . . . . . . . . . . . . . . . . . . . 23
2.4 Specifications . . . . . . . . . . . . . . . . . . . . . . . . . . . . . . . . . . . . . . . . . . . . . . . . . . . . . . . . . . . . . . . . . . . . . . . 25
2.4.1 Dimensional Illustrations . . . . . . . . . . . . . . . . . . . . . . . . . . . . . . . . . . . . . . . . . . . . . . . . . . . . . . . . 25
2.4.2 VQM Controller Specifications . . . . . . . . . . . . . . . . . . . . . . . . . . . . . . . . . . . . . . . . . . . . . . . . . . . 27
2.4.3 Mass Spectrometer Gauge Specifications . . . . . . . . . . . . . . . . . . . . . . . . . . . . . . . . . . . . . . . . . . . . 28
2.4.4 Viewer Software Specifications . . . . . . . . . . . . . . . . . . . . . . . . . . . . . . . . . . . . . . . . . . . . . . . . . . . . 29
2.4.5 Host/PC Requirements . . . . . . . . . . . . . . . . . . . . . . . . . . . . . . . . . . . . . . . . . . . . . . . . . . . . . . . . . 29
2.4.6 Trigger Input/Output Specifications . . . . . . . . . . . . . . . . . . . . . . . . . . . . . . . . . . . . . . . . . . . . . . . 30
2.4.7 Analog Input/Output Specifications. . . . . . . . . . . . . . . . . . . . . . . . . . . . . . . . . . . . . . . . . . . . . . . . 30
2.5 Compliance . . . . . . . . . . . . . . . . . . . . . . . . . . . . . . . . . . . . . . . . . . . . . . . . . . . . . . . . . . . . . . . . . . . . . . . . 31
2.6 Warranty Information . . . . . . . . . . . . . . . . . . . . . . . . . . . . . . . . . . . . . . . . . . . . . . . . . . . . . . . . . . . . . . . . 31
Chapter 3 Hardware Installation . . . . . . . . . . . . . . . . . . . . . . . . . . . . . . . . . . . . . . . . . . . . . . . . . . . . . . . . . . . . . . . 33
3.1 Introduction . . . . . . . . . . . . . . . . . . . . . . . . . . . . . . . . . . . . . . . . . . . . . . . . . . . . . . . . . . . . . . . . . . . . . . . 33
3.2 Terms used in this chapter . . . . . . . . . . . . . . . . . . . . . . . . . . . . . . . . . . . . . . . . . . . . . . . . . . . . . . . . . . . . . 33
3.3 Unpacking the Components . . . . . . . . . . . . . . . . . . . . . . . . . . . . . . . . . . . . . . . . . . . . . . . . . . . . . . . . . . . 34
3.3.1 Before Opening the Boxes . . . . . . . . . . . . . . . . . . . . . . . . . . . . . . . . . . . . . . . . . . . . . . . . . . . . . . . 34
3.3.2 Checklist of Components . . . . . . . . . . . . . . . . . . . . . . . . . . . . . . . . . . . . . . . . . . . . . . . . . . . . . . . . 34
3.3.2.1 Standard Equipment - See Figure 3-1 . . . . . . . . . . . . . . . . . . . . . . . . . . . . . . . . . . . . . . . 34
3.3.2.2 Optional Equipment - See Figure 3-2 . . . . . . . . . . . . . . . . . . . . . . . . . . . . . . . . . . . . . . . 34
3.4 MS Gauge Installation . . . . . . . . . . . . . . . . . . . . . . . . . . . . . . . . . . . . . . . . . . . . . . . . . . . . . . . . . . . . . . . . 36
3.4.1 Introduction. . . . . . . . . . . . . . . . . . . . . . . . . . . . . . . . . . . . . . . . . . . . . . . . . . . . . . . . . . . . . . . . . . 36
3.4.2 Installation Requirements. . . . . . . . . . . . . . . . . . . . . . . . . . . . . . . . . . . . . . . . . . . . . . . . . . . . . . . . 37
3.4.3 Operational Requirements . . . . . . . . . . . . . . . . . . . . . . . . . . . . . . . . . . . . . . . . . . . . . . . . . . . . . . . 38
3.4.4 Mounting Procedure . . . . . . . . . . . . . . . . . . . . . . . . . . . . . . . . . . . . . . . . . . . . . . . . . . . . . . . . . . . 39
3.5 Micro-Ion Gauge Installation . . . . . . . . . . . . . . . . . . . . . . . . . . . . . . . . . . . . . . . . . . . . . . . . . . . . . . . . . . 40
3.5.1 Introduction. . . . . . . . . . . . . . . . . . . . . . . . . . . . . . . . . . . . . . . . . . . . . . . . . . . . . . . . . . . . . . . . . . 40
3.5.2 Installation Requirements. . . . . . . . . . . . . . . . . . . . . . . . . . . . . . . . . . . . . . . . . . . . . . . . . . . . . . . . 41
3.5.3 Mounting Procedure . . . . . . . . . . . . . . . . . . . . . . . . . . . . . . . . . . . . . . . . . . . . . . . . . . . . . . . . . . . 41
3.6 VQM Controller, MS Gauge & Micro-Ion Gauge Connections . . . . . . . . . . . . . . . . . . . . . . . . . . . . . . . . 42
3.6.1 Introduction. . . . . . . . . . . . . . . . . . . . . . . . . . . . . . . . . . . . . . . . . . . . . . . . . . . . . . . . . . . . . . . . . . 42
3.6.2 Connection Requirements . . . . . . . . . . . . . . . . . . . . . . . . . . . . . . . . . . . . . . . . . . . . . . . . . . . . . . . 42
3.6.3 MS Gauge Connection Procedure . . . . . . . . . . . . . . . . . . . . . . . . . . . . . . . . . . . . . . . . . . . . . . . . . 42
3.6.4 Micro-Ion Gauge Connection Procedure . . . . . . . . . . . . . . . . . . . . . . . . . . . . . . . . . . . . . . . . . . . . 44
3.7 VQM Controller - 24 Vdc Power Connection . . . . . . . . . . . . . . . . . . . . . . . . . . . . . . . . . . . . . . . . . . . . . 45
3.7.1 Introduction. . . . . . . . . . . . . . . . . . . . . . . . . . . . . . . . . . . . . . . . . . . . . . . . . . . . . . . . . . . . . . . . . . 45
3.7.2 Connection Requirements . . . . . . . . . . . . . . . . . . . . . . . . . . . . . . . . . . . . . . . . . . . . . . . . . . . . . . . 45
3.7.3 Connection Procedure . . . . . . . . . . . . . . . . . . . . . . . . . . . . . . . . . . . . . . . . . . . . . . . . . . . . . . . . . . 45
Table of Contents
6
Series 835 Vacuum Quality Monitor
Instruction Manual - 835000
3.8 System Grounding Procedure . . . . . . . . . . . . . . . . . . . . . . . . . . . . . . . . . . . . . . . . . . . . . . . . . . . . . . . . . . 46
3.8.1 VQM Controller Ground Connections . . . . . . . . . . . . . . . . . . . . . . . . . . . . . . . . . . . . . . . . . . . . . 48
3.8.2 System Ground Test Procedure . . . . . . . . . . . . . . . . . . . . . . . . . . . . . . . . . . . . . . . . . . . . . . . . . . . 48
3.9 VQM Controller - Signal Input/Output Connections . . . . . . . . . . . . . . . . . . . . . . . . . . . . . . . . . . . . . . . 49
3.9.1 Trigger Input . . . . . . . . . . . . . . . . . . . . . . . . . . . . . . . . . . . . . . . . . . . . . . . . . . . . . . . . . . . . . . . . . 50
3.9.2 Trigger Output. . . . . . . . . . . . . . . . . . . . . . . . . . . . . . . . . . . . . . . . . . . . . . . . . . . . . . . . . . . . . . . . 50
3.9.3 Analog Input / External Total Pressure. . . . . . . . . . . . . . . . . . . . . . . . . . . . . . . . . . . . . . . . . . . . . . 50
3.9.4 Analog Output . . . . . . . . . . . . . . . . . . . . . . . . . . . . . . . . . . . . . . . . . . . . . . . . . . . . . . . . . . . . . . . . 50
3.9.5 VQM Controller to Host/PC Connection . . . . . . . . . . . . . . . . . . . . . . . . . . . . . . . . . . . . . . . . . . . 50
3.10 Initial Startup . . . . . . . . . . . . . . . . . . . . . . . . . . . . . . . . . . . . . . . . . . . . . . . . . . . . . . . . . . . . . . . . . . . . . . 51
Chapter 4 Software Installation . . . . . . . . . . . . . . . . . . . . . . . . . . . . . . . . . . . . . . . . . . . . . . . . . . . . . . . . . . . . . . . 53
4.1 Introduction to the Software Installation . . . . . . . . . . . . . . . . . . . . . . . . . . . . . . . . . . . . . . . . . . . . . . . . . . 53
4.1.1 Installation Issues . . . . . . . . . . . . . . . . . . . . . . . . . . . . . . . . . . . . . . . . . . . . . . . . . . . . . . . . . . . . . . 53
4.2 Install the Viewer Application Software . . . . . . . . . . . . . . . . . . . . . . . . . . . . . . . . . . . . . . . . . . . . . . . . . . . 54
4.3 Install the USB Driver . . . . . . . . . . . . . . . . . . . . . . . . . . . . . . . . . . . . . . . . . . . . . . . . . . . . . . . . . . . . . . . . 59
4.3.1 Installing the 835 Driver from the CD . . . . . . . . . . . . . . . . . . . . . . . . . . . . . . . . . . . . . . . . . . . . . . 59
4.3.2 Installing the GP Device Driver after a Software Installation . . . . . . . . . . . . . . . . . . . . . . . . . . . . . 59
4.4 Troubleshooting . . . . . . . . . . . . . . . . . . . . . . . . . . . . . . . . . . . . . . . . . . . . . . . . . . . . . . . . . . . . . . . . . . . . 59
4.4.1 Installation Does Not Complete. . . . . . . . . . . . . . . . . . . . . . . . . . . . . . . . . . . . . . . . . . . . . . . . . . . 59
Chapter 5 VQM® Controller Overview . . . . . . . . . . . . . . . . . . . . . . . . . . . . . . . . . . . . . . . . . . . . . . . . . . . . . . . . . 61
5.1 Introduction . . . . . . . . . . . . . . . . . . . . . . . . . . . . . . . . . . . . . . . . . . . . . . . . . . . . . . . . . . . . . . . . . . . . . . . 61
5.2 Terms used in this chapter . . . . . . . . . . . . . . . . . . . . . . . . . . . . . . . . . . . . . . . . . . . . . . . . . . . . . . . . . . . . . 62
5.3 VQM Controller Overview . . . . . . . . . . . . . . . . . . . . . . . . . . . . . . . . . . . . . . . . . . . . . . . . . . . . . . . . . . . . 62
5.4 Front Panel Controls, Interconnects, and LEDs . . . . . . . . . . . . . . . . . . . . . . . . . . . . . . . . . . . . . . . . . . . . 64
5.4.1 Buttons. . . . . . . . . . . . . . . . . . . . . . . . . . . . . . . . . . . . . . . . . . . . . . . . . . . . . . . . . . . . . . . . . . . . . . 64
5.4.2 Power Button/LED . . . . . . . . . . . . . . . . . . . . . . . . . . . . . . . . . . . . . . . . . . . . . . . . . . . . . . . . . . . . 65
5.4.3 SCAN Button/LED . . . . . . . . . . . . . . . . . . . . . . . . . . . . . . . . . . . . . . . . . . . . . . . . . . . . . . . . . . . . 66
5.4.4 MASS SPEC Button/LED . . . . . . . . . . . . . . . . . . . . . . . . . . . . . . . . . . . . . . . . . . . . . . . . . . . . . . . 67
5.4.4.1 MS Gauge Normal Mode: . . . . . . . . . . . . . . . . . . . . . . . . . . . . . . . . . . . . . . . . . . . . . . . . 68
5.4.4.2 MS Gauge standby Mode: . . . . . . . . . . . . . . . . . . . . . . . . . . . . . . . . . . . . . . . . . . . . . . . . 68
5.5 Front Panel Connectors . . . . . . . . . . . . . . . . . . . . . . . . . . . . . . . . . . . . . . . . . . . . . . . . . . . . . . . . . . . . . . . 70
5.5.1 Trigger IN BNC Connector / LED . . . . . . . . . . . . . . . . . . . . . . . . . . . . . . . . . . . . . . . . . . . . . . . . 70
5.5.2 Trigger OUT BNC Connector / LED . . . . . . . . . . . . . . . . . . . . . . . . . . . . . . . . . . . . . . . . . . . . . . 71
5.5.3 Analog IN BNC Connector / LED. . . . . . . . . . . . . . . . . . . . . . . . . . . . . . . . . . . . . . . . . . . . . . . . . 72
5.5.4 Analog OUT BNC Connector / LED . . . . . . . . . . . . . . . . . . . . . . . . . . . . . . . . . . . . . . . . . . . . . . 73
5.5.5 USB Port / LED. . . . . . . . . . . . . . . . . . . . . . . . . . . . . . . . . . . . . . . . . . . . . . . . . . . . . . . . . . . . . . . 73
5.5.6 External Total Pressure Connector / LED . . . . . . . . . . . . . . . . . . . . . . . . . . . . . . . . . . . . . . . . . . . 74
5.6 Rear Panel Controls and Interconnects . . . . . . . . . . . . . . . . . . . . . . . . . . . . . . . . . . . . . . . . . . . . . . . . . . . 75
5.6.1 TOTAL PRESSURE Connector . . . . . . . . . . . . . . . . . . . . . . . . . . . . . . . . . . . . . . . . . . . . . . . . . . 75
5.6.2 MASS SPEC Connector. . . . . . . . . . . . . . . . . . . . . . . . . . . . . . . . . . . . . . . . . . . . . . . . . . . . . . . . . 76
5.6.3 24 Vdc, 75 W Connector . . . . . . . . . . . . . . . . . . . . . . . . . . . . . . . . . . . . . . . . . . . . . . . . . . . . . . . . 77
5.6.4 Grounding Lug. . . . . . . . . . . . . . . . . . . . . . . . . . . . . . . . . . . . . . . . . . . . . . . . . . . . . . . . . . . . . . . . 77
5.7 MS Gauge Ion Trap Power Supply Settings . . . . . . . . . . . . . . . . . . . . . . . . . . . . . . . . . . . . . . . . . . . . . . . . 78
5.7.1 Filament Overpower Detection . . . . . . . . . . . . . . . . . . . . . . . . . . . . . . . . . . . . . . . . . . . . . . . . . . . 80
5.7.2 RF Signal Generator. . . . . . . . . . . . . . . . . . . . . . . . . . . . . . . . . . . . . . . . . . . . . . . . . . . . . . . . . . . . 80
5.7.3 Electrometer . . . . . . . . . . . . . . . . . . . . . . . . . . . . . . . . . . . . . . . . . . . . . . . . . . . . . . . . . . . . . . . . . . 83
5.8 Power Modes . . . . . . . . . . . . . . . . . . . . . . . . . . . . . . . . . . . . . . . . . . . . . . . . . . . . . . . . . . . . . . . . . . . . . . . 84
5.9 Power ON/OFF Sequence . . . . . . . . . . . . . . . . . . . . . . . . . . . . . . . . . . . . . . . . . . . . . . . . . . . . . . . . . . . . . 85
5.9.1 Power ON Sequence. . . . . . . . . . . . . . . . . . . . . . . . . . . . . . . . . . . . . . . . . . . . . . . . . . . . . . . . . . . . 85
5.9.2 Standby Power Sequence . . . . . . . . . . . . . . . . . . . . . . . . . . . . . . . . . . . . . . . . . . . . . . . . . . . . . . . . 86
5.9.3 Power-On Self-Test . . . . . . . . . . . . . . . . . . . . . . . . . . . . . . . . . . . . . . . . . . . . . . . . . . . . . . . . . . . . 86
7
Series 835 Vacuum Quality Monitor
Instruction Manual - 835000
5.10 Micro-Ion Gauge Operation . . . . . . . . . . . . . . . . . . . . . . . . . . . . . . . . . . . . . . . . . . . . . . . . . . . . . . . . . . . 87
5.10.1 Autopressure Mode. . . . . . . . . . . . . . . . . . . . . . . . . . . . . . . . . . . . . . . . . . . . . . . . . . . . . . . . . . . . 88
5.10.2 Overpressure Protection . . . . . . . . . . . . . . . . . . . . . . . . . . . . . . . . . . . . . . . . . . . . . . . . . . . . . . . . 90
5.11 Mass Spectrometry Scan Control . . . . . . . . . . . . . . . . . . . . . . . . . . . . . . . . . . . . . . . . . . . . . . . . . . . . . . . . 91
5.11.1 Manual Scan Control . . . . . . . . . . . . . . . . . . . . . . . . . . . . . . . . . . . . . . . . . . . . . . . . . . . . . . . . . . 92
5.11.2 External Trigger Scan Control . . . . . . . . . . . . . . . . . . . . . . . . . . . . . . . . . . . . . . . . . . . . . . . . . . . 92
5.11.3 Remote Scan Control . . . . . . . . . . . . . . . . . . . . . . . . . . . . . . . . . . . . . . . . . . . . . . . . . . . . . . . . . . 92
5.11.4 Mass Spectrometry Scan Count . . . . . . . . . . . . . . . . . . . . . . . . . . . . . . . . . . . . . . . . . . . . . . . . . . 92
5.11.5 Single Scan . . . . . . . . . . . . . . . . . . . . . . . . . . . . . . . . . . . . . . . . . . . . . . . . . . . . . . . . . . . . . . . . . . 92
5.11.6 Continuous Scans. . . . . . . . . . . . . . . . . . . . . . . . . . . . . . . . . . . . . . . . . . . . . . . . . . . . . . . . . . . . . 93
5.12 Typical System Configurations . . . . . . . . . . . . . . . . . . . . . . . . . . . . . . . . . . . . . . . . . . . . . . . . . . . . . . . . . 93
5.12.1 Standard Setup . . . . . . . . . . . . . . . . . . . . . . . . . . . . . . . . . . . . . . . . . . . . . . . . . . . . . . . . . . . . . . . 93
5.12.2 Standard Setup with External Trigger Pulses . . . . . . . . . . . . . . . . . . . . . . . . . . . . . . . . . . . . . . . . 94
5.12.3 Stand Alone Setup . . . . . . . . . . . . . . . . . . . . . . . . . . . . . . . . . . . . . . . . . . . . . . . . . . . . . . . . . . . . 96
5.12.4 Stand Alone Setup with External Pulses . . . . . . . . . . . . . . . . . . . . . . . . . . . . . . . . . . . . . . . . . . . . 97
5.13 Timing Diagrams for MS Scan Control . . . . . . . . . . . . . . . . . . . . . . . . . . . . . . . . . . . . . . . . . . . . . . . . . . . 98
5.13.1 Immediate Trigger Mode . . . . . . . . . . . . . . . . . . . . . . . . . . . . . . . . . . . . . . . . . . . . . . . . . . . . . . . 98
5.13.2 Internal Trigger with No USB Data . . . . . . . . . . . . . . . . . . . . . . . . . . . . . . . . . . . . . . . . . . . . . . . 99
5.13.3 Internal Trigger with USB Data . . . . . . . . . . . . . . . . . . . . . . . . . . . . . . . . . . . . . . . . . . . . . . . . . 100
5.13.4 Buffer Overwrite. . . . . . . . . . . . . . . . . . . . . . . . . . . . . . . . . . . . . . . . . . . . . . . . . . . . . . . . . . . . . 100
Chapter 6 Ion Trap Mass Spectrometer Gauge . . . . . . . . . . . . . . . . . . . . . . . . . . . . . . . . . . . . . . . . . . . . . . . . . . . 103
6.1 Introduction to the MS Gauge . . . . . . . . . . . . . . . . . . . . . . . . . . . . . . . . . . . . . . . . . . . . . . . . . . . . . . . . 103
6.2 Terms used in this chapter . . . . . . . . . . . . . . . . . . . . . . . . . . . . . . . . . . . . . . . . . . . . . . . . . . . . . . . . . . . . 103
6.3 MS Gauge Overview . . . . . . . . . . . . . . . . . . . . . . . . . . . . . . . . . . . . . . . . . . . . . . . . . . . . . . . . . . . . . . . . 103
6.4 MS Gauge Principles of Operation . . . . . . . . . . . . . . . . . . . . . . . . . . . . . . . . . . . . . . . . . . . . . . . . . . . . . 110
6.5 Construction Materials . . . . . . . . . . . . . . . . . . . . . . . . . . . . . . . . . . . . . . . . . . . . . . . . . . . . . . . . . . . . . . 115
6.6 Ionizer . . . . . . . . . . . . . . . . . . . . . . . . . . . . . . . . . . . . . . . . . . . . . . . . . . . . . . . . . . . . . . . . . . . . . . . . . . . 116
6.7 Ion Trap Mass Separator . . . . . . . . . . . . . . . . . . . . . . . . . . . . . . . . . . . . . . . . . . . . . . . . . . . . . . . . . . . . . 118
6.8 Ion Detector Assembly . . . . . . . . . . . . . . . . . . . . . . . . . . . . . . . . . . . . . . . . . . . . . . . . . . . . . . . . . . . . . . 121
6.9 MS Gauge Advanced User Settings . . . . . . . . . . . . . . . . . . . . . . . . . . . . . . . . . . . . . . . . . . . . . . . . . . . . . 123
6.9.1 Electron Multiplier Bias . . . . . . . . . . . . . . . . . . . . . . . . . . . . . . . . . . . . . . . . . . . . . . . . . . . . . . . . 126
6.9.2 RF Amplitude Peak-to-Peak . . . . . . . . . . . . . . . . . . . . . . . . . . . . . . . . . . . . . . . . . . . . . . . . . . . . . 126
6.9.3 Filament Emission . . . . . . . . . . . . . . . . . . . . . . . . . . . . . . . . . . . . . . . . . . . . . . . . . . . . . . . . . . . . 128
6.9.4 Repeller Plate Bias . . . . . . . . . . . . . . . . . . . . . . . . . . . . . . . . . . . . . . . . . . . . . . . . . . . . . . . . . . . . 129
6.9.5 Exit Plate Bias. . . . . . . . . . . . . . . . . . . . . . . . . . . . . . . . . . . . . . . . . . . . . . . . . . . . . . . . . . . . . . . . 130
6.9.6 Electron Multiplier Shield Bias. . . . . . . . . . . . . . . . . . . . . . . . . . . . . . . . . . . . . . . . . . . . . . . . . . . 130
6.9.7 Filament Bias . . . . . . . . . . . . . . . . . . . . . . . . . . . . . . . . . . . . . . . . . . . . . . . . . . . . . . . . . . . . . . . . 131
6.9.8 Entry Plate Bias . . . . . . . . . . . . . . . . . . . . . . . . . . . . . . . . . . . . . . . . . . . . . . . . . . . . . . . . . . . . . . 131
6.9.9 Pressure Plate Bias . . . . . . . . . . . . . . . . . . . . . . . . . . . . . . . . . . . . . . . . . . . . . . . . . . . . . . . . . . . . 131
6.9.10 Cup Bias. . . . . . . . . . . . . . . . . . . . . . . . . . . . . . . . . . . . . . . . . . . . . . . . . . . . . . . . . . . . . . . . . . . 131
6.9.11 Transition Bias . . . . . . . . . . . . . . . . . . . . . . . . . . . . . . . . . . . . . . . . . . . . . . . . . . . . . . . . . . . . . . 132
6.10 Superharmonics . . . . . . . . . . . . . . . . . . . . . . . . . . . . . . . . . . . . . . . . . . . . . . . . . . . . . . . . . . . . . . . . . . . . 132
Chapter 7 MS Gauge Maintenance . . . . . . . . . . . . . . . . . . . . . . . . . . . . . . . . . . . . . . . . . . . . . . . . . . . . . . . . . . . . 135
7.1 Introduction . . . . . . . . . . . . . . . . . . . . . . . . . . . . . . . . . . . . . . . . . . . . . . . . . . . . . . . . . . . . . . . . . . . . . . 135
7.2 Unpacking, Handling, and Long-Term Storage . . . . . . . . . . . . . . . . . . . . . . . . . . . . . . . . . . . . . . . . . . . . 135
7.2.1 Storage Recommendations . . . . . . . . . . . . . . . . . . . . . . . . . . . . . . . . . . . . . . . . . . . . . . . . . . . . . . 136
7.3 Bakeout Procedure . . . . . . . . . . . . . . . . . . . . . . . . . . . . . . . . . . . . . . . . . . . . . . . . . . . . . . . . . . . . . . . . . . 136
7.4 Environmental Requirements . . . . . . . . . . . . . . . . . . . . . . . . . . . . . . . . . . . . . . . . . . . . . . . . . . . . . . . . . 138
7.4.1 Pressure Ranges . . . . . . . . . . . . . . . . . . . . . . . . . . . . . . . . . . . . . . . . . . . . . . . . . . . . . . . . . . . . . . 138
7.4.1.1 UHV Operation . . . . . . . . . . . . . . . . . . . . . . . . . . . . . . . . . . . . . . . . . . . . . . . . . . . . . . 138

Table of Contents
8Series 835 Vacuum Quality Monitor
Instruction Manual - 835000
7.4.1.2 Operation at Close to Upper Pressure Limit . . . . . . . . . . . . . . . . . . . . . . . . . . . . . . . . . 138
7.4.2 Temperature Range . . . . . . . . . . . . . . . . . . . . . . . . . . . . . . . . . . . . . . . . . . . . . . . . . . . . . . . . . . . 138
7.4.3 Humidity Range. . . . . . . . . . . . . . . . . . . . . . . . . . . . . . . . . . . . . . . . . . . . . . . . . . . . . . . . . . . . . . 139
7.4.4 Warm-up Periods . . . . . . . . . . . . . . . . . . . . . . . . . . . . . . . . . . . . . . . . . . . . . . . . . . . . . . . . . . . . 139
7.5 Filament Assembly . . . . . . . . . . . . . . . . . . . . . . . . . . . . . . . . . . . . . . . . . . . . . . . . . . . . . . . . . . . . . . . . . . 140
7.5.1 Introduction. . . . . . . . . . . . . . . . . . . . . . . . . . . . . . . . . . . . . . . . . . . . . . . . . . . . . . . . . . . . . . . . . 140
7.5.2 Filament Assembly Replacement. . . . . . . . . . . . . . . . . . . . . . . . . . . . . . . . . . . . . . . . . . . . . . . . . . 140
7.5.3 Repeller Voltage Optimization . . . . . . . . . . . . . . . . . . . . . . . . . . . . . . . . . . . . . . . . . . . . . . . . . . . 145
7.5.4 Filament Operation . . . . . . . . . . . . . . . . . . . . . . . . . . . . . . . . . . . . . . . . . . . . . . . . . . . . . . . . . . . 146
7.6 Electron Multiplier Detector . . . . . . . . . . . . . . . . . . . . . . . . . . . . . . . . . . . . . . . . . . . . . . . . . . . . . . . . . . 146
7.6.1 Introduction. . . . . . . . . . . . . . . . . . . . . . . . . . . . . . . . . . . . . . . . . . . . . . . . . . . . . . . . . . . . . . . . . 146
7.6.2 Best-Known Practices . . . . . . . . . . . . . . . . . . . . . . . . . . . . . . . . . . . . . . . . . . . . . . . . . . . . . . . . . . 146
7.6.3 Operating Pressure . . . . . . . . . . . . . . . . . . . . . . . . . . . . . . . . . . . . . . . . . . . . . . . . . . . . . . . . . . . . 147
7.6.4 Operating Temperature . . . . . . . . . . . . . . . . . . . . . . . . . . . . . . . . . . . . . . . . . . . . . . . . . . . . . . . . 147
7.6.5 Bakeout Temperature . . . . . . . . . . . . . . . . . . . . . . . . . . . . . . . . . . . . . . . . . . . . . . . . . . . . . . . . . . 147
7.6.6 Operating Voltage . . . . . . . . . . . . . . . . . . . . . . . . . . . . . . . . . . . . . . . . . . . . . . . . . . . . . . . . . . . . 148
7.6.7 Contamination . . . . . . . . . . . . . . . . . . . . . . . . . . . . . . . . . . . . . . . . . . . . . . . . . . . . . . . . . . . . . . . 148
7.6.8 Initial Operation. . . . . . . . . . . . . . . . . . . . . . . . . . . . . . . . . . . . . . . . . . . . . . . . . . . . . . . . . . . . . . 149
7.6.9 Gain Adjustment . . . . . . . . . . . . . . . . . . . . . . . . . . . . . . . . . . . . . . . . . . . . . . . . . . . . . . . . . . . . . 149
7.6.10 Electron Multiplier Replacement . . . . . . . . . . . . . . . . . . . . . . . . . . . . . . . . . . . . . . . . . . . . . . . . 149
7.7 Cleaning a VQM Gauge . . . . . . . . . . . . . . . . . . . . . . . . . . . . . . . . . . . . . . . . . . . . . . . . . . . . . . . . . . . . . 154
Chapter 8 Initial Operation & Viewer Software . . . . . . . . . . . . . . . . . . . . . . . . . . . . . . . . . . . . . . . . . . . . . . . . . . 155
8.1 VQM® Viewer Application Software for the VQM System . . . . . . . . . . . . . . . . . . . . . . . . . . . . . . . . . . 155
8.1.1 Software VIs, Services, and Driver . . . . . . . . . . . . . . . . . . . . . . . . . . . . . . . . . . . . . . . . . . . . . . . . 156
8.2 VQM Viewer Application Icons and Screen Displays . . . . . . . . . . . . . . . . . . . . . . . . . . . . . . . . . . . . . . . 156
8.2.1 Viewer Application Icons . . . . . . . . . . . . . . . . . . . . . . . . . . . . . . . . . . . . . . . . . . . . . . . . . . . . . . . 157
8.2.1.1 Connect See Section 8.4.1 . . . . . . . . . . . . . . . . . . . . . . . . . . . . . . . . . . . . . . . . . . . . . . 157
8.2.1.2 Multi-function Mass Spec Control See Section 8.4.2. . . . . . . . . . . . . . . . . . . . . . . . . . . 157
8.2.1.3 Auto Tune See Section 8.4.3 . . . . . . . . . . . . . . . . . . . . . . . . . . . . . . . . . . . . . . . . . . . . 157
8.2.1.4 Summary See Section 8.4.4 . . . . . . . . . . . . . . . . . . . . . . . . . . . . . . . . . . . . . . . . . . . . . . 157
8.2.1.5 Trend See Section 8.4.5 . . . . . . . . . . . . . . . . . . . . . . . . . . . . . . . . . . . . . . . . . . . . . . . . 158
8.2.1.6 Leak See Section 8.4.6 . . . . . . . . . . . . . . . . . . . . . . . . . . . . . . . . . . . . . . . . . . . . . . . . . 158
8.2.1.7 Settings See Section 8.4.7 . . . . . . . . . . . . . . . . . . . . . . . . . . . . . . . . . . . . . . . . . . . . . . . 158
8.2.1.8 Tune See Section 8.4.8 . . . . . . . . . . . . . . . . . . . . . . . . . . . . . . . . . . . . . . . . . . . . . . . . . 158
8.2.1.9 Log Data See Section 8.4.8.4 and Section 8.4.9 . . . . . . . . . . . . . . . . . . . . . . . . . . . . . . 159
8.2.1.10 Save See Section 8.4.10 . . . . . . . . . . . . . . . . . . . . . . . . . . . . . . . . . . . . . . . . . . . . . . . . 159
8.2.1.11 VQI® (Vacuum Quality IndexTM) See Section 8.4.11 . . . . . . . . . . . . . . . . . . . . . . . 159
8.2.1.12 VQI Status See Section 8.4.12 . . . . . . . . . . . . . . . . . . . . . . . . . . . . . . . . . . . . . . . . . . 159
8.3 Initial Operation Procedure . . . . . . . . . . . . . . . . . . . . . . . . . . . . . . . . . . . . . . . . . . . . . . . . . . . . . . . . . . . 160
8.3.1 Connect the USB Cable . . . . . . . . . . . . . . . . . . . . . . . . . . . . . . . . . . . . . . . . . . . . . . . . . . . . . . . . 161
8.3.2 Initial Pump Down . . . . . . . . . . . . . . . . . . . . . . . . . . . . . . . . . . . . . . . . . . . . . . . . . . . . . . . . . . . 161
8.3.2.1 Background . . . . . . . . . . . . . . . . . . . . . . . . . . . . . . . . . . . . . . . . . . . . . . . . . . . . . . . . . . 161
8.3.2.2 Procedure . . . . . . . . . . . . . . . . . . . . . . . . . . . . . . . . . . . . . . . . . . . . . . . . . . . . . . . . . . . 161
8.3.3 Abbreviated Initial Startup/Setup Procedure. . . . . . . . . . . . . . . . . . . . . . . . . . . . . . . . . . . . . . . . . 162
8.3.3.1 Procedure . . . . . . . . . . . . . . . . . . . . . . . . . . . . . . . . . . . . . . . . . . . . . . . . . . . . . . . . . . . 163
8.3.4 Filament Outgassing. . . . . . . . . . . . . . . . . . . . . . . . . . . . . . . . . . . . . . . . . . . . . . . . . . . . . . . . . . . 166
8.3.4.1 Background . . . . . . . . . . . . . . . . . . . . . . . . . . . . . . . . . . . . . . . . . . . . . . . . . . . . . . . . . . 166
8.3.4.2 Procedure . . . . . . . . . . . . . . . . . . . . . . . . . . . . . . . . . . . . . . . . . . . . . . . . . . . . . . . . . . . 166
8.3.5 Electron Multiplier Preconditioning. . . . . . . . . . . . . . . . . . . . . . . . . . . . . . . . . . . . . . . . . . . . . . . 167
8.3.5.1 Background . . . . . . . . . . . . . . . . . . . . . . . . . . . . . . . . . . . . . . . . . . . . . . . . . . . . . . . . . . 167
8.3.5.2 Procedure . . . . . . . . . . . . . . . . . . . . . . . . . . . . . . . . . . . . . . . . . . . . . . . . . . . . . . . . . . . 167
8.3.6 Auto Tune . . . . . . . . . . . . . . . . . . . . . . . . . . . . . . . . . . . . . . . . . . . . . . . . . . . . . . . . . . . . . . . . . . 168
8.3.6.1 Background . . . . . . . . . . . . . . . . . . . . . . . . . . . . . . . . . . . . . . . . . . . . . . . . . . . . . . . . . . 168
9
Series 835 Vacuum Quality Monitor
Instruction Manual - 835000
8.3.6.2 Procedure . . . . . . . . . . . . . . . . . . . . . . . . . . . . . . . . . . . . . . . . . . . . . . . . . . . . . . . . . . . 168
8.3.7 Manual Electron Multiplier Bias Voltage Adjustment (optional) . . . . . . . . . . . . . . . . . . . . . . . . . 169
8.3.7.1 Background . . . . . . . . . . . . . . . . . . . . . . . . . . . . . . . . . . . . . . . . . . . . . . . . . . . . . . . . . . 169
8.3.7.2 Procedure . . . . . . . . . . . . . . . . . . . . . . . . . . . . . . . . . . . . . . . . . . . . . . . . . . . . . . . . . . . 169
8.3.8 Mass Axis Calibration. . . . . . . . . . . . . . . . . . . . . . . . . . . . . . . . . . . . . . . . . . . . . . . . . . . . . . . . . . 170
8.3.8.1 Background . . . . . . . . . . . . . . . . . . . . . . . . . . . . . . . . . . . . . . . . . . . . . . . . . . . . . . . . . . 170
8.3.8.2 Procedure . . . . . . . . . . . . . . . . . . . . . . . . . . . . . . . . . . . . . . . . . . . . . . . . . . . . . . . . . . . 171
8.3.9 Storing the Gauge Settings . . . . . . . . . . . . . . . . . . . . . . . . . . . . . . . . . . . . . . . . . . . . . . . . . . . . . . 172
8.4 Using the Viewer Application . . . . . . . . . . . . . . . . . . . . . . . . . . . . . . . . . . . . . . . . . . . . . . . . . . . . . . . . . 173
8.4.1 Connect . . . . . . . . . . . . . . . . . . . . . . . . . . . . . . . . . . . . . . . . . . . . . . . . . . . . . . . . . . . . . . . . . . . 173
8.4.1.1 To Connect to a VQM Controller . . . . . . . . . . . . . . . . . . . . . . . . . . . . . . . . . . . . . . . . . 173
8.4.1.2 To Connect to a Log Data File . . . . . . . . . . . . . . . . . . . . . . . . . . . . . . . . . . . . . . . . . . . 174
8.4.1.3 To Connect to a Raw Log File . . . . . . . . . . . . . . . . . . . . . . . . . . . . . . . . . . . . . . . . . . . . 174
8.4.2 Gauge Operating Mode . . . . . . . . . . . . . . . . . . . . . . . . . . . . . . . . . . . . . . . . . . . . . . . . . . . . . . . . 175
8.4.3 Auto Tune . . . . . . . . . . . . . . . . . . . . . . . . . . . . . . . . . . . . . . . . . . . . . . . . . . . . . . . . . . . . . . . . . 176
8.4.3.1 Electron Multiplier Only Auto Tune . . . . . . . . . . . . . . . . . . . . . . . . . . . . . . . . . . . . . . . 177
8.4.3.2 Express Auto Tune . . . . . . . . . . . . . . . . . . . . . . . . . . . . . . . . . . . . . . . . . . . . . . . . . . . . 177
8.4.3.3 Complete Auto Tune . . . . . . . . . . . . . . . . . . . . . . . . . . . . . . . . . . . . . . . . . . . . . . . . . . 178
8.4.4 Summary . . . . . . . . . . . . . . . . . . . . . . . . . . . . . . . . . . . . . . . . . . . . . . . . . . . . . . . . . . . . . . . . . . 179
8.4.4.1 Clear History and Zoom Functions . . . . . . . . . . . . . . . . . . . . . . . . . . . . . . . . . . . . . . . . 179
8.4.4.2 Results Table . . . . . . . . . . . . . . . . . . . . . . . . . . . . . . . . . . . . . . . . . . . . . . . . . . . . . . . . . 179
8.4.4.3 Total Pressure . . . . . . . . . . . . . . . . . . . . . . . . . . . . . . . . . . . . . . . . . . . . . . . . . . . . . . . . 181
8.4.4.4 Averaging (Post-Processing) . . . . . . . . . . . . . . . . . . . . . . . . . . . . . . . . . . . . . . . . . . . . . . 181
8.4.4.5 Short-Term Trend Graph . . . . . . . . . . . . . . . . . . . . . . . . . . . . . . . . . . . . . . . . . . . . . . . 182
8.4.4.6 Histogram . . . . . . . . . . . . . . . . . . . . . . . . . . . . . . . . . . . . . . . . . . . . . . . . . . . . . . . . . . . 182
8.4.5 Trend . . . . . . . . . . . . . . . . . . . . . . . . . . . . . . . . . . . . . . . . . . . . . . . . . . . . . . . . . . . . . . . . . . . . . 184
8.4.6 Leak . . . . . . . . . . . . . . . . . . . . . . . . . . . . . . . . . . . . . . . . . . . . . . . . . . . . . . . . . . . . . . . . . . . . . . 185
8.4.6.1 Leak Parameters . . . . . . . . . . . . . . . . . . . . . . . . . . . . . . . . . . . . . . . . . . . . . . . . . . . . . . . 187
8.4.6.2 Leak Trend Graph . . . . . . . . . . . . . . . . . . . . . . . . . . . . . . . . . . . . . . . . . . . . . . . . . . . . . 187
8.4.6.3 Initiating Leak Check . . . . . . . . . . . . . . . . . . . . . . . . . . . . . . . . . . . . . . . . . . . . . . . . . . 189
8.4.7 Settings (preferences) . . . . . . . . . . . . . . . . . . . . . . . . . . . . . . . . . . . . . . . . . . . . . . . . . . . . . . . . . 191
8.4.7.1 Mass Spectrum Library . . . . . . . . . . . . . . . . . . . . . . . . . . . . . . . . . . . . . . . . . . . . . . . . . 191
8.4.7.2 Pressure Setup (configuration) . . . . . . . . . . . . . . . . . . . . . . . . . . . . . . . . . . . . . . . . . . . . 192
8.4.7.3 Scan Range . . . . . . . . . . . . . . . . . . . . . . . . . . . . . . . . . . . . . . . . . . . . . . . . . . . . . . . . . . 193
8.4.8 Tune . . . . . . . . . . . . . . . . . . . . . . . . . . . . . . . . . . . . . . . . . . . . . . . . . . . . . . . . . . . . . . . . . . . . . . 194
8.4.8.1 Selected Peak Parameters . . . . . . . . . . . . . . . . . . . . . . . . . . . . . . . . . . . . . . . . . . . . . . . . 196
8.4.8.2 Calibration Control . . . . . . . . . . . . . . . . . . . . . . . . . . . . . . . . . . . . . . . . . . . . . . . . . . . . 196
8.4.8.3 Diagnostics . . . . . . . . . . . . . . . . . . . . . . . . . . . . . . . . . . . . . . . . . . . . . . . . . . . . . . . . . . 197
8.4.8.4 Raw Logging . . . . . . . . . . . . . . . . . . . . . . . . . . . . . . . . . . . . . . . . . . . . . . . . . . . . . . . . . 198
8.4.8.5 Tuning Spectrum . . . . . . . . . . . . . . . . . . . . . . . . . . . . . . . . . . . . . . . . . . . . . . . . . . . . . . 198
8.4.8.6 Header . . . . . . . . . . . . . . . . . . . . . . . . . . . . . . . . . . . . . . . . . . . . . . . . . . . . . . . . . . . . . . 199
8.4.9 Log Data . . . . . . . . . . . . . . . . . . . . . . . . . . . . . . . . . . . . . . . . . . . . . . . . . . . . . . . . . . . . . . . . . . 200
8.4.10 Save . . . . . . . . . . . . . . . . . . . . . . . . . . . . . . . . . . . . . . . . . . . . . . . . . . . . . . . . . . . . . . . . . . . . . 202
8.4.10.1 Save Menu . . . . . . . . . . . . . . . . . . . . . . . . . . . . . . . . . . . . . . . . . . . . . . . . . . . . . . . . . . 202
8.4.11 VQI® (Vacuum Quality IndexTM) . . . . . . . . . . . . . . . . . . . . . . . . . . . . . . . . . . . . . . . . . . . . . 203
8.4.12 VQI Status . . . . . . . . . . . . . . . . . . . . . . . . . . . . . . . . . . . . . . . . . . . . . . . . . . . . . . . . . . . . . . . . . 205
8.4.13 Status/Error Reporting and Contextual Help . . . . . . . . . . . . . . . . . . . . . . . . . . . . . . . . . . . . . . . 205
8.4.13.1 Error/Event List . . . . . . . . . . . . . . . . . . . . . . . . . . . . . . . . . . . . . . . . . . . . . . . . . . . . . . 206
8.4.14 Adding Pressure Sources. . . . . . . . . . . . . . . . . . . . . . . . . . . . . . . . . . . . . . . . . . . . . . . . . . . . . . . 207
8.4.15 Customizing Data Analysis Peak Fitting. . . . . . . . . . . . . . . . . . . . . . . . . . . . . . . . . . . . . . . . . . . 207
8.4.16 Adding Gases or Customizing Gas Coefficients . . . . . . . . . . . . . . . . . . . . . . . . . . . . . . . . . . . . . 207
8.5 Troubleshooting . . . . . . . . . . . . . . . . . . . . . . . . . . . . . . . . . . . . . . . . . . . . . . . . . . . . . . . . . . . . . . . . . . . 209
8.5.1 Viewer Application Does Not Open. . . . . . . . . . . . . . . . . . . . . . . . . . . . . . . . . . . . . . . . . . . . . . . 209
8.5.1.1 First Connection After a Fresh Install . . . . . . . . . . . . . . . . . . . . . . . . . . . . . . . . . . . . . . 209

Table of Contents
10 Series 835 Vacuum Quality Monitor
Instruction Manual - 835000
8.5.1.2 First Connection After a a PC Reboot . . . . . . . . . . . . . . . . . . . . . . . . . . . . . . . . . . . . . . 209
8.5.2 Viewer Application Does Not List Any VQM Controllers . . . . . . . . . . . . . . . . . . . . . . . . . . . . . . 209
8.5.3 Viewer Application Does Not Connect to a Listed Controller . . . . . . . . . . . . . . . . . . . . . . . . . . . 209
8.5.4 Service is not Responding . . . . . . . . . . . . . . . . . . . . . . . . . . . . . . . . . . . . . . . . . . . . . . . . . . . . . . . 210
8.5.5 .Net Error when attempting to connect Viewer Application to Controller . . . . . . . . . . . . . . . . . . 210
8.5.6 Viewer Application displays Generic Error 42 or Error 74 when connecting to a Controller. . . . . 210
8.5.7 Loss of Communication . . . . . . . . . . . . . . . . . . . . . . . . . . . . . . . . . . . . . . . . . . . . . . . . . . . . . . . . 210
8.5.8 Mass Spec Light Red or Gauge Won't Turn On. . . . . . . . . . . . . . . . . . . . . . . . . . . . . . . . . . . . . . 212
8.5.9 System Stopped Scanning or Won't Scan . . . . . . . . . . . . . . . . . . . . . . . . . . . . . . . . . . . . . . . . . . . 212
8.5.10 Auto Tune Failures. . . . . . . . . . . . . . . . . . . . . . . . . . . . . . . . . . . . . . . . . . . . . . . . . . . . . . . . . . . 212
8.5.10.1 390 Checksum Error . . . . . . . . . . . . . . . . . . . . . . . . . . . . . . . . . . . . . . . . . . . . . . . . . . 213
8.5.11 Auto Tune Errors . . . . . . . . . . . . . . . . . . . . . . . . . . . . . . . . . . . . . . . . . . . . . . . . . . . . . . . . . . . . 213
8.5.12 835 VQM Controller Errors. . . . . . . . . . . . . . . . . . . . . . . . . . . . . . . . . . . . . . . . . . . . . . . . . . . . 215
8.5.13 Low Signal . . . . . . . . . . . . . . . . . . . . . . . . . . . . . . . . . . . . . . . . . . . . . . . . . . . . . . . . . . . . . . . . . 217
8.5.14 Missing Peaks . . . . . . . . . . . . . . . . . . . . . . . . . . . . . . . . . . . . . . . . . . . . . . . . . . . . . . . . . . . . . . . 217
8.5.15 Noisy Signal . . . . . . . . . . . . . . . . . . . . . . . . . . . . . . . . . . . . . . . . . . . . . . . . . . . . . . . . . . . . . . . . 218
8.5.16 Timeouts, etc.. . . . . . . . . . . . . . . . . . . . . . . . . . . . . . . . . . . . . . . . . . . . . . . . . . . . . . . . . . . . . . . 218
8.5.17 Where are the Logs? . . . . . . . . . . . . . . . . . . . . . . . . . . . . . . . . . . . . . . . . . . . . . . . . . . . . . . . . . . 218
8.5.18 Error 5013 - Not able to create Raw Logs. . . . . . . . . . . . . . . . . . . . . . . . . . . . . . . . . . . . . . . . . . 219
8.6 VQM Utility Application . . . . . . . . . . . . . . . . . . . . . . . . . . . . . . . . . . . . . . . . . . . . . . . . . . . . . . . . . . . . 220
8.6.1 File Menu. . . . . . . . . . . . . . . . . . . . . . . . . . . . . . . . . . . . . . . . . . . . . . . . . . . . . . . . . . . . . . . . . . . 220
8.6.2 Diagnostics Tab . . . . . . . . . . . . . . . . . . . . . . . . . . . . . . . . . . . . . . . . . . . . . . . . . . . . . . . . . . . . . . 220
8.6.2.1 Verifying the Installation . . . . . . . . . . . . . . . . . . . . . . . . . . . . . . . . . . . . . . . . . . . . . . . . 220
8.6.2.2 Install Device Driver . . . . . . . . . . . . . . . . . . . . . . . . . . . . . . . . . . . . . . . . . . . . . . . . . . . 221
8.6.2.3 Firmware/Control Panel Tests . . . . . . . . . . . . . . . . . . . . . . . . . . . . . . . . . . . . . . . . . . . . 221
8.6.3 Cable Power Limit Tab . . . . . . . . . . . . . . . . . . . . . . . . . . . . . . . . . . . . . . . . . . . . . . . . . . . . . . . . 221
8.6.4 Firmware Upgrade Tab. . . . . . . . . . . . . . . . . . . . . . . . . . . . . . . . . . . . . . . . . . . . . . . . . . . . . . . . . 221
8.6.5 SCPI Command Tab . . . . . . . . . . . . . . . . . . . . . . . . . . . . . . . . . . . . . . . . . . . . . . . . . . . . . . . . . . 222
Chapter 9 835 VQM® Command Set . . . . . . . . . . . . . . . . . . . . . . . . . . . . . . . . . . . . . . . . . . . . . . . . . . . . . . . . . 225
9.1 Introduction . . . . . . . . . . . . . . . . . . . . . . . . . . . . . . . . . . . . . . . . . . . . . . . . . . . . . . . . . . . . . . . . . . . . . . 225
9.1.1 USB Driver Installation . . . . . . . . . . . . . . . . . . . . . . . . . . . . . . . . . . . . . . . . . . . . . . . . . . . . . . . . 225
9.1.2 Logical Instruments . . . . . . . . . . . . . . . . . . . . . . . . . . . . . . . . . . . . . . . . . . . . . . . . . . . . . . . . . . . 225
9.1.3 Command Format . . . . . . . . . . . . . . . . . . . . . . . . . . . . . . . . . . . . . . . . . . . . . . . . . . . . . . . . . . . . 227
9.2 SCPI Command Tables . . . . . . . . . . . . . . . . . . . . . . . . . . . . . . . . . . . . . . . . . . . . . . . . . . . . . . . . . . . . . . 228
9.2.1 Input Format . . . . . . . . . . . . . . . . . . . . . . . . . . . . . . . . . . . . . . . . . . . . . . . . . . . . . . . . . . . . . . . . 228
9.2.2 Response Format . . . . . . . . . . . . . . . . . . . . . . . . . . . . . . . . . . . . . . . . . . . . . . . . . . . . . . . . . . . . . 228
9.3 IEEE 488.2 Required Commands . . . . . . . . . . . . . . . . . . . . . . . . . . . . . . . . . . . . . . . . . . . . . . . . . . . . . . 230
9.3.1 CALibration Subsystem . . . . . . . . . . . . . . . . . . . . . . . . . . . . . . . . . . . . . . . . . . . . . . . . . . . . . . . . 231
9.3.2 CONFigure Subsystem. . . . . . . . . . . . . . . . . . . . . . . . . . . . . . . . . . . . . . . . . . . . . . . . . . . . . . . . . 231
9.3.3 FETCh Subsystem . . . . . . . . . . . . . . . . . . . . . . . . . . . . . . . . . . . . . . . . . . . . . . . . . . . . . . . . . . . . 232
9.3.4 FORMat Subsystem . . . . . . . . . . . . . . . . . . . . . . . . . . . . . . . . . . . . . . . . . . . . . . . . . . . . . . . . . . . 232
9.3.5 INPut Subsystem . . . . . . . . . . . . . . . . . . . . . . . . . . . . . . . . . . . . . . . . . . . . . . . . . . . . . . . . . . . . . 233
9.3.6 INSTrument Subsystem . . . . . . . . . . . . . . . . . . . . . . . . . . . . . . . . . . . . . . . . . . . . . . . . . . . . . . . . 234
9.3.7 MEASure Subsystem . . . . . . . . . . . . . . . . . . . . . . . . . . . . . . . . . . . . . . . . . . . . . . . . . . . . . . . . . . 235
9.3.8 MEMory Subsystem. . . . . . . . . . . . . . . . . . . . . . . . . . . . . . . . . . . . . . . . . . . . . . . . . . . . . . . . . . . 236
9.3.9 OUTPut Subsystem . . . . . . . . . . . . . . . . . . . . . . . . . . . . . . . . . . . . . . . . . . . . . . . . . . . . . . . . . . . 237
9.3.10 SENSe Subsystem. . . . . . . . . . . . . . . . . . . . . . . . . . . . . . . . . . . . . . . . . . . . . . . . . . . . . . . . . . . . 238
9.3.11 SOURce Subsystem . . . . . . . . . . . . . . . . . . . . . . . . . . . . . . . . . . . . . . . . . . . . . . . . . . . . . . . . . . 238
9.3.12 STATus Subsystem. . . . . . . . . . . . . . . . . . . . . . . . . . . . . . . . . . . . . . . . . . . . . . . . . . . . . . . . . . . 240
9.3.13 SYSTem Subsystem . . . . . . . . . . . . . . . . . . . . . . . . . . . . . . . . . . . . . . . . . . . . . . . . . . . . . . . . . . 250
9.3.14 TEST Subsystem . . . . . . . . . . . . . . . . . . . . . . . . . . . . . . . . . . . . . . . . . . . . . . . . . . . . . . . . . . . . 251
11
Series 835 Vacuum Quality Monitor
Instruction Manual - 835000
9.4 Test Report . . . . . . . . . . . . . . . . . . . . . . . . . . . . . . . . . . . . . . . . . . . . . . . . . . . . . . . . . . . . . . . . . . . . . . . 252
9.4.1 TRIGger Subsystem . . . . . . . . . . . . . . . . . . . . . . . . . . . . . . . . . . . . . . . . . . . . . . . . . . . . . . . . . . . 253
9.4.2 Reset State . . . . . . . . . . . . . . . . . . . . . . . . . . . . . . . . . . . . . . . . . . . . . . . . . . . . . . . . . . . . . . . . . . 254
9.4.3 Error/Event Codes . . . . . . . . . . . . . . . . . . . . . . . . . . . . . . . . . . . . . . . . . . . . . . . . . . . . . . . . . . . . 255
9.4.4 Data Interchange Format . . . . . . . . . . . . . . . . . . . . . . . . . . . . . . . . . . . . . . . . . . . . . . . . . . . . . . . 261
9.5 Simplified Programming Overview and Examples . . . . . . . . . . . . . . . . . . . . . . . . . . . . . . . . . . . . . . . . . . 266
9.5.1 Bias Voltages . . . . . . . . . . . . . . . . . . . . . . . . . . . . . . . . . . . . . . . . . . . . . . . . . . . . . . . . . . . . . . . . 266
9.5.2 Filament Power . . . . . . . . . . . . . . . . . . . . . . . . . . . . . . . . . . . . . . . . . . . . . . . . . . . . . . . . . . . . . . 267
9.5.3 Emission Current and Filament Bias Voltage . . . . . . . . . . . . . . . . . . . . . . . . . . . . . . . . . . . . . . . . 267
9.5.4 Formatting Fetch data . . . . . . . . . . . . . . . . . . . . . . . . . . . . . . . . . . . . . . . . . . . . . . . . . . . . . . . . . 267
9.5.5 Partial Pressure Measurement . . . . . . . . . . . . . . . . . . . . . . . . . . . . . . . . . . . . . . . . . . . . . . . . . . . . 269
9.5.6 External Total Pressure. . . . . . . . . . . . . . . . . . . . . . . . . . . . . . . . . . . . . . . . . . . . . . . . . . . . . . . . . 270
9.5.7 Store/Load Ion Trap and Controller Settings . . . . . . . . . . . . . . . . . . . . . . . . . . . . . . . . . . . . . . . . 270
9.5.8 Change or Calibrate Electrometer Gain/Sensitivity. . . . . . . . . . . . . . . . . . . . . . . . . . . . . . . . . . . . 271
9.5.9 Real-Time Clock . . . . . . . . . . . . . . . . . . . . . . . . . . . . . . . . . . . . . . . . . . . . . . . . . . . . . . . . . . . . . 271
9.5.10 Manual Control of the Digital Output on the BNC. . . . . . . . . . . . . . . . . . . . . . . . . . . . . . . . . . 271
9.5.11 Fatal Errors. . . . . . . . . . . . . . . . . . . . . . . . . . . . . . . . . . . . . . . . . . . . . . . . . . . . . . . . . . . . . . . . . 271
9.5.12 Reading Controller Status/Clearing Status Registers . . . . . . . . . . . . . . . . . . . . . . . . . . . . . . . . . . 272
9.6 Using a Terminal to Communicate with the VQM System . . . . . . . . . . . . . . . . . . . . . . . . . . . . . . . . . . . 272
9.6.1 Using HyperTerminal . . . . . . . . . . . . . . . . . . . . . . . . . . . . . . . . . . . . . . . . . . . . . . . . . . . . . . . . . 274
Chapter 10 Service & Maintenance . . . . . . . . . . . . . . . . . . . . . . . . . . . . . . . . . . . . . . . . . . . . . . . . . . . . . . . . . . . . 277
10.1 Service Guidelines . . . . . . . . . . . . . . . . . . . . . . . . . . . . . . . . . . . . . . . . . . . . . . . . . . . . . . . . . . . . . . . . . . 277
10.2 Damage Requiring Service . . . . . . . . . . . . . . . . . . . . . . . . . . . . . . . . . . . . . . . . . . . . . . . . . . . . . . . . . . . . 277
10.3 General Repair Guidelines . . . . . . . . . . . . . . . . . . . . . . . . . . . . . . . . . . . . . . . . . . . . . . . . . . . . . . . . . . . . 278
10.4 MS Gauge Repair . . . . . . . . . . . . . . . . . . . . . . . . . . . . . . . . . . . . . . . . . . . . . . . . . . . . . . . . . . . . . . . . . . 279
Chapter 11 Index . . . . . . . . . . . . . . . . . . . . . . . . . . . . . . . . . . . . . . . . . . . . . . . . . . . . . . . . . . . . . . . . . . . . . . . . . . 281

Table of Contents
12 Series 835 Vacuum Quality Monitor
Instruction Manual - 835000
13
Series 835 Vacuum Quality Monitor
Instruction Manual - 835000
Chapter 1
1Safety Instructions
1.1 Safety Introduction
BEGIN BY READING THESE IMPORTANT SAFETY INSTRUCTIONS AND NOTES collected here
for your convenience and repeated with additional information at appropriate points throughout
this instruction manual.
These safety alert symbols in this manual or on the Product mean caution - personal safety, property
damage or danger from electric shock. Read these instructions carefully.
This product was designed and tested to offer reasonably safe service provided it is installed,
operated, and serviced in strict accordance with these safety instructions.
Danger indicates a hazardous situation which, if not
avoided, will result in death or serious injury.
Warning indicates a hazardous situation which, if not
avoided, could result in death or serious injury.
Caution indicates a hazardous situation or unsafe
practice which, if not avoided, may result in minor or
moderate personal injury.
Indicates a situation or unsafe practice which, if not
avoided, may result in equipment damage.
Notice
These instructions do not and cannot provide for every contingency that
may arise in connection with the installation, operation, or maintenance of
this product. If further assistance is needed, contact MKS/Granville-Phillips.
See Section 1.6 or Section 10.1 of this instruction manual.
Safety Precautions
Failure to comply with these instructions may result in serious
personal injury, including death, or property damage.
Always observe and follow all safety notices that are
provided throughout this instruction manual and on the
product.
1 Safety Instructions
14 Series 835 Vacuum Quality Monitor
Instruction Manual - 835000
These safety precautions must be observed during all phases of operation, installation, and service
of this product. Failure to comply with these precautions or with specific warnings elsewhere in this
manual violates safety standards of design, manufacture, and intended use of the instrument.
MKS/Granville-Phillips disclaims all liability for the customer's failure to comply with these
requirements.
•Read Instructions – Read all safety and operating instructions before operating the product.
•Retain Instructions – Retain the Safety and Operating Instructions for future reference.
•Heed Warnings – Adhere to all warnings on the product and in the operating instructions.
•Follow Instructions – Follow all operating and maintenance instructions.
•Accessories – Do not use accessories not recommended in this manual as they may be
hazardous.
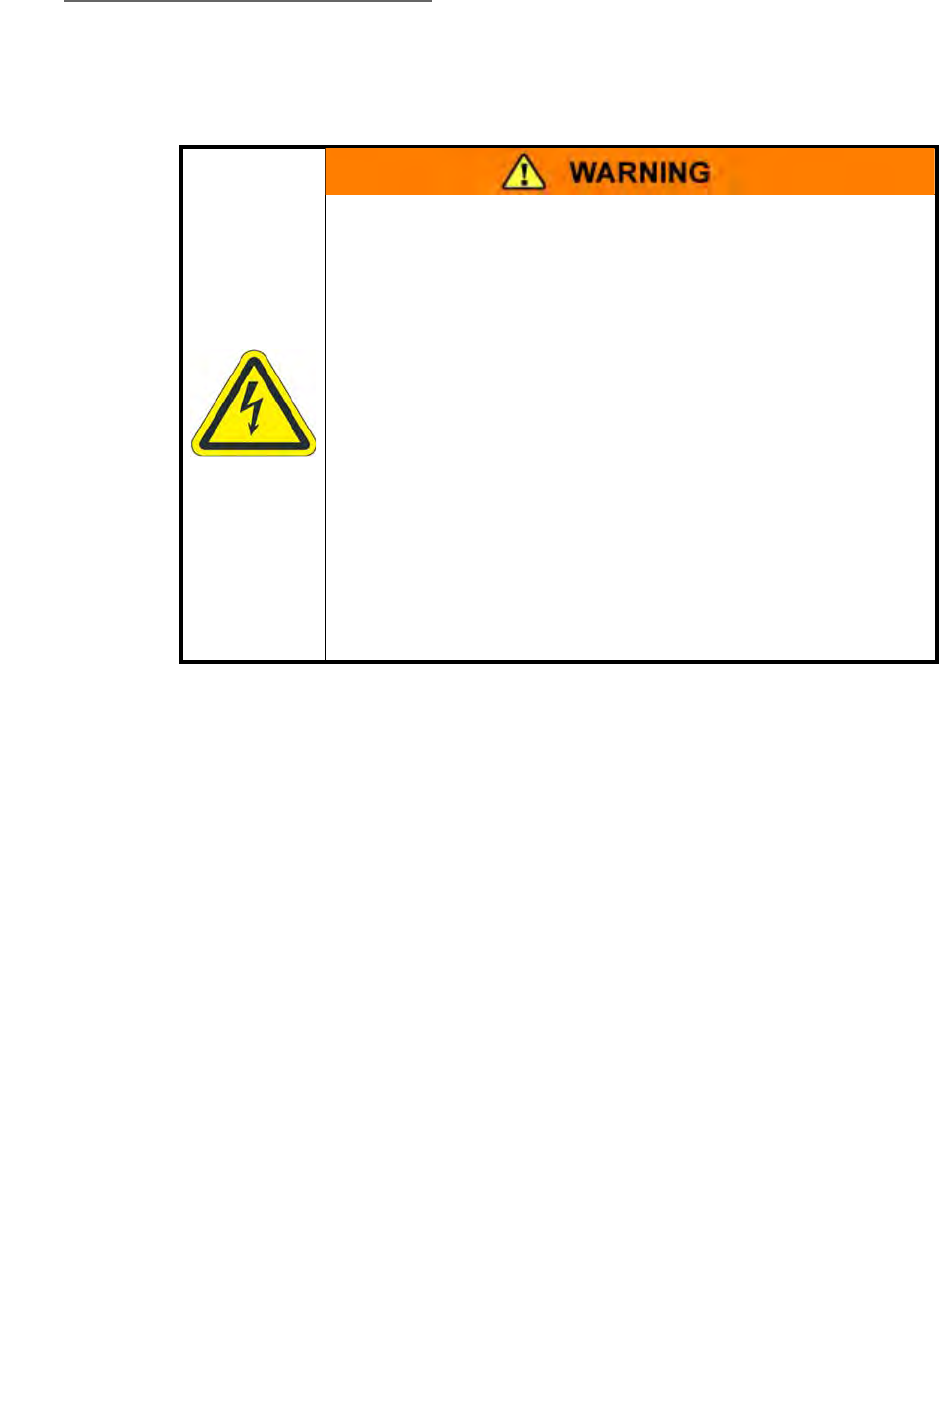
High Voltage
Be aware that when high voltage is present in any vacuum
system, a life threatening electrical shock hazard may exist
unless all exposed conductors are maintained at Earth ground.
This hazard is not unique to this product.
High Voltage
Be aware that an electrical discharge through a gas may
couple dangerous high voltage directly to an ungrounded
conductor almost as effectively as would a copper wire
connection. A person may be seriously injured or even killed
by merely touching an exposed ungrounded conductor at high
potential.
This hazard is not unique to this product.
High Voltage
To reduce the risk of fire or electric shock, do not expose this
product to rain or moisture.
1 Safety Instructions
15
Series 835 Vacuum Quality Monitor
Instruction Manual - 835000
Replacement Parts
Do not substitute parts or modify the instrument.
If replacement parts are required, be certain to use the
replacement parts that are specified by Granville-Phillips or
that have the same characteristics as the original parts.
Unauthorized substitutions may result in fire, electric shock or
other hazards.
Return the product to a service facility designated by
Granville-Phillips for service and repair to ensure that safety
features are maintained. Do not use this product if it has
unauthorized modifications.
Objects and Liquid Entry
Never push objects of any kind into this product through
openings as they may touch dangerous voltage points or short
out parts that could result in a fire or electric shock.
Be careful not to spill liquid of any kind onto the products
Finite Lifetime
After ten years of normal use or even non-use, the electrical
insulation in this product may become less effective at
preventing electrical shock. Under certain environmental
conditions which are beyond the manufacturer’s control, some
insulation material may deteriorate sooner. Therefore,
periodically inspect all electrical insulation for cracks, chafing,
or other signs of deterioration. Do not use if the electrical
insulation has become unsafe.
Safety Check
Upon completion of any service or repairs to this product, ask
the Qualified Service Person to perform safety checks to
determine that the product is in safe operating order.
1 Safety Instructions
16 Series 835 Vacuum Quality Monitor
Instruction Manual - 835000
1.2 Equipment Grounding
All components of the Vacuum System MUST be properly grounded. See Section 3.8 and
Figure 3-15 on page 48.
Proper Grounding
All components of a vacuum system used with this or any
similar high voltage product must be maintained at Earth
ground for safe operation. The power cord of this product
MUST be connected only to a properly grounded outlet. Be
aware, however, that grounding this product does not
guarantee that other components of the vacuum system are
maintained at Earth ground. Have a licensed electrician check
the entire system to assure proper and safe grounding of all
electrical components.
Complying with the usual warning to connect the power cable
only to a properly grounded outlet is necessary but not
sufficient for safe operation of a vacuum system with this or
any similar high voltage producing product.
Verify that the vacuum port to which the MS Gauge and all
vacuum gauges are mounted are electrically grounded. It is
essential for personnel safety as well as proper operation that
the envelope of the gauge be connected to a facility ground.
Use a ground lug on a flange bolt if necessary.
1 Safety Instructions
17
Series 835 Vacuum Quality Monitor
Instruction Manual - 835000
1.3 Implosion / Explosion
Danger of injury to personnel and damage to equipment exists on all vacuum systems that
incorporate gas sources or involve processes capable of pressurizing the system above the limits it
can safely withstand.
For example, danger of explosion in a vacuum system exists during backfilling from pressurized gas
cylinders because many vacuum devices such as ionization gauge tubes, glass windows, glass bell
jars, etc., are not designed to be pressurized.
Install suitable devices that will limit the pressure from external gas sources to the level that the
vacuum system can safely withstand. In addition, install suitable pressure relief valves or rupture
disks that will release pressure at a level considerably below that pressure which the system can
safely withstand.
Suppliers of pressure relief valves and pressure relief disks can be located via an online search, and
are listed on ThomasNet.com under “Relief Valves” and “Rupture Discs. Confirm that these safety
devices are properly installed before installing the product. In addition, check that:
a. The proper gas cylinders are installed,
b. Gas cylinder valve positions are correct on manual systems, and
c. The automation is correct on automated gas delivery systems.
It is the installer's responsibility to ensure that the automatic signals provided by the product are
always used in a safe manner. Carefully check manual operation of the system and the set point
programming before switching to automatic operation.
Where an equipment malfunction could cause a hazardous situation, always provide for fail-safe
operation. As an example, in an automatic backfill operation where a malfunction might cause high
internal pressures, provide an appropriate pressure relief device.
Implosion / Explosion
Do not use the Product in an environment of explosive or
combustible gases or gas mixtures. Operation of any electrical
instrument in such an environment constitutes a definite safety
hazard. Do not use the product to measure the pressure of
explosive gases or gas mixtures.
Install suitable devices that will limit the pressure to the level
that the vacuum system can safely withstand. In addition,
install suitable pressure relief valves or rupture disks that will
release pressure at a level considerably below the pressure
that the system can safely withstand.
1 Safety Instructions
18 Series 835 Vacuum Quality Monitor
Instruction Manual - 835000
1.4 User’s Responsibility
It is the responsibility of the Customer to comply with all local, state, and federal ordinances,
regulations, and laws applicable to the installation, operation and service of this equipment.
It is the responsibility of the end user to provide sufficient lighting at work to meet local regulations.
Operation and Service of this equipment in strict accordance with the methods and procedures
supplied by MKS/Granville-Phillips is the responsibility of the Customer.
MKS/Granville-Phillips assumes no liability, whatsoever, for any personal injuries or damages
resulting from the operation or service of this equipment in any manner inconsistent or contrary to
the methods supplied in Granville-Phillips literature including, but not limited to, manuals,
instructions, bulletins, communications, and recommendations.
For emergencies and for product safety related matters, contact the MKS /Granville-Phillips
Customer Service Department. See Section 1.6 or Section 10.1 for detailed information regarding
how to contact MKS /Granville-Phillps Customer Service Representatives.
1.5 Damage Requiring Service
Disconnect the product from all power sources and refer servicing to Qualified Service Personnel
under the following conditions:
a. When any cable or plug is damaged.
b. If any liquid has been spilled onto, or objects have fallen into the product.
c. If the product has been exposed to rain or water.
d. If the product does not operate normally even if you follow the operating instructions. Adjust
only those controls that are covered by the operation instructions. Improper adjustment of other
controls may result in damage and will often require extensive work by a qualified technician
to restore the product to its normal operation.
e. If the product has been dropped or the enclosure has been damaged.
f. If the product exhibits a distinct change in performance, service may be required.
User’s Responsibility
It is the user's responsibility to ensure that the automatic
signals provided by the product are always used in a safe
manner. Carefully check the system programming before
switching to automatic operation.

1 Safety Instructions
19
Series 835 Vacuum Quality Monitor
Instruction Manual - 835000
1.6 Service Guidelines
If the product requires service, contact the MKS/Granville-Phillips Customer Service Department at
1-303-652-4400 for troubleshooting help over the phone.
If the product must be returned to the factory for service, request a Return Material Authorization
(RMA) from MKS/Granville-Phillips. Do not return products without first obtaining an RMA. In
some cases a hazardous materials document may be required. The MKS/Granville-Phillips
Customer Service Representative will advise you if the hazardous materials document is required.
When returning products to Granville-Phillips, be sure to package the products to prevent shipping
damage. Circuit boards and modules separated from the gauge assembly must be handled using
proper anti-static protection methods and must be packaged in anti-static packaging. Shipping
damage on returned products as a result of inadequate packaging is the Buyer's responsibility.
Customer Service / Technical Support:
MKS Pressure and Vacuum Measurement Solutions
MKS Instruments, Inc., Granville-Phillips® Division
6450 Dry Creek Parkway
Longmont, Colorado 80503 USA
Tel: 303-652-4400
Fax: 303-652-2844
Email: mks@mksinst.com
MKS Corporate Headquarters
MKS Instruments, Inc.
2 Tech Drive, Suite 201
Andover, MA 01810 USA
Tel: 978-645-5500
Fax: 978-557-5100
1.7 FCC Verification
This equipment has been tested and found to comply with the limits for a Class A digital device,
pursuant to Part 15 of the FCC Rules. These limits are designed to provide reasonable protection
against harmful interference when the equipment is operated in a commercial environment. This
equipment generates, uses, and can radiate radio frequency energy and, if not installed and used in
accordance with this instruction manual, may cause harmful interference to radio communications.
However, there is no guarantee that interference will not occur in a particular installation.
Operation of this equipment in a residential area is likely to cause harmful interference in which
case the user will be required to correct the interference at his own expense. If this equipment does
cause harmful interference to radio or television reception, which can be determined by turning the
equipment off and on, the user is encouraged to try to correct the interference by one or more of the
following measures:
• Reorient or relocate the receiving antenna.
• Increase the separation between the equipment and the receiver.
• Connect the equipment into an outlet on a circuit different from that to which the receiver is
connected.

1 Safety Instructions
20 Series 835 Vacuum Quality Monitor
Instruction Manual - 835000
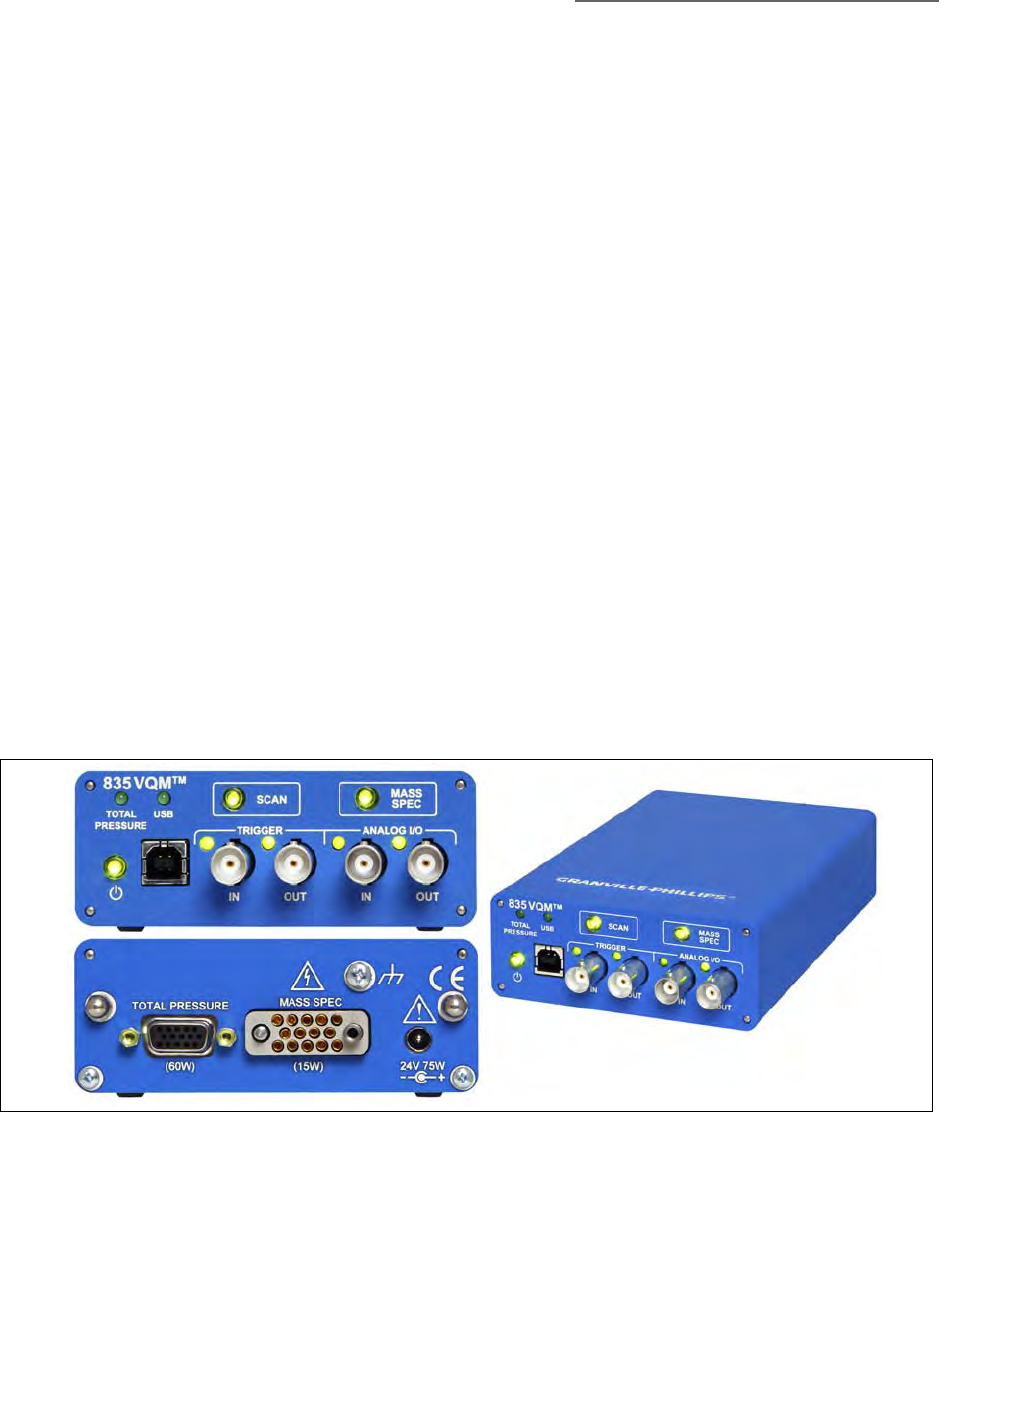
2 Introduction & Specifications
21
Series 835 Vacuum Quality Monitor
Instruction Manual - 835000
Chapter 2
2Introduction & Specifications
2.1 General Description
The Vacuum Quality Monitor (VQM®) by Granville-Phillips combines the highest performance gas
analysis technology with outstanding instrumentation functional design that transforms complex
measurement into actionable information. The VQM System is the world's fastest, lowest power, gas
compositional analysis instrument with full data collection, spectral decomposition, and data
logging over the full 1-300 amu measurement range.
The VQM System is a mass spectrometer consisting of an Autoresonant Ion Trap Mass Spectrometry
(ART MS) Gauge (hereafter referred to as the MS Gauge), the VQM Controller, an interconnect
cable, a communications interface for user-application development, and a VQM Viewer Software
application. The MS Gauge mounts directly onto any standard 2.75" ConFlat port of a vacuum
chamber. All of the internal components of the MS Gauge reside in the vacuum space where the gas
analysis measurements are performed.
The VQM Viewer Software application provides most of the functionality required to operate the
system. In addition, a high-level VQM Command Set, along with a serial USB interface port
provides full control of the VQM System from a Windows-based host PC.
A full-range total pressure measurement kit (the Micro-Ion ATM vacuum gauge module - see Figure
2-3) is available from Granville-Phillips to provide vacuum system pressure readouts and process
control functions, absolute partial pressure measurements, and mass spectrometer gauge
overpressure protection.
Figure 2-1 VQM Controller Front and Rear Panels
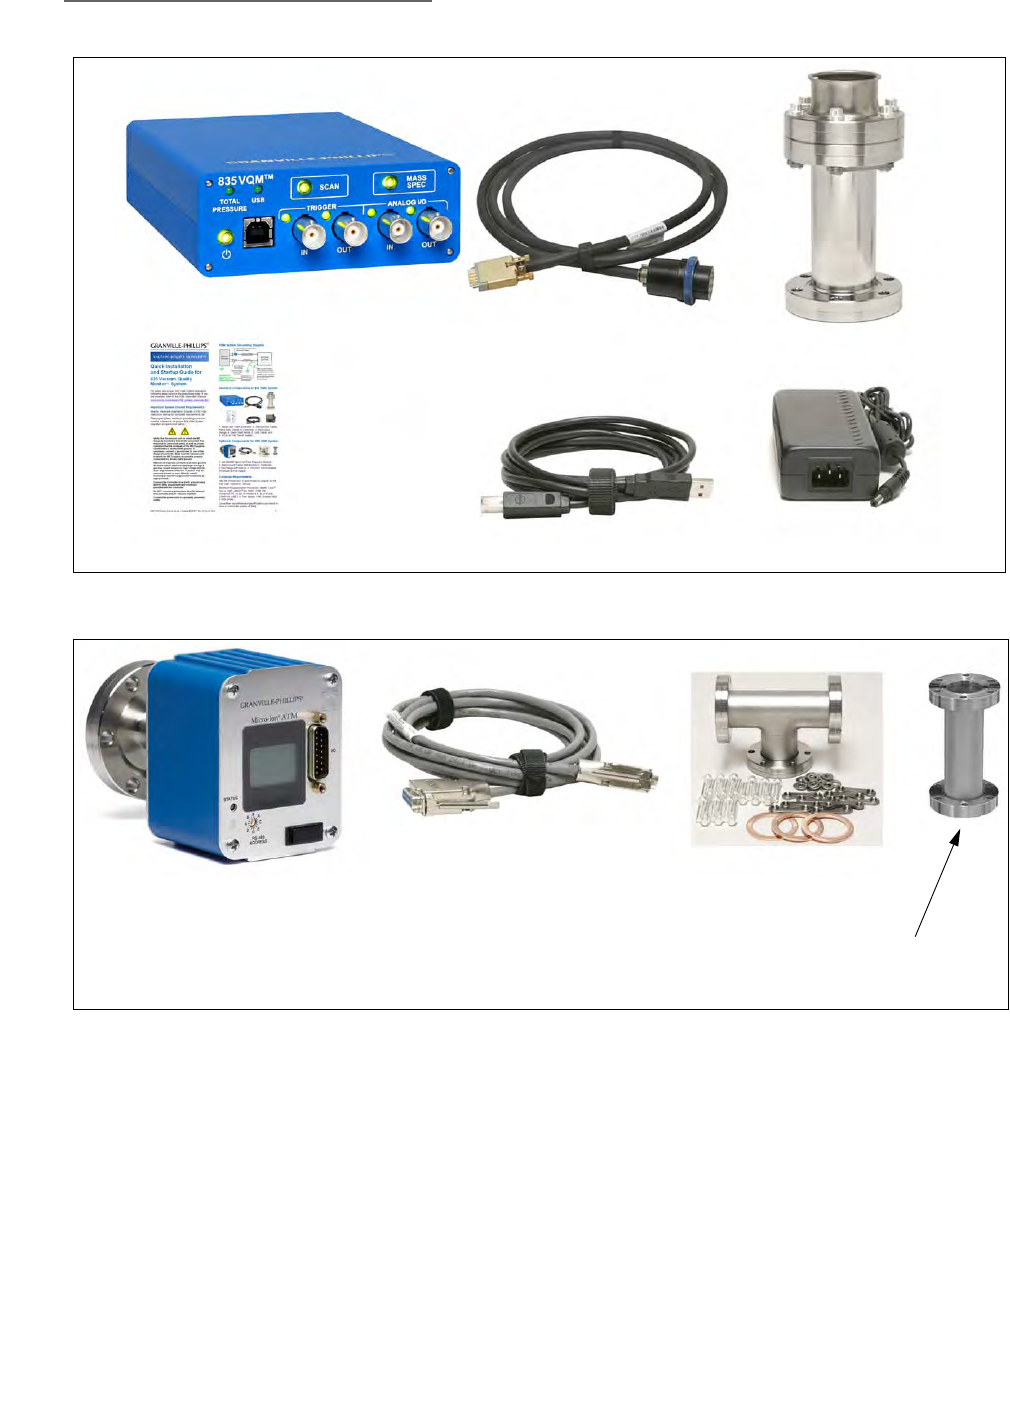
2 Introduction & Specifications
22 Series 835 Vacuum Quality Monitor
Instruction Manual - 835000
Figure 2-2 Standard Components of the Vacuum Quality Monitor System
Figure 2-3 Optional Components of the Vacuum Quality Monitor System
VQM Controller
VQM Ion Trap
Mass Spectrometer Gauge
Interconnect Cable - Controller
to Mass Spectrometer Gauge
Quick Installation
and Startup Guide
AC to 24 Vdc
Power Supply
USB Interconnect Cable
Micro-Ion Total Pressure Gauge
(Catalog #390802)
Interconnect Cable: Micro-Ion
Gauge to VQM Controller
(Catalog #802301-01 for 1
meter long, or 802301-03 for 3
meters long) Demountable Envelope
Nipple (Catalog #801270)
for Nude MS Gauge
T-Flange (Catalog #
801272) and 3 Bolt Kits
(Catalog #801274-1)

2 Introduction & Specifications
23
Series 835 Vacuum Quality Monitor
Instruction Manual - 835000
2.2 Receiving Inspection
Inspect all materials received for shipping damage. Confirm that your shipment includes all the
materials and options that were ordered. If materials are missing or damaged, the carrier that made
the delivery must be notified within 15 days of delivery in accordance with Interstate Commerce
regulations to file a valid claim with the carrier. Any damaged material, including all containers and
packaging, should be held for carrier inspection.
If your shipment is not correct for reasons other than shipping damage, contact MKS,
Granville-Phillips Division Customer Service Department, 6450 Dry Creek Parkway, Longmont,
Colorado 80503, phone +1-303-652-4400.
2.3 Glossary of Terms
Table 2-1 Acronyms and Definitions
Term Definition
VQM Vacuum Quality Monitor
Series 835 VQM A combination of an ion trap mass spectrometer vacuum gauge and VQM Controller
integrated into an operational system that measures gases in a vacuum chamber.
Absolute partial pressure A partial-pressure display of gases in a chamber, showing the absolute pressure of
each gas.
ADC Analog-to-Digital Converter
AMU, amu Atomic Mass Units. The atomic mass unit is defined as 1/12th the weight of a single
carbon-isotope 12 atom.
Anharmonic An oscillating system that is not undergoing simple harmonic motion; not harmonic
Analog Input The Series 835 Controller has one analog input port that can be used to digitize
analog voltage signals from external sources. A common use of the analog input port
is to collect total pressure readings from the analog output of an ionization gauge
controller. See Section 2.4.7.
Analog Output The Series 835 VQM Controller has one analog output. When Enabled, it is
electrically connected to the voltage output of the electrometer, and the signal is
available for each executed MS scan. See Section 2.4.7
API Application Programming Interface.
ART MS Autoresonant Ion Trap Mass Spectrometer. An ion trap mass spectrometer that stores
ions using purely electrostatic potentials and that relies on autoresonant excitation of
ion motions in an anharmonic trapping potential for mass selective ejection. See Ion
Trap.
Auto Tune A procedure that can be initiated in the Viewer Application software that optimizes
several voltages of the MS Gauge.
Connection An established USB communication link between a Host/PC and a specific VQM
Controller, or an RS-485 link between the VQM Controller and the Total Pressure
Module.
Controller (835) The Series 835 VQM Controller.
DAQ Data Acquisition - Data acquisition is the process of measuring an electrical or
physical phenomenon such as voltage, current, temperature, pressure, or sound. A
DAQ is used to acquire, analyze, and present information. DAQ systems typically use
fast ADCs to digitize the analog voltage readings related to the signal being
measured.

2 Introduction & Specifications
24 Series 835 Vacuum Quality Monitor
Instruction Manual - 835000
Data Output The Series 835 VQM Controller supports USB communication with a Host/PC via a
high level, text-based command-set. The data output means a digital message that
contains information that is associated with a measured value.
EM Electron Multiplier (see page 107 & page 108)
FWHM The width of a mass peak at the 50% amplitude points.
Gas Library The Viewer Application software has a library of 10 gases.
The 10 gases are: Hydrogen, Helium, Nitrogen, Oxygen, Water, Carbon Monoxide,
Argon, Carbon Dioxide, Krypton, and Neon. When the Viewer Application is in Gas
display mode, fitted gases from this list will be displayed along with residual AMUs.
Gas Measurement The relative partial pressure of one or more amu peaks. For example, Air could be
defined as a ratiometric relationship of 78% Nitrogen (amu peak 28), 21% Oxygen
(amu peak 32), and 0.9% Argon (amu peak 40).
Gauge (Sensor) The Mass Spec Gauge is a gas-sensor device (transducer) mounted to the vacuum
chamber that provides species mass spectral readings to the 835 VQM Controller.
"Gauge" also indicates the Total Pressure Measurement Gauge.
Host/PC Remote user interface (being executed on a PC) to the VQM Controller.
Ion Trap A physical device that captures and stores ions based on electrostatic, electrodynamic
or magnetic confinement fields. Most ion traps used for analytical purposes also offer
the capability to mass selectively eject the stored ions.
ITMS Ion Trap Mass Spectrometry
MDPP Minimum Detectable Partial Pressure
Mass range Smallest to largest mass that can be measured with the VQM system.
Mass Spectrometry An analytical technique that measures the mass-to-charge ratio of charged particles. It
is used to determine masses of particles or to determine the elemental composition of
a sample or molecule.
Maximum pressure The maximum total pressure where the device operates with a known and acceptable
accuracy.
Micro-Ion Gauge A Granville-Phillips Wide-Range Series 390802 Micro-Ion ATM Gauge with RS485
interface to provide vacuum chamber total pressure measurement. The option
includes a 1-meter or 3-meters long interconnect cable. The Micro-Ion Gauge
connects to the VQM Controller via a 15-pin "D" connector on the rear of the 835
VQM Controller.
MS or Mass Spec Mass Spectrometer. An instrument that can measure the masses and relative
concentrations of atoms and molecules.
MS Gauge Mass Spectrometer Gauge: The vacuum sensor used by the 835 VQM System to
determine and measure the gases in the vacuum chamber.
msec or ms Millisecond -- 1000th (10-3) of 1 second
m/z or m/Q Mass-to-charge ratio - defined as the atomic weight of an ion divided by its charge.
A number defining how a particle will respond to an electric or magnetic field that
can be calculated by dividing the mass of a particle by its charge.
PP or partial pressure The partial pressure of a component in a gas mixture is the pressure that the gas
would exert on the vacuum system if all other gases were removed from the chamber.
Ratiometric partial
pressure
A partial-pressure display of gases in a chamber, showing the contribution of each gas
relative to the others. Units: %, parts-per-million, etc.
Table 2-1 Acronyms and Definitions
Term Definition
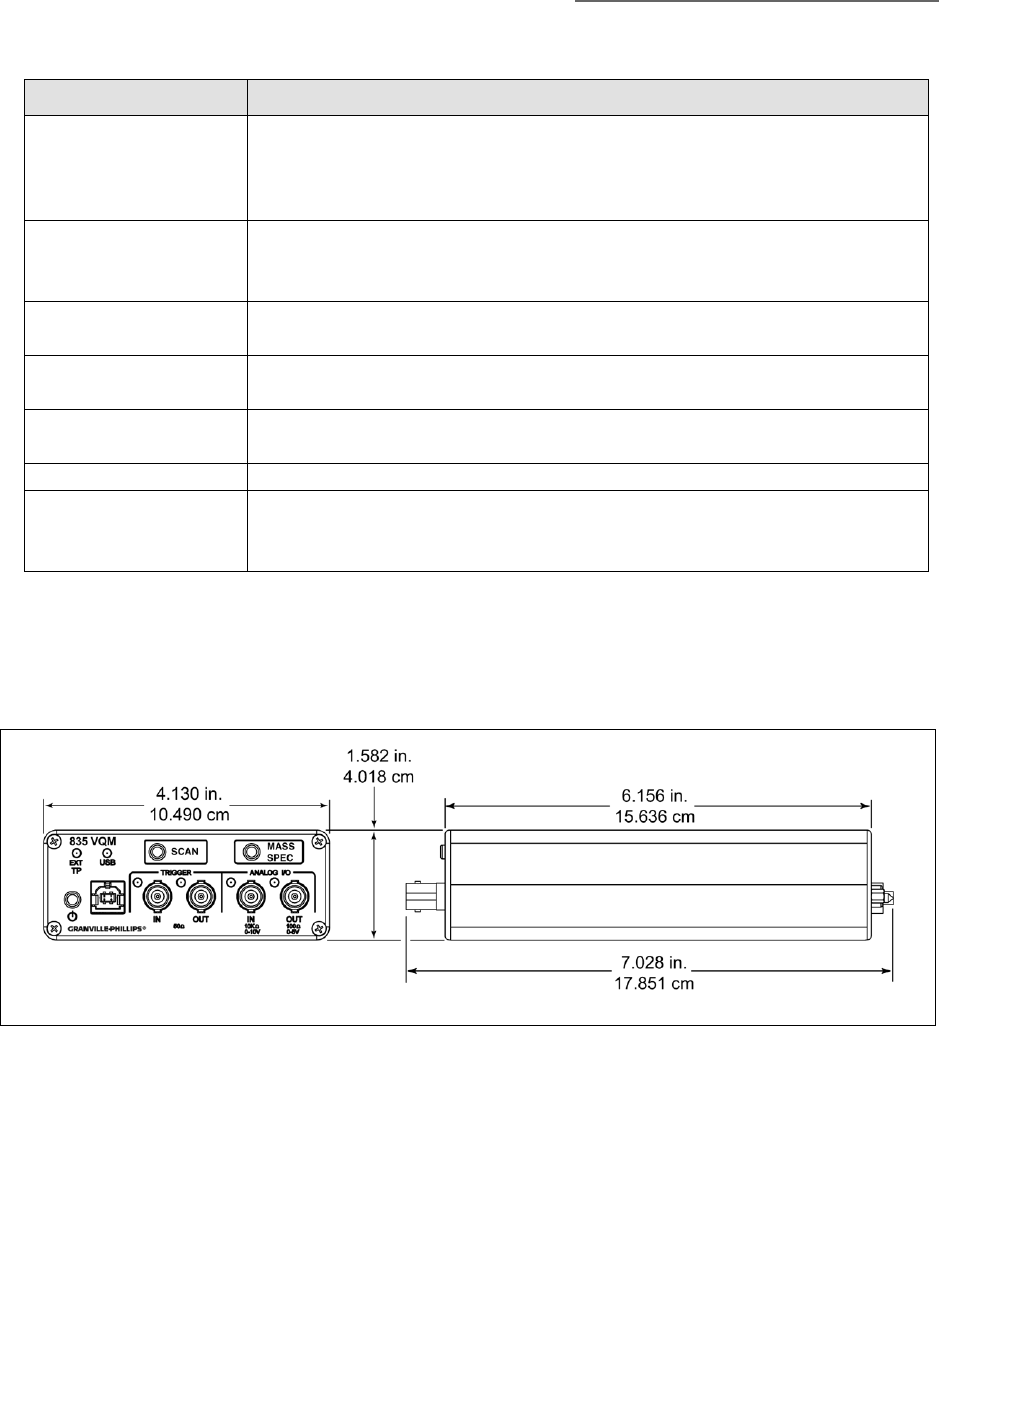
2 Introduction & Specifications
25
Series 835 Vacuum Quality Monitor
Instruction Manual - 835000
2.4 Specifications
2.4.1 Dimensional Illustrations
Resolution Resolution measures the ability to distinguish peaks of very similar mass-to-charge
ratio. The resolution at a specific mass-to-charge m/Q is measured as the FWHM
(50% peak height) for its mass peak in the spectrum. Higher resolution values are
desirable.
Resolving power (m/Δm) Resolution is measured as resolving power, which is a given mass-to-charge (m/Q)
ratio and the FWHM, ΔM 50%, R=M/ΔM. Large resolution power is desirable to fully
differentiate the mass peaks.
Session Interactive monitor/control transactions occurring between the Host and a specific
VQM Controller.
Total Pressure
Measurement Gauge
See Micro-Ion Gauge.
TP or Total Pressure Total pressure is equal to the sum of the partial pressures. Total pressure can be
provided to the box via the Micro-Ion Gauge or Analog Input (configurable).
Trend A plot of a single or multiple values against time.
VQI®Vacuum Quality IndexTM: allows the creation of Boolean expressions to trigger audio
alerts and drive the trigger out on the Controller in response to real-time data from the
Controller.
Figure 2-4 VQM Controller Dimensions
Table 2-1 Acronyms and Definitions
Term Definition
The VQM Controller is a
benchtop mount unit.
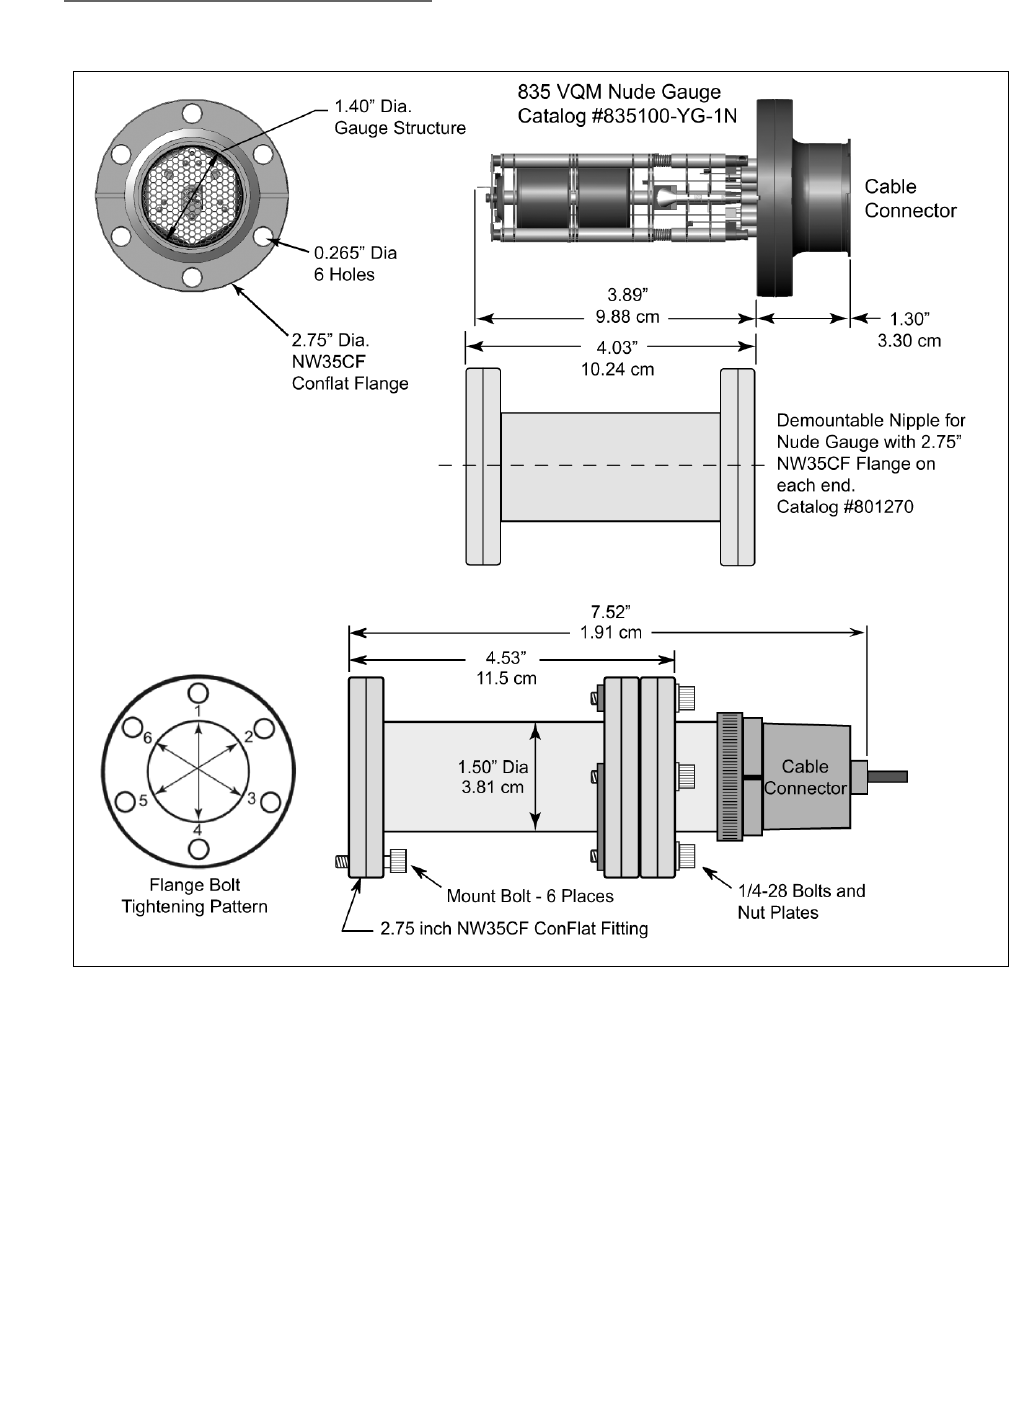
2 Introduction & Specifications
26 Series 835 Vacuum Quality Monitor
Instruction Manual - 835000
Figure 2-5 VQM Mass Spectrometer Gauge Dimensions
For the Nude Gauge
configuration, the inside
diameter of the vacuum port to
which the Gauge is mounted
MUST be 1.430 inches (3.632
mm) or larger. Damage to the
gauge will result if the inside
diameter is less than specified.

2 Introduction & Specifications
27
Series 835 Vacuum Quality Monitor
Instruction Manual - 835000
2.4.2 VQM Controller Specifications
Specifications and dimensions are subject to change without notice.
** The USB cable must meet the specifications for USB 2.0, USB-IF. The VQM Controller is
not configured for USB 3.0. Some PCs, particularly laptops, provide USB 3.0 ports, but the
835 VQM is USB 2.0. USB 3.0 is generally backwards compatible with USB 2.0, but some
PC implementations are not fully compatible. See Section 8.5.7.
Table 2-2 VQM Controller Specifications
Parameter Specification
Mass Range/Scan
Time
1 - 145 amu in 85 ms, or 1 - 300 amu in 125 msec
Scan RF Frequency 2.65 MHz to ~147 kHz
Inputs and Outputs
1. Trigger In (BNC)
2. Trigger Out (BNC)
3. Analog In (BNC)
4. Analog Out (BNC)
5. USB (Type B)
6. MS Gauge
7. Ext TP Gauge
Analog I/O, Trigger I/O, USB, Mass Spec Gauge, External Total Pressure Gauge
1. 50 Ω, positive TTL, 1 msec, minimum pulse width
2. 50 Ω, Active High, TTL frame pulse, or VQI output
3. 10K Ω, 0-10 V, 12 bit resolution
4. 0 V to +5 V with 30 KHz 3 db bandwidth
5. 2.0, full speed, 12 Mb/sec **
6. 14-Pin connector for the Mass Spectrometer Gauge
7. 15-Pin "D" connector for the optional Total Pressure Measurement Kit
(390802 with RS-485)
LEDs on front panel EXT TP, USB, Trigger IN, Trigger OUT, Analog IN, Analog OUT
Buttons on front panel Power, Scan, Mass Spec
Input Power -
Controller and MS
Gauge Only
24 Vdc, 15 Watts required, 8 Watts typical
NOTE: The System MUST be properly grounded. See Section 3.8 and Figure 3-15 on
page 48.
Input power when
using the optional
Series 390802
Micro-Ion ATM
Gauge
24 Vdc, 75 Watts maximum
NOTE: The System MUST be properly grounded. See Section 3.8 and Figure 3-15 on
page 48.
Input Power Plug DC power jack, 5.5 mm OD x 2.5 mm ID x 11 mm long
Operating
Temperature
0 oC to 40 oC (32 oF to 104 oF)
Non-operating
Temperature
0 oC to 80 oC (32 oF to 176 oF)
Relative Humidity < 90%, non-condensing
Physical Dimensions See Figure 2-5
Weight 720 grams (25 ounces)
IP Rating IP20

2 Introduction & Specifications
28 Series 835 Vacuum Quality Monitor
Instruction Manual - 835000
2.4.3 Mass Spectrometer Gauge Specifications
Specifications and dimensions are subject to change without notice.
* Measured at 28 amu, N2 at 2 x10⁻⁷ Torr at default VQM Controller settings. Δm measured at FWHM.
Table 2-3 VQM MS Gauge Specifications
Parameter Specification
Measurement Range Partial Pressure: 1 x 10⁻⁵ Torr to UHV
Total Pressure with the optional Micro-Ion Total Pressure Measurement Gauge: ATM to
1 x 10 -9 Torr. For total pressure measurement below 1 x 10⁻⁹ Torr, use a
Granville-Phillips Series 370 Vacuum Gauge Controller.
Mass Range 1 to 145 amu, or 1 to 300 amu (Relative Partial Pressure or Partial Pressure)
Mass Separator Type Autoresonant Ion Trap
Resolution (m/Δm ) 150 typical, 100 minimum *
Dynamic Range 2 decades for single scan, >3 decades with averaging
Response Time ~125 msec for 1-300 amu at default VQM Controller settings
Filament Single Yttria coated Iridium, field replaceable
Operating
Temperature
0 oC to 50 oC (32 oF to 122 oF), non-condensing
Detector Type Continuous Dynode Electron Multiplier, field replaceable
Bakeout Temperature 200 oC maximum, non-operating, with the cable disconnected, degas not required
Mounting Flange NW35CF 2.75 inch ConFlat type
Interconnect cable 1, 3, 20, or 50 meters long
Physical Dimensions See Figure 2-5
Weight 420 grams (14.8 ounces)
Materials exposed to
process environment
304L Stainless Steel, 316L Stainless Steel, Alumina Ceramic, Al2O3 98% Min., Nickel,
Molybdenum, Ag/Cu eutectic braze, Gold, Iridium, Yttria, Y2O3 99.95%, Lead Glass
(multiplier body), Chromium
Heater Jacket for the
MS Gauge
120 VAC, 34 W or 240 VAC, 34 W
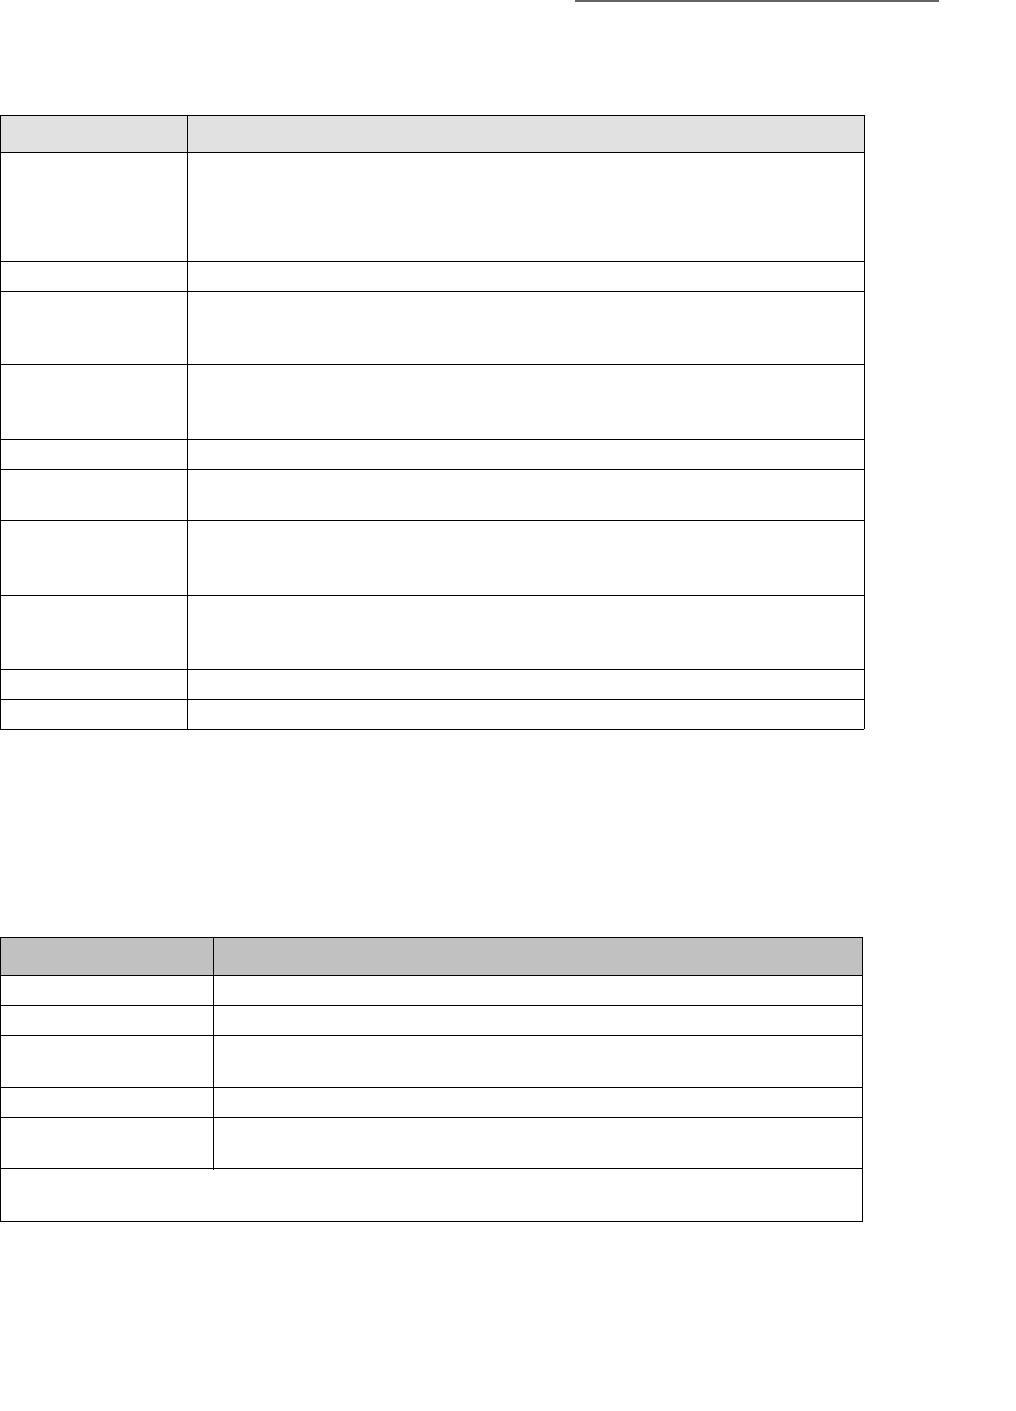
2 Introduction & Specifications
29
Series 835 Vacuum Quality Monitor
Instruction Manual - 835000
2.4.4 Viewer Software Specifications
Specifications and dimensions are subject to change without notice.
2.4.5 Host/PC Requirements
The VQM System can be used without a Host/PC. A Host/PC is required (1) to use the VQM Viewer
Application Software, (2) control the VQM Controller from a remote location, or (3) program
additional control functions that provide process automation or input/output data.
Table 2-4 VQM Viewer Software Specifications
Parameter Specification
Top Ten Gases
Display Table
Automatic listing by species or amu. The Viewer Application software has a library of
10 gases; Hydrogen, Helium, Nitrogen, Oxygen, Water, Carbon Monoxide, Argon,
Carbon Dioxide, Krypton, and Neon. Up to 20 additional gases can be added using
the Gas Library Editor.
Gas Recipe Fit Correlation fit against expected gas spectrum
Total Pressure Trend
Graph
Range: ATM to 10-9 Torr (Requires Micro-Ion ATM Gauge Total Pressure Gauge or
analog input from another pressure source, such as a Granville-Phillips Series 370
Stabil-Ion Gauge Controller.)
Pressure Trend of
User Selected Gases
or Masses
User selection in display table. Maximum of 10 displayed.
Sensor Spectrum Displayed, 1-145 or 1- 300 amu
Capture, Display
Information
1-300 amu scan, total pressure, timestamp
Logging, VQM Data Binary
Exportable comma separated variable (csv) (MS Excel Compatible)
1-300 amu scan, total pressure, timestamp, status per scan
VQM Controller
Configuration
Mass Spec Mode: ON / OFF
Acquisition: via application control or external trigger control
Mass Spectrometer Calibration: single gas/mass, manual
Leak Detection User assigned leak gas detection, audible tone
Software interface API, LabVIEW VIs
Table 2-5 Host/PC Requirements
Parameter Requirements
Processor/Memory Intel Core 2 Duo T7250@2Ghz with 2.56G of Ram or equivalent
Display Resolution Minimum: 1024 x 768 pixels, larger to take advantage of resizing
Operating System Windows 7 (32 or 64 bit)/ Windows XP (32 bit) SP2, .NET 3.5 Framework SP1
(provided)
Disk Space Minimum: 1.6 GB. (More will be needed for large log files.)
Optional Development
Environment
LabVIEW 2013 SP1 required to use LabVIEW VIs.
.NET development platform required to use API. (tested with Visual Studio 2010.)
Minimum requirements are for one PC connected to one VQM Controller. Four or Eight core systems are
recommended when driving multiple Controllers.

2 Introduction & Specifications
30 Series 835 Vacuum Quality Monitor
Instruction Manual - 835000
2.4.6 Trigger Input/Output Specifications
Trigger IN
Use the Trigger IN port to deliver valid external trigger pulses to the VQM Controller to execute
single mass spectrometry scans synchronous with external events. See Section 5.5.1 for more
information.
Trigger OUT
Use the Trigger OUT port to access the output trigger pulses available to time frame the MS analog
out signal available from the VQM Controller or driven by VQI. See Section 5.5.2 and Section
8.4.11 for more information.
Logic Level Outputs
Trigger Logic: TTL Active HIGH. The output level becomes High as the MS scan is initiated. The
output becomes Low again at the end of the scan. Use the rising edge to trigger external DAQ
systems. Use the length of the pulse to frame the scan. The output trigger pulse remains low
between completion of the previous scan and the start of a new scan (in continuous scan mode).
2.4.7 Analog Input/Output Specifications
Analog IN
Use the Analog IN port to connect sensors with analog voltage signal outputs to the VQM
Controller. The Analog IN port is electrically connected to a 12-bit ADC converter and can be
treated as a total pressure input or a VQI® equation by the VQM Viewer Software. See Section 5.5.3
and Section 8.4.11.
Analog OUT
Use the Analog OUT port to monitor the voltage output of the electrometer during MS Scans. The
Analog OUT port is electrically connected to the voltage output of the electrometer via a gain=2X
voltage amplifier which also has a 30 kHz low pass filter attached to its output. The MS analog out
signal is available for each executed MS scan. See Section 5.5.4.
Table 2-6 Trigger Input and Output Connections
Port Specification
Trigger IN port (BNC) • Input Impedance: 50 Ω
• Trigger Logic: Edge Trigger, Low to High, TTL Levels
• Minimum Pulse Width: 1 msec
Trigger OUT port (BNC) • Output Impedance: 50 Ω
• Trigger Logic: Low to High, TTL Levels
Table 2-7 Analog Input/Output Connections
Port Specification
Analog IN port (BNC) • Input Impedance: 10K Ω
• Voltage Range: 0-10 V
• ADC Specs: 12 bit resolution
Analog OUT port (BNC) • Output Impedance:100 Ω
• Voltage Range: 0-5 V
• Trans-impedance Gain: 2X electrometer voltage
output with 30kHz low pass filter

2 Introduction & Specifications
31
Series 835 Vacuum Quality Monitor
Instruction Manual - 835000
2.5 Compliance
All components of the Vacuum Quality Measurement System are compliant with the following:
EMC......................... EN61326-1
Safety....................... EN61010-1
Environmental.......... RoHS Compliant
IP Rating .................. IP20
* MKS, Granville-Phillips Division recommends the use of interconnect cables of 3 meters or less in
length for connection to the VQM Controller. The attachment of any cable greater than 3 meters in
length will result in failure of the system to meet CE Compliance specifications; more specifically,
the ability to meet the Conducted RF Immunity standard IEC 61000-4-6. The test for this standard
couples RF into I/O cables over the same RF frequency range that is injected into the Ion Trap,
directly affecting the signal. This includes all generic cables such as USB and BNC cables that are
connected to the VQM Controller. Use of cables longer than 3 meters should not affect the
performance of the system, but the system will not be CE Compliant.
2.6 Warranty Information
MKS, Granville Phillips warrants that new 835 Series VQM Products shall be free of defects in
material and workmanship for a period of 18 months (excluding consumables) from the date of
shipment from the manufacturer or from a MKS, Granville-Phillips regional office or supply center.
The gauge filament and electron multiplier are consumables and are not warranted against wear
due to use, accelerated failures in harsh environments, or misuse through improper handling or
configuration.

2 Introduction & Specifications
32 Series 835 Vacuum Quality Monitor
Instruction Manual - 835000
Notes:
33
Series 835 Vacuum Quality Monitor
Instruction Manual - 835000
Chapter 3
3Hardware Installation
3.1 Introduction
Initial installation and setup requires mounting the VQM® Mass Spectrometer Gauge (MS Gauge) to
your vacuum chamber and making the necessary interconnections to the bench-top mounted VQM
Controller. This chapter describes the process of unpacking, checking and installing the VQM
System on a vacuum chamber. Initial installation and setup requires mounting the MS Gauge and
the optional Micro-Ion Total Pressure Measurement Gauge on a vacuum chamber and making the
necessary interconnections to the bench-top mounted VQM Controller. Read and follow all
installation instructions and safety procedures listed in this chapter to assure operator safety and
optimum performance for the instrument.
3.2 Terms used in this chapter
Notice
Do not apply power to the instrument (Controller) until specifically directed
in the Initial Operation Procedure in Chapter 8.
Do not operate the VQM System if the pressure in the vacuum system
exceeds 1x10⁻⁵ Torr. Use a Pressure Reduction System if higher pressures
are present.
Table 3-1 Term and Definitions
Term Definition
Controller The VQM Mass Spectrometer Gauge Controller. See Figure 3-1.
Micro-Ion Gauge The Series 390802 Micro-Ion ATM Total Pressure Measurement Gauge. See Figure 2-3,
Figure 3-2, and Figure 3-6. Separate instruction manuals (p/n 390001 & p/n 390015)
are provided with the Micro-Ion Gauge.
MS Gauge The Mass Spectrometer Gauge that is connected to the vacuum chamber. The MS
Gauge can be configured as a nude gauge (see below) or mounted inside a
demountable envelope (full-nipple). See Figure 2-5, Figure 3-3 and Figure 3-4.
Nude Gauge The Mass Spectrometer Gauge that is connected to the vacuum chamber, but the
sensors of the gauge are inside the chamber rather inside a nipple that is mounted to the
chamber. See Figure 2-5, Figure 3-3, and Figure 6-2.
T-Flange An optional mounting flange for the purpose of mounting the MS Gauge and the
Micro-Ion Gauge at the same port on the vacuum chamber. See Figure 2-3 and Figure
3-2.
UHV Ultra High Vacuum - usually referring to pressures below 10-9 Torr.
VQM Vacuum Quality Monitor - refers to the VQM System, which consists of the VQM
Controller and the VQM Mass Spectrometer Gauge.

3 Hardware Installation
34 Series 835 Vacuum Quality Monitor
Instruction Manual - 835000
3.3 Unpacking the Components
3.3.1 Before Opening the Boxes
• Adhere to good high vacuum practices throughout the Mass Spectrometer Gauge installation
procedure.
• Select a clean and dust free area next to the vacuum port before the Mass Spectrometer
Gauge installation process begins.
• To reduce the chances of contamination and to maximize the lifetime of the electron
multiplier detector, do not break the seal of the metalized Mylar® bag used to package the
mass spectrometer gauge until you are ready to install it on the vacuum chamber.
• Take a moment at this time to review the Electron Multiplier Detector in Section 7.6
• Inspect all components of the VQM System upon unpacking. Report any damage or missing
components to Granville-Phillips.
3.3.2 Checklist of Components
3.3.2.1 Standard Equipment - See Figure 3-1
• VQM Mass Spectrometer Gauge (in a vacuum-sealed metalized Mylar® bag)
• VQM Controller Unit, bench-top mount
• Cable, interconnect, VQM Controller-to-Mass Spectrometer Gauge
• Cable, interconnect, USB, VQM Controller-to-Computer
• Universal Power Supply for VQM System (AC to 24 Vdc)
• CD, VQM Viewer Application Software
3.3.2.2 Optional Equipment - See Figure 3-2
• Micro-Ion ATM Total Pressure Measurement Gauge
• Cable, interconnect, VQM Controller-to-Micro-Ion ATM Module
• Cable for Log/Linear analog pressure output from a Granville-Phillips Series 370 Ion Gauge
Controller
• Heater Jacket for the Mass Spectrometer Gauge
• Field replacement Filament Assembly Kit
• Field replacement Electron Multiplier
• Demountable envelope (Full-Nipple) for the Nude Mass Spectrometer Gauge
• T-Flange adapter
• Hardware bolt kit
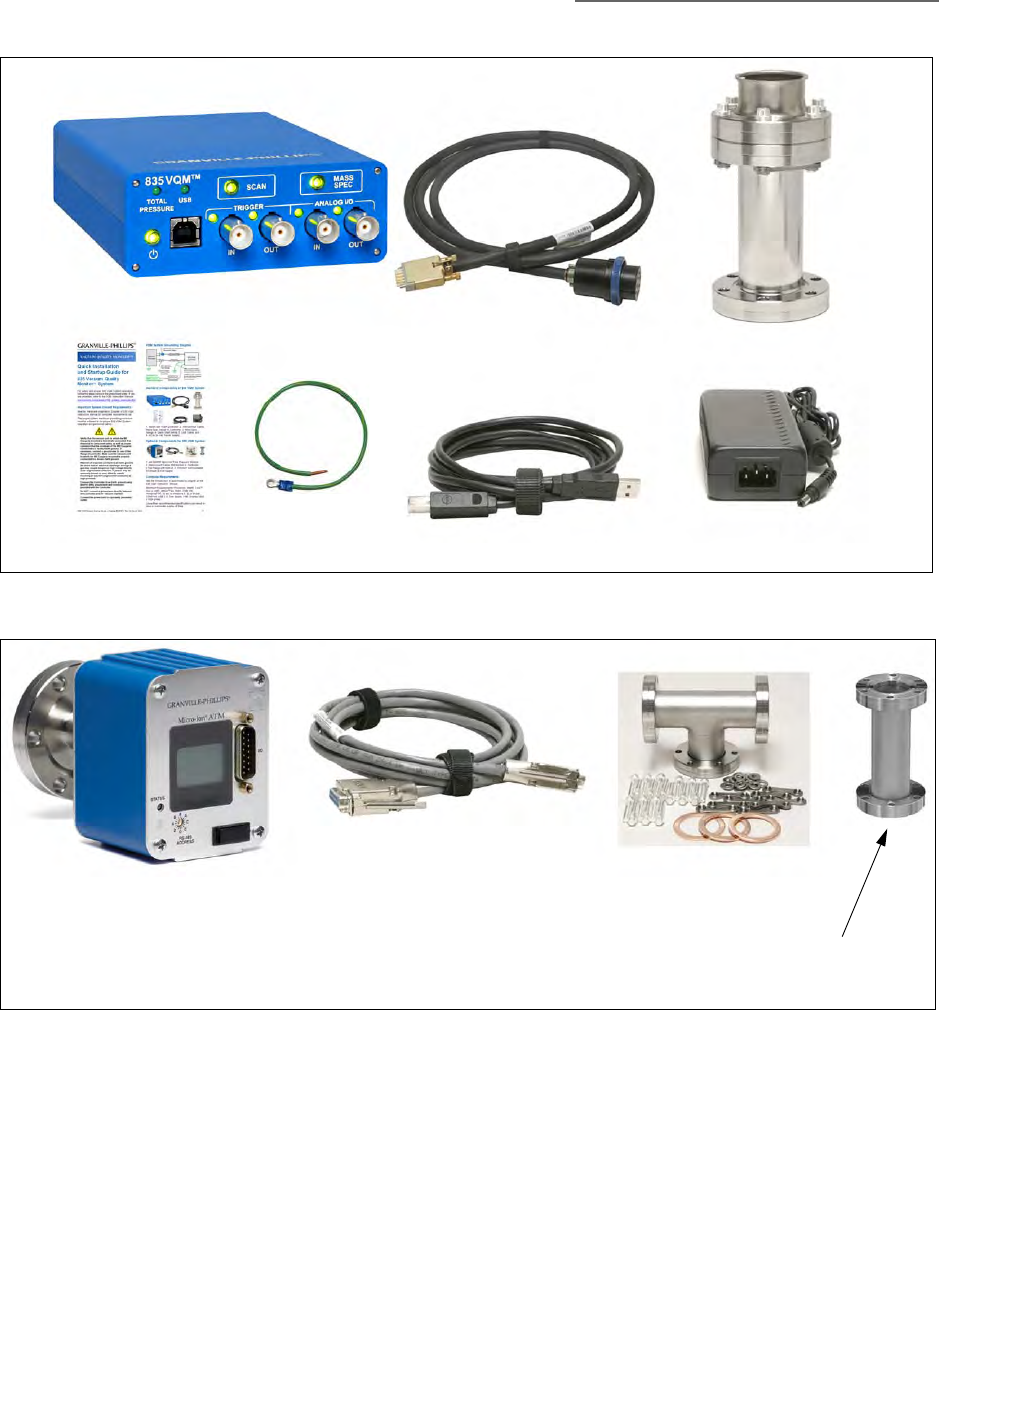
3 Hardware Installation
35
Series 835 Vacuum Quality Monitor
Instruction Manual - 835000
Figure 3-1 Standard Components of the Vacuum Quality Monitor System
Figure 3-2 Optional Components of the Vacuum Quality Monitor System
835 VQM Controller
VQM Ion Trap
Mass Spectrometer Gauge
Interconnect Cable - Controller
to Mass Spectrometer Gauge
Quick Installation
and Startup Guide
AC to 24 Vdc
Power Supply
USB Interconnect Cable
Ground Wire
Micro-Ion Total Pressure Gauge
(Catalog #390802)
Interconnect Cable: Micro-Ion
Gauge to VQM Controller
(Catalog #802301-01M for 1
meter long, or 802301-03 for 3
meters long) Demountable Envelope
Nipple (Catalog #801270)
for Nude MS Gauge
T-Flange (Catalog #
801272) and 3 Bolt Kits
(Catalog #801274-1)
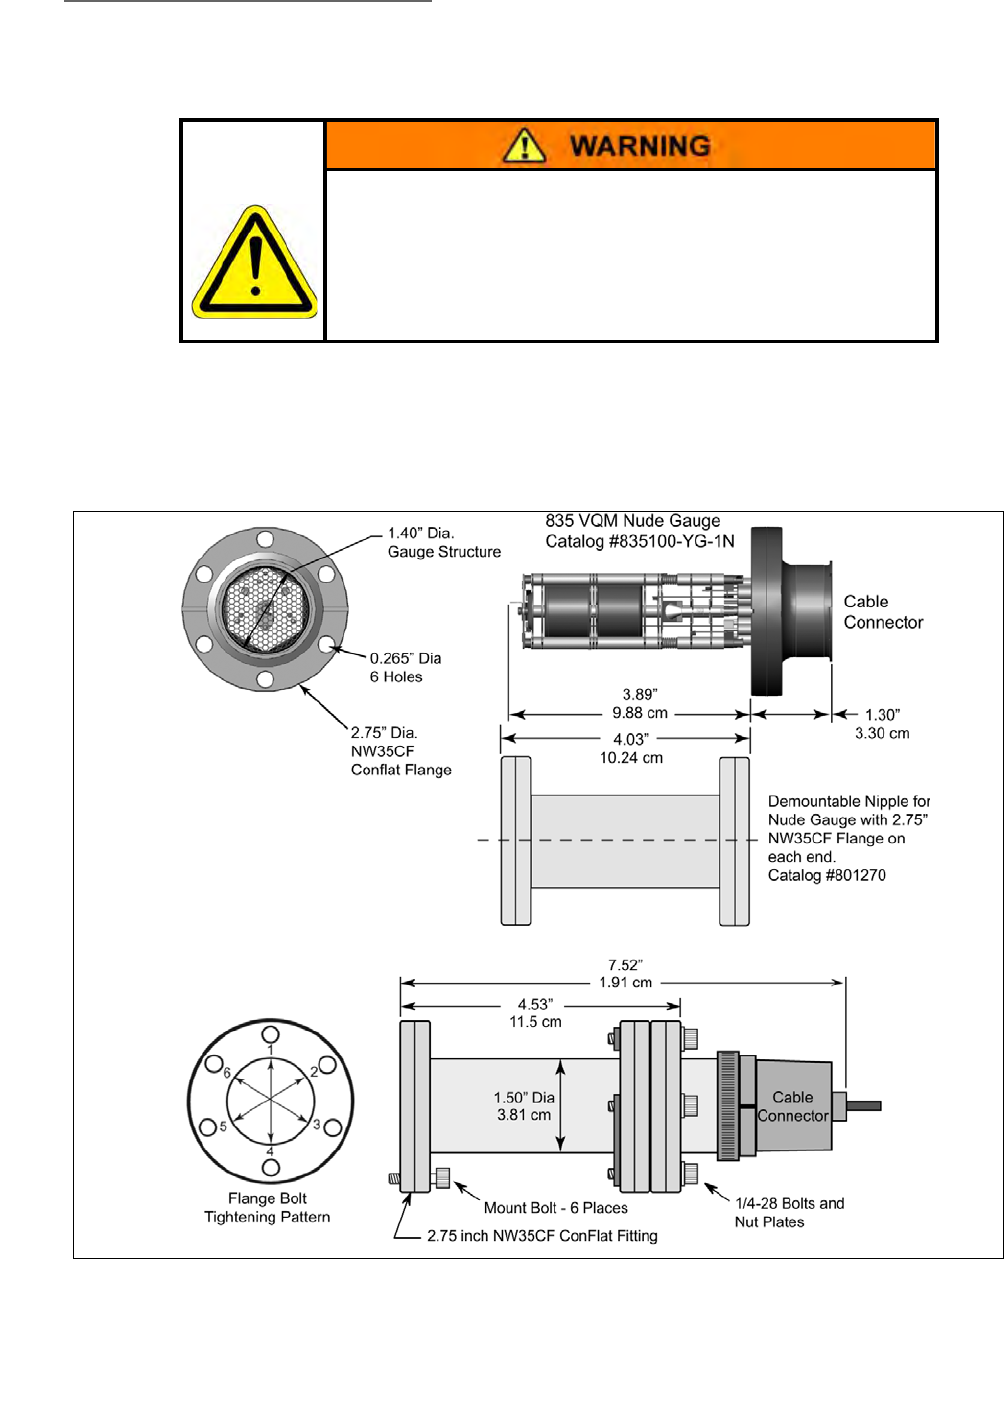
3 Hardware Installation
36 Series 835 Vacuum Quality Monitor
Instruction Manual - 835000
3.4 MS Gauge Installation
3.4.1 Introduction
The Mass Spectrometer Gauge (MS Gauge) connects to a high vacuum system and is designed to
operate at gas pressures between UHV and 10-5 Torr. The MS Gauge is available in two different
configurations: nude and demountable envelope. Figure 3-1 illustrates a Nude MS Gauge mounted
in a demountable envelope (nipple).
Safety Precautions
Verify that the vacuum port to which the Gauge is mounted is
electrically grounded. It is essential for personnel safety as
well as proper operation that the envelope of the gauge be
connected to a facility Earth ground. Use a ground lug on a
flange bolt if necessary.
Figure 3-3 VQM Mass Spectrometer Gauge and Connector
For the Nude Gauge
configuration, the inside
diameter of the vacuum port to
which the Gauge is mounted
MUST be 1.430 inches (3.632
mm) or larger. Damage to the
gauge will result if the inside
diameter is less than specified.
3 Hardware Installation
37
Series 835 Vacuum Quality Monitor
Instruction Manual - 835000
3.4.2 Installation Requirements
• For best results, locate the MS Gauge close to the point where gas composition needs to be
analyzed. Gas sources, long tubulation and other constrictions can cause large errors in
indication. Note that if placed near a pump, the pressure in the gauge may be considerably
lower than in the rest of the system. If placed near a gas inlet or source of contamination, the
pressure in the gauge may be much higher.
• Connection to a vacuum system occurs through a standard 2.75" ConFlat port.
• The MS Gauge with a demountable envelope can be attached directly to any standard 2.75"
ConFlat port.
• For systems including the optional Micro-Ion ATM Total Pressure Measurement Gauge, connect
the MS Gauge and the Micro-Ion Gauge in close proximity to each other and without conductance
restrictions between them. Ideally, the MS Gauge and the Micro-Ion Gauge must be exposed to
identical vacuum conditions. An optional T-Flange adapter is available to connect both sensors to
a single vacuum port.
• For systems relying on analog output signals from a Granville-Phillips Series 370 ionization
gauge controller to provide total pressure readings to the control unit, connect the MS Gauge
in close proximity to the ionization gauge sensor, and without vacuum conductance
restrictions between them. If necessary, use an optional T-Flange to connect the ionization
gauge and MS Gauge to a single port.
• If an optional T-Flange adapter and Total Pressure Measurement Gauge are included in the
installation procedure, evaluate the best possible orientation and configuration for the
T-Flange connection and verify that enough room is available to mount both the MS Gauge
and the Micro-Ion Gauge to the same T-Flange adapter.
• To eliminate chances of contamination during shipment, and to minimize the exposure of
the electron multiplier detector to air, the MS Gauge is shipped in a sealed, evacuated and
metalized Mylar bag. Do not break the seal until you are ready to mount the MS Gauge on
the vacuum port.
• Use proper vacuum procedures while installing the MS Gauge: Wear dust-free gloves, work
in a clean area, do not breathe into open vacuum ports, and use clean tools.
• For Nude gauges, avoid contact with the exposed surfaces of the gauge. Handle the gauge
Notice
For the Nude Gauge configuration, the inside diameter of the vacuum port
to which the MS Gauge is mounted MUST be 1.430 inches (3.632 mm) or
larger, and the insertion length must be 4 inches or longer. Damage to the
gauge will result if the inside diameter and the length are less than
specified.
Notice
The nude version of the MS Gauge does not fit into the optional T-Flange.
Use the demountable envelope to attach a Nude MS Gauge to the standard
T-Flange or to any 2.75" ConFlat flange that does meet the minimum
internal diameter and insertion length requirements.

3 Hardware Installation
38 Series 835 Vacuum Quality Monitor
Instruction Manual - 835000
by its mounting flange and wear dust free gloves at all times.
• To minimize the possibility of leaks with ConFlat flanges, use high strength stainless steel
bolts and a new, clean OFHC copper gasket. Avoid scratching the seal surfaces. Do not use
nonmetal gaskets.
• Finger tighten all 6 bolts, then continue tightening each about 1/8 turn in crisscross order,
e.g., 1, 4, 2, 5, 3, 6, 4, 1, 5, 2, 6, 3 . . . until the flanges are in contact. After contact, further
tighten each bolt about 1/16 turn.
• It is the user's responsibility to install cables to/from the VQM Controller and Mass
Spectrometer Gauge, whether provided by MKS, Granville-Phillips Division or not, in
accordance with the applicable local, state, and national safety requirements.
• Under certain conditions, dangerous high voltage can be coupled directly to an ungrounded
conductor through a gas almost as effectively as through a copper wire connection. This
hazard, which is not peculiar to this product, is a consequence of the ability of an electric
current to flow through a gas under certain circumstances. A person may be seriously
injured, or even killed by merely touching an exposed ungrounded conductor at high
potential. High voltage can couple through a gas to the internal electrodes of a gauge. Do
not touch the exposed pins on any gauge installed on a vacuum system where high voltage
is present. To avoid the chances of electrical shock, all exposed conductors, including the
feed-through pins of the MS Gauge, must be maintained at Earth ground before the cable
connector is attached to the MS Gauge. See System Grounding Procedure in Section 3.8.
3.4.3 Operational Requirements
• Do not operate the MS Gauge in a corrosive gas environment. Corrosive gases will limit
gauge lifetime and degrade both filament and electron multiplier detector performance.
• Do not operate the MS Gauge in the presence of strong magnetic fields.
• The operating pressure range for the MS Gauge is between Ultra High Vacuum (UHV) and
1x10⁻⁵ Torr.
• The VQM System provides optimal performance at 2x10⁻⁷ Torr or lower.
• The maximum safe operating pressure for the MS Gauge is 10-5 Torr.
• The MS Gauge can be mounted in any orientation.
• The MS Gauge must be located in a position close to where the partial pressures are to be
measured.
• The MS Gauge must be distanced or shielded from all other instruments that could
potentially affect the mass spectrometry readings.
• The MS Gauge must be protected from evaporation sources that could provide line of sight
contamination into the gauge.
• Allow enough clearance for the MS Gauge/Controller interconnect cable connector.
• Allow enough thermal clearance for (1) a heater jacket to be mounted on the MS Gauge and
(2) the heat generated during operation to be dissipated.
• The location of the MS Gauge relative to the VQM Controller must be compatible with the
available interconnect cable length.
• To obtain accurate total and ratiometric partial pressure measurements from a common gas
environment, connect the MS Gauge and the ionization gauge responsible for simultaneous
total pressure readings in close proximity to each other and without vacuum conductance
restrictions between them.

3 Hardware Installation
39
Series 835 Vacuum Quality Monitor
Instruction Manual - 835000
3.4.4 Mounting Procedure
1. Determine the best placement for the MS Gauge following both the Installation and
Operational Requirements.
2. Install the optional T-Flange adapter for the Micro-Ion Gauge on the vacuum port (if required).
The MS Gauge will be installed on one of the vacuum ports of the T-flange, and the Micro-Ion
Gauge on the other port.
3. Break the hermetic seal of the Mylar Bag and remove the hard plastic shell that mechanically
protects the MS Gauge.
4. Remove the MS Gauge from its hard plastic shell. Do breath directly into an open vacuum
port. At this point the internal components of the MS Gauge are exposed to ambient air and
particles.
5. An additional plastic cylinder protects the electrode structure of the Nude MS Gauge. Remove
the plastic cylinder prior to mounting.
6. Hold the MS Gauge in an upright position and visually inspect both ends of the cylindrical unit
checking for damage that might have occurred during shipment, including loose, damaged or
misaligned components. Inspect the quality of the knife edges in the vacuum port and in the
MS Gauge mounting flange.
7. Position the copper gasket, align the holes in both flanges and tighten the six bolts using
standard ConFlat flange sealing procedures.
NOTE: Use caution when installing the copper gasket for a nude MS Gauge. Abrading
the copper gasket on the insulators of the gauge can cause electrical contacts
along the surface of the insulators.
8. For the Nude MS Gauge, it is also good practice to use an ohmmeter to check for electrical
shorts between the feed-through pins and the vacuum chamber walls. There should be no
electrical connection between any of the pins and the vacuum system walls.
9. Begin the initial pumpdown of the vacuum chamber as soon as the flange connection is
sealed. The MS Gauge is pre-cleaned and leak checked at the factory and should only
contribute to the chemical composition of the vacuum gas environment through normal
outgassing from its walls (mostly water). If available, use a total pressure ionization gauge to
monitor the pressure of the vacuum system into the high vacuum levels required for safe MS
Gauge operation. Contact the factory if a leak in the feed-through flange is detected or
suspected.
See the Section 8.3 in Chapter 8 for additional information and recommendations for the
initial pumpdown, and Section 7.3 in Chapter 7 for recommended Bakeout Procedures.
10. Attach the optional Heating Jacket (see Figure 3-5), if being used. See Section 7.3 for bakeout
procedures, Table 2-3 for voltage requirements, and the instruction guide that was included
with the Heater Jacket.
11. See Section 3.6.3 to electrically connect the MS Gauge to the VQM Controller using the MS
Gauge interconnect cable.
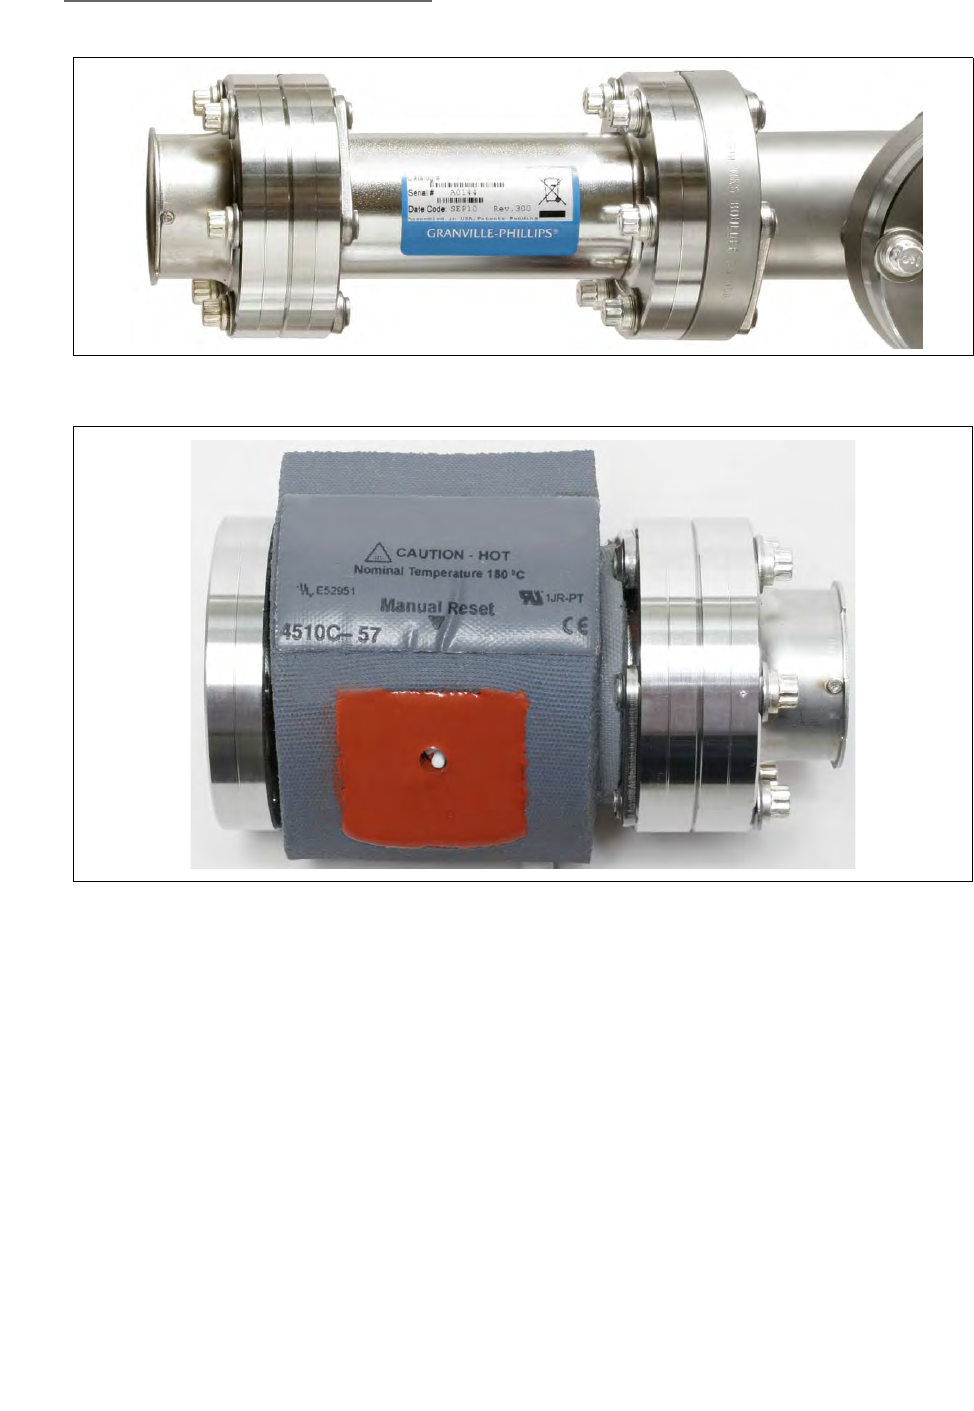
3 Hardware Installation
40 Series 835 Vacuum Quality Monitor
Instruction Manual - 835000
3.5 Micro-Ion Gauge Installation
3.5.1 Introduction
An optional Series 390802 Micro-Ion ATM Total Pressure Measurement Gauge is available to
provide pressure measurement from Atmosphere to 10-9 Torr. The Micro-Ion Gauge connects to the
same high vacuum system as the Mass Spectrometer Gauge.
Figure 3-4 MS Gauge on a Vacuum Chamber
Figure 3-5 Optional Heater Jacket on a VQM MS Gauge
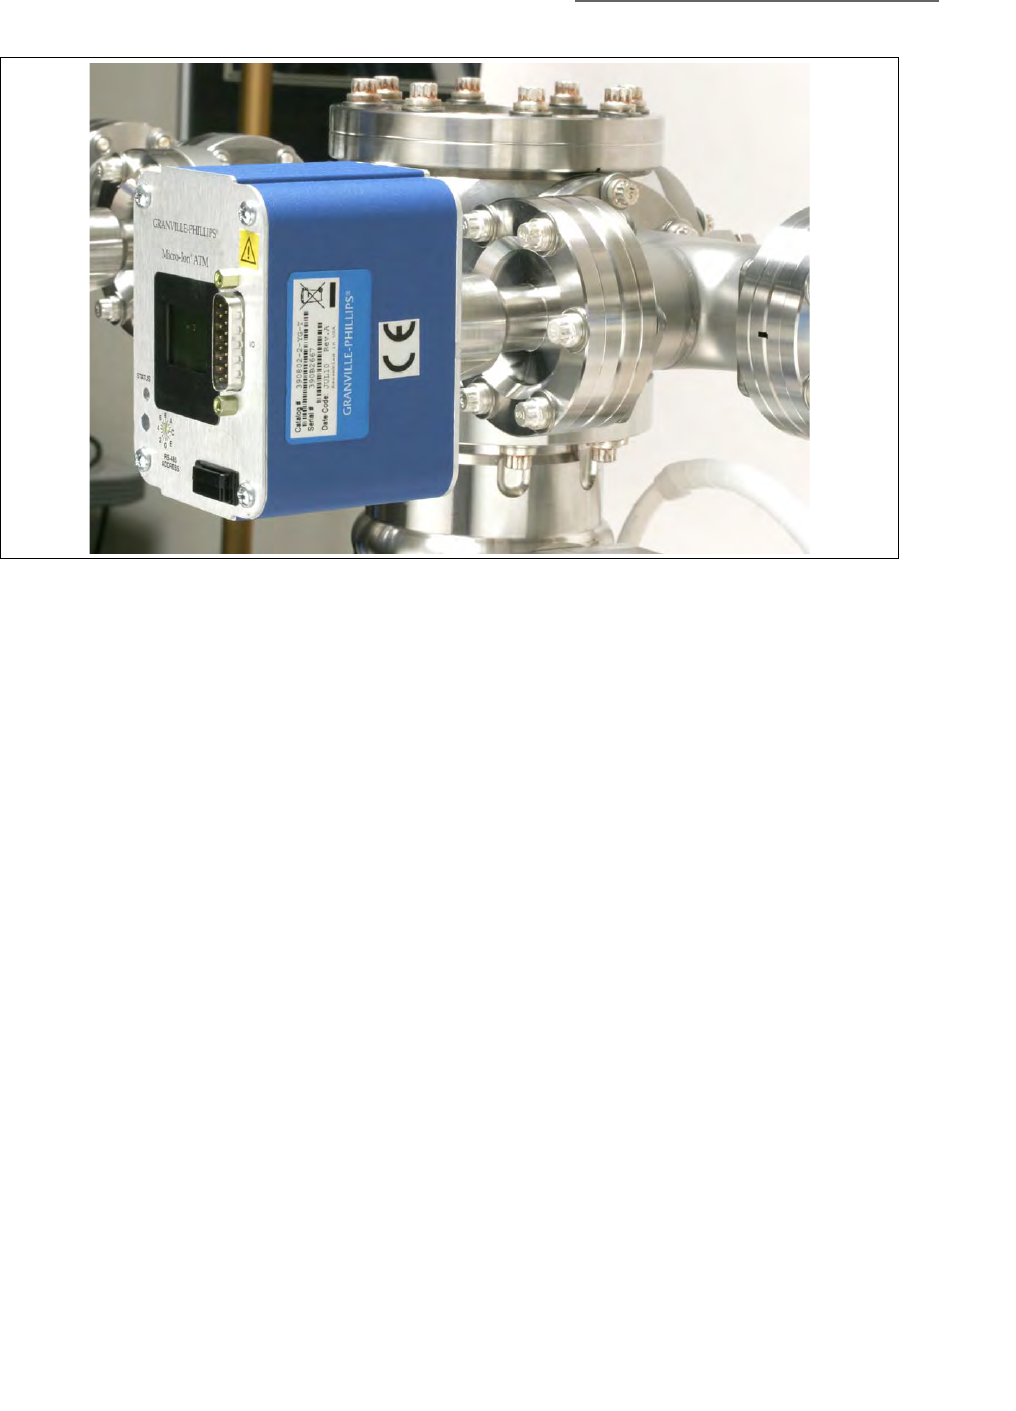
3 Hardware Installation
41
Series 835 Vacuum Quality Monitor
Instruction Manual - 835000
3.5.2 Installation Requirements
• For systems including an optional Micro-Ion Gauge, connect the MS Gauge and the
Micro-Ion Gauge in close proximity to each other and without conductance restrictions
between them. Ideally, the MS Gauge and the Micro-Ion Gauge must be exposed to identical
vacuum conditions.
• An optional T-Flange is available to allow connection of the Micro-Ion Gauge to the same
port as the Mass Spectrometer Gauge.
• Any mounting orientation may be used.
• Allow enough clearance for the interconnect cable connector.
• The Power button on the VQM Controller also controls power to the Micro-Ion Gauge. If
power is turned OFF to the Controller, power is also turned OFF to the Micro-Ion Gauge.
Users requiring "independent" power control for the Micro-Ion Gauge need to use a different
wiring setup where power is provided from an independent source. The connector pinout
for the Micro-Ion Gauge is illustrated in Figure 3-11.
3.5.3 Mounting Procedure
1. If a Granville-Phillips 390802 Micro-Ion Gauge is bundled with your system, install the gauge
on your system following the instructions in Instruction Manual #390001 and Addendum
#390015. The Instruction Manuals for the Micro-Ion Gauge are provided with the gauge. For
additional assistance, contact Granville-Phillips Customer Support - the contact information is
listed in the front and the back of this Instruction Manual.
2. See Section 3.6.4 to electrically connect the Micro-Ion Gauge to the VQM Controller using the
Micro-Ion Gauge-to-VQM Controller interconnect cable.
Figure 3-6 Micro-Ion Gauge Mounted on a Vacuum Chamber
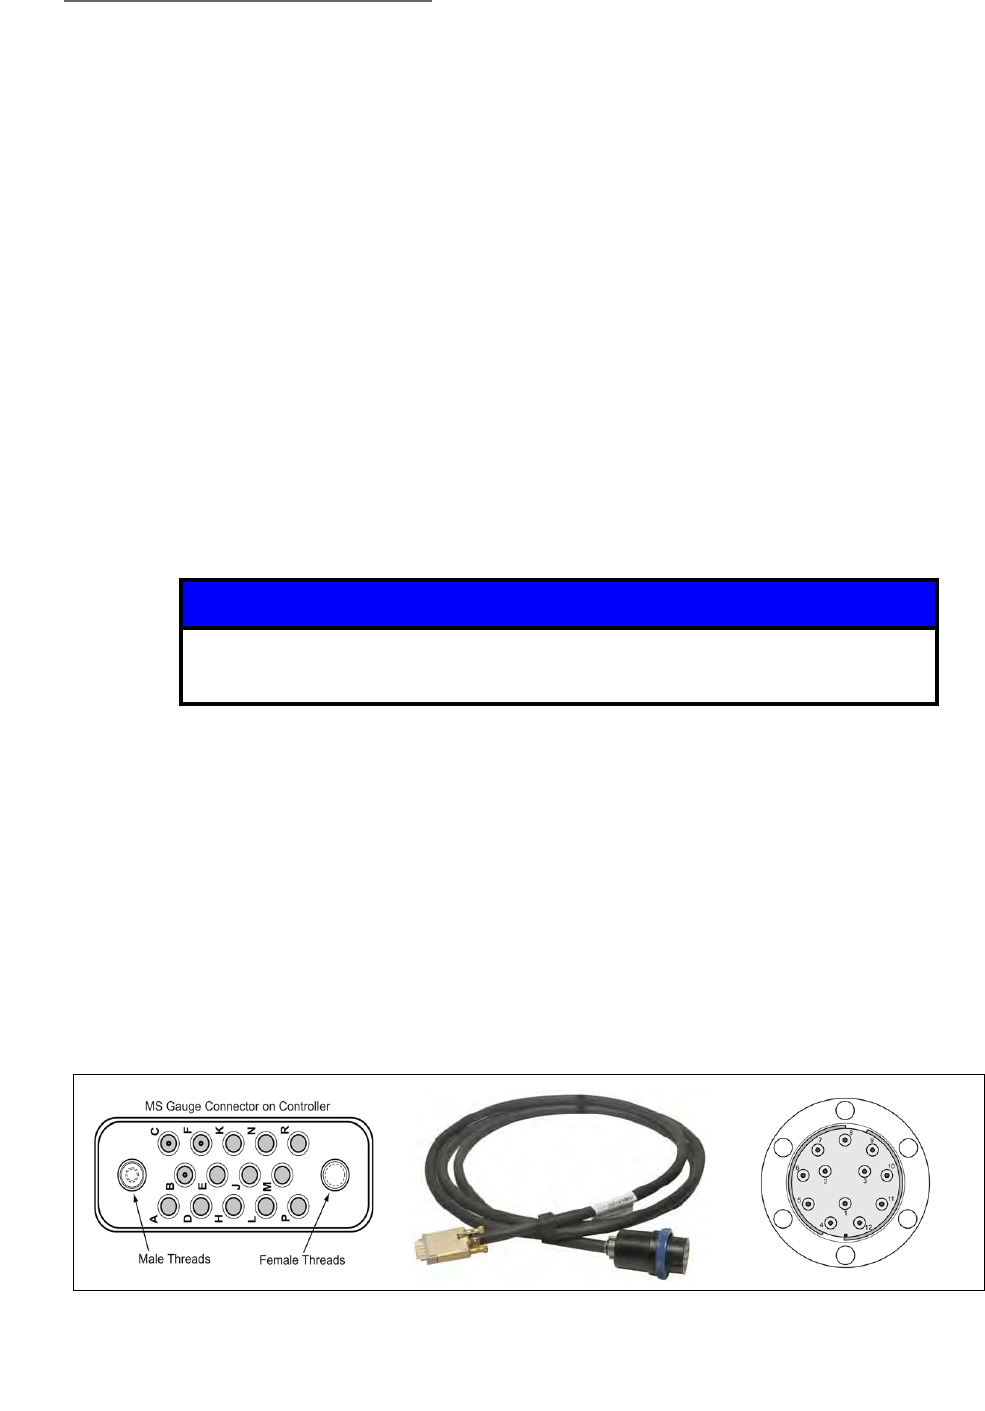
3 Hardware Installation
42 Series 835 Vacuum Quality Monitor
Instruction Manual - 835000
3.6 VQM Controller, MS Gauge & Micro-Ion Gauge Connections
3.6.1 Introduction
The VQM Controller is designed for benchtop mount operation. The Controller connects to the
Mass Spectrometer Gauge (MS Gauge) and the Micro-Ion Gauge using two individual interconnect
cables. This section describes the process of connecting the VQM Controller to the MS Gauge and
the Micro-Ion Gauge.
3.6.2 Connection Requirements
• The distance between the VQM Controller, the MS Gauge and the Micro-Ion Gauge must be
compatible with the interconnect cable lengths available.
• Provide adequate ventilation for the VQM Controller to dissipate up to 75 Watts.
• The VQM Controller should be mounted in a location with unrestricted air flow and ambient
temperature less than 40 0C (104 0F).
• Do not mount the VQM Controller above other equipment that generates excessive heat.
• Do not locate the VQM Controller where it will be exposed to corrosive gases such as
mercury vapor or fluorine.
• Do not locate the VQM Controller in areas where liquid spills are possible.
3.6.3 MS Gauge Connection Procedure
1. Place the VQM Controller on a clean benchtop close to the MS Gauge and the Micro-Ion
Gauge.
2. Connect and secure the VQM Controller to the MS Gauge using the MS Gauge interconnect
cable. Insert the gauge connection plug into the metal guard located on the receptacle of the
MS Gauge. Use the alignment pin inside the metal guard of the receptacle on the MS Gauge
and the matching slot on the plug to assure proper orientation of the connector sockets relative
to the feedthrough pins before pushing the plug into the metal receptacle. Lock (rotate) the
connector collar with the integral pin guard.
Connect the other end of the MS Gauge interconnect cable to the VQM Controller. Insert the
cable plug into the VQM Controller's back panel connector labeled MASS SPEC. The thumb
screws of the plug are Male and Female to match with the connector on the VQM Controller.
Tighten the thumb screws. The pins will not be visible once the thumb screws are tightened.
Notice
The VQM Controller should be mounted in a location with adequate air flow
and ambient temperature less than 40 oC (104 oF).
Figure 3-7 Cable Connectors on the MS Gauge and the Rear of the VQM Controller
MS Gauge Cable
Connector on MS Gauge
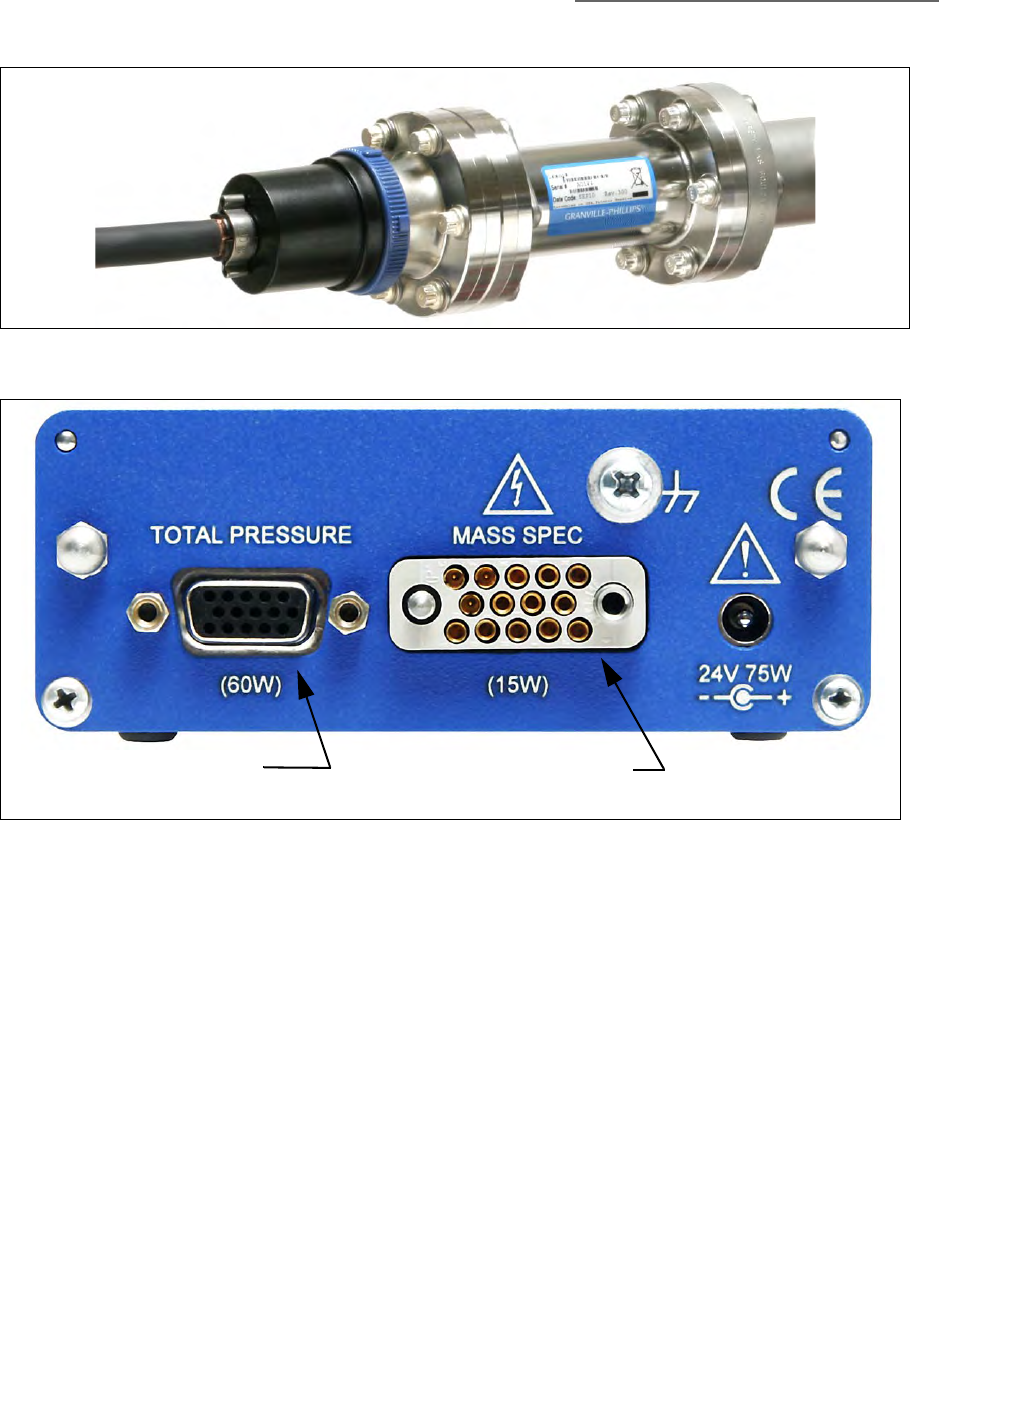
3 Hardware Installation
43
Series 835 Vacuum Quality Monitor
Instruction Manual - 835000
Figure 3-8 Cable Connected to the MS Gauge
Figure 3-9 VQM Controller Rear Panel
Micro-Ion Gauge
Connector MS Gauge Connector
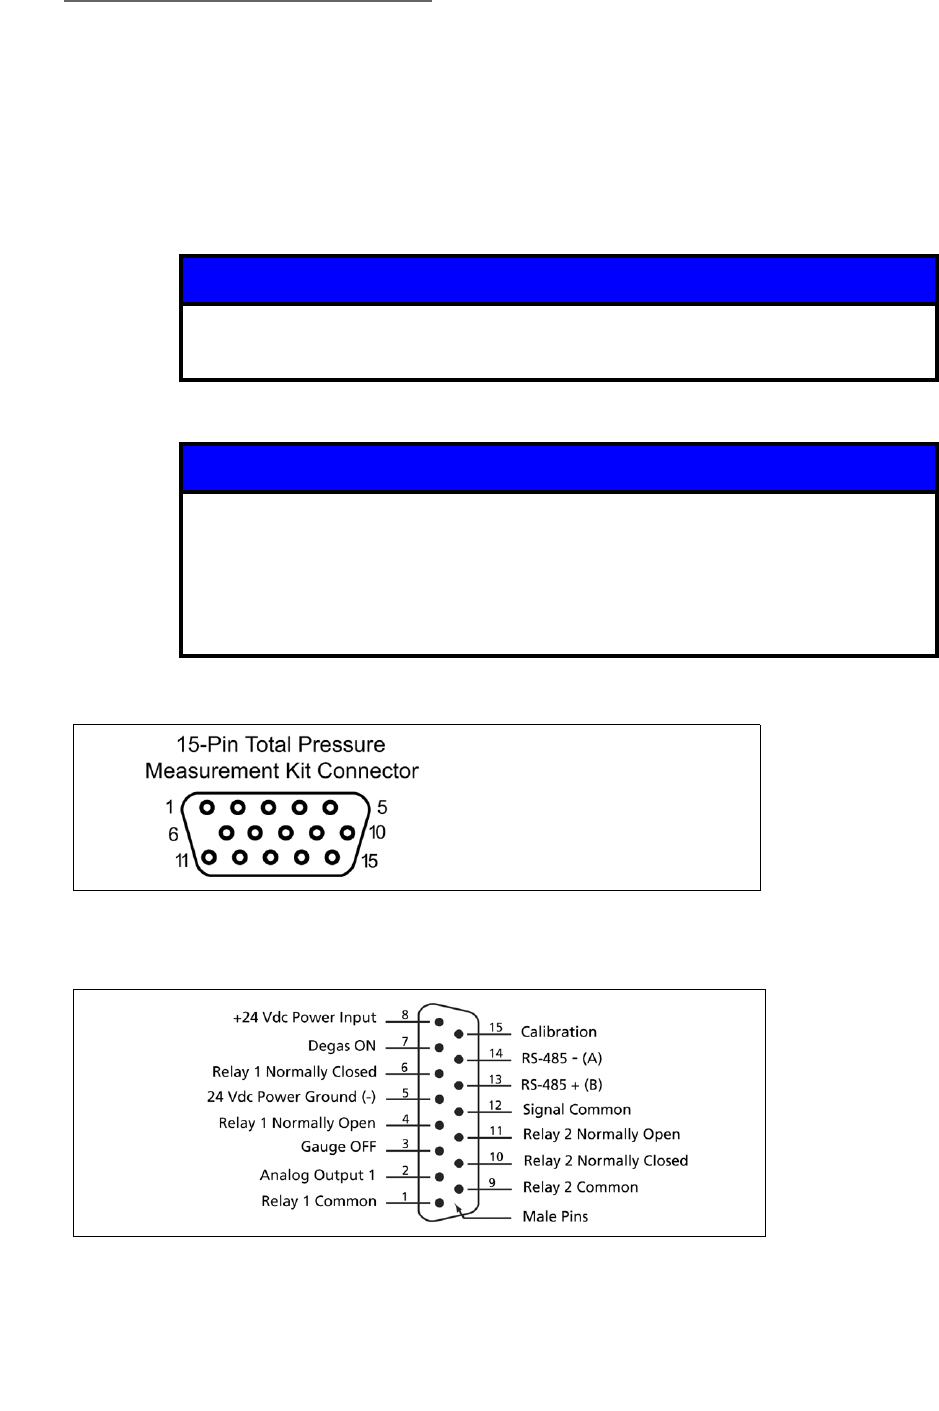
3 Hardware Installation
44 Series 835 Vacuum Quality Monitor
Instruction Manual - 835000
3.6.4 Micro-Ion Gauge Connection Procedure
1. Connect the Micro-Ion Gauge to the VQM Controller using the 1-meter or 3-meter
interconnect cable. DC power and communications with the Micro-Ion Gauge are provided
through the 15-pin connector labeled TOTAL PRESSURE on the rear panel of the VQM
Controller. Connect and secure the interconnect cable between the VQM Controller and the
Micro-Ion Gauge.
2. Tighten the connector screws.
Notice
Be sure that the DC power to the VQM Controller is 24 Vdc, 75 Watts when
using the Micro-Ion Gauge. See Table 2-2 on page 27.
Notice
The Power button on the VQM Controller also controls power to the
Micro-Ion Gauge. If power is turned OFF to the VQM Controller, power is
also turned OFF to the Micro-Ion Gauge. Users requiring independent
power control for the Micro-Ion Gauge need to use a different wiring setup
where power is provided from an independent source. The connector on the
Micro-Ion Gauge is illustrated in Figure 3-11.
Figure 3-10 Micro-Ion Gauge Connector on the Rear of the VQM Controller
Figure 3-11 Connector Pinout on the 390802 Micro-Ion Gauge
Pin assignments:
2 & 8 = +24 Vdc Output to 390802
5 & 15 = –24 V Power Ground
7 & 12 = Signal Common
13 = RS-485 – (A)
14 = RS-485 + (B)
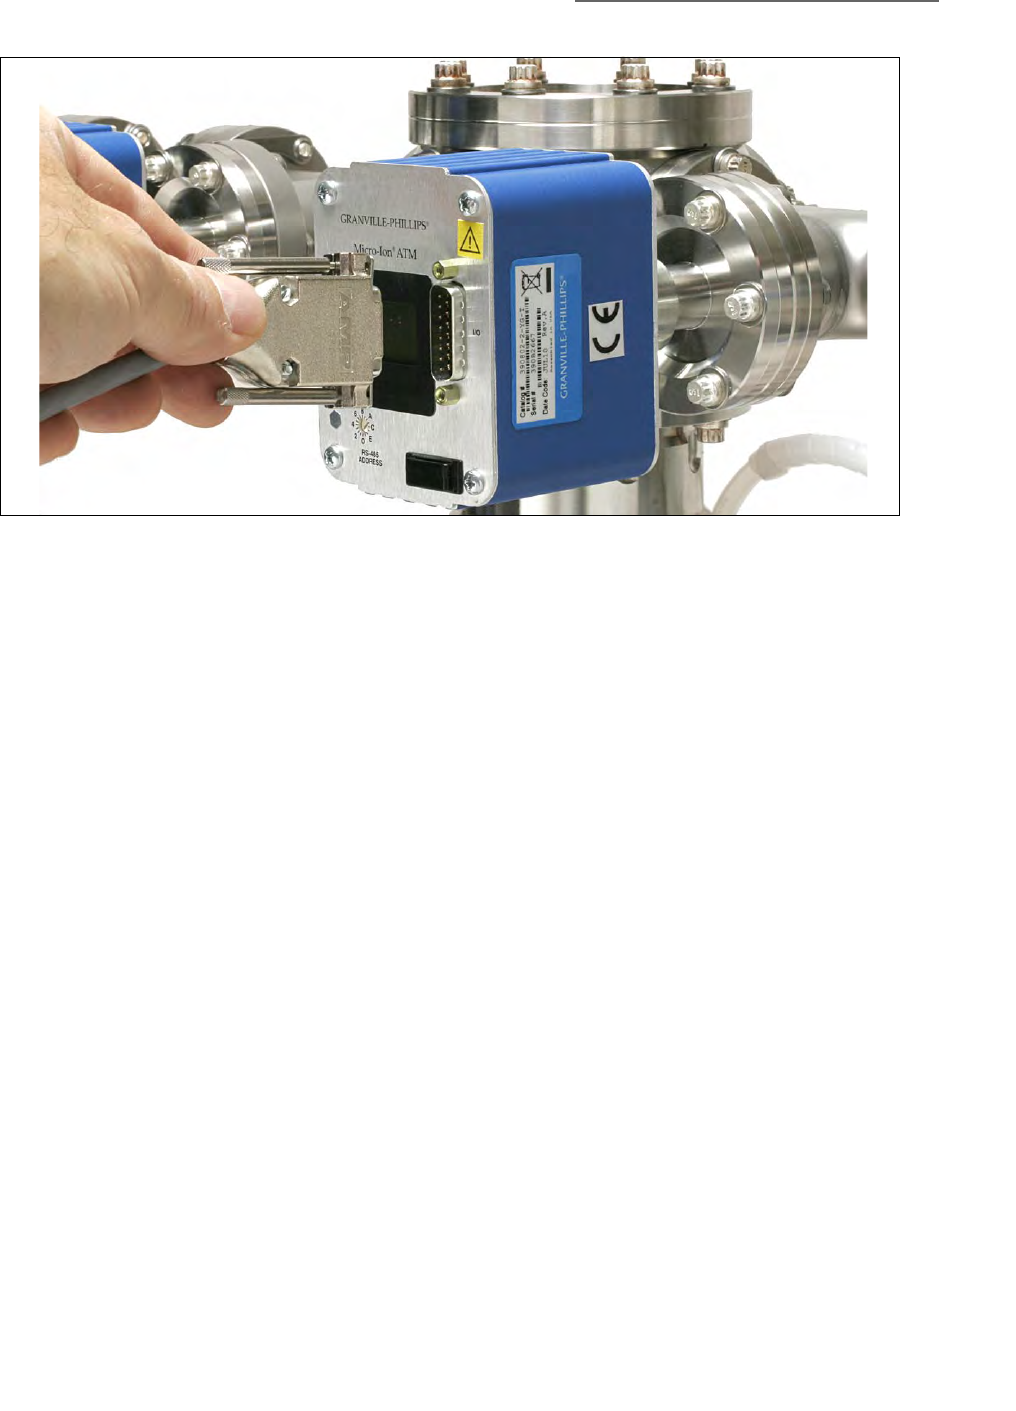
3 Hardware Installation
45
Series 835 Vacuum Quality Monitor
Instruction Manual - 835000
3.7 VQM Controller - 24 Vdc Power Connection
3.7.1 Introduction
The VQM System requires 24 Vdc power for operation. Power consumption depends on whether a
Micro-Ion Gauge is included in the system. Mass Spectrometer Gauge operation requires 24 Vdc,
15 W power. The addition of a Micro-Ion Gauge increases the power requirement to 24 Vdc, 75 W.
A factory-provided DC power supply is available and recommended for operation of the VQM
System, including a Micro-Ion Gauge.
3.7.2 Connection Requirements
• It is recommended that a factory-provided DC power supply be used to provide power to the
VQM System.
• Be sure that the DC power to the VQM Controller is 24 Vdc, >75 Watts when using the
optional Micro-Ion Gauge.
• If you are not using the Granville-Phillips DC power supply, be sure the DC power supply
being used meets the requirements listed in Table 2-2 on page 27 of this Instruction Manual.
Power and ground connections are illustrated in Figure 3-13.
• Do not apply power to the Controller until instructed later in this manual.
3.7.3 Connection Procedure
1. Connect the 24 Vdc power supply to the back panel of the VQM Controller. Plug in the DC
power plug on the rear panel of the VQM Controller (24 Vdc, 75 W connector), but do NOT
plug in the AC power supply at this time.
Figure 3-12 Connect the Cable to the Micro-Ion Gauge
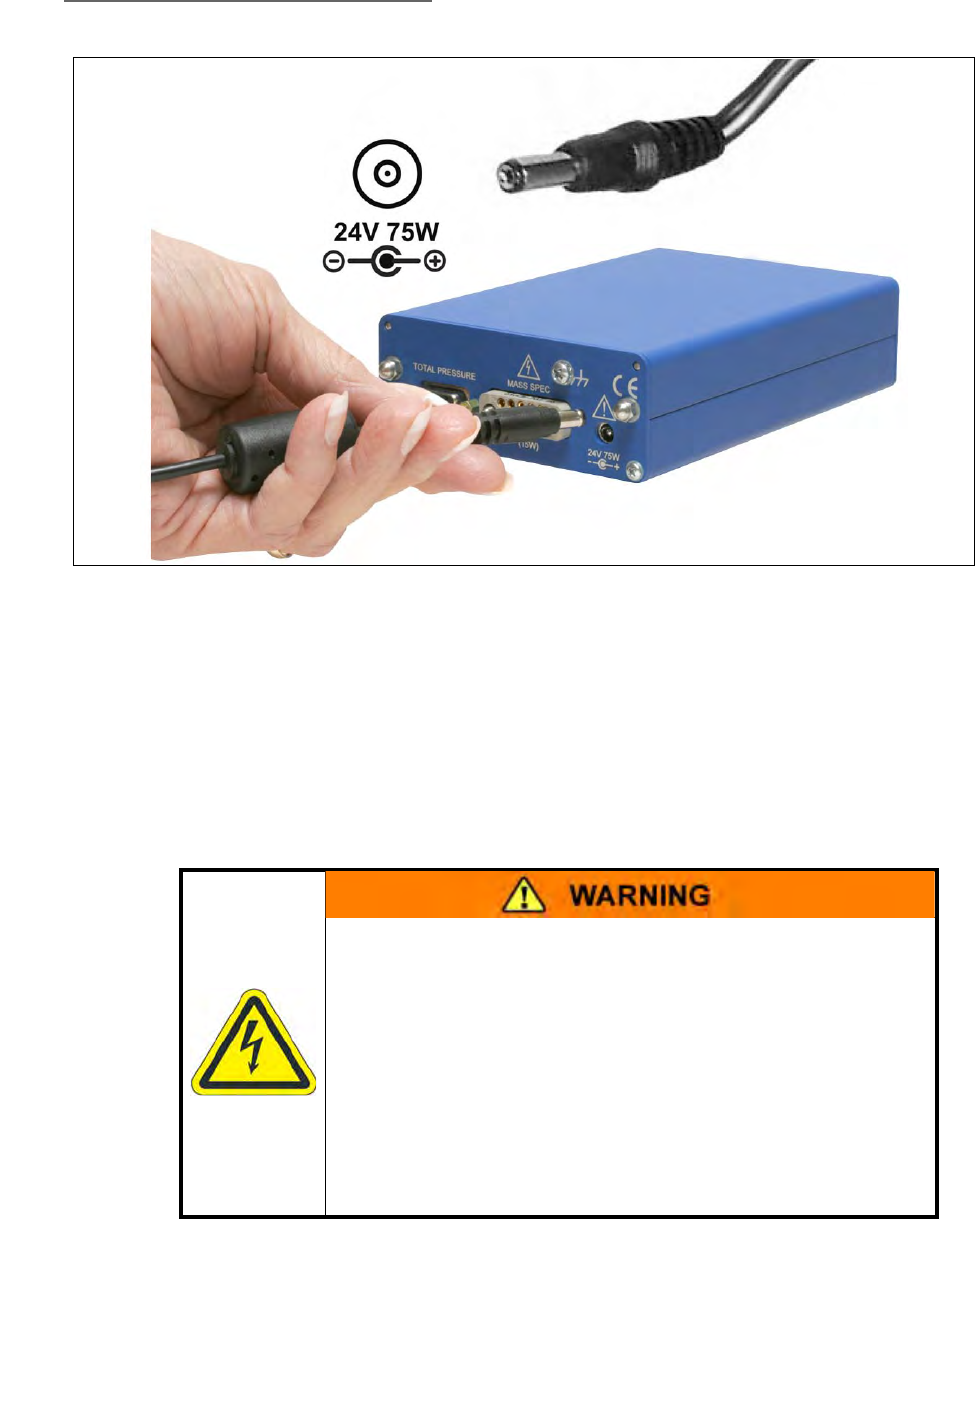
3 Hardware Installation
46 Series 835 Vacuum Quality Monitor
Instruction Manual - 835000
2. Follow the System Grounding Procedure described in the following section.
3.8 System Grounding Procedure
A strict ground protocol is required due to the electronic circuits within the VQM System and the
process by which data is gathered and output. The emission current, ion trap voltage gradient, and
detector are all precision signals relative to the Mass Spectrometer Gauge/vacuum system ground.
The proper system electrical grounding procedure must be adhered to for proper VQM System
operation, data integrity and personnel safety.
Figure 3-13 DC Power Plug
High Voltage
Improper grounding can cause product damage or personal
injury.
Follow the ground network requirements for the facility.
Maintain all exposed conductors at Earth ground.
Connect the power cord to a properly grounded outlet.
Make sure the vacuum port to which the gauge is mounted is
properly grounded.
Connect the gauge envelope to a facility ground. If necessary,
use a ground lug on the flange bolt.
3 Hardware Installation
47
Series 835 Vacuum Quality Monitor
Instruction Manual - 835000
High Voltage
Be aware that an electrical discharge through a gas may
couple dangerous high voltage directly to an ungrounded
conductor almost as effectively as would a copper wire
connection. A person may be seriously injured or even killed
by merely touching an exposed ungrounded conductor at high
potential.
This hazard is not unique to this product.
High Voltage
Provide a connection to ground for each ungrounded metal
component in, on, or around the vacuum system, including the
gauge envelopes, which personnel may touch and which can
potentially be exposed to high voltage electrical discharges
within the vacuum system.
High Voltage
Compliance with the usual warning to connect the power cable
only to a properly grounded outlet is necessary but not
sufficient for safe operation of a vacuum system with this or
any similar high voltage producing product. Grounding this
product does not and cannot guarantee that other components
of the vacuum system are all maintained at Earth ground.
High Voltage
All conductors in, on, or around the vacuum system that are
exposed to potential high voltage electrical discharges must
either be shielded at all times to protect personnel or must be
connected to Earth ground at all times.
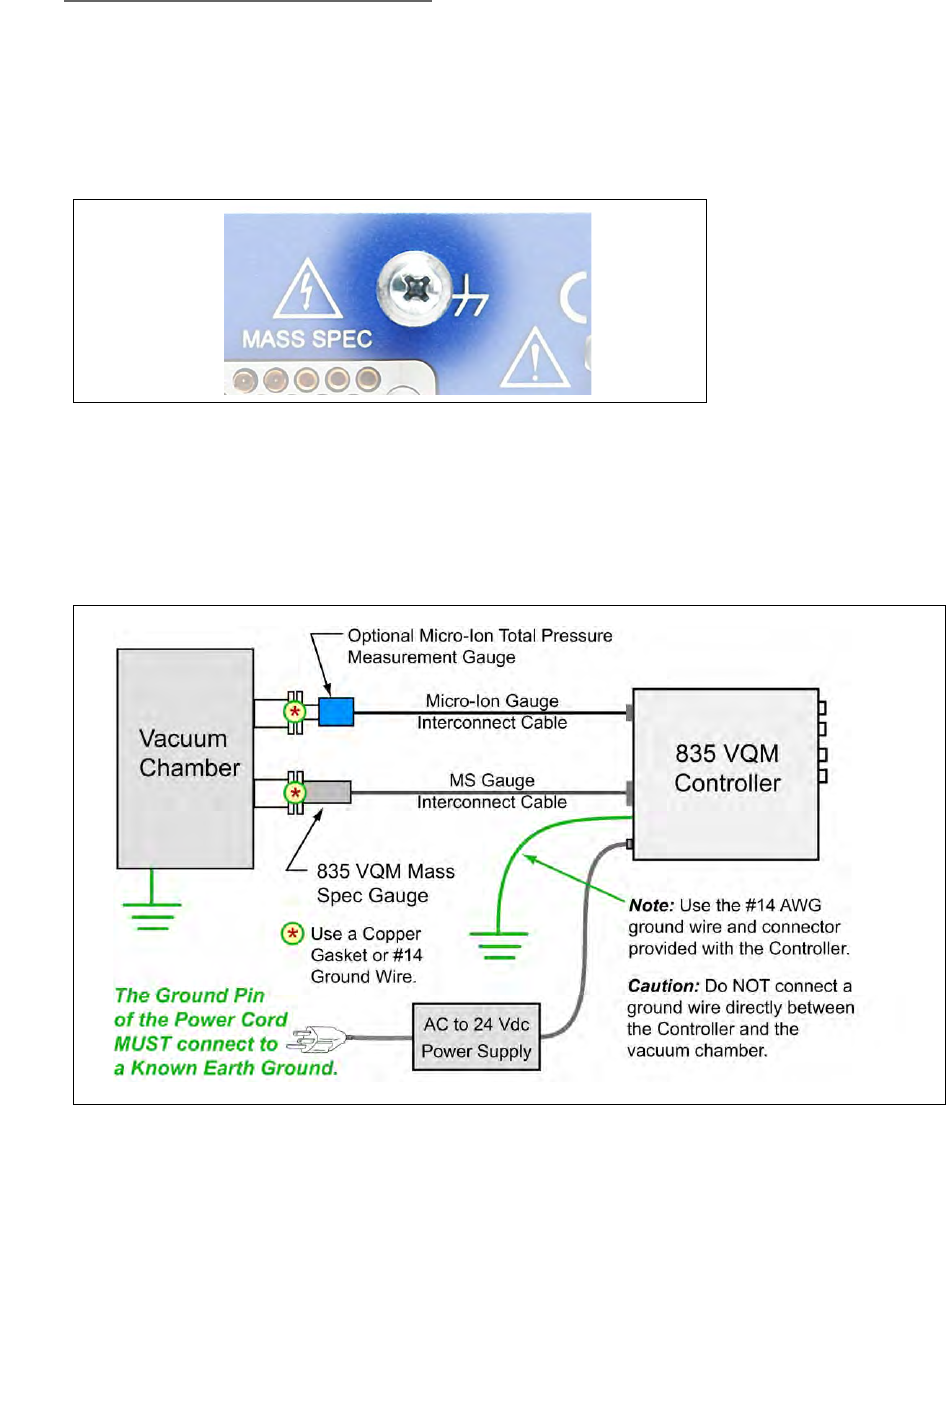
3 Hardware Installation
48 Series 835 Vacuum Quality Monitor
Instruction Manual - 835000
3.8.1 VQM Controller Ground Connections
1. Connect a #14 AWG ground wire (provided) from the ground lug (6-32 thread) on the rear
panel of the VQM Controller to a known Earth ground. Do NOT connect a ground wire
directly between the VQM Controller and the vacuum chamber. See Figure 3-14 and Figure
3-15.
2. Plug in the VQM Controller AC power supply making sure that the ground pin of the power
cord is connected to a known Earth ground.
3. Do NOT turn ON the VQM Controller at this time.
4. Perform the System Ground Test Procedure described in the following section.
3.8.2 System Ground Test Procedure
Use the following procedure to test vacuum systems that incorporate a VQM System:
NOTE: Use a digital multimeter and a 10 Ohm, 10 Watt resistor for this procedure.
1. Examine the grounding of both the VQM Controller and the vacuum chamber. Make sure there
is a heavy duty ground connection to all exposed conductors on the chamber.
Figure 3-14 Ground Connection on the Rear of the VQM Controller
Figure 3-15 VQM System Grounding Diagram
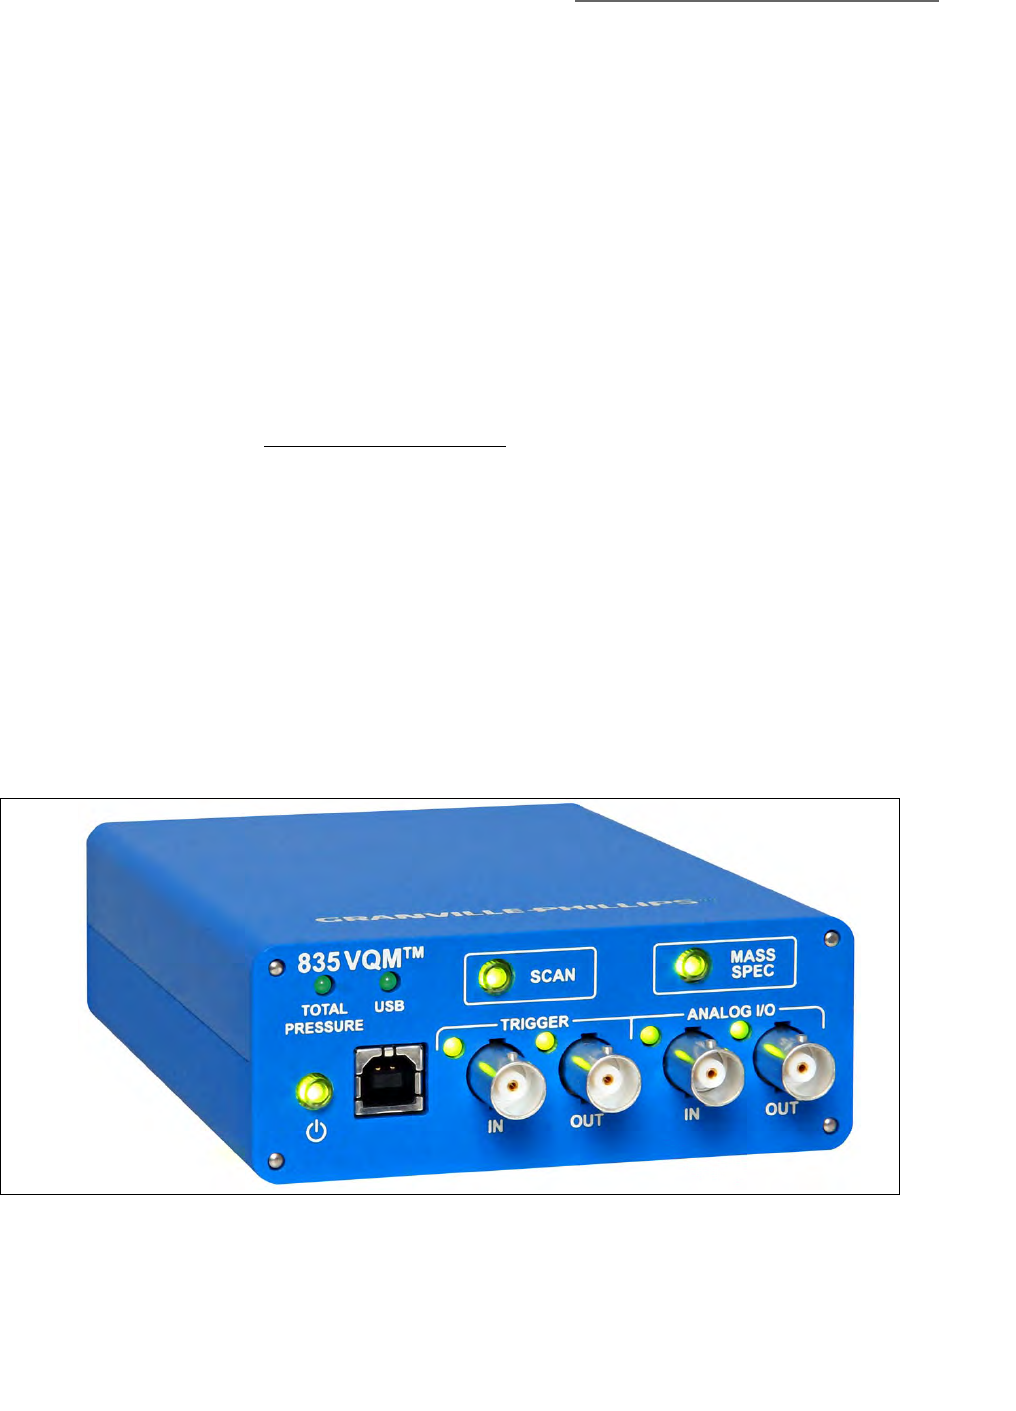
3 Hardware Installation
49
Series 835 Vacuum Quality Monitor
Instruction Manual - 835000
2. With the VQM Controller turned OFF, test for both DC and AC voltages between the metal
parts of the vacuum chamber and the VQM Controller chassis.
3. If no voltages exist, measure the resistance. The resistance should not exceed 2 Ohms. A
resistance of 2 Ohms or less implies commonality of these grounds that should prevent a
plasma from creating a dangerous voltage between them. This test does not prove that either
connection is at Earth ground, only that they are the same. If more than 2 Ohms is indicated,
check with a licensed electrician.
4. If AC or DC voltages exist and are less than 10 volts, shunt the meter with a 10 Ohm/10 Watt
resistor. Repeat the voltage measurement. With the shunt in place across the meter, if the
voltage remains at 83% or more of the unshunted value, commonality of the grounds is
implied. Repeat the measurements several times to be sure that the voltage ratio is not
changing with time. This should prevent a plasma from creating a dangerous voltage between
these grounds. Make sure that no more than 10 volts exists between grounds.
If the voltage change in step 3 is greater than 17% due to the placement of the shunt, it complicates
the measurement. The commonality of the grounds may be satisfactory and the coupling poor, or
the commonality could be poor. Be sure to check the electrical continuity between these two
ground systems.
3.9 VQM Controller - Signal Input/Output Connections
The VQM Controller includes four independent signal input/output ports on the front panel.
The VQM Controller and MS Gauge can be used without a Host/PC. However, only limited
operating functionality is available. See Section 5.12.3 and Section 5.12.4 for more information.
Figure 3-16 Front Panel of the VQM Controller
VOLTAGE (SHUNTED)
VOLTAGE (UNSHUNTED) = 0.83 OR MORE

3 Hardware Installation
50 Series 835 Vacuum Quality Monitor
Instruction Manual - 835000
3.9.1 Trigger Input
The Trigger IN connector is a BNC-type. The Trigger Input is a Transistor-Transistor Logic (TTL) level
input. A single mass spectrometry scan is completed each time a low-to-high TTL transition is
detected at the port (1 millisecond minimum pulse width). The Trigger Input port is connected to
external TTL trigger signals and used to synchronize mass spectrometry scans with external events.
See Section 2.4.6 and Section 5.5.1 for more information.
3.9.2 Trigger Output
The Trigger OUT connector is a BNC-type. The Trigger Output is a Transistor-Transistor Logic (TTL)
level output that frames the start and end of each mass spectrometry scan. The output of the port
goes high when a mass spectrometry scan is initiated and returns to its low state at the end of the
mass spectrometry scan (80 milliseconds nominal scan time). Use the Trigger Output pulses to
trigger fast data acquisition systems connected to the Analog Output port (Stand-Alone Mode of
operation). See Section 2.4.6 and Section 5.5.2 for more information.
The Trigger Output can also be used to provide output based on the status of the Vacuum Quality
Index (VQI). See Section 8.4.11.
3.9.3 Analog Input / External Total Pressure
The Analog IN connector is a BNC-type. The analog input port is used to digitize external analog
signals in synchronicity with mass spectral scans. Connect the analog input port to any external
transducer capable of delivering analog output signals. A common application of the analog Input
port is to connect the analog output of Granville-Phillips Ionization Gauge Controllers to the VQM
Controller. An optional cable is available to connect the analog output of Granville-Phillips Series
370 ionization gauge controller to the Analog Input port of the VQM Controller. The VQM Viewer
Application can read analog voltages digitized by the Analog Input port and convert them into
ionization gauge total pressures for specific Granville-Phillips ionization gauge controllers. See
Section 2.4.7, Section 5.5.3, and Section 8.2.1.2 for more information.
3.9.4 Analog Output
The Analog OUT connector is a BNC-type. The Analog Out port provides a voltage signal
proportional to twice the output of the electrometer connected to the mass spectrometer detector.
Connect the Analog Output Signal to a fast data acquisition system triggered by the Trigger Output
pulses. See Section 2.4.7 and Section 5.5.4 for more information.
3.9.5 VQM Controller to Host/PC Connection
To use the VQM System with a Host/PC and the Viewer Application, connect a USB cable to the
VQM Controller and the Host/PC. See the software installation instructions in Section 4.
A Host/PC can be used to control the VQM System using the Viewer Application (see Chapter 8),
Granville-Phillips’ Application Programming Interface (manual p/n 835003), or a custom software
application and the instrument's VQM Command Set (see Chapter 9).
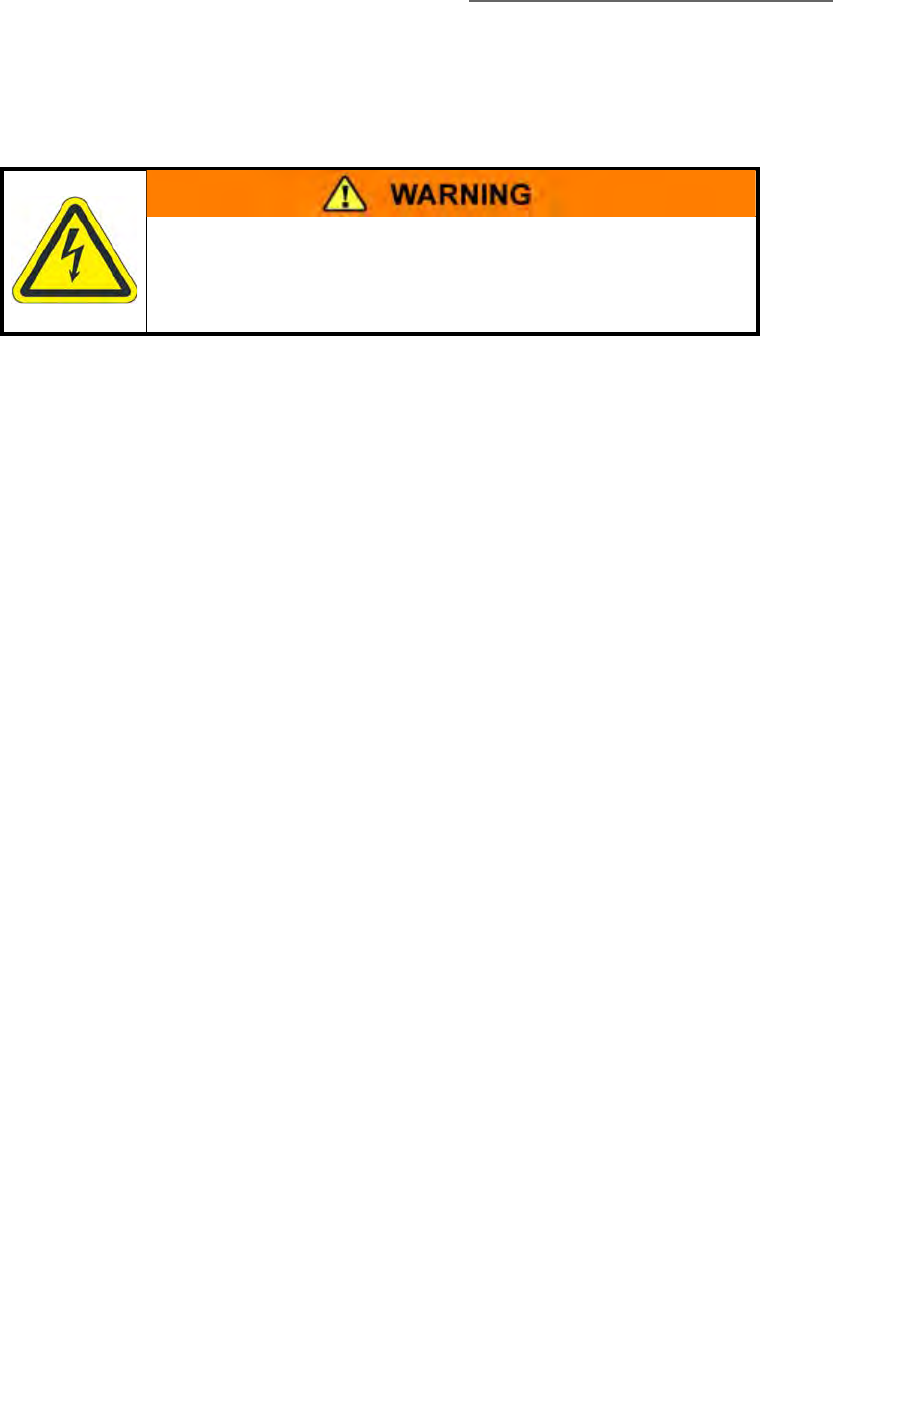
3 Hardware Installation
51
Series 835 Vacuum Quality Monitor
Instruction Manual - 835000
3.10 Initial Startup
Refer to Chapter 4 and Chapter 8 for detailed instructions regarding the VQM Viewer Software
Application installation and Initial Operation Procedures.
1. Plug in the DC power supply to the VQM Controller to an AC outlet, but do NOT turn ON
power to the VQM Controller at this time.
2. Turn ON power to all components of the vacuum system and pump down the chamber to
normal process pressure (typically 10-5 Torr, or lower).
3. Turn ON the Host/PC, if used, to communicate with the VQM Controller.
4. Press the Power button on the VQM Controller to turn ON power to the VQM Controller and
the Micro-Ion Total Pressure Measurement Gauge, if used. Do NOT press the Scan or Mass
Spec buttons until instructed to do so in the Initial Powerup Procedure in Chapter 8.
High Voltage
Before turning ON power to the VQM Controller, make sure all
components of the system are properly grounded as outlined
in Section 3.8, and all electrical cables are properly connected.

3 Hardware Installation
52 Series 835 Vacuum Quality Monitor
Instruction Manual - 835000
Notes:

53
Series 835 Vacuum Quality Monitor
Instruction Manual - 835000
Chapter 4
4Software Installation
4.1 Introduction to the Software Installation
The VQM® Viewer Software is a Windows software package that communicates with the VQM
Controller through a USB 2.0, Full Speed, 12.5 Mb/sec interface, allowing data acquisition and full
Mass Spectrometer Gauge control. Advanced users can also access the full functionality of the
VQM Controller using the VQM Command Set (see Chapter 9), a USB link, a Host/PC, and custom
designed software packages and GUIs.
Some PCs, particularly laptops, provide USB 3.0 ports which are backwards compatible with USB
2.0, but some are not fully USB 2.0 compatible. If problems occur when using the VQM system
while connected to a USB 3.0 port, see Section 8.5.7 for additional information.
Due to the User Access Control in Windows 7, the USB Driver for communication between the
VQM Controller and the Host/PC may not automatically install during the Viewer software
installation procedure. See Section 4.3 if the USB Driver does not install during the software
installation. The person installing the Viewer Software must have Administrator access.
If complications are experienced while installing the Viewer Software, check the Windows firewall
and anti-virus settings on the PC.
The service part of the VQM software needs to run as a system level service and some anti-virus
policies prevent general installation of system level services. In windows XP SP2, the user that
launches the installation must have been granted the impersonate client after authentication
privilege in the Local Security Policy in the User Rights Assignment section.
4.1.1 Installation Issues
If complications are experienced while installing the Viewer Software, check the Windows firewall
and anti-virus setting on the PC. The service part of the VQM software needs to run as a system level
service and some anti-virus policies prevent general installation of system level services. The user
that launches the installation must also have been granted the impersonate client after
authentication privilege in the Local Security Policy in the User Rights Assignment section. (See
https://flexeracommunity.force.com/customer/articles/en_US/PROBLEM/Q111303 for more
information).
If the above criteria are met and the person installing the software has admin rights, but the
installation still fails, it may be possible to install the suite components individually. First, remove
what has been installed via the Control Panel and to remove any registry entries for the GP VQM.
Then using the Windows Explorer open the Disk1 folder on the CD. Instead of clicking on the 835
VQM Software Sutie.exe, open the individual folders and click on the setup.exe or msi.
4 Software Installation
54 Series 835 Vacuum Quality Monitor
Instruction Manual - 835000
4.2 Install the Viewer Application Software
Recommended computer requirements are given in Section 2.4.5.
When the software installation is complete, an icon for the Viewer Application is placed on the
desktop of your computer.
The InstallShield Wizard installs the Viewer Application software in a logical and easy-to-follow
procedure.
1. Disconnect the USB cable from the VQM Controller before installing or upgrading the Viewer
Application software.
2. Insert the CD labeled VQM Software Suite into your computer.
3. Use Windows Explorer to open the CD.
4. Double click "835 System Software Suite.exe" to open the installer.
Figure 4-1 Desktop Icon for the VQM Viewer Application
Figure 4-2 Files on the Installation CD
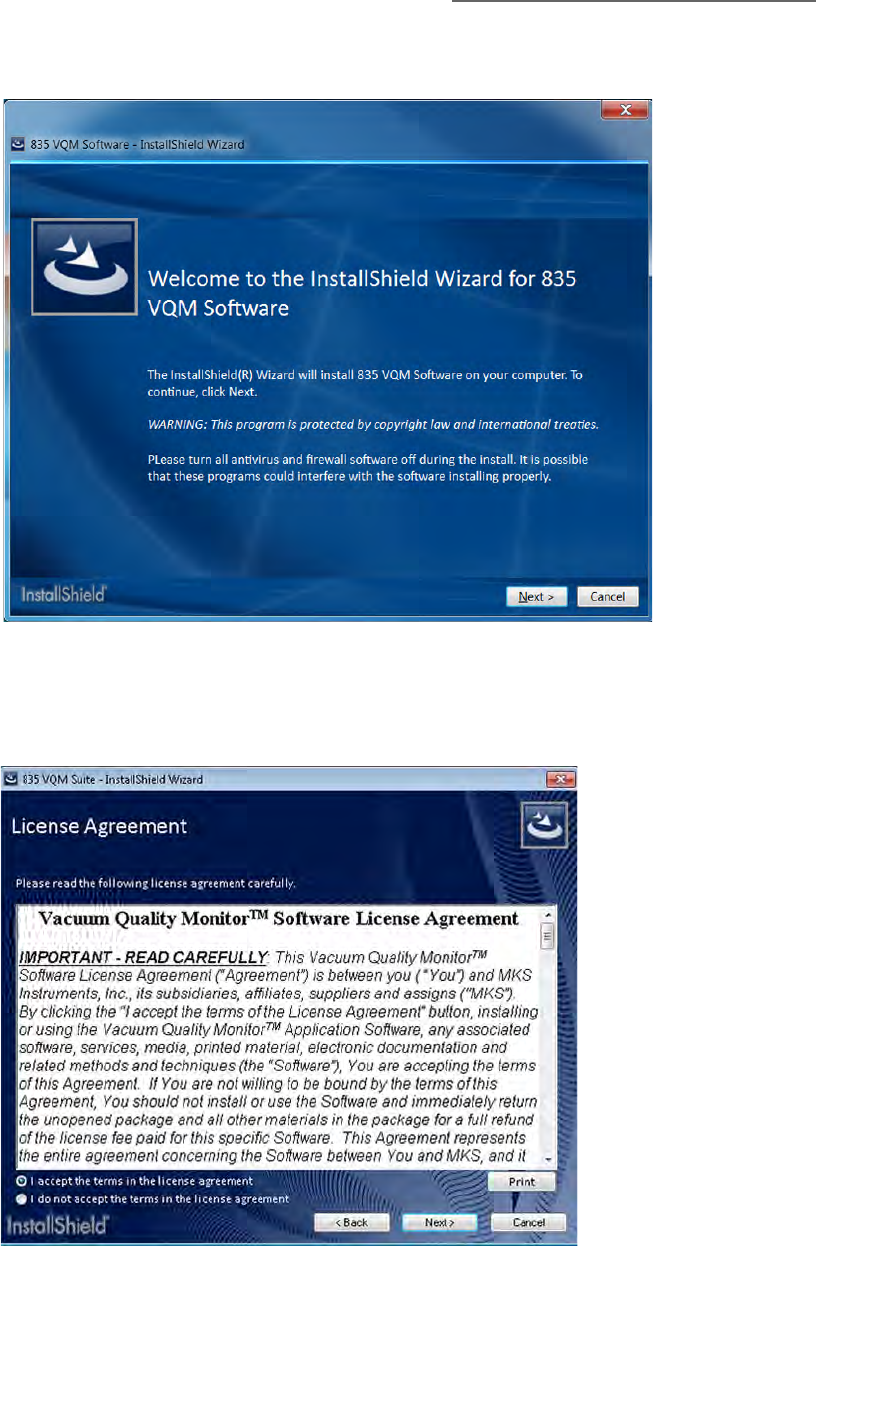
4 Software Installation
55
Series 835 Vacuum Quality Monitor
Instruction Manual - 835000
5. The InstallShield Wizard will open. Click "Next" to begin the installation.
6. Read the license agreement, select "I accept the terms in the license agreement", and click
"Next".
Figure 4-3 Install Wizard for VQM Software
Figure 4-4 User Software License Agreement
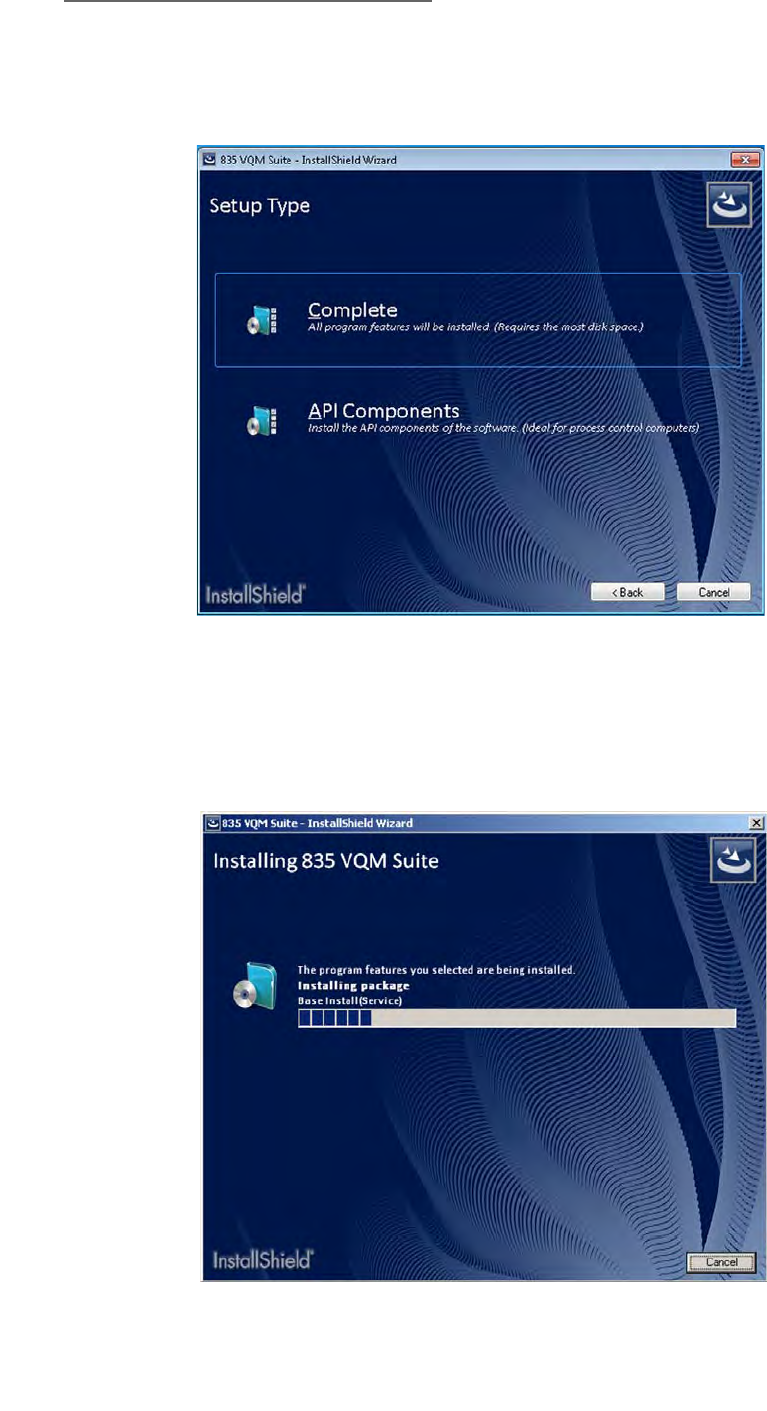
4 Software Installation
56 Series 835 Vacuum Quality Monitor
Instruction Manual - 835000
7. Click the preferred setup type for installation of the VQM software. "Complete" installs all of
the features of the software. Use the "API Files" option only when the software will be used in a
development environment requiring the use of the programming interface.
8. Click "Install" to begin installation of the software. The InstallShield Wizard will install the
necessary Windows drivers, LabVIEW, and the Viewer Application software for the "Complete"
setup.
Figure 4-5 Select Setup Type
Figure 4-6 Installing the VQM Suite Software
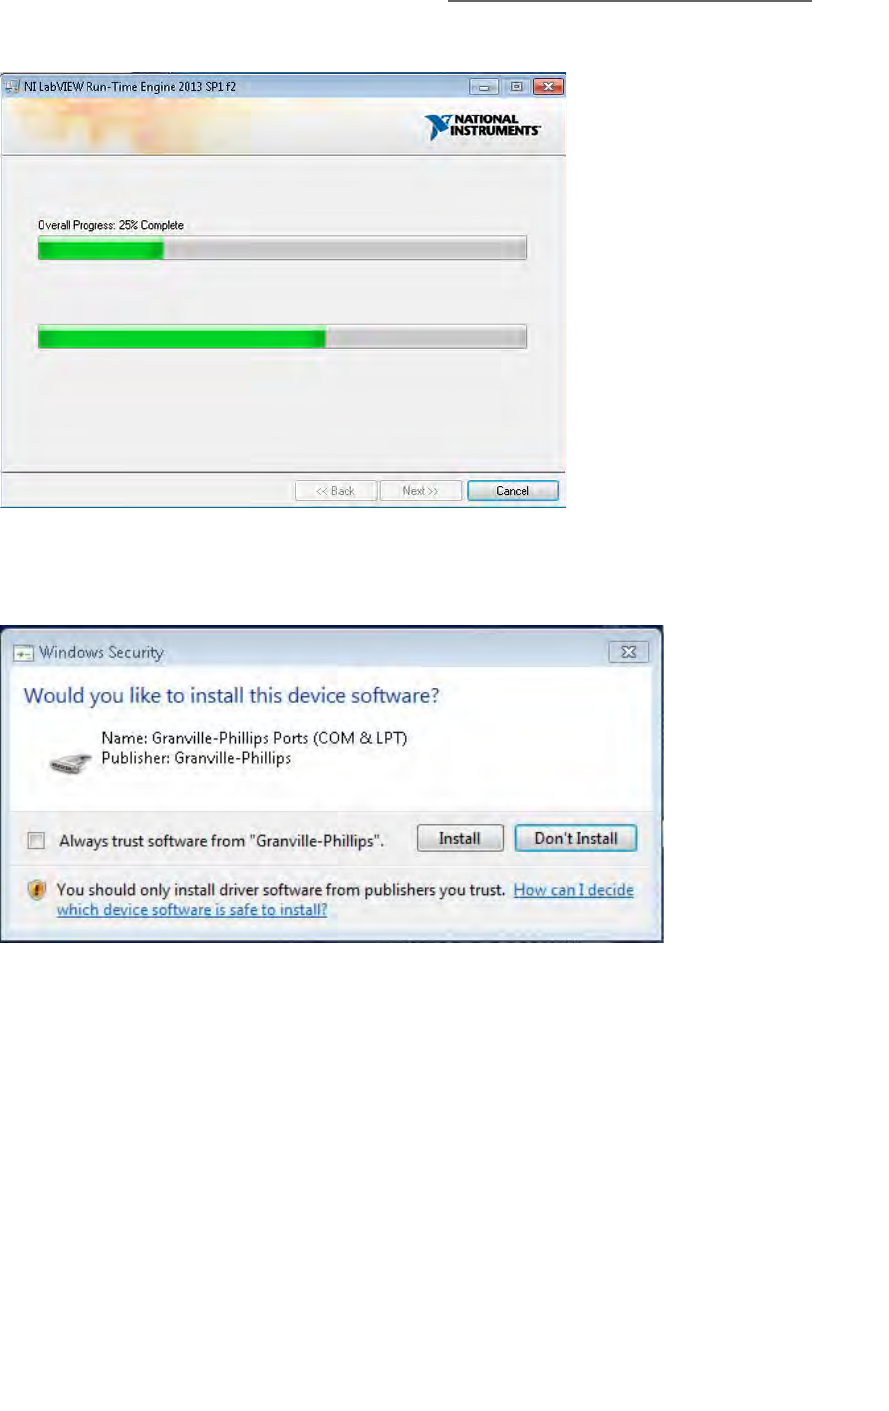
4 Software Installation
57
Series 835 Vacuum Quality Monitor
Instruction Manual - 835000
9. Click "Install" to install the driver for the 835 VQM system.
10. Click "Finish" to complete the installation of the VQM Viewer Application Software.
Figure 4-7 Installing the LabVIEW Software
Figure 4-8 Installing the VQM Driver
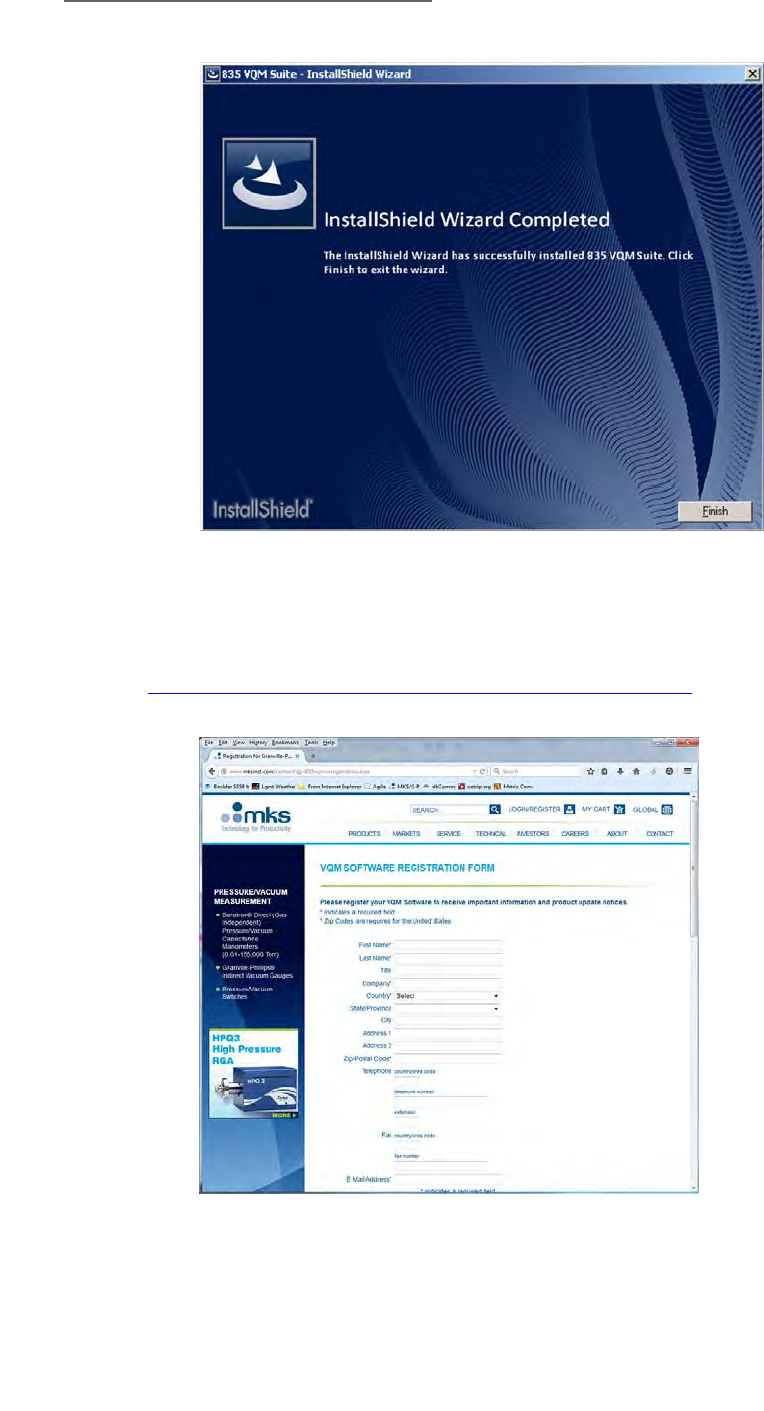
4 Software Installation
58 Series 835 Vacuum Quality Monitor
Instruction Manual - 835000
11. When the installation is complete, the Registration screen will appear in your browser.
Registration is strongly recommended to receive important information, product updates, and
access to helpful utilities and documentation. The link to the VQM software registration page
is: www.mksinst.com/contact/gp-835vqmswregistration.aspx
12. The Viewer Application is now installed and ready to use. See the Quick Start Guide for initial
startup and setup procedures, and Chapter 8 for detailed operation instructions.
Figure 4-9 Installation Complete
Figure 4-10 VQM Viewer Application Software Registration

4 Software Installation
59
Series 835 Vacuum Quality Monitor
Instruction Manual - 835000
4.3 Install the USB Driver
A specific driver is required for a USB communication link with the VQM Controller. If you have
installed the Viewer Application software, the proper driver was installed during that procedure. In
some cases, a Windows operating system may block the installation of the driver. This will become
evident when you open the Viewer software and try to connect to an VQM Mass Spectrometer
Gauge. If you cannot connect to an MS Gauge, the USB driver will have to be activated.
To communicate with the VQM Controller without using the Viewer software, the GP Device Driver
must be installed.
4.3.1 Installing the 835 Driver from the CD
1. Insert the CD labeled VQM Software Suite into your computer.
2. Use Windows Explorer to open the CD.
3. Install the Viewer Application software as outlined in Section 4.2.
4. Use Windows Explorer to access "C:\Program Files\GP\Device Driver" or "C:\Program
Files(x86)\GP\Device Driver".
5. Double click the appropriate driver "GP Device Driver(64 bit).msi" or "GP Device Driver.msi"
to install the driver.
6. Simply follow the prompts to install the driver. The InstallShield Wizard will install the
necessary Windows driver.
4.3.2 Installing the GP Device Driver after a Software Installation
1. Use Windows Explorer to access "C:\Program Files\GP\Device Driver" (for a 32-bit host) or
"C:\Program Files(x86)\GP\Device Driver" (for a 64-bit host).
2. Click the appropriate driver, "GP Device Driver(64 bit).msi" or "GP Device Driver.msi", to
install the driver.
3. Accept the agreement and follow the prompts to install the GP Device driver. The Install Shield
Wizard will install the necessary Windows driver.
4.4 Troubleshooting
4.4.1 Installation Does Not Complete
If a previous version of the 835 VQM software was installed (or partially installed), remove all
components of the older version using the following process:
1. Use the Windows Control Panel => Add/remove or Uninstall tool to remove the 835 suite.
2. Refresh the control panel list with CTRL-F5.
3. Sort the list by publisher.
4. Remove any remaining Brooks or Brooks Automation components, and any Granville-Phillips
components that are for a different application or gauge.
5. Delete the C:\Program Files\Brooks\VQM\835 folder and contents - this will be C:\Program
Files (x86) on 64-bit Windows 7 hosts.
6. On Windows XP hosts, delete the Data folder in C:\Document and Settings\All
Users\Documents\VQM and its contents. On Windows 7 hosts delete the Data folder in
c:\Users\Public\Public Documents\VQM and its contents.
7. Turn OFF all firewalls and try the installation again. Be sure to install the driver.

4 Software Installation
60 Series 835 Vacuum Quality Monitor
Instruction Manual - 835000
Notes:
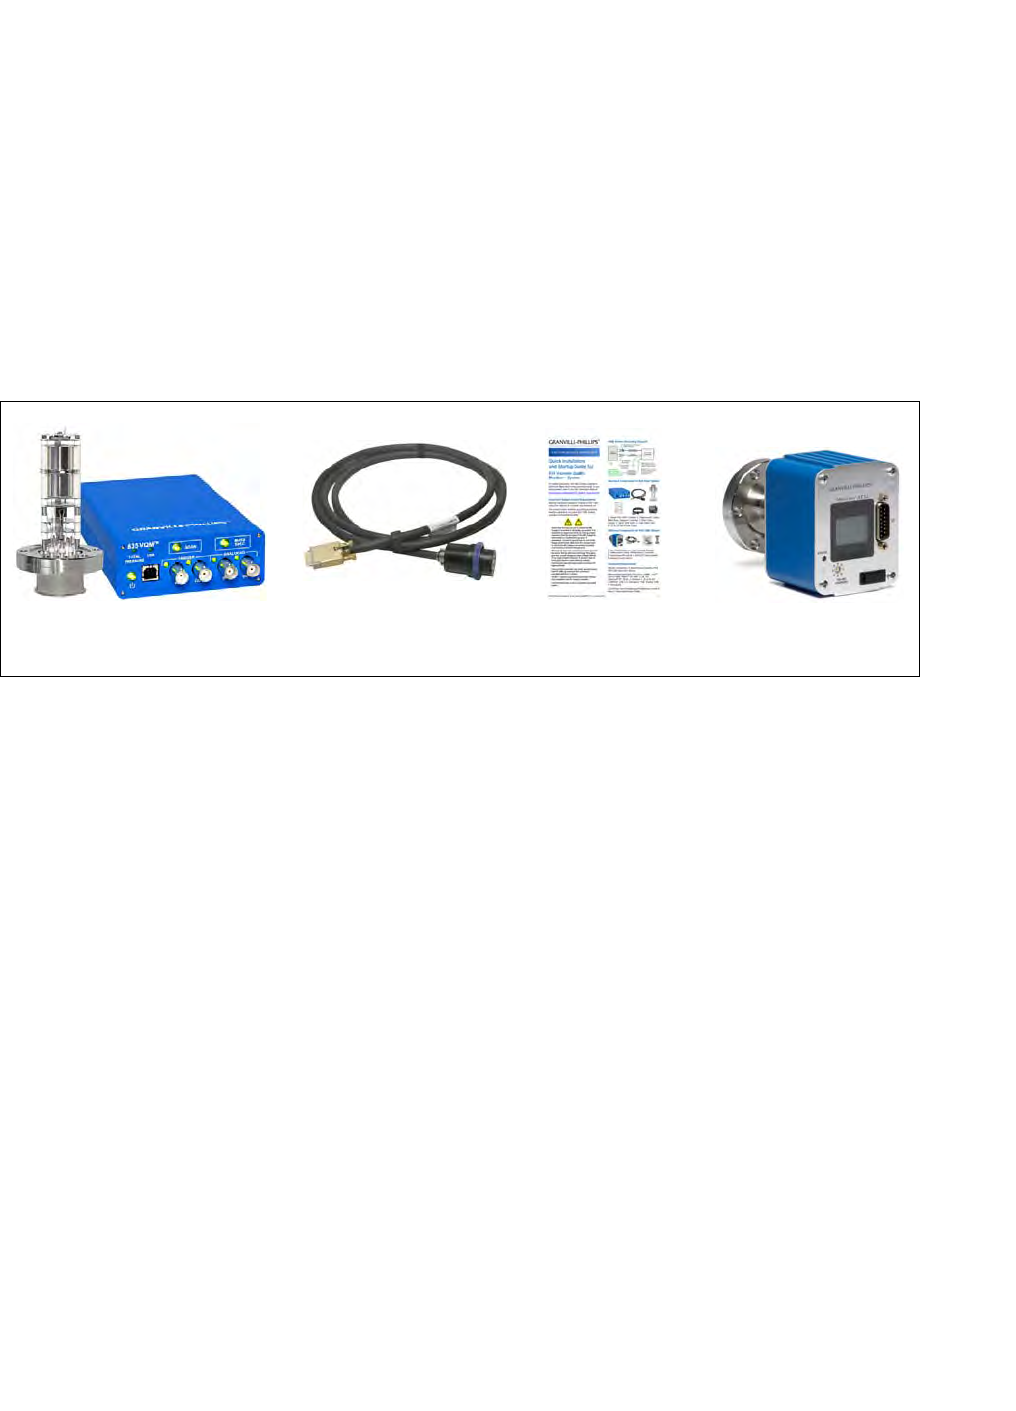
61
Series 835 Vacuum Quality Monitor
Instruction Manual - 835000
Chapter 5
5VQM® Controller Overview
5.1 Introduction
This chapter describes the basic components and functionality of the VQM Controller.
The Series Vacuum Quality Monitor (VQM) System is a gas analysis instrument based on
Autoresonant Ion Trap Mass Spectrometry (ART MS) technology that generates mass spectrometry
(MS) scans, from 1 to 135 amu in 100 msec, or (optionally) 1 to 300 amu in 125 msec. The basic
VQM System includes: (1) VQM Controller, (2) Ion Trap Mass Spectrometer Gauge (MS Gauge), (3)
Controller-to-MS Gauge interconnect cable, and (4) Viewer Software.
An optional Micro-Ion Total Pressure Measurement Gauge is also available as part of the VQM
measurement system. See Section 5.10, Figure 2-3, and Figure 5-1.
The instrument communicates with a Host/PC via a USB 2.0 link. All communications between the
VQM System and the Host/PC take place over a fast USB, Full Speed, serial interface using an
intuitive, text-based VQM Command Set which allows both instrument programmability and data
acquisition.
The VQM System is a versatile gas analysis instrument which can also be operated in 'stand-alone'
mode without requiring a Host/PC connection. An external trigger input port (TTL Logic) on the
front panel of the VQM Controller allows users to execute single mass spectrometry scans triggered
by external events. An analog output signal, proportional to the voltage output of the mass
spectrometer's electrometer, is available over the analog output port and an output trigger port
provides external trigger pulses that can be used to synchronize external data acquisition systems
and time-frame MS data collected with digital data loggers. See Section 2.4.6 for specifications.
Several built in checks constantly monitor the proper operation of the system and its operating
environment. For example, the filament emission and electron multiplier are immediately shut
down in the event of an overpressure condition. The total pressure readings provided by the
Micro-Ion Gauge are automatically used by the VQM Controller to protect the MS Gauge from
overpressure conditions. The amount of power delivered to the filament is constantly monitored
and power to the MS Gauge is immediately removed if an overpower condition is detected.
Figure 5-1 VQM System Components
VQM Mass Spec Controller
and MS Gauge
Interconnect Cable - VQM
Controller to MS Gauge
Quick Installation
and Startup Guide
Optional Series 390802
Micro-Ion ATM Gauge

5 VQM® Controller Overview
62 Series 835 Vacuum Quality Monitor
Instruction Manual - 835000
5.2 Terms used in this chapter
5.3 VQM Controller Overview
The VQM Controller contains all the electronics required to (1) power and operate the VQM Mass
Spectrometer Gauge (MS Gauge), (2) power and communicate with the Micro-Ion Total Pressure
Measurement Gauge, and (3) communicate with a Host/PC over a serial USB communication link.
The VQM Controller (1) controls the operation of the MS Gauge, (2) stores all required mass-axis
and electrometer calibration information, (3) stores and sets all MS Gauge settings, and (4)
processes and transmits mass spectrometry data in real time to a host computer for analysis and
display. During normal operation of the VQM system, several current and voltage supplies built into
the VQM Controller set the electron emission current, the voltage biases on the ion trap electrode
structures, and the high voltage bias across the electron multiplier detector. The VQM Controller
also includes a Direct Digital Synthesis RF Signal Generator required to produce mass-selective ion
ejection from the ion trap. A fast electrometer measures electron currents produced by the detector
and converts them into voltage signals that are read by a built-in A/D converter. A microprocessor
Table 5-1 Terms and Definitions
Term Definition
Analog to Digital
Converter (ADC)
Analog-to-digital conversion is an electronic process in which a continuously variable
(analog) signal is changed, without altering its essential content, into a multi-level
(digital) signal.
ART MS Auto Resonant Ion Trap Mass Spectrometry: A new mass separation technology used in
the VQM System.
AutoPressure Pressure status information from the Micro-Ion Gauge that is used to protect the MS
Gauge. See Section 5.10.1.
Controller The VQM Controller. See Figure 5-1 and Figure 5-2.
DIF header Data Interchange Format.
ETPR External Total Pressure
FETCh? A command that tells the software program to go ’get’ some particular data.
Micro-Ion Gauge The Series 390802 Micro-Ion ATM Total Pressure Measurement Gauge. See Figure 2-3.
MS Gauge The Mass Spectrometer Gauge that is connected to the vacuum chamber. The MS
Gauge can be configured as a nude gauge (see below) or mounted inside a
demountable envelope (full-nipple). See Figure 2-5, Figure 3-3, and Figure 3-4.
Nude Gauge The Mass Spectrometer Gauge that is connected to the vacuum chamber, but the
sensors of the gauge are inside the chamber rather than inside a nipple that is mounted
to the chamber. See Figure 2-5, Figure 3-3, and Figure 3-4.
Power On Self Test
(POST)
A test that the Controller runs at power-up or reset. See Section 5.9.3.
Ratiometric A ratio of the concentration of gases.
T-Flange An optional mounting flange for the purpose of mounting the MS Gauge and the
Micro-Ion Gauge at the same location on the vacuum chamber. See Figure 2-2
UHV Ultra High Vacuum - usually referring to pressures below 10-9 Torr.
VQM Vacuum Quality Monitor - refers to the VQM System, which consists of the VQM
Controller and the VQM Mass Spectrometer Gauge.

5 VQM® Controller Overview
63
Series 835 Vacuum Quality Monitor
Instruction Manual - 835000
controls all the internal workings of the Controller and transmits the mass spectral data to the
Host/PC in real time over a serial USB 2.0 communication interface. Default factory settings are
stored in the internal memory of the VQM Controller.
The VQM Controller includes a TOTAL PRESSURE (DB 15-pin) connector on the rear panel to
power and interface (RS485) with the optional 390802 Micro-Ion ATM Total Pressure Measurement
Gauge. The total pressure and status information provided by the Micro-Ion Gauge can be used for
a variety of purposes:
1. Display, store, and graph total pressure on the Host/PC screen along with the ratiometric mass
spectral data provided by the MS Gauge.
2. Combine ionization gauge total pressure data with ratiometric gas analysis information to
provide absolute partial pressure measurements.
3. Provide overpressure protection for the MS Gauge.
An analog input port on the front panel of the VQM Controller enables users to digitize analog
voltage signals in synchronicity with mass spectral scans. Each mass spectrum transmitted to a
Host/PC contains (1) mass spectral data, (2) total pressure measurement (when using the optional
Micro-Ion Gauge), and (3) analog input voltage signal. The combination of the three sources of data
can be used to derive vacuum quality measurement information from the VQM System.
The front panel of the VQM Controller includes 6 LED indicators, 3 buttons (with LED indicators), 4
BNC connectors, and one USB connector. See Figure 5-2. The active LEDs on the front panel of the
Controller provide real time feedback on (1) MS Gauge status, (2) trigger and analog port status, and
(3) system error/status conditions. The buttons on the front panel allow activation and operation of
the MS Gauge (power on/off) and VQM Controller (scan start/stop, power on/off) without the need
for a Host/PC connection.
The rear panel of the VQM Controller includes three connectors: MASS SPEC (for the MS Gauge),
TOTAL PRESSURE (for the optional Micro-Ion Gauge), and 24 Vdc, 75 W (power connector.) A
grounding lug completes the connections to the back panel. See Figure 5-2. Low power
requirements combined with simplicity of operation allow remote operation of the MS Gauge using
interconnect cable lengths of 1 meter or 3 meters. The ability to locate and operate the VQM
Controller remotely from the MS Gauge is considered a very important advantage.
The VQM Controller is designed for bench-top operation and is powered by a 24 Vdc power supply.
Use the 24 Vdc, 75 W connector on the back panel of the Controller unit to provide power to the
instrument. Minimum DC power requirements are listed in Chapter 2, Section 2.4.2 on page 27,
and depend on whether the optional Micro-Ion Gauge is being used. The power requirements are
24 Vdc, 15 W, for MS Gauge operation only, and 24 Vdc, 75 W for the additional Micro-Ion Gauge.
Granville-Phillips offers a universal external DC power supply, 24 Vdc, 80 W, which provides
enough power to operate both the MS Gauge and the optional Micro-Ion Gauge.
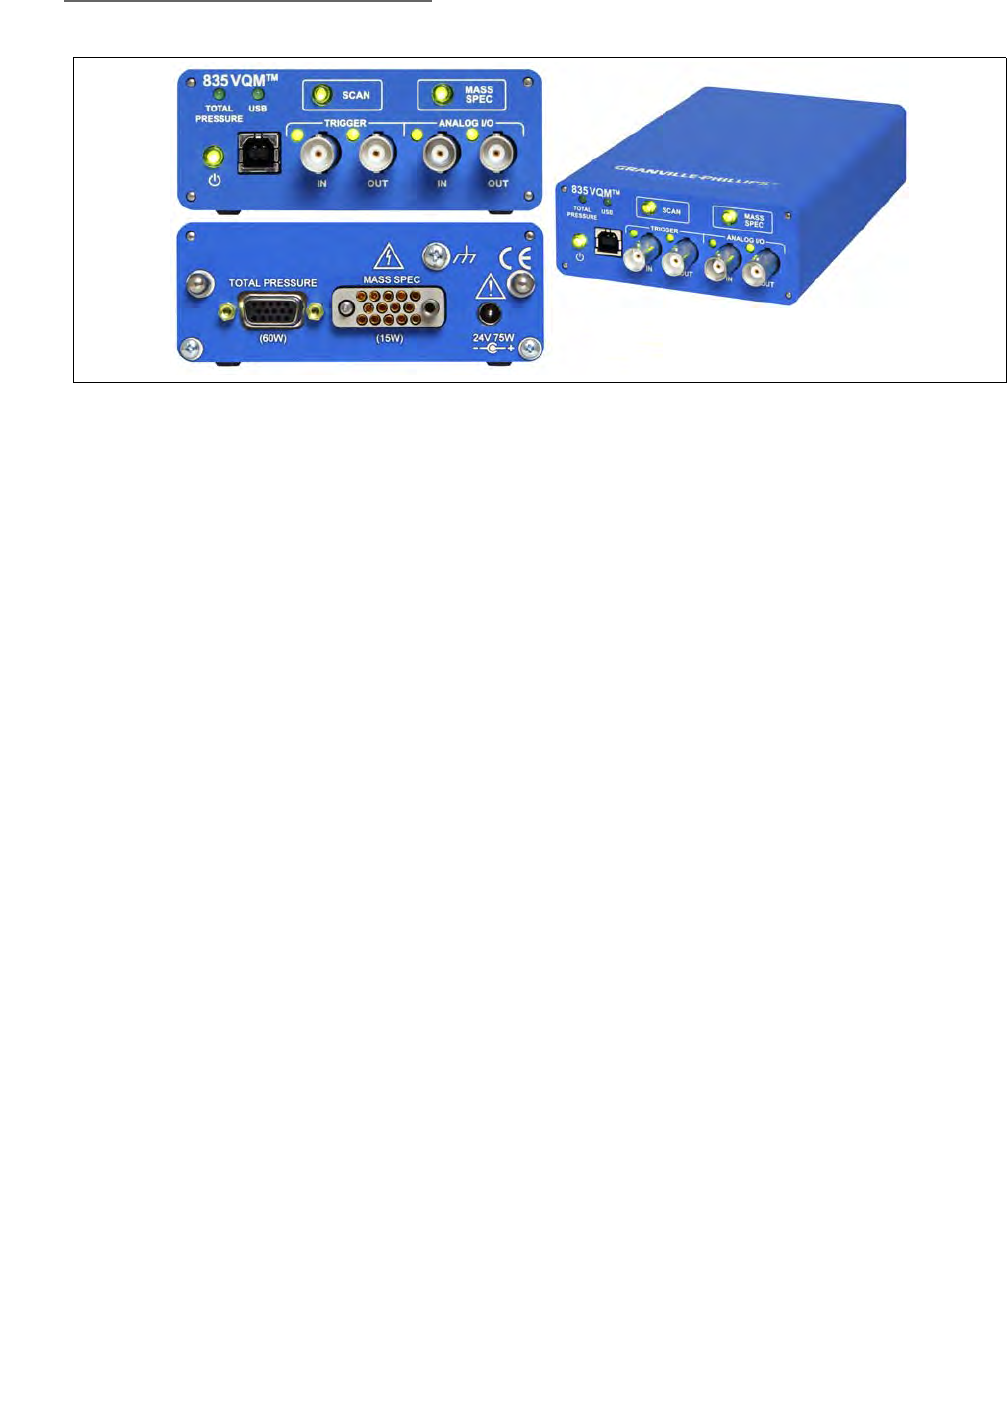
5 VQM® Controller Overview
64 Series 835 Vacuum Quality Monitor
Instruction Manual - 835000
The VQM Controller provides two different ways to turn the MS Gauge On/Off: (1) manual control
(MASS SPEC button) and (2) Host/PC control (VQM Command Set).
Mass Spectrometry scanning can be controlled in three different ways:
1. Manual control (MASS SPEC button) on the front panel of the VQM Controller - continuous
scanning.
2. External trigger pulse control - single scan.
3. Host/PC Control (VQM Command Set) - single or continuous scan.
The flexible connectivity of the VQM Controller allows operation of the VQM System under many
different experimental conditions. One unique advantage of this instrument is its ability to generate
and provide mass spectrometry data without the need for Host/PC connection.
5.4 Front Panel Controls, Interconnects, and LEDs
5.4.1 Buttons
Three buttons on the front panel of the VQM Controller allow manual operation of the instrument
directly from the front panel and enable MS Gauge operation in Stand Alone setups. Each button
includes LED illumination and provides information on the status and activity of the function it
controls.
Power button/LED - See Section 5.4.2
SCAN button/LED - See Section 5.4.3
MASS SPEC button/LED - See Section 5.4.4
Figure 5-2 VQM Controller Front and Rear Panels

5 VQM® Controller Overview
65
Series 835 Vacuum Quality Monitor
Instruction Manual - 835000
5.4.2 Power Button/LED
Use the POWER button to turn the VQM Controller ON or OFF (OFF = Standby) while a 24 Vdc power
is connected to the instrument. Press the Power button to toggle between the ON and standby
power modes of the VQM Controller.
Note: The Power button is not a hard-power switch, and requires 24 Vdc power to operate in the
manner described in this section. Pressing the Power button while 24 Vdc power is not delivered to
the VQM Controller unit will have no consequence on the power mode of the VQM Controller.
Table 5-2 VQM Controller Power Modes
The Power button also controls power to the Micro-Ion Gauge. If power is turned OFF to the VQM
Controller (standby mode), power is also turned OFF to the Micro-Ion Gauge. Users requiring
dedicated power control for the Micro-Ion Gauge controller will need to use a different wiring setup
where power is provided from an independent source. A dedicated command is also available to
turn the Micro-Ion Gauge OFF while the VQM Controller is ON.
LED Illumination
(GREEN)
LED Illumination
(RED) Power Status Description
OFF OFF OFF The Controller is disconnected from the 24 Vdc
power supply.
Fade OFF Standby The Controller is in standby mode with the 24
Vdc power supply connected.
Blink OFF Power On Self Test The Controller is in Power-ON Self-Test (POST)
mode. The LED blinks ON-OFF while the self-test
procedure is performed and until completed.
POST takes approximately 13 seconds.
ON OFF Power ON The Controller power is ON and the POST has
completed without errors.
OFF ON Power ON with
Power ON Self Test
(POST) failure
One or more of the Power-On Self-Tests has
failed. Use the SCPI command "TEST:REPORT?"
to get the test results from the Controller.
OFF Blink Power ON with
hard error
The Controller has experienced a hard error that
is not recoverable without pressing the power
button, or cycling the power connector. Restart
the Controller and immediately upon
reconnection via USB, capture the output of
"SYSTEM:LOG?" to obtain error information to
return to the factory.

5 VQM® Controller Overview
66 Series 835 Vacuum Quality Monitor
Instruction Manual - 835000
5.4.3 SCAN Button/LED
The SCAN button is used to manually Start/Stop Mass Spectrometry (MS) Scans. The Controller will
ignore single presses of the Scan Button while the MS gauge is OFF. The SCAN button is also used to
toggle between Immediate and External triggering modes. Press and hold the SCAN button down for
> 2 seconds will cause the Power Button LED to blink green momentarily to confirm that the
transition has taken place.
Immediate trigger mode is the default configuration for the Controller. In this mode the Digital In
LED will be OFF in most cases. It is possible to use SCPI commands to configure the Digital In LED
to be on, but the Controller will ignore trigger pulses from this source. The press and hold technique
with the SCAN button ensures that the Digital In LED is OFF.
The MS gauge LED must be ON Green to start an MS Scan with the SCAN button.
MS Scan START:
• When the Controller is configured for immediate triggering, a single press of the SCAN
button will START continuous triggering of MS Scans. The SCAN button LED will transition
from OFF to Blinking Green when scanning.
• When the Controller is configured for external triggering a single press of the SCAN button
will alert the Controller to wait for a trigger event. The SCAN button LED will transition from
OFF to ON Green. In this mode a trigger event can come from the Digital IN, SCPI trigger
command, or another single press of the SCAN button. The trigger event will cause the SCAN
button LED to Blink Green once, indicating that a single MS Scan was executed.
MS Scan STOP:
• When the Controller is configured for immediate triggering, a single press of the SCAN
button will STOP continuous triggering of the MS Scans. The SCAN button LED will
transition from Blinking Green to OFF.
• When the Controller is configured for external triggering, only one MS scan is executed at a
time.
The SCAN button illuminates with a dual color LED (Green, Amber), which indicates the status of
the MS Scan functionality of the instrument. The SCAN button LED Status in this table assumes that
the MS Gauge is powered ON in Normal power mode with a solid Green LED. The SCAN button
LED will not be illuminated if this is not the case.
5 VQM® Controller Overview
67
Series 835 Vacuum Quality Monitor
Instruction Manual - 835000
Table 5-3 SCAN Button LED Power Modes
5.4.4 MASS SPEC Button/LED
Use the MASS SPEC button on the front panel of the VQM Controller to select the MS Gauge power
ON, OFF, or standby. This is very useful to turn the filament and electron multiplier OFF before
venting the vacuum system, and to turn the MS Gauge back ON directly from the front panel after a
system pump down. The VQM Controller is often located closer to the vacuum system than the
Host/PC. Front panel manual control of MS Gauge power provides:
1. Safety in case of sudden overpressure events.
2. Access to MS Scan functionality when a Host/PC is not connected or available (stand alone
setup).
3. Warm up time savings when the MS Gauge is in standby mode before the Viewer Software
takes control of the instrument's operation. The MS Gauge must be Normal ON before the
SCAN button becomes enabled.
Total Pressure must be at or less than 5x10⁻⁵ Torr. Upon entering the ON state, the Controller
sets gauge voltages to the values stored in the Controller's non-volatile memory. If the user has
not previously saved configuration values, then the Controller's Factory Default values are
applied.
LED
Illumination
(GREEN)
LED
Illumination
(RED) Scan Status Description
OFF OFF Idle Immediate Triggering Mode: MS Scan IDLE
External Triggering Mode: MS Scan IDLE
ON OFF Wait for
Trigger
Immediate Trigger Mode: Not a valid LED state.
External Trigger Mode: MS Scan waiting for a trigger event
from the Digital IN, SCPI Trigger command, or a SCAN button
press.
Blinking OFF Scanning Immediate Trigger Mode: Continuous MS Scanning active
External Trigger Mode: Single MS Scan executed.
Blinking Blinking Over trigger
detected
Immediate Trigger Mode: Not a valid LED state.
External Trigger Mode: MS scan is active and another trigger
was detected in the middle of a scan. This trigger is ignored by
the Controller.
High Voltage
Bias voltages include high voltage and are a shock hazard. To
avoid shock hazard, allow 2 minutes after turning OFF the MS
Gauge before disconnecting the cable or handling the MS
Gauge.

5 VQM® Controller Overview
68 Series 835 Vacuum Quality Monitor
Instruction Manual - 835000
The MASS SPEC button is used to manually turn ON and OFF the Mass Spectrometer Gauge (MS
Gauge). The MASS SPEC button is also use to toggle the power mode of the MS Gauge between
Normal and standby mode. Press and hold the MASS SPEC button for > 2 seconds to cause the
Power Button LED to blink green momentarily to confirm that the transition has taken place. MS
Scanning is only possible when the MS Gauge power mode is Normal. The MS Gauge standby
power mode is used to keep the MS Gauge warm when not scanning.
5.4.4.1 MS Gauge Normal Mode:
• Single press the MASS SPEC button to manually turn ON and OFF the MS Gauge in Normal
Mode.
• Press and Hold the MASS SPEC button down for > 2 seconds (wait for the Power Button LED
to blink momentarily) to manually turn ON the MS Gauge in standby Mode.
5.4.4.2 MS Gauge standby Mode:
• Single press the MASS SPEC button to manually turn ON the MS Gauge in Normal Mode if
the MS Gauge is already ON in standby Mode.
• Press and Hold the MASS SPEC button down for > 2 seconds (wait for the Power Button LED
to blink momentarily) to manually turn ON and OFF the MS Gauge in standby Mode.
The MASS SPEC button illuminates with a dual color LED (Green/Red) indicating possible status
conditions of the MS Gauge.
Notice
The Mass Spec button does not affect the Micro-Ion Gauge status. Pressing
the MASS SPEC button does not turn the Micro-Ion Gauge power ON/OFF.
Notice
If a Micro-Ion Gauge is being used, the MS Gauge will turn ON only if the
total pressure reported by the Micro-Ion Gauge is below the pressure limit
expected by the Overpressure Protection Mode. If a Micro-Ion Gauge is not
being used, the MS Gauge tries to turn ON, and will stay on if able to do so
under the current pressure conditions of the gauge's environment.
See Autopressure Mode on page 88 and Overpressure Protection on page
90.

5 VQM® Controller Overview
69
Series 835 Vacuum Quality Monitor
Instruction Manual - 835000
Table 5-4 MASS SPEC Button Power Modes
LED Illumination
(GREEN)
LED Illumination
(RED) MS Gauge Description
OFF OFF OFF The MS Gauge is turned OFF and the MS Scan is
disabled.
ON OFF ON - Normal
Mode
The MS Gauge is turned ON:
1. The bias voltages are present on the ion trap
electrodes.
2. The electron multiplier detector is turned ON.
3. The filament emission is turned ON.
4. The MASS SPEC status LED is illuminated.
Fade OFF ON - Standby
Mode
The MS Gauge is turned ON, in standby mode, and
MS Scan is disabled.
OFF ON OFF No filament wire is detected by the Controller unit
prompting a MS Gauge connection error.
1. The MS Gauge is turned OFF.
2. The SCAN Button LED is turned OFF - MS Scan is
disabled.
The Controller Unit constantly checks for the
presence of a filament wire. The first filament
connection check takes place right after "Power On
Self Test" (POST). The Controller will continue to
monitor the filament connection status as long as the
Controller is powered up. If an MS Gauge
connection error is detected, the MS Gauge is
disabled, MS Scan is disabled, and the MASS SPEC
Red LED is illuminated. This state will over-ride the
Over-pressure condition state.
OFF Blink OFF The Controller detected an Over-pressure condition
from the TPMK. The MS Gauge is disabled and MS
Scan is disabled. The Over-pressure condition must
be resolved before the MS Gauge can be enabled.
Filament detection will continue in this state and will
over-ride this status if the filament connection is lost.
Notice
Wait for a minimum of 15 seconds before starting to perform mass
spectrometry scans. This is to allow time for the voltages and currents to be
properly set on the trap electrode structures, and to assure proper mass
axis calibration in the mass spectrometry system.

5 VQM® Controller Overview
70 Series 835 Vacuum Quality Monitor
Instruction Manual - 835000
5.5 Front Panel Connectors
There are four BNC connectors and one USB port on the front panel of the VQM Controller Unit.
1. Trigger IN (BNC) - See Section 2.4.6 for specifications and Section 5.5.1 for details.
2. Trigger OUT (BNC) - See Section 2.4.6 for specifications and Section 5.5.2 for details.
3. Analog IN (BNC) - See Section 2.4.7 for specifications and Section 5.5.3 for details.
4. Analog OUT (BNC) - See Section 2.4.7 for specifications and Section 5.5.4 for details.
5. USB (Type B, 2.0, 12.5 Mb/sec) - See Section 5.5.5 for details.
The Trigger IN connection allows the external trigger pulses responsible for external trigger Mass
Spec Control.
The Trigger OUT and Analog OUT connections are used together to synchronize external data
acquisition systems (DAQs) to collect the MS analog output signal only during the time framed by
the output trigger pulses generated each time an MS scan is executed. The Trigger OUT can be
decoupled from the SCAN to be used as an independent SCPI command controlled digital output.
The Analog IN connection allows input auxiliary analog voltage signals into the VQM Controller.
Use the auxiliary signals to synchronize MS data acquisition with independent analog signals.
Use the USB connector to connect to a Host/PC with a USB interface.
5.5.1 Trigger IN BNC Connector / LED
Use the external Trigger IN port to deliver valid external trigger pulses to the VQM Controller to
execute single mass spectra scans synchronous with external events. There is no input
programmability of the trigger logic on the VQM Controller:
• Input Impedance: 50 Ohm
• Trigger Logic: EDGE Trigger, Low to High, TTL levels.
• Minimum Pulse Width: 1 ms
The Trigger IN LED illuminates with a single color, Green, which indicates (1) whether the external
trigger IN port is enabled or disabled, and (2) if valid external trigger pulses are being delivered to,
and detected by, the VQM Controller.

5 VQM® Controller Overview
71
Series 835 Vacuum Quality Monitor
Instruction Manual - 835000
Table 5-5 Trigger IN Connector LED
The Trigger IN port is disabled as the factory default when the VQM Controller is turned ON. To use
the Trigger IN port to trigger a MS Scan the port must be enabled and the Trigger mode must be
switched to External. This can be done through the SCPI command interface, or by pressing and
holding the SCAN button for > 2 seconds.
Missed triggers due to over triggering (i.e., a new trigger issued before the previous MS Scan is
completed) are detected, accumulated in a dedicated counter and prompted through the SCAN
button Amber LED blinking with the Green LED. If trigger pulses are delivered at a rate faster than
the scan rate, the SCAN button LED blinks Amber each time a trigger is received before the previous
scan is completed. This allows real time debugging of over triggers - i.e., the user must slow down
trigger rate until the SCAN button Amber LED stops blinking.
5.5.2 Trigger OUT BNC Connector / LED
Use the Trigger OUT port to access the output trigger pulses available to time frame the MS Analog
Out signal available from the VQM Controller, or to trigger external data acquisition/display devices
and time-frame the MS analog out signal. The output trigger pulse frames the start and end of the
ion trap frequency sweep. Output trigger pulses can also be used to trigger/time frame the MS
analog out signal digitized with oscilloscopes, analog-to-digital converters, and data loggers.
The Trigger OUT port is enabled when the VQM Controller is first turned ON.
• Connector Type: BNC
• Output Impedance: 50 Ohm
• Trigger Logic: TTL Active HIGH. The Output level becomes High as the MS scan is initiated.
The output becomes Low again at the end of the MS scan. Use the rising edge to trigger
external DAQ systems. Use the length of the pulse to frame the MS scan.
The Trigger OUT port can be decoupled from the MS Scan to be used as a SCPI command
controlled Digital Output. The Digital Mode is changed from Trigger to Manual which allows the
user to send SCPI command to set the Digital Data Bit of 0 or 1 to make the Trigger OUT port low or
high. This configuration may be stored in one of the user profiles so that the state of the Trigger OUT
port is preserved through a power cycle.
LED Illumination
(Green)
Trigger Input
Port Status Description
OFF Disabled The Trigger IN port is disabled. External trigger pulses delivered to the
VQM Controller using the external Trigger IN port are ignored.
ON Enabled The Trigger IN port is enabled. If the trigger mode is set to External, the
trigger pulses delivered to the Controller using the external Trigger IN
port are processed by the Controller and used to trigger single scans. If
the trigger mode is set to Immediate, the trigger pulses are ignored.
Blinking Scanning The Trigger IN port is enabled and valid external trigger pulses are
actively being delivered to the Controller. If the Controller trigger source
is configured for EXTernal then the Controller will attempt to execute a
scan each time a pulse is received. The Trigger IN LED will blink when a
valid trigger pulse is detected. The Trigger IN rate must be less than the
scan rate to prevent over-triggering.

5 VQM® Controller Overview
72 Series 835 Vacuum Quality Monitor
Instruction Manual - 835000
The Trigger OUT LED illuminates with a single color, Green, which indicates (1) whether the Trigger
OUT port is enabled or disabled and (2) if output trigger pulses are delivered by the VQM
Controller each time a Mass Spec scan is performed.
Table 5-6 Trigger OUT Connector LED
5.5.3 Analog IN BNC Connector / LED
Use the Analog IN port to connect transducer voltage signals to the VQM Controller. For example,
connect the port to pressure or temperature transducers. This functionality allows sensor integration
and signal synchronization.
The Analog IN port is electrically connected to a 12 bit analog-to-digital converter (ADC). The fast
ADC provides a fresh reading every 2.688 milliseconds (average of 32 digitizations). The values are
time stamped each time the user requests an analog input voltage value from the command
interface and each time a FETCh? Command is received by the VQM Controller.
The Analog IN LED illuminates with a single color, Green, and is always blinking when the Analog
IN is enabled.
• Connector Type: BNC
• Input Impedance: 10K Ohm
• Voltage Range: 0-10V
• ADC Specs: 12 bit resolution
A common application of the Analog IN port is to collect total pressure readings from the analog
output signal of ionization gauge controllers. An optional cable is available from Granville-Phillips
to allow connection of the Analog IN port of the VQM Controller to the analog output signal port of
Series 370 Stabil-Ion Controllers. The Viewer Software is able to convert the analog voltage signal
from Series 370 Controllers into total pressures that are then used to display total pressure, provide
overpressure protection, and allow absolute partial pressure calculation from ratiometric gas
composition data.
LED Illumination
(Green)
Trigger Output Port
Status Description
OFF Disabled The Trigger OUT port is disabled. No trigger output pulses are
available from the Trigger OUT port.
ON Enabled The trigger OUT port is enabled. In Trigger mode, output
trigger pulses are available from the trigger OUT port each
time an MS scan is executed. In Manual mode the output state
of the Trigger OUT is Low.
Blinking Scanning The trigger OUT port is enabled and output trigger pulses are
actively being delivered by the VQM Controller that frame
each MS scan that is executed. The LED blinks OFF each time
an MS scan is executed in Trigger Mode. In Manual mode the
LED will continue to blink the entire time the output state is
High.

5 VQM® Controller Overview
73
Series 835 Vacuum Quality Monitor
Instruction Manual - 835000
5.5.4 Analog OUT BNC Connector / LED
Use the Analog OUT port to monitor the voltage output of the VQM Controller's electrometer
during MS Scans.
The analog OUT port is electrically connected to the voltage output of the electrometer through a
2X voltage amplifier with 30kHz low pass filter response. An MS Analog OUT signal is available for
each executed MS scan, time framed by the Trigger OUT pulse.
• Connector Type: BNC
• Output Impedance:100 Ohm
• Voltage Range: 0-5 V
• Trans-impedance Gain=2X trans-impedance gain of the electrometer
• Filter: 30 kHz, low pass
Table 5-7 Analog Out Connector LED
The Analog OUT port is enabled when the VQM Controller is turned ON. Digitize the MS analog
output signal using an oscilloscope, fast ADC, or data logger. Use the external trigger OUT pulses to
frame the MS Analog OUT signal provided during each scan.
5.5.5 USB Port / LED
Use the USB port to connect the VQM Controller to a Host/PC.
• Connector: Standard, Type B
• Data rates: Full Speed 2.0, 12 Mb/sec
NOTE: Windows PC users must install a Virtual COM port driver to be able to
communicate with the VQM Controller over USB. An information file provided
with the VQM Viewer Application Software is used by Windows to identify the
proper COM port driver to use. See Section 4.3.
The Host/PC must have the required virtual COM port drivers pre-installed to properly enumerate
the instrument. Once the VQM Controller is enumerated and a COM port is assigned, the Host/PC
can communicate with the instrument through a high level VQM Command Set.
The USB LED illuminates with a single color, Green, to indicate that (1) a valid USB physical Link is
established between the VQM Controller and a Host/PC, and (2) that the VQM Controller is
properly configured by the Host/PC.
LED Illumination
(Green)
Analog OUT Port
Status Description
OFF Disabled The Analog OUT port is disabled. No analog output signal is
available from the Analog OUT port.
ON Enabled The Analog OUT port is enabled. The output of the
electrometer is connected to the Analog OUT port through a
2X voltage amplifier/buffer.
Blinking Scanning The Analog OUT LED blinks OFF each time an MS scan is
executed.
5 VQM® Controller Overview
74 Series 835 Vacuum Quality Monitor
Instruction Manual - 835000
Table 5-8 USB Port Status LED
5.5.6 External Total Pressure Connector / LED
The EXT TP LED, located on the upper-left corner of the front panel, indicates the status of the
RS485 communication between the VQM Controller and an external Micro-Ion Gauge.
The EXT TP LED illuminates with a single color, Green.
Table 5-9 External Total Pressure Connector LED
LED Illumination
(Green) USB Port Status Description
OFF Device Not
Configured
The VQM Controller is not connected to a Host/PC or the
proper COM driver is not installed in the Host/PC.
ON Device Configured The VQM Controller is connected to a Host/PC and ready to
communicate through an assigned virtual COM port.
Notice
Suddenly disconnecting the USB cable from a VQM Controller that is
running continuous scans can cause a loss of data if a FETCh? command is
in progress. Stop all continuous scanning before disconnecting the USB plug
from the VQM Controller to avoid this potential problem.
LED Illumination
(Green)
Micro-Ion Gauge
Communication
Status
Description
OFF Disabled There is no active communication between the VQM
Controller and the Micro-Ion Gauge. Autopressure Mode=OFF.
Blinking Active There are two conditions that lead to a blinking EXT TP LED:
1. (1) First Communication: The VQM Controller was just (1)
powered up (front panel), (2) power cycled (front panel), or
(3) the ETPR logical instrument was just turned ON
(Host/PC command) and an attempt to communicate with
the Micro-Ion Gauge is underway.
2. (2) Autopressure Mode=ON: A valid RS485 communication
between the Micro-Ion Gauge and the VQM Controller is
established, and real-time pressure and status information
are available from the Micro-Ion Gauge.
Notice
Active communication between the VQM Controller and the Micro-Ion
Gauge (i.e., a persistent blinking EXT TP LED) indicates that Autopressure
Mode is ON and the VQM Controller is receiving real-time pressure and
status data from the Micro-Ion Gauge. This is a requirement for proper
operation of the Overpressure Protection Mode that is available when a
Micro-Ion Gauge is connected to the VQM Controller. See Autopressure
Mode on page 88 and Overpressure Protection on page 90.
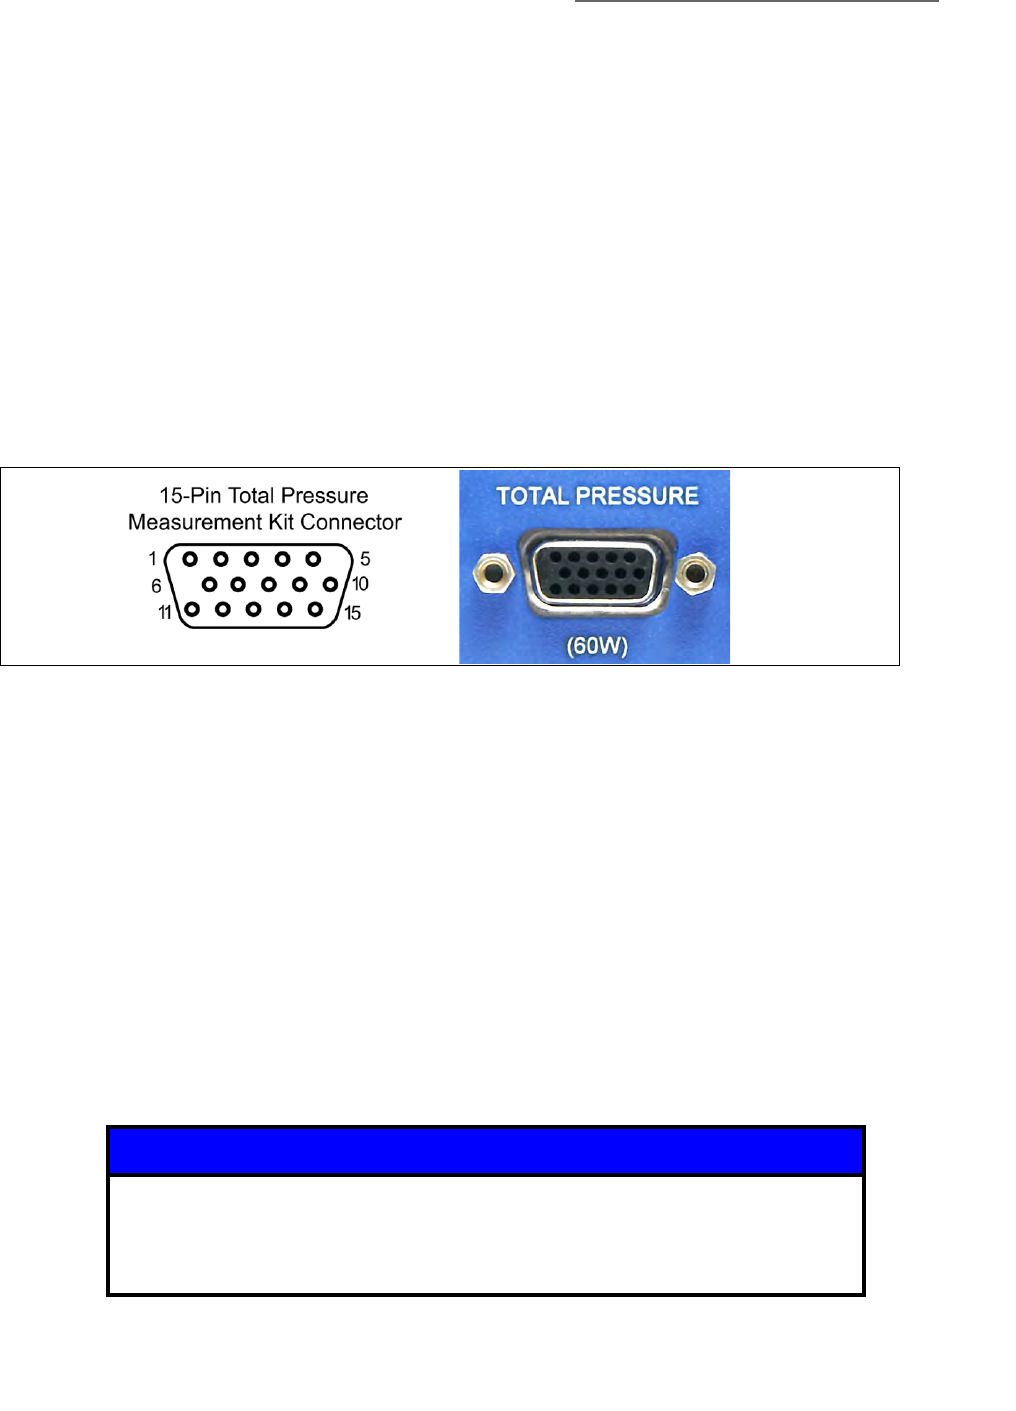
5 VQM® Controller Overview
75
Series 835 Vacuum Quality Monitor
Instruction Manual - 835000
5.6 Rear Panel Controls and Interconnects
There are three connectors and a grounding lug on the back panel of the VQM Controller:
1. TOTAL PRESSURE Connector - Section 5.6.1
2. MASS SPEC Connector - Section 5.6.2
3. 24 Vdc 75 W Connector - Section 5.6.3
4. Grounding Lug - Section 5.6.4
5.6.1 TOTAL PRESSURE Connector
The TOTAL PRESSURE connector, 15-pin D-type, provides power and an RS-485 communication
link for the optional Micro-Ion Gauge.
The TOTAL PRESSURE port provides 24 Vdc power to the Micro-Ion Gauge when: (1) the VQM
Controller is powered up (front panel), (2) power is cycled (front panel), or (3) when the ETPR
logical instrument is turned ON (VQM Command Set).
The 24 Vdc power is routed from the power supply connected to the 24 Vdc, 75 W connector
which is located on the rear panel. Once 24 Vdc power is applied and the Micro-Ion Gauge powers
up, the VQM Controller attempts to establish communication with the Micro-Ion Gauge module
through the RS-485, address=2, communication link during POST. The EXT TP LED blinks as the
initial communication attempt takes pace. If communication is successfully established, the VQM
Controller continues to query the Micro-Ion Gauge for pressure and status information every 50
milliseconds (i.e., Autopressure Mode ON) and the EXT TP LED blinks persistently to reflect the
exchange of data between both devices. Autopressure must be ON for Overpressure Protection to
work properly.
See Autopressure Mode on page 88 and Overpressure Protection on page 90.
Figure 5-3 Total Pressure Connector on the rear of the VQM Controller
Notice
The VQM Controller will only power and communicate with a Micro-Ion
ATM Gauge, p/n 390802. Any attempt to connect a different product
version to the VQM Controller will result in power being removed from the
TOTAL PRESSURE port and an error report generated by the VQM Controller.
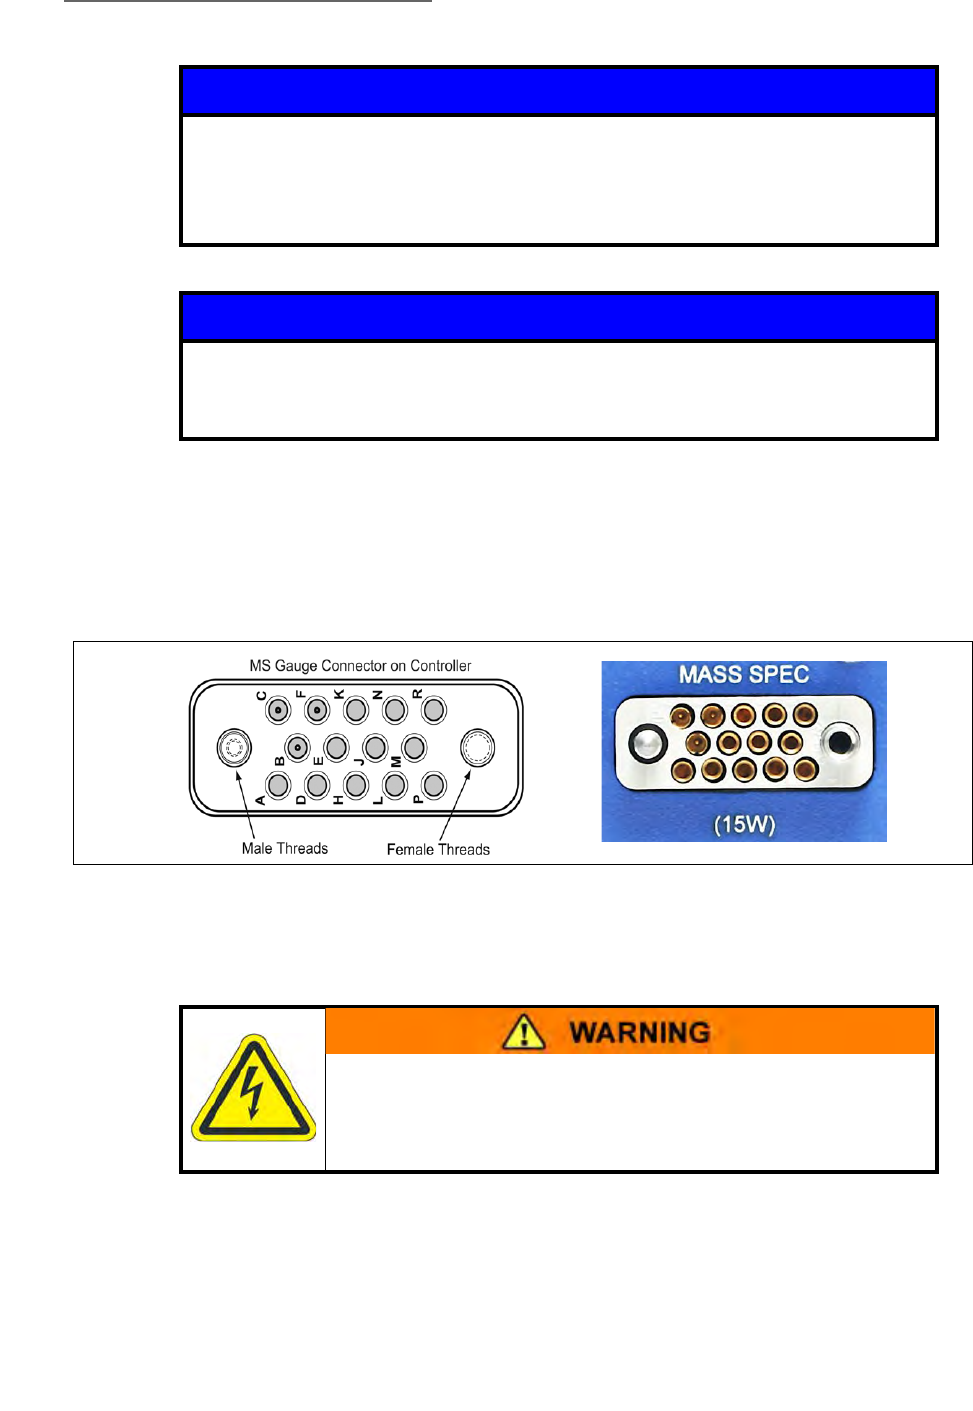
5 VQM® Controller Overview
76 Series 835 Vacuum Quality Monitor
Instruction Manual - 835000
5.6.2 MASS SPEC Connector
The MASS SPEC connector provides power, electrical biases and ion current connections for the MS
Gauge.
Power is delivered to the MS Gauge when the MASS SPEC button is pressed on the front panel or
when the MS Gauge Logical instrument is turned ON from a Host/PC through the VQM Command
Set. High voltages are present on some of the connector pins when the MS Gauge is ON.
The VQM Controller constantly monitors the MASS SPEC connector for a filament connection and
will indicate an error (i.e., MASS SPEC LED Red) if a filament wire is not sensed, even when the MS
Gauge is OFF.
Notice
The Micro-Ion Gauge cable (1- or 3-meter lengths) must be used to connect
the VQM Controller to the Micro-Ion Gauge.
For maximum safety and reliability, secure the Micro-Ion Gauge cable to
the TOTAL PRESSURE connector using the connector screws.
Notice
The (60W) label below the connector indicates the amount of 24 Vdc power
that is required to operate a Micro-Ion Gauge from the VQM Controller. That
power is in addition to the power required to operate the MS Gauge.
Figure 5-4 Mass Spec Connector
High Voltage
To avoid risks of electrical shock, wait 30 seconds before
removing the cable plug from the MASS SPEC connector after
power is removed from the MS Gauge.
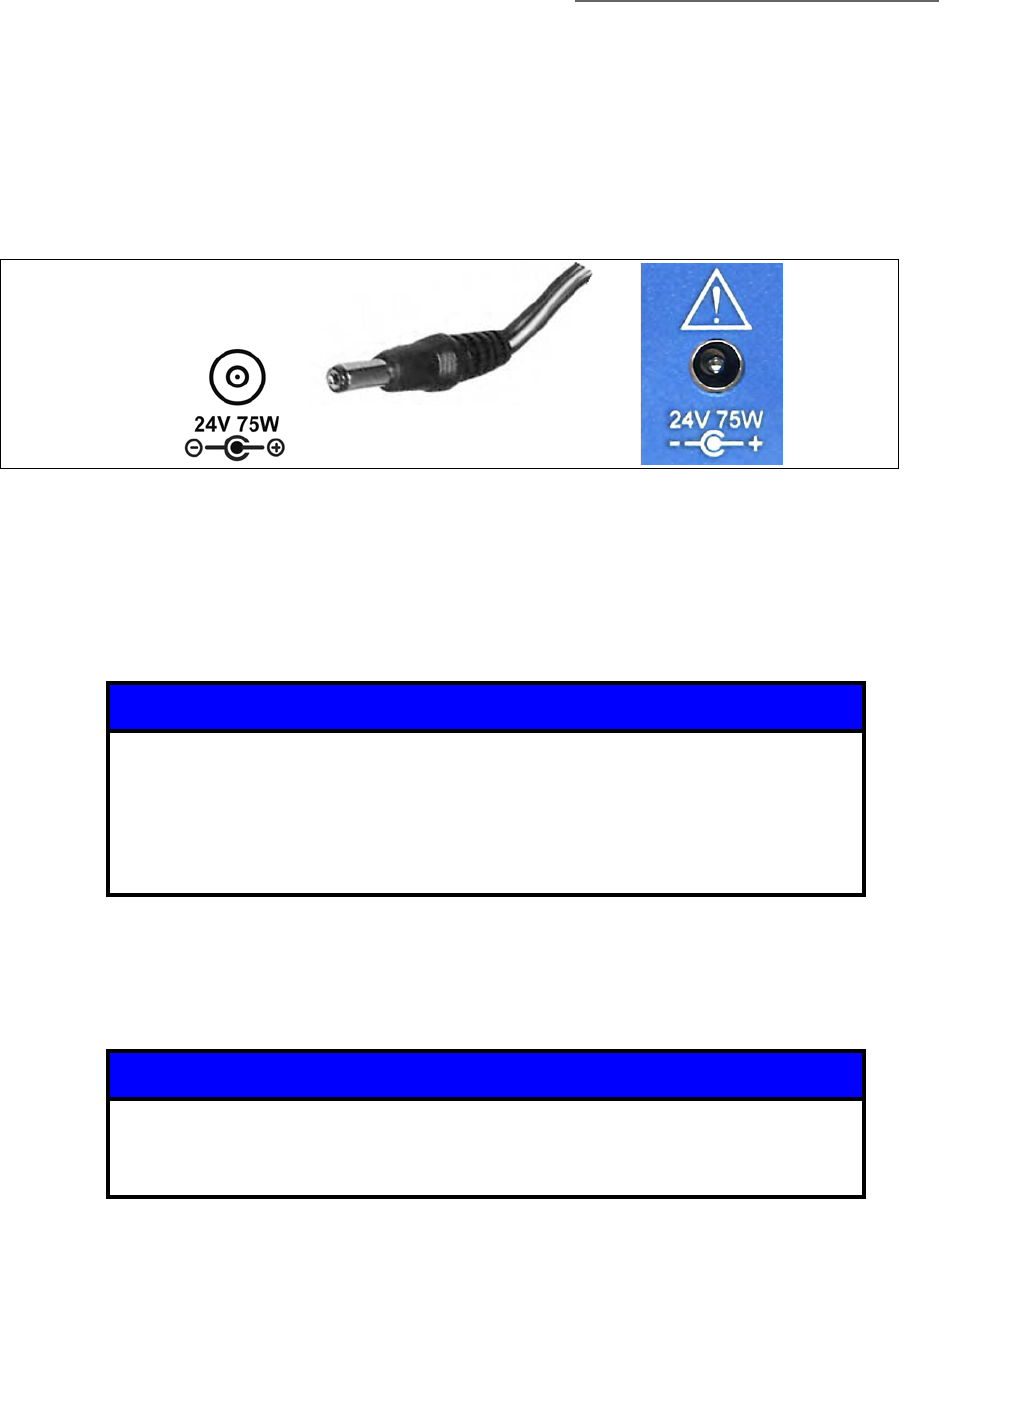
5 VQM® Controller Overview
77
Series 835 Vacuum Quality Monitor
Instruction Manual - 835000
A custom cable (1-meter, 3-meters, or 20-meters long) is available from the factory to connect the
VQM Controller to the MS Gauge. Thumb screws on the cable connector facilitate alignment and
insertion of the cable plug into the MASS SPEC Connector and provide safe and reliable operation
compatible with both industrial and research vacuum setups.
5.6.3 24 Vdc, 75 W Connector
Use the 24 Vdc, 75 W connector on the rear panel of the VQM Controller to provide power to the
instrument.
The 24 Vdc power connector requires a DC power plug described as: DC Power Jack, 5.5mm OD x
1.5 mm ID x 11 mm long. See Controller Power, Section 3.7 in Chapter 3.
Minimum DC power requirements are listed in Chapter 2, Section 2.4.3, Table 2-2, and depend on
whether the optional Micro-Ion Gauge is being used. The power requirements are 24 Vdc, 15 W,
for MS Gauge operation only, and 24 Vdc, 75 W when using the additional Micro-Ion Gauge.
5.6.4 Grounding Lug
Use the grounding Lug on the rear panel of the VQM Controller to properly ground the system.
Follow the Grounding Requirements instructions in Chapter 3, Section 3.8.1.
Figure 5-5 24 Vdc Connector
Notice
Under most circumstances, MS Gauge-only operation (i.e., without a
Micro-Ion Gauge) requires as little as 7.5 W to operate. However, a 15 W
minimum requirement is listed under the connector to allow for enough
power headroom in case the power supply being used becomes
deregulated by operation at the high operating temperature limit of the
instrument.
Notice
A #14 AWG ground wire (green and yellow) is provided with the VQM
Controller, which MUST be used to connect the VQM Controller chassis to an
Earth ground.
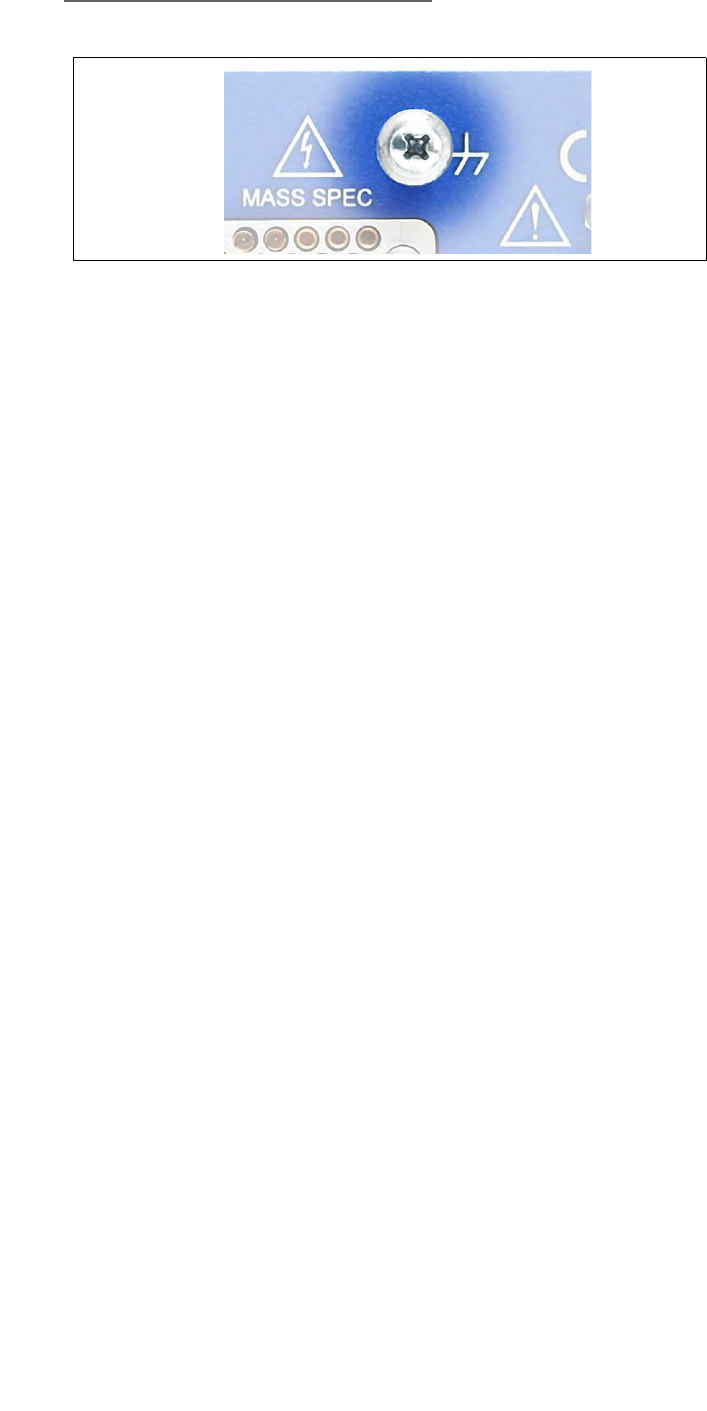
5 VQM® Controller Overview
78 Series 835 Vacuum Quality Monitor
Instruction Manual - 835000
5.7 MS Gauge Ion Trap Power Supply Settings
The VQM Controller is a densely packed box of electronics which includes several regulated power
supplies in a single electronics board design. During normal operation of the MS Gauge, regulated
power supplies set the electron emission current, the voltage levels on the ionizer and ion trap
electrodes, and the high voltage bias across the electron multiplier.
Ion Trap Mass Spectrometry Gauges are electrostatic ion storage devices, and as such, require low
power from their voltage supplies. Most of the electrical power consumed by the VQM Controller is
used to heat up the filament in the MS Gauge and produce electron emission current for the
ionization process.
The VQM Controller is shipped with default factory values for all voltage and current settings of the
MS Gauge. The default settings are stored in NVRAM (user settings) and transferred into the
Controller's memory when the unit is first powered up. The settings present in memory are used to
operate the ion trap when the MS Gauge is turned ON. A VQM System operated under default
settings will provide a mass range typically extending from 1 to 300 amu or 1 to 145 amu based on
the selected factory model. The user can change the Ion Trap settings in memory through the VQM
Command Set and can also choose to replace the values stored in NVRAM when the MS Gauge is
OFF (settings are transferred from memory into NVRAM). The user settings stored in NVRAM are
transferred into memory and used to configure the ion trap every time the VQM Controller is
powered back up. Since the VQM Controller offers a variable RF signal frequency sweep and the
mass-dependent ejection frequency of ions depends on the ion trap settings, changes in the mass
axis calibration and the mass range of the VQM System can be expected each time a user changes
the voltage biases of the ion trap electrodes. A single gas calibration capability built into the VQM
Viewer Software allows users to recalibrate the mass axis of the VQM when changes are made to
the ion trap voltage settings. A copy of the factory default settings is also stored in memory to allow
users to revert to factory default settings in case the VQM Controller ceases to operate properly
under user preferred settings.
The following table summarizes the power supplies (voltage and current) present in the VQM
Controller electronics along with Min, Max and Increment settings.
Figure 5-6 Ground Connection on the Rear of the VQM Controller

5 VQM® Controller Overview
79
Series 835 Vacuum Quality Monitor
Instruction Manual - 835000
All MS Gauge settings can be modified by the user at any time through dedicated commands, or
through the Tune Screen of the Viewer Application software.
The VQM Command Set available for the VQM System allow users to vary settings on the ion trap,
and also provides an internal measurement of the actual voltages and currents delivered to the ion
trap by the VQM Controller. Built-in diagnostics circuitry constantly monitors and measures the
voltages and currents supplied to the MS Gauge and dedicated commands are available to query
the measured values and to monitor the system for deviations between the requested and the actual
settings present on the ion trap.
Table 5-10 Power Supply Settings for the MS Gauge Ion Trap
Power Supply Min. / Max. Increment Default Description
Electron Emission
Current
0.005 mA / 1.5 mA /
0.001 mA
0.070 mA The electron emission source consists of a filament
power supply and a feedback loop system that
allows regulation of the power based on requested
emission current. The emission current is the current
between the Filament and the Entry Plate due to the
emission of electrons.
Repeller Bias -5 V / -60 V / 25 mV -31 V The Repeller bias voltage is used to optimize the
focusing of the electron beam into the ion trap
through the entry plate slit. The Repeller bias voltage
is derived from the Transition Plate High Voltage
power supply.
Filament Bias 10 V / 70V / 25 mV 30 V The Filament bias is used to set the electron energy.
The electron energy, in eV units, is equal to the
difference in voltage between the entry plate and the
filament bias voltages.
Entry Plate Bias 123 V / 153 V / 20 mV 130 V The Entry Plate voltage affects the electron energy
and one edge of the ion trap.
Pressure Plate 49V /147V / 25 mV 75 V
Cups 15 V / 85 V / 25 mV 27 V
Transition Plate Bias -500 V /-1000 V / .25 V -685 V
Exit Plate Bias 68 V / 154 V / 25 mV 122 V The exit plate bias sets the asymmetry of the trap. In
general the difference between the Entry and Exit
plate must remain between 0 and 20 V. Higher
asymmetries will lead to larger baseline offset.
Electron Multiplier
Shield Plate Bias
27 V / 147 V / 25 mV 124 V The electron multiplier shield bias is required to
optimize the coupling of the ion current into the top
cone of the electron multiplier.
Electron Multiplier
Negative HV
Supply
-500/-1500/ .25 V -900 V The Electron Multiplier bias voltage sets the gain of
the detector.
DDS RF Amplitude 0 / 1.26 / .001 0.45 mV The RF Amplitude is proportional to this value.
5 VQM® Controller Overview
80 Series 835 Vacuum Quality Monitor
Instruction Manual - 835000
5.7.1 Filament Overpower Detection
The Filament power supply is constantly monitored to detect overpower conditions.
To generate the requested emission current, a low voltage/high current filament power supply
delivers power to the filament wire. The filament wire heats up until it reaches a temperature at
which thermionic emission produces the requested electron emission current. The electrons are
ejected from the filament, focused through the entry plate slit, and finally neutralized on the back
plane of the entry plate. A feedback loop regulates the power delivered to the filament to keep the
emission current at the requested value. The power required by standard MS Gauge filaments is
about 2W (1V/2A). The amount of power required to operate the filament is affected by the work
function of the filament's thermionic emission surfaces and by the pressure around the filament. If
the filament is worn out, or the pressure is too high, the filament will require higher heating powers
to operate. Even though heating powers slightly above nominal will not damage the filament wire,
powers above 4W are considered to be deleterious to the Iridium wire; i.e., quick recrystallization
and embrittlement of the wire are possible.
The VQM Controller continuously monitors the amount of power required to establish the
requested emission current and turns OFF filament emission and trap operation if the heating power
exceeds 4W for longer than 0.5 seconds. A gauge shut down due to filament overpower increments
the Error Counter, adds an error code 779 "Fil Virtual Burn Limit Reached" to the Error Event queue
but does not illuminate the MASS SPEC Red LED. The Viewer Software continuously monitors the
error counter and alerts users if an error 779 code is detected in the Error Event Code list. The power
limit of 4W can be changed via SCPI commands. This may be necessary based on the length of MS
Gauge cable attached to the Controller.
5.7.2 RF Signal Generator
The VQM Controller includes a Direct Digital Signal Synthesizer (DDS) capable of delivering phase
continuous RF frequency sweeps of constant amplitude to the MS Gauge as required for
autoresonant ejection of ions from the ion trap. The RF signal is applied to the transition plate of the
Autoresonant Ion trap, on top of the negative high-voltage DC trapping potential (transformer
Notice
The power supplies are tested during the Power-ON Self-Test (POST)
procedure, and the results of that test are available through the VQM
Command Set (TEST:REPort). All self diagnostic voltage checks are
performed at low voltages (44V max) allowing safe testing the operation
of the Controller's power supplies even if no MS Gauge is connected to the
VQM Controller.
Notice
Since part of the heating power provided by the VQM Controller is
dissipated by the interconnect wire, users must be aware that filament
Overpower Errors can be generated in cases where wires with poor
conductance paths or connections are used.

5 VQM® Controller Overview
81
Series 835 Vacuum Quality Monitor
Instruction Manual - 835000
coupling), resulting in ejection of ions at twice their natural oscillation frequency (NOF). The
amplitude of the RF signal is kept constant throughout the frequency sweep and can be adjusted by
the user through the VQM Command Set (DDS_Ref adjustment).
The VQM Instrument offers two frequency sweep profiles to support the 1-145 amu product, and
the 1-300 amu product.
The 1-300 amu product has the following RF profile characteristics:
• Frequency Span: 3 MHz to 147.5 kHz, phase continuous.
• Amplitude: Constant throughout the scan, user adjustable between 5mVpp-150mVpp.
• Scan Profile: 1/f - meaning that d(1/f)/dt = constant throughout the scan.
• Sweep length: 120 msec - 30 segments, 4 msec each.
The 1-145 amu product has the following RF profile characteristics:
• Frequency Span: 3 MHz to 214 kHz, phase continuous.
• Amplitude: Constant throughout the scan, user adjustable between 5mVpp-150mVpp.
• Scan Profile: 1/f - meaning that d(1/f)/dt = constant throughout the scan.
• Sweep length: 80 msec - 20 segments, 4 msec each.
The DDS chip starts at high frequencies and scans towards lower frequencies as required for
autoresonant ejection of ions from the MS Gauge. The 1/f scan profile is optimized to provide
efficient ejection of ions across the entire mass range of the instrument. For default instrument
settings (i.e., 616 kHz ejection frequency for water at 18.01 amu, typical) this frequency range
provides ejection of ions between 1 and 300 amu. In actual implementation, the phase continuous
120 msec frequency sweep profile is approximated with a sequence of 30 linear frequency sweep
segments, 4 msec increments, as described in the following table. Phase continuity is guaranteed
through all segment transitions. The overall sweep time is 120 msec, and a framing pulse available
from the TRIGGER OUT port indicates the beginning and end of the frequency sweep.
The Frequency Range Table, below, shows the RF range to the 1-300 amu sweep. The 1-145 amu
sweep uses the same table, but it stops at 80 msec.
Notice
The RF coupling transformer is located inside the MS Gauge connector of the
gauge-controller interconnect cable. Placement of the transformer close to
the MS Gauge head allows efficient transfer of the RF power to the gauge
and reduces power consumption.

5 VQM® Controller Overview
82 Series 835 Vacuum Quality Monitor
Instruction Manual - 835000
NOTE: (*) The exact atomic mass of hydrogen is 1.00794 amu.
(&) The mass calculation assumes ejection of water (18.01 amu) at 616 kHz
i.e., typical for default trap settings.
The above frequency table assumes that the instrument is operating under default ion trap
operational conditions, i.e., ejection frequency for water is 616 kHz @ 18.01 amu. Since the
frequency sweep profile is fixed, the mass range of the mass spectrometer will change each time the
Table 5-11 Frequency Range
Time (msec) Frequency / Hz Samples /
Segment Mass / amu (&)
0 2699999.57 1333 0.938
4 1712946.65 924 2.329
8 1268772.84 706 4.246
12 991164.21 571 6.957
16 813494.68 480 10.327
20 695048.33 414 14.147
24 606213.57 364 18.597
28 535145.76 324 23.865
32 479624.03 293 29.710
36 435206.65 266 36.083
40 399672.75 245 42.785
44 368087.05 227 50.443
48 338475.47 210 59.665
52 316266.78 197 68.327
56 297759.53 184 77.085
60 277160.17 174 88.969
64 261710.64 165 99.783
68 247977.73 156 111.141
72 235103.13 148 123.647
76 224374.29 141 135.754
80 214074.61 135 149.131
84 204418.66 129 163.553
88 195835.59 123 178.203
92 187788.96 119 193.802
96 180064.20 115 210.787
100 173197.75 110 227.832
104 167017.94 106 245.004
108 161653.52 102 261.534
112 156503.68 100 279.030
116 151675.70 96 297.076
120 147384.17 90 314.628
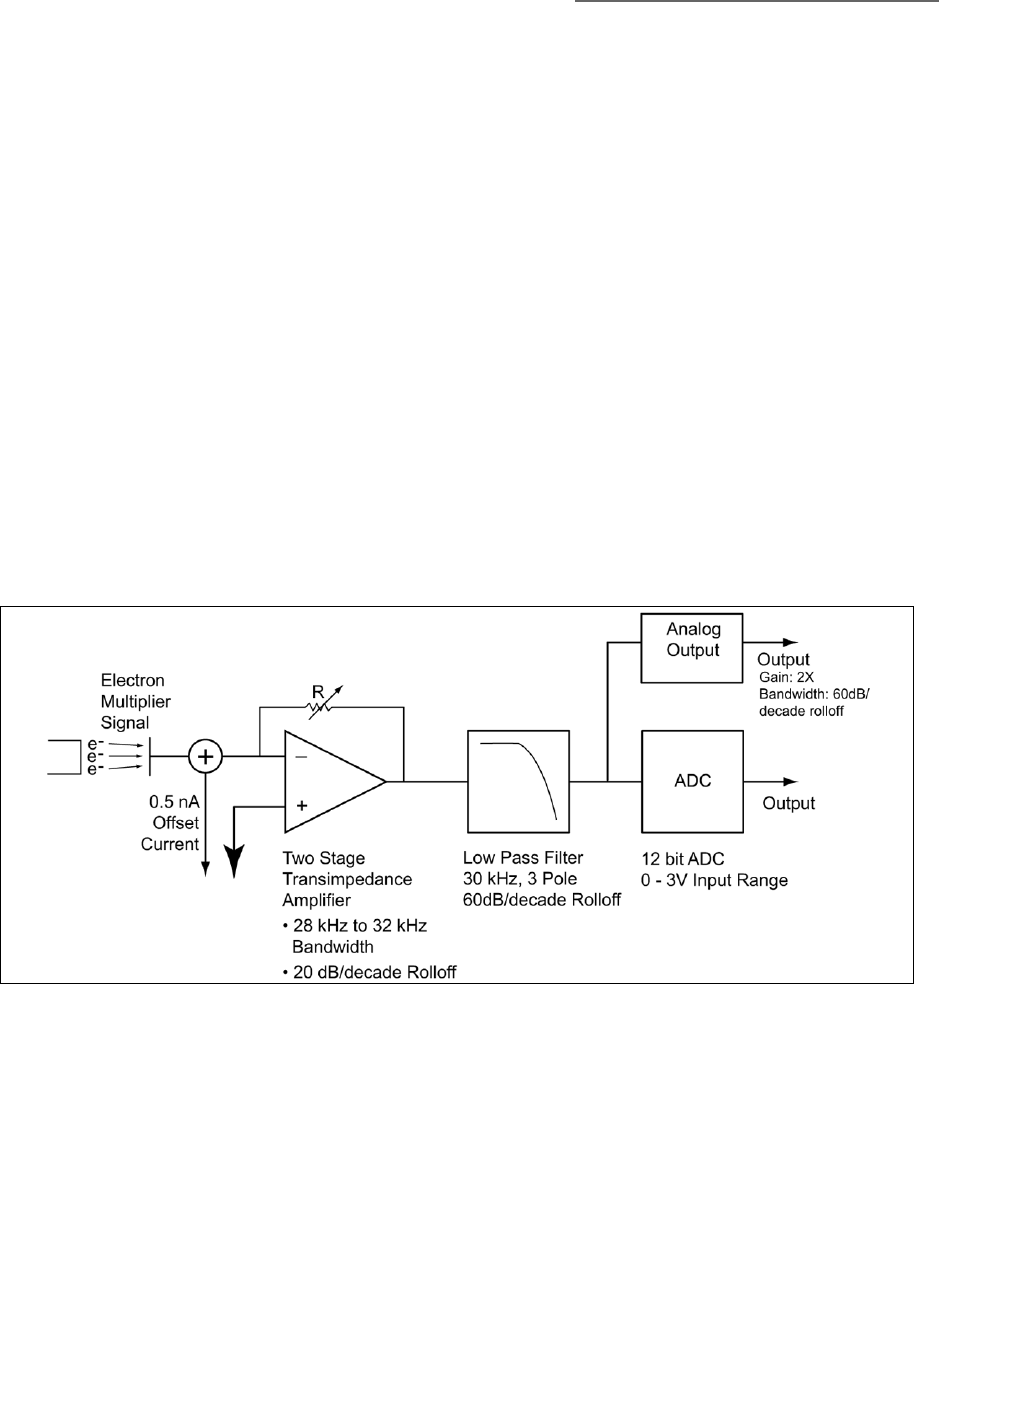
5 VQM® Controller Overview
83
Series 835 Vacuum Quality Monitor
Instruction Manual - 835000
trap parameters are modified and the ejection frequency of the ions shifts to new values. In general,
large frequency shifts should be expected any time bias voltages for electrodes located inside the
ion storage volume of the trap are changed.
The VQM Controller provides a single frequency sweep profile, but allows changes to the RF
amplitude through the VQM Command Set. The amplitude setting provided in the VQM Command
Set (DDS_Ref) is related to the peak-to-peak voltage (RF_Vpp) experienced by the transition plate as:
RF_Vpp= 0.12 * DDS_Ref. This means that if the RF amplitude setting is 0.5, then 0.5*0.12 mV= 60
mV RF_Vpp is present on the transition plate.
NOTE: The RF amplitude setting is adjustable through the VQM Viewer Application
or the VQM Command Set.
The effect of RF_Vpp amplitude on the Ion Trap Signal is discussed in Section
6.9 of this manual.
5.7.3 Electrometer
The typical output of the MS Gauge consists of a series of ion current peaks with amplitudes in the
order of tens of picoAmps and bandwidths extending to 30 kHz. An electron multiplier detector is
required to amplify those ion currents into the nanoAmp range (gain is approximately equal to
1000X, typical) so that standard electrometers can be used to collect ion signals in real time without
peak shifts and resolution degradation due to bandwidth limitations of standard transimpedance
amplifiers.
An electrometer built into the VQM Controller converts the electron current output of the electron
multiplier into a voltage signal that is then filtered and fed into an A/D converter and the Analog
Output. The gain and bandwidth of the electrometer are optimized to accommodate the range of
peak amplitudes and widths that are typical in the VQM System over the 1-300 amu scan range.
The gain factor for the two-stage transimpedance amplifier of the electrometer can be set and
calibrated (commands) between 10 and 121 nA/V, with a factory default value of 20 nA/V. The
bandwidth of the transimpedance amplifier is typically between 28 kHz and 32 kHz over the
available range (based on simulations) and is fully compatible with the bandwidth of the current
signals provided by the MS Gauge. The output of the transimpedance amplifier is fed into a 3-pole
30 kHz Low-Pass filter with a 60 dB/decade roll-off. The filtered analog signal is then connected to
Figure 5-7 MS Gauge Electrometer Simple Schematic

5 VQM® Controller Overview
84 Series 835 Vacuum Quality Monitor
Instruction Manual - 835000
a 16-bit A/D converter with a 0 - 3 V input voltage range (3 V = 65535 counts) and the Analog
Output. A 1 nA DC Offset current is continuously added into the input of the electrometer to assure
a positive baseline offset at all times.
The electrometer gain is set and calibrated to 20 nA/V at the factory, but the user can readjust the
electrometer gain value between 3 and 34 nA/V using the VQM Command Set. A dedicated
calibration command triggers a calibration of the electrometer gain against a reference current
source built into the VQM Controller at any time (Note: the MS Gauge needs to be turned OFF, as
any output from an active Electron Multiplier/Gauge would be additive to the reference current
source). The gain of the electrometer is also recalibrated during each Power ON procedure. The last
calibrated electrometer gain value is available through a command query and is also incorporated
into the MS Scan Data Header when FETCh? commands are used to collect data from the
instrument. The output of the electrometer (ADC counts) combined with the electrometer gain can
then be used to calculate and display electron multiplier currents for each scan.
5.8 Power Modes
The VQM Controller has three different power modes of operation. See Table 2-2 on page 27 for
recommended power input requirements.
Table 5-12 Controller Power Modes
Power Mode
Power Button
LED Status
(GEREEN)
Description Access
OFF OFF No external 24 Vdc power available
to the Controller.
Pressing the power button in this
state has no consequence.
Remove 24 Vdc power from the
Controller to access this state.
Note: The VQM Controller saves its
power state when 24 Vdc power is
removed. The instrument returns to the
same state (standby or ON) when the
power supply is reconnected to the
Controller.
Standby Fade External 24 Vdc power is applied to
the Controller but all gauge
functionality and the USB port are
disabled. All front panel LEDs are
OFF except the power button LED is
fading green.
This is a state of minimal power
consumption in which all
functionality of the mass
spectrometer, Micro-Ion Gauge, and
USB communication are disabled.
The microprocessor is awake but
uses the minimum possible amount
of power.
Note: No power is available for the
Micro-Ion Gauge in this state.
Pressing the Power button in this
state forces the Controller into the
ON power mode.
External 24 Vdc power must be
available to the Controller to access this
state. To place the Controller in standby
mode, press the Power button on the
front panel of the Controller.
Note: The Controller cannot be
awakened from standby mode through
the USB interface.

5 VQM® Controller Overview
85
Series 835 Vacuum Quality Monitor
Instruction Manual - 835000
5.9 Power ON/OFF Sequence
5.9.1 Power ON Sequence
The power ON sequence for the VQM Controller (1) performs a complete Power-On Self-Test
(POST) of the Controller, (2) confirms the presence of an MS Gauge connection, (3) searches for an
available Micro-Ion Gauge connection, (4) allows troubleshooting in case of a system error, (5)
enables stand alone functionality (i.e., analog and trigger I/O signals), and (6) allows connection to
Host/PC via the USB Link.
1. Connect a 24 Vdc power supply to the VQM Controller. The VQM Controller remembers the
power mode from the last time it was connected to a 24 Vdc power supply and automatically
reinstates the same power mode when a power connection is re-established.
2. The Power LED will illuminate, but will fade Green after a few seconds if the most recent
power mode was Standby.
3. As soon as the Power button is pressed the user settings are transferred from NV RAM into
Controller memory (memory check is invoked as well) and the electrometer gain is set and
calibrated. If the Power Mode=ON, 24 Vdc is applied to the TOTAL PRESSURE port to activate
a Micro-Ion Gauge that may be connected to the VQM Controller and the Power-ON Self-Test
(POST) procedure is activated. The Power button Green LED blinks until POST is completed.
When the self-diagnostic procedure is complete (~13 seconds) the Analog I/O, Trigger I/O and
Power Button LEDs turn ON.
ON ON External 24 Vdc power is applied to
the Controller and all gauge
functionality and the USB port is
enabled.
• External 24 Vdc Power is
available
• The power LED is ON
• The USB LED is ON and the USB
link is enabled
• The Trigger and Analog I/O LEDs
are ON
• Power is available to the
Micro-Ion Gauge (unless the user
turns the Micro-Ion Gauge logical
instrument OFF sending the
appropriate command from the
Host/PC)
• The EXT TP LED - per user set
configuration/activity
Pressing the Power button in this
state forces the Controller into
standby power mode.
External 24 Vdc power must be
available to the Controller unit to access
this state. Press the Power button on the
Controller to turn the Controller ON and
to activate the communication interface.
The Power ON sequence includes a
Power-On Self-Test (POST) procedure.
The LED blinks ON-OFF while POST is
performed. If a Micro-Ion Gauge is
available, power is applied to the
Micro-Ion Gauge before POST Starts but
communication with the Micro-Ion
Gauge first occurs after POST to allow
the Micro-Ion Gauge to establish
communication.
A dedicated command is available to
turn the Micro-Ion Gauge logical
instrument OFF (i.e., remove power)
when the Controller is ON.
Table 5-12 Controller Power Modes
Power Mode
Power Button
LED Status
(GEREEN)
Description Access
5 VQM® Controller Overview
86 Series 835 Vacuum Quality Monitor
Instruction Manual - 835000
4. Once POST is completed, the Controller tries to establish a valid RS-485 connection with a
Micro-Ion Gauge. If communication with a Micro-Ion Gauge is successfully established, the
EXT TP LED blinks repeatedly to indicate the presence of active communication with the
Micro-Ion Gauge, i.e., Autopressure Mode=ON. Filament overpressure protection is available
as long as Autopressure Mode=ON. If no Micro-Ion Gauge is found, power is removed from
the TOTAL PRESSURE port until the next Power ON sequence or until the ETPR Logical
instrument is reactivated through the command interface.
5. In addition to the POST procedure, the VQM Controller also looks for a valid MS Gauge
connection by detecting the presence of its filament. If a filament connection is not detected,
the MASS SPEC Button LED remains Red indicating a system error. However, note that the
error counter is not incremented and that no error code 780 is added to the queue if a filament
connection is not detected upon Power Up.
6. If a USB connection to a Host/PC is available, the USB LED turns ON if a valid enumeration of
the USB port occurs with the Host/PC. A valid enumeration requires the presence of all
required VQM USB drivers in the Host/PC. Follow the Software Installation procedure of
Chapter 4 to assure all the required drivers are available in the Host/PC. If a USB connection is
not present, or proper enumeration does not take place, the USB LED remains OFF.
Once the Power ON procedure is completed successfully, the VQM Controller is ready for
operation of the MS Gauge and Micro-Ion Gauge for Stand Alone operation and for communication
with a Host/PC over USB serial link. Toggle the MASS SPEC button to turn ON the MS Gauge
(assuming pressure is below 1x10⁻⁵ Torr). Once the MASS SPEC button becomes illuminated, the
instrument is ready to scan. Press the SCAN button to perform MS Scan-Start or apply external
trigger pulses to the external trigger IN port to perform external trigger MS Scan-Start. Use the VQM
Viewer Software or custom application to control the MS Scan or to acquire MS Data provided by
the external trigger or manual MS Scan control.
5.9.2 Standby Power Sequence
The Standby power sequence for the VQM Controller (1) removes power/charge from the MS
Gauge, (2) removes power from the Micro-Ion Gauge, (3) disables all front panel input and outputs
(including the USB link), and (4) press the Power button to place the Controller in Standby mode.
1. Press the Power button to place the VQM Controller in Standby mode. All operation and scan
functions are disabled and the VQM Controller enters the standby power mode. All scan,
trigger, and I/O functions are disabled, and all LEDs are OFF except for the Power Button LED
Fading Green.
5.9.3 Power-On Self-Test
A Power-ON Self Test (POST) procedure is executed as soon as the VQM Controller is first turned
ON. POST does not require an MS Gauge connection to operate. The purpose of the POST
procedure is to make sure the power supplies (voltage and current) built into the VQM Controller
operate properly. During POST, power modules are powered to safe voltages and checked internally
to make sure they deliver the proper output. The Direct Digital Synthesis generator, responsible for
the RF signal, and the Filament power supply are not tested during POST.
Notice
Do not apply power to the MS Gauge until the pressure in the vacuum
chamber is <1x10⁻⁵ Torr, and instructed to do so in the Initial Operation
procedure outlined in Section 8.3.

5 VQM® Controller Overview
87
Series 835 Vacuum Quality Monitor
Instruction Manual - 835000
The sequence of tests is as follows:
1. Positive voltage supplies
2. Emission control circuitry
3. Electrometer
4. Analog I/O
5. Digital I/O
If an error is detected during POST, the Power button Red LED is illuminated, the error counter is
incremented, and an error is added to the Error queue: error Code 2310, "POST failed - run
TEST:REPort?". If a POST Error is logged, use the TEST:REPort? command to obtain a list of the
modules that generated errors. The TEST:REPort? information should be sent to the factory to aid in
debugging the self test failure.
In the event a POST error occurs, some high level debug can be performed on the Controller. If the
Controller is not connected to an MS gauge, the issue could be with the Controller and not
necessarily the MS Gauge or MS Gauge cable. In this case, contact Granville-Phillips Customer
Support with the TEST:REPort? information on how to proceed.
If the POST error occurs while the Controller is connected to the MS Gauge, disconnect the MS
Gauge from the Controller and run POST again. If a terminal is available, send the TEST? command
and wait for the results of the test to be displayed on the screen. If a terminal is not available, power
cycle the Controller by pressing the Power Button twice and wait for the Green Power LED to stop
blinking. A solid Green Power LED indicates that the Controller has passed the POST and the issue
is probably the MS Gauge. A solid Red Power LED indicates that the issue is with the Controller. In
this case, contact Granville-Phillips Customer Support with the TEST:REPort? information on how to
proceed.
5.10 Micro-Ion Gauge Operation
The VQM System includes an optional Micro-Ion Gauge which connects directly to the VQM
Controller and provides full range total pressure readings from atmospheric to high vacuum
pressure levels.
The Micro-Ion Gauge consists of:
1. Micro-Ion ATM Gauge, Model 390802
2. Interconnect cable: 1 meter or 3 meter length options.
3. Instruction Manual #390001 and Addendum #390015.
Notice
The TOTAL PRESSURE Connector on the rear of the VQM Controller will
power and communicate with a Micro-Ion ATM model 390802. Other
versions of the Micro-Ion Gauge product line will not be powered by the
VQM Controller and will generate errors if connected to the VQM
Instrument.
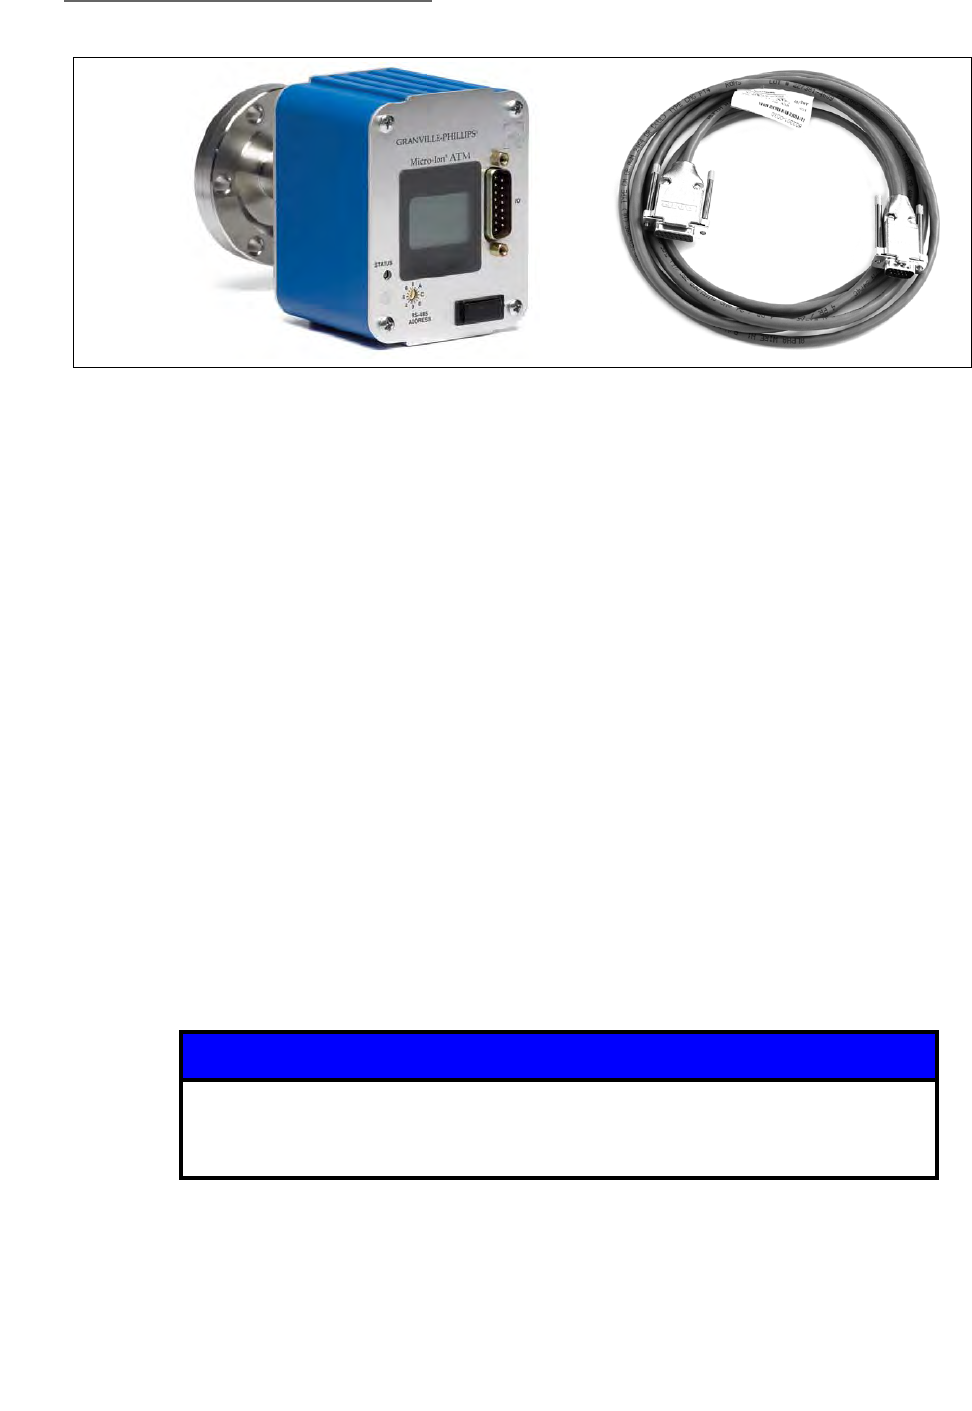
5 VQM® Controller Overview
88 Series 835 Vacuum Quality Monitor
Instruction Manual - 835000
Total pressure and status information, provided by the Micro-Ion Gauge, can be used for a variety of
purposes:
• Display, store, and graph total pressure on the Host/PC screen along with the ratiometric
mass spectral data provided by the MS Gauge.
• Combine ionization gauge total pressure data with ratiometric gas analysis information to
provide absolute partial pressure measurements.
• Provide overpressure protection for the MS Gauge.
Real-time communication between the VQM Controller and the Micro-Ion Gauge takes place
through the Autopressure Mode of communication built into the Controller's firmware which
directs the VQM System to query the Micro-Ion Gauge for total pressure and gauge status
information every 50 msec as required to maintain the Overpressure Protection Mode active.
The Power button on the VQM Controller also controls power to the Micro-Ion Gauge. If power is
turned OFF to the VQM Controller, power is also turned OFF to the Micro-Ion Gauge. Users
requiring independent power control for the Micro-Ion Gauge need to use a dedicated wiring setup
where power is provided from an independent source.
5.10.1 Autopressure Mode
The VQM Controller includes a TOTAL PRESSURE (DB 15-pin) connector on the rear panel to
power and interface (RS-485) with the optional Micro-Ion Gauge. The 24 Vdc power required to
operate the Micro-Ion Gauge is routed from the same power supply connected to the 24 Vdc, 75 W
connector.
Figure 5-8 Series 390802 Micro-Ion ATM Total Pressure Measurement Gauge and Interconnect Cable
Notice
A 24 Vdc, 80 W power supply is available from Granville-Phillips which
provides enough power to operate the MS Gauge as well as the Micro-Ion
Gauge.

5 VQM® Controller Overview
89
Series 835 Vacuum Quality Monitor
Instruction Manual - 835000
The TOTAL PRESSURE port delivers 24 Vdc power to the Micro-Ion Gauge when (1) the VQM
Controller is powered up (front panel), (2) power is cycled (front panel), and (3) when the ETPR
logical instrument is turned ON (VQM Command Set.) Once 24 Vdc power becomes available, the
Micro-Ion Gauge becomes active, and ~5 seconds later the VQM Controller attempts to establish
communication with the Micro-Ion Gauge through the RS-485 (address=2) communication link. If
communication is successfully established (i.e., a response is received within 150 msec), the VQM
Controller continues to query the Micro-Ion Gauge for pressure and status information every 50
milliseconds, i.e., Autopressure Mode=ON. Autopressure must be ON for overpressure protection
to function as specified.
While Autopressure Mode=ON, the VQM Controller continues to query the Micro-Ion Gauge for
pressure and status data every 50 msec. Failure to obtain a pressure/status update after 3 retries is
considered a communication failure. If communication between the Micro-Ion Gauge and the
VQM Controller fails after 3 consecutive tries: (1) all RS-485 communication is interrupted (i.e.,
Autopressure Mode=OFF), (2) power is removed from the TOTAL PRESSURE connector, and (3) the
EXT TP LED turns OFF. If power to the Micro-Ion Gauge is removed by turning OFF the ETPR logical
instrument through the VQM Command Set, the EXT TP LED also turns OFF to reflect the loss of
RS-485 communication with the Micro-Ion Gauge and the Autopressure mode is set to OFF. Power
is not automatically restored to the TOTAL PRESSURE connector until the VQM Controller is power
cycled or until the External Total Pressure (ETPR) logical instrument is turned back ON from the
command interface.
While Autopressure=ON, the VQM Controller continuously queries the Micro-Ion Gauge every 50
msec; however, this does not mean that the 390802 Micro-Ion Gauge will provide pressure and
status information at a deterministic 50 msec update rate. Pressure update rates will typically
oscillate between 50 and 150 msec. A communication failure between the VQM Controller and the
Micro-Ion Gauge is only assumed if pressure and status data fail to be received by the VQM
Controller for a period longer than 150 msec.
The VQM Controller receives both pressure and status information from the Micro-Ion Gauge
during Autopressure Mode=ON, but does not use the Status information to drive front panel
warnings or errors, or to interrupt the Autopressure mode. Warnings from the Micro-Ion Gauge are
Notice
The RS-485 address for the Micro-Ion Gauge must be set=2 (the factory
default value) for successful communication with the VQM Controller.
The Micro-Ion Gauge must be p/n 390802 to operate with the VQM
Controller. Other Micro-Ion models will not be recognized and will not be
powered by the VQM Controller.
Any Series 390 Micro-Ion ATM Gauge powered separately can be
interfaced to the VQM Instrument by connecting its analog output signal to
the ANALOG IN port of the VQM Controller. This connection scheme
provides total pressure information in synchronicity with MS Scans, but
does not include any exchange of status information between the ion
gauge and the VQM Controller. Use a standard 390802 Micro-Ion Gauge to
obtain total pressures with the VQM System.

5 VQM® Controller Overview
90 Series 835 Vacuum Quality Monitor
Instruction Manual - 835000
not displayed by the VQM Controller, but are reported on the display panel of the Micro-Ion Gauge.
The Status register from the Micro-Ion Gauge is included into the data header when a FETCh?
Command is received by the VQM Controller and is also available through the command interface.
5.10.2 Overpressure Protection
One of the most critical functions of the Micro-Ion Gauge is to provide overpressure protection for
the MS Gauge. The MS Gauge has pressure sensitive components, (1) the electron multiplier
detector and (2) the filament, which can be damaged if the pressure exceeds certain upper limits. In
addition, the MS Gauge cannot provide reliable gas compositional information as the pressure in
the vacuum chamber exceeds 1x10⁻⁵ Torr. As a general rule there is no good reason to turn the MS
Gauge ON if the pressure exceeds 5x10⁻⁵ Torr as no useful data will be available from the
instrument. The VQM Controller automatically enables Overpressure Protection Mode as
Autopressure Mode=ON. Overpressure protection mode operates even if no Host/PC is connected
to the VQM Controller providing gauge protection in Stand Alone Mode of operation.
NOTE: Users cannot change the Autopressure status through the VQM Command Set.
The total pressure information provided by the Autopressure Mode=ON is used by the VQM
Controller to provide real-time overpressure protection of the MS Gauge. The overpressure
protection mode is used to decide (1) whether it is safe to turn ON the MS Gauge, and (2) whether
it is safe to keep the MS Gauge ON.
The overpressure protection logic is based on three independent total pressure thresholds:
1. Low Pressure Threshold (PL= 5x10⁻⁵ Torr): The MS Gauge will only turn ON if the last pressure
reading reported by the Autopressure Mode is below the Low Pressure threshold. Alternatively,
the MS Gauge will not turn ON if the last pressure reading obtained from the Autopressure
mode exceeds the Low Pressure Threshold. Attempting to turn ON an MS Gauge while an
overpressure condition exists will result in an overpressure error (code 1025 or 1026) being
posted to the Error/Event Queue. The error code for "Over-Pressure detected" is 1026 and the
error code for "Extreme Over-Pressure detected" is 1025.
2. Extreme High Pressure Threshold (PEH=5E-4 Torr): The MS Gauge will immediately turn OFF if
the last pressure reading reported by the Autopressure Mode exceeds the extreme High
Pressure Threshold. Operation of an MS Gauge at a pressure above PEH compromises the
filament and the electron multiplier detector, and also creates the possibility of internal arcing
inside the electrode structure. An "Extreme Over-pressure detected", Code 1025, error is added
to the Error-event queue when an MS Gauge is turned OFF by an extreme overpressure event.
3. High Pressure Threshold: The MS Gauge will be turned OFF if the pressures reported by the
Micro-Ion Gauge starts above the High Pressure threshold, stays above the Low Pressure
threshold, and stays below the Extreme Pressure threshold for more than 2 seconds. An
"Over-pressure detected", code 1026, error is added to the error-event queue when an MS
Gauge is turned OFF due to this sort of error.
5 VQM® Controller Overview
91
Series 835 Vacuum Quality Monitor
Instruction Manual - 835000
5.11 Mass Spectrometry Scan Control
The VQM Controller provides three distinct Mass Spectrometry (MS) Scan control options.
Scans can be performed (1) by pressing the SCAN button on the front panel of the VQM Controller
(Manual Scan), (2) using external trigger input signals (pulses) to initiate scans (External Trigger
Scan), or (3) using Host/PC commands to trigger commands and gather the MS scan data (Remote
Scan).
Events During MS Scanning
• The SCAN button LED blinks ON every time an MS Scan is executed.
• The Trigger OUT LED blinks OFF every time an MS Scan is executed. This indicates that a
Trigger OUT time framing pulse is available for each scan.
• The Analog OUT LED blinks OFF every time an MS Scan is executed. This indicates that fresh
MS analog OUT signal is available for each scan.
• Scans are executed back-to-back with minimal delay in between. See the Timing Diagrams
in Section 5.13.
The SCAN Button LED remains OFF when the MASS SPEC Button is pressed on the front panel and
voltages start to be applied to the MS Gauge electrodes. Allow a minimum of 20 seconds before
pressing the SCAN Button to start to scan to make sure the bias voltages are properly established on
the electrodes (i.e., accurate mass axis calibration) and up to 60 minutes for the electron multiplier
detector and filament assembly to completely warm up. See Warm-up Periods, Section 7.4.4.
Figure 5-9 VQM System Overpressure Diagram
Notice
Overpressure protection for the MS Gauge is a standard function of the
VQM Controller when the 390802 Micro-Ion Gauge is used. Overpressure
protection is also available through the VQM Viewer Application software.
If total pressure is available to the Viewer Application (i.e., a Micro-Ion
Gauge or an external Granville-Phillips Series 370 Ion Gauge Controller is
connected to the Analog In port), overpressure protection can be executed
through the Host/PC viewer controls.

5 VQM® Controller Overview
92 Series 835 Vacuum Quality Monitor
Instruction Manual - 835000
If the MASS SPEC button LED is illuminated Green, the VQM Controller is ready to scan and will
respond to MS Scan depending on the selected triggering mode (Immediate or External).
To interrupt a scan in the middle of its mass range, press the MASS SPEC button on the front panel,
turn OFF the MS Gauge through a command, or simply turn OFF the unit.
5.11.1 Manual Scan Control
Manual scan control is performed in either Immediate or External mode.
• When the Controller is configured for Immediate triggering a single press of the SCAN button
will START continuous triggering of MS Scans. The SCAN button LED will transition from
OFF to Blinking Green when scanning. A single press of the SCAN button will STOP
continuous triggering of the MS Scans. The SCAN button LED will transition from Blinking
Green to OFF.
• When the Controller is configured for External triggering a single press of the SCAN button
will prepare the Controller to wait for a trigger event. The SCAN button LED will transition
from OFF to ON Green. In this mode a trigger event can come from the Digital IN, SCPI
trigger command, or another single press of the SCAN button. The trigger event will cause
the SCAN button LED to Blink Green once indicating that a single MS Scan was executed
5.11.2 External Trigger Scan Control
Triggered scanning performs one full scan each time a signal (pulse) is received at the trigger IN port
of the VQM Controller. See Section 5.5.1. To transition the Controller to External Trigger mode,
press and hold the SCAN button for >2 seconds and wait for the Power Button LED to momentarily
blink Green confirming the transition. The Digital IN LED should be ON. If the MS Gauge was OFF,
turn the MS Gauge ON. If the SCAN Button LED is not ON Green, press the SCAN Button once to
tell the Controller to wait for a trigger. The SCAN Button LED should be ON Green and now the
Controller is ready to trigger from the Digital IN.
5.11.3 Remote Scan Control
Scans can be initiated with commands sent from a Host/PC that is connected to the VQM Controller
Unit via the USB link. Commands are available to initiate both single and continuous scanning.
The external trigger IN port is disabled when continuous MS scanning is executed under Host/PC
scan control in immediate Trigger mode. From the INSTrument MSP logical instrument:
• With the MS Gauge ON, issue a command (INITiate:CONTinuous ON) from the Host/PC to
execute MS scanning in single or continuous scanning mode.
• To stop continuous scanning, issue a command (INITiate:CONTinuous OFF) to interrupt
execution of continuous scanning.
• Use the FETCh? Command to collect MS Data with the Host/PC during continuous scanning.
5.11.4 Mass Spectrometry Scan Count
The VQM system allows for two different scan count modes: single and continuous scan.
5.11.5 Single Scan
One MS scan is executed.
• Send an external trigger pulse to the VQM Controller, or send a command from the Host/PC
to execute a single (one) MS scan. There are two different commands available that allow
single scans: (1) INITiate:FETCh? or (2) TRIGger:FETCh?.

5 VQM® Controller Overview
93
Series 835 Vacuum Quality Monitor
Instruction Manual - 835000
5.11.6 Continuous Scans
MS scans are continuously executed until a Stop command is issued. Continuous MS scans can be
executed manually or by command from a Host/PC.
For manual continuous MS scanning, press the SCAN button on the VQM Controller. The Controller
will perform scans continuously until the SCAN button is pushed again.
For Host/PC commanded continuous scanning, send a Continuous Scan command. There is a single
command sequence that allows continuous scans: INITiate:CONTinuous ON then send multiple
FETCh? commands.
A Scan-Stop command must be issued if a new Scan Start needs to be issued while continuous
scanning, or if access to external trigger scan control becomes necessary. To stop scanning or switch
triggering mode, send INITiate:CONTinuous OFF first then send ABORt.
5.12 Typical System Configurations
The VQM System is a versatile instrument capable of providing mass spectrometry data under many
different instrumentation setups and with a very wide range of data collection options. The
following sections describe 4 basic modes of operation for the VQM System.
5.12.1 Standard Setup
This is a very common configuration for the VQM System. This operational mode provides access to
both manual or Host/PC MS Scan control. The Trigger Mode must be changed to Immediate for this
setup.
In this configuration:
• The MS Gauge is mounted on the vacuum system.
• The interconnect cable connects the MS Gauge to the VQM Controller.
• The VQM Controller connects to a Host/PC via a USB link using standard USB device
connection.
• The Host/PC has the proper Virtual COM port drivers installed and can communicate with
the VQM Controller through text-based commands. The Controller provides full MS data
records via the USB interface at the end of each MS scan (FETCh?).
• The user interacts with the VQM Controller (1) through the VQM Viewer Application
Software package bundled with the instrument, (2) through a user developed custom
software application, or (3) through specially developed LabView Virtual Interfaces.
• Users interested in collecting or displaying MS data with their own fast data acquisition
systems (i.e., scopes or fast DAQs) also have the option of using the Trigger Out and Analog
Out signal ports to collect, store, and display MS analog out signals.
• Manual scan control allows users to execute manual scans from the front panel of the VQM
Controller while collecting MS data with the Host/PC and/or auxiliary fast DAQ equipment.
Manual scan control is ideal for applications in which synchronization with external events
relies on direct user observations and synchronization during a process/experiment.
• An optional Micro-Ion Gauge can also be connected to the VQM Controller providing access
to independent total pressure information to the Host/PC over the USB link.
• There is real-time synchronization between the total pressure and ratiometric gas
compositional analysis.
• Auxiliary analog voltage signals, connected to the Analog IN signal port can be digitized
synchronously with MS data acquisition.
5 VQM® Controller Overview
94 Series 835 Vacuum Quality Monitor
Instruction Manual - 835000
This Operational Mode supports:
1. Manual MS Gauge control
2. Host/PC MS Gauge control
3. Manual MS scan control
4. Host/PC scan control
5. MS analog out signal data acquisition, storage, and real-time display
6. External total pressure data acquisition and display (optional Micro-Ion Gauge required)
7. Host/PC full MS data acquisition and display
8. Analog input signal digitization
Comments:
• The Trigger Out port and the Analog Out port are enabled by factory default.
• The External Trigger In port is disabled by factory default.
• The full MS data record transmitted over USB at the end of each MS scan must be processed
in real time by the Host/PC at the end of each scan. This requires fast data collection systems.
5.12.2 Standard Setup with External Trigger Pulses
This setup builds upon the Standard Setup adding the ability to perform external trigger scan
control, and provides access to the entire functionality of the Mass Spectrometer including the three
independent means for MS scan control that are available for the instrument. The Trigger Mode
must be changed to External for this setup.
Figure 5-10 Basic System: Standard Setup
5 VQM® Controller Overview
95
Series 835 Vacuum Quality Monitor
Instruction Manual - 835000
This Operational Mode supports:
1. Manual MS Gauge control
2. Host/PC MS Gauge control (custom application)
3. Manual MS scan control
4. Host/PC Scan control
5. External trigger scan control
6. MS analog out signal data acquisition, storage, and real-time display
7. External total pressure data acquisition and display
8. Host/PC MS data acquisition and display
9. Analog input signal digitization
Comments:
• Valid external trigger pulses can be used to execute single MS scans. If a valid USB Link is
present, MS data is transmitted to the Host/PC at the end of each scan, if requested with a
FETCh? Command.
• The user must be careful not to over trigger during external trigger MS scan control. The over
trigger counter is incremented for each over trigger event. Over triggering should be avoided
to ensure that a MS scan is executed for each trigger event.
• Manual Scan - The user may press the SCAN button in External trigger mode to trigger MS
Scans independently from the Digital IN.
• The Output trigger port and Analog signal output port are enabled by factory default.
Figure 5-11 Basic System: Standard Setup with External Trigger Pulses
5 VQM® Controller Overview
96 Series 835 Vacuum Quality Monitor
Instruction Manual - 835000
5.12.3 Stand Alone Setup
This setup takes advantage of the fast pulsed scan operation of the MS Gauge and does not require a
Host/PC for data acquisition and control. This setup relies exclusively on manual MS scan control
and uses external fast DAQ systems to collect/store/display all MS data. The Trigger Mode must be
changed to Immediate for this setup.
This setup is useful for users who:
• do not have access to, space for, or the power required to operate a Host/PC.
• do not have a USB port in their embedded computer.
• want to use their pre-existing DAQ systems to collect MS data during scans.
In this configuration:
1. The MS Gauge is mounted on the vacuum system.
2. The interconnect cable connects the MS Gauge to the VQM Controller.
3. No Host/PC is connected to the VQM Controller: (1) no USB link is enabled, (2) no MS data is
transmitted out of the USB port at the end of each scan, (3) no Host/PC control of the ion trap
or MS Scan is available.
NOTE: The VQM Controller operates under nominal scan and trap conditions.
4. Manual scan control is the only option available to execute MS Scans.
5. Press the MASS SPEC button to turn ON the MS Gauge and enable the SCAN button.
6. Wait 20 seconds and press the enabled SCAN button to MS Scan-Start (i.e., continuous scan
mode is executed).
7. A user-provided fast DAQ system is required to acquire, store, and display all MS data.
Examples of fast DAQ systems include: oscilloscopes, data logger, etc.
8. Use the output trigger pulses to trigger the data acquisition system and to time-frame the MS
analog out signal.
Figure 5-12 Basic System: Stand Alone Mode
5 VQM® Controller Overview
97
Series 835 Vacuum Quality Monitor
Instruction Manual - 835000
This Operational Mode supports:
• Manual ion trap control
• Manual scan control
• MS Analog out signal data acquisition, storage and real-time display
5.12.4 Stand Alone Setup with External Pulses
This setup builds on the previous one and adds the ability to perform external trigger scan control
using external trigger sources. This mode provides access to manual and external trigger MS scan
control. While this mode of operation does not require a Host/PC to perform MS scans, it does
allow synchronization with external trigger pulses originating from the same setup. The Trigger
Mode must be changed to External for this setup.
In this configuration:
1. The MS Gauge is mounted on the vacuum system.
2. The interconnect cable connects the MS Gauge to the VQM Controller.
3. No Host/PC is connected to the VQM Controller: (1) no USB link is enabled, (2) no MS data is
transmitted out of the USB port at the end of each scan, and (3) no Host/PC control of the MS
Gauge or MS scan is available.
4. Manual scan control can be used to execute MS scans.
5. External trigger control is also allowed to perform MS scan control.
6. Press the MASS SPEC button to turn ON the MS Gauge.
7. Press the SCAN button to illuminate the SCAN button LED green. The Controller is now ready
to receive external trigger pulses.
8. Provide a valid external trigger pulse while the SCAN button is illuminated and while the
external trigger input port is enabled to perform single scans.
Figure 5-13 Basic System: Stand Alone with External Trigger Pulses

5 VQM® Controller Overview
98 Series 835 Vacuum Quality Monitor
Instruction Manual - 835000
9. A user-provided fast data acquisition system is required to acquire, store and display all MS
data. Examples of fast DAQ systems include: oscilloscopes, fast DAQ, data logger, etc.
10. Use the output trigger pulses to trigger the data acquisition system and to time-frame the MS
analog out signal.
This Operational Mode supports:
• Manual MS Gauge control
• Manual MS Scan control
• External trigger scan control
• MS Analog out signal data acquisition, storage and real-time display
NOTE: The manual scan is in continuous mode and external trigger input generates a
single scan.
5.13 Timing Diagrams for MS Scan Control
The Mass Spectrometer is a pulsed device that outputs a full mass spectrum scan of two different full
spectrum ranges. The 1-145 amu is generated in 80 msecs, and the 1-300 amu spectrum is
generated in 120 msecs. The non-linear difference in amu range and time is due to the 1/f RF sweep
profile. A scan can be triggered internally (i.e., single or continuous scan mode from a Host/PC), or
can be triggered externally by a logical signal supplied by the user. Data can be collected via the
Analog OUT connection on the front panel, or digitally via USB link. One of the main features of
the VQM Controller is the ability to collect the 1-145 amu mass spectrum in 100 ms or less. During
this 100 ms time period, a wide range of actions take place.
The following timing diagrams show the sequence of events that occur when different triggering
mechanisms are initiated for the 1-145 amu scan range. The timing diagrams focus mainly on the
timing of the four front panel BNC outputs as they progress from initiation of a scan to the time
when a user can expect data and the possible variations. Data transfer over USB using the FETCh?
command is also discussed.
5.13.1 Immediate Trigger Mode
The immediate trigger timing diagram can be broken down into two different cases: (1) when no
USB data (i.e., no FETCh? command received) is sent to a Host/PC and (2) when the FETCh?
command is received and data is transferred over USB to a Host/PC.
5 VQM® Controller Overview
99
Series 835 Vacuum Quality Monitor
Instruction Manual - 835000
5.13.2 Internal Trigger with No USB Data
This is the simplest and most predictable case where scans are triggered internally with no requests
for data to be sent over the USB. The internal triggered timing diagram can be broken down further
into two sections:
Start Scan - T1 (2-4 ms): Before the actual Analog OUT/MS Scan is triggered, a number of tasks
must be completed. During this time a buffer is allocated to capture the DIF header data, Noise
data, and MS scan data. The Noise from the electrometer is sampled with the RF OFF prior to T1.
NOTE: The Analog IN and External Total Pressure data is asynchronous with respect
to this timing diagram. The data retrieved for the DIF header is the most recent
data the VQM Controller has acquired (i.e., MS Scan).
T1 - T2 (80 ms): The RF sweep takes place during this time and an output trigger pulse frames the
frequency sweep. The output trigger pulse is coincident with the RF sweep and is available at the
Trigger OUT connector on the front panel marked by a low-to-high transition TTL pulse. The output
of the electrometer is also ported to the Analog OUT connector during this time. The data collected
from the Analog OUT during the framed Digital Output pulse represents the spectrum as Analog
Figure 5-14 Internally Generated Trigger Timing Diagram

5 VQM® Controller Overview
100 Series 835 Vacuum Quality Monitor
Instruction Manual - 835000
OUT voltage vs. time data. The time scale must be converted to frequency and then mass to obtain
mass information. See Table 5-11. he DIF header data is collected after the Trigger OUT during the
MS scan to mask the time required for this operation.
This is the most predicable case because all activities involved are deterministic to within a few
microprocessor clock cycles, therefore, the data output will be very regular.
5.13.3 Internal Trigger with USB Data
Regardless of whether or not the FETCh? command is received, the VQM Controller continuously
fills one of two buffers with the current scan DIF header and scan data. All timing described in the
previous section holds. This section will discuss only how the FETCh? command affects the timing
when internal triggering while asking for data via USB. The situation is very similar to internally
triggering except that the VQM System can receive a query for the data collected to be transmitted
to a host computer at any point during the Total Scan Time. If a FETCh? command is received, the
Controller will select the buffer with the most recently collected data to return to the Host/PC. This
may include data from a MS scan that has not completed. The Controller will send whatever data is
available to the HOST/PC at the time of the request and will keep transmitting data until the entire
buffer has been sent.
Start Scan - T1 (2-7 ms): If a FETCh? command is received in this region, the Controller will wait for
the DIF header data to be collected after the Trigger OUT is sent and then begin to transmit the data
once it is available.
T1 - T2 (80 ms): In the case that the FETCh? command has already been received, the scan data will
be transmitted as it becomes available in small data packets.
If the FETCh? command is received shortly after the initial trigger pulse, the data in the buffer up to
that point will be sent in one transaction followed by the rest of the scan data as it becomes
available. The later in time that the FETCh? command is received, the larger the initial data buffer is,
so it will take more time to transmit. If a FETCh? is received late into a trigger pulse, it is possible
that the amount of time to transmit the data buffer may exceed the time remaining until the next
expected trigger pulse. In this case, the Controller will begin to fill the other buffer with scan data
while the first buffer finishes transmitting to the Host/PC. This way the MS Scan performance is not
greatly affected based on the FETCh? rate.
This example uses the 80 ms profile, but it is applicable to all the other limited or extended MS scan
profiles. The Trigger OUT that frames the MS scan is always an exact multiple of 4 ms. The framing
of the data will never vary except for a change to the selected AMU range.
5.13.4 Buffer Overwrite
The Buffer Overwrite counter will increment whenever the buffer that is being sent to the host takes
more time than a scan period. This is common when the Controller has been configured for a short
scan range. The shortest scan period is a 4 msec scan with 3 msecs of overhead. If the Host/PC does
not send a new request to the Controller for more data then the Controller uses the other buffer and
begins a new MS Scan without waiting. If the Host/PC does not keep up the Controller will end up
overwriting the buffer. This counter can be used to see how many MS Scans are being missed.
External Trigger (100 ms example)
The use of an external trigger can cause a new event called over triggering. This case will be
discussed in the sections to follow. The external trigger timing diagram can be broken down into
two different cases. The first case is when no USB data (i.e., no FETCh? command received) is sent
and when the FETCh? command is received and data is transferred over USB.
5 VQM® Controller Overview
101
Series 835 Vacuum Quality Monitor
Instruction Manual - 835000
External Trigger with no USB Data
This example will use the same 80 ms, 1-145 amu MS scan range profile from the Immediate trigger
model. The concepts in this example are directly applicable to all of the other possible scan ranges.
The externally triggered timing diagram can be broken down further into three sections:
Start Scan - T1 (3-5 ms): The start of the scan is triggered by an external pulse through the Trigger IN
connector on the front panel. Before the actual Analog OUT/MS Scan is triggered, a number of tasks
must be completed. During this time a buffer is allocated to capture the DIF header data, Noise
data, and MS scan data. The Noise from the electrometer is sampled with the RF off prior to T1.
Once the scan has start until T2 all additional triggers from the Digital IN, Scan button press, and or
SCPI commands will result in an over-trigger event.
NOTE: The Analog IN and External Total Pressure data is asynchronous with respect
to this timing diagram. The data retrieved for the DIF header is the most recent
data the VQM System has received.
Figure 5-15 External Trigger Timing Diagram

5 VQM® Controller Overview
102 Series 835 Vacuum Quality Monitor
Instruction Manual - 835000
T1 - T2 (80 ms): The RF sweep takes place during this time and an output trigger pulse frames the
frequency sweep. The output trigger pulse is coincident with the RF sweep and is available at the
Trigger OUT connector on the front panel marked by a low-to-high transition TTL pulse. The output
of the electrometer is also ported to the Analog OUT connector during this time. The data collected
from the Analog OUT during the framed Digital Output pulse represents the spectrum as voltage vs.
time data. The time scale must be converted to mass manually to obtain mass information. The DIF
header data is collected after the Trigger OUT during the MS scan to mask the time required for this
operation.
T2 - T3 (15-17 ms for 100 ms example): The System remains idle, waiting for another trigger.
External Trigger with USB Data
Regardless of whether or not the FETCh? command is received, the VQM Controller continuously
fills one of two buffers with the current scan DIF header and scan data. All timing described in the
previous section holds. This section will discuss only how the FETCh? command affects the timing
when internal triggering while asking for data via USB. The situation is very similar to internally
triggering except that the VQM System can receive a query for the data collected to be transmitted
to a host computer at any point during the Total Scan Time. If a FETCh? command is received, the
Controller will select the buffer with the most recently collected data to return to the Host/PC. This
may include data from an MS scan that has not completed. The Controller will send whatever data
is available to the HOST/PC at the time of the request and will keep transmitting data until the entire
buffer has been sent.
Start Scan - T1 (2-7 ms): If a FETCh? command is received in this region, the Controller will wait for
the DIF header data to be collected after the Trigger OUT is sent and then begin to transmit the data
once it is available.
T1 - T2 (80 ms): In the case that the FETCh? command has already been received, the scan data will
be transmitted as it becomes available in small data packets.
If the FETCh? command is received shortly after the initial trigger pulse, the data in the buffer up to
that point will be sent in one transaction followed by the rest of the scan data as it becomes
available. The later in time that the FETCh? command is received, the larger the initial data buffer is,
so it will take more time to transmit. If a FETCh? is received late into a trigger pulse, it is possible
that the amount of time to transmit the data buffer may exceed the time remaining until the next
expected trigger pulse. In this case, the Controller will begin to fill the other buffer with scan data
while the first buffer finishes transmitting to the Host/PC. This way the MS Scan performance is not
greatly affected based on the FETCh? rate.
T2 - T3 (15-17 ms): This is when the Controller is ready to accept another trigger from the External
Digital IN, or any other single trigger source.
Over Triggers
The Controller Scan Button LED will blink Amber to Green every time a trigger is detected that does
not fall outside Start Scan to T2. The over trigger counter is also incremented and can be read from
the Controller at any time. The External Trigger rate should be adjusted so that over-triggering does
not occur. If it does occur, reduce the frequency for the trigger source and the Amber Scan Button
LED will stop blinking. For the shortest MS Scan range of 4 ms, the maximum External Digital IN
trigger rate should be less than 125 Hz, and for the maximum scan range of 120 ms the maximum
External Digital IN trigger rate should be less than 8 Hz.
103
Series 835 Vacuum Quality Monitor
Instruction Manual - 835000
Chapter 6
6Ion Trap Mass Spectrometer Gauge
6.1 Introduction to the MS Gauge
This chapter describes the design and principles of operation of the VQM® Ion Trap Mass
Spectrometer Gauge.
6.2 Terms used in this chapter
6.3 MS Gauge Overview
The Vacuum Quality Monitor (VQM) System is a gas analysis instrument consisting of: (1) VQM
Controller, (2) Ion Trap Mass Spectrometer Gauge (MS Gauge), (3) Controller-to-MS Gauge
Interconnect Cable, and (4) VQM Viewer Software. An optional Micro-Ion Total Pressure
Measurement Gauge is also available as part of the VQM System.
Table 6-1 Terms and Definitions
Term Definition
Controller The VQM Mass Spectrometer Gauge Controller. (See Figure 6-1.)
EM Electron Multiplier (see page 107 & page 108)
Ionizer The region of the ion trap where ions are formed from gas molecules by electron impact
ionization. (See Figure 6-3 through Figure 6-6.)
M/q Mass-to-charge ratio (See page 111.)
Mass Separator The region of the ion trap where ions are separated based on their mass-to-charge ratios.
MS Gauge The Mass Spectrometer Gauge that is connected to the vacuum chamber. The MS Gauge
can be configured as a nude gauge or mounted inside a demountable envelope
(full-nipple). (See Figure 6-2.)
NOF Natural oscillation frequency (See page 111.)
Nude Gauge The Mass Spectrometer Gauge that is connected to the vacuum chamber, but the
electrodes of the gauge are inside the chamber rather than inside a nipple that is
mounted to the chamber. (See Figure 6-2.)
RF Amp P-P Radio Frequency Peak-to-Peak. Amplitude setting in the VQM Viewer Software.
RF Vpp Radio Frequency Voltage Peak-to-Peak on the Transition Plate
RFpp (mV) = 0.12* RFpp Amp (V)
This is the RF signal amplitude that is delivered to the ion trap electrodes.
VQM Vacuum Quality Monitor - refers to the VQM System, which consists of the VQM
Controller, the VQM Mass Spectrometer Gauge, interconnect cable, and Viewer
Application Software.
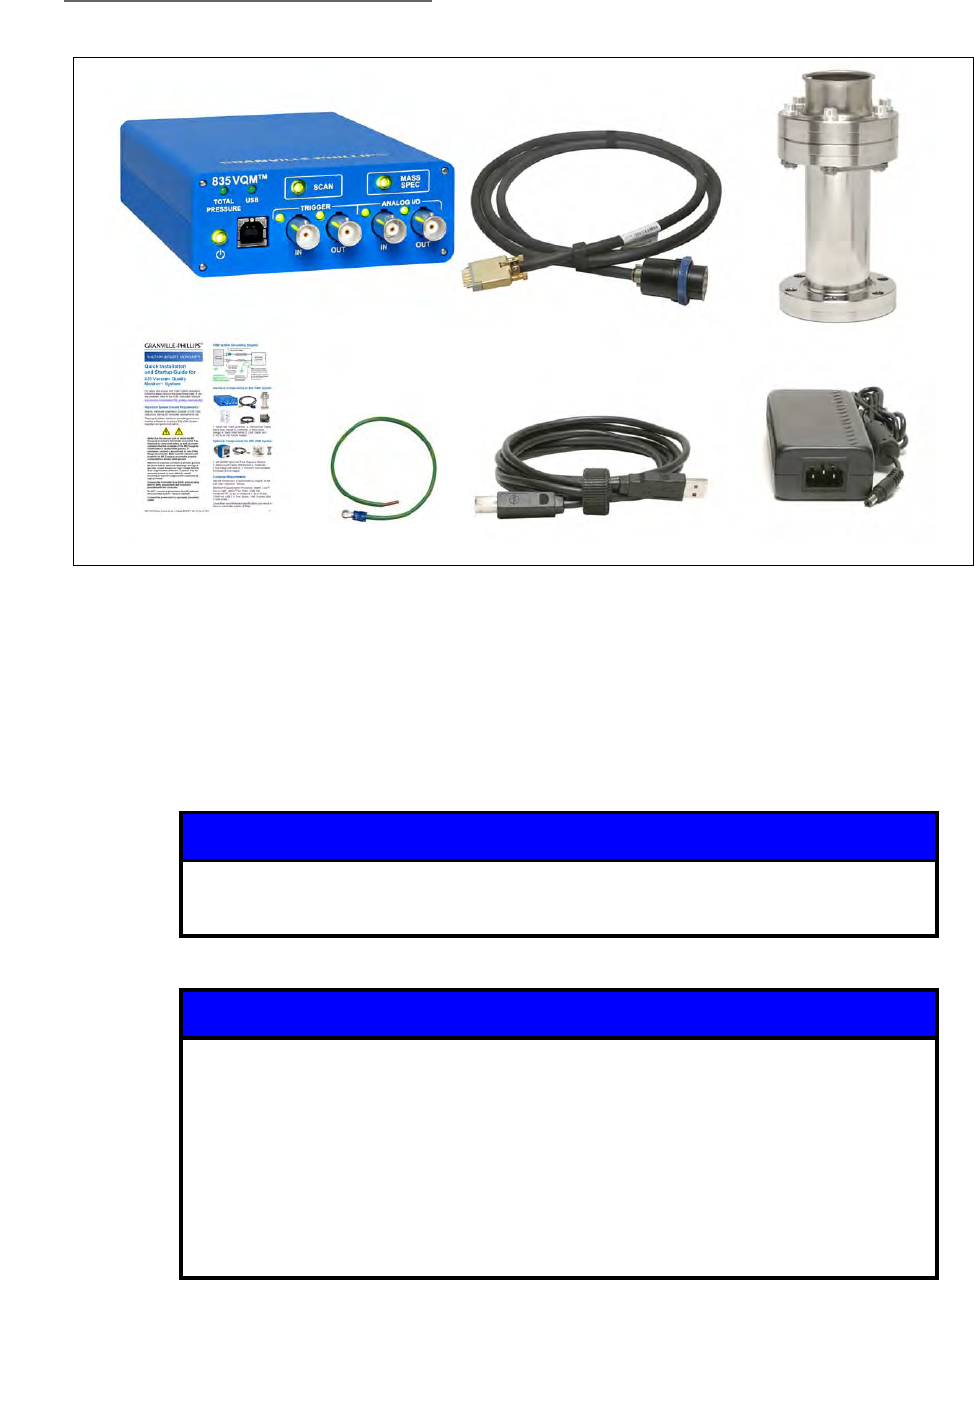
6 Ion Trap Mass Spectrometer Gauge
104 Series 835 Vacuum Quality Monitor
Instruction Manual - 835000
The MS Gauge is a specially engineered form of an Autoresonant Trap Mass Spectrometer (ART MS)
sensor that connects directly to a high vacuum system and operates at gas pressures between UHV
and 10-5 Torr. It is mostly constructed of series 304L stainless steel and high purity alumina, and
mounts directly onto a 2.75" ConFlat port of a high vacuum chamber.
The MS Gauge is available in two different configurations: Nude and Demountable Envelope. See
Figure 6-2.
Figure 6-1 VQM System Components
Notice
The Mass Spectrometer Gauge is a precision instrument. Always handle the
Gauge with care.
Notice
For the Nude Gauge configuration, the inside diameter of the vacuum port
to which the MS Gauge is mounted MUST be 1.430 inches (3.632 mm) or
larger, and the insertion length must be 4 inches or longer. Damage to the
gauge will result if the inside diameter and the length are less than
specified.
The nude version of the MS Gauge does not fit into the optional T-Flange.
Use the demountable envelope to attach a Nude MS Gauge to the standard
T-Flange or to any 2.75" ConFlat flange that does meet the minimum
internal diameter and insertion length requirements.
VQM Controller
VQM Ion Trap
Mass Spectrometer Gauge
Interconnect Cable - Controller
to Mass Spectrometer Gauge
Quick Installation
and Startup Guide
AC to 12 Vdc
Power Supply
USB Interconnect Cable
Ground Wire
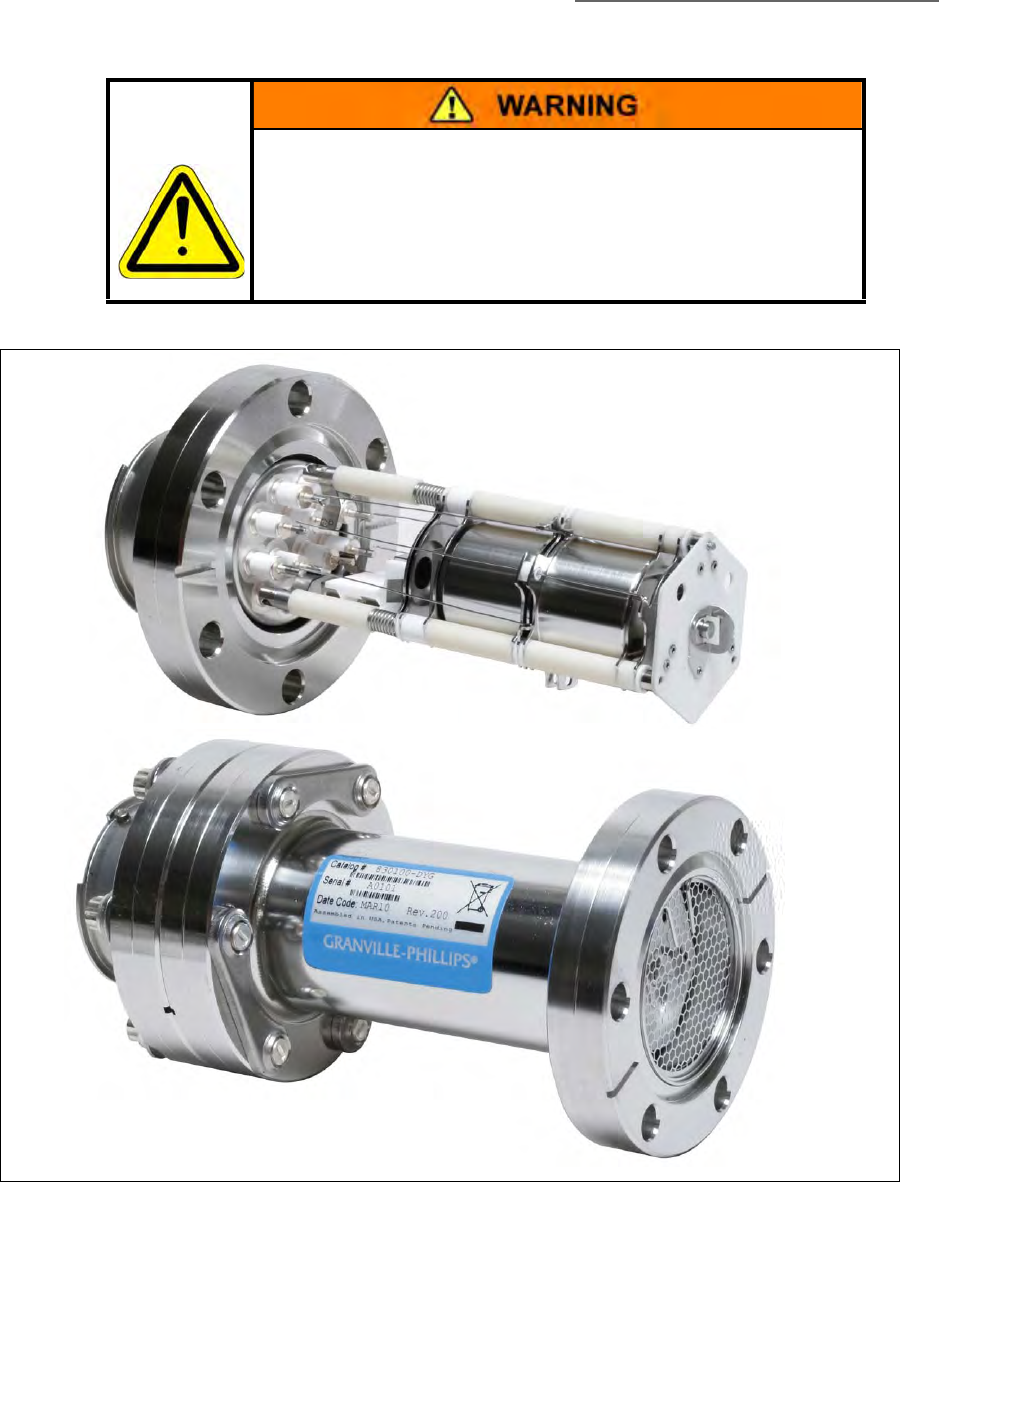
6 Ion Trap Mass Spectrometer Gauge
105
Series 835 Vacuum Quality Monitor
Instruction Manual - 835000
The MS Gauge uses purely electrostatic fields to store ionized gas molecules within a cylindrical ion
trap. Ions are generated directly inside the trap by electron impact of gas molecules. An anharmonic
trapping potential well confines the ion trajectories of all ion masses, and a wide range of initial
Safety Precautions
Verify that the vacuum port to which the Gauge is mounted is
electrically grounded. It is essential for personnel safety as
well as proper operation that the envelope of the gauge be
connected to a facility Earth ground. Use a ground lug on a
flange bolt if necessary.
Figure 6-2 MS Gauge Configurations
Nude MS Gauge
Nude MS Gauge in
Demountable Envelope
(4-inch Nipple)
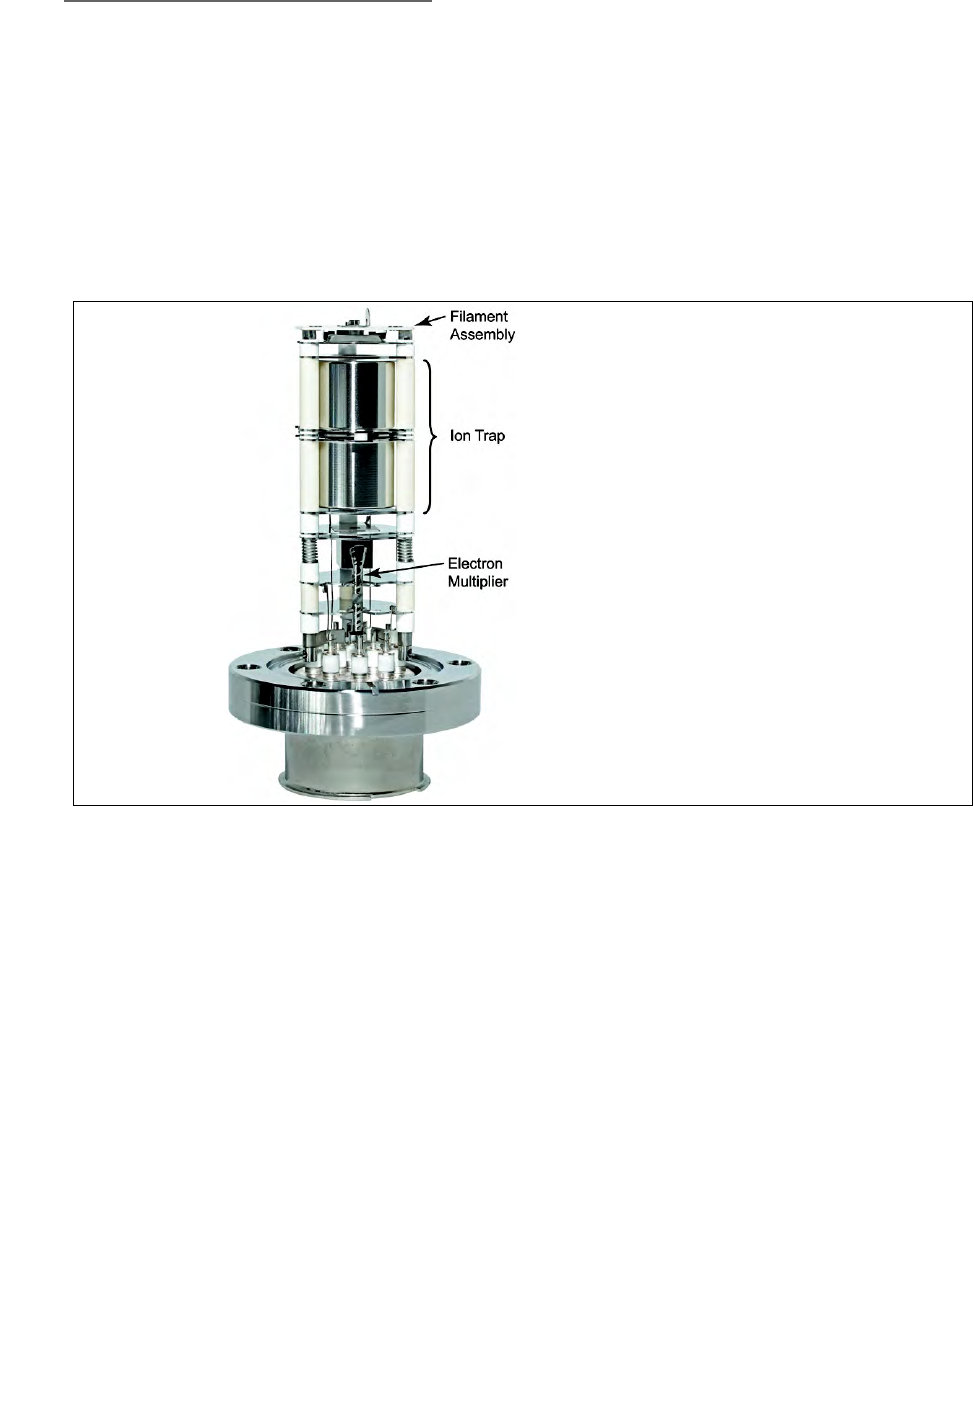
6 Ion Trap Mass Spectrometer Gauge
106 Series 835 Vacuum Quality Monitor
Instruction Manual - 835000
energies to stable oscillatory motions along the axis of the trap. Mass selective ejection is achieved
through an autoresonant energy pumping process. The mass spectrometer has unlimited mass
range, is capable of achieving high sensitivity at high and ultrahigh vacuum levels, is capable of fast
scan rates, is very compact, and requires extremely low power to operate as it uses only static bias
potentials and very small RF signal levels (<100 mV). The MS Gauge sensor is natively a ratiometric
measurement device that provides detailed compositional analysis of a gas mixture. To measure
absolute partial pressure readings, the VQM System requires (1) auxiliary total pressure
measurements from an ionization gauge (i.e., Micro-Ion Gauge) and (2) advanced data analysis
built into the VQM Viewer Software.
The sensor consists of three major parts: (1) the Ionizer, (2) the Autoresonant Ion Trap, and (3) the
Ion Detector. The three parts reside inside the vacuum space where the gas analysis measurements
need to be made. Nude MS Gauge configurations allow direct insertion of the internal components
into the vacuum system, provided the inside diameter of the vacuum port is at least 1.43 inches in
diameter and the available depth clearance exceeds four inches. For MS Gauges in a demountable
envelope, a stainless steel tube covers the probe assembly and provides electrical isolation from
other ion sources in the high vacuum system.
Figure 6-3 Components of the Mass Spectrometer Gauge
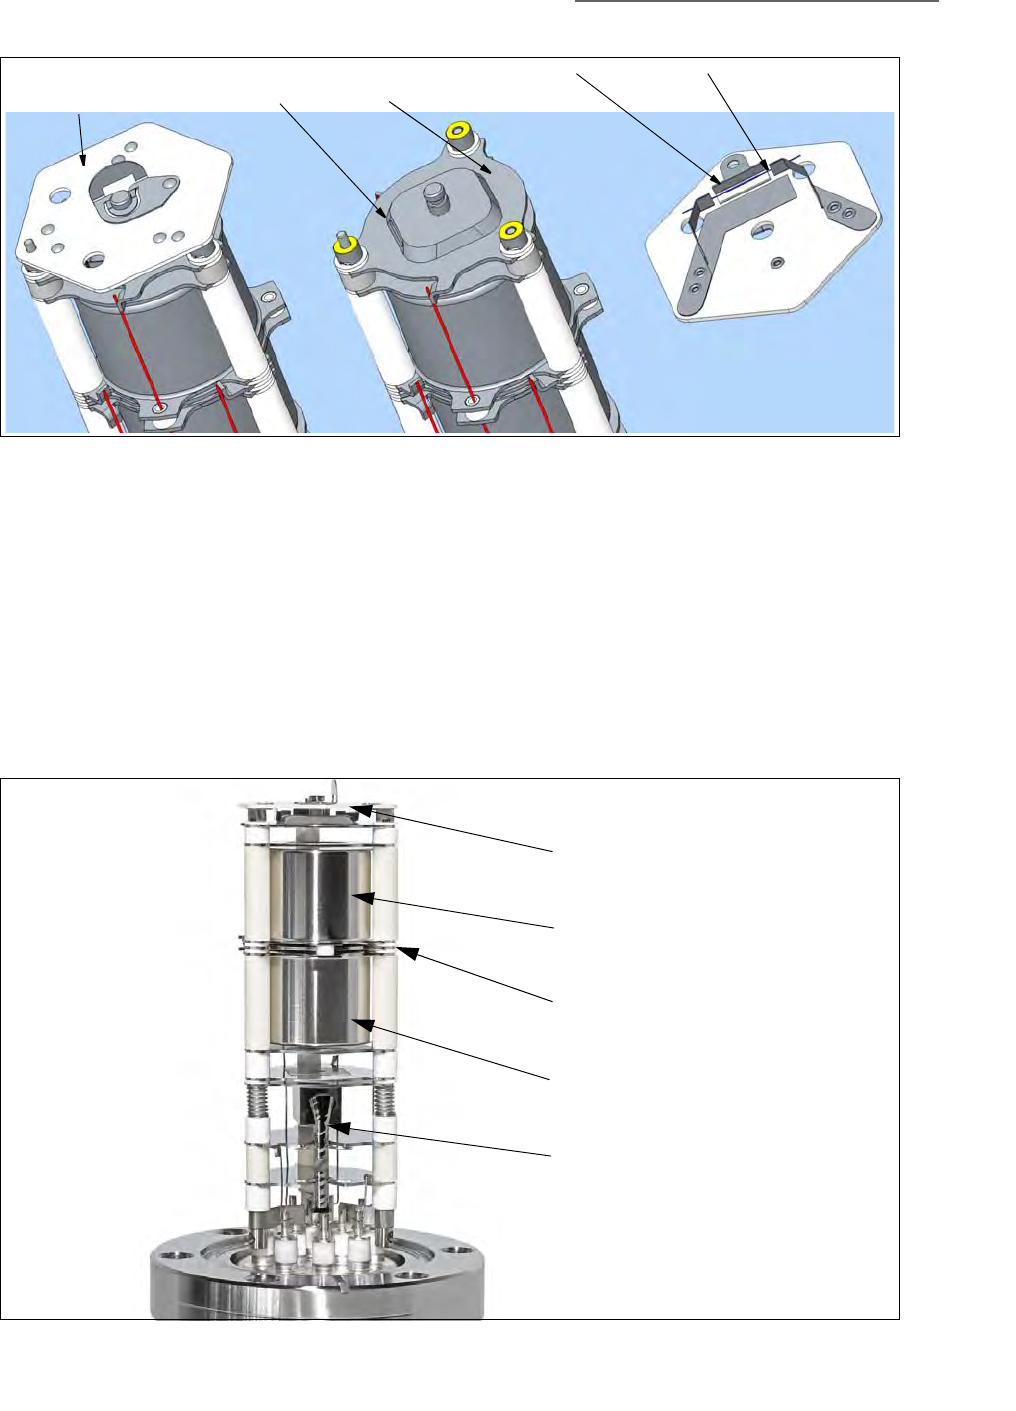
6 Ion Trap Mass Spectrometer Gauge
107
Series 835 Vacuum Quality Monitor
Instruction Manual - 835000
The ionizer relies on electron impact to produce ions from sample gas molecules. The factory
default setting for the electron energy is 100eV. Off-axis electron beam geometry provides high
quality mass spectra without significant baseline offset contribution. The electron current (0.070 mA
factory default) is generated by thermionic emission from a single Yttria-coated Iridium filament
which is part of a field-replaceable assembly. A focusing electrode, called the Repeller, provides an
adjustable bias voltage setting which is available to the user to optimize the focusing of the electron
beam through a narrow slit into the ion trap volume. Overpressure protection algorithms built into
the VQM Controller protect the filament from dangerous operational conditions. In addition, the
power delivered to the filament by the VQM Controller is continuously monitored by its
microprocessor and used to protect the filament wire from overpower conditions.
Figure 6-4 MS Gauge Filament Assembly
Figure 6-5 MS Gauge Ion Trap
Filament
Assembly
Off-Axis
Slit
Entry
Plate
Repeller Filament
Filament Assembly
Ion Trap Entry Cup
Transition Plate
Ion Trap Exit Cup
Electron Multiplier
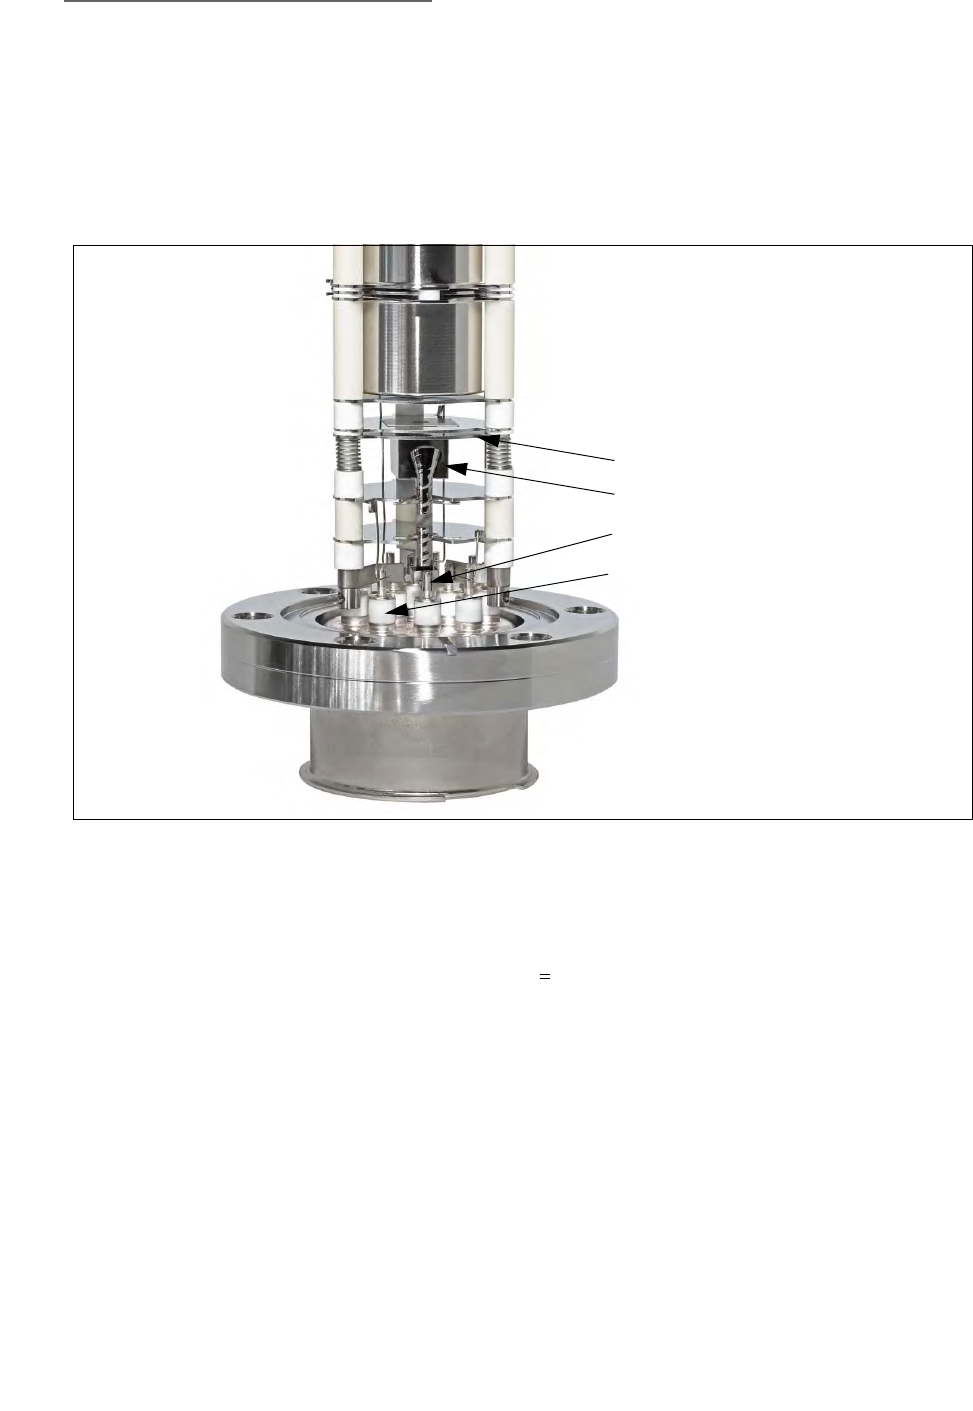
6 Ion Trap Mass Spectrometer Gauge
108 Series 835 Vacuum Quality Monitor
Instruction Manual - 835000
The ion trap relies on (1) electrostatic potentials to confine ions in oscillatory motions along its
cylindrical axis and (2) a small (100 mV range) RF-signal frequency-sweep to mass-selectively eject
ions. Autoresonance principles are responsible for the ejection of ions. The RF signal is delivered
from the VQM Controller to the transition plate of the ion trap through the Controller-to-MS Gauge
interconnect cable. The small RF signals required make it possible to operate the sensor remotely
from its VQM Controller using fairly long interconnect cables.
The ion detector is an electron multiplier with a continuous dynode design. The electron multiplier
assembly, consisting of the electron multiplier (EM), the EM shield plate, and the EM cup directs the
ions ejected from the trap into a conversion dynode and converts the impinging ion current into a
proportional electron current, with a typical gain ~ 1000x. The high gain is required to provide
current signals compatible with the wide bandwidth (>30kHz) electrometer, which is demanded by
the high scan rates. The actual gain is determined by the magnitude of the HV bias applied across
the electron multiplier, which is a setting available to the user. The gain of an electron multiplier is
known to slowly degrade over time. This can be compensated for in the field by increasing its bias
voltage (greater negative bias). The electron multiplier detector is a delicate component of the MS
Gauge and must be protected while it is electrically biased. Operation of the electron multiplier at
high pressures can cause irreversible reduction of its gain. The Overpressure and Filament
Overpower Protection algorithms in the VQM Controller shut down the electron multiplier and the
filament current in the case of a dangerous overpressure condition.
Figure 6-6 MS Gauge Electron Multiplier Assembly
EM Shield
EM Cup
EM Anode Cup & Feed Through
–HV Feedthrough
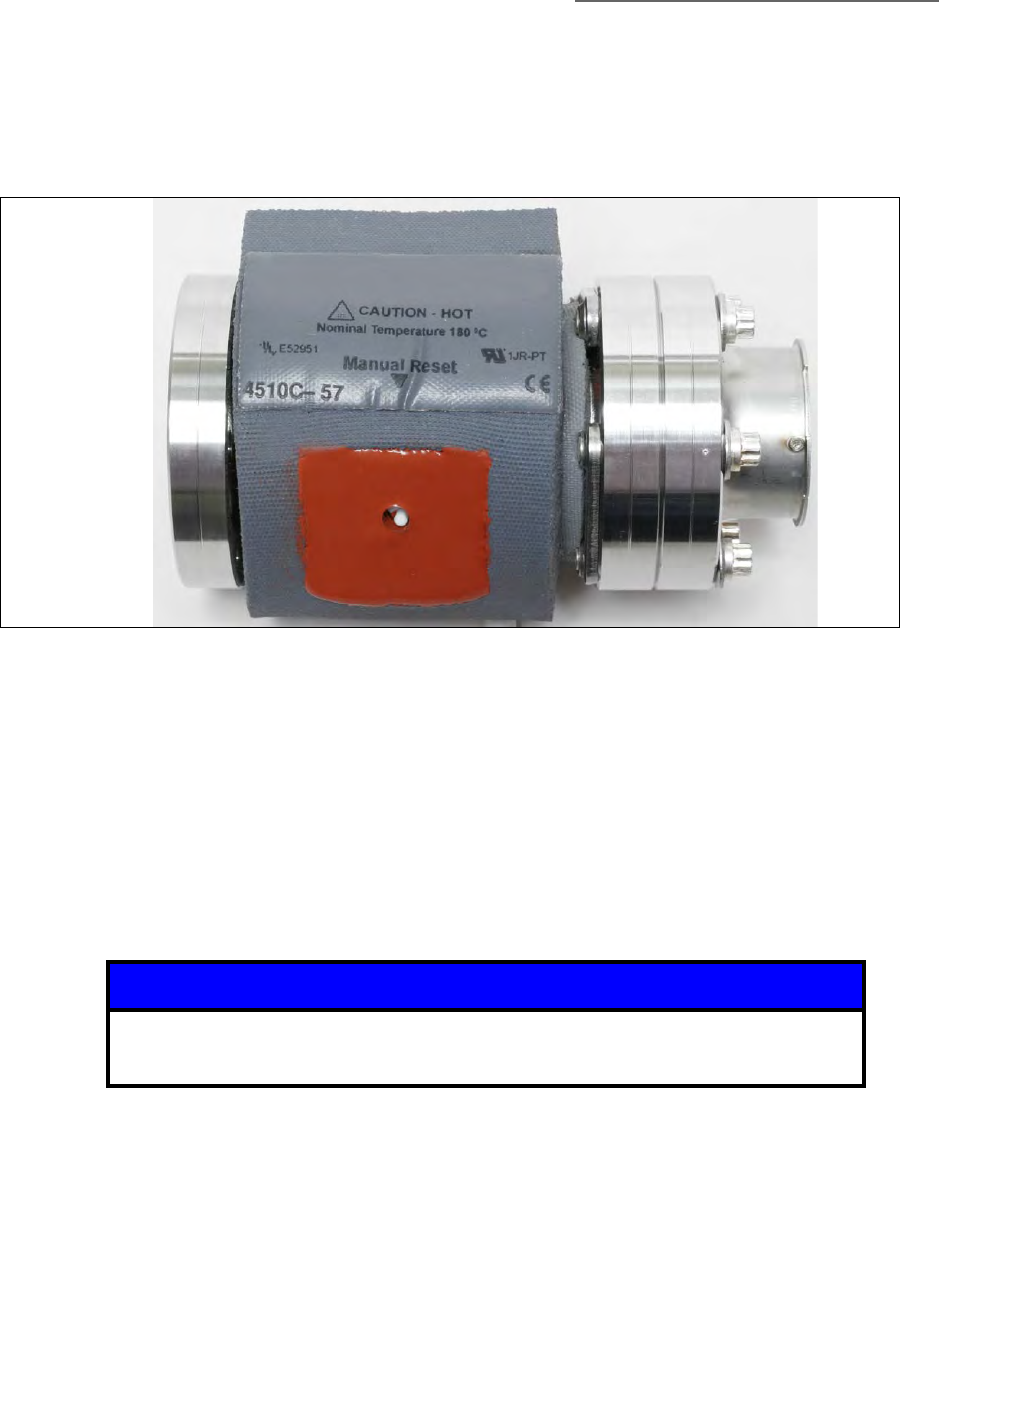
6 Ion Trap Mass Spectrometer Gauge
109
Series 835 Vacuum Quality Monitor
Instruction Manual - 835000
Electron multipliers are also sensitive to exposure to atmospheric air. Dedicated long-term storage
precautions and best-known operational practices are provided in Chapter 10 to assure long and
optimal operation of the detector. The MS Gauge features a field replaceable electron multiplier.
The replacement procedure is outlined in Section 7.6.10. The maximum operational temperature of
the electron multiplier must not exceed 50 ºC while voltage is present across the detector.
The VQM MS Gauge is assembled at the factory using the highest standards of cleanliness and
vacuum-compatible manufacturing. Critical components are cleaned and vacuum-fired prior to
assembly to eliminate the potential of internal outgassing. Filament assemblies are tested and
outgassed in a dedicated test vacuum system to avoid irreversible contamination of ion trap
electrode structures during initial operation. Hands-free factory tooling is used throughout the
assembly process to minimize chances of contamination.
A custom silicone jacket is available from the factory to heat the MS Gauge probe to 180 ºC for
extended bakeouts. Users relying on custom-built heating jackets, or tapes, must be careful not to
exceed 200 ºC during bakeouts as recommended by the detector manufacturer.
A removable plasma screen located on the mounting port of the MS Gauge protects internal
components from electrical fields present inside the vacuum system and from ions originating from
neighboring ionization sources. The presence of the screen is not necessary for operation, but is
recommended as best practice. See Figure 6-8.
The operational specifications of the VQM System were derived assuming the MS gauge is
connected to a standard VQM Controller. Users expecting to operate the sensor at pressure
conditions that deviate significantly from the specifications or wishing to optimize the performance
Figure 6-7 MS Gauge with Heater Jacket
Notice
Bakeout temperatures exceeding 200 0C will cause irreversible damage to
the sensor, resulting in reduced signal output and degraded resolution.
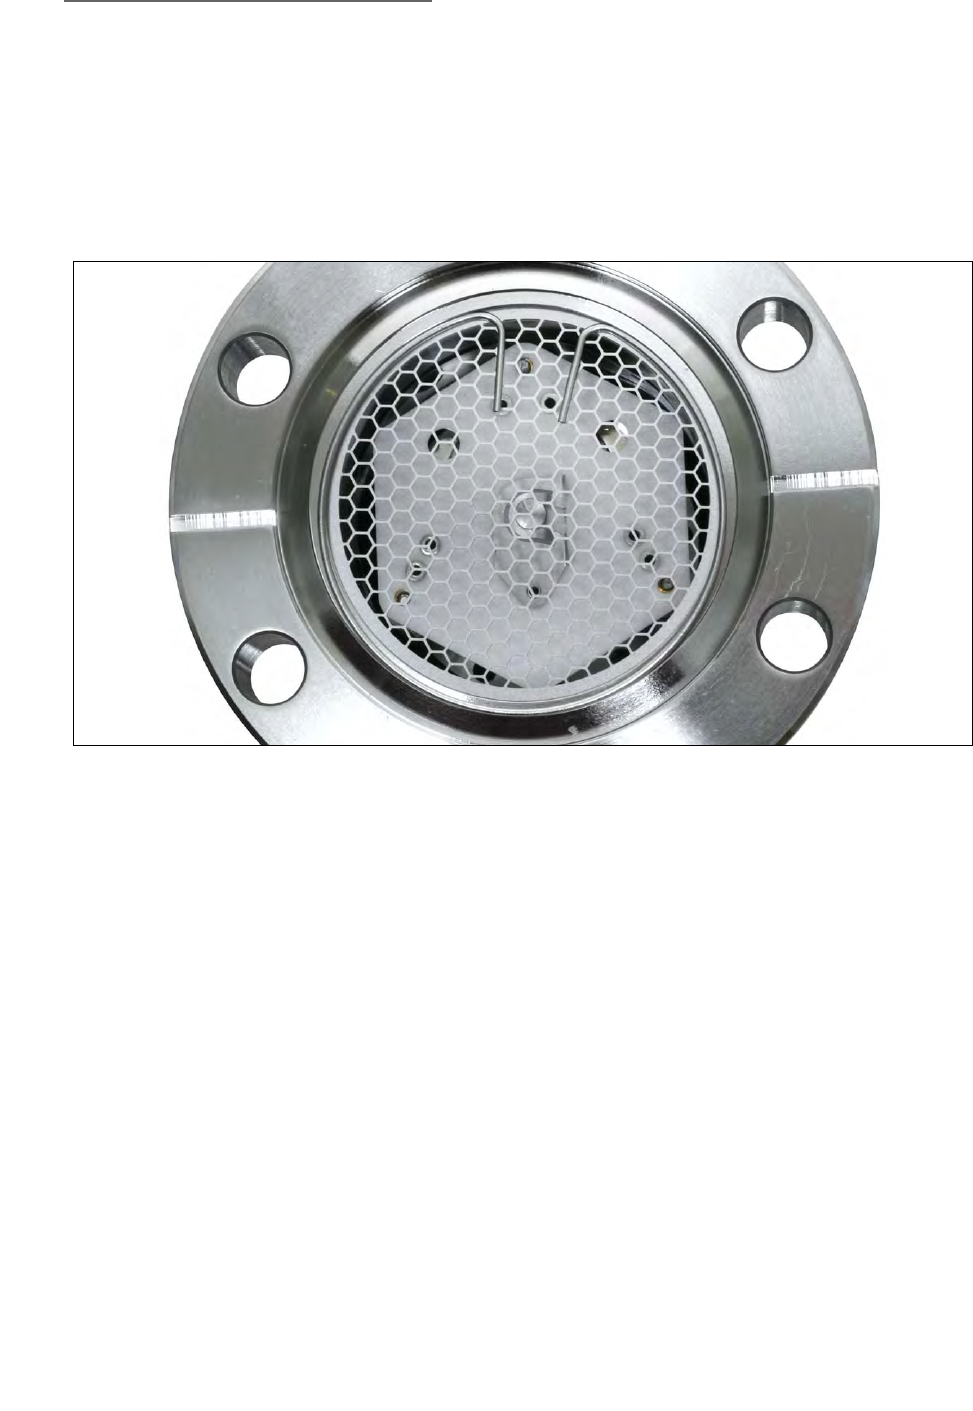
6 Ion Trap Mass Spectrometer Gauge
110 Series 835 Vacuum Quality Monitor
Instruction Manual - 835000
of the device for a targeted application, will find it useful to adjust the settings of the ion trap to
achieve optimal results. This chapter includes an extensive and detailed discussion of all MS Gauge
settings available to the user. In all cases, it is important to remember that a set of factory default
values is stored in the VQM Controller memory to restore the instrument to factory default settings
in case the device ceases to provide useful data, or when an MS Gauge filament assembly or
electron multiplier is replaced.
6.4 MS Gauge Principles of Operation
The Mass Spectrometer Gauge consists of three basic components: (1) Ionizer (electron impact), (2)
Mass Separator (ion trap), and (3) Ion Detector (electron multiplier). Ions are formed by electron
impact ionization inside the ion trap, mass-selectively ejected by autoresonant ejection, and
detected outside the trap with an off-axis electron multiplier. The entire assembly has cylindrical
symmetry and is mounted on a 2.75" ConFlat feed-through flange. The construction materials are
predominantly 304L stainless steel and high-purity alumina.
Figure 6-6 illustrates the basic electrode structure of the VQM Ion Trap Mass Spectrometer Gauge.
The ion trap assembly includes two opposed mirror electrode structures and a central lens electrode
structure. Each mirror electrode structure is composed of a cup with an on-axis aperture, a pressure
plate with an on-axis aperture, and a compensation plate. The mirror structure located on the
ionization end of the assembly is called the entry mirror. The mirror electrode structure located on
the detector side is called the exit mirror. The entry compensation plate, called the entry plate, has
an off-axis slit to allow the entry of electrons into the ionization region located inside the trap. The
exit compensation plate, called the exit plate, has a gridded on-axis circular aperture to allow the
autoresonant ejection of confined ions. The central lens electrode structure, called the transition
plate, is a flat plate with an axially located aperture and is connected to the RF signal. The
Figure 6-8 Plasma Screen in the Demountable Envelope (4-inch Nipple)
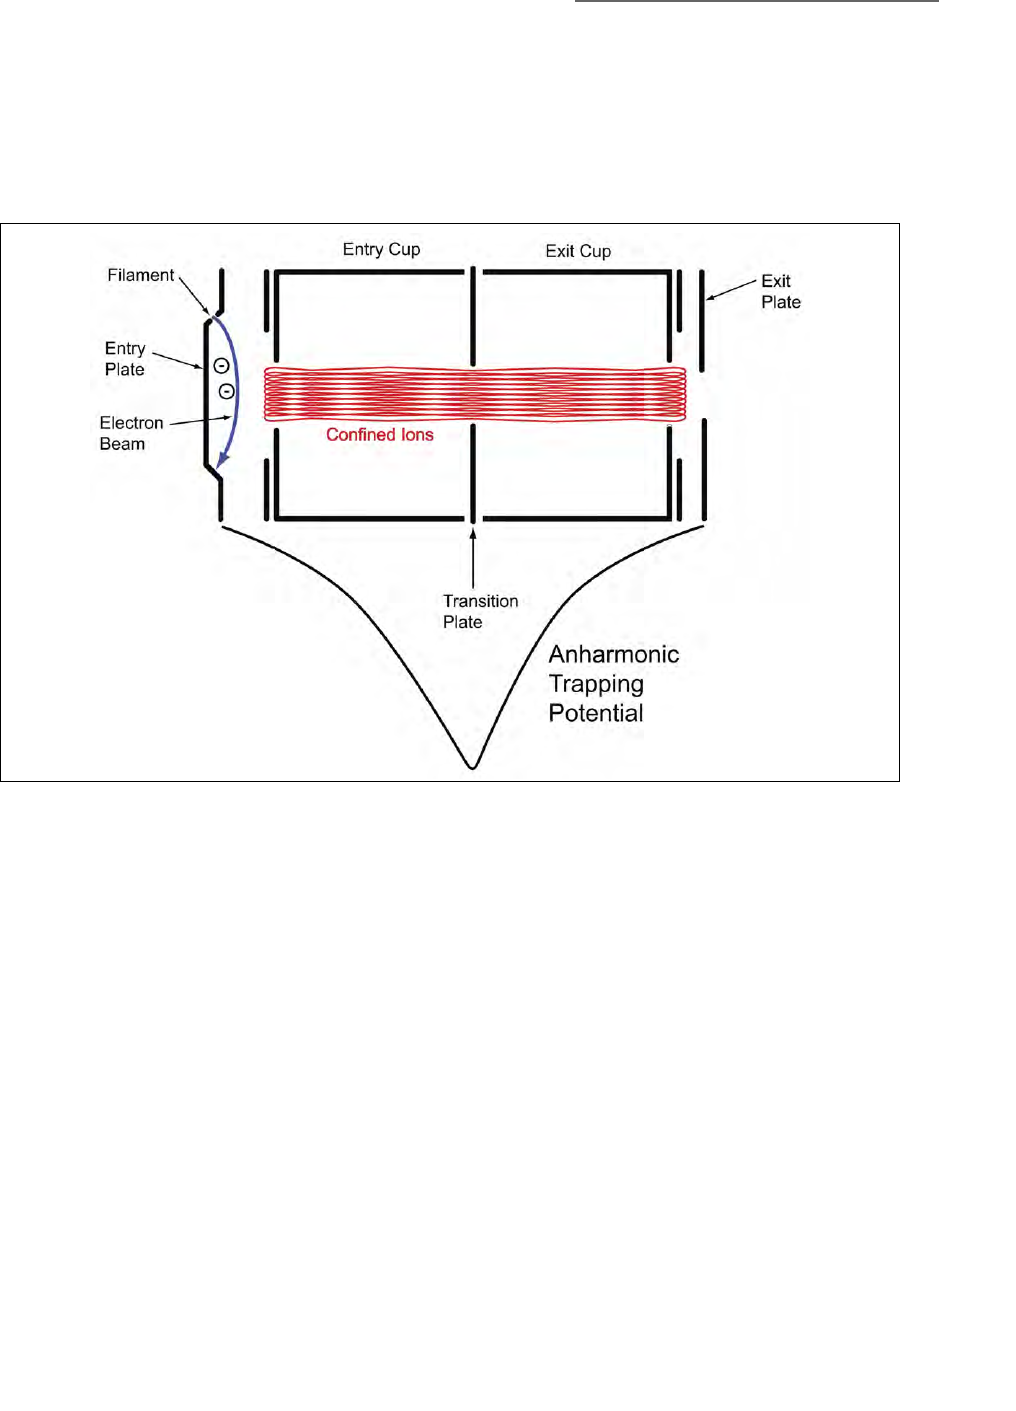
6 Ion Trap Mass Spectrometer Gauge
111
Series 835 Vacuum Quality Monitor
Instruction Manual - 835000
field-replaceable filament assembly is located outside the electrostatic ion trap assembly, directly
above the entry plate. An electron multiplier detector assembly is located at the opposite end of the
ion trap, directly below the exit plate and above the feed-through flange. The detector assembly
consists of an electron multiplier shield plate, a continuous dynode electron multiplier and the
electron multiplier anode cup which collects the electron current signal and is connected to the
Controller's electrometer input.
Figure 6-9 illustrates a cross section of the ion trap electrode assembly. The blue arrow depicts the
path of the electron beam, and represents how ions are created between the entry plate and entry
cup, directly inside the trap volume. During operation, the filament is always powered, providing
continuous ionization. Notice that the electrons are thermionically generated outside the ion trap
(hot filament source), but directed into the ion trap volume through an off-axis aperture located on
the entry plate.
Figure 6-9 also illustrates a potential curve depicting the negative high voltage (-HV) trapping
potential well that develops along the cylindrical axis of the trap. The purely electrostatic ion trap
confines the ions of different mass-to-charge (M/q) ratios and kinetic energies within an anharmonic
potential well. Ions of all masses and a wide range of initial energies oscillate along the cylindrical
axis of the trap, confined by the electrostatic potential well. The red trace depicts the oscillatory
path for a single ion (modeled by SIMIONTM) and demonstrates that radial focusing of the ion
motion along with uniaxial oscillation are responsible for providing stable oscillatory trajectories
(i.e. ion confinement). The natural oscillation frequency (NOF) of an ion in such a potential well
depends on the amplitude of oscillation and results in anharmonic oscillatory motion. This means
that the NOF of a specific ion trapped in such potential well is determined by four factors: (1) the
details of the trap geometry (i.e., mechanical design), (2) the ion's mass-to-charge ratio (M/q), (3) the
ion's instantaneous amplitude of oscillation (related to its initial energy), and (4) the depth of the
Figure 6-9 Cross Section of MS Gauge and Electrostatic Trapping Potential Well

6 Ion Trap Mass Spectrometer Gauge
112 Series 835 Vacuum Quality Monitor
Instruction Manual - 835000
potential trap defined by the voltage gradient established between the mirror electrodes and the
transition plate. The depth of the potential well (i.e., between the end plates and the transition
plate), under factory default settings, is -685 V. The exact shape of the electrostatic trapping
potential well is defined by the combination of trap geometry and bias voltages.
The ion trap uses strong anharmonicity in the ion oscillatory motion as a means for ion trapping
(i.e., red trace) but also for mass-selective autoresonant excitation and ejection of ions. In a
nonlinear axial field (negative nonlinearity), the ions with larger oscillation amplitudes have lower
oscillation frequencies than same mass ions with smaller oscillation amplitudes. In other words,
trapped ions will experience a decrease in oscillation frequency and an increase in oscillation
amplitude if their energy increases (i.e., anharmonic oscillations).
Ions of all masses and energies created and stored inside the ion trap are mass selectively excited
and ejected using an autoresonance method. Implementation of the autoresonant approach is
simple and relies on the application of a small RF signal on the transition plate. Autoresonant
excitation of a group of ions of given mass-to-charge ratio, M/q, is achieved in the following
fashion:
1. Electrostatically trapped ions undergo nonlinear oscillations within the anharmonic potential
with a natural oscillation frequency, fM.
2. The RF drive is connected to the transition plate with an initial drive frequency, fd, greater than
2 times the natural oscillation frequency of the ions: fd > 2x fM.
3. Continuously reducing the positive frequency difference between the drive frequency, fd, and
twice the natural oscillation frequency of the ions, 2x fM, until the instantaneous frequency
difference approaches nearly zero, causes the oscillatory motion of the ions to phase-lock into
persistent autoresonance with the drive. In an autoresonant oscillator, the ions will then
automatically adjust their instantaneous amplitude of oscillation by extracting energy from the
drive as needed to keep their natural oscillation frequency phase-locked to the drive
frequency.
4. Further attempts to change trap conditions towards a negative difference between the drive
frequency and twice the natural oscillation frequency of the ions results in energy transfer from
the RF field into the oscillatory system, changing the oscillatory amplitude and frequency of
oscillation of the ions.
5. For a typical electrostatic ion trap with a negative nonlinear potential (such as depicted in
Figure 6-9), the oscillatory amplitudes become larger and the ions oscillate closer to the end
plates as energy is transferred from the RF field into the oscillatory system. Eventually, the
oscillation amplitude of the ions exceeds the length of the ion trap and the ions leave the trap
through the semi-transparent mesh of the exit plate. Setting the bias potential of the exit plate a
few volts lower than the entry plate assures that all ions excited through autoresonance are
ejected from the trap exclusively through the exit plate mesh (lower energy) instead of the
entry plate (higher energy).
6. The RF Drive frequency at which the ions are ejected from the trap is defined as the ejection
frequency of the ions, fd = fe, which is dependent on the trap's bias potentials and the
mass-to-charge ratio of the ions.
This methodology implies that by ramping the RF signal frequency (i.e., programmable RF supply) fd
down, we can cause all ions with same mass-to-charge ratio, M/q, to leave the trap in synchronicity
at a frequency fe, irrespective of when or where the ions were initially generated within the
ionization region. There is a one-to-one mapping between mass and ejection frequency: each M/q
has its unique fe. Once the ions leave the trap, their currents are detected and amplified as required
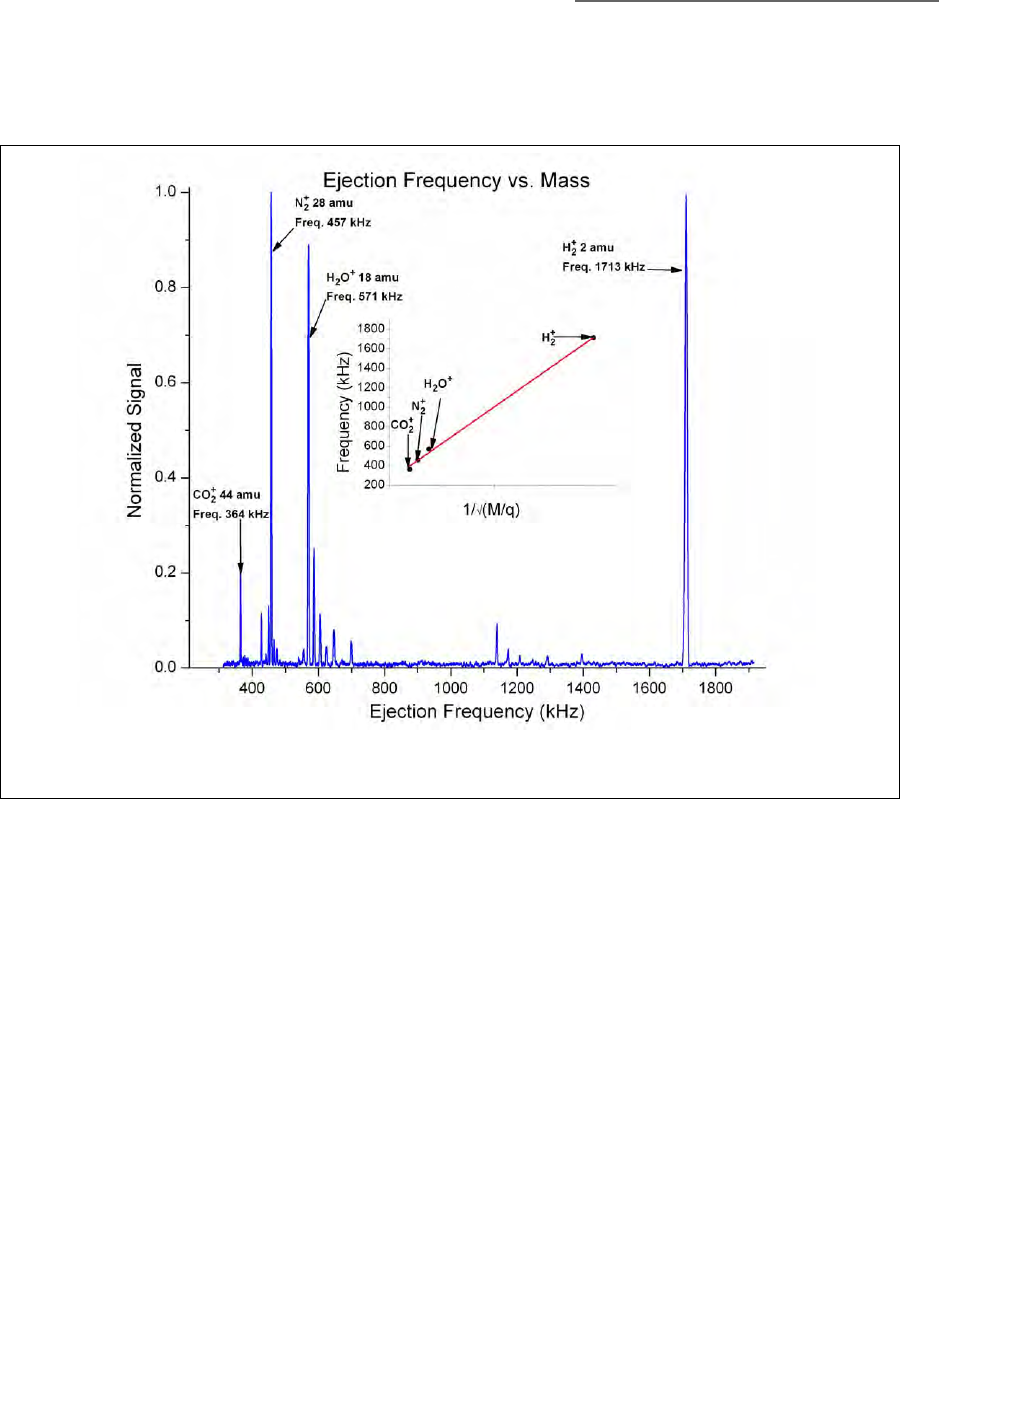
6 Ion Trap Mass Spectrometer Gauge
113
Series 835 Vacuum Quality Monitor
Instruction Manual - 835000
by the electron multiplier detector to produce a mass spectrum. Many M/q values will contribute to
a typical mass spectrum. For a fixed trapping potential, the ejection frequencies for emergent ions,
fe, will follow a strict fe proportional to 1/sqrt (M/q).
In the VQM System, the RF drive is applied to the transition plate so that ion energies are excited
parametrically; i.e., ejection frequencies correspond to twice the natural oscillation frequency
(NOF). Since the transition plate electrode is biased at a negative high voltage potential, transformer
coupling is used to float the RF signal (frequency chirp) on top of the DC bias voltage. The high
voltage compatible RF transformer is located inside the gauge connector plug of the Controller-to-
Gauge interconnect cable. The RF frequency is swept, non-linearly with time in an effort to equalize
the number of RF cycles used in ejection of each M/q unit and minimize the dependence of ion
ejection efficiency on mass-to-charge value. In addition, the RF signal is ramped from high to low
frequencies over a frequency range selected to eject all M/q ions with every scan cycle. As
predicted by autoresonance theory, a minimum RF signal amplitude (i.e., RF ejection threshold),
dependent on the RF frequency sweep rate, will be required to eject ions out of an ion trap. The
VQM System offers a fixed, non-linear, phase continuous, proprietary RF frequency sweep profile
that is completed in 125 milliseconds for a 1 - 300 amu scan and spans from 2.7 MHz to 147.5
kHz. The only user-adjustable parameter for the frequency sweep is the RF amplitude which can be
controlled from the Tune Settings of the VQM Viewer Software or through the Controller's VQM
Command Set.
Figure 6-10 Mass Spectrum Representing the Relationship Between Ejection Frequency (kHz) and Mass (AMU)
In this scan, the ejection frequency for water was 571 kHz. The inner
plot shows the linear relationship between mass and 1/sqrt(M/q).
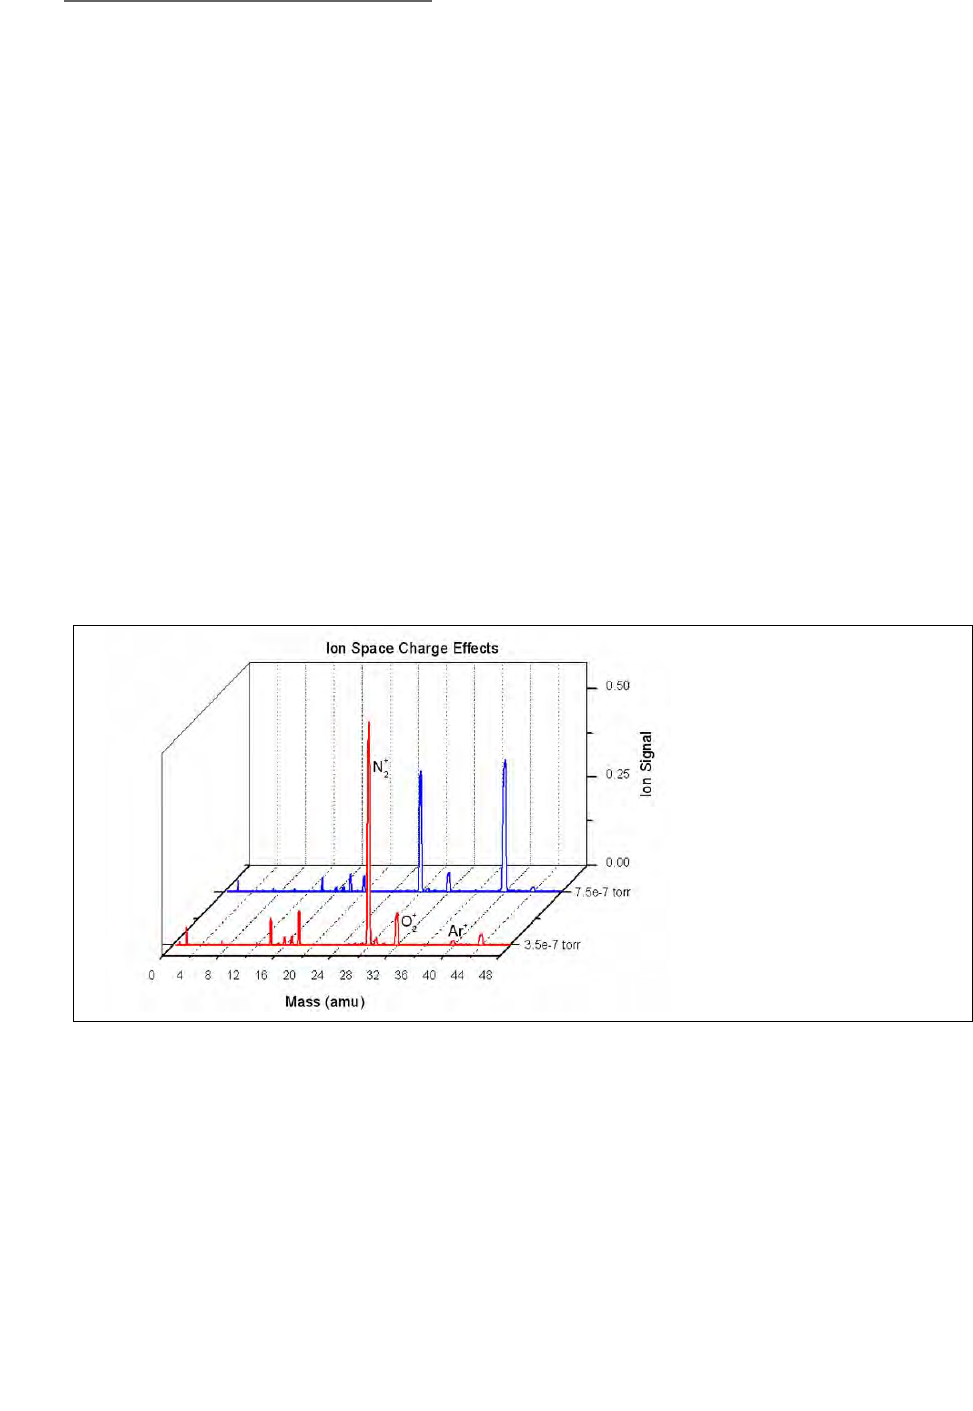
6 Ion Trap Mass Spectrometer Gauge
114 Series 835 Vacuum Quality Monitor
Instruction Manual - 835000
Mass axis calibration is very straightforward. Ion ejection frequencies are strictly proportional to the
inverse of the square root of mass-to-charge ratio, M/q. Mass calibration is performed based on a
single mass peak in the spectrum, linking its ejection frequency to the square root of the mass, fe =
K /sqrt (M/q). The square root dependence, K, between mass and frequency is then applied to assign
masses to all other peaks in the spectrum based on their unique ejection frequencies. The Mass
Calibration factor used by the VQM System consists of the ejection frequency value for singly
ionized water molecules (M/q=18.011 amu.) For factory default settings, the ejection frequency for
singly charged water ions, at 18.011 amu, corresponds to 616 kHz (typically.) In Figure 6-10, the
ejection of singly charged water ions takes place at fe=571 kHz. The VQM Viewer Software uses the
ejection frequency for water ions to calculate the square root dependence factor, K, and to display
calibrated mass spectra across the entire mass range.
Whereas the presence of strong anharmonicity in the potential trapping well is a basic prerequisite
for ion excitation through autoresonance, there are no strict or unique requirements or conditions to
meet in terms of the exact functional form of the trapping potentials present inside the trap. Tune
settings in the VQM Viewer Software are available to modify the bias voltages of each electrode
structure and the exact shape of the anharmonic potential well through the VQM Viewer Software
as well as through the Controller's VQM Command Set. Autoresonance theory provides an
excellent theoretical framework to explain the basic operational principles of anharmonic
electrostatic traps and is the foundation for instrument design and performance optimization. The
principles of autoresonance (1) direct the adjustment and optimization of gauge performance and
(2) predict the effects that variations in operational parameters might have on mass spectral output.
The number of ions stored inside the ion trap is the result of the interaction between four competing
processes: (1) ionization rate (gain, function of electron emission current and pressure), (2)
autoresonant ejection efficiency (loss, function of Controller settings), (3) ion-neutral scattering
collisions (loss, function of pressure), and (4) space charge saturation (loss, electrostatic repulsion).
One important characteristic of ion traps (not peculiar to the VQM MS Gauge) is the fact that
electrostatic forces set an upper limit to the total number of ions that can be stored in the oscillating
ion beam. The VQM Mass Spectrometer Gauge, operated under factory default settings, will
typically achieve full charge capacity at pressures above 2x10⁻⁷ Torr, and well before ion-neutral
scattering collisions set in. Nonlinearities between partial pressure and peak intensity can be
observed at vacuum levels as low as 1x10⁻⁹ Torr. Since the amplitude of the mass peaks is directly
Figure 6-11 Space Charge Saturation Effects
The front trace (Red)
corresponds to a spectrum
of nitrogen enriched air at
a pressure of 3.5x10⁻⁷
Torr. The rear trace (Blue)
corresponds to a spectrum
obtained for the same air
sample, but with an
additional 4x10⁻⁷ Torr of
Argon added to the gas
mixture.

6 Ion Trap Mass Spectrometer Gauge
115
Series 835 Vacuum Quality Monitor
Instruction Manual - 835000
related to the number of ions stored in the confined beam, and since the number of ions stored does
not scale with partial pressures of the components, ion peak signal amplitudes in a mass spectrum
should not be expected to scale with the absolute partial pressures of the gas components in the
mixture. Figure 6-11 shows an example of the charge density saturation effects that occur in the ion
trap. The front trace (Red) corresponds to a spectrum of nitrogen enriched air at a pressure of
3.5x10⁻⁷ Torr. The rear trace (Blue) corresponds to a spectrum obtained for the same air sample, but
with an additional 4x10⁻⁷ Torr of Argon added to the gas mixture. The two gases are detected in
proper ratios (i.e., native ratiometric data), but the addition of argon ions to the trap volume
displace nitrogen and oxygen ions from the ion confinement volume to keep the ion density at the
same total level. As a result of this charge saturation effect, quantitative operation of the MS Gauge
requires knowledge of the absolute total pressure in the system to normalize the native ratiometric
information provided by the mass spectrum and to provide absolute partial pressure readings. An
optional Micro-Ion Gauge is available as part of the VQM System which provides ionization gauge
based total pressure readings in synchronicity with MS scans.
6.5 Construction Materials
The Mass Spectrometer gauge is mostly constructed out of stainless steel 304L and high purity
alumina and mounts directly onto a 2.75" ConFlat Port of a high vacuum chamber.
The following list includes all the materials utilized in the construction of the Mass Spectrometer
gauge and exposed to the vacuum environment during operation:
• 304L stainless Steel
• 316L stainless Steel
• Alumina Ceramic (Al2O3, 98% Min.)
• Nickel
• Molybdenum
• Ag/Cu Eutectic Braze
•Gold
• Iridium
• Yttria (Y2O3, 99.95% Min.)
• Lead-silicate Glass (Electron Multiplier) - SiO2 doped with Pb.
•Chromium
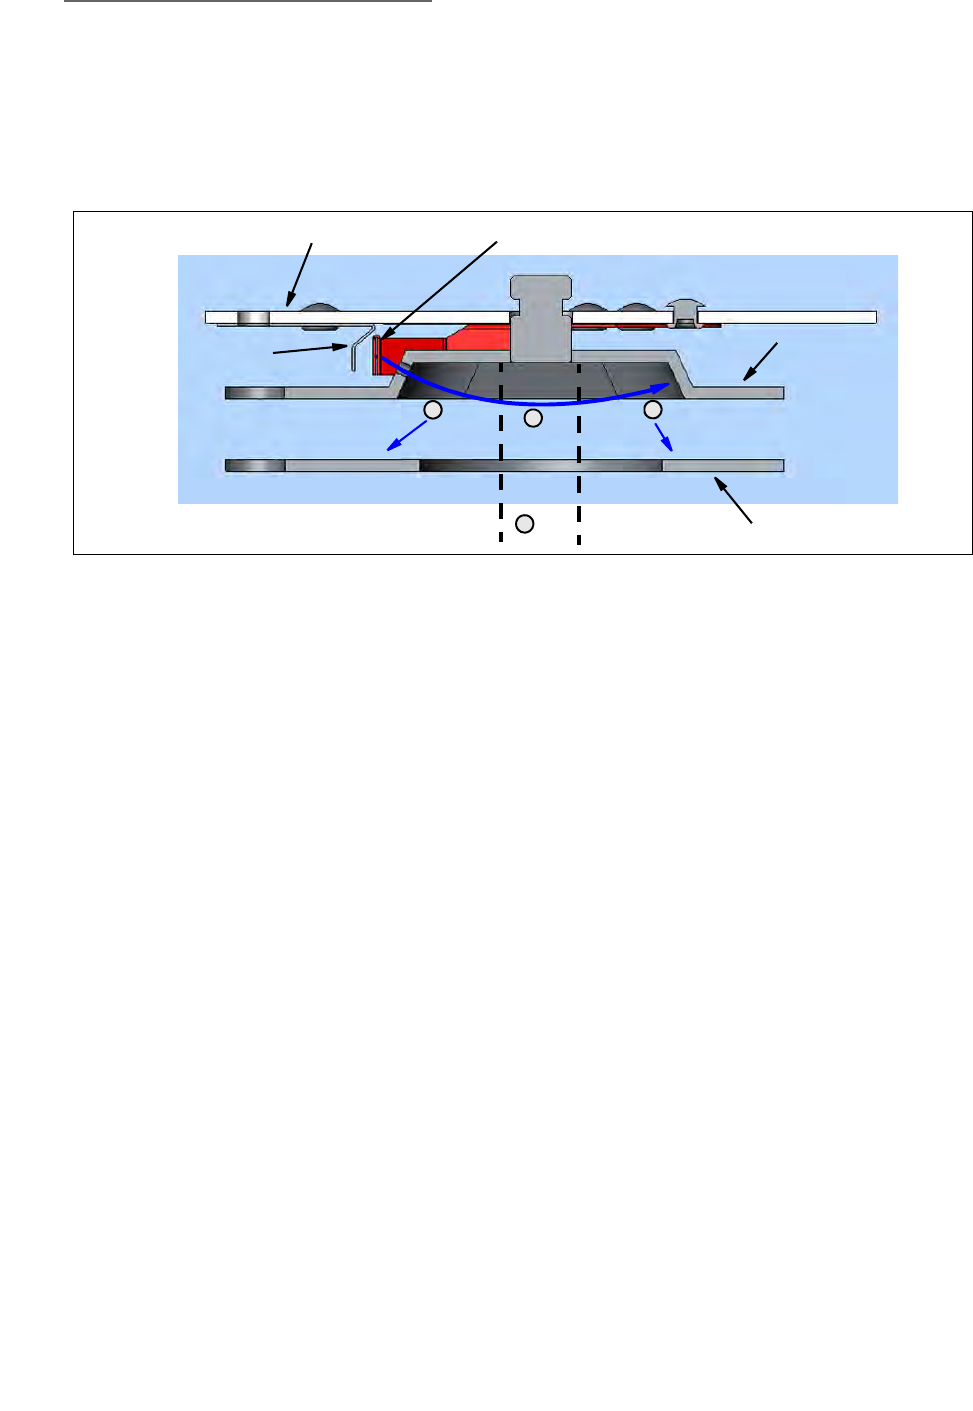
6 Ion Trap Mass Spectrometer Gauge
116 Series 835 Vacuum Quality Monitor
Instruction Manual - 835000
6.6 Ionizer
Positive ions are formed directly inside the Ion Trap volume by continuously bombarding gas
molecules with energetic electrons generated from a heated filament (i.e., thermionic emission). A
fraction of the ions formed inside the ion trap are confined into oscillatory motions and contribute
to the mass spectral output of the gauge (autoresonant ejection).
Figure 6-12 illustrates a cross section of the ionization region within the ion trap electrode
assembly. The blue arrow traces the ionization path of an off-axis electron beam and defines two
regions where ions are created between the entry plate and entry cup. Ions formed in the region
close to the axis of the trap (Region 1) are confined into oscillatory motion and contribute to the
mass spectrometer signal. Ions formed away from the axis (Region 2) are directed towards the
pressure plate and do not contribute to the mass spectrum since they are neutralized on impact.
Continuous ionization means that ions are continuously added to the oscillating beam, replacing
ions lost to (1) collisions, (2) electrostatic repulsion, and (3) autoresonant ejection. The rate of ion
formation inside the trap is directly related to the electron emission current and the pressure inside
the trap. Off-axis electron beam geometry provides high quality mass spectra without significant
baseline offset contribution.
The main function of the pressure plate is to absorb ions that are formed within Region 2 of the
ionization volume. The pressure plate shields the entry cup from the unconfined ions so that better
voltage control is available on the cups. The pressure plate is discussed in more detail in Section
6.7.
The ionizer has an open configuration that assures unrestricted conductance between the vacuum
environment and the ionization region. Coupling of the electron beam into the ionization region
through a narrow slit minimizes the introduction of chemical compounds outgassed from the
heated filament surface directly into the ionization volume providing a more accurate
representation of the gas composition in the vacuum system.
Figure 6-12 VQM MS Gauge Ionizer
Ceramic Plate
Repeller
Filament
Entry Plate
Region 2
Region 2
Pressure Plate
Confined Ions
Region 1
+
+
++
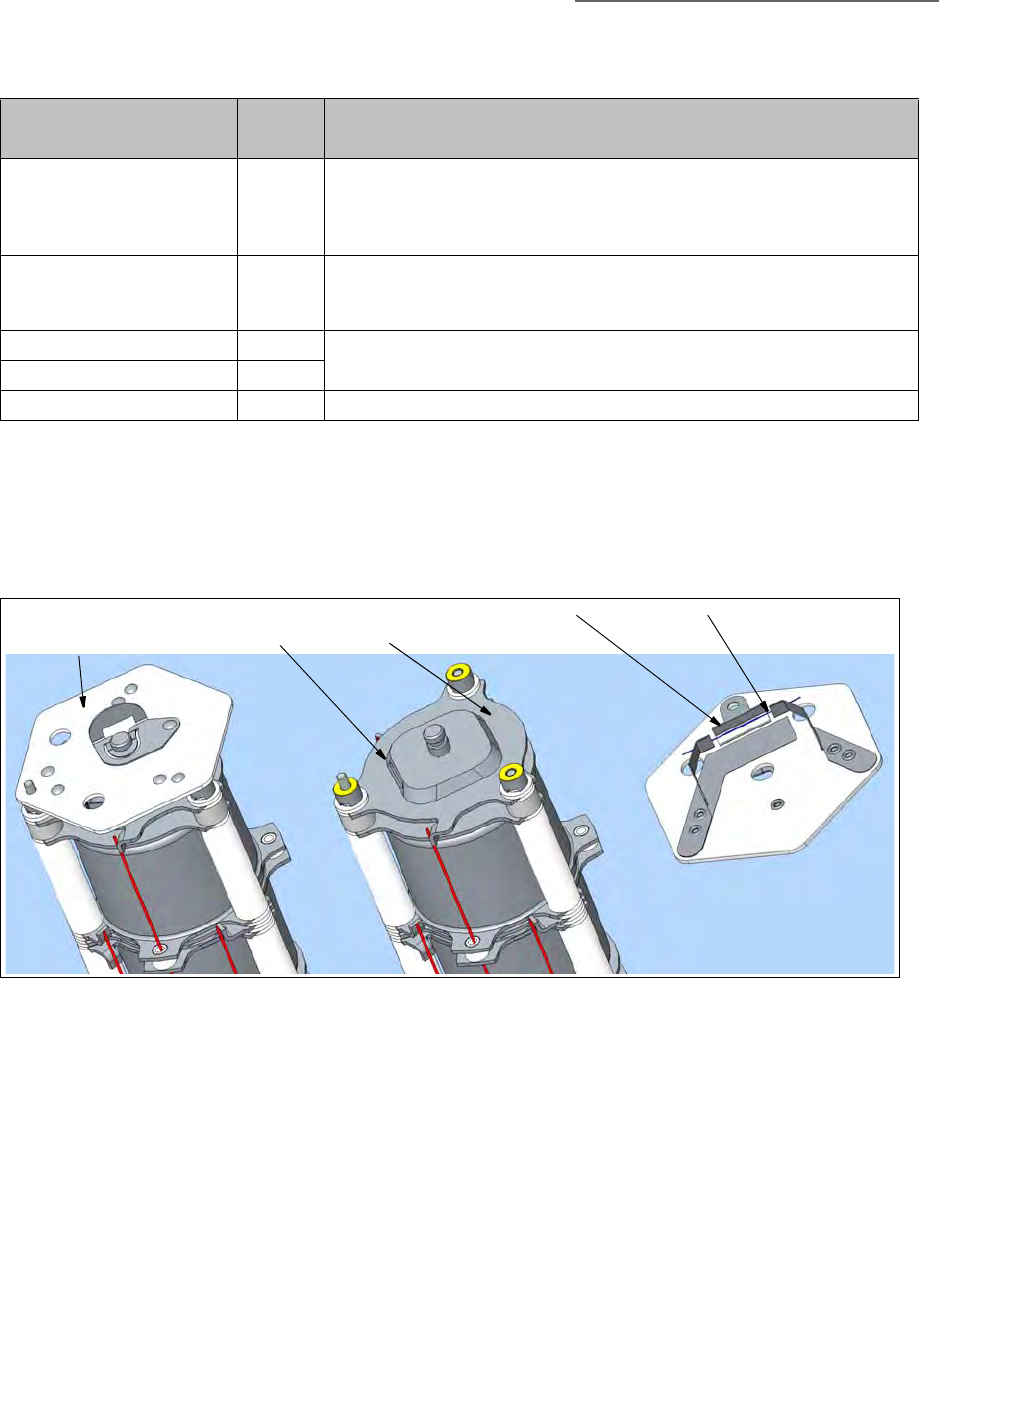
6 Ion Trap Mass Spectrometer Gauge
117
Series 835 Vacuum Quality Monitor
Instruction Manual - 835000
The main components of the ionizer are: (1) the filament, (2) the Repeller, (3) the entry plate with
off-axis slit, and (4) the pressure plate. The VQM Controller contains all the necessary voltage and
current supplies required to bias the ionizer's electrodes and establish a regulated electron emission
current. All ionizer settings are user adjustable through the Tune Settings of the VQM Viewer
Software, an Application Programming Interface, or through the VQM Command Set. See the Tune
Settings section in Chapter 8 for details.
A single filament is located outside the ion trap volume, and the electron beam is directed into the
ionization region through a narrow off-axis slit aperture located on the entry plate. A negatively
biased focusing electrode, called the Repeller, directs all emitted electrons to the entry plate and
provides focusing of the electron beam as required to clear the narrow entrance slit.
The ionization energy of the electrons is calculated as the difference between the entry plate and
the filament bias voltage (100 eV factory default). Changes in the electron energy can be affected by
changing either one or both of those voltages, and will generally have significant impact on the
output of the gauge.
Table 6-2 MS Gauge Ionizer Settings
Ionizer Settings Default
Value Comments
Repeller Bias (V) -31 Use the Repeller bias voltage setting to optimize the coupling of the
electron beam into the ionization region.
Optimize the Repeller voltage each time a new filament assembly is
installed in a sensor.
Filament emission (mA) 0.070 Increase the emission current at UHV levels to achieve higher signals.
Decrease the emission current setting starting at pressures above 1x10⁻⁶ Torr
to minimize baseline offset increases.
Filament Bias (V) 30 Electron energy (eV)= Entry Plate Bias - Filament Bias
Default= 100eV
Entry Plate Bias (V) 130
Pressure Plate Bias (V) 75 See the Tune Settings section.
Figure 6-13 MS Gauge Filament Assembly
Filament
Assembly
Off-Axis
Slit
Entry
Plate
Repeller Filament

6 Ion Trap Mass Spectrometer Gauge
118 Series 835 Vacuum Quality Monitor
Instruction Manual - 835000
The electron current (0.070 mA factory default) is generated by thermionic emission from a single
filament. The electron emission current is user adjustable. In general, currents higher than the
factory default value might be required at UHV levels (total pressure <1x10⁻⁹ Torr), to increase peak
amplitudes, while current settings lower than factory default might be desirable at pressures
>1x10⁻⁶ Torr to reduce baseline offset increases. The electron emission current is regulated by a
tight feedback control loop which dynamically adjusts the temperature of the filament to control the
thermionic emission of electrons in real time.
The filament is made of air-resistant Yttria-coated Iridium wire, which operates at low temperature
and can be over-pressured in air without the risk of immediate burnout. The filament and the
Repeller are part of a field replaceable assembly. Once the filament wears out, the assembly can be
easily replaced in the field (see Filament Replacement instructions in Section 7.5.2).
Several overpressure protection algorithms built into the Controller's firmware protect the filament
from dangerous overpressure conditions. In addition, the power delivered to the filament by the
Controller (2W typical) is continuously monitored by its microprocessor and used to protect the
filament wire from overpower conditions. See Section 5.7.1 and Section 5.10.2 for additional
information on Filament Protection modes.
6.7 Ion Trap Mass Separator
The ion trap is the cylindrical multi-electrode structure extending from the entry plate to the exit
plate (see Figure 6-5). The main components of the ion trap structure are:
• Entry Plate
• Pressure Plates
• Entry and Exit Cups
• Transition Plate
• Exit Plate
The ion trap components are made of type 304L stainless steel plates and cups. Precise plate
placement is assured by high precision, >98% pure, Alumina spacers. Compressed springs secure
the integrity of the electrode stack-up at all times. The cylindrical structure has an open design to
ensure unrestricted gas flow between electrodes.
The main function of the pressure plates is to absorb unconfined ions in the ionization region of the
ion trap. However, adjustments to the pressure plate voltage can also affect signal levels and
resolution in the sensor. See the Tune Settings section in Chapter 8 for additional details.
The VQM Controller contains all the necessary voltage supplies required to independently bias
each ion trap component and the RF supply to deliver the frequency chirp required for autoresonant
ejection of ions. All ion trap settings are user adjustable through the Tune Settings of the VQM
Viewer Software and through the VQM Command Set.

6 Ion Trap Mass Spectrometer Gauge
119
Series 835 Vacuum Quality Monitor
Instruction Manual - 835000
Positive ions are formed inside the ion trap volume in an ionization region located between the
entry plate and the entry cup as illustrated in Figure 6-9. Electrons are thermionically generated
outside the ion trap (hot filament source) and directed into the ion trap volume through an off-axis
slit located on the entry plate. A fraction of the positive ions are confined inside the ion trap volume
by the electrostatic potential well. The rest of the ions that are not confined by the electrostatic
potential well and are mostly lost to neutralizing collisions with the pressure plate.
Ions of all masses and energies created and stored inside the ion trap are mass selectively excited
and ejected using an autoresonance method. A small RF signal is AC coupled into the negatively
biased transition plate and scanned from high to low frequency with a fixed peak-to-peak
amplitude.
Excited ions are ejected from the trap through the exit plate's gridded aperture and are detected by
the electron multiplier detector to produce a mass spectrum. The exit plate is typically biased a few
volts lower (i.e. 5V, default) than the entry plate to ensure that all excited ions are ejected through
the exit plate before reaching the back surface of the entry plate.
Many M/q values will contribute to a typical mass spectrum. For a fixed trapping potential, the
ejection frequencies for emergent ions, fe, will follow a strict fe proportional to 1/sqrt (M/q).
Changes in any of the electrode bias voltages inside the trap will alter the shape of the electrostatic
trapping potential well and will result in a shift in the ejection frequency of all ions, which will
require recalibration of the mass axis.
Table 6-3 Ion Trap Mass Separator Default Values
Ion Trap Setting Default
Value Comments
Entry Plate Bias (V) 130 Electron energy (eV)= Entry Plate Bias - Filament Bias
Pressure Plate Bias (V) 75 Both pressure plates are electrically connected and biased thru a single
feed-through pin.
Cups Voltage (V) 27 + RF Both Cups are electrically connected and DC biased through a single
feedthrough flange pin. RF is also capacitively coupled from the transition
plate into the Cups. The coupling capacitors are located inside the gauge
connector of the Controller-to-Gauge interconnect cable.
Transition Voltage (V) -685 + RF The transition plate is negatively biased (High Voltage). A coupling transformer
is located inside the gauge connector of the Controller-to-Gauge interconnect
cable. AC couples RF into the plate for parametric autoresonant energy
pumping.
Exit Plate Bias Voltage (V) 125 The exit plate bias voltage is typically set a few Volts lower (i.e. 5V, default)
than the entry plate voltage.
RF Amp Voltage (V) 0.45 The RF AMP Voltage setting is the only adjustable parameter for the RF signal
source.
Multiply this voltage setting by 0.12 to obtain the RF Vpp applied to the
transition plate, in units of mV.
The RF Amp Voltage should be optimized every time the potential gradients
inside the trap are modified.
There is a very weak dependence of mass axis calibration on RF Amp Voltage.
Increasing the RF Amp Voltage high above the ejection threshold value can
lead to the appearance of superharmonic peaks in the spectra and generally
shifts the mass peaks to lower masses.

6 Ion Trap Mass Spectrometer Gauge
120 Series 835 Vacuum Quality Monitor
Instruction Manual - 835000
Since ion ejection frequencies are strictly proportional to the inverse of the square root of
mass-to-charge ratio, M/q, mass axis calibration is very straight forward: mass calibration is
performed on a single mass peak of the spectrum, mathematically linking its ejection frequency to
the square root of the mass, fe = K /sqrt (M/q). The calculated factor, K, is then used to assign masses
to all other peaks in the spectrum based on their unique ejection frequencies. The dependence of
ejection frequency on square root (M/q) is strongly dependent on the shape of the trapping potential
well which is a function of (1) trap geometry (fixed by design), and (2) bias voltages applied to the
electrodes. Recalibration of the spectrometer's mass axis will be required every time a bias voltage
is changed inside the trap. There is a very slight dependence of mass axis calibration factor on RF
Amp Voltage setting.
The critical operational parameters of the ion trap mass separator include: (1) mass range, (2) mass
resolution, and (3) pressure range.
The Mass Range is determined by the interplay between (1) the bias voltages present on the
electrode components (user adjustable), and (2) the fixed RF Chirp frequency range. The VQM
System offers a single (i.e., no user adjustment), nonlinear, phase continuous, and proprietary RF
frequency sweep profile that is scanned in 125 milliseconds and spans from 2.7 MHz to 147.5 kHz.
Under factory default settings, the mass range for the extended range VQM System spans from 1 to
300 amu. Changes in ion trap electrode voltages will require recalibration of the mass axis and will
impact the mass range of the sensor.
The mass resolving power of the device is calculated as the ratio between the particular mass M and
the width of its mass peak at 50% full height: R = M/ΔM50%. Mass resolution depends on a variety
of ion trap and environmental settings: (1) total pressure, (2) RF Amp Voltage, and (3) Trap Voltages.
In general, a user should expect to see the resolution, R, decrease as the pressure in the system
increases and as the RF Amp Voltage is increased (see more below). The MS Gauge delivers its
highest resolving power at UHV pressure levels and while operating with RF source levels close to
ejection thresholds. The resolution for a VQM MS Gauge operated (1) at factory default settings,
and (2) measured on the 28 amu peak for pure N2 at 2x10⁻⁷ Torr, is ~150 typical. Higher resolving
powers can be achieved with lower RF Amp Voltage settings, at the expense of Dynamic range. See
the factory specifications in Chapter 2.
The pressure range of the device is set by the ability of the trap to store and eject ions as the pressure
increases. The highest operational pressure for the device is presently specified as 1x10⁻⁵ Torr. As
the total pressure in the system increases beyond its operational "sweet spot" (i.e., total pressure =
2x10⁻⁷ Torr), users should expect to see (1) a decrease in signal levels and mass resolution, (2) an
increase in baseline offset levels, and (3) a decrease in the dynamic range. Advanced setting
adjustments will be required to extend the range of the device into total pressures higher than
3x10⁻⁶ Torr.
Notice
In the VQM System, the Mass Axis Calibration factor consists of the ejection
frequency value for singly ionized water molecules. The factory default
ejection frequency for singly charged water ions at 18.01 amu corresponds
to 616 kHz typical. The mass calibration factor must be checked
periodically, and recalculated each time Ion Trap voltage settings are
modified.
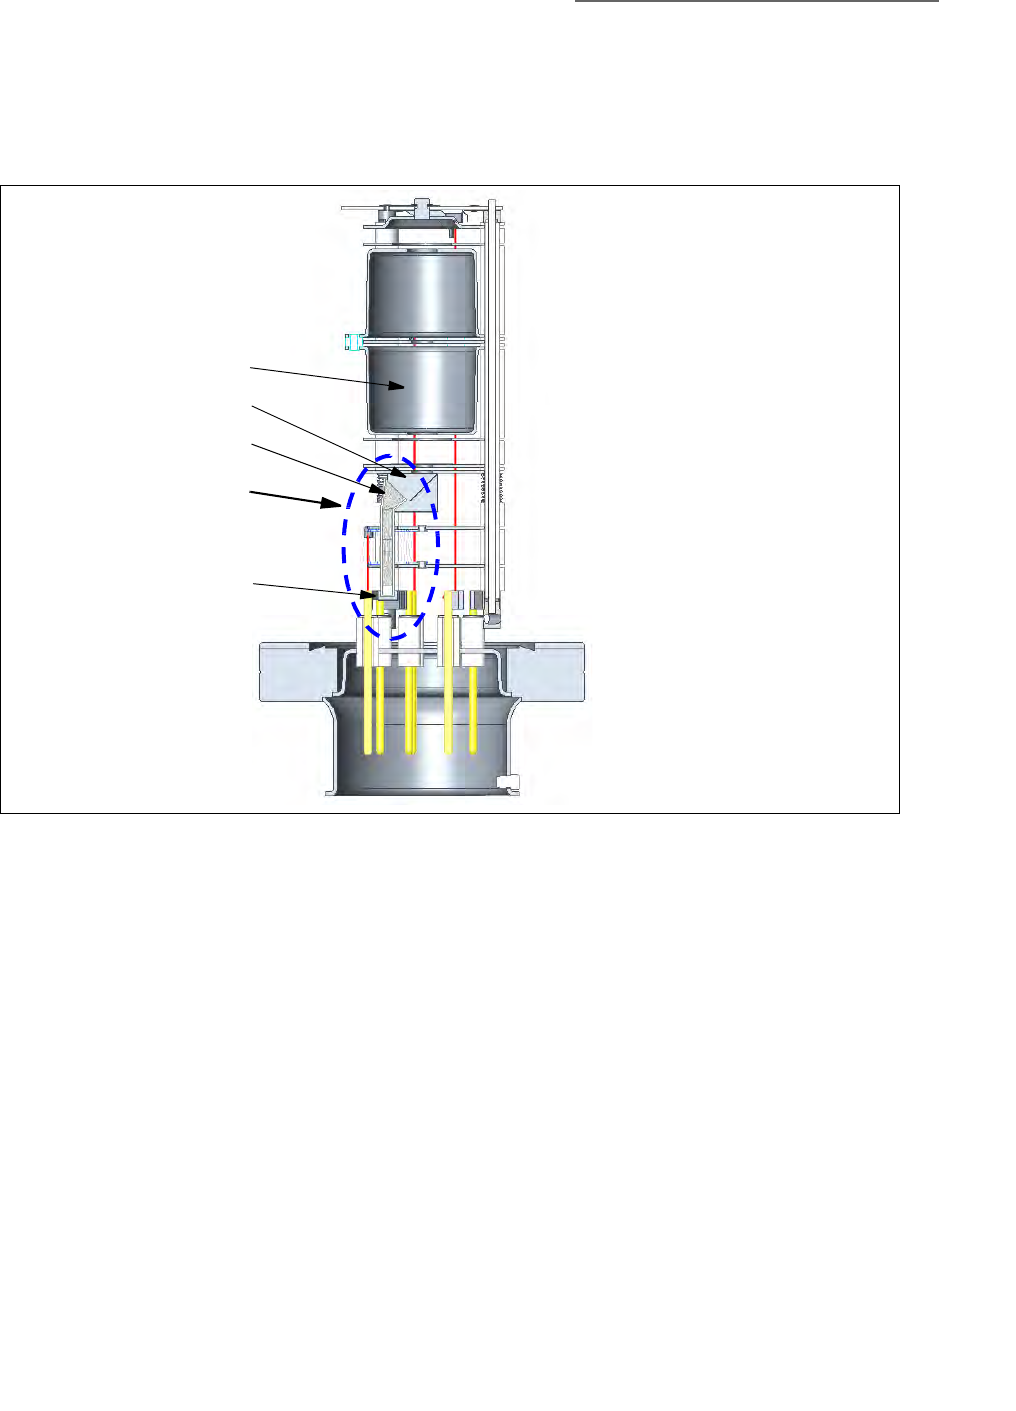
6 Ion Trap Mass Spectrometer Gauge
121
Series 835 Vacuum Quality Monitor
Instruction Manual - 835000
6.8 Ion Detector Assembly
Positive ions autoresonantly ejected through the exit plate of the ion trap mass separator are
directed towards the ion detector assembly which includes an electron multiplier device specially
designed for the VQM Mass Spectrometer Gauge.
The detector assembly consists of three components:
1. Electron Multiplier Shield
2. Electron Multiplier Detector
3. Anode Cup
The VQM Mass Spectrometer Gauge is a fast scanning device that requires a high bandwidth
electrometer to record ion current output without signal distortion (i.e, amplitude and/or phase
distortion). Since transimpedance amplifiers have a limited gain-bandwidth product, the current
output of the ion trap mass separator (i.e., picoAmp range) must be amplified to match both the gain
and bandwidth of the Controller's electrometer. See Section 5.7.3.
The input to the detector is the ion current ejected from the ion trap during frequency sweeps. The
output of the detector is an electron current, proportional to the ion current, generated by a
state-of-the-art electron multiplier. The electron multiplier gain factor, defined as gain = (electron
current / ion current), is dependent on the electron multiplier bias voltage, a user adjustable setting.
Figure 6-14 MS Gauge Electron Multiplier
Ion Trap
EM Shield
EM Cup
EM Detector
Assembly
EM Anode Cup &
Feed Through
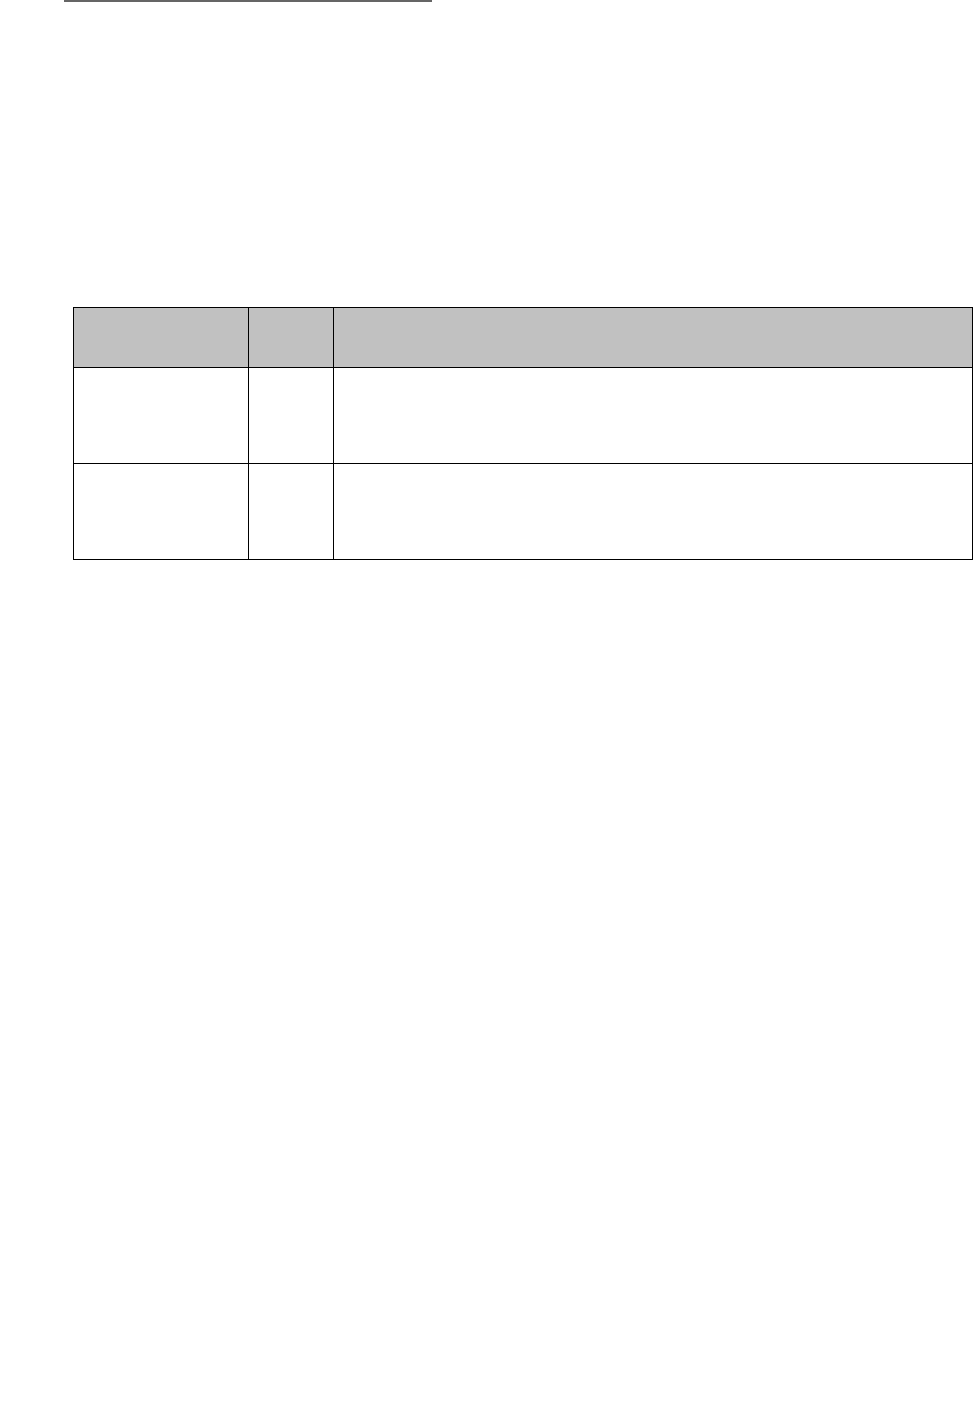
6 Ion Trap Mass Spectrometer Gauge
122 Series 835 Vacuum Quality Monitor
Instruction Manual - 835000
The combination of (1) electron multiplier negative high voltage bias and (2) electron multiplier
shield bias voltage, directs the ions ejected from the trap into the multiplier's conversion dynode
(secondary electron generation) and converts the impinging ion current into a proportional electron
current through an avalanche electron multiplication process.
The VQM Controller contains all the necessary voltage supplies required to independently bias
each detector component and a high speed electrometer to collect the output of the electron
multiplier. All detector settings are user adjustable through the Tune Settings of the VQM Viewer
Software and through the VQM Command Set.
The electron multiplier detector consists of a straight single tube made of a special resistive glass
with a cone of the same material attached to the top end. It is placed upright and off-axis relative to
the cylindrical axis of symmetry of the ion trap. It is held in place by two clips that deliver the
required bias voltages. The top clip is connected to a high voltage feedthrough and is responsible
for (1) biasing the top cone (i.e., conversion dynode) to a negative high voltage and (2) providing the
detector biasing current. The bottom clip connects to the instrument's analog ground and provides
the return path for the biasing current that flows through the detector when High Voltage bias is
present. Chrome electrical coatings deposited on the electron multiplier's outer surfaces provide the
required electrical connection to the clips. The electron multiplier is field replaceable. The
replacement procedure is outlined in Section 7.6.10.
A small anode cup located at the exit of the multiplier and biased at analog ground voltage collects
the secondary electrons exiting the back of the multiplier. The electron current is collected by the
anode cup and directed into the electrometer's input through a dedicated feedthrough pin.
The electron multiplier gain is controlled by adjusting the amplitude of the negative high voltage
bias applied across the electron multiplier, which is a user-adjustable setting. Increasing the gain of
an electron multiplier has two very important consequences on the instrument's performance: (1)
the sensitivity and dynamic range of the instrument increases as the peak amplitudes rise above the
baseline noise and (2) the stability and lifetime of the electron multiplier decreases. Most mass
spectrometer users are familiar with this delicate interplay between electron multiplier gain,
stability, and lifetime.
The bias current established by the voltage drop across the resistive glass replenishes the lost charge
as secondary electrons are ejected by the avalanche process inside the electron multiplier tube.
Electron multipliers operate linearly (i.e., fixed gain) until their output current is approximately 10%
of that bias current. For example, considering a typical channel resistance of 50 MOhm and a bias
voltage of -1100V, the bias current is 22 microAmps, and the output current must not exceed 2
Table 6-4 Ion Detector Default Values
Detector Assembly
Settings
Default
Value Comments
Electron Multiplier
Shield Voltage
127 The electron multiplier shield voltage is adjusted to optimize the coupling of ions
into the conversion dynode.
In general, good results are obtained if the Electron Multiplier Shield Voltage is set
+2V more positive than the Exit Plate bias voltage.
Electron Multiplier
Bias Voltage
-900 The electron multiplier bias voltage defines the gain of the multiplier.
The electron multiplier gain slowly degrades over time. Increase the bias voltage
to compensate against long-term gain degradation.
Increase the bias voltage to enhance detection limits for trace gas components.

6 Ion Trap Mass Spectrometer Gauge
123
Series 835 Vacuum Quality Monitor
Instruction Manual - 835000
microAmps. In practice, the electron multiplier bias voltage is selected so that peak heights in the
mass spectra never exceed 60 nA. Thus, a 22 microAmp upper limit is much higher than any of the
recommended output currents used during normal operation of the ion trap.
A high electron multiplier gain, typically ~ 1000X, is required to achieve the recommended output
levels for the ion trap. Signal levels above 60 nA exceed the factory default input range of the
electrometer, causing peak clipping (i.e. data is compromised) and compromising the stability and
lifetime of the electron multiplier.
The gain of an electron multiplier is known to degrade over time, but can be restored in the field by
adjusting (i.e. increasing) its voltage bias. An adjustable Electron Multiplier High Voltage setting is
available to restore detector gain. Gain degradation limits the lifetime of all electron multipliers.
Eventually, the gain drops to unacceptable levels and the multiplier needs to be replaced. The
electron multiplier voltage can be decreased without risks down to -1350 V. However, voltage
settings below this can lead to internal arcing, reduced and erratic signal levels, and unreliable
operation.
The electron multiplier detector must be carefully protected while the voltage is active. Operation
of the electron multiplier at high pressures can cause irreversible gain reduction and increases
signal noise. The overpressure and filament overpower protection modes built into the VQM
Controller shut down the electron multiplier and filament power in the case of an overpressure
condition. Electron multipliers are somewhat sensitive to long-term exposure to atmospheric air.
Dedicated long-term storage precautions and best-known operational practices are provided in the
Maintenance Chapter to assure optimal operation of the detector.
Electron multipliers should not be exposed to certain chemical species. Contamination by organic
compounds and interaction with highly reactive/corrosive gases must be avoided. The active gain
medium of the electron multiplier channel is known to be sensitive to reducing agents such as
Silane (SiH4).
Electron multipliers have a long history of successful applications in mass spectrometry. However,
to achieve maximum useful lifetime and optimal performance it is very important to handle them
properly. See Section 7.6.
6.9 MS Gauge Advanced User Settings
The VQM System is shipped preloaded with factory default settings for each of the Mass
Spectrometer Gauge voltage, current and calibration settings. User default settings were not
designed to provide optimal performance for the MS Gauge, but rather to provide a "safe" set of
parameters that can be recalled at any time to reset a VQM Controller. An Auto Tune procedure
must be executed during the Initial Operation Procedure to obtain the optimal operational
parameters for each specific Controller. Additional adjustments to the operational settings might be
occasionally required to:
• Optimize settings for a new filament assembly or a new electron multiplier.
• Optimize the performance throughout the allowed operational pressure range.
• Optimize resolution or peak shape in specific amu ranges.
• Shift the mass range.
• Remove superharmonic peaks and/or perform other spectrum improvements.
• Perform a specialized application (leak checking, isotope ratio measurements, trace analysis,
etc).
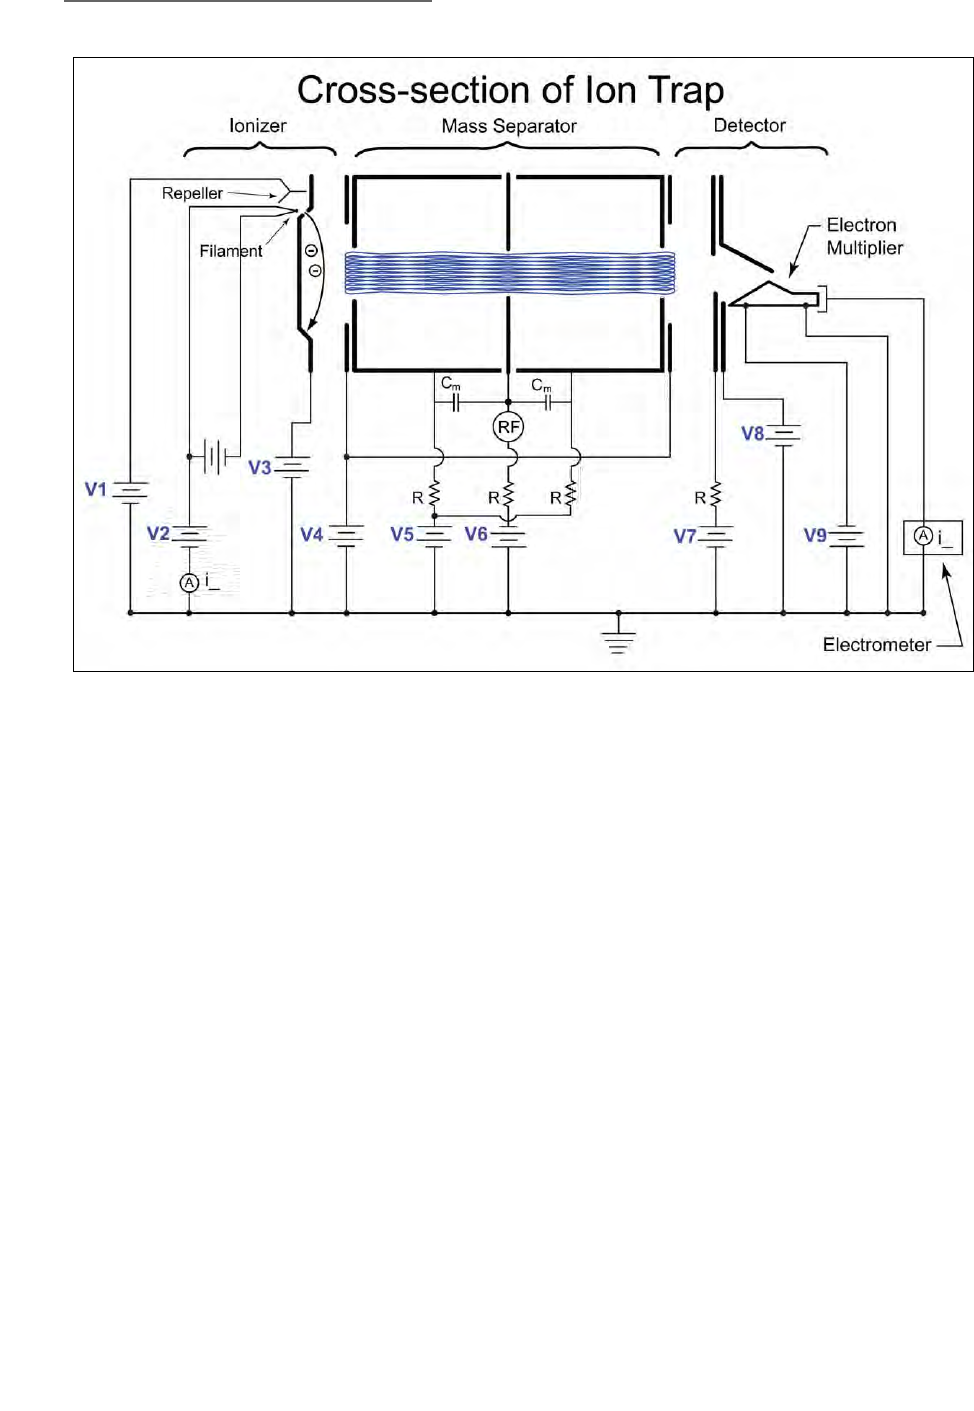
6 Ion Trap Mass Spectrometer Gauge
124 Series 835 Vacuum Quality Monitor
Instruction Manual - 835000
The VQM Controller is shipped with a copy of the factory default operational parameters stored in
its User Settings (i.e. NV RAM). Each time the VQM System is turned ON, the User Settings are
transferred into volatile memory locations and used to control the instrument. The Controller
operational parameters are stored in volatile memory, used to control the mass spectrometer gauge,
and can be changed/adjusted at any time using (1) the Tune screen of the VQM Viewer Software or
(2) the VQM Controller's comprehensive VQM Command Set. New operational parameters
become effective immediately and can also replace the User Settings when flashed into NV RAM
(i.e. Flash user settings to NV RAM in the VQM Viewer Software). A copy of the factory default
settings is always available in the non-volatile memory and can be used to restore factory default
values for the operational parameters (i.e. Restore Factory Settings in the VQM Viewer Software).
NOTE: Flashing operational parameters into the NV RAM User Settings requires
turning OFF the power momentarily to the Mass Spectrometer Gauge.
Table 6-5,Operational Parameters, summarizes the Operational Parameters available to the user.
Figure 6-15 shows the corresponding Mass Spectrometer Gauge connections for the VQM MS
Gauge.
Figure 6-15 Ion Trap Voltages

6 Ion Trap Mass Spectrometer Gauge
125
Series 835 Vacuum Quality Monitor
Instruction Manual - 835000
Figure 6-15 suggests that establishing the desired anharmonic electrostatic potential to confine ions
to trajectories at natural oscillation frequencies involves designing a proper electrode structure, and
applying the proper bias voltages and RF signals to the electrodes. Some of the operational settings
(i.e. marked with "X" in the Mass Axis column of Table 6-5) have a significant impact on mass axis
calibration and mass range of the mass spectrometer, and require a single gas mass-axis calibration
procedure after their values are changed. See Mass Axis Calibration in the Initial Operation
Procedure in Chapter 8.
Table 6-5 Operational Parameters
Parameter Units Label (Fig
6-20)
Min / Max /
Increment
Default
Value
Affects
Mass
Axis
Comments
Filament Emission mA 0.001 mA /
1.5 mA /
0.001 mA
0.070 Electron emission current used
for ionization
Repeller Bias (AT) Volts V1 10 V / -60 V /
-25 mV
-31 Voltage required to optimize
the coupling of electrons into
the ionization volume.
Filament Bias (NR) Volts V2 10 V / 70 V /
20 mV
30 Electron energy [eV] = Entry
Plate Bias-Filament Bias
Entry Plate Bias (NR) Volts V3 123 / 153 / 30
mV
130 X
Pressure Plate Bias (NR) Volts V4 49 / 147 / 30
mV
75 X
Cup Bias (NR) Volts V5 15 / 85 / 20
mV
27 X
Transition Bias (NR) Volts V6 -1000 / -400 /
250 mV
-685 X Potential well depth (V) = Entry
Plate Bias-Transition Plate Bias
Exit Plate Bias (AT) Volts V7 68 / 154 / 30
mV
125 X
Electron Multiplier
Shield Bias (AT)
Volts V8 27 / 147 / 30
mV
127
Electron Multiplier
Bias
Volts V9 -1500 / -500 /
250 mV
-900
RF Amp Peak-to-Peak Volts RF 0 / 1.2 / 1 mV 0.45 Multiply by 0.12 to obtain the
approximate peak-to-peak RF
Voltage signal applied to the
transition plate in [mV]. The RF
amplitude has a very slight
effect on mass axis calibration.
Electrometer Gain nA/V 10/121/1nA/V 20
(AT) These operational parameters are affected by the Auto Tune function.
(NR) Changing these voltages is not recommended.

6 Ion Trap Mass Spectrometer Gauge
126 Series 835 Vacuum Quality Monitor
Instruction Manual - 835000
6.9.1 Electron Multiplier Bias
(V9 in Figure 6-15)
The electron multiplier is a state-of-the-art ion current amplifier device that collects a significant
fraction of the ions ejected from the trap and converts each ion into many electrons with a gain
factor which is nominally ~1000X, and controlled through the Bias Voltage setting. The current
emitted from the electron multiplier is collected with an anode cup, biased at analog ground and
connected to an electrometer with a default 20 nA/V gain, a 3 V input voltage range, and a 60 nA
output range.
The gain of the electron multiplier is controlled through its bias voltage. The gain of the electron
multiplier and the amplitude of the peaks in the mass spectra increase as the electron Multiplier
Bias Voltage becomes more negative. However, any gain increase in the electron multiplier occurs
at the expense of electron multiplier lifetime and gain stability. As in all mass spectrometry
applications relying on electron multiplier detectors, the user must carefully weigh the interplay
between signal amplitude and detector lifetime while optimizing the mass spectrometer gauge
detector.
Adjustments to the electron multiplier bias are required when:
1. Gain losses due to long-term aging or contamination severely impact the dynamic range of the
device.
2. Higher signal dynamic range is necessary to improve the detection limits of the sensor.
3. The electron multiplier is replaced.
4. Connecting the VQM Controller to a different MS Gauge.
The VQM MS Gauge electron multiplier provides the best compromise between gain and long-term
performance when the peak amplitudes in the mass spectra remain below 60 nA. For a new
electron multiplier this typically represents an electron multiplier bias voltage between -900 and
-1000 Volts.
To adjust the electron multiplier bias voltage, see the Initial Operation Procedure in Chapter 8.
6.9.2 RF Amplitude Peak-to-Peak
(RF in Figure 6-15)
A small amplitude RF signal, i.e. RF Vpp = 0 mV to 144 mV, is AC coupled into the Transition plate
and used to eject confined ions through parametric autoresonant excitation. Transformer AC
coupling is used to inject the RF Vpp signal into the transition plate on top of the negative DC
Transition Bias Voltage. The coupling transformer is located inside the gauge connector plug of the
MS Gauge-to-Controller interconnect cable. AC coupling the RF into the center plate is preferred
because it simplifies the electrical scheme required to symmetrically distribute the RF through the
trap. Center plate excitation has also been shown to produce fewer spurious peaks due to
subharmonic and superharmonic excitation (i.e. parametric excitation).
Notice
There is a recommended warm-up time of 20 minutes for the system once
power is applied to the MS Gauge.

6 Ion Trap Mass Spectrometer Gauge
127
Series 835 Vacuum Quality Monitor
Instruction Manual - 835000
The peak-to-peak amplitude of the RF signal, RF Vpp, is controlled through the RF Amp P-P
adjustment in the Tune Settings of the VQM Viewer Software:
RFpp (mV) = 0.12* RFpp Amp (V)
Where,
RF Amp P-P = 0 - 1.2 V, Tune Settings Adjustment, [V]
RF Vpp= 0 - 144 mV, Peak-to-peak RF signal on the transition plate, [mV]
The VQM MS Gauge, operated under default bias voltage settings, operates at approximately 54 mV
of RF Vpp (i.e. RF Amp P-P =0.45 V) between 2.7 MHz and 147.5 KHz, in a 125 msec scan time.
The frequency range and scan profile are factory fixed. The RF Vpp may need to be occasionally
adjusted to:
1. Modify/optimize peak amplitudes, ratios, and resolution in the mass spectra.
2. Adapt to pressures close to the 1E-5 Torr upper limit of the sensor.
3. Minimize the contribution of sub- and superharmonic peaks to mass spectrum (see Section
6.10).
The RF Vpp adjustments are designed to control the interplay between (1) peak resolution, (2) peak
amplitude and (3) relative contribution from sub- and superharmonics to mass spectra. Changes in
the RF Amp P-P settings have a minimal effect on ejection frequency; however, mass-axis
calibration is recommended after large RF Amp P-P changes since peaks shift slightly to lower
masses as the RF signal amplitude is increased.
As predicted by autoresonance theory, the RF Vpp needs to operate above the autoresonance
threshold for ions to be ejected from the trap. The ejection thresholds for superharmonic peaks are
larger than for fundamental peaks. See Superharmonics in Section 6.10. The ejection threshold
depends on (1) scan speed (i.e. fixed for VQM System), (2) the initial energy of the ions, (3) the
depth of the potential well, (4) the shape and symmetry of the trapping potential, and (5) the total
pressure.
As the RF Vpp increases above threshold:
1. the peak amplitude increases until an amplitude plateau is achieved.
2. the peak resolution decreases - i.e., until a minimum resolution plateau is achieved.
3. the appearance of superharmonic peaks can also take place if the RF Vpp gets very large.
Operation close to threshold provides the highest mass resolution at the expense of peak
amplitudes and (often) ratiometric information quality. As the RF Vpp gets closer to threshold, it is
not unusual to see the highest peaks in the spectra drop in intensity before the lower intensity peaks
start to drop out. This effect is caused by "RF Field depletion" inside the trap, which is caused by the
absorption of RF power by the most abundant confined ions, which drives RF field levels closer to
the ejection threshold for the most abundant ions. Ratiometric information is affected by this
depletion phenomenon, since it selectively affects the amplitudes of the most prominent peaks (i.e.
peak ratios are compromised). Figure 6-16 shows an example of a water spectrum in which the ratio
between the 18 amu to 17 amu peaks change depending on the RF Vpp selected to operate the trap.
Operation at higher RF Vpp values minimizes this problem. As a general guideline, use the
maximum RF Vpp value possible to obtain the most accurate ratiometric information while still
achieving the desired resolving power.
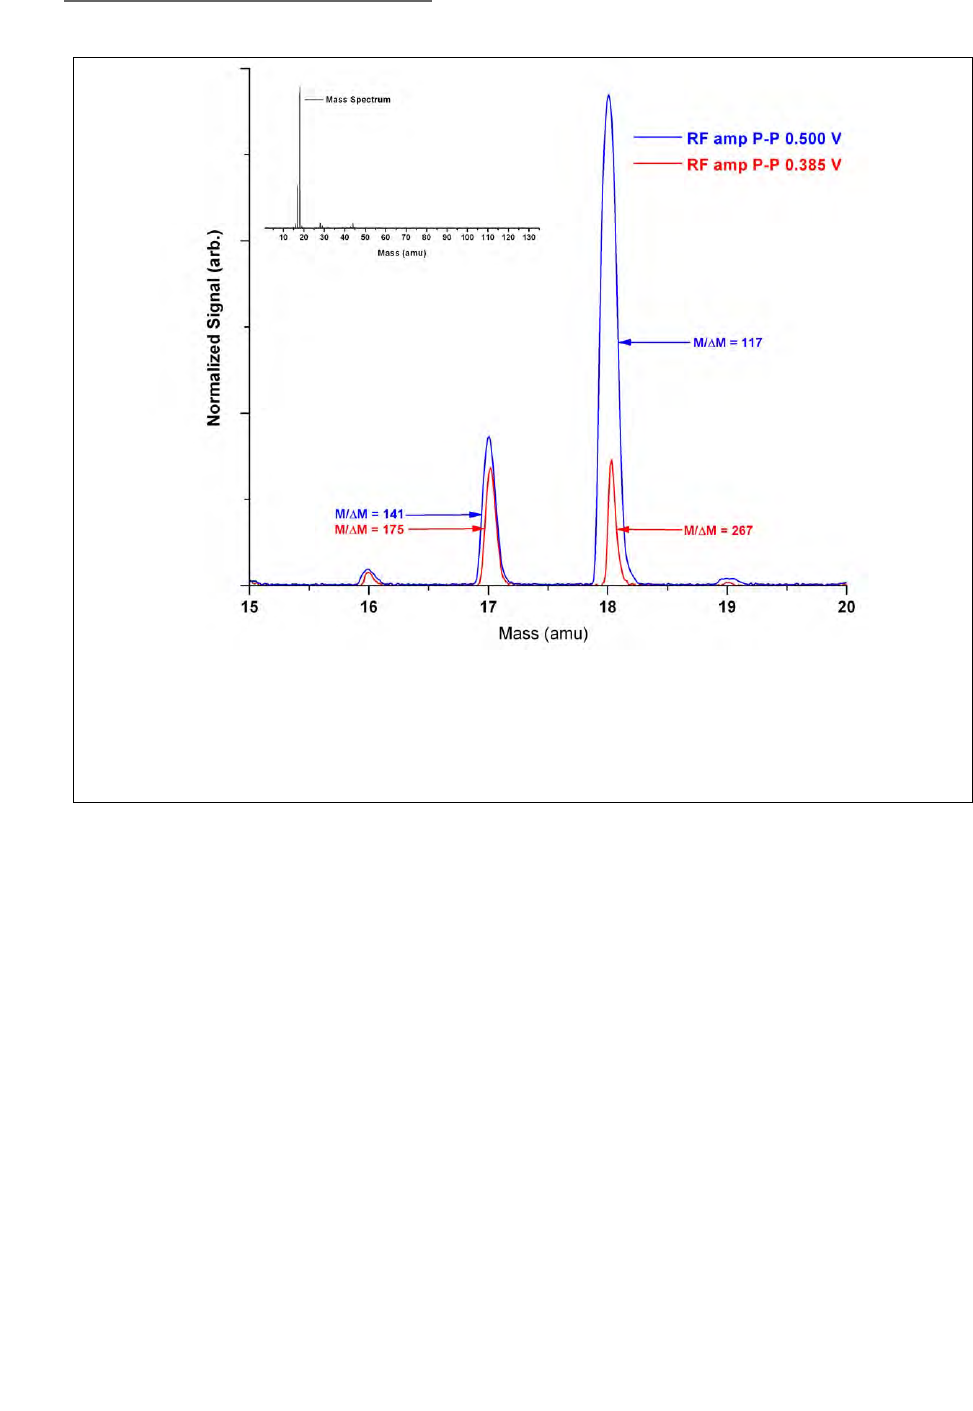
6 Ion Trap Mass Spectrometer Gauge
128 Series 835 Vacuum Quality Monitor
Instruction Manual - 835000
As the pressure in the system increases, peak quality is often improved by an increase in RF Vpp
voltage. The increase in RF Vpp reduces the time required for the ions to be ejected from the trap
before scattering collisions prevent them from being effectively extracted. "Kicking the ions harder"
with higher RF values forces them to exit the trap sooner and without losses to scattering collisions.
As a general guideline, use the maximum RF Vpp value possible to obtain the most accurate
ratiometric information while still achieving the desired resolving power.
6.9.3 Filament Emission
The filament emission current is a critical adjustment for the ion trap. The emission current is equal
to the number of electrons that leave the filament surface per unit of time. (i.e. measured at the
filament). The Repeller plate bias is responsible for focusing the electron beam through the entry
plate slit and into the ionization volume of the ion trap.
The number of ions stored inside the ion trap (confined ions) is the product of the balance between
(1) ions being formed by electron ionization and (2) ions being lost through autoresonant ejection,
coulombic repulsion and ion-neutral scattering. The rate of ion formation due to electron ionization
is determined by the product of (1) the pressure in the system, and (2) the electron emission current.
The ideal emission current produces enough ions during each scan to (1) replenish the ions emitted
by autoresonant ejection, and (2) to keep the trap filled with ions.
Figure 6-16 RF Field Depletion Effect
Proper ratiometric information is observed for RF Amp P-P = 0.500 V.
However, RF field depletion is obvious for RF Amp P-P = 0.385 V
which is very close to threshold. The peak’s drop in amplitude and the
resolution of the reduced peaks is much higher than the resolution for
other peaks in the spectra.

6 Ion Trap Mass Spectrometer Gauge
129
Series 835 Vacuum Quality Monitor
Instruction Manual - 835000
The default electron emission current, 0.070 mA, was selected at the factory assuming operation at
the pressure sweet spot of 2x10⁻⁷ Torr of nitrogen. Changes in electron emission current will be
required to optimize performance as the pressure moves away from the sweet spot. In general,
emission adjustments are required as outlined below.
Low Pressure Operation
As the pressure drops below 1x10⁻⁹ Torr the number of ions stored in the trap decreases as the rate
of ion formation falls behind the rate of ion losses. As the density of ions confined inside the trap
decreases, the peak amplitudes drop leading to reduced dynamic range. In order to regain dynamic
range, it is necessary to increase the rate of ion formation by increasing the emission current. The
emission current must be adjusted in small increment steps of 0.01mA looking for the following
changes:
1. Increase the emission current until no further peak amplitude increases are observed. Peak
amplitude saturation indicates that the trap is now filled with as many ions as it can hold.
2. Stop increasing the emission current if the baseline offset increases above 2 nA. Baseline
increases indicate that unconfined ions are starting to leak out the trap while the trap is already
at its full capacity.
3. Stop increasing the emission current if significant outgassing from the filament starts to
become apparent. Increasing the emission current above 0.2 mA introduces outgassing
components from the filament into the gas stream and complicates gas analysis.
High Pressure Operation
As the pressure rises above 1x10⁻⁶ Torr, the baseline offset starts to increase as the number of ions
formed at the ionization region far outnumbers the number of ions that can be stored in the trap.
The unconfined ions formed at the ionizer escape the trap into the electron multiplier, providing a
DC offset that scales with pressure. Under these operational conditions, the emission current should
be reduced until the baseline drops below 2 nA. High baseline offset levels are deleterious to the
electron multiplier detector and must be carefully monitored.
6.9.4 Repeller Plate Bias
(V1 in Figure 6-15)
The Repeller plate is designed to optimize the coupling of electrons emitted from the filament
through the narrow off-axis slit located on the entry plate. Optimization of the Repeller voltage is a
simple procedure that is performed by the Auto Tune procedure included in the VQM Viewer
Application.
Optimization of the Repeller voltage setting may be required when:
1. Performing an Initial Operation Procedure on a new instrument.
2. A new Filament Replacement Assembly is installed.
3. Operation of a different MS Gauge with the VQM Controller is required.
For best results, allow the filament to warm up for at least 20 minutes before performing an Auto
Tune procedure.

6 Ion Trap Mass Spectrometer Gauge
130 Series 835 Vacuum Quality Monitor
Instruction Manual - 835000
6.9.5 Exit Plate Bias
(V7 in Figure 6-15)
The Exit Plate has a centrally located semi-transparent gridded aperture through which all detected
ions are ejected from the trap. The exit plate bias is generally a few volts (i.e. -5 Volts, factory
default) lower than the entry plate bias. Operating the exit plate at a voltage bias lower than the
entry plate assures that all excited ions are ejected from the trap through the exit aperture without
being able to reach, and get lost to, the back plane of the entry plate.
In general, the exit plate bias is operated between 0 and -10 Volts below the entry plate potential.
The exit plate voltage can be optimized using the Auto Tune procedure built into the VQM Viewer
Application. Manual adjustment of the exit plate voltage is not recommended unless the Auto Tune
procedure cannot be performed or fails during execution- see the Initial Operation Procedure in
Chapter 8.
The difference in voltage between the entry and exit plates defines the Trap Potential Asymmetry
and has significant impact on: (1) ejection frequency (i.e. mass-axis calibration), (2) RF Vpp ejection
threshold, (3) mass range, (4) mass spectrum baseline offset levels, and (5) presence of sub and
superharmonics in the spectra.
The hard upper limit of the exit plate bias is the entry plate bias. Setting the exit plate bias at a
voltage above the entry plate bias will result in all peak signals rapidly disappearing from the
spectra as the ions are lost to collisions with the back plane of the entry plate before reaching the
exit grid for ejection.
Dropping the potential of the exit plate far below the entry plate bias, i.e. below the recommended
-5V differential, will generally cause two undesirable effects: (1) increases in baseline offset signal,
and (2) the appearance of super- and sub-harmonic peaks in the spectra at higher masses.
Changing the exit plate bias often affects the peak shapes in the spectra. The relationship between
the exit plate bias voltage and the peak shapes is beyond the scope of this operations manual.
6.9.6 Electron Multiplier Shield Bias
(V8 in Figure 6-15)
The electron multiplier shield plate consists of (1) a flat circular plate with a centrally located
aperture, and (2) an off-axis ion deflection plate located inside a square metal box attached to the
center of the plate. The purpose of this electrode assembly is to optimize the transfer of the ejected
ions into the Top Cone (i.e. conversion dynode) of the electron multiplier and to shield the cone
from unconfined ions not ejected from the trap.
The electron multiplier shield operates at a voltage very close to the exit plate voltage. Excellent
results are generally obtained biasing the electron multiplier shield +2V relative to the Exit Plate
Bias. The Electron Multiplier Shield Bias voltage is automatically adjusted to 2V higher than the Exit
plate at the end of the Auto Tune Procedure included in the VQM Viewer application.
Since the electron multiplier shield plate is located outside the mass separator's electrode structure,
no detectable shift takes place in the position of the mass spectrometer peaks once this adjustment
is performed. Mass Axis calibration would not be required.

6 Ion Trap Mass Spectrometer Gauge
131
Series 835 Vacuum Quality Monitor
Instruction Manual - 835000
6.9.7 Filament Bias
(V2 in Figure 6-15)
The filament bias is the electrical potential of the filament wire and sets the initial potential energy
of the ionizing electrons. The filament is part of the electron acceleration structure for the ionizer.
The electron energy in the ionizer is defined as: Electron Energy (eV) = Entry Plate Bias minus
Filament Bias. Changes in electron energy have a significant impact on the ionization initial
conditions and on the performance of the gauge.
Changes to the Filament Bias voltage are not recommended - i.e. always bias the Filament at its
factory default setting of +30V to provide the optimal 100eV electron energy required to operate the
MS Gauge.
Since the filament is located outside the mass separator's electrode structure, changes in the
Filament Bias do not have a detectable impact on the position of the mass spectrometer peaks.
6.9.8 Entry Plate Bias
(V3 in Figure 6-15)
The Entry Plate Bias is part of the electron beam acceleration structure for the ionizer. The electron
energy in the ionizer is defined as: Electron energy (eV) = Entry Plate Bias V minus Filament Bias V.
The entry plate bias is generally equal or higher than the exit plate bias. See Section 6.9.5.
Changes to the Entry Plate Bias voltage are not recommended - i.e. always bias the Entry Plate at the
factory default setting.
6.9.9 Pressure Plate Bias
(V4 in Figure 6-15)
A pressure plate is located in the space between each end cup and end plate.
Both pressure plates (1) operate at the same bias voltage, (2) are electrically connected inside the
gauge, and (3) are biased by the Controller through a single feed-through connector. The pressure
plate at the entry side of the trap absorbs the charge from ions formed outside the confinement
beam (i.e. shielding the entry cup from unconfined ion bombardment). The pressure plate on the
exit side provides symmetry to the trapping potential as required to minimize the chances of
generating subharmonic peaks in the spectra.
The factory default setting for the pressure plate bias voltage (75 V) was carefully selected to provide
a good balance between peak amplitude and resolution. Changes to the Pressure Plate Bias voltage
are not recommended - i.e. always bias the pressure plates at the factory default setting.
6.9.10 Cup Bias
(V5 in Figure 6-15)
The two cups, entry and exit, are (1) electrically connected inside the gauge, (2) biased to identical
DC voltages through a single feed-through pin, and (3) AC coupled to the transition plate through
high voltage (HV) capacitors. The two coupling capacitors, along with two DC isolation resistors,
are located inside the gauge connector plug of the Gauge-to-Controller interconnect cable.
Changes to the Cup Bias voltage are not recommended - i.e. always bias the cup electrodes at the
factory default setting.

6 Ion Trap Mass Spectrometer Gauge
132 Series 835 Vacuum Quality Monitor
Instruction Manual - 835000
6.9.11 Transition Bias
(V6 in Figure 6-15)
The Transition plate is one of the most important structures of the electrode assembly. The Transition
Bias Voltage is the negative High Voltage DC bias applied to the transition plate which determines
the depth of the electrostatic potential well and has significant impact on (1) ejection frequency of
ions, (2) mass-axis calibration factor, (3) RF Vpp ejection threshold, and (4) Mass Range of the
instrument. An RF signal is also applied on top of the DC bias, and is responsible for the parametric
autoresonant ejection of ions from the trap. See RF Amplitude Peak-to-Peak, Section 6.9.2 for
details.
The factory default setting for the transition plate bias voltage was carefully selected based on the
geometrical design of the trap to provide optimal MS Gauge performance. For the VQM System, the
voltage on the transition plate is factory set to -685 V, corresponding to a -815 V potential well
depth. Such voltage provides the specified performance without requiring sophisticated or
specialized HV insulation components, cables, and connectors. Changes to the Transition Plate
Bias voltage are not recommended - i.e. always bias the transition electrode at its factory default
setting.
6.10 Superharmonics
The VQM System was carefully designed to minimize the incidence of superharmonic peaks in the
system.
Mass Peaks corresponding to the ejection of ions at frequencies corresponding to multiples of the
fundamental ejection frequency (i.e. twice the natural oscillation frequency of the ions for
parametric excitation) are called superharmonic peaks and generally appear at low masses in mass
spectra collected with RF Vpp values far above the ejection threshold.
For example, under certain trap conditions, a peak at 7 amu (i.e. 28/22 amu) may appear in the
mass spectrum when a large peak at 28 amu (corresponding to N2+ ions) is also present. The peak at
7 amu corresponds to excitation at the second (factor of 2) harmonic of the fundamental ejection
frequency for 28 amu ions. As a general rule, superharmonic ejection of ions has higher RF Vpp
thresholds than ejection at the fundamental frequency (i.e. twice the natural oscillation frequency if
the RF excitation is applied to the transition plate) so that lowering the RF Vpp setting in the trap is
the simplest way to selectively eliminate superharmonic peaks from mass spectra.
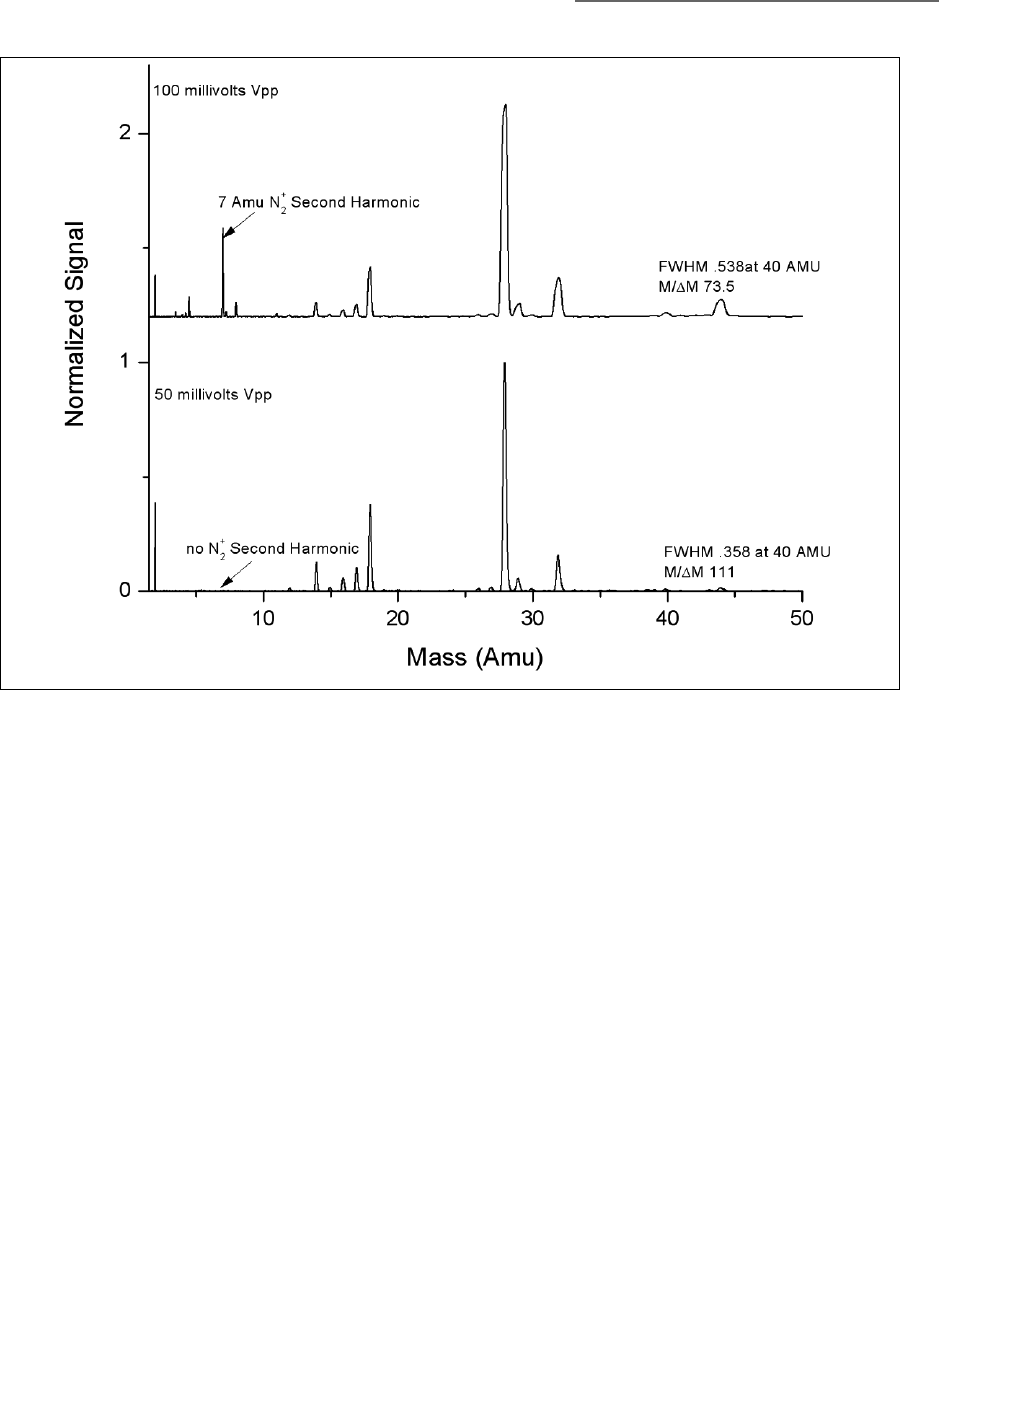
6 Ion Trap Mass Spectrometer Gauge
133
Series 835 Vacuum Quality Monitor
Instruction Manual - 835000
As illustrated in Figure 6-17, the top spectrum, with large RF Vpp (i.e., far above ejection threshold)
shows a superharmonic peak for the ejection of N2 at 7 amu. The superharmonic peaks disappear
from the spectra as the RF Vpp is lowered from 100 mV to 50 mV. Resolution also improves as the
RF Vpp voltage is reduced.
The factors that lead to the appearance and mitigation of superharmonics are:
1. RF Vpp Superharmonic peaks appear when the RF Vpp is increased above a certain threshold
that allows the ions to be ejected by multiples of their fundamental ejection frequency. In
general, the superharmonic peaks are the first to disappear from the spectrum as the RF Vpp is
reduced since they have the highest ejection thresholds. In other words, since the threshold
value for ejection of superharmonics is larger than for the ejection at twice the natural
oscillation frequency of the ions, the superharmonic peaks are the first to drop out of the
spectrum as RF Vpp is reduced.
2. Exit plate voltage: The presence of superharmonics is affected by the voltage on the exit plate.
As the voltage on the exit plate drops (i.e., becomes more negative for positive ions), the
relative abundance of superharmonic peaks increases. Lowering the exit plate voltage (setting
the exit plate bias more negative) lowers the threshold for the ejection of superharmonics.
Consequently, superharmonics are eliminated by (1) increasing the exit plate voltage (setting it
closer to the entry plate voltage) and (2) reducing RF Vpp.
Figure 6-17 AC Excitation Voltage Effects

6 Ion Trap Mass Spectrometer Gauge
134 Series 835 Vacuum Quality Monitor
Instruction Manual - 835000
Notes:

135
Series 835 Vacuum Quality Monitor
Instruction Manual - 835000
Chapter 7
7MS Gauge Maintenance
7.1 Introduction
This chapter describes common maintenance and troubleshooting procedures as well as
best-known practices for the VQM® Mass Spectrometer (MS Gauge). It also provides practical
information regarding unpacking, handling, and storage of the MS Gauge.
7.2 Unpacking, Handling, and Long-Term Storage
The MS Gauge is a high vacuum sensor that must be handled and stored following strict high
vacuum industry standards to avoid (1) the buildup of contamination, (2) performance degradation,
and (3) irreversible damage to its functional components.
The MS Gauge is assembled at the factory using the highest standards of cleanliness and
vacuum-compatible manufacturing. Selected components are vacuum-fired prior to assembly to
reduce the potential of internal outgassing. Filament assemblies are tested and outgassed in a
dedicated vacuum station to avoid irreversible contamination of ion trap electrode structures when
first activated. Factory tooling handles all assembly stages (i.e. hands-free assembly) to minimize
chances of contamination. The completed gauge assembly is fully tested and calibrated at the
factory in an UHV compatible vacuum system located in a clean room. The finished product is
packed inside a hard plastic shell to provide mechanical protection and stored in an evacuated
hermetically sealed metalized MylarTM bag prior to shipment.
To reduce the chances of contamination during shipment and storage, and to minimize exposure of
the electron multiplier detector to air and water (i.e. oxidizing agents), the MS Gauge is shipped in
a sealed, and evacuated metalized Mylar® bag.
Long-term storage of the MS Gauge must take into consideration the chances of: (1) chemical
contamination of the internal structures, (2) build up of particulate inside the probe, (3) damage to
the electron multiplier due to exposure to oxidizing agents such as Oxygen and Water, and (4)
degradation of the electron multiplier due to exposure to light (particularly UV). Users in areas of
high humidity levels must take extra precautions to avoid the effects of water on the electron
multiplier. Nude gauges stored in bright locations must be shielded from the damaging effects of
light on the electron multiplier; sealable metalized Mylar bags are recommended. Particle free
desiccant cartridges are also recommended. Keep the plastic plug on the sensor port until just
before installation to eliminate particulate contamination.
Notice
Do not break the bag seal until you are ready to mount the MS Gauge on a
vacuum port. Do not discard the hard plastic shell and resealable Mylar
bag as they might be required for storage of the sensor if removed from a
vacuum system or for returns to the factory.

7 MS Gauge Maintenance
136 Series 835 Vacuum Quality Monitor
Instruction Manual - 835000
7.2.1 Storage Recommendations
The following options are available for long-term storage:
1. Most desirable: Store the MS Gauge under high vacuum conditions at all times. An isolation
valve between the vacuum system and the MS Gauge is recommended to protect the sensor in
cases where condensation of contaminants on to the gauge's internal components might be
possible during process.
2. If high vacuum storage is not available, consider storing the sensor in a vacuum desiccator,
glove box or general purpose dry box with a steady flow of oxygen-free dry nitrogen or Argon.
Use the plastic hard shell to mechanically protect the sensor and keep all particulates away
from the gauge.
3. Least desirable: Store the gauge in a metalized Mylar bag that has been purged with dry
nitrogen or argon and sealed from ambient air. One option is to use the Metalized bag that was
received with the product. Another option is to procure metalized Mylar bags with
re-closeable zippers from a reliable source (www.alinebags.com).
MS Gauges exposed to an air environment for long periods of time (i.e. longer than 3 months) will
experience irreversible detector degradation. The gain medium of the electron multiplier internal
channel(s) relies on the presence of a reduced lead oxide glass layer, that will degrade irreversibly
when exposed to oxidizing agents such as oxygen and water. The output signal levels of the
electron multiplier will degrade over time and will require operating the detector at higher bias
voltages to achieve nominal output signal levels. If the signal drops below acceptable levels,
consider replacing the electron multiplier. See Section 7.6.10.
Contamination buildup during storage due to plasticizer outgassing from storage containers will
require an extensive pumpdown duration and bakeout to eliminate background hydrocarbon
contributions to mass spectra. See the Bakeout Procedure, below.
7.3 Bakeout Procedure
Bakeout of the MS Gauge is recommended in the following cases:
• After first installation of the MS Gauge into a vacuum chamber.
• After prolonged exposure of the mass spectrometer gauge to ambient air.
• When background contamination is evident in the mass spectra.
• When performance degradation due to contamination is evident.
Every time a new component or instrument is introduced into a vacuum system or the vacuum
chamber is vented to air, outgassing of molecules (mostly water) from the walls will determine the
time it takes the pumping system to achieve its targeted base pressure. A vacuum system bakeout
expedites the outgassing of molecules from chamber walls and provides the shortest possible
pumpdown times. A proper bakeout should include heating up both the MS Gauge and the vacuum
system walls so that contaminants do not condense on cold surfaces and continue to contribute to
the base pressure and background mass spectra. A custom silicone jacket is available from
Granville-Phillips to heat the MS Gauge probe to 180 ºC for extended bakeouts.
As the MS Gauge is used, deposits can slowly accumulate on the internal electrode structures of the
sensor, particularly around the ionization area. The performance of the MS Gauge is affected by
contamination buildup. The typical symptoms of contamination buildup include: (1) decreased
signal levels, (2) decreased peak resolution, (3) distorted peak shapes, (4) increased baseline offset,
and (5) increased background gas contribution to the spectra. Periodic MS Gauge bakeouts keep the
sensor clean and minimize those problems.
7 MS Gauge Maintenance
137
Series 835 Vacuum Quality Monitor
Instruction Manual - 835000
The recommended bakeout procedure includes:
1. Turn OFF the MS Gauge and disconnect the MS Gauge-to-Controller interconnect cable.
2. Attach the heating jacket (180-200 ºC). Do not exceed 200 ºC with any heating system.
3. Make sure the chamber pressure is below 1x10⁻⁵ Torr.
4. Establish a slow flow of dry N2 gas (scrubber gas) in the vacuum chamber 1x10⁻⁵ Torr or less.
5. Bake the probe for at least 12 hours (i.e. overnight).
6. Remove the heating jacket and wait for the sensor to cool to room temperature.
7. Connect the MS Gauge-to-Controller interconnect cable and wait for the pressure to drop
below 1x10⁻⁵ Torr and reach the targeted base pressure.
8. Perform a few mass spectrometry scans and use the gas analysis outputs to check the integrity
of the spectrometer and measure contamination levels. Repeat the bakeout if necessary.
Notice
See the Initial Operation Procedure in Chapter 8 for initial operation of a
VQM Mass Spectrometer Gauge.
The VQM System does not include a Degas function. The MS Gauge does not
build contamination in its ionizer region in a fashion that benefits from
electron bombardment cleanup. The only effective way to reduce
contamination levels in a Mass Spectrometer Gauge is to perform an
overnight bakeout as described in this section.
Severe contamination of the probe with non-volatile components may not
be effectively mitigated by a probe bakeout procedure. Contact the factory
if persistent contamination in your vacuum system is not reduced by the
bakeout procedure.
Electron Multiplier detectors are affected by hydrocarbon contamination.
Periodic bakeouts are recommended to minimize the presence of volatile
hydrocarbon species around the gauge area.
Do NOT exceed 200 oC during bakeout of the MS Gauge.
Exceeding 200 oC can cause damage to the Electron Multiplier.
Disconnect the cable connector from the MS Gauge before
starting the bakeout procedure.
Do NOT turn ON the MS Gauge while bakeout is in progress.
Always use a high-quality heater with a built-in temperature
limit switch to avoid the risk of component damage and the
risk of fire.
Use only metal gasket seals during a bakeout procedure.

7 MS Gauge Maintenance
138 Series 835 Vacuum Quality Monitor
Instruction Manual - 835000
7.4 Environmental Requirements
The VQM System must be operated within certain environmental conditions to operate safely and
to perform within its published specifications.
7.4.1 Pressure Ranges
The VQM Mass Spectrometer Gauge (MS Gauge) is an Autoresonant Ion Trap Mass Spectrometer
(ART MS).
ART MS ion traps are intrinsically UHV sensors which operate under 1x10⁻⁵ Torr of total pressure.
Each system is tested and calibrated at the factory at its pressure sweet-spot corresponding to 2x10⁻⁷
Torr of pure nitrogen. An Auto Tune procedure built into the Viewer Application software provides
automated adjustment of MS Gauge parameters. Additional adjustments to the ion trap's
operational settings will be required to optimize the performance of the system for lower and higher
vacuum pressure ranges. Operation of the electron multiplier at pressures above 1x10⁻⁵ Torr is not
recommended by the electron multiplier manufacturer. A Tune Settings panel on the VQM Viewer
Software or voltage setting commands in the VQM Command Set, allow VQM users to modify the
trap operational parameters when the pressure conditions in a chamber change drastically. See
Tune, in Chapter 8 before modifying any operational parameters in your system.
7.4.1.1 UHV Operation
Operation at UHV levels will provide clean mass spectra with reduced baseline offset levels and
excellent resolution. However, it may require an increase in the electron emission current if the
mass peak amplitudes drop significantly and the dynamic range is below the measurement
requirements. As the pressure in the system enters the UHV range, the rate of ion formation
decreases and starts lagging behind the ion loss ejection rates. An increase in the electron emission
current produces a proportional increase in ion formation rate and in peak intensities. Increases in
emission current >0.2 mA can cause significant background gas contamination to the mass
spectrum from filament outgassing.
7.4.1.2 Operation at Close to Upper Pressure Limit
Operation at pressures above 3x10⁻⁶ Torr will lead to spectra with lower resolution, increased
baseline offset levels, and decreased dynamic range while operating under factory default settings.
As the pressure in the systems reaches the upper pressure limit of the sensor, the following
parameter modifications are typically required: (1) increase the RF Amp Voltage, and (2) decrease
the electron emission current. See Section 8.4.8, in Chapter 8 before modifying any operational
parameters in your system.
ART MS ion traps operate under space-charge saturation at pressures above 1x10⁻⁷ Torr (under
factory default settings). As a result, ion traps do not provide a strict proportionality between peak
heights and partial pressures over the entire pressure range of the sensor. The MS Gauge ion traps
are native ratiometric partial pressure measurement devices, and rely on auxiliary total pressure
data from ionization gauges to provide absolute partial pressure readings.
7.4.2 Temperature Range
• The MS Gauge is specified to operate over a temperature range spanning 0 ºC to 50 ºC (non
condensing).
• The cable connector plug that attaches to the feed-through flange on the MS Gauge is made
of high-temperature plastic capable of withstanding temperatures as high as 180 ºC.
However, the connector plug houses a circuit board with passive components (an HV RF
coupling transformer and ceramic capacitors) which are rated for operation at temperatures
below 105 ºC.
7 MS Gauge Maintenance
139
Series 835 Vacuum Quality Monitor
Instruction Manual - 835000
• The electron multiplier detector will be irreversibly damaged if operated (i.e. electrically
biased) at temperatures exceeding 100 ºC.
• The electron multiplier detector will be irreversibly damaged if heated above 200 ºC.
7.4.3 Humidity Range
Humidity is not an important factor affecting the performance of the Mass Spectrometer Gauge.
However, it has a direct impact on the longevity of the electron multiplier during storage outside a
high vacuum system and on the operation of the VQM Controller. See Section 2.4.2, VQM
Controller Specifications in Chapter 2.
7.4.4 Warm-up Periods
The VQM System requires a minimum warm-up time before a stable output is available. The
warm-up time for the Controller/MS Gauge is typically around 5 minutes and is defined as the time
it takes its power supplies to provide stable voltage and current outputs. The low power
requirements of the ion trap sensor, combined with an external 24 Vdc power supply connection,
minimizes the amount of power dissipated inside the VQM Controller and provides a very short
warm-up cycle.
The Mass Spectrometer Gauge is capable of providing spectra within 20 seconds from the time the
gauge is turned ON. However, slight drifts in mass axis calibration are detectable for periods of time
extending into 1 hour. If mass accuracy requirements beyond 0.5% (ΔM/M x 100) are required over
long periods of time, users should wait for an hour before performing a mass axis calibration on the
sensor. The drift in mass axis calibration is due to the thermal expansion of the trap as heat
dissipates from the filament into adjacent electrode structures. Changes in the ion trap length
translate into changes in the ejection frequency of ions.
Safety Check
Disconnect the cable connector from the MS Gauge before
starting the bakeout procedure.
Do NOT turn ON the MS Gauge while bakeout is in process.
Do NOT bakeout the MS Gauge at temperatures exceeding
200 0C.
7 MS Gauge Maintenance
140 Series 835 Vacuum Quality Monitor
Instruction Manual - 835000
7.5 Filament Assembly
7.5.1 Introduction
The VQM Controller constantly monitors the MS Gauge for failed filament operation. Once the
filament coating wears out and/or its wire breaks open, the filament can be replaced in the field
without a need to return the MS Gauge to the factory.
The filament is part of a filament assembly that (1) assures proper alignment of the wire with the
entry plate slit, (2) protects its coating from mechanical damage during shipment and installation,
and (3) provides a Repeller plate with an adjustable bias to optimize the focusing of electrons
through the entry slit.
Filament assemblies are manufactured following strict high vacuum practices and outgassed in a
dedicated test station prior to shipment. Thermal pre-treatment of the filament assemblies hardens
the Yttria coating on the filament wire and minimizes the initial release of contaminants into the
vacuum system the first time the filament is powered up. Section 6.6 provides a detailed description
of the components of the filament assembly (ionizer) and how it functions.
Filament replacement is a simple procedure that is described in the following section. Once
filament replacement is completed, the user should perform the Initial Pumpdown and Filament
Outgassing and Repeller Voltage Optimization procedures as described in the Initial Operation
Procedure in Chapter 8. Repeller Voltage Optimization completes the replacement process and
corrects against slight variations in filament-to-slit alignment that might take place between filament
assemblies.
7.5.2 Filament Assembly Replacement
A failed filament in the Mass Spectrometer Gauge can be replaced. If troubleshooting has revealed
that the MS Gauge is inoperative, follow the procedure below to replace the filament assembly.
Notice
Even though the delicate filament coating is protected, users must still be
extremely careful while handling the filament assembly and strictly follow
all instructions and warnings.
High Voltage
High voltages present within the Mass Spectrometer Gauge
present a risk of electrical shock capable of causing injury or
death. Turn OFF and disconnect power to the VQM Controller,
and disconnect the cable from the MS Gauge before removing
the Gauge from the vacuum chamber.
Do NOT disconnect the cable from the MS Gauge while power
to the VQM Controller is ON. Damage to the Gauge could
result.
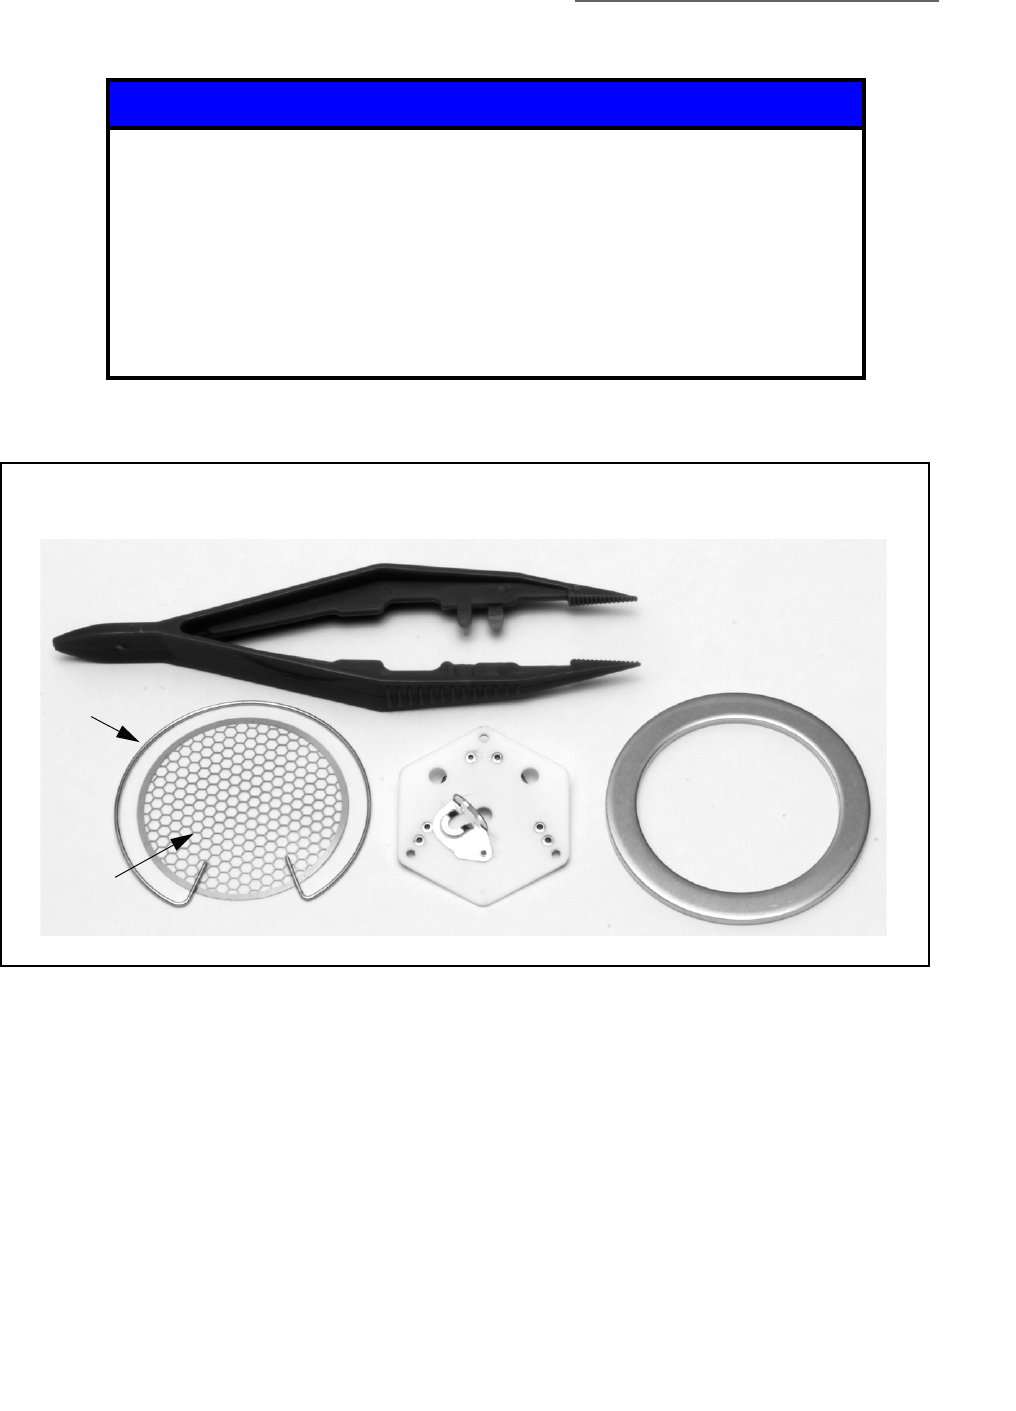
7 MS Gauge Maintenance
141
Series 835 Vacuum Quality Monitor
Instruction Manual - 835000
1. Turn OFF power to the VQM System and vent the vacuum chamber to atmosphere.
a. Press the POWER Button on the front of the VQM Controller to turn OFF the power.
b. Unplug the power input cord on the rear of the VQM Controller.
c. Wait at least 10 seconds before disconnecting the Gauge cable (step 2).
2. Disconnect the cable from the MS Gauge.
3. Remove the MS Gauge from the vacuum chamber. See Figure 7-2.
Notice
The MS Gauge is an Ultra High Vacuum instrument and MUST be handled
as such. Replacement of the filament should be done only in an
environment suitable for UHV components. Be sure to prevent
contamination of the MS Gauge and components. Use only clean-room
suitable tools, wear clean-room suitable gloves, face mask, and clothes
during this replacement procedure.
The components of the MS Gauge are fragile. Be especially careful when
disassembling and reassembling the gauge.
Do NOT scratch the ConFlat knife edge on the gauge.
Figure 7-1 Components of the Filament Replacement Kit
NOTE: The filament replacement kit includes a custom pair of
tweezers that are notched to grasp the retaining ring.
Tweezers to grasp
the retaining ring
Copper
Gasket
Filament
Assembly
Plasma
Screen
Retaining
Ring
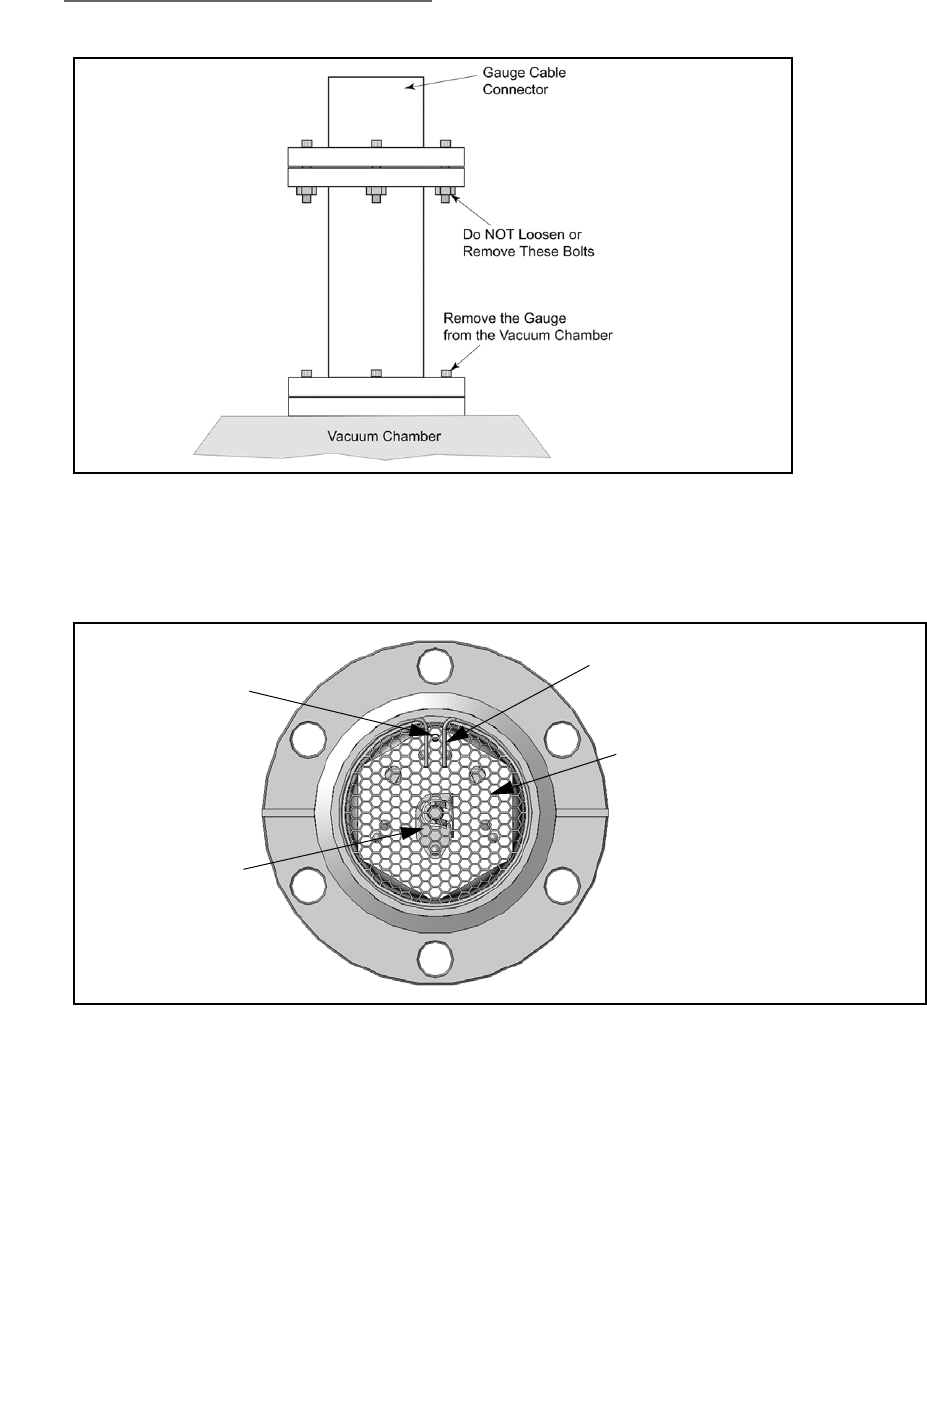
7 MS Gauge Maintenance
142 Series 835 Vacuum Quality Monitor
Instruction Manual - 835000
4. Look closely at the port of the MS Gauge and make note of the position of the components as
shown in Figure 7-3. Orient the gauge as shown in Figure 7-3.
5. Remove the retaining ring. Use the tweezers provided in the kit to squeeze the tabs together
and carefully lift the retaining ring from the gauge. Be careful not to damage the plasma screen
or to scratch the ConFlat knife edge when removing the retaining ring.
6. Remove the plasma screen. Be careful not to damage the plasma screen when removing it
from the gauge.
Figure 7-2 Remove the VQM MS Gauge from the Vacuum Chamber
Figure 7-3 VQM MS Gauge Components
Retaining
Plasma Screen
NOTE: The filament
assembly is under the
plasma screen.
Alignment Pin
See Figure 7-5
Filament Latch
See Figure 7-5
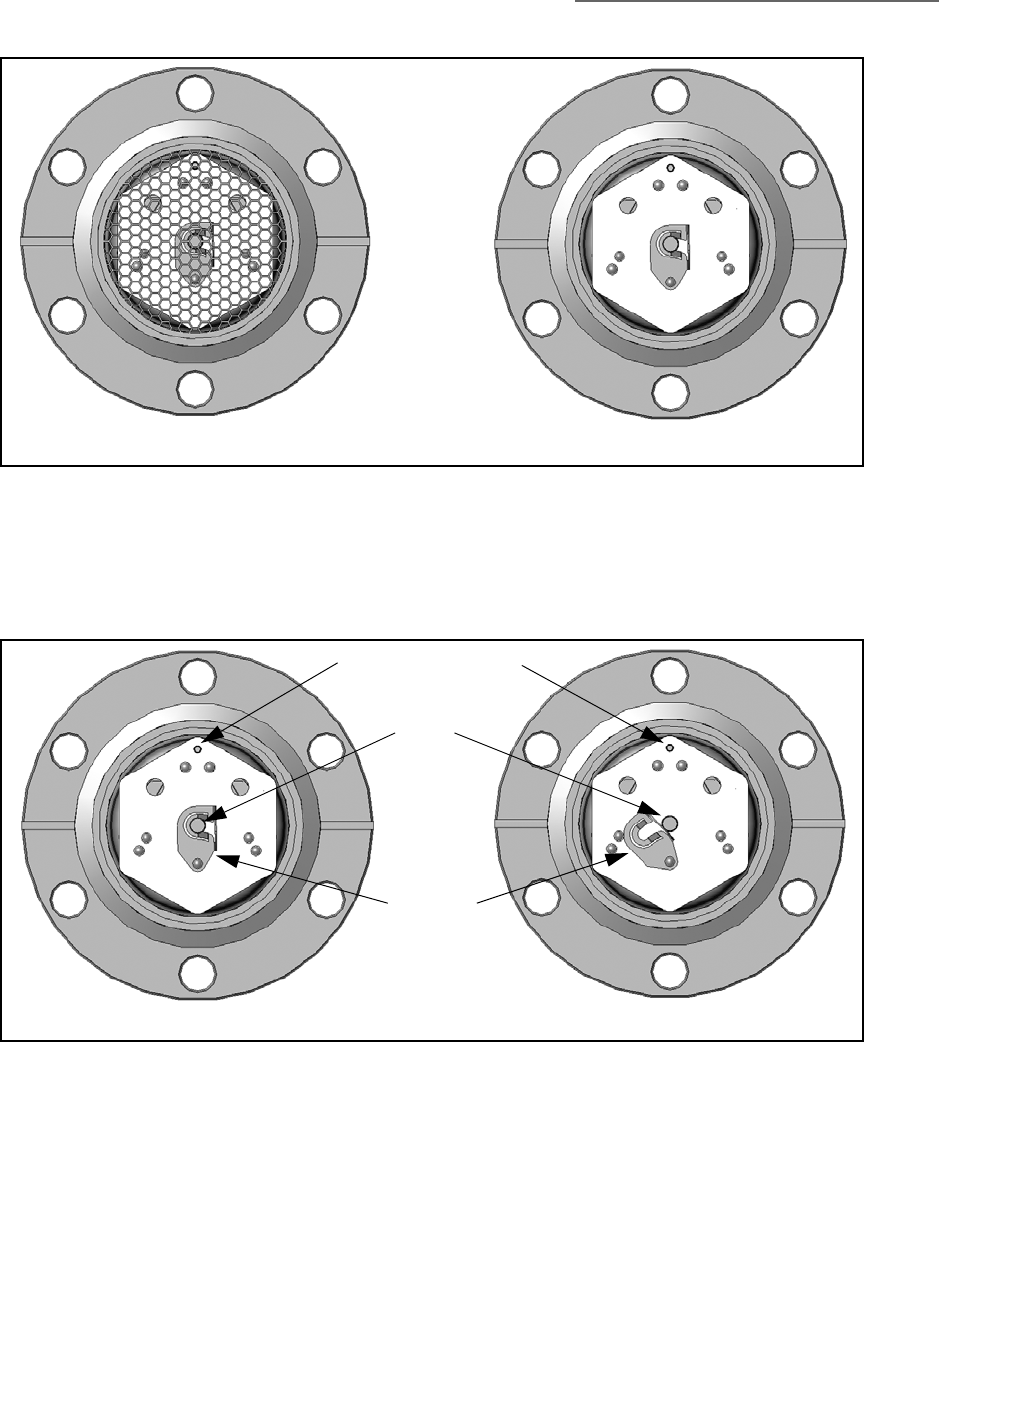
7 MS Gauge Maintenance
143
Series 835 Vacuum Quality Monitor
Instruction Manual - 835000
7. Unlatch the filament assembly so it can be removed from the gauge. Use tweezers or small
needle nose pliers to rotate the latch counterclockwise. See Figure 7-5. Do Not use excessive
force when unlocking or locking the filament latch.
8. Carefully lift the filament assembly from the gauge. Use tweezers or small needle nose pliers.
Note the position of the alignment pin and center pin (latch pin). Also, note the position of the
filament, which is between the two large holes. See Figure 7-5.
Figure 7-4 Snap Ring and Plasma Screen Removed
Figure 7-5 Filament Assembly Latch
Retaining Ring Removed Plasma Screen Removed
Filament Latch Locked (Closed) Filament Latch Unlocked (Open)
Filament Assembly
Alignment Pin
Filament
Assembly
Latch
Latch
Pin
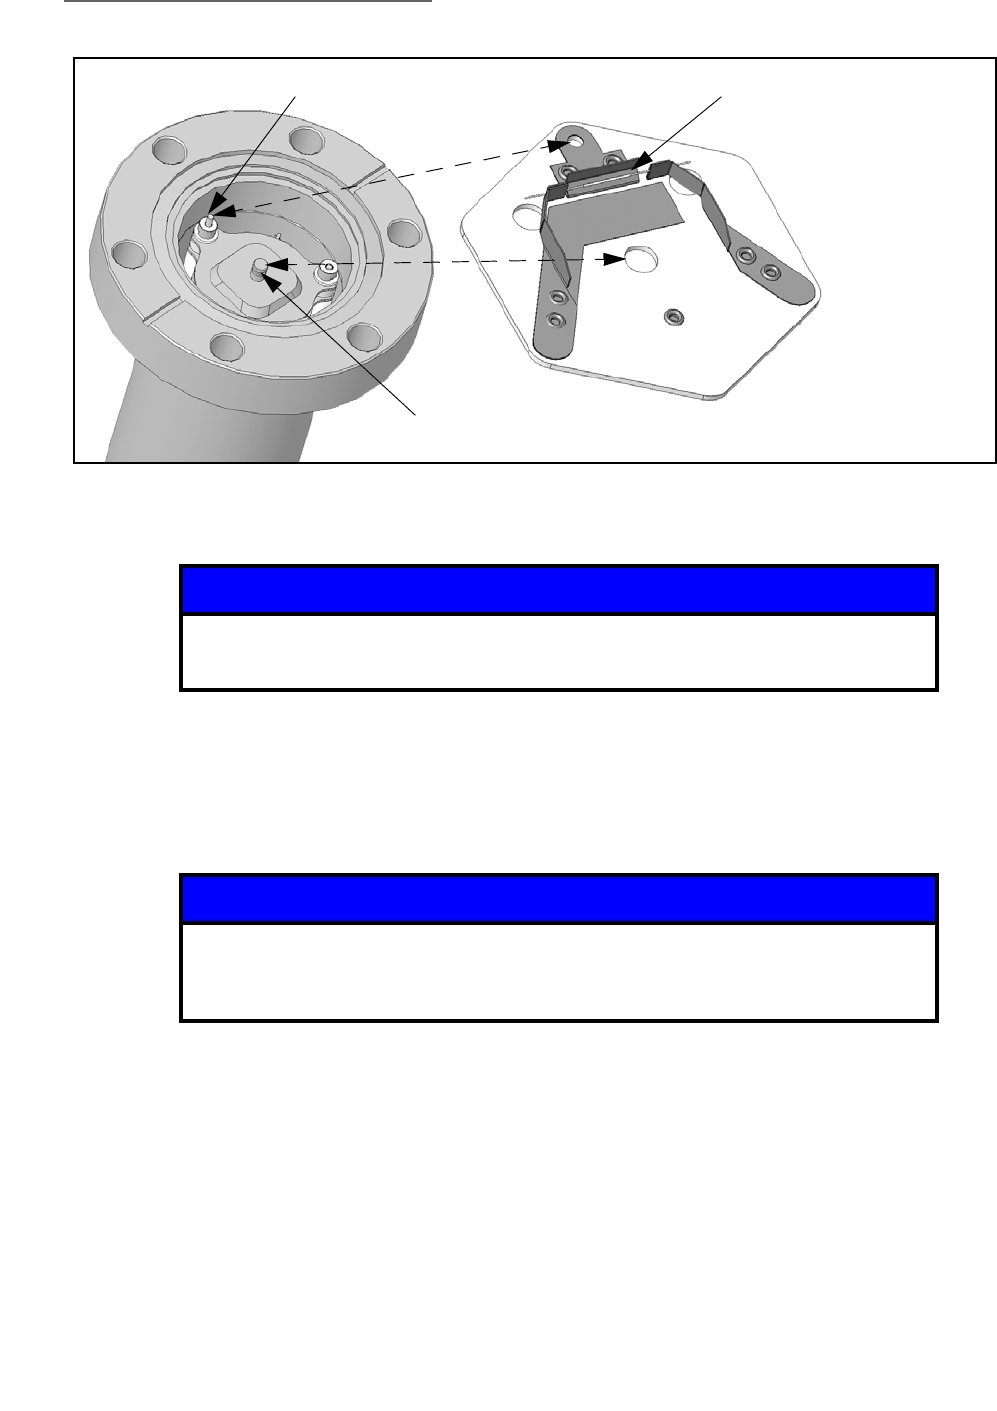
7 MS Gauge Maintenance
144 Series 835 Vacuum Quality Monitor
Instruction Manual - 835000
9. Insert the replacement filament assembly.
a. Be SURE the replacement filament assembly is oriented in the exact position as the one just
removed.
b. Make sure the center hole in the ceramic disk of the filament assembly fits completely
down onto the latch pin so the latch closes easily.
10. Rotate the latch clockwise to lock the replacement filament in place. Use tweezers or small
needle nose pliers. Make sure the latch is in the closed position as shown in Figure 7-5.
11. Insert the new plasma screen. Be careful not to damage the plasma screen or scratch the
ConFlat knife edge of the gauge.
12. Install the new retaining ring. Hold the retaining ring down on a clean, flat surface and grasp
both retaining ring tabs with notched tweezers held at a right angle to the surface (vertical).
Close the tabs tightly together so the retaining ring can be securely picked up. Insert the
retaining ring over the plasma screen and carefully release the tabs so the retaining ring
expands into the groove above the plasma screen.
Figure 7-6 Position of the Filament and the Alignment Pins
Notice
Trying to insert the replacement filament when not properly oriented will
cause damage to the replacement filament.
Notice
If the ceramic disk becomes trapped in the notch of the latch pin, the latch
will not close. Do NOT force the latch to close. Carefully reposition the
ceramic disk so it is properly seated at the bottom of the latch pin.
NOTE:
The Filament
Assembly is
shown
up-side-down
in this
illustration.
Alignment Pin
Latch Pin
Ceramic Disk
Filament

7 MS Gauge Maintenance
145
Series 835 Vacuum Quality Monitor
Instruction Manual - 835000
13. Install the gauge on the vacuum chamber. Be sure to use a new copper gasket when attaching
the MS Gauge to the vacuum chamber.
14. Connect the gauge cable and pumpdown the chamber to the 10-5 range.
15. Connect the power cord to the rear of the VQM Controller.
16. Perform the (1) Initial Pumpdown (Section 8.3.2), (2) Filament Outgassing (Section 8.3.4), and
(3) Auto Tune (Section 8.3.6).
7.5.3 Repeller Voltage Optimization
Perform the Repeller Voltage Optimization procedure each time: (1) a new filament assembly is
installed, (2) the filament assembly is repositioned, (3) a change in filament bias takes place, (4) a
change in entry plate bias takes place, or (5) a change in electron emission current takes place.
The Repeller plate was specifically designed to (1) mechanically protect the filament coating and (2)
optimize the focusing of electrons into the ionization region and through the off-axis slit of the entry
plate.
The mechanical alignment between the filament wire and the entry plate slit plays an important role
in the coupling efficiency of electrons into the ionization region. Small variations in alignments
between the filament wire and the entry slit result in: (1) decreased peak amplitudes and (2)
distorted peak shapes (i.e. shoulders). The Repeller bias voltage can be used to compensate against
slight filament variations in alignments.
Run the Auto Tune function. If it fails, use the following manual procedure to optimize the coupling
of electrons into the ionization region:
1. Starting from the Tune panel of the VQM Viewer Software, select Advanced Display/Advanced
and Tuning Display mode/Raw (nA).
2. Set the Repeller bias voltage to -20 V and collect a spectrum. Focus on the amplitude and
shape of the mass peaks in the spectra.
3. Decrease the Repeller bias voltage in increments of -5 V until the maximum peak amplitude is
achieved without peak shape distortions (i.e. optimum voltage setting).
4. Set the Repeller to the new optimum value and store the new Setting to NV RAM using the
Store User button on the Tune screen.

7 MS Gauge Maintenance
146 Series 835 Vacuum Quality Monitor
Instruction Manual - 835000
7.5.4 Filament Operation
There are two critical settings for the operation of the filament:
1. Emission Current -0.070 mA, default
2. Filament Bias Voltage -30 eV, default
The emission current defines the number of electrons that pass through the ionization region per
unit time. The filament bias voltage defines the electron energy (Electron Energy [eV]= Entry Plate
Bias [V] minus Filament Bias [V]) which affects the efficiency of ionization for the energetic
electrons.
The factory default setting for the emission current was selected based on operation at the sweet
spot of the ion trap, i.e. 2x10⁻⁷ Torr. Deviations in pressure away from the sweet spot will generally
benefit from changes in the emission current: (1) increase the emission current as the pressure drops
below 1x10⁻⁹ Torr, and (2) decrease the emission current as the pressure approaches the 1x10⁻⁵ Torr
Upper limit. Low emission currents result in lower filament temperatures, which in turn improves
filament lifetime and reduces contamination build-up due to thermal decomposition of chemicals
on the filament surface.
Adjustments to the electron energy can be affected by changing the filament or entry plate bias.
Modifying the entry plate bias has a large impact on the performance of the trap, as it requires
changes to all electrode voltages inside the trap, and is not recommended. In general, changes to
the filament bias are recommended instead. The filament bias is set to +30 V as factory default so
that electrons emitted from the filament cannot reach grounded surfaces in the vacuum system (i.e.
minimizes cross talk with other ionizing sources). Changes in the filament bias voltage must be
followed by a Repeller Voltage Optimization procedure (see Section 7.5.3).
7.6 Electron Multiplier Detector
7.6.1 Introduction
Continuous dynode electron multipliers have an excellent track record of high performance and
dependability in mass spectrometry instrumentation. By following the simple recommendations
described in the following sections, VQM users should be able to experience long useful lifetimes
from their detectors.
Electron multipliers must be regarded as a consumable item that will eventually need to be
replaced; they suffer irreversible gain degradation over time. The lifetime of an electron multiplier
will vary depending on the user's specific application and adherence to Best-Known Practices
described in Section 7.6.2. A field replaceable electron multipliers is available and strongly
recommended. See Section 7.6.10.
7.6.2 Best-Known Practices
To optimize the performance and lifetime of the electron multiplier, VQM users must adhere to the
following best-known practices:
• Perform the Initial Pump Down and Pre-conditioning procedures on any new MS Gauge, as
described in the Initial Operation Procedure in Chapter 8.
• Perform the Initial Pump Down and Pre-conditioning procedure on Mass Spectrometer
gauges that have been sitting in ambient air for a few months.
• To minimize gain degradation while no mass spectrometry data is being collected:
(1) Switch the VQM Controller to Standby mode. See Section 8.4.2.
7 MS Gauge Maintenance
147
Series 835 Vacuum Quality Monitor
Instruction Manual - 835000
(2) Remove power from the MS Gauge if the filament does not need to be powered. Idle
gauges should be proactively protected from contaminant condensation and line of sight
deposits.
(3) Use isolation valves or shutters to protect the MS Gauge from contaminants.
• Use the minimum detector output level (i.e. electron multiplier gain) compatible with your
detection limit and dynamic range requirements. Operating the electron multiplier at high
gain creates two potential risks: (1) peak clipping due to electrometer saturation (i.e.
unreliable data) and (2) lifetime and gain stability reduction.
• Use the optional Micro-Ion Total Pressure Measurement Gauge to actively protect the
filament and electron multiplier from overpressure conditions.
• Perform routine bakeouts of your MS Gauge and vacuum system.
• Do not operate above the maximum recommended pressure or temperature.
• Minimize exposure to contaminants (especially hydrocarbons) and reactive gases.
• Follow the recommended storage and handling procedures for the MS Gauge and spare
electron multipliers. See Section 7.2.
• Do not exceed the maximum recommended bias voltage. (Note: the bias voltage is a
negative voltage.)
7.6.3 Operating Pressure
The lifetime of an electron multiplier is inversely proportional to system pressure. The maximum
recommended operating pressure for the electron multiplier is < 1x10⁻⁵ Torr.
7.6.4 Operating Temperature
The safe operating temperature for an electron multiplier is < 100 ºC (212 ºF). Never apply bias
voltage to an electron multiplier at a temperature above 100 ºC.
Electron multipliers have a negative temperature coefficient of resistance and can experience a
run-away thermal burnout if operated at temperatures above 100 ºC.
7.6.5 Bakeout Temperature
The bakeout temperature must be less than 200 ºC (392 ºF) with no bias voltage applied across the
detector. An optional heating jacket is available from the factory which provides safe, regulated
bakeout temperatures.
Notice
Never apply high voltage to an electron multiplier at a pressure exceeding
1x10⁻⁵ Torr since it might cause irreversible damage to the detector due to
high voltage arcing.
Notice
Do NOT exceed 200 oC during bakeout of the MS Gauge. Exceeding 200 oC
may cause damage to the Electron Multiplier.

7 MS Gauge Maintenance
148 Series 835 Vacuum Quality Monitor
Instruction Manual - 835000
The active layer, i.e. secondary electron generation layer, on the surface of the internal channel
relies on the presence of reduced Lead atoms on its surface. Heating the electron multiplier above
200 ºC induces migration of lead atoms away from the surface and affects the secondary electron
emission yields.
7.6.6 Operating Voltage
The gain of an electron multiplier is controlled through bias voltage adjustments. There is a
nonlinear relationship between gain and high voltage bias. In general, higher output signals (i.e.
higher gains) correlate with faster gain degradation and shorter detector lifetimes. A new electron
multiplier will typically operate at a bias voltage between -900 and -1050 V. The negative high
voltage level will need to be increased on a regular basis to adjust against gain degradation. The
typical operating range for the VQM MS Gauge electron multiplier is -900 to -1350 V. Operation of
the electron multiplier at bias voltages beyond the -1350 V limit is acceptable, but not
recommended for long periods of time, since it increases the risk of arcing inside the sensor and
leads to accelerated gain degradation (especially in the presence of contaminants).
Notes:
a. The maximum output available from the electron multiplier high voltage power supply is −1500 V.
b. As the bias voltage in the electron multiplier reaches −1350 V, the user should start planning to replace
the electron multiplier detector at the earliest convenient time.
c. The electron multiplier high voltage supply is linked to the Repeller voltage supply, and the electron
multiplier bias voltage must be at least −750 V for the Repeller bias to be able to span its entire
specified range.
It is very important to be aware of the fact that both the filament and the electron multiplier are
powered every time the Mass Spectrometer Gauge is turned ON - i.e. there are no separate controls
for the filament and the electron multiplier.
7.6.7 Contamination
The electron Multiplier detector relies on the availability of a clean and unobstructed secondary
electron generation channel. The active surface of the electron multiplier can withstand repeated
exposures to ambient air without degradation. However, long-term exposure to ambient air (>3
months) has been known to cause irreversible damage to the detector. Oxidizing agents in the air,
(water and oxygen) adsorb onto the active layer of the channel and oxidize the lead atoms
responsible for the high secondary electron yields of the device. The MS Gauge storage
recommendations in this chapter are strictly designed to protect the electron multiplier from such
irreversible damage.
The electron multiplier active channel must be kept free of dust, lint or any other particulates.
Organic compounds such as pump oil or cleaning solvents are particularly deleterious to the long
term performance of the detector. Reactive compounds, such as fluorine, HF and fluorinated
hydrocarbons, are damaging to the filament and to the electron multiplier.
A Filament Outgassing procedure is described in the Initial Operation Procedure in Chapter 8 that
was specifically designed to minimize exposure of the electron multiplier to the initial gas load
evolved from the filament assembly the first time the filament is powered up. Use this procedure on
any new gauge or after a filament assembly replacement procedure.
Idle MS Gauges must be protected from the environment using (1) isolation valves (against
contaminants) or (2) baffles or shutters (against line of sight contaminants).

7 MS Gauge Maintenance
149
Series 835 Vacuum Quality Monitor
Instruction Manual - 835000
7.6.8 Initial Operation
To best assure high gain and long term stability of electron multipliers, it is very important to
complete the procedures described in the Initial Operation Procedure in Chapter 8 the first time an
MS Gauge is powered up: (1) Initial Pump Down, (2) Filament Outgassing, and (3) EM
Preconditioning.
The Initial Pumpdown and Pre-conditioning procedures are required to outgas water molecules
from the internal surfaces of the detector's channel(s) and to assure best possible gain stability.
Filament outgassing prevents exposure of the electron multiplier to the initial gas load that might be
outgassed from the filament assembly the first time it is powered up.
Mass Spectrometer Gauges exposed to ambient air for long periods of time (> 1 month) must be
treated the same way as a new gauge when first turned ON (i.e. the Initial Operation Procedure in
Chapter 8).
7.6.9 Gain Adjustment
The lifetime and the rate of gain degradation of the electron multiplier is inversely proportional to its
output signal intensity (gain). Output ion currents below 60 nA are recommended to avoid fast
degradation while still providing adequate dynamic range and detection limits for signal
acquisition.
Gain adjustment is recommended, and described in the Initial Operation Procedure in Chapter 8.
for each new MS Gauge.
The output of the electron multiplier must be checked periodically and readjusted as necessary
through increases in its high voltage bias. See the Electron Multiplier Gain Adjustment procedure in
the Initial Operation Procedure in Chapter 8.
7.6.10 Electron Multiplier Replacement
The gain of an electron multiplier is known to degrade over time, but can be compensated for in the
field by adjusting (i.e. increasing) its voltage bias. An adjustable Electron Multiplier High Voltage
setting is available to restore detector gain. Gain degradation limits the lifetime of all electron
multipliers. Eventually, the gain drops to unacceptable levels and the multiplier needs to be
replaced. The electron multiplier voltage can be decreased without risks down to -1450 V.
However, voltage settings below this can lead to internal arcing, reduced and erratic signal levels,
and unreliable operation.
A failed electron multiplier in the Mass Spectrometer Gauge can be replaced. If troubleshooting has
revealed that the MS Gauge is inoperative, follow the procedure below to replace the electron
multiplier assembly.
Notice
Failure to follow these recommended procedures the first time the MS
Gauge is powered up can lead to gain instabilities and potential
irreversible gain degradation in the electron multiplier.
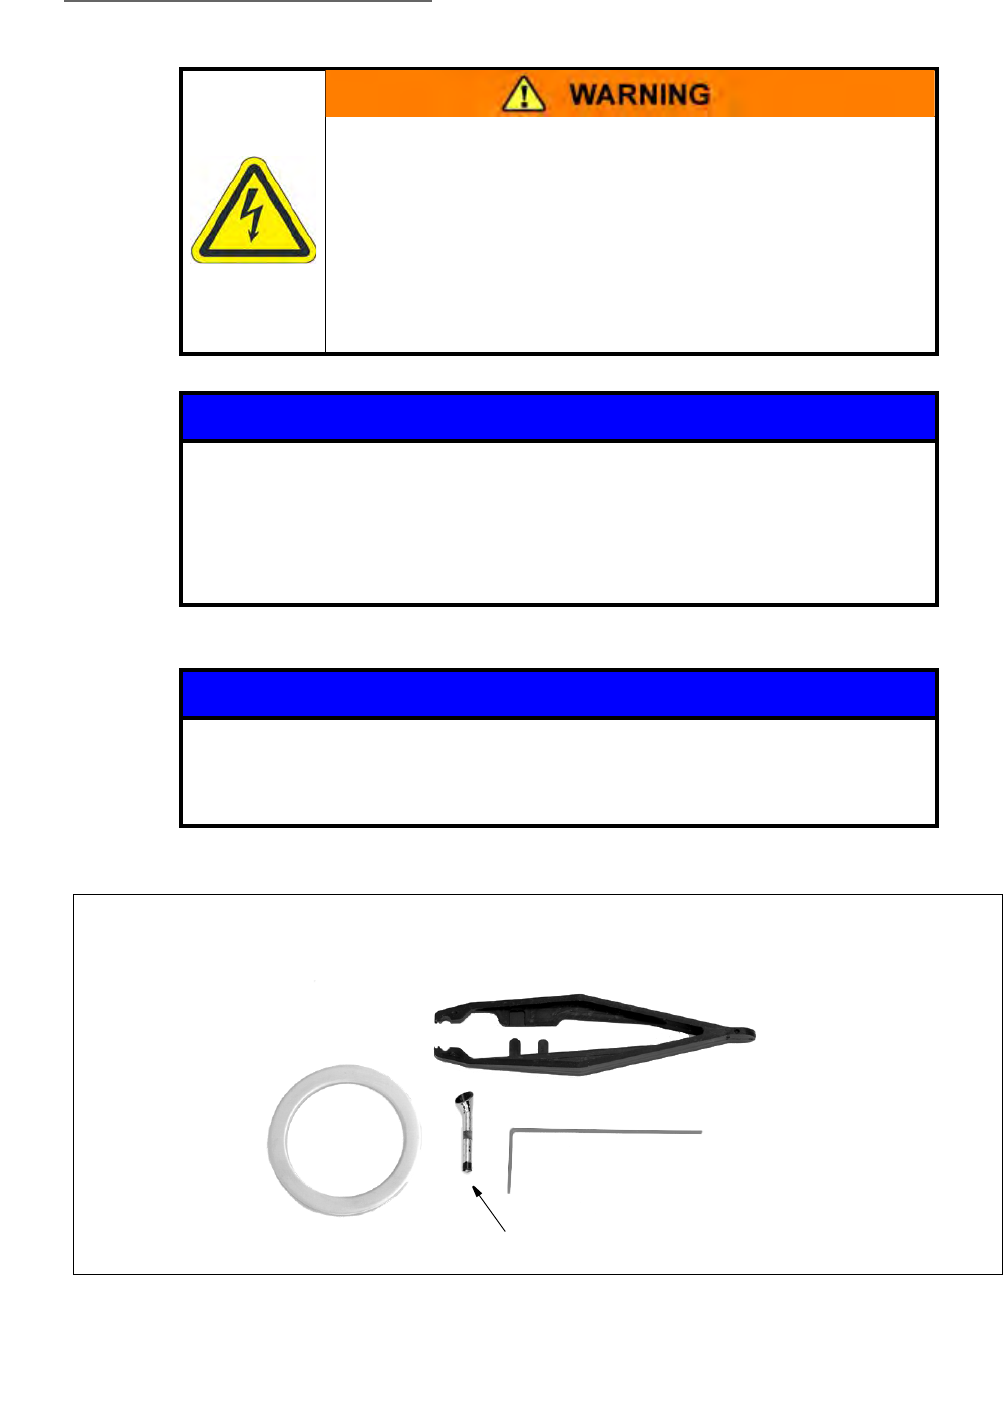
7 MS Gauge Maintenance
150 Series 835 Vacuum Quality Monitor
Instruction Manual - 835000
High Voltage
High voltages present within the Mass Spectrometer Gauge
present a risk of electrical shock capable of causing injury or
death. Turn OFF and disconnect power to the VQM Controller,
and disconnect the cable from the MS Gauge before removing
the Gauge from the vacuum chamber.
Do NOT disconnect the cable from the MS Gauge while power
to the VQM Controller is ON. Damage to the Gauge could
result.
Notice
The MS Gauge is an Ultra High Vacuum instrument and MUST be handled
as such. Replacement of the electron multiplier should be done only in an
environment suitable for UHV components. Be sure to prevent
contamination of the MS Gauge and components. Use only clean-room
suitable tools, wear clean-room suitable gloves, face mask, and clothes
during this replacement procedure.
Notice
The components of the MS Gauge are fragile. Be especially careful when
disassembling and reassembling the gauge.
Do NOT scratch the ConFlat knife edge on the gauge.
Figure 7-7 Components of the Electron Multiplier Replacement Kit
NOTE: The electron multiplier replacement kit includes a custom
pair of tweezers that are notched to grasp the electron
multiplier and the 0.040 diameter feeler gauge.
Tweezers to grasp the
Electron Multiplier
0.040 diameter gauge wire
Replacement Electron Multiplier
Replacement
copper gasket
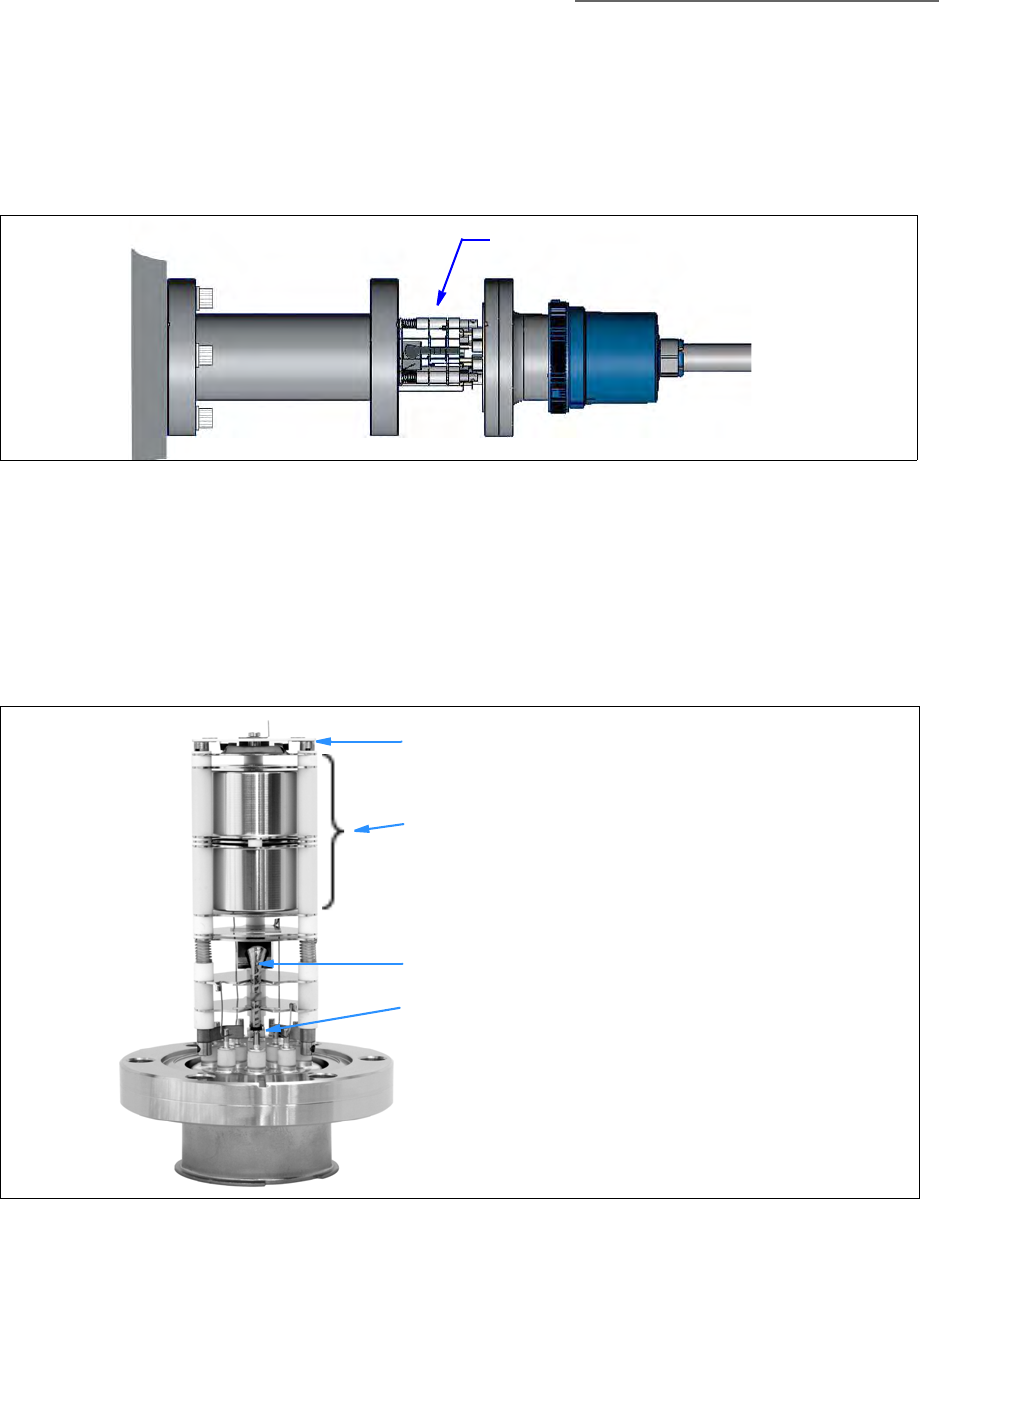
7 MS Gauge Maintenance
151
Series 835 Vacuum Quality Monitor
Instruction Manual - 835000
1. Turn OFF power to the VQM System and vent the chamber to atmosphere. Disconnect the
cable from the MS Gauge and remove the 6 bolts that attach the MS Gauge to the envelope
nipple. See Figure 7-8.
2. Carefully remove the MS Gauge from the envelope. Avoid sliding the ceramic insulators of the
MS Gauge along the inside of the envelope.
3. Look closely at the MS Gauge and make note of the position of the components as shown in
Figure 7-9.
Figure 7-8 Remove the MS Gauge from the Envelope Nipple
Figure 7-9 MS Gauge Components
MS Gauge Assembly
with Electron Multiplier
Vacuum Chamber
Envelope
Nipple Cable
Connector
Filament Assembly
Ion Trap
Electron Multiplier
Signal Cup
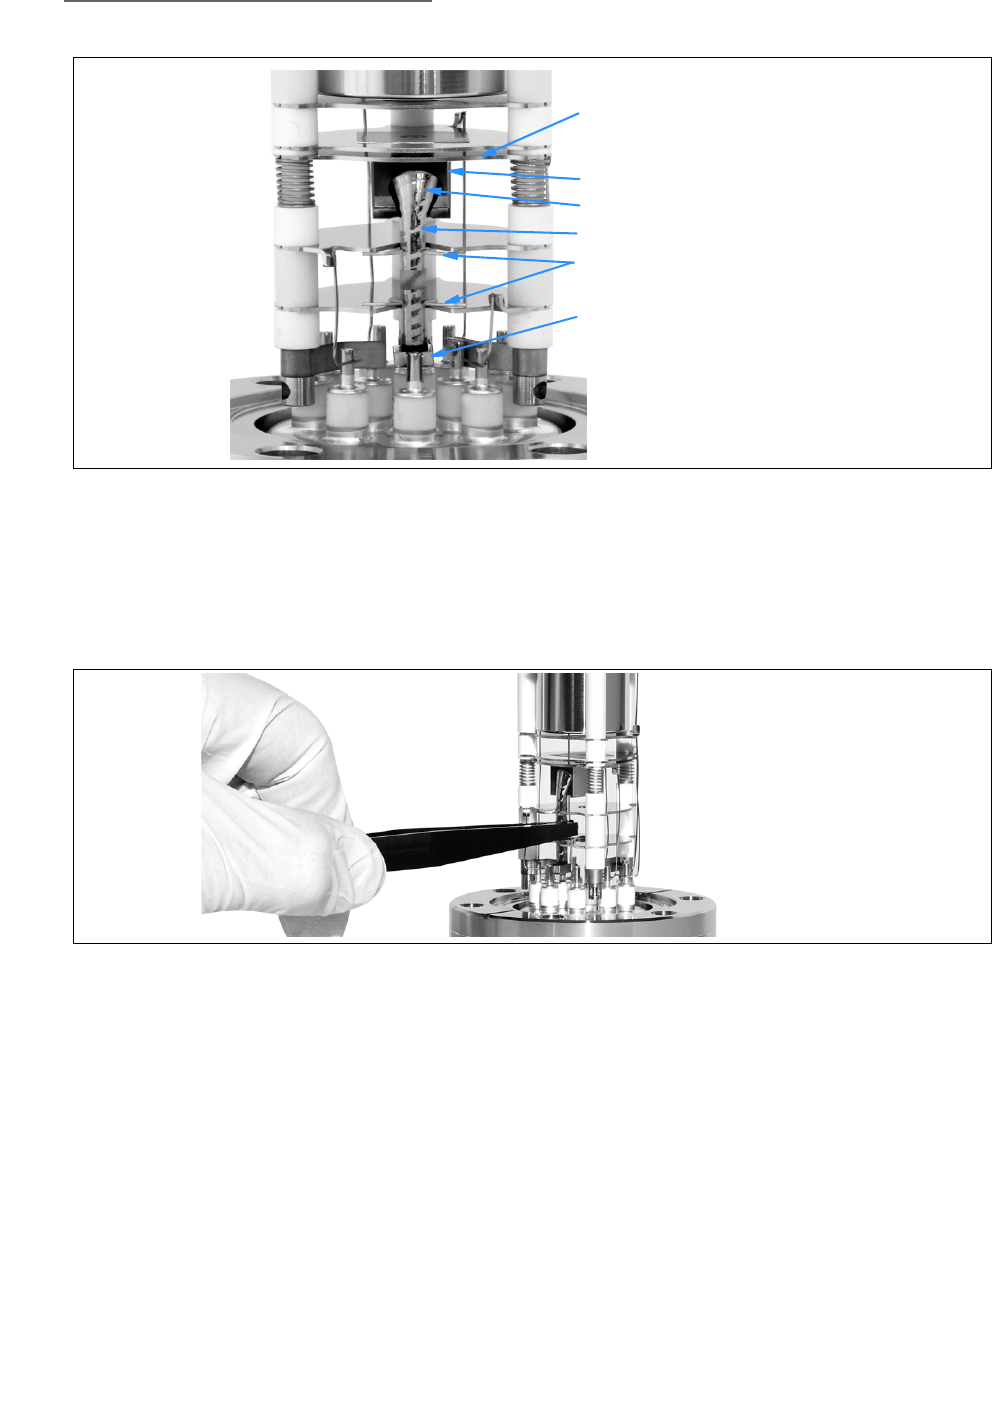
7 MS Gauge Maintenance
152 Series 835 Vacuum Quality Monitor
Instruction Manual - 835000
4. Use the larger notch of the tweezers to remove the Electron Multiplier (EM) as shown in Figure
7-11. Note that the electron multiplier sets into a socket (signal cup) at the bottom. After the
EM is disengaged (gently pull outward) from the two retaining springs, lift the EM to remove it
from the signal cup.
5. Grasp the new EM with the tweezers, making sure the bell of the EM will face directly to the
center of the MS Gauge.
6. Insert the new EM into the signal cup and carefully push the upper part of the EM into the two
retaining springs that lock it in place. Make sure the bell of the EM is facing toward the center
of the MS Gauge.
7. Use the 0.040 gauge wire to adjust the EM to the proper location as illustrated in Figure 7-12
and Figure 7-13. The gauge wire can also be used if slight rotational adjustment is required to
make sure the bell of the EM is facing toward the center of the MS Gauge. To do so, slide the
wire between the bell and the sides of the EM Shield (see Figure 7-10).
Figure 7-10 Close-up of the Electron Multiplier
Figure 7-11 Remove the Electron Multiplier
Electron Multiplier
Retaining Springs
Signal Cup
Electron Multiplier Bell
Electron Multiplier Shield Plate
Electron Multiplier Shield
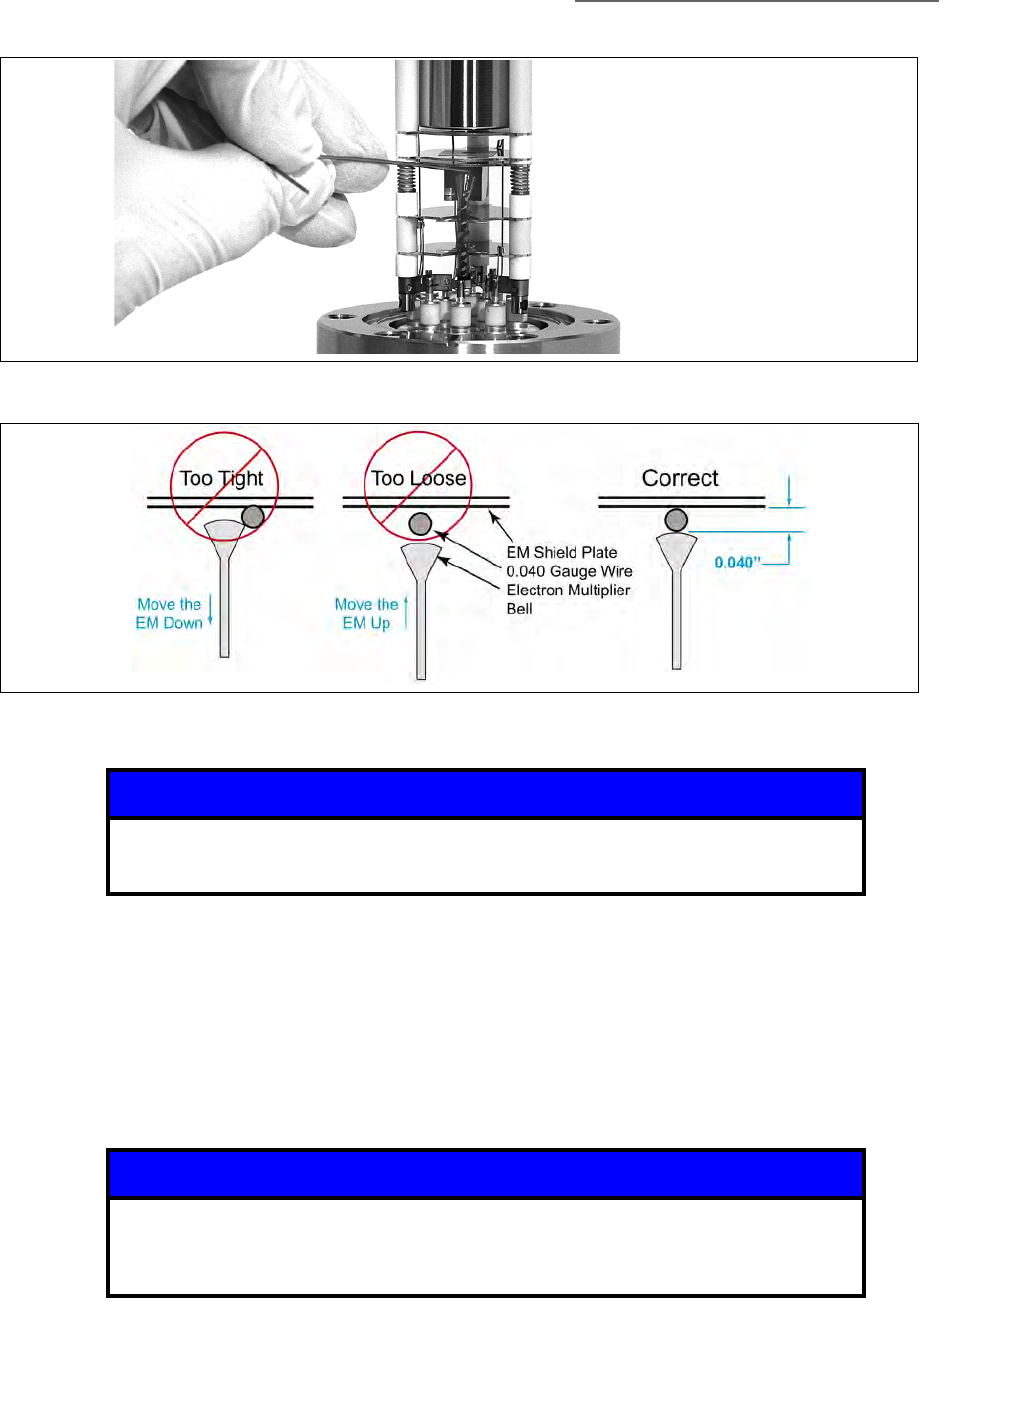
7 MS Gauge Maintenance
153
Series 835 Vacuum Quality Monitor
Instruction Manual - 835000
8. Using the new copper gasket provided in the EM Kit, carefully insert the MS Gauge into the
envelope. Avoid sliding the ceramic insulators of the MS Gauge along the inside of the
envelope.
9. Install the bolts that were removed in Step 1.
10. Pump down the vacuum chamber to<1x10⁻⁵ Torr.
11. Connect the interconnect cable from the VQM Controller to the MS Gauge.
Figure 7-12 Electron Multiplier Adjustment
Figure 7-13 Proper Electron Multiplier Adjustment Setting
Notice
Be sure the new copper gasket is in the proper location before installing the
bolts that hold the MS Gauge in the envelope nipple.
Notice
Be sure to pump down the vacuum chamber to 1x10⁻⁵ Torr or lower before
turning ON the VQM Controller. The MS Gauge filament may be damaged
at system pressures higher than 1x10⁻⁵ Torr.

7 MS Gauge Maintenance
154 Series 835 Vacuum Quality Monitor
Instruction Manual - 835000
12. Connect the USB cable from the computer with the VQM Viewer Application software to the
VQM Controller.
13. Open the Viewer Application software.
14. Turn ON power to the VQM Controller, but do not apply power to the MASS SPEC at this time.
15. Use the Tune Settings in the VQM Application software to set the EM Bias Voltage to -750V.
See “Tune Settings” Section 8.4.8 in Chapter 8 of this Instruction Manual.
16. Turn ON the MASS SPEC Gauge and perform the (1) Initial Pumpdown, (2) Filament
Outgassing, and (3) EM Preconditioning, (4) Auto Tune, (5) EM Gain Adjustment, and (6) Mass
Axis Calibration as outlined in Chapter 8, Section 8.3 of this Instruction Manual.
7.7 Cleaning a VQM Gauge
The VQM MS Gauge is not liquid solvent cleanable due to the large number of close fitting
triple-nested spacers. Solvents will dissolve surface contamination and carry it into all these small
clearances by capillary action, where it will be impossible to rinse out. The solvent will eventually
evaporate leaving the contamination behind.
The best cleaning method is to bake the gauge at high vacuum. See Section 7.3.
Notice
Before turning ON the MASS SPEC Gauge, the EM Bias Voltage MUST be set
to -750V. Failure to do so, especially if it is currently set to a lower (-)
voltage, may damage the new electron multiplier.

155
Series 835 Vacuum Quality Monitor
Instruction Manual - 835000
Chapter 8
8Initial Operation & Viewer Software
8.1 VQM® Viewer Application Software for the VQM System
This chapter explains the required initial operation (startup) procedures and how to use the Viewer
Application Software to obtain the best results from the VQM System. The 835 VQM Viewer
Software provides the fastest and easiest way to access the full functionality and optimize the
performance of the instrument. The Viewer Software is required for the Initial Operation Procedures
described in this chapter (Section 8.3).
The subjects addressed in this chapter include:
• Application Icons and Basic Screen Displays (Section 8.2)
• Initial Operation Procedure for the instrument (Section 8.3)
• Using the Viewer Application (Section 8.4)
Mass spectrometry experts will find that the full set of adjustments (advanced settings) and peak
analysis functions embedded into the Tune screens provide a very convenient way to characterize
and optimize the performance of the system. Vacuum technologists will immediately benefit from
the data-mining functions built into the application including: mass peak finding and gas
identification. The VQM Viewer Software application provides a full set of functions that quickly
and accurately report the 10 most prevalent gases and their partial pressures in a vacuum chamber.
A data logging engine is available to track vacuum system pump downs including both total and
partial pressure information. Gas analysis results can be displayed as ratios (normalized),
percentages (%), and absolute values. Graphical screen displays show the total pressure, partial
pressure, and full spectral data. Partial pressure trend graphs and a leak testing screen allow
monitoring specific gas concentrations and partial pressures as a function of time. And, a
single-peak mass-axis calibration allows users to easily calibrate the mass axis of the spectrometer.
The VQM Viewer Application Software is a Windows-based application that communicates with
the VQM Controller through a Windows Service which is installed with the Viewer Application. The
USB port on the VQM Controller is a type B, 2.0, full-speed, 12.5 Mb/sec connection to interface
with a Host/PC. The USB cable must meet the specifications for USB 2.0, USB-IF.
Notice
Be SURE to complete the Initial Operation Procedure, Section 8.3, BEFORE
using the 835 VQM System to collect mass spectra. Failure to perform the
procedure may result in premature sensor degradation and inaccurate data
collection.
Notice
If the USB cable becomes disconnected while the VQM Controller power is
ON, the Controller may need to be turned OFF and restarted to reestablish
proper communication with the Host/PC.
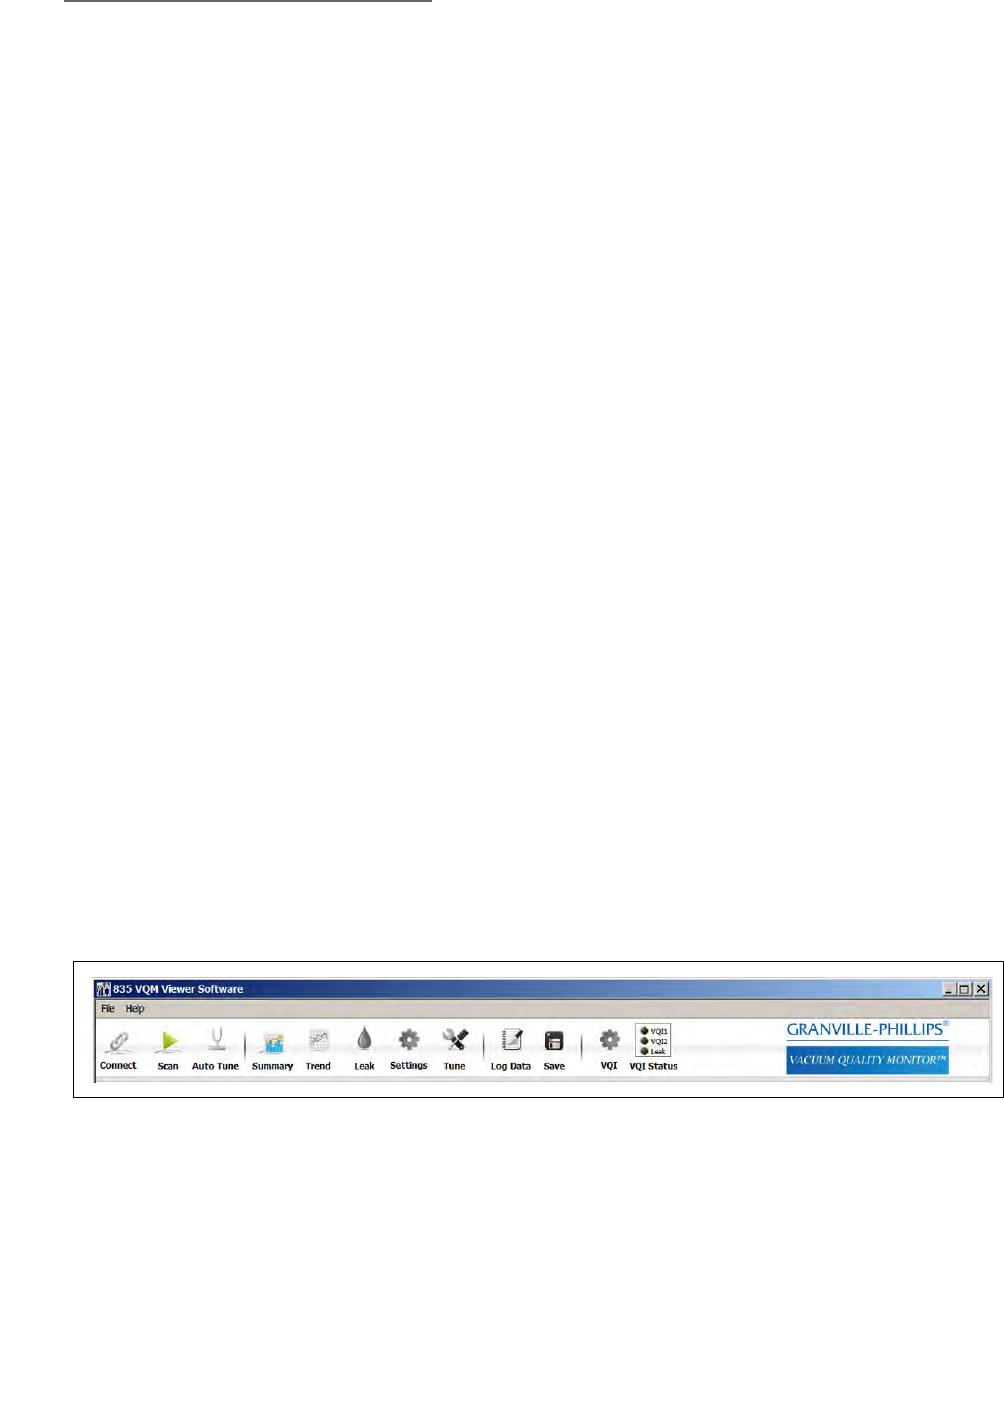
8 Initial Operation & Viewer Software
156 Series 835 Vacuum Quality Monitor
Instruction Manual - 835000
Users can develop their own applications to perform control and data collection activities using the
same API used by the Viewer Application. See the Programmer's Reference Guide, p/n 835003.
Also, users can access the functionality of the instrument using the VQM Command Set (see
Chapter 9), a USB link, a Host/PC, and user designed software.
NOTE: A list of Acronyms and Definitions that are used throughout this
chapter is given in Table 2−1, Section 2.3 on page 23 of this instruction
manual.
8.1.1 Software VIs, Services, and Driver
APIs
The Viewer Application uses LabVIEW VIs to interact with the Controller. A user can use the
LabVIEW VIs, or the .NET APIs to create a custom application. See the Programmer's Reference
Guide, p/n 835003.
Services
To facilitate several applications communicating with several Controllers, the VQM Software Suite
includes Windows Services that coordinate the communications. A master application (such as the
Viewer Application) can control a VQM System (Controller and MS Gauge) while a monitor
application (such as a custom application that logs operating statistics) simultaneously collects the
results. The default installation supports 4 Services (4 Controller connections) simultaneously. Use
of this feature is limited only by the power of the CPU being used.
When an 835 Service is using a USB port for a Controller, a terminal emulator program like
HyperterminalTM cannot gain access to the same port. It may be necessary to stop a Service that is
using the port for the terminal emulator to access the USB port.
Driver
The driver used by the Services and the command prompt to communicate with the Controller is
installed as part of the VQM Software Suite. The same driver is used for both. This provides reliable
communications with the Controller and should not be bypassed.
8.2 VQM Viewer Application Icons and Screen Displays
When the VQM System is connected to a Host/PC with the VQM Viewer Software, the icons listed
across the top of the screen allow the user to select numerous functions and settings when using the
VQM System. They are arranged in four groups:
• First Group: (on the left side of the screen) provides access to the primary functions.
• Second Group: provides access to the data display, modes of operation, and system settings.
• Third Group: provides access to the logging and save functions.
• Fourth Group: provide access to the VQI (Vacuum Quality IndexTM) Setup page and VQI status.
Figure 8-1 Program Control Icons

8 Initial Operation & Viewer Software
157
Series 835 Vacuum Quality Monitor
Instruction Manual - 835000
Each icon has an up (slightly elevated) state indicating that it is currently inactive, and a down
(slightly depressed state) indicating that it is currently active.
Help information is available any time the Viewer Software is active. Press "Control H" on the
keyboard and hover the cursor over any of the icons for a short description of its function. Press
"Control H" again to disable the help information.
8.2.1 Viewer Application Icons
8.2.1.1 Connect See Section 8.4.1
Connects/Disconnects to/from the VQM System (Controller and MS Gauge) via USB.
With no active connection, click on the Connect icon to display a connection pop-up window that
lists the COM port number and Controller serial number for all VQM Systems presently connected
to the Host PC. Select the desired device and click "Use this Device" to establish a communication
link between the Viewer Application and the Controller.
The Connect icon can also be used to view a previously saved Log file.
8.2.1.2 Multi-function Mass Spec Control See Section 8.4.2.
The second icon from the left side of the tool bar applies/removes all voltages to the MS Gauge and
controls scanning.
The states included are Off, Standby, On, and Scan. Transitions between any two states are allowed.
•Off removes power to the gauge.
•Standby applies power, but keeps the Electron Multiplier Bias voltage at -500 V. The Standby
mode should be used for outgassing and to keep the MS Gauge warm without degrading the
Electron Multiplier.
•On applies all power to the gauge. The system is not scanning while in the ON mode.
•Scan applies power and activates continuous scanning for the selected mass range (see Section
8.4.7). Mass spectrometry data is generated and available for display. Select a display mode
using: Summary, Histogram, Trend, Tune, and Leak icons.
To protect the MS Gauge from destructive overpressure conditions, the VQM Viewer Application
uses the total pressure readings provided by the analog output signal from numerous vacuum
measurement products. If the reported total pressure is too high, software overpressure protection
will disable all the voltages in the device, overriding a request to enable them. The default value for
the software overpressure protection is 1x10⁻⁵ Torr. The user can set the overpressure protection to a
pressure lower than 1x10⁻⁵ Torr (i.e. 1x10⁻⁶ Torr), but not to a higher pressure. See Section 8.4.7.2.
8.2.1.3 Auto Tune See Section 8.4.3
The operating parameters of the gauge interact with each other. Auto Tune assumes control of the
Controller and MS Gauge, and attempts to find the optimal operating settings for the MS Gauge. The
Auto Tune function optimizes the settings for the Repeller Bias Voltage, Exit Plate, Electron
Multiplier Shield Voltage, Electron Multiplier Bias, and the Filament emission current.
8.2.1.4 Summary See Section 8.4.4
Displays the Summary screen, which provides:
• The Results table which contains the normalized intensity, percentage, and absolute partial
pressure for either the Top or User Selected Gases/Masses.
• A short term trend graph of the total pressure and absolute or ratiometric (%) data for the
entries in the Top Gas/Select Gas table.
• A histogram of the Mass Spectrum.

8 Initial Operation & Viewer Software
158 Series 835 Vacuum Quality Monitor
Instruction Manual - 835000
• Average and instantaneous total pressure.
• Averaging settings.
• Response time.
8.2.1.5 Trend See Section 8.4.5
Displays the long term Trend screen, which provides:
• The Results table which contains the normalized intensity, percentage, and absolute partial
pressure for either the Top or User Selected Gases/Masses.
• An infinite time scale (finite data) trend graph of the total pressure and the absolute partial or
ratiometric pressure values for the entries in the Results Table.
• Average and instantaneous total pressure indicators.
• Averaging settings
• Response Time
8.2.1.6 Leak See Section 8.4.6
Displays the Leak check screen, which provides:
• Leak detect software which optimizes the performance of the VQM to better detect small
leaks.
• A Mass select control.
• An Audio ON/OFF control.
• Averaging Controls.
• Instantaneous and trend displays of the leak mass.
8.2.1.7 Settings See Section 8.4.7
Displays the Settings Screen which provides:
• The Mass Spectrum Library Builder.
• Pressure Setup controls, including: pressure source, over-pressure limit, external pressure
valid indicator and pressure display units.
• A mass range selector control and indication of current mass range.
• A histogram of the Mass Spectrum.
• Averaging settings.
8.2.1.8 Tune See Section 8.4.8
Displays the Tune screen for Initial Operation, Calibration, and Advanced Configuration.
The Tune screen provides:
• A section to check or modify VQM gauge settings.
• Buttons to store or load settings from/to Non Volatile RAM or from/to a file.
• The analog spectrum with user’s selections of Raw nA, Raw counts, or normalized curves.
Notice
A total pressure measurement gauge is required to provide absolute partial
pressure measurements.

8 Initial Operation & Viewer Software
159
Series 835 Vacuum Quality Monitor
Instruction Manual - 835000
• Mass axis calibration control.
• Mass peak analysis of a selected mass.
• Control raw data logging.
• Averaging control.
• Diagnostics.
8.2.1.9 Log Data See Section 8.4.8.4 and Section 8.4.9
Logs all data in two ASCII files. Files include a header file with all status and voltages of the VQM
System at the point of initiating the log, and a data file that contains the logged percentages of each
mass peak. The icon will appear blue while the logging is active. The base filename is entered by
the user. The extension for the header file is ".hdr". The extension for the percentages file is ".csv".
8.2.1.10 Save See Section 8.4.10
Allows the user to save the current histogram, trend, and analog curve data. Saves a single set of
result data (mass vs. intensity) to a user-named comma-delimited file.
8.2.1.11 VQI® (Vacuum Quality IndexTM) See Section 8.4.11
The VQI Screen provides access to the Vacuum Quality Index setup. Two VQI signals, including
optional audio outputs or a single digital output can be configured.
8.2.1.12 VQI Status See Section 8.4.12
This cluster includes indicators for VQI status.
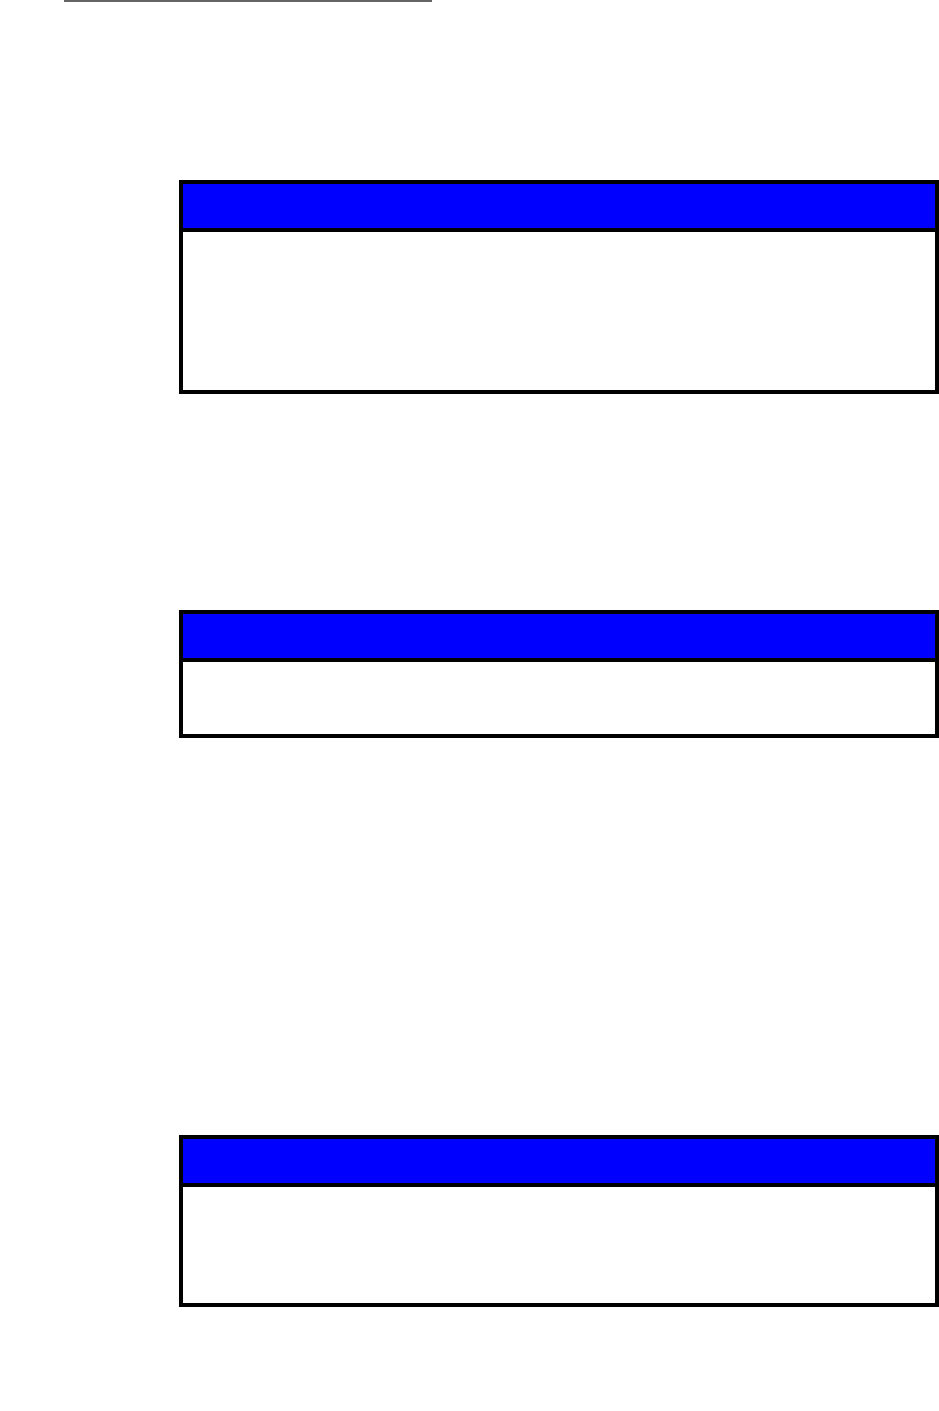
8 Initial Operation & Viewer Software
160 Series 835 Vacuum Quality Monitor
Instruction Manual - 835000
8.3 Initial Operation Procedure
The following sections describe the recommended startup procedure to optimize the VQM System
after installing a new MS Gauge. Some of the actions must be repeated after maintenance
procedures (replacement of the filament or electron multiplier).
The filament assembly and the electron multiplier are the two most sensitive components of the MS
Gauge, and both must be protected from (1) over-pressure conditions, (2) reactive or corrosive
gases, (3) contamination sources, and (4) over-power conditions. To assure optimal performance
and long term stability for both components, it is very important to perform the procedures
described in the following sections after the Hardware Installation activity described in Chapter 3 is
completed.
The Electron Multiplier must be regarded as a consumable item that will eventually need to be
replaced; it suffers irreversible gain degradation over time. The lifetime of an electron multiplier will
vary depending on (1) the user's specific application and (2) adherence to Best-Known Practices
(see Section 7.6.2) described in the Electron Multiplier section of the MS Gauge Maintenance
Chapter.
The VQM Controller electrometer has an input current range of 0 to 60 nA under optimal settings.
The output of the MS Gauge detector must be optimized so that peak amplitudes do not exceed the
input range of the electrometer during initial operation. The Electron Multiplier Gain Adjustment
procedure must be executed to avoid electrometer overloads and peak clipping in the mass spectra.
The Mass axis calibration factor must be verified, and recalibrated if necessary, during the initial
operation procedure for the gas identification routines of the VQM Viewer Application software to
operate properly.
Notice
Do not turn ON the MS Gauge until directed by the Initial Operation
Procedure.
Do not turn ON the MS Gauge until the vacuum chamber pressure is below
1x10⁻⁵ Torr.
Do not keep the MS Gauge turned ON unless measurements are required.
Notice
The filament and the electron multiplier in the MS Gauge are consumables
that degrade irreversibly over time as the MS Gauge remains active.
Notice
A Host PC and the VQM Viewer Software are required to complete some of
the procedures described in the following sections. For Stand-Alone
operation, i.e. without a Host PC connection, consult the factory for
instructions that do not require the VQM Viewer Application Software.
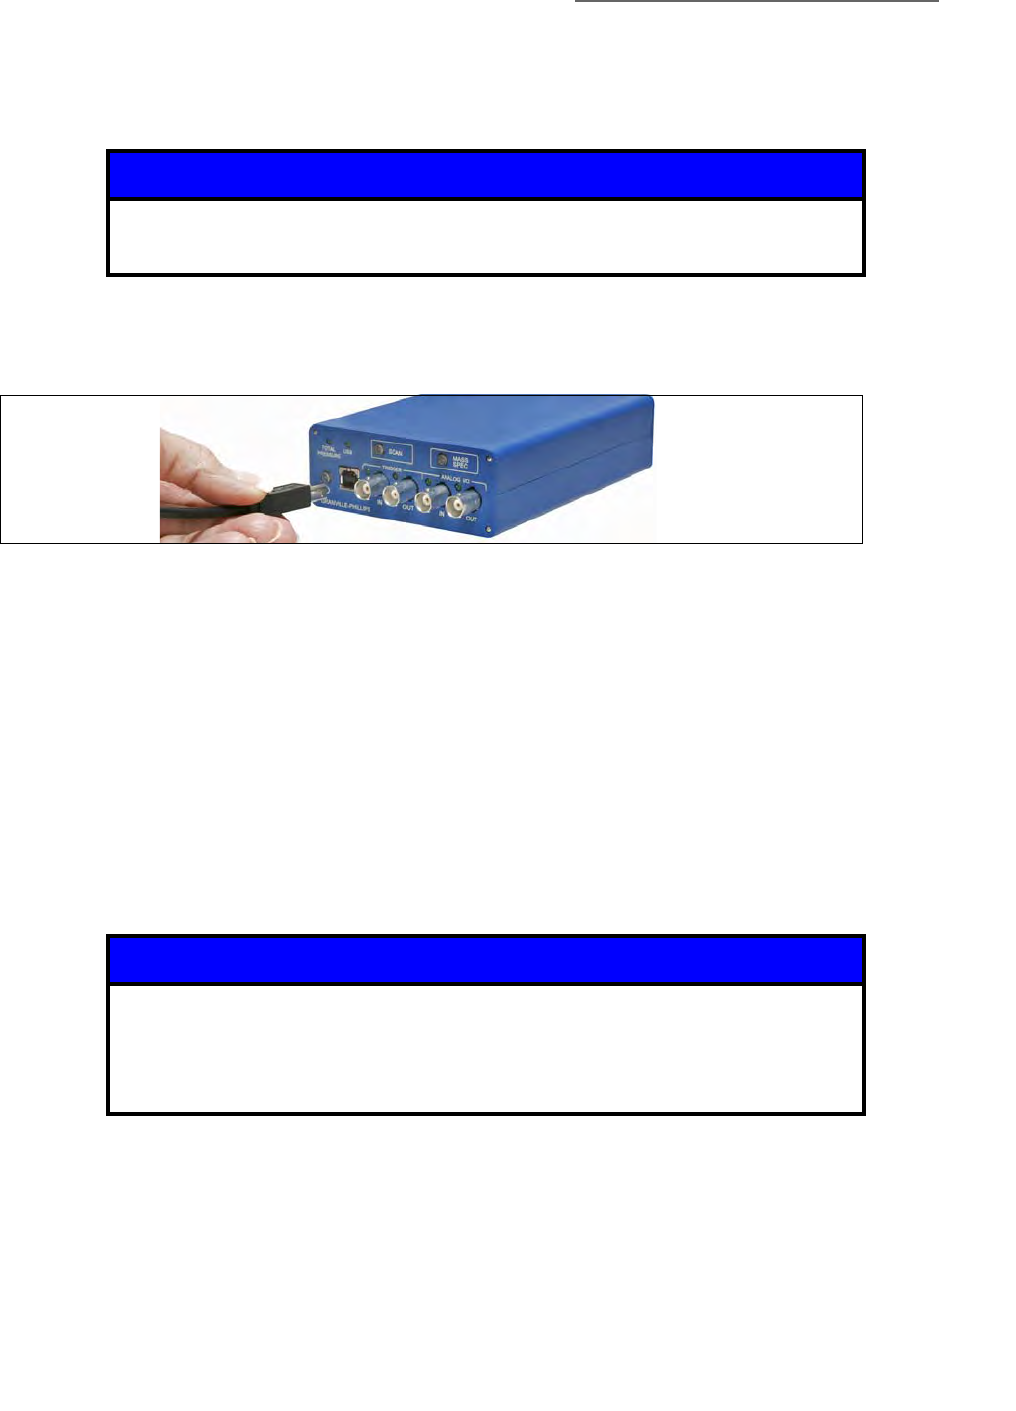
8 Initial Operation & Viewer Software
161
Series 835 Vacuum Quality Monitor
Instruction Manual - 835000
8.3.1 Connect the USB Cable
The USB port is a type B, 2.0, full-speed, 12.5 Mb/sec connection used to interface with a Host/PC.
• The USB cable must meet the specifications for USB 2.0.
Connect the USB cable to the VQM Controller and the computer with the Viewer Application
software.
8.3.2 Initial Pump Down
8.3.2.1 Background
Each individual Mass Spectrometer Gauge is (1) cleaned, (2) leak checked, and (3) operated under
high vacuum conditions during a thorough test and verification procedure which includes
monitoring the outgassing levels from the internal structures of the mass spectrometer gauge.
However, surface accumulation of contaminants, such as water, should be expected during
transport. Thus, it is very important to perform an initial pump down of the MS Gauge prior to its
first activation, or after any exposure to ambient conditions. The initial pump down procedure
requires the presence of a high vacuum compatible total pressure gauge on the vacuum chamber to
detect (1) leaks (feed-through damage during shipment), (2) high outgassing levels (due to
environmental conditions), and (3) vacuum system problems.
8.3.2.2 Procedure
1. Select a high vacuum system capable of reaching a target pressure <1x10⁻⁵ Torr (i.e., below the
upper pressure limit of the instrument and below the overpressure limit of the VQM Viewer
Software). The VQM System provides optimal performance at its pressure sweet spot of 2x10⁻⁷
Torr and is fully compatible with UHV operation.
Notice
When operating in an environment with power irregularities, it is
recommended that an opto-isolator be used on the USB cable.
Figure 8-2 Connect the USB Cable to the VQM Controller
Notice
The Initial Pump Down procedure is also recommended after storage
outside a high vacuum environment or when the vacuum chamber has
vented to atmosphere.
Do not turn ON the MS Gauge until directed in this procedure.

8 Initial Operation & Viewer Software
162 Series 835 Vacuum Quality Monitor
Instruction Manual - 835000
2. Track the pumpdown process with an ionization total pressure gauge until the targeted base
pressure (i.e. <1x10⁻⁵ Torr) for the vacuum system is reached. Proceed to Step 5 if base
pressure cannot be attained.
3. For HV applications (total pressure >1x10⁻⁹ Torr), continue pumping the MS Gauge for a
minimum of 2 hours, at or below the target pressure. Bakeout of the Mass Spectrometer Gauge
(Section 7.3) is not required above 1x10⁻⁹ Torr.
For UHV applications (total pressure <1x10⁻⁹ Torr), a Bakeout Procedure, described in Section
7.3, is highly recommended to accelerate pumpdown to the targeted UHV levels. Continue
pump down, at or below target pressure, for a minimum of 2 hours after target pressure is
attained.
4. Perform the Filament Outgassing procedure (Section 8.3.4) following successful completion of
the Initial Pump Down (Section 8.3.2) activity.
5. If the pumping system is operating properly, failure to reach the "targeted" base pressure may
indicate (1) the presence of a leak in the MS Gauge, (2) the presence of surface contaminants
on the gauge internal structures.
If the total pressure reaches below 1x10⁻⁵ Torr, use the MS Gauge to diagnose the cause of the
slow pumpdown rates in your vacuum system. Consult the factory if necessary.
If the base pressure cannot drop below the 1x10⁻⁵ Torr upper limit, do not operate the gauge
until the pumpdown issue is corrected. Consult the factory for additional information.
8.3.3 Abbreviated Initial Startup/Setup Procedure.
This section (8.3.3) is the same as the instructions provided in the VQM Quick Start Guide (p/n
835001), and is presented here as a quick reference guide. More detailed information is presented
throughout Sections 8.3.4 to 8.3.8 of this manual.
Notice
Do not bake the MS Gauge above 50 oC with the cable connected, or above
200 oC with the cable disconnected. An optional heater blanket is
available.
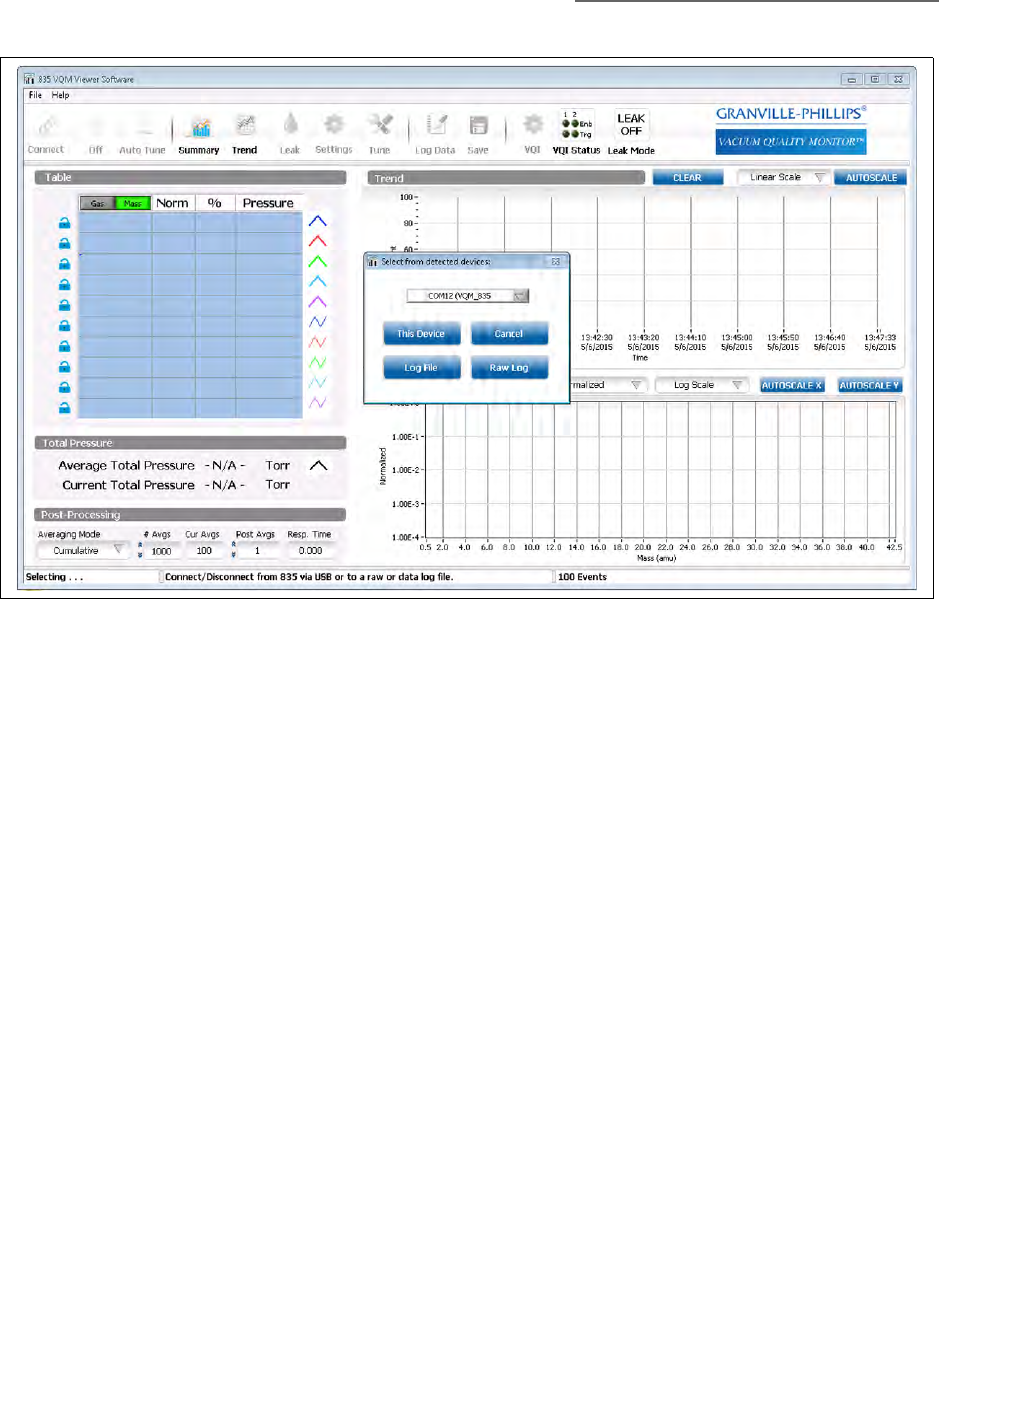
8 Initial Operation & Viewer Software
163
Series 835 Vacuum Quality Monitor
Instruction Manual - 835000
8.3.3.1 Procedure
a. Pump down the vacuum chamber to 1x10⁻⁵ Torr or lower before turning ON the VQM
Controller.
b. Press the Power button on the front of the VQM Controller to turn ON power to the Controller.
The power button LED will illuminate to solid Green indicating that the power is ON. Do Not
turn ON the MS Gauge at this time.
c. Open the 835 VQM Viewer Application by clicking on the 835 VQM.exe icon on the computer.
1. Click on the Connect icon on the Viewer Application display screen to activate the connection
between the computer and the 835 VQM System. See Figures 8-3 and 8-4.
2. Change the gauge mode to Standby. This places the MS Gauge in Standby mode with default
emission current but with a reduced electron multiplier bias voltage (500 V). The purpose of
Standby Mode is to outgas the MS Gauge filament while protecting the electron multiplier
from wearing out. Allow the system to run under this condition for 2 hours.
3. Open the Settings screen and select the Total Pressure Source (usually the 390802 Micro-Ion
Gauge).
Figure 8-3 Initial Connection Screen
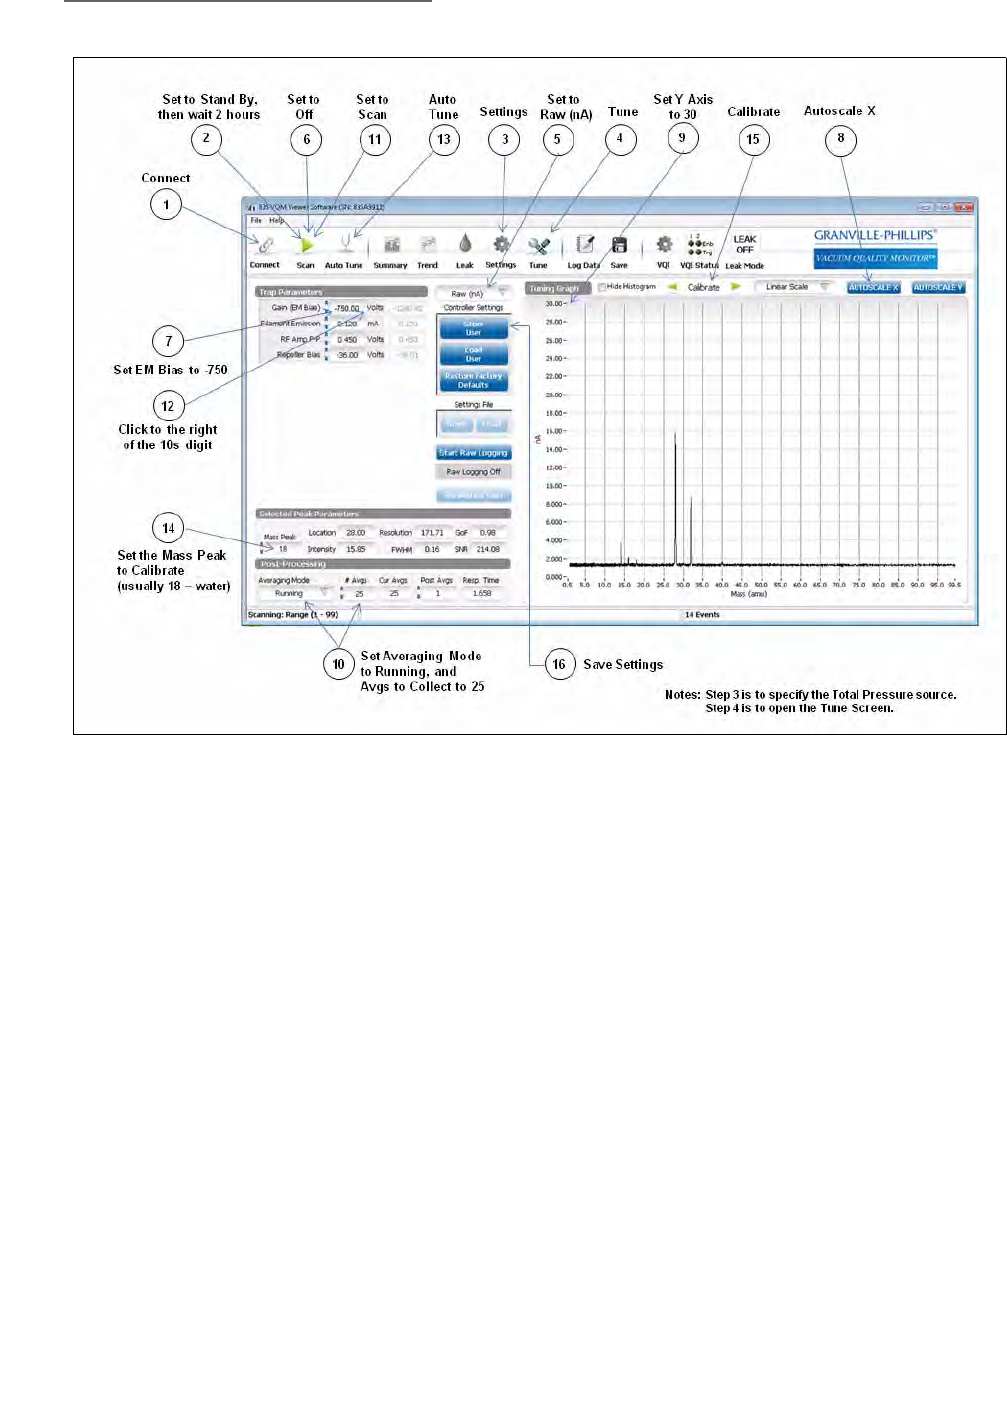
8 Initial Operation & Viewer Software
164 Series 835 Vacuum Quality Monitor
Instruction Manual - 835000
4. Click on the Tune icon to open the Tune Screen to continue the setup procedure.
5. Click on the Display Mode button just above the words "Controller Settings" and select Raw
(nA).
6. Change the Scan function from Standby to Off.
7. Set the EM Bias to (minus) -750 Volts. Drag the cursor across the current voltage setting and
type "-750".
8. Click the Autoscale X button to set the display of the mass spectra.
9. Set the Y Axis to 30. (Drag the cursor across the existing number at the top of the axis and type
"30".)
10. Set the Averaging Mode to Running, and the Avgs to Collect to 25.
11. Change the Scan function from Off to Scan. This turns On MS Gauge scanning to precondition
the Electron Multiplier.
12. Click to the right of the 10s digit of the EM Bias setting, then use the Down arrow to Decrease
the voltage by 10 volts every 30 seconds until the EM Bias equals -900 Volts.
Allow the system to operate under these conditions for 2 hours.
Figure 8-4 Tune Screen

8 Initial Operation & Viewer Software
165
Series 835 Vacuum Quality Monitor
Instruction Manual - 835000
13. Click the Auto Tune icon to allow the auto tune function to run. Select Complete Auto Tune
and Standard. Auto Tune is a procedure that automatically sets some of the MS Gauge
parameters for optimum performance and stores the settings in volatile memory in the VQM
Controller.
If conditions do not allow Auto Tune to succeed, contact Customer Support at
+1-800-776-6543 or +1-303-652-4400 to get the recommended gauge settings for each VQM
MS Gauge. Instructions will be provided for easy loading of the settings into the Viewer
Application software.
14. Select a known Mass Peak to calibrate. Any gas in the system can be used, but water (amu 18)
is usually used for calibration of the system.
Another method to use is to enter the amu number for a known mass that is in the system in
the Mass Peak box.
15. Calibrate the Mass Axis display. Use the Left and Right Calibrate Arrows (i.e. Top of Tuning
Spectrum) to mass-shift the peak until the location window indicates the correct amu (18.01
for water). This provides single gas mass-axis calibration for the 835 VQM System.
16. Click Store User to save the settings of this setup procedure. This stores the settings in
non-volatile Flash memory and turns OFF power to the MS Gauge. To begin scanning again,
set the Scan function from OFF to Scan.
17. The 835 VQM System is now ready to operate. See Section 8.4 in the Instruction Manual.
NOTE: To assure maximum gauge lifetime, turn the MS Gauge OFF or to Standby
when not in use.
8 Initial Operation & Viewer Software
166 Series 835 Vacuum Quality Monitor
Instruction Manual - 835000
8.3.4 Filament Outgassing
8.3.4.1 Background
Filament assemblies are manufactured following best-known vacuum practices and outgassed at
high temperatures in a dedicated test station prior to shipment. Thermal pretreatment of the filament
assemblies hardens the Yttria coating and minimizes the release of particulate material and
contaminants into the chamber the first time a MS Gauge is turned ON.
Surface contaminants can accumulate on the internal surfaces of the MS Gauge during shipment
and long term storage, and a sudden release of contaminant gases can be experienced when power
is applied to a filament in a vacuum system. If the contaminant levels are high, the sudden burst of
gas can lead to premature degradation of the electron multiplier gain response.
The purpose of the Filament Outgassing procedure is to apply power to the MS Gauge with the
electron multiplier biased at a voltage setting at which it cannot be compromised by the sudden
release of contaminants from the filament assembly.
The Filament Outgassing procedure is recommended:
1. The first time power is applied to the MS Gauge after initial installation or replacement.
2. After long periods of storage inside plastic containers.
3. Every time a Filament or Electron Multiplier is replaced.
8.3.4.2 Procedure
1. Pump down the vacuum chamber to <1x10⁻⁵ Torr. See Section 8.3.2.2.
2. Connect and apply power to the VQM Controller. See Section 3.7.
3. Turn ON the VQM Controller, but do Not turn ON the MS Gauge at this time.
4. Connect the VQM Controller to the Host/PC using a compatible USB interface cable. (See
Section 8.3.1.)
5. Launch the VQM Viewer Software.
6. Connect the VQM Viewer software to the VQM System using the Connect icon.
7. Click the gauge operating mode Off icon on the Viewer Application tool bar (Section 8.4.2),
and click STANDBY on the drop down list of icons.
8. The MS Gauge will be in the Standby mode with the default emission current but with a
reduced electron multiplier bias voltage (500 V), which does not provide observable peaks in
the mass spectra.
9. Allow the MS Gauge to operate for 2 hours (minimum) under these conditions.
10. Perform the Electron Multiplier Preconditioning Procedure as outlined in Section 8.3.5.
Notice
When the Power button on the Controller is pressed, the Power LED will
blink Green while the Controller performs the Power ON Self Test, and
illuminate solid when the self test is complete. See Section 5.4.2.

8 Initial Operation & Viewer Software
167
Series 835 Vacuum Quality Monitor
Instruction Manual - 835000
8.3.5 Electron Multiplier Preconditioning
8.3.5.1 Background
All electron multipliers undergo an initial cleanup phase during which loosely adsorbed molecules
are removed from the active channel surface. If during this time the detector is exposed to high
input ion current or operated at high bias voltage settings, permanent gain degradation may result.
To maximize lifetime, the electron multiplier should be preconditioned. During this process loosely
bonded water molecules are released from the surface. Failure to perform the pre-conditioning
process could lead to early detector degradation and large signal fluctuations during the initial
hours of operation of a mass spectrometer.
8.3.5.2 Procedure
1. Complete the Filament Outgassing procedure as outlined in Section 8.3.4.
2. Go to the Settings screen and select "390802 (RS-485)" as the Pressure Source so the software
recognizes the 390802 total pressure gauge. Or, select the appropriate analog total pressure
source.
3. On the Tune screen, change the gauge operating mode from Standby to Off by clicking the
Standby button on the top bar and selecting Off from the drop-down menu.
4. Set the EM Bias voltage to -750 V by typing "-750" in the entry box next to the EM Bias in the
Trap Parameters section of the Tune screen.
5. Change the gauge operating mode from Off to Scan in the drop-down menu.
6. On the Tune screen, select the Raw (nA) view of the spectrum by clicking the drop-down menu
button: it may be labeled Normalized, Raw (nA), Raw (Counts) or Diagnostics
7. Change the EM Bias setting by clicking to the right of the 10s digit, then use the Down arrow to
decrease the voltage -20 V every 1 minute (or 10 V every 30 seconds) until: (1) the EM Bias
voltage reaches -900 V (i.e. factory default setting) or (2) any of the peaks in the mass spectrum
reaches a 20 nA amplitude; whichever comes first.
8. Run the VQM System under these conditions for at least 2 hours.
Notice
The preconditioning procedure is not peculiar to the VQM Mass
Spectrometer Gauge. In fact, preconditioning is recommended by all
manufacturers of continuous dynode electron multipliers.
The Electron Multiplier Preconditioning procedure requires adjustment of
the Electron Multiplier Bias Voltage setting. A Host PC and the VQM Viewer
software provide the easiest access to all VQM Controller Settings.
Alternatively, the electron multiplier voltage can be modified using a
standard communication program such as Hyperterminal (Section 9.6)
using the voltage setting commands (Section 9.6).
To perform preconditioning, a multiplier must be placed under the best
possible vacuum conditions. It is recommended that a pressure of 1x10⁻⁶
Torr or lower be used.
8 Initial Operation & Viewer Software
168 Series 835 Vacuum Quality Monitor
Instruction Manual - 835000
8.3.6 Auto Tune
8.3.6.1 Background
The optimal control parameters for each gauge are different and interact in complex ways. It is
possible to adjust the parameters in such a way that the results are either sub-optimal or incorrect.
Auto Tune is a procedure that attempts to correctly sets the gauge parameters for the Repeller Bias,
Exit Plate, and EM Shield settings. It also determines an EM Bias voltage and Filament Emission
Current.
Auto Tune is a required procedure for the initial operation of the VQM System. Complete Auto Tune
must be performed:
• Every time a new MS Gauge is installed in a vacuum system.
• After each filament or electron multiplier replacement procedure.
• After detectable losses in the detection limits of the instrument due to gain degradation.
• After long storage periods at ambient pressure conditions. See Storage Recommendations in
Section 7.2.1.
• When the number of peaks in the spectra increases or decreases significantly relative to the last
adjustment procedure.
8.3.6.2 Procedure
1. Complete the Electron Multiplier Preconditioning procedure. See Section 8.3.5.
2. Assure that the chamber pressure is reasonably stable and no activities are being performed in
the vacuum chamber that would significantly alter the chamber pressure or gas composition in
the chamber. Do not try to alter voltages on other VQM MS Gauges or change from Standby to
ON with other gauges on the same vacuum chamber. Do not perform outgassing on other
gauges during Auto Tune.
3. Click the Auto Tune icon at the top of the Viewer Application. Select Complete Auto Tune and
the desired sensitivity from the popup dialog. The Auto Tune procedure locks out all other
Viewer Application functions until it finishes.
4. Upon successful Auto Tune completion, an option appears to store the new settings on the
Controller as the new User Settings or to continue without storing them. Choose to continue
without storing them. Adjust the Mass Calibration Factor and store the settings to the VQM
Controller. See Section 8.3.9.
Notice
Although Auto Tune works well under most conditions, this procedure is
designed to be performed in the presence of 1 to 3 x10⁻⁷ Torr of pure
(>90%) nitrogen gas.
The filament and electron multiplier components of the MS Gauge must be
regarded as consumables. Both devices undergo irreversible gain
degradation over time as the MS Gauge is operated. The MS Gauge should
be turned OFF when not in use to extend the lifetime of the Gauge and
minimize the mean time between services.

8 Initial Operation & Viewer Software
169
Series 835 Vacuum Quality Monitor
Instruction Manual - 835000
8.3.7 Manual Electron Multiplier Bias Voltage Adjustment (optional)
8.3.7.1 Background
The default EM bias voltage setting is -900V. As the EM ages, the voltage may need to be adjusted
down to a limit of -1500V. A more negative voltage creates more gain in the EM. More gain
provides increased dynamic range for ionized gases at the expense of EM lifetime.
During the Auto Tune procedure, the EM bias voltage is adjusted until maximum counts received by
the A/D converter are optimized without risk of saturation. The proposed value is in the list of events
and errors accessed at the bottom right of the viewer application. Depending on the conditions that
Auto Tune was run, this proposed value may or may not be optimal. The proposed value may be
typed in during step 6 below in place of the manual adjustment. The manual adjustment is
preferable if one of the following is true:
• The system is, or will be operating at UHV.
• There is a very complex mass spectrum in normal operation.
• It is acceptable to run at reduced Electron Multiplier Bias Voltages to extend the life of the
Electron Multiplier.
8.3.7.2 Procedure
1. Change the gauge operating mode to Scan
2. Set the Averaging mode to Running, and Avgs to Collect to 25.
3. Select the Raw (nA) option for the Tune screen's graph.
4. Click the Autoscale X and Autoscale Y buttons to ensure the graph is scaled to show the
spectrum.
5. Check the nA reading of the tallest peak in the spectrum. This can be done visually on the
graph or by entering the mass number of the tallest peak into the Mass Peak entry box in the
Selected Peak Parameters section. The peak height can be seen in the Intensity box. If using a
visual measurement, to avoid the main peak going beyond the top scale of the graph, change
the scale by typing "50" in place of the top number on the Y axis. If the EM gain is too low, the
peak might not be seen.
6. Adjust the EM Bias in -10 V increments until the main peak is around 20 nA. A voltage can be
typed into the EM Bias entry box, or adjusted with the up and down arrows next to the box.
Click the mouse to the right of the digit that the arrows will adjust (for 10 V increments, click
one digit left of the decimal point). Do not drive the tallest peak above 50 nA to avoid
saturation (which occurs at 60 nA).
7. Order a new EM replacement when the voltage exceeds -1350V.
Notice
After Auto Tune, the Repeller, Exit Plate, EM Shield, and EM Bias settings are
set on the Controller to the Auto Tuned values. If Total Pressure was
available, the Filament Emission Current was set to an appropriate value.
RF Amplitude values have been restored to the previous setting. The
proposed RF Amplitude can be seen by clicking on the notifications section
at the bottom lower right-hand side of the Viewer Application. This will
popup a list of events and errors. One of the events will be the summary
results for Auto Tune.
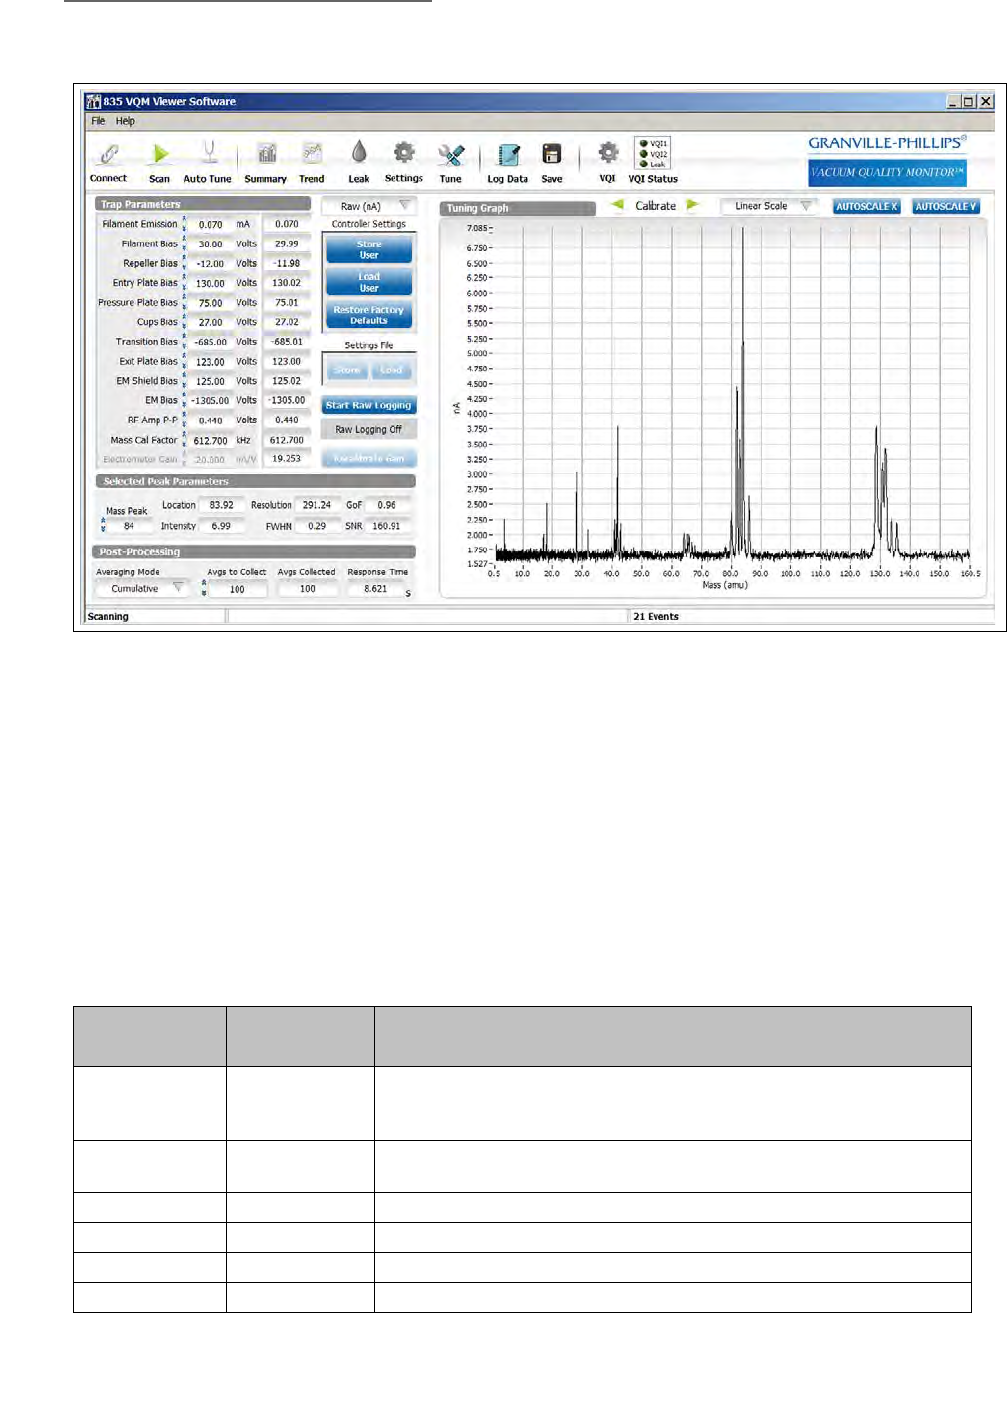
8 Initial Operation & Viewer Software
170 Series 835 Vacuum Quality Monitor
Instruction Manual - 835000
8.3.8 Mass Axis Calibration
8.3.8.1 Background
Since every operating environment has a unique set of interacting conditions, Mass axis calibration
is required to perform proper gas identification and ensure masses are associated with the correct
amu value for any specific environment.
Table 8-1 shows some of the typical mass peaks that are often found in mass spectra and can be
used to perform a single gas Mass Axis Calibration of the mass spectrometer.
Figure 8-5 Electron Multiplier Bias Voltage Adjustment at 20 nA
Table 8-1 Parent Peaks from Gas Species Commonly used for the Mass Axis Calibration Procedure
Gas Species Mass-to-Charge
(amu) Comments
H2 - Molecular
Hydrogen
2.02 Calibration based on molecular Hydrogen is only recommended for UHV
systems, where other species might not be present with enough abundance
to allow calibration.
H2O- Water 18.01 Water is always present in a vacuum system. Use the parent peak at 18 amu
to calibrate the Mass Cal Factor.
N2- Nitrogen 28.01 Nitrogen is the calibration gas used for manufacturing verification.
O2 - Oxygen 31.99
Ne- Neon 19.99 Often present in Ion Pumped systems.
Ar- Argon 39.96 Often present in ion pumped systems and also in air leaks.
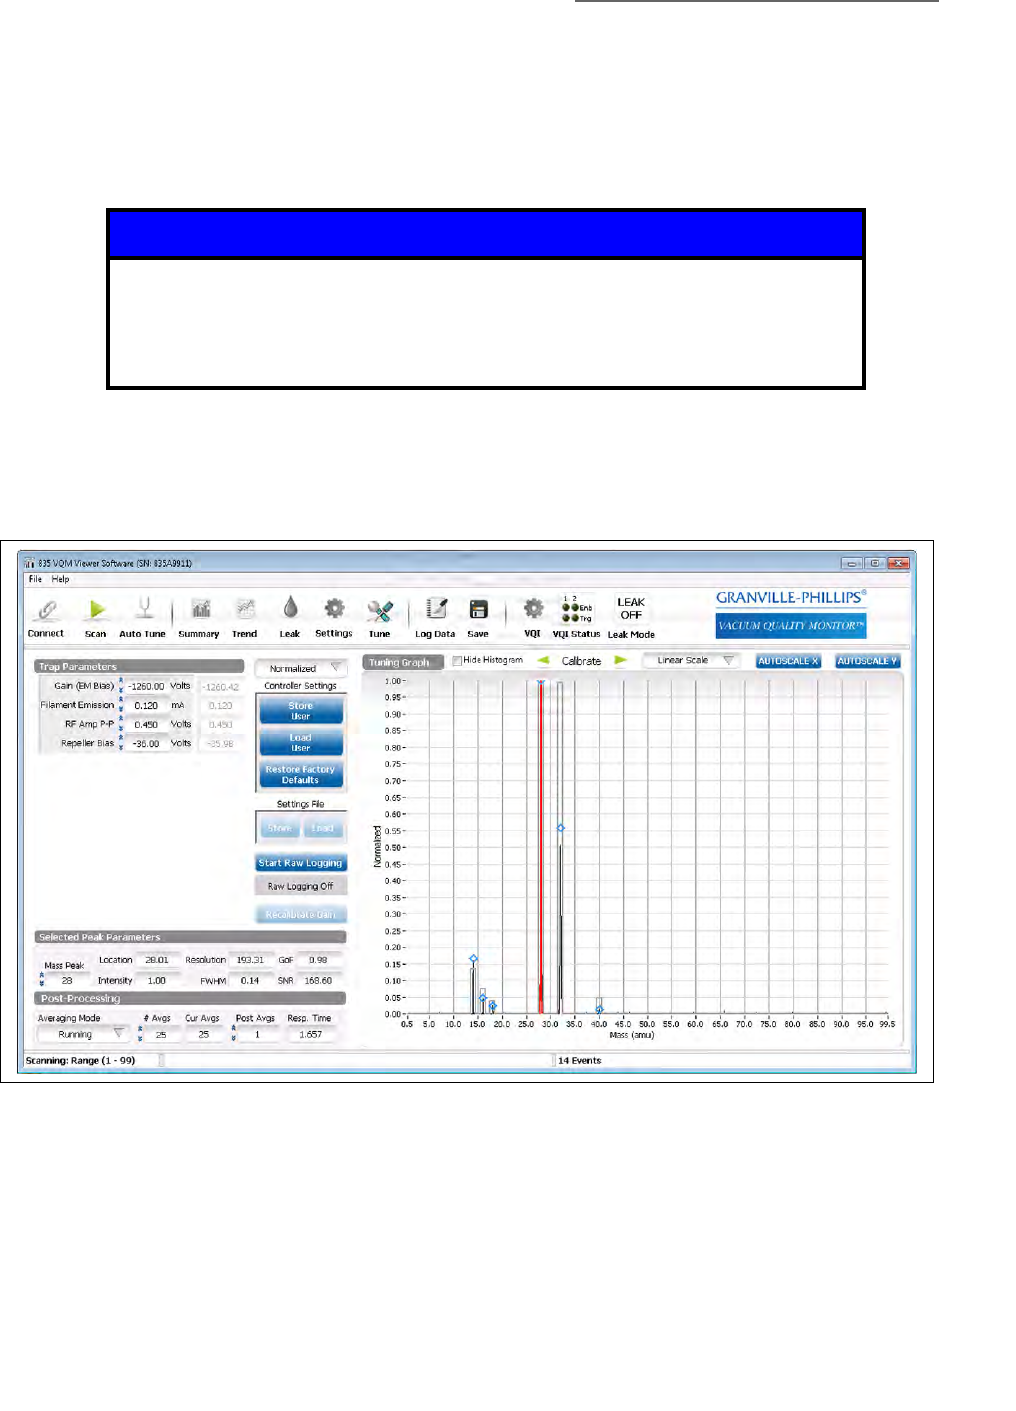
8 Initial Operation & Viewer Software
171
Series 835 Vacuum Quality Monitor
Instruction Manual - 835000
The mass axis calibration procedure may be required:
• during the Initial Operation procedure if the VQM Viewer software will be used.
• each time the gauge settings are changed (other than EM bias).
8.3.8.2 Procedure
8. Complete the Auto Tune procedure in Section 8.3.6.
9. Access the Tune screen display of the VQM Viewer Software and select the Normalized view.
See Figure 8-6.
10. Change the gauge operating mode to Scan.
11. Set the averaging mode and number of buffers so the peak to be used for calibration is reliably
fitted. For example, select Cumulative Average and 100 averages to collect. Increase the
number of averages if the graph is still noisy.
12. Type the integer value of the calibration peak into the Mass Peak field of the Selected Peak
Parameters. For example, type "18" if water is to used to calibrate the system.
Notice
A Host PC and the VQM Viewer Software are required to complete this
procedure.
VQM users relying on stand-alone operation (i.e. no Host PC Connection)
should contact the factory for additional information.
Figure 8-6 Tune Screen

8 Initial Operation & Viewer Software
172 Series 835 Vacuum Quality Monitor
Instruction Manual - 835000
13. Note the value displayed in the Location field. Click the Calibration arrows at the top of the
graph to move the peak left or right until the Location is as close as it can get to the target
location. For example, move it until it is at location 18.01 for water.
8.3.9 Storing the Gauge Settings
After performing Auto Tune and Calibration, the tuned settings are stored by the VQM Controller in
volatile memory. To store them in non-volatile FLASH memory so they will not be lost after a power
cycle of the Controller, they should be saved as User Settings. Simply click the "Store User" button
under the Controller Settings section on the Tune screen. This will store the settings and turn OFF
the MS gauge power. To start scanning again, change the gauge operating mode to Scan.
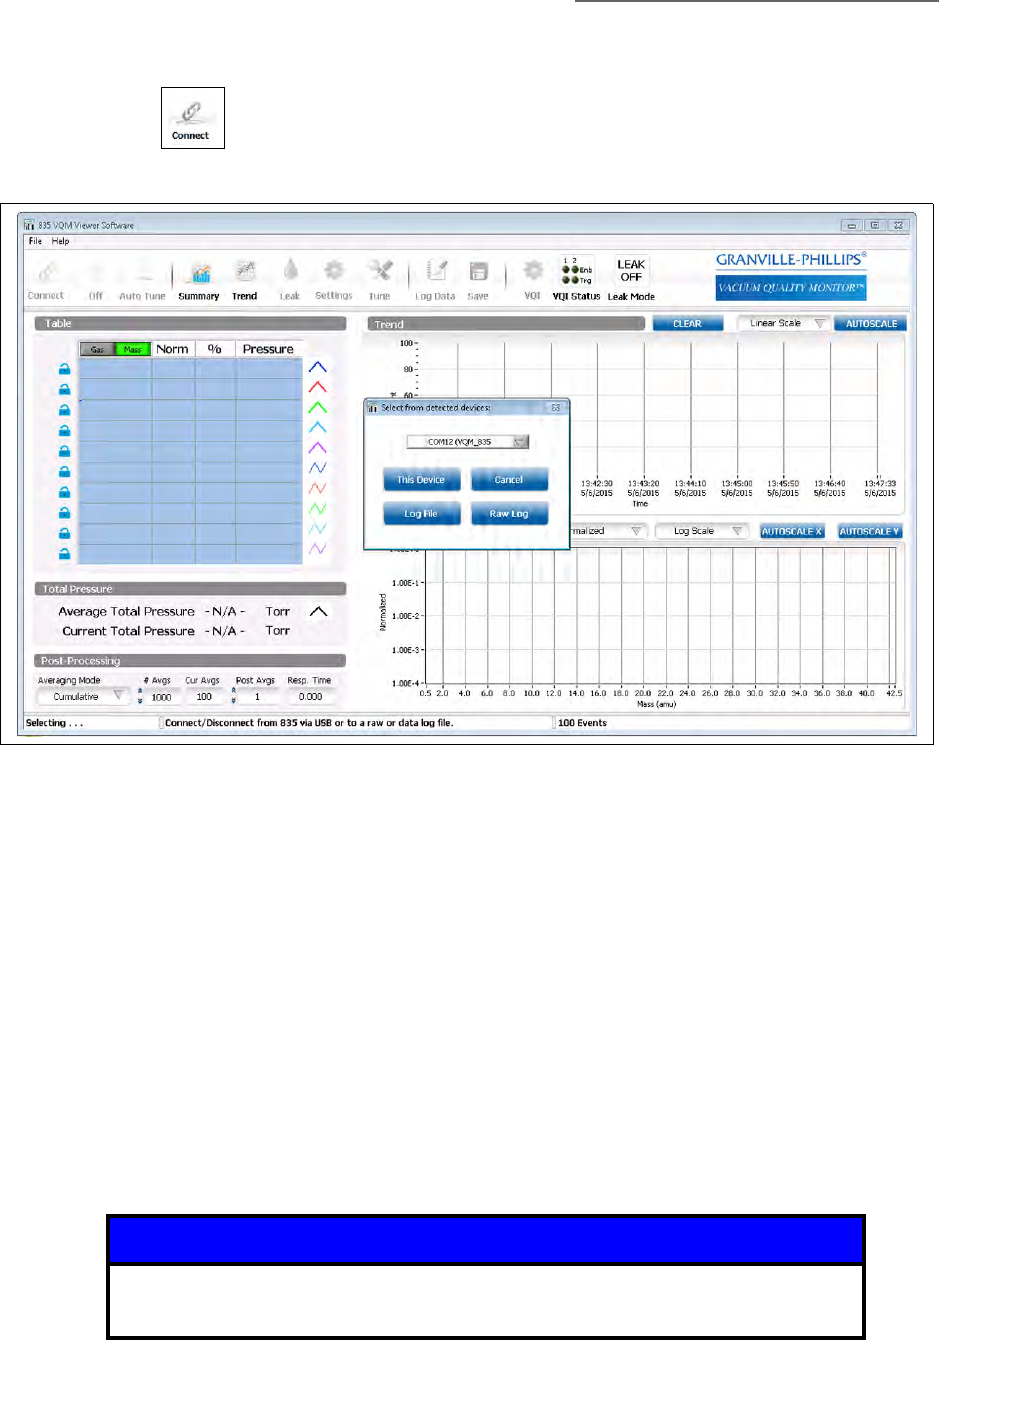
8 Initial Operation & Viewer Software
173
Series 835 Vacuum Quality Monitor
Instruction Manual - 835000
8.4 Using the Viewer Application
8.4.1 Connect
Use the Connect button (icon) to connect to a VQM Controller, or to connect to a Log file.
8.4.1.1 To Connect to a VQM Controller
Press the Power button on the VQM Controller to apply power to the Controller.
NOTE: Press the Power button on the Controller to turn ON power to the Controller
before clicking the Connect icon.
Power is also applied to the Micro−Ion Gauge ATM Total Pressure
Measurement Gauge when power is turned ON to the VQM Controller.
Wait for the VQM Controller to complete its Power On Self Test (POST). The POST blinks and
flashes many of the LEDs on the front panel of the Controller. The POST is complete when the
SCAN and MASS SPEC LEDs complete a cycle of flashing together three times, ending with
both of them OFF.
Click the Connect icon on the Viewer Application to establish communications between the
VQM Controller and the Viewer Application via the USB link.
Click on "This Device". If multiple VQM Instruments are physically connected to the Host/PC,
scroll through the list in the "Select from detected" selection box.
Figure 8-7 Initial Connection Screen
Notice
If the USB cable becomes disconnected while the Controller power is ON,
the Controller may need to be turned OFF and restarted.
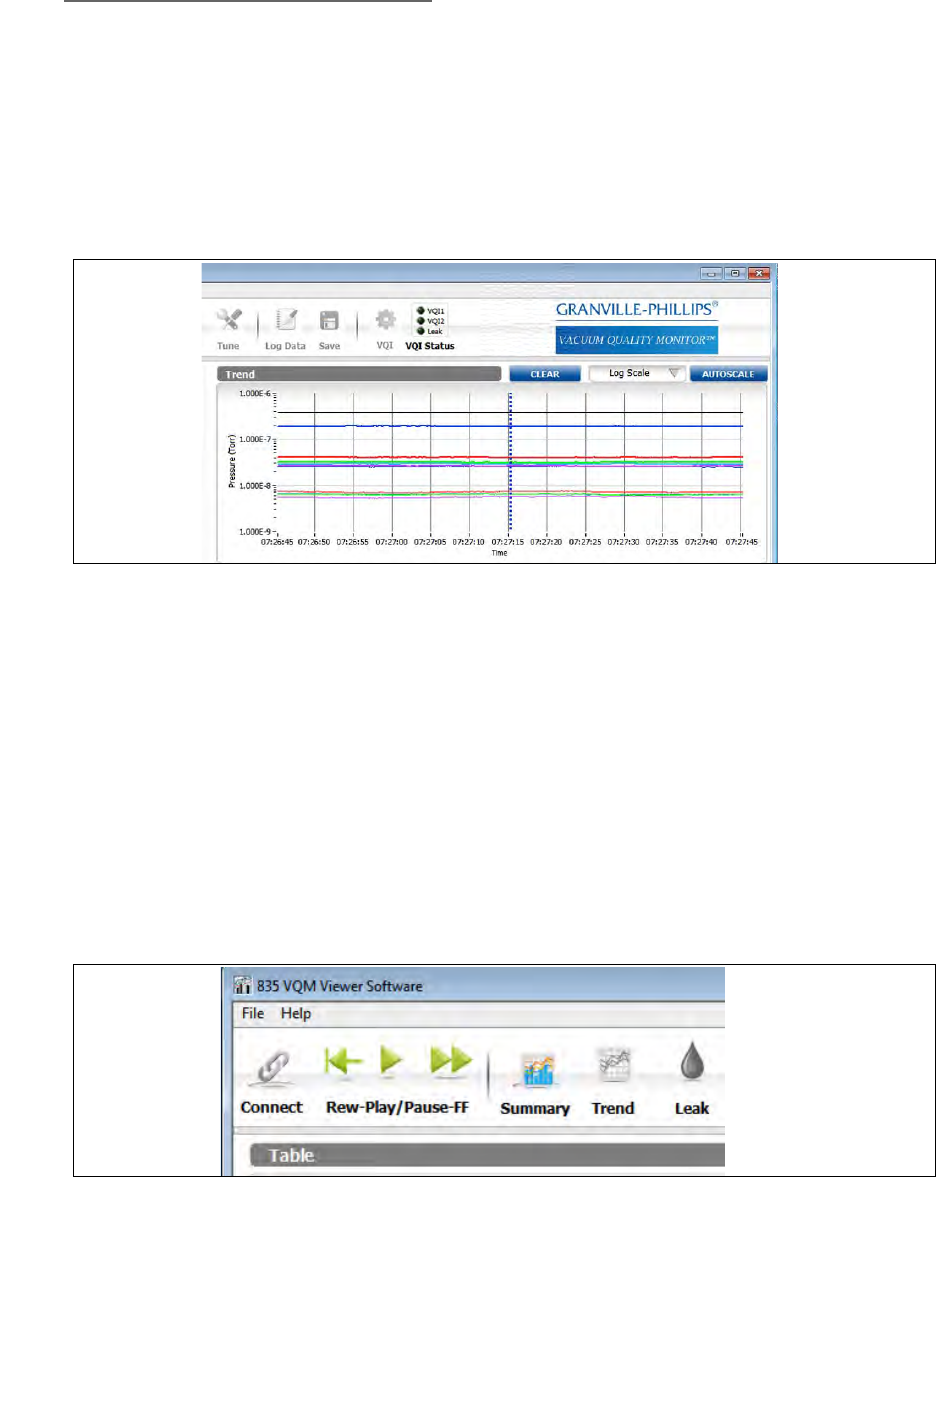
8 Initial Operation & Viewer Software
174 Series 835 Vacuum Quality Monitor
Instruction Manual - 835000
8.4.1.2 To Connect to a Log Data File
To connect to a LogData file click on "Log File" (see Section 8.4.9 - how to create a LogData file).
Use the file selection window to select the Log Data file to view. The Viewer Application will read
this file and display the contents on the Summary screen and the Trend screen. The Trend graph will
have a vertical cursor (the dotted vertical blue line) which can be moved to show the histogram and
results table at that point in the log file. Other screens including Tune, VQI®, Leak and Setting
screens and their functions are disabled when connected to a LogData file.
8.4.1.3 To Connect to a Raw Log File
To connect to a raw log, click on "Raw Log". (see Section 8.4.8.4 - how to create raw logs.) Use the
file selection window to select the raw log to play back. This feature of the Viewer Application is
quite useful for exploring the differences between the averaging modes and for debugging VQI
outputs as most Viewer Application functionality except for changing trap settings, changing mass
calibration, or creating LogData files is available when connected to a raw log.
Note that when a raw log is created, the Viewer Application creates a folder with multiple files
named with the serial number of the Controller followed by "_dataX" where X is the sequence
number for these files. Select the first file or a starting point file. Click Play/Pause to start playback of
the raw log file. Use Pause to pause the playback at any time. Click FF to fast forward the playback
of the raw log.
Use the Rew (rewind) icon to reset to the beginning of the raw log to start the playback over.
Figure 8-8 Log Data File Screen Display
Figure 8-9 Raw Log File Control Icons
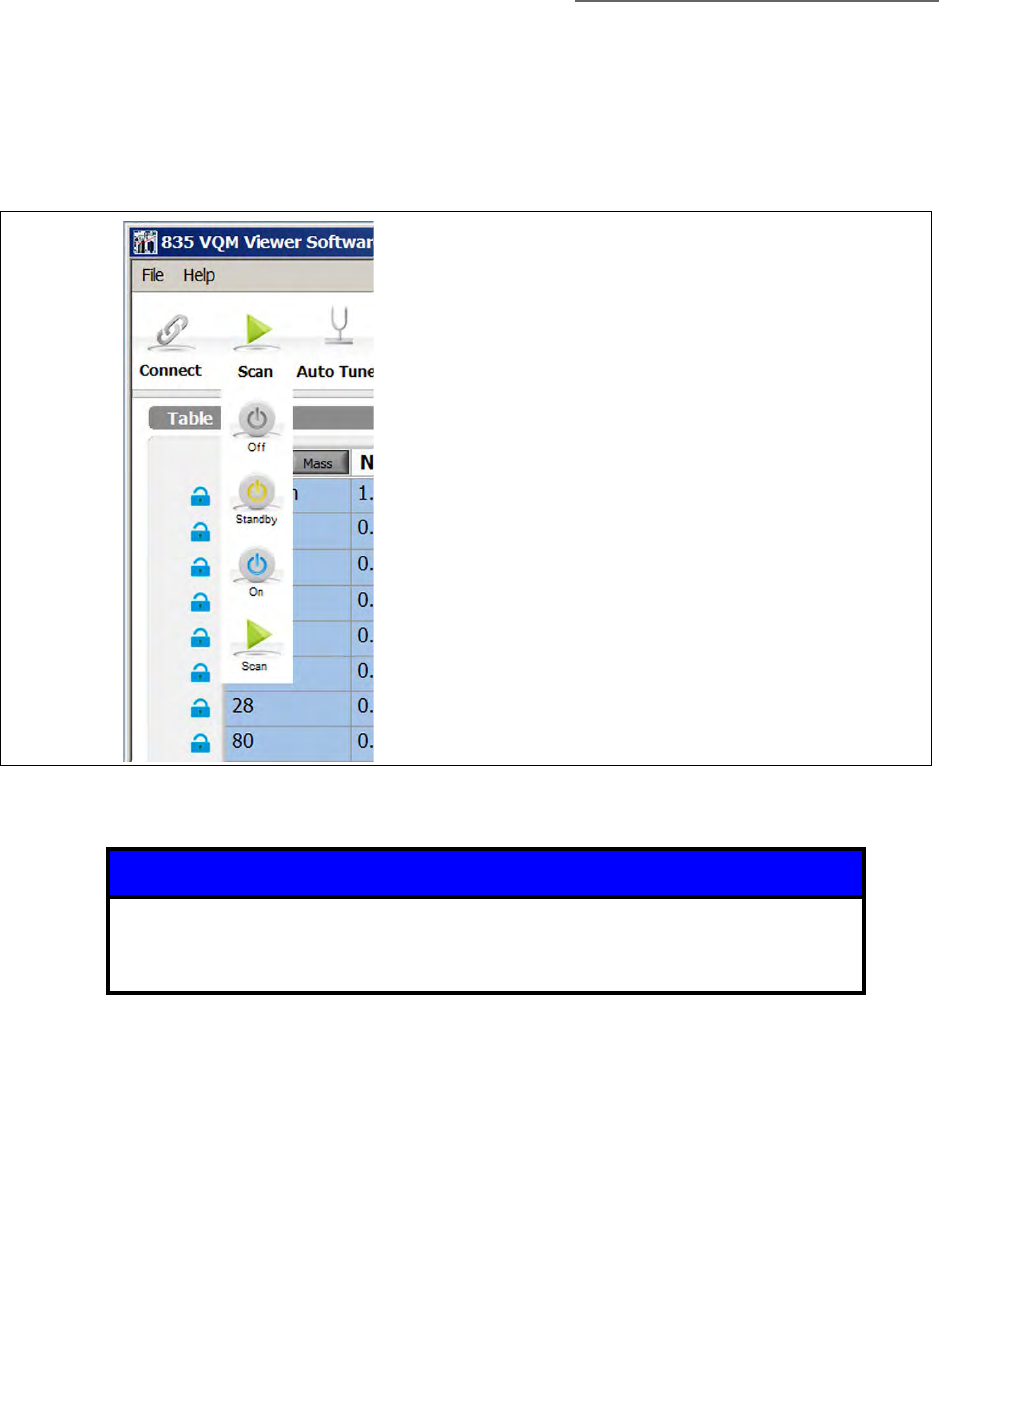
8 Initial Operation & Viewer Software
175
Series 835 Vacuum Quality Monitor
Instruction Manual - 835000
8.4.2 Gauge Operating Mode
A dropdown menu allows selection of the MS Gauge operating mode. See Figure 8-10.
Once the Viewer Application is connected to a Controller, the Gauge Operating Mode updates
to the current mode of the Controller. Click on the icon to open a dropdown menu to change
to a different operating mode.
Figure 8-10 Scan Icon Dropdown Menu
Notice
When using the VQM Viewer Application, do not press the SCAN or MASS
SPEC buttons on the front of the VQM Controller. Use the Gauge Operating
Mode selector rather than the buttons on the Controller.
Off - The Gauge is OFF. This is a safe setting and is
the setting to use if the vacuum system has not yet
pumped down to operating pressures.
Standby - Most of the gauge voltages and currents
are applied. However, the EM Bias voltage is set to a
reduced value. This setting allows the Gauge to
remain ready without stressing the Electron
Multiplier.
On - All of the Gauge voltages and currents are
applied. The Scanning frequency profile is not
applied so scan results are not available. This is the
same as Standby, except that the EM Bias voltage is
at its setpoint.
Scan - All of the Gauge voltages and currents are
applied. The Scanning frequency is applied. Scan
results are available.
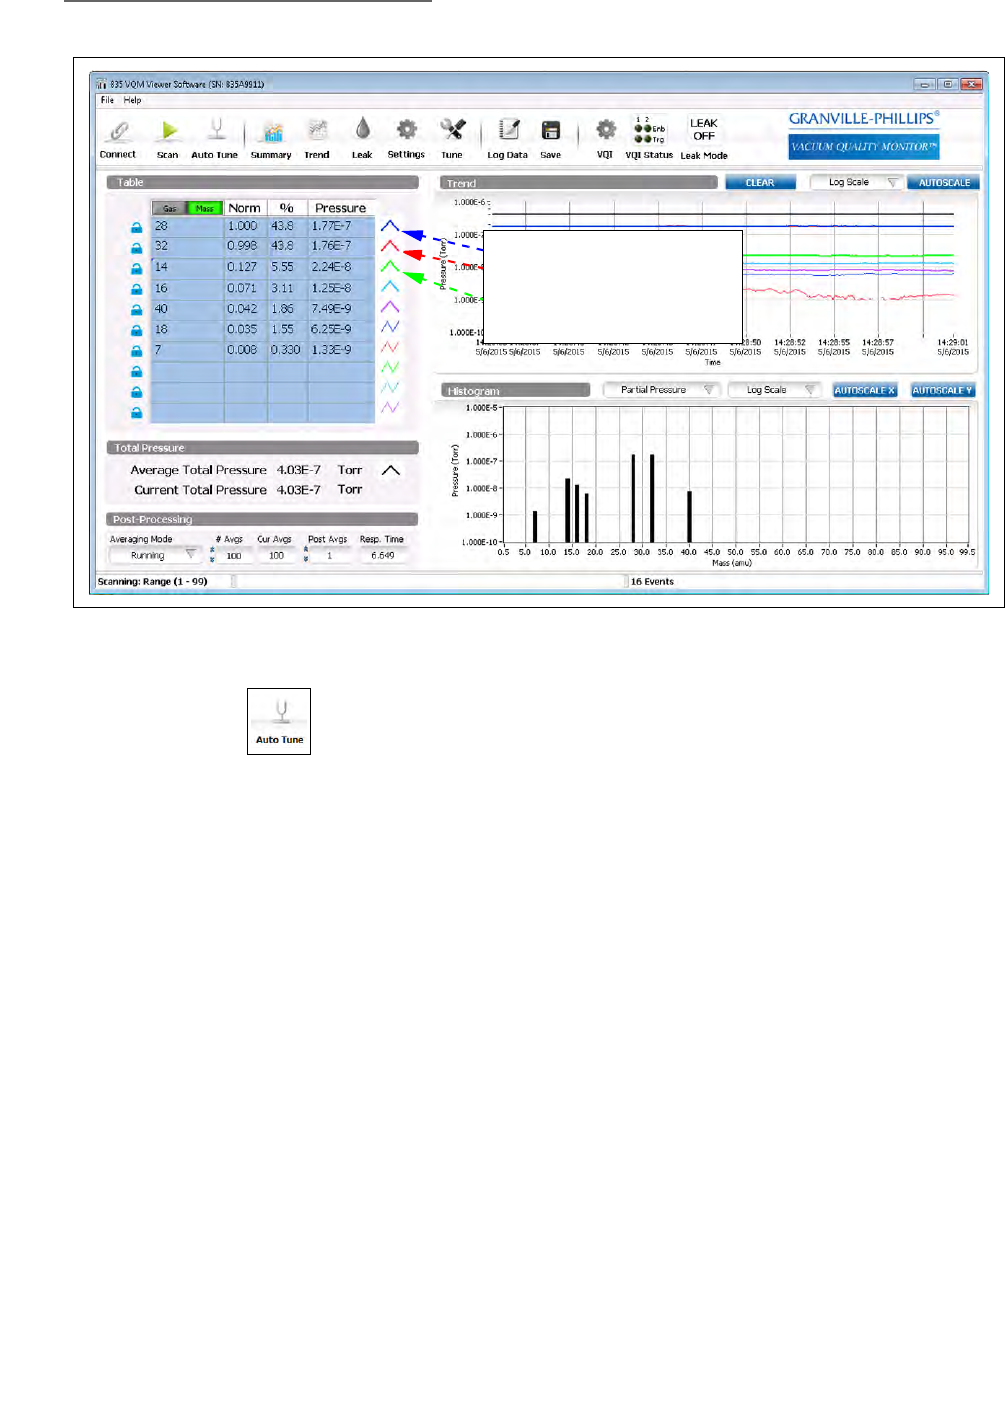
8 Initial Operation & Viewer Software
176 Series 835 Vacuum Quality Monitor
Instruction Manual - 835000
8.4.3 Auto Tune
Initiates an Auto Tune Procedure. There are three options for the Auto Tune procedure.
See Figure 8-12.
Run the MS Gauge in Standby mode for 20 minutes prior to initiating any of the Auto Tune
procedures. Also, the total pressure in the system must remain stable and at less than 1 x 10⁻⁵ Torr
for the Auto Tune procedure to succeed. Do not Auto Tune more than one MS Gauge in the vacuum
system at the same time. In general, do not cause emission sources to turn ON and OFF in the
vacuum chamber during Auto Tune, as that will cause the pressure in the system to vary during the
procedure.
At the end of a successful Auto Tune, a popup dialog box asks the user to store the new settings to
the EEPROM in the Controller or continue without storing. Choose to continue without storing. The
settings remain in the Controller either way, but will be lost if the power to the Controller is reset.
It is recommended that the Mass Calibration Factor be recalibrated after the Auto Tune procedure is
complete, then flash the new settings.
A complete Auto Tune should be performed on a new system and after every replacement of a
filament or electron multiplier. Running Complete Auto Tune frequently is not necessary, and is not
recommended as it may shorten the life of the electron multiplier.
The definitions of the Gain Adjustment values are (1) Long Life, (2) Standard, and (3) High
Sensitivity. Each value represents different target signal levels for the highest peak in the normal
scan range (1 to 135-145 AMU).
Figure 8-11 Scan Screen Display
Notes:
The blue line relates to the 1st Mass
The red line relates to the 2nd Mass
The green line relates to the 3rd Mass
and so on
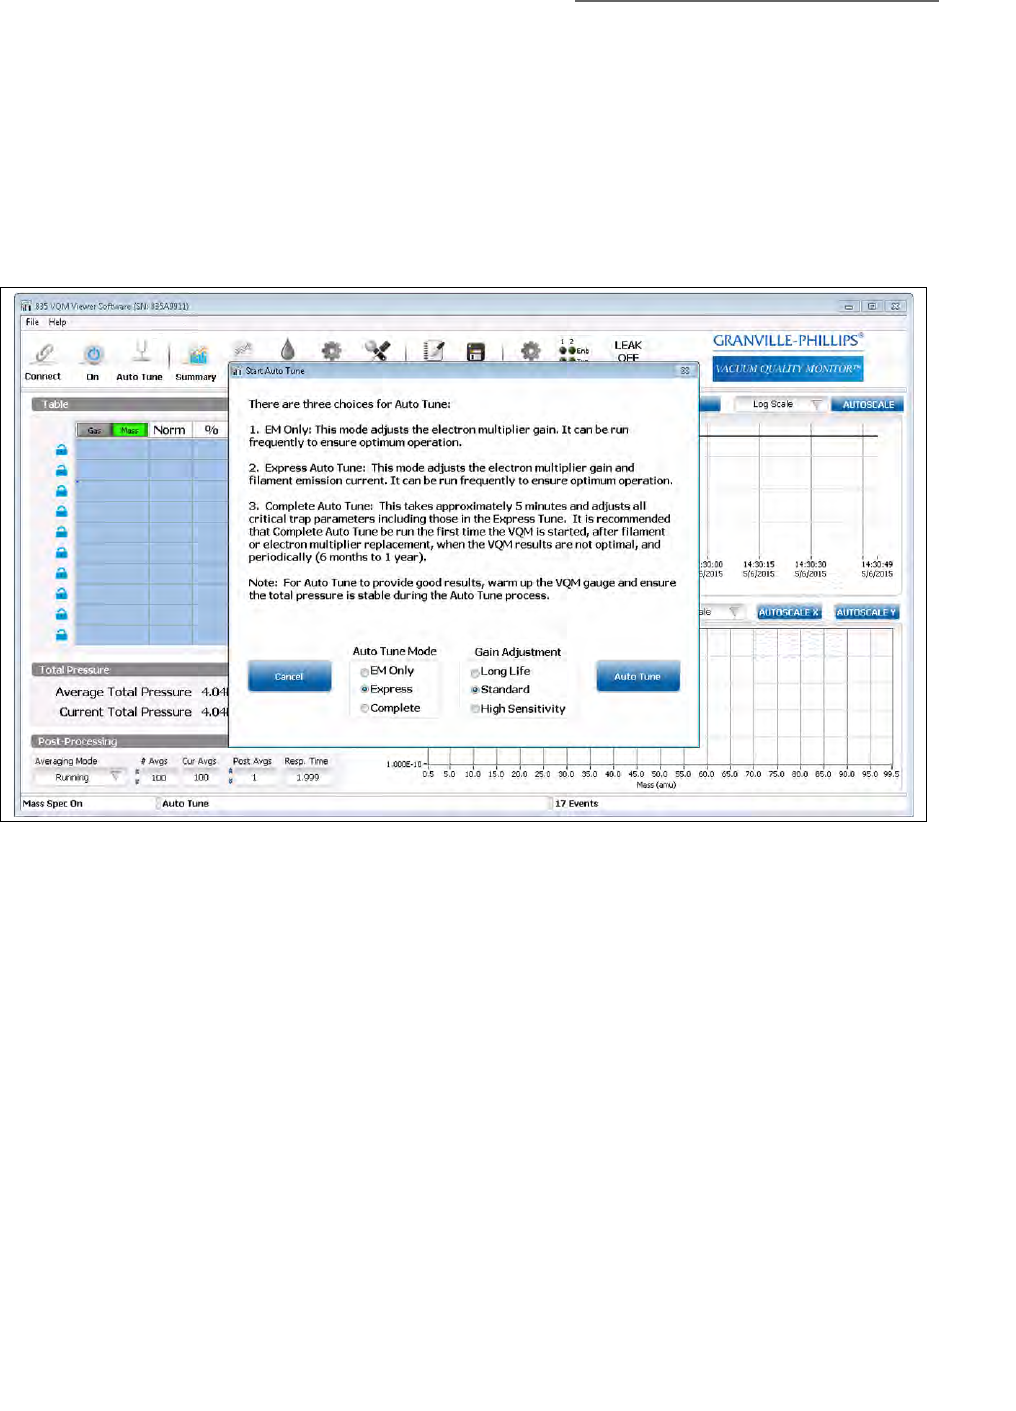
8 Initial Operation & Viewer Software
177
Series 835 Vacuum Quality Monitor
Instruction Manual - 835000
• Long Life adjusts the Electron Multiplier bias voltage gain so that the highest peak is around
8 nAmps, which is enough to see major peaks without stressing the electron multiplier.
• Standard adjusts the gain so that the highest peak in the scan range is around 20 nAmps
which is a typical gain level.
• High sensitivity attempts to adjust the gain so that the highest peak is around 50 nAmps. This
setting is used for looking at small peaks relative to the major peak(s). It is harder on the
electron multiplier.
8.4.3.1 Electron Multiplier Only Auto Tune
The EM Only Auto Tune optimizes just the EM Bias voltage to achieve the targeted signal level. This
is the Auto Tune procedure to use if you have manually tuned the filament emission or RF
Amplitude settings and don't want to overwrite them with a full Auto Tune. It is also useful if the
scan range is limited since it uses the scan range set when this Auto Tune procedure is initiated
instead of the normal scan range. All controls for the Viewer Application are locked out for the
duration (< 1 minute) of this procedure. At the end of a successful EM Only Auto Tune, a popup
dialog box asks to store the new settings to the Controller or continue without storing. The settings
remain on the Controller either way, but will be lost if the Controller is reset. If the EM bias change
was large (e.g., going from long life setting to high sensitivity or the reverse), it is recommended that
the mass calibration factor be checked/recalibrated before storing the new settings.
8.4.3.2 Express Auto Tune
Express Auto Tune adjusts the filament emission current if there is a valid total pressure source and
adjusts the EM Bias setting to achieve the targeted signal level. All controls for the Viewer
Application are locked out for the duration (< 1 minute) of this procedure.
Figure 8-12 Start Auto Tune Screen
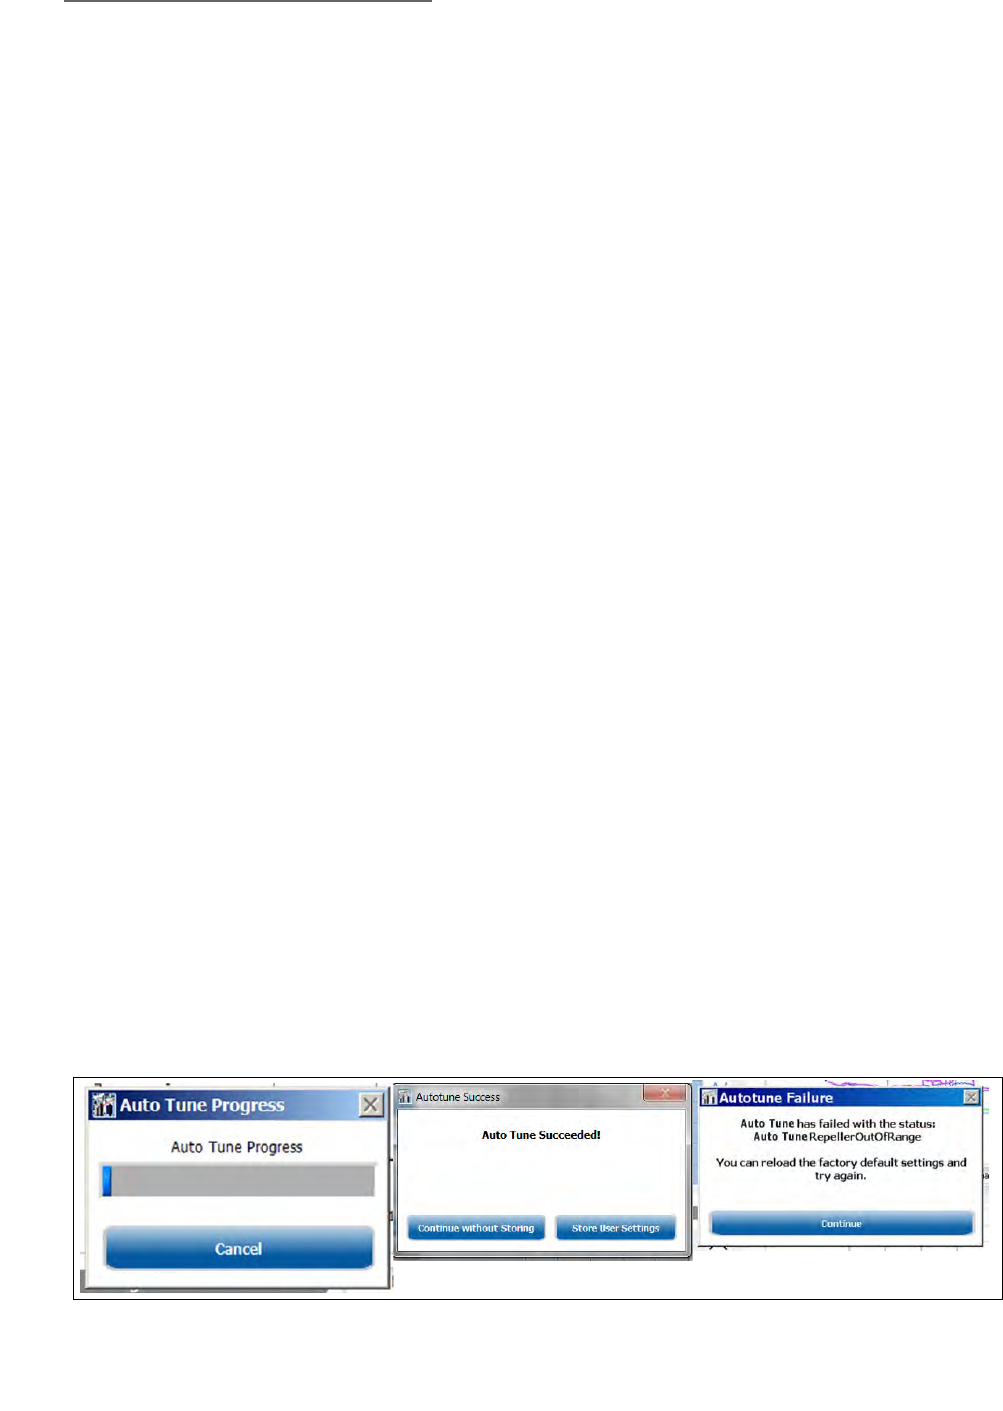
8 Initial Operation & Viewer Software
178 Series 835 Vacuum Quality Monitor
Instruction Manual - 835000
It is recommended that the MS gauge be ON at the last known good EM Bias to warm the gauge up
prior to initiating the Express Auto Tune. If the difference between the MS gauge starting point EM
Bias voltage is too different from the EM Bias voltage needed to achieve the target signal range, the
Express Auto Tune may fail.
At the end of a successful Express Auto Tune, a popup dialog box asks to store the new settings to
the VQM Controller or continue without storing. The settings remain in the Controller either way,
but will be lost if the Controller is reset. If the EM bias change was large (e.g., going from long life
setting to high sensitivity or the reverse), it is recommended that the mass calibration factor be
checked/recalibrated before storing the new settings.
Express Auto Tune can be run frequently as the scan range is changed, the pressure in the vacuum
chamber is significantly different from the last Express Auto Tune, or a different signal level is
desired.
8.4.3.3 Complete Auto Tune
The Complete Auto Tune procedure optimizes several ion trap settings for (1) a new system, (2) a
new or replaced MS Gauge, (3) when an Electron Multiplier (EM) or Filament assembly has been
replaced in the MS Gauge, or (4) to improve the spectrum. The procedure optimizes the Repeller
bias voltage, the Exit plate bias voltage, and the Electron Multiplier Shield voltage. It adjusts the EM
bias voltage needed to achieve the targeted overall signal and logs the default RF Amplitude. Note
that the RF Amplitude determined by Auto Tune is not stored on the Controller at the end of Auto
Tune. Instead, Auto Tune restores the user settings for RF Amplitude when it completes. A user may
opt to use the logged RF Amplitude setting, may use the original user settings, or may manually
adjust EM Bias voltage and RF Amplitude after the Auto Tune is complete.
All controls in the Viewer Application are locked out during this 5-7 minute Complete Auto Tune
procedure. The displayed graphs and charts will not be meaningful. A progress bar shows the
percent completion of the Auto Tune procedure. The Auto Tune procedure can be canceled at any
time while Auto Tuning is in process; the original settings will be restored.
If Auto Tune has failed, the user is notified of the nature of the failure. The original Gauge settings
will be restored if possible (if there is still a connection to the Controller), but the Auto Tune Log can
be viewed to determine if any Auto Tune settings are available for the steps that did not fail. For
example, the EM Bias voltage and Repeller Bias voltages may have been successfully tuned even
though the Exit Plate and EM Shield settings were not successfully tuned. These values would be
visible in the Auto Tune Log. The logs are stored in
"C:\Users\Public\Documents\VQM\Autotunelogs\<serial # of the VQM Controller>". Each log
name includes a date and time stamp as part of its name.
NOTE: See Section 8.5.17 for a list of the directory paths where log files are stored.
Figure 8-13 Auto Tune Progress, Succeeded, and Failure Screens
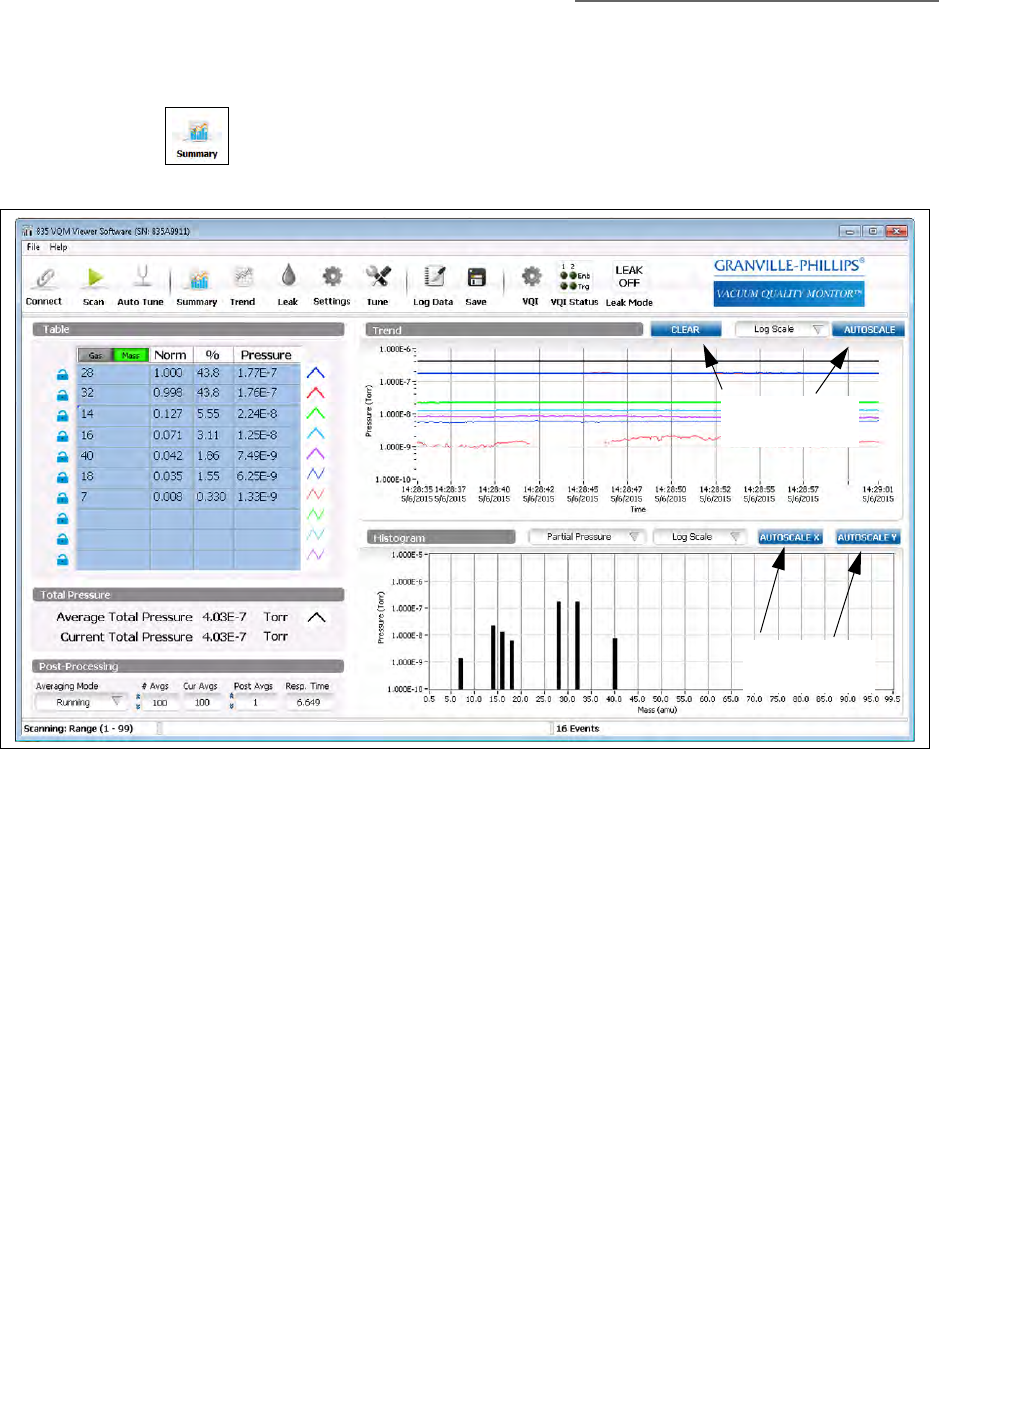
8 Initial Operation & Viewer Software
179
Series 835 Vacuum Quality Monitor
Instruction Manual - 835000
8.4.4 Summary
The Summary page shows a summary of the data currently being collected.
8.4.4.1 Clear History and Zoom Functions
*1: Clears the chart history.
*2: Scales the Trend graph to show the minimum and maximum values.
*3: Restores the X axis to show the full scan range.
*4: Scales the Y axis to show the largest and the smallest peaks.
Highlighting an area (in the direction indicated by the cursor) of any graph or histogram, and
dragging the mouse over the area of interest, will change the scale of the graph to zoom in on
the area highlighted.
NOTE: The Autoscale buttons are very useful; expect to use them often. Also, the scale
of the graph or histogram can be changed by editing the first or final values of
the X or Y axis labels.
8.4.4.2 Results Table
By default, the results table displays data relevant to the ten most prevalent gases or masses in the
system, but can be configured to show other gases and masses. The color key to the right of the
table identifies the color and width of the Trend Graph plot for that gas. The colors cannot be
changed, but the user can configure which gas appears on which line.
Figure 8-14 Summary of Current Data
*1 *2
(See below)
*3 *4
(See below)
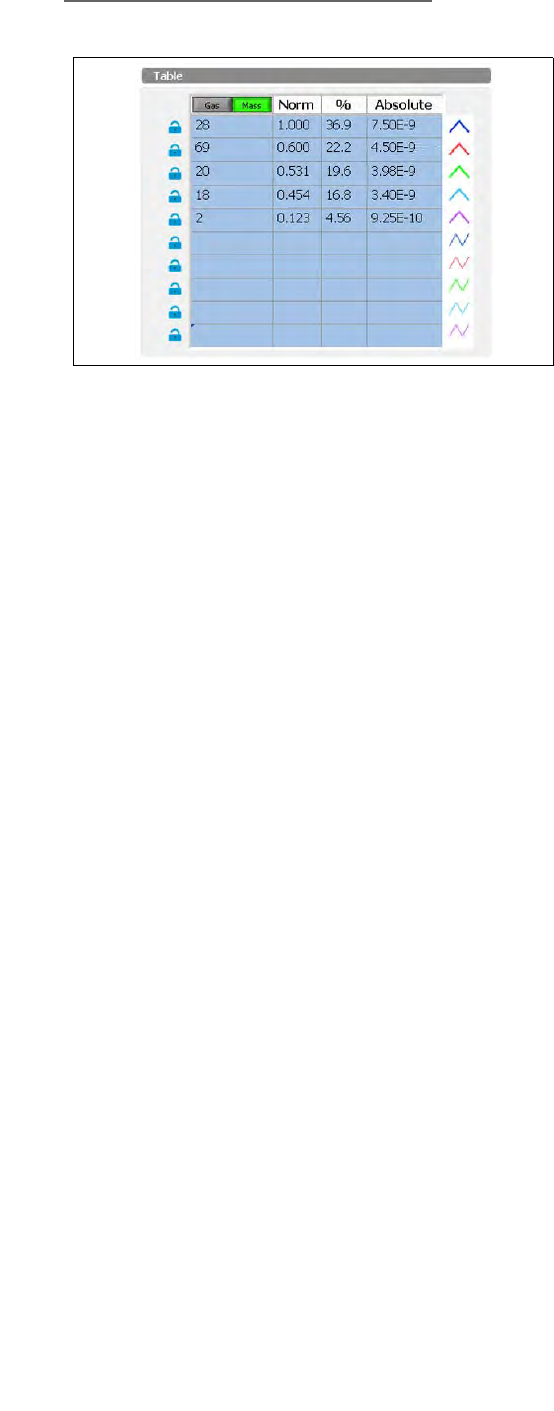
8 Initial Operation & Viewer Software
180 Series 835 Vacuum Quality Monitor
Instruction Manual - 835000
Gas/Mass Selector
The Results Table can be configured to display either fitted gases or masses. If configured for gases,
masses will still appear on the table, but they represent residual masses after gases are fit. In other
words, if you have a Water fit, you might still see 18 amu, but the value displayed for it will be
much less than the value displayed for 18 in mass mode. Select between the modes by pressing
either the Gas or Mass buttons on top of the first column of the table.
Locks
Along the left side of the Results Table are 10 Locks. The order of the gases or masses in the table
update based on relative quantity, with the species of the greatest quantity at the top of the table. If
you click on the lock, the line's background will turn green and the line's gas or mass is now locked
in the table. That is, even if the gas or mass is not one of the 10 most prevalent, it will appear on the
table and on the Trend Graph. Locked gases and masses appear at the top of the Results Table. The
remaining positions (with blue backgrounds) are the most prevalent unlocked gases or masses. All
10 positions can be locked. The locked gas or mass can be changed with the Locked Gas/Mass
Identifiers.
Locked Gas/Mass Identifiers
To change the locked gas or mass, click on the lock for a line in the table; the line will turn green.
Click on the name of the gas or the number of the mass (the cell in the first column that identifies
the gas or mass). A popup will appear.
• Gas Mode: If you are in Gas mode, you can set the locked value to either a gas or a mass.
To select a gas, click the "Select Species" radio button and then select the gas from the
Species Select drop down menu at the top of the popup. To select a mass, click the "Select
Mass" radio button and then enter the mass into the Mass in amu field. Finally, exit with
Continue to make your selection or Cancel to cancel the change.
• Mass Mode: If you are in Mass mode, you can only set a mass. Enter the mass you want to
lock into position. Click Continue to save your selection and Cancel to cancel the change.
Figure 8-15 Results Table
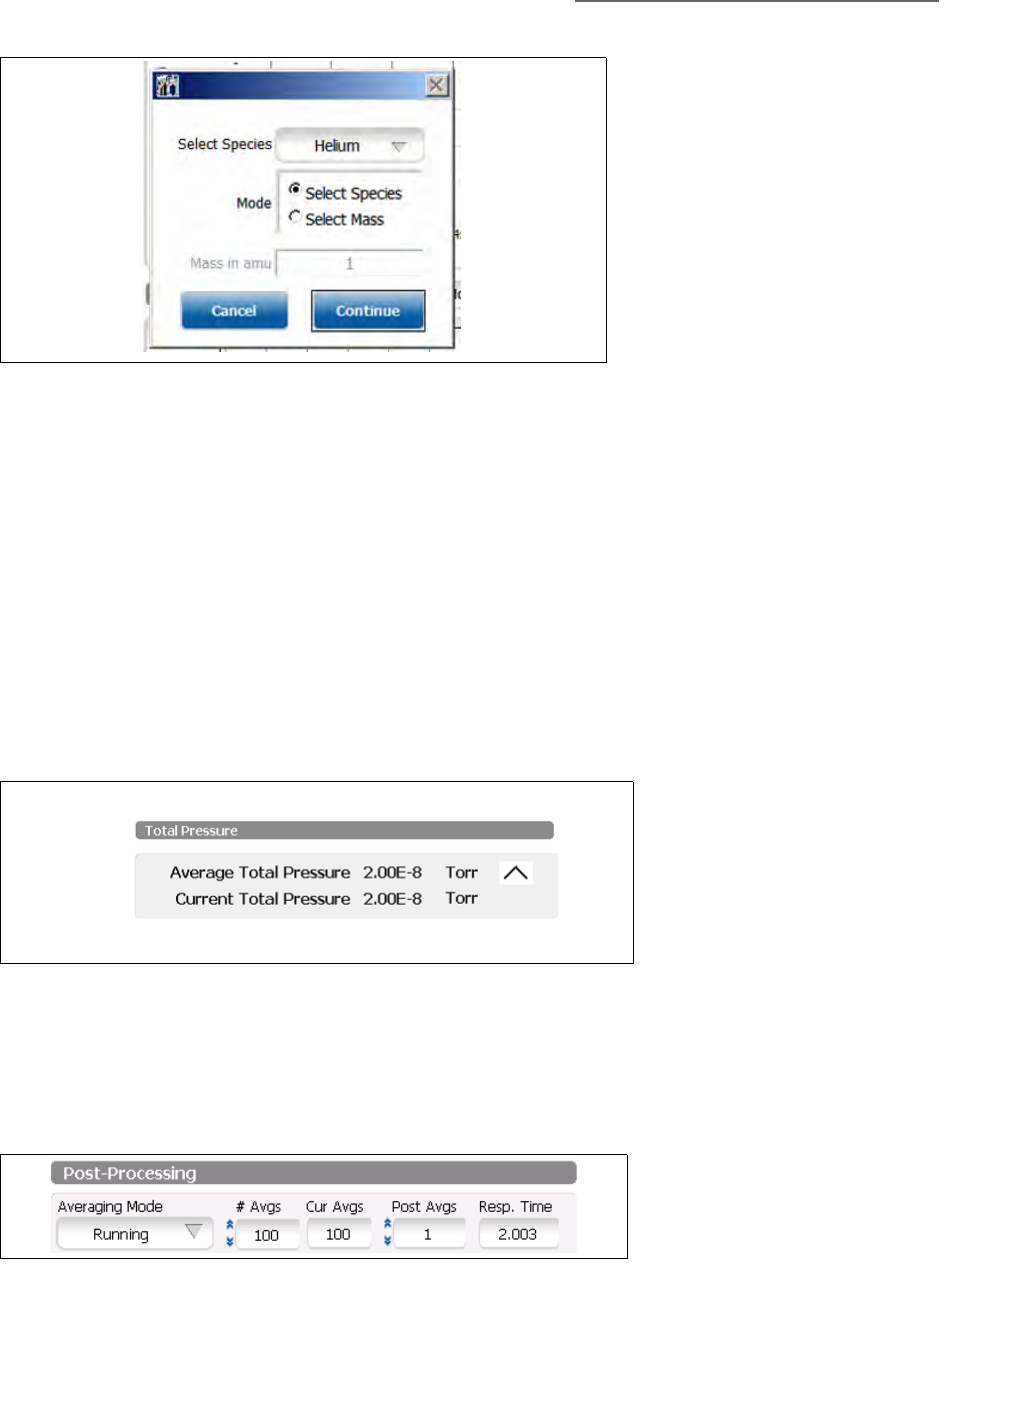
8 Initial Operation & Viewer Software
181
Series 835 Vacuum Quality Monitor
Instruction Manual - 835000
8.4.4.3 Total Pressure
The default value for total pressure source is NONE. If a 390802 Micro-Ion Gauge or other total
pressure gauge is being used, go to the Settings screen and select the pressure source.
The Total Pressure section displays the average total pressure and current total pressure. The average
total pressure is logged in the Trend graph in black as indicated by the black line adjacent to the
average total pressure reading. If there is no total pressure input, the values for the total pressure and
the partial pressure values in the Absolute column of the table will show as NaN (Not a Number).
The current total pressure is the instantaneous total pressure. The average total pressure is the
average of the total pressure readings over the number of scans being averaged.
Note: When the MS Gauge is first turned ON, a pressure spike associated with outgassing when the
filament is first powered may be seen. This pressure should drop quickly, although its effects could
be momentarily reflected in the averaged total pressure if the averaging value is set.
8.4.4.4 Averaging (Post-Processing)
The Post-Processing area of the Left Pane can be used to change the averaging options. The left-most
drop down control allows the user to select a type of averaging (Off, Running Average, Cumulative,
and Accumulator). The #Avgs control allows the user to set the number of scans to average.
• Off: No averaging.
Figure 8-16 Select Gas Species or Mass
Figure 8-17 Total Pressure
Figure 8-18 Post Processing
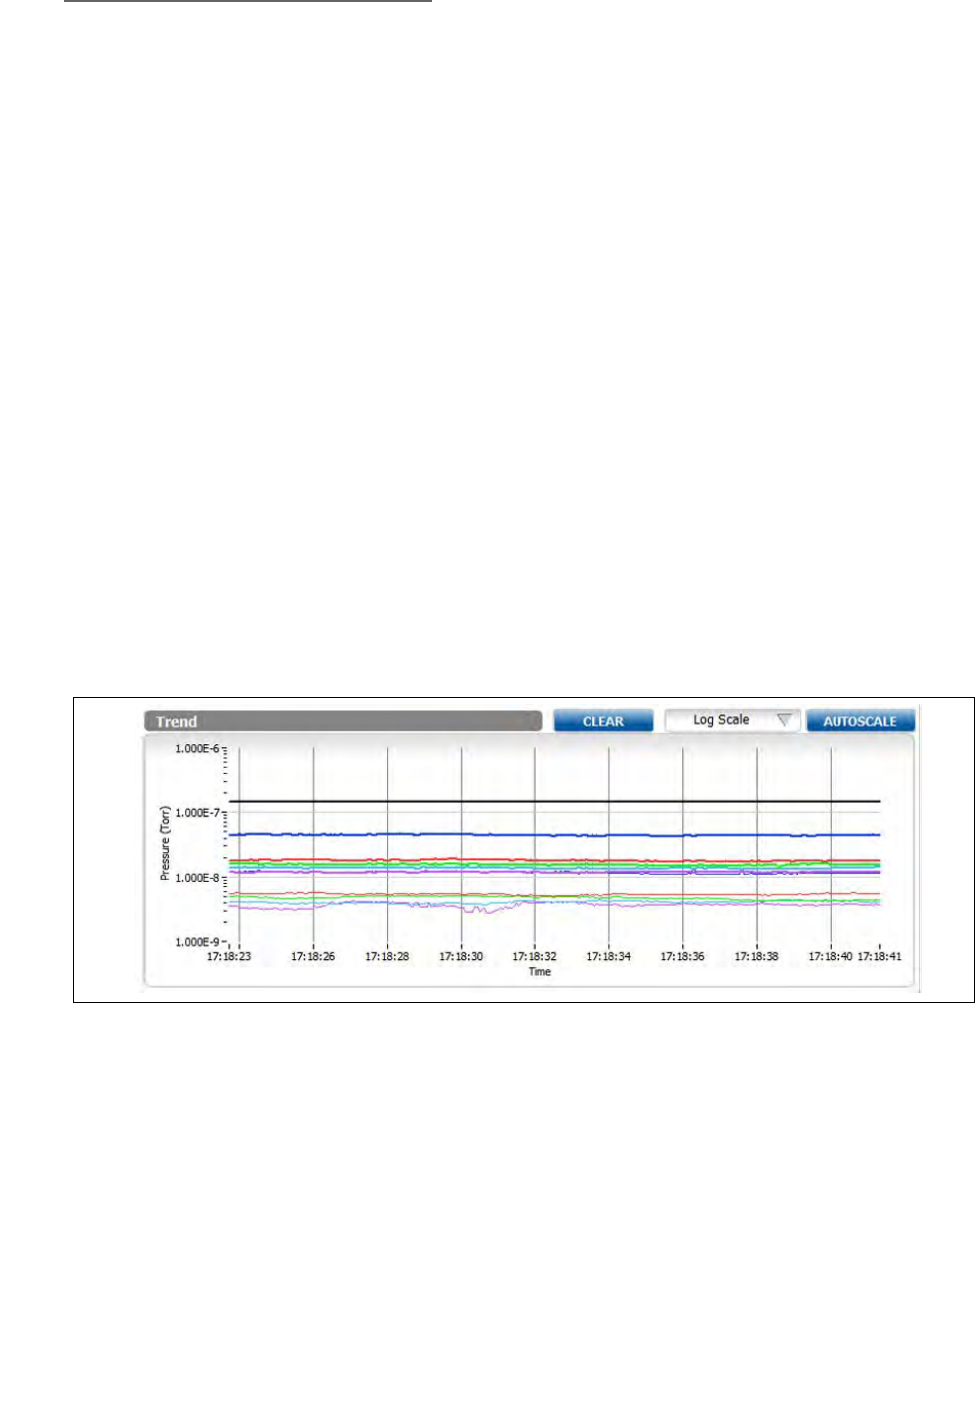
8 Initial Operation & Viewer Software
182 Series 835 Vacuum Quality Monitor
Instruction Manual - 835000
• Running Average (Finite Impulse Response (FIR) filter.): The N most recent scans are summed
and divided by N, where N is the number of scans to average. You may perform a running
average from 2 to 100 scans.
• Cumulative Moving Average (Infinite Impulse Response (IIR) filter.): ((N-1)*previous average
+ current scan)/N, where N is the number of buffers to average. A cumulative moving
average from 2 to 50000 scans can be performed.
• Accumulate: Sum N scans and divide by N. A new value is reported every N scans. That is,
unlike the Running Average, there are no intermediate values. You may accumulate a
moving average from 2 to 50000 scans. Results Table, Trend Graphs, and Histograms are
only updated once per N scans. Logging does not occur until the data is collected and the
accumulator average calculated.
The #Avgs identifies how many scans are currently collected towards the average as configured. The
Response Time is a calculation of the number of scans times (X) the hardware loop time.
8.4.4.5 Short-Term Trend Graph
The Short-Term Trend Graph appears only on the Summary Screen. It displays approximately 15
minutes of history from the entries in the Results Table. Note that gases and masses may come and
go on the Results Table. When an entry disappears from the Results Table, it may be replaced by a
different gas or mass. If the entry is locked, but has a value below 1x10-15 Torr, it will appear as a
blank space on the Trend Graph. The Trend Graph will display percent for the Y-axis units if
pressure is not available.
The trend data for all detected species is logged in a buffer on the computer. If a user-selected
species is in the table, the current and historical information for that species will be displayed.
• CLEAR: The Trend Graph can be cleared by clicking the CLEAR control at the top.
• AUTOSCALE: You can force the graph to autoscale the Y axis by clicking the AUTOSCALE
control.
• Log Scale/Linear Scale: The Log/Linear control allows the user to select the display mode for
the graph. Upon connection, the Viewer Application will restore the last user setting for the
connected Controller. It will default to Log if pressure is available and to Linear if pressure is
not available.
8.4.4.6 Histogram
The mass spectrum Histogram Graph can be viewed on the Summary Screen or the Settings Screen.
Figure 8-19 Short Term Trend Graph
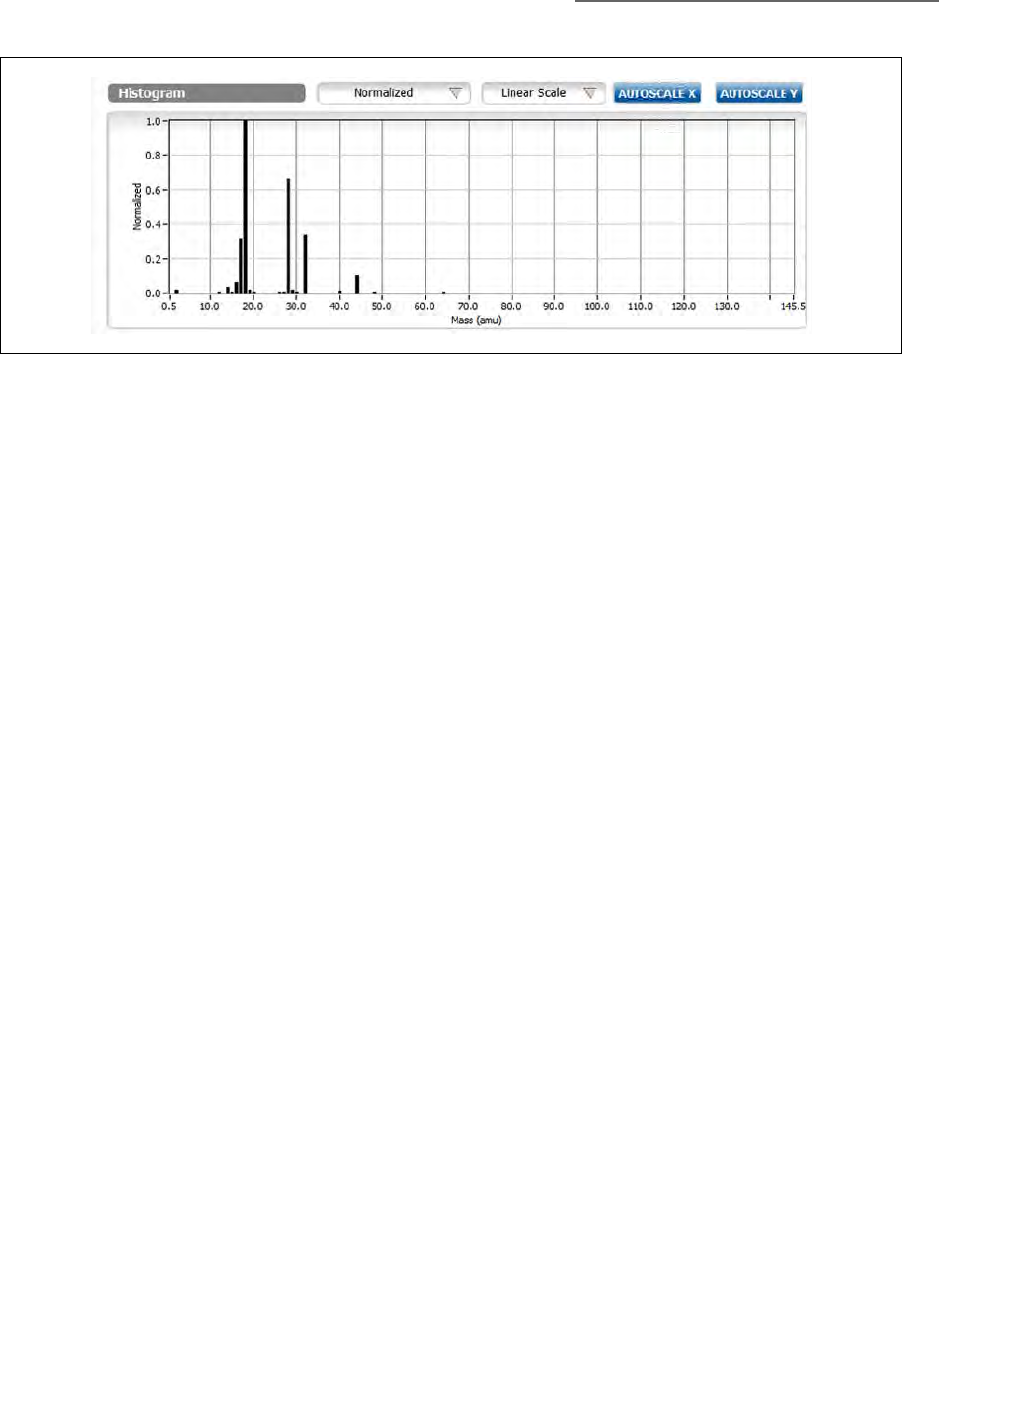
8 Initial Operation & Viewer Software
183
Series 835 Vacuum Quality Monitor
Instruction Manual - 835000
• AUTOSCALE X: Display full mass range that is being scanned.
• AUTOSCALE Y: Change the scale of the Y-axis to optimize the setting for the displayed X-axis
zoomed area.
• Log Scale/Linear Scale: The Log/Linear control allows you to select the display mode for the
graph.
• Normalized or Partial Pressure: If a total pressure source is available, partial pressures can
be displayed.
• X Zoom via Mouse: The user can zoom in on the X-axis using the mouse. Click and hold the
left mouse button and sweep through the zoom area. Release the left mouse button to
complete the zoom area selection. The AUTOSCALE X control will restore the X-axis to its
default.
• Zoom via axis modification: The user may select and edit the text for the upper or lower
Y-axis legend or the left or right X-axis legend, thus identifying both an X and Y zoom factor.
Figure 8-20 Histogram Graph
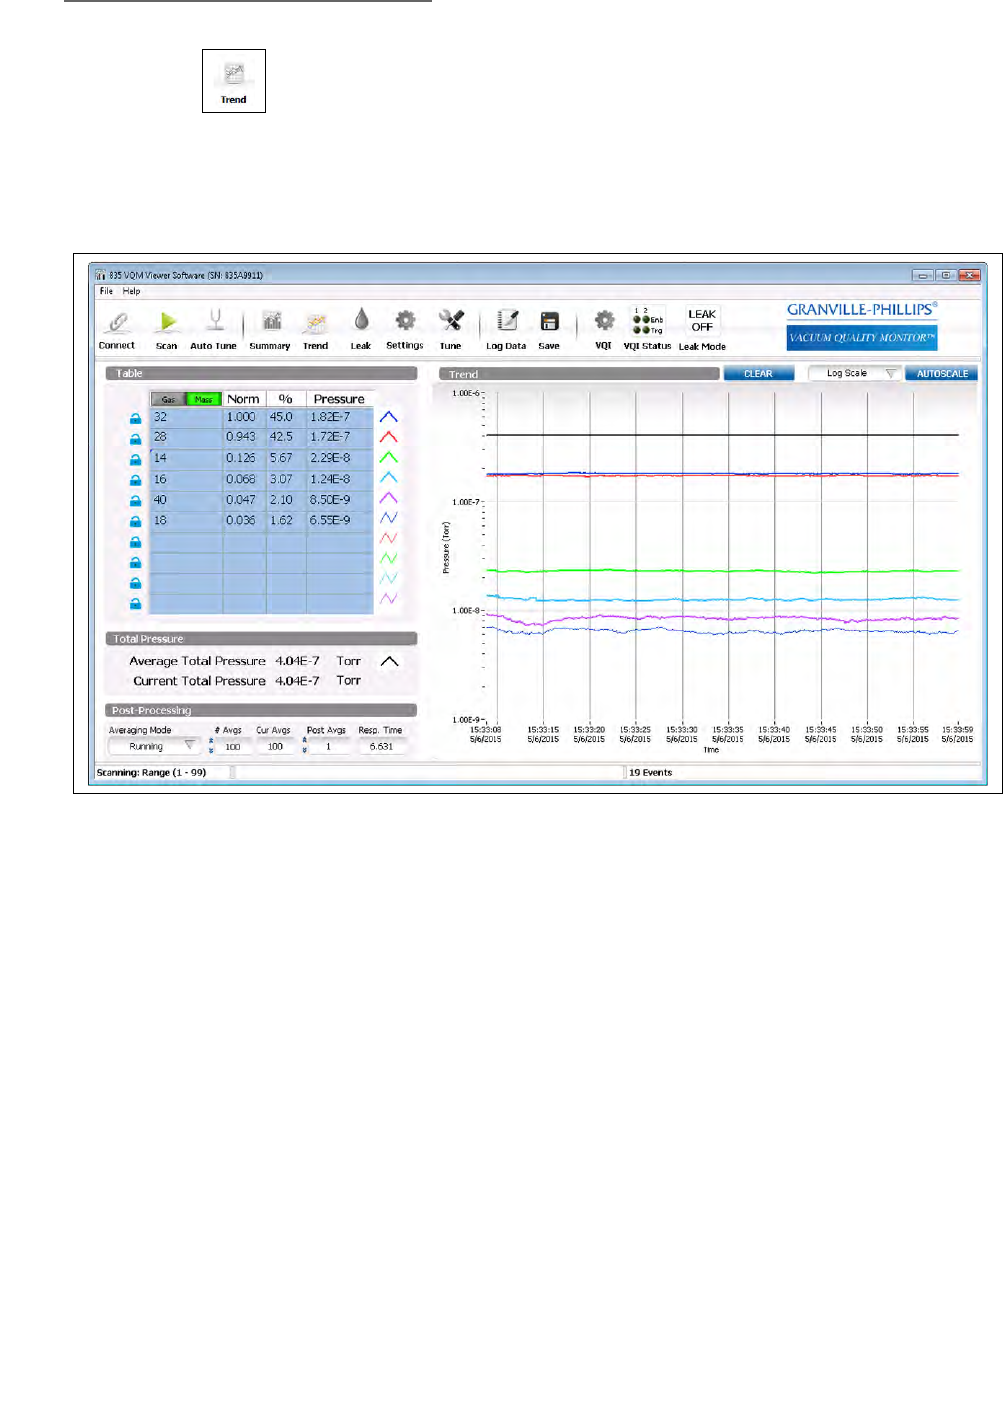
8 Initial Operation & Viewer Software
184 Series 835 Vacuum Quality Monitor
Instruction Manual - 835000
8.4.5 Trend
The Trend Screen displays a Long-Term Trend Graph. This trend graph has an infinite time, but
finite data. It may be valuable for tracking pumpdowns or other longer term vacuum processes.
To fit a longer time scale on the graph, intermediate graph points will be discarded as the finite
data is filled. Use the Trend graph on the Summary Screen to capture/view transient behavior.
Also, see Results Table in Section 8.4.4.2 and Averaging (Post-Processing) in Section 8.4.4.4.
The controls for the Long-Term Trend Graph are identical to those for the Short-Term Trend Graph.
The difference is that the time scale for the Long-Term Trend Graph continues to grow until it is
cleared (either via the button or because of disconnect.)
NOTE: Data on the Long Term Trend graph is compressed to fit the space, with the
data collection rate adjusting as a greater amount of data is collected.
The trend data for all detected species is logged in a buffer on the computer. If a user-selected
species is in the table, the current and historical information for that species will be displayed.
It is not necessary to preselect what to trend. The long-term trend data for all species can be saved
in a "csv" file through the Save function.
Figure 8-21 Trend Screen

8 Initial Operation & Viewer Software
185
Series 835 Vacuum Quality Monitor
Instruction Manual - 835000
8.4.6 Leak
The Leak Detection Screen provides a visual and audio indication of whether the user-selected
leak mass changes above an initial base line.
Use the Leak function when checking the vacuum chamber/fittings for leaks. Use a known gas
(such as helium, Mass 4) to check suspected areas where leaks may occur. Select an AMU
from the drop-down menu to check for leaks.
Click on the Audio Alert Enable check box to turn the leak tone ON or OFF. It may be
necessary to adjust the speaker settings to hear the tone. The leak tone starts at its baseline tone
when the enable box is clicked on. At that time, the leak amu is sampled and this partial
pressure is mapped to the low tone. The frequency of the tone will go higher as the partial
pressure of the amu goes up. The frequency will not drop below the baseline level. If there is a
significant increase or decrease in the leak check gas from the initial start of the leak check
process, you may need to press the Reset Baseline button.
If there is a significant increase in the baseline of the leak check species after starting leak
checking or after pressing the Reset Baseline Button, the frequency of the Audio alert may stay
at the maximum frequency. To audibly discern changes in concentration, the leak check
species can be pumped back down to the previous level, or the Reset Baseline button can be
pressed to use this new level of the leak check species as the baseline for the audible alert
lowest pitch.
NOTE: If the quantity of the leak check species decreases after leak check is initiated
or after the last time the Reset Baseline button is pressed, the frequency of the
audible alert will stay at the base pitch until the leak check gas reaches the last
set baseline level. Pressing the Reset Baseline button will recalibrate the
baseline for the current quantity of the leak check species in the system.
To optimize the leak check function for the leak mass selected, when the Start Leak Detection
button is selected, an Auto Setup option is available which optimizes the signal for the selected
Mass leak check. The effects of this optimization are:
• Reduces the scan range, which has two main advantages:
• More scans can be averaged together for noise reduction without increasing the
response time.
• The electron multiplier gain can be increased without saturation if you are not scanning
the largest peaks. Partial pressure information is calculated from the relative percentage
of each species and the total pressure. Operating with a reduced scan range provides
the relative percentage of the species within the scan range. Partial pressures calculated
from this can be significantly over-reported if the dominate peaks are outside the scan
range.
• Increases the number of averages.
• Decreases the EM Bias voltage, which increases the gain of the electron multiplier. There is
a trade-off between electron multiplier gain and lifetime of the electron multiplier. However,
for short periods of time, if more gain is needed, this is a proven technique. A detailed
explanation of the Electron Multiplier Bias is given in Section 6.9.3.
• Increases the RF Amplitude (see Section 8.4.8, the Tune function). Increasing the RF
amplitude ejects more ions from the trap improving dynamic range. Increasing RF amplitude
beyond the recommended setting reduces resolution and may decrease the peak-finding
capability of the VQM.
For leak detect, when sensitivity is needed, resolution and peak finding are usually less
important. While the Leak check function does not utilize the software peak finding, the
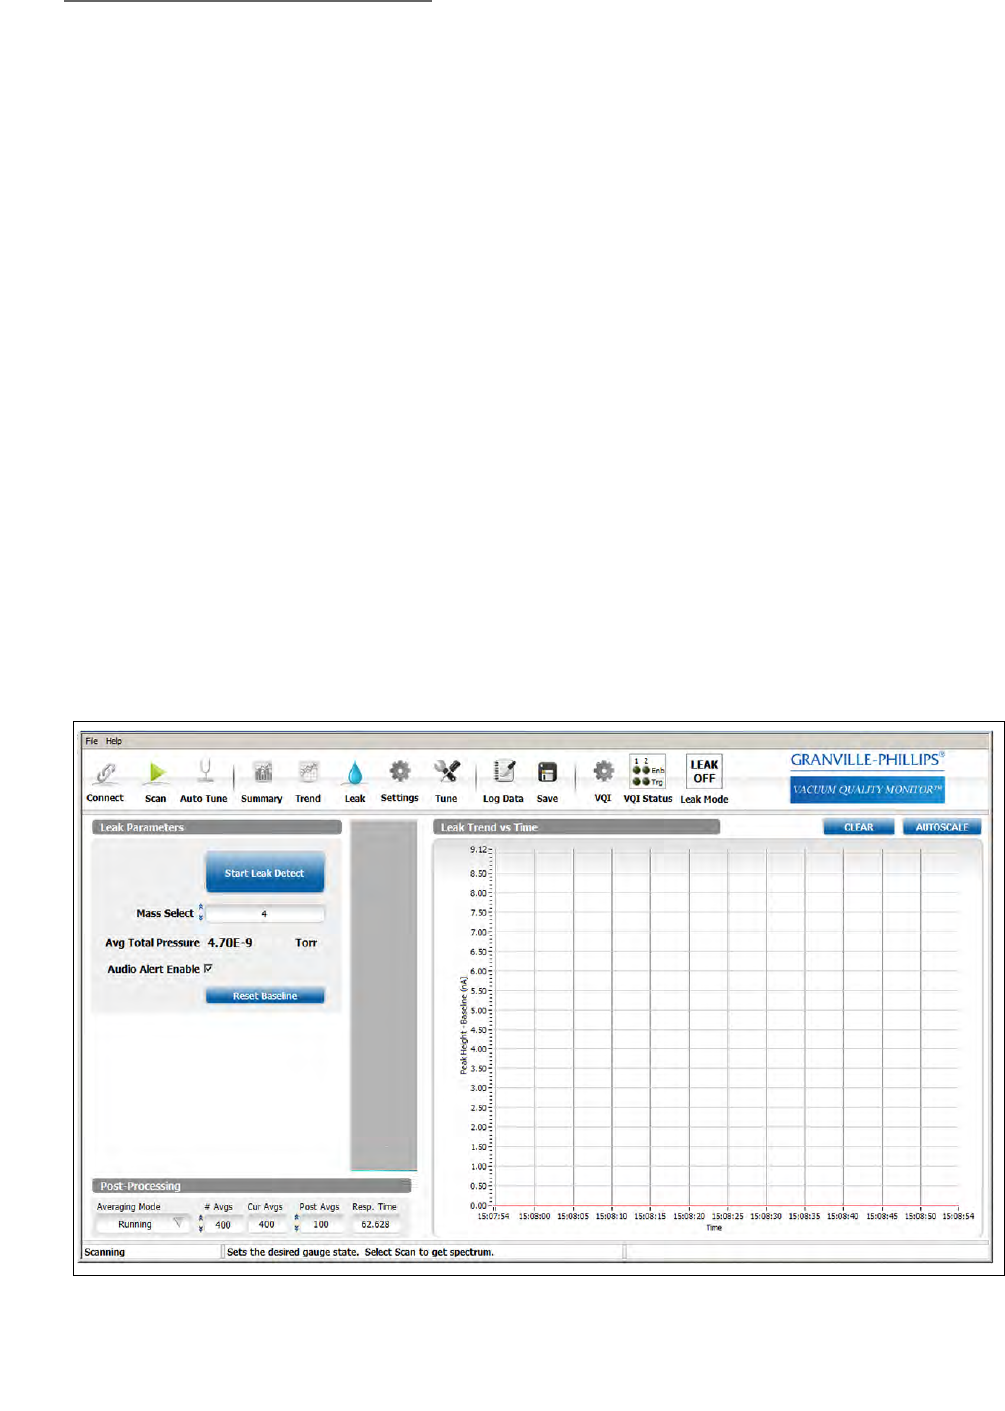
8 Initial Operation & Viewer Software
186 Series 835 Vacuum Quality Monitor
Instruction Manual - 835000
Summary Screen, Mass and Gas Trend screens, Histograms, and the Log Data function use
data that is generated from the peak finding algorithm. At the high RF settings, as set by the
Leak check autosetup, the data on these screens may show intermittent results if the peaks
become too wide for the peak finding to consistently identify the peak as a valid peak.
NOTE: A detailed explanation of the RF Amplitude is given in Section 6.9.2.
• When leak checking is completed, be sure to press the Stop Leak Check button to terminate
leak checking, which returns the RF Amplitude, EM Bias, and Mass Scan Range to their
previous settings.
NOTE: Do not increase the scan range when running in the leak check optimized
settings as the signal gain is optimized for the signal within the scan range.
Shifting to a full scan range while in leak check mode could cause excessive
wear on the electron multiplier. Press the Stop Leak Check button to return to
full scan mode,
NOTE: If communication between the computer and the VQM Controller is lost while
in leak check mode, the Controller will continue to run with the leak check
adjusted gain, scan range and RF with the distinct possibility of unnecessary
wear on the electron multiplier if the Controller is left running with these
settings for an extended period and if the scan range is extended with the
amplified gain. If communication is lost to the Controller, cycling the power on
the Controller will return it to the last saved gain and RF power settings.
• When the Stop Leak Check Button is pressed, there is an option to save the current leak check
settings. These settings will be stored on the computer to a file name and location of the
user’s selection. If the computer will be used with multiple VQM sensors, or with various
leak check gases, it is advisable to save the leak check settings file to a file name that
indicates what sensor or sensor location (such as Chamber A) so that the file can be easily
selected the next time when leak checking with the same sensor.
Figure 8-22 Start Leak Check
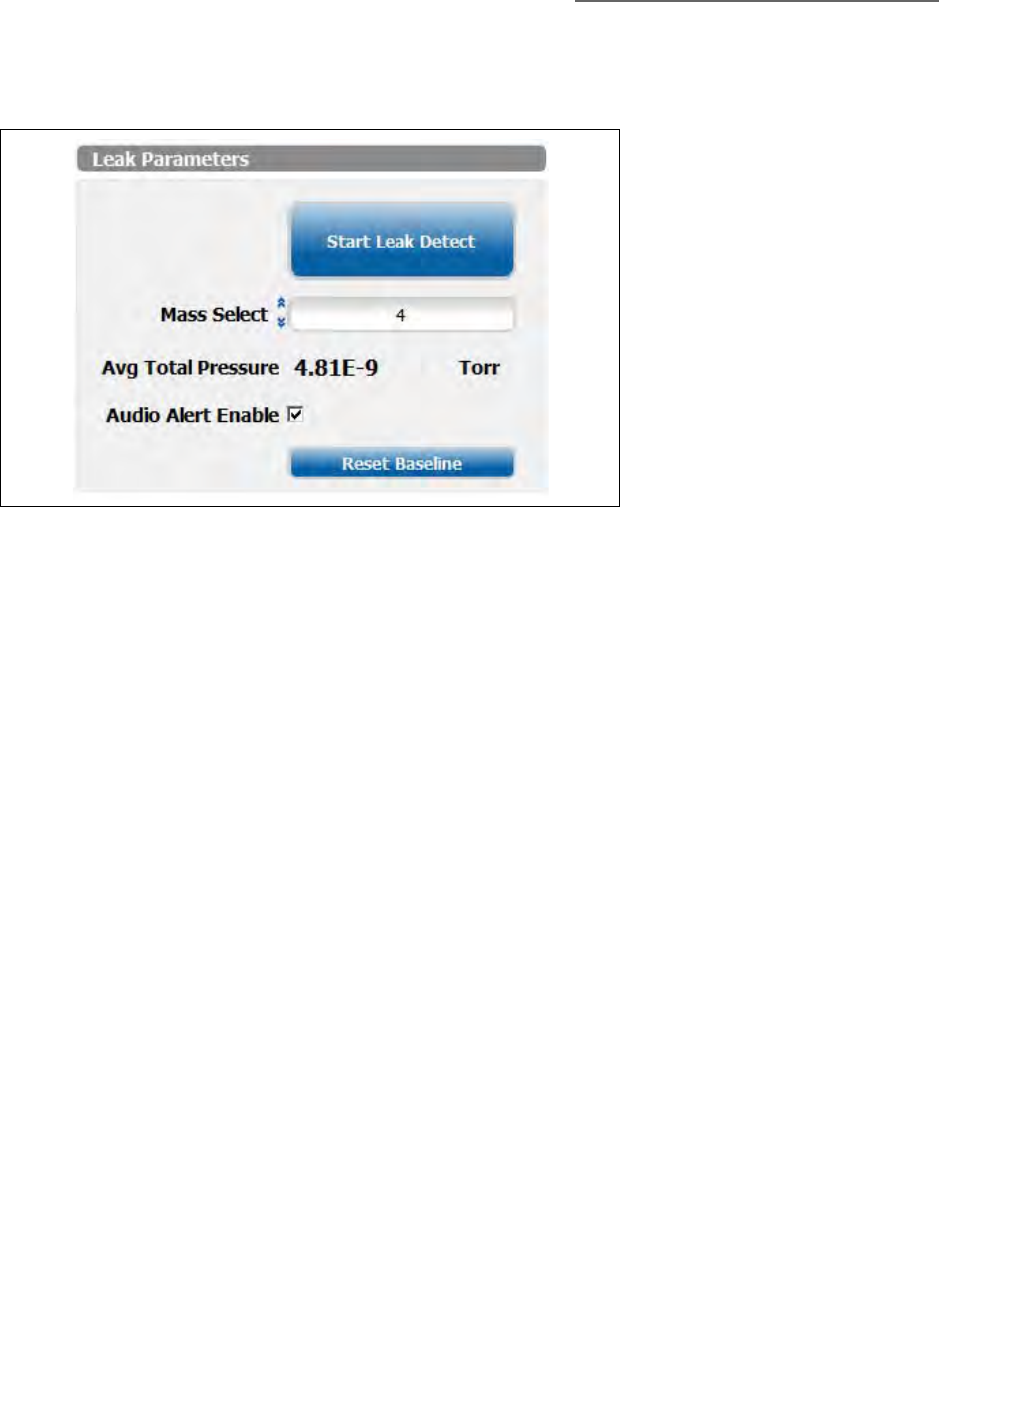
8 Initial Operation & Viewer Software
187
Series 835 Vacuum Quality Monitor
Instruction Manual - 835000
8.4.6.1 Leak Parameters
The Leak Parameters include the Leak Mass Select.
• Mass Select: Use the Up or Down arrows, or enter a mass number, to select a gas to use for
leak detection. It does not matter whether the VQM Controller is in Gas or Mass mode, the
monitored value is the Mass. The most common gas for leak checking is Helium, which is
Mass 4.
8.4.6.2 Leak Trend Graph
The Leak Trend Graph is a 1 minute trend of the leak check mass analog peak height vs. the analog
scan baseline noise. Just to the left of the Trend Chart is an instantaneous bar chart showing the
current quantity of the leak check gas. Press the Reset Baseline button to set the current leak check
amount to the bottom of the bar graph.
If the quantity of the leak check species decreases after leak check is initiated or after the last time
the Reset Baseline button is pressed, the indicated quantity of gas in the bar graph will stay at the
bottom level until the leak check quantity comes up to the previous base level. Press the Reset
Baseline button to recalibrate the baseline for the current quantity of the leak check species in the
system.
Figure 8-23 Leak Parameters
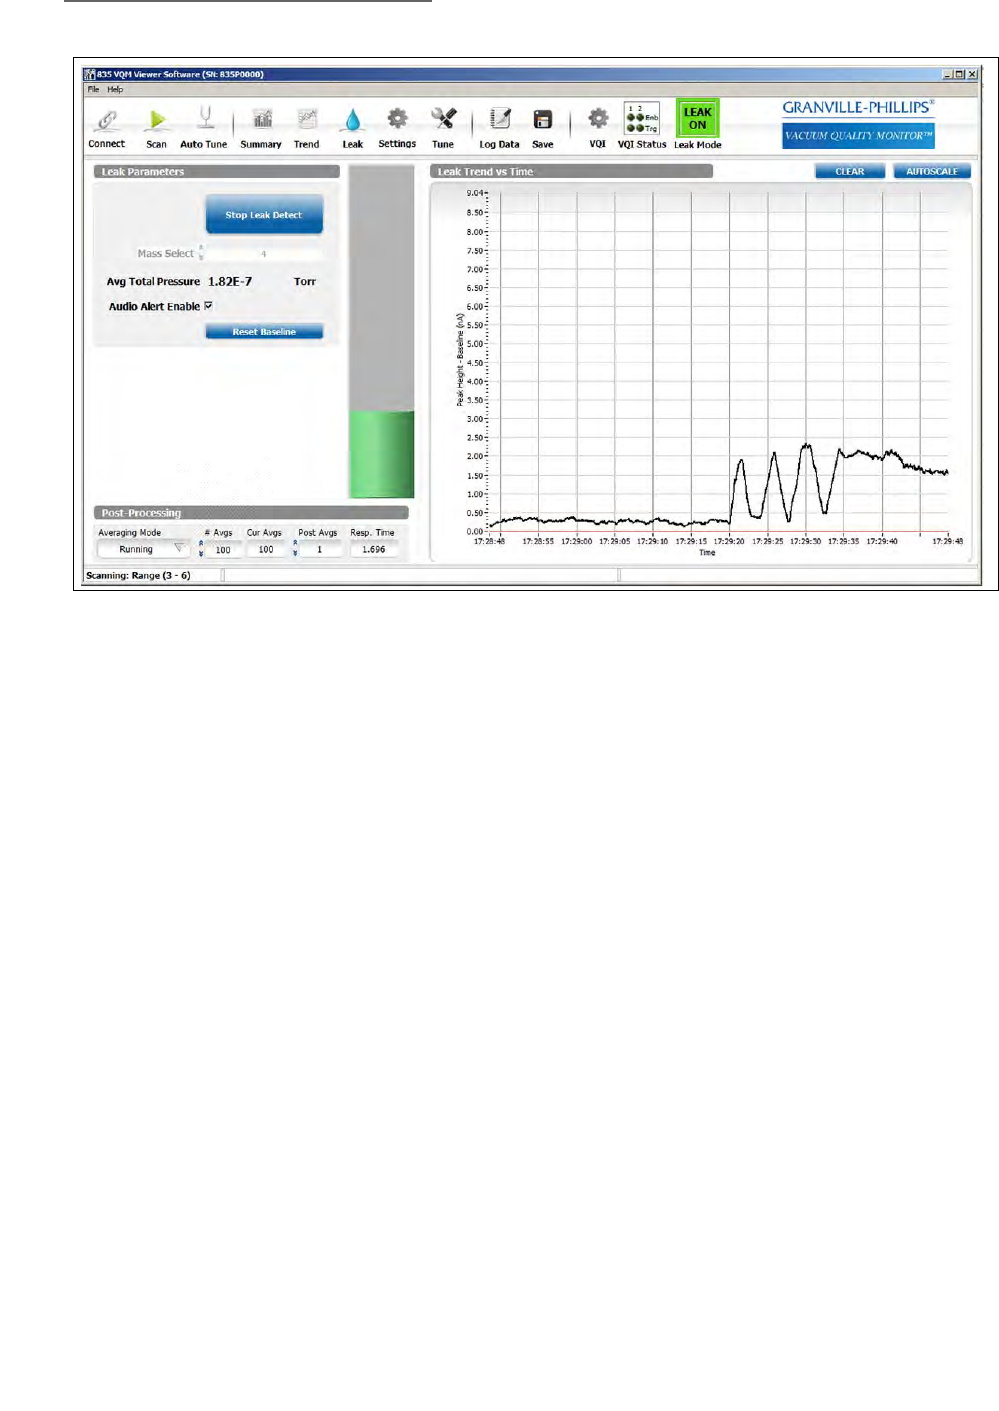
8 Initial Operation & Viewer Software
188 Series 835 Vacuum Quality Monitor
Instruction Manual - 835000
• CLEAR: Use the CLEAR control to erase Leak Graph history.
• AUTOSCALE: Use AUTOSCALE to set the graph y-axis to scale the graph for the data
currently in the leak trend time window.
• Y-Zoom via Mouse: You can zoom in on the Y-axis by clicking and holding the left mouse
button, dragging through the desired Y range, and then releasing the button.
• Y-Zoom via axis modification: The user may select and edit the text for the upper or lower
Y-axis legend to identify the Y-axis extents. This method allows zooming out as well as in.
In the Leak Check Post-Processing section, the Scan averaging parameters can be adjusted.
• Averaging Mode: The averaging mode is adjustable, but it is recommended to stay in the
running average mode for leak detection.
• # Averages: This setting allows adjustment of the number of scans to be averaged. The more
scans averaged, the greater the sensitivity to the leak check gas, but the slower the response
time. Adjust the averages to allow the required response time / sensitivity for the leak
checking to be done. Typically this should be between 100 and 200.
Post Averages: For Leak Check, the Post averaging does not do anything. Leave this set to 1.
Figure 8-24 Leak Check Trend and Bar Graph
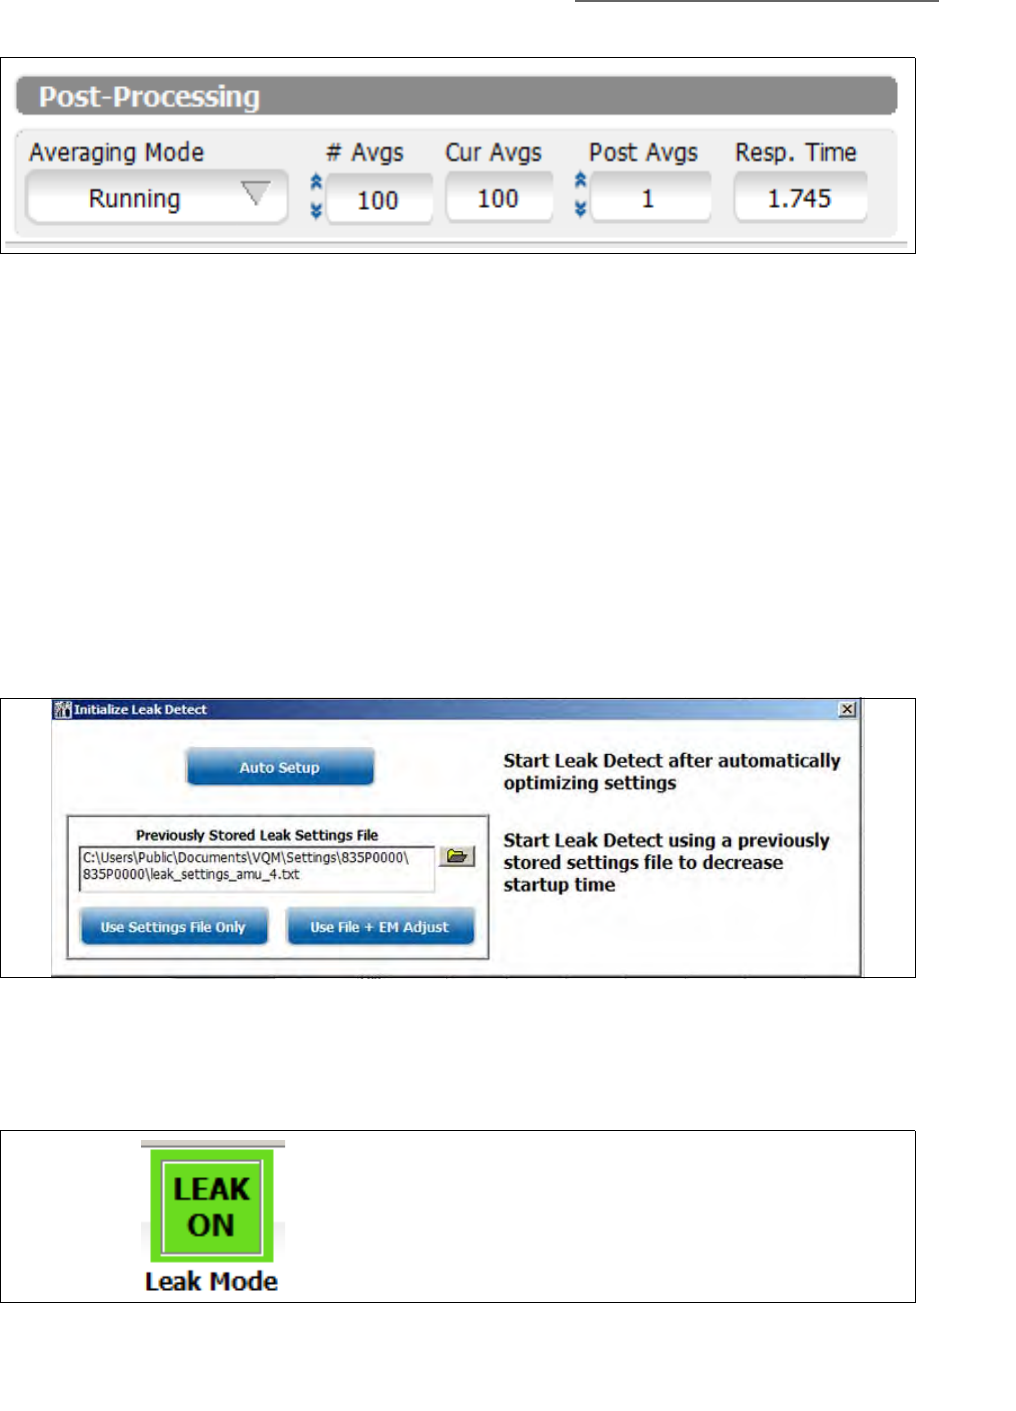
8 Initial Operation & Viewer Software
189
Series 835 Vacuum Quality Monitor
Instruction Manual - 835000
8.4.6.3 Initiating Leak Check
Press the Start Leak Detect button to initiate the leak check mode. A pop up window will appear to
either run an Auto Setup, Load a previously stored Leak Check settings file, or Load a previously
stored leak check settings file but have the software optimize the Electron Multiplier gain to adjust
for any wear on the electron multiplier since the last time the leak check gain was optimized for the
sensor.
• Select Auto Setup if this is the first time using the Leak Check mode with a specific VQM
sensor.
• Select Use File + EM Adjust if settings are stored from the last time the VQM sensor was used
for leak checking, but it has been several weeks or months since it last used.
• Select Use Settings File Only if Auto Setup for the VQM sensor was recently run. This option
takes the least time to set up.
When in Leak Check mode, the Leak Icon at the top right of the screen will be green and indicate
LEAK ON.
Figure 8-25 Post Processing Averaging Mode
Figure 8-26 Leak Check Auto Setup
Figure 8-27 Leak Check - Leak Mode ON

8 Initial Operation & Viewer Software
190 Series 835 Vacuum Quality Monitor
Instruction Manual - 835000
To exit leak mode, press the Exit Leak Mode button. A pop up box will appear allowing you to save
the leak check settings. If these are new leak check settings, you may want to save the settings or
update them if a previous leak check settings file has already been created. If you have multiple
VQM sensors, you may want to save these settings with a file name indicating the specific sensor or
sensor location for ease of selection when initiating a new leak check session.
Figure 8-28 Leak Check Use File + EM Adjust
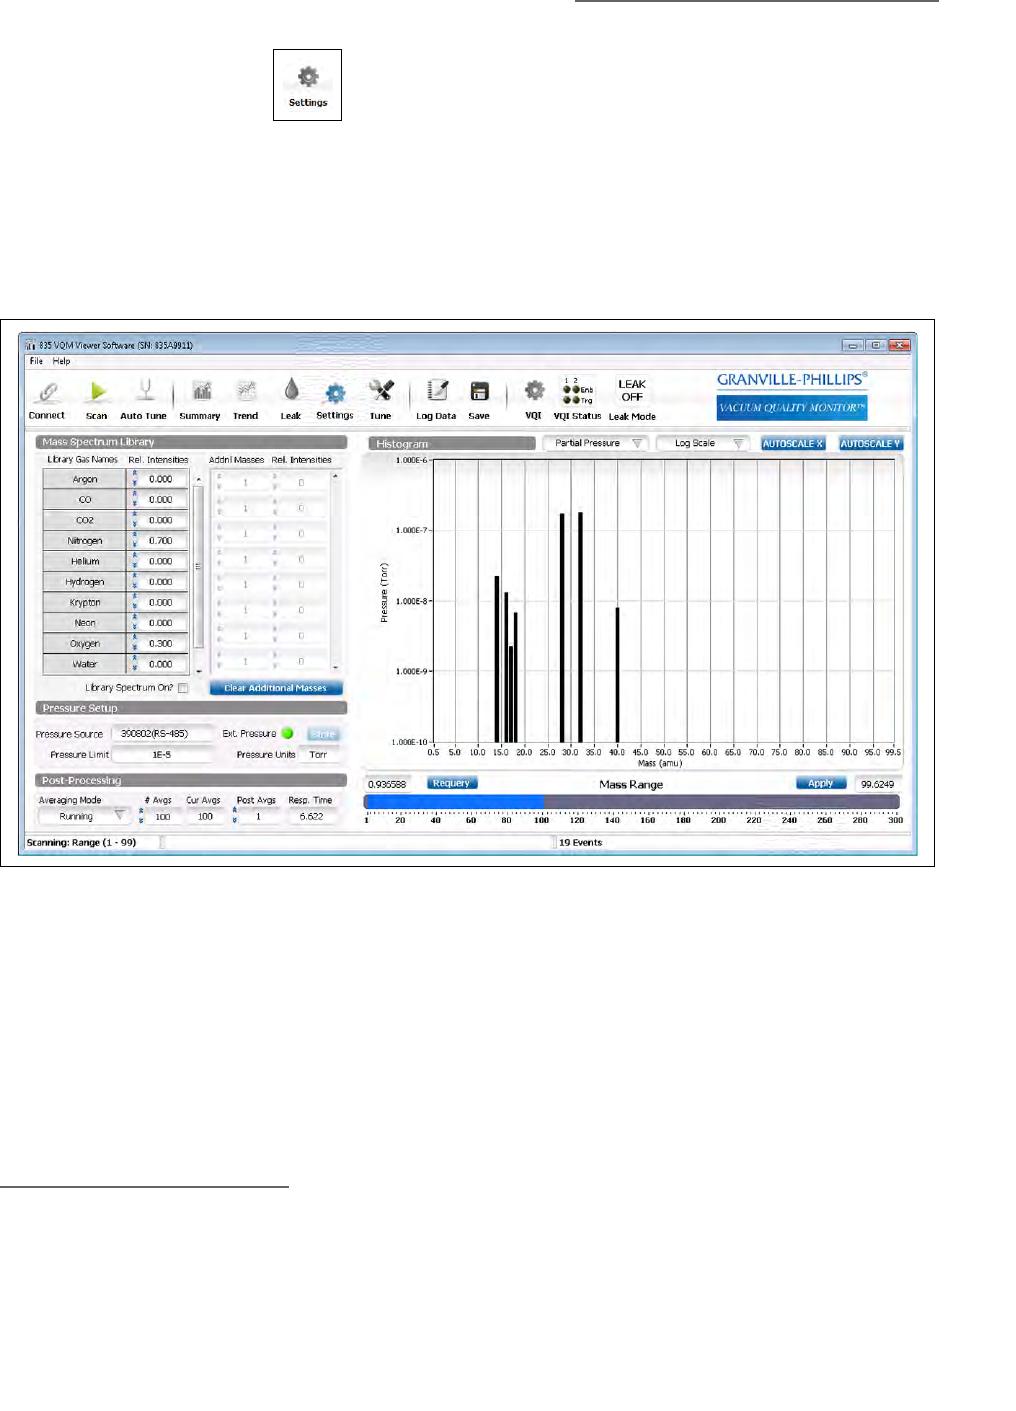
8 Initial Operation & Viewer Software
191
Series 835 Vacuum Quality Monitor
Instruction Manual - 835000
8.4.7 Settings (preferences)
The Settings screen provides a mechanism to identify/modify the system configuration. Use the
Settings screen to identify the total pressure source, set the overpressure limit, select the
pressure display units, and the Mass Scan Range. It also provides the Library Spectrum
Definition Controls and an indicator that is ON when a Total Pressure source is detected and
OFF when the Total Pressure source is not detected. Along with selecting the display pressure
units, the pressure units displayed on the LCD of the 390802 Micro-Ion Gauge (if attached)
can be programmed.
8.4.7.1 Mass Spectrum Library
The Mass Spectrum Library can be used to display a fingerprint of the desired gas composition.
On the Mass Spectrum Library area of the screen, selections from the library of gases can be
made, and the relative intensity of the gases. Click "Library Spectrum On?" to overlay the
library gases and library intensities over the mass spectrum display. The library gases will show
as a red overlay on the graph. For species not in the library, the user can manually input the
additional masses and relative intensities. (1)
1. * When a gas (rather than a mass) is identified in the library spectrum, the red outline for the gas includes
only the main peaks (and their levels) that are required to fit the gas. The red outline does not include the
smaller peaks that may also be residuals of that gas. However, if the residual peaks exist, they will be "used"
by the gas fit and the amount of them that is used will be subtracted from those peaks, and only the
remaining amount of them will appear in the results table as residuals.
Figure 8-29 Settings Display Screen
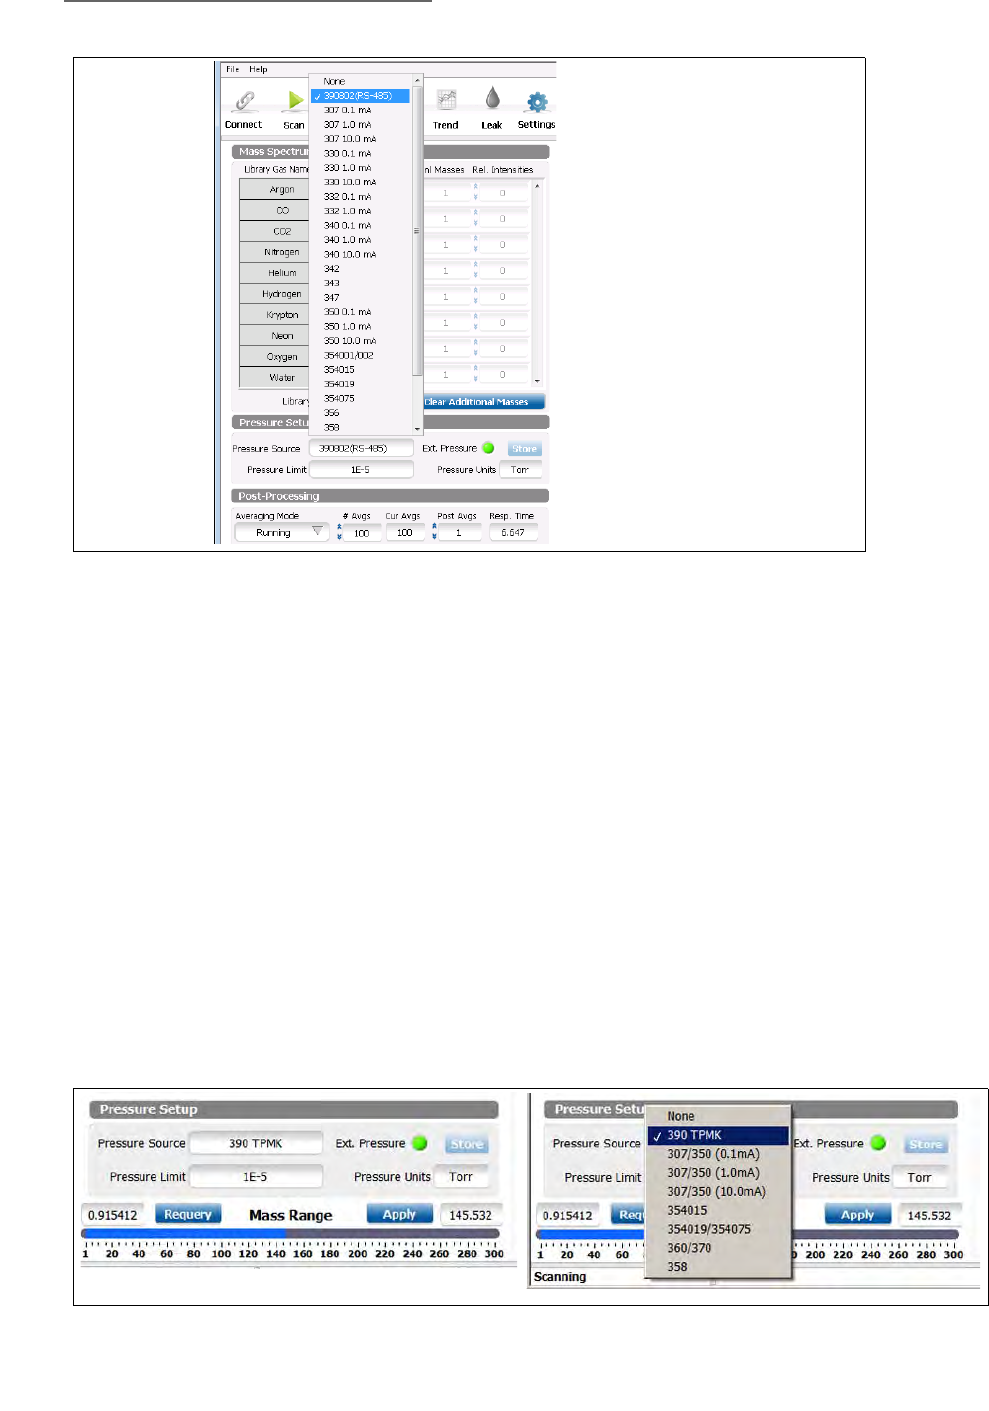
8 Initial Operation & Viewer Software
192 Series 835 Vacuum Quality Monitor
Instruction Manual - 835000
• Relative Intensities: Set the value of the intensity of the mass or gas, normalized to 1.0. The
values for gases and masses are summed. This means that calculated Relative Intensities may
be adjusted based on the highest sum for an amu.
• Additional Masses: Enter a mass value for intensities not provided by gas relative intensity
settings. If you enter a mass that is provided by one or more gases, be aware that the
intensities are summed. If you enter a mass more than once, the intensities will be summed.
• Library Spectrum On: Check this box to display the Mass Spectrum Library. Displaying the
Mass Spectrum Library consumes CPU cycles. A backlog may result.
• Clear Additional Masses: Clear Relative Intensities and their amu values from the Additional
Masses part of the control.
8.4.7.2 Pressure Setup (configuration)
On the Pressure Setup area of the screen, pressure units, total pressure source, and software
over-pressure limit can be set. The over-pressure limit is the pressure at which the MS Gauge
will be turned OFF to protect the gauge. The software over-pressure limit cannot be set higher
than the Controller's over-pressure limit. When a 390802 Micro-Ion Gauge is connected and
the Mass Spec power is OFF, press the Store button to program the Micro-Ion Gauge to display
the selected units.
Figure 8-30 Mass Spectrum Library
Figure 8-31 Pressure Setup

8 Initial Operation & Viewer Software
193
Series 835 Vacuum Quality Monitor
Instruction Manual - 835000
•Pressure Source: Select the source for your total pressure reading. Available options include
the 390802 Total Pressure Measurement Gauge, several different Granville-Phillips
ionization gauge controllers, user-defined gauges (see Section 8.4.14), and None. It is
strongly recommended that a Total Pressure Source be used to protect the MS Gauge and
provide partial pressure information.
•Pressure Limit: Enter a pressure value at which power will be removed from the MS Gauge.
This is an available soft protection feature that works in addition to the embedded pressure
protection provided by the 835 Controller. The recommended setting is 1x10⁻⁵ Torr. If the
pressure limit is set to a value higher than 1x10⁻⁵ Torr, the auto ON feature is enabled. The
VQM gauge will be turned OFF at the pressure limit then automatically turned back ON
when the pressure gets lower than 1x10⁻⁵ Torr.
•External Pressure: This indicator informs the user if external pressure is available. If the Total
Pressure Source is a Micro-Ion Gauge, unreasonable values will result in the Viewer
Application turning OFF the indicator and failing to display total pressure. The indicator is
always OFF if you select None as your total pressure source.
•Pressure Units: Use the drop down list to select the units to use for pressure display and
graphing. The pressure units can be set to Torr, Pa, or mbar. This will change the units
displayed on the Histogram and Trend displays.
•Store: If the Total Pressure Source is a 390802 Micro-Ion Gauge, the Store button can be
used to alter the 390's displayed pressure units. Select the desired pressure units. Use the
Gauge Operating Mode button to turn OFF the MS Gauge. Click the Store button to write the
pressure unit setting to the 390802 Micro-Ion Gauge.
8.4.7.3 Scan Range
The Mass Scan range can be modified to decrease the scan time for faster response or to
increase the number of averages to reduce noise while getting the same response time.
As long as the gases in the vacuum system have their AMUs in the scan range and the system
has a total pressure source, the partial pressures displayed in the Results Table will be
meaningful. However, once the settings are changed so that the scan range is not fully
covering the gas mix, the partial pressure readings will be calculated with the assumption that
all gases are scanned: the numbers may no longer be meaningful. On the other hand, the %
and Norm columns will represent the values as calculated for the scanned range.
For example, if the scan range is 1-145 and the vacuum has Krypton (most of the peaks are in
the range 40 to 90 amu) in it, the partial pressure calculation will "see" all the peaks expected
from Krypton. If the scan range is changed to 1-40, the Krypton peaks will no longer be
scanned and their pressures will not be considered in the partial pressure calculations. The
peaks between 1 and 40 amu will increase to higher percentages and normalized values. The
Partial Pressures will also increase to higher values. This can be seen on the Trend Screen. By
changing the scan range again to 1-145, all of the peaks between 1 and 40 amu will decrease
and the peaks for Krypton will now be considered.
Adjust the Scan Range by adjusting the slider (blue section) to cover the desired scan range.
Press the Apply button to save the change. The scan range is not infinitely adjustable. When
the Apply button is pressed, the actual mass range is displayed in the cell just above the range
slider. Adjusting the X Axis Calibration will make minor changes in the scan range. Press the
Requery button to update the scan range display. When operating with a scan range below
145 amu, the scan range is displayed in the lower-left corner of the screen.
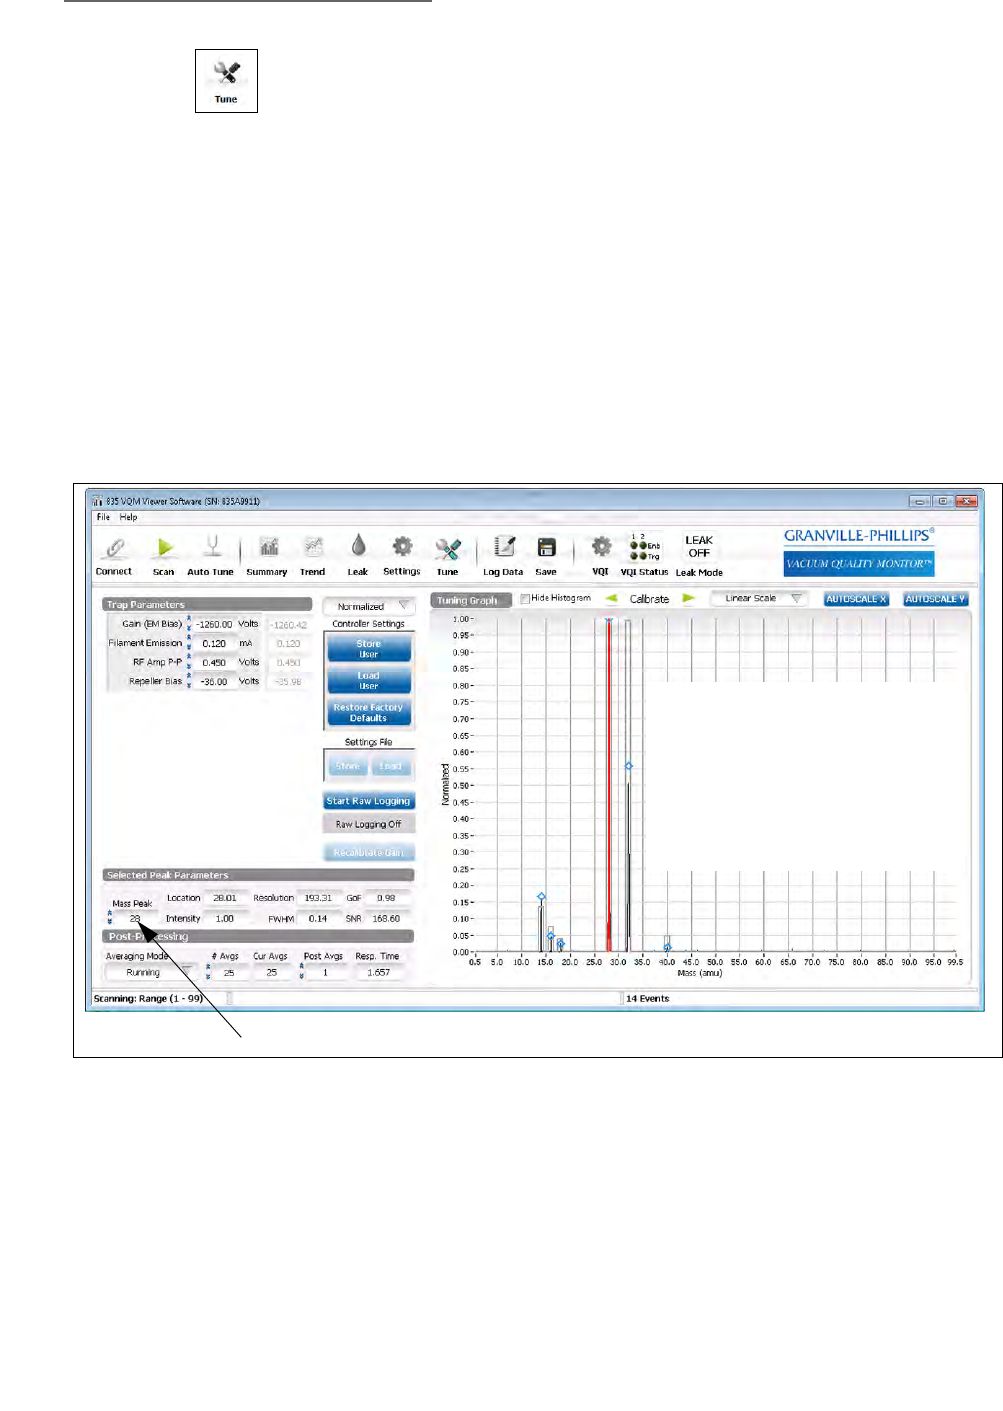
8 Initial Operation & Viewer Software
194 Series 835 Vacuum Quality Monitor
Instruction Manual - 835000
8.4.8 Tune
The Tune Screen is used to set the gauge parameters, including performing the Mass Axis
Calibration. The tune screen provides access to the raw spectral output of the mass
spectrometer and also to the header information which provides specific information on
parameters, status, and hardware. The tune screen also provides access to the factory default
and User Settings of the VQM Controller and the raw mass spectra logging engine.
NOTE: The gain of the electron multiplier degrades over time and periodic EM bias
adjustments will be required to restore detection limits and dynamic range.
The electrometer gain is somewhat temperature sensitive and a periodic
recalibration is recommended in the presence of large temperature shifts in the
Controller environment.
Raw Mass Spectra Logs are large and require sufficient hard disk resources to
log the desired data. The duration of the raw logging is set in the associated
dialog, but raw logging may also be stopped manually.
The left-hand pane of the Tune screen includes several different displays:
• An area to set gauge settings and the current readings for those settings - Section 6.9, MS
Gauge Advanced User Settings, explains each parameter in detail. Use DTRL Tune to see all
of the gauge settings.
• A selector for the information displayed on the right hand pane: Normalized, Raw (nA), Raw
(Counts), and Diagnostic information
• Buttons to save user settings, recover user settings, and recover factory defaults
Figure 8-32 Tune Function Basic Screen
The blue diamonds highlight
found peaks. The red trace shows
the Gaussian fit to the currently
selected peak at 84 amu. The grey
rectangle shows the normalized
area under the curve for each
found peak.
Selected Peak
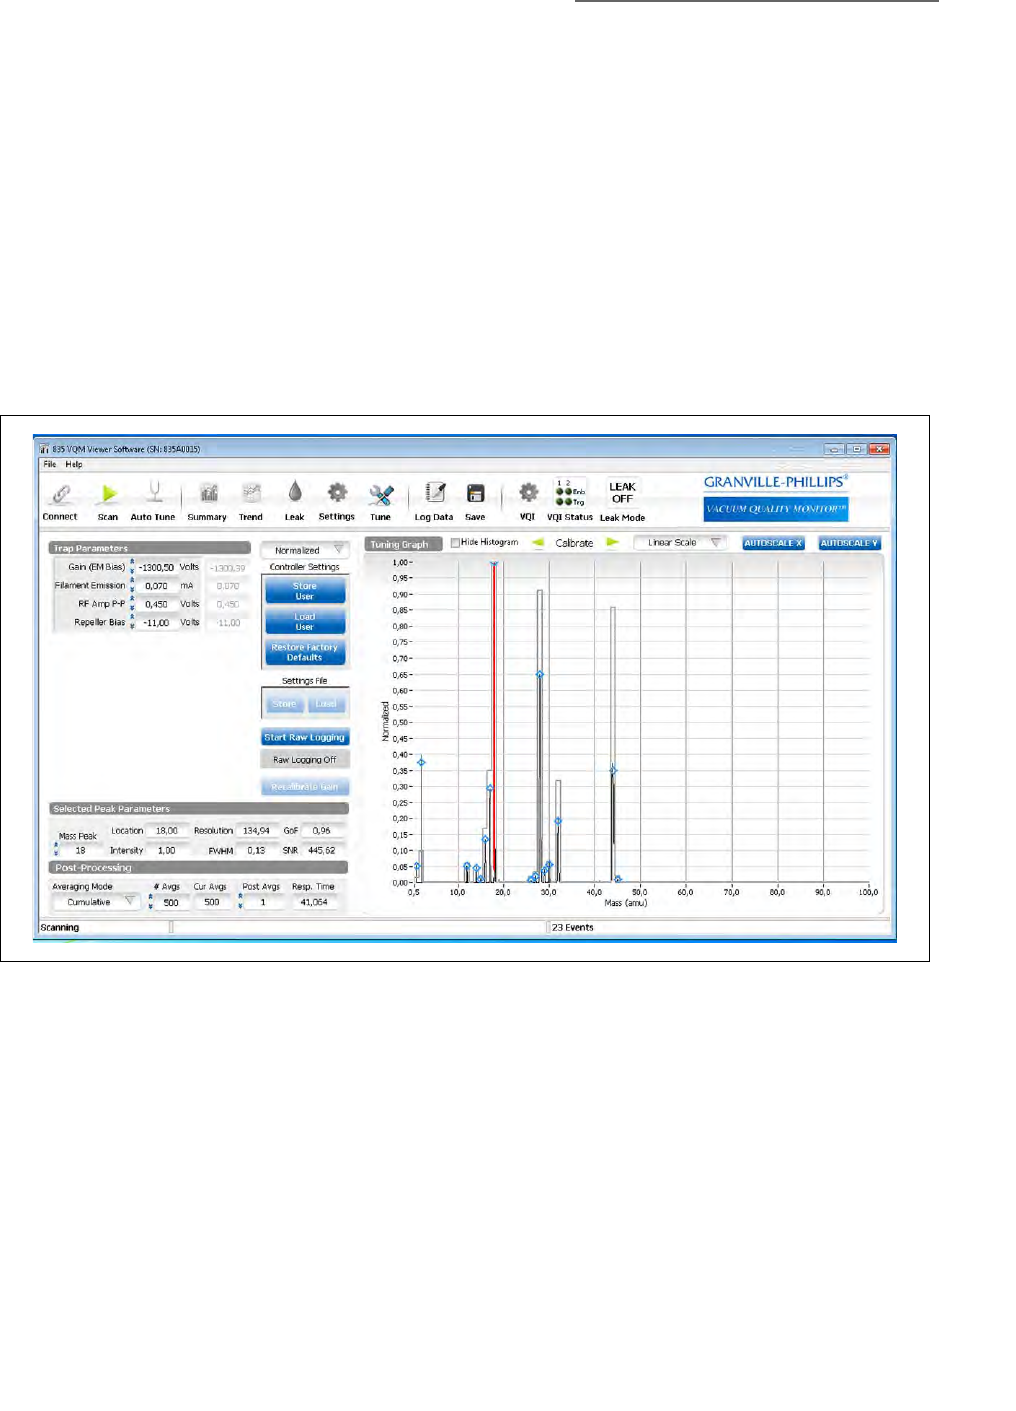
8 Initial Operation & Viewer Software
195
Series 835 Vacuum Quality Monitor
Instruction Manual - 835000
• Details of the peak statistics for a single selected peak
• Averaging control
The right-hand pane of the Tune Screen displays the information identified by the selector:
• Normalized - shows the filtered analog spectrum with blue diamonds identifying the
amplitude of the found peaks and the overlayed histogram representing the relative
normalized amplitude of the peak. If a Mass Peak is selected in the Selected Peak Parameters
section of the left pane, the Gaussian fit for the peak is shown in red.
• Raw (nA) - shows the analog spectrum for the averaged data (before filtering) on the
nano-Amp scale, representing the signal current from the electron multiplier
• Raw (Counts) - the same averaged data shown on the Raw (nA) graph, but with the y-axis in
ADC counts
• Diagnostics - Header information from the Controller and hardware loop times for the scans
Figure 8-33 Tune Function Normalized Screen
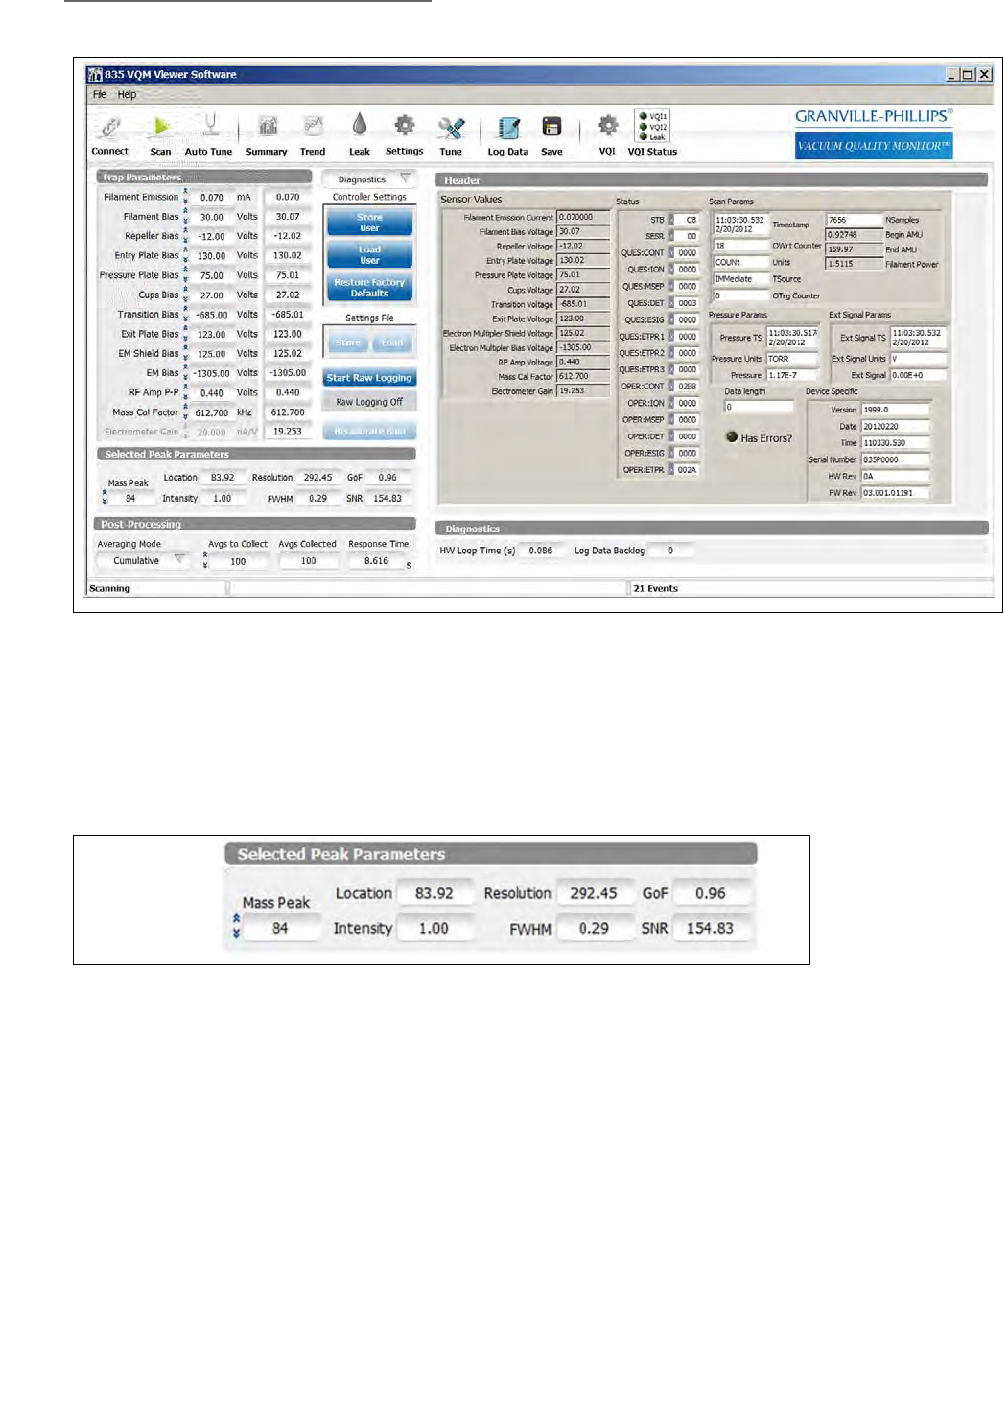
8 Initial Operation & Viewer Software
196 Series 835 Vacuum Quality Monitor
Instruction Manual - 835000
8.4.8.1 Selected Peak Parameters
The Selected Peak Parameters can be used to facilitate calibration and to collect metrics on a
particular mass peak on the Tuning Spectrum Graph. Select the Mass Peak of interest using the
increment and decrement controls or by typing in the amu value. If the selected peak is fit, the fitted
Gaussian curve will appear in Red on the Normalized view of the Tuning Graph.
8.4.8.2 Calibration Control
X-Axis Calibration can be performed using the Mass Cal Factor adjustment control on the left pane
or by clicking the green left and right arrows on the Tuning Spectrum Graph. You must be actively
scanning in order to calibrate the mass axis of MS Gauge.
To facilitate calibration, select a calibration peak by entering the amu value for the peak into the
Selected Peak Parameters Mass Peak control. The fitted Gaussian curve for the selected peak will
appear in Red on the graph. Use the Calibration arrows to shift the data curve so that the diamond
at the top of the assigned peak is aligned with the known mass of that peak. Refine the alignment be
shifting the data curve left or right until the Location field of the Selected Peak is positioned
correctly.
Figure 8-34 Tune Function Diagnostics Screen
Figure 8-35 Selected Peak Parameters
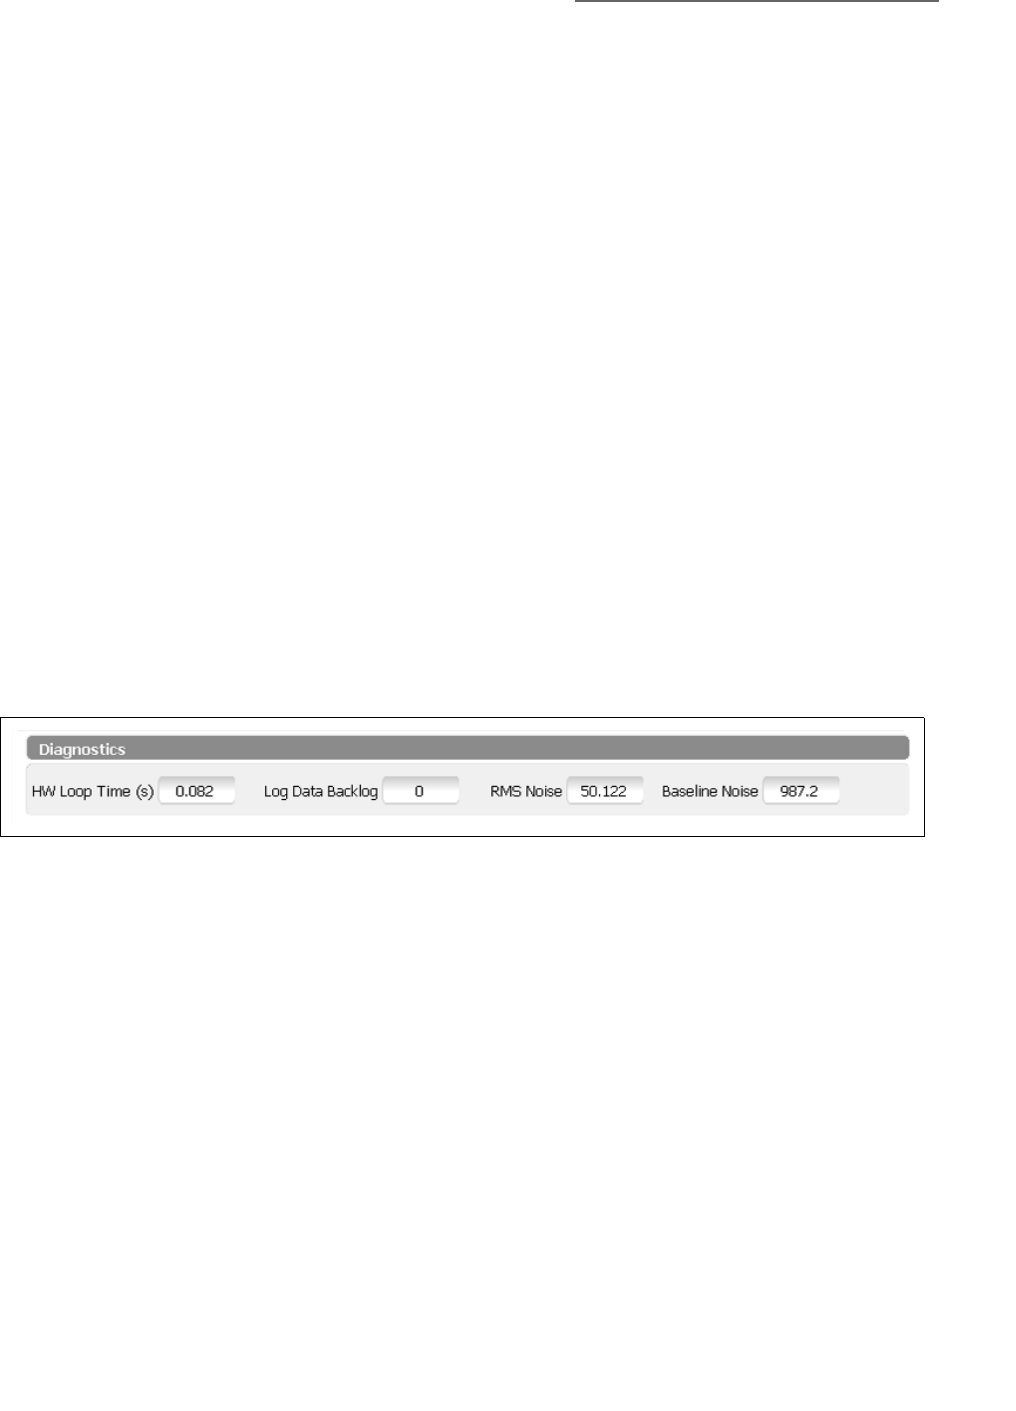
8 Initial Operation & Viewer Software
197
Series 835 Vacuum Quality Monitor
Instruction Manual - 835000
The calibrated Mass Cal Factor can be stored on the 835 Controller as a user setting via the Store
User button. See Mass Axis Calibration (Section 8.3.8) in the Initial Operation Procedure of this
chapter.
The Advanced view of the Tune Screen includes three buttons that provide interaction with the 835
Controller's EEPROM.
• Store User: Use this button to save Calibration and other gauge settings on the Controller
box. These settings will be used each time the 835 Controller is reset. The buttons remain
disabled while the EEPROM values are stored. Do not turn OFF the 835 Controller while the
buttons are disabled.
• Load User: Use this button to restore the current 835 Controller settings from the most
recently stored user settings.
• Restore Factory Defaults: Use this button to restore the current 835 Controller settings from
the factory defaults. Use this button when you are connecting a new gauge to protect the
gauge electronics from damage.
8.4.8.3 Diagnostics
The Diagnostics provide information about how the Viewer Application is performing. The
information can be used to diagnose CPU load problems. The Viewer Application is designed to run
on a minimum computer configuration and runs best on faster CPUs with more memory and disk
space. Nevertheless, you may find that you can get adequate performance on a computer with a
slower CPU, less memory, etc. Similarly, you may be running the Viewer Application on a computer
that meets the minimum requirements or better, but you are still losing data or seeing sub-optimal
performance. The Diagnostic information is visible when Diagnostics is selected for the right pane
view of the Tune screen.
• HW Loop Time: The HW Loop time is a function of the scan range. For a 1 to 145 AMU scan
range, the HW Loop time should be about 85ms. For a 1 to 300 AMU scan range, the HW
loop time should be about 125ms. A user selected reduced scan range should provide a
reduced HW Loop Time from these full scan range values. Longer HW loop times are an
indication that the computer is not keeping up with the scan rate. This is not necessarily a
problem, but it does mean that the user is not getting the best sensitivity / responsiveness
possible from the VQM. Consider shutting down other tasks / programs on the computer or
if the computer is below specification, consider upgrading to a computer within the
specifications for the VQM. See Section 2.4.5 for computer specifications.
• Log Data Backlog: A measure of how well the data logging is keeping up with the scanning.
Usually, scanning is slow enough that there is no backlog. However, if the hard-disk is slow
or fragmented, the number may increase.
• Baseline Noise: The average of the noise buffer in counts.
• RMS Noise: The RMS of the noise buffer after subtracting the baseline.
Figure 8-36 Diagnostics
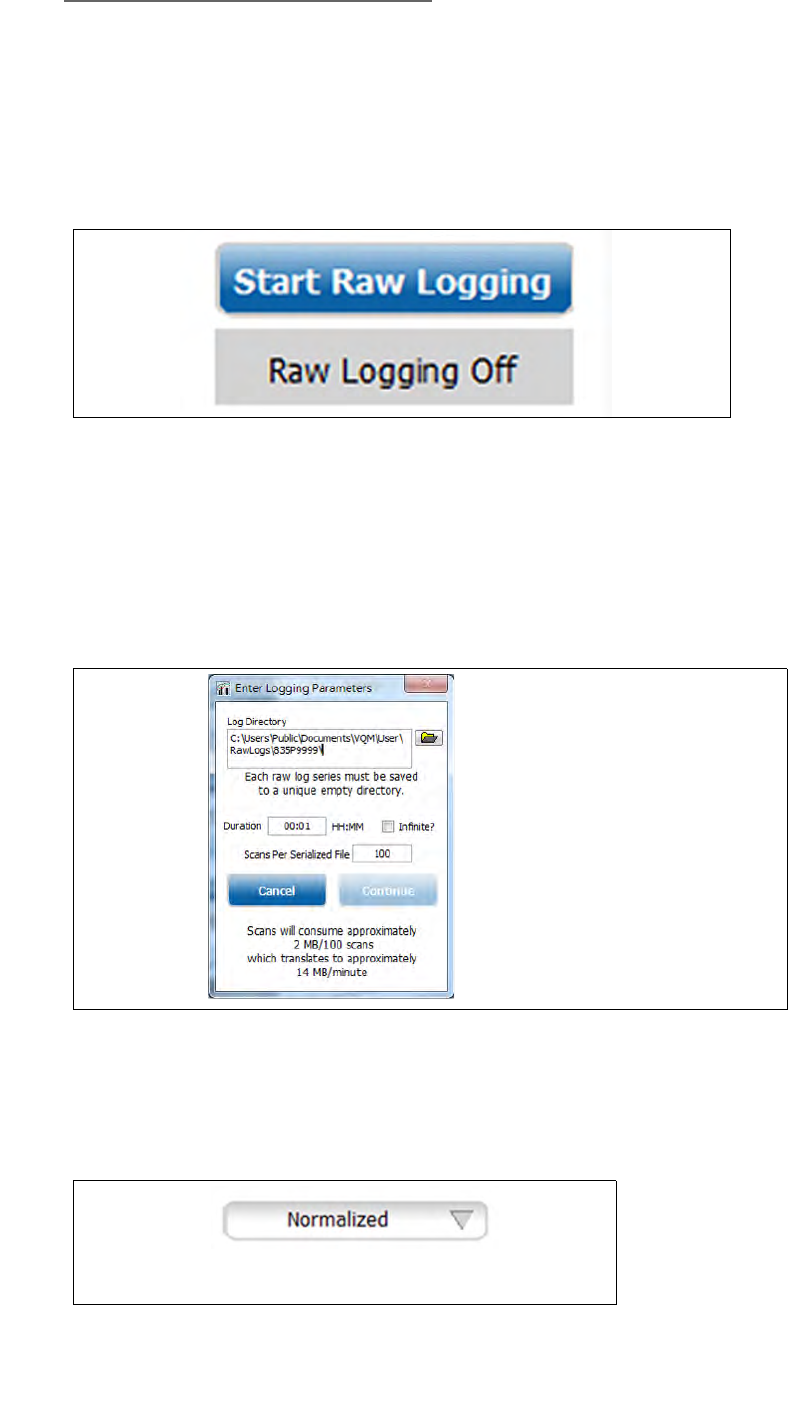
8 Initial Operation & Viewer Software
198 Series 835 Vacuum Quality Monitor
Instruction Manual - 835000
8.4.8.4 Raw Logging
Raw Logging allows the user to log the Raw data from the VQM Controller.
NOTE: Raw logging uses a lot of disk space very quickly. Many applications will be
unable to open the Log file because of its size. Line lengths are very large and
the number of lines in the file can also be very large. (For example, users of
Excel 2003 or WordPad may not be able to view the files.)
A Log Raw Data popup appears when the Start Raw Logging button is pushed. Raw logs are large.
Be sure that you have sufficient disk resources to log the desired data before starting. The Raw
Logging activity can be stopped manually.
Use the popup to identify the directory for the raw log files. The default directory is:
"C:\Users\Public\Documents\VQM\User\Rawlogs". Each raw log must be saved to a unique
directory. The raw log file can be played back in the Viewer Application using the Connect button.
8.4.8.5 Tuning Spectrum
The Tuning Spectrum Graph provides three alternative ways to view the averaged analog spectrum:
Normalized, the Raw (nAmp), or the Raw (Counts) view.
Figure 8-37 Raw Logging
Figure 8-38 Raw Log Popup Dialog Box
Figure 8-39 Tuning Spectrum
Use the Tuning Display Mode to
select the desired graph view.
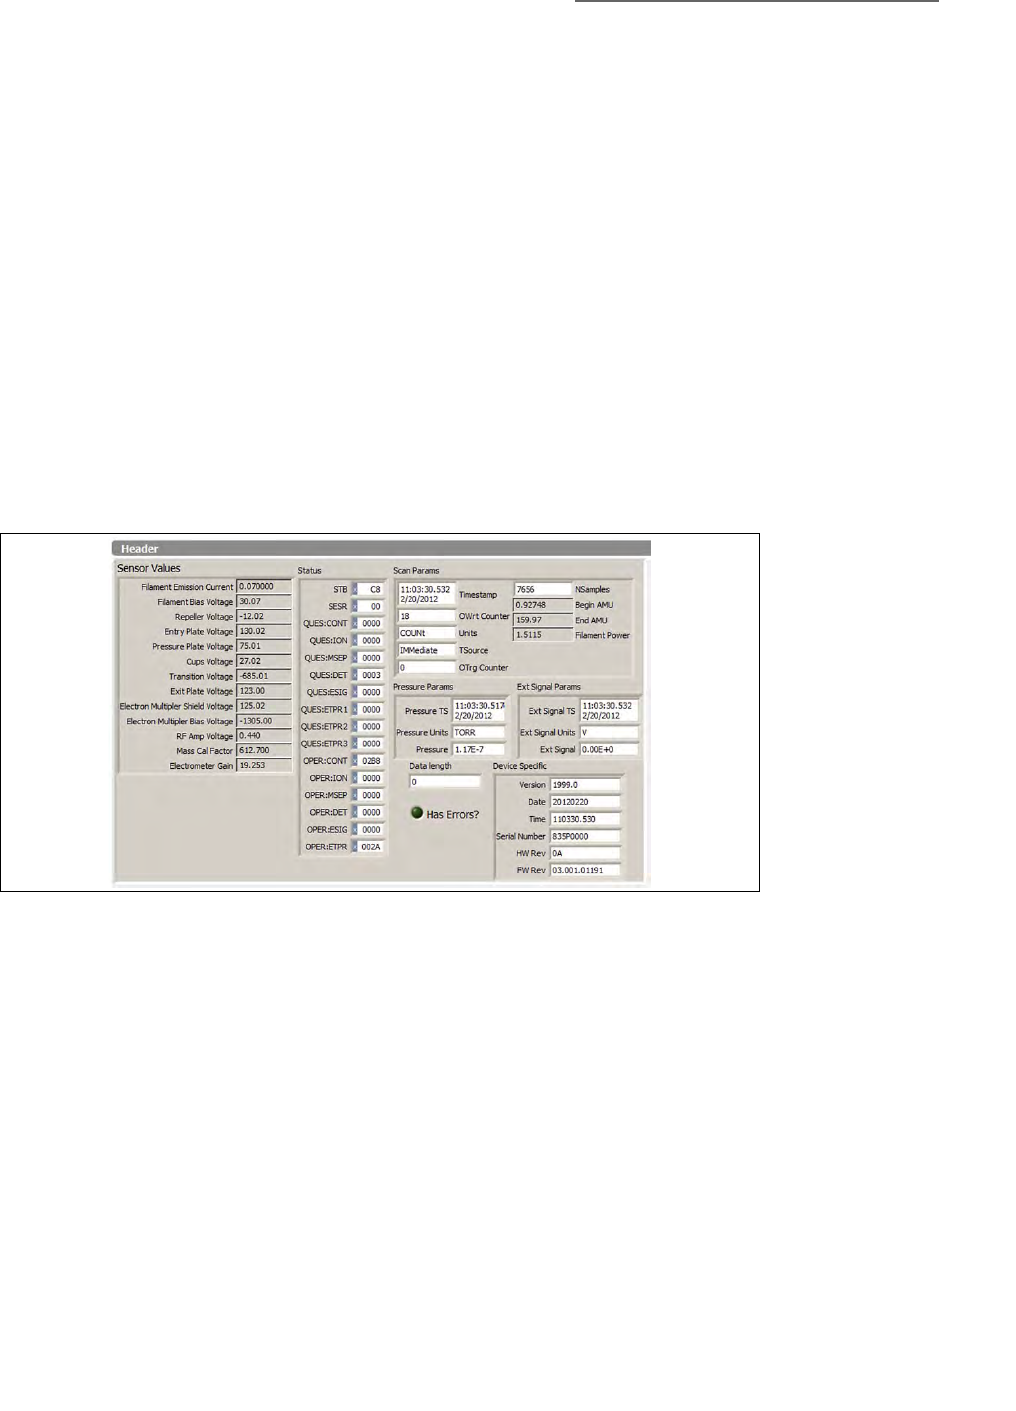
8 Initial Operation & Viewer Software
199
Series 835 Vacuum Quality Monitor
Instruction Manual - 835000
• Normalized View: The Normalized view contains several plots on a single graph: the
histogram (gray bars), the fitted peaks (blue diamonds), the filtered raw data (black trace), and
the Gaussian fit of a selected peak (red trace). This graph is the one often used for X-Axis
calibration. You can use the mouse to zoom in on a piece of the x-axis. The red gaussian
curve will be overlayed on the peak for the mass selected in the peak parameter section.
• Raw (nAmp) View: To view the raw data on the current (nanoAmps) scale, select the raw
nAmps view of the graph. The y-axis identifies the detected current for the full amu range.
This view displays averaged, but unfiltered, mass vs. current raw data. No other overlay
elements are available in this view. The Selected Peak Parameters are maintained from the
Normalized view.
• Raw (Counts) View: To view the raw data on the counts scale, select the raw counts view of
the graph. The y-axis identifies the ADC counts from the VQM Controller.
8.4.8.6 Header
The Header information is visible when Diagnostics is selected as the right pane view on the Tune
screen. The displayed fields are not editable. Use this view to identify the 835 Controller firmware
revision.
Figure 8-40 Diagnostics Header
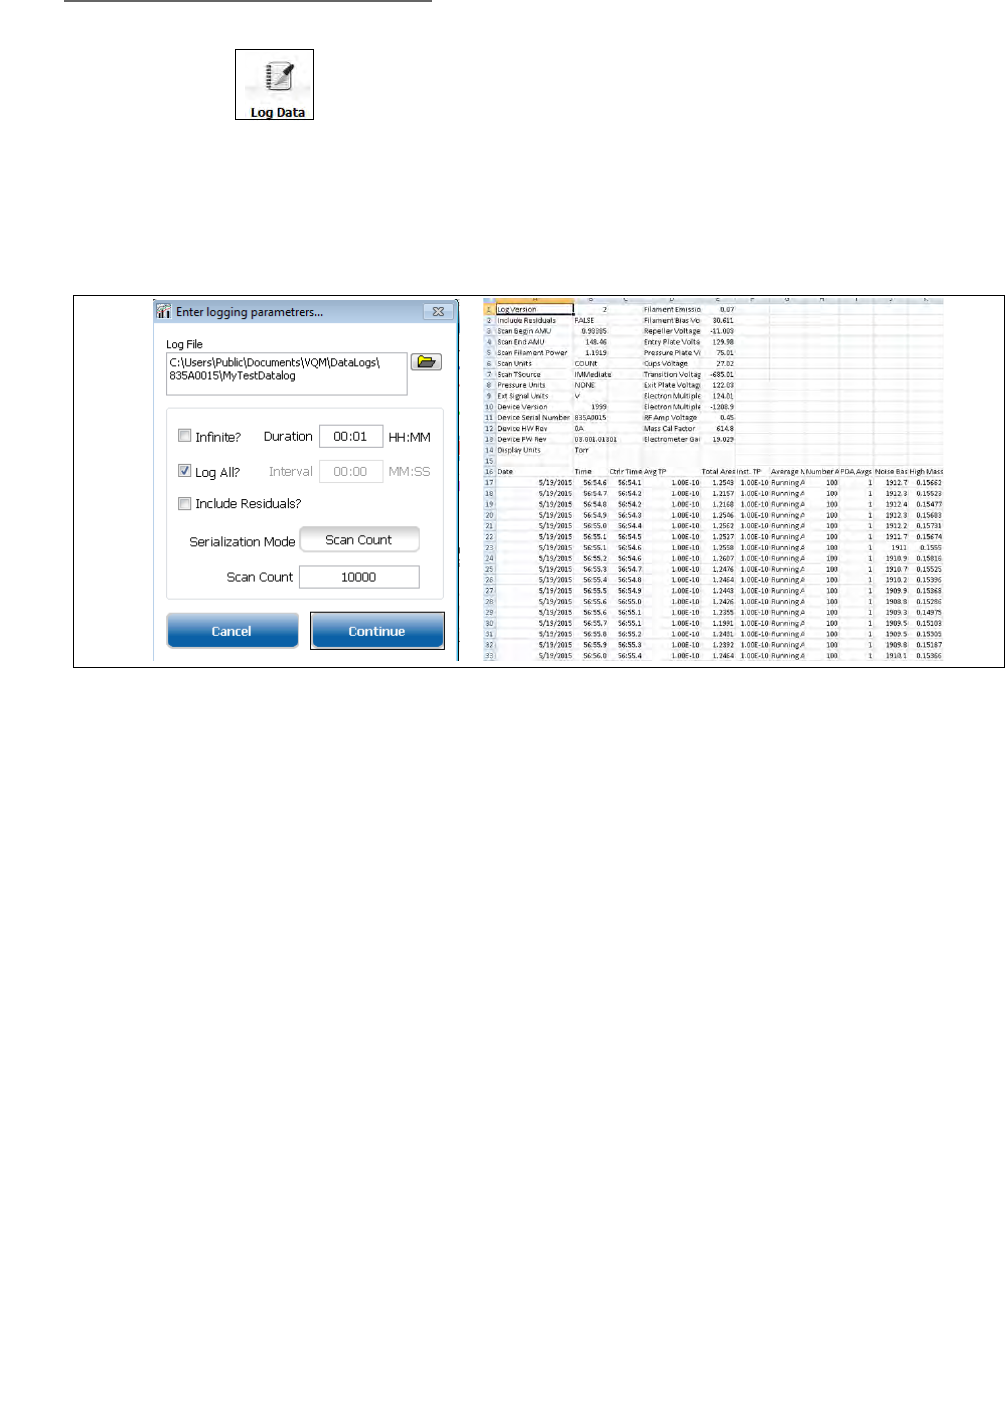
8 Initial Operation & Viewer Software
200 Series 835 Vacuum Quality Monitor
Instruction Manual - 835000
8.4.9 Log Data
Use this control to log mass spectrum data. Fill in the dialog that the Viewer Application
displays (Figure 8-41). Enter a base name for the data log files. Data capture times are in hours
and minutes. The data interval is in minutes and seconds or check the Log All? box to record
data for every scan. Checking the Infinite? box records data until the user clicks on the blue log
data icon. Click on the Continue button when finished making selections. The log data icon
will turn blue while the logging is active. Clicking on it while it is blue will stop logging.
The logged data is stored in serialized binary files of two types (*.bdl and *.bdx). One
complete, the data log files can be played back by connecting the Viewer Application to the
first bdl file in the series (in the example MyTestDataLog_0000.bdl).
Once the Viewer application reads in the binary data logs, the data can be exported into a CSV
file that is readable in Microsoft Excel by using the File menu Export CSV Data Log option. The
exported data log is stored in two files with EXP_ prepended to the name of the binary file from
which it was derived. The *.idx files are binary files that provide the indexing needed by the
Viewer Application to play the exported files back. The CSV files contain a header with trap
parameters, the scan range, pressure units, and information for playing back the CSV data log
file, followed by the following columns of data:
•Date
•Time
• Controller Time
• Average Total Pressure -pressure units are in the header. NaN or not a number means that
the pressure source is set to None or the VQM is not receiving valid pressure data.
• Total Area
• Instantaneous Total Pressure
•Averaging Mode
• Number of Averages Collected
• Number of Post Data Analysis Averages
• Noise Baseline in ADC counts
Figure 8-41 Log Data Screen and Sample Spectrum Log File

8 Initial Operation & Viewer Software
201
Series 835 Vacuum Quality Monitor
Instruction Manual - 835000
• High Mass Area - total charge above the high mass AMU set. Note that this will include
charges at fractional AMUs.
• Error Count
• Mass Spectrum - column for each AMU
• Gas Fit - fraction contributed by the gas fit. GL1 to GL10 for the factory list are Argon, CO,
CO2, Nitrogen, Helium, Hydrogen, Krypton, Neon, Oxygen, and Water. Additional gases
can be added (see Section 8.4.16). The current gas list can be obtained via an API call to
GetComboFileData or by looking in the 835 Series ControllerN_error log.
• Residuals - if selected in original capture of log data. These are the fractions of the Amu left
over after the amount attributed to the fit gases has been removed
The data capture times are in hours, minutes, and seconds.
Log All? records data for every scan.
Log Infinite logs until the user clicks the blue log data icon.
NOTE: Enter the file name in the Log File Name box and click on the browse folder
icon to select or assign a location to store the file. The default file location is
"C:\Users\Public\Documents\VQM\DataLogs\<controller serial number>\.
NOTE: See Section 8.5.17 for a list of the directory paths where log files are stored.
The log can be displayed in the Viewer Application using the Connect button.
NOTE: Due to the number of columns in the log file, Excel 2007 or newer is needed to
view the file.
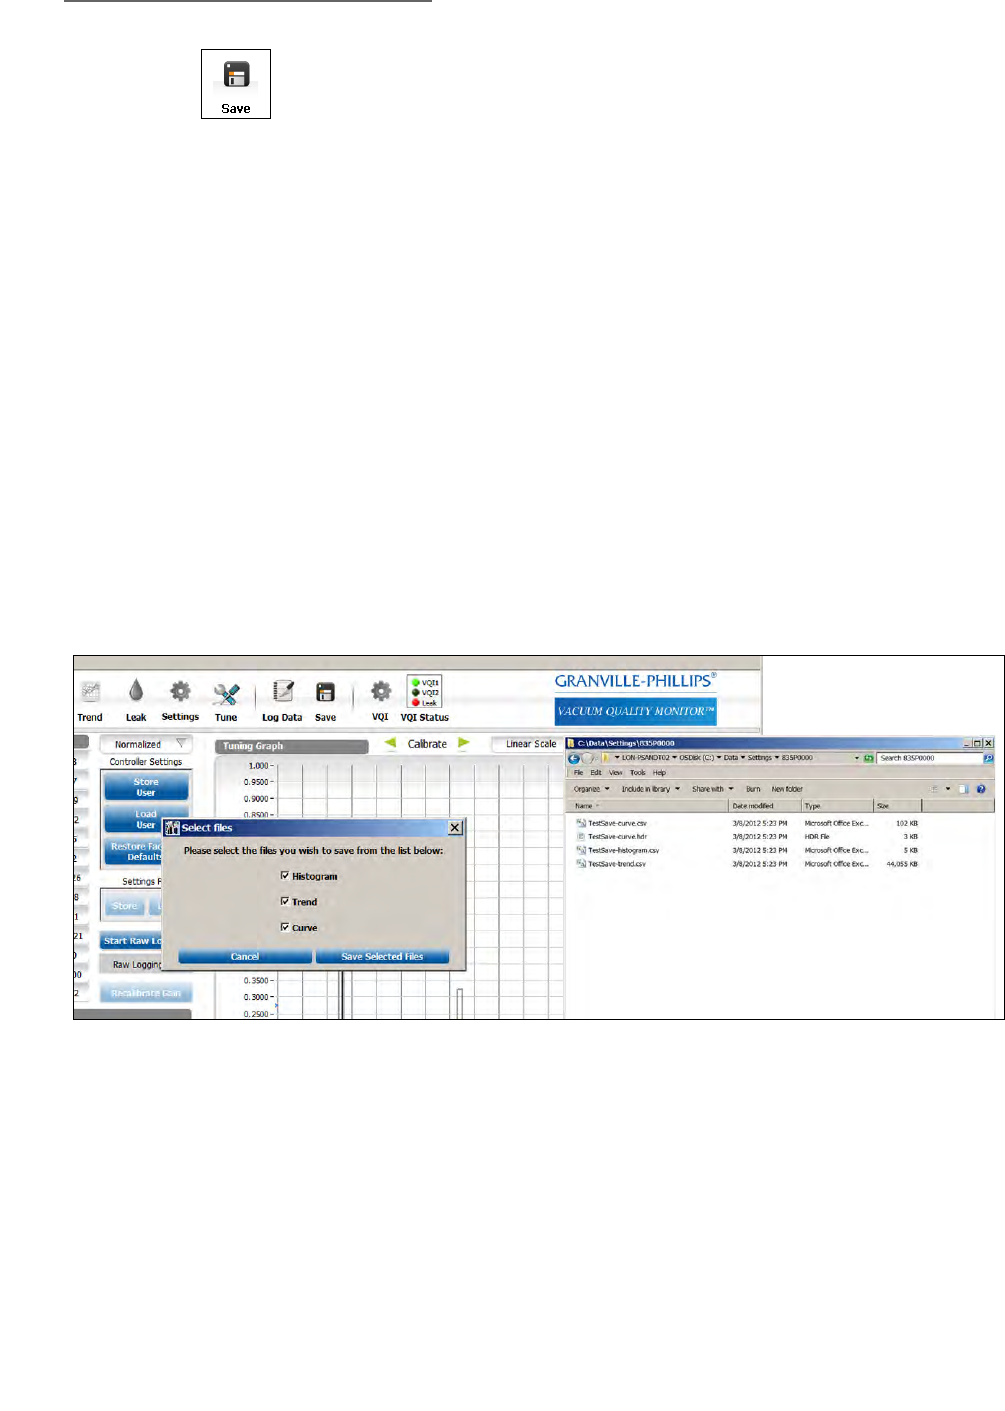
8 Initial Operation & Viewer Software
202 Series 835 Vacuum Quality Monitor
Instruction Manual - 835000
8.4.10 Save
Optionally saves a snapshot of the raw averaged spectrum (curve), the header information, the
histogram, and/or the trend information. A list of check boxes appears that identifies which data to
save. Select the desired files and click the Save Selected Files button. Enter a filename and location,
and click Save Selected Files. The files will be saved in the provided location with the base filename
given and an added identifier. The default directory is:
"C:\Users\Public\Documents\VQM\User\Snapshot". The curve, histogram and trend files have a
.csv extension and can be opened with MS Excel or other programs. See Section 8.5.17 for a list of
the directory paths where log files are stored.
When selected, the save command creates the following files:
• Base-filename-curve.csv: Raw averaged data reported as ADC counts from the electrometer
output. The first column indicates the amu.
• Base-filename-curve.hdr: VQM Controller status and gauge settings. This is a plain text file.
• Base-filename-histogram.csv: Histogram information with percentage of each mass reported,
one line per amu.
• Base-filename-trend.csv: Each column includes the value for each of 300 amu, 10 gases, and
300 residuals. Each row is another scan. This allows review of the displayed peak trends as
well as all of the other peak trends tracked by the Viewer Application.
8.4.10.1 Save Menu
A Save Popup appears when the Save icon is clicked. Select among the Trend, Histogram, and
Curve data files. The default is to save all three. Select the directory and filename for the save data.
No additional information is required for this operation. Use the OK button to continue with the
save data operation and the Cancel button to exit without saving the data.
If you save all the data files, four files will be created. The Curve data is stored in a file with the base
filename appended with "-curve.csv" and "-curve.hdr". The histogram is stored in a file with the base
filename appended with "-histogram.csv". The Trend data is stored in a file with the base filename
appended with "-trend.csv".
Figure 8-42 Save Scan Data Screens
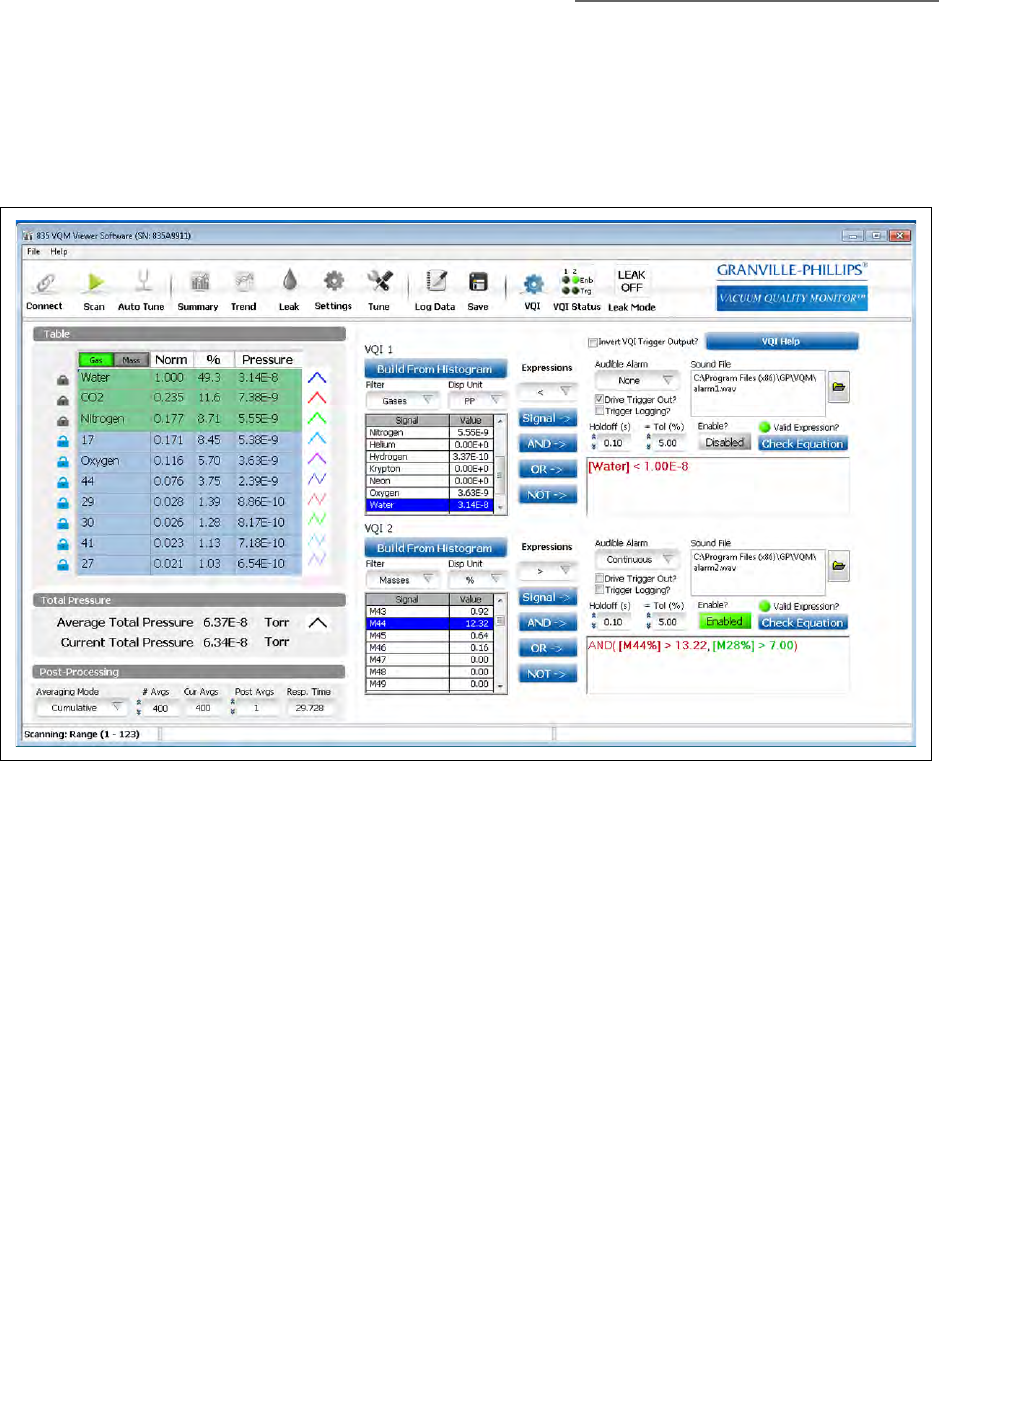
8 Initial Operation & Viewer Software
203
Series 835 Vacuum Quality Monitor
Instruction Manual - 835000
8.4.11 VQI® (Vacuum Quality IndexTM)
VQI allows you to create Boolean expressions to trigger audio alerts and drive the trigger out on the
Controller in response to real-time data from the Controller. The VQI Screen includes the standard
Results Table, the Total Pressure details, and the Averaging controls on the left pane. On the right
are clusters of controls for configuring two independent Vacuum Quality Indexes.
Each cluster contains several elements:
• A Build From Histogram button - This button will populate the Expression text box with an
equation with each non-zero term from the selected histogram file. (A histogram file may have
previously been saved.) Use the Save button at the top of the application to save a histogram.
The histogram file is editable; zero some of the smaller peaks in the file before loading the
equation from it. The equation can be edited in the Expression Text box.
• A Signal Selector Table - A list of the masses, gases, and residuals along with total pressure.
Select one of these items for use in the Expression text box.
• A Signal Type Filter - The list of masses, gases, and residuals is long. Use this selector to filter the
displayed values.
• A Units Type Selector - The signal may be expressed in either partial pressure or %. The units
displayed in the Signal Selector Table (AND, OR, NOT buttons) are in the selected units.
• An Expression Type Selector - The operator applied to the selected Signal. Options include >, <,
and =.
• Signal button - The signal button transfers the currently selected item in the Signal Selector Table
to the Expression text box.
• And button - The And button inserts an AND operator into the expression text box along with its
associated parentheses.
• Or button - The Or button inserts an OR operator into the expression text box along with its
associated parentheses.
Figure 8-43 Save Scan Data Screen

8 Initial Operation & Viewer Software
204 Series 835 Vacuum Quality Monitor
Instruction Manual - 835000
• Not button - The Not button inserts a NOT operator into the expression text box along with its
associated parentheses.
• Audible Alarm Selector - The Audible Alarm Selector allows you to select among 4 audible
alarm options: None (no audible alarm), Once (one tone sequence when asserted), Repeatt the
tone until snoozed or dismissed. Deassertion and Reassertion will trigger the audible alarm
again.), and Continuous (Tone will sound during assertion.)
• Drive Trigger Out check box - Drive the Digital Output of the Controller with the VQI signal. If
both VQI outputs drive the Trigger Out, then they are Red together. Since the computer's
response time depends on processor speed, system configuration, and number of processes
currently running, there will be a small delay between the VQI resolution and the Digital
Output Trigger changing state. To minimize this delay, reduce the load on the computer.
• Trigger Logging check box - Initiate a log file when the VQI is asserted. There is only one log file
at any given time, so only one of the VQI definitions is tied to the log file: the one that is entered
most recently.
• Alarm file text box - Identifies the .wav file that is used for the Audible Alarm. Two defaults are
provided. Any .wav file on the computer may be used.
• Hold off - The amount of time that the expression must remain stable before the VQI's state is
changed.
• Tolerance - A percentage applied to equals (=) conditions. This percentage means that an equals
condition is true if the measured value is within this percentage of the comparison value. For
example, if the tolerance is 5%, then [M18%] = 20.0 means that the condition is true if the
percentage of mass 18 is between 19 and 21. That is, the 5% is applied to the 20, not 100%.
This means that using the equals condition for small numbers may be impractical.
• Enable/Disable button - This button is Green when the VQI condition is enabled. Click the
button to enable or disable the VQI output.
• Valid Expression indicator - The Valid Expression indicator notifies the user if the Expression as
typed is valid (parsable). Use the Highlight button to find the invalid parts of the Expression.
• Check Equation button - The Check Equation button can be used to determine why a complex
VQI condition is not asserted. Click it to see which conditions are met (green) and which are not
(red). Any part of the Expression which is not parsable appears in black. This information may
help you debug your VQI Expression.
• Expression text box - The text of the current VQI Expression. The contents can be edited using
the buttons and selectors provided or can be edited directly.
Example:
To create an alarm when Argon is > 2E-7 AND Water < 1E-8:
1. Push the AND-> button.
2. Make sure that the Expressions selection is set to >; the Filter is set to Gases; and the Disp Unit
is set to PP.
3. Select Argon from the Signal list, then click the Signal-> button.
4. In the equation window, change the number after Argon to 2E-7.
5. In the equation window, change the number after Water to 1E-8.
6. Change the Audible Alarm mode to the desired setting.
7. Set the Trigger Logging and Drive Trigger Out as desired.
8. Click the Enable? button to enable the Alarm.

8 Initial Operation & Viewer Software
205
Series 835 Vacuum Quality Monitor
Instruction Manual - 835000
It is important to understand that, although the Audible tone is called an Alarm, the VQI assertion
may be for a good condition or a bad condition. That is, you might use the VQI to indicate that your
operating conditions have reached a desirable state. For example, your expression might be [TP] <
1.4E-7, which would assert when the total pressure is below a target of 1.4 E-7. Similarly, you might
define your condition to be [M18%] > 20.0 to indicate that the water in your vacuum system is too
high.
The format of the Expression AND, OR, and NOT clauses is similar to those used by some common
spreadsheet programs. That is, AND (term1, term2, term3) to AND the three terms together.
If a VQI Expression contains either a Total Pressure term or Partial Pressure terms, the outputs will
be deasserted if no Total Pressure is available. Similarly, if the Controller is not scanning, outputs
will be deasserted if the expression contains anything other than a Total Pressure term.
NOTE: It is the responsibility of the expression author to program to avoid failures.
For example, Analog Input sources for total pressure may evaluate to a
pressure, even when the Analog Input is unplugged accidentally. It is prudent
to put both a low and a high bound on such terms. For example, [TP] < 1.7E−7
will assert when the Analog Input total pressure source is unplugged because it
may read 1E−11 at 0 volts. A more prudent equation may be
AND([TP]<1.7E−7, [TP]>1.0E−9).
When building and debugging VQI expressions, consider using a RAW LOG file (see Section
8.4.8.4). By using the system to produce a raw log of the conditions to test with VQI, the logs can
be played and re-played, testing the VQI until the desired results are achieved.
8.4.12 VQI Status
The three indicators to the right of the VQI Screen selector indicate whether the three signals VQI1,
VQI2, and Leak are asserted. The VQI1 and VQI2 indicators are green when asserted. Leak is red
when asserted. All are disabled during Auto Tune. A VQI Expression may have only the total
pressure term, in which case it remains enabled when scanning is not active. All others are disabled
when Scanning is not active.
8.4.13 Status/Error Reporting and Contextual Help
The bottom bar of the viewer application display provides Status, Help and Error/Event information
in three distinct side-by-side areas. Status Indications include:
• Disconnected: The VQM Viewer Application is not currently connected to a VQM
Controller.
• Mass Spec OFF: The VQM Viewer Application is connected to a VQM Controller, but there
is no power on the MS Gauge. Total Pressure information may be available if a Micro-Ion
Gauge is being used.
• Mass Spec ON: The VQM Viewer Application is connected to a VQM Controller and power
is applied to the MS Gauge. The system is ready to scan.
• Scanning: The VQM Viewer Application is connected to a VQM Controller, the MS Gauge
is powered up, and the Controller is actively collecting partial and total pressure information.
If the scan range is set to be less that 1-145 amu, the range is displayed to indicate that the
range is limited, and spectral information is only based on that range. This display is also
active during playback of logged data.
The Help area displays a short help message each time you hover over a control with the mouse
pointer on the Viewer Application screen. Additional Help may be accessed by typing ctl-H.
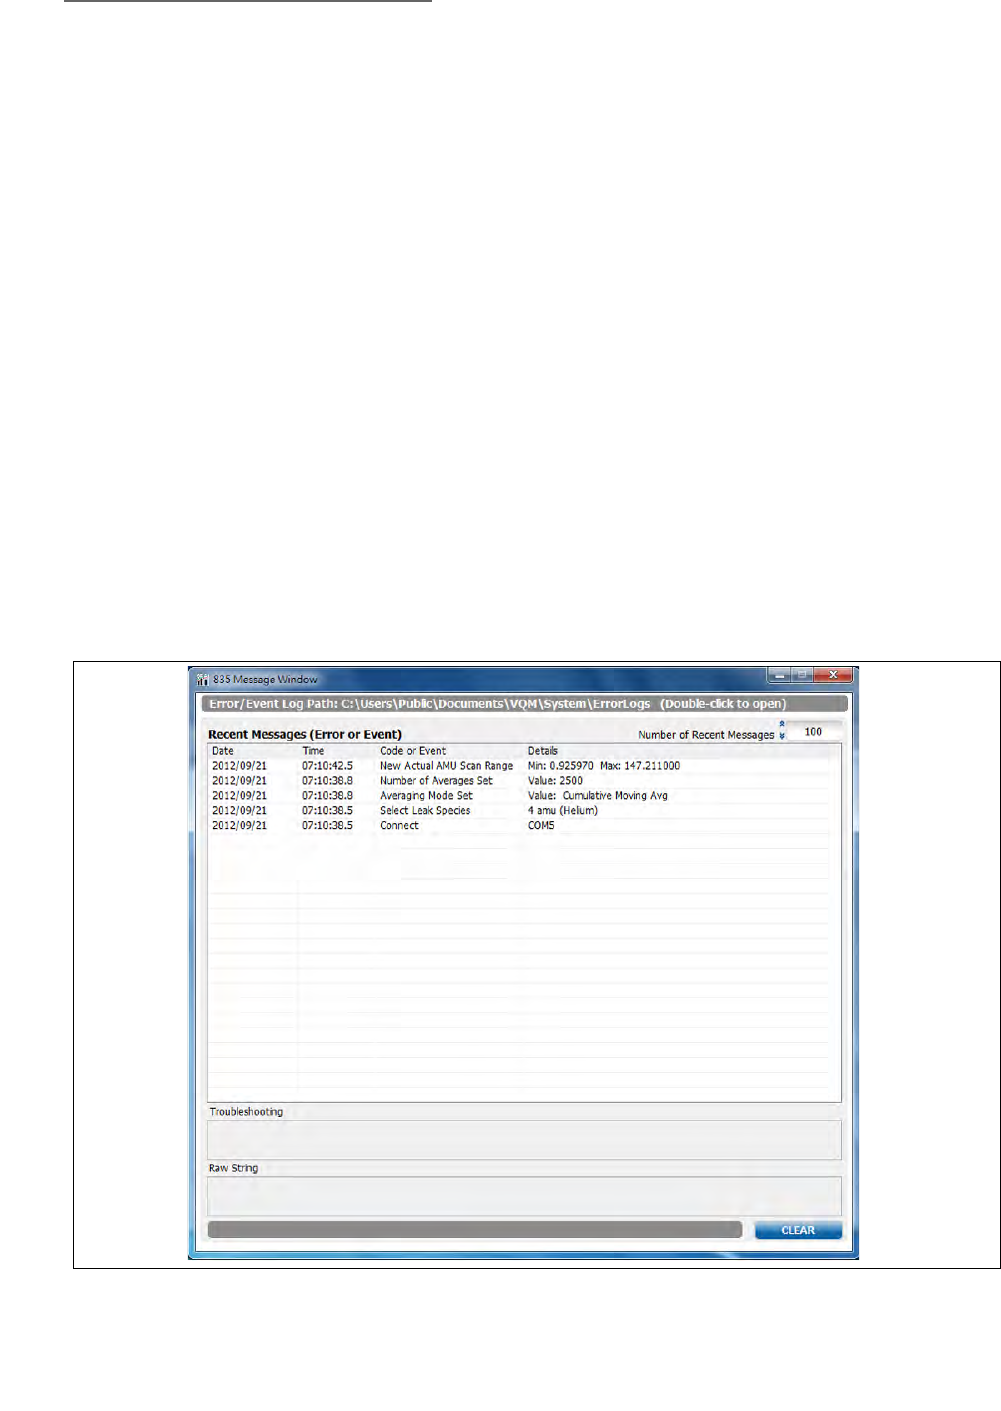
8 Initial Operation & Viewer Software
206 Series 835 Vacuum Quality Monitor
Instruction Manual - 835000
The Error/Event area displays a count of events or errors as listed in the Viewer Application list or
the most recent error. Clicking on this area brings up a popup window that displays the contents of
the list. The list holds the most recent 100 (configurable) events until the Clear button is pressed or
the Viewer Application is connected to a new sensor or reconnected to the same sensor. (The list is
cleared for each new connect because its contents are gauge specific.)
A daily log of events and errors is maintained in the C:\Data\ErrorLogs directory. If multiple
connects are performed in a single day, error/status changes will be appended to the daily log file. A
shortcut to the directory appears at the top of the list popup. Double click it to open the directory.
8.4.13.1 Error/Event List
Clicking the right box the status bar at the bottom of the screen causes the Error/Event List to be
displayed. Significant events and errors are logged to a log file and the most recent entries appear in
this on-screen list. The length of this list is configurable. The user can also clear the list. (The entries
are preserved in the Error/Event Log file.)
Errors in this list have associated troubleshooting guidelines. Click on the error line and the exact
text associated with the error is displayed in a text box at the bottom of the popup. Just above the
text of the message is the troubleshooting guide. Some troubleshooting guides can be scrolled.
At the top of the Error/Event List popup appears a message: Error Event Log Path: The default
directory is: "C:\Users\Public\Documents\VQM\System\Errorlogs (Double click to Open)".
Double clicking on this message will open the directory. The current log file has today's date. Other
log files may be in the same directory. See Section 8.5.17 for a list of the directory paths where log
files are stored.
Figure 8-44 Error/Event List

8 Initial Operation & Viewer Software
207
Series 835 Vacuum Quality Monitor
Instruction Manual - 835000
8.4.14 Adding Pressure Sources
While the installed 835 VQM Software Suite provides a number of pre-defined analog pressure
sources that can be used, it also provides the ability to add new total pressure sources to the local
list. To add a pressure source, find the equation for the pressure as a function of the analog voltage
output by the device - this is usually provided in the manual for the pressure gauge. Note that some
gauges have configurable or selectable outputs. Then create a text file named
TotalPressureSources.dat. For each source or configuration to be added, create a line with a unique
string name followed by a comma and then the equation as a function of v for voltage. For example:
• Leybold Extractor Gauge,10^((v*0.8) -12)
• CCG 500 config A,10^(v-10)
• Squared,10^((v*v) - 15)
The equation must start with the 10^ (ten to a power). The exponent does not have to be linear but
must only depend upon v (the analog in voltage). Do not duplicate any of the names including
those already included in the installation.
Copy the TotalPressureSources.dat file to the GP\VQM\Data folder under program files or program
files (x86) for each of your hosts that have the 835 VQM software installed and might need to use
this total pressure source. Restart the services for the new custom total pressure source to be
selectable. Use the Windows control panel or the 800SeriesRestart.cmd in the Utilities folder under
the installation folder if you have the privileges. Otherwise, the new pressure sources will be added
to the list when the services are restarted after the next computer reboot. If the new pressure source
is not displayed on the list after the services have restarted, check the 835 Series
ControllerN_error.log files to see if the TotalPressureSources.dat file has errors.
8.4.15 Customizing Data Analysis Peak Fitting
Sometimes there is a need to change the resolution limits used by the data analysis feature to
discriminate between peaks and noise. Sometimes there is a need to find the total charge above a
specified AMU as a high mass contribution (e.g. from organics). The 835 VQM Software provides
the ability to customize the peak resolution limits and the AMU used for totaling high mass charge.
To do either, locate the text file named CustomAnalysisLimits.dat file in the GP\VQM\Data
subfolder under program files for 32-bit Windows or program files (x86) for 64-bit Windows hosts.
Edit this file but do not change the header in case you need to go back to the original defaults.
Remove the starting asterisk in the line you want to customize and change the number to the value
you want. The file header gives the applicable ranges for these values. Save the file in place. These
values will take effect with the next connection to the Controller.
Note for application programmers using the API: The API provides methods to change the high mass
index, but the high mass index is non-intuitive because it is an index into the mass axis array which
changes with the scan range. This is an easier way to get the same result because you specify the
AMU for the high mass designation.
8.4.16 Adding Gases or Customizing Gas Coefficients
The 835 VQM Software provides coefficients for fitting ten common gases, but there are other gases
which can be of importance in a particular application. As a result, the software provides the ability
to add up to 20 additional gases or to modify the coefficients to fit the gases in your particular
vacuum environment. A GasLibraryEditor.exe is installed in the <installation directory>\Utilities
directory to facilitate adding or changing gas coefficients. Click on this executable.

8 Initial Operation & Viewer Software
208 Series 835 Vacuum Quality Monitor
Instruction Manual - 835000
Click on the Load Defaults button to start the list of gases with the factory gases. Then click on the
Add Gas button to add a template for the gas. Replace New Item with a unique gas name. Then on
the AMU row, fill in the columns with the AMUs of the fragments expected if this gas is present in
the system starting with the major AMU. In the respective columns in the fit row, enter the
percentage of the AMU needed to say that the gas is present. The first AMU column should be 100
and the other columns are relative to the 100 percent column. In the respective columns in the
residual row, enter the percentage maximum that could be attributed to the gas and might or might
not be created from the gas. The Save File button allows the file to be saved for further editing by
using the Load File button and browsing for the saved file.
When all the custom gases have been added, click the make Active button. This saves the file as the
correct name (combolib.dat) in the <installation directory>\Data directory where the software
services will look for a customized file. Then restart the services (see Section 8.5.3). After this the
Viewer Application and any programs written using the 835 API will use these coefficients to fit the
gases. This file can be removed to get back to the factory default gases.

8 Initial Operation & Viewer Software
209
Series 835 Vacuum Quality Monitor
Instruction Manual - 835000
8.5 Troubleshooting
8.5.1 Viewer Application Does Not Open
The installation was not complete. Uninstall (see Section 4.4) and reinstall the complete 835 VQM
suite.
8.5.1.1 First Connection After a Fresh Install
When the 835 VQM software is first installed, the services needed to communicate with the 835
Controller are not automatically started until the host computer is rebooted. The services can also
be started by using the 800SeriesServiceRestart.cmd which is found in the <installdir>\Utilities
folder (must have admin privilege).
To establish a connection to the 835 VQM Controller, the GP Device driver must be loaded. The
first time a given host computer sees a specific Controller it will find and load this driver. The
process can be sped up if you skip looking for the driver from Windows Update. The driver was
installed as part of the 835 VQM Software Suite and there is no windows Update for it. See Section
4.3 of this manual if the USB driver was not installed.
8.5.1.2 First Connection After a a PC Reboot
After a host computer re-boot or initial PC startup, the VQM services necessary to communicate
with the VQM Controller are intentionally delayed to allow the Windows services to start up first.
Depending upon the speed of the PC this can take a bit of time. In addition, the GP device Driver
needs to be found and loaded by the windows system. Do not attempt to connect or expect any
connections if the device driver is not installed (see Section 8.5.2).
8.5.2 Viewer Application Does Not List Any VQM Controllers
Verify that power is applied to the VQM controller and the VQM controller is turned on. The Power
LED should be Solid Green. A pulsing power LED indicates that power is applied to the controller,
but the controller power button has not been pressed to turn on the controller. Verify that the USB
cable is connected to the controller and the computer.
Use the device manager to view the Ports (COM & LPT), if the VQM Controller is detected. you
should see something like Granville-Phillips VQM 835 (COM10) where COM10 will be the COM
port the Windows operating system has designated for the device. If you do not see a VQM 835 in
the list, power cycle the Controller and watch for the new device detected message. If the
Controller is still not found by the device manger, reinstall the driver. See Section 4.3.
8.5.3 Viewer Application Does Not Connect to a Listed Controller
Errors can be:
• No Valid Connections Error (5027)
• .NET Error (5001)
• Too Many Communication Failures (7004)
If the services are not responding, check that the 835 Controller is connected to the PC via the USB
cable and powered ON. Then check that the GP Device driver was installed during the installation
procedure (see Section 4.3) and has been loaded by Windows. If there was no visual or audio
notification that the driver was loaded, use the Control Panel Device Manager to see that a COM
port is designated as a Granville-Phillips VQM 835.

8 Initial Operation & Viewer Software
210 Series 835 Vacuum Quality Monitor
Instruction Manual - 835000
If the Device Manager does not show the Granville-Phillips VQM 835, but shows an Unknown
device in the COM ports list or a yellow triangle with an exclamation point, the driver has not
correctly loaded. While this problem is rare, it generally can be corrected by physically removing
the USB cable from the PC and moving it to another USB port on the PC.
If the 835 VQM is shown in the Device Manager but not the Viewer Application, the services may
not be responding.
If the software was installed without a computer restart, the services have not been started. Check
the Error Logs folder in the logs directory for 835 Series Controller1_error.log. If the install directory
does not contain any 835 Series ControllerN_error.logs, the services have not been started.
There are several options to start the services.
1. As an Administrator, start the services in the Windows Control Panel => Administrative Tools
=> Services tool. Start the services named 835 Series Controller1 through Controller4.
2. Use the 800Series ServiceRestart.cmd in the <install directory>\Utilities directory. Double
click this to restart all of the services. (The user must have administrator privileges.)
3. As a User, not an Administrator, restart the host computer. The services should automatically
start. (The 835 services are started after the Windows services have had a chance to start.)
8.5.4 Service is not Responding
An executable script is in the <install directory>\Utilities directory: 800SeriesServiceRestart.cmd.
Double click this to restart all the services. To restart a single service, use the Windows
Administrative Tools Services tool to select the specific Service to restart. There are four services that
determine which Service Log file belongs to the Controller that has stopped responding. These logs
are in the install directory.
Services may need to be restarted if the host has gone into hibernate mode to save power, or had
power interrupted due to a power failure or discharged battery.
8.5.5 .Net Error when attempting to connect Viewer Application to Controller
Look in Control Panel Event Viewer to see if WMI is corrupted.
8.5.6 Viewer Application displays Generic Error 42 or Error 74 when connecting to a Controller.
Older *.ini configuration files were used by the Viewer Application. On Windows XP hosts, delete
the Data folder in c:\Document and Settings\All Users\Documents\VQM and its contents. On
Windows 7 hosts, delete the Data folder in c:\Users\Public\Public Documents\VQM and its
contents. Then restart the Viewer Application.
8.5.7 Loss of Communication
There are several conditions that can make it seem that the 835 Controller has stopped
communicating with the software in addition to an actual loss of connection. Verify that the
Controller is still physically connected to the PC and verify that the USB LED on the Controller front
panel is illuminated green. If the USB LED is not illuminated green, power-cycle the Controller.
Allow the Controller to do its power ON self test and allow the Controller services to detect the
device and reload the driver. Then reconnect the Viewer Application.
If the USB LED is ON, look at the logs and determine if there was an error event such as an
over-pressure event or Controller errors that turned scanning OFF, or that turned the Mass Spec LED
red.
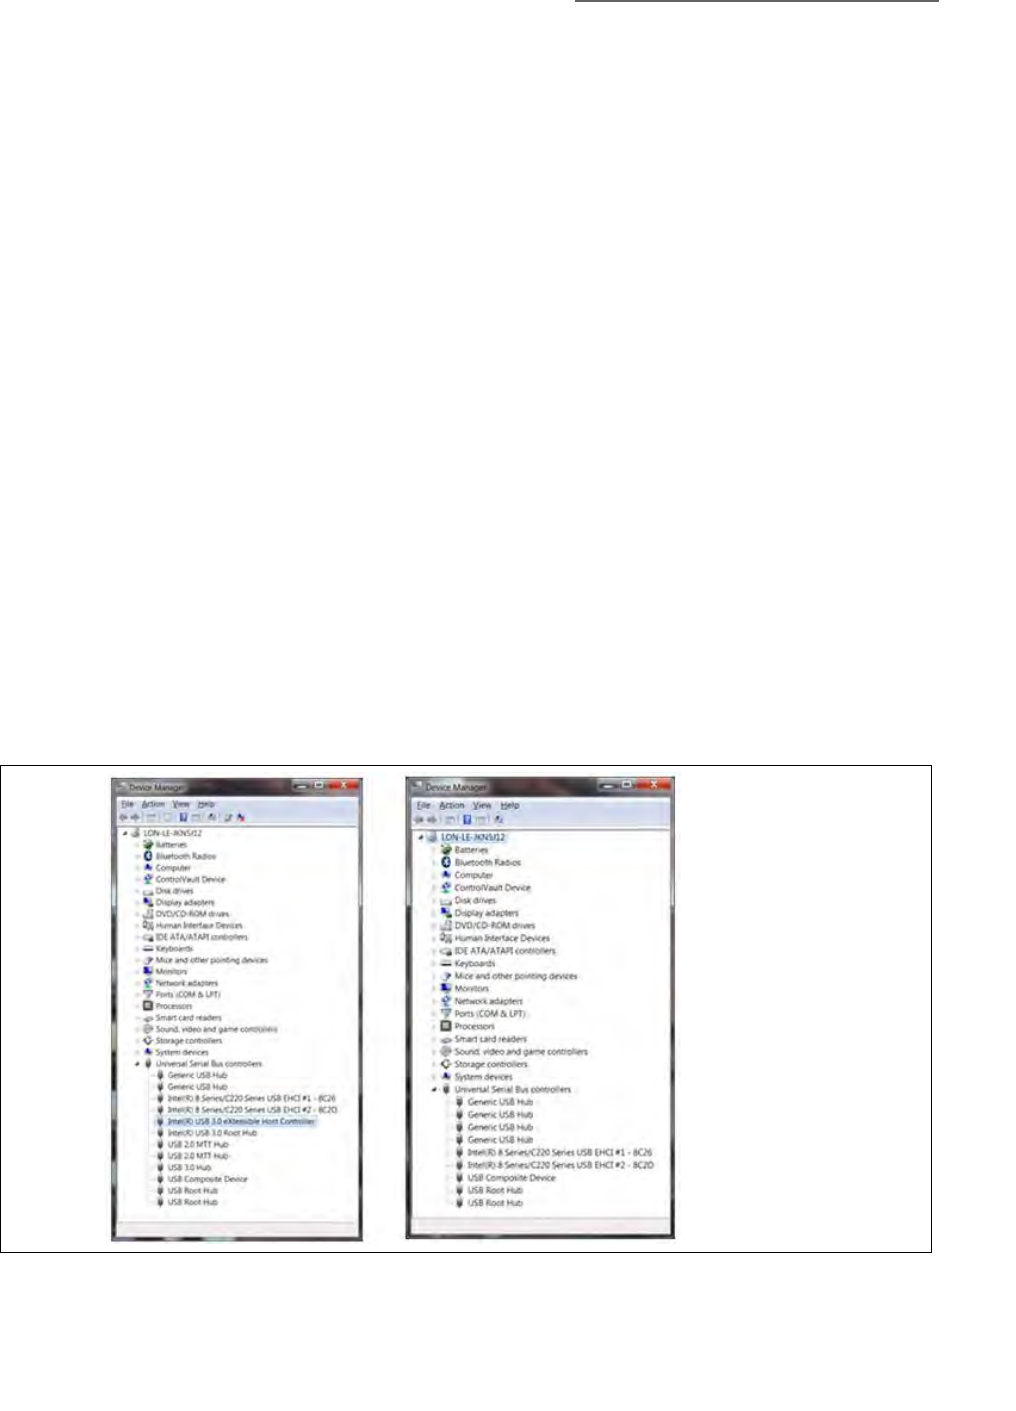
8 Initial Operation & Viewer Software
211
Series 835 Vacuum Quality Monitor
Instruction Manual - 835000
Make sure that any computer sleep modes or USB sleep modes are disabled in the computer power
settings screen and or computer BIOS. Some computers have USB sleep mode as a configurable in
the BIOS. Ensure that this is set to prevent the USB from being put to sleep by the computer.
Some PCs, particularly laptops, provide USB 3.0 ports, but the 835 VQM is USB 2.0. USB 3.0 is
generally backwards compatible with USB 2.0, but some PC implementations are not fully
compatible. This causes the communication between the Controller and PC to be fragile, fail to
connect, or to lose connection, primarily due to the USB sleep function built into USB 3.0. If the PC
in question does not provide USB 2.0 ports to use, it is possible to disable the USB 3.0 Controller in
the BIOS to use the COM ports as 2.0 to achieve reliable USB communication with the 835
Controller. Capability for disabling USB 3.0 depends on the motherboard in the PC. Depending on
your organization's policies, you may have to consult your system administrator or consult the
manufacturer's instructions for your PC to enter the BIOS setup mode. Look for a section pertaining
to USB, and an option to disable USB 3.0. If available, disabling USB 3.0 in the BIOS is preferable
to uninstalling the manufacturer's drivers in case you want to enable it in the future.
For example, on a Dell Precision M4800 Mobile Workstation:
• While Windows is starting, press the F2 key to enter the BIOS screen
• Choose BIOS Setup
• From Settings select USB Configuration
• Deselect the check box for Enable USB 3.0 Controller" (Select to enable 3.0)
• Select Apply to save the changes, then Exit to continue starting Windows.
• Check Device Manager (Control Panel -> System -> Device Manager)
If USB 3.0 is enabled on your system, the Controller will be listed when Universal Serial Bus
Controllers is expanded.
Figure 8-45 Device Manager - USB 3.0 Controller: Enabled (left), Disabled (right)

8 Initial Operation & Viewer Software
212 Series 835 Vacuum Quality Monitor
Instruction Manual - 835000
The Viewer application will also disconnect from the 835 Controller if there are too many attempts
to fetch data without a response. These can be due to other programs such as virus scanners, file
indexing, etc. executing while the Viewer application is running. Minimize these other applications
or resize your system to handle it.
The services may need to be restarted if the host has gone into hibernate mode to save power. See
Section 8.5.3.
8.5.8 Mass Spec Light Red or Gauge Won't Turn On
Look at the Controller front panel and note the color of the Mass Spec LED. If it is red or blinks red
when you attempt to scan, there is a problem that prevents applying high voltage to the gauge.
Check that the gauge cable is connected to the gauge and the Controller properly. Since the cable is
quite stiff it may not be seated fully. If someone has forced the cable connector into the Controller
connector and bent the pins or has failed to properly connect it, (possibly resulting in arcing when
the Controller attempts to apply the high voltage), it typically turns OFF.
If the connection seems secure, look at the error logs to see if there are any Controller errors and
then refer to that part of the troubleshooting section.
8.5.9 System Stopped Scanning or Won't Scan
If the scan button on the Controller has not been pushed to turn OFF scanning, look at the Viewer
Application's Error/Event log or the Controller service error logs to see if there was an over-pressure
event or Controller errors that would prevent scanning. Short duration over-pressure events are
reasonably common. If the over-pressure condition can be corrected, scanning can be resumed. If
the vacuum system occasionally goes over 1E-5 Torr but says under 5E-5 Torr, raise the pressure
limit on the Settings Screen in the Viewer Application. This will then re-initiate scanning when the
pressure goes below 1E-5 again. There will then be gaps in the Trend graphs in the Viewer
Application showing the duration of the over-pressure.
Look at the Controller front panel and note the color of the Mass Spec LED. If it is red or blinks red
when attempting to scan, there is a problem that prevents the Controller from applying high voltage
to the VQM gauge. Look at the error logs to find out the reported Controller error.
For Controller errors, see that part of the troubleshooting section for suggestions.
8.5.10 Auto Tune Failures
Most Auto Tune failures are due to failure to allow the VQM gauge to warm up and outgas before
auto tuning or an unstable or high vacuum system pressure. After connecting to the gauge and
verifying that the vacuum system pressure is stable and in a the safe range (less than 1E-5 Torr) and
the EM Bias voltage is at the last known good value, change the gauge state to ON. Wait for at least
15 seconds before attempting to auto tune.
The Auto Tune process automatically creates a log in the <root logs directory>\AutotuneLogs
directory. This is in the public documents region so all users should have write permissions but
verify that you have permission. If auto tune started, there will be an Autotune log
(AutoTune_<serial number of controller>_<date>_<time>.log) in the folder. This should have
information about the failure that can help determine whether to try auto tuning again. If the error
was a scan timeout or communication issue, repeating the auto tune is likely to succeed. If auto
tune failed because the vacuum system pressure was not stable, auto tune is likely to succeed once
the pressure is stable. If auto tune failed because of an over-pressure event, pumping the system
down to less than 1E-5 Torr should allow auto tune to succeed.
However if auto tune failed because of a Controller error, simply rerunning auto tune is unlikely to
work and may indicate a fundamental problem. See the Controller errors section.

8 Initial Operation & Viewer Software
213
Series 835 Vacuum Quality Monitor
Instruction Manual - 835000
If the Auto Tune process failed to determine a suitable Electron Multiplier (EM) bias voltage to use,
use the last EM bias voltage in the log or try a slightly different filament emission current or RF
amplitude to try Auto Tune again.
If the Viewer Application Error/Event message log contains an in-range Repeller bias, use this for the
Repeller voltage and try Auto tune again.
8.5.10.1 390 Checksum Error
The Viewer Application may occasionally report an error from the VQM Controller such as 390
Checksum error. These errors are infrequent and can be overcome by the following sequence:
1. Disconnect the Viewer Application from the VQM Controller.
2. Turn OFF the VQM Controller.
3. Verify that the interconnect cable between the VQM Controller and the 390 Total Pressure
Gauge is properly connected.
4. Turn ON the VQM Controller.
5. Reconnect the Viewer Application to the VQM Controller.
These errors usually do not prevent running but may mean that the total pressure reading may not
be as accurate as it should be. If the errors persist, check the instruction manual (p/n 390001) for the
Series 390802 Micro-Ion ATM Total Pressure Measurement Gauge for troubleshooting
recommendations.
8.5.11 Auto Tune Errors
Table 8-2 Auto Tune Errors
Auto Tune Error Possible Solution
AutoTuneVacuumSystemUnstable The total pressure in the vacuum system has changed by more than 10%
during the Auto Tune process. Stabilize the chamber total pressure and retry
Auto Tune.
AutoTuneExitPlateOutOfRange or
AutoTuneElectronMultiplierShieldOut
OfRange
The VQM gauge was not ON or was at an EM bias voltage producing very
little signal prior to initiating Auto Tune. Run the Just EM Auto Tune Standard
and leave the gauge ON or scanning for about 10 seconds before retrying
Complete Auto Tune.
AutoTuneRepellerOutOfRange Run the Just EM Auto Tune Standard and leave the gauge ON or scanning for
about 10 seconds before retrying Complete Auto Tune. Or, use the last good
Repeller setting and do an Express Auto Tune.
AutoTuneTargetNotAchieved Auto tune was not able to adjust the signal for the highest peak to be within
10% of the targeted value. Verify that the signal level is adequate for your
purposes. Try Complete Auto tune to tune the Repeller, exit plate and EM
shield bias voltages.
AutoTuneNoiseTooHigh Other gauges nearby on the vacuum system may have been turned ON while
Auto Tuning. Try Auto Tune again. The VQM gauge itself may not have been
warmed up or the electron multiplier may be worn out and need to be
replaced. Leave the gauge ON or scanning for about 10 seconds before
retrying Auto Tune.

8 Initial Operation & Viewer Software
214 Series 835 Vacuum Quality Monitor
Instruction Manual - 835000
AutoTuneGainLimitReached EM bias voltage set to -1475 v and still did not get the targeted signal level for
highest peak. Gauge may be worn out and need to be replaced or the other
trap settings are not optimal. Try Complete Auto Tune to set the Repeller, exit
plate, and EM shield bias voltages. Other possibilities are to Express Auto
Tune for less sensitivity or to increase the RF slightly and then Auto Tune. If
Just EM Auto tune was used and the scan range did not include major peaks,
try a larger scan range.
AutoTuneFailedToStart Reconnect the application as a master.
AutoTuneFailedToSetFilamentEmission Look in the log for preceding Controller error.
AutoTuneControllerError See the Controller error table (Table 8-3) for the specific Controller error.
Table 8-2 Auto Tune Errors
Auto Tune Error Possible Solution

8 Initial Operation & Viewer Software
215
Series 835 Vacuum Quality Monitor
Instruction Manual - 835000
8.5.12 835 VQM Controller Errors
Controller errors are reported in the Viewer Application event/error log and in the Controller service
logs.
Table 8-3 Controller Errors
835 Controller Error Possible Solution
775 · Filament is
Disconnected
Firmware has not detected a
filament in the VQM gauge.
Check the mass spec LED on the controller. A solid
red LED indicates that the controller is not detecting
the filament. Check the VQM sensor cable to make
sure that both ends are fully connected.
Inspect the pins and sockets on the VQM sensor and
both ends of the sensor cable to make sure that all
pins are clean, fully inserted and have not become
recessed in the cable.
Check the resistance on pins 2 and 3 of the sensor.
They should be about 1/2 ohm. If the filament is
open, it will need to be replaced. Field replacement
filament kits are available and the replacement is very
simple. If the resistance is high, the filament may
need to be reseated. Remove and reinstall the
filament assembly - see Section 7.5. When the
filament is removed, clean the filament contact points
both in the sensor and on the back side of the
filament assembly with a lint free cloth and DI water.
778 · MS Gauge ON request
at unsafe pressure
Attempted to turn gauge ON
or scan when pressure was
above the over-pressure limit.
Relieve the over-pressure condition in the vacuum
system.
779 · FIL Virtual Burn Limit
reached
The firmware has detected
that the power to the filament
has reached its limit.
If using a cable >3 meters long, use the 835 Cable
setting utility to properly set the filament burn limit.
Be sure to not turn ON the gauge at too high a
pressure.
780 · FIL Gauge/Load
Disconnected
Firmware has not detected the
gauge filament.
Verify that the gauge cable connecting the gauge to
the Controller is properly connected.
782 · MS Gauge On request
with FIL Gage/Load
Disconnected
Firmware has not detected the
gauge filament.
Verify that the gauge cable connecting the gauge to
the Controller is properly connected.
789 · MSI not ready to scan A condition has been
detected that will prevent
scanning.
The Controller won't scan if there is an over-pressure
condition, or a broken filament, or the unit has
reached the burn limit. Check for preceding errors.
1026 · Over-pressure
detected
The vacuum system is above
the over-pressure limit.
Reduce the pressure in the vacuum system. See
Section 8.4.7.2.

8 Initial Operation & Viewer Software
216 Series 835 Vacuum Quality Monitor
Instruction Manual - 835000
1027 · RS485
communications error
The Controller did not get a
response back from the
390802 Micro-Ion external
total pressure vacuum gauge
within the required 1.5
seconds on power startup.
Verify that you have purchased and installed a
390802-2-YG-T Micro-Ion Gauge with the VQM.
The 835 VQM Controller can only communicate
with 390 Micro-Ion gauges p/n390802-2-YG-T.
Verify that the Micro-Ion pressure gauge cable is fully
connected both at the VQM Controller and at the
Micro-Ion pressure gauge.
Verify that the RS-485 address setting on the
Micro-Ion pressure gauge is set to 02.
If the RS-485 baud rate on the Micro-Ion Gauge was
changed from its default value, reset the baud rate to
9600.
Check the Micro-Ion total pressure gauge screen for
error messages and refer to the Micro-Ion Gauge
manual.
If no Micro-Ion Gauge was purchased, other pressure
gauges can be used through the 835 Controller
analog input. See Section 8.4.7.2.
1028 · External Total Pressure
version error
Only 390802 version C or
higher are accepted in the
RS485 connection to the
Controller.
Use a total pressure vacuum gauge as an analog input
to the VQM Controller. Select the appropriate total
pressure gauge from the default list or add the total
pressure gauge to the list. See Section 8.4.7.2.
1033 · ETPR is locked
(External Total Pressure)
The 390802 external pressure
gauge is locked so that
pressure units and other
configuration variable can't
be changed without
unlocking.
Use the 835 Diagnostic Utility to unlock the settings.
2310 · POST Failed (Power
ON Self Test)
Power ON self test failed. Check the 835 VQM Controller power status light. A
solid red LED indicates that the Controller failed the
Power On Self Test. (POST)
Verify that the VQM sensor cable is fully connected
at both ends.
Cycle power to the VQM Controller.
Check the resistance between all combinations of
pins on the VQM sensor (gauge) and from each pin
to ground. All pins should be open pin to pin (except
the filament between pins 2 and 3). If there is
continuity between any other pins on the sensor or
between any pin and ground, remove the sensor, and
inspect for shorts between the sensor electrodes or
the sensor and ground.
Look at the VQM Controller diagnostic log at
C:\Users\Public\Documents\VQM\ErrorLogs\<seri
al number>Diagnostic.log and contact MKS service
with the information in this log.
775 - Filament is
disconnected
Firmware has not detected a
filament in the VQM Gauge.
Check the gauge cable connecting the gauge to the
Controller and verify that it is properly connected at
both ends and not arcing.
If this persists, check the resistance on pins 2 and 3 of
the gauge (see Figure 8-46) - which should be about
½ Ohm. If the resistance is high but not open, the
filament may need to be reseated.
Table 8-3 Controller Errors
835 Controller Error Possible Solution
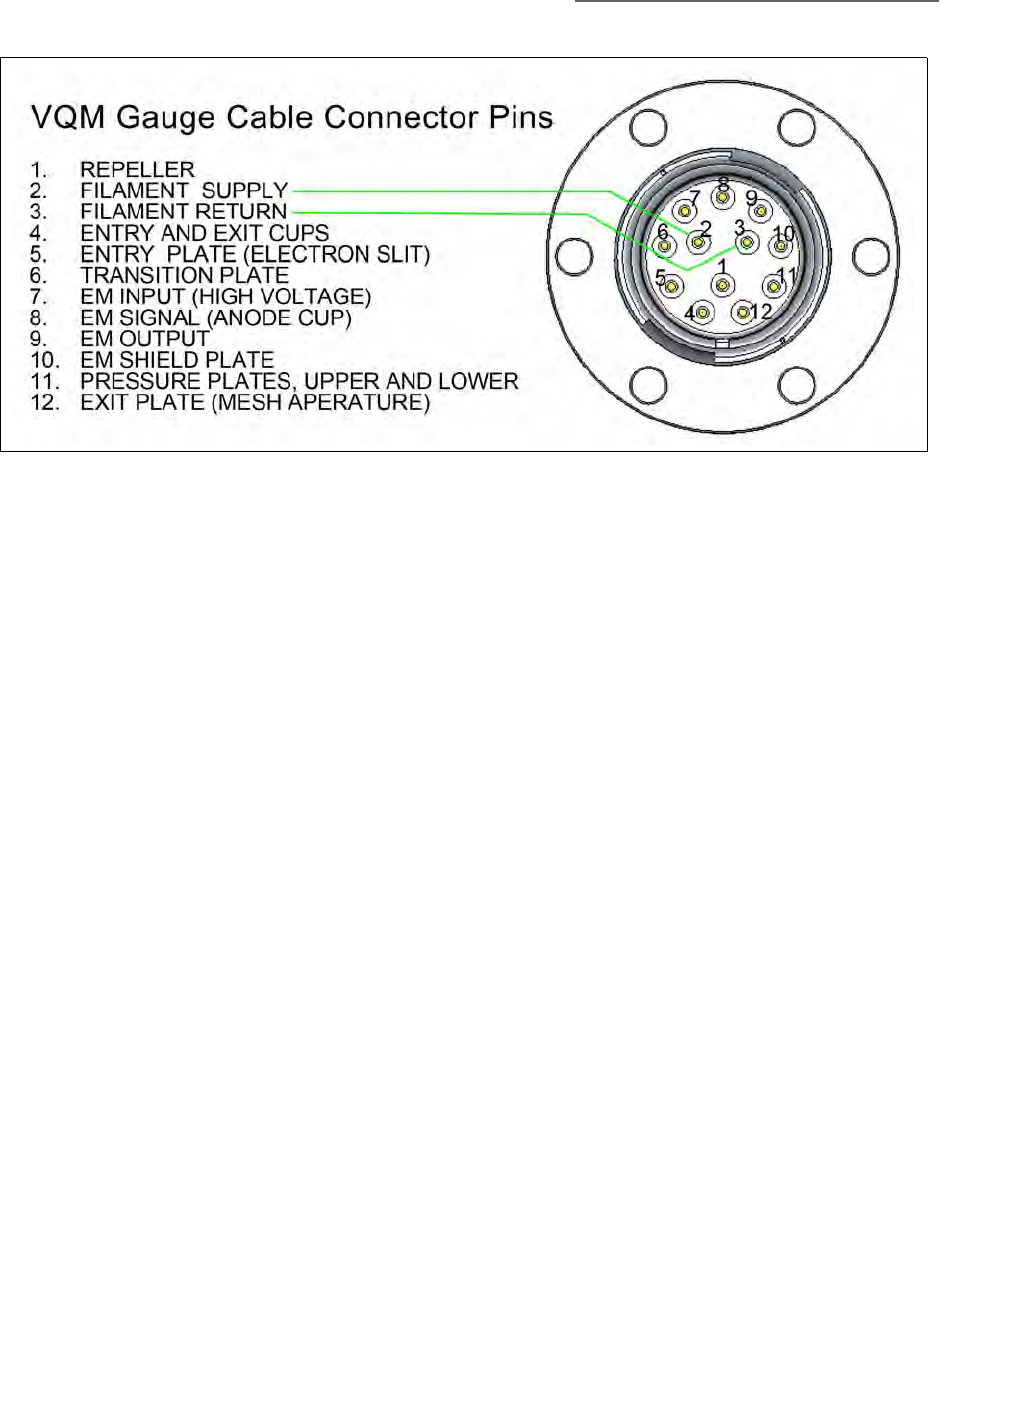
8 Initial Operation & Viewer Software
217
Series 835 Vacuum Quality Monitor
Instruction Manual - 835000
8.5.13 Low Signal
When the signal to noise on the Tune screen is too low to see peaks, the EM bias voltage (gain)
should be adjusted to a more negative value to increase the signal gain. The Express Auto Tune or
Just EM Auto Tune features are easy and quick ways to adjust the EM bias to get the signal within an
acceptable range. If the Controller has not had a Complete Auto Tune for a while or a message has
indicated to check the Repeller bias voltage and/or exit plate voltages, run a Complete Auto Tune.
Lowering the Exit plate voltage by a volt or 2 will allow more ions to leave the trap which may
increase the signal. Alternatively, increasing the RF amplitude slightly may increase the signal.
If a VQM gauge cable longer than 3 meters is in use, use the Cable Adjustment tab of the 835 Utility
application (available in the program files / /GP/vqm/utilities/Diagnostic Utility) to adjust the
parameters necessary for the longer cable. One of the parameters this will change is the RF
amplitude for low AMUs.
If the vacuum system is below E-9 Torr, increasing the filament emission current increases the
number of ions created and can increase the signal. In addition, adjusting the RF can increase the
signal. However, increasing the RF will reduce the resolution. As a result it is generally
recommended to not raise the RF over .7 V. Raising the RF from the default may result in a need to
lower the minimum resolution limit for data analysis to fit the peaks. See Section 8.4.15.
8.5.14 Missing Peaks
If the expected peaks are not detected, go to the Tune screen and view the nA graph. If the peak is
still not detected, increase the sensitivity by making the EM bias voltage more negative or increase
the averaging. Note that it takes a few seconds for the EM bias voltage to stabilize after the gauge
has been in the OFF or Standby state. Verify on the Tune Screen that the actual EM Bias voltage is
close to the setpoint value. See Section 8.4.8.
If the peak that is missing is a a large peak on the raw nA graph, verify that the maximum peak
amplitude is not exceeding the 835 controller electrometer maximum value of 57nA. A peak with a
flat top at 57nA indicates that the electrometer current has been exceeded and the EM Bias needs to
be adjusted to reduce the signal gain. You may note that on the normalized graph that the diamond
at the top of this peak indicating a detected peak may be intermittent.
Figure 8-46 VQM Gauge Connector Pins

8 Initial Operation & Viewer Software
218 Series 835 Vacuum Quality Monitor
Instruction Manual - 835000
Intermittent peak detection can also be caused by too wide or too narrow peaks. High RF values
give wider peaks, and low RF values give narrower peaks. If the settings giving the narrow or wide
peaks are desirable, the allowable minimum and maximum peak resolution values can be adjusted
by the user.
8.5.15 Noisy Signal
The initial signal can be noisy if the gauge has been OFF or in Standby, and then you initiate
scanning as the trap voltages, particularly the EM bias voltage, stabilize to their respective setpoints.
This effect is mitigated if the gauge is turned to the ON state for a few seconds prior to initiating
scanning,
If the overall signal level is low, especially if the main peaks are only a couple of nAmps, there may
be many false (noise) peaks on the tune graph. Many of these false peaks will not show on the
histogram or trend graphs, but some will jump in and out of these graphs. Use the Just EM or
Express Auto Tune features or manually adjust the EM bias (more negative) until the main peak is
around 8 nAmps.
8.5.16 Timeouts, etc.
Scan timeouts can occur if the host computer is running other applications or the Viewer
Application is set to log data over the network. Avoid overloading the host computer and avoid
writing extensive log files across the network. Also verify that the computer meets the minimum
computer requirements given in Section 2.4.5.
If a lot of errors are occurring, check the <public documents>\VQM\ErrorLogs directory for 835
Series ControllerN_error.log files as these log files may help to determine the problem. If the log
does not help troubleshoot the problem, send the log to Granville-Phillips Technical Support for
assistance. Stopping and restarting the services and power cycling the VQM Controller can
sometimes clear the cause of the timeouts. If there are a lot of scan timeouts, it can be helpful to
delete the 835 Series ControllerN_error.log files when they get large.
8.5.17 Where are the Logs?
The root log directory has subdirectories that are automatically created by the VQM System.
The root directory for Windows 7is: C:\Users\Public\Documents\VQM\
The root directory for Windows XP is: C:\Documents and Settings\All users\Documents\VQM\
AutotuneLogs - When an Auto Tune is run, the error log is written to this directory regardless of
success or failure.
Config - Used by the Viewer Application to store various settings, including User Interface
settings. The Viewer Application will save a serial numbered config file for each Controller that
is connected, as well as a base file that is loaded when not connected to any Controller.
DataLogs - Default Location. The user can select their own location when they are initiating
logging. Stores the Viewer Application captured logs that can be viewed or played back.
ErrorLogs - Error logs from the Viewer Application and from the service are written here. The
Viewer Application logs the events and the errors for the day in a single log file under a
subdirectory named for the Controller serial number. There are four service error logs, 835
Series ControllerN.log that contain information about the service's interaction with the
Controller and the Viewer Application. Do not put any other data in this directory as the
software does maintenance on this folder to delete old error log files. Other files written to this

8 Initial Operation & Viewer Software
219
Series 835 Vacuum Quality Monitor
Instruction Manual - 835000
location may be deleted during this file maintenance. Also the Utility Application allows the
error logs to be zipped and sent to customer service if there is a problem requiring the error
logs to diagnose.
RawLogs - Default Location. The user can select their own location when they initiate logging.
Stores the raw logs which contain raw data logged through the Raw Log option on the Tune
screen. These raw logs can be played back using the Viewer Application.
Settings - Default Location. The user can select their own location when they press the Store
button. These values are all of the trap voltage values. These settings files are used by
customers who have multiple sensors and one VQM Controller, and want to be able to quickly
load the last used settings for a particular sensor. Settings is the default location for the files
saved when the Store button under Setting File on the run Page is clicked. This is the file that
saves all the trap parameters that the Viewer Application would send down when a setting file
is loaded in the Viewer Application.
Snapshot - Stores the histogram, trend, and curve files that were selected after the Save button
is clicked. These files save the data current at that moment in time.
To facilitate reviewing the logs, shortcuts can be setup to these directories.
The Viewer Application also allows locations to be assigned for the raw logs, data logs, and save
files.
8.5.18 Error 5013 - Not able to create Raw Logs
Open the 835 VQM Config<serial number>.ini file and edit the paths.rawlog= line to a correct path.
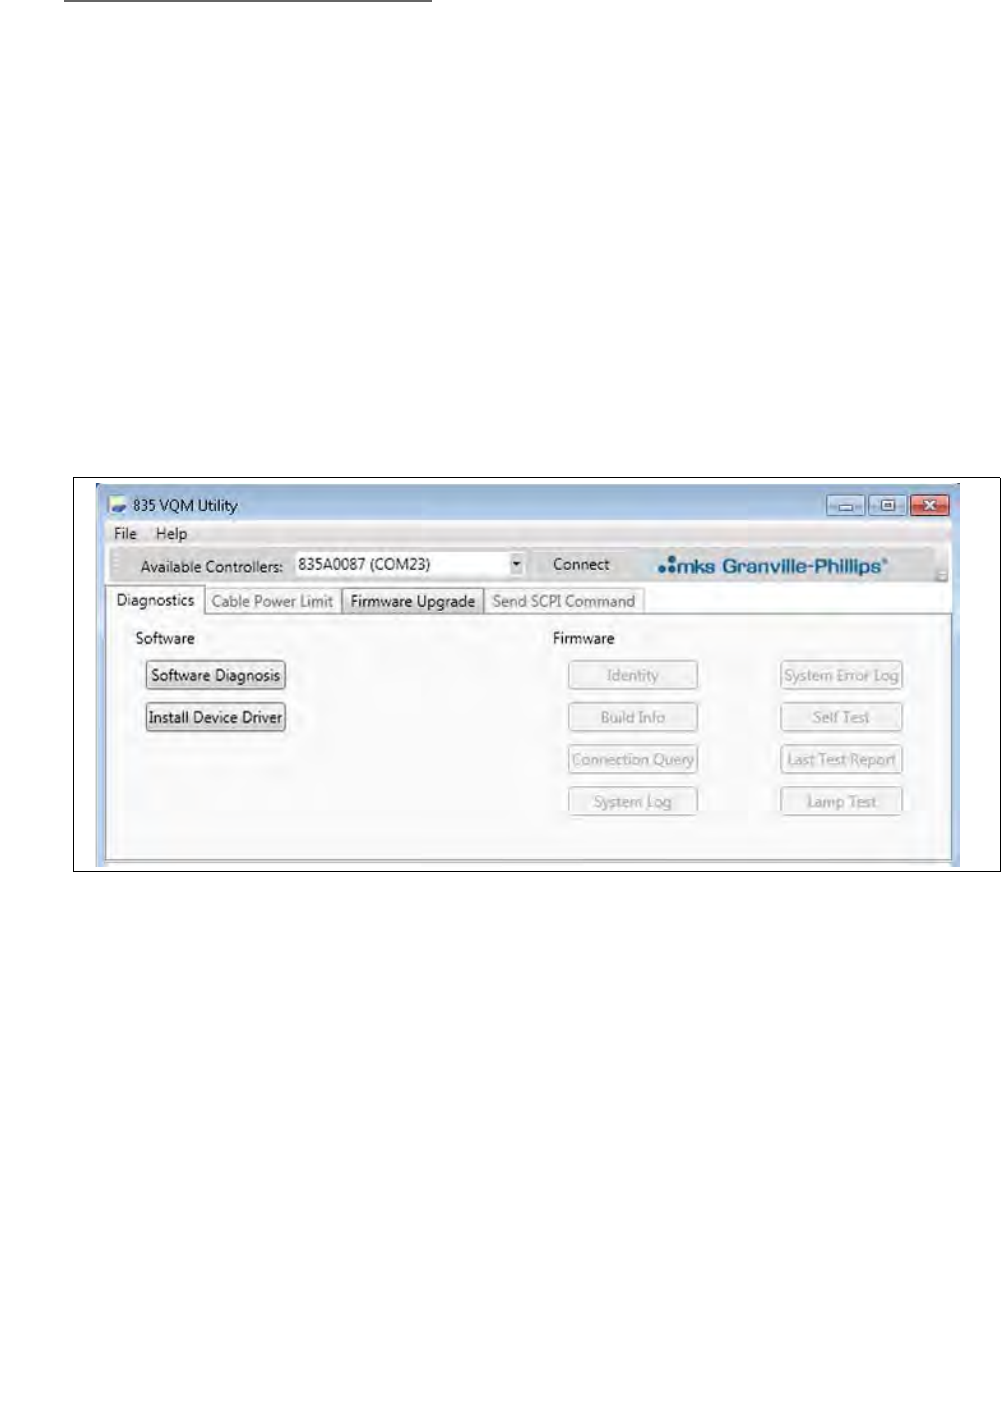
8 Initial Operation & Viewer Software
220 Series 835 Vacuum Quality Monitor
Instruction Manual - 835000
8.6 VQM Utility Application
The 835 Utility Application combines several small applications that are occasionally necessary for
setting up the 835 VQM Controller or diagnosing problems. Because of the infrequent use for these
utilities, a desktop shortcut is not installed. The 835 Utility is available via the Start => All
Programs=>GP=>835 Utility or by clicking on the 835 VQM Utility.exe found in <install
directory>\Utilities\Diagnostic Utility.
8.6.1 File Menu
The File Menu provides an option to save the output screen to a text file that can be emailed to
Granville-Phillips for analysis. It also provides an option to zip up the error logs from the Viewer
application, the Controller services, and Auto Tune into a package to be emailed to
Granville-Phillips for analysis. If problems have occurred, the Granville-Phillips application
engineer may suggest using some of the other buttons to diagnosis the problem.
The File Menu also provides an option to clear the output screen to try different tests and not have to
scroll as far.
8.6.2 Diagnostics Tab
8.6.2.1 Verifying the Installation
Click on the Software Diagnosis button of the Diagnostics tab to verify that the 835 VQM Suite
components are installed and are the correct version. This is typically only necessary if the host
computer had an earlier beta release installed that was not properly removed or there was an
interruption to the 835 Suite installer during the installation of the software.
This utility gathers information about the system in use and verifies that the correct versions of the
critical pieces are installed. It then verifies that the four services are present and that one or more
835 VQM Controllers are available. If there are any existing error logs, the utility checks the logs for
error messages. The utility also attempts to stop and restart the services after querying the user if the
user wants to do this.
Figure 8-47 VQM Utility Application
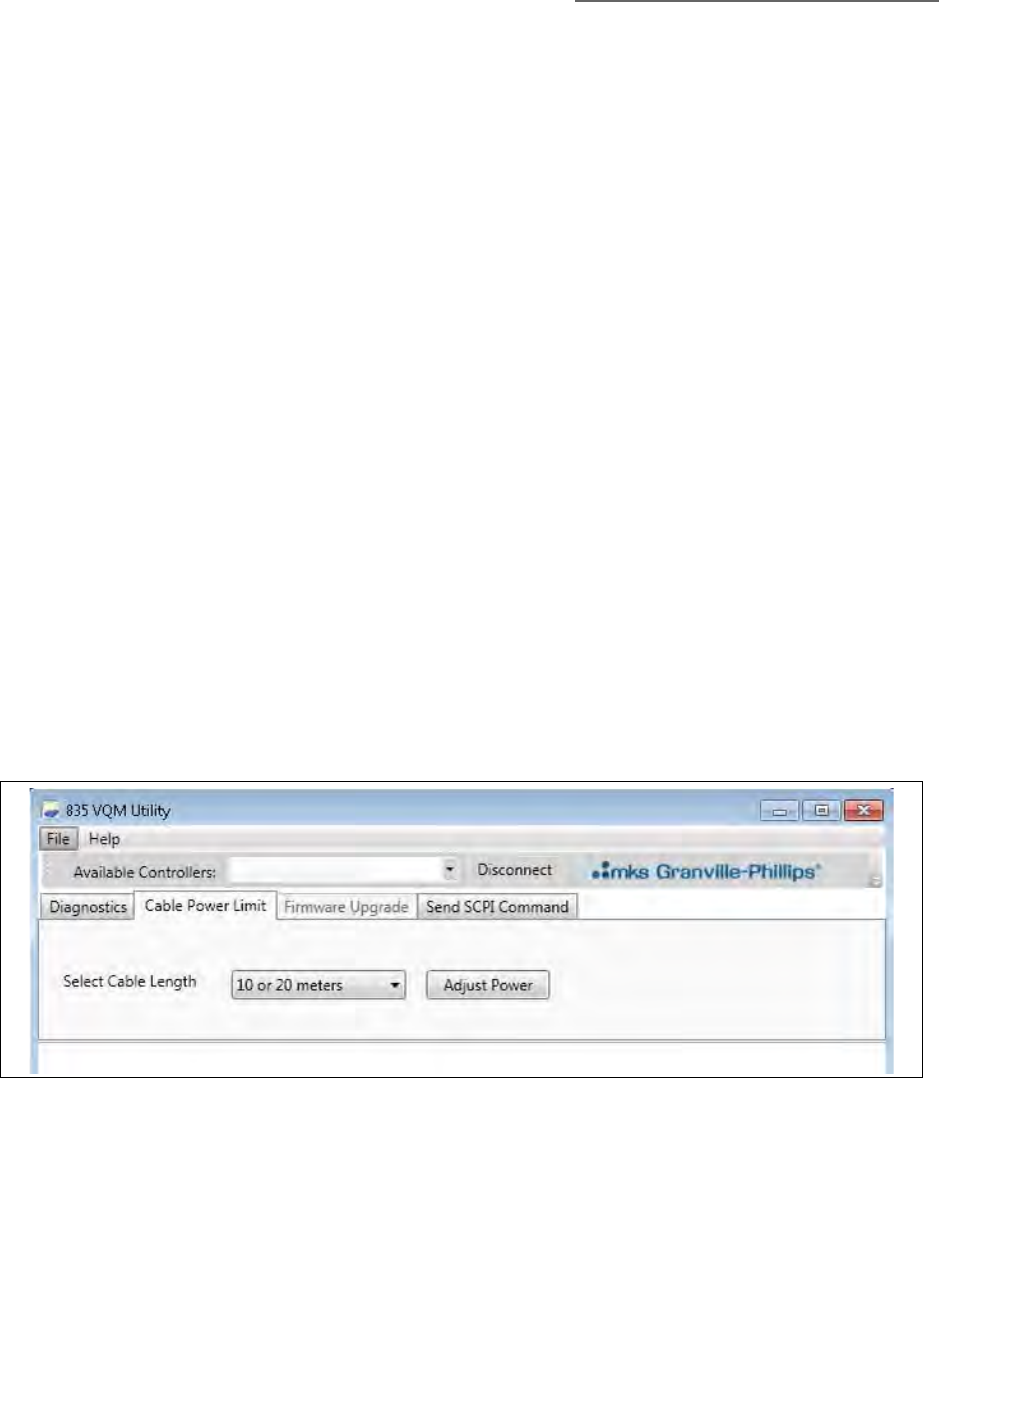
8 Initial Operation & Viewer Software
221
Series 835 Vacuum Quality Monitor
Instruction Manual - 835000
If a device is available, but not connected, the utility then attempts to use the API to connect to the
device and will display the serial number and firmware revision number of the Controller. If there is
a device showing in the Available Controllers box, clicking on the Connect button next to it will
connect the software to that Controller and allow for the firmware tests. The Connect button will
change to a Disconnect button when connected to a Controller.
8.6.2.2 Install Device Driver
The install Device Driver button on the Diagnostics tab brings up the installer for the GP Device
Driver appropriate for the host operating system. If the driver was not initially installed, this button
can be used to install it, assuming that you have admin privileges. Without the GP Device Driver
installed on the host, the Viewer Application and other applications will be unable to communicate
with the VQM Controller.
8.6.2.3 Firmware/Control Panel Tests
When an 835 VQM Controller is connected, the buttons on the Firmware side of the Diagnostic tab
are enabled. The Identity button shows the string returned for the Controller to the *idn? Command.
The Last Test Report button shows the results of the last self test, which is run if there is a POST
(Power On Self Test) error to see what component of the device failed. The Lamp Test button cycles
the LEDs to display if any are malfunctioning. The Self Test button runs the low voltage self test.
8.6.3 Cable Power Limit Tab
If the software is connected to a Controller, the Cable Power Limit tab is available. Clicking on this
tab will display the identity information of the Controller. Typically the 835 Controller is configured
for gauge cables of 3 meters or less. However, 10 meter, 20 meter, and 50 meter cables are
available. If these longer cables are used, several parameters must be changed to get proper signal
levels including the filament virtual burn limit. The pull-down list provides the ability to change the
Controller parameters necessary for different cables lengths. First use the pull-down to select the
gauge cable length in use and then click the Adjust Power button.
8.6.4 Firmware Upgrade Tab
Clicking on the Firmware Upgrade tab brings up the 835 Download For Upgrade (DFU) installer if
the DFU driver was not previously installed on the host PC. The 835 DFU driver used for upgrading
the firmware is a totally different driver than the GP Device Driver used for general communication
Figure 8-48 Cable Power Limit Tab
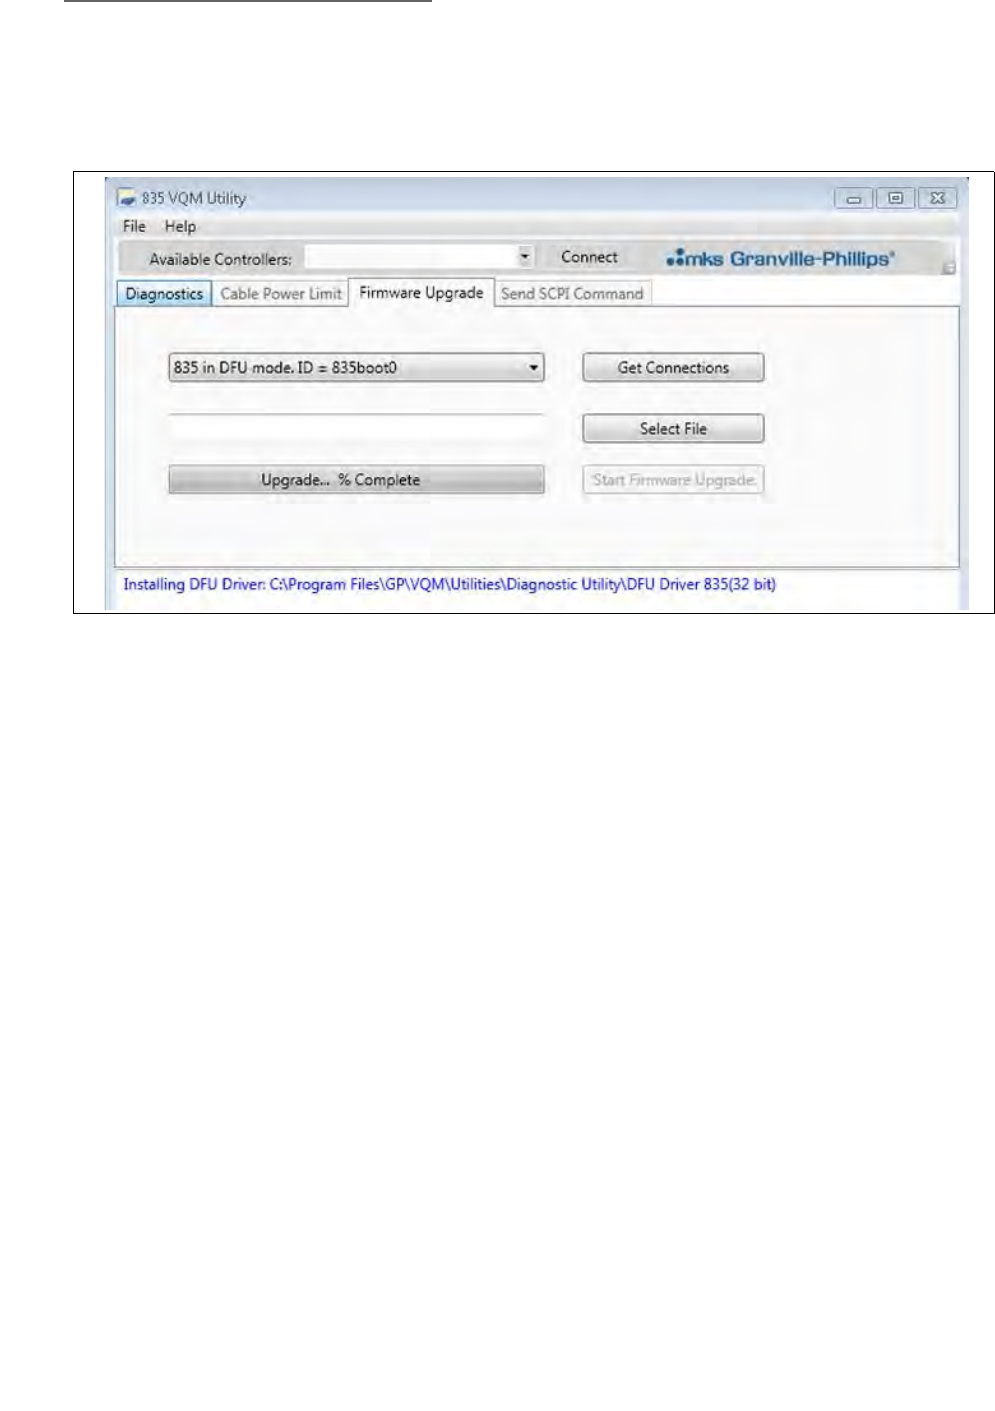
8 Initial Operation & Viewer Software
222 Series 835 Vacuum Quality Monitor
Instruction Manual - 835000
with the Controller. This DFU driver installer enables installation of the DFU driver which is a
necessary component for upgrading the firmware. Another necessary component for upgrading is a
DFU file containing the new firmware version from Granville-Phillips.
The utility software will also display the following screen.
It may be necessary to upgrade the 835 VQM Controller firmware. To put the Controller in DFU
mode, power-cycle the Controller while depressing the Scan button on the Controller front panel.
The scan button will turn yellow when it is in DFU mode. Make sure that this is the only 835 device
physically connected to the host.
Allow time for Windows to load the DFU driver. It will be in the bottom tray or it will show in the
Device Manger under Universal Serial Bus Controllers. Click on the Get Connection button and the
software will display a list of Controllers in DFU mode. Select the Controller to be upgraded. Use
the Select File to browse to the DFU file. Then click on the Start Firmware Upgrade button. The
utility software will display the progress. When the download is successfully completed, the
software will reset the Controller into normal mode. If unsuccessful, the 835 stays in DFU so the
firmware upgrade can be run again. Power-cycling the Controller will also set the device back to
normal application mode.
8.6.5 SCPI Command Tab
The SCPI Command tab provides a simple way to send SCPI commands to the Controller (see
Chapter 9 for the VQM command set). This tab can be used even if no serial terminal emulators
have been installed on the host PC. (The GP Device driver is still needed.) Type the command in
one of the text boxes, check the SCPI Command check box on that line and click once on the Send
Selected button to send a single command. Or, fill each text box with commands, and check each
of the SCPI Command boxes to send multiple SCPI commands. The entered and selected
commands can also be run in a loop by checking the Loop? box and then typing the number of
times to send the selected commands.
Figure 8-49 Firmware Upgrade Tab
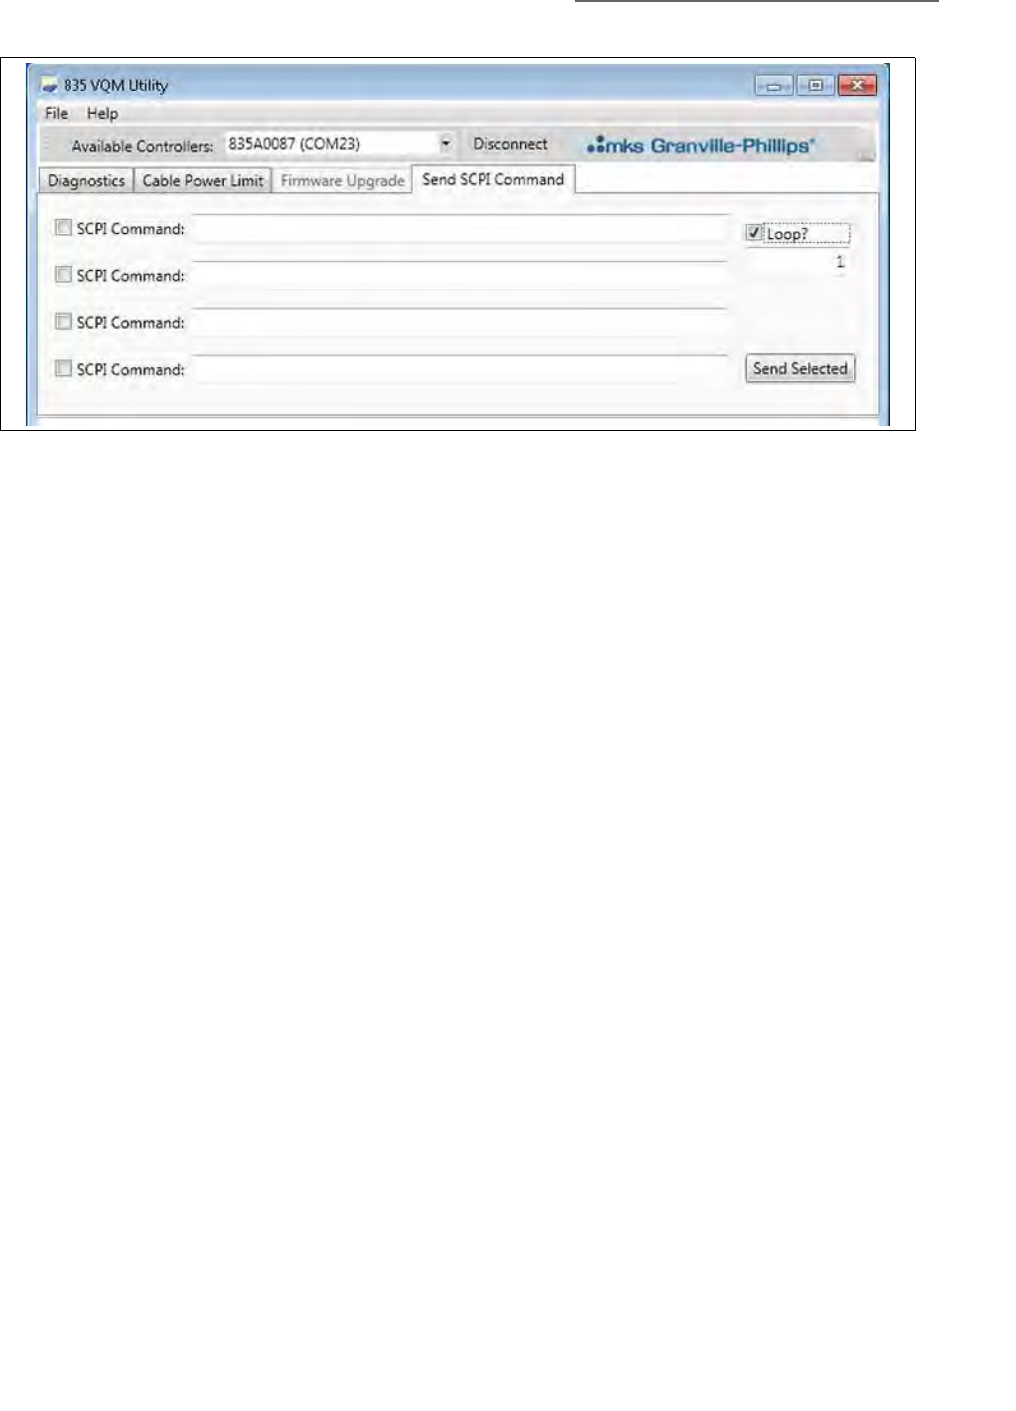
8 Initial Operation & Viewer Software
223
Series 835 Vacuum Quality Monitor
Instruction Manual - 835000
Figure 8-50 Send SCPI Command

8 Initial Operation & Viewer Software
224 Series 835 Vacuum Quality Monitor
Instruction Manual - 835000

225
Series 835 Vacuum Quality Monitor
Instruction Manual - 835000
Chapter 9
9835 VQM® Command Set
9.1 Introduction
This chapter describes how to program the VQM System from a host computer using the
Controller's Command Set and a direct USB link.
The installed Service requires access to the VQM Controller(s) and the following techniques bypass
the Service interface. Consequently, the user may need to stop the Service to gain access to the USB
ports. Similarly, terminate the communications described below to gain access to the ports via the
Service.
The VQM System includes a standard USB 2.0, Full Speed, communications port on the front panel.
A host computer interfaced with the instrument can easily configure, calibrate, diagnose and
operate the system using an ASCII-based instrument VQM Command Set. The command language
described in this chapter allows integration of all the VQM System functions into any processing or
monitoring application.
9.1.1 USB Driver Installation
Installation of a specific driver is required for Windows to recognize the VQM Controller as a
"Virtual COM Port". See Section 4.3 in the Software Installation chapter.
9.1.2 Logical Instruments
The VQM System can be thought of as several logical instruments in one; the same way a digital
multi-meter is logically an ohmmeter, voltmeter, ammeter, etc. The system contains power supplies
(voltage biases on the ion trap electrodes and power for the filament), ammeter (electrometer), and
a waveform generator (RF source). These components make up the lower-level logical instruments.
The VQM System uses these lower-level logical instruments to create higher-level logical
instruments - the Mass Spectrometer, Ionizer, Mass Separator, Micro-Ion Gauge Total Pressure
Measurement/Monitoring Device, and External Signal Capture Device (Analog input).
Since the VQM System is many instruments in one, the Command Set interface is separated into
many different logical instruments using the "INSTrument Subsystem". This allows the same
command to perform different actions depending on the currently selected logical instrument.
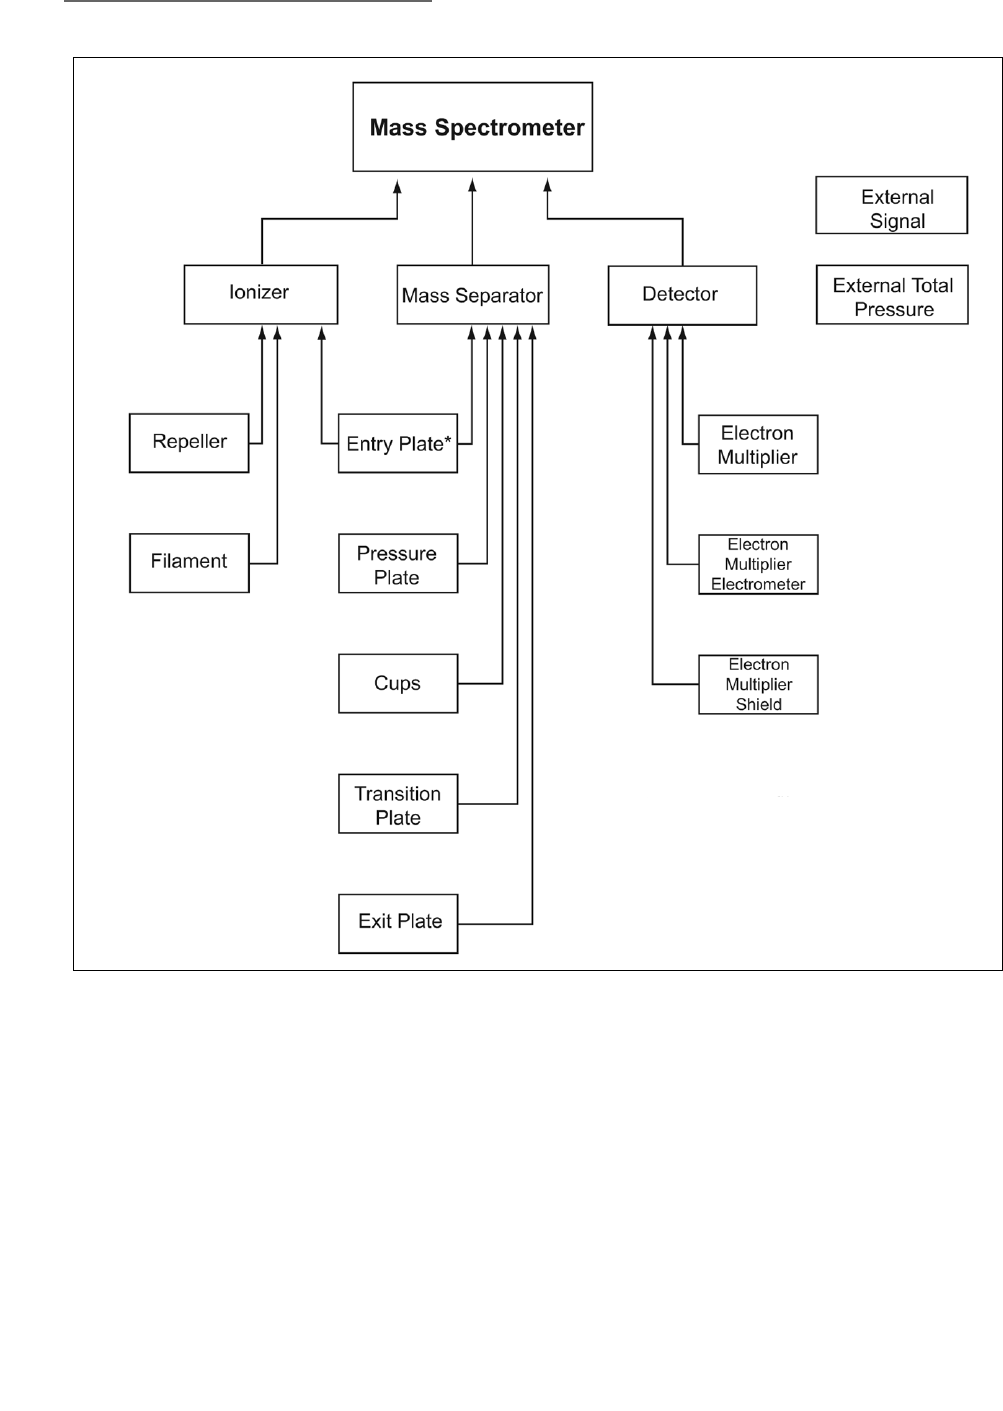
9 835 VQM® Command Set
226 Series 835 Vacuum Quality Monitor
Instruction Manual - 835000
Figure 9-1 VQM System Logical-Level Hierarchy
* The Entry Plate is used in the
Ionizer to establish emission,
and in the Mass Separator as
part of its voltage gradient.

9 835 VQM® Command Set
227
Series 835 Vacuum Quality Monitor
Instruction Manual - 835000
9.1.3 Command Format
The command syntax tables that follow show most commands (and some parameters) as a mixture
of upper- and lower-case letters. The upper-case letters indicate the abbreviated spelling for the
command. For shorter program lines, send the abbreviated form. For better program readability,
send the long form. Commands are not case-sensitive.
SCPI considers a single, carriage-return-terminated string a "command." (For purposes of discussion,
we shall refer to this as a "command string" to differentiate it from the semantic "SCPI command" the
formats of which are described in the command tables below.)
The user can send the VQM Controller command strings of up to 255 characters, including a
terminating carriage return (Ascii 13, 0Dh).
A command string can either contain a single SCPI command, or it can be composed of
semicolon-delimited "command units", each of which constitute a single SCPI command.
Command units must adhere to proper SCPI-99 "command node position" syntax. A command unit,
upon completion, leaves the parser at a particular "command node position."
Example: syst:err:all?
syst:is the "syst" command's "root" node
syst:err:is a secondary command node
syst:err:all?is the terminal node (no other colon-separated commands follow)
Example:
Consider the command string:
syst:err:all?;count?
After the parser invokes the SCPI command 'syst:err:all?' from the first unit, the parser is left at the
command node 'syst:err:'. The next command unit, 'count?', is then processed.
Example:
The following are equivalent commands:
syst:err:all?;count?
syst:err:all? (followed by) syst:err:count?
Any subsequent unit that does not begin with a colon is considered to have an implied 'syst:err:'
prepended to that unit. Subsequent units that wish to invoke commands that are not beneath the
current command node position must begin with a colon, which places the parser at a new "root
command node."
To allow a unit to return the parser to the "root" node, a colon must be preprepended to it. The only
exception is command units beginning with an asterisk (such as "*idn?").
Example:
syst:err:all?;count?;:fetch?;*idn? is legal syntax, but
syst:err:all?;count?;fetch?;*idn? is not.
(Note the absence of a colon before 'fetch?' in the third command unit. The parser did not
return to the "root node," and could not match the string 'sys:err:fetch?'.)

9 835 VQM® Command Set
228 Series 835 Vacuum Quality Monitor
Instruction Manual - 835000
If a single unit within a multi-unit command string fails, that offending unit and all units to the end
of the command string are considered errored commands, and are not executed (only the first
offending unit's failure is noted in the Event Queue).
All 835 commands (and all command units within a command string) are sequential (not
over-lapped)-execution of a command finishes before the start of the execution of the next
command, and the execution of a command unit within a command finishes before the start of the
execution of next command unit.
Each command (or command unit) consists of a header and zero or more parameters. The header
and parameters are separated by a "white space" (ASCII code 0x20).
The header consists of one or more keywords, separated by colons. Most keywords have a long
form and a short form. In the command reference below, these keywords are specified with upper-
and lower-case letters. The uppercase letters alone define the short form of the keyword; the
long-form is defined as the entire keyword. For example, the short-form of the keyword VOLTage is
"volt", in any combination of case. The long-form is "voltage", again, in any combination of case.
Only the short-form or the long-form of a keyword are valid.
Queries are formed by directly appending a question mark to the header.
Command strings must be terminated by a carriage return (Ascii 13, 0x0D). All responses terminate
with a carriage return. NMulti-line responses use a line-feed (ascii 10, 0Ah) to separate lines.
Sample Command:VOLTage:DC:RANGe {<range> I MINimum I MAXimum} (CR)
In the sample syntax statement above, VOLT and VOLTAGE are both acceptable terms. You can use
upper- or lower-case letters; VOLTAGE, volt, and Volt are all acceptable. Other forms, such as VOL
or VOLTAG, will generate an error as these are not short- or long-forms of the keyword "VOLTage".
9.2 SCPI Command Tables
9.2.1 Input Format
In the following tables, the parameter format column displays default parameter values in bold.
Optional parameters are enclosed in [braces]. Text between <chevrons> is descriptive-the <> are
not meant to be input by the user.
Boolean values can be entered as "ON" or "OFF", or '1' or '0'.
9.2.2 Response Format
The response format is consistent with response formatting described in IEEE 488.2, Section 8:
"Device Talking Elements"
Responses are emitted by commands that end with a question mark.
Response formats are described in the "Comments" column. Standard response formats that may be
referenced are:
<integer>Integer value (signed or unsigned, a range may be specified.
<hex integer>Integer value, but as a hexadecimal (#Hnnnn).
<float>An NR3-compliant scientific floating point number with the format:
{+-}n.mmmmmE{+-}ee
where n is a single number representing the integral part, mmmmm is the fractional part,
and ee is the exponent.

9 835 VQM® Command Set
229
Series 835 Vacuum Quality Monitor
Instruction Manual - 835000
<unquoted string>An unquoted string of printable ASCII characters.
All responses except for "FETC?" are terminated by a carriage-return.
Table 9-1 Symbols used in SCPI Commands
Symbol Function Comments
Braces { } Braces enclose the parameter choices for a given command
string. The braces are not sent with the command string.
Square Brackets [ ] Square brackets indicate that a parameter is optional and can
be omitted. The square brackets are not sent with the
command string.
Triangle Brackets < > In command parameters, triangle brackets indicate that you
must specify a value for the enclosed parameter. The triangle
brackets are not sent with the command string.
In response definitions, triangle brackets indicate the type of
value being returned (e.g., <float>, <integer>). In some cases,
the text within the brackets describes additional details of the
value returned.
Vertical Bar I The vertical bar separates multiple parameter choices for a
given command string. Only one parameter choice can be
used at a time.
Colon : Keyword
Separator
A colon separates a command keyword from a lower-level
keyword. Insert a blank space to separate a parameter from a
command keyword. If a command requires more than one
parameter, separate the adjacent parameters with a comma.
For example:
CONF : VOLT : DC 10, 0.05
Question Mark ? Query A question mark at the end of a command header signifies a
query. For example:
TRIG : COUN? or TRIG : COUN? MAX
BOLD System default value or setting (the value the command will
assume if a parameter is not provided by the user).
Unicode and other non-8-bit characters are not supported.

9 835 VQM® Command Set
230 Series 835 Vacuum Quality Monitor
Instruction Manual - 835000
9.3 IEEE 488.2 Required Commands
Table 9-2 Required IEEE Commands
Keyword Parameter Format/
Response Format Comments
*CLS Clears all status data structures - SESR, OPERation, QUEStionable,
Error/Event Queue. Clears output buffer.
*ESE <integer, 0-255> Standard Event Status Enable Command. Chooses which events in the
SESR to contribute to the Status Byte SESR summary bit.
*ESE? Response: <integer, 0-255> Standard Event Status Enable Query
*ESR? Response: <integer, 0-255> Standard Event Status Register Query
*IDN? Response: <unquoted string,
less than 73 characters>
Identification query - returns four fields delimited by commas:
Manufacturer, Model, Serial Number (ASCII character 0 if not available),
and Firmware level or equivalent (ASCII character 0 if not available).
"MKS Instruments, Inc., 835, SN, Firmware Version"
The output will be less than 73 characters.
*OPC Operation complete command. Sets the OPC bit in SESR.
NOTE: because the 835 is a sequential device, it is always in OCIS, and
the only change in the system is a change in the SESR.
*OPC? Response: <integer> Places the 835 momentarily in OQAS.
NOTE: because the 835 is a sequential device, and would immediately
return to OQID, the effect this command is to merely display the digit “1.”
*RST Reset to known configuration. Does not affect any Event Enable or Event
register settings, the power-on-status-clear flag, or other settings specified
in IEEE 488.2 Section 10.32.1. See the section "Reset State" below.
*SRE <integer>, 0-255, bit 6 is
ignored>
Service Request Enable Command - chooses which events reported in the
Status Byte Register create a RQS condition. Bit 6 MUST be ignored.
*SRE? Response: <integer> Service Request Enable Query. Bit 6 is always 0.
*STB? Response: <integer, 0-255> Read Status Byte Query. Does NOT clear the Status Byte Register; use the
*CLS command to clear.
*TST? Response: <integer, 0 or 1> Self-Test Query.
A response of 0 indicates a pass; a response of 1 indicates a failure.
"TEST:REPort?" can be used to get detailed test data.
*WAI Wait-to-Continue Command.
Because the 835 is a sequential device, the effect is a no-op: a device
supporting only sequential commands is always in OCIS.

9 835 VQM® Command Set
231
Series 835 Vacuum Quality Monitor
Instruction Manual - 835000
9.3.1 CALibration Subsystem
This subsystem has the functions to perform system calibration.
9.3.2 CONFigure Subsystem
The "CONFigure" command sets up the instrument to perform the measurement by the specified
function.
Table 9-3 Calibration Commands
Keyword Parameter Format/
Response Format Comments
CALibration Commands to calibrate the logical instrument. All logical
instruments will have at least one set of gain/offset values.
:MEASure? Response: <float> Defined only for the EMEL logical instrument. Measures electron
multiplier electrometer gain.
:VALue <float> | MIN | MAX | DEF Defined only for the Mass Spec (MSP) and Electron Multiplier
Electrometer (EMEL) logical instruments.
For the MSP, this is the value of the reference signal used in
calibration. For the EMEL, this is the electrometer gain value.
The units of Reference Signal value are in Hertz.
:VALue? Parameter: [DEF | MIN | MAX]
Response: <float>
Defined only for the Mass Spec (MSP) and Electron Multiplier
Electrometer (EMEL) logical instruments.
For the MSP, the reference signal value5 last used in calibration (or,
if specified, the minimum, maximum, or default settable reference
signal values).
For the EMEL, this is the last-assigned electrometer gain value (or, if
specified, the minimum, maximum, or default settable reference
signal values).
If no parameter is specified, the currently-assigned value is
retrieved.
Table 9-4 Calibration Commands
Keyword Parameter Format/
Response Format Comments
CONFigure Commands to configure device properties.
:AMU <start AMU> | MIN | MAX | DEF,
<stop AMU> | MIN | MAX | DEF
AMU given as integer or float.
Defined for the Mass Spec (MSP) logical instrument only.
Sets the start and stop AMU range. Note that the read-back value
might be different than the set values, depending on the currently
assigned CALibration:Value.
:AMU? Parameters:
<start AMU>,<stop AMU>, where
the <requested value> are
[MIN | MAX | DEF ]
Response: <float, float>
(start AMU, stop AMU)
Defined for the Mass Spec (MSP) logical instrument only.
Display the current AMU range assigned. See the AMU command
above regarding possible variance with actual input values.
If a MIN/MAX/DEF alias is specified, the returned value is the
internal value for that AMU at the time of the call; the values may
depend of the current Mass Calibration Factor.
If no parameter is specified, then the actual lower or upper value
currently assigned is retrieved.

9 835 VQM® Command Set
232 Series 835 Vacuum Quality Monitor
Instruction Manual - 835000
9.3.3 FETCh Subsystem
The "FETCh?" command transfers data related to the Mass Spec (MSP) logical instrument to the
output buffer. It is used to obtain (1) MSP state information, (2) partial pressure data counts, and (3)
the scan's atomic mass units (as calculated at the time of the scan). The default "FORMat" command
shall allow the return of the DIF header and partial pressure data counts only. Other configurations
are possible.
9.3.4 FORMat Subsystem
This subsystem sets the data format for transferring information from/to the instrument. This
becomes important when transferring large sets of data at a time (such as data from a partial
pressure scan). The DIF header containing all of the mass spectrometer settings will always be
returned when a FETCh? command is issued. It is possible to turn off both the COUNt and AMU
section and only receive the DIF header section. See TRIGger Subsystem, section 6.3.18.
:UNITs TORR | MBAR | PAL Valid for the ETPR logical instrument only. The ETPR unit must be
active and communicating; this command, if successful, sets
persistently the farend device to the desired units.
Sets pressure units to torr, millibar, or pascal.
:UNITs? Response: <unquoted string> Valid for the ETPR logical instrument only.
Displays pressure units: TORR", "MBAR", or "PAL" or "NONE" if the
ETPR is inactive/not present.
Table 9-5 Fetch Commands
Keyword Parameter Format/
Response Format Comments
FETCh Response: <unquoted string> Defined only for the Mass Spec (MSP) logical instrument. See the
section "Data Interchange Format" below for output format.
Table 9-6 Format Commands
Keyword Parameter Format/
Response Format Comments
FORMat Sets format for transferring numeric and array information.
[:ALL] ON | OFF, ON | OFF Enables/disables both format modes in one command. In order, the
booleans represent:
COUNt mode
AMU mode
[:ALL]? Response: <integer: 1 or 0> Displays the enable/disable mode of both format modes in one
command. The display format is:
<bool>,<bool> where 1=ON, 0=OFF.
In order, the booleans displayed represent:
COUNt mode
AMU mode
Table 9-4 Calibration Commands
Keyword Parameter Format/
Response Format Comments
9 835 VQM® Command Set
233
Series 835 Vacuum Quality Monitor
Instruction Manual - 835000
9.3.5 INPut Subsystem
This subsystem is only valid for the Digital In (DIN) and Analog In (AIN) logical instruments. It
controls the enabling and disabling of the low level hardware signals that are INPuts to the VQM
Controller.
:COUNt ON | OFF Enables/disables reporting of partial pressure data counts.
If ON, the partial pressure data will be included in terms of 16 bit
counts from the A2D converter when a FETCh? command is issued.
If OFF, no partial pressure data is included.
:COUNt? Response: <integer: 1 or 0> Displays the current COUNt mode.
1=ON, 0=OFF
:AMU ON | OFF Enables/disables reporting of atomic mass unit data.
If ON, the AMU values for the corresponding partial pressure data
points are sent when a FETCh? command is issued.
If OFF, the AMU values are not retrieved.
AMU? Response: <integer: 1 or 0> Displays the current AMU mode:
1=ON, 0=OFF
Table 9-7 Route Commands
Keyword Parameter Format/
Response Format Comments
INPut
[:STATe] OFF | ON Disables/Enables the input for the selected logical instrument.
Defined for:
DIN
AIN
[:STATe]? Response: <integer: 1 or 0> Responds with "0" (OFF) or "1" (ON).
Table 9-6 Format Commands
Keyword Parameter Format/
Response Format Comments

9 835 VQM® Command Set
234 Series 835 Vacuum Quality Monitor
Instruction Manual - 835000
9.3.6 INSTrument Subsystem
This subsystem allows the user to select the different logical instruments that make up the 835 VQM
System.
Table 9-8 Instrument Commands
Keyword Parameter Format/
Response Format Comments
INSTrument Select the logical of the 835 VQM by number or name.
[:SELect] MSPectrometer | IONizer |
MSEParator | DETector |
ESIG-nal | ETPRessure |
FILament | REPeller | DDS |
ENTRyplate | PPLate | CUPS |
TPLate | EXIT-plate | EMSHield |
EMULtiplier | EMELectrometer |
DIN | DOUT | AIN | AOUT
Instrument List (and associated numerical IDs), corresponding in
order to the parameter form to the left:
1.Mass Spectrometer
2.Ionizer
3.Mass Separator
4.Detector
5.External Signal
6.External Total Pressure
7.Filament
8.Repeller
9.DDS
10.Entry Plate
11.Pressure Plate
12.Cups
13.Transition Plate
14.Exit Plate
15.Electron Multiplier Shield
16.Electron Multiplier
17.Electron Multiplier Electro-meter
18.Digital IN
19.Digital OUT
20.AnalogIN
21.AnalogOUT
[:SELect]? Response: <unquoted string> Queries the name of the selected logical instrument.
NSELect 1 | 2 | 3 | 4 | 5 | 6 | 7 | 8 | 9 | 10
| 11 | 12 | 13 | 14 | 15 | 16 | 17
| 18 | 19 | 20 | 21
Select a logical instrument by numerical ID. See the command
"INSTrument[SELect]" above for IDs.
:NSELect? Response: <integer: 1 to 21> Queries the numerical ID of the selected logical instrument. See the
command "INSTru-ment[SELect]" above for IDs.

9 835 VQM® Command Set
235
Series 835 Vacuum Quality Monitor
Instruction Manual - 835000
9.3.7 MEASure Subsystem
This subsystem gives high level commands to make basic measurements. (Configuration and
triggering is determined automatically by the currently-selected logical instrument).
Table 9-9 Measure Commands
Keyword Parameter Format/
Response Format Comments
MEASure
[:SCALar]:CURRent[:DC]? Response: <float> Valid only for the FILament logical instrument, in FIXed
mode.
Measures the current instrument's Filament Power Supply
current.
[:SCALar]:POWer[:DC]? Response: <float> Valid only for the FILament logical instrument, in FIXed
mode.
Measures the current instrument's Filament Power Supply
power output.
[:SCALar]:PRESsure? Response: <float> Valid only for the External Total Pressure Module (ETPR)
logical instrument.
If the pressure units (as ob-served via the CONF:UNITs?
command) are Torr, millibar, or pascal, the command
displays the total pressure reading as measured by the ETPR.
If the units reported in the units query are "NONE" (if the
ETPR is inactive or not present), then the SCPI NaN value
(+9.91000E+37) is displayed.
[:SCALar]:VOLTage[:DC]? Response: <float> Valid only for the following logical instruments: REP, ENTR,
PPL, CUPS, TPL, EXIT, EMSH, EMUL, EMEL, AIN, and FIL
(in ADJustable mode).
Measures the current instrument's bias voltages.

9 835 VQM® Command Set
236 Series 835 Vacuum Quality Monitor
Instruction Manual - 835000
9.3.8 MEMory Subsystem
This subsystem manages persistent user configuration. The "startup profile" is a configuration block,
identified by an integer (1-6), that is read from NVRAM at startup to populate the system's
configuration values.
Table 9-10 Memory Commands
Keyword Parameter Format/
Response Format Comments
MEMory
:LOAD [1 - 6 | FACTory] Loads the specified configuration profile from nonvolatile
memory to RAM, applying the new values to hardware.
If no profile is specified, the Controller will retrieve the
profile data associated with the 'startup configuration
profile id' (the profile whose id is equivalent to the id
obtained from the PROFile command-see below)
This command DOES NOT change the active profile ID;
however, changing the PROFile will affect the default
behavior of the LOAD command:
(assume current PROFile is 1)
mem:load
Loads cfg from profile 1
mem:profile 3
mem:load
Loads cfg from profile 3
:LOAD? Response: 0-6 Response: <integer: 0-6>Retrieves the last loaded
configuration.
A 1-6 indicates the a user profile was last loaded.
A 0 indicates the factory default config was last loaded.
:PROFile <1-6> Modifies the startup configuration profile id.
:PROFile? Response: 1-6 Retrieves the startup active profile id.
See: LOAD command, above.
:STORe [1-6] Copies the current configuration in RAM to the specified
configuration profile location in NVRAM.
If no parameter is specified, the current configuration is
stored to the currently-assigned active profile location in
NVRAM.
This command DOES NOT change the active profile ID;
however, changing the PROFile will affect the default
behavior of the LOAD command:
(assume current PROFile is 2)
mem:storeStore cfg to profile 2
mem:profile 5
mem:loadStore cfg to profile 5
:CONFiguration
:GAUGe
:IDENtification <A 27-char-max quoted string> Sets the gauge ID for the current config. To save to profile
n, make sure to issue a STORe n command.
:IDENtification? Response: A 27-char-max string Retrieves the gauge ID.
:DESCription A 31-char-max quoted string. Sets the gauge description for the current config. To save
to profile n, make sure to issue a STORe n command.
:DESCription? Response: A 31-char-max string. Retrieves the gauge ID.

9 835 VQM® Command Set
237
Series 835 Vacuum Quality Monitor
Instruction Manual - 835000
9.3.9 OUTPut Subsystem
This subsystem is dependent on the currently selected logical instrument.
:FEATure
:ALL? Response: An XML
representation of the
features/working attributes.
The catalog id is included in the output.
Each feature in <features> is identified by the feature's
"name " attribute. Each feature's <value> tag is a 32-bit
unsigned integer.
:XRANge? Response: 0 or 1 Retrieves the Extended AMU Range capability for this
Controller.
1 - Extended AMU Range is available.
0 - Extended AMU Range is not available.
Table 9-11 Output Commands
Keyword Parameter Format/
Response Format Comments
OUTPut
[:STATe] OFF | ON Disables/Enables the output for the selected logical instrument.
In non-diagnostic mode, defined for:
MSPectrometer
DOUT
AOUT
ETPRessure
(The ETPR must be attached via a communication cable for the
command to succeed for the ETPR instrument.)
In diagnostic mode, also defined for:
IONizer
MSEParator
DETector
FILament
REPeller
DDS
ENTRyplate
PPLate
CUPS
TPLate
EXITplate
EMSHield
EMULtiplier
Never defined for:
EMELectrometer
DIN
AIN
[:STATe]? Response: 0 or 1 Responds with "0" (OFF) or "1" (ON).
ETPR only: Responds with "0" if either the module is missing or it is
operationally off/powered down.
Table 9-10 Memory Commands
Keyword Parameter Format/
Response Format Comments
9 835 VQM® Command Set
238 Series 835 Vacuum Quality Monitor
Instruction Manual - 835000
9.3.10 SENSe Subsystem
This subsystem provides control for all logical instruments that primarily sense signals.
9.3.11 SOURce Subsystem
This subsystem provides control for logical instruments that primarily source signals (such as all the
bias power supplies).
Table 9-12 Sense Commands
Keyword Parameter Format/
Response Format Comments
SENSe
:CORRection
:OFFSet
[:MAGNitude] <amps> | DEF | MIN | MAX Defined only for the Electron Multiplier Electrometer (EMEL) logical
instrument.
Sets the Electrometer offset (in amps).
[:MAGNitude]? Parameter: [DEF| MIN | MAX]
Response: <float >
Defined only for the Electron Multiplier Electrometer (EMEL) logical
instrument.
If no parameter is specified, displays the currently-assigned value.
Queries the current Electrome-ter offset (in amps).
Table 9-13 Source Commands
Keyword Parameter Format/
Response Format Comments
SOURce
:CURRent[:LEV
el] [:IMMediate]
[:AMPLitude]
<amps> | DEF | MIN | MAX Defined only for the Filament (FIL) logical instrument, in
adjustable (ADJ) mode.
Sets the filament amplitude.
:CURRent[:LEV
el] [:IMMediate]
[:AMPLitude]?
Parameter: [DEF| MIN | MAX]
Response: <float >
Defined only for the Filament (FIL) logical instrument, in
adjustable (ADJ) mode.
Retrieves the current filament current, or the specified limit.
If no parameter is specified, displays the currently assigned
value.
:DIGital
:DATa
:BIT [0 | 1 ] Set the logic level output of the digital out (DOUT) logical
instrument. A "0" sets the logic level low, and a "1" sets the logic
level high.
This command is only valid for the DOUT logical instrument.
:BIT? Response: 0 or 1 Retrieves the logic level output of the digital out (DOUT) logical
instrument. A "0" indicates the logic level is low; a "1" indicates
the logic level is high.
This command is only valid for the DOUT logical instrument.

9 835 VQM® Command Set
239
Series 835 Vacuum Quality Monitor
Instruction Manual - 835000
:MODe [TRIGger | MANual] Defined only for the Digital Out (DOUT) logical instrument.
Used to select the source that drives the Digital Out output.
When TRIGger mode is selected a TRIGger operation to start a
scan will drive the Digital Out output state high and then drive it
low and the end of a scan. When MANual mode is selected a
SCPI will control the output state.
:MODe? Response: <unquoted string> Defined only for the Digital Out (DOUT) logical instrument.
Returns the Digital Output mode TRIGger or MANual.
:STATe? Response: <integer: 1 or 0> Returns the value of the digital data that was sent to the DOUT
logical instrument. A return value of "0" indicates that the digital
output signal is at a low logic level. A return value of "1"
indicates that the digital output signal is at a high logic level.
This command is only valid for the DOUT logical instrument.
:MODe Filament:
[ADJustable | FIXed]
MSP:
[NORMal | STANdby]
Defined only for the FILament or MSPectrometer logical
instruments.
FILament instrument:
Used to determine if the current represents the current of the
power supply (FIXed) or emission current (ADJustable) and if the
voltage represents voltage of the power supply (FIXed) or the
bias voltage of the filament (ADJustable). OUTPut of the
FILament logical instrument must be turned off first.
MSPectrometer instrument:
Used to determine if Gauge should operate in normal or standby
mode.
:MODe? Response: <unquoted string> Defined only for the FILament or MSPectrometer logical
instruments.
FILament instrument:
Returns the Filament mode: FIXed or ADJustable.
MSPectrometer instrument:
Returns the Gauge mode: NORMal or STANdby.
:POWer[:LEVel]
[:IMMediate]
[:AMPLitude]
[<current> | DEF | MIN | MAX] Defined only for the Filament (FIL) logical instrument.
In FIXed mode, sets power control.
Not defined for ADJustable mode
:POWer[:LEVel]
[:IMMediate]
[:AMPLitude]?
[DEF | MIN | MAX]
Response: <float>
Defined only for the Filament (FIL) logical instrument.
In FIXed mode, retrieves the power control current.
If no parameter is specified, retrieves the currently-assigned
value.
Not defined for ADJustable mode.
:POWer:LIMit[:
AMPLitude]
[<power> | DEF | MIN | MAX]
where power is an integer or a
float
Defined only for the FILament logical instruments (in either
fixed or adustable mode).
Sets the FILament logical instrument's filament burn limit power,
in watts.
:POWer:LIMit[:
AMPLitude]?
[DEF | MIN | MAX]
Response: <float>
Defined only for the Filament (FIL) logical instrument (in either
fixed or adustable mode).
Retrieves the FILament's burn limit power, in watts.
If no parameter is specified, retrieves the currently-assigned
value.
:VOLTage[:LEVe
l] [:IMMediate]
[:AMPLitude]
<volts> | DEF | MIN | MAX
where volts is an integer or a
float
Defined only for the following logical instruments: FIL (in
ADJustable mode), REP, DDS, ENTR, PPL, CUPS, TPL, EXIT,
EMSH, and EMUL.
Sets the current logical instrument's filament/bias voltage.
Table 9-13 Source Commands
Keyword Parameter Format/
Response Format Comments

9 835 VQM® Command Set
240 Series 835 Vacuum Quality Monitor
Instruction Manual - 835000
9.3.12 STATus Subsystem
This subsystem controls event status collection behavior and reports system status. At power-up, the
default values for all enable mask and positive transition mask fields is 0x7FFF, and 0x0000 for all
negative transition mask fields.
Note that the STATus:PRESet command does not return the system to these values (see the
STATus:PRESet command below).
:VOLTage[:LEVe
l][:IMMediate]
[:AMPLitude]?
Parameter: [DEF | MIN | MAX]
Response: <float>
Defined only for the following logical instruments: FIL (in
ADJustable mode), REP, DDS, ENTR, PPL, CUPS, TPL, EXIT,
EMSH, and EMUL.
Retrieves the current logical instrument's filament/bias voltage.
If no parameter is specified, retrieves the currently-assigned
value.
Table 9-14 Status Commands
Keyword Parameter Format/
Response Format Comments
STATus
:OPERation
[:EVENt]? Response: <0-32767> Returns the contents of the Operational Status Register
event word (range 0-32767).
Is cleared after read.
:CONDition? Response: <0-32767> Returns the contents of the Operational Status Register
condition word (range 0-32767
:ENABle <0-32767> Sets the Operational Status register event enable mask.
:ENABle? Response: <0-32767> Retrieves the Operational Status register event enable
mask (range 0-32767).
:NTRansition <integer: <0-32767> Sets the Operational Status register negative transition
mask.
:NTRansition? Response: <0-32767> Retrieves the Operational Status register negative
transition mask (range 0-32767).
:PTRansition <integer: <0-32767> Sets the Operational Status register positive transition
mask.
:PTRansition? Response: <0-32767> Retrieves the Operational Status register positive
transition mask (range 0-32767).
:SWEeping
[:EVENt]? Response: <0-32767> Returns the contents of the Operational Sweeping Status
Register event word (range 0-32767).
Is cleared after read.
:CONDition? Response: <0-32767> Returns the contents of the Operational Sweeping Status
Register condition word (range 0-32767).
:ENABle <0-32767> Sets the Operational Sweeping Status Register event
enable mask.
Table 9-13 Source Commands
Keyword Parameter Format/
Response Format Comments

9 835 VQM® Command Set
241
Series 835 Vacuum Quality Monitor
Instruction Manual - 835000
:ENABle? Response: <0-32767> Retrieves the Operational Sweeping Status Register event
enable mask (range 0-32767).
:NTRansition <0-32767> Sets the Operational Sweeping Status Register negative
transition mask.
:NTRansition? Response: <0-32767> Retrieves the Operational Sweeping Status Register
negative transition mask (range 0-32767).
:PTRansition 0-32767> Sets the Operational Sweeping Status Regis-ter positive
transition mask.
:PTRansition? Response: <0-32767> Retrieves the Operational Sweeping Status Register
positive transition mask (range 0-32767).
:CONTroller
[:EVENt]? Response: <0-32767> Returns the contents of the Controller Operational Status
Register event word (range 0-32767).
Is cleared after read.
:CONDition? Response: <0-32767> Returns the contents of the Controller Operational Status
Register condition word (range 0-32767).
:ENABle <integer: 0-32767> Sets the Controller Operational Status Register event
enable mask.
:ENABle? Response: <0-32767> Retrieves the Controller Operational Status Register event
enable mask (range 0-32767).
:NTRansition <0-32767> Sets the Controller Operational Status Register negative
transition mask.
:NTRansition? Response: <0-32767> Retrieves the Controller Operational Status Register
negative transition mask (range 0-32767).
:PTRansition <0-32767> Sets the Controller Operational Status Register positive
transition mask.
:PTRansition? Response: <0-32767> Retrieves the Controller Operational Status Register
positive transition mask (range 0-32767).
:INSTrument
[:EVENt]? Response: <0-32767> Returns the contents of the Instrument Operational Status
Register event word (range 0-32767).
Is cleared after read.
:CONDition? Response: <0-32767> Returns the contents of the Instrument Operational Status
Register condition word (range 0-32767).
:ENABle <0-32767> Sets the Instrument Operational Status Register event
enable mask.
:ENABle? Response: <0-32767> Retrieves the Instrument Operational Status Register
event enable mask (range 0-32767).
:NTRansition <0-32767> Sets the Instrument Operational Status Register negative
transition mask.
:NTRansition? Response: <0-32767> Retrieves the Instrument Operational Status Register
negative transition mask (range 0-32767).
:PTRansition <integer: 0-32767> Sets the Instrument Operational Status Register positive
transition mask.
:PTRansition? Response: <0-32767> Retrieves the Instrument Operational Status Register
positive transition mask (range 0-32767).
Table 9-14 Status Commands
Keyword Parameter Format/
Response Format Comments

9 835 VQM® Command Set
242 Series 835 Vacuum Quality Monitor
Instruction Manual - 835000
:IONizer
[:EVENt]? Response: <0-32767> Returns the contents of the Ionizer Operational Status
Register event word (range 0-32767).
Is cleared after read.
:CONDition? Response: <0-32767> Returns the contents of the Ionizer Operational Status
Register condition word (range 0-32767).
:ENABle <0-32767> Sets the Ionizer Operational Status Register event enable
mask.
:ENABle? Response: <0-32767> Retrieves the Ionizer Operational Status Register event
enable mask (range 0-32767).
:NTRansition <0-32767> Sets the Ionizer Operational Status Register negative
transition mask.
:NTRansition? Response: <0-32767> Retrieves the Ionizer Operational Status Register negative
transition mask (range 0-32767).
:PTRansition <0-32767> Sets the Ionizer Operational Status Register positive
transition mask.
:PTRansition? Response: <0-32767> Retrieves the Ionizer Operational Status Register positive
transition mask (range 0-32767).
:MSEParator
[:EVENt]? Response: <0-32767> Returns the contents of the Mass Separator Operational
Status Register event word (range 0-32767).
Is cleared after read.
:CONDition? Response: <0-32767> Returns the contents of the Mass Separator Operational
Status Register condition word (range 0-32767).
:ENABle <0-32767> Sets the Mass Separator Operational Status Register event
enable mask.
:ENABle? Response: <0-32767> Retrieves the Mass Separator Operational Status Register
event enable mask (range 0-32767).
:NTRansition <0-32767> Sets the Mass Separator Operational Status Register
negative transition mask.
:NTRansition? Response: <0-32767> Retrieves the Mass Separator Operational Status Register
negative transition mask (range 0-32767).
:PTRansition <0-32767> Sets the Mass Separator Operational Status Register
positive transition mask.
:PTRansition? Response: <0-32767> Retrieves the Mass Separator Operational Status Register
positive transition mask (range 0-32767).
:DETector
[:EVENt]? Response: <0-32767> Returns the contents of the Detector Operational Status
Register event word (range 0-32767).
Is cleared after read.
:CONDition? Response: <0-32767> Returns the contents of the Detector Operational Status
Register condition word (range 0-32767).
:ENABle <0-32767> Sets the Detector Operational Status Register event
enable mask.
:ENABle? Response: <0-32767> Retrieves the Detector Operational Status Register event
enable mask (range 0-32767).
Table 9-14 Status Commands
Keyword Parameter Format/
Response Format Comments

9 835 VQM® Command Set
243
Series 835 Vacuum Quality Monitor
Instruction Manual - 835000
:NTRansition <0-32767> Sets the Detector Operational Status Register negative
transition mask.
:NTRansition? Response: <0-32767> Retrieves the Detector Operational Status Register
negative transition mask (range 0-32767).
:PTRansition <0-32767> Sets the Detector Operational Status Register positive
transition mask.
:PTRansition? Response: <0-32767> Retrieves the Detector Operational Status Register
positive transition mask (range 0-32767).
:ETPRessure
[:EVENt]? Response: <0-32767> Returns the contents of the External Total Pressure
Module Operational Status Register event word (range
0-32767).
Is cleared after read.
:CONDition? Response: <0-32767> Returns the contents of the External Total Pressure
Module Operational Status Register condition word
(range 0-32767).
:ENABle <0-32767> Sets the External Total Pressure Module Operational
Status Register event enable mask (range 0-32767).
:ENABle? Response: <0-32767> Retrieves the External Total Pressure Module Operational
Status Register event enable mask (range 0-32767).
:NTRansition <0-32767> Sets the External Total Pressure Module Operational
Status Register negative transition mask.
:NTRansition? Response: <0-32767> Retrieves the External Total Pressure Module Operational
Status Register negative transition mask (range 0-32767).
:PTRansition <0-32767> Sets the External Total Pressure Module Operational
Status Register positive transition mask.
:PTRansition? Response: <0-32767> Retrieves the External Total Pressure Module Operational
Status Register positive transition mask (range 0-32767).
:ESIGnal
[:EVENt]? Response: <0-32767> Returns the contents of the External Signaling
Operational Status Register event word (range 0-32767).
Is cleared after read.
:CONDition? Response: <0-32767> Returns the contents of the External Signaling
Operational Status Register condition word (range
0-32767).
:ENABle <0-32767> Sets the External Signaling Operational Status Register
event enable mask.
:ENABle? Response: <0-32767> Retrieves the External Signaling Operational Status
Register event enable mask (range 0-32767).
:NTRansition <0-32767> Sets the External Signaling Operational Status Register
negative transition mask.
:NTRansition? Response: <0-32767> Retrieves the External Signaling Operational Status
Register negative transition mask (range 0-32767).
:PTRansition <0-32767> Sets the External Signaling Operational Status Register
positive transition mask.
Table 9-14 Status Commands
Keyword Parameter Format/
Response Format Comments

9 835 VQM® Command Set
244 Series 835 Vacuum Quality Monitor
Instruction Manual - 835000
:PTRansition? Response: <0-32767> Retrieves the External Signaling Operational Status
Register positive transition mask (range 0-32767).
:QUEStionable
[:EVENt]? Response: <0-32767> Returns the contents of the Questionable Status Register
event word (range 0-32767).
Is cleared after read.
:CONDition? Response: <0-32767> Returns the contents of the Questionable Status Register
condition word (range 0-32767).
:ENABle <0-32767> Sets the Questionable Status register event enable mask.
:ENABle? Response: <0-32767> Retrieves the Questionable Status register event enable
mask (range 0-32767).
:NTRansition <0-32767> Sets the Questionable Status register negative transition
mask.
:NTRansition? Response: <0-32767> Retrieves the Questionable Status register negative
transition mask (range 0-32767).
:PTRansition <0-32767> Sets the Questionable Status register positive transition
mask.
:PTRansition? Response: <0-32767> Retrieves the Questionable Status register positive
transition mask (range 0-32767).
:CALibration
[:EVENt]? Response: <0-32767> Returns the contents of the Questionable Calibration
Status Register event word (range 0-32767).
Is cleared after read.
:CONDition? Response: <0-32767> Returns the contents of the Questionable Calibration
Status Register condition word (range 0-32767).
:ENABle <0-32767> Sets the Instrument Questionable Calibration Status
Register event enable mask.
:ENABle? Response: <0-32767> Retrieves the Questionable Calibration Status Register
event enable mask (range 0-32767).
:NTRansition <0-32767> Sets the Questionable Calibration Status Register negative
transition mask.
:NTRansition? Response: <0-32767> Retrieves the Questionable Calibration Status Register
negative transition mask (range 0-32767).
:PTRansition <0-32767> Sets the Questionable Calibration Status Register positive
transition mask.
:PTRansition? Response: <0-32767> Retrieves the Questionable Calibration Status Register
positive transition mask (range 0-32767).
:CONTroller
[:EVENt]? Response: <0-32767> Returns the contents of the Questionable Controller
Status Register event word (range 0-32767).
Is cleared after read.
:CONDition? Response: <0-32767> Returns the contents of the Questionable Controller
Status Register condition word (range 0-32767).
:ENABle <0-32767> Sets the Instrument Questionable Controller Status
Register event enable mask.
Table 9-14 Status Commands
Keyword Parameter Format/
Response Format Comments

9 835 VQM® Command Set
245
Series 835 Vacuum Quality Monitor
Instruction Manual - 835000
:ENABle? Response: <0-32767> Retrieves the Questionable Controller Status Register
event enable mask (range 0 3276
:NTRansition <0-32767> Sets the Questionable Controller Status Register negative
transition mask.
:NTRansition? Response: <0-32767> Retrieves the Questionable Controller Status Register
negative transition mask (range 0-32767).
:PTRansition <0-32767> Sets the Questionable Controller Status Register positive
transition mask.
:PTRansition? Response: <0-32767> Retrieves the Questionable Controller Status Register
positive transition mask (range 0-32767).
:FREQuency
[:EVENt]? Response: <0-32767> Returns the contents of the Questionable Frequency
Status Register event word (range 0-32767).
Is cleared after read.
:CONDition? Response: <0-32767> Returns the contents of the Questionable Frequency
Status Register condition word (range 0-32767).
:ENABle <0-32767> Sets the Instrument Questionable Frequency Status
Register event enable mask.
:ENABle? Response: <0-32767> Retrieves the Questionable Frequency Status Register
event enable mask (range 0-32767).
:NTRansition <0-32767> Sets the Questionable Frequency Status Reg-ister negative
transition mask.
:NTRansition? Response: <0-32767> Retrieves the Questionable Frequency Status Register
negative transition mask (range 0-32767).
:PTRansition <0-32767> Sets the Questionable Frequency Status Reg-ister positive
transition mask.
:PTRansition? Response: <0-32767> Retrieves the Questionable Frequency Status Register
positive transition mask (range 0-32767).
:INSTrument
[:EVENt]? Response: <0-32767> Returns the contents of the Instrument Questionable
Status Register event word (range 0-32767).
Is cleared after read.
:CONDition? Response: <0-32767> Returns the contents of the Instrument Questionable
Status Register condition word (range 0-32767).
:ENABle <0-32767> Sets the Instrument Questionable Status Register event
enable mask.
:ENABle? Response: <0-32767> Retrieves the Instrument Questionable Status Register
event enable mask (range 0-32767).
:NTRansition <0-32767> Sets the Instrument Questionable Status Register negative
transition mask.
:NTRansition? Response: <0-32767> Retrieves the Instrument Questionable Status Register
negative transition mask (range 0-32767).
:PTRansition <0-32767> Sets the Instrument Questionable Status Register positive
transition mask.
:PTRansition? Response: <0-32767> Retrieves the Instrument Questionable Status Register
positive transition mask (range 0-32767).
Table 9-14 Status Commands
Keyword Parameter Format/
Response Format Comments

9 835 VQM® Command Set
246 Series 835 Vacuum Quality Monitor
Instruction Manual - 835000
:IONizer
[:EVENt]? Response: <0-32767> Returns the contents of the Ionizer Questionable Status
Register event word (range 0-32767).
Is cleared after read.
:CONDition? Response: <0-32767> Returns the contents of the Ionizer Questionable Status
Register condition word (range 0-32767).
:ENABle <0-32767> Sets the Ionizer Questionable Status Register event
enable mask.
:ENABle? Response: <0-32767> Retrieves the Ionizer Questionable Status Register event
enable mask (range 0-32767).
:NTRansition <0-32767> Sets the Ionizer Questionable Status Register negative
transition mask.
:NTRansition? Response: <0-32767> Retrieves the Ionizer Questionable Status Register
negative transition mask (range 0-32767).
:PTRansition <0-32767> Sets the Ionizer Questionable Status Register positive
transition mask.
:PTRansition? Response: <0-32767> Retrieves the Ionizer Questionable Status Register
positive transition mask (range 0-32767).
:MSEParator
[:EVENt]? Response: <0-32767> Returns the contents of the Mass Separator Questionable
Status Register event word (range 0-32767).
Is cleared after read.
:CONDition? Response: <0-32767> Returns the contents of the Mass Separator Questionable
Status Register condition word (range 0-32767).
:ENABle <0-32767> Sets the Mass Separator Questionable Status Register
event enable mask.
:ENABle? Response: <0-32767> Retrieves the Mass Separator Questionable Status Register
event enable mask (range 0-32767).
:NTRansition <0-32767> Sets the Mass Separator Questionable Status Register
negative transition mask.
:NTRansition? Response: <0-32767> Retrieves the Mass Separator Questionable Status Register
negative transition mask (range 0-32767).
:PTRansition <0-32767> Sets the Mass Separator Questionable Status Register
positive transition mask.
:PTRansition? Response: <0-32767> Retrieves the Mass Separator Questionable Status Register
positive transition mask (range 0-32767).
:DETector
[:EVENt]? Response: <0-32767> Returns the contents of the Detector Questionable Status
Register event word (range 0-32767).
Is cleared after read.
:CONDition? Response: <0-32767> Returns the contents of the Detector Questionable Status
Register condition word (range 0-32767).
:ENABle <0-32767> Sets the Detector Questionable Status Register event
enable mask.
:ENABle? Response: <0-32767> Retrieves the Detector Questionable Status Register event
enable mask (range 0 3276
Table 9-14 Status Commands
Keyword Parameter Format/
Response Format Comments

9 835 VQM® Command Set
247
Series 835 Vacuum Quality Monitor
Instruction Manual - 835000
:NTRansition <0-32767> Sets the Detector Questionable Status Register negative
transition mask.
:NTRansition? Response: <0-32767> Retrieves the Detector Questionable Status Register
negative transition mask (range 0-32767).
:PTRansition <0-32767> Sets the Detector Questionable Status Register positive
transition mask.
:PTRansition? Response: <0-32767> Retrieves the Detector Questionable Status Register
positive transition mask (range 0-32767).
:ETPRessure1
[:EVENt]? Response: <0-32767> Returns the contents of the External Total Pressure
Module Questionable Status Register 1 event word (range
0-32767).
Is cleared after read.
:CONDition? Response: <0-32767> Returns the contents of the External Total Pressure
Module Questionable Status Register 1 condition word
(range 0-32767).
:ENABle <0-32767> Sets the External Total Pressure Module Questionable
Status Register 1 event enable mask.
:ENABle? Response: <0-32767> Retrieves the External Total Pressure Module Questionable
Status Register 1 event enable mask (range 0-32767).
:NTRansition <0-32767> Sets the External Total Pressure Module Questionable
Status Register 1 negative transition mask.
:NTRansition? Response: <0-32767> Retrieves the External Total Pressure Module
Questionable Status Register 1 negative transition mask
(range 0-32767).
:PTRansition <0-32767> Sets the External Total Pressure Module Questionable
Status Register 1 positive transition mask.
:PTRansition? Response: <0-32767> Retrieves the External Total Pressure Module
Questionable Status Register 1 positive transition mask
(range 0-32767).
:ETPRessure2
[:EVENt]? Response: <0-32767> Returns the contents of the External Total Pressure
Module Questionable Status Register 2 event word (range
0-32767).
Is cleared after read.
:CONDition? Response: <0-32767> Returns the contents of the External Total Pressure
Module Questionable Status Register 2 condition word
(range 0-32767).
:ENABle <0-32767> Sets the External Total Pressure Module Questionable
Status Register 2 event enable mask.
:ENABle? Response: <0-32767> Retrieves the External Total Pressure Module
Questionable Status Register 2 event enable mask (range
0-32767).
:NTRansition <0-32767> Sets the External Total Pressure Module Questionable
Status Register 2 negative transition mask.
Table 9-14 Status Commands
Keyword Parameter Format/
Response Format Comments

9 835 VQM® Command Set
248 Series 835 Vacuum Quality Monitor
Instruction Manual - 835000
:NTRansition? Response: <0-32767> Retrieves the External Total Pressure Module
Questionable Status Register 2 negative transition mask
(range 0-32767).
:PTRansition <0-32767> Sets the External Total Pressure Module Questionable
Status Register 2 positive transition mask.
:PTRansition? Response: <0-32767> Retrieves the External Total Pressure Module
Questionable Status Register 2 positive transition mask
(range 0-32767).
:ETPRessure3
[:EVENt]? Response: <0-32767> Returns the contents of the External Total Pressure
Module Questionable Status Register 3 event word (range
0-32767).
Is cleared after read.
:CONDition? Response: <0-32767> Returns the contents of the External Total Pressure
Module Questionable Status Register 3 condition word
(range 0-32767).
:ENABle <0-32767> Sets the External Total Pressure Module Questionable
Status Register 3 event enable mask.
:ENABle? Response: <0-32767> Retrieves the External Total Pressure Module
Questionable Status Register 3 event enable mask (range
0-32767).
:NTRansition <0-32767> Sets the External Total Pressure Module Questionable
Status Register 3 negative transition mask.
:NTRansition? Response: <0-32767> Retrieves the External Total Pressure Module
Questionable Status Register 3 negative transition mask
(range 0-32767).
:PTRansition <0-32767> Sets the External Total Pressure Module Questionable
Status Register 3 positive transition mask.
:PTRansition? Response: <0-32767> Retrieves the External Total Pressure Module
Questionable Status Register 3 positive transition mask
(range 0-32767).
:ESIGnal
[:EVENt]? Response: <0-32767> Returns the contents of the External Signaling Register
event word (range 0-32767).
Is cleared after read.
:CONDition? Response: <0-32767> Returns the contents of the External Signaling Register
condition word (range 0-32767).
:ENABle <0-32767> Sets the External Signaling Register event enable mask.
:ENABle? Response: <0-32767> Retrieves the External Signaling Register event enable
mask (range 0-32767).
:NTRansition <0-32767> Sets the External Signaling Register negative transition
mask.
:NTRansition? Response: <0-32767> Retrieves the External Signaling Register negative
transition mask (range 0-32767).
:PTRansition <0-32767> Sets the External Signaling Register positive transition
mask.
Table 9-14 Status Commands
Keyword Parameter Format/
Response Format Comments

9 835 VQM® Command Set
249
Series 835 Vacuum Quality Monitor
Instruction Manual - 835000
:PTRansition? Response: <0-32767> Retrieves the External Signaling Register positive
transition mask (range 0-32767).
:POWer
[:EVENt]? Response: <0-32767> Returns the contents of the Questionable Power Status
Register event word (range 0-32767).
Is cleared after read.
:CONDition? Response: <0-32767> Returns the contents of the Questionable Power Status
Register condition word (range 0-32767).
:ENABle <0-32767> Sets the Instrument Questionable Power Status Register
event enable mask.
:ENABle? Response: <0-32767> Retrieves the Questionable Power Status Register event
enable mask (range 0-32767).
:NTRansition <0-32767> Sets the Questionable Power Status Register negative
transition mask.
:NTRansition? Response: <0-32767> Retrieves the Questionable Power Status Register
negative transition mask (range 0-32767).
:PTRansition <0-32767> Sets the Questionable Power Status Register positive
transition mask.
:PTRansition? Response: <0-32767> Retrieves the Questionable Power Status Register positive
transition mask (range 0-32767).
:TEMPerature
[:EVENt]? Response: <0-32767> Returns the contents of the Questionable Temperature
Status Register event word (range 0-32767).
Is cleared after read.
:CONDition? Response: <0-32767> Returns the contents of the Questionable Temperature
Status Register condition word (range 0-32767).
:ENABle <0-32767> Sets the Instrument Questionable Temperature Status
Register event enable mask.
:ENABle? Response: <0-32767> Retrieves the Questionable Temperature Status Register
event enable mask (range 0-32767).
:NTRansition <0-32767> Sets the Questionable Temperature Status Register
negative transition mask.
:NTRansition? Response: <0-32767> Retrieves the Questionable Temperature Status Register
negative transition mask (range 0-32767).
:PTRansition <0-32767> Sets the Questionable Temperature Status Register
positive transition mask
:PTRansition? Response: <0-32767> Retrieves the Questionable Temperature Status Register
positive transition mask (range 0-32767).
:VOLTage
[:EVENt]? Response: <0-32767> Returns the contents of the Questionable Voltage Status
Register event word (range 0-32767).
Is cleared after read.
:CONDition? Response: <0-32767> Returns the contents of the Questionable Voltage Status
Register condition word (range 0-32767).
:ENABle <0-32767> Sets the Instrument Questionable Voltage Status Register
event enable mask.
Table 9-14 Status Commands
Keyword Parameter Format/
Response Format Comments
9 835 VQM® Command Set
250 Series 835 Vacuum Quality Monitor
Instruction Manual - 835000
9.3.13 SYSTem Subsystem
The System commands report errors, set and get date and time, and perform system resets.
:ENABle? Response: <0-32767> Retrieves the Questionable Voltage Status Register event
enable mask (range 0-32767).
:NTRansition <0-32767> Sets the Questionable Voltage Status Register negative
transition mask.
:NTRansition? Response: <0-32767> Retrieves the Questionable Voltage Status Register
negative transition mask (range 0-32767).
:PTRansition <0-32767> Sets the Questionable Voltage Status Register positive
transition mask.
:PTRansition? Response: <0-32767> Retrieves the Questionable Voltage Status Register
positive transition mask (range 0-32767).
:PRESet Response: <0-32767> Sets registers per §20.2 of the SCPI-99 specification, with
the exception that the Enable mask for all registers is set
to 7FFFh.
Each register field is assigned as follows:
All status register values are set to the following:
Enable mask7FFFh
PTR mask7FFFh
NTR mask0000h
The Event Status Register and the Status Byte are not
affected.
Table 9-15 System Commands
Keyword Parameter Format/ Response Format Comments
SYSTem
:COMMunicate
:SERial
:ACOMmand? <address>,<command string>
where address is an integer, and
command string is a 390 command.
Response: <quoted string>
Sends an arbitrary command to the RS485 bus. This
command expects a response within 500ms.
Input: RS-485 address and command string.
Output: response string.
:DATe <year>,<month>,<day>
<year> must be 1970-2099
<month> must be 1-12
<day> must be 1-31
Sets the system date. <year> must be 1970-2099,
<month> must be 1-12, <day> must be 1-31. A
non-existent day in a month will roll over to the next
month. For example, if <month> is set to 2 and
<day> is set to 31, the resulting date will be set to
March 3. (Non leap year example shown)
:DATe? Response:
<year>,<month>,<day>
Retrieves the system date in
<hour>,<minute>,<second> format.
:ERRor
[:NEXT]? Response: <unquoted string> Retrieve and clear the next error in the queue.
If no error is present, then 0, "No error" is reported.
Table 9-14 Status Commands
Keyword Parameter Format/
Response Format Comments

9 835 VQM® Command Set
251
Series 835 Vacuum Quality Monitor
Instruction Manual - 835000
9.3.14 TEST Subsystem
This subsystem provides commands for self-test.
:ALL? Response: <unquoted string> Retrieve a comma-delimited list of events, and clear
all the events in the queue.
If no error is present, then 0, "No error" is reported.
:COUNt? Response: <integer > Retrieves the number of events in the Event Queue.
:LOG? Response: <System log information> Dumps various system information.
:RESet [APPLication | BOOTloader] Resets the Controller (via MCU reset). The
subsequent power-on reset depends on the parmeter:
APPLication - Boot normally.
BOOTloader - Reset into bootloader.
:TIMe <hour>,<minute>,<second>
<hour> must be 0-23
<minute> must be 0-59
<second> must be 0-59.
Sets the system time.
:TIMe? Response: <hour>,<minute>,<sec> Retrieves the system time in
<hour>,<minute>,<second> format.
:UPTime? Response: <integer> Retrieves the number of seconds elapsed since the
last power-on, or power-on reset.
:VERSion? Response: <unquoted string> Queries the version of the SCPI specification the
instrument conforms to (ex: 1999.0).
Table 9-16 Test Commands
Keyword Parameter Format/ Response Format Comments
TEST
[:SAFe]? Response:
Test results, in columns
Columns are:
Test Name
Lower Limit
Actual
Upper Limit
Time (ms)
Status
Runs the same test that is run during Power-On Self
Test (POST) and returns a test report. The test is done
at safe voltages.
:FULL
[:RUN]? Response:
Test results, in columns
Columns are:
Test Name
Lower Limit
Actual
Upper Limit
Time (ms)
Status
Runs a full self-test at unsafe voltages and returns a
test report. The test will not run if a Filament is
detected.
:UNLock? Response: <unquoted string> Unlocks "TEST:FULL?" command and returns a
disclaimer.
Table 9-15 System Commands
Keyword Parameter Format/ Response Format Comments
9 835 VQM® Command Set
252 Series 835 Vacuum Quality Monitor
Instruction Manual - 835000
9.4 Test Report
The test report consists of a Line Feed comma- delimited list of tested systems or channels. Each
element indicates the test name, the acceptable values, the measured value, the test duration, and a
status indicating if the element passed, failed, or was not tested.
Example Test Report:
NOTE: The elements in Table 9−17 are shown in table format for clarity. However, the
actual format is a comma deliminated string.
<LF> indicates a Line Feed character (ASCII 10, 0Ah). <CR> indicates a Carriage Return character
(ASCII 13, 0Dh).
:LOCK Locks "TEST:FULL?" command.
:POST[:ENABle] <boolean> Sets the enable state of POST.
1 (ON) - POST is run at startup.
0 (OFF) - POST is not run at startup.
:POST? Response: 0 or 1 Queries the enable state of POST.
1 - POST is run at startup.
0 - POST is not run at startup.
:REPort? Response:
Test results, in columns
Columns are:
Test Name
Lower Limit
Actual
Upper Limit
Time (ms)
Status
Returns a full self-test report from the last-run
self-tests. This command does not actually run a
self-test.
Table 9-17 Test Report
Test Name Lower Limit Actual Upper Limit Time (ms) Status
<LF>
Entry Plate Min. (V) +1.10699E+02 +1.11948E+02 +1.35300E+02 00200 PASS<LF>
Entry Plate Max. (V) +1.37699E+02 +1.50357E+02 +1.68300E+02 00050 PASS<LF>
Pressure Plate Min. (V) +4.16500E+01 +4.69393E+01 +5.63499E+01 00000 PASS<LF>
Pressure Plate Max. (V) +1.24949E+02 +1.29682E+02 +1.69050E+02 00100 PASS<LF>
Cups Min. (V) +1.20000E+01 +1.52962E+01 +1.80000E+01 00000 PASS<LF>
Cups Max. (V) +6.80000E+01 +7.89606E+01 +1.02000E+02 00200 PASS<LF>
Exit Plate Min. (V) +6.12000E+01 +6.79086E+01 +7.48000E+01 00000 PASS<LF>
Exit Plate Max. (V) +1.38600E+02 +1.45356E+02 +1.69399E+02 00100 PASS<LF>
Elect. Mult. Shield Min. (V) +2.16000E+01 +2.75668E+01 +3.24000E+01 00000 PASS<LF>
Elect. Mult. Shield Max. (V) +1.17599E+02 +1.41238E+02 +1.76399E+02 00150 PASS<LF>
Emission Current Min. (A) +1.58387E-04 +2.25622E-04 +2.63979E-04 01450 PASS<LF>
Emission Current Max. (A) +2.59351E-04 +3.22005E-04 +4.32252E-04 01400 PASS<LF>
Electrometer Min. (A) +3.00000E-01 +4.94384E-01 +7.00000E-01 00500 PASS<LF>
Table 9-16 Test Commands
Keyword Parameter Format/ Response Format Comments
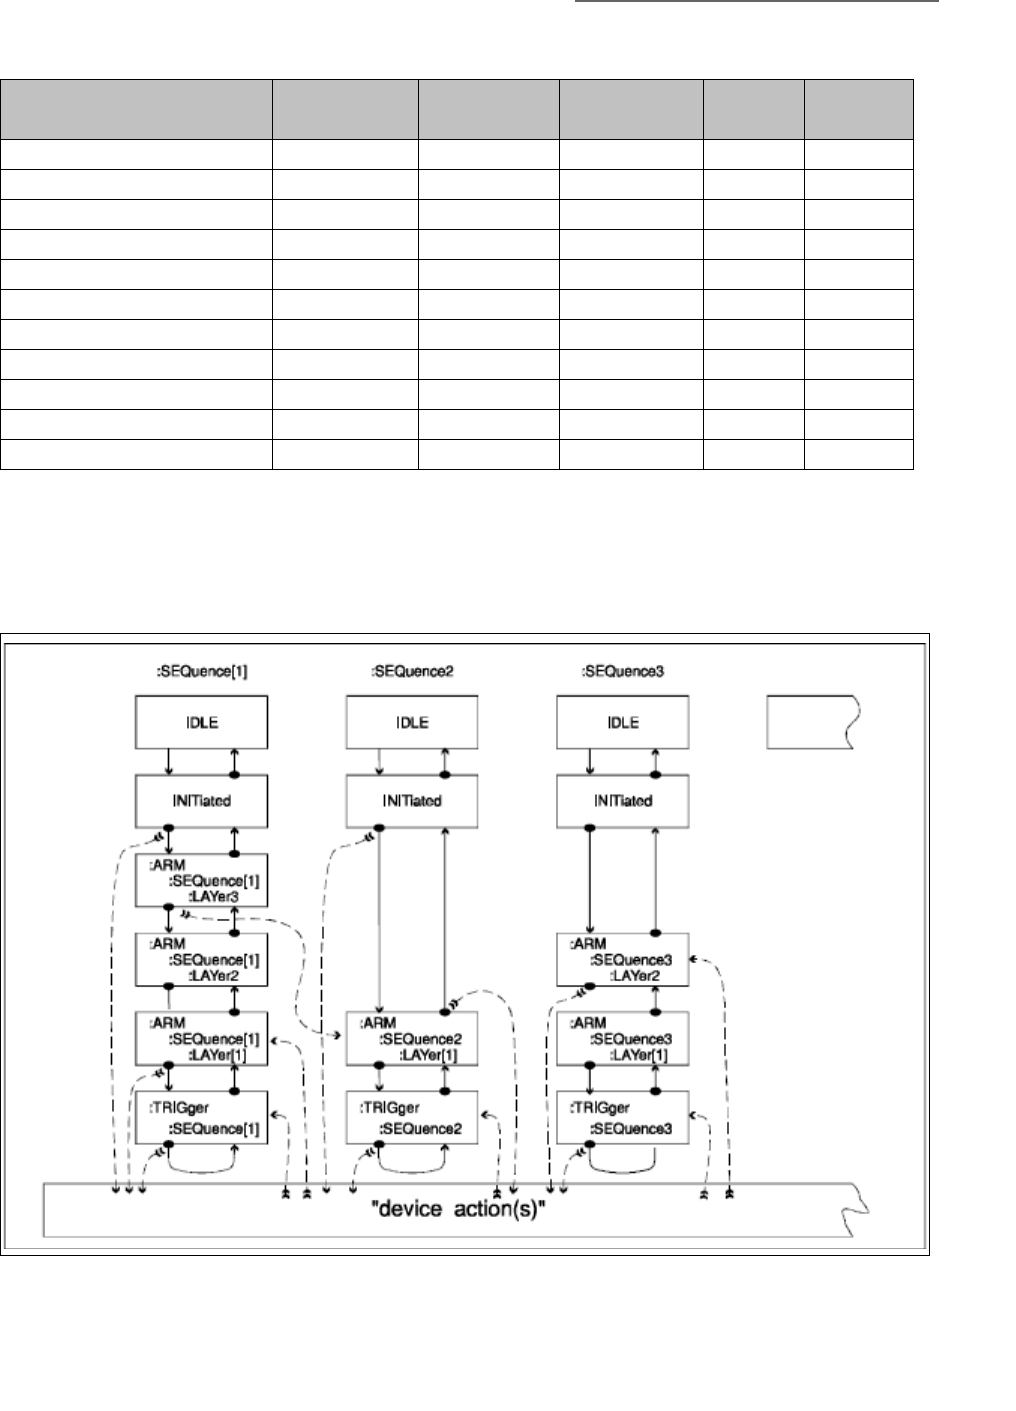
9 835 VQM® Command Set
253
Series 835 Vacuum Quality Monitor
Instruction Manual - 835000
9.4.1 TRIGger Subsystem
This subsystem controls input/output triggering on the 835 VQM Controller. Commands are only
defined for the Mass Spec (MSP) logical instrument, and for pressure measurements.
Electrometer Max. (A) +1.92000E+00 +2.40673E+00 +2.88000E+00 00050 PASS<LF>
Digital Input/Output Min. (TTL) +0.00000E+00 +0.00000E+00 +0.00000E+00 00050 PASS<LF>
Digital Input/Output Max. (TTL) +1.00000E+00 +1.00000E+00 +1.00000E+00 00500 PASS<LF>
Analog Input/Output Min. (V) +8.00000E-01 +9.88134E-01 +1.20000E+00 00500 PASS<LF>
Analog Input/Output Max. (V) +3.20000E+00 +3.99435E+00 +4.80000E+00 00050 PASS<LF>
Transition Plate Min. (V) -1.10000E+03 -1.04824E+03 -9.00000E+02 00050 PASS<LF>
Transition Plate Max. (V) -5.50000E+02 -4.85852E+02 -4.50000E+02 00050 PASS<LF>
Repeller Min. (V) -7.20000E+01 -4.81647E+01 -4.80000E+01 00900 PASS<LF>
Repeller Max. (V) -6.00000E+00 -5.97418E+00 -4.00000E+00 04300 PASS<LF>
Electron Multiplier Min. (V) -1.65000E+03 -1.57323E+03 -1.35000E+03 00050 PASS<LF>
Electron Multiplier Max. (V) -5.50000E+02 -4.73045E+02 -4.50000E+02 00050 PASS<CR>
Figure 9-2 "Expanded Capability" Trigger Model
Table 9-17 Test Report
Test Name Lower Limit Actual Upper Limit Time (ms) Status
<LF>
9 835 VQM® Command Set
254 Series 835 Vacuum Quality Monitor
Instruction Manual - 835000
9.4.2 Reset State
The "*RST" command returns all parameters to known values. Values not preserved in NVRAM are
returned to the below-stated default values. Values that are preserved in NVRAM are returned to the
values stored in profile k, where k is the Startup Profile ID (set via the MEM:PROFILE command).
To restore values to Factory Defaults, use the MEM:LOAD FACTory command. Note that the
MEM:LOAD FACTory command will not modify values indicated in Table 9-19 as "profile-k
restored" commands.
Table 9-18 Trigger Commands
Keyword Parameter Format/
Response Format Comments
ABORt Reset trigger system and places all trigger
sequences in the IDLE state.
INITiate
[:IMMediate][:ALL] Immediately initiate the trigger system for all
sequences.
:CONTinuous[:ALL] <boolean> Sets the trigger system to continuously initiate
for all sequences.
1 (ON) - Continuous enabled
0 (OFF) - Continuous disabled
:CONTinuous[:ALL]? Response: 0 or 1 Responds with "0" (OFF) or "1" (ON).
TRIGger
[:SEQuence][:IMMediate] Trigger the sequence immediately
[:SEQuence]:OCOunter? Response: <integer> Overtrigger counter. Indicates number of times
an external trigger was detected in the
overtrigger period.
Cleared after read.
[:SEQuence]:SOURce IMMediate | EXTernal Defined only for the Mass Spectrometer (MSP)
logical instrument.
Sets the Mass Spectrometer trigger source
mode.
[:SEQuence]:SOURce? Response: <unquoted string> Defined only for the Mass Spectrometer (MSP)
logical instrument.
Retrieves the Mass Spectrometer trigger source
mode.
Responds with "IMMediate"or "EXTernal"
Table 9-19 Reset State of Parameters
Parameter Reset Value
Startup Profile ID Unchanged
Current Logical INSTrument MSP
Diagnostic Mode Locked
Manufacturing Mode Locked
OUTPut instrument state (all) Off
Mass Spec Source Mode (norm/stby) Normal

9 835 VQM® Command Set
255
Series 835 Vacuum Quality Monitor
Instruction Manual - 835000
9.4.3 Error/Event Codes
Error codes exist in [-32768"..."32767]. Negative numbers are defined by the "SCPI Specification";
positive numbers are instrument-dependent. Zero is reserved as a "No error" value.
The instrument returns
Filament Power Value previously saved in profile k, where k is the startup profile id.
Filament Source Mode (adj/fixed) Adjustable
Filament Bias Voltage Value previously saved in profile k, where k is the startup profile id.
Emission Current Value previously saved in profile k, where k is the startup profile id.
Repeller Voltage Value previously saved in profile k, where k is the startup profile id.
Entry Plate Voltage Value previously saved in profile k, where k is the startup profile id.
Pressure Plate Voltage Value previously saved in profile k, where k is the startup profile id.
Entry Plate Voltage Value previously saved in profile k, where k is the startup profile id.
Cups Voltage Value previously saved in profile k, where k is the startup profile id.
Transition Plate Voltage Value previously saved in profile k, where k is the startup profile id.
Exit Plate Voltage Value previously saved in profile k, where k is the startup profile id.
Electron Muliplier Shield Voltage Value previously saved in profile k, where k is the startup profile id.
Electron Mulitplier Voltage Value previously saved in profile k, where k is the startup profile id.
DDS Reference Voltage Value previously saved in profile k, where k is the startup profile id.
Electron Multiplier Electrometer Gain Value previously saved in profile k, where k is the startup profile id.
Electron Multiplier Electrometer Offset Value previously saved in profile k, where k is the startup profile id.
Mass Calibration Factor Value previously saved in profile k, where k is the startup profile id.
AMU range (lower and upper) Value previously saved in profile k, where k is the startup profile id.
External Total Pressure Units Value previously saved in profile k, where k is the startup profile id.
Status Register Event Masks (all) Value previously saved in profile k, where k is the startup profile id.
Status Register Positive Transition Masks (all) Value previously saved in profile k, where k is the startup profile id.
Status Register Negative Transition Masks (all) Value previously saved in profile k, where k is the startup profile id.
Trigger Source (immediate/external) Value previously saved in profile k, where k is the startup profile id.
Digital Output Mode (manual/triggered) Value previously saved in profile k, where k is the startup profile id.
Manual Mode Digital Output Level Value previously saved in profile k, where k is the startup profile id.
Digital In Device Value previously saved in profile k, where k is the startup profile id.
Digital Out Device Value previously saved in profile k, where k is the startup profile id.
Analog In Device Value previously saved in profile k, where k is the startup profile id.
Analog Out Device Value previously saved in profile k, where k is the startup profile id.
Format system for Data Interchange OFF,OFF
POST at startup Value previously saved in profile k, where k is the startup profile id.
Full Test Lock State Locked
System Date Unchanged
System Time Unchanged
Table 9-19 Reset State of Parameters
Parameter Reset Value

9 835 VQM® Command Set
256 Series 835 Vacuum Quality Monitor
Instruction Manual - 835000
<code>, "<error description>;<device-dependent Information>" when reporting errors/events.
The format of the "device-dependent Information" is:
<text of command>',<current logical instrument>,<timestamp>
If the error/event was not caused by a user-entered command (that is, an internal error/event), the
<text of command> field is an empty string. In addition, an empty event queue will yield an empty
<text of command> field
Example:
The current logical instrument is the MSP (Mass Spectrometer).
syst:err:all?
0,"No error;'',MSP,7/1/2011 9:20:33.145"
my bad command
syst:err:all?
-113,"Undefined header;'my bad command',MSP,7/1/2011 09:20:35.250"
Several command codes are meaningful to the developer, only (those with the description "Internal
error"). Internal errors should not normally occur, but if they do, the error code should be reported
to Granville-Phillips Customer Service.
Table 9-20 Error Codes
Error Code Error Description
0No Error
257 Internal error
258 Internal error
259 Internal error
260 Internal error
261 Internal error
262 Internal error
263 Internal error
264 Internal error
265 Internal error
266 Internal error
267 Internal error
268 Internal error
269 Internal error
270 Internal error
271 Internal error
513 Internal error
514 Command queue overflow
515 String too long or invalid
516 Internal error
517 Internal error
518 Illegal password

9 835 VQM® Command Set
257
Series 835 Vacuum Quality Monitor
Instruction Manual - 835000
519 Diagnostic mode not enabled
520 Manufacturing edit mode not enabled
521 Manufacturing edit mode currently enabled
522 Scanning enabled during diagnostic
523 Generic bad value
769 Invalid logical instrument
770 MSI parameter out-of-range
771 Invalid Filament Power Supply mode
772 Invalid Gauge mode
773 Electron Multiplier is ON
774 Filament Power Supply is ON
775 Filament is disconnected
776 Invalid instrument mode selected
777 Invalid output state
778 MS Gauge ON request at unsafe pressure
779 FIL Virtual Burn Limit reached
780 FIL Gauge/Load disconnected
781 FIL Gauge/Load connected
782 MS Gauge ON request with FIL Gauge/Load disconnected
783 Internal error
784 A scan is already in progress
785 Overtrigger event
786 Immediate/external mode command in non-idle state
787 Internal error
788 System is busy calibrating
789 MSI not ready to scan
790 Unable to control PID loop
1025 Extreme over-pressure detected
1026 Over-pressure detected
1027 RS-485 communications error
1028 External Total Pressure version error
1029 ETPR missing or cannot communicate
1030 Internal error
1031 Unable to initialize ETPR
1032 ETPR command is blacklisted
1033 ETPR command is locked
1034 ETPR command failed
1035 ETPR command had a syntax error
1036 ETPR command had a range error
1037 Malformed response from ETPR
Table 9-20 Error Codes
Error Code Error Description

9 835 VQM® Command Set
258 Series 835 Vacuum Quality Monitor
Instruction Manual - 835000
1038 ETPR is initializing
1039 ETPR Degas request while gauge ON
1040 Unknown ETPR command
1281 Invalid configuration version
1282 Configuration store error
1283 Configuration load error
1284 Bad CRC in config
1285 EEPROM limit error
1286 Invalid configuration profile id
1287 Bad EEPROM address
1288 Config init failed, defaults restored
1289 Internal error
1290 Illegal config value
1291 Illegal working attribute id
1292 Internal error
1293 Internal error
1294 Internal error
1295 Gauge on while attempting NVRAM read/write
1537 USB transmision error
1793 Event queue post failed
1794 Bad Event Status Register Enable mask
1795 Internal error
1796 Internal error
1797 Bad Status Register Enable mask
1798 Illegal status parameter
1799 Illegal status register id
1800 Internal error
1801 Lamptest try while mass spec on
2049 Internal error
2051 Internal error
2052 Internal error
2053 Internal error
2305 Internal error
2306 Internal error
2307 Internal error
2308 Internal error
2309 Internal error
2310 POST failed - run 'TEST:REPort?'
2311 Invalid GPIO pin
2312 Invalid A2D pin
Table 9-20 Error Codes
Error Code Error Description

9 835 VQM® Command Set
259
Series 835 Vacuum Quality Monitor
Instruction Manual - 835000
2313 Invalid PWM pin
2314 Internal error
2315 Internal error
2316 Internal error
2317 Internal error
2318 Internal error
2319 Internal error
2320 Internal error
2321 Internal error
2322 Internal error
2323 Internal error
2324 Internal error
2325 Internal error
2326 Internal error
2327 Internal error
2328 Internal error
2329 Internal error
2330 Internal error
2331 Internal error
2332 Internal error
2333 Internal error
2334 Internal error
2335 Internal error
2336 Internal error
2337 Internal error
2338 Internal error
2339 Internal error
2340 Internal error
2341 Internal error
2342 Internal error
2343 Internal error
2344 Internal error
2345 Internal error
2346 Internal error
2347 Internal error
2348 Internal error
2349 Internal error
2350 Internal error
2351 Internal error
2352 Internal error
Table 9-20 Error Codes
Error Code Error Description

9 835 VQM® Command Set
260 Series 835 Vacuum Quality Monitor
Instruction Manual - 835000
2353 Invalid RS485 address
2354 RS485 receive buffer overflow
2355 RS485 receive buffer overrun
2356 RS485 transmit timeout
2357 RS485 receive timeout
2358 Internal error
2359 Internal error
2360 Internal error
2361 Internal error
2362 Internal error
2363 Internal error
2364 Internal error
2365 Internal error
2366 Internal error
2367 Internal error
-100 Command error
-104 Data type error
-109 Missing parameter
-110 Command header error
-113 Undefined header
-115 Unexpected number of parameters
-120 Numeric data error
-140 Character data error
-200 Execution error
-203 Command protected
-210 Trigger error
-211 Trigger ignored
-212 Arm ignored
-213 Init ignored
-220 Parameter error
-221 Settings conflict
-222 Data out of range
-224 Illegal parameter value
-225 Out of memory
-230 Data corrupt or stale
-231 Data questionable
-232 Invalid format
-233 Invalid version
-240 Hardware error
-241 Hardware missing
Table 9-20 Error Codes
Error Code Error Description

9 835 VQM® Command Set
261
Series 835 Vacuum Quality Monitor
Instruction Manual - 835000
9.4.4 Data Interchange Format
The Data Interchange Format (DIF) is described in Volume 3 of the SCPI-99 specification. The DIF is
block-structured; the following major blocks are used for the 835:
• DIF identifies the expression as a <dif_expression> and contains the version of the standard
used to create the data set.
• IDENtify names the data set and describes the environment in which it was generated.
• DIMension specifies the structure and format of the data in the DATA block.
• DATa contains the actual data.
Data blocks and sub-blocks are separated by parentheses, commas, equal signs, and white space
characters. To improve readability the example below contains a white space character after each
line. A white space character does not follow an open parenthesis on a new line or a comma on a
new line.
Within each block are sub-blocks that contain more information about the data. The following are
examples of a sample data set ("<LF>" is used to represent "Line Feed", "<CR>" is used to represent
"Carriage Return"):
<Date> YYYY,MM,DD Y=4 digit year, M=2 digit month, D=2 digit day
<Time> HH,MM,SS.XXX H=2 digit hour, M=2 digit minute, S=2 digit second. X=3
digit millisecond
<String> The length of the string will always match what is in the
DIF header example
<HEX8> #H00 8 bit hexadecimal value
<HEX16> #H0000 16 bit hexadecimal value
<HEX32> #H00000000 32 bit hexadecimal value
<NR3> {+|-}n.mmmmmE{+|-}ee Always + or - followed by 1 digit, a '.', and then 5 digits
then E and then + or - followed by 2 digits
<Block1> #Nxxxxx <data bytes> # then one digit describing the length of the string that
represents the number of bytes to transfer to the host
followed by a space separating all the remaining data
bytes. Block1 data contains byte swapped 16 bit values
from the analog to digital converter. #517312 is
interpreted as #5 says that the next 5 characters
represents the decimal number of bytes that will follow
separated by white space.
<Block2> #Nxxxxx <data bytes> Same format as Block1 except the data represents a 32
bit value floating point number corresponding to each
atomic mass unit from the scan region selected.
-330 Self-test failed
-340 Calibration failed
-350 Queue overflow
Table 9-20 Error Codes
Error Code Error Description

9 835 VQM® Command Set
262 Series 835 Vacuum Quality Monitor
Instruction Manual - 835000
Table 9-21 Header Descriptions and Data
Header Description Header Data Format
(DIF (DIF
(VERSion 1999.0) (VERSion 1999.0)
IDENtify ( IDENtify (
DATE yyyy,mm,dd DATE 2010,02,05 <Date>
TIME hh,mm,ss.xxx TIME 14,22,29.585 <Time>
UUT ( UUT (
ID ID
"<serial number>" "835P0000" <String>
DESign DESign
"<Hardware revision>,<Firmware rev>" "0A,01.001.00782" <String>
))
REGisters ( REGisters (
VALues VALues
<STB>, #H00, <HEX8>
<SESR>, #H00, <HEX8>
<STATus QUEStionable CONTroller>, #H0000, <HEX16>
<STATus OPERational CONTroller>, #H0000, <HEX16>
<STATus QUEStionable INSTrument
IONizer>,
#H0000, <HEX16>
<STATus OPERational INSTrument IONizer>, #H0000, <HEX16>
<STATus QUEStionable INSTrument
MSEParator>,
#H0000, <HEX16>
<STATus OPERational INSTrument
MSEParator>,
#H0000, <HEX16>
<STATus QUEStionable INSTrument
DETector>,
#H0000, <HEX16>
<STATus OPERational INSTrument
DETector>,
#H0000, <HEX16>
<STATus QUEStionable INSTrument
ESIGnal>,
#H0000, <HEX16>
<STATus OPERational INSTrument ESIGnal>, #H0000, <HEX16>
<STATus QUEStionable INSTrument
ETPRessure1>,
#H0000, <HEX16>
<STATus QUEStionable INSTrument
ETPRessure2>,
#H0000, <HEX16>
<STATus QUEStionable INSTrument
ETPRessure3>,
#H0000, <HEX16>
<STATus OPERational INSTrument
ETPRessure>
#H0000 <HEX16>

9 835 VQM® Command Set
263
Series 835 Vacuum Quality Monitor
Instruction Manual - 835000
))
DIMension=INSTrument (TYPE EXPLicit UNITs "") DIMension=INSTrument (TYPE EXPLicit UNITs "")
DATA ( DATA (
MEASurement=TSETtings ( MEASurement=TSETtings (
VALues VALues
<Repeller voltage>, +0.00000E+00, <NR3>
<filament emission current>, +0.00000E+00, <NR3>
<filament bias voltage>, +0.00000E+00, <NR3>
<filament power>, +0.00000E+00, <NR3>
<entry plate voltage>, +0.00000E+00, <NR3>
<pressure plate voltage>, +0.00000E+00, <NR3>
<cups voltage>, +0.00000E+00, <NR3>
<transition plate voltage>, +0.00000E+00, <NR3>
<exit plate voltage>, +0.00000E+00, <NR3>
<DDS amplitude> +0.00000E+00, <NR3>
<electron multiplier shield voltage>, +0.00000E+00, <NR3>
<electron multiplier voltage>, +0.00000E+00, <NR3>
<electron mult. electrometer gain>, +0.00000E+00, <NR3>
<electron mult. electrometer offset> +0.00000E+00 <NR3>
))
MEASurement=ETPRessure ( MEASurement=ETPRessure (
DATE yyyy,mm,dd DATE 2010,01,03 <Date>
TIME hh,mm,ss.xxx TIME 16,04,14.000 <Time>
UNITs UNITs
"TORR| BAR | PAL" "TORR" <String>
VALues VALues
<total pressure measurement> +0.00000E+00 <NR3>
))
MEASurement=AIN ( MEASurement=AIN (
DATE yyyy,mm,dd DATE 2010,01,03 <Date>
TIME hh,mm,ss.xxx TIME 16,04,14.000 <Time>
UNITs "V" UNITs "V"
VALues VALues
<analog in voltage> +0.00000E+00 <NR3>
))
DIMension=NOISe DIMension=NOISe
(TYPE EXPLicit UNITs "COUNt") (TYPE EXPLicit UNITs "COUNt")
DATA ( DATA (
NSAMples NSAMples
<number of samples> #H00000000
Table 9-21 Header Descriptions and Data
Header Description Header Data Format

9 835 VQM® Command Set
264 Series 835 Vacuum Quality Monitor
Instruction Manual - 835000
BLINe BLINe <HEX32>
<signal baseline offset> +0.00000E+00
RMSNoise RMSNoise <NR3>
<RMS noise calculation> +0.00000E+00
CURVe ( CURVe ( <NR3>
DATE yyyy,mm,dd DATE 2010,01,03 <Date>
TIME hh,mm,ss.xxx TIME 16,04,14.000 <Time>
VALues VALues
<noise data bytes> #41024 <data bytes> <Block1>
))
DIMension=COUNt DIMension=COUNt
(TYPE EXPLicit UNITs "COUNt") (TYPE EXPLicit UNITs "COUNt")
DATA ( DATA (
TSOurce TSOurce
"EXTernal |IMMediate" "IMMediate" <String>
OTCounter OTCounter
<over trigger counter> #H00000000 <HEX32>
BOCounter BOCounter
<buffer overwrite counter> #H00000000 <HEX32>
CVALue CVALue
<calibration value mass axis> +0.00000E+00 <NR3>
BAMu BAMu
<begin amu> +0.00000E+00 <NR3>
EAMu EAMu
<end amu> +0.00000E+00 <NR3>
BSEGment BSEGment
<begin segment> #H00 <HEX16>
ESEGment ESEGment
<end segment> #H00 <HEX16>
NSAMples NSAMples
<number of samples> #H00000000 <HEX32>
BLINe BLINe
<signal baseline offset> +0.00000E+00 <NR3>
RMSNoise RMSNoise
<RMS noise calculation> +0.00000E+00 <NR3>
CURVe ( CURVe (
DATE yyyy,mm,dd DATE 2010,01,03 <Date>
TIME hh,mm,ss.xxx TIME 16,04,14.000 <Time>
VALues VALues
<mass spec data bytes> #517312 <data bytes> <Block1>
Table 9-21 Header Descriptions and Data
Header Description Header Data Format

9 835 VQM® Command Set
265
Series 835 Vacuum Quality Monitor
Instruction Manual - 835000
))
DIMension=AMU DIMension=AMU
(TYPE IMPLicit UNITs "U") (TYPE IMPLicit UNITs "U")
DATA ( DATA (
CVALue CVALue
<calibration value mass axis> +0.00000E+00 <NR3>
BAMu BAMu
<begin amu> +0.00000E+00 <NR3>
EAMu EAMu
<end amu> +0.00000E+00 <NR3>
BSEGment BSEGment
<begin segment> #H00 <HEX16>
ESEGment ESEGment
<end segment> #H00 <HEX16>
NSAMples NSAMples
<number of samples> #H00000000 <HEX32>
MEASurement=SEGMent ( MEASurement=SEGMent (
VALues VALues
<samples segment 1>, #H0000, <HEX16>
<samples segment 2>, #H0000, <HEX16>
<samples segment 3>, #H0000, <HEX16>
<samples segment 4>, #H0000, <HEX16>
<samples segment 5>, #H0000, <HEX16>
<samples segment 6>, #H0000, <HEX16>
<samples segment 7>, #H0000, <HEX16>
<samples segment 8>, #H0000, <HEX16>
<samples segment 9>, #H0000, <HEX16>
<samples segment 10>, #H0000, <HEX16>
<samples segment 11>, #H0000, <HEX16>
<samples segment 12>, #H0000, <HEX16>
<samples segment 13>, #H0000, <HEX16>
<samples segment 14>, #H0000, <HEX16>
<samples segment 15>, #H0000, <HEX16>
<samples segment 16>, #H0000, <HEX16>
<samples segment 17>, #H0000, <HEX16>
<samples segment 18>, #H0000, <HEX16>
<samples segment 19>, #H0000, <HEX16>
<samples segment 20>, #H0000, <HEX16>
<samples segment 21>, #H0000, <HEX16>
<samples segment 22>, #H0000, <HEX16>
Table 9-21 Header Descriptions and Data
Header Description Header Data Format

9 835 VQM® Command Set
266 Series 835 Vacuum Quality Monitor
Instruction Manual - 835000
9.5 Simplified Programming Overview and Examples
This section gives basic examples on operating the 835 using the SCPI interface.
• Periodically check for errors using "SYST:ERR:ALL?". A query command that does not
respond within a reasonable time or a command that is not performing as expected might
have an error.
• Place a 10ms delay between commands when sending multiple non-query commands to
avoid filling up the input buffer in the 835 and dropping commands on the floor. "*OPC?"
or "SYST:ERR:ALL?" can always be used to find when a non-query command has completed.
Querying the errors will also validate that the command did execute correctly.
9.5.1 Bias Voltages
The bias voltages of the sensor are logical instruments that perform like power supplies. To set the
voltage of the Entry Plate to 125V:
INST ENTR
SOUR:VOLT 125
To enable the Entry Plate (along with the rest of the Mass Spectrometer):
INST MSP
OUTP ON
To measure the actual voltage:
INST ENTR
MEAS:VOLT?
<samples segment 23>, #H0000, <HEX16>
<samples segment 24>, #H0000, <HEX16>
<samples segment 25>, #H0000, <HEX16>
<samples segment 26>, #H0000, <HEX16>
<samples segment 27>, #H0000, <HEX16>
<samples segment 28>, #H0000, <HEX16>
<samples segment 29>, #H0000, <HEX16>
<samples segment 30> #H0000 <HEX16>
))
CURVe ( CURVe (
DATE yyyy,mm,dd DATE 2010,01,03 <Date>
TIME hh,mm,ss.xxx TIME 16,04,14.000 <Time>
VALues VALues
<atomic mass data bytes> #534624 <data bytes> <Block2>
))
)<CR> )<CR> <END>
Table 9-21 Header Descriptions and Data
Header Description Header Data Format

9 835 VQM® Command Set
267
Series 835 Vacuum Quality Monitor
Instruction Manual - 835000
9.5.2 Filament Power
The Filament Power Supply is a logical instrument that performs like a power supply. A power can
be set, the output state can be changed, and the user can measure the actual power being applied
to the filament.
To set the filament power to 3W:
INST FIL
SOUR:MODE FIX
SOUR:POW 3
To enable the Filament Power Supply (along with the rest of the Mass Spectrometer):
INST MSP
OUTP ON
To measure the actual power applied to the filament:
INST FIL
MEAS:POW?
9.5.3 Emission Current and Filament Bias Voltage
The Emission Current and Filament Bias Voltage are dependent.
To set the Emission Current to 100uA and the Filament Bias Voltage to 30V:
INST ENTR
SOUR:VOLT 30
INST FIL
SOUR:MODE ADJ
SOUR:CURR 100E-6
To enable the Filament Power Supply (along with the rest of the Mass Spectrometer):
INST MSP
OUTP ON
To measure the Filament Bias Voltage:
INST FIL
MEAS:VOLT?
9.5.4 Formatting Fetch data
The "FORMat" command is used to specify what data is returned by the "FETCh?" command. The
following table illustrates the possible scenarios for formatting the system and partial pressure data
returned by the MSP logical instrument.
Table 9-22 FORMat and FETCh? Data
Format
:COUNt
Format
:AMU FETCh? Command Sequence Result
LIVE MSP system data in the DIF header

9 835 VQM® Command Set
268 Series 835 Vacuum Quality Monitor
Instruction Manual - 835000
OFF OFF X Returns only the DIF header with the latest data for the MSP logical
instrument.
Data format follows SCPI-99 Data Interchange Format.
OFF ON X Return the DIF header with the latest data for the MSP logical
instrument and the X axis AMU values for the presently configured
scan range.
Data format follows SCPI-99 Data Interchange Format.
STATIC MSP system data in the DIF header associated with the
INITiate or TRIGger event
ON ON -230 Data corrupt or stale. If a FETCh? is requested without a prior
INITiate or TRIGger.
OR
Returns the DIF header, Y axis values in terms of 16 bit counts, and
X axis values in terms of AMU for the configured AMU scan range
associated with the last INITiate or TRIGger for the MSP logical
instrument.
Subsequent FETCh? commands without an additional INITiate or
TRIGger will result in the EXACT SAME DATA being returned to the
host.
Scan performance will be reduced depending on the AMU scan
range selected.
Data format follows SCPI-99 Data Interchange Format.
ON OFF X -230 Data corrupt or stale. If a FETCh? is requested without a prior
INITiate or TRIGger.
OR
Returns the DIF header and Y axis values in terms of 16 bit counts
for the configured AMU scan range associated with the last INITiate
or TRIGger for the MSP logical instrument.
Subsequent FETCh? commands without an additional INITiate or
TRIGger will result in the EXACT SAME DATA being returned to the
host.
Scan performance will be reduced depending on the AMU scan
range selected.
Data format follows SCPI-99 Data Interchange Format.
Table 9-22 FORMat and FETCh? Data
Format
:COUNt
Format
:AMU FETCh? Command Sequence Result

9 835 VQM® Command Set
269
Series 835 Vacuum Quality Monitor
Instruction Manual - 835000
9.5.5 Partial Pressure Measurement
Partial pressure is determined by sweeping the frequency of a sinusoidal waveform and determining
the current through the Electron Multiplier vs. Frequency.
To perform a single partial pressure measurement:
INST MSP
OUTP ON
INIT
FETC?
A "continuous trigger method":
INST MSP
OUTP ON"
INIT:CONT ON
FETC?
Single trigger from EXTernal trigger:
ON ON X -230 Data corrupt or stale. If a FETCh? is requested without a prior
INITiate or TRIGger.
OR
Returns Y axis values in terms of 16 bit counts, and X axis values in
terms of AMU for the configured AMU scan range associated with
the last INITiate or TRIGger for SEQuence1 for the MSP logical
instrument.
Subsequent FETCh? commands without an additional INITiate or
TRIGger for SEQuence1 will result in the EXACT SAME DATA being
returned to the host.
Scan performance will be reduced depending on the AMU scan
range selected.
Data format follows IEEE 488.2 section 8.7.9
ON OFF X -230 Data corrupt or stale. If a FETCh? is requested without a prior
INITiate or TRIGger.
OR
Returns Y axis values in terms of 16 bit counts for the configured
AMU scan range associated with the last INITiate or TRIGger for the
MSP logical instrument.
Subsequent FETCh? commands without an additional INITiate or
TRIGger for SEQuence1 will result in the EXACT SAME DATA being
returned to the host.
Scan performance will be reduced depending on the AMU scan
range selected.
Data format follows IEEE 488.2 section 8.7.9
Table 9-22 FORMat and FETCh? Data
Format
:COUNt
Format
:AMU FETCh? Command Sequence Result

9 835 VQM® Command Set
270 Series 835 Vacuum Quality Monitor
Instruction Manual - 835000
INST MSP
OUTP ON
TRIG:SOUR EXT
INIT
[Wait for the digital in trigger]
FETC?
To stop continuous triggering and stop scanning quickly, the following commands must be executed
in this order. If initiate continuous is on, the ABORt command does NOT change the continuous to
OFF. The result would momentarily enter the IDLE state and then immediately transition to the
TRIGger state. Send Command OFF first then ABORt.
INIT:CONT OFF(Reset all Sequences to the IDLE state upon completion of all trigger events)
ABORt (Immediately abort the trigger sequences without a trigger event and shutdown
scanning)
9.5.6 External Total Pressure
To get the total pressure from an external instrument:
INST ETPR
OUTP ON
MEAS:PRES?
9.5.7 Store/Load Ion Trap and Controller Settings
The EEPROM stores user and factory preferred settings. At POR, or upon transitioning on from
Standby mode, the Controller loads and validates the user settings as the current trap configuration
and loads and validates the factory preferred settings as the default trap configuration. The user is
able to store/load one of six user setting profiles to/from the EEPROM and restore the trap to the
factory preferred settings.
To save the current trap settings to EEPROM:
MEM:STOR
SYST:ERR:ALL? (Check for errors in communication with EEPROM)
To overwrite the current trap settings with the user settings in the EEPROM:
MEM:LOAD
SYST:ERR:ALL?
To overwrite the current trap settings with the factory preferred settings:
MEM:LOAD FACT
SYST:ERR:ALL?
Note: To make the MEM:LOAD commands permanent, issue a MEM:STOR command.

9 835 VQM® Command Set
271
Series 835 Vacuum Quality Monitor
Instruction Manual - 835000
9.5.8 Change or Calibrate Electrometer Gain/Sensitivity
The gain or sensitivity of the electrometer (expressed in Amps/Volt) is controlled by a digital
potentiometer within the 835. Commands are available to change the gain of the electrometer and
to find what the actual gain is.
To query the desired gain:
INST EMEL
CAL:VAL?
To measure the actual gain:
INST MSP
OUTP OFF (measuring and setting the gain requires the Electron Multiplier to be off so that no
current is contributed from the Electron Multiplier)
INST EMEL
CAL:MEAS?
To set and calibrate to 50nA/V:
INST MSP
OUTP OFF
INST EMEL
CAL:VAL 50E-9
CAL:MEAS?(Verify gain is close to what we want)
9.5.9 Real-Time Clock
The user may use the SYSTem:DATe and SYSTem:TIMe command to set the on-board real-time
clock. While in standby mode, the real-time clock continues to update. If coming up from a
power-on reset, the clock will assume a default date/time.
9.5.10 Manual Control of the Digital Output on the BNC
Independent command control of the Digital Out BNC
INST DOUT
SOUR:DIG:MOD MAN
SOUR:DIG:MOD?(responds with "MANual")
OUTP ON
SOUR:DIG:DATA:BIT 1
SOUR:DIG:STAT?(responds with "1")
9.5.11 Fatal Errors
If a fatal error occurs, the Power LED will appear solid red for a moment (indicating trace and other
information at the time of the error is being stored to flash), and will then begin to blink red. After
the LED begins to blink red, the user may press the power button to restart the Controller. The user
may now retrieve the the system log saved at the time of the crash.
To display this post-mortem data, issue the dump log command after the restart:
SYST:LOG?

9 835 VQM® Command Set
272 Series 835 Vacuum Quality Monitor
Instruction Manual - 835000
The user should dump and save this log as soon as possible after the restart: data coincident with a
subsequent fatal error will overwrite the data that was saved at the time of the previous fatal error.
9.5.12 Reading Controller Status/Clearing Status Registers
Event registers are cleared of their event bits upon issuing STATus:* commands. The condition bits
always return the current value of the board condition associated with that bit; user queries do not
affect these bits.
The *CLS command clears all status registers (including the Status Byte and the Event Status
Register), as well as the event/error queue.
The Standard Event Status Register (SESR) may be read with the *ESR? command. It is cleared on
read.
The Status Byte (STB) may be read with the *STB? command. Its Service Request Enable mask (set
with the *SRE command, and read with the *SRE? command) controls the updating of the MSS bit
(bit 6). If at least one other status bit become set or cleared, and the corresponding Service Request
Enable Register mask bit is set, the Controller will set the MSS bit, indicating a Service Request
event occurred. Neither reading of the Status Byte, nor the *CLS command, will affect the condition
fields of the Status Byte (as it reports real-time status, not a previous event). If the *CLS command is
issued, however, no service-related condition feeding the Status Byte will be present, and so the net
effect with be a zeroing of the STB.
Bit 2 of the Status Byte indicates the real-time population status of the event/error queue. When a
message is enqueued, the bit is set, and remains set until the queue is emptied by issuing a *CLS
command, by reading the last queue entry with a SYSTem:ERRor:[NEXT]? command, or by a
SYSTem:ERRor:ALL? command.
Bit 2 of the SESR is set if the corresponding event mask is set via the *ESE command and, if the
system is unable to store an error or event in the error/event queue. This can happen if the queue
becomes full, but it can result from an internal error/event queue operation. If this bit is set, but the
error/event queue is empty, an internal error has occurred.
9.6 Using a Terminal to Communicate with the VQM System
Since the 835 Controller looks like a "Virtual COM Port" to Windows (Figure 1) through the USB
interface, any program that can access serial ports through Windows (like HyperTerminal) can be
used to communicate with the 835 Controller using the provided command set.
There are many terminals available (some free) that can accomplish this task. This section focuses
on HyperTerminal (available on Windows XP or http://www.hilgraeve.com/hyperterminal.html), but
terminals such as TeraTerm (http://ttssh2.sourceforge.jp/), and Termie
(http://www.codeproject.com/KB/mobile/) can also be used.
Notice
Installation of a specific driver is required for Windows to recognize the
VQM Controller as a "Virtual COM Port". See Section 4.3 in the Software
Installation chapter.
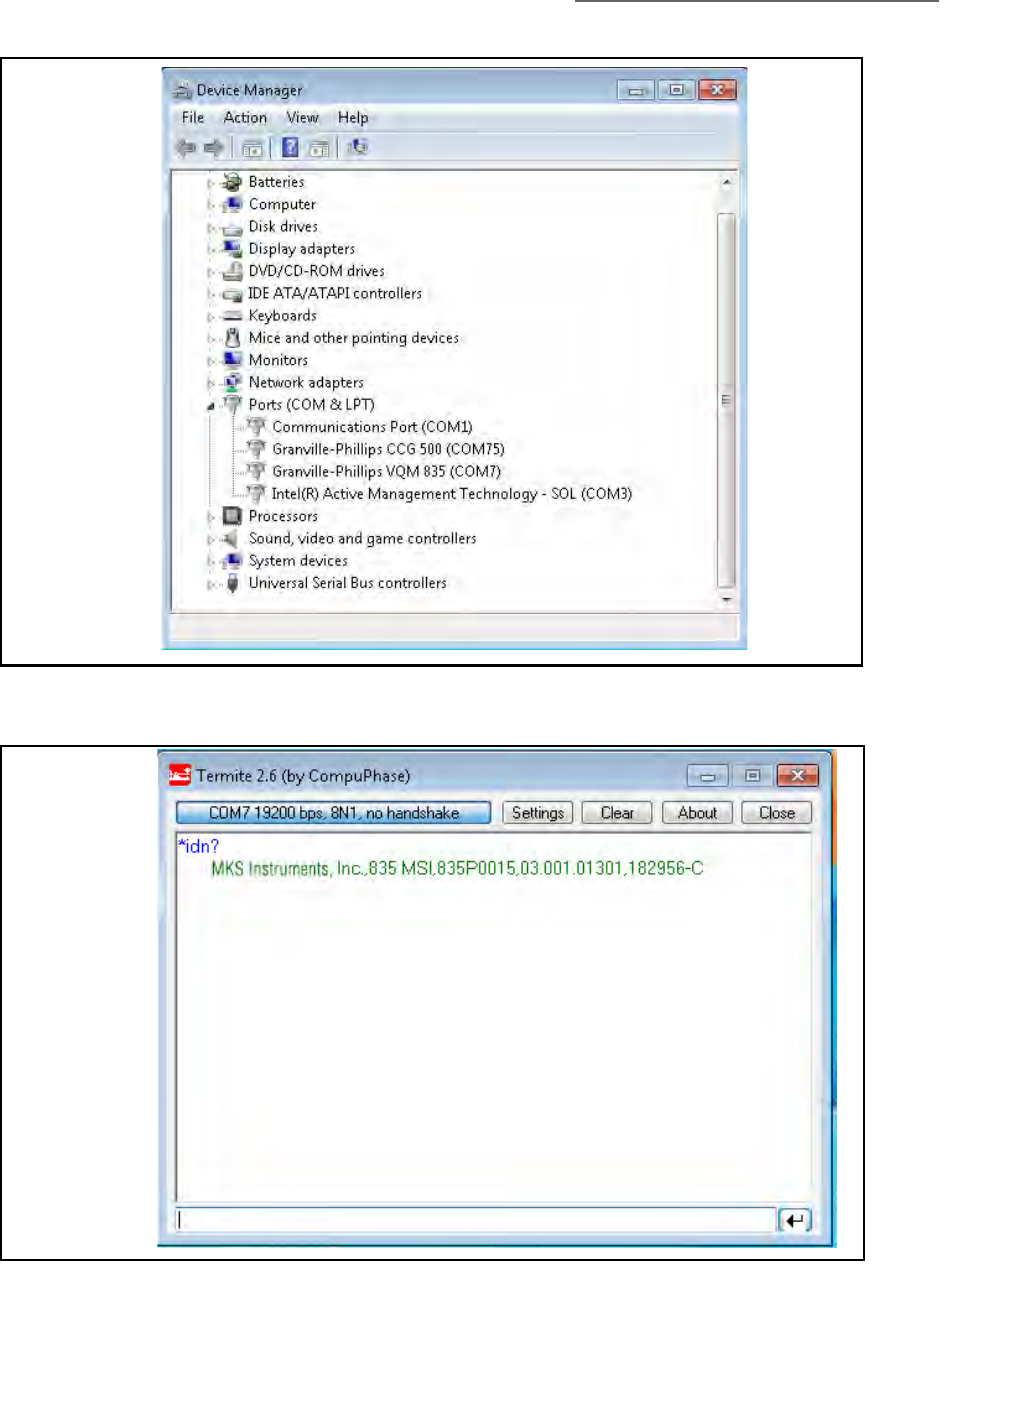
9 835 VQM® Command Set
273
Series 835 Vacuum Quality Monitor
Instruction Manual - 835000
Figure 9-3 COM Port Descriptions in Device Manager
Figure 9-4 Tera Term
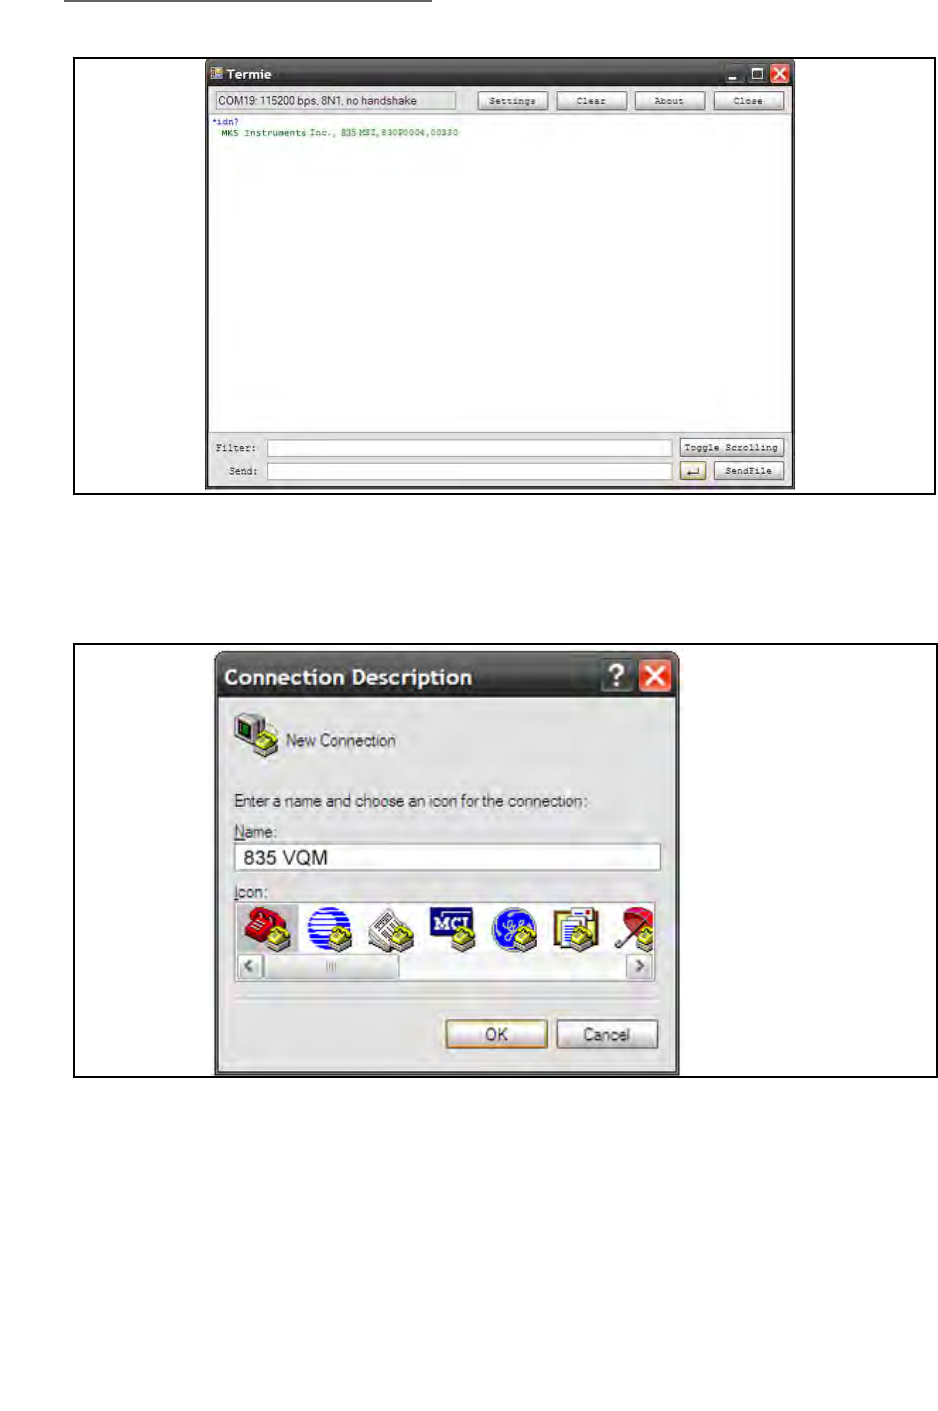
9 835 VQM® Command Set
274 Series 835 Vacuum Quality Monitor
Instruction Manual - 835000
9.6.1 Using HyperTerminal
Open HyperTerminal and choose an appropriate name for the connection. Select "OK".
Choose the COM Port representing the VQM Controller. Select "OK".
Figure 9-5 Termie
Figure 9-6 HyperTerminal New Connection
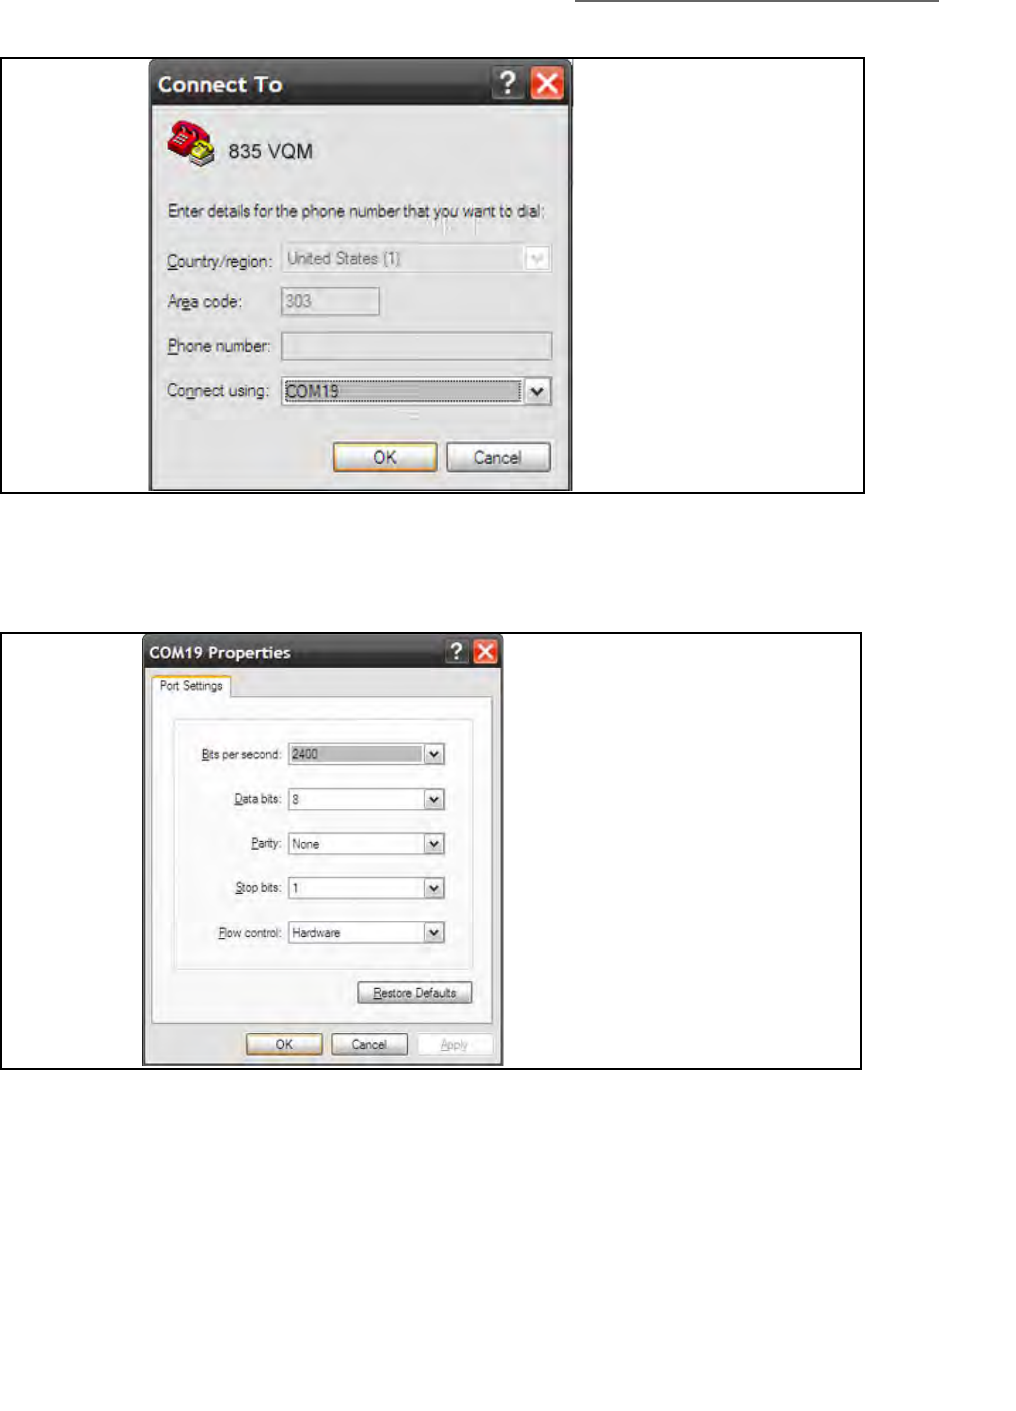
9 835 VQM® Command Set
275
Series 835 Vacuum Quality Monitor
Instruction Manual - 835000
Choose the following Port Settings. Since the VQM Controller is a Virtual COM Port, the "Bits
per second" and "Flow Control" settings do not matter. Select "OK".
Go to "File" -> "Properties" -> "Settings" -> "ASCII Setup…". Make changes as shown for clarity.
Select "OK".
Figure 9-7 COM Port Selection
Figure 9-8 COM Port Settings
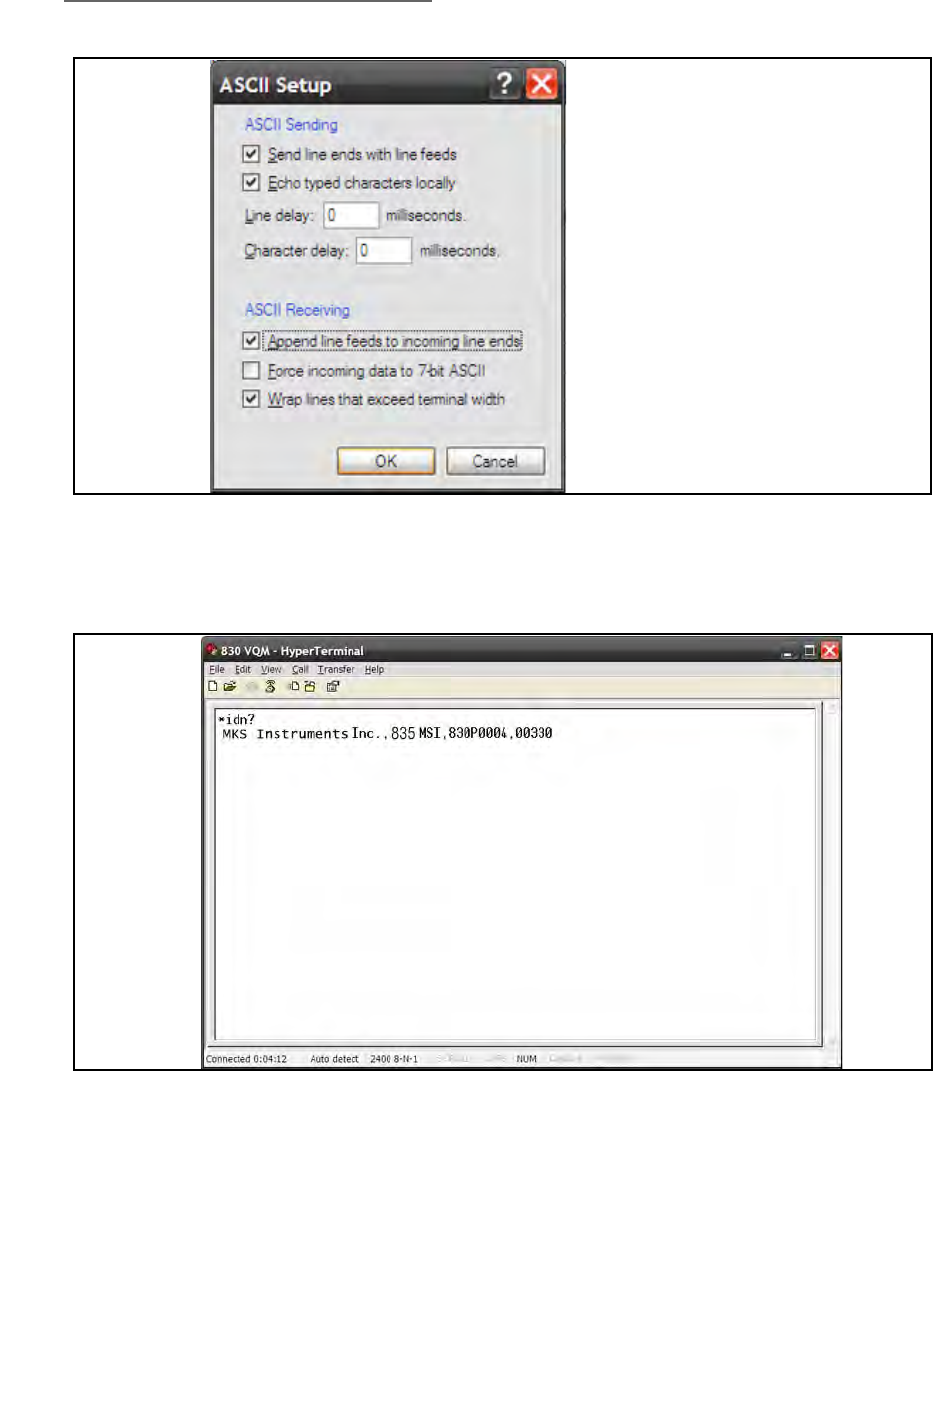
9 835 VQM® Command Set
276 Series 835 Vacuum Quality Monitor
Instruction Manual - 835000
Type "*IDN?" and press "Enter" (commands are not case sensitive). The VQM Controller should
respond with its identity (could be slightly different than shown).
Figure 9-9 ASCII Setup
Figure 9-10 "*IDN?" Query

277
Series 835 Vacuum Quality Monitor
Instruction Manual - 835000
Chapter 10
10 Service & Maintenance
10.1 Service Guidelines
If the product requires service, contact the MKS/Granville-Phillips Customer Service Department at
1-303-652-4400 for troubleshooting help over the phone.
If the product must be returned to the factory for service, request a Return Material Authorization
(RMA) from MKS/Granville-Phillips. Do not return products without first obtaining an RMA. In
some cases a hazardous materials document may be required. The MKS/Granville-Phillips
Customer Service Representative will advise you if the hazardous materials document is required.
When returning products to Granville-Phillips, be sure to package the products to prevent shipping
damage. Circuit boards and modules separated from the gauge assembly must be handled using
proper anti-static protection methods and must be packaged in anti-static packaging. Shipping
damage on returned products as a result of inadequate packaging is the Buyer's responsibility.
Customer Service / Technical Support:
MKS Pressure and Vacuum Measurement Solutions
MKS Instruments, Inc., Granville-Phillips® Division
6450 Dry Creek Parkway
Longmont, Colorado 80503 USA
Tel: 303-652-4400
Fax: 303-652-2844
Email: mks@mksinst.com
MKS Corporate Headquarters
MKS Instruments, Inc.
2 Tech Drive, Suite 201
Andover, MA 01810 USA
Tel: 978-645-5500
Fax: 978-557-5100
10.2 Damage Requiring Service
Disconnect this product from the power source and refer servicing to Qualified Service Personnel if
any the following conditions exist:
• The gauge cable, power-supply cord, or connector is damaged.
• Liquid has been spilled onto, or objects have fallen into, the product.
• The product does not operate normally even if you have followed the Operation Instructions.
Adjust only those controls that are covered in this instruction manual.
• The product has been dropped or the enclosure has been damaged.
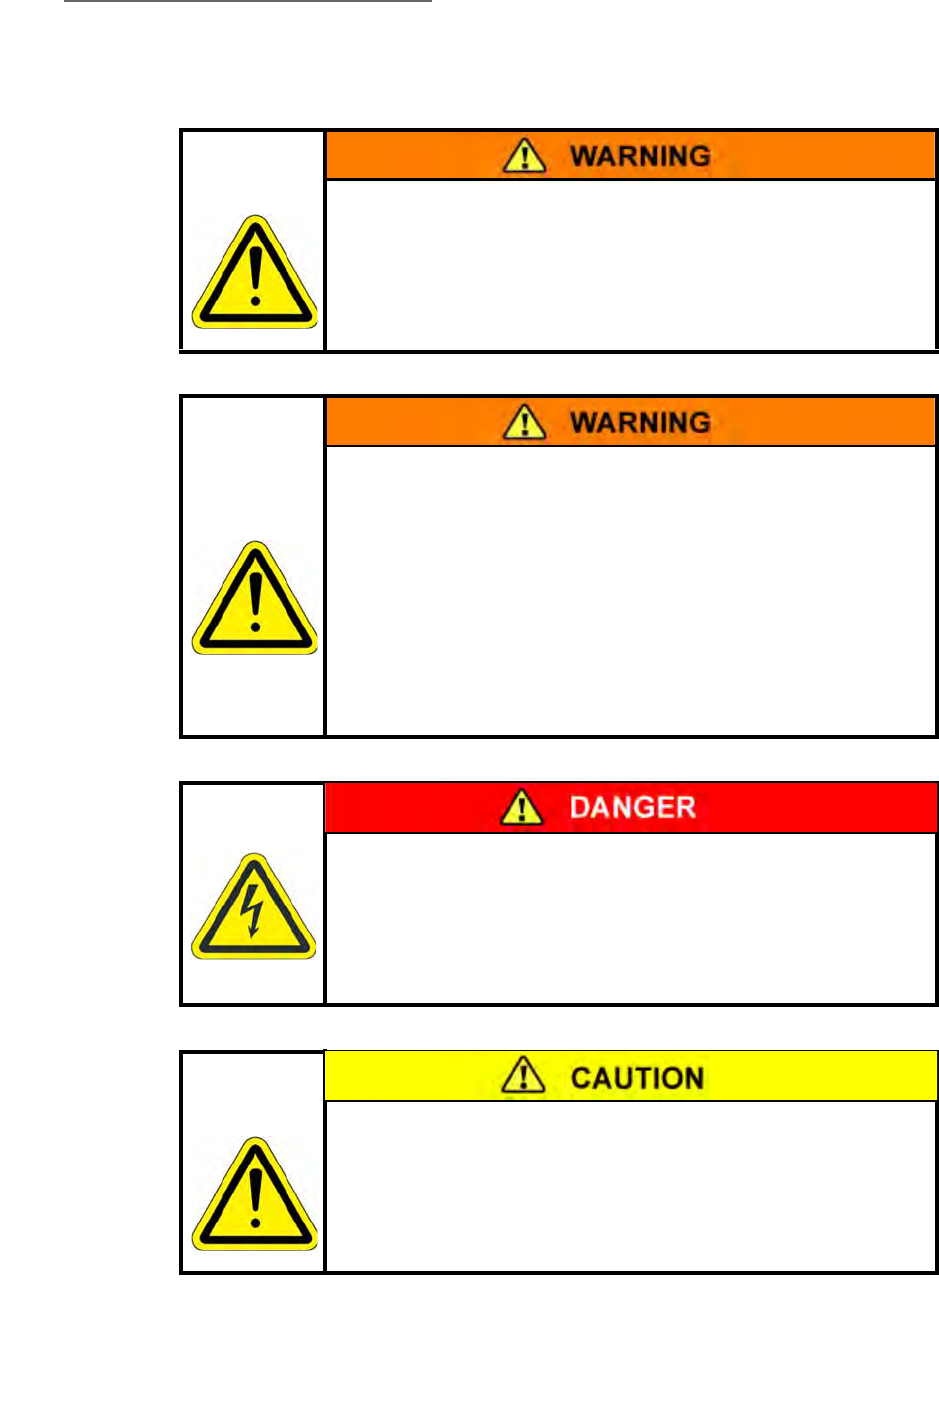
10 Service & Maintenance
278 Series 835 Vacuum Quality Monitor
Instruction Manual - 835000
10.3 General Repair Guidelines
Safety Precautions
The service and repair information in this manual is for the use
of Qualified Service Personnel. To avoid shock, do not perform
any procedures in this manual or perform any servicing on
this product unless you are qualified to do so.
Replacement Parts
Do not substitute parts or modify the instrument.
If replacement parts are required, be certain to use the
replacement parts that are specified by Granville-Phillips or
that have the same characteristics as the original parts.
Unauthorized substitutions may result in fire, electric shock or
other hazards.
Return the product to a service facility designated by
Granville-Phillips for service and repair to ensure that safety
features are maintained. Do not use this product if it has
unauthorized modifications.
Safety Precautions
High voltages are present within the VQM Controller and Mass
Spectrometer Gauge capable of causing injury or death. Use
extreme caution while troubleshooting when power is
applied.
Safety Check
Upon completion of any service or repairs to this product, ask
the Qualified Service Person to perform safety checks to
determine that the product is in safe operating order.

10 Service & Maintenance
279
Series 835 Vacuum Quality Monitor
Instruction Manual - 835000
Because the VQM System contains static-sensitive electronic parts, the following precautions must
be followed when troubleshooting:
• Use a grounded, conductive work surface. Wear a high impedance ground strap for personal
protection.
• Use conductive or static dissipative envelopes to store or ship static sensitive devices or printed
circuit boards.
• Do not operate the product with static sensitive devices or other components removed from the
product.
• Do not handle static sensitive devices more than absolutely necessary, and only when wearing a
ground strap.
• Do not use an ohmmeter for troubleshooting MOS circuits. Rely on voltage measurements.
• Use a grounded, electrostatic discharge safe soldering iron.
10.4 MS Gauge Repair
The filament assembly and the electron multiplier components of the MS Gauge can be replaced by
service technicians.
Filament assembly replacement instructions are given in Section 7.5.2, and electron multiplier
replacement instructions are given in Section 7.6.10. The bakeout procedure is given in Section 7.3.

10 Service & Maintenance
280 Series 835 Vacuum Quality Monitor
Instruction Manual - 835000
A
Acronyms, Terms, and Definitions 23, 33, 62, 103
Auto Resonant Ion Trap Mass Spectrometry 62
Auto Tune 157, 168, 172, 176, 205
Initial Operation Procedure
168
Autoresonant Ion Trap Mass Spectrometer 23, 138
Autoresonant Ion Trap Mass Spectrometry 21, 61
C
Caution Notices & Symbols 13, 14
Components
System 35
Controller
Connections 45
Front Panel Connectors 70
Front Panel Controls 64
Overview 61, 62
Power Modes 84
Power ON/OFF Sequence 85
Rear Panel Interconnections 75
Signal Input/Output Connections 49
D
Damage Requiring Service 18, 277
Dimensions 151
VQM Controller 25
E
Electron Multipler
Preconditioning 167
Electron Multiplier 108
Bias Voltage Adjustment 169
Consumable item 160
Overpressure Conditions 61
Electron Multiplier Bias 126
Explosion / Implosion 17
F
FCC Verification 19
Figures
dimensions 151
Filament Assembly
MS Gauge 117
Filament Bias 131
G
Gases 207
Adding
Customizing Gas Coefficients 207
Gas Library Editor 207
Gauge
Bakeout Procedure 136
Connection Procedure 42
Dimensions 36
Electron Multiplier Detector 146
Electron Multiplier_Bakeout Temperature 147
Electron Multiplier_Best Known Practices 146
Electron Multiplier_Contamination 148
Electron Multiplier_Gain Adjustment 149
Electron Multiplier_Initial Operation 149
Electron Multiplier_Operating Temperature 147
Electron Multiplier_Operating Voltage 148
Environmental Requirements 138
Filament Assembly 140
Filament Assembly Replacement 140
Filament Outgassing 166
Filament, Overpower Detection 80
Humidity Range 139
Installation 36
Installation Requirements 37
Ionizer Settings 117
Maintenance 135
Mounting Procedure 39
Operation at Close to Upper Pressure Limit 138
Operational Parameters 125
Operational Requirements 38
Overpressure Conditions 61
Photo 107
Power Supply Settings 78
Pressure Ranges 138
Principles of Operation 110
Repeller Voltage Optimization 145
Specifications 28
Storage Recommendations 136
Temperature Range 138
UHV Operation 138
Warm-up Periods 139
Glossary of Terms 23
Grounding
Equipment 16
System Requirements & Procedure 46
H
Heater Jacket
MS Gauge 109
High Voltage 14
How to Log Data 200
I
Icon
Auto Tune 157
1Index
Series 835 Vacuum Quality Monitor
Instruction Manual - 835000
Connect 157
Histogram 158
Leak 158
Log Data 159
Mass Spec 157
Save 159
Settings 158
Summary 157
Trend 158
Tune 158
VQI 159
Icons and Screen Displays
Viewer Application Software
Program Control Icons 156
Implosion / Explosion 17
Initial Operation Procedure
Abbreviated Initial Startup/Setup 162
Auto Tune 168
Electron Multiplier Preconditioning 167
Filament Outgassing 166
Initial Pump Down 161
MS Gauge 160
Installation
Gauge 36
Hardware 36
Micro-Ion Gauge 40
Software 53
Ion Detector Assembly 121
Ion Trap 21, 22, 23, 24, 35, 46, 61, 62, 69, 71,
78, 79, 105, 106, 107, 110, 111, 112, 114, 116,
121, 138, 146, 151, 178
Mass Separator 118
Mass Separator Default Values 119
MS Gauge 118
Power Supply Settings 78
Ion Trap Mass Spectrometer Gauge 103
Ionizer
MS Gauge 116
L
Leak Check 185
Initiating 189
Log Data
Connect to a Log Data File 174
Connect to a Raw Log File 174
Log Files
Autotune Log File 178
Error Event Log 206
Log Data 200
Root Directories 218
Save Selected Files 202
M
Mass Spectrometry
Scan Control 91
Timing Diagrams 98
Micro-Ion Gauge 41
Total Pressure Measurement Gauge 25, 35, 75,
88
MS Gauge
Advanced User Settings 123
Auto Tune Procedures 176
Bakeout Requirements 162
Components 106
Electron Multiplier 108
Electron Multiplier Bias 126
Filament Assembly 107, 117
Filament Bias 131
Filament Outgassing 162, 166
Heater Jacket
Bakeout 109
High Pressure Operation 129
Initial Operation Procedure 160
Introduction 103
Ion Detector Assembly 121
Ion Trap 110, 118
Ionizer 116
Low Pressure Operation 129
Mass Separator 118
Materials 115
Overview 103
Photo 108
O
Optional Equipment 34
Overpower Detection
Gauge, Filament 80
Overpressure Condition 108
Overpressure Conditions 17
Electron Electron Multiplier 61
Filament 61
Overview
Controller 61, 62
Viewer Application Software 155
P
POST
Power-On Self-Test 85
Power-On Self-Test
POST 85
Pressure Relief Valves 17
R
Replacement Parts 15
RF Signal Generator 80
S
Safety
Cautions & Warnings 13, 14
Series 835 Vacuum Quality Monitor
Instruction Manual - 835000
Instructions 13
Introduction 13
Service Guidelines 19, 277
Software VIs 156
Specifications 25
Analog Input/Output 30
Controller 27
General 21
Host PC 29
Mass Spectrometer Gauge 28
Trigger Input/Output 30
Viewer Application Software 29
System Components 35
System Configurations, Typical 93
T
Timing Diagrams
Mass Spectrometry 98
Total Pressure Measurement Gauge
Installation 40
Required 158
Total Pressure Measurement Kit
Operation 87
Total Pressure Measurement Sources
Adding 207
Troubleshooting 209
VQM Controller Errors 215
U
USB Cable
Requirements
Connection 161
USB cable 155
USB port 155
Using a Terminal to Communicate with the VQM
System 272
Using the VQM System
How to Auto Tune the MS Gauge 176
How to check for Leaks 185
How to Connect to a VQM Controller 173
How to Display a Trend Graph 184
How to use the Settings Screen 191
How to use the Summary Screen 179
Status/Error Reporting and Contextual Help 205
Utility Application 220
V
Vacuum Quality Index 203
Vacuum Quality Indicator 159
Viewer Application Components
Gas/Mass Selector 180
Histogram 182
Leak Parameters 187
Leak Trend Graph 187
Locks 180
Mass Identifiers 180
Raw Logging 198
Results Table 179
Selected Peak Parameters 196
Short-Term Trend Graph 182
Total Pressure 181
Viewer Application Software
Icons and Screen Displays 156
Initial Operation Procedure 160
Introduction 155
Overview 155
Using the Viewer Application 173
VQI 159, 203
VQM
System Components 35, 104
Utility Application 220
VQM Command Set
Introduction 225
Logical Instruments 225
VQM Controller
Dimensions 25
VQM Viewer Application Software 155
W
Warning Notices & Symbols 13, 14
Warranty Information 19
Series 835 Vacuum Quality Monitor
Instruction Manual - 835000

Granville-Phillips® Series 835
Vacuum Quality MonitorTM
Instruction manual part number 835000
Revision H - November 2016
Series 835
Instruction Manual
Customer Service / Technical Support:
MKS Pressure and Vacuum Measurement Solutions
MKS Instruments, Inc., Granville-Phillips® Division
6450 Dry Creek Parkway
Longmont, Colorado 80503 USA
Tel: 303-652-4400
Fax: 303-652-2844
Email: mks@mksinst.com
MKS Corporate Headquarters
MKS Instruments, Inc.
2 Tech Drive, Suite 201
Andover, MA 01810 USA
Tel: 978-645-5500
Fax: 978-557-5100
Email: mks@mksinst.com
