A 01 Bar Pendulum Experiment Manual
User Manual:
Open the PDF directly: View PDF ![]() .
.
Page Count: 11

Bar Pendulum
Introduction
Galileo was the first person to show that at any given place, all bodies – big or small –
fall freely when dropped, with the same (uniform) acceleration, if the resistance due to air
is negligible. The gravitational attraction of a body towards the center of the earth results
in the same acceleration for all bodies at a particular location, irrespective of their mass,
shape or material, and this acceleration is called the acceleration due to gravity, g. The
value of g varies from place to place, being greatest at the poles and the least at the
equator. Because this value is large, bodies fall quickly to the surface of the earth when
dropped, and so it is very difficult to measure their acceleration directly with considerable
accuracy.
Therefore, the acceleration due to gravity is often determined by indirect methods – for
example, using a simple pendulum or a compound pendulum. If we determine g using
a simple pendulum, the result is not very accurate because an ideal simple pendulum
cannot be realized under laboratory conditions. Hence, you will use two different
compound pendulums to determine the acceleration due to gravity in the laboratory,
namely the Bar pendulum and the Kater’s pendulum.
Apparatus
Bar Pendulum
Small metal wedge
Spirit level
Telescope
Stop watch
Meter rod
Theory
A bar pendulum is the simplest form of compound pendulum. It is in the form of a
rectangular bar (with its length much larger than the breadth and the thickness) with holes
(for fixing the knife edges) drilled along its length at equal separation.
If a bar pendulum of mass M oscillates with a very small amplitude about a horizontal
axis passing through it, then its angular acceleration (d
2/dt2) is proportional to the
angular displacement . The motion is simple harmonic and the time period T is given
by
Mgl
I
T
2, (1)
where I denotes the moment of inertia of the pendulum about the horizontal axis through
its center of suspension and l is the distance between the center of suspension and C.G.
of the pendulum.
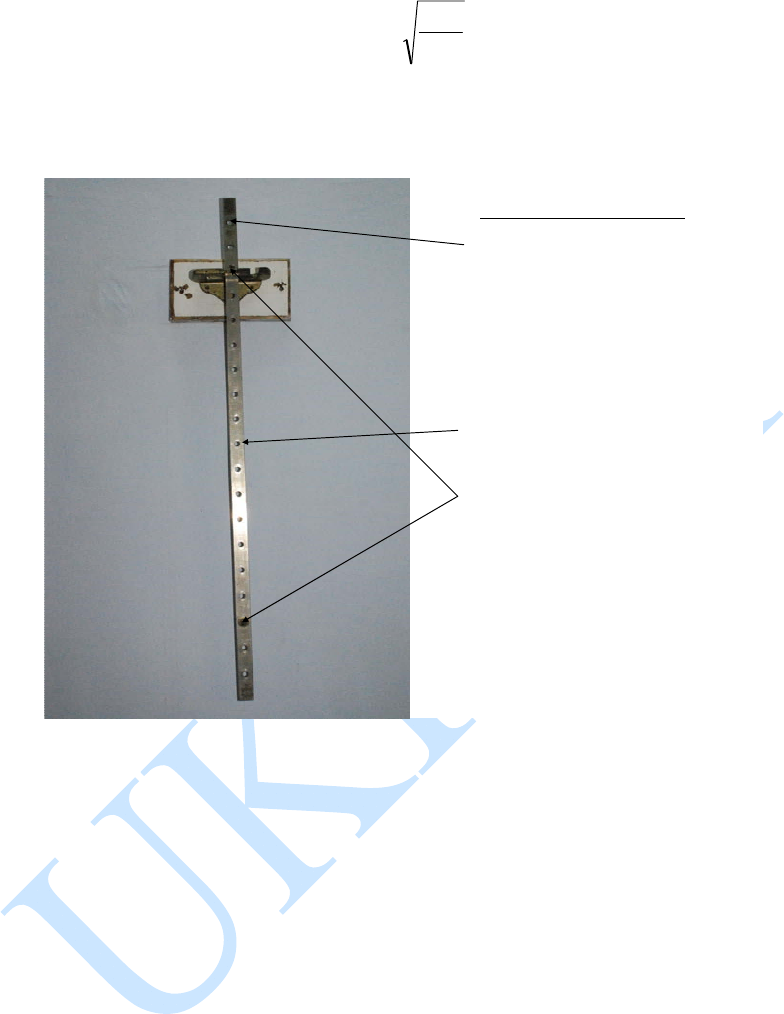
•Bar pendulum
•A uniform
rectangular metallic
bar (~1m long), with
holes drilled along
its length (~5 cm
apart)
•CG in the middle of
the bar
•2 knife edges
symmetrically placed
on either side of CG
to suspend it at
various distances
from CG
Photograph of a typical bar pendulum
According to the theorem of parallel axes, if IG is the moment of inertia of the pendulum
about an axis through C.G., then the moment of inertia I about a parallel axis at a distance
l from C.G. is given by
(2)
22
2
MlMk
MlII G
where k is the radius of gyration of the pendulum about the axis through C.G. Using
Equation (2) in Equation (1), we get

22
2
22
2
2
2
2,
M
kMl
TMgl
kl
gl
kl
l
g
L
g
(3)
where L is the length of the equivalent simple pendulum, given by
l
l
k
L 2 (4)
Therefore,
2
2
4T
L
g
. (5)
The point at a distance L from the centre of suspension along a line passing through the
centre of suspension and C.G. is known as the centre of oscillation. Time period T will
have minimum value when l = k (using Equation (3)). Hence PQ = 2k (refer to Figure1).
Simplifying Equation (4), we get
. (6)
0
22 klLl
Equation (6) is a quadratic equation in l having two roots. If l1 and l2 are the two values of
l, then by the theory of quadratic equations
Ll l
21 , (7)
and
(8)
So we can write the solutions as
2
21 kl l
2
12
1
,k
ll ll l
(9)
Since both the sum and the product of the two roots are positive, for any particular value
of l, there is a second point on the same side of C.G. and at a distance k2/l from it, about
which the pendulum will have the same time period.
If a graph is plotted with the time period as ordinate and the distance of the point of
suspension from C.G. as abscissa, it is expected to have the shape shown in Figure 1,
with two curves which are symmetrical about the C.G. of the bar.
To find the length L of a simple pendulum with the same period, a horizontal line
ABCDE can be drawn which cuts the graph at points A, B, D and E, all of which read the
same time period. For A as the center of suspension, D is the center of oscillation (D is at
distance of from the centre of suspension A). Similarly, for B as the center of
suspension, E is the center of oscillation.
Ll l 21

The measurements can also be used to determine g using Ferguson’s method as explained
below.
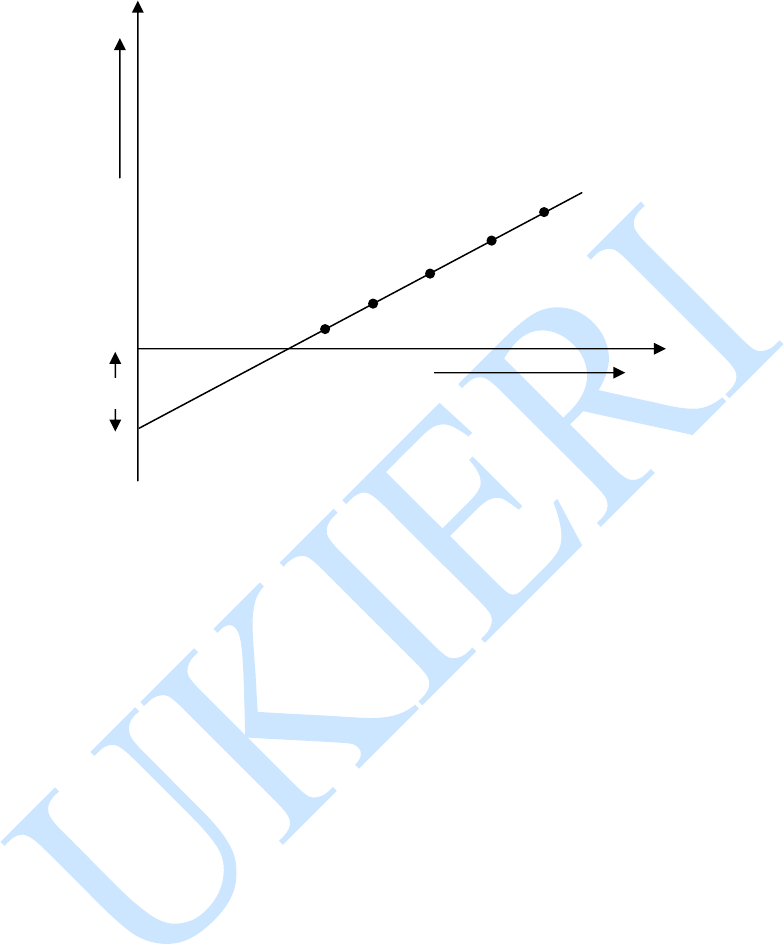
Ferguson’s method for determination of g
Using Equations (5) and (6) we get
22
2
2
4klT
g
l
.
A graph between l 2 and lT 2 should therefore be a straight line with slope 2
4
g, as shown
in Figure 2. The intercept on the y-axis is – k 2.
Acceleration due to gravity, g = 42 × slope
Radius of gyration, k = (intercept)
C.G.
Distance from C.G.
P
Figure 1: Expected variation of time period with distance of the point of suspension
from C.G.
Q
A B C D E
A B CD
Time
period
T
Y
l
2
Figure 2: Expected form of the graph between l 2 and lT 2.
Learning Outcomes
This experiment will enable you
1. To determine the acceleration due to gravity (g) using a bar pendulum.
2. To verify that there are two pivot points on either side of the centre of gravity (C.G.)
about which the time period is the same.
3. To determine the radius of gyration of a bar pendulum by plotting a graph of time
period of oscillation against the distance of the point of suspension from C.G.
4. To determine the length of the equivalent simple pendulum.
Pre-lab Assessment
Now to know whether you are ready to carry out the experiment in the lab, pick the
correct answer from the following. If you score 80%, you are ready, otherwise read
the preceding text again. (Answers are given at the end of this experiment.)
(1) A simple harmonic motion is the one where the force is proportional to
a) displacement
b) velocity
(2) A simple pendulum is
a) a heavy mass suspended with light and inextensible thread
l
T
2
0
k2
X

b) a mass suspended with spring
(3) A compound pendulum is
a) a bar supported at two knife edges
b) a rigid body capable of oscillating in vertical plane
(4) Acceleration due to gravity is
a) rate of change of velocity along vertical direction
b) rate of change of velocity towards the centre of earth
(5) Least count of any instrument is
a) minimum distance measured by any instrument
b) smallest measurement that can be made by the instrument
(6) The centre of gravity is
a) the point at which total mass of the body is concentrated
b) the point at the centre of the instrument
(7) A rigid body is
a) a solid body
b) one in which the distance between any two points of the body always remains
fixed
(8) At the point of suspension, the glass surface is used
a) to minimize the frictional effects at the point of contact of knife edge and glass
surface
b) to minimize the effect of viscosity of air
(9) The limiting value of angle of displacement for simple harmonic motion a pendulum
is approximately
a) 20 degrees
b) 5 degrees
(10) Are the centre of suspension and centre of oscillation in a compound pendulum
interchangeable?
a) yes
b) no
Procedure
1. Balance the bar on a sharp wedge and mark the position of its C.G.
2. Fix the knife edges in the outermost holes at either end of the bar pendulum. The
knife edges should be horizontal and lie symmetrically with respect to centre of
gravity of the bar.
3. Check with spirit level that the glass plates fixed on the suspension wall bracket are
horizontal. The support should be rigid.
4. Suspend the pendulum vertically by resting the knife edge at end A of the bar on the
glass plate.
5. Adjust the eye piece of the telescope so that the cross wires are clearly visible through
it. Focus the telescope on the lower end of the bar and put a reference mark on the
wall behind the bar to denote its equilibrium position.

6. Displace the bar slightly to one side of the equilibrium position and let it oscillate
with the amplitude not exceeding 5 degrees. Make sure that there is no air current in
the vicinity of the pendulum.
7. Use the stop watch to measure the time for 30 oscillations. The time should be
measured after the pendulum has had a few oscillations and the oscillations have
become regular.
8. Measure the distance l from C.G. to the knife edge.
9. Record the results in Table 1. Repeat the measurement of the time for 30 oscillations
and take the mean.
10. Suspend the pendulum on the knife edge of side B and repeat the measurements in
steps 6 -9 above.
11. Fix the knife edges successively in various holes on each side of C.G. and in each
case, measure the time for 30 oscillations and the distance of the knife edges from
C.G.
Observations
Table 1: Measurement of T and l
Least count of stop-watch = ……sec.
Side A up Side B up S. No.
Time for 30
oscillations
(t)
1 2
t
(mean)
T=t/30
(sec)
l
(cm)
Time for 30
oscillations
(t)
1 2
t
(mean)
T=t/30
(sec)
l
(cm)
1
2
3
4
5
6
7
8
9
Calculations
Plot a graph showing how the time period T depends on the distance from the center of
suspension to C.G. (l). Figure 1 shows the expected variation of time period with distance
of the point of suspension from C.G.

Acceleration due to gravity (g)
Draw horizontal lines on the graph corresponding to two periods, T1 and T2 , as shown in
Figure 1.
For the line ABCDE
2
1
BEAD
L
= ……… cm.
T1 = ………..sec.
Hence, using the formula for g as given in Equation (5),
g = ………...cm/sec2.
For the line A'B'C'D'E'
2
2
EBDA
L
= ………. cm.
T2 = ………. sec.
Hence, g = ………...cm/sec2.
Mean value of g = ……….. cm/sec2
Radius of gyration (k)
Let l1 = ½ (AC + CE) = ½ AE,
and l2 = ½ (BC + CD) = ½ BD.
Calculate the radius of gyration using the expression
21 llk = ……cm.
Calculate another value for k from the line A'B'C'D'E':
k' = ……cm.
Hence, the mean value for radius of gyration about C.G. is
kmean = ½(k + k') = ………..cm.
Also, the mean length corresponding to minimum time period is kPQ 2
.
If M is the mass of the bar pendulum, the moment of inertia of the bar pendulum is
obtained using the equation
Make the following table for calculated values of l2 and lT2 corresponding to all the
measurements recorded in Table 1.
2
MkI

Table 2: Calculated values of l2 and lT2
Side A up Side B up Mean values
S.
No.
l2
(cm2)
lT2
(cm sec2)
l2
(cm2)
lT2
(cm sec2)
l2
(cm2)
lT2
(cm sec2)
1
2
3
4
5
6
7
8
9
Plot a graph of l2 against lT2 (as shown in Figure2) and determine the values of the slope
and the intercept on the l2 axis.
Slope of the graph = ……………… cm/sec2.
Intercept = …………….. cm2.
Acceleration due to gravity g = 42 x slope = …………… cm/sec2.
Radius of gyration, k = (intercept) ……. cm2.
Estimation of error
Maximum log error
Using Equation (5)
2
2
4
T
L
g
Taking logarithm on both sides and differentiating, we have
T
T
L
L
g
g
2
T
T
L
L
gg 2,
where L and T are the least counts of distance and period axes of the graph between
time period and distance from C.G.

Results
The acceleration due to gravity, g = -------- cm/s2
Actual value = --------- cm/s2
Percentage error = -------- %
Maximum log error = --------- cm/s2
The radius of gyration about the axis of rotation = ------- cm.
The M.I. of the pendulum about the axis of rotation = ---- gcm2.
Answers to Pre-lab Assessment
1. a
2. a
3. b
4. b
5. b
6. a
7. b
8. a
9. b
10. a

