AA 4949A TC VT55 Programming Manual
AA-4949A-TC VT55 Programming Manual AA-4949A-TC VT55 Programming Manual
User Manual: AA-4949A-TC VT55 Programming Manual
Open the PDF directly: View PDF ![]() .
.
Page Count: 74

VT55
Programming Manual
Order No. AA-4949A-TC

February 1977
This
document
describes methods and available software for programming
the
VT55 terminal in
the
FORTRAN
and
BASIC-PLUS languages.
VT55
Programming Manual
Order No. AA-4949A-TC
SUPERSESSION/UPDATE
INFORMATION:
For
RT-ll/FORTRAN
users, this manual supersedes
Chapter
1
of
the
FORTRAN/RT-ll
Extensions Manual
(DEC-II-LRTEA-C-D).
For
the
other
operating systems
it contains
new
information.
OPERATING
SYSTEM
AND
VERSION: RT -11 V02C
RSX-llMV03
RSX-IID
V6.2
lAS
V1.1
RSTS/E V6A
SOFTWARE VERSION:
FORTRAN
IV
VIC
BASIC-PLUS
VI
FORTRAN-IV
PLUS V02
First Printing
February
1977
The
information in this
document
is
subject to
change
without notice
and
should
not be construed
as
a
commitment
by Digital
Equipment
Corporation. Digital Equipment Corporation assumes
no
responsibility
for any errors that may appear in this
document.
The
software described in this
document
is
furnished
under
a license
and
may be used or copied only in
accordance with
the
terms
of
such
license.
Digital Equipment Corporation assumes no responsibility for
the
use or reliability
of
its software on equip-
ment
that
is
not
supplied by DIGITAL.
Copyright © 1977 by Digital
Equipment
Corporation
The
following are trademarks
of
Digital
Equipment
Corporation.
COMPUTER
LABS DEC
US
FOCAL MASSBUS
COMTEX DECsystem-IO
INDAC
RSTS
DDT
DIBOL LAB-8 RSX
DEC
DIGITAL
OMNIBUS TYPESET-8
DECCOMM EDUSYSTEM OS/8 TYPESET-IO
DECtape FLIP
CHIP
PDP
TYPESET-II
PHA
UNIBUS
9/77-14
PREFACE
CHAPTER
1
1.1
1.2
1.3
1.4
1.5
1.6
CHAPTER
2
2.1
2.2
2.2.1
2.2.2
2.2.3
2.2.4
CHAPTER
3
3.1
3.1.1
3.1.2
3.1.3
3.1.4
3.2
3.3
3.4
APPENDIX A
A.1
A.2
A.2.1
A.2.2
A.2.3
CONTENTS
GENERAL INFORMATION
......................................
.
GETTING
USED TO
GRAPHIC
TERMS
..........................
.
GRAPHIC
FIGURES
............................................
.
CURSOR CONTROL
............................................
.
MATHEMATICAL
TERMS
......................................
.
TERMS FOR
LARG
E SYSTEMS
..................................
.
FURTHER
READING
..........................................
.
FORTRAN
PROGRAMMING
....................................
.
INTRODUCTION
TO PLOT55
...................................
.
PLOT55 PROCEDURES
.........................................
.
Attaching and Detaching a Terminal (RSX
-11
and lAS Only)
.....
.
Graphic Procedures
.........................................
.
Alphanumeric Procedures
...................................
.
Sending Escape Sequences
...................................
.
BASIC-PLUS
PROGRAMMING
..................................
.
FNV5,
THE
GENERAL
GRAPHIC
FUNCTION
...................
.
Opening and Closing a VT55 for Output.
.......................
.
Graphic Display with
FNV5
...
:
..............................
.
Alphanumeric Display with
FNV5
............................
.
Producing Hard Copy with
FNV5
.............................
.
FNV6,
THE
TEXT
OUTPUT
FUNCTION
.........................
.
FNV7,
THE
INITIALIZATION
FUNCTION
.......................
.
FNV8,
THE
STEP HISTOGRAM
FUNCTION
......................
.
FORTRAN (PLOT55) ASSEMBLY AND LINKING PROCEDURES
....
ASSEMBLING
AN
OBJECT
FILE
................................
.
LINKING
AN
OBJECT
FILE
TO YOUR
PROGRAM
...............
.
Procedure for R T
-11
Users
...................................
.
Procedure for
RSX-ll
Users
..................................
.
Procedure for lAS Users
.....................................
.
iii
Page
v
1-1
1-1
1-2
1-2
1-3
1-4
1-4
2-1
2-1
2-2
2-2
2-3
2-13
2-16
3-1
3-3
3-3
3-3
3-11
3-11
3-13
3-13
3-15
A-I
A-I
A-3
A-3
A-3
A-4
APPENDIX B
B.l
B.2
B.3
B.4
B.5
APPENDIX C
INDEX
C.l
C.2
C.3
CA
CONTENTS (Cont.)
SUGGESTED
PWT55
APPLICATIONS
...........................
.
INITIALIZATION
..............................................
.
GRIDS
AND
COORDINATE
AXES
...............................
.
GRAPH
PLOTTING ROUTINES
.................................
.
LABELING
A
GRAPHIC
DISPLA Y
.............................
..
ATTACHING
THE
VT55
AS
AN
OUTPUT DEVICE
................
.
SUGGESTED BASIC-PLUS APPLICATIONS
......................
.
INITIALIZATION
..............................................
.
GRIDS
AND
COORDINATE
AXES
...............................
.
PLOTTING
GRAPHS
..........................................
..
SHADING
A
GRAPH
...........................................
.
iv
B-1
B-1
B-2
B-2
B-4
B-5
C-l
C-2
C-2
C-4
C-4
Index-l
PREFACE
This manual will introduce you, a new VT55 user, to
the
methods
and
resources
that
take fullest advantage
of
the
VT55's capabilities.
The
VT55 can be used as
the
programming console
of
a very small system
such
as might be found in a laboratory or as
one
of
a large
number
of
terminals for an extensive multiuser com-
puter system, as well as
the
range
of
intermediate applications.
The
programming
methods
outlined in this
book are standard for
all
applications
under
the
programming languages
that
are covered.
In order to
understand
this manual fully, you
should
be
familiar with
PDP-II
FORTRAN (for users
of
the
RT-II,
RSX-llM,
RSX-IID,
and
lAS operating systems) or with BASIC-PLUS (for users
of
the
RSTS/E
operating system).
If
you are new to programming or
need
to refresh your
memory,
consult
the
list
of
asso-
ciated
documents
in Section
1.6.
All
users should first read
Chapter
1
and
then
the
chapter
describing
the
programming language to be employed.
Acquiring a high degree
of
skill in programming takes time,
but
the
VT55 software can still be used by
relatively unsophisticated programmers. You will find that, as with any sort
of
practical experience, VT55
programming
is
easiest to learn by simply working examples
and
progressing to
more
sophisticated applica-
tions as your expertise increases. This book
is
therefore
oriented toward examples which illustrate VT55
features in simple
terms
and
which provide good starting points for beginning graphic programmers.
The
chapter
for each programming language will discuss
the
fundamental
FORTRAN
and
BASIC-PLUS
commands
and
concepts
that
a VT55
programmer
needs
to know to get started.
v

1.1
GETIING
USED
TO
GRAPHIC
TERMS
CHAPTER 1
GENERAL INFORMATION
There
are
many
words which have a special
meaning
in graphic programming,
and
you should try to be
familiar with
them
before getting started.
The
VT55 terminal has
more
than
one
terminal
mode.
The
difference
between
one
terminal mode
and
another
has to do with
the
way data are
interpreted
by
the
computer
when
it
is
either
sending
data to
the
VT55
or
receiving data from it.
There
are
three
modes for
the
VT55 terminal:
Alphanumeric
mode
is
the
one
which
is
in effect when you first
turn
on
the
power to a VT55. This mode
implies
that
letters
and
numbers
you type on
the
terminal will be received and
interpreted
by
the
computer
according to a binary code called
the
American Standard Code for Information
Interchange
(ASCII).
AS-
CII characters are
the
symbols used by
the
computer
to perform calculations
and
most
of
the
other
func-
tions
that
we normally associate with
computers
as strictly computational devices. In fact,
the
old-style "tel-
etypewriter" terminal might
never
leave
alphanumeric
mode at
all
in
the
normal course
of
operation, so in
this
sense
alphanumeric
mode
is
the
"normal" mode
of
the
VT55.
The
VT55,
of
course, can also display graphic figures on its screen such as function graphs, markers, and
lines.
These
figures are
put
together from a special set
of
graphic instructions. In order for
the
computer
to
realize
that
a
stream
of
data contains graphic instructions
rather
than
the
usual ASCII characters,
the
VT55
must
enter
a different mode called graphic mode. While in this
mode
the
VT55 will
send
graphic
instructions only,
and
the
data received by
the
VT55 will be displayed
on
the
screen
in graphical form rath-
er
than
as alphabetic
or
numeric
characters. In
other
words,
the
graphic mode changes
the
way data are
interpreted,
not
the
data themselves.
The
VT55 software discussed in this
manual
will switch
the
VT55 from
one
mode to
the
other
automatical-
ly
when
you
run
programs.
It
is
this feature which allows you to
combine
statements
that display graphs
and
statements
that
display
alphanumeric
characters in
the
same
program.
The
VT55 also has a third, temporary
mode
called escape mode. Data
that
are received by a VT55 in escape
mode
are
interpreted
as "immediate" control instructions for
the
VT55.
These
instructions do
such
things
as erasing portions
of
the
screen,
changing
the
position at which a line
of
text
will
appear, and,
if
your ter-
minal has a "hard copy"
unit
built in, making a paper copy
of
the
VT55 screen.
When
the
terminal has
completed
the
function
commanded
by
such
an escape sequence, it
returns
to its previous mode, and so
the
escape mode
is
only a temporary state. VT55 software covered in this book allows you to
send
escape
sequences to
the
VT55 which force it to
enter
escape mode, perform a function
such
as
the
ones
men-
tioned,
and
then
to
return
to
the
former mode, all with a single
subroutine
call.
The
chapters
for each pro-
gramming
language discuss escape
sequences
in
more
detail.
1-1
Genera/In/ormation
1.2
GRAPHIC
FIGURES
The
VT55 allows you to display
the
following types
of
graphic figures on its
screen:
Graphs, which are plotted on
the
screen
as a series
of
points or line
segments;
Shaded Graphs, with
the
screen
"filled in"
underneath
the
graphed function;
Markers,
which are
short
vertical line
segments
that
can be displayed at
interesting
points on a
graph;
and
Horizontal
or
vertical lines, which
span
the
entire
width
or
height
of
the
screen
and can be used,
for example, to display a grid
or
to
layout
coordinate axes on
the
screen.
At any given time, you can simultaneously display on
the
screen
up to two functions (two graphs, two
shaded
graphs,
or
one
of
each),
up to 24 lines
of
80
alphanumeric
characters, 236 horizontal lines, 512 ver-
tical lines,
and
512 graph markers.
As
you might expect,
the
VT55 has to be in graphic mode for
any
of
these
graphic features to operate; only
in
that
mode will
the
graphic data
be
properly interpreted. Additionally, you
must
specifically
enable
each
graphic figure you wish to use;
the
graphic figures are
not
available immediately
upon
entering
graphic
mode. Enabling a figure
such
as
"Shaded
Graph
1"
does not
mean
that
a
shaded
graph immediately appears
on
the
screen
but
only
that
the
VT55
is
now capable
of
displaying a
shaded
graph;
nor
does
the
enabling
of
this figure
mean
that
the
next
function to be plotted will be identified
thereafter
as Shaded
Graph
1.
Put-
ting a
shaded
graph on
the
screen,
to
continue
with
the
example,
is
a
three-step
process in both program-
ming
languages:
Step 1 invokes graphic
mode
and
enables
Shaded
Graph
1 in a single
subroutine
call;
Step 2
is
a
second
subroutine
call to select Shaded
Graph
1 as
the
next
figure to be plotted;
Step 3
is
a third
subroutine
call
that
tells
the
VT55 to plot Shaded
Graph
1.
In
the
same
subroutine
call employed in Step
1,
you can also selectively disable
each
graphic figure. As you
will see in
some
of
the
examples
in later
chapters,
repeated calls to
the
subroutines
referred to
here
can
make
various graphic figures
appear
on
the
screen
(two
superimposed
graphs, for
example)~
and
then
some
of
the
figures
can
be erased
without
affecting
the
others.
Each
of
the
three
steps
must
be
done
for
every
graphic figure you display on
the
VT55
screen,
but
the
steps
do
not
necessarily have to
occur
in
the
above order. For
example,
the
subroutine
referred to in Step 3,
which plots graphs
and
shaded
graphs,
is
actually telling
the
VT55 to store a value or series
of
values in its
graphic memory.
When
you plot a single point a single value
is
stored,
and
a graph
is
plotted by storing a
series
of
related points.
There
are two sections,
or
registers, in
the
graphic
memory,
one
for
Graph
0
and
one
for
Graph
1.
When,
in Step
3,
you plot Shaded
Graph
1,
you
have
loaded a series
of
values into Register
1,
whether
or
not Shaded
Graph
1 is enabled.
If
you
enable
Shaded
Graph
1 later,
these
values will still be in
Register
1,
so
the
shaded
graph will
appear
on
the
screen
immediately. It follows
that
if
you
then
disable
Shaded
Graph
1,
the
shaded
graph will
vanish
from
the
screen,
but
the
plotting values will still
remain
in
Register
1.
Both
programming
languages
covered
by this
manual
have
a facility for clearing
the
graphic
memory,
that
is, resetting all
the
values in
both
registers to zero.
1.3
CURSOR
CONTROL
When
you first
turn
on
a VT55, a small flashing horizontal line appears in
the
upper
left
corner
of
the
screen
when
the
terminal has
warmed
up. This flashing figure
is
called
the
cursor
and
the
upper
left
corner
is
the
cursor's
home position.
When
the
terminal
is
in
alphanumeric
mode,
the
cursor
shows you
the
posi-
tion at which
the
next
alphanumeric
character
will appear.
1-2
General
Information
When
the
terminal is first switched
on,
it is in alphanumeric mode.
Any
system
commands,
text editing,
and
other
normal programming dialog will appear
on
the
VT55
screen
and
remain there.
The
text
of
these
dialogs will stay
on
the
screen
even
after you
execute
a graphic
command;
graphic
commands
switch to
graphic
mode
but
do
not
contain any instructions to automatically erase alphanumeric characters from
the
screen. VT55 graphic
commands
also are designed to automatically
return
the
terminal to alphanumeric
mode
after
they
complete
the
designated graphic process. You
must
decide
whether
you want only your
graphic program's
output
or
the
program's
output
plus system dialogs on
the
screen.
If
you want to draw a
graph, for example, on a blank screen,
move
the
cursor
to
the
home
position
and
then
command
the
VT55
to erase all
the
text from
the
cursor to
the
bottom
of
the
screen. Both
the
FORTRAN
and
the
BASIC-
PLUS VT55 software contain
commands
that
simplify this operation.
1.4 MATHEMATICAL
TERMS
This manual also uses a few terms borrowed from mathematics to describe plotting graphic figures on a
coordinate system.
VT55 software
under
both
languages allows you to display line segments
on
the
screen
of
any length and at
any position or angle (except vertical). These line segments (not to be confused with
the
vertical and hori-
zontallines
described previously), are drawn on
the
screen
from a particular starting point until
they
con-
nect with a stated destination.
The
language
of
geometry calls this sort
of
"directed" line
segment
a vector,
and
this book uses
the
term to distinguish your variable line segments from
the
previously
mentioned
lines, which are always
either
vertical or horizontal in direction
and
have a fixed length (the height
and
width
of
the
VT55 screen, respectively).
VT55 software allows you to construct a figure from a series
of
vectors and "label"
the
figure as
either
Graph
0
or
Graph
1 (with a Select
command
like
the
command
described in connection with plotting a
shaded graph). Once again, you can use this feature to make figures appear and disappear, or by labeling
portions
of
the
figure differently, to selectively erase part
of
a drawing.
In both programming languages,
the
VT55 constructs graphs from one-dimensional arrays. As you will re-
call, arrays in a program are algebraic variables
that
are created by a
statement
such
as
(for
FORTRAN):
INTEGER
DISPLAY(IOO)
If
you began your VT55 program with this
statement,
you could
then
write additional
statements
to "fill"
the
100 positions
of
DISPLAY with an ordered list
of
numbers
,"for
example:
00
11=1,100
DISPLA Y(I)=SIN(I*3.14159150.)
In both languages,
the
VT55 software
is
designed to plot graphs by reading values from
such
arrays, with a
single
subroutine
call.
The
same
subroutine
call can, with a
minor
change, plot a single isolated point with-
out reference to an array; see
the
chapter
appropriate to your programming language.
In both programming languages, you can
change
the
starting coordinates
of
graphs
and
vectors. You can,
for example, declare
the
starting coordinates to be
the
middle
of
the
screen (x=236 and
y=1l8).
Ifso,
the
next
graph to be displayed starts at x=236,
or
the
next
vector starts at
the
point (236,118).
When
you draw a series
of
vectors, each vector will start at
the
destination point
of
the
previous vector (or
at
the
starting coordinates you have defined, in
the
case
of
the
first vector to
be
drawn). Note also
that
vectors do not have to be enabled,
as
other
figures do.
1-3
Genera/Information
NOTE
The
vector-drawing routines in
both
languages can be used to clear a
single register in
the
graphic
memory
without disturbing
the
other
register. This operation
is
done
by setting
the
graph
number
to
the
number
of
the
register you want to clear
and
then
drawing a vector
from the point (0,0) to
the
point (512,0). Doing
so
will load
the
regis-
ter
with zeroes.
1.5
TERMS
FOR
LARGE SYSTEMS
Each
of
the
input/output
paths in a RSTS/E or
RSX-ll
computer
system
is
assigned a
number
called a
logical
unit
number. This
number,
in effect, tells
the
computer
to
either
send
or receive data
through
a
specific communication channel.
If
the
data are being
sent
to
some
output
device, it
is
obviously important
that
they
end
up at
the
right place, e.g., a line printer
rather
than
a paper tape punch.
The
logical unit
number
tells
the
computer
what the proper destination
is
for a certain stream
of
data,
or
in
the
case
of
input, where to look to find data
on
which to operate. For instance,
the
number
5 in
the
FORTRAN
state-
ment
WRITE
(5,1)
is
a logical unit
number
that
is
normally assigned by
the
FORTRAN
compiler to
the
user's terminal. VT55 software allows you to override this "default" assignment and change the logical unit
number
of
your VT55. This feature will be discussed in detail in
the
chapters
that
follow.
In
the
RSTS/E
operating system,
there
can be a large
number
of
terminals attached to the host computer.
Each terminal, VT55s included, has
an
identification code called a terminal number. A particular installa-
tion will assign codes
such
as
KB20:, for "Keyboard
20,"
to identify an individual device.
The
number
20
would be used in
the
Open VT55
command
described in Section
3.1.1
of
this manual.
In
the
RSX-ll
and lAS systems, event flags are used to "synchronize" several programs (called "tasks")
that
are competing for use
of
the
computer.
If
several tasks are ready to run,
event
flags keep track of, for exam-
ple,
input
or
output
operations
that
are currently underway.
When
a high-priority task
is
waiting for a data
transfer operation to be completed,
the
resources
of
the
computer
can be used by lower priority tasks until
an
event
flag informs
the
system
that
the
data transfer
is
finished. This type
of
synchronization can be
valuable to VT55 programmers using large systems.
If
you fall into this category, consult your system's
Executive Reference
Manual
for information about system directives used for controlling
event
flags. One
form
of
the
subroutine
PLOT55, described in Section
2.2.1
of
this manual,
names
a specific event flag
number
that
can be used to synchronize your VT55 program.
1.6
FURTHER
READING
You will find
the
following manuals helpful if you
need
further
information on BASIC-PLUS,
FORTRAN,
operating systems,
or
the
VT55 hardware.
Languages
BASIC-PLUS Language Manual
(DEC-II-0RBPB-A-D)
IAS/RSX-ll
FORTRAN
IV User's
Guide
(DEC-ll-LMFUA-C-D)
PDP-II
FORTRAN
Language
Reference
Man ual
(DEC-ll-LFLRA-C-D)
RT-Il1RSTS/E
FORTRAN
IV User's
Guide
(DEC-II-LRRUA-A-D)
1-4
Genera/In/ormation
Operating Systems
RSX-llM
Operator's Procedures Manual
(OEC-ll-OMOGA-C-O)
RT-ll
System
Reference
Manual
(OEC-ll-ORUGA-C-O,
ONl,
ON2)
RSTS/E Programming Manual
(OEC-ll-ORPMA-A-O)
RSX-ll
M Executive
Reference
Manual
(DEC-ll-OMERA-C-O)
RSX-110
Executive
Reference
Manual
(OEC-ll-OXERA-A-D)
lAS Executive
Reference
Manual, Volume 1
(DEC-ll-OIEI
A-A-O)
lAS User's
Guide
(OEC-II-0IUGA-A-O)
VT55
Hardware
VT55-E,F OECgraphic Scope Users' Manual
(EK-VT55E-TM-OOn
1-5

2.1 INTRODUCTION
TO
PLOT55
CHAPTER
2
FORTRAN
PROGRAMMING
FORTRAN
control
of
the
VT55
is
provided by a single
subroutine
called PLOT55. A call to this routine
from your main program has
one
of
the
following two forms:
CALL
PLOT550CMO,IX,IY,ITBL)
or
CALL
PLOT550CMO,IX,IY)
ICMO, IX, IY, and ITBL,
the
arguments
of
PLOT55,
must
all
be
integers or, in certain cases, integer arrays.
The
arguments
have
the
following meanings in
the
three-argument
form
of
PLOT55:
ICMO
defines
the
procedure
that
will
be
carried
out
by a single call to PL0T55.
IX is, in most cases,
the
x coordinate of, for example, a point to be plotted
on
the
VT55
screen.
The
specific use
of
this
argument
varies
depending
on
the
procedure being per-
formed (i.e.,
depending
on
the
value
of
ICMO). Its use will be explained for each procedure
in
the
next
section.
I Y is, similarly,
the
y coordinate
of
a point. Its use will also be covered for each procedure.
The
purpose
of
ITBL, which
is
a 16-element integer array,
is
to provide a storage space
that
PLOT55 can
use to store status information (e.g., which graphic figures are enabled) from
one
PLOT55 call to
the
next.
For this reason, ITBL
is
called a status table.
If
you do not specify
the
fourth
argument,
PLOT55
will
use
an
internally
defined
array for
the
same
purpose.
The
use
of
this fourth
argument
in R T
-11
FORTRAN
pro-
grams usually makes
no
difference in
the
way
your
PLOT55 program functions (see Appendix B
of
this
manual
for
some
important
exceptions).
When
you
do
specify ITBL, begin your program with
the
state-
ments:
INTEGER
ITBL(16)
OAT
A ITBLlI6*O/
These
statements
a) define a 16-element array called ITBL,
and
b) fill
the
array with zeroes.
Remember
that
the
ITBL
must
be initialized (as with
the
OAT
A
statement
above) at
the
beginning
of
each
new
PLOT55 program.
2-1
FOR
TRAN
Programming
NOTES
1.
Do
not
use
both
three-
and
four-argument
forms
of
PLOT55
in
the
same
program,
since
doing
so
would
effectively
create
two
separate
ITBLs.
2.
If
you
use
the
four-argument
form in
an
overlaid
program,
ITBL
must
be
placed
in
the
root
of
the
overlay
so
that
all PLOT55
calls
can
gain access
to
it.
3.
RSX -11
and
lAS
users
must
use
the
four-ar-
gument
version
of
PLOT55
at
all times.
2.2
PLOT55
PROCEDURES
There
are
14
procedures
that
you can
control
by
changing
the
value
of
ICMD
in
CALL
PLOT55
(ICMD
IX, IY [,ITBL]).
ICMD
can
be
any
integer
in
the
range
0 to 13, with
the
results
described
in this section. '
NOTE
In
many
cases, you
do
not
have
to specify all
three
(or four)
arguments
in a PLOT55 call.
However,
three-argument
calls
must
always
contain
two
com-
mas,
and
four-argument
calls,
three
commas.
PLOT55
programs
will
function
unpredictably
if
any
commas
are left out.
2.2.1
Attaching
and
Detaching
a
Terminal
(RSX-ll
and
lAS
Only)
Format:
CALL
PLOT55(O,ILUN,IEFN,ITBL)
ILUN
is
the
logical
unit
number
and
IEFN
is
the
event
flag
number.
If
ILUN
is
-1,
the
VT55
terminal
is
detached.
If
ILUN
is
a positive
integer
(1-12),
the
logical
unit
specified by
ILUN
is
attached
to
the
task
being
executed
and
will
not
accept
input
from
another
task.
IEFN,
the
event
flag
number
(1-32),
is
important
in
controlling
the
scheduling
of
tasks in a
multitask
system.
A detailed
explanation
of
this
number
is
beyond
the
scope
of
this book,
but
more
information
can
be
found
on
this
number
(and
the
logical
unit
number)
in
the
Execu-
tive
Reference
Manual
for your
system.
The
actual
function
of
ICMD=O
is
to
store
the
logical
unit
number
(ILUN)
and
event
flag
number
(lEFN)
in
the
status
table (ITBL).
Once
this
function
is
performed,
all
output
from PLOT55 calls (graphic
and
al-
phanumeric
instructions)
is
sent
to
the
device
associated with
ILUN.
The
ICMD=O
call does
not
associate
ILUN
with
the
VT55; you
must
do
that
job
separately, using
any
of
several
methods
available to users
of
lAS,
RSX-l1
M,
and
RSX-IID.
The
system
directive
ASNLUN
is
one
such
method.
ASNLUN
can be written
into
your
program
as
ifit
were a
FORTRAN
subroutine:
CALL
ASNLUN
(I,'TT',17)
In this
example,
17
is
the
octal
terminal
number
of
the
VT55,
so
that
logical
unit
I
is
associated with physi-
cal
device
TTI7:.
Note
that
if
this
call were written
into
a
program
that
was
run
from
TTI5:,
for
example,
2-2
FOR
TRAN
Programming
the
VT55 would
only
display
information
created
by PLOT55. Unless you reassigned logical units 5
and
6
as well,
these
numbers
would
continue
to refer to
the
terminal
interface
(TTI5:)
and
the
line
printer,
respectively. You
could
therefore
keep
the
VT55
screen
free
of
unwanted
alphanumeric
displays,
such
as
the
messages
created
by
PAUSE
statements.
In
any
case, it is
best
to use
ASNLUN
or
some
other
method
to
assign
ILUN
to
the
VT55
before
you call
ICMD=O. See
the
documentation
for
your
operating
system
for
alternative
methods
of
making
this assign-
ment.
Appendix
B suggest a
FORTRAN
subroutine
that
performs
the
assignment
and
attachment
in a single
call.
NOTE
ICMD=O
is
useful
only
under
the
RSX
-11
and
lAS
systems.
This
command
form
can
appear
in R T
-11
programs, too,
but
will
not
perform
any
operation.
2.2.2
Graphic
Procedures
Select
Graph
Number
(ICMD=l)
Format:
CALL
PLOT55
{I,IGRF,[,ITBLD
IG R F, always
either
0
or
1,
specifies
the
graph
number
of
the
next
graph
(regular
or
shaded)
to be plotted. This
number
will
be
the
label
of
the
next
regular
or
shaded
graph
to
be
plotted
and
will be
the
label
of
that
figure as long as
the
figure is
enabled.
Note
that
this value
of
ICMD
does not display
or
plot a graphic figure
but
only identifies
the
register
that
will
contain
the
plotting values for
the
graph. Plotting
the
figure actually loads this register with plotting
values (see
ICMD=3),
and
enabling
the
figure
(lCMD=2)
allows it to
appear
on
the
screen
as
soon
as it
is
plotted.
Enable
or
Disable
Graphic
Figures
(ICMD=2)
Format:
CALL
PL0T55
(2,IEN
AB,IDISAB[,ITBLD
This call
is
the
"fundamental"
form
of
PLOT55,
because
graphic figures
cannot
be
displayed
until
they
have
been
enabled.
Therefore,
you will, in
most
cases,
want
this
form
to
be
one
of
the
first calls to PLOT55 in
your
program.
Of
course,
this form
can
also
appear
later in
the
program
if
you
want
to
enable
some
new
figure
or
to disable a figure
that
is already
on
the
screen.
IENAB
and
IDISAB
are
lists
of
figures to be
enabled
or
disabled, respectively. You
can
use
the
following values in
these
two
lists:
=
Enter
(leave) graphic
mode.
2 =
Enable
(disable)
Graph
O.
4 =
Enable
(disable)
Graph
1.
8 =
Enable
(disable)
Shaded
Graph
O.
2-3
FOR
TRAN
Programming
16
= Enable (disable) Shaded Graph
1.
32
= Enable (disable) horizontal lines.
64 = Enable (disable) vertical lines.
128 = Enable (disable) markers for Graph (or Shaded Graph)
O.
256 = Enable (disable) markers for Graph (or Shaded Graph)
1.
512 = Disable
all
graphic figures and clear the graphic memory (IENAB only).
To enable or disable more than one figure in a single PLOT55 call, you can enter lists
of
num-
bers, separated by plus signs, for
lEN
AB
or IDISAB. For example, instead
of
putting the
number
1 in
the
IENAB position (to enter graphic mode), you could put 1 +2+4+512, which
would first clear
the
graphic memory and then enter graphic mode and enable Graph 0 and
Graph
1.
NOTES
1.
If
you enter
the
same
number
for both IENAB
and IOISAB,
the
graphic figure for that
number
will
be enab led.
2.
You can also
enter
the
sum
of
several numbers
rather than a list, e.g.,
the
number
24
(instead
of
8+
16)
to represent both shaded graphs. Howev-
er, your program
will
be more easily understood
by other users
if
you avoid this practice.
3.
As
a matter
of
good practice you should always
include the 512 argument in the IENAB posi-
tion the first time you call PLOT55 with
ICMO=2, e.g.,
CALL PLOT55(2,1 +512+2,)
This three-argument example would put the
terminal in graphic mode, enable Graph
1,
and
also would clear
all
previous graphic informa-
tion from the status table and memory.
If
you
were running several graphic programs in se-
quence, the 512 would erase
the
graphic output
of
the last program from the screen before dis-
playing a new figure. (Notice also that in the
sample call above,
the
IOISAB position
is
emp-
ty, indicating that no graphic figures are being
disabled,
but
that
the
"trailing" comma
is
still in-
cluded.)
4.
It
is
usually not desirable to enable different
fig-
ures with
the
same label (for instance, both
Graph 0 and Shaded Graph 0).
2-4
FOR
TRAN
Programming
Plot Graph (ICMD=3)
After you have enabled a graph and selected its label (ICMD=2
and
ICMD=I,
respectively),
you can use
ICMD=3
to plot
the
figure.
Format: CALL PLOT55 (3,IX,IY[,ITBL])
or
CALL PLOT55(3,IX,IARRAY[,ITBL])
When
the
first format
is
used,
ICMD=3
will display a single point
on
the
screen at
the
coordi-
nates given by IX
(0-510
and IY (0-235).
When
you use
the
second format, IX should be a negative integer and
IARRAY
an integer
array
that
you have previously filled with a series
of
values. In this form,
ICMD=3
will plot a
series of points on the screen.
The
number
of
points plotted
will
be
the
absolute value
of
IX;
the
same
number
of
y coordinates will be selected from
IARRA
Y,
starting with
the
first ele-
ment
of
the
array; and the points will be separated by one unit in
the
x direction.
For example,
CALL PLOT55(3,100,100)
will plot a single point
on
the
screen at a position 100 units from
the
bottom
of
the
screen
(y=
100) and 100 points from
the
left edge (x=IOO).
The
other
form,
CALL PLOT55 (3,-1 OO,ISINE)
would plot a sine function on
the
screen (assuming
that
ISINE has
been
identified in a DI-
MENSION
statement
and filled with sine values before this call to PLOT55).
The
sine
function would be made
of
100 points (the absolute value ofIX=-IOO), and each point would
be separated from neighboring points by one x unit on the screen.
NOTE
It
is
generally necessary to define a starting x posi-
tion (ICMD=7) before plotting regular or shaded
graphs.
It
is
not possible to assign two or more y val-
ues to
the
same x value in a single graph; therefore,
vertical lines cannot be plotted with ICMD=3.
Example I demonstrates
the
use
of
ICMD=I,
ICMD=2, and
ICMD=3
to display a series
of
functions on the VT55 screen.
2-5
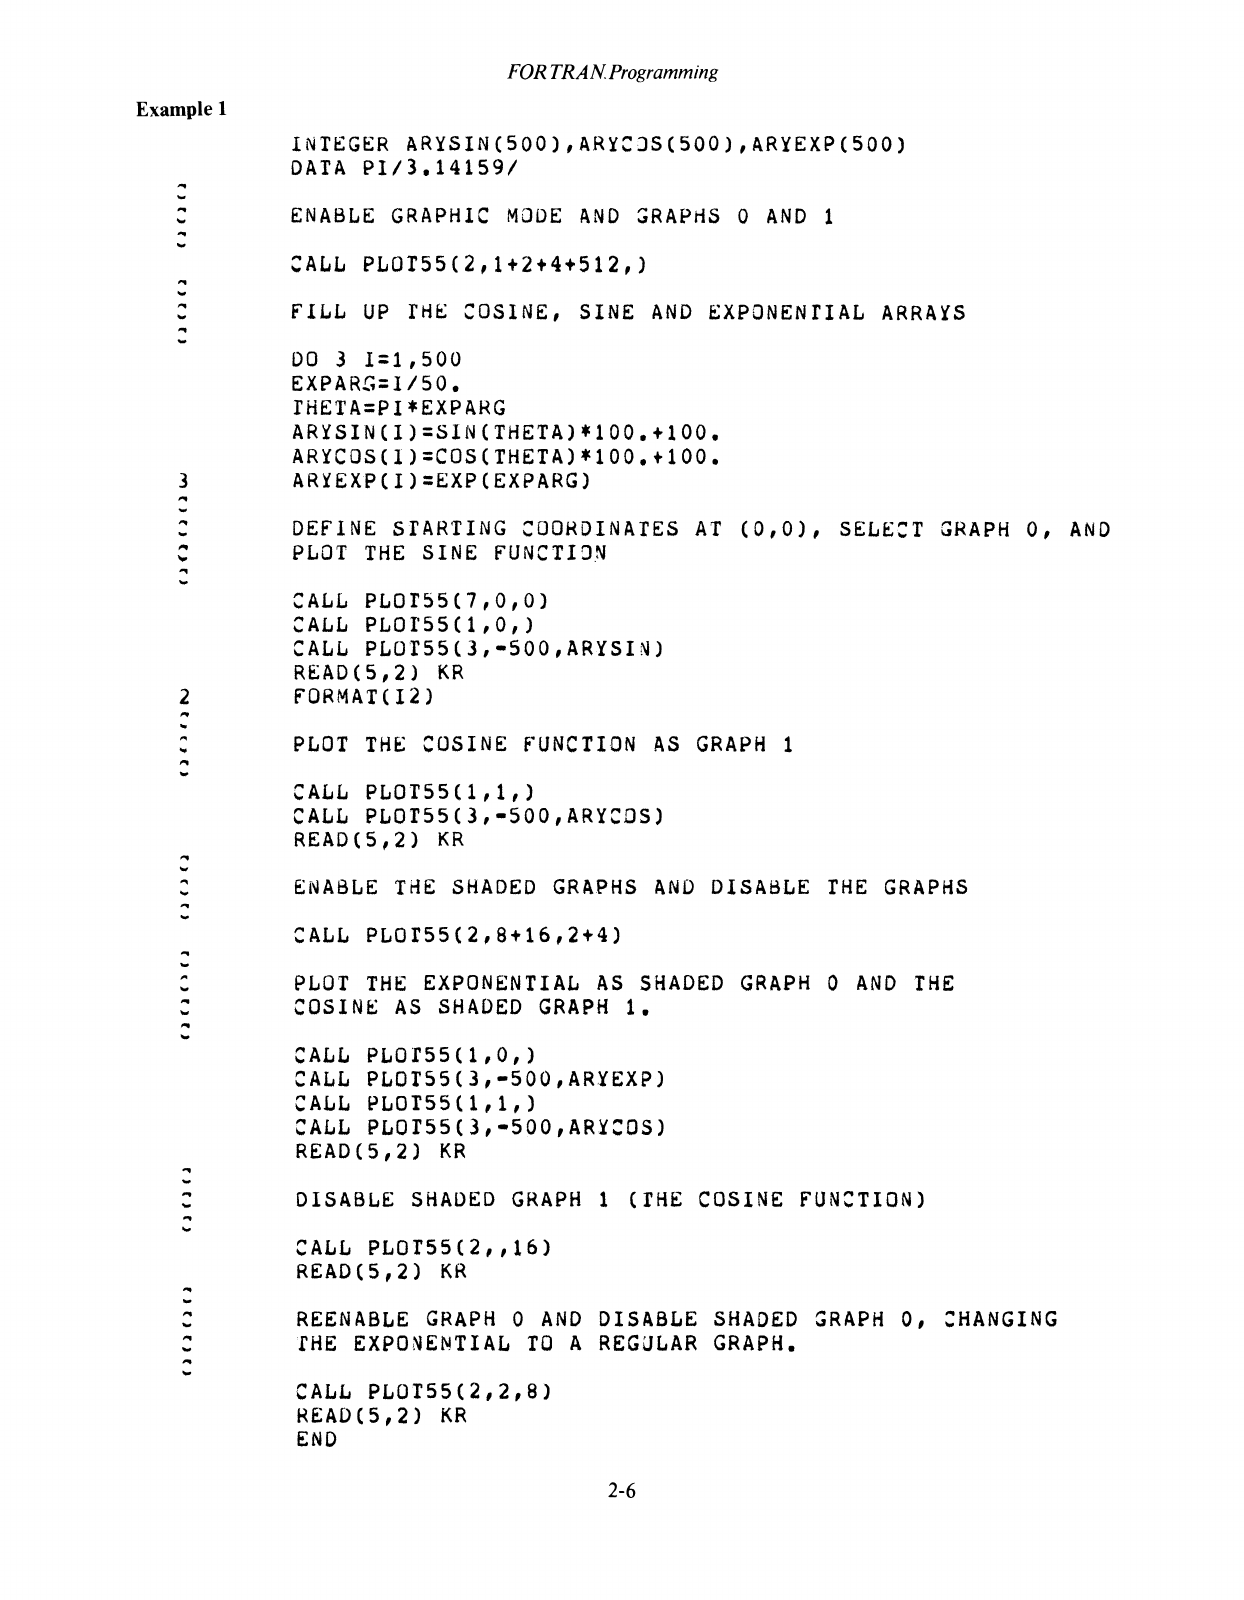
Example 1
...
""
...
""
...
""
...
""
...
3
...
w
...
'"
...
""
FOR
TRA N
Programming
INTEGER
ARYSIN(500),ARYCJSC500),ARYEXP(500)
DATA
PI/3.141S91
ENABLE
GRAPHIC
MODE
AND
~RAPHS
0
AND
1
CALL
PLOfSS(2,1+2+4+512,)
fILL
UP
rH~
COSINE, SINE
AND
~XPONENTIAL
ARRAYS
DO
3
1=1,500
EXPARG=I/50.
rHETA=PI*EXPARG
ARYSINCI)=SlNCTHETA)*100.+100.
ARYCOSCl)=COS(THETA)*100.+100.
ARYEXPCI)=EXPCEXPARG)
DEFINE
STARTING
COORDINATES
AT
(0,0),
SELE:T
GRAPH
0,
AND
PLOT
THE
SINE
fUNCTION
CALL
PLOTS5(7,0,0)
CALL
PLOrSS(l,O,)
CALL
PLOTSS(3,-SOO,ARYSIN)
READCS,2)
KR
2
FORMATCI2)
...
..
...
w
...
""
...
..
~
...
...
""
...
..
...
..
...
""
...
..
...
w
...
...
...
...
...
...
PLOT
THE
COSINE
fUNCTION
AS
GRAPH
1
CALL
PLOT55(1,1,)
CALL
PLOT55(3,-500,ARYCDS)
READ(S,2)
KR
ENABLE
THE
SHADED
GRAPHS
AND
DISABLE
THE
GRAPHS
CALL
PLOfSS(2,8+16,2+4)
PLOT
THE
EXPONENTIAL
AS
SHADED
GRAPH
0
AND
THE
COSINE
AS
SHADED
GRAPH
1 •
CALL
PLOfS5(1,O,)
CALL
PLOTSS(3,-SOO,ARYEXP)
CALL
PLOTS5(1,1,)
CALL
PLOTSS(3,-500,ARY:OS)
READ(S,2)
KR
DISABLE
SHADED
GRAPH
1
CTHE
CALL
PLOrS5(2,,16)
READ(S,2)
KR
REENABLE
GRAPH
0
AND
DISABLE
fHE
EXPONENTIAL
TO
A
REGULAR
CALL
PLOTS5(2,2,8)
READ(5,2)
KR
END
2-6
COSINE
FUNCTION)
SHADED
GRAPH
0,
CHANGING
GRAPH.
FOR
TRAN Programming
Notes on Example
1:
1.
The subroutine PLOT55(7,0,0) defines a starting x position (x=O) for
all
the
graphs to be dis-
played by the program. Unless you want to change
the
starting position
of
graphic figures,
you do not have to repeat this call.
2.
The statements READ(5,2)
KR
are used in this example to make
the
program pause be-
tween each graphic display. Each time this statement
is
reached,
the
computer
will
attempt to
read a character from
the
keyboard (logical unit 5); when you type a carriage return on
the
keyboard the program
will
continue.
FOR
TRAN
provides a better method, the PAUSE statement, for doing
the
same thing, but
using it
will
make
the
letters "PAUSE--" appear on the screen each time
the
program reaches
a PAUSE statement. A later example
will
show you how to remove this sort
of
undesired text
from
the
screen.
(IAS/RSX-ll
users: see Section
2.2.3
for a further discussion
of
the PAUSE
statement.)
3.
At this point, you should try running this example program.
It
will
function
as
follows:
a)
First, Graph
0,
a sine function,
will
be traced out on
the
screen
of
the VT55 by 100 dots.
b) Type a carriage return, and Graph
1,
a cosine function,
will
also appear. Notice that the
sine and cosine functions have the same starting x position.
c) Type another carriage return, and both graphs
will
disappear and be replaced by Shaded
Graphs 0 and
1,
which represent
the
exponential and cosine functions, respectively.
d) Type another carriage return and Shaded Graph 1
will
be disabled, making
the
cosine
function vanish.
e) Typing a final carriage return
will
disable
the
shaded graphs and reenable Graph
O.
This
time
the
Graph 0 label
is
given to the exponential function, so the shaded graph
of
the
exponential
will
be replaced with a regular graph
of
the
same function.
Plot Horizontal Line (ICMD=4)
Format: CALL PL0T55(4,IDISP,IY[,ITBLj)
This form
is
used to either erase or display horizontal lines that span the entire width
of
the
screen.
IDISP
is
set to 0 to erase a line or to 1 to display a line.
IY
gives the y coordinate (0 to 235)
of
the line to be erased or displayed.
2-7
FORTRAN
Programming
Plot Vertical Line (ICMD=5)
Example 2
...
..
..
...
..
...
..
...
...
...
..
...
...
...
...
...
...
...
..
...
Format: CALL PLOT55 (5,IX,IDISP[,ITBL))
This form
is
very similar to
the
previous ICMD=4,
but
controls vertical rather than horizon-
tal lines. Note that
the
position
of
IDISP
is
different for this format than for ICMD=4.
IX
gi
ves
the
x coordinate (0 to
5(1)
of
a vertical line to be erased or displayed.
IDISP
is
set
to 0 to erase a line or to 1 to display a line.
Example 2 demonstrates
the
use
of
both line types.
THIS
SAMPLE
PROGRAM
SHONS
HOW
TO
DRAN
AND
ERASE
HORIZONTAL
AND
VERTI:AL
LINES
B~GIN
BY
RESETTING
THE
GRAPHIC
MEMORY
(THE
512
ARGU~ENT)
AND
ENABLING
BJrH
LINE
TYPES
CALL
PLOr55(2,1+32+64+512,)
NEXT
DRAN
51
VEHTICAL
LINES
D(J
1
1=2,502,10
1
CALL
PLOr55(5,I,1)
READ(5,2)
KR
2
fORMAT(A2)
...
...
...
...
NON
DRAw
IN
24
HORIZONTAL
LINES
ro
fJRM
A
GRID
J
DO
3
1=2,232,10
CALL
PLOr55(4,1,I)
READ(5,2)
KR
...
...
..
...
..
...
ERASE
THE
VERTICAL
LINES
DO
4
1=2,502,10
4
CALL
PL(Jr55(5,I,O)
END
Notes on Example
2:
As
the
example shows,
ICMD=4
and
ICMD=5
can each be used to either erase or display horizontal and
vertical lines. Again,
the
READ
statement
is
used to insert temporary pauses, preventing unwanted text
from appearing on
the
screen.
2-8
FOR
TRAN
Programming
Plot
Markers
(ICMD=6)
Format: CALL PLOT55(6,IX,IDISP[,ITBL))
With this command, you can place markers (short vertical line segments) at any points on a
regular or shaded graph.
The
markers for
Graph
0 and for
Graph
1 must
be
enabled separate-
ly (see ICMD=2).
When
you call PLOT55 with ICMD=6, markers will be displayed
on
the
graph
that
has cur-
rently been selected (see ICMD=1).
The
following example illustrates a
common
error:
CALL PLOT55(2,1+2+4+256,) (Enable both graphs and markers for
Graph
1)
CALL PLOT55(1,0,) (Select
Graph
0)
CALL PLOT55(6,50,1) (Plot marker at x=50)
This example will not work, because the second call selected
Graph
0,
and only
the
markers for
Graph
1 have been enabled.
If
you plan to use markers in a graphic display,
avoid this problem by enabling both sets
of
markers
when
you use both
Graph
0 and
Graph
1 (or Shaded
Graph
0 and Shaded
Graph
1). You
will
still have to be careful,
of
course, to
ensure
that
a marker
is
placed on
the
correct graph.
IX, an integer from 0 to 511, gives
the
x coordinate at which the
marker
will appear.
If
a
graph exists at
that
x position,
the
marker will appear on the graph; if
there
is
no graph at
that
x position on
the
screen, the marker
will
appear on
the
y=O
line at the bottom
of
the
screen.
IDISP
will
cause
the
marker to either be erased (IDISP=O) or displayed (IDISP= 1).
Example 3 demonstrates the proper use
of
markers.
2-9
Example 3
...
...
...
...
...
...
...
...
...
...
'"
...
...
..
...
...
...
...
...
..
1
...
...
...
...
...
..
FOR
TRAN
Programming
THIS
PROGRAM
DEMONSTRATES
THE
USE
OF
MARKERS
ON
GRAPHS
AND
SHADED
GRAPHS
INTEGER
ARISIN(SOO)
DATA
PI/3.141S91
RESET
THE
GRAPHIC
MEMORr,
ENTER
GRAP~IC
MODE,
AND
ENABLE
GRAPH
0
AND
MARKERS
FOR
GRAPH
0
CALL
PLOTSS(2,512+1+2+128,)
FILL
THE
ARRAY
WITH
A
SINE
fUNCTION
DO
1
1=1,500
ARrSIN(I)=SIN(Pl*I/SO.)*100.+100.
DEFINE
STARTING
X
COORDINATE,
SELECT
GRAPH
0,
AND
PLOT
THE
SINE
FUNCTI3N
•
CALL
PLOT55(7,0,O)
CALL
PLOT5S(1,0,)
CALL
PLOTS5(3,-500,ARrSIN)
READ(5,2)
KR
2
FORMAT(I2)
'"
...
...
...
...
...
PUT
A
MARKER
ON
GRAPH
0
EV~Rr
25
X
UNITS
DO
3
1=25,500,25
3
CALL
PLOT55(6,I,1)
READ(5,2)
KR
...
...
..
...
..
..
...
...
...
..
...
..
..
...
NOW
DISABLE
GRAPH
0
AND
ENABLE
SHADED
GRAPH
0:
PLOTTING
THE
SINE
AS
A
SHADED
GRAPH
CALL
PLOT55(2,8,2)
READ(5,2)
KR
REMOVE
THE
MARKERS,
BUT
LEAVE
THE
SHADED
GRAPH
DO
4
1=25,500,25
4
CALL
PLOT55(6,I,O)
READ
(5,2)
KR
END
2-10
FOR
TRA
N
Programming
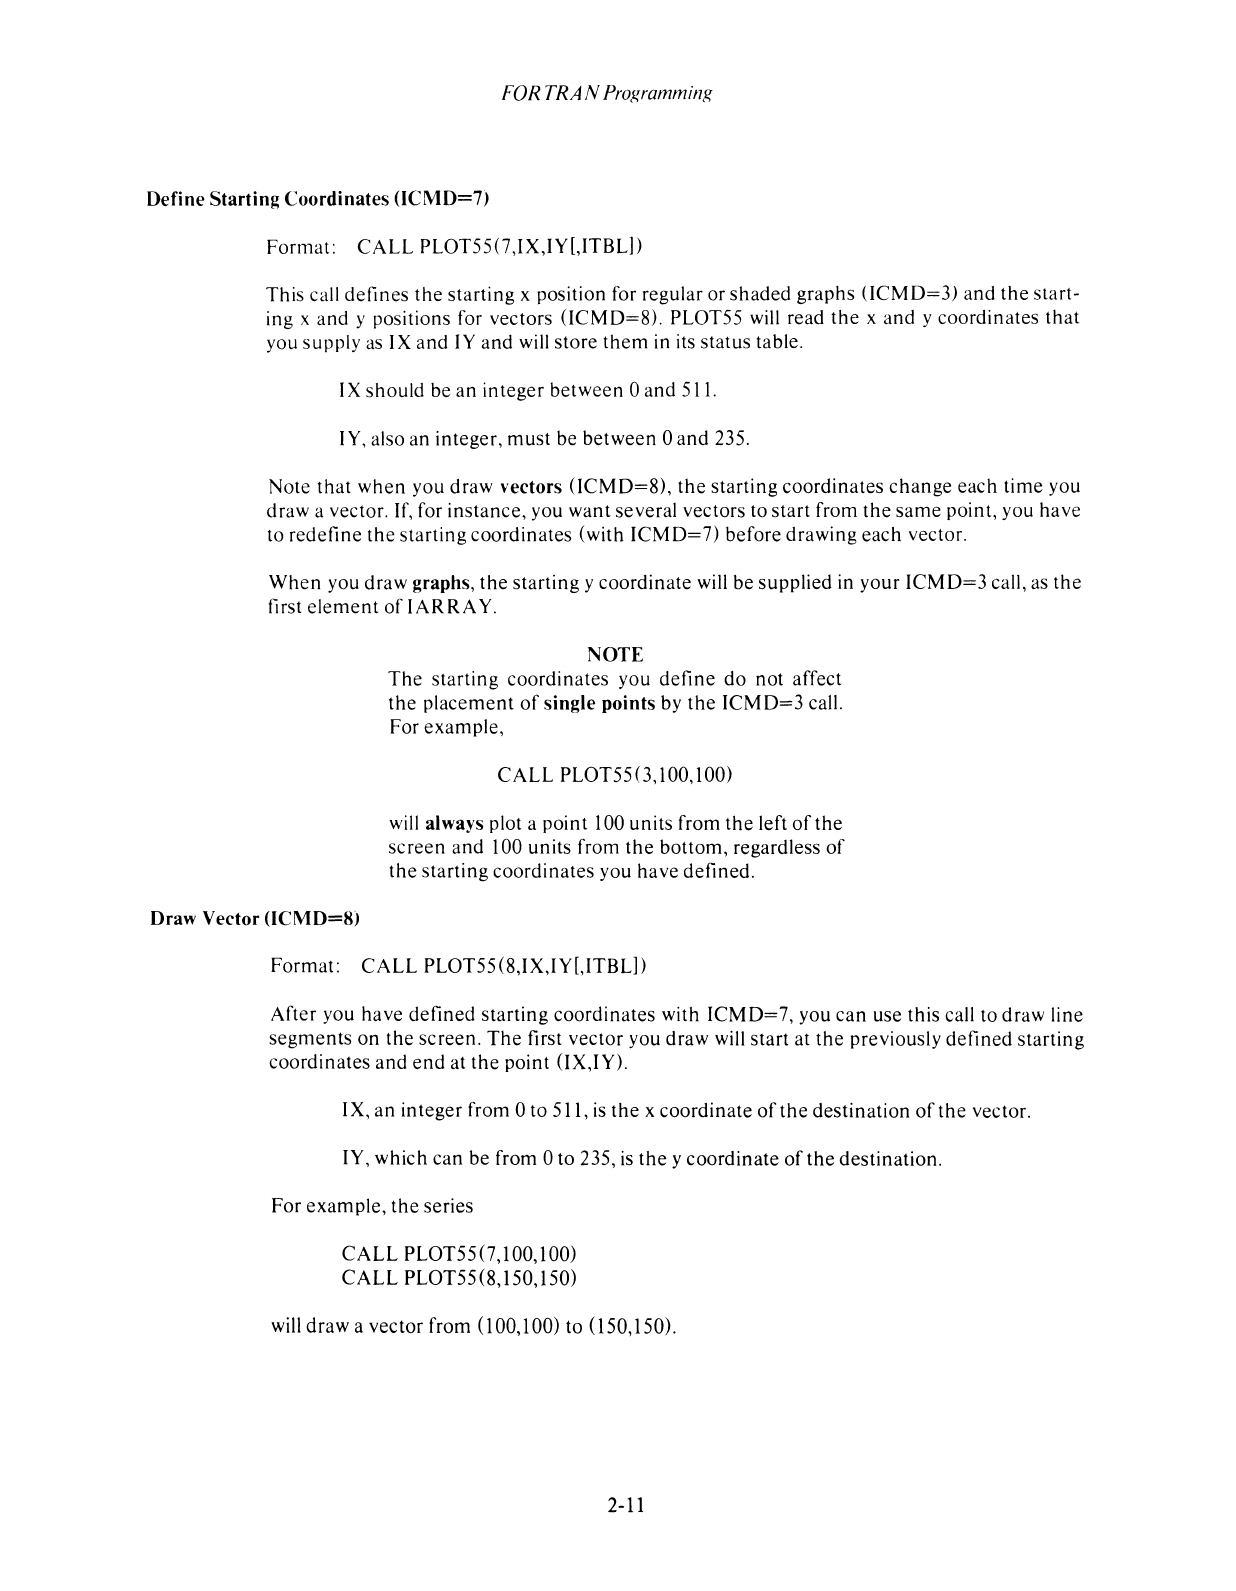
Define
Starting
Coordinates
(ICMD=7)
Format:
CALL
PLOTSS(7,IX,IY[,ITBL])
This call defines
the
starting
x position for regular or
shaded
graphs
(lCMD=3)
and
the
start-
ing x and y positions for vectors
(ICMD=8).
PLOTSS will read
the
x
and
y coordinates
that
you supply as IX
and
IY
and
will
store
them
in its status table.
IX should be
an
integer
between
0
and
Sil.
IY, also an integer,
must
be
between
0
and
23S.
Note
that
when
you draw vectors
(ICMD=8),
the
starting coordinates
change
each
time
you
draw a vector. If, for instance, you
want
several vectors to
start
from
the
same
point, you
have
to redefine
the
starting coordinates (with
ICMD=
7) before drawing
each
vector.
When
you draw graphs,
the
starting y coordinate will be supplied in
your
ICMD=3
call, as
the
first
element
ofIARRA
Y.
Draw Vector
(lCMD=8)
NOTE
The
starting
coordinates you
define
do
not
affect
the
placement
of
single points by
the
ICMD=3
call.
For example,
CALL
PLOTSS(3,IOO,lOO)
will always plot a point 100 units from
the
left
of
the
screen
and
100 units from
the
bottom, regardless
of
the
starting
coordinates you
have
defined.
Format:
CALL
PL0T5S(8,IX,IY[,ITBL])
After
you have
defined
starting
coordinates with
ICMD=7,
you
can
use this call to draw line
segments
on
the
screen.
The
first vector you draw will start at
the
previously
defined
starting
coordinates
and
end
at
the
point (IX,IY).
IX,
an
integer from 0 to
Sll,
is
the
x coordinate
of
the
destination
of
the
vector.
IY, which
can
be
from 0 to 23S,
is
the
y coordinate
of
the
destination.
For
example,
the
series
CALL
PL0T5S(7,100,100)
CALL
PLOTSS(8,ISO,ISO)
will
draw
a vector from
(l00,100)
to (lSO,ISO).
2-11
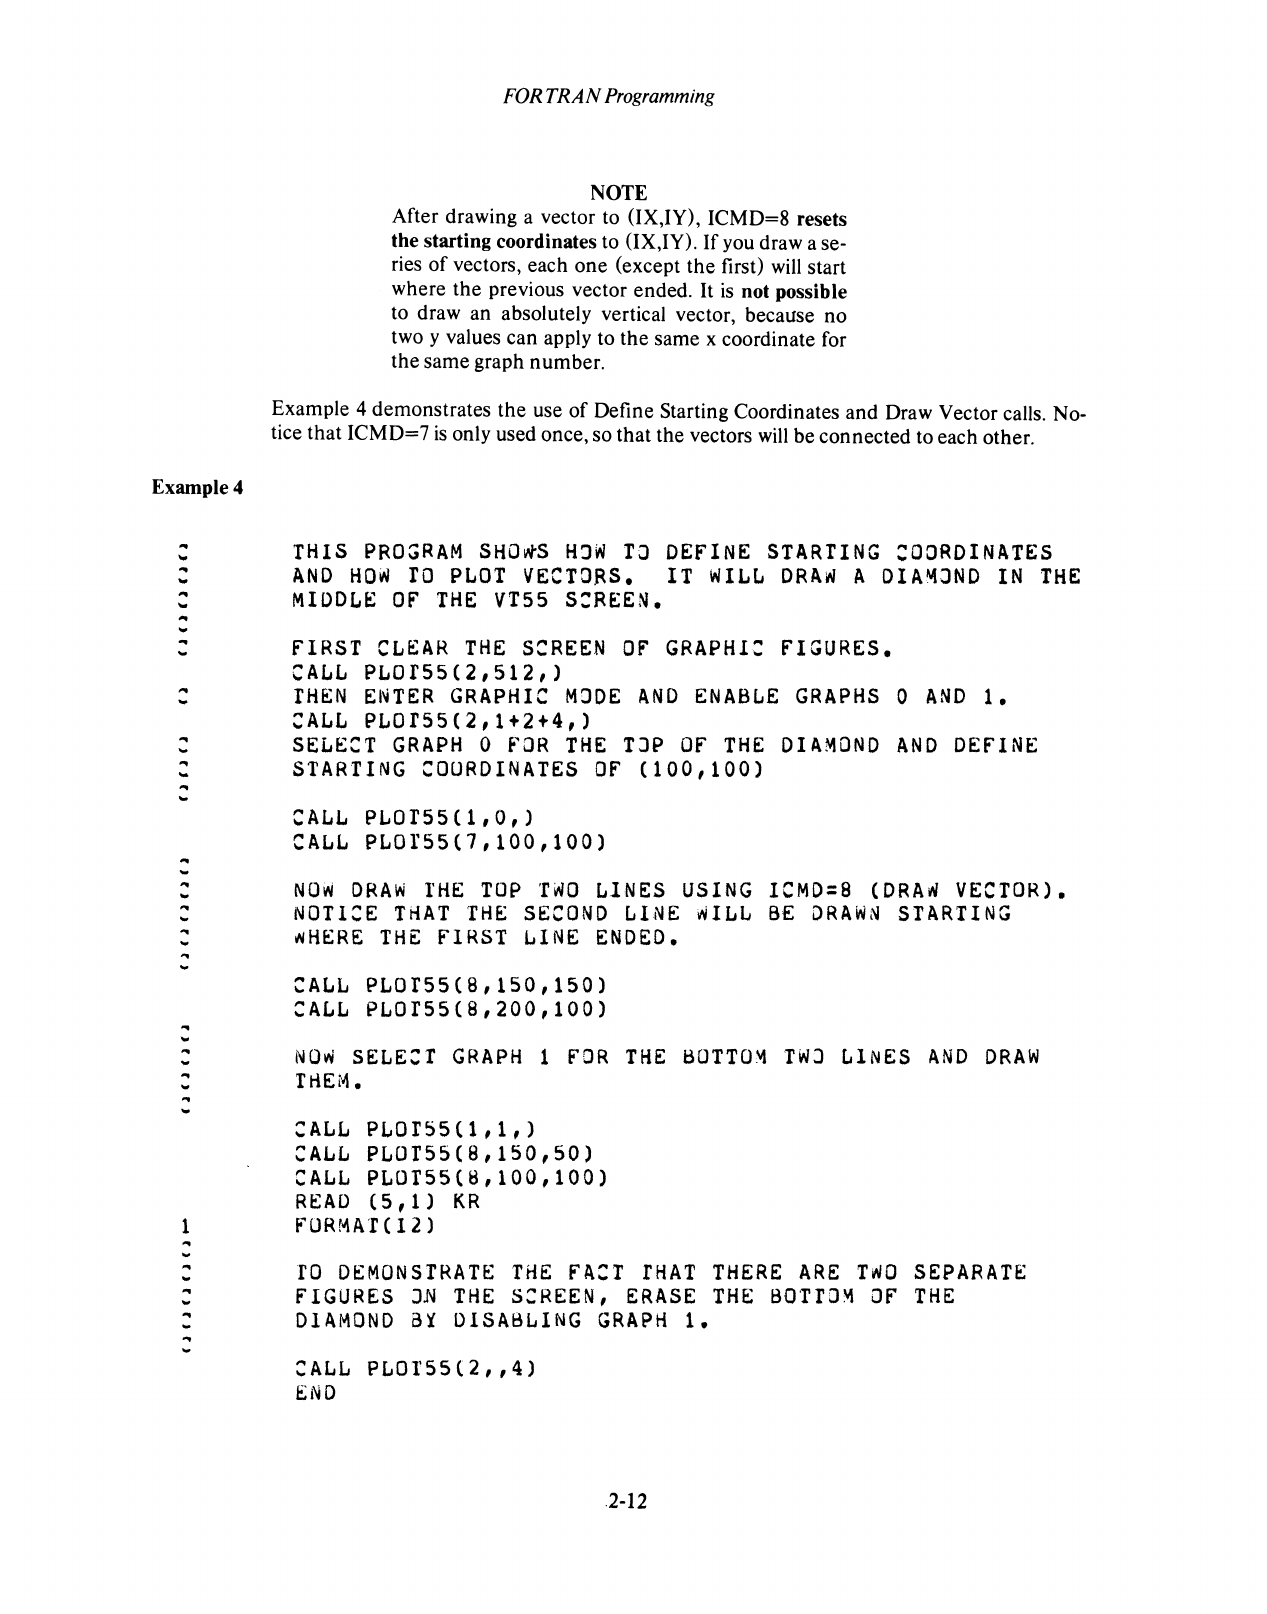
Example 4
..
..
..
...
..
...
..
...
..
..
...
..
..
..
..
..
..
...
..
..
..
..
..
..
..
..
..
..
..
...
..
..
..
..
..
..
FOR
TRAN
Programming
NOTE
After drawing a vector to (IX,IY), ICMD=8 resets
the starting coordinates to (IX,IY).
If
you draw a se-
ries
of
vectors, each one (except the first)
will
start
where the previous vector ended.
It
is
not possible
to draw an absolutely vertical vector, because no
two y values can apply to the same x coordinate for
the same graph number.
Example 4 demonstrates the use
of
Define Starting Coordinates and Draw Vector calls. No-
tice that ICMD=7
is
only used once, so that the vectors
will
be connected to each other.
THIS
PRO~RAM
SHOwS
HJw
TO
DEFINE
STARTING
COORDINATES
AND
HOw
TO
PLOT
VECTORS.
IT
WILL
DRAW
A
DIA~JND
IN
THE
MIDDLE
OF
THE
VT55
S:REEN
•
FIRST
CLEAR
THE
SCREEN
OF
GRAPHI:
FIGURES
•
CALL
PLOTs5(2,512,)
THEN
ENTER
GRAPHIC
MJDE
AND
ENABLE
GRAPHS
0
AND
1 •
CALL
PLOr55(2,1+2+4,)
SELECT
GRAPH
0
FOR
THE
TJP
OF
THE
DIAMOND
AND
DEFINE
STARTING
COURDINATES
OF
(100,100)
CALL
PLOT55(1,O,)
CALL
PLOIS5(1,100,100)
NOW
DRAW
THE
TOP
TwO
LINES
USING
ICMD=8
(DRAw
VECTOR)
•
NOTICE
THAT
THE
SECOND
LINE
~ILL
BE
DRAWN
STARTING
~HERE
THE
FIRST
LINE
ENDED
•
CALL
PLOT5s(8,lS0,150)
CALL
PLOT5S(8,200,100)
NOw
SELECT
GRAPH
1
FOR
THE
BOTTOM
TWJ
LINES
AND
DRAW
THEM
•
CALL
PLOTS5(1,1,)
CALL
PLOTS5(8,150,SO)
CALL
PLOTSS(ij,100,100)
READ
(5,1)
KR
1 rORMAT(I2)
..
..
..
..
..
..
..
..
..
..
ro
DEMONSTRATE
THE
FACT
fHAT
THERE
ARE
TWO
SEPARATE
FIGURES
IN
THE
SCREEN,
ERASE
THE
BOTTOM
OF
THE
DIAMOND
a1
DISABLING
GRAPH
1 •
CALL
PLOTSS(2,,4)
END
.2-12
FORTRAN
Programming
2.2.3 Alphanumeric Procedures
Position Cursor (ICMD=9)
Format: CALL PLOT55(9,IX,IY[,ITBL])
This simple command positions the cursor at the point (IX,IY).
IX can be from ° to 79; and
IY
can be from ° to
23
You can use this command to decide where the next display
of
alphanumeric characters
will
appear on
the
screen. IX will give
the
column
number
(with ° being the leftmost column)
and
IY
will
be the line
number
(line °
is
the
top line on
the
screen).
Erase from Cursor to End of Screen (ICMD=10)
Format: CALL PLOT55
(1
0" [,ITBL])
NOTE
The
"x"
and
"y"
positions are always empty, but you
must still include
the
two commas (three if ITBL
is
specified).
This
command
erases
all
alphanumeric characters from the present cursor position to
the
end
of
the
screen.
The
position
of
the
cursor is not changed by
ICMD=
1
0.
Graphic figures are not affected
by
ICMD=10.
The subroutine CLEAR, shown in Example
5,
uses
ICMD=9
and ICMD=lO to clear
the
en-
tire screen.
CLEAR functions by first returning
the
cursor to the
home
position:
CALL PLOT55(9,0,0)
and
then
erasing from this position to
the
end
of
the
screen:
CALL PLOT55 (10,,)
Erase from Cursor to End of Line
(ICMD=l1)
Format: CALL PLOT55(11,,[,ITBL])
This call performs the same sort
of
procedure
as
ICMD=lO;
but
it only erases text from
the
present cursor position to
the
end
of
the
line. As with ICMD=10,
the
erasure does
not
change the cursor's position, nor does it change
the
status
of
graphic figures.
2-13
FORTRAN
Programming
Display Text (ICMD=12)
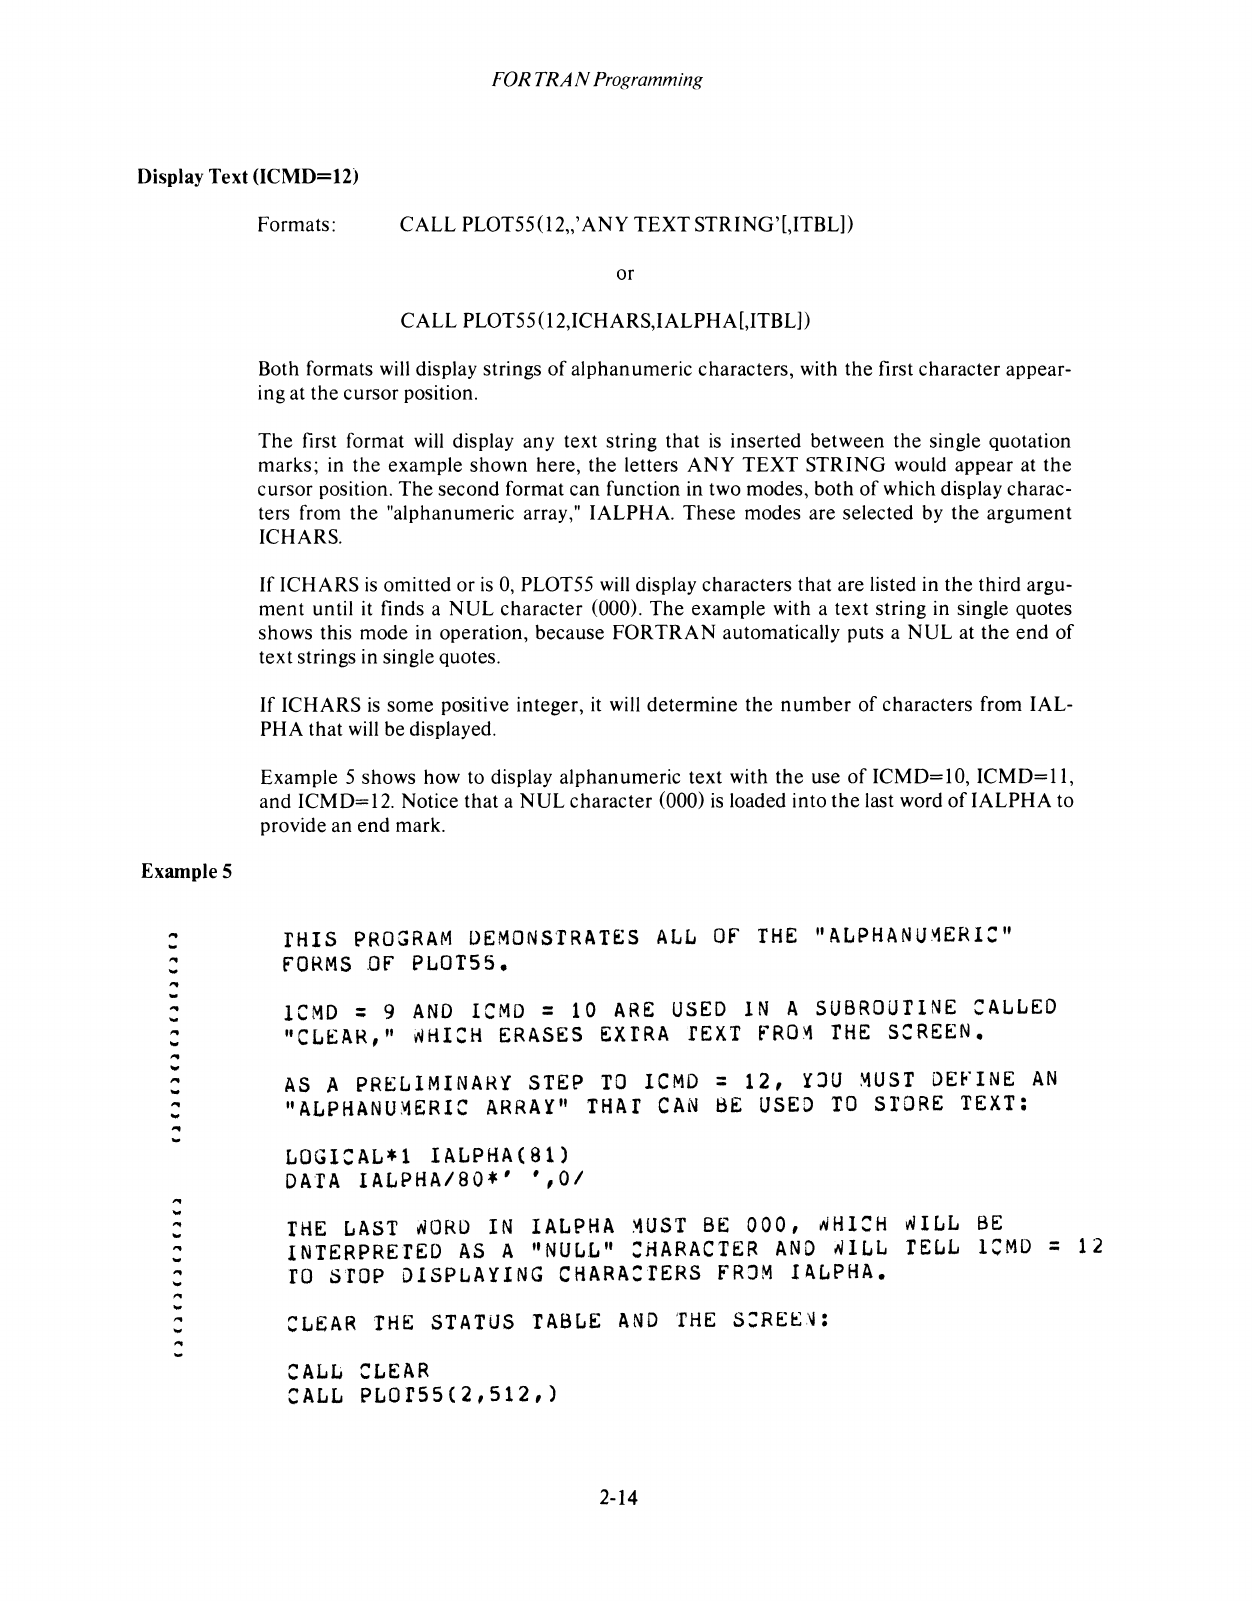
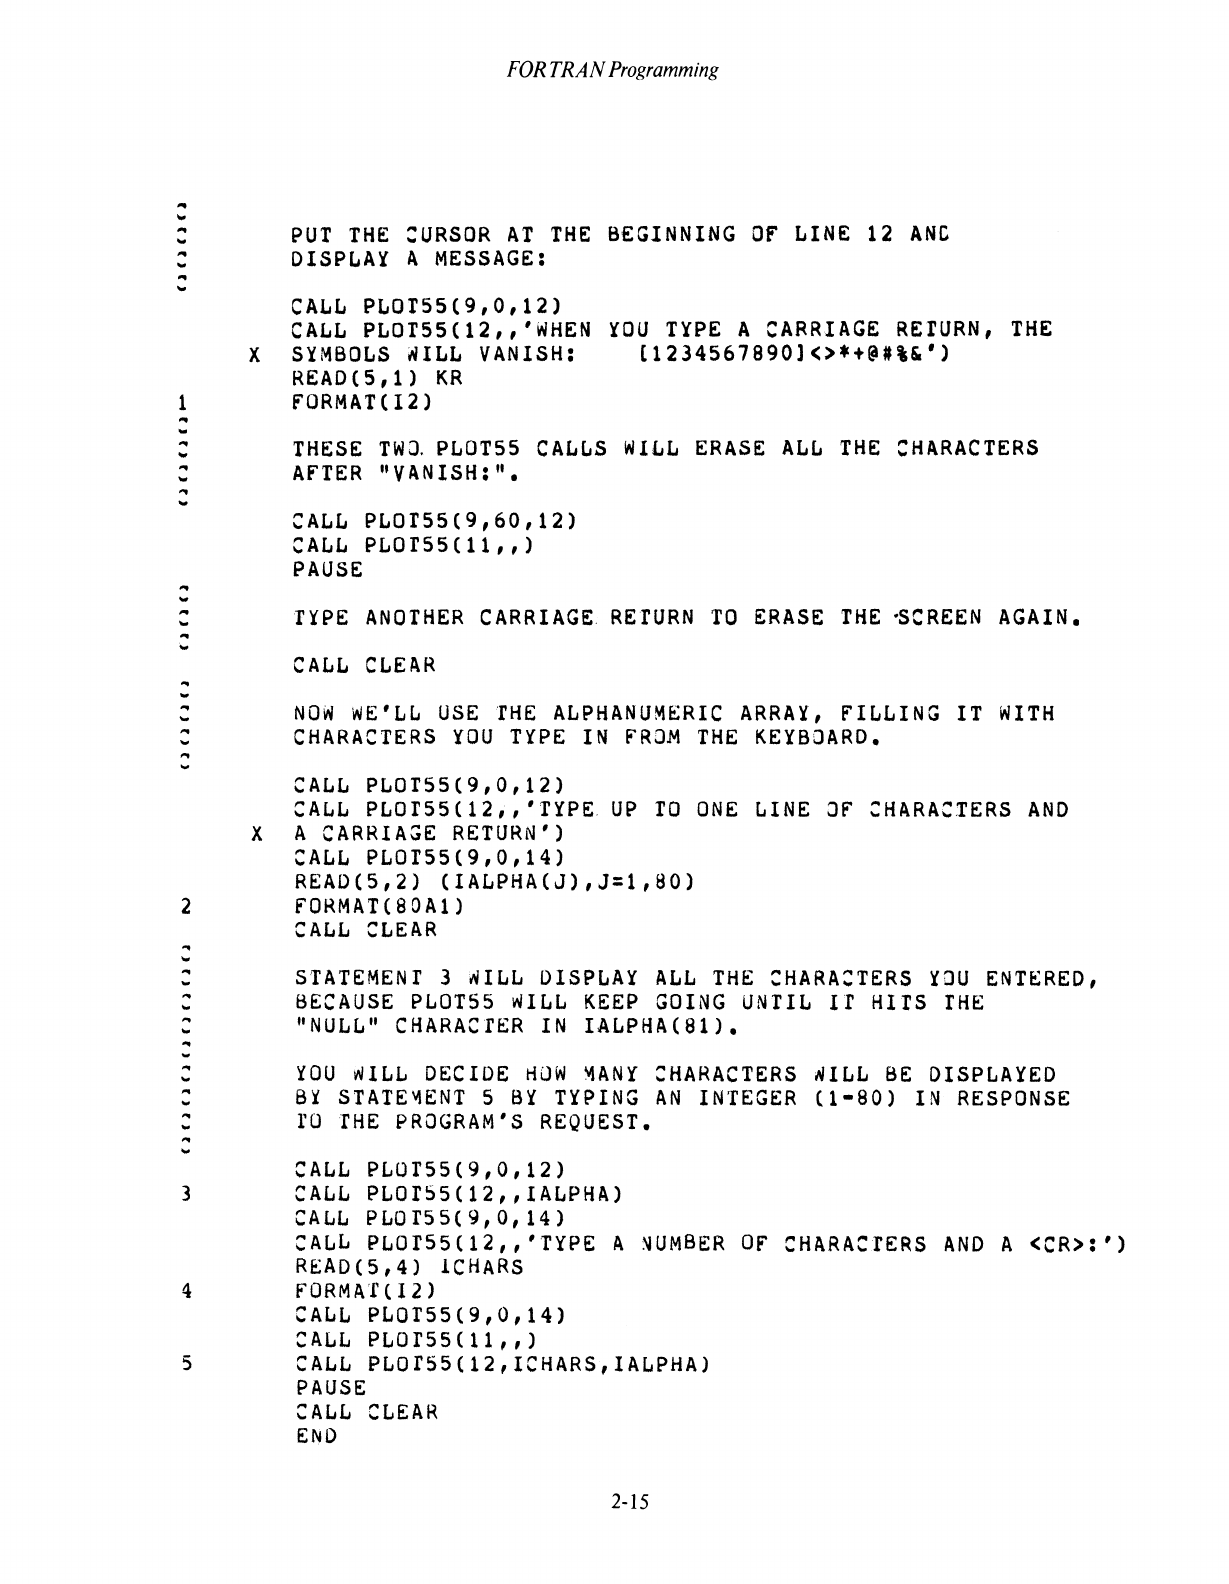
Example 5
...
...
...
...
..
...
..
....
...
...
..
...
...
...
...
...
..
..
'"
..
...
Formats: CALL PLOT55 (12,,'
ANY
TEXT
STRING'[,ITBL])
or
CALL PLOT55(12,ICHARS,IALPHA[,ITBL])
Both formats will display strings
of
alphanumeric characters, with
the
first character appear-
ing at the cursor position.
The
first format
will
display any text string that
is
inserted between the single quotation
marks; in the example shown here,
the
letters
ANY
TEXT STRING would appear at
the
cursor position.
The
second format can function in two modes, both
of
which display charac-
ters from
the
"alphanumeric array," IALPHA. These modes are selected by the argument
ICHARS.
If ICHARS
is
omitted or
is
0,
PLOT55
will
display characters that are listed in
the
third argu-
ment
until it finds a
NUL
character (000).
The
example with a text string in single quotes
shows this mode in operation, because
FORTRAN
automatically puts a
NUL
at
the
end
of
text strings in single quotes.
If
ICHARS
is
some positive integer, it will determine the
number
of
characters from IAL-
PHA that will be displayed.
Example 5 shows how to display alphanumeric text with
the
use
of
ICMD=10,
ICMD=II,
and
ICMD=
12.
Notice that a NUL character (000)
is
loaded into
the
last word
of
IALPHA to
provide an
end
mark.
IHIS
PROGRAM
DEMONSTRATES
ALL
OF
THE
"ALPHANU~ERl:"
fORMS
OF
PLOT55
•
ICMD
: 9
AND
ICMD
=
10
ARE
USED
IN
A
SUBROUTINE
CALLED
"CLEAR,"
~HlCH
ERASES
EXIRA
fEXT
FRO~
THE
SCREEN
•
AS
A
PRELIMINARY
STEP
TO
ICMD
=
12,
~JU
~UST
DEfINE
AN
"ALPHANU~ERIC
ARRA~"
THAT
CAN
BE
USED
TO
STORE
TEXT:
LOGICAL*1
lALPHA(SI)
DATA
IALPHA/80*'
',01
THE
LAST
~ORO
IN
lALPHA
~UST
BE
000,
~HI:H
~ILL
BE
INTERPRETED
AS
A
"NULL"
:HARACTER
AND
~ILL
TELL
lCMO
=
12
ro
STOP
DISPLAYING
CHARACTERS
FRJM
IALPHA
•
CLEAR
THE
STATUS
TABLE
AND
THE
S:REE~:
CALL
CLEAR
CALL
PLOfSS(2,512,)
2-14
...
'"
..
...
..
...
..
...
FOR
TRAN
Programming
PUT
THE
:URSOR
AT
THE
BEGINNING
OF
LINE
12
ANC
DISPLAY
A
MESSAGE:
CALL
PLOTSS(9,O,12)
CALL
PLOTS5(12,,'WHEN
YOU
TYPE
A
CARRIAGE
REtURN,
THE
X
SYMBOLS
WILL
VANISH:
[1234S67890]<>.+@#\")
READ
( 5 ,
1)
KR
1 fORMAT(I2)
...
...
...
...
...
...
..
...
...
...
...
...
..
...
..
...
..
...
...
...
...
...
THESE
TW~
PLOT
55
CALLS
WILL
ERASE
ALL
THE
CHARACTERS
AfTER
"VANISH:" •
CALL
PLOT55(9,60,12)
CALL
PLOr55(11,,)
PAUSE
TYPE
ANOTHER
CARRIAGE
RETURN
TO
ERASE
THE
~CREEN
AGAIN
•
CALL
CLEAR
NOW
WE'LL
USE
THE
ALPHANUMERIC
ARRAY,
fILLING IT
WITH
CHARACTERS
YOU
TYPE
IN
fROM
THE
KEYBOARD
•
CALL
PLOT55(9,O,12)
CALL
PLOrS5(12i,'TYPE.
UP
TO
ONE
LINE
Of
CHARACTERS
AND
X A
CARRIAGE
RETURN')
CALL
PLOTSS(9,O,14)
READ(S,2)
(IALPHA(J),J=1,aO)
2
fORMAT(BOA1)
...
...
..
...
...
...
...
...
...
...
...
...
...
...
...
..
...
...
STATEMENT
3
WILL
DISPLAY
ALL
THE
CHARACTERS
YJU
ENTERED,
BECAUSE
PLOT55
WILL
KEEP
GOING
UNTIL
Il
HITS
rHE
"NULL"
CHARACTER
IN
IALPHA(81) •
YOU
wILL
DECIDE
~OW
~ANY
CHARACTERS
WILL
BE
DISPLAYED
BY
STATE~ENT
S
BY
TYPING
AN
INTEGER
(1-80)
IN
RESPONSE
ro
THE
PROGRAM'S
REQUEST
•
CALL
PLOT5S(9,O,12)
3
CALL
PLOrSS(12"lALPHA)
CALL
PLOr55(9,O,14)
CALL
PLOrS5(12,,'TYPE
A
~UMBER
Of
CHARACTERS
AND
A
<CR>:')
READ(S,4)
lCHARS
4
fORMAT(12)
CALL
PLOrS5(9,O,14)
CALL
PLOfSS(11,,)
5
CALL
PLOfSS(12,ICHARS,IALPHA)
PAUSE
CALL
CLEAR
ENO
2-15
FOR
TRAN Programming
SUBROUTINE
CLEAR
CALL
PLOT55(9,O,O)
CALL
PLOT55(10,,)
RETURN
END
NOTE
In
lAS
operation,
the
PAUSE
statement
is
ignored.
The
READ
statement
should
be
used instead.
In
RSX-ll
systems
the
PAUSE
statement
will
sus-
pend
the
task,
which
must
be
restarted with
the
MCR
command
RESUME:
> RES
taskname
<
CR
>
Merely typing a carriage
return
will
not
resume
the
task in
RSX-ll.
When
you
run
an
RSX-ll
task con-
taining PAUSE
statements,
give it a specific task
name,
for instance:
RUN
EXAMI/TASK=EXAM
<CR>
where
EXAMl.TSK
is
the
name
of
the
file contain-
ing
the
task
and
EXAM
is
the
name
that
would
be
used in
the
RES
command.
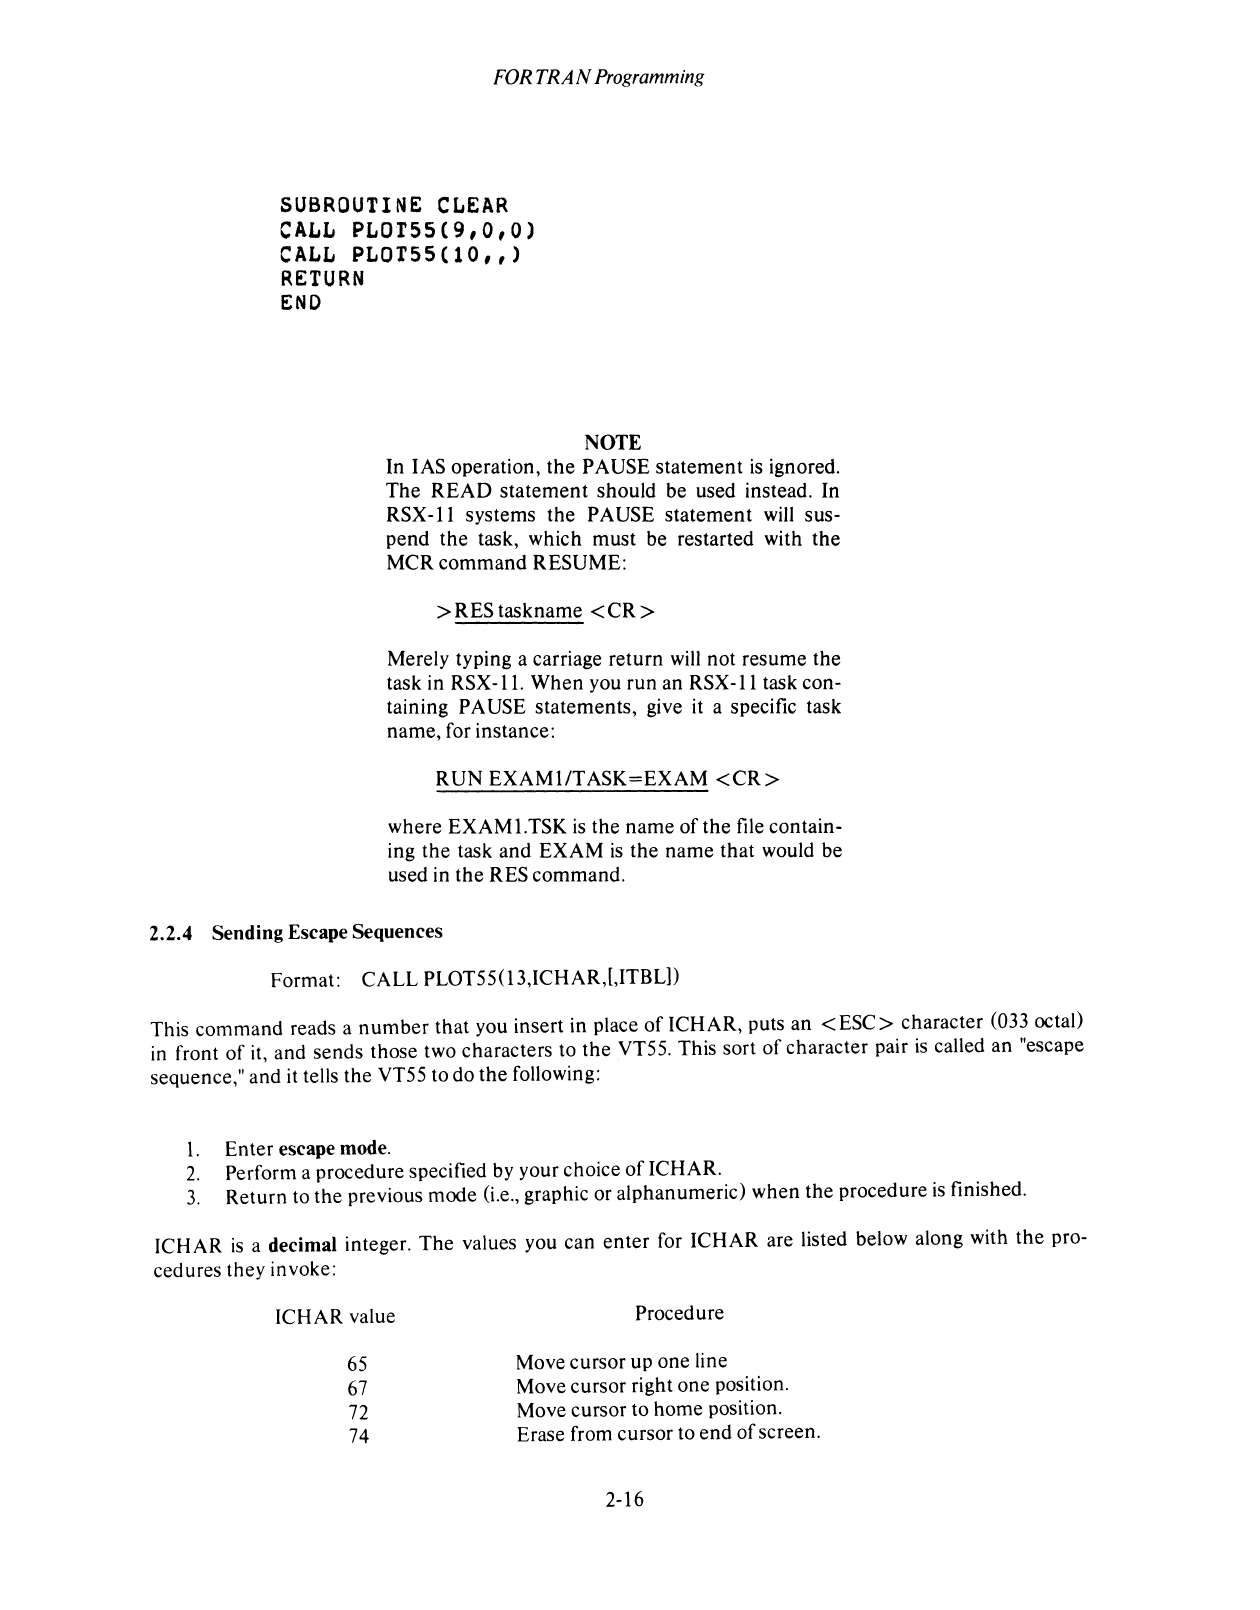
2.2.4 Sending Escape Sequences
Format:
CALL
PLOT55(13,ICHAR,[,ITBL))
This
command
reads a
number
that
you insert in place
of
ICHAR,
puts
an
<ESC>
character
(033 octal)
in front
of
it,
and
sends
those two characters to
the
VT55. This
sort
of
character
pair
is
called
an
"escape
sequence,"
and
it tells
the
VT55 to
do
the
following:
I.
Enter
escape mode.
2.
Perform a procedure specified by your choice
of
ICHAR.
3.
Return
to
the
previous
mode
(i.e., graphic or
alphanumeric)
when
the
procedure is finished.
ICHAR
is
a decimal integer.
The
values you
can
enter
for
ICHAR
are listed below along with
the
pro-
cedures
they
invoke:
ICHAR
value
65
67
72
74
Procedure
Move
cursor
up
one
line
Move
cursor
right
one
position.
Move
cursor
to
home
position.
Erase from
cursor
to
end
of
screen.
2-16
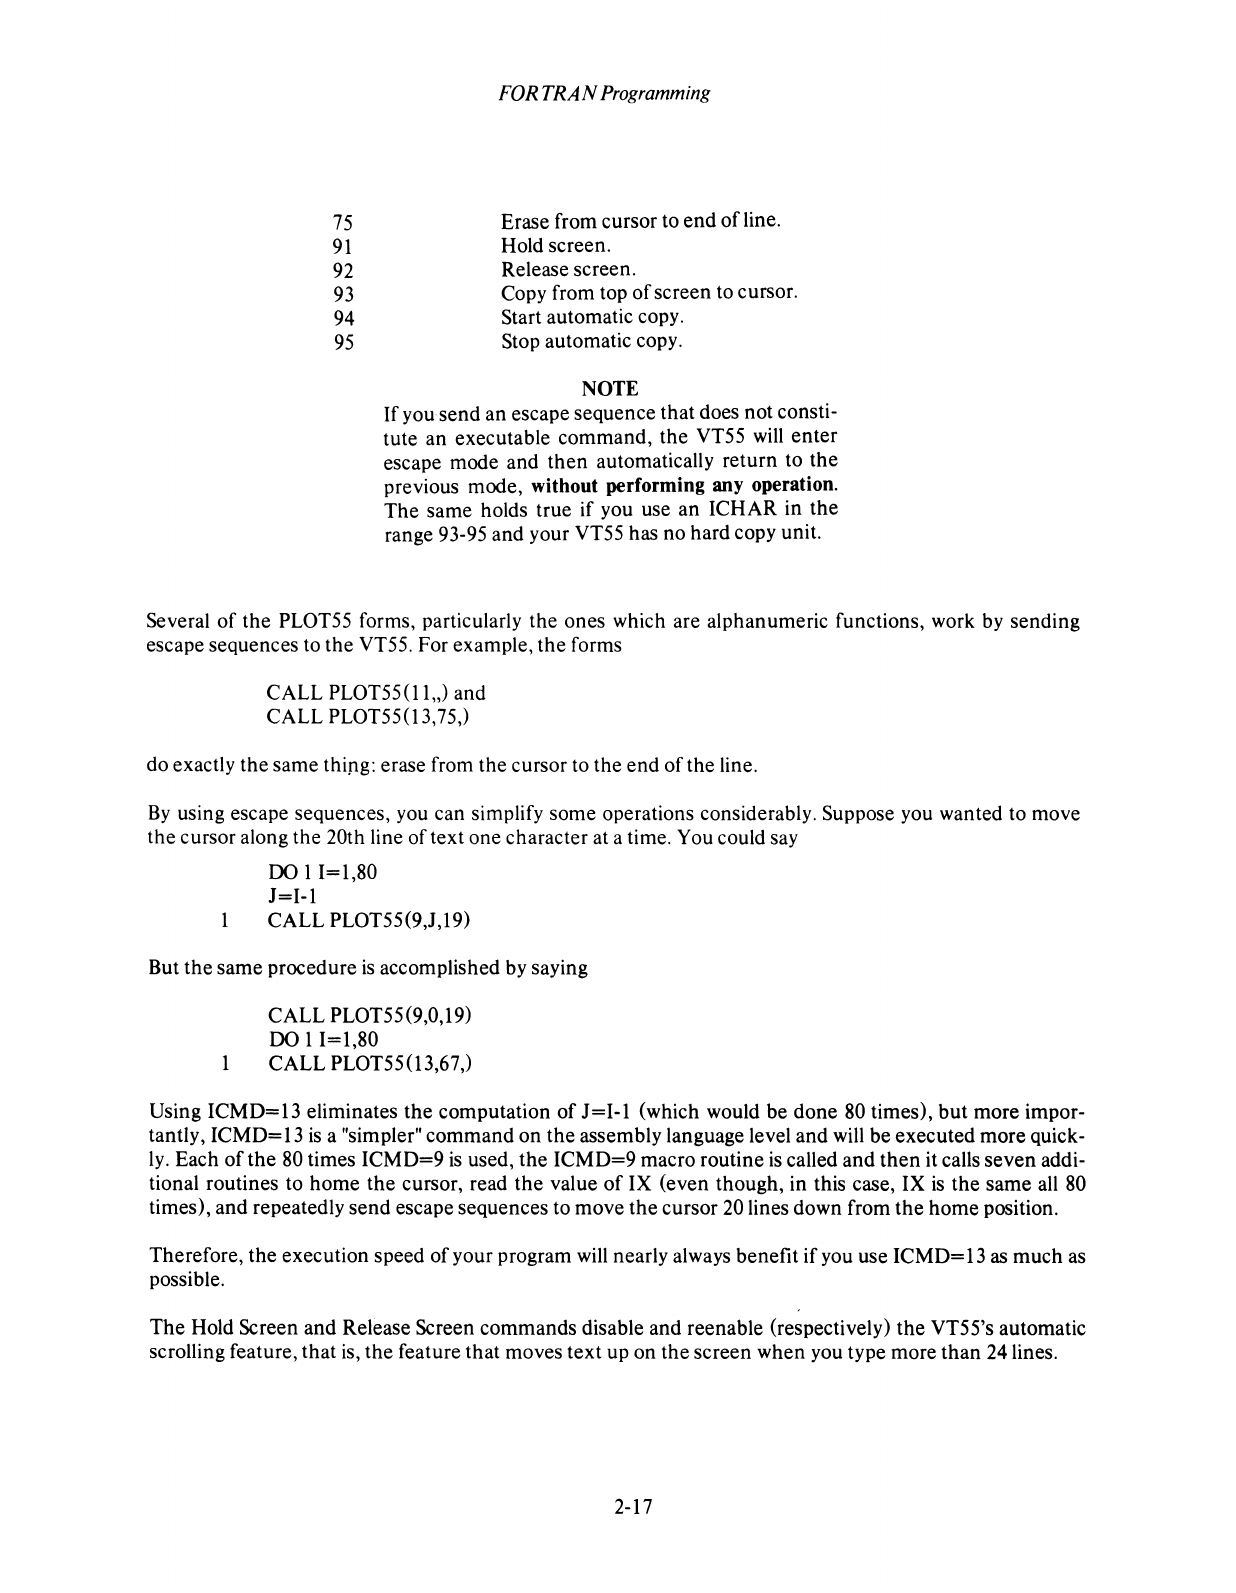
75
91
92
93
94
95
FOR
TRAN
Programming
Erase from cursor to
end
of
line.
Hold screen.
Release screen.
Copy from top
of
screen to cursor.
Start automatic copy.
Stop automatic copy.
NOTE
If
you
send an escape sequence that does not consti-
tute an executable command, the VT55
will
enter
escape mode and
then
automatically return to the
previous mode, without performing any operation.
The
same holds true if you use an ICHAR in the
range 93-95 and your VT55 has no hard copy unit.
Several
of
the PLOT55 forms, particularly the ones which are alphanumeric functions, work by sending
escape sequences to the VT55. For example, the forms
CALL PLOT55(11,,) and
CALL PLOT55(13,75,)
do exactly the same thing: erase from the cursor to the end of the line.
By
using escape sequences, you can simplify some operations considerably. Suppose you wanted to move
the cursor along the 20th line of text one character at a time. You could say
DO
11=1,80
J=I-l
1 CALL PLOT55(9,J,19)
But the same procedure
is
accomplished by saying
CALL PLOT55(9,0,19)
DO 11=1,80
1 CALL PLOT55 (13,67,)
Using ICMD=13 eliminates the computation
of
J=I-l
(which would be done
80
times),
but
more impor-
tantly, ICMD=13
is
a "simpler" command on the assembly language level and will be executed more quick-
ly.
Each
of
the
80
times ICMD=9
is
used, the ICMD=9 macro routine
is
called and
then
it calls seven addi-
tional routines to
home
the cursor, read
the
value
of
IX (even though, in this case, IX
is
the same
all
80
times), and repeatedly send escape sequences to move the cursor 20 lines down from the horne position.
Therefore, the execution speed
of
your program
will
nearly always benefit
if
you use
ICMD=
13
as
much
as
possible.
The
Hold Screen and Release Screen commands disable and reenable (respectively) the VT55's automatic
scrolling feature, that is, the feature that moves text up on the screen when you type more
than
24 lines.
2-17
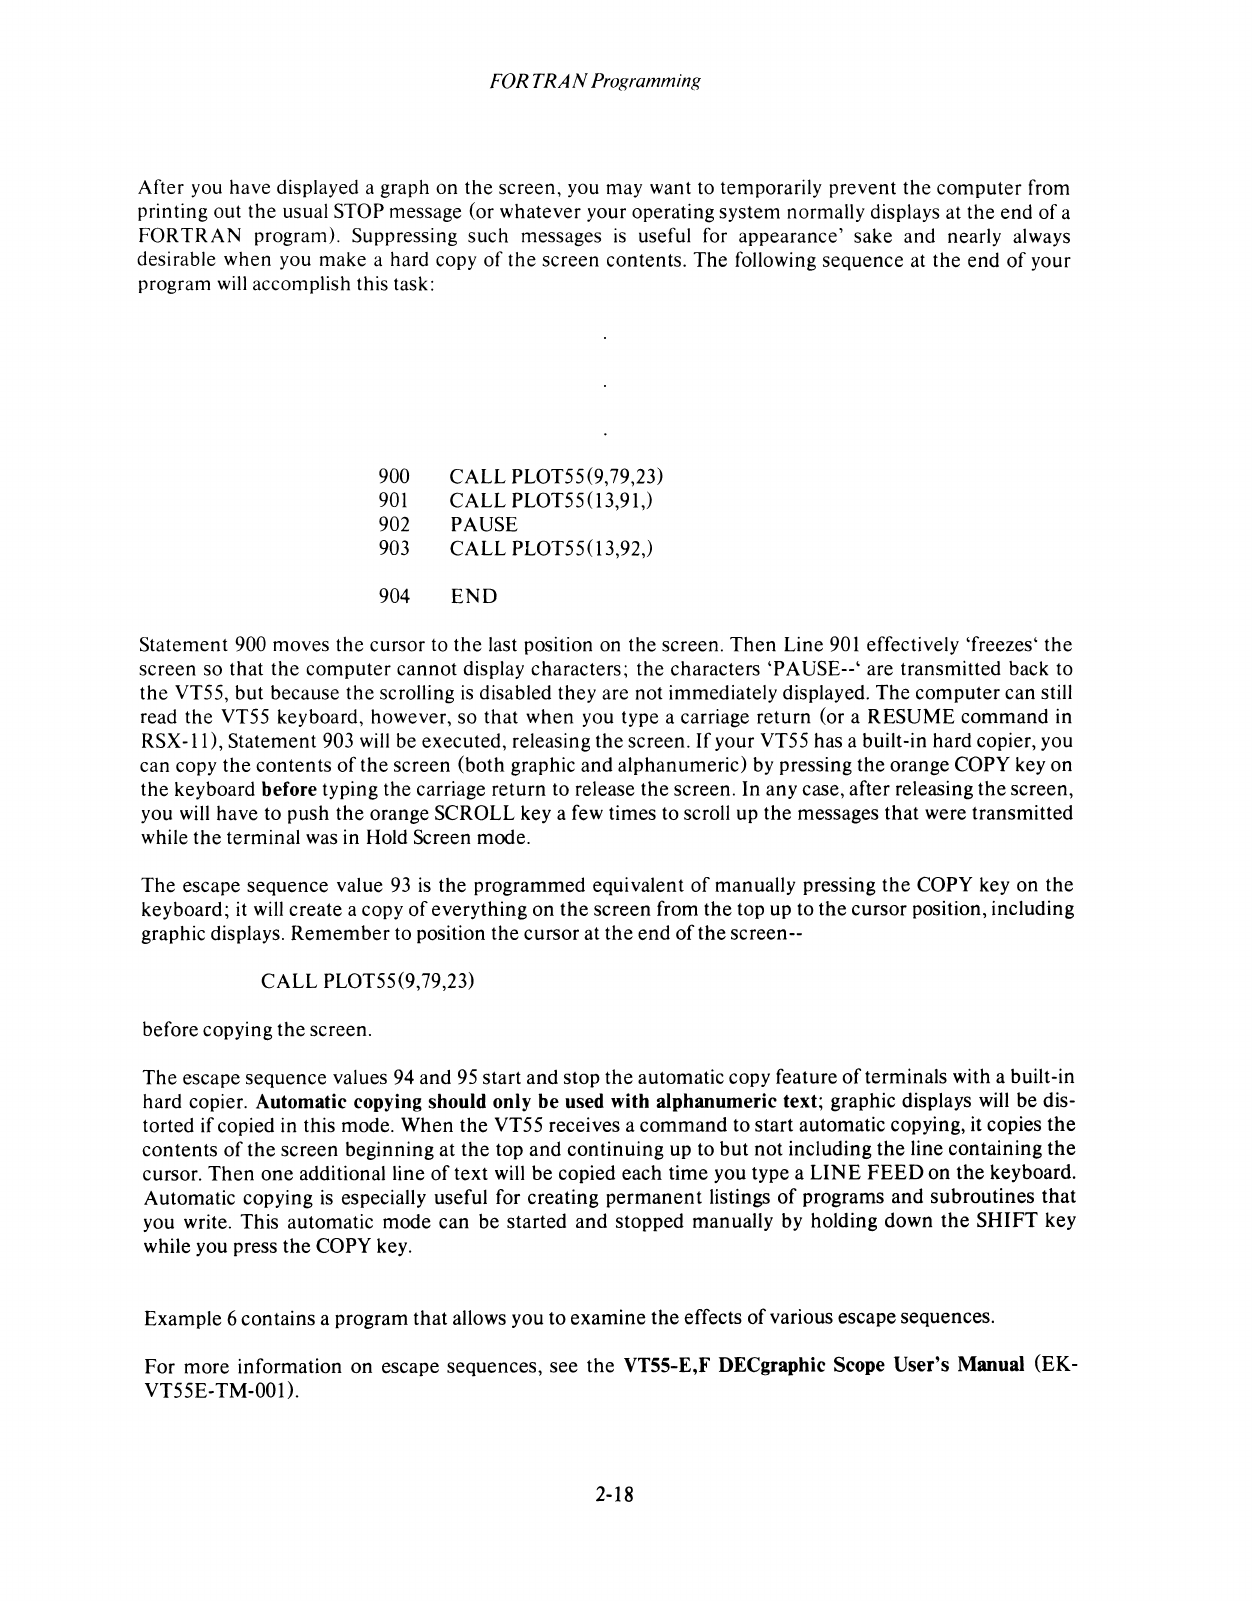
FORTRAN
Programming
After you have displayed a graph on the screen, you may want to temporarily prevent the computer from
printing out the usual STOP message (or whatever your operating system normally displays at the end
of
a
FORTRAN program). Suppressing such messages
is
useful for appearance' sake and nearly always
desirable when you make a hard copy
of
the screen contents. The following sequence at the end
of
your
program
will
accomplish this task:
900 CALL PLOT55(9,79,23)
901
CALL PLOT55(13,91,)
902 PAUSE
903 CALL PLOT55(13,92,)
904
END
Statement 900 moves the cursor to
the
last position on the screen.
Then
Line
901
effectively 'freezes' the
screen so that the computer cannot display characters; the characters 'PAUSE--' are transmitted back to
the VT55, but because the scrolling
is
disabled they are not immediately displayed. The computer can still
read the VT55 keyboard, however, so that when you type a carriage return (or a RESUME command in
RSX-ll),
Statement 903
will
be executed, releasing the screen.
If
your VT55 has a built-in hard copier, you
can copy the contents
of
the screen (both graphic and alphanumeric) by pressing the orange COPY key on
the keyboard before typing the carriage return to release the screen. In any case, after releasing
the
screen,
you
will
have to push the orange SCROLL key a few times to scroll up the messages that were transmitted
while the terminal
was
in Hold Screen mode.
The escape sequence value
93
is
the programmed equivalent
of
manually pressing
the
COPY key on the
keyboard; it
will
create a copy
of
everything on
the
screen from the top up to the cursor position, including
graphic displays.
Remember
to position the cursor at
the
end
of
the screen--
CALL PLOT55(9,79,23)
before copying the screen.
The
escape sequence values 94 and
95
start and stop the automatic copy feature
of
terminals with a built-in
hard copier. Automatic copying should only be used with alphanumeric text; graphic displays
will
be dis-
torted
if
copied in this mode. When the VT55 receives a command to start automatic copying, it copies
the
contents
of
the screen beginning at the top and continuing up to
but
not including the line containing
the
cursor.
Then
one additional line
of
text will be copied each time you type a
LINE
FEED
on
the
keyboard.
Automatic copying
is
especially useful for creating permanent listings
of
programs and subroutines that
you write. This automatic mode can be started and stopped manually by holding down
the
SHIFT key
while you press the COPY key.
Example 6 contains a program that allows you to examine the effects
of
various escape sequences.
For more information on escape sequences, see the VT55-E,F DECgraphic Scope User's Manual (EK-
VT55E-
TM-OOO.
2-18
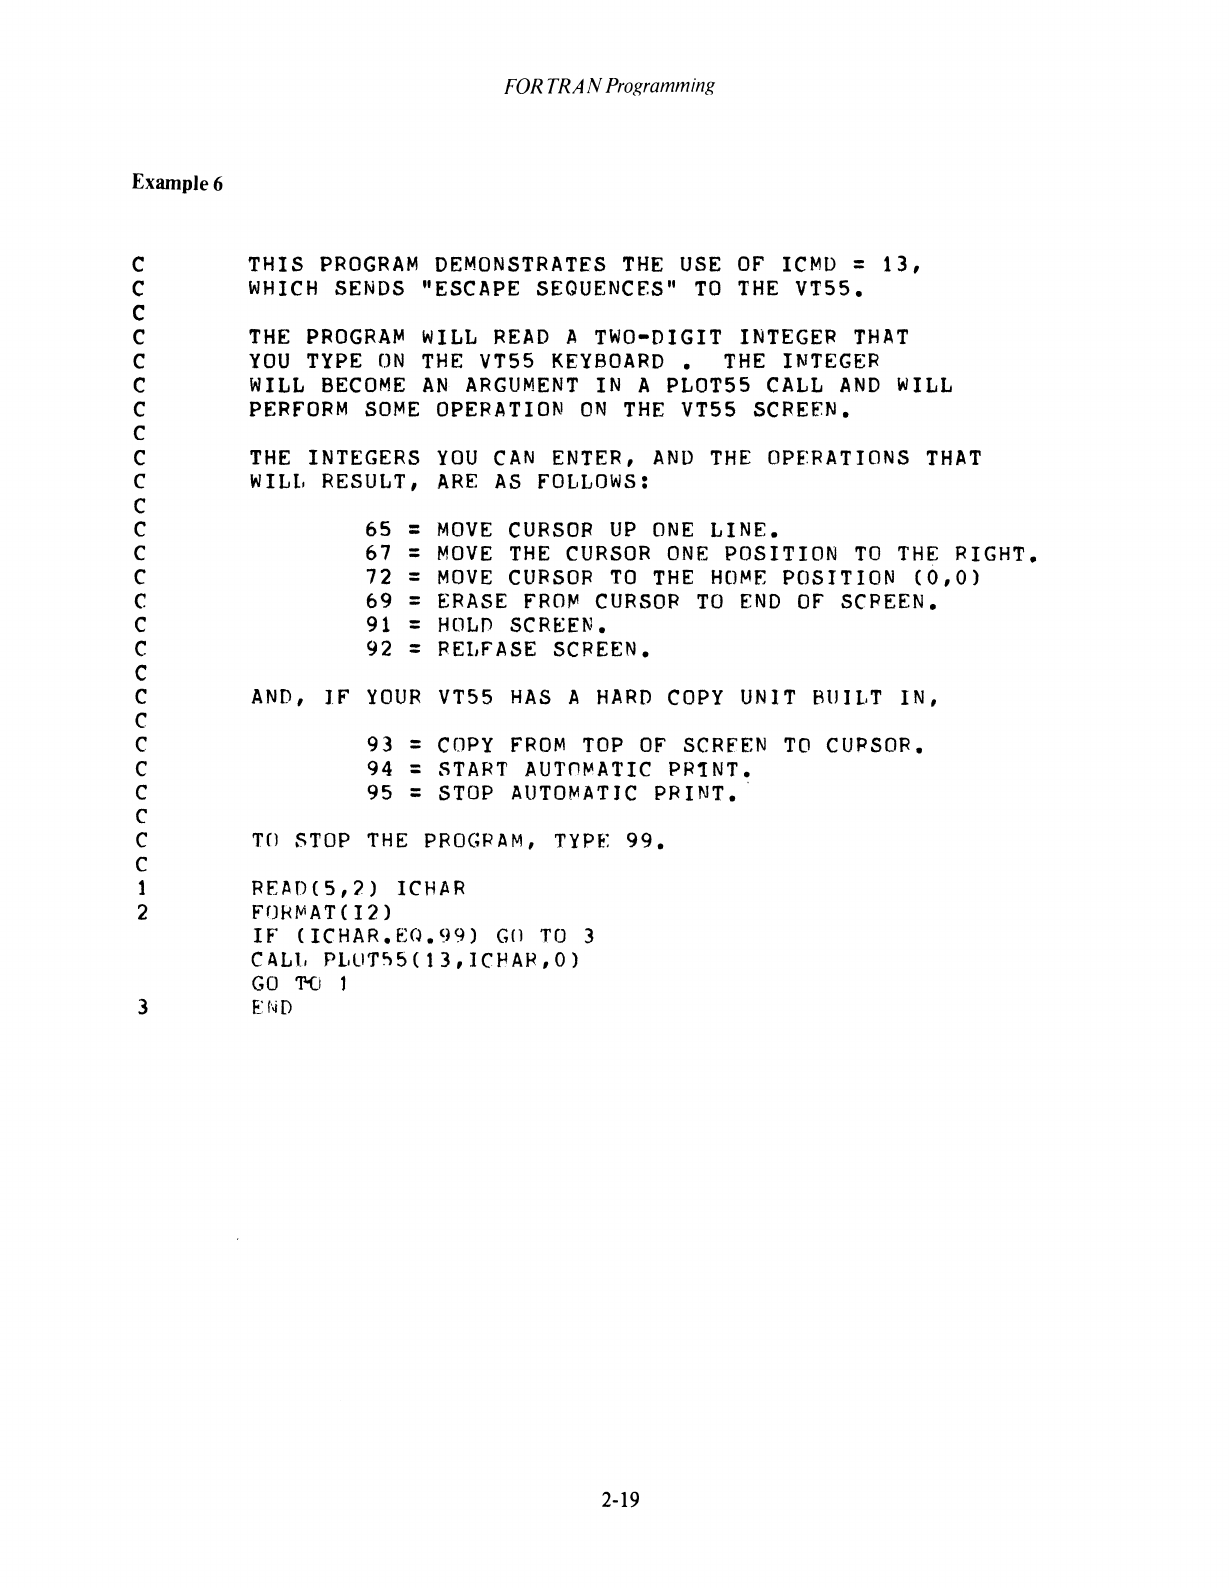
FOR
TRA
N
ProKramminK
ExampJe6
C THIS
PROGRAM
DEMONSTRATES
THE
USE
OF
ICMD
=
13,
C
WHICH
SENDS
"ESCAPE
SEQUENCES"
TO
THE
VT55.
C
C
THE
PROGRAM
WILL
READ
A TWO-DIGIT
INTEGER
THAT
C
YOU
TYPE
ON
THE
VT55
KEYBOARD.
THE
INTEGER
C
WILL
BECOME
AN
ARGUMENT
IN
A PLOT55
CALL
AND
WILL
C
PERfORM
SOME
OPERATION
ON
THE
VT55
SCREFN.
C
C
THE
INTEGERS
YOU
CAN
ENTER,
AND
THE
OPERATIONS
THAT
C W ILl, RESULT,
ARE
AS
fOLLOWS:
C
C 65 =
MOVE
CURSOR
UP
ONE
LINE.
C 67 =
MOVE
THE
CURSOR
ONE
POSITION
TO
THE
RIGHT.
C 72 =
MOVE
CURSOR
TO
THE
HOME
POSITION
(0,0)
C
69
=
ERASE
FRO~
CURSOR
TO
END
OF
SCREEN.
C 91 =
HOLD
SCREEN.
C 92 =
RELFASE
SCREEN.
C
C
AND,
IF
YOUR
VT55
HAS
A
HARD
COpy
UNIT
BUILT
IN,
C
C 93 =
COpy
FROM
TOP
OF
SCRfEN
TO
CURSOR.
C 94 =
START
AUTn~ATIC
PR!NT.
C 95 =
STOP
AUTOMATIC
PRINT.·
C
C
TO
STOP
THE
PROGP
AM,
TYPE:
99.
C
1 READ(S,2)
ICHAR
2
F~HMAT(I2)
IF
(ICHAR.E:(J.99) G(] TO 3
CALI,
Pl,UT"'5(13,ICf-lAR,O)
GO
T-Ci
1
3 END
2-19

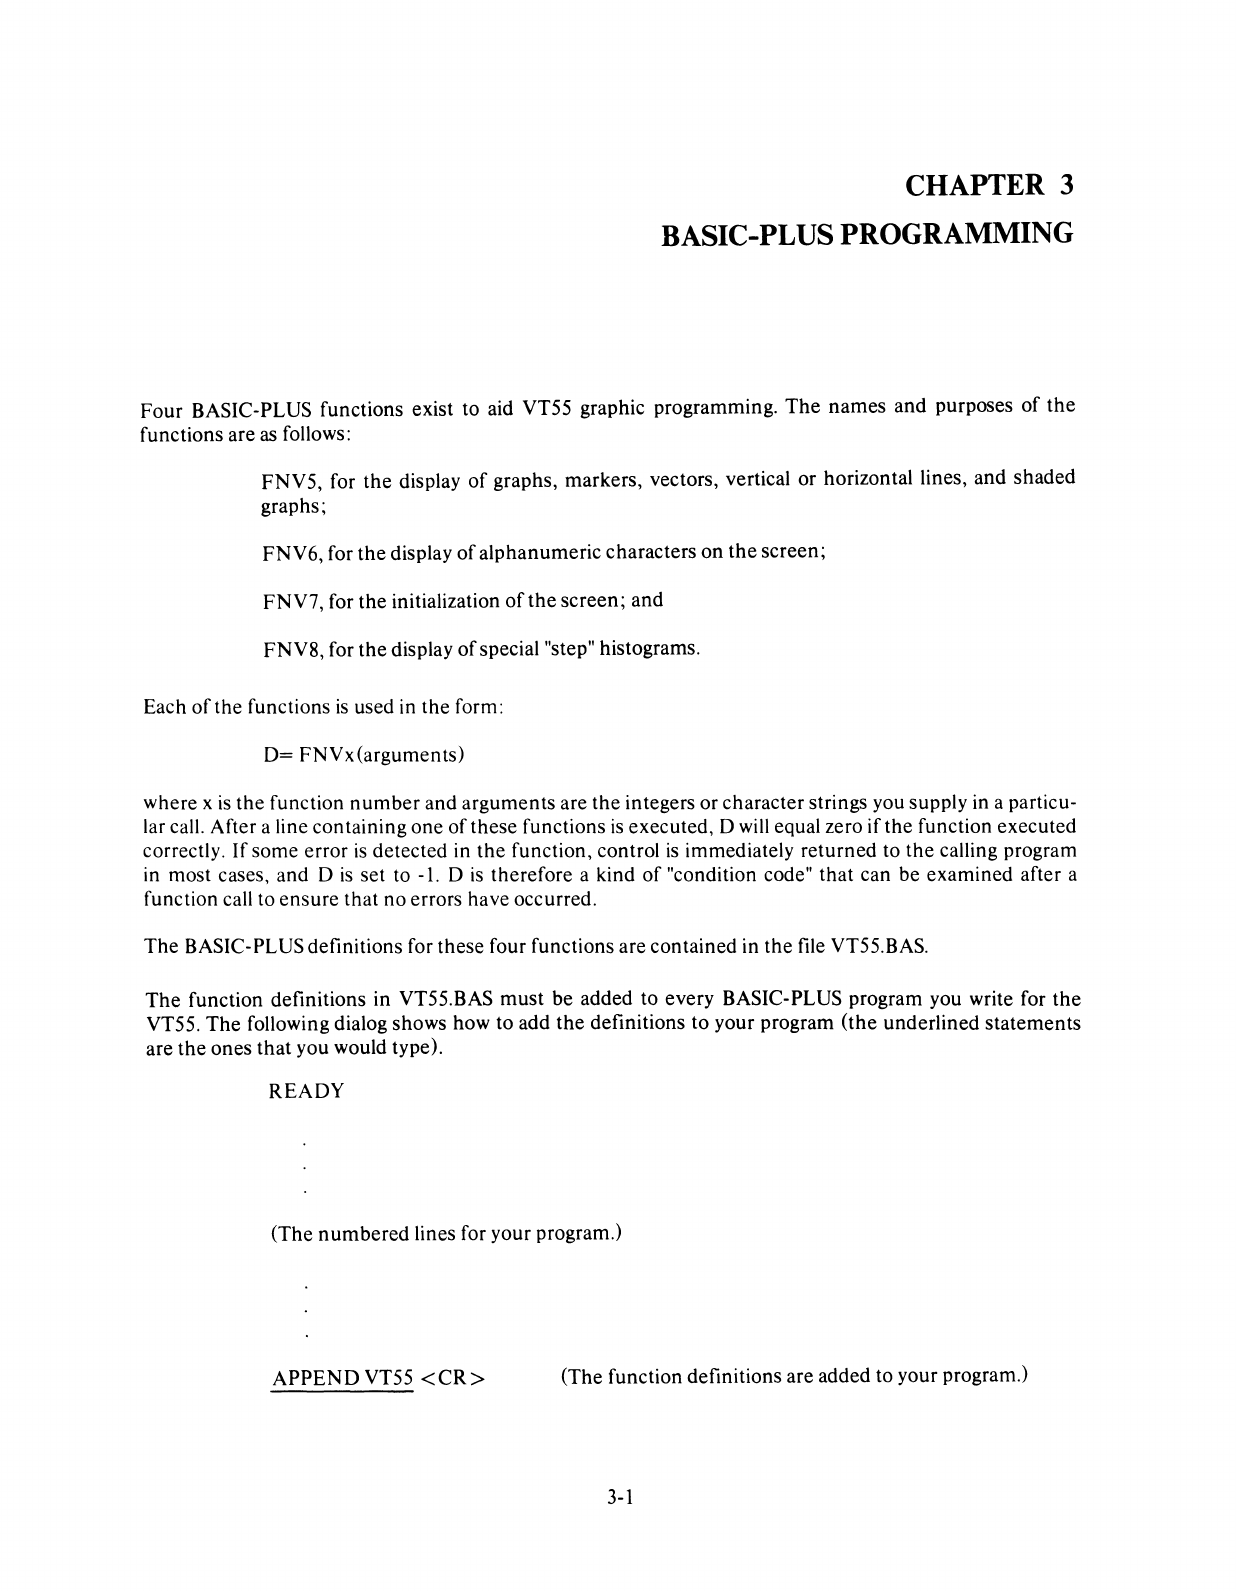
CHAPTER 3
BASIC-PLUS PROGRAMMING
Four
BASIC-PLUS
functions
exist to aid VT55 graphic programming.
The
names
and
purposes
of
the
functions
are
as follows:
FNV5,
for
the
display
of
graphs,
markers,
vectors, vertical
or
horizontal lines,
and
shaded
graphs;
FNV6,
for
the
display
of
alphanumeric
characters
on
the
screen;
FNV7,
for
the
initialization
of
the
screen;
and
FNV8,
for
the
display
of
special "step" histograms.
Each
of
the
functions
is
used in
the
form:
D=
FNVx(arguments)
where
x
is
the
function
number
and
arguments
are
the
integers
or
character
strings you supply in a particu-
lar call.
After
a line
containing
one
of
these
functions
is
executed,
D will equal zero
if
the
function
executed
correctly.
If
some
error
is
detected
in
the
function,
control
is
immediately
returned
to
the
calling program
in
most
cases,
and
D
is
set
to -1. D
is
therefore
a kind
of
"condition code"
that
can
be
examined
after a
function call to
ensure
that
no
errors
have
occurred.
The
BASIC-PLUS definitions for
these
four functions
are
contained
in
the
file VT55.BAS.
The
function
definitions
in
VT55.BAS
must
be
added
to
every
BASIC-PLUS
program
you write for
the
VT55.
The
following dialog
shows
how
to
add
the
definitions
to
your
program
(the
underlined
statements
are
the
ones
that
you
would type).
READY
(The
numbered
lines for
your
program.)
APPEND
VT55
<CR>
(The
function definitions
are
added
to your program.)
3-1
BASfC-PL
US Programming
READY
RUN
or
RUNNH
<CR>
(The
program will
be
executed.)
Notice
that
there
is
no
line
number
for
the
APPEND
statement.
This procedure
will
add
the
lines in VT55.BAS to
the
end
of
your program, so
that
it will now contain
both
the
function definitions
and
an
END
statement.
Be
sure
t9 observe
the
following rules:
1.
Put an
END
statement
with line
number
32767 at
the
end
of
each program.
2.
The
file VT55.BAS contains BASIC-PLUS
statements
with line
numbers
from 20000 to 29999.
Avoid using
these
line
numbers
in your program.
3.
Similarly,
the
function definitions use
the
following "internal" variables to store graphic informa-
tion, so
they
should not be used
as
variables in your main program:
C9%:
Channel
number
for terminal.
CS$:
Output
buffer
for
alphanumeric
text.
C7%:
Current
graph
number.
07%: X value
of
origin.
Q7%: Y value
of
origin.
06%: Enable/disable memory.
Q6%: Enable/disable memory.
4.
The
following variables will be destroyed by
the
functions in VT55.BAS. Do not use
them
in your
program if
they
should
be
unchanged
after a call to
one
of
the
functions:
C9$:
Output
string for FNV6.
09%, Q9%,
OS%,
QS%,
09,
Q9,OS,
QS,
07,
A2, A7:
Temp~
rary "scratch" variables.
In addition to VT55.BAS, a
demonstration
program, DEM055.BAS, has
been
supplied in your BASIC-
PLUS kit. After you have read
and
understood
this manual, you should
run
DEM055
(preferably after list-
ing
the
program
on
a line printer) so
that
you can observe
the
functions in operation:
READY
OLD
DEM055
<CR>
READY
APPEND
VT55
<CR>
READY
RUNNH
<CR>
NOTE
See
the
introduction to
Appendix
C for instructions
on
loading
VT55.BAS from
the
distribution
medium
to your
system
disk.
3-2
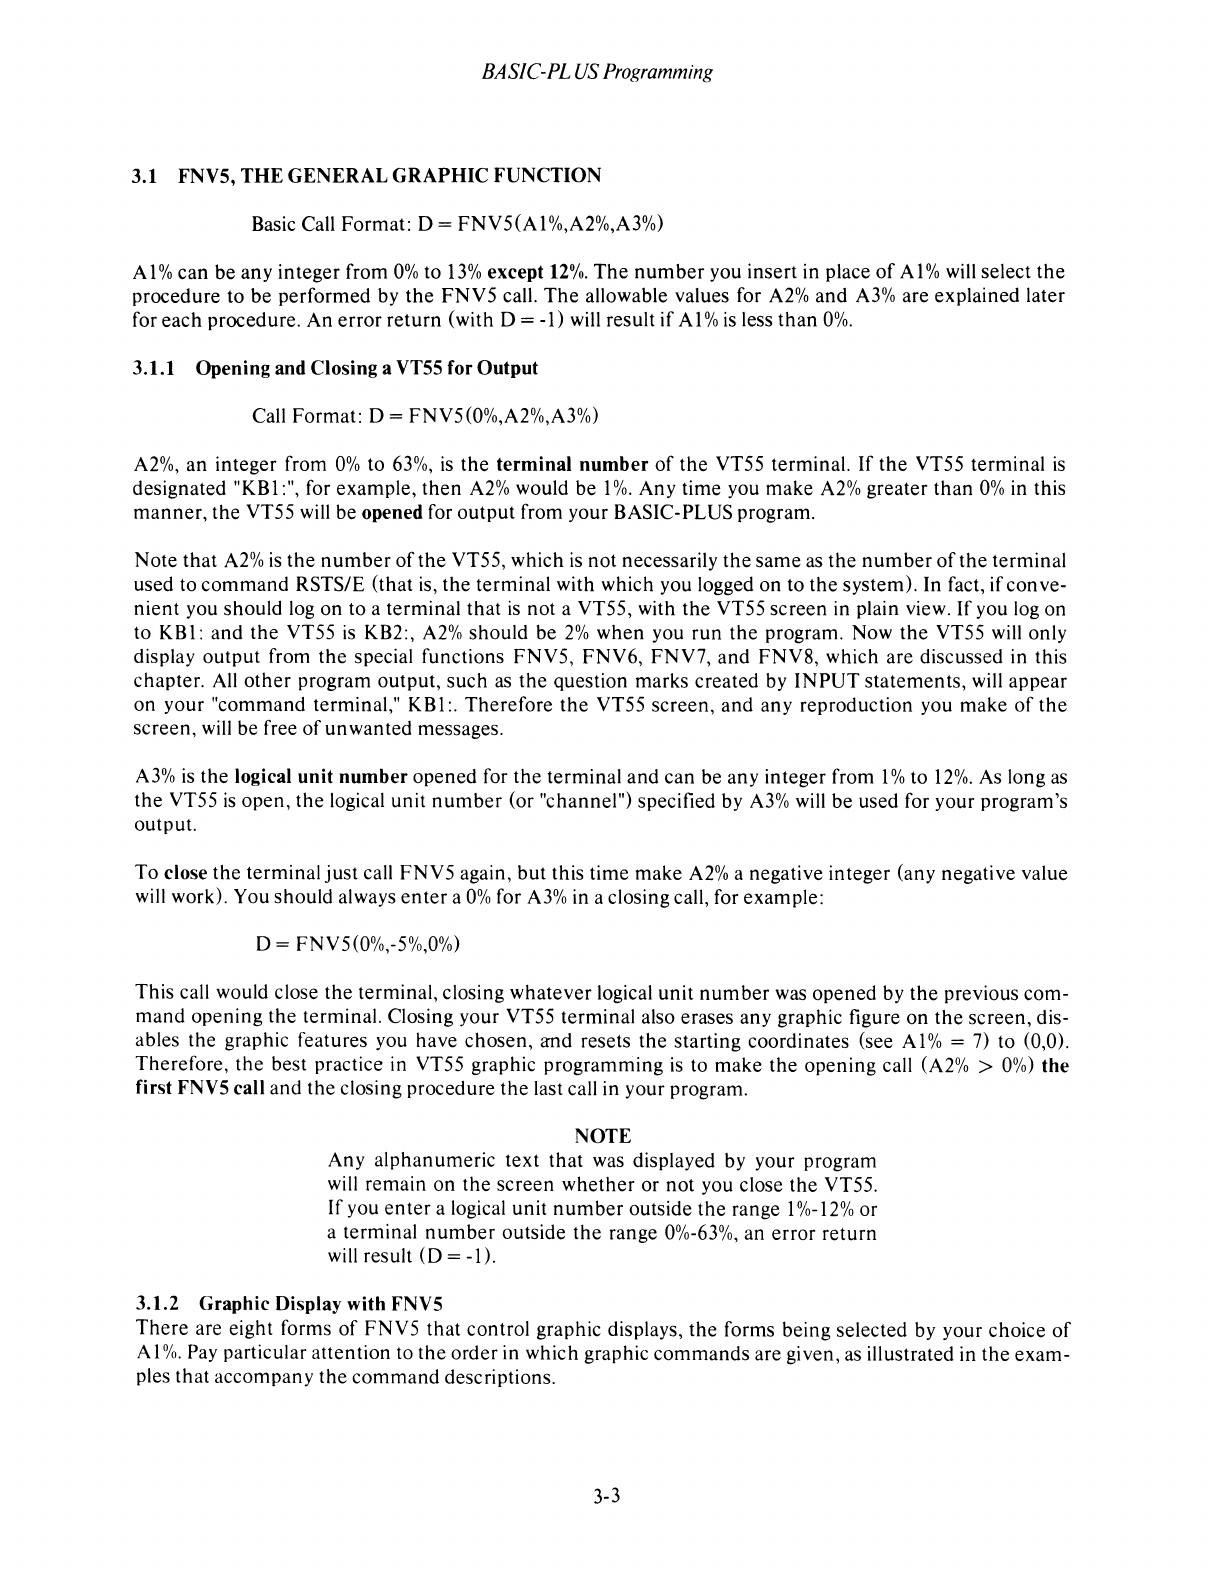
BASIC-PL
US
Programming
3.1 FNV5,
THE
GENERAL
GRAPHIC
FUNCTION
Basic Call Format: D =
FNV5(AI
%,A2%,A3%)
Al
% can be
any
integer from
0%
to
13%
except
12%.
The
number
you insert in place
of
Al
% will select
the
procedure to be performed by
the
FNV5
call.
The
allowable values for
A2%
and
A3%
are explained later
for
each
procedure. An
error
return
(with D = -1) will result if
Al
%
is
less
than
0%.
3.1.1 Opening and Closing a VT55 for
Output
Call Format: D = FNV5(0%,A2%,A3%)
A2%,
an integer from
0%
to
63%,
is
the
terminal
number
of
the
VT55 terminal.
If
the
VT55 terminal
is
designated "KBI
:",
for example,
then
A2%
would be
1%.
Any time you make
A2%
greater
than
0%
in this
manner,
the
VT55 will be opened for
output
from your BASIC-PLUS program.
Note that
A2%
is
the
number
of
the
VT55, which
is
not
necessarily
the
same
as
the
number
of
the
terminal
used to
command
RSTS/E (that is,
the
terminal with which you logged
on
to
the
system). In fact, if conve-
nient
you should log on to a terminal
that
is
not a VT55, with
the
VT55 screen in plain view.
If
you log on
to KBI:
and
the
VT55
is
KB2:,
A2%
should be
2%
when
you
run
the
program. Now
the
VT55 will only
display
output
from
the
special functions FNV5, FNV6, FNV7,
and
FNV8, which are discussed in this
chapter. All
other
program output,
such
as
the
Question marks created by
INPUT
statements,
will appear
on your "command terminal,"
KB
I:. Therefore
the
VT55 screen,
and
any reproduction you make
of
the
screen,
will
be free
of
unwanted
messages.
A3%
is
the
logical
unit
number
opened
for
the
terminal and can be any integer from
1%
to
12%.
As long as
the
VT55
is
open,
the
logical unit
number
(or "channel") specified by
A3%
will be used for your program's
output.
To close
the
terminal
just
call
FNV5
again,
but
this time make
A2%
a negative integer (any negative value
will work). You should always
enter
a
0%
for
A3%
in a closing call, for example:
D = FNV5(O%,-5%,0%)
This call would close
the
terminal, closing
whatever
logical
unit
number
was opened by
the
previous com-
mand
opening
the
terminal. Closing your VT55 terminal also erases any graphic figure
on
the
screen, dis-
ables the graphic features you have chosen,
and
resets
the
starting coordinates (see
Al
% =
7)
to (0,0).
Therefore,
the
best practice in VT55 graphic programming
is
to make
the
opening call
(A2%
>
0%)
the
first FNV5 call and
the
closing procedure
the
last call in your program.
NOTE
Any alphanumeric
text that
was displayed by your program
will remain on
the
screen
whether
or
not
you close
the
VT55.
If you
enter
a logical
unit
number
outside
the
range
P/o-12%
or
a terminal
number
outside
the
range 0%-63%, an
error
return
will result
(D
= -0.
3.1.2 Graphic Display with FNV5
There
are eight forms
of
FNV5
that control graphic displays,
the
forms being selected by your choice
of
Al
%.
Pay particular attention to
the
order in which graphic
commands
are given,
as
illustrated in
the
exam-
ples that accompany
the
command
descriptions.
3-3
BASIC-PL
US
Programming
Select Graph
Number
(Al% =
1%)
Call Format: D = FNV5(1 %,A2%,0%)
A2%
should
either
be
0%
or 1 % and will select
the
graph
number
for
the
next
regular or
shaded
graph to be
plotted. This
number
will serve
as
the
"label" for
the
figure as long
as
the
figure
is
enabled.
A3%
is always
0%
in this call. Note that selecting this graph
number
is
only a labeling procedure (that is, it selects a regis-
ter to contain
the
graph plotting values) and does not display a graph. Displaying a graphic figure
is
a
three-
step process:
1.
Enable
the
figure (A 1 % =
2%).
2.
Select graph
number
(A 1 % = 1
%).
3.
Plot
the
figure
(AI
% =
3%).
Enable or Disable Graphic Figures (Al% =
2%)
Call Format: D = FNV5(2%,A2%,A3%)
This
command
is
the
"fundamental" form
of
FNV5, because all the graphic figures
must
be
enabled before
they will appear on
the
VT55 screen.
These
figures are all disabled at first, and once enabled they will re-
main so until specifically disabled.
A2%
and
A3%
tell which figures will be enabled or disabled, respectively.
The
following
numbers
can
be
used for
either
A2%
or
A3%:
1 % =
Enter
(or leave) graphic mode.
2%
= Enable (disable)
Graph
O.
4%
= Enable (disable)
Graph
1.
8%
= Enable (disable) Shaded
Graph
O.
16%
= Enable (disable) Shaded
Graph
1.
32%
= Enable (disable) horizontal lines.
64%
= Enable (disable) vertical lines.
128%
= Enable (disable) markers on
Graph
or Histogram
O.
256%
= Enable (disable) markers
on
Graph
or Histogram
1.
512% = Disable all figures and clear
the
graphic
memory
(A2% only).
When
you are enabling
and
disabling figures, you
can
either
put
single integers in
the
call for
A2%
and
A3%,
or you can substitute expressions
that
combine
any
or all
of
the
figures.
For
example,
D = FNV5(2%,1 %+2%+512%,8%)
would
do
the
following procedures:
1.
Erase any graphic figures left
on
the
screen
by previous programs (512%);
2.
Enter
graphic mode
and
enable
Graph
0
(1
%+2%);
and
3.
Disable Shaded
Graph
0 (A3% = 8%).
3-4
BASIC-PL
US
Programming
NOTES
1.
If
you
enter
the
same
number
for A2%
and
A3%,
the
corresponding
graphic figure will
be
enabled.
2.
Instead
of
an
expression
like 1 %+2%, you
can
enter
the
sum
of
several
numbers
to
enable
or disable fig-
ures,
such
as
24% to
refer
to
both
Shaded
Graph
0
and
Shaded
Graph
1.
However,
the
expression
form
will be
more
readily
understood
by
other
persons
reading
your
program.
3.
It
is
a good practice
to
always
include
the
number
512% in
the
A2% position
the
first
time
you
enable
graphic figures. Doing so will
eliminate
graphic dis-
plays left
on
the
screen
by a previous program.
4.
It
is
usually
undesirable
to
enable
a
graph
and
a
shaded
graph
with
the
same
graph
number
(e.g.,
Graph
0
and
Shaded
Graph
0).
5.
An
error
return
will
occur
(with D
set
to
-I)
if
the
sums
of
the
arguments
are outside
the
range
0%-
1023% (for A2%)
or
0%-511 % (for A3%).
Plot
Graph
(Al
% =
3%)
Call Formats: D =
FNV50%,A2%,A3%)
or
D =
FNV50%,A2%,0%)
The
first call
format
shown
is
used
to plot a
single
point
at
the
coordinates given by A2%
(0%
to 511
%)
and
A3%
(0%
to 235%).
For
example,
850
FOR
1%
=
1%
TO
511%
860 D =
FNV50%,I%,235%*RND)
870
NEXT
1%
will plot points
on
the
screen
with x values from 1 to 511
and
with y varying
randomly
between
0
and
235.
The
second
format
plots points with y values
from
an
array
called
V5.
You
must
dimension
V5
and
fill it
with y values
before
trying
to
plot
the
graphic figure.
V5
must
be
dimensioned
to
at
least -A2%-l%.
Other-
wise,
the
FNV5
call will
cause
a fatal
subscript
error.
Remember
that
BASIC-PLUS arrays begin with a
zero
subscript,
so
that
the
statement
DIM
V5(511)
creates
a
512-element
array.
For
example,
340
DIMENSION
V5(511)
350
FORI%=0%T0511%
360 V5(I%) = 118%+ 100%*SIN(I%150.)
370
NEXT
1%
380 D =
FNV5(1
%,0%,0%)
390 D = FNV5(2%,1 %+2%,0%)
400 D =
FNV50%,-512%,0%)
3-5
BASIC-PL
US
Programming
Lines 340-370 set up
V5
as a 512-element array and
then
fill
up
V5
with sine values.
Line 380 selects 0
as
the
label
of
the next graphic figure. Line 390 enters graphic mode and enables Graph
O.
Line 400 now plots
the
sine function in
the
form
of
a graph (Graph 0). Notice
that
A2%
is
a negative integ-
er. When
A2%
is
negative,
FNV5
plots a
number
of
y values from
V5
equal to
the
absolute value
of
A2%.
In
the
example shown here, 512 values (the entire contents
of
V5) will be used, so
the
sine function will
extend over the entire width
of
the
screen.
Example 1
NOTE
An error return (D = -1) will occur if
A2%
is
ever less than -512% (for the
second format). D
is
also set to
-1
if you plot a point with coordinates outside
the
screen area
(A2%
<
0%,
A3%
<
0%,
A2%
>
511
%,
or
A3%
> 235%).
THIS
SA~PLE
BASIC-PLUS
PROGRAM
USES
THE
FOUR
FUNCTION
STATE~ENTS
NEEDED
TO
PLOT
GRAPHS
~ND
SHADED
GRAPHS.
BEGIN
B~
CREATING
THREE
ARRA~S:
Al%
WILL
BE
THE
SINE
FUNCTION,
A2%
THE
COSINE
FUNCTION
AND
A3%
THE
EXPONENTIAL
FUNCTION.
100
DIM
A1%(499),A2%(499),A3%(499),V5(499)
110
FOR
1%
=
0%
TO
499%
120
Fl=I%/50.
130
f1=PI*Fl
140 Al%(!%) =
SIN(T1)*100+100
150
A2%(I%)
= COS(Tl)*100+100
IbO
A3%(I%)=EXP(Fl)
170 NExr
1%
180
INPUT
"WHAT
IS
THE
VTSS·S
KEYBOARD
NU~BER";I%
190 D = FNV5(O%,I%,1%)
!"CHANNEL
1"
ATTACHED.
lDEFINE
STARlING
POSITION,
SELECT
GRAPH
0,
!AND
PLOr
THE
SINE FUN:TIJN.
200 D =
FNV5(7%,O%,O%)
!STARf
AT
X=O.
210 D =
FNV5(2%,I%+2%,-O%)
!ENABLE
GRAPHIC
MJDE
ANO
lGRAPH
O.
220 D =
FNV5(1%,O%,O%)
lSELECT
GRAP~
O.
230 V5(1%1=Al%(I%)
FOR
1%=0%
TO
499%
lV5
IS
NJ~
THE
SINE FUNCfION.
240 D = FNV5(3%,-500%,0%)
!PLOT
THE
SINE
GRAPH.
2S0
INPUT
"C~NTINUE";C$
lPAUSE
AND
WAIT
FOR
CARRIAGE
RETURN;
THEN
!PUr
THE
CUSINE
FUNCTION
OM
THE
SCREEN,
TO~.
3-6
BASIC-PL
US
Programming
260 D =
FNVS(2,,4%,0%)
!ENABLE
GRAPH
1.
270 D = FNV5(1%,1%,0%) !SELECT
GRAPH
1.
280 V5(1%)=A2%(I%)
FOR
1%=0%
TO
499%
!CHANGE
V5
TO
COSINE.
290 D = FNV5(3%,-500%,0%) !PLOT
THE
COSINE
GRAPH.
300
INPUT
"CJ~TINUE";C$
!ERASE
BO~H
GRAPHS
(BY
DISABLING
rHE~)
AND
!PREPARE
TO
DISPLAY
SHADED
GRAPHS
INSTEAD.
310 D = FNV5(2%,8%+16%,2%+4%)
320
330
340
350
360
370
380
390
400
410
420
32767
!SHADED
GRAPH
0
~ILL
BE
fH~
EXPONENTIAL
AND
!SHADED
~RAPH
1
wILL
BE
fHE
COSINE.
D = FNV5(1%,0%,0%) !SELECT
SHADED
GRAPH
O.
V5(I%)=A3%(I%)
FOR
1%=0%
ro
499%
!VS
=
EXPON~NTIAL.
D = FNV5(3%,-500%,0%) !PLOT
THE
EXPJNENTIAL.
D = FNV5(1%,1%,0%) !SELECT
SHADED
GRAPH
1.
V5(I%)=A2%(1%)
FOR
1%=0%
ro
499%
!NOW
V5
= COSINE.
D = FNV5(3%,-500%,0%) !PLOT
THE
COSIN~.
1 N
PUT
" C
D.N
TIN
U E " ; C $
D = FNV5(2%,0%,16%)
!ERAS~
THE
CJSINE
SHADED
GRAPH.
INPUT
"CJNTINUE";CS
D = FNV5(2%,2%,B%)
!:HANGE
EXPO~ENTIAL
fJ
A
GRAPH.
!ENABLED
GRAPH
0
AND
~DISABLED
SHADED
GRAPH
O.
D =
fNV5(O%,-1%,O%)
!:LOSE
CHANN~L
1.
END
Plot Horizontal Line (AI % =
4%)
Call
Format:
0=
FNV5(4%,A2%,A3%)
A3% gives
the
y coordinate (0%-235%)
of
the
horizontal
line.
A2%
is
either
0%
or 1
%.
A2% =
0%
will erase
the
line at
the
y position
given
by A3%. A2% = 1 % will display
the
line.
Remember
that
the
horizontal
line
feature
must
have
been
enabled
previously
by
a call
such
as
0=
FNV5(2%,1
%+32%,0%)
NOTE
An
error
return
will
occur
if
you
try
to
display a line
off
the
screen
(A3% <
0%
or
A3% > 235%)
or
if
A2%
is
any
number
other
than
0%
or
1
%.
3-7
BASIC-PL
US
Programming
Plot Vertical Line (At% =
5%)
Call Format:
0=
FNV5(5%,A2%,A3%)
This command
is
very similar to
Al
% =
4%,
but
it uses a different combination
of
arguments to plot verti-
cal lines instead
of
horizontal lines.
In this call
A2%
is
the
x coordinate at which a vertical line will either be displayed or erased.
A2%
can take
values between
0%
and
511
%.
A3%
=
0%
will erase
the
line and
A3%
= 1 % will display
the
line.
Again, any values entered for
A2%
or
A3%
that
are not within the legal range will cause an error return.
Example
2:
10
20
30
40
50
60
70
80
90
100
110
120
130
140
150
32767
!THIS
PROGRAM
DRAWS
A "GRID"
ON
THE
SCFEEN
WITH
i
THr<:
VERTIC
AL.
AND
H01<1
ZONTAL
LINE
FI
GURES.
INPUT
"WHAT
IS
THE
VT55'S
TERMINAL
NUM8ER";T%
D = FNV5(0%,T%,1%)
!OPEN
AS
CHANNEL
1.
D = FNV5(2%,1%+512%+32%+64%,0%)
!GRAPHIC
MEMORY
CL~ARED;
GRAPHIC
MODE
AND
!BOTH
LINE
TYPES
ENABLED.
FOR
1%=2%
TO
502%
ST~P
10%
D = fNV5(5%,1%,1%)
NEXT
1%
!51
VERTI.CAI,
LINES
ARE
ON
THE
SCREEN;
PAUSE.
INPUT
"CONTINUE":C$
!TYPE A
CARRIAGE
RETURN
TO
CONTINUE.
FOR
1%=2%
TO
232%
STEP
10%
D = FNV5(4%,1%,I%)
NEXT
1%
124
HORIZONTAL
LINES
ADDED.
INPUT
"CONTINUE";CS
FOR
1%=2%
1'0
502%
S.TEP
10%
D = FNV5(5%,I%,0%)
NEXT
1%
1VERTICAL
LINES
ERASED.
D = FNV5(0%,-1%,O%)
ENn
!CLOSF
CHANNEL
1.
Plot
Markers
(At
% =
6%)
Call Format:
0=
FNV5(6%,A2%,A3%)
This
command
will display or erase markers on regular and shaded graphs plotted with
Al%
=
3%.
The
markers are
short
vertical line segments
that
will appear
on
the
graph at
the
x position you specify in
the
call.
A2%
is
the
x position
of
the
marker
(0%-511
%).
A3%
=
0%
will erase
the
marker, and
A3%
= 1 % will display it.
3-8
Example 3:
100
110
120
130
140
150
160
170
180
190
200
210
220
230
240
250
260
32767
BASIC-PL
US
Programming
NOTE
This
command
will not work properly unless
A2%
and
A3%
are within
the
stated ranges.
lTHIS
PRO~RAM
DEMONSTRATES
THE
USE
OF
MARKERS
ON
lGRAPHS
AND
HISTOGRAMS.
DIM
V5(499)
INPUT
"WHAT
IS
THE
VT55'S
TERMINAL
NUMBER":T%
o = FNV5CO%,T%,1\) lJPEN
FOR
OUTPUT
AS
:HANNEL
1.
V5(I%)=SINCPI*I%/SO.)*100.+100.
FOR
1%=0%
TO
499%
lV5
NOW
:ONTAINS
SINE
VALUES.
o = FNVSC2%,1%+SI2%+2%+128%,0%)
lRESET
THE
GRAPHIC
MEMORY
AND
1ENABLE
GRAPHIC
'MOoE,
GRAPH
0,
o = FNVSC7%,0%,0%)
o = FNV5Cl%,0%,0%)
o = FNV5C3%,-SOO%,0%)
INPUT
"CO~TINUE";C$
FOR
1%
=
SO%
TO
500%
STEP
SO%
D = FNVSC6%,I%,1%)
NEXT
1%
AND
MARKERS
FJR
GRAPH
0,
lSTART
AT
X=O.
ISELE:T
GRAPH
O.
lPLOr
THE
SINE
GRAPH.
SPUT
A
MARKER
ON
THE
INPUT
"CJHTINUE";CS
GRAPH
EVER¥
50 X UNITS.
lPAUSE.
D = FNVS(2%,8%,2%)
lENABLE
SHADED
GRAPH
0,
loISABLE
GRAPH
O.
INPUT
"COHTINUE":CS
!:HANGE
SINE
TU
SHADED
GRAPH.
lPAUSE.
D = FNVS(2%,0%,128%)
lREMOVE
THE
MARKERS,
D = FNV5(0%,-1%,0%)
BUT
LEAVE
THE
SHAPED
GRAPH.
!:LOSE
:HANNEL
1.
END
Define Starting Coordinates
(At
% =
7%)
Call Format: FNV5(7%,A2%,A3%)
This
command
defines new starting coordinates for vectors, graphs, and shaded graphs. For regular
and
shaded graphs,
the
Define Starting Coordinates
command
supplies a starting x coordinate for
the
figure,
without affecting
the
starting y coordinate. This
command
has no effect on single points plotted with
Al
%
=
3%).
Draw Vector
(At
% =
8%)
Call Format:
NOTE
An
error return will occur unless
A2%
is
in the
range 0%-511 % and
A3%
is
in
the
range 0%-235%.
D = FNV5(8%,A2%,A3%)
3-9
BASIC-PL
US
Programming
This
command
draws line
segments
called vectors, which
extend
from
the
starting
coordinates to a point
on
the
screen
given by
A2%
and
A3%.
A2%
is
the
x coordinate
of
the
vector's destination point
and
should
be
a
number
from
0%
to
511
%.
A3%
is
the
destination y coordinate, with allowable values
between
0%
and
235%. (An
error
return
will
occur
if
A2%
or
A3%
is
outside its legal range.)
If
you
have
previously
defined
starting coordinates
(AI
% =
7%)
when
you draw a vector,
the
vector will
begin at those coordinates.
Remember
that
the
"initialization" function
FNV7
(described later) resets
the
starting coordinates to (0,0).
The
Draw Vector
command
itself also resets
the
starting
coordinates to those of
the
destination point sup-
plied in your call. This feature allows you to "chain" vectors
together
to form geometric figures
or
other
straight-line drawings.
If
you want to draw a series
of
vectors
that
originate at
the
same
point, you
can
sim-
ply interweave Define Starting Coordinates
commands
with your Draw Vector
commands.
Vectors are
not
graphic figures, strictly speaking, because
they
do
not
have to
be
enabled. However, you
can (and
should)
label a series
of
vectors
that
make
a design
as
Graph
0
or
Graph
1,
and
Graphs
0
and
1 do,
of
course,
have
to be enabled.
Remember
that
you
cannot
draw a vector
that
is
perfectly vertical.
Example
4:
100
110
120
130
140
150
160
110
180
190
200
210
220
32767
!THIS
SAMPLE
PROGRAM
DEMJNSTRATES
THE
USE
!Of
VECTJRS,
WHI:H
CAN
BE
USED
T8
DR4~
!GEOMETRI: fIGURES
(A
DIAMOND
IN
THIS
CASE)
!AND
CAN
BE
LABELED
LIKE
GRAPHS.
INPUT
"WHAT
IS
THE
VT55'S
TERMINAL
NU~BER";T%
D =
fNV~(O%,T%,l%)
!DPE~
"CHANNEL
1."
D = fNV5(2%,1%+512%+2%+4%,O%)
!CLEAR
THE
SCREEN
Of
GRAPHIC
DISPLAYS,
ENTER
!GRAPHIC
MODE,
AND
ENABLE
BOTH
GRAPHS.
D = fNV5(1%,O%,O%) !SELECT
GRAPH
0.
D = FNV5(7%,100%,lOO%)
!(100,100)
IS
THE
STARTING
D = FNV5(8%,150%,150%)
D = fNV5(8%,200%,200%)
D = FNV5(1%,1%,O%)
POINT
OF
rHE
FIRsr
VECTOR.
!fIRST
VECTOR.
!SECJND V£CTJR.
!SELECT
GRAPH
1.
!THE
BOT
rOM
OF
THE
DIAMOND
wILL
D = FNV5(8%,150%,50%)
BE
GRAPH
1.
!THIRD VEcrOR.
D = fNV5(8%,200%,100%)
!FOURTH
(fINAL)
VECTOR.
!THE
DIA~OND
IS
COMPLETE.
I~Pur
"CJHTINUE";CS
!TYPE
A
CARRIAGE
RETURN
fJ
CONTINUE.
D = fNV5(2%,0%,4%)
!DISABL~
GRAPH
1.
lTO
DEMONSTRATE
THE
FACT
THAT
TWJ
SEPARAfE
!"GRAPHS"
ARE
BEING
DISPLAYED,
GRAPH
!1
(TH~
BOTTOM
Of
THE
DIAMOND)
WAS
ERASED.
D = fNV5(O%,-1%,O%)
!CLOSE
CHANNEL
1.
END
3-10
BASIC-PL
US
Programming
3.1.3
Alphanumeric
Display with FNVS
The
actual
output
of
alphanumeric
characters to
the
VT55
screen
is
done
with a separate function, FNV6.
However,
FNV5
contains
three
command
forms
that
are useful for
alphanumeric
display programming.
Position
Cursor
(At
% =
9%)
Call Format: D = FNV5(9%,A2%,A3%)
This
command
positions
the
cursor at a
new
point whose coordinates are given by
A2%
and
A3%.
A2%
is
the
number
of
character
positions from
the
left edge
of
the
screen
at which
the
cursor will appear.
A2%
can
therefore
take values from
0%
to
79%.
A3%
is
the
number
of
lines from
the
top
of
the
screen
at which
the
cursor will appear. Since
there
are 24
lines per
screen,
A3%
can
be
any
integer from
0%
to
23%.
Note
that
an
error
return
(D
= -1) will
occur
if
you
enter
values for
A2%
or
A3%
that
exceed
the
legal
ranges.
Note also
that
moving
the
cursor
with this
command
has no effect
on
graphic
or
alphanumeric
displays
on
the
screen.
Erase from
Cursor
to End
of
Screen
(At
% = to%J
Call Format: D = FNV5(lO%,0%,0%)
This
command
erases all
alphanumeric
text from
the
screen, starting at
the
cursor position
and
continuing
to
the
bottom
of
the
screen.
This
command
does not erase graphic figures from
the
screen,
nor
does it
change
the
cursor position.
Notice
that
the
call format
is
completely
standard
for this
command;
the
arguments
are always 10%,0%,
and
0%.
Erase from Cursor to End of Line
(At
% =
11
%)
Call Format: D =
FNV5(l
1
%,0%,0%)
This
command
is
very similar to
Al
% =
10%,
the
difference being
that
the
erasure
stops at
the
end
of
the
cursor's line instead
of
continuing
to
the
end
of
the
screen.
Note again
that
the
format
is
constant.
As with
the
previous
command,
the
status
of
graphic figures
and
the
cursor position are unaffected by
the
erasure.
3.1.4 Producing Hard Copy with FNVS
FNV5
can be used to
send
special instructions called "escape sequences" to
the
VT55 terminal. An escape
sequence
consists
of
the
ASCII code 155, which
is
interpreted
as
an
<
ESC>
character
in RSTS/E,
and
a
value you supply as
A2%
in
the
following call:
0=
FNV5(l3%,A2%,0%)
3-11
BASIC-PL
US
Programming
As
is
discussed in
the
VT55-E,F DECgraphic Scope User's Manual, escape sequences can be used to per-
form a variety
of
functions, including "cursor control" and screen erasure. Of course, these two types
of
control are provided by forms
of
the
FNV5 function, so that there
is
no
advantage to using escape se-
quences.
The
most helpful application
of
escape sequences
is
in producing a
paper-
copy
of
the screen display. This
procedure
is
only valid for VT55 terminals with a built-in hard copy unit;
the
same program can be run on
a terminal with no hard copier, but the hard copy commands (93%-95%)
will
be ignored.
Following
is
a list
of
values for
A2%
that
will
perform hard copy operations:
A2%
Value
91%
92%
93%
94%
95%
Procedure
Hold screen.
Release screen.
Copy from top
of
screen to cursor.
Start automatic copying.
Stop automatic copying.
The following example would copy
all
graphic and alphanumeric displays from the screen:
100
110
120
130
D = FNV5(9%,79%,23%)
D = FNV5(13%,91
%,0%)
D = FNV5(13%,93%,0%)
D = FNV5(13%,92%,0%)
!Cursor to bottom right.
!Hold screen.
!Copy entire screen.
!Release screen.
As
shown in Line 100, you have to first move the cursor to the bottom right corner
of
the
screen, because
the
copy operation
will
stop when the cursor
is
reached.
Line 110
will
"hold" the screen, temporarily preventing the display
of
further text or graphic
figures. While the VT55
is
in this mode,
the
computer
will
still read characters typed on
the
keyboard, but
will
not "echo" them, so they
will
not appear on the screen.
Line 120 now copies everything on
the
screen, from the topmost line to the cursor.
Now that
the
copy operation
is
finished,
the
screen
is
released by Line 130, which cancels
the
previous Hold Screen command. After the screen
is
released, you
will
have to press
the
SCROLL key a few times before you can continue. The SCROLL key
will
display any mes-
sages that were received while the screen
was
still being held, for instance, the READY mes-
sage that tells you the system
is
ready for new commands.
If
you have a screen display consisting entirely
of
alphanumeric text, you can use the automatic copy com-
mands to produce "line printer" type listings. When the VT55
is
in automatic copy mode, it
will
first copy
everything up to but not including the line containing
the
cursor;
then
it
will
copy one additional line each
time you push the
<LINE
FEED>
key on the keyboard.
The
following example shows a programmed
automatic copy operation:
100 D = FNV5(9%,0%,0%) !Cursor to home position.
11
0 D = FNV5
(1
3%,91
%,0%)
!Hold screen.
120 D = FNV5(13%,93%,0%) !Start automatic copying.
130 INPUT A$
!A LINE
FEED
WILL COPY
ONE
MORE
!LINE.
THE
LETTER'S'
WILL STOP
!AUTOMA TIC COPYING.
3-12
140
150
160
BASIC-PL
US
Programming
IF
A$='S'
GOTO 160
GOTO 130
D = FNV5(I3%,95%,0%)
!Type S to stop.
!Read
the
next
character.
!Stop automatic copy.
This example will read each line feed
that
you
enter
to copy lines.
It
will keep
the
terminal in
automatic copy mode until you
enter
the
character
S.
NOTES
1.
Automatic copying should only
be
used
with alphanumeric text.
The
hard copy
of
a
graphic figure will be distorted
if
produced
in line-by-line fashion.
2.
The
screen
will temporarily go blank while a
copy operation
is
in progress.
3.
The
copy operation can
be
manually started
any time the program pauses by simply
pressing
the
orange COPY key
on
the
VT55
keyboard. Similarly, pressing
the
COPY key
while holding down
the
SHIFT key will
both start and stop automatic copying.
3.2 FNV6,
THE
TEXT OUTPUT FUNCTION
Call Format: D = FNV6(N%,CI$)
FNV6
displays a character string on
the
VT55 screen.
The
string will appear with
the
first character at
the
cursor position, so
that
FNV6
is
often used in combination with
the
"alphanumeric" forms
of
FNV5, which
control
the
cursor position and
the
erasure
of
characters (see Section 3.1.3).
As
the
format shows, there are only two arguments for FNV6, both
of
which are required at all times.
CI$,
a string variable, stores
the
text
that
you wish to display
on
the
screen.
CI$
can
be
either a regular or
subscripted variable,
depending
on
the
type
of
display you are designing. A regular string variable can ac-
cept a string
of
80 characters, which
is
the
maximum
width
of
a line
of
characters on
the
screen. Therefore,
you can use regular variables when
the
string will
be
displayed horizontally. Vertical displays require ei-
ther
subscripted variables, so
that
one
element
can be displayed per line, or alternatively,
the
use
of
the
BASIC-PLUS function MID, which selects "substrings" from a regular character string variable and there-
by allows you to address individual characters or groups
of
characters in a string. Example 5 shows how
MID
can
be
used to
put
a vertical label
on
a graph.
3.3 FNV7,
THE
INITIALIZATION FUNCTION
Call Format:
D=FNV7
This simple function (notice
that
there
are no arguments) resets
the
screen to an "initial state,"
that
is:
1.
The
starting coordinates are reset to the point (0,0), the lower left corner
of
the
screen;
2.
All graphic figures are erased from
the
screen, leaving only alphanumeric text;
3-13
BASIC-PL
US
Programming
3.
The
internal
variables
06%
and
Q6%,
which
store
information
about
the
graphic figures, are reset
to 0,
disabling
all
graphic
figures;
and
4.
The
terminal
is
returned
to
alphanumeric
mode.
All
four
of
these
initializations
can,
of
course,
be
performed
by
FNV5
calls,
but
FNV7
is
a
more
direct
and
simple
method.
Therefore,
it
is
good practice to call
FNV7
immediately
after
opening
the
terminal
(see
Example
5).
Example
5:
NOTE
FNV7
should
not
be
used
in
the
middle
of
a
program unless you
want
to totally
eliminate
the
ef-
fects
of
previous
FNV5
calis.
!THIS
SAMPLE
PROGRAM
USES
SEVERAL
FORMS
OF
F~VS
!
AS
WELL
AS
THE
ALPHANU~E:RIC
Fll~,ICTION
FNV6
AND
!THE
INITIALIZATION
FUNCTION
fNV7.
90
DIM
V5(499)
100
INPUT
"WHAT
IS
THE
VT55'S
TERMINAL
NUMBER":T%
110 D = FNV5(0%,T%,1%)
!OPEN
"CHANNEt
1."
120 D =
FNV7
!FNV7
CLEARS
THE
SCREEN
OF
GRAPHIC
FIGURES
AND
!RESETS
THE
STARTING
COORDINATES
TO
(0,0).
130
GOSUB
1000
!THE
SUBROUTINE
AT
LINE
1000
CLEARS
ANY
STRAY
TEXT
!FROM
THE
SCREEN.
140 D = FNV5(9%,0%,12%)
!PUT
THE
CURSOR
AT
THE
BEGINNING
OF
LINE 12
AND
!DISPLAY A
MESSAGE.
150
160
170
180
190
200
210
C9S='TYPE A
CARRIAGE
o = FNV6(58%,C9S)
INPUT
"CONTINUE";C$
D = FNV5(9%,44%,12%)
D = FNV5(11%,0%,0%)
INPUT
"CONTINUE";CS
GOSUB
1000
RfTURN;
SYMBOLS
WILL
VANISH:
1234567890(>+'
DISPLAY
THE
CHARACTERS.
PAUSE
FOR
CARRIAGE
RETURN.
REPOSITION
CURSOR.
ERASE
SYMBOLS.
PAUSE.
CLEAR
SCREEN.
.!
liSE
FNV6
TO
I,ABF:L.A
GFAPH.
,
-
220
0.=
FNV5(2%,1%+2%+32%+64%+128%,0%)
230
PRINT 'TYPE X
AXIS
LABEL
(UP
TO
80 CHARACTERS):'
240 D = fNV5(9%,0%,2%) !POStTION
CURSOR.
250
INPUT
X1S
260
GOSllB
1000
!CLEAR
SCREEN.
270 PRINT 'TYPE Y
AXIS
LABEL
(UP
TO
24 CHARACTERS):'
280 D = FNV5(9%,O%,2%)
290
INPUT
Y1S
3-14
BASIC-PL
US
Programming
300
GOSUB
1000
lCLEAR SCREEN.
310
FOR
1%=0%
TO
499%
320
V5(I%)
=
SINCPI*I%/50.)*100.+100.
lV5=SINE.
330
NEXT
1%
340
0 =
FNV5C5%,0%,1%)\D
= FNV5C4%,1%,0%) 10ISPLAY AXES.
350
0 =
fNV5C9%,0%,23%)
lCURSOR
TO
BOTTOM
LINE.
360
0 =
FNV6(80%,X1S)
lDISPLAY X AXIS LABEL.
370
FOR
1%
=
1%
TO
LEN(Y1S)
380
L2%
= 1%-1% !L2%
IS
A LINE COUNTER.
390
0 = FNV5(9%,0%,L2%1
!POSITION
CURSOR
FOR
1 CHARACTER.
400
0 =
FNV6(1%,MID(Y1S,I%,1%»
!DISPLAY
ONE
CHARACTER.
410
NEXT
1%
lCONTINUE UNTIL Y AXIS
LABEL
IS
COMPLETE.
420
D =
FNV5(1%,0%,0%)
lNOW
DISPLAY
THE
SINE
FUNCTION.
430
0 =
FNV5(3%,-500%,0%)
440
0 =
FNV5(9%,40%,0%)
450
INPUT
"X
POSITION
OF
MARKER";Ml%
460
0 =
FNV5(9%,40%,0%)
470
0 =
FNV5(11%,0%,0%)
lERASE
THE
PREVIOUS MESSAGE.
480
0 =
FNV5(6%,Ml%,1%)
lPUT A
MARKER
AT
X=M1%.
1000
1010
1020
1030
32767
!THIS
SUBROUTINE CLEARS
o = FNV5(9%,O%,0%)
o = FNV5(10%,O%,O%)
RETURN
END
THE
SCREEN.
!CURSOR
TO
HOME
POSITION.
!ERASE SCREEN.
3.4 FNV8,
THE
STEP
HISTOGRAM
FUNCTION
Call
Format:
D = FNV8(N%,O$,Q$)
FNV8
creates step histograms,
or
vertical
bar
graphs, from
the
array V5. V5
must
be
properly
dimensioned
and
filled with values in
the
main
program,
and
you
must
select
either
Shaded
Graph
0
or
Shaded
Graph
1
before
the
FNV8
call.
After
these
preliminaries, a call to
FNV8
has
the
following results:
1.
The
first
N%
values
are
selected from V5.
2.
The
screen
width (512 x units)
is
divided
into
N% equal-sized segments.
3.
N%
horizontal vectors are drawn,
each
with a width
of
512%/N%.
The
screen
area
beneath
each
vector
is
then
shaded to
create
N%
vertical bars.
4.
The
horizontal vectors
have
been
enabled
separately as
Graph
0 (or 1
if
you selected
that
number
before
the
FNV8
call).
The
entire
step
figure is
then
enabled
as a Shaded
Graph
with
the
same
number
as
the
vectors' graph
number.
Because
of
this dual use
of
the
same
graph
number,
the
envelope
of
the
step
histogram
(that
is,
the
vectors) will
have
a
higher
display
intensity
than
the
rest
of
the
figure. As was
mentioned
previously (Section
3.1.2),
the
effect
of
using
the
same
graph
number
twice
is
usually undesirable,
although
it adds clarity to
the
final figure in this case.
5.
The
different
bars will
have
heights equal to
the
corresponding
"y
values" selected from V5.
3-15
BASIC-PL
US
Programming
6.
Finally, the character strings you have supplied for
0$
and Q$ are displayed as labels for
the
hori-
zontal and vertical axes
of
the
histogram, respectively.
0$
can be a string
of
up to 80 characters,
and Q$
as
many
as
24
characters.
Consider the following calling sequence:
10
DIM V5(I9)
20
D =
FNV5(I
%,0%,0%)
!Select graph number.
30
FOR
1%
=
0%
TO
19%
40
V5(1%)
=
10%*(1%
+ 1
%)
!Fill
V5
with integers.
50 NEXT
1%
60
D = FNV8(20%, 'FIRST
20
INTEGERS', 'INTEGERS TIMES
TEN')
This fragment would display twenty bars, each about
25
x units wide
(512%120%).
The
first bar would be
10
y units tall and
the
twentieth bar, 200 units.
Besides being a useful function in its own right, FNV8
is
a good model for new functiOns you can create for
your special needs. BASIC-PLUS has easy procedures for writing new functions, and your growing experi-
ence with VT55 programming
will
allow you to combine FNV5, FNV6, FNV7, and FNV8 to create in-
creasingly powerful graphic commands. Appendix C
of
this manual suggests
other
functions that you may
find useful.
3-16
APPENDIX
A
FORTRAN
(PLOT55)
ASSEMBLY
AND
LINKING
PROCEDURES
PLOT55
is
supplied in both source and object form.
If
the
PLOT55 file in your kit
is
labeled PLOT55.MAC,
it
is
a
MACRO-ll
source file and must be assembled (Section
At)
and
then
linked to each program you
write that contains PLOT55 calls (Section
A2).
If
you are given a preassembled object file (PLOT55.0BJ),
you only have to follow the linking procedures for your operating system.
A.I
ASSEMBLING
AN
OBJECT FILE
This procedure
will
translate the MACRO-II assembly language code in PLOT55.MAC into binary ma-
chine instructions. You must do this job and
the
linking procedure shown in Section
A.2
before your pro-
gram
will
work.
Suppose you are using a PDP-1l/34 computer with a pushbutton console, two RK05 disk drives, and
the
R T
-11
operating system.
1.
Put
the
DECpack containing PLOT55.MAC in Disk Drive 1 (DKI:) and close the door. Push
the
switch on the disk drive panel from LOAD to RUN.
2.
In the same manner, load your "system disk" into Drive 0 (DKO:). This disk should contain an RT-
11
operating system, the MACRO-II assembler (MACRO.SA V), and the System MACRO Library
(SYSMAC.SML).
3.
Start the R T
-11
system by these procedures:
A Push the button marked CTRL on the PDP-1l/34 and hold it down while you press the
BOOT
button. The terminal
will
display a list
of
octal numbers followed by the $ symbol.
B.
Type the two-letter device code on the terminal that represents
the
storage device containing
your system. Because
we
are using RK05 disks in our example, you would type the under-
lined symbols:
077776. 012456. 127645
$DK
<CR>
C.
The computer
will
read
the
bootstrap from your system in Drive
0,
start the
RT-ll
system,
and display the system title, for example:
RT-ll
FIB
V02C
Then
the
system
will
display a period
(.)
at the left margin, meaning that it
is
ready to accept
system commands.
A-I
FORTRA
N
(PLOT55)
Assembly and Linking Procedures
4.
Assemble the PLOT55 object file by typing the underlined parts
of
these lines:
.R MACRO < CR >
*PLOT55=DKl:PLOT55
<CR>
*TC
The second asterisk shown above
will
not appear until the assembly
of
the
object file
is
complete. To exit
from MACRO, you
then
type "Control C" by holding down
the
CTRL key on the terminal while you type a
C.
At this point PLOT55.0BJ has been created on Disk
O.
If
you want the new object file to be placed on
Disk I, type DKI :PLOT55 on both sides
of
the equal sign rather than only the right side.
If you are using a different computer:
Follow the customary procedures for bootstrapping the system and
then
begin with Step 4
of
the previous assembly procedure.
If
you are using an
RSX-ll
system:
When your PLOT55 source
is
on a DECtape (DT:) or RK disk (OK:):
>MOU
DK:(or DT:)PLOT55
<CR>
>MAC
PLOT55~K:(or
DT:)[200,200]PLOT55
<CR>
When your source
is
on magnetic tape:
>FLX
SY:/RS=MT: (or MM:) [200,200] PLOT55.MAC/OOS
<CR>
>MAC
PLOT55=PLOT55
<CR>
Both procedures
will
assemble PLOT55.0BJ on the system device, placing
the
object file in
the VIC under which you have logged on to the system.
The
additional FLX command
is
necessary in the second step because the magnetic tape
is
in DOS-II format.
If you are using an lAS system:
When your PLOT55 source
is
on a DECtape (DT:) or
RKdisk
(OK:):
PDS>MOUNT
<CR>
DEVICE? OK: (or DT:)
<CR>
VOLUME-ID? PLOT55
<CR>
PDS>MACRO
OK: (or DT:) [200,200]PLOT55
<CR>
When
your PLOT55 source
is
on magnetic tape:
PDS>
MOUNT IFOREIG N/OVERRIDE:
VOLUMEID<CR
>
DEVICE? MT: (or MM:)
<CR>
VOLUME-ID? PLOT55
<CR>
PDS>COPY
<CR>
FROM? MT: (or MM:) [200,200] PLOT55.MAC/OOS
<CR>
TO?
*.*
<CR>
--
PDS>
MACRO PLOT55
<CR>
After either procedure, the assembled file PLOT55.0BJ
will
exist on the system device with
the same UIC under which you logged on to lAS.
A-2
FOR
TRA
N (PL0T55) Assembly and Linking
Procedures
If
your storage devices are not RK05 disks:
The
only change
is
the
two-letter code for
the
device. Standard codes include:
SY:
DB:
=
DX:
DT:
CT:
DP:
MT: =
MM:=
Any device identified beforehand as the system device for your installa-
tion.
RP04, RP05, or RP06 disk drive.
RXOI "floppy disk" drive.
DECtape drive.
DECcassette tape drive
(RT-ll
only).
RP02/03 disk drive.
TUI0
magnetic tape drive.
TJU16 magnetic tape drive.
A.2 LINKING AN
OBJECT
FILE TO YOUR
PROGRAM
A.2.t
Procedure for
RT-ll
Users
Type
the
underlined parts
of
the following R T
-11
commands:
.RLINK<CR>
*program=object,PLOT55IF
<CR
>
*lC
where "program"
is
the
name
you want for
the
finished program, and "object"
is
the
name
of
the
object file
for
that
program (that is,
the
output
of
the
FORTRAN
compiler). PLOT55
is
the
object file
that
was
either
supplied in your software kit or was produced by
the
assembly procedure in Section A.t.
The
"IF"
switch
tells the
LINK
program
that
your program
is
using
FORTRAN
statements
and library functions.
LINK
will
look for
the
FORTRAN
library (FORLIB.OBJ)
on
the
system disk.
If
FORLIB
is
on
some
other
stor-
age device, follow
the
PLOT55
name
with ",dc:FORLIB" instead
of
the
IF,
where dc:
is
the
code for
the
device containing FORLIB.
LINK
will print
the
second asterisk shown to indicate
that
the
linkage was successful. To exit from LINK,
type
CTRL
C.
Your VT55 program can now
be
run
by typing
.R program <
CR
>
A.2.2 Procedure for
RSX-ll
Users
Type
the
underlined part
of
the
following
command
in response to
the
prompt
symbol
(»:
>TKB
task=objectlFP,PLOT55
<CR>
The
name
you insert for "task"
will
be
assigned to
the
finished, executable task image
of
your
FORTRAN
program.
The
label "object" refers to
the
compiled form
of
your program, and "PLOT55"
is
actually
PLOT55.0BJ,
the
object file
that
was
either
supplied in your software kit or created by
the
assembly pro-
cedures in Section A.t.
The
IFPswitch
means
that
the
Floating Point Processor will
be
used.
Notice
that
the
command
line has
no
references to a
FORTRAN
library.
The
task builder will expect
SYS-
LIB to contain
the
FORTRAN
object code
needed
by your program.
If
SYSLIB
is
not
on
your disk, or
if
A-3
FORTRAN
(PLOT55) Assembly and Linking Procedures
you are using a separate
FORTRAN
library, you have to state
the
exact
name
and
location
of
the
library in
the
TKB command, for instance:
> TKB task=objectlFP,PLOT55,DKI : FORLIB/LB
<CR>
Regardless
of
the
particular TKB
command
you use,
the
prompt symbol will reappear
when
the
task image
is
ready. You are
then
ready to
run
your VT55 program by typing
>RUNtask
<CR>
If
you received the binary file PLOT55.0BJ in your kit rather
than
the
source file PLOT55.MAC, you
should transfer
the
object file to your UIC before
running
TKB. Use
the
RSX-ll
MOU
and
FLX
com-
mands described in Section A.I.
The
only change required
is
making
the
file
name
extension .OBJ instead
of.MAC.
A.2.3 Procedure for lAS Users
Type
the
underlined part
of
the
following
command
in response to
the
Program Development System's
prompt symbol:
PDS>LINK/TASK:task
object PLOT55
<CR>
where task
is
the
name
you want for
the
finished, executable task image
and
object
is
the
name
of
the file
containing the compiled form
of
your main program. PLOT55 represents
the
file PLOT55.0BJ, which was
either supplied in your software kit or created by a previous assembly
of
the
file PLOT55.MAC.
The
PDS>
prompt symbol will reappear
when
the
task
is
finished and ready to run.
The
lAS
LINK
utility assumes
that
the
Floating Point Processor will
be
used.
When
the
LINK
program
is
finished building
the
task,
the
task can
be
executed with
the
command
PDS>RUN
task<CR>
If
you received
the
binary file PLOT55.oBJ in your kit
rather
than
the
source file PLOT55.MAC, you
should transfer PLOT55.0BJ to your UIC before
running
LINK. Use
the
same lAS
MOUNT
and COPY
commands
described in Section A.I, changing
the
.MAC extension in
the
COPY
command
to .OBJ.
A-4
APPENDIX
B
SUGGESTED
PLOT55
APPLICATIONS
This appendix contains examples
of
FORTRAN subroutines that combine various PLOT55 calls to
achieve "higher level" functions. For example, your use
of
a VT55 might require
the
display
of
a large num-
ber
of
graphs, in which case you can avoid a large
number
of
PLOT55 calls in your program by following
the techniques suggested in this appendix.
Not
all
of
these routines would be needed by every user, and there
is
rarely any saving in execution speed,
because
the
routines result in just about
the
same
number
of
PLOT55 calls as would occur anyway.
The
advantage
of
subroutines
is
that they allow you to define, debug, and save an entire procedure, which can
then
be reused
as
often
as
necessary without the risk
of
new programming errors.
You can try the routines suggested in this appendix by compiling and linking
them
as
you did for PLOT55.
You may find that they can be used
as
they are shown here or that some additional modifications would
make
them
more applicable to your needs.
Notice that these subroutines use the four-argument form
of
PLOT55.
The
fourth argument
is
the 16-ele-
ment
array
1ST
AT, and it
is
placed in a common area labeled STATUS.
The
use
of
such a common status
table allows you to share the same status information between any
number
of
routines. Within each rou-
tine, individual elements
of
1ST
AT can be examined and changed to control
the
overall status
of
the
VT55
display. For example, the element ISTAT(8) stores the current graph number; ISTAT(8) equals 0 if Graph
o
is
in use and 8 if Graph 1
is
in use. The full list
of
status table elements and their uses
is
as
follows:
ISTAT(l):
ISTAT(2):
ISTAT(3):
ISTAT(4):
ISTAT(5):
ISTAT(6):
ISTAT(7):
ISTAT(8):
ISTAT(9):
ISTAT(10):
ISTAT(l1):
ISTAT(12)-
ISTAT(16):
B.t
INITIALIZATION
Logical unit
number
of
terminal.
Event
flag
number
to be used.
X value
of
origin.
Y value
of
origin.
Work register (do not change contents!).
Work register.
Graphic status (holds the current total from IENAB).
o
if
Graph 0
is
in use; 8
if
Graph
1.
Graphic mode switch (O=Off, I=On).
Work register for vectors (do not change!).
Character count (RSX
-11
only).
Character output buffer (RSX -11).
In
most applications, it
is
useful to have a routine such
as
the
one shown here that
will
return the VT55 to
some initial state
as
preparation for running a new program.
SUBROUTINE
INIT
COMMON/ST ATUS/ISTAT(16)
DATA ISTAT/16*01
B-1
SUf.{f~ested
PLOT55
Applications
CALL PLOTSS(13,72"ISTAT)
CALL PLOTSS(l3,74"ISTAT)
CALL
PL0T5S(2,1
+SI2"IST
AT)
RETURN
END
The
statement
CALL
INIT
will first clear all
alphanumeric
text
from
the
screen
and
then
will disable all
graphic figures, clearing
the
screen
of
graphic displays as well.
INIT
is
therefore
a good example
of
a
"starting routine" for a graphic program.
B.2
GRIDS
AND COORDINATE AXES
2
3
4
SUBROUTINE
GRID(IDX,IDY)
COMMON
1ST
A TUS/IST A
T(l6)
CALL
PL0T55
(2, 1 + 32+64"IST AT)
00
1
1=I,SI2
CALL
PLOTS5(5,I-l,0,ISTAT)
DO
21=1,236
CALL
PLOT55 (4,0,I-l,IST AT)
00
3
I=I,512,IDX
CALL
PLOT55(5,I-l,I,ISTAT)
00
4 1=1,236,IDY
CALL
PLOT55(4,I,I-l,IST AT)
RETURN
END
The
numbers
you supply for
lOX
and
lOY
in a
CALL
GRID
statement
will
be
the
spacing in
screen
units
between
the
vertical
and
horizontal lines, respectively.
GRID
will
therefore
display a rectangular grid
on
the
screen, which can be superimposed
on
other
figures
such
as graphs
and
histograms.
If
GRID
is
called
several times in
the
same
program, it will erase any old grid before displaying a new one.
To display only a y axis at
the
left edge
and
an
x axis at
the
bottom
of
the
screen, use a
CALL
GRID
state-
ment
with
lOX
equal to any integer greater
than
S11
and
lOY
any
integer greater
than
23S.
The
markers described in
Chapter
2 (ICMD = 6) are
the
best way to
mark
off
a graph in
the
x direction.
You may, however, want to
put
a vertical scale
on
a graphic figure
as
well. With a routine
such
as
GRID,
you could, for example, scale
the
screen
vertically in
increments
of
20 units by calling
GRID
with
lOX>
S11
and
lOY
=
20.
B.3
GRAPH
PLOITING
ROUTINES
The
examples in this section suggest "canned" procedures for
the
most
common
use
of
VTSS: plotting
graphs or
shaded
graphs
of
already
computed
data.
SUBROUTINE
GRAPH
(N
,IARRA
Y)
COMMON
1ST
ATUS/IST
AT(l6)
DIMENSION
IARRAY(SI2)
NUMBER=IST
AT(8)/8
CALL
PLOT5S(7,O,O,IST AT)
CALL
PLOTSS(8,S12,0,ISTAT)
CALL
PLOTSS(2,1
+(NUMBER+
1)*2,(NUMBER+
1)*10,ISTAT)
CALL
PLOTSS(3,-
N,IARRA
Y,IST AT)
CALL
PLOTSS(l,l-NUMBER"ISTAT)
RETURN
END
B-2
Suggested
PL0T55
Applications
When
you write a CALL
GRAPH
statement, a graph will appear that displays
the
first N points from IAR-
RA
Y (where
IARRA
Y
is
some integer array that you have filled with the points you want to display).
This particular
GRAPH
routine also switches automatically between Graph 0 and
Graph
1,
in
the
follow-
ing manner:
1.
After a CALL
INIT
statement, CALL
GRAPH
will use
Graph
0 to plot
the
array you supply.
2.
If
GRAPH
is
called a second time in
the
same program (without calling
INIT
again),
the
second
graph
will
appear as Graph
1,
superimposed on Graph
O.
3.
If
GRAPH
is
called a third time,
the
new graph will be
Graph
0 again, erasing
the
old
Graph
0
but
leaving
Graph
1 on
the
screen.
The
erasure
of
the old graph
is
done
by drawing a vector from
the
point (0,0) to
the
point (512,0), which
is
a short method for resetting
all
the
y values
of
a graph to
O.
4.
Consequently,
all
even-numbered
calls to
GRAPH
will create a new
Graph
1,
and odd-numbered
calls a new
Graph
O.
SUBROUTINE SHADOW
COMMON/STATUS/lSTAT(l6)
NUMBER=IST
AT(S)/S
CALL PLOT55(2,1+(1-NUMBER)*S+S,(l-NUMBER)*2+2,ISTAT)
RETURN
END
CALL SHADOW converts a regular graph to a shaded graph.
If
you want to "shade" a particular graph, you
must
call SHADOW immediately after calling
GRAPH,
for
example,
CALL
GRAPH
(500,SINE)
[Plot the sine function on
Graph
0.]
CALL SHADOW [Shade
Graph
0.]
CALL GRAPH(500,COSINE) [Graph
1.]
CALL SHADOW [Shade
Graph
1.]
Shading
is
a useful practice for distinguishing two graphs. For example,
the
sine and cosine graphs have
exactly the same shape, and so are
much
easier to tell apart if
one
of
them
is
shaded.
SUBROUTINE BARS(N,IARRA Y)
COMMON/ST ATUS/IST
AT(l6)
DIMENSION IBAR(236,2),IARRAY(512)
NUMBER=IST
AT(S)/S
CALL PLOT55(7,0,0,ISTAT)
CALL PLOT55(S,512,0,ISTAT)
CALL PLOT55 (2, 1 +
(NUMBER
+
1)
*2"IST A
T)
WIDTH=512.1FLOAT(N)
DO
1
I=I,N
IBAR(I,l)=I*WIDTH
IBAR(I,2)=IARRAY(I)
CALL PLOT55 (7,0,IBAR(l,2),ISTAT)
DO
2
I=I,N
B-3
2
Suggested PLOT55 Applications
CALL PLOT55(S,IBAR(I,l),IBAR(I,2),1STAT)
CALL PLOT55 (7,IBAR(I,l),1BAR(I+ 1,2),ISTA
T)
CALL PLOT55 (1,1-NUMBER"IST A T)
CALL SHADOW
RETURN
END
BARS creates a special type
of
shaded graph called a step histogram, or "bar graph." BARS
will
display N
vertical shaded bars
of
width 512/N on the screen."The bars
will
have heights equal to the first N elements
of
IARRA
Y.
This example
of
a bar graph routine has the same mechanisms
as
the previous
GRAPH
rou-
tine for switching between Graph 0 and Graph 1 and for erasing old graphs (the "zeroing vector").
B.4 LABELING A GRAPHIC DISPLAY
3
4
SUBROUTINE LABEL(IXLABL,IYLABL)
COMMON/ST ATUS/IST AT(16)
LOGICAL*1IYLABL(24)
CALL PLOT55 (9,0,23,1STAT)
CALL PLOT55 (12"IXLABL,ISTAT)
00
3 1=1,24
IF(IYLABL(I).EQ.O) GO TO 4
CALL PLOT55(9,0,1-1,ISTAT)
CALL PLOT55 (12, 1 ,1YLABL(I)
,1ST
A T)
CALL PLOT55 (9,0,23,ISTAT)
CALL PLOT55 (13,91"ISTAT)
PAUSE
CALL PLOT55 (13,92"IST AT)
RETURN
END
LABEL
will
use the two strings you
enter
for
IXLABL and IYLABL
as
axis labels for the x and
yaxes,
respectively. Note that the labels you supply must be enclosed in single quotation marks (') to identify
them
as
alphanumeric strings in
FORTRAN
symbology.
The
x axis label
will
appear on the very bottom line
of
the screen, below the x axis.
It
can be up to 80
characters long (including spaces).
The
y axis label
will
read from top to bottom (one letter per line) and
will
appear in "Column
0,"
the left-
most column
of
the screen. This column
is
to the left
of
a vertical line at x =
0,
because the graph area
of
the VT55
is
slightly smaller
than
the alphanumeric area.
The
y axis label can be up to 24 characters long,
including spaces.
Notice that the LABEL routine sends two escape sequences.
The
first one holds
the
screen to prevent the
STOP message from interfering with
the
display.
The
screen
will
not be released until you type a carriage
return (or a "RESUME task" command in RSX
-11
systems).
If
you
will
be using lAS, replace the PAUSE
statement with the statement pair
READ(5,5)KR
5 FORMA T(I2)
The
PAUSE statement
will
be ignored in an lAS execution. (To bring
the
terminal back to a completely
normal state after this sort
of
procedure, press
the
orange SCROLL key until
the
STOP message and the
operating system's prompt symbol reappear.)
B-4

Suggested
PL0T55
Applications
B.S
AIT
ACHING
THE
VTSS
AS AN OUTPUT DEVICE
The subroutine ATTACH assigns logical unit 1 to
the
terminal
number
of
the
VT55.
Then
the
routine
stores
ILUN
= 1
and
IEFN
= 1 in the status table. This subroutine should precede any
other
PLOT55 calls in
a program.
SUBROUTINE ATTACH
COMMON/ST ATUS/IST AT(16)
WRITE(5,l)
1
FORMAT('WHAT
IS
THE
VT55
TERMINAL
NUMBER?')
READ(5,2)
NR
2
FORMAT(02)
CALL ASNLUN(1,'TT',NR)
CALL PLOT55(O,1,l,ISTAT)
RETURN
END
When
you use this routine or any
other
that attaches
the
VT55,
remember
to detach
the
VT55 at the end
of
the program.
CALL PLOT55(O,-1,O,ISTAT)
END
NOTE
ATT ACH will only work with lAS or
RSX-ll
systems.
B-5

APPENDIX C
SUGGESTED BASIC-PLUS APPLICATIONS
Chapter
3 suggested
that
you may want to design some BASIC-PLUS functions
of
your own, using
the
four
functions supplied in your kit (FNV5, FNV6, FNV7,
and
FNV8)
as
building blocks. This appendix gives
you a few samples that show
the
four functions
as
they
might be
combined
to yield
even
higher-level,
and
therefore simpler, graphic support.
Your VT55 software kit
is
supplied
either
on RK05 disk, DECtape, or DOS-II format magnetic tape. Use
the
following procedures to write
the
VT55 software
onto
your RSTS/E system disk:
For RK05 disk distribution:
l.
Place
the
RK05 disk in disk drive 0 (DKO:). Close
the
door.
2.
Log
onto
the system
and
type
the
following
command
in response to
the
READY
message:
MOUNT
DKO:VT55
<CR>
(Change the device
number
to
DKl:
if you are using drive
1.)
3.
Now use
the
PIP
program to copy
the
disk:
READY
PIP
<CR>
=(PIP
VERSION printed by system)
#SY: VT55.BAS=
DKO:
VT55.BAS(200,200)
<CR>
#1Z
READY
DISMOUNT DKO:VT55
<CR>
For DECtape distribution:
The
same
procedure
is
used as for RK05 disks except
that
the
device code,
wherever
it ap-
pears, should be
DTO:
(for DECtape drive 0) or
DTl:
(for drive 1).
The
MOUNT
and
DISMOUNT
commands
may
not
be necessary;
check
with your system manager.
For
magnetic tape distribution:
READY
MOUNT
MTO:
<CR>
READY
C-l

Suggested
BASIC-PL
US Applications
PIP
<CR>
iSY:VT55.BAS=MTO:[200,200]VT55.BAS/OOS
<CR>
#lZ
READY
DISMOUNT
MTO:/UNLOAD
<CR>
All
of
these procedures will write
the
file VT55.BAS
onto
the
system disk
under
the
account that you used
to log on.
C.l
INITIALIZATION
The standard function
FNV7
is
called an initialization function because
it
erases old graphic displays from
the
screen and returns
the
VT55 terminal to its initial state, ready to receive new graphic programming
instructions. What FNV7 does
not
do, however,
is
to also clear
the
screen
of
the
letters and
numbers
that
make up the alphanumeric part
of
a display. In
other
words, FNV7 performs a "single" initialization:
the
graphic display
is
cleared from the screen,
but
the
alphanumeric display remains. FNV7
is
thus useful
when you want to change from one graph to
the
next without changing
the
labels on the axes. In
other
cases you might want to combine
the
graphic initialization
of
FNV7
with a second initialization that clears
the
alphanumeric information from
the
screen
as
well. Consider this example:
15000
DEF
FNV9
15010 D = FNV5(9%,0%,0%) !Cursor to home position.
15020 D = FNV5(10%,0%,0%) !Erase screen.
15030
FNEND
FNV9
is
a different kind
of
single initialization; it clears the alphanumeric display from the screen
but
leaves
the
graphic display alone.
FNV9
could be used by itself in a program you write, or it could be com-
bined with
FNV7
in yet
another
function that performs a "dual" initialization:
15040
DEF
FNV1
15050 D =
FNV7
15060 D =
FNV9
15070
FNEND
If
your graphic programs contained these function definitions,
then
the
statement
D =
FNV7
would clear
only the graphic display, D =
FNV9
would clear only
the
alphanumeric display, and D = FNV1 would
clear both displays.
C.2 GRIDS AND COORDINATE AXES
16000
DEF
FNV2(D1
%,D2%)
16010 D = FNV5(2%,1 %+32%+64%,0%)
16020 FOR
1%
=
1%
TO
512%
16030 D = FNV5(5%,I%-1
%,0%)
C-2
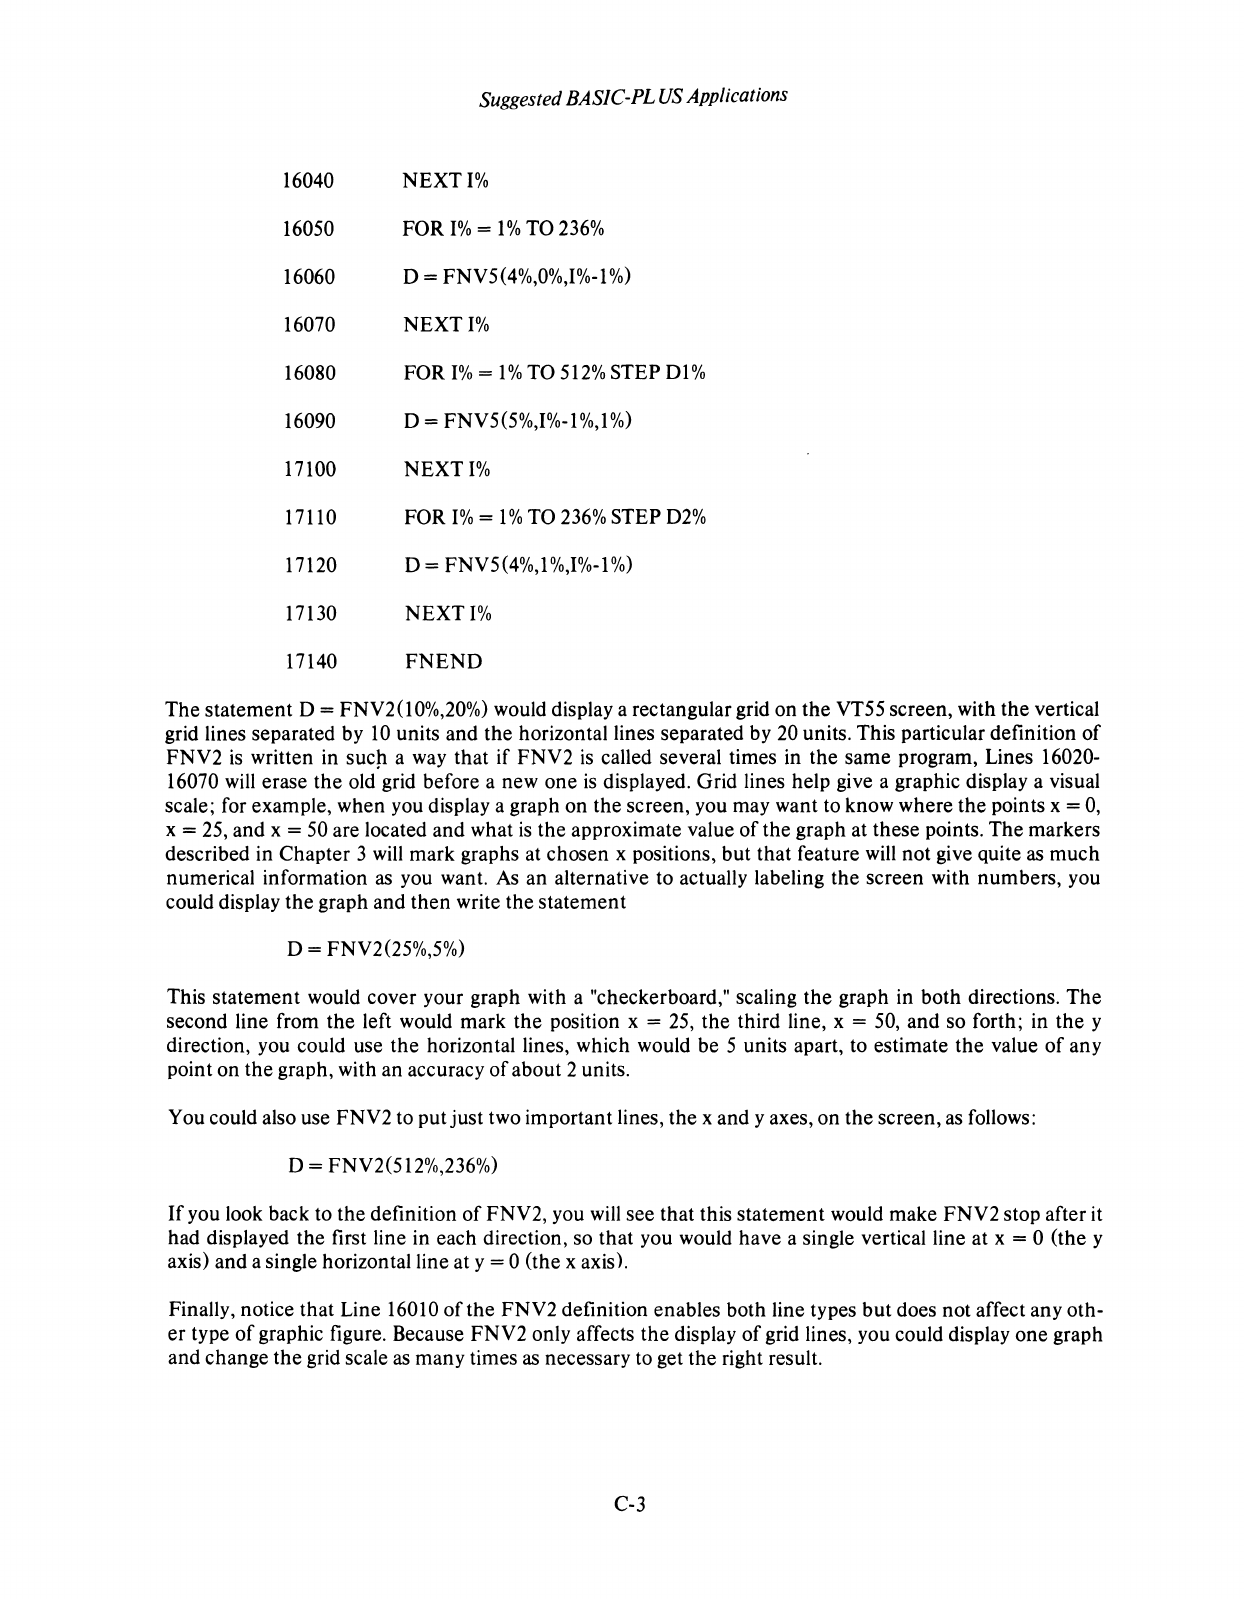
Suggested BASIC-PL
US
Applications
16040
NEXT
1%
16050 FOR
1%
=
1%
TO
236%
16060 D = FNV5(4%,0%,I%-1
%)
16070
NEXT
1%
16080 FOR
1%
=
1%
TO
512%
STEP Dl%
16090 D = FNV5(5%,I%-I%,1
%)
17100
NEXT
1%
17110 FOR
1%
= 1 % TO
236%
STEP
D2%
17120 D = FNV5(4%,1
%,1%-1
%)
17130
NEXT
1%
17140
FNEND
The
statement
D = FNV2(I0%,20%) would display a rectangular grid on
the
VT55 screen, with
the
vertical
grid lines separated by
10
units and
the
horizontal lines separated by 20 units. This particular definition
of
FNV2
is
written in sucp. a way that if
FNV2
is
called several times in the same program, Lines 16020-
16070 will erase
the
old grid before a new one
is
displayed. Grid lines help give a graphic display a visual
scale; for example, when you display a graph on the screen, you may want to know where
the
points x =
0,
x = 25, and x = 50 are located and what
is
the approximate value
of
the graph at these points.
The
markers
described in Chapter 3
will
mark graphs at chosen x positions,
but
that feature will
not
give quite
as
much
numerical information
as
you want.
As
an alternative to actually labeling the screen with numbers, you
could display
the
graph and
then
write the
statement
D = FNV2(25%,5%)
This statement would cover your graph with a "checkerboard," scaling
the
graph in both directions.
The
second line from
the
left would mark
the
position x = 25,
the
third line, x = 50,
and
so forth; in
the
y
direction, you could use
the
horizontal lines, which would be 5 units apart, to estimate
the
value
of
any
point on
the
graph, with an accuracy
of
about 2 units.
You could also use FNV2 to put
just
two important lines, the x and y axes, on the screen, as follows:
D = FNV2(512%,236%)
If
you look back to
the
definition
of
FNV2, you will see that this
statement
would make
FNV2
stop after it
had displayed the first line in each direction, so that you would have a single vertical line at x = 0 (the y
axis) and a single horizontal line at y = 0 (the x axis).
Finally, notice that Line 16010
of
the
FNV2
definition enables both line types
but
does not affect any oth-
er
type
of
graphic figure. Because
FNV2
only affects
the
display
of
grid lines, you could display
one
graph
and
change
the
grid scale
as
many times
as
necessary to get
the
right result.
C-3
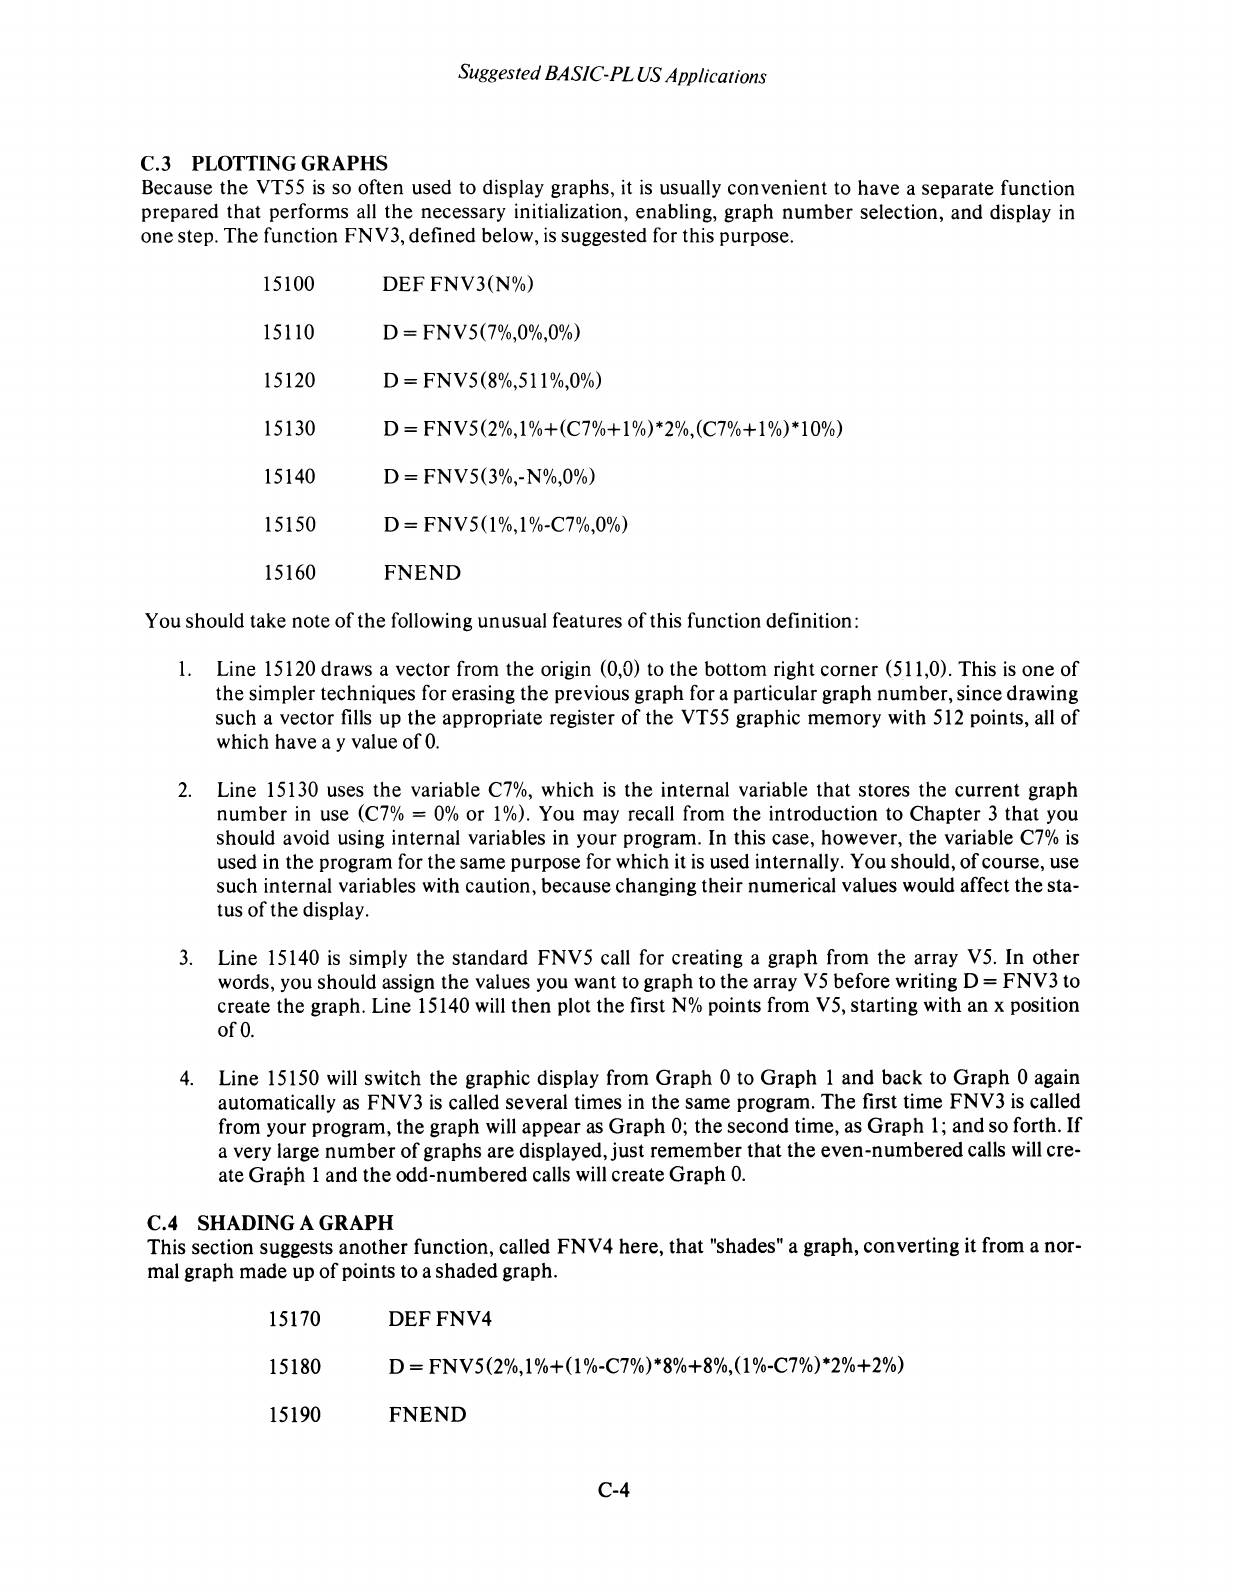
Suggested BASIC-PL US Applications
C.3 PLOTTING GRAPHS
Because
the
VT55
is
so often used to display graphs, it
is
usually
convenient
to have a separate function
prepared
that
performs all
the
necessary initialization, enabling, graph
number
selection, and display in
one
step.
The
function FNV3, defined below,
is
suggested for this purpose.
15100
DEF
FNV3(N%)
15110 D = FNV5(7%,0%,0%)
15120 D =
FNV5
(8%,511
%,0%)
15130 D = FNV5(2%,I%+(C7%+1 %)*2%,(C7%+ 1%)*10%)
15140 D = FNV5(3%,-N%,0%)
15150 D =
FNV50%,1
%-C7%,0%)
15160
FNEND
You should take note
of
the
following unusual features
of
this function definition:
l.
Line 15120 draws a vector from
the
origin (0,0) to
the
bottom right
corner
(511,0). This
is
one
of
the
simpler techniques for erasing
the
previous graph for a particular graph
number,
since drawing
such a vector fills up
the
appropriate register
of
the VT55 graphic
memory
with 512 points, all
of
which have a y value
of
O.
2.
Line 15130 uses
the
variable
C7%,
which
is
the
internal variable
that
stores the
current
graph
number
in use
(C7%
=
0%
or 1
%).
You may recall from
the
introduction to Chapter 3
that
you
should avoid using internal variables in your program. In this case, however, the variable
C7%
is
used in the program for
the
same
purpose for which it
is
used internally. You should,
of
course, use
such internal variables with caution, because changing their numerical values would affect
the
sta-
tus
of
the display.
3.
Line 15140
is
simply
the
standard
FNV5
call for creating a graph from
the
array
V5.
In
other
words, you should assign the values you want to graph to
the
array
V5
before writing D =
FNV3
to
create the graph. Line 15140
will
then
plot the first
N%
points from V5, starting with an x position
ofO.
4.
Line 15150 will switch
the
graphic display from
Graph
0 to
Graph
1 and back to
Graph
0 again
automatically as
FNV3
is
called several times in
the
same program.
The
first time
FNV3
is
called
from your program, the graph
will
appear
as
Graph
0;
the
second time, as
Graph
1;
and
so
forth.
If
a very large
number
of
graphs are displayed,
just
remember
that
the
even-numbered
calls will cre-
ate
Graph
1 and
the
odd-numbered
calls will create
Graph
O.
C.4 SHADING A GRAPH
This section suggests
another
function, called
FNV4
here,
that
"shades" a graph, converting it from a nor-
mal graph made up
of
points to a
shaded
graph.
15170
DEFFNV4
15180 D = FNV5(2%,1
%+0
%-C7%)*8%+8%,(l %-C7%)*2%+2%)
15190
FNEND
C-4
Suggested BASIC-PL
US
Applications
FNV
4 uses
the
variable
C7%,
the
graph
number,
in
the
same way as described for
FNVl
FNV
4 should be
called immediately after displaying
the
graph that you want to shade, because
FNV
4 will only shade
the
graph with
the
most recent graph
number,
for example:
15200 V5(I%)=SI
(1%)
FOR
1%=0%
TO
511
%
!SI CONTAINS SINE V ALVES.
15210
D=FNV9
!ERASE SCREEN.
15220 D = FNV3(512%) !PLOT 512-POINT SINE.
15230
D=FNV4
!SHADE
THE
SINE
GRAPH.
15240
V5(I%)=CI0%)
FOR
1%=0%
TO
511
%
!Cl CONTAINS COSINE.
15250 D = FNV3(512%) !PLOT 512-POINT
COSINE.
In this example,
the
sine graph would be shaded, but the cosine graph would remain a standard "point-
plot" graph. Shading
is
very useful in just
such
a case, because the sine and cosine graphs are identical in
shape and can be hard to tell apart unless
one
of
them
is
shaded.
C-5

Alphanumeric array, 2-14
Alphanumeric mode, 1-1,
1-3
APPEND
statement,
3-1
Arrays,
1-3
alphanumeric, 2-14
plotting graphs from,
1-3
ASCII character,
1-1
ASNLUN,2-2
Assigning logical unit numbers, 2-2
Automatic copying, 2-18, 3-12
Automatic graph
number
switching, B-3, C-4
BASIC-PLUS definitions,
3-1
BASIC-PLUS demonstration program, 3-2
BASIC-PLUS programming rules, 3-2
Blank screen, 1-3
Bootstrap, A-I
Channel,
communication, 1-4
Character,
ASCII,
1-1
Characters,
display of, 2-14, 3-13
erasing, 2-13, 2-16, 3-11
CLEAR, 2-13
Clearing graphic memory, 1-2, 2-4, 3-4
Code,
condition,
3-1
Commas in PLOT55, 2-2
trailing, 2-4
Common status table,
B-1
Communication channel, 1-4
Condition code,
3-1
Coordinates,
defining starting, 2-11, 3-9
starting, 1-3
COpy
key, 2-18, 3-13
Copying, 2-18, 3-12
automatic, 2-18, 3-12
Cursor,
1-2
Position, 2-13, 2-16, 3-11
DECpack,
A-I,
C-l
DECtape, A-2,
C-l
Defining starting coordinates, 2-11, 3-9
Definitions,
BASIC-PLUS,
3-1
INDEX
Demonstration program,
BASIC-PLUS, 3-2
Destination point,
1-3
Devices,
storage, A-3
Disabling graphic figures, 1-2, 2-3, 3-4
Display,
suppressing text, 2-18, 3-12
Display-only device,
VT55 as
a,
2-2, 3-3
Displaying text, 2-14, 3-13
Displays,
vertical text, 3-13, B-4
Drawing vectors, 2-11, 3-10
Enabling graphic figures, 1-2, 2-3, 3-4
Erasing graphs, 1-2
Erasing graphs with vectors, 1-4
Erasing text, 2-13, 2-16, 3-11, 3-12
Error return, 3-3
Escape mode, 1-1, 2-16
Escape sequence, 1-1, 2-16, 3-11
Event flags, 1-4, 2-2
Figures,
graphic,
1-2
Figures with same graph
number,
3-15
Flags,
even
t,
1-4, 2-2
FNV5 format, 3-3
Format,
FNV5, 3-3
general PLOT55,
2-1
FOR
TRAN
histograms,
B-3
General PLOT55 format,
2-1
Graph
number,
1-2
figures with same, 3-15
selecting, 2-3, 3-4
Graph
number
switching, automatic, B-3, C-4
Graphic figures, 1-2
disabling, 1-2, 2-3, 3-4
enabling, 1-2, 2-3, 3-4
Graphic memory, 1-2
clearing, 2-4, 3-4
Graphic mode, 1-1, 1-2
Graphing program, sample, 2-6, 3-6
Index-l
Graphs, 1-2, 2-3,
3-1
erasing,
1-2
plotting,
1-2
plotting BASIC-PLUS,
3-5
plotting FORTRAN,
2-5
shaded,
1-2
shading regular,
B-3,
C-4
starting position for, 2-11, 3-9
Graphs from arrays, plotting,
1-3
Graphs with vectors, erasing, 1-4
Hard copy unit, 1-1, 2-17, 2-18, 3-12
Histograms,
3-1
FORTRAN,
B-3
Hold screen command, 2-17, 3-12
Home position,
1-2
Horizontal lines, 1-2, 2-7, 3-7
lAS,
2-2,
2-16, A-2
Initialization,
3-1
ITBL,
2-1,
B-1
Line segments,
1-3
Line-drawing program, sample,
2-8,
3-8
Lines,
horizontal,
1-2
plotting horizontal, 2-7, 3-7
plotting vertical,
2-8,
3-8
vertical,
1-
2,
Listings, 2-18, 3-12
Logical unit number, 1-4,
2-2,
3-3
Logical unit numbers, assigning,
2-2
Magnetic tape, A-2,
C-l
Markers,
1-2
plotting, 2-9,
3-8
sample program for, 2-10,
3-9
Memory;
graphic,
1-2
Messages,
unwanted, 2-3,
3-3
MID function, 3-13
Mode,
alphanumeric, 1-1,
1-3
escape, 1-1, 2-16
graphic, 1-1,
1-2
terminal,
1-1
Name,
task, 2-16
NUL character, 2-14
Number,
graph, 2-3, 3-4
logical unit, 1-4, 2-2, 3-3
terminal, 1-4, 2-2,
3-3
Index
Overlaid program,
2-2
Pause, READ for programmed,
2-7
PAUSE statement, 2-7, 2-16, 2-18
PLOT55,
commas in,
-2-2
PLOT55 format, general,
2-1
Plotting graphs,
1-2
BASIC-PLUS,
3-5
FORTRAN,
2-5
Plotting graphs from arrays,
1-3
Plotting horizontal lines, 2-7, 3-7
Plotting markers, 2-9,
3-8
Plotting single points,
1-
3
Plotting vertical lines, 2-8,
3-8
Point,
destination,
1-3
single, 1-3, 2-11, 3-5, 3-9
Position,
cursor, 2-13, 2-16,
3-11
home,
1-2
Position for graphs, starting, 2-11, 3-9
Program,
overlaid,
2-2
sample for markers, 2-10, 3-9
sample for vectors, 2-12, 3-10
sample graphing, 2-6, 3-6
sample line-drawing, 2-8,
3-8
sample text-display, 2-14, 3-14
Programmed pause, READ for, 2-7
Programming rules, BASIC-PLUS, 3-2
READ for programmed pause,
2-7
Registers, 1-2,
2-3
Regular graphs, shading,
B-3,
C-4
Release screen command, 2-17, 3-12
RESUME, 2-16, 2-18
Return, error, 3-3
RK05, A-I,
C-l
RSTS/E,
1-4
RSX-ll,
1-4, 2-2, 2-16, 2-18, A-2
Rules,
BASIC-PLUS programming, 3-2
Same graph number, figures with, 3-15
Sample graphing program, 2-6, 3-6
Sample line-drawing program, 2-8, 3-8
Sample program for markers, 2-10, 3-9
Sample program for vectors, 2-12, 3-10
Sample text-display program, 2-14, 3-14
Scale, vertical,
B-2,
C-3
Screen, blank
1-3
SCROLL key, 2-18, 3-12
Scrolling, 2-17
Selecting graph number, 1-2, 2-3, 3-4
Index-2
Sequence, escape, 1-1, 2-16,
3-11
Shaded graphs,
1-2
Shading regular graphs,
B-3,
C-4
Single points, 1-3, 2-5, 2-11, 3-5, 3-9
Starting coordinates,
1-
3
defining, 2-11, 3-9
Starting position for graphs, 2-11,
3-9
Status table,
2-1
common,
B-1
use of,
B-1
Storage devices, A-3
Suppressing text display, 2-18, 3-12
Switching terminal modes,
1-3
Table, status, 2-1,
B-1
Task name, 2-16
Terminal mode,
1-1
switching,
1-3
Terminal number, 1-4, 2-2,
3-3
Text,
displaying, 2-14, 3-13
erasing, 2-16, 2-17,
3-11
Text display, suppressing, 2-18, 3-12
Index
Text displays, vertical, 3-13, B-4
Text-display program, sample, 2-14, 3-14
Trailing commas, 2-4
Unwanted messages, 2-3,
3-3
Use
of
status table,
B-1
V5,
3-5
Vector,
zeroing, 1-4,
B-4,
C-4
Vectors,
1-3
drawing, 2-11, 3-10
erasing graphs with, 1-4,
B-4,
C-4
sample program for, 2-12, 3-10
Vertical lines, 1-2, 2-5, 2-8, 3-1, 3-8
Vertical scale,
B-2,
C-3
Vertical text displays, 3-13,
B-4
VT55
as
a display-only device, 2-2,
3-3
VT55.BAS,
3-1
X position, starting, 2-7, 3-9
Zeroing vector, 1-4,
B-4,
C-4
Index-3

READER'S COMMENTS
VT55 Programming Manual
AA-4949A-TC
NOTE: This form
is
for document comments only. DIGITAL will use comments submitted on this form at the
company's discretion. Problems with software should be reported on a Software Performance Report
(SPR) form. If you require a written reply and are eligible to receive one under SPR service, submit
your comments on an SPRform.
Did you find errors
in
this manual?
If
so, specify by page.
Did you find this manual understandable, usable, and well-organized? Please make suggestions for improvement.
Is
there sufficient documentation on associated system programs required for
use
of
the software described in this
manual? If
not,
what material
is
missing and where should it be placed?
Please indicate the type
of
user/reader that you most nearly represent.
o Assembly language programmer
o Higher-level language programmer
o Occasional programmer (experienced)
o User with little programming experience
o Student programmer
o Non-programmer interested in computer concepts and capabilities
Name Date
____________________
_
Organization
_____________________________________
_
Street
_______________________________________
___
City
________________
State
______________
Zip Code
________
_
or
Country
·------------------------------------------------------------Fold lIere------------------------------------------------------------
.-----------------------------------------------
Do
Not
Tear
-
Fold
lIere
and
Staple
-----------------------------------------------
BUSINESS REPLY MAIL
NO POSTAGE STAMP NECESSARY
IF
MAILED IN
THE
UNITED STATES
Postage will be paid
by:
Software Documentation
146 Main Street
ML
5·5/E39
Maynard, Massachusetts 01754
FIRST CLASS
PERMIT NO.
33
MAYNARD.
MASS.


digital
equipment corporation
Printed
in
U.S.A.
