ACL Participant Guide 0219
ACL_Participant_Guide_0219
User Manual:
Open the PDF directly: View PDF ![]() .
.
Page Count: 86
- Usernames and Passwords
- Table of Contents
- Autonomous Cloud Management
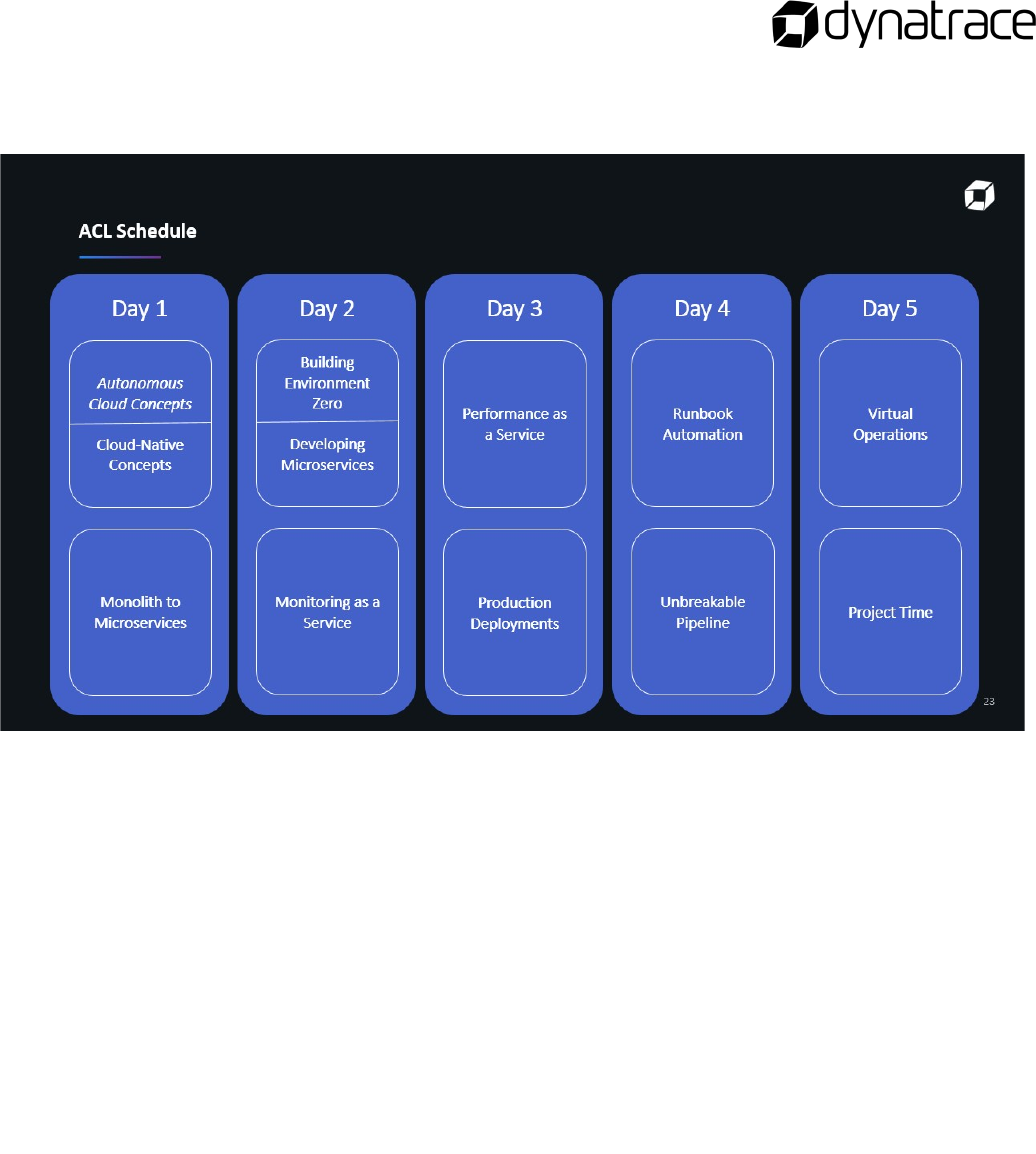
- Agenda and Class Information
- Cloud-Native Concepts
- Monolith to Microservices
- Building Environment Zero
- Developing Microservices
- Monitoring as a Service
- Performance as a Service
- Production Deployments
- Runbook Automation and Self-Healing
- Unbreakable Delivery Pipeline
- Virtual Operations
- Autonomous Cloud Lab Questions
- ACL Key Takeaways
- Contact Information

Autonomous Cloud Lab
Participant Guide
2
Usernames and Passwords
The following usernames and passwords will be used throughout the lab. You will be assigned a
username. Passwords are all the same.
Bastion Host IP Username Password
Common IP Address Common Password

3
Table of Contents
Usernames and Passwords ..................................................................................................................................................... 2
Table of Contents ................................................................................................................................................................... 3
Autonomous Cloud Management ........................................................................................................................................... 5
Agenda and Class Information ................................................................................................................................................ 6
Housekeeping ................................................................................................................................................................................. 6
Ground Rules .................................................................................................................................................................................. 6
Cloud-Native Concepts ........................................................................................................................................................... 7
What is a Microservice? ............................................................................................................................................................... 7
What is a Container Image? ....................................................................................................................................................... 7
Comparing Containers and Virtual Machines ...................................................................................................................... 7
What is a Container Registry? ................................................................................................................................................... 7
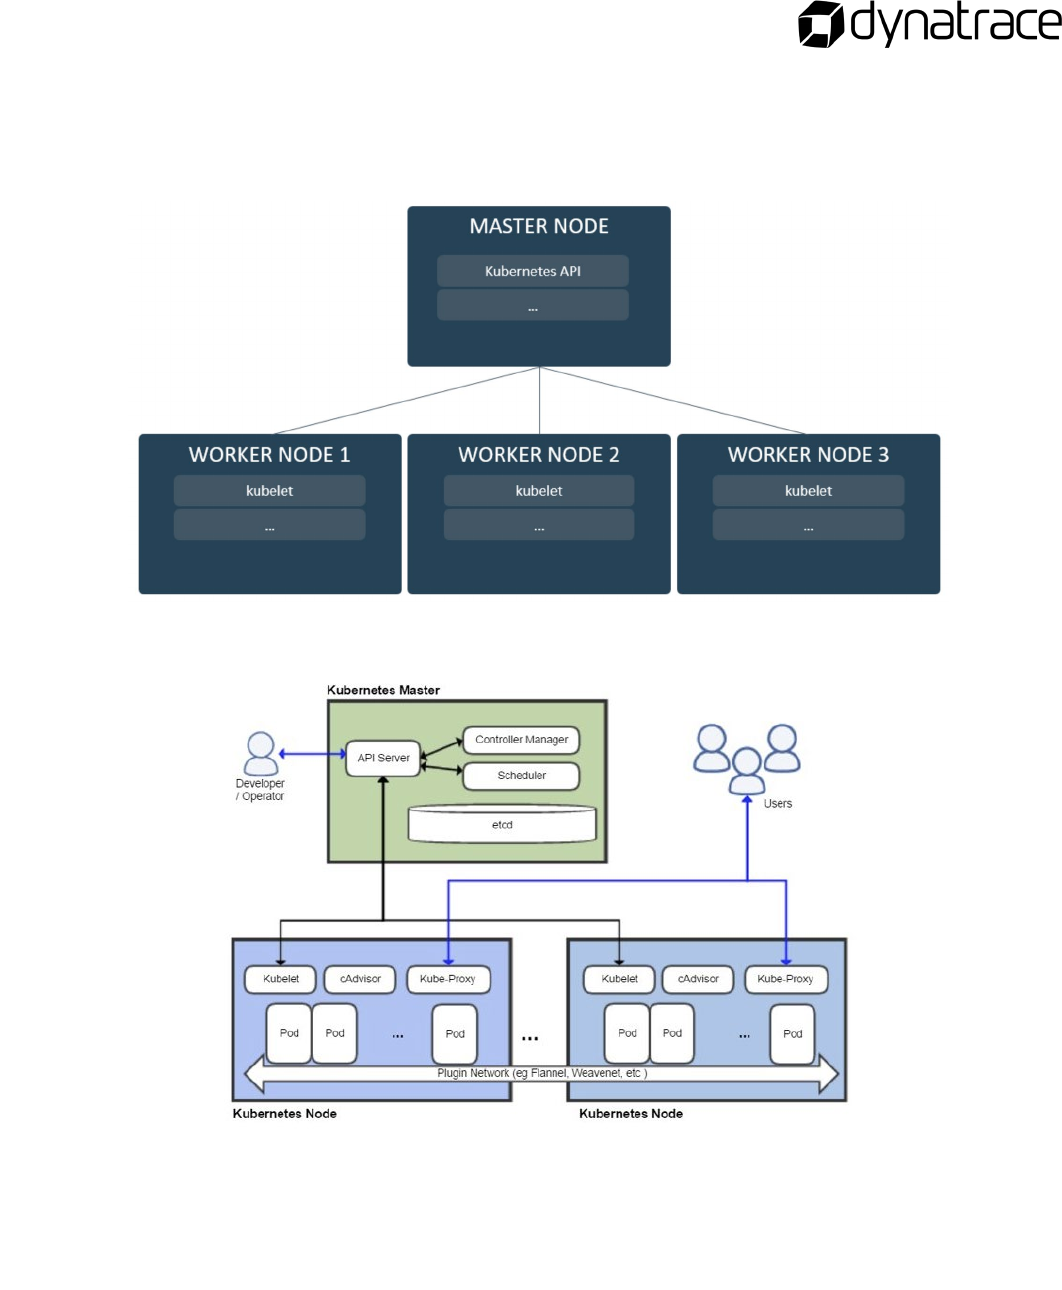
What is Kubernetes? .................................................................................................................................................................... 9
Kubernetes Architecture ........................................................................................................................................................ 9
What is OpenShift? ...................................................................................................................................................................... 9
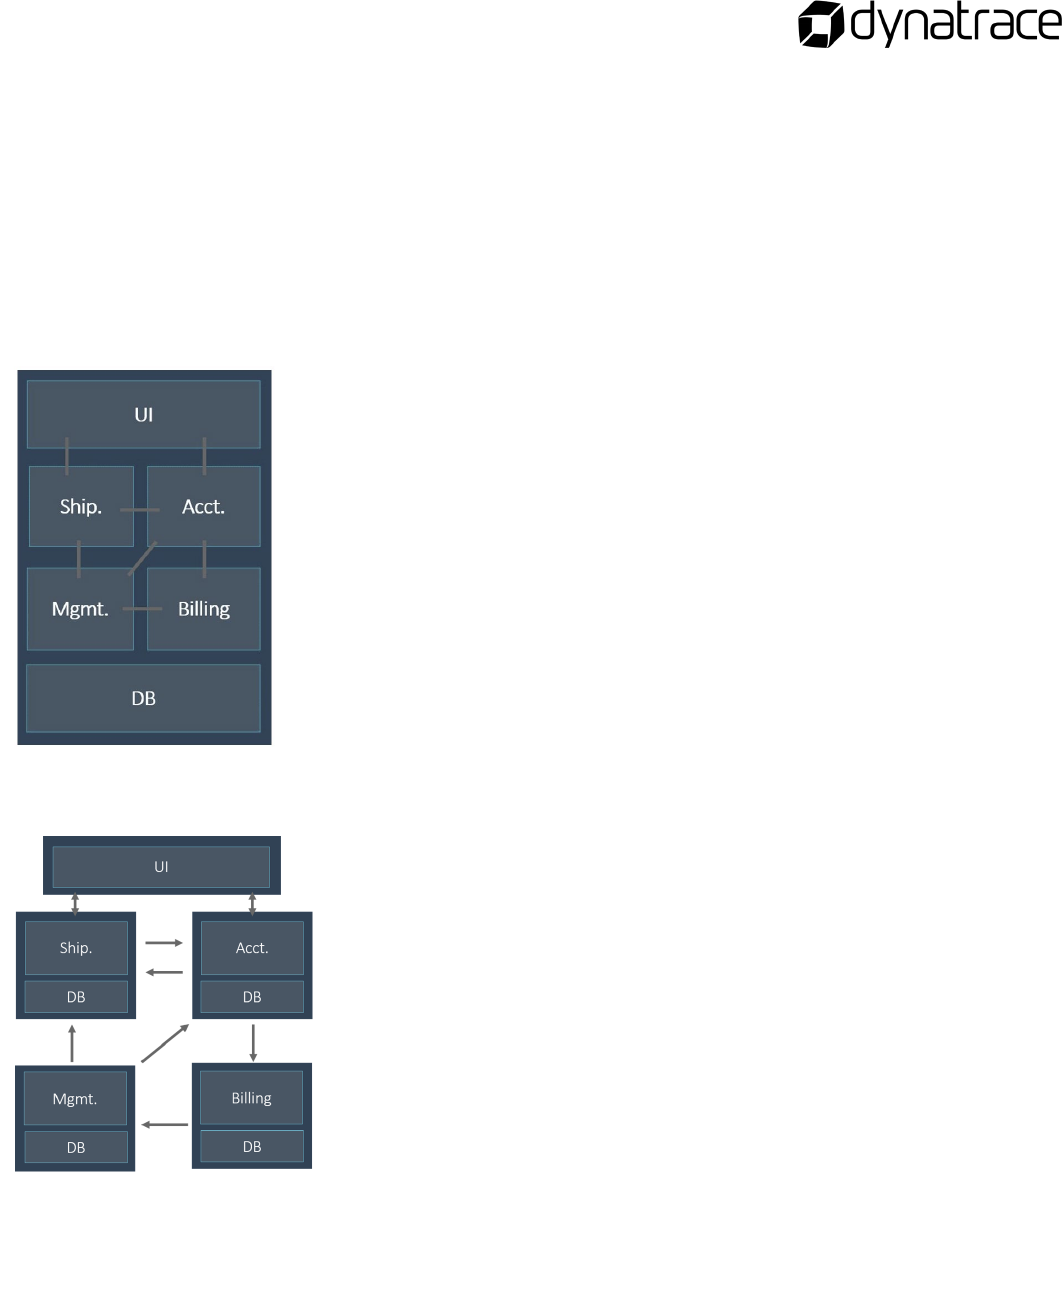
Monolith to Microservices .................................................................................................................................................... 11
Limitation of monolithic applications ................................................................................................................................... 11
Limitations of Monoliths have given rise to Microservices .......................................................................................... 11
Building Environment Zero ................................................................................................................................................... 20
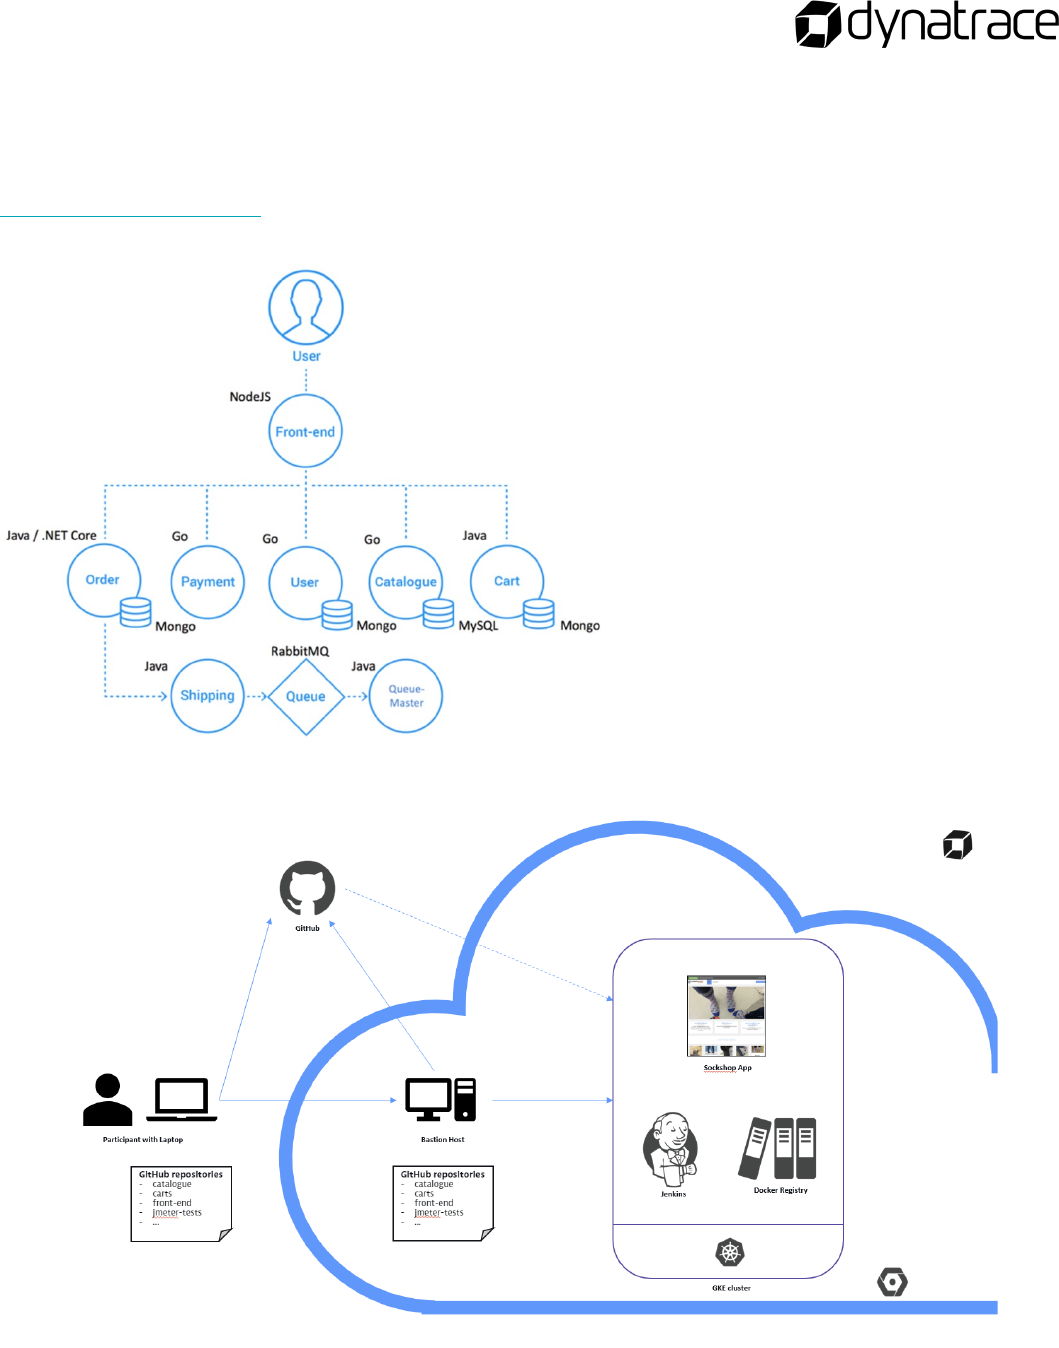
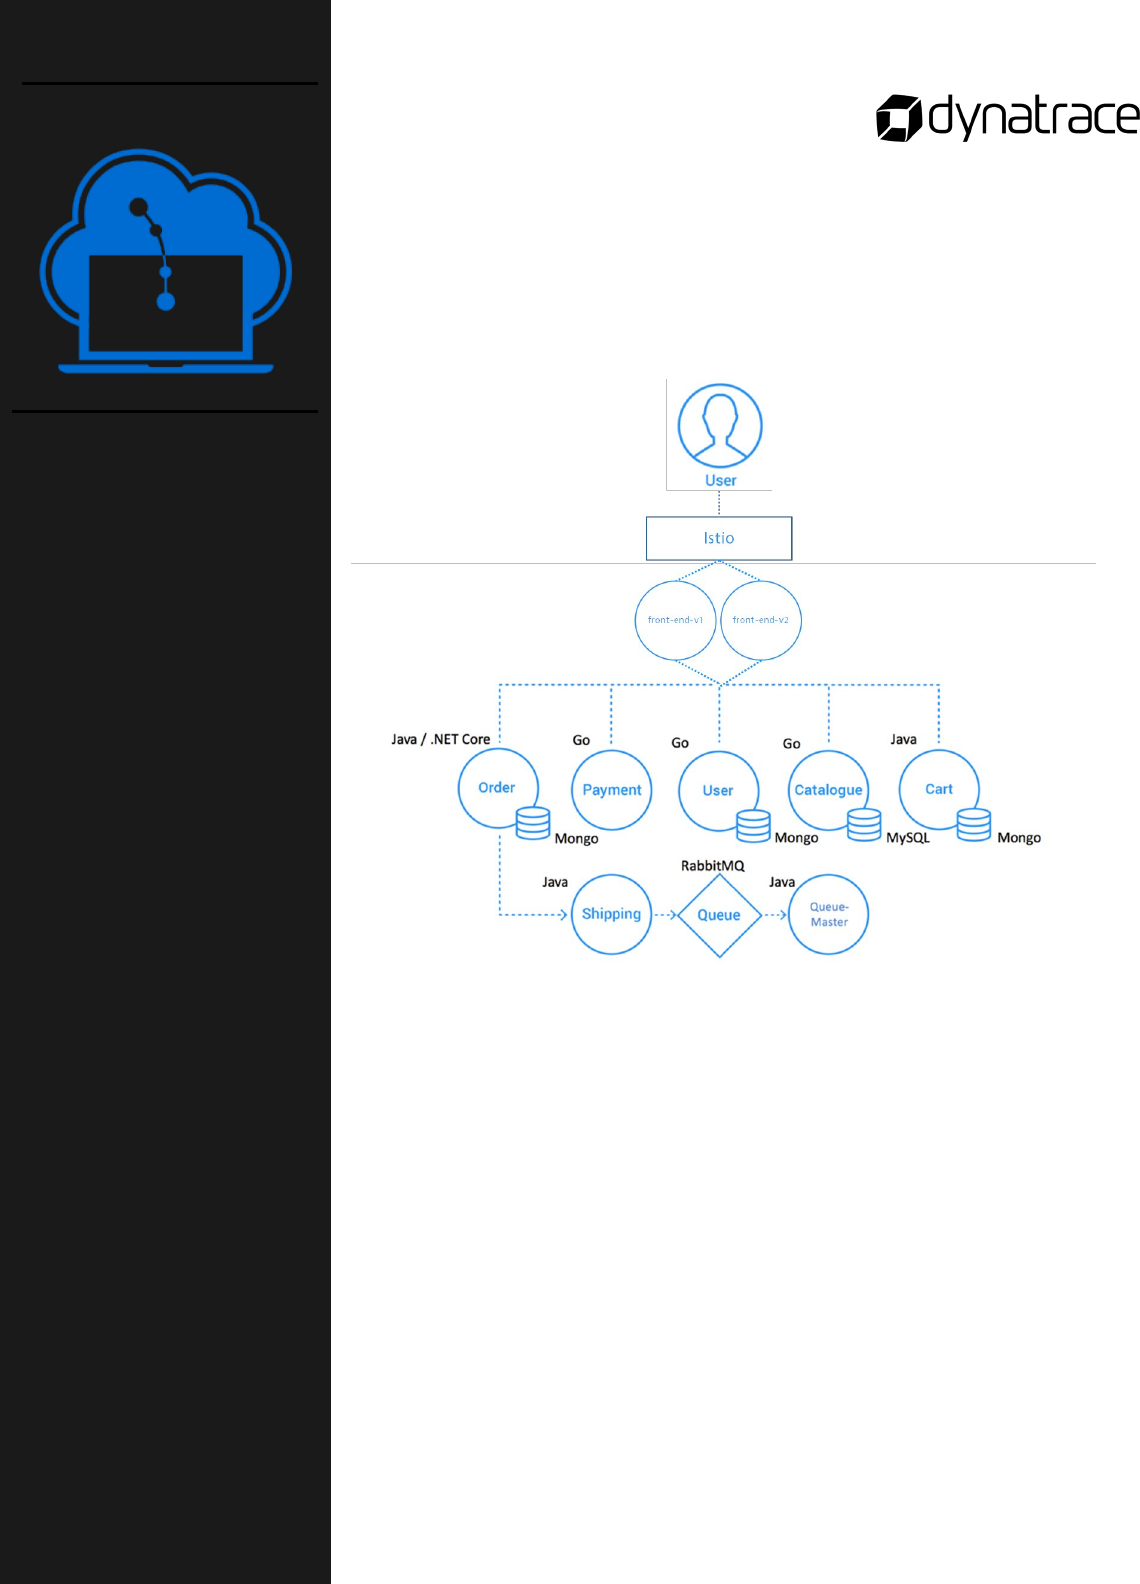
Sockshop Application ................................................................................................................................................................ 20
Architecture .............................................................................................................................................................................. 20
Lab Setup .................................................................................................................................................................................. 20
Developing Microservices ..................................................................................................................................................... 28
Steps to Deploy a Microservice on Kubernetes .............................................................................................................. 28
The Liveness Probe and Readiness Probe .......................................................................................................................... 29
When should you use liveness or readiness probes? ............................................................................................... 29
Monitoring as a Service ........................................................................................................................................................ 34
Full-Stack: Monitoring as a Platform ................................................................................................................................... 34
Process Groups ............................................................................................................................................................................. 36
Process Group Best Practices ............................................................................................................................................. 36
Performance as a Service ..................................................................................................................................................... 44
Use Cases – Key Takeaways .................................................................................................................................................. 44
Load Testing Integration: ......................................................................................................................................................... 44

4
Ensure Proper Tagging and Deployment Events ............................................................................................................ 45
Production Deployments ...................................................................................................................................................... 54
Deployment Strategies ............................................................................................................................................................. 54
Istio architecture ......................................................................................................................................................................... 56
Istio components .................................................................................................................................................................... 56
Runbook Automation and Self-Healing ................................................................................................................................. 65
Unbreakable Delivery Pipeline .............................................................................................................................................. 71
Hands-on Building the Unbreakable Delivery Pipeline ................................................................................................. 71
Virtual Operations ................................................................................................................................................................ 80
Using the Dynatrace API .......................................................................................................................................................... 80
Using Dynatrace Davis .............................................................................................................................................................. 80
Autonomous Cloud Lab Questions ....................................................................................................................................... 86
ACL Key Takeaways .............................................................................................................................................................. 86
Contact Information ............................................................................................................................................................. 86
5
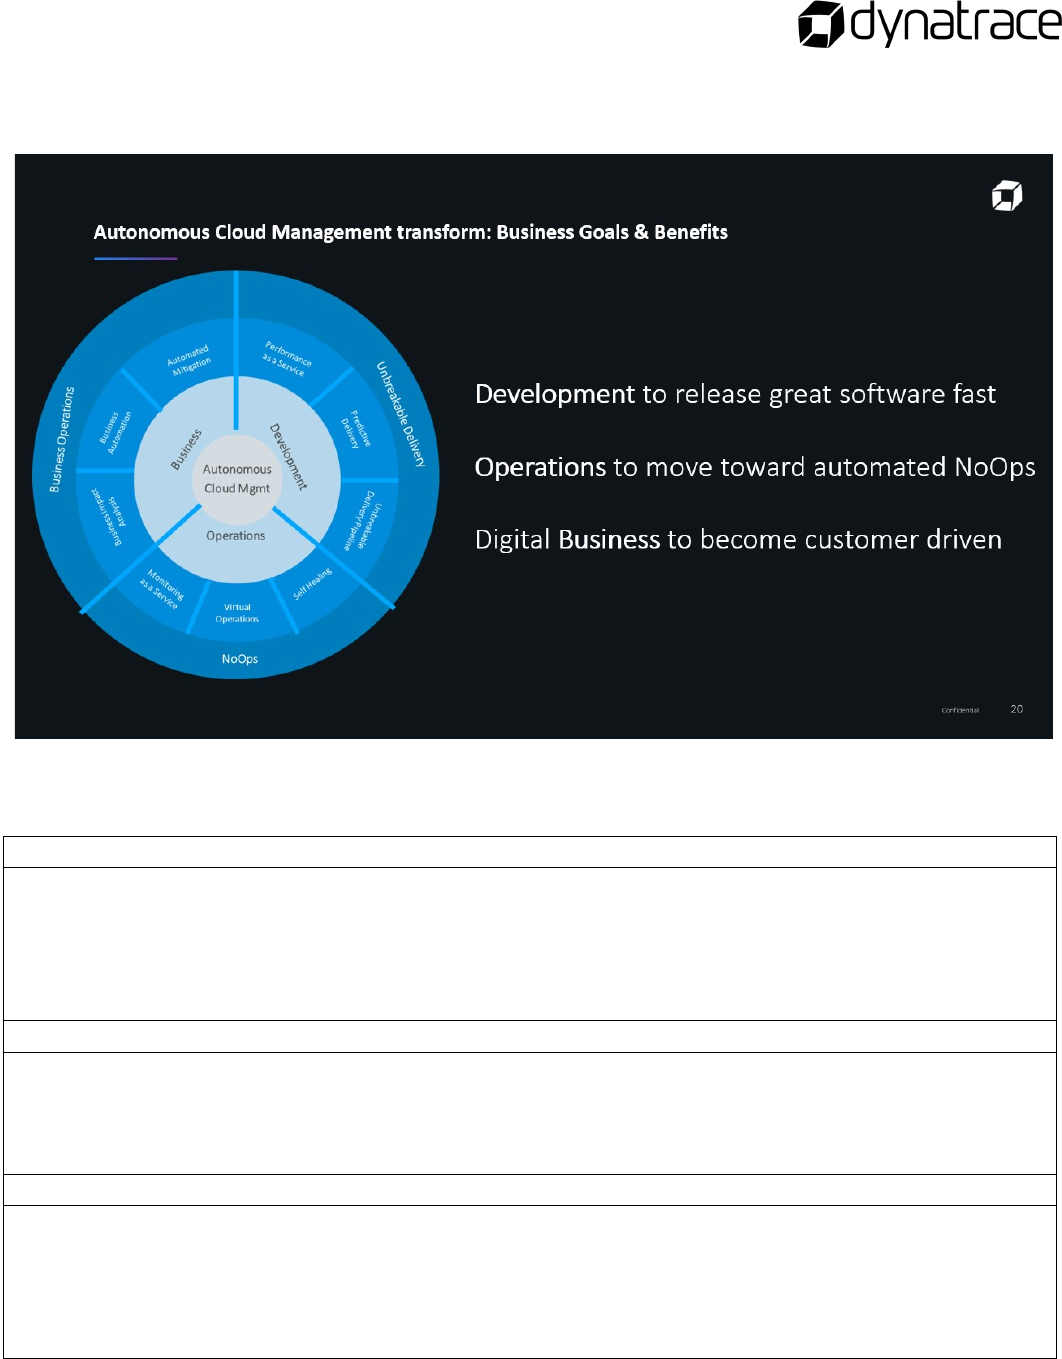
Autonomous Cloud Management
As the instructor introduces Autonomous Cloud Management, think about the following questions
and record your thoughts.
What challenges do you face within your organization?
How many apps can you manage?
What are your goals?
6
Agenda and Class Information
Housekeeping
• Facilities instructions
• Wi-Fi passwords
• Parking lot
Ground Rules
• Eliminate Distractions: Silence cell phones, email notifications, messaging and social media.
• Express any challenges: If you have an immediate question or get held up completing any
activity, let us know.
• Exercise patience: Some of the tools used in this lab may be new for some but not for others.
We will move along quickly, but please be patient so that we can all be successful.
7
Cloud-Native Concepts
In this module you will learn a definition of Cloud-native concepts such as Microservice, Container
(and Container Image), Container Registry, and Kubernetes.
What is a Microservice?
An architectural style that structures an application as a collection of loosely coupled services.
Services are fine-grained, and their protocols are lightweight.
How could microservices help with your development?
What is a Container Image?
A container image is a lightweight, stand-alone, executable package of software that
includes everything needed to run it: code, runtime, system tools, system libraries, and settings.
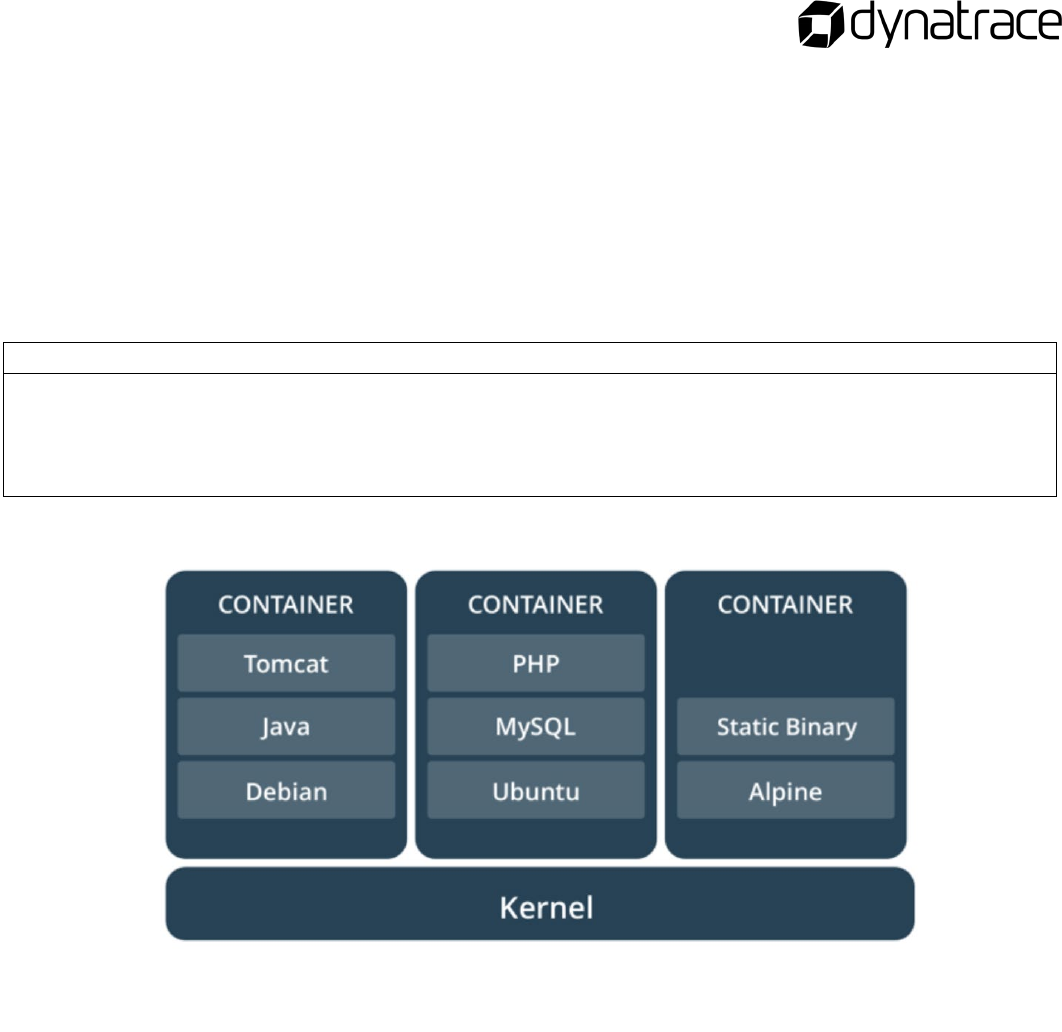
Comparing Containers and Virtual Machines
Containers and virtual machines have similar resource isolation and allocation benefits, but function
differently because containers virtualize the operating system instead of hardware. Containers are more
portable and efficient.
What is a Container Registry?
In a Container Registry you can store, manage, and secure your Docker container images.

8
The goal of this lab activity is to provide you with hands-on
experience with container registries. To reach this goal, you will:
o Create a Dockerfile
o Build and tag a container image
o Run a container
o Pull a container image from a container registry
Instructions
If you have not, clone or download the lab GitHub repository to your local
machine.
This lab is found in the GitHub workshop repository:
course-repository/02_Cloud_native_Concepts/01_Working_with_Containers/
Notes:
Lab activity:
Working with
Container Images
and Containers
9
What is Kubernetes?
Kubernetes is an open-source system for automating deployment, scaling, and management of
containerized applications.
Kubernetes Architecture
What is OpenShift?
Red Hat OpenShift Origin is an open source container application platform based on the Kubernetes
container orchestrator for enterprise application development and deployment.

10
Summary Statements
Can you complete the following summary statements about cloud-native concepts?
• A ___________________________ structures an application as a collection of loosely coupled services that
enable continuous delivery and deployment.
• A ___________________________ is a lightweight, stand-alone, executable package of software that
includes everything needed to run it. When the image is run it becomes a _______________________.
• A ___________________________ allows you to store, manage and secure docker container images.
• ________________________ is an open-source system used to automate deployment, scaling, and the
management of container applications.
• ____________________________________ is an open source container application platform based on the
Kubernetes container orchestrator for enterprise application development and deployment.
Questions
Do you have any questions about how these cloud-native concepts could be applied within your
organization? Jot them down here, there will be an opportunity to discuss with a Dynatracer.
11
Monolith to Microservices
In this module you'll learn how to migrate a monolithic application to the cloud and how to fearlessly
break it up into microservices. Therefore, we want to walk you through the different stages of
identifying and extracting a microservice, as well as strangling it around its origin – the monolith. For
this purpose, the module provides step-by-step instructions and labs showing the best practices we
have identified for migrating a monolith to the cloud.
Limitation of monolithic applications
Agility
– Rebuilding the whole application takes a decent amount of
time
Scalability
– Scaling a monolith happens in both directions:
vertically as well as horizontally - causing unused resources
DevOps Cycle
– Continuous delivery (high frequency of
deployments) fails due to high build time
Availability, fault tolerance, and resiliency
Limitations of Monoliths have given rise to Microservices
Agility
- Scope changes can be done in one microservice - other
microservices are not impacted from these changes
Scalability
- Individual components can scale as needed
DevOps Cycle
- Since each component operates independently,
continuous delivery cycle reduces
12
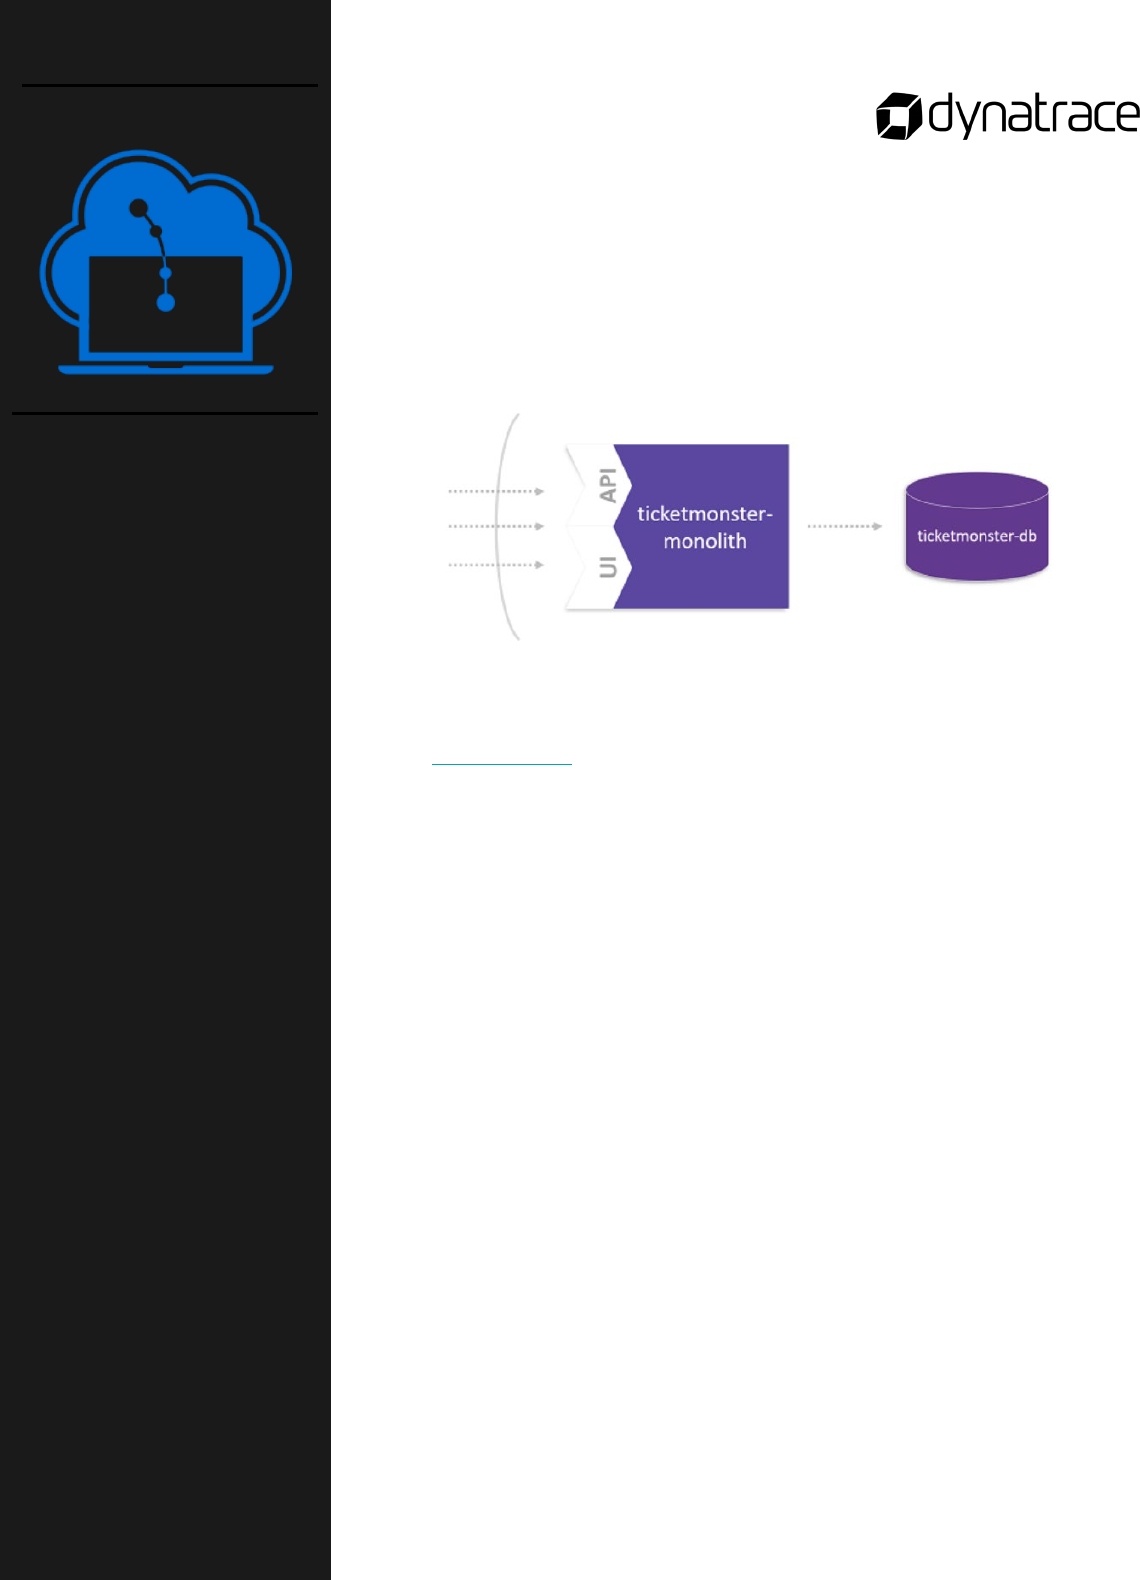
The goal of this lab activity is to provide you with hands-on
experience with moving a monolithic application to a cloud platform
applying lift and shift concepts. To reach this goal, you will:
o Create a MySQL service for monolith
o Push application to OpenShift
o Bind MySQL service to monolith
Instructions
Make sure you have:
1. OpenShift CLI
2. The OpenShift Cluster, username, and password for use with this
lab (ask instructor)
3. The Dynatrace tenant, with username, and password (ask
instructor)
This lab is found in the GitHub workshop repository:
course-repository/03_Monolith_to_Microservices/1_Lift-and-
Shift_TicketMonster/
Notes:
Lab activity:
Monolith to
Microservices
Part 1 of 7
Lift-and-Shift
TicketMonster
13
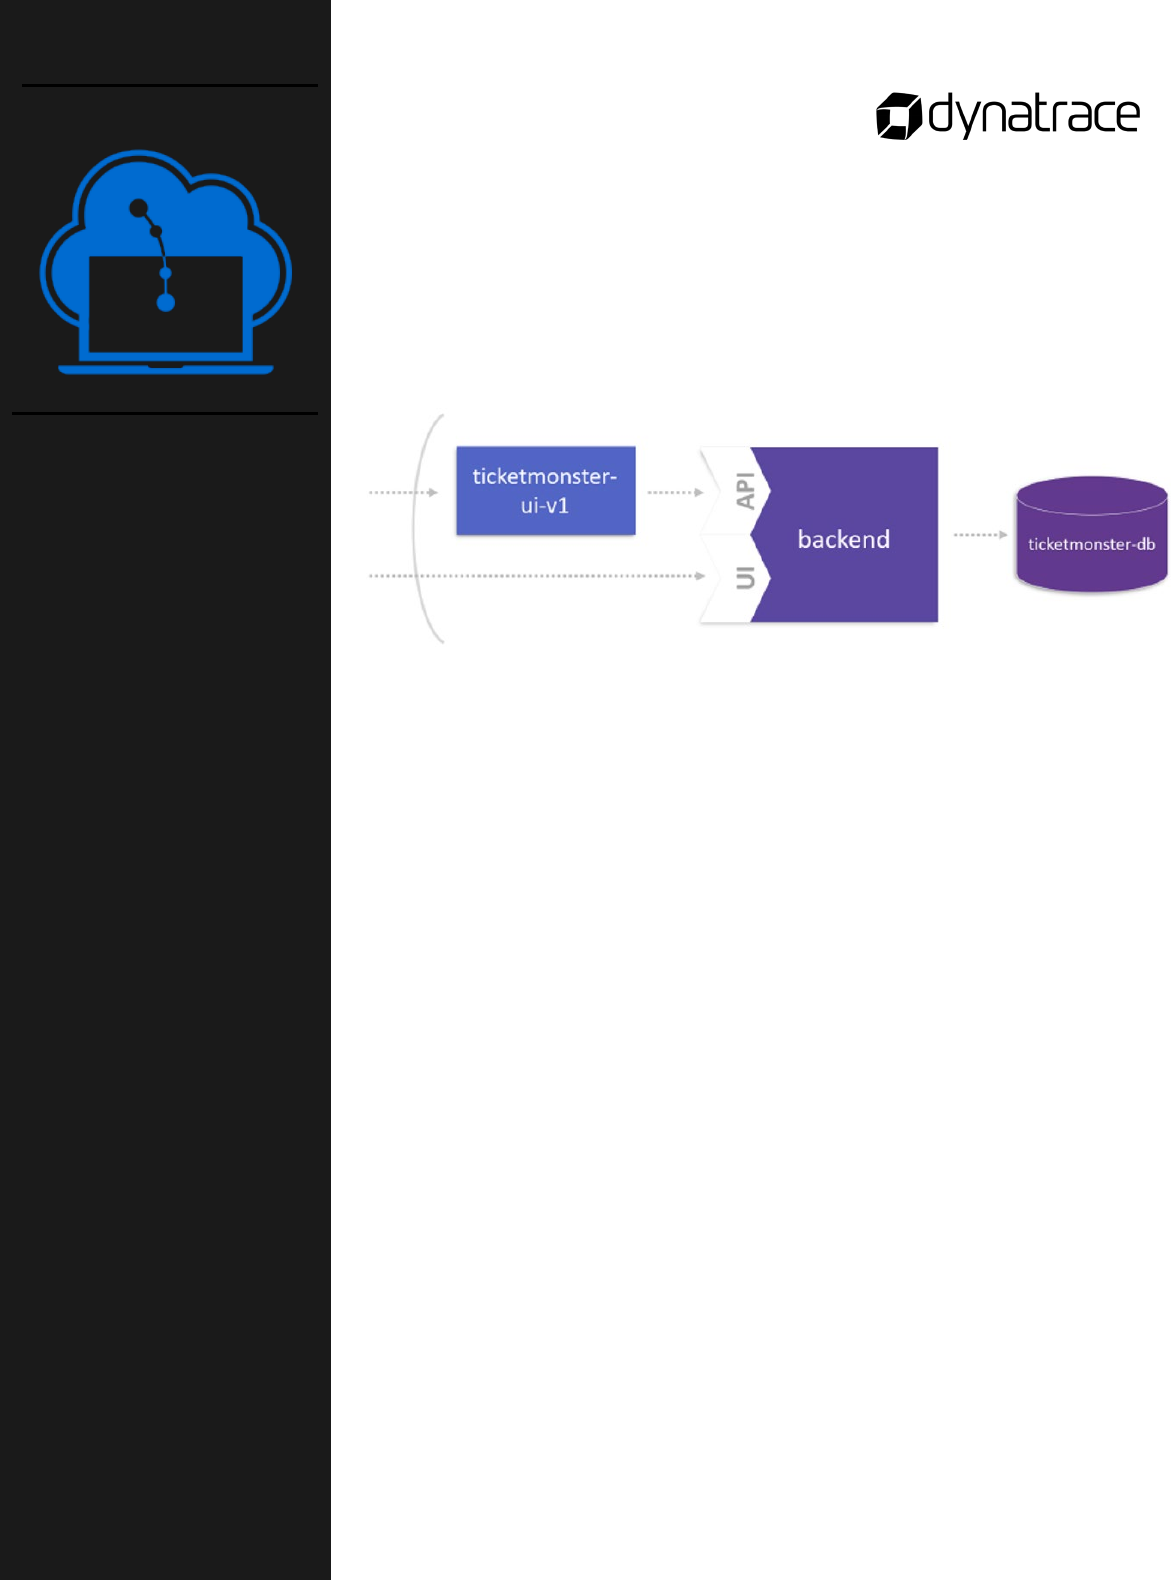
The goal of this lab activity is to launch the first microservice used to
separate the user interface from the monolithic application. To reach
this goal, you will:
o Define a new route to the monolith
o Decouple the UI from the monolith
o Test the UI that hits the monolith
Instructions
This lab is found in the GitHub workshop repository:
course-
repository/03_Monolith_to_Microservices/2_Extract_UI_From_Monolith
Notes:
Lab activity:
Monolith to
Microservices
Part 2 of 7
Extract the User
Interface from the
Monolith
14
The goal of this lab activity is to run load generation scripts that
simulate navigation scenarios. To reach this goal, you will:
o Build docker image
o Run container and start script
Instructions
This lab is found in the GitHub workshop repository:
course-repository/03_Monolith_to_Microservices/3_Generate_Load_on_UI
Notes:
Lab activity:
Monolith to
Microservices
Part 3 of 7
Generate Load on
the User Interface
15
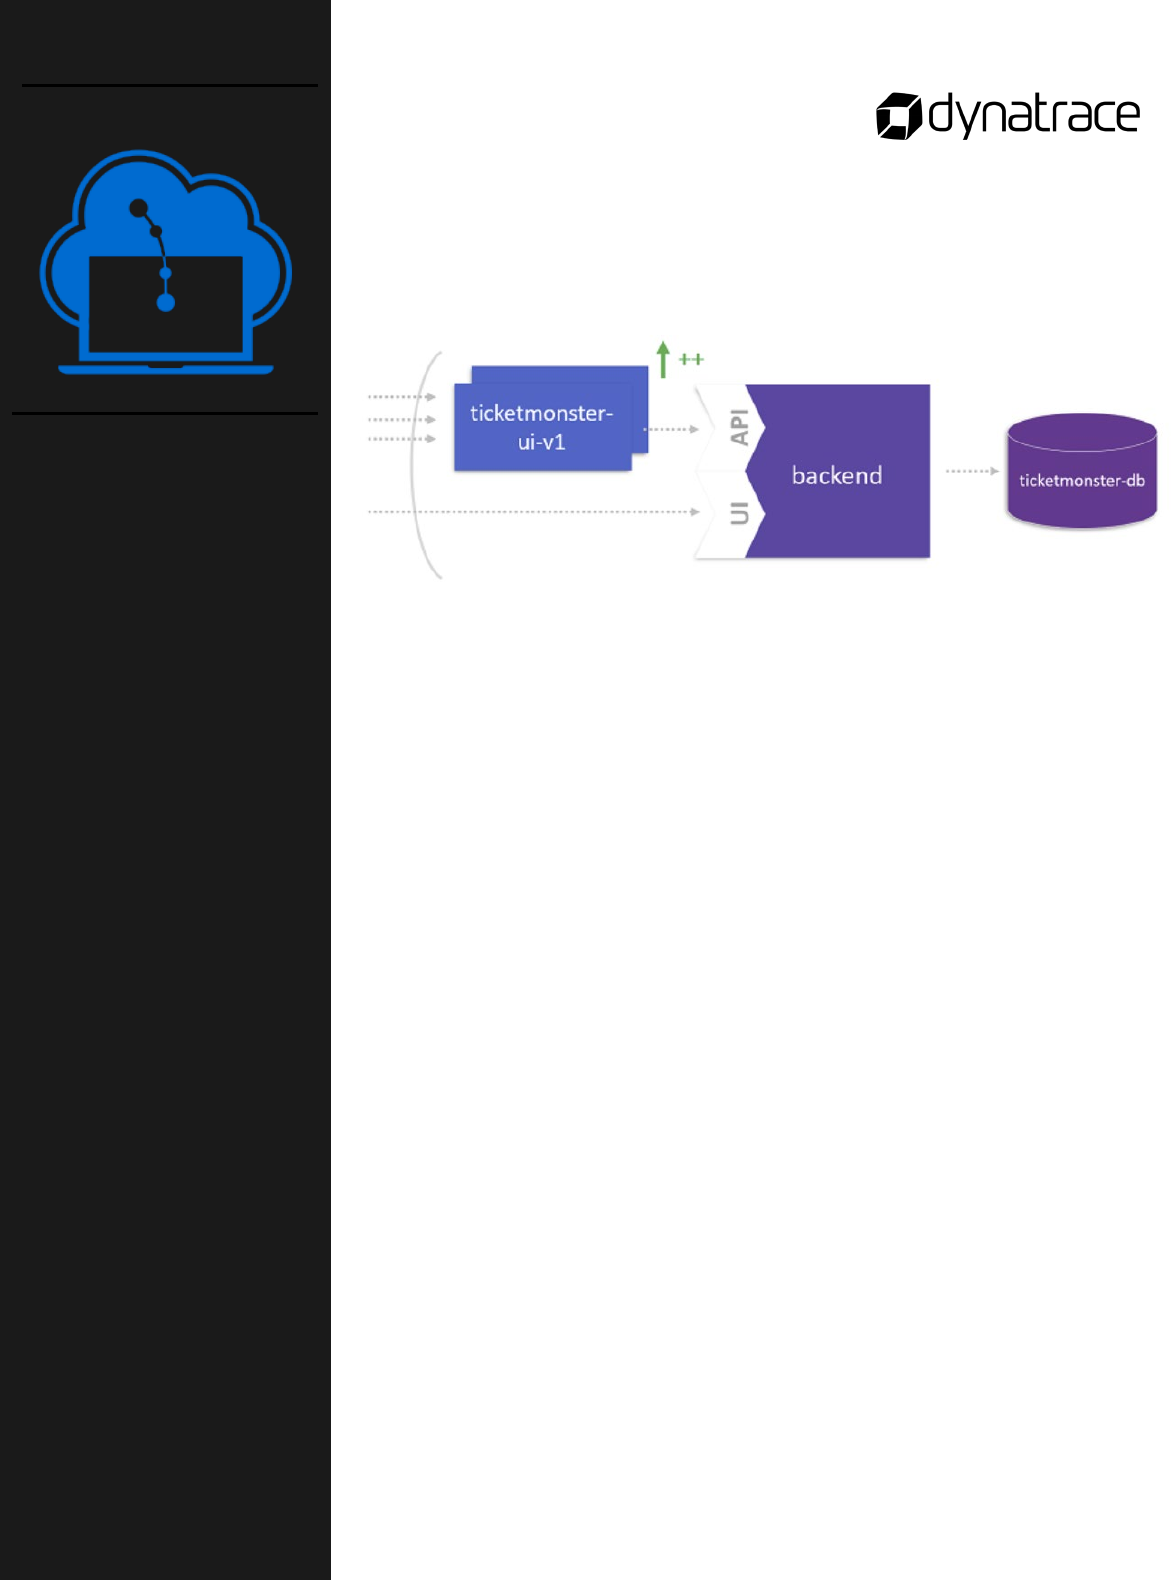
The goal of this lab activity is to virtually break a monolithic
application using Dynatrace Service Detection to define an entry
point. To reach this goal, you will:
o Define custom service entry points
o Restart pods to activate custom service detection
o Book a ticket on TicketMonster
o Consider service flow in Dynatrace
Instructions
This lab is found in the GitHub workshop repository:
course-repository/03_Monolith_to_Microservices/4_Identify_a_Microservice
Notes:
Lab activity:
Monolith to
Microservices
Part 4 of 7
Identify a
Microservice
16
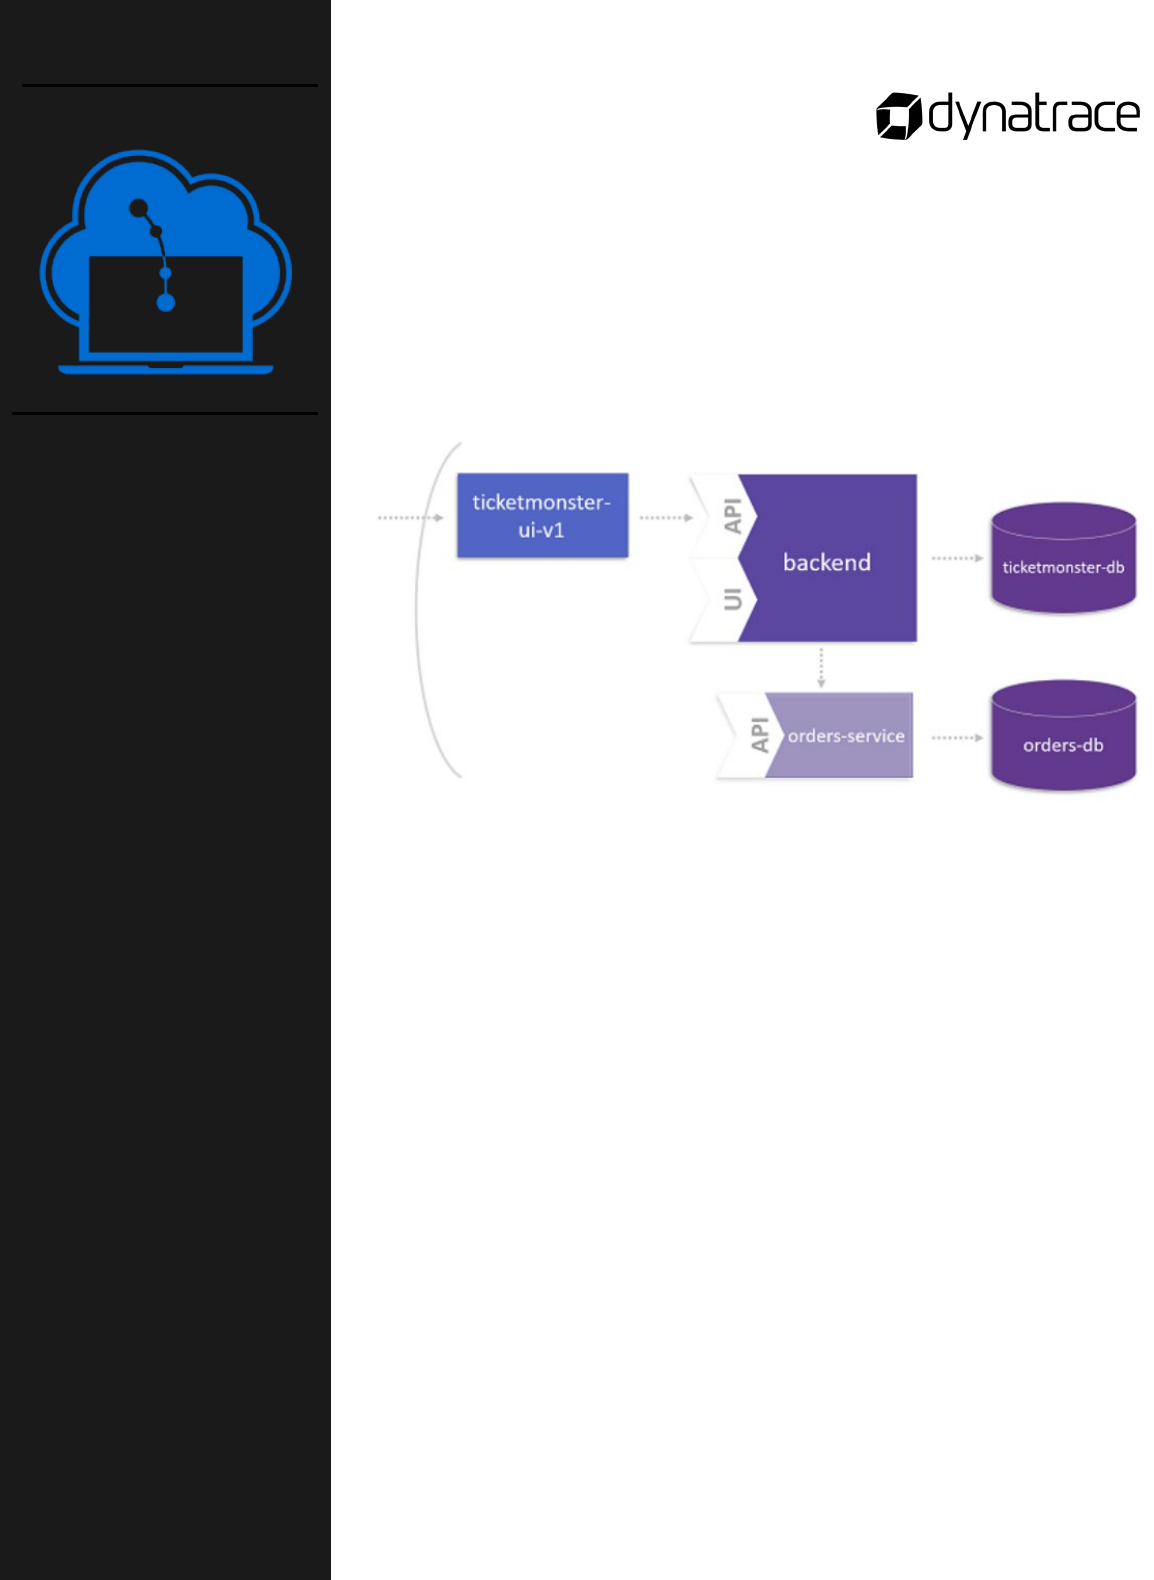
The goal of this lab activity is focused on the data management of the
microservice created. The microservice should consume legacy data
from the monolith while persisting new data in its own database. To
reach this goal, you will:
o Use Dynatrace to learn more about the Domain Model
o Create a database for the microservice
o Setup the database
Instructions
This lab is found in the GitHub workshop repository:
course-repository/03_Monolith_to_Microservices/
5_Domain_Model_of_Microservice
Notes:
Lab activity:
Monolith to
Microservices
Part 5 of 7
Identifying the
Domain Model of
the Microservice

17
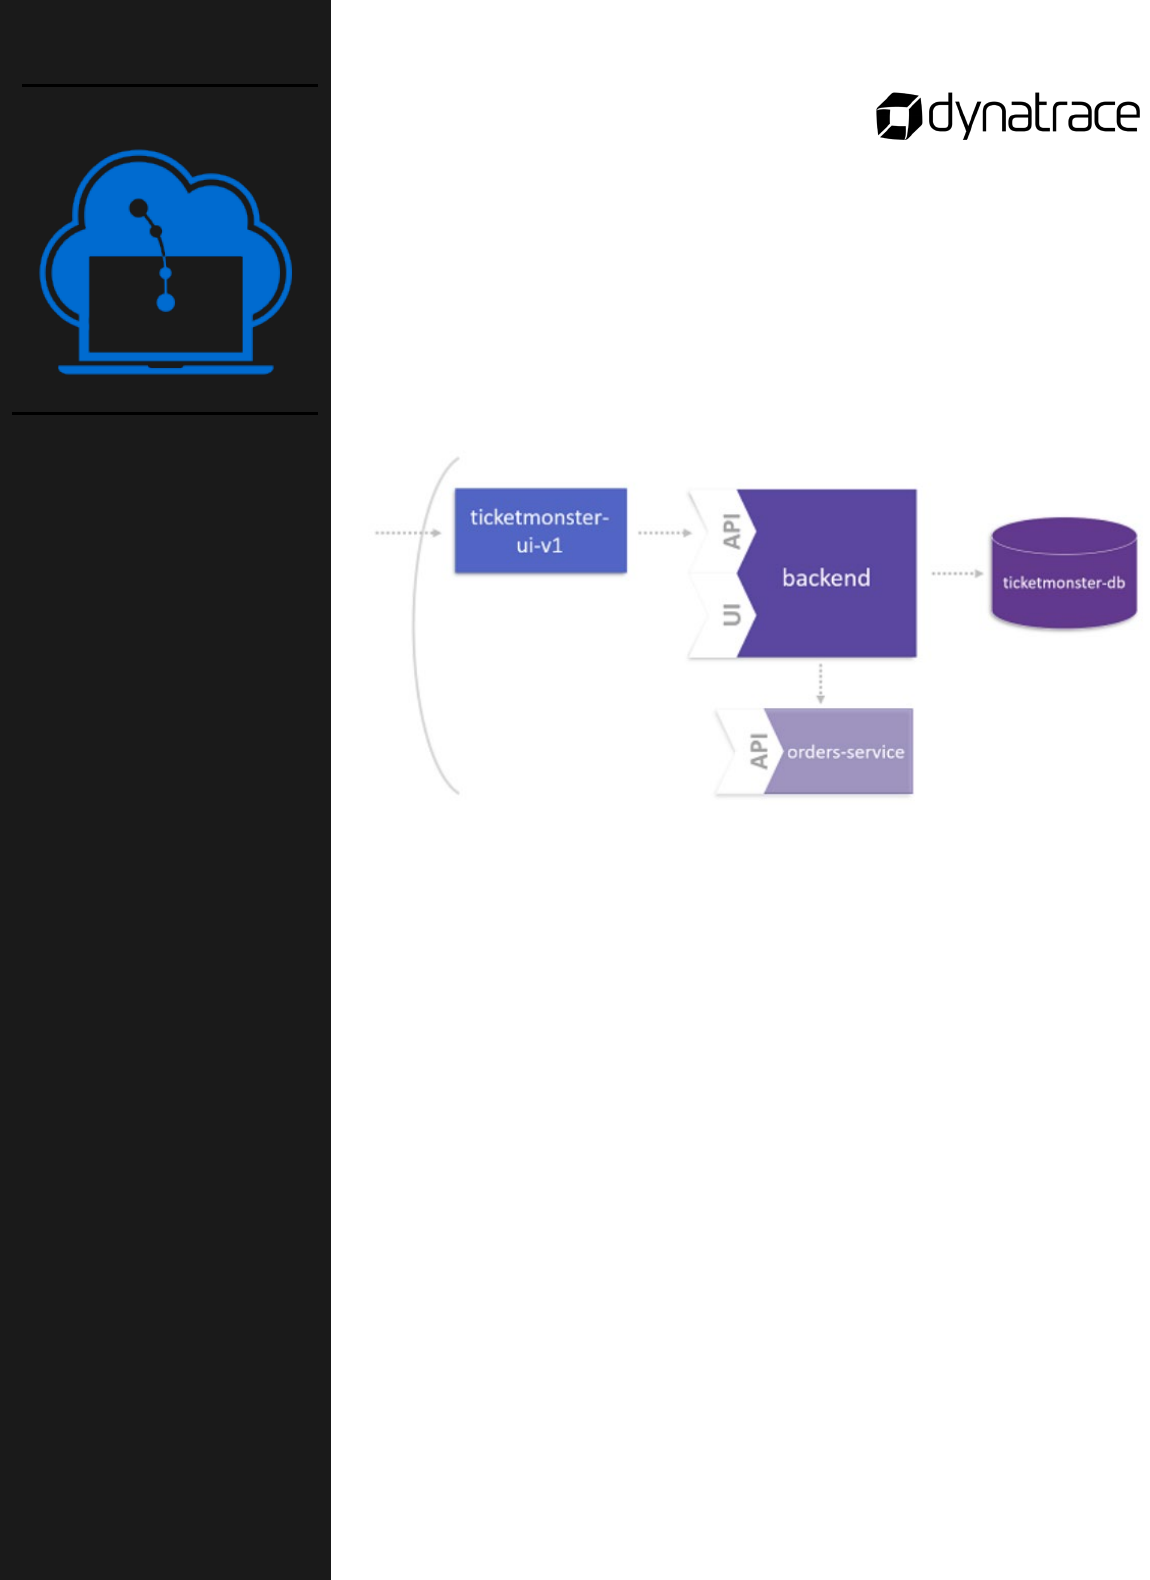
You have identified the microservice OrderService that has its own
code repository and defines its own domain model. The goal of this
lab activity is to direct the backend service to intercept all incoming
requests and forward synthetic or live traffic to OrderService. To reach
this goal, you will:
o Deploy the Microservice
o Deploy a new backend version (v2) of the monolith
o Switch feature Flag and test your microservice
Instructions
This lab is found in the GitHub workshop repository:
course-repository/03_Monolith_to_Microservices/
6_Deploy_the_Microservice
Notes:
Lab activity:
Monolith to
Microservices
Part 6 of 7
Deploy the
Microservice

18
The goal of this lab activity is to clean up the OpenShift project and
Dynatrace. To reach this goal, you will::
o Delete services and pods on OpenShift
o Delete management zone and Custom Service Detection in
Dynatrace
Instructions
This lab is found in the GitHub workshop repository:
course-repository/03_Monolith_to_Microservices/9_Clean_up
Notes:
Lab activity:
Monolith to
Microservices
Part 7 of 7
Clean up
19
Summary
Dynatrace can be leveraged in this Monolith to Microservices Journey to:
• Get Dependency Information
• Detect Service Endpoints, Usage & Behavior
• Understand Service Flow per Endpoint
• Finding Entry Points with CPU Sampling Data
• Define Custom Service Entry Points
Additional Learning
Dynatrace Blog post: Fearless Monolith to Microservices Migration – A guided journey
Questions
Do you have any questions about moving your monolith application to microservices? Jot them
down here and share them with your instructor.

21
The goal of this lab activity is to provide you with hands-on
experience setting up your own GKE cluster to use for the duration of
the lab. To reach this goal, you will:
o Setup Jenkins and a Docker Registry
o Fork several GitHub repositories
o Configure build pipelines for all microservices in the SockShop
application hosted in the GitHub repositories
Instructions
To get started, checked that you have access to the Bastion Host and that
kubectl is configured. Follow the steps found here:
course-repository/04_Building_Environment_zero/1_Check_Prerequisites
Notes:
Lab activity:
Building
Environment Zero
Part 1 of 6
Check Prerequisites

22
This lab activity will get you started by creating your own GitHub
repository. To do this, you will:
o Need your GitHub user account and password
o Login to GitHub
o Create a GitHub organization
o Clone a repository on the Bastion host
Instructions
This lab is found in the GitHub workshop repository:
course-repository/
04_Building_Environment_zero/2_Fork_GitHub_Repositories
Notes:
Lab activity:
Building
Environment Zero
Part 2 of 6
Fork GitHub
Repositories

23
The goal of this lab activity is to use the Docker registry to save the
build artifacts, i.e. Docker containers. The registry allows us to host
multiple versions of an artifact. To reach this goal you will:
o Create Kubernetes namespaces
o Create a PersistentVolumeClaim (PVC) where Docker images of the
registry will be stored
o Create the service and the deployment for the Docker registry
Instructions
This lab is found in the GitHub workshop repository:
course-repository/
04_Building_Environment_zero/3_Deploy_Docker_Registry
Notes:
Lab activity:
Building
Environment Zero
Part 3 of 6
Deploy Docker
Registry

24
For this lab, we will use Jenkins CI/CD pipeline tool. The goal of this
lab activity is to deploy Jenkins as a Kubernetes service. To reach this
goal, you will:
o Create a PersistentVolumeClaim (PVC) for Jenkins
o Create and deploy the Jenkins service
o Login to and configure Jenkins
Instructions
This lab is found in the GitHub workshop repository:
course-repository/04_Building_Environment_zero/4_Deploy_Jenkins
Notes:
Lab activity:
Building
Environment Zero
Part 4 of 6
Deploy Jenkins

25
The goal of this lab activity is to prepare the dev, staging, and
production namespaces in Kubernetes, so that the services find the
infrastructure components that they need. Then, the build pipelines
can be triggered. To reach this goal, you will:
o Setup databases and Rabbit MQ
o Trigger build pipelines in Jenkins
Instructions
This lab is found in the GitHub workshop repository:
course-repository/ 04_Building_Environment_zero/5_Trigger_Build_Pipelines
Notes:
Lab activity:
Building
Environment Zero
Part 5 of 6
Trigger Build
Pipelines
26
As the last activity in this lab, you will clone the previously forked
GitHub repositories (Step 2) to your local environment, for editing in
Visual Studio Code.
Instructions
This lab is found in the GitHub workshop repository:
course-repository/ 04_Building_Environment_zero/
6_Clone_GitHub_Repositories
Additional Learning
kubectl Cheat Sheet
Notes:
Questions
Do you have any questions about GitHub, Jenkins, or any of the
steps performed during these lab activities? Jot them down here
and share them with your instructor.
Lab activity:
Building
Environment Zero
Part 6 of 6
Clone GitHub
Repositories
27
Questions
Do you have any questions about the steps taken to “Build Environment Zero”? Jot them down
here and share them with your instructor.
28
Developing Microservices
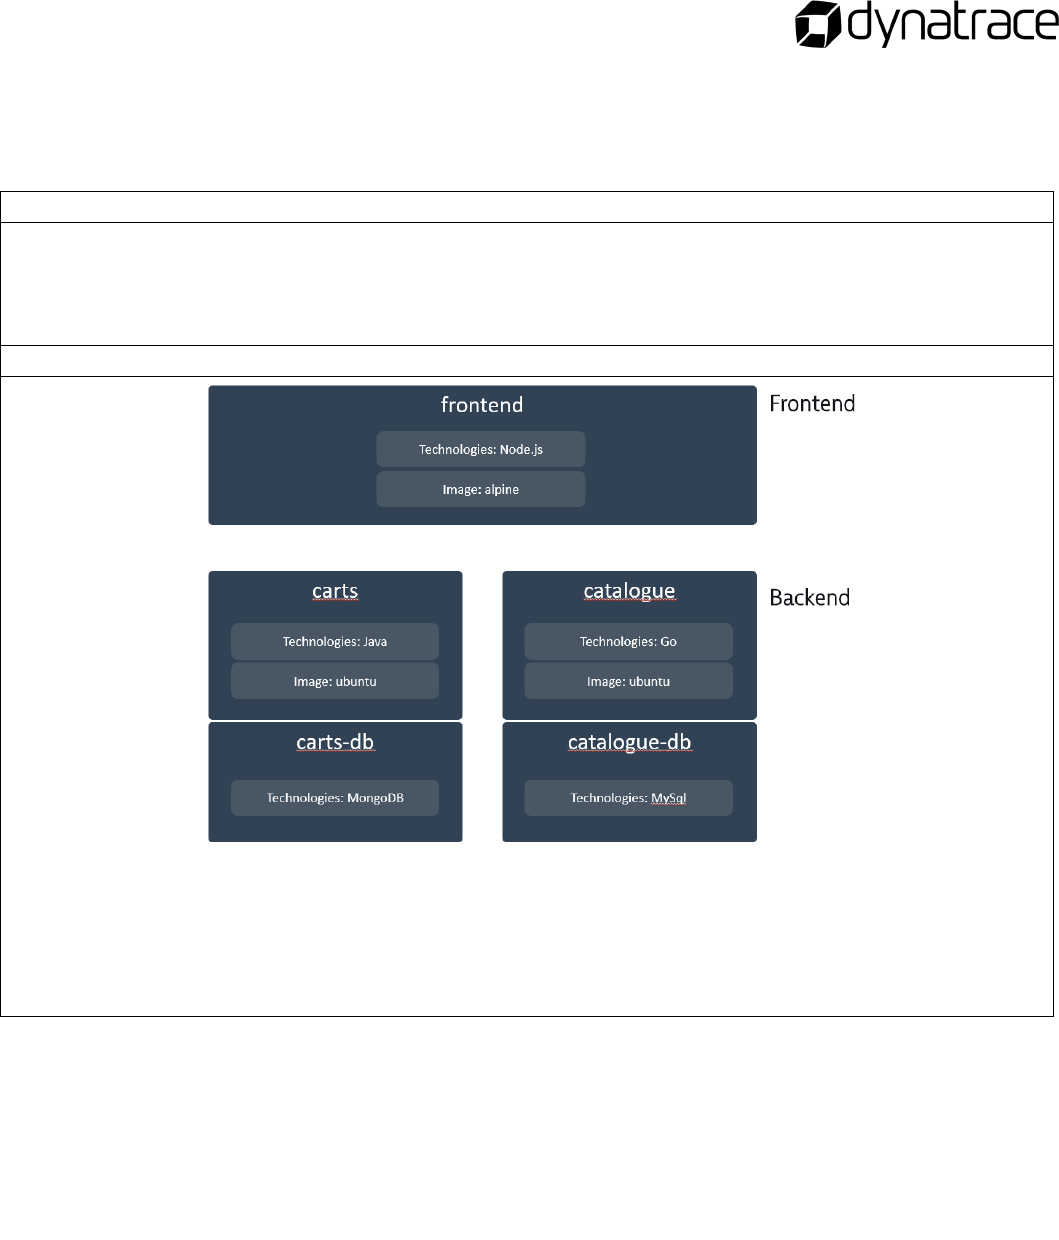
In this module you will learn more about the structure of a microservice from a code perspective.
Recalling the information from Day 1, how would you describe the microservices architecture?
How would you define the endpoints?
Steps to Deploy a Microservice on Kubernetes
Step 1: Create a configuration (.yaml Files)
Step 2: Create a deployment configuration (carts-dep.yaml)
Step 3: Create a service configuration (carts-svc.yaml)
Step 4: Execute the configuration (.yaml Files)

29
The Liveness Probe and Readiness Probe
Generally, a Probe is a diagnostic performed periodically by the kubelet on a Container. The kubelet
can optionally perform and react to two kinds of probes on running containers:
livenessProbe: Indicates whether the Container is running
readinessProbe: Indicates whether the Container is ready to service requests
When should you use liveness or readiness probes?
• If the process in your Container can crash on its own
• If you’d like your Container to be killed and restarted if a probe fails
• If you’d like to start sending traffic to a Pod only when a probe succeeds, specify a readiness
probe.
• If your Container needs to work on loading large data, configuration files, or migrations during
startup, specify a readiness probe.

30
The goal of this lab is to provide you with hands-on experience
structuring a microservice from a code perspective. To reach this goal,
you will:
o Deep dive into the carts service from a code perspective
o Commit a change of carts and re-deploy it into the environment
o Create a release branch to trigger the pipeline for the staging
environment
In part 1, you'll first investigate the code structure of a microservice and
then deploy it to a Kubernetes cluster to see the service in action. To do
this you will:
o Become familier with the carts microservice from a code
perspective
o Deploy the service to a Kubernetes cluster
Instructions
This lab is found in the GitHub workshop repository:
course-
repository/05_Developing_Microservices/01_Deep_Dive_into_Carts_Service
Notes:
Lab activity:
Developing
Microservices
Part 1 of 3
Deep Dive into
Carts Service
31
The goal of this lab activity is to learn how the Jenkins pipeline is
designed to build, deploy, and test a microservice after pushing a
source code change to its repository. To do this you will:
o Modify the carts service
o Build a new version in Jenkins
Instructions
This lab is found in the GitHub workshop repository:
course-
repository/05_Developing_Microservices/02_Deploy_Microservice_to_Dev
Notes:
Lab activity:
Developing
Microservices
Part 2 of 3
Deploy the Carts
Service to Dev
32
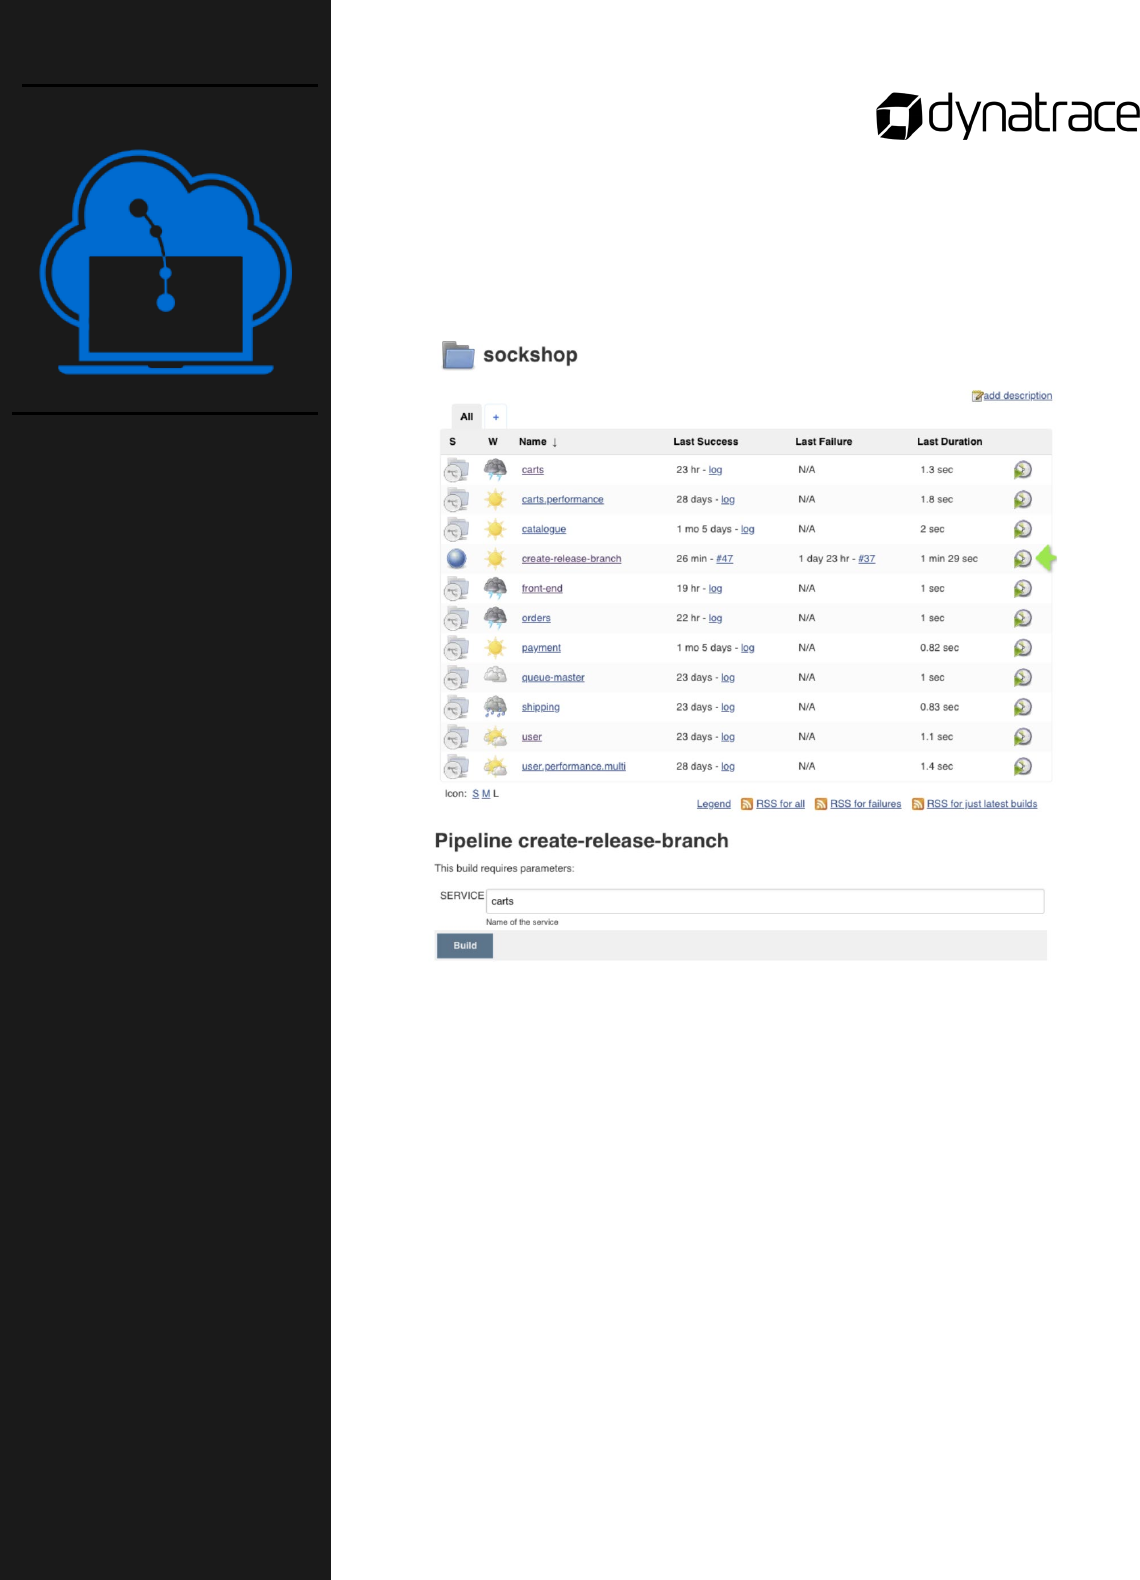
The goal of this lab activity is to learn how to use the Jenkins pipeline
to release a microservice to the staging environment. To do this you
will:
o Create a new release
o Build a new release in Jenkins
Instructions
This lab is found in the GitHub workshop repository:
course-repository/05_Developing_Microservices/
03_Deploy_Microservice_to_Staging
Notes:
Lab activity:
Developing
Microservices
Part 3 of 3
Deploy the
Microservice to
Staging

33
Summary
• A Microservice Architecture structures an application as a collection of loosely coupled services that
help enable continuous delivery and deployment.
• kubelet probes:
o livenessProbe: Indicates whether the Container is running.
o readinessProbe: Indicates whether the Container is ready to service requests.
• In the labs we:
o Explored the code structure of the carts service and deployed it to a Kubernetes cluster.
o Committed a change and re-deployed it to the development environment using the Jenkins
pipeline.
o Used the Jenkins pipeline to release the microservice to the staging environment.
Questions
Do you have any questions about developing microservices, Kubelet probes, or about any of the
steps performed during these lab activities? Jot them down here and share them with your
instructor.
34
Monitoring as a Service
In this module, you will learn how to move from a long manual process of configuring monitoring for
a new app to fully automated monitoring.
Full-Stack: Monitoring as a Platform
• Deploy one agent per host (kubectl create)
• Auto instrumentation of containerized microservices
• Auto distributed transaction tracing
• AI based root cause analytics
What is an Operator in Kubernetes?
What is Dynatrace One Agent Operator?

35
In this lab you'll instrument the Kubernetes Cluster (from the Building
Environment Zero lab) with Dynatrace OneAgent, which automatically
monitors all your processes, containers, services, applications, and
end-users. To do this you will:
o Define the Cluster Role Binding
o Get the Dynatrace API URL, API Token, and PaaS Token
o Rollout Dynatrace OneAgent Operator
o Enable Go monitoring
Then, you will explore the automated monitoring result in Dynatrace.
Instructions
This lab is found in the GitHub workshop repository:
course-repository/ 06_Monitoring_as_a_Service/
01_Instrument_Cluster_with_Dynatrace_OneAgent
Additional Learning
What is OneAgent Operator?
Notes :
Lab activity:
Monitoring as a
Service
Step 1 of 7
Instrument
Kubernetes Cluster
with Dynatrace
OneAgent Operator
36
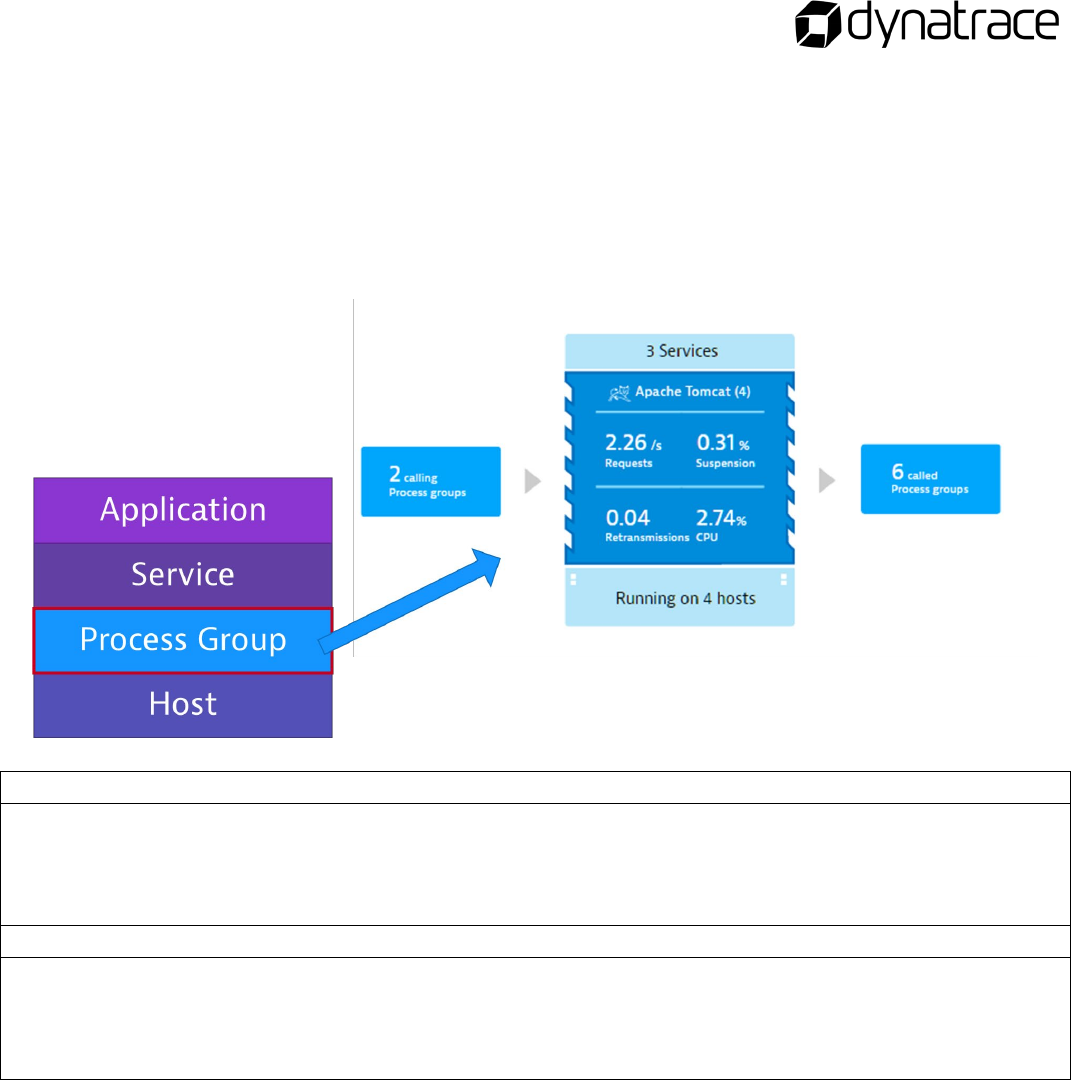
Process Groups
Process groups are clusters of processes that belong together. They run on the same software between
hosts and services.
• Used as configuration points
• Creates continuity within process and plugin metrics
• Automatic for all process types
What are characteristics of process groups?
How can process groups be customized?
Process Group Best Practices
• Unique enough to easily identify the process role
• No version numbers
• ”Environments” split out
• Don’t manually change the name unless 100% certain it will be consistent through deployments
• Configure Process Groups BEFORE Services if possible
• ALL rule changes require a process restart to take effect

37
In this lab you learn which meta-data is captured automatically, how
to pass custom meta-data and how you can use this meta-data to
influence process group detection and automated tagging. To do this
you will:
o Add the DT_TAGS and DT_CUSTOM_PROP environment variables
o Redeploy the carts service
Then, you will be able to see the tag and custom meta-data in Dynatrace.
Instructions
This lab is found in the GitHub workshop repository:
course-repository/ 06_Monitoring_as_a_Service/ 02_Pass_Extract_Meta-
Data_for_Process_or_Container
Additional Learning
Define your own process group metadata
Adapt the composition of default process groups
Automated rule-based tagging for services
Notes :
Lab activity:
Monitoring as a
Service
Step 2 of 7
Pass and Extract
Meta-Data for each
deployed Process
or Container

38
In this lab you'll learn how to automatically apply tags on the service
level. This allows you to query service-level metrics automatically
based on meta-data that you have passed during a deployment. To do
this you will:
o Create a Naming Rule for Process Groups
o Create Service Tag Rules
Then, you will be able to see the carts service tagged in Dynatrace.
Instructions
This lab is found in the GitHub workshop repository:
course-repository/ 06_Monitoring_as_a_Service/
03_Tagging_and_Naming_of_Services
Notes :
Lab activity:
Tagging of Services
and Naming of
Process Groups
Step 3 of 7
Pass and Extract
Meta-Data for each
deployed Process
or Container

39
In this lab you'll learn how to push deployment and configuration
events to Dynatrace using the Performance Signature Plugin in
Jenkins. To do this you will:
o Configure Jenkins
o Extaned the carts and staging pipelines
Then, you will be able to see the deployment events in Dynatrace.
Instructions
This lab is found in the GitHub workshop repository:
course-repository/ 06_Monitoring_as_a_Service/
04_Push_Events_to_Dynatrace
Additional Learning
Dynatrace Events API
Notes :
Lab activity:
Monitoring as a
Service
Step 4 of 7
Push Deployment &
Configuration
Change Events to
Dynatrace

40
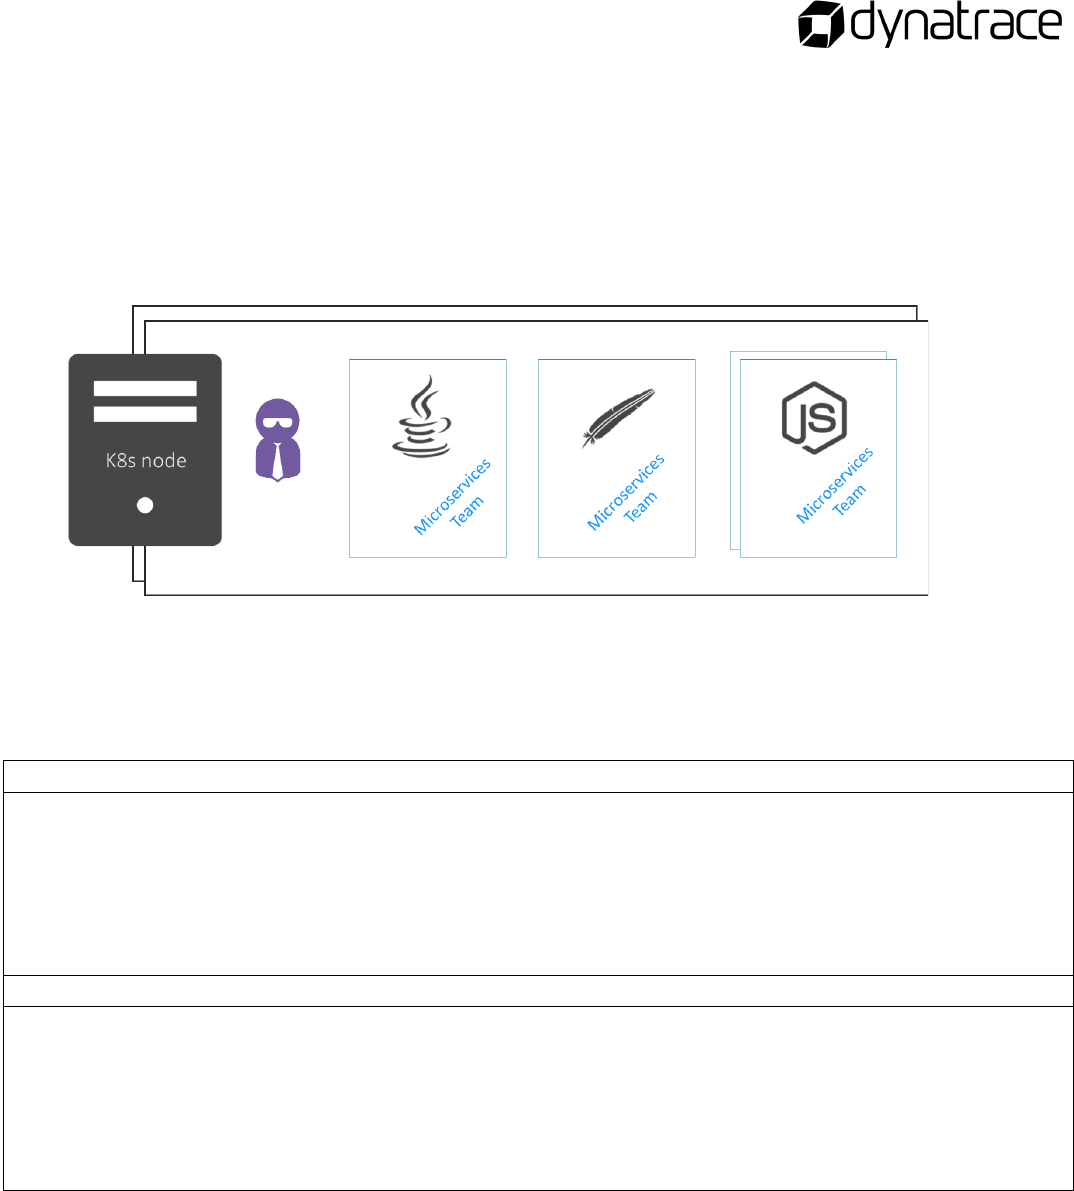
In this lab you'll learn how to create Management Zones in Dynatrace
to give each team access to the data they are supposed to see.
You will create management zones for:
o The Frontend Team
o The Dev Team
o The Architect Team
o The Operations Team
o The Business Team
Instructions
This lab is found in the GitHub workshop repository:
course-repository/ 06_Monitoring_as_a_Service/
05_Define_Management_Zones
Additional Learning
Management Zones
Notes :
Lab activity:
Monitoring as a
Service
Step 5 of 7
Define
Management Zones
in Dynatrace to
create Access
Control
41
In this lab you’ll see how automation works for the staging
environment. To do this you will:
o Create release branches for all microservices
o Build the new release in Jenkins
Instructions
This lab is found in the GitHub workshop repository:
course-repository/ 06_Monitoring_as_a_Service/
06_Deploy_Sockshop_to_Staging
Notes :
Lab activity:
Monitoring as a
Service
Step 6 of 7
Deploy Sockshop to
Staging and
Validate
Automation

42
In this lab you'll learn how to define an alerting profile to notifying
someone when a particular problem is identified by Dynatrace. To do
this you will:
Define in Dynatrace:
o An Alerting Profile
o Problem Notification
Instructions
This lab is found in the GitHub workshop repository:
course-repository/ 06_Monitoring_as_a_Service/
07_Setup_Notification_Integration
Notes :
Lab activity:
Monitoring as a
Service
Step 7 of 7
Setup Alerting
Profile for
Availability Issues
and Integrate with
a ChatOps Tool
43
Summary Statements
Can you complete the following summary statements about monitoring as a service?
• The goal of __________________________________ is to move from a long manual process of configuring
monitoring for a new app to fully automated monitoring.
• Deploying ____________________________ achieves this, even in a containerized environment.
• ___________________________________________ are clusters of related processes which run on the same
software.
• A ________________________________ is a process group running on a host.
• Dynatrace has out of the box and custom _________________________________.
Questions
Do you have any questions about monitoring as a service? Jot them down here and share them
with your instructor.

44
Performance as a Service
In this module, you will learn more about Performance as a Self Service and work through load testing
integration use cases.
Performance as a Self-Service aims on moving
• from manual sporadic execution and analysis of performance tests
• to a fully automated on-demand self-service model for performance testing in a development
environment.
Provides early performance feedback which results in better performing software that gets deployed into
staging or production environments.
Use Cases – Key Takeaways
Push Testing Metrics to Dynatrace
Pass Test Script Context via Request Attributes
Automate Analysis
Compare Hotspots
Load Testing Integration:
Taken from:
https://github.com/dynatrace-innovationlab/jenkins-dynatrace-pipeline-tutorial
How do Jenkins and Dynatrace work together?
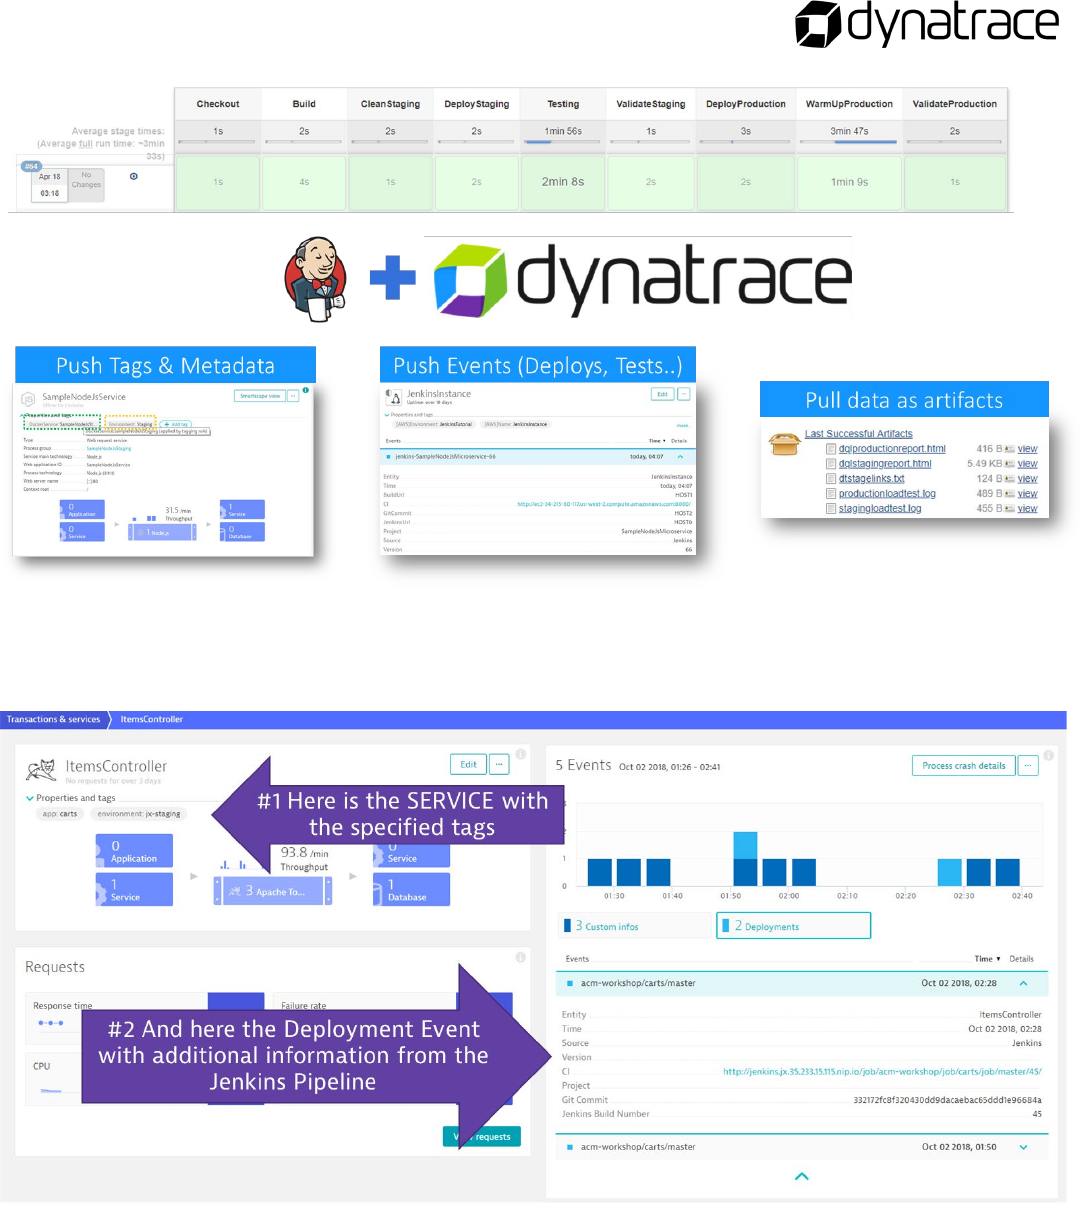
45
Ensure Proper Tagging and Deployment Events

46
The goal of this lab activity is to learn how to write a JMeter load test
that stresses a service with a bulk of requests. To do this you will:
o Add the following parameters:
o SERVER_URL - The domain of the service.
o SERVER_PORT - The port of the service.
o CHECK_PATH - The endpoint to send the requests to.
o DT_LTN - The Load Test Name uniquely identifies a test
execution.
o VUCount - The number of virtual users.
o LoopCount - The number of loops each virtual user
performs.
o Correctly tag each request for identification:
o VU - Virtual User ID of the unique user who sent the
request.
o TSN - Test Step Name is a logical test step within your load
testing script (for example, Login or Add to cart.
o LSN - Load Script Name - name of the load testing script.
This groups a set of test steps that make up a multi-step
transaction (for example, an online purchase).
o LTN - The Load Test Name uniquely identifies a test
execution (for example, 6h Load Test – June 25)
Instructions
This lab is found in the GitHub workshop repository:
course-repository07_Performance_as_a_Self_Service/
01_Write_Load_Test_Script
Additional Learning
https://www.dynatrace.com/support/help/integrations/third-party/test-
automation/dynatrace-and-load-testing-tools-integration/
Notes:
Lab activity:
Performance as a
Service
Step 1 of 7
Write Load Test
Script

47
The goal of this lab activity is to learn how to capture requrest
attributes in Dynatrace based on web request data. To do this you
will:
o Create request attributes for Load Test Name (LTN)
o Create request attribute for Test Script Name (TSN)
Instructions
This lab is found in the GitHub workshop repository:
course-repository07_Performance_as_a_Self_Service/
02_Define_Request_Attributes
Additional Learning
https://www.dynatrace.com/support/help/monitor/transactions-and-
services/request-attributes/how-do-i-capture-request-attributes-based-on-
web-request-data/
Notes:
Lab activity:
Performance as a
Service
Step 2 of 7
Define Request
Attributes

48
The goal of this lab activity is to learn how to validate the
performance of a service. To do this you will:
o Validate average response time
o Validate percentile of response time
o Validate the number of requests and requests/minute
o Server-side failure rate
Instructions
This lab is found in the GitHub workshop repository:
course-repository07_Performance_as_a_Self_Service/
03_Define_Performance_Signature
Additional Learning
https://www.dynatrace.com/support/help/integrations/third-party/test-
automation/dynatrace-and-load-testing-tools-integration/
Notes:
Lab activity:
Performance as a
Service
Step 3 of 7
Define
Performance
Signature for Cart
Service

49
The goal of this lab activity is to learn how to build a Jenkins pipline
for implementing the Performance as a Self-Service approach for the
carts service used to manually trigger performance testing against a
service.. To do this you will:
o Record Dynatrace Session and Push Info Events
o Trigger JMeter Test by a separate function
o Validate the performance signature definition
o Create a performance pipeline for carts
Instructions
This lab is found in the GitHub workshop repository:
course-repository 07_Performance_as_a_Self_Service/
04_Define_Performance_Pipeline
Notes:
Lab activity:
Performance as a
Service
Step 4 of 7
Define
Performance
Pipeline

50
The goal of this lab activity is to learn how to run performance testing
on current and new implementation of carts. To do this you will:
o Run performance test on current implementation
o Introduce a slowdown in the carts service
o Build the new version
o Run performance testing on the new version
o Explore results in Jenkins
Instructions
This lab is found in the GitHub workshop repository:
course-repository 07_Performance_as_a_Self_Service/
05_Run_Performance_Tests
Notes:
Lab activity:
Performance as a
Service
Step 5 of 7
Run Performance
Tests

51
The goal of this lab activity is to learn how to leverage Dynatrace to
identify the difference between two performance tests. To do this
you will:
o Open Dynatrace from Jenkins Pipeline
o Narrow down the requests based on request attributes
o Open the Comparison view
o Compare response time hotspots
Instructions
This lab is found in the GitHub workshop repository:
course-repository07_Performance_as_a_Self_Service/
06_Compare_Tests_in_Dynatrace
Notes:
Lab activity:
Performance as a
Service
Step 6 of 7
Compare Tests in
Dynatrace

52
The goal of this lab activity is to remove the slowdown in the carts
service to have a solid version.. To do this you will:
o Revert the original behavior of carts
o Build the new version
o Run performance test on the new version.
Instructions
This lab is found in the GitHub workshop repository:
course-repository07_Performance_as_a_Self_Service/
07_Retry_Performance_Test
Notes:
Lab activity:
Performance as a
Service
Step 7 of 7
Retry Performance
Test

53
Summary
• Performance as a Self-Service aims on moving
o from manual sporadic execution and analysis of performance tests
o to a fully automated on-demand self-service model for performance testing in a
development environment.
• Provides early performance feedback which results in better performing software that gets
deployed into staging or production environments.
• Load Testing Integration
o Push Testing Metrics to Dynatrace
o Pass Test Script Context via Request Attributes
o Automate Analysis: Compare Builds and Method Hotspots in Dynatrace
• Performance as a Self-Service
o Fully automated on-demand self-service model for performance testing in a development
environment
Questions
Do you have any questions about Performance as a Self-Service? Jot them down here and share
them with your instructor.

54
Production Deployments
In this module, we will describe production deployments, deployment strategies, and showcase using Istio
on Kubernetes to canary-deploy a new front-end version.
Deployment Strategies
Recreate
Shut down version A
Deploy version B after A is turned off
Pros:
• Easy to do
• Application state entirely renewed
Cons:
• Downtime – High impact on the user
Ramped
aka Rolling upgrade
Replace instances with new version one by one
Pros:
• Easy to setup
• New version is slowly released
• Stateful applications can rebalance
data
Cons:
• No control over traffic
Blue/Green
Version B (green) is deployed alongside version A (blue)
Traffic is switched to green at load balancer
Blue is not immediately deleted
Pros:
• Instant rollout and rollback
• Avoiding version conflicts
Cons:
• Difficult for stateful applications
• Long running transactions
55
Canary
Gradually shifting traffic from version A to B
E.g.: 90% A - 10% B for 10 mins, then 80% A - 20% B ...
Controlled rollout with easy rollback
Criteria for traffic distribution
Pros:
• New version only released to a subset
of users
• Tryouts under production conditions
• Fast and easy rollback
Cons:
• Difficult for stateful applications
A/B Testing
No deployment strategy but related
Testing conversion rates of features
Criteria for traffic distribution
Pros:
• Run several versions in parallel
• Full traffic control
Cons:
• Requires intelligent load balancer (L7)
• Hard to troubleshoot
Shadow
Deploy version B alongside version A
Mirror traffic to version B
Go live when quality requirements are met
Pros:
• Testing B under real conditions
• No user impacts
• Controlled rollout
Cons:
• Expensive – twice the resources
• Not a true user test
• May require mocking services
56
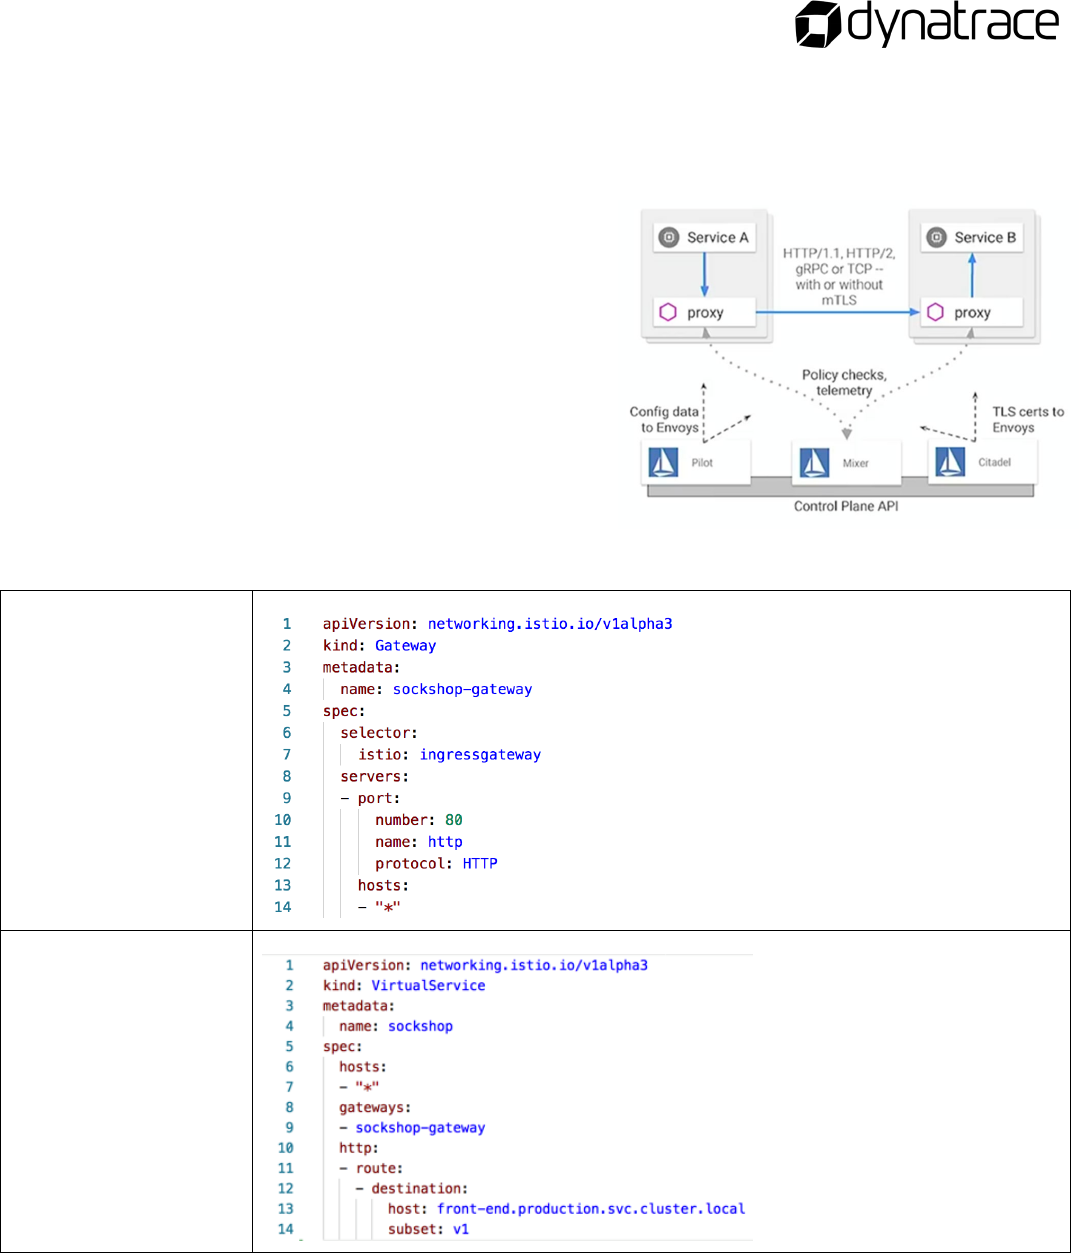
Istio architecture
Istio is an open source project initiated by Google and IBM used to manage service interactions.
Pilot
• Control plane to configure and push service
communication policies
• Routing and forwarding policies
Mixer
• Policy enforcement with a flexible plugin
model for providers for a policy
Citadel
• Service-to-service authentication and
encryption using mutual TLS with built-in
identify and credential management
Istio components
Gateway
VirtualService
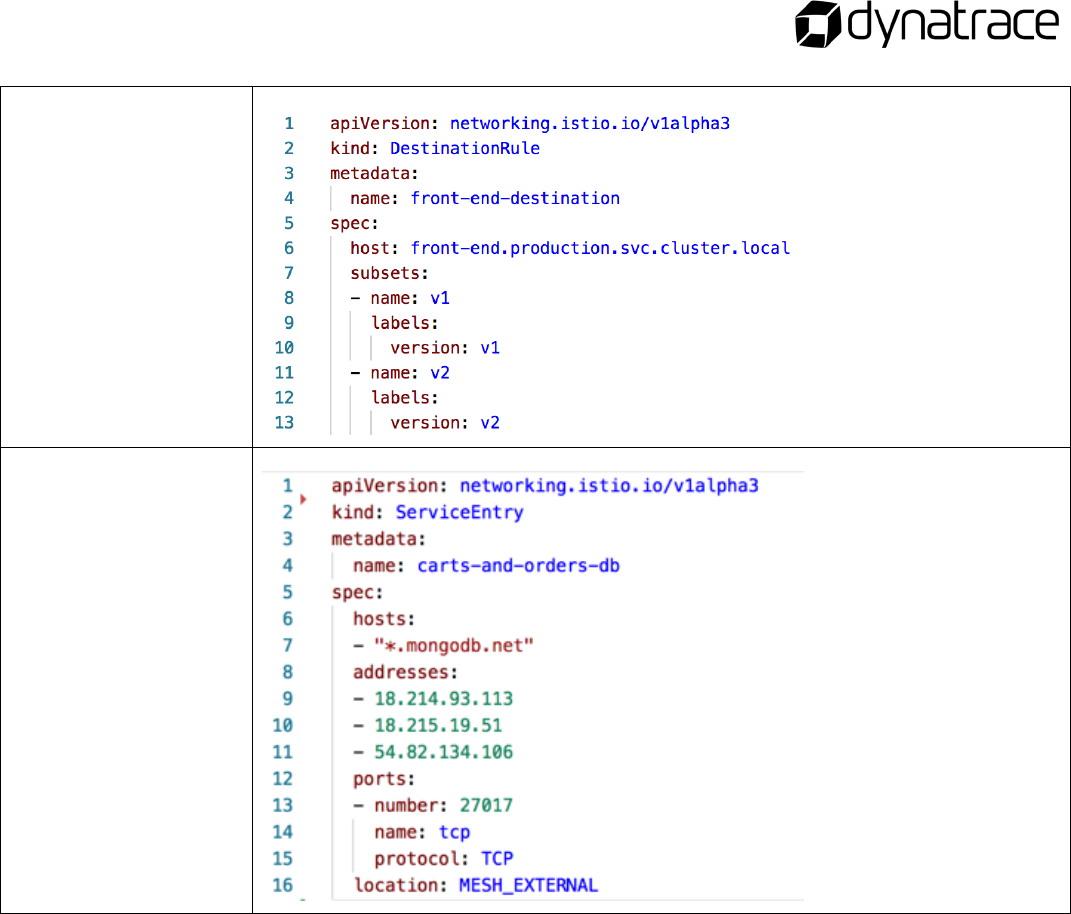
57
DestinationRule
ServiceEntry

58
The goal of this lab activity is to install Istio components and verify
that they are running in the k8s cluster To do this you will:
o Go to your home directory on the bastion host
o Install Istio’s custom resource definitions (CRDs)
Instructions
This lab is found in the GitHub workshop repository:
course-repository08_Production_Deployments/
08_Production_Deployments/1_Install_istio
Notes:
Lab activity:
Production
Deployment
Step 1 of 6
Install Istio

59
The goal of this lab activity is to enable Istio’s automatic sidecar
injection for one k8s namespace. To do this you will:
o Create and configure mandatory Istio components
o Allow external traffic to leave the service mesh
Instructions
This lab is found in the GitHub workshop repository:
course-repository08_Production_Deployments/
2_Configure_istio_components
Notes:
Lab activity:
Production
Deployment
Step 2 of 6
Configure Istio
Components

60
The goal of this lab activity is to promote all components that are
currently in the staging name space to the production namespace. To
do this you will:
o Trigger the pipeline in Jenkins
Instructions
This lab is found in the GitHub workshop repository:
course-repositor08_Production_Deployments/
03_Define_Performance_Signature
Notes:
Lab activity:
Deploy to
Production
Step 3 of 6
Deploy to
Production

61
The goal of this lab activity is to create an improved version of the
front-end service. To do this you will:
o Change the color of the application header
o View the effect of traffic routing between two different artifact
versions
Instructions
This lab is found in the GitHub workshop repository:
course-repository 08_Production_Deployments/
4_Create_front-end_v2
Notes:
Lab activity:
Production
Deployment
Step 4 of 6
Create front-end v2

62
The goal of this lab activity is to promote the new version of the
front-end service to production. To do this you will:
o Trigger the parameterized pipeline
o Enter parameters
Instructions
This lab is found in the GitHub workshop repository:
course-repository08_Production_Deployments/5_Deploy_front-end_v2
Notes:
Lab activity:
Production
Deployment
Step 5 of 6
Deploy front-end
v2
63
The goal of this lab activity is to configure traffic routing in Istio to
redirect traffic based on different criteria. To do this you will:
o Redirect traffic using wieght rules
o Redirect logged in users
o Redirect Chrome users
Instructions
This lab is found in the GitHub workshop repository:
course-repository 6_Istio_Traffic_Routing
Notes:
Lab activity:
Production
Deployment
Step 6 of 6
Istio Traffic
Routing

64
Summary
• Production deployments from idea to production
• Deployment strategies
• Recreate - Shut down version A; Deploy version B after A is turned off
• Ramped - aka Rolling upgrade; Replace instances with new version one by one
• Blue/Green - Version B (green) is deployed alongside version A (blue); Traffic is switched to
green at load balancer; Blue is not immediately deleted
• Canary - Gradually shifting traffic from version A to B; Controls rollout with easy rollback;
Criteria for traffic distribution
• A/B testing - No deployment strategy but related; Tests conversion rates of features; Criteria
for traffic distribution
• Shadow - Deploy version B alongside version A; Mirror traffic to version B; Go live when
quality requirements are met
• Istio
• Open source project initiated by Google and IBM
• Reviewed architecture and components
Questions
Do you have any questions about Deployment Strategies or the steps taken in the labs? Jot them
down here and share them with your instructor.
65
Runbook Automation and Self-Healing
In this module, you will learn about Ansible and Ansible tower.
Runbooks:
• “compilation of routine procedures and operations that the system operator (administrator)
carries out”
Ansible:
• Simple automation language + automation engine
• Human readable (yaml)
Ansible Tower:
• Web UI
• Management of runbooks
• Powerful API for automation

66
The goal of this lab activity is to deploy Ansible Tower for automation
inside of our cluster. To do this you will:
o Go to https://www.ansible.com/license
o Setup a free trial license file.
o Deploy Ansible Tower
Instructions
This lab is found in the GitHub workshop repository:
course-repository09_Runbook_Automation_and_Self_Healing/
01_Deploy_Ansible_Tower
Notes:
Lab activity:
Runbook
Automation
Step 1 of 4
Deploy Ansible
Tower

67
The goal of this lab activity is to setup and configure our Ansible
Tower environment. To do this you will:
o Add Github credentials to be able to check out Github repository
o Create a project in Ansible Tower that holds defines which
repository to use
o Create an inventory that holds additional information such as
userdata and variables
o Create job templates that can then be executed and will run our
playbooks.
Instructions
This lab is found in the GitHub workshop repository:
course-repository09_Runbook_Automation_and_Self_Healing/
02_Setup_Tower
Notes:
Lab activity:
Runbook
Automation
Step 2 of 4
Setup Tower

68
The goal of this lab activity is to integrate Ansible Tower Runbook in
Dynatrace. To do this you will:
o Setup Problem Notifications
o Login to your Ansible Tower Instance
Instructions
This lab is found in the GitHub workshop repository:
course-repository09_Runbook_Automation_and_Self_Healing/
03_Setup_Dynatrace
Notes:
Lab activity:
Runbook
Automation
Step 3 of 4
Setup Dynatrace

69
The goal of this lab activity is run our promotional campaign in our
production environment by applying a change to our configuration of
the carts service. To do this you will:
o Run the campaign in our production environment
Instructions
This lab is found in the GitHub workshop repository:
course-repository09_Runbook_Automation_and_Self_Healing/
04_Run_Playbook
Notes:
Lab activity:
Runbook
Automation
Step 4 of 4
Run Playbook
70
Summary Statements
Can you complete the following summary statements about runbook automation?
• __________________________ are a compilation of routine procedures and operations that the system
operator (administrator) carries out.
• _________________________ is a simple automation language + automation engine.
Questions
Do you have any questions about Runbook Automation or the steps taken in the labs? Jot them
down here and share them with your instructor.
71
Unbreakable Delivery Pipeline
The overall goal of the Unbreakable Delivery Pipeline is to implement a pipeline that prevents bad code
changes from impacting your real end users. Therefore, it relies on three concepts known as Shift-Left,
Shift-Right, and Self-Healing:
Shift-Left: Ability to pull data for specific entities (processes, services, applications) through an
Automation API and feed it into the tools that are used to decide on whether to stop the pipeline
or keep it running.
Shift-Right: Ability to push deployment information and meta data to your monitoring
environment, e.g.: differentiate BLUE vs GREEN deployments, push build or revision number of
deployment, notify about configuration changes.
Self-Healing: Ability for smart auto-remediation that addresses the root cause of a problem and
not the symptom
In this module you will learn how to implement such an Unbreakable Delivery Pipeline with Dynatrace
and Ansible Tower.
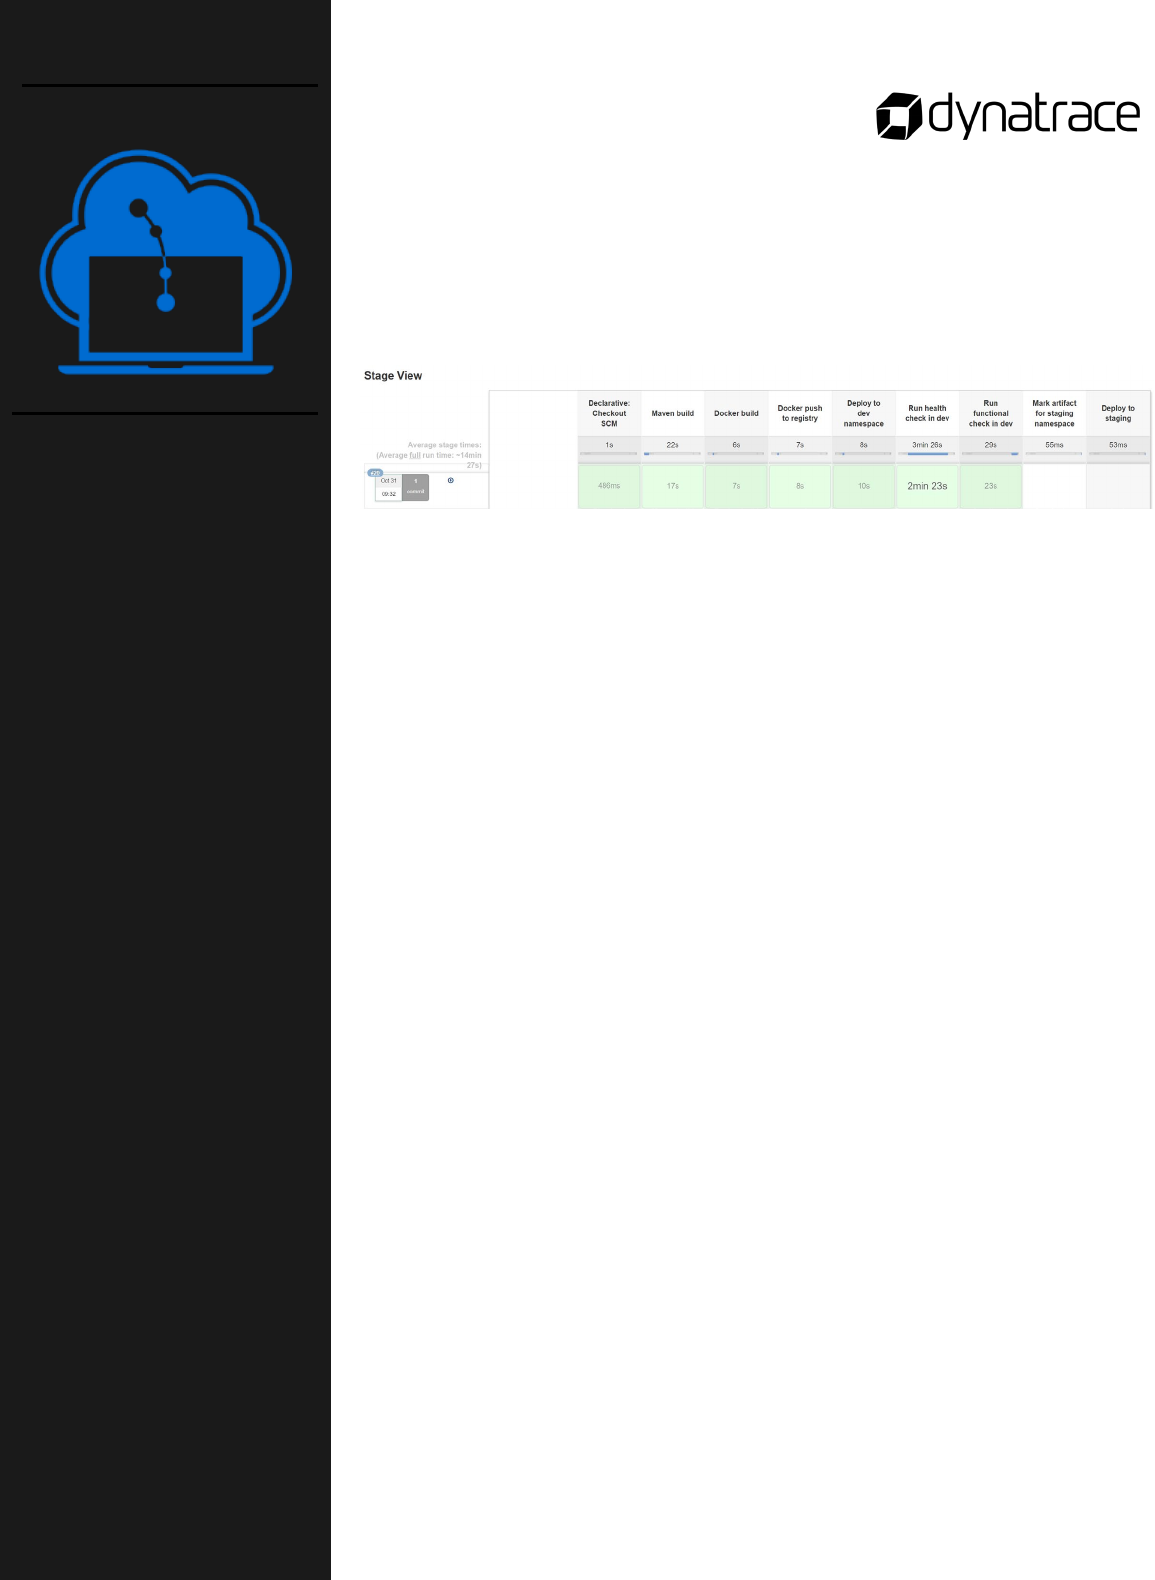
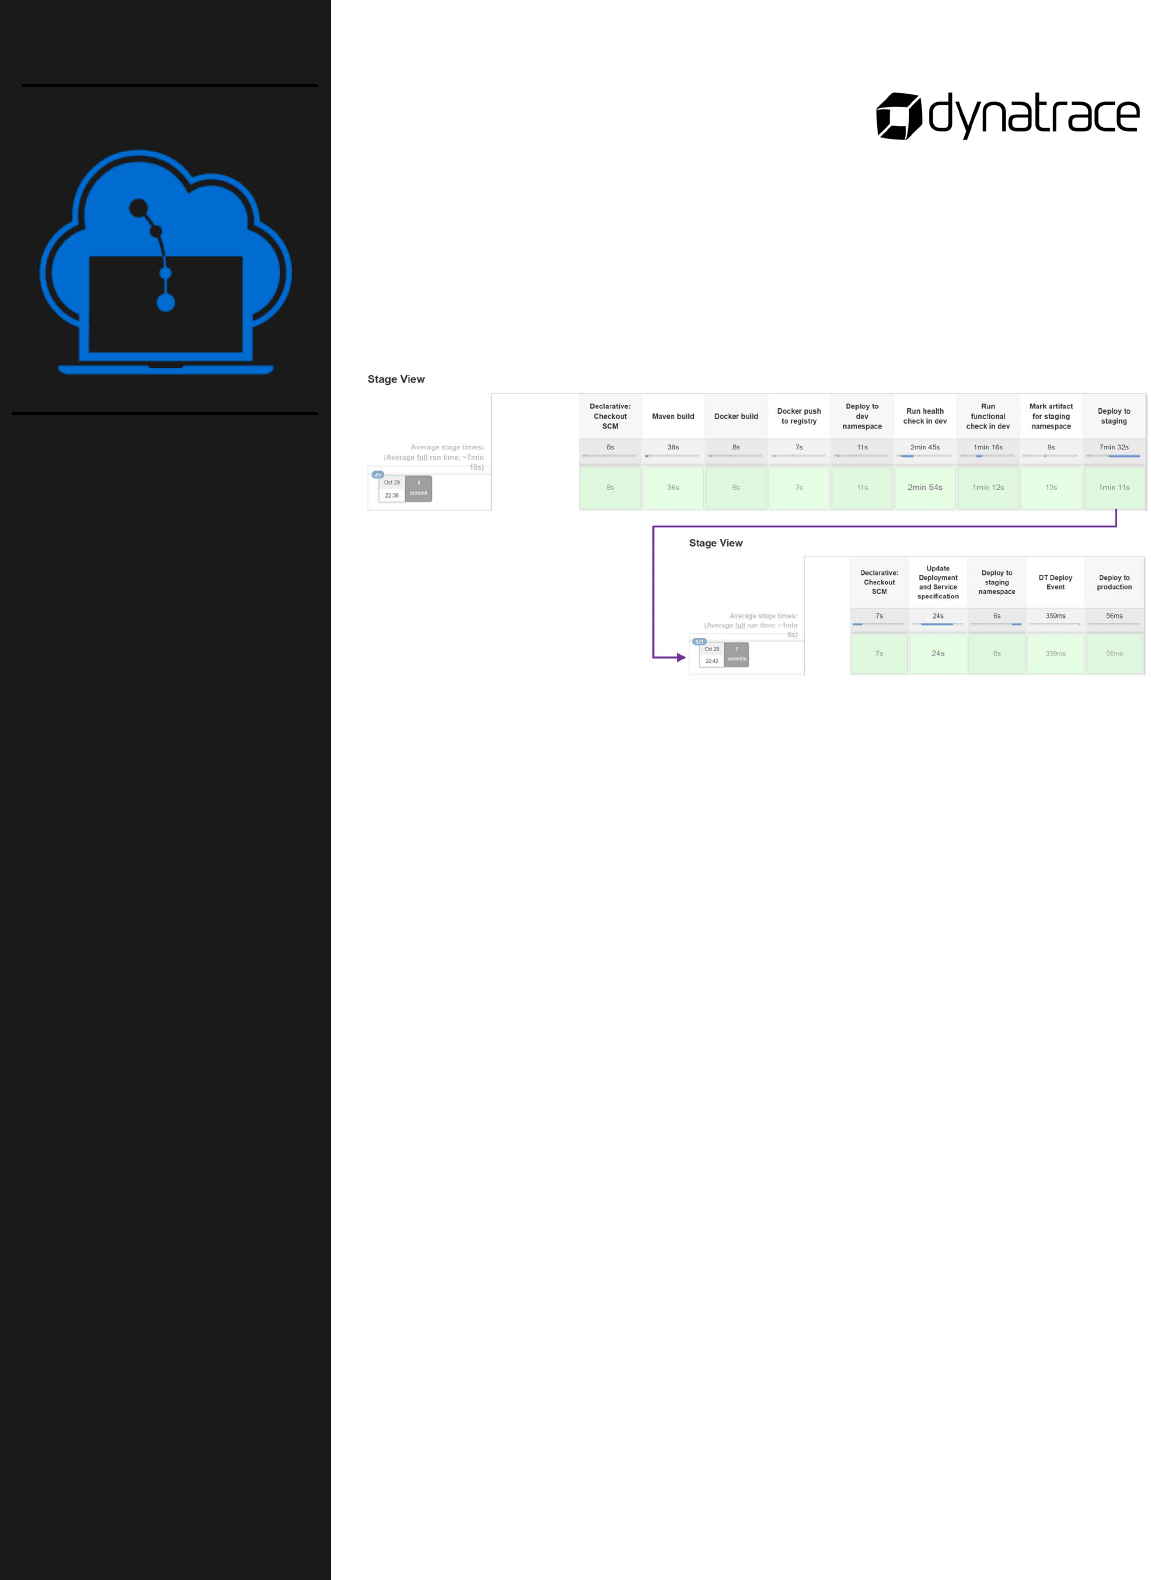
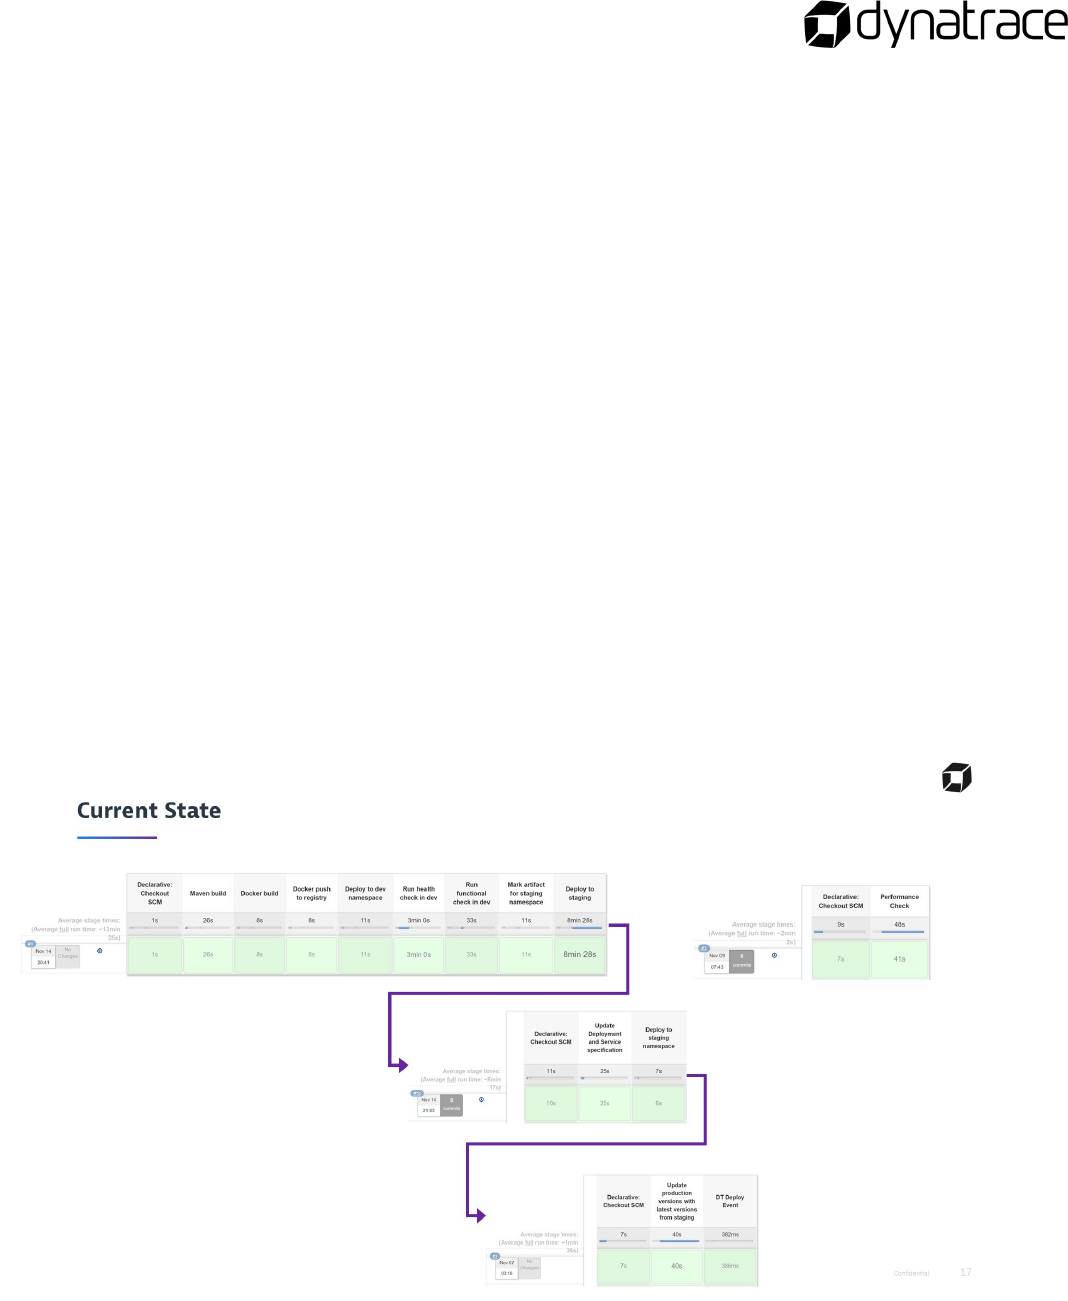
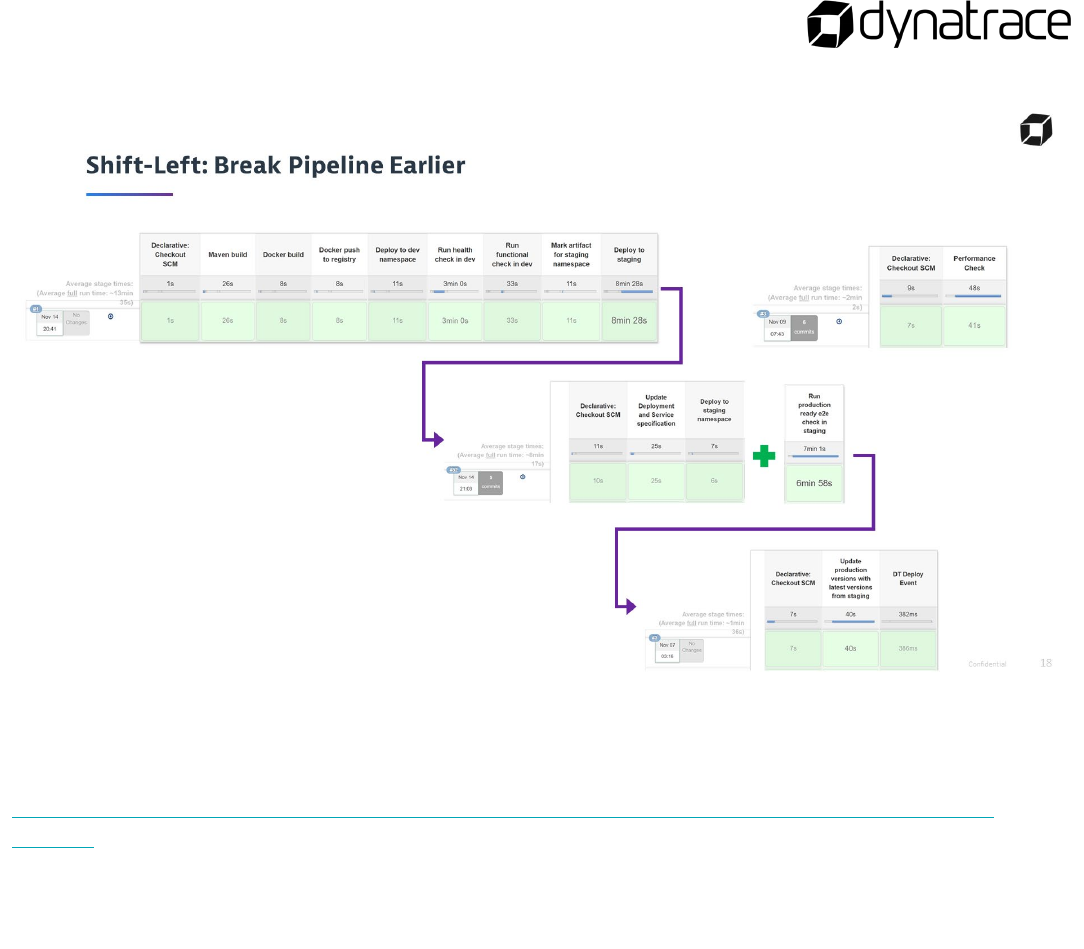
Hands-on Building the Unbreakable Delivery Pipeline

73
In this module you will learn how to implement an Unbreakable
Delivery Pipeline with Dynatrace and Ansible Tower by following
these four labs:
o Harden Staging Pipeline with Quality Gate
o Simulate Early Pipeline Break
o Setup Self-Healing for Production
o Introduce a Failure into Front-End
o Simulate a Bad Production Deployment
Instructions
First, there are a few steps to perform:
1. Add Env Variables to Jenkins
2. Add a Container to the Kubernetes Pod Template kubegit
This lab is found in the GitHub workshop repository:
course-repository/10_Unbreakable_Delivery_Pipeline/
00_Preparation_for_Unbreakable_Delivery_Pipeline
Notes:
Lab activity:
Unbreakable
Delivery Pipeline
Prep Work

74
In this lab activity you'll add an additional quality gate to your CI
pipeline. An end-to-end check will verify the functionality of the
Sockshop application in the staging environment. To do this you will
perform the following steps:
o Comment out the "DT Deploy Event"
o Add e2e Test to Staging Pipeline
o Set the Upper and Lower Limit in the Performance Signature
Instructions
This lab is found in the GitHub workshop repository:
course-repository/10_Unbreakable_Delivery_Pipeline/
01_Harden_Staging_Pipeline_with_Quality_Gate
Notes:
Lab activity:
Unbreakable
Delivery Pipeline
Part 1 of 5
Harden Staging
Pipeline with
Quality Gate

75
In this lab you'll release a service to staging that is not tested based
on performance tests. Intentionally, the service is slowed down to fail
at the e2e check in the staging pipeline. To do this you will perform
the following steps:
o Introduce a Slowdown into the Carts Service
o Create a new Release
o Build the new Release in Jenkins
o Follow the Jenkins Build Pipelines
o Remove the Slowdown in the Carts Service
o Create a new Release
o Build the new Release in Jenkins
Instructions
This lab is found in the GitHub workshop repository:
course-repository/10_Unbreakable_Delivery_Pipeline/
02_Simulate_Early_Pipeline_Break
Notes:
Lab activity:
Unbreakable
Delivery Pipeline
Part 2 of 5
Simulate Early
Pipeline Break
76
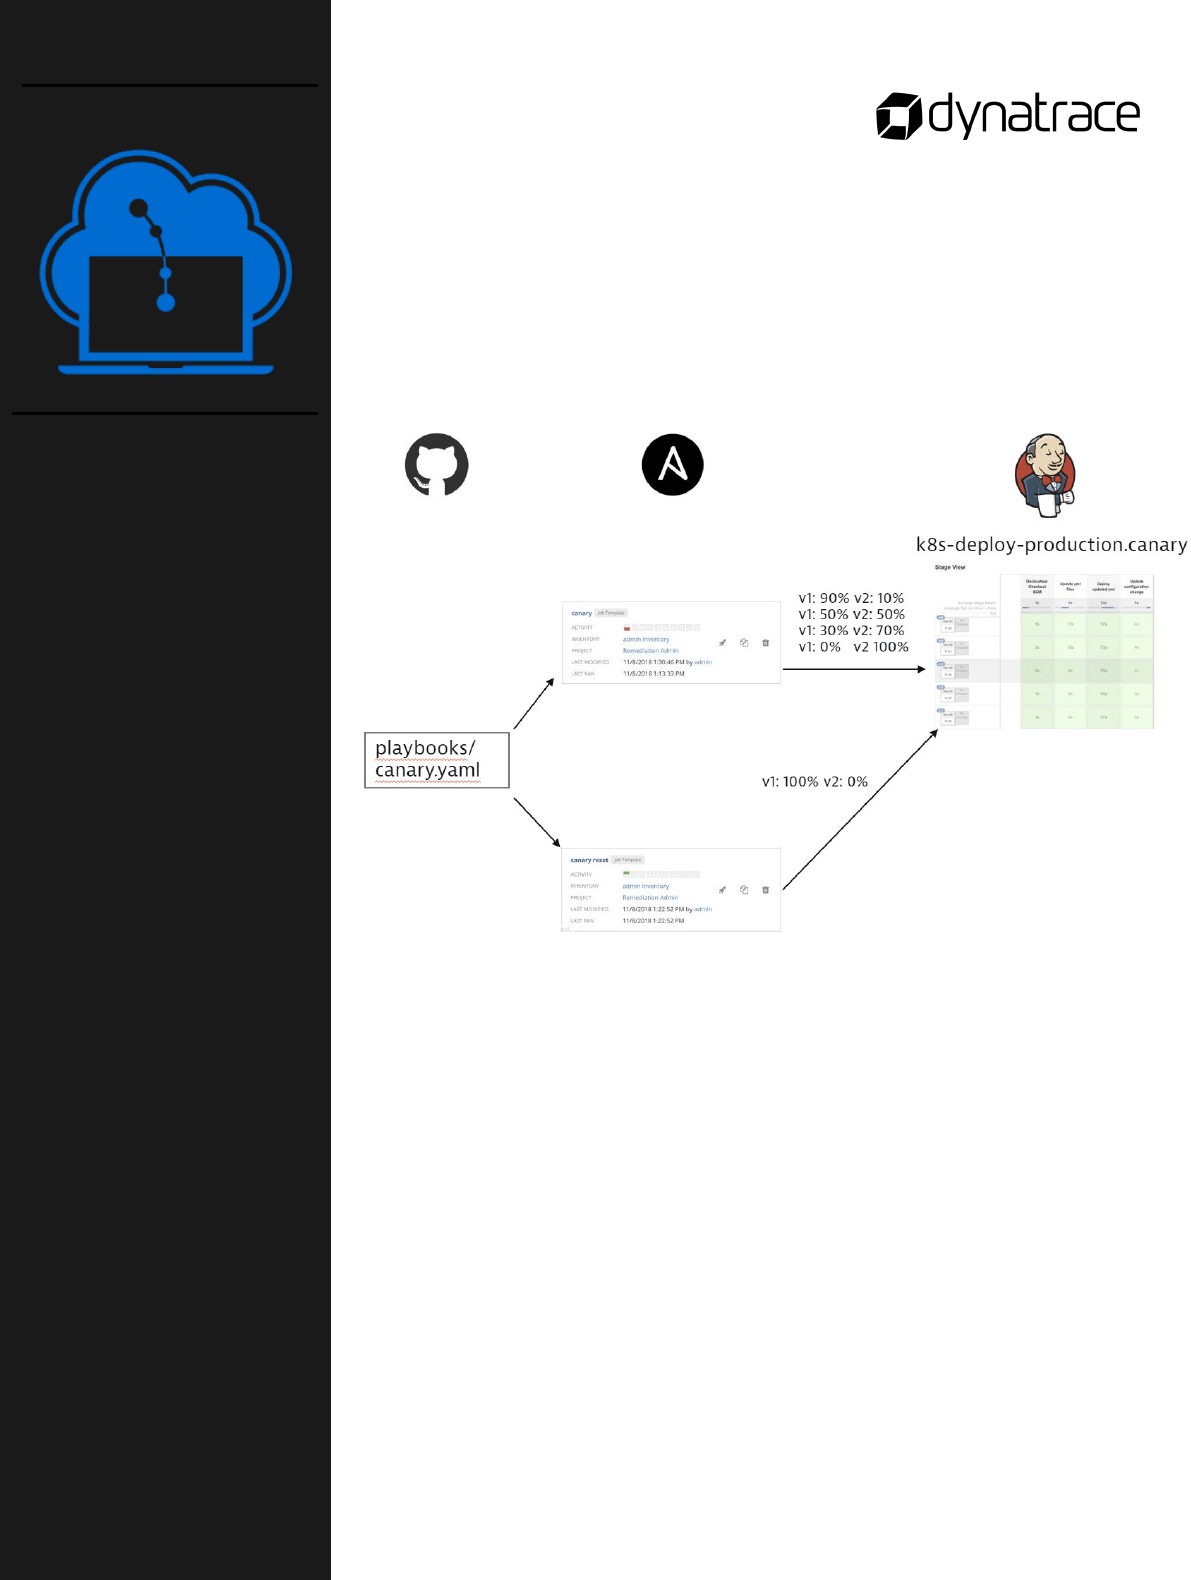
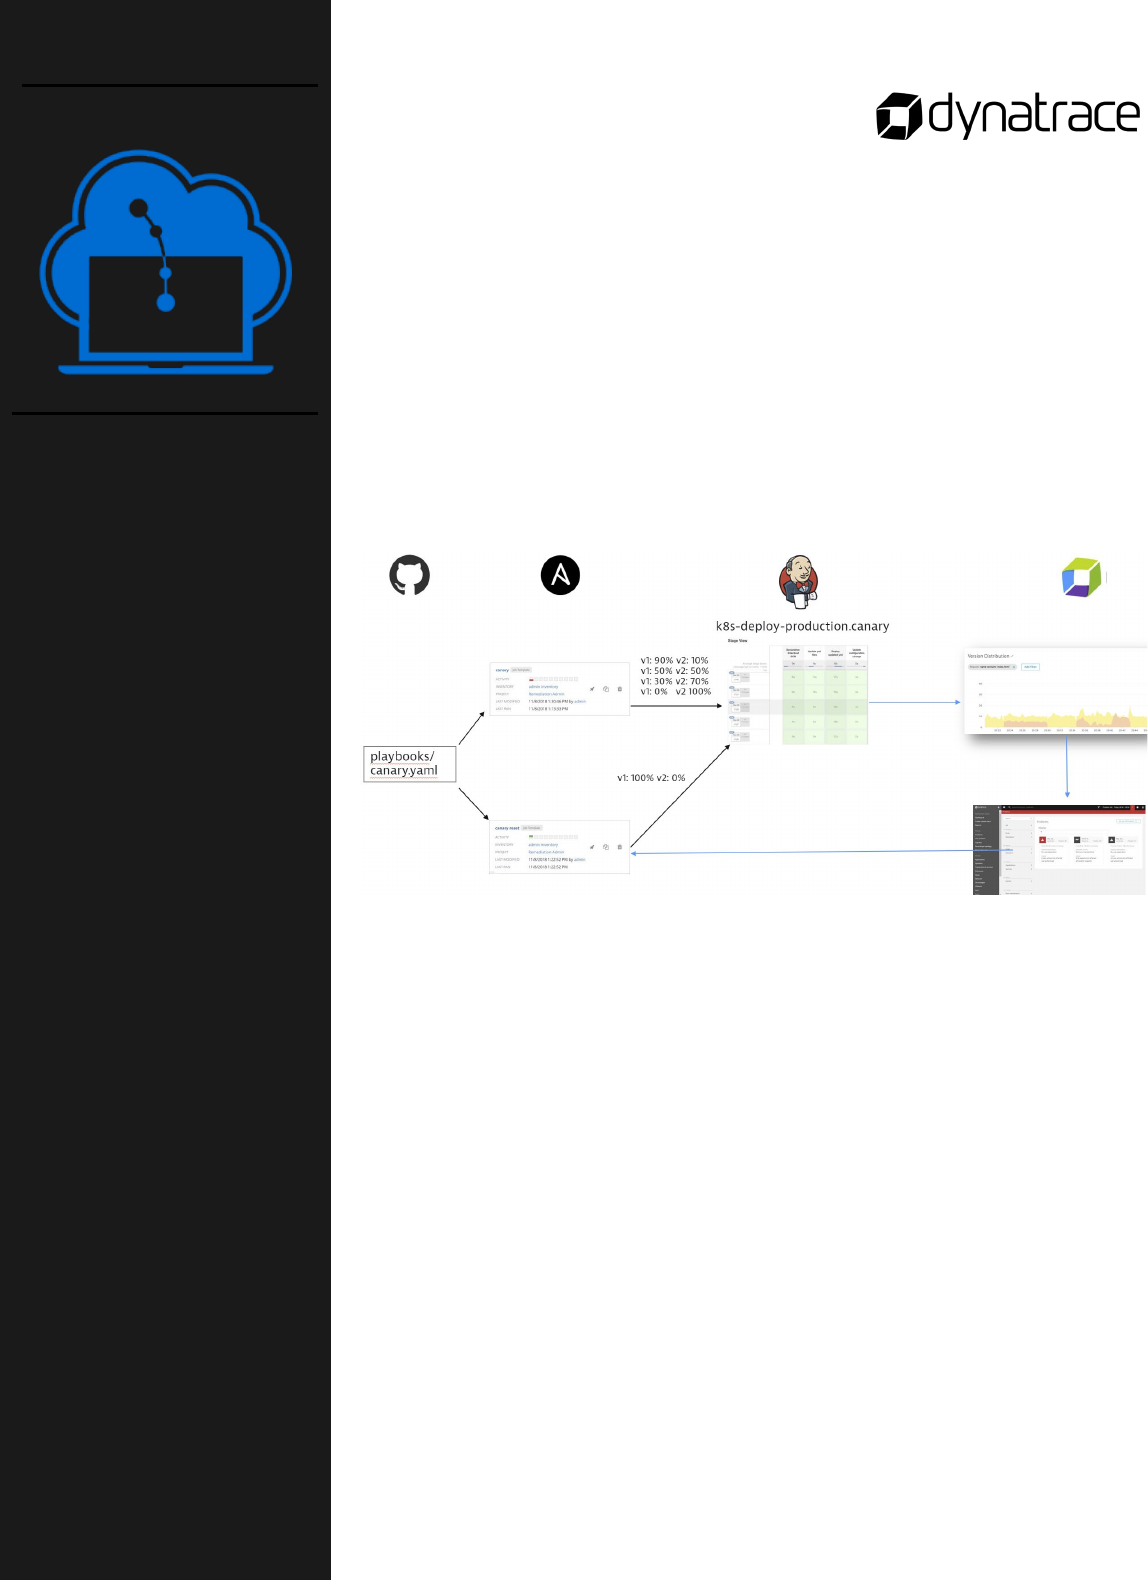
In this lab you'll create an Ansible Tower job that releases a
deployment in a calaray release manner. Additionally, you will create a
second job that switches back to the old version in case the canary
(i.e., the new version of front-end) behaves wrong. To do this you will
perform the following steps:
o Create Job Template for Canary Release in Ansible Tower
o Duplicate Job Template for Self-Healing in Ansible Tower
Instructions
This lab is found in the GitHub workshop repository:
course-repository/10_Unbreakable_Delivery_Pipeline/
03_Setup_Self_Healing_for_Production
Notes:
Lab activity:
Unbreakable
Delivery Pipeline
Part 3 of 5
Setup Self-Healing
Action for
Production
Deployment

77
In this lab lab you will introduce a Java Script error into front-end and
deploy it as version 2. To do this perform the following steps:
o Introduce a JavaScript error in the Front-end Service
o Create a new Release
o Build the new Release in Jenkins
o Delete the Virtual Service for Sockshop
o Deploy the new Front-End to Production
o Apply the Virtual Service for Sockshop
Instructions
This lab is found in the GitHub workshop repository:
course-repository/10_Unbreakable_Delivery_Pipeline/
04_Introduce_a_Failure_into_Front-End
Notes:
Lab activity:
Unbreakable
Delivery Pipeline
Part 4 of 5
Introduce a Failure
into Front-End
78
In this lab you'll create a deployment of the front-end service that
passes the quality gate in the staging pipeline and will be deployed to
production. All traffic will be be routed to this new version using a
prepared deployment pipeline. To do this you will perform the
following steps:
o Create a Synthetic Monitor in Dynatrace
o Run Job Template in the Ansible Tower
o Adjust Sensitivity of Anomaly Detection
o Wait for a Probkem to Appear in Dynatrace
Instructions
This lab is found in the GitHub workshop repository:
course-repository/10_Unbreakable_Delivery_Pipeline/
05_Simulate_a_Bad_Production_Deployment
Notes:
Lab activity:
Unbreakable
Delivery Pipeline
Part 5 of 5
Simulate a Bad
Production
Deployment

79
Questions
Do you have any questions about Deployment Strategies or the steps taken in the labs? Jot them
down here and share them with your instructor.

80
Virtual Operations
Using the Dynatrace API
Use the Dynatrace API to automate your monitoring tasks and export different types of data into your
third-party reporting and analysis tools. The Dynatrace API uses a token mechanism for authentication.
You need to generate the token and assign the required permissions to it.
https://www.dynatrace.com/support/help/dynatrace-api/dynatrace-api-authentication/
Dynatrace API is a powerful HTTP REST API that allows you to seamlessly integrate with Dynatrace to
build your own customized tasks.
Using Dynatrace Davis
When we started with Davis 2 years ago, the hype around natural language processing was just starting.
We had two personas in mind:
• Operations teams get a virtual team member, that answers technical questions through a
conversational interface and serves as starting point to drill deeper into problems if there are any.
• Executives get a virtual assistant, that answers high level questions about overall application
health.
Without the need to log in to the product, Davis blends right into daily routines and all it takes is to ask
Davis for a report.
Davis is available for free at: https://davis.dynatrace.com

81
In this lab lab you will explore the Dynatrace API. You will do this by
perfomring the following 4 labs:
o Check Prerequisites
o Explore the Dynatrace API
o Monitor Host Utilization
o Get the Most Volatile Service
Instructions
To get started, you will check that Node.js is installed on the Bastion host.
This lab is found in the GitHub workshop repository:
course-repository/11_Virtual_Operations_and_API/ 1_Check_Prerequisites
Notes:
Lab activity:
Virtual Operations
Part 1 of 4
Check Prerequisites

82
Dynatrace provide extensive APIs for querying and manipulating data.
All API related information and documentation is located inside your
Dynatrace environment under Settings / Integration / Dynatrace API.
To start exploring the Dynatrace API, you will first need to:
o Create an API Token
o Authorize the API Token
Instructions
This lab is found in the GitHub workshop repository:
course-repository/11_Virtual_Operations_and_API/
2_Explore_the_Dynatrace_API
Notes:
Lab activity:
Virtual Operations
Part 2 of 4
Explore the
Dynatrace API

83
In this lab you will create a simple dashboard that analyzes host
utilization and display the host instances that are underutilized.
To do this you will need:
o A list of all hosts
o A way to find out the CPU utilization for a certain timeframe for a
given host
During this lab we will walk you through setting this up.
Instructions
This lab is found in the GitHub workshop repository:
course-repository/11_Virtual_Operations_and_API/
3_Monitor_Host_Utilization
Notes:
Lab activity:
Virtual Operations
Part 3 of 4
Monitor Host
Utilization

84
The lab activity shows you how to analyze deployment events to
create a list of services ranked by the number of deployment events.
To do this you will need:
o A list of all services
o The number of deployment events per service
Instructions
This lab is found in the GitHub workshop repository:
course-repository/11_Virtual_Operations_and_API/
4_Get_the_Most_Volatile_Service
Notes:
Lab activity:
Virtual Operations
Part 4 of 4
Get the Most
Volatile Service

85
Summary Statements
• _____________________________ is a powerful HTTP REST API that allows you to seamlessly integrate
with Dynatrace to build your own customized tasks.
• _______________________________ is available to everyone, can be integrated with Alexa and Slack.
Questions
Do you have any questions about using the Dynatrace API or Davis? Jot them down here and
share them with your instructor.

86
Autonomous Cloud Lab Questions
You have reached the end of the planned exercises. Do you have any remaining questions? Jot
them here and be sure to address them with your instructor.
ACL Key Takeaways
What key points will you take away from the Autonomous Cloud Lab? Jot them here for reference
when you return to home base.
Contact Information
Colin Lesko
PDP Team Lead
Email: Collin.lesko@dynatrace.com
