Spectrum Master MS2721B, MS2723B, MS2724B User Guide ANRITSU/ANRITSU MS2724,21 22B Users ANRITSU
User Manual: ANRITSU/ANRITSU MS2724,21 22B Users
Open the PDF directly: View PDF ![]() .
.
Page Count: 470 [warning: Documents this large are best viewed by clicking the View PDF Link!]
- Cover
- Title Page
- Warranty
- Table of Contents
- Chapter 1 General Information
- Chapter 2 Quick Start Guide
- Chapter 3 Key Functions
- Chapter 4 Measurement Fundamentals
- Chapter 5 Field Measurements
- Introduction
- Occupied Bandwidth Measurement
- Channel Power Measurement
- CDMA Channel Power
- CDMA Channel Power Measurement
- GSM Channel Power Measurement
- AMPS Channel Power Measurement
- Adjacent Channel Power Ratio
- Adjacent Channel Power Measurement
- GSM Adjacent Channel Power Measurement
- AMPS (TDMA) Adjacent Channel Power Measurement
- Out-of-Band Spurious Emission Measurement
- In-band/Out-of-Channel Measurements
- In-band Spurious Measurement
- Field Strength
- AM/FM/SSB Demodulation
- Carrier to Interference Ratio Measurement
- Chapter 6 Interference Analysis Measurements
- Chapter 7 Channel Scanner Measurements
- Chapter 8 Tracking Generator
- Chapter 9 WCDMA/HSDPA Measurements
- Introduction
- WCDMA/HSDPA Signal Analyzer Mode
- Amplitude
- File
- Freq (Frequency)
- Measurements
- Mode
- Preset
- Setup
- System
- WCDMA/HSDPA Measurements
- Carrier Frequency
- Carrier Feedthrough
- CDP
- Code Utilization
- Amplifier Capacity
- Max Amplifier Power
- CPICH Power
- Frequency Error Averaging
- Channel Power
- Scrambling Code
- Spreading Factor (also called OVSF codes)
- Freq Error
- Codogram
- Noise Floor
- Threshold
- Occupied Bandwidth
- EVM (Error Vector Magnitude)
- Symbol EVM (@EVM)
- Peak to Average Power
- Peak CD Error (Peak Code Domain Error)
- Ec
- Ec/Io
- Pilot Dominance
- Total Power
- CPICH Abs Power
- P-CCPCH Abs Power
- S-CCPCH Abs Power
- P-SCH Abs Power
- S-SCH Abs Power
- PICH
- HSDPA Power versus Time Display
- Constellation
- Measurement Setup
- WCDMA/HSDPA RF Measurements
- Demodulator
- Over The Air Measurements
- Pass/Fail Mode
- Chapter 10 GSM/GPRS/EDGE Measurements
- Chapter 11 High Accuracy Power Meter
- Chapter 12 GPS Option
- Chapter 13 Fixed WiMAX Signal Analyzer
- Chapter 14 Mobile WiMAX Signal Analyzer
- Chapter 15 CDMA Signal Analyzer
- Introduction
- Getting Started
- CDMA Measurement Setup
- CDMA RF Measurement Setup
- CDMA Demodulator Measurements Setup
- CDMA Over-The-Air Measurement Setup
- Pass Fail Setup
- CDMA Measurement Descriptions
- CDMA MENUS
- Amplitude Menu
- File Menu
- Freq (Frequency) Menu
- Limit Menu
- Marker Menu
- Measurements Menu
- Mode Menu
- Preset Menu
- Setup Menu
- Sweep Menu
- System Menu
- Chapter 16 EVDO Signal Analyzer
- Introduction
- Getting Started
- EVDO Measurement Setup
- EVDO RF Measurements Setup
- EVDO Demodulator Measurements Setup
- EVDO Over-The-Air Measurement Setup
- Pass Fail Setup
- EVDO Summary Setup
- EVDO Measurement Descriptions
- EVDO Menus
- Amplitude
- File
- Frequency
- Limit
- Marker
- Measurements Menu
- Mode Menu
- Setup
- System
- Preset
- Sweep
- Trace
- Chapter 17 DVB-T/H Signal Analyzer
- Introduction
- Getting Started
- Measurement Setup and Execution
- Frequency and Reference Level Configurations
- Signal Power Measurement
- Modulation Analysis
- Tx Meas Analysis
- BER Analysis
- Spectrum Monitor
- Saving Measurement Results
- Menus
- Frequency/Level Menu
- Meas Selection Menu
- Signal Power Menu
- Modulation Analysis, Constellation
- Modulation Analysis, Impulse Response
- Tx Meas Menu
- BER Menus
- Spectrum Monitor Menus
- Glossary
- Chapter 18 DVB-T/H SFN Analyzer
- Appendix A Signal Standards
- Appendix B Error Messages
- Introduction
- Self Test or Application Self Test Errors
- Operation Errors
- ADC Over range: Increase Reference Level
- Fatal Error
- Trace not saved. Please wait for complete sweep and try again.
- Measurement not valid in Zero Span
- Freq Range of Antenna Invalid
- Minimum permitted Sweep time is 50µs
- Invalid Attenuation for Preamp
- Valid Attenuations with Preamp on are 0 dB and 10 dB
- Unable to add additional limit points. %d is the maximum.
- Use Demod type USB or LSB to use Beat Frequency Osc
- Trace A/B/C has no data to view
- DSP Memory Failure
- Locking to Internal Ref failed
- Locking to External Ref failed Lock attempt Failed
- EEPROM TEST: FAIL
- UNKNOWN ERROR In SPA
- DSP version different from released version
- Operation not Permitted in Recall Mode
- Cannot change scale in Linear mode
- Ref Marker is invalid
- Ref Marker is a counter Marker
- Current Marker is not ON
- Marker must be ON to Use the feature
- Triggering valid only in Zero Span
- Cannot change Modes for Recalled/Inactive Traces
- Cannot change average for Recalled/Inactive Traces
- Pretune Calibration Failure
- Lock failed during initialization
- Reference LVL Cal is OFF
- IF Cal is OFF
- Lock failure
- Cannot set Delta Mkr Freq to Demod Freq
- Fan Failure
- High Temp Warning
- Copy failed. Please check External Card
- Interference Analyzer Messages
- Channel Scanner Messages
- GSM/WCDMA Messages
- Fixed WiMAX Messages
- Mobile WiMAX Messages
- CDMA and EVDO Messages
- Appendix C DVB-T/H Channel Maps
- Appendix D Code TPS Warning Messages
- Index
A High Performance Handheld Spectrum Analyzer and Base Station
Analyzer
Spectrum Master™
MS2721B, MS2723B, and MS2724B
User’s Guide
00986-00200_MS272xB UG.qxd 2/5/07 1:28 PM Page 1

MS2721B, MS2723B,
and MS2724B
Spectrum Master
User Guide
Anritsu Company
490 Jarvis Drive
Morgan Hill, CA 95037-2809
USA
Part Number: 10580-00175
Revision: H
Published: January 2008
Copyright © 2008 Anritsu Company

WARRANTY
The Anritsu product(s) listed on the title page is (are) warranted against defects in
materials and workmanship for one year from the date of shipment.
Anritsu's obligation covers repairing or replacing products which prove to be
defective during the warranty period. Buyers shall prepay transportation charges for
equipment returned to Anritsu for warranty repairs. Obligation is limited to the
original purchaser. Anritsu is not liable for consequential damages.
LIMITATION OF WARRANTY
The foregoing warranty does not apply to Anritsu connectors that have failed due to
normal wear. Also, the warranty does not apply to defects resulting from improper
or inadequate maintenance by the Buyer, unauthorized modification or misuse, or
operation outside the environmental specifications of the product. No other
warranty is expressed or implied, and the remedies provided herein are the Buyer's
sole and exclusive remedies.
TRADEMARK ACKNOWLEDGMENTS
Windows, Windows 2000 and Windows XP are registered trademarks of the
Microsoft Corporation. Intel Pentium is a trademark of Intel Corporation. VxWorks is
a registered trademark, and WindML is a trademark of Wind River Systems, Inc. NI
is a trademark of National Instruments. Spectrum Master is a trademark of Anritsu
Company.
NOTICE
Anritsu Company has prepared this manual for use by Anritsu Company personnel
and customers as a guide for the proper installation, operation and maintenance of
Anritsu Company equipment and computer programs. The drawings, specifications,
and information contained herein are the property of Anritsu Company, and any
unauthorized use or disclosure of these drawings, specifications, and information is
prohibited; they shall not be reproduced, copied, or used in whole or in part as the
basis for manufacture or sale of the equipment or software programs without the
prior written consent of Anritsu Company. All other trademarks contained herein are
the property of their respective owners.
UPDATES
Updates to this manual, if any, may be downloaded from the Anritsu internet site at:
http://www.us.anritsu.com.
VxWorks Runtime License WindML Target License
2000-1189 2000-1372
NI Device License
2000-1486 2000-1421
WindRiver USB Runtime License
Notes On Export Management
This product and its manuals may require an Export License or approval by the
government of the product country of origin for re-export from your country.
Before you export this product or any of its manuals, please contact Anritsu Company
to confirm whether or not these items are export-controlled.
When disposing of export-controlled items, the products and manuals need to be broken
or shredded to such a degree that they cannot be unlawfully used for military purposes.

CE Conformity Marking
Anritsu affixes the CE Conformity marking onto its conforming products in accordance with
Council Directives of The Council Of The European Communities in order to indicate that
these products conform to the EMC and LVD directive of the European Union (EU).
C-tick Conformity Marking
Anritsu affixes the C-tick marking onto its conforming products in accordance with the
electromagnetic compliance regulations of Australia and New Zealand in order to indicate
that these products conform to the EMC regulations of Australia and New Zealand.
Mercury Notification
This product uses an LCD backlight lamp that contains mercury.
Disposal may be regulated due to environmental considerations.
Please contact your local authorities or, within the United States,
the Electronics Industries Alliance (www.eiae.org) for disposal
or recycling information.
Contents 1
Table of Contents
Chapter 1 General Information
Introduction. . . . . . . . . . . . . . . . . . . . . . . . . . . . . . . . . . . . . . . . . . . . 1-1
Description . . . . . . . . . . . . . . . . . . . . . . . . . . . . . . . . . . . . . . . . . . . . 1-3
Options . . . . . . . . . . . . . . . . . . . . . . . . . . . . . . . . . . . . . . . . . . . . . . . 1-4
Accessories . . . . . . . . . . . . . . . . . . . . . . . . . . . . . . . . . . . . . . . . . . . . 1-7
Preventive Maintenance . . . . . . . . . . . . . . . . . . . . . . . . . . . . . . . . 1-10
Calibration Requirements . . . . . . . . . . . . . . . . . . . . . . . . . . . . . . . 1-10
ESD Cautions . . . . . . . . . . . . . . . . . . . . . . . . . . . . . . . . . . . . . . . . . 1-10
Anritsu Reference Documents . . . . . . . . . . . . . . . . . . . . . . . . . . . . 1-11
Battery Replacement . . . . . . . . . . . . . . . . . . . . . . . . . . . . . . . . . . . 1-12
Tilt Bail Stand. . . . . . . . . . . . . . . . . . . . . . . . . . . . . . . . . . . . . . . . . 1-13
Chapter 2 Quick Start Guide
Introduction. . . . . . . . . . . . . . . . . . . . . . . . . . . . . . . . . . . . . . . . . . . . 2-1
Turning the Spectrum Master On for the First Time . . . . . . . . . . . . 2-1
Front Panel Overview . . . . . . . . . . . . . . . . . . . . . . . . . . . . . . . . . . . . 2-2
Display Overview . . . . . . . . . . . . . . . . . . . . . . . . . . . . . . . . . . . . . . . 2-4
Front Panel Keys . . . . . . . . . . . . . . . . . . . . . . . . . . . . . . . . . . . . . . 2-4
Soft Key Types . . . . . . . . . . . . . . . . . . . . . . . . . . . . . . . . . . . . . . . . 2-6
Parameter Setting . . . . . . . . . . . . . . . . . . . . . . . . . . . . . . . . . . . . . . . 2-7
Text Entry . . . . . . . . . . . . . . . . . . . . . . . . . . . . . . . . . . . . . . . . . . . . . 2-7
Test Panel Connectors . . . . . . . . . . . . . . . . . . . . . . . . . . . . . . . . . . . 2-9
Symbols and Indicators. . . . . . . . . . . . . . . . . . . . . . . . . . . . . . . . . . 2-14
Self Test . . . . . . . . . . . . . . . . . . . . . . . . . . . . . . . . . . . . . . . . . . . . . 2-15
Mode Selector Menu . . . . . . . . . . . . . . . . . . . . . . . . . . . . . . . . . . . 2-15
Making Spectrum Analyzer Measurements . . . . . . . . . . . . . . . . . 2-16
Chapter 3 Key Functions
Introduction. . . . . . . . . . . . . . . . . . . . . . . . . . . . . . . . . . . . . . . . . . . . 3-1
Amplitude . . . . . . . . . . . . . . . . . . . . . . . . . . . . . . . . . . . . . . . . . . . . . 3-2
BW (Bandwidth). . . . . . . . . . . . . . . . . . . . . . . . . . . . . . . . . . . . . . . . 3-4
File . . . . . . . . . . . . . . . . . . . . . . . . . . . . . . . . . . . . . . . . . . . . . . . . . . 3-6
Freq (Frequency). . . . . . . . . . . . . . . . . . . . . . . . . . . . . . . . . . . . . . . 3-12
Limit . . . . . . . . . . . . . . . . . . . . . . . . . . . . . . . . . . . . . . . . . . . . . . . . 3-14
Marker . . . . . . . . . . . . . . . . . . . . . . . . . . . . . . . . . . . . . . . . . . . . . . 3-20
Measure . . . . . . . . . . . . . . . . . . . . . . . . . . . . . . . . . . . . . . . . . . . . . 3-24
Mode . . . . . . . . . . . . . . . . . . . . . . . . . . . . . . . . . . . . . . . . . . . . . . . 3-27
Preset . . . . . . . . . . . . . . . . . . . . . . . . . . . . . . . . . . . . . . . . . . . . . . . 3-28
Span . . . . . . . . . . . . . . . . . . . . . . . . . . . . . . . . . . . . . . . . . . . . . . . . 3-29
Sweep . . . . . . . . . . . . . . . . . . . . . . . . . . . . . . . . . . . . . . . . . . . . . . . 3-31
System . . . . . . . . . . . . . . . . . . . . . . . . . . . . . . . . . . . . . . . . . . . . . . 3-34
Trace . . . . . . . . . . . . . . . . . . . . . . . . . . . . . . . . . . . . . . . . . . . . . . . 3-37
Contents 2
Chapter 4 Measurement Fundamentals
Introduction. . . . . . . . . . . . . . . . . . . . . . . . . . . . . . . . . . . . . . . . . . . . 4-1
Resolution Bandwidth . . . . . . . . . . . . . . . . . . . . . . . . . . . . . . . . . . . 4-1
Video Bandwidth . . . . . . . . . . . . . . . . . . . . . . . . . . . . . . . . . . . . . . . 4-2
Sweep Limitations . . . . . . . . . . . . . . . . . . . . . . . . . . . . . . . . . . . . . . 4-2
Attenuator Functions. . . . . . . . . . . . . . . . . . . . . . . . . . . . . . . . . . . . . 4-2
Preamplifier Operation . . . . . . . . . . . . . . . . . . . . . . . . . . . . . . . . . . 4-3
Chapter 5 Field Measurements
Introduction. . . . . . . . . . . . . . . . . . . . . . . . . . . . . . . . . . . . . . . . . . . . 5-1
Occupied Bandwidth Measurement . . . . . . . . . . . . . . . . . . . . . . . . 5-1
Channel Power Measurement . . . . . . . . . . . . . . . . . . . . . . . . . . . . . 5-2
CDMA Channel Power . . . . . . . . . . . . . . . . . . . . . . . . . . . . . . . . . . 5-3
CDMA Channel Power Measurement . . . . . . . . . . . . . . . . . . . . . . . 5-3
GSM Channel Power Measurement . . . . . . . . . . . . . . . . . . . . . . . . 5-4
AMPS Channel Power Measurement . . . . . . . . . . . . . . . . . . . . . . 5-5
Adjacent Channel Power Ratio. . . . . . . . . . . . . . . . . . . . . . . . . . . . . 5-6
Adjacent Channel Power Measurement . . . . . . . . . . . . . . . . . . . . . 5-6
GSM Adjacent Channel Power Measurement . . . . . . . . . . . . . . . . 5-7
AMPS (TDMA) Adjacent Channel Power Measurement . . . . . . . 5-8
Out-of-Band Spurious Emission Measurement . . . . . . . . . . . . . . . 5-9
In-band/Out-of-Channel Measurements . . . . . . . . . . . . . . . . . . . 5-10
In-band Spurious Measurement . . . . . . . . . . . . . . . . . . . . . . . . . . 5-10
Field Strength . . . . . . . . . . . . . . . . . . . . . . . . . . . . . . . . . . . . . . . . 5-11
AM/FM/SSB Demodulation . . . . . . . . . . . . . . . . . . . . . . . . . . . . 5-13
Carrier to Interference Ratio Measurement . . . . . . . . . . . . . . . . . 5-13
Chapter 6 Interference Analysis Measurements
Introduction. . . . . . . . . . . . . . . . . . . . . . . . . . . . . . . . . . . . . . . . . . . . 6-1
Freq Menu. . . . . . . . . . . . . . . . . . . . . . . . . . . . . . . . . . . . . . . . . . . . . 6-2
Amplitude Menu. . . . . . . . . . . . . . . . . . . . . . . . . . . . . . . . . . . . . . . . 6-4
BW (Bandwidth) Menu . . . . . . . . . . . . . . . . . . . . . . . . . . . . . . . . . . 6-6
Measurements Menu. . . . . . . . . . . . . . . . . . . . . . . . . . . . . . . . . . . . . 6-7
Spectrum Menu. . . . . . . . . . . . . . . . . . . . . . . . . . . . . . . . . . . . . . . . . 6-8
Spectrogram Menu . . . . . . . . . . . . . . . . . . . . . . . . . . . . . . . . . . . . . 6-12
Signal Strength Menu . . . . . . . . . . . . . . . . . . . . . . . . . . . . . . . . . . 6-13
RSSI (Received Signal Strength Indicator) Menu . . . . . . . . . . . . . 6-15
Marker Menu . . . . . . . . . . . . . . . . . . . . . . . . . . . . . . . . . . . . . . . . 6-16
Spectrogram Procedure . . . . . . . . . . . . . . . . . . . . . . . . . . . . . . . . . 6-18
Signal Strength . . . . . . . . . . . . . . . . . . . . . . . . . . . . . . . . . . . . . . . 6-20
RSSI Procedure . . . . . . . . . . . . . . . . . . . . . . . . . . . . . . . . . . . . . . 6-21
Contents 3
Chapter 7 Channel Scanner Measurements
Introduction. . . . . . . . . . . . . . . . . . . . . . . . . . . . . . . . . . . . . . . . . . . . 7-1
Scanner . . . . . . . . . . . . . . . . . . . . . . . . . . . . . . . . . . . . . . . . . . . . . . . 7-1
Amplitude . . . . . . . . . . . . . . . . . . . . . . . . . . . . . . . . . . . . . . . . . . . . . 7-3
Custom Setup . . . . . . . . . . . . . . . . . . . . . . . . . . . . . . . . . . . . . . . . . . 7-4
Measurements . . . . . . . . . . . . . . . . . . . . . . . . . . . . . . . . . . . . . . . . . . 7-5
Sample Procedure . . . . . . . . . . . . . . . . . . . . . . . . . . . . . . . . . . . . . . 7-7
Custom Setup . . . . . . . . . . . . . . . . . . . . . . . . . . . . . . . . . . . . . . . . . 7-7
Chapter 8 Tracking Generator
Introduction. . . . . . . . . . . . . . . . . . . . . . . . . . . . . . . . . . . . . . . . . . . . 8-1
Menu Structure . . . . . . . . . . . . . . . . . . . . . . . . . . . . . . . . . . . . . . . . . 8-1
Normalization . . . . . . . . . . . . . . . . . . . . . . . . . . . . . . . . . . . . . . . . . 8-3
Tracking Generator Operation . . . . . . . . . . . . . . . . . . . . . . . . . . . . . 8-3
Measurement Example . . . . . . . . . . . . . . . . . . . . . . . . . . . . . . . . . 8-3
Chapter 9 WCDMA/HSDPA Measurements
Introduction. . . . . . . . . . . . . . . . . . . . . . . . . . . . . . . . . . . . . . . . . . . . 9-1
WCDMA/HSDPA Signal Analyzer Mode . . . . . . . . . . . . . . . . . . . . 9-2
Amplitude . . . . . . . . . . . . . . . . . . . . . . . . . . . . . . . . . . . . . . . . . . . . 9-2
File . . . . . . . . . . . . . . . . . . . . . . . . . . . . . . . . . . . . . . . . . . . . . . . . . . 9-3
Freq (Frequency) . . . . . . . . . . . . . . . . . . . . . . . . . . . . . . . . . . . . . . . 9-8
Measurements . . . . . . . . . . . . . . . . . . . . . . . . . . . . . . . . . . . . . . . . . 9-9
Mode . . . . . . . . . . . . . . . . . . . . . . . . . . . . . . . . . . . . . . . . . . . . . . . . 9-14
Preset . . . . . . . . . . . . . . . . . . . . . . . . . . . . . . . . . . . . . . . . . . . . . . . 9-15
Setup . . . . . . . . . . . . . . . . . . . . . . . . . . . . . . . . . . . . . . . . . . . . . . . 9-16
System . . . . . . . . . . . . . . . . . . . . . . . . . . . . . . . . . . . . . . . . . . . . . . 9-18
WCDMA/HSDPA Measurements . . . . . . . . . . . . . . . . . . . . . . . . 9-21
Measurement Setup . . . . . . . . . . . . . . . . . . . . . . . . . . . . . . . . . . . . 9-26
WCDMA/HSDPA RF Measurements . . . . . . . . . . . . . . . . . . . . . 9-30
Demodulator . . . . . . . . . . . . . . . . . . . . . . . . . . . . . . . . . . . . . . . . . 9-37
Over The Air Measurements . . . . . . . . . . . . . . . . . . . . . . . . . . . . . 9-44
Pass/Fail Mode . . . . . . . . . . . . . . . . . . . . . . . . . . . . . . . . . . . . . . . 9-48
Chapter 10 GSM/GPRS/EDGE Measurements
Introduction. . . . . . . . . . . . . . . . . . . . . . . . . . . . . . . . . . . . . . . . . . . 10-1
Amplitude . . . . . . . . . . . . . . . . . . . . . . . . . . . . . . . . . . . . . . . . . . . . 10-2
Freq (Frequency). . . . . . . . . . . . . . . . . . . . . . . . . . . . . . . . . . . . . . . 10-3
Setup . . . . . . . . . . . . . . . . . . . . . . . . . . . . . . . . . . . . . . . . . . . . . . . . 10-4
Measurements . . . . . . . . . . . . . . . . . . . . . . . . . . . . . . . . . . . . . . . . . 10-5
External Reference Frequency Setup . . . . . . . . . . . . . . . . . . . . . . 10-7
GSM/GPRS/EDGE RF Measurements . . . . . . . . . . . . . . . . . . . . . 10-7
Demodulator . . . . . . . . . . . . . . . . . . . . . . . . . . . . . . . . . . . . . . . . 10-11
GSM/GPRS/EDGE Mode Pass/Fail Mode . . . . . . . . . . . . . . . . . 10-13
Measurement Results . . . . . . . . . . . . . . . . . . . . . . . . . . . . . . . . . . 10-15
Contents 4
Chapter 11 High Accuracy Power Meter
Introduction. . . . . . . . . . . . . . . . . . . . . . . . . . . . . . . . . . . . . . . . . . . 11-1
Required Equipment . . . . . . . . . . . . . . . . . . . . . . . . . . . . . . . . . . . 11-1
Mode . . . . . . . . . . . . . . . . . . . . . . . . . . . . . . . . . . . . . . . . . . . . . . . . 11-1
Procedure . . . . . . . . . . . . . . . . . . . . . . . . . . . . . . . . . . . . . . . . . . . 11-2
Menus . . . . . . . . . . . . . . . . . . . . . . . . . . . . . . . . . . . . . . . . . . . . . . . 11-5
Chapter 12 GPS Option
Introduction. . . . . . . . . . . . . . . . . . . . . . . . . . . . . . . . . . . . . . . . . . . 12-1
Chapter 13 Fixed WiMAX Signal Analyzer
Introduction. . . . . . . . . . . . . . . . . . . . . . . . . . . . . . . . . . . . . . . . . . . 13-1
Amplitude . . . . . . . . . . . . . . . . . . . . . . . . . . . . . . . . . . . . . . . . . . . . 13-2
File . . . . . . . . . . . . . . . . . . . . . . . . . . . . . . . . . . . . . . . . . . . . . . . . . 13-3
Freq (Frequency). . . . . . . . . . . . . . . . . . . . . . . . . . . . . . . . . . . . . . . 13-7
Limit . . . . . . . . . . . . . . . . . . . . . . . . . . . . . . . . . . . . . . . . . . . . . . . . 13-8
Measure. . . . . . . . . . . . . . . . . . . . . . . . . . . . . . . . . . . . . . . . . . . . . . 13-8
Measurements . . . . . . . . . . . . . . . . . . . . . . . . . . . . . . . . . . . . . . . . . 13-9
Mode . . . . . . . . . . . . . . . . . . . . . . . . . . . . . . . . . . . . . . . . . . . . . . . 13-11
Setup . . . . . . . . . . . . . . . . . . . . . . . . . . . . . . . . . . . . . . . . . . . . . . . 13-12
System. . . . . . . . . . . . . . . . . . . . . . . . . . . . . . . . . . . . . . . . . . . . . . 13-14
Preset. . . . . . . . . . . . . . . . . . . . . . . . . . . . . . . . . . . . . . . . . . . . . . . 13-18
Sweep . . . . . . . . . . . . . . . . . . . . . . . . . . . . . . . . . . . . . . . . . . . . . . 13-19
Trace . . . . . . . . . . . . . . . . . . . . . . . . . . . . . . . . . . . . . . . . . . . . . . . 13-19
Fixed WiMAX Measurements . . . . . . . . . . . . . . . . . . . . . . . . . . . 13-19
Measurement Setup . . . . . . . . . . . . . . . . . . . . . . . . . . . . . . . . . . . 13-21
Fixed WiMAX RF Measurements . . . . . . . . . . . . . . . . . . . . . . . 13-23
Fixed WIMAX Demodulator . . . . . . . . . . . . . . . . . . . . . . . . . . . 13-28
Pass/Fail Mode . . . . . . . . . . . . . . . . . . . . . . . . . . . . . . . . . . . . . . 13-35
WiMAX Summary . . . . . . . . . . . . . . . . . . . . . . . . . . . . . . . . . . . 13-37
Chapter 14 Mobile WiMAX Signal Analyzer
Introduction. . . . . . . . . . . . . . . . . . . . . . . . . . . . . . . . . . . . . . . . . . . 14-1
Mobile WiMAX Measurements . . . . . . . . . . . . . . . . . . . . . . . . . . 14-2
Measurement Setup . . . . . . . . . . . . . . . . . . . . . . . . . . . . . . . . . . . 14-3
Mobile WiMAX RF Measurements . . . . . . . . . . . . . . . . . . . . . . . . 14-6
Mobile WIMAX Demodulator . . . . . . . . . . . . . . . . . . . . . . . . . . 14-9
Mobile WIMAX Over the Air (OTA) Measurements . . . . . . . . 14-15
Pass/Fail Mode . . . . . . . . . . . . . . . . . . . . . . . . . . . . . . . . . . . . . . . 14-17
WiMAX Summary . . . . . . . . . . . . . . . . . . . . . . . . . . . . . . . . . . . . 14-17
Menus . . . . . . . . . . . . . . . . . . . . . . . . . . . . . . . . . . . . . . . . . . . . . . 14-18
Secondary Function Menus . . . . . . . . . . . . . . . . . . . . . . . . . . . . . 14-32
Contents 5
Chapter 15 CDMA Signal Analyzer
Introduction. . . . . . . . . . . . . . . . . . . . . . . . . . . . . . . . . . . . . . . . . . . 15-1
Getting Started . . . . . . . . . . . . . . . . . . . . . . . . . . . . . . . . . . . . . . . . 15-1
CDMA Measurement Setup . . . . . . . . . . . . . . . . . . . . . . . . . . . . . 15-1
CDMA RF Measurement Setup . . . . . . . . . . . . . . . . . . . . . . . . . . 15-8
CDMA Demodulator Measurements Setup . . . . . . . . . . . . . . . 15-10
CDMA Over-The-Air Measurement Setup . . . . . . . . . . . . . . . . 15-12
Pass Fail Setup . . . . . . . . . . . . . . . . . . . . . . . . . . . . . . . . . . . . . . 15-14
CDMA Measurement Descriptions . . . . . . . . . . . . . . . . . . . . . . . 15-15
CDMA MENUS . . . . . . . . . . . . . . . . . . . . . . . . . . . . . . . . . . . . . . 15-18
Amplitude Menu . . . . . . . . . . . . . . . . . . . . . . . . . . . . . . . . . . . . . 15-18
File Menu . . . . . . . . . . . . . . . . . . . . . . . . . . . . . . . . . . . . . . . . . . . 15-19
Freq (Frequency) Menu . . . . . . . . . . . . . . . . . . . . . . . . . . . . . . . . 15-22
Limit Menu . . . . . . . . . . . . . . . . . . . . . . . . . . . . . . . . . . . . . . . . . . 15-23
Marker Menu . . . . . . . . . . . . . . . . . . . . . . . . . . . . . . . . . . . . . . . . 15-24
Measurements Menu . . . . . . . . . . . . . . . . . . . . . . . . . . . . . . . . . . 15-25
Mode Menu. . . . . . . . . . . . . . . . . . . . . . . . . . . . . . . . . . . . . . . . . . 15-28
Preset Menu . . . . . . . . . . . . . . . . . . . . . . . . . . . . . . . . . . . . . . . . . 15-28
Setup Menu . . . . . . . . . . . . . . . . . . . . . . . . . . . . . . . . . . . . . . . . . 15-29
Sweep Menu . . . . . . . . . . . . . . . . . . . . . . . . . . . . . . . . . . . . . . . . . 15-30
System Menu . . . . . . . . . . . . . . . . . . . . . . . . . . . . . . . . . . . . . . . 15-31
Chapter 16 EVDO Signal Analyzer
Introduction. . . . . . . . . . . . . . . . . . . . . . . . . . . . . . . . . . . . . . . . . . . 16-1
Getting Started . . . . . . . . . . . . . . . . . . . . . . . . . . . . . . . . . . . . . . . . 16-1
EVDO Measurement Setup . . . . . . . . . . . . . . . . . . . . . . . . . . . . . 16-2
EVDO RF Measurements Setup . . . . . . . . . . . . . . . . . . . . . . . . . . 16-5
EVDO Demodulator Measurements Setup . . . . . . . . . . . . . . . . . . 16-9
EVDO Over-The-Air Measurement Setup . . . . . . . . . . . . . . . . . 16-12
Pass Fail Setup . . . . . . . . . . . . . . . . . . . . . . . . . . . . . . . . . . . . . . 16-14
EVDO Summary Setup . . . . . . . . . . . . . . . . . . . . . . . . . . . . . . . . 16-15
EVDO Measurement Descriptions . . . . . . . . . . . . . . . . . . . . . . . . 16-16
EVDO Menus . . . . . . . . . . . . . . . . . . . . . . . . . . . . . . . . . . . . . . . . 16-18
Amplitude . . . . . . . . . . . . . . . . . . . . . . . . . . . . . . . . . . . . . . . . . . . 16-18
File . . . . . . . . . . . . . . . . . . . . . . . . . . . . . . . . . . . . . . . . . . . . . . . . 16-18
Frequency . . . . . . . . . . . . . . . . . . . . . . . . . . . . . . . . . . . . . . . . . . . 16-18
Limit . . . . . . . . . . . . . . . . . . . . . . . . . . . . . . . . . . . . . . . . . . . . . . . 16-18
Marker. . . . . . . . . . . . . . . . . . . . . . . . . . . . . . . . . . . . . . . . . . . . . . 16-18
Measurements Menu . . . . . . . . . . . . . . . . . . . . . . . . . . . . . . . . . . 16-19
Mode Menu. . . . . . . . . . . . . . . . . . . . . . . . . . . . . . . . . . . . . . . . . . 16-23
Setup . . . . . . . . . . . . . . . . . . . . . . . . . . . . . . . . . . . . . . . . . . . . . . . 16-23
System. . . . . . . . . . . . . . . . . . . . . . . . . . . . . . . . . . . . . . . . . . . . . . 16-23
Preset. . . . . . . . . . . . . . . . . . . . . . . . . . . . . . . . . . . . . . . . . . . . . . . 16-23
Sweep . . . . . . . . . . . . . . . . . . . . . . . . . . . . . . . . . . . . . . . . . . . . . . 16-23
Trace . . . . . . . . . . . . . . . . . . . . . . . . . . . . . . . . . . . . . . . . . . . . . . . 16-23
Contents 6
Chapter 17 DVB-T/H Signal Analyzer
Introduction. . . . . . . . . . . . . . . . . . . . . . . . . . . . . . . . . . . . . . . . . . . 17-1
Getting Started . . . . . . . . . . . . . . . . . . . . . . . . . . . . . . . . . . . . . . . . 17-5
Measurement Setup and Execution. . . . . . . . . . . . . . . . . . . . . . . . . 17-7
Frequency and Reference Level Configurations . . . . . . . . . . . . . 17-7
Signal Power Measurement . . . . . . . . . . . . . . . . . . . . . . . . . . . . . 17-8
Modulation Analysis . . . . . . . . . . . . . . . . . . . . . . . . . . . . . . . . . 17-10
Tx Meas Analysis . . . . . . . . . . . . . . . . . . . . . . . . . . . . . . . . . . . 17-17
BER Analysis . . . . . . . . . . . . . . . . . . . . . . . . . . . . . . . . . . . . . . . 17-19
Spectrum Monitor . . . . . . . . . . . . . . . . . . . . . . . . . . . . . . . . . . . 17-21
Saving Measurement Results . . . . . . . . . . . . . . . . . . . . . . . . . . . . 17-22
Menus . . . . . . . . . . . . . . . . . . . . . . . . . . . . . . . . . . . . . . . . . . . . . . 17-23
Frequency/Level Menu . . . . . . . . . . . . . . . . . . . . . . . . . . . . . . . . 17-23
Meas Selection Menu . . . . . . . . . . . . . . . . . . . . . . . . . . . . . . . . . . 17-26
Signal Power Menu . . . . . . . . . . . . . . . . . . . . . . . . . . . . . . . . . . . 17-27
Modulation Analysis, Constellation . . . . . . . . . . . . . . . . . . . . . . 17-29
Modulation Analysis, Impulse Response . . . . . . . . . . . . . . . . . . . 17-33
Tx Meas Menu . . . . . . . . . . . . . . . . . . . . . . . . . . . . . . . . . . . . . . 17-38
BER Menus . . . . . . . . . . . . . . . . . . . . . . . . . . . . . . . . . . . . . . . . . 17-42
Spectrum Monitor Menus . . . . . . . . . . . . . . . . . . . . . . . . . . . . . . 17-44
Glossary . . . . . . . . . . . . . . . . . . . . . . . . . . . . . . . . . . . . . . . . . . . 17-46
Chapter 18 DVB-T/H SFN Analyzer
Introduction. . . . . . . . . . . . . . . . . . . . . . . . . . . . . . . . . . . . . . . . . . . 18-1
Getting Started . . . . . . . . . . . . . . . . . . . . . . . . . . . . . . . . . . . . . . . . 18-1
Measurement Setup and Execution. . . . . . . . . . . . . . . . . . . . . . . . . 18-3
SFN Measurement . . . . . . . . . . . . . . . . . . . . . . . . . . . . . . . . . . . . 18-4
Saving Measurement Results . . . . . . . . . . . . . . . . . . . . . . . . . . . . . 18-6
Menus . . . . . . . . . . . . . . . . . . . . . . . . . . . . . . . . . . . . . . . . . . . . . . . 18-7
Frequency/Level Menu . . . . . . . . . . . . . . . . . . . . . . . . . . . . . . . . . 18-7
Measurement Setup Menus . . . . . . . . . . . . . . . . . . . . . . . . . . . . . 18-10
Appendix A Signal Standards
Introduction. . . . . . . . . . . . . . . . . . . . . . . . . . . . . . . . . . . . . . . . . . . . A-1
Appendix B Error Messages
Introduction. . . . . . . . . . . . . . . . . . . . . . . . . . . . . . . . . . . . . . . . . . . . B-1
Self Test or Application Self Test Errors . . . . . . . . . . . . . . . . . . . . . B-1
Operation Errors . . . . . . . . . . . . . . . . . . . . . . . . . . . . . . . . . . . . . . . . B-2
Interference Analyzer Messages. . . . . . . . . . . . . . . . . . . . . . . . . . . . B-7
Channel Scanner Messages. . . . . . . . . . . . . . . . . . . . . . . . . . . . . . . . B-9
GSM/WCDMA Messages . . . . . . . . . . . . . . . . . . . . . . . . . . . . . . . . B-9
Fixed WiMAX Messages . . . . . . . . . . . . . . . . . . . . . . . . . . . . . . . . B-10
Mobile WiMAX Messages . . . . . . . . . . . . . . . . . . . . . . . . . . . . . . . B-11
CDMA and EVDO Messages. . . . . . . . . . . . . . . . . . . . . . . . . . . . . B-12
Contents 7
Appendix C DVB-T/H Channel Maps
Introduction. . . . . . . . . . . . . . . . . . . . . . . . . . . . . . . . . . . . . . . . . . . . C-1
Channel Maps . . . . . . . . . . . . . . . . . . . . . . . . . . . . . . . . . . . . . . . . . . C-1
Level Accuracy and Noise Floor . . . . . . . . . . . . . . . . . . . . . . . . . . . C-5
Frequency Accuracy and Frequency Lock Range . . . . . . . . . . . . . C-12
1 dB Compression Level. . . . . . . . . . . . . . . . . . . . . . . . . . . . . . . . . C-13
Appendix D Code TPS Warning Messages
Introduction. . . . . . . . . . . . . . . . . . . . . . . . . . . . . . . . . . . . . . . . . . . . D-1
TPS Warning Codes . . . . . . . . . . . . . . . . . . . . . . . . . . . . . . . . . . . . D-1
Index
Contents 8

1-1
Chapter 1
General Information
Introduction
This chapter provides a description, performance specifications, optional accessories,
preventive maintenance, and calibration requirements for the Anritsu Handheld Spectrum
Analyzer models listed below. Throughout this manual, this instrument may be referred to as
a Spectrum Master.
Model Frequency Range(s)
MS2721B Spectrum Analyzer Mode 9 kHz to 7.1 GHz
MS2721B Interference Analyzer Mode 9 kHz to 7.1 GHz
MS2721B Channel Scanner Mode 9 kHz to 7.1 GHz
MS2721B WCDMA/HSDPA Mode 824-894 MHz
1710-2170 MHz
2300-2700 MHz
MS2721B GSM/GPRS/EDGE Mode 380-400 MHz
410-430 MHz
450-468 MHz
478-496 MHz
698-746 MHz
747-792 MHz
806-866 MHz
824-894 MHz
890-960 MHz
880-960 MHz
876-960 MHz
870-921 MHz
1710-1990 MHz
MS2721B Fixed WiMAX Mode 2.3 to 2.7 GHz
3.3 to 3.8 GHz
5.25 to 5.875 GHz
MS2721B Mobile WiMAX Mode 2.3 to 2.7 GHz
3.3 to 3.8 GHz
MS2721B CDMA Mode 1 MHz to 2.7 GHz
MS2721B EVDO Mode 1 MHz to 2.7 GHz
MS2723B Spectrum Analyzer Mode 9 kHz to 13 GHz
MS2723B Interference Analyzer Mode 9 kHz to 13 GHz
MS2723B Channel Scanner Mode 9 kHz to 13 GHz

1-2
MS2723B WCDMA/HSDPA Mode 824-894 MHz
1710-2170 MHz
2300-2700 MHz
MS2723B GSM/GPRS/EDGE Mode 380-400 MHz
410-430 MHz
450-468 MHz
478-496 MHz
698-746 MHz
747-792 MHz
806-866 MHz
824-894 MHz
890-960 MHz
880-960 MHz
876-960 MHz
870-921 MHz
1710-1990 MHz
MS2723B Fixed WiMAX Mode 2.3 to 2.7 GHz
3.3 to 3.8 GHz
5.25 to 5.875 GHz
MS2723B Mobile WiMAX Mode 2.3 to 2.7 GHz
3.3 to 3.8 GHz
MS2723B CDMA Mode 1 MHz to 2.7 GHz
MS2723B EVDO Mode 1 MHz to 2.7 GHz
MS2724B Spectrum Analyzer Mode 9 kHz to 20 GHz
MS2724B Interference Analyzer Mode 9 kHz to 20 GHz
MS2724B Channel Scanner Mode 9 kHz to 20 GHz
MS2724B WCDMA/HSDPA Mode 824-894 MHz
1710-2170 MHz
2300-2700 MHz
MS2724B GSM/GPRS/EDGE Mode 380-400 MHz
410-430 MHz
450-468 MHz
478-496 MHz
698-746 MHz
747-792 MHz
806-866 MHz
824-894 MHz
890-960 MHz
880-960 MHz
876-960 MHz
870-921 MHz
1710-1990 MHz
MS2724B Fixed WiMAX Mode 2.3 to 2.7 GHz
3.3 to 3.8 GHz
5.25 to 5.875 GHz
Model Frequency Range(s)

1-3
Description
The Spectrum Master is a synthesizer-based hand held spectrum analyzer that provides
quick and accurate measurement results. Measurements can be easily made by using the
main instrument functions: frequency, span, amplitude, and bandwidth. Dedicated keys for
common functions and a familiar calculator-type keypad are available for fast data entry.
Time and date stamping of measurement data is automatic. The internal memory provides
for the storage and recall of up to 1000 measurement setups and up to 1000 traces using
Master Software Tools. External storage can be used for bulk measurement storage. The
bright daylight-viewable, high-resolution color liquid crystal display (LCD) provides easy
viewing in a variety of lighting conditions. The Spectrum Master is capable of up to 3 hours
of continuous operation from a fully charged battery and can be operated from a 12 VDC
source, which also simultaneously charges the battery.
The Spectrum Master is designed for monitoring, measuring, and analyzing signal
environments. Typical measurements include: in-band interference and transmit spectrum
analysis, plus cell site and 802.11a/b/g interference testing. A full range of marker
capabilities (such as peak, center, and delta functions) are provided for faster, more
comprehensive analysis of displayed signals. Upper and lower multi-segmented limit lines
are available to create quick, simple pass/fail measurements. A menu option provides for an
audible alert when the limit value is exceeded.
Anritsu Master Software Tools, a PC-based software program, provides for storing
measurement data. Master Software Tools can also convert the Spectrum Master display into
several graphic formats.
Measurements may be stored in internal memory, a USB flash drive, or the Compact Flash.
Stored measurements can be downloaded to a PC by using the included USB and Ethernet
cables. Once stored, the graphic trace can then be displayed, scaled, or enhanced with
markers and limit lines. Historical graphs can be overlaid with current data by using the PC
mouse in drag-and-drop fashion. The underlying data can be extracted and used in
spreadsheets or for other analytical tasks.
In transmitter analyzer mode, the Spectrum Master displays six markers and the marker table
in Code Domain Power, HSDPA, and Codogram displays. In Spectrum Analyzer mode, a
full range of marker capabilities (such as peak, center, and delta functions) are provided for
faster, more comprehensive analysis of displayed signals. Upper and lower multi-segmented
limit lines are available to create quick, simple pass/fail measurements. A menu option
provides for an audible alert when the limit value is exceeded. Markers are not available in
GSM mode.
MS2724B Mobile WiMAX Mode 2.3 to 2.7 GHz
3.3 to 3.8 GHz
MS2724B CDMA Mode 1 MHz to 2.7 GHz
MS2724B EVDO Mode 1 MHz to 2.7 GHz
Model Frequency Range(s)

1-4
Options
The following options are available for the MS2721B:
Option # Description
MS2721B-009 RF and Demodulation Hardware
MS2721B-019 High Accuracy Power Meter
MS2721B-020 Tracking Generator
MS2721B-025 Interference Analyzer
MS2721B-027 Channel Scanner
MS2721B-031 GPS (includes GPS antenna)
MS2721B-033 cdmaOne and CDMA2000 1xRTT Over The Air (OTA)
Measurements (requires Option 009 and Option 031)
MS2721B-034 EVDO Over The Air (OTA) Measurements (requires
Option 009 and Option 031)
MS2721B-035 WCDMA/HSDPA Over The Air (OTA) Measurements
(requires Option 009 and Option 031)
MS2721B-037 Mobile WiMAX Over the Air (OTA) Measurements (requires
Option 009)
MS2721B-040 GSM/GPRS/EDGE RF Measurements (requires Option 009)
MS2721B-041 GSM/GPRS/EDGE Demodulator (requires Option 009)
MS2721B-042 CDMA RF Measurements (requires Option 009)
MS2721B-043 cdmaOne and CDMA2000 1xRTT Demodulator (requires
Option 009)
MS2721B-044 WCDMA/HSDPA RF Measurements (requires Option 009)
MS2721B-045 WCDMA Demodulator (requires Option 009)
MS2721B-046 Fixed WiMAX RF Measurements (requires Option 009)
MS2721B-047 Fixed WiMAX Demodulation (requires Option 009)
MS2721B-057 DVB-T/H Bit Error Rate (BER) Testing (requires Option 064)
MS2721B-062 EVDO RF Measurements (requires Option 009)
MS2721B-063 EVDO Demodulator (requires Option 009)
MS2721B-064 DVB-T/H Digital Video Measurements (requires Option 009)
MS2721B-065 WCDMA/HSDPA Demodulator (requires Option 009)
MS2721B-066 Mobile WiMAX RF Measurements (requires Option 009)
MS2721B-067 Mobile WiMAX Demodulator (requires Option 009)
MS2721B-078 DVB-T/H Single Frequency Network (requires Option 009)

1-5
The following options are available for the MS2723B:
Option # Description
MS2723B-009 RF and Demodulation Hardware
MS2723B-019 High Accuracy Power Meter
MS2723B-025 Interference Analyzer
MS2723B-027 Channel Scanner
MS2723B-031 GPS (includes GPS antenna)
MS2723B-033 cdmaOne and CDMA2000 1xRTT Over The Air (OTA)
Measurements (requires Option 009, 031)
MS2723B-034 EVDO Over The Air (OTA) Measurements (requires
Option 009 and Option 031)
MS2723B-035 WCDMA/HSDPA Over The Air (OTA) Measurements
(requires Option 009 and Option 031)
MS2723B-037 Mobile WiMAX Over the Air (OTA) Measurements (requires
Option 009)
MS2723B-040 GSM/GPRS/EDGE RF Measurements (requires Option 009)
MS2723B-041 GSM/GPRS/EDGE Demodulator (requires Option 009)
MS2723B-042 CDMA RF Measurements (requires Option 009)
MS2723B-043 cdmaOne and CDMA2000 1xRTT Demodulator (requires
Option 009)
MS2723B-044 WCDMA/HSDPA RF Measurements (requires Option 009)
MS2723B-045 WCDMA Demodulator (requires Option 009)
MS2723B-046 Fixed WiMAX RF Measurements (requires Option 009)
MS2723B-047 Fixed WiMAX Demodulation (requires Option 009)
MS2723B-062 EVDO RF Measurements (requires Option 009)
MS2723B-063 EVDO Demodulator (requires Option 009)
MS2723B-065 WCDMA/HSDPA Demodulator (requires option 009)
MS2723B-066 Mobile WiMAX RF Measurements (requires Option 009)
MS2723B-067 Mobile WiMAX Demodulator (requires Option 009)
MS2723B-089 IF Output

1-6
The following options are available for the MS2724B:
Option # Description
MS2724B-009 RF and Demodulation Hardware
MS2724B-019 High Accuracy Power Meter
MS2724B-025 Interference Analyzer
MS2724B-027 Channel Scanner
MS2724B-031 GPS (includes GPS antenna)
MS2724B-033 cdmaOne and CDMA2000 1xRTT Over The Air (OTA)
Measurements (requires Option 009 and Option 031)
MS2724B-034 EVDO Over The Air (OTA) Measurements (requires
Option 009 and Option 031)
MS2724B-035 WCDMA/HSDPA Over The Air (OTA) Measurements
(requires Option 009 and Option 031)
MS2724B-037 Mobile WiMAX Over the Air (OTA) Measurements (requires
Option 009)
MS2724B-040 GSM/GPRS/EDGE RF Measurements (requires Option 009)
MS2724B-041 GSM/GPRS/EDGE Demodulator (requires Option 009)
MS2724B-042 CDMA RF Measurements (requires Option 009)
MS2724B-043 cdmaOne and CDMA2000 1xRTT Demodulator (requires
Option 009)
MS2724B-044 WCDMA/HSDPA RF Measurements (requires Option 009)
MS2724B-045 WCDMA Demodulator (requires Option 009)
MS2724B-046 Fixed WiMAX RF Measurements (requires Option 009)
MS2724B-047 Fixed WiMAX Demodulation (requires Option 009)
MS2724B-062 EVDO RF Measurements (requires Option 009)
MS2724B-063 EVDO Demodulator (requires Option 009)
MS2724B-065 WCDMA/HSDPA Demodulator (requires Option 009)
MS2724B-066 Mobile WiMAX RF Measurements (requires Option 009)
MS2724B-067 Mobile WiMAX Demodulator (requires Option 009)
MS2724B-089 IF Output

1-7
Accessories
The following standard accessories are supplied with the Spectrum Master:
The following optional accessories are available for the Spectrum Master:
Part Number Description
10580-00175 MS2721B, MS2723B and MS2724B User's Guide
65729 Soft Carrying Case
2300-498 Master Software Tools Program CD ROM
633-44 Rechargeable Li-Ion Battery
40-168 AC-DC Adapter
806-141 Automotive Cigarette Lighter 12 Volt DC Adapter
3-2000-1498 USB A/5-pin mini-B Cable
3-806-152 Cross-over Ethernet Cable, 7 feet (213 cm)
2000-1371 Ethernet Cable, 7 feet (213 cm)
1091-27 Type-N male to SMA female Adapter
1091-172 Type-N male to BNC female Adapter
2000-1520-R 2 GB USB Flash Drive
64343 Tilt Bail Stand
One year Warranty (includes battery, firmware, and software)
CAUTION
When using the Automotive Cigarette Lighter 12 VDC Adapter (Anritsu
Part Number 806-141) always verify that the supply is rated for a
minimum of 60 Watts @ 12 VDC, and that the socket is clear of any dirt
or debris. If the adapter plug becomes hot to the touch during operation,
discontinue use immediately.
Part
Number Description
42N50A-30 Attenuator, 30 dB, 50 W, DC-18 GHz, N(m) to N(f)
34NN50A Precision Adapter, DC to 18 GHz, 50 Ω, N(m) to N(m)
34NFNF50C Precision Adapter, DC to 18 GHz, 50 Ω, N(f) to N(f)
15NN50-1.5C Test port cable armored, 1.5 meter, N(m) to N(m), 6 GHz
15NN50-3.0C Test port cable armored, 3.0 meter, N(m) to N(m), 6 GHz
15NN50-5.0C Test port cable armored, 5.0 meter, N(m) to N(m), 6 GHz
15NNF50-1.5B Test port cable armored, 1.5 meter, N(m) to N(f), 18 GHz

1-8
15NNF50-1.5C Test port cable armored, 1.5 meter, N(m) to N(f), 6 GHz
15NNF50-3.0B Test port cable armored, 3.0 meter, N(m) to N(f), 18 GHz
15NNF50-3.0C Test port cable armored, 3.0 meter, N(m) to N(f), 6 GHz
15NNF50-5.0B Test port cable armored, 5.0 meter, N(m) to N(f), 18 GHz
15NNF50-5.0C Test port cable armored, 5.0 meter, N(m) to N(f), 6 GHz
15ND50-1.5C Test port cable armored, 1.5 meter, N(m) to 7/16 DIN(m),
6.0 GHz
15NDF50-1.5C Test port cable armored, 1.5 meter, N(m) to 7/16 DIN(f),
6.0 GHz
12N50-75B 75 Ω Adapter, 7.5 dB loss
510-90 Adapter, 7/16 DIN (f) to N(m), DC to 7.5 GHz, 50 Ω
510-91 Adapter, 7/16 DIN (f)-N(f), DC to 7.5 GHz, 50 Ω
510-92 Adapter, 7/16 DIN (m)-N(m), DC to 7.5 GHz, 50 Ω
510-93 Adapter, 7/16 DIN(m)-N(f), DC to 7.5 GHz, 50 Ω
510-96 Adapter 7/16 DIN (m) to 7/16 DIN (m), DC to 7.5 GHz,
50 Ω
510-97 Adapter 7/16 DIN (f) to 7/16 DIN (f), 7.5 GHz
65729 Spare Soft Carrying Case
40-168 Spare AC/DC Adapter
806-141 Spare Automotive Cigarette Lighter 12 Volt DC Adapter
760-243-R Master Products Transit Case
2300-498 Master Software Tools Program CD-ROM
10580-00175 MS2721B, MS2723B, and MS2724B User's Guide (spare)
10580-00176 MS2721B, MS2723B, and MS2724B Programming
Manual
633-44 Rechargeable battery, Li-Ion
2000-1374 Dual Battery charger, Li-Ion with universal power supply
2000-1030 Portable antenna, 50 Ω, SMA (m) 1.71-1.88 GHz
2000-1031 Portable antenna, 50 Ω, SMA (m) 1.85-1.99 GHz
2000-1032 Portable antenna, 50 Ω, SMA (m) 2.4-2.5 GHz
2000-1035 Portable antenna, 50 Ω, SMA (m) 896-941 MHz
2000-1200 Portable antenna, 50 Ω, SMA (m) 806-869 MHz
2000-1361 Portable Antenna, 50 Ω, SMA (m) 5725-5825 MHz
Part
Number Description

1-9
2000-1411t Portable Yagi Antenna, 10 dBd, N(f), 822 to 900 MHz
2000-1412 Portable Yagi antenna, 10 dBd, N(f), 885 to 975 MHz
2000-1413 Portable Yagi antenna, 10 dBd, N(f), 1.71 to 1.88 GHz
2000-1414 Portable Yagi antenna, 9.3 dBd, N(f), 1.85 to 1.99 GHz
2000-1415 Portable Yagi antenna, 10 dBd, N(f), 2.4 to 2.5 GHz
2000-1416 Portable Yagi antenna, 10 dBd, N(f), 1.92 to 2.17 GHz
3-2000-1500 256 MB Compact Flash Memory Module
2000-1501-R 256 MB USB Flash Drive
2000-1520-R 2 GB USB Flash Drive
87A50 Bridge, 2 GHz to 18 GHz, GPC-7 connector, 35 dB
directivity, Type-N (f) input and output, GPC-7 test port
connector
87A50-1 Bridge, 2 GHz to 18 GHz, GPC-7 connector, 38 dB
directivity, Type-N (f) input and output, GPC-7 test port
connector
34AN50 Adapter, GPC-7 to N(m)
34ANF50 Adapter, GPC-7 to N(f)
PSN50 High Accuracy Power Sensor, 50 MHz to 6 GHz
3-2000-1498 USB A/mini-B cable, 10 ft
3-1010-122 Attenuator, 20 dB, 5 Watt, DC to 12.4 GHz, N(m)-N(f)
3-1010-123 Attenuator, 30 dB, 50 Watt, DC to 8.5 GHz, N(m)-N(f)
3-1010-124 Attenuator (Uni-directional), 40 dB, 100 Watt, DC to
8.5 GHz, N(m)-N(f)
1010-127-R Attenuator, 30 dB, 150 Watt, DC to 3 GHz, N(m)-N(f)
3-806-152 Spare Cross-over Ethernet Cable
2000-1371 Spare Ethernet Patch Cable
Part
Number Description

1-10
Preventive Maintenance
Spectrum Master preventive maintenance consists of cleaning the unit and inspecting and
cleaning the RF connector on the instrument and all accessories. Clean the Spectrum Master
with a soft, lint-free cloth dampened with water or water and a mild cleaning solution.
Clean the RF connectors and center pins with a cotton swab dampened with denatured
alcohol. Visually inspect the connectors. The fingers of N(f) connectors and the pins of N(m)
connectors should be unbroken and uniform in appearance. If you are unsure whether the
connectors are good, gauge the connectors to confirm that their dimensions are correct.
Visually inspect the test port cables. The test port cable should be uniform in appearance, not
stretched, kinked, dented, or broken.
Calibration Requirements
The Spectrum Master loads factory calibration data during start-up, eliminating the need for
daily calibration checks.
Although the Spectrum Master does not require daily field calibration, Anritsu recommends
annual calibration and performance verification by local Anritsu service centers. Anritsu
service centers are listed in this chapter.
ESD Cautions
The Spectrum Master, like other high performance instruments, is susceptible to ESD
damage. Very often, coaxial cables and antennas build up a static charge, which, if allowed
to discharge by connecting directly to the instrument without discharging the static charge,
may damage the instrument input circuitry. Spectrum Master operators should be aware of
the potential for ESD damage and take all necessary precautions.
Operators should exercise practices outlined within industry standards such as JEDEC-625
(EIA-625), MIL-HDBK-263, and MIL-STD-1686, which pertain to ESD and ESDS devices,
equipment, and practices. As these apply to the Spectrum Master, it is recommended that
any static charges that may be present be dissipated before connecting coaxial cables or
antennas to the instrument. This may be as simple as temporarily attaching a short or load
device to the cable or antenna prior to attaching to the instrument. It is important to
remember that the operator may also carry a static charge that can cause damage. Following
the practices outlined in the above standards will ensure a safe environment for both
personnel and equipment.
CAUTION: To avoid damaging the display or case, do not use solvents or
abrasive cleaners.
1-11
Anritsu Reference Documents
The following URL is an Internet link to the Spectrum Master MS2721B product page.
Spectrum Master product page link.
http://www.us.anritsu.com/products/ARO/North/Eng/showProd.aspx?ID=816&cat=1&cat2
=2&cat3=3&cat4=0#DownloadList
The following URL is an Internet link to the Spectrum Master MS2723B product page.
Spectrum Master product page link.
http://www.us.anritsu.com/products/ARO/North/Eng/showProd.aspx?ID=817&cat=1&cat2
=2&cat3=3&cat4=0#DownloadList
The following URL is an Internet link to the Spectrum Master MS2724B product page.
Spectrum Master product page link.
http://www.us.anritsu.com/products/ARO/North/Eng/showProd.aspx?ID=818&cat=1&cat2
=2&cat3=3&cat4=0#DownloadList
A table at the bottom of each web page presents Internet links to related literature and
software. Examples include information for the following subjects:
• Technical Data Sheet (includes instrument specifications)
• Practical Tips on HSDPA Measurements
• Technical Note – The Basis of Spectrum Analyzers
• High Accuracy Power Meter PSN50
• High Performance 9 kHz to 7.1 GHz Handheld Spectrum Analyzer Data Sheet
• 13 GHz High Performance Handheld Spectrum Analyzer Data Sheet
• 20 GHz High Performance Handheld Spectrum Analyzer Data Sheet
1-12
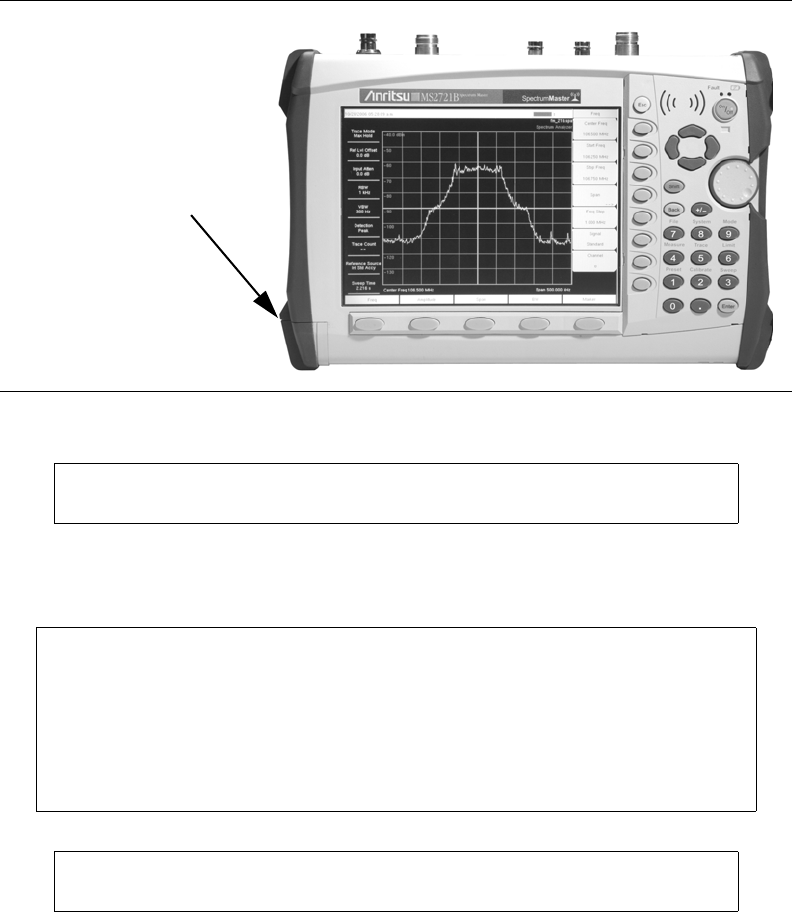
Battery Replacement
The battery can be replaced without the use of tools. The battery compartment is located on
the lower left side of the instrument. Slide the battery door down, towards the bottom of the
instrument, to remove it. Remove the battery pack from the instrument by pulling straight
out on the battery lanyard. Replacement is the opposite of removal.
The battery supplied with the Spectrum Master may need charging before use. The battery
can be charged in the Spectrum Master, using either the AC-DC Adapter (40-168) or the 12
Volt DC adapter (806-141), or separately in the optional Dual Battery Charger (2000-1374).
Figure 1-1. Battery Compartment Location
NOTE: Use only Anritsu approved batteries, adapters and chargers with
this instrument.
CAUTION
When using the Automotive Cigarette Lighter 12 VDC Adapter, Anritsu
Part Number 806-141, always verify that the supply is rated for a
minimum of 60 Watts @ 12 VDC, and that the socket is clear of any dirt
or debris. If the adapter plug becomes hot to the touch during operation,
discontinue use immediately.
NOTE: Anritsu Company recommends removing the battery for long-term
storage of the instrument.
Battery
Compartment
1-13
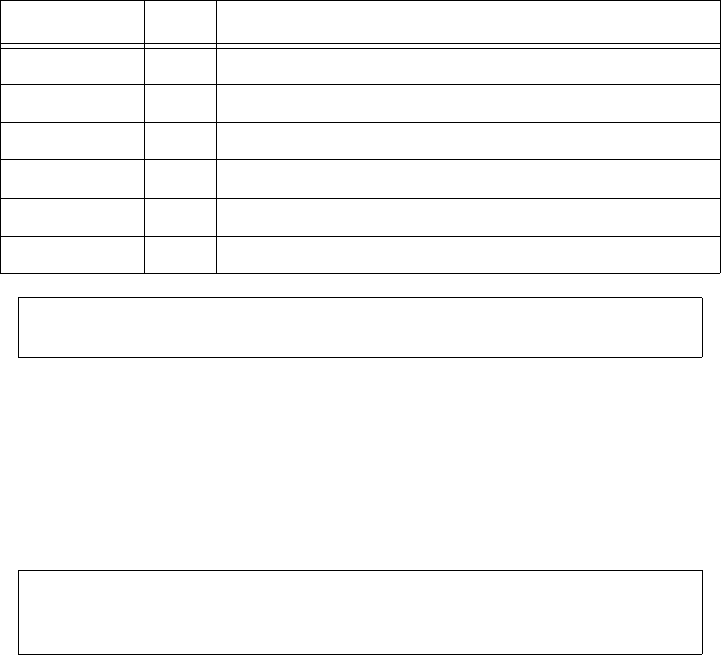
Tilt Bail Stand
The supplied Tilt Bail can be installed for desktop operation. When properly installed, the
tilt bail provides a backward tilt for improved stability and air flow. The tilt bail kit (part
number 64343) is a standard accessory and consists of the following:
1. With a flat-blade screwdriver, remove only the top screw from the carrying strap
D-ring holder on the right side of the instrument. Save the screw and the D-ring holder,
as they will need to be reinstalled if the tilt bail is removed.
Step 1. Remove the carrying strap D-ring from the holder that was removed in 1. and
install the D-ring onto the new right support bumper assembly.
Step 2. Using one M3 x 12 mm stainless steel, slotted pan head screw and one 6.2 mm
OD stainless steel, split lock washer (provided), install the new right support
bumper assembly onto the instrument.
Step 3. Use the other M3 x 12 mm stainless steel, slotted pan head screw and 6.2 mm OD
stainless steel, split lock washer to attach the left support bumper assembly to the
left side of the instrument.
Step 4. Flex the tilt bail to install it into the two bumper assemblies.
Table 1-1: Tilt Bail Kit
Part Number Qty. Description
64344 1 Tilt Bail
63763 1 Right Support Bumper Assembly for Tilt Bail
63764 1 Left Support Bumper Assembly for Tilt Bail
905-2691 2 M3 x 12 mm stainless steel slotted pan head screw
905-2692 2 6.2 mm OD stainless steel split lock washer
790-367 2 Hardware, bumper
NOTE: When the tilt bail is installed, the unit cannot be placed back into
the soft carrying case.
NOTE: Do not use the screw that was removed in 1. to install the new right
support bumper assembly. Use only the screws that are provided with the
kit.
1-14
Figure 1-2. Tilt Bail Installed
2-1
Chapter 2
Quick Start Guide
Introduction
This chapter provides a brief overview of the Anritsu MS272xB Spectrum Master. The
intent of this chapter is to provide the user with a starting point for making basic
measurements. For more detailed information, see Key Functions and
Measurement Fundamentals.
Turning the Spectrum Master On for the First Time
The Anritsu MS272xB Spectrum Master is capable of up to three hours of continuous
operation from a fully charged, field-replaceable battery (see Chapter 1). The Spectrum
Master can also be operated from a 12 VDC source (which will also simultaneously charge
the battery). This can be achieved with either the Anritsu AC-DC Adapter (Anritsu part
number 40-168) or 12 VDC Automotive Cigarette Lighter Adapter (Anritsu part number
806-141). Both items are included as standard accessories (see the list of accessories in
Chapter 1).
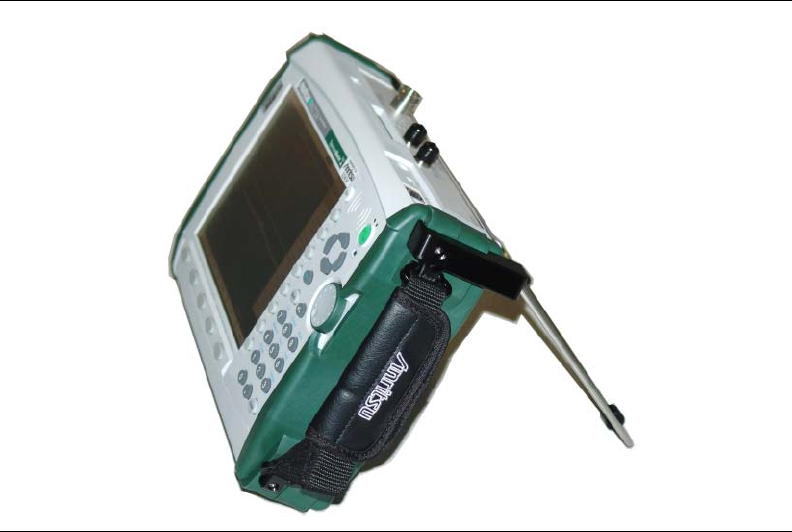
To turn on the Spectrum Master, press the On/Off front panel button (Figure 2-1).
CAUTION
When using the Automotive Cigarette Lighter 12 VDC Adapter (Anritsu
Part Number 806-141) always verify that the supply is rated for a
minimum of 60 Watts at 12 VDC, and that the socket is clear of any dirt
or debris. If the adapter plug becomes hot to the touch during operation,
then discontinue use immediately.
Figure 2-1. MS272xB On/Off Button
On/Off
Button
2-2
The MS272xB Spectrum Master takes about thirty-five seconds to complete power up and to
load the application software. At the completion of this process, the instrument is ready to
use.
For information on making measurements with the Spectrum Master, refer to “Making
Spectrum Analyzer Measurements” on page 2-16. For advanced applications, refer to
Measurement Fundamentals, and Field Measurements.
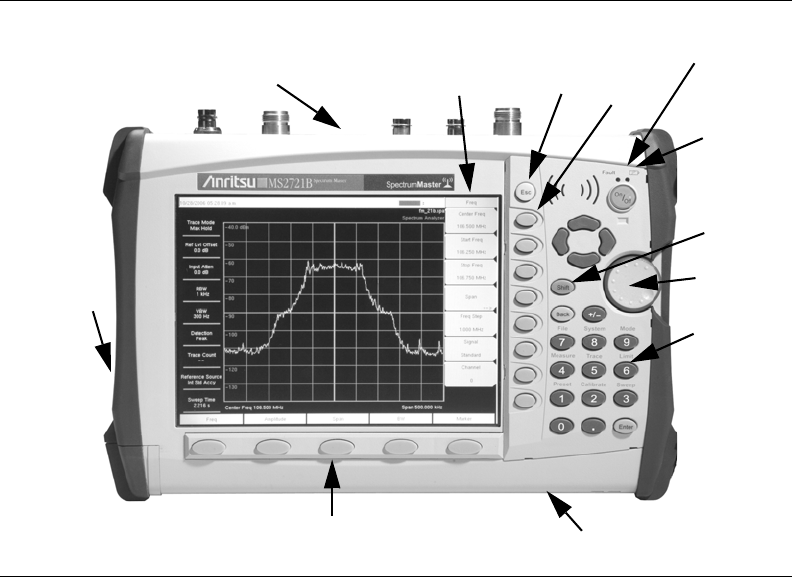
Front Panel Overview
The Spectrum Master menu-driven interface is easy to use and requires little training. Hard
keys on the front panel are used to initiate function-specific menus. Five function hard keys
are located below the display: Frequency, Span, Amplitude, Bandwidth and Marker.
A rotary knob and 21 hard keys are located to the right of the display. Eight of the hard keys
are dual purpose, depending upon the current mode of operation. The dual-purpose keys are
labeled with a number on the key itself and the alternate function printed on the panel above
the key. Use the Shift key to access the functions printed on the panel. The Escape key, used
for aborting data entry, is the round button located above the soft keys. The rotary knob and
the keypad can both be used to change the value of an active parameter.
In addition, eight soft keys are located to the right of the display. They can change the
function depending upon the current menu selection. The current soft key function is
indicated in the active function block to the right of the display. The locations of the different
keys are shown in Figure 2-2.
Figure 2-2. Spectrum Master Overview
Keypad
Function Hard Keys
Active Function
Block Soft
Keys
Fan Exhaust
Port
Fan Inlet
Escape
Key
Fan
Exhaust
Port
Shift Key
Rotary
Knob
Battery
Charge
LED
Charge
Fault LED
2-3
Battery Charge LED (green)
The Battery Charge LED will flash if the battery is charging, and remain on steady when the
battery is fully charged.
Charge Fault LED (red)
The Charge Fault LED will remain on steady under a battery charger fault condition. Fault
conditions include a battery cell voltage that is too low to charge, or a battery temperature
outside the temperature range (0º C to +45º C) to charge.
Fan Inlet and Exhaust Ports
It is important to keep the fan inlet and exhaust ports clear of obstructions at all times for
proper ventilation and cooling of the instrument.
2-4
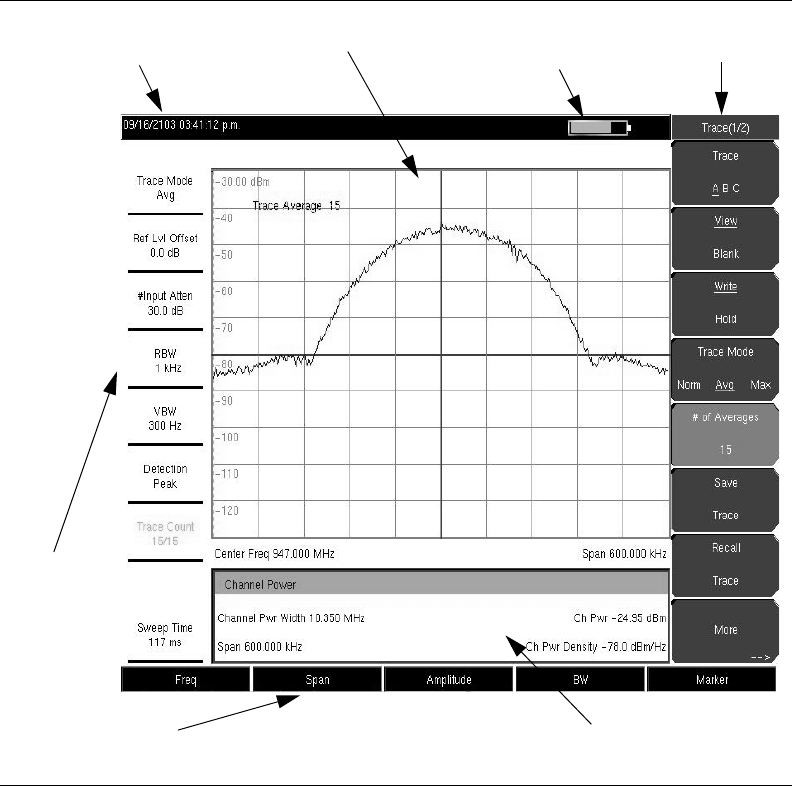
Display Overview
Figure 2-3 illustrates some of the primary information areas of the instrument display. Refer
to Key Functions, for more detailed key descriptions.
Front Panel Keys
The term hard key refers to all of the buttons on the instrument face except for the vertical
row of gray buttons adjacent to the measurement display. The eight vertically arranged gray
buttons are called soft keys, and they are used to activate virtual soft key buttons within the
measurement display screen.
Esc Key
Pressing this key cancels any setting that is currently being made.
Enter Key
Press this key to finalize data input. Pressing the rotary knob performs this same function.
Figure 2-3. Display Overview
Soft Key
Labels
Battery Charge
Indicator
Display Area
Real Time
Clock
Instrument
Settings
Summary
Hard Key Labels Optional Data Window
2-5
Arrow Keys
The four arrow keys (between the rotary knob and the Esc key) are used to scroll up, down,
left, or right. The arrow keys can often be used to change a value or to change a selection
from a list. This function is similar to the function of the rotary knob. The arrow keys are
also used to move markers.
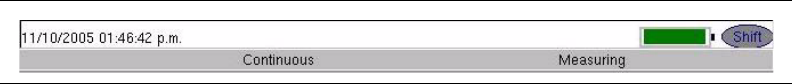
Shift Key
Pressing the Shift key and then a number key executes the function that is indicated in blue
text above the number key. When the Shift key is active, its icon is displayed at the top-right
of the measurement display area between the battery charge indicator and the soft key menu
label.
Back Key
Press this key to delete only one character, one number, or the range that is specified by the
cursor.
Code (+/-) Key
Press this key to change the sign of numbers that are entered with the number keys.
Number Keypad
These keys are used to directly input numbers.
Rotary Knob
Turning the rotary knob changes numerical values, scrolls through selectable items from a
list, and moves markers. Values or items may be within a dialog box or an edit window.
Pressing this knob finalizes the input function in the same manner as pressing the Enter key.
Function Hard Keys
These five function keys are horizontally arranged adjacent to the measurement display
screen along the lower edge. These buttons have no labels. As with the soft keys, they are
positioned to accompany virtual key labels that are displayed to match instrument modes
and functions. These function hard key labels change to match specific instrument Mode
settings. Each Mode has a specific set of Function Hard Keys. For details about the Mode
settings, refer to the section “Mode Selector Menu” on page 2-15.
Soft Keys
These eight gray keys have no labels. They are arranged adjacent to the measurement
display screen along the right-hand edge. They are positioned to accompany virtual soft key
labels that are displayed to match instrument modes and measurement functions. These soft
key labels (also called the Active Function Block) change as instrument measurement
settings change. The following soft key descriptions describe how these keys are used:
Figure 2-4. Shift Key Icon
2-6
Soft Key Types
Select
A Select soft key has a small circle in the upper-right corner of the virtual key face and is
used to select the function or item that is displayed on the virtual soft key label. When not
selected, the circle is gray. When selected, the circle is red to indicate that the function is
active.
Press the key to make the selection. Press a different key to make a different selection.
A Select soft key may also be a Switching soft key. These keys show both a gray circle and
an arrow mark (-->).
A Select soft key may change to a Switching soft key when active. These keys show only
the gray circle when not active, but show the arrow mark as well as the red circle when
active. Refer to section “Switching” on this page.
Input
An Input soft key is used to select an item or a value. This type of soft key displays the
setting parameter and the setting value on the virtual key face. When the key is pressed, a
select box or edit box may open on the display screen, or the key face may turn a darker gray
color to show that the setting is being made. At any time before finalizing the input, press the
escape (Esc) key to abort the change and retain the previously existing setting.
To set or select an item or a value, use the number keys, the arrow keys, or the rotary knob.
Press the rotary knob or the Enter key to finalize data input. If a value is being selected or
entered, then the soft key Active Function Block may change to provide one or more soft
keys for units, such a Hz or dB. Pressing a unit soft key sometimes finalizes the data input in
the same manner as pressing the Enter key. If more than one unit key is displayed, then
pressing the Enter key without first pressing a unit key selects a specific unit by default.
With some functions, only a specific set of values are valid. When scrolling with the
Up/Down arrow keys or the rotary knob, only valid values are offered. If different values are
set with the number keypad, then those values might not be accepted. Even if different
values are accepted on the soft key face, the values may not be valid for the selected
measurement.
Toggle
A Toggle soft key displays the setup item and the toggle states. Toggle states may be On and
Off or may be a selection of types or values, such as: 50 ohms, 75 ohms, Other.
Each press of the Toggle soft key moves the selection to the next value or item in sequence.
The selected item or value is underlined on the virtual key face.
Switching
A Switching soft key is used to open an additional soft key menu, and it has an arrow
mark (-->) in the lower-right corner of the virtual key face.
Some Select soft keys become Switching soft keys after being pressed (after becoming
active). These keys do not display the arrow mark until their circle is red. An additional
press, after the circle is red and the arrow mark is displayed, opens the additional soft key
menu. Refer to section “Select” on this page.
The Switching soft key that is labeled More opens a menu with additional soft key functions.
The Switching soft key that is labeled Back returns to a previous soft key menu. The Back
key has the arrow mark (<--) in the lower-left corner of the virtual key face.
2-7
Parameter Setting
Pop-up list boxes or edit boxes are used to provide selection lists and selection editors. Scroll
through a list of items or parameters with the arrow keys or the rotary knob. Select numerical
values by scrolling with the arrow keys or rotary knob or by entering the digits directly from
the number keypad. These list boxes and edit boxes frequently display a range of possible
values or limits for possible values.
Finalize the input by pressing the rotary knob or the Enter key. At any time before finalizing
the input, press the escape (Esc) key to abort the change and retain the previously existing
setting.
Some parameters (such as for antennas or couplers) can be added to list boxes by creating
them and importing them through the use of Master Software Tools.
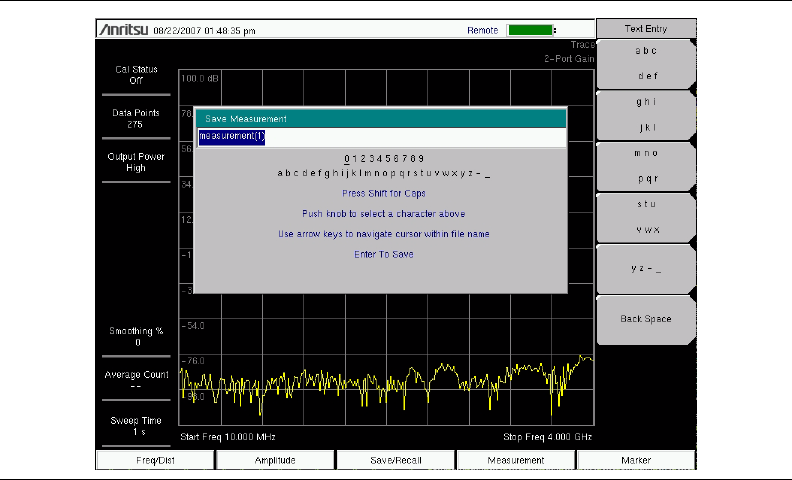
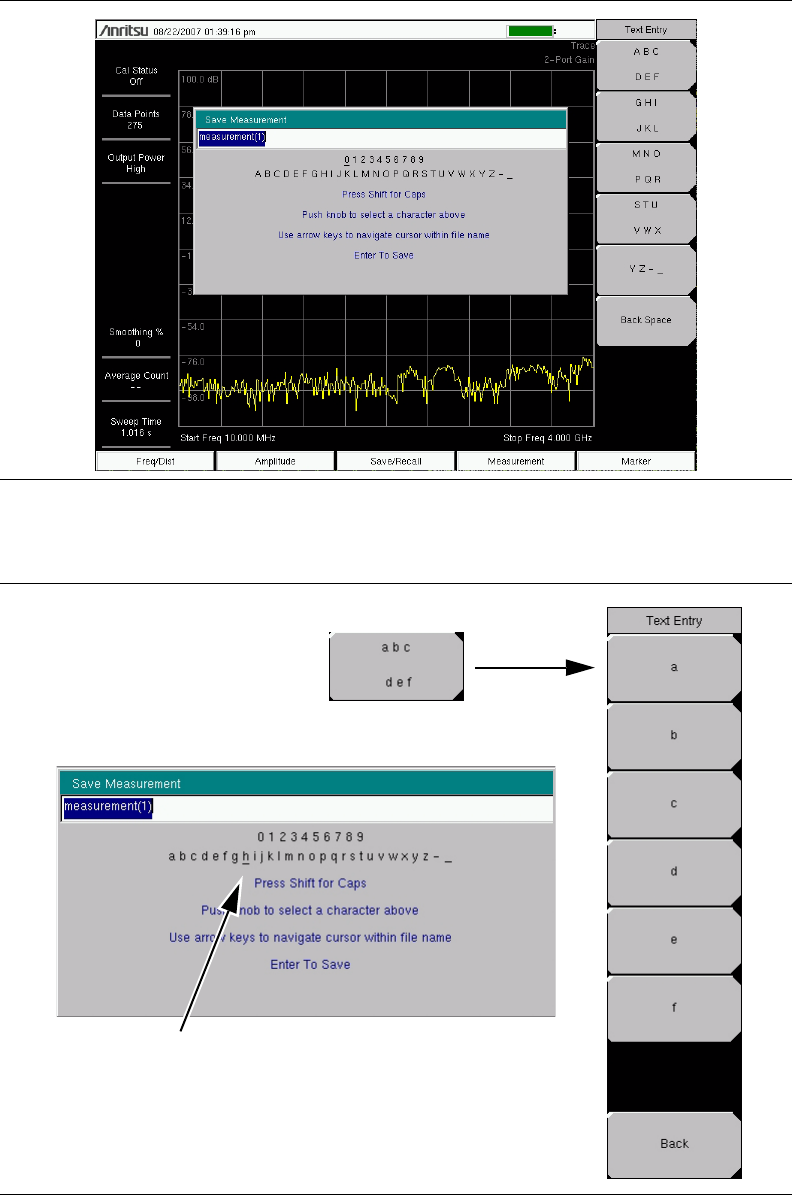
Text Entry
When entering text (as when saving a measurement) the soft key menu for Text Entry
displays the characters (alphabet, hyphen, and underscore) in 6 letters per soft key.
Characters can be entered by using the rotary knob or by using the soft keys.
The rotary knob scrolls through the characters in a pop-up window and is pressed to select
each character in sequence.
Alternatively, press the abc/def soft key (for example) to open another soft key menu
with a separate key for each of these letters. The menu returns to the complete character set
after each individual letter is entered.
Use the arrow keys to navigate within a name or character string. Use the Shift key for
capital letters. Press the Enter key or the rotary knob to finalize a text entry.
Refer to Figures 2-5, 2-6, and 2-7.
Figure 2-5. Text Entry Menu – Lower Case
2-8
Figure 2-6. Text Entry Menu – Upper Case
Figure 2-7. Text Entry Menu – Selecting Characters
Rotary Knob has
scrolled to letter h
2-9
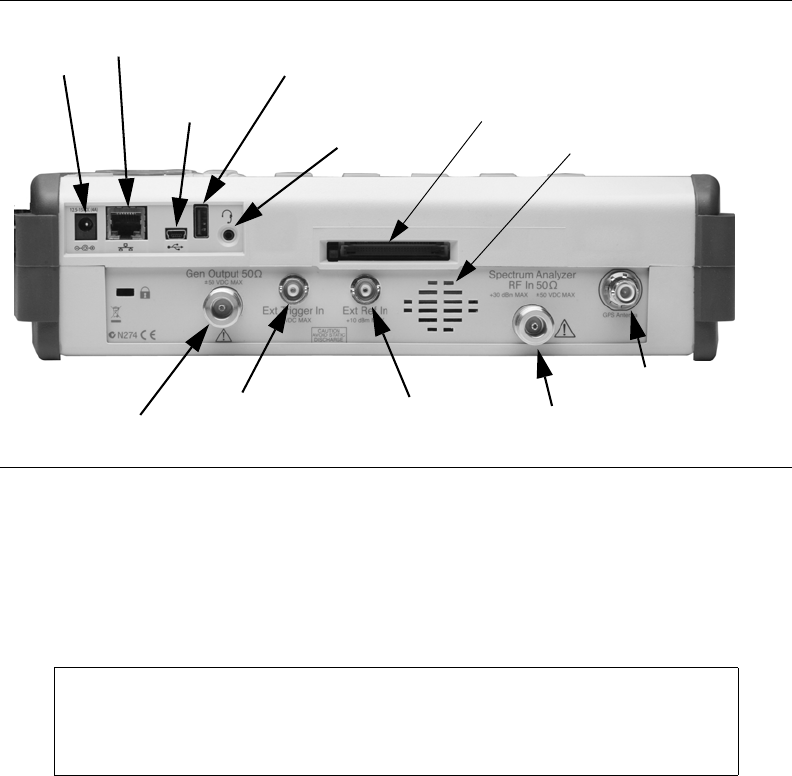
Test Panel Connectors
The connectors and indicators located on the test panel are shown in Figure 2-8 and are
described below.
External Power
The external power connector is used to power the unit and for battery charging. Input is
12 VDC to 15 VDC at up to 5.0 A. A green flashing indicator light near the power switch
shows that the instrument battery is being charged by the external charging unit. The
indicator is steadily illuminated when the battery is fully charged.
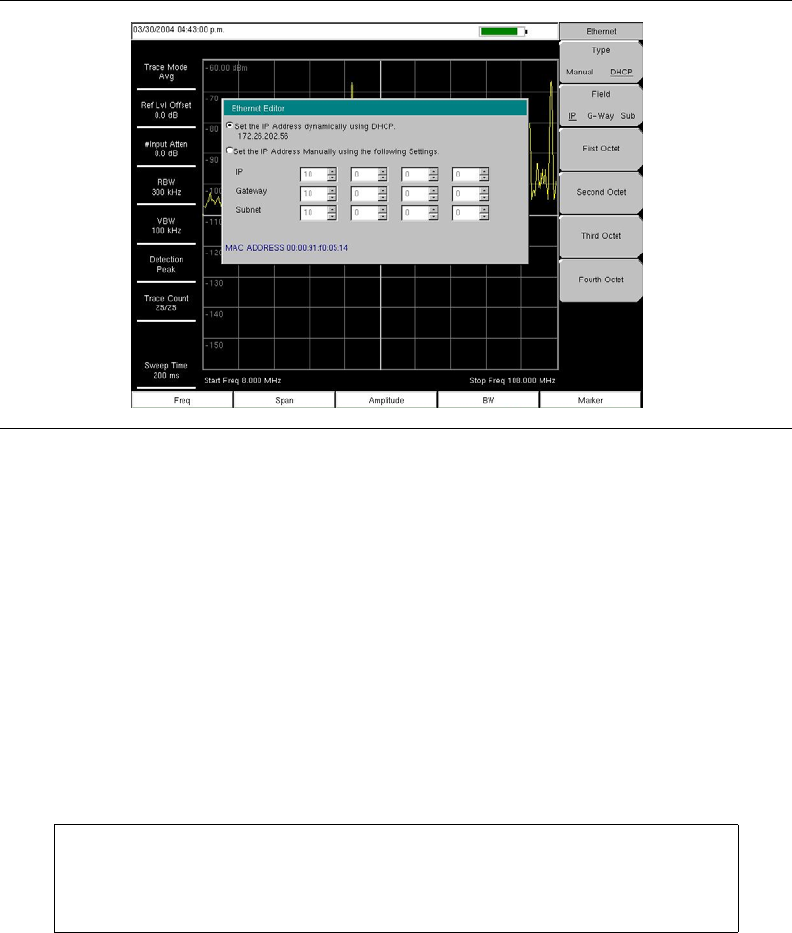
LAN Connection
The RJ-45 connector is used to connect the Spectrum Master to a local area network.
Integrated into this connector are two LEDs. The amber LED indicates the presence of LAN
voltages—a live LAN connection—while the green LED flashes to show that LAN traffic is
present. The instrument IP address is set by pressing the Shift key, then the System (8) key
followed by the System Options soft key and the Ethernet Config soft key. The instrument
Ethernet address can be set automatically using DHCP, or manually by entering the desired
IP address, gateway address and subnet mask.
Dynamic Host Configuration Protocol (DHCP) is an Internet protocol that automates the
process of setting IP addresses for devices that use TCP/IP, and is the most common method
of configuring a device for network use. To determine if a network is set up for DHCP,
connect the instrument to the network and select DHCP protocol in the Ethernet Config
menu.
Figure 2-8. Test Panel Connectors
WARNING: When using the AC-DC Adapter, always use a three-wire power
cable connected to a three-wire power line outlet. If power is supplied without
grounding the equipment in this manner, then theuser is at risk of receiving a
severe or fatal electric shock.
External
Power
LAN
Connection
USB Interface
Mini-B Headset
Jack
External Trigger External Frequency
Reference RF In
Compact Flash Socket
Fan Exhaust Port
USB Interface
Type-A
Gen Output
GPS
Antenna
Connector
2-10
Turn the Spectrum Master off, and then on. If the network is set up for DHCP, the assigned
IP address should be displayed briefly after the power up sequence.
To display the IP address with the instrument on, press the Shift key, then the System key,
then the System Options soft key and the Ethernet Config soft key. The IP address will be
displayed as shown in Figure 2-9.
More about DHCP
DHCP stands for Dynamic Host Configuration Protocol. DHCP is a protocol that allows a
server to dynamically assign IP addresses to devices that are connected to the network. Most
networks include a DHCP server to manage IP addresses. When a DHCP server is available
on the network, DHCP is the preferred IP address assignment mode.
When using DHCP, no setup is required to lease and use a dynamic IP address. In a dynamic
IP operation, the IP address in use may change from use to use. The DHCP server hands out
IP addresses on a first come, first served basis. As soon as the device is disconnected from
the network, the IP address that it was using becomes available to lease to the next unit that
requests an IP address. Normally, some amount of lag time is present on the DHCP server
end, so if the device is connected again reasonably soon, it may end up with the same
address.
When a DHCP server is not available, a Static IP address can be used. A Static IP address is
a fixed address. After being set, it will always remain the same, and care must be taken to not
conflict with other equipment on the network.
When using a static IP address on an established network, always request a Static IP address
from the network administrator. Randomly choosing a Static IP address on an established
network may result in duplicate IP addresses or other conflicts.
Figure 2-9. IP Address Assigned Using DHCP
NOTE: The Spectrum Master must be connected to the network before it is
turned on in order for DHCP to function. Key elements of the DHCP lease
are performed only during the instrument startup operations, or when
switching from manual to DHCP.

2-11
Three parameters must be set prior to using a Static IP address:
IP Address
This is the Static IP address on the network.
Default Gateway
Often when a static IP address is assigned, a default gateway is also identified. If the
default gateway is unknown, type in the Static IP address so that the Static IP address and
Default Gateway are the same number.
Subnet Mask
This parameter is usually extracted from the Static IP address based on the class of the
address and determines the destination of any broadcast messages that might be sent from
the instrument. It can be customized if necessary. The subnet mask may also be provided
with the Static IP address.
Example 1
In this example, a Static IP address has been chosen because there is no network available.
The instrument is connected to the network port on the PC with a crossover Ethernet cable
(not included). This is also referred to as Direct Connect:
IP Address: 10.0.0.2
Default Gateway: 10.0.0.2
Subnet Mask: 255.255.0.0
Example 2
In this example, the Static IP address has been assigned with an associated gateway and
subnet mask:
IP Address: 153.56.100.42
Default Gateway: 153.56.100.1
Subnet Mask: 255.255.252.0
A few tools that are built into the Microsoft Windows operating system can assist in making
some determinations about the network that the PC is plugged into. Typing ipconfig at a
command prompt will display information about the in-use parameters of the PC and its
network connection. Below is an example of the typical results expected.
Y:\>ipconfig
Windows 2000 IP Configuration
Ethernet adapter Local Area Connection:
Connection-specific DNS Suffix. : us.anritsu.com
IP Address. . . . . . . . . . . . : 172.26.202.172
Subnet Mask . . . . . . . . . . . : 255.255.252.0
Default Gateway . . . . . . . . . : 172.26.200.1
NOTE: The ipconfig display does not report if the information is from a
DHCP server or from a Static IP setup.

2-12
Another tool that can find out if a selected IP address is already on the network is ping. Ping
is a harmless way to determine if an address is found on the network, and if it is found, for it
to reply. Greatly simplified, ping sends out a request to a specific address to determine if it is
there. If it is found, it will respond by sending back what was sent to it. If it is not found, the
response will be "request timed out" meaning that there was no reply from that IP address.
Y:\>ping 172.26.202.172
Pinging 172.26.202.172 with 32 bytes of data:
Reply from 172.26.202.172: bytes=32 time<10ms TTL=128
Reply from 172.26.202.172: bytes=32 time<10ms TTL=128
Reply from 172.26.202.172: bytes=32 time<10ms TTL=128
Reply from 172.26.202.172: bytes=32 time<10ms TTL=128
Ping statistics for 172.26.202.172:
Packets: Sent = 4, Received = 4, Lost = 0 (0% loss),
Approximate round trip times in milli-seconds:
Minimum = 0ms, Maximum = 0ms, Average = 0ms
USB Interface - Type Mini-B
The USB 2.0 device connector can be used to connect the Spectrum Master directly to a PC.
The first time the instrument is connected to a PC, the normal USB device detection by the
computer operating system will take place. The CD-ROM shipped with the instrument
contains a driver for Windows XP that is installed when Master Software Tools is installed.
Drivers are not available for earlier versions of the Windows operating system. During the
driver installation process, place the CD-ROM in the computer drive and specify that the
installation wizard should search the CD-ROM for the driver.
The USB 2.0 device connector can also be used to connect to USB Flash drives and the
PSN50 High Accuracy Power Meter. It can not be used to connect to other devices such as
printers or mass storage devices.
USB Interface - Type A
The Spectrum Master can also be a USB Host and allow various USB Flash Memory
devices to be connected to the instrument for storing measurements, setups, and so forth.
Headset Jack
The headset jack provides audio output from the built-in AM/FM/SSB demodulator and
other audio signals for testing and troubleshooting wireless communication systems. The
jack accepts a 2.5 mm 3-wire miniature phone plug such as those commonly used with
cellular telephones.
Ext Trigger
A TTL signal applied to the External Trigger female BNC input connector causes a single
sweep to occur. This mode is used in zero span, and triggering occurs on the rising edge of
the signal. After the sweep is complete, the resultant trace is displayed until the next trigger
signal arrives.
NOTE: Install Master Software Tools before connecting the instrument to
the PC USB port.
2-13
Ext Freq Ref
BNC female connector for connection of an external frequency reference or external trigger.
Select the Ext Ref Freq soft key under the System menu to select the frequency of the
external reference from the list presented. Valid frequencies are 1 MHz, 1.2288 MHz,
1.544 MHz, 2.048 MHz, 2.4576 MHz, 4.8 MHz, 4.9152 MHz, 5 MHz, 9.8304 MHz,
10 MHz, 13 MHz and 19.6608 MHz at amplitude from –10 dBm to +10 dBm.
Gen Output
Tracking Generator (Option 20) output connector. The tracking generator operates over a
frequency range of 100 kHz to 7.l GHz, and provides a signal with an output frequency that
is the same as the tuning frequency of the spectrum analyzer. The output power and flatness
is specified from 400 kHz to 7.1 GHz. Refer to Chapter 8 for more information about using
the tracking generator.
RF In
50Ω Type-N female connector.
USB Flash Drive
The Spectrum Master is shipped with a 256 MB USB Flash Drive, Anritsu Part Number
2000-1501.
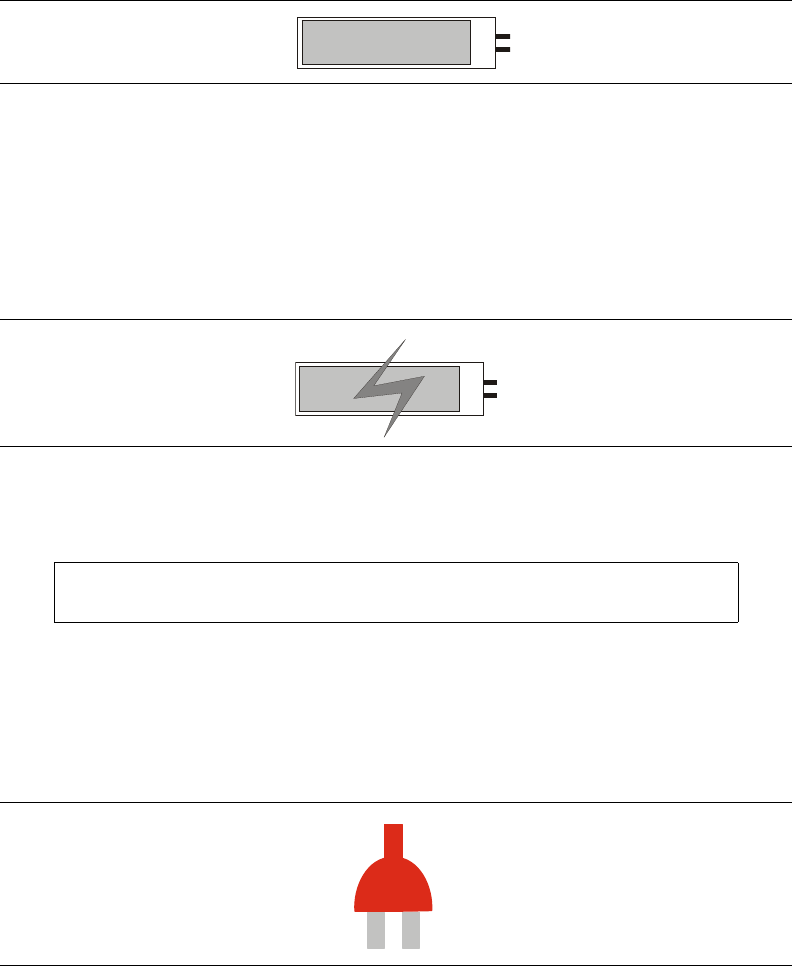
2-14
Symbols and Indicators
The following symbols and indicators convey the instrument status or condition on the
display.
Battery Symbol:
The battery symbol above the display (shown in Figure 2-10) indicates the charge remaining
in the battery. The colored section inside the symbol changes size and color with the charge
level.
Green: Battery is 30 to 100% charged
Yellow: Battery is 10 to 30% charged
Red: Battery 0 to 10% charged
When the battery is charging, either from the AC-DC Adapter (40-168) or the 12 Volt DC
adapter (806-141), the symbol will change to that shown in Figure 2-11. :
The Battery Charge LED will flash when the battery is charging, and remain on steady when
the battery is fully charged.
The battery symbol is replaced by a red plug body to indicate that the instrument is running
from external power and is not charging the battery (or the battery is not present). When the
external AC adaptor is connected, the battery automatically receives a charge, and the
battery symbol with the lightning bolt is displayed (Figure 2-11). When the battery is fully
charged, the charging circuit shuts off and the red plug body is displayed, as shown in
Figure 2-12.
Figure 2-10. Battery Charge Remaining Symbol
Figure 2-11. Battery Charging Symbol
NOTE: Use only Anritsu approved batteries, adapters, and chargers with
this instrument.
Figure 2-12. Battery Not Charging or Not Available

2-15
Hold
The Spectrum Master is on hold. To resume sweeping, toggle from Hold to Run in the Sweep
menu.
Single Sweep
Single Sweep is selected. Select Continuous sweep to resume sweeping.
Self Test
When turned on, the Spectrum Master runs through a series of quick checks to ensure that
the system is functioning properly. The System self test runs a series of tests that are related
to the instrument. The Application Self Test runs a series of tests that are related to the
application portion of the instrument.
If the self test fails, if the battery is fully charged, and if the Spectrum Master is within the
specified operating temperature range, then contact your Anritsu Service Center.
To initiate a self test when the system is already powered up:
Step 1. Press the Shift key and then the System (8) key.
Step 2. Select the Self Test soft key. The Self Test results will be displayed.
Step 3. Press the Esc key to continue.
Mode Selector Menu
To access the functions under the Mode menu, select the Shift key, then the Mode (9) key.
Use the directional arrow keys or the rotary knob to highlight the selection and press the
Enter key to select. The list of modes that appears in this menu will vary depending upon the
options that are installed and activated in your instrument. Figure 2-13 is an example of the
Mode menu. Your instrument may not show the same list.
Figure 2-13. Mode Selector Menu
MODE SELECTOR
Spectrum Analyzer
Cable & Antenna Analyzer
T1 Analyzer
Power Meter
Channel Scanner
WCDMA/HSDPA Analyzer
Interference Analyzer
GSM/GPRS/EDGE Signal Analyzer

2-16
Making Spectrum Analyzer Measurements
Required Equipment
• MS2721B, MS2723B, or MS2724B Spectrum Master
• Optionally, an antenna appropriate for the frequency range to be measured
Making a Measurement
To make a measurement, locate and display the signals of interest by selecting the desired
frequency, span, and amplitude value, as explained below.
Step 4. Connect the input signal or antenna to the RF In test port.
Step 5. Press the Freq key to display the Frequency menu.
Step 6. To enter a center frequency, select the Center Freq soft key and enter the desired
center frequency.
Step 7. To set a specific frequency band, select the Start Freq soft key and enter the
desired start frequency, then select the Stop Freq soft key and enter the desired
stop frequency.
Step 8. Press the Span key to display the Span menu and enter the span, or for a full span,
select the Full Span soft key. Selecting a full span will override any previously set
Start and Stop frequencies. For a single frequency measurement, select the Zero
Span soft key.
Setting the Amplitude
Step 9. Press the Amplitude key.
Step 10. Press the Reference Level soft key and use the Up/Down arrow keys or the keypad
to set the reference level. Press Enter to set the reference level.
Step 11. Press the Scale soft key and use the Up/Down arrow keys or the keypad to enter
the desired scale. Press Enter to set the scale.
NOTE: In most cases, information and parameters can be entered into the
Spectrum Master through the keypad, the directional arrow keys, or the
rotary knob. The numerical keypad enters the information directly. The up
and down arrow keys change a frequency parameter by the value entered
through the Freq Step soft key (default value is 1 MHz). The left and right
arrow keys change the frequency parameter by one graticule, that is,
one-tenth of the total span. The rotary knob changes the frequency
parameter by one pixel per step. In normal mode, the screen is 551 pixels
across, and in full-screen mode, the screen is 661 pixels across. Choose
whichever method is most convenient to enter the required information.
NOTE: To quickly move the span value up or down, select the Span Up
1-2-5 or Span Down 1-2-5 soft keys. These keys facilitate a zoom-in,
zoom-out in a 1-2-5 sequence.
NOTE: To change the current measurement units, press the Units soft key
and select the required units from the soft keys presented. Press the Back
soft key to return to the Amplitude menu.

2-17
Selecting a Signal Standard
Selecting a signal standard sets the center frequency, channel spacing, integration
bandwidth and span for the first channel of the selected standard. Appendix A contains a
table of the signal standards available in the instrument.
To select a signal standard:
Step 12. Press the Freq key to display the Frequency menu.
Step 13. Press the Signal Standard soft key and use the Up/Down arrow keys or the rotary
knob to highlight the desired signal standard. Press Enter to select the highlighted
signal standard.
Step 14. Press the Channel# soft key to choose the required channel. By default, if a
channel number has not yet been entered, the lowest channel number for that
standard is automatically selected. The channel numbers that can be selected
correspond to the channel numbering schemes of the various signal standards.
Setting Bandwidth Parameters
Both resolution bandwidth (RBW) and video bandwidth (VBW) can be automatically or
manually coupled to the frequency span. That is, the wider the span, the wider the RBW. The
ratio of the span width to the resolution bandwidth is 300:1 by default, and if necessary, can
be changed as follows:
Step 15. Press the BW key.
Step 16. Select the Span/RBW soft key. The current Span/RBW ratio is shown as part of
the soft key label. Change the value using the keypad, the directional arrows or the
rotary knob.
When auto coupling between the span and the RBW is selected, it is indicated on the left
side of the display as RBW XXX, where XXX is the bandwidth value. If manual RBW
coupling is selected, then a "#" is shown in front of RBW on the left side of the display, and
the resolution bandwidth can be adjusted independently of the span. If a non-existent
resolution bandwidth is entered, then the instrument will select the next higher resolution
bandwidth. If a value greater than the widest RBW is entered, then the widest RBW will be
selected.
Auto coupling of the VBW links the video bandwidth to the resolution bandwidth, so that
the wider the RBW, the wider the VBW. Auto coupling is indicated on the left side of the
display as VBW XXX. If manual VBW coupling is selected, then a "#" is shown in front of
VBW on the left side of the display, and the video bandwidth can be adjusted independently
of the RBW. If a non-existent video bandwidth is entered, then the instrument will select the
next higher video bandwidth. If a value greater than the widest VBW is entered, then the
widest VBW will be selected.
The ratio of the resolution bandwidth to the video bandwidth can be changed by pressing the
BW key, the RBW/VBW soft key, and then using the keypad, the directional arrows or the
rotary knob to set the ratio. The current value of the ratio is shown as part of the soft key
label.
NOTE: The Scale parameter cannot be changed when linear units are
selected (Watts or Volts).
Press the Amplitude soft key and select Auto Atten coupling of the attenuator
setting and the reference level to help ensure that harmonics and spurs
are not introduced into the measurements. See “Attenuator Functions” on
page 4-2. for more information.
2-18
Setting Sweep Parameters
To set the sweep parameters, press the Shift key and then the Sweep (3) key.
Single/Continuous
When this soft key is pressed the instrument toggles between single sweep and continuous
sweep. In single sweep mode, after the sweep the instrument waits in Hold mode until the
Manual Trigger soft key is pressed or another triggering mode is selected.
Trigger Type
To select a specific type of triggering, press the Trigger Type soft key. Selections are:
Free Run
The default trigger type is "Free Run" in which the instrument begins another sweep as
soon as one is finished.
External
A TTL signal applied to the External Trigger BNC input connector causes a single
sweep to occur. This mode is used in zero span, and triggering occurs on the rising
edge of the signal. After the sweep is complete, the resultant trace is displayed until the
next trigger signal arrives.
Video
This mode is used in zero span to set the power level at which a sweep is initiated. The
power level can be set from –120 dBm to +20 dBm. Trigger is based on the measured
signal level. If no signal reaches or exceeds the trigger level, there will be no trace on
the screen.
Change Trigger Position
This soft key is used in conjunction with video triggering to set the horizontal position
on the display where a signal that meets the video triggering criterion will be placed.
The value can be from 0% to 100%. Zero percent places the triggering event at the left
edge of the screen while 100% places the triggering at the right edge of the screen.
When the trigger position is any value other than 0%, the portion of the trace before the
trigger event is displayed very quickly since the trace data is stored in memory. The
portion of the trace after the trigger point is painted on the screen at the normal rate as
the signal is swept.
Manual Trigger
This soft key can be used in zero span to immediately trigger a sweep when the trigger
type is set to External or Video.
3-1
Chapter 3
Key Functions
Introduction
This chapter describes the Spectrum Master keys and how to use them. The major key
sections are arranged in alphabetical order. The soft key menus under those key selections
are listed in the order that they appear on the instrument, from top to bottom.
The five function hard keys are located below the display and are used to initiate
function-specific menus (Frequency, Span, Amplitude, Bandwidth, and Marker). In
addition, 21 hard keys and a rotary knob are located to the right of the display. Eight of the
hard keys are dual purpose, depending upon the current mode of operation. The
dual-purpose keys are labeled with a number on the key itself and with the alternate function
printed on the panel above the key. Use the Shift key to access the functions printed on the
panel. The Escape key, used for aborting data entry, is the round button that is located above
the soft keys. The rotary knob and the keypad can both be used to change the value of an
active parameter.
Eight soft keys are located to the right of the display. They change function depending upon
the current menu selection. The current soft key function is indicated in the active function
block (soft key menu) on the right of the display.
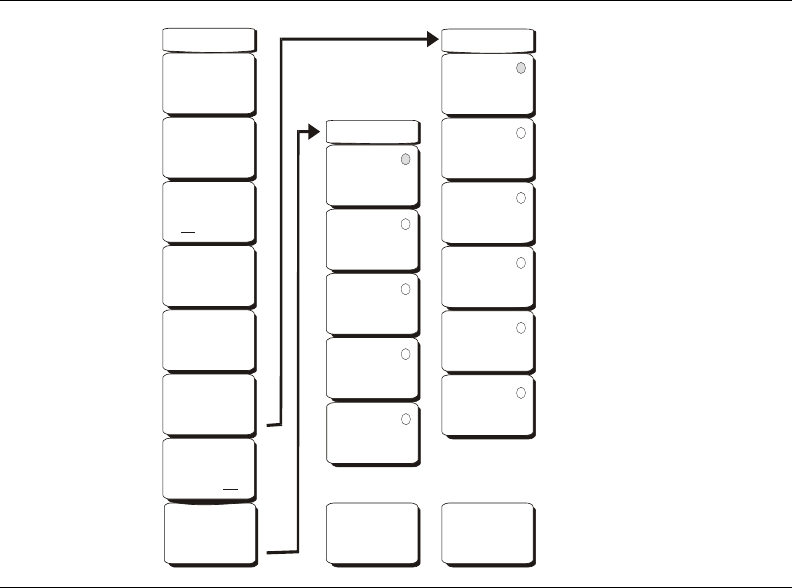
3-2
Amplitude
The Amplitude hard key is located below the display. The Amplitude menu soft keys are
shown in Figure 3-1.
Reference Level
The reference level is the top graticule line on the display, and can be set from +30 dBm to
–150 dBm. A value may be entered from the key pad, using the ± key as the minus sign.
After entering the value press the dBm soft key or the Enter key. The Up/Down arrow keys
change the reference level in 10 dB steps, and the Left/Right arrow keys change the value
by 1 dB. The rotary knob changes the value by 0.1 dB per detent.
The reference level value may be modified by the reference level offset value, discussed
later in this chapter.
Scale
The scale can be set in 1 dB steps from 1 dB per division to 15 dB per division. The value
can be changed using the keypad, the rotary knob or the Up/Down arrow keys.
Auto Atten On/Off
Input attenuation can be either tied to the reference level (On) or manually selected (Off).
When input attenuation is tied to the reference level, attenuation is increased as higher
reference levels are selected to make sure the instrument input circuits are not saturated by
large signals that are likely to be present when high reference levels are required.
Atten Lvl
Input attenuation can be set from 0 dB to 65 dB, in 5 dB steps. Select this soft key and use
the keypad, the rotary knob or the Up/Down arrow keys to change the attenuation value.
When the Preamplifier is turned on, the allowed attenuation settings are 0 dB and 10 dB.
Figure 3-1. Amplitude Menu Soft Keys
Amplitude
Reference Level
10.0 dBm
Scale
10 dB/div
Auto Atten
OffOn
Atten Level
30.0 dB
RL Offset
0.0 dB
Units
Detection
-->
-->
Detection
Units
Watt
Back
Peak
dBm
RMS
dBV
Negative
dBmV
Sample
Quasi-peak
dbuV
Volt
Back
-->-->
Pre Amp
On Off
3-3
RL Offset
Reference Level Offset compensates for the presence of input attenuation or gain external
to the instrument. Enter a positive value to compensate for an external amplifier or a
negative value to compensate for an external attenuator. Use the ± key to enter the negative
sign when a negative attenuation value is being entered.
Units
Select the display units from the soft key menu. Press the Back soft key to return to the
Amplitude menu.
Pre Amp On/Off
This soft key turns the low-noise front-end preamplifier on or off. The preamplifier in the
MS2721B lowers the noise floor by approximately 25 dB. To assure accurate measurement
results, the largest signal into the instrument input when the preamplifier is turned on
should be <–50 dBm. For the MS2723B and MS2724B, the preamplifier gain is
approximately 10 dB and functions up to 4 GHz.
Detection
Several detection methods tailor the performance of the instrument to meet specific
measurement requirements. In general, there are more measurement points across the
screen than display points. The various detection methods are different ways of dealing
with selecting which measurement point will be shown at each display point.
Peak
This method causes the largest measurement point to be shown for each display point,
and assures that a narrow peak is not missed.
RMS
This method performs a root-mean-square calculation of all the measurement points in
each display point, and is particularly useful in displaying the average value of noise.
Negative
This method causes the smallest measurement point to be shown for each display point.
Typically this mode is used to help detect small discrete signals in the presence of
nearly equal values of noise. The display points that contain only noise will tend to
show lower amplitudes than those that contain discrete signals.
Sample
This is the fastest detection method since for each display point only one frequency
point is measured. Use this method when speed is of paramount importance and the
possibility of missing a narrow peak is not important.
Quasi-peak
When this selection is made, resolution bandwidths and video bandwidths of 220 Hz,
9 kHz and 120 kHz are available. This detection method is designed to meet CISPR
requirements.
Back
Returns to the previous menu.

3-4
BW (Bandwidth)
The BW hard key is located below the display. The BW menu soft keys are shown in
Figure 3-2.
RBW
The current resolution bandwidth value is displayed in this soft key. The RBW can be
changed using the keypad, the Up/Down arrow keys, or the rotary knob. The range is 1 Hz
to 3 MHz in a 1-3 sequence, from 1 Hz to 3 Hz to 10 Hz, and so on.
Auto RBW
When Auto RBW is On, the instrument selects the resolution bandwidth based on the
current span width. The ratio of span width to RBW can be specified using the Span/RBW
soft key.
VBW
The current video bandwidth value is displayed in this soft key. The VBW can be changed
using the keypad, the Up/Down arrow keys, or the rotary knob. The range is 1 Hz to
3 MHz in a 1-3 sequence.
Auto VBW
When Auto VBW is On, the instrument selects the video bandwidth based on the
resolution bandwidth. The ratio of video bandwidth to resolution bandwidth can be set
using the RBW/VBW soft key.
RBW/VBW
This soft key displays the ratio between resolution bandwidth and video bandwidth. To
change the ratio, select this soft key and use the keypad, the Up/Down arrow keys, or the
rotary knob to select a new ratio. The default ratio is 3. When the quasi-peak detector is
selected, the RBW/VBW ratio is changed to 1.
Figure 3-2. BW Menu Soft Keys
BW
RBW
3 MHz
Auto RBW
OffOn
Auto VBW
OffOn
VBW
1 MHz
Span/RBW
300
RBW/VBW
3
3-5
Span/RBW
This soft key displays the ratio between the span width and the resolution bandwidth. The
default value is 300, meaning that the span width is approximately 300 times the resolution
bandwidth. The value is approximate because resolution bandwidth filters come in discrete
steps while span width can be set to any value up to 7.1 GHz. To change the ratio, select
this soft key and use the keypad, the Up/Down arrow keys, or the rotary knob to select a
new ratio.
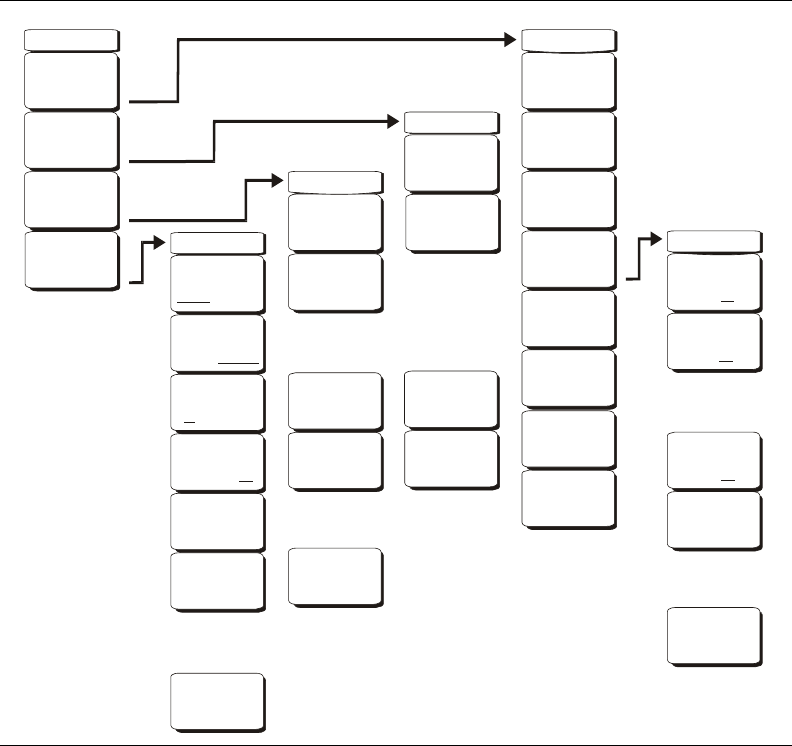
3-6
File
To access the functions under the File menu, select the Shift key, then the File (7) key. The
File menu soft keys are shown in Figure 3-3.
Save
Measurements may be saved to the internal memory or to a Type-1 Compact Flash module
or a USB Flash Drive. The Spectrum Master is shipped with a 256 MB USB Flash Drive,
Anritsu Part Number 2000-1501-R. A maximum of 1000 internally saved measurements
may be listed even though more may be saved. Anritsu recommends saving to external
storage if a large number of measurements are going to be saved. The removable compact
flash card or USB flash drive must be a minimum of 256 MB to be able to hold the entire
contents of the internal memory. Modules up to 512 MB have been tested. Compact Flash
modules with greater storage capacity may not function properly, and should be properly
tested before relying on them.
Figure 3-3. File Menu Soft Keys
File
Save
Recall
Recall
-->
-->
Back
Back
Back
-->
-->
-->
Back
-->
Save
Save
Setup
Sort Method
Type DateName
Save
Measurement
Sort
Ascend Descend
Current Location
USB CFInt
Format CF
Copy to Destination
Int USB CF
Copy from
Current Location
to Destination
Save
On
Event
Directory
Management
Directory
Management
Directory
Management
Save
Screen
as JPEG
Delete
Selected
File
Delete
All
Measurements
Delete
All
Mode Files
Delete
All
Contents
-->
-->
-->
-->
-->
Delete
Delete
Back
-->
… Crossing Limit
On Off
… Sweep Complete
On Off
… Save Then Stop
On Off
Clear All
Save On …
Recall
Setup
Recall
Measurement
Directory Management
*
*
*

3-7
Save Setup
Opens a dialog box to name and save the current operating settings, allowing them to
be recalled later to return the instrument to the state it was in at the time the setup was
saved. The saved setup can be named using the keypad to select numbers, the rotary
knob to highlight a number or character and pressing the knob to select, or by selecting
the soft key for each letter. Use the Shift key to select an upper case letter. Use the
Left/Right directional arrows to move the cursor position. Press Enter to save the
setup.
Save Measurement
Initiates a dialog box to name and save the current active Trace A. The saved
measurement trace can be named using the keypad to select numbers, the rotary knob
to highlight a number or character and pressing the knob to select, or by selecting the
soft key for each letter. Use the Shift key to select an upper case letter. Use the
Left/Right directional arrows to move the cursor position. Press Enter to save the
measurement trace. Measurements are saved in a directory called /usr on the Compact
Flash memory module.
Save On Event…
The instrument can be configured to automatically save a measurement if a selected
condition is satisfied. As measurements are saved, an on-screen message indicates
approximately how many more files can be saved. Over 3000 spectrum analyzer
measurements can be saved before the internal memory is full. The number of
measurements that can be stored in the Compact Flash memory depends on the size of
the memory module. When measurements are saved, they are saved into subdirectories
that are automatically created in the /usr subdirectory. The names are based on the date
and time. By design, each subdirectory contains 100 measurements to minimize sort
time.
NOTE: If a measurement has been previously saved, the Save
Measurement dialog box will open with the previously saved name
displayed along with a modification to make it different. To save the new
measurement with a similar name (for example, Trace-1, Trace-2, and so
forth), press the Right directional arrow and add the changes. To create a
completely new name, use the keypad or the rotary knob, or select the soft
key for each letter.
Table 3-1: Compact Flash Memory
CF Memory Size Approximate # of SPA Files Stored
64 MB 2600
128 MB 4700
256 MB 8900
512 MB 17800
1 GB 31000
2 GB 63000

3-8
… Crossing Limit On/Off
When Crossing Limit is On, and an upper or lower limit line is set, if any point in a
measurement exceeds either the upper or lower limit line, then the measurement is
automatically saved at the end of the sweep. The saved measurement is named "LIM"
followed by the date and time in the following format: LIMyyyymmddhhmmss. The
time value in the file name will generally be slightly earlier than the measurement
time stamp shown in the file list, since the file name is created at the time the limit
violation is noted and the time stamp is the time at which the measurement file is
actually saved.
If a limit line has not been set, selecting this soft key results in the on-screen
message: "You must have a limit ON first."
… Sweep Complete On/Off
When Sweep Complete is On, the measurement is automatically saved at the end of a
sweep. This is particularly useful for very slow sweeps. The saved measurement is
named "EOS" with a file name in the following format: EOSyyyymmddhhmmss.
Save Then Stop On/Off
When the Save Then Stop soft key is set to On, the instrument will save just one
measurement when the Crossing Limit or Sweep Complete soft keys are set to On,
and the qualifying event occurs. Sweeping stops after a measurement is saved. If it is
set to Off, sweeping continues after a measurement is saved and more measurements
may be saved. The default for this selection is Off.
Clear All
Pressing this soft key turns off both save on event conditions and sets Save then Stop
to Off, the default state.
Back
Returns to the top-level file menu.
Save Screen as JPEG
This function saves a measurement trace as a graphics file. The saved measurement can
be named using the keypad to select numbers, the rotary knob to highlight a number or
character and pressing the knob to select, or by selecting the soft key for each letter.
Use the Shift key to select an upper case letter. Use the Left/Right directional arrows to
move the cursor position. Press Enter to save the measurement after entering the file
name. The file is saved in the internal memory with the specified name, with .jpg
appended.
Directory Management
Sort Method
Name Type Date
File lists can be sorted by the name of the file, the type of file (SPA file, STP file, etc.)
or by the date that the file was saved.
NOTE: If a measurement has been previously saved, then the Save
Measurement dialog box will open with the previously saved name
displayed along with a modification to make it different. To save the new
measurement with a similar name (for example, Trace-1, Trace-2, and so
forth), press the Right directional arrow and add the changes. To create a
completely new name, use the keypad or the rotary knob, or select the soft
key for each letter.

3-9
Sort
Ascending Descending
Selects whether the selected sort is sorted from lowest to highest (ascending) or highest
to lowest (descending). When sorting by name, the sort will place file names that start
with numbers before file names that start with letters (an ASCII sort).
Current Location
Int USB CF
This choice lets you select where measurements and setups will be saved. Pressing the
soft key toggles between storing files on the internal memory, USB flash drive or a
Compact Flash memory module. The "current location" and the "copy to destination"
may not be the same. Changing the current location to save files causes the "copy to
destination" to be automatically changed if the selected storage location is the same as
the selected current location.
Copy to Destination
Int USB CF
This choice lets you select where measurements and setups in the "current location"
will be copied. The "current location" and the "copy to destination" may not be the
same. If you change the destination to which the instrument will copy files, the current
location is automatically changed if the current location is the same as the selected
copy to destination.
Copy From Current Location To Destination
Pressing this soft key causes all measurements, setups and jpg files stored in the user
selected "current location" to be copied to the "copy to destination." If no storage
module is installed in the instrument, an error message is displayed.
Format CF
This selection erases all files on an installed Compact Flash module. A message is
displayed warning that all files will be erased. Press Enter to confirm that you want to
erase or press Esc to quit without erasing. In addition to erasing all files stored on the
Compact Flash, the /usr directory is created for storage of measurements, setups, and
jpg files.
Back
The Back key returns to the previous menu.
Recall
Recall Setup
This soft key brings up a selection box that allows selection and recall of a previously
stored instrument setup in the current storage location. Use the rotary knob or the
Up/Down arrow keys to highlight the saved setup, and press Enter, the rotary knob, or the
Recall soft key to select. All current instrument settings are replaced by the stored setup
information. Press the Esc key to cancel the recall.
Recall Measurement
Brings up a selection box that allows recall of a previously stored measurement trace from
the currently selected storage location. Use the rotary knob or the Up/Down arrow keys to
highlight the saved measurement trace, and press Enter, the rotary knob, or the Recall soft
key to select. A recalled trace may be displayed as Trace A, in place of the live trace, or as
Trace B or Trace C along with the live trace. Use the rotary knob or the Up/Down arrow
keys to highlight the recalled trace option, and press the Enter key to select. Press the Esc
key to cancel the recall.
3-10
To remove a recalled measurement trace from the screen, select the Shift key and the
Trace (5) key to open the Trace menu. Use the Trace soft key to select the trace to be
removed from the screen and use the View/Blank soft key to view or blank the trace. Use
the Trace key to select an active trace after blanking a recalled trace.
Directory Management
See “Directory Management” on page 3-8.
Back
Returns to the previous menu.
Delete
Brings up a selection box that shows the first 1000 stored setups and traces in the currently
selected location (see “Directory Management” on page 3-8). The list shows the setup and
measurement names, the type (stp for a saved setup, spa for a saved trace, jpg for a JPEG
file) and the date and time the information was saved. Use the rotary knob or the Up/Down
arrow keys to highlight the file to be deleted, and press Enter, or the Delete soft key to
delete. Press the Esc key to cancel the operation. Note that no mechanism is available to
retrieve deleted files.
Delete Selected File
Use the up and down arrow buttons or the rotary knob to select the file that is to be
deleted. Press Enter to confirm that you want to delete the file or Esc to exit without
deleting.
Delete ALL Measurements
Deletes all measurements of the current mode in the currently selected storage location.
The memory from which measurements will be deleted is set in the Directory
Management menu and is the Current Location.
Delete ALL Mode Files
Deletes all measurements of the type saved in the current operating mode of the
instrument. In addition all jpg and setup files (regardless of the mode) are deleted.
Delete ALL Contents
Deletes all measurements, jpg files and setup files of all measurement types. All
contents of external devices are deleted (CF and USB memory). For internal memory,
all user files are deleted. Use with caution.
Back
The Back key returns to the previous menu.
Save Screen as JPEG
This function saves a measurement trace as a graphics file. The saved measurement can
be named using the keypad to select numbers, the rotary knob to highlight a number or
character and pressing the knob to select, or by selecting the soft key for each letter.
Use the Shift key to select an upper case letter. Use the Left/Right directional arrows to
move the cursor position. Press Enter to save the measurement after entering the file
name. The file is saved in the internal memory with the specified name, with .jpg
appended.
Back
The Back key returns to the previous menu.

3-11
Save On Event…
The instrument can be configured to automatically save a measurement if a selected
condition is satisfied. Over 3000 measurements can be saved in the internal memory
before the memory is full. Saving to either the Compact Flash or USB flash drive can
simplify transferring measurements to a computer.
… Crossing Limit On/Off
When Crossing Limit is On, and an upper or lower limit line is set, if any point in a
measurement exceeds either the upper or lower limit line, the measurement is
automatically saved at the end of the sweep. The saved measurement is named "LIM"
followed by the date and time in the following format: LIMyyyymmddhhmmss. The
time value in the file name will generally be slightly earlier than the measurement time
stamp shown in the file list, since the file name is created at the time the limit violation
is noted and the time stamp is the time at which the measurement file is actually saved.
If a limit line has not been set, selecting this soft key results in the on-screen message:
"You must have a limit ON first."
… Sweep Complete On/Off
When Sweep Complete is On, the measurement is automatically saved at the end of a
sweep. This is particularly useful for very slow sweeps. The saved measurement is
named "EOS" with a file name in the following format: EOSyyyymmddhhmmss.
Save Then Stop On/Off
When the Save Then Stop soft key is set to On, the instrument will save just one
measurement when the Crossing Limit or Sweep Complete soft keys are set to On, and
the qualifying event occurs. Sweeping stops after a measurement is saved. If it is set to
Off, sweeping continues after a measurement is saved and more measurements may be
saved. The default for this selection is Off.
Clear All
Pressing this soft key turns off both save on event conditions and sets Save then Stop to
Off, the default state.
Back
Returns to the top-level file menu.
NOTE: This feature should be used with care. With Save Then Stop set to
Off (the default) a large number of measurements can be saved when the
Crossing Limit or Sweep Complete soft keys are set to On, making it
time-consuming to retrieve saved measurements or to delete unwanted
measurements. When many measurements have been saved, the time
required to display a file list can be several minutes. When it is necessary
to save many measurements, it is best to save them to either the Compact
Flash memory module or to a USB Flash Drive, and then read them
directly into a computer.

3-12
Freq (Frequency)
The tuning frequency range for the Spectrum Master can be entered in several different ways
depending on what makes the most sense for the user or for the application. The center
frequency and span can be specified, the start and stop frequencies can be entered, or a
signal standard and channel number can be selected from the built-in list. The Freq hard key
is located below the display. The Freq menu soft keys are shown in Figure 3-4.
Center Frequency
Press the Freq key followed by the Center Freq soft key and enter the desired frequency
using the keypad, the arrow keys, or the rotary knob. If entering a frequency using the
keypad, the soft key labels change to GHz, MHz, kHz, and Hz. Select the appropriate units
key. Selecting the Enter key has the same affect as the MHz soft key.
Figure 3-4. Freq Menu Soft Keys
NOTE: When using the up and down arrows, the frequency moves in
steps that are defined by the value that was entered using the Freq Step
soft key.
When using the left or right arrow keys, the frequency of the active
parameter moves by 10% of the current frequency span. If the instrument
is in zero span, then the left and right arrows do nothing.
Turning the rotary knob changes the active frequency parameter in
increments of one display point for each click of the knob. The width
across the screen is 551 display points (661 points wide in full-screen
mode).
Freq
Center Freq
3.550 GHz
Start Freq
0 Hz
Stop Freq
7.100 GHz
Span
7.100 GHz
Freq Step
1.000 MHz
Signal
Standard
Channel
- -
3-13
Start Frequency
Press the Freq key followed by the Start Freq soft key and enter the desired frequency
using the keypad, the arrow keys, or the rotary knob. If a start frequency higher than the
current stop frequency is entered, the stop frequency will be changed to yield a 10 Hz span.
Stop Frequency
Press the Freq key followed by the Stop Freq soft key and enter the desired frequency
using the keypad, the arrow keys, or the rotary knob. If a stop frequency lower than the
current start frequency is entered, the start frequency will be changed to yield a 10 Hz
span.
Span
Press the Freq key followed by the Span soft key and enter the desired span. The Span
menu is used to set the frequency range over which the instrument will sweep. For the
MS2721B, the span can be set from 10 Hz to 7.1 GHz. For the MS2723B, the span can be
set from 10 Hz to 13 GHz, and for the MS2724B, the span can be set from 10 Hz to
20 GHz. Span can also be set to zero span for all models.
The soft key shows the current value for span in units of GHz, MHz, kHz, or Hz. When the
Span button is pressed, span becomes the active parameter and may be changed. Use the
keypad, the directional arrow keys or the rotary knob to increase or decrease the span
frequency. If the span is changed using the Up/Down arrow keys, the span changes by the
value of the Frequency Step for each key press.
Freq Step
Press the Freq key followed by the Freq Step soft key to enter the desired frequency step
size. The frequency step specifies the amount by which a frequency will change when the
Up/Down arrow keys pressed. The center frequency, start frequency, and stop frequency
values can be changed using Freq Step. The active parameter will be changed by the
frequency step when the Up/Down arrow keys are pressed. If Freq Step is the active
parameter, nothing happens when the arrow keys are pressed. The frequency step size can
be any value from 1 Hz to 7.1 GHz, 13 GHz, or 20 GHz with a resolution of 1 Hz.
Use the keypad or the rotary knob to change the Frequency Step size.
Signal Standard
Use the Up/Down arrow keys or the rotary knob to highlight a signal standard and press
Enter to select.
When a signal standard is selected, the center frequency and span for the first channel of
the particular standard is automatically tuned. Other settings, such as channel spacing and
integration bandwidth, are also automatically entered. Appendix A contains a table of the
signal standards that are in the instrument firmware.
Channel #
Use the Up/Down arrow keys, the keypad, or the rotary knob to select a channel number
for the selected signal standard. The center of the channel is tuned to the center of the
spectrum analyzer display.
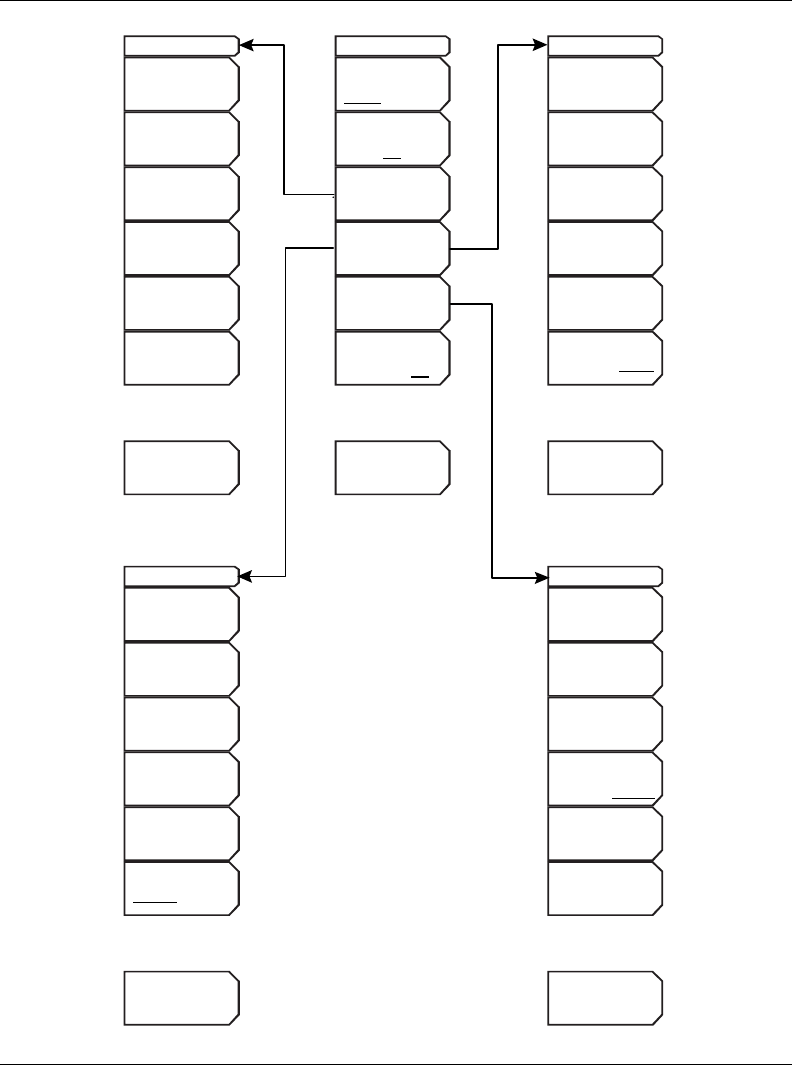
3-14
Limit
To access the functions under the Limit menu, select the Shift key, then the Limit (6) key.
The Limit menu soft keys are shown in Figure 3-5.
Figure 3-5. Limit Menu Soft Keys
Back
<--
Limit Envelope
Create Envelope
Update
EnvelopeAmplitude
Update Square
Envelope Frequency
Lower Points
##
Lower Offset
## dB
Lower Shape
Square Slope
Back
<--
Limit Advanced
Move Limit
to Current
Center Freq
Move Limit
## dB
Move Limit
## Hz
Limit Line Type
Absolute Relative
Save
Limit
Recall
Limit
-->
-->
-->
Set Default Limit
Limit Alarm
On Off
Limit Advanced
Limit
Upper Lower
Limit
On
Off
Limit Edit
Limit Envelope
Back
<--
Upper Points
##
Upper Offset
## dB
Upper Shape
Square Slope
Limit Envelope
Create Envelope
Update
Envelope Amplitude
Update Square
Envelope Frequency
Back
<--
Edit
Frequency
## Hz
Amplitude
### dBm
Add
Point
Delete
Point
Next
Point
Left
Next
Point
Right

3-15
Two types of limit lines can be specified, lower limit lines and upper limit lines. Limit lines
can be used for visual reference only, or for pass/fail criteria using the limit alarm (refer to
“Limit Alarm, On/Off” on page 3-18). Limit alarm failures are reported whenever a signal is
above the upper limit line or below the lower limit line.
Each limit line can consist of a single segment, or as many as 40 segments across the entire
frequency span of the instrument. These limit segments are retained regardless of the current
frequency span of the instrument, which allows the configuring of specific limit envelopes at
various frequencies of interest without having to re-configure them each time the frequency
is changed.
Limit Upper/Lower
This soft key selects which limit line will be active for editing. The limit line that is
currently selected for editing is underlined.
On/Off
This soft key turns the active limit line (upper or lower) on or off.
Limit Edit
This soft key displays a submenu that allows creating or editing of single or multi-segment
limit lines. The currently active limit point is marked by a red circle on the display.
Frequency, ## Hz
The frequency of each inflection point in a limit line can be individually set. When a
new point is added, it takes on a value halfway between two existing points, or it takes
on the stop frequency of the current sweep if no point is higher in frequency than the
one being added. See the Add Point soft key description for more details. Use the
keypad, the Left/Right arrow keys, or the rotary knob to change the frequency of an
inflection point.
Amplitude, ### dBm
The amplitude of each inflection point can also be individually set. By default, when a
new point is added, it takes on the amplitude that is on the limit line at the frequency
where the point was added. Use the keypad (using the ± key to set a negative value),
the Up/Down arrow keys, or the rotary knob to move the point to the desired value.
The unit of the amplitude limit is the same as the current vertical amplitude unit. See
the Add Point soft key description for more details.
Add Point
The precise behavior of this soft key depends upon which inflection point is active at
the time that the key is pressed. If the active limit point is somewhere in the middle of a
multi-segment limit line, then a new limit point is added that is halfway between the
currently active point and the point immediately to its right. The amplitude of the
inflection point will be such that it falls on the limit line. For example, if a limit point
exists at 2.0 GHz with an amplitude of –30 dBm, and if the next point is 3.0 GHz with
an amplitude of –50 dBm, then the added point will be at 2.5 GHz with an amplitude of
–40 dBm. The frequency and amplitude values of the new point can be adjusted as
needed with the Frequency and Amplitude soft keys.
If the last limit point is active (assuming it is not at the right edge of the display), then
the new limit point will be placed at the right edge of the display at the same amplitude
as the point immediately to its left. Points may not be added beyond the current sweep
limits of the instrument.
Delete Point
This soft key deletes the currently active point. The active point becomes the point that
is immediately to the left of the point that was deleted.
3-16
Next Point Left
This soft key selects the inflection point that is immediately to the left of the active
point, making this newly selected point active for editing or deletion. With each key
press, the active point becomes that point to the left of the previously active point, until
the newly selected active point becomes the leftmost point on the screen.
Next Point Right
This soft key selects the limit point immediately to the right of the active point, making
this newly selected point active for editing or deletion. With each key press, the active
point becomes that point to the right of the previously active point, until the newly
selected active point becomes the rightmost point on the screen.
Back
Press this soft key to return to the Limit soft key menu.
Limit Envelope
A limit envelope is very useful when you want to easily detect new signals in the presence
of other preexisting signals. Use the limit envelope function to automatically create upper
or lower limit lines that are based upon the on-screen measured spectrum analysis values.
Refer to Figure 3-6 for an example limit envelope.
Press this soft key to open the Limit Envelope soft key menu.
Create Envelope
Press this soft key to generate the envelope using the Limit Envelope characteristics. If
the default results are not satisfactory, then you can make adjustments to the amplitude
and frequency of each inflection point, and you can add or delete inflection points.
Update Envelope Amplitude
While working on your envelope (or if your signal amplitude changes), you may want
to adjust the amplitude of the current limit without changing the frequencies of the
inflection points. Pressing this soft key makes those amplitude adjustments without
frequency adjustments.
Update Square Envelope Frequency
Press this soft key to adjust the envelope frequency. If the magnitudes of two adjacent
limit inflection points are the same (a horizontal line), then the frequencies of the next
two limit inflection points are tested.
If the magnitudes of two adjacent limit inflection points are further than two sweep
points apart (a gradual slope indicating a narrower span), then the second inflection
point is brought back closer to the first inflection point so that the slope increases to
near vertical.
If the magnitudes of two adjacent limit inflection points are closer than two sweep
points apart (so close that the second inflection point may not be able to be displayed),
then the second inflection point is pushed further out from the first inflection point so
that the slope becomes near vertical.
If the user has adjusted the magnitude of some limit inflection points so that the
horizontal lines are no longer horizontal, then the algorithm will probably have
difficulty with the update, and unintended results may occur.
Upper Points, ## (if Upper Limit is selected)
Lower Points, ## (if Lower Limit is selected)
Use this soft key to define how many inflection points you want for the selected upper
or lower limit envelopes. The value can be between 2 and 41. Note that the upper and
lower limit lines do not need to have the same number of points.
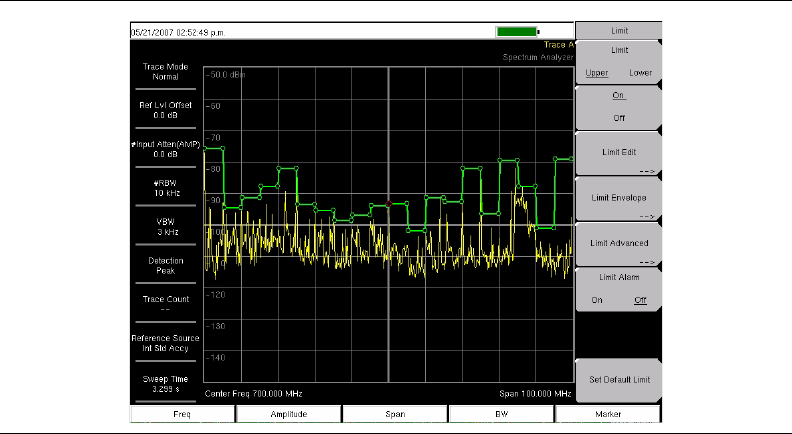
3-17
Upper Offset, ## dB (if Limit is toggled to Upper)
Lower Offset, ## dB (if Limit is toggled to Lower)
This soft key is used to define how far away from the measured signal the upper or
lower envelope will be placed. The limits are ±100 dB. For an upper envelope, usually
the value will be positive in order to place the envelope above the signal. for a lower
envelope, the value will usually be negative in order to place the envelope below the
signal.
Upper Shape, Square/Slope (if Limit is toggled to Upper)
Lower Shape, Square/Slope (if Limit is toggled to Lower)
With this soft key you can choose whether the default for the upper or lower envelope
will be with flat tops and reasonably vertical lines to change level or whether the
envelope will have sloped lines between adjacent inflection points. When the square
envelope type is selected, two inflection points are used for each horizontal segment.
You can toggle between a square envelope and a sloped envelope by pressing this soft
key.
Back
Press this soft key to return to the Limit soft key menu
.
Limit Advanced
The advanced limit line section offers several useful functions. In this section, you can
create either an absolute limit line (which is one based upon the frequencies that are
entered for each inflection point) or a relative limit line (which is based upon the delta
frequencies between the center frequency and the inflection points). Both types of limit
lines can be saved and recalled.
Press this soft key to open the Limit Advanced soft key menu.
Move Limit to Current Center Freq
Pressing this soft key moves the center of the existing limit line to the center frequency
of the measurement. The span of the existing limit line is not changed by doing this.
Use this soft key as an easy way to get an existing limit line on screen. If no limit line is
turned on, a new, flat default limit line is turned on and is located 2.5 divisions
Figure 3-6. Example Limit Envelope, Square
3-18
(2.5 graticule lines) from the top of the screen for the upper limit line or 2.5 divisions
from the bottom of the screen for the lower limit line.
Move Limit, ## dB or Move Limit, ## dBm
If the limit line is flat, then use this soft key to move the limit line to an absolute power
point in dBm. If the limit line is not flat, then use this soft key to move the limit line up
or down by the selected number of dB. Use the keyboard to enter the desired value. The
entire line moves by the amount that is entered. The limit line can also be moved by
using the rotary knob. Turn the rotary knob clockwise to move the line to higher power
levels.
Move Limit, ## Hz
Pressing this soft key allows you to adjust the frequencies of the limit line. All
inflection points are moved by the value entered. The rotary knob can also be used to
make this adjustment. Turn the rotary knob clockwise to move the limit line to higher
frequencies.
Limit Line Type, Absolute/Relative
You can choose to have either limit line be either absolute or relative. The upper and
lower limit lines may be different. This soft key may be used at any time while working
with limit lines.
Absolute limit lines set the limit inflection points based upon the entered frequencies
for each point.
Relative limit lines set the limit inflection points relative to the current center
frequency.
Regardless of how a limit line is set up, saved, or recalled, it can be changed between
absolute and relative by toggling with this soft key.
Save Limit
Pressing this soft key opens a dialog to save the current upper and lower limit lines.
You can name the saved limit line yourself or accept the name that is suggested by the
instrument (which is based upon a previously saved name). If you did not intend to
save the limit line, then press Esc to stop the dialog and avoid saving the limit line.
Recall Limit
Pressing this soft key opens a dialog box to recall a saved limit line. The dialog box
presents a list of saved limit lines. Highlight the desired limit line and press Enter. If
you decide not to recall a limit line, then press Esc to stop the dialog.
If the saved limit is a relative limit, then it is recalled centered about the current center
frequency. If the saved limit is an absolute limit, then it is recalled to the frequency at
which it was created.
If you recall an absolute limit, and if it is off screen, then you will see the left or right
limit off-screen indicator on the edge of the screen.
Back
Press this soft key to return to the Limit soft key menu.
Limit Alarm, On/Off
Pressing this soft key toggles the alarm function ON and OFF for the currently active limit
line. When ON, an alarm beep will occur when a data point exceeds the limit.
3-19
Set Default Limit
Pressing this soft key deletes all limit points for the currently active limit line and sets the
default limit line value, which is a single limit whose position is 2.5 graticule lines from
the top of the screen (for the upper limit line) or 2.5 graticule lines from the bottom of the
screen (for the lower limit line), depending upon which limit is active. The inactive limit
line is not altered.

3-20
Marker
Press the Marker function hard key to open the Marker menu. The Spectrum Master is
equipped with six markers. Any or all markers can be employed simultaneously. The Marker
hard key is located below the display. The Marker menu soft keys are shown in Figure 3-7.
Marker 1 23456
Use this soft key to select the active marker. The underlined marker number is the active
marker. Each press of the soft key moves the underline to the next marker number.
Pressing the Shift button causes subsequent button presses to move from higher marker
numbers to lower numbers. Press the Shift button again to change back to the original
direction.
On/Off
This soft key make the active marker, selected by the Marker soft key above, active for
editing. It does this without changing the value of the associated Delta marker. However, if
the marker is currently active for editing, pressing the On/Off key causes the selected
marker and the associated Delta marker to be turned off.
Figure 3-7. Marker Menu Soft Keys
-->
Marker(1/2)
Marker
2 3 4 5 61
On
Off
Peak Search
Delta
On Off
Marker
to
Ref Lvl
Marker Freq
to
Center
More
Peak
Options
More
-->
-->
Recall
Measurement
Copy All
to
External Card
Delete
Save
Screen
as JPEG
Copy All
from
External Card
-->
Marker & Peak
Peak Search
Next Peak
Left
Delta Marker
to
Span
Next Peak
Right
Peak Threshold
10.00%
Back
-->
Marker
to
Ref Lvl
Marker Freq
to
Center
Marker(2/2)
Marker Noise
On Off
Marker Table
On Off
Counter Marker
On Off
Marker 1
Reference
On Off
All Markers
Off
Set Marker
To
Channel
Marker Style
Fixed Tracking
Back
-->
3-21
Delta On/Off
If the Delta marker is on, but not active for editing, pressing this soft key makes the Delta
marker active for editing. If the marker is currently active for editing, pressing the On/Off
key causes the delta marker to be turned off.
Peak Search
This soft key places the currently active marker on the highest signal amplitude currently
displayed on screen.
Marker Freq to Center
This soft key changes the center frequency to place the currently active marker at the
center of the display.
Marker to Ref Level
This soft key causes the amplitude of the currently active marker to become the reference
level, which is the top horizontal line of the display.
More Peak Options
This soft key brings up a secondary menu of soft keys for more peak searching options.
Peak Search
This soft key places the currently active marker on the highest amplitude signal
currently on screen.
Next Peak Left
From the current position of the active marker, the instrument searches to the left
(toward lower frequencies) for a peak signal that rises at least a certain amount above
the previous valley. If no such peak is found, the marker is placed at the left end of the
trace. The Peak Threshold soft key allows the user to specify the performance of peak
searching.
Next Peak Right
From the current position of the active marker, the instrument searches to the right
(toward higher frequencies) for a peak signal that rises at least a certain above the
previous valley. If no such peak is found, the marker is placed at the right end of the
trace. The Peak Threshold soft key allows the user to specify the performance of peak
searching.
Delta Marker to Span
Sets the total span width to the value of the delta marker. If the delta marker is zero, the
span is set to 10 Hz. If there is no delta marker, or the delta marker value is set to less
than 10 Hz, then the span will be set to 10 Hz.
Marker Freq to Center
Sets the center frequency to the frequency of the currently active marker.
Marker to Ref Lvl
Sets the amplitude of the currently active marker to the top graticule line as the
reference level.
Peak Threshold
This soft key allows the user to specify how far above the average noise floor a signal
must rise before it is considered a peak. The default value is 10%.
Back
Returns to the higher-level menu.
More
Opens a submenu of further Marker options.

3-22
Marker Noise
This marker option turns the markers into noise markers with units of dBm/Hz. When
this option is selected, the detection method is automatically changed to RMS and the
displayed value is compensated for the noise bandwidth of resolution bandwidth filter.
Marker Table
Pressing this soft key causes a table to be displayed below the sweep window. The
table is automatically sized to display all markers that are turned on. In addition to the
marker frequency and amplitude, the table also shows delta frequencies and amplitude
deltas for all markers that have deltas entered for them.
All Markers Off
This soft key turns off all markers and the marker table.
Counter Marker On Off
Sets the frequency counter mode for all markers. Marker frequency values are
normally limited in resolution to individual display pixels. Each pixel may represent
multiple frequencies. Using Counter Marker in association with Marker to Peak will
result in the exact frequency of the peak within the pixel to a resolution of 1 Hz.
Set Marker To Channel
If a signal standard has been selected, pressing this soft key brings up a dialog box to
select a channel. Select a channel number for the current signal standard, and the active
marker will be set to the center frequency of the channel.
If no signal standard has been selected, then a message "No standard selected. Press
Enter or Escape to Continue." is displayed. Press either button to leave the settings as
they were before the soft key was pressed.
Marker Style Fixed Tracking
This soft key changes the behavior of the reference markers. If Fixed is selected,
reference markers stay at the amplitude they were at when the associated delta marker
was turned on. If Tracking is selected, the amplitude of the reference marker changes as
the signal amplitude is changed. Note that the reference marker tracks the amplitude
(not the frequency) of a signal.
Marker 1 Reference On Off
This soft key selects whether Marker 1 is the reference for all six delta markers, or
whether each of the six reference markers has an associated delta marker. When
Marker 1 reference is turned ON, Marker 1 is set to the current frequency. The six delta
markers are distributed evenly across the screen unless the frequency is in the AM
broadcast band. In that case, the delta markers are set to ±10.2 kHz, ±25 kHz, and
±75 kHz. The marker table is also turned on.
Back
Returns to the previous menu.
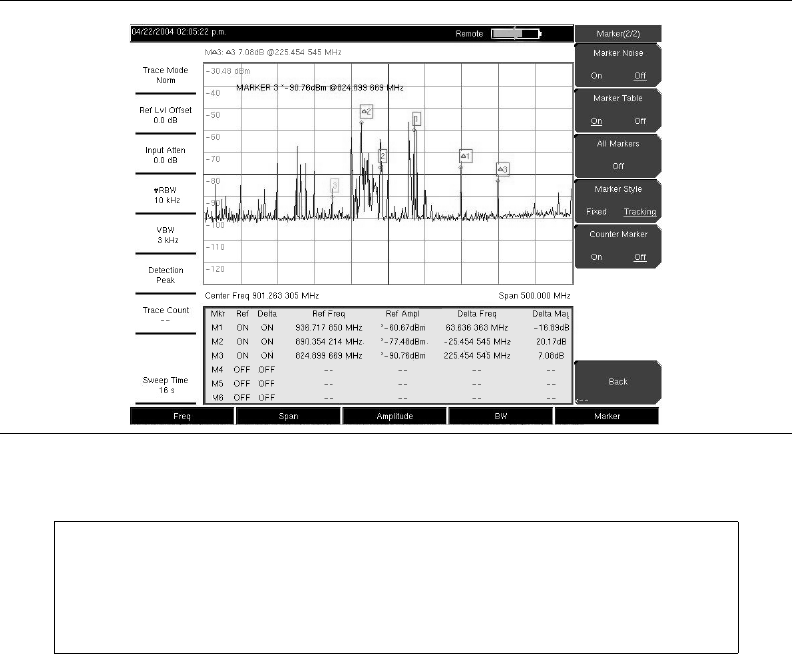
3-23
Figure 3-8. Markers
NOTE: When using the up and down arrows, the active marker moves in
steps that are defined by the value that was entered using the Freq Step
soft key.
When using the left or right arrow keys, the active marker moves by one
division.
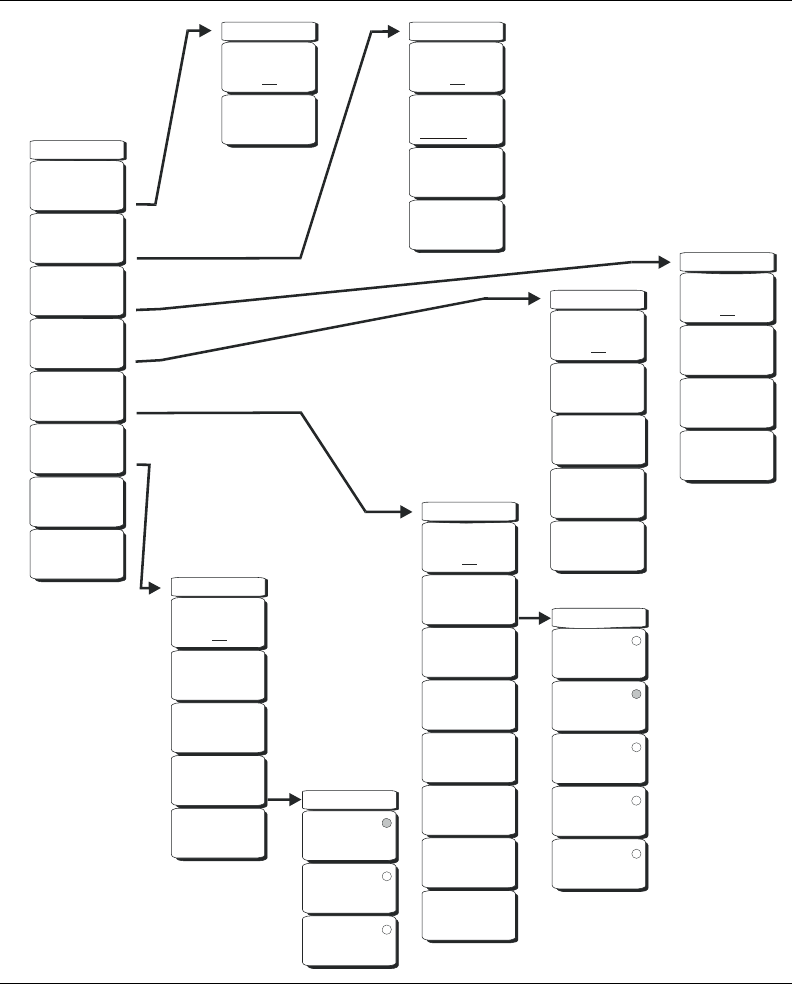
3-24
Measure
To access the functions under the Measure menu, select the Shift key, then the Measure (4)
key. The Measure menu soft keys are shown in Figure 3-9.
Field Strength
This measurement allows the use of an antenna with known gain characteristics and
measures the field strength over the frequency range of the antenna in units of dBm/meter,
dbV/meter, dBmV/meter, dBµV/meter, volts/meter or watts/meter.
Figure 3-9. Measure Menu Soft Keys
Measure
Field
Strength
OCC BW
Channel
Power
ACPR
AM/FM
Demod
C/I -->
Measurement Off
Tracking
Generator
MS2721B with
Option 20 only
*
*
-->
-->
-->
-->
-->
F Strength
On
Off
Antenna
OCC BW
On
Off
Method
%
99.00 %
dBc
3
Channel Pwr
On
Off
Center Freq
3.550 GHz
Ch Pwr Width
10.350 MHz
Span
7.100 GHz
A
CPR
Main Ch BW
10.350 MHz
Ch Spacing
10.350 MHz
A
dj Ch BW
10.350 MHz
Span
7.100 GHz
On
Off
C/I
On
Off
Center Freq
3.550 GHz
Span
7.100 GHz
Carrier
Signal
Type
Min Sweep Time
50 us
--> C/I Signal Type
NB FHSS
WB FHSS
Broadband
AM/FM Demod
Beat Freq Osc
0 Hz
Volume
Back
On
Off
Demod Type
Demod Freq
10.350 MHz
Demod Time
3 s
Set Demod Freq
to Current
Marker Freq
-->
-->
Demod Type
FM Wide
Band
FM Narrow
Band
A
M
USB
LSB
% Int Pwr dBc

3-25
On Off
Turns field strength measurements on or off.
Antenna
This soft key brings up a dialog box that lists all the antennas for which the instrument
has data, including both standard antennas and custom antenna that have been added
using Master Software Tools. Use the Up/Down arrow keys or the rotary knob to select
the desired antenna and press Enter.
Back
Returns to the previous menu.
OCC BW
Activates the occupied bandwidth menu. Select either % or dBc method of occupied
bandwidth measurement.
Method % Down/dBc Down
Select either the % of Power (default) or dB Down measurement method as displayed
in the message area.
%
Use the keypad, the directional arrow keys or the rotary knob to enter the percent of
power, from 0% to 100%.
dBc
Use the keypad, the directional arrow keys or the rotary knob to enter the dBc value
(0 dB to 100 dB).
Back
Returns to the previous menu.
Channel Power
Activates the Channel Power measurement function. Channel Power and Channel Power
Density are measured based on the selection in the Units menu.
On Off
Begins or ends the channel power measurement. When the measurement is on, Ch Pwr
will appear below the display. The detection method will automatically be changed to
RMS Average when the measurement is started. The detection method can be modified
by pressing the Shift and the Sweep keys and selecting the Detection soft key.
Center Freq
Activates the center frequency function, and sets the center frequency of the Spectrum
Master for the channel power measurement. Use the keypad, the directional arrow keys
or the rotary knob to enter the center frequency.
Ch Pwr Width
Sets the integration bandwidth for channel power measurement. Modifying this value
automatically adjusts the channel span to maintain the same ratio. Use the keypad, the
directional arrow keys or the rotary knob to enter the integration bandwidth.
Span
Sets the channel span for channel power measurement. Use the keypad, the directional
arrow keys or the rotary knob to enter the channel span.
Back
Returns to the previous menu.
ACPR
Accesses a menu of Adjacent Channel Power Ratio measurement options:

3-26
On Off
Begins or ends the ACPR measurement.
Main Ch BW
Sets the bandwidth of the main channel for ACPR measurement. Use the keypad, the
directional arrow keys or the rotary knob to enter the a specific frequency. When using
the keypad, select the GHz, MHz, kHz, or Hz soft key to accept the frequency input.
Changing this value automatically changes the adjacent channel bandwidth and
channel spacing.
Adj Ch BW
Sets the bandwidth of the adjacent channels for ACPR measurement. Use the keypad,
the directional arrow keys or the rotary knob to enter the a specific frequency. When
using the keypad, select the GHz, MHz, kHz, or Hz soft key to accept the frequency
input.
Ch Spacing
Sets the channel spacing between the main and adjacent channels. Use the keypad, the
directional arrow keys or the rotary knob to enter the a specific frequency. When using
the keypad, select the GHz, MHz, kHz, or Hz soft key to accept the frequency input.
This value must be greater than or equal to half of the main channel bandwidth, plus
half of the adjacent channel bandwidth.
Back
Returns to the previous menu.
AM/FM Demod
The user can select AM, Narrow Band FM (300 µs de-emphasis), Wide Band FM (50 µs
de-emphasis), Upper Sideband or Lower Sideband.
On Off
Turns AM/FM Demodulation on or off.
Demod Type
Provides soft keys to select the type of signal to be demodulated:
FM Wide Band
FM Narrow Band
AM
USB
LSB
Demod Freq
Use the keypad, the directional arrow keys or the rotary knob to enter the center
frequency of the signal to be demodulated. This frequency does not have to be within
the current frequency sweep range to which the instrument is set.
Demod Time
Use the keypad, the directional arrow keys or the rotary knob to increase or decrease
the demodulation time, and press the Enter key to select. The demodulation time can
be set from 100 milliseconds to 500 seconds. The instrument sweeps one time for
every demodulation period. Sweeping pauses during the demodulation time.
Set Demod Freq to Current Marker Freq
Sets the demodulation frequency to the frequency of the current marker.
Beat Freq Osc
Sets the beat frequency of the oscillator to exactly set the demodulation frequency of
USB and LSB signals.

3-27
Volume
The current volume setting is displayed on the screen. Use the Up/Down arrow keys or
rotary knob to change the volume, and press the Enter key to select.
Back
Returns to the previous menu.
C/I
The Carrier to Interference ratio is a two-step measurement sequence that first measures
the amplitude of a carrier, then, with the carrier turned off, measures the amplitude of all
other interfering signals within the channel bandwidth.
On Off
Starts and stops the carrier to interference measurement.
Center Freq
Use the keypad, the directional arrow keys or the rotary knob to enter the center
frequency.
Span
Use the keypad, the directional arrow keys or the rotary knob to enter the frequency
span.
Carrier Signal Type
Opens a menu to select the carrier signal type.
NB FHSS (Narrow Band Frequency Hopping Spread Spectrum)
Use this setting when the signal being measured is 802.11b.
WB FHSS (Wide Band Frequency Hopping Spread Spectrum)
Use this setting when the signal being measured is 802.11a or 802.11g.
Broadband
Use this setting when the signal being measured is a digital modulation format such
as CDMA, GSM, and so forth.
Back
Returns to the previous menu.
Min Sweep Time
Set the minimum sweep time for the measurement.
Back
Returns to the previous menu.
Tracking Generator (MS2721B with Option 20 only)
See Chapter 8 for information about the Tracking Generator (Option 20) for the MS2721B.
Measurement Off
Pressing this soft key turns off any active measurement, including demodulation.
Mode
To access the functions under the Mode menu, select the Shift key, then the Mode (9) key.
Available modes include Spectrum Analyzer, Interference Analyzer, Channel Scanner,
several 3G cellular measurement options, and WiMAX measurement options. The mode list
in a particular instrument depends upon the options that are purchased for that instrument.

3-28
Preset
To access the functions under the Preset menu, select the Shift key, then the Preset (1) key.
The Preset menu soft keys are shown in Figure 3-10.
Preset
This key resets the instrument to the default starting conditions of full band sweep,
10 dBm log reference level, 10 dB/division scaling, 0 dB reference level offset, all
measurements turned off and trigger set to free run.
Save Setup
Opens a dialog box to name and save the current operating settings, allowing them to be
recalled later to return the instrument to the state it was in at the time the setup was saved.
The saved setup can be named using the keypad to select numbers, the rotary knob to
highlight a number or character and pressing the knob to select, or by selecting the soft key
for each letter. Use the Shift key to select an upper case letter. Use the Left/Right
directional arrows to move the cursor position. Press Enter to save the setup.
Recall Setup
This soft key brings up a selection box that allows selection and recall of a previously
stored instrument setup. Use the rotary knob or the Up/Down arrow keys to highlight the
saved setup, and press Enter, the rotary knob, or the Recall soft key to select. All current
instrument settings are replaced by the stored setup information. Press the Esc key to
cancel the recall.
Figure 3-10. Preset Menu Soft Keys
Preset
Preset
Save
Setup
Recall
Setup

3-29
Span
The Span menu is used to set the frequency range over which the instrument will sweep.
For the MS2721B, the span can be set from 10 Hz to 7.1 GHz. For the MS2723B the span
can be set from 10 Hz to 13 GHz, and for the MS2724B the span can be set from 10 Hz to
20 GHz. The Span can also be set to zero span for all models.
Press the Span function key located below the display to access the Span menu. The Span
menu soft keys are shown in Figure 3-11.
Span
This soft key shows the current value for span in units of GHz, MHz, kHz, or Hz. When
the Span button is pressed, span becomes the active parameter and may be changed. Use
the keypad, the directional arrow keys or the rotary knob to increase or decrease the span
frequency. If the span is changed by using the up and down arrow keys, the span changes
by the value of the Frequency Step entered in the Frequency menu.
Span Up 1-2-5
This is a convenient way to quickly arrive at a wider span value. The first time the soft key
is pressed, the span value increases to the nearest even value that starts with 1, 2, or 5. For
example if the span is 1.8 MHz, pressing the soft key for the first time changes the span to
2.0 MHz, the next press takes the value to 5.0 MHz and so on.
Span Down 1-2-5
This is a convenient way to narrow the frequency span. The first time the soft key is
pressed, the span value decreases to the nearest even value that starts with 1, 2, or 5. For
example if the span is 1.8 MHz, pressing the soft key for the first time changes the span to
1.0 MHz, the next press takes the value to 500 kHz, then 200 kHz and so on.
Full Span
Pressing this button sets the span to cover the entire tunable spectrum of the instrument.
Figure 3-11. Span Menu Soft Keys
Span
Span
7.100 GHz
Span Up
1-2-5
Span Down
1-2-5
Full Span
Zero Span
Last Span
3-30
Zero Span
This soft key sets zero span. In this mode the display shows amplitude changes at a single
frequency. This function is frequently used to allow the easy monitoring of power
variations over time. For example, if information about the amplitude of an 802.11a access
point signal is needed, the access point frequency would be set as the center frequency,
resolution bandwidth would be set to a value wide enough to encompass the signal and the
tester would walk around the access point usable area while the Spectrum Master records
the amplitude using slow sweep.
Last Span
This soft key returns the span to the most recent span value immediately before a change
was made.
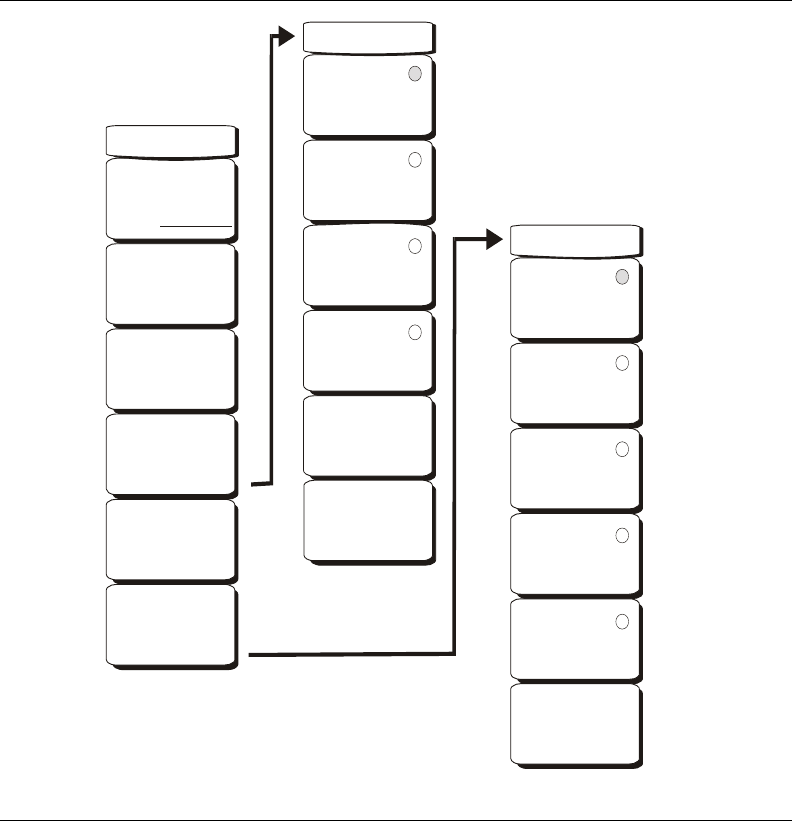
3-31
Sweep
To access the functions under the Sweep menu, select the Shift key, then the Sweep (3) key.
The Sweep menu soft keys are shown in Figure 3-12.
Sweep Single/Continuous
This soft key toggles between continuous sweep and single sweep. In single sweep mode,
the results of a sweep are displayed on the screen while the instrument awaits a trigger
event to start a new sweep.
Manual Trigger
Pressing this soft key causes the instrument to make a single sweep when the instrument is
in single sweep mode. This key has no function when the instrument is in continuous
sweep mode.
Reset Sweep
This soft key stops the current sweep, clears trace averaging results, clears the maximum
hold results, if selected, and restarts the sweep at the left side of the screen.
Figure 3-12. Sweep Menu Soft Keys
Sweep
Sweep
Single Continuous
Manual
Trigger
Reset
Sweep
Detection
Min Sweep Time
50 us
Trigger
Type -->
-->
Trigger
Free
Run
External
Video
Change
Trigger
Position
Manual
Trigger
Back
-->
Detection
Peak
RMS
Negative
Sample
Quasi-peak
Back
-->
3-32
Detection
Several detection methods tailor the performance of the instrument to meet specific
measurement requirements. In general, there are more measurement points across the
screen than display points. The various detection methods are different ways of dealing
with selecting which measurement point will be shown at each display point.
Peak
This method causes the largest measurement point to be shown for each display point,
and assures that a narrow peak is not missed.
RMS
This method performs a root-mean-square calculation of all the measurement points in
each display point, and is particularly useful in displaying the average value of noise.
Negative
This method causes the smallest measurement point to be shown for each display point.
Typically this mode is used to help detect small discrete signals in the presence of
nearly equal values of noise. The display points that contain only noise will tend to
show lower amplitudes than those that contain discrete signals.
Sample
This is the fastest detection method since for each display point only one frequency
point is measured. Use this method when speed is of paramount importance and the
possibility of missing a narrow peak is not important.
Quasi-peak
Selects the quasi-peak detector. When the quasi-peak detector is selected, the allowed
resolution bandwidths are 200 Hz, 9 kHz, and 120 kHz. Also, the RBW/VBW ratio is
set to 1 so that the video bandwidth is the same as the resolution bandwidth.
Back
Returns to the previous menu.
Min Sweep Time
This function allows a minimum sweep time to be specified. Use the keypad, the
directional arrow keys or the rotary knob to set the minimum sweep time from
10 microseconds to 600 seconds. When using the keypad, the available time units are
minutes, seconds, milliseconds, and microseconds.
If the required sweep time for accurate measurement is longer than the specified minimum,
then the time required for accurate measurements will prevail.
Trigger Type
Sets the type of trigger to be used.
Free Run
In this mode, a new sweep is started immediately upon completion of an old sweep. No
trigger event is required to initiate a sweep.
External
A TTL signal applied to the External Trigger BNC input connector causes a single
sweep to occur. This mode is used in zero span, and triggering occurs on the rising
edge of the signal. After the sweep is complete, the resultant trace is displayed until the
next trigger signal arrives.
3-33
Video
This mode is used in zero span to set the power level at which a sweep is initiated. The
power level can be set from –120 dBm to +20 dBm. The trigger is based on the
measured signal level. If no signal reaches or exceeds the trigger level, there will be no
trace on the screen. This mode is used in Zero Span.
Change Trigger Position
This soft key is used in conjunction with video triggering to set the horizontal position
on the display where a signal that meets the video triggering criterion will be placed.
The value can be from 0% to 100%. Zero percent places the triggering event at the left
edge of the screen while 100% places the triggering at the right edge of the screen.
When the trigger position is any value other than 0%, the portion of the trace before the
trigger event is displayed very quickly since the trace data is stored in memory. The
portion of the trace after the trigger point is displayed on the screen at the normal rate
as the signal is swept. This mode is used in Zero Span.
Back
Returns to the previous menu.

3-34
System
To access the functions under the System menu, select the Shift key, then the System (8)
key. The System menu soft keys are shown in Figure 3-13.
Status
Pressing this soft key displays the current system status, including the operating system
and firmware versions, temperatures and other details such as current battery information.
Press Esc or Enter to return to normal operation.
Figure 3-13. System Menu Soft Keys
System
Status
Self
Test
Application
Self
Test
Application
Options
System
Options -->
-->
Back
-->
Back
-->
Options
Impedance
50 Ohm 75 Ohm Other
Ext Ref Freq
Reset
Factory
Defaults
Master
Reset
Update
OS Via
Ethernet
Update
OS Via
USB
System Options
Date
&
Time
Ethernet
Config
Language
Brightness
Name
Volume
Reset
Back
-->
-->
3-35
Self Test
This soft key initiates a series of diagnostic tests that test the components of the
instrument. A display will list the individual tests with a pass or fail indication. Press Esc
or Enter to return to normal operation.
Application Self Test
This soft key initiates a series of diagnostic tests related to the performance of the
spectrum analyzer. A display will list the individual tests with a pass or fail indication.
Press Esc or Enter to return to normal operation.
Application Options
This soft key presents a menu to select application options.
Impedance 50 Ohm/75 Ohm/Other
Select either 50 ohm, 75 ohm, or other impedance value. Selecting 75 ohm selects the
7.5 dB loss of the Anritsu 12N50-75B or 12N75B adapter. For other adapters, select
Other and enter the appropriate loss.
Ext Ref Freq
Select the frequency of the external reference from the list presented. Valid frequencies
are 1 MHz, 1.2288 MHz, 1.544 MHz, 2.048 MHz, 2.4576 MHz, 4.8 MHz,
4.9152 MHz, 5 MHz, 9.8304 MHz, 10 MHz, 13 MHz and 19.6608 MHz at amplitude
from –10 dBm to +10 dBm.
Back
Returns to the previous menu.
System Options
This key opens a selection of system option soft keys.
Date and Time
This soft key brings up a dialog box for setting the current date and time. Use the soft
keys or the Left/Right arrow keys to select the field to be modified. Use the keypad, the
Up/Down arrow keys or the rotary knob to select the date and time. Select Enter to
accept the changes, or press the Esc key to return to normal operation without
changing anything.
Ethernet Configuration
This soft key brings up a dialog box to set the IP address of the instrument.
Type Manual/DHCP
This softkey selects whether the address will be entered manually, or supplied
automatically by a network DHCP server. If Manual is selected, use the soft keys or
the Left/Right arrow keys to select the field to be modified. Use the keypad, the
Up/Down arrow keys or the rotary knob to enter the input. Select Enter to accept the
changes, or press the Esc key to return to normal operation without changing
anything.
Language
This soft key brings up a selection box allowing selection from a list of built-in
languages for the Spectrum Master displays. The languages currently available are
English, French, German, Spanish, Japanese, Chinese, Korean, and Italian. In addition,
up to two custom languages may be selected if they have been defined using the Master
Software Tools software and loaded into the instrument. Two custom languages may be
loaded into the instrument. If a mode does not have language translations available,
English is the default language. Select Enter to accept the change, or press the Esc key
to return to normal operation without changing anything.
3-36
Brightness
The brightness of the display can be adjusted to optimize viewing under a wide variety
of lighting conditions. Use the keypad, the Up/Down arrow keys or the rotary knob to
select a brightness level from 1 to 9, 9 being the brightest. Select Enter to accept the
change.
Name
Opens a dialog box to name the instrument. The unit can be named using the keypad to
select numbers, the rotary knob to highlight a number or character and pressing the
knob to select, or by selecting the soft key for each letter. Use the Shift key to select an
upper case letter. Use the Left/Right directional arrows to move the cursor position.
Press Enter to save the name.
Volume
The current volume setting is displayed on the screen. Use the keypad, the Up/Down
arrow keys or the rotary knob to change the volume and press the Enter key to accept
the change.
Reset
Opens a menu of reset and update options.
Factory Defaults
Restores the instrument to the factory default values, including Ethernet, language
and brightness settings. Press the Enter key to initiate the reset, and turn the unit off,
then on again to complete. Press Esc to return to normal operation without resetting.
Master Reset
This will restore factory setting to all system parameters, including Time/Date,
Ethernet, language and brightness settings. Also, all user files in the internal memory
are deleted, and the original language and antenna files are restored. Press the Enter
key to initiate the reset, and turn the unit off, then on again to complete. Press Esc to
return to normal operation without resetting.
Update OS Via Ethernet
Select this soft key to update the instrument operating system via the Ethernet
connection. Press Enter to begin the update, or press Esc to return to normal
operation without updating.
Update OS Via USB
Select this soft key to update the instrument operating system via the USB
connection. Press Enter to begin the update, or press Esc to return to normal
operation without updating.
Back
Returns to the previous menu.
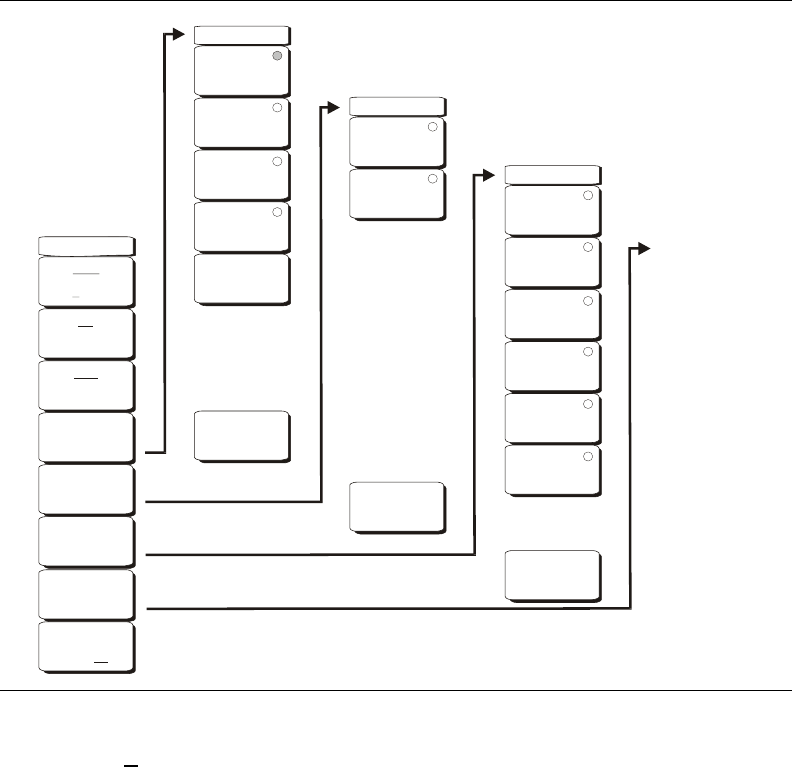
3-37
Trace
To access the functions under the Trace menu, select the Shift key, then the Trace (5) key.
The Spectrum Master is capable of displaying up to three traces, one with live data, Trace B
with either live data or a stored measurement and Trace C with a stored measurement. The
Trace menu soft keys are shown in Figure 3-14.
Trace A, B, C
This soft key selects which trace is the active trace. The active trace is the one that is
underlined. As the key is pressed, the underline advances from A to B to C and back to A.
View Blank
This soft key toggles the currently active trace to be either visible or hidden.
Write/Hold
Hold is used to temporarily stop writing measurement points to the screen. The instrument
will continue to sweep in the background without updating the screen. This is useful if
Max Hold or Averaging are running in the background to capture an elusive event, while
enabling close observation of the last sweep update.
Selecting Write will update the screen with all the accumulated measurement data
collected while Hold was activated. Hold is not applicable to Trace B, and is only available
on Trace C when using Trace Math operations.
Figure 3-14. Trace Menu Soft Keys
Trace A Ops
Normal ->A
Max Hold ->A
Min Hold ->A
Average ->A
Back
-->
# of Averages
10
Trace C Ops
A -> C
Max Hold ->C
B < - > C
Min Hold ->C
Back
-->
B-A->C
A-B ->C
Trace B Ops
A ->B
B < - > C
Back
-->
-->
Trace
Trace
A B C
View
Blank
Trace A
Operations
Trace B
Operations
Trace C
Operations
Write
Hold
-->
-->
-->
-->
Full Screen
On Off
Save/Recall
See File Menu,
page 3-6.
3-38
Trace A Operations
All choices related to Trace A, which is the default main trace are organized under this soft
key.
Normal -> A
Displays a trace based on the detection method selected: Peak, RMS, Negative or
Sample. These detection choices are explained in the amplitude and sweep menus since
you can make a choice in either place.
Max Hold -> A
Displays the largest signal for each display point over multiple sweeps. Using this
function along with Min Hold on Trace C allows the simultaneous live display of the
maximum and minimum values of sweeps.
Min Hold -> A
Displays the smallest signal for each display point over multiple sweeps. Using this
function along with Max Hold on Trace C allows the simultaneous live display of the
maximum and minimum values of sweeps.
Average -> A
Displays the average value of multiple sweeps for each display point.
# of Averages
This soft key lets the user choose how many traces to average. The value can be
anywhere from 1 to 65535.
Back
Returns to the previous menu.
Trace B Operations
All choices related to Trace B are under this menu. Trace B displays only stored traces,
never live, dynamic traces.
A -> B
Takes the trace currently displayed in Trace A and copies it into Trace B. If Trace B
was turned off, pressing this button not only copies the trace but also turns on Trace B
for viewing, the same as selecting Trace B and pressing the "View/Blank" soft key.
B <- -> C
Swaps Trace B and Trace C.
Back
Returns to the previous menu.
Trace C Operations
A -> C
Stores Trace A into Trace C and turns on Trace C if it was off.
B<- ->C
Swaps Traces B and C.
Max Hold ->C
Shows the live maximum value of Trace A in Trace C. Note that by using Traces C and
A, one with max hold and one with min hold you can simultaneously see both values.
Min Hold -> C
Shows the live minimum value of Trace A in Trace C.

3-39
A - B -> C
Shows the difference between the trace A and trace B values in trace C. This can be a
live trace if trace A is a live trace.
B - A -> C
Subtracts the value of trace A from trace B and places the results in trace C. This
function is very useful for observing the changes in values of live trace A compared to
a trace stored in trace B. Display scaling can be set to a value that makes the
differences easy to see.
Back
Returns to the previous menu.
Save
Selecting this soft key opens a list of save function soft keys, as explained below.
Save Setup
Opens a dialog box to name and save the current operating settings, allowing them to
be recalled later to return the instrument to the state it was in at the time the setup was
saved. The saved setup can be named using the keypad to select numbers, the rotary
knob to highlight a number or character and pressing the knob to select, or by selecting
the soft key for each letter. Use the Shift key to select an upper case letter. Use the
Left/Right directional arrows to move the cursor position. Press Enter to save the
setup.
Save Measurement
Initiates a dialog box to name and save the current active trace A. The saved
measurement trace can be named using the keypad to select numbers, the rotary knob
to highlight a number or character and pressing the knob to select, or by selecting the
soft key for each letter. Use the Shift key to select an upper case letter. Use the
Left/Right directional arrows to move the cursor position. Press Enter to save the
measurement trace.
Save On Event…
The instrument can be configured to automatically save a measurement if a selected
condition is satisfied. Approximately 3000 measurements can be saved before the
memory is full. Saving to either the Compact Flash or USB flash drive can simplify
transferring measurements to a computer.
… Crossing Limit On/Off
When Crossing Limit is On, and an upper or lower limit line is set, if any point in a
measurement exceeds either the upper or lower limit line, the measurement is
automatically saved at the end of the sweep. The saved measurement is named "LIM"
followed by the date and time in the format: LIMyyyymmddhhmmss. The time value in
the file name will generally be slightly earlier than the measurement time stamp shown
in the file list, since the file name is created at the time the limit violation is noted and
the time stamp is the time at which the measurement file is actually saved.
If a limit line has not been set, selecting this soft key results in the on-screen message:
"You must have a limit ON first."
NOTE: If a measurement has been previously saved, then the Save
Measurement dialog box will open with the previously saved name
displayed. To save the new measurement with a similar name (for
example, Trace-1, Trace-2, and so forth), press the Right directional arrow
and add the changes. To create a completely new name, use the keypad
or the rotary knob, or select the soft key for each letter.

3-40
… Sweep Complete On/Off
When Sweep Complete is On, the measurement is automatically saved at the end of a
sweep. This is particularly useful for very slow sweeps. The saved measurement is
named "EOS" with a file name in the format: EOSyyyymmddhhmmss.
Save Then Stop On/Off
When the Save Then Stop soft key is set to On, the instrument will save just one
measurement when the Crossing Limit or Sweep Complete soft keys are set to On, and
the qualifying event occurs. Sweeping stops after a measurement is saved. If it is set to
Off, sweeping continues after a measurement is saved and more measurements may be
saved. The default for this selection is Off.
Clear All
Pressing this soft key turns off both save on event conditions and sets Save then Stop to
Off, the default state.
Back
Returns to the top-level file menu.
Save Screen as JPEG
This function saves a measurement trace as a graphics file. The saved measurement can
be named using the keypad to select numbers, the rotary knob to highlight a number or
character and pressing the knob to select, or by selecting the soft key for each letter.
Use the Shift key to select an upper case letter. Use the Left/Right directional arrows to
move the cursor position. Press Enter to save the measurement after entering the file
name. The file is saved in the internal memory with the specified name, with .jpg
appended.
Directory Management
Sort Method
Name Type Date
File lists can be sorted by the name of the file, the type of file (SPA file, STP file, and
so forth) or by the date that the file was saved.
Sort
Ascending Descending
Selects whether the selected sort is sorted from lowest to highest (ascending) or
highest to lowest (descending). When sorting by name, the sort will place file names
that start with numbers before file names that start with letters (an ASCII sort).
NOTE: This feature should be used with care. With Save Then Stop set to
Off (the default) a large number of measurements can be saved when the
Crossing Limit or Sweep Complete soft keys are set to On, making it
time-consuming to retrieve saved measurements or to delete unwanted
measurements. When there are many saved measurements, the time
required to display a file list can be several minutes. When it is necessary
to save many measurements, it is best to save them to the Compact Flash
module or USB Flash Drive.

3-41
Current Location
Int USB CF
This choice lets you select where measurements and setups will be saved. Pressing
the soft key toggles between storing files on the internal memory or a Compact Flash
memory module. The "current location" and the "copy to destination" will never be
the same. Changing the current location to save files causes the "copy to destination"
to be automatically changed if the selected storage location is the same as the selected
current location.
Copy to Destination
Int USB CF
This choice lets you select where measurements and setups in the "current location"
will be copied. The "current location" and the "copy to destination" may not be the
same. If you change the destination to which the instrument will copy files, the
current location is automatically changed if the current location is the same as the
selected copy to destination.
Copy From Current Location To Destination
Pressing this soft key causes all measurements, setups and jpg files stored in the user
selected "current location" to be copied to the "copy to destination." If no storage
module is installed in the instrument, an error message is displayed.
Format Compact Flash
This selection erases all files on an installed Compact Flash module. A message is
displayed warning that all files will be erased. Press Enter to confirm that you want to
erase and Esc to quit without erasing. In addition to erasing all files stored on the
Compact Flash, the /usr directory is created for storage of measurements, setups and
jpg files.
Back
The Back key returns to the previous menu.
Full Screen On/Off
Toggles between a standard screen display, with 551 measurement data points, and the Full
Screen mode, with 661 measurement data points. The increased size of the full screen X-Y
display hides the data labels on the left side of the display. When in Full Screen mode,
measurement and marker boxes are not available.
3-42
4-1
Chapter 4
Measurement Fundamentals
Introduction
Measurement fundamentals include the use of additional spectrum analyzer functions
beyond frequency, span, amplitude and marker functions. In particular, this section focuses
on resolution bandwidth, video bandwidth, sweep, and attenuator functions.
Resolution Bandwidth
Resolution Bandwidth is determined by the intermediate frequency (IF) filter bandwidth.
The spectrum analyzer traces the shape of the IF filter as it tunes past a signal. If more than
one IF filter is used in a spectrum analyzer, the narrowest one dominates and is considered
the resolution bandwidth. The choice of resolution bandwidth depends on several factors.
Filters take time to settle. That is, when a signal first appears at the input of the filter, it will
take a while before the signal appears at the output. Additionally, the output of the filter will
take some time to settle to the correct value, so that it can be measured. The narrower the
filter bandwidth (resolution bandwidth) the longer the settling time needs to be and so the
slower the sweep speed.
The choice of resolution bandwidth will depend on the signal being measured. If two
closely-spaced signals are to be measured individually, then a narrow bandwidth is required.
If a wider bandwidth is used, then the energy of both signals will be included in the
measurement. Thus, the wider bandwidth does not have the ability to look at frequencies
selectively but instead simultaneously measures all signals falling within the resolution
bandwidth. Therefore, a broadband measurement would include all signals and noise within
the measurement bandwidth into a single measurement.
On the other hand, a narrow-band measurement will separate the frequency components,
resulting in a measurement that includes separate peaks for each signal. There are
advantages to each. The ultimate decision will depend on the type of measurement required
by the user.
There is always some amount of noise present in a measurement. Noise is often broadband
in nature; that is, it exists at a broad range of frequencies. If the noise is included in the
measurement, the measured value could be in error (too large) depending on the noise level.
With a wide bandwidth, more noise is included in the measurement. With a narrow
bandwidth, less noise enters the resolution bandwidth filter, and the measurement is more
accurate. If the resolution bandwidth is narrower, the noise floor will drop on the spectrum
analyzer display. This is because the IF filter of the analyzer has been made narrower in
bandwidth, which lets in less noise. As the measured noise level drops, smaller signals that
were previously obscured by the noise can now be measured.
4-2
Video Bandwidth
Spectrum analyzers typically use another type of filtering after the detector called video
filtering. This filter also affects the noise on the display but in a different manner than the
resolution bandwidth. In video filtering, the average level of the noise remains the same but
the variation in the noise is reduced. Hence, the effect of video filtering is a "smoothing" of
the signal noise. The resultant effect on the analyzer's display is that the noise floor
compresses into a thinner trace, while the position of the trace remains the same.
Changing the video bandwidth (VBW) does not improve sensitivity, but it does improve
repeatability when making low-level measurements. As a general rule of thumb, most field
spectrum analyzer measurements are made at a video bandwidth that is a factor of 10 to 100
less than the resolution bandwidth. In the Spectrum Master, this ratio can be specified in the
BW menu. For a resolution bandwidth of 30 kHz, the typical video bandwidth setting
options are either 3 kHz or 300 Hz.
Sweep Limitations
With some spectrum analyzers, the user has control over sweep time (the elapsed time of
each sweep, sometimes called scan time). An analyzer cannot be swept arbitrarily fast while
maintaining its specified accuracy, but will have a sweep rate limitation depending on the
resolution bandwidth, video bandwidth, and frequency range selected. The sweep rate is not
usually chosen by the user but is determined by the frequency range swept divided by the
sweep time. The limitation on sweep rate comes from the settling or response time of the
resolution and video bandwidth filters. If an analyzer is swept too quickly, the filters do not
have time to respond, and the measurement is inaccurate. Under such conditions, the
analyzer display tends to have a "smeared" look to it, with the spectral lines being wider than
normal and shifted to the right.
Fortunately, the Spectrum Master is designed to relieve the user from having to calculate the
sweep speed or experiment to discover a sweep speed that yields accurate results. When
changing the RBW and VBW with the Spectrum Master, the sweep speed automatically
changes to the fastest sweep speed that will yield accurate results. The sweep speed will be
faster for a wide RBW or VBW and slower for a narrow RBW or VBW. The sweep speed
can also be changed manually, by pressing the Shift and Sweep keys, then selecting the Min
Sweep Time soft key. Enter a sweep time from 0.05 ms to 600 seconds. If the minimum
sweep time entered by the user is less than the value needed to assure accurate results, the
value that delivers accurate results will be used. Regardless of the minimum sweep time
setting, the Spectrum Master will never sweep faster than the RBW and VBW settings will
allow. The Spectrum Master is designed to assure that no uncalibrated measurement
conditions will occur.
Attenuator Functions
Attenuation adjusts the hand held spectrum analyzer input attenuator. In Auto mode, as the
reference level is increased, the attenuation is increased. In Manual mode, the input
attenuation can be adjusted using the keypad or the Up/Down arrow keys. The attenuator
range is 0 dB to 65 dB, in 5 dB steps. When the preamplifier is on, input attenuation can be
either 0 dB or 10 dB.
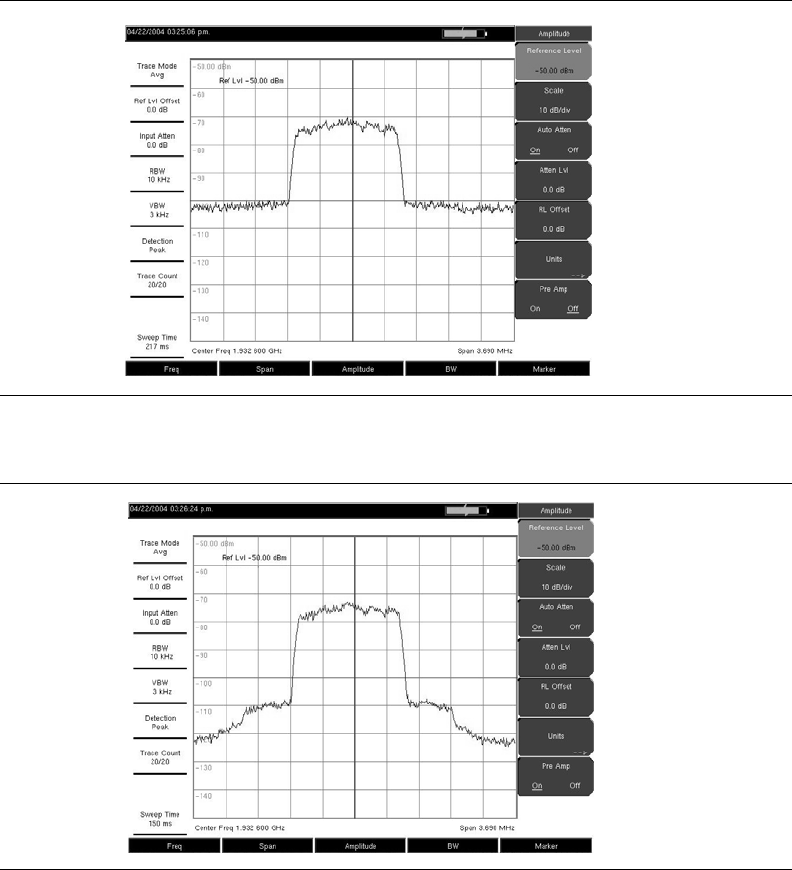
4-3
Preamplifier Operation
The preamplifier can be turned on and off by pressing the Amplitude key, then selecting the
Preamp On/Off soft key. The preamplifier in the MS2721B has a gain of approximately
25 dB and generally will lower the noise floor by that amount. When the preamplifier is on,
input attenuation can be either 0 dB or 10 dB. The preamplifier in the MS2723B and
MS2724B has a gain of approximately 10 dB from 9 kHz to 4 GHz and no gain above 4
GHz. Setting a frequency greater than 4 GHz will turn off the Preamp (MS2723B and
MS2724B only).
Preamplifier Measurement Example
Figure 4-1 and Figure 4-1 show the same signal with the preamplifier off and then on.
Notice that when the preamplifier is turned on, the noise floor drops significantly allowing
spectral regrowth components that were lost in the noise without the preamplifier to become
easily visible.
Figure 4-1. Preamplifier Off
Figure 4-2. Preamplifier On in the MS2721B
4-4
5-1
Chapter 5
Field Measurements
Introduction
One-button measurements are built into the Spectrum Master for field strength, occupied
bandwidth, channel power, adjacent channel power ratio, and carrier to interference ratio
(C/I) tests. In addition, AM/FM/SSB demodulation is available to aid in the identification of
interfering signals. This chapter presents brief examples demonstrating the use of these
measurements.
Occupied Bandwidth Measurement
Occupied bandwidth (OBW) is a common measurement performed on radio transmitters.
This measurement calculates the bandwidth containing the total integrated power occupied
in a given signal bandwidth. There are two different methods of calculation depending on
the technique used to modulate the carrier.
% Down Method
The occupied frequency bandwidth is calculated as the bandwidth containing the specified
percentage of the transmitted power.
dBc Down Method
The occupied frequency bandwidth is defined as the bandwidth between the upper and
lower frequency points at which the signal level is a desired number of dB below the peak
carrier level.
Required Equipment
• Anritsu Spectrum Master
• Test Port Extension Cable, Anritsu part number 15NNF50 - 1.5C
• 30 dB, 50 Watt, bi-directional, DC –18 GHz, N(m) - N(f), Attenuator, Anritsu 42N50A-30
(required if the power level being measured is >+30 dBm)
Procedure
1. Using the test port extension cable and the 30 dB, 50 watt, bi-directional attenuator (if
needed) connect the Spectrum Master to the appropriate transmitter test port or signal
source.
2. Press the Freq key followed by the Center Freq soft key and enter the center frequency
using the keypad, the arrow keys, or the rotary knob. If entering a frequency using the
keypad, then the soft key labels change to GHz, MHz, kHz, and Hz. Select the
appropriate units key. Selecting the Enter key has the same affect as the MHz soft key.
3. If the attenuator was connected in 1., then press the Amplitude key and select the RL
Offset soft key and set the reference level offset to –30 dB to compensate for the loss in
the attenuator.
4. Press the Amplitude key then press the Reference Level soft key to set the appropriate
reference level.
5. Press the Atten Lvl soft key to set the input attenuation level or leave Auto Atten set to
On.
6. Press the BW key to set the resolution bandwidth and video bandwidth if desired.
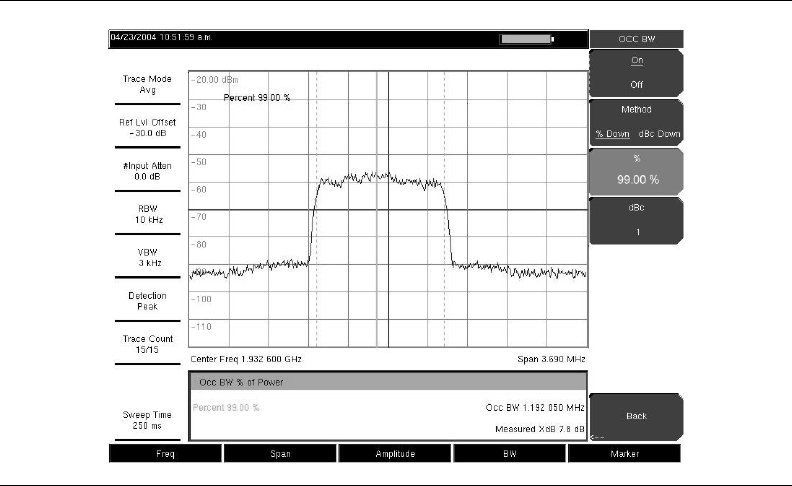
5-2
7. Press the Shift key then the Measure (4) key followed by the OCC BW soft key.
Choose the measurement method (dBc Down or % Down) by pressing the Method soft
key. The selected method is underlined.
8. Press the dBc or % soft keys to adjust the settings as needed. Common values are 99%
and 30 dBc.
9. Press the On/Off soft key to start the measurement. An information box will appear
below the graph while occupied bandwidth measurement is on.
Figure 5-1 shows the occupied bandwidth results using the % of power method on a CDMA
signal. Occupied Bandwidth is a constant measurement; once it is turned on, it remains on
until it is turned off by pressing the On/Off soft key again. Occupied bandwidth is calculated
at the end of each sweep.
Channel Power Measurement
Channel power measurement is one of most common measurements for a radio transmitter.
This test measures the output power, or channel power, of a transmitter over the frequency
range. Out-of-specification power measurements indicate system faults, which can be in the
power amplifiers or in filter circuits. Channel Power measurements can be used to validate
transmitter performance, comply with government regulations, or to keep overall system
interference at a minimum.
Frequency and span settings for many signal standards can be automatically set by pressing
the Frequency key and then the Signal Standard soft key. Choose the desired standard and
press Enter. Press the Channel # soft key to enter the channel number at which the
measurement is to take place.
Figure 5-1. Occupied Bandwidth Results Using the % of Power Method

5-3
CDMA Channel Power
The Spectrum Master can be used to measure CDMA signals in terms of channel power. It is
important to use the proper settings to accurately measure a CDMA signal because a CDMA
signal is different from a CW signal in many respects.
The following are the recommended settings for IS-95 CDMA measurements:
• CDMA Channel Bandwidth: 1.23 MHz
• Auto RBW setting: 10 kHz
• Auto VBW setting: 3 kHz
These values are set automatically when the appropriate signal standard is selected.
Averaging may be used if desired.
CDMA Channel Power Measurement
Required Equipment
• Anritsu Spectrum Master
• 30 dB, 50 Watt, bi-directional, DC –18 GHz, N(m) - N(f), Attenuator, Anritsu 42N50A-30
(required if the power level being measured is >+30 dBm)
• Test Port extension cable, Anritsu 15NNF50 - 1.5C
Procedure
1. Using the test port extension cable and 30 dB attenuator (if needed), connect the signal
source to the input of the attenuator, and connect the output of the attenuator to the
RF In test port of the Spectrum Master.
2. Press the Freq key followed by the Signal Standard soft key. Scroll through the dialog
box using the rotary knob or Up/Down arrow keys to highlight the desired air interface
standard. In this case, select CDMA US PCS - Downlink and press Enter.
3. Press the Channel# soft key and enter the channel number using the keypad, the arrow
keys, or the rotary knob. In this case, select channel 50.
4. If the attenuator was connected in 1., press the RL Offset soft key and set the reference
level offset to –30 dB to compensate for the loss of the attenuator.
5. Press the Amplitude key and select the Reference Level soft key. Set the reference
level to –50 dBm.
6. Press the Scale soft key and set the scale to 10 dB/division.
7. Press the Shift key then the Measure (4) key, and select the Channel Power soft key.
8. Select the Center Freq soft key and verify that the center frequency of the Spectrum
Master is set to that of the CDMA signal, 1.9326 GHz in this example. This value is
automatically set when the air interface standard and channel number are selected.
9. Press the Ch Pwr Width soft key and verify that the integration bandwidth is set to
1.23 MHz.
10. Press the Span soft key and verify that the span is set to 3.69 MHz.
NOTE: The integration bandwidth is defined as the frequency span in
which the spectrum analyzer integrates measured power readings, while
the channel span is the frequency range of the analyzer sweeps.

5-4
11. Make the measurement by pressing the On/Off soft key. The Spectrum Master displays
the measurement results in the message area.
GSM Channel Power Measurement
Global Systems for Mobile (GSM) communication is a globally accepted standard for digital
cellular communication. There are three frequency bands allocated to GSM mobile phones,
one at 850 MHz, one at 900 MHz, and another at 1800 MHz. GSM uses a combination of
Frequency Division Multiple Access (FDMA) and Time Division Multiple Access (TDMA).
Within each band are approximately one hundred available carrier frequencies on 200 kHz
spacing (FDMA), and each carrier is broken up into time-slots so as to support eight separate
conversations (TDMA). Each channel has an uplink and a downlink, 80 MHz apart. GSM
uses the Gaussian Minimum Shift Keying (GMSK) modulation method. Due to the nature of
TDMA, GSM transmitters ramp RF power rapidly. If the transmitter keys on too quickly,
users on different frequencies (especially those close to the channel of interest) may
experience significant interference. This is one of the reasons that spurious measurements
are extensively used in GSM applications.
Required Equipment
• Anritsu Spectrum Master
• Test Port extension cable, Anritsu 15NNF50 - 1.5C
Procedure
1. Using the test port extension cable, connect the signal source to the RF In test port of
the Spectrum Master.
1. Press the Amplitude key and select the Reference Level soft key to set the reference
level to –20 dBm. Adjust the values given in this procedure to match your measurement
conditions.
2. Press the Scale soft key and set the scale to 10 dB/division.
3. Press the BW key and verify that RBW Auto and VBW Auto are On.
4. Press the Freq key followed by the Signal Standard soft key. Scroll through the dialog
box using the rotary knob or Up/Down arrow keys to highlight the GSM900 standard for
the measurement and press Enter.
5. Press the Channel# soft key and enter the channel number using the keypad, the arrow
keys, or the rotary knob. For this example, select Channel 60.
6. Press the Shift key then the Measure (4) key and press the Channel Power soft key.
7. Select the Center Freq soft key and verify that the center frequency of the Spectrum
Master is set to that of the GSM signal, in this case 947.0 MHz.
8. Press the Ch Pwr Width soft key and enter 200 kHz for the integration bandwidth, or set
the integration bandwidth appropriate for the particular application.
9. Select the Span soft key and enter 800 kHz as the channel span, or set the channel span to
a value appropriate for the particular application.
10. Make the measurement by pressing the Measure soft key. The Spectrum Master displays
the measurement results in the message area.
NOTE: Channel power is a constant measurement. Once it is turned on, it
will remain on until it is turned off by pressing the On/Off key again.
NOTE: Channel Power is a constant measurement. Once it is turned on, it
will remain on until it is turned off by pressing the On/Off soft key again.

5-5
AMPS Channel Power Measurement
The Spectrum Master can be used to test Advanced Mobile Phone System (AMPS) base
stations. These systems are narrow-band FM voice transceivers with system control
functionality. The energy of the AMPS signal is represented by multiple narrow band FM
channels spread over a wide frequency range. AMPS frequency allocations are within the
800 MHz and 900 MHz cellular telephone spectrum. Each service provider can use half of
the 825-845 MHz range for receiving signals from cellular phones and half the
870-890 MHz range for transmitting to cellular phones. The bands are divided into 30 kHz
channels with 12 kHz maximum frequency deviation.
Required Equipment
• Anritsu Spectrum Master
• Test Port extension cable, Anritsu 15NNF50 - 1.5C
• 30 dB, 50 Watt, bi-directional, DC –18 GHz, N(m) - N(f), Attenuator, Anritsu 42N50A-30
(required if the power level being measured is >+30 dBm)
Procedure
1. Using the test port extension cable, and the 30 dB attenuator if needed, connect the
signal source to the input of the attenuator, and connect the output of the attenuator to
the RF In test port of the Spectrum Master.
11. If the attenuator was connected in 1., press the Amplitude key and select the RL Offset
soft key and set the reference level offset to –30 dB to compensate for the loss in the
attenuator.
12. Press the Amplitude key and select the Reference Level soft key to set the reference
level to –50 dBm.
13. Press the Scale soft key and set the scale to 10 dB/division.
14. Press the Amplitude key followed by the Auto Atten soft key if needed to turn On auto
attenuation.
15. Press the BW key and verify that RBW Auto and VBW Auto are On.
16. Press the Shift key then the Trace (5) key. Press the Trace Mode soft key as needed to
select Max (maximum hold).
17. Press the Shift key then the Measure (4) key and press the Channel Power soft key.
18. Select the Center Freq soft key and set the center frequency of the Spectrum Master to
that of the signal, in this example 888.852728 MHz.
19. Press the Ch Pwr Width soft key and enter 30 kHz for the integration bandwidth.
20. Select the Channel Span soft key and enter 90 kHz as the channel span, or set the channel
span to a value appropriate for the particular application.
21. Make the measurement by pressing the On/Off soft key.
NOTE: Channel Power is a constant measurement. Once it is turned on, it
will remain on until it is turned off by pressing the On/Off soft key again.
5-6
Adjacent Channel Power Ratio
Another common transmitter measurement is that of Adjacent Channel Power Ratio
(ACPR), or adjacent channel leakage power. This is defined as the ratio of the amount of
leakage power in an adjacent channel to the total transmitted power in the main channel.
This measurement can be used to replace the traditional two-tone intermodulation distortion
(IMD) test for system non-linear behavior.
The result of an ACPR measurement is expressed as a power ratio. In order to calculate the
upper and lower adjacent channel values, the Spectrum Master needs to know the values of
four parameters:
• Main Channel Center Frequency
• Measurement Channel Bandwidth
• Adjacent Channel Bandwidth
• Channel Spacing
When a signal standard is selected from the list in the Spectrum Master, these four values are
automatically set for that signal standard.
Adjacent Channel Power Measurement
Required Equipment
• Anritsu Spectrum Master
• 30 dB, 50 watt, Bi-Directional, DC - 18 GHz, N(m) - N(f), Attenuator, Anritsu
42N50A-30 (if needed for the power level being measured)
• Test Port extension cable, Anritsu 15NNF50 - 1.5C
Procedure
1. Using the test port extension cable, and the 30 dB attenuator if needed, connect the
signal source to the input of the attenuator, and connect the output of the attenuator to
the RF In test port of the Spectrum Master.
22. If the attenuator was connected in 1., press the Amplitude key and select the RL Offset
soft key and set the reference level offset to –30 dB to compensate for the loss of the
attenuator.
23. Press the Amplitude key and select the Reference Level soft key to set the reference
level to the appropriate reference level.
24. Press the Atten Lvl soft key to set the input attenuation level needed for the
measurement. This value depends on the input power level and any external attenuator.
Enter an attenuation level to achieve roughly –40 dBm at the input mixer.
25. Press the BW key and verify that RBW Auto and VBW Auto are On.
26. You can set the measurement parameters in two ways. If the signal standard and channel
are known, then press the Freq key and set the Signal Standard and Select Channel soft
keys for the signal to be measured then skip to 32.. If the signal standard and channel are
not known, then follow the procedure in 27. through 31.
27. Press the Freq key, select the Center Freq soft key, and enter the desired center
frequency.
28. Press the Shift key then the Measure key and press the ACPR soft key.
29. Press the Main Ch BW soft key, and enter the desired main channel bandwidth. For an
IS-95 CDMA signal, enter 1.23 MHz.

5-7
30. Press the Adj Ch BW soft key, and enter the desired adjacent channel bandwidth. For an
IS-95 CDMA signal, enter 1.23 MHz.
31. Press the Ch Spacing soft key, and enter the desired channel spacing. For an IS-95
CDMA signal, enter 1.23 MHz.
32. Begin making measurement by pressing the On/Off soft key. The Spectrum Master
displays the measurement results in the message area.
GSM Adjacent Channel Power Measurement
Required Equipment
• Anritsu Spectrum Master
• 30 dB, 50 watt, Bi-Directional, DC - 18 GHz, N(m) - N(f), Attenuator, Anritsu
42N50A-30 (if required for the power level being measured)
• Test Port extension cable, Anritsu 15NNF50 - 1.5C
Procedure
1. Using the test port extension cable and 30 dB attenuator, connect the signal source to
the input of the attenuator, and connect the output of the attenuator to the RF In test
port of the Spectrum Master.
2. If the attenuator was connected in 1., press the RL Offset soft key and set the reference
level offset to –30 dB to compensate for the loss of the attenuator.
3. Press the Amplitude key and select the Reference Level soft key to set the reference
level to 60 dBm.
4. Press the Atten Lvl soft key to set the input attenuation level needed for the
measurement. This value depends on the input power level and any external attenuator.
Enter an attenuation level to achieve roughly –40 dBm at the input mixer.
5. Press the BW key and verify that RBW Auto and VBW Auto are On.
6. There are two ways to set the measurement parameters. If the signal standard and
channel are known, press the Freq key and set the Signal Standard and Select Channel
soft keys for the signal to be measured then skip to 12. If the signal standard and
channel are not known, then follow the procedure in 7. through 12.
7. Press the Freq key, select the Center Freq soft key, and enter the desired center
frequency.
8. Press the Shift key then the Measure key and select the ACPR soft key.
9. Select the Main Ch BW soft key, and enter the main channel bandwidth.
10. Select the Adj Ch BW soft key, and enter the adjacent channel bandwidth.
11. Select the Ch Spacing soft key, and enter the channel spacing.
12. Make the measurement by pressing the On/Off soft key. The detection method is
automatically changed to RMS Average.
Solid vertical lines are drawn on the display to indicate the main channel. Dashed vertical
lines define the adjacent channels. The Spectrum Master will display the measurement
results in the message area.
NOTE: Adjacent Channel Power Ratio is a constant measurement. After it
is turned on, it will remain on until it is turned off by pressing the On/Off key
again.
NOTE: Adjacent Channel Power Ratio is a constant measurement. Once it
is turned on, it will remain on until it is turned off by pressing the On/Off soft
key again.

5-8
AMPS (TDMA) Adjacent Channel Power Measurement
Required Equipment
• Anritsu Spectrum Master
• 30 dB, 50 watt, Bi-Directional, DC - 18 GHz, N(m) - N(f), Attenuator, Anritsu
42N50A-30 (if needed for the power level being measured)
• Test Port extension cable, Anritsu 15NNF50 - 1.5C
Procedure
1. Using the test port extension cable, and the 30 dB attenuator if needed, connect the
signal source to the input of the attenuator, and connect the output of the attenuator to
the RF In test port of the Spectrum Master.
2. If the attenuator was connected in 1., press the Amplitude key and select the RL Offset
soft key and set the reference level offset to –30 dB to compensate for the loss in the
attenuator.
3. Press the Amplitude key and select the Reference Level soft key to set the reference
level to –50 dBm.
4. Press the RL Offset soft key to set the reference level offset to –30 dB.
5. Press the Auto Atten soft key and set automatic attenuation to On.
6. Press the Freq key, select the Center Freq soft key, and enter 835 MHz.
7. Press the Shift key then the Measure key and press the ACPR soft key.
8. Press the Main Ch BW soft key to enter the main channel bandwidth. For an AMPS
signal, enter 30 kHz.
9. Press the Adj Ch BW soft key, and enter the adjacent channel bandwidth. For an AMPS
signal, enter 30 kHz.
10. Select the Ch Spacing soft key, and enter the channel spacing. For an AMPS signal,
enter 30 kHz.
11. Make the measurement by pressing the On/Off soft key.
The detection method is automatically changed to RMS Average. Solid vertical lines are
drawn on the display to indicate the main channel. Dashed vertical lines define the adjacent
channels. The Spectrum Master will display the measurement results in the message area.
NOTE: Adjacent Channel Power Ratio is a constant measurement. Once it
is turned on, it will remain on until it is turned off by pressing the On/Off soft
key again.
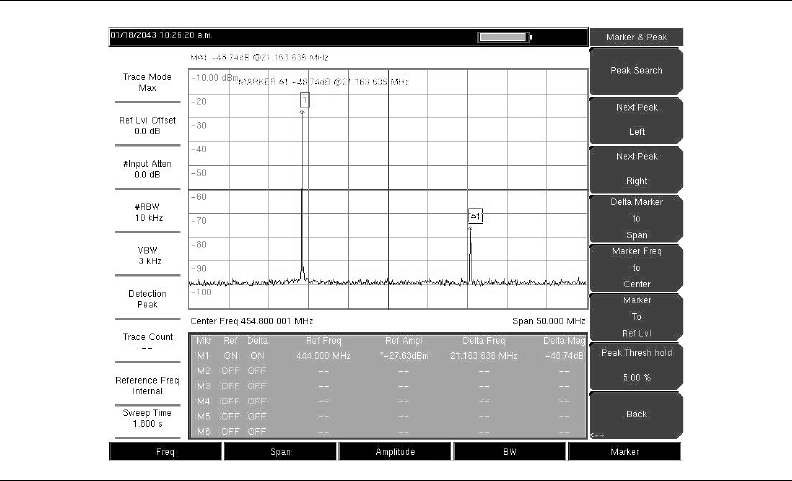
5-9
Out-of-Band Spurious Emission Measurement
Required Equipment
• Anritsu Spectrum Master
• Test Port extension cable, Anritsu 15NNF50 - 1.5C
Procedure
1. Using the test port extension cable, connect the signal source to the RF In test port of
the Spectrum Master.
2. Press the Freq key, select the Center Freq soft key, and enter the center frequency.
3. Press the Span key. Set the span wide enough to include the primary channel
bandwidth and upper and lower channel bandwidths.
4. Press the Amplitude key, then press the Reference Level soft key and set the reference
level to –20 dBm.
5. Press the Auto Atten soft key set the attenuation to On.
6. Press the BW key and use the RBW and VBW soft keys to set the resolution bandwidth
to 3kHz and the video bandwidth to 300 Hz.
7. Press the Marker key and press the Marker123456 soft key to select marker 1. The
underlined number indicates the active marker.
8. Press the On/Off soft key and use the arrow keys, the keypad, and the rotary knob to
move the marker over one of the spurs.
9. Compare the value of the marker to the specified allowable level of out-of-band
spurious emissions for the corresponding channel transmit frequency.
10. Repeat 8. and 9. for the remaining spurs. Use either Marker 1 again, or choose another
marker. Figure 5-2 shows a simulated out-of-band spurious signal 21.000 MHz from
the carrier using a delta marker.
Figure 5-2. Simulated Out-of-Band Spurious Emission Measurement
5-10
In-band/Out-of-Channel Measurements
The in-band/out-of-channel measurements are those measurements that measure distortion
and interference within the system band, but outside of the transmitting channel. These
measurements include in-band spurious emissions and adjacent channel power ratio (also
called spectral regrowth). There are stringent regulatory controls on the amount of
interference that a transmitter can spill to neighboring channels. In order to determine
compliance with the allowable level of spurious emissions, two parameters need to be
specified:
• Measurement channel bandwidth
• Allowable level of spurious emissions
In-band Spurious Measurement
Required Equipment
• Anritsu Spectrum Master
• 30 dB, 50 watt, Bi-Directional, DC - 18 GHz, N(m) - N(f), Attenuator, Anritsu
42N50A-30
• Test Port extension cable, Anritsu 15NNF50 - 1.5C
Procedure
1. Using the test port extension cable and 30 dB, 50 watt, Bi-directional attenuator,
connect the Spectrum Master to appropriate transmit test port.
2. Press the Freq key, select the Center Freq soft key, and enter the center frequency.
3. Press the Span key. Set the span wide enough to include the primary channel
bandwidth and upper and lower channel bandwidths.
4. Press the Amplitude key and then press the Reference Level soft key to set the
reference level to –20 dBm.
5. Select the RL Offset soft key to set the reference level offset to –30 dB to compensate
for the loss of the attenuator
6. Press the Auto Atten soft key set the attenuation to On.
7. Press the BW key and use the RBW and VBW soft keys to set the resolution bandwidth
to 10 kHz and the video bandwidth to 300 Hz.
8. Press the Marker key and press the Marker 1 2 3 4 5 6 soft key to select marker 1. The
underlined number indicates the active marker.
9. Press the On/Off soft key and use the arrow keys, the keypad and the knob to move the
marker over one of the spurs.
10. Compare the value of the marker to the specified allowable level of
in-band/out-of-channel spurious emissions for the corresponding channel transmit
frequency.
11. Repeat steps 9 and 10 for the remaining spurs. Use either Marker 1 again, or choose
another marker.
Figure 5-3 shows a simulated in-band spur at 1.625 MHz from the carrier frequency. The
carrier is measured by M1. The delta marker on M1 shows the signal at fc+ 1.625 MHz to be
60.17 dB down from the carrier. These values should be compared against the specification
for the transmitter being tested.
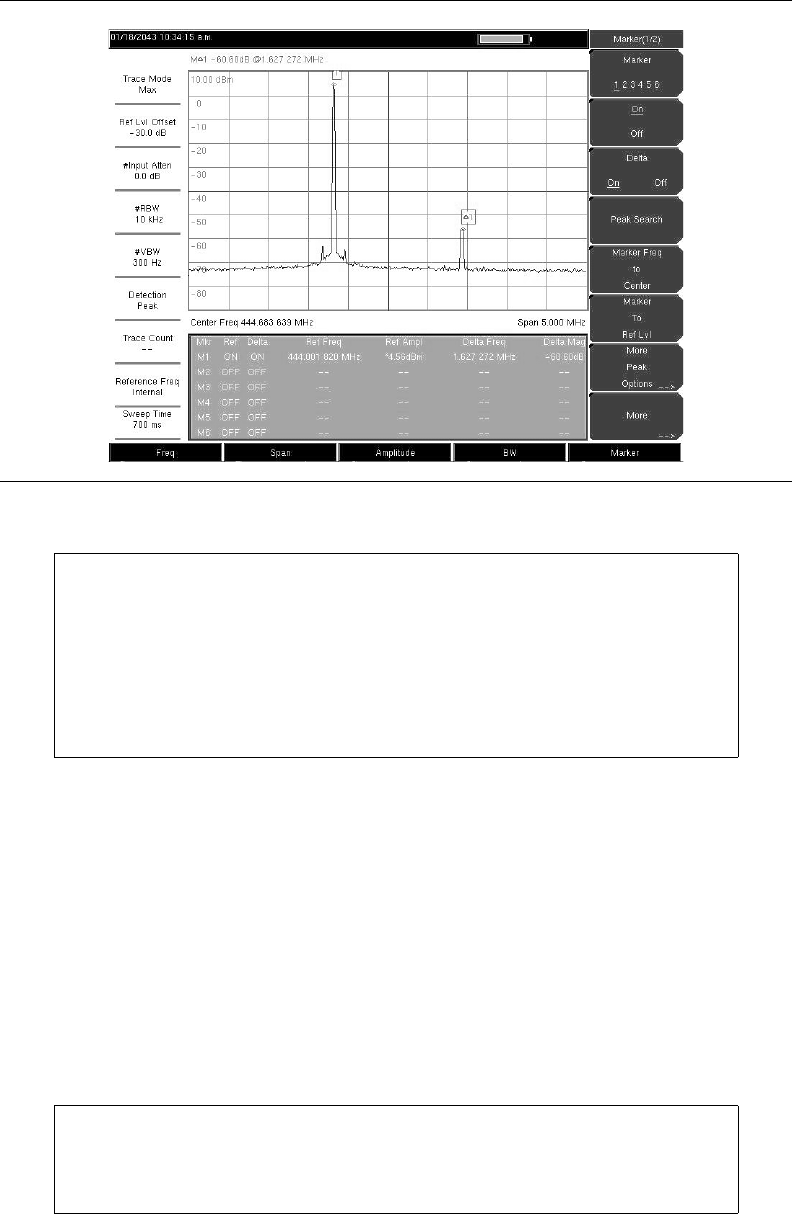
5-11
Field Strength
Required Equipment
• Anritsu Spectrum Master
• Portable Antenna for which antenna factors or antenna gain and bandwidth data are
available.
Procedure
1. Press the Shift key then the Measure key and press the Field Strength soft key.
2. Press the Antenna soft key and use the Up/Down arrow keys or the rotary knob to
select the desired antenna. Press the Enter key to select.
3. Connect the antenna to the Spectrum Master.
Figure 5-3. In-band Spurious Measurement
NOTE: The resolution bandwidth of a spectrum analyzer is determined by
the intermediate frequency (IF) filter bandwidth. The Spectrum Master
traces the shape of the IF filter as it sweeps past a signal. Therefore, if two
equal-amplitude signals are very close to each other, the measurement
result can appear to be one single response because the IF or resolution
bandwidth is not small enough to resolve the two signals. Similarly, if two
signals are not equal in amplitude but are very close together, the smaller
signal may not be seen because it is hidden under the large response.
NOTE: Select an antenna from the standard list available in the Spectrum
Master, or use the Antenna Editor feature of Anritsu Master Software Tools
to define a custom antenna and upload the antenna information to the
antenna list.
5-12
4. Press the Freq key, select the Center Freq soft key, and enter the center frequency.
5. Press the Span key. Set the span wide enough to include the primary channel
bandwidth and upper and lower channel bandwidths.
6. Press the BW key and verify that RBW Auto and VBW Auto are On.
7. To change the units of measurement, press the Amplitude hard key, then press the
Units soft key and select dBm, dBV, dBmV, or dBµV.
8. Select either the Volts or Watts soft key, as required. The Spectrum Master
automatically adjusts the measurement by the antenna factors selected. Marker values
will be displayed in the same units as selected for the amplitude.
Antenna Calculations
The following is a list of various antenna calculations should you find it necessary to convert
from one to another:
Conversion of signal levels from W to V in a 50 ohm system:
P=V2/R
where:
P = power in Watts
V = voltage level in Volts
R = resistance in Ohms
Note that 1 mW = 10-3 W and 1µV = 10-6V.
For power in dBm, and voltage in dB(µV).
VdB(µV) = P (dBm) + 107 dB
Power density to field strength. An alternate measure of field strength to electric field is
power density:
Pd=E2/120p
where:
E = field strength in V/m
P = Power density in W/m
Power density at a point:
Pd=PtGt/(4 pr2)
In the far field, where electric and magnetic fields are related by the impedance of free
space:
Where Pd = power density in W/m
Pt= power transmitted in Watts
Gr = gain of transmitting antenna
r = distance from the antenna in meters
5-13
AM/FM/SSB Demodulation
The Spectrum Master built-in demodulator for AM, narrowband FM, wideband FM and
single sideband (selectable USB and LSB) allows a technician to hear an interfering signal
to ease identification. The demodulated signal can be heard using either the built-in speaker,
or through a monaural headset connected to the 2.5-mm jack on the test panel.
Demodulation Procedure
1. Press the Shift key followed by the Measure (4) key and the AM/FM Demod soft key.
2. Press the Demod Type soft key and select FM Wide Band, FM Narrow Band, AM, USB,
or LSB to match the modulation format of the signal.
3. Press the Back soft key.
4. Press the Demod Freq soft key and use the keypad or rotary knob to enter the center
frequency of the signal to be demodulated. For USB and LSB signals, fine tune the
signal by adjusting the Beat Freq Osc. By default the BFO frequency is set to zero,
meaning that the re-injected carrier is exactly at the demodulation frequency. The Beat
Freq Osc soft key allows adjustment of the beat frequency oscillator to fine tune the
signal through a span of ±10000 Hz.
5. Press the On/Off soft key to enable the measurement.
6. Press the Volume soft key and use the Up/Down arrow keys or rotary knob to change
the audio volume from 0% to 100%. For most headsets a volume of 40% is adequate.
7. The Demod Time soft key sets the time the Spectrum Master will demodulate the
signal. Enter a value from 100 ms to 500 seconds.
Carrier to Interference Ratio Measurement
Carrier to Interference Ratio (C/I) Measurement is a two-step process, first measuring the
carrier level and then, with the carrier turned off, measuring the remaining signals and noise
in the band of interest. After the two measurements are complete, the ratio of the carrier
level to the noise plus interference is displayed using three assumptions:
• The interferer is a narrowband frequency hopping signal (NB FHSS)
• The interferer is a wideband frequency hopping signal (WB FHSS)
• The interferer is a broadband signal (BB).
The primary application for this type of measurement is determining the magnitude of
interference problems for 802.11b, 802.11g and 802.11a access points (hot spots).
Procedure
1. Press the Frequency key followed by the Signal Standard soft key. Select the
appropriate signal standard based on the signal to be measured and press Enter.
2. Press the Select Channel soft key, select the operating channel of the access point
being measured and press Enter.
3. Press the Shift key followed by the Measure (4) key and the C/I soft key.
4. Press the Center Freq soft key and enter the desired frequency, unless a Signal
Standard and Channel have already been selected in the Frequency menu.
5. If needed, press the Span soft key and set an appropriate span width for the signal to be
measured.
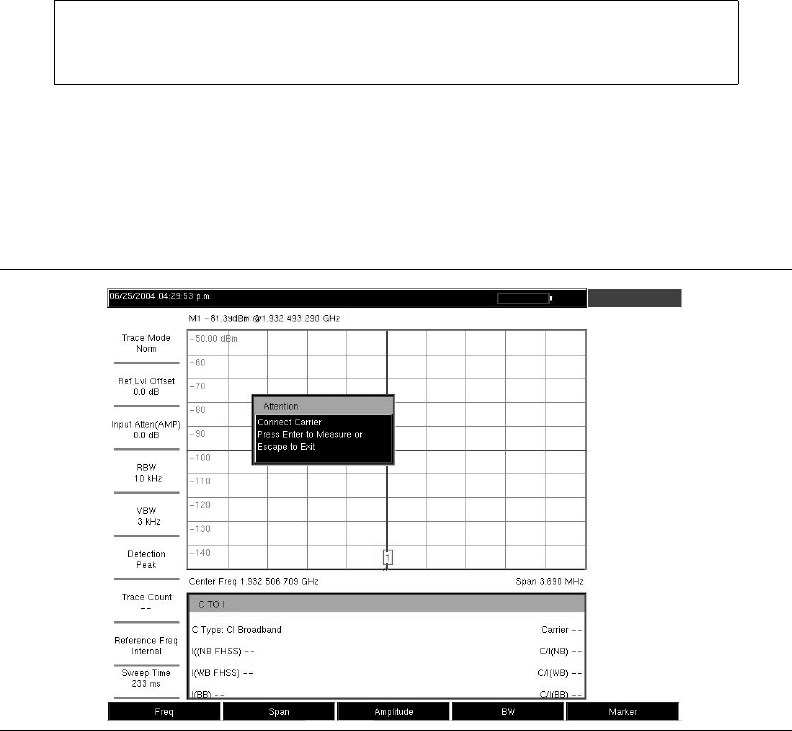
5-14
6. If the signal environment includes slow frequency hopping signals, such as cordless
telephones, press the Min Sweep Time soft key to set a sweep time of one second or
more to give a good chance of capturing instances of the interfering signal.
7. Press the On/Off soft key and follow the on-screen prompts to complete the
measurement.
8. After the measurement is complete, the measurement box gives results for the three
different signal types. Some measurement results may show as Error, and this is to be
expected.
The following figures show the C/I measurement steps, ready to measure the carrier, with
the carrier measured, and the measurement results.
NOTE: Access to the transmitter is required to complete this procedure as
the transmitted carrier must be turned off for the second portion of the
measurement.
Figure 5-4. C/I Measurement, Ready to Measure the Carrier
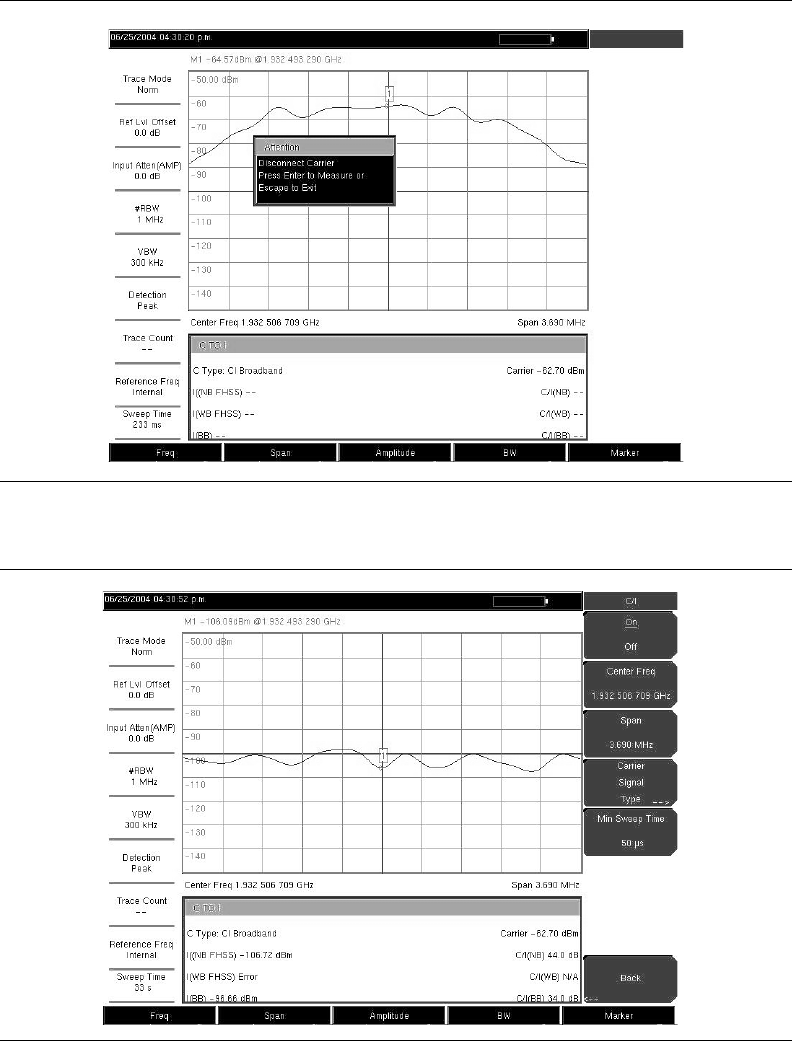
5-15
Figure 5-5. C/I Measurement, Carrier Measured
Figure 5-6. C/I Measurement, Results
5-16
6-1
Chapter 6
Interference Analysis
Measurements
Introduction
Many wireless networks operate in complicated signal environments. Three or four base
station antennas may be located on the same tower, and can create interference problems,
which can affect system capacity and coverage.
The Interference Analyzer, option 25, adds three measurement capabilities to the Spectrum
Master to aid in the solving of interference problems:
• Spectrogram
• Signal Strength
• RSSI
The instrument also has a spectrum mode which displays signals in a traditional spectrum
analyzer view.
The following menus are available in Interference Analyzer mode.
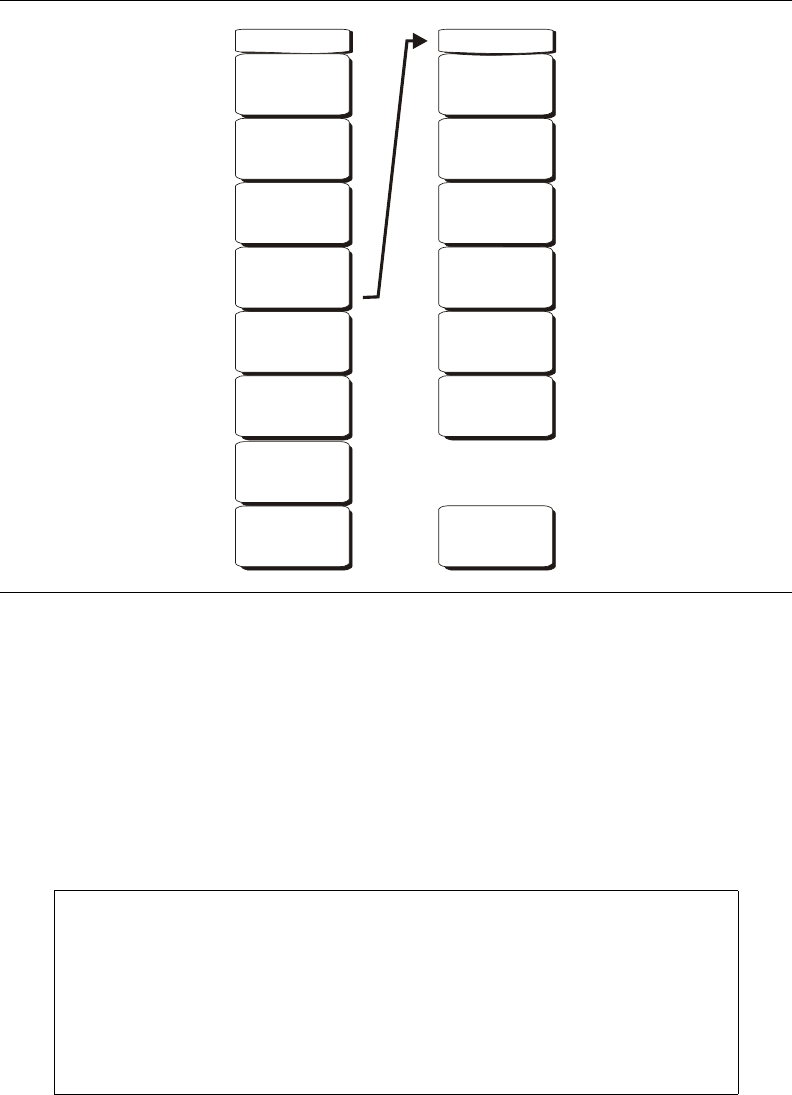
6-2
Freq Menu
The tuning frequency range for the Spectrum Master can be entered in several different ways
depending on what makes the most sense for the user or for the application. The center
frequency and span can be specified, the start and stop frequencies can be entered, or a
signal standard and channel number can be selected from the built-in list.
Center Freq
Press the Freq key followed by the Center Freq soft key and enter the desired frequency
using the keypad, the arrow keys, or the rotary knob. If entering a frequency using the
keypad, the soft key labels change to GHz, MHz, kHz, and Hz. Select the appropriate units
key. Selecting the Enter key has the same affect as the MHz soft key.
Start Freq
Press the Freq key followed by the Start Freq soft key and enter the desired frequency
using the keypad, the arrow keys, or the rotary knob. If a start frequency higher than the
current stop frequency is entered, the stop frequency will be changed to yield a 10 Hz span.
Figure 6-1. Interference Analyzer Mode Freq Menu
NOTE: When using the up and down arrows, the frequency moves in
steps defined by the value entered using the Freq Step soft key.
When using the left or right arrow keys, the frequency of the active
parameter moves by 10% of the current frequency span. If the instrument
is in zero span, the left and right arrows do nothing.
Turning the rotary knob changes the active frequency parameter in
increments of one display point for each click of the knob. There are 551
display points across the screen (661 points in full-screen mode).
Back
-->
Freq Span
Span
7.100 GHz
Span Up
1-2-5
Span Down
1-2-5
Full Span
Zero Span
Last Span
Center Freq
3.550 GHz
Start Freq
0 Hz
Stop Freq
7.100 GHz
Span
Freq Step
1.000 MHz
Signal
Standard
Channel
-- --
-->
6-3
Stop Freq
Press the Freq key followed by the Stop Freq soft key and enter the desired frequency
using the keypad, the arrow keys, or the rotary knob. If a stop frequency lower than the
current start frequency is entered, the start frequency will be changed to yield a 10 Hz
span.
Span
Press the Freq key followed by the Span soft key and enter the desired span. The Span
menu is used to set the frequency range over which the instrument will sweep. For the
MS2721B, the span can be set from 10 Hz to 7.1 GHz. For the MS2723B, the span can be
set from 10 Hz to 13 GHz, and for the MS2724B the span can be set from 10 Hz to
20 GHz. The span can also be set to zero.
The soft key shows the current value for span in units of GHz, MHz, kHz, or Hz. When the
Span button is pressed, span becomes the active parameter and may be changed. Use the
keypad, the directional arrow keys or the rotary knob to increase or decrease the span
frequency. If the span is changed using the Up/Down arrow keys, the span changes by the
value of the Frequency Step for each key press.
Freq Step
Press the Freq key followed by the Freq Step soft key to enter the desired frequency step
size. The frequency step specifies the amount by which a frequency will change when the
Up/Down arrow key is pressed. The center frequency, start frequency, and stop frequency
values can be changed using Freq Step. The active parameter will be changed by the
frequency step when the Up/Down arrow keys are pressed. If Freq Step is the active
parameter, nothing happens when the arrow keys are pressed. The frequency step size can
be any value from 1 Hz to 7.1 GHz with a resolution of 1 Hz in the MS2721B, up to
13 GHz in the MS2723B and up to 20 GHz in the MS2724B.
Use the keypad or the rotary knob to change the Frequency Step size.
Signal Standard
Use the Up/Down arrow keys or the rotary knob to highlight a signal standard and press
Enter to select.
When a signal standard is selected, the center frequency and span for the first channel of
the particular standard is automatically tuned. Other settings, such as channel spacing and
integration bandwidth, are also automatically entered. Appendix A contains a table of the
signal standards that are in the instrument firmware.
Channel --
Use the Up/Down arrow keys, the keypad, or the rotary knob to select a channel number
for the selected signal standard. The center of the channel is tuned to the center of the
spectrum analyzer display.
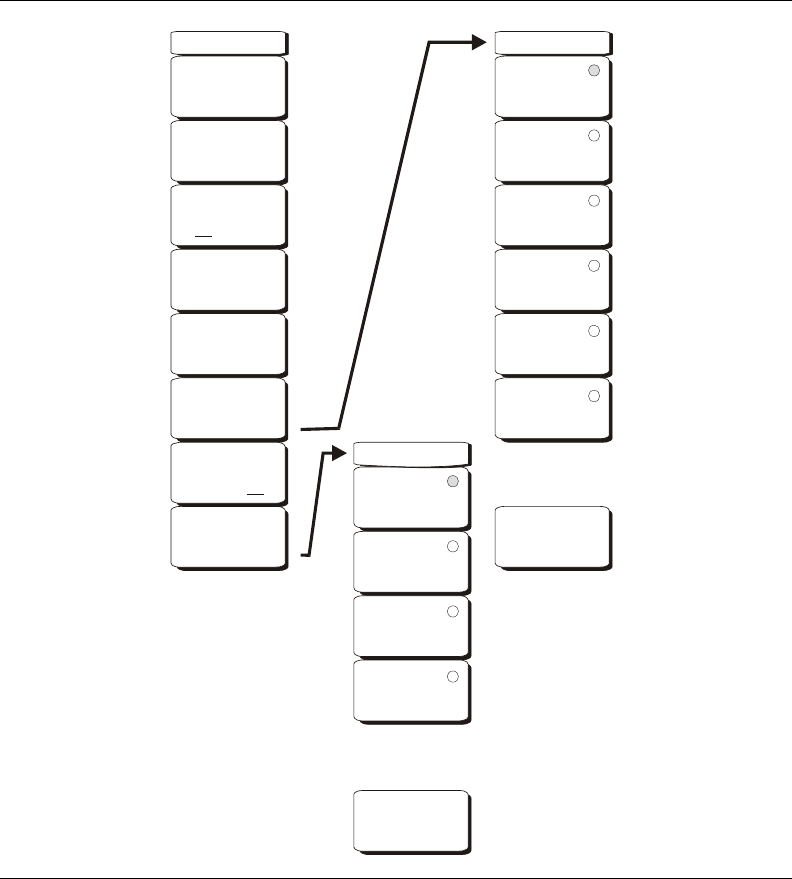
6-4
Amplitude Menu
Reference Level
The reference level is the top graticule line on the display, and can be set from +30 dBm to
–150 dBm. A negative value may be entered from the key pad, using the ± key as the
minus sign. After entering the value press the dBm soft key or the Enter key. The
Up/Down arrow keys change the reference level in 10 dB steps, and the Left/Right arrow
keys change the value by 1 dB. The rotary knob changes the value by 0.1 dB per detent.
The reference level value may be modified by the reference level offset value to
compensate for an external attenuator, as discussed later in this chapter.
Scale
The scale can be set in 1 dB steps from 1 dB per division to 15 dB per division. The value
can be changed using the keypad, the rotary knob or the Up/Down arrow keys.
Figure 6-2. Interference Analyzer Mode Amplitude Menu
Amplitude
Reference Level
10.0 dBm
Scale
10 dB/div
Auto Atten
OffOn
Atten Lvl
30.0 dB
RL Offset
0.0 dB
Units
-->
Units
Watt
Back
dBm
dBV
dBmV
dbuV
Volt
-->
Detection
Detection
Back
Peak
RMS
Negative
Sample
-->
Pre Amp
On Off
-->
6-5
Auto Atten On/Off
Input attenuation can be either tied to the reference level (On) or manually selected (Off).
When input attenuation is tied to the reference level, attenuation is increased as higher
reference levels are selected to make sure the instrument input circuits are not saturated by
large signals that are likely to be present when high reference levels are required.
Atten Lvl
Input attenuation can be set from 0 dB to 65 dB, in 5 dB steps. Select this soft key and use
the keypad, the rotary knob or the Up/Down arrow keys to change the attenuation value.
When the Preamplifier is turned on, the allowed attenuation settings are 0 dB and 10 dB.
RL Offset
Reference Level Offset compensates for the presence of input attenuation or gain external
to the instrument. Enter a positive value to compensate for an external amplifier or a
negative value to compensate for an external attenuator. Use the ± key to enter the negative
sign when a negative attenuation value is being entered.
Units
Select the display units from this soft key menu:
dBm
dBV
dBmV
dBµV
Volt
Watt
The Units soft key is only available in the Spectrum view. Press the Back soft key to return
to the Amplitude menu.
Pre Amp On/Off
This soft key turns the low-noise front-end preamplifier on or off. The preamplifier lowers
the noise floor by approximately 25 dB in the MS2721B. To assure accurate measurement
results, the largest signal into the instrument input when the preamplifier is turned on
should be <–50 dBm. In the MS2723B and MS2724B, the preamplifier lowers the noise
floor by approximately 10 dB up to 4 GHz.

6-6
BW (Bandwidth) Menu
RBW
The current resolution bandwidth value is displayed in this soft key. The RBW can be
changed using the keypad, the Up/Down arrow keys, or the rotary knob. The range is
10 Hz to 3 MHz in a 1-3 sequence, from 10 Hz to 30 Hz to 100 Hz, and so on.
Auto RBW
When Auto RBW is On, the instrument selects the resolution bandwidth based on the
current span width. The ratio of span width to RBW can be specified using the Span/RBW
soft key.
VBW
The current video bandwidth value is displayed in this soft key. The VBW can be changed
using the keypad, the Up/Down arrow keys, or the rotary knob. The range is 1 Hz to
3 MHz in a 1-3 sequence.
Auto VBW
When Auto VBW is On, the instrument selects the video bandwidth based on the
resolution bandwidth. The ratio of video bandwidth to resolution bandwidth can be set
using the RBW/VBW soft key.
RBW/VBW
This soft key displays the ratio between resolution bandwidth and video bandwidth. To
change the ratio, select this soft key and use the keypad, the Up/Down arrow keys, or the
rotary knob to select a new ratio. The default ratio is 3.
Span/RBW
This soft key displays the ratio between the span width and the resolution bandwidth. The
default value is 300, meaning that the span width is approximately 300 times the resolution
bandwidth. The value is approximate because resolution bandwidth filters come in discrete
steps while span width can be set to any value up to 7.1 GHz in the MS2721B, 13 GHz in
the MS2723B and up to 20 GHz in the MS2724B. To change the ratio, select this soft key
and use the keypad, the Up/Down arrow keys, or the rotary knob to select a new ratio.
Figure 6-3. Interference Analyzer Mode BW Menu
BW
RBW
3 MHz
Auto RBW
OffOn
Auto VBW
OffOn
VBW
1 MHz
Span/RBW
300
RBW/VBW
3
6-7
Measurements Menu
Spectrum
Selecting the Spectrum soft key sets the instrument to a traditional spectrum analyzer
display. When Spectrum is active, pressing the Spectrum soft key opens a menu for
Spectrum Analyzer measurements.
Spectrogram
Selecting the Spectrogram soft key sets the instrument to display a representation of the
spectrum over time, with color used to show power. When Spectrogram is active, pressing
the Spectrogram soft key opens a menu of spectrogram settings.
Signal Strength
Selecting the Signal Strength soft key sets the instrument to display an analog meter
movement showing signal strength. When Signal Strength is active, pressing the Signal
Strength soft key opens a menu of signal strength settings.
RSSI
Selecting the RSSI soft key sets the instrument to display the received signal strength.
When RSSI is active, pressing the RSSI soft key opens a menu of RSSI settings.
Figure 6-4. Interference Analyzer Mode Measurements Menu
NOTE: The red circle on the soft key indicates the currently active
measurement.
Measurements
Spectrum
Spectrogram
Signal Strength
RSSI
-->
-->
-->
-->
6-8
Spectrum Menu
Field Strength
This measurement allows the use of an antenna with known gain characteristics and
measures the field strength over the frequency range of the antenna in units of
dBm/meter2, dbV/meter2, dBmV/meter2, dBµV/meter2, volts/meter or watts/meter.
On Off
Turns field strength measurements on or off.
Figure 6-5. Interference Analyzer Mode Spectrum Menu
Measure
Field
Strength
OCC BW
Channel
Power
ACPR
AM/FM
Demod
C/I -->
-->
-->
-->
-->
-->
F Strength
On
Off
Antenna
OCC BW
On
Off
Method
dBc Down% Down
%
99.00 %
dBc
3
Channel Pwr
On
Off
Center Freq
3.550 GHz
Ch Pwr Width
10.350 MHz
Span
7.100 GHz
ACPR
Main Ch BW
10.350 MHz
Ch Spacing
10.350 MHz
Adj Ch BW
10.350 MHz
Span
7.100 GHz
On
Off
C/I
On
Off
Center Freq
3.550 GHz
Span
7.100 GHz
Carrier
Signal
Type
Min Sweep Time
50 us
--> C/I Signal Type
NB FHSS
WB FHSS
Broadband
AM/FM Demod
Beat Freq Osc
0 Hz
Volume
Back
On
Off
Demod Type
Demod Freq
10.350 MHz
Demod Time
3 s
Set Demod Freq
to Current
Marker Freq
-->
-->
Back
-->
Back
-->
Demod Type
FM Wide
Band
FM Narrow
Band
AM
USB
LSB

6-9
Antenna
This soft key brings up a dialog box that lists all the antennas for which the instrument
has data, including both standard antennas and custom antenna that have been added
using Master Software Tools. Use the Up/Down arrow keys or the rotary knob to select
the desired antenna and press Enter.
Back
Returns to the previous menu.
OCC BW
Activates the occupied bandwidth menu. Select either % or dBc method of occupied
bandwidth measurement.
Method % Down/dBc Down
Select either the % of Power (default) or dB Down measurement method as displayed
in the message area.
%
Use the keypad, the directional arrow keys or the rotary knob to enter the percent of
power, from 0% to 100%.
dBc
Use the keypad, the directional arrow keys or the rotary knob to enter the desired value
(0 dB to 100 dB) as dB below the carrier.
Back
Returns to the previous menu.
Channel Power
Activates the Channel Power measurement function. Channel Power and Channel Power
Density are measured based on the selection in the Units menu.
On Off
Begins or ends the channel power measurement. When the measurement is on, Ch Pwr
will appear below the display. The detection method will automatically be changed to
RMS Average when the measurement is started. The detection method can be modified
by pressing the Shift and the Sweep keys and selecting the Detection soft key.
Center Freq
Activates the center frequency function, and sets the center frequency of the Spectrum
Master for the channel power measurement. Use the keypad, the directional arrow keys
or the rotary knob to enter the center frequency.
Ch Pwr Width
Sets the integration bandwidth for channel power measurement. Modifying this value
automatically adjusts the channel span to maintain the same ratio. Use the keypad, the
directional arrow keys or the rotary knob to enter the integration bandwidth.
Span
Sets the channel span for channel power measurement. Use the keypad, the directional
arrow keys or the rotary knob to enter the channel span.
Back
Returns to the previous menu.
ACPR
Accesses a menu of Adjacent Channel Power Ratio measurement options:
On Off
Begins or ends the ACPR measurement.

6-10
Main Ch BW
Sets the bandwidth of the main channel for ACPR measurement. Use the keypad, the
directional arrow keys or the rotary knob to enter the a specific frequency. When using
the keypad, select the GHz, MHz, kHz, or Hz soft key to accept the frequency input.
Changing this value automatically changes the adjacent channel bandwidth and
channel spacing.
Adj Ch BW
Sets the bandwidth of the adjacent channels for ACPR measurement. Use the keypad,
the directional arrow keys or the rotary knob to enter the a specific frequency. When
using the keypad, select the GHz, MHz, kHz, or Hz soft key to accept the frequency
input.
Ch Spacing
Sets the channel spacing between the main and adjacent channels. Use the keypad, the
directional arrow keys or the rotary knob to enter the a specific frequency. When using
the keypad, select the GHz, MHz, kHz, or Hz soft key to accept the frequency input.
This value must be greater than or equal to half of the main channel bandwidth, plus
half of the adjacent channel bandwidth.
Back
Returns to the previous menu.
AM/FM Demod
The user can select AM, Narrow Band FM (300 µs de-emphasis), Wide Band FM (50 µs
de-emphasis), Upper Sideband or Lower Sideband.
On Off
Turns AM/FM Demodulation on or off.
Demod Type
Provides soft keys to select the type of signal to be demodulated:
FM Wide Band
FM Narrow Band
AM
USB
LSB
Demod Freq
Use the keypad, the directional arrow keys or the rotary knob to enter the center
frequency of the signal to be demodulated. This frequency does not have to be within
the current frequency sweep range to which the instrument is set.
Demod Time
Use the keypad, the directional arrow keys or the rotary knob to increase or decrease
the demodulation time, and press the Enter key to select. The demodulation time can
be set from 100 milliseconds to 200 seconds. The instrument sweeps one time for
every demodulation period. Sweeping pauses during the demodulation time.
Set Demod Freq to Current Marker Freq
Sets the demodulation frequency to the frequency of the current marker.
Beat Freq Osc
Sets the beat frequency of the oscillator to exactly set the demodulation frequency of
USB and LSB signals.

6-11
Volume
The current volume setting is displayed on the screen. Use the Up/Down arrow keys or
rotary knob to change the volume, and press the Enter key to select.
Back
Returns to the previous menu.
C/I
The Carrier to Interference ratio is a two-step measurement sequence that first measures
the amplitude of a carrier, then, with the carrier turned off, measures the amplitude of all
other interfering signals within the channel bandwidth.
On Off
Starts and stops the carrier to interference measurement.
Center Freq
Use the keypad, the directional arrow keys or the rotary knob to enter the center
frequency.
Span
Use the keypad, the directional arrow keys or the rotary knob to enter the frequency
span.
Carrier Signal Type
Opens a menu to select the carrier signal type.
NB FHSS (Narrow Band Frequency Hopping Spread Spectrum)
Use this setting when the signal being measured is 802.11b.
WB FHSS (Wide Band Frequency Hopping Spread Spectrum)
Use this setting when the signal being measured is 802.11a or 802.11g.
Broadband
Use this setting when the signal being measured is a digital modulation format such
as CDMA, GSM, and so forth.
Back
Returns to the previous menu.
Min Sweep Time
Set the minimum sweep time for the measurement.
Back
Returns to the previous menu.

6-12
Spectrogram Menu
Sweep Interval
Press the Sweep Interval soft key and use the rotary knob or keypad to set the time from
0 seconds to 60 seconds.
Time Span
To set the total time span for a display, press the Time Span soft key and use the rotary
knob or keypad to enter a time between 1 minute and 4320 minutes (72 hours). When the
time span is reached, the measurement stops. When set to zero (Auto) time span, the
measurement runs continuously. Entering a time span value causes the corresponding
sweep interval value to be automatically computed and shown when the Sweep Interval
soft key is pressed.
Auto Save
When the Time Span is set to an interval other than Auto, the spectrogram plots can be
automatically saved when the waterfall display is full by pressing the Auto Save soft key.
Time Cursor
The Time Cursor is used to view the spectrum at any spot in the spectrogram display.
Press the Time Cursor soft key to turn on the horizontal time cursor. Use the Up/Down
arrow key to move the cursor vertically through the spectrogram. The date and time that
the measurement at the cursor position was taken is displayed at the top of the screen.
Reset/Restart Measurement
Resets or Restarts the measurement.
Figure 6-6. Interference Analyzer Mode Spectrogram Menu
Back
-->
Spectrogram
Sweep Interval
Auto
Time Span
Auto
Auto Save
On Off
Time Cursor
0
Reset/
Restart
Measurement
6-13
Signal Strength Menu
Auto Scale
Press the Auto Scale soft key to automatically scale the display range.
Max Level
Set the desired maximum display range value by selecting the Max Level soft key.
Min Level
Set the desired maximum display range value by selecting the Max Level soft key.
Speaker On/Off
Press the Speaker On/Off soft key to turn on the audio output.
Volume
If necessary, press the Volume soft key to set the speaker or headphone volume to a
comfortable level. Use the Up/Down arrow keys to adjust the volume.
Field Strength
This measurement allows the use of an antenna with known gain characteristics and
measures the field strength over the frequency range of the antenna in units of
dBm/meter2, dbV/meter2, dBmV/meter2, dBµV/meter2, volts/meter or watts/meter.
On Off
Turns field strength measurements on or off.
Figure 6-7. Interference Analyzer Mode Signal Strength Menu
Field
Strength
F Strength
On
Off
Antenna
Back
-->
Back
-->
Signal Strength
Auto Scale
Max Level
-40.0 dBm
Speaker
On Off
Min Level
-140.0 dBm
Volume
-->
6-14
Antenna
This soft key brings up a dialog box that lists all the antennas for which the instrument
has data, including both standard antennas and custom antenna that have been added
using Master Software Tools. Use the Up/Down arrow keys or the rotary knob to select
the desired antenna and press Enter.
Back
Returns to the previous menu.

6-15
RSSI (Received Signal Strength Indicator) Menu
Time Interval
Press the Time Interval soft key to set the time between adjacent measurement points. This
time may be set from 70 ms to 1 minute.
Time Span
Press the Time Span soft key to set the overall time span for the RSSI measurement. This
time can be set from zero, to give manual control of the time span, to a maximum of seven
days. After the specified time span, the measurement is halted. Depending on the time
interval selected, the data will scroll to the left once the trace fills the screen.
Auto Scale
Press the Auto Scale soft key to automatically set the reference level and scale factor to
place the trace on the screen.
Auto Save On/Off
To store the RSSI data, press the Auto Save On/Off soft key to turn on data logging. The
data is named Log – followed by the time at which the data was stored. Each screen full of
551 data points will be stored as a separate display, and can save up to seven days of data
at a time (see Time Span above). The unit saves the data in the saved trace directory and it
can be recalled by selecting recall trace measurement.
Reset/Restart Measurement
Resets or Restarts the measurement. The RSSI trace is erased and begins anew at the right
side of the display.
Back
Returns to the previous menu.
Figure 6-8. Interference Analyzer Mode RSSI Menu
Back
-->
RSSI
Auto Scale
Time Interval
70 ms
Auto Save
On Off
Time Span
Auto
Reset/
Restart
Measurement
6-16
Marker Menu
Markers are available in Spectrum and Spectrogram measurements. Press the Marker
function hard key to open the Marker menu. The Spectrum Master is equipped with six
markers. Any or all markers can be employed simultaneously.
Marker 1 2 3 4 5 6
Use this soft key to select the active marker. The underlined marker number is the active
marker. Each press of the soft key moves the underline to the next marker number. To
move to a lower marker number, press the Shift key before pressing the Marker soft key.
On/Off
This soft key turns the active marker, selected by the Marker soft key above, on or off.
Delta On/Off
This function turns on a delta marker and prompts for a delta offset frequency, either
positive or negative from the frequency of the currently active marker.
Peak Search
This soft key places the currently active marker on the highest signal amplitude currently
displayed on screen.
Marker Freq to Center
This soft key changes the center frequency to place the currently active marker at the
center of the display.
Figure 6-9. Interference Analyzer Mode Marker Menu
-->
Marker(1/2)
Marker
2 3 4 5 61
On
Off
Peak Search
Delta
On Off
Marker
to
Ref Lvl
Marker Freq
to
Center
More
Peak
Options
More
-->
-->
Recall
Measurement
Copy All
to
External Card
Delete
Save
Screen
as JPEG
Copy All
from
External Card
-->
Marker & Peak
Peak Search
Next Peak
Left
Delta Marker
to
Span
Next Peak
Right
Peak Threshold
10.00%
Back
-->
Marker
to
Ref Lvl
Marker Freq
to
Center
Marker(2/2)
Marker Noise
On Off
Marker Table
On Off
Counter Marker
On Off
All Markers
Off
Back
-->
6-17
Marker to Ref Level
This soft key causes the amplitude of the currently active marker to become the reference
level, which is the top horizontal line of the display.
More Peak Options
This soft key brings up a secondary menu of soft keys for more peak searching options.
Peak Search
This soft key places the currently active marker on the highest amplitude signal
currently on screen.
Next Peak Left
From the current position of the active marker, the instrument searches to the left
(toward lower frequencies) for a peak signal that rises at least a certain amount above
the average noise level. If no such peak is found, the marker is placed at the left end of
the trace. The Peak Threshold soft key allows the user to specify the performance of
peak searching.
Next Peak Right
From the current position of the active marker, the instrument searches to the right
(toward higher frequencies) for a peak signal that rises at least a certain above the
average noise level. If no such peak is found, the marker is placed at the right end of
the trace. The Peak Threshold soft key allows the user to specify the performance of
peak searching.
Delta Marker to Span
Sets the total span width to the value of the delta marker. If the delta marker is zero, the
span is set to 10 Hz. If there is no delta marker, or the delta marker value is set to less
than 10 Hz, then the span will be set to 10 Hz.
Marker Freq to Center
Sets the center frequency to the frequency of the currently active marker.
Marker to Ref Lvl
Sets the reference level, top graticule line, to the amplitude of the currently active
marker.
Peak Threshold
This soft key allows the user to specify how far above the average noise floor a signal
must rise before it is considered a peak. This feature can be especially useful in noisy
environments, where there are a lot of small noise spikes. The default peak threshold is
10%. In noisy environments, increase the peak threshold to avoid stopping on noise
spikes or small signals.
Back
Returns to the higher-level menu.
More
Opens a submenu of further Marker options.
Marker Noise
This marker option turns the markers into noise markers with units of dBm/Hz. When
this option is selected, the detection method is automatically changed to RMS and the
displayed value is compensated for the noise bandwidth of resolution bandwidth filter.

6-18
Marker Table
Available only in Spectrum view, pressing this soft key causes a table to be displayed
below the sweep window. The table is automatically sized for all possible markers and
delta markers. In addition to the marker frequency and amplitude, the table also shows
delta frequencies and amplitude deltas for all markers that have deltas entered for them.
All Markers Off
This soft key turns off all markers and the marker table, if it is on.
Counter Marker On Off
Sets the frequency counter mode for all markers. Marker frequency values are
normally limited in resolution to individual display pixels. Each pixel may represent
multiple frequencies. Using Counter Marker in association with Marker to Peak will
result in the exact frequency of the peak within the pixel to a resolution of 1 Hz.
Back
Returns to the previous menu.
Spectrogram Procedure
A Spectrogram is a three dimensional representation of frequency, time and power useful for
identifying intermittent interference. Color is used to represent power levels.
Procedure
The following procedure demonstrates one example of an Interference Analyzer
Spectrogram setup.
1. Select the Shift key, then the Mode (9) key, using rotary knob or Up/Down arrow keys
select Interference Analyzer and press the Enter key to select.
2. Press the Freq function hard key.
3. Select the Signal Standard soft key and select the desired air interface standard from
the dialog box displayed. Alternatively, choose the appropriate soft keys and enter the
center, start and stop frequencies and the span.
4. For the most effective spectrogram display, press the Amplitude key, select the
Reference Level soft key and set the reference level such that the largest signal to be
displayed will be near the top of the spectrum analyzer area of the screen. The
reference value required can be determined by observing the color of the highest signal
and changing the reference level to place that value near the top of the spectrum
analyzer area.
5. Select the Scale soft key and set the scale value to place the lowest signal near the
bottom of the screen. In general, 4 dB/division or 5 dB/division will be good starting
values.
6. Select the BW function hard key and set Auto RBW and Auto VBW On, or set the
applicable RBW and VBW values by selecting the RBW and VBW soft keys.
7. Press the Measurements function hard key and the Spectrogram soft key.
8. Set the time between sweeps by selecting the Sweep Interval soft key, or set the total
time for a full spectrogram by selecting the Time Span soft key.
9. To change the time between sweeps, press the Sweep Interval soft key and use the
rotary knob or keypad to set the time from 0 seconds to 660 seconds. Entering the time
interval value causes the corresponding time span value to be automatically computed.
The time span can be viewed or changed by selecting the Time Span soft key and using
the rotary knob or keypad to set the span. As expected, changing the time span will
automatically change the sweep interval.
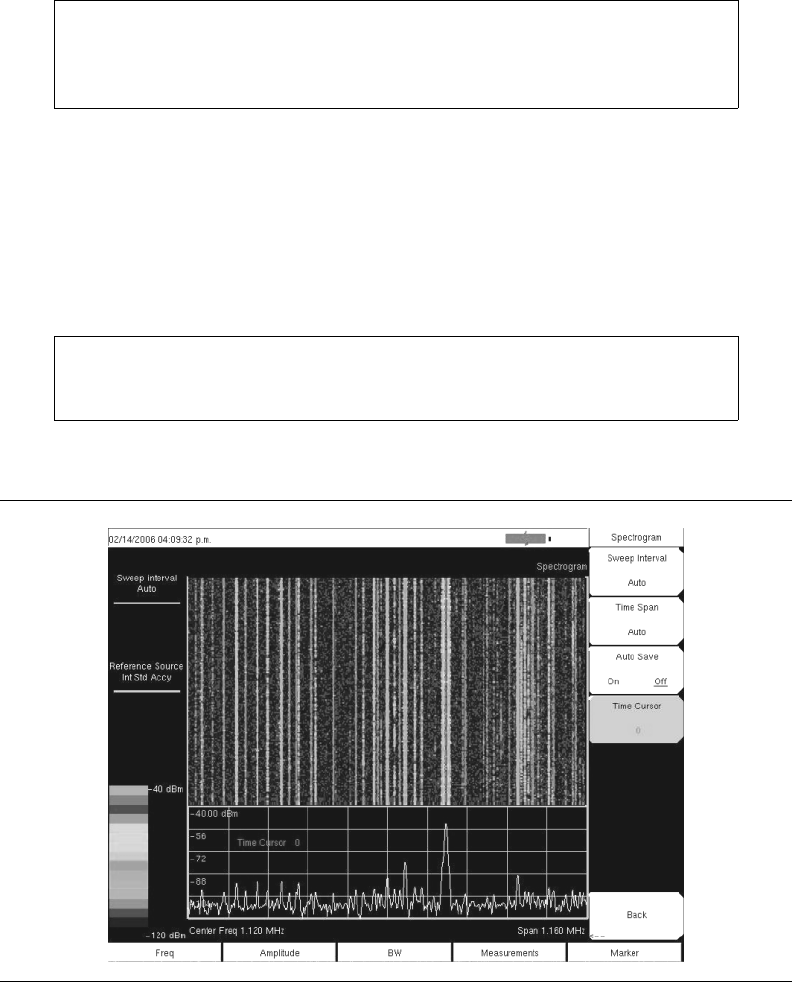
6-19
1. To set the total time span for a complete display, press the Time Span soft key and use the
rotary knob or keypad to enter a time between 1 minute and 4320 minutes (72 hours).
Entering a time span value causes the corresponding sweep interval value to be
automatically computed and shown when the Sweep Interval soft key is pressed.
2. The instrument can be set so that spectrogram plots can be automatically saved when the
display is full. Press the Auto Save soft key to toggle auto save On or Off.
3. The Time Cursor soft key is used to turn on the horizontal time cursor. Use the Up/Down
arrow key to move the cursor vertically through the spectrogram. The date and time that
the measurement at the cursor position was taken is displayed at the top of the screen.
10. Press the Marker key to place up to six markers on the signal and display the power
and frequency of the currently active marker.
NOTE: Setting a Sweep Interval value >0 will change the detection
method to Max Hold, so that any event within the time interval will be
captured to the screen. This allows for extended measurement times to be
set.
NOTE: When the Time Cursor is activated and not on the zero trace
position, the unit will automatically stop making measurements to allow
analysis of signals of interest.
Figure 6-10. Interference Analyzer Mode Sample Spectrogram Display
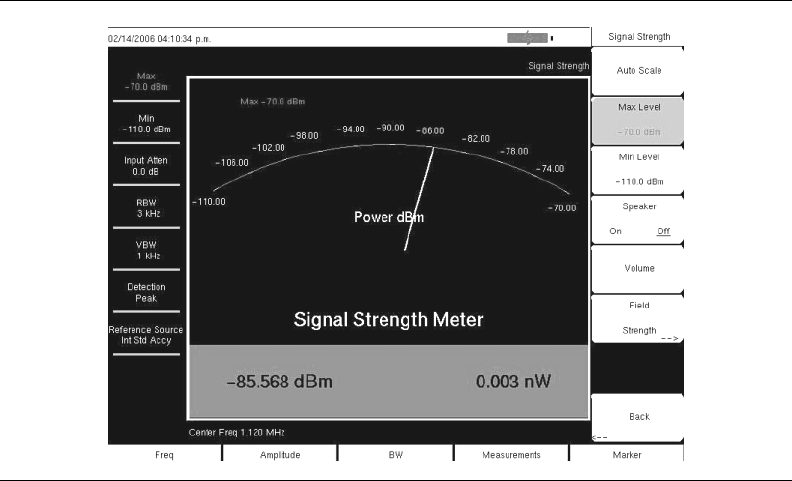
6-20
Signal Strength
The Signal Strength meter is useful for tracking down the source of an interfering signal.
This measurement is done at a single frequency in zero span. The power at a frequency (in
dBm and watts) is displayed along with an audible indicator that may be turned on or off.
Connect a directional antenna and the audio beep frequency will increase as the measured
signal strength increases. This mode is especially useful when attempting to locate an
emitter using a directional antenna.
For field strength measurements, antenna factors are included. Antenna factors for all
antennas offered by Anritsu are stored in the unit. Custom antenna factors can be created and
downloaded into the instrument using Anritsu Master Software Tools software.
Procedure:
The following procedure demonstrates a common Interference Analyzer Signal Strength
setup.
1. Select the Shift key, then the Mode (9) key, using rotary knob or Up/Down arrow keys
select Interference Analyzer and press the Enter key to select.
2. Press the Freq function hard key to set the desired frequency. Select the Center soft
key, and use the soft keys to tune the center frequency to place the signal of interest in
the center of the display.
3. Connect the appropriate directional antenna to the RF In port and press the
Measurements key.
4. Press the Signal Strength soft key to activate the signal strength measurement menu.
5. Press the Auto Scale soft key to automatically scale the display range, or set the desired
and maximum and minimum values by selecting the Max Level and Min Level soft
keys.
6. Press the Speaker On/Off soft key to turn on the audio output.
7. If necessary, press the Volume soft key to set the speaker or headphone volume to a
comfortable level. Use the Up/Down arrow keys to adjust the volume.
Figure 6-11. Interference Analyzer Mode Signal Strength Display
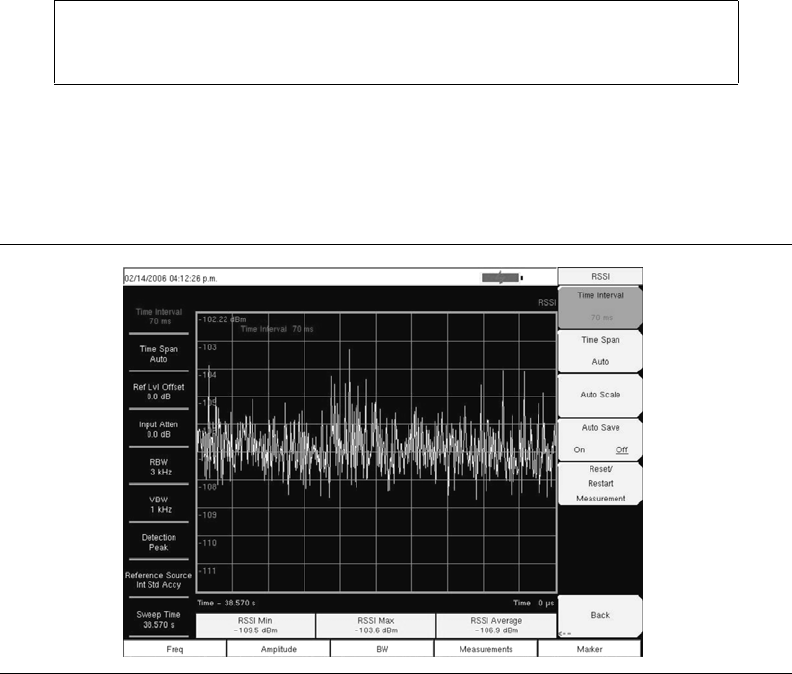
6-21
RSSI Procedure
The Received Signal Strength Indicator, RSSI. is useful for observing signal strength at a
single frequency over time.
Procedure
The following procedure demonstrates a common Interference Analyzer RSSI setup. To
select Interference Analyzer mode:
1. Select the Shift key, then the Mode (9) key, using rotary knob or Up/Down arrow keys
select Interference Analyzer and press the Enter key to select.
2. Press the Freq function hard key to set the desired frequency. Select the Center soft
key, and use the soft keys to tune the center frequency to place the signal of interest in
the center of the display.
3. Press the Measurements key and select the RSSI soft key.
4. Press the Time Interval soft key to set the time between adjacent measurement points.
This time may be set from 70 ms to 1 minute.
5. Press the Time Span soft key to set the overall time span for the RSSI measurement.
This time can be set from zero, to give manual control of the time span, to a maximum
of seven days. After the specified time span, the measurement is halted. Depending on
the time interval selected, the data will scroll to the left once the trace fills the screen.
6. Press the Auto Scale key to automatically set the reference level and scale factor to
place the trace on the screen.
7. To store the RSSI data, press the Auto Save On/Off soft key to turn on data logging.
The data is named Log – followed by the time at which the data was stored. Each
screen full of 551 data points will be stored as a separate display, and up to seven days
of data can be saved in one measurement. The unit saves the data in the saved trace
directory and it can be recalled by selecting recall trace measurement.
NOTE: The Time Span only captures the last display, not the entire time of
the Time Span. Use a longer time interval to extend the effective trace
capture time.
Figure 6-12. Interference Analyzer Mode RSSI Display
6-22
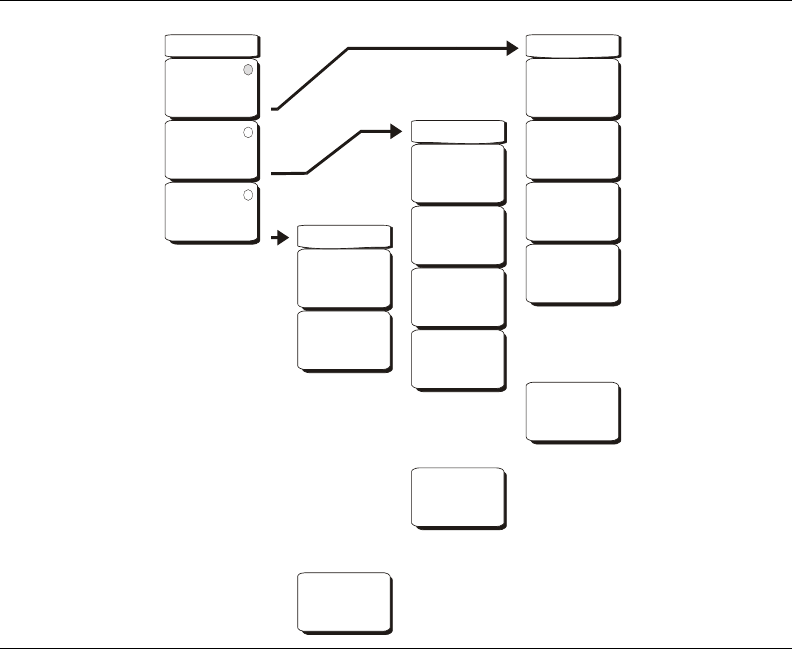
7-1
Chapter 7
Channel Scanner Measurements
Introduction
This chapter presents Channel Scanner information and procedures. The Channel Scanner,
option 27, measures the signal power of multiple transmitted signals. The power can be
displayed as either a bar graph or a text display showing the channel power of selected
channels for a given air interface standard, or the manually entered channels. Up to
20 channels can be measured.
The operating frequency range for Channel Scanner mode can either be set manually, or the
desired air interface standard can be selected from the Signal Standard and channel list in the
instrument. When the channels are selected from the Signal Standard list, all frequency
related parameters for the standard are automatically set to the appropriate values. The
frequency and bandwidth settings can be manually entered using the Scan Frequencies
selection if none of the available air interface standards meet the measurement need. A
custom channel list can also be created to allow up to 20 independent channels to be defined.
Scanner
Figure 7-1. Channel Scanner Mode Scanner Menu
Scanner
Scan
Channels
Scan
Frequencies
Scan
Custom List
-->
-->
-->
Recall
Measurement
Copy All
to
External Card
Delete
Copy All
from
External Card
-->
Channel Scan
Signal Standard
Channel
1
Channel Step Size
1
Number of Channels
10
Back
-->
Recall
Measurement
Copy All
to
External Card
Delete
Copy All
from
External Card
-->
Freq Scan
Start Freq
825.030 MHz
Freq Step Size
30.000 kHz
Number of Channels
10
Bandwidth
30.000 kHz
Back
-->
Recall
Measurement
Delete
-->
Custom Scan
Edit List
Number of Channels
10
Back
-->
7-2
Scan Channels
Select scan channels to activate the scan channel menus:
Signal Standard
Sets the signal standard.
Channel
Sets the starting channel on the display.
Number of Channels
Sets the number of channels to be displayed. From 1 to 20 channels can be displayed.
Channel Step Size
Sets the number of channels to skip between displayed channels.
Back
Returns to the previous menu.
Scan Frequencies
Select scan frequencies to activate the scan frequencies menu:
Start Freq
Sets the center frequency of the first channel to be displayed.
Freq Step Size
Sets the spacing between frequencies on the display.
Bandwidth
The channel bandwidth can be manually entered in GHz, MHz, kHz, or Hz.
Number of Channels
Sets the number of channels to be displayed (1 to 20).
Back
Returns to the previous menu.
Scan Custom List
Edit List
Edit the Signal Standard, Channel, Frequency and Bandwidth for a selected standard.
Number of Channels
Sets the number of channels to be displayed (1 to 20).
Back
Returns to the previous menu.

7-3
Amplitude
Reference Level
Activates the amplitude reference level function which sets the amplitude at the top of the
display. Valid reference levels are from +30 to –130 dBm.
Scale
Activates the scale function which sets the dB/division value from 1 dB/div to 15 dB/div
in 1 dB steps.
Figure 7-2. Channel Scanner Mode Amplitude Menu
Amplitude
Reference Level
10.0 dBm
Scale
15 dB/div

7-4
Custom Setup
Edit List
Edit the Signal Standard, Channel, Frequency and Bandwidth for selected item.
Number of Channels
Sets the number of channels to be displayed (1 to 20).
Back
Returns to the previous menu.
Figure 7-3. Channel Scanner Mode Custom Setup Menu
Recall
Measurement
Delete
-->
Custom Scan
Edit List
Number of Channels
10
Back
-->
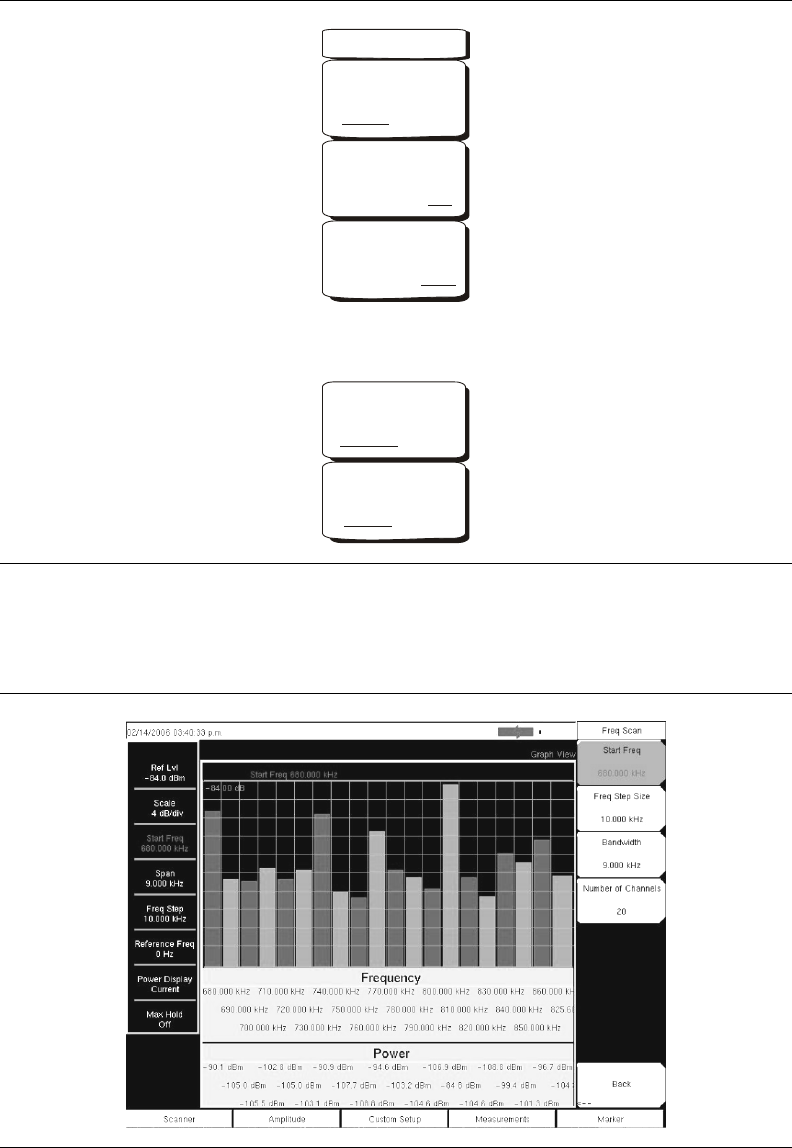
7-5
Measurements
Display Graph/Table
Toggles the display between table and graph formats (see figures below).
Figure 7-4. Channel Scanner Mode Measurements Menu
Figure 7-5. Channel Scanner Mode Sample Graph Display
Measurements
Display
TableGraph
Max Hold
On 5 sec Off
Channel Units
Channel Freq
Units Display
MaxCurrent
Color Code
DualSingle
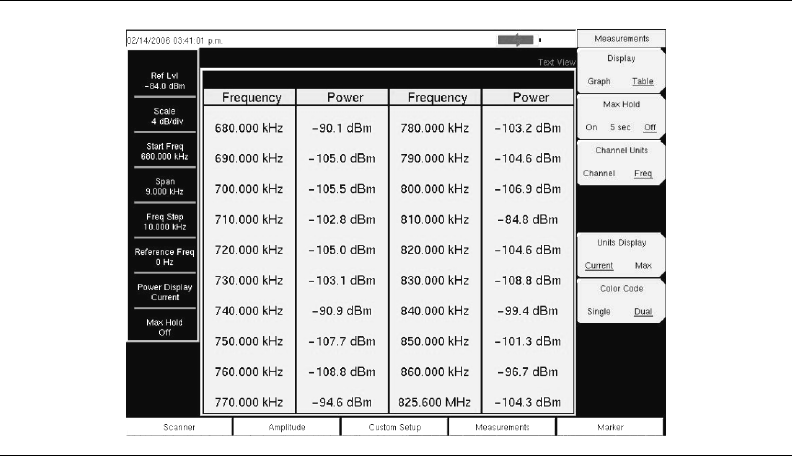
7-6
Max Hold On/5 sec/Off
Turns on or off small yellow lines for every channel/frequency on the display that indicate
the highest level that channel or frequency has reached. The 5sec option holds the small
yellow line at the highest level in the last 5 seconds.
Channel Units Channel/Freq
Toggles the display channel units between channel number and frequency.
Units Display Current/Max
The current power units are displayed at the bottom of the channels, or the maximum
power is displayed (activated only when Max Hold is set to On or 5sec).
Color Code Single/Dual
The channels can be represented in one color or two alternating colors.
Figure 7-6. Channel Scanner Mode Sample Table Display

7-7
Sample Procedure
The following procedure demonstrates a common channel scanner setup.
1. On the Spectrum Master, select the Shift key, then the Mode (9) key.
2. Use the directional arrow keys or the rotary knob to highlight Channel Scanner and
press the Enter key to select.
3. Press the Scanner key to activate the Scanner menu. The power can be scanned using
a signal standard and channel numbers or by entering a start frequency, frequency step
size and bandwidth. The channels can be customized using the Scan Custom List or
Custom Setup. For this example, select the channels by pressing the Scan Channels
soft key, then the Signal Standard soft key. Select the CDMA US PCS signal standard.
4. Select the Number of Channels soft key and enter 20.
5. Select the Amplitude key and set the Reference Level and Scale so that the power of
all the channels is displayed on the screen.
6. Select the Measurements key to activate the Measurement menu.
7. Press the Display soft key and select Graph display to display the measurements in the
graph format.
8. Press the Channel Units soft key and select Channel to display the measurements in
channel format.
9. Press the Max Hold soft key and turn Max Hold on (On is underlined).
10. Press the Units Display soft key and choose Max to display the maximum measured
power for each channel.
11. Press the Color Code soft key and select Dual to display the measurements in dual
colors.
Custom Setup
NOTE: Measurements can be made when the base station is in service,
out of service, or over the air.
7-8
Procedure
1. On the Spectrum Master, select the Shift key, then the Mode (9) key.
2. Use the directional arrow keys or the rotary knob to highlight Channel Scanner and
press the Enter key to select.
3. Press the Custom Setup key.
4. Press the Number of Channels soft key to define how many channels to include in the
custom list. This choice can be changed later if needed.
5. Press the Edit List soft key to bring up the list of channels. The channel highlighted in
blue is the channel active for editing. Use the up and down arrows to select the channel
to edit. Each channel can be set up differently.
6. Press either the Select Signal Standard soft key or the Set Freq soft key. If the Select
Signal Standard soft key was selected, select the desired air interface standard from the
dialog box displayed. When a standard is selected, the usual bandwidth for that
standard is automatically set. The bandwidth can be changed if desired. After the air
interface standard is selected, press the Set Channel soft key to enter the desired
channel number.
If the Set Freq soft key was selected, the frequency value of the active channel will be
highlighted in a red box. Use the rotary knob or the numeric key pad to enter the
desired center frequency in Hz, kHz, MHz, or GHz.
7. Press the Set Bandwidth soft key and use the rotary knob or numeric keypad to enter
the desired value in Hz, kHz, MHz, or GHz.
8. Repeat 5. through 7. for all channels.
Custom Setup Example
This example explains how to monitor several signals, plus a potential intermodulation
product, to see if there is a correlation between the nearby signals and an intermittent
interference problem.
The signals on or near the rooftop are:
• An FM broadcast station at 106.5 MHz
• A paging transmitter at 157.86 MHz
• Three cellular sites:
US CDMA PCS channel 50 (1932.5 MHz)
AMP/EIA 553 channel 525 (885.750 MHz)
GSM 1800 channel 512 (1805.2 MHz)
• A Ham repeater at 147.36 MHz
• A Ham repeater at 446.5 MHz
• A land mobile repeater at 451.7875 MHz
• A public safety repeater at 485.5625 MHz
• In addition, the site is near the flight path of an airport. The approach frequency is
121.4 MHz.
Set up a measurement channel for each of the signals to be observed plus extra channels for
any intermodulation products to be observed.
After the channels are set up, press | Shift | File | Save, Recall, Delete, & Copy | Save Setup|
and name the setup for easy recall later.
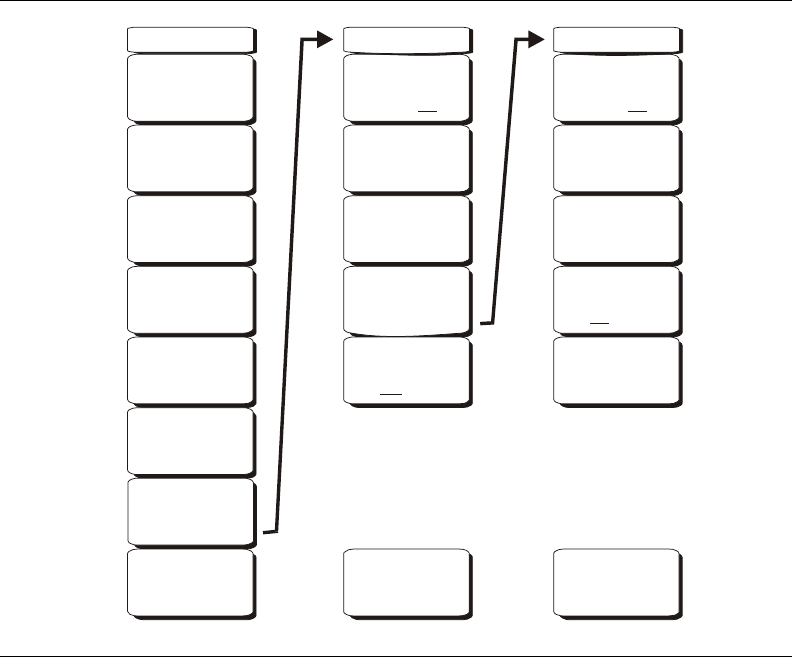
8-1
Chapter 8
Tracking Generator
Introduction
This chapter provides a description of the optional Tracking Generator (Option 20) for the
MS2721B. The Tracking Generator operates over a frequency range of 100 kHz to 7.l GHz,
and provides a signal with an output frequency that is the same as the tuning frequency of
the spectrum analyzer. The output power and flatness is specified from 400 kHz to 7.1 GHz.
When the spectrum analyzer is set to zero span, the output frequency becomes a CW signal.
The output power is leveled and can be adjusted from 0 dBm to –40 dBm in 0.1 dB steps.
Menu Structure
The tracking generator frequency is controlled with the spectrum analyzer Frequency and
Span menus (refer to “Freq (Frequency)” on page 3-12 and “Span” on page 3-29). Other
tracking generator control is in the Measure menu. To access the functions under the
Measure menu, select the Shift key, then the Measure (4) key. The Measure menu is
described in Chapter 3 on page 3-24. The addition of Option 20 adds the Tracking Generator
soft key and subsequent soft key menus shown below.
Figure 8-1. Measure Menu with Tracking Generator (Option 20)
Measure
Field
Strength
OCC BW
Channel
Power
ACPR
AM/FM
Demod
C/I
Tracking
Generator
-->
-->
Measurement Off
-->
-->
-->
-->
-->
Tracking Generator
Track Gen
Off On
Output Power
0.00 dBm
Reset
Sweep
S21
Insertion
Loss
Abs Max, Min, Avg
OnOff
Back
-->
-->
S21 Insertion Loss
S21 Ref Level
0.0 dBm
S21 Scale
10 dB/div
S21 RL Offset
0.0 dB
Back (S21 OFF)
-->
Normalize
Off On
S21 Max, Min, Avg
OnOff

8-2
Track Gen Off On
Turns the output of the tracking generator on and off. The output power turns on at the
level set with the Output Power soft key.
Output Power
Sets the output power from 0 dBm to –40 dBm, in 0.1 dB steps, at the output connector.
The output is leveled and flat over the specified frequency range of the tracking generator.
Reset Sweep
Restarts the sweep at the lowest frequency selected and restarts Averaging.
S21 Insertion Loss
Brings up a secondary menu to manage relative measurements.
Normalize Off On
Starts a calibration process. Make a through connection between the Tracking
Generator Output and the Spectrum Analyzer Input connectors before doing
normalization. For the most accurate results, use the same cables and adapters that will
be used for the measurement while performing normalization.
S21 Ref Level
Sets the value of the top graticule line in dB relative to the through connection made
when normalization was performed.
S21 Scale
Sets the scale factor from 1 dB/division to 15 dB/division in 1 dB steps.
S21 Max, Min, Avg Off On
Toggles a measurement box that shows the maximum signal, the minimum signal and
the numeric average of all data points in dB.
S21 RL Offset
Compensates for amplifiers or attenuators added to the measurement path after
normalization. Use negative values for added attenuation and positive values for added
amplification.
Back (S21 Off)
Turns off S21 normalization and returns to the main tracking generator menu.
Abs Min/Max/Avg Off On
Shows the power in dBm of the lowest and highest points along with the numeric average
of all data points.
8-3
Normalization
Normalization is a scalar process designed to remove the loss and variation caused by cables
and adapters and to display a 0 dB reference level. After normalization is complete, the
display changes from dBm to dB, relative to the calibrated 0 dB reference.
Tracking Generator Operation
1. Press the Track Gen Off/On soft key to turn the output of the tracking generator on and
off. The output power turns on at the level set with the Output Power soft key.
2. Press the Output Power soft key and set the output power from 0 dBm to –40 dBm, in
0.1 dB steps, at the output connector. The output is leveled and flat over the specified
frequency range of the tracking generator.
3. The Reset Sweep soft key restarts the sweep at the lowest frequency selected and
restarts Averaging.
Measurement Example
This example demonstrates how to calibrate the instrument and make a measurement.
1. Set the frequency range to cover the range of the DUT being tested. In this example,
the center frequency is set to 1.96 GHz with a 500 MHz span.
2. Select the Shift key, then the Sweep (3) key.
3. Press the Detection soft key and select the Sample detector for the fastest sweeps.
4. Select the Shift key, then the Measure (4) key.
5. Select the Tracking Generator soft key.
6. Press the Track Gen Off/On soft key to turn the output of the tracking generator on.
7. Press the Output Power soft key and set the output power from 0 dBm to –40 dBm, in
0.1 dB steps, for the device being measured. In this example, measuring a bandpass
filter, the power level is set to 0 dBm to get the maximum signal through the filter.
8. Connect the DUT between the RF Out and RF In connectors on the instrument. Use
good quality cables and adapters to make the connections.
9. Observe the measurement to confirm that the frequency range covers the frequency
range that was intended.
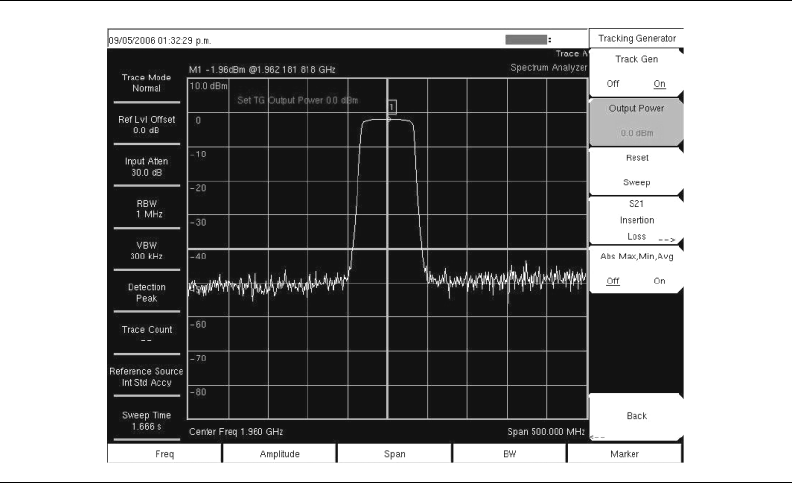
8-4
10. If the dynamic range is not sufficient for the necessary measurements, reduce the input
attenuation and RBW to maximize the dynamic range. It is likely that the scale will
have to be changed from 10 dB/division to a higher value to see the stop band of a
good filter. In this example the scale was changed to 15 dB/division.
11. When measuring a filter with a very high insertion in the stop band, select the Shift
key, then the Trace (5) key. Select the Trace A Operations soft key, then the
Average →A soft key to turn on averaging and clean up the stop band area. An
averaging value of 10 will probably be adequate for most filters.
Figure 8-2. Measurement Before Normalization
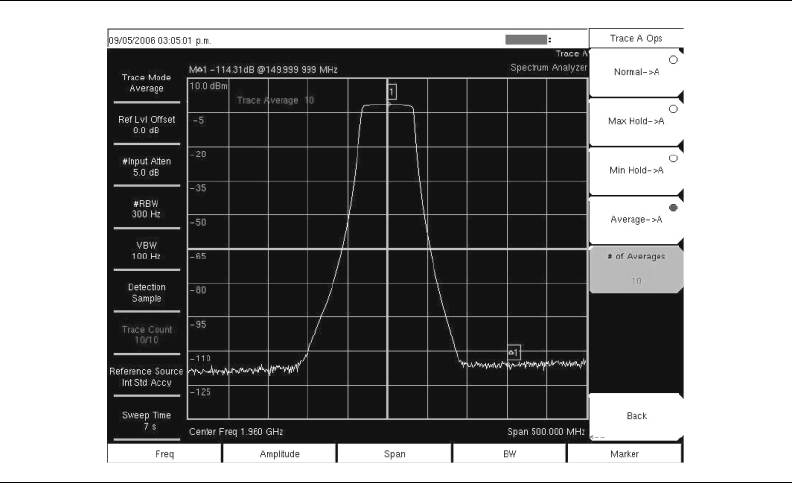
8-5
12. Once the frequency range and other settings are satisfactoy, disconnect the DUT and
make a through connection between the the RF Out and RF In connectors. For the most
accurate results, use the same cables and adapters for this connection as were used to
connect the DUT.
13. Confirm that the display shows a nearly flat signal when the through is connected. If
the signal is not reasonably flat, verify that the cables and connections are in good
condition and that the connectors are properly tightened.
14. Select the S21 Insertion Loss soft key.
15. Select the Normalize soft key to set Normalization On.
Figure 8-3. Instrument Set for Good Measurement Before Normalization
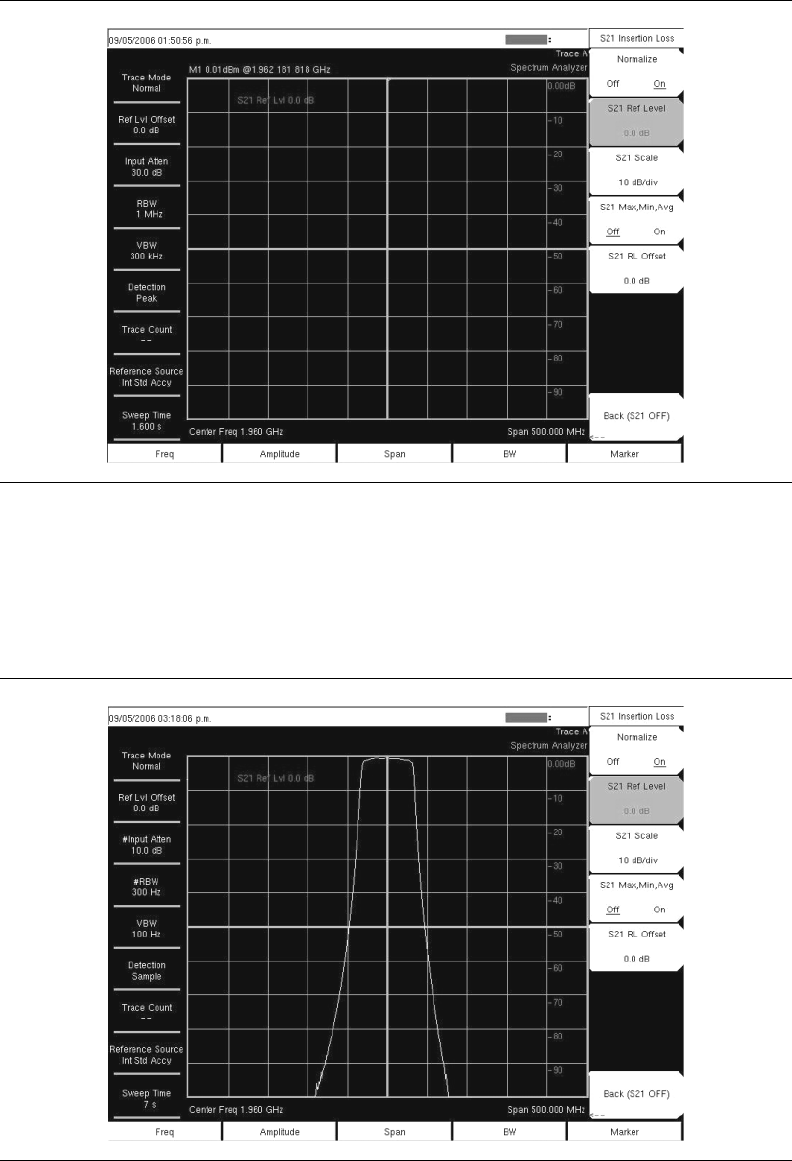
8-6
16. After the normalization sweep is finished, reconnect the DUT between the the RF Out
and RF In connectors. The following figure shows the measurement after
normalization. If desired, the resolution bandwidth and video bandwidth can be
changed after normalization without needing to renormalize. If the input attenuation is
changed, a new normalization sweep is required.
Figure 8-4. Flat Sweep After Normalization
Figure 8-5. Measurement After Normalization (scale at 10 dB/division)
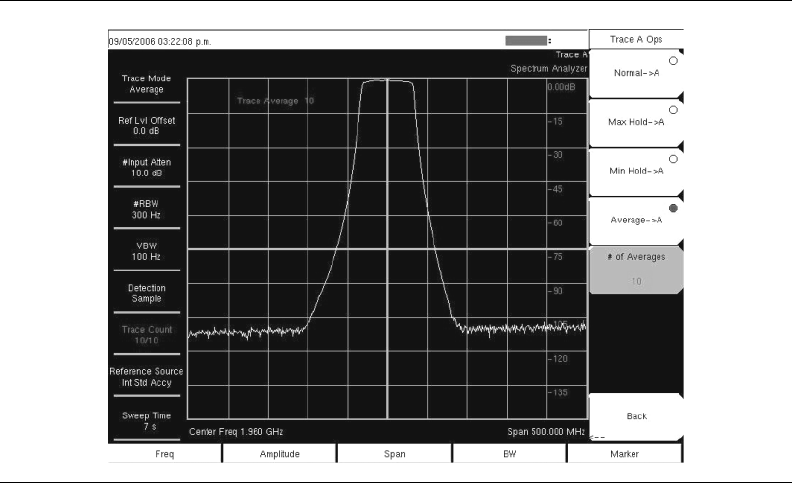
8-7
17. If necessary, select the S21 Scale soft key and change the scale to view the entire
measurement.
Figure 8-6. S21 Scale Changed to 15 dB/division
8-8

9-1
Chapter 9
WCDMA/HSDPA Measurements
Introduction
The Spectrum Master offers three WCDMA/HSDPA options and one WCDMA option:
WCDMA/HSDPA RF Measurements (Option 44), WCDMA Demodulator (Option 45),
WCDMA/HSDPA Demodulator (Option 65) and WCDMA/HSDPA Over The Air (OTA)
(Option 35) measurements. Connect the Spectrum Master to any Node B/UMTS base station
for accurate RF and demodulator measurements.
The Spectrum Master can measure node B transmitter performance over the air by
connecting an antenna or by connecting the node B equipment directly to the Spectrum
Master. To measure a WCDMA signal over the air, connect the appropriate frequency band
antenna to the Spectrum Master RF In connector. To connect the node B equipment directly
to the Spectrum Master, connect the power amplifier of the node B equipment to the RF In
connector of the Spectrum Master using a coupler or attenuator.
NOTE: The WCDMA/HSDPA Demodulator option demodulates both
WCDMA and HSDPA signals. The WCDMA Demodulator only
demodulates WCDMA signals.
NOTE: The maximum input damage level of the MS2721B RF In port is
+43 dBm. The maximum input damage level of the MS2723B and
MS2724B RF In port is +30 dBm. To prevent damage always use a
coupler or high power attenuator. The maximum usable input for
measurements is +30 dBm.

9-2
WCDMA/HSDPA Signal Analyzer Mode
Amplitude
Scale
The scale can be set in 1 dB steps from 1 dB per division to 15 dB per division. The value
can be changed using the keypad, the rotary knob or the Up/Down arrow keys.
Power Offset
Choose power offset to have the Spectrum Master automatically adjust for the loss through
any external cables, attenuators and couplers. The power can be offset from 0 dB to
100 dB. Press the Power Offset key, enter the values and press the dB softkey.
Auto Range
Adjusts the reference level automatically when Auto Range is activated. Toggles between
On and Off.
Adjust Range
Adjust the range adjusts the reference level to be optimal based on the measured signal.
Figure 9-1. WCDMA/HSDPA Amplitude Menu
Amplitude
Scale
__ __
Power Offset
0.0 dB
Auto Range
OffOn
Adjust
Range
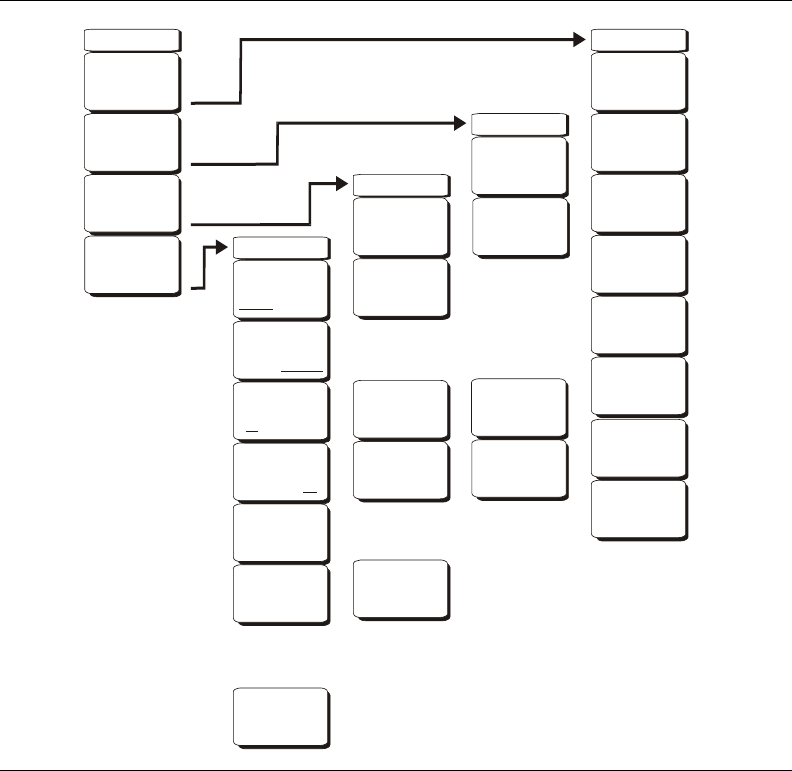
9-3
File
To access the functions under the File menu, select the Shift key, then the File (7) key.
Save
Measurements may be saved to the internal memory or to a Type-1 Compact Flash
module. The Spectrum Master is shipped with a 256 MB USB Flash Drive, Anritsu Part
Number 2000-1501. The removable compact flash card, USB Flash Drive, must be a
minimum of 256 MB to be able to hold the entire contents of the internal memory.
Modules up to 512 MB have been tested. Memory modules with greater storage capacity
may not function properly, and should be properly tested before relying on them.
Save Setup
Opens a dialog box to name and save the current operating settings, allowing them to
be recalled later to return the instrument to the state it was in at the time the setup was
saved. The saved setup can be named using the keypad to select numbers, the rotary
knob to highlight a number or character and pressing the knob to select, or by selecting
the soft key for each letter. Use the Shift key to select an upper case letter. Use the
Left/Right directional arrows to move the cursor position. Press Enter to save the
setup.
Figure 9-2. WCDMA/HSDPA File Menu
File
Save
Recall
Recall
-->
-->
Back
Back
Back
-->
-->
-->
Back
-->
Save
Save
Setup
Sort Method
Type DateName
Save
Measurement
Sort
Ascend Descend
Current Location
USB CFInt
Format CF
Copy to Destination
Int USB CF
Copy from
Current Location
to Destination
Save
On
Event
Directory
Management
Directory
Management
Directory
Management
Save
Screen
as JPEG
Delete
Selected
File
Delete
All
Measurements
Delete
All
Mode Files
Delete
All
Contents
-->
-->
-->
-->
-->
Delete
Delete
Recall
Setup
Recall
Measurement
Directory Management
*
*
*

9-4
Save Measurement
Initiates a dialog box to name and save the current active trace A. The saved
measurement trace can be named using the keypad to select numbers, the rotary knob
to highlight a number or character and pressing the knob to select, or by selecting the
soft key for each letter. Use the Shift key to select an upper case letter. Use the
Left/Right directional arrows to move the cursor position. Press Enter to save the
measurement trace. Measurements are saved in a directory called /usr on the Compact
Flash memory module.
Save On Event…
The instrument can be configured to automatically save a measurement if a selected
condition is satisfied. As measurements are saved, an on-screen message indicates
approximately how many more files can be saved. Over 3000 spectrum analyzer
measurements can be saved before the internal memory is full. The number of
measurements that can be stored in the Compact Flash or USB Flash Drive memory
depends on the size of the memory module. When measurements are saved, they are
saved into subdirectories that are automatically created in the /usr subdirectory. The
names are based on the date and time. Each subdirectory can contain a maximum of
100 measurements. For CF Memory sizes, refer to Table 3-1 on page 3-7.
… Crossing Limit On/Off
When Crossing Limit is On, and an upper or lower limit line is set, if any point in a
measurement exceeds either the upper or lower limit line, the measurement is
automatically saved at the end of the sweep. The saved measurement is named "LIM"
followed by the date and time in the format: LIMyyyymmddhhmmss. The time value
in the file name will generally be slightly earlier than the measurement time stamp
shown in the file list, since the file name is created at the time the limit violation is
noted and the time stamp is the time at which the measurement file is actually saved.
If a limit line has not been set, selecting this soft key results in the on-screen
message: "You must have a limit ON first."
… Sweep Complete On/Off
When Sweep Complete is On, the measurement is automatically saved at the end of a
sweep. This is particularly useful for very slow sweeps. The saved measurement is
named "EOS" with a file name in the format: EOSyyyymmddhhmmss.
Save Then Stop On/Off
When the Save Then Stop soft key is set to On, the instrument will save just one
measurement when the Crossing Limit or Sweep Complete soft keys are set to On,
and the qualifying event occurs. Sweeping stops after a measurement is saved. If it is
set to Off, sweeping continues after a measurement is saved and more measurements
may be saved. The default for this selection is Off.
Clear All
Pressing this soft key turns off both save on event conditions and sets Save then Stop
to Off, the default state.
Back
Returns to the top-level file menu.
NOTE: If a measurement has been previously saved, then the Save
Measurement dialog box will open with the previously saved name
displayed. To save the new measurement with a similar name (for
example, Trace-1, Trace-2, and so forth), press the Right directional arrow
and add the changes. To create a completely new name, use the keypad
or the rotary knob, or select the soft key for each letter.

9-5
Save Screen as JPEG
This function saves a measurement trace as a graphics file. The saved measurement can
be named using the keypad to select numbers, the rotary knob to highlight a number or
character and pressing the knob to select, or by selecting the soft key for each letter.
Use the Shift key to select an upper case letter. Use the Left/Right directional arrows to
move the cursor position. Press Enter to save the measurement after entering the file
name. The file is saved in the internal memory with the specified name, with .jpg
appended.
Directory Management
Sort Method
Name Type Date
File lists can be sorted by the name of the file, the type of file (SPA file, STP file, and
so forth) or by the date that the file was saved.
Sort
Ascending Descending
Selects whether the selected sort is sorted from lowest to highest (ascending) or highest
to lowest (descending). When sorting by name, the sort will place file names that start
with numbers before file names that start with letters (an ASCII sort).
Current Location
Int USB CF
This choice lets you select where measurements and setups will be saved. Pressing the
soft key selects the location for storing files on the internal memory, USB flash drive,
or a Compact Flash memory module. The "current location" and the "copy to
destination" will never be the same. Changing the current location to save files causes
the "copy to destination" to be automatically changed if the selected storage location is
the same as the selected current location.
Copy to Destination
Int USB CF
This choice lets you select where measurements and setups in the "current location"
will be copied. The "current location" and the "copy to destination" may not be the
same. If you change the destination to which the instrument will copy files, the current
location is automatically changed if the current location is the same as the selected
copy to destination..
Copy From Current Location To Destination
Pressing this soft key causes all measurements, setups and jpg files stored in the user
selected "current location" to be copied to the "copy to destination." If no storage
module is installed in the instrument, an error message is displayed.
Format CF
This selection erases all files on an installed Compact Flash module. A message is
displayed warning that all files will be erased. Press Enter to confirm that you want to
erase and Esc to quit without erasing. In addition to erasing all files stored on the
Compact Flash, the /usr directory is created for storage of measurements, setups and
jpg files.
NOTE: If a measurement has been previously saved, then the Save
Measurement dialog box will open with the previously saved name
displayed. To save the new measurement with a similar name (for
example, Trace-1, Trace-2, and so forth), press the Right directional arrow
and add the changes. To create a completely new name, use the keypad
or the rotary knob, or select the soft key for each letter.
9-6
Back
The Back key returns to the previous menu.
Recall
Recall Setup
This soft key brings up a selection box that allows selection and recall of a previously
stored instrument setup in the current storage location. Use the rotary knob or the
Up/Down arrow keys to highlight the saved setup, and press Enter, the rotary knob, or the
Recall soft key to select. All current instrument settings are replaced by the stored setup
information. Press the Esc key to cancel the recall.
Recall Measurement
Brings up a selection box that allows recall of a previously stored measurement trace from
the currently selected storage location. Use the rotary knob or the Up/Down arrow keys to
highlight the saved measurement trace, and press Enter, the rotary knob, or the Recall soft
key to select. A recalled trace may be displayed as Trace A, in place of the live trace, or as
Trace B or Trace C along with the live trace. Use the rotary knob or the Up/Down arrow
keys to highlight the recalled trace option, and press the Enter key to select. Press the Esc
key to cancel the recall.
To remove a recalled measurement trace from the screen, select the Shift key and the
Trace (5) key to open the Trace menu. Use the Trace soft key to select the trace to be
removed from the screen and use the View/Blank soft key to view or blank the trace. Use
the Trace key to select an active trace after blanking a recalled trace.
Directory Management
See “Directory Management” on page 9-5.
Back
Returns to the previous menu.
Delete
Brings up a selection box that shows all stored setups and traces in the currently selected
location (see “Directory Management” on page 9-5). The list shows the setup and
measurement names, the type (stp for a saved setup, spa for a saved trace, jpg for a JPEG
file) and the date and time the information was saved. Use the rotary knob or the Up/Down
arrow keys to highlight the file to be deleted, and press Enter, or the Delete soft key to
delete. Press the Esc key to cancel the operation. Note that there is no mechanism to
retrieve deleted files.
Delete Selected File
Use the up and down arrow buttons or the rotary knob to select the file that is to be
deleted. Press Enter to confirm that you want to delete the file or press Esc to exit
without deleting.
Delete ALL Measurements
Deletes all measurements of the current mode in the currently selected storage location.
The memory from which measurements will be deleted is set in the Directory
Management menu and is the Current Location.
Delete ALL Mode Files
Deletes all measurements of the type saved in the current operating mode of the
instrument. In addition all jpg and setup files (regardless of the mode) are deleted.
Delete ALL Contents
Deletes all measurements, jpg files and setup files of ALL measurement types.
Back
The Back key returns to the previous menu.
9-7
Print
The Print key can be used to save a measurement trace as a graphics file. This file can then
be downloaded to a PC using Master Software Tools and printed.
Save Screen as JPEG
This function saves a measurement trace as a graphics file. The saved measurement can
be named using the keypad to select numbers, the rotary knob to highlight a number or
character and pressing the knob to select, or by selecting the soft key for each letter.
Use the Shift key to select an upper case letter. Use the Left/Right directional arrows to
move the cursor position. Press Enter to save the measurement after entering the file
name. The file is saved in the internal memory with the specified name, with .jpg
appended.
Save On Event
Not applicable in WCDMA/HSDPA Signal Analyzer Mode.

9-8
Freq (Frequency)
Center Freq
Press the Freq key followed by the Center Freq soft key and enter the desired frequency
using the keypad, the arrow keys, or the rotary knob. If entering a frequency using the
keypad, the soft key labels change to GHz, MHz, kHz, and Hz. Select the appropriate units
key. Selecting the Enter key has the same affect as selecting the MHz soft key.
Signal Standard
Use the Up/Down arrow keys or the rotary knob to highlight a signal standard and press
Enter to select. When a signal standard is selected, the center frequency and span for the
first channel of the selected standard is automatically tuned. Other settings, such as
channel spacing and integration bandwidth, are also automatically entered. Appendix A
contains a table of the signal standards that are in the instrument firmware.
Channel
Use the Up/Down arrow keys, the keypad, or the rotary knob to select a channel number
for the selected signal standard. The center of the channel is automatically tuned to the
center frequency of the selected WCDMA channel.
Set CF To Closest Channel
The instument will choose the channel closest to the currently selected center frequency.
Decrement Channel
The channel number will be decremented one channel.
Increment Channel
The channel number will be incremented one channel.
Figure 9-3. WCDMA/HSDPA Freq Menu
Freq
Center Freq
1.000 GHz
Decrement
Channel
Set CF
To
Closest Channel
Increment
Channel
Signal
Standard
Channel
- -
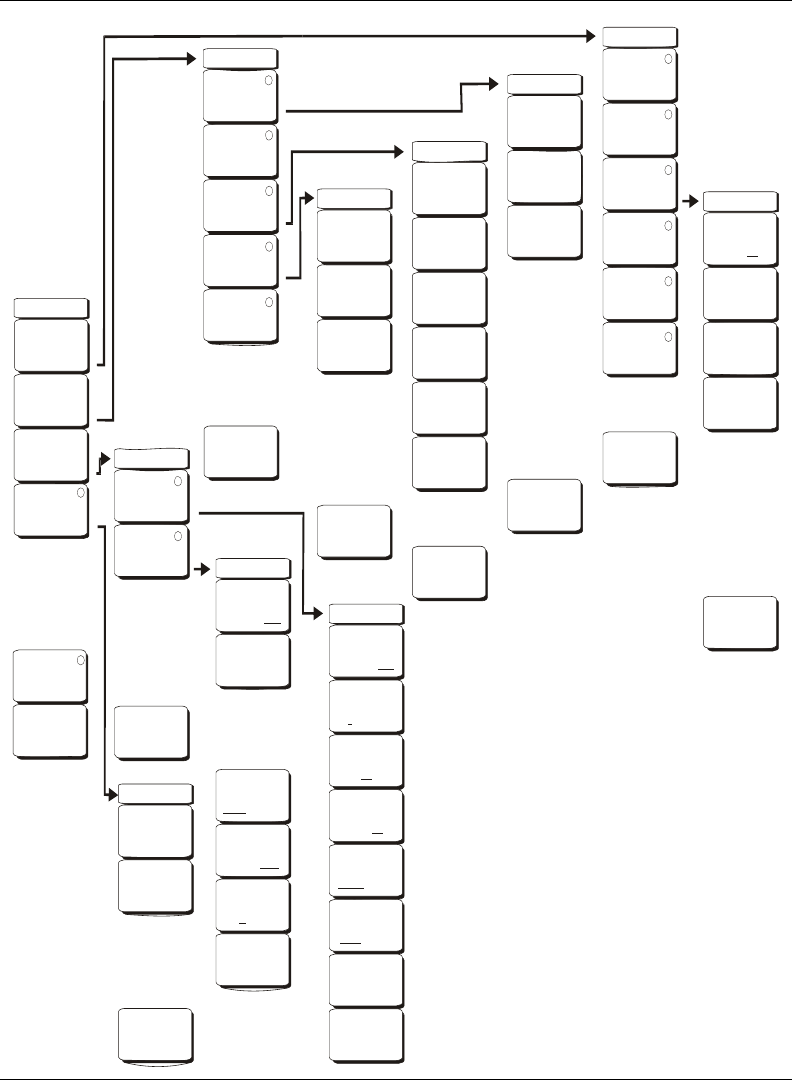
9-9
Measurements
Figure 9-4. WCDMA/HSDPA Measurements Menu
OTA Setup
Sort By
PowerCode
Reset
Back
Scrambling Code
Manual Auto
Manual Code
2 3 4 5 61
On
Off
Code Lock
On Off
Display Unit
EC/IoCPICH
Multipath
Horiz Display
Chips uSec
Distance
ftm
Back
Scrambling Code
Manual Auto
Manual Scrambling
Code
0
Vert Display
Rel PwrRSCP
-->
WCDMA
Summary
Save
Measurement
Measurements
RF Measurement
Demodulator
Over
the
Air
Pass
Fail
Mode
-->
-->
ACLR
RF
Summary
Control Channels
Rel Abs Delta
Back
Back
Back
Back
Back
Display Trace
On Off
Channel
Spectrum
Zoom Start
0
Next Active
Code
Right
Zoom Time
240 s
Select
# of
Main Channels
Select
# of
Adjacent Channels
ACLR
Control Channels
Rel Abs Delta
Total Time
240 s
Single Sweep Time
5s
Spectral
Emission
Mask
Single Sweep Time
5s
Channel Width
5.000 MHz
Spectral
Emission
Summary
IQ Persistance
1
-->
-->
-->
Back
-->
-->
Back
-->
-->
Pass Fail Mode
CDP
Table
Select
Pass/Fail
Test
HSDPA
Reset
Codogram
Modulation
Summary
Over The Air
Scrambling Code
Multipath
Back
-->
-->
-->
-->
-->
-->
-->
-->
-->
-->
RF Measurement
CDP
HSDPA
Codogram
Band
Spectrum
Zoom
32 64 128
Next Active
Code
Left
Zoom
32 64 128
Demod
CDP
9-10
RF Measurement
Opens the RF measurement menu.
Band Spectrum
Displays the spectrum of the selected band.
Ref Level
Sets the required reference level.
Scale
Change the scale.
Band Channel
Use the cursor to select the required channel and the unit analyzes the selected
channel signal.
Previous Band
The unit automatically selects the previous band.
Next Band
The unit automatically selects the next band.
Back
Returns to the previous menu.
Channel Spectrum
Displays the spectrum of the selected channel. The screen also displays Channel Power
in dBm and watts, Peak to Average power and Occupied Bandwidth.
ACLR
Displays the Adjacent Channel Leakage Ratio (ACLR). The user can set the main
channels and adjacent channels from 1 to 4 channels. This screen can display up to
12 channels total.
Display Trace
Select ON to display the trace.
Select # of Main Channels
Set the main channels from 1 to 4 channels.
Select # of Adjacent Channels
Set the adjacent channels from 1 to 4 channels.
Channel Width
Change the WCDMA Channel width setting by pressing More in the setup menu and
selecting the Channel Width soft key. Enter the desired value and press the Enter soft
key. Use the Up/Down arrow keys, or the rotary knob to to set the desired value and
press the Enter soft key. The default value is 5 MHz.
Spectral Emission Mask
Displays the received signal and the mask based on received signal strength.
Spectral Emission Summary
Displays the spectral emission mask in table format and whether the received signal
passed in each frequency range.
RF Summary
Displays the RF measurements in table form.
Back
Returns to the previous menu.

9-11
Demodulator
Spectrum Master in demodulator mode demodulates the received WCDMA signal. The
demodulator has 3 displays, CDP, Codogram, and Modulation Summary.
CDP
When Code Domain Power (CDP) is selected the screen displays all the selected OVSF
codes and selected OVSF zoom codes in the graphical format. The display also
displays P-CPICH Abs power, EVM, Carrier Frequency, Channel Power, Carrier
Feedthrough, Frequency Error in Hz and PPM, Noise Floor and Peak CD Error. The
screen also displays CPICH, P-CCPCH, S-CCPCH, PICH, P-SCH and S-SCH powers
in the table format. If the marker is set on the code, the marker will display the code
number, power and Symbol EVM.
Zoom
Select a zoom function of 32, 64, or 128 codes.
Zoom Start
Enter the required zoom start code. For example, to start at code 2, enter 2.
Control Channels
The Control Channels soft key selects relative power, absolute power or the delta
power using CPICH as the reference. Typically node-B control channels will be
configured the same throughout a network. The delta power value makes it possible
to quickly check whether the control channels are set to the correct power levels.
CDP Table
When Code Domain Power Table (CDP Table) is selected, the screen displays a list of
all the active OVSF codes in a tabular format. The display shows the Spreading Factor,
Code Number, Status, EVM, Modulation type, Relative Power in dB, and Absolute
Power in dBm for each active OVSF code. Use the rotary knob to scroll up and down
the CDP Table when there are more codes than a single page can display.
HSDPA
When HSDPA is selected, the screen displays all of the selected OVSF including high
speed data channel codes and selected OVSF with high speed codes in the graphical
format. The selected code Power versus time and Constellation diagram will be
displayed. The display also displays P-CPICH Abs power, EVM, Carrier Frequency,
Channel Power, Carrier Feedthrough, Frequency Error in Hz and PPM, Noise Floor,
and Peak CD Error. The screen also displays CPICH, P-CCPCH, S-CCPCH, PICH,
P-SCH and S-SCH powers in the table format.
Next Active Code Left
Select the next active code left.
Next Active Code Right
Select the right side active code.
NOTE: For the WCDMA/HSDPA demodulator option, the CDP screen
displays HSDPA and WCDMA signals. P-CPICH Abs power, EVM, Carrier
Frequency, Channel Power, Carrier Feedthrough, Frequency Error in Hz
and PPM, Noise Floor, and Peak CD Error are also displayed. The screen
displays CPICH, P-CCPCH, S-CCPCH, PICH, P-SCH and S-SCH powers
in the table format. If the marker is set on the code, then the marker will
display the code number, power, and Symbol EVM.
9-12
Total Time
Set the time for the power versus time screen. The minimum total time is
240 seconds and the maximum total time is 72 hours.
Single Sweep Time
Set the single sweep time. The unit automatically calculates the total time.
IQ Persistence
Set the number of samples before displaying the screen (maximum 48).
Control Channels
The Control Channels soft key selects relative power, absolute power or the delta
power using CPICH as the reference. Typically node-B control channels will be
configured the same throughout a network. The delta power value makes it possible
to quickly check whether the control channels are set to the correct power levels.
Back
Returns to the previous menu.
Codogram
When Codogram is selected the screen displays the changes in code power levels over
time. Two graphs are displayed on the screen, the top one displays all the selected
OVSF codes and the bottom one displays the selected OVSF zoom codes.
Zoom
Select a zoom function of 32, 64, or 128 codes.
Zoom Start
Enter the required zoom start code. For example, to start at code 2, enter 2.
Total Time
Use the keypad, the Up/Down arrow keys, or the rotary knob to enter the total time to
display the changes in code power levels. The maximum total time for Codogram is
72 hours.
Single Sweep Time
Single sweep time is related to total time. Use the keypad, the Up/Down arrow keys,
or the rotary knob to set the single sweep time.
Modulation Summary
Displays the demodulation parameters in the table format.
Back
Returns to the previous menu.
Over the Air
Scrambling Code
Displays the WCDMA Over The Air Measurements, six scrambling codes, CPICH, Ec/Io,
Ec, Pilot Dominance, and OTA total power.
Scrambling Code
Set the scrambling codes manually or auto.
Manual Code
Set the manual codes manually.
On/Off
Switch On/Off the manual codes.
9-13
Code Lock
Lock the measured codes.
Display Unit
Display the codes by CPICH or Ec/Io.
Sort By
Sort the measured codes by code numbers or power.
Reset
Reset the measurement screen.
Back
Returns to the previous menu.
Multipath
Displays up to 6 multi-path components of the Strongest Scrambling Code, measuring Tau
in Sec, Tau in Chips, Distance in feet or meters, Received Signal Code Power (RSCP),
Relative Power.
Scrambling Code
Set the scrambling codes manually or auto.
Manual Code
Set the manual codes manually.
Vertical Display
Set vertical scale to RSCP (Absolute Power) or Relative Power
Horizontal Display
Set Horizontal scale to Chips or Sec.
Distance
Set distance units to meters or feet.
Back
Returns to the previous menu.
Pass/Fail Mode
The Spectrum Master saves the five test model conditions specified in the 3GPP
specification to test the base station. After the selected test model, the unit displays
whether the base station passed or failed the test. Using Master Software Tools, a custom
test list can be created and downloaded into the unit. All critical measurements can be
selected for pass fail testing including each individual code power, spreading factor and
symbol EVM. The results are displayed in table format with clear identification of pass/fail
results including min/max thresholds and measured results.
Select Pass/Fail Test
Select the parameters file from the list.
Reset
Restart the measurement.
Back
Returns to the previous menu
WCDMA Summary
Displays the critical WCDMA measurements in a table format.

9-14
Save Measurement
Initiates a dialog box to name and save the current measurement. The saved measurement
can be named using the keypad to select numbers, the rotary knob to highlight a number or
character and pressing the knob to select, or by selecting the soft key for each letter. Use
the Shift key to select an upper case letter. Use the Left/Right directional arrows to move
the cursor position. Press Enter to save the measurement WCDMA measurements are
saved with a .wcd extension.
Mode
To access the functions under the Mode menu, select the Shift key, then the Mode (9) key.
The available modes are Spectrum Analyzer, WCDMA/HSDPA Signal Analyzer, and
GSM/GPRS/EDGE Signal Analyzer. Use the directional arrow keys or the rotary knob to
highlight the selection and press the Enter key to select.
NOTE: If a measurement has been previously saved,then the Save
Measurement dialog box will open with the previously saved name
displayed. To save the new measurement with a similar name (for
example, Trace-1, Trace-2, and so forth), press the Right directional arrow
and add the changes. To create a completely new name, use the keypad
or the rotary knob, or select the soft key for each letter.

9-15
Preset
To access the functions under the Preset menu, select the Shift key, then the Preset (1) key.
Preset
This key resets the instrument to the default starting conditions of full band sweep,
10 dBm log reference level, 10 dB/division scaling, 0 dB reference level offset, all
measurements turned off, and trigger set to free run.
Save Setup
Opens a dialog box to name and save the current operating settings, allowing them to be
recalled later to return the instrument to the state it was in at the time the setup was saved.
The saved setup can be named using the keypad to select numbers, the rotary knob to
highlight a number or character and pressing the knob to select, or by selecting the soft key
for each letter. Use the Shift key to select an upper case letter. Use the Left/Right
directional arrows to move the cursor position. Press Enter to save the setup.
Recall Setup
This soft key brings up a selection box that allows selection and recall of a previously
stored instrument setup. Use the rotary knob or the Up/Down arrow keys to highlight the
saved setup, and press Enter, the rotary knob, or the Recall soft key to select. All current
instrument settings are replaced by the stored setup information. Press the Esc key to
cancel the recall.
Figure 9-5. WCDMA/HSDPA Preset Menu
Preset
Preset
Save
Setup
Recall
Setup

9-16
Setup
Setup (1/2) Menu
Scrambling Code, Auto / Manual
Press the Scrambling soft key to toggle between Auto and Manual scrambling code.
Manual Scrambling Code
Press the Manual Scrambling Code soft key to manually enter the scrambling code by
using the number keys or the rotary knob.
Max Spreading Factor
Press the Max Spreading Factor soft key to toggle between 256 codes and 512 codes.
Select Reference Frequency
Press the Select Reference Frequency soft key to select from the pop-up list by using the
Up/Down arrow keys or the rotary knob, and then press Enter.
S-CCPCH Spread
Press the S-CCPCH (Secondary Common Control Physical Channel) soft key to enable the
S-CCPCH spreading factor and to enter the desired code. The default value is 256.
S-CCPCH Code
Press the S-CCPCH Code soft key to enable and to enter the S-CCPCH code. The default
value is 3.
Figure 9-6. WCDMA/HSDPA Setup Menu
Setup (1/2)
Scrambling Code
ManualAuto
Manual Scrambling Code
493
Max Spreading Factor
256 512
Select
Reference
Frequency
S-CCPCH Spread
256
S-CCPCH Code
3
PICH Code
16
More
-->
dBm
Watts
Power
Threshold
ManualAuto
Setup (2/2)
Manual Threshold
-30.0 dB
Max Amp Pwr
xx dBm
CPICH Pwr
xx dBm
Freq Err Avg
Off On
Freq Err Avg Cnt
#
Back
<--
9-17
PICH Code
Press the PICH soft key to activate Paging Indicator Channel, and enter the desired code.
The default value is 16.
More
Pressing this soft key opens the second Setup menu (2/2).
Setup (2/2) Menu
Threshold Auto/Manual
Press the Threshold Auto/Manual soft key to toggle from Auto to Manual.
Manual Threshold
Press the Manual Threshold soft key, enter the desired value, and press Enter. The default
value is –30 dB.
Max Amp Pwr
Press this soft key to change the Maximum Amplifier Power value. This measurement
setting is used to input the maximum transmit power (typically 43 dBm or 46 dBm) of the
base station. This value will be used to calculate the Amplifier Capacity percentage in the
CDP Table measurement. Use the rotary knob or the numerical keypad to enter a value,
then press the Enter key. The rotary knob allows you to scroll through dBm values. When
using the numerical keypad, an additional soft key menu opens with keys for dBm and
Watts. Press the desired units soft key to enter the value in dBm or watts, then press the
Enter key.
Power
Press the dBm or Watts soft key to set the power units, then press the Enter key.
CPICH Pwr
Press this soft key to change the CPICH power value. This value will be used to calculate
the Amplifier Capacity percentage in the CDP Table measurement. Use the rotary knob or
the numerical keypad to enter a value, then press the Enter key. The rotary knob allows
you to scroll through dBm values. When using the numerical keypad, an additional soft
key menu opens with keys for dBm and Watts. Press the desired units soft key to enter the
value in dBm or watts, then press the Enter key.
Power
Press the dBm or Watts soft key to set the power units, then press the Enter key.
Freq Err Avg, Off / On
Press this soft key to toggle frequency error averaging ON or OFF when making WCDMA
measurements. The active state is underlined on the displayed soft key face.
Freq Err Avg Cnt
Press this soft key to set the number of frames to be used in the averaging function for
frequency error measurements. The range is 2 through 15. Use the rotary knob or the
numerical keypad to enter a value, then press the Enter key.
Back
Returns to the previous menu
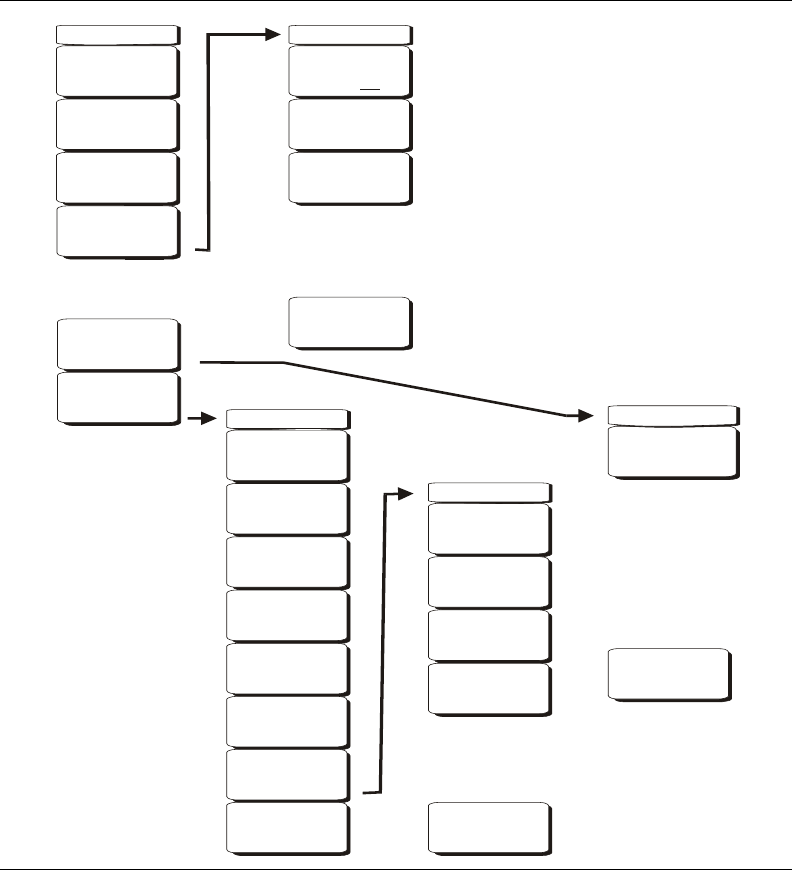
9-18
System
To access the functions under the System menu, select the Shift key, then the System (8)
key.
Status
Pressing this soft key displays the current system status, including the operating system
and firmware versions, temperatures and other details such as current battery information.
Press Esc or Enter to return to normal operation.
Self Test
This soft key initiates a series of diagnostic tests that test the components of the
instrument. A display will list the individual tests with a pass or fail indication. Press Esc
or Enter to return to normal operation.
Figure 9-7. WCDMA/HSDPA System Menu
System
Status
Self
Test
Application
Self
Test
GPS
Application
Options
System
Options -->
-->
-->
Back
-->
Options
Select
Reference
Frequency
Back
-->
GPS
GPS
On Off
GPS
Info
Reset
Back
-->
Reset
Factory
Defaults
Master
Reset
Update
OS Via
Ethernet
Update
OS Via
USB
System Options
Date
&
Time
Ethernet
Config
Language
Brightness
Name
Volume
Reset
Back
-->
-->
9-19
Application Self Test
This soft key initiates a series of diagnostic tests related to the performance of the
Spectrum Master in WCMDA mode. A display will list the individual tests with a pass or
fail indication. Press Esc or Enter to return to normal operation.
GPS
If the GPS option is installed, then the GPS menu will be displayed.
GPS On/Off
Turns the GPS on or off.
GPS Info
Displays the current GPS information.
Reset
Resets the GPS for a new location.
Back
Returns to the previous menu.
Application Options
This soft key presents a menu to select application options.
Select Reference Frequency
This soft key brings up a dialog box for selecting the Reference Frequency. Use the
rotary knob or the Up/Down arrow keys to highlight the Reference Frequency and
press Enter to select, or press the Esc key to cancel.
Back
Returns to the previous menu.
System Options
This key opens a selection of system option soft keys.
Date and Time
This soft key brings up a dialog box for setting the current date and time. Use the soft
keys or the Left/Right arrow keys to select the field to be modified. Use the keypad, the
Up/Down arrow keys or the rotary knob to select the date and time. Select Enter to
accept the changes, or press the Esc key to return to normal operation without
changing anything.
Ethernet Configuration
This soft key brings up a dialog box to set the IP address of the instrument.
Type Manual/DHCP
This softkey selects whether the address will be entered manually, or supplied
automatically by a network DHCP server. If Manual is selected, then use the soft
keys or the Left/Right arrow keys to select the field to be modified. Use the keypad,
the Up/Down arrow keys or the rotary knob to enter the input. Select Enter to accept
the changes, or press the Esc key to return to normal operation without changing
anything.
Language
This soft key brings up a selection box allowing selection from a list of built-in
languages for the Spectrum Master displays. The languages currently available are
English, French, German, Spanish, Japanese, Chinese, Korean, and Italian.

9-20
In addition, a custom language may be selected if it has been defined using the Master
Software Tools software and loaded into the Spectrum Master. Two custom languages
may be loaded into the instrument using Master Software Tools. If a mode does not
have language translations available, then English is the default language. Select Enter
to accept the change, or press the Esc key to return to normal operation without
changing anything.
Brightness
The brightness of the display can be adjusted to optimize viewing under a wide variety
of lighting conditions. Use the keypad, the Up/Down arrow keys, or the rotary knob to
select a brightness level from 1 to 9, 9 being the brightest. Select Enter to accept the
change.
Name
Opens a dialog box to name the instrument. The unit can be named using the keypad to
select numbers, the rotary knob to highlight a number or character and pressing the
knob to select, or by selecting the soft key for each letter. Use the Shift key to select an
upper case letter. Use the Left/Right directional arrows to move the cursor position.
Press Enter to save the name.
Volume
The current volume setting is displayed on the screen. Use the keypad, the Up/Down
arrow keys, or the rotary knob to change the volume, and press the Enter key to accept
the change.
Reset
Opens a menu of reset and update options.
Factory Defaults
Restores the instrument to the factory default values, including Ethernet, language,
and brightness settings. Press the Enter key to initiate the reset, and turn the unit off,
then on again to complete. Press Esc to return to normal operation without resetting.
Master Reset
This will restore factory setting to all system parameters, including Time/Date,
Ethernet, language, and brightness settings. Also, all user files in the internal memory
are deleted, and the original language and antenna files are restored.
Press the Enter key to initiate the reset, and turn the unit off, then on again to
complete. Press Esc to return to normal operation without resetting.
Update OS Via Ethernet
Select this soft key to update the instrument operating system via the Ethernet
connection. Press Enter to begin the update, or press Esc to return to normal
operation without updating.
Update OS Via USB
Select this soft key to update the instrument operating system via the USB
connection. Press Enter to begin the update, or press Esc to return to normal
operation without updating.
Back
Returns to the previous menu.
NOTE: The Update OS via Ethernet and Update OS via USB selections
are accomplished in conjunction with the Master Software Tools program.
Improper use of the Master Software Tools program could render the
system unusable.

9-21
WCDMA/HSDPA Measurements
Carrier Frequency
Carrier Frequency is the selected transmitter operating center frequency that is entered by
the user or is calculated from the signal standard and channel number that are entered by the
user.
Carrier Feedthrough
Carrier Feedthrough measures the amount of unmodulated signal that is leaking through the
transmitter and is displayed in the Code Domain Power display. The WCDMA 3GPP
specification does not specify carrier feedthrough measurement.
CDP
Code Domain Power displays how much of the channel power is in each Orthogonal
Variable Spreading Factor (OVSF). Power is normalized to the channel power, so if a code
reads –10 dB, then that code is 1/10th of the channel power. Colors are applied according to
the following table:
NOTE: Use an applicable band pass filter to eliminate out of band signals
that can cause mixer saturation.
Table 9-1: Code Domain Power Parameter colors
Parameter Description Color VIewable on Display
CPICH Common Pilot Channel Red All CDP views
P-CCPCH Primary Common Control
Physical Channel
Magenta All CDP views
S-CCPCH Secondary Common Control
Physical Channel
Cyan All CDP views
PICH Paging Indicator Channel Green All CDP views
P-SCH Primary Sync Channel Navy Blue Control Channels
S-SCH Secondary Sync Channel Blue Control Channels
Traffic WCDMA Traffic Yellow All CDP views
Noise Noise Grey All CDP views
HS-PDSCH High Speed Physical Downlink
Shared Channel
Orange HSDPA Screen and
CDP Screen when the
WCDMA/HSDPA option
is installed
NOTE: In WCDMA specification the P-SCH and S-SCH are not assigned
spreading codes and therefore do not appear in the code domain power
display. They have special non-orthogonal scrambling codes and are on
10% of the time.
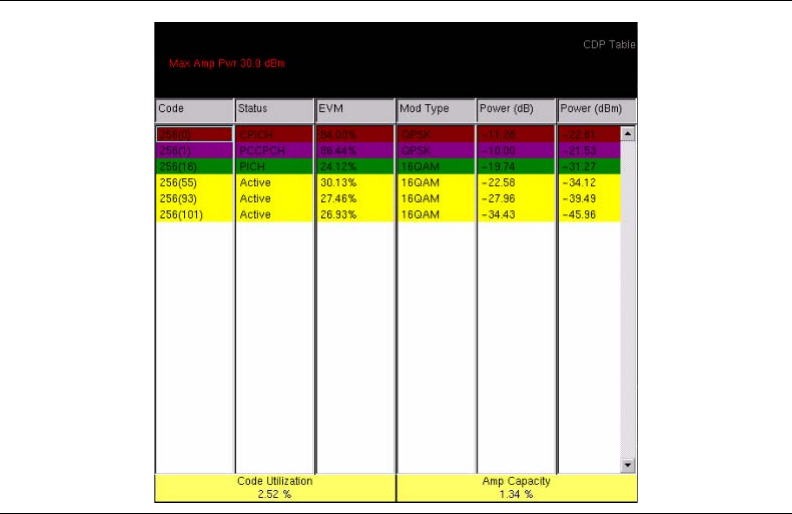
9-22
The Code Domain Power table displays the percentage distribution of signal power
(Amplifier Capacity) to the percentage of users (Code Utilization). Usually. these two
percentage values are approximately the same. As the number of users increases, more codes
are assigned, and the base station power output increases to produce the additional signals.
Coded information within the signals indicates signal strength at the user end so that the
signal power for each code can be adjusted at the base station. Example situations for which
the two percentages may vary more widely than usual include having only a few users who
are far from the base station or who are within a building or other structure that requires
stronger signals for penetration.
Code Utilization
Code Utilization is the percent of active OVSF codes. This measurement displays the current
percentage of active traffic in the measured sector. The utilization of codes is displayed as a
percentage because the number of OVSF codes that are assigned to a single user varies with
signal demands. Any data user, for example, can access and use a large number of OVSF
codes to download a data file.
Amplifier Capacity
The Amplifier Capacity indicates the estimated percent of total amplifier capacity used by
the Node B (UMTS base station). This is useful for comparing with the Code Utilization. In
most applications, the two measurements follow each other closely. Node B inefficiencies
can be easily caught when the percentages of Code Utilization and Amplifier Capacity vary
by a large amount.
Figure 9-8. CDP (Code Domain Power) Table
9-23
Max Amplifier Power
This measurement setting is used to indicate the maximum transmit power of the base
station. The value is used to calculate the amplifier capacity percentage in the CDP table
measurement.
CPICH Power
This measurement setting is used to indicate the CPICH power, which is used to calculate
the amplifier capicty percentage in the CDP table measurement.
Frequency Error Averaging
This feature is used when making frequency error measurements in WCDMA. The number
of frames to use in the averaging calculation can be set from 2 to 15.
Channel Power
Channel power is the total power transmitted in the 3.8 MHz WCDMA channel specified.
Channel Power measures the node B/base station transmitting power across the entire
3.84 MHz WCDMA (UMTS) channel. Channel power is displayed in dBm and Watts.
For Over the Air (OTA) measurements, the channel power will vary as the signal path from
the node B transmitter to the Spectrum Master varies.
Scrambling Code
In the WCDMA specification the scrambling code can be from 0 to 511. If the scrambling
code is known, then its value can be entered and the test set can decode and display the code
domain power of the signal. If the scrambling code is unknown, then the Spectrum Master
can be set to auto scrambling so that the test set can lock onto the strongest code in order to
decode and display the code domain power of the signal.
Spreading Factor (also called OVSF codes)
According to the 3GPP standard the spreading factor can be from 4 to 512, and the Spectrum
Master can be set to a maximum spreading factor of 256 or 512.
Freq Error
Frequency error is the difference between the received center frequency and the specified
center frequency. This is tied to the external frequency reference accuracy and is typically
only useful with a good external frequency reference.
Codogram
When Codogram is selected the screen displays the changes in code power levels over time.
Noise Floor
The average power of inactive codes in the code domain, displayed in the CDP measurement
display.
9-24
Threshold
The Active Channel Threshold Level can be set to indicate which code channels are
considered active. Any code channels exceeding this power level are considered active
traffic channels and any code channels below this power level are considered inactive (or
noise). A horizontal red line on the screen represents the threshold level. The Spectrum
Master can set this level automatically based on the received signal, or the user can manually
enter a value in the Threshold setup menu.
Occupied Bandwidth
The measured occupied bandwidth is calculated as the bandwidth containing 99% of the
total integrated power within the transmitted spectrum around the selected center frequency.
EVM (Error Vector Magnitude)
The Error Vector Magnitude is the ratio in percent of the difference between the reference
waveform and the measured waveform. EVM metrics are used to measure the modulation
quality of a transmitter. The 3GPP standard requires the EVM not to exceed 17.5%.
Symbol EVM (@EVM)
Symbol EVM is defined as the EVM for a single code channel.
Peak to Average Power
Peak to Average power is the ratio of the peak power and the RMS power of the signal
calculated over one frame interval and is displayed in dB.
Peak CD Error (Peak Code Domain Error)
PCDE takes the noise and projects the maximum impact it will have on all OVSF codes.
PCDE is the maximum value for the code domain error for all codes (both active and
inactive).
In the 3GPP standard to address the possibility of uneven error power distribution in
WCDMA, the EVM measurement has been supplemented with PCDE. The 3GPP standard
requires the PCDE not to exceed –33 dB at a spreading factor of 256.
Ec
Ec is a measurement of energy. Ec is determined by multiplying CPICH by the chip time.
Ec/Io
The pilot power compared to the total channel power. Ec/Io is displayed in text only and
OTA measurement displays.
Pilot Dominance
The strength of the strongest pilot compared to the next strongest pilot in the same channel.
This should be >10 dB to make good measurements.
Total Power
The total power of all the scrambling codes, also called (Io) and displayed in dBm.
9-25
CPICH Abs Power
CPICH Abs power is the energy over one chip of the Common Pilot Channel power
displayed in dBm.
P-CCPCH Abs Power
P-CCPCH Abs power is the absolute Primary Common Control Physical Channel power
displayed in dBm.
S-CCPCH Abs Power
S-CCPCH Abs power is the absolute Secondary Common Control Physical Channel power
displayed in dBm.
P-SCH Abs Power
P-SCH Abs power is the absolute Primary Sync Channel power displayed in dBm.
S-SCH Abs Power
S-SCH Abs power is the absolute Secondary Sync Channel Power displayed in dBm.
PICH
PICH is the paging indicator channel power.
HSDPA Power versus Time Display
Select the code and set the time to display how the code is varying over time. In CDP view,
HSDPA signals are displayed in orange.
Constellation
In the HSDPA view, the symbol constellation for the selected code is displayed (16QAM or
QPSK).

9-26
Measurement Setup
WCDMA/HSDPA Mode
To prepare for WCDMA measurements, the Spectrum Master must be configured for
WCDMA mode, as follows:
1. Select the Shift key, then the Mode (9) key. The available modes are Spectrum
Analyzer, UMTS/WCDMA Signal Analyzer, and GSM/GPRS/EDGE Signal Analyzer.
2. Use the directional arrow keys or the rotary knob to highlight WCDMA/HSDPA Signal
Analyzer and press the Enter key to select.
Setting up the Measurement Frequency
The measurement frequency can be set by entering the center frequency or by selecting the
applicable signal standard and channel, which allows the Spectrum Master to automatically
set the frequency.
To enter the center frequency:
1. Press the Freq function hard key.
2. Press the Center Freq soft key.
3. Enter the desired frequency using the keypad, the arrow keys, or the rotary knob. If
entering a frequency using the keypad, the soft key labels change to GHz, MHz, kHz,
and Hz. Select the appropriate units key. Selecting the Enter key has the same affect as
selecting the MHz soft key.
4. Press the Enter key to set the Center Frequency. The current setting is shown on the
left side of the display.
To select a signal standard:
1. Press the Freq function hard key.
2. Select the Signal Standard soft key.
3. Use the Up/Down arrow keys or the rotary knob to highlight a signal standard and
press Enter to select. When a signal standard is selected, the center frequency for the
first channel of the selected standard is automatically tuned.
4. Select the Channel soft key and use the Up/Down arrow keys, the keypad, or the rotary
knob to select a channel number for the selected signal standard. The center of the
channel is tuned to the center of the display.
The current settings are displayed on the left side of the screen.
NOTE: UMTS/WCDMA mode supports HSDPA measurements when
Option 65, WCDMA/HSDPA Demod, Option 44, WCDMA/HSDPA RF
Meas, Option 35, WCDMA/HSDPA OTA are installed and the name of the
mode is labeled as WCDMA/HSDPA Signal Analyzer. When Option 45,
WCDMA Demod is installed, the mode is labeled as WCDMA Signal
Analyzer.
9-27
Power Offset for Compensating External Loss
To get accurate results the external attenuation should be compensated using power offset. In
power offset mode the compensation factor is in dB. The external attenuation is caused by
using an external cable or external high power attenuator.
1. Press the Amplitude function hard key.
2. Press the Power Offset soft key and use the keypad, the arrow keys, or the rotary knob
to enter the desired offset value. Press the Enter key to set the Power Offset. The value
entered is displayed on the left side of the screen.
Scrambling Code Setup
The Spectrum Master can set up a scrambling code automatically or manually.
In Auto mode the unit automatically locks on to the strongest scrambling code in the signal.
In Manual mode the desired code is manually entered and the unit looks only for that
specific scrambling code.
To set up auto scrambling:
1. Press the Setup function hard key.
2. Press the Scrambling Code soft key to select Auto
To manually set up a Scrambling Code:
1. Press the Setup function hard key.
2. Press the Scrambling Code soft key to select Manual and use the keypad, the arrow
keys, or the rotary knob to enter the desired Scrambling Code, as shown on the left side
of the screen. Press the Enter key to set the scrambling code.
Maximum Spreading Factor Setup
In a WCDMA system, the number of chips per data symbol is called the Spreading Factor.
The lower the spreading factor the higher the data rate. According to the 3GPP standard, the
spreading factor can vary from 4 to 512 and the maximum spreading factor is either 256 or
512. The Spectrum Master can be set to 256 or 512 maximum spreading factors. To set up
the maximum spreading factor:
1. Press the Setup function hard key.
2. Press the Max Spreading Factor soft key to select either 256 or 512.
External Reference Frequency Setup
In order to get the best frequency accuracy measurements, it is important to use an external
reference frequency attached to the Spectrum Master Ext Ref In connector. Most node B
equipment has a reference frequency available on a BNC connector. To configure the
Spectrum Master to use an external reference frequency:
1. Press the Setup function hard key.
2. Press the Select Reference Frequency soft key to display a list of the available
reference frequencies:

9-28
3. Use the Up/Down arrow keys or the rotary knob to highlight the applicable reference
frequency on the list and press the Enter key to set the reference frequency.
As the Spectrum Master locks to the source, the Reference Freq value is displayed in the
user settable parameters to the left of the display.
S-CCPCH and PICH
S-CCPCH Spreading Factor, S-CCPCH Code, and PICH Code setup
In the 3GPP specification, two optional control channels are provided for S-CCPCH and
PICH. These codes can have different spreading codes and spreading factors. In the
Spectrum Master, the S-CCPCH spreading factor and S-CCPCH and PICH codes can be
manually entered.
1. Press the Setup function hard key.
2. Select the S-CCPCH Spread soft key and manually enter the desired spreading factor.
3. Select the S-CCPCH Code soft key and manually enter the desired spreading code.
4. Select the PICH Code soft key and manually enter the desired spreading code.
Table 9-2: Reference Frequencies
1 MHz
1.2288 MHz
1.544 MHz
2.048 MHz
2.4576 MHz
4.8 MHz
4.9152 MHz
5 MHz
9.8304 MHz
10 MHz
13 MHz
19.6608 MHz
NOTE: For the most accurate results, manually enter the S-CCPCH
spreading and S-CCPCH and PICH codes before taking the
measurement.
NOTE: The S-CCPCH spreading factor default value is 256. The default
S-CCPCH Code is 3 and the default PICH code is 16.

9-29
Threshold Setup
The threshold level is an advanced setting that can be set to indicate which codes are
considered active. In the Code Domain Power screen, the threshold level is indicated by a
horizontal dotted red line. Any code channels that exceed this power level are considered
active traffic channels, and any code channels below this power level are considered inactive
or noise. The threshold level can be manually set by the following steps:
1. Press the Setup function hard key.
2. Select the More soft key.
3. Select the Threshold soft key and select either Auto or Manual.
4. If Manual is selected, select the Manual Threshold soft key and enter a value, followed
by the Enter soft key.
Filtered versus Unfiltered Power
In the Spectrum Master, the ACLR measurement uses the filtered channel power to
determine the ACLR values, and it is listed as filtered on the display. In all other screens, the
unfiltered channel power is displayed as channel power.
NOTE: Threshold can only be set in Codogram or Code Domain Power
modes. The default threshold level is –30 dB.
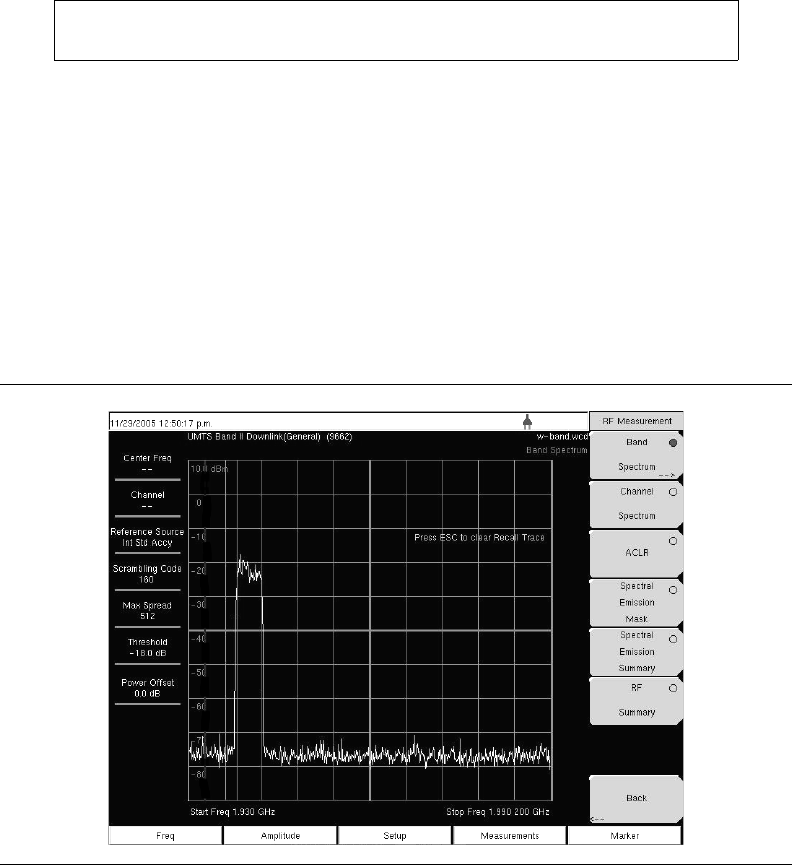
9-30
WCDMA/HSDPA RF Measurements
The WCDMA/HSDPA RF Measurements consist of three measurements: Spectrum,
Adjacent Channel Leakage Ratio (ACLR), and Spectral Emission Mask. To make WCDMA
RF measurements, connect the Spectrum Master to the node B equipment by following the
instructions.
Band Spectrum
Displays the selected band spectrum. The cursor can be moved to select the desired channel
using the directional arrow keys or the rotary knob. The Channel Number can also be
directly entered using the numerical keypad.
Band Spectrum Procedure
1. Select the Shift key, then the Mode (9) key.
2. Use the directional arrow keys or the rotary knob to highlight WCDMA/HSDPA Signal
Analyzer and press the Enter key to select.
3. Press the Freq function hard key.
4. Press the Signal Standard soft key and select the applicable WCDMA standard.
5. Press the Measurements function hard key and the RF Measurements soft key.
6. Press the Band Spectrum soft key to display the band spectrum.
7. Move the cursor, using the directional arrow keys or the rotary knob, to select the
desired channel. The Channel Number can also be directly entered using the numerical
keypad.
NOTE: Selecting Channel Spectrum after selecting a channel using the
cursor will display the measurements for the selected signal.
Figure 9-9. Band Spectrum
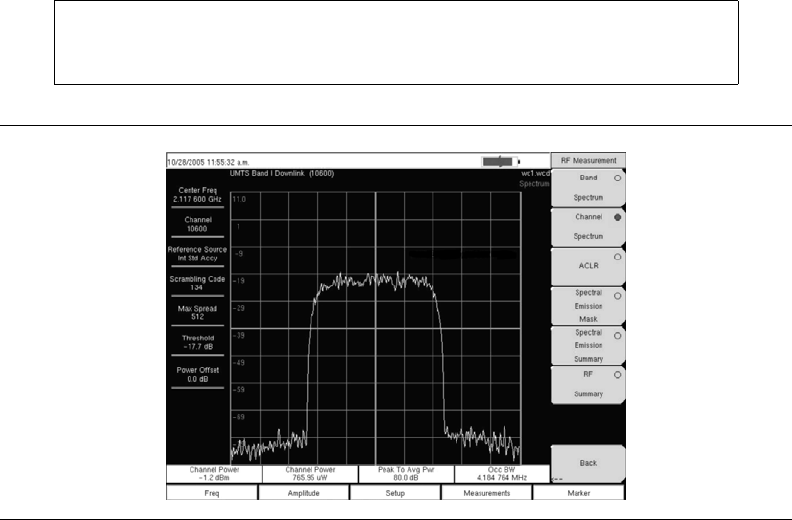
9-31
Channel Spectrum
The channel spectrum screen displays the selected channel signal and the following
measurements: channel power in dBm and Watts, occupied bandwidth, and peak to average
power. When Channel Spectrum is selected, the unit automatically displays the
measurements for the selected signal.
Procedure
1. Select the Shift key, then the Mode (9) key.
2. Use the directional arrow keys or the rotary knob to highlight WCDMA/HSDPA Signal
Analyzer and press the Enter key to select.
3. Press the Freq function hard key.
4. Press the Center Freq soft key and enter the desired frequency manually, or press the
Signal Standard soft key and select the applicable WCDMA standard.
5. Select the Channel soft key and use the Up/Down arrow keys, the keypad, or the rotary
knob to select a channel number for the selected signal standard. The center of the
channel is tuned to the center of the display.
6. Press the Setup function hard key.
7. For the most accurate frequency measurements, press the Select Reference Frequency
soft key to display a list of the available reference frequencies and select the desired
reference frequency or activate the GPS (if equipped) and synchronize the Spectrum
Master to High Internal accuracy.
8. Press the Measurements function hard key.
9. Press the RF Measurements soft key.
10. Press the Channel Spectrum soft key to activate the spectrum measurement. The red
dot on the soft key indicates that it is selected.
NOTE: Using the Band Spectrum cursor, select the desired channel, and
the unit will automatically display the measurements for the selected
channel when the Channel Spectrum key is selected.
Figure 9-10. RF Measurement Example

9-32
ACLR Measurement Screen
ACLR (Adjacent Channel Leakage Ratio) is defined as the ratio of the amount of leakage
power in an adjacent channel to the total transmitted power in the main channel and is
displayed in table format under the bar graph. The 3GPP standard specifies one main
channel and two adjacent channels. The ACLR screen displays the main channel power and
the power of two adjacent channels on each side as a bar graph.
The channel spacing is –10 MHz, –5 MHz, +5 MHz and +10 MHz and the channels are
color coded. The 3GPP standard requires the adjacent channel power leakage ratio to be
better than 45 dB at 5 MHz offset and 50 dB at 10 MHz offset.
The Spectrum Master can also make ACLR measurements for multi-channel systems by
measuring the main channels and the adjacent channels, from one to four channels. The
ACLR screen can display up to 12 channels total.
In the ACLR measurement mode the filtered channel power is used to determine ACLR
values and is listed as filtered on the display.
The following procedure is for one main channel two adjacent channels.
Procedure
1. Select the Shift key, then the Mode (9) key.
2. Use the directional arrow keys or the rotary knob to highlight WCDMA/HSDPA Signal
Analyzer and press the Enter key to select.
3. Press the Freq function hard key.
4. Press the Center Freq soft key and enter the desired frequency manually, or press the
Signal Standard soft key and select the applicable WCDMA standard.
5. Select the Channel soft key and use the Up/Down arrow keys, the keypad, or the rotary
knob to select a channel number for the selected signal standard. The center of the
channel is tuned to the center of the display.
6. Press the Measurements function hard key.
7. Press the RF Measurement soft key.
8. Press the ACLR soft key to activate the ACLR measurement. The red dot on the soft
key indicates that it is selected.
NOTE: In the Spectrum Master, the ACLR measurement uses the filtered
channel power to determine the ACLR values, and it is listed as filtered on
the display. In all other screens, the unfiltered channel power is displayed
as channel power.
NOTE: Using the Band Spectrum cursor, select the required channel and
press the ACLR soft key. The Spectrum Master will display the
measurement.
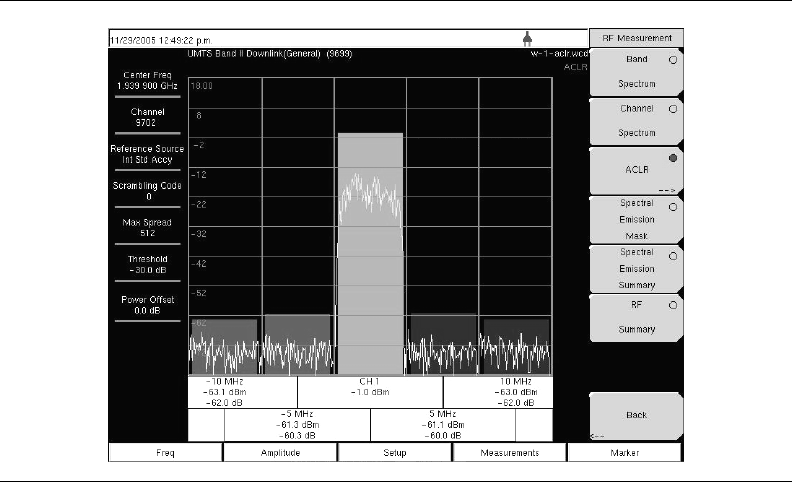
9-33
9. Press the ACLR soft key again and select one main channel and two adjacent channels.
Multi-channel ACLR Procedure
1. Select the Shift key, then the Mode (9) key.
2. Use the directional arrow keys or the rotary knob to highlight WCDMA/HSDPA Signal
Analyzer and press the Enter key to select.
3. Press the Freq function hard key.
4. Press the Center Freq soft key and enter the desired frequency manually, or press the
Signal Standard soft key and select the applicable WCDMA standard.
5. Select the Channel soft key and use the Up/Down arrow keys, the keypad, or the rotary
knob to select a channel number for the selected signal standard. The center of the
channel is tuned to the center of the display.
6. Press the Measurements function hard key.
7. Press the RF Measurement soft key.
8. Press the ACLR soft key to activate the ACLR measurement. The red dot on the soft
key indicates that it is selected.
9. Press the ACLR soft key again and select the number of main and adjacent channels.
For this example, four main channels and four adjacent channels are selected.
Figure 9-11. ACLR Measurement Example
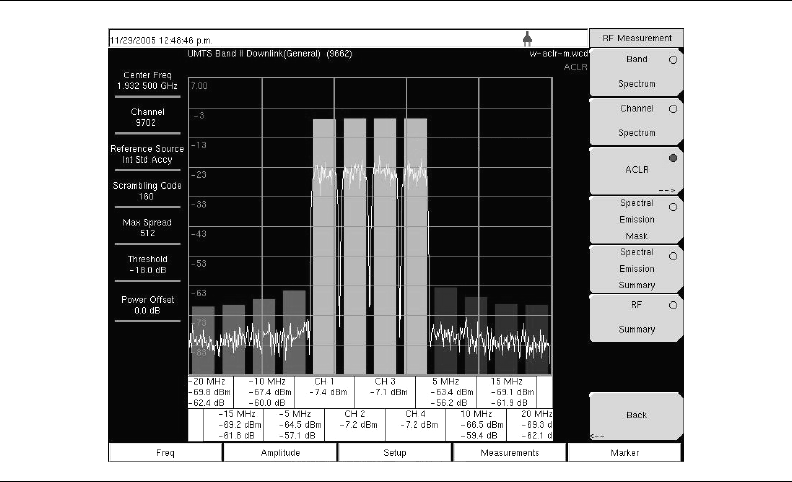
9-34
Spectral Emission Mask
The Spectral Emission Mask displays the selected signal and the mask, as defined in the
3GPP specification. The mask varies depending upon the input signal. The Spectrum Master
also indicates if the signal is within the specified limits by displaying PASSED or FAILED.
The emission mask is also displayed in a table format with different frequency ranges and an
indication whether the signal PASSED/FAILED in that region.
The 3GPP specification specifies four masks depending upon the base station output power:
•P Š 43 dBm
•39 £ P < 43 dBm
• 31 £ P < 39 dBm
• P < 31 dBm
Procedure
1. Select the Shift key, then the Mode (9) key.
2. Use the directional arrow keys or the rotary knob to highlight WCDMA/HSDPA Signal
Analyzer and press the Enter key to select.
3. Press the Freq function hard key.
4. Press the Center Freq soft key and enter the desired frequency manually, or press the
Signal Standard soft key and select the applicable WCDMA standard.
5. Select the Channel soft key and use the Up/Down arrow keys, the keypad, or the rotary
knob to select a channel number for the selected signal standard. The center of the
channel is tuned to the center of the display.
6. Press the Measurements function hard key.
7. Press the RF Measurements soft key.
8. Press the Spectral Emission Mask soft key to activate the Spectral Emission Mask
measurement. The red dot on the soft key indicates it is selected.
Figure 9-12. ACLR Multi-channel Measurement Example
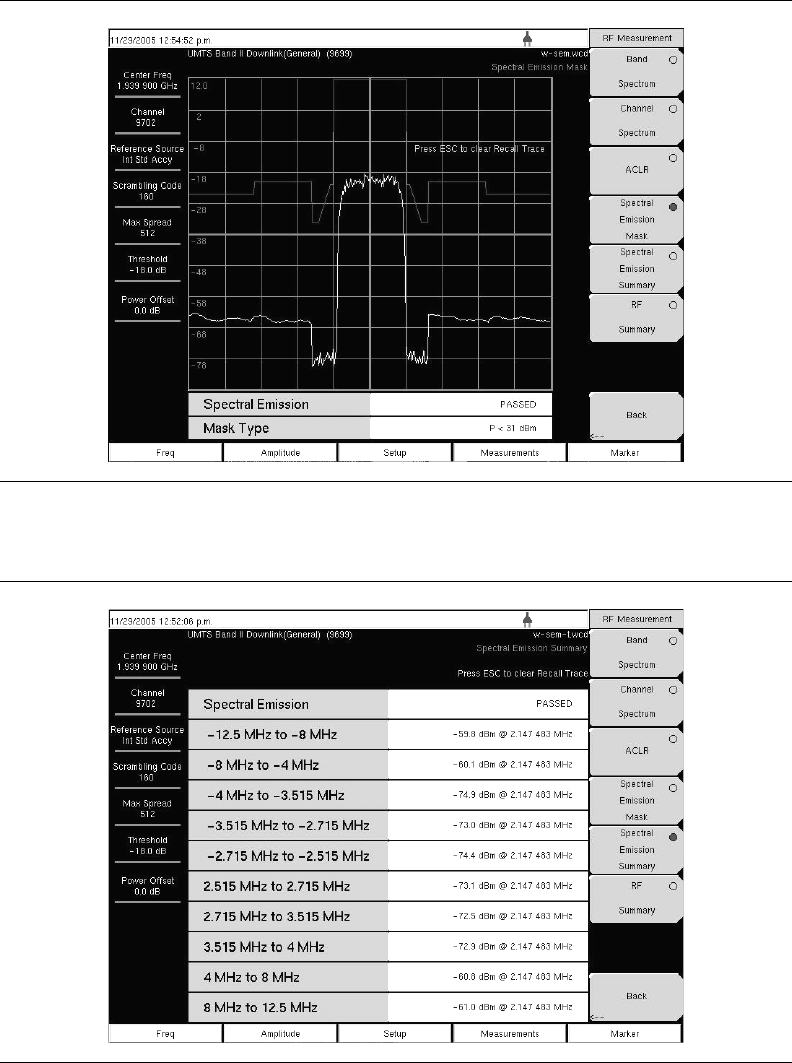
9-35
9. Press the Spectral Emission Summary soft key to display the Spectral Emission
Summary table. The red dot on the soft key indicates it is selected.
For a Spectral Emission Summary:
Figure 9-13. Spectral Emission Mask Measurement Example
Figure 9-14. Spectral Emission Mask Measurement Summary Example
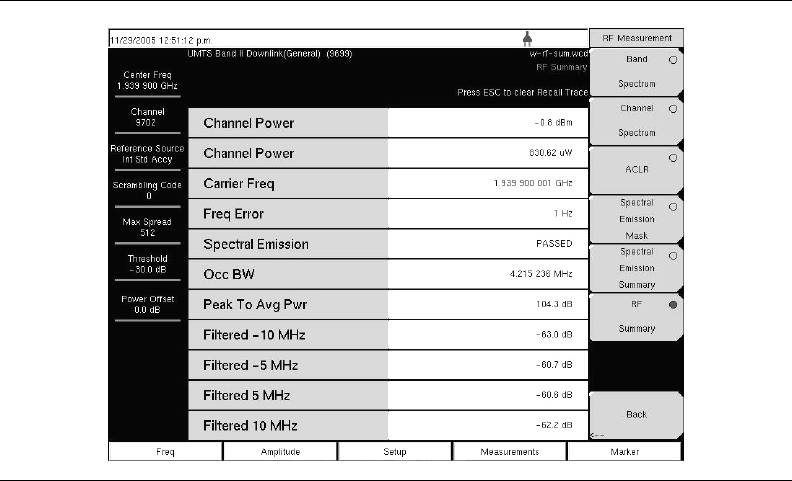
9-36
RF Summary
The RF Summary displays the critical transmitter performance measurements in the table
format, without demodulating the WCDMA/HSDPA signal. The parameters displayed in the
RF summary table are Channel Power in dBm and Watts, Carrier Frequency, Frequency
Error, Spectral emission Pass/Fail criteria, Occupied Bandwidth, Peak to Average Power,
ACLR at –10 MHz, –5 MHz, 5 MHz and 10 MHz channels.
Figure 9-15. RF Summary Example

9-37
Demodulator
In the demodulator mode the Spectrum Master is connected to the node B equipment and the
unit will demodulate the WCDMA signal. The WCDMA/HSDPA demodulator has Code
Domain Power (CDP), HSPDA, Codogram, and Modulation Summary screens.
Zoom Function
In CDP and Codogram measurements, the Zoom function can be activated to zoom in on
selected OVSF codes. The Zoom function can be set to start from a particular OVSF code.
Code Domain Power (CDP)
The Code Domain Power (CDP) display includes spreading factor (OVSF codes) 256 or 512
with zoom-in on codes. The Spectrum Master can zoom to 32, 64, and 128 codes, and the
user can input the zoom code to start the zoom-in from the entered OVSF codes. The
demodulator also displays CPICH, P-CCPCH, S-CCPCH, PICH, P-SCH, and S-SCH power
in the table format. For WCDMA/HSDPA Demodulator, the HSDPA codes are also
displayed.
Procedure
1. Select the Shift key, then the Mode (9) key.
2. Use the directional arrow keys or the rotary knob to highlight WCDMA/HSDPA Signal
Analyzer and press the Enter key to select.
3. Press the Freq function hard key.
4. Press the Center Freq soft key and enter the desired frequency manually, or press the
Signal Standard soft key and select the applicable WCDMA standard.
5. Select the Channel soft key and use the Up/Down arrow keys, the keypad, or the rotary
knob to select a channel number for the selected signal standard. The center of the
channel is tuned to the center of the display.
6. Press the Setup function hard key.
7. Press the Scrambling Code soft key to select Auto so that the Spectrum Master will
automatically detect the scrambling code.
8. Press the Select Reference Frequency soft key to display a list of the available
reference frequencies and select the desired reference frequency to get accurate
frequency measurements or activate the GPS (if equipped) and synchronize the
Spectrum Master to High Internal accuracy.
9. Connect the external reference to the Ext RF Input BNC connector and wait for the unit
to recognize the external reference (page 27) and lock up to it.
10. Press the S-CCPCH Spread soft key to manually set the S-CCPCH spreading. The
Spectrum Master will display the default S-CCPCH spreading factor of 256 in all the
views. Set the S-CCPCH spreading factor to show accurate results.
11. Press the S-CCPCH Code soft key to enter the correct S-CCPCH code. The Spectrum
Master will display the default S-CCPCH code of 3 in all the views. Set the S-CCPCH
code to show accurate results.
NOTE: The WCDMA/HSDPA Demodulator option demodulates both
WCDMA and HSDPA signals. The WCDMA Demodulator only
demodulates WCDMA signals.
NOTE: Press CDP or Codogram twice to activate the zoom function. The
arrow in the lower right corner of the soft key indicates that a sub menu is
available.
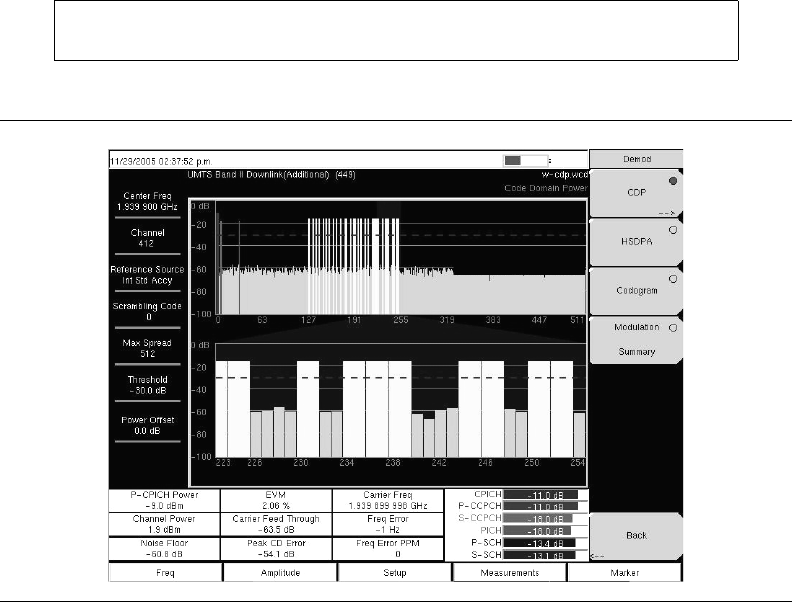
9-38
12. Press the PICH Code soft key to enter the correct PICH code. The Spectrum Master
will display the default PICH code of 16 in all the views. Set the PICH code to show
accurate results.
13. Press the Threshold soft key to manually set the Threshold level which determines
which codes are active. The default value is –30 dB.
14. Press the Measurements function hard key.
15. Select soft key to activate the demodulator menu.
16. Press the CDP soft key to activate the CDP measurement. The red dot on the soft key
indicates it is selected.
17. Press the CDP soft key again to activate the zoom function.
18. Press the Zoom soft key to select the appropriate zoom level. The Zoom key toggles
among 32, 64, and 128.
19. Press the Zoom Start soft key to manually enter the zoom start code.
20. Press the Back soft key to go back to the CDP measurement.
NOTE: The blue color block on the CDP screen represents the selected
zoom codes and the same codes are displayed in the zoom screen.
Figure 9-16. WCDMA Code Domain Power Measurement Screen Example
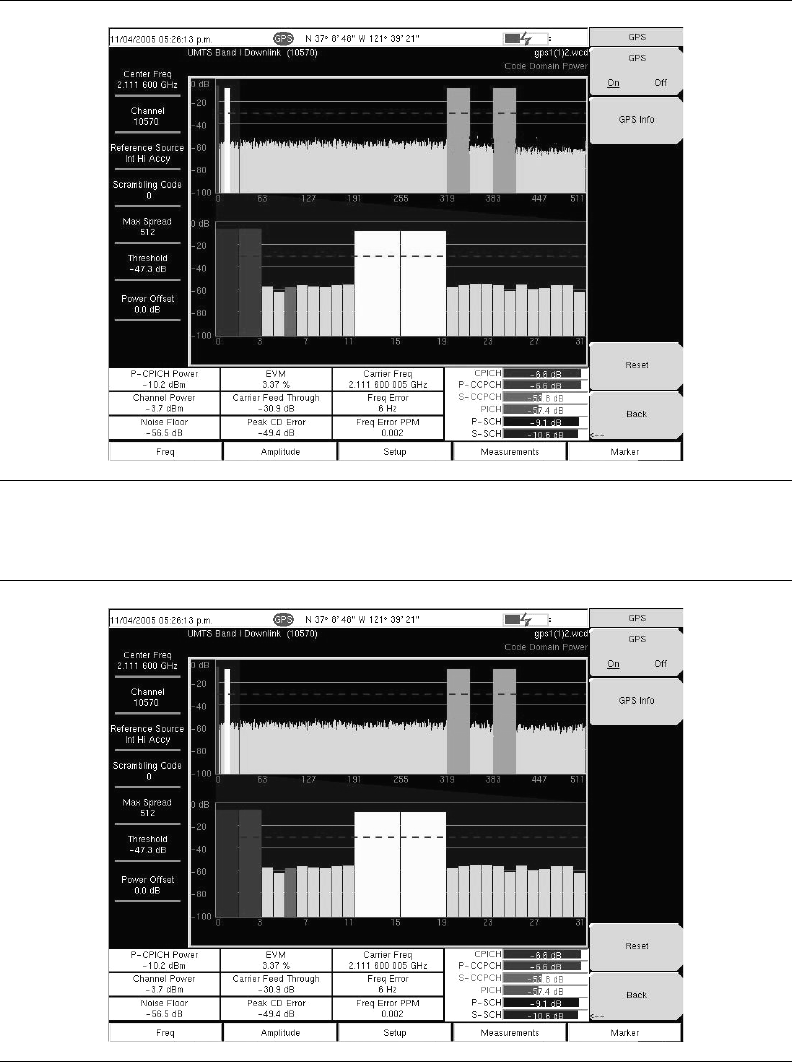
9-39
Figure 9-17. Code Domain Power Measurement Screen with GPS High Accuracy Example
Figure 9-18. HSDPA Code Domain Power Measurement Screen Example
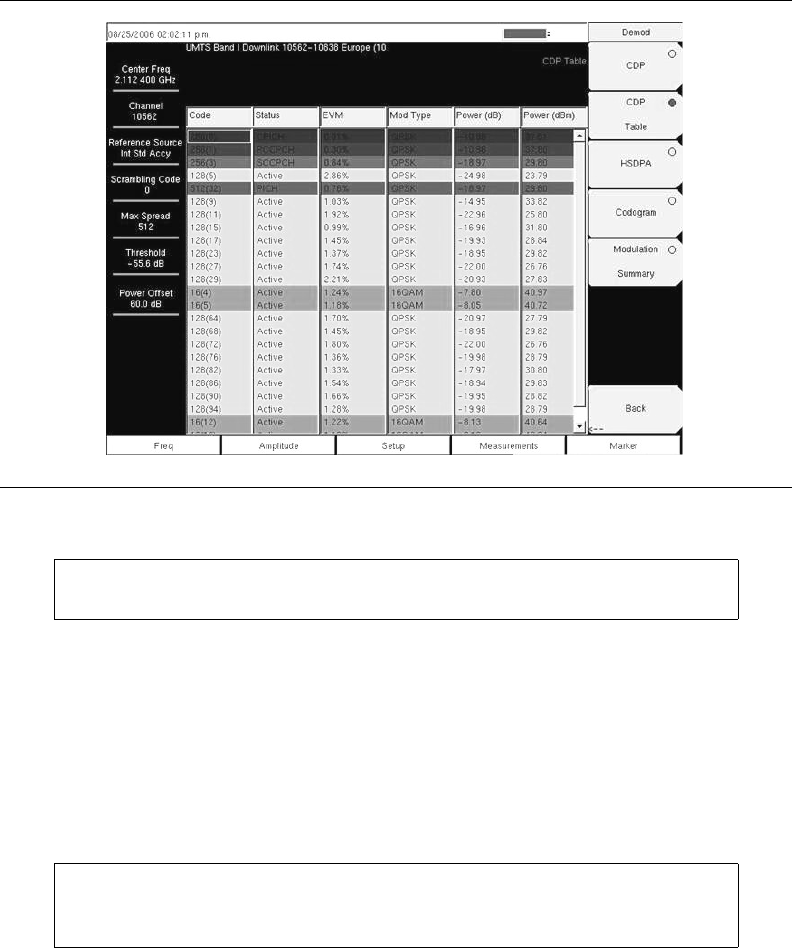
9-40
Code Domain Power Table (CDP Table)
The Code Domain Power Table (CDP Table) display includes all active spreading factor
(OVSF) codes. The table displays every OVSF, Code (Spreading Factor and code number),
Status, Symbol EVM, Modulation Type, Relative Power (dB), and Absolute power (dBm) in
a table format. For WCDMA/HSDPA Demodulator, the HSDPA codes and modulation type
are also displayed.
Procedure
1. Select the Demodulator soft key to activate the demodulator menu.
2. Press the CDP Table soft key to activate the CDP Table measurement. The red dot on
the soft key indicates CDP Table is selected.
3. Use the scroll wheel to scroll up and down the CDP Table.
Activating Markers
1. Press the Marker function hard key to display the Marker menu.
2. Press the Marker soft key to select the appropriate marker (1-6). The underlined marker
number is the currently selected marker.
3. Press the On/Off soft key to activate the selected marker.
4. Press the Marker Table soft key to display the Marker table. The marker table is
displayed on the screen below the CDP measurements table.
Figure 9-19. Code Domain Power Table Measurement Screen Example
NOTE: This screen is available with the WCDMA/HSDPA demod option
only.
NOTE: Markers can be used to read the individual code power, symbol
EVM (@ EVM), and type of code and can be activated in all of the
WCDMA/HSDPA measurements.
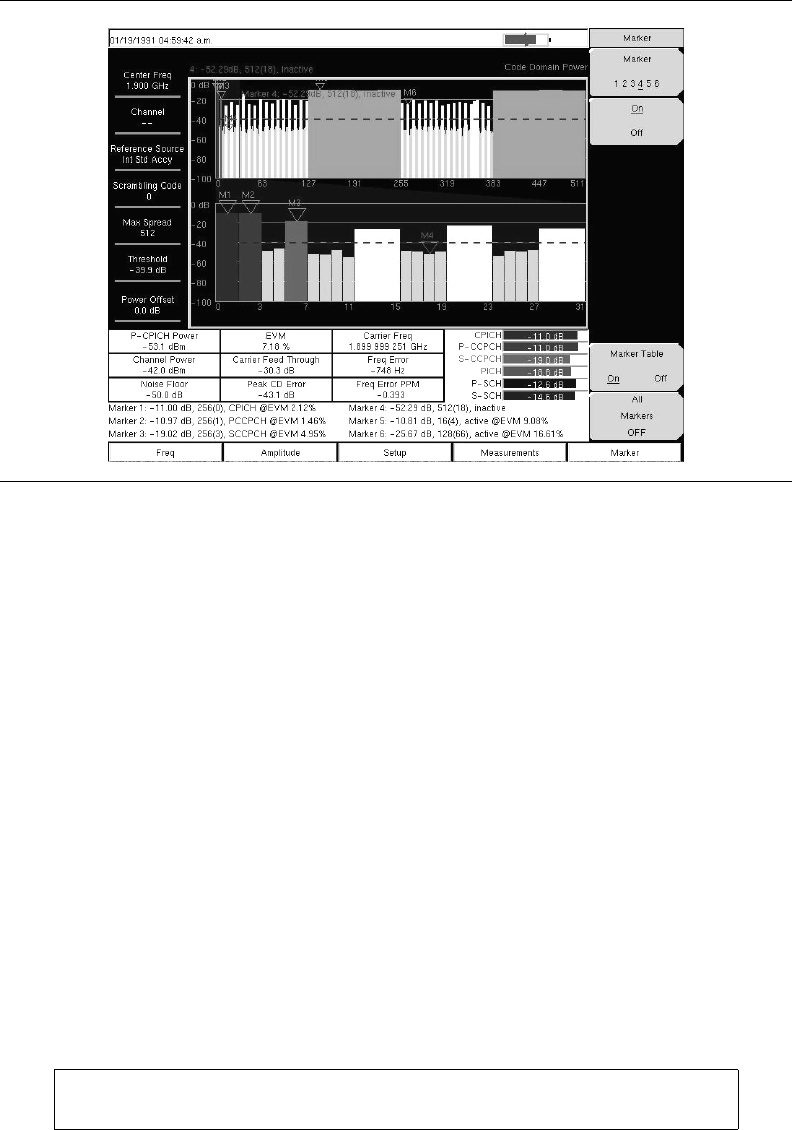
9-41
HSDPA
HSDPA displays the spreading factor (OVSF codes) 256 codes or 512 codes and high speed
downlink physical shared channel codes HS-PDSCH. The right or left active codes can be
selected using the cursor. The selected code power versus time and constellation are
displayed. The demodulator also displays CPICH, P-CCPCH, S-CCPCH, PICH, P-SCH, and
S-SCH power in the table format.
Procedure
1. Select the Demodulator soft key to activate the demodulator menu.
2. Press the HSDPA soft key to activate the HSDPA measurement. The red dot on the soft
key indicates HSDPA is selected.
3. Press the HSDPA soft key again to display the HSDPA measurement signal parameters.
4. Press the Total Time soft key to set the time or the Single Sweep Time soft key to set the
time for the power versus time display. The maximum time is 72 hours.
5. Use the cursor to select the desired code. The code parameters are displayed on the
screen.
6. Press the IQ Persistence soft key and use the keypad or rotary knob to set the IQ
Persistence to 2. The Spectrum Master will display the constellation diagram after the
first sample, and then update the constellation diagram after the second sample. IQ
Persistence can be set as high as 48. When the maximum is reached, the first sample is
replaced, and so on.
Figure 9-20. Code Domain Power Measurement Screen Example with Markers Activated
NOTE: The WCDMA modulation type is QPSK, and the HSDPA
modulation is 16QAM or QPSK.

9-42
Activating Markers
1. Press the Marker function hard key to display the Marker menu.
2. Press the Marker soft key to select the appropriate marker (1-6). The underlined marker
number is the currently selected marker.
3. Press the On/Off soft key to activate the selected marker.
4. Press the Marker Table soft key to display the Marker table. The marker table is
displayed on the screen below the measurements table.
Codogram
Codogram displays the code power levels over time. Two graphs are displayed on the screen,
the top one displays all the selected OVSF codes, and the bottom one displays the selected
OVSF zoom codes.
Procedure
1. Select the Shift key, then the Mode (9) key.
2. Use the directional arrow keys or the rotary knob to highlight WCDMA/HSDPA Signal
Analyzer and press the Enter key to select.
3. Press the Freq function hard key.
4. Press the Center Freq soft key and enter the desired frequency manually, or press the
Signal Standard soft key and select the applicable WCDMA standard.
5. Select the Channel soft key and use the Up/Down arrow keys, the keypad, or the rotary
knob to select a channel number for the selected signal standard. The center of the
channel is tuned to the center of the display.
6. Press the Setup function hard key.
7. Press the Scrambling Code soft key to select Auto so that the Spectrum Master will
automatically detect the scrambling code.
8. Press the Select Reference Frequency soft key to display a list of the available
reference frequencies and select the desired reference frequency to get accurate
frequency measurements.
9. Press the S-CCPCH Spread soft key to manually set the S-CCPCH spreading. The
Spectrum Master will display the default S-CCPCH spreading factor of 256 in all the
views. Set the S-CCPCH spreading factor to show accurate results.
10. Press the S-CCPCH Code soft key to enter the correct S-CCPCH code. The Spectrum
Master will display the default S-CCPCH code of 3 in all the views. Set the S-CCPCH
code to show accurate results.
11. Press the PICH Code soft key to enter the correct PICH code. The Spectrum Master
will display the default PICH code of 16 in all the views. Set the PICH code to show
accurate results.
12. Press the Threshold soft key to manually set the Threshold level which determines
which codes are active. The default value is –30 dB.
13. Press the Measurements function hard key.
14. Select the Demodulator soft key to activate the demodulator menu.
15. Press the Codogram soft key to activate the Codogram measurement.
16. Press the Codogram soft key to activate the zoom function and to set the time for the
measurement.
17. Press the Zoom soft key to select the appropriate zoom level. The Zoom key toggles
among 32, 64, and 128.
18. Press the Zoom Start soft key to manually enter the zoom start code.
NOTE: Markers can be used to read the individual code power, symbol
EVM (@ EVM), and type of code and can be activated in all of the
WCDMA/HSDPA measurements.
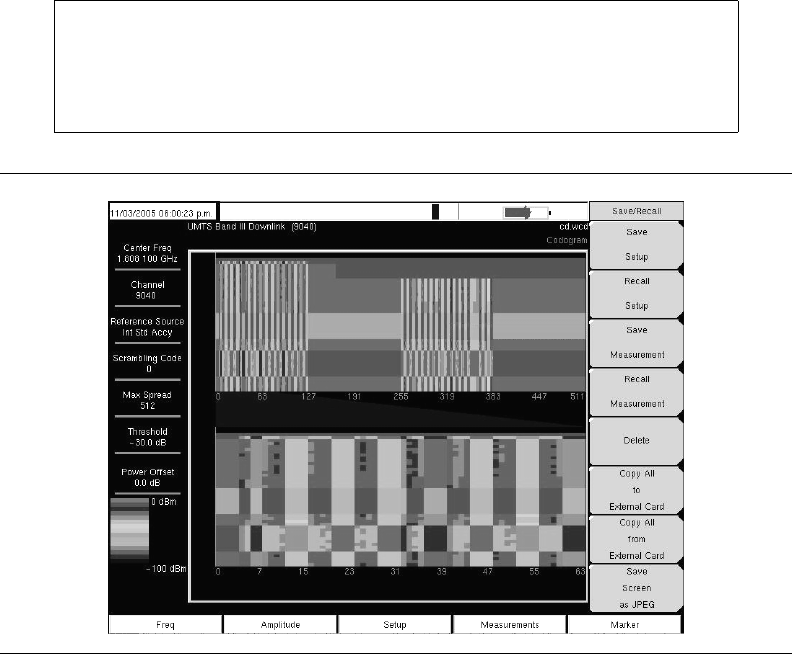
9-43
19. Press the Total Time or Single Sweep Time soft key to set the required time.
20. Press the Back soft key to go back to the Codogram measurement.
NOTE: The blue color block on the Codogram screen represents the
selected zoom codes, and the same codes are displayed in the zoom
screen.
Save the data before making any measurements, otherwise the data will
be lost.
Figure 9-21. Codogram Measurement Screen Example

9-44
Over The Air Measurements
There are two measurements in the Over The Air measurement section, Scrambling Code
and Multi-Path Power.
Scrambling Code
The Scrambling Code screen displays six strongest scrambling codes as bar graphs and
underneath the bar graphs the scrambling code number, CPICH, Ec/Io, Ec, and pilot
dominance related to the strongest scrambling code are displayed in the table format.
In Over The Air measurement the Scrambling Code can be set to Auto to automatically
measure and display the six strongest scrambling codes, or Manual, to look for the set
scrambling codes.
The Scrambling Code measurement screen can be locked by pressing the Code Lock On/Off
soft key. The Display Unit soft key can be used to display the Scrambling Code bar graph by
selecting CPICH or Ec/Io. The default display is CPICH. The Sort By soft key can display the
scrambling codes sorted by Power or Code.
Procedure
1. Select the Shift key, then the Mode (9) key.
2. Use the directional arrow keys or the rotary knob to highlight WCDMA/HSDPA Signal
Analyzer and press the Enter key to select.
3. Connect the appropriate antenna to the RF In connector to make OTA measurements.
4. Press the Freq function hard key.
5. Press the Center Freq soft key and enter the desired frequency manually, or press the
Signal Standard soft key and select the applicable WCDMA standard.
6. Select the Channel soft key and use the Up/Down arrow keys, the keypad, or the rotary
knob to select a channel number for the selected signal standard. The center of the
channel is tuned to the center of the display.
7. Press the Measurements function hard key.
8. Select the Over the Air soft key.
9. Select the Scrambling Code soft key to activate the Scrambling Code measurement.
10. Select the Scrambling Code soft key again to display the Scrambling Code soft key
menu.
11. Press the Scrambling Code soft key and select Auto to automatically detect the six
scrambling codes.
NOTE: Press Reset to activate the OTA measurement in a different
location for accurate results.
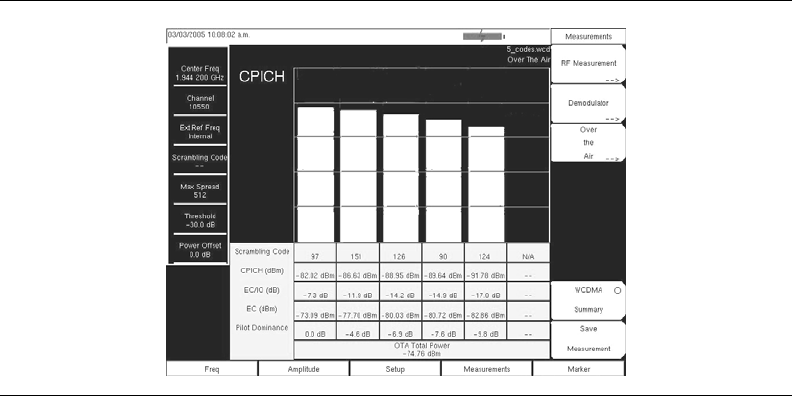
9-45
12. To only look for specific scrambling codes, press the Scrambling Code soft key to
highlight Manual, then use the Manual Code soft key to select the specific code and the
On/Off soft key to turn the selected code on or off. The Code Lock soft key locks the
code, so that the code will not change with each update.
Multi-Path Power
The Multi-Path Power screen displays the Primary signal (strongest Pilot) as bar #0 and up
to the six strongest multi-path components of that primary signal as numbered bar graphs
(1-6) and underneath the bar graphs the multi-path number, Tau ( sec), Tau (chips), Distance
(meters or feet), RSCP (Received Signal Code Power) dBm, and Relative Power (dB) are
displayed in the table format.
In Multi-Path power measurement the Scrambling Code can be set to Auto to automatically
measure and display the strongest scrambling code and it's multi-path components, or
Manual, to look for a set scrambling code.
Procedure
1. Press the Measurements function hard key.
2. Select the Over the Air soft key.
3. Select the Multipath soft key to activate the Multi-Path measurement.
4. Select the Multipath soft key again to display the Multipath soft key menu.
5. Press the Scrambling Code soft key and select Auto to automatically detect the
strongest scrambling code.
6. To look for specific scrambling code, press the Scrambling Code soft key to highlight
Manual, then use the Manual Scrambling Code soft key to select the specific code.
7. Select the Vertical Display soft key to change the graphs vertical scale between RSCP
(Absolute power) and Relative Power. The vertical scale chosen will be underlined.
8. Select the Horizontal Display soft key to change the horizontal scale between chips and
sec. The horizontal scale chosen will be underlined.
9. Select the Distance soft key to choose the units (meters or feet) to be displayed for
distance in the table. The choice will be underlined.
10. Press the Back key to return to the previous Over The Air Menu.
Figure 9-22. Scrambling Code Measurement Screen Example
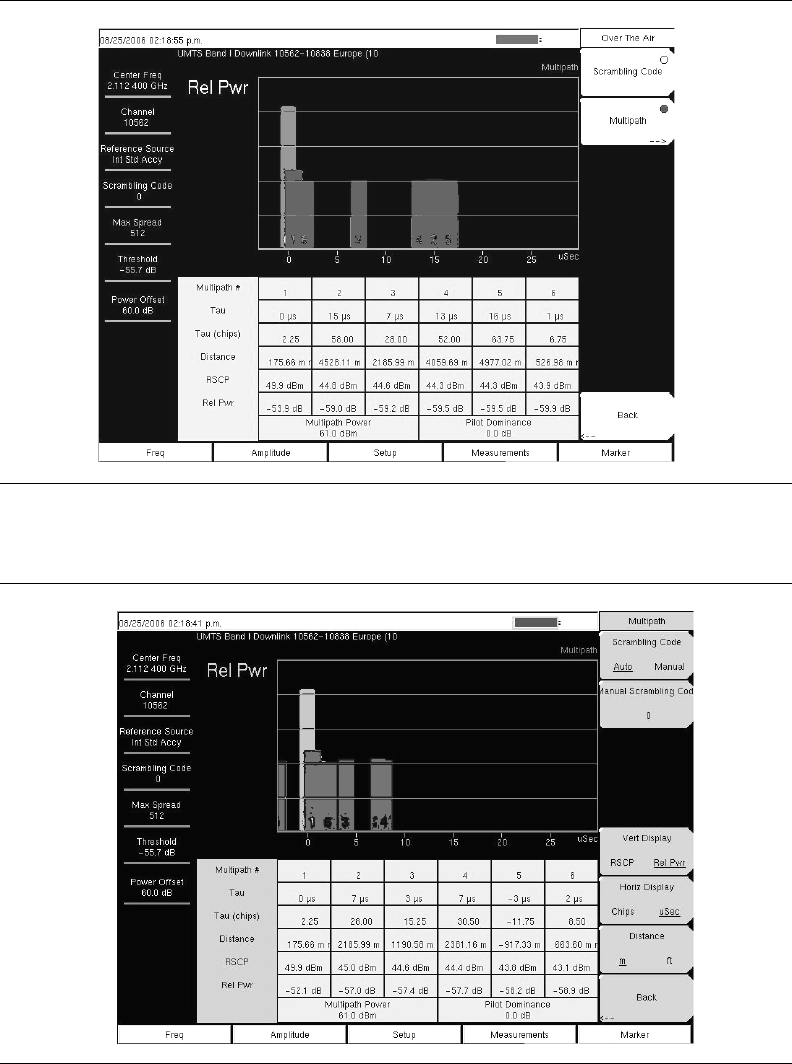
9-46
Figure 9-23. Multi-Path Power Measurement Screen Example
Figure 9-24. Multi-Path Power Measurement Screen Example
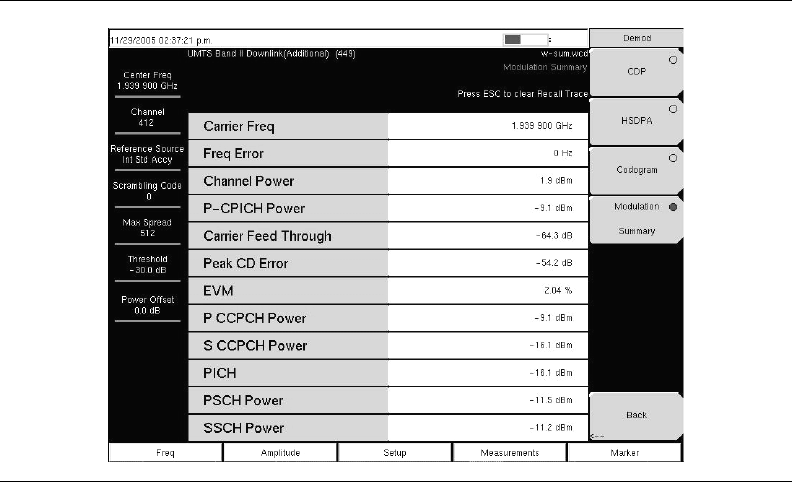
9-47
WCDMA Summary
WCDMA summary displays the critical WCDMA measurements from RF and
demodulation measurements.
WCDMA Summary Procedure
1. Select the Shift key, then the Mode (9) key.
2. Use the directional arrow keys or the rotary knob to highlight WCDMA/HSDPA Signal
Analyzer and press the Enter key to select.
3. Press the Freq function hard key.
4. Press the Center Freq soft key and enter the desired frequency manually, or press the
Signal Standard soft key and select the applicable WCDMA standard.
5. Select the Channel soft key and use the Up/Down arrow keys, the keypad, or the rotary
knob to select a channel number for the selected signal standard. The center of the
channel is tuned to the center of the display.
6. Press the Setup function hard key.
7. Press the Scrambling Code soft key to select Auto so that the Spectrum Master will
automatically detect the scrambling code.
8. Press the Select Reference Frequency soft key to display a list of the available
reference frequencies, Select the desired reference frequency to get accurate frequency
measurements or activate the GPS (if equipped) and synchronize the Spectrum Master
to High Internal accuracy.
9. Connect the external reference to the Ext RF Input BNC connector and wait for the unit
to recognize the external reference and lock to it.
10. Press the S-CCPCH Spread soft key to manually set the S-CCPCH spreading. The
Spectrum Master will display the default S-CCPCH spreading factor of 256 in all the
views. Set the S-CCPCH spreading factor to show accurate results.
11. Press the S-CCPCH Code soft key to enter the correct S-CCPCH code. The Spectrum
Master will display the default S-CCPCH code of 3 in all the views. Set the S-CCPCH
code to show accurate results.
Figure 9-25. WCDMA Summary Measurement Screen Example
9-48
12. Press the PICH Code soft key to enter the correct PICH code. The Spectrum Master
will display the default PICH code of 16 in all the views. Set the PICH code to show
accurate results.
13. Press the Threshold soft key to manually set the Threshold level which determines
which codes are active. The default value is –30 dB.
14. Press the Measurements function hard key.
15. Press the WCDMA Summary soft key.
Pass/Fail Mode
The Spectrum Master stores the five test models specified in the 3GPP specification
(TS 125.141) for testing base station performance and recalls these models for quick easy
measurements. After selection of a test model, the Spectrum Master displays test results in
tabular format with clear PASS or FAIL indications that include min/max threshold.
Using Master Software Tools, a custom test list can be created and downloaded into the
Spectrum Master. All critical parameters can be selected for pass/fail testing, including each
individual code power level, the spreading factor and symbol EVM.
Pass/Fail Mode Procedure
1. Select the Shift key, then the Mode (9) key.
2. Use the directional arrow keys or the rotary knob to highlight WCDMA/HSDPA Signal
Analyzer and press the Enter key to select.
3. Connect the appropriate antenna to the RF In connector to make OTA measurements.
4. Press the Freq function hard key.
5. Press the Center Freq soft key and enter the desired frequency manually, or press the
Signal Standard soft key and select the applicable WCDMA standard.
6. Select the Channel soft key and use the Up/Down arrow keys, the keypad, or the rotary
knob to select a channel number for the selected signal standard. The center of the
channel is tuned to the center of the display.
7. Press the Measurements function hard key.
8. Press the Pass/Fail Mode soft key to display the pass/fail mode menu.
9. Press the Select Pass/Fail Test soft key and select the applicable Test Model to activate
the measurement.
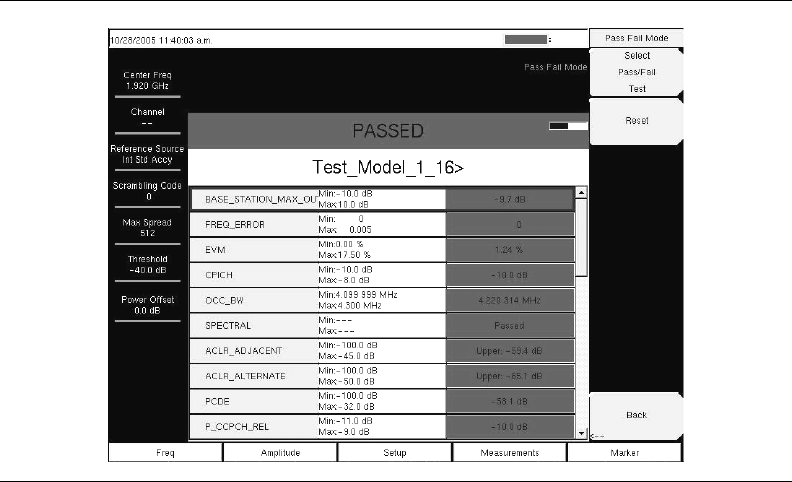
9-49
Figure 9-26. Pass/Fail Mode Example Screen
9-50
10-1
Chapter 10
GSM/GPRS/EDGE Measurements
Introduction
Global Systems for Mobile (GSM) communication is a globally accepted standard for digital
cellular communication. GSM uses a combination of Frequency Division Multiple Access
(FDMA) and Time Division Multiple Access (TDMA). Within each band are approximately
one hundred available carrier frequencies on 200 kHz spacing (FDMA), and each carrier is
broken up into time-slots so as to support eight separate conversations (TDMA). Each
channel has an uplink and a downlink. GSM uses the Gaussian Minimum Shift Keying
(GMSK) modulation method.
GPRS/EDGE is an extension of GSM technology and is applicable to data services.
GSM/GPRS uses Gaussian Minimum Shift Keying (GMSK) modulation and EGDE uses
8PSK Phase Shift Keying modulation.
The GSM/GPRS/EDGE frequency ranges are 380-400 MHz, 410-430 MHz, 450-468 MHz,
478-496 MHz, 698-746 MHz, 747-792 MHz, 806-866 MHz, 824-894 MHz, 890-960 MHz,
880-960 MHz, 876-960 MHz, 870-921 MHz and 1710-1990 MHz.
The Spectrum Master MS2721B and MS2723B feature two GSM/GPRS/EDGE
measurement modes: RF Measurements and Demodulator. The instrument can be directly
connected to any GSM/GPRS/EDGE base station for accurate measurements. When a
physical connection is not available or required, the instrument can receive and demodulate
GSM/GPRS/EDGE signals over the air.
GSM/GPRS/EDGE RF measurements (Option 40) provide views of spectrum, power versus
time (frame), power versus time (slot) with mask and summary screens.
The spectrum view displays channel spectrum and multichannel spectrum. The channel
spectrum screen includes channel power, burst power, average burst power, frequency error,
modulation type and Training Sequence Code (TSC). The multichannel spectrum displays as
many as ten channels and, using the cursor to select a channel, can display the measurements
for just the selected channel.
GSM/GPRS/EDGE Demodulator (Option 41) demodulates GSM/GPRS/EDGE signals and
displays the results of detailed measurements to analyze transmitter modulation
performance. Results are shown for phase error (rms), phase error peak, EVM (rms), EVM
(peak), origin offset, C/I, modulation type and magnitude error (rms) and a vector diagram
of the signal.
This chapter describes the Spectrum Master MS2721B and MS2723B keys in
GSM/GPRS/EDGE Signal Analyzer mode. The major sections are arranged in alphabetical
order with soft key menus listed in the order they appear from top to bottom.
10-2
Amplitude
The Amplitude function hard key opens the following soft key menu keys:
Power Offset
Choose power offset to have the Spectrum Master automatically adjust for the loss through
any external cables, attenuators and couplers. The power can be offset from –100 dB to
+100 dB. Press the Power Offset key, enter the values and press the dB softkey. Press Esc
to cancel.
Auto Range
When Auto Range is activated, the Spectrum Master adjusts the reference level
automatically. Pressing the Auto Range soft key toggles between On and Off.
Adjust Range
This soft key adjusts the reference level to be optimal based on the measured signal. Adjust
range is used only when the Auto Range setting is Off.
Figure 10-1. GSM/GPRS/EDGE Mode Amplitude Menu
NOTE: By default, the Spectrum Master will automatically change
attenuation, preamplifier, and digital gain settings to make the best GSM
measurements.
Amplitude
Power Offset
0.0 dB
Auto Range
OffOn
Adjust
Range

10-3
Freq (Frequency)
The Freq function hard key opens the following soft key menu:
Center Freq
Press the Freq key followed by the Center Freq soft key and enter the desired frequency
using the keypad, the arrow keys, or the rotary knob. If entering a frequency using the
keypad, the soft key labels change to GHz, MHz, kHz, and Hz. Select the appropriate units
key. Selecting the Enter key has the same affect as selecting the MHz soft key.
Signal Standard
Use the Up/Down arrow keys or the rotary knob to highlight a signal standard and press
Enter to select. When a signal standard is selected, the center frequency and span for the
first channel of the selected standard is automatically tuned. Other settings, such as
channel spacing and integration bandwidth, are also automatically entered. Appendix A
contains a table of the signal standards that are in the instrument firmware.
Channel
Use the Up/Down arrow keys, the keypad, or the rotary knob to select a channel number
for the selected signal standard. The center of the channel is automatically tuned to the
center frequency of the selected GSM/EDGE channel.
Set CF to Closest Channel
This soft key moves the current Center Frequency of a signal to the closest frequency to
center it on a GSM channel.
Decrement Channel
Pressing this button reduces the channel number by one.
Increment Channel
Pressing this button increases the channel number by one.
Figure 10-2. GSM/GPRS/EDGE Mode Freq Menu
Freq
Center Freq
1.000 GHz
Decrement
Channel
Set CF
To
Closest Channel
Increment
Channel
Signal
Standard
Channel
- -

10-4
Setup
The Setup function hard key opens the following soft key menu:
GSM/EDGE Select
This soft key toggles between Auto, GSM, and EDGE. Auto allows the instrument to
search for a GSM or EDGE signal automatically. Selecting GSM or EDGE sets the
instrument to measure only a GSM or EDGE signal.
Ext Ref Freq
Select the Ext Ref Freq soft key to select the frequency of the external reference from the
list presented (“Ext Freq Ref” on page 2-13). Use the arrow keys or the rotary knob to
highlight the desired frequency and press the Enter key to select. Press the Esc key to
cancel.
Figure 10-3. GSM/GPRS/EDGE Mode Setup Menu
Setup
GSM/EDGE Select
GSM EDGEAuto
Ext Ref Freq
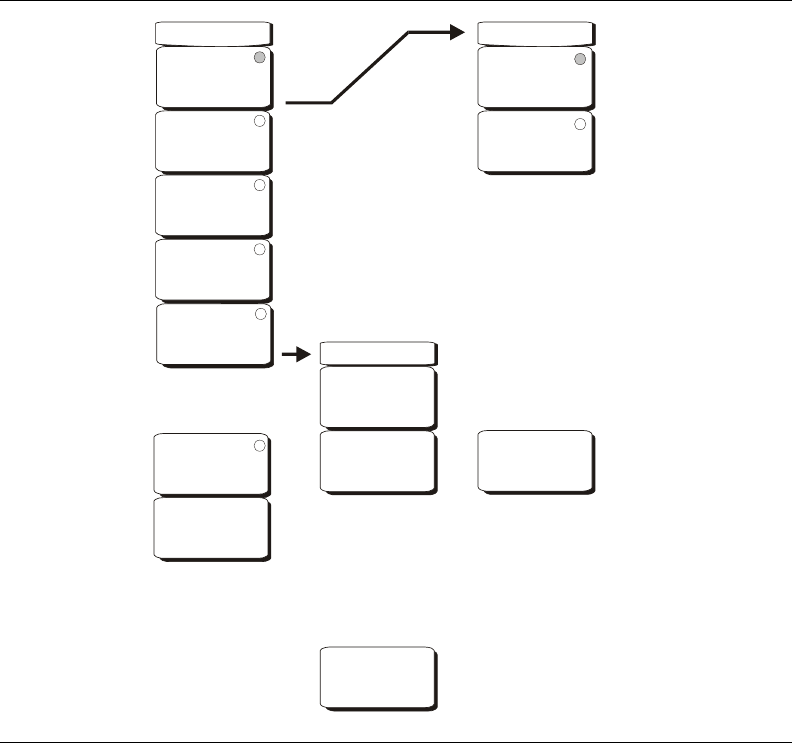
10-5
Measurements
The Measurements function hard key opens the following soft key menu:
Spectrum
Opens the spectrum menu.
Channel Spectrum
Displays the spectrum of the selected channel. The screen also displays Channel
Power, Burst Power, Frequency Error in PPM and Hz, Occupied Bandwidth, and the
Training Sequence Code (TSC).
Multi-Channel Spectrum
Displays the spectrum of ten GSM/EDGE channels.
Channel Cursor
Select Channel Cursor to place the cursor at a specific channel location. Use the
rotary knob or the Up/Down arrow keys to select the channel. Press the Enter key
to select.
Figure 10-4. GSM/GPRS/EDGE Mode Measurements Menu
GSM/EDGE
Summary
Save
Measurement
Measurements
Power vs.
Time
(Frame)
Power vs.
Time
(Slot)
Spectrum
Demodulator
Pass/Fail
Mode -->
-->
Pass Fail Mode
Select
Pass/Fail
Test
Reset
Back
-->
Spectrum
Channel
Spectrum
Multi
Channel
Spectrum
Back
-->

10-6
Freq Cursor
Select Freq Cursor to place the cursor at a specific frequency. Use the rotary knob
or the Up/Down arrow keys to select the frequency. Press the Enter key to select.
Power vs. Time (Frame)
Displays approximately eight and a half slots of the GSM/EDGE signal frame starting
from the first active slot found. The screen also displays Channel Power, Burst Power,
Frequency Error in PPM and Hz, Occupied Bandwidth, and Training Sequence Code
(TSC).
Power vs. Time (Slot)
Displays the first active slot of the GSM/EDGE signal capture. The mask is as specified in
3GPP TS 05.05. The screen also displays Channel Power, Burst Power, Frequency Error in
PPM and Hz, Occupied Bandwidth, and Training Sequence Code (TSC).
Demodulator
Displays the IQ vector of the GSM/EDGE signal. The screen also displays Phase Err
RMS, Phase Err Pk, EVM (rms), EVM (pk), Origin Offset (dBc), C/I (dB), Modulation
Type, and Magnitude Error (rms).
Pass/Fail Mode
Displays the Pass/Fail Mode menu.
Select Pass/Fail Test
Display the available test sets.
Reset
Resets the Pass/Fail Mode test.
Back
Returns to the previous menu.
GSM/EDGE Summary
Displays the measurement results in a table format.
GSM/GPRS/EDGE Pass/Fail mode
Displays the Pass/Fail measurements in a table format with clear pass or fail indicators
that include min/max thresholds and actual measured results.
Save Measurement
Initiates a dialog box to name and save the current measurement. The saved measurement
trace can be named using the keypad to select numbers, the rotary knob to highlight a
number or character and pressing the knob to select, or by selecting the soft key for each
letter. Use the Shift key to select an upper case letter. Use the Left/Right directional arrows
to move the cursor position. Press Enter to save the measurement trace.
NOTE: GSM uses GMSK modulation and EDGE uses 8 PSK modulation.
EVM (rms), EVM(pk), Orgin Offset, C/I are not measured for GSM signals
(shows N/A on the display).
NOTE: If a measurement has been previously saved,then the Save
Measurement dialog box will open with the previously saved name
displayed. To save the new measurement with a similar name (for
example, Trace-1, Trace-2, and so forth), press the Right directional arrow
and add the changes. To create a completely new name, use the keypad
or the rotary knob, or select the soft key for each letter. GSM
measurements are saved with a .gsm file extension, and EDGE
measurements are saved with a .edg extension.

10-7
External Reference Frequency Setup
For the best frequency accuracy measurements, it is important to use an external reference
frequency attached to the Spectrum Master Ext Ref In connector (“Ext Freq Ref” on
page 2-13). Most base stations have a reference frequency available on a BNC connector
that can be used for this purpose. To configure the Spectrum Master to use an external
reference frequency:
1. Press the Setup function hard key.
2. Press the Ext Ref Freq soft key to display a list of the available reference frequencies.
3. Use the Up/Down arrow keys or the rotary knob to highlight the applicable reference
frequency on the list and press the Enter key to set the reference frequency.
GSM/GPRS/EDGE RF Measurements
GSM RF measurements consists of Spectrum, Power versus Time (frame), Power versus
Time (slot), Summary, and Demodulator. To make GSM/GPRS/EDGE measurements
connect the unit to the base station following the instructions.
1. Select the Shift key, then the Mode (9) key, using rotary knob or Up/Down arrow keys
select GSM/GPRS/EDGE Signal Analyzer and press the Enter key to select.
2. Press the Freq function hard key.
3. Press the Center Freq soft key and enter the desired frequency, or press the Signal
Standard soft key and select the applicable GSM standard.
4. Select the Channel soft key and use the Up/Down arrow keys, the keypad, or the rotary
knob to select a channel number for the selected signal standard. The center of the
channel is tuned to the center of the display.
5. Press the Setup function hard key.
6. Press the GSM/EDGE Select soft key and highlight Auto to automatically select the
GSM or EDGE signal.
7. Press the Ext Ref Freq soft key to display a list of the available reference frequencies
and select the desired reference frequency to get accurate frequency measurements as
described in the previous section, or activate the GPS (if equipped) to get GPS High
Accuracy frequency error measurements.
CAUTION: The maximum input power without damage is +43 dBm on the
RF In port. To prevent damage, always use a coupler or high power
attenuator.
NOTE: Highlight GSM or EDGE to set the instrument to measure only a
GSM or EDGE signal.
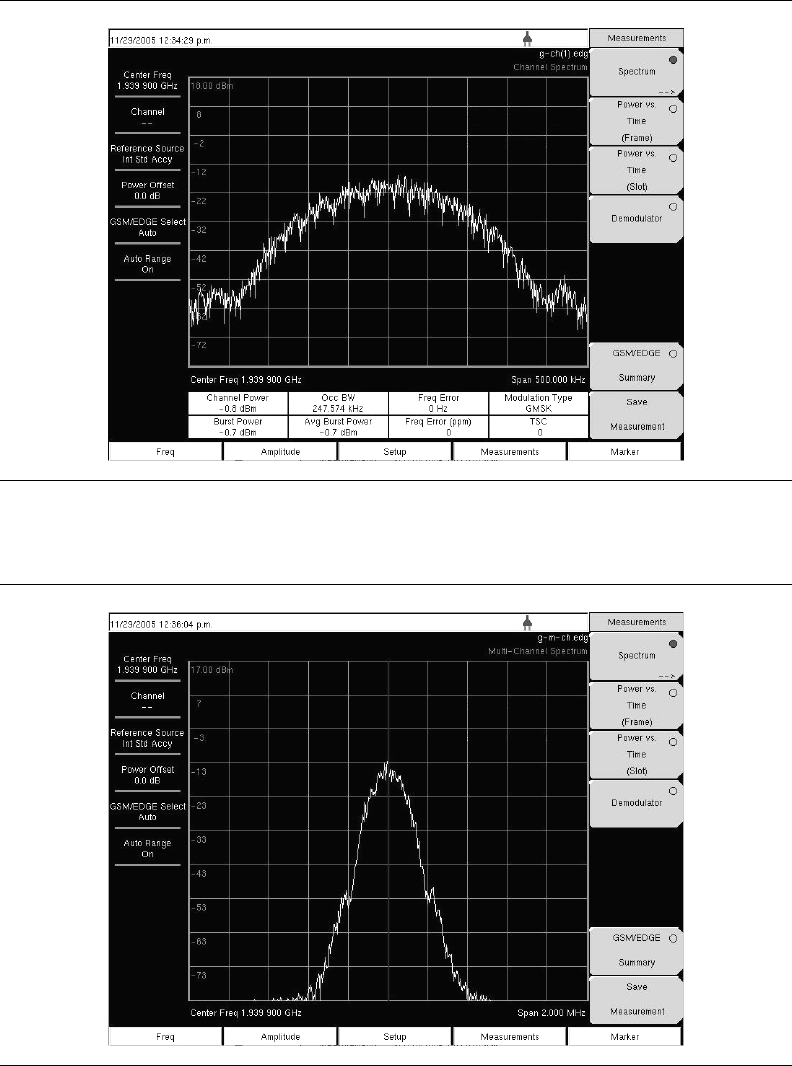
10-8
Measurement Display
Press the Measurements function hard key to select measurement display options.
To display Spectrum, press the Spectrum soft key. The red dot on the soft key indicates it is
selected. Select the Channel Spectrum soft key for a single channel, or the Multi-Channel
Spectrum soft key to display the multi-channels spectrum.
Figure 10-5. GSM Single Channel Measurement Example
Figure 10-6. GSM Multi-channel Measurement Example
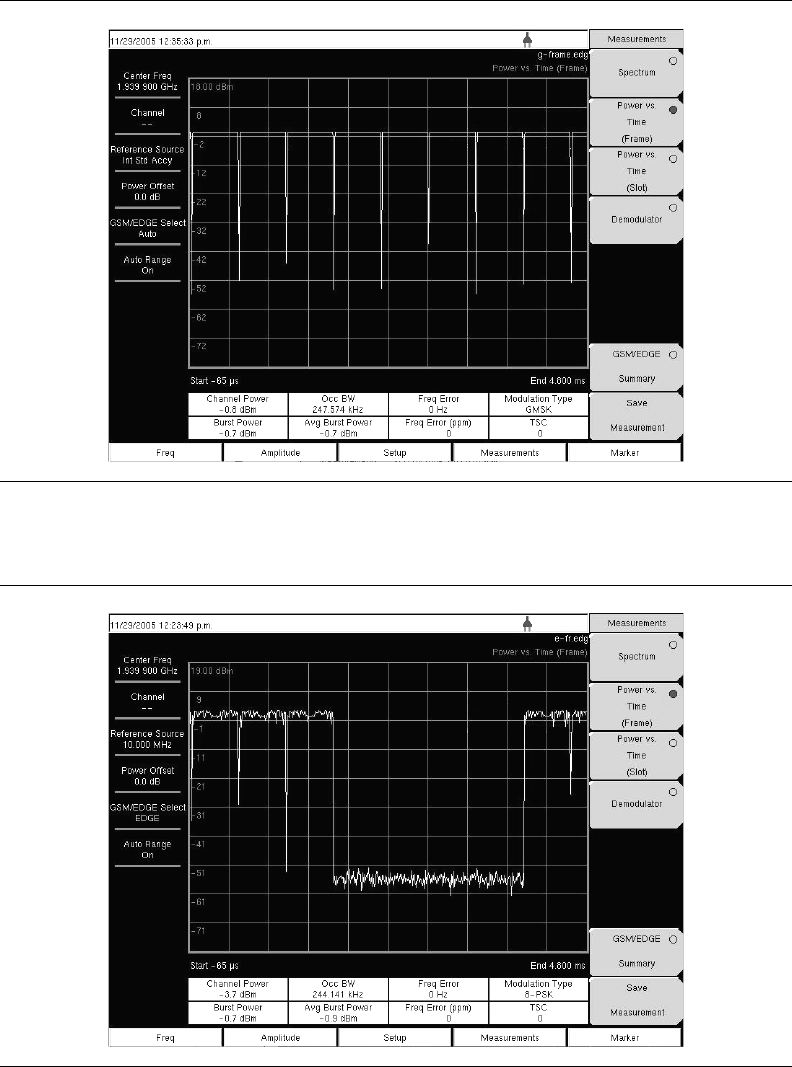
10-9
To display Power versus Time (Frame) press the Power vs. Time (Frame) soft key to activate
the Power vs. Time (Frame) measurement. The red dot on the soft key indicates it is selected.
Figure 10-7. GSM Power versus Time (Frame) Measurement Example
Figure 10-8. EDGE Power versus Time (Frame) Measurement Example
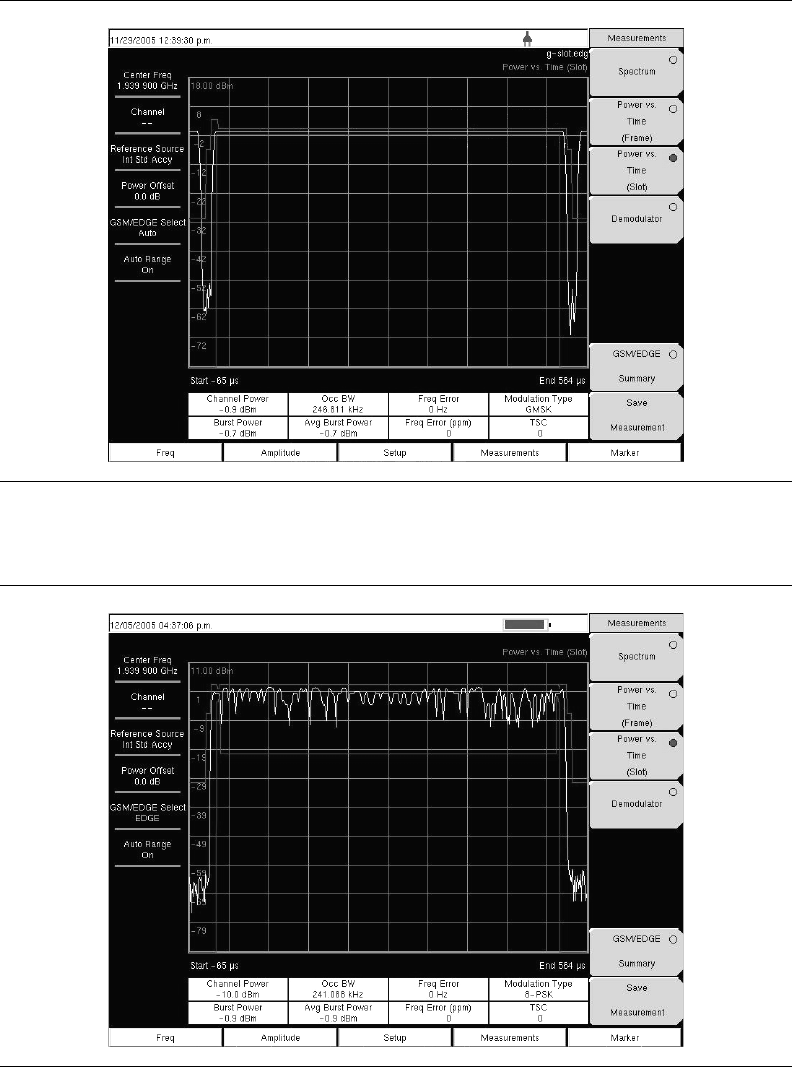
10-10
To display Power versus Time (Slot) press the Power vs. Time (Slot) soft key to activate the
Power vs. Time (Slot) measurement. The mask is according to the 3GPP TS 05.05
specification. The MS2721B and MS2723B display the first slot information. The red dot on
the soft key indicates it is selected.
Figure 10-9. GSM Power versus Time (Slot) Measurement Example
Figure 10-10. EDGE Power versus Time (Slot) Measurement Example
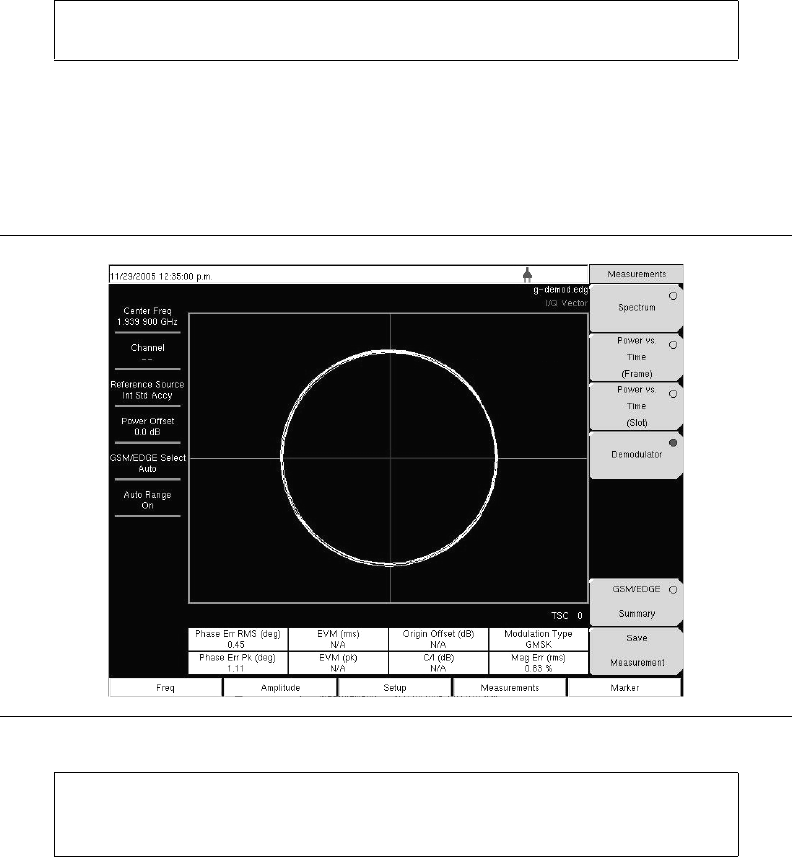
10-11
Demodulator
This measurement demodulates the GSM/GPRS/EDGE signal and displays the vector with
Phase Error, EVM, Origin Offset, C/I, Modulation Type and Magnitude Error (as
applicable). To demodulate the GSM/EDGE signal:
1. Select the Shift key, then the Mode (9) key, using rotary knob, or Up/Down arrow keys
select GSM/GPRS/EDGE Signal Analyzer and press the Enter key to select.
2. Press the Freq function hard key.
3. Press the Center Freq soft key and enter the desired frequency manually, or press the
Signal Standard soft key and select the applicable GSM standard.
4. Select the Channel soft key and use the Up/Down arrow keys, the keypad, or the rotary
knob to select a channel number for the selected signal standard. The center of the
channel is tuned to the center of the display.
5. Press the Setup function hard key.
6. Press the GSM/EDGE Select soft key and highlight Auto to automatically select the
GSM or EDGE signal.
7. Press the Ext Ref Freq soft key to display a list of the available reference frequencies
and select the desired reference frequency to get accurate frequency measurements as
described in the previous section, or activate the GPS (if equipped) to get GPS High
Accuracy frequency error measurements.
8. Press the Measurements function hard key.
9. Press the Demodulator soft key. The red dot on the soft key indicates it is selected.
NOTE: Highlight GSM or EDGE to set the instrument to measure only a
GSM or EDGE signal.
Figure 10-11. GSM Demodulator Measurement Example
NOTE: Using multichannel spectrum, channel cursor, select the channel
and press the Demodulator soft key, and the unit will demodulate the
selected channel.
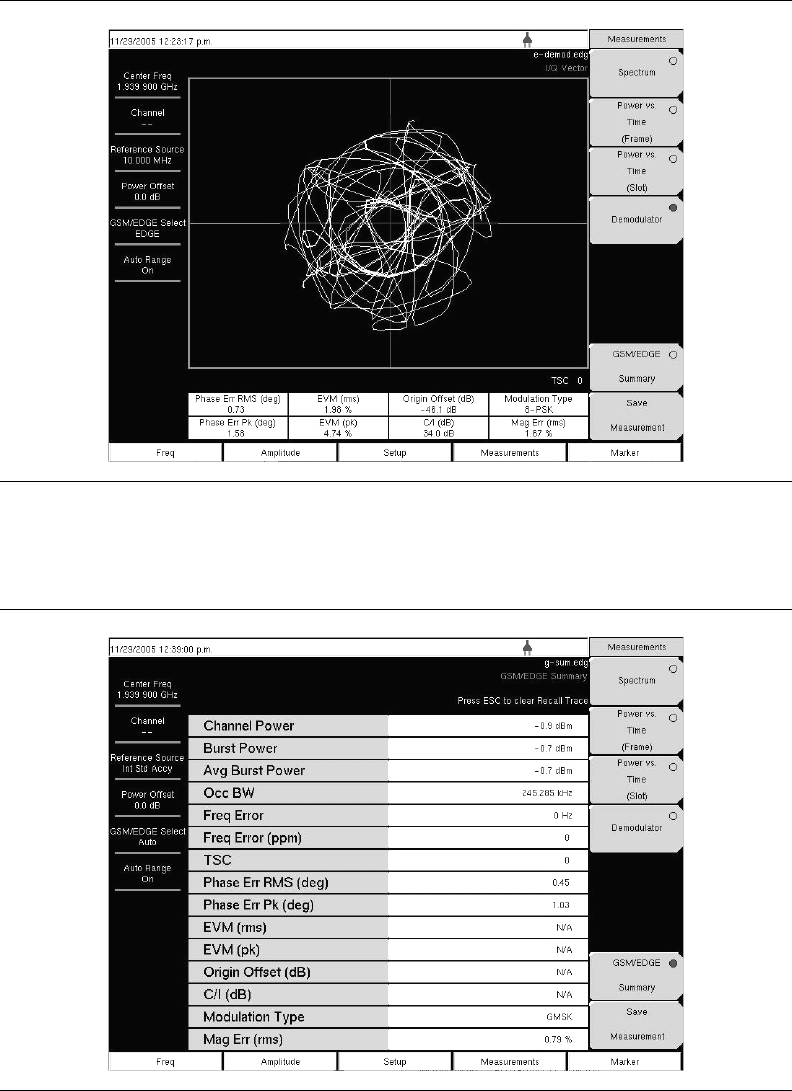
10-12
To display the GSM/EDGE Summary screen, press the GSM/EDGE Summary soft key. The
red dot on the soft key indicates it is selected.
Figure 10-12. EDGE Demodulator Measurement Example
Figure 10-13. GSM Summary Screen Example
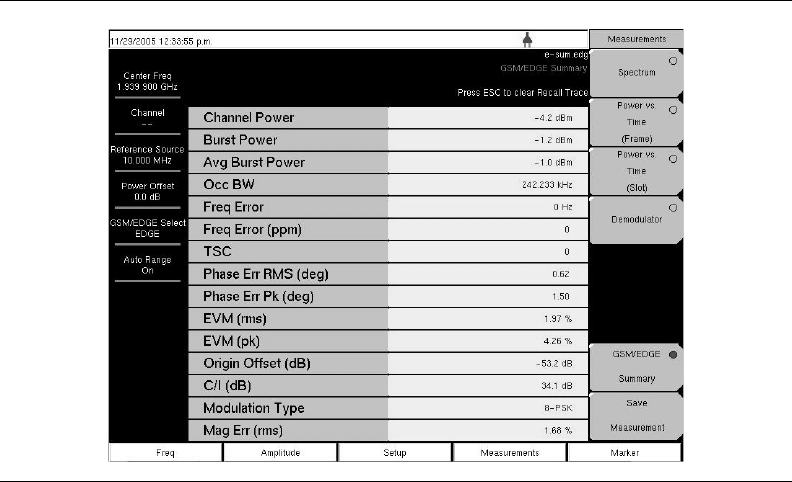
10-13
GSM/GPRS/EDGE Mode Pass/Fail Mode
The Spectrum Master MS2721B and MS2723B can store test sets for testing base station
performance and can recall these test sets for quick, easy measurements. These test sets are
for reference only and can be edited using Master Software Tools. When a test set is
selected, the Spectrum Master displays the test results in a tabular format with PASS or FAIL
indications that include min/max thresholds.
Figure 10-14. EDGE Summary Screen Example
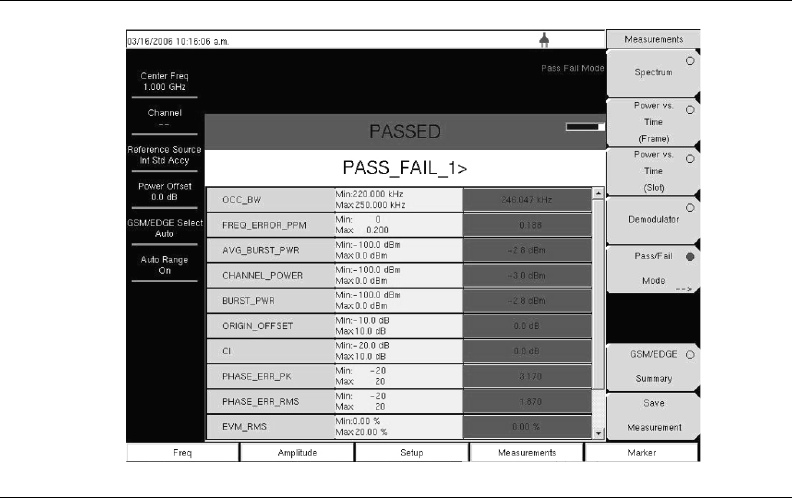
10-14
Using Master Software Tools, a custom test set can also be created and downloaded into the
Spectrum Master. All measurement parameters can be selected for pass/fail testing.
Pass/Fail Mode Procedure
1. Select the Shift key, then the Mode (9) key, using rotary knob or Up/Down arrow keys
select GSM/GPRS/EDGE Signal Analyzer and press the Enter key to select.
2. Press the Freq function hard key.
3. Press the Center Freq soft key and enter the desired frequency manually, or press the
Signal Standard soft key and select the applicable GSM standard.
4. Select the Channel soft key and use the Up/Down arrow keys, the keypad, or the rotary
knob to select a channel number for the selected signal standard. The center of the
channel is tuned to the center of the display.
5. Press the Measurements function hard key.
6. Press the Pass/Fail Mode soft key to activate Pass/Fail Mode.
7. Press the Pass/Fail Mode soft key to display the Pass/Fail Mode menu and then press
the Select Pass/Fail Test soft key to display the available test sets.
8. Use the rotary knob or Up/Down arrow keys to select the applicable test set and to
activate the measurement.
Figure 10-15. Pass/Fail Mode Example Screen
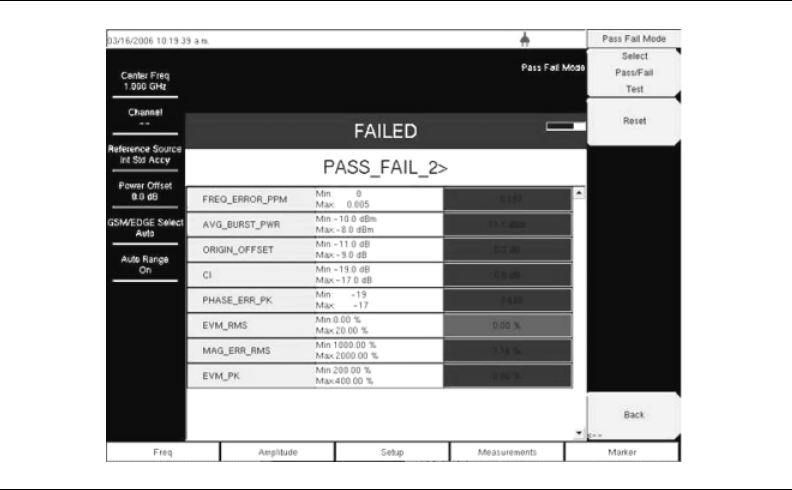
10-15
Measurement Results
Average Burst Power
The average burst power over 10 measured burst power values. This average is restarted
when a new frequency is selected.
Channel Power
Channel power measures the average power in a GSM/EDGE frame in the frequency
specified. Out of specification power indicates system faults. Channel power is expressed in
dBm.
Freq Error
The difference between the received frequency and the specified frequency is the frequency
error. This number is only as accurate as the frequency reference used, and is typically only
useful with a good external frequency reference or GPS. Frequency error is displayed in both
Hz and ppm.
Meas Occ BW
The occupied bandwidth is calculated as the bandwidth containing 99% of the transmitted
power.
Burst Power
Burst power is the average power over the useful part of the first active burst GSM/EDGE
slot. A GSM/EDGE signal has eight time slots in a frame.
Figure 10-16. Pass/Fail Mode Test Results Example
10-16
TSC
The Training Sequence Code detected in the first active burst is displayed. GSM/EDGE base
stations may use Training Sequence Codes 0-7. If no valid TSC is detected 'Not Found' is
displayed.
Phase Err RMS (deg)
The RMS phase error in degrees between the received signal and an ideal reconstructed
reference signal of the first active slot.
Phase Err Pk (deg)
The peak phase error in degrees between the received signal and an ideal reconstructed
reference signal of the first active slot.
EVM (rms)
The RMS (%) of all the error vectors between the ideal reconstructed reference symbol
points and the received symbol points divided by the RMS value of the signal present in the
first active slot. This measurement is performed for 8PSK modulated signals (EDGE) only.
EVM (pk)
The peak (%) of all the error vectors between the ideal reconstructed reference symbol
points and the received symbol points divided by the RMS value of the signal present in the
first active slot. This measurement is performed for 8PSK modulated signals (EDGE) only.
Origin Offset (dB)
Origin Offset is the carrier leakage component of the measured signal in dB and this
measurement is applicable to EDGE signal only.
Carrier to Interference Ratio - C/I (dB)
Carrier to Interference Ratio is the ratio of the desired carrier power to the undesired signal
power (interferer) in dB. This value is an estimate that is derived from the measured RMS
EVM value. This measurement is applicable to an EDGE signal only.
Modulation type
The modulation type can be GMSK (for GSM signals) or 8PSK (for EDGE signals).
Mag Err (rms)
The RMS of the magnitude error between the received signal and an ideal reconstructed
reference signal of the first active slot in %.

11-1
Chapter 11
High Accuracy Power Meter
Introduction
The Spectrum Master with Option 19 and sensor PSN50 can be used to make High Accuracy
Power Measurements from 50 MHz to 6 GHz. This high performance sensor option
provides true RMS measurements from –30 dBm to +20 dBm with accurate measurements
for both CW and complex digitally modulated signals.
The instrument display shows the power values in both dBm and Watts. The Relative Power
feature allows the display of power changes with respect to a desired reference value in both
dB and % (percent). Limit values can be turned on as needed in order to indicate if a
measurement is within or outside specified limits. Running averaging and a Max/Hold
feature are also available.
The Spectrum Master connects to the PSN50 High Accuracy Power Sensor with a USB
A/mini-B cable (3-2000-1360, 6 ft.) or (3-2000-1498, 10 ft.).
The zeroing feature improves the accuracy between –20 dBm and –30 dBm by removing
measured system noise. Calibration factors can be used to correct both efficiency and
mismatch loss.
Attenuators can be used to ensure that the power does not exceed the specified measurement
range. The Enter Offset feature allows entering offset values for any cables and attenuators.
Required Equipment
• Spectrum Master
• High Accuracy Power Sensor, PSN50
• USB cable, 3-2000-1498
• 30 dB, 50 W, bi-directional, DC-8.5 GHz, N(m)-N(f), Attenuator, 3-1010-123
Mode
Refer to section “Mode Selector Menu” on page 2-15 for information about setting the
instrument mode.
NOTE: The PSN50 sensor is not included with Option 19.
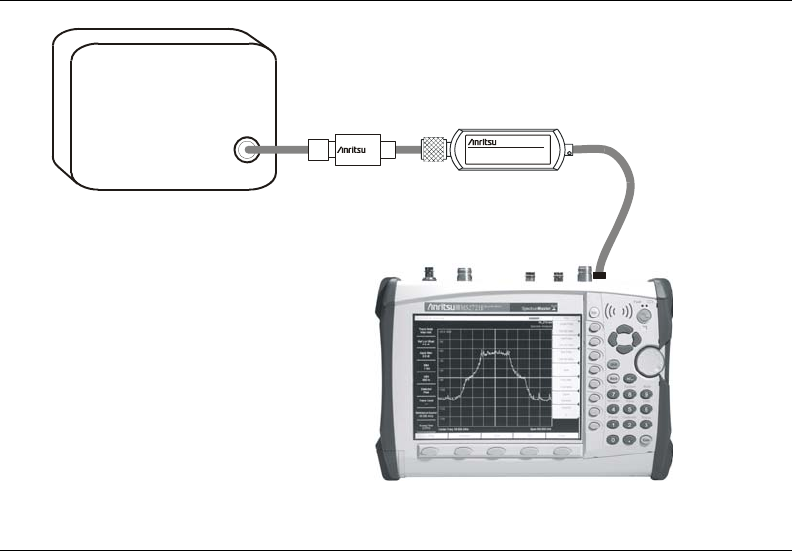
11-2
Procedure
Turning on the Spectrum Master and the Sensor
1. Connect the USB A/mini-B cable between the High Accuracy Power Sensor and the
Spectrum Master.
2. Press the ON/OFF key on the Spectrum Master.
3. Press the Shift and Mode (9) keys. Use the Up/Down arrow keys or rotary knob to
select High Accuracy Power Meter mode and press Enter.
Zero and Cal
1. Press the Zero/Cal key and select the Cal Factor soft key. Enter the Center Frequency
or select the Signal Standard key and the Up/Down arrow keys to select a particular
standard. The Cal Factors will be derived for the corresponding center frequency. The
channel number is not required because the Cal Factor frequencies are rounded to the
nearest 500 MHz. The Cal Factor message in the display window will show ON if the
Cal Factor command has been properly sent to the sensor.
2. With no power applied to the sensor, press the Zero soft key in order to zero the sensor.
This step is recommended when making power measurements below –20 dBm.
Figure 11-1. High Accuracy Power Meter Setup Example
MS272xB
ATTENUATOR
DUT
RF
OUT
PSN50 HIGH ACCURACY
POWER SENSOR
USB CABL
E

11-3
Changing the Scale of the Analog Display
1. Press the Amplitude key.
2. Press the Auto Scale soft key to align the needle in the middle of the analog display.
The maximum and minimum values align accordingly.
3. Press the Max soft key and use the key pad to manually set the maximum value of the
analog display.
4. Press the Min soft key and use the key pad to manually set the minimum value of the
analog display.
Using Attenuators
1. Press the Amplitude key and select the Enter Offset soft key.
2. Enter the offset value for the attenuator at the frequency of operation.
Displaying Relative Power
1. Press the Amplitude key.
2. With the desired base power level input to the sensor, press the Relative soft key. The
power reading will show 0 dB and 100%. If, for example, you are measuring a 10 dBm
signal and the Relative key is selected, then a drop to 7 dBm shows –3 dB and 50%.
Averaging/Max Hold/Run Hold
1. Press the Average key.
2. Press the Running Averages key. Use the keypad to enter the desired number of
averages.
3. Press the Max Hold soft key to toggle between Max Hold On and Max Hold Off. If
averaging is selected, then Max Hold displays the maximum value of the non-averaged
data.
Limits
1. Press the Limit key.
2. Press the Lower Limit soft key. Enter the lower limit value in dBm or in Watts.
3. Press the Upper Limit soft key. Enter the upper limit value in dBm or in Watts.
4. Press the Limit On/Off soft key to turn the Limits on and off. The number display turns
green if the measurement is passing or turns red if the measurement is failing.
5. Press the Amplitude key and select the Units soft key to change between dBm and
Watts.
NOTE: With no offset, the maximum value for the display is the upper
measurement range, which is +20 dBm. With an offset, such as with 10 dB
of attenuation, the upper value can be set to +30 dBm. With an offset of
xx dB, the upper value can be set to +20 dBm plus xx dB.
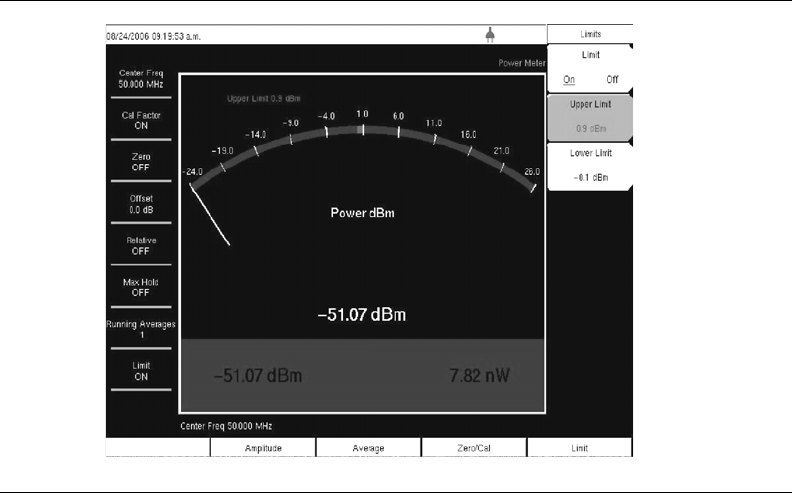
11-4
Saving the Measurement
1. Press the Shift key and the File (7) key.
2. Select the Save soft key.
3. Press the Save Measurement soft key and use the Text Entry soft keys to enter the
desired file name.
4. Press the Save Screen as JPEG soft key to save an image of the screen as a JPEG. file.
Figure 11-2. Limits Menu
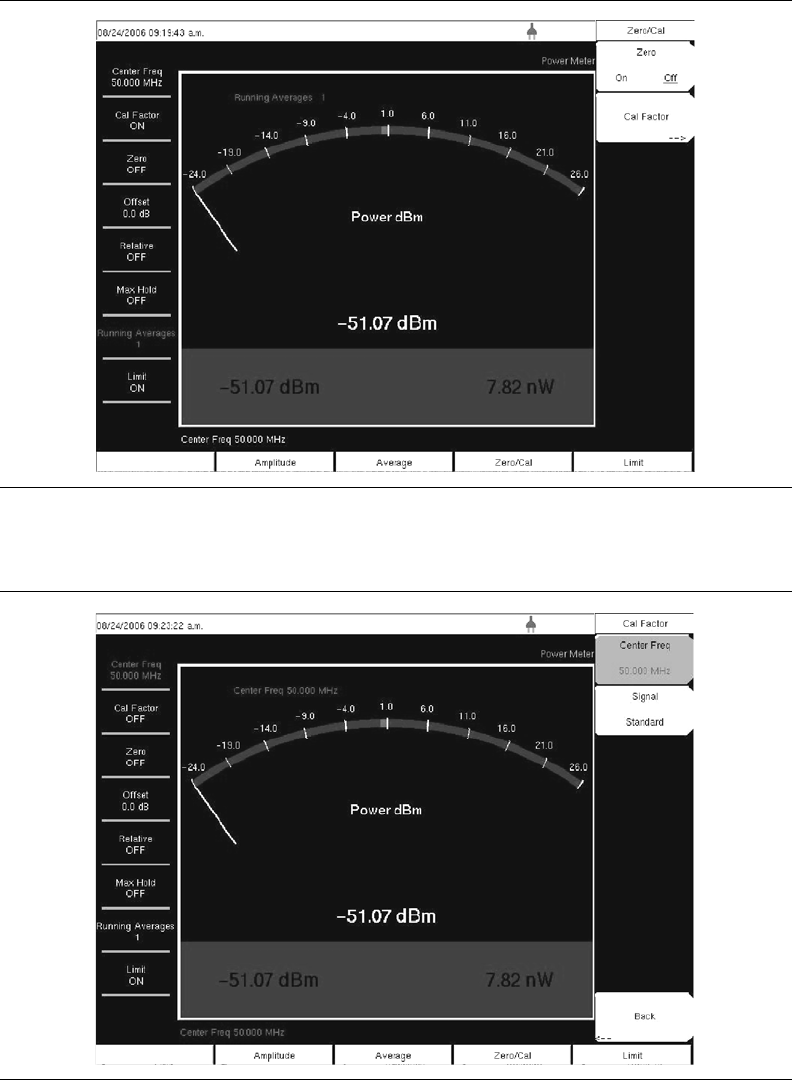
11-5
Menus
Soft key menu choices are shown in the following illustrations.
Figure 11-3. Zero/Cal Menu
Figure 11-4. Cal Factor Menu
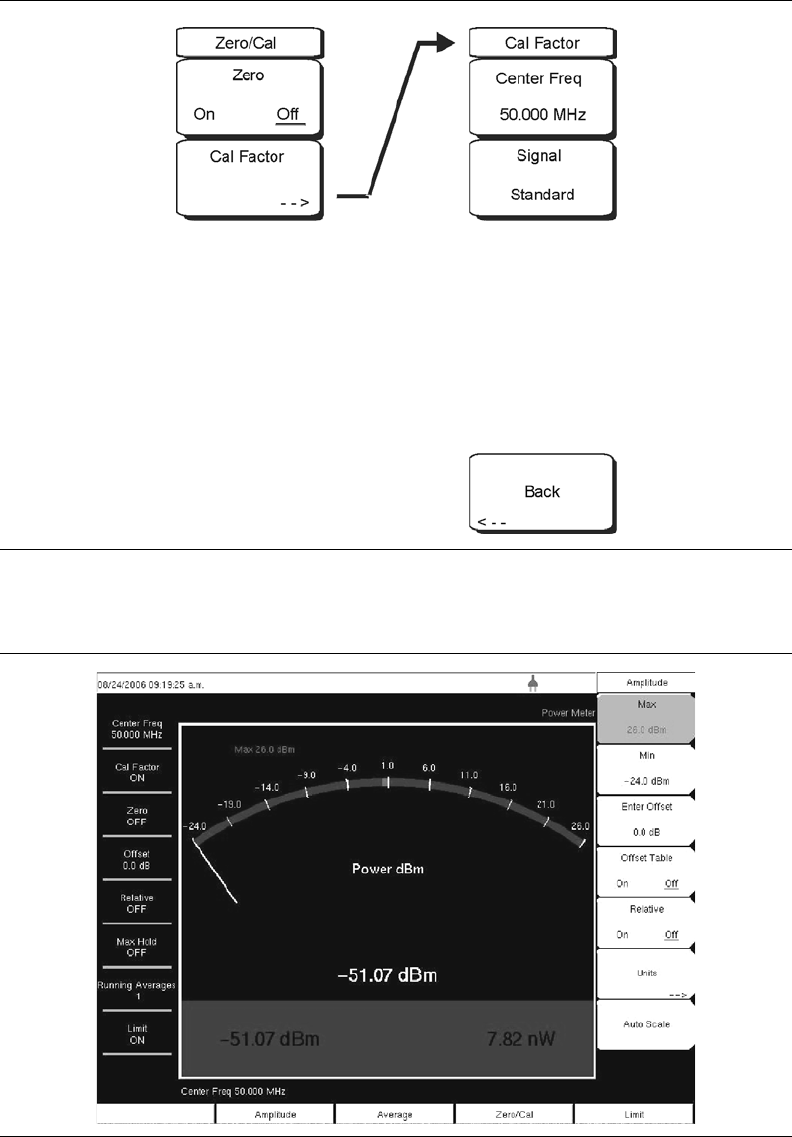
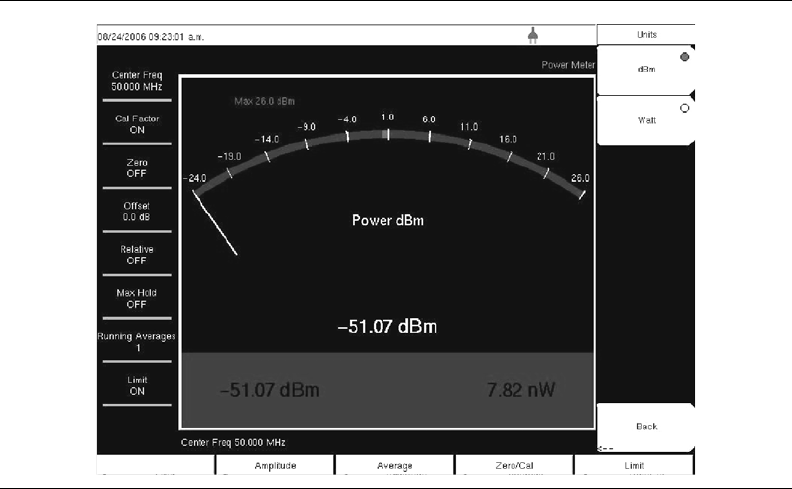
11-7
Figure 11-7. Units Menu
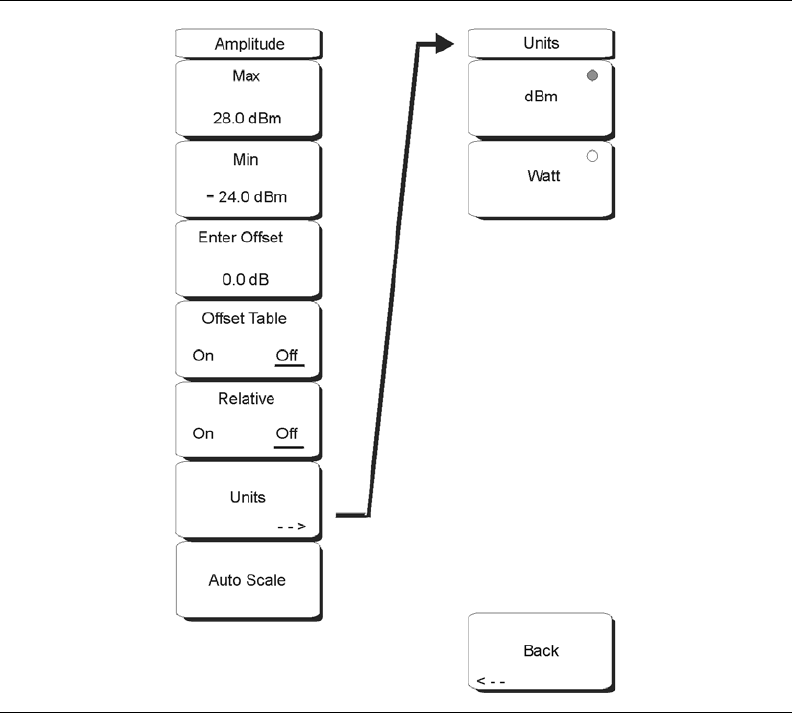
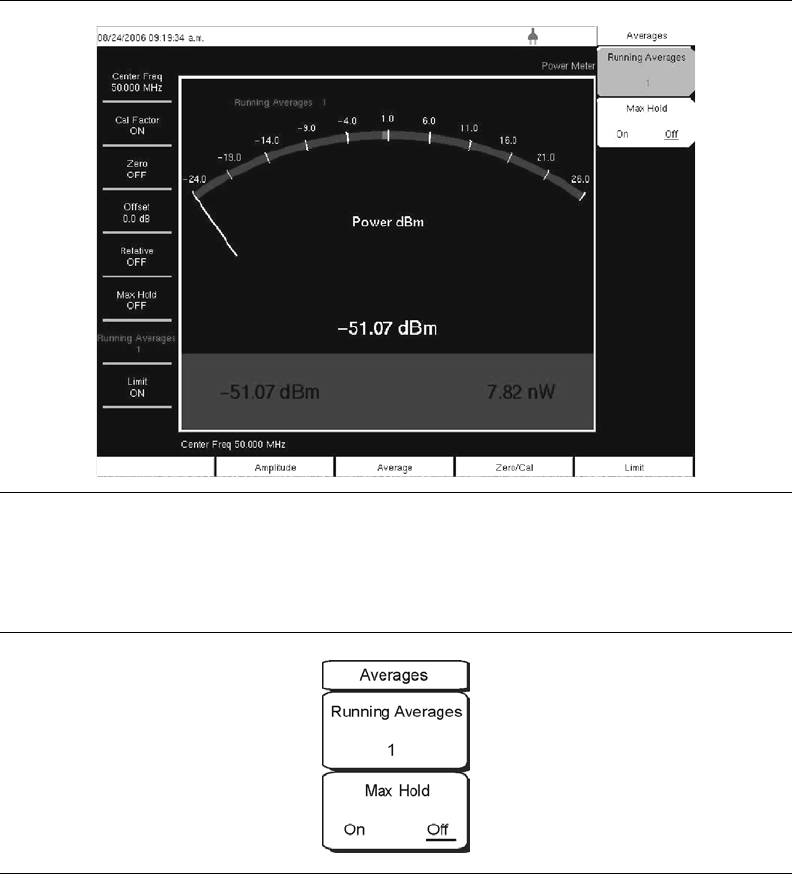
11-9
Figure 11-9. Averages Menu
Figure 11-10. Averages Soft Key Menu
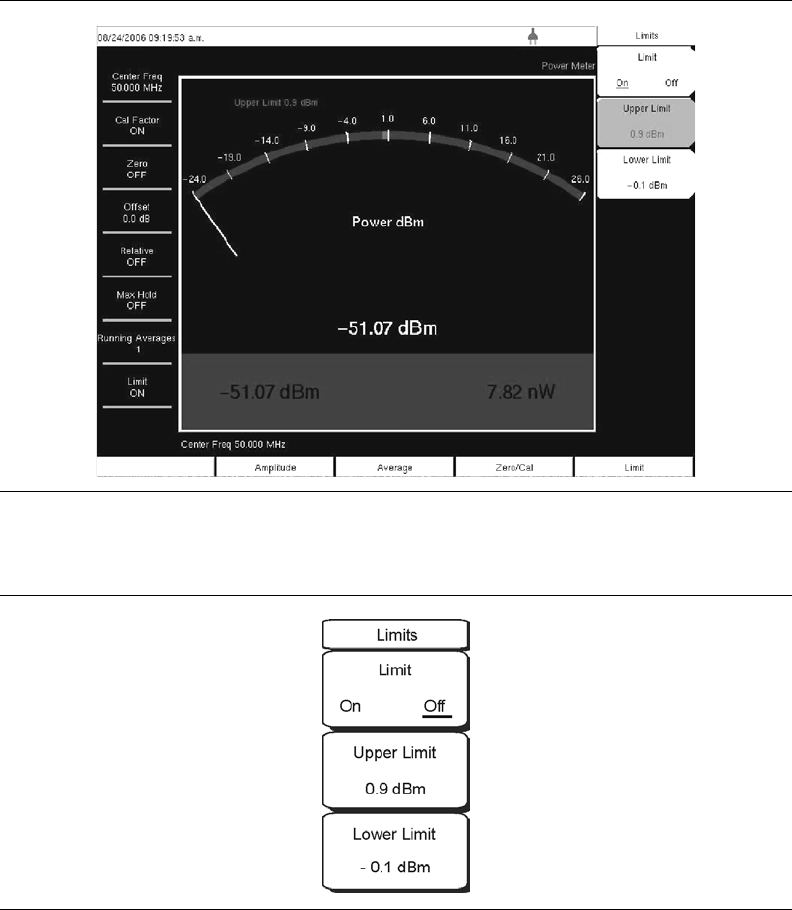
11-10
Figure 11-11. Limits Menu
Figure 11-12. Limits Soft Key Menu

12-1
Chapter 12
GPS Option
Introduction
The Spectrum Master is available with a built-in GPS receiver feature (Option 31). When
GPS is actively locked to satellites, the Latitude and Longitude information is saved with all
saved measurements and can be displayed with Master Software Tools. This option also
enhances frequency reference oscillator accuracy.
Within three minutes of satellite acquisition, the reference oscillator will have an accuracy of
better than 25 ppb (parts per billion) in the selected instrument operating mode. The OCXO
internal standard accuracy is ±0.3 PPM. The correction factor applied to the internal OCXO
allows the instrument to maintain GPS frequency accuracy for three days at better than
50 ppb, even when the instrument is obstructed from receiving signals from the GPS
satellites.
In order to acquire data from the GPS satellites, the user must have line-of-sight to the
satellites, or the antenna must be placed outside without any obstructions. The following
GPS antenna is provided with the unit:
• 2000-1410 Magnet Mount GPS Antenna with 15-foot cable
Activating the GPS Feature
To activate the GPS feature:
1. Install the Anritsu GPS antenna to the GPS antenna connection on the Spectrum
Master connector panel.
2. Press the Shift key, then the System (8) key to open the system options menu.
3. Press the GPS soft key to open the GPS menu.
4. Press the GPS On/Off soft key to turn the GPS feature on or off. When GPS is first
turned on, the GPS icon below will be displayed in red:
CAUTION: The GPS antenna connection on the Spectrum Master is fitted
with a reverse BNC connector in order to help prevent damage to the GPS
circuitry. A DC voltage is present on this connector. Do not connect
anything other than the Anritsu GPS antenna to this port.
Figure 12-1. Red GPS Icon
GPS

12-2
When the GPS receiver is tracking at least three satellites, the GPS icon will change to
green:
5. Press the GPS Info soft key to view the number of tracked satellites, latitude, longitude,
altitude, and UTC timing information, and so forth.
The green GPS icon with a red cross (shown in Figure 12-3) appears when GPS satellite
tracking is lost.
When GPS High Accuracy is achieved, the internal reference is adjusted and will hold this
adjusted value even when GPS satellites can no longer be received. This status will be
indicated by “Internal High Accuracy” showing in the Status menu, as displayed on the left
side of the screen. This internally-controlled high accuracy will hold for up to 72 hours.
Figure 12-2. Green GPS Icon
NOTE: As long as three minutes may be required for the Ref Freq status to
change to GPS High Accuracy in the Status menu, as displayed on the left
side of the screen.
NOTE: Press the Reset soft key to reset the GPS.
Figure 12-3. Green GPS Icon with Red Cross
NOTE: When the GPS feature is not enabled, the reference source will
display either "Internal Standard Accuracy" or a user-selected external
reference frequency in the Status menu on the left side of the screen.
GPS
GPS

13-1
Chapter 13
Fixed WiMAX Signal Analyzer
Introduction
The MS272xB Spectrum Master offers two Fixed WiMAX options: Fixed WiMAX RF
Measurements and Fixed WiMAX Demodulator. Connect the instrument to any Fixed
WiMAX BTS for accurate RF and demodulator measurements. The Spectrum Master works
for FDD and TDD networks.
The Spectrum Master can measure WiMAX BTS transmitter performance over the air by
connecting an antenna or by connecting the BTS equipment directly to the instrument. To
connect the BTS equipment directly to the MS272xB, connect the power amplifier of the
BTS equipment to the RF In connector of the instrument using a coupler or attenuator. To
measure a WiMAX signal over the air, connect the appropriate frequency band antenna to
the MS272xB RF In connector.
Instrument Options for Fixed WiMAX
Fixed WiMAX RF Measurements (Option 46)
Fixed WiMAX Demodulator (Option 47)
NOTE: The maximum (without damage) input level of the RF In port is
+30 dBm. To prevent damage, always use a coupler or high power
attenuator.

13-2
Amplitude
Scale
Scale changes the y axis scale and can be set from 1 dB/div to 15 dB/div. The units change
from dB/div to % when EVM is the y axis value. The default value changes from
10 dB/div to 1 dB/div when the Spectral Flatness view is selected.
Power Offset
Choose power offset to have the instrument automatically adjust for the loss through any
external cables, attenuators and couplers. The power can be offset from –100 dB to
100 dB. To set a power offset, press the Power Offset soft key, use the keypad to enter the
offset values and press the dB soft key.
Auto Range
When Auto Range is activated the reference level is automatically adjusted. Press the Auto
Range soft key to switch between On and Off.
Adjust Range
Adjust Range adjusts the internal reference level to be optimal based on the measured
signal. Auto Range is set to the Off state and a manual Auto Range operation is performed
once.
Y axis Max
Sets the maximum value of the Y axis. In combination with the Scale control, this allows
the user to zoom in and out on the Y axis. This control is available only in the Spectral
Flatness and EVM versus Symbol/Sub-carrier views.
Figure 13-1. Fixed WiMAX Signal Analyzer Mode Amplitude Menu
Amplitude
Scale
10 dB/div
Auto Range
OffOn
Power Offset
0.0 dB
Y Axis Max
Adjust
Range
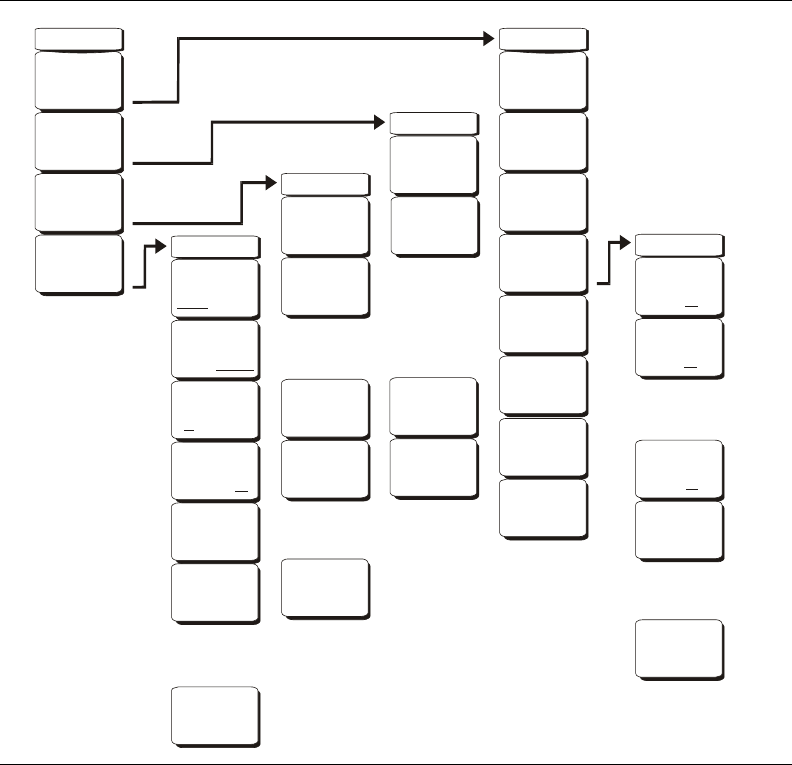
13-3
File
To access the functions under the File menu, select the Shift key, then the File (9) key.
Save
Measurements may be saved to the internal memory, to a USB Flash Drive, or to a Type-1
Compact Flash module. The Spectrum Master is shipped with a 256 MB Compact Flash
Memory Module, Anritsu Part Number 2000-1501. Removable memory can be up to
512 MB. Compact Flash modules with greater storage capacity may not function properly,
and should be properly tested before relying on them. A USB Flash drive or Compact
Flash module with at least 256 MB of storage may be used to store all measurements that
may be stored internally.
Figure 13-2. Fixed WiMAX Signal Analyzer Mode File Menu
File
Save
Recall
Recall
-->
-->
Back
Back
Back
-->
-->
-->
Back
-->
Save
Save
Setup
Sort Method
Type DateName
Save
Measurement
Sort
Ascend Descend
Current Location
USB CFInt
Format CF
Copy to Destination
Int USB CF
Copy from
Current Location
to Destination
Save
On
Event
Directory
Management
Directory
Management
Directory
Management
Save
Screen
as JPEG
Delete
Selected
File
Delete
All
Measurements
Delete
All
Mode Files
Delete
All
Contents
-->
-->
-->
-->
-->
Delete
Delete
Back
-->
… Crossing Limit
On Off
… Sweep Complete
On Off
… Save Then Stop
On Off
Clear All
Save On …
Recall
Setup
Recall
Measurement
Directory Management
*
*
*

13-4
Save Setup
Opens a dialog box to name and save the current operating settings, allowing them to
be recalled later to return the instrument to the state it was in at the time the setup was
saved. The saved setup can be named using the keypad to select numbers, the rotary
knob to highlight a number or character and pressing the knob to select, or by selecting
the soft key for each letter. Use the Shift key to select an upper case letter. Use the
Left/Right directional arrows to move the cursor position. Press Enter to save the
setup.
Save Measurement
Initiates a dialog box to name and save the current active Trace A. The saved
measurement trace can be named using the keypad to select numbers, the rotary knob
to highlight a number or character and pressing the knob to select, or by selecting the
soft key for each letter. Use the Shift key to select an upper case letter. Use the
Left/Right directional arrows to move the cursor position. Press Enter to save the
measurement trace. Measurements are saved in a directory called /usr on the Compact
Flash memory module and the USB Flash Drive.
Save On Event…
Not implemented in WiMAX mode.
Save Screen as JPEG
This function saves a measurement trace as a graphics file. The saved measurement can
be named using the keypad to select numbers, the rotary knob to highlight a number or
character and pressing the knob to select, or by selecting the soft key for each letter.
Use the Shift key to select an upper case letter. Use the Left/Right directional arrows to
move the cursor position. Press Enter to save the measurement after entering the file
name. The file is saved in the internal memory with the specified name, with .jpg
appended.
Directory Management
Sort Method
Name Type Date
File lists can be sorted by the name of the file, the type of file (SPA file, STP file, and
so forth) or by the date that the file was saved.
Sort
Ascend Descend
Selects whether the selected sort is sorted from lowest to highest (ascending) or highest
to lowest (descending). When sorting by name, the sort will place file names that start
with numbers before file names that start with letters (an ASCII sort).
NOTE: If a measurement has been previously saved, then the Save
Measurement dialog box will open with the previously saved name
displayed. To save the new measurement with a similar name (for
example, Trace-1, Trace-2, and so forth), press the Right directional arrow
and add the changes. To create a completely new name, use the keypad
or the rotary knob, or select the soft key for each letter.

13-5
Current Location
Int USB CF
This choice lets you select where measurements and setups will be saved. Pressing the
soft key selects the storage location to be the internal memory, USB Flash drive, or
Compact Flash memory module. The "current location" and the "copy to destination"
will never be the same. Changing the current location to save files causes the "copy to
destination" to be automatically changed if the selected storage location is the same as
the selected current location.
Copy to Destination
Int USB CF
This choice lets you select where measurements and setups in the "current location"
will be copied. The "current location" and the "copy to destination" may not be the
same. If you change the destination to which the instrument will copy files, the current
location is automatically changed if the current location is the same as the selected
copy to destination.
Copy From Current Location To Destination
Pressing this soft key causes all measurements, setups and jpg files stored in the user
selected "current location" to be copied to the "copy to destination." If no storage
module is installed in the instrument, an error message is displayed.
Format Compact Flash
This selection erases all files on an installed Compact Flash module. A message is
displayed warning that all files will be erased. Press Enter to confirm that you want to
erase and Esc to quit without erasing. In addition to erasing all files stored on the
Compact Flash, the /usr directory is created for storage of measurements, setups and
jpg files.
Back
The Back key returns to the previous menu.
Recall
Recall Setup
This soft key brings up a selection box that allows selection and recall of a previously
stored instrument setup in the current storage location. Use the rotary knob or the
Up/Down arrow keys to highlight the saved setup, and press Enter, the rotary knob, or the
Recall soft key to select. All current instrument settings are replaced by the stored setup
information. Press the Esc key to cancel the recall.
Recall Measurement
Brings up a selection box that allows recall of a previously stored measurement trace from
the currently selected storage location. Use the rotary knob or the Up/Down arrow keys to
highlight the saved measurement trace, and press Enter, the rotary knob, or the Recall soft
key to select. A recalled trace may be displayed as Trace A, in place of the live trace, or as
Trace B or Trace C along with the live trace. Use the rotary knob or the Up/Down arrow
keys to highlight the recalled trace option, and press the Enter key to select. Press the Esc
key to cancel the recall.
To remove a recalled measurement trace from the screen, select the Shift key and the
Trace (5) key to open the Trace menu. Use the Trace soft key to select the trace to be
removed from the screen and use the View/Blank soft key to view or blank the trace. Use
the Trace key to select an active trace after blanking a recalled trace.
Directory Management
See “Directory Management” on page 13-4.
13-6
Back
Returns to the previous menu.
Delete
Brings up a selection box that shows all stored setups and traces in the currently selected
location (see “Directory Management” on page 13-4). The list shows the setup and
measurement names, the type (stp for a saved setup, spa for a saved trace, jpg for a JPEG
file) and the date and time the information was saved. Use the rotary knob or the Up/Down
arrow keys to highlight the file to be deleted, and press Enter, or the Delete soft key to
delete. Press the Esc key to cancel the operation. Note that there is no mechanism to
retrieve deleted files.
Delete Selected File
Use the up and down arrow buttons or the rotary knob to select the file that is to be
deleted. Press Enter to confirm that you want to delete the file or press Esc to exit
without deleting.
Delete ALL Measurements
Deletes all measurements of the current mode in the currently selected storage location.
The memory from which measurements will be deleted is set in the Directory
Management menu and is the Current Location.
Delete ALL Mode Files
Deletes all measurements of the type saved in the current operating mode of the
instrument. In addition all jpg and setup files (regardless of the mode) are deleted.
Delete ALL Contents
Deletes all measurements, jpg files and setup files of ALL measurement types.
Back
The Back key returns to the previous menu.

13-7
Freq (Frequency)
Center Freq
The Center Freq soft key is used to set the receiver center frequency to the desired value.
Enter the frequency using the keypad, the arrow keys, or the rotary knob. When entering a
frequency using the keypad, the soft key labels will change to GHz, MHz, kHz, and Hz.
Select the appropriate units soft key. Pressing the Enter key has the same affect as
selecting the MHz soft key.
Signal Standard
Use the Up/Down arrow keys or the rotary knob to highlight a signal standard and press
Enter to select. When a signal standard is selected, the center frequency and span for the
first channel of the selected standard is automatically tuned. Other settings, such as
channel spacing and integration bandwidth, are also automatically entered.
The applicable signal standards (for 10 MHz BW only) are U-NII middle, U-NII upper,
CEPT band B, and CEPT band C.
Channel
Use the Up/Down arrow keys, the keypad, or the rotary knob to select a channel number
for the selected Signal Standard. The center of the channel is automatically tuned to the
center frequency of the selected channel. The listed channels are from 0 – 199.
Set CF to Closest Channel
This soft key moves the current Center Frequency to the closest frequency that matches a
channel number in the current Signal Standard.
Figure 13-3. Fixed WiMAX Signal Analyzer Mode Freq Menu
Freq
Center Freq
2.5 GHz
Set CF
To
Closest Channel
Decrement
Channel
Increment
Channel
Signal
Standard
Channel
- -
13-8
Decrement Channel
Press this soft key to decrease the selected channel number by one channel.
Increment Channel
Press this soft key to increase the selected channel number by one channel.
Limit
This function is not implemented in this mode.
Measure
To access the functions under the Measure menu, select the Shift key, then the Measure (4)
key. The Measure key brings up the same menus as the Measurements function hard key.
Refer to “Measurements” on page 13-9 for information on these menus.
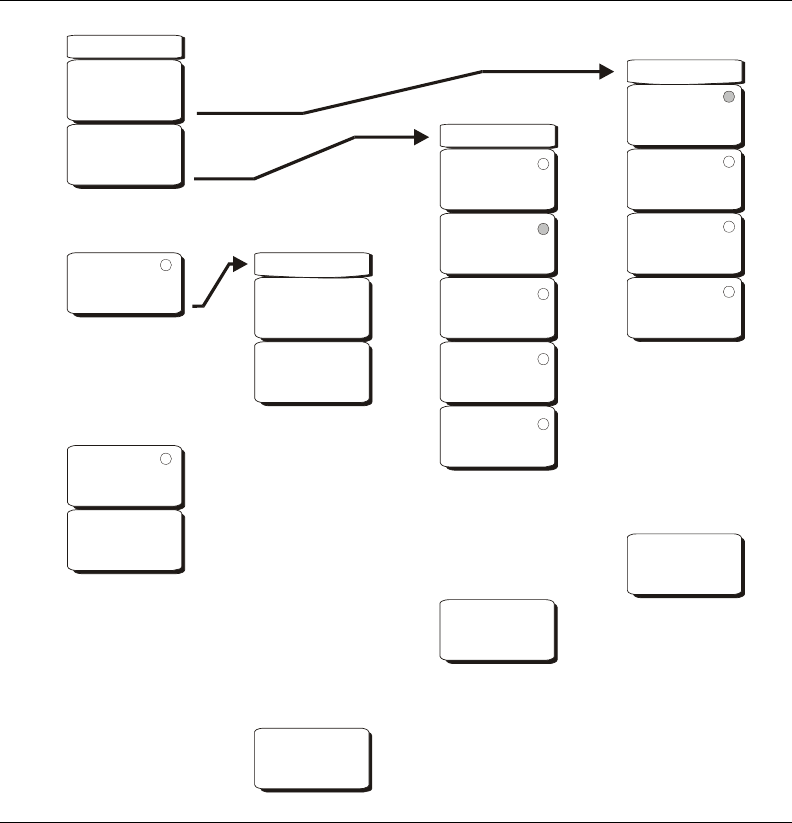
13-9
Measurements
RF
Spectrum
This view displays the spectrum of the input signal. The span is automatically adjusted
to the next largest available span based on the bandwidth setting. Channel Power
(RSSI) in dBm and Occupied Bandwidth measurements are displayed as numerical
values.
Span
Opens the Span selection dialog. Select the desired Span for the Spectrum view by
using the Up/Down arrow keys or the rotary knob, and press Enter.
The list shows the following choices: 5 MHz, 10 MHz, 20 MHz, 30 MHz.
Figure 13-4. Fixed WiMAX Signal Analyzer Mode Measurements Menu
Measurements
RF
Demodulator
Pass/Fail
Mode -->
-->
-->
WiMax
Summary
Save
Measurement
Back
-->
Demodulator
Constellation
Spectral Flatness
EVM vs
Symbol
EVM vs
Sub Carrier
Modulation
Summary
RF Meas
Power vs Time
ACPR
RF
Summary
Back
-->
Spectrum
-->
-->
Back
-->
Pass Fail Mode
Select
Pass/Fail
Test
Reset

13-10
Power vs. Time
The Power vs. Time view shows the time domain view of a WiMAX 802.16-2004
OFDM signal over approximately one frame.
The Channel Power in dBm, Preamble power in dBm, burst power of data bursts in
dBm, and the Crest Factor are displayed as numerical values.
ACPR (Adjacent Channel Power Ratio)
The ACPR view shows one main channel and two adjacent channels, and displays the
power levels for each channel (both absolute and relative).
RF Summary
Displays a summary of all the RF numerical measurement results.
Back
Returns to the previous menu.
Demodulator
Constellation
The constellation view shows the constellation of the demodulated data symbols over
one frame. The various constellations are color coded as follows:
BPSK is shown in orange
QPSK is shown in purple
16-QAM is shown in green
64-QAM is shown in yellow
The numerical results displayed in this view are:
RCE (rms) in dB
RCE (pk) in dB
EVM (rms) in %
EVM (pk) in %
Freq Error in Hz
Freq Error in ppm
Carrier Frequency in Hz
Base Station ID.
Reference Points
Toggles the display of reference points for the various constellations on the display.
Spectral Flatness
The Spectral Flatness view shows the data collected from the preamble at the channel
estimation step. The deviation of the spectral flatness from the average over all the
carriers is shown in dB.
A mask that conforms to the specification is overlaid on the trace. Green color on the
mask indicates pass and red indicates regions of the mask where it fails.
NOTE: The span value is automatically adjusted to the next largest
available span when the BW setting is changed. The user can change the
span to any of the above values in order to override the automatic
selection.
13-11
The specification for the mask is:
±0 to 50 subcarriers < ±2dB,
±50 to 100 subcarriers < +2 dB and –4 dB
This mask is referenced from the average of all 200 subcarrier amplitude values.
Absolute delta of the power between adjacent subcarriers in dB is displayed as a
numerical values.
EVM vs. Sub Carrier
This view shows the EVM (rms) values vs. OFDM subcarriers. The pilot subcarriers
are shown in orange.
EVM vs. Symbol
This view shows the EVM (rms) values vs. OFDM symbols.
Modulation Summary
Displays a summary of all the Modulation related numerical measurement results.
Back
Returns to the previous menu.
Pass/Fail Mode
Pass/Fail mode allows the selection of a user-defined file that specifies a list of
measurements with pass/fail criteria. This mode will sequence through the appropriate
measurements and indicate a pass or fail state based on the criteria. A custom test list can
be created with Master Software Tools and downloaded into the unit. All critical
measurements can be selected for pass fail testing. The results are displayed in table format
with clear identification of pass/fail results including min/max thresholds and measured
results.
Select Pass/Fail Test
Displays the list of available Pass/Fail tests.
Reset
Resets the Pass/Fail test.
Back
Returns to the previous menu.
WiMAX Summary
Displays a summary of all the WiMAX related numerical measurement results.
Save Measurement
Initiates a dialog box to name and save the current measurement. The saved measurement
can be named using the keypad to select numbers, the rotary knob to highlight a number or
character and pressing the knob to select, or by selecting the soft key for each letter. Use
the Shift key to select an upper case letter. Use the Left/Right directional arrows to move
the cursor position. Press Enter to save. Wimax measurements are saved with a .wmxd
extension.
Mode
The contents of the Mode list box depend on the options installed in the instrument. The
current mode is highlighted by default.
To access the functions under the Mode menu, select the Shift key, then the Mode (9) key.
Use the directional arrow keys or the rotary knob to highlight the desired mode and press
Enter to implement. Also refer to section “Mode Selector Menu” on page 2-15.

13-12
Setup
BW
Select the Bandwidth using the Up/Down arrow keys or the rotary knob and press Enter.
The following bandwidths are available: 1.25 MHz, 1.5 MHz, 1.75 MHz, 2.50 MHz,
3.0MHz, 3.5MHz, 5MHz, 5.5MHz, 6.0MHz, 7MHz, or 10MHz. The default
bandwidth is 1.25 MHz.
CP Ratio (G)
Select the desired Cyclic Prefix Ratio using the Up/Down arrow keys or the rotary knob
and press Enter. Available CP Ratios are: 1/4, 1/8, 1/16, and 1/32. The default CP Ratio is
1/4.
Span
Select the desired Span for the Spectrum view using the Up/Down arrow keys or the rotary
knob and press Enter. The available Span selections are: 5 MHz, 10 MHz, 20 MHz, or
30 MHz.
Frame Length
Select the frame length by pressing this soft key to toggle through the available
selections: 2.5 ms, 5 ms, or 10 ms. The selected value is underlined on the virtual soft key
face.
Figure 13-5. Fixed WiMAX Signal Analyzer Mode Setup Menu
NOTE: The span value is automatically adjusted to the next largest
available span when the BW setting is changed. The span can be changed
to any of the above values in order to override the automatic selection.
Setup
BW
1.25 MHz
Ext. Refer ence
Fr equen c y
CP Ratio (G)
1/4
Spa n
5 MHz
Frame Length
2.5 ms 5 ms 10 ms
13-13
Ext. Ref. Freq
Select the desired External Reference Frequency using the Up/Down arrow keys or the
rotary knob and press Enter. The following External Reference Frequencies are available:
1 MHz, 1.2288 MHz, 1.544 MHz, 2.048 MHz, 2.4576 MHz, 4.8 MHz, 4.9152 MHz,
5 MHz, 9.8304 MHz, 10 MHz, 13 MHz, and 19.6608 MHz. The default External
Reference Frequency is 10 MHz.

13-14
System
To access the functions under the System menu, select the Shift key, then the System (8)
key.
Status
Pressing this soft key displays the current system status, including the operating system
and firmware versions, temperatures and other details such as current battery information.
Press Esc or Enter to return to normal operation.
Figure 13-6. Fixed WiMAX Signal Analyzer Mode System Menu
System
Status
Self
Test
Application
Self
Test
Application
Options
GPS
System
Options -->
-->
-->
Back
-->
Options
Ext Ref Freq
GPS
GPS
On Off
GPS Info
Reset
Back
-->
Back
-->
Reset
Factory
Defaults
Master
Reset
Update
OS Via
Ethernet
Update
OS Via
USB
System Options
Date
&
Time
Ethernet
Config
Language
Brightness
Name
Volume
Reset
Back
-->
-->
13-15
Self Test
This soft key initiates a series of diagnostic tests that test the components of the
instrument. A display will list the individual tests with a pass or fail indication. Press Esc
or Enter to return to normal operation.
Application Self Test
This soft key initiates a series of diagnostic tests related to the performance of the
spectrum analyzer. A display will list the individual tests with a pass or fail indication.
Press Esc or Enter to return to normal operation.
Application Options
This soft key presents a menu to select application options.
Ext Ref Freq
Select the frequency of the external reference from the list presented.
Back
Returns to the previous menu.
System Options
This key opens a selection of system option soft keys.
Date and Time
This soft key brings up a dialog box for setting the current date and time. Use the soft
keys or the Left/Right arrow keys to select the field to be modified. Use the keypad, the
Up/Down arrow keys or the rotary knob to select the date and time. Select Enter to
accept the changes, or press the Esc key to return to normal operation without
changing anything.
Ethernet Configuration
This soft key brings up a dialog box to set the IP address of the instrument.
Type Manual/DHCP
This softkey selects whether the address will be entered manually, or supplied
automatically by a network DHCP server. If Manual is selected, use the soft keys or
the Left/Right arrow keys to select the field to be modified. Use the keypad, the
Up/Down arrow keys or the rotary knob to enter the input. Select Enter to accept the
changes, or press the Esc key to return to normal operation without changing
anything.
Language
This soft key brings up a selection box allowing selection from a list of built-in
languages for the Spectrum Master displays. The languages currently available are
English, French, German, Spanish, Japanese, Chinese, Korean, and Italian. In addition,
up to two custom languages may be selected if they have been defined using the Master
Software Tools software and loaded into the instrument. Two custom languages may be
loaded into the instrument. If a mode does not have language translations available,
English is the default language. Select Enter to accept the change, or press the Esc key
to return to normal operation without changing anything.
Brightness
The brightness of the display can be adjusted to optimize viewing under a wide variety
of lighting conditions. Use the keypad, the Up/Down arrow keys or the rotary knob to
select a brightness level from 1 to 9, 9 being the brightest. Select Enter to accept the
change.
13-16
Name
Opens a dialog box to name the instrument. The unit can be named using the keypad to
select numbers, the rotary knob to highlight a number or character and pressing the
knob to select, or by selecting the soft key for each letter. Use the Shift key to select an
upper case letter. Use the Left/Right directional arrows to move the cursor position.
Press Enter to save the name.
Volume
The current volume setting is displayed on the screen. Use the keypad, the Up/Down
arrow keys or the rotary knob to change the volume and press the Enter key to accept
the change.
Reset
Opens a menu of reset and update options.
Factory Defaults
Restores the instrument to the factory default values, including Ethernet, language
and brightness settings. Press the Enter key to initiate the reset, and turn the unit off,
then on again to complete. Press Esc to return to normal operation without resetting.
Master Reset
This will restore factory setting to all system parameters, including Time/Date,
Ethernet, language and brightness settings. Also, all user files in the internal memory
are deleted, and the original language and antenna files are restored. Press the Enter
key to initiate the reset, and turn the unit off, then on again to complete. Press Esc to
return to normal operation without resetting.
Update OS Via Ethernet
Select this soft key to update the instrument operating system via the Ethernet
connection. Press Enter to begin the update, or press Esc to return to normal
operation without updating.
Update OS Via USB
Select this soft key to update the instrument operating system via the USB
connection. Press Enter to begin the update, or press Esc to return to normal
operation without updating.
Back
Returns to the previous menu.
GPS
If the GPS option is installed, the GPS menu will be displayed.
GPS On/Off
Turns the GPS on or off.
GPS Info
Displays the current GPS information.
Reset
Resets the GPS for a new location.
Back
Returns to the previous menu.
Application Options
This soft key presents a menu to select application options.
13-17
Ext. Ref. Freq
This soft key brings up a dialog box for selecting the External Reference Frequency.
Use the rotary knob or the Up/Down arrow keys to highlight the Reference Frequency
and press Enter to select, or press the Esc key to cancel.
System Options
This key opens a selection of system option soft keys.
Date and Time
This soft key brings up a dialog box for setting the current date and time. Use the soft
keys or the Left/Right arrow keys to select the field to be modified. Use the keypad, the
Up/Down arrow keys or the rotary knob to select the date and time. Select Enter to
accept the changes, or press the Esc key to return to normal operation without
changing anything.
Ethernet Config
This soft key brings up a dialog box to set the IP address of the instrument.
Type Manual/DHCP
This softkey selects whether the address will be entered manually, or supplied
automatically by a network DHCP server. If Manual is selected, use the soft keys or
the Left/Right arrow keys to select the field to be modified. Use the keypad, the
Up/Down arrow keys or the rotary knob to enter the input. Select Enter to accept
the changes, or press the Esc key to return to normal operation without changing
anything.
Language
This soft key brings up a selection box allowing selection from a list of built-in
languages for the Spectrum Master displays. The languages currently available are
English, French, German, Spanish, Japanese, Chinese, Korean, and Italian.
In addition, a custom language may be selected if it has been defined using the Master
Software Tools software and loaded into the instrument. Two custom languages may be
loaded into the instrument using Master Software Tools. If a mode does not have
language translations available, English is the default language. Select Enter to accept
the change, or press the Esc key to return to normal operation without changing
anything.
Brightness
The brightness of the display can be adjusted to optimize viewing under a wide variety
of lighting conditions. Use the keypad, the Up/Down arrow keys or the rotary knob to
select a brightness level from 1 to 9, with 9 being the brightest. Select Enter to accept
the change.
Name
Opens a dialog box to name the instrument. The unit can be named using the keypad to
select numbers, the rotary knob to highlight a number or character and pressing the
knob to select, or by selecting the soft key for each letter. Use the Shift key to select an
upper case letter. Use the Left/Right directional arrows to move the cursor position.
Press Enter to save the name.
Volume
The current volume setting is displayed on the screen. Use the keypad, the Up/Down
arrow keys or the rotary knob to change the volume and press the Enter key to accept
the change.
Reset
Opens a menu of reset and update options.
13-18
Factory Defaults
Restores the instrument to the factory default values, including Ethernet, language
and brightness settings. Press the Enter key to initiate the reset, and turn the unit
off, then on again to complete. Press Esc to return to normal operation without
resetting.
Master Reset
This will restore factory setting to all system parameters, including Time/Date,
Ethernet, language and brightness settings. Also, all user files in the internal
memory are deleted, and the original language and antenna files are restored.
Press the Enter key to initiate the reset, and turn the unit off, then on again to
complete. Press Esc to return to normal operation without resetting.
Update OS Via Ethernet
Select this soft key to update the instrument operating system via the Ethernet
connection. Press Enter to begin the update, or press Esc to return to normal
operation without updating.
Update OS Via USB
Select this soft key to update the instrument operating system via the USB
connection. Press Enter to begin the update, or press Esc to return to normal
operation without updating.
Back
Returns to the previous menu.
Preset
To access the functions under the Preset menu, select the Shift key, then the Preset (1) key.
Preset
This key resets the instrument to the default starting conditions.
Save Setup
Opens a dialog box to name and save the current operating settings, allowing them to be
recalled later to return the instrument to the state it was in at the time the setup was saved.
The saved setup can be named using the keypad to select numbers, the rotary knob to
highlight a number or character and pressing the knob to select, or by selecting the soft key
for each letter. Use the Shift key to select an upper case letter. Use the Left/ Right
directional arrows to move the cursor position. Press Enter to save the setup.
Recall Setup
This soft key brings up a selection box that allows selection and recall of a previously
stored instrument setup in the current storage location. Use the rotary knob or the
Up/Down arrow keys to highlight the saved setup, and press Enter, the rotary knob, or the
Recall soft key to select. All current instrument settings are replaced by the stored setup
information. Press the Esc key to cancel the recall.

13-19
Sweep
To access the functions under the Sweep menu, select the Shift key, then the Sweep (9) key.
Sweep Continuous/ Single
When Continuous is selected, the instrument continuously makes measurements. When
Single is selected, the instrument makes one measurement and then waits for a Trigger
Sweep key press to sweep again.
Trigger Sweep
When the Sweep state is set to Single, pressing this soft key triggers a new measurement
sweep. This key does nothing when the Sweep state is set to Continuous.
Trace
To access the functions under the Trace menu, select the Shift key, then the Trace (5) key.
Max Hold
Toggles Max Hold On and Off. Applies to Spectrum View, EVM vs. Subcarrier and EVM
vs. Symbol views. Allows the Spectrum Trace to hold its peak value from trace to trace.
This helps in capturing a representative spectrum of a bursted RF signal like WiMAX. All
Max Hold operations show two traces – one with the max hold values and the other is a
live trace with the current measurement results.
Fixed WiMAX Measurements
The following measurements can be made when the MS272xB Spectrum Master is set to
Fixed WiMAX mode.
Channel Power (RSSI)
Channel power measures the average time domain power within the selected bandwidth and
is expressed in dBm. Received Signal Strength Indicator (RSSI) is vendor-defined in the
standard and is typically the same as Channel Power.
Occupied BW
The occupied bandwidth is calculated as the bandwidth containing 99% of the transmitted
power in the given RF Span.
Figure 13-7. Fixed WiMAX Signal Analyzer Mode Sweep Menu
Sweep
Sweep
SingleContinuous
Trigger
Sweep
13-20
Data Burst Power
Data Burst power is the RMS power over the data burst part of the WiMAX downlink
subframe.
Preamble Power
Preamble power is the RMS power over the preamble part of the WiMAX downlink
subframe.
Crest Factor
Crest Factor is the ratio of the peak to average power over the entire downlink subframe.
Freq Error
The difference between the received frequency and the specified frequency is the frequency
error. This number is only as accurate as the frequency reference used. Frequency error is
displayed in both Hz and ppm.
EVM (Error Vector Magnitude)
The Error Vector Magnitude is the ratio in percent of the difference between the reference
waveform and the measured waveform. EVM metrics are used to measure the modulation
quality of a transmitter. Both rms and peak values over an entire downlink subframe are
displayed.
Relative Constellation Error (RCE)
Relative Constellation Error is similar to EVM but is expressed in dB (RCE = 20 log(EVM
in %/100). Both rms and peak values over an entire downlink subframe are displayed.
Carrier Frequency
Carrier Frequency is the measured frequency of the input signal after demodulation, and is
the same as the tuned Center Frequency of the instrument plus the measured Frequency
Error from demodulation.
Base Station ID
Each transmitter has a unique ID. The instrument displays the ID as Base Station ID by
decoding the FCH part of the downlink frame.
Adjacent Subcarrier Flatness (Peak)
Adjacent Subcarrier Flatness is the absolute difference between the adjacent subcarriers.
13-21
Measurement Setup
To prepare for Fixed WiMAX measurements, the instrument must be configured for Fixed
WiMAX mode, as follows:
1. Select the Shift key, then the Mode (9) key.
2. Use the directional arrow keys or the rotary knob to highlight Fixed WiMAX Signal
Analyzer and press the Enter key to select.
Setting up the Measurement Frequency
The measurement frequency can be set by entering the center frequency or by selecting the
applicable signal standard and channel, which allows the instrument to automatically set the
frequency.
To set the measurement frequency by entering the center frequency:
1. Press the Freq function hard key.
2. Press the Center Freq soft key.
3. Enter the required frequency using the keypad, the arrow keys, or the rotary knob.
When entering a frequency using the keypad, the soft key labels change to GHz, MHz,
kHz, and Hz. Select the appropriate units key. Selecting the Enter key has the same
affect as selecting the MHz soft key.
4. Press the Enter key to set the Center Frequency. The current setting is shown on the
left side of the display.
To set the measurement frequency by selecting a signal standard:
1. Press the Freq function hard key.
2. Select the Signal Standard soft key.
3. Use the Up/Down arrow keys or the rotary knob to highlight a signal standard and
press Enter to select. When a signal standard is selected, the center frequency for the
channel of the selected standard is automatically tuned.
4. Select the Channel soft key and use the Up/Down arrow keys, the keypad, or the rotary
knob to select a channel number for the selected signal standard. The center of the
channel is tuned to the center of the display. The current settings are displayed on the
left side of the screen.
Power Offset for Compensating External Loss
To get accurate results, any external attenuation should be compensated using power offset.
In power offset mode the compensation factor is in dB. External attenuation can be caused
by using an external cable or external high power attenuator.
1. Press the Amplitude function hard key.
2. Press the Power Offset soft key and use the keypad, the arrow keys, or the rotary knob
to enter the desired offset value. Press the Enter key to set the Power Offset. The value
entered is displayed on the left side of the screen.
13-22
Bandwidth Setup
The 802.16-2004 standard specifies a bandwidth from 1.25 MHz to 20 MHz. The bandwidth
can be manually set from 1.25 MHz to 10 MHz.
To set the bandwidth:
1. Press the Setup function hard key.
2. Press the Bandwidth soft key to display a set of available bandwidths: 1.25 MHz,
1.5MHz, 1.75MHz, 2.50MHz, 3.0MHz, 3.5MHz, 5MHz, 5.5MHz, 6.0MHz,
7 MHz, and 10 MHz.
3. Use the Up/Down arrow keys or the rotary knob to highlight the applicable bandwidth
on the list and press the Enter key to set the bandwidth. The selected bandwidth is
displayed in the user settable parameters to the left of the display.
CP Ratio (G) Setup
The 802.16-2004 standard specifies CP ratios from 1/4 to 1/32. With the Spectrum Master, a
specific CP ratio can be manually set . The instrument offers support for the following ratios:
1/4, 1/8, 1/16, 1/32.
To set the CP ratio:
1. Press the Setup function hard key.
2. Press the CP Ratio (G) soft key to display the available ratios: 1/4, 1/8, 1/16, 1/32.
3. Use the Up/Down arrow keys or the rotary knob to highlight the applicable ratio and
press the Enter key to set the ratio. The selected ratio is displayed in the user settable
parameters to the left of the display.
Span Setup
To set the span for Spectrum View:
1. Press the Setup function hard key.
2. Press the Span soft key to display the available spans: 5 MHz, 10 MHz, 20 MHZ,
30 MHz.
3. Use the Up/Down arrow keys or the rotary knob to highlight the applicable span on the
list and press the Enter key to set the span.
Frame Length Setup
To set the frame length:
1. Press the Setup function hard key.
2. Press the Frame Length soft key to toggle through the available frame length
selections: 2.5 ms, 5 ms, 10 ms.
13-23
External Reference Frequency Setup
In order to get the best frequency accuracy measurements, it is important to use an external
reference frequency attached to the Ext Ref In connector. Most base stations have a reference
frequency available on a BNC connector. To configure the instrument to use an external
reference frequency:
1. Press the Setup function hard key.
2. Press the Ext. Reference Frequency soft key to display a list of the available reference
frequencies: 1 MHz, 1.2288 MHz, 1.544 MHz, 2.048 MHz, 2.4576 MHz, 4.8 MHz,
4.9152 MHz, 5 MHz, 9.8304 MHz, 10 MHz, 13 MHz, 19.6608 MHz.
3. Use the Up/Down arrow keys or the rotary knob to highlight the applicable reference
frequency on the list and press the Enter key to set the reference frequency. As the
instrument locks to the source, the Reference Freq value is displayed in the user
settable parameters to the left of the display.
Fixed WiMAX RF Measurements
Fixed WiMAX RF Measurements consists of three measurements: Spectrum, Power vs.
Time and Adjacent Channel Leakage Ratio (ACPR). The following sections describe how to
make Fixed WiMAX RF measurements.
Spectrum
The Spectrum screen displays the spectrum of the input signal and channel power in dBm
and occupied bandwidth measurements.
Procedure
1. Select the Shift key, then the Mode (9) key.
2. Use the directional arrow keys or the rotary knob to highlight Fixed WiMAX Signal
Analyzer and press the Enter key to select.
3. Press the Freq function hard key.
4. Press the Center Freq soft key and enter the desired frequency manually, or press the
Signal Standard soft key and select the applicable standard from the Signal Standards
list presented and press the Enter key.
5. Select the Channel soft key and use the Up/Down arrow keys, the keypad, or the rotary
knob to select a channel number for the selected signal standard and press the Enter
key. The center of the channel is tuned to the center of the display.
6. Press the Setup function hard key.
7. Set the bandwidth, frame length, and CP Ratio as described in the measurement setup
section.
8. For the most accurate frequency measurements, press the Ext. Ref. Freq soft key to
display a list of the available reference frequencies and select the desired reference
frequency, or activate the GPS (if equipped) and synchronize the instrument to Internal
High Accuracy.
9. Press the Measurements function hard key.
10. Press the RF soft key.
11. Press the Spectrum soft key to activate the spectrum measurement. The red dot on the
soft key indicates it is selected.
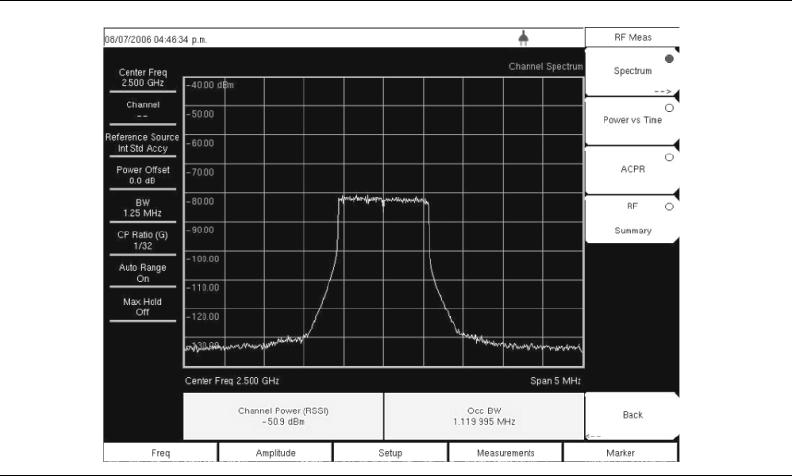
13-24
Figure 13-8. Spectrum View
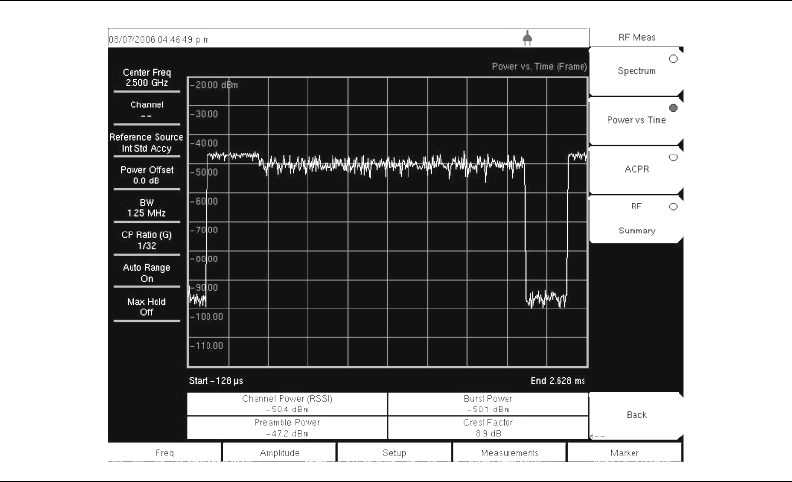
13-25
Power vs. Time
The Power versus Time view shows the time domain view of a WiMAX 802.16-2004
OFDM signal over approximately one frame. The preamble is always 3 dB higher than the
data. The screen also displays Channel Power (RSSI), Data Burst Power, Preamble Power
and Crest Factor.
Procedure
1. Select the Shift key, then the Mode (9) key.
2. Use the directional arrow keys or the rotary knob to highlight Fixed WiMAX Signal
Analyzer and press the Enter key to select.
3. Press the Freq function hard key.
4. Press the Center Freq soft key and enter the desired frequency manually, or press the
Signal Standard soft key and select the applicable standard from the Signal Standards
list presented and press the Enter key.
5. Select the Channel soft key and use the Up/Down arrow keys, the keypad, or the rotary
knob to select a channel number for the selected signal standard and press the Enter
key. The center of the channel is tuned to the center of the display.
6. Press the Setup function hard key.
7. Set the bandwidth, frame length, and CP Ratio as described in the measurement setup
section.
8. For the most accurate frequency measurements, press the Ext. Ref. Freq soft key to
display a list of the available reference frequencies and select the desired reference
frequency, or activate the GPS (if equipped) and synchronize the instrument to Internal
High Accuracy.
9. Press the Measurements function hard key.
10. Press the RF soft key.
11. Press the Power vs Time soft key to activate the measurement. The red dot on the soft
key indicates it is selected.
Figure 13-9. Power Versus Time View
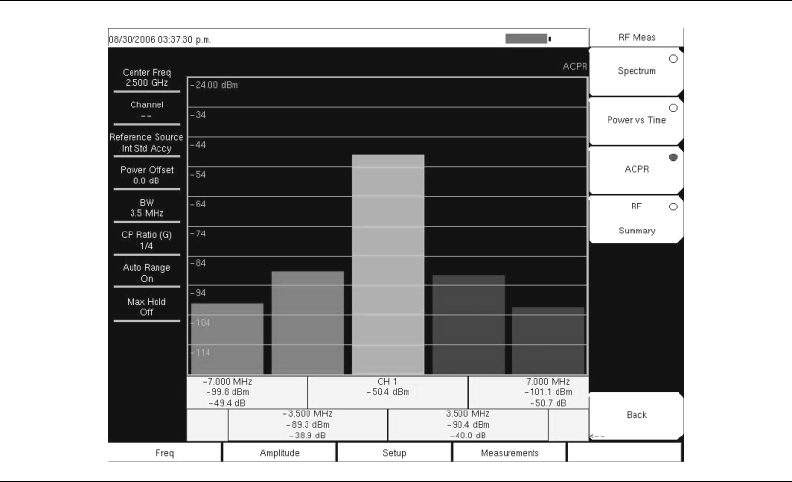
13-26
Adjacent Channel Power Ratio (ACPR)
The ACPR view shows one main channel and two adjacent channels and displays the power
levels for each channel (both absolute and relative). The channel spacing matches the
selected bandwidth and the channels are color coded.
Procedure
1. Select the Shift key, then the Mode (9) key.
2. Use the directional arrow keys or the rotary knob to highlight Fixed WiMAX Signal
Analyzer and press the Enter key to select.
3. Press the Freq function hard key.
4. Press the Center Freq soft key and enter the desired frequency manually, or press the
Signal Standard soft key and select the applicable standard from the Signal Standards
list presented and press the Enter key.
5. Select the Channel soft key and use the Up/Down arrow keys, the keypad, or the rotary
knob to select a channel number for the selected signal standard and press the Enter
key. The center of the channel is tuned to the center of the display.
6. Press the Setup function hard key.
7. Set the bandwidth, frame length, and CP Ratio as described in the measurement setup
section.
8. For the most accurate frequency measurements, press the Ext. Ref. Freq soft key to
display a list of the available reference frequencies and select the desired reference
frequency, or activate the GPS (if equipped) and synchronize the instrument to Internal
High Accuracy.
9. Press the Measurements function hard key.
10. Press the RF soft key.
11. Press the ACPR soft key to activate the measurement. The red dot on the soft key
indicates it is selected.
Figure 13-10. ACPR View
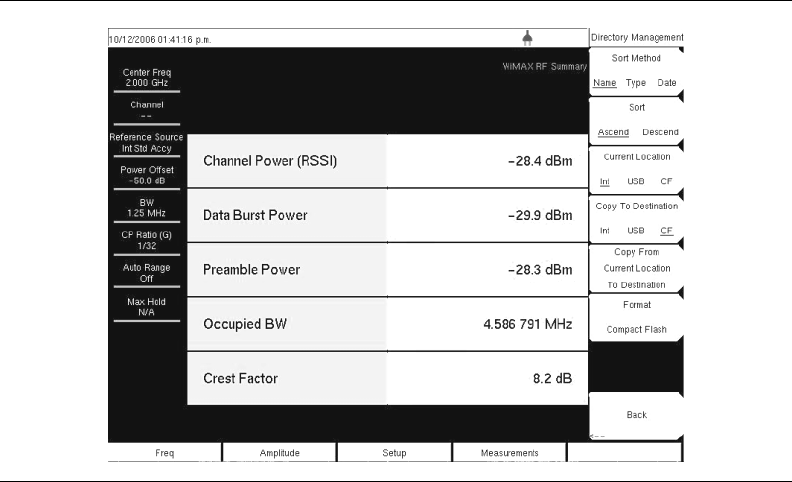
13-27
RF Summary
The RF Summary displays the critical RF transmitter performance measurements in a table
format, without demodulating the WiMAX signal. The parameters displayed in the RF
summary table are Channel Power in dBm, Data Burst power in dBm, Preamble power in
dBm, Occupied Bandwidth and Crest Factor.
Procedure
1. Select the Shift key, then the Mode (9) key.
2. Use the directional arrow keys or the rotary knob to highlight Fixed WiMAX Signal
Analyzer and press the Enter key to select.
3. Press the Freq function hard key.
4. Press the Center Freq soft key and enter the desired frequency manually, or press the
Signal Standard soft key and select the applicable standard from the Signal Standards
list presented and press the Enter key.
5. Select the Channel soft key and use the Up/Down arrow keys, the keypad, or the rotary
knob to select a channel number for the selected signal standard and press the Enter
key. The center of the channel is tuned to the center of the display.
6. Press the Setup function hard key.
7. Set the bandwidth, frame length, and CP Ratio as described in the measurement setup
section.
8. For the most accurate frequency measurements, press the Ext. Ref. Freq soft key to
display a list of the available reference frequencies and select the desired reference
frequency, or activate the GPS (if equipped) and synchronize the instrument to Internal
High Accuracy.
9. Press the Measurements function hard key.
10. Press the RF soft key.
11. Press the RF Summary soft key to activate the measurement. The red dot on the soft
key indicates it is selected.
Figure 13-11. RF Summary View
13-28
Fixed WIMAX Demodulator
The MS272xB Spectrum Master will demodulate a Fixed WiMAX Signal from a Base
Station and can display the results in Constellation, Spectral Flatness, EVM versus Sub
Carrier, EVM versus Symbol and Modulation Summary views.
Constellation
The instrument displays the constellation of the demodulated data symbols over one frame.
The various constellations are color coded as follows:
• BPSK is shown in orange
• QPSK is shown in purple
• 16-QAM is shown in green
• 64-QAM is shown in yellow
The numerical results displayed in this view are: RCE (rms) in dB, RCE (pk) in dB,
EVM (rms) in %, EVM (pk) in %, Freq Error in Hz, Freq Error in ppm, Carrier Frequency
in Hz, Base Station ID.
Procedure
1. Select the Shift key, then the Mode (9) key.
2. Use the directional arrow keys or the rotary knob to highlight Fixed WiMAX Signal
Analyzer and press the Enter key to select.
3. Press the Freq function hard key.
4. Press the Center Freq soft key and enter the desired frequency manually, or press the
Signal Standard soft key and select the applicable standard from the Signal Standards
list presented and press the Enter key.
5. Select the Channel soft key and use the Up/Down arrow keys, the keypad, or the rotary
knob to select a channel number for the selected signal standard and press the Enter
key. The center of the channel is tuned to the center of the display.
6. Press the Setup function hard key.
7. Set the bandwidth, frame length, and CP Ratio as described in the measurement setup
section.
8. For the most accurate frequency measurements, press the Ext. Ref. Freq soft key to
display a list of the available reference frequencies and select the desired reference
frequency, or activate the GPS (if equipped) and synchronize the instrument to Internal
High Accuracy.
9. Press the Measurements function hard key.
10. Press the Demodulator soft key.
11. Press the Constellation soft key to activate the measurement. The red dot on the soft
key indicates it is selected.
12. Press the Constellation soft key again to activate the reference points menu.
13. Press the Reference Points soft key to switch the reference points On or Off (see figures
next page).
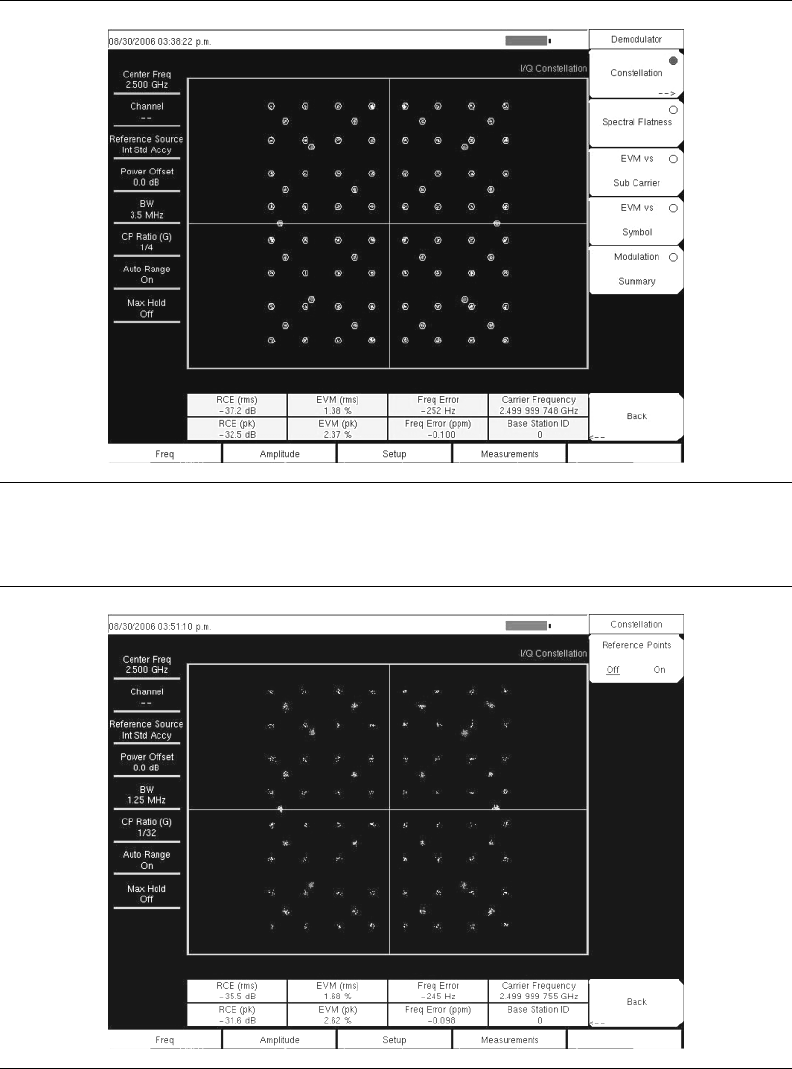
13-29
Figure 13-12. Constellation with Reference Points On
Figure 13-13. Constellation with Reference Points Off
13-30
Spectral Flatness
The Spectral Flatness view shows the data collected from the preamble at the channel
estimation step. The deviation of the Spectral Flatness from the average over all the carriers
is shown in dB. A mask that conforms to the specification is overlaid on the trace. Green
color on the mask indicates pass and red indicates regions of the mask where it fails. The
specification for the mask is:
±0 to 50 subcarriers < ±2dB,
±50 to 100 subcarriers < +2 dB and –4 dB
This mask is referenced from the average of all 200 subcarrier amplitude values. The
numerical result displayed in this view is the adjacent sub-carrier flatness (in dB).
Procedure
1. Select the Shift key, then the Mode (9) key.
2. Use the directional arrow keys or the rotary knob to highlight Fixed WiMAX Signal
Analyzer and press the Enter key to select.
3. Press the Freq function hard key.
4. Press the Center Freq soft key and enter the desired frequency manually, or press the
Signal Standard soft key and select the applicable standard from the Signal Standards
list presented and press the Enter key.
5. Select the Channel soft key and use the Up/Down arrow keys, the keypad, or the rotary
knob to select a channel number for the selected signal standard and press the Enter
key. The center of the channel is tuned to the center of the display.
6. Press the Setup function hard key.
7. Set the bandwidth, frame length, and CP Ratio as described in the measurement setup
section.
8. For the most accurate frequency measurements, press the Ext. Ref. Freq soft key to
display a list of the available reference frequencies and select the desired reference
frequency, or activate the GPS (if equipped) and synchronize the instrument to Internal
High Accuracy.
9. Press the Measurements function hard key.
10. Press the Demodulator soft key.
11. Press the Spectral Flatness soft key to activate the measurement. The red dot on the
soft key indicates it is selected.
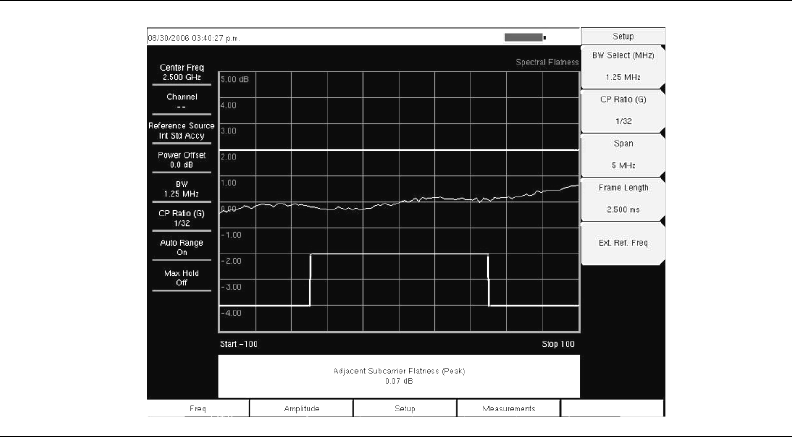
13-31
Figure 13-14. Spectral Flatness View
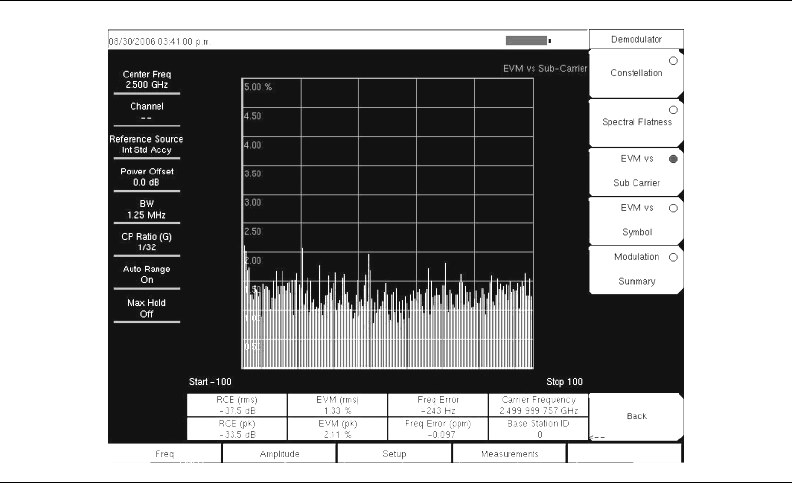
13-32
EVM versus SubCarrier
This view shows the EVM (rms) values versus OFDM sub-carriers. Eight pilot sub-carriers
are shown in orange, and 192 data sub-carriers are shown in yellow. The numerical results
displayed in this view are: RCE (rms) in dB, RCE (pk) in dB, EVM (rms) in %, EVM (pk)
in %, Freq Error in Hz, Freq Error in ppm, Carrier Frequency in Hz, Base Station ID.
Procedure
1. Select the Shift key, then the Mode (9) key.
2. Use the directional arrow keys or the rotary knob to highlight Fixed WiMAX Signal
Analyzer and press the Enter key to select.
3. Press the Freq function hard key.
4. Press the Center Freq soft key and enter the desired frequency manually, or press the
Signal Standard soft key and select the applicable standard from the Signal Standards
list presented and press the Enter key.
5. Select the Channel soft key and use the Up/Down arrow keys, the keypad, or the rotary
knob to select a channel number for the selected signal standard and press the Enter
key. The center of the channel is tuned to the center of the display.
6. Press the Setup function hard key.
7. Set the bandwidth, frame length, and CP Ratio as described in the measurement setup
section.
8. For the most accurate frequency measurements, press the Ext. Ref. Freq soft key to
display a list of the available reference frequencies and select the desired reference
frequency, or activate the GPS (if equipped) and synchronize the instrument to Internal
High Accuracy.
9. Press the Measurements function hard key.
10. Press the Demodulator soft key.
11. Press the EVM vs. SubCarrier soft key to activate the measurement. The red dot on the
soft key indicates it is selected.
Figure 13-15. EVM Versus SubCarrier View
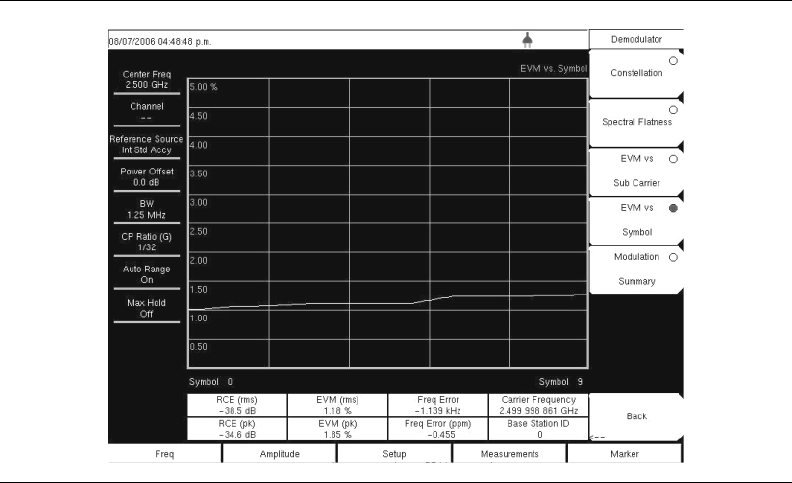
13-33
EVM versus Symbol
This view shows the EVM (rms) values versus OFDM symbols. The numerical results
displayed in this view are: RCE (rms) in dB, RCE (pk) in dB, EVM (rms) in %, EVM (pk)
in %, Freq Error in Hz, Freq Error in ppm, Carrier Frequency in Hz, Base Station ID.
Procedure
1. Select the Shift key, then the Mode (9) key.
2. Use the directional arrow keys or the rotary knob to highlight Fixed WiMAX Signal
Analyzer and press the Enter key to select.
3. Press the Freq function hard key.
4. Press the Center Freq soft key and enter the desired frequency manually, or press the
Signal Standard soft key and select the applicable standard from the Signal Standards
list presented and press the Enter key.
5. Select the Channel soft key and use the Up/Down arrow keys, the keypad, or the rotary
knob to select a channel number for the selected signal standard and press the Enter
key. The center of the channel is tuned to the center of the display.
6. Press the Setup function hard key.
7. Set the bandwidth, frame length, and CP Ratio as described in the measurement setup
section.
8. For the most accurate frequency measurements, press the Ext. Ref. Freq soft key to
display a list of the available reference frequencies and select the desired reference
frequency, or activate the GPS (if equipped) and synchronize the instrument to Internal
High Accuracy.
9. Press the Measurements function hard key.
10. Press the Demodulator soft key.
11. Press the EVM vs. Symbol soft key to activate the measurement. The red dot on the soft
key indicates it is selected.
Figure 13-16. EVM Versus Symbol View
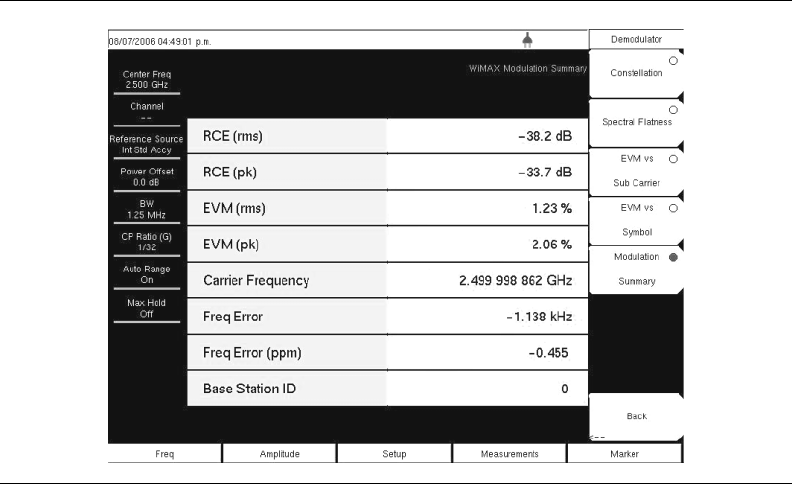
13-34
Modulation Summary
The Modulation Summary displays the critical Modulation transmitter performance
measurements in a table format by demodulating the WiMAX signal. The parameters
displayed in the Modulation summary table RCE (rms) in dB, RCE (pk) in dB, EVM (rms)
in %, EVM (pk) in %, Freq Error in Hz, Freq Error in ppm, Carrier Frequency in Hz, Base
Station ID.
Procedure
1. Select the Shift key, then the Mode (9) key.
2. Use the directional arrow keys or the rotary knob to highlight Fixed WiMAX Signal
Analyzer and press the Enter key to select.
3. Press the Freq function hard key.
4. Press the Center Freq soft key and enter the desired frequency manually, or press the
Signal Standard soft key and select the applicable standard from the Signal Standards
list presented and press the Enter key.
5. Select the Channel soft key and use the Up/Down arrow keys, the keypad, or the rotary
knob to select a channel number for the selected signal standard and press the Enter
key. The center of the channel is tuned to the center of the display.
6. Press the Setup function hard key.
7. Set the bandwidth, frame length, and CP Ratio as described in the measurement setup
section.
8. For the most accurate frequency measurements, press the Ext. Ref. Freq soft key to
display a list of the available reference frequencies and select the desired reference
frequency, or activate the GPS (if equipped) and synchronize the instrument to Internal
High Accuracy.
9. Press the Measurements function hard key.
10. Press the Demodulator soft key.
11. Press the Modulation Summary soft key to activate the measurement. The red dot on
the soft key indicates it is selected.
Figure 13-17. Modulation Summary View
13-35
Pass/Fail Mode
The Pass/Fail mode allows selection of a user-defined file that specifies a list of
measurements with pass/fail criteria. This mode sequences through the appropriate
measurements and indicates a pass or fail state based on the criteria. Using Master Software
Tools, a custom test list can be created and downloaded into the unit. All critical
measurements can be selected for pass fail testing. The results are displayed in a table format
with clear identification of pass/fail results including min/max thresholds and measured
results.
Procedure
1. Select the Shift key, then the Mode (9) key.
2. Use the directional arrow keys or the rotary knob to highlight Fixed WiMAX Signal
Analyzer and press the Enter key to select.
3. Press the Freq function hard key.
4. Press the Center Freq soft key and enter the desired frequency manually, or press the
Signal Standard soft key and select the applicable standard from the Signal Standards
list presented and press the Enter key.
5. Select the Channel soft key and use the Up/Down arrow keys, the keypad, or the rotary
knob to select a channel number for the selected signal standard and press the Enter
key. The center of the channel is tuned to the center of the display.
6. Press the Setup function hard key.
7. Set the bandwidth, frame length, and CP Ratio as described in the measurement setup
section.
8. For the most accurate frequency measurements, press the Ext. Ref. Freq soft key to
display a list of the available reference frequencies and select the desired reference
frequency, or activate the GPS (if equipped) and synchronize the instrument to Internal
High Accuracy.
9. Press the Measurements function hard key.
10. Press the Pass/Fail Mode soft key.
11. Press the Pass/Fail Mode soft key again to activate the sub-menu.
12. Press the Select Pass/Fail Test soft key to view a list of pass/fail test definition files.
13. Use the Up/Down arrow keys or the rotary knob to highlight the applicable pass/fail
test on the list and press the Enter key to select
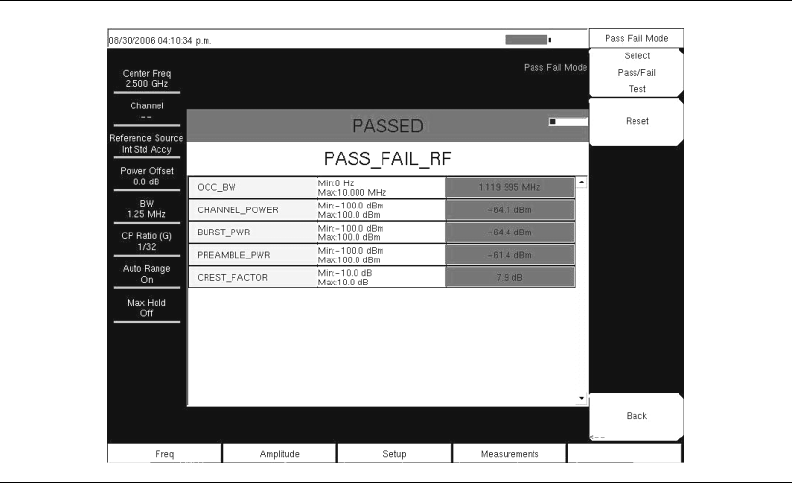
13-36
.
Figure 13-18. Pass/Fail Mode
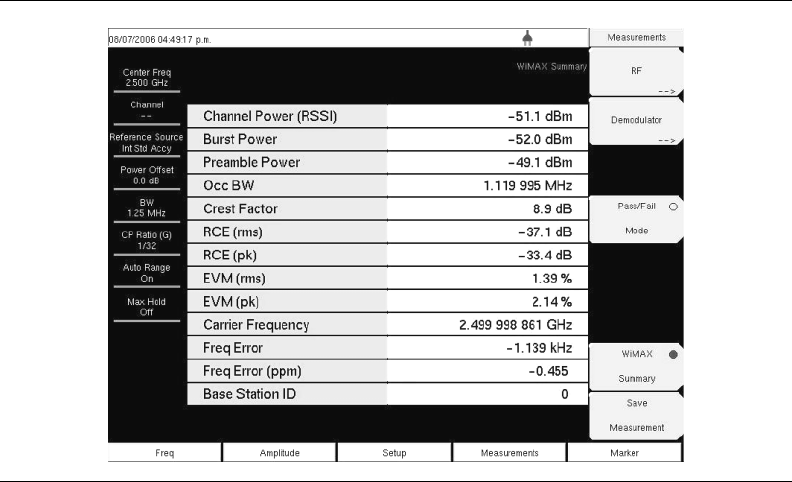
13-37
WiMAX Summary
The WiMAX Summary is a summary of critical Fixed WiMAX measurements from the RF
and Demodulation measurements.
Procedure
1. Select the Shift key, then the Mode (9) key.
2. Use the directional arrow keys or the rotary knob to highlight Fixed WiMAX Signal
Analyzer and press the Enter key to select.
3. Press the Freq function hard key.
4. Press the Center Freq soft key and enter the desired frequency manually, or press the
Signal Standard soft key and select the applicable standard from the Signal Standards
list presented and press the Enter key.
5. Select the Channel soft key and use the Up/Down arrow keys, the keypad, or the rotary
knob to select a channel number for the selected signal standard and press the Enter
key. The center of the channel is tuned to the center of the display.
6. Press the Setup function hard key.
7. Set the bandwidth, frame length, and CP Ratio as described in the measurement setup
section.
8. For the most accurate frequency measurements, press the Ext. Ref. Freq soft key to
display a list of the available reference frequencies and select the desired reference
frequency, or activate the GPS (if equipped) and synchronize the instrument to Internal
High Accuracy.
9. Press the Measurements function hard key.
10. Press the WiMAX Summary soft key.
Figure 13-19. WiMAX Summary View
13-38

14-1
Chapter 14
Mobile WiMAX Signal Analyzer
Introduction
The Spectrum Master MS272xB offers three Mobile WiMAX options for testing WiMAX
BTS transmitter performance: Over the Air (OTA), RF Measurements, and Demodulator
Measurements. OTA Measurements require that an antenna be attached to the Spectrum
Analyzer RF In 50Ω connector on the Spectrum Master. Attach a coupler or attenuator to
the same connector to take measurements directly from the WiMAX BTS transmitter.
Instrument Options for Mobile WiMAX
Mobile WiMAX Over the Air (OTA) Measurements (Option 37)
Mobile WiMAX RF Measurements (Option 66)
Mobile WiMAX Demodulator (Option 67)
CAUTION: The maximum (without damage) input level of the RF In port is
+30 dBm. To prevent damage, always use a coupler or high power
attenuator.
14-2
Mobile WiMAX Measurements
The following measurements are made in this mode:
Channel Power (RSSI)
Channel power measures the average time domain power within the selected bandwidth and
is expressed in dBm. Received Signal Strength Indicator (RSSI) is vendor-defined and is
often the same as Channel Power.
Occupied BW
The occupied bandwidth is calculated as the bandwidth containing 99% of the transmitted
power in the given RF Span.
Downlink Burst Power
Downlink Burst power is the RMS power over the downlink portion of the WiMAX frame.
Uplink Burst Power
Uplink Burst power is the RMS power over the uplink portion of the WiMAX frame.
Preamble Power
Preamble power is the RMS power over the preamble part of the downlink subframe.
Freq Error
The difference between the received frequency and the specified frequency is the frequency
error. Frequency error is displayed in both Hertz (Hz) and parts-per-million (ppm).
EVM (Error Vector Magnitude)
The Error Vector Magnitude is the ratio in percent of the difference between the reference
waveform. EVM metrics are used to measure the modulation quality of a transmitter. Both
rms and peak values over the downlink portion are displayed (the preamble portion is
excluded for this measurement).
Relative Constellation Error (RCE)
Relative Constellation Error is similar to EVM but is expressed in dB (RCE = 20 log(EVM
in %/100)). Both rms and peak values over an entire downlink subframe are displayed. (The
preamble portion is excluded for this measurement).
Carrier Frequency
Carrier frequency is the measured frequency of the input signal after demodulation, and is
the same as the tuned center frequency of the instrument plus the measured frequency error
from demodulation.
Sector ID
Three cell sectors may produce signals with identical data but with different preambles. The
Sector ID may be 0, 1, or 2. The Sector ID is displayed in several of the Demodulator
measurements.
14-3
Adjacent Subcarrier Flatness (Peak)
Adjacent Subcarrier Flatness is the absolute difference between the adjacent subcarriers in
the Spectral Flatness measurement.
Measurement Setup
Set Mode
To prepare for Mobile WiMAX measurements, the Spectrum Master must be configured for
Mobile WiMAX Signal Analyzer mode, as follows:
1. Select the Shift key, then the Mode (9) key.
2. Use the Up/Down arrow keys or the rotary knob to highlight Mobile WiMAX Signal
Analyzer and press the Enter key to select.
For additional information about the Mode menu, refer to Mode Selector Menu on
page 2-15.
Hard Keys and Soft Keys
For a general description of these key functions, refer to section Front Panel Keys on
page 2-4.
Setting up the Measurement Frequency
The measurement frequency can be set by entering the center frequency or by selecting the
applicable signal standard and channel, which allows the Spectrum Master to automatically
set the frequency.
To Set the Measurement Frequency by Entering the Center Frequency:
1. Press the Freq function hard key.
2. Press the Center Freq soft key.
3. Enter the required frequency by using the keypad, the arrow keys, or the rotary knob.
When entering a frequency using the keypad, the soft key labels change to GHz, MHz,
kHz, and Hz. Press the appropriate unit key. Pressing the Enter key has the same affect
as pressing the MHz soft key.
4. Press the Enter key to set the Center Frequency. The current setting is shown at the top
of the instrument settings summary column on the left side of the screen.
To Set the Measurement Frequency by Selecting a Signal Standard:
1. Press the Freq function hard key.
2. Press the Signal Standard soft key.
3. Use the Up/Down arrow keys or the rotary knob to highlight a signal standard, and
press Enter to select. When a signal standard is selected, the center frequency for the
channel of the selected standard is automatically tuned.
4. Press the Channel soft key and use the Up/Down arrow keys, the keypad, or the rotary
knob to select a channel number for the selected signal standard. The center of the
channel is tuned to the center of the display. The current settings are displayed in the
instrument settings summary column on the left side of the screen.
14-4
Power Offset for Compensating External Loss
To get accurate results, compensate for any external attenuation by using power offset. In
power offset mode, the compensation factor is in dB. External attenuation can be caused by
using an external cable or an external high power attenuator.
1. Press the Amplitude function hard key.
2. Press the Power Offset soft key and use the keypad, the arrow keys, or the rotary knob
to enter the desired offset value. When using the rotary knob, the value changes in
increments of 0.1 dB. When using the Left/Right arrow keys, the value changes in
increments of 1.0 dB. When using the Up/Down arrow keys, the value changes in
increments of 10.0 dB. The value that is entered is displayed in the instrument settings
summary column on the left side of the screen.
Bandwidth Setup
The Spectrum Master bandwidth can be manually set to 5 MHz, 8.75 MHz, or 10 MHz.
1. Press the Setup function hard key.
2. Press the BW (bandwidth) soft key to display a set of available bandwidths: 5 MHz,
8.75 MHz, and 10 MHz.
3. Use the Up/Down arrow keys or the rotary knob to highlight the applicable bandwidth
on the list, and press the Enter key to set the bandwidth. The selected bandwidth is
displayed in the instrument settings summary column.
Frame Length Setup
The frame length can be set to 5 ms or 10 ms. For Demodulation and Power versus Time
measurements, frame length needs to be set correctly for successful preamble
synchronization.
1. Press the Setup function hard key.
2. Press the Frame Length soft key to toggle between 5 ms and 10 ms.
Demod Type Setup
The Spectrum Master can demodulate the signal in three ways: It can demodulate the signal
by decoding the downlink map (DL-MAP). It can demodulate the signal based upon
manually entered parameters for the DL-MAP (by using an .xml file). It can demodulate
only the frame control header (FCH) portion of the signal.
1. Press the Setup function hard key.
2. If Manual needs to be selected, press the Load Parameter File soft key to load an .xml
file with the DL-MAP parameters defined using the Anritsu IQProducer software.
3. Press the Demod Type soft key repeatedly to cycle through Auto, Man, and FCH.
Span Setup
1. Press the Setup function hard key.
2. Press the Span soft key to display the available spans: 5 MHz, 10 MHz, 20 MHZ,
30 MHz.
3. Use the Up/Down arrow keys or the rotary knob to highlight the applicable span on the
list, and press the Enter key to set the span.

14-5
External Reference Frequency Setup
In order to get the best frequency accuracy measurements, the use of an external reference
frequency is important. Attach it to the Spectrum Master Ext Ref In connector. Most base
stations have a reference frequency that is available on a BNC connector.
1. Press the Setup function hard key.
2. Press the Ext. Ref. Freq soft key to display a list of the available reference
frequencies: 1 MHz, 1.2288 MHz, 1.544 MHz, 2.048 MHz, 2.4576 MHz, 4.8 MHz,
4.9152 MHz, 5 MHz, 9.8304 MHz, 10 MHz, 13 MHz, 19.6608 MHz.
3. Use the Up/Down arrow keys or the rotary knob to highlight the applicable reference
frequency on the list, and press the Enter key to set the reference frequency. As the
Spectrum Master locks to the source, the reference frequency value is displayed in the
user settable parameters in the instrument settings summary column.
NOTE: Screen captured images are provided as examples. The image
and measurement details shown on your instrument may differ from the
examples in this user guide.
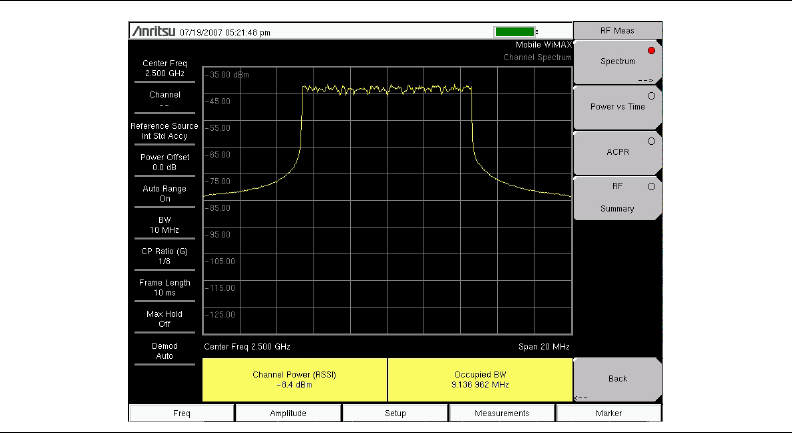
14-6
Mobile WiMAX RF Measurements
Mobile WiMAX RF Measurements consists of three measurement types: Spectrum,
Power versus Time, and Adjacent Channel Power Ratio (ACPR).
Setup for RF Measurements
1. Press the Measurements function hard key.
2. Press the RF soft key to select one of the following RF measurements.
Spectrum
The Spectrum screen displays the spectrum of the input signal and channel power in dBm
and occupied bandwidth.
1. Press the Spectrum soft key to select the spectrum measurement.
2. Press the Spectrum soft key again to open the Spectrum menu and change the Span, if
desired. Span choices are: 5 MHz, 10 MHz, 20 MHz, 30 MHz.
Figure 14-1. Channel Spectrum Measurement
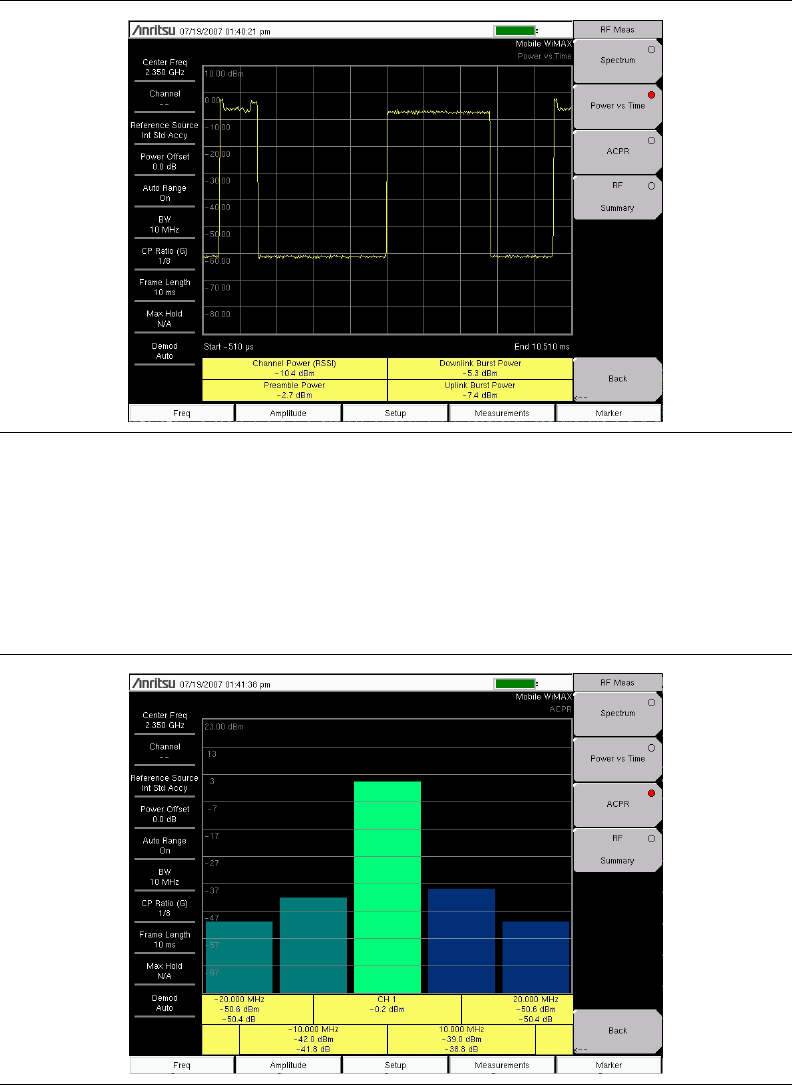
14-7
Power versus Time
The Power versus Time view shows the time domain view of a Mobile WiMAX signal over
approximately one frame. The screen also displays Channel Power (RSSI), Downlink Burst
Power, Uplink Burst Power, and Preamble Power.
1. Press the Power vs Time soft key to select the measurement.
Adjacent Channel Power Ratio (ACPR)
The ACPR view shows one main channel and two adjacent channels on each side, and also
displays the power levels for each channel (both absolute and relative). The channel spacing
matches the selected bandwidth, and the channels are color coded.
• Press the ACPR soft key to select the measurement.
Figure 14-2. Power versus Time Measurement
Figure 14-3. Adjacent Channel Power Ratio Measurement
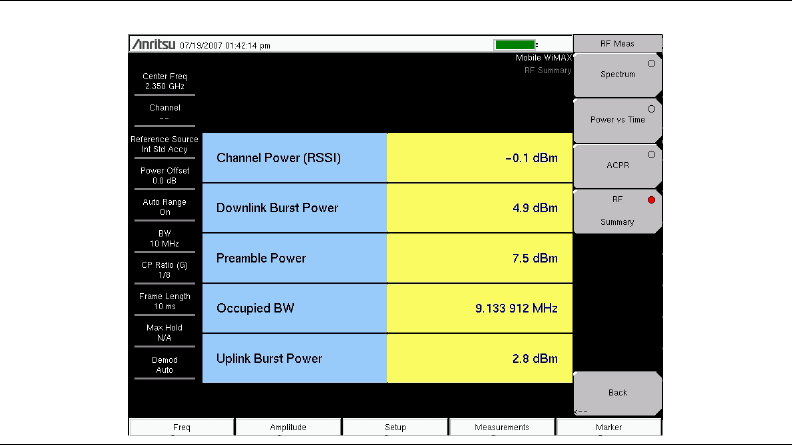
14-8
RF Summary
The RF Summary measurement displays the critical RF transmitter performance
measurements in a table format, without demodulating the WiMAX signal. The parameters
that are displayed in the RF Summary table are Channel Power (dBm), Downlink Burst
Power (dBm), Uplink Burst Power (dBm), Preamble Power (dBm), and Occupied
Bandwidth (Hz).
•Press the RF Summary soft key to activate the measurement.
Figure 14-4. RF Summary Measurement
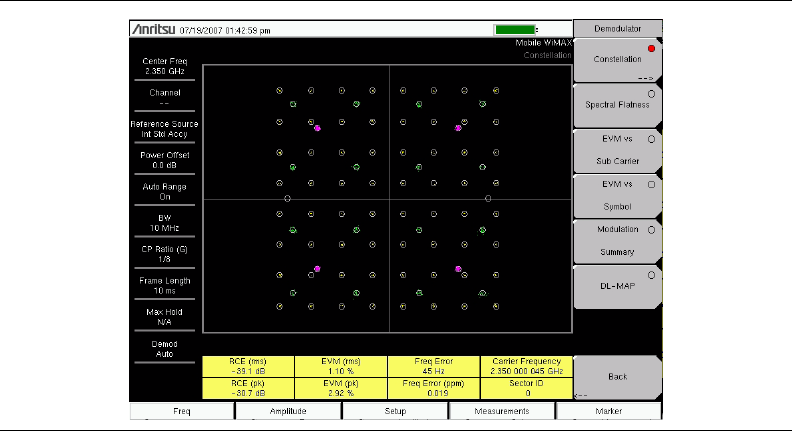
14-9
Mobile WIMAX Demodulator
The Spectrum Master will demodulate a Mobile WiMAX Signal from a Base Station, and it
can display the results in Constellation, Spectral Flatness, EVM versus Sub Carrier, EVM
versus Symbol, Modulation Summary, and DL-MAP views.
Setup for Demodulator Measurements
1. Press the Measurements function hard key.
2. Press the Demodulator soft key to open the Demodulator menu and select one of the
following demodulator measurements.
Constellation
The Spectrum Master displays the constellation of the demodulated data symbols over one
frame. The various constellations are color coded as follows:
QPSK is shown in purple
16QAM is shown in green
64QAM is shown in yellow
The numerical results that are displayed in this view are: RCERMS (dB), RCEPEAK (dB),
EVMRMS (%), EVMPEAK (%), Freq Error (Hz), Freq Error (ppm), Carrier Frequency (Hz),
and Sector ID.
1. Press the Constellation soft key to activate the measurement.
2. Press the Constellation soft key again to activate the reference points menu.
3. Press the Reference Points soft key to toggle the reference points On or Off.
Figure 14-5. Constellation Measurement
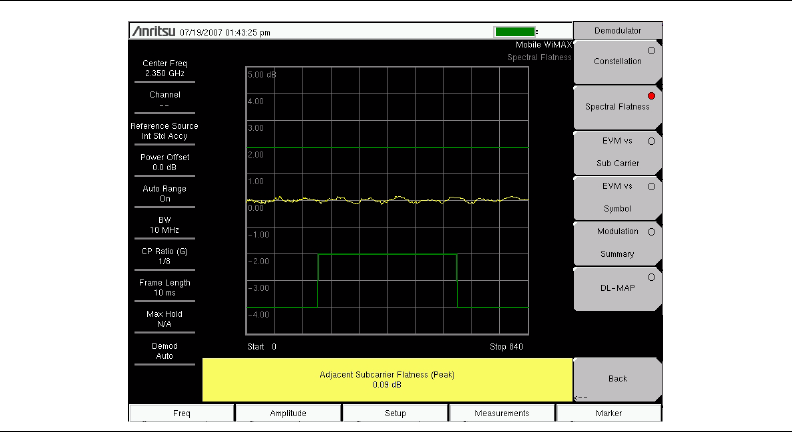
14-10
Spectral Flatness
The Spectral Flatness view shows the data that is collected from the preamble at the channel
estimation step. The deviation of the Spectral Flatness from the average over all of the
carriers is shown in dB. A mask that conforms to the specification is overlaid on the trace.
Green color on the mask indicates pass, and red color on the mask indicates regions of the
mask where the signal fails.
This mask is referenced from the average of all subcarrier amplitude values. The numerical
result displayed in this view is the adjacent subcarrier flatness (in dB).
•Press the Spectral Flatness soft key to select the measurement..
Figure 14-6. Spectral Flatness View
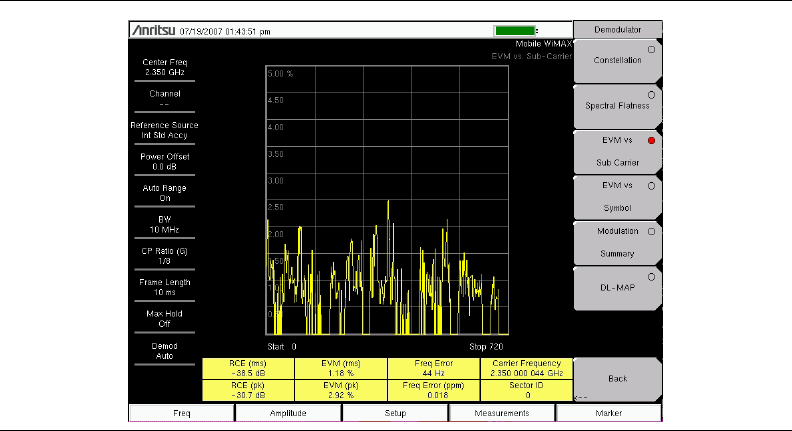
14-11
EVM versus Sub Carrier
This view shows the EVMRMS values versus OFDMA subcarriers. The numerical results
that are displayed in this view are: RCERMS (dB), RCEPEAK (dB), EVMRMS (%),
EVMPEAK (%), Freq Error (Hz), Freq Error (ppm), Carrier Frequency (Hz), and Sector ID.
•Press the EVM vs Sub Carrier soft key to select the measurement.
Figure 14-7. EVM versus Sub Carrier Measurement
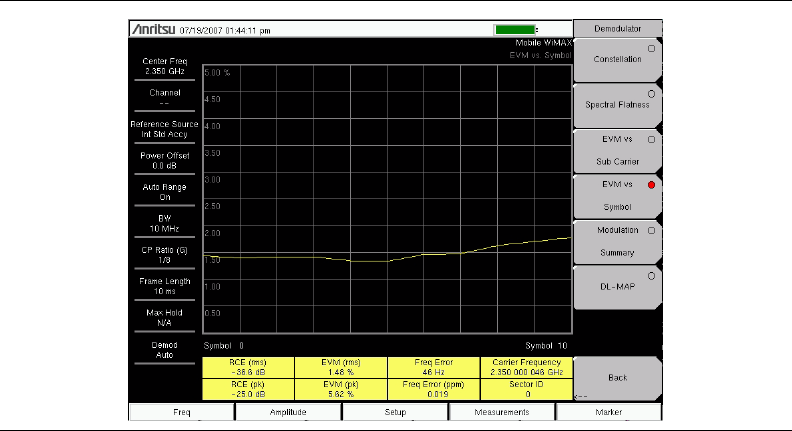
14-12
EVM versus Symbol
This view shows the EVMRMS values versus OFDM symbols. The numerical results that are
displayed in this view are: RCERMS (dB), RCEPEAK (dB), EVMRMS (%), EVMpeak (%),
Freq Error (Hz), Freq Error (ppm), Carrier Frequency (Hz), and Sector ID.
•Press the EVM vs Symbol soft key to select the measurement.
Figure 14-8. EVM versus Symbol Measurement
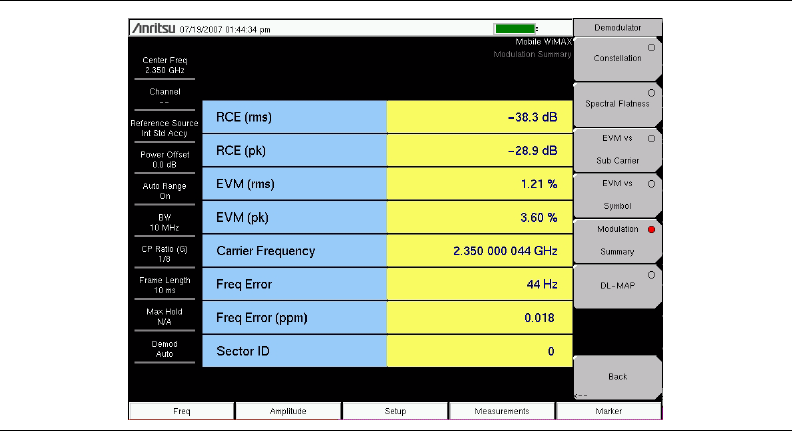
14-13
Modulation Summary
The Modulation Summary measurement displays the critical Modulation transmitter
performance measurements in a table format by demodulating the WiMAX signal. The
parameters that are displayed in the Modulation summary table are: RCERMS (dB),
RCEPEAK (dB), EVMRMS (%), EVMPEAK (%), Freq Error (Hz), Freq Error (ppm), Carrier
Frequency (Hz), and Sector ID.
•Press the Modulation Summary soft key to select the measurement.
Figure 14-9. Modulation Summary Measurement
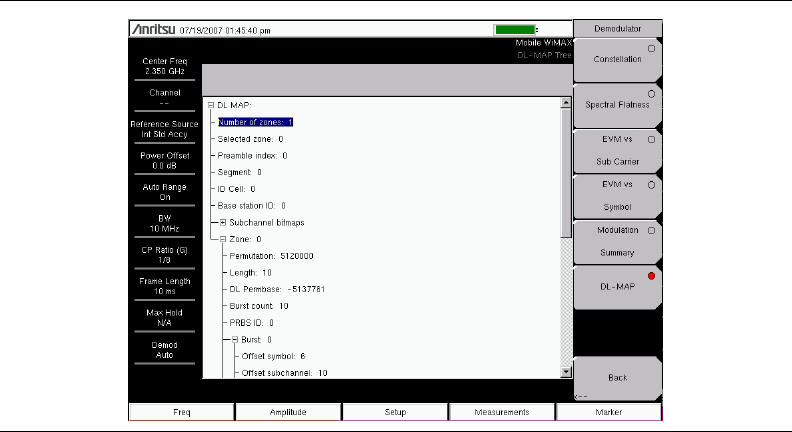
14-14
DL-MAP
The DL-MAP measurement displays the DL-MAP information either from the decoded
results (Auto mode) or from the parsed information, which is from the .xml parameter file
(Manual mode).
1. Press the DL-MAP soft key to open the DL-MAP Tree, which displays a list of WiMAX
parameters.
1. Use the Up/Down and Left/Right arrow keys to close or open subordinate lists within
the map.
Figure 14-10. DL-MAP Measurement
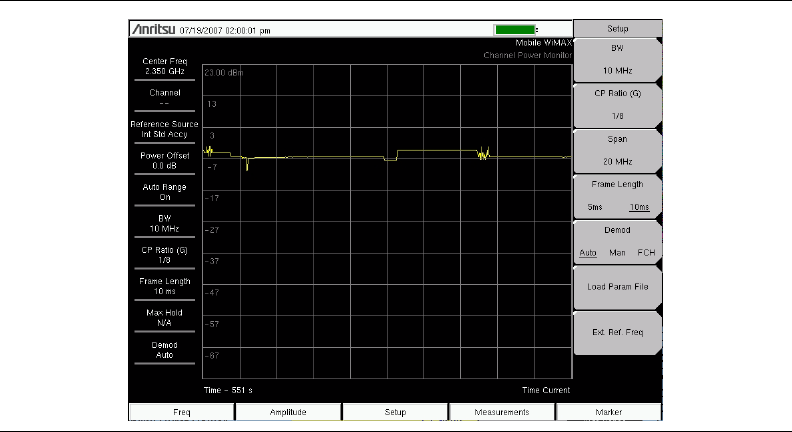
14-15
Mobile WIMAX Over the Air (OTA) Measurements
The Over the Air (OTA) Measurement option consists of a Channel Power Monitor
measurement.
Setup for OTA Measurements
1. Press the Measurements function hard key.
2. Press the OTA soft key open the OTA menu.
3. Press the Channel Power Monitor soft key to select the measurement.
4. Press the Channel Power Monitor soft key again to open the Channel Power Monitor
menu.
Figure 14-11. Example Channel Power Monitor Measurement
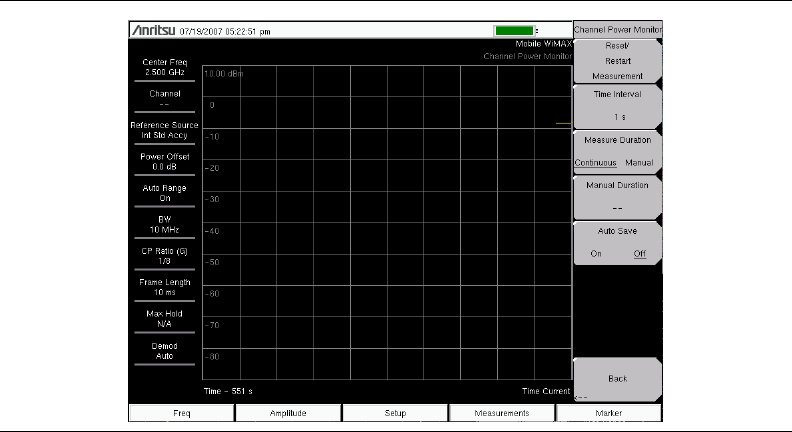
14-16
Channel Power Monitor
This measurement displays the Channel Power (RSSI) value over a period of time that you
specify. You can also specify the time interval between channel power measurements. Time
stamps are recorded along with the power information. If GPS is activated on the instrument,
then UTC time is stored, and GPS coordinates are also stored. If GPS is not activated on the
instrument, then the internal clock is used.
1. Press the Measurements function hard key.
2. Press the OTA soft key.
3. Press the Channel Power Monitor soft key twice, once to select the Channel Power
Monitor measurement and again to open the Channel Power Monitor menu.
4. Press the Time Interval soft key to specify measurement update intervals. Use the
Up/Down or Left/Right arrow keys to scroll to the desired interval, 1 sec, 2 sec, or
60 sec, and press Enter.
5. Press the Measure Duration soft key to toggle between Continuous and Manual.
6. Press the Manual Duration soft key to manually set a measurement duration.
7. Press the Auto Save button to turn On or Off the automatic measurement saving
feature.
8. Press the Reset/Restart Measurement soft key to discard logged Channel Power data
and restart logging of the data.
Figure 14-12. Channel Power Monitor Measurement Menu
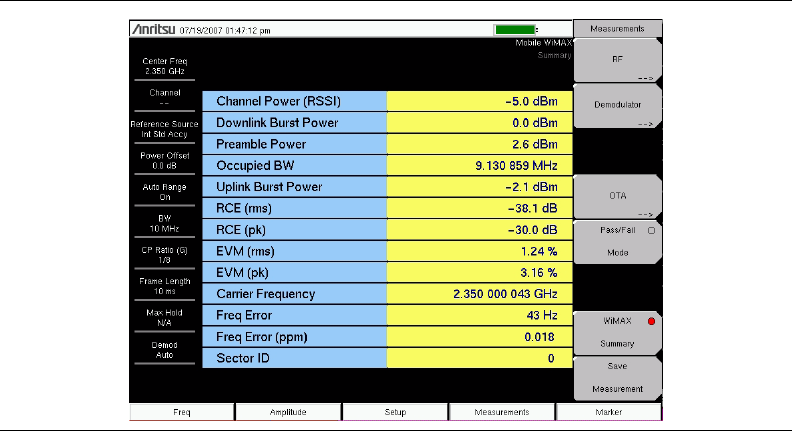
14-17
Pass/Fail Mode
The Pass/Fail mode allows selection of a user-defined file that specifies a list of
measurements with pass/fail criteria. In this mode, the Spectrum Master steps in sequence
through the appropriate measurements and indicates a pass or fail state based upon the
criteria. Using Master Software Tools (MST), a custom test list can be created and
downloaded into the unit. All of the critical measurements are available and can be selected
for pass/fail testing. The results are displayed in a table format with clear identification of
pass/fail results, including minimum and maximum thresholds and measured results.
1. Press the Measurements function hard key.
2. Press the Pass/Fail Mode soft key.
3. Press the Pass/Fail Mode soft key again to activate the Pass Fail Mode menu.
4. Press the Select Pass/Fail Test soft key to view a list of pass/fail test definition files.
5. Use the Up/Down arrow keys or the rotary knob to highlight the applicable pass/fail
test on the list, and press the Enter key to select.
6. Press the Reset soft key to begin a new pass/fail test measurement.
WiMAX Summary
The WiMAX Summary is a summary of critical Mobile WiMAX measurements from the RF
and Demodulator measurements.
1. Press the Measurements function hard key.
2. Press the WiMAX Summary soft key.
Figure 14-13. WiMAX Summary Display
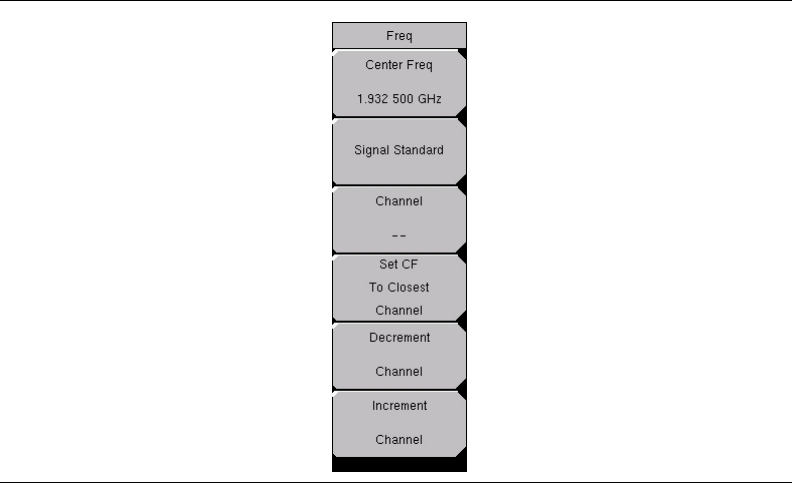
14-18
Menus
The following section describes function hard keys menus, associated soft keys, and
submenus.
Freq (Frequency)
Center Freq, ##
Press the Center Freq Input soft key to set the receiver center frequency to the desired
value. Enter the frequency using the keypad, the arrow keys, or the rotary knob. When
entering a frequency using the keypad, the soft key labels change to GHz, MHz, kHz, and
Hz. Press the appropriate unit soft key. Pressing a unit soft key finalizes the data input.
Pressing the Enter key has the same affect as pressing the MHz soft key.
Signal Standard
Pressing this Input soft key opens the Signal Standards list box. Use the Up/Down arrow
keys or the rotary knob to highlight a signal standard and press Enter to select. When a
signal standard is selected, the center frequency and span are automatically tuned for the
first channel of the selected standard. Other settings, such as channel spacing and
integration bandwidth, are also entered automatically.
The applicable signal standards (for 10 MHz BW only) are U-NII middle, U-NII upper,
CEPT Band B, and CEPT Band C.
Channel
Press this Input soft key and use the Up/Down arrow keys, the keypad, or the rotary knob
to select a channel number for the selected Signal Standard. The Spectrum Master
measurement display is automatically tuned to the center frequency of the selected
channel.
Set CF to Closest Channel
Pressing this Input soft key moves the current Center Frequency to the closest frequency
that matches a channel number in the current Signal Standard.
Figure 14-14. Frequency Menu
14-19
Decrement Channel
Press this Input soft key to decrease the selected channel number by the specified channel
step size for the selected standard.
Increment Channel
Press this Input soft key to increase the selected channel number by the specified channel
step size for the selected standard.
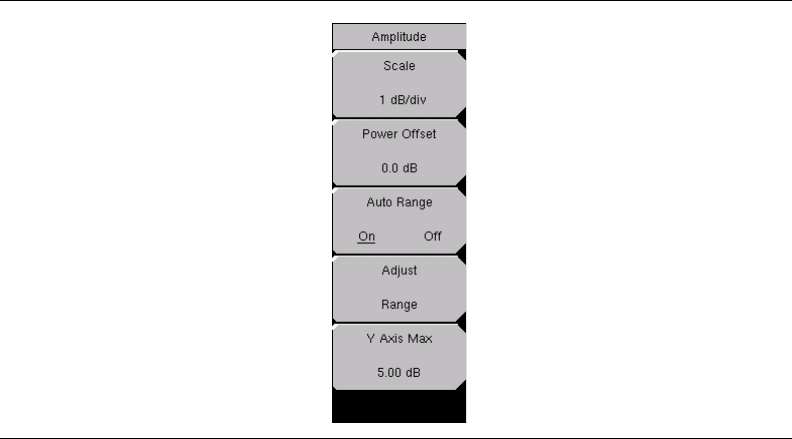
14-20
Amplitude
Scale, ##
Press this Input soft key to set the scale of the y-axis on the measurement display. Scale
can be set from 1 dB/div to 15 dB/div. The default value is 10 dB/div. When EVM is the
y-axis value, the units change from dB/div to %/div. When the Spectral Flatness view is
selected, the default value changes from 10 dB/div to 1 dB/div.
Power Offset, ##
Press the Power Offset Input soft key to set the instrument to automatically adjust for loss
through external cables, attenuators, and couplers. Power can be offset (–100 dB to
+100 dB) by using the rotary knob or the Up/Down and Left/Right arrow keys. Set the
offset value, then press the Enter key.
Auto Range, On/Off
Press the Toggle soft key to toggle between On and Off. The on or off state is underlined
on the virtual soft key face. When On (the default state), the reference level is adjusted
automatically (automatic gain ranging).
Adjust Range
Press this Input soft key to modify the internal reference level to be optimally based upon
the measured signal. When the Adjust Range soft key is pressed, Auto Range is set to the
Off state, and a manual Auto Range operation is performed once. The Spectrum Master no
longer adjusts the internal gain automatically because Auto Range has been set to Off by
pressing this soft key. Press the Auto Range soft key to toggle the setting to On in order to
resume automatic gain ranging.
Y Axis Max, ##
Press this Input soft key to set the maximum value of the y-axis. In combination with the
Scale control, this setting allows zooming in and out on the y-axis. This control is
available only in the Demodulator measurements for Spectral Flatness view,
EVM versus Symbol view, and EVM versus Sub Carrier view.
Figure 14-15. Amplitude Menu
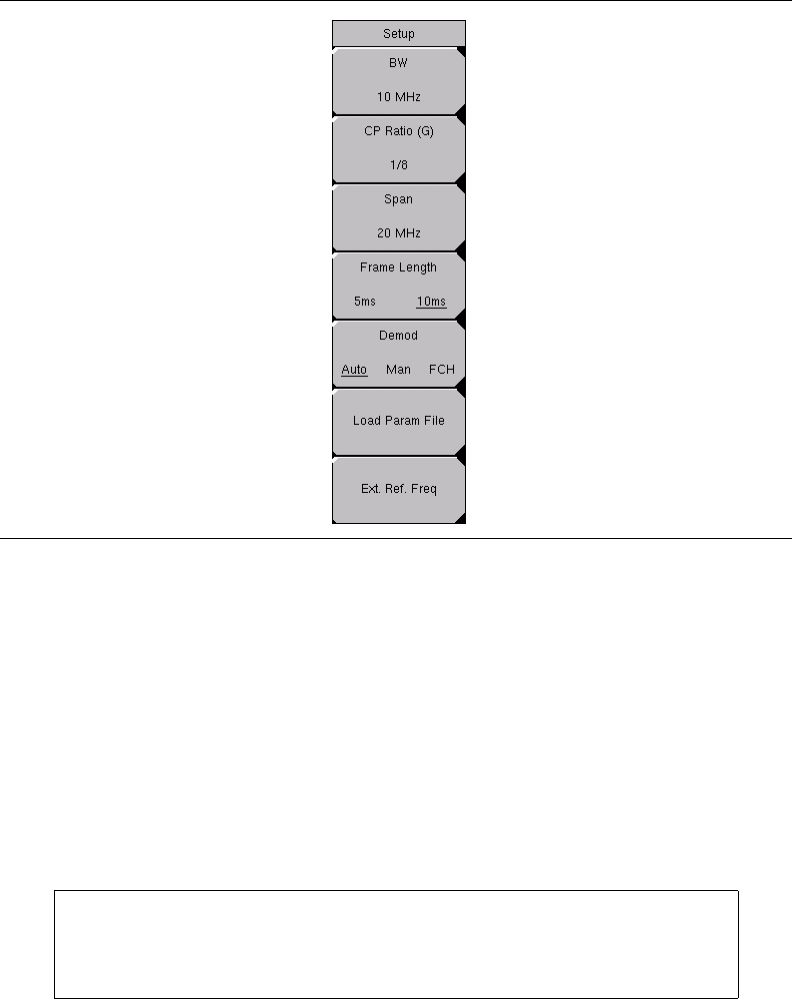
14-21
Setup
BW, ##
Press this Input soft key to open the Select Bandwidth pop-up window. Use the Up/Down
arrow keys or the rotary knob, and then press the Enter key. The following three
bandwidths are available: 5 MHz, 8.75 MHz, and 10 MHz. The default bandwidth is
5MHz.
CP Ratio (G), #
The CP Ratio is fixed at 1/8 for Mobile WiMAX. No change is available.
Span, ##
Press this Input soft key to open the Span list box and select the desired span for the
Spectrum view. Use the Up/Down arrow keys or the rotary knob, and then press the Enter
key. The available span selections are: 5 MHz, 10 MHz, 20 MHz, and 30 MHz.
Frame Length, #
Press this Toggle soft key to toggle between 5 ms and 10 ms for frame length.
Figure 14-16. Setup Menu
NOTE: The span value is automatically adjusted to the next largest
available span when the bandwidth setting is changed. The span can be
changed to any of the available values in order to override the automatic
selection.

14-22
Demod, Auto/Man/FCH
Press this Toggle soft key to toggle through the available selections for Automatic,
Manual, and Frame Control Header: Auto, Man, FCH.
When Auto is chosen, the Spectrum Master attempts to demodulate the signal, decode the
DL-MAP, and use that information to demodulate the data portion of the frame.
When Manual is chosen, a parameter file must be available (you must have already loaded
this parameter file). The parameters from this file are used by the Spectrum Master to
demodulate the data bursts.
When FCH is chosen, only the FCH portion of the signal is demodulated.
Load Param File
Press this Input soft key to open the Parameter Files (XML) list box and to select the
parameters that are stored in an XML file. This file needs to be generated by using the
Anritsu IQProducer software.
Ext. Ref. Freq
Press this Input soft key to open the External Reference Frequency list box and select a
frequency from the list. The following External Reference Frequencies are
available: 1 MHz, 1.2288 MHz, 1.544 MHz, 2.048 MHz, 2.4576 MHz, 4.8 MHz,
4.9152 MHz, 5 MHz, 9.8304 MHz, 10 MHz, 13 MHz, and 19.6608 MHz. The default
External Reference Frequency is 10 MHz.
NOTE: The Manual mode setting is not saved in setup files, nor is it saved
when power is turned off. If Demod is set to Manual mode before the
instrument is turned off, then the Demod setting becomes Auto mode
when the instrument is turned on.
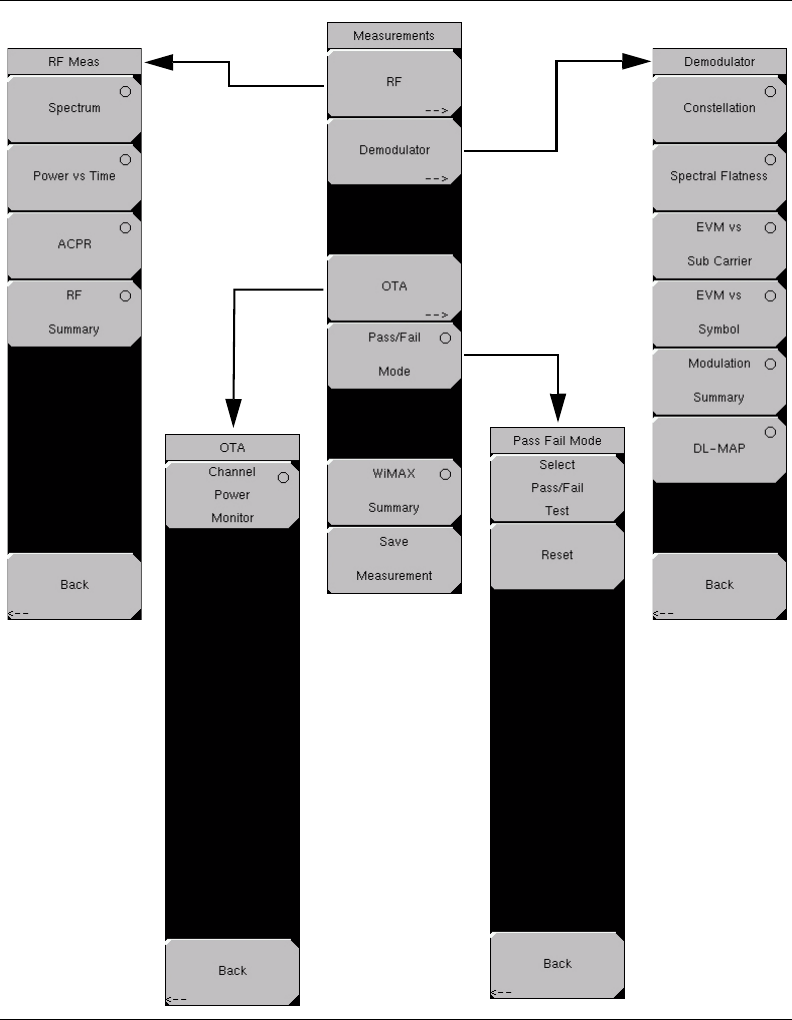
14-23
Measurements
RF Measurements
Press this switching soft key to open the RF Meas soft key menu in order to select an RF
type of measurement.
Figure 14-17. Measurements Menu
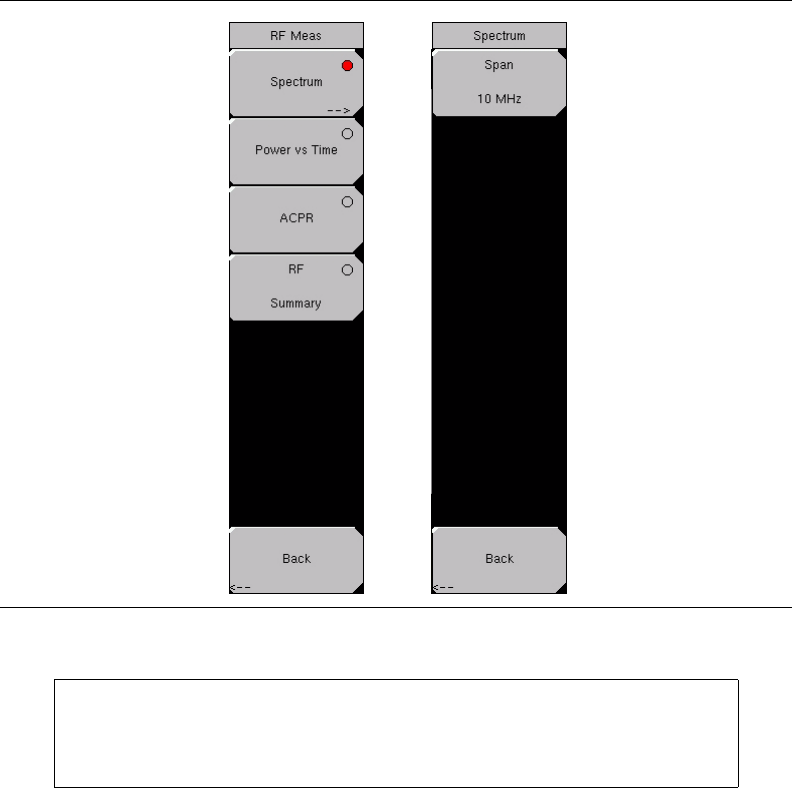
14-24
RF Meas soft Key Menu
Spectrum
Press this Select soft key to set the RF measurement type to Spectrum. This view
displays the spectrum of the input signal. The span is automatically adjusted to the next
largest available span based on the bandwidth setting. Channel Power (RSSI) in dBm
and Occupied bandwidth measurements are displayed as numerical values. The
Spectrum Select soft key becomes a Switching soft key that opens the Spectrum soft
key menu. The Spectrum soft key menu has only two soft keys: Span and Back.
Spectrum Soft Key Menu
Span, #
Press this Input soft key to open the Span pop-up window and to select the desired
span for the Spectrum measurement. The list displays the following four
choices: 5 MHz, 10 MHz, 20 MHz, and 30 MHz. The default value is 10 MHz.
Back
Press the Back Switching soft key to return to the previous menu.
Figure 14-18. RF Spectrum Measurements
NOTE: The span value is automatically adjusted to the next largest
available span when the bandwidth setting is changed (by using the Setup
function hard key and the BW soft key). You can override the automatic
selection by using the Span soft key.
14-25
Power vs Time
Press the Power vs Time Select soft key to use this measurement display. The power
versus time view shows the time domain view of a WiMAX 802.16e signal over
approximately one frame. The Spectrum Master automatically tries to synchronize to
the downlink preamble without the need for an external trigger. If the frame length
setting does not match the input signal frame length, then the synchronization will not
be reliable.
The Channel Power (dBm), Preamble Power (dBm), Downlink Burst Power (dBm)
and Uplink Burst Power (dBm) are displayed as numerical values.
ACPR (Adjacent Channel Power Ratio)
Press the ACPR Select soft key to show one main channel and two adjacent channels,
and to display the power levels for each channel (both absolute power and relative
power).
RF Summary
Press the RF Summary Select soft key to display a summary of all of the RF numerical
measurement results.
Back (from the RF Meas soft key menu)
Press the Back Switching soft key to return to the Measurements menu.
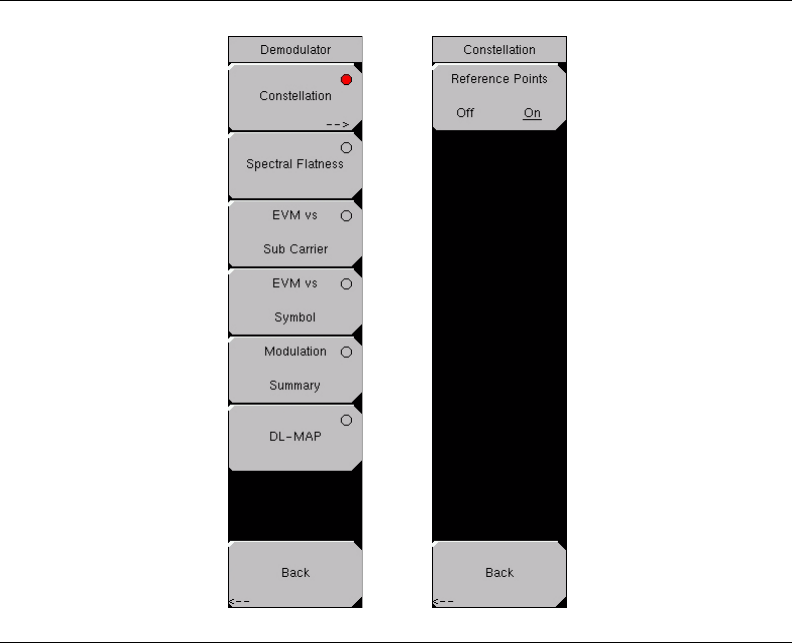
14-26
Demodulator
Press the Demodulator switching soft key to open the Demodulator soft key menu.
Demodulator Soft Key Menu
Constellation
Press the Constellation Select soft key to set the demodulation to Constellation view.
The constellation view shows the constellation of the demodulated data symbols over
one frame. The constellations are color coded as follows:
• QPSK is shown in purple
• 16-QAM is shown in green
• 64-QAM is shown in yellow
The numerical results that are displayed in this view are:
• RCE (rms) in dB
• RCE (pk) in dB
• EVM (rms) in %
•EVM(pk) in%
•FreqError inHz
• Freq Error in ppm
• Carrier Frequency in Hz
• Sector ID
Figure 14-19. Demodulator Menu
14-27
The Constellation Select soft key becomes a Switching soft key that opens the
Constellation soft key menu. The Constellation soft key menu has only two soft
keys: Reference Points, Off/On and Back.
Constellation Soft Key Menu
Reference Points, Off/On
Press this toggle soft key to display reference points for the various constellations.
The default state is On.
Back (from the Constellation soft key menu)
Press the Back Switching soft key to return to the Demodulator menu.
Spectral Flatness
Press this Select soft key to show the spectral flatness data that is measured from the
preamble at the channel estimation step. The deviation of the spectral flatness from the
average of all the carriers is shown in dB. A mask that conforms to the specification is
overlaid on the trace. Green color on the mask indicates pass, and red color on the mask
indicates fail.
This mask is referenced from the average of all subcarrier amplitude values. Absolute
delta of the power between adjacent subcarriers is displayed as a numerical value
in dB.
EVM vs Sub Carrier
Press this Select soft key to display the EVM (rms) values versus subcarriers. Because
some subcarriers are not used in OFDMA, their values are set to 0.
EVM vs Symbol
Press this Select soft key to display the EVM (rms) values versus OFDM symbols.
Modulation Summary
Press this Select soft key to display a summary of all of the modulation-related
numerical measurement results. The following measurements are displayed:
• RCE (rms)
• RCE (pk)
•EVM(rms)
•EVM(pk)
• Carrier Frequency
•FreqError
• Freq Error (ppm)
• Sector ID
DL-MAP
Press this Select soft key to display the DL-MAP information from either the decoded
results (Auto mode) or the parsed information from the .xml parameter file (Manual
mode).
Back (from the Demodulator soft key menu)
Press the Back Switching soft key to return to the Measurement menu.
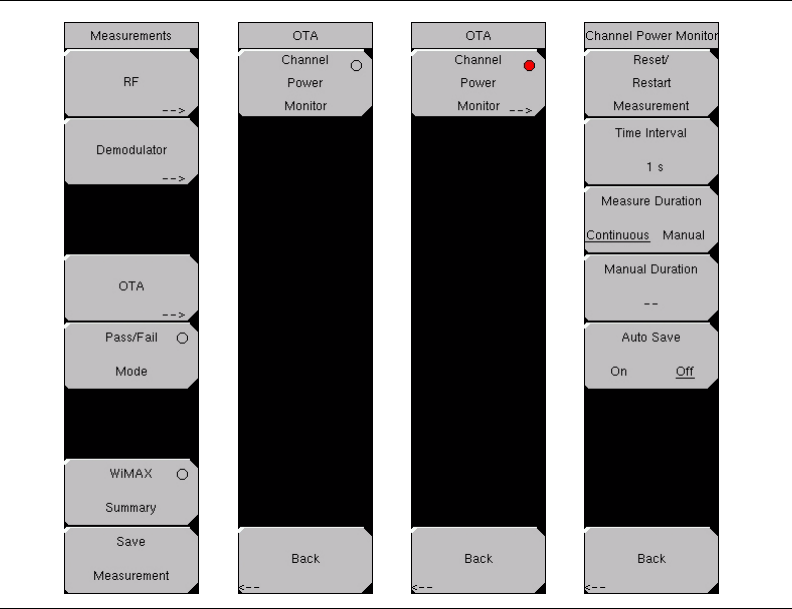
14-28
OTA
Press the OTA Switching soft key to open the OTA soft key menu. The OTA soft key menu
has only two soft keys: Channel Power Monitor and Back.
OTA Soft Key Menu
Channel Power Monitor
Press this Select soft key to display the Channel Power (RSSI) value over a variable
time period that is specified with the Measure Duration and Time Interval soft keys.
The Time Interva Inputl soft key is used to specify the time interval between channel
power measurements. Time stamps are recorded along with the power information. If
GPS is activated on the instrument, then UTC time is stored, and GPS coordinates are
also stored. If GPS is not activated on the instrument, then the internal clock is used.
The Channel Power Monitor Select soft key becomes a Switching soft key that opens
the Channel Power Monitor soft key menu to set up RSSI (Received Signal Strength
Indicator). The menu has five soft keys, which are:
Reset/Start Measurement; Time Interval, #; Measure Duration, Continuous/Manual;
Manual Duration, #; Auto Save, On/Off; and Back.
Channel Power Monitor Soft Key Menu
Reset/Restart Measurement
Press this Input soft key to reset or to restart the measurement. Pressing this soft
key discards logged Channel Power data and restarts logging of the data.
Figure 14-20. OTA Menu
14-29
Time Interval, #
Press this Input soft key to select a time interval between measurements. Press the
rotary knob or the Enter key to set the value. If the number keypad is used, then the
Time soft key menu opens with four keys: min, s, ms, µs.
Setting the Time Interval specifies how often the instrument measures Channel
Power and logs the information.
Measure Duration
Press this Toggle soft key to toggle between Continuous and Manual. Pressing this
soft key specifies the duration for which Channel Power data is logged.
When Measure Duration is set to Continuous, the instrument continuously monitors
Channel Power at the specified time intervals. If Auto Save is On, then the
instrument saves the logged data to a file after every 551 data points are collected
(1 screenful of data). If the instrument runs out of memory, then it continues
measuring but stops writing data to files in memory.
When Measure Duration is set to Manual, the instrument stops monitoring Channel
Power after the specified duration. If Auto Save is On, then the instrument saves the
logged data to a file at the end of the duration. If the duration causes the unit to log
more than 551 data points, then multiple files are saved, one after each set of
551 data points is collected.
Manual Duration
Press this Input soft key to specify the duration for which the instrument monitors
Channel Power. If the Measure Duration is currently set to Continuous, then
pressing this soft key automatically changes measurement duration to Manual and
allows you to set a value for Manual Duration. The range is from a minimum value
of 60 seconds to a maximum value of 259200 seconds (72 hours). After choosing a
time duration, press the Enter key to set the value. If a numerical value is entered
with the number keypad, then the Time soft key menu offers units of min, s, ms, and
µs. Regardless of the unit key that you use, the set value is displayed in the
corresponding number of seconds (60 min = 3600 s and 60000 ms = 60 s).
Auto Save, On/Off
Press this Toggle soft key to toggle between On and Off. When the Auto Save
function is On, measurements are automatically saved to file.
When the Auto Save function is active, each 551 data points are saved as a
measurement. The amount of available memory in the instrument determines how
many measurements can be saved. If the Time Interval and Measure Duration are
already set to values that will require more memory than is available, then pressing
the Auto Save soft key causes the instrument to reset the Measure Duration to a
value that allows saving all of the measurements that are taken. The instrument can
continue monitoring the signal, but additional measurements are not saved.
Back (from Channel Power Monitor)
Press this Switching soft key to return to the OTA soft key menu.
Back (from OTA)
Press this Switching soft key to return to the Measurements menu.
14-30
Pass/Fail Mode
Press this Select soft key to display the PASS_FAIL table. The Pass/Fail Mode soft key
changes to a Switching soft key. Press this Switching soft key to open the Pass Fail Mode
soft key menu, which has three soft keys: Select Pass/Fail Test, Reset, and Back. Refer to
Figure 14-17 on page 14-23.
A custom list can be created with Master Software Tools and downloaded into the
Spectrum Master. All critical measurements can be selected for pass/fail testing. The
results are displayed in table format with clear identification of pass/fail results, including
minimum and maximum threshold values and measured results.
Pass/Fail Mode allows the selection of a user-defined file (created with Master Software
Tools) that specifies a list of measurements with pass/fail criteria. You can select just those
measurements that are of interest to you and create a pass/fail test file. When you press the
Select Pass/Fail Test soft key, select a test file, and press the Enter key, then the Spectrum
Master measures each parameter and displays the results in the Pass/Fail table.
Pass Fail Mode Soft Key Menu
Select Pass/Fail Test
Press this Input soft key to select a pass/fail test model from the list of available
Pass/Fail tests. The default list is:
PASS_FAIL_RF
PASS_FAIL_DEMOD
PASS_FAIL_ALL
Reset
Press this Input soft key to restart a Pass/Fail test.
Back (from the Pass Fail Mode soft key menu)
Returns to the Measurements menu.
WiMAX Summary
Press this Select soft key to display a summary of all of the WiMAX related numerical
measurement results. Refer to Figure 14-17 on page 14-23. These measurements include
the following:
• Channel power in dBm
• Downlink Data Burst Power
• Preamble Power
• Occupied Bandwidth
• Uplink Data Burst Power
• RCE (rms)
• RCE (pk)
•EVM(rms)
•EVM(pk)
• Carrier Frequency
•FreqError
• Freq Error (ppm)
• Sector ID
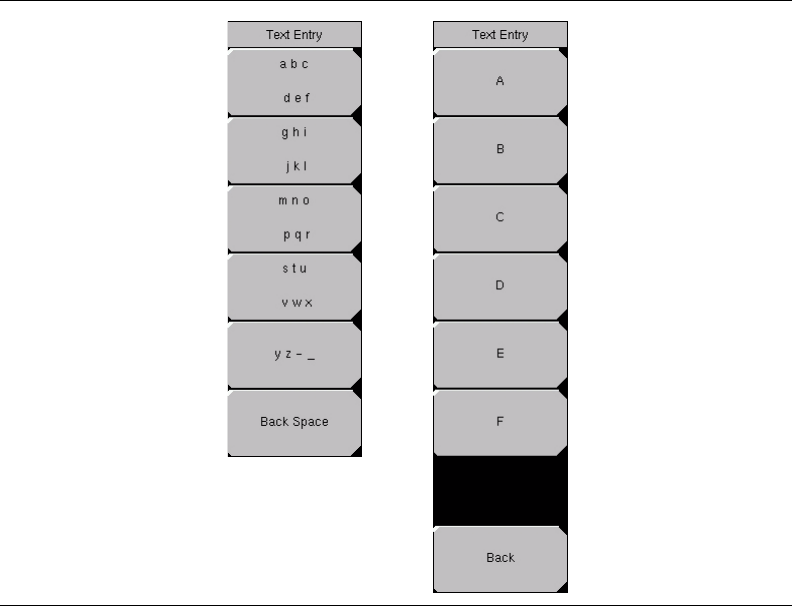
14-31
Save Measurement
Pressing this Input soft key opens the Save Measurement pop-up window. Refer to
Figure 14-17 on page 14-23. A suggested filename is placed in the edit box by default. Use
the Text Entry soft keys to enter a different filename. WiMAX measurements are saved
with a .wmxe extension. For more information about the Text Entry soft keys, refer to Text
Entry on page 2-7.
Figure 14-21. Text Entry Soft Keys
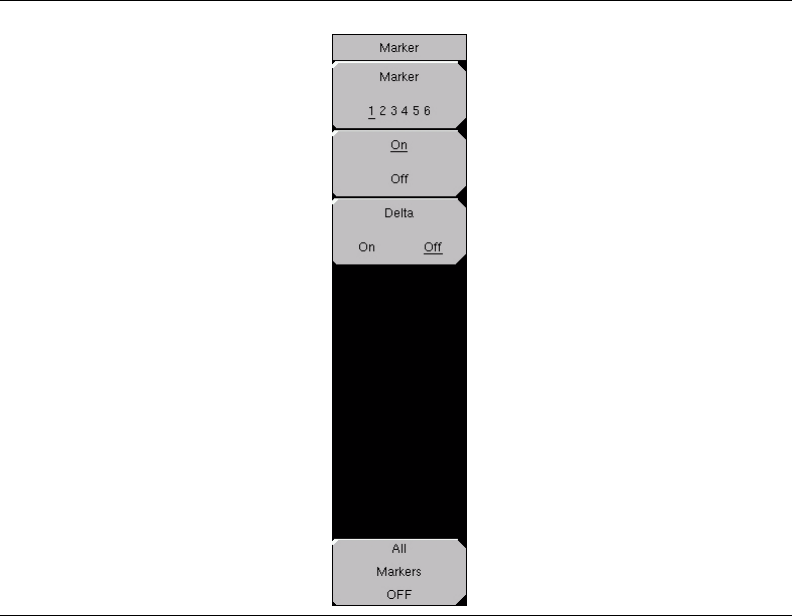
14-32
Marker
This feature is available only when the Power vs Time measurement is activated. This
function hard key opens the Marker menu.
Using Markers in Power versus Time Measurements
Six regular line markers and six delta markers are available. Marker information includes
time and power level in dBm. Delta marker information includes delta time and delta power.
Marker,123456
Press this Toggle soft key to select and set up a marker for display.
On/Off
Press this Toggle soft key to turn On and Off the selected (underlined) marker in the
Marker virtual soft key face.
Delta, On/Off
Press this Toggle soft key to turn On a delta marker. You are prompted for a delta offset
frequency (positive or negative) from the frequency of the currently active marker.
All Markers Off
Press this Input soft key to turn Off all markers and remove them from the display.
Secondary Function Menus
Pressing the Shift key and a number key selects the menu function that is printed in blue
characters above the number key.
Figure 14-22. Marker Menu
14-33
File
The File (7) key menu is the same as the File menu on page 13-3 in Chapter 13.
Limit
The Limit (6) key function is not implemented in the Mobile WiMAX Signal Analyzer mode.
Measure
The Measure (4) key brings up the same menu as the Measurements function hard key.
Refer to section Measurements on page 14-23 for information about these menus.
Mode
The Mode (9) key opens the Mode Selector list box. For information about setting the mode,
refer to section Mode Selector Menu on page 2-15.
System
The System (8) key menu is the same as the System menu on page 13-14 in Chapter 13.
Preset
The Preset (1) key menu is the same as the Preset menu on page 13-18 in Chapter 13.
Sweep
Press the Shift key, then the Sweep (3) key to open the Sweep sub menu that allows control
over the measurements.
Sweep, Continuous/ Single
Press this Toggle soft key to toggle between Continuous and Single. When Continuous is
selected, the instrument continuously makes measurements. When Single is selected, the
instrument makes one measurement and then waits for a press of the Trigger Sweep soft
key to sweep again.
Trigger Sweep
When the Sweep state is set to Single, pressing this Input soft key triggers a new
measurement sweep. This soft key does nothing when the Sweep state is set to Continuous.
Trace
Press the Shift key, then the Trace (5) key to open the sub menu for Trace functions.
Max Hold, Off/On
Pressing this Toggle soft key toggles Max Hold to On or Off. It applies to Spectrum view
and EVM vs Sub Carrier view. This function allows the spectrum trace to hold its peak
value from trace to trace. This helps in capturing a representative spectrum of a burst RF
signal such as WiMAX. All Max Hold operations show two traces. One trace is a max hold
value, and the other is a live trace with the current measurement results.
14-34

15-1
Chapter 15
CDMA Signal Analyzer
Introduction
The Spectrum Master MS272xB offers three CDMA options:
• Option 33, cdmaOne and CDMA2000 1xRTT (OTA), requires Option 31
• Option 42, CDMA RF measurements
• Option 43, cdmaOne and CDMA2000 1xRTT demodulator
The Spectrum Master can measure CDMA signals over the air (OTA) with an antenna or by
directly connecting the Spectrum Master to the base station.
Getting Started
CDMA Mode
To prepare for CDMA measurements, the MS272xB must be configured for CDMA mode,
as follows:
1. Select the Shift key, then the Mode (9) key.
2. Use the directional arrow keys or the rotary knob to highlight CDMA Signal Analyzer
and press the Enter key to select.
CDMA Measurement Setup
The Spectrum Master can measure CDMA performance over the air (OTA) with an antenna,
or by connecting the base station directly to the Spectrum Master.
To measure a CDMA signal over the air, connect the appropriate frequency band antenna to
the Spectrum Master RF Input and connect an Anritsu GPS antenna to the Spectrum Master
GPS connector.
To connect the base station to the Spectrum Master, connect the power amplifier of the base
station to the RF In port of the Spectrum Master by using a coupler or attenuator.
Setting Up the Measurement Frequency
The measurement frequency can be set by entering the center frequency or by selecting the
applicable signal standard and channel, which allows the Spectrum Master to automatically
set the frequency.
To Enter the Center Frequency:
1. Press the Freq function hard key.
2. Press the Center Freq soft key.
3. Enter desired frequency by using the keypad, the arrow keys, or the rotary knob.
CAUTION: The maximum input damage level of the RF In port is +30 dBm.
To prevent damage always use a coupler or high power attenuator.
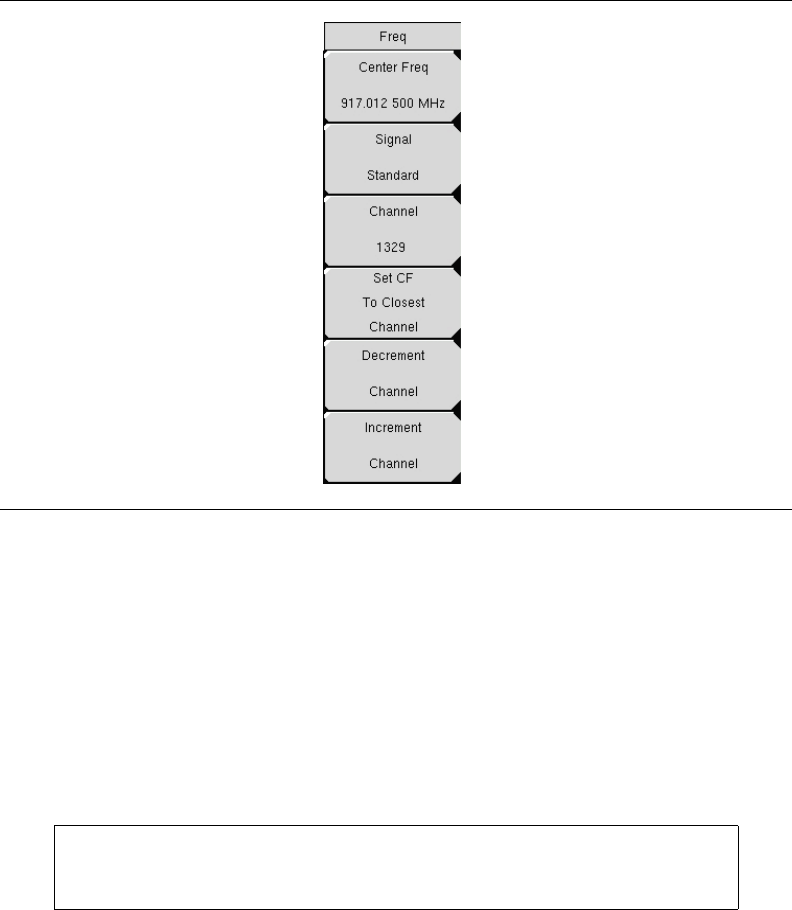
15-2
If entering a frequency using the keypad, then the soft key labels change to GHz, MHz, kHz,
and Hz. Select the appropriate units key. Selecting the Enter key has the same affect as
selecting the MHz soft key.
4. Press the Enter key to set the Center Frequency. The current setting is shown on the
left side of the measurement screen.
To Select A Signal Standard:
1. Press the Freq function hard key.
2. Select the Signal Standard soft key.
3. Use the Up/Down arrow keys or the rotary knob to highlight a signal standard, and
press Enter to select. When a signal standard is selected, the center frequency for the
first channel of the selected standard is automatically tuned.
4. Select the Channel soft key and use the Up/Down arrow keys, the keypad, or the rotary
knob to select a channel number for the selected signal standard. The center of the
channel is tuned to the center of the screen. The current settings are displayed on the
left side of the measurement screen.
Power Offset for Compensating External Loss
To get accurate results, the external attenuation should be compensated using power offset.
In power offset mode, the compensation factor is in dB. The external attenuation is caused
by using an external cable or by using an external high power attenuator.
1. Press the Amplitude function hard key.
Figure 15-1. Frequency Setup
NOTE: Screen captured images are provided as examples. The image
and measurement details shown on your instrument may differ from the
examples in this user guide.
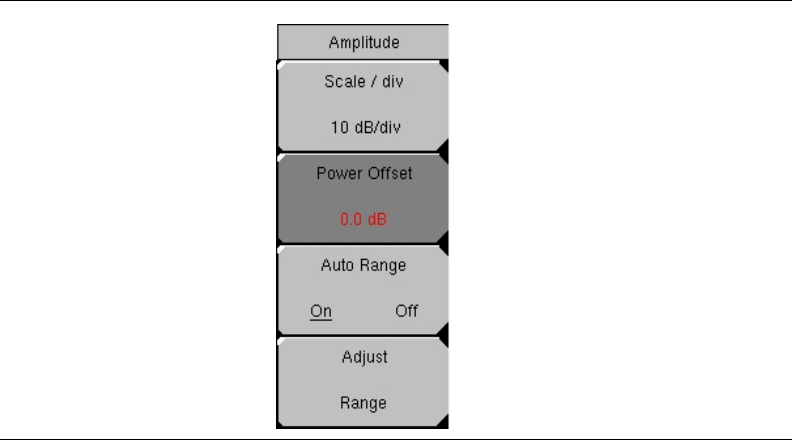
15-3
2. Press the Power Offset soft key and use the keypad, the arrow keys, or the rotary knob
to enter the desired offset value. Press the Enter key to set the Power Offset. The
entered value is displayed on the left side of the measurement screen.
PN Select
The Spectrum Master needs a timing reference in order to determine PN Offset and timing
errors. This reference comes from the base station when it is connected to the Spectrum
Master, or it can be recovered from GPS when a GPS antenna is connected to the Spectrum
Master. The setup for this function is as follows:
1. Press the Setup function hard key.
2. Press the PN Setup soft key to open the PN setup menu.
3. Press the PN Trigger soft key to toggle through No Trigger, GPS, or External.
Figure 15-2. Power Offset
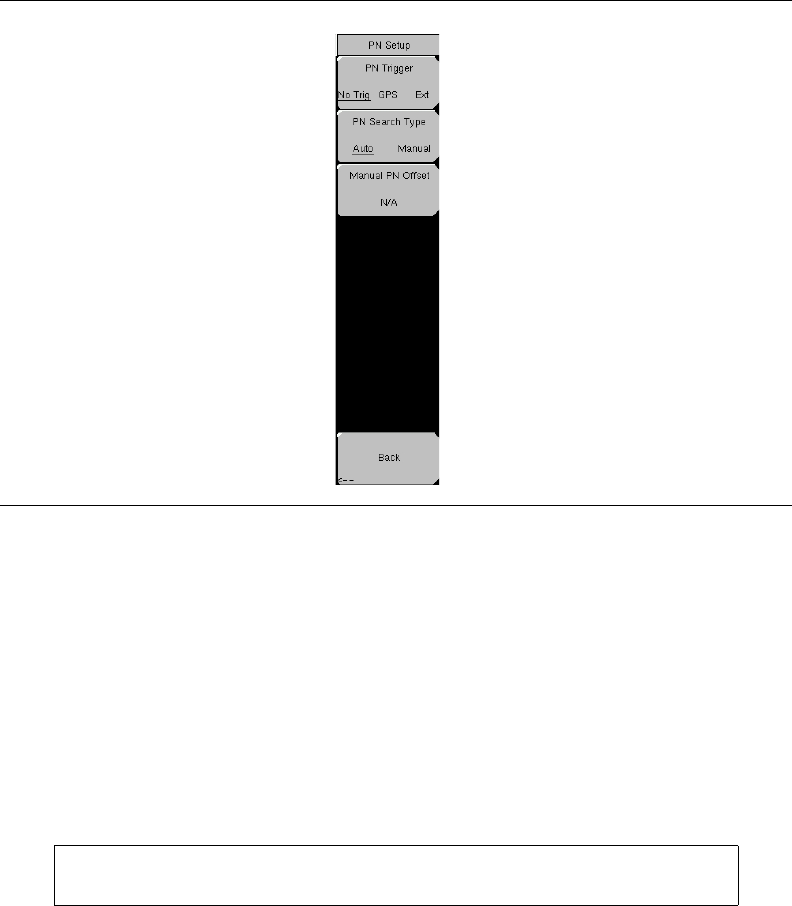
15-4
No Trigger If both GPS and external timing are unavailable, then you may choose No
Trigger for the PN search.
GPS Spectrum Master uses GPS as the timing reference.
External Spectrum Master uses an external, even-second time mark as the timing reference.
The time mark is usually available at the base station on a BNC connector labeled “ESTM”
or “PP2S”. ESTM must be connected to the External Trigger In connector on the Spectrum
Master.
4. Press the PN Search Type soft key to toggle between Auto or Manual. In Auto mode,
the Spectrum Master automatically detects the strongest pilot, while in Manual mode it
searches only for the specified PN.
5. Press Back to return to the previous menu.
Walsh Codes Setup
Walsh Codes setup is used to select whether cdmaOne (Walsh Codes 64) or CDMA2000
1xRTT (Walsh Codes 128) is required for the measurements. When 128 codes is selected,
the upper CDP (Code Domain Power) graph displays the CDP in bit-reversed order.
1. Press the Setup function hard key.
2. Press the Walsh Codes soft key to toggle between 64 codes and 128 codes.
Figure 15-3. PN Setup
NOTE: If Manual Search Type is selected, then press Manual PN Offset
and enter the desired PN value.
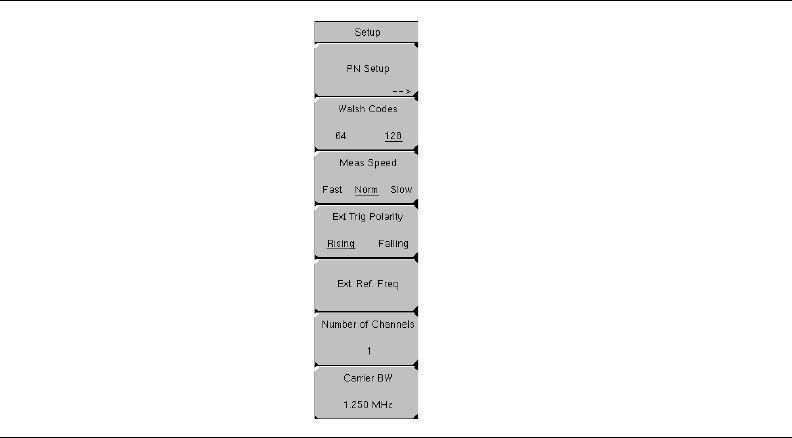
15-5
Select Reference Frequency Setup
In order to get the best frequency accuracy measurements, an external reference frequency
must be attached to the Spectrum Master Ext Ref In connector, or a GPS connection must be
attached to the Spectrum Master GPS connector. Most base stations have a reference
frequency that is available on a BNC connector. To configure the Spectrum Master to use an
external reference frequency, use the following procedure:
1. Press the Setup function hard key.
2. Press the Ext. Ref. Freq soft key to display a list of the available references
frequencies:
1 MHz
1.2288 MHz
1.544 MHz
2.048 MHz
2.4576 MHz
4.8 MHz
4.9152 MHz
5 MHz
9.8304 MHz
10 MHz
13 MHz
19.6608 MHz
3. Use the Up/Down arrow keys or the rotary knob to highlight the applicable reference
frequency on the list, and then press the Enter key to set the reference frequency.
As the Spectrum Master locks to the source, the Reference Freq value is displayed within the
user-settable parameters that are shown to the left of the measurement screen.
Figure 15-4. Walsh Codes Setup

15-6
GPS Setup
GPS provides improved accuracy in the timing circuit, which reduces frequency error. To
configure the Spectrum Master to use GPS, use the following procedure:
1. Install the Anritsu GPS antenna to the GPS antenna connection on the Spectrum
Master connector panel.
One antenna that is now available from Anritsu and that is suitable for this purpose is
the 2000-1410 Magnet Mount GPS Antenna with 5 m (15 ft.) cable.
2. Press the Shift key and the System (8) key to open the system options menu. Refer to
Figure 15-22 CDMA System Menu on page 15-31.
3. Press the GPS soft key to open the GPS menu.
4. Press the GPS On/Off soft key to turn the GPS feature on or off. When GPS is first
turned on, the GPS icon (shown in Figure 15-5) is displayed in red:
When the GPS receiver is tracking at least three satellites, the GPS icon changes to
green, as shown in Figure 15-6:
5. Press the GPS Info soft key to view the number of tracked satellites, latitude,
longitude, altitude, UTC timing information, and so forth.
CAUTION: Note that the GPS antenna connection on Spectrum Master is
fitted with a reverse BNC connector to help prevent damage to the GPS
circuitry. A DC voltage is present on this connector. Never connect
anything other than the Anritsu GPS antenna to this port.
Figure 15-5. GPS Icon, Red
Figure 15-6. GPS Icon, Green
NOTE: As long as three minutes may be required for the Ref Freq status to
change to GPS High Accuracy in the Status menu. Status is displayed on
the left side of the measurement screen.
NOTE: To reset the GPS, press the Reset soft key. The green GPS icon
with a red cross appears when GPS satellite tracking is lost (Figure 15-7).
This occurs after being active (tracking three or more satellites).
GPS
GPS
15-7
Within three minutes of satellite acquisition, the reference oscillator will have an accuracy of
less than 25 PPB (parts per billion). The OCXO internal standard accuracy is ±0.3 PPM. The
correction factor that is applied to the internal OCXO allows the instrument to maintain GPS
frequency accuracy for three days, even when the instrument is obstructed from receiving
signals from the GPS satellites. In order to acquire data from the GPS satellites, the
instrument must have line-of-sight to the satellites, or the antenna must be placed outside
without any obstructions.
After GPS High Accuracy is achieved, the internal reference is adjusted and will hold this
adjusted value even when GPS satellites can no longer be received. This status is indicated
by “Internal High Accuracy” showing in the Status menu that is displayed on the left side of
the measurement screen. This improved frequency accuracy of better than 50 ppm will hold
for up to three days.
Figure 15-7. GPS Icon, Green with Red Cross
NOTE: When the GPS feature is not enabled, the reference source will
display either “Internal Standard Accuracy” or a user-selected external
reference frequency in the Status menu on the left side of the
measurement screen.
NOTE: CDMA base stations have GPS available at the cell Site. Connect
the Spectrum Master to the base station GPS connector to make accurate
frequency error and timing measurements.
GPS
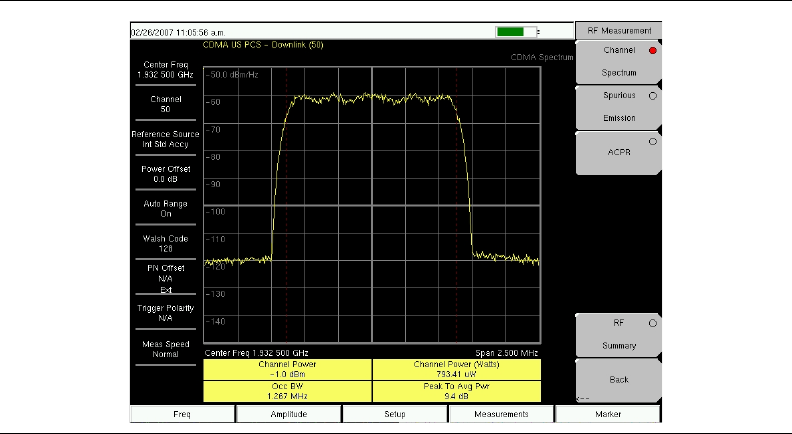
15-8
CDMA RF Measurement Setup
To make CDMA RF measurements, connect the Spectrum Master to the base station and
follow these setup instructions:
1. Select the Shift key, then the Mode (9) key.
2. Use the directional arrow keys or the rotary knob to highlight CDMA Signal Analyzer,
and press the Enter key to select.
3. Follow the setup instructions in the measurement section to make accurate
measurements.
4. Press Measurement and RF Measurement soft keys to open measurement menu.
Channel Spectrum Setup
This measurement displays the spectrum of the specified channel and channel power,
occupied bandwidth, and peak-to-average power.
From the Measurement menu, use the following procedure for Channel Spectrum:
1. Press the RF Measurement soft key to open the RF Measurement menu.
2. Press Channel Spectrum to display the active measurement.
Spurious Emission Setup
This measurement displays the spectrum of the input signal at specific offsets (based upon
the Signal Standard, which is selected from the frequency (Freq) menu). Markers are
automatically tuned to measure the input power at these offsets and to determine a PASS or
FAIL according to limits that are set by the signal standard. A blue mask is also calculated
and shown on the spectrum to visually check for pass fail conditions.
From the Measurement menu, use the following procedure for Spurious Emission:
1. Press the RF Measurement soft key.
2. Press the Spurious Emission soft key to activate the measurement. The red dot on the
soft key indicates that it is selected.
Figure 15-8. Channel Spectrum RF Measurement
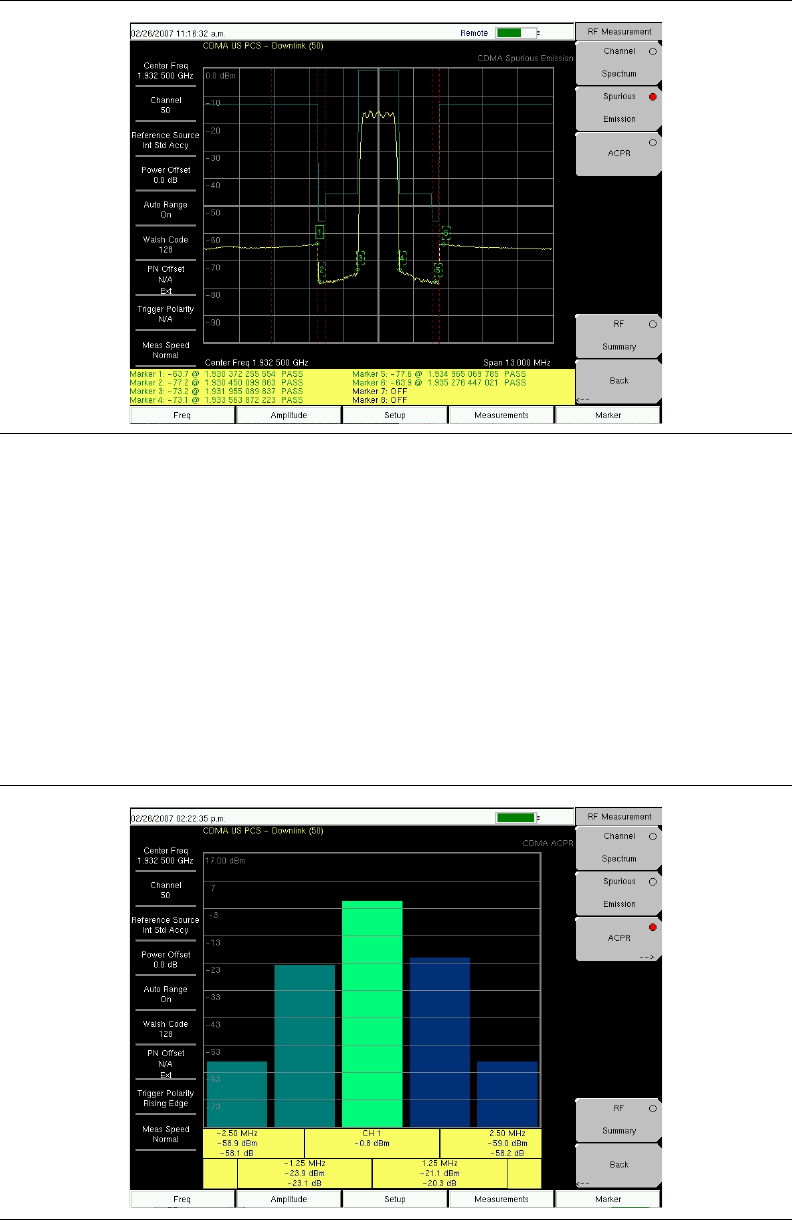
15-9
ACPR Setup
ACPR (Adjacent Channel Power Ratio) is defined as the ratio of the amount of leakage
power in an adjacent channel to the total transmitted power in the main channel and is
displayed in table format under the bar graph.
From the Measurement menu, use the following procedure for ACPR:
1. Press the RF Measurement soft key.
2. Press the ACPR soft key to activate the ACPR measurement. The red dot on the soft
key indicates that it is selected.
3. Press the ACPR soft key again to specify the Number of Carriers in a multi-carrier
configuration and to specify Carrier BW.
Figure 15-9. RF Measurement, Spurious Emission
Figure 15-10. RF Measurement, ACPR

15-10
CDMA Demodulator Measurements Setup
CDMA demodulator measurements are selected by pressing the Measurements hard key.
CDMA demodulator measurements include Code Domain Power (CDP), CDP table, and
modulation summary. To demodulate cdmaOne and CDMA2000 1xRTT signals, connect the
Spectrum Master to the base station following the setup instructions.
To make CDMA Demodulator measurements, connect the Spectrum Master to the base
station and follow these setup instructions:
1. Select the Shift key, then the Mode (9) key.
2. Use the directional arrow keys or the rotary knob to highlight CDMA Signal Analyzer,
and press the Enter key to select.
3. Follow the setup instructions in the measurement section to make accurate
measurements.
4. Press the Freq function hard key.
5. Press the Center Freq soft key and enter the desired frequency manually, or press the
Signal Standard soft key and select the applicable CDMA standard.
6. Select the Channel soft key and use the Up/Down arrow keys, the keypad, or the rotary
knob to select a channel number for the selected signal standard. The center of the
channel is tuned to the center of the display.
7. Press the Setup key to open the Setup menu.
8. Press the PN Setup soft key and choose No Trig, GPS, or External .
9. Press the PN Search Type soft key and select Auto search or Manual search by
toggling the soft key.
10. Press Back to go to the previous (Setup) menu.
11. Press the Walsh Codes soft key to choose 64 codes or 128 codes depending upon the
transmitting signal.
12. Press the Measurement key to open measurements menu.
13. Press the Demodulator soft key to activate demodulation measurements menu.
CDP Setup
The CDP screen displays 64 Walsh Codes or 128 Walsh Codes. Pilot, Sync, Paging, and
Quick Paging codes are displayed in a control channel table for easy viewing. Pilot power,
channel power, Rho, channel carrier feedthrough, RMS phase error, Frequency Error, and
Noise Floor measurements are displayed as numerical values.
From the Demodulator measurement menu, use the following procedure for CDP:
1. Press the CDP soft key to display the Code Domain Power menus. This may require
pressing the CDP soft key a second time.
2. Press the Zoom soft key to activate zoom for 16, 32, or 64 codes.
3. Press the Zoom Start Index soft key and enter desired location manually.
4. Press CDP Units to select either Relative Power (in dB) or Absolute power (in dBm).
NOTE: If Manual Search is selected, then press Manual PN Offset soft key
and enter the PN value manually.
NOTE: 64 Walsh Codes can be displayed when the unit is in 128 code
mode, and the Walsh Codes will be repeated.
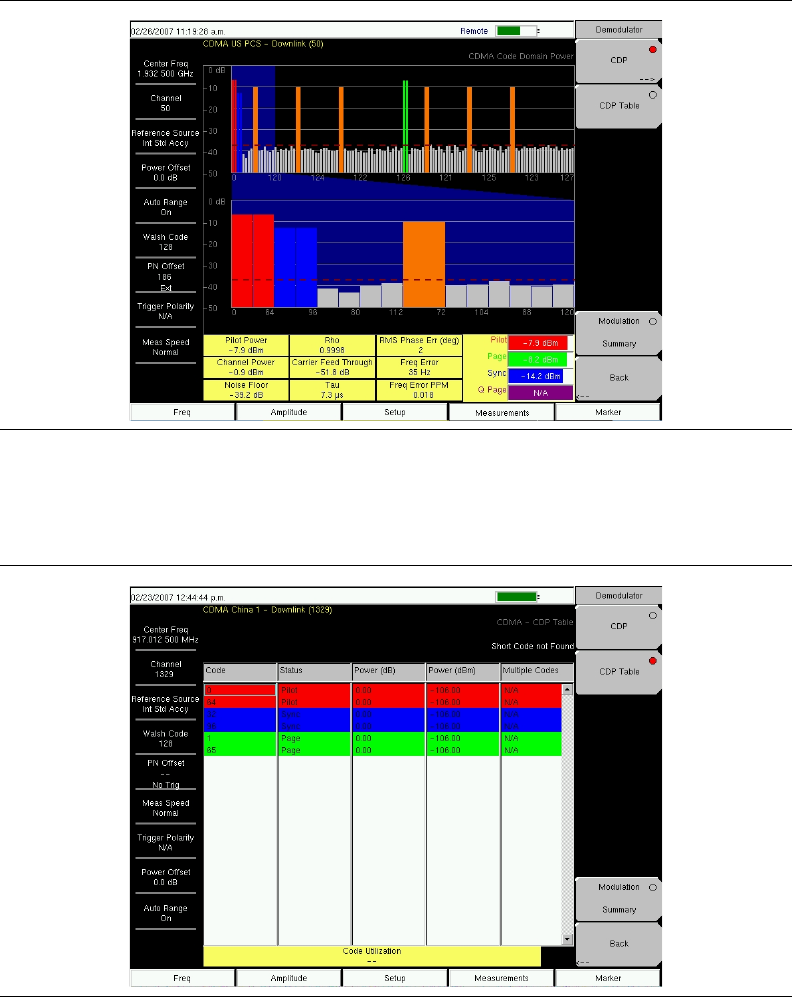
15-11
CDP Table View Setup
The CDP table view displays all of the active codes in a tabular format.
From the Demodulator measurement menu, use the following procedure for CDP Table view:
1. Press the CDP soft key to display the Code Domain Power menus.
2. Press the Zoom soft key to activate zoom for 16, 32, or 64 codes.
3. Press the Zoom Start Index soft key and enter the desired location manually.
4. Press CDP units to select either Relative Power (in dB) or Absolute power (in dBm).
5. Press Back to go back to the previous menu.
6. Press the CDP Table soft key to display the measurements.
Figure 15-11. Demodulator Menu with CDP Measurement
Figure 15-12. CDP Table
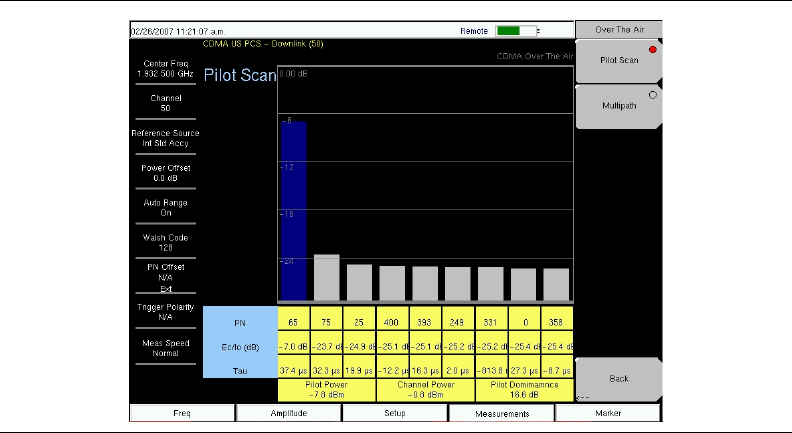
15-12
CDMA Over-The-Air Measurement Setup
OTA (over-the-air) testing provides field technicians with the ability to monitor
hard-to-reach pole-top base stations. Traditionally, the repair process for pole-top base
stations entailed pulling down the failed base station, then installing a new one. The failed
base station was then returned to the manufacturer or repair depot for service. If a base
station was determined to be healthy (no trouble found, or NTF), then the cost of the process
was incurred unnecessarily. OTA testing provides information about the health of the base
station, thereby improving the likelihood that a correct decision will be made with regard to
the base station condition. The result is fewer NTFs and elimination of associated costs.
If you choose to measure CDMA performance over the air with an antenna, then additional
setup is required, as explained in the setup section. The Spectrum Master needs a timing
reference to determine PN Offset and timing errors. This reference comes from the base
station GPS when it is connected to the Spectrum Master or it can be recovered from GPS
when a GPS antenna is connected to the Spectrum Master.
Figure 15-13. Over The Air Pilot Scan Measurement
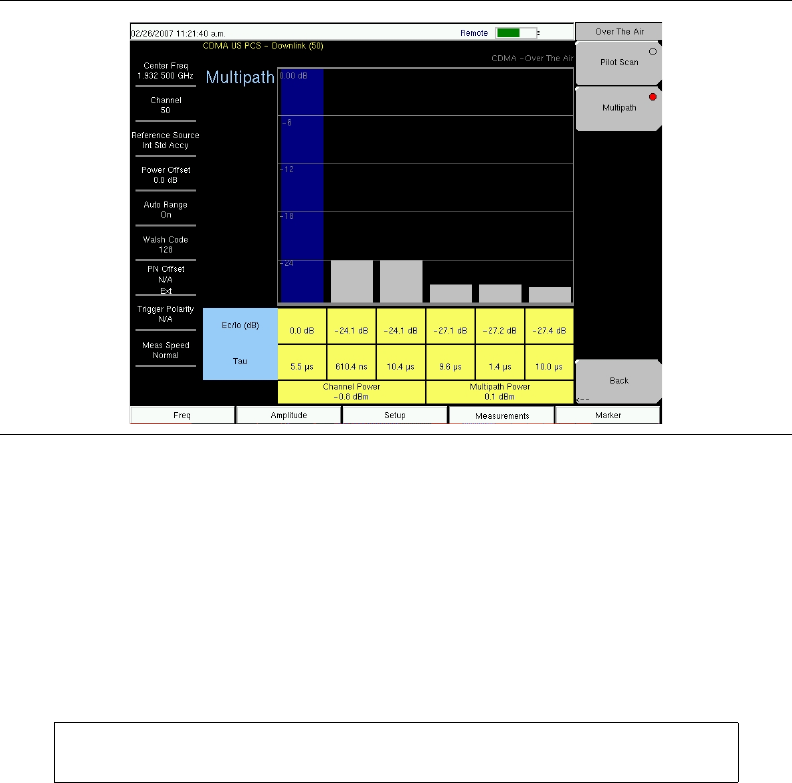
15-13
To make CDMA OTA measurements, connect the Spectrum Master to the base station and
follow these setup instructions:
1. Select the Shift key, then the Mode (9) key.
2. Use the directional arrow keys or the rotary knob to highlight CDMA Signal Analyzer,
and press the Enter key to select.
3. Follow the setup instructions for GPS.
4. After GPS setup is complete, continue the OTA measurement setup as follows:
5. Press the Walsh Codes soft key to choose 64 codes or 128 codes depending upon the
transmitting signal.
6. Press the Measurement key to open the Measurements menu.
7. Press the OTA soft key to activate Over-The-Air measurements.
Pilot Scan Setup
From the Over The Air menu, press the Pilot Scan soft key to display the nine strongest
pilots, the PN codes, Ec/Io, Tau, Pilot Power, Channel Power, and Pilot Dominance.
Multipath Setup
From the Over The Air menu, press the Multipath soft key to measure and display multipath
parameters.
Figure 15-14. Over The Air Pilot Multipath Measurement
NOTE: 64 Walsh Codes can be displayed when the unit is in 128 code
mode, and the Walsh Codes will be repeated.
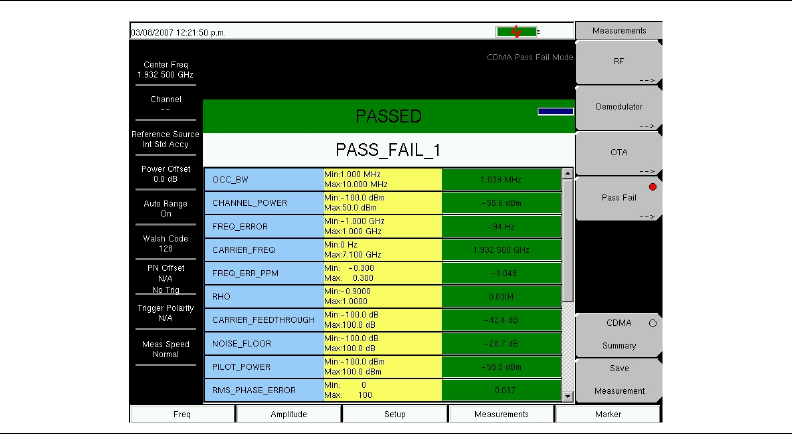
15-14
Pass Fail Setup
The Spectrum Master stores user-defined Pass Fail criteria for testing base station
performance and recalls these models for quick, easy measurements. After selection of a test
file, the Spectrum Master displays test results in tabular format with clear PASS or FAIL
indications that include minimum/maximum threshold.
Using Master Software Tools, a custom test list can be created and downloaded into the
Spectrum Master. All critical parameters can be selected for pass fail testing.
From the Measurements menu, use the following procedure for Pass Fail setup:
1. Press the Pass Fail Mode soft key to display the pass fail measurements.
2. Press the Pass Fail Mode soft key again to display the Pass Fail Mode menu.
3. Press the Select Pass/Fail Test soft key and select the applicable Test Model to activate
the measurement.
4. Press Reset to reset the pass fail fuction and begin a new pass fail test.
Figure 15-15. Pass Fail Measurement
15-15
CDMA Measurement Descriptions
Code Division Multiple Access (CDMA) is used in spread spectrum systems to achieve
multiple access. The frequency spectrum of a signal is spread by using a code that is not
correlated with the data signal. This code is unique to each recipient. A distinction can be
made among signals because the codes are chosen to have low cross-correlation values. By
matching the send and receive codes, the receiver is able to properly translate the message or
data.
RF
Channel Spectrum
This function includes (below the measurement display) a table view of Channel Power (in
dBm and Watts), Occ BW, and Peak To Avg Pwr.
Occupied BW
The occupied bandwidth is calculated as the bandwidth containing 99% of the transmitted
power.
Peak to Average Power
This is a ratio of the peak envelope power to the average power, in dB
Spurious Emission
This function includes a measurement display with eight fixed markers. The marker values
are displayed below the measurement and include the power and frequency at each marker
along with a pass fail indication.
ACPR
This function displays from 1 to 5 channels (carriers) and two adjacent channels on each
side. The power of each channel is displayed below the measurement graph and includes the
frequency and power in each of the 4 adjacent channels.
RF Summary
This function displays a table view of Channel Power (in dBm and Watts), Spurious
Emission, Occ BW, and Peak To Avg Pwr.
Demodulator
Code Domain Power
Code Domain Power (CDP) displays how much of the channel power is in each Walsh Code.
Power is normalized to the channel power and, therefore, a code reading of –10 dB means
that the power in that code is 1/10th of the channel power. The upper half of the
measurement display shows all of the channels, and the lower half shows a zoom view of
selected channels. The number of zoom channels and the starting position (relative to the
upper display) are set with CDP soft keys for Zoom and Zoom Start Index. A colored
background in the upper display indicates the channels that are in the lower, zoom display.

15-16
Colors are applied according to the following table:
Carrier FeedThrough
Carrier Feedthrough measures the amount of unmodulated signal that is leaking through the
transmitter.
Frequency Error
Frequency error is the difference between the received center frequency and the specified
center frequency. This is only as accurate as the frequency reference that is used and is
typically only useful with a good quality external frequency reference.
Noise Floor
Noice floor is the average power in the unused Walsh Codes.
Paging Code Power
Paging Code Power is a measure of Page Walsh Code power, displayed in dBm.
Q Paging Power
Q Paging Power is Quick Page Walsh Code 80 power, displayed in dBm.
Rho
Estimated rho is a measure of modulation quality and measures the amount of power that is
correctly transmitted. An estimated rho of 1.0 indicates a perfect signal. The standard
requires >0.912, and common measurements are >0.94. Due to environmental factors,
estimated rho values are typically poor (<0.9) when measured over the air, and are usually
useful only when connected to a base station.
Sync Power
Sync Power is a measure of Sync Walsh Code power, displayed in dBm.
Tau
Tau is the timing error. It is the timing offset, or the difference in time between when the PN
sequence (or short code) restarts, and when the PN sequence should restart. A base station
needs to be aligned in time to an absolute reference such as GPS. This cannot be measured if
the PN search is set to No Trigger.
Pilot Red
Sync Blue
Page Green
Quick Page Purple
IS95 Traffic Yellow
CDMA2000 Traffic Orange
Noise Grey
15-17
Note that during OTA measurement, Tau increases as the Spectrum Master gets farther from
the transmitter due to the finite speed of light. If the Spectrum Master is connected to the
base station, then a Tau of 10 μs or less is specified, and 5 μs is typical. If the timing error
becomes too large, mobiles may have trouble when being handed off to this particular base
station.
CDP Table
This function displays a table view of the channels with channel code number, status, power
(dB and dBm), and whether multiple codes are used. Overall code utilization is displayed as
a percent at the bottom of the measurement screen.
Modulation Summary
This function displays a table view of the values of Pilot Power, Channel Power, Freq error,
Freq error PPM, Carrier Freq, Rho, Noise floor, RMA Phase Err (deg), and Tau.
OTA
Pilot Scan
The strongest nine received PNs are displayed as bar graphs, and the PN numbers are
displayed at the bottom of the bar graphs.
For each PN, a table displays PN number, Ec/Io, and Tau. Also shown are Pilot Power,
Channel Power, and Pilot Dominance.
Pilot Power Pilot power is the total power in the pilot channel. This is normally a
constant for a base station. When the Spectrum Master is connected to the base station,
if the measured power is unexpected, then check that the entered power offset is correct
and that the connections are tight. Unexpected readings may indicate an incorrect
power setting at the base station. For Over The Air (OTA) measurements, the pilot
power will vary as the signal path from the transmitter to receiver varies.
Channel Power Channel power is the total power that is broadcast in the specified
CDMA channel.
Pilot Dominance Pilot Dominance is a measure of the strength of the strongest pilot
compared to the next strongest pilot in the same channel. This should be >10 dB to
make good measurements.
Multipath
The length of the bar represents the relative strength in the channel. Six channels are
displayed.
For each channel, a table below the bar graph displays Ec/Io and Tau. Also shown are
Channel Power and Multipath Power.
Multipath Power Multipath Power is a measure of the total power in the dominant
signal (spread in time due to multipath echoes) relative to its power in the main
transmission path. This value should be <0.4 dB to make good measurements.
Ec/Io
Ec/Io is the pilot power compared to the total channel power.

15-18
CDMA MENUS
Amplitude Menu
Scale/div
The scale can be set in 1 dB steps from 1 dB per division to 15 dB per division. The value
can be changed using the keypad, the rotary knob, or the Up/Down arrow keys.
Scale changes the y-axis scale. This applies to the Spectrum view only. When in any other
view, the display is “--”.
Power Offset
Choose power offset to have the Spectrum Master automatically adjust for the loss that
occurs through any external cables, attenuators, and couplers. The power can be offset
from 0 dB to 100 dB. Press the Power Offset key, enter the values, and press the dB soft
key.
Auto Range
Pressing this soft key toggles between On and Off. This function adjusts the reference
level automatically when Auto Range is activated.
Adjust Range
Pressing this soft key changes the Auto Range setting to Off and performs a manual Auto
Range operation, which adjusts the internal reference level to be optimal based upon the
measured signal.
Figure 15-16. CDMA Amplitude Menu
Amplitude
Adjust
Range
Power Offset
## dB
Auto Range
On Off
Scale / div
## dB / div
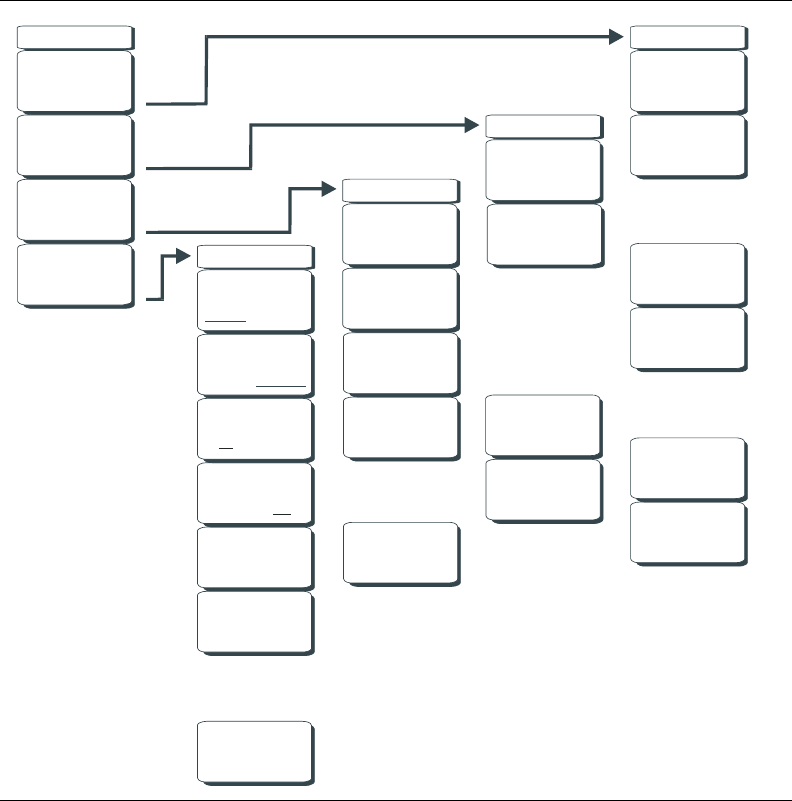
15-19
File Menu
To access the functions under the File menu, select the Shift key, then the File (7) key.
Save
Measurements may be saved to the internal memory or to a Type-1 Compact Flash
module. The Spectrum Master is shipped with a 256 MB Compact Flash Memory Module,
Anritsu Part Number 3-2000-1500. The removable compact flash card can be up to
512 MB. Compact Flash modules with greater storage capacity may not function properly,
and should be properly tested before relying on them. A USB Flash drive with at least
256 MB storages may be used to store all measurements that may be stored internally.
Save Setup
Opens a dialog box to name and save the current operating settings, allowing them to
be recalled later to return the instrument to the state it was in at the time the setup was
saved. The saved setup can be named using the keypad to select numbers, the rotary
knob to highlight a number or character and pressing the knob to select, or by selecting
the soft key for each letter. Use the Shift key to select an upper case letter. Use the Left/
Right directional arrows to move the cursor position. Press Enter to save the setup.
Figure 15-17. CDMA File Menu
File
Save
Recall
Recall
-->
-->
Back
Back
Back
-->
-->
-->
Back
-->
Save
Save
Setup
Sort Method
Type DateName
Save
Measurement
Sort
Ascend Descend
Copy from
Current Location
to Destination
Save
On
Event
Directory
Management
Directory
Management
Directory
Management
Save
Screen
as JPEG
Delete
Selected
File
-->
-->
-->
-->
-->
Delete
Delete
Recall
Setup
Recall
Measurement
Directory Management
*
*
*
Delete ALL
Measurements
Delete ALL
Mode Files
Delete
ALL
Contents
Format
Compact Flash
Current Location
USB CFInt
Copy to Destination
Int USB CF

15-20
Save Measurement
Initiates a dialog box to name and save the current active trace A. The saved
measurement trace can be named using the keypad to select numbers, the rotary knob
to highlight a number or character and pressing the knob to select, or by selecting the
soft key for each letter. Use the Shift key to select an upper case letter. Use the
Left/Right directional arrows to move the cursor position. Press Enter to save the
measurement trace. Measurements are saved in a directory called /usr on the Compact
Flash memory module and the USB Flash Drive.
Save On Event…
Not applicable in CDMA analyzer mode.
Save Screen as JPEG
This function saves a measurement trace as a graphics file. The saved measurement can be
named using the keypad to select numbers, the rotary knob to highlight a number or
character and pressing the knob to select, or by selecting the soft key for each letter. Use
the Shift key to select an upper case letter. Use the Left/Right directional arrows to move
the cursor position. Press Enter to save the measurement after entering the file name. The
file is saved in the internal memory with the specified name, with .jpg appended.
Directory Management
Sort Method, Name Type Date
File lists can be sorted by the name of the file, the type of file (SPA file, STP file, and
so forth.) or by the date that the file was saved.
Sort, Ascend Descend
Selects whether the selected sort is sorted from lowest to highest (ascending) or highest
to lowest (descending). When sorting by name, the sort will place file names that start
with numbers before file names that start with letters (an ASCII sort).
Current Location, Int USB CF
This choice lets you select where measurements and setups will be saved. Pressing the
soft key selects the storage location to be the internal memory, USB Flash drive, or
Compact Flash memory module. The "current location" and the "copy to destination"
will never be the same. Changing the current location to save files causes the "copy to
destination" to be automatically changed if the selected storage location is the same as
the selected current location.
Copy to Destination, Int USB CF
This choice lets you select where measurements and setups in the "current location"
will be copied. The "current location" and the "copy to destination" may not be the
same. If you change the destination to which the instrument will copy files, the current
location is automatically changed if the current location is the same as the selected
copy to destination.
Copy From Current Location To Destination
Pressing this soft key causes all measurements, setups and jpg files stored in the user
selected "current location" to be copied to the "copy to destination." If no storage
module is installed in the instrument, an error message is displayed.
NOTE: If a measurement has been previously saved, the Save
Measurement dialog box will open with the previously saved name
displayed. To save the new measurement with a similar name (for
example, Trace-1, Trace-2, and so forth) simply press the Right directional
arrow and add the changes. To create a completely new name, use the
keypad, the rotary knob or select the soft key for each letter.
15-21
Format Compact Flash
This selection erases all files on an installed Compact Flash module. A message is
displayed warning that all files will be erased. Press Enter to confirm that you want to
erase and Esc to quit without erasing. In addition to erasing all files stored on the
Compact Flash, the /usr directory is created for storage of measurements, setups and
jpg files.
Back
Returns to the previous (File) soft key menu.
Recall
Pressing this soft key opens the Recall soft key menu.
Recall Setup
This soft key brings up a selection box that allows selection and recall of a previously
stored instrument setup in the current storage location. Use the rotary knob or the
Up/Down arrow keys to highlight the saved setup, and press Enter, the rotary knob, or
the Recall soft key to select. All current instrument settings are replaced by the stored
setup information. Press the Esc key to cancel the recall.
Recall Measurement
Brings up a selection box that allows recall of a previously stored measurement trace
from the currently selected storage location. Use the rotary knob or the Up/Down
arrow keys to highlight the saved measurement trace, and press Enter, the rotary knob,
or the Recall soft key to select.
Directory Management '
See “Directory Management” on page 15-20..
Back
Returns to the previous (File) soft key menu.
Delete
Brings up a selection box that shows all stored setups and traces in the currently selected
location (See “Directory Management” on page 15-20.). The list shows the setup and
measurement names, the type (stp for a saved setup, spa for a saved trace, jpg for a JPEG
file) and the date and time the information was saved. Use the rotary knob or the Up/Down
arrow keys to highlight the file to be deleted, and press Enter, or the Delete soft key to
delete. Press the Esc key to cancel the operation. Note that there is no mechanism to
retrieve deleted files.
Delete Selected File
Use the up and down arrow buttons or the rotary knob to select the file that is to be
deleted. Press Enter to confirm that you want to delete the file or Esc to exit without
deleting.
Delete ALL Measurements
Deletes all measurements of the current mode in the currently selected storage location.
The memory from which measurements will be deleted is set in the Directory
Management menu and is the Current Location.
Delete ALL Mode Files
Deletes all measurements of the type saved in the current operating mode of the
instrument. In addition all jpg and setup files (regardless of the mode) are deleted.
Delete ALL Contents
Deletes all measurements, jpg files and setup files of ALL measurement types.

15-22
Back
Returns to the previous (File) soft key menu.
Freq (Frequency) Menu
Center Freq
Press the Freq key followed by the Center Freq soft key and enter the desired frequency
using the keypad, the arrow keys, or the rotary knob. If entering a frequency by using the
keypad, the soft key labels change to GHz, MHz, kHz, and Hz. Select the appropriate units
key. Pressing the Enter key has the same affect as selecting the MHz soft key.
Signal Standard
Use the Up/Down arrow keys or the rotary knob to highlight a signal standard and press
Enter to select. When a signal standard is selected, the center frequency and span for the
first channel of the selected standard are automatically tuned. Other settings (such as
channel spacing and integration bandwidth) are also automatically entered. Appendix A
contains a table of the signal standards that are in the instrument firmware. The Signal
Standards dialog box includes all of the CDMA standards.
Channel
Use the Up/Down arrow keys, the keypad, or the rotary knob to select a channel number
for the selected signal standard. The center of the channel is automatically tuned to the
center frequency of the selected CDMA channel. The Channel Editor dialog box indicates
the selected signal standard. The range of channels and the channel step size depend upon
the selected standard.
Set CF To Closest Channel
Press this soft key to change the center frequency to the closest channel.
Figure 15-18. CDMA Frequency Menu
Freq
Center Freq
- - - -
Set CF
To Closest
Channel
Decrement
Channel
Increment
Channel
Signal
Standard
Channel
- -
15-23
Decrement Channel
Use this soft key to decrease the channel number. Channel number is decremented by one
channel or by a step size. Depending upon the signal standard and upon the selected
channel, pressing this soft key decrements the channel number by a standard step size.
Increment Channel
Use this soft key to increase the channel number. Channel number is incremented by one
channel or by a step size. Depending upon the signal standard and upon the selected
channel, pressing this soft key increments the channel number by a standard step size.
Limit Menu
This menu function is not implemented in the CDMA mode.

15-24
Marker Menu
Marker Soft Key Menu
In CDMA mode, markers are available only for CDP and Spectrum measurements.
Marker, 1 2 3 4 5 6
Press this soft key to select a marker. the selected marker is underlined on the soft key
image. Each press of the soft key moves the selection to the next marker number. Use the
On Off soft key to turn the marker On or Off.
On, Off
Press this soft key to turn On or Off the marker that is currently selected (shown
underlined) on the Marker, 1 2 3 4 5 6 key.
Marker Table
Pressing this soft key opens a display of a marker table below the measurement display.
The marker table indicates the values of all active markers.
All Markers Off
Pressing this soft key turns OFF all markers.
Figure 15-19. CDMA Marker Menu
Marker
Marker
1 2 3 4 5 6
On
Off
Marker Table
On Off
All
Markers
Off

15-25
Measurements Menu
RF
Pressing this soft key opens the RF Measurement soft key menu.
Channel Spectrum
Pressing this soft key displays the channel spectrum of the input signal (2.5 MHz
span). The screen also displays numeric values of Channel Power in dBm and
watts, Peak to Average power in dB, and Occupied Bandwidth (Occ BW).
Spurious Emission
Pressing this soft key displays the received signal and the mask, based upon
received signal strength.
Figure 15-20. CDMA Measurements Menu
Measurements
Rf
-->
Demodulator
-->
OTA
-->
-->
Save
Measurement
Pass Fail
º
Summary
CDMA º
RF Measurement
º
Channel
Spectrum
º
Spurious
Emission
ACPR
º
º
RF
Summary
Back
<--
Demodulator
CDP
º
CDP Table
º
º
Modulation
Summary
Back
<--
Back
<--
Over The Air
Pilot Scan
º
Multipath
º
Back
<--
Pass Fail Mode
Select
Pass/Fail
Tes t
Reset
Back
<--
CDP
Zoom
16 32 64
Zoom Start Index
#
CDP Units
Relative Absolute
Back
<--
ACPR
Carrier BW
# # # #
Number of Carriers
#
15-26
ACPR
Pressing this soft key displays the Adjacent Channel Power Ratio (ACPR). The
instrument displays one or more main channels and two adjacent channels on each
side of the main channel. A data window below the channel measurement display
indicates the power in each channel. When this soft key is active (an arrow on the
key symbol indicates that a sub menu is available), another key press opens the
ACPR soft key menu.
Number of Carriers
Press this soft key to set the number of main channels from 1 to 5. Change the
number of main channels with the arrow keys or the rotary knob, then press the
rotary knob or the Enter key. Or change the number of channels by pressing a
number on the numeric keypad, press the Enter soft key, and then press the
Enter key. The adjacent channels remain displayed.
Carrier BW
Press this soft key and use the numeric keypad to enter a frequency. The soft
key menu displays units of GHz, MHz, kHz, and Hz. After choosing the units,
press the Enter key. If the Enter key is used without first selecting units, then
the default units are MHz, and the Enter key must be pressed a second time to
set the frequency. You can also use the arrow keys or rotary knob to change the
carrier bandwidth in 1 Hz increments, then press the rotary knob or the Enter
key to set the frequency.
Back
Returns to previous (RF Measurement) soft key menu.
RF Summary
Pressing this soft key displays a summary of all the RF numerical measurement
results in a table format.
Back
Returns to previous (Measurements) soft key menu.
Demodulator
In demodulator mode, the Spectrum Master demodulates the received CDMA signal. The
demodulator has three measurement displays: CDP, CDP Table, and Modulation
Summary.
CDP
The first press of this soft key displays the Code Domain Power and also displays an
arrow on the soft key symbol (to indicate that a sub menu is available).
When Code Domain Power (CDP) is selected, the screen displays all of the selected
Walsh Codes and the selected Walsh Codes zoom codes in a graphical format.
Depending upon the Walsh Code set parameter, this display includes either 64 Walsh
Codes or 128 Walsh Codes. When 128 Walsh Codes is selected, the top CDP graph
displays the CDP in bit-reversed order. The screen also displays the following Control
channels in table format: Pilot, Page, Sync, and Quick Page. If the marker is set on the
code, then the marker displays the code number, power, and code type.
The codes are color coded as follows:
Pilot in Red
Page in Green
Sync in Blue
cdmaOne (IS95) Traffic in Yellow
CDMA2000 1xRTT Traffic in Orange
15-27
An additional press of the CDP soft key opens the CDP soft key menu.
Zoom
Pressing this soft key toggles through a zoom function of 16, 32, or 64 codes.
Zoom Start Index
Press this soft key, then enter the required zoom start index. For example, to start at
code 120, which is the 15th code power that is displayed, press the 1 key and the
5 key on the numeric keypad, then press either the Enter soft key (which appears
when the numeric keypad is used) or the Enter key.
Also, press this soft key, then use the arrow keys or rotary knob to change the zoom
start index. The CDP soft key menu remains after pressing the rotary knob or the
Enter key.
CDP units
Use this soft key to toggle between Relative units (in dB) or Absolute units in
(dBm). When units are Relative, the code power is measured relative to Channel
Power.
Back
Returns to previous (Demodulator) soft key menu.
CDP Table
This screen shows the power of the codes in a tabular format. The table displays the
following 5 columns:
Code number
Status: Pilot, Page, Sync, All Traffic (Color Coded rows)
Relative Power (in dB)
Absolute Power( in dBm)
Multiple codes: A number indicating how many codes are used up by a particular
user (traffic)
Modulation Summary
Pressing this soft key displays a summary of all the modulation-related numerical
measurements in a table format, with rows for: Pilot Power, Channel Power, Freq
Error, Freq Error PPM, Carrier Freq, Rho, Noise Floor, RMS Phase Err (deg), and Tau.
Back
Returns to previous (Measurements) soft key menu.
OTA
Soft key to open the Over The Air soft key menu. OTA displays the CDMA Over The Air
measurements, which include: Pilot Codes, Ec/Io (dB), Tau, Pilot Power, Channel Power,
Pilot Dominance, and Multipath.
Pilot Scan
Displays the power of the 9 strongest PNs. The strongest PN or the user-selected PN is
color coded blue, those colored red are probably real pilots, and the remaining, which
are color coded gray, are probably noise.
Multipath
Displays 6 multipaths in graphical format. The strongest is color coded blue. The
remaining are color coded red, or are color coded gray if noise. The unit also displays
Ec/Io (dB), Tau, Channel Power, and Multipath Power.
Back
Returns to previous (Measurements) soft key menu.
15-28
Pass Fail
The first press of this soft key puts the Spectrum Master into Pass Fail Mode. The next
press of the soft key opens the Pass Fail Mode soft key menu.
Select Pass/Fail Test
This soft key function allows the selection of a user-defined file that specifies a list of
measurements with pass fail criteria. Select a test model by using the arrow keys or
rotary knob. This mode will sequentially assess the appropriate measurements and
indicate a pass or fail state based upon the test model criteria. Custom pass fail tests can
be created by using Master Software Tools.
Reset
Press this soft key to restart the measurement.
Back
Returns to previous (Measurements) soft key menu.
CDMA Summary
Pressing this soft key displays a summary of all of the CDMA-related numerical
measurement in a table format.
Save Measurement
Pressing this soft key opens a dialog box to name and save the current measurement. Press
Enter to save the CDMA measurement, which is saved with a .cdma extension.
Mode Menu
To access the functions under the Mode menu, select the Shift key, then the Mode (9) key.
Use the directional arrow keys or the rotary knob to highlight the selection and press the
Enter key to select. The list of modes that appears in this menu will vary depending upon the
options that are installed and activated in your instrument.
Preset Menu
To access the functions under the Preset menu, select the Shift key, then the Preset (1) key.
Preset
This key resets the instrument to the default starting conditions.
Save Setup
See the Save description under the File menu.
Recall Setup
See the Recall description under the File menu.

15-29
Setup Menu
PN Setup
Press this soft key for the PN Setup menu.
PN Trigger
Press this soft key to toggle through “No Trig” (no trigger), “GPS”, and “Ext” (external
trigger).
PN Search Type
Press this soft key to toggle between “Auto” and “Manual” PN search. In the Auto
mode, the Spectrum Master automatically searches for the strongest PN. When using
manual setup, enter the required PN offset to limit the search. Auto search is available
only when the trigger selection is GPS or External. If “No Trig” is selected, then
pressing this soft key causes an error message to be displayed, stating “Applicable only
when PN Type is GPS or External”.
Figure 15-21. CDMA Setup Menu
Ext Trig Polarity
Rising Falling
Ext. Ref. Freq
Number of Carriers
-
Carrier BW
- - - -
Setup
PN Setup
-->
Walsh Codes
64 128
Meas Speed
Fast Norm Slow
PN Setup
PN Trigger
No Trig GPS EXT
PN Search Type
Auto Manual
Manual PN Offset
N/A
<--
Back
15-30
Manual PN Offset
Press this soft key to manually set the PN offset. Use the arrow keys, rotary knob, or
numeric keypad to choose an offset, then press the rotary knob or the Enter key to
select the value. Editing this value automatically changes the PN Search Type to
Manual.
The Manual PN Offset function is available only when the trigger selection is GPS or
External. If “No Trig” is selected, then pressing this soft key causes an error message to
be displayed, stating “Applicable only when PN Type is GPS or External”.
Back
Press this soft key to return to the previous (Setup) soft key menu.
Walsh Codes
Press this soft key to toggle between 64 codes and 128 codes.
Meas Speed
Press this soft key to toggle through “Fast”, “Norm” (normal), and “Slow” measuring
speed.
Ext Trig Polarity
Press this soft key to toggle between Rising edge and Falling edge trigger polarity.
Ext. Ref. Freq
Pressing this soft key opens a list box of reference frequencies. Use the arrow keys or the
rotary knob to choose a specific reference frequency, then press the rotary knob or the
Enter key to select the frequency. Press the Esc key to keep the previously set reference
frequency.
List Box: 1 MHz, 1.2288 MHz, 1.544 MHz, 2.048 MHz, 2.4576 MHz, 4.8 MHz,
4.9152 MHz, 5 MHz, 9.8304 MHz, 10 MHz, 13 MHz, 19.6608 MHz
Number of Carriers
Press this soft key to set the number of required channels. After pressing the soft key, use
the arrow keys, rotary knob, or number keypad to enter the number of channels. Press the
rotary knob or the Enter key to set the new number. This affects the ACPR and Spurious
Emissions measurements.
Carrier BW
Press this soft key to set the carrier bandwidth. After pressing the soft key, use the arrow
keys, rotary knob, or number keypad to enter the carrier bandwidth. Press the rotary knob
or the Enter key to set the new number.
Sweep Menu
To access the functions under the Sweep menu, select the Shift key, then the Sweep (3)
key.
Sweep
Press this soft key to toggle between Single and Continuous sweep modes. Selecting
Single sets the instrument to make 1 measurement and stop. Selecting Continuous sets the
instrument to continuously make measurements.
Trigger Sweep
When the Sweep state is Single, pressing this soft key triggers a new measurement every
time it is pressed. It does nothing when Sweep state is Continuous.
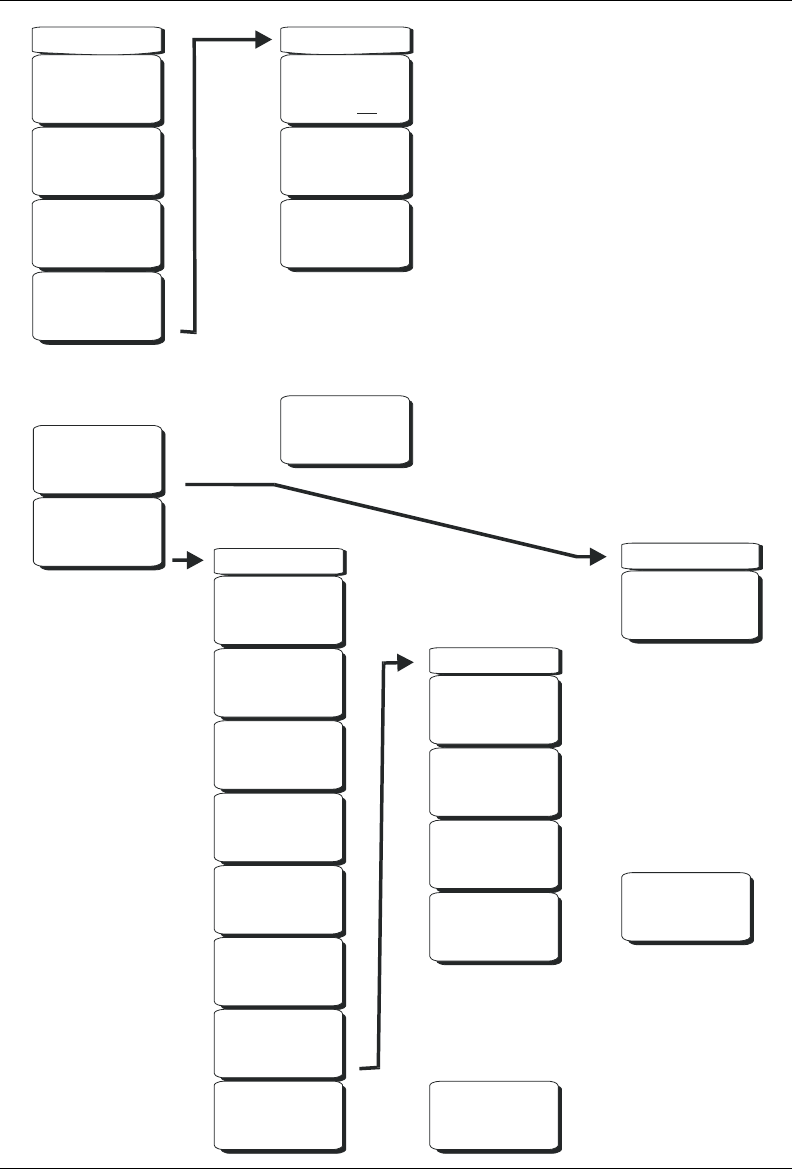
15-31
System Menu
Figure 15-22. CDMA System Menu
System
Status
Self
Test
Application
Self
Test
GPS
Application
Options
System
Options -->
-->
-->
Back
-->
GPS
GPS
On Off
GPS
Info
Reset
Back
-->
Reset
Factory
Defaults
Master
Reset
Update
OS Via
Ethernet
Update
OS Via
USB
System Options
Date
&
Time
Ethernet
Config
Language
Brightness
Name
Volume
Reset
Back
-->
-->
Back
-->
Options
Ext. Ref. Freq
15-32
To access the functions under the System menu, select the Shift key, then the System (8)
key.
Status
Pressing this soft key displays the current system status, including the operating system
and firmware versions, temperatures and other details such as current battery information.
Press Esc or Enter to return to normal operation.
Self Test
This soft key initiates a series of diagnostic tests that test the components of the
instrument. A display will list the individual tests with a pass or fail indication. Press Esc
or Enter to return to normal operation.
Application Self Test
This soft key initiates a series of diagnostic tests related to the performance of the
Spectrum Master in CDMA mode. A display will list the individual tests with a pass or fail
indication. Press Esc or Enter to return to normal operation.
GPS
If the GPS option is installed, the GPS menu will be displayed.
GPS On/Off
Turns the GPS On or Off.
GPS Info
Displays the current GPS information.
Reset
Resets the GPS for a new location.
Back
Returns to the previous (System) soft key menu.
Application Options
This soft key presents a menu to select application options.
Ext. Ref. Freq
Pressing this soft key opens a list box for selecting a Reference Frequency. Use the
rotary knob or the Up/Down arrow keys to highlight the desired external reference
frequency and press the rotary knob or the Enter key to select, or press the Esc key to
cancel.
Back
Returns to the previous (System) soft key menu.
System Options
This key opens a selection of system option soft keys.
Date and Time
This soft key brings up a dialog box for setting the current date and time. Use the soft
keys or the Left/Right arrow keys to select the field to be modified. Use the keypad, the
Up/Down arrow keys or the rotary knob to select the date and time. Select Enter to
accept the changes, or press the Esc key to return to normal operation without
changing anything.
15-33
Ethernet Configuration
This soft key brings up a dialog box to set the IP address of the instrument.
Type Manual/DHCP
This softkey selects whether the address will be entered manually, or supplied
automatically by a network DHCP server. If Manual is selected, use the soft keys or
the Left/Right arrow keys to select the field to be modified. Use the keypad, the
Up/Down arrow keys or the rotary knob to enter the input. Select Enter to accept the
changes, or press the Esc key to return to normal operation without changing
anything.
Language
This soft key brings up a selection box allowing selection from a list of built-in
languages for the Spectrum Master displays. The languages currently available are
English, French, German, Spanish, Japanese, Chinese, Korean, and Italian.
In addition, a custom language may be selected if it has been defined using the Master
Software Tools software and loaded into the MS272xB. Two custom languages may be
loaded into the instrument using Master Software Tools. If a mode does not have
language translations available, English is the default language. Select Enter to accept
the change, or press the Esc key to return to normal operation without changing
anything.
Brightness
The brightness of the display can be adjusted to optimize viewing under a wide variety
of lighting conditions. Use the keypad, the Up/Down arrow keys or the rotary knob to
select a brightness level from 1 to 9, 9 being the brightest. Select Enter to accept the
change.
Name
Opens a dialog box to name the instrument. The unit can be named using the keypad to
select numbers, the rotary knob to highlight a number or character and pressing the
knob to select, or by selecting the soft key for each letter. Use the Shift key to select an
upper case letter. Use the Left/Right directional arrows to move the cursor position.
Press Enter to save the name.
Volume
The current volume setting is displayed on the screen. Use the keypad, the Up/Down
arrow keys or the rotary knob to change the volume and press the Enter key to accept
the change.
Reset
Opens a menu of reset and update options.
Factory Defaults
Restores the instrument to the factory default values, including Ethernet, language
and brightness settings. Press the Enter key to initiate the reset, and turn the unit
off, then on again to complete. Press Esc to return to normal operation without
resetting.
Master Reset
This will restore factory setting to all system parameters, including Time/Date,
Ethernet, language and brightness settings. Also, all user files in the internal
memory are deleted, and the original language and antenna files are restored.
Press the Enter key to initiate the reset, and turn the unit off, then on again to
complete. Press Esc to return to normal operation without resetting.

15-34
Update OS Via Ethernet
Select this soft key to update the instrument operating system via the Ethernet
connection. Press Enter to begin the update, or press Esc to return to normal
operation without updating.
Update OS Via USB
Select this soft key to update the instrument operating system via the USB
connection. Press Enter to begin the update, or press Esc to return to normal
operation without updating.
Back
Returns to the previous (System Options) soft key menu.
Back
Returns to the previous (System) soft key menu.
NOTE: The Update OS via Ethernet and Update OS via USB selections
are accomplished in conjunction with the Master CodeLoader program,
which is supplied with Master Software Tools. Improper use of the Master
CodeLoader program could render the system unusable.
16-116-1
Chapter 16
EVDO Signal Analyzer
Introduction
The Spectrum Master MS272xB offers three EVDO options:
• Option 34, EVDO Over the Air (OTA) Measurements, requires Option 31
• Option 62, EVDO RF measurements
• Option 63, EVDO Demodulator, Rev. A compatible
CDMA2000 1xEVDO has a chip rate of 1.2288 MHz, the same as cdmaOne and
CDMA2000 1xRTT. Each chip lasts for a duration of 0.8138 microseconds. In downlink, an
EVDO signal can be time-divided into “half slots.” Each half slot has 1024 chips.
The 1024 chips in a half slot can be further time-divided into three different channels: Pilot,
MAC, and Data. The Pilot Channel provides synchronization for the EVDO Access
Terminals (for example, cell phones, laptops, and so forth.). The MAC (Medium Access
Control) Channel controls the overall EVDO traffic. The Data Channel transmits data to
various users.
The Pilot and MAC Channels are always active in an EVDO signal, but the Data Channel
may sometimes transmit no data. When no data is transmitted, the half slot is considered
idle. Otherwise, it is called an active slot.
The Spectrum Master can measure EVDO signals over the air (OTA) by connecting the
antenna to the unit or by directly connecting the Spectrum Master to the base station.
Getting Started
EVDO Mode
To prepare for EVDO measurements, the MS272xB must be configured for EVDO mode, as
follows:
1. Select the Shift key, then the Mode (9) key.
2. Use the directional arrow keys or the rotary knob to highlight EVDO Signal Analyzer,
and then press the rotary knob or press the Enter key to select.
16-216-2
EVDO Measurement Setup
The Spectrum Master can measure EVDO performance over the air (OTA) with an antenna,
or by connecting the base station directly to the Spectrum Master.
To measure an EVDO signal over the air, connect the appropriate frequency band antenna to
the Spectrum Master RF Input, and connect an Anritsu GPS antenna to the Spectrum Master
GPS connector.
Setting up the Measurement Frequency
The measurement frequency can be set by entering the center frequency or by selecting the
applicable signal standard and channel, which allows the Spectrum Master to automatically
set the frequency.
To enter the center frequency:
1. Press the Freq function hard key.
2. Press the Center Freq soft key.
3. Enter the desired frequency by using the keypad, the arrow keys, or the rotary knob.
If entering a frequency using the keypad, then the soft key labels change to GHz, MHz,
kHz, and Hz. Select the appropriate units key. Selecting the Enter key has the same
affect as selecting the MHz soft key.
4. Press the Enter key to set the Center Frequency. The current setting is shown on the
left side of the measurement screen.
To select a signal standard:
5. Press the Freq function hard key.
6. Select the Signal Standard soft key.
7. Use the Up/Down arrow keys or the rotary knob to highlight a signal standard, and
press Enter to select. When a signal standard is selected, the center frequency for the
first channel of the selected standard is automatically tuned.
8. Select the Channel soft key and use the Up/Down arrow keys, the keypad, or the rotary
knob to select a channel number for the selected signal standard. The center of the
channel is tuned to the center of the display. The current settings are displayed on the
left side of the measurement screen.
Power Offset for Compensating External Loss
In order to get accurate results, the external attenuation should be compensated by using
power offset. In power offset mode, the compensation factor is in dB. The external
attenuation is caused by using an external cable or by an external high power attenuator.
1. Press the Amplitude function hard key.
2. Press the Power Offset soft key and use the keypad, the arrow keys, or the rotary knob
to enter the desired offset value. Press the rotary knob or the Enter key to set the Power
Offset. The value that is entered is displayed on the left side of the measurement
screen.

16-316-3
PN Select
The Spectrum Master needs a timing reference in order to determine PN Offset and timing
errors. This reference comes from the base station when it is connected to the Spectrum
Master, or it can be recovered from GPS when a GPS antenna is connected to the Spectrum
Master.
The setup menu for this function is:
1. Press the Setup function hard key.
2. Press the PN Setup function soft key to open up the PN Setup menu.
3. Press the PN Trigger soft key to toggle through No trigger, GPS, and External.
No Trigger: If both GPS and external timing are unavailable, then you may choose
No Trigger for the PN search.
GPS: The Spectrum Master uses GPS as the timing reference.
External: The Spectrum Master uses an external even-second time mark as the
timing reference. The time mark is usually available at the base station on a BNC
connector labeled “ESTM” or “PP2S”. ESTM must be connected to the Ext. Trig. In
connector on the Spectrum Master.
4. Press the PN Search Type soft key to toggle between Auto and Manual. In Auto mode,
the Spectrum Master automatically detects the strongest pilot, while in Manual mode it
searches only for the specified PN.
5. Press Back to go back to the previous (Setup) menu.
MAC Codes Setup
MAC Walsh Codes setup is used to select 64 codes or 128 codes.
1. Step 1. Press the Setup function hard key.
2. Step 2. Press the Walsh Codes soft key to toggle between 64 codes and 128 codes.
External Reference Frequency Setup
In order to get the best frequency accuracy measurements, an external reference frequency
must be attached to the Spectrum Master Ext Ref In connector, or a GPS connection must be
attached to the Spectrum Master GPS connector. Most base stations have a reference
frequency that is available on a BNC connector.
To configure the Spectrum Master to use an external reference frequency, perform the
following:
1. Press the Setup function hard key.
2. Press the external reference frequency (Ext. Ref. Freq) soft key to display a list of the
available reference frequencies:
NOTE: If Manual Search Type is selected, then press Manual PN Offset and
enter the desired PN value.

16-416-4
3. Use the Up/Down arrow keys or the rotary knob to highlight the applicable reference
frequency on the list, and then press the rotary knob or the Enter key to set the
reference frequency.
As the Spectrum Master locks to the source, the Reference Freq value is displayed
within the user-settable parameters that are shown to the left of the measurement
screen.
GPS Setup
GPS gives accurate timing and frequency errors. To configure the Spectrum Master to use
GPS, perform the following:
1. Install the Anritsu GPS antenna to the GPS antenna connection on the Spectrum
Master connector panel.
One antenna now available from Anritsu that is suitable for this purpose is the 2000-1410
Magnet Mount GPS Antenna with 5 m (15 ft.) cable.
2. Press the Shift key then the System (8) key to open the system options menu.
3. Press the GPS soft key to open the GPS menu.
4. Press the GPS On/Off soft key to turn the GPS feature on or off. When GPS is first
turned on, the GPS icon is displayed in red.
When the GPS receiver is tracking at least three satellites, the GPS icon changes to green.
5. Press the GPS Info soft key to view the number of tracked satellites, latitude, longitude,
altitude, and UTC timing information, and so forth.
Table 16-1: External Reference Frequencies for EVDO
1 MHz 2.4576 MH
z9.8304 MH
z
1.2288 MH
z4.8 MHz 10 MHz
1.544 MHz 4.9152 MH
z13 MHz
2.048 MHz 5 MHz 19.6608 M
Hz
NOTE: The GPS antenna connection on the Spectrum Master is fitted with
a reverse BNC connector to help prevent damage to the GPS circuitry. A
direct current voltage is present on this connector. Never connect anything
other than the Anritsu GPS antenna to this port.
NOTE: As long as three minutes may be required for the Ref Freq status to
change to GPS High Accuracy in the Status menu, which is displayed on
the left side of the measurement screen.
NOTE: To reset the GPS, press the Reset soft key. The green GPS icon
with a red cross appears when GPS satellite tracking is lost. This occurs
after being active (tracking three or more satellites).

16-516-5
Within three minutes of satellite acquisition, the reference oscillator will have an accuracy of
less than 25 PPB (parts per billion). The accuracy of the OCXO internal standard is
±0.3 PPM. The correction factor that is applied to the internal OCXO allows the instrument
to maintain GPS frequency accuracy for three days even when the instrument is obstructed
from receiving signals from the GPS satellites. In order to acquire data from the GPS
satellites, the user must have line-of-sight to the satellites, or the antenna must be placed
outside without any obstructions to the satellites.
After GPS High Accuracy is achieved, and the internal reference is adjusted, this status will
be indicated by “Internal High Accuracy” showing in the Status menu, which is displayed on
the left side of the measurement screen. When the GPS feature is not enabled, the reference
source displays either “Internal Standard Accuracy” or a user-selected external reference
frequency in the Status menu on the left side of the measurement screen.
EVDO RF Measurements Setup
To make EVDO RF measurements, connect the Spectrum Master to the base station
following the setup instructions.
1. Select the Shift key, then the Mode (9) key.
2. Use the directional arrow keys or the rotary knob to highlight EVDO Signal Analyzer
and press the Enter key to select.
3. Follow the setup instructions in the measurement section to make accurate
measurements.
4. Press the Measurement and RF Measurement soft keys to open the measurement
menu.
Channel Spectrum Setup
This measurement displays the spectrum of the specified channel and channel power,
occupied bandwidth, and peak-to-average power.
From the RF Measurement menu, press Channel Spectrum to display the active
measurement.
NOTE: EVDO base stations have GPS available at the cell Site. Connect
the Spectrum Master to the base station GPS connector to make accurate
frequency error and timing measurements.
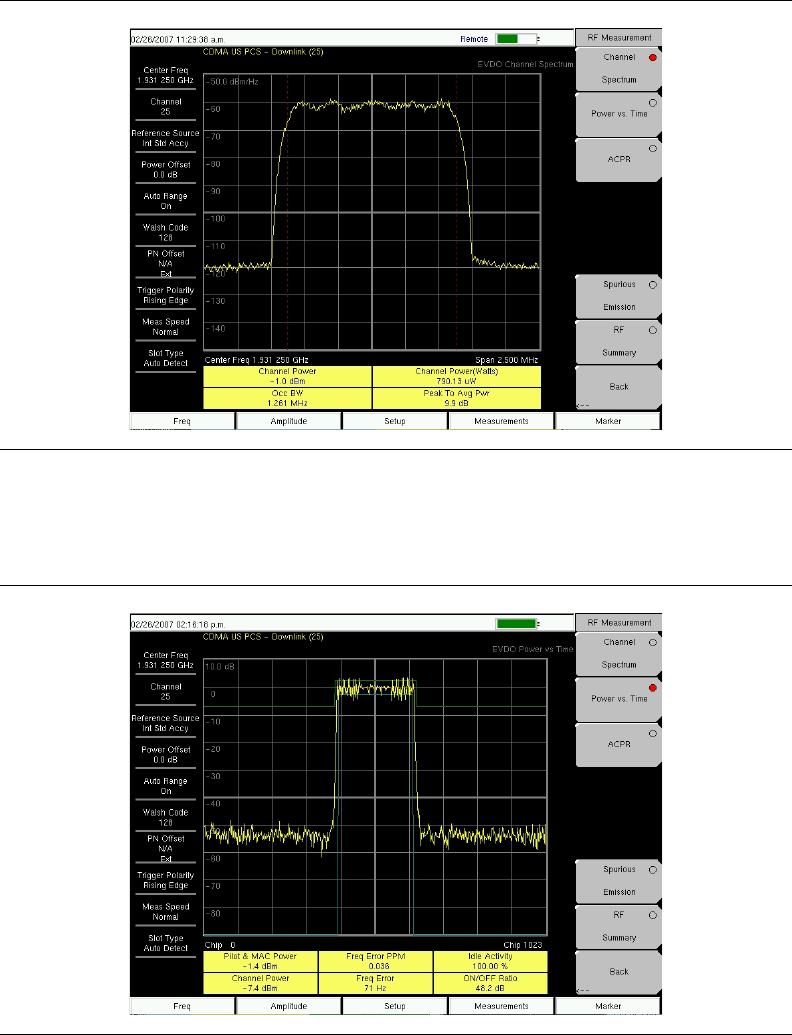
16-616-6
Power vs Time Setup
From the RF Measurement menu, press Power vs Time to display the active measurement
Figure 16-1. EVDO Channel Spectrum Measurement Display
Figure 16-2. EVDO Power Versus Time Measurement Display
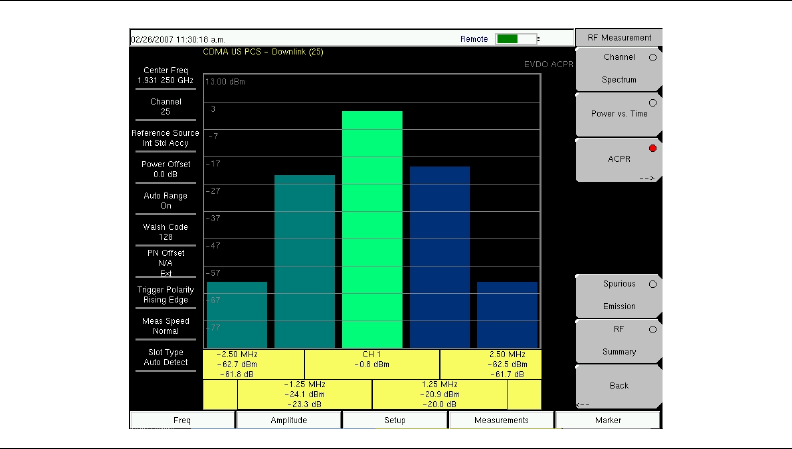
16-716-7
ACPR Setup
ACPR (Adjacent Channel Power Ratio) is defined as the ratio of the amount of leakage
power in an adjacent channel to the total transmitted power in the main channel and is
displayed in table format under the bar graph.
From the RF Measurement menu, use the following procedure for ACPR:
1. Press the ACPR soft key to activate the ACPR measurement. The red dot on the soft
key indicates that it is selected.
2. Press the ACPR soft key again to specify the Number of Carriers in a multi-carrier
configuration and to specify Carrier BW.
Figure 16-3. EVDO ACPR Measurement Display
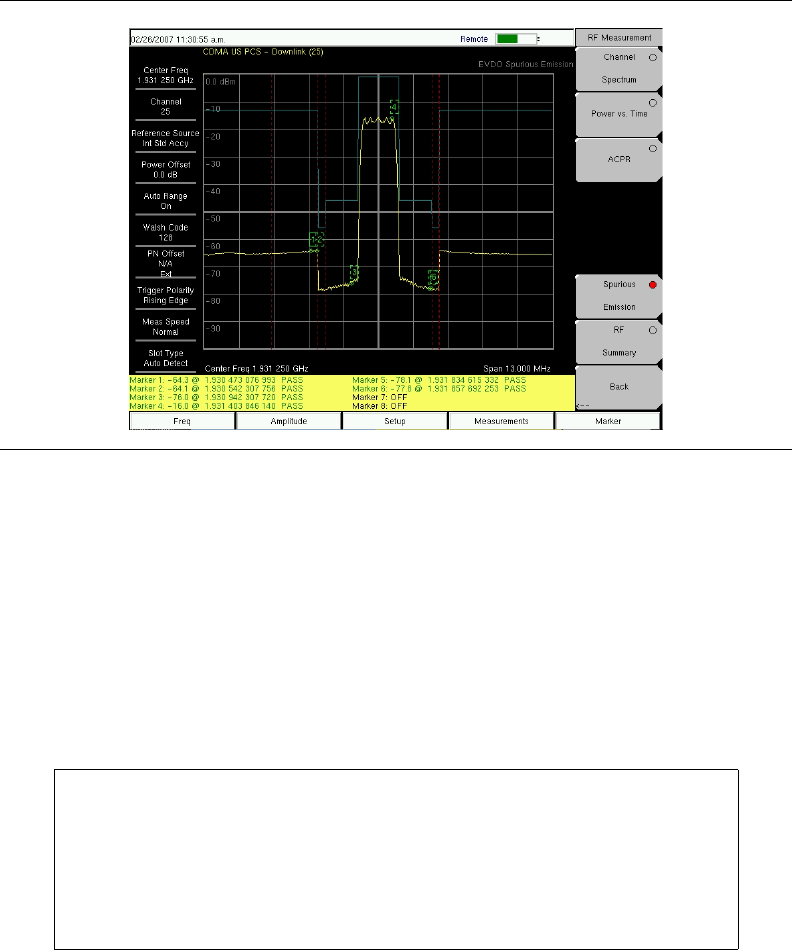
16-816-8
Spurious Emission Setup
The Spurious Emission test examines emissions at frequencies that are outside of the
assigned EVDO channel. Spurious emission should be measured at the base station RF
output port by using a direct cable connection.
To perform the test, select the correct band class and channel number. A band-class-specific
mask will be shown on the screen. Maximum emission power in each frequency offset
region will be highlighted by markers. Typical resolution bandwidths (RBW) that are used in
the emission test are 30 KHz and 1 MHz. Due to the variable RBW in some band classes, the
spectrum can appear to have “steps”.
For accurate EVDO emission measurements, users are required to input an all-idle or
all-active signal, and to set the Spectrum Master slot setting accordingly. The emission mask
is drawn according to the following document: Recommended Minimum Performance
Standards for cdma2000 High Rate Packet Data Access Network. (See 3GPP2 C.S0032-A
or TIA-864-A for details.)
From the RF Measurement menu, press the Spurious Emission soft key to activate the
measurement. The red dot on the soft key indicates that it is selected.
Figure 16-4. EVDO Spurious Emission Measurement Display
NOTE: (1) In the case of a multi-carrier EVDO signal, the Spectrum Master
“Number of Carrier” setting can be changed (setting it to a maximum of
5 carriers).
NOTE: (2) When the center frequency of a signal is entered directly
(instead of giving Band Class and Channel Number info), the Spectrum
Master automatically determines the most likely band class and its
emission mask, according to the specified frequency.
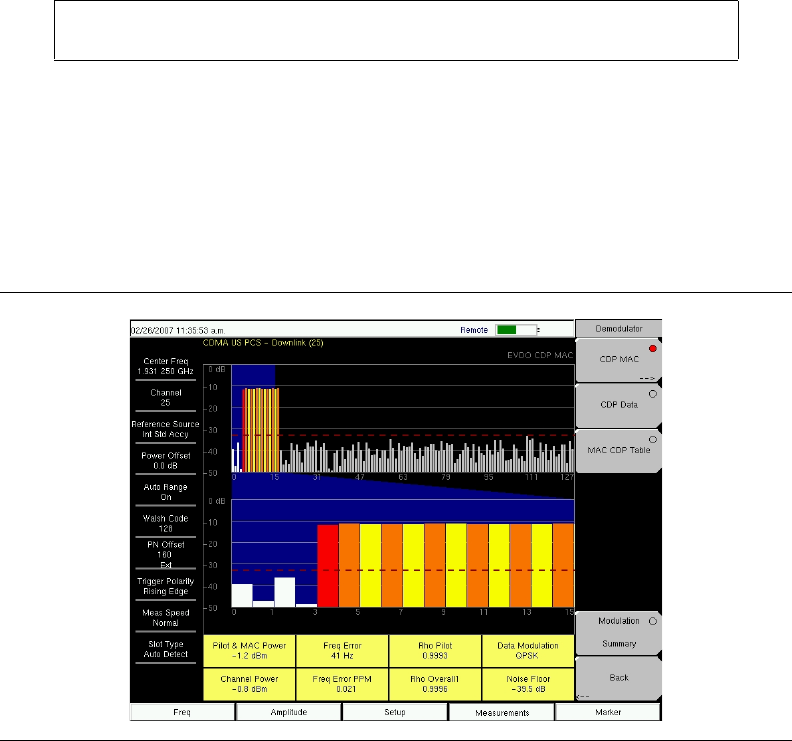
16-916-9
EVDO Demodulator Measurements Setup
EVDO demodulator measurements include, CDP MAC, CDP Data, MAC CDP table, and
Modulation Summary. To demodulate EVDO signals, connect the Spectrum Master to the
base station by using the following setup instructions:
1. Select the Shift key, then the Mode (9) key.
2. Use the directional arrow keys or the rotary knob to highlight EVDO Signal Analyzer,
and press the Enter key to select.
3. Press the Freq function hard key.
4. Press the Center Freq soft key and enter the desired frequency manually, or press the
Signal Standard soft key and select the applicable EVDO standard.
5. Select the Channel soft key and use the Up/Down arrow keys, the keypad, or the rotary
knob to select a channel number for the selected signal standard. The center of the
channel is tuned to the center of the display.
6. Press the Setup key to open Setup menu.
7. Press the PN Setup soft key and choose the trigger type: No Trigger (No Trig), GPS,
or External (Ext).
8. Press PN Search Type soft key to toggle between Auto and Manual search.
9. Press Back to go to the previous menu.
10. Press the Walsh Codes soft key to choose 64 codes or 128 codes.
11. Press the Measurement key to open the measurements menu.
12. Press the Demodulator soft key to activate demodulation measurements menu.
CDP MAC Setup
Pressing this soft key displays the CDP MAC codes. The lower part of the screen displays
the zoom codes.
NOTE: If Manual Search is selected, then press the Manual PN Offset soft
key and enter the PN value manually.
Figure 16-5. EVDO CDP MAC Measurement Display
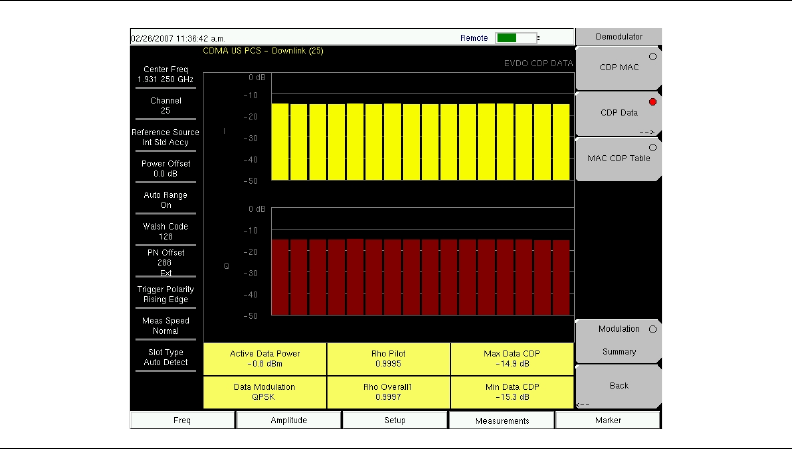
16-1016-10
From the Demodulator menu, use the following procedure for CDP MAC measurements:
1. Press the CDP MAC soft key to display MAC codes.
2. Press the CDP MAC soft key again to display the CDP MAC soft key menu.
3. Press the Zoom soft key and select 16 codes, 32 codes, or 64 codes.
4. Press the Zoom Start soft key and enter the desired zoom starting code.
5. Press the CDP Units soft key to select Relative Power (in dB) or Absolute Power
(in dBm).
Marker Setup (Activating Markers)
1. Press the Marker function hard key to display the Marker menu.
2. Press the Marker soft key to select the appropriate marker (1 through 6). The
underlined marker number is the currently selected marker.
3. Press the On/Off soft key to toggle the selected marker On or Off.
4. Press the Marker Table soft key to display the Marker table. The marker table is
displayed on the measurement screen below the CDP measurements table.
CDP Data Setup
CDP Data displays the data I (In phase) and Q (Quadrature phase) codes.
From the Demodulator menu, use the following procedure for CDP Data measurements:
1. Press the CDP Data soft key to display the codes.
2. Press the CDP Data soft key again to display the CDP Data soft key menu.
3. Press the CDP Units soft key to select Relative Power (in dB) or Absolute Power
(in dBm).
Figure 16-6. EVDO CDP Data Measurement Display
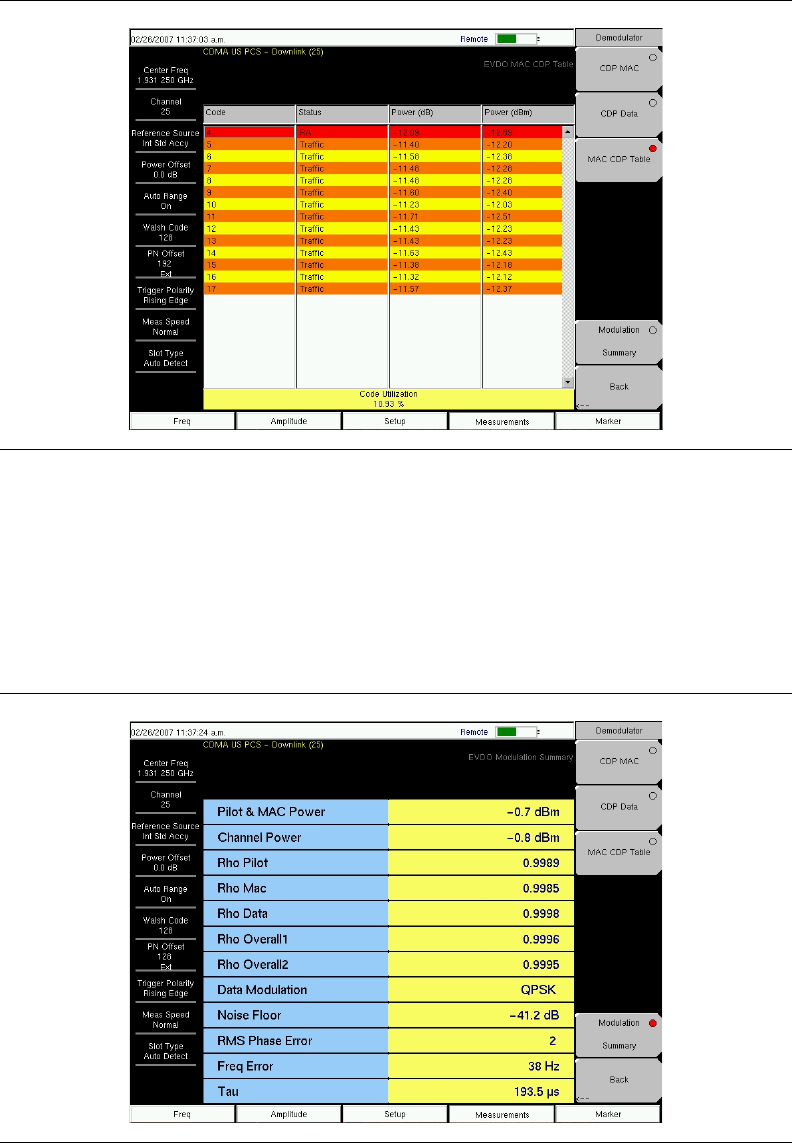
16-1116-11
MAC CDP Table Setup
The MAC CDP Table View displays all of the active codes in a tabular format.
From the Demodulator menu, use the following procedure to enter MAC CDP Table View:
1. Press the MAC CDP Table soft key to display the Code Domain Power table view.
EVDO Modulation Summary Setup
The EVDO modulation summary view displays EVDO critical RF and demodulator
measurements in tabular format.
Figure 16-7. EVDO MAC CDP Table Measurement Display
Figure 16-8. EVDO Demodulator Modulation Summary Measurement Display

16-1216-12
The following is the procedure to enter the EVDO Demodulator Modulation Summary view:
From the Demodulator menu, press the Modulation Summary soft key to display the
summary of measurements.
EVDO Over-The-Air Measurement Setup
OTA (over-the-air) testing provides field technicians with the ability to monitor
hard-to-reach pole-top base stations. Traditionally, the repair process for pole-top base
stations entailed pulling down the failed base station, then installing a new one. The failed
base station was then returned to the manufacturer or repair depot for service. If a base
station was determined to be healthy (a no trouble found (NTF) event), then the cost of the
process was incurred unnecessarily. OTA testing provides information about the health of
the base station, thereby improving the likelihood that a correct decision will be made with
regard to the base station. The result is fewer NTFs and elimination of their associated costs.
If you choose to measure EVDO performance over the air with an antenna, then additional
setup is required, as explained in the setup section. The Spectrum Master needs a timing
reference in order to determine PN Offset and timing errors. This reference comes from the
base station GPS when it is connected to the Spectrum Master, or it can be recovered from
GPS when a GPS antenna is connected to the Spectrum Master.
To make EVDO OTA measurements, connect the Spectrum Master to the base station and
perform the following setup procedure:
1. Select the Shift key, then the Mode (9) key.
2. Use the directional arrow keys or the rotary knob to highlight EVDO Signal Analyzer,
and press the Enter key to select.
3. Press the Freq function hard key.
4. Press the Center Freq soft key and enter the desired frequency manually, or press the
Signal Standard soft key and select the applicable EVDO standard.
5. Select the Channel soft key and use the Up/Down arrow keys, the keypad, or the
rotary knob to select a channel number for the selected signal standard. The center of
the channel is tuned to the center of the display.
6. Press the Setup key to open the Setup menu.
7. Press the PN Setup soft key and choose GPS.
8. Press the PN Search Type soft key and select Auto.
9. Press the Setup key to open the Setup menu.
10. Press the Walsh Codes soft key to toggle between 64 codes and 128 codes depending
upon the transmitting signal.
11. Press the Measurements key to open the measurements menu.
12. Press the OTA soft key to activate Over The Air measurements.
NOTE: Follow the GPS setup procedure in the Setup section.
NOTE: 64 Walsh Codes can be displayed when the unit is in 128 code
mode. The Walsh Codes will be repeated on the measurement screen.
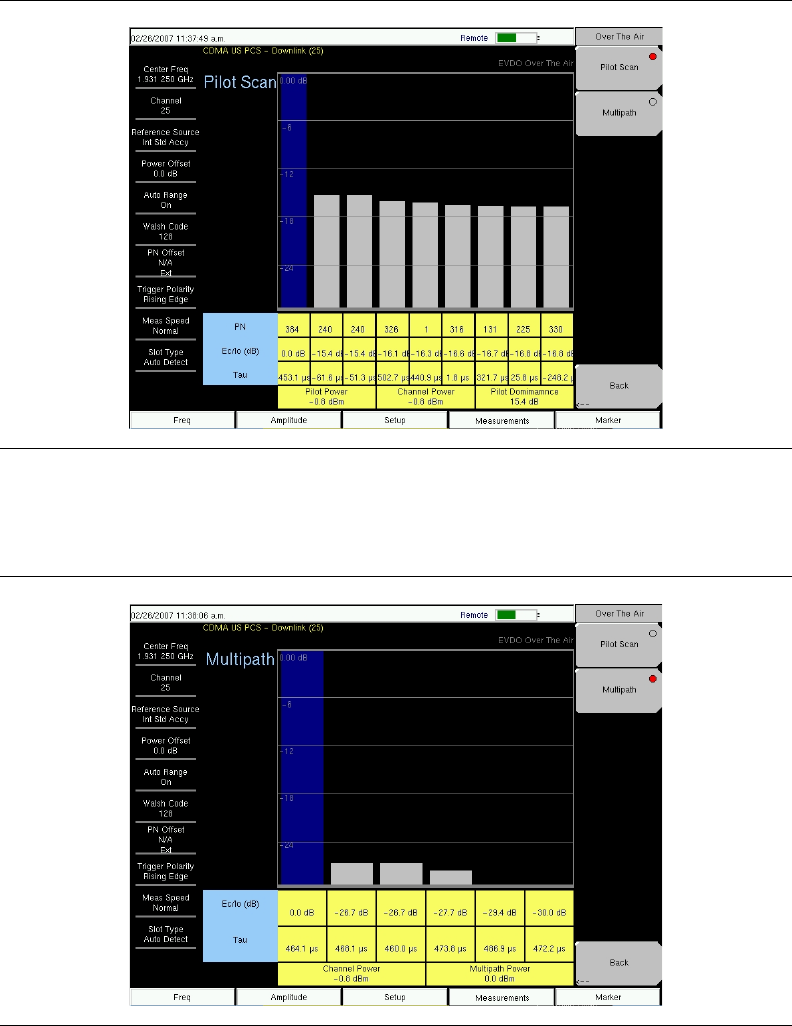
16-1316-13
The following procedures are used to display the OTA Pilot Scan and Multipath views:
From the Over-The-Air menu, press the Pilot Scan soft key to display the nine strongest
pilots, the PN codes, Ec/Io, Tau, Pilot Power, Channel Power, and Pilot dominance.
From the Over-The-Air menu, press the Multipath soft key to display six channels of
multipath parameters, including Ec/Io, Tau, Channel Power, and Multipath Power.
Figure 16-9. EVDO OTA Pilot Scan Measurement Display
Figure 16-10. EVDO OTA Multipath Measurement Display
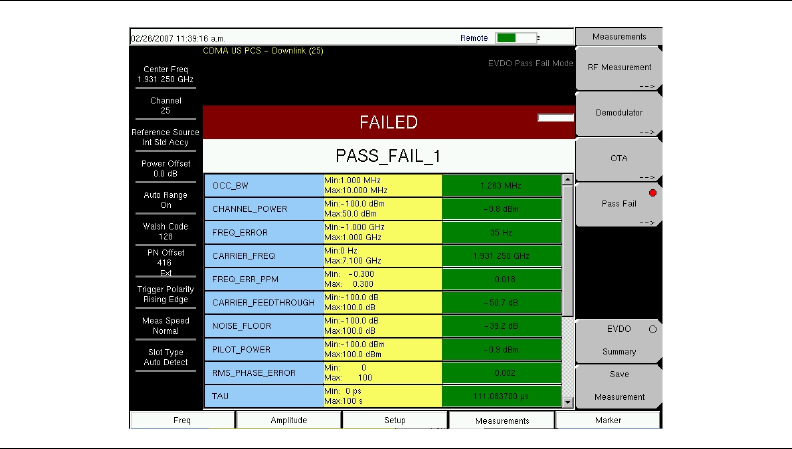
16-1416-14
Pass Fail Setup
The Spectrum Master stores user-defined pass fail criteria test models for testing base station
performance and recalls these models for quick, easy measurements. After selection of a test
model, the Spectrum Master displays test results in tabular format with clear PASS or FAIL
indications that include min/max threshold.
Using Master Software Tools, a custom test list can be created and downloaded into the
Spectrum Master. All critical parameters can be selected for pass fail testing.
From the Measurements menu, use the following procedure to enter the Pass Fail Mode:
1. Press the Pass Fail soft key to display pass fail criteria.
2. Press the Pass Fail soft key again to open the Pass Fail soft key menu.
3. Press the Select Pass/Fail Test soft key and select the applicable Test Model to activate
the measurement.
4. Press the Reset soft key to reset the pass fail function and begin a new pass fail test.
Figure 16-11. EVDO Pass Fail Measurement Display
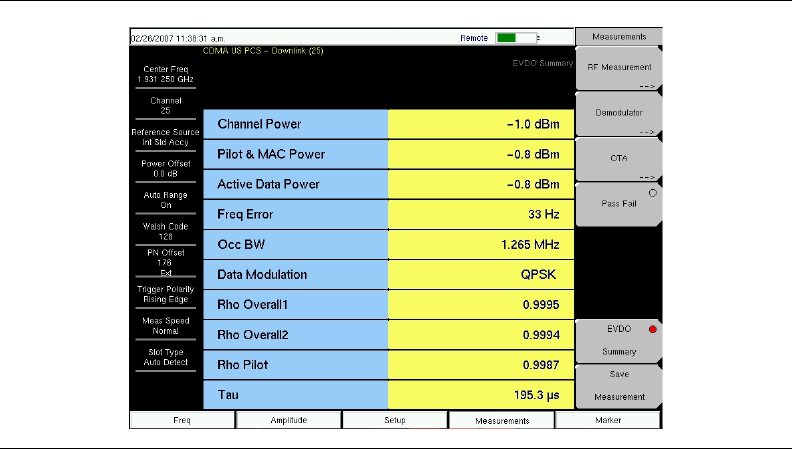
16-1516-15
EVDO Summary Setup
EVDO summary displays EVDO critical RF and demodulator measurements in tabular
format.
From the Measurements menu, press the EVDO Summary soft key to display the
measurements in tabular format.
From the Measurements menu, press the Save Measurement soft key to open a dialog box in
order to name and save the current measurement.
Figure 16-12. EVDO Summary Measurement Display

16-1616-16
EVDO Measurement Descriptions
Pilot & MAC Power: The Pilot & MAC power shows the average power of the Pilot and
MAC Channels. It is an absolute number that is expressed in dBm or Watts.
Active Data Power: Active Data Power is the average power of the Data Channel. When
the slot is active, the data power should be very similar to the MAC & Pilot power (less than
2.5 dB difference). When the slot is idle, the Active Data Power should be at least 7 dB
below the MAC & Pilot power if the Spectrum Master is connected directly to a base station.
Channel Power: During an active slot, Channel Power should be similar to Pilot & MAC
power and should also be similar to Active Data Power. During an idle slot, channel power
should be somewhere between the Pilot & MAC power and Data Power, because it is a
weighted average of the two. When measuring an EVDO station with live traffic, channel
power will vary according to how busy the downlink is, because channel power also depends
upon the percentage of idle slots and active slots in the Spectrum Master captured sample.
Noise Floor: Noise floor is the average power of the inactive MAC channels, relative to the
total MAC channel power. It is expressed in dB. When connected to a good EVDO source,
the noise floor should be –31.5 dB or below. When noise or distortion is present (for
example, in an over-the-air measurement), the noise floor can be considerably higher.
Freq Error: Frequency error is the difference between the received center frequency and the
specified center frequency. This is only as accurate as the frequency reference that is being
used and is typically more useful with a good external frequency reference or GPS.
Data Modulation: The Spectrum Master can determine the data channel modulation type
automatically. EVDO data channel has three modulation types: QPSK, 8PSK, and 16QAM.
When the slot is idle, the Spectrum Master displays “Idle”.
PN Offset: Each EVDO base station is identified by a unique PN Offset in its pilot signal.
This is similar to CDMA.
Tau: Tau measures the time delay from the input trigger to the “start of a slot.” This means
that Tau can be much larger than what is commonly seen in CDMA if the signal is not
synchronized to the trigger.
Rho: Rho is a number between 0 and 1. A good signal should have a Rho that is close to 1.
When connected to a good EVDO source, all Rhos should be 0.97 or above, and should
decrease when the channel power is too weak. When noise or distortion is present, for
example in an over-the-air measurement, Rhos can drop dramatically.
Rho Pilot: Rho Pilot is an indicator of the quality of the Pilot Channel.
Rho Data: Rho Data is an indicator of the quality of the Data Channel.
Rho MAC: Rho MAC is an indicator of the quality of the MAC Channel.
NOTE: The EVDO PN must be aligned with the start of an EVDO slot, in
addition to referencing the external trigger or GPS signal. Therefore, when
the user connects an external trigger that is poorly aligned with the EVDO
signal slots, the Spectrum Master may report a Tau value that is very large
in magnitude, in order to give the best possible PN Offset estimation.

16-1716-17
Rho Overall 1 and 2: Rho Overall 1 and 2 are both indicators of the overall quality of the
EVDO signal during an active slot. They differ from each other in the sense that Rho
Overall 1 measures from the beginning to the end of a half slot, while Rho Overall 2
measures from the middle of one half slot to the middle of another half slot. In general, they
should have similar values.
Carrier Feedthrough: Carrier Feedthrough measures the amount of unmodulated signal
that is leaking through the transmitter.
CDP Data: The Data Channel in EVDO consists of 16 “I” sub channels and 16 “Q” sub
channels. Each of these channels should have a power of approximately –15.05 dB relative
to the total Data Channel power. When connected to a good signal source, the Data Code
Min is usually larger than –15.5 dB, and the Data Code Max is usually less than –14.6 dB.
The smaller the difference between these two values, the better the signal quality.
CDP MAC: MAC channels are Walsh despread into 64 sub-channels (physical layer
Subtype 0 or 1) or 128 sub-channels (physical layer Subtype 2). See the menu description
for CDP MAC for color code details.
Pilot Scan: The strongest 9 PNs that are received are displayed. The length of the bar
represents the absolute or relative power of the signal in dBm or dB. The strongest PN or the
user-selected PN is color coded blue, those colored red are probably real pilots, and the
remaining, which are color coded gray, are probably noise.
Multipath: The length of the bar represents the relative power in the signal path in dB. Ec/Io
and Tau are displayed below each bar. The strongest signal is color coded blue. The
remaining signals are color coded red, or they are color coded gray if they are due to system
noise.
Pilot Dominance: Pilot Dominance is a measure of the strength of the strongest pilot
compared to the next strongest pilot in the same channel. This should be >10 dB in order to
make good demodulator measurements.
Multipath Power: Multipath Power is a measure of the total amount of power in the
dominant signal (that is being spread in time due to multipath echoes) relative to its power in
the main transmission path. This should be <0.4 dB in order to make good measurements.
Ec/Io: The pilot power compared to the total channel power during the pilot time slot.
Occ BW: The occupied bandwidth is calculated as the bandwidth containing 99% of the
transmitted power in a 2.5 MHz span.
Active Data Power: The average power of the data channel portion of the active EVDO slot
that is captured. If no active slots are captured, then the unit will display N/A.
Power vs. Time Graph: This view shows the time domain view of an EVDO half-slot. The
Slot Type selection in the Setup menu determines the priorities regarding which slot is
displayed.
Idle or Active Activity %: This shows the estimated percentage of idle or active slots in the
total number of slots captured. Expect the idle percent (%) to be low and the active percent
to be high when many EVDO users are connected to a base station.
NOTE: This graph is not meaningful if the PN search is set to No Trigger.
16-1816-18
EVDO Menus
Amplitude
See “Amplitude Menu” on page 15-18..
File
See “File Menu” on page 15-19..
Frequency
See “Freq (Frequency) Menu” on page 15-22..
Limit
See “Limit Menu” on page 15-23..
Marker
Markers are available only in CDP MAC and Spectrum measurements.
See “Marker Menu” on page 15-24. for other descriptions.
Marker Table
This functions turns On and Off a marker table in the CDP MAC view only. The marker
table indicates the values of all active markers.

16-1916-19
Measurements Menu
Also refer to the similar CDMA “Measurements Menu” on page 15-25.
RF Measurement
EVDO includes Power vs. Time, and the Spurious Emission soft key is located further
down. The menu functions are similar to CDMA, except for the following:
Power vs. Time
Pressing this soft key displays a power versus time measurement. This view shows the
time domain view of an EVDO half-slot. The Slot Type selection in the Setup menu
determines the priority of which slot is displayed. Below the measurement display,
numerical values are included for:
Pilot and Mac Power in dBm
Freq Error in Hz and PPM
Channel Power in dBm
ON/OFF Ratio: Power ratio (in dB) of Pilot and MAC power to the data power in
an idle slot
Idle Activity: Percentage of idle slots relative to total slots in the captured signal
Figure 16-13. EVDO Measurements Menu
Measurements
Rf Measurement
-->
Demodulator
-->
OTA
-->
-->
Save
Measurement
Pass Fail
º
Summary
EVDO º
Back
<--
Over The Air
Pilot Scan
º
Multipath
º
Back
<--
Pass Fail Mode
Select
Pass/Fail
Test
Reset
Back
<--
CDP
Zoom
16 32 64
Zoom Start
#
CDP Units
Relative Absolute
Back
<--
ACPR
Carrier BW
# # # #
Number of Carriers
#
RF Measurement
º
Channel
Spectrum
º
Power vs. Time
ACPR
º
º
RF
Summary
Back
<--
º
Spurious
Emission
Demodulator
CDP MAC
º
CDP Data
º
º
Modulation
Summary
Back
<--
MAC CDP Table
º
CDP Data
CDP Units
Relative Absolute
Back
<--
16-2016-20
Demodulator
Pressing this soft key opens the Demodulator soft key menu with the following four
functions.
CDP MAC
The first press of this soft key begins a CDP MAC measurement and also displays an
arrow on the soft key (to indicate that a sub menu is available). The Code Domain
Power (CDP) MAC view displays all of the Pilot and MAC codes in a color coded
graphical format. MAC channels are Walsh despread into 64 sub-channels (physical
layer Subtype 0 or Subtype 1) or 128 sub-channels (physical layer Subtype 2).
The bottom half of the CDP graph area shows a zoomed-in view of the code powers. A
blue mask behind the zoomed-in area is duplicated in the upper graph to indicate which
signals are in the zoom view.
The numerical results displayed in this view are
Pilot and MAC Power (dBm)
Channel Power (dBm)
Freq Error in Hz and PPM
Rho Pilot
Rho Overall1
Data Modulation
Noise Floor (dB)
The codes are color coded according to the following list:
Reserved Channels in White
Inactive channels in Gray
Reverse Activity (RA) in Red
Active channels alternate between Orange and Yellow
Zoom, 16, 32, 64
Press this soft key to select one of these three settings to view 16, 32, or 64 carriers
in the measurement display.
Zoom Start
Press this soft key, then enter the required zoom start index. For example, to start at
code 2, which is the second code power that is displayed, press the 2 key on the
numeric keypad, then press either the Enter soft key (which appears when the
numeric keypad is used) or the Enter key.
Also, press this soft key, then use the arrow keys or rotary knob to change the zoom
start index. The CDP soft key menu remains after pressing the rotary knob or the
Enter key.
Back
Returns to previous (Demodulator) soft key menu.
16-2116-21
CDP Data
The first press of this soft key displays EVDO CDP Data. The next press of the soft
key opens the CDP Data soft key menu. The Code Domain Power (CDP) Data view
displays only the data code powers. The display is split into the I (In phase) data
and Q (Quadrature phase) data components. Each contains 16 sub-channels.
The numerical results that are displayed in this view are:
Active Data Power (dBm)
Data Modulation Type
Rho Pilot
Rho Overall1
Max Data CDP
Min Data CDP
CDP Units, Relative Absolute
Press this soft key to toggle between Relative units (in dB) or Absolute units in
(dBm). Select Relative to show CDP power values in dB relative to Pilot and
MAC Power, or Absolute to show power values in dBm.
Back
Returns to previous (Demodulator) soft key menu.
MAC CDP Table
This screen shows the power of the codes in a tabular format. The table displays the
following 4 columns:
Code number
Status: RA, Active, Pilot, Page, Sync, All Traffic (Color Coded rows)
Relative Power (in dB)
Absolute Power (in dBm)
Code Utilization is displayed in percent (%) at the bottom of the table. It is a
number indicating how many codes are used by a particular user (traffic).
Modulation Summary
Pressing this soft key displays a summary of all the modulation-related numerical
measurement results in a table format, with rows for: Pilot & MAC Power,
Channel Power, Rho Pilot, Rho MAC, Rho Data, Rho Overall1, Rho Overall2,
Data Modulation, Noise Floor, RMS Phase Err, Freq Error, and Tau.
Back
Returns to previous (Measurements) soft key menu.
16-2216-22
OTA
Soft key to open the Over The Air soft key menu. OTA displays the EVDO Over The Air
measurements, which include: Pilot Codes, Ec/Io (dB), Tau, Pilot Power, Channel Power,
Pilot Dominance, and Multipath.
Pilot Scan
Displays the power of the 9 strongest PNs in histogram graphical format. The strongest
PN or the user-selected PN is color coded blue, those colored red are probably real
pilots, and the remaining, which are color coded gray, are probably noise. PN, Ec/Io,
and Tau are displayed below each PN bar graph signal. Pilot Power (dBm), Channel
Power (dBm), and Pilot Dominance (dB) are displayed below the graph.
Multipath
Displays six multipaths in histogram graphical format. The strongest is color coded
blue. The remaining signals are color coded red, or they are color coded gray if they are
due to system noise. The numerical results that are displayed in this view are
Ec/Io (dB) and Tau for each path. Channel Power, and Multipath Power are displayed
below the graph.
Back
Returns to previous (Measurements) soft key menu.
Pass Fail
The first press of this soft key puts the Spectrum Master into Pass Fail Mode. The next
press of the soft key opens the Pass Fail Mode soft key menu. See “Pass Fail” on
page 15-28..
Select Pass/Fail Test
This soft key function allows the selection of a user-defined file that specifies a list of
measurements with pass fail criteria. Select a test model by using the arrow keys or
rotary knob. This mode will sequentially assess the appropriate measurements and
indicate a pass or fail state based upon the test model criteria. Custom pass fail tests can
be created by using Master Software Tools.
Reset
Press this soft key to restart the measurement.
Back
Returns to previous (Measurements) soft key menu.
EVDO Summary
Pressing this soft key displays a summary of all of the EVDO-related numerical
measurements in a table format.
Save Measurement
Pressing this soft key opens a dialog box to name and save the current measurement. Press
Enter to save the EVDO measurement, which is saved with a .evdo extension. See “Save”
on page 15-19..
16-2316-23
Mode Menu
To access the functions under the Mode menu, select the Shift key, then the Mode (9) key.
Use the directional arrow keys or the rotary knob to highlight the selection and press the
Enter key to select. The list of modes that appears in this menu will vary depending upon the
options that are installed and activated in your instrument.
Setup
See “Setup Menu” on page 15-29.. Items that are different are shown below
Walsh Codes
This allows you to toggle between 64 and 128 MAC indices. Note that MAC 128 is
applicable only to Rev. A physical layer subtype 2.
Slot Type
Press this soft key to toggle through Auto, Active, and Idle slot types. Selecting Active
makes the Power vs Time display an active slot if one is available. Selecting Idle makes
the Power vs Time display an idle slot if one is available. Selecting Auto makes the Power
vs Time show an Idle slot, or an Active slot if no idle slot is available. This setting also
affects the type of power trigger that is used in a Spurious Emission Test.
System
See “System Menu” on page 15-31..
Preset
See “Preset Menu” on page 15-28..
Sweep
See “Sweep Menu” on page 15-30..
Trace
This menu is not available in EVDO mode.
16-2416-24
17-1
Chapter 17
DVB-T/H Signal Analyzer
Introduction
This chapter provides a brief description of DVB-T/H setup and measurement for signal
power and signal analysis with Option 64 and Bit Error Rate (BER) testing with Option 57
on the Spectrum Master MS2721B. Digital Video Broadcasting (Terrestrial & Handheld) is
abbreviated as DVB-T/H.
DVB-T
DVB-T (terrestrial DVB) is a multi-carrier system using approximately 2000 carriers or
8000 carriers, each of which carries QPSK, 16QAM, or 64QAM. QAM (Quadrature
Amplitude Modulation) is one available method that is used to increase the amount of
information per modulation symbol. With 64QAM, for example, the hierarchical system
maps the data onto 64QAM in such a way that a QPSK stream is effectively buried within
the 64QAM stream. In addition, the spacing between constellation states can be adjusted to
protect the QPSK (HP) stream at the expense of the 64QAM (LP) stream.
Good quality reception allows receivers to resolve the entire 64QAM constellation. In areas
with reception of poorer quality, or in the case of mobile or portable reception, receivers may
be able to resolve only those portions of the constellation that correspond to QPSK.
In a 64QAM constellation, 6 bits can be coded per 64QAM symbol. In hierarchical
modulation, the 2 most significant bit (MSB) would be used for robust mobile service. The
remaining 6 bits could contain, for example, an HDTV service. The first two MSB
correspond to a QPSK service that is embedded in the 64QAM service.
DVB-H
DVB-H (handheld DVB) uses the DVB-T transmission system as the physical layer and
adds extra error correction and time-slicing mechanisms on the link layer. DVB-H carries IP
datagrams that are encapsulated by using multi-protocol encapsulation. DVB-H differs from
DVB-T by using approximately 4000 carriers (with QPSK, 16QAM, or 64QAM).
A full DVB-H system is defined by combining elements in the physical and link layers as
well as service information. DVB-H makes use of the following technology elements for the
link layer and the physical layer:
Link layer
• Time-slicing to reduce average power consumption of terminal and to enable smooth
and seamless frequency handover
• Forward error correction for multi-protocol encapsulated data (MPE-FEC) for
improvement in the C/N (carrier-to-noise ratio) and Doppler performance in mobile
channels, also improving tolerance to impulse interference
17-2
Physical layer
DVB-T plus the following technical elements specifically targeting DVB-H use:
• DVB-H signalling in TPS-bits to enhance and speed up service discovery. A cell
identifier is also carried on TPS-bits in order to support faster signal scan and
frequency handover on mobile receivers.
• 4K mode (3409 carriers) for trading off mobility and SFN cell size, allowing single
antenna reception in medium SFNs at very high speed, thus adding flexibility in the
network design
• Optional in-depth symbol interleaver for 2K (1705 carriers) and 4K (6817 carriers)
modes for further improving robustness in mobile environment and impulse noise
conditions
• Transmission parameters to operate transmission system in 5 MHz channel
bandwidth, even outside traditional broadcasting bands
2k, 4k, 8k Modes
Using a smaller number of subcarriers allows for more inter-carrier spacing and thereby
provides more tolerance to echos that are influenced by Doppler effect. Shorter symbol
duration limits the maximum delay of accepted echos. Using a larger number of subcarriers
creates smaller inter-carrier spacing and provides a longer symbol duration. The choice
among these three modes is based upon balancing the influence of Doppler effect against the
maximum delay of echos. For receivers that are in motion, signal complexity evolves from
the many echoes that are received (which are delayed in the time domain) and also from the
frequency shift (the Doppler effect) that distorts both the incoming signal and the echoes.
Guard Intervals
In order to decrease receiver complexity, each OFDM block is extended by a guard interval,
placing a copy of the end of the OFDM block at the front of the block, thereby creating a
cyclic prefix. The width of a guard interval can be 1/4, 1/8, 1/16, or 1/32 the length of the
original block. This fraction represents the ratio between the guard interval and the active
symbol period. The overall data capacity is reduced by the same fractional proportion.
Guard Intervals (GI) are used to ensure that distinct transmissions do not interfere with one
another. Guard Intervals introduce immunity to propagation delays, echoes, and reflection,
to which digital data is normally very sensitive. A GI at the beginning of each symbol allows
time for echoes to fade before the active symbol period begins. Protection is inversely
proportional to data rate efficiency. A 1/32 GI gives high data rate efficiency and the lowest
protection, while a 1/4 GI provides the best protection but the lowest data rate efficiency.
Guard intervals help to reduce echo interference at the receiver if the duration of the echoes
does not exceed the duration of the guard band.
17-3
FFT Start
The FFT Start position is used to synchronize the reading of the OFDM frame. The start can
be set at the end of the complete GI, at the beginning of the GI, or can be set to include a
fraction of the GI, which is divided into eighths. The FFT Start may be set from 0⁄8 (none of
the GI) to 8⁄8 (all of the GI). This control is used in the modulation analysis measurements
(constellation and impulse response) and the transmitter carrier MER measurement. The
flexibilty that is provided by a selection of FFT Start positions allows synchronizing with a
strong signal.
If the FFT Start position is set to any of the GI positions (0/8 to 8/8), and if the 0 µs position
on the Impulse Response (All) graph is subsequently changed, then the FFT Start position is
automatically modified by the MS2721B. If the FFT Start position is set to 0/8 Fixed
through 8/8 Fixed, then the FFT Start position is not modified when the 0 µs position is
changed on the Impulse Response (All) graph.
Measurement Functions
Signal Power Measurement
The signal power measurement is useful for adjusting antenna angles and for area surveys.
Modulation Analysis, Constellation and Impulse Response
Constellation Measurement
The constellation function is useful for analyzing the condition of the received signal by
monitoring the modulation symbol movement. In addition, this function measures the center
frequency accurately by using a proprietary signal processing technique.
The Modulation Error Ratio (MER) measurement function, which directly quantifies the
modulation signal quality of digital broadcasting signals, is essential for managing signal
margin and the fixed deterioration of equipment with time, as well as for maintaining stable
broadcast services.
MER indicates signal deterioration even when BER measurement does not detect
errors (error-free range).
MER is unrelated to modulation parameters, so one MER result can be compared with
other MER results.
Impulse Response Measurement
This function measures the difference in time and frequency of multipath signals. By
measuring the channel frequency response, the multipath effect and frequency selective
fading can be observed. This is useful for adjusting the timing of SFN repeaters.
Tx Carrier MER
This function is useful for transmitter installation or maintenance because it offers a wide
dynamic range (50 dB) on the vertical scale for high-performance transmitters and also
offers precise checks of each carrier by providing a zoom view for all carriers on the
horizontal scale.
BER Measurements (Option 57)
This option adds hardware to the instrument to perform bit error rate (BER) measurements
on DVB broadcast signals. Measurement of BER is a useful tool for evaluating the quality of
a broadcast signal. BER (Bit Error Rate) and PER (Packet Error Rate) can be measured
simultaneously along with channel power and MER (Modulation Error Ratio). BER
measurements also accommodate in-service and out-of-service testing.
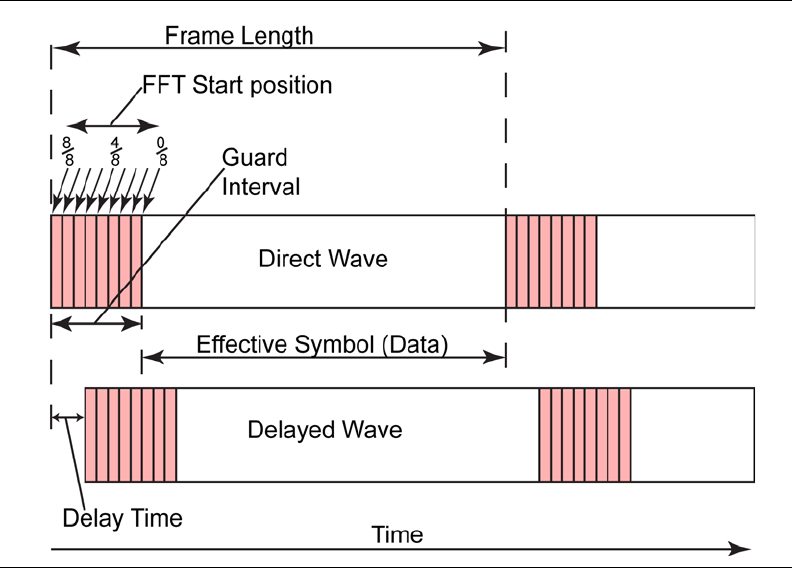
17-4
Spectrum Monitor
This function displays the frequency response around the desired channel. The varable span
supports display of up to 51 channels simultaneously, so that broadcast service signals can
be checked at a glance.
Time-slicing
The objective of time-slicing is to reduce the average power consumption of
battery-powered receivers and to enable smooth and seamless service handover.
Time-slicing consists of sending data in bursts using a significantly higher instantaneous bit
rate compared to the bit rate required if the data were transmitted using traditional streaming
mechanisms.
To indicate to the receiver when to expect the next burst, the time (delta-t) to the beginning
of the next burst is indicated within the burst. Between the bursts, data of the elementary
stream is not transmitted, which allows other elementary streams to use the bandwidth
otherwise allocated. Time-slicing enables a receiver to stay active only a fraction of the time
and still receive bursts of a requested service. Note that the transmitter is constantly on (in
other words, the transmission of the transport stream is not interrupted).
Time-slicing also allows a receiver to monitor neighboring cells during the off-times
(between bursts). By switching the reception from one transport stream to another during an
off period, a better handover decision is possible as well as seamless service handover.
Time-slicing is always used in DVB-H.
Figure 17-1. FFT Start and Guard Interval
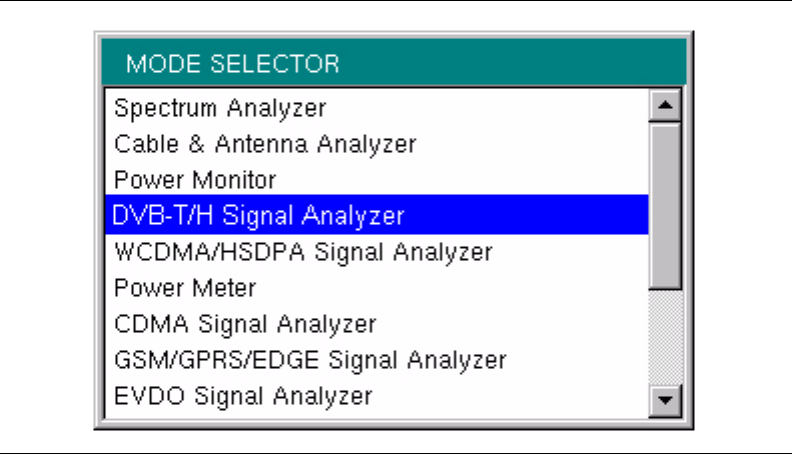
17-5
MPE-FEC
The objective of MPE-FEC (forward error correction for multi-protocol encapsulated data)
is to improve the C/N and Doppler performance in mobile channels and to improve tolerance
to impulse interference. This is accomplished through the introduction of an additional level
of error correction at the MPE layer. By adding parity information that is calculated from the
datagrams and by sending this parity data in separate MPE-FEC sections, error-free
datagrams can be output after MPE-FEC decoding, even with bad reception conditions. The
use of MPE-FEC is optional.
Hierarchical Modulation
In hierarchical modulation, two separate data streams are modulated onto a single DVB-T
stream. One stream, called the High Priority (HP) stream, is embedded within a Low Priority
(LP) stream. Receivers with good reception conditions can receive both streams, while those
with poorer reception conditions may receive only the High Priority stream. Broadcasters
can target two different types of DVB-T receiver with two completely different services.
Typically, the LP stream is of a higher bit rate but lower robustness than the HP stream. A
broadcaster could choose, for example, to deliver HDTV in the LP stream.
Getting Started
Quick Start Configuration, Setup, and Testing
DVB-T/H Signal Analyzer Mode
To prepare for DVB-T/H measurements, the MS2721B must be configured for DVB-T/H
mode, as follows:
1. Press the Shift key, then the Mode (9) key.
2. Use the Up/Down arrow keys or the rotary knob to highlight DVB-T/H Signal
Analyzer and then press the Enter key or the rotary knob to select this mode.
Figure 17-2. Mode Selector Menu
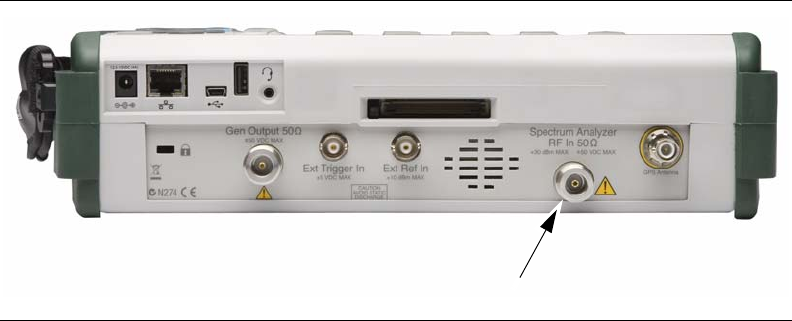
17-6
Antenna Setup
The antenna attaches to the MS2721B with a coaxial cable. The antenna and coaxial cable
are not supplied with the MS2721B and are to be procured separately.
The antenna factors are different for each antenna. Refer to the documentation for your
antenna. Also, remember to add the cable loss to the measurement correction table.
1. Attach the antenna to the Spectrum Analyzer connector on top of the instrument (refer
to Figure 17-3).
Select the antenna as follows:
2. Press the Meas Selection function hard key.
3. Press the Signal Power soft key.
4. Press the Meas Setup function hard key.
5. Press the Antenna (Correction Level) soft key.
6. In the Select Antenna list box, scroll to the desired Anritsu antenna model number by
using the Up/Down arrow keys or the rotary knob, and press the rotary knob or the
Enter key to select it.
Figure 17-3. Spectrum Master Connections – Spectrum Analyzer RF in
Spectrum
Analyzer input
17-7
Measurement Setup and Execution
The function hard keys have the following labels with option 64:
Frequency/Level, Meas Selection, Meas Setup, Execute Measure, Save Files
Frequency and Reference Level Configurations
The following procedure is used to set up the MS2721B for DVB-T/H measurement and
analysis:
1. Press the Frequency/Level function hard key.
Configure the parameters as needed: Channel Map, Frequency, Bandwidth, Auto
Reference Level, Reference Level, and Pre Amp.
2. Press the Channel Map soft key. The Select Channel Map list box opens. Select one of
the three choices, and then press the Enter key or the rotary knob.
3. If you have selected UHF (Australia) or UHF (Europe), then press the Channel soft key,
scroll to the desired channel, and press the Enter key. The bandwidth (7 MHz or
8 MHz) and the frequency range are automatically selected by the choice of channel
map. The selected channel number is displayed on the face of the Channel soft key. If
no channel map (None) is selected, then the Frequency and Band Width soft keys are
present in the soft key menu so that these parameters can be set manually.
4. If you have selected None, then use the Frequency and Band Width soft keys to set
these parameters.
5. Press the Frequency soft key to open the Frequency Editor dialog box, which indicates
the acceptable range for input. The Units soft key menu displays four units keys: GHz,
MHz, kHz, and Hz. If the frequency is outside the DVB measurement, then the
Spectrum Master displays “Out of range” at the bottom of the Frequency Editor
window. Set the frequency by using the Up/Down arrow keys, the rotary knob, or the
number keys. When the desired range is displayed, press the appropriate units soft key,
the rotary knob, or the Enter key.
6. Press the Band Width soft key to open the Select Band Width list box and select a
bandwidth.
7. Press the Auto Reference Level soft key to allow the MS2721B to set an optimum
reference level, or press the Reference Level soft key to open the Reference Level
Editor dialog box. To manually set the dBm reference level, use the Up/Down arrow
keys, the rotary knob, or the number keys, then press the rotary knob or the Enter key.
After entering a value by using the number keys, press the +/- key to create a negative
value.
8. Press the Pre Amp soft key to toggle the this function ON and OFF.

17-8
Signal Power Measurement
Select the Test
1. Press the Meas Selection function hard key.
2. Press the Signal Power soft key to select this measurement.
Set Up the Test
•Press the Meas Setup function hard key to open the Meas Setup (1/2) menu.
Configure the parameters as needed: Meas Mode, Average Count, Impedance,
Impedance Loss, and Antenna.
Measure Mode
1. Press the Meas Mode soft key to open the Select Meas Mode list box and choose
from: Single, Continuous, Average, Moving Average, or Max Hold. If you select
Average or Moving Average, then also set the Average Count.
2. Press the Average Count soft key to open the Average Count Editor dialog box and
select a count number within the displayed range.
3. Press the Impedance soft key to toggle through the three impedance
parameters: 50 ohm, 75 ohm, and Other. If you select Other, then set the impedance
loss.
4. Press the Impedance Loss soft key to open the Impedance Loss Editor dialog box and
select a dB loss level within the displayed range.
5. Press the Antenna (Correction Level) soft key to open the Select Antenna list box, and
select the desired Anritsu antenna model number from the list.
Execute the Test
•Press the Execute Measure function hard key to begin testing. If the input signal cannot
be measured, a message is displayed with red highlighting near the top of the display area,
as follows: Under Level : Increase input level.
Save the Test Results
•Press the Save Files function hard key to save a measurement. A confirmation window
opens briefly to indicate that the measurement has been saved.
NOTE: If you are not using an Anritsu antenna, then you can create a
custom antenna correction with Master Software Tools and upload it into
your MS2721B.
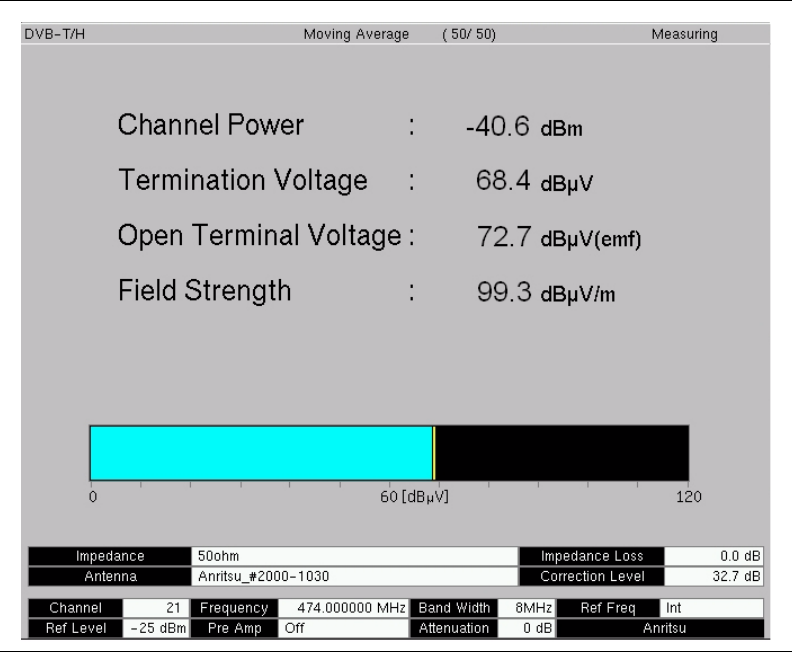
17-9
Figure 17-4. Signal Power Measurement
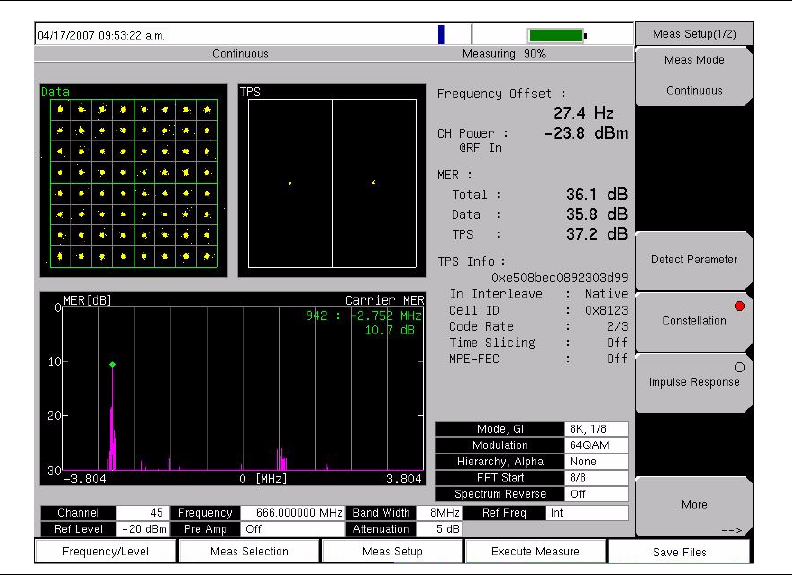
17-10
Modulation Analysis
Select the Test
1. Press the Meas Selection function hard key.
2. Press the Modulation Analysis soft key.
Set Up the Test
1. Press the Meas Setup function hard key to open the Meas Setup (1/2) menu.
Configure the following parameters: Meas Mode, Detect Parameter, Constellation, or
Impulse Response.
Pressing either Constellation or Impulse Response determines the type of modulation
analysis to be performed, and also determines the subsequent soft keys that are
displayed after pressing the More soft key.
2. Press the Meas Mode soft key to open the Select Meas Mode list box. Scroll and select
the desired mode. If you select Average or Moving Average, then also set the
Average Count.
3. Press the Average Count soft key to open the Average Count Editor dialog box and
select a count number within the displayed range.
4. Press the Detect Parameter soft key to automatically detect for Mode, GI, Modulation,
and Hierarchy parameters.
Figure 17-5. Constellation Measurement with Alpha = None
17-11
Constellation Configuration
Configure the following parameters: Mode, GI, TPS Info, FFT Start, Spectrum Reverse,
Zoom, and Marker. The marker is used only in the Carrier MER graph.
1. Press the Constellation soft key, and then press the More soft key to open the additional
Meas Setup (2/2) soft key menu.
2. Press the Mode, GI soft key and scroll to select the desired Guard Interval parameters.
3. Press the TPS Info soft key.
4. From the TPS Info menu, press the Modulation soft key and choose from: QPSK,
16QAM, and 64QAM.
5. If modulation is set to QPSK, then skip this step (the hierarchy soft key is not
displayed). Press the Hierarchy, Alpha soft key and choose: None, 1, 2, or 4.
6. Press the Back soft key to return to the Meas Setup (2/2) menu.
7. Press the FFT Start soft key to open the Select FFT Start list box and select the desired
start position with a guard interval (0/8 indicates no guard interval).
8. Press the Spectrum Reverse On/Off soft key to toggle between On and Off. The active
state is underlined on the soft key face.
9. Press the Zoom soft key to open the Zoom menu.
10. Press the Zoom On/Off soft key to toggle between On and Off. The active state is
underlined on the soft key face.
11. To use the zoom feature, press the Data soft key or the TPS soft key. Data displays an
enlarged data constellation, or TPS displays an enlarged TPS constellation, only when
the zoom function is On. The red circle on either soft key face indicates that the key is
active.
12. Press the Back soft key to return to the Meas Setup (2/2) menu while leaving the zoom
function as set.
13. Press the Marker On/Off soft key to toggle the marker between On and Off. The active
state is underlined on the soft key face.
14. Press the Back soft key to return to the Meas Setup (1/2) menu.
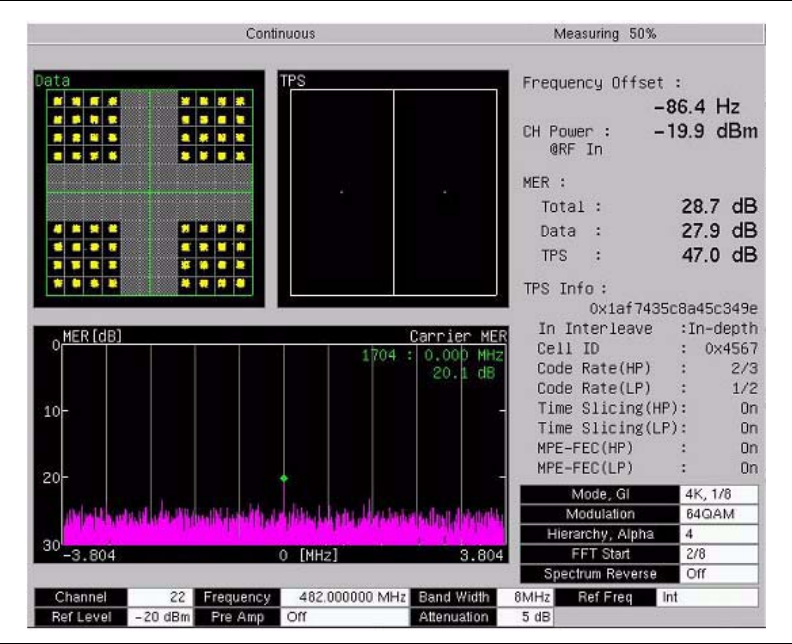
17-12
Figure 17-6. Constellation Measurement with Alpha = 4
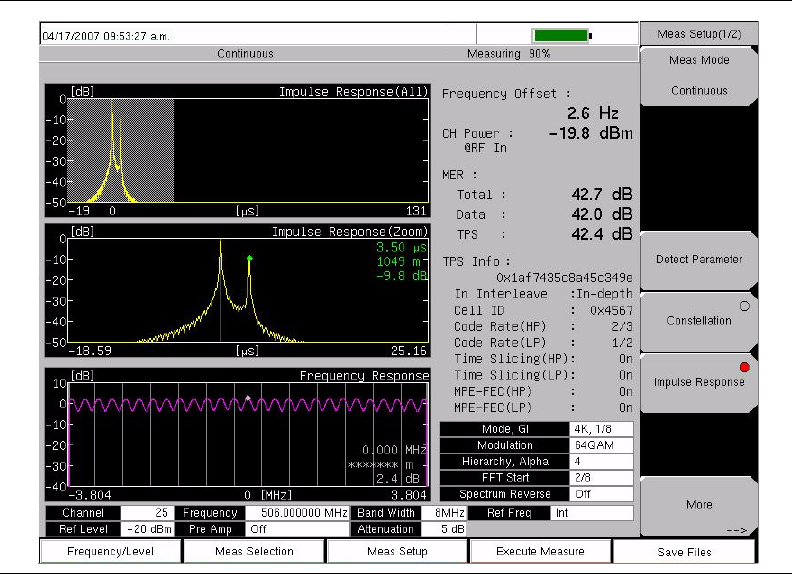
17-13
Impulse Response Configuration
Configure the following parameters: Mode, GI, TPS Info, FFT Start, Spectrum Reverse,
Impulse Response, Frequency Response, and Marker.
1. Press the Impulse Response soft key, and then press the More soft key to open the
additional Meas Setup (2/2) soft key menu. The Impulse Response (Zoom) graph
displays the enlarged portion of the Impulse Response (All) graph that is indicated by
the range markers, whether the marker function is On or Off.
2. Press the Mode, GI soft key to open the Select Mode, GI list box and scroll to select the
desired Guard Interval parameters.
3. Press the TPS Info soft key.
4. From the TPS Info menu, press the Modulation soft key and choose from: QPSK,
16QAM, and 64QAM.
5. Press the Hierarchy, Alpha soft key and choose: None, 1, 2, or 4.
6. Press the Back soft key to return to the Meas Setup (2/2) menu.
7. Press the FFT Start soft key to open the Select FFT Start list box and select the desired
parameter.
8. Press the Spectrum Reverse On/Off soft key to toggle between On and Off. The active
state is underlined on the soft key face.
9. Press the Impulse Response Vertical Range soft key to open the Vertical Range menu.
Then select a range (in dB) and press the Back soft key to return to the
Meas Setup (2/2) menu.
10. Press the Freq. Response Vertical Range soft key to open the Vertical Range menu.
Then select a range (in dB) and press the Back soft key to return to the
Meas Setup (2/2) menu.
Figure 17-7. Impulse Response Measurement
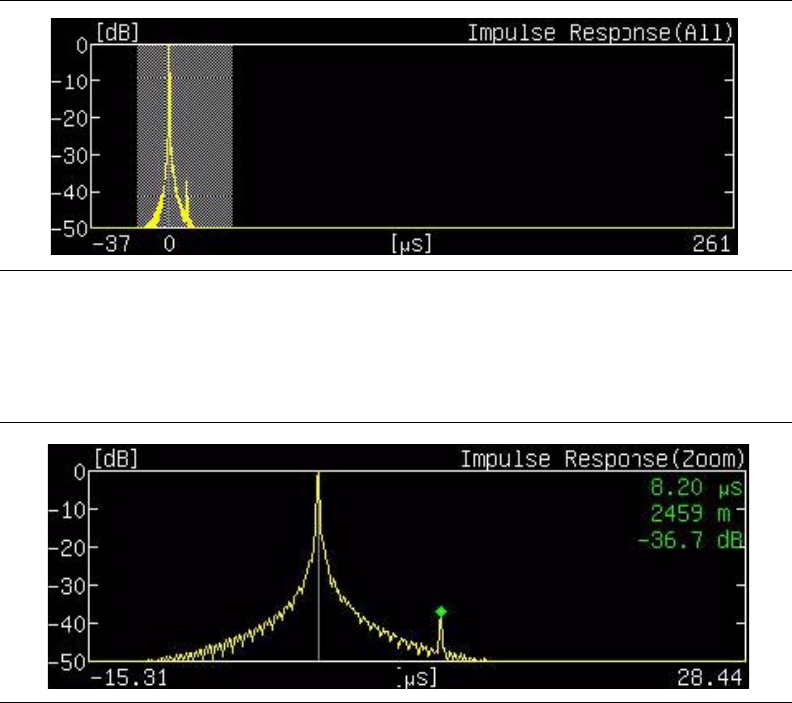
17-14
Configure the Markers
Configure the Markers that are used in the impulse response and frequency graphs.
1. Press the Marker On/Off soft key to toggle the marker between On and Off. Turn the
marker ON.
2. Press the Impulse Response soft key to display the range marker in the whole graph of
impulse response and to display the signal position marker in the zoom graph of
impulse response. Move the marker range with the arrow keys or the rotary knob.
Move the position marker in the zoom graph by turning the rotary knob. When the
markers are set as desired, press the rotary knob, press the Enter key, or press the
Frequency Response soft key to use the marker in the Frequency Response graph.
The portion of the impulse response signal that is within the range markers is displayed
in the zoom graph of impulse response. When the Impulse Response soft key is active,
the Detect Max_Level soft key is also displayed.
Figure 17-8. Impulse Response (All) Range Marker
Figure 17-9. Impulse Response (Zoom) Marker
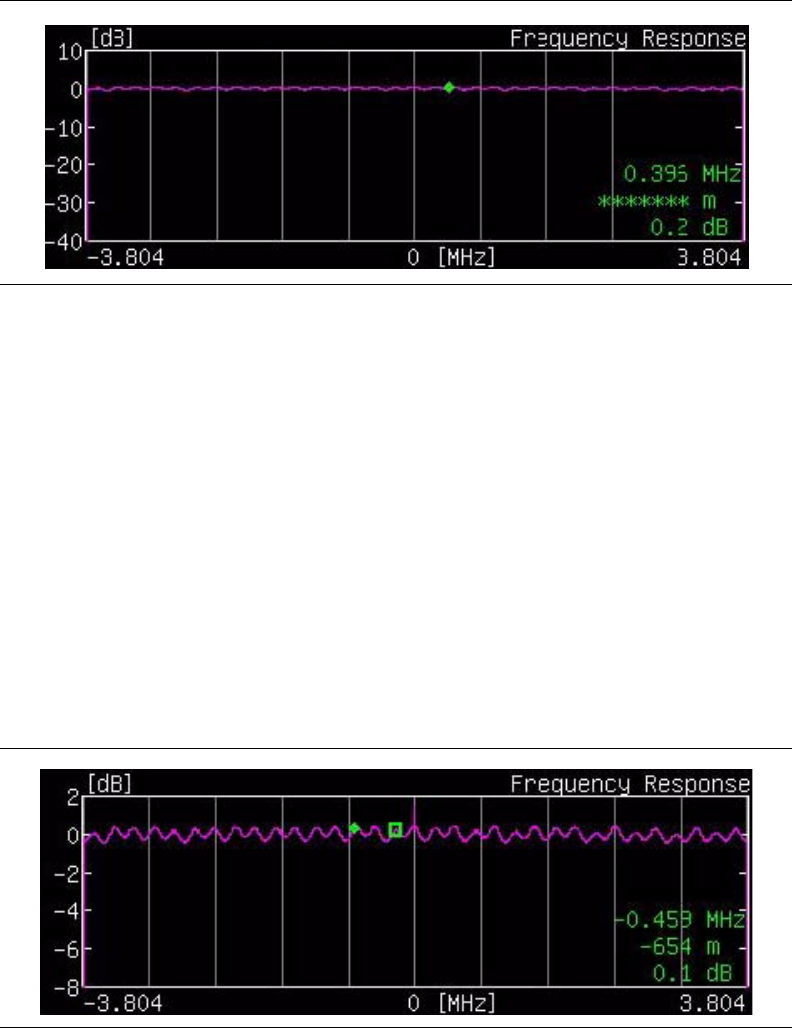
17-15
1. Press the Frequency Response soft key to display the marker on the frequency
response graph within the channel bandwidth. Move the marker in large increments
with the Up/Down arrow keys, in increments half as large with the Left/Right arrow
keys, and in small increments with the rotary knob.
2. Press the Delta Marker On/Off soft key to toggle the additional delta marker function
On and Off. The active state is underlined on the soft key face. When ON, this marker
function displays the difference of time, distance, and level between two points.
When turning On the delta marker while using the impulse response setting, the
standard marker becomes the square reference marker and is placed at the center of the
impulse response range markers, and the numerical data within the All graph indicates
the measurement at the square delta maker. The arrow keys move the range marker,
and the rotary knob moves the delta marker. The numerical data that is displayed at the
upper right within the Zoom graph indicates the relative value of the delta marker
(relative time, distance, and level) to the standard marker (now the square reference
marker), based upon the marker position. The square reference maker is displayed in
the Zoom graph as long as the range marker (in the ALL graph) is not moved beyond
the reference marker after the delta marker function is turned On.
3. When turning On the delta marker while using the frequency response setting, the
reference marker is initially placed at the location of the standard (now square) marker.
The arrow keys and rotary knob move the delta marker.
4. Press the Back soft key to return to the Meas Setup (2/2) menu. If the marker or delta
marker or both are left On, the arrow keys and rotary knob continue to move the
marker.
Figure 17-10. Frequency Response Marker
Figure 17-11. Frequency Response Delta Marker
17-16
Execute the Measure
•Press the Execute Measure function hard key to begin testing.
Save the Test Results
1. Press the Save Files function hard key to save measurements. The instrument can save
the displayed measurement results in the JPEG format and CSV format to the internal
memory. The measurement results file may be saved either manually by the user or
automatically by the instrument.
2. To save the measurement results files automatically, press the Save Files function hard
key. After a few seconds, the saving is complete, and a confirmation window is
displayed briefly.
In the case of auto saving, the instrument uses the measurement status information, the
date, and the time to provide a filename. For filename details, refer to section “Saving
Measurement Results” on page 17-22.
17-17
Tx Meas Analysis
Select the Test
1. Press the Meas Selection function hard key.
2. For Tx Analysis, press the following soft keys in sequence: Tx Meas, Carrier MER,
and Back.
Set Up the Test
1. Press the Meas Setup function hard key to open the Meas Setup (1/2) menu.
Configure the following parameters: Meas Mode, Detect Parameter, Mode, GI,
TPS Info, FFT Start, Spectrum Reverse, Vertical Range, and Marker.
2. Press the Meas Mode soft key and select a mode. If you select Average or Moving
Average, then also set the Average Count.
3. Press the Average Count soft key to open the Average Count Editor dialog box and
select a count number within the displayed range.
4. Press the Detect Parameter soft key, which automatically detects for Mode, GI,
Modulation, and Hierarchy parameters.
5. Press the More soft key to open the Meas Setup (2/2) menu and continue configuring
Carrier MER(Tx).
6. Press the Mode, GI soft key to open the Select Mode, GI list box and scroll to select the
desired Guard Interval parameters.
7. Press the TPS Info soft key.
8. From the TPS Info menu, press the Modulation soft key to open the Select Modulation
list box and choose from: QPSK, 16QAM, and 64QAM.
If you select QPSK, then the parameter for Hierarchy, Alpha is automatically set to
None.
9. If you select 16QAM or 64QAM, then press the Hierarchy, Alpha soft key and
choose: None, 1, 2, or 4.
10. Press the Back soft key to return to the Meas Setup (2/2) menu.
11. Press the FFT Start soft key to open the Select FFT Start list box and select the desired
start position with a guard interval (0/8 indicates no guard interval).
12. Press the Spectrum Reverse On/Off soft key to toggle between On and Off. The active
state is underlined on the soft key face.
13. Press the Vertical Range soft key to open the Vertical Range menu. Then select a range
(in dB) for the Carrier MER(Tx) graph and press the Back soft key to return to the
Meas Setup (2/2) menu.
14. Press the Marker soft key to open the marker menu, the press the Marker On/Off soft
key to toggle the marker between On and Off. Turn the marker ON so that the zoom
markers on the whole graph of Carrier MER(Tx) (All) can be displayed. The
Carrier MER soft keys are also displayed.
15. Press the Carrier MER(All) soft key to display the zoom markers on the whole graph of
Carrier MER(Tx) (All).
16. Press the Carrier MER (Zoom) soft key to display the marker on the Carrier MER(Tx)
(Zoom) graph.
17. Press the Back soft key to return to the Meas Setup (2/2) menu.
Execute the Measure
•Press the Execute Measure function hard key to begin testing.
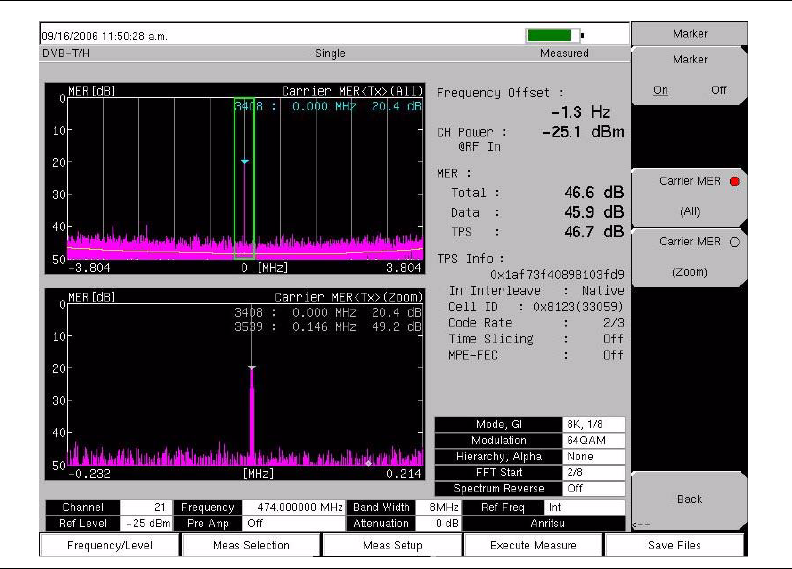
17-18
Save the Test Results
•Press the Save Files function hard key to save measurements. For details about saving
measurement files, refer to section “Save the Test Results” on page 17-8. For filename
details, refer to section “Saving Measurement Results” on page 17-22.
Figure 17-12. Tx Carrier MER Measurement
17-19
BER Analysis
Select the Test
1. Press the Meas Selection function hard key.
2. For BER analysis, press the BER soft key.
Set Up the Test
1. Press the Meas Setup function hard key to open the Meas Setup(1/2) menu. Configure
the following parameters: Meas Mode, Bit Count Setting, Service, Stream,
Result Disp, and Spectrum Reverse.
Meas Setup(1/2) Menu
2. Press the Meas Mode soft key. The Select Meas Mode list box opens. Highlight the
desired measurement mode (Single or Repeat) and press Enter. The selected
measurement mode is displayed on the virtual soft key face.
3. Press the Bit Count Setting soft key to open the Bit Count Setting Editor. Key in the
desired Mantissa and Exponent and press Enter. For additional Bit Count Setting
mantissa and exponent information, refer to Table 17-1 on page 17-20.
4. Press the Service soft key. The Select Service list box opens. Choose between
In Service testing and Out of Service testing and press Enter.
a) If Out of Service is selected, then the soft key, BER Meas Point, is added to the
Meas Setup(1/2) menu list, and TS Packet is added to the Meas Setup(2/2) menu
list.
b) Press the BER Meas Point soft key, and highlight the desired parameter
(Before Viterbi, Before RS, or After RS) and press Enter.
c) Press the More soft key and then press the TS Packet soft key to open the
Select TS Packet list box. Highlight the desired TS Packet value and press Enter.
d) Press the Back soft key to return to the Meas Setup(1/2) menu.
5. Press the Stream soft key, which opens the Select Stream list box. Highlight
HP (High Priority) or LP (Low Priority) stream and press Enter.
6. Press the BER Meas Point soft key, and highlight the desired parameter (Before Viterbi,
Before RS, or After RS) and press Enter.
7. Press the Result Disp soft key. Select Current to view the current measurement or select
Last to view the last measurement taken, and then press Enter.
8. Press the More soft key to open the Meas Setup(2/2) menu in order to continue
configuring BER measurements.
Meas Setup(2/2) Menu
9. Press the TS Packet soft key to open the Select TS Packet list box. Highlight the
desired TS Packet value and press Enter.
10. Press the Spectrum Reverse soft key to toggle between On and Off. The desired value
is underlined on the virtual soft key face.
11. Press the TPS warning soft key to display any available warning messages.
12. Press the Back soft key to return to the Meas Setup(1/2) menu.
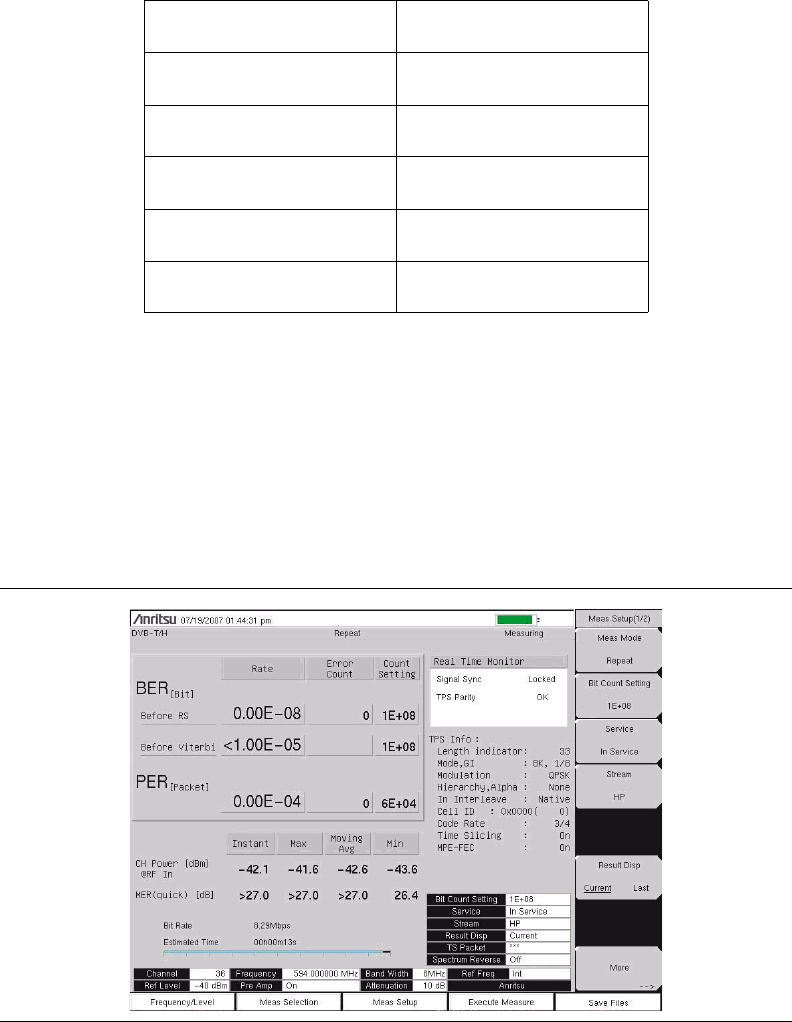
17-20
Execute the Measure
Press the Execute Measure function hard key to begin testing.
Save the Test Results
Press the Save Files function hard key to save measurements. For details about saving
measurement files, refer to section “Save” on page 3-6. For filename details, refer to section
“Saving Measurement Results” on page 17-22.
Table 17-1: BER Setup Parameters Table
Bit Count Setting 3E+07
Service Out Of Service
Stream HP
Result Disp Current
TS Packet 1+[187]+16
Spectrum Reverse On
Figure 17-13. BER Measurement Result Display
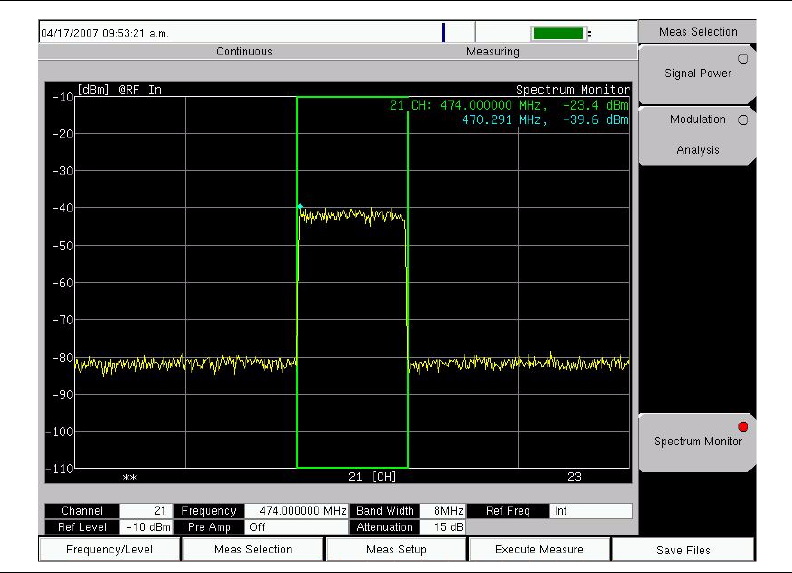
17-21
Spectrum Monitor
Select the Test
1. Press the Meas Selection function hard key.
2. Press the Spectrum Monitor soft key to configure the spectrum monitor measurements.
Set Up the Test
1. Press the Meas Setup function hard key to open the Meas Setup menu.
Configure the Meas Mode, Span, and Zone Position.
2. Press the Meas Mode soft key to open the Select Meas Mode list box and select a
mode.
3. Press the Span soft key to open the Select Span list box and select a span.
4. Press the Zone Position To Center soft key to set the channel of the current zone
marker to the center of the screen.
Execute the Measure
•Press the Execute Measure function hard key to begin testing.
Spectrum monitor detection is set for RMS for all available span settings.
Save the Test Results
•Press the Save Files function hard key to save measurements. For details about saving
measurement files, refer to section “Save the Test Results” on page 17-8. For filename
details, refer to section “Saving Measurement Results” on page 17-22.
Figure 17-14. Spectrum Monitor Measurement
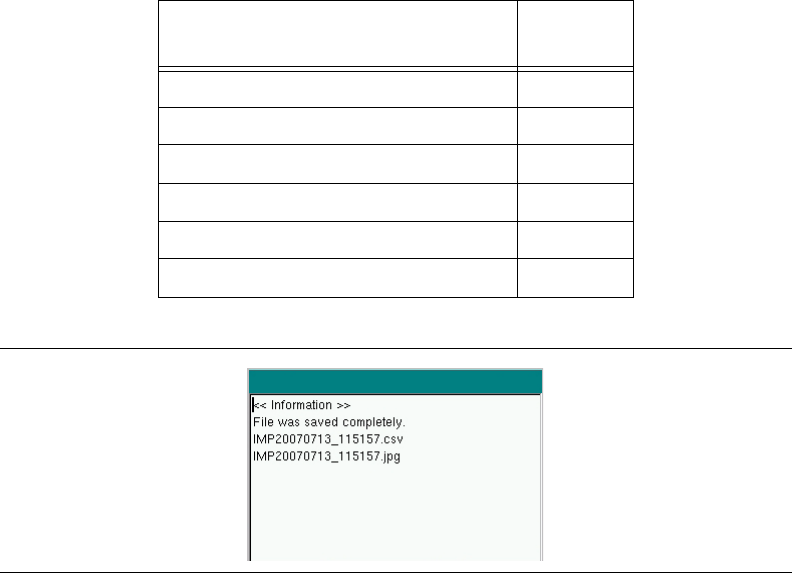
17-22
Saving Measurement Results
Automatic File Saving
Files are saved in the JPEG format and the CSV format. The filename format uses a string of
3 characters followed by a string of digits for the date and time. The entire character string
appears as follows:
XXXYYYYMMDD_HHMMSS.csv
XXXYYYYMMDD_HHMMSS.jpg
The “XXX” characters are related to the measurement type, as displayed in Table 17-2. The
date is expressed as year (YYYY), month (MM), and day (DD) followed by an underscore, and
then the time is expressed as hour (HH), minute (MM), and second (SS), all followed by a
period and the file extension (csv or jpg).
Filename Examples (also refer to Figure 17-15):
PWR20060712_140225.jpg
IMP20061203_094507.jpg
Manual File Saving
To save a measurement manually, refer to Figure 3-3 and to section “Save” on page 3-6 and
to “Text Entry” on page 2-7.
Table 17-2: Auto File Naming Convention
Measurement Type Character
String
Signal Power PWR
Spectrum Monitor SPM
Modulation Analysis/Constellation CON
Modulation Analysis/Impulse Response IMP
Tx Meas/Carrier MER<Tx> CAM
BER BER
Figure 17-15. Auto Save Confirmation Window
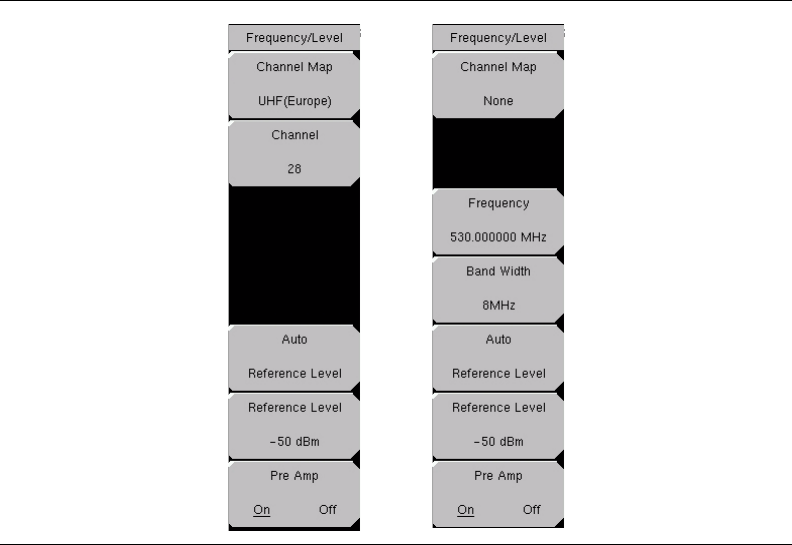
17-23
Menus
Function Hard keys
In DVB-T/H Signal Analyzer mode (Option 64, and including Option 57), the MS2721B
displays the following five function hard key menus: Frequency/Level, Meas Selection,
Meas Setup, Execute Measure, and Save Files.
Frequency/Level Menu
Channel Map
This Input soft key opens the Select Channel Map list box to allow channel map selections
for UHF(Australia), UHF(Europe), or None. Selecting UHF(Australia) sets the bandwidth
to 7 MHz, and selecting UHF(Europe) sets the bandwidth to 8 MHz, and a Channel
number soft key is added to the Frequency/Level menu. Selecting None adds two soft keys
to the Frequency/Level menu in order to allow manual setting of frequency and bandwidth.
Channel ##
If UHF is selected, then the next soft key is Channel. Press this Input soft key to open the
Channel Editor dialog box to select a channel within a specified range that is displayed in
the window.
If None is selected, then the next soft key is Frequency.
Figure 17-16. Frequency/Level Menu
17-24
Frequency ##
If None is selected, then the soft keys for Frequency and Band Width are added to the
menu. Press this Input soft key to open the Frequency Editor dialog box to manually select
a frequency within a specified range that is displayed in the window. The soft key menu
displays units: GHz, MHz, kHz, and Hz.
Band Width #
Press this Input soft key to open the Select Band Width list box to select a bandwidth of
7MHz or 8MHz.
Auto Reference Level
Press this Input soft key to automatically set the reference level to an optimum value. This
reference level indicates the signal level input to the MS2721B.
The reference level range for input to the instrument is determined by the reference level
setting. Immediately after a signal is applied to the instrument, the input attenuator is
automatically set according to the reference level. The relationship between the reference
level and the input attenuator is fixed. Table 17-3 shows the relationship between the
reference level and the input attenuator for each measurement item.
Raising the reference level increases attenuation of the input attenuator, enabling the user
to handle a high input level. Note that the noise floor rises in proportion to the attenuation
of the input attenuator.
When applying a signal to the instrument, input a signal level that does not exceed the
reference level value. If the signal level exceeds the reference level, raise the reference
level. For example, if the signal level is 0.5 dBm with preamplifier off, set the reference
level to 5 dBm, not to 0 dBm.
If an interfering wave other than the intended signal exists and the power within the
frequency range of approximately 100 kHz to 7.1 GHz is 15 dB or more higher than the
measurement signal level, set the reference level to take the large signal into account.
Reference Level ##
Press this Input soft key to open the Reference Level Editor dialog box to select a signal
reference value within the specified range that is displayed in the window. If the Pre Amp
soft key is On, then the reference level range is from –10 dBm to –50 dBm in 10 dB
increments. If the Pre Amp soft key is Off, then the reference level range is from –25 dBm
to 20 dBm in 5 dB increments.
Pre Amp On/Off
Pressing this Toggle soft key toggles the preamplifier On and Off. When the preamplifier is
switched On, the reference level is automatically set to –30 dBm. When the preamplifier is
switched Off, the reference level is automatically set to –25 dBm.

17-25
Table 17-3: Relationship between Reference Level and Input Attenuator
Preamplifier
Attenuation of Input Attenuator (dB)
Reference
Level (dBm) Signal
Power Modulation
Analysis Spectrum
Monitor
Off 20 404545
Off 15 354040
Off 10 303535
Off 5 25 30 30
Off 0 20 25 25
Off –5 152020
Off –10 10 15 15
Off –15 5 10 10
Off–20055
Off–25000
On –10 404040
On –20 303030
On –30 202020
On –40 101010
On–50000
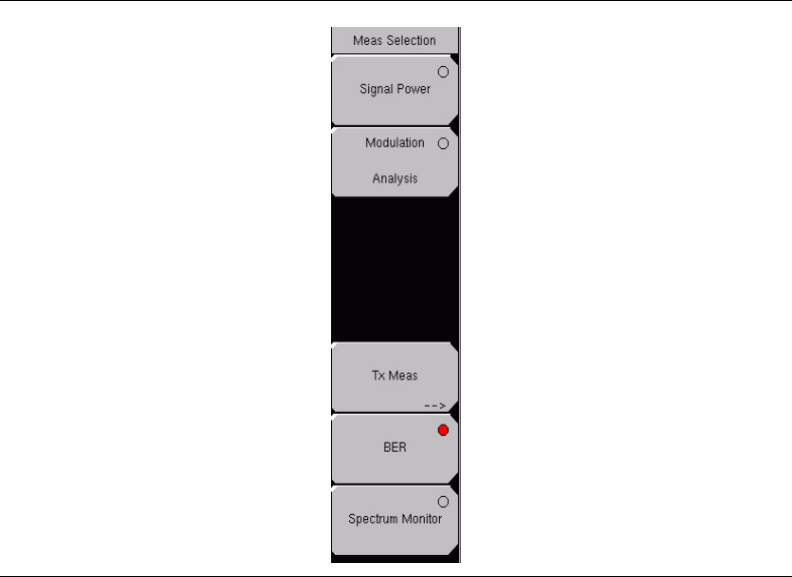
17-26
Meas Selection Menu
Press the Meas Selection function hard key to open the Meas Selection soft key menu.
Signal Power
Press this Select soft key to measure the channel power and field strength.
Modulation Analysis
Press this Select soft key to measure MER (Modulation Error Ratio), frequency offset of
the modulated signal, constellation, impulse response, and frequency response.
Tx Meas
Press this Switching soft key to open the Tx Meas soft key menu to measure the Carrier
MER (Modulation Error Ratio).
Carrier MER
Press this Select soft key to measure the transmission Carrier MER.
BER
Press this Select soft key to select Bit Error Rate testing. Press the Meas Setup function
hard key to set up the Bit Error Rate testing parameters.
Spectrum Monitor
Press this Select soft key to display the spectrum of the input signal.
Figure 17-17. Measure Selection Menu
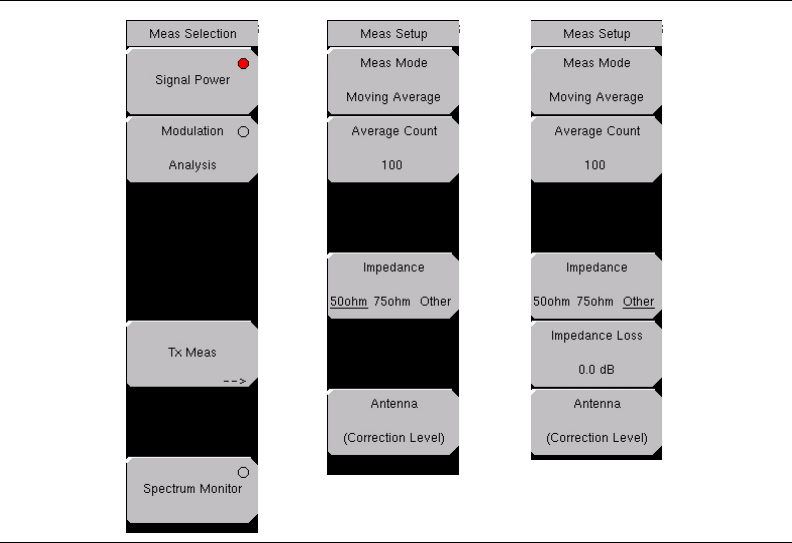
17-27
Signal Power Menu
Press the Meas Selection function hard key to open the Meas Selection soft key menu.
Signal Power
Press this Select soft key to make signal power measurements. For an illustration of the
measurement display, refer to Figure 17-4 on page 17-9.
Press the Meas Setup function hard key to open the Meas Setup soft key menu for Signal
Power measurements.
Meas Mode
Press this Input soft key to open the Select Meas Mode list box and select a
measurement mode. Five test mode options are available: Single, Continuous,
Average, Moving Average, and Max Hold.
Single sets up the test for one measurement. The MS2721B acquires the
measurement and displays the results. This mode is useful for capturing screen
images.
Continuous sets up the test to take measurements continuously and display the
results. The mode is helpful for real-time signal analysis.
Average sets up the test to mathematically average the measurement results for the
specified number of measurement, as set with the Average Count soft key.
Moving Average sets up the test to take the number of measurements that are set
with the Average Count soft key. An average result is calculated from those
measurements and is displayed. Then another measurement is taken, and another
average is calculated from the last number of measurements, as set in
Average Count, and the display screen is updated. This mode is useful while aiming
the antenna.
Figure 17-18. Measure Selection Menus for Signal Power

17-28
Example for Moving Average :
First (m1 + m2 + m3 + m4 + m5) = r1 r1 displayed on screen
then (m2 + m3 + m4 + m5 + m6) = r2 r2 displayed on screen
then (m3 + m4 + m5 + m6 + m7) = r3 r3 displayed on screen
then (m4 + m5 + m6 + m7 + m8) = r4 r4 displayed on screen
This cycle of measurement average calculations continues until a different
measurement is selected. This mode is useful while aiming the antenna.
Max Hold displays the measurement result that has the largest value. This mode is
helpful for acquiring the maximum result, for example, when measuring off-the-air
signals that are not stable. The Max Hold setting is available only for Signal Power
measurements.
Average Count
Press this Input soft key to open the Average Count Editor dialog box and select a
count number. the range is displayed in the window. This count number sets the
number of measurements that are included in the averaging calculations for both
Average and Moving Average. When Single, Continuous, or Max Hold is selected as
the measurement mode, this soft key is not displayed.
Impedance, 50ohm, 75ohm, Other
Press this Toggle soft key to toggle through the impedance values. The MS2721B
impedance is 50 ohms by default, but it can be changed to 75 ohms by pressing this
soft key, or it can be changed by using the external impedance converter (by pressing
this soft key to toggle to Other).
50 ohms Select this impedance when no converter is used. Impedance loss is
automtically set to 0.0 dB.
75 ohms Select this impedance when impedance converter 12N50-75B is used.
Impedance loss is automatically set to 7.5 dB.
Other (75 ohms) Set impedance to Other when an impedance converter other than
12N50-75B is used. Use the Impedance Loss soft key to set the insertion loss of the
impedance converter that is used as the impedance loss.
Impedance Loss, ##
This virtual soft key appears only when the Impedance soft key is toggled to Other.
Press this Input soft key to open the Impedance Loss Editor dialog box and set
impedance loss to match an external impedance converter. Impedance loss range is
0.0 dB to 100.0 dB in steps of 1 dB when using the Up/Down arrow keys and in steps
of 0.1 dB when using the rotary knob. The impedance loss can also be set by using the
numeric keypad. Set the value by pressing the rotary knob, the Enter key, or the dB
units soft key (which appears when the Impedance Loss soft key is pressed).
Set the impedance loss to 1.9 dB when using the MA1621A as the impedance
converter.
Figure 17-19. Current Count Average Count Display
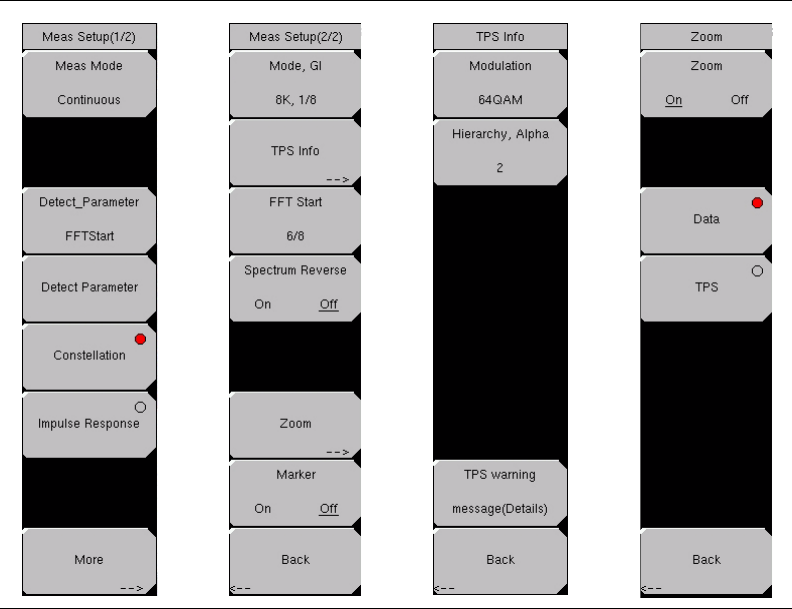
17-29
Antenna (Correction Level)
Press this Input soft key to open the Select Antenna list box and to select the correction
table for the field strength measurement. For details, refer to section “Antenna Setup”
on page 17-6.
Modulation Analysis, Constellation
Press the Meas Selection function hard key to open the Meas Selection soft key menu. Then
press the Modulation Analysis soft key to set up the measurement.
Press the Meas Setup function hard key to open the Meas Setup(1/2) soft key menu.
Measurement Setup for Constellation Modulation Analysis
Meas Mode
Refer to section “Meas Mode” on page 17-27. Note that Constellation Modulation
Analysis does not include Max Hold.
Average Count
When the measurement mode is Average or Moving Average, this Input soft key is
displayed. Refer to section “Average Count” on page 17-28.
Detect Parameter, FFT Start (Option 57, DVB-T/H BER)
Press this Input soft key to automatically detect the Mode, Guard Interval, TPS
information, and FFT Start from the input signal. Measurement starts after the parameters
are detected. This function is invalid when the FFT Start setup value is a fixed value.
Figure 17-20. Constellation Measurement Menus
17-30
Detect Parameter
Press this Input soft key to automatically detect TPS and Mode, GI information from the
input signal. Measurement begins when parameters are detected. For additional
information, refer to “Mode, GI” or “TPS Info” on page 17-30.
Constellation
Press this Select soft key to configure the software to display the constellation
measurement window along with the Frequency Offset, CH Power, MER, and TPS Info.
Impulse Response
Press this Select soft key to configure the software to display three graphs: Impulse
Response (All), Impulse Response (Zoom) and Frequency Response. Additional
measurement results that are also displayed on the screen are: Frequency Offset,
CH Power, MER, and TPS Info.
More
Press this Switching soft key to display the next page of the Meas Setup (2/2) menu. The
soft keys that are displayed in the Meas Setup (2/2) menu differ depending upon the type
of measurement, Constellation, Impulse Response, or Tx Meas.
The following setup parameters are for configuring Constellation.
Mode, GI
Press this Input soft key to open the Select Mode, GI list box. Scroll through the list to
select the Mode (number of subcarriers) and the Guard Interval. For more information
about Mode or Guard Interval, refer to “2k, 4k, 8k Modes” or “Guard Intervals” on
page 17-2.
TPS Info
Press this Switching soft key to open the TPS Info soft key menu.
TPS Info Soft Key Menu
Modulation
Press this Input soft key to open the Select Modulation list box. Scroll to select QPSK,
16QAM, or 64QAM modulation. The selection is displayed on the virtual soft key
face. Selecting QPSK automatically sets the Hierarchy, Alpha parameter to None.
Hierarchy, Alpha, #
Press this Input soft key to open the Select Hierarchy, Alpha list box. Scroll to select
None, 1, 2, or 4. The selection is displayed on the virtual soft key face. This selection is
used to shape the 16QAM and 64QAM constellations. A value of α=1 describes an
equally-spaced constellation.
TPS Warning, message(Details)
Press this Input soft key to open the TPS Warning, message(Details) message box. The
warning and its description are displayed in the window. If measured TPS parameters
are questionable, then look in this message box to check for any warnings.
Back
Press this Switching soft key to return to the Meas Setup(2/2) soft key menu for
constellation measurement display.
FFT Start, ##
Press this Input soft key to open the Select FFT Start list box. Scroll to select an FFT Start
position to synchronize with the data that is used for measurement. A setting of 0/8 uses
none of the guard interval and includes only the effective symbol (the data portion of the
OFDM frame). A setting of 1/8 adjusts the FFT Start position to use 1/8 of the guard
interval, and a setting of 8/8 adjusts the FFT Start position to use all of the guard interval.

17-31
Refer to Figure 17-1 on page 17-4 for details about the relationship between the FFT Start
position and the guard intervals. Signals that arrive with or without interference can be
synchronized and measured by adjusting the FFT Start position. When measuring a
delayed wave (a signal where one or more earlier, but weaker, signals exist), changing the
FFT Start position can filter interference.
Spectrum Reverse, On/Off
Press this Toggle soft key to turn the function On or Off. Use Spectrum Reverse to
measure the signal whose sub carrier location is inverted on the frequency axis, such as the
IF signal of the transmitter.
Zoom
Press this Switching soft key to open the Zoom soft key menu.
Zoom Soft Key Menu
Zoom, On/Off
Press this Toggle soft key to toggle zoom On or Off. When Zoom is Off, the screen
displays the Data, TPS, and Carrier MER graphs. When Zoom is On, the screen
displays a larger view of either the Data graph or the TPS graph.
Data
Press this Select soft key (when Zoom is On) to display an enlarged view of the Data
graph.
TPS
Press this Select soft key (when Zoom is On) to display an enlarged view of the TPS
graph.
Back
Press this Switching soft key to return to the Meas Setup(2/2) menu.
Table 17-4: Guard Interval Lengths in Microseconds
Length2K4K8K
1/4 56 µs 112 µs 224 µs
1/8 28 µs 56 µs 112 µs
1/16 14 µs 28 µs 56 µs
1/32 7 µs 14 µs 28 µs
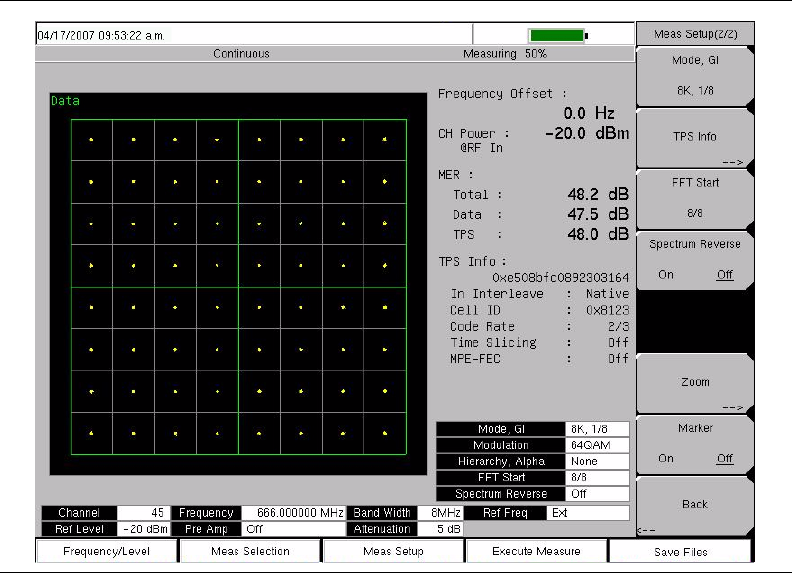
17-32
Marker, On/Off
Press this Toggle soft key to toggle the marker On or Off for the Carrier MER graph. The
marker is diamond shaped and green. Information relating to the carrier signal at the
marker is displayed at the top right of the Carrier MER graph. Use the Up/Down and
Left/Right arrow keys or the rotary knob to move the marker on the graph. The Up/Down
arrow keys move the marker full range in 6 increments. The Left/Right arrow keys move
the marker full range in 10 increments. The rotary knob moves the marker in 1 kHz
increments across a bandwidth of 8 MHz.
Back
Press this Switching soft key to return to the Meas Setup(1/2) menu.
Figure 17-21. Constellation Data Zoom
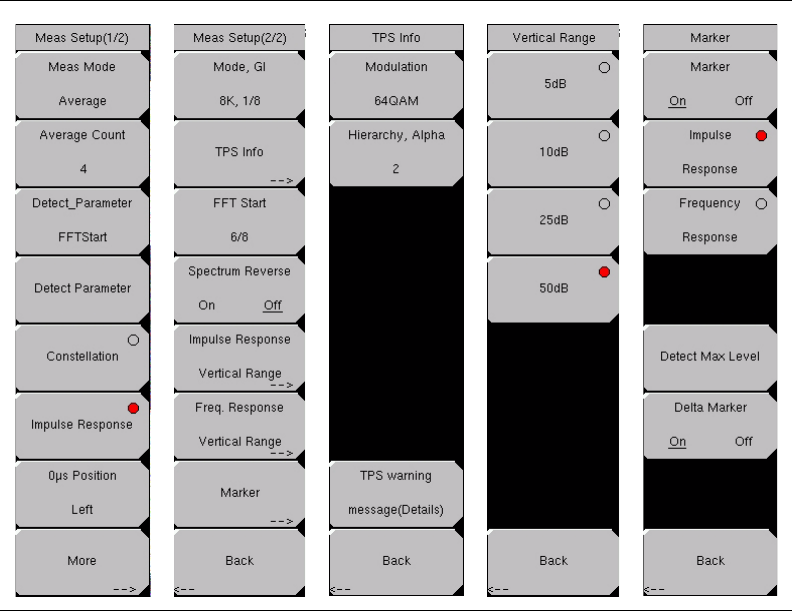
17-33
Modulation Analysis, Impulse Response
Press the Meas Selection function hard key to open the Meas Selection soft key menu. Then
press the Modulation Analysis soft key to set up the measurement.
Press the Meas Setup function hard key to open the Meas Setup(1/2) soft key menu.
Measurement Setup for Impulse Response Modulation Analysis
Meas Setup(1/2) Soft Key Menu
Meas Mode
Refer to section “Meas Mode” on page 17-27. Note that Impulse Response Modulation
Analysis does not include Max Hold.
Average Count, #
For a description of this Input soft key, refer to section “Average Count” on page 17-28.
Detect Parameter, FFT Start (Option 57, DVB-T/H BER)
Press this Input soft key to automatically detect the Mode, Guard Interval, TPS
information, and FFT Start from the input signal. Measurement starts after the parameters
are detected. This function is invalid when the FFT Start setup value is a fixed value.
Detect Parameter
Press this Input soft key to automatically detect TPS and Mode, GI information from the
input signal. Measurement begins when parameters are detected. For additional
information, refer to “Mode, GI” or “TPS Info” on page 17-30.
Constellation
Refer to section “Constellation” on page 17-30.
Figure 17-22. Impulse Response Measurement Menus

17-34
Impulse Response
Press this Select soft key to display the Impulse Response measurements.
0 µs Position, Left/Center/Right
Press this Input soft key to open the Select 0 µs Position list box and select a
zero microsecond signal display position on the Impulse Response graphs. Changing this
setting can affect the FFT Start position. For more information about this relationship,
refer to section “FFT Start” on page 17-3.
More
Press this Switching soft key to display the next page of the Meas Setup (2/2) menu. The
soft keys that are displayed in the Meas Setup (2/2) menu differ depending upon the type
of measurement, Impulse Response, Constellation, or Tx Meas.
Meas Setup(2/2) Soft Key Menu
Mode, GI, ##
Press this Input soft key to open the Select Mode, GI list box. Scroll through the list to
select the Mode (number of subcarriers) and the Guard Interval. For more information
about Mode or Guard Interval, refer to “2k, 4k, 8k Modes” or “Guard Intervals” on
page 17-2.
TPS Info
Press this Switching soft key to open the TPS Info soft key menu.
TPS Info Soft Key Menu.
Modulation, QPSK/16QAM/64QAM
Press this Input soft key to open the Select Modulation list box and select one of the
three modulation types.
Hierarchy, Alpha, #
Press this Input soft key to open the Select Hierarchy, Alpha list box and select a
value. The Alpha Hierarchy Mode is used to shape the 16QAM and 64QAM
constellations. A value of α=1 describes an equally-spaced constellation. The
Hierarchy, Alpha soft key is not displayed if the modulation type is QPSK.
TPS Warning, message (Details)
Press this Input soft key to open the TPS warning message (Details) message box
and read a message description.
Back
Press this Switching soft key to return to the Meas Setup (2/2) menu.
FFT Start, ##
Press this Input soft key to open the Select FFT Start list box and select a value for the
starting position for reading effective symbol data. For more information, refer to
section “FFT Start” on page 17-3.
Table 17-5: Relationship between Signal Mode and Impulse Response
Mode Impulse Response
2K 4.464 kHz
4K 2.232 kHz
8K 1.116 kHz
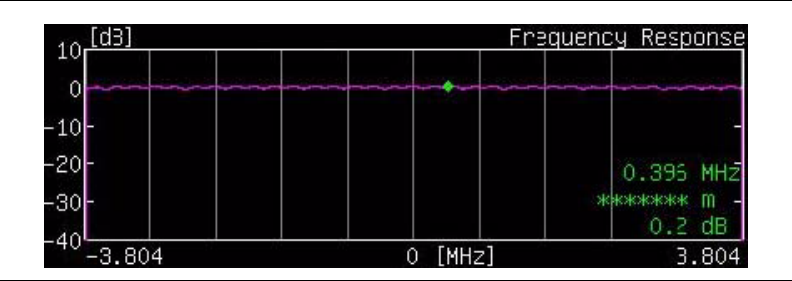
17-35
Spectrum Reverse, On/Off
Press this Toggle soft key to turn the spectrum reverse function On or Off. Use
Spectrum Reverse to measure the signal whose sub carrier location is inverted on the
frequency axis, such as the IF signal of the transmitter.
Impulse Response Vertical Range
Press this Switching soft key to display the Vertical Range options. Select the vertical
range for the impulse response graph from the Vertical Range soft key menu.
Vertical Range Soft Key Menu
Press a Select soft key to choose one of the values: 5 dB, 10 dB, 25 dB, or 50 dB.
Frequency Response Vertical Range
Press this Switching soft key to display the Vertical Range options. Select the vertical
range for the impulse response graph from the Vertical Range soft key menu, which is
the same menu that is displayed for Impulse Response Vertical Range.
Marker
Press this Switching soft key to open the Marker soft key menu.
Marker Soft Key Menu
Marker, On/Off
Press this Toggle soft key to toggle the marker On or Off for the Impulse Response
graph or the Frequency Response graph. When Marker is Off, only this soft key and
the Back soft key are displayed. When Marker is On, the additional soft keys are
displayed.
The Impulse Response (All) graph displays the measurement in µs (on the
horizontal axis) and in dB (on the vertical axis). When Marker is On and
Impulse Response is selected, a pair of green marker lines select approximately 1/6
of the displayed width of the Impulse Response (All) graph. This portion of the
measurement is expanded horizontally in the Impulse Response (Zoom) graph.
This area marked for Zoom can be scrolled left and right on the Impulse
Response (All) graph by pressing the Up/down arrow keys (for coarser
movements) or the Left/Right arrow keys (for finer movements). Refer also to
section “0 µs Position, Left/Center/Right” on page 17-34. The rotary knob moves a
green diamond-shaped marker along the measured signal trace within the Impulse
Response (Zoom) graph. The difference between the reference signal and a delayed
signal is displayed in the upper-right corner of the Impulse Response (Zoom) graph
in microseconds (µs), meters (m), and relative signal strength (dB).
Figure 17-23. Frequency Response with Marker

17-36
The Frequency Response graph displays the measurement in frequency (on the
horizontal axis) and in dB (on the vertical axis). When Marker is On and
Frequency Response is selected, a green diamond-shaped marker can be scrolled
with the rotary knob or the Up/Down and Left/Right arrow keys. The difference
between the 0 MHz reference point and the signal at the marker is displayed in the
lower-right corner of the Frequency Response graph in frequency (MHz, for
example), meters (m), and relative signal strength (dB). The frequency and relative
power are indicated for the marker position, but the distance (meters) is not relevant
with this marker (refer to the soft key description for “Delta Marker, On/Off”).
Impulse Response
Press this Select soft key to use the marker in the Impulse Response graphs.
Frequency Response
Press this Select soft key to use the marker in the Frequency Response graphs.
Detect Max Level
Press this Input soft key to move the marker to the maximum level point (only on
the Impulse Response (Zoom) graph). This soft key is dsiplayed only when the
Impulse Response soft key is active.
Delta Marker, On/Off
Press this Toggle soft key to turn On or Off the delta marker function. To use this
Delta Marker in the Impulse Response graphs, first (with Delta Marker Off) place the
non-delta marker (green diamond) at the desired location within the displayed
measurement trace. Then turn Delta Marker On. The Delta Marker is displayed as a
fixed green square. The rotary knob and arrow keys move the green diamond
marker relative to the fixed green square marker, and the displayed measurements
indicate the differences in the signal trace between these two marker locations.
The Up/Down arrow keys move the marker in the largest increments, the Left/Right
arrow keys move the marker approximately half that amount, and the rotary knob
moves the marker in the smallest increments.
Table 17-6: Marker Range for Impulse Response
Mode Impulse Response Frequency Response
7 MHz, 2K –10.50 to 74.63 µs –3.234 to +3.234 MHz
7 MHz, 4K –21.25 to 149.25 µs –3.281 to +3.281 MHz
7 MHz, 8K –42.50 to 298.63 µs –3.305 to +3.305 MHz
8 MHz, 2K –9.19 to 65.30 µs –3.696 to +3.696 MHz
8 MHz, 4K –18.59 to 130.59 µs –3.750 to +3.750 MHz
8 MHz, 8K –37.19 to 261.30 µs –3.777 to +3.777 MHz
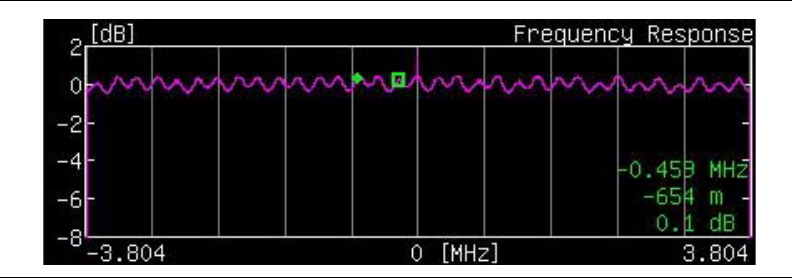
17-37
To use this Delta Marker in the Frequency Response graphs, first (with Delta Marker
Off) place the non-delta marker (green diamond) at the desired location within the
displayed measurement trace. Then turn Delta Marker On. The difference between
the signal at the fixed marker and the signal at the moving marker is displayed in
the lower-right corner of the Frequency Response graph in frequency (MHz, for
example), meters (m), and relative signal strength (dB).
Back
Press this Switching soft key to return to the Meas Setup(2/2) menu.
Back
Press this Switching soft key to return to the Meas Setup(1/2) menu.
Figure 17-24. Frequency Response with Delta Maker
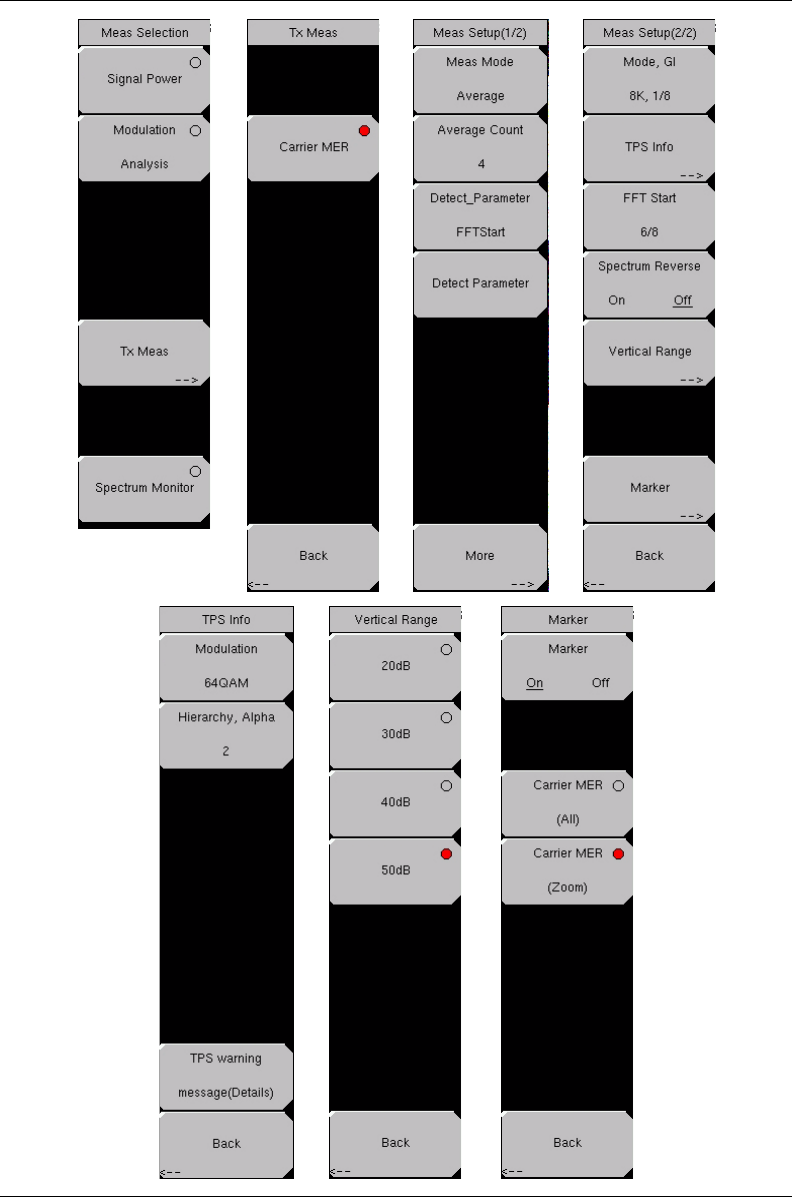
17-38
Tx Meas Menu
Figure 17-25. Measure Selection Menus
17-39
Press the Meas Selection function hard key to open the Meas Selection soft key menu.
Tx Meas
Press this Switching soft key to open the Tx Meas soft key menu.
Carrier MER
Press this Select soft key to enable the Carrier MER transmission measurement.
Back
Press the Back soft key to return to the Tx Meas menu.
Press the Meas Setup function hard key to open the Meas Setup(1/2) soft key menu.
Meas Mode, xxx
Press this Input soft key to open the Select Meas Mode list box and choose from: Single,
Continuous, Average, or Moving Average. The selected mode appears on the virtual soft
key face. Refer to section “Meas Mode” on page 17-27. Note that Tx Meas Analysis does
not include Max Hold.
Average Count, ##
Press this Input soft key to open the Average Count Editor dialog box and select a count
within the indicated range. The selected count appears on the virtual soft key face.
Detect Parameter, FFT Start (Option 57, DVB-T/H BER)
Press this Input soft key to automatically detect the Mode, Guard Interval, TPS
information, and FFT Start from the input signal. Measurement starts after the parameters
are detected. This function is invalid when the FFT Start setup value is a fixed value.
Detect Parameter
Press this Input soft key to automatically detect TPS and Mode, GI information from the
input signal. Measurement begins when parameters are detected. For additional
information, refer to “Mode, GI” or “TPS Info” on page 17-30.
More
Press this Switching soft key to open the Meas Setup(2/2) soft key menu.
Mode, GI, xx
Press this Input soft key to open the Select Mode, GI list box. Scroll through the list to
select the Mode (number of subcarriers) and the Guard Interval. For more information
about Mode or Guard Interval, refer to “2k, 4k, 8k Modes” or to “Guard Intervals” on
page 17-2.
TPS Info
Press this Switching soft key to open the TPS Info soft key menu.
TPS Info Soft Key Menu
Refer to “TPS Info Soft Key Menu” on page 17-30.
FFT Start, ##
Press this Input soft key to open the Select FFT Start list box and select a value for the
starting position for reading effective symbol data. For more information, refer to
section “FFT Start” on page 17-3.
Spectrum Reverse, On/Off
Press this Toggle soft key to turn the spectrum reverse function On or Off. Use
Spectrum Reverse to measure the signal whose sub carrier location is inverted on the
frequency axis, such as the IF signal of the transmitter.
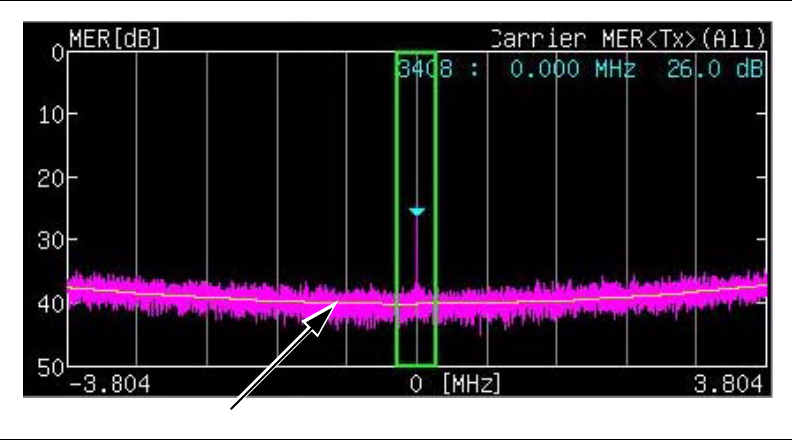
17-40
Vertical Range
Press this Switching soft key to display the Vertical Range options. Select the range
from the Vertical Range soft key menu.
Vertical Range Soft Key Menu
Press a Select soft key to choose one of the values: 20 dB, 30 dB, 40 dB, or 50 dB.
Back
Press this Switching soft key to return to the Meas Setup(2/2) soft key menu.
Marker
Press this Switching soft key to open the Marker soft key menu.
Marker Soft Key Menu
Marker, On/Off
Press this Toggle soft key to turn the Marker On and Off. The MER soft keys are not
displayed until the Marker is On.
Carrier MER (All)
Press this Select soft key to use the range marker in the Carrier MER (All) graph.
The Left/Right arrow keys and the rotary knob move the marker region up and
down in frequency. The Up/Down arrow keys move the marker region in twice the
increment size compared to the other controls. This marker range region indicates
the zoomed (enlarged) area that is displayed in the Carrier MER (Zoom) graph. A
yellow Trend line shows the trend of the Carrier MER values. The Trend line is
calculated by the least-square method, and two calculations are made to determine
the curve from the center frequency to each edge of the frequency measurement.
The blue (triangular) marker shows the point of minimum MER.
Figure 17-26. Tx Carrier MER with Trend Line
Trend Line
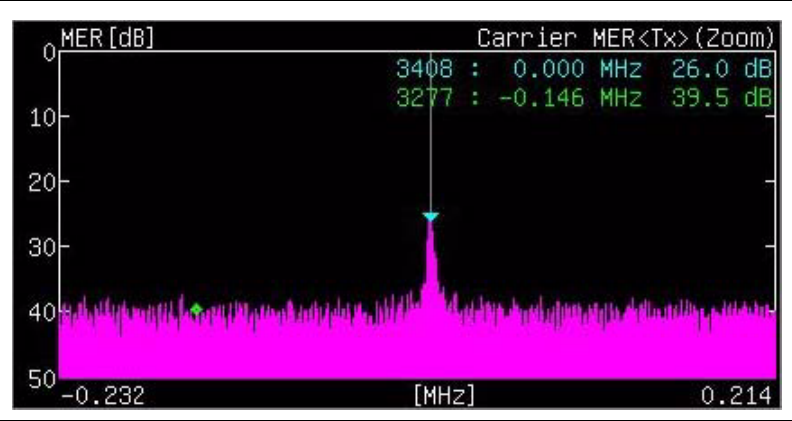
17-41
Carrier MER (Zoom)
Press this Select soft key to use the marker in the Carrier MER (Zoom) graph. The
Up/Down arrow keys move the green trace marker in the largest increments. The
Left/Right arrow keys move the marker in increments half the distance of the
Up/Down arrow keys. The rotary knob moves the marker in the smallest
increments. The blue (triangular) marker shows the point of minimum MER. The
green (diamond) trace marker follows the value of the measurement and is moved
by the keys and rotary knob.
Back
Press this Switching soft key to return to the Meas Setup(2/2) soft key menu.
Back
Press this Switching soft key to return to the Meas Setup(1/2) soft key menu.
Figure 17-27. Tx Carrier Zoom with Markers
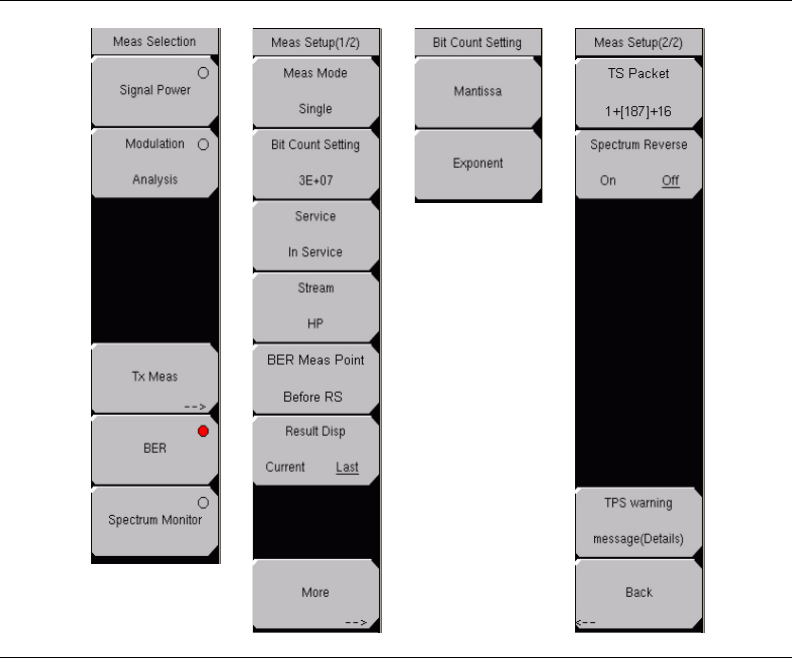
17-42
BER Menus
Press the Meas Selection function hard key to open the Meas Selection soft key menu.
BER
Press this Select soft key to select the BER test. Press the Meas Setup function hard key
to set up the Bit Error Rate testing parameters.
Meas Mode, xxx
Press this Input soft key to open the Select Meas Mode list box and choose between Single
and Repeat. The selected mode appears on the virtual soft key face.
Single: This mode sets the test for one measurement. The Spectrum Master acquires
the measurement and displays the results. This mode is useful for screen capture of
measurements.
Repeat: This mode sets the test for continous measurements, which are displayed as
they are made. This mode is useful for real-time analysis. Measurement of the set
number of bits is repeated.
Bit Count Setting
Press this Input soft key to open the Bit Count Setting Editor. Use the Mantissa or
Exponent soft key to select between these parameters to edit. Enter the desired mantissa
and exponent. The mantissa value ranges from 1 to 9, and the exponent value ranges from
6 to 12. Resolution is 1 for both.
Figure 17-28. BER Selection Menus
17-43
Service
Press this Input soft key to open the Select Service list box and choose between In Service
and OutOfService.
In Service: Select this mode when the input signal is a broadcast wave. The BER
measurement point is fixed to Before RS and Before Viterbi. This mode also performs
a Packet Error Rate (PER) measurement.
Out Of Service: Select this mode when the input signal is PRBS23. The measurement
point can be selected from Before RS, After RS, and Before Viterbi. PER is measured
only when After RS is selected.
Stream
Press this Input soft key to open the Select Stream list box and select between a high
priority (HP) or low priority (LP) signal stream.
BER Meas Point (If Out Of Service is selected.)
Press this Input soft key to view the current or last measurement taken.
Before Viterbi: Sets the measurement point before the Viterbi decoder. No error count
is displayed when Before Viterbi is selected as the BER measurement point.
Before RS: Sets the measurement point before the Reed Solomon decoder.
After RS: Sets the measurement point after the Reed Solomon decoder.
Result Disp
Press this Toggle soft key to view the current or last measurement taken. The Current
measurement display is periodically updated.
More
Press this Switching soft key to continue setting up the BER measurement parameters.
TS Packet (If Out Of Service is selected.)
Press this Input soft key view the current or last measurement taken.
1+[187]+16: Sets the measurement point before the Reed Solomon decoder.
4+[184]+16: Sets the measurement point after the Reed Solomon decoder.
When OutOfService is selected and BER Measure Point is Before Viterbi, then TS Packet
is automatically set to PRBS23.
Spectrum Reverse
Press this Toggle soft key to measure the signal whose sub carrier location is inverted on
the frequency axis, such as the IF signal of the transmitter.
TPS warning message (Details)
Press this Input soft key to open the TPS Warning Message (Details) message box. For
details about TPS Warning messages, refer to Appendix D, Code TPS Warning Messages.
Back
Press this Switching soft key to return to the Meas Setup(1/2) menu for BER testing.
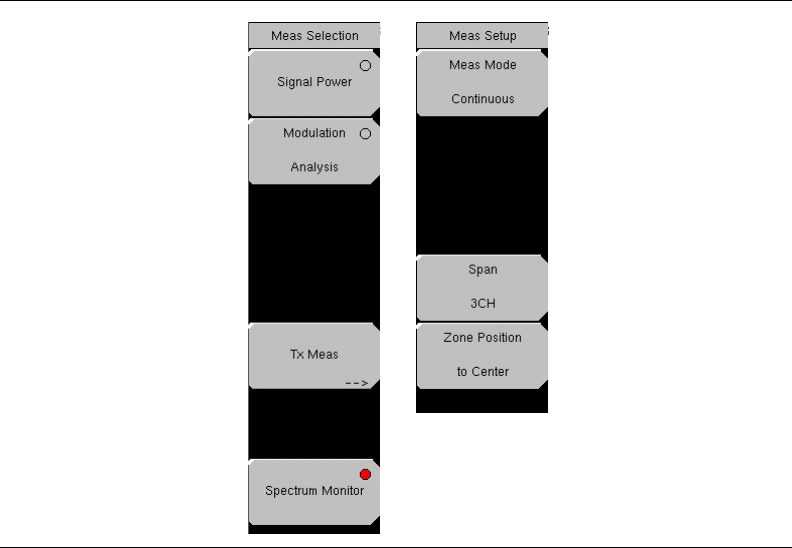
17-44
Spectrum Monitor Menus
Press the Meas Selection function hard key to open the Meas Selection soft key menu.
Spectrum Monitor
Press this Select soft key to display the spectrum of the input signal.
Press the Meas Setup function hard key to open the Meas Setup soft key menu.
Meas Mode, xxx
Press this Input soft key to open the Select Meas Mode list box and choose between Single
and Continuous. The selected mode appears on the virtual soft key face.
Single: This mode sets the test for one measurement. The MS2721B acquires the
measurement and displays the results. This mode is useful for screen capture of
measurements.
Continuous: This mode sets the test for continous measurements, which are displayed
as they are made. This mode is useful for real-time analysis.
Span, #CH
Press this Input soft key to open the Select Span list box and choose the desired number of
channels to span in the displayed measurement. When the setting is entered, the
measurement is restarted. Detection type is set to RMS on the spectrum monitor for all
available span settings.
Figure 17-29. Spectrum Monitor Menus

17-45
The Up/Down arrow keys also change the span selection and restart the measurement.The
RBW and VBW values are set internally and are not displayed on the screen.
Zone Position to Center
Press this Input soft key to set the channel of the current zone marker at the center of the
measurement display and restart the measurement.
The Left/Right arrow keys and the rotary knob also move the channel of the current zone
marker, but they do not restart the measurement.
Press the Execute Measure function hard key at any time to restart the measurement.
Table 17-7: Span Relation to Bandwidth
Span RBW VBW
1 CH 10 kHz 3 kHz
3 CH 30 kHz 10 kHz
5 CH 100 kHz 30 kHz
11 CH 100 kHz 30 kHz
31 CH 300 kHz 100 kHz
51 CH 1 MHz 300 kHz
17-46
Glossary
Alpha Hierarchy
This mode is used to shape the 16QAM and 64QAM constellations. A value of α=1
describes an equally spaced constellation.
Channel Power
The output power of a transmitter over the frequency range in a specific time interval.
dBi
dBi is the dB gain with reference to an isotropic radiator.
FFT
Fast Fourier Transform.
GI
In telecommunications, guard intervals (GI) are used to ensure that distinct transmissions do
not interfere with one another. These transmissions may belong to different users (as in
TDMA) or to the same user (as in OFDM). Guard intervals introduce immunity to
propagation delays, echoes, and reflections, to which digital data is normally very sensitive.
MER
Modulation Error Ratio is a signal-to-noise ratio in a digitally modulated signal. It is a
measure that is used to quantify the performance of a digital radio transmitter or receiver in a
system using QAM (Quadrature Amplitude Modulation). It includes the parameters
amplitude imbalance, quadrature error, and distortion.
MPE
Multiprotocol Encapsulation is a datalink layer protocol that is defined by DVB.
MPE-FEC
MPE-FEC (Multi-Protocol Encapsulation / Forward Error Correction) is a method that is
used to deliver additional Forward Error Correction to datagrams that are delivered in MPE
sections.
OFDM
Orthogonal Frequency-Division Multiplexing is a digital multi-carrier modulation scheme
that uses a large number of closely-spaced orthogonal subcarriers. It allows the transmission
of data on multiple adjacent subcarriers, each subcarrier being modulated in a traditional
manner with a linear modulation scheme such as QAM (Quadrature Amplitude Modulation).
Orthogonality allows the carriers to be placed very close to one another, in such a way that
no guard bands are needed, and therefore, no information is sacrificed when using frequency
division multiplexing.
Data for transmission is converted into several parallel streams, and each stream is used to
modulate a separate subcarrier. Only a small amount of the total data is sent via each
subcarier, and it is sent in a subchannel that is a fraction of the width of the total channel.
17-47
PER
Packet Error Rate (PER) is a measurement that shows the number of transmitted packets that
contain errors. The information is shown as an error rate and as the number of errors.
QAM
Quadrature Amplitude Modulation (QAM) is a modulation scheme which conveys data by
changing (modulating) the amplitude of two carrier waves. These two waves, usually
sinusoids, are out of phase with each other by 90° and are thus called quadrature carriers.
QPSK
Quadrature Phase-Shift Keying is a type of digital phase modulation that contains four
allowed phases for each transmitted bit.
RBW
Resolution bandwidth is determined by the intermediate frequency (IF) filter bandwidth.
The spectrum analyzer traces the shape of its IF filter as it tunes past a signal. If more than
one IF filter is used in a spectrum analyzer, then the narrowest one dominates and is
considered the resolution bandwidth.
Spectrum Reverse
The signal whose subcarrier location is inverted on the frequency axis, such as the IF signal
of the transmitter.
TPS
Transmission Parameter Signaling (TPS) carriers are used for the purpose of signaling
parameters related to the transmission scheme, in other words, to channel coding and
modulation. The TPS is transmitted in parallel on 17 TPS carriers for the 2K mode and on
68 carriers for the 8K mode. Every TPS carrier in the same symbol conveys the
differentially encoded information bit. TPS information includes the following:
• Modulation, including the α value of the QAM constellation pattern
• Hierarchy information
•Guard interval
• Inner code rates
• Transmission mode: 2K or 8K
• Frame number in a super-frame
• Cell identification
Time-Slicing
Time-slicing is a method that is used to deliver MPE sections and MPE-FEC sections in
bursts.
VBW
Video bandwidth
17-48
18-1
Chapter 18
DVB-T/H SFN Analyzer
Introduction
This chapter provides a description of DVB-T/H single frequency network (SFN) setup and
measurement for signal power and signal analysis with Option 78 on the MS2721B
Spectrum Master. The user can measure channel power along with the field strength and
power of each incoming signal even with several incoming multipath signals. The time for
impulse response measurements is longer to allow for the measurement of signals coming
from distant sites in the network.
Field strength measurements in SFN environments include Level, Delay, and DU Ratio of
each incoming signal along with the time delay between signals.
Measurement Functions
Impulse Response Measurement
This function measures the difference in time and frequency of multipath signals. Measuring
the channel frequency response allows observation of the multipath effect and
frequency-selective fading. This is useful for adjusting the timing of SFN repeaters.
Inband Spectrum
This function is useful for transmitter installation or maintenance because it offers a wide
dynamic range (50 dB) on the vertical scale for high-performance transmitters. It also offers
precise checks of each carrier by providing a zoom view for all carriers on the horizontal
scale.
Getting Started
Quick Start Configuration, Setup, and Testing
DVB-T/H SFN Analyzer Mode
To configure the instrument for DVB-T/H SFN Analyzer measurements:
1. Press the Shift key, then the Mode (9) key.
2. Use the Up/Down arrow keys or the rotary knob to highlight DVB-T/H SFN Analyzer
and then press the Enter key or press the rotary knob to select this mode.
Refer to Mode Selector Menu on page 2-15 for more information about selecting instrument
modes.
18-2
Antenna Setup
The antenna attaches to the instrument with a coaxial cable. The antenna and coaxial cable
are not supplied with the instrument and are to be procured separately.
The antenna factors are different for each antenna. Refer to the documentation for your
antenna. Also, remember to include the cable loss to the measurement correction table when
you are entering the antenna factors.
1. Attach the antenna to the Spectrum Analyzer connector on top of the Spectrum Master
(refer to Figure 17-3 Spectrum Master Connections – Spectrum Analyzer RF in on
page 17-6).
2. Select the antenna as follows:
a) Press the Meas Setup function hard key.
b) Press the Impulse Response soft key followed by pressing the More soft key.
c) Press the Correction Value soft key.
d) Press the Antenna (Correction Level) soft key. The Select Antenna list box opens.
e) Highlight the desired Anritsu antenna model number and press Enter.
f) Press the Back soft key twice to return to the Meas Setup(1/2) menu.
18-3
Measurement Setup and Execution
Of the five function hard keys, only four are used with Option 78. They have the following
labels:
Frequency/Level, BLANK, Meas Setup, Execute Measure, and Save Files
Frequency and Reference Level Configurations
The following procedure is used to set up the instrument for DVB-T/H SFN measurement
and analysis:
1. Press the Frequency/Level function hard key. Configure the following parameters as
needed: Channel Map, Frequency, Bandwidth, Auto Reference Level,
Reference Level, and Pre Amp.
2. Press the Channel Map soft key. The Select Channel Map list box opens. Select one of
the three choices, and then press the Enter key or the rotary knob.
a) If you have selected UHF (Australia) or UHF (Europe), then press the Channel soft
key, scroll to the desired channel, and press the Enter key. The bandwidth (7 MHz
or 8 MHz) and the frequency range are automatically selected by the choice of
channel map. The selected channel number is displayed on the face of the Channel
soft key. If no channel map (None) is selected, then the Frequency and Band Width
soft keys are listed in the soft key menu so that these parameters can be set
manually.
b) If you have selected None, then use the Frequency and Band Width soft keys to set
these two parameters.
•Press the Frequency soft key to open the Frequency Editor dialog box, which
indicates the acceptable range for input. The Units soft key menu displays four
unit keys: GHz, MHz, kHz, and Hz. If any of these units are not appropriate,
then pressing the key displays Outofrange at the bottom of the Frequency
Editor window. Set the frequency by using the Up/Down arrow keys, the rotary
knob, or the number keys. When the desired range is displayed, press the
appropriate unit soft key, the rotary knob, or the Enter key.
•Press the Band Width soft key to open the Select Band Width list box and select
either 7MHz or 8MHz bandwidth.
3. Press the Auto Reference Level soft key to allow the instrument to set an optimum
reference level, or press the Reference Level soft key to open the Reference Level
Editor dialog box. To manually set the dBm reference level, use the Up/Down arrow
keys, the rotary knob, or the number keys, then press the rotary knob or press the Enter
key. After entering a value by using the number keys, press the +/- key to create a
negative value.
4. Press the Pre Amp soft key to toggle this function ON and OFF.
18-4
SFN Measurement
Set Up the Test
1. Press the Meas Setup function hard key to list the Meas Setup(1/2) menu.
2. Press the Meas Mode soft key to open the Select Meas Mode list box and choose either
Single or Continuous.
3. Press the Detect Parameter soft key to automatically detect Mode, GI, and TPS
information from the input signal.
Impulse Response Measurement Setup
1. Press the Impulse Response soft key to select the Impulse Response screen. Press the
More soft key to list the Meas Setup(2/2) soft key menu in order to continue
configuring for Impulse Response parameters.
2. Press the Mode, GI soft key and scroll to select the desired Guard Interval (GI)
parameters.
3. Press the TPS Info soft key.
a) From the TPS Info menu, press the Modulation soft key and choose from: QPSK,
16QAM, and 64QAM.
b) If modulation is set to 16QAM or 64QAM, then press the Hierarchy, Alpha soft key
and choose: None, 1, 2, or 4. If modulation is set to QPSK, then skip this step (the
hierarchy soft key is not displayed).
c) Press the Back soft key to return to the Meas Setup(2/2) menu.
4. Press the FFT Start soft key to open the Select FFT Start list box and select the desired
start position with a guard interval (GI). The value 0/8 indicates no guard interval.
5. Press the Spectrum Reverse On/Off soft key to toggle between On and Off. The active
state is underlined on the virtual soft key face.
6. Press the Correction Value soft key to display the Correction Value menu.
a) Press the Antenna soft key, highlight the desired Anritsu antenna model number,
and press Enter.
b) Press the Impedance soft key to toggle through the following choices: 50 ohm,
75 ohm, or Other.
If you select Other, then the Impedance Loss soft key is listed. Press the
Impedance Loss soft key to open the Impedance Loss Editor dialog box and enter a
loss level value (in dB) within the displayed range.
c) Press the Back soft key to return to the Meas Setup(2/2) menu.
7. Press the Impulse Response Vertical Range soft key. Select a range (in dB). The red
dot on the virtual soft key face denotes the selected vertical range. Then press the Back
soft key to return to the Meas Setup(2/2) menu.
8. Press the Display Waveform soft key to open the Display Waveform soft key menu.
a) Press the Last Result soft key to toggle On or Off a view of the last waveform
(yellow) result.
b) Press the Power Method soft key to toggle On or Off a display of the delay path
profile waveform (light blue) that is created by the power spectrum method.
c) Press the Transfer Method soft key to toggle On or Off a display of the delay path
profile waveform (magenta) that is created by the transfer function method.
d) Press the Back soft key to return to the Meas Setup(2/2) menu.
9. Press the Back soft key again to return to the Meas Setup(1/2) menu.
18-5
10. Press the Marker soft key to open the marker soft key menu.
a) Press the Marker soft key to toggle between Move the marker and Fix the marker.
b) Press the Impulse Response soft key to select and configure the marker for Impulse
Response (All) view or Impulse Response (Zoom) view.
c) If Impulse Response Zoom is selected, then press the Marker Mode soft key to
select either Normal or Zone.
d) Press the Unit soft key to select dBµV/m (Field Strength) or
dBµV (Termination Voltage)
e) Press the Detect MaxLevel soft key.
f) Press the Main to Center of Zoom soft key.
g) Press the Path to Center of Zoom soft key.
h) Press the Back soft key to return to the Meas Setup(1/2) menu.
Inband Spectrum Mesurement Setup
1. Press the Inband Spectrum soft key to select the Inband Spectrum screen. Press the
More soft key to display the Meas Setup(2/2) soft key menu in order to continue
configuring for Inband Spectrum parameters.
2. Press the Mode, GI soft key and scroll to select the desired Guard Interval parameters.
3. Press the TPS Info soft key.
a) From the TPS Info menu, press the Modulation soft key and choose from: QPSK,
16QAM, and 64QAM.
b) If modulation is set to QPSK, then skip this step (the hierarchy soft key is not
displayed).
Press the Hierarchy, Alpha soft key and choose: None, 1, 2, or 4.
c) Press the Back soft key to return to the Meas Setup(2/2) menu.
4. Press the FFT Start soft key to open the Select FFT Start list box and select the desired
start position with a guard interval (GI). A value of 0/8 indicates no guard interval.
5. Press the Spectrum Reverse On/Off soft key to toggle between On and Off. The active
state is underlined on the virtual soft key face.
6. Press the Correction Value soft key to display the Correction Value soft key menu. The
active state is underlined on the virtual soft key face.
a) Press the Antenna soft key, highlight the desired Anritsu antenna model number,
and press Enter.
b) Press the Impedance soft key to toggle among the choices: 50 ohm, 75 ohm, or
Other. The active state is underlined on the virtual soft key face.
c) Press the Back soft key to return to the Meas Setup(2/2) menu.
7. Press the Inband Spectrum Vertical Range soft key. Select a range (in dB) by pressing a
soft key. The red dot denotes the selected vertical range. Then press the Back soft key
to return to the Meas Setup(2/2) menu.
8. Press the Back soft key again to return to the Meas Setup(1/2) menu.
9. Press the Marker soft key to display the Marker soft key menu.
a) Press the Marker soft key to toggle the marker function On or Off.
b) Press the Delta Marker soft key to toggle the delta marker On or Off.
Use the arrow keys or the rotary knob to move the marker and the delta marker.
c) Press the Back soft key to return to the Meas Setup(1/2) menu.
Execute the Test
Press the Execute Measure function hard key to begin testing. If the input signal cannot be
measured, then a message is displayed with red highlighting near the top of the display area,
such as: Under Level : Increase input level. Or: Under range : Reduce Reference Level.
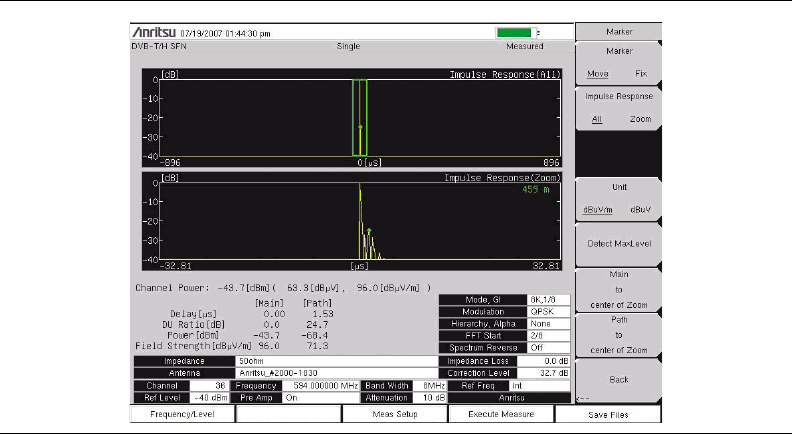
18-6
Save the Test Results
Press the Save Files function hard key to save a measurement. A confirmation window
opens briefly to indicate that the measurement has been saved.
Saving Measurement Results
Automatic File Saving
Files are saved in the JPEG format and the CSV format. The filename format uses a string of
3 characters followed by a string of digits for the date and time. The entire character string
appears as follows:
Impulse Response
SFIYYYYMMDD_HHMMSS.csv
SFIYYYYMMDD_HHMMSS.jpg
Inband Spectrum
SFSYYYYMMDD_HHMMSS.csv
SFSYYYYMMDD_HHMMSS.jpg
The date is expressed as year (YYYY), month (MM), and day (DD) followed by an
underscore, and then the time is expressed as hour (HH), minute (MM), and second (SS), all
followed by a period and the file extension (CSV or JPG).
Manual File Saving
To save a measurement manually, refer to sections File and Save on page 3-6 and to section
Text Entry on page 2-7.
Figure 18-1. Impulse Response Mesurement
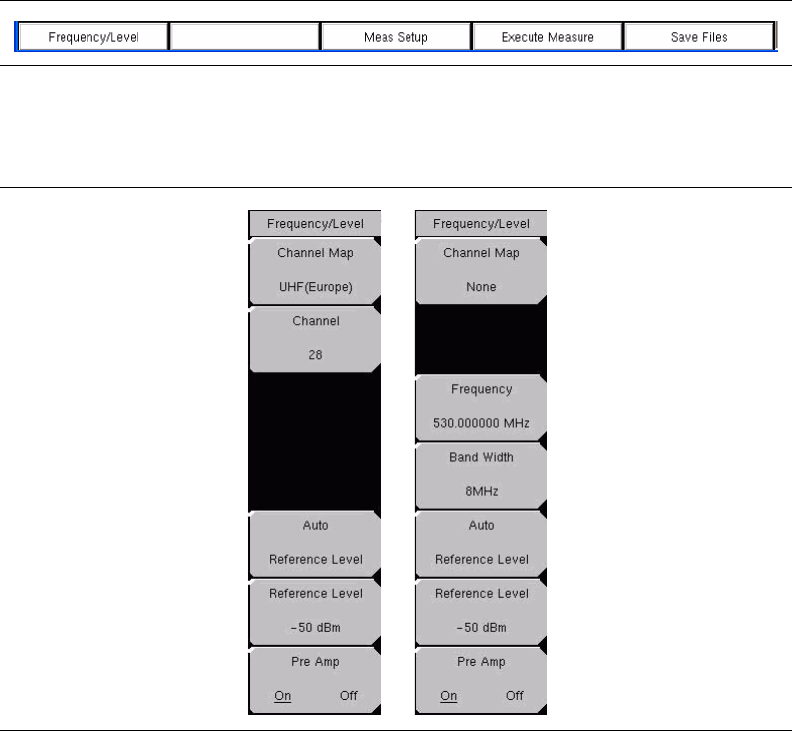
18-7
Menus
Function Hard keys
In DVB-T/H SFN Analyzer mode (Option 78), the Spectrum Master displays the following
4 function hard key menu choices: Frequency/Level, Meas Setup, Execute Measure, and
Save Files.
Frequency/Level Menu
Channel Map
This Input soft key opens the Select Channel Map list box to allow channel map selections
for UHF(Australia), UHF(Europe), or None. Selecting UHF(Australia) sets the bandwidth to
7 MHz, selecting UHF(Europe) sets the bandwidth to 8 MHz, and a Channel Number soft
key is added to the Frequency/Level menu. Selecting None adds two soft keys to the
Frequency/Level menu in order to allow manual setting of frequency and bandwidth.
Channel ##
If UHF is selected for Channel Map, then the next soft key is Channel ##. Press this Input
soft key to open the Channel Editor dialog box to select a channel within a specified range
that is displayed in the window. If None is selected, then the next soft key is Frequency.
Figure 18-2. Function Hard Key Menu
Figure 18-3. Frequency/Level Menus
18-8
Frequency ##
If None is selected for Channel Map, then the soft keys for Frequency and Band Width are
added to the menu. Press this Input soft key to open the Frequency Editor dialog box to
manually enter or select a frequency within a specified range that is displayed in the
window. The Units soft key menu displays virtual soft keys for the following
units: GHz,MHz, kHz, and Hz.
Band Width #
Press this Input soft key to open the Select Band Width list box to select a bandwidth of
7MHz or 8MHz.
Auto Reference Level
Press this Input soft key to automatically set the reference level to an optimum value. This
reference level indicates the signal level input to the instrument.
The reference level range for input to the instrument is determined by the reference level
setting. Immediately after a signal is applied to the instrument, the input attenuator is
automatically set according to the reference level. The relationship between the reference
level and the input attenuator is fixed. Table 18-1 shows the relationship between the
reference level and the input attenuator for each measurement item.
Raising the reference level increases attenuation of the input attenuator, enabling the
Spectrum Master to handle a high input level. Note that the noise floor rises in proportion
to the attenuation of the input attenuator.
When applying a signal to the instrument, enter a signal level that does not exceed the
reference level value. If the signal level exceeds the reference level, then raise the
reference level. For example, if the signal level is 0.5 dBm with preamplifier off, then set
the reference level to 5 dBm, not to 0 dBm.
If an interfering signal exists other than the intended signal, and if the power (within the
frequency range of approximately 100 kHz to 7.1 GHz) is 15 dB or more higher than the
measurement signal level, then set the reference level to take the large signal into account.
Reference Level ##
Press this Input soft key to open the Reference Level Editor dialog box in order to select a
signal reference value within the specified range that is displayed in the window. If the
Pre Amp soft key is On, then the reference level range is from –10 dBm to –50 dBm in
10 dB increments. If the Pre Amp soft key is Off, then the reference level range is from
–25 dBm to 20 dBm in 5 dB increments.
Pre Amp On/Off
Press this Toggle soft key to toggle the preamplifier function between On and Off. When
the preamplifier is switched On, the reference level is automatically set to –30 dBm. When
the preamplifier is switched Off, the reference level is automatically set to –25 dBm.

18-9
Table 18-1: Relationship between Reference Level and Input Attenuator
Preamplifier Reference Level (dBm) Input Attenuator (dB)
Off 20 45
Off 15 40
Off 10 35
Off 5 30
Off 0 25
Off –5 20
Off –10 15
Off –15 10
Off –20 5
Off –25 0
On –10 40
On –20 30
On –30 20
On –40 10
On –50 0
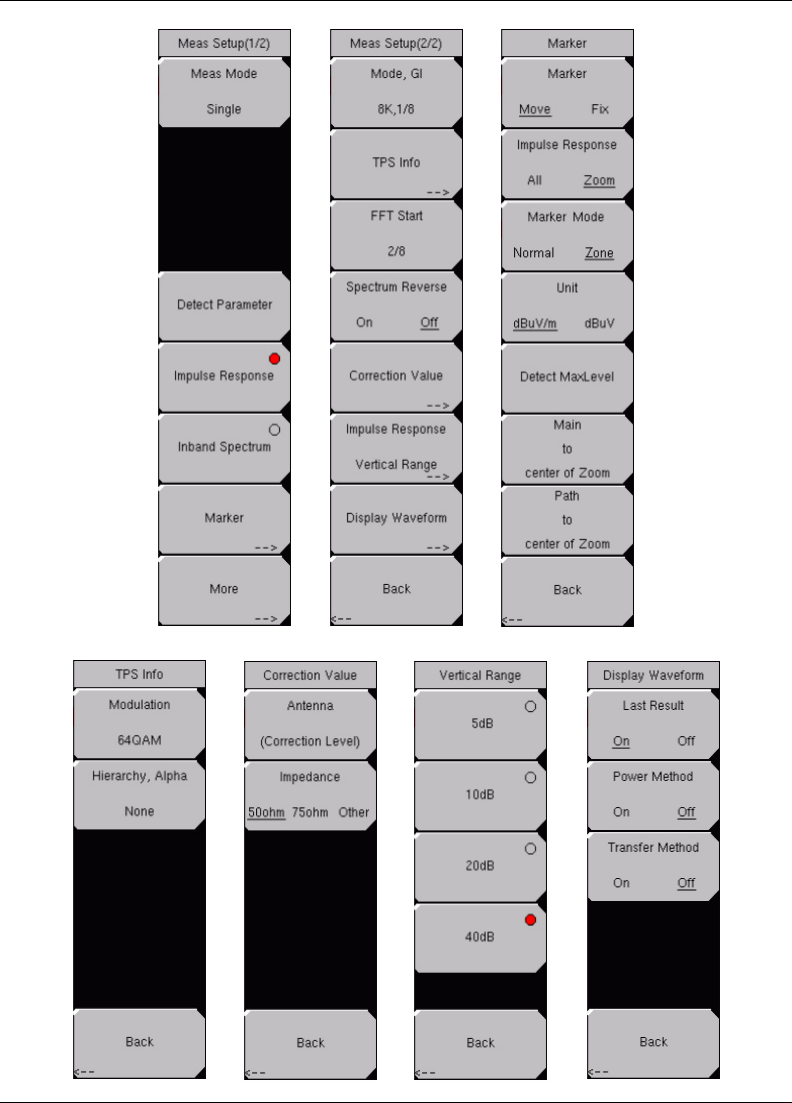

18-11
Measure Setup(1/2) Soft Key Menu
Meas Mode
Press this Input soft key to open the Select Meas Mode list box and select a measurement
mode. Two test mode options are available: Single and Continuous.
Single sets up the test for one measurement. A measurement is taken, and the results are
displayed on the screen. This mode is useful for capturing screen images.
Continuous sets up the test to take measurements continuously and to display the results.
The mode is helpful for real-time signal analysis.
Detect Parameter
Press this Input soft key to automatically detect TPS and Mode, GI information from the
input signal. Measurement begins when parameters are detected. For additional
information, refer to Mode, GI on page 18-15 and TPS Info on page 18-15.
Impulse Response
Press this Select soft key to activate the Impulse Response measurement mode and the
associated Meas Setup menus. The red dot in the upper right portion of the virtual soft key
face denotes that the measurement mode is selected.
Inband Spectrum
Press this Select soft key to activate the Inband Spectrum measurement mode and the
associated Meas Setup menus.
Marker (Impulse Response Measurement Setup)
Press this Switching soft key to list the Marker soft key menu.
Marker Soft Key Menu
Marker
Press this Toggle soft key to select either Move or Fix.
When Move is selected, you are allowed to position the Marker, Enlarged Window, and
Zone Marker in the Impulse Response (All) and Impulse Response (Zoom) graphs.
When Fix is selected, the soft keys for Impulse Response, Marker Mode,
Detect MaxLevel, Main to center of Zoom, and Path to center of Zoom are not
displayed.
Impulse Response
Press this Toggle soft key to toggle between All and Zoom in order to display the
marker and the enlarged window on the Impulse Response (All) graph. The enlarged
window shows the displayed range of the enlarged Impulse Response (Zoom) graph.
Marker Mode
Press this Toggle soft key to select either Normal or Zone. When Zone is selected, the
Zone Marker is turned on for display in the Impulse Response (Zoom) graph.
Figure 18-5. Impulse Response (All) Graph with Marker
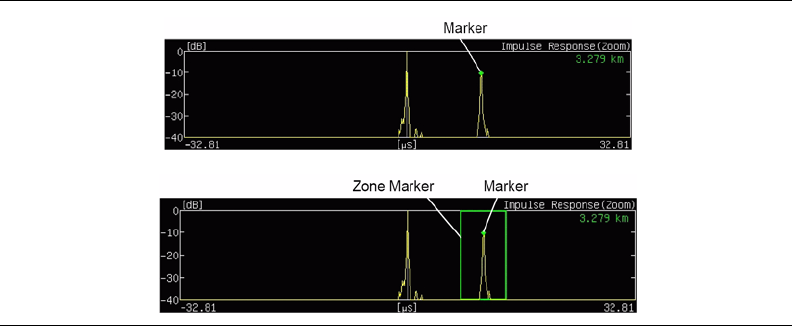
18-12
Unit
Press this Toggle soft key to view the Field Strength or the Termination measurement.
Field Strength: dBµV/m
Termination Voltage:dBµV
Detect MaxLevel
Press this Input soft key to detect the various maximum levels of the
Impulse Response (All) and Impulse Response (Zoom) graphs.
Impulse Response (All): Detects the maximum level of the last result within the
enlarged window and adjusts the marker to the maximum level.
Impulse Response (Zoom), Marker Mode-Normal: Detects the maximum level
of the last result within the enlarged graph and adjusts the marker to the maximum
level.
Impulse Response (Zoom), Marker Mode-Zone: Detects the maximum level of
the last result within the enlarged graph and adjusts the zone marker to the
maximum level, so that the detection position of the maximum level is located at
the center. The marker frame is automatically resized in the graph when the
maximum level is located at either edge of the enlarged graph.
Main to Center of Zoom
Press this Input soft key to move the All graph enlarged window so that the main wave
(delay time of 0 µs) can be displayed, focusing around the enlarged graph.
Path to Center of Zoom
Press this Input soft key to move the enlarged window so that the current marker
position can be displayed, focusing around the enlarged graph.
Back
Press this Switching soft key to return to the Meas Setup(1/2) soft key menu.
Figure 18-6. Impulse Response (Zoom) Graph with Zone Marker
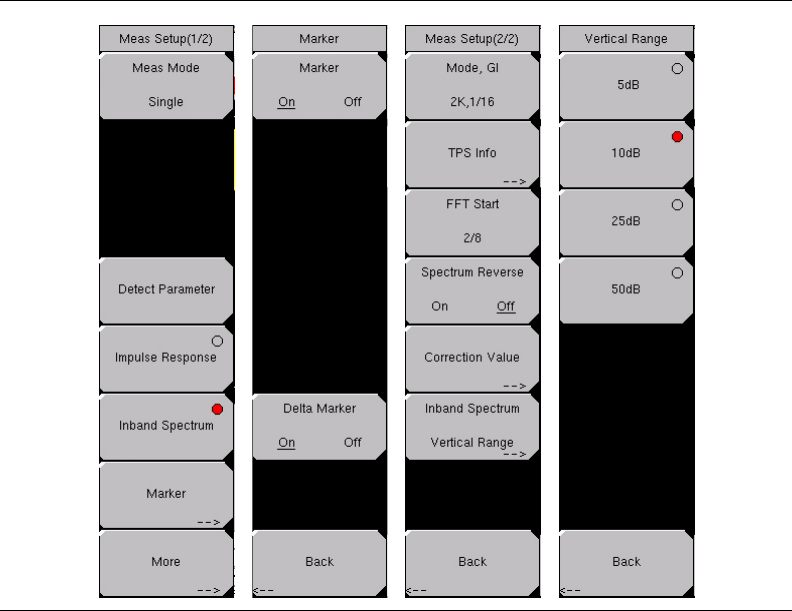
18-13
Press the Meas Setup function hard key to open the Meas Setup(1/2) soft key menu. When
Inband Spectrum is selected, the available soft key menu options are as shown in
Figure 18-7.
Marker (Inband Spectrum Measurement Setup)
Press this Switching soft key to open the Marker soft key menu. After turning on the
marker or the delta marker, use the Left/Right arrow keys to move the marker in steps, or
use the rotary knob to move the marker one point at a time.
Marker Soft Key Menu
Marker
Press this Toggle soft key to turn Marker On or Off. When On is selected, the diamond
shaped marker is displayed. The marker frequency, distance, and level are displayed in
green at the bottom-right corner of the graph.
Delta Marker
Press this Toggle soft key to turn Delta Marker On or Off. When On is selected, both
the Standard Marker (square) and Delta Marker (diamond) are displayed on the graph.
Delta Marker data for frequency, distance, and level are in reference to the standard
marker position.
Figure 18-7. Measurement Setup Menus for Inband Spectrum
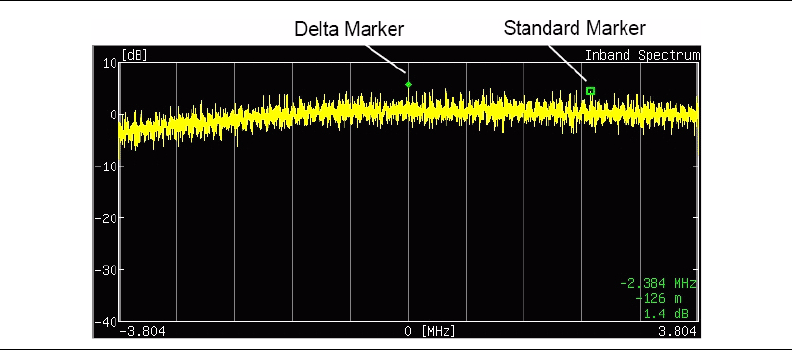
18-14
Back
Press this Switching soft key to return to the Meas Setup(1/2) soft key menu.
More
Press this Switching soft key to open the Measure Setup(2/2) soft key menu to continue
setting up either Impulse Response or Inband Spectrum measurements.
The following soft keys provide the same functions in the Inband Spectrum measurements
as in the Impulse Response measurements: Mode, GI, TPS Info, FFT Start,
Spectrum Reverse, Correction Value, Back. The menus are the same as shown in
Figure 18-4.
Figure 18-8. Delta Marker, Inband Spectrum Measurement

18-15
Measure Setup(2/2) Soft Key Menu
Mode, GI
Press this Input soft key to open the Select Mode, GI list box. Scroll through the list to
select the Mode (number of subcarriers) and the Guard Interval. For more information
about Mode or Guard Interval, refer to 2k, 4k, 8k Modes on page 17-2 and Guard
Intervals on page 17-2.
TPS Info
Press this Switching soft key to open the TPS Info soft key menu.
TPS Info Soft Key Menu
Modulation
Press this Input soft key to open the Select Modulation list box. Scroll to select
QPSK, 16QAM, or 64QAM modulation. The selection is displayed on the virtual
soft key face. Selecting QPSK automatically sets the Hierarchy, Alpha parameter to
None.
Hierarchy, Alpha, #
Press this Input soft key to open the Select Hierarchy, Alpha list box. Scroll to
select None, 1, 2, or 4. The selection is displayed on the virtual soft key face. This
selection is used to shape the 16QAM and 64QAM constellations. A value of α=1
describes an equally-spaced constellation.
Back
Press this Switching soft key to return to the Meas Setup(2/2) soft key menu.
Table 18-2: Mode and Guard Interval
Mode Guard Interval
2K 1/4
2K 1/8
2K 1/16
2K 1/32
4K 1/4
4K 1/8
4K 1/16
4K 1/32
8K 1/4
8K 1/8
8K 1/16
8K 1/32

18-16
FFT Start, ##
Press this Input soft key to open the Select FFT Start list box. Scroll to select an
FFT Start position in order to synchronize with the data that is used for measurement.
A setting of 0/8 uses none of the guard interval and includes only the effective symbol
(the data portion of the OFDM frame). A setting of 1/8 adjusts the FFT Start position to
use 1/8 of the guard interval, and a setting of 8/8 adjusts the FFT Start position to use
all of the guard interval.
Refer to Figure 17-1 FFT Start and Guard Interval on page 17-4 for details about the
relationship between the FFT Start position and the guard intervals. Signals that arrive
with or without interference can be synchronized and measured by adjusting the
FFT Start position. When measuring a delayed wave (a signal comprising one or more
earlier, but weaker, signals), changing the FFT Start position can filter interference.
Spectrum Reverse, On/Off
Press this Toggle soft key to turn the Spectrum Reverse function On or Off. Use this
function to measure the signal whose subcarrier location is inverted on the frequency
axis, such as the IF signal of the transmitter.
Correction Value
Press this Switching soft key to open the Correction Value soft key menu.
Correction Value Soft Key Menu
Antenna (Correction Level)
Press this Input soft key to open the Select Modulation list box. Scroll to select
QPSK, 16QAM, or 64QAM modulation. The selection is displayed on the virtual
soft key face. Selecting QPSK automatically sets the Hierarchy, Alpha parameter to
None.
Impedance
Press this Toggle soft key to toggle through the values until the desired value is
underlined. The default value is 50 ohms.
50 ohms Select this impedance when no converter is used. Impedance loss is
automatically set to 0.0 dB.
75 ohms Select this impedance when impedance converter 12N50-75B is used.
Impedance loss is automatically set to 7.5 dB.
Other Set impedance to Other when any impedance converter other than
12N50-75B is used. Selecting this value enables the Impedance Loss soft key.
Table 18-3: Guard Interval Lengths in Microseconds
Length 2K 4K 8K
1⁄4 56 µs 112 µs 224 µs
1⁄8 28µs 56µs 112µs
1⁄16 14 µs 28 µs 56 µs
1⁄32 7µs 14µs 28µs

18-17
Impedance Loss
Press this Input soft key to open the Impedance Loss Editor. Type in or scroll to set
the insertion loss of the impedance converter. For example, when using an Anritsu
MA8994A Impedance Converter, set the insertion loss to 1.8 dB. This soft key
appears only when the Impulse soft key is toggled to Other.
Back
Press this Switching soft key to return to the Meas Setup(2/2) soft key menu for
constellation measurement display.
Continuing the Measure Setup(2/2) Soft Key Menu
Impulse Response, Vertical Range
Press this Switching soft key to open the Vertical Range soft key menu. Press the Input
soft key that is associated with the desired range.
Back
Press this Switching soft key to return to the Meas Setup(2/2) soft key menu for
constellation measurement display.
Inband Spectrum, Vertical Range
Press this Switching soft key to open the Vertical Range soft key menu. Press the Input
soft key that is associated with the desired range.
Back
Press this Switching soft key to return to the Meas Setup(2/2) soft key menu for
constellation measurement display.
Display Waveform (Impulse Response graph only)
Press this Switching soft key to open the Display Waveform soft key menu.
Table 18-4: Impulse Response, Vertical Range
Vertical Range Value (dB)
50 to -5
10 0 to -10
20 0 to -20
40 0 to -40
Table 18-5: Inband Spectrum Vertical Range
Vertical Range Value (dB)
51 to -4
10 2 to -8
25 5 to -20
50 10 to -40
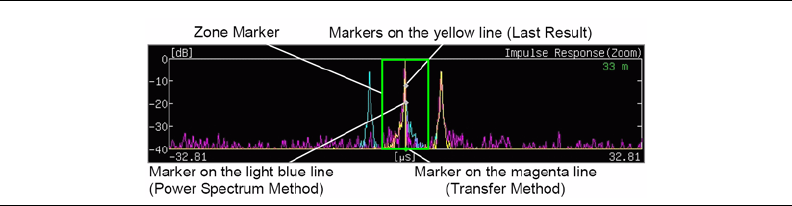
18-18
Display Waveform Soft Key Menu
Last Result
Press this Toggle soft key to turn On or Off a display of the waveform (yellow) last
measured.
Power Method
Press this Toggle soft key to turn On or Off a display of the delay path profile
waveform (light blue) that is created by the power spectrum method.
Transfer Method
Press this Toggle soft key to turn On or Off a display of the delay path profile
waveform (magenta) that is created by the transfer function method.
Back
Press this Switching soft key to return to the Meas Setup(2/2) soft key menu for
constellation measurement display.
Back
Press this Switching soft key to return to the Meas Setup(1/2) soft key menu.
Figure 18-9. Display Waveform, Impulse Response Graph
A-1
Appendix A
Signal Standards
Introduction
This appendix provides a list of the signal standards included in the Spectrum Master. The
standards displayed depend on the operating mode selected.
AMPS / EIA 553 - Uplink
C-450(P) - Uplink
C-450(P) - Downlink
C-450(SA) - Uplink
C-450(SA) - Downlink
CDMA China 1 - Uplink
CDMA China 1 - Downlink
CDMA China 2 - Uplink
CDMA China 2 - Downlink
CDMA Japan - Uplink
CDMA Japan - Downlink
CDMA Korea PCS - Uplink
CDMA Korea PCS - Downlink
CDMA US Cellular - Uplink
CDMA US Cellular - Downlink
CDMA US PCS - Uplink
CDMA US PCS - Downlink
CDMA2000 Class 0 Korea Cellular - Uplink
CDMA2000 Class 0 Korea Cellular - Downlink
CDMA2000 Class 0 N.A. Cellular - Uplink
CDMA2000 Class 0 N.A. Cellular - Downlink
CDMA2000 Class 1 N.A. PCS - Uplink
CDMA2000 Class 1 N.A. PCS - Downlink
CDMA2000 Class 2 (TACS Band) - Uplink
CDMA2000 Class 2 (TACS Band) - Downlink
CDMA2000 Class 3 (JTACS Band) - Uplink
CDMA2000 Class 3 (JTACS Band) - Downlink
CDMA2000 Class 4 Korea PCS - Uplink
CDMA2000 Class 4 Korea PCS - Downlink
CDMA2000 Class 5 (NMT-450-20 kHz)- Uplink
CDMA2000 Class 5 (NMT-450-20 kHz)- Downlink
CDMA2000 Class 5 (NMT-450-25 kHz)- Uplink
CDMA2000 Class 5 (NMT-450-25 kHz)- Downlink
CDMA2000 Class 6 IMT-2000- Uplink
CDMA2000 Class 6 IMT-2000- Downlink
CDMA2000 Class 7 N.A. 700 MHz Cellular - Uplink
CDMA2000 Class 7 N.A. 700 MHz Cellular - Downlink
DCS 1800 - Uplink
DCS 1800 - Downlink
Digital Multimedia Broadcasting
ETACS - Uplink
ETACS - Downlink
GSM 450 - Uplink
A-2
GSM 450 - Downlink
GSM 480 - Uplink
GSM 480 - Downlink
GSM 850 - Uplink
GSM 850 - Downlink
GSM 900 - Uplink
GSM 900 - Downlink
P-GSM 900 - Uplink
P-GSM 900 - Downlink
E-GSM 900 - Uplink
E-GSM 900 - Downlink
R-GSM 900 - Uplink
R-GSM 900 - Downlink
GSM 1800 - Uplink
GSM 1800 - Downlink
GSM 1900 - Uplink
GSM 1900 - Downlink
JTACS - Uplink
JTACS - Downlink
MATS-E - Uplink
MATS-E - Downlink
N-AMPS / IS-88L - Uplink
N-AMPS / IS-88L - Downlink
N-AMPS / IS-88M - Uplink
N-AMPS / IS-88M - Downlink
N-AMPS / IS-88U - Uplink
N-AMPS / IS-88U - Downlink
NADC IS136 Cellular - Uplink
NADC IS136 Cellular - Downlink
NADC IS136 PCS - Uplink
NADC IS136 PCS - Downlink
NMT-411-25kHz - Uplink
NMT-411-25kHz - Downlink
NMT-450-20kHz - Uplink
NMT-450-20kHz - Downlink
NMT-450-25kHz - Uplink
NMT-450-25kHz - Downlink
NMT-470-20kHz - Uplink
NMT-470-20kHz - Downlink
NMT-900 - Uplink
NMT-900 - Downlink
NMT-900(Offset) - Uplink
NMT-900(Offset) - Downlink
NTACS - Uplink
NTACS - Downlink
PCS 1900 - Uplink
PCS 1900 - Downlink
PDC 800 Analog - Uplink
PDC 800 Analog - Downlink
PDC 1500 (JDC) - Uplink
PDC 1500 (JDC) - Downlink
PHS - Uplink
PHS - Downlink
SMR 800 - 12.5 kHz - Uplink
A-3
SMR 800 - 12.5 kHz - Downlink
SMR 800 - 25 kHz - Uplink
SMR 800 - 25 kHz - Downlink
SMR 1500 - Uplink
SMR 1500 - Downlink
TACS - Uplink
TACS - Downlink
Digital Terrestrial TV Japan
Terrestrial TV Japan
Terrestrial TV USA
Terrestrial TV Eur. UHF-8MHz
UMTS Band I Uplink 9612-9888 Europe
UMTS Band I Downlink 10562-10838 Europe
UMTS Band II Uplink(General) 9262-9538 US
UMTS Band II Uplink(Additional) 12-287 US
UMTS Band II Downlink(General) 9662-9938 US
UMTS Band II Downlink(Additional) 412-687 US
UMTS Band III Uplink 8562-8913 Europe
UMTS Band III Downlink 9037-9388 Europe
UMTS Band IV Uplink(General) 8562-8763
UMTS Band IV Uplink(Additional) 1162-1362
UMTS Band IV Downlink(General) 10562-10763
UMTS Band IV Downlink(Additional) 1462-1662
UMTS Band V Uplink(General) 4132-4233 US
UMTS Band V Uplink(Additional) 782-782 US
UMTS Band V Downlink(General) 4357-4458 US
UMTS Band V Downlink(Additional) 1007-1007 US
UMTS Band VI Uplink(General) 4162-4188 Japan
UMTS Band VI Uplink(Additional) 812-837 Japan
UMTS Band VI Downlink(General) 4387-4413 Japan
UMTS Band VI Downlink(Additional) 1037-1062 Japan
802.11a
802.11b
802.11 FH
802.11 DS
802.11g
A-4
B-1
Appendix B
Error Messages
Introduction
This chapter provides a list of error messages that could be displayed on the Spectrum
Master. If any error condition persists, contact your local Anritsu Service Center.
Self Test or Application Self Test Errors
Overall Status FAILED
One or more elements of the System or Application Self Test has failed. Refer to the other
pass fail tests listed below to determine which specific test failed.
ADC Self Test FAILED
The Analog to Digital converter failed to return an answer. Insure that the battery level is
adequate for operation or that the temperature is within acceptable limits. Reset to factory
defaults with either Factory Defaults, ESC+ON, or MASTER RESET, System+ON.
Caution: Use of MASTER RESET, System+ON, will erase all user saved setups and
measurement traces and return the unit to a fully Factory Default condition. If the error
persists, contact your Anritsu Service Center.
DDC FAILED
The Digital Down Converter failed to return a value. Insure that the battery level is adequate
for operation or that temperature is within acceptable limits. Reset to factory defaults with
either Factory Defaults, ESC+ON, or MASTER RESET, System+ON. Caution: Use of
MASTER RESET, System+ON, will erase all user saved setups and measurement traces and
return the unit to a fully Factory Default condition. If the error persists, contact your Anritsu
Service Center.
Lock Test FAILED
One or more Phase Lock Loops Failed to properly achieve Lock Status. Insure that the
battery level is adequate for operation or that temperature is within acceptable limits. Reset
to factory defaults with either Factory Defaults, ESC+ON, or MASTER RESET,
System+ON. Caution: Use of MASTER RESET, System+ON, will erase all user saved
setups and measurement traces and return the unit to a fully Factory Default condition. If the
error persists, contact your Anritsu Service Center.
Over Power FAILED
RF Power applied to the input connector is too high. Remove or reduce the input power or
add additional attenuation. Sometimes out of band frequencies may be present that can cause
an Over Power Error. In highly rich RF environments it may be necessary to add an external
band pass filter to reduce unwanted interference. See the accessories section for a list of
available band pass filters from Anritsu. Out of band frequencies can often be detected by
increasing the Span to maximum in the peak detect mode of operation. Another resolution
may be to reset to factory defaults with either Factory Defaults, ESC+ON, or MASTER
RESET, System+ON. Caution: Use of MASTER RESET, System+ON, will erase all user
B-2
saved setups and measurement traces and return the unit to a fully Factory Default condition.
If the error persists, contact your Anritsu Service Center.
Over Power Start FAILED
RF Power applied to the input connector is too high at turn on. See Over Power FAILED
error above.
Mixer Saturation: Increase Attenuation
or
Mixer Overdrive FAILED
Too much power applied with too little Attenuation. Increase attenuation. Sometimes even
out of band frequencies may be present that would cause a Mixer Overdrive Error. In highly
rich RF environments it may be necessary to add an external band pass filter to reduce
unwanted interference. See the accessories section for a list available band pass filters from
Anritsu. Out of band frequencies can often be detected by increasing the SPAN to maximum
in peak detect mode of operation. Another resolution may be to Reset to factory defaults
with either Factory Defaults, ESC+ON, or MASTER RESET, System+ON. Caution: Use of
MASTER RESET, System+ON, will erase all user saved setups and measurement traces and
return the unit to a fully Factory Default condition. If the error persists, contact your Anritsu
Service Center.
Operation Errors
ADC Over range: Increase Reference Level
Input signal is too large for the Analog to Digital converter to process. Increase the internal
or external attenuation or, if using Auto attenuation, increasing the Reference Level should
resolve the error. See also the Mixer Overdrive error above for information on Out of band
RF power.
Fatal Error
Usually caused by a failure to communicate with one section or another. Sometimes resolved
by restarting the unit or by Factory Defaults, ESC+ON, resetting of the unit. Under extreme
cases the use of MASTER RESET, System+ON, may resolve the issue. Caution: Use of
MASTER RESET, System+ON, will erase all user saved setups and measurement traces and
return the unit to a fully Factory Default condition. If the error persists, contact your Anritsu
Service Center.
Trace not saved. Please wait for complete sweep and try again.
Attempted to save a measurement trace before the sweep had completed at least once. Wait
for at least one complete sweep and try to save again.
Measurement not valid in Zero Span
Attempt was made to make a automated measurement that requires more than ZERO SPAN
to accomplish. An example would be Occupied Bandwidth measurement.
B-3
Freq Range of Antenna Invalid
The Freq range of the Antenna is invalid for this setup. Please select another
Antenna
Choose a start and stop frequency that is within the defined frequency range for the selected
antenna compensation table. See also Master Software Tools for creation and Upload of
Antenna correction files.
Minimum permitted Sweep time is 50µs
An attempt was made to set the minimum Sweep time to less than 50 us.
Invalid Attenuation for Preamp
The only valid attenuation settings while the Preamp is operational are 0 dB and 10 dB. All
other settings attempted by the user will result in this message. Select 0 dB or 10 dB or select
AUTO Attenuation to let the system determine the correct setting based on the reference
level selected.
Valid Attenuations with Preamp on are 0 dB and 10 dB
Same as above
Unable to add additional limit points. %d is the maximum.
Attempted to add an additional limit line point beyond the maximum number of allowed
points.
Use Demod type USB or LSB to use Beat Frequency Osc
An attempt to use the Beat Frequency Oscillator while not in Upper or Lower Sideband
Demodulation mode.
Trace A/B/C has no data to view
Attempt to turn on or VIEW a trace that has never had data recalled into this trace location.
Refer to RECALL TRACE section for instructions on how to recall stored measurement
traces into either Trace A, B or C.
DSP Memory Failure
DSP Memory Failure, Address, Ext High, Ext Middle, Ext low, Ext1, Ext2
One of the DSP memory locations has failed. The DSP will attempt to resolve the memory
Failure location and Byte. There are two external memory banks (Ext1 = bank one, Ext2 =
Bank 2 ) with three bytes wide (Ext High, Ext Middle and Ext Low. Byte)
Locking to Internal Ref failed
Switching from an external frequency reference to the internal reference has failed. Some
additional warm up time may be needed if the unit has been on external reference for a long
time or the unit is not warmed up enough.
B-4
Locking to External Ref failed Lock attempt Failed
Switching from an internal frequency reference to the external reference has failed. verify
that the correct external reference frequency value has been selected from the list of valid
external reference frequencies. Verify that the level of the external reference frequency is at
least 1vp-p.
EEPROM TEST: FAIL
Hardware communications between modules has failed. Insure that the battery level is
adequate for operation or that temperature is within acceptable limits. Reset to factory
defaults with either Factory Defaults, ESC+ON, or MASTER RESET, System+ON.
Caution: Use of MASTER RESET, System+ON, will erase all user saved setups and
measurement traces and return the unit to a fully Factory Default condition. If the error
persists, contact your Anritsu Service Center.
UNKNOWN ERROR In SPA
Hardware communications between modules has failed. Insure that the battery level is
adequate for operation or that temperature is within acceptable limits. Reset to factory
defaults with either Factory Defaults, ESC+ON, or MASTER RESET, System+ON.
Caution: Use of MASTER RESET, System+ON, will erase all user saved setups and
measurement traces and return the unit to a fully Factory Default condition. If the error
persists, contact your Anritsu Service Center.
DSP version different from released version
May occur during firmware update. Likely cause is incomplete firmware package
installation. Finish complete firmware update with Master Software Tools Product Firmware
update function.
Operation not Permitted in Recall Mode
Attempted to perform an operation on a recalled trace. Many operations are valid only on a
live or active trace.
Cannot change scale in Linear mode
Linear display mode of operation does not support a scaling change like the Log display
mode.
Ref Marker is invalid
Cannot turn on delta marker because Ref Marker is invalid
Delta markers cannot be enabled unless the primary marker is within the displayed span.
Ref Marker is a counter Marker
Cannot turn on delta marker because Ref Marker is a counter Marker
Delta markers cannot be enabled unless the primary marker is NOT a counter Marker. Turn
off the Counter Marker mode of marker operation to use Delta Marker.
Current Marker is not ON
Attempted to use a marker mode or feature for a marker that is not enabled. Turn on the
appropriate marker to use this function or switch to a marker that is already enabled.
B-5
Marker must be ON to Use the feature
Attempted to use a marker mode or feature for a marker that is not enabled. Turn on the
appropriate marker to use this function or switch to a marker that is already enabled.
Triggering valid only in Zero Span
External triggering can only be used while the SPAN is set to 0 (zero)
Cannot change Modes for Recalled/Inactive Traces
Detection modes or other elements like RBW/VBW, averaging etc. cannot be altered on a
recalled trace. The trace is displayed with the same parameters in which it was saved.
Cannot change average for Recalled/Inactive Traces
Cannot set Delta Detection modes or other elements like RBW/VBW, averaging etc. cannot
be altered on a recalled trace. The trace is displayed with the same parameters in which it
was saved.
Pretune Calibration Failure
Insure that the battery level is adequate for operation or that temperature is within acceptable
limits. Reset to factory defaults with either Factory Defaults, ESC+ON, or MASTER
RESET, System+ON. Caution: Use of MASTER RESET, System+ON, will erase all user
saved setups and measurement traces and return the unit to a fully Factory Default condition.
If the error persists, contact your Anritsu Service Center.
Lock failed during initialization
One or more of the Phase Lock Loops failed to achieve lock status during startup. Insure that
the battery level is adequate for operation or that temperature is within acceptable limits.
Reset to factory defaults with either Factory Defaults, ESC+ON, or MASTER RESET,
System+ON. Caution: Use of MASTER RESET, System+ON, will erase all user saved
setups and measurement traces and return the unit to a fully Factory Default condition. If the
error persists, contact your Anritsu Service Center.
Reference LVL Cal is OFF
Factory Calibration is OFF. Insure that the battery level is adequate for operation or that the
temperature is within acceptable limits. Reset to factory defaults with either Factory
Defaults, ESC+ON, or MASTER RESET, System+ON. Caution: Use of MASTER RESET,
System+ON, will erase all user saved setups and measurement traces and return the unit to a
fully Factory Default condition. If the error persists, contact your Anritsu Service Center.
IF Cal is OFF
Factory Calibration is OFF. Insure that the battery level is adequate for operation or that the
temperature is within acceptable limits. Reset to factory defaults with either Factory
Defaults, ESC+ON, or MASTER RESET, System+ON. Caution: Use of MASTER RESET,
System+ON, will erase all user saved setups and measurement traces and return the unit to a
fully Factory Default condition. If the error persists, contact your Anritsu Service Center.
B-6
Lock failure
One or more of the Phase Lock Loops cannot keep the frequency controlled accurately.
Insure that the battery level is adequate for operation and that the temperature is within
acceptable limits. Reset to factory defaults with either Factory Defaults, ESC+ON, or
MASTER RESET, System+ON. Caution: Use of MASTER RESET, System+ON, will erase
all user saved setups and measurement traces and return the unit to a fully Factory Default
condition. If the error persists, contact your Anritsu Service Center.
Cannot set Delta Mkr Freq to Demod Freq
Marker to Demod frequency is only available with a primary marker as the selected marker.
Fan Failure
The system has determined that the fan should be running due to the internal temperature of
the unit, but cannot detect that the fan is actually running.
It is important to keep the fan inlet and exhaust ports clear of obstructions. The cooling fan
will vary the speed in relation to the internal temperature of the instrument. The fan will turn
on at low speed when the internal temperature of the instrument reaches 44ºC, and will
increase the fan speed to maximum at 54ºC. As the internal temperature of the instrument
decreases, the fan will reduce speed until the temperature reaches 39ºC, at which point the
fan will turn off.
High Temp Warning
The internal temperature has reached an excessive level, 85ºC. Verify that the ventilation
openings are unobstructed and that the fan is running. Internal temperatures may be
manually verified by using the SELF TEST function. Turn off the unit and allow the
temperature to cool down. If the fault is not resolved and the internal temperature reaches
90ºC, a countdown of 10 seconds will begin to give the user a chance to save the current
setup before it will turn itself off before internal temperatures can cause any damage. If the
error persists after removing any obstructions and allowing the unit to cool, reset to the
factory defaults with either Factory Defaults, ESC+ON. Caution: Use of MASTER RESET,
System+ON, will erase all user saved setups and measurement traces and return the unit to a
fully Factory Default condition. If the error persists, contact your Anritsu Service Center.
Figure B-1. Fan Speed versus Temperature
FAN
SPEED
OFF LOW HIGH
HI TEMP WARNIN
G
AUTO SHUT OFF
Temperature Rising
FAN
SPEED
OFF LOW HIGH
Temperature Falling
TEMP
39 41 43 45 47 49 51 53
-100 85 90 +100
o
C
40 42 44 46 48 50 52 54
B-7
Copy failed. Please check External Card
Attempt to copy user saved data to external the Compact Flash Card has failed. Do not
attempt to remove or power down the unit before the copy has completed. Be sure that the
CF is not already full and that it is fully inserted into the CF-Card slot.
Interference Analyzer Messages
Information Messages
Attenuation has been changed
Reference Level has been changed
Minimum permitted Sweep time is 10 µs
Preamp has been turned off
Preamp has been turned on
Units has been changed to dBm
Reference Locked Successfully
Startup Selftest successful
Startup DSP Memory test successful
Reference LVL Cal is OFF
IF Cal is OFF
Successfully locked
Attempting to lock to Internal ref
Attempting to lock to External ref
Attempting to lock to ext ref
Press ESC to clear Recall Trace
Sweep Stopped After Saving On Event
Connect Carrier\nPress Enter to Measure or Escape to Exit
Disconnect Carrier\nPress Enter to Measure or Escape to Exit
Press Escape to keep old settings, or Enter to use Recalled Values
Changing Active trace to A
Use Min/Max buttons under the Signal Strength Sub-Menu to change measure range
Cannot change scale in Linear mode
Use Min/Max buttons under the Signal Strength Sub-Menu to change display range
Valid Attenuations with Preamp on are 0 dB and 10 dB
Cannot turn on delta marker because Ref Marker is a counter Marker
Current Marker is not ON
Turning off Delta Marker
ADC Over range: Increase Reference Level
Mixer Saturation: Increase Attenuation
B-8
Error Messages
Trace not saved. Please wait for complete sweep and try again.
Measurement has been turned OFF
Measurement not valid in Zero Span
Measurements can not be displayed in Full Screen mode
The Freq range of the Antenna is invalid for this setup. Please select another Antenna
DDC Failure
Lock failed during initialization
Invalid Attenuation for PreAmp Setting
Unable to add additional limit points. %d is the maximum.
Hidden inflection points prevent this action. Decrease Span to reveal hidden points.
Trace A has no data to view
Trace B has no data to view
Trace C has no data to view
Turning off Trace Overlay
Only HOLD is valid for Trace C when Trace C is not being updated from A
Auto Save not available when Time Span is Auto
The specified Time span is too big to save all measurments. Automatically adjusted Time
Span to a valid number
DSP Memory Failure
Pretune Calibration Failure
Lock failure %x
Locking to Internal Ref failed
Locking to External Ref failed
Lock attempt Failed
Timed Measurement Done. Press Reset/Restart Meas to continue measuring
Current measurement is stopped when Cursor is not zero
OVER POWER ERROR
Fatal error, Unknown
Fatal error, EEPROM failed
Fatal error, no IA board connected
Fatal error not decoded by DSP
UNKNOWN ERROR In IA
Operation not Permitted in Recall Mode
Operation not Permitted in this Mode
Marker must be ON to Use the feature
Triggering valid only in Zero Span
Only HOLD is valid for Trace B
Cannot change average for Recalled/Inactive Traces
Cannot set Delta Mkr Freq to Demod Freq
B-9
Channel Scanner Messages
Information Messages
Reference Locked Successfully
Startup Selftest successful
Startup DSP Memory test successful
Attempting to lock to Internal ref
Attempting to lock to External ref
Attempting to lock to ext ref
Press ESC to clear Recall Trace
Error Messages
Error Recalling Measurement
Not Available when Max Hold is OFF
Operation not Permitted in Recall Mode
ADC Over range: Increase Reference Level
Mixer Saturation: Increase Attenuation
GSM/WCDMA Messages
Warning Messages
1. External Reference not found. Internal reference Locked successfully
2. External Reference Locked Successfully
Notifications
1. RF Over Power
2. ADC over range
a. If Auto Range is ON - ADC over range: Decrease input power.
b. If Auto Range is Off and if Atten = 65 then ADC over range: Decrease input power.
c. If Auto Range is Off and Atten is < 65 then ADC over range: Adjust range.
3. Level Under
a. If Auto Range is ON - No signal detected: Increase input power.
b. If Auto Range is Off and if Atten = 0 & Preamp is On then no signal detected:
Increase input power.
c. If Auto Range is Off and not (b) then no signal detected: Adjust range.
4. Out of band saturation
5. Poor Range
a. If Auto Range is ON - Weak signal: Increase input power.
b. If Auto Range is Off and if Atten = 0 & Preamp is On then Weak signal: Increase
input power.
c. If Auto Range is Off and not (b) then Weak signal: Adjust range
6. Lock Failure
7. Attempting to lock to Internal ref.
8. Attempting to lock to External ref.
B-10
Fixed WiMAX Messages
Attempting to lock to External Reference
When the instrument detects an external reference frequency has been connected, this
message is displayed briefly.
External Reference Locked Successfully
When the instrument has detected an external reference and has successfully locked to the
reference, this message is displayed briefly.
External Reference / Internal Reference
External Reference not found. Internal Reference Locked successfully
This message is displayed when the instrument has detected an external reference but
couldn’t lock to the reference. It automatically switches to the Internal Reference. This could
happen if the external reference frequency does not match the specified external reference
frequency in the Setup menu.
Lock Failure xx
When there is a lock failure detected from any of the internal LOs, this message is displayed.
The xx is usually an error code in hex that can be interpreted by a service center to obtain
more information on which LO had the failure.
ADC over range
When the software detects that the internal ADC is being overloaded, this message is
displayed. Depending on the gain settings, either a “decrease input power” or “adjust range”
message is also displayed with this message.
Out of band saturation
When the software detects that there is too much power outside the current frequency range,
this message is displayed. This usually means that the instrument is currently tuned to a
frequency with a very low amplitude signal or no signal and there is a strong signal at
another frequency outside the current IF bandwidth.
Weak Signal: Increase input power
When the software does not measure enough signal power at the input, this message is
displayed. Measurement results are cleared (‘--‘ is seen in the result area). The instrument
will continue to check the signal power and start showing results when the power is
increased
DL Short Preamble not found
When the software does not detect a Downlink short preamble in the burst, this message is
displayed on the screen. All Demodulation measurement results are cleared (‘--‘ is seen in
the result area). The short preamble is required for all Demodulation measurements.
The short preamble is also required for the Power vs. Time trace to be synchronized but if
the preamble is not present, an unsynchronized time domain trace is displayed and all but the
Channel Power result is cleared.
The instrument will continue to check for the presence of the short preamble.
B-11
DL Long Preamble not found
When the software does not detect a Downlink long preamble in the burst, this message is
displayed on the screen. All Demodulation measurement results are cleared (‘--‘ is seen in
the result area). The long preamble is required for all Demodulation measurements.
The instrument will continue to check for the presence of the long preamble
FCH decoder failed
This message is displayed when there is an error detected in the FCH decoder that is used to
determine the base station ID.
Mobile WiMAX Messages
Attempting to lock to External Reference
When the instrument detects that an external reference frequency has been connected, this
message is displayed briefly.
External Reference Locked Successfully
When the instrument has detected an external reference and has successfully locked to the
reference, this message is displayed briefly.
External Reference / Internal Reference
External Reference not found. Internal Reference Locked Successfully
This message is displayed when the instrument has detected an external reference but could
not lock to the reference. The instrument automatically switches to the Internal Reference.
This can happen if the external reference frequency does not match the specified external
reference frequency in the Setup menu.
Lock Failure xx
When a lock failure is detected from any of the internal local oscillators (LOs), this message
is displayed. The xx is usually an error code in hex that can be interpreted by a service center
to obtain more information on which LO had the failure.
ADC over range
When the software detects that the internal ADC (Analog to Digital Converter) is being
overloaded, this message is displayed. Depending upon the gain settings, either a “decrease
input power” or an “adjust range” message is also displayed with this message.
Out Of Band Saturation
When the software detects that too much power is outside the current frequency range, this
message is displayed. This usually means that the instrument is currently tuned to a
frequency with a very low amplitude signal or no signal, and a strong signal is present at
another frequency outside the current IF bandwidth.
Weak Signal: Increase input power
When the software does not measure enough signal power at the input, this message is
displayed. Measurement results are cleared (“--” is seen in the result area). The instrument
continues to check the signal power and starts showing results when the power is increased.
B-12
DL Short Preamble not found
When the software does not detect a Downlink short preamble in the burst, this message is
displayed on the screen. All demodulation measurement results are cleared (“--” is seen in
the result area). The short preamble is required for all demodulation measurements.
The short preamble is also required for the Power versus Time trace to be synchronized, but
if the preamble is not present, then an unsynchronized time domain trace is displayed, and
all data results are cleared except the Channel Power result. The instrument continues to
check for the presence of the short preamble.
Demodulation Error
This message is typically displayed if the input signal is a proprietary implementation of
Mobile WiMAX.
The Demodulation Error is displayed when the following conditions are not met:
• FFT size is 1024 or 512
• preamble index is within the range of 0 to 113
• modulation type is QPSK, 16QAM, or 64 QAM
• reserved bit is not zero in DL-MAP
• first zone is not PUSC
DL-MAP not CC encoded
When Demod Type is set to Auto, and the decoded information from the DL-MAP indicates
that the encoding type is not Convolutional Coding (CC), then this message is displayed
because the instrument supports only Convolutional Coding at this time.
Too many symbols in DL-MAP
When the number of symbols exceeds the maximum number that is supported by the
instrument, then this message is displayed.
CDMA and EVDO Messages
Warning Messages
“No trigger found”
This message is displayed if the PN trigger is setup for External or GPS, and the software
does not detect a trigger. Most measurement results that depend on a trigger are then cleared
('--' is seen in the result area).
“Short Code not found”
This message is displayed if no dominant PN short code is found in the input signal. Most
demodulation measurement results are then cleared ('--' is seen in the result area).

C-1
Appendix C
DVB-T/H Channel Maps
Introduction
The tables in this appendix provide channel mapping for channel frequency, level accuracy,
noise floor, frequency accuracy, frequency lock range, and 1 dB compression level.
Channel Maps
The following table provides a list of channels for UHF (Australia). The bandwidth of these
channels is 7 MHz.
Table C-1: UHF (Australia) Channel and Frequency Map
Channel
(CH)
Center
Frequency
(MHz)
Lower
Bound
(MHz)
Upper
Bound
(MHz)
28 529.5 526 533
29 536.5 533 540
30 543.5 540 547
31 550.5 547 554
32 557.5 554 561
33 564.5 561 568
34 571.5 568 575
35 578.5 575 582
36 585.5 582 589
37 592.5 589 596
38 599.5 596 603
39 606.5 603 610
40 613.5 610 617
41 620.5 617 624
42 627.5 624 631
43 634.5 631 638
44 641.5 638 645

C-2
45 648.5 645 652
46 655.5 652 659
47 662.5 659 666
48 669.5 666 673
49 676.5 673 680
50 683.5 680 687
51 690.5 687 694
52 697.5 694 701
53 704.5 701 708
54 711.5 708 715
55 718.5 715 722
56 725.5 722 729
57 732.5 729 736
58 739.5 736 743
59 746.5 743 750
60 753.5 750 757
61 760.5 757 764
62 767.5 764 771
63 774.5 771 778
64 781.5 778 785
65 788.5 785 792
66 795.5 792 799
67 802.5 799 806
68 809.5 806 813
69 816.5 813 820
Table C-1: UHF (Australia) Channel and Frequency Map
Channel
(CH)
Center
Frequency
(MHz)
Lower
Bound
(MHz)
Upper
Bound
(MHz)

C-3
The following table provides a list of channels for UHF (Europe). The bandwidth of these
channels is 8 MHz.
Table C-2: UHF (Europe) Channel and Frequency Map
Channel
(CH)
Center
Frequency
(MHz)
Lower
Bound
(MHz)
Upper
Bound
(MHz)
21 474 470 478
22 482 478 486
23 490 486 494
24 498 494 502
25 506 502 510
26 514 510 518
27 522 518 526
28 530 526 534
29 538 534 542
30 546 542 550
31 554 550 558
32 562 558 566
33 570 566 574
34 578 574 582
35 586 582 590
36 594 590 598
37 602 598 606
38 610 606 614
39 618 614 622
40 626 622 630
41 634 630 638
42 642 638 646
43 650 646 654
44 658 654 662

C-4
45 666 662 670
46 674 670 678
47 682 678 686
48 690 686 694
49 698 694 702
50 706 702 710
51 714 710 718
52 722 718 726
53 730 726 734
54 738 734 742
55 746 742 750
56 754 750 758
57 762 758 766
58 770 766 774
59 778 774 782
60 786 782 790
61 794 790 798
62 802 798 806
63 810 806 814
64 818 814 822
65 826 822 830
66 834 830 838
67 842 838 846
68 850 846 854
69 858 854 862
Table C-2: UHF (Europe) Channel and Frequency Map
Channel
(CH)
Center
Frequency
(MHz)
Lower
Bound
(MHz)
Upper
Bound
(MHz)

C-5
Level Accuracy and Noise Floor
The following table provides level accuracy values for UHF (Europe), Channel 21 with the
preamplifier Off.
Table C-3: Level Accuracy UHF (Europe) – Channel 21, Preamp Off
Signal
Level
(dBm)
Reference
Level
(dBm)
Specification
(dB) Guard Band
(dB)
–10 –10 ±1.5 0.5
–15 –15 ±1.5 0.5
–20 –20 ±1.5 0.5
–25 –25 ±1.5 0.5
–30 –25 ±1.5 0.5
–35 –25 ±1.5 0.5
–40 –25 ±1.5 0.5
–45 –25 ±1.5 0.5
–50 –25 ±1.5 0.5
–55 –25 ±1.5 0.5
–60 v25 ±1.5 0.5
–65 NA NA NA
–70 NA NA NA
–75 NA NA NA
–80 NA NA NA
–84 NA NA NA

C-6
The following table provides level accuracy values for UHF (Europe), Channel 21 with the
preamplifier On.
Table C-4: Level Accuracy UHF (Europe) – Channel 21, Preamp On
Signal
Level
(dBm)
Reference
Level
(dBm)
Specification
(dB) Guard Band
(dB)
–10 NA NA NA
–15 NA NA NA
–20 –20 ±1.5 0.5
–25 –20 ±1.5 0.5
–30 –30 ±1.5 0.5
–35 –30 ±1.5 0.5
–40 –40 ±1.5 0.5
–45 –40 ±1.5 0.5
–50 –50 ±1.5 0.5
–55 –50 ±1.5 0.5
–60 –50 ±1.5 0.5
–65 –50 ±1.5 0.5
–70 –50 ±1.5 0.5
–75 –50 ±1.5 0.5
–80 –50 ±1.5 0.5
–84 –50 ±1.5 0.5

C-7
The following table provides level accuracy values for UHF (Europe), Channel 45 with the
preamplifier Off.
Table C-5: Level Accuracy UHF (Europe) – Channel 45, Preamp Off
Signal
Level
(dBm)
Reference
Level
(dBm)
Specification
(dB) Guard Band
(dB)
–10 –10 ±1.5 0.5
–15 –15 ±1.5 0.5
–20 –20 ±1.5 0.5
–25 –25 ±1.5 0.5
–30 –25 ±1.5 0.5
–35 –25 ±1.5 0.5
–40 –25 ±1.5 0.5
–45 –25 ±1.5 0.5
–50 –25 ±1.5 0.5
–55 –25 ±1.5 0.5
–60 –25 ±1.5 0.5
–65 NA NA NA
–70 NA NA NA
–75 NA NA NA
–80 NA NA NA
–84 NA NA NA

C-8
The following table provides level accuracy values for UHF (Europe), Channel 45 with the
preamplifier On.
Table C-6: Level Accuracy UHF (Europe) – Channel 45, Preamp On
Signal
Level
(dBm)
Reference
Level
(dBm)
Specification
(dB) Guard Band
(dB)
–10 NA NA NA
–15 NA NA NA
–20 –20 ±1.5 0.5
–25 –20 ±1.5 0.5
–30 –30 ±1.5 0.5
–35 –30 ±1.5 0.5
–40 –40 ±1.5 0.5
–45 –40 ±1.5 0.5
–50 –50 ±1.5 0.5
–55 –50 ±1.5 0.5
–60 –50 ±1.5 0.5
–65 –50 ±1.5 0.5
–70 –50 ±1.5 0.5
–75 –50 ±1.5 0.5
–80 –50 ±1.5 0.5
–84 –50 ±1.5 0.5

C-9
The following table provides level accuracy values for UHF (Europe), Channel 69 with the
preamplifier Off.
Table C-7: Level Accuracy UHF (Europe) – Channel 69
Signal
Level
(dBm)
Reference
Level
(dBm)
Specification
(dB) Guard Band
(dB)
–10 –10 ±1.5 0.5
–15 –15 ±1.5 0.5
–20 –20 ±1.5 0.5
–25 –25 ±1.5 0.5
–30 –25 ±1.5 0.5
–35 –25 ±1.5 0.5
–40 –25 ±1.5 0.5
–45 –25 ±1.5 0.5
–50 –25 ±1.5 0.5
–55 –25 ±1.5 0.5
–60 –25 ±1.5 0.5
–65 NA NA NA
–70 NA NA NA
–75 NA NA NA
–80 NA NA NA
–84 NA NA NA

C-10
The following table provides level accuracy values for UHF (Europe), Channel 69 with the
preamplifier On.
Table C-8: Level Accuracy UHF (Europe) – Channel 69
Signal
Level
(dBm)
Reference
Level
(dBm)
Specification
(dB) Guard Band
(dB)
–10 NA NA NA
–15 NA NA NA
–20 –20 ±1.5 0.5
–25 –20 ±1.5 0.5
–30 –30 ±1.5 0.5
–35 –30 ±1.5 0.5
–40 –40 ±1.5 0.5
–45 –40 ±1.5 0.5
–50 –50 ±1.5 0.5
–55 –50 ±1.5 0.5
–60 –50 ±1.5 0.5
–65 –50 ±1.5 0.5
–70 –50 ±1.5 0.5
–75 –50 ±1.5 0.5
–80 –50 ±1.5 0.5
–84 –50 ±1.5 0.5

C-11
The following table provides noise floor values for UHF (Europe), Channel 21.
The following table provides noise floor values for UHF (Europe), Channel 45.
The following table provides noise floor values for UHF (Europe), Channel 69.
Table C-9: Noise Floor UHF (Europe) – Channel 21
Preamplifier Off Preamplifier On
Reference
Level
(dBm)
Maximum
Value of
Specification
(dBm)
Guard
Band
(dB)
Reference
Level
(dBm)
Measurement
Value (dBm)
Guard
Band
(dB)
–25 ≤–69 0.0 –50 ≤–93 0.0
Table C-10: Noise Floor UHF (Europe) – Channel 45
Preamplifier Off Preamplifier On
Reference
Level
(dBm)
Measurement
Value (dBm)
Maximum
Value of
Specification
(dBm)
Reference
Level
(dBm)
Measurement
Value (dBm)
Guard
Band
(dB)
–25 ≤–69 0.0 –50 ≤–93 0.0
Table C-11: Noise Floor UHF (Europe) – Channel 69
Preamplifier Off Preamplifier On
Reference
Level
(dBm)
Maximum
Value of
Specification
(dBm)
Reference
Level
(dBm)
Measurement
Value (dBm) Guard Band
(dB)
–25 ≤–69 –50 ≤–93 0.0

C-12
Frequency Accuracy and Frequency Lock Range
The following table provides frequency accuracy values for UHF (Europe), Channels 21, 45,
and 69.
Table C-12: Frequency Accuracy UHF (Europe) – Channels 21, 45, and 69
Channel Preamp Reference
Level
(dBm)
Specification
Range (Hz) Guard Band
(Hz)
21 Off –20 ≤±0.2 0.1
21 On –50 ≤±0.2 0.1
45 Off –20 ≤±0.2 0.1
45 On –50 ≤±0.2 0.1
69 Off –20 ≤±0.2 0.1
69 On –50 ≤±0.2 0.1

C-13
1 dB Compression Level
The following table provides 1 dB compression level values for UHF (Europe), Channel 21
with Preamplifier Off.
Table C-13: 1 dB Compression Level UHF (Europe) – Channel 21,
Preamp Off
Signal
Level
(dBm)
Reference
Level
(dBm)
Specification
Range (dB) Guard Band
(dB)
–25 –25 Dif<1 1.0
–24 –25 Dif<1 1.0
–23 –25 Dif<1 1.0
–22 –25 Dif<1 1.0
–21 –25 Dif<1 1.0
–20 –25 Dif<1 1.0
–19 –25 Dif<1 1.0
–18 –25 Dif<1 1.0
–17 –25 Dif<1 1.0
–16 –25 Dif<1 1.0
–15 –25 Dif<1 1.0
–14 –25 Dif<1 1.0
–13 –25 Dif<1 1.0
–12 –25 Dif<1 1.0
–11 –25 Dif<1 1.0
–10 –25 Dif<1 1.0

C-14
The following table provides 1 dB compression level values for UHF (Europe), Channel 21
with Preamplifier On.
Table C-14: 1 dB Compression Level UHF (Europe) – Channel 21,
Preamp On
Signal
Level
(dBm)
Reference
Level
(dBm)
Specification
Range (dB) Guard Band
(dB)
–50 –50 Dif<1 1.0
–49 –50 Dif<1 1.0
–48 –50 Dif<1 1.0
–47 –50 Dif<1 1.0
–46 –50 Dif<1 1.0
–45 –50 Dif<1 1.0
–44 –50 Dif<1 1.0
–43 –50 Dif<1 1.0
–42 –50 Dif<1 1.0
–41 –50 Dif<1 1.0
–40 –50 Dif<1 1.0
–39 –50 Dif<1 1.0
–38 –50 Dif<1 1.0
–37 –50 Dif<1 1.0
–36 –50 Dif<1 1.0
–35 –50 Dif<1 1.0

C-15
The following table provides 1 dB compression level values for UHF (Europe), Channel 45
with Preamplifier Off.
Table C-15: 1 dB Compression Level UHF (Europe) – Channel 45,
Preamp Off
Signal
Level
(dBm)
Reference
Level
(dBm)
Specification
Range (dB) Guard Band
(dB)
–25 –25 Dif<1 1.0
–24 –25 Dif<1 1.0
–23 –25 Dif<1 1.0
–22 –25 Dif<1 1.0
–21 –25 Dif<1 1.0
–20 –25 Dif<1 1.0
–19 –25 Dif<1 1.0
–18 –25 Dif<1 1.0
–17 –25 Dif<1 1.0
–16 –25 Dif<1 1.0
–15 –25 Dif<1 1.0
–14 –25 Dif<1 1.0
–13 –25 Dif<1 1.0
–12 –25 Dif<1 1.0
–11 –25 Dif<1 1.0
–10 –25 Dif<1 1.0

C-16
The following table provides 1 dB compression level values for UHF (Europe), Channel 45
with Preamplifier On.
Table C-16: 1 dB Compression Level UHF (Europe) – Channel 45,
Preamp On
Signal
Level
(dBm)
Reference
Level
(dBm)
Specification
Range (dB) Guard Band
(dB)
–50 –50 Dif<1 1.0
–49 –50 Dif<1 1.0
–48 –50 Dif<1 1.0
–47 –50 Dif<1 1.0
–46 –50 Dif<1 1.0
–45 –50 Dif<1 1.0
–44 –50 Dif<1 1.0
–43 –50 Dif<1 1.0
–42 –50 Dif<1 1.0
–41 –50 Dif<1 1.0
–40 –50 Dif<1 1.0
–39 –50 Dif<1 1.0
–38 –50 Dif<1 1.0
–37 –50 Dif<1 1.0
–36 –50 Dif<1 1.0
–35 –50 Dif<1 1.0

C-17
The following table provides 1 dB compression level values for UHF (Europe), Channel 69
with Preamplifier Off.
Table C-17: 1 dB Compression Level UHF (Europe) – Channel 69,
Preamp Off
Signal
Level
(dBm)
Reference
Level
(dBm)
Specification
Range (dB) Guard Band
(dB)
–25 –25 Dif<1 1.0
–24 –25 Dif<1 1.0
–23 –25 Dif<1 1.0
–22 –25 Dif<1 1.0
–21 –25 Dif<1 1.0
–20 –25 Dif<1 1.0
–19 –25 Dif<1 1.0
–18 –25 Dif<1 1.0
–17 –25 Dif<1 1.0
–16 –25 Dif<1 1.0
–15 –25 Dif<1 1.0
–14 –25 Dif<1 1.0
–13 –25 Dif<1 1.0
–12 –25 Dif<1 1.0
–11 –25 Dif<1 1.0
–10 –25 Dif<1 1.0

C-18
The following table provides 1 dB compression level values for UHF (Europe), Channel 69
with Preamplifier On.
Table C-18: 1 dB Compression Level UHF (Europe) – Channel 69,
Preamp On
Signal
Level
(dBm)
Reference
Level
(dBm)
Specification
Range (dB) Guard Band
(dB)
–50 –50 Dif<1 1.0
–49 –50 Dif<1 1.0
–48 –50 Dif<1 1.0
–47 –50 Dif<1 1.0
–46 –50 Dif<1 1.0
–45 –50 Dif<1 1.0
–44 –50 Dif<1 1.0
–43 –50 Dif<1 1.0
–42 –50 Dif<1 1.0
–41 –50 Dif<1 1.0
–40 –50 Dif<1 1.0
–39 –50 Dif<1 1.0
–38 –50 Dif<1 1.0
–37 –50 Dif<1 1.0
–36 –50 Dif<1 1.0
–35 –50 Dif<1 1.0
D-1
Appendix D
Code TPS Warning Messages
Introduction
TPS Warning messages occur in DVB-T/H signals during BER measurements. A TPS
Warning Code is displayed in hexadecimal. Several TPS warning messages may be
simultaneously displayed. When displayed simultaneously, the values of the message codes
are added, and the summation is displayed, as shown in the following examples:
When 0x000001 and 0x000002 simultaneously occur, 0x000003 is displayed.
When 0x000004 and 0x000008 simultaneously occur, 0x00000C is displayed.
When 0x000100 and 0x000010 simultaneously occur, 0x000110 is displayed.
TPS Warning Codes
0x000000 No warning message
0x000001 When Hierarchy is None, Code Rate (LP) must be set to 1/2.
0x000002 When Mode is 8K, Inner Interleave must be set to Native.
0x000004 When Length indicator is 23, Cell ID must be set to 0.
0x000008 When Modulation is QPSK, Hierarchy must be set to None.
0x000010 Mode is set to Reserved.
0x000020 Modulation is set to Reserved.
0x000040 Code Rate (HP) is set to Reserved.
0x000080 Code Rate (LP) is set to Reserved.
0x000100 Mode is different from received signal.
0x000200 GI is different from received signal.
D-2
Index -1
Index
Symbols
16QAM
color coded constellation view .
13-10, . . . . . . . . . . 13-28
DVB-T/H-SFN modulation 18-4
EVDO modulation . . . . . . 16-16
64QAM
color coded constellation view .
13-10, . . . . . . . . . . 13-28
DVB-T/H-SFN modulation 18-4
8PSK
EVDO modulation type . . 16-16
A
accessories
optional . . . . . . . . . . . . . . . . 1-7
supplied . . . . . . . . . . . . . . . . 1-7
tilt bail kit . . . . . . . . . . . 1-13
ACLR . . . . . . . . . . . . . . . . . . . . 9-30
ACPR . . . . . . . . . . . . . .13-10, 13-26
IA spectrum menu . . . . . . . . 6-9
Mobile WiMAX measurement .
14-7
ACPR (Adjacent Channel Power Ratio)
. . . . . . . . . . . . . . . . . . . . . . . . . . 5-6
ACPR field measurements . . . . . 5-6
ACPR, adj channel power ratio 3-25
Active Activity, EVDO . . . . . 16-17
Active Data Power, EVDO . . 16-16,
16-17
adapter
12 Volt accessory . . . . . . . . . 1-7
AC-DC accessory . . . . . . . . 1-7
AC-DC, battery charging . . 1-12
Adjacent Channel Power Ratio (ACPR)
CDMA measurement . . . . . 15-9
Advanced Mobile Phone System
(AMPS) base stations . . . . . . . . . 5-5
Alternate Mark Inversion (AMI)
T1/T3 glossary . . . . . . . . . 17-46
AM/FM demodulation . . . . . . . 3-26
AM/FM/SSB demodulation . . . . 5-1
AM/FM/SSB demodulation
measurements . . . . . . . . . . . . . . 5-13
amplitude reference, channel scanner
7-3
AMPS (Advanced Mobile Phone
System) . . . . . . . . . . . . . . . . . . . . 5-5
AMPS (TDMA) adjacent channel
power measurement . . . . . . . . . . 5-8
AMPS channel power measurement .
5-5
antenna
calculations . . . . . . . . . . . . . 5-12
files, master reset . . . . . . . 15-33
GPS . . . . . . . . . . . . . . . . . . . 12-1
antenna factor, DVB-T/H . . . . . 17-6
antenna setup, DVB-T/H-SFN . 18-2
application
self test . . . . . . . . . . . . . . . . 2-15
attenuation
amplitude menu . . . . . . . . . . . 3-2
attenuation, auto, IA amplitude menu
6-5
auto range . . . . . . . . . . . . . . . . . 10-2
Auto RBW . . . . . . . . . . . . . . . . . 5-3
BW menu . . . . . . . . . . . . . . . 3-4
Auto VBW . . . . . . . . . . . . . . . . . 5-3
Auto VBW,BW menu . . . . . . . . . 3-4
automatic attenuation . . . . . . . . . 4-2
automatic coupling . . . . . . 2-17, 4-2
automatic file saving, DVB-T/H 17-22
B
bandwidth
channel scanner . . . . . . . . . . . 7-2
battery
symbol . . . . . . . . . . . . . . . . . 2-14
battery replacement . . . . . . . . . . 1-12
beat frequency oscillator . . . . . . 3-26
Index -2
BER measurements
DVB-T/H
BER analysis . . . . . . . 17-19
option 57 . . . . . . . . . . . 17-3
packet error rate (PER) 17-43
BPSK, color coded constellation view
13-10, . . . . . . . . . . . . . . . . . . . 13-28
brightness . . . . . . 9-20, 13-15, 15-33
brightness, system menu . . . . . 3-36
burst power . . . . . . . . . . . . . . 10-15
C
C/I field measurements . . . . . . . 5-1
measure menu . . . . . . . . . . 3-27
calibration requirements . . . . . . 1-10
Carrier Feedthrough
EVDO . . . . . . . . . . . . . . . 16-17
carrier FT . . . . . . . . . . . . . . . . 15-16
Carrier to Interference ratio (C/I) 3-27
carrier to interference ratio (C/I)
Interference Analyzer . . . . . 6-11
carrier to interference ratio (C/I)
measurement . . . . . . . . . . . . . . 5-13
CDMA
ACPR setup . . . . . . . . . . . . 15-9
carrier FT . . . . . . . . . . . . . 15-16
CDP table setup . . . . . . . . 15-11
Channel Power . . . . . . . . . 15-17
demodulator setup . . . . . . 15-10
Ec/Io . . . . . . . . . . . . . . . . . 15-17
Freq Error . . . . . . . . . . . . . 15-16
GPS setup . . . . . . . . . . . . . . 15-6
measurement setup . . . . . . . 15-1
Multipath . . . . . . . . . . . . . 15-17
Multipath Power . . . . . . . 15-17
Noise Floor . . . . . . . . . . . 15-16
OTA setup . . . . . . . . . . . . 15-12
Paging Code Power . . . . . 15-16
pass/fail setup . . . . . . . . . . 15-14
Pilot dominance . . . . . . . . 15-17
PN Scan . . . . . . . . . . . . . . 15-17
PN select measurement . . . 15-3
power offset . . . . . . . . . . . . 15-2
Q Paging Power . . . . . . . . 15-16
RF measurement setup . . . . 15-8
Rho . . . . . . . . . . . . . . . . . . 15-16
select ref freq setup . . . . . . . 15-5
select signal standard . . . . . 15-2
signal analyzer chapter . . . . 15-1
Sync Power . . . . . . . . . . . . 15-16
Tau . . . . . . . . . . . . . . . . . . 15-16
Walsh codes setup . . . . . . . . 15-4
CDMA channel power . . . . . . . . 5-3
CDP (Code Domain Power)
CDMA . . . . . . . . . . . . . . . . 15-4
described . . . . . . . . . . . . . . 15-15
OVSF, WCDMA/HSDPA . 9-37
WCDMA/HSDPA . . . . . . . 9-21
CDP Data, EVDO . . . . . . . . . . 16-17
CDP MAC, EVDO . . . . . . . . . 16-17
center frequency, enter for CDMA . .
15-1
center frequency, freq menu . . . 3-13
CEPT . . . . . . . . . . . . . . . . . . . . . 13-7
channel maps, DVB-T/H . . . . . .C-1
channel power
CDMA . . . . . . . . . . . . . . . 15-17
channel scanner . . . . . . . . . . . 7-1
EVDO . . . . . . . . . . . . . . . . 16-16
field measurement . . . . . . . . . 5-2
IA spectrum menu . . . . . . . . . 6-9
measure menu . . . . . . . . . . . 3-25
Mobile WiMAX (RSSI) . . 14-16
channel scanner
measurement setup . . . . . . . . 7-7
chip rate, EVDO . . . . . . . . . . . . 16-1
CISPR
radio interference std . . . . . . 3-3
Code Domain Power, see CDP
Code TPS Warning Messages . . D-1
Codes, TPS Warning . . . . . . . . . D-1
Codogram . . . . . . . . . . . . . . . . . 9-42
Codogram, WCDMA . . . . . . . . 9-23
compensating external loss
CDMA . . . . . . . . . . . . . . . . 15-2
EVDO . . . . . . . . . . . . . . . . . 16-2
Fixed WiMAX . . . . . . . . . 13-21
Mobile WiMAX . . . . . . . . . 14-4
WCDMA . . . . . . . . . . . . . . . 9-27
connectors, test panel . . . . . . . . . 2-9
Index -3
constellation
Mobile WiMAX measurement .
14-9
constellation configuration, DVB-T/H
17-11
constellation view, WiMAX
16-QAM . . . . . . . . .13-10, 13-28
64-QAM . . . . . . . . .13-10, 13-28
BPSK . . . . . . . . . . .13-10, 13-28
demodulator . . . . . . . . . . . 13-28
QPSK . . . . . . . . . . .13-10, 13-28
coupling, auto . . . . . . . . . . . . . . 2-17
CPICH, WCDMA . . . . . . . . . . 9-25
custom setup . . . . . . . . . . . . . . . 7-7
custom setup for channel scanner 7-7
cyclic prefix ratio . . . . . . . . . . 13-12
D
Data Modulation, EVDO . . . . 16-16
defaults
factory . . . . . . . . . . . . . . . . 3-36
delete
point . . . . . . . . . . . . . . . . . . 3-15
demod
AM/FM, IA spectrum menu 6-10
AM/FM, measure menu . . . 3-26
AM/FM/SSB . . . . . . . . . . . 5-13
frequency . . . . . . . . . . 6-10, B-6
frequency, measure menu . 3-26
time . . . . . . . . . . . . . . . . . . 6-10
time, measure menu . . . . . . 3-26
demodulator
Mobile WiMAX measurement .
14-9
WCDMA/HSDPA . . . . . . . 9-37
detection
amplitude menu . . . . . . . . . . 3-3
detection, sweep menu . . . . . . . 3-32
DHCP
connection . . . . . . . . . . . . . . 2-9
dynamic IP Address . . . . . . 3-35
manual entry . . . . . .9-19, 13-15
system options
WCDMA/HSDPA . . . 15-33
Digital Video Broadcasting
(Terrestrial & Handheld),
DVB-T/H . . . . . . . . 17-1
Directory Management
CDMA . . . . . . . . . . . . . . . 15-20
distortion measurements . . . . . . 5-10
DL-MAP
Mobile WiMAX measurement . .
14-14
Doppler, with DVB . . . . . . . . . . 17-2
DU Ratio, DVB-T/H-SFN . . . . 18-1
DVB-T/H
main topic . . . . . . . . . . . . . . 17-1
antenna factor . . . . . . . . . . . 17-6
channel maps . . . . . . . . . . . . .C-1
glossary . . . . . . . . . . . . . . . 17-46
measurements
automatic file saving . . 17-22
BER analysis . . . . . . . . 17-19
BER packet error rate (PER)
17-43
constellation config . . . 17-11
freq, ref level config . . . 17-7
impulse response config 17-13
marker configuration . . 17-14
modulation analysis . . 17-10
signal power . . . . . . . . . 17-8
spectrum monitor . . . . 17-21
Tx meas analysis . . . . . 17-17
modes . . . . . . . . . . . . . . . . . 17-2
quick start . . . . . . . . . . . . . . 17-5
DVB-T/H-SFN
main topic . . . . . . . . . . . . . . 18-1
antenna setup . . . . . . . . . . . . 18-2
Code TPS Warning Messages D-1
measurements . . . . . . . . . . . 18-4
automatic file saving . . . 18-6
freq, ref level config . . . 18-3
impulse response setup . 18-4
inband spectrum . . . . . . 18-5
Index -4
E
Ec, WCDMA . . . . . . . . . . . . . . 9-24
Ec/Io
CDMA . . . . . . . . . . . . . . . 15-17
EVDO . . . . . . . . . . . . . . . 16-17
Ec/Io, WCDMA . . . . . . . . . . . . 9-24
ESD cautions . . . . . . . . . . . . . . 1-10
Ethernet
address . . . . . . . . . . . . . . . . . 2-9
cable, accessory . . . . . . . . . . 1-7
config
CDMA . . . . . . . . . . . . 15-33
fixed WiMAX . . . . . . 13-15
system menu . . . . . . . . 3-35
WCDMA . . . . . . . . . . . 9-19
EVDO
ACPR setup . . . . . . . . . . . . 16-7
Active Activity . . . . . . . . . 16-17
Active Data Power .16-16, 16-17
Carrier Feedthrough . . . . . 16-17
CDP Data . . . . . . . . . . . . . 16-17
CDP data setup . . . . . . . . . 16-10
CDP MAC . . . . . . . . . . . . 16-17
CDP MAC setup . . . . . . . . 16-9
Channel Power . . . . . . . . . 16-16
chip rate . . . . . . . . . . . . . . . 16-1
Data Modulation . . . . . . . 16-16
demodulator setup . . . . . . . 16-9
Ec/Io . . . . . . . . . . . . . . . . . 16-17
ext ref freq setup . . . . . . . . 16-3
Freq Error . . . . . . . . . . . . . 16-16
general measurement setup 16-2
GPS setup . . . . . . . . . . . . . . 16-4
half slot . . . . . . . . . . . . . . . 16-1
Idle Activity . . . . . . . . . . . 16-17
MAC CDP table setup . . . 16-11
MAC codes setup . . . . . . . . 16-3
modulation summary setup 16-11
Multipath . . . . . . . . . . . . . 16-17
Multipath Power . . . . . . . 16-17
Noise Floor . . . . . . . . . . . 16-16
Occ BW . . . . . . . . . . . . . . 16-17
OTA setup . . . . . . . . . . . . 16-12
pass/fail setup . . . . . . . . . . 16-14
Pilot & MAC Power . . . . 16-16
Pilot Scan . . . . . . . . . . . . . 16-17
PN Offset . . . . . . . . . . . . . 16-16
PN select measurement . . . . 16-3
Power vs Time Graph . . . . 16-17
power vs time setup . . . . . . 16-6
RF measurement setup . . . . 16-5
Rho . . . . . . . . . . . . . . . . . . 16-16
Rho Overall 1 and 2 . . . . . 16-17
Rho Pilot . . . . . . . . . . . . . . 16-16
spurious emission setup . . . 16-8
summary setup . . . . . . . . . 16-15
Tau . . . . . . . . . . . . . . . . . . 16-16
EVM
fixed WiMAX
amplitude . . . . . . . . . . . 13-2
measurement . . . . . . . . 13-20
GSM GPRS EDGE . . . . . . 10-16
versus subcarrier
Mobile WiMAX . . . . . 14-11
versus symbol
Mobile WiMAX . . . . . 14-12
WCDMA . . . . . . . . . . . . . . . 9-24
ext ref freq, EVDO . . . . . . . . . . 16-4
external loss, compensating
CDMA . . . . . . . . . . . . . . . . 15-2
EVDO . . . . . . . . . . . . . . . . . 16-2
Fixed WiMAX . . . . . . . . . 13-21
Mobile WiMAX . . . . . . . . . 14-4
WCDMA . . . . . . . . . . . . . . . 9-27
external reference . . . . . . . . . . 13-15
external reference frequency . . . 3-35
F
fan ports . . . . . . . . . . . . . . . . . . . 2-3
FDD . . . . . . . . . . . . . . . . . . . . . 13-1
FDMA . . . . . . . . . . . . . . . . . . . . 10-1
FDMA with GSM . . . . . . . . . . . . 5-4
FFT Start description, DVB . . . 17-3
FHSS (Frequency Hopping Spread
Spectrum) . . . . . . . . . . . . 3-27, 6-11
field strength measurements . . . 5-11
field strength, IA spectrum menu 6-8
field strength, measure menu . . 3-24
filtered . . . . . . . . . . . . . . . . . . . . 9-29
Fixed WiMAX . . . . . . . . . . . . . 13-1
Index -5
Freq Error
CDMA . . . . . . . . . . . . . . . 15-16
EVDO . . . . . . . . . . . . . . . 16-16
freq, ext ref, EVDO . . . . . . . . . 16-4
frequency
center . . . . . . . . . . . . . . . . . 2-17
center, IA signal standard . . 6-3
error . . . . . . . . . . . . . . . . . 10-15
external reference . . . . . . . . 2-13
range, Interference Analyzer 6-2
setting start and stop values 2-16
frequency config
DVB-T/H-SFN . . . . . . . . . . 18-3
frequency config, DVB-T/H . . 17-7
frequency error, GPS . . . . . . . . 15-6
frequency menu
center . . . . . . . . . . . . . . . . . 3-13
range . . . . . . . . . . . . . . . . . . 3-12
front panel keys . . . . . . . . . . . . . 2-4
full screen instrument display . 3-41
G
gateway (IP Address) . . . . . . . . . 2-9
glossary
DVB-T/H . . . . . . . . . . . . . 17-46
GMSK . . . . . . . . . . . . . .10-1, 10-16
GMSK with GSM . . . . . . . . . . . 5-4
GPS
main topic . . . . . . . . . . . . . 12-1
activation . . . . . . . . . . . . . . 12-1
menu, CDMA . . . . . . . . . . 15-31
setup for CDMA . . . . . . . . 15-6
GSM
main topic . . . . . . . . . . . . . 10-1
adjacent channel power . . . . 5-7
channel power . . . . . . . . . . . 5-4
global systems, mobile . . . . . 5-4
GSM/GPRS/EDGE
demodulator measurements 10-11
external reference frequency setup
10-7
measurement parameters . 10-15
pass/fail measurements . . 10-13
RF measurements . . . . . . . . 10-7
guard interval description, DVB 17-2
H
half slot, EVDO . . . . . . . . . . . . 16-1
headset jack . . . . . . . . . . . . . . . . 2-12
High Accuracy Power Meter
measurements . . . . . . . . . . . 11-2
PSN50 sensor . . . . . . . . . . . 11-1
relative power feature . . . . . 11-1
required equipment . . . . . . . 11-1
USB A/mini-B cable . . . . . . 11-1
hold . . . . . . . . . . . . . . . . . 2-18, 3-37
hold versus run . . . . . . . . . . . . . 2-15
HSDPA . . . . . . . . . . . . . . . . . . . . 9-1
activating markers . . . . . . . . 9-42
Codogram measurements . . 9-42
OVSF codes . . . . . . . . . . . . 9-41
I
Idle Activity, EVDO . . . . . . . . 16-17
IMD (intermodulation distortion) 5-6
impedance selection for adaptors 3-35
impulse response configuration
DVB-T/H-SFN . . . . . . . . . . 18-4
impulse response configuration,
DVB-T/H . . . . . . . . . . . . . . . . 17-13
inband spectrum, DVB-T/H-SFN 18-5
in-band spurious measurements 5-10
integration bandwidth . . . . . . . . . 5-3
integration bandwidth, IA spectrum
menu . . . . . . . . . . . . . . . . . . . . . . 6-9
integration bandwidth, measure menu
3-25
Interference Analyzer
RSSI measurements . . . . . . 6-21
signal strength measurements 6-20
interference measurements . . . . 5-10
intermodulation product, channel
scanner . . . . . . . . . . . . . . . . . . . . 7-8
IP address . . 2-9, 3-35, 9-19, 13-15,
15-33
J
jpeg . . . . . . . . . . . . .9-6, 13-6, 15-21
jpeg, saved trace . . . . . . . . . . . . 3-10
Index -6
K
keyfront panel keys . . . . . . . . . . 2-4
soft key types . . . . . . . . . . . . 2-6
L
LAN connection . . . . . . . . . . . . . 2-9
language . . . . . . . . . . . . .9-19, 13-15
language selection for Spectrum Master
. . . . . . . . . . . . . . . . . . . . . . . . . 3-35
language system options
WCDMA . . . . . . . . . . . . . 15-33
latitude, GPS . . . . . . . . . . . . . . 12-1
LCD, Spectrum master display . 1-3
limit lines
absolute or relative . . . . . . . 3-18
advanced options . . . . . . . . 3-17
alarm . . . . . . . . . . . . . . . . . 3-18
limit envelope . . . . . . . . . . 3-16
save and recall . . . . . . . . . . 3-18
square or slope . . . . . . . . . . 3-17
uses . . . . . . . . . . . . . . . . . . . 3-15
link layer, DVB . . . . . . . . . . . . 17-1
longitude, GPS . . . . . . . . . . . . . 12-1
losscable . . . . . . . . . . . . . . . . . 15-18
M
MAC (Medium Access Control)
CDP MAC setup . . . . . . . . 16-9
code setup, EVDO . . . . . . . 16-3
EVDO demod measurements 16-9
MAC CDP Table view . . . 16-11
MAC Power, EVDO . . . . 16-16
overall EVDO traffic . . . . . 16-1
Rho MAC, quality of MAC channel
. . . . . . . . . . . . . . . 16-16
magnitude error . . . . . . . . . . . 10-16
maintenance, preventive . . . . . 1-10
marker . . . . . . . . . . . . . . .9-40, 9-42
noise . . . . . . . . . . . . . . . . . . 3-22
table . . . . . . . . . . . . . . . . . . 3-22
marker configuration, DVB-T/H 17-14
marker menu . . . . . . . . . . . . . . 3-20
Interference Analyzer . . . . . 6-16
mask . . . . . . . . . . . . . . . . . . . . . 9-34
master reset . . . . . . . . . . . . . . . . 3-36
measure menu . . . . . . . . . . . . . . 3-24
measurement menu
EVDO . . . . . . . . . . . . . . . . 16-19
measurements
CDMA
ACPR . . . . . . . . . . . . . . 15-9
CDMA2000 . . . . . . . . 15-10
cdmaOne . . . . . . . . . . . 15-10
CDP . . . . . . . . . . . . . . . 15-10
CDP table . . . . . . . . . . 15-11
channel spectrum . . . . . 15-8
demodulator . . . . . . . . 15-10
enter CDMA mode . . . . 15-1
GPS setup . . . . . . . . . . . 15-6
measurement setup . . . . 15-1
over the air . . . . . . . . . 15-12
pass/fail mode . . . . . . . 15-14
PN select . . . . . . . . . . . . 15-3
power offset . . . . . . . . . 15-2
RF . . . . . . . . . . . . . . . . . 15-8
setup center freq . . . . . . 15-1
setup ref freq . . . . . . . . . 15-5
setup signal standard . . . 15-2
spurious emission . . . . . 15-8
Walsh Codes setup . . . . 15-4
Channel Scanner
custom setup . . . . . . . . . . 7-7
setup . . . . . . . . . . . . . . . . 7-7
DVB-T/H
automatic file saving . . 17-22
BER analysis . . . . . . . . 17-19
constellation config . . . 17-11
freq, ref level config . . . 17-7
impulse response config 17-13
marker configuration . . 17-14
modulation analysis . . 17-10
signal power . . . . . . . . . 17-8
spectrum monitor . . . . 17-21
Tx meas analysis . . . . . 17-17
DVB-T/H-SFN
freq, ref level config . . . 18-3
impulse response setup . 18-4
inband spectrum . . . . . . 18-5
Index -7
EVDO
ACPR . . . . . . . . . . . . . . 16-7
CDP Data . . . . . . . . . . 16-10
CDP MAC . . . . . . . . . . 16-9
CDP Table . . . . . . . . . 16-11
demodulator . . . . . . . . . 16-9
ext ref freq setup . . . . . 16-3
frequency, setup . . . . . . 16-2
general setup . . . . . . . . 16-2
GPS setup . . . . . . . . . . . 16-4
MAC Code setup . . . . . 16-3
markers . . . . . . . . . . . . 16-10
OTA . . . . . . . . . . . . . . 16-12
Pass/Fail . . . . . . . . . . . 16-14
PN Select . . . . . . . . . . . 16-3
power offset . . . . . . . . . 16-2
power vs time . . . . . . . . 16-6
RF . . . . . . . . . . . . . . . . . 16-5
signal standard, select . 16-2
spurious emission . . . . . 16-8
Summary . . . . . . . . . . 16-15
field
adj channel power ratio . 5-6
AM/FM/SSB demodulation .
5-13
AMPS (TDMA) adjacent
channel power . . 5-8
AMPS channel power . . 5-5
carrier to interference ratio (C/I)
. . . . . . . . . . . . . 5-13
CDMA channel power . . 5-3
field strength . . . . . . . . 5-11
GSM adjacent channel power
5-7
GSM channel power . . . 5-4
in-band spurious . . . . . . 5-10
in-band/out-of-channel . 5-10
occupied bandwidth . . . . 5-1
out-of-band spurious emission
5-9
GPS . . . . . . . . . . . . . . . . . . 12-1
GSM/GPRS/EDGE
demodulator . . . . . . . . 10-11
external ref freq setup . 10-7
pass/fail . . . . . . . . . . . 10-13
RF . . . . . . . . . . . . . . . . . 10-7
High Accuracy Power Meter 11-2
HSDPA
activating markers . . . . . 9-42
Codogram . . . . . . . . . . . 9-42
OVSF codes . . . . . . . . . 9-41
Interference Analyzer
RSSI . . . . . . . . . . . . . . . 6-21
signal strength . . . . . . . . 6-20
spectrogram . . . . . . . . . . 6-18
Mobile WiMAX
ACPR . . . . . . . . . . . . . . 14-7
channel power (RSSI) . 14-16
constellation . . . . . . . . . 14-9
demodulator . . . . . . . . . 14-9
DL-MAP . . . . . . . . . . . 14-14
EVM versus subcarrier 14-11
EVM versus symbol . . 14-12
modulation summary . 14-13
OTA . . . . . . . . . . . . . . 14-15
power versus time . . . . . 14-7
RF . . . . . . . . . . . . . . . . . 14-6
RF summary . . . . . . . . . 14-8
setup . . . . . . . . . . . . . . . 14-3
spectral flatness . . . . . . 14-10
spectrum . . . . . . . . . . . . 14-6
types . . . . . . . . . . . . . . . 14-2
spectrum analyzer
introduction . . . . . . . . . . 2-16
selecting signal standard 2-17
setting amplitude . . . . . . 2-16
setting bandwidth . . . . . 2-17
sweep . . . . . . . . . . . . . . 2-18
tracking generator
calibration . . . . . . . . . . . . 8-3
example . . . . . . . . . . . . . . 8-3
WCDMA
summary . . . . . . . . . . . . 9-47
WCDMA/HSDPA
ACLR . . . . . . . . . . . . . . 9-32
activating markers . . . . . 9-40
CDP table . . . . . . . . . . . 9-40
channel spectrum . . . . . 9-31
demodulator . . . . . . . . . 9-37
multi-path power . . . . . . 9-45
OTA . . . . . . . . . . . . . . . 9-44
pass/fail . . . . . . . . . . . . . 9-48
Index -8
RF . . . . . . . . . . . . . . . . . 9-30
setup . . . . . . . . . . . . . . . 9-26
spectral emission mask 9-34
WiMAX
ACPR . . . . . . . . . . . . . 13-26
demodulator . . . . . . . . 13-28
EVM vs SubCarrier . . 13-32
EVM vs Symbol . . . . . 13-33
modulation summary . 13-34
pass/fail . . . . . . . . . . . 13-35
power vs time . . . . . . . 13-25
RF . . . . . . . . . . . . . . . . 13-23
RF Summary . . . . . . . 13-27
setup . . . . . . . . . . . . . . 13-21
spectral flatness . . . . . 13-30
summary . . . . . . . . . . . 13-37
Mobile WiMAX
measurements
ACPR . . . . . . . . . . . . . . 14-7
channel power (RSSI) 14-16
constellation . . . . . . . . . 14-9
demodulator . . . . . . . . . 14-9
DL-MAP . . . . . . . . . . 14-14
EVM versus subcarrier 14-11
EVM versus symbol . . 14-12
modulation summary . 14-13
OTA . . . . . . . . . . . . . . 14-15
power versus time . . . . 14-7
RF . . . . . . . . . . . . . . . . . 14-6
RF summary . . . . . . . . . 14-8
setup . . . . . . . . . . . . . . . 14-3
spectral flatness . . . . . 14-10
spectrum . . . . . . . . . . . . 14-6
mobile WiMAX
measurements . . . . . . . . . . . 14-2
mode
DVB . . . . . . . . . . . . . . . . . . 17-2
DVB-T/H . . . . . . . . . . . . . . 17-5
mode menu . . . . . . . . . . . . . . . . 3-27
mode selector menu . . . . . . . . . 2-15
modulation
16QAM
DVB-T/H SFN . . . . . . . 18-4
EVDO . . . . . . . . . . . . 16-16
64QAM
DVB-T/H-SFN . . . . . . . 18-4
8PSK
EVDO . . . . . . . . . . . . . 16-16
QPSK
DVB-T/H-SFN . . . . . . . 18-4
EVDO . . . . . . . . . . . . . 16-16
modulation analysis, DVB-T/H 17-10
modulation summary
Mobile WiMAX measurement . .
14-13
MPE-FEC, DVB . . . . . . . . . . . . 17-5
Multipath
CDMA . . . . . . . . . . . . . . . 15-17
EVDO . . . . . . . . . . . . . . . . 16-17
multipath
DVB-T/H-SFN . . . . . . . . . . 18-1
Multipath Power
CDMA . . . . . . . . . . . . . . . 15-17
EVDO . . . . . . . . . . . . . . . . 16-17
N
Noise Floor
CDMA . . . . . . . . . . . . . . . 15-16
EVDO . . . . . . . . . . . . . . . . 16-16
normalization, tracking generator 8-3
O
Occ BW
CDMA . . . . . . . . . . . . . . . 15-25
EVDO . . . . . . . . . . . . . . . . 16-17
occupied bandwidth . . . . . . . . 10-15
occupied bandwidth measurement 5-1
occupied bandwidth, IA spectrum
menu . . . . . . . . . . . . . . . . . . . . . . 6-9
occupied bandwidth, measure menu .
3-25
OCXO, GPS . . . . . . . . . . . . . . . 12-1
OFDM . . . . . . . . . . . . . . . . . . . 13-11
OFDM signal, WiMAX . . . . . 13-10
OFDMA subcarriers, EVDO . 14-11
OFDMA, EVM vs subcarrier . 14-27
Index -9
option
09, Hardware, RF & Demodulation
. . . . . . . . . . . . . . . . . 1-4
19, High Accuracy Power Meter
11-1
20, Tracking Generator . . . . 8-1
25, Interference Analyzer . . . 6-1
27, Channel Scanner . . . . . . 7-1
31, GPS . . . . . . . . . . . . . . . 12-1
33, CDMA OTA . . . . . . . . 15-1
34, EVDO OTA . . . . . . . . . 16-1
35, WCDMA/HSDPA OTA 9-1
37, Mobile WiMAX OTA . 14-1
40, GSM/GPRS/EDGE RF 10-1
41, GSM/GPRS/EDGE
Demodulator . . . . . 10-1
42, CDMA RF . . . . . . . . . . 15-1
43, CDMA Demodulator . . 15-1
44, WCDMA/HSDPA RF . . 9-1
45, WCDMA Demodulator . 9-1
46, Fixed WiMAX RF . . . . 13-1
47, Fixed WiMAX Demodulator
13-1
57, DVB-T/H BER . . . . . . 17-1
62, EVDO RF . . . . . . . . . . 16-1
63, EVDO Demodulator . . 16-1
64, DVB-T/H Analyzer . . . 17-1
65, WCDMA/HSDPA
Demodulator . . . . . . 9-1
66, Mobile WiMAX RF . . . 14-1
67, Mobile WiMAX Demodulator
14-1
78, DVB-T/H SFN . . . . . . . 18-1
system . . . . . 9-19, 13-15, 15-32
option soft key, system menu . 3-35
origin offset . . . . . . . . . . . . . . 10-16
oscillator, beat frequency .3-26, 6-10
oscillator, oven-controlled crystal,
OCXO . . . . . . . . . . . . . . . . . . . 12-1
OTA
Mobile WiMAX measurement .
14-15
OTA (Over the Air)
CDMA measurement . . . . . 15-1
EVDO measurement . . . . . 16-1
out-of-band spurious emission
measurement . . . . . . . . . . . . . . . . 5-9
oven-controlled crystal oscillator,
OCXO . . . . . . . . . . . . . . . . . . . . 12-1
OVSF . . . . . . . . . . . . . . . . . . . . 9-21
P
packet error rate (PER) measurement,
DVB BER . . . . . . . . . . . . . . . . 17-43
Paging Code Power . . . . . . . . . 15-16
paging, WCDMA . . . . . . . . . . . 9-25
panel, keys on front panel . . . . . . 2-4
pass/fail
CDMA . . . . . . . . . . . . . . . 15-14
EVDO . . . . . . . . . . . . . . . . 16-14
fixed WiMAX . . . . . . . . . . 13-35
GSM GPRS EDGE . . . . . . 10-13
WCDMA mode . . . . . . . . . . 9-13
P-CCPCH, WCDMA . . . . . . . . 9-25
PCDE, WCDMA . . . . . . . . . . . 9-24
peak . . . . . . . . . . . . . . . . . . . . . . 3-21
threshold . . . . . . . . . . . . . . . 3-21
phase error . . . . . . . . . . . . . . . . 10-16
physical layer, DVB . . . . . . . . . 17-2
PICH, WCDMA . . . . . . . . . . . . 9-25
pilot & MAC power, EVDO . . 16-16
pilot dominence, WCDMA . . . . 9-24
Pilot Power
described . . . . . . . . . . . . . . 15-17
EVDO . . . . . . . . . . . . . . . . 16-16
Pilot Scan
CDMA . . . . . . . . . . . . . . . 15-17
EVDO . . . . . . . . . . . . . . . . 16-17
ping, network request . . . . . . . . 2-12
PN Offset
EVDO PN Select . . . . . . . . 16-3
PN Offset, EVDO . . . . . . . . . . 16-16
PN Scan . . . . . . . . . . . . . . . . . . 15-17
power offset
compensating external loss
CDMA . . . . . . . . . . . . . 15-2
EVDO . . . . . . . . . . . . . . 16-2
Fixed WiMAX . . . . . . 13-21
Mobile WiMAX . . . . . . 14-4
WCDMA . . . . . . . . . . . . 9-27
Index -10
power versus time
Mobile WiMAX measurement .
14-7
Power vs Time Graph, EVDO 16-17
preamplifier
amplitude menu . . . . . . . . . . 3-3
preamplifier operation . . . . . . . . 4-3
preset . . . . . . . . . . . . . . . . . . . . 9-15
preset menu . . . . . . . . . . . . . . . 3-28
preventive maintenance . . . . . . 1-10
print . . . . . . . . . . . . . . . . . . . . . . 9-7
P-SCH . . . . . . . . . . . . . . . . . . . 9-21
PSN50 sensor . . . . . . . . . . . . . . 11-1
Q
Q Paging Powe . . . . . . . . . . . . 15-16
QPSK
DVB-T/H-SFN modulation 18-4
EVDO modulation . . . . . . 16-16
QPSK, color coded constellation view
13-10, . . . . . . . . . . . . . . . . . . . 13-28
quasi-peak
amplitude menu . . . . . . . . . . 3-3
R
RBW . . . . . . . . . . . . . . . . . . . . 2-17
RBW, VBW and sweep speed . . 4-2
RCE . . . . . . . . . . . . . . . . . . . . 13-20
recall
measurement . . . . . . .3-9, 15-21
setup . . . . . . . . . . . . . . . . . 15-21
recall setup, file menu . . . . . . . . 3-9
reference level
amplitude menu . . . . . . . . . . 3-2
reference level and attenuation . 4-2
reference Level config
DVB-T/H-SFN . . . . . . . . . . 18-3
reference level config, DVB-T/H 17-7
reference level, IA amplitude menu .
6-4
relative power . . . . . . . . . . . . . . 11-1
reset . . . . . . . . . . . . . . . . . . . . . 3-36
master . . . . . . . . . . . . . . . . . 3-36
sweep . . . . . . . . . . . . . . . . . 3-31
resolution bandwidth . . . . . . . . 5-11
BW menu . . . . . . . . . . . . . . . 3-4
resolution bandwidth, description 4-1
resolution bandwidth, IA BW menu .
6-6
RF Mobile WiMAX measurement . .
14-6
RF summary
Mobile WiMAX measurement . .
14-8
Rho
CDMA . . . . . . . . . . . . . . . 15-16
EVDO . . . . . . . . . . . . . . . . 16-16
Rho Data, EVDO . . . . . . . . . . 16-16
Rho MAC, EVDO . . . . . . . . . . 16-16
Rho Overall 1 and 2, EVDO . . 16-17
Rho Pilot, EVDO . . . . . . . . . . 16-16
RMS, WCDMA . . . . . . . . . . . . 9-24
RSSI . . . . . . . . . . . . . . . . 6-1, 13-19
see channel power . . . . . . . 14-16
RSSI, Interference Analyzer
measurements . . . . . . . . . . . . . . 6-21
run versus hold . . . . . . . . . . . . . 2-15
S
scale function, channel scanner . 7-3
S-CCPCH, WCDMA . . . . . . . . 9-25
scrambling code . . . . . . . . . . . . 9-27
scrambling code, WCDMA . . . 9-23
self test . . . . . . . . . . . . . . . . . . 13-15
self test, system . . . . . . . . . . . . . 2-15
self test, system menu . . . . . . . . 3-35
service centers . . . . . . . . . . . . . . 1-14
setup
Mobile WiMAX . . . . . . . . . 14-3
recall 9-6, 9-15, 13-5, 13-18, 15-21
recall, file menu . . . . . . . . . . 3-9
save . . . . . . . . . . . . . . . . . . . 9-15
save and recall, preset menu 3-28
save, trace menu . . . . . . . . . 3-39
signal power measurement, DVB-T/H
17-8
signal standard . . . . . . . . . . . . . 2-17
channel scanner . . . . . . . . . . . 7-2
soft key . . . . . . . . . . . . . . . 15-22
signal standard, IA frequency menu .
6-3
Index -11
signal standard, selecting for CDMA
15-2
signal strength . . . . . . . . . . . . . . 6-1
signal strength measurements
Interference Analyzer . . . . . 6-20
signal strength menu . . . . . . . . 6-13
single sweep mode . . . . . . . . . . 2-15
soft key types . . . . . . . . . . . . . . . 2-6
span menu . . . . . . . . . . . . . . . . 3-29
span, IA frequency menu . . . . . . 6-3
spectral flatness . . . . . . . . . . . 13-10
Mobile WiMAX measurement .
14-10
spectrogram . . . . . . . . . . . . . . . . 6-1
spectrogram measurements . . . 6-18
spectrogram plots . . . . . . . . . . . 6-12
spectrum
Mobile WiMAX measurement .
14-6
spectrum analyzer measurements 2-16
spectrum monitor, DVB-T/H . 17-21
spreading factor, WCDMA . . . 9-23
S-SCH . . . . . . . . . . . . . . . . . . . 9-21
Start Freq soft key . . . . . . . . . . 2-16
start frequency . . . . . . . . . . . . . 2-16
Stop Freq soft key . . . . . . . . . . 2-16
subnet (IP Address) . . . . . . . . . . 2-9
sweep . . . . . . . . . . . . . . . . . . . . 9-12
sweep limitations . . . . . . . . . . . . 4-2
sweep menu . . . . . . . . . . . . . . . 3-31
Sync Power . . . . . . . . . . . . . . 15-16
system
options . . . . . 3-35, 13-15, 15-32
self test . . . . . . . . . . . . . . . . 2-15
system menu . . . . . . . . . . . . . . 3-34
system options . . . . . . . . . . . . . 9-19
T
TauCDMA . . . . . . . . . . . . . . . 15-16
EVDO . . . . . . . . . . . . . . . 16-16
TDD . . . . . . . . . . . . . . . . . . . . . 13-1
TDMA . . . . . . . . . . . . . . . . . . . 10-1
TDMA with GSM . . . . . . . . . . . 5-4
test panel and connectors . . . . . . 2-9
test set . . . . . . . . . . . . . . . . . . 10-14
threshold . . . . . . . . . . . . . . . . . . 9-29
peak . . . . . . . . . . . . . . . . . . . 3-21
threshold, WCDMA . . . . . . . . . 9-24
tilt bail kit . . . . . . . . . . . . . . . . . 1-13
time cursor . . . . . . . . . . . . . . . . 6-12
time mark, reference for CDMA 15-4
time-slicing, DVB . . . . . . . . . . . 17-4
timing accuracy, GPS . . . . . . . . 15-6
TPS Warning Codes . . . . . . . . . D-1
trace menu . . . . . . . . . . . . . . . . . 3-37
tracking generator . . . . . . . . . . . . 8-1
calibration . . . . . . . . . . . . . . . 8-3
example measurement . . . . . . 8-3
trigger
external . . . . . . . . . . . 2-12, 2-18
external, sweep menu . . . . . 3-32
manual, sweep menu . . . . . . 3-31
position . . . . . . . . . . . . . . . . 2-18
position, sweep menu . . . . . 3-33
TSC . . . . . . . . . . . . . . . . . . . . . 10-16
TTL . . . . . . . . . . . . . . . . . . . . . . 2-18
Tx meas analysis, DVB-T/H . . 17-17
U
unfiltered . . . . . . . . . . . . . . . . . . 9-29
units
display
amplitude menu . . . . . . . . 3-3
linear . . . . . . . . . . . . . . . . . . 2-17
USB
A/mini-B cable . . . . . . . . . . 11-1
cable accessory . . . . . . . . . . . 1-7
flash drive . . . . . . . . . . . . . . 2-13
interface connection . . . . . . 2-12
saving measurements . . . . 15-19
V
VBW . . . . . . . . . . . . . . . . . 2-17, 4-2
video bandwidth, description . . . 4-2
volume
CDMA . . . . . . . . . . . . . . . 15-33
fixed WiMAX . . . . . . . . . . 13-16
IA measurements . . . . . . . . 6-20
measure menu . . . . . . . . . . . 3-27
system menu . . . . . . . . . . . . 3-36
WCDMA . . . . . . . . . . . . . . . 9-20
Index -12
W
Walsh Codes
CDMA . . . . . . . . . . . . . . . . 15-4
EVDO, MAC channel . . . 16-17
EVDO, MAC Codes setup . 16-3
Warning Codes, TPS . . . . . . . . . D-1
WCDMA . . . . . . . . . . . . . . . . . . 9-1
summary measurements . . . 9-47
WCDMA/HSDPA
ACLR measurements . . . . . 9-32
activating markers . . . . . . . 9-40
CDP table measurements . . 9-40
channel spectrum measurements
9-31
demodulator measurements 9-37
measurement setup . . . . . . . 9-26
multi-path power measurements
9-45
OTA measurements . . . . . . 9-44
pass/fail measurements . . . 9-48
RF measurements . . . . . . . . 9-30
spectral emission mask
measurements . . . . . 9-34
WCDMA/HSDPA measurement
parameters . . . . . . . . . . . . . . . . . 9-21
WiMAX . . . . . . . . . . . . . . . . . . 13-1
ACPR measurements . . . . 13-26
demodulator measurements 13-28
EVM vs SubCarrier measurements
13-32
EVM vs Symbol measurements .
13-33
measurement setup . . . . . . 13-21
modulation summary
measurements . . . . 13-34
pass/fail measurements . . . 13-35
power vs time measurements 13-25
RF measurements . . . . . . . 13-23
RF Summary measurements 13-27
see Mobile WiMAX . . . . . . 14-1
spectral flatness measurements . .
13-30
summary . . . . . . . . . . . . . . 13-37
WiMAX measurement parameters . .
13-19
Z
zoom . . . . . . . . . . . . . . . . . . . . . 9-37
