JasonDefault APES Report Writing Guide
User Manual:
Open the PDF directly: View PDF ![]() .
.
Page Count: 23
30 March 2016
How to write a report in the format of a scientific paper: a guide for APES
Jason P. Marshal and Francesca Parrini
School of Animal, Plant and Environmental Sciences,
University of the Witwatersrand, Private Bag 3, Wits 2050
ABSTRACT
This document provides a standard for style and formatting for research reports that you will
be asked to prepare for classes in the School of Animal, Plant and Environmental Sciences
(APES). The standard research report consists of a Title Page, Abstract, Keywords,
Introduction, Materials and Methods, Results, Discussion, Acknowledgements and
References. Proper citing and referencing are particularly important to avoid plagiarism, a
very serious offence at the University of the Witwatersrand. Careful formatting is essential to
prepare a report that is organized, concise, targets the correct audience, and is easy to read and
understand. The more closely you follow these guidelines, the better your report and your
mark will be.
KEYWORDS: APES; report format; School of Animal, Plant and Environmental Sciences;
scientific report; writing guidelines; writing style
This document provides a guide for how to write and format a scientific report for
courses that you will take in the School of Animal, Plant and Environmental Sciences
(APES). It is formatted exactly as you should format your own scientific report, and is
intended to provide an example to which you can compare your own writing. Please note that
your lecturer might have different requirements to those outlined in this guide. Consult with
your lecturer before you prepare your own report. Also note that lecturers read hundreds of
reports over their careers, and they know one thing to be true: the easier your report is to
read, the better your mark will be!
Unless you are told otherwise by your lecturer, include theses sections in your
scientific report: Title page, Abstract, Keywords, Introduction, Materials and Methods,
Results, Discussion, Acknowledgements and References. There are many detailed
references on scientific writing. Two good ones are (Day, 1994) and (Brower et al., 1997).
Scientific reports use two levels of headings. Section titles (i.e. Abstract, Introduction, etc.)
are capitalized, in bold and left-justified. Subsection titles have an initial capital letter only,
are bold and are left-justified.
TITLE PAGE
The title should reflect the contents of the study. The title of the paper will often
determine whether someone doing a literature search reads the paper. Hence, it is critical that
the title provide enough information to tell a reader the objectives of the study. Also, it should
not be too long—a maximum of 20 words is a good guideline. Type the title of your paper in
lower case letters, except for the first letter, and centred it on the page. On the title page, also
include the date of the assignment, your name and student number. The title page of this
guide provides an example.
ABSTRACT
The Abstract provides a concise summary of the facts of a piece of scientific writing in
no more than 300 words. It should explain what happened in the study, why it happened, and
where it happened. It should also present the methods most directly relevant to the question
under investigation. It provides the most important results, the principle conclusions, and it
provides the implications of that conclusion (i.e. the broader importance). To be sure it
accurately captures the contents of your entire paper, it should be the section you write last.
In many cases, the abstract is all a researcher reads. Thus, a well-written Abstract that
provides a useful summary of the entire study is vital. Sentences like, “the implications of
these results are discussed” or “alternative hypotheses are reviewed” are uninformative and a
waste of valuable space. Do not cite references, or refer to figures or tables in the Abstract.
KEYWORDS
The keywords list should include about five words or phrases that describe the main
topic or contents of the report. Put them in alphabetical order, separated by semi-colons, with
no full stop at the end of the list. For example, you might include common and scientific
names of study organisms (brown locust, Locustana pardalina), the study area (Pretoriuskop,
Kruger National Park), or important concepts (interspecific competition, optimal foraging
theory).
INTRODUCTION
This section sets the context for the investigation. It makes clear the importance of the
study and the purpose for writing the paper. It also provides sufficient background to permit
readers to understand the findings without having to go to other references. Finally, it makes
clear the objectives, questions or research hypotheses under investigation. Because most of
this section is based on previously published science, the convention is to write it in present
tense.
A good Introduction states first, as clearly as possible, the nature and scope of the
problem under investigation. When readers pick up a scientific paper, they need to be
hooked from the first sentence; otherwise, they will never make it beyond the Introduction.
This part of the Introduction should answer the questions, “what is the broader issue that
makes this study important?”, “what is motivating this research”, and most importantly, “why
should anyone keep reading?”
Next, the Introduction provides background by way of a brief review relevant
literature. In doing so, you will establish the general context of the work and summarize
current understanding of the question being addressed. Hence, it is critical that you read
relevant literature, especially recent work. This part of the Introduction should answer the
question, “what did we know about this subject before I did this study?” In preparing this
background, cover each important topic in its own paragraph. Also be explicit to point out the
connection between each background topic and the overall problem. The topic and the
connection should be clear in the first sentence of each paragraph (i.e. the topic sentence).
Once the background is set, the gaps in our current knowledge, and thus the rationale,
should be apparent. As you near the end of the Introduction (i.e. at the beginning of the last
paragraph), review the important gaps in understanding that motivated this research (e.g.
“Given the absence of information on nocturnal resource selection and behavioural patterns in
sable antelope, my goal was to...”). This part of the Introduction should answer the question,
“why was my question important?” and “what were the limitations or holes in knowledge that
have led to this study?”
Once the background and the rationale are clear, state your specific research
questions, objectives, or research hypotheses, toward the end of the last paragraph in the
Introduction. You might also want to state the broad methodological approach of
investigation in a sentence or two. Knowing this information ahead of time will help the
reader to link the objective of your paper to the Methods and Results you present later on.
This part of the Introduction should answer the question, “What were the objectives and how
will perusing them advance our knowledge?”
Example
Think of the Introduction as an inverted triangle: the broadest part at the top represents
the most general information and it focuses down to the specific problem you studied. For
example, beginning the paper with “I was interested in whether spines on acacia trees were
different lengths in different areas depending on the density of mammalian browsers” is too
specific and provides no context for the question. No one would be hooked to read further.
Rather start with statement that sets the broader context: “Many recent studies of
plants and marine invertebrates indicate that formation of mechanical defences such as spines,
spicules and barbs may be triggered by the actions of predators in the environment. In
environments with strong pressure from herbivory, plants are faced with the challenge of
allocating scarce resources between a continuous need for growth and an intermittent but
intense requirement to defend their tissues against herbivores.” This is the problem that
motivates the study and attracts attention to your paper.
Then narrow your focus down to the hypotheses you are planning to test: “The
production of defence structures presumably comes at an energetic cost to the organism. An
organism that does not produce defences under benign conditions may therefore allocate more
energy to other functions such as growth and reproduction than a conspecific in the presence
of predators. Acacia trees are well known for the production of spines on branches and twigs;
spinescence is furthermore presumed to provide some protection against mammalian
browsing. We test two hypotheses in this paper: (1) individuals of the species Acacia krugeri
that have been protected from browsing will have shorter spines than size-matched
individuals immediately outside the exclosure, and (2) individual plants within the herbivore-
free area will have greater leaf area than do the size-matched individuals outside the
exclosure.” Make sure your reader knows by the end of the Introduction exactly what
hypotheses you are testing, questions you are asking, or problems you are solving.
MATERIALS AND METHODS
This section describes what you did, why you did it and how you did it. The Methods
must explicitly explain how you went about testing the hypothesis, answering the question or
solving the problem. Describe your methods in enough detail that someone else could
replicate your study. A critical aspect of the scientific process is that research should be
repeatable. In other words, anyone should be able to duplicate your methods to verify or
refute what you found. Common subheadings used in the Materials and Methods are Study
area, Study species, Experimental design and protocol, and Data analysis.
Study area
If the paper describes a study that was carried out in the field, you need to provide a
description of the study area. State the name of the area (e.g. Suikerbosrand Nature Reserve),
and if available, give the latitude and longitude. Describe the physical and biological
characteristics of the area (e.g. terrain, vegetation cover, common animal species). Also
include the date and time of day that the study occurred. Sometimes a map (included as a
figure) is more useful than a description, but be sure to include a caption that explains the
map.
Study species
Provide the common and scientific names of the species used in the study, a brief
description of its biology and natural history, and include a brief rationale for its use.
Experimental design and protocol
In this section, you need to describe your experimental design and the procedures you
used to conduct the study. Include descriptions of all controls, treatments and variables, and
provide the number of replicates you used. Also provide sample sizes. Identify each
treatment using a descriptive name (e.g. 35°C), rather than generic names or numbers (e.g.
Treatment 1). Make sure that the experimental conditions are adequately described. Getting
the right amount of detail can be difficult for students. On one hand, the requirement to be
able to repeat a study demands substantial detail; however, it is possible to include too much
detail. A good test is to ask yourself, “could omitting this detail affect the outcome?” For
example, there are many ways to pick random numbers when conducting a random sample
(e.g. textbook random numbers table, computer, coin toss, throwing dice, seconds readout on
a digital watch). The important detail is that you conducted a random sample; how you chose
the random numbers can probably be omitted. Briefly explain the rationale for the measures
you made. For example, “To test the tree density hypothesis, we counted all trees over 10 cm
DBH on a 5 x 100-m transect” is more informative than simply stating that you counted the
trees in a transect. Tables are often useful for describing experimental design and flow
diagrams for sequential protocols.
Among the details to be included in this section, most important are the quantitative
aspects of your study (e.g. masses, volumes, incubation times, concentrations). Provide
details such as the model, manufacturer and city where the company is located (e.g. Model
FC-10A, Sable Systems, Las Vegas, USA; Garmin GPS 60CSx, Taipei, Taiwan) for
specialised equipment you used (e.g. analytical and measurement equipment—gas analysers,
transmitters; and chemicals). This detail is not necessary for laboratory consumables, such as
petri dishes and test tubes.
Data analyses
This section is critical for understanding how you moved from data collected during a
study to biological conclusions. Describe the method of analysis you used, but also provide a
rationale for its use—why was this method appropriate for your questions and data? Be clear
on how you present your data (e.g. mean ± SD or mean ± SE), whether your data were
transformed (e.g. log or square-root-arcsine) and why, and the name of the statistical method
used for analysis (e.g. t-test, ANOVA, ANCOVA). Explicitly state the variables you are
using, describe those variables (what they represent and whether they are categorical,
continuous, binomial), and specify how they are incorporated into the analysis method (e.g.
explanatory, response, grouping, interaction). Provide the name and publisher of software
you used for statistical analyses (e.g. R Core Team, 2013), and remember to include this
citation in your reference list.
RESULTS
The Results section is the core of the paper, and its purpose is simple: to objectively
present the findings of the investigation. The overall goal is to describe patterns, not to
explain them. Think of the Results section as telling a story about what you found when you
conducted your study—that means writing the text of your Results section in past tense. The
results section contains two parts: (1) an overall description of the investigation that provides
the big picture, without detailing the experimental design and (2) presentation of the data.
Start with a basic summary of the data, not statistical results (e.g. ‘We caught a total of
50 rodents over 200 trap days for an overall trapping rate of 25%. Of these 50 rodents, 19
were female and 31 were male’). You might also provide basic natural history data relevant
to your study, how they might have changed over time, or how they differed between study
areas. The purpose here is to set the context within which the data were collected. That will
help the reader to understand more fully the data and analyses specific to your objectives.
Above all, make the biology the subject of your Results section.
When presenting analyses, some pre-digestion is necessary: do not report all the
numbers you collected (i.e. raw data). Rather report summaries (averages, standard errors,
ranges), trends or changes in trends over time, or differences between experiments, study
areas or periods of data collection. When planning what to present, begin by thinking about
what information the reader will need to assess whether you answered your questions or
achieved your objectives. Because that information is central to the paper, it should be
presented in a form that is easy to read, which usually means putting it in a figure or a table.
Tables and figures
Always place figures and tables at the end of your report (Fig. 1, Table 1). Doing so
will force you to talk about the science your figures or tables represent, and to point out
patterns, trends and differences in the text of your Results section. If you can easily
summarise data in the text, do not use a table or a figure. When given the choice between
presenting the same information in a table or a figure, a figure is always preferable. In
general, use a figure if your data have a pronounced trend that shows an interesting picture.
Use tables only if you must present repetitive data (e.g. a summary of a statistical analysis).
Never present the same data in both a table and a figure. In the text of the Results section,
never begin a sentence with “Figure 1 shows...” or “Table 1 shows...”; rather state what it
shows as a result and then refer to it (Fig. 1, Table 1). Examples of a table and a figure are at
the end of this guide (Fig. 1, Table 1). As you refer to tables or figures in the text of your
Results section, number and refer to them consecutively (e.g. Table 1, Table 2...).
When planning figures, begin by deciding the layout. Normally, the explanatory
variable (i.e. perceived to be causing the relationship) is on the X-axis, and the response
variable (i.e. perceived to be affected by the explanatory variable) on the Y-axis. If both
variables are continuous (e.g. measurements, counts, time), a line graph is appropriate. If the
X-axis is categorical (e.g. male/female, juvenile/yearling/adult, low/medium/high treatments
of an experiment), then a bar graph is appropriate. Each graph should have values along the
X and Y axes, clear labels for each axis (with units), and a complete legend.
Tables should be arranged in columns, each with a heading that includes the relevant
units. Place a horizontal line (a) at the top of the table, (b) under the column headings, and (c)
at the bottom of the table. Do not put horizontal lines between each row or vertical lines of
any kind. An example is at the end of this guide (Table 1). Footnotes to clarify specific
points in your table can be used sparingly. Place superscripts (e.g. a, b, c) in the table and an
explanation that goes with each superscript below the bottom line of the table.
Tables have captions at the top and figures have captions at the bottom. A figure or
table should be able to stand alone and make sense without the reader having to refer to the
text of the report to understand what is being presented. Thus, provide a brief description of
data, symbols and abbreviations you use in a figure and of the data and column headings in a
table. Figure legends, like table headings, should provide enough information for someone to
understand what a figure shows without having to refer to the rest of the paper. DO NOT
PRESENT ALL YOUR RAW DATA IN A RESULTS TABLE.
Presenting statistics
Remember that the goal of using statistics is to make clear the biological patterns
relevant to your study; make biology the focus of your Results section, not the statistics.
Statistics are merely a tool. To help you focus on the biological relationships, be sure to
report parameter estimates that describe quantities, trends or differences (e.g. means, slopes of
regression lines, mean differences between two areas), measures of how precisely those
parameters were estimated (e.g. standard errors, 95% confidence intervals), and sample size.
An estimate without a measure of precision is merely a guess and has no scientific value.
When presenting the results of a statistical hypothesis test (e.g. t-test, ANOVA), please
do not write about “significant differences”. Again, emphasize the biology by describing the
estimated size of the difference, the precision of its estimate, and then (if you must) place
associated hypothesis-testing statistics at the end of the statement in parentheses. For
example:
1. Preferred: “Average leaf area was 9.7 cm2 (95% CI: 7.4—12.0) larger for the low-
sunlight treatment than for the high-sunlight treatment.”
2. Acceptable: “Average leaf area was 9.7 cm2 larger for the low-sunlight treatment than
for the high-sunlight treatment (t = 4.332, df = 47, P < 0.001).”
3. Unacceptable: “There was a significant difference in average leaf area between the
two sunlight treatments (t = 4.332, df = 47, P < 0.001).”
Example 1 focuses on the biology of the finding and provides the most understandable
information about the size of the difference between the two treatments. Example 2 also
focuses on the biology, but is less desirable because it does not include a measure of the
precision (i.e. the 95% CIs). Example 3 makes it clear that there is a difference, but the reader
will not know the size of the difference, which treatment is larger, or how precise the estimate
of difference is.
Whenever using statistics, make sure you are clear about which test or method you
used, the value of the test statistic or parameter, the sample size or degrees of freedom, and
the P-value. Round off statistical values (F, t, χ2, P) to three decimal places. However, when
reporting estimates (e.g. means), think about the number of decimal places that is appropriate.
If you counted whole individuals, is it reasonable to report estimates of abundance to eight
decimal places? The number of decimal places should match between the measurements and
the estimates that are derived from those measurements.
Negative results
Findings of no relationship or no difference can also be informative in a research
paper, but one must be careful how to present them. Rarely can we be sure that there was
truly no difference or effect. Usually all we can say is that we did not find one. Indeed there
might be no effect, but we usually cannot distinguish that from being unable to detect one
because of small sample size, large variance, or confounding factors. Thus, one states “there
was no evidence of an effect” or “we were unable to detect a difference”, and then reports the
associated statistics in parentheses. For example, “we found no evidence of a correlation
between dragonfly density and mosquito density (r2 = 0.058, df = 12, P = 0.447).”
Just because you did a statistical test does not mean that it has to be included in your
report; be selective and include only what is relevant to tell your story. You might have
strived mightily to produce your statistical results, but they merely back up the patterns that
exist in your data and support the biology of your investigation. Make biology the subject of
your Results.
Appendices
Your lecturer might ask you to include an appendix to your report. Commonly these
contain peripheral information, which are necessary to produce your report but not to
understand the investigation (e.g. raw data, lengthy calculations). Like tables and figures,
they should have clear captions and labels, be numbered consecutively, be placed at the end of
your report, and be referred to in the text of your paper.
DISCUSSION
The Results describes the patterns found in your investigation. The Discussion
interprets those patterns. It explains what the patterns mean (i.e. why you found the results
you did). Emphasize the strengths rather than the weaknesses of your study. Anyone can find
fault with a two-day field project. Your challenge is to find the value of your study and
discuss your results in a positive yet realistic manner.
Remind the reader of the overall findings
Begin by reminding the reader of your most important findings. Present principles,
generalisations, and relationships from the Results; this is not a repetition of the Results, but a
synthesis to bring out the overall patterns and to set the context for the explanation of those
patterns. Put your results in the larger biological context with which you started the
Introduction.
Summarize the evidence and interpret
For investigations with more than one objective or question, a reader can most easily
follow the paper if the Discussion is structured to discuss each objective in the same order as
they were described in the rest of the paper. For each objective, remind the reader what your
goal was and summarize the evidence that addresses each goal. Then explain why you think
you found what you did. What might have been the cause of the patterns your found? You
need not reiterate your results in detail; rather use careful wording to provide reminders. For
example, “The observation that species A grew faster than species B suggests that….” Do
your results provide answers to hypotheses that you posed in the introduction? What new
insights do your results give into the ideas under examination? Do your results raise new
questions?
Compare to other work
The Discussion compares your results and interpretations to other work—use the
scientific literature to help you. How are they similar? How are they different? Why might
there be differences between your study and others? Cite references appropriately. Like for
the Introduction, writing the Discussion requires a good knowledge of the relevant literature.
Point out problems
An important role of the Discussion is to address problems, disagreements, or lack of
relationship, especially where you might have been expecting more favourable results. What
do you think was the cause of unfavourable or unexpected results? Explain the special
circumstances in your study that may have influenced your outcome (e.g. whether your study
area was experiencing drought that might have affected your ability to find frogs). A vital part
of the Discussion is a critical evaluation of your methods and results. Are there potential
sources of error in your methods? Were your sample sizes large enough? How reliable do
you think your results are?
Suggestions for future work
Use the call for future study sparingly. At the very least, make concrete suggestions
about what the next studies should do.
Conclude
At the end, clearly state your conclusions, and briefly summarise your evidence for
each conclusion. Most importantly, be sure to address the scientific (not statistical)
significance of your work. Write your Discussion to address one all-important question: “So
what?” What is the overall importance of the findings? Why should anyone care?
ACKNOWLEDGEMENTS
Any person who made a direct contribution to the study should be acknowledged. If
applicable, funding sources should be mentioned. Also acknowledge that ethical clearance
was obtained where necessary (e.g. for any research involving animal capture, handling, or
experimentation; where human subjects are involved).
CITING AND REFERENCES
Every fact or opinion that you obtain from a published source must be referenced. For
APES assignments, follow the guidelines and formats described here, unless indicated
otherwise by your lecturer. Failure to adhere to citing your sources could result in
PLAGIARISM. This is a very serious offence, with consequences ranging from receiving
zero on an assignment to expulsion from the university, depending on the seriousness of the
offence. Be sure you are doing your own work and not representing the work of others as
your own. One strategy to avoid plagiarizing a published work is to read the section you want
to use in your paper, and then set that published work aside. Write the information into your
report from memory. You are guaranteed to be writing that information in your own words—
this is called paraphrasing. YOU STILL MUST CITE THE SOURCE OF
INFORMATION.
For your reports, use the Harvard style of formatting citations and references. Get into
the habit of using a reference managing software that can automatically format citations and
references in your report document. It will save you a lot of work. A free reference manager
is Zotero, and its website has clear instructions for its use.
In the text, references should be cited as Augspurger (1983) or (Augspurger, 1983) for
single-author publications, Burdon and Chilvers (1975) or (Burdon and Chilvers, 1975) for
publications with two authors, and Bennett et al. (2009) or (Bennett et al., 2009) for
publications with three or more authors. “et al.” is an abbreviation of the Latin “et alia”,
means “and others”, and should always be italicized and end with a full stop.
When you cite more than one reference at once, cite papers from oldest to most recent.
One very common mistake is to write a paragraph and then insert just one citation right at the

end; rather cite throughout the paragraph and not always from the same source. For anything
you prepare for an APES course, do not quote directly from a reference.
AVOID USING WEBSITES AS SOURCES OF SCIENTIFIC INFORMATION. THEY
FREQUENTLY ARE UNRELIABLE.
Reference Formatting – DO NOT FORMAT YOUR REFERENCES AS A BULLETED
OR NUMBERED LIST. Please list all cited references in ALPHABETIC ORDER in your
reference list. The References section of this guide provides an example of how to format a
References section. References in this guide follow the “Elsevier Harvard (with titles)” style
in Zotero, but with full journal names rather than abbreviations.
Scientific Papers
Augspurger, C.K., 1983. Seed dispersal of the tropical tree, Platypodium elegans, and the
escape of its seedlings from fungal pathogens. Journal of Ecology, 71, 759–771.
Burdon, J.J., Chilvers, G.A., 1975. A comparison between host density and inoculum density
effects on the frequency of primary infection foci in Pythium-induced damping-off
disease. Australian Journal of Botany, 23, 899–904.
Books
Wilson, E.O., 1971. The insect societies. Harvard University Press, Cambridge, USA.
Drake, J.A., Mooney, H.A., di Castri, F., Groves, R.H., Kruger, F.J., Rejmanek, M.,
Williamson, M., 1989. Biological invasions: a global perspective. John Wiley & Sons,
New York, USA.
Book Chapters
Brokaw, N., 1982. Treefalls: frequency, timing, and consequences, in Leigh, E.G., Rand, A.S.,
Windsor, D.M. (Eds.), The ecology of a tropical forest: seasonal rhythms and long-term

changes. Smithsonian Institution Press, Washington DC, USA, pp. 101-108.
Thesis/Dissertation
Rashbrook, V. K., 1989. Interactions between ants, herbivorous insects and bracken
(Pteridium aquilinum), a fern with extrafloral nectaries. MSc thesis, Rhodes University,
Grahamstown, South Africa.
FORMAT AND STYLE
Format of the overall report
Pages should have 2.5-cm margins. Text on pages should be in 12-point serif font,
like Times New Roman (serifs are the little lines at the tops and bottoms of the letters you are
reading now; they make reading large blocks of text much easier). Use double spacing (not
space-and-a-half) for line spacing and left-justify your text (not full justification). Include
page numbers on the top-right corner of each page.
Spelling, grammar, usage and punctuation should conform to the Oxford English
Dictionary for UK English (not US English). Word processors like Microsoft Word have
spelling- and grammar-checking tools that will make adhering to usage guidelines much
easier. In Word, you should be able to see the default language on the status bar at the bottom
of the screen. Double-click on the status bar to change to UK or South African English. But,
do not rely entirely on these tools! Even they can make mistakes. After using spelling or
grammar checkers, carefully proofread your final draft before submission. Printing a hard-
copy for this purpose can be very helpful.
Paragraphs
Paragraphs are a useful way to separate topics and organizing your arguments within a
paper. Students frequently miss subject changes and combine different topics in the same
paragraph when those topics should be separate, which makes understanding and marking a
report more difficult. As a rule of thumb, if you write an entire page of text without beginning
a new paragraph, you probably missed a place where the subject changed. Each new
paragraph begins with an indentation. The first sentence should make clear the topic of that
paragraph and all sentences within it should pertain to that topic.
Scientific names of organisms
All scientific names for genera and species should be in italics (e.g. Ninepin heath
Erica mammosa). At first mention, the scientific name for a species should be given in full,
but when mentioned subsequently, the genus should be abbreviated to an upper case letter
(e.g. E. mammosa). Similarly, a list of species in the same genus may be given as Erica
bakeri, E. mammosa and E. verticillata. If you are discussing organisms of more than one
genus which share a common initial letter, you need to write the full genus names to avoid
confusion (Erica mammosa and Encephalartos woodii). When starting a sentence with a
genus name write the name in full, even if presented previously.
Numbers
Spell out numbers smaller than 10, but use numerals for 10 and more. Also spell out
any number that begins a sentence. When numbers are being compared (we captured 3, 7, 14,
and 17 shrews on subsequent nights) or are accompanied by units of measurement (3 kg, 9
cm), use numerals only.
Abbreviations
Use abbreviations sparingly and only if they will save substantial verbiage throughout
your paper. Adding abbreviations (particularly abbreviations that are common in your field of
study) can make a paper more concise, but overuse simply adds confusion. Be sure to define
abbreviations in full at first use by writing out the term in full, and then placing the
abbreviation in parentheses; e.g. basal metabolic rate (BMR), body temperature (Tb). Do not
begin a sentence with an abbreviation.
Writing style
The main goal of scientific writing is to communicate your results or ideas in a way
that is understandable to readers. To achieve this, one must think about (1) the data or
information to be presented and how to present them, (2) the arguments to be made and (3)
the target audience. Many people benefit from writing or drawing an outline of the paper in
the form of a bullet chart, flow chart or mind map, before beginning to write.
Organization
Maintain a consistent order of ideas. If you present three hypotheses in the
Introduction, then you should deal with those hypotheses in the same order in the Methods,
Results, and Discussion sections. Maintaining clarity when you present your hypotheses or
objectives will help you structure the rest of the paper more clearly.
If you are having difficulty organizing your paper so that it flows logically, it
sometimes helps to put keywords associated with each of your ideas in the margin. This can
help in several ways: you can to order your ideas so that they are easier to follow from one to
the next, you can see where common ideas should be grouped into the same paragraph, and
you can see where topics change and ideas should be split into separate paragraphs.
Strive to be concise
Above all else, scientific writing needs to be clear and concise—keep your writing
brief, to the point and unambiguous. Often, we include “filler” words that can be removed
without changing our meaning. For example, “Our results showed that species X goes into
senescence when...” could be written more concisely as “Species X senesces when...”, or “We
conducted the study in order to...” could be just “We conducted the study to...” Also use
shorter sentences and shorter phrases where possible. Avoid run-on sentences with lots of
commas and conjunctions, because these are far more difficult to read and understand.
Audience
Many writing style problems can be avoided simply by thinking carefully about the
audience for whom you are writing. For instance, a scientific article will be written in a
different style to an article in a popular magazine. With that in mind, avoid colloquial
expressions and slang, and spell out fully contractions such as “don’t” or “isn’t”. In most
cases, you should be writing for a scientific audience that has an interest in the questions you
are investigating, but might not know all the jargon, technical terms or issues that pertain to it.
For undergraduate assignments, write as though your target audience has a similar level of
knowledge that you have—would the person sitting next to you be able to understand your
writing?
Use of terms and jargon
If you must use scientific terminology, define terms at their first use, and be consistent
in how you use them. Such terms usually have very specific meanings and can cause
confusion when misused. Rather, make your paper readable by the largest possible audience
by avoiding highly technical terms. Avoid longer, more complicated words when shorter ones
will do. “Employ” is better than “utilise”, but not as good as “use”. “Round” in better than
“isodiametric”. Plain language is always preferable to jargon if they convey the same
meaning.
Active versus passive voice
It used to be standard practice in scientific writing to use the passive voice (e.g. “The
data were collected...”). This distanced the writer from the action and made the observations
seem more remote and objective. Editorial policy is tending away from passive voice toward
active voice (e.g. “We collected the data...”), which has the advantages of making writing
more concise and easier to follow because the subject of the sentence (that which is doing the
action) is apparent. Most scientific writing, however, uses a mixture of active and passive
voice to vary the writing style and make it more interesting to read. Preference for active or
passive voice is usually lecturer-specific. For the purpose of your APES reports, consult your
lecturer for their preferences.
ACKNOWLEDGEMENTS
We are grateful to Andrew McKecknie and Mark Keith, who invested substantial time
and effort into the preparation of previous versions of this writing guide. We also thank the
staff of APES for their helpful comments as we endeavour to revise and improve this
document.
REFERENCES
Augspurger, C.K., 1983. Seed dispersal of the tropical tree, Platypodium elegans, and the
escape of its seedlings from fungal pathogens. Journal of Ecology 71, 759–771.
Bennett, N.C., Faulkes, C.G., Hart, L., Jarvis, J.U.M., 2009. Bathyergus suillus (Rodentia:
Bathyergidae). Mammalian Species 828, 1–7.
Brower, J.E., Zar, J.H., von Ende, C.N., 1997. Field and laboratory methods for general
ecology, 4th ed. McGraw-Hill, Boston, USA.
Burdon, J.J., Chilvers, G.A., 1975. A comparison between host density and inoculum density
effects on the frequency of primary infection foci in Pythium-induced damping-off
disease. Australian Journal of Botany 23, 899–904.
Day, R.A., 1994. How to write and publish a scientific paper, 4th ed. Orxy Press, Phoenix,
USA.
R Core Team, 2013. R: A language and environment for statistical computing. R Foundation
for Statistical Computing, Vienna, Austria.

Table 1. Common mistakes in scientific writing.
Mistake Should be
“Data” is plural
“Datum” is singular
The data is... The data are...
Here are the data.
The data suggest...
Split infinitives To boldly go where no one
has gone before...
To go boldly where no one
has gone before...
Latin singular and plural
forms
Criterias
Phenomenas
Indexes
Larvas
Pupas
Genuses
Specie
Criterion/criteria
Phenomenon/phenomena
Index/indices
Larva/larvae
Pupa/pupae
Genus/genera
Species (s and pl)
Less versus fewer Less: indeterminate quantity
Fewer: you can count them
Between versus among Between: two things
Among(st): three or more
Its, it’s, its’ Its’ Its: belonging to it
It’s: conjunction of “it is”
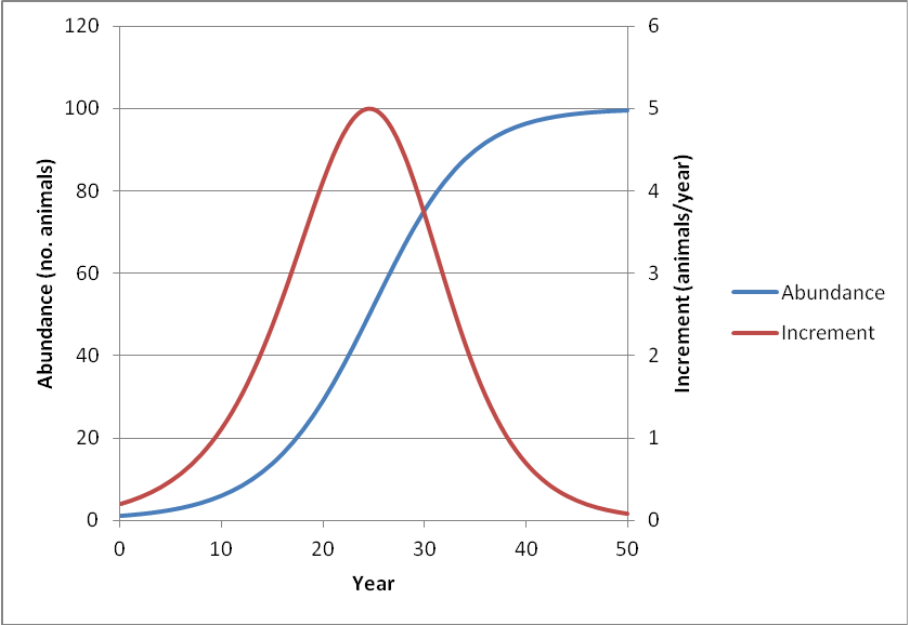
Figure 1. Logistic population model showing predicted number of animals over time and
number of animals added to the population each year (increment). The model was dN/dt = rN
(1 – N/K), r (intrinsic growth rate) = 0.2 per year, K (maximum abundance) = 100 and
abundance (N) in year (t) zero = 1.
