APEX 1 Manual
User Manual:
Open the PDF directly: View PDF ![]() .
.
Page Count: 51

Version 1.1.0
March 20, 2010
Pathogen Functional Genomics Resource Center
J. Craig Venter Institute
9704 Medical Center Drive
Rockville, MD 20850
2
Table of Contents
Welcome to APEX .............................................................................................................. 3
License and Copyright ........................................................................................................ 4
Computer Requirements ..................................................................................................... 5
Computer Requirements ..................................................................................................... 5
Launching APEX for the First Time ................................................................................... 5
Tips on Common Problems and Getting Help .................................................................... 6
Data Requirements – Input File Types ............................................................................... 7
APEX Process Overview – The Three Major Processing Tasks ........................................ 8
Visual Representation of the Processing Tasks ............................................................ 10
APEX Interface Overview ................................................................................................ 11
Process Panels .............................................................................................................. 11
Help System ................................................................................................................... 13
APEX Menu Options ..................................................................................................... 14
Process Descriptions: More Details .................................................................................. 15
Building Training Data ................................................................................................. 15
Generating Oi Values .................................................................................................... 19
Computing APEX Abundance Values ........................................................................... 23
Utilities and Analysis .................................................................................................... 27
Merging APEX Results............................................................................................. 27
Two Sample z-score Test .......................................................................................... 29
Classifier Cross Validation ....................................................................................... 31
Attribute Evaluation .................................................................................................. 33
The Appendices ............................................................................................................... 37
Appendix I File Formats ............................................................................................... 37
FASTA Protein Sequence File .................................................................................. 37
ProteinProphet Protein XML File ............................................................................. 37
Attribute-Relation File Format (Weka ARFF File, *.arff) ....................................... 37
Oi File Format (*.oi) ................................................................................................. 38
APEX File Format (*.apex) ...................................................................................... 38
Appendix II. PeptideProphet and ProteinProphet: Using the Trans-Proteomic Pipeline
(TPP) to Generate Protein XML (protXML) Files for use in the APEX Tool. ............. 39
Appendix III. Peptide Physicochemical Properties ...................................................... 40
Appendix IV. Weka: Java Data Mining Tools: In support of APEX ............................. 44
Appendix V. Classifier Customization .......................................................................... 46
Appendix VI. APEX Digestion Schemes – Defining Custom Schemes.......................... 48
Contributions and Acknowledgements ............................................................................. 49
References ......................................................................................................................... 51
3
Welcome to APEX
The APEX Quantitative Proteomics Tool is designed to generate APEX, Absolute Protein
Expression Estimates, according to the technique described in:
Peng Lu, Christine Vogel, Rong Wang, Xin Yao, Edward M. Marcotte. Absolute
Protein Expression Profiling Estimates the Relative Contributions of Transcriptional
and Translational Regulation. Nature Biotech. 25(1):117-124, 2007.
John C Braisted, Srilatha Kuntumalla, Christine Vogel, Edward M Marcotte, Alan R
Rodrigues, Rong Wang, Shih-Ting Huang, Erik S Ferlanti, Alexander I Saeed, Robert
D Fleischmann, Scott N Peterson, Rembert Pieper. The APEX Quantitative
Proteomics Tool: Generating protein quantitation estimates from LC-MS/MS
proteomics results. BMC Bioinformatics 2008.
The APEX technique uses a modified spectral counting technique that utilizes machine
learning techniques to arrive at protein abundance values with improved accuracy over
traditional spectral counting techniques. The APEX Tool provides computational support
for this technique through a set of interfaces designed to guide the user through the
process of generating APEX protein abundance estimates.
A Note on this Manual and the Companion Tutorial Document
This manual describes the use of the APEX Tool in detail. This manual includes a
description of resource requirements including file format descriptions, details on the
major processing tasks and related parameter selections. The APEX technique paper,
cited above, is also a very good source for details on the theory behind the APEX
quantitation method.
It is highly recommended to read the overview section of this manual and then run
through the brief tutorial that is described in a companion document in the
documentation folder. The tutorial will lead you through the three major functions of
the tool using a provided data set. The tutorial will provide hands-on experience and
provide a first opportunity to become familiar with the APEX user interface. The tutorial
will also serve to make the processing tasks more concrete and will enhance
understanding of how the tasks fit together to arrive at APEX protein abundance values.

4
License and Copyright
License
The APEX Quantitative Proteomics Tool is a free open source software application that
is intended to support the needs of the general proteomics research community. The
APEX Tool is licensed under the GNU General Public License version 3 (GPLv3). A
text file copy of the GPLv3 license is included in the main APEX directory and is labeled
license_gpl-3.0.txt. The terms of this license are also found on-line at:
http://www.gnu.org/copyleft/gpl.html.
Copyright
All code within this program is © J. Craig Venter Institute. All rights reserved. March
20, 2010. This software may utilize packages authored by other organizations that have
been licensed to JCVI via a GNU General Public License (GPL), the GNU Lesser
General Public License (LGPL), or some other form of copyleft. This software is
licensed to the USER under GPL version three-point-zero (3.0). To view the text of this
license, please visit: http://www.gnu.org/licenses/gpl.txt.
THIS SOFTWARE IS PROVIDED “AS IS” WITHOUT WARRANTY OF ANY KIND,
EITHER EXPRESS OR IMPLIED, INCLUDING WITHOUT LIMITATION, THE
IMPLIED WARRANTIES OF MERCHANTABILITY, FITNESS FOR USE OF A
PARTICULAR PURPOSE, OR NONINFRINGEMENT.

5
Computer Requirements
Java
The APEX Tool was written in the Java programming language which means that the
program will run on computers running Microsoft™ Windows® (2000, XP or Vista),
Linux®, and Mac® OSX (1.4 or 1.5) operating systems. APEX requires a Java Runtime
Environment (JRE) installation of version 1.5 or greater. Most computers will have an
installation of Java but if Java has not been installed it can be downloaded and installed
from http://java.sun.com/downloads. You can determine your JRE version using the
command „java –version‟ on the command prompt in a dos window or in a terminal
window (Mac and Linux).
Hardware
Being developed in Java, the APEX Tool is compatible with Windows, Linux, and Mac
operating systems. APEX has been tested on machines with as little as 256MB of RAM
however, 512MB to 1GB of memory is recommended. The processor speed will impact
the time required to complete tasks. APEX has been tested on machines with processor
speeds below 1 GHz but faster processors that run above 2 GHz will help speed
processing.
Launching APEX for the First Time
The APEX tool will run on major operating systems however the process for launching
APEX differs based on the operating system being used. The following table describes
the procedure for launching APEX on Windows, Linux, and Mac OSX operating
systems.
Operating System
APEX Launching Instructions
Windows XP, Windows Vista
Double click on the apex.bat file. (If file extensions are
hidden, the icon looks like a window with a gear in it.)
Linux (various builds)
Use a terminal window to navigate to the directory
containing apex.sh and enter „apex.sh‟ or „sh apex.sh‟ on
the command line prompt.
Max OSX, 1.4 or 1.5
Double Click on the „MacAPEX‟ application bundle OR
use a terminal window, navigate to the APEX Tool
folder containing apex.sh and enter „apex.sh‟ or
„sh apex.sh‟.

6
Tips on Common Problems and Getting Help
APEX Won’t Launch
If APEX fails to launch, the DOS prompt window (for Windows OS), command line (for
Linux), or the Console (for Mac) will log an error. Often the error will be something like
java command not found or version error. This can be usually fixed by installing the
latest Java Runtime Environment (JRE ) by using the link above.
APEX Presented an Error Message During Processing
If an error message arises during APEX computational processes, a small window with a
text error message will appear. This window will list the process and approximate
processing step that generated the error as well as a more detailed error message
generated from the Java code. You can copy and paste (select text, ctrl-c, then ctrl-v) this
text or save the error messages to an error log file. If you save the error, a standard file
browser will be presented for output file specification. Initially the file will be labeled as
“error_log_” plus a randomly generated error log id number and be ready to place into
the main APEX folder. You can change the destination file and location if you desire.
Getting Help
The performance of the APEX tool and your satisfaction with the tool is very important
to us. We would like to help resolve any problem or question you might have regarding
the APEX tool and its use. We are happy to field questions regarding software problems,
questions about the underlying computations, or features that you think would enhance
the tool‟s abilities in ways that would help the research community.
The APEX menu contains a Report a Problem menu option that will open an HTML
page that includes a hyperlink to start a mail message to APEX Tool support. You can
click on the email link on that page or simply use your email system to send us an email.
Here are the key points:
1.) Our address: apex@jcvi.org
2.) Please include [APEX] on the subject line.
3.) In the body of the email, please describe the problem or question in as much detail as
you can. The following list describes some of the information that could be useful to us
when addressing your question. These are just some ideas, not all will apply in all cases.
* Operating System (Windows XP, Vista, Linux, Mac OSX)
* Operating System version (Vista, XP, Linux type, OSX version, etc.)
* Computer hardware information, amount of memory can be an important consideration
* The process being run when an error was raised and the state of the progress log
window
* Please save the error log to file if present and attach it to the email to us.
* If there are separate errors reported in the DOS window (or Terminal window or
Console for Linux or Mac) please copy them and send them to us.
7
Data Requirements – Input File Types
Several files types are required as input to the APEX tool. Appendix A will describe the
various file formats in some detail. This section is designed to clearly list resources that
are required prior to analyzing your data with the APEX tool. Note that an overview of
the basic functions of the APEX Tool will be covered in the next section and will
describe how each of these files is used in the APEX tool. Note each process within the
tool has different requirements that are described in more details in later sections.
Protein Accession List
This file contains a list of protein accessions that correspond to a known set of high
abundance proteins within the proteome under study. The identifiers are typically NCBI
gi numbers or SwissProt accessions. The main concern is that the identifiers match the
identifiers in the FASTA Sequence file. These proteins, often between 40 and 100 in
number, represent a set of proteins are very likely to be identified by your MS technique
within the samples under study.
FASTA Format Protein Sequence File
This file should contain all protein sequences known to possibly be observed within the
samples under study. Normally this sequence file covers the sequences for an entire
species or strain under study.
ProteinProphet XML Protein File
The Transproteomic Pipeline (TPP) is a collection of analysis tools that sequentially
processes mass spectrometric (MS) data to produce estimates of protein identification
probabilities and other values. MASCOT search result dat files or SEQUEST summary
HTML files are fed into the pipeline where PeptideProphet followed by ProteinProphet
are applied to generate an XML format file (protXML) that contains the list of identified
proteins, a probability of accurate identification, and information relating to the number
and sequence of peptides observed that relate to each identified protein. An Appendix
section contains additional information on the TPP. The main point at this stage is
that PeptideProphet and ProteinProphet should be used to generate this input protein
XML file.
8
APEX Process Overview – The Three Major Processing Tasks
The APEX tool performs three primary processing tasks toward the generation of APEX
protein abundance results. The first two of these tasks are concerned with building a
resource file (Oi file) that is used in the third processing task of computing apex
abundance values. Note that the first two tasks which build the resource file (Oi file) only
need to be run one time for a particular study. Once the resource Oi file has been built,
future analyses can be run without running tasks 1 and 2 described below.
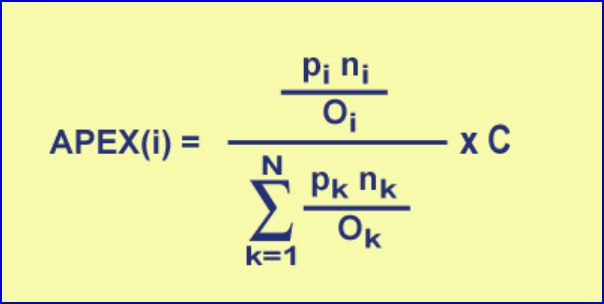
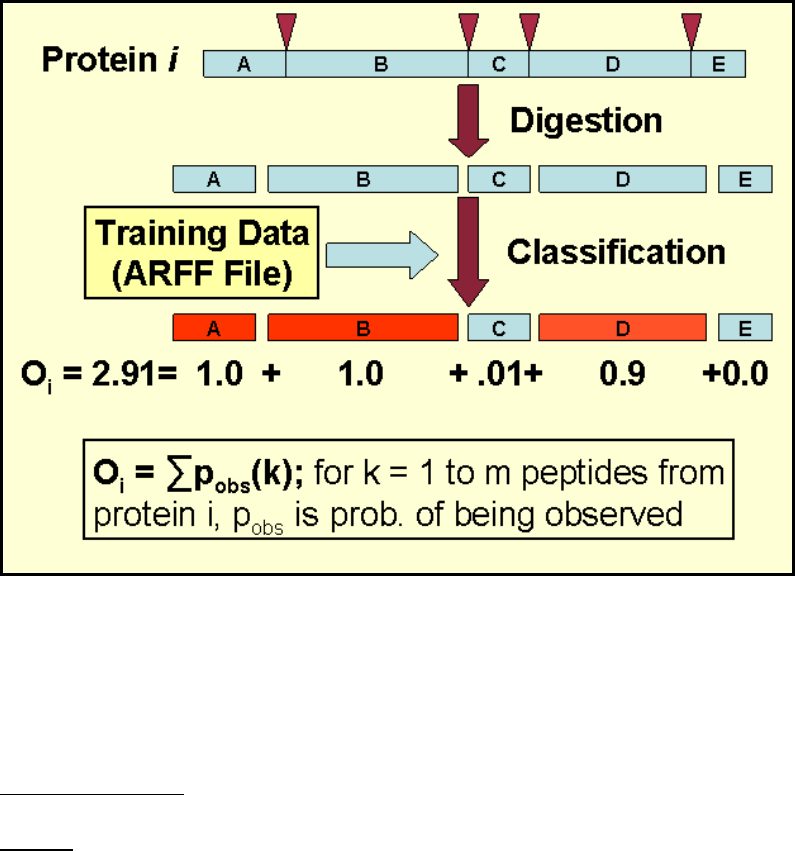
Before describing the three major processing tasks, it is important to understand the
primary computational process. The equation below gives the formula for computing an
APEX quantitation value for protein i from a collection of N proteins being assessed. pi
refers to the protein identification probability for protein i while ni refers to the total
number of peptides (not necessarily unique) observed by MS that are attributed to protein
i. pi and ni are both input from a ProteinProphet XML file which is generated from
processing MASCOT or SEQUEST result files (See Appendix B for information on
ProteinProphet and the Trans-Proteomic Pipeline.). C is input by the user and is typically
an estimate of the number of proteins per cell and thus puts the relative abundance value
in absolute terms.
Figure 1. APEX Computation Formula
The first two APEX processing steps described below are concerned with computing
accurate estimates of Oi values to be used in this equation during the third processing
step, actual abundance computation. Oi refers to the number of peptides that are expected
or predicted to be observed from a single molecule of protein i. The ratio of ni/Oi is at the
heart of the APEX computation since it relates an observed number of peptides to a
computationally derived expected number of peptides. A number of peptides are derived
from protein i during digestion, however only a subset of these peptides is detected by
MS. A complex set of factors relating to the peptide‟s physicochemical properties
determine which peptides are likely to be detected by MS techniques. The Mallick et al.
paper (see reference section for citation) describes how different physicochemical
properties impact peptide detection by various MS techniques.
1.) Training Data Generation – Building the ARFF Training File
APEX uses machine learning techniques to improve quantitation accuracy. These
machine learning techniques require a data set that contains peptide physicochemical
9
property values and an indication of which peptides have been previously detected by
MS. This data matrix provides information that characterizes a set of peptides and an
indication of whether each peptide was observed or not by MS. This data correlates
peptide detection by MS to a set of peptide physicochemical properties. In the next task,
this data, training data, will be used to build or train a classifier to predict the probability
of a peptide being detected by MS based on its physicochemical properties. Note that the
output file from this process is in a standardized format called Attribute Relation File
Format and is described in further detail in the Appendix on file formats.
2.) Generating Oi Estimates – Building an Oi data file
In preparation for MS, the proteins in the sample undergo a digestion. Only a subset of
these resulting peptides is detected by MS because of particular physicochemical
properties that favor or limit detection. Oi values refer to the predicted number of
peptides derived from protein i that will be detected by the MS technique being utilized.
The training data generated in the previous step is used to build a classifier to predict
which peptides will be detected based on their physicochemical properties.
The process of computing the Oi values starts by reading a FASTA protein sequence file
that covers the proteins under study. The protein sequences then undergo an in silico
digestion to produce a set of peptides derived from each protein. Physicochemical
properties are computed for each of these peptides and are used by the classifier to derive
the peptide‟s probability of being detected by MS. The Oi values are the summation of
these peptide MS detection probabilities for protein i. Oi values are stored in a file that
contains protein accessions and corresponding Oi values that will be used in computing
the APEX scores in the next step.
3.) Computing APEX Scores
The primary processing task in APEX is actually computing APEX scores according to
the equation in figure 1. The Oi data file produced in steps 1 and 2 above covers a
particular set of proteins supplied in the FASTA file in step 2. This Oi file is suitable for
all studies that have proteins that are a subset of those in the file. This means that tasks 1
and two are run very infrequently.
The APEX computation panel is the first panel presented in the interface. The process
requires a ProteinProphet result XML file, an Oi file from step 2, a specified output file
name, and the C factor. During computation a table will be presented that lists all
proteins in the input XML file. Either the pi or the false positive error rate can be used as
a criterion to select a subset of this protein list to enter APEX abundance computation.
Clicking on a row in the table will select that protein an all proteins with higher pi values.
After APEX computation, a table view will be presented to display the results as well as
the specified output file.
10
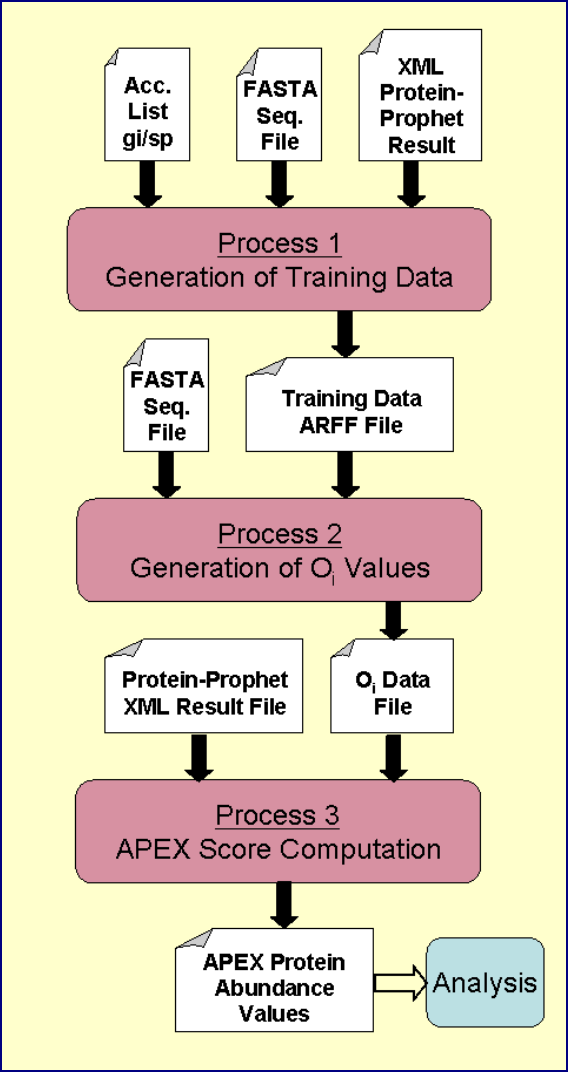
Visual Representation of the Processing Tasks
The following figure summarizes the file inputs and outputs for each of the three primary
APEX processing tasks. The main point to take from this figure is that the first task
builds the training data (ARFF file), the second task takes this training data and creates
the Oi file. The Oi file is then fed into subsequent APEX score computations.
Figure 2. Graphical Representation of APEX Processing Tasks
11
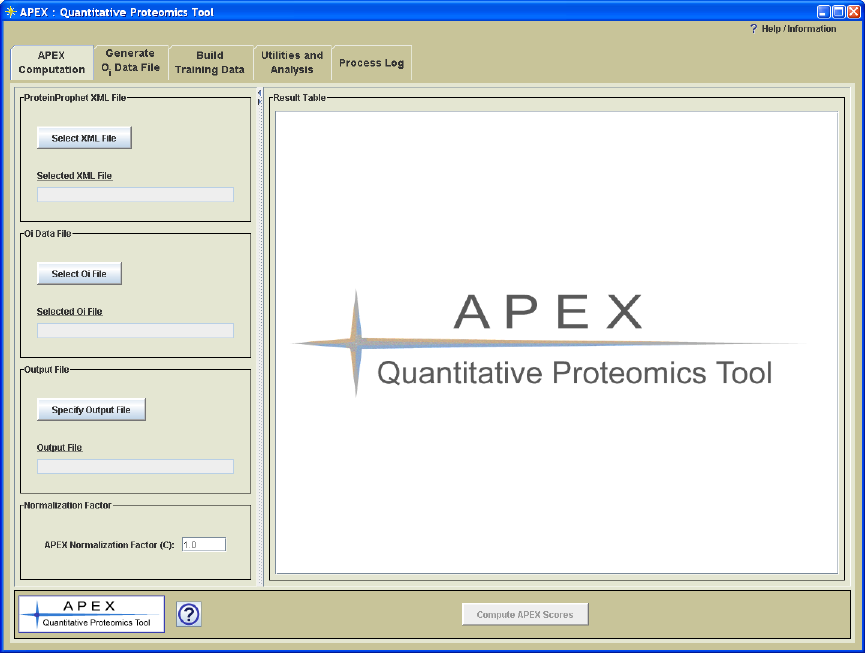
APEX Interface Overview
Figure 3. APEX Interface
Process Panels
The APEX interface is organized into a window where processing tasks are separated and
handled on separate tabbed panes (Figure 3.). Each tabbed pane contains a process panel
which is designed to encapsulate parameter selections and controls for a particular APEX
processing task. The processing panels are ordered such that the processes that are most
frequently used are toward the front. Table 1 provides a brief overview of each
processing panel.
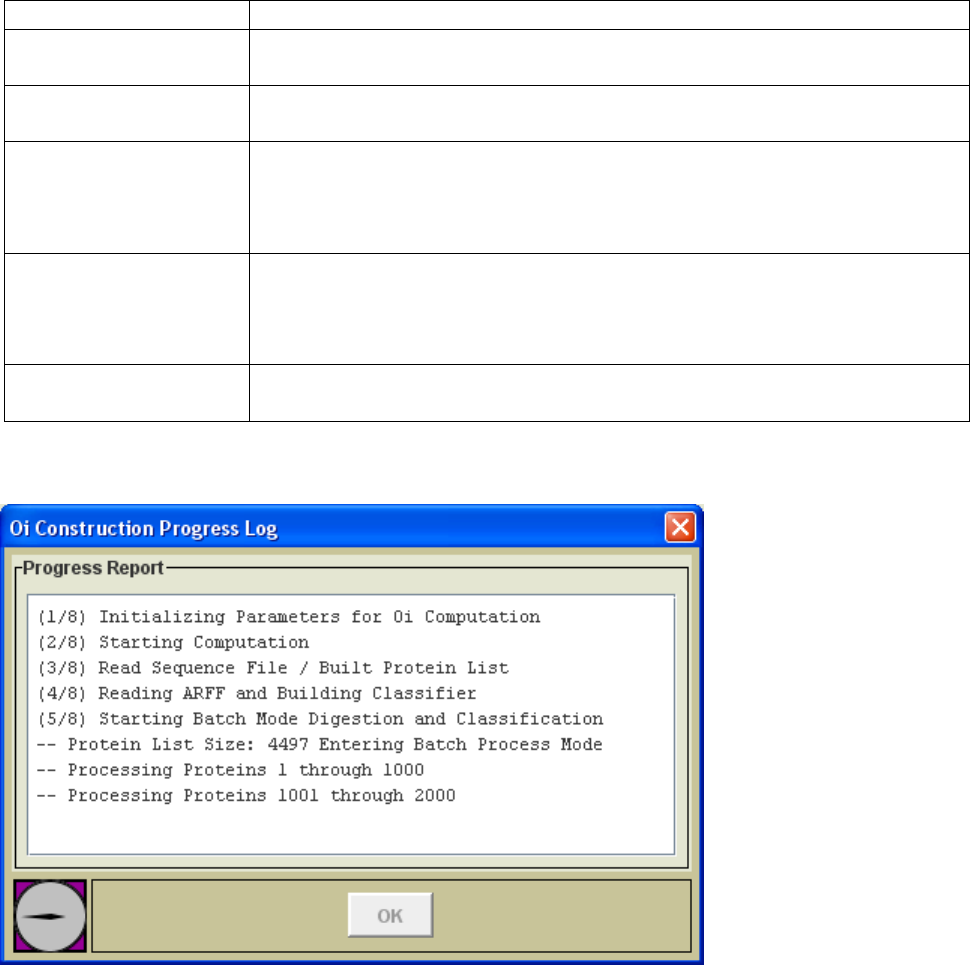
The execution button on each process page is disabled until all required selections have
been made. Once the file selections and parameters have been specified, the excecution
button at the bottom of the panel will be enabled. During processing a progress log
window (Figure 4.) will be opened and will log key progress events. On completion of
the task, the progress dialog will display a message indicating completion and will enable
the „OK‟ button to allow dismissal of the progress dialog.
12
Table 1. Description of APEX Process Panels
Process Panel Title
Description
APEX Computation
This panel is used to process ProteinProphet XML data files and an Oi
file to produce APEX protein abundance values.
Generate Oi Data File
This panel supports the generation of an Oi file that covers the set of
proteins under study.
Build Training Data
This panel constructs a training data set, ARFF file, to be used in Oi
generation. Since the training data is constructed based on prior results,
the training set reflects the nature of the results derived from the
researcher‟s specific MS technique and instrumentation.
Utilities and Analysis
This panel handles utilities such as merging APEX results into a single
output file for comparison, the two sample z-test for differential
expression, and classifier cross validation testing. The capabilities of
this area will expand in future versions.
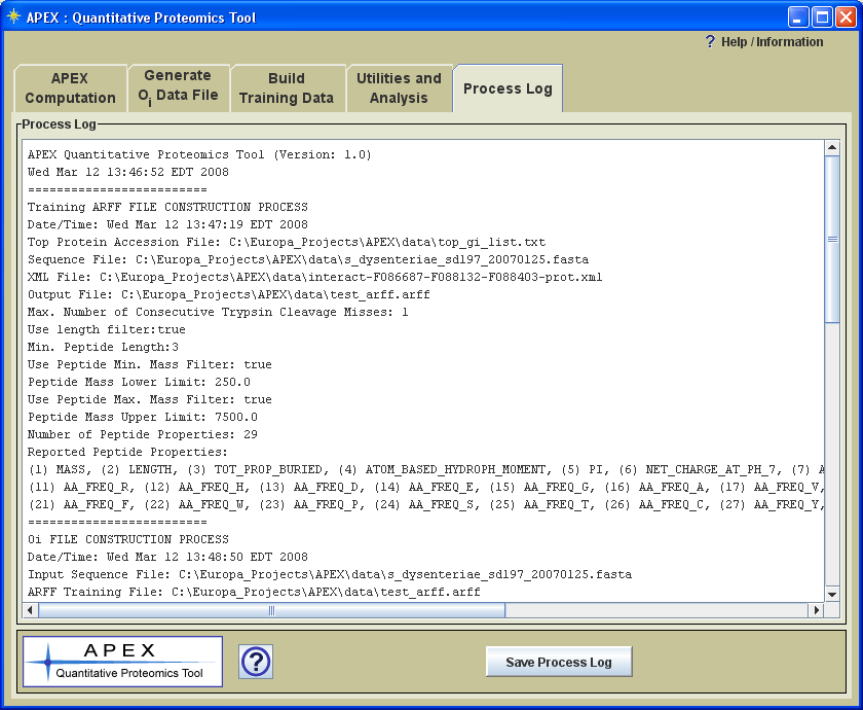
Processing Log
This panel captures the details of each processing action. The panel
captures input and output file names as well as all parameter selections.
Figure 4. Progress Log
Note that a complete description of the processes that have been run, including file and
parameter selections, is written to a text log panel labeled „Process Log‟ (Figure 5). This
log can be saved as a text file for future reference.
13
Figure 5. Process Log Captures Process Parameter Information
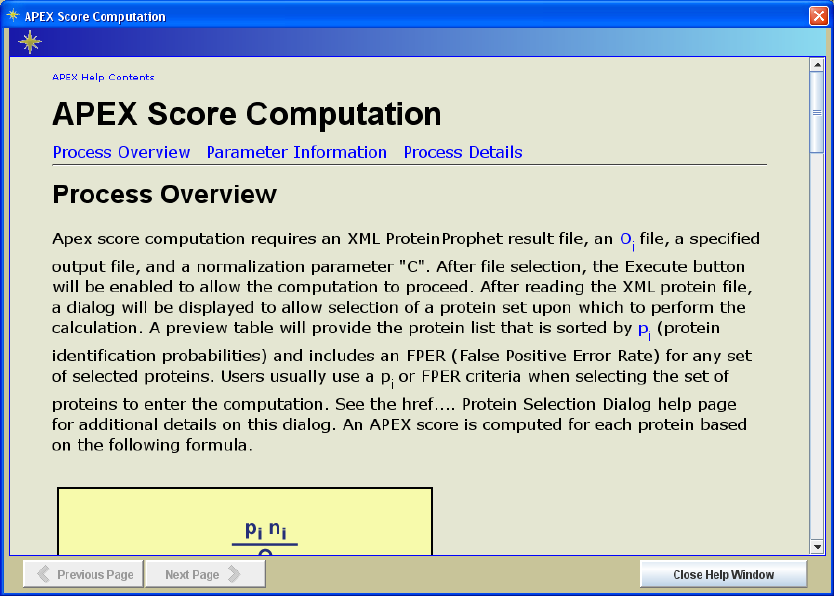
Help System
All process panels have an information button in the lower left area of the interface (see
sample help page in Figure 6.). The help pages for the three primary processing panels
are divided into three major areas: Process Overview, Parameter Information, and
Process Details. The Process Overview provides a descriptive overview of the process
that is handled by the currently selected process panel. The Parameter Information
section describes the various files and parameters that can be selected to control the
current process. This section contains important information regarding the options
presented on the current processing panel. The last section, Process Details, provides
information about how data is handled and processed in more detail. This last section
provides a step-by-step description of what is happening to the data during each step of
processing.
All help pages have a link back to the main Help Contents page. This page provides links
to each of the main process panels‟ help pages as well as a link to the APEX overview
page which provides a slightly condensed overview of the tool‟s major functions and how
they work together. The content of this page is very similar to the Process Overview
provided earlier within this manual.
14
Figure 6. Sample Information Page
APEX Menu Options
The APEX menu only plays a supporting role in the tool‟s interface in providing access
to the help system and general information.
Open Help System and Open APEX Overview open help pages that display the main help
contents page or the APEX overview page.
APEX Tutorial opens an APEX tutorial. This is a good way to become familiar with the
APEX tool after reading the overview pages. A PDF version of the tutorial can also be
found within the documentation folder.
The Report a Problem menu option will attempt to open the default web browser to
display a help system information page. The help information page provides the email
address for support as well as some tips on key pieces of information to report when
requesting help. If APEX cannot open the browser, an abbreviated message window will
be displayed with instructions.
APEX Citations is a quick link to a list of references related to the APEX tool including
the original paper cited in the Welcome section at the start of this manual.
15
Process Descriptions: More Details
This section of the manual describes each of the main functions of the APEX tool. Each
section describes the input files, the parameters, and the output files.
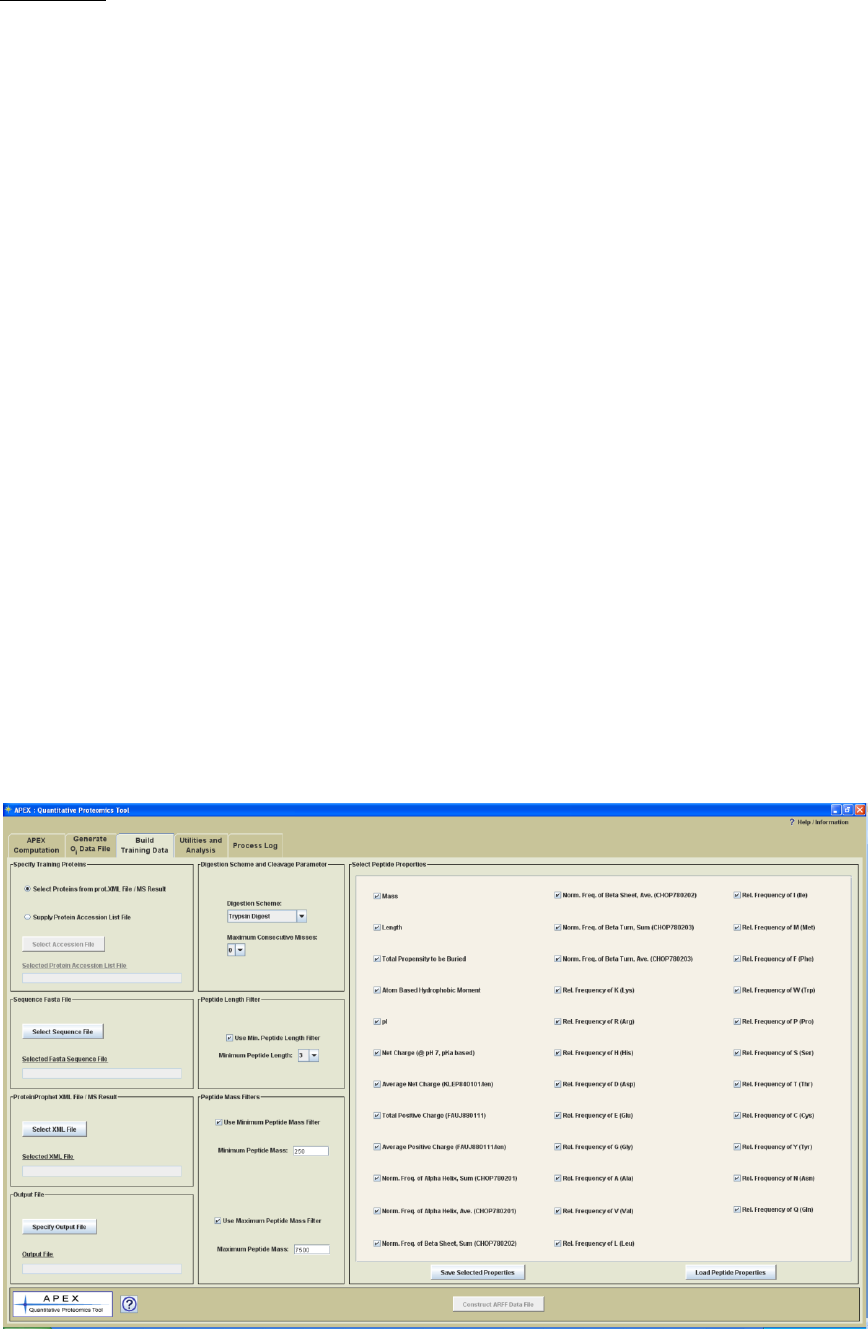
Building Training Data
Process Panel Title: Build Training Data
Process: Constructs a training data set in ARFF format that will be used for Oi generation.
Input Files:
1.) A list of accessions of high abundance proteins likely to be in the sample (usually 40-
100 protein accessions) determines which proteins will be used to generate peptides for
the training data set. This protein list is required to be input either by a selection from a
ProteinProphet XML file/MS Result (input by step 3 below) based on setting a prefilter
criteria, or by supplying a Protein Accession List File, which is a simple text file with a
column of accessions, one accession per line.
If the option to Select Proteins from prot.XML File / MS Result is desired, after the
Sequence Fasta File, ProteinProphet XML File and Output File are specified, a Protein
Probability Prefilter dialog (see Figure 7.) followed by an APEX Protein List Selection
dialog (see Figure 8.) will be displayed during ARFF File Construction.
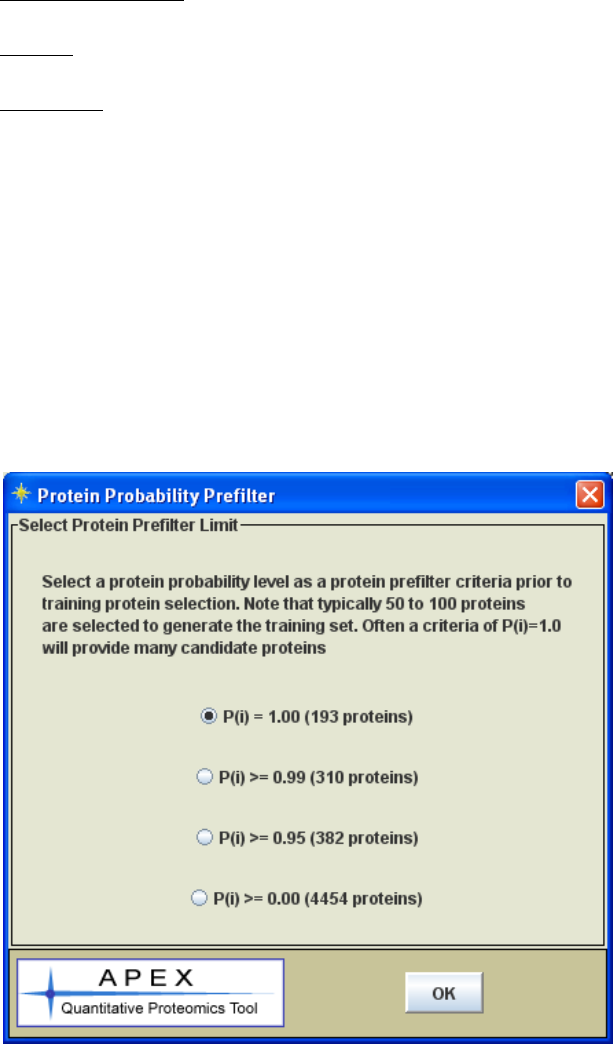
Figure 7. Protein Probability Prefilter Dialog
16
In the Protein Probability Prefilter dialog, a protein probability prefilter limit is required
to be set by selecting from a list of criteria. The number of proteins that will pass the
criteria is calculated and presented. Note that typically 50 to 100 proteins are needed to
generate the training set. Often a criteria of P(i) = 1.0 will provide many candidate
proteins.
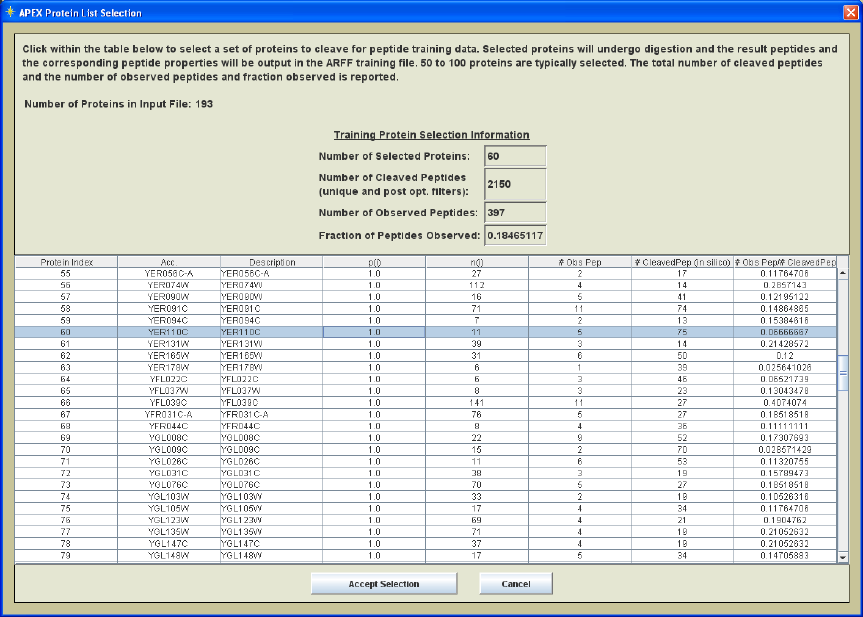
Figure 8. Protein List Selection Dialog
In the APEX Protein List Selection dialog, those proteins that have passed the protein
probability prefilter criteria are listed in a tabular form. Click within the table to select a
set of proteins to cleave for peptide training data. The selected proteins will undergo
digestion and the resulting peptides and the corresponding peptide properties will be
output in the ARFF training file. 50 to 100 proteins are typically selected. The total
number of cleaved peptides and the number of observed peptides as well as the fraction
observed are reported in the top section of the dialog. This allows users to verify the
number of cleaved peptides and the fraction of those peptides that are observed in the
protXML file.
2.) A protein sequence FASTA file is required which includes sequences that correspond
to the proteins in the accession list file. Note that this file often covers thousands of
proteins. The key point is to include the proteins in the accession list file.
3.) A ProteinProphet protein protXML file is required for input. This file provides a list
of peptides that were observed during one or more MS runs. The Appendix on the Trans-
Proteomic Pipeline will provide information on the construction of this file.
17
Parameters:
Maximum Consecutive Cleavage Misses: This parameter indicates the number of
cleavage misses permitted during Insilico trypsin digestion of the input proteins. At this
stage it makes sense to focus on peptides that are generated based on zero misses since
these are most likely to be observed, or not observed, based mostly upon
physicochemical properties. If the miss rate is higher then peptides will be evaluated so
that the result will include possible missed cleavages. These peptides may not be
observed because the cleavage miss was rare. At this point we want to focus on peptides
that were not detected purely based on physicochemical properties and so a miss rate of 0
or 1 seems appropriate.
Minimum Length Filter: This optional filter eliminates or disregards peptides below a
certain sequence length. Peptides smaller than a certain sequence length are likely not to
be detected by MS. Since we want to focus on physicochemical properties as a
determinant of detection, it makes sense to exclude very short peptides. The original Lu
paper on APEX allowed a minimum peptide length of 3 amino acid residues.
Peptide Mass Filters: These optional filters eliminate peptides that are smaller than a
lower cutoff and greater than an upper mass cutoff. Usually this is set to mimic the range
of settings applied during the MS analysis and searches.
Peptide Properties: A number of check boxes allow one to select a set of peptide
properties to report in the training data set. *At this stage it is acceptable to select to
report on all possible peptide properties available within the APEX tool. A subset of
these peptide properties will work as predictors of whether a peptide will be detected or
not in the Oi generation process. These properties characterize the input peptides that are
derived from the input proteins and that pass the peptide filters.
Figure 9. Build Training Data Process Panel
18
Process Details:
1.) The accession list of high abundance proteins is loaded from an accession file or
selected from a protein list of proteins from the prot.XML file. Next the FASTA
sequence file is read. The accession list (supplied by the input file or selected from the
prot.XML file) is used to dictate which protein sequences are retained for further
processing.
2.) The retained protein sequences then undergo an in silico trypsin digestion to produce
peptides. The maximum miss rate is taken into account during this stage. Increased miss
rate will increase the number of peptides. For instance, if a protein naturally cleaves into
three peptides, A, B, and C with zero misses, one miss would produce two additional
peptides, AB and BC. Note that at this stage we want to focus on reporting on peptides
that were very likely to be present during the MS run but were detected or not detected
based on physicochemical properties of the peptides.
3.) The optional length and mass filters are applied to remove peptides that fall outside
these constraints.
4.) The PeptideProphet XML file is read and all peptide sequences are loaded based on
the peptide_sequence tag in the XML file. This peptide list includes all peptides that
were observed by MS in previous runs. This observed peptide list is checked for the
existence of each of the peptides in the peptide list derived from in silico digestion.
5.) The rows in the output file consist of peptide properties for each peptide from in silico
digestion and an indication of whether the peptide was observed or not in the XML file of
MS results. The file is produced one row at a time by taking a peptide, computing its
peptide property values, then checking the XML file supplied peptide list for whether the
peptide was observed by MS. Each line then consists of a comma delimited set of
peptide property values followed with the text tags Obs or Not to indicate whether the
peptide was detected by MS or not.
See the Appendix on file formats and the sample .arff file to better understand the output
format of this step.
19
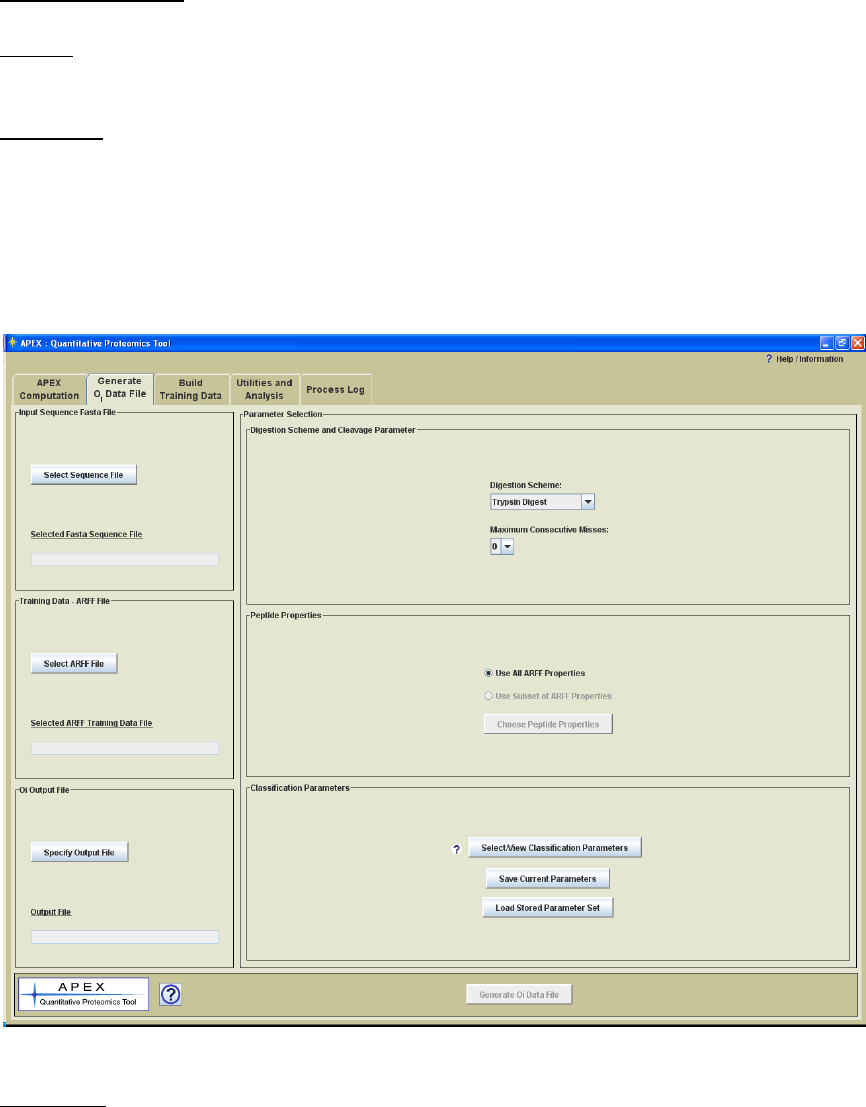
Generating Oi Values
Process Panel Title: Generate Oi Data File
Process: This process produces an Oi data file for the proteins within an input FASTA
sequence file.
Input Files:
1.) A protein sequence FASTA file is required to supply protein sequences. An Oi value
will be generated for each protein sequence in the file.
2.) The ARFF Training data file generated in the previous step will be used to train the
classifier that generates Oi values in this step.
Figure 10. Oi Generation Process Panel
Parameters:
Digestion Scheme: This parameter indicates the in silico digestion scheme that each
protein undergoes to form peptide sequences, which are fed into a classifier trained on
previously constructed training data. Note that the selected digestion scheme should
20
mimic that used in the lab to process samples for MS. Five default digestion options are
presented for selection.
Trypsin Digest: Proteins are only cleaved by trypsin.
Chymotrypsin Digest: Proteins are only cleaved by chymotrypsin.
Trypsin>Chymotrypsin: Sequential or serial digestion, proteins are first cleaved
by trypsin and then cleaved by chymotrypsin.
Trypsin+Chymotrypsin: Parallell digestion, combination of the cleavage results of
Typsin Digestion and Chymotrypsin digestion as if the proteins are digested by
the two enzymes in two separate aliquots then later combined.
TrypsinChymotrypsin: Combination of the cleavage results of trypsin and
chymotrypsin. This is a combination of digestion rules for trypsin and
chymotrypsin and matches an option that is found in some popular peptide search
software packages.
The digestion schemes presented in APEX are determined based on a configuration file
found in the apex_config folder labeled, enzyme_rules.config. Users can modify this file
to define digestion schemes that are needed to model those used in the lab. An appendix
section, APEX Digestion Schemes – Defining Custom Schemes, contains information on
how to add new digestion schemes or modify existing rules. Note that trypsin is the most
common enzyme used and is presented as the default option.
Maximum Consecutive Cleavage Misses: This parameter indicates the number of
cleavage misses permitted during in silico digestion of the input proteins. This setting
should match the setting used during previous MS searches. If the MS technique is set up
to identify peptides that result from missed cleavages, this parameter should be set to
match.
Peptide Properties: A set of peptide properties will be computed for each peptide cleaved
from the input proteins. These peptide properties will be used in conjunction with the
classifier to determine a probability of MS detection for each peptide. Many classifiers
select random sets of properties (attributes) to find a set that can be used as a predictor of
peptide MS detection. The various peptide properties are described in a section of the
appendix.
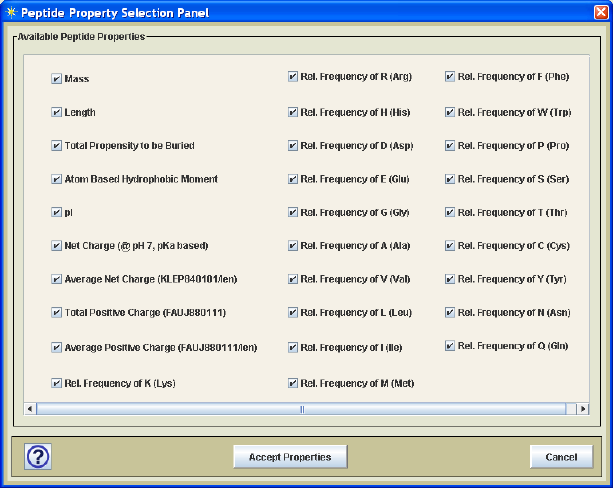
21
Figure 11. Protein Property Selection Panel
The user has two options with regard to these properties. One option is to use all peptide
properties contained in the selected training data ARFF file while the other allows one to
select a subset of the protein properties using the peptide property selection dialog as
shown in Figure 11. Unless one has specific information about which properties are most
important to determine which peptides will be detected by MS, it is best to just include all
peptide properties and allow the classifier (e.g. Random Forest) to select attributes.
Classifier Options: A classifier is trained to determine the probability that a peptide will
be detected (observed) by MS. APEX uses a Java data mining package, Weka, which
contains many different classifiers. The Lu et al. paper used a Random Forest
classifier with good success and for that reason Random Forest is the default
classifier used by the APEX Tool. The Random Forest parameters match those used
by Lu et al. and most will find that these default parameters work fine. Two other
classifiers, RIDOR, and J48 Trees, also supported by Weka, are included in APEX. Each
classifier algorithm has distinct parameter options that help to control the process of
building the classifier. Additional information on Weka is found in the Appendices.
The APEX tool has a configuration file that lists the available classifiers and their
parameters. This file is read when APEX starts and initializes a set of classifiers that can
be used by APEX. Experienced users that are familiar with machine learning classifiers
and the Weka data mining tool set, can customize the entries in the
weka_parameters.config file in the apex_config folder. The comments in this
configuration file include instructions on how to modify this file. Note that it is
necessary to be familiar with the Weka classifier and specific parameter tags in order to
add a classifier and new parameters to those already supported.
*As previously mentioned, the Lu paper found that the Random Forest classifier worked
well with particular options set such as running as a cost sensitive classifier with Bagging
which averages results. It is beyond the scope of this manual to describe classifier
algorithms and related parameters in detail but the Lu paper and Weka documentation
provides additional information on classifiers and their specific parameter selections.
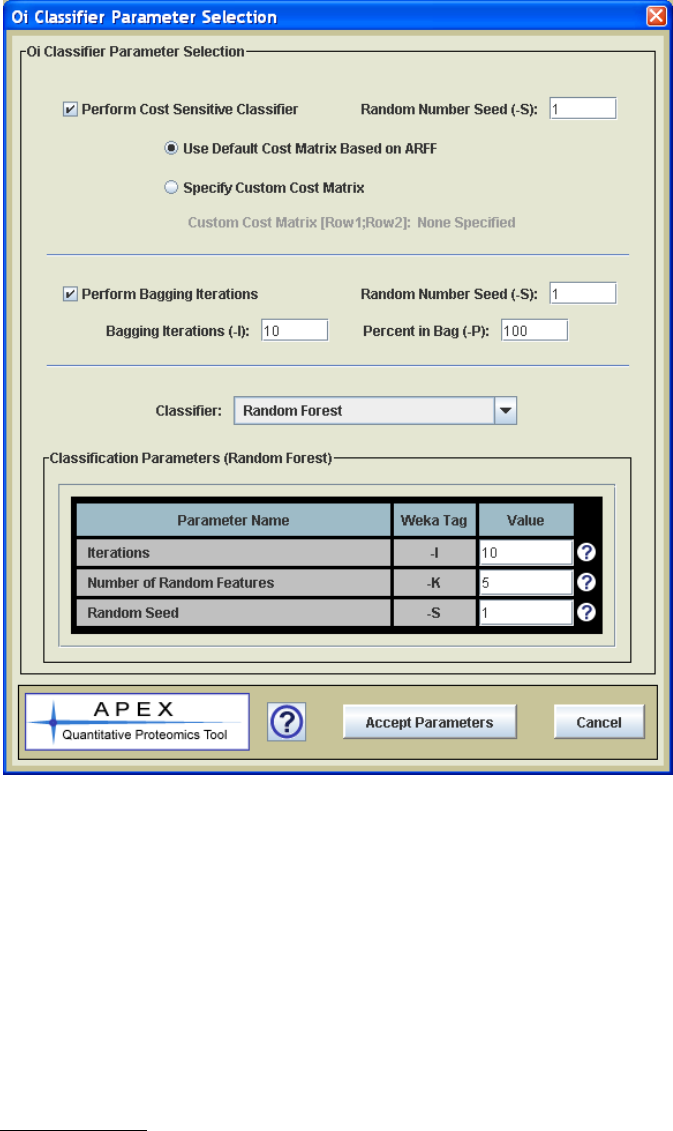
22
Figure 12. Classifier Parameter Selection Dialog
The Select/View Classifier Parameters button is used to open the classifier parameter
selection dialog. This dialog, shown in Figure 12, allows one to select a classifier for
APEX from a drop-down menu. When the classifier is selected, the parameter list
updates to support the parameters that are specific to the selected classifier. The value
types and value constraints (valid value ranges if applicable) are enforced based on
Weka‟s requirement for these parameters.
Process Details:
1.) The first step is reading the input FASTA sequence file. This file contains all protein
sequences of interest and for smaller genomes such as prokaryotes it typically covers all
proteins known to exist. The file is read and the protein accession, annotation, and
sequence is stored in a data structure.
2.) The loaded proteins are then subjected to the in silico digestion to produce a set of
23
peptides for each protein. This process takes into account the consecutive cleavage miss
rate parameter.
3.) Next the classifier is constructed. The ARFF training file is read, the selected peptide
parameters (often all parameters in the ARFF) are used to build a classifier. At this stage
the selected classifier parameters come into play to control the construction of the
classifier.
4.) The peptides generated during digestion are then assigned probabilities (probability of
being observed, 0-1) by the trained classifier. Each peptide is first characterized by a set
of computed peptide properties. The assigned probability for each peptide is based on
these computed physicochemical properties.
5.) The Oi values are computed by summing all peptide probabilities associated with the
peptides derived from protein i. The Oi values as well as all of the file and parameter
selections are output to a file. These Oi values will later be used during APEX abundance
computation.
Figure 13. Oi Generation Figure.
Computing APEX Abundance Values
Process Panel Title: APEX Computation
Process: This process computes APEX protein abundance values using an XML protein
file and the generated Oi values.
24
Input Files:
1.) A ProteinProphet protein XML result file is required to supply the protein list, pi, and
ni values for the computation shown in figure 1.
2.) An Oi file is required that has Oi values that cover the proteins within the sample.
Parameters:
C value: A numerical value, denoted as C, is used in the equation in figure 1. This value
converts the relative APEX score to absolute terms. Up to this point this value has
usually been an estimate of # proteins/cell. Lu et al. presented reported estimates of 5 x
107 proteins/cell for yeast and 2-3 x 10⁷ proteins/cell for E. coli based on Futcher et al.
1999 and Neidhardt et al. 1996 respectively.
Process Details:
Once the Oi file has been generated, the process of computing is quite simple, following
the equation given in figure 1.
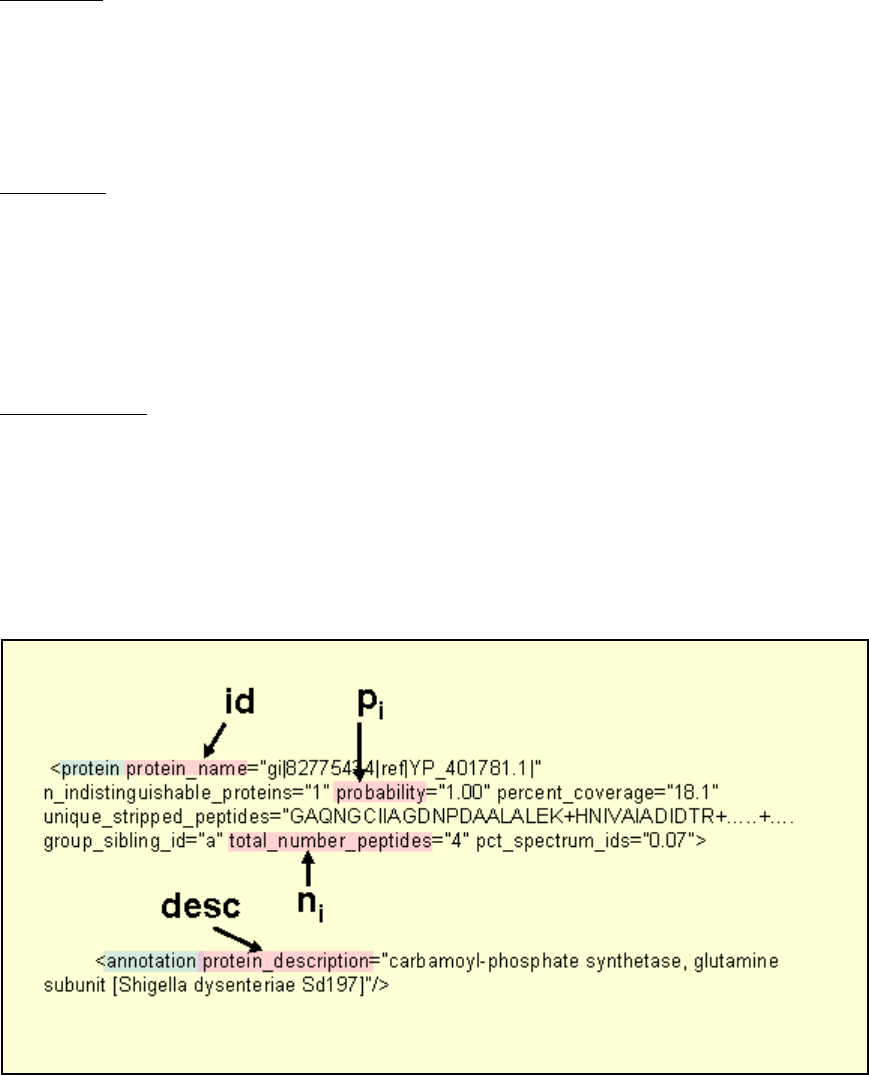
1.) The input ProteinProphet XML file is input and protein id, pi, ni, and description are
pulled from the file according to the tag labels shown in figure 14 which shows a section
of a sample XML file.
Figure 14. Sample section of ProteinProphet XML file showing the fields that are parsed
to supply information for computation.
2.) The protein list from the XML file is ordered by pi (protein identification probability)
and the estimated false positive rate is computed for the N ordered subsets of proteins.
The estimated false positive error rate for a set of n proteins that is ordered by pi is given
by:
25
listtheinproteinsnp
n
FPREst n
i
i#;)1(
1
_
1
The FPR can be used to estimate the number of proteins in a list that are false positives.
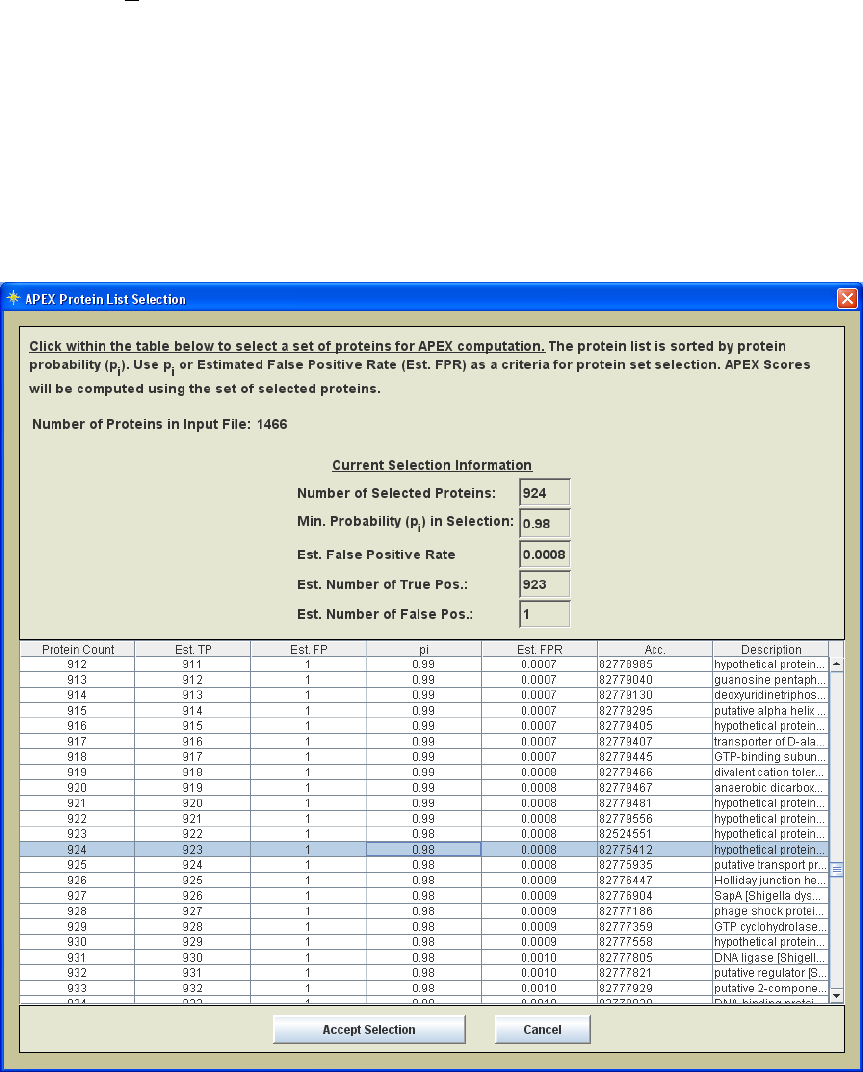
3.) The ordered set of proteins are displayed in a table as shown in figure 15. This table
is used to select a set of proteins to enter APEX computation. FPR or pi can be used as a
criteria. The information at the top of the table viewer is updated when you click on a
row in the table. Once you have selected the proteins to enter APEX the Accept Selection
button is hit and computation begins.
Figure 15. Protein selection list ordered by pi
4.) APEX values are computed as described by the equation in figure 1. The results are
output to file and are also displayed in the interface as shown in Figure 16.
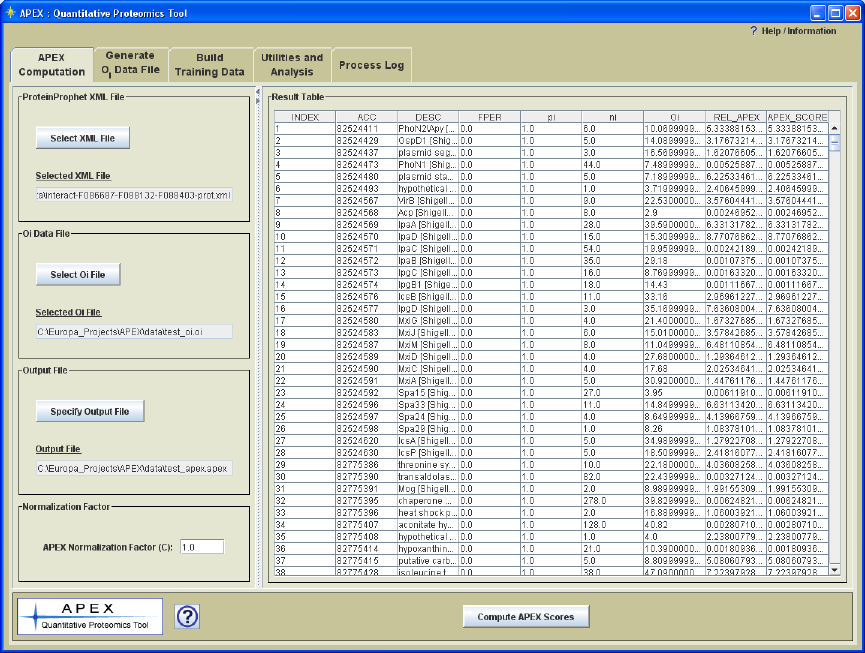
26
Figure 16. APEX Computation Panel with APEX Quantitation Results
The output file has a standardized output format where each data row includes and index,
protein accession, description, false positive rate (relates to the set of proteins with index
<= to the observed row), pi, ni, Oi, relative APEX, and absolute APEX score. The
comments section in the file lists the analysis date, the input files, and the C value.
27
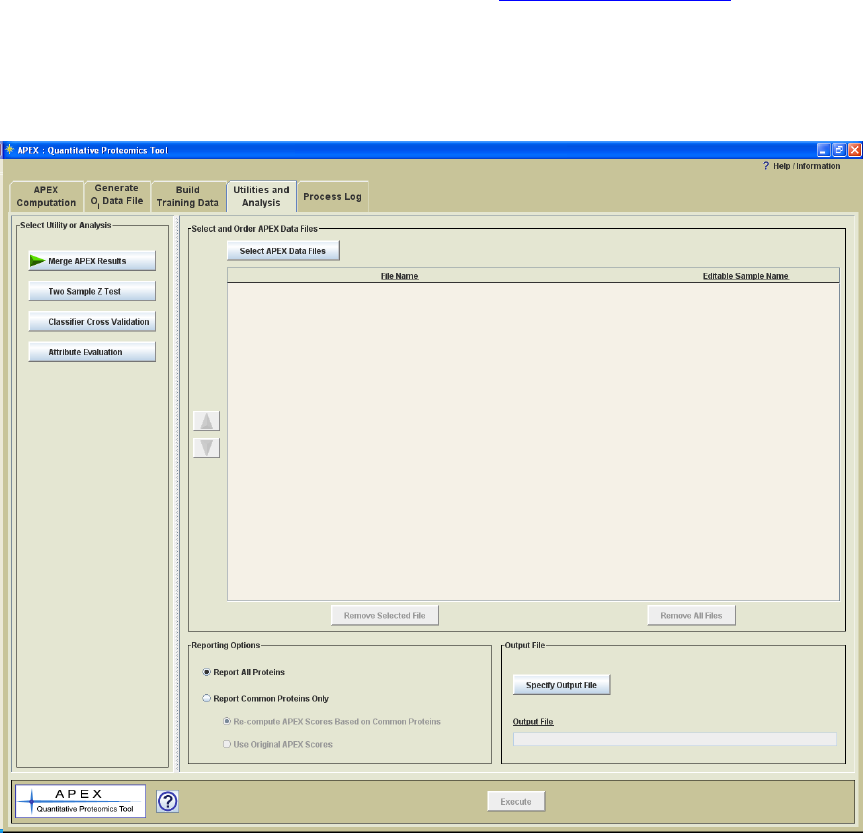
Utilities and Analysis
Merging APEX Results
The Utilities and Analysis panel includes four options for APEX version 1.1.0. The first
option is a utility that merges two or more APEX data files into a tab delimited text file
that summarizes multiple experiments. The output file format is a tabular format where
data columns represent different apex results, perhaps different experimental conditions,
and the rows contain protein data including annotation and apex scores. The file format
conforms to the TDMS (Tab Delimited Multiple Sample) format specification of the
MultiExperiment viewer (of the TM4 suite of tools, www.tm4.org/mev.html) also known
as MeV. MeV is a clustering and statistical analysis application that was originally
produced for microarray data but has more recently been used with quantitative
proteomics data for finding proteins that share trends in protein expression over the
conditions under study.
Figure 17. Utilities and Analysis Panel
Once files have been selected using the multi-file chooser (Figure 18), the files can be
ordered (Figure 19) according to the experimental design to place time points in the
proper order or to group samples based on common experimental conditions. Note that
one can assign a descriptive sample identifier by clicking in the text field to the right of
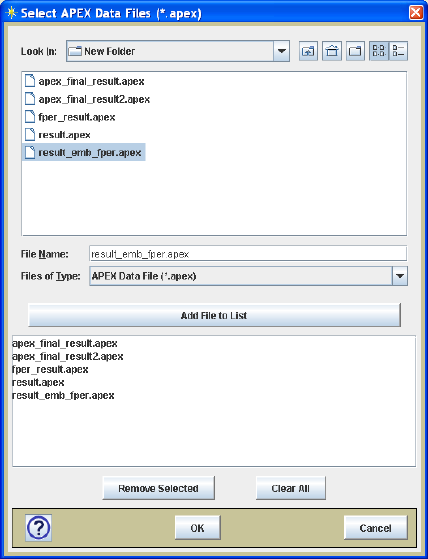
28
the file name as shown in Figure 19. This descriptive sample name is useful when data
mining as it provides a meaningful label for each sample.
Figure 18. Multi-file selection dialog.
It is likely that the selected files have many proteins in common but that the protein lists
from the files may not overlap entirely. The default option is to report all proteins, the
union set of all proteins in all lists. It may be the case that for a particular protein that
only 1 sample has an APEX value. In that case a placeholder text value will be inserted
for each missing value. This option allows one to see a record of which proteins were
only reported under certain conditions. The alternative reporting option is to take an
intersection of common proteins and only report on those found in all lists. This option
will result in a smaller protein set but will not have any missing values. If only common
proteins are reported, there is an option to re-compute APEX (by equation in Figure 1)
using just the common proteins. The APEX equation denominator will be smaller since
this common protein set is smaller and thus will achieve relatively higher APEX scores.
The difference is that the APEX scores are computed for the same set of proteins across
all input samples. The alternative to re-computing the APEX scores is to report the
original APEX scores that were based on analysis within a different protein set. The
reporting options are found on the file merge utility panel (Figure 17 or Figure 19).
29
Figure 19. File Merge Utility Panel with Loaded Samples.
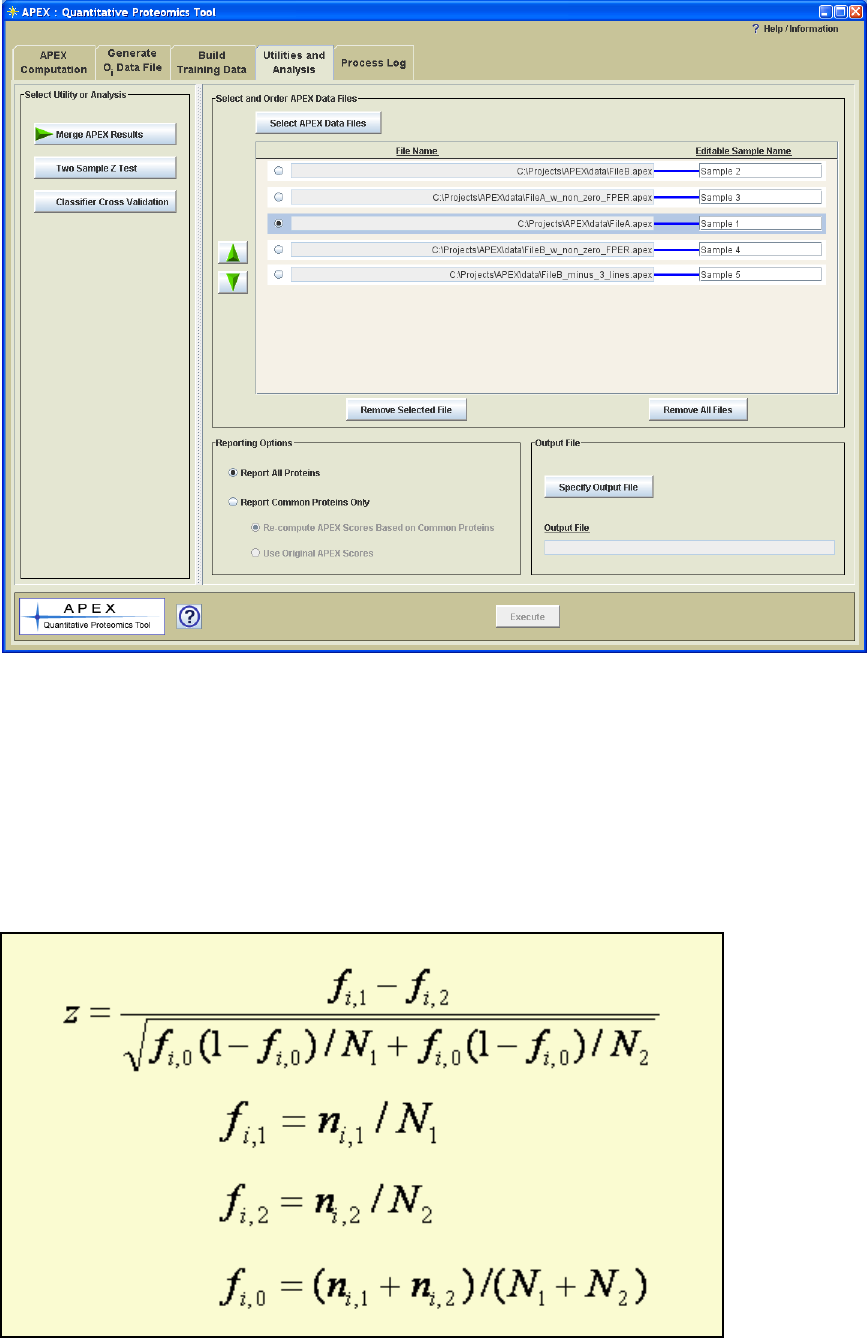
Two Sample z-score Test
The Lu et al. paper presented a formula for computing a z-score for investigating
differential protein expression between two samples. The formula is shown here for
reference. Please refer to the Lu reference (full citation is at the end of this manual) for
further information on this statistic and the assumptions made regarding the normality of
the distribution of f values.
Figure 20. Z score computation.
30
Note that if the experimental design contains multiple biological replicate samples of one
or more experimental conditions, that it is advisable to use the data merge utility and use
the parametric or non-parametric statistical tests in MeV to find proteins that show
significant changes in abundance between experimental groups. The z-test shown here is
specifically for the case where there are exactly two samples to compare.
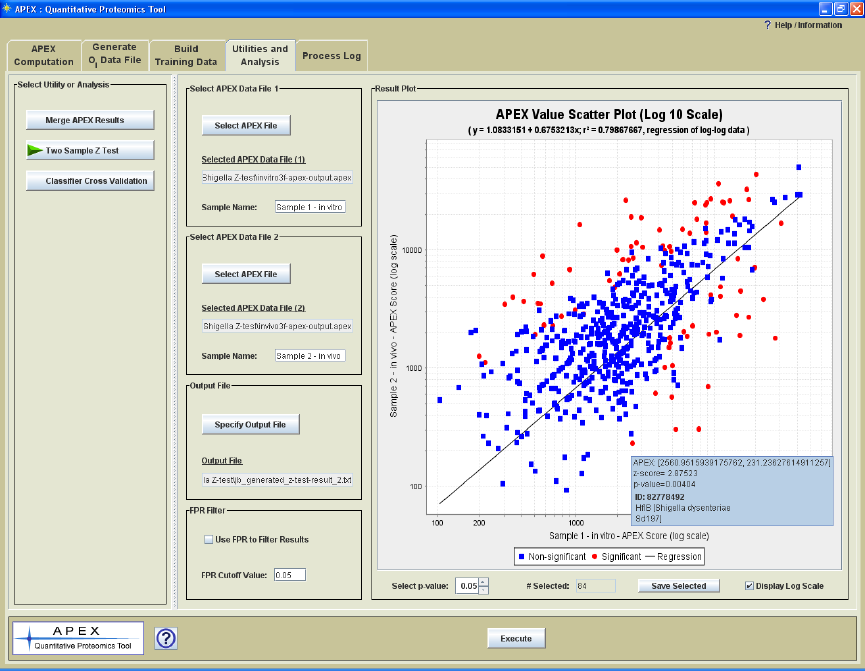
The z-score test processing panel (Figure 21) includes controls to select the two input
files, specify the output file name, and a control to filter the result based on the estimated
false positive rate (FPR) computed from pi values. If the FPR filter is applied, all
proteins are reported for which at least one of the two samples includes the protein in the
subset of proteins with FPR lower than the supplied cutoff. For example if Protein A is
present in both samples but is in the list of sorted proteins that has an FPR greater than
the cutoff, protein A would be excluded from the report file. In this case protein A would
have had a relatively low pi in both files. If the FPR for a list of peptides in at least one
file was lower than the cutoff, then the protein would be reported. In this case both
samples contained the protein but one sample had a relatively high pi and the other had a
low pi. The point here is that only proteins in common are reported and if the FPR filter
is applied, only one of the two proteins needs to pass the filter criteria.
Figure 21. Z-score Test Processing Panel with Result
In addition to the output file, the result is displayed as a graph that shows the correlation
of APEX scores between the two samples. Initially the view is in log scale but the linear
scale can be viewed as well. Moving the mouse cursor over points in the plot will open a
tool tip that displays the APEX values, z-score, p-value, protein id, and protein
description.
31
A p-value selector is found in the lower left area of the result plot. This cutoff value is
applied to the data and will update the graph to show which points are significant based
on z-score p-value. A text area to the right of the p-values selector will display the
number of proteins that have p-values the fall at or below the entered criteria. The Save
Selected button will save the proteins that pass the p-value cutoff (have p-values <= the
cutoff) to file. The p-values here are two-tailed probabilities of the z-scores taken from a
normal distribution.
The main output file contains information on the two input files, the sample names, and
information about the source for the z-score equation and the derivation of p-values. For
each data row relating to a particular protein the following information is output: protein
accession, protein description, APEX scores (2), APEX fold change, ni values (2), z-
scores, and p-values.
Classifier Cross Validation
The Oi generation process uses the training data (ARFF file) to build a classifier that is
used to generate peptide observation probabilities which are summed to result in the Oi
value. Please refer to Figure 13 and related description for more information on the role
of the classifier. The improvement of the APEX technique over traditional spectral
counting techniques is that a protein‟s observed spectral count is compared with it‟s
expected or predicted spectral count, the Oi value. The accuracy of the Oi value is
dependent on the ability of the classifier to generate accurate peptide probabilities that are
based on their physicochemical properties. This cross validation utility allows one to
examine classifier performance. This utility reports on how accurately the classifier
partitions the observed and non-observed peptides in the training ARFF file. Improved
classifier performance will presumably result in more accurate Oi values which can
improve APEX quantitation results.
The cross validation process starts by selection of an APEX generated training ARFF file.
This training data is used to build a classifier based on input classifier options and a
selected set of peptide attributes. The number of validation iterations, Cross Validation
Folds, is selected. On each iteration a number of training peptides from the ARFF file are
selected to build a new classifier. The remaining data is fed into the classifier as test data.
For example, suppose we select to run 10 iterations of cross validation. On each
iteration, 9/10ths of the data is used to train the classifier. The remaining 1/10th of the
data is then used as test data. The peptides in the test data have known classifications,
each has been observed or not observed during a previously run MS experiment. The
classifier tries to predict a class for each test peptide and since we know the actual
classification we can assess classification accuracy. On each iteration of cross validation
the subset of training data is selected such that it has nearly the same proportion of
observed to not-observed peptides that is present in the data set as a whole.
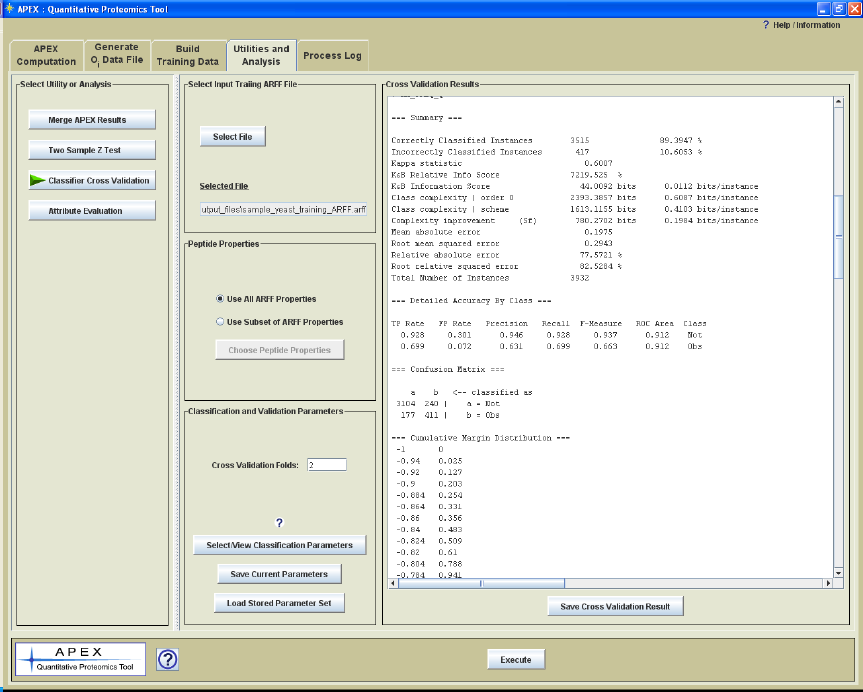
Figure 22 shows the Cross Validation Parameter Panel with the text result from a cross
validation run. Following the run the results are displayed in a panel on the right side of
the interface. A button below the result panel allows one to save the result to a text file.
32
Weka code supports building the classifier and performing the cross validation steps.
The output from cross validation is an extension of the typical Weka output from cross
validation. The output includes the ARFF file name, classifier options, number of ARFF
peptide properties, number of ARFF peptide properties selected to enter the process, the
peptide property list, and a summary that includes the number and percentage of test
peptides that are classified correctly and incorrectly. The output also includes details
separated by class such as precision (fraction correct) and recall (sensitivity, number
peptides that are captured into the proper category.) A confusion matrix is also included
that lists the number of true positives, true negatives, false positives, and false negatives.
The last section of the output is the cumulative margin distribution which describes the
separation of probabilities between the two classes over the set of iterations.
Figure 22. Cross Validation Utility Parameter Panel with a Displayed Result.
Note that APEX uses a Weka class (Evaluation.java) for cross validation and that
software piece does not report on the progress of the process. This means that the APEX
progress dialog will be able to indicate when the validation starts but will not be able to
report on the progress of the validation iterations. As a reference, an ARFF file with
5239 peptides and 27 peptide properties, took approximately 5 minutes to complete on a
relatively new PC with 1GB ram and a dual core processor. Fortunately, most users will
find that Random Forest with the default parameters works well and hence extensive
evaluation of classifiers will not be strictly required however, having classifier
performance information is good information to convey when publishing results.
33
Attribute Evaluation
The APEX method uses knowledge about peptide properties and prior MS result to build
a classifier to predict which peptide sequences are likely to be observed based on peptide
properties. The APEX tool has the ability to report on many different peptide properties.
In data mining and classification, these properties are generically referred to as attributes.
These attributes characterize the object, in our case peptides, that are being classified.
The attributes that are computed vary in their ability to predict the class of interest, in our
case the ability to detect or not to be able to detect a peptide using the procedures and MS
instrumentation in use. This aspect of each attribute might be considered its predictive
value. Attributes that are tightly correlated with observed and not-observed classes are
generally better predictors of the class. Most classifiers use multiple attributes and it is
the case that sometimes multiple attributes combine to work better at predicting the two
classes (observed and not observed).
Most classifiers, like the default in APEX, Random Forest, consider subsets of attributes
and evaluates for their predictive value and therefore it isn‟t strictly necessary for users of
the tool to pre-select attributes. This utility is primarily available to provide users a set of
reports that help to evaluate which attributes appear to be most critical in predicting
peptide observation. Some work suggests that the critical attributes will vary based on
LC or sample preparation differences and instrumentation characteristics and it is of
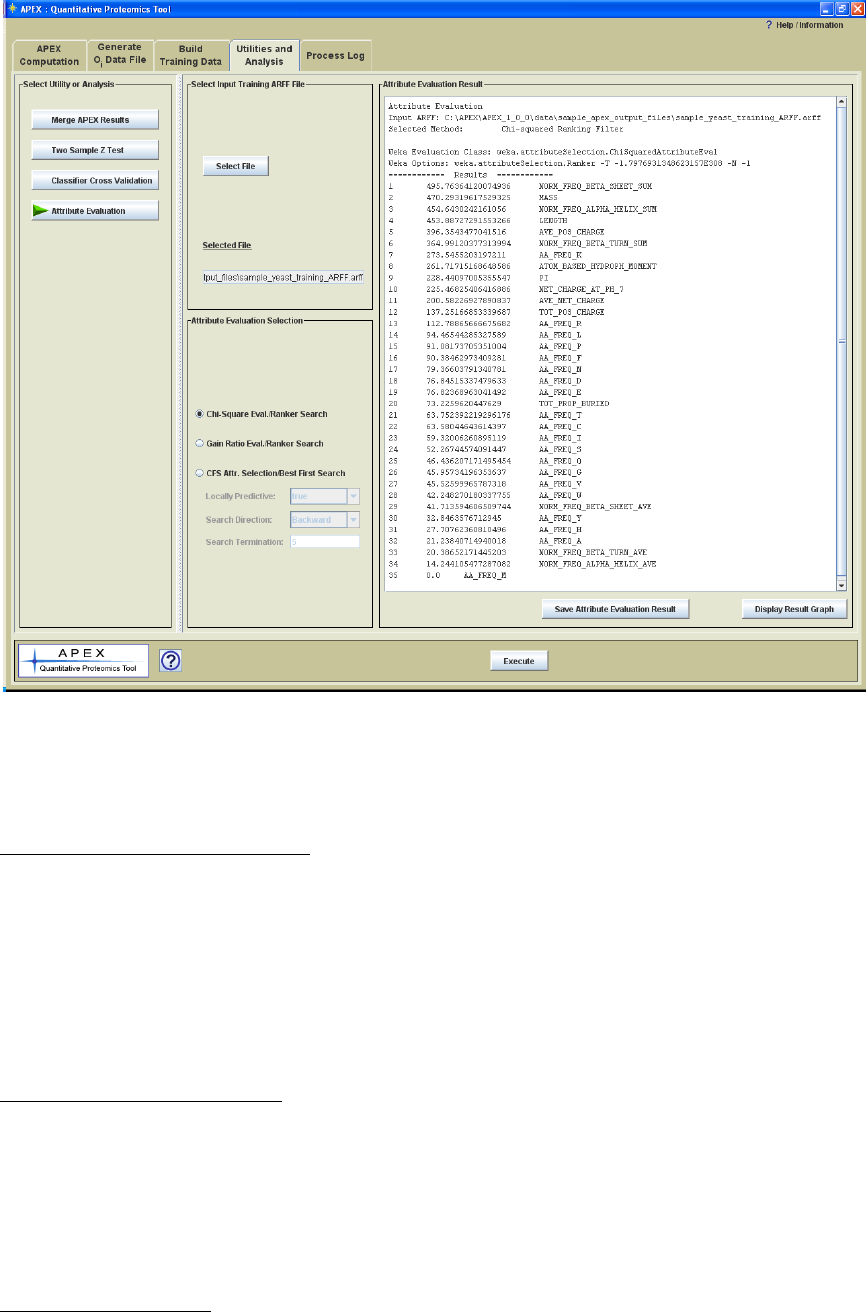
interest to some to report this information. Figure 23 shows the Attribute Evaluation
Parameter Panel with the text result from a cross validation run. Following the run the
results are displayed in a panel on the right side of the interface. A button below the
result panel allows one to save the result to a text file.
34
Figure 23. Attribute Evaluation Utility Parameter Panel with a Displayed Result.
The main input for these methods is the training ARFF file.
Chi Square Attribute Evaluation
The Chi Square Attribute Evaluation test considers each attribute independently.
The attribute values are binned into two bins, high and low, according to a
computed threshold, and the Chi Square score is computed. The output is sorted
based on score, placing the attributes with the highest scores on top. A bar graph
can be used to visualize the scores and to look for logical break points in the
scores.
Gain Ratio Attribute Evaluation
Gain Ratio Attribute Evaluation reports on the worth of an attribute by measuring the
information gain ratio with respect to the class where,
GainRatio(Class, Attribute) = (H(Class) - H(Class | Attribute)) / H(Attribute) where H
represents the Shannon entropy, also known as information value.
CFS Attribute Selection
CFS attribute selection (Correlation-based Feature Selection) technique tends to select a
subset of attributes with high correlation to the class (observed vs. not observed in our
35
case) and low attribute-to-attribute correlation (low redundancy). For example, this
means that attributes that are highly correlated with each other such as peptide mass and
peptide length would tend not to be included in the selected subset of attributes. One of
the two attributes might represent the pair if they are both well correlated with the
predicted classes.
Locally Predictive
Identify locally predictive attributes. Iteratively adds attributes with the highest
correlation with the class as long as there is not already an attribute in the subset that has
a higher correlation with the attribute in question.
Search Direction
Weka‟s BestFirst search algorithm used in APEX can select attributes in a forward
direction by starting with an empty set of attributes and adding attributes to the tentative
subset. On each addition the subset of attributes is evaluated for it‟s predictive value.
Another search approach direction described as backward, refers to starting with the full
set of attributes and eliminating attributes and assessing the remaining subset of
attributes. Bidirectional combines these approaches.
Search Termination
This option controls the amount of backtracking that can be done when evaluating
attributes. Decisions are made to add (forward search) or remove (backward elimination)
attributes to the subset. Each of these choices can affect future attribute additions or
subtractions during the search process. This parameter controls how many steps
backward the process can go (sort of an undo feature) before trying another branch in the
decision tree.
36
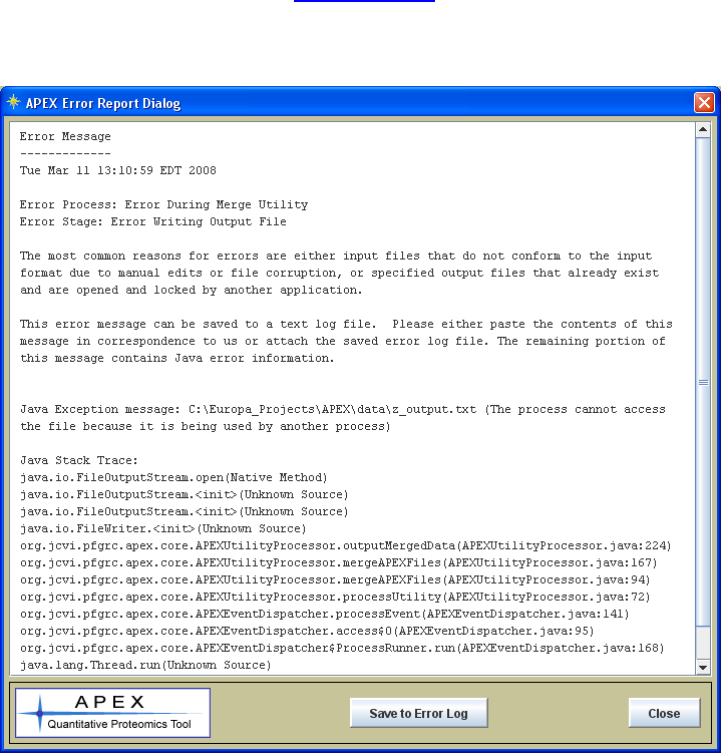
Reporting Errors
The most common reasons for a process to error is if either a file is locked by another
application (as reported in the sample Error Dialog shown in figure 21), or if an input file
has been corrupted or manually edited such that it doesn‟t conform to the expected format
specification. Efforts have been made to capture and report errors that occur in
descriptive way in order to help the user and the APEX support team (me) to isolate and
remedy the problem. Figure 24 shows an error dialog launched from APEX when a
process (file merge utility) tried to write to a file that was already open and locked by
another application. The main areas of the error message are the date, process,
processing stage, the Java Exception Message and the Java Stack Trace. The Java
Exception Message is usually descriptive and fairly explicit. The Stack Trace is
primarily used as a tool for developers to find the code line associated with the error.
The error log can be saved to file and if you can‟t resolve the problem, the error log can
be attached to an email sent to apex@jcvi.org. Please also check the DOS command
prompt window (Terminal or Console for Linux or Mac) in case there is an additional
error message.
Figure 24. Sample Error Dialog

37
The Appendices
Appendix I. File Formats
FASTA Protein Sequence File
The protein sequence files used in APEX conform to the NCBI standard format for
protein sequence FASTA files. The description of the FASTA format can be found here:
http://www.ncbi.nlm.nih.gov/blast/fasta.shtml
ProteinProphet Protein XML File
Appendix II describes the Trans-Proteomic Pipeline (TPP), a set of software tools which
include PeptideProphet and ProteinProphet which are required to produce this protein
XML file. These tools work on SEQUEST or MASCOT output files.
The document at this URL contains the schema for the protXML format:
http://sashimi.sourceforge.net/schema_revision/protXML/Docs/protXML_v3.html
More important than knowing the details of this XML format is having the capability to
produce files of this type as input to the APEX Tool. Please refer to Appendix II for
details on generating these files.
Attribute-Relation File Format (Weka ARFF File, *.arff)
The Attribute Relation File Format is a standardized format that was developed for use
with the Weka data mining tools. This file‟s main data area is a comma delimited matrix
of values. In the case of APEX, each row contains the values (APEX peptide properties)
relating to a specific peptide in the training data set. The last value in each row is the
classification of the peptide indicating whether or not the peptide containing those
properties (attributes) was detected by MS. Each row in the data section is an ordered list
of attributes for a peptide. Just above the „@DATA‟ matrix in the file, there is an ordered
list of attributes which identifies the columns in the data matrix. These values are
preceded by the text „@ATTRIBUTE‟ and list the attribute name and data type.
Comments in the ARFF file are preceded with a „%‟ character. APEX generated ARFF
files include three main comment areas:
1.) General Information - describes the basic structure of the file.
2.) Input Parameters – captures the input accession file, the FASTA sequence file, the
protXML ProteinProphet input file, the number of consecutive trypsin cleavage
misses allowed during in silico digestion. The length filer and mass filter limits
are also captured.
3.) Output File Information – captures the number of input protein accessions in the
list file, the number of computed peptide attributes, total number of tryptic
peptides before and after applying length and mass filers, the number of peptides

38
observed and not observed by MS. A sample file that was produced by the APEX
tool can be found in the data/sample_apex_generated_files.
A full description of the ARFF file format is found at this Weka page:
http://www.cs.waikato.ac.nz/~ml/weka/arff.html
Oi File Format (*.oi)
APEX Oi files are used as input to the APEX abundance value computation. Comment
lines in the file are marked by „#‟. Comments include the construction date and time,
input sequence file, ARFF Training File, output file, missed cleavage parameter, number
and list of peptide properties, and the Weka classifier parameters. The data rows include
protein accession, total cleaved peptide count (taking into account missed cleavages), and
the Oi values. A sample Oi file, sample_Oi.oi, can be found in the
data/sample_ouput_data folder.
Column Labels: ACC, TOT_PEP_CNT, Oi
APEX File Format (*.apex)
The APEX output file captures the construction date and time, the XML input file, the Oi
input file, and the C values. The file also captures the number of proteins in the set, the
minimum pi, and the false positive rate for the set of proteins entering the computation.
The data rows in the file include a sequential index, the protein accession, the protein
description, the false positive error rate, pi, ni, Oi, relative APEX, APEX score.
Column Labels: INDEX, ACC, DESC, FPER, pi, ni, Oi, REL_APEX, APEX_SCORE

39
Appendix II. PeptideProphet and ProteinProphet: Using the Trans-Proteomic Pipeline
(TPP) to Generate Protein XML (protXML) Files for use in the APEX Tool.
The Trans-Proteomic Pipeline (TPP) is a collection of software tools for the analysis of
MS/MS proteomics data. The TPP tools are used to generate the input files for the APEX
tool. The following steps describe the use of the TPP tools to generate the protXML files
for input to APEX.
1.) The general data flow starts with a file format conversion from SEQUEST
summary HTML file or MASCOT search result dat file to the TPP‟s pepXML
file format. Support for this conversion is available from the TPP interface but
Sequest2XML or Mascot2XML modules are actually doing the work. Note that
for SEQUESST the process also requires the sequest.params file and Mascot
conversion requires the search database FASTA file.
2.) The pepXML file is then processed by the TPP‟s PeptideProphet and
ProteinProphet to produce two output XML files. One file, labeled as
interact_<original_input_file_name>.xml contains PeptideProphet results while
the other file, interact_<original_input_file_name>-prot.xml contains
ProteinProphet results that are used as input
These pages describe the Trans-Proteomic Pipeline:
http://tools.proteomecenter.org/wiki/index.php?title=Software:TPP
http://sashimi.sourceforge.net/software_tpp.html
Refer to Keller et al., 2005 in the reference section for additional information on the TPP.

40
Appendix III. Peptide Physicochemical Properties
Peptide physicochemical properties are used as predictors that are used by the classifier
during Oi generation to assign the probability of the peptide being detected by MS.
Peptide properties such as mass, length, net charge, hydrophobicity, among others help to
determine which peptides will be detected by MS. Mallick et al. 2007 characterizes
several properties that are good predictors for peptide detection for four different MS
technologies. The following table describes the peptide properties in available in the
APEX tool. Note that some entries below represent two properties where a amino acid
values are either summed or averaged.
Peptide Property
Description
Mass
Mass is a major determinant as to whether a peptide will fly
during MS. Peptide mass in APEX is the sum of the
monoisotopic amino acid masses (each minus 18.01 Da). +
18.01 for the two end residues‟ –OH and H.
Formula:
n
i
i
mMass
1
01.18
; where mi is the mass of residue i
given the particular residue at position i where mi comes
from this list:
MASS_A = 71.04
MASS_C = 103.01
MASS_D = 115.03
MASS_E = 129.04
MASS_F = 147.07
MASS_G = 57.02
MASS_H = 137.00
MASS_I = 113.08
MASS_K = 128.09
MASS_L = 113.08
MASS_M = 131.04
MASS_N = 114.04
MASS_P = 97.05
MASS_Q = 128.06
MASS_R = 156.10
MASS_S = 87.03
MASS_T = 101.05
MASS_V = 99.07
MASS_W = 186.08
MASS_Y = 163.06
Sequence Length
Sequence length is also an important determinant of
detection by MS as is the related (correlated) property of
mass.
Relative Amino Acid
Compositions
This is actually the set of 20 to amino acid frequencies
where the count of each amino acid is divided by the

41
sequence length. Some of these amino acid frequencies
tend to be more critical. Histidine tends to be an important
predictor of peptide detection by some MS techniques
according to Mallick et al. 2007 (reference at end of
manual).
Net Charge @ pH7
(pKa Based Charge)
This computation takes into account pKa values of charged
residues.
jpKa
pH
pH
j
ipKa
pH
pKa
ij
i
iNNZ 1010
10
1010
10
Where residues with for the first term with subscript i are
are residues of K (pKa = 10.5), R (pKa =12.4), H
(pKa=6.00), or the NH2- terminus (pKa=9.69).
The second term residues (j index) include D (pka=3.86), E
(pka = 4.25), C (pKa=8.33), Y (pKa=10.0) or the –COOH
terminus (pKa=2.34).
pI (Isoelectric Point)
pH at which the net charge (pKa method above) is zero.
APEX performs a bisection method to find the pH where
charge is zero (within machine measurable tolerance).
Average Net Charge
KLEP840101
KLEP840101 is the amino acid index (AAindex1) in the
GenomeNet database for this property. This url links to a
page for amino acid values for this property:
http://www.genome.ad.jp/dbget-
bin/www_bget?aax1:KLEP840101
This reference is provided as a reference to these values:
Klein, P., Kanehisa, M. and DeLisi, C. Prediction of protein
function from sequence properties: Discriminant analysis of
a data base. Biochim. Biophys. Acta 787, 221-226 (1984)
For this value we increment by +1 for positively charged
residues (R,K) and decrement by -1 for all negatively
charged residues (E,D). *Note that according to this source
database, Histidine (H) is not contributing to the value.
Once this summation has been completed, the value is
divided by the length of the sequence. Note that this
method does not take into account the pH nor pKa value of
the amino acids as does our „Net charge @ pH 7‟ property
above.
n
DErKRr
eAveNetCh ii
n
i
],|1][,|1[
arg 1
To paraphrase, we add 1 for R or K, and subtract 1 for each
E or D in the sequence. After account for all residues, this
Net Charge is divided by the length of the sequence (n).

42
Total Positive Charge
FAUJ880111
FAUJ880111 is the reference number (AAIndex1) for this
property at GenomeNet. This url links to the amino acid
values for this property:
http://www.genome.ad.jp/dbget-
bin/www_bget?aax1:FAUJ880111
Reference to the values:
Fauchere, J.L., Charton, M., Kier, L.B., Verloop, A. and
Pliska, V. Amino acid side chain parameters for correlation
studies in biology and pharmacology Int. J. Peptide Protein
Res. 32, 269-278 (1988)
For this property we go down the sequence and increment a
counter for each positively charged residue (R,K, and H)
],,|1[arg
1
HKRreTotPosCh i
n
i
Average Positive Charge
FAUJ880111 divided by
sequence length
This is the Total Positive Charge divided by the sequence
length.
Atom Based Hydrophobic
Moment, EISD860102
EISD860102 is the reference number of this property at
GenomeNet. URL for this property:
http://www.genome.ad.jp/dbget-
bin/www_bget?aaindex+EISD860102
The following reference is cited in reference to this
property:
Eisenberg, D. and McLachlan, A.D. Solvation energy in
protein folding and binding. Nature 319, 199-203 (1986)
In APEX we simply take the summation of the amino acid
values for this property and divide by the sequence length.
We use the amino acid level values found at the URL which
match the Eisenberg values.
Total Propensity to be
Buried, WERD780101
WERD780101 is the reference for this property at
GenomeNet. URL:
http://www.genome.ad.jp/dbget-
bin/www_bget?aaindex+WERD780101
Reference:
Wertz, D.H. and Scheraga, H.A. Influence of water on
protein structure. An analysis of the preferences of amino
acid residues for the inside or outside and for specific
conformations in a protein molecule. Macromolecules 11,
9-15 (1978)

43
In APEX we take the summation of the amino acid values
for this property and divide by the length of the sequence.
Normalized frequency of
alpha-helix
(CHOP780201)
(report SUM or AVE)
CHOP780201 is the reference for this property at
GenomeNet. URL:
http://www.genome.ad.jp/dbget-
bin/www_bget?aaindex+CHOP780201
Reference:
Chou, P.Y. and Fasman, G.D. Prediction of the secondary
structure of proteins from their amino acid sequence
Adv. Enzymol. 47, 45-148 (1978)
In APEX we take the summation of the amino acid values
for this property for the SUM property and divide by the
length of the sequence for the corresponding AVE property.
Normalized frequency of
beta-sheet (CHOP780202)
(report SUM or AVE)
CHOP780202 is the reference for this property at
GenomeNet. URL:
http://www.genome.ad.jp/dbget-
bin/www_bget?aaindex+CHOP780202
Reference:
Chou, P.Y. and Fasman, G.D. Prediction of the secondary
structure of proteins from their amino acid sequence
Adv. Enzymol. 47, 45-148 (1978)
In APEX we take the summation of the amino acid values
for this property for the SUM property and divide by the
length of the sequence for the corresponding AVE property.
Normalized frequency of
beta-turn (CHOP780203)
(report SUM or AVE)
CHOP780203 is the reference for this property at
GenomeNet. URL:
http://www.genome.ad.jp/dbget-
bin/www_bget?aaindex+CHOP780203
Reference:
Chou, P.Y. and Fasman, G.D. Prediction of the secondary
structure of proteins from their amino acid sequence
Adv. Enzymol. 47, 45-148 (1978)
In APEX we take the summation of the amino acid values
for this property for the SUM property and divide by the
length of the sequence for the corresponding AVE property.

44
Appendix IV. Weka: Java Data Mining Tools: In support of APEX
The peptide classification step within the Oi generation process is handled by Java code
from Weka, a free open source data mining software project. Weka has a vast number of
machine learning algorithms and is well established as a leader in the field of software for
data mining. Weka is issued under the GNU General Public License (GPL). The authors
of APEX are grateful for the rich capabilities supported by Weka and the fact that these
powerful tools are offered to the public both within the Weka interface and behind many
other tools, such as APEX, that utilize Weka for these capabilities. Please visit Weka at
http://www.cs.waikato.ac.nz/ml/weka/ for additional information on Weka tools.
The following reference book (referenced below) is very useful in that it provides basic
theory behind data mining with machine learning techniques and presents the information
with practical examples that can be run using Weka. This book provides much more
information than is necessary for most APEX users but it is a good reference to the
general ideas behind machine learning.
Ian H. Witten and Eibe Frank (2005) "Data Mining: Practical machine learning tools
and techniques", 2nd Edition, Morgan Kaufmann, San Francisco, 2005.
APEX presents three optional classifiers, Random Forest, RIDOR, and J48 Trees. The
next appendix section will describe how users familiar with Weka and its classifiers can
easily configure APEX to utilize different classifier implementations that are found in
Weka. Each of these classifiers is an implementation of the Weka software. The Lu
paper that introduces the APEX technique, describes the Random Forest as having
superior performance during cross validation tests of peptide property data sets. During
development of this tool, the Random Forest technique has also shown to give very good
results in our testing. The Random Forest algorithm, coupled with an option that makes
the classifier cost sensitive (weighting training instances based on the frequency of
observed and not observed peptides in the training set) and Bagging (iterations of
classifier training on random subsets of the training data) work fine in our hands and was
found to work quite well following extensive classifier testing described in the Lu APEX
paper‟s supplemental information document.
The following classifier options are the default options in APEX. Note that the letter tags
are option tags used within Weka to specify parameters. Within the APEX tool we
present the official Weka tags as well as a descriptive parameter name.
Cost Sensitive Classification (weka.classifiers.meta.CostSensitiveClassifier)
This option weights the training data instances based on the frequency of observed and
not observed peptides. This option helps the handle the situation that non-observed
peptides are naturally much more prevalent than observed peptides within the training
data set.
-cost-matrix arff-cost
45
This Weka option is used to specify the cost matrix for the cost sensitive classifier. Note
that the default value, arff-cost, is not a standard Weka value but is rather a value that
tells APEX to generate an appropriate cost matrix based on the frequency of observed
and not observed peptides in the training set. Note that one can modify this option and
supply a specific cost matrix however the matrix generated by the arff class frequencies is
appropriate for our purposes.
Bagging (weka.classifiers.meta.Bagging)
The bagging option causes the classifier to be built several times on random subsets of
the data. This can help to eliminate possible biases that may exist in a subset of the data.
Another benefit is that bagging will average results from randomized algorithms
-I 10
This option indicates that Bagging should iterate 10 times (builds the classifier 10 times).
-P 100
This option instructs Bagging to use 100% of the data on each iteration.
-S 1
This is a random number seed. Any number will do for this parameter.
Random Forest (weka.classifiers.trees.RandomForest)
This option indicates the use of the Random Forest classifier as the primary classifier.
-I 10
This option tells random forest to construct 10 classifiers (iterations), each using a set of
randomly selected features (peptide properties or attributes).
-K 5
This option instructs random forest to use 5 random features on each of the iterations.
-S 1
This is a random number seed value. Any number is fine for this parameter.
A note for Weka savy users: when using these options with Weka and in APEX, each
classifier is preceded by the –W tag which marks the beginning of a new classifier. If
you move the mouse over the question mark next to the Select/View Classifier
Parameters button on the Oi Processing Panel, you will see a listing of the currently
selected classification parameters.
46
Appendix V. Classifier Customization
The default Random Forest classifier implemented in Weka has performed well
according the work reported in the Lu paper describing the APEX technique. In work at
our center, this classifier also seems to perform fine for our data. If one is interested in
using classifiers other than the three currently available in APEX, one can configure
APEX to utilize other classifiers within the Weka collection. Classifier options are
loaded when the APEX tool is launched according to the contents of the
weka_parameters.config file found in the apex_config folder. The following text has
been copied from the configuration file (slightly reformatted to fix line breaks). It
describes the configuration fields that are used in the file and shows the specification for
Random Forest within the configuration file as an example. Each classifier has default
values that can be altered. The first classifier in the configuration file is the default
classifier inside the APEX tool. Note that appending additional Weka classifiers to this
configuration file demands that one be familiar with the Weka option tags that are
available for the classifier and have an understanding about option value types, possible
value constraints, and option dependencies (one option depending on the value of
another). A backup of the original file is included in the apex_config folder.
# APEX Weka Classifier Definition File
#
# This file is used to configure Weka classifier options available in
# APEX. The first classifier in this file is always taken as the
# default classifier and parameter values. In order to add a
# classifier it is necessary to be # familiar with Weka's command line
# tag options for the classifier of interest. This # includes
# specification of parameter dependencies. In some cases the inclusion
# of a particular parameter is dependent on the state of another,
# usually BOOLEAN, parameter.
#
#
# Key Glossary:
#
# CLASSIFIER - marks the start of a classifier entry
#
# CLASSIFIER_END - marks the end of a classifier entry
#
# WEKA_CLASSIFIER_CLASS - is the fully qualified (includes Java
# packages) classifier class name.
#
# PERMITS_COST_SENS - indicates if cost sensitive is permitted, value
# is Y or N
#
# PERMITS_BAGGING - indicates if bagging is permitted, value is Y or N
#
# PARAMETER_NAME - a descriptive parameter name, also marks the start
# of a parameter entry
#
# PARAMETER_WEKA_TAG - the corresponding Weka option tag for the
# parameter
#
# PARAMETER_DEFAULT_VALUE - a default value for the parameter
#
# PARAMETER_TYPE - several options <INT>=integer, <NUMERICAL>=float,
# <BOOLEAN>=boolean [TRUE | FALSE]
#
47
# PARAMETER_CONSTRAINT - value constraint options <NONE>, <POS>,
# <BOUNDED>
#
# PARAMETER_BOUND_UPPER (or LOWER) - <NONE> or numerical if constraint
# is <BOUNDED>
#
# PARAMETER_DEPEND_TAG_AND_TRIGGER_VALUE - if the presence of this tag
# is dependent on the state of another variable, specify the other
# variable and a trigger value delimited by a :.
# Example: PARAMETER_DEPEND_TAG_AND_TRIGGER_VALUE:-R:TRUE
#
# PARAMETER_END - marks the end of a parameter
#
#
#
CLASSIFIER
CLASSIFIER_NAME:Random Forest
WEKA_CLASSIFIER_CLASS:weka.classifiers.trees.RandomForest
PERMITS_COST_SENS:Y
PERMITS_BAGGING:Y
#
PARAMETER_NAME:Iterations
PARAMETER_WEKA_TAG:-I
PARAMETER_DEFAULT_VALUE:10
PARAMETER_TYPE:INT
PARAMETER_CONSTRAINT:POS
PARAMETER_BOUND_UPPER:NONE
PARAMETER_BOUND_LOWER:NONE
PARAMETER_END
#
PARAMETER_NAME:Number of Random Features
PARAMETER_WEKA_TAG:-K
PARAMETER_DEFAULT_VALUE:5
PARAMETER_TYPE:INT
PARAMETER_CONSTRAINT:POS
PARAMETER_BOUND_UPPER:NONE
PARAMETER_BOUND_LOWER:NONE
PARAMETER_END
#
PARAMETER_NAME:Random Seed
PARAMETER_WEKA_TAG:-S
PARAMETER_DEFAULT_VALUE:1
PARAMETER_TYPE:INT
PARAMETER_CONSTRAINT:NONE
PARAMETER_BOUND_UPPER:NONE
PARAMETER_BOUND_LOWER:NONE
PARAMETER_END
CLASSIFIER_END
#
48
Appendix VI. APEX Digestion Schemes – Defining Custom Schemes
The apex_config folder contains a file that contains a file, enzyme_rules.config, that
defines digestion schemes in APEX. The tab delimited text file file can be edited to
define new schemes or to adjust the rules of existing schemes. Below is the default state
of the enzyme_rules.config file as of version 1.1.
LABEL_NAME
CLEAVE_TARGETS
STOPPER_RES
CLEAVE_TERMINAL
Tyrpsin Digest
KR
P
C
Chymotrypsin Digest
YWFL
P
C
Trypsin>Chymotrypsin
KR>YWFL
P>P
C>C
TrypsinChymotrypsin
KRYWFL
P
C
Trypsin+Chymotrypsin
KR+YWFL
P+P
C+C
The LABEL_NAME field provides a descriptive title for the digestion option.
CLEAVE_TARGETS are the amino acids that are targets for the digestion scheme.
STOPPER_RES refers to amino acid residues that cause a digestion miss when
associated with the cleavage terminal on the cleavage target. CLEAVE_TERMINAL
specifies whether cleavage should be on the C or the N terminal. NOTE: APEX version
1.1 only supports C terminal cleavage rules. Future releases will include N terminal
options.
There are several special characters within the digestion scheme designations. The greater
than symbol „>‟ indicates that the digestion scheme is a two stage, sometimes referred to
as sequential or serial, digestion. This is where one enzyme is applied followed by a
second enzyme. The „+‟ symbol refers to a case where the sample is split into two
aliquots, digested with two different enzymes, then the digestion peptides are combined
and analyzed. We sometimes refer to this as parallel digestion. While parallel digestion
is an option, we are not aware of a general need for this at this time.
The file can be edited in Excel® and the file can be output as tab delimited text. It is
recommended that users back up their enzyme_rule.config file prior to editing.

49
Contributions and Acknowledgements
The following list includes some of the key contributors to the underlying APEX
technology and the development of this software tool. The list is roughly in
chronological order of contribution, from development of the technique, though software
prototyping and validation, and on to the design and implementation of this tool. This list
can not fully describe the many helpful exchanges and interactions that made the initial
idea of this tool a reality. The authors of this tool are sincerely grateful to all who
participated, both inside the PFGRC and J. Craig Venter Institute and those at the
University of Texas at Austin.
Edward Marcotte,
Christine Vogel, and the
Marcotte Lab
Center for Systems and
Synthetic Biology,
Department of Chemistry
and Biochemistry, Institute
for Cellular and Molecular
Biology, 2500 Speedway,
University of Texas,
Austin TX 78712, U.S.A.
Developed the underlying
computational technique,
advised regarding parameter
options, interface design, and
functional requirements.
Alan Rodrigues
Pathogen Functional
Genomics Resource
Center, J. Craig Venter
Institute, 9704 Medical
Center Drive, Rockville,
MD 20850, U.S.A
(PFGRC/JCVI)
Researched the APEX
technique, prototyped the
various computational steps in
Perl, spearheaded the PFGRC‟s
evaluation of the technique.
Srilatha Kuntumalla
PFGRC/JCVI
Investigated the technique,
supported development of the
Perl prototypes, performed
proteomic studies to validate the
computational technique and
both the Perl and this Java
implementation, technical
bridge between software
developers and proteomics/MS
realm.
Rong Wang, Huang
Shih-Ting, Rembert
Piper
PFGRC/JCVI
APEX tool design input,
technical support contacts for
developers.
Erik Ferlanti,
PFGRC/JCVI
APEX tool design input,
technical support for setting up
TPP components on the JCVI
network,
John Braisted
PFGRC/JCVI
APEX Quantitative Proteomics
Tool author, software design
and architect. Implemented the
computational, program control,
and interface of the APEX Tool.
Authored the manual and help

50
page system.
Alex Saeed, Vasily
Sharov, Jianwei Li, Wei
Liang, Chun Hua Wan,
Miguel Covarrubias,
Lynn Stevens
Bioinformatics/Analysis
Group, PFGRC/JCVI
Helpful discussions on tool
design.
Supporting Software
The authors of the APEX Tool would like to acknowledge three supporting software
projects that help to support some of the APEX processing tasks. The classification
support in APEX comes from the Weka set of Java machine learning / data mining tools.
Weka is a well established set of tools that is widely used in data mining applications (see
Appendix IV). The graphs displayed following the z-score test (Utilities and Analysis
process panel) are rendered using the JFreeChart graph package. Z-score p-values are
generated with support from the JSci Java scientific computational package. The
protXML format files that serve as MS input to the APEX tool are processed via the
Trans-Proteomic Pipeline (TPP) from the Proteome Center at the Institute for Systems
Biology. The quality of these packages is a testament to the ideals of open source
software.

51
References
Futcher B., G.I. Latter, P. Monardo, C.S. McLaughlin, J.I. Garrels. A Sampling of the
Yeast Proteome. Mol. Cell. Biol., 19:7357-7368, 1999.
* Lu P., C. Vogel, R. Wang, X. Yao, E. M. Marcotte. Absolute Protein Expression
Profiling Estimates the Relative Contributions of Transcriptional and Translational
Regulation. Nature Biotech., 25(1):117-124, 2007.
Neidhardt, F.C., H.E. Umbarger. Escherichia coli and Salmonella typhimurium: Cellular
and Molecular Biology, edn. 2, vol.1 (eds. Niedhardt, F.C. et al.) 13-16 (ASM Press,
Washington, DC, 1996)
Mallick P., M. Schirle, S.S. Chen, M.R. Flory, H. Lee, D. Martin, J. Ranish, B. Raught,
R. Schmitt, T. Werner, B. Kuster, R. Aebersold. Computational Prediction of Proteotypic
Peptides for Quantitative Proteomics. Nature Biotech., 25(1):125-131, 2007.
Witten I.H. and E. Frank "Data Mining: Practical machine learning tools and
techniques", 2nd Edition, Morgan Kaufmann, San Francisco, 2005.
Keller A, Eng J, Zhang N, Li X, Aebersold R: A uniform proteomics MS/MS analysis
platform utilizing open XML file formats. Mol. Syst. Biol. 2005, 1-17.
[http://tools.proteomecenter.org/TPP.php]
* This reference is to the original paper that describes the APEX technique.
