Analysis Of Wear Metals And Additive Package Elements In New Used Oil Using The Optima 8300 ICP OES With Flat Plate Plasma T Series APP Optima8300Elements
User Manual: 8300 Series
Open the PDF directly: View PDF ![]() .
.
Page Count: 5

Introduction
The analysis of new and used oil for concentration trends of
wear metals and for formulation or depletion of additive package
metals has been around for over 30 years. Wear metals such
as copper (Cu) and iron (Fe) may indicate wear in an engine
or any oil-wetted compartment. Boron (B), silicon (Si) or sodium
(Na) may indicate contamination from dirt or antifreeze leading
to a failure. Additive elements such as calcium (Ca), phosphorus
(P) and zinc (Zn) are analyzed for depletion which contributes
to wear since these elements contribute to certain key lubri-
cation characteristics. A sound maintenance program, which
routinely measures metals in the lubricating oils, not only
reduces the expense of routinely dismantling the components for visual inspection, but
can indicate unexpected wear before component failure.
Atomic absorption spectrometers (AAS) were first used for these applications in the early-
to-mid 1960s. As the number of elements and samples grew over the years, inductively
coupled plasma-optical emission spectrometers (ICP-OES) were used for oil analysis.
Today, many oil analysis labs will handle between 500 to 2000 samples per day and
analyze from 15 to 24 elements per sample.
Many improvements to ICP technology have taken place over the years with the most
recent being the replacement of the helical load coil used to generate the plasma. The
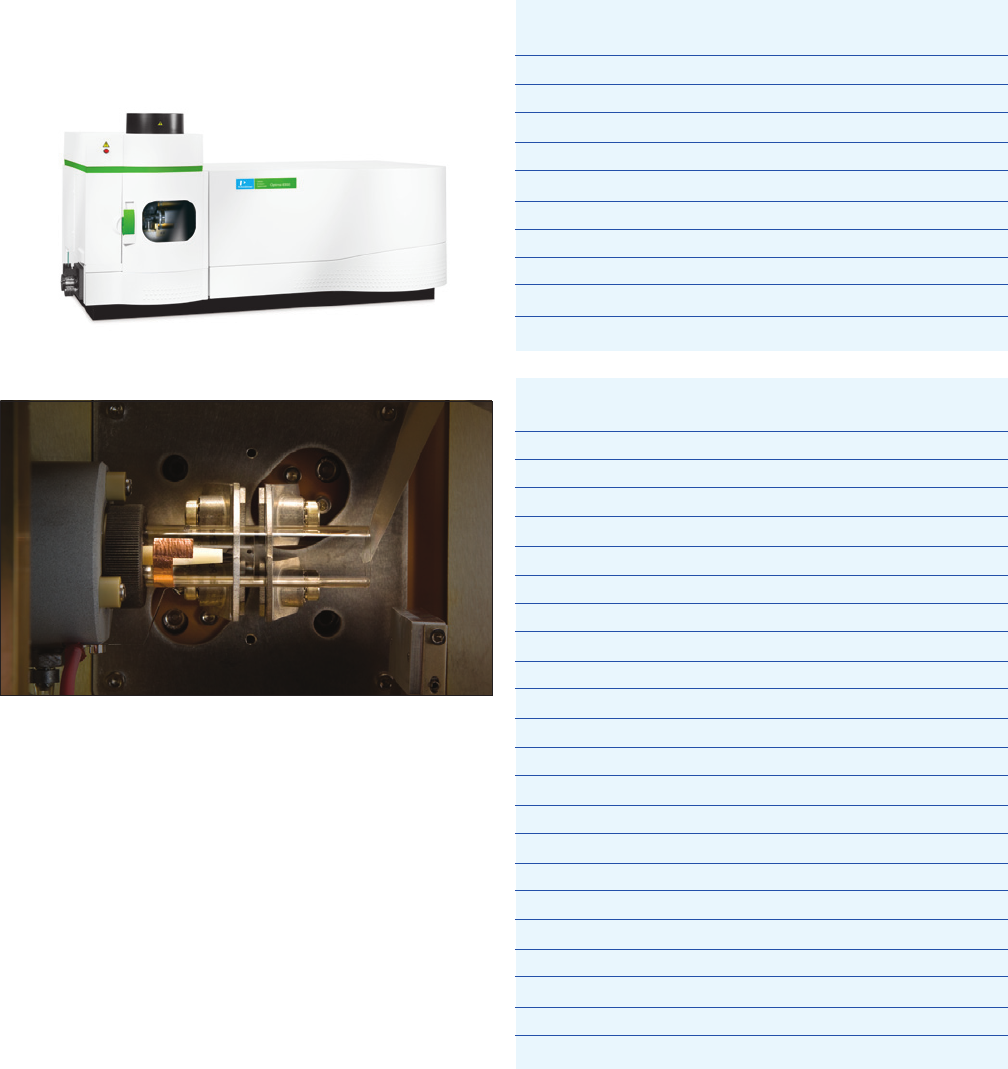
Optima™ 8x00 ICP-OES series (Figure 1 – Page 2) utilizes the new Flat Plate™ plasma technology
that replaces the traditional helical coil design used since the inception of the inductively
coupled plasma. The Flat Plate plasma technology utilizes two flat induction plates
ICP-Optical Emission Spectroscopy
application note
Author
David Hilligoss
PerkinElmer, Inc.
Shelton, CT USA
Analysis of Wear Metals
and Additive Package
Elements in New and
Used Oil Using the
Optima 8300 ICP-OES
with Flat Plate Plasma
Technology
2
Plasma parameters for the analysis of wear metals and
additive package elements in new and used oil using the
Optima 8300 ICP-OES are listed in Table 1. The analytical
wavelength for the elements analyzed are listed in Table 2.
Several important parameters from the WinLab32™ software’s
oil method conditions are described in Table 3 (Page 3).
Table 1. Plasma parameters for all analytes using the Optima
8300 ICP-OES.
Parameter Value
Source Delay (sec) 15
Plasma Aerosol Type Wet
Nebulizer Start-up Instant
Plasma Gas (L/min) 10
Auxillary Gas (L/min) 0.6
Nebulizer Gas (L/min) 0.35
Power (W) 1500
Viewing Distance (mm) 15.0
Viewing Mode Radial
Table 2. Analytical wavelengths used for detection of wear
metals in oil using ICP-OES.
Analyte Wavelength
Ag 328.066
Al 394.408
B 249.673
Ca 315.890
Co (Int. Std.) 228.613
Cr 205.559
Cu 324.757
Fe 259.940
K 766.494
Mg 279.076
Mn 257.613
Mo 203.843
Na 588.995
Ni 231.604
P 214.915
Pb 220.351
Si 288.161
Sn 189.926
Ti 334.943
V 292.397
Zn 213.854
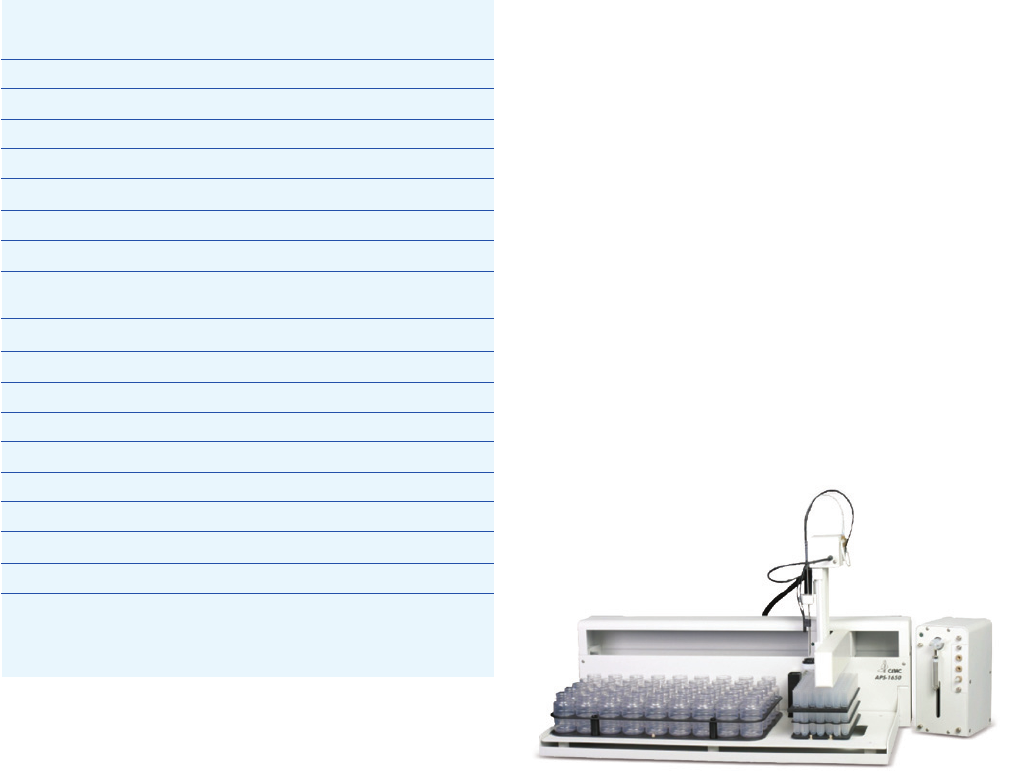
(Figure 2) to produce a plasma that is compact, dense and
robust. This plasma utilizes about half the argon required
by previous helical coil designs while still delivering excep-
tional analytical performance. The Flat Plate system produces
a flat-bottom plasma that minimizes the escape of sample
and vapors around the outside of the plasma, making organic
sample analysis easier. Plasma argon flow has been reduced
to 10 L/min versus the typical 15-18 L/min used by helical
systems for this application which helps to reduce the cost
of analysis.
Experimental Conditions
Instrumentation
Data were collected using the PerkinElmer® Optima 8300
ICP-OES with a CETAC® ASX-1400 stirring autosampler
(CETAC Technologies®, Omaha, NE). The standard sample
introduction system is as follows:
• Alow-flowGemCone™ nebulizer (Part No. N0770358)
• A4mmbaffledcyclonicspraychamber(PartNo.N0776090)
• A1.2mmi.d.quartzinjector(PartNo.N0781019)
• Ascreenedautosamplerprobe(PartNo.N0771529)
Figure 1. PerkinElmer Optima 8300 ICP-OES spectrometer.
Figure 2. Torch-box of an Optima 8300 spectrometer showing the revolutionary
Flat Plate plasma technology.
3
Forty-five sample bottles, or 90 samples poured into small
sample cups for dilution, can be prepared in a batch which
requires approximately 35 seconds preparation time per
sample. All sample information is transferred directly
from the APS-1650 software into the WinLab32 software,
eliminating the need to enter the data twice. Only 5 mL
of diluted solution is required for the analysis. This volume
allows for a sample to be analyzed twice in case of a QC
failure. Cobalt is used during the analysis as an internal
standard to overcome the matrix suppression caused by
different oil viscosities. The cobalt can be added to the
solvent diluent prior to sample dilution, thus eliminating the
need to add the internal standard to each individual sample
or through an online addition tubing. Since the additive
elements are organic-metallic and soluble in the oil, the use
of an internal standard provides a more accurate result. The
wear-metal elements are suspended in the oil matrix and
the results compare favorably to other analysis techniques.
Another sample and standard dilution option would be the
PerkinElmer OilPrep™ 8 Oil Diluter (Figure 4, Page 4)
(Part No. L1610000). To meet the need for increased
throughput in wear-metal analysis programs, the OilPrep 8
Oil Diluter is equipped with ultrasonic liquid-level detection
(patent pending) and an 8-tip Varispan™ pipetting arm option
for rapid “on-the-fly” reformatting and diluting of samples
in various sized vessels. The system utilizes multiple syringes
along with disposable tips to increase sample throughput
while eleminating carryover between samples and solvent
waste (no rinsing is required). The sample preparation
is done on a volume-to-volume basis. Ninety-six sample
bottles, or any larger numbers of smaller sample containers,
can be prepared at a time. Throughput can be as high as
300 samples per hour. All sample information is transferred
directly from WinPREP® software into the WinLab32 software,
eliminating the need to enter the data twice.
Table 3. WinLab32 for ICP method parameters for the
analysis of wear metals and additive package elements in oil.
Parameter Value
Read Delay Time (sec) 14
Replicates 2
Read Time (sec) Automatic – Min: 0.100, Max: 2.000
Sample Flow Rate (mL/min) 4.00
Sample Flush Time (sec) 5
Sample Flush Rate (mL/min) 6.00
Wash Frequency Every sample + extra time if limit
exceeded
Wash Rate (mL/min) 5.00
Wash Time (sec) 2
Additional Wash Time (sec) 30
Peak Algorithm Peak area (3-point)
Background Correction 2-point
Internal Standard Co
Calibration Equation Linear through zero
Sample Units ppm
Quality Control Limits (%) ±10
Quality Control Fail Actions Recalibrate, re-analyze check
standard, re-analyze affected
samples.
Reagents
All solutions were prepared with a CETAC® APS-1650
Automated Prep Station. Calibration standards were made
usingthreeV23(VHGLabs®) blended standards at 500, 100,
and 50 ppm (Part Nos. 500: N0776106; 100: N0776105;
50: N0776104). The V23 standards contain 23 elements (Ag,
Al, B, Ba, Ca, Cd, Cr, Cu, Fe, K, Mg, Mn, Mo, Na, Ni, P, Pb,
Sb, Si, Sn, Ti, V, and Zn) in 75 centistoke (cSt) hydrocarbon oil.
A higher-concentration calibration standard for the additive
elements was prepared using Metals Additives Standard 4
(VHGLabs)whichcontainsCaat5000µg/gplusMg,Pand
Znat1600µg/g(PartNo.N9308259).Thesolventforall
cases was V-Solv™ (Part No. N9308265). The solvent for all
dilutions was a solution of 2.5 grams of a 6% cobalt standard
(in mineral spirits) (Part No. N0776107) added to one gallon
of V-Solv™.
Sample and Standard Preparation
All samples and standards were diluted 1:10 with V-Solv™
(containing cobalt) on a CETAC® APS-1650 Automated Prep
Station (Figure 3) (Part No. N0777177). The prep station
picks up the oil from standard 2-4 oz bottles or 3 mL sample
cups, dispenses the oil into an autosampler tube, adds solvent
and mixes the sample directly in the autosampler rack. The
sample preparation is done on a volume-to-volume basis.
Figure 3. CETAC® APS-1650 Automated Prep Station for use with an Optima
8300 ICP-OES.
Results and discussion
Below are the mean results obtained for the analysis of
a used oil sample utilizing the Optima 8300 without the
ASXpress™ (Table 4). Analysis time per sample was 45 seconds,
which includes washing between samples and two replicate
readings per sample. Two check standards for low (wear
metal – 50 mg/L) (Table 5, Page 5) and high concentrations
(additive elements – 1600 mg/L), were analyzed every 20
to 40 samples with upper and lower limits set at ±10%.
With the stability of the Optima 8300 system, the check
standards rarely failed in an 8-10 hour period. If a check
standard should fail, the action selected in the software is
to recalibrate, rerun the check standard to verify it is within
limits, and then rerun all samples since the last acceptable
check standard. The % RSDs were as expected – low when
analytes were present at typical concentration levels of > 5 ppm
and higher when very little analyte was present. Similar
results would be seen using the ASXpress™ with sample
times of 24 seconds per sample.
Table 4. Example of a mean result for the analysis of a used
oil sample using the Optima 8300 ICP-OES (n=2).
Analyte Conc. (ppm) Std. Dev. (ppm) % RSD
Ag ND --- ---
Al 6 0.10 1.6
B 51 0.04 0.09
Ca 828 10 1.2
Cr 3 0.03 1.2
Cu 23 0.29 1.2
Fe 481 5.1 1.1
K 6 0.58 9.6
Mg 18 0.06 0.3
Mn 12 0.04 0.31
Mo 3 0.38 15
Na 5 0.08 1.5
Ni 2 0.23 13
P 947 0.13 0.01
Pb 2 0.28 14
Si 24 0.45 1.9
Sn 1 0.18 16
Ti ND --- ---
V ND --- ---
Zn 503 5.5 1.1
Co (Int. Std.) 92% 0.70 0.76
Increased ICP Sample Throughput
ICP sample analysis time can be greatly reduced by adding
a sampling valve to the ICP such as the CETAC® ASXpress™.
A standard analysis system relies upon a single peristaltic
pump to both deliver samples to the nebulizer and rinse the
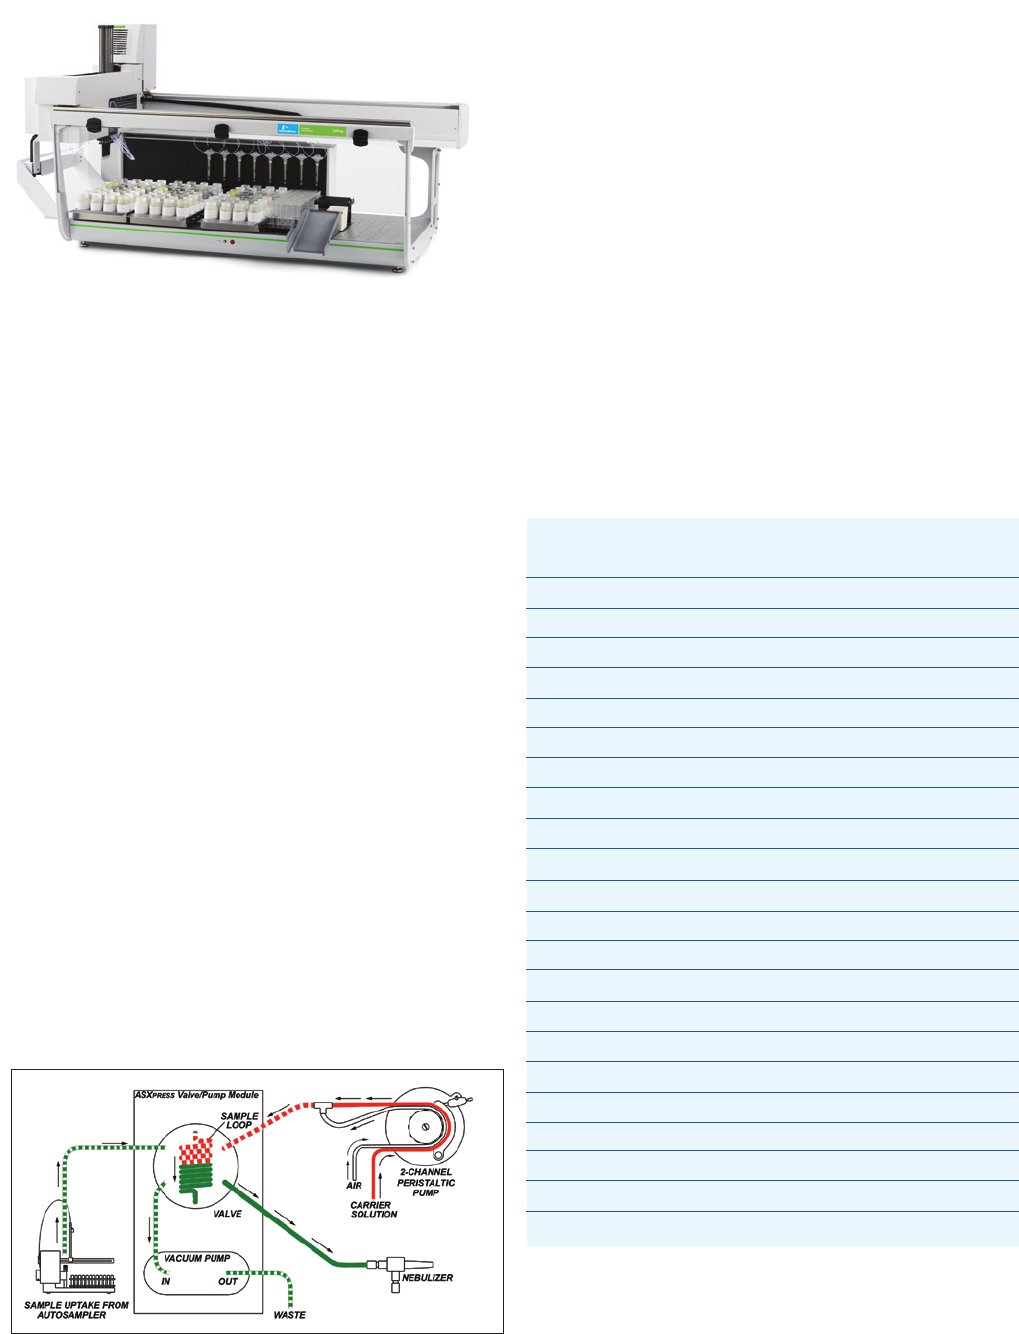
sample flow path between sample deliveries. The ASXpress™
system utilizes a high-speed vacuum pump in addition to the
ICP-OES peristaltic pump (Figure 5). The 6-port valve allows
the use of both pumps simultaneously, reducing total sample
analysis time significantly. The use of the valve effectively
divides each analysis into two stages. First, while the valve is
in the load position, the vacuum pump rapidly fills the sample
loop, while the ICP-OES peristaltic pump simultaneously
transports carrier solution, keeping the plasma stable.
In the second position, the loaded sample is pushed into
the nebulizer for analysis via the carrier solution flowing
through the ICP-OES peristaltic pump. At the same time,
the autosampler probe is moved to the rinse station and
the uptake flow path is flushed with rinse solution via the
vacuum pump. Improvements from this approach are:
• Analysistimepersamplecanbeasshortas20seconds
(2 replicates per sample) without any degradation in the
analysis precision or long-term stability.
• Lesscarbonbuild-uponthetorchand/ortheinjector.
• Stabilityisincreasedforalongerperiodoftime,requiring
less recalibration and improving QC.
4
Figure 4. PerkinElmer OilPrep 8 Oil Diluter pipettes 8 samples simultaneously.
Figure 5. Schematic of the CETAC® ASXpress™ Rapid Sample Introduction
System.

Conclusion
The PerkinElmer Optima 8300 ICP-OES handles the diluted
oil matrix very easily and increases sample throughput over
previous Optima models to 45 seconds per sample with little
carryover between samples. The Optima 8300 is the ideal
ICP spectrophotometer for oil laboratories with moderate
workloads. For laboratories with a heavy workload, an
Optima 8300 combined with a CETAC® APS-1650 Automated
Prep Station or a PerkinElmer OilPrep 8 Oil Diluter and
CETAC® ASXpress™ Rapid Sample Introduction System is
suggested.
The Optima 8000 ICP-OES, also equipped with Flat Plate
plasma technology, may also be used for this analysis.
Table 5. Example of a single 50 ppm QC sample.
Analyte % Recovery Std. Dev. (ppm) % RSD
Ag 100 0.04 0.09
Al 106 0.59 1.1
B 99.3 0.05 0.09
Cr 103 0.29 0.56
Cu 99.5 0.09 0.18
Fe 102 0.05 0.10
K 101 0.20 0.39
Mn 103 1.1 2.2
Mo 99.2 0.28 0.56
Na 103 1.0 2.1
Ni 101 0.61 1.2
Pb 103 2.0 3.9
Si 103 1.2 2.3
Sn 103 0.68 1.3
Ti 101 1.1 2.3
V 103 0.04 0.07
Co (Int. Std.) 100 0.54 0.54
Ca, Mg, P and Zn were not reported as QC analytes.
For a complete listing of our global offices, visit www.perkinelmer.com/ContactUs
Copyright ©2011-2012, PerkinElmer, Inc. All rights reserved. PerkinElmer® is a registered trademark of PerkinElmer, Inc. All other trademarks are the property of their respective owners.
009951A_01
PerkinElmer, Inc.
940 Winter Street
Waltham, MA 02451 USA
P: (800) 762-4000 or
(+1) 203-925-4602
www.perkinelmer.com
