APTANI Supplementary & Instructions Checkpoint
APTANI_supplementary_%26_Instructions
User Manual:
Open the PDF directly: View PDF ![]() .
.
Page Count: 13

1
Supplementary Information
APTANI: a computational tool to select aptamers through
sequence-structure motif analysis of HT-SELEX data
Caroli J1, Taccioli C1, De La Fuente A2, Serafini P2 and Bicciato S1
1Center for Genome Research, Department of Life Sciences, University of Modena and Reggio Emilia – Modena – Italy;
2Department of Microbiology & Immunology, UM/Sylvester Comprehensive Cancer Center, Leonard M. Miller School of
Medicine, University of Miami – Miami – USA
BACKGROUND………………………………………………………………………………………………………….
2
WORKFLOW DESCRIPTION………………………………………………………………………………………..…
2
Step 1: frequency calculation…………………………………………………………………………………………
2
Step 2: calculation of secondary structure and motif breakdown………………………………………………..
3
Step 3: extraction of structural motif consensus sequences…………………………………………………….
3
Step 4: aptamer scoring and structural motif identification ………………………………………………………
4
INSTALLATION AND USAGE…………………………………………………………………………………………
4
Installation……………………………………………………………………………………………..…………….…
4
Parameters……………………………………………………………………………………………..……………...
4
Usage…………………………………………………………………………………………………………………..
5
Computational performances………………………………………………………………………………………..
6
Validation of results………………………………………………………………………………………………….
6
Comparison of outputs from different HT-SELEX cycles…………………………………………………………
8
COMPARISON WITH OTHER METHODS……………………………………………………………………………
9
Tools for the analysis of SELEX and HT-SELEX data……………………………………………………………
9
Comparison with AptaCluster and FASTAptamer………………………………………………………………..
10
MATERIALS AND METHODS………………………………………………………………………………………….
10
Library and SELEX primers and templates………………………………………………………………………..
10
DNA tagging for HT-sequencing…………………………………………………………………………………….
11
RT-PCR tagging and HT-sequencing.……………………………………………………………………………..
11
Synthesis of Cl.42 and mutCl.42 aptamers………………………………………………………………………....
11
Bead conjugation with recombinant proteins…………………………………………………………………….…
11
Aptamer mediated binding of recombinant protein-conjugated beads …………………………………………
12
REFERENCES……………………………………………………………………………………………………………
12

2
BACKGROUND
RNA aptamers are small oligonucleotides selected in-vitro to bind target molecules with high affinity and
specificity due to their stable three-dimensional conformation. We (Roth et al., 2012) and others (Liu et al.,
2013; Zhou et al., 2012) have shown that their high affinity is maintained in-vivo, thereby enabling aptamers
to bind a specific receptor or ligand on the surface of a target cell. Several unique features make aptamers
more attractive than antibodies or other nano-platforms, e.g. they can be generated with high specificity and
affinity towards virtually any molecule; their bioavailability and pharmacokinetics can be changed on
demand; they are non-immunogenic and, finally, they are chemically synthesized allowing for rapid, scalable,
and reproducible production at low cost, facilitating their synthesis and manufacturing approval for clinical
trials (Keefe et al., 2010; Povsic et al., 2013; Jörg et al., 2002; Rossi, 2011; Nimjee et al., 2005). All these
characteristics make aptamers one of most promising, novel, and efficient tools to deliver therapeutic agents
in a tissue- or cell-specific manner (Farokhzad et al., 2006; Chu, Marks, et al., 2006; McNamara et al., 2006).
Indeed, aptamers have been exploited as targeting agents for delivery a variety of reagents to specific cell
populations or tissues (Hicke and Stephens, 2000; Zhou and Rossi, 2009; Yan and Levy, 2009). Through
specific interaction with its cellular membrane receptor, aptamers enhance the accumulation or retention of
therapeutic agents (Zhou et al., 2012) including small interfering RNAs (Guo, 2005; Guo et al., 2005; Chu,
Twu, et al., 2006), (McNamara et al., 2006), (Wullner et al., 2008; Zhou et al., 2008; Dassie et al., 2009;
Zhou et al., 2009), toxins (Chu, Marks, et al., 2006), chemotherapy agents (Bagalkot et al., 2006; Huang et
al., 2009; Taghdisi et al., 2010), and drug-encapsulated nanoparticles (Farokhzad et al., 2006), (Farokhzad
et al., 2004; Dhar et al., 2008; Gu et al., 2008; Cao et al., 2009; Kang et al., 2010; Zhang et al., 2007; Huang
et al., 2008; Javier et al., 2008). Therapeutics can be linked directly to the aptamers via intercalation
(Bagalkot et al., 2006), electrostatic interaction (McNamara et al., 2006) or direct conjugation (Huang et al.,
2009). Lately, aptamers have entered the clinical pipeline for cancers and other diseases and more than 9
phase I and II clinical trials are currently ongoing (Keefe et al., 2010).
Aptamers are selected based on their affinity to bind molecular targets using the SELEX technique
(Systematic Evolution of Ligands by EXponential enrichment). The SELEX process allows the simultaneous
screening of billions of random oligonucleotide sequences against a target of interest and the selection of a
small subset of aptamers, from the original library, that bind to the target. Although it has been recently
recognized that aptamers bind the target of interest through conformational recognition (Liu et al., 2013;
Zhou et al., 2012), to date the bioinformatics analysis of SELEX data for aptamer selection mostly relies on
the sole sequence content, disregarding 2- and 3-D conformations. Here, we present APTANI a
bioinformatics tool that combines sequence and structure analysis of SELEX data, either standard or high
throughput (HT-SELEX), to select target-specific aptamers.
This supplementary section details APTANI workflow, installation and usage and reports the comparison with
other tools for the analysis for HT-SELEX data.
WORKFLOW DESCRIPTION
APTANI builds on AptaMotif algorithm (Hoinka et al., 2012), originally implemented to analyze SELEX data,
and extends the applicability of AptaMotif to HT-SELEX, introducing additional functionalities, as the
possibility to identify binding motifs, to cluster aptamer families or to compare output results from different
HT-SELEX cycles. Outputs are in the form of tables and graphical representations to facilitate the
downstream biological interpretation of results.
APTANI is written in Python 3.3 and consists of four major steps. The first step calculates the frequency of
each aptamer sequence produced by the HT-SELEX process and filters out less abundant sequences. In the
second step, APTANI predicts all possible secondary structures (in a specific energy range above the
minimum free energy range) of each aptamer that passed the frequency filter, and extracts the motifs
represented in these structures (i.e., sub-structures and the correspondent sub-sequences). The third step
extracts consensus representations for any of the four secondary structure motifs from the sub-sequences of
all aptamers where a specific structural motif has been detected. In the last step, any aptamer sub-
sequence, correspondent to a specific secondary structural motif, is aligned to the consensus sequence of
that structural motif.
Step 1: frequency calculation
In the first step, APTANI calculates the frequencies of the aptamers retrieved from the HT-SELEX protocol.
HT-SELEX outputs a collection of DNA/RNA aptamer sequences of defined length, which may vary
according to the experimental setup. By default, the aptamer length is set to 99 nucleotides, but this value
can be modified through the –n (--number) parameter. The frequency of each individual aptamer
sequence is calculated from the FASTQ input file and results are stored in the count.csv file. Low
abundant sequences are then filtered according to the -f (or --frequency) parameter, i.e. a threshold on
the minimal frequency (the default value is 10-7). To reduce HT-SELEX errors that may affect the nucleotides
encoded outside the constant regions, frequency calculation and filtering can be performed on the variable

3
region only, i.e., on the aptamer portion comprised between a right and a left flanking sequence (named
tags) designed according to the HT-SELEX experimental protocol. Frequency count on the variable region
can be imposed through the --variable parameter. By default, tag sequences are AUGCGG and CAGACG
for left and right tags, respectively. Both tag sequences can be modified using the parameters --left for
left tag and --right for right tag. When considering the variable region only, the default sequence length is
set to 30 nucleotides and can be modified through the --cutoff parameter.
Step 2: calculation of secondary structure and motif breakdown
In the second step, a set of potential secondary structures is calculated, for each aptamer that passed the
frequency filter of step 1, using the RNAsubopt algorithm (verison 2.1.9; Hofacker et al., 1994; Wutchy et al.
1999) of the ViennaRNA package (version 2.0; Lorenz et al. 2011). RNAsubopt generates suboptimal
secondary structures within a user defined energy range above a minimum free energy (MFE) threshold. For
this type of calculation, the default minimum free energy threshold is usually set to 3 Kcal/mol; however, in
this specific case, given the massive number of analyzed sequences in any SELEX/HT-SELEX experiment
(from 1 to 3 million sequences), an MFE threshold of 3 Kcal/mol would have required an excessive
computational time and disk usage. Thus, we performed several rounds of secondary structure prediction
testing different values of the MFE threshold and identified in 1 Kcal/mol a reasonable trade-off between an
acceptable computational time and a robust structure investigation. Nevertheless, this value can be easily
modified setting the -e (or --energy) parameter in APTANI command line (see the Parameters section for
additional details). RNAsubopt is embedded in the APTANI package as a binary file compiled using a 64-bit
Intel processor and released with a GPL license. In case of using a different type of processor, we suggest to
download the complete ViennaRNA package from http://www.tbi.univie.ac.at/RNA/index.html#download and
recompile RNAsubopt.
As in AptaMotif, we consider four different types of secondary structure motifs, i.e., hairpin loop, intra-strand
loop, left bulge loop, and right bulge loop. Specifically:
1. hairpin loops are closed continuous structures characterized by the pairing of two nucleotides that close
the loop and confer the hairpin conformation;
2. intra-strand loops are structures consisting of two different strands of variable length, ranging from three
to a non-definite number of nucleotides;
3. bulge loops (either right or left) are sub-structures of the intra-strand loop category in which one strand
consists of two nucleotides, while the other has a non-defined length. Right and left bulge loops are
defined depending on where the two-nucleotide strand lays.
Since in RNAsubopt output, secondary structures are coded as combinations of dots and brackets, we
developed dedicated regular expressions to search each type of loop structure, retrieving the associated
nucleotide sequence from the investigated aptamer. When APTANI is used with default settings, all input
sequences for the secondary structure calculation have the same length. Instead, if APTANI is set to
consider only the variable region, the input sequences may vary in length (with a minimum length equal to
the --cutoff parameter).
Step 3: extraction of structural motif consensus sequences
In the third step, consensus representations, for any of the four secondary structure motifs, are extracted
from the sub-sequences of those aptamers where a specific structural motif has been identified. To reduce
the computational load of inspecting all sub-structures and sub-sequences of the whole aptamer pool, we
assume that if a structural motif is shared by a large fraction of aptamers, then it is highly probable that the
motif will emerge even when considering only a subset of the entire pool (Bowser, 2005). Thus, a portion of
all aptamers and their secondary structure motifs are iteratively randomly picked from the output of step 2
and their sub-sequences are aligned to obtain a consensus sequence for any of the four secondary structure
motifs. Consensus sequences, for any of the four secondary structure motifs, are constructed using the most
frequent nucleotides of the aligned sequences. Gaps are introduced in the case nucleotides show a
frequency lower than a background frequency or when two or more nucleotides have the same frequency.
The background frequency is calculated counting the occurrences of each nucleotide in the filtered aptamers
pool and dividing them by the total number of nucleotides investigated. The number of sub-samplings and
the percentage of the whole aptamer pool selected at each iteration can be specified through the -c and the
-p parameters, respectively. Multiple sequence alignment is performed with Clustal Omega (Sievers and
Higgins, 2014), a bioinformatics software designed to rapidly align multiple short DNA or RNA sequences.
Clustal Omega can be downloaded from http://www.clustal.org/omega/ and is called within APTANI using
default parameters. However, Clustal Omega parameters (as, e.g., the number of Hidden Markov Model
(HMM) iterations or the maximum number of examples in any cluster) can be modified from the APTANI
command line (see the Parameters section for additional details). Clustal Omega alignments can be
visualized as a clustering tree. The clustering plot can be generated using FigTree, included in APTANI and
freely available at http://tree.bio.ed.ac.uk/software/figtree/. Although useful, we recommend visualizing the

4
clustering tree only if the number of sequences is less than 5000, since the generation of the image file (in
PDF format) is memory intensive.
Step 4: aptamer scoring and structural motif identification
In the last step, any aptamer sub-sequence, correspondent to a specific secondary structural motif, is
aligned to the consensus sequence of that structural motif and scored. Before computing the alignment
score, the motif sub-sequence in each aptamer is trimmed to the length of the consensus sequence. The
alignment score is then calculated using a match/mis-match scoring (match=+1; mis-match=-1) with a gap
penalty equal to 0.5. The total score is finally normalized to account for the different consensus sequence
lengths:
consensus sequence
A
G
-
G
C
A
-
T
A
motif in aptamer i
A
G
C
C
G
T
C
T
A
alignment score
1
1
0.5
-1
-1
-1
0.5
1
1
=2/9
=0.22 (normalized score)
Score values range from -1 to 1, with a score of -1 indicating that the aptamer secondary structure motif is
completely different from its respective consensus sequence. Instead, a score of 1 indicates a complete
match between the aptamer and the consensus secondary structure motifs. In essence, the score,
quantifying the similarity of an aptamer secondary structure motif to the ideal motif of the most abundant
secondary structures, gives an indication of the binding potential of aptamer sequences bearing the motif.
The normalized alignment score is thus used to rank aptamers (that passed the frequency filter) in terms of
matching of the motifs they contain to the corresponding secondary structure consensus motifs.
Finally, the output returns, for any aptamer, its abundance, the alignment scores, the retrieved structural
motifs, the sub-sequences encoding for the structural motifs, and the consensus sequences (Supplementary
Table S1).
INSTALLATION AND USAGE
Installation
APTANI is freely available at http://aptani.unimore.it/downloads.php. The package contains all the necessary
files for the execution of a complete analysis and does not require any installation. Output files are written in
the same directory where the package is downloaded (working directory).
APTANI is written in Python 3.3, does not require any specific Python module, depends on:
— Python 3.3 (or a later version);
— Clustal Omega (http://www.clustal.org/omega/);
— Java Virtual Machine;
and includes:
— RNAsubopt to calculate secondary structure (http://www.tbi.univie.ac.at/RNA/documentation.html - install)
— FigTree to generate the clustering tree image (http://tree.bio.ed.ac.uk/software/figtree/).
Parameters
APTANI usage requires specifying several parameters. most of parameters are associated to default values,
which have been quantified during rounds of tests conducted on different subsets of SELEX and HT-SELEX
data and that represent a reasonable trade-off between accuracy and computation time for most SELEX/HT-
SELEX experiment. Nevertheless, default values must not be considered as the best possible but as an
optimized setup to run APTANI. Users can then modify the parameter values to meet specific needs.
-c, --cycles [ITERATIONS]
Mandatory input. This parameter sets the number of random sub-samplings of the aptamer pool in each
analysis. We suggest setting the number of iterations in the range 50-200. The default value is set to 50.
-p, --percentage [PERCENTAGE]
Mandatory input. This parameter sets the number of randomly selected sequences at any iteration (in terms
of percentage of the total number of sequences). Although this number may be varied depending on the total
number of available sequences, we suggest to always select at least 20% of the total aptamer pool. The
default value is set to 20.
-e, --energy [ENERGY]
This parameter sets the energy range for the RNAsubopt calculation step in Kcal/mol. The default value is 1
Kcal/mol. Augmenting the value of the -e parameter allows a more extensive analysis of the secondary
structure conformation, but generates files of larger dimensions and increases the computation time. In all
cases (as indicated by the original authors of RNAsubopt), we suggest to keep the value of this parameter
smaller than 3 (Kcal/mol).

5
-f, --frequency [FREQUENCY]
This parameter sets the frequency cut-off to filter out low abundant sequences. The default value is equal to
10-7. We suggest to modify this parameter according to the quality of the HT-SELEX input.
-n, --number [LENGHT]
This parameter sets the length of the aptamer sequences in the FASTQ file. The default value is set to 99
although the length of aptamer sequences may vary depending on the HT-SELEX experiment. This value
takes into account the length of both left and right flanking regions.
-d, --delete
This parameter prevents from erasing frequency.csv and count.csv files from the hard drive. The
frequency.csv file contains all sequences that passed the frequency cut-off, whereas the count.csv file
contains all sequences retrieved from the input file. By default, both files are erased from the hard drive.
--tree
This command allows the creation of the clustering tree image in PDF format. Image size and generation
time depend on the number of clustered sequences. We recommend visualizing the clustering tree only if the
number of sequences is less than 5000.
--width [WIDTH]
This parameter sets the width of the clustering tree image in pixels. The default value is set at 10000.
--height [HEIGHT]
This parameter sets the height of the clustering tree image in pixels. The default value is set at 10000.
--left [LEFT TAG]
This parameter allows setting the aptamer left tag in RNA format. Aptamer variable sequences, generated
through evolutionary selection, are located within two flanking regions (including PCR and Illumina tags) that
may vary in any HT-SELEX experiment. Thus, both flanking sequences need to be specified to enhance
flexibility in data analysis. The default left tag sequence is AUGCGG.
--right [RIGHT TAG]
As for the --left [LEFT], this parameter allows setting the aptamer right tag in RNA format. The default
right tag sequence is CAGACG.
--max-hmm-iterations [ITERATIONS]
This is the maximum number of iterations in Clustal Omega Hidden Markov Model. For additional details on
this parameter, please check Clustal Omega help (http://www.clustal.org/omega/README). The default
value is set to 1.
--cluster-size [CLUSTER_SIZE]
This is the maximum number of branches in each Clustal Omega cluster. For additional details on this
parameter, please check Clustal Omega help (http://www.clustal.org/omega/README). The default value is
set to 100.
--variable
This parameter allows switching the analysis from whole sequence (default) to variable region (i.e., the
region comprised between left and right tags).
--cutoff [CUTOFF]
This parameter defines the minimum length of the variable region searched in the first step of the algorithm.
The use of this parameter is strictly related to the use of the --variable parameter. The default value is
set to 30 (nucleotides).
Usage
APTANI is invoked by APTANI.py within Python environment. For instance, starting from an input_file
of FASTQ sequences, the following command:
python APTANI.py -c 100 -p 20 -f 0.00001 --left UUUCG --right GGGAU --variable
input_file
specifies an analysis conducted on the variable region of aptamers with a minimal abundance of 10-5
(frequency threshold), left tag set as UUUCG and right tag set as GGGAU, randomly selecting 20% of the total
number of input sequences in any of the 100 iterations.
Instead, to run APTANI, using default settings for frequency threshold, iterations, percentage of sequences
and tags on a subset of aptamers with a length of 60 nucleotides, the command is as following:

6
python APTANI.py -n 60 input_file
APTANI returns in output a comma-separated value (.csv) file for each secondary structure motif:
— hairpins_data.csv;
— intra_Strand_data.csv;
— left_Bulges_data.csv;
— right_Bulges_data.csv.
Each file contains (Supplementary Table S1):
— the aptamer sequence;
— the aptamer frequency;
— the id of the aptamer cluster;
— the aptamer sub-sequence of the secondary structure motif;
— the consensus sequence;
— the alignment score between the consensus and the secondary structure motif sequences;
— the frequency of the secondary structure motif sub-sequence.
Table S1. APTANI output table (for a hairpin secondary structure motifs; hairpins_data.csv). The same table
format is adopted in intra_Strand_data.csv, left_Bulges_data.csv, and right_Bulges_data.csv output files.
Aptamer sequence
Aptamer
frequency
Cluster
ID
Motif sub-
sequence
Consensus
sequence
Alignment
score
Frequency of
motif sub-
sequence
ACGCUGAGAGGACGAUGCGGGUUACCAACUUGAACGCCGAGAGUGUGGUC
ACGUGUUCUGCAGACGACUCGCUGAGGAUCCGAGAUUGCUCGCAGAU
2.8x10⁻⁵
1
GAGAGUGU
G-GAGAG-
0.6250
0.1718
ACGCUGAGAGGACGAUGCGGGUUACCAACUUGAACGCCGAGAGUGUGGUC
ACGUGUUCUGCAGACGACUCGCUGAGGAUCCGAGAUUGCUCGCAGAU
2.8x10⁻⁵
1
GAGAGUGU
CAGAGAG-
0.4375
0.1718
ACGCUGAGAGGACGAUGCGGCCCAUCACUCCCGCGCAUUGCGAACGCAUC
GUUAUUUAGCCGUCGACUCGCUGAGGAUCCGAGAUUGCUCGCAGACG
3.41x10⁻⁴
2
AUCCGAGAUU
G-CG-AGAG-
0.2500
0.3867
Computational performance
We used a Linux Server to determine the optimal set of parameters for the analysis of HT-SELEX data and
test APTANI performances. A typical APTANI run with 100 iterations and 20% of randomly picked aptamers,
uses from 2 to 6GB of RAM and takes 45 minutes to analyze an HT-SELEX input file of ~7GB.
Validation of results
To test APTANI performances and validate its findings, we analyzed a sequence library corresponding to an
HT-SELEX experiment designed to isolate aptamers specific for murine IL4Ra (interleukin 4 receptor, alpha)
(Roth et al., 2012). Briefly, epoxy beads conjugated with the extracellular domain of IL4Ra were used to
screen a combinatorial random RNA library of approximately 1014 aptamer species. Libraries from the PCR
reaction of SELEX cycles 3, 5, and 11 were tagged in 5’ and 3’ with DNA tails containing: a) the primer for
hybridization, b) the primers for read 1 and read 2, c) the Illumina Truetag, and d) two additional tags.
Libraries were quantified via Real Time PCR and bio-analyzer and admixed equally. Sequencing reaction
was performed by the University of Miami Genomic Service. The derived FASTQ files were processed with
Illumina software to separate the clones from each library and imputed to APTANI to select potentially
binding aptamers directed to IL4Ra. The experiment comprised 11 different cycles of evolutionary selection
of the randomly generated aptamers, leading to a final cycle containing approximately 2 to 3 million
sequences. To access the impact of different parameter values on the final results, we run two different
analyses with different parameter values. In the first run, we set 100 iterations selecting, at each iteration, a
number of random aptamers equal to 20% of the entire pool. The second run was performed with less
iterations (50), while keeping constant the percentage of randomly picked aptamers for each cycle (i.e., 20%
of all aptamers). Setting the threshold for the frequency cut-off at 10-7, APTANI selected, from cycle 11 data,
410,842 different aptamer sequences of 99 base pair length. The majority of the sequences from the last
cycle were extremely similar (in terms of Clustal Omega alignment score) to the Cl.42 aptamer, previously
demonstrated to be specific for mouse and human IL4Ra using conventional methods (i.e. cloning and
sequencing; Roth et al., 2012). Interestingly, while conventional methods were able to identify the Cl.42
clone starting from cycle 5, APTANI identified Cl.42 just from the data of the first cycle of selection (cycle 1),
i.e. from a pool of sequences that is still in the process of being selected and is mostly composed of the
initial random oligonucleotides with only few enriched aptamers displaying affinity for the target. The
secondary structure analysis of these cycle 1 sequences allowed selecting 53 aptamers containing
secondary structure motif sub-sequences with an alignment score (with loop consensus sequences) greater
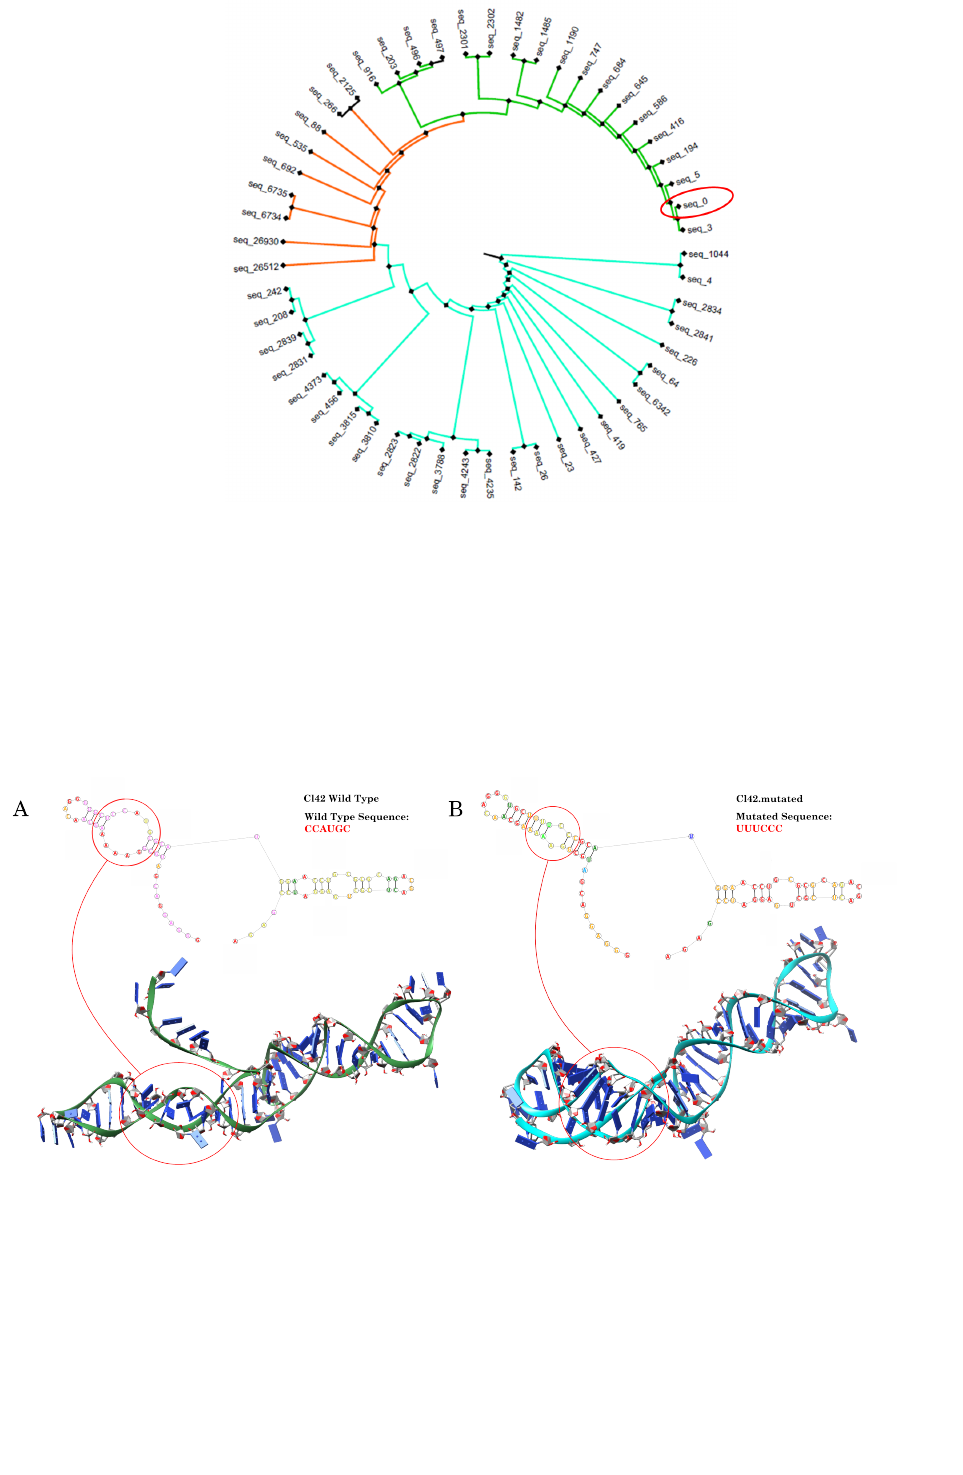
than 0.25 and clustering in 3 major families dominated by Cl.42 aptamer (Figure 1S).
7
Figure S1. Clustering tree of the 53 aptamers selected after secondary structure analysis. Aptamers
containing secondary structure motif sub-sequences with an alignment score greater than 0.25 with loop
consensus sequences cluster in 3 major families. The Cl.42 aptamer is circled in red.
From the analysis of the Cl.42 secondary structure emerged that the intra-strand loop formed by the
CCAUGC sub-sequence could be relevant to confer a tridimensional structure functionally relevant for the
interaction with IL4Ra. Following the indications of RNAfold (Denman, 1993) and RNAComposer (Popenda
et al., 2012), suggesting that a mutation in the CCAUGC sub-sequence should completely disrupt the Cl.42
conformation, we first generated a mutant aptamer (mutCl.42) substituting the CCAUGC intra-strand loop
with UUUCCC (Figure S2).
Figure S2. Secondary and tertiary structure of Cl.42 (A) and mutant Cl.42 (mutCl.42; B) aptamers as
generated by RNAComposer and RNAfold. The region CCAUGC in the Cl.42 aptamer allows the formation
of an intra-strand loop structure, while the mutation of this sequence does not allow the formation of any kind
of secondary structure.
Then, to experimentally validate the functional relevancy of the CCAUGC region, we labeled both native and
mutant Cl.42 aptamers with Cy3 dye and evaluated via FACS their binding affinity in a binding assay against
epoxy beads loaded with recombinant IL4Ra. As shown in Figure S3, while Cl.42 aptamer correctly binds to
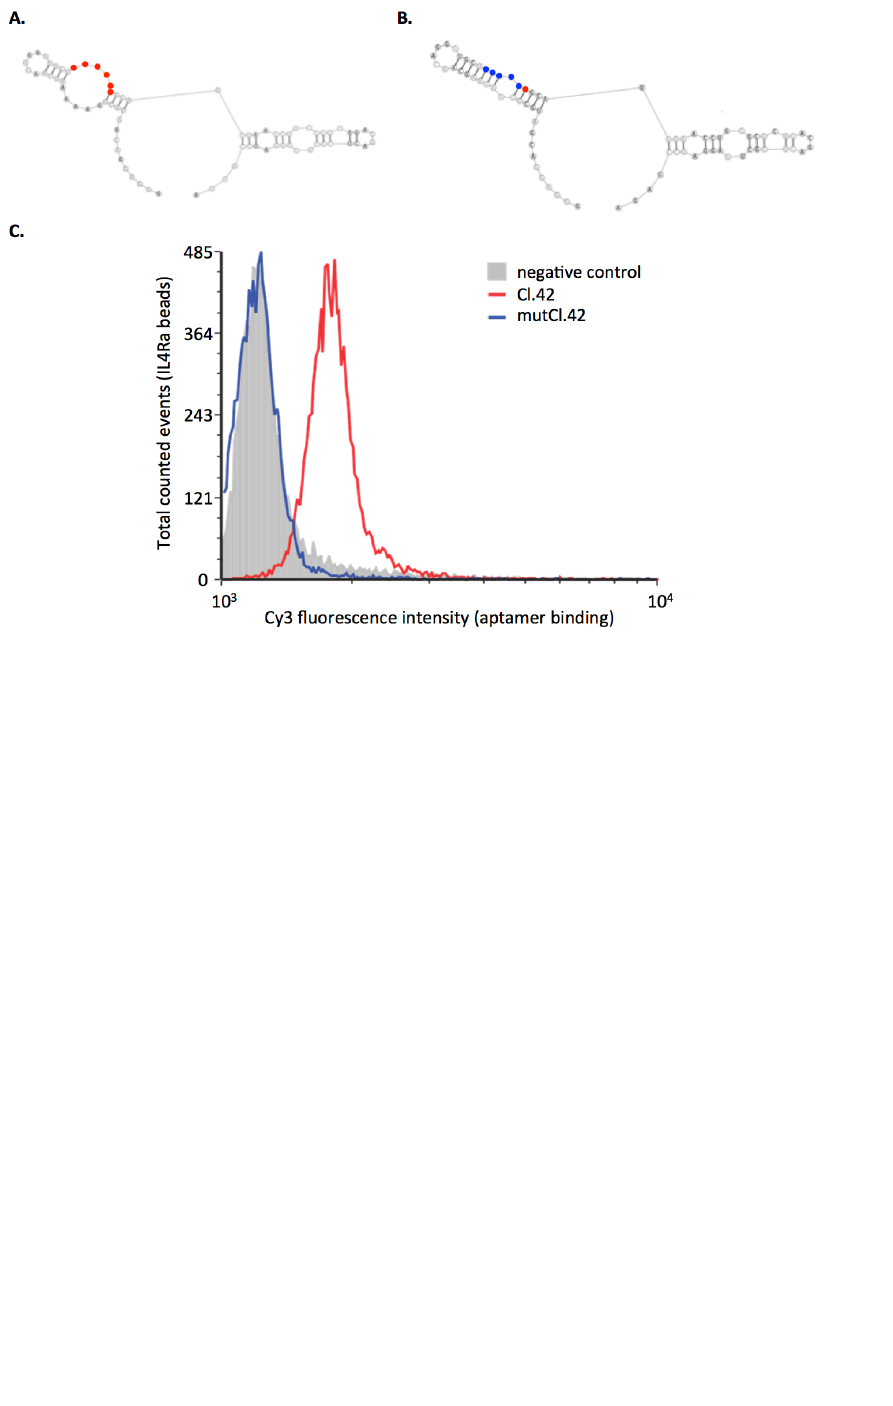
8
IL4Ra-loaded beads, the mutant aptamer does not show any binding activity confirming that the interior loop
identified by APTANI is indeed required for conferring functional activity to the aptamer sequence.
Figure S3. To assess the functional relevance of the CCAUGC motif identified by APTANI, we first
synthetized the Cl42 aptamer (A) and a mutant Cl.42 (mutCl.42, B), with the original CCAUG sequence
substituted by UUUCC. Secondary structure analysis suggests that this 5 nucleotides substitution completely
abrogates the original intra-strand loop (A and B). Then, to evaluate whether the CCAUGC motif was
important for the aptamer binding to IL4Ra, Cl.42, mutCl.42, and an irrelevant aptamer were labeled with
Cy3 and incubated with epoxybeads conjugated with recombinant IL4Ra. Binding was evaluated by FACS
after washing out the unbound Cy3 labeled aptamer with PBS (C). As expected, the Cl.42 aptamer (red line)
binds to the cognate receptor as determined by the higher fluorescence intensity detected on beads. On the
contrary, the mutCl.42 aptamer (blue line) shows a binding similar to the irrelevant aptamer (gray), used as
negative control.
Finally, we performed the same analysis considering the aptamer variable region. With the same set of
parameters used in the previous experiments, APTANI retrieved, from cycle 11, 416,616 different variable
sequences, with a frequency spanning from 10-1 to 10-8 and a length ranging from 35 to 40 nucleotides. Of
these variable sequences, 42 presented highly populated motifs and frequencies. As in the previous
experiments, Cl.42 aptamer resulted the most abundant sequence and its intra-strand loop among the most
represented motifs.
Comparison of outputs from different HT-SELEX cycles
APTANI contains also a python script, called cycle_analyzer.py, to compare the frequencies of the most
significant aptamers created during different HT-SELEX cycles. The script compares the count.csv file
containing the frequencies at a given cycle (indicated as reference) with all other count.csv files generated
during all other cycles. Otherwise deleted, the count.csv file of any cycle can be saved running APTANI
with the -d flag (see Parameters section for a full description of the -d option).
The cycle_analyzer.py script is written in Python 3.3 and outputs a file with sequences in the rows and
the frequency of any sequence at the various cycles in the columns. In case a sequence is not found at a
given cycle, then it will be tagged as not-found. Columns (i.e., cycles) are ordered as specified in the
command line, with the reference (i.e., the investigated cycle) in the last column.
An example of the cycle_analyzer.py command line is as follows:

9
python cycle_analyzer.py -i count1.csv count2.csv count3.csv -r count4.csv -t 30
-o output.txt
were the various parameters are:
-i --input_files
The -i parameter specifies the names of the input file(s) to be investigated. The script accepts any number
of input files and processes them in the same order they are written in the command line. This parameter is
mandatory.
-r --reference
The -r flag parameter specifies the name of reference file (i.e., the file generated at a given HT-SELEX
cycle). This parameter accepts only one file as input.
-t –top [NUMBER]
The -t parameter specifies the number of most significant sequences (as identified by APTANI) whose
frequencies, in the selected cycle, will be compared to the frequencies in all other cycles. In both input
files and reference files, sequences are unique and sorted by frequency. The default value is set to 10.
-o --output
The -o parameter specifies the name of the output file (returned in tab delimited text format).
COMPARISON WITH OTHER METHODS
Tools for the analysis of SELEX and HT-SELEX data
To date, four different tools are available to analyze aptamers sequences obtained by SELEX and HT-
SELEX experiments (Table S2):
— AptaMotif (Hoinka et al., 2012), the algorithm that inspired APTANI, performs a secondary structure motif
analysis on SELEX data, but cannot be applied to HT-SELEX experiments;
— AptaCluster (Hoinka et al., 2014) is a robust method to cluster SELEX and HT-SELEX data. Although
extremely efficient in clustering large aptamer pools, AptaCluster does not take into account the
secondary structure conformation of the aptamers during the investigation process. Moreover, its usability
is hampered by some software dependencies (i.e., MySQL, C++ libraries, etc.) that require a sound
informatics expertise for installation and usage;
— MPBind (Jiang et al., 2014), written in Python 2.7, scans aptamer sequences for conserved sub-
sequence motifs and then applies a statistical analysis to define their relevance. Although MPBind is able
to retrieve sub-sequence motifs, no secondary structure analysis is performed during this process.
MPBind cannot analyze HT-SELEX data;
— FASTAptamer (Alam et al., 2015) is a toolkit written in Perl that can handle both SELEX and HT-SELEX
data. FASTAptamer has been designed to normalize and rank read counts derived from FASTQ files,
compare sequences and generate clusters of sequence families. Moreover, FASTAptamer contains a
dedicated tool, named FASTAptamer_Search, that allows the user to interrogate and search the aptamer
pool for user-defined sequence motifs. However, FASTAptamer is not designed neither to perform any
secondary structure analysis nor to search for de-novo sub-sequences or sub-structures.
The main characteristics of APTANI, AptaMotif, ApataCluster, MPBind, and FASTAptamer are summarized
in Table S2.
Table S2. Main characteristics of the various tools for the analysis of SELEX and HT-SELEX data (✔
available, ✗ not-available).
Characteristic
APTANI
AptaMotif
AptaCluster
MPBind
FASTAptamer
Analysis of SELEX data
✔
✔
✔
✔
✔
Analysis of HT-SELEX data
✔
✗
✔
✗
✔
Secondary structure analysis
✔
✔
✗
✗
✗
Motif finding
✔
✔
✗
✔
✗
Motifs finding (secondary structure analysis)
✔
✔
✗
✗
✗
Cluster investigation
✔
✗
✔
✗
✔
Cluster evolution through cycles investigation
✔
✗
✔
✗
✔
Linear motif investigation
✔
✔
✗
✔
✗
Non-linear motif investigation
✔
✔
✗
✗
✗
Loop structure investigation
✔
✔
✗
✗
✗
Graphic User Interface (GUI)
✗
✗
✔
✗
✗
Single instruction program
✔
✔
✔
✗
✗
Multi-instruction program
✗
✗
✗
✔
✔

10
Complete pipeline of analysis
✔
✗
✗
✗
✗
Clustering tree figure
✔
✗
✗
✗
✗
Aptamer frequency analysis
✔
✔
✔
✗
✔
Programming language
Python 3.3
Most likely
Python
C++
Python 2.7
Perl
Code availability
Free
Not publicly
available;
most likely
comprised in
AptaCluster
Free
Free
Free
Required libraries and/or programs
Clustal Omega,
RNAsubopt
MySQL-client,
MySQL-server,
MySQL-connector,
libmysqlclient-dev,
NCurses, Boost,
bzip2, gcc>4.8,
cmake version>2.8,
JVM
None
None
Comparison with AptaCluster and FASTAptamer
As evidenced in Table S1, only AptaCluster and FASTAptamer can analyze HT-SELEX data and thus we
compared APTANI performances to those of AptaCluster and FASTAptamer. Unfortunately, at the time of
writing the manuscript, we could not install AptaCluster in different Linux system including Centos 6.0,
Debian Wheezy, and Ubuntu 14.04 due to a compilation error in Aptacluster’s C++ code. Instead we were
able to compare the performances of APTANI versus FASTAptamer on the FASTAptamer reference dataset
(Ditzler et al., 2013). This dataset contains a RNA aptamer library enriched against Reverse Transcriptase
(RT) from HIV-1 strain BH10 through 14 rounds of SELEX. When applied to this data, APTANI identified as
intra-strand loops the asymmetric loop structures of FASTAptamer original publication (Alam et al., 2015).
Moreover, APTANI retrieved several different sub-sequences, related to this secondary structure motif,
partially overlapping with the degenerate motifs ArCGUy and CArAr (r and y stand for any purine and any
pyrimidine, respectively) identified by FASTAptamer (Table S3).
Table S3. Motifs retrieved by FASTAptamer and APTANI from the analysis of FASTAptamer dataset.
Left strand
Right strand
Left strand
abundance (%)
Right strand
abundance (%)
FASTAptamer
ArCGUy
CArAr
2.9*
APTANI
UGUCG
CAAAA
0.6800
0.330
UAUCG
CAAAA
0.0180
0.330
CGACGU
AAGG
0.0060
0.044
UGCAG
CGAAA
0.0055
0.290
CGGCGU
AAGG
0.0007
0.044
*total abundance (left+right strand abundance)
APTANI was also able to identify high-populated hairpin loops that FASTAptamer algorithm was unable to
find (Table S4). Although both algorithms used less than 8GB of RAM, APTANI outperformed FASTAptamer
in terms of computational speed, completing the analysis in about 30 minutes compared to the 90 minutes
required by FASTAptamer. Finally, the FASTA format of FASTAptamer output resulted less intuitive to
interpret compared to the tab delimited tables produced by APTANI.
Table S4. Highly populated hairpin loops identified by APTANI in the FASTAptamer dataset
Hairpin structure
Abundance (%)
GACUCGC
16.51
GACUCGCC
14.25
UAUGCAAAUUAA
13.74
MATERIALS AND METHODS
Library and SELEX primers and templates
Sullinger library 1: 5’ TCTCGGATCCTCAGCGAGTCGTCTG40(N)CCGCATCGTCCTCCCTA 3’
Sul3’: 5’TCTCGGATCCTCAGCGAGTCGTC 3’
Sul5’: 5’ GGCCATCGTCCTCCCTATAGTGAGTCGTATTAGAATTCCCCC 3’
Sul3’ short: 5’ TCTCGGATCCTCAGCGAGTC 3’

11
Cl.42:5’TCTCGGATCCTCAGCGAGTCGTCTGCGCGCAGGTTCCATGCGCATGGAGCACCCTGTTGCTTT
TTCCGCATCGTCCTCCCTA3’
mutCl.42:5’TCTCGGATCCTCAGCGAGTCGTCTGCGCGCAGGTTCCATGCGGGAAAAGCACCCTGTTGC
TTTTTCCGCATCGTCCTCCCTA3’
DNA tagging for HT-sequencing
PCR tagging Cycle 1. First PCR : 1PFA (5’-CCT ACA CGA CGC TCT TCC GAT CTC TAA GCG AGG
ACGATGCGG-3’), 1PRA (5’-GGA GTT CAG ACG TGT GCT CTT CCG ATC TGA CAG TCT CGG
ATCCTCAGCG-3’); second PCR: UPFB (5’- AAT GAT ACG GCG ACC ACC GAG ATC TAC ACT CTT TCC
CTA CAC GAC GCT CTT CCGA- 3’), 1PRB (5’-CAA GCA GAA GAC GGC ATA CGA
GATACATCGGTGACTGGAGTTCAGACGTGTGCTCTTCCG-3’).
PCR tagging Cycle 3. First PCR : 2PFA (5’-CCT ACA CGA CGC TCT TCC GAT CTA CTG AGA GGA
CGATGCGG-3’), 2PRA (5’-GGA GTT CAG ACG TGT GCT CTT CCG ATC CAT GCT
CTCGGATCCTCAGCG-3’); second PCR: UPFB, 2PRB (5’-CAA GCA GAA GAC GGC ATA CGA GAT
CGTGATGTGACTGGAGTTCAGACGTGTGCTCTTCCG-3’).
PCR tagging Cycle 5. First PCR : 3PFA (5’-CCTA CAC GAC GCT CTT CCG ATC TGG TCA
ATGAGGACGATGCGG-3’), 3PRA (5’-GGA GTT CAG ACG TGT GCT CTT CCG ATC ATC TAA CTC
TCGGATCCTCAGCG-3’); second PCR: UPFB, 3PRB (5’-CAA GCA GAA GAC GGC ATA CGA GAT
TGGTCAGTGACTGGAGTTCAGACGTGTGCTCTTCCG-3’).
PCR tagging Cycle 11. First PCR: 4PFA (5’-CCT ACA CGA CGC TCT TCC GAT CTT ACG CTG
AGAGGACGATGCGG-3’), 4PRA (5’-GGA GTT CAG ACG TGT GCT CTT CCG ATC GCG AGC
AATCTCGGATCCTCAGCG-3’); second PCR: UPFB, 4PRB (5-‘CAA GCA GAA GAC GGC ATA CGA
GATATTGGCGTGACTGGAGTTCAGACGTGTGCTCTTCCG-3’).
RT-PCR tagging and HT-sequencing
Aptamers libraries were derived from a previously published SELEX experiment, where the Sullinger library
template was used as starting material for the selection of aptamers specific for IL4Ra using epoxy beads
conjugated with the extracellular domain of the relevant receptor (Roth et al., 2012). RT-PCRs from the
different cycles were purified using the QIAquick PCR Purification Kit (Qiagen) following manufactured
instruction. Purified DNA was tagged using two sequential PCRs. The first PCR reactions were performed in
100 µl of water containing 1XPCR buffer, MgCl (1.5 mM), dNTPs (200 µM), DNA template (5 ng/µl
recombinant taq polymerase (5 U, Invitrogen) and the PFA and PRA primers corresponding to each cycle
described above. The reactions were performed in the GS482 termocycler (G-STORM) using the following
program: 95ºC, 5’, 5x(95ºC 1’, 56ºC 30”, 72ºC 30”), 72ºC 10’. PCR was purified via gel extraction using the
QIAquick Gel Extraction Kit (QIAGEN) following manufacturer instructions. The second PCR was performed
using the same condition described above but using the UFB and PRB primers and the following program:
95ºC, 5’, 6x(95ºC 30’’, 65ºC 30’’, 72ºC 1”), 72ºC 10’. Product were purified by gel extraction, quality and
quantity evaluated via bio-analyzer (Agilent). Library quantitation and pooling took place at the Hussman
Institute for Human Genomics-Center for Genome Technology using the KAPA Library Quantification Kit for
Illumina platforms (part#KK4854). 10-13pM of pooled samples were loaded on the Illumina cBot for cluster
generation according to manufacturer's recommendations. Sequencing occurred on the Illumina HiSeq
2000/2500 (HCS 2.0.12.0) using the reagents provided in the Illumina TruSeq PE Cluster Kit v3 and the
TruSeq SBS Kit-HS (200 cycle) kit. Data processing was done using HiSeq’s Real Time Analysis (RTA) from
Casava software. Base calling files were transformed into zipped FASTQ files containing raw reads with
base qualities. These raw read files were then filtered by Illumina’s internal filter resulting in 2 FASTQ files (1
per read) containing all pass-filter reads. FASTQ files were used as input with APTANI.
Synthesis of Cl.42 and mutCl.42 aptamers
Aptamers were produced by PCR followed by T7 RNA polymerase reaction. Briefly, Cl.42 and Cl.42mut
dsDNAs were generated by PCR by admixing the SUL3’ and SUL5’ primers (50 pmoles each), with, as
template (100 pmoles), either the Cl42_template or mutCl.42_template described above in 50µl of water
containing: 1XPCR buffer, MgCl (1.5mM), dNTPs (200µM), and recombinant Taq polymerase (5U,
Invitrogen). Reaction mixture was amplified in the GS482 termocycler (G-STORM) with the following
program: 95ºC, 5’, 3x(94ºC 30”, 52ºC 20”, 72ºC 25”), 20x(94ºC 30”, 54ºC 20”, 72ºC 25”), 72ºC 5’. PCR
products were purified with QIAquick PCR Purification Kit (QIAGEN) and transcribed in vitro by Durascribe
T7 RNA synthesis kit (Epicentre) following manufacturer instructions. DNA was removed by the reaction by
1h’ treatment with DNAse1 (20U, epicenter) followed by RNA purification using the RNeasy kit (QIAGEN)
and following manufacturer’s instructions.

12
Bead conjugation with recombinant proteins
20x106 Dynabeads M-450 Epoxybeads (Invitrogen) were conjugated with 10 µg of recombinant rmIL-4 R/Fc
Chimera protein (R&D systems) in 1 ml of binding buffer (Na3PO4 0.1M PH8) in a glass vial, overnight at RT
in a 90° angle rotator. Beads were washed twice with PBS 1X and store in PBS at 4°C at 20x106 beads/ml.
Aptamer mediated binding of recombinant protein-conjugated beads
Cl.42, mutCl.42, or RNA aptamer library composed of random aptamers, were Cy3 labeled with the Cy3 dye
RNA labeling kit (Ambion) following the manufacturer instruction and product were purified by ethanol
precipitation. Cy3 labeling was quantified by Nanodrop (Fisher) analysis and agarose gel. Prior to binding,
aptamers were heated at 65°C for 5’ and left to cool at RT for 10’ to allow a correct secondary structure
refolding. Binding to the magnetic beads was performed by incubating, at RT for 10 minutes, 37 pmoles of
the Cy3-aptamers with 2x10⁵ beads in 50 µl binding buffer_2 (PBS 1X, MgCl2 900 µM, CaCl2 490µM). After
incubation beads were washed twice with binding buffer_2 and fluorescence was measured in a LSR2 flow
cytometer (BD). Data were analyzed using FCS express V3.0 (de novo software).
REFERENCES
Alam,K.K. et al. (2015) FASTAptamer: A Bioinformatic Toolkit for High-throughput Sequence Analysis of
Combinatorial Selections. Mol. Ther. Nucleic Acids, 4, e230.
Bagalkot,V. et al. (2006) An aptamer-doxorubicin physical conjugate as a novel targeted drug-delivery
platform. Angew Chem Int Ed Engl, 45, 8149–8152.
Bowser,M.T. (2005) SELEX: just another separation? Analyst, 130, 128–130.
Cao,Z. et al. (2009) Reversible cell-specific drug delivery with aptamer-functionalized liposomes. Angew
Chem Int Ed Engl, 48, 6494–6498.
Chu,T.C., Twu,K.Y., et al. (2006) Aptamer mediated siRNA delivery. Nucleic Acids Res, 34, e73.
Chu,T.C., Marks,J.W., et al. (2006) Aptamer:toxin conjugates that specifically target prostate tumor cells.
Cancer Res, 66, 5989–5992.
Dassie,J.P. et al. (2009) Systemic administration of optimized aptamer-siRNA chimeras promotes regression
of PSMA-expressing tumors. Nat Biotechnol, 27, 839–849.
Denman,R.B. (1993) Using RNAFOLD to predict the activity of small catalytic RNAs. BioTechniques, 15,
1090–1095.
Dhar,S. et al. (2008) Targeted delivery of cisplatin to prostate cancer cells by aptamer functionalized Pt(IV)
prodrug-PLGA-PEG nanoparticles. Proc Natl Acad Sci USA, 105, 17356–17361.
Ditzler,M.A. et al. (2013) High-throughput sequence analysis reveals structural diversity and improved
potency among RNA inhibitors of HIV reverse transcriptase. Nucleic Acids Res, 41, 1873–1884.
Farokhzad,O.C. et al. (2004) Nanoparticle-Aptamer Bioconjugates A New Approach for Targeting Prostate
Cancer Cells. Cancer Res., 64, 7668–7672.
Farokhzad,O.C. et al. (2006) Targeted nanoparticle-aptamer bioconjugates for cancer chemotherapy in vivo.
Proc Natl Acad Sci USA, 103, 6315–6320.
Gu,F. et al. (2008) Precise engineering of targeted nanoparticles by using self-assembled biointegrated
block copolymers. Proc Natl Acad Sci USA, 105, 2586–2591.
Guo,P. (2005) RNA nanotechnology: engineering, assembly and applications in detection, gene delivery and
therapy. J Nanosci Nanotechnol, 5, 1964–1982.
Guo,S. et al. (2005) Specific delivery of therapeutic RNAs to cancer cells via the dimerization mechanism of
phi29 motor pRNA. Hum Gene Ther, 16, 1097–1109.
Hicke,B.J. and Stephens,A.W. (2000) Escort aptamers: a delivery service for diagnosis and therapy. J Clin
Invest, 106, 923–928.
Hofacker,I.L. et al. (1994) Fast Folding and Comparison of RNA Secondary Structures. Monatshefte f.
Chemie, 125, 167-188.
Hoinka,J. et al. (2014) AptaCluster - A Method to Cluster HT-SELEX Aptamer Pools and Lessons from its
Application. Res Comput Mol Biol, 8394, 115–128.
Hoinka,J. et al. (2012) Identification of sequence-structure RNA binding motifs for SELEX-derived aptamers.
Bioinforma. Oxf. Engl., 28, i215–223.
Huang,Y.-F. et al. (2008) Cancer cell targeting using multiple aptamers conjugated on nanorods. Anal Chem,
80, 567–572.
Huang,Y.-F. et al. (2009) Molecular assembly of an aptamer-drug conjugate for targeted drug delivery to
tumor cells. Chembiochem, 10, 862–868.
Javier,D.J. et al. (2008) Aptamer-targeted gold nanoparticles as molecular-specific contrast agents for
reflectance imaging. Bioconjug Chem, 19, 1309–1312.
Jiang,P. et al. (2014) MPBind: a Meta-motif-based statistical framework and pipeline to Predict Binding
potential of SELEX-derived aptamers. Bioinformatics.
Jörg,I. et al. (2002) Anticoagulant-related skin reactions. Expert Opin Drug Saf, 1, 287–294.

13
Kang,H. et al. (2010) A liposome-based nanostructure for aptamer directed delivery. Chem Commun Camb,
46, 249–251.
Keefe,A.D. et al. (2010) Aptamers as therapeutics. Nat Rev Drug Discov, 9, 537–550.
Liu,K. et al. (2013) Aptamers: a promising tool for cancer imaging, diagnosis, and therapy. J Cell Biochem,
114, 250–255.
Lorenz,R. et al. (2011) ViennaRNA Package 2.0. Algorithms Mol Biol, 6, 26.
McNamara,J.O. et al. (2006) Cell type-specific delivery of siRNAs with aptamer-siRNA chimeras. Nat
Biotechnol, 24, 1005–1015.
Nimjee,S.M. et al. (2005) Aptamers: an emerging class of therapeutics. Annu Rev Med, 56, 555–583.
Popenda,M. et al. (2012) Automated 3D structure composition for large RNAs. Nucleic Acids Res., 40, e112.
Povsic,T.J. et al. (2013) A Phase 2, randomized, partially blinded, active-controlled study assessing the
efficacy and safety of variable anticoagulation reversal using the REG1 system in patients with acute
coronary syndromes: results of the RADAR trial. Eur Heart J, 34, 2481–2489.
Rossi,J.J. (2011) RNA nanoparticles come of age. Acta Biochim Biophys Sin Shanghai, 43, 245–247.
Roth,F. et al. (2012) Aptamer-mediated blockade of IL4Rα triggers apoptosis of MDSCs and limits tumor
progression. Cancer Res, 72, 1373–1383.
Sievers,F. and Higgins,D.G. (2014) Clustal Omega, accurate alignment of very large numbers of sequences.
Methods Mol Biol, 1079, 105–116.
Taghdisi,S.M. et al. (2010) Targeted delivery of daunorubicin to T-cell acute lymphoblastic leukemia by
aptamer. J Drug Target, 18, 277–281.
Tuerk,C. and Gold,L. (1990) Systematic evolution of ligands by exponential enrichment: RNA ligands to
bacteriophage T4 DNA polymerase. Science, 249, 505–510.
Wullner,U. et al. (2008) Cell-specific induction of apoptosis by rationally designed bivalent aptamer-siRNA
transcripts silencing eukaryotic elongation factor 2. Curr Cancer Drug Targets, 8, 554–565.
Wuchty,S. et al. (1999) Complete suboptimal folding of RNA and the stability of secondary structures.
Biopolymers, 49, 145–165.
Yan,A.C. and Levy,M. (2009) Aptamers and aptamer targeted delivery. RNA Biol, 6, 316–320.
Zhang,L. et al. (2007) Co-delivery of hydrophobic and hydrophilic drugs from nanoparticle-aptamer
bioconjugates. ChemMedChem, 2, 1268–1271.
Zhou,J. et al. (2012) Current progress of RNA aptamer-based therapeutics. Front Genet, 3, 234.
Zhou,J. et al. (2008) Novel dual inhibitory function aptamer-siRNA delivery system for HIV-1 therapy. Mol
Ther, 16, 1481–1489.
Zhou,J. et al. (2009) Selection, characterization and application of new RNA HIV gp 120 aptamers for facile
delivery of Dicer substrate siRNAs into HIV infected cells. Nucleic Acids Res, 37, 3094–3109.
Zhou,J. and Rossi,J.J. (2009) The therapeutic potential of cell-internalizing aptamers. Curr Top Med Chem,
9, 1144–1157.
