What Is Azure Security Center?| Microsoft Docs ASC Workshop Guide V1
User Manual:
Open the PDF directly: View PDF ![]() .
.
Page Count: 96

Provision Lab Environment
This workshop will be using 2 different Azure Environments and access will need to be setup
to both. For ease of identification we will call them Red Subscription and Blue Subscription.
Different Scenarios below will use different Subscriptions.
Setup Red Subscrption:
1. Collect Azure Pass Promo Code.
2. Make sure you have an email address that does not have access to a current subscription.
If you do not have an email address available, please create a new email address with an
online email service, such as www.outlook.com.
3. Visit microsoftazurepass.com to redeem code.
a. Review Instructions for Redeeming Code and Activating Subscription -
https://www.microsoftazurepass.com/Home/HowTo
4. Ensure Azure Subscription is active by logging into http://portal.azure.com with same
credentials used on #2.
5. Provision a single small, such as B2s size, Windows 2016 Virtual Machine with default
options.
Setup Blue Subscrption:
1. Collect Azure Login and Password.
2. Ensure Azure Subscription Access is working by logging into http://portal.azure.com with
credentials used on #1.
3. If you can see a VM named ‘aschack-vm1’ then you are ready to go.
4. This is a shared environment so please do not change anything.
Azure Security Center Provisioning
Scenario – Red Subscription
Azure Security Center provides unified security management and threat protection across
your hybrid cloud workloads. While the Free tier offers limited security for your Azure
resources only, the Standard tier extends these capabilities to on-premises and other clouds.
Security Center Standard helps you find and fix security vulnerabilities, apply access and
application controls to block malicious activity, detect threats using analytics and
intelligence, and respond quickly when under attack. You can try Security Center Standard at
no cost for the first 60 days.
In this scenario, you upgrade to the Standard tier for added security and install the Microsoft
Monitoring Agent on your virtual machines to monitor for security vulnerabilities and threats.
Prerequisites
To get started with Security Center, you must have a subscription to Microsoft Azure.
To upgrade a subscription to the Standard tier, you must be assigned the role of Subscription
Owner, Subscription Contributor, or Security Admin.
Enable your Azure subscription
1. Sign into the Azure portal.
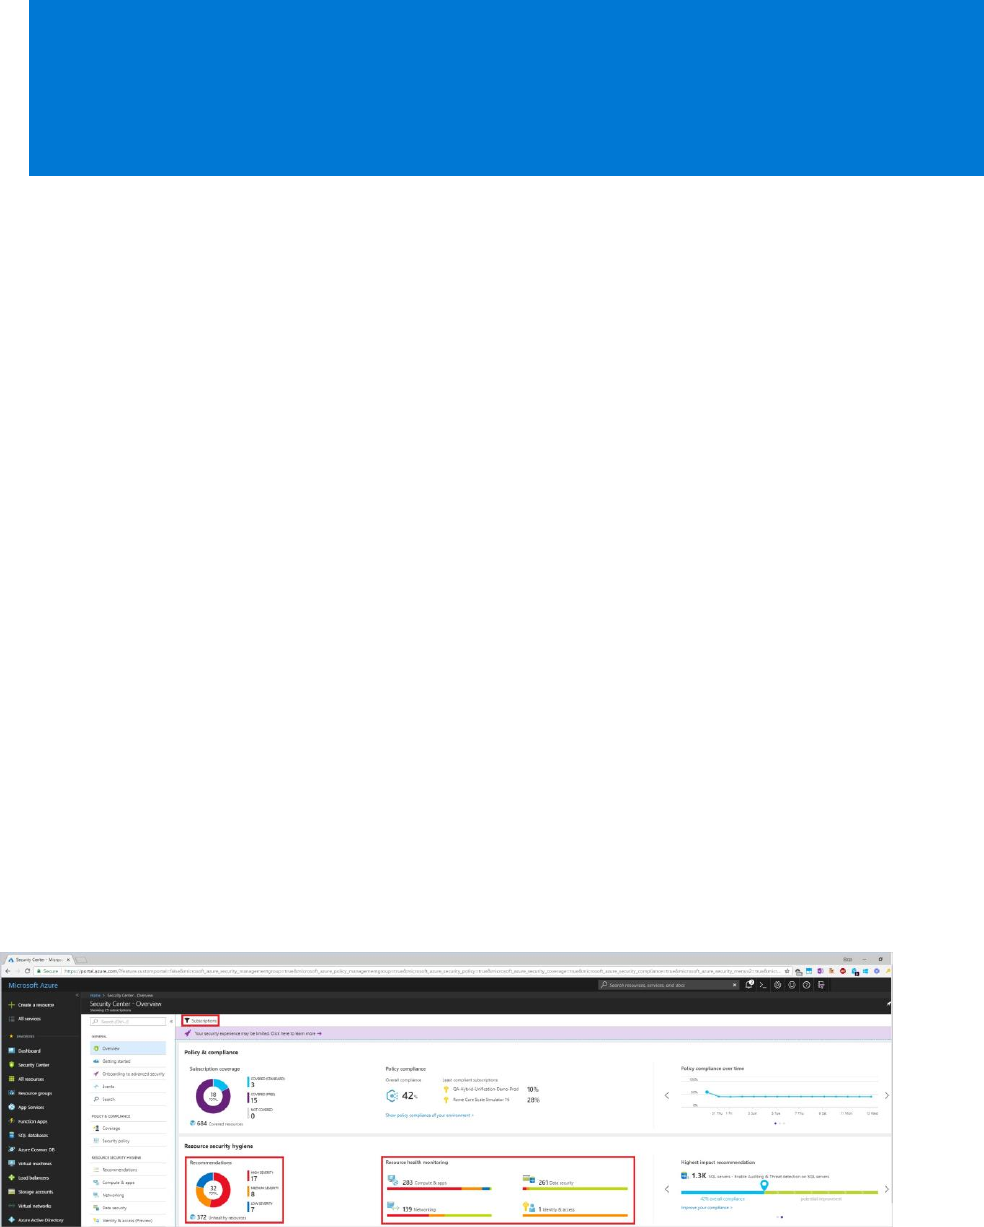
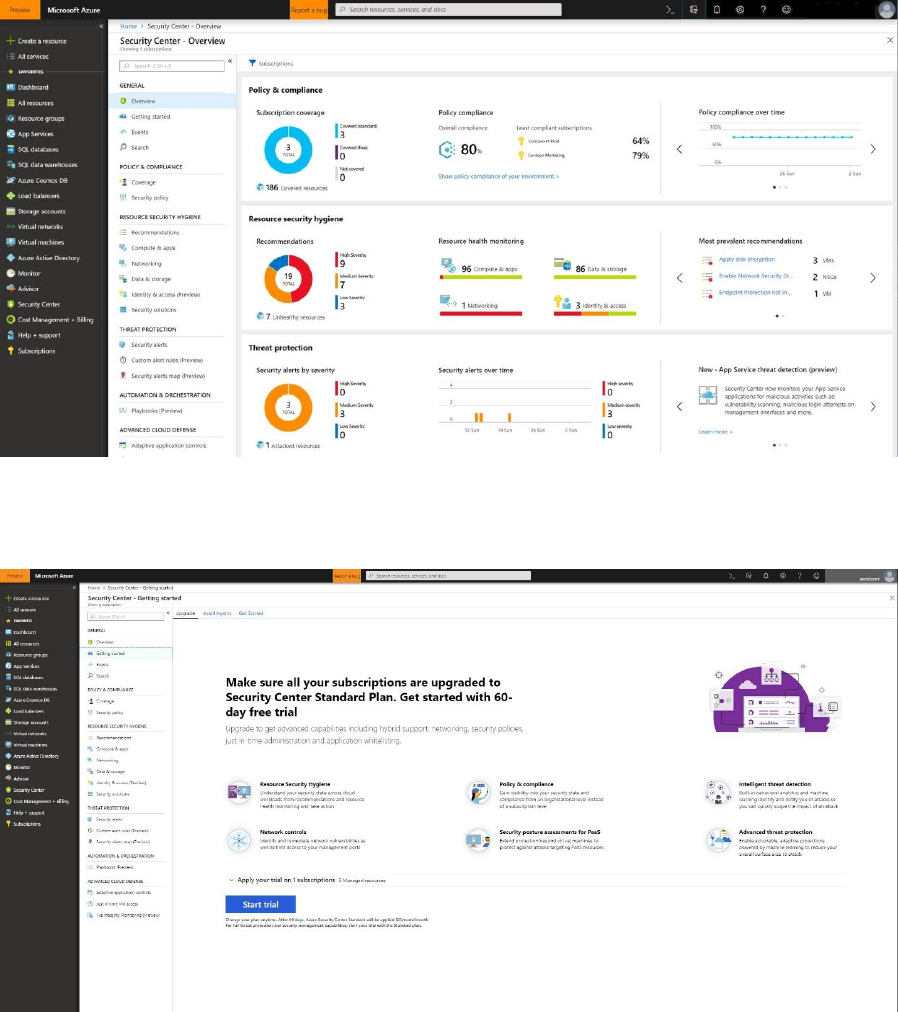
2. On the Microsoft Azure menu, select Security Center. Security Center - Overview
opens.
Security Center – Overview provides a unified view into the security posture of your hybrid
cloud workloads, enabling you to discover and assess the security of your workloads and to
identify and mitigate risk. Security Center automatically enables any of your Azure
subscriptions not previously onboarded by you or another subscription user to the Free tier.

You can view and filter the list of subscriptions by clicking the Subscriptions menu item.
Security Center will now begin assessing the security of these subscriptions to identify security
vulnerabilities. To customize the types of assessments, you can modify the security policy. A
security policy defines the desired configuration of your workloads and helps ensure
compliance with company or regulatory security requirements.
Within minutes of launching Security Center the first time, you may see:
Recommendations for ways to improve the security of your Azure subscriptions. Clicking
the Recommendations tile will launch a prioritized list.
An inventory of Compute & apps, Networking, Data security, and Identity & access
resources that are now being assessed by Security Center along with the security posture
of each.
To take full advantage of Security Center, you need to complete the steps below to upgrade
to the Standard tier and install the Microsoft Monitoring Agent.
Upgrade to the Standard tier
For the purpose of this scenario you must upgrade to the Standard tier. NOTE: Your first 60
days of Security Center are free, and you can return to the Free tier any time.
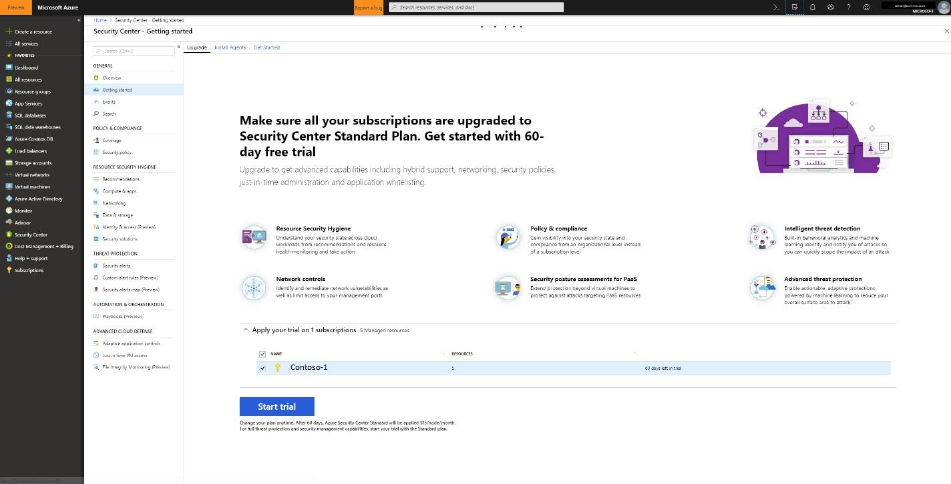
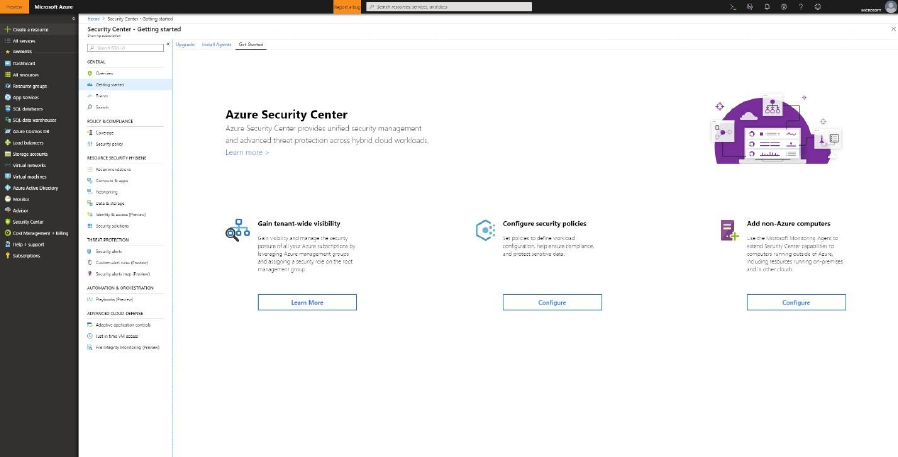
1. Under the Security Center main menu, select Getting started.
2. Under Upgrade, Security Center lists subscriptions and workspaces eligible for onboarding.
You can click on the expandable Apply your trial to see a list of all subscriptions and
workspaces with their trial eligibility status.
You can upgrade subscriptions and workspaces that are not eligible
for trial. You can select eligible workspaces and subscriptions to
start your trial.
3. Click Start trial to start your trial on the selected subscriptions.
Automate data collection
Security Center collects data from your Azure VMs and non-Azure computers to monitor for
security vulnerabilities and threats. Data is collected using the Microsoft Monitoring Agent,
which reads various security related configurations and event logs from the machine and
copies the data to your workspace for analysis. By default, Security Center will create a new
workspace for you.
When automatic provisioning is enabled, Security Center installs the Microsoft Monitoring
Agent on all supported Azure VMs and any new ones that are created. Automatic provisioning
is strongly recommended.
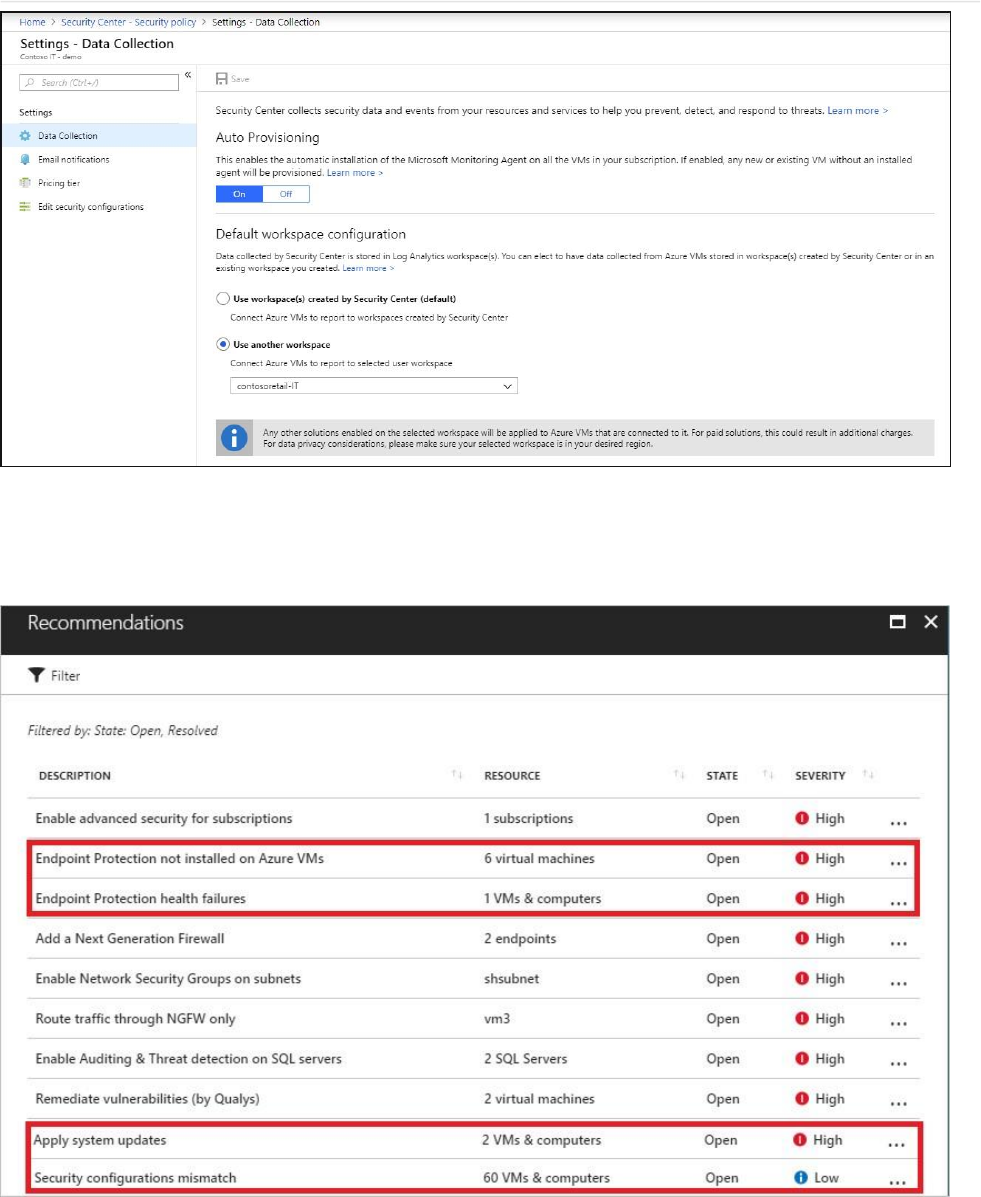
To enable automatic provisioning of the Microsoft Monitoring Agent:
1. Under the Security Center main menu, select Security Policy.
2. On the row of the subscription, select Edit settings>.
3. In the Data Collection tab, set Auto provisioning to On.
4. Select Save.
With this new insight into your Azure VMs, Security Center can provide additional
Recommendations related to system update status, OS security configurations, endpoint
protection, as well as generate additional Security alerts.
Permissions in Azure Security Center –
Advanced
Azure Security Center uses Role-Based Access Control (RBAC), which provides built-in roles
that can be assigned to users, groups, and services in Azure.
Security Center assesses the configuration of your resources to identify security issues
and vulnerabilities. In Security Center, you only see information related to a resource when
you are assigned the role of Owner, Contributor, or Reader for the subscription or
resource group that a resource belongs to.
In addition to these roles, there are two specific Security Center roles:
Security Reader: A user that belongs to this role has viewing rights to Security Center. The
user can view recommendations, alerts, a security policy, and security states, but cannot
make changes.
Security Administrator: A user that belongs to this role has the same rights as the Security
Reader and can also update the security policy and dismiss alerts and recommendations.
NOTE
The security roles, Security Reader and Security Administrator, have access only in Security Center.
The security roles do not have access to other service areas of Azure such as Storage, Web &
Mobile, or Internet of Things.
Roles and allowed actions
The following table displays roles and allowed actions in Security Center. An X indicates that
the action is allowed for that role.
ROLE
EDIT SECURITY
POLICY
APPLY SECURITY
RECOMMENDATIONS
FOR A RESOURCE
DISMISS ALERTS
AND
RECOMMENDATIONS
VIEW ALERTS AND
RECOMMENDATIONS
Subscription
Owner
X
X
X
X
Subscription
Contributor
X
X
X
X
Resource
Group Owner
--
X
--
X
Resource
Group
Contributor
--
X
--
X
Reader
--
--
--
X
Security
Administrator
X
--
X
X
Security
Reader
--
--
--
X
NOTE
We recommend that you assign the least permissive role needed for users to complete their tasks.
For example, assign the Reader role to users who only need to view information about the security
health of a resource but not take action, such as applying recommendations or editing policies.
Onboard Windows computers to Azure
Security Center – Review Only
After you onboard your Azure subscriptions, you can enable Security Center for resources
running outside of Azure, for example on-premises or in other clouds, by provisioning the
Microsoft Monitoring Agent.
Add new Windows computer
1. Sign into the Azure portal.
2. On the Microsoft Azure menu, select Security Center. Security Center - Overview opens.
3. Under the Security Center main menu, select Getting started.
4. Select the Get started tab.
5. Click Configure under Add new non-Azure computers. A list of your Log Analytics
workspaces is shown. The list includes, if applicable, the default workspace created for you
by Security Center when automatic provisioning was enabled. Select this workspace or
another workspace you want to use.
The Direct Agent blade opens with a link for downloading a Windows agent and keys for
your workspace ID to use in configuring the agent.
6. On the right of Workspace ID, note the copy icon.
7. On the right of Primary Key, note the copy icon.
DO NOT Install the agent…
The following would be the steps to install the agent, please review.
1. Copy the file to the target computer and Run Setup.
2. On the Welcome page, select Next.
3. On the License Terms page, read the license and then select I Agree.
4. On the Destination Folder page, change or keep the default installation folder and then
select Next.
5. On the Agent Setup Options page, choose to connect the agent to Azure Log Analytics
and then select Next.
6. On the Azure Log Analytics page, paste the Workspace ID and Workspace Key (Primary
Key) that you copied into Notepad in the previous procedure.
7. If the computer should report to a Log Analytics workspace in Azure Government cloud,
select Azure US Government form the Azure Cloud dropdown list. If the computer needs
to communicate through a proxy server to the Log Analytics service, select Advanced and
provide the URL and port number of the proxy server.
8. Select Next once you have completed providing the necessary configuration settings.
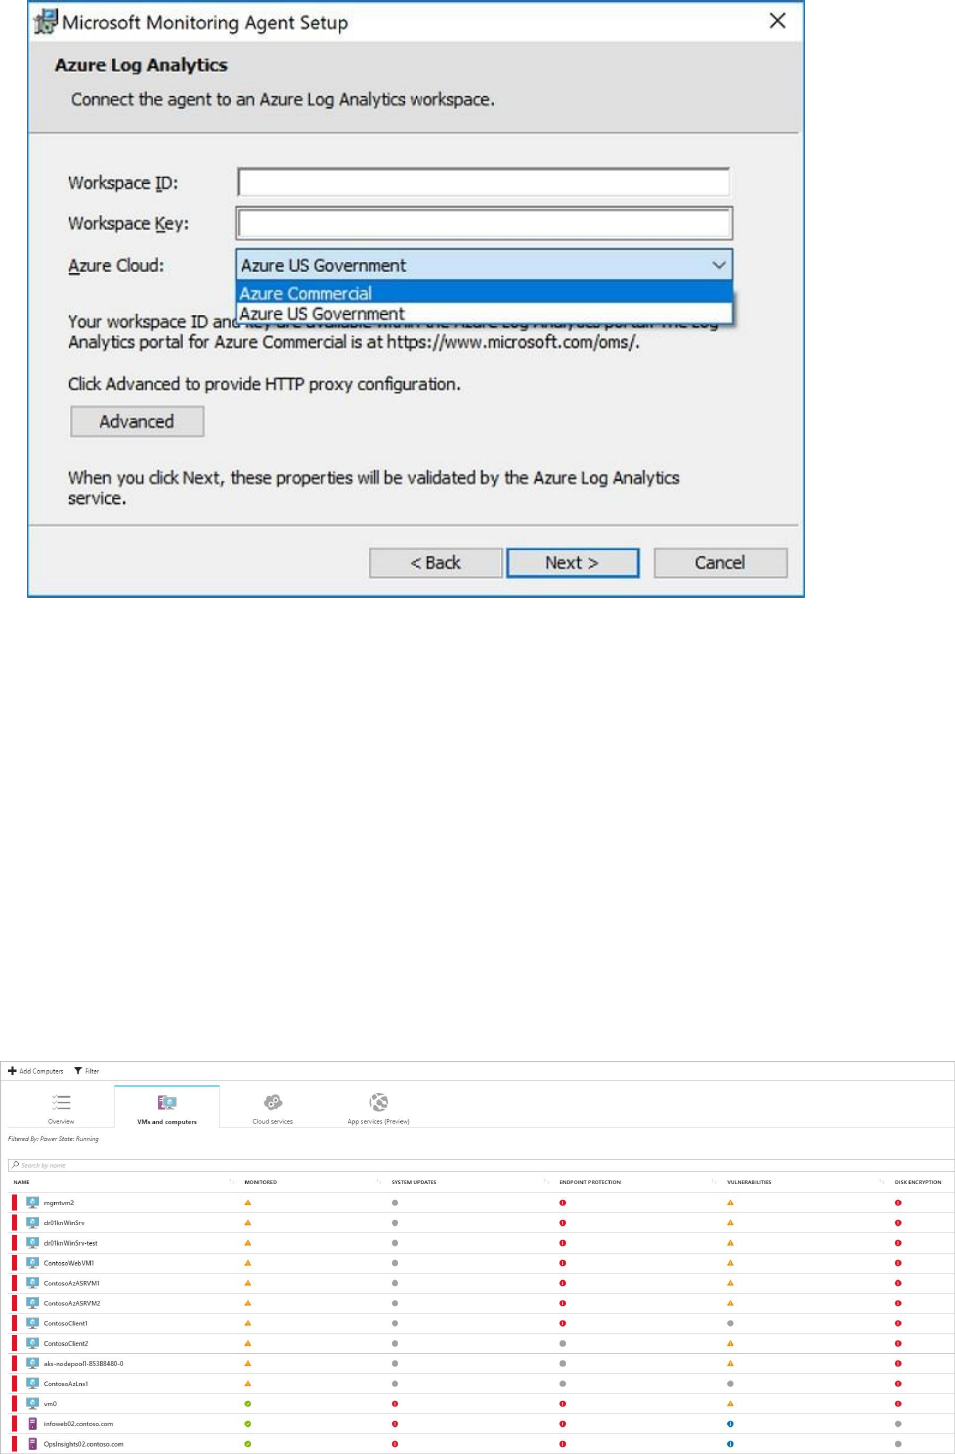
9. On the Ready to Install page, review your choices and then select Install.
10. On the Configuration completed successfully page, select Finish
When complete, the Microsoft Monitoring Agent appears in Control Panel. You can review
your configuration there and verify that the agent is connected.
For further information on installing and configuring the agent, see Connect Windows
computers.
Now you can monitor your Azure VMs and non-Azure computers in one place. Under
Compute, you have an overview of all VMs and computers along with recommendations.
Each column represents one set of recommendations. The color represents the VM's or
computer's current security state for that recommendation.
Security Center also surfaces any detections for these computers in Security alerts.
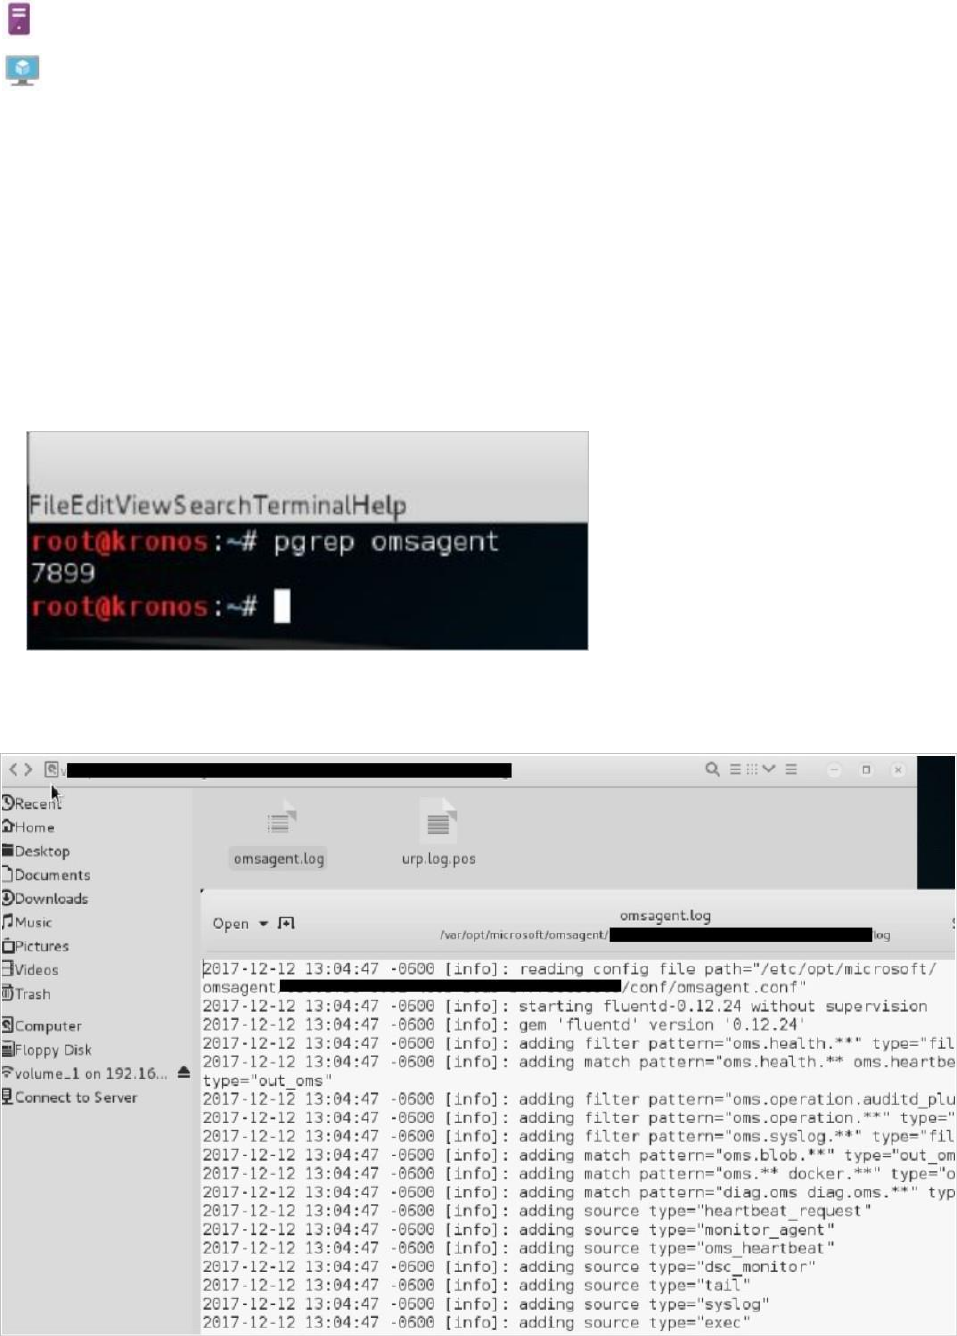
There are two types of icons represented on the Compute blade:
Non-Azure computer
Azure VM
Installing the agent on a Linux machine is very similar
until the Installation, which is explained here.
1. On your Linux computer, open the file that was previously saved. Select the entire content,
copy, open a terminal console, and paste the command.
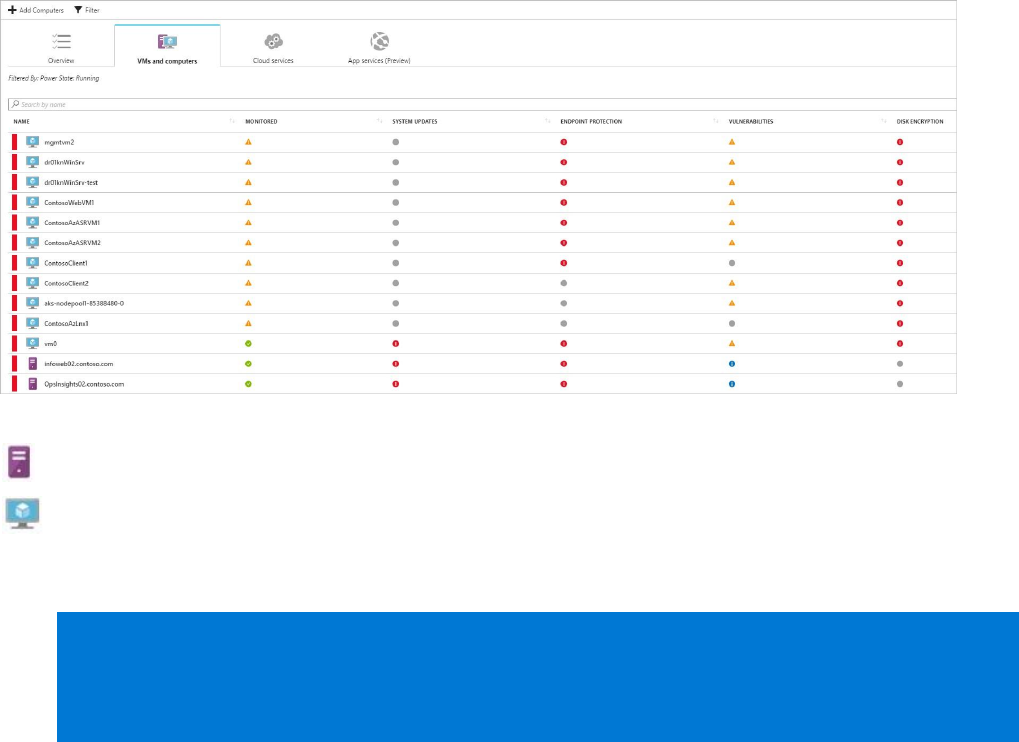
2. Once the installation is finished, you can validate that the omsagent is installed by running
the pgrep command. The command will return the omsagent PID (Process ID) as shown
below:
The logs for the Security Center Agent for Linux can be found at:
/var/opt/microsoft/omsagent//log/
After some time, it may take up to 30 minutes, the new Linux computer will appear in Security
Center.
Now you can monitor your Azure VMs and non-Azure computers in one place. Under
Compute, you have an overview of all VMs and computers along with recommendations.
Each column represents one set of recommendations. The color represents the VM's or
computer's current security state for that recommendation. Security Center also surfaces any
detections for these computers in Security alerts.
There are two types of icons represented on the Compute blade:
Non-Azure computer
Azure VM
Connect security solutions to Security
Center – Review Only
In addition to collecting security data from your computers, you can integrate security data
from a variety of other security solutions, including any that support Common Event Format
(CEF). CEF is an industry standard format on top of Syslog messages, used by many security
vendors to allow event integration among different platforms.
Prerequisites
You would need a Linux machine, with Syslog service that is already connected to your Security
Center, but this is a View Only scenario.
Connect solution using CEF
1. Sign into the Azure portal.
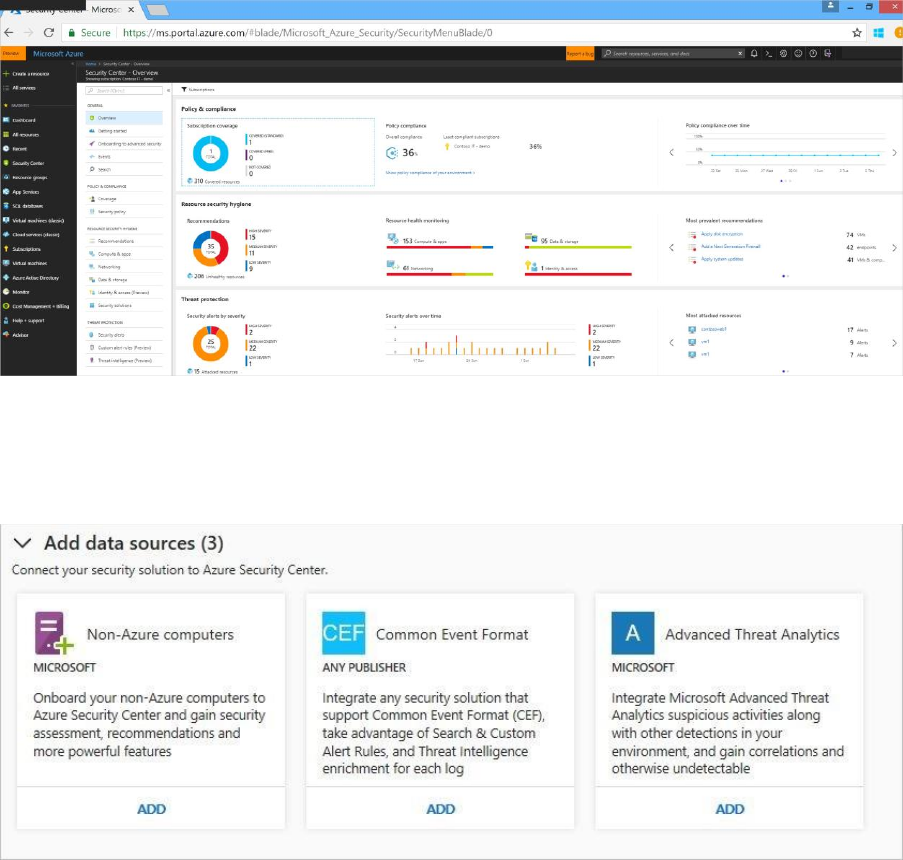
2. On the Microsoft Azure menu, select Security Center. Security Center - Overview opens.
3. Under the Security Center main menu, select Security Solutions.
4. In the Security Solutions page, under Add data sources (3), click Add under Common Event
Format.
5. In the Common Event Format Logs page, expand the second step, Configure Syslog
forwarding to send the required logs to the agent on UDP port 25226, and follow the
instructions below in your Linux computer:
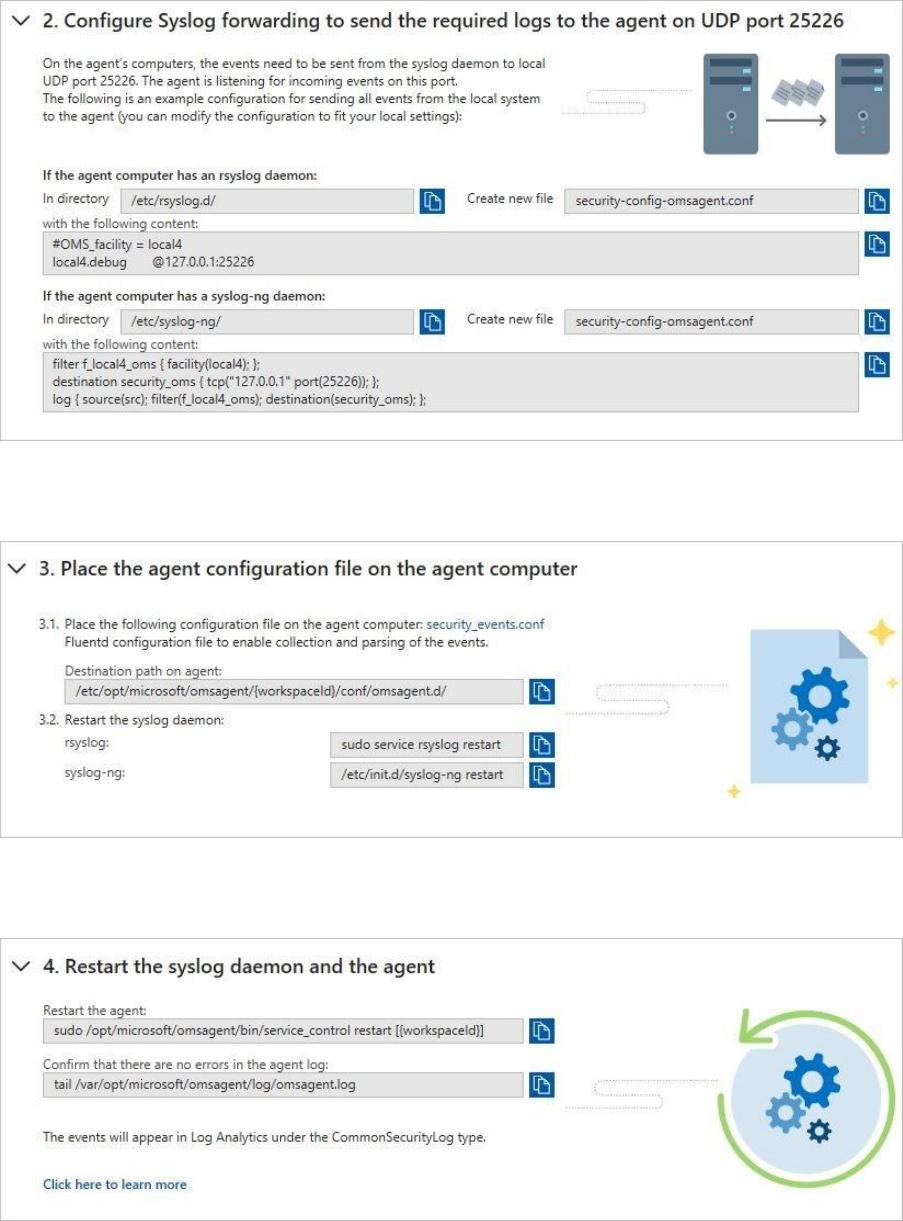
6. Expand the third step, Place the agent configuration file on the agent computer, and
note the instructions below for a Linux computer:
7. Expand the fourth step, Restart the syslog daemon and the agent, and note the
instructions below for your Linux computer:
To Validate the connection
You cannot do this in this scenario.
1. In the left pane, of the Security Center dashboard, click Search.
2. Select the workspace that the Syslog (Linux Machine) is connected to.
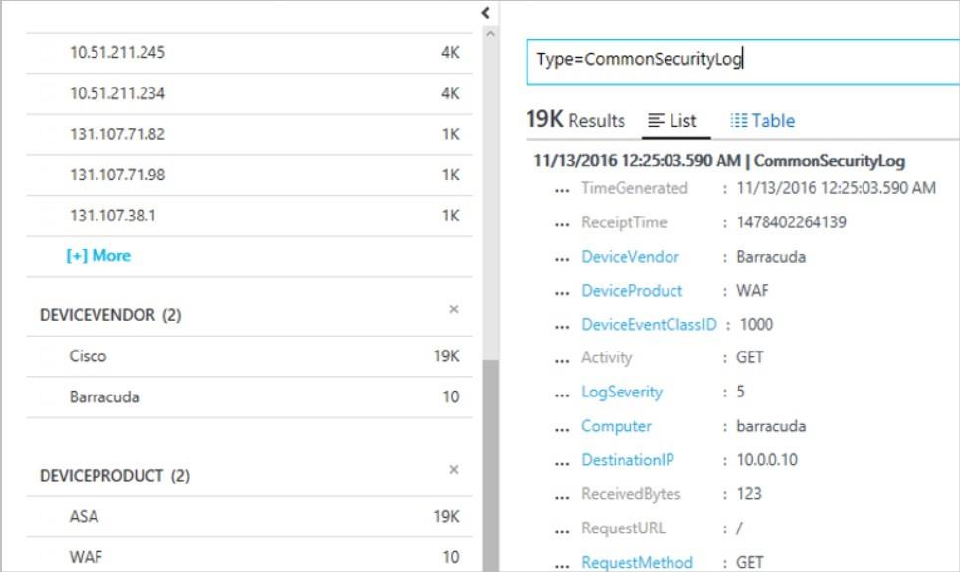
3. Type CommonSecurityLog and click the Search button.
The following example shows the result of these steps:
Azure Security Center Prevent Scenario
– Red Subscription and Blue
Subscription
Security Center helps ensure compliance with company or regulatory security requirements
by using security policies to define the desired configuration of your workloads. Once you
define policies for your Azure subscriptions, and adapt them to the type of workload or the
sensitivity of your data, Security Center can provide security recommendations for your
compute, application, networking, data & storage, and identity & access resources. In this
scenario, you will learn how to:
Configure security policy – Red Subscription
Assess the security of your resources – Blue Subscription
Configure security policy – Red Subscription
Security Center automatically creates a default security policy for each of your Azure
subscriptions. Security policies are comprised of recommendations that you can turn on or
turn off according to the security requirements of that subscription. To make changes to the
default security policy, you need to be an owner, contributor, or security administrator of the
subscription.
1. At the Security Center main menu, select Security policy.
2. Select the subscription that you want to use.
3. Under Compute and apps, Network, and Data, set each security configuration you want to
monitor to On. Security Center will continuously assess the configuration of your
environment and when vulnerability exists, Security Center will generate a security
recommendation. Select Off if the security configuration is not recommended or not

relevant. For example, in a dev/test environment you might not require the same level of
security as a production environment. After selecting the policies that are applicable to your
environment, click Save.
Wait until Security Center processes these policies and generates recommendations. Some
configurations, such as system updates and OS configurations can take up to 12 hours, while
network security groups and encryption configurations can be assessed almost instantly. Once
you see recommendations in the Security Center dashboard, you can proceed to the next step.
Setting security policies in Security
Center or in Azure Policy - Advanced
Azure Scurity Center policies integrate with Azure Policies, so you can set them either in
Security Center on a specific subscription, or in Azure Policy, which enables you to set
policies across Management groups and across multiple subscriptions..
What are security policies?
A security policy defines the desired configuration of your workloads and helps ensure
compliance with company or regulatory security requirements. In Azure Security Center, you
can define policies for your Azure subscriptions and tailor them to your type of workload or
the sensitivity of your data. For example, applications that use regulated data, such as
personally identifiable information, might require a higher level of security than other
workloads. To set a policy across subscriptions or on Management groups, set them in Azure
Policy.
NOTE
If you previously configured security policies on a subscription that is part of a management group,
or has multiple policy assigments, those policies appear greyed out in Security Center so that you
can manage the policy at the management group level via the Azure Policy page.
How security policies work
Security Center automatically creates a default security policy for each of your Azure
subscriptions. You can edit the policies in Security Center or use Azure Policy to do the
following things:
Create new policy definitions.
Assign policies across management groups and subscriptions, which can represent an
entire organization or a business unit within the organization. Monitor policy compliance.
For more information about Azure Policy, see Create and manage policies to enforce
compliance.
An Azure policy consists of the following components:
A policy is a rule
An initiative is a collection of policies
An assignment is an application of an initiative or a policy to a specific scope (management
group, subscription, or resource group)
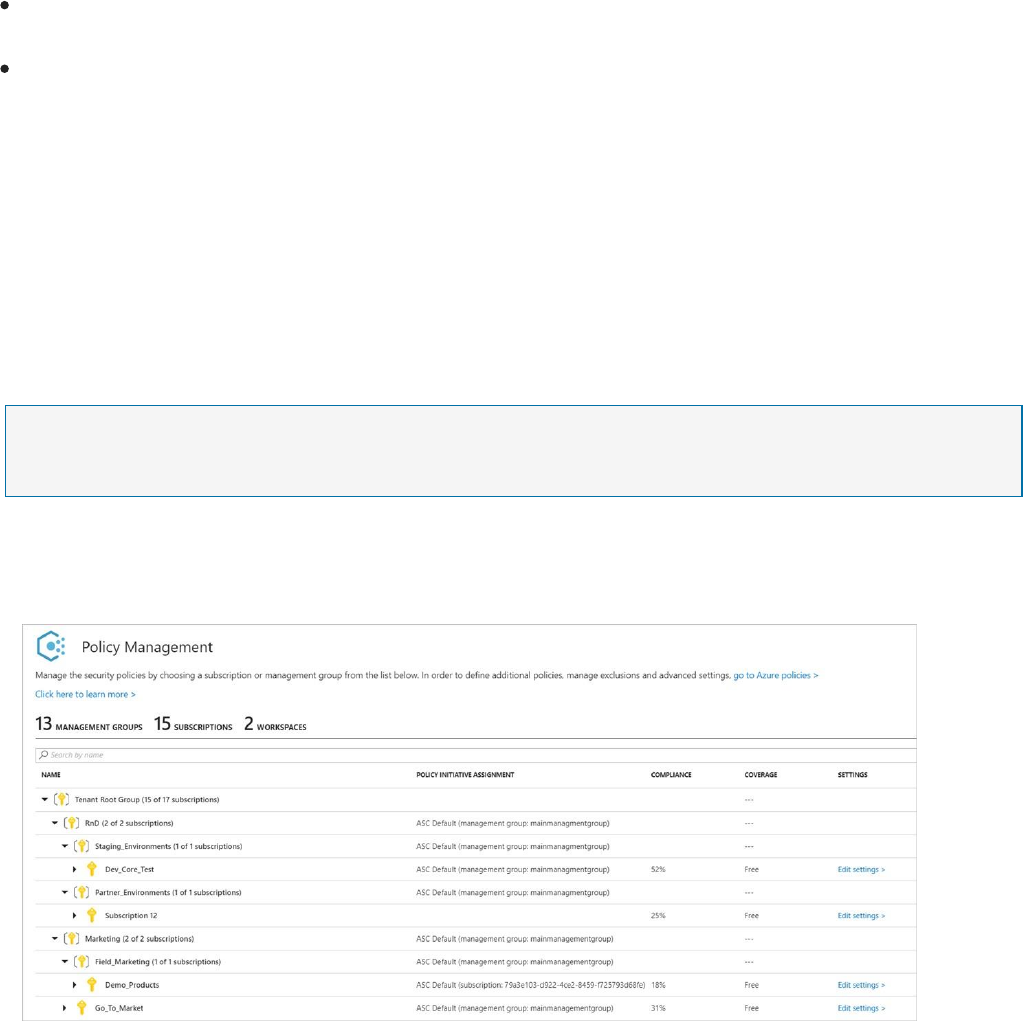
A resource is evaluated against the policies that are assigned to it and receives a compliance
ratio according to the number of policies the resource is compliant to.
Who can edit security policies?
Security Center uses Role-Based Access Control (RBAC), which provides built-in roles that can
be assigned to users, groups, and services in Azure. When users open Security Center, they
see only information that's related to resources they have access to. Which means that users
are assigned the role of owner, contributor, or reader to the subscription or resource group
that a resource belongs to. In addition to these roles, there are two specific Security Center
roles:
Security reader: Have view rights to Security Center, which includes recommendations,
alerts, policy, and health, but they can't make changes.
Security admin: Have the same view rights as security reader, and they can also update the
security policy and dismiss recommendations and alerts.
Edit security policies
You can edit the default security policy for each of your Azure subscriptions and management
groups in Security Center. To modify a security policy, you must be an owner, contributor, or
security administrator of the subscription or the containing management group. To view your
security policies in Security Center:
NOTE
Any policies set on a subscription that is part of a management group, or has multiple policy
assigments, will appear greyed out in Security Center. You can edit these policies in Azure Policy.
1. On the Security Center dashboard, under POLICY & COMPLIANCE, select Security
policy. Policy Management opens.
Policy Management displays the number of management groups, subscriptions, and
workspaces as well as your management group structure.
NOTE
The Security Center dashboard may show a higher number of subscriptions under Subscription
coverage than the number of subscriptions shown under Policy Management. Subscription
coverage shows the number of Standard, Free, and “not covered” subscriptions. The “not
covered” subscriptions do not have Security Center enabled and are not displayed under Policy
Management.
The columns in the table display:
Policy Initiative Assignment –Security Center built-in policies and initiatives that are
assigned to a subscription or management group.
Compliance – Overall compliance score for a management group, subscription, or
workspace. The score is the weighted average of the assignments. The weighted
average factors in the number of policies in a single assignment and the number of
resources the assignment applies to.
For example, if your subscription has two VMs and an initiative with five policies
assigned to it, then you have 10 assessments in your subscription. If one of the VMs
doesn't comply to two of the policies, then the overall compliance score of your
subscription’s assignment is 80%.
Coverage – Identifies the pricing tier, Free or Standard, that the management group,
subscription, or workspace is running on. See Pricing to learn more about Security
Center's pricing tiers.
Settings – Subscriptions have the link Edit settings. Selecting Edit settings lets you update
your subscription settings such as data collection, pricing tier, and email notifications.
2. Select the subscription or management group that you want to enable a security policy for.
Security policy opens.
3. Under Security policy, select the controls that you want Security Center to monitor for and
provide recommendations on by selecting On. Select Off if you don't want Security Center
to monitor that control.
4. Select Save.
Management groups
If your organization has many subscriptions, you may need a way to efficiently manage
access, policies, and compliance for those subscriptions. Azure Management Groups provides
a level of scope above subscriptions. You organize subscriptions into containers called
"management groups" and apply your governance policies to the management groups. All
subscriptions within a management group automatically inherit the policies applied to the
management group. Each directory is given a single top-level management group called the
"root" management group. This root management group is built into the hierarchy to have all
management groups and subscriptions fold up to it. This root management group allows for
global policies and RBAC assignments to be applied at the directory level. To set up
management groups for use with Azure Security Center, follow the instructions in the Gain
tenant-wide visibility for Azure Security Center article.
NOTE
It’s important that you understand the hierarchy of management groups and subscriptions. See
Organize your resources with Azure Management Groups to learn more about management
groups, root management, and management group access.
Customize OS security configurations in
Azure Security Center (Preview) – Red
Subscription
What are OS security configurations?
Azure Security Center monitors security configurations by applying a set of over 150
recommended rules for hardening the OS, including rules related to firewalls, auditing,
password policies, and more. If a machine is found to have a vulnerable configuration, Security
Center generates a security recommendation.
By customizing the rules, organizations can control which configuration options are more
appropriate for their environment. You can set a customized assessment policy and then
apply it on all applicable machines in the subscription.
NOTE
Currently, customization of the OS security configuration is available for Windows
Server versions 2008, 2008 R2, 2012, and 2012 R2 operating systems only.
The configuration applies to all VMs and computers that are connected to all
workspaces under the selected subscription.
OS security configuration customization is available only on the Security Center standard tier.
You can customize the OS security configuration rules by enabling and disabling a specific
rule, changing the desired setting for an existing rule, or adding a new rule that's based on
the supported rule types (registry, audit policy, and security policy). Currently, the desired
setting must be an exact value.
New rules must be in the same format and structure as other existing rules of the same type.
NOTE
To customize OS security configurations, you must be assigned the role of Subscription Owner,
Subscription Contributor, or Security Administrator.
Customize the default OS security configuration
To customize the default OS security configuration in Security Center, do the following:
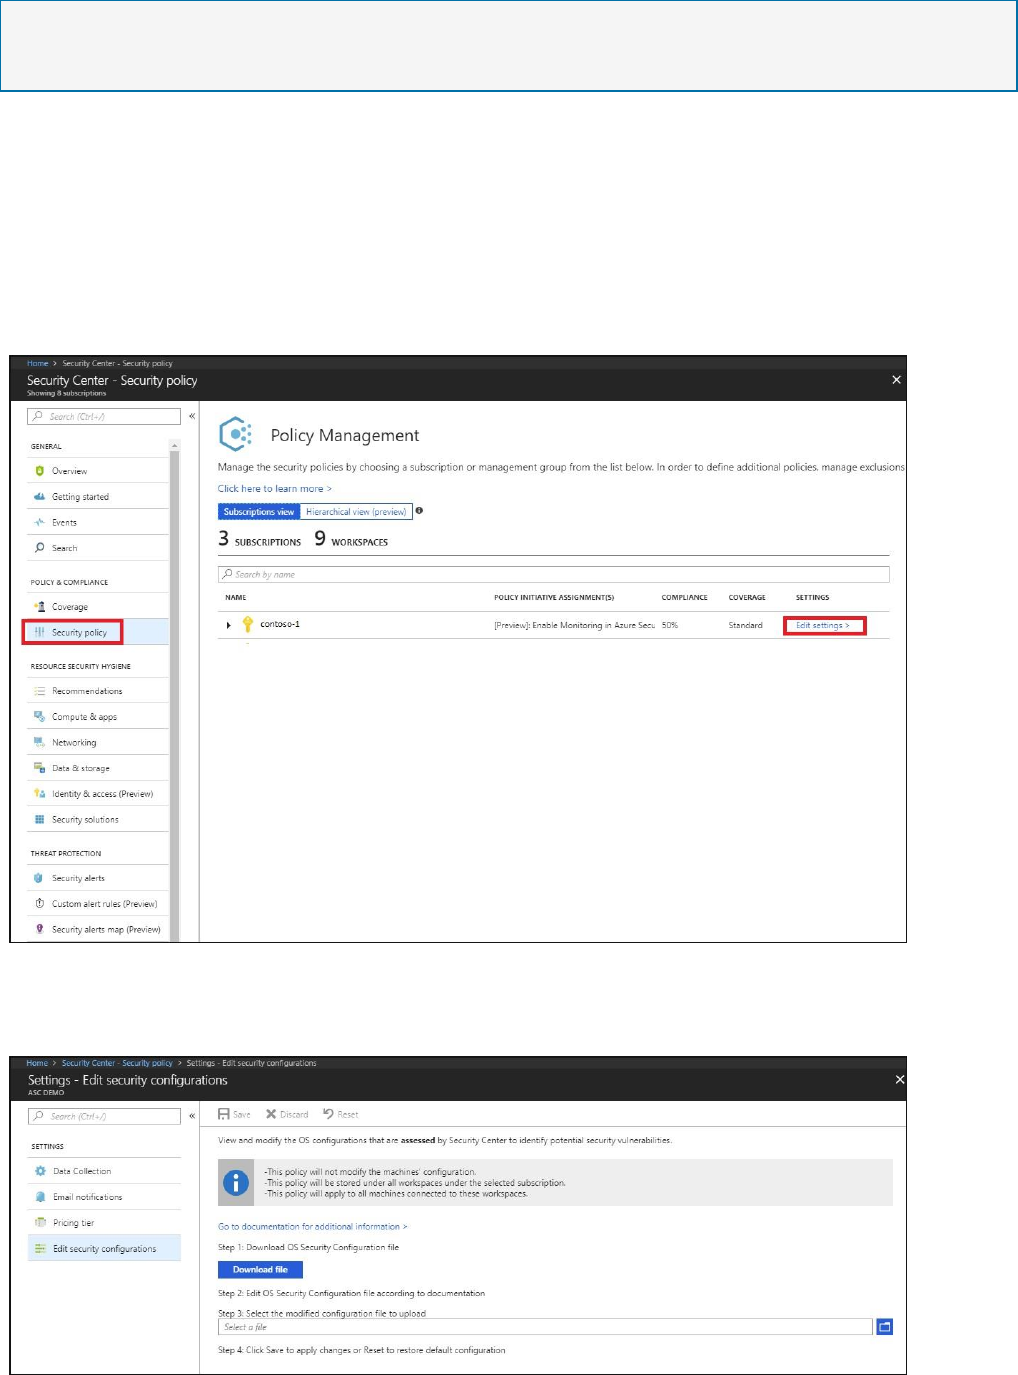
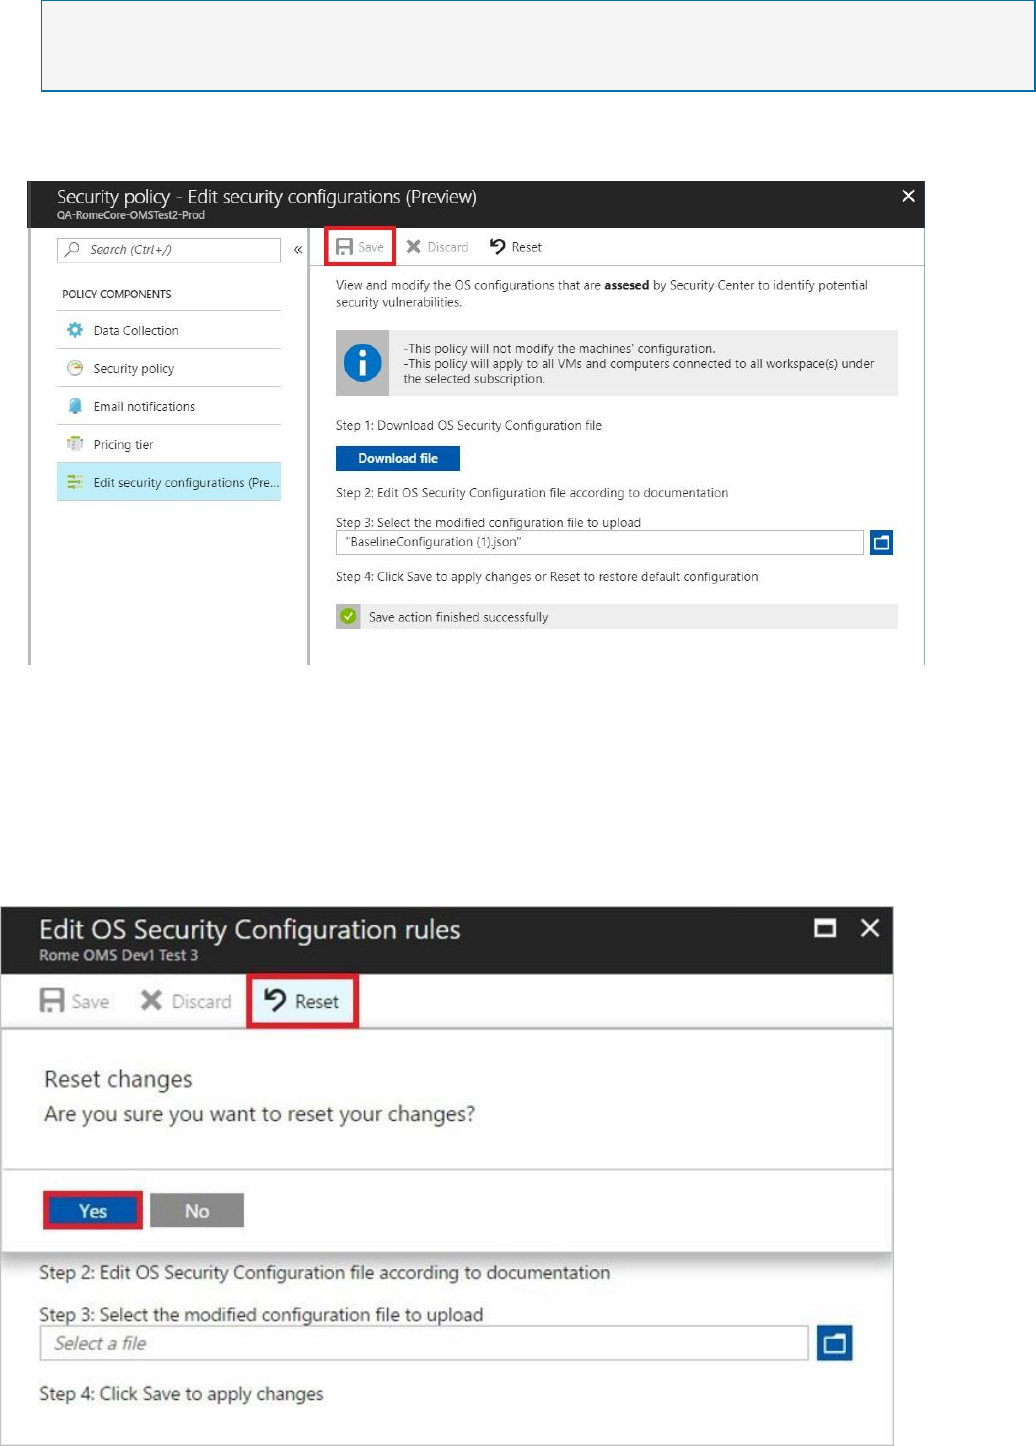
1. Open the Security Center dashboard.
2. In the left pane, select Security policy.
3. In the row of the subscription you want to customize, click Edit settings.
4. Select Edit security configurations.
5. Follow the steps to download, edit, and upload the modified file.
NOTE
By default, the configuration file that you download is in json format. For instructions about
modifying this file, go to Customize the configuration file.
6. To commit the change, select Save. Otherwise, the policy is not stored.
After you've successfully saved the file, the configuration is applied to all VMs and
computers that are connected to the workspaces under the subscription. The process
usually takes a few minutes but can take longer, depending on the infrastructure size.
At any point, you can reset the current policy configuration to its default state. To do so, in
the Edit OS security configuration rules window, select Reset. Confirm this option by
selecting Yes in the confirmation pop-up window.
Customize the configuration file
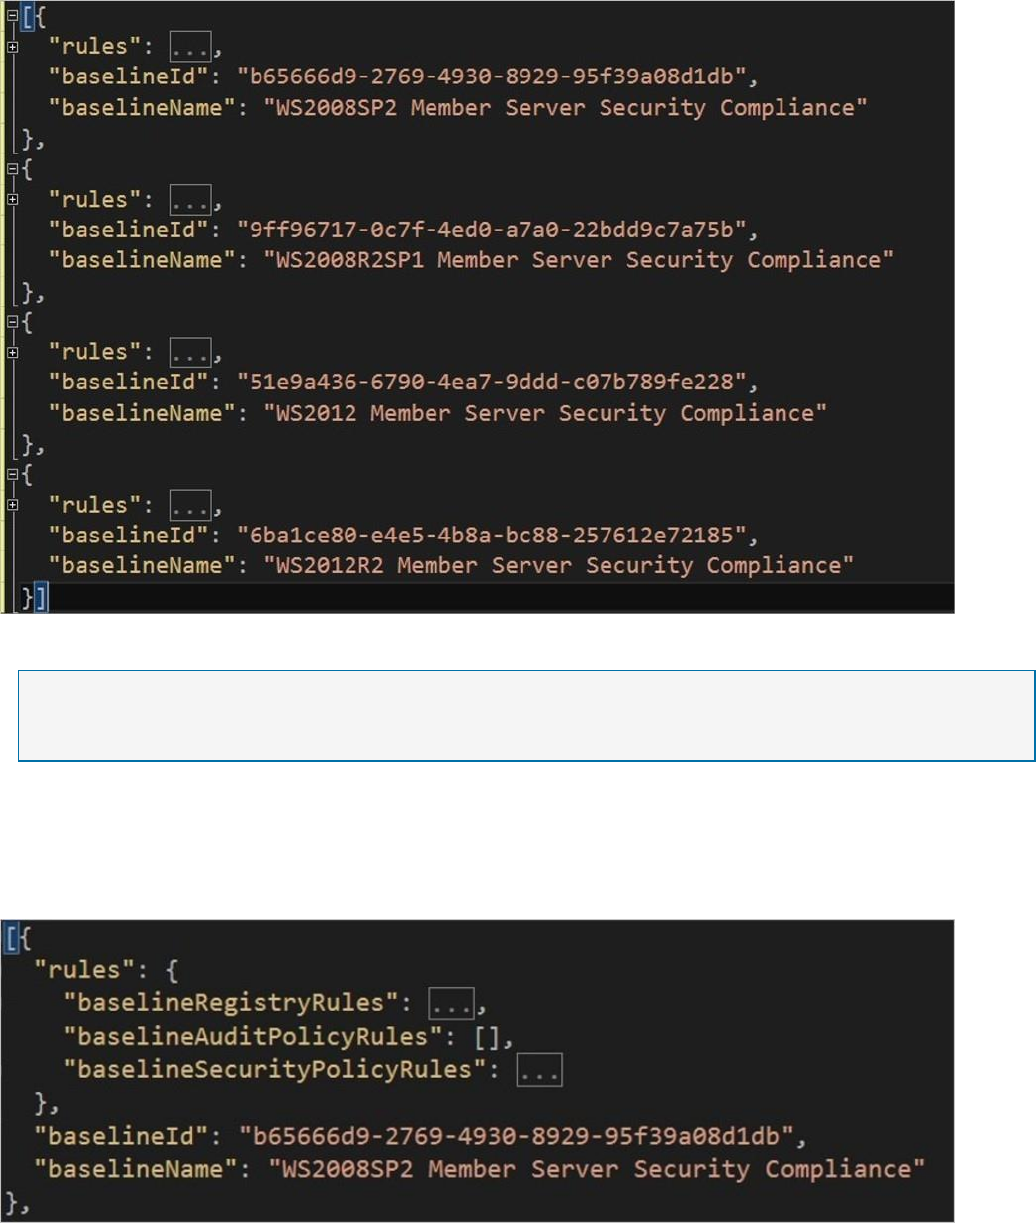
In the customization file, each supported OS version has a set of rules, or ruleset. Each ruleset
has its own name and unique ID, as shown in the following example:
NOTE
This example file was edited in Visual Studio, but you can also use Notepad if you have the JSON
Viewer plug-in installed.
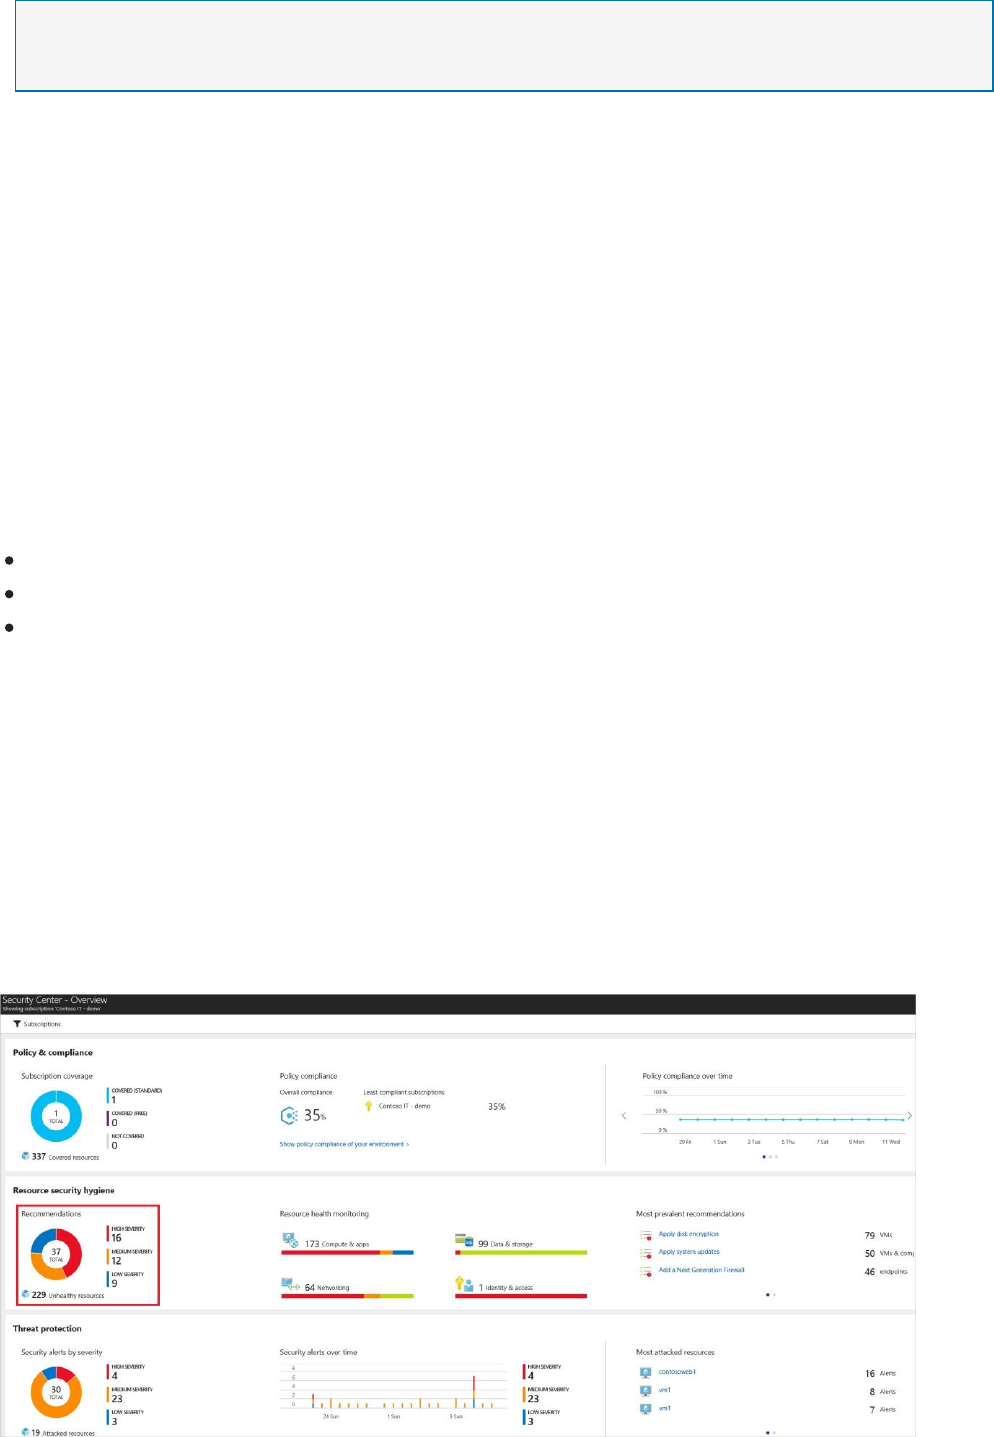
When you edit the customization file, you can modify one rule or all of them. Each ruleset
includes a rules section that's separated into three categories: Registry, Audit Policy, and
Security Policy, as shown here:
Each category has its own set of attributes. You can change the following attributes:

expectedValue: This attribute’s field data type must match the supported values per
rule type, for example:
baselineRegistryRules: The value should match the regValueType that's defined in that
rule.
baselineAuditPolicyRules: Use one of the following string values:
Success and Failure
Success baselineSecurityPolicyRules: Use one of the
following string values:
No one
List of allowed user groups, for example: Administrators, Backup Operators state:
The string can contain the options Disabled or Enabled. For this private preview release,
the string is case-sensitive.
These are the only fields that can be configured. If you violate the file format or size, you won’t
be able to save the change. You will receive an error telling you that you need to upload a valid
JSON configuration file.
For a list of other potential errors, see Error codes.
The following three sections contain examples of the preceding rules. The expectedValue
and state attributes can be changed. baselineRegistryRules
{
"hive": "LocalMachine",
"regValueType": "Int",
"keyPath":
"System\\\\CurrentControlSet\\\\Services\\\\LanManServer\\\\Parameters",
"valueName": "restrictnullsessaccess",
"ruleId": "f9020046-6340-451d-9548-3c45d765d06d",
"originalId": "0f319931-aa36-4313-9320-86311c0fa623",
"cceId": "CCE-10940-5",
"ruleName": "Network access: Restrict anonymous access to Named
Pipes and Shares",
"ruleType": "Registry",
"expectedValue": "1",
"severity": "Warning",
"analyzeOperation": "Equals",
"source": "Microsoft",
"state": "Disabled"
}
baselineAuditPolicyRules

{
"auditPolicyId": "0cce923a-69ae-11d9-bed3-505054503030",
"ruleId": "37745508-95fb-44ec-ab0f-644ec0b16995",
"originalId": "2ea0de1a-c71d-46c8-8350-a7dd4d447895",
"cceId": "CCE-11001-5",
"ruleName": "Audit Policy: Account Management: Other Account Management Events",
"ruleType": "AuditPolicy",
"expectedValue": "Success and Failure",
"severity": "Critical",
"analyzeOperation": "Equals",
"source": "Microsoft",
"state": "Enabled"
}
baselineSecurityPolicyRules
{
"sectionName": "Privilege Rights",
"settingName": "SeIncreaseWorkingSetPrivilege",
"ruleId": "b0ec9d5e-916f-4356-83aa-c23522102b33", "originalId": "b61bd492-74b0-40f3-909d-
36b9bf54e94c",
"cceId": "CCE-10548-6",
"ruleName": "Increase a process working set",
"ruleType": "SecurityPolicy",
"expectedValue": "Administrators, Local Service",
"severity": "Warning",
"analyzeOperation": "Equals",
"source": "Microsoft",
"state": "Enabled"
}
Some rules are duplicated for the different OS types. Duplicate rules have the same originalId
attribute.
Review the allowed Expected Values for the settings above and try to make a change and
upload the file back into your Azure Subscription.
Reviewing security recommendations
in Azure Security Center – Blue
Subscription
This scenario walks you through how to use recommendations in Azure Security Center to
help you protect your Azure resources.
NOTE
This document introduces the service by using an example deployment. This document is not a
step-by-step guide.
What are security recommendations?
Security Center periodically analyzes the security state of your Azure resources. When
Security Center identifies potential security vulnerabilities, it creates recommendations.
The recommendations guide you through the process of configuring the needed
controls.
Implementing security recommendations
Set recommendations
In Setting security policies in Azure Security Center, you learn to:
Configure security policies.
Turn on data collection.
Choose which recommendations to see as part of your security policy.
Current policy recommendations center around system updates, baseline rules, anti-
malware programs, network security groups on subnets and network interfaces, SQL
database auditing, SQL database transparent data encryption, and web application
firewalls. Setting security policies provides a description of each recommendation option.
Monitor recommendations
After setting a security policy, Security Center analyzes the security state of your
resources to identify potential vulnerabilities. The Recommendations tile under
Overview lets you know the total number of recommendations identified by Security
Center.
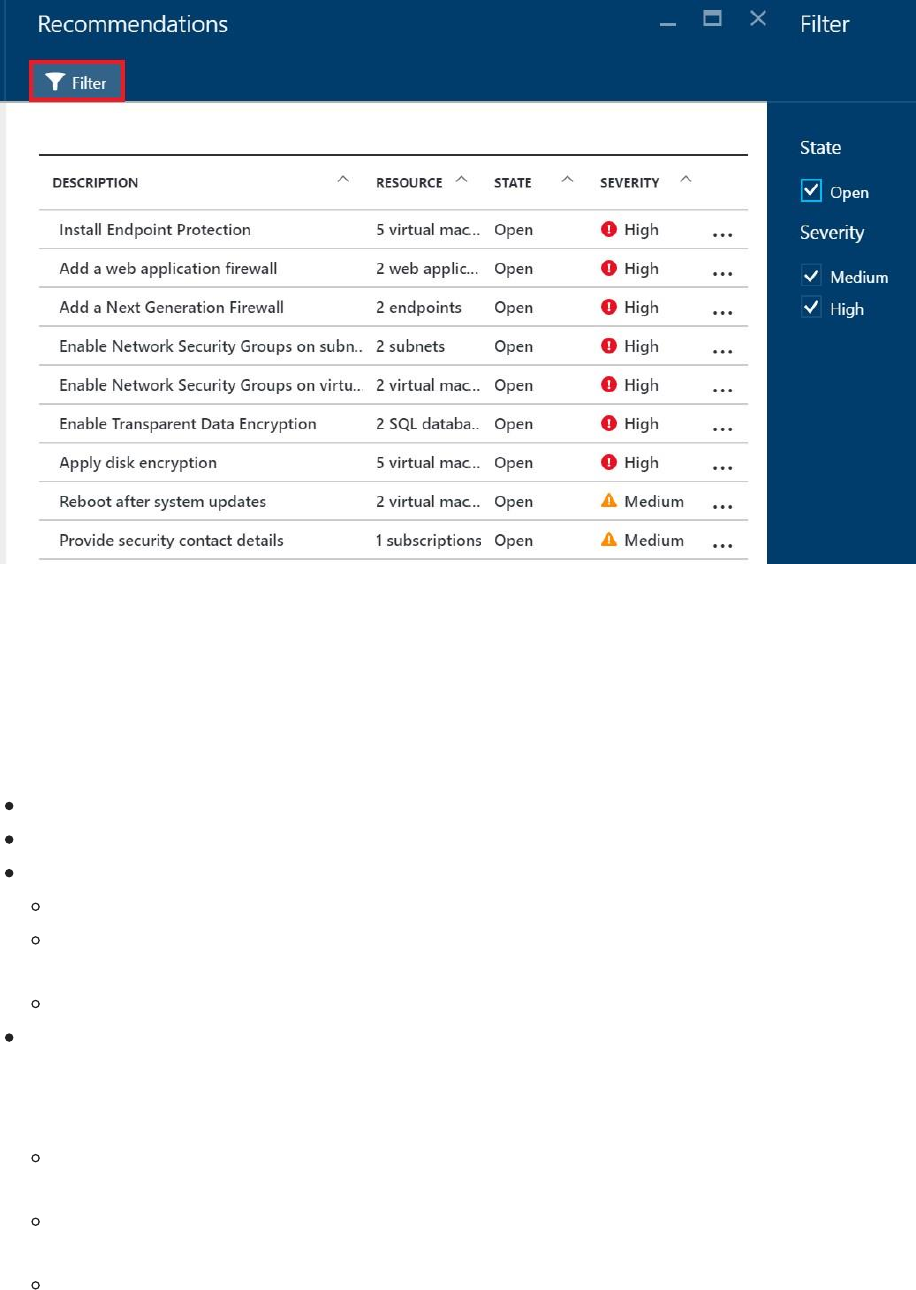
To see the details of each recommendation, select the Recommendations tile under
Overview. Recommendations opens.
You can filter recommendations. To filter the recommendations, select Filter on the
Recommendations blade. The Filter blade opens and you select the severity and state
values you wish to see.
The recommendations are shown in a table format where each line represents one
particular recommendation. The columns of this table are:
DESCRIPTION: Explains the recommendation and what needs to be done to address
it.
RESOURCE: Lists the resources to which this recommendation applies.
STATE: Describes the current state of the recommendation:
Open: The recommendation hasn't been addressed yet.
In Progress: The recommendation is currently being applied to the resources, and no
action is required by you.
Resolved: The recommendation has already been completed (in this case, the
line is grayed out).
SEVERITY: Describes the severity of that particular recommendation:
High: A vulnerability exists with a meaningful resource (such as an application, a VM,
or a network security group) and requires attention.
Medium: A vulnerability exists and non-critical or additional steps are required to
eliminate it or to complete a process.
Low: A vulnerability exists that should be addressed but does not require immediate
attention. (By default, low recommendations aren't presented, but you can filter on
low recommendations if you want to see them.)
Monitoring security health
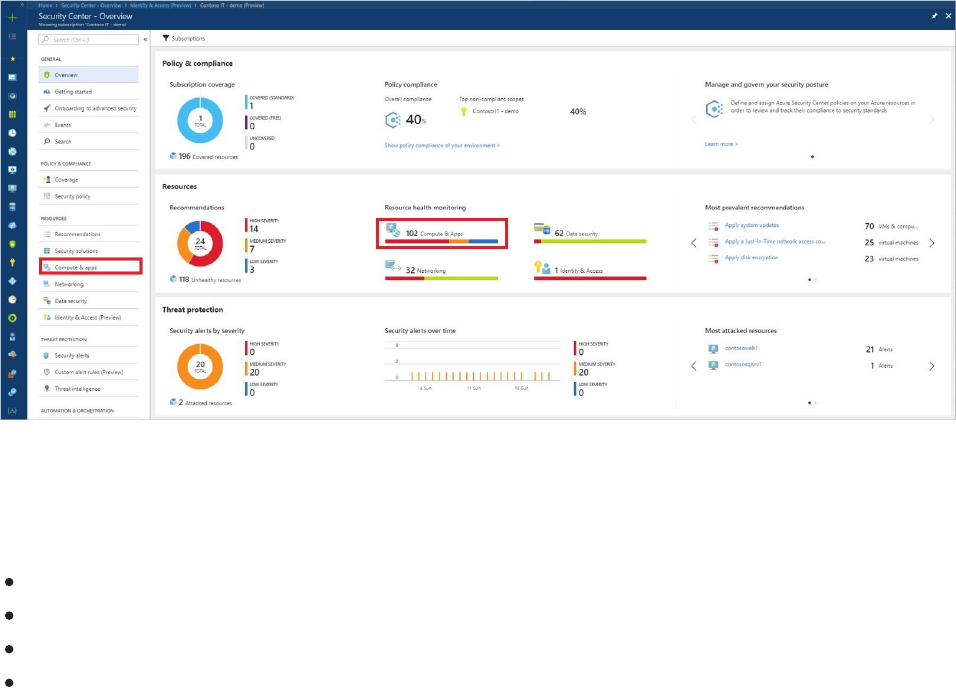
You can monitor the security state of your resources on the Security Center – Overview
dashboard. The Resources section provides the number of issues identified and the security
state for each resource type.
You can view a list of all issues by selecting Recommendations. For more information about
how to apply recommendations, see Implementing security recommendations in Azure
Security Center.
For a complete list of Compute and App services recommendations, see Recommendations.
To continue, select Compute & apps under Resources or the Security Center main menu.
Monitor Compute and App services
Under Compute, there are four tabs:
Overview: monitoring and recommendations identified by Security Center.
VMs and computers: list of your VMs, computers, and current security state of each.
Cloud Services: list of your web and worker roles monitored by Security Center.
App services (Preview): list of your App service environments and current security state of
each. To continue, select Compute & apps under Resources or the Security Center main
menu.
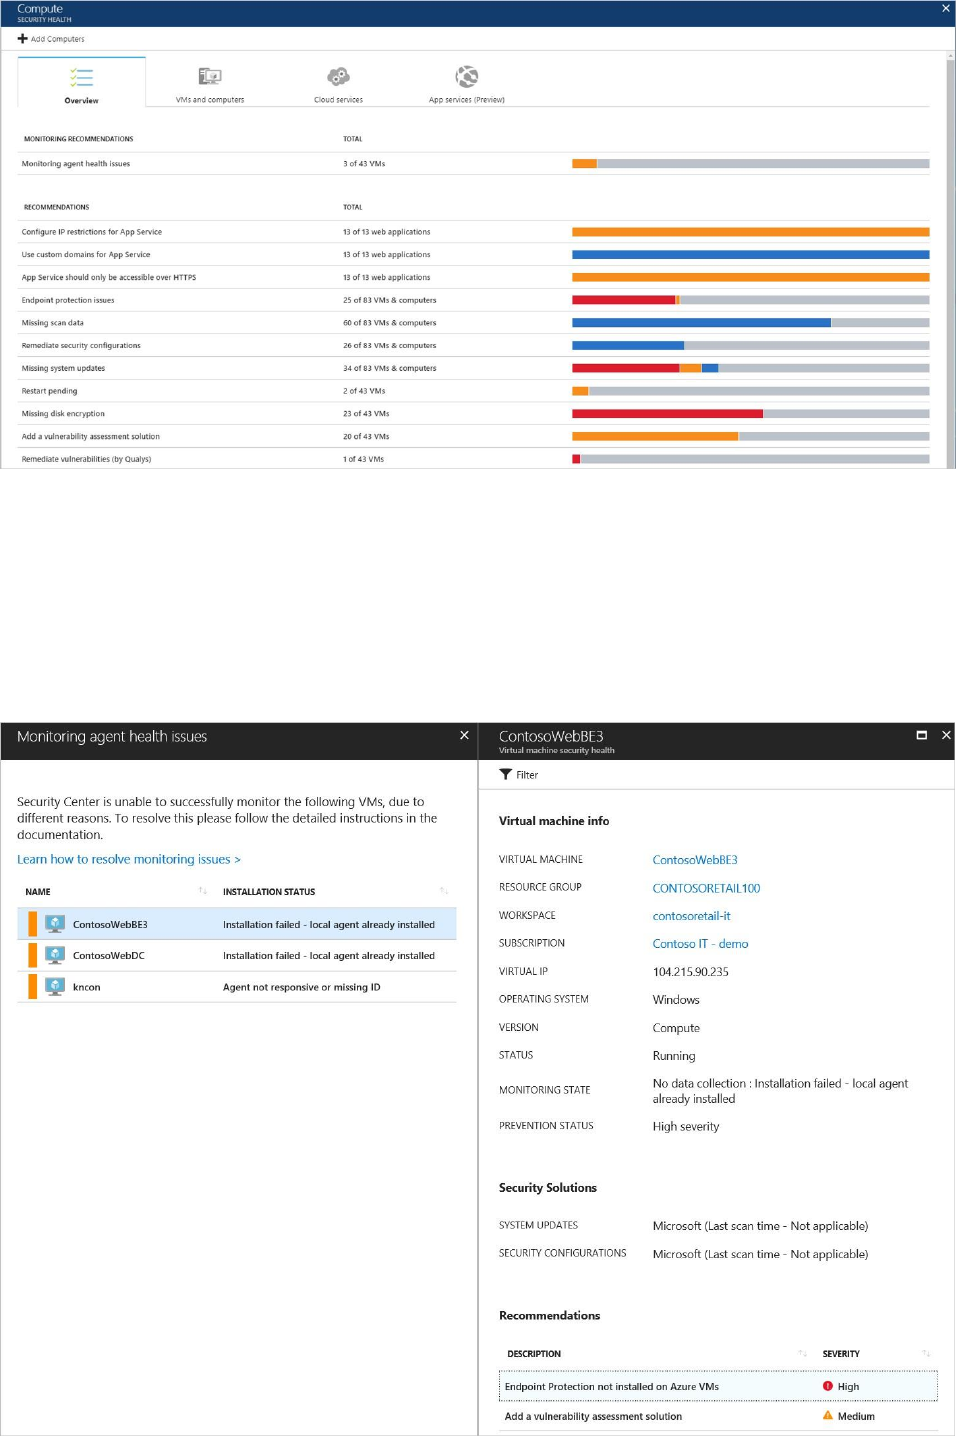
In each tab you can have multiple sections, and in each section, you can select an individual
option to see more details about the recommended steps to address that particular issue.
Monitoring recommendations
This section shows the total number of VMs and computers that were initialized for automatic
provisioning and their current statuses. In this example there is one recommendation,
Monitoring agent health issues. Select this recommendation.
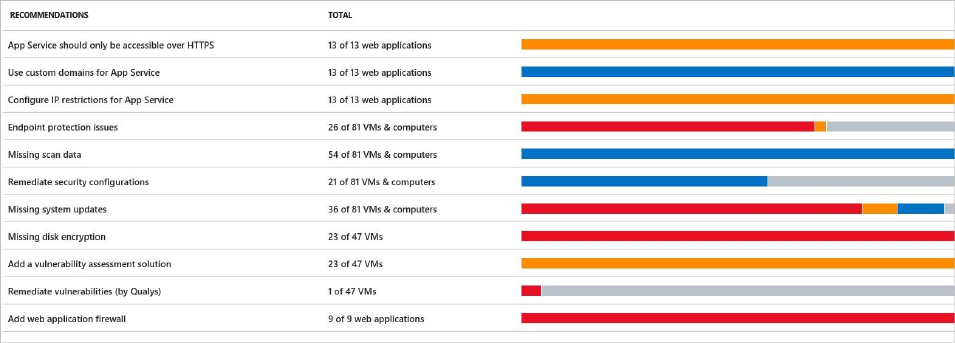
Monitoring agent health issues opens. VMs and computers that Security Center is unable to
successfully monitor are listed. Select a VM or computer for detailed information.
MONITORING STATE provides a reason
why Security Center is unable to monitor. See the Security Center troubleshooting guide for a
list of MONITORING STATE values, descriptions, and resolution steps.
Unmonitored VMs and computers
A VM or computer is unmonitored by Security Center if the machine is not running the
Microsoft Monitoring
Agent extension. A machine may have a local agent already installed, for example the OMS
direct agent or the SCOM agent. Machines with these agents are identified as unmonitored
because these agents are not fully supported in Security Center. To fully benefit from all of
Security Center’s capabilities, the Microsoft Monitoring Agent extension is required.
You can install the extension on the unmonitored VM or computer in addition to the already
installed local agent. Configure both agents the same, connecting them to the same
workspace. This enables Security Center to interact with the Microsoft Monitoring Agent
extension and collect data. See Enable the VM extension for instructions on how to install the
Microsoft Monitoring Agent extension.
See Monitoring agent health issues to learn more about the reasons Security Center is unable
to successfully monitor VMs and computers initialized for automatic provisioning.
Recommendations
This section has a set of recommendations for each VM and computer, web and worker roles,
Azure App Service Web Apps, and Azure App Service Environment that Security Center
monitors. The first column lists the recommendation. The second column shows the total
number of resources that are affected by that recommendation. The third column shows the
severity of the issue as illustrated in the following screenshot:
Each recommendation has a set of actions that you can perform after you select it. For
example, if you select Missing system updates, the number of VMs and computers that
are missing patches, and the severity of the missing update appears, as shown in the
following screenshot:
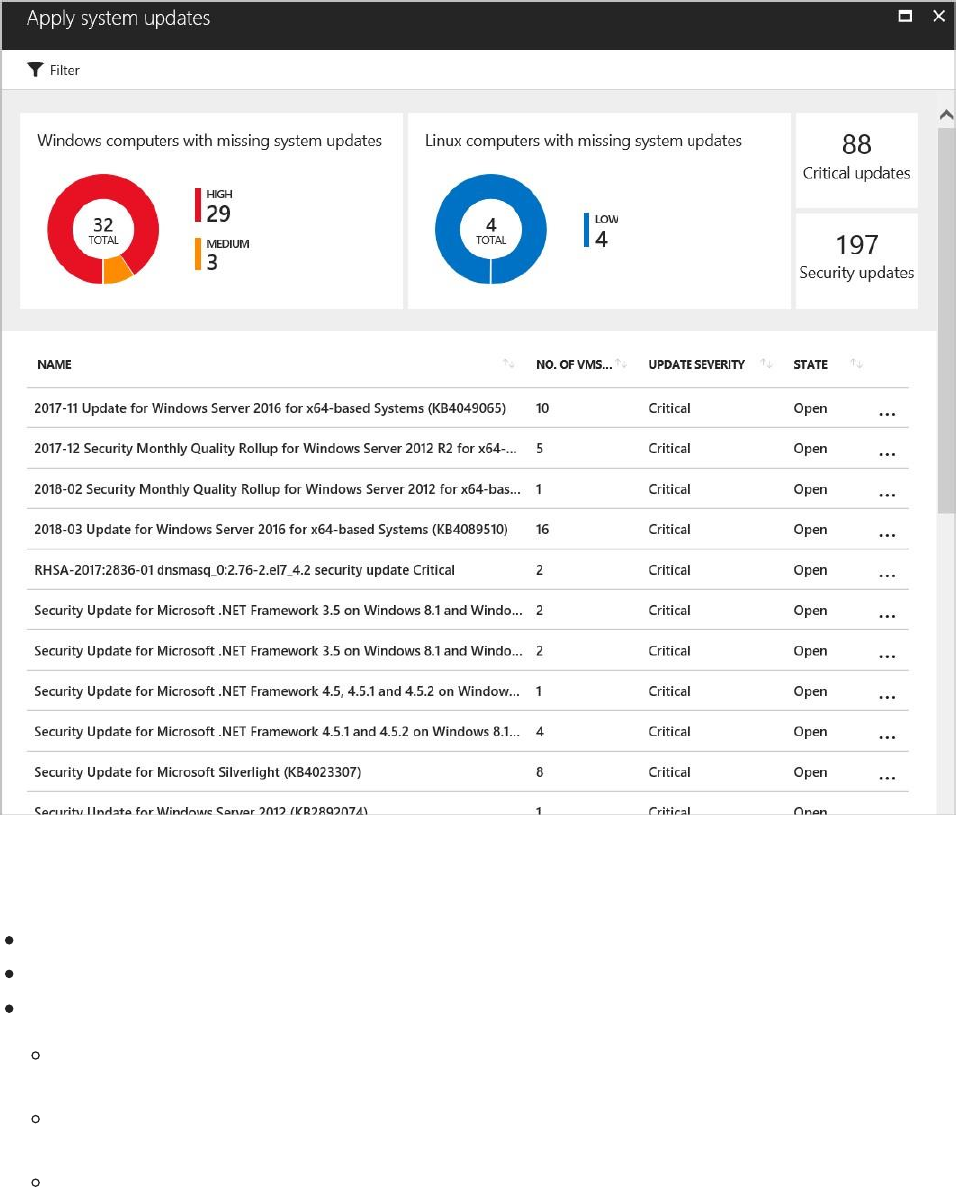
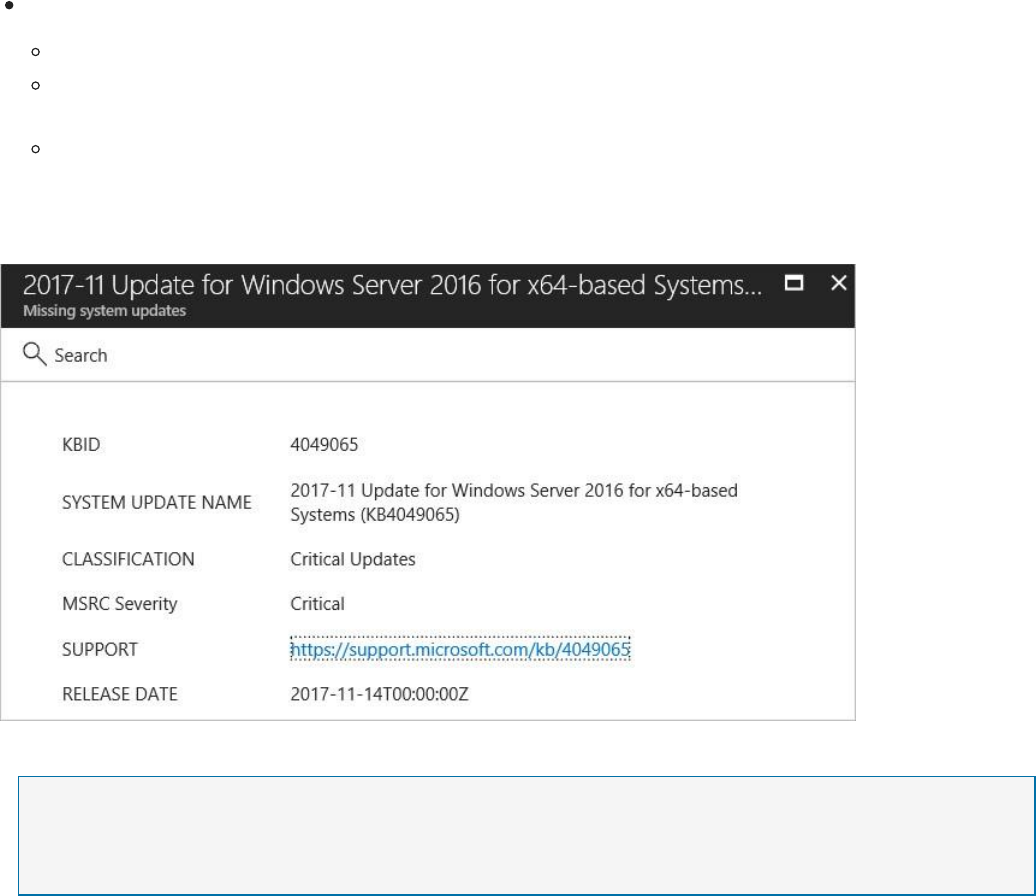
Apply system updates has a summary of critical updates in a graph format, one for Windows,
and one for Linux. The second part has a table with the following information:
NAME: Name of the missing update.
NO. OF VMs & COMPUTERS: Total number of VMs and computers that are missing
this update. UPDATE SEVERITY: Describes the severity of that particular
recommendation:
Critical: A vulnerability exists with a meaningful resource (application, virtual machine,
or network security group) and requires attention.
Important: Non-critical or additional steps are required to complete a process or
eliminate a vulnerability.
Moderate: A vulnerability should be addressed but does not require immediate attention.
(By default, low recommendations are not presented, but you can filter on low
recommendations if you want to view them.)
STATE: The current state of the recommendation:
Open: The recommendation has not been addressed yet.
In Progress: The recommendation is currently being applied to those resources, and
no action is required by you.
Resolved: The recommendation was already finished. (When the issue has been resolved,
the entry is dimmed).
To view the recommendation details, click the name of the missing update from the list.
NOTE
The security recommendations here are the same as those under the Recommendations tile. See
Implementing security recommendations in Azure Security Center for more information about how
to resolve recommendations.
VMs and computers
The VMs and computers section gives you an overview of all VM and computer
recommendations. Each column represents one set of recommendations as shown in the
following screenshot:
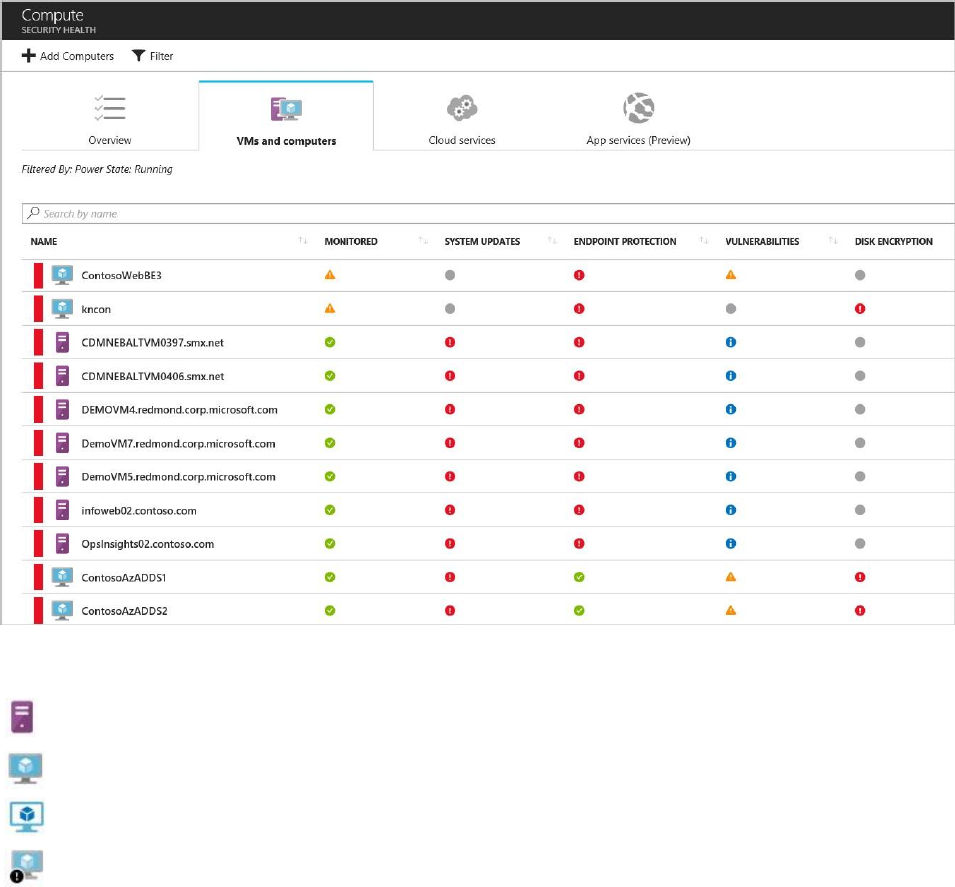
There are four types of icons represented in this list:
Non-Azure computer.
Azure Resource Manager VM.
Azure Classic VM.
VMs that are identified only from the workspace that is part of the viewed subscription.
This includes VMs from other subscriptions that report to the workspace in this subscription,
and VMs that were installed with SCOM direct agent, and have no resource ID.
The icon that appears under each recommendation helps you to quickly identify the VM and
computer that needs attention, and the type of recommendation. You can also use the Filter
option to select which options you will see on this screen.

In the previous example, one VM has a critical recommendation regarding endpoint protection.
Select the VM to get more information about it:

Here you see the security details for the VM or computer. At the bottom you can see the
recommended action and the severity of each issue.
Cloud services
For cloud services, a recommendation is created when the operating system version is out of
date as shown in the following screenshot:
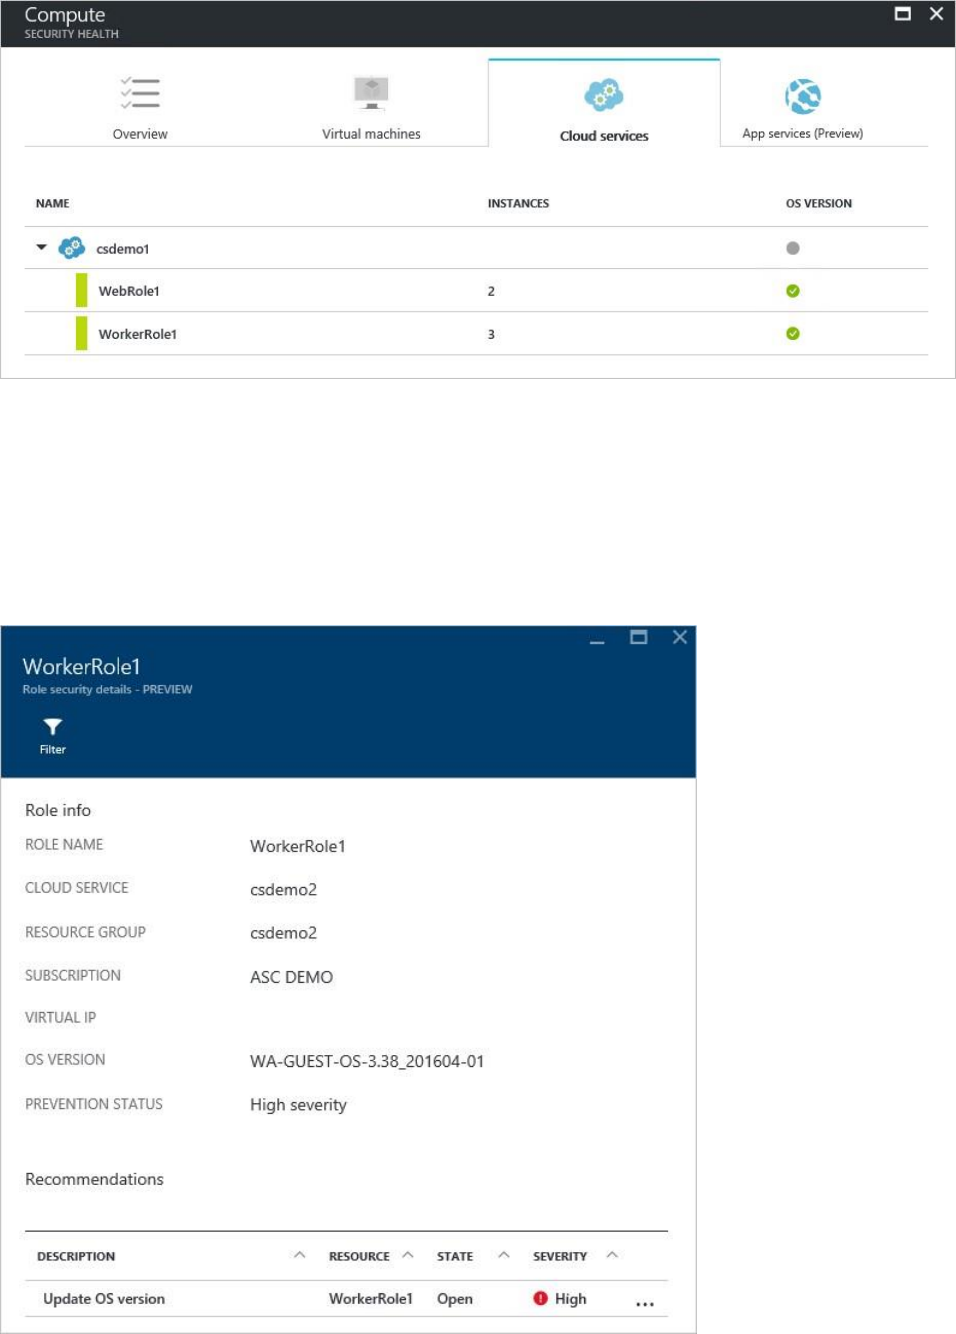
In a scenario where you do have a recommendation (which is not the case for the previous
example), you need to follow the steps in the recommendation to update the operating
system version. When an update is available, you will have an alert (red or orange - depends
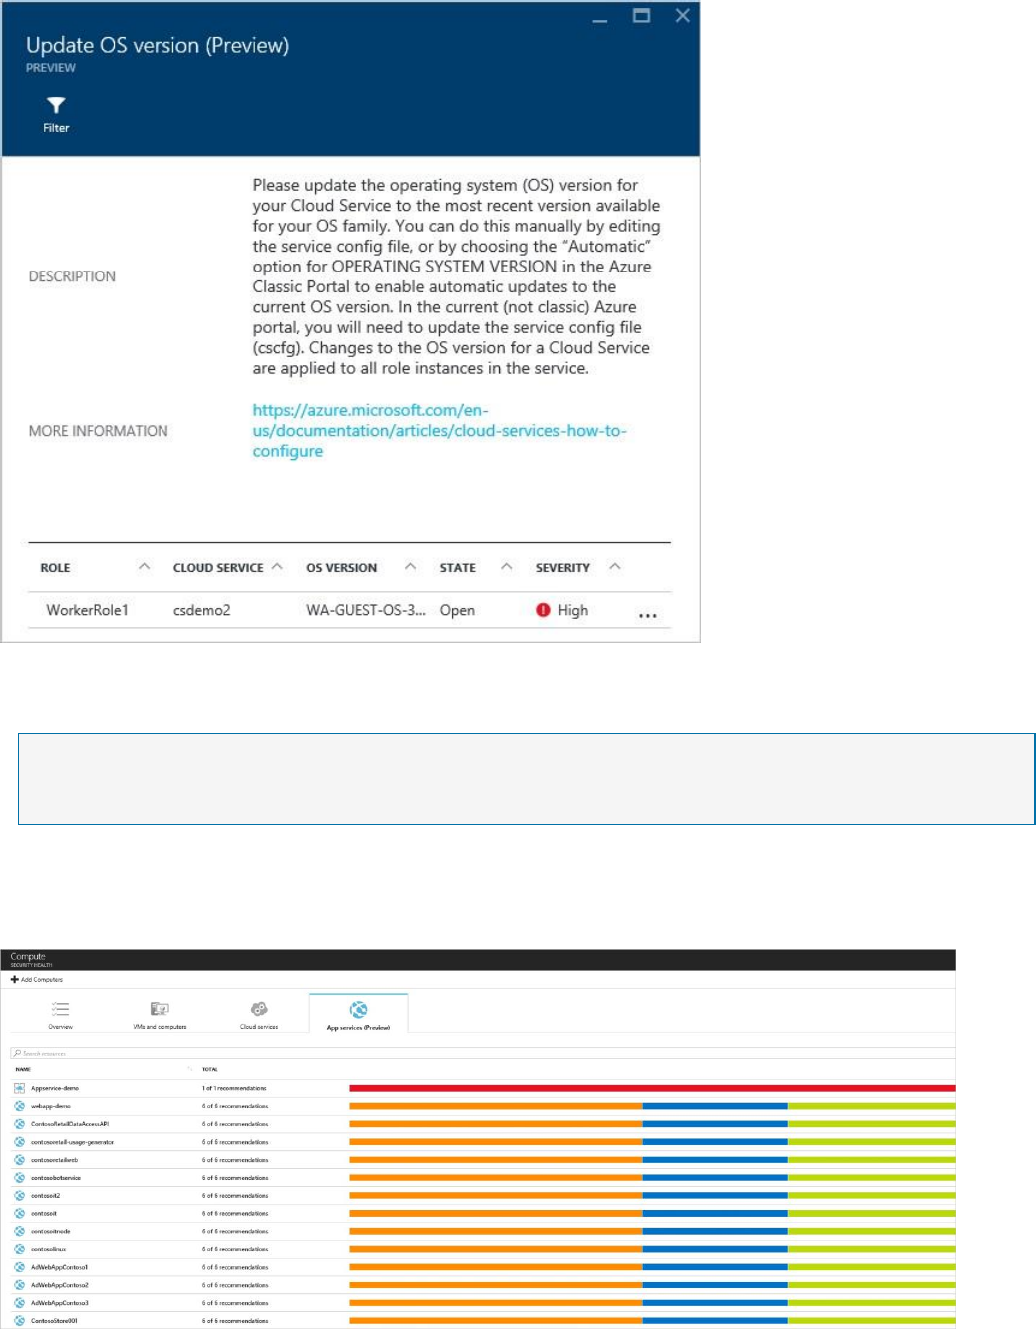
on the severity of the issue). When you select this alert in the WebRole1 (runs Windows
Server with your web app automatically deployed to IIS) or WorkerRole1 (runs Windows
Server with your web app automatically deployed to IIS) rows, you see more details about this
recommendation as shown in the following screenshot:
To see a more prescriptive explanation about this recommendation, click Update OS version
under the DESCRIPTION column.
App services (Preview)
NOTE
Monitoring App Service is in preview and available only on the Standard tier of Security Center. See
Pricing to learn more about Security Center's pricing tiers.
Under App services, you find a list of your App service environments and the health summary
based on the assessment Security Center performed.
There are three types of icons represented in this list:
App services environment.
Web application.
Function application.
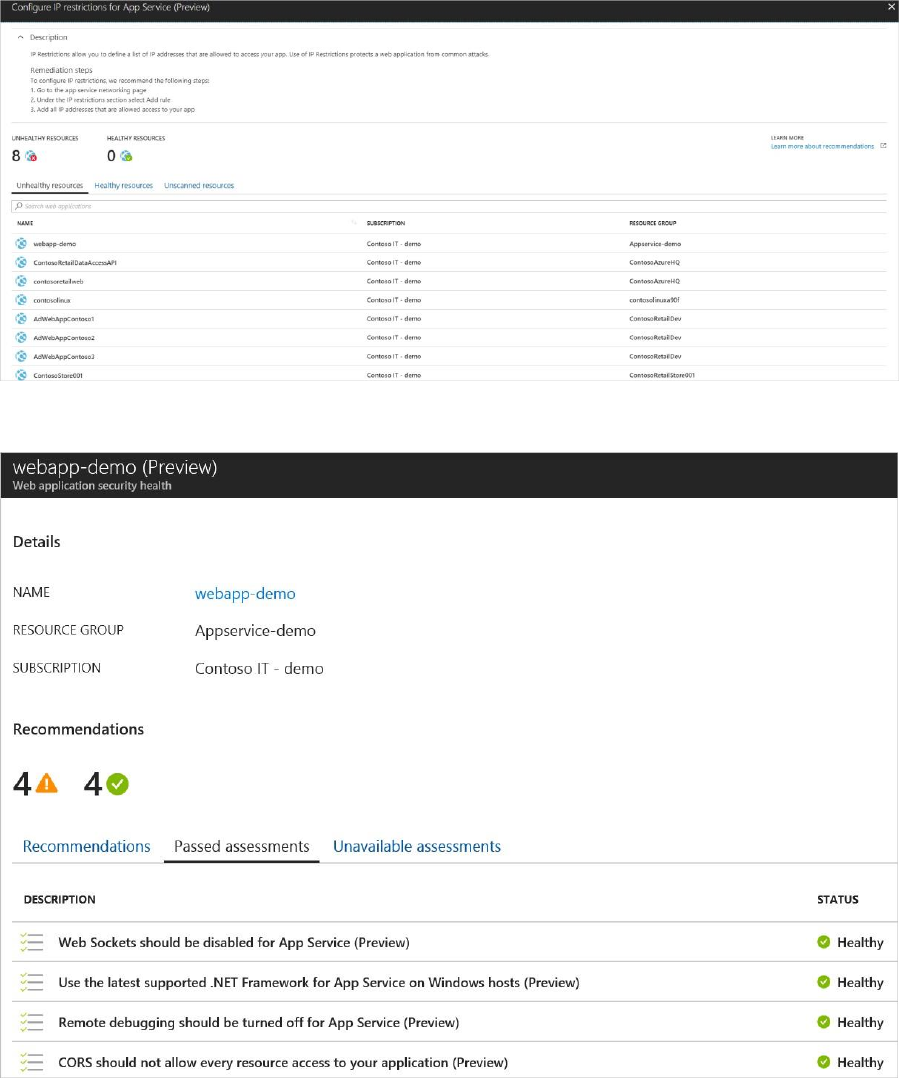
1. Select a web application. A summary view opens with three tabs:
Recommendations: based on assessments performed by Security Center that failed.
Passed assessments: list of assessments performed by Security Center that passed.
Unavailable assessments: list of assessments that failed to run due to an error or the
recommendation is not relevant for the specific App service
Under Recommendations is a list of the recommendations for the selected web application
and severity of each recommendation.
2. Select a recommendation for a description of the recommendation and a list of unhealthy
resources, healthy resources, and unscanned resources.
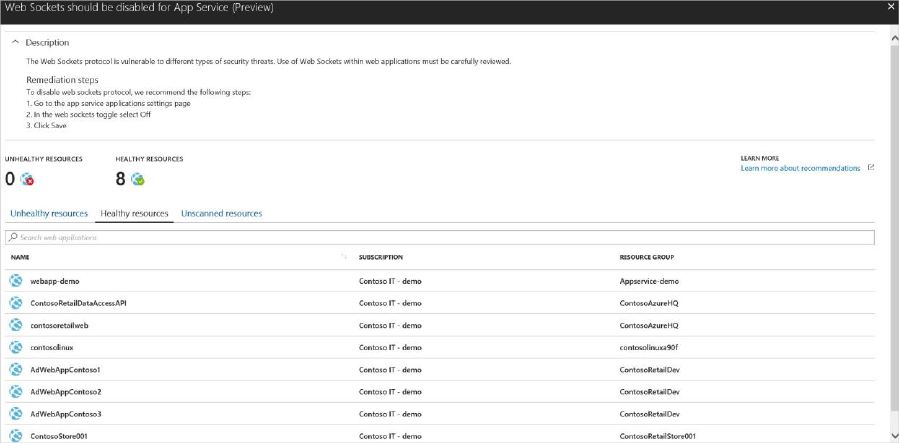
Under Passed assessments is a list of passed assessments. Severity of these assessments is
always green.
3. Select a passed assessment from the list for a description of the assessment, a list of
unhealthy and healthy resources, and a list of unscanned resources. There is a tab for
unhealthy resources but that list is always empty since the assessment passed.
LUNCH
Break
Azure Security Center Protect Scenario
– Red Subscription
Security Center limits your exposure to threats by using access and application controls to
block malicious activity. Just in time virtual machine (VM) access reduces your exposure to
attacks by enabling you to deny persistent access to VMs. Instead, you provide controlled
and audited access to VMs only when needed. Adaptive application controls help harden
VMs against malware by controlling which applications can run on your VMs. Security Center
uses machine learning to analyze the processes running in the VM and helps you apply
whitelisting rules using this intelligence.
In this scenario you learn how to:
Configure a just in time VM access policy
Configure an application control policy
Manage VM access
Just in time virtual machine (VM) access can be used to lock down inbound traffic to your
Azure VMs, reducing exposure to attacks while providing easy access to connect to VMs when
needed.
NOTE
The just in time feature is available on the Standard tier of Security Center. See Pricing to learn
more about Security Center's pricing tiers.
Attack scenario
Brute force attacks commonly target management ports as a means to gain access to a VM.
If successful, an attacker can take control over the VM and establish a foothold into your
environment.
One way to reduce exposure to a brute force attack is to limit the amount of time that a port
is open.
Management ports do not need to be open at all times. They only need to be open while
you are connected to the VM, for example to perform management or maintenance tasks.
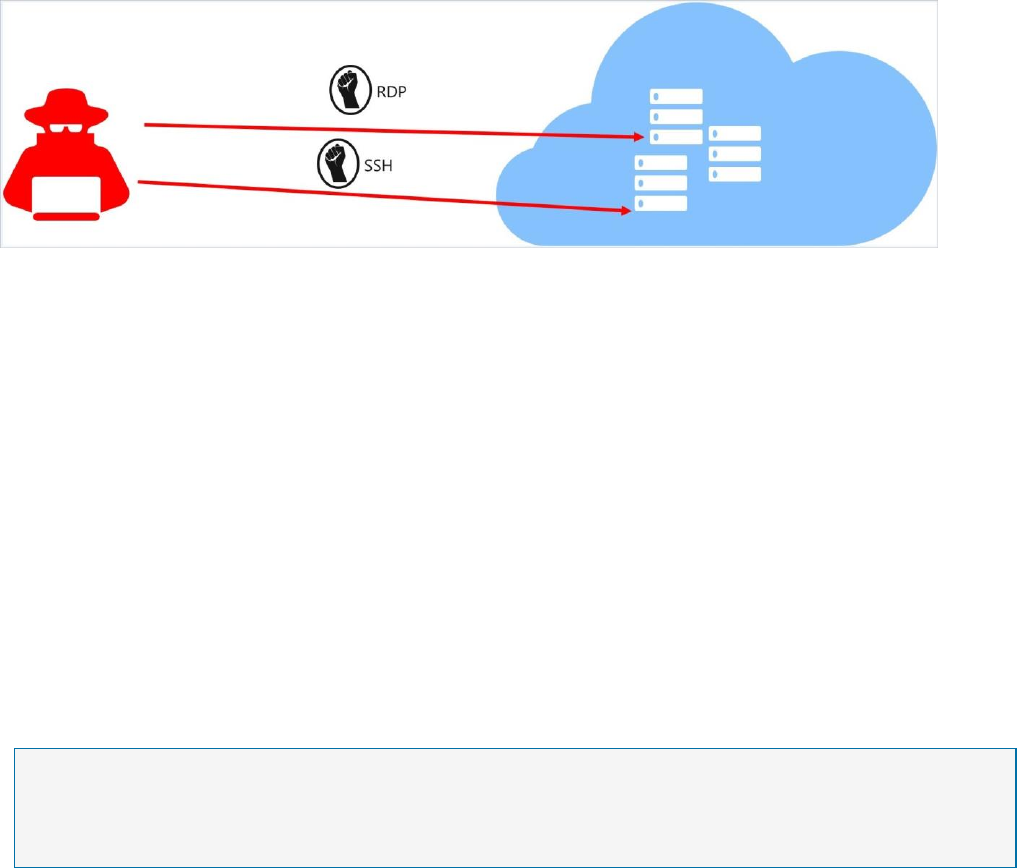
When just in time is enabled, Security Center uses network security group (NSG) rules, which
restrict access to management ports so they cannot be targeted by attackers.
How does just in time access work?
When just in time is enabled, Security Center locks down inbound traffic to your Azure VMs
by creating an NSG rule. You select the ports on the VM to which inbound traffic will be
locked down. These ports are controlled by the just in time solution.
When a user requests access to a VM, Security Center checks that the user has Role-Based
Access Control (RBAC) permissions that provide write access for the VM. If they have write
permissions, the request is approved and Security Center automatically configures the
Network Security Groups (NSGs) to allow inbound traffic to the selected ports for the amount
of time you specified. After the time has expired, Security Center restores the NSGs to their
previous states. Those connections that are already established are not being interrupted,
however.
NOTE
Security Center just in time VM access currently supports only VMs deployed through Azure
Resource Manager. To learn more about the classic and Resource Manager deployment models
see Azure Resource Manager vs. classic deployment.
Using just in time access
1. Open the Security Center dashboard.
2. In the left pane, select Just in time VM access.
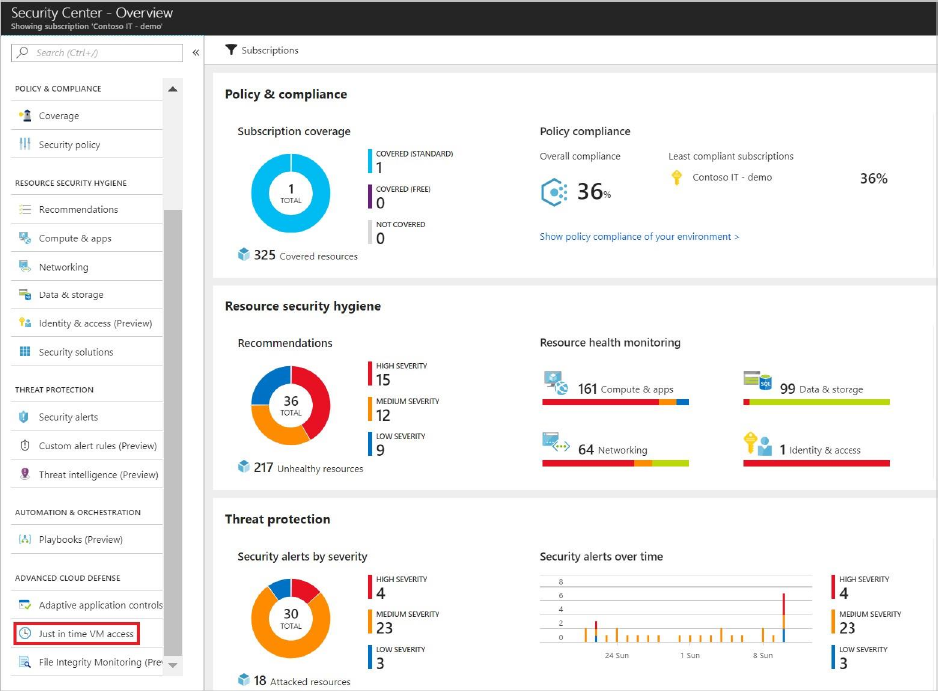
The Just in time VM access window opens.
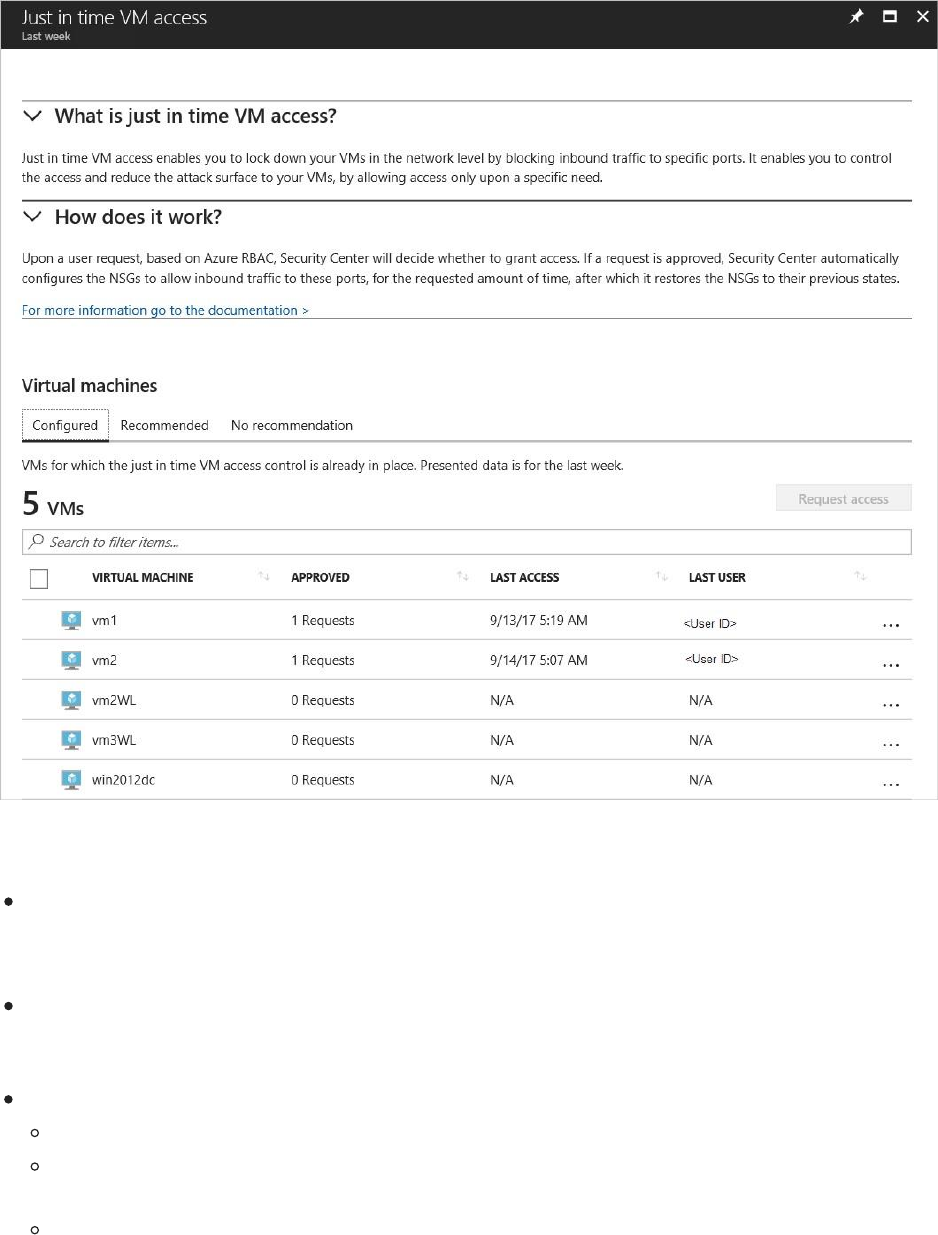
Just in time VM access provides information on the state of your VMs:
Configured - VMs that have been configured to support just in time VM access. The data
presented is for the last week and includes for each VM the number of approved requests,
last access date and time, and last user.
Recommended - VMs that can support just in time VM access but have not been
configured to. We recommend that you enable just in time VM access control for these
VMs. See Configuring a just in time access policy.
No recommendation - Reasons that can cause a VM not to be recommended are:
Missing NSG - The just in time solution requires an NSG to be in place.
Classic VM - Security Center just in time VM access currently supports only VMs
deployed through Azure Resource Manager. A classic deployment is not supported by
the just in time solution.
Other - A VM is in this category if the just in time solution is turned off in the security policy
of the subscription or the resource group, or that the VM is missing a public IP and doesn't
have an NSG in place.
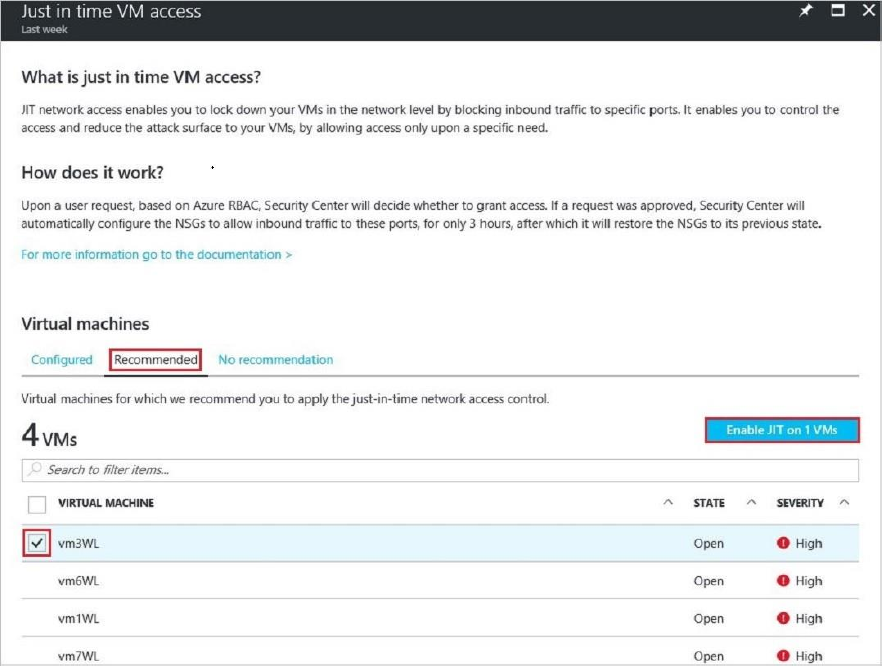
Configuring a just in time access policy
To select the VMs that you want to enable:
1. Under Just in time VM access, select the Recommended tab.
2. Under VIRTUAL MACHINE, select the VMs that you want to enable. This puts a
checkmark next to a VM.
3. Select Enable JIT on VMs.
4. Select Save.
Default ports
You can see the default ports that Security Center recommends enabling just in time.
1. Under Just in time VM access, select the Recommended tab.
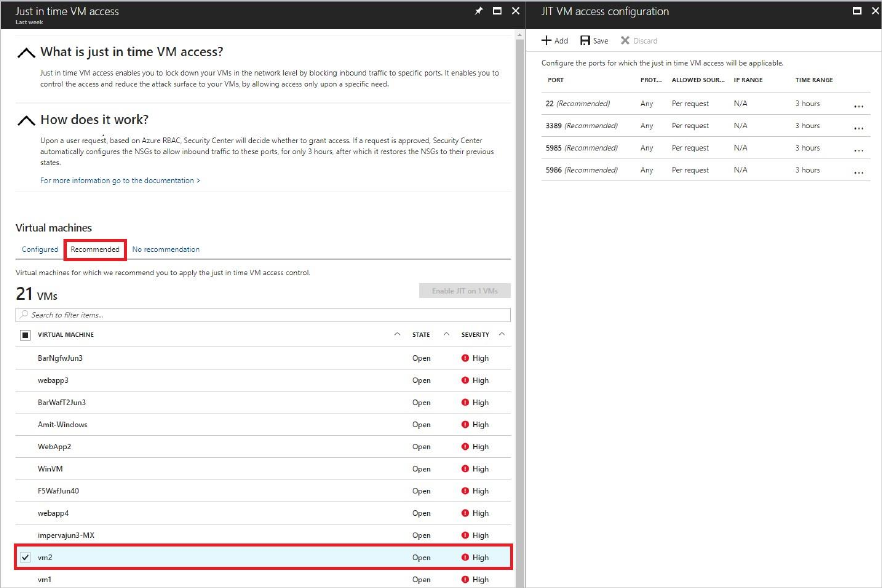
2. Under VMs, select a VM. This puts a checkmark next to the VM and opens JIT VM
access configuration. This blade displays the default ports.
Add ports
Under JIT VM access configuration, you can also add and configure a new port on which
you want to enable the just in time solution.
1. Under JIT VM access configuration, select Add. This opens Add port configuration.
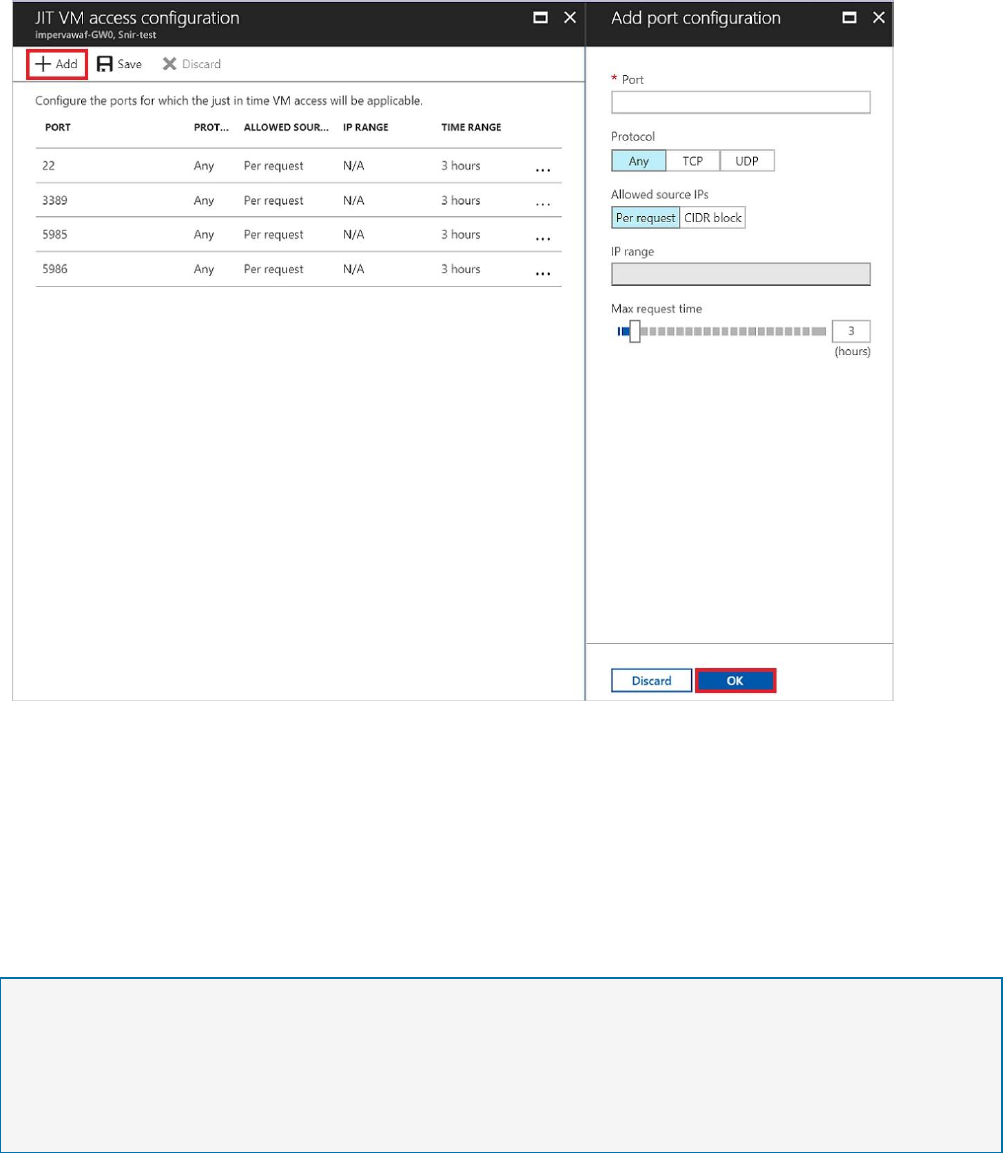
2. Under Add port configuration, you identify the port, protocol type, allowed source IPs,
and maximum request time.
Allowed source IPs are the IP ranges allowed to get access upon an approved request.
Maximum request time is the maximum time window that a specific port can be opened.
3. Select OK.
NOTE
When JIT VM Access is enabled for a VM, Azure Security Center creates deny all inbound traffic
rules for the selected ports in the network security groups associated with it. The rules will either
be the top priority of your Network Security Groups, or lower priority than existing rules that are
already there. This depends on an analysis performed by Azure Security Center that determines
whether a rule is secure or not.
Set just-in-time within a VM
To make it easy to roll out just-in-time access across your VMs, you can set a VM to allow
only just-in-time access directly from within the VM.
1. In the Azure portal, select Virtual machines.
2. Click on the virtual machine you want to limit to just-in-time access.
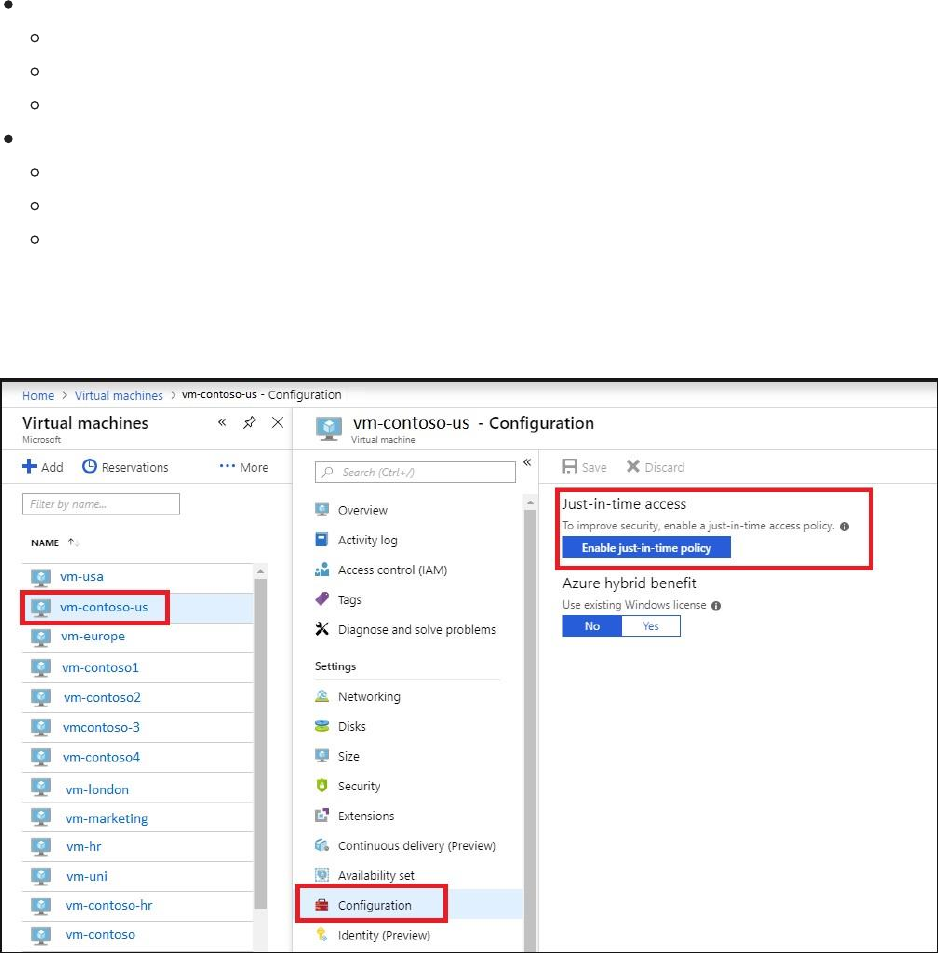
3. In the menu, click Configuration.
4. Under Just-in-time-access click Enable just-in-time policy.
This enables just-in-time access for the VM using the following settings:
Windows servers:
RDP port 3389
3 hours of access
Allowed source IP addresses is set to Per
request Linux servers:
SSH port 22
3 hours of access
Allowed source IP addresses is set to Per request
If a VM already has just-in-time enabled, when you go to its configuration page you will be
able to see that justin-time is enabled and you can use the link to open the policy in Azure
Security Center to view and change the settings.
Requesting access to a VM
To request access to a VM:
1. Under Just in time VM access, select the Configured tab.
2. Under VMs, select the VMs that you want to enable access. This puts a checkmark next
to a VM.
3. Select Request access. This opens Request access.
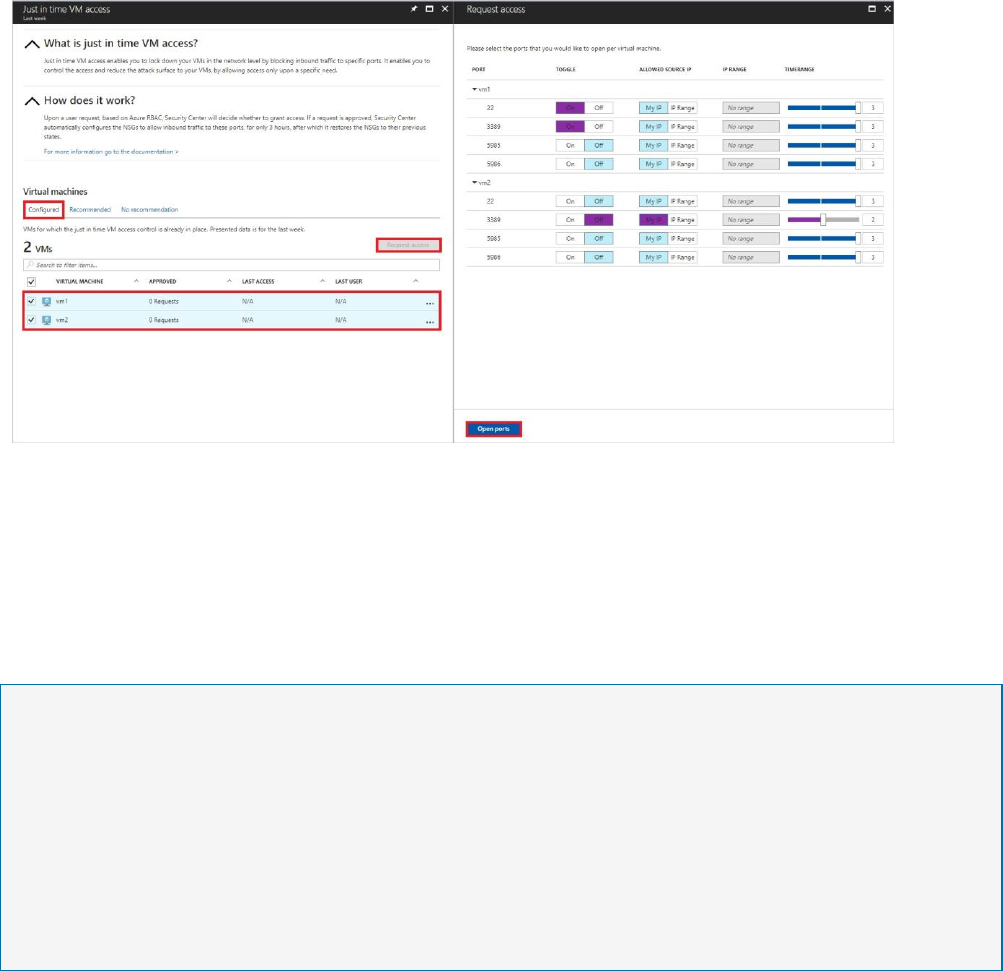
4. Under Request access, you configure for each VM the ports to open along with the
source IP that the port is opened to and the time window for which the port is opened.
You can request access only to the ports that are configured in the just in time policy.
Each port has a maximum allowed time derived from the just in time policy.
5. Select Open ports.
NOTE
When a user requests access to a VM, Security Center checks that the user has Role-Based Access
Control (RBAC) permissions that provide write access for the VM. If they have write permissions,
the request is approved.
NOTE
If a user who is requesting access is behind a proxy, the “My IP” option may not work. There may
be a need to define the full range of the organization.
Editing a just in time access policy
You can change a VM's existing just in time policy by adding and configuring a new port to
open for that VM, or by changing any other parameter related to an already protected port.
In order to edit an existing just in time policy of a VM, the Configured tab is used:
1. Under VMs, select a VM to add a port to by clicking on the three dots within the row for
that VM. This opens a menu.
2. Select Edit in the menu. This opens JIT VM access configuration.
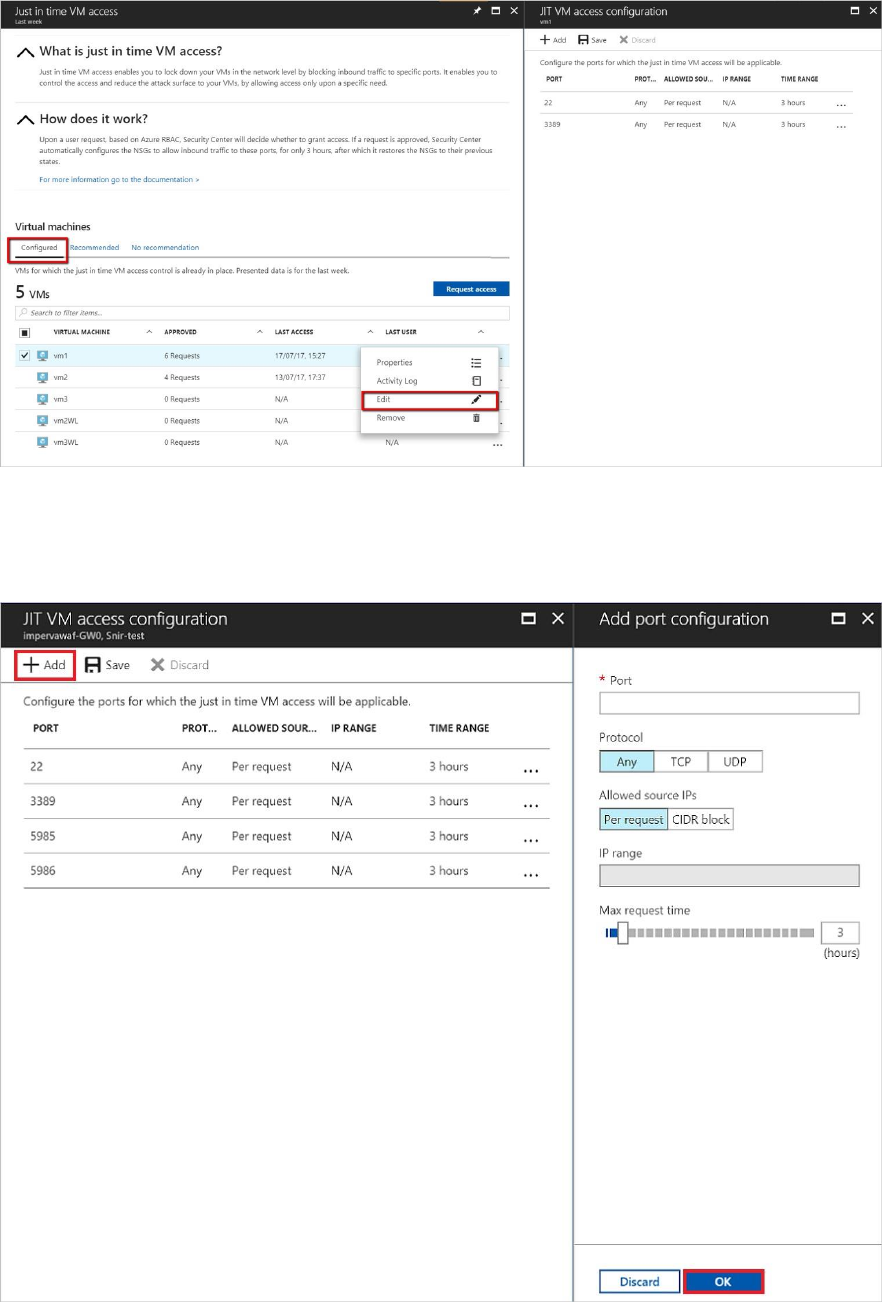
3. Under JIT VM access configuration, you can either edit the existing settings of an already
protected port by clicking on its port, or you can select Add. This opens Add port
configuration.
4. Under Add port configuration, identify the port, protocol type, allowed source IPs, and
maximum request time.
5. Select OK.
6. Select Save.
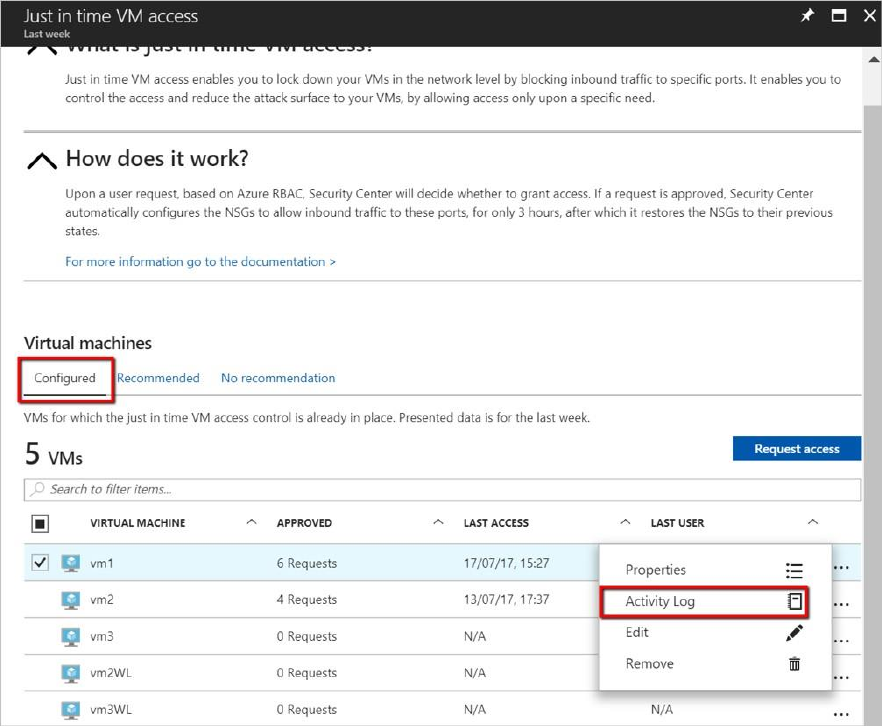
Auditing just in time access activity
You can gain insights into VM activities using log search. To view logs:
1. Under Just in time VM access, select the Configured tab.
2. Under VMs, select a VM to view information about by clicking on the three dots within the
row for that VM. This opens a menu.
3. Select Activity Log in the menu. This opens Activity log.
Activity log provides a filtered view of previous operations for that VM along with time,
date, and subscription.
You can download the log information by selecting Click here to download all the items as
CSV.
Modify the filters and select Apply to create a search and log.
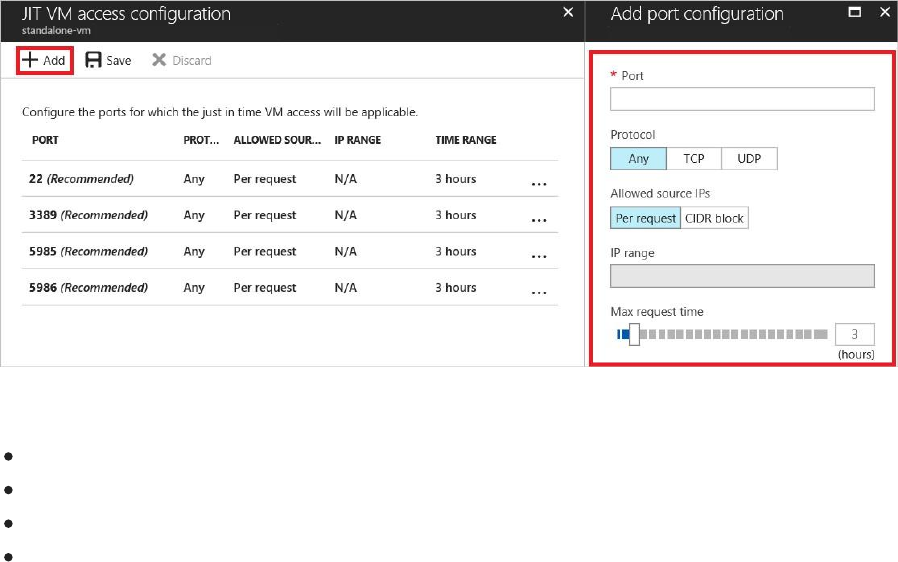
1. Under Add port configuration, you identify:
The port
The protocol type
Allowed source IPs - IP ranges allowed to get access upon an approved
request Maximum request time - maximum time window that a specific
port can be opened
2. Select OK to save.
3. Attempt to RDP to your VM. This should fail.
4. Enabled JIT for your VM. Attempt to RDP to your VM. This should work.
Harden VMs against malware
Learn how to configure application control in Azure Security Center using this walkthrough.
What are adaptive application controls in Security
Center?
Adaptive application controls is an intelligent, automated end-to-end application whitelisting
solution from Azure Security Center. It helps you control which applications can run on your
VMs located in Azure, which among other benefits helps harden your VMs against malware.
Security Center uses machine learning to analyze the applications running on your VMs and
helps you apply the specific whitelisting rules using this intelligence. This capability greatly
simplifies the process of configuring and maintaining application whitelisting policies,
enabling you to:
Block or alert on attempts to run malicious applications, including those that might
otherwise be missed by antimalware solutions.
Comply with your organization's security policy that dictates the use of only licensed
software.
Avoid unwanted software to be used in your environment.
Avoid old and unsupported apps to run.
Prevent specific software tools that are not allowed in your
organization. Enable IT to control the access to sensitive data through
app usage.
How to enable adaptive application controls?
Adaptive application controls help you define a set of applications that are allowed to run on
configured groups of VMs. This feature is only available for Windows machines (all versions,
classic, or Azure Resource Manager). The following steps can be used to configure application
whitelisting in Security Center:
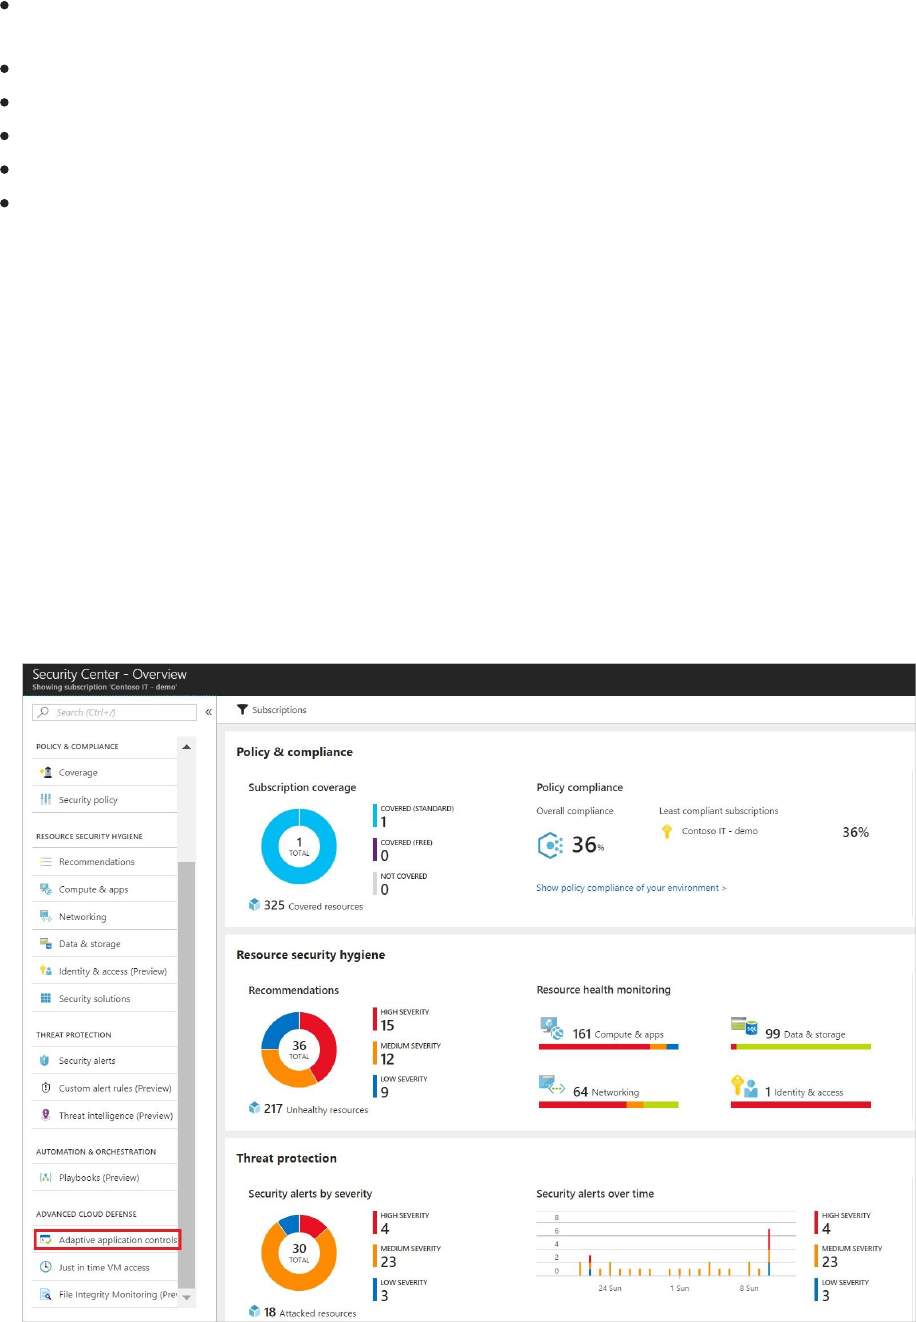
1. Open the Security Center dashboard.
2. In the left pane, select Adaptive application controls located under Advanced cloud
defense.
The Adaptive application controls page appears.
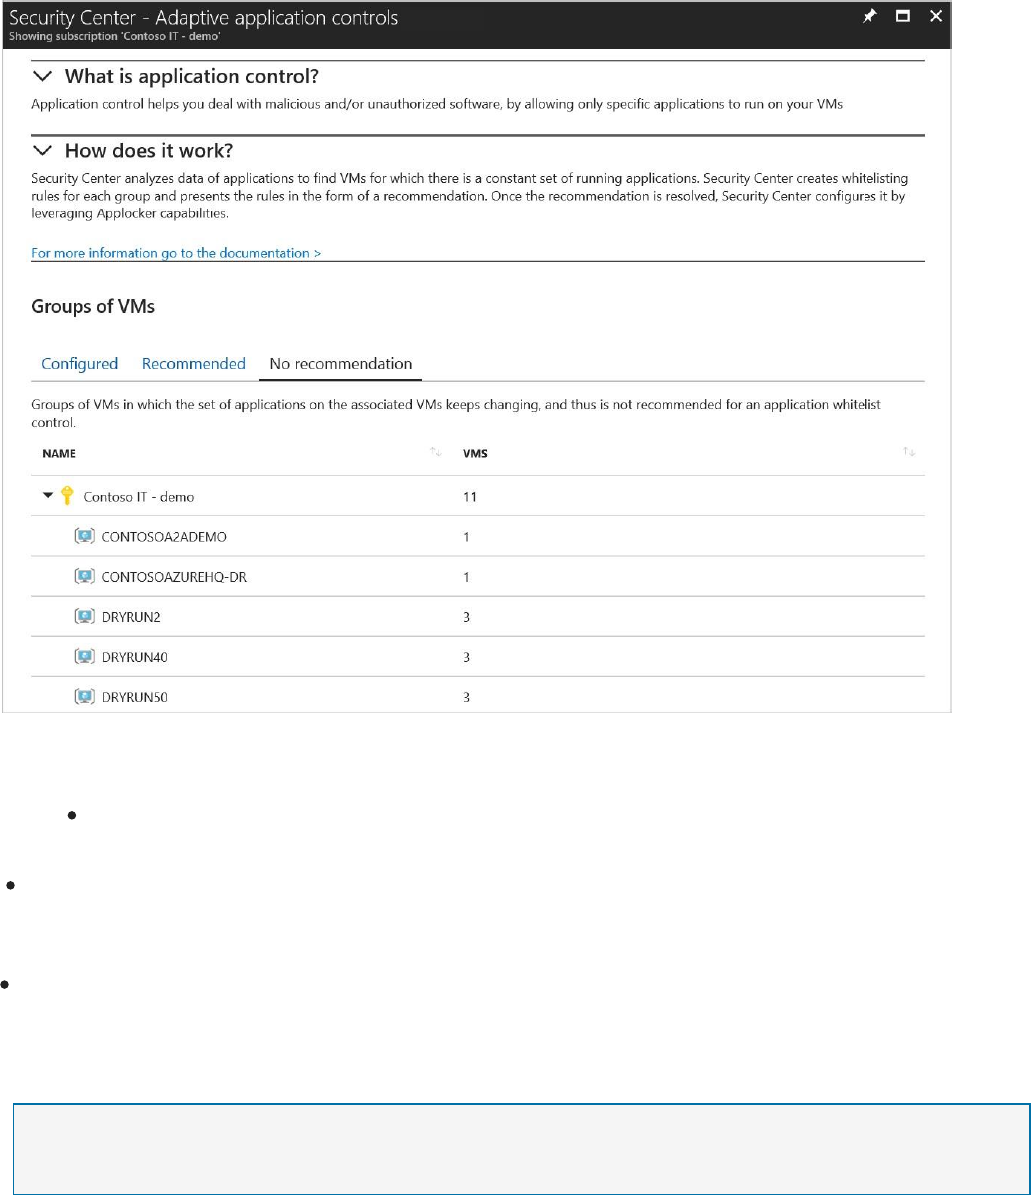
The Groups of VMs section contains three tabs:
Configured: list of groups containing the VMs that were configured with
application control.
Recommended: list of groups for which application control is recommended. Security
Center uses machine learning to identify VMs that are good candidates for application
control based on whether the VMs consistently run the same applications.
No recommendation: list of groups containing VMs without any application control
recommendations. For example, VMs on which applications are always changing, and haven’t
reached a steady state.
NOTE
Security Center uses a proprietary clustering algorithm to create groups of VMs making sure that
similar VMs get the optimal recommended application control policy.
Configure a new application control policy
1. Click on the Recommended tab for a list of groups with application control
recommendations:
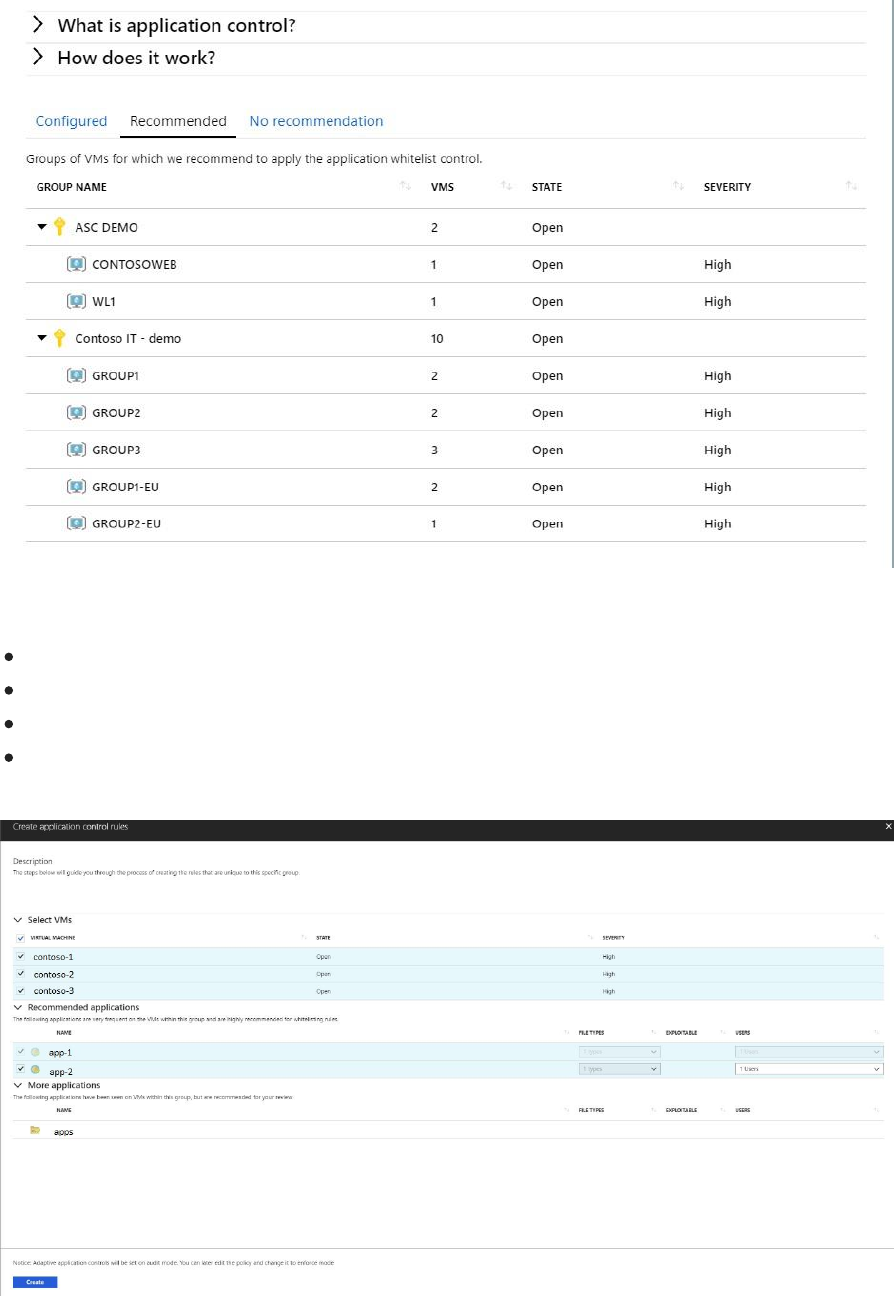
The list includes:
NAME: the name of the subscription and group
VMs: the number of virtual machines in the group
STATE: the state of the recommendations
SEVERITY: the severity level of the recommendations
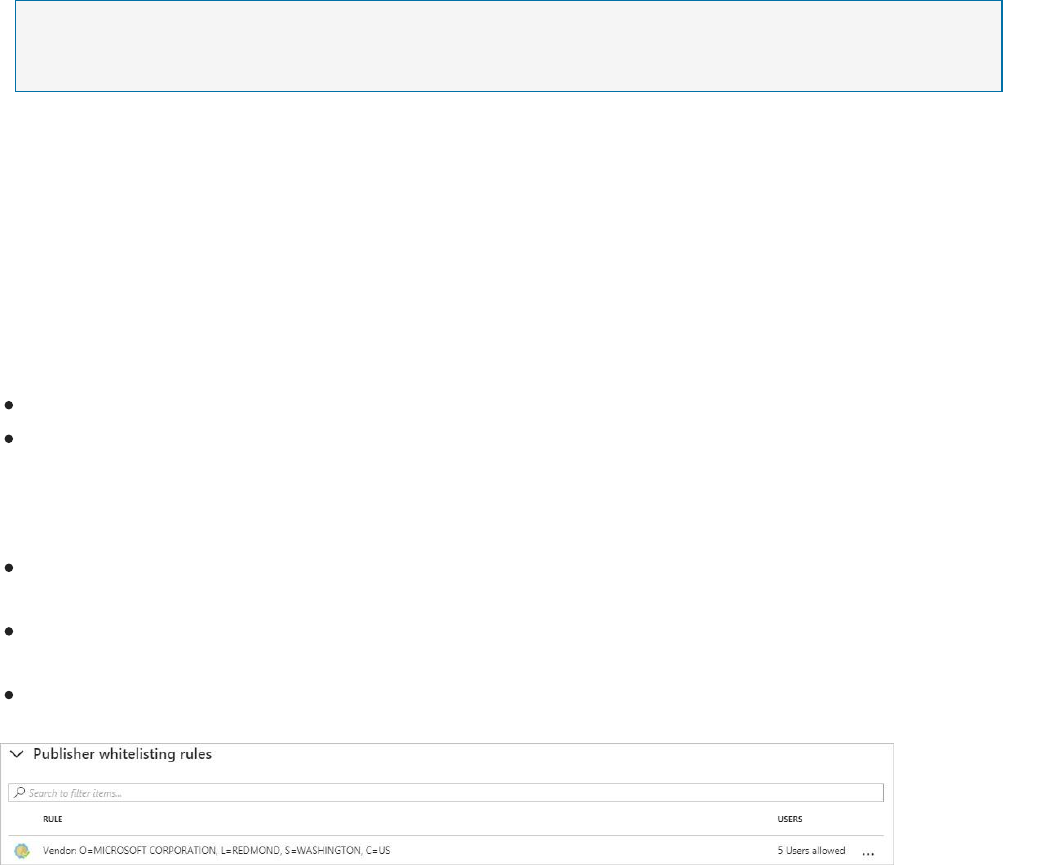
2. Click on a group to open the Create application control rules option.
3. In the Select VMs, review the list of recommended VMs and uncheck any you do not want
to apply an application whitelising policy to. Next, you see two lists:

Recommended applications: a list of applications that are frequent on the VMs within
this group, and are recommended to be allowed to run.
More applications: a list of applications that are either less frequent on the VMs within
this group or that are known as Exploitables (see more below), and recommended for
review.
4. Review the applications in each of the lists, and uncheck any you do not want to apply. Each
list includes:
NAME: the certificate information or the full path of an application
FILE TYPES: the application file type. This can be EXE, Script, MSI, or any permutation of
these types.
EXPLOITABLE: a warning icon indicates if a specific application could be used by an
attacker to bypass an application whitelisting solution. It is recommended to review
these applications prior to their approval.
USERS: users that are recommended to be allowed to run an application
5. Once you finish your selections, select Create.
After you select Create, Azure Security Center automatically creates the appropriate rules
on top of the built-in application whitelisting solution available on Windows servers
(AppLocker).
NOTE
Security Center relies on a minimum of two weeks of data in order to create a baseline
and populate the unique recommendations per group of VMs. New customers of
Security Center standard tier should expect a behavior in which at first their groups of
VMs appear under the no recommendation tab.
Adaptive Application Controls from Security Center doesn’t support VMs for which an
AppLocker policy is already enabled by either a GPO or a local security policy.
As a security best practice, Security Center will always try to create a publisher rule for
applications that are selected to be allowed, and only if an application doesn’t have a
publisher information (aka not signed), a path rule will be created for the full path of the
specific application.
Editing and monitoring a group configured with application control
1. To edit and monitor a group configured with an application whitelisting policy, return to the
Adaptive application controls page and select CONFIGURED under Groups of VMs:

The list includes:
Name: the name of the subscription and group
VMs: the number of virtual machines in the group
Mode: Audit mode will log attempts to run non-whitelisted applications; Enforce
will not allow nonwhitelisted applications to run Alerts: any current violations
2. Click on a group to make changes in the Edit application control policy page.
3. Under Protection mode, you have the option to select between the following:
Audit: in this mode, the application control solution does not enforce the rules, and
only audits the activity on the protected VMs. This is recommended for scenarios
where you want to first observe the overall behavior before blocking an app to run in
the target VM.
Enforce: in this mode, the application control solution does enforce the rules, and makes
sure that applications that are not allowed to run are blocked.
NOTE
As previously mentioned, by default a new application control policy is always configured in
Audit mode.
4. Under Policy extension, you can add any application path that you want to allow. After
you add these paths, Security Center updates the application whielisting policy on the
VMs within the selected group of VMS and creates the appropriate rules for these
applications, in addition to the rules that are already in place.
5. Review the current violations listed in the Recent alerts section. Click on each line to be
redirected to the Alerts page within Azure Security Center, and view all the alerts that
were detected by Azure Security Center on the associated VMs.
Alerts: any violations that were logged.
No. of VMs: the number of virtual machines with this alert type.
6. Under Publisher whitelisting rules, Path whitelisting rules, and Hash whitelisting
rules you can see which application whitelisting rules are currently configured on the
VMs within a group, according to the rule collection type. For each rule you can see:
7. Click on the three dots at the end of each line if you want to delete the specific rule or
edit the allowed users.
8. After making changes to an Adaptive application controls policy, click Save.
Not recommended list
Security Center only recommends application whitelisting policies for virtual machines running
a stable set of applications. Recommendations are not created if applications on the associated
VMs keep changing.
Rule
:
The specific parameters according to which an application is examined by AppLocker to determine
if an application is allowed to
run.
File type
:
The file types that are covered by a specific rule. This can be any of the following: EXE, Script,
MSI, or any permutation of those file types.
Users
:
Name or number of users who are allowed to run an application that is covered by an application
whitelisting rule.

The list contains:
NAME: the name of the subscription and group
VMs: the number of virtual machines in the group
Azure Security Center enables you to define an application whitelisting policy on non-
recommended groups of VMs as well. Follow the same principles as were previously
described, to configure an application whitelisting policy on those groups as well.
File Integrity Monitoring
Learn how to configure File Integrity Monitoring (FIM) in Azure Security Center using this
walkthrough.
What is FIM in Security Center?
File Integrity Monitoring (FIM), also known as change monitoring, examines files and
registries of operating system, application software, and others for changes that might
indicate an attack. A comparison method is used to determine if the current state of the file is
different from the last scan of the file. You can leverage this comparison to determine if valid
or suspicious modifications have been made to your files.
Security Center’s File Integrity Monitoring validates the integrity of Windows files, Windows
registry, and Linux files. You select the files that you want monitored by enabling FIM.
Security Center monitors files with FIM enabled for activity such as:

File and Registry creation and removal
File modifications (changes in file size, access control lists, and hash of the
content) Registry modifications (changes in size, access conrol lists, type, and
the content)
Security Center recommends entities to monitor, which you can easily enable FIM on. You can
also define your own FIM policies or entities to monitor. This walkthrough shows you how.
NOTE
The File Integrity Monitoring (FIM) feature works for Windows and Linux computers and VMs and is
available on the Standard tier of Security Center. See Pricing to learn more about Security Center's
pricing tiers. FIM uploads data to the Log Analytics workspace. Data charges apply, based on the
amount of data you upload. See Log Analytics pricing to learn more.
NOTE
FIM uses the Azure Change Tracking solution to track and identify changes in your environment.
When File Integrity Monitoring is enabled, you have a Change Tracking resource of type Solution.
If you remove the Change Tracking resource, you disable the File Integrity Monitoring feature in
Security Center.
Which files should I monitor?
You should think about the files that are critical for your system and applications when
choosing which files to monitor. Consider choosing files that you don’t expect to change
without planning. Choosing files that are frequently changed by applications or operating
system (such as log files and text files) create a lot of noise which make it difficult to identify
an attack.
Security Center recommends which files you should monitor as a default according to known
attack patterns that include file and registry changes.
Using File Integrity Monitoring
1. Open the Security Center dashboard.
2. In the left pane under Advanced Cloud Defense, select File Integrity Monitoring.
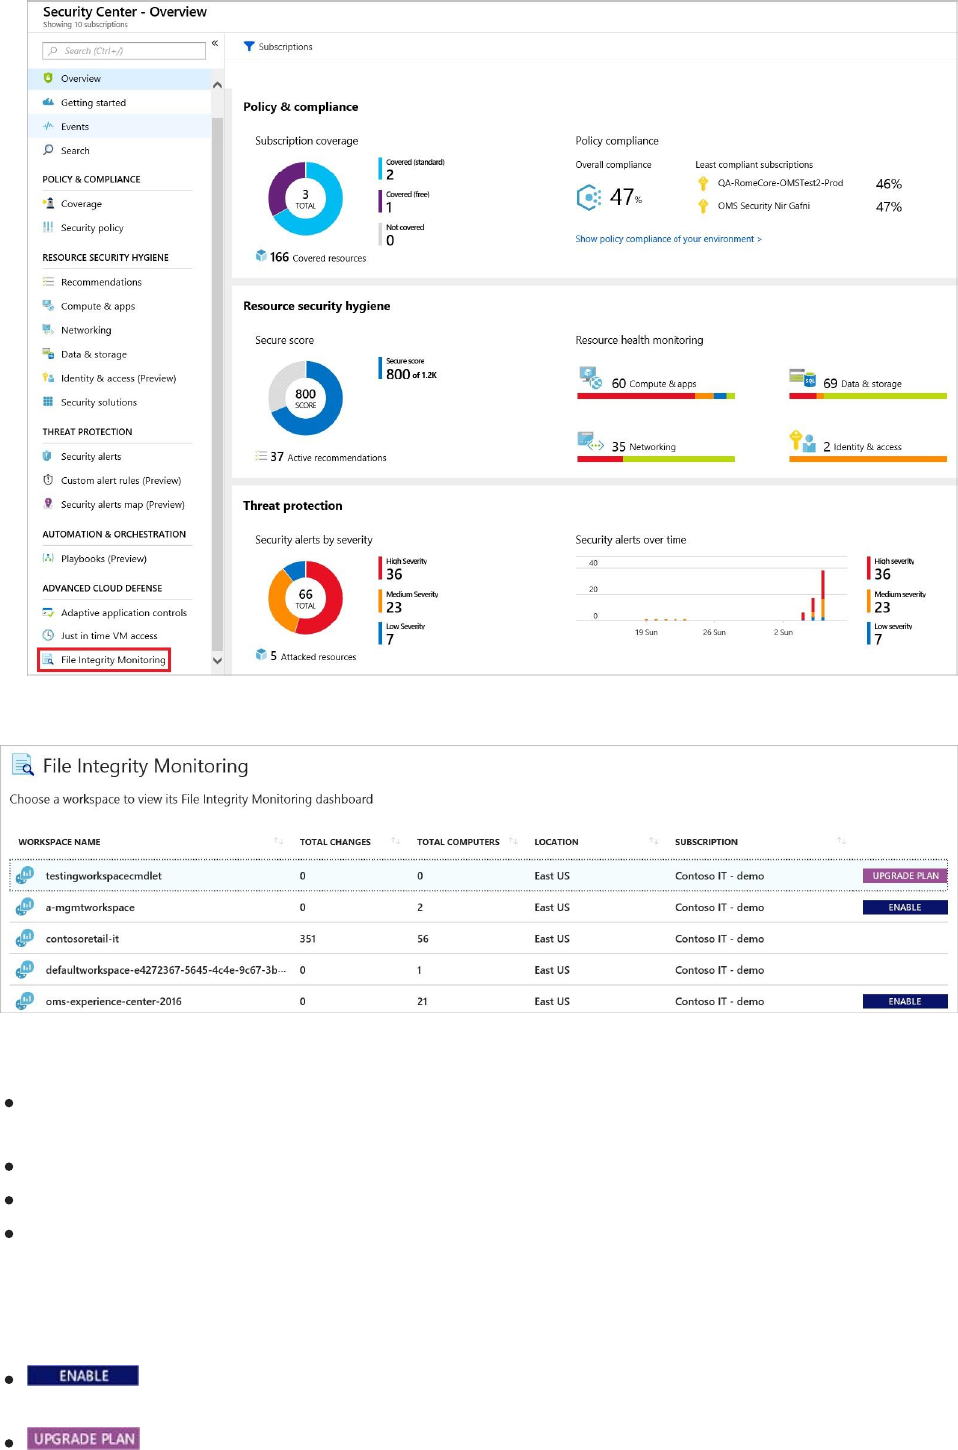
File Integrity Monitoring opens.
The following information is provided for each workspace:
Total number of changes that occurred in the last week (you may see a dash "-“ if FIM is not
enabled on the workspace)
Total number of computers and VMs reporting to the workspace
Geographic location of the workspace
Azure subscription that the workspace is under
The following buttons may also be shown for a workspace:
Indicates that FIM is not enabled for the workspace. Selecting the workspace lets you
enable FIM
on all machines under the workspace.

Indicates that the workspace or subscription is not running under Security Center’s
Standard tier. To use the FIM feature, your subscription must be running Standard. Selecting
the workspace enables you to upgrade to Standard. To learn more about the Standard tier
and how to upgrade, see Upgrade to Security Center's Standard tier for enhanced security.
A blank (there is no button) means that FIM is already enabled on the workspace.
Under File Integrity Monitoring, you can select a workspace to enable FIM for that workspace,
view the File Integrity Monitoring dashboard for that workspace, or upgrade the workspace to
Standard.
Enable FIM
To enable FIM on a workspace:
1. Under File Integrity Monitoring, select a workspace with the Enable button.
2. Enable file integrity monitoring opens displaying the number of Windows and Linux
machines under the workspace.
The recommended settings for Windows and Linux are also listed. Expand Windows files,
Registry, and Linux files to see the full list of recommended items.
3. Uncheck any recommended entities you do not want to apply FIM to.
4. Select Apply file integrity monitoring to enable FIM.
NOTE
You can change the settings at any time. See Edit monitored entities below to learn more.
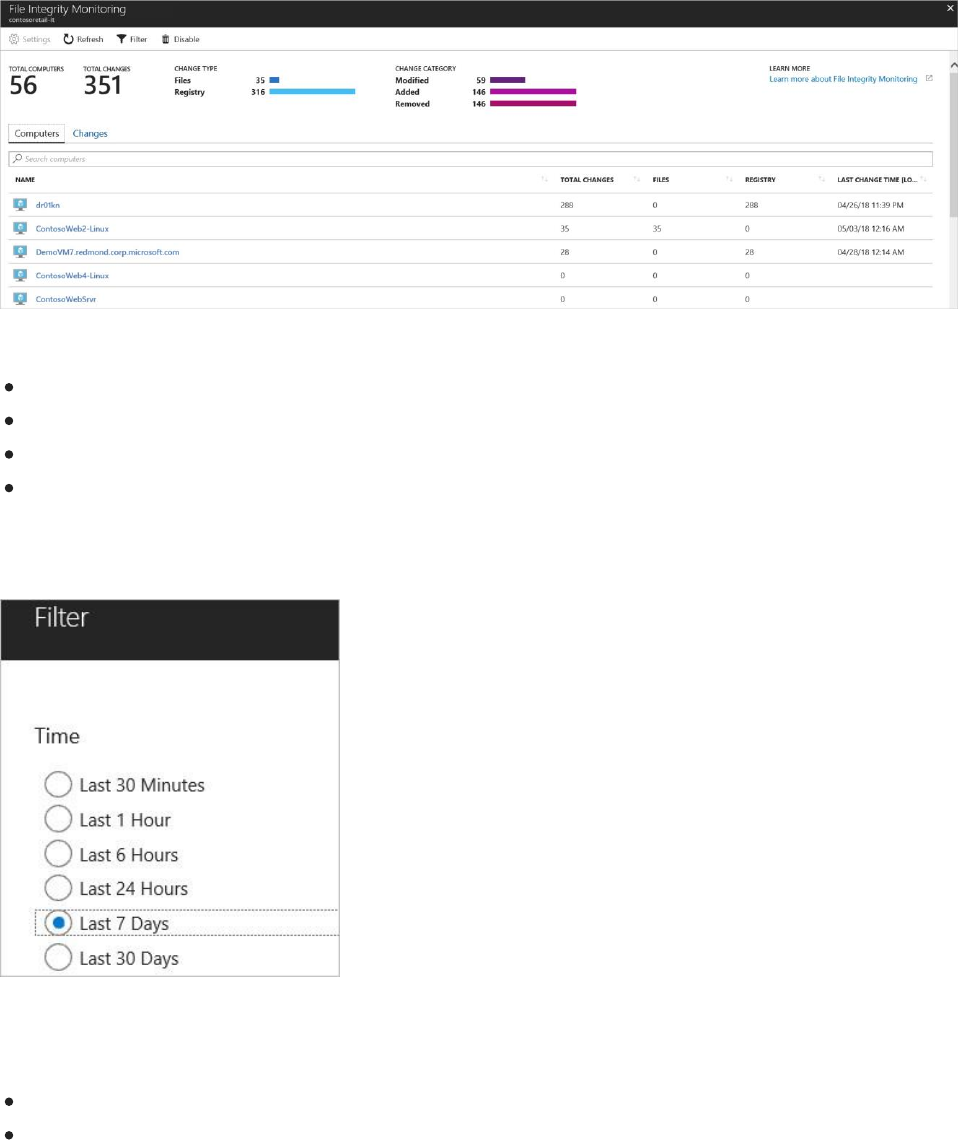
View the FIM dashboard
The File integrity monitoring dashboard displays for workspaces where FIM is enabled.
The FIM dashboard opens after you enable FIM on a workspace or when you select a
workspace in the File Integrity Monitoring window that already has FIM enabled.
The FIM dashboard for a workspace displays the following:
Total number of machines connected to the workspace
Total number of changes that occurred during the selected time period
A breakdown of change type (files, registry)
A breakdown of change category (modified, added, removed)
Selecting Filter at the top of the dashboard lets you apply the period of time that you want to
see changes for.
The Computers tab (shown above) lists all machines reporting to this workspace. For each
machine, the dashboard lists:
Total changes that occurred during the selected period of time
A breakdown of total changes as file changes or registry changes
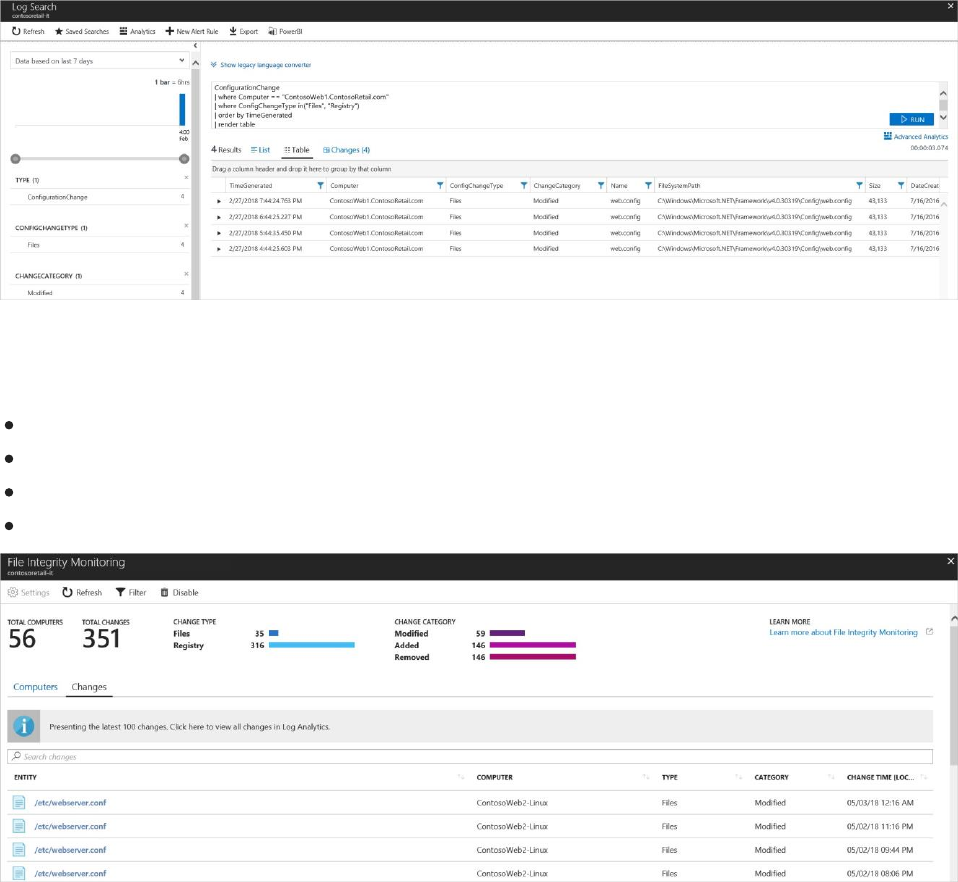
Log Search opens when you enter a machine name in the search field or select a machine listed
under the Computers tab. Log Search displays all the changes made during the selected time
period for the machine. You can expand a change for more information.
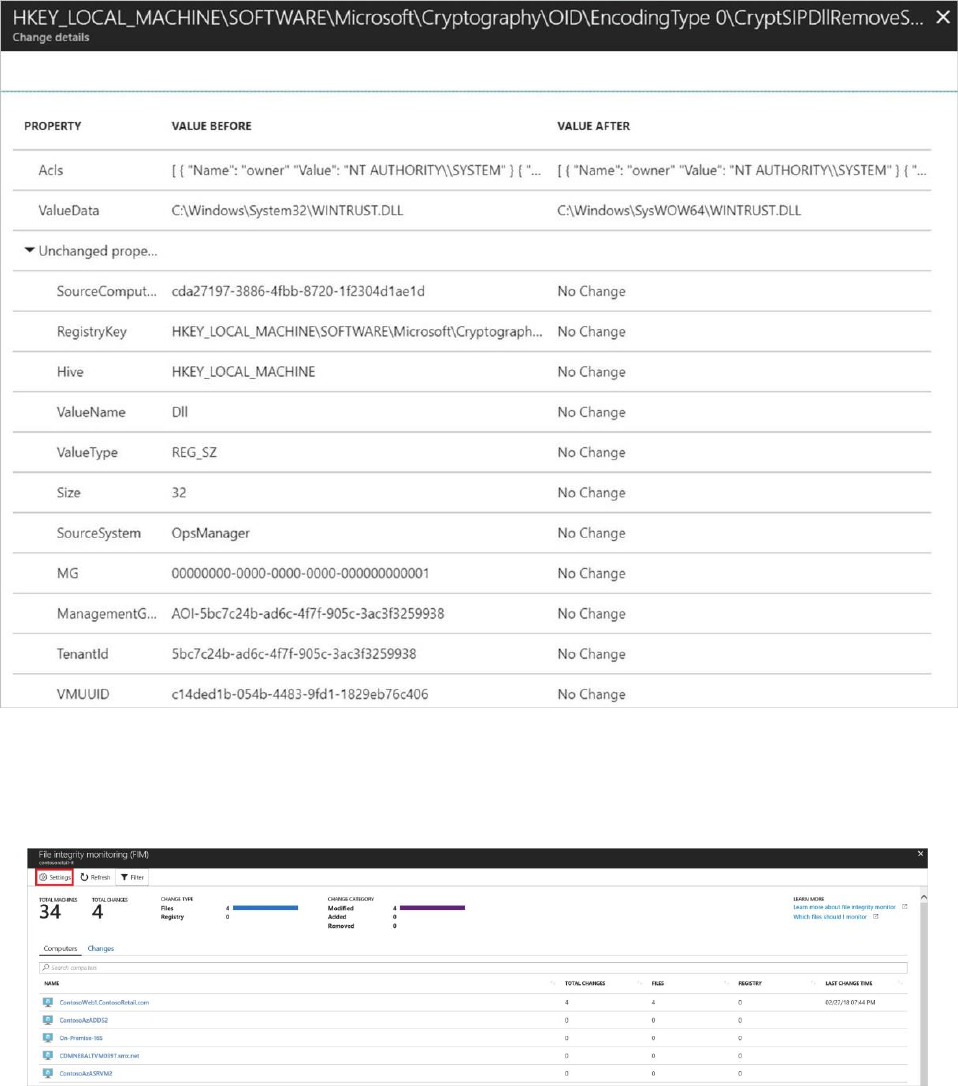
The Changes tab (shown below) lists all changes for the workspace during the selected time
period. For each entity that was changed, the dashboard lists the:
Computer that the change occurred on
Type of change (registry or file)
Category of change (modified, added, removed)
Date and time of change
Change details opens when you enter a change in the search field or select an entity listed
under the Changes tab.
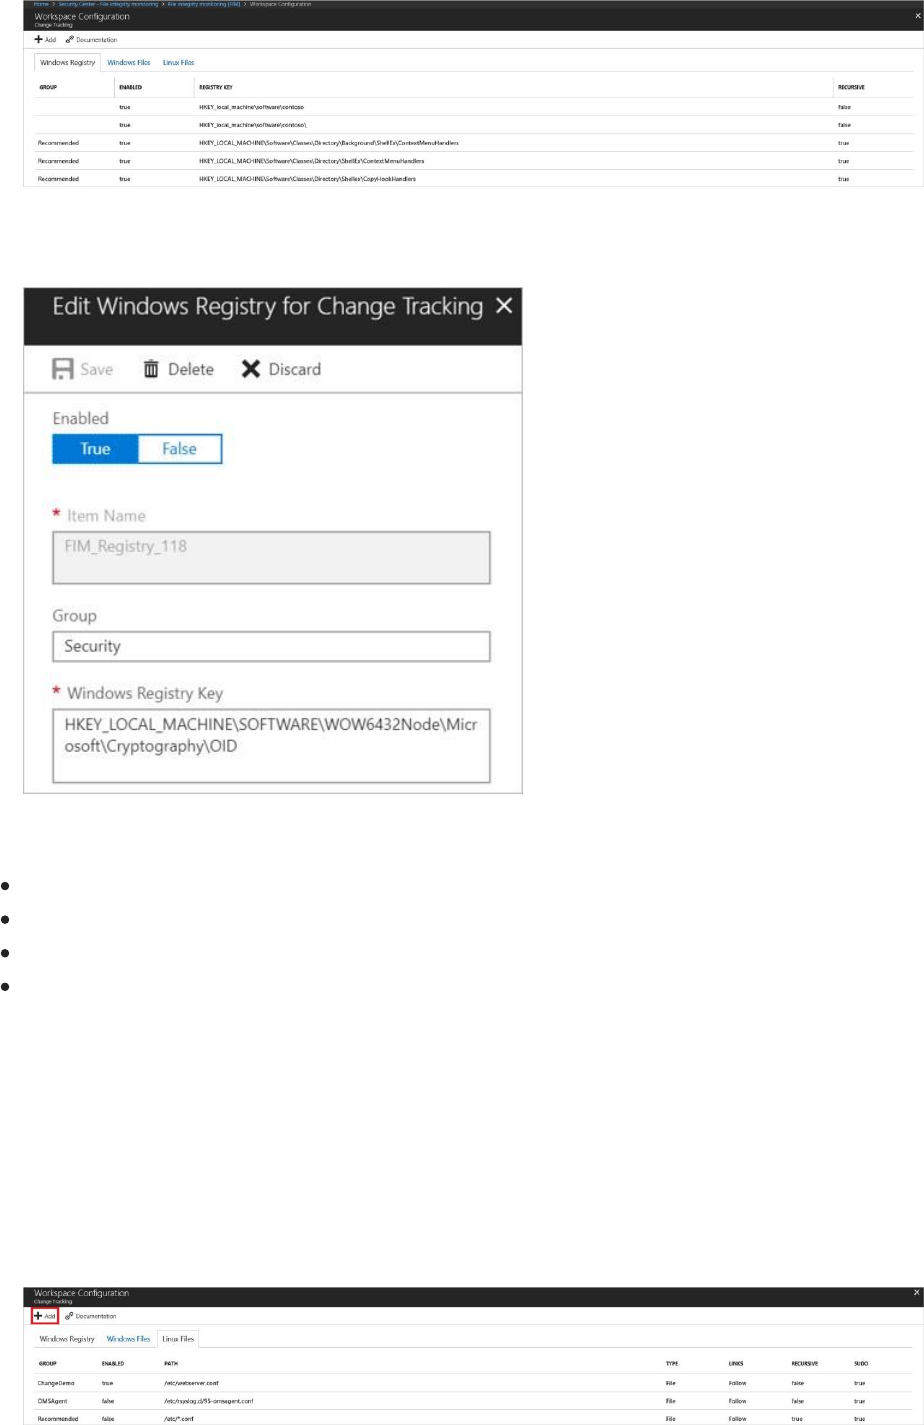
Edit monitored entities
1. Return to the File Integrity Monitoring dashboard and select Settings.
Workspace Configuration opens displaying three tabs: Windows Registry, Windows Files,
and Linux
Files. Each tab lists the entities that you can edit in that category. For each entity listed,
Security Center identifies if FIM is enabled (true) or not enabled (false). Editing the entity lets
you enable or disable FIM.
2. Select an identityprotection. In this example, we selected an item under Windows Registry.
Edit for Change Tracking opens.
Under Edit for Change Tracking you can:
Enable (True) or disable (False) file integrity monitoring
Provide or change the entity name
Provide or change the value or path
Delete the entity, discard the change, or save the change
Add a new entity to monitor
1. Return to the File integirty monitoring dashboard and select Settings at the top.
Workspace Configuration opens.
2. Under Workspace Configuration, select the tab for the type of entity that you want to
add: Windows Registry, Windows Files, or Linux Files. In this example, we selected Linux
Files.
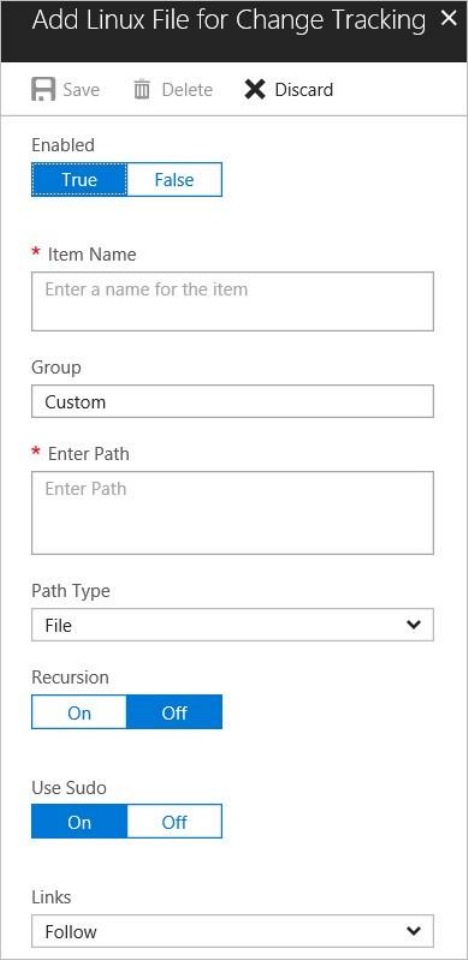
3. Select Add. Add for Change Tracking opens.
4. On the Add page, type the requested information and select Save.
Disable monitored entities
1. Return to the File Integrity Monitoring dashboard.
2. Select a workspace where FIM is currently enabled. A workspace is enabled for FIM if it is
missing the Enable button or Upgrade Plan button.
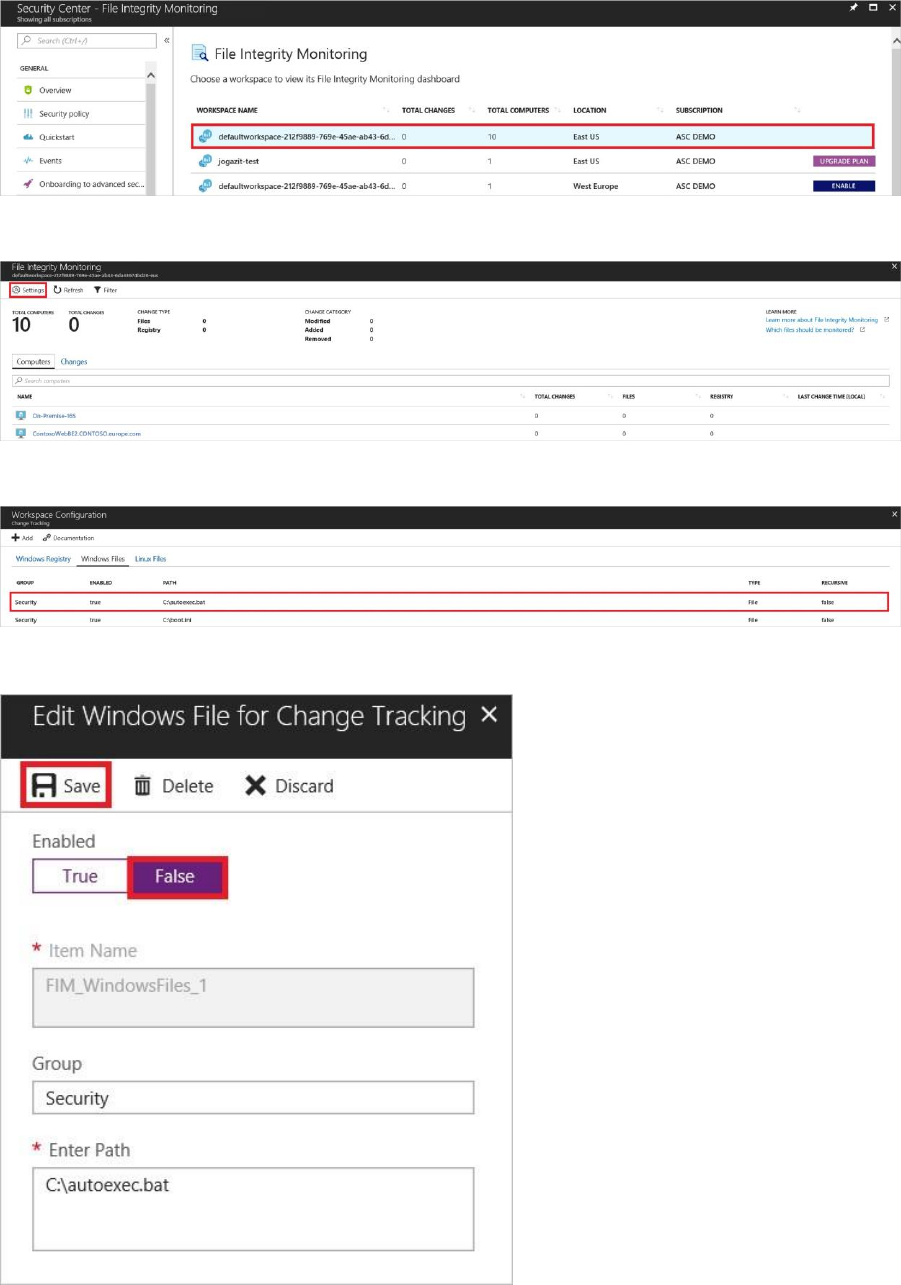
3. Under File Integrity Monitoring, select Settings.
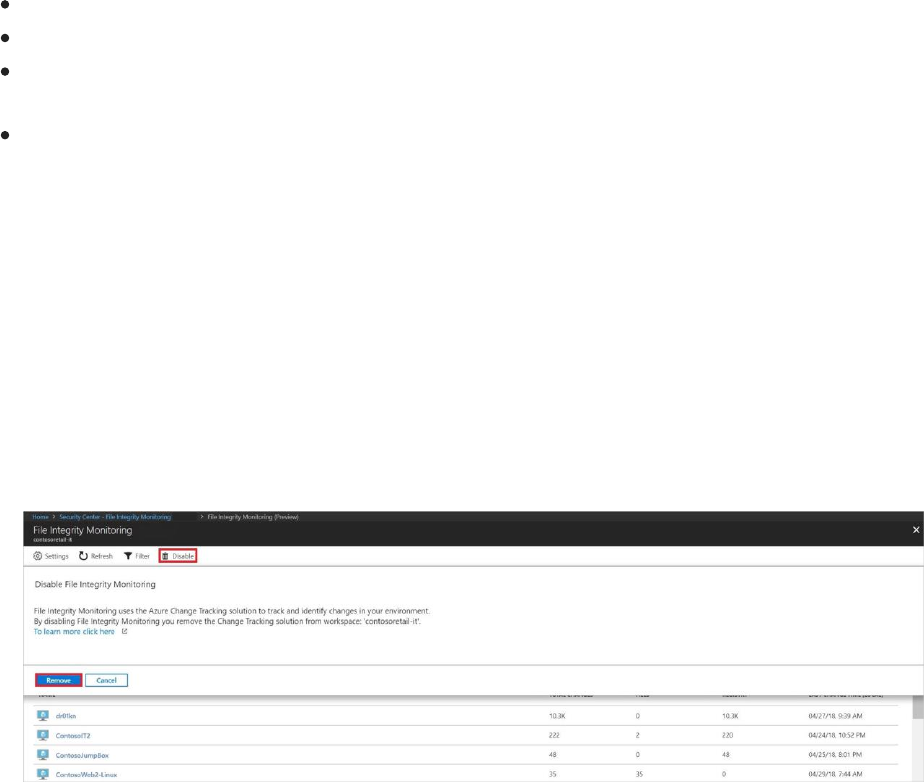
4. Under Workspace Configuration, select a group where Enabled is set to true.
5. Under Edit for Change Tracking window set Enabled to False.
6. Select Save.
Folder and path monitoring using wildcards
Use wildcards to simplify tracking across directories. The following rules apply when you
configure folder monitoring using wildcards:
Wildcards are required for tracking multiple files.
Wildcards can only be used in the last segment of a path, such as C:\folder\file or /etc/*.conf
If an environment variable includes a path that is not valid, validation will succeed but the
path will fail when inventory runs.
When setting the path, avoid general paths such as c:*.* which will result in too many
folders being traversed.
Disable FIM
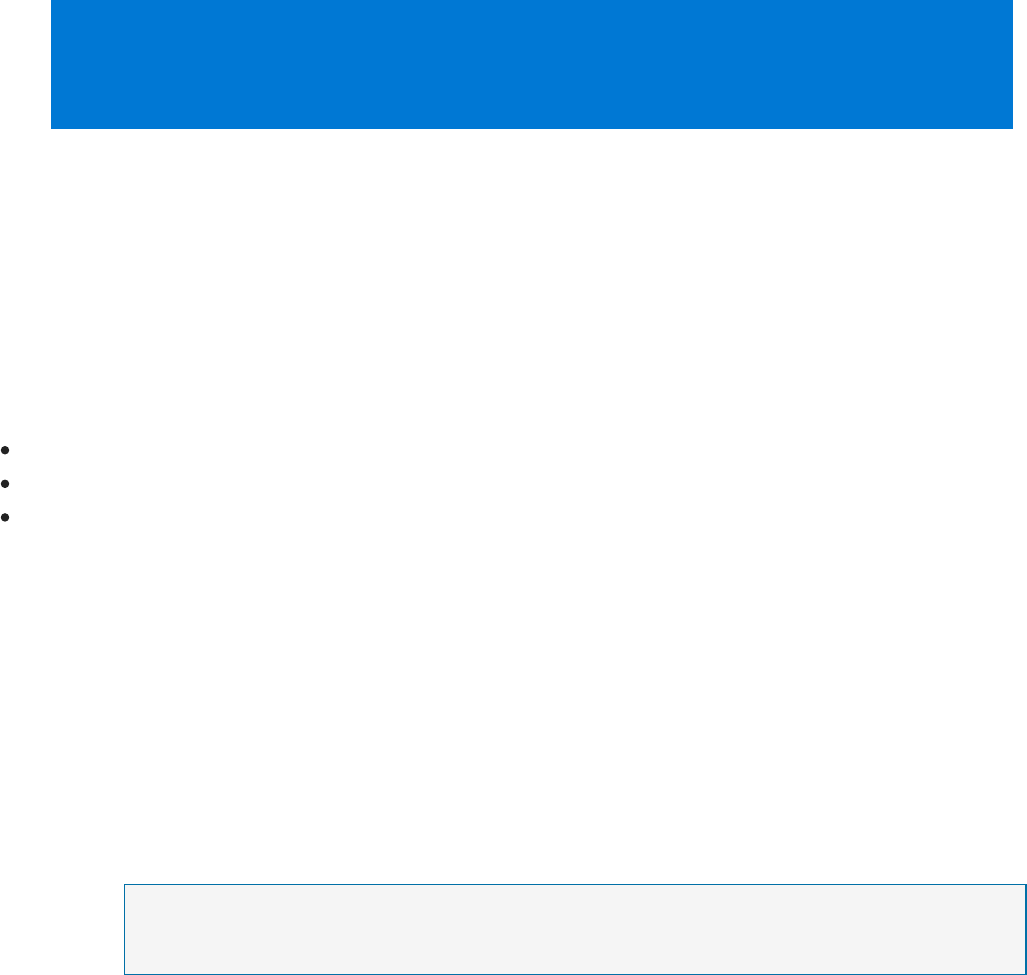
You can disable FIM. FIM uses the Azure Change Tracking solution to track and identify changes
in your environment. By disabling FIM, you remove the Change Tracking solution from selected
workspace.
1. To disable FIM, return to the File Integrity Monitoring dashboard.
2. Select a workspace.
3. Under File Integrity Monitoring, select Disable.
4. Select Remove to disable.
Azure Security Center – Detect and
Respond Scenario – Blue Subscription
Security Center continuously analyzes your hybrid cloud workloads using advanced analytics
and threat intelligence to alert you to malicious activity. In addition, you can integrate alerts
from other security products and services into Security Center, and create custom alerts
based on your own indicators or intelligence sources. Once an alert is generated, swift action
is needed to investigate and remediate. In this tutorial, you will learn how to:
Triage security alerts
Investigate further to determine the root cause and scope of a security incident Search
security data to aid in investigation
What are security alerts?
Security Center automatically collects, analyzes, and integrates log data from your
Azure resources, the network, and connected partner solutions, like firewall and
endpoint protection solutions, to detect real threats and reduce false positives. A
list of prioritized security alerts is shown in Security Center along with the
information you need to quickly investigate the problem and recommendations for
how to remediate an attack.
NOTE
For more information about how Security Center detection capabilities work, read Azure
Security Center Detection Capabilities.
Managing security alerts
You can review your current alerts by looking at the Security alerts tile. Follow the
steps below to see more details about each alert:
1. On the Security Center dashboard, you see the Security alerts tile.
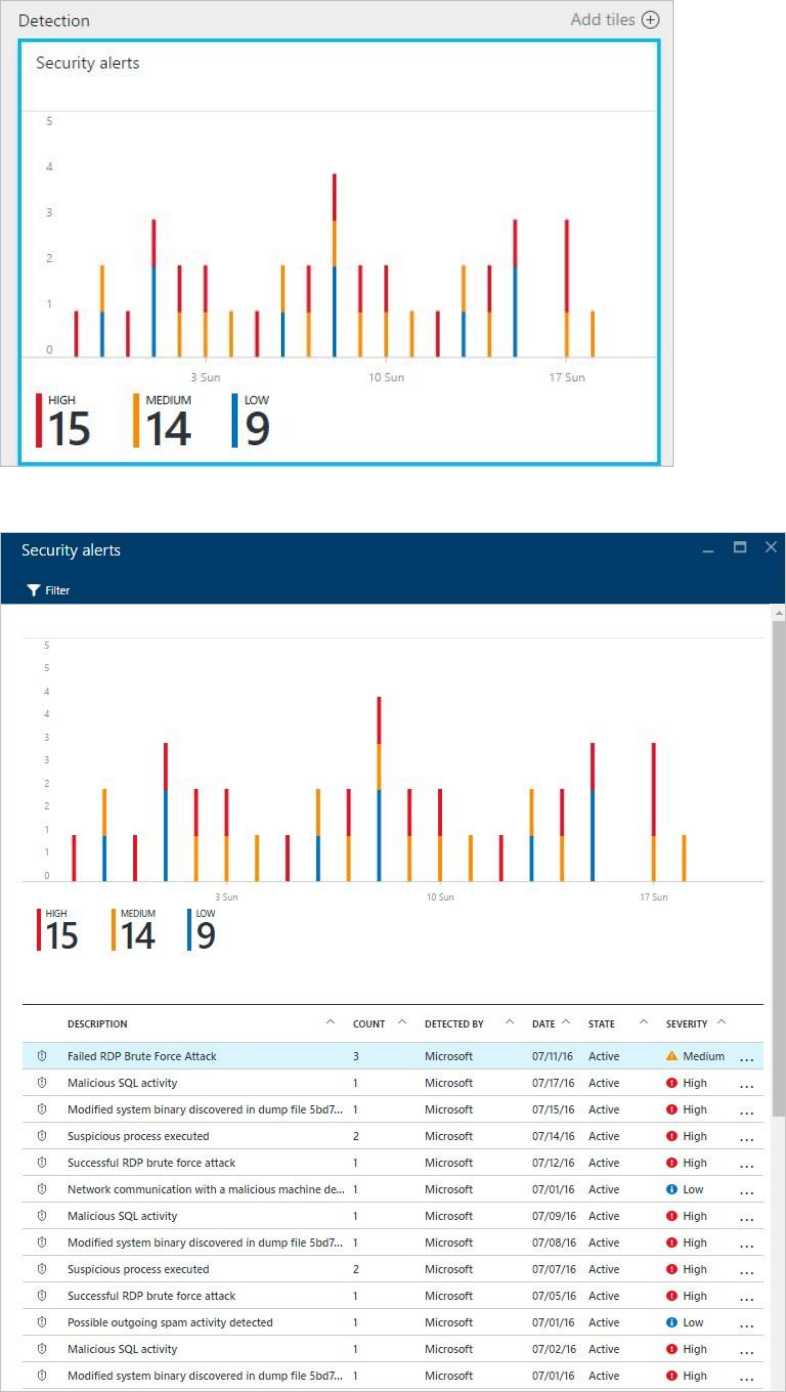
2. Click the tile to open the Security alerts to see more details about the alerts.
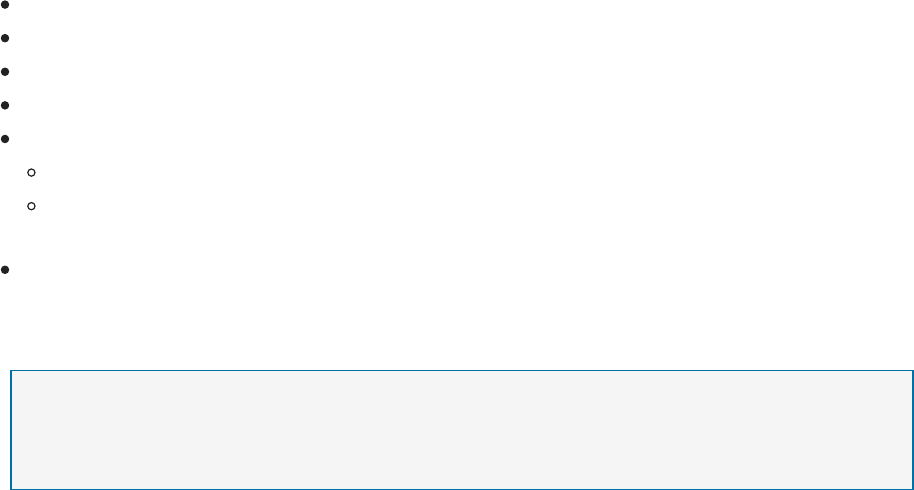
In the bottom part of this page are the details for each alert. To sort, click the column
that you want to sort by. The definition for each column is given below:
Description: A brief explanation of the alert.
Count: A list of all alerts of this specific type that were detected on a specific day.
Detected by: The service that was responsible for triggering the alert.
Date: The date that the event occurred.
State: The current state for that alert. There are two types of states:
Active: The security alert has been detected.
Dismissed: The security alert has been dismissed by the user. This status is
typically used for alerts that were investigated and either mitigated or found
not to be an actual attack. Severity: The severity level, which can be high,
medium or low.
NOTE
Security alerts generated by Security Center will also appear under Azure Activity Log.
For more information about how to access Azure Activity Log, read View activity logs to
audit actions on resources.
Filtering alerts
You can filter alerts based on date, state, and severity. Filtering alerts can be useful
for scenarios where you need to narrow the scope of security alerts show. For
example, you might you want to address security alerts that occurred in the last
24 hours because you are investigating a potential breach in the system.
1. Click Filter on the Security Alerts. The Filter opens and you select the date,
state, and severity values you wish to see.

Respond to security alerts
Select a security alert to learn more about the event(s) that triggered the alert and
what, if any, steps you need to take to remediate an attack. Security alerts are
grouped by type and date. Clicking a security alert opens a page containing a list of
the grouped alerts.
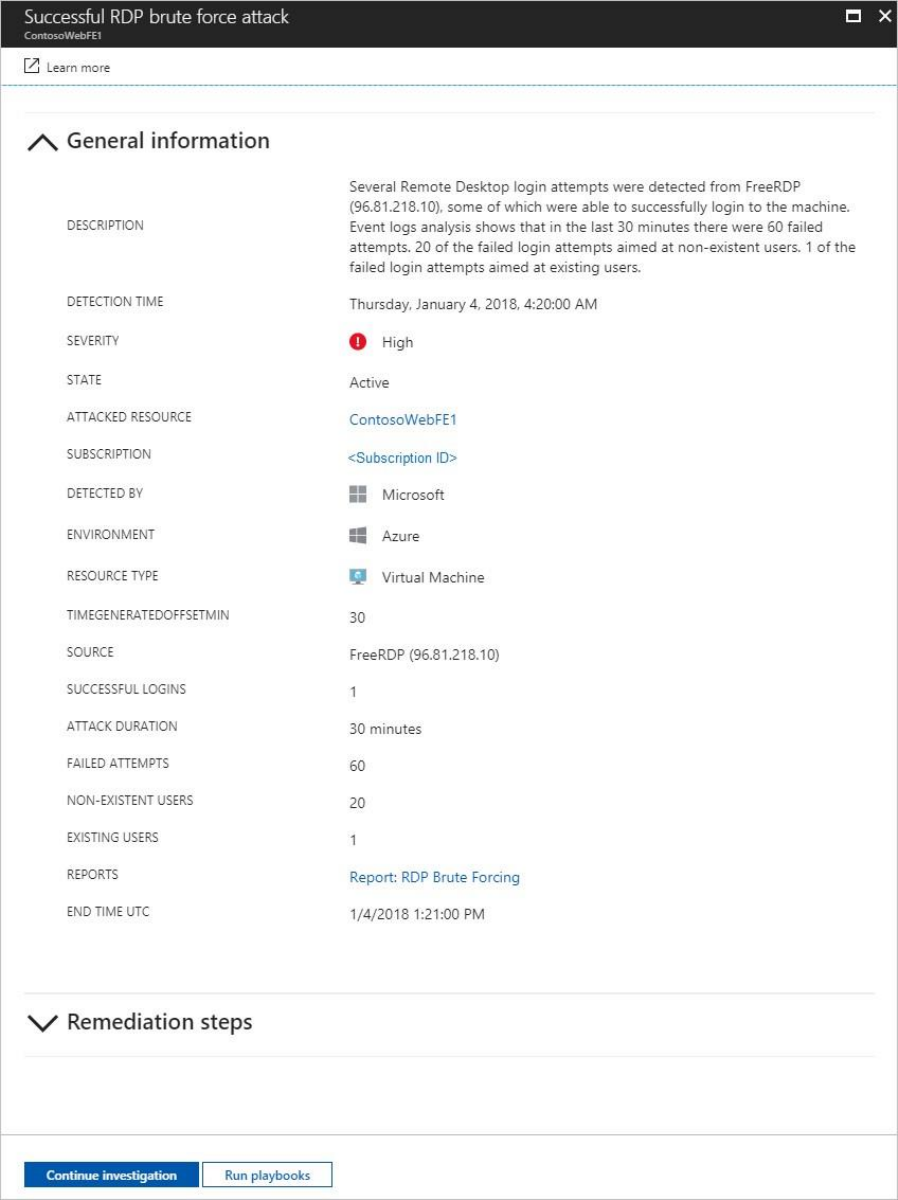
In this case, the alerts that were triggered refer to suspicious Remote Desktop
Protocol (RDP) activity. The first column shows which resources were attacked; the
second shows how many times the resource was attacked; the third shows the time
of the attack; the fourth shows state of the alert; and the fifth shows the severity of
the attack. After reviewing this information, click the resource that was attacked.
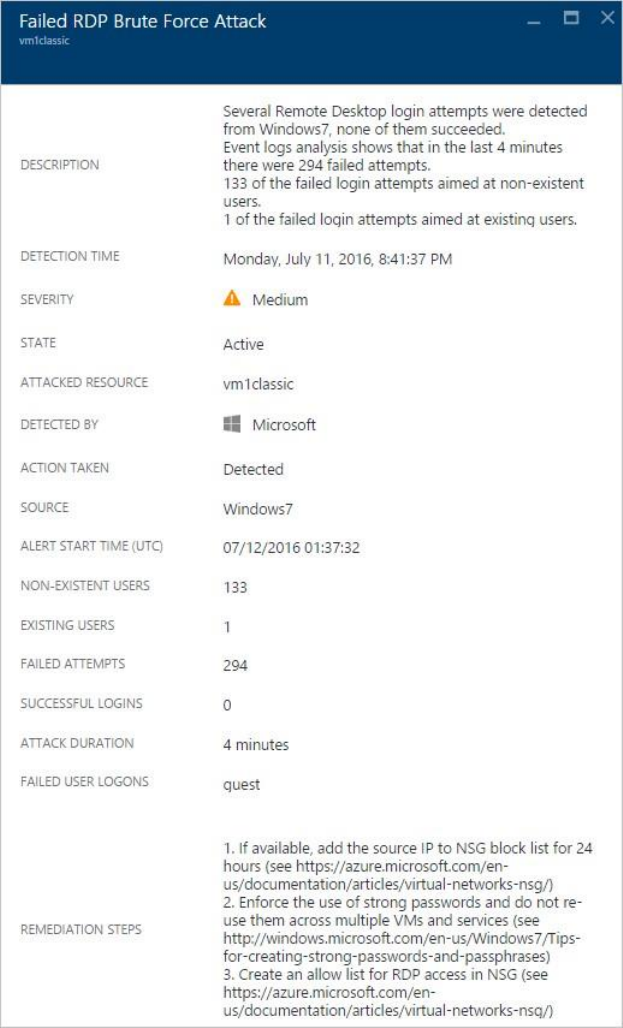
In the Description field you find more details about this event. These additional
details offer insight into what triggered the security alert, the target resource, when
applicable the source IP address, and recommendations about how to remediate. In
some instances, the source IP address is empty (not available) because not all
Windows security events logs include the IP address.
The remediation suggested by Security Center vary according to the security alert. In
some cases, you may have to use other Azure capabilities to implement the
recommended remediation. For example, the remediation for this attack is to
blacklist the IP address that is generating this attack by using a network ACL or a
network security group rule. For more information on the different types of alerts,
read Security Alerts by Type in Azure Security Center.

NOTE
Security Center has released to limited preview a new set of detections that leverage
auditd records, a common auditing framework, to detect malicious behaviors on Linux
machines. Please send an email with your subscription IDs to us to join the preview.
Triage security alerts
Security Center provides a unified view of all security alerts. Security alerts are ranked based
on the severity and when possible related alerts are combined into a security incident. When
triaging alerts and incidents, you should:
Dismiss alerts for which no additional action is required, for example if the alert is a false
positive
Act to remediate known attacks, for example blocking network traffic from a malicious IP
address Determine alerts that require further investigation
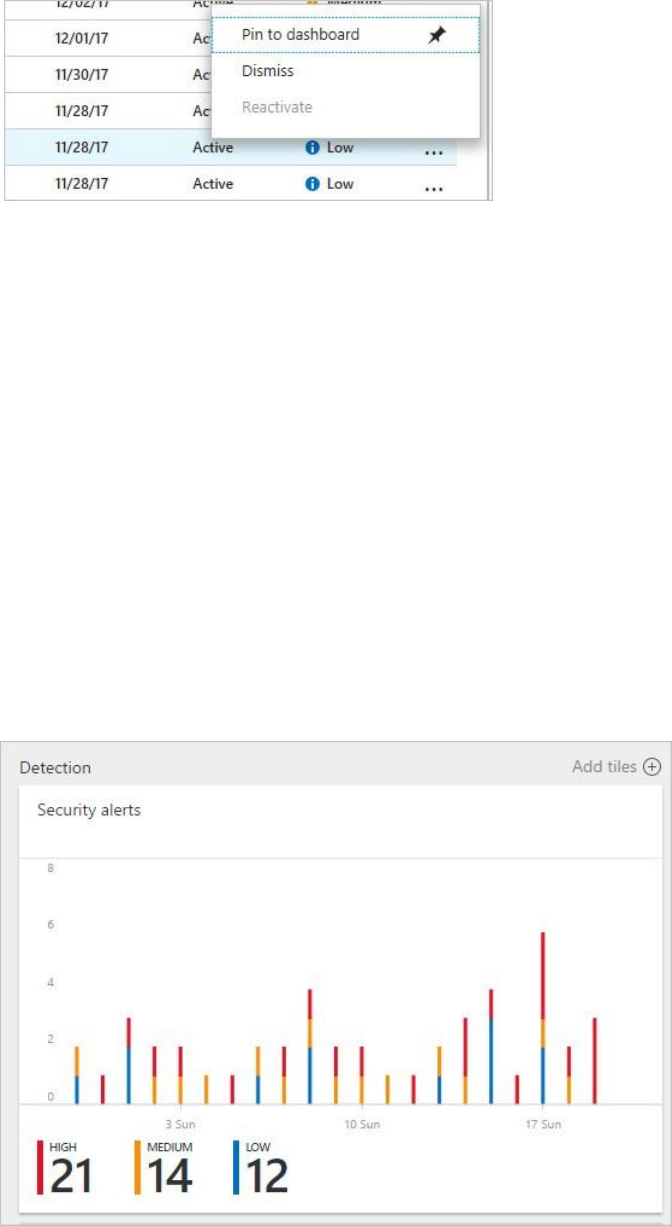
1. On the Security Center main menu under DETECTION, select Security alerts:
2. In the list of alerts, click on a security incident, which is a collection of alerts, to learn more
about this incident. Security incident detected opens.
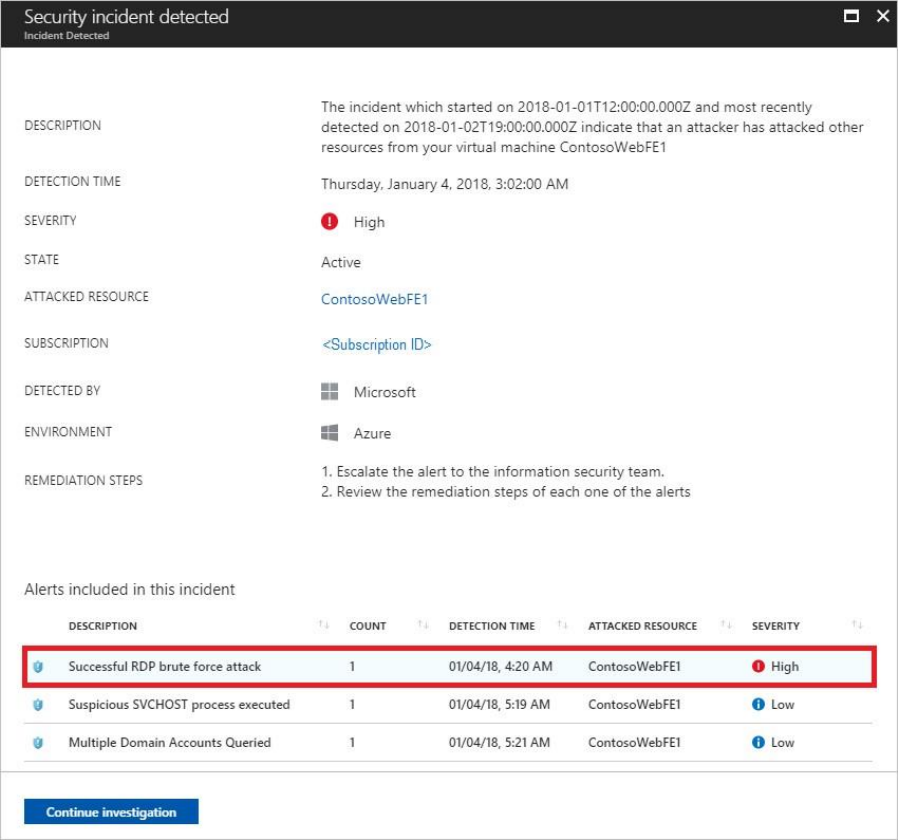
3. On this screen you have the security incident description on top, and the list of alerts that
are part of this incident. Click on the alert that you want to investigate further to obtain
more information.
4. If the root cause and scope of the malicious activity is unknown, proceed to the next step
to investigate further.
What is a security incident?
In Security Center, a security incident is an aggregation of all alerts for a resource that align
with kill chain patterns. Incidents appear in the Security Alerts tile and blade. An Incident will
reveal the list of related alerts, which enables you to obtain more information about each
occurrence.
Managing security incidents
You can review your current security incidents by looking at the security alerts tile. Access the
Azure Portal and follow the steps below to see more details about each security incident:
1. On the Security Center dashboard, you will see the Security alerts tile.
2. Click on this tile to expand it and if a security incident is detected, it will appear under the
security alerts graph as shown below:
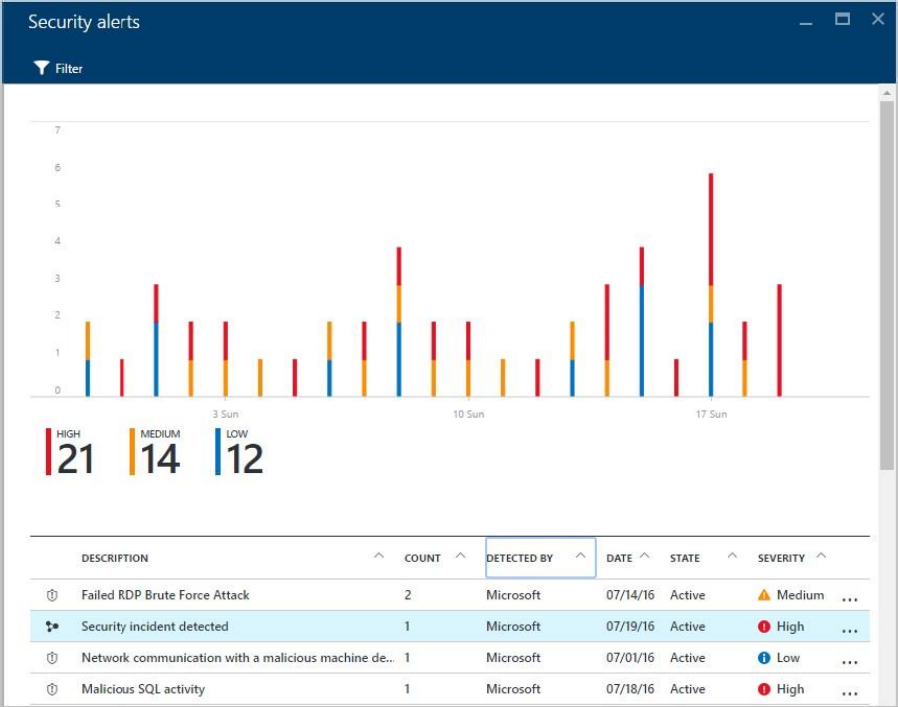
3. Notice that the security incident description has a different icon compared to other alerts.
Click on it to view more details about this incident.
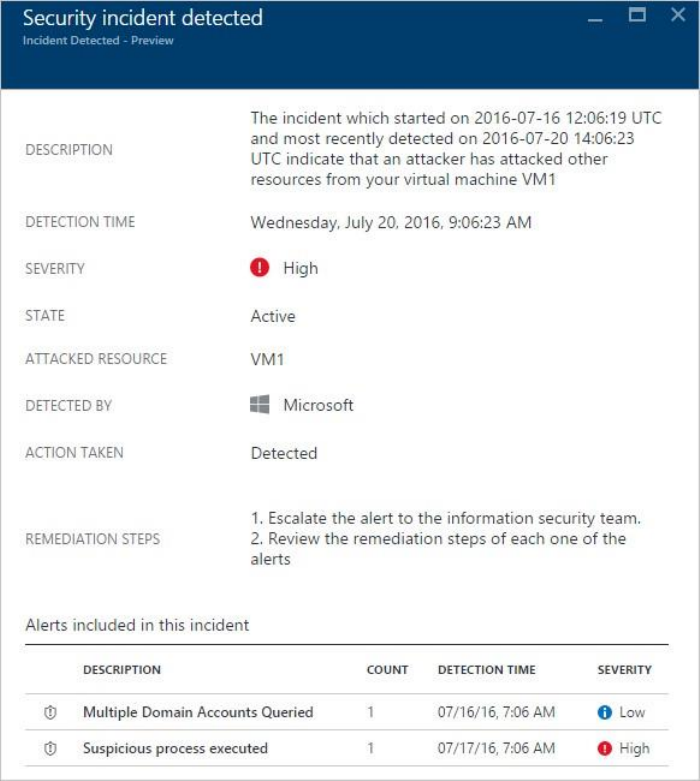
4. On the incident blade you will see more details about this security incident, which includes
its full description, its severity (which in this case is high), its current state (in this case it is
still active, which implies the user hasn't taken an action to it - this can be done by right
clicking on the incident in the Security alerts blade), the attacked resource (in this case
VM1), the remediation steps for the incident, and in the bottom pane you have the alerts
that were included in this incident. If you want to obtain more information on each alert,
just click on it and another blade will open, as shown below:
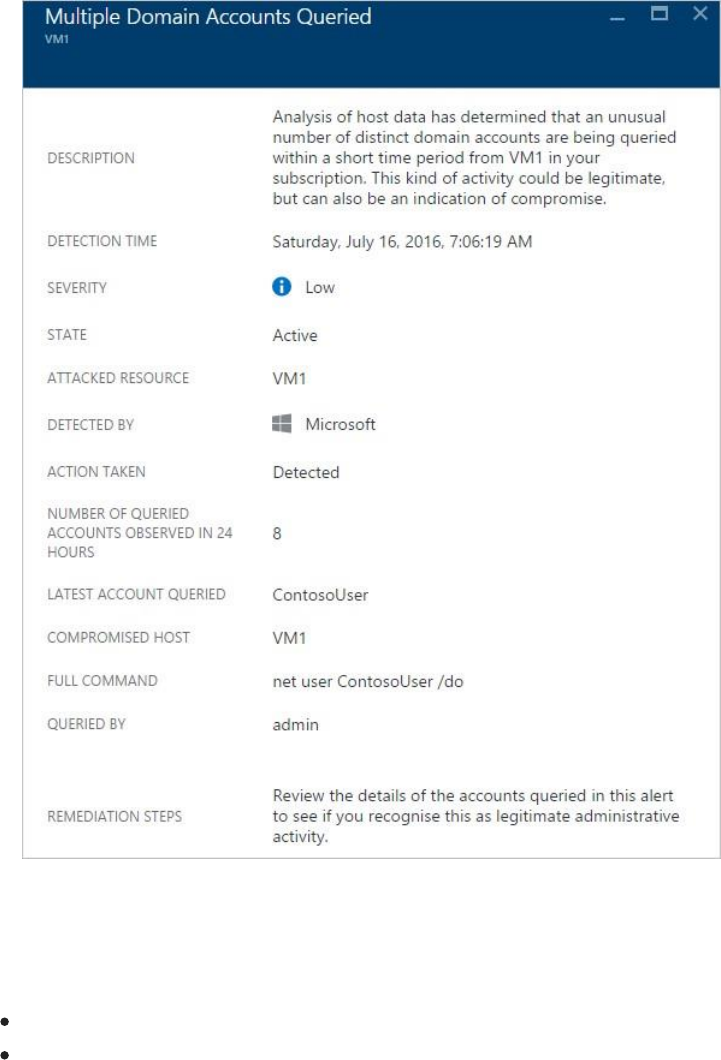
The information on this blade will vary according to the alert. Read Managing and responding
to security alerts in Azure Security Center for more information on how to manage these alerts.
Some important considerations regarding this capability:
A new filter enables you to customize your view to Incident only, Alerts only, or both.
The same alert can exist as part of an Incident (if applicable), as well as to be visible as a
standalone alert.
Investigate an alert or incident
1. On the Security alert page, click Start investigation button (if you already started, the
name changes to Continue investigation).

The investigation map is a graphical representation of the entities that are connected to
this security alert or incident. By clicking on an entity in the map, the information about
that entity will show new entities, and the map expands. The entity that is selected in the
map has its properties highlighted in the pane on the right side of the page. The
information available on each tab will vary according to the selected entity. During the
investigation process, review all relevant information to better understand the attacker’s
movement.
2. If you need more evidence, or must further investigate entities that were found during the
investigation, proceed to the next step.
Search data for investigation
You can use search capabilities in Security Center to find more evidence of compromised
systems, and more details about the entities that are part of the investigation.
To perform a search open the Security Center dashboard, click Search in the left navigation
pane, select the workspace that contains the entities that you want to search, type the search
query, and click the search button.
What is a threat intelligence report?
Security Center threat detection works by monitoring security information from your Azure
resources, the network, and connected partner solutions. It analyzes this information, often
correlating information from multiple sources, to identify threats. This process is part of the
Security Center detection capabilities.
When Security Center identifies a threat, it will trigger a security alert, which contains detailed
information regarding a particular event, including suggestions for remediation. To assist
incident response teams investigate and remediate threats, Security Center includes a threat
intelligence report that contains information about the threat that was detected, including
information such as the:
Attacker’s identity or associations (if this information is available)
Attackers’ objectives
Current and historical attack campaigns (if this information is available)
Attackers’ tactics, tools and procedures
Associated indicators of compromise (IoC) such as URLs and file hashes
Victimology, which is the industry and geographic prevalence to assist you in determining if
your Azure resources are at risk
Mitigation and remediation information
NOTE
The amount of information in any particular report will vary; the level of detail is based on the
malware’s activity and prevalence.
Security Center has three types of threat reports, which can vary according to the attack. The
reports available are:
Activity Group Report: provides deep dives into attackers, their objectives and tactics.
Campaign Report: focuses on details of specific attack campaigns.
Threat Summary Report: covers all of the items in the previous two reports.
This type of information is very useful during the incident response process, where there is
an ongoing investigation to understand the source of the attack, the attacker’s motivations,
and what to do to mitigate this issue moving forward.
How to access the threat intelligence report?
You can review your current alerts by looking at the Security alerts tile. Open the Azure Portal
and follow the steps below to see more details about each alert:
1. On the Security Center dashboard, you will see the Security alerts tile.
2. Click the tile to open the Security alerts blade that contains more details about the alerts
and click in the security alert that you want to obtain more information about.
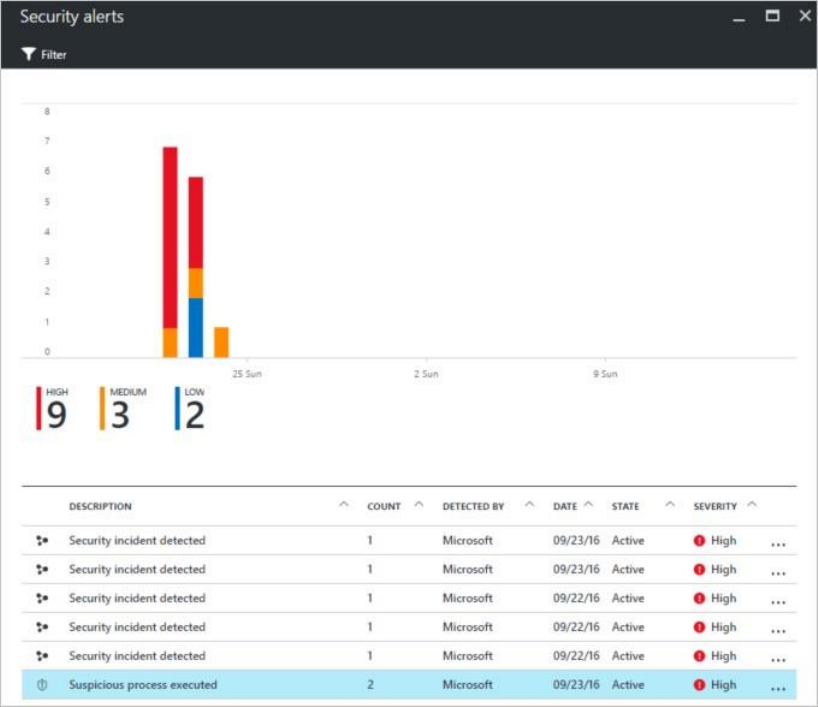
3. In this case the Suspicious process executed blade shows the details about the alert as
shown in the figure below:

4. The amount of information available for each security alert will vary according to the type
of alert. In the REPORTS field you have a link to the threat intelligence report. Click on it
and another browser window will appear with PDF file.

In the Blue Subscription please review the Windows registry persistence method
detected Alert for this report.
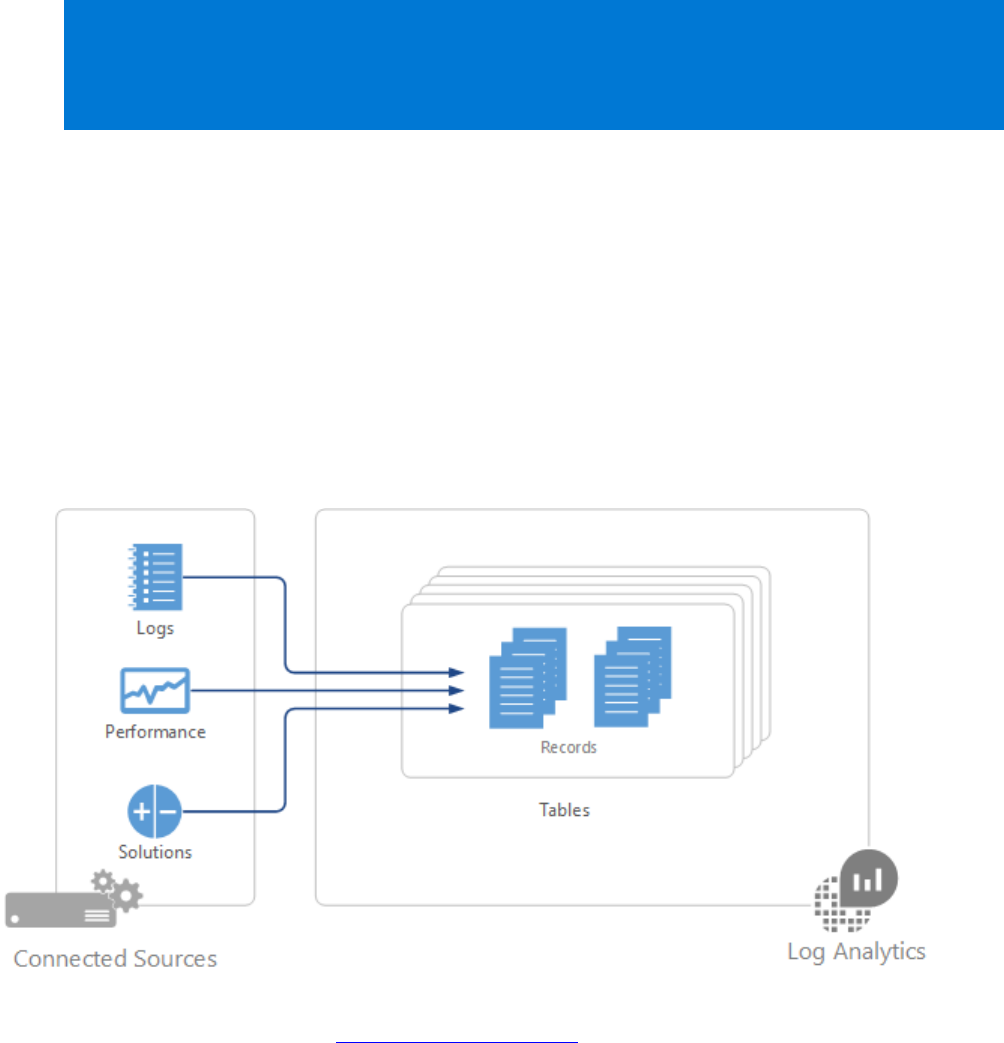
Audit, Query, Report Scenario – Blue
Subscription and Red Subscrption
Security Center Audit Rules – Red Subscription
Log Analytics is used for most Audit scenarios and collects data from your Connected Sources and
stores it in your Log Analytics workspace. The data that is collected from each is defined by the
Data Sources that you configure. Data in Log Analytics is stored as a set of records. Each data
source creates records of a particular type with each type having its own set of properties.
Data Sources are different than management solutions, which also collect data from Connected
Sources and create records in Log Analytics. In addition to collecting data, solutions typically
include log searches and views to help you analyze the operation of a particular application or
service.
Summary of data sources
The following table lists the data sources that are currently available in Log Analytics. Each has a
link to a separate article providing detail for that data source. It also provides information on their
method and frequency of data collection into Log Analytics. You can use the information in this
article to identify the different solutions available and to understand the data flow and connection

requirements for different management solutions. For explanations of the columns, see Data
collection details for management solutions in Azure.
Data
source
Platfo
rm
Microso
ft
monitor
ing
agent
Operati
ons
Manage
r agent
Azur
e
stora
ge
Operati
ons
Manage
r
require
d?
Operatio
ns
Manager
agent
data sent
via
managem
ent group
Collecti
on
freque
ncy
Custom
logs
Windo
ws
•
on
arrival
Custom
logs
Linux
•
on
arrival
IIS logs
Windo
ws
•
•
•
depends
on Log
File
Rollove
r setting
Performa
nce
counters
Windo
ws
•
•
as
schedul
ed,
minimu
m of 10
seconds
Performa
nce
counters
Linux
•
as
schedul
ed,
minimu
m of 10
seconds
Syslog
Linux
•
from
Azure
storage:
10
minutes
; from
agent:
on
arrival
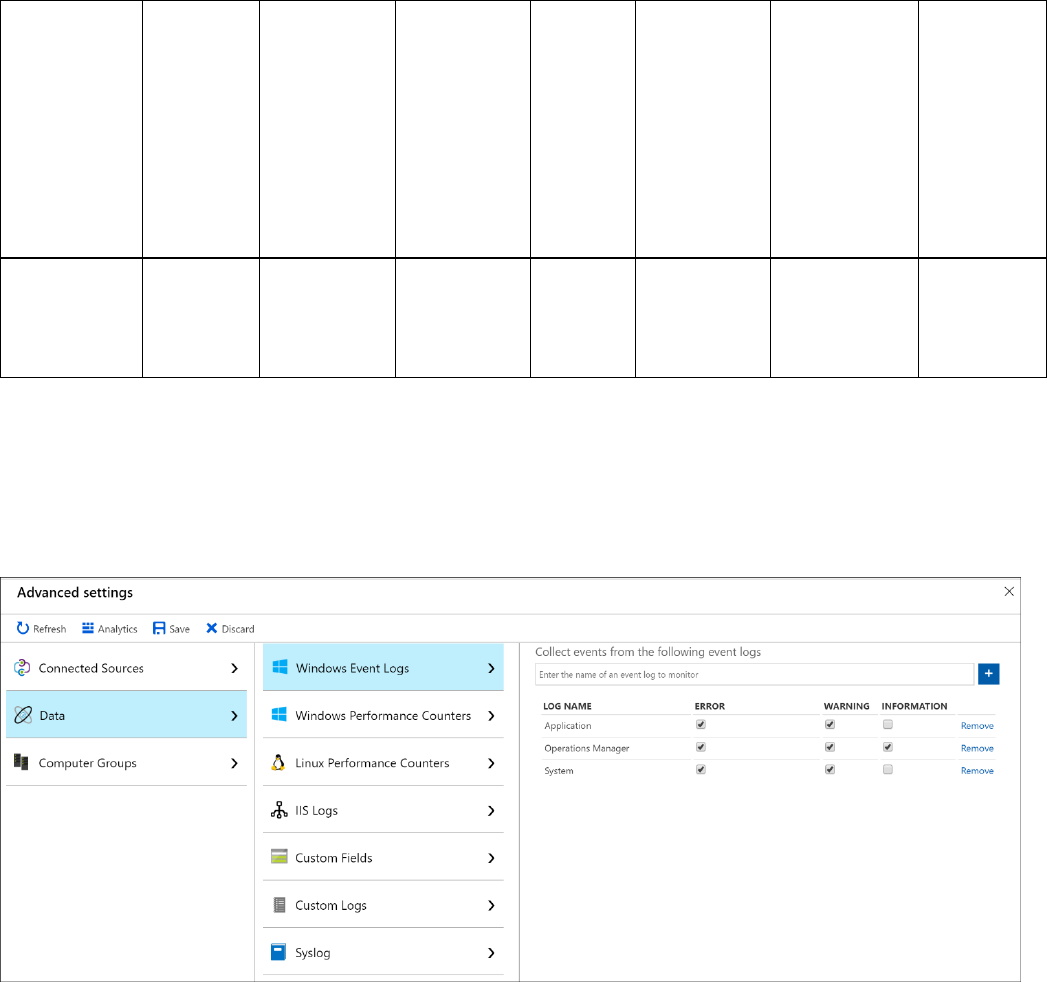
Data
source
Platfo
rm
Microso
ft
monitor
ing
agent
Operati
ons
Manage
r agent
Azur
e
stora
ge
Operati
ons
Manage
r
require
d?
Operatio
ns
Manager
agent
data sent
via
managem
ent group
Collecti
on
freque
ncy
Windows
Event
logs
Windo
ws
•
•
•
•
on
arrival
Configuring data sources
You configure data sources from the Data menu in Log Analytics Advanced Settings. Any
configuration is delivered to all connected sources in your workspace. You cannot currently
exclude any agents from this configuration.
1. In the Azure portal, select Log Analytics > your workspace > Advanced Settings.
2. Select Data.
3. Click on the data source you want to configure, such as Windows Event Logs
4. Add System Log Error, Warning, Information
5. Add Application Log Error, Warning, Information.
Data collection
Data source configurations are delivered to agents that are directly connected to Log Analytics
within a few minutes. The specified data is collected from the agent and delivered directly to Log
Analytics at intervals specific to each data source. See the documentation for each data source for
these specifics.

For System Center Operations Manager agents in a connected management group, data source
configurations are translated into management packs and delivered to the management group
every 5 minutes by default. The agent downloads the management pack like any other and collects
the specified data. Depending on the data source, the data will be either sent to a management
server which forwards the data to the Log Analytics, or the agent will send the data to Log
Analytics without going through the management server. See Data collection details for
management solutions in Azure for details. You can read about details of connecting Operations
Manager and Log Analytics and modifying the frequency that configuration is delivered at
Configure Integration with System Center Operations Manager.
If the agent is unable to connect to Log Analytics or Operations Manager, it will continue to collect
data that it will deliver when it establishes a connection. Data can be lost if the amount of data
reaches the maximum cache size for the client, or if the agent is not able to establish a connection
within 24 hours.
Log Analytics records
All data collected by Log Analytics is stored in the workspace as records. Records collected by
different data sources will have their own set of properties and be identified by their Type
property. See the documentation for each data source and solution for details on each record
type.
Azure Security Center Search – Blue Subscription
Azure Security Center uses Log Analytics search to retrieve and analyze your security
data. Log Analytics includes a query language to quickly retrieve and consolidate data.
From Security Center, you can leverage Log Analytics search to construct queries and
analyze collected data.
Search is available in both the Free tier and Standard tier of Security Center. The data
available in your log searches is dependent on the tier level applied to your
workspace. See the Security Center pricing page for more information.
NOTE
Security Center does not save security data for a workspace under the Free tier. You can send a
variety of logs to a workspace under the Free tier and search on that data but search results do
not include data from Security Center. Security Center only saves data to a workspace under the
Standard tier.

Access search
1. Under the Security Center main menu, select Search.
2. Security Center lists all workspaces under your Azure subscriptions. Select a
workspace. (If you have only one workspace, this workspace selector does not
appear.)
3. Log Search opens. To query for more data under the selected workspace, enter
this example query: SecurityEvent | where EventID == 4625 | summarize count() by
TargetAccount Result shows all accounts that failed to logon (event 4625).
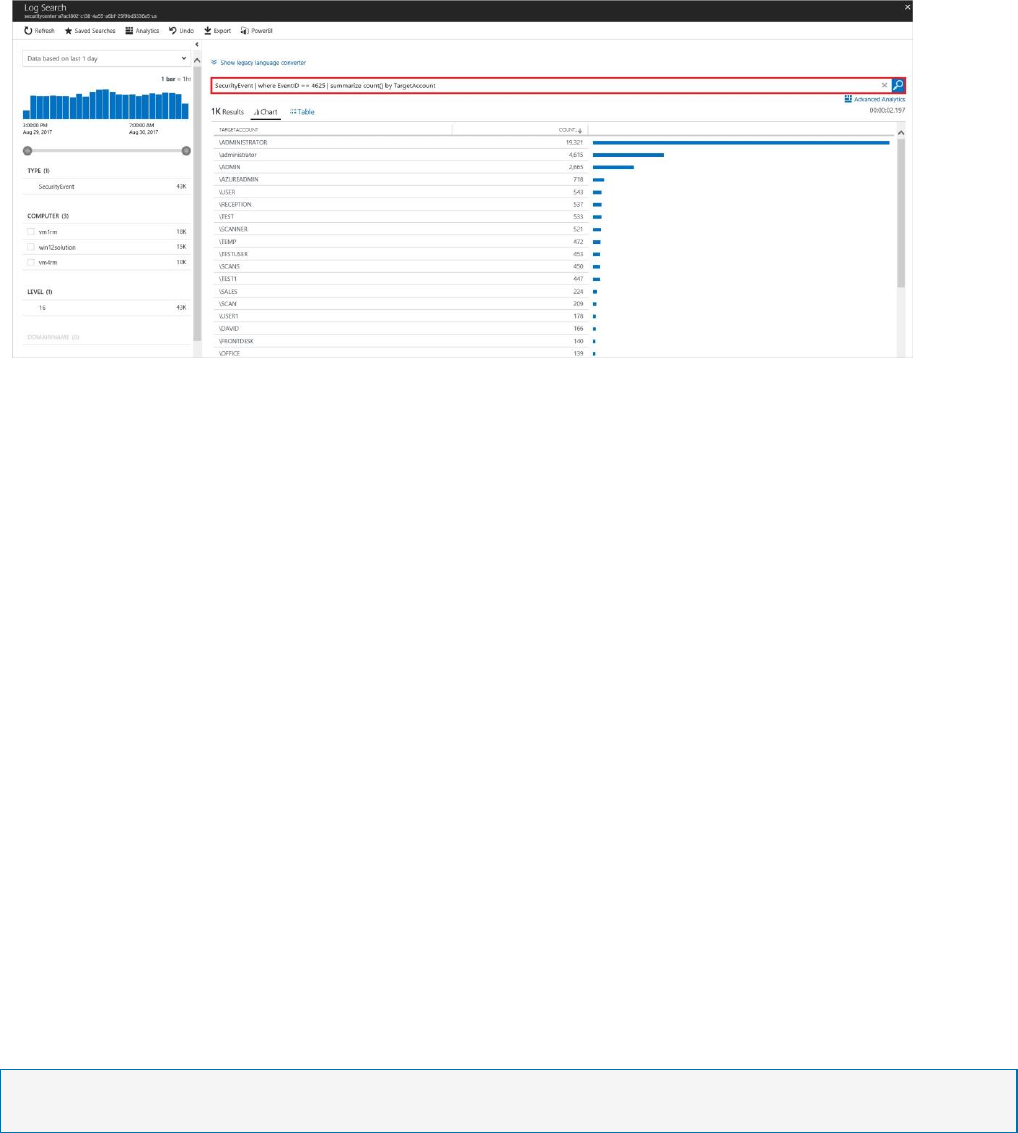
4. Results can also be EXPORTED or you can use PowerBI to display results.
See Log Analytics query language for more information on how to query for data under the
selected workspace.
Security Center Alert Rules – Red Subscription
What are custom alert rules in Security Center?
Security Center has a set of predefined security alerts, which are triggered when a
threat, or suspicious activity takes place. In some scenarios, you may want to create a
custom alert to address specific needs of your environment.
Custom alert rules in Security Center allow you to define new security alerts based on
data that is already collected from your environment. You can create queries, and the
result of these queries can be used as criteria for the custom rule, and once this criteria
is matched, the rule is executed. You can use computers security events, partner's
security solution logs or data ingested using APIs to create your custom queries.
NOTE
Custom alerts are not supported in Security Center's investigation feature.
How to create a custom alert rule in Security Center?
Open Security Center dashboard, and follow these steps to create a custom alert rule:
1. In the left pane, under Detection click Custom alert rules (Preview).
2. In the Security Center – Custom alert rules (Preview) page click New custom alert rule.
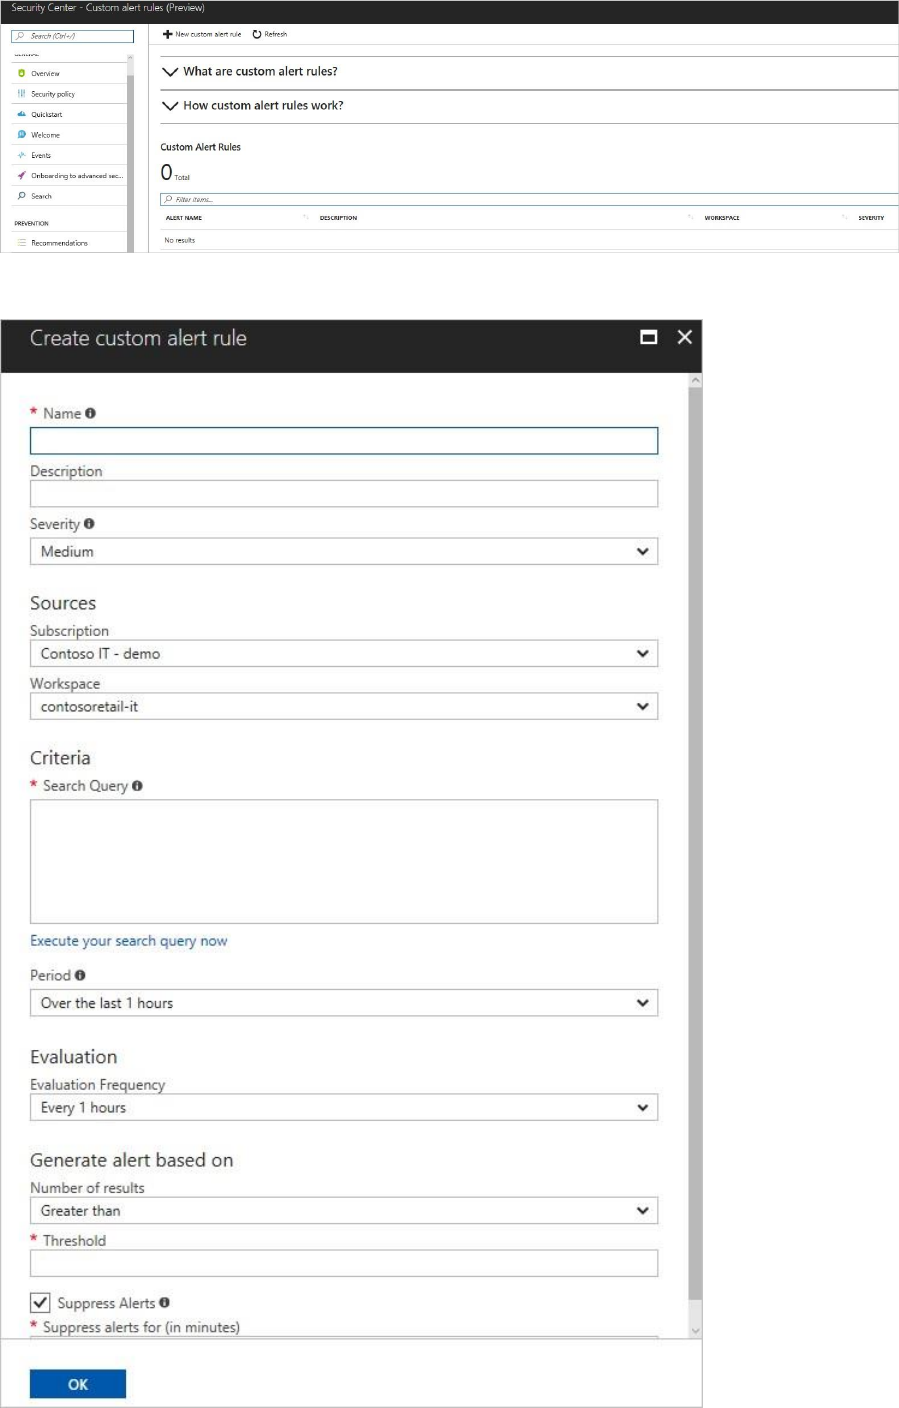
3. The Create custom alert rule page appears with the following options:
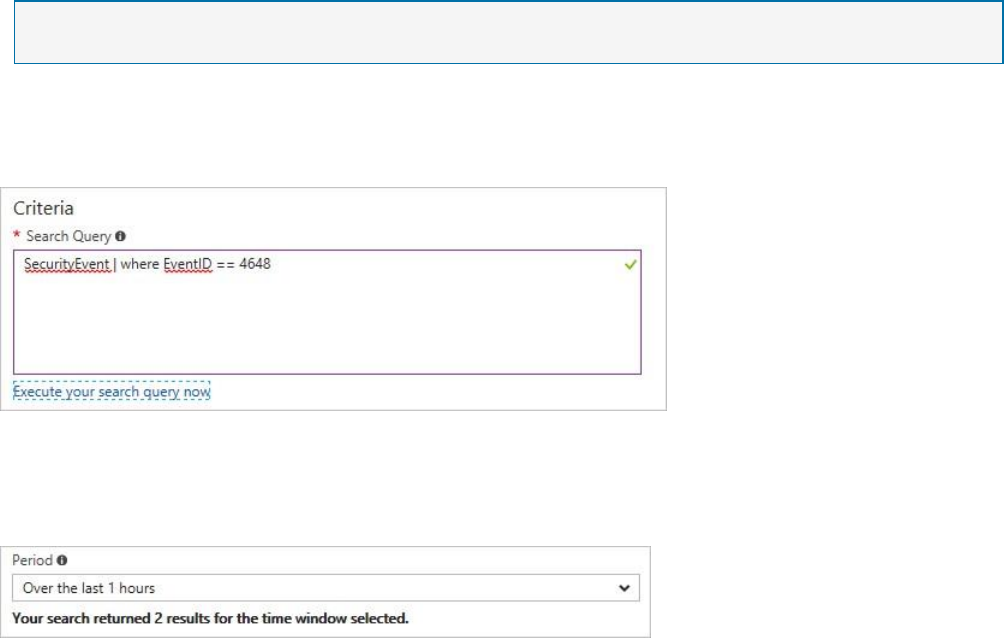
4. Type the name for this custom rule in the Name field.
5. Type a brief description that reflects the intent of this rule in the Description field.
6. Select the severity level (High, Medium, Low) according to your needs in the Severity field.
7. Select the subscription in which this rule is applicable in the Subscription field.
8. Select the workspace that you want to monitor with this rule in the Workspace field, and in
the Search Query field, the query that you want to use to obtain the results.
NOTE
You need write permission in the workspace that you select to store your custom alert.
The query’s result triggers the alert. Notice that when you type a valid query, the
green check mark appears in the right corner of this field:
9. Select the time span in which the query above will be executed in the Period field. Notice
that the search result in the bottom of this field will change the according to the time span
that you select.
10. In the Evaluation field select the frequency that this rule should be evaluated and executed.
11. In the Number of results field, select the operator (greater than, or lower than).
12. In the Threshold field type a number that will be used as reference for the operator that
was previous selected.
13. Enable Suppress Alerts option if you want to set a time to wait before Security Center sends
another alert for this rule.
14. Click OK to finish.
After you finish creating the new alert rule, it will appear in the list of custom alert rules.
Once the conditions of that rule are met, a new alert will be triggered, and you can see
in the Security Alerts dashboard.
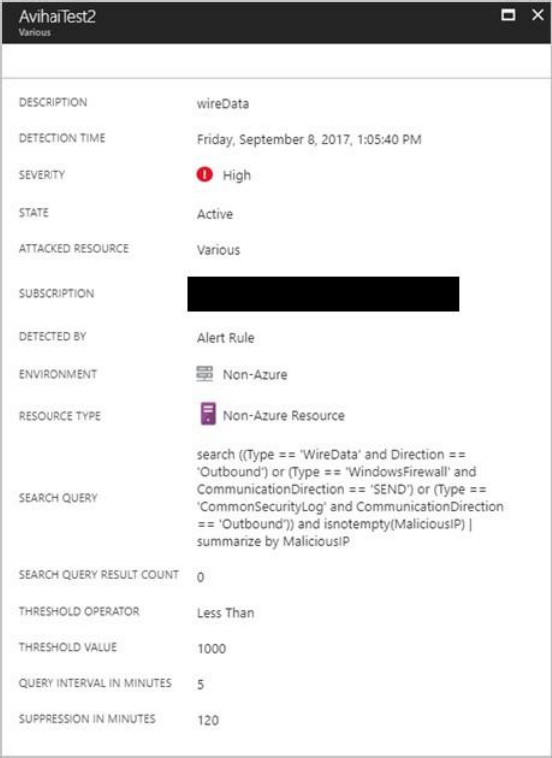
Notice that the parameters (search query, threshold, etc.) that were established during the rule
creation are
available in the alert for this custom rule.
