AWNVOL49_4 BUILT TO LAST PW3002 AWN VOL49 4
User Manual: BUILT TO LAST PW3002
Open the PDF directly: View PDF ![]() .
.
Page Count: 82

79
A n n u a l W h e a t N e w s l e t t e r V o l. 4 9.
ITEMS FROM PAKISTAN
AGRONOMIC RESEARCH STATION
Bahawalpur, Pakistan.
Identifying sources of resistance to wheat leaf rust under induced and natural conditions.
Altaf Hussain Tariq, Saeed Ahmad, Muhammad Arshad Hussain, Muhammad Ziaullah,Lal Hussain Akhtar, and Sabir
Zameer Siddiqi.
Background. Rust diseases pose a major threat to the productivity of wheat crop when epidemics develop. Leaf rust is
world wide in distribution and a most dreaded disease that can spread rapidly and devastate the wheat crop (McIntosh et
al. 1997). In Egypt, Abdel Haq et al. (1980) estimated yield losses up to 50 % in wheat. This disease has appeared in
epidemic form several times in Pakistan. During 1978, a national loss of 86 x 106 USD was estimated (Hussain et al.
1980). Chemical control of rust diseases is not economical. Therefore, cultivation of resistant cultivars is of paramount
importance. Breeders need to plan their hybridization program judiciously in order to produce cultivars with different
genetic backgrounds for resistance to rusts so that any danger of a disease epidemic can be avoided. The present studies
explored new sources for rust resistance in wheat, which will help the breeders in planning future wheat-breeding
programs.
Materials and methods. Local Wheat Diseases Screening Nurseries (LWDSN) comprised of 293 and 346 advanced
wheat lines were planted at Bahawalpur during 2001 and 2002, respectively. Ten commercial wheat cultivars also were
included in the nurseries. The entries, which gave reactions from trace to MRMS at Bahawalpur, and 10 commercial
cultivars also were sown at Kaghan. Each entry was planted in a single 2-m row, 30 cm apart, at both the locations. Two
rows of susceptible checks (Morocco and Local White) were sown repeatedly after every fifth entry and around the
block. The nurseries were inoculated artificially with a spore suspension of leaf rust by injecting, rubbing, and spraying
from the first week of February until 10 March at Bahawalpur during both the years. Kaghan is a summer station about
7,000 ft ASL. Natural rust epidemics occur frequently in this area. The planting at Kaghan was made during the first
week of June. Observations on rust infections were recorded at 10–15 day intervals throughout the growing period at
Bahawalpur and during the end of August at Kaghan. Data were recorded according to the modified Cobb’s scale at both
locations (Peterson et al. 1948). The observations were compared among years and locations to establish the distribution
of rust incidence.
Results and discussion. The
observations of leaf rust on
the 10 commercial wheats
sown at Bahawalpur and
Kaghan in 2001 and 2002
indicated that the intensity of
rust infection during 2001 was
comparatively higher than that
in 2002 at both locations.
Natural infection at Kaghan
was less in 2002 because of
less precipitation throughout
the country during 2002 and
the environmental influence
on the host-pathogen interac-
tion at Kaghan where the
growing season is shorter (80–
90 days) and cooler with a
shorter daylength (Table 1).
Six cultivars, FSD-85, Inqlab-
Table 1. Reaction to the leaf rust pathogen of commercial wheat cultivars at two
different locations in Pakistan during 2001–02. Infection types are listed as TR =
trace, R = resistant, MR = moderately resistant, MS = moderately susceptible, and S
= susceptible.
RARI, Bahawalpur Kaghan
Cultivar (artificial inoculation) (natural infection)
2001 2002 2001 2002
Kohinoor-83 60S 40S 30S 20S
Faisal-85 20R 5R 10MR 5MS
Inqlab-91 TR (< 5 %) 5MR 10MRMS 5MR
Pasban 40S 20S 20S 10S
Rohtas-90 TR 30MRMS 30MRMS 20MRMS
Punjab-96 5MSS 5MS 5MRMS 5MR
Bahawalpur-97 20MRMS 10MRMS 20RMR 10MRMS
MH-97 20MR 20MR 20RMR 5MR
Uqab-2000 10MR 5R 30RMR 20MR
Iqbal-2000 20RMR 30MR 20RMR 5MR

80
A n n u a l W h e a t N e w s l e t t e r V o l. 4 9 .
91, Rohtas-90, MH-97, Uqab-2000, and Iqbal-2000, were resistant with < 5–30 % infection during both years at
Bahawalpur. At Kaghan, these cultivars exhibited almost the same reaction but with less intensity during 2002. These
cultivars have the Lr10 gene along with Lr27+Lr31 have been very effective in providing resistance to leaf rust. In field
experiments conducted at Faisalabad in Pakistan, Khan et al. (1997) found Pavan, Faisalabad-85, and Inqlab-91 to be
slow rusting. Chaudhry et al. (1996) evaluated 14 commercial wheat cultivars in the field and reported Inqlab-91,
Parwaz-94, and Chakwal-86 resistant to leaf and yellow rust throughout Punjab and the North Western Frontier Province
during 1994 and 1995. Kohinoor-83, Pasban-90, and Punjab-96 remained susceptible to leaf rust at both sites under
induced and natural conditions, whereas Bahawalpur-97 maintained its MR–MS level during both the years.
The leaf rust observations at
the different locations of new ad-
vanced lines during 2001 and 2002
are presented in Table 2. These
observations indicate the number of
test entries under different categories
of rust-infection levels. During 2001,
95 of 293 entries were immune and
135 (46 % of the total) were trace to
moderately resistant. Among 346
lines, 77 remained immune, 92 had
trace infection, 103 were resistant,
and 51 were moderately resistant
during 2002. At Kaghan, the number
of entries was less compared to
Bahawalpur during both years,
because they were selected on the
basis of disease reactions (traces to
resistant and moderately resistant) and
yield traits. Generally, the entries that
were moderately susceptible under
induced conditions at Bahawalpur
were mostly resistant to moderately
resistant reactions at Kaghan during
both years. The inheritance of leaf rust resistance was better in these lines. Rust inoculum is dynamic in nature and
changes from year to year and place to place. Virulence in one environment may not necessarily appear in another
(Khan et al. 2002). The virulence patterns observed at the two sites confirm this hypothesis.
The evolution of new rust races is a permanent feature of the rust pathogen. Whenever new cultivars are
deployed in the field, new races of the pathogen develop after several years and the existing cultivars become suscep-
tible. This phenomenon has been reported by number of workers (Ezzahiri 1989; Meshkova 1990; Meena-Kumari et al.
1992). At present, more than 80 % of the area under wheat cultivation is occupied by the single cultivar Inqlab-91,
which is fraught with the danger. Under these circumstances, steps to avoid monoculture need to be taken. A number of
advanced lines are available from the present studies that were resistant to prevailing rust races to provide sufficient
material for developing new, resistant wheat cultivars.
References.
Abdel Hak ATM, El-Sherif NA, Bassiourny AA, Shafik II, and El-Dauadi Y. 1980. Control of wheat leaf rust by
systemic fungicides. In: Proc Fifth Eur Mediterranean Cereal Rust Conf, Bari, Itlay. Pp. 255-266.
Chaudhary MH, Hussain M, and Shah JA. 1996. Wheat rust scenario, 1994-1995. Pak J Phytopathology 8(1):96-100.
Ezzahiri B and Rolelf AP. 1989. Inheritance and expression of adult plant resistance of leaf rust in Era Wheat. Plant Dis
73:549-551.
Hussain M, Hassan SF, and Kirmani MAS. 1980. Virulence in Puccinia recondita Rob.Ex. Desm. of sp. Tritici in
Pakistan during 1978 and 1979. In: Proc Fifth Eur Mediterranean Cereal Rust Conf, Bari, Itlay. Pp. 179-184.
Khan MA and Hussain M. 2002. Wheat leaf rust (Puccinia recondita) occurrence and shift in its virulence in Punjab
and NWFP. Pak J Phytopathology 14(1):1-6.
Khan MF, Ilyas MB, and Hussain M. 1997. Impact of leaf rust infection on grain yield of various wheat cultivars. Pak J
Phytopathology 9(1):64-66.
Table 2. Reaction to the leaf rust pathogen under natural infection and
induced conditions in new advanced lines at two different locations in
Pakistan during 2001–02. Infection types are listed as I = immune, TR =
trace, R = resistant, MR = moderately resistant, MS = moderately suscep-
tible, S = susceptible, and HS = highly susceptible.
Number of plants
RARI, Bahawalpur Kaghan
(induced epidemic) (natural infection)
Infection type 2001 2002 2001 2002
I (0) 95 77 17 61
TR (< 5 %) 51 92 45 70
R (5–20 %) 70 103 112 114
MR (21–40 %) 14 51 46 20
MS (41–50 %) 28 10 11 6
S (51–80 %) 35 13 1 4
HS (> 80 %) — — — —
Total 293 346 232 275

81
A n n u a l W h e a t N e w s l e t t e r V o l. 4 9.
McIntosh RA, Wellings CR and Park RF. 1997. Wheat rusts. An Atlas of resistance genes. CSIRO Publications, P.O.
Box-89, 314 Albert Street, East Melbourn, Victoria 3002, Australia.
Meena-Kumari KVS, Singh DV and Srivastava KD. 1992. Estimation of yield losses in wheat cultivars due to leaf rust
at different growth stages under artificial inoculation. Ind Phytopathology 45(2):266-268.
Meshkova LV. 1990. Source of resistance to wheat brown rust in Western Siberia. Nauch noissledovatel, Skii Institut
Sels Kogo Khozyatstva 6:10-16 and USSR Rev Plant Path 1992, 71(2):802.
Peterson RF, Campbell AB, and Hannah AE. 1948. A diagrammatic scale for estimating rust intensity on leaves and
stems of cereals. Can J Res Sec C 26:496-500.
Performance of advanced wheat genotypes to Helicoverpa armigera Hubner.
Abdul Rashid, Habib Ahmad Saeed, Lal Hussain Akhtar, Altaf Hussain Tariq, and Sabir Zameer Siddiqi.
Background. Wheat is the staple diet of the people of Pakistan, contributing 12.1 % to value added in agriculture and
2.9 % to the GDP. Wheat was grown on an area of 6.30 x 10⁶ ha with a production of 15.42 x 10⁶ tons in 2000–01 in
Punjab (Anonymous 2001). The by-products of wheat are used in bakery products and confectionery. For the last few
years, Pakistan has become self sufficient in wheat production. Surplus wheat is exported to various countries such as
Vietnam, United Arab Emirates, Somalia, Egypt, Ethiopia, Kenya, and Afghanistan. Various rust and smut diseases,
aphids, Helicoverpa armigera, and termites attack this crop. Ann (2002) observed that aphids can be controlled easily
with predators such as Coccinelid beetles and chrysopa and syrphis flies, whereas the reverse is true for H. armigera,
which is a devastating pest of many crop plants world wide (Patankar et al. 2001). Saleem and Rashid (2000) reported a
loss of 13.98 % in grain yield in wheat caused by a single caterpillar of H. armigera per tiller. Being the staple diet, the
use of chemicals is not feasible for the control of this pest because of residual effects that may be hazardous to human
health. The ultimate solution to the problem is the screening of genotypes with built-in resistance to H. armigera.
Keeping in view the significance of the pest, we screened for genotypes of wheat resistant or tolerant to H. armigera.
Materials and methods. To asses wheat losses caused by H. armigera, 20 advance strains of wheat including two
checks were evaluated for spike and grain damage during the Rabi season 1998–99 at the Regional Agricultural Research
Institute, Bahawalpur. The experiment setup was a RCB design with three replications and plot size of 12 m2. Similar
agronomic practices were applied to all genotypes throughout the growing season. Observations of spike damage were
recorded at the harvest by counting the total number of spikes and the number of spikes damaged by the pest from three
randomly selected spots of 1 ft2 from each plot. Grain-damage data were recorded by counting the total number of grains
and number of grains damaged by the pest from five randomly selected spikes from each plot after harvest. Thus, the
percentage of damaged spikes/grains was calculated as follows:
No. of damaged spikes / grains
Spike/grain damage (%) = x 100
No. of total spikes/grains
Data were subjected to statistical analysis using a computer package MSTATC. Correlations were computed
using the Correlation subprogram of
MSTATC. Means were compared by
Duncan’s New Multiple Range Test
(Steel and Torrie 1980).
Results and discussion. Statistical
analysis of the data revealed the highly
significant differences among the mean
values of spike and grain damage (P <
0.01) of all the genotypes (Table 3).
Spike and grain damage ranged from
19.95 to 80.47 and 3.90 to 22.16 % in
the check genotypes, respectively
(Table 4). The most susceptible
genotypes in terms of spike damage
Table 3. Analysis of variance of data with regard to spike and grain damage
of various wheat genotypes after damage by Helicoverpa armigera.
Damaged spikes Damaged grains
Parameter (%) (%)
Means squares 65392 96.35
Probability 0.000 0.000
Coefficient of variation (%) 3.54 % 7.32 %
Cd1 (0.05 %) 2.728 1.558
Cd2 (0.01 %) 3.654 2.086
Standard error 0.953 0.544
Correlation between the two traits (r2) 0.422

82
A n n u a l W h e a t N e w s l e t t e r V o l. 4 9 .
were D-94654 (80.47 %), PR-68
(76.00 %), WS-94194 (59.53 %),
and V-94091 (58.28 %). The
genotype 92T001 was found to be
the most tolerant with the least spike
damage (19.95 %). For grain
damage, SD-4 had the maximum
damage (22.16 %) and V-8120 had
the least (3.89 %), a vast range of
damage differences. The present
results support the data of Saleem
and Rashid (2000) who found that a
single caterpillar of H. armigera per
tiller caused 13.98 % loss in grain
yield of wheat. Such information
will encourage the wheat breeders to
incorporate this character in their
breeding program. Efforts are being
made to develop the wheat geno-
types tolerant to H. armigera at our
institute.
References.
Anonymous. 2001. Agriculture.
Economic Bulletin, Economic &
Business Research Wing, Na-
tional Bank of Pakistan.
28(8):19-20.
Anonymous. 2002. Agriculture. Economic Bulletin, Economic & Business Research Wing, National Bank of Pakistan.
29(7-8):19-20.
Patankar AG, Giri AP, Harsulkar AM, Sainari MN, Deshpade VV, Ranjekar PK, and Gupta VS. 2001. Complexity in
specificities and expression of Helicoverpa armigera gut proteinases explains polyphagous nature of insect pest.
Insect Biochem Mol Biol 31:453-464.
Saleem M and Rashid A. 2000. Helicoverpa armigera infestation on various wheat varieties. Ann Wheat Newslet
46:101-102.
Steel RGD and Torrie JH. 1980. Principles and Procedures of Statistics. McGraw Hill Book Company, New York, NY.
Pp. 187-188.
Manthar – a high-yielding cultivar of wheat released for general cultivation in southern Punjab.
Sabir Zameer Siddiqi, Mushtaq Ahmad, Manzoor Hussain, Lal Hussain Akhtar, Abdul Rashid, Ghulam Hussain,
Muhammad Aslam, Muhammad Safdar, Muhammad Masood Akhtar, Muhammad Rafiq, and Muhammad Arshad.
Background. Wheat is the main staple food of the people of Pakistan and is grown on the largest area covering more
than 15 x 106 acres in the Punjab. Although Pakistan is a wheat exporter, this situation has been changing for the last 2
years. New steps now are needed to be adopted to progress forward. Agronomic advancement is the utmost need,
including the development of genotypes possessing high-yield potential. Wheat breeders are trying to improve the
potential at their research stations, resulting in wheat cultivars with acceptable and improved characteristics.
Manthar is selection from CIMMYT material and has been tested at Regional Agricultural Research Institute,
Bahawalpur and outstations for 7 years. This strain has the famous CIMMYT line Kauz in its pedigree, which is a more
adapted and a high yielder. Genetically, this strain differs from existing commercial cultivars of Punjab. Manthar rated a
position among the top five strains in National Uniform Wheat Yield Trial the first year and the first position in late
planting and second in 23 sites in Pakistan in its second year. Manthar has improved yield potential and better adaptabil-
Table 4. Data for various traits of the wheat genotypes tested for resistance to
Helicoverpa armigera at the Regional Agricultural Research Institute,
Bahawalpur during 1998–99.
Genotype Damaged spikes Damaged grains Yield (kg/ha)
V-95219 41.01 11.48 4,062
94B-3047 39.34 14.19 3,861
WS-94194 59.53 15.18 3,674
V-94105 52.37 9.58 3,861
PR-68 76.00 14.94 3,243
D-94654 80.47 18.09 3,292
SD-4 39.04 22.16 3,049
92T001 19.95 4.09 4,035
V-95153 45.75 20.52 4,021
AUP-9701 34.58 6.12 4,333
V-94091 58.28 11.44 3,597
93B2707 37.85 14.32 3,674
PR-67 46.72 9.01 3,507
V-95069 36.22 12.29 3,604
DN-10 50.48 9.96 2,931
V-8120 24.23 3.90 3,382
91BT010-1 45.33 4.00 3,986
V-94045 52.42 18.24 3,326
INQ-91 52.37 19.78 3,674
Local check 41.31 19.12 3,771

83
A n n u a l W h e a t N e w s l e t t e r V o l. 4 9.
ity. Dry and unfavorable conditions in 2001–02 produced a successful wheat crop during a continuous drought. This
genotype rated the second position in Pakistan based on drought and heat tolerance. The cultivar is resistant to leaf rust
and yellow rust at CDRI, Islamabad. We hope that Manthar will help boost the average wheat yield because of its better
economic characteristics while being a general-purpose cultivar.
Materials and methods. Manthar, selected from CIMMYT (Mexico) material, was tested at Regional Agricultural
Research Institute, Bahawalpur, and outstations for 7 years (1996–
2002) and given the number 97B2210. This line was evaluated for
its yield potential in 81 trials at various locations Preliminary
Yield and Advanced Yield Trials, the Micro Wheat Yield Trials
(2000–01), and the National Uniform Wheat Yield Trial (2000–
01). Sowing date and fertilizer trials also were conducted to
evaluate its production technology during 2000–01 to 2001–02.
The line 97B2210 also was tested for resistance to rusts, loose
smut, and Karnal bunt at the Regional Agricultural Research
Institute, Bahawalpur; the Wheat Research Institute, Faisalabad,
and the Crop Disease Research Institute, NARC, Islamabad during
2000–02 and compared with standard cultivars. The Coordinator
Wheat, NARC, Islamabad, also studied the quality characteristics
of the line in 2000–01. The Federal Seed Certification and
Registration Department, Islamabad, evaluated plant characteris-
tics. The yield data were subjected to ANOVA using the MSTAT
statistical program and means were compared using Duncan's
Multiple Range Test (Steel and Torrie 1980).
Results and discussion.
Yield performance. Station Yield Trials. Manthar was tested in
preliminary and advance yield trials at the Regional Agricultural
Research Institute, Bahawalpur, between 1996–97 and 2001–02 in
late planting and compared with the national checks, Uqab-2000
and Inqlab-91. The performance of Manthar is given in Table 5.
Over a 3-year average, the cultivar had a 7.1 % higher yield than
Inqlab-91 (Table 5) and also outyielded the check by a margin of
3.7 % in zonal trials conducted at three
locations in 1999–2000 (Table 6).
Micro Wheat Yield Trial. The
Director, Wheat Research Institute,
Faisalabad, also evaluated the perfor-
mance of Manthar under a coded number
during 2000–01 at various locations in
Punjab in replicated yield trials. The
results show yields 2.0, 13, and 11 %
higher for Manthar when compared to
Inqlab-91, Uqab-2000, and Iqbal-2000,
respectively, an average of 10 locations
(Table 7).
National Uniform Wheat Yield
Trial. The Coordinator Wheat,
Islamabad, also evaluated Manthar in a
replicated trial called the National
Uniform Yield Trial under normal and
short conditions throughout Pakistan
during 2001–02. The performance of
Table 5. Results of the station yield trials at
Bahawalpur, Pakistan, for Manthar (97B2210)
and the check cultivar Inqlab-91.
Year Trial 97B2210 Inq-91
1997–98 A1 (N) 5,671 a5,322 a
1998–99 B3 (N) 4,750 a4,417 b
1999–2000 CI (N) 6,115 a5,693 b
Average 5,512 5,144
% increase over check + 7.1
Table 6. Zonal testing of Manthar (97B2210) and
the check cultivar Inqlab-91 (Inq-91) at three
locations in Pakistan during 1999–2000.
Location 97B2210 Inq-91
CRSS, Haroonabad 5,245 4,936
ORS, Khanpur 4,442 4,393
ARS, Khanewal 4,782 4,630
Average 4,823 4,652
% increase over check + 3.7
Table 7. Results of the Micro Wheat Yield Trials at various locations in
Pakistan in 2000–01. Source: Director Wheat, Faisalabad.
97B2210 Uqab Iqbal
Location (Manthar) Inqlab-91 2000 2000
RARI, Bhawalpur 5,405 a4,826 a5,004 a4,676 b
ARF, Rahim Yar khan 5,204 a4,932 a4,721 b4,186 bc
CRSS, Haroonabad 6,346 a5,990 a3,741 c4,486 bc
WRL, Faisalabad 5,735 a5,920 a5,965 a5,550 a
ARF, Vehari 3,290 ab 3,660 a3,382 ab 3,290 ab
PSC, Khanewal 3,799 b4,819 a4,819 a5,097 a
Thatta Jawana Jhang 4,263 a3,614 b4,031 a4,031 a
Hafizabad Pindi Bhattian 4,170 a4,263 a2,124 c2,965 b
ARF, Gujranwala 4,911 a4,726 a4,355 b4,633 a
RRI, Kala Shah Kaku 4,720 a4,165 b4,165 b4,165 b
Average with PSC 4,784 4,691 4,231 4,307
% increase over check + 2 + 13 + 11
Average without PSC 4,894 4,677 4,165 4,220
% increase over check + 4.66 + 18 + 16

84
A n n u a l W h e a t N e w s l e t t e r V o l. 4 9 .
Manthar in this trial is given is Table 8. Manthar
had a 7.1 % higher yield than the local check at the
National level on the basis of 12 locations in 24
trials.
Varietal characteristics. Various varietal
characteristics recorded by the Federal Seed
Certification and Registration Department,
Islamabad, in comparison with Inq-91 are given in
Table 9.
Agronomic studies. Six trials were
conducted at Regional Agricultural Research
Institute, Bahawalpur, during 2000–02 to ascertain
production technology. Sowing time is 10
November to 10 December at a seeding rate of 125
kg/ha. Fertilizer requirements include 125–100–
50 NPK with 4–5 irrigations.
Pathology studies. The response of
Manthar to various foliar diseases was studied at
Crop Diseases Research Institute, NARC,
Islamabad; the Wheat Research Institute,
Faisalabad; and the Regional Agricultural Re-
search Institute, Bahawalpur. The data are given
in Table 10. The data indicates that Manthar is
resistant/tolerant to the yellow rust, leaf rust, loose
smut, Fusarium, and Karnal bunt pathogens.
Entomology studies. The response of
Manthar to aphid and Helicoverpa armigera also
was studied at Regional Agricultural Research
Institute, Bahawalpur, in 2000–02. Data are given
in Table 11 shows the performance of Manthar as
compared to commercial checks.
Quality studies. The quality characters
were recorded by the National Agricultural
Research Centre, Islamabad, and are given in
Table 12. The new cultivar is
better than the existing checks.
Conclusion. The cultivar
Manthar (97B2210) not only is
a high-yielder and tolerant/
resistant to all diseases but also
best suited to a wheat–cotton–
wheat rotation. Because of
better adaptability, Manthar has
the potential of replacing
previously approved wheat
cultivars, especially in the
southern Punjab. This cultivar
was approved and released by Variety Evaluation Committee, Islamabad, for general cultivation during 2002.
Table 10. Disease response of Manthar and a local check to rust recorded by the
Crops Disease Research Institute, Islamabad, during 2000–01.
ACI RRI
Year Cultivar leaf rust yellow rust leaf rust yellow rust
2000–01 97B2210 3.4 — 6.7 —
Local White 56.6 — — —
2001–02 97B2210 0.7 0 7.6 8.9
Local White 45.65 — — —
Table 9. Ccharacteristics of Manthar compared to the
local check cultivar Inqlab-91.
Characteristic Manthar Inqlab-91
Days to handing 98 114
Days to maturity 142 135
Plant height 94 cm 98 cm
Lodging Resistant Resistant
Tillers per meter row 145 132
1,000-kernel weight 40–45 g 44.0 g
Protein 12.97 % 10.51 %
Disease reaction Resistant/tolerant Resistant
Grain size Medium —
Maturity status Medium Medium
Growth habit Erect Drooping
Yield potential 6,708 kg/ha 6,900 kg/ha
Table 8. Results of the National Uniform Wheat Yield Trial at
various locations in Pakistan in 2001–02. Seeding date is for
normal and late dates combined. Source: Anonymous 2002.
97B2210
Location (Manthar) Local check
ARF, Rahim Yar khan 3,773 3,348
ORS, Khanpur 4,081 3,619
RARI, Bahawalpur 3,583 3,335
CRSS, Haroonabad,BWN 3,827 3,490
ARF, Vehari 3,852 3,583
PSC, Khanewal 3,919 4,177
WRI, Faisalabad 4,843 4,853
ARF, Layyah Karore 2,977 2,125
Gill Model Farm S.Abad Jhang 3,700 3,382
Hafizabad Pindi Bhattian 4,344 4,567
In service Trg. Sargodha 3,927 3,281
ARF, Sheikhpura 3,813 3,792
Average 3,887 3,629
% increase over check + 7.1

85
A n n u a l W h e a t N e w s l e t t e r V o l. 4 9.
References.
Anonymous. 2002. National Uniform Wheat Yield Trials
Summary Results 2001-2002. National Agricultural
Research Centre, Islamabad.
Mustafa SZ, Yasmin S, and Kisana NS. 2001. Results of
the National Uniform Wheat Yield Trials, 2000–2001.
Coordinated Wheat-Barley and Triticale Programme,
Pakistan Agricultural Research Council, P.O. Box 1031,
Islamabad. P. 25.
Steel RGD and Torrie JH. 1980. Principles and Procedures
of Statistics. McGraw Hill Book Company, New York.
Pp. 187-188.
Development of 012679, a new wheat strain with
special characteristics.
Table 11. Leaf rust reaction of Manthar (97B2210) and a check in the National
Wheat Disease Screening Nursery at CDRI, Islamabad, 2001–02.
PRC, AARI, RARI, CCRLD, NIFA, NARC, CDRI RRI
Cultivar SKT FSD BWP SBK PWAR ISD KHI
97B2210 0 10MR 0 0 0 5MRMS 0 7.6
Morocco 50S 90MS 50MSS 40S 20S 80S 30S —
Table 12. Resistance to aphids in Manthar compared with
the standard commercial check cultivars.
Aphid Yield
Year Cultivar population (kg/ha)
2000–01 Manthar 21.4 3,250
Inq-91 22.3 3,084
2001–02 Manthar 0.50 2,512
Auquab-2000 0.55 2,392
Iqbal-2000 0.55 2,332
Table 14. Results of the National Uniform Wheat yield
Trial in 2000–01 for Manthar compared to the local
check cultivar Inqlab-91.
Characteristic Manthar Inqlab-91
1,000-kernel weight 42.3 g 37.0 g
Test weight 79.5 g 74.2 g
PSI (%) 29.0 42.2
Ash (%) 1.55 1.54
Gluten content MS MS
Dry gluten (5) 8.20 5.79
Crude protein (%) 12.79 10.06
Table 13. Resistance to Helicoverpa armigera in
Manthar and some commercial check cultivars in 2000–01
Aphid population Yield
(per tiller) (kg/ha)
Cultivar Normal Late Norma Late
Manthar 0 0.30 4,475 4,175
Inqbal-91 0.33 0.62 4,150 3,880
MH-97 0.34 7.11 4,262 3,925
Mushtaq Ahmad, Ghulam Hussain, Muhammad Rafiq, Manzoor Hussain, Lal Hussain Akhtar, and Sabir Zameer Siddiqi.
Wheat not only is the main staple food of Pakistan, but more than 33 % population of world also depend upon it for
nourishment. Hybridization efforts are not bearing significant yield improvements. Improvement in grain yield is the
ultimate objective of all agronomic and breeding investigations. Genetic yield potential can be improved by increasing
the number of grains/unit area and grain weight. Efforts at the Regional Agricultural Research Institute, Bahawalpur,
seek to improve grain weight and grain number/unit area and combine them in the same plant with required protein and
gluten levels. A new wheat strain was bulked during 2000–01 with number 012679. Strain 012679 is a local cross
(Debaria/WL-711) attempted during 1994–95. The F1 to F6 were grown from 1995–96 to 2000–01 at RAI, Bahawalpur.
The cultivar was evaluated for yield in yield trials during 2001–02 with under the number 012679.
Strain 012679 produced 41.12 % and 61 % more yield than the commercial checks Inqbal-91 and PND-I,
respectively (Tables 15 and 16). Further studies are in progress in yield trials during 2002–03 to confirm these results.
Strain 012679 differs from the existing cultivars in following characteristics: a thick stem is resistant to lodging;
increasing the seeding rate compensates for a lower number of tillers/seed; early maturity fits in a wheat-based cropping
pattern; a thick, dense head with 100 % maturity gives more grains/spike; and more grains than commercial standards
results in a higher grain yield.

86
A n n u a l W h e a t N e w s l e t t e r V o l. 4 9 .
Effect of irrigation and various nitrogen
and phosphorus levels on wheat yield.
Muhammad Aslam, Manzoor Hussain, Lal
Hussain Akhtar, Mushtaq Ahmad, Ghulam
Hussain, Abdul Rashid, Muhammad Safdar,
Muhammad Masood Akhtar, Muhammad Arshad,
and Sabir Zameer Siddiqi.
Background. Wheat, a major food grain of
Pakistan, is being adversely affected by shortage
of water. During 2001–02, a decline of 2.4 % in
cultivated area and yield was found due mainly to
dry weather, a shortage of irrigation water, low
application of NP fertilizer, and a delayed sowing
of the 2001–02 season crop (Sabir et al. 2000;
Anonymous 2002). Under these circumstances,
the positive role of irrigation and NP levels need to
be demonstrated. Similarly, the high use of
irrigation water also is being restricted due to
shortage of canal water and high prices of subsoil
water. The NP fertilizer and irrigation factors play
an important role in getting the highest grain yield
from the wheat crop. Ibrahim (1999) obtained a
high grain yield of 4.6 and 4.8 t/ha using three and
four irrigations. Kalita et al. (2000) achieved a high grain yield from three irrigations. Laxminarayana and Thakur
(1999) found that grain yield increased with an increase in applied phosphorus up to 90 kg/ha. Sabir et al. (2000)
obtained their highest yields with the application of 150:100 kg/ha N:P. Pandey et al. (1999) reported that grain yield
increased up to 150:75 N:P levels. Naser et al. (1999) and Maliwal et al. (2000) found that irrigation treatments increase
the yield. Therefore, this project was to determine the best NP level with three and five irrigations for obtaining best
wheat yield.
Materials and methods. The study was conducted at Regional Agricultural Research Institute, Bahawalpur, during the
years, 2000–02. The wheat cultivar Punjnad-1 was sown during both the years on well prepared seed bed with a single-
row drill in rows 30 cm apart. Ten treatments involving two irrigation levels (three (at crown root, boot, and milk stages)
and five (at crown root, tillering, boot, milk, and grain-formation stages)) with five levels of NP 0–0, 50–50, 100–75,
150–100, and 200–125 kg/ha, were studied. K was kept constant (60 kg/ha) in all treatments. A split-plot design with
four replications was used with net plot size of ‘6 m x 1.8 m’. All phosphorus and potassium was applied as a basal dose
at sowing. All nitrogen fertilizer was applied with the first irrigation. Other agronomic practices were kept uniform for
all the treatments. Grain yield
(kg/ha) was recorded at
harvest. The data were
analyzed statistically by using
Fisher’s analysis of variance
and differences among the
treatments means were
compared by Duncan’s
Multiple Range Test (Steel
and Torrie 1980). Table 17
lists the treatments given.
Results and discussion. Grain yield significantly increases with interactive effects of irrigation and NP (Table 18). T4
gave the highest grain yield of 3,678 kg/ha, which was more economical than T5 because addition of 50–25 kg/ha more
NP in T5 compared to T4 resulted in only 144 kg/ha additional yield which is uneconomical. T7 gave four times more
yield (2,360 kg/ha) than T6 (558 kg/ha). Similarly T8 and T9 gave maximum yield of 3,983 and 4,178 kg/ha, respec-
tively. T10 was at par with T9. The present results support the findings of E1-Far and Teama (1999) who reported that
Table 17. Different treatment regimes used in evaluating different nitrogen and
phosphorus levels and irrigation levels on wheat yield.
NP (kg/ha)
Irrigation 0–0 50–50 100–75 150–100 200–125
Three T1 T2 T3 T4 T5
Five T6 T7 T8 T9 T10
Table 15. Yield data for the new cultivar 012679 compared
with commercial cultivars in 2001–02 at the Regional Agricul-
tural Research Station, Bahawalpur, Pakistan.
Yield Yield
Cultivar (kg/ha) Cultivar (kg/ha)
012672 3,953 012678 4,848
012673 5,222 012679 5,796
012674 4,710 012680 5,219
012675 4,538 Inq-91 4,108
012676 3,810 Punjnad-I 3,600
012677 5,067 Uquab-2000 3,545
Table 16. Yield components of the new cultivar 012679
compared to the local checks in 2001–02 at the Regional
Agricultural Research Station, Bahawalpur, Pakistan.
1,000-kernel No. of Spike Yield
Cultivar weight (g) grain/spike weight (g) (kg/ha)
012679 50.05 108 5.24 5,796
Inqbal-91 40.45 55 4.32 4,108
PND-I 38.20 59 4.54 3,600

87
A n n u a l W h e a t N e w s l e t t e r V o l. 4 9.
grain yield was the highest when crop
was irrigated after every 31 days and
lowest when irrigation was applied
after every 60 days. Ibrahim (1999)
obtained grain yield of 4.6 t/ha and
4.8 t/ha using three and four irriga-
tions, respectively. Kalita et al.
(1999) obtained the highest grain
yield from three irrigations. Pandey
et al. (1999) reported that grain yield
increased up to 150:75 kg/ha NP.
Sabir et al. (2000) obtained the
highest yield with the application of 150–100 NP. Laxminarayana and Thakur (1999) reported that grain yield increased
with increase of phosphorus upto 90 kg/ha. Five irrigations were applied at crown root, tillering, boot, milk, and grain-
formation stages.
References.
Anonymous. 2002. Agriculture: wheat production below target. Economic Bulletin, National Bank of Pakistan. 29(11-
12):16.
Ibrahim SM. 1999. Wheat cultivation under limited irrigation and high water table conditions. Egypt J Soil Sci
39(3):361-372.
Kalita MC, Sarmah NN, and Barkakoty PK. 1999. Irrigation regimes on growth and yield of wheat under different land
situations. J Agric Sci Soc North East India. 12(1):18-23.
Laxminarayana KI and Thakur NSA. 1999. Effect of phosphorus on yield performance of wheat in acidic soils of
Mizoram. J Hill Res 12(2):138-140.
Maliwal GL, Patel JK, Kaswala RR, Patel ML, Bhatnagar R, and Patel JC. 2000. Scheduling of irrigation for wheat
(Triticum aestivum) under restricted water supply in Normada region. Ind J Agric Sci 70(2):90-92.
Naser HM, Islam MT, Begum HH, and Idris M. 1999. Effects of time and frequency of irrigation on yield of wheat.
Thai J Agric Sci 32(2):205-209.
Pandey AK, Chauhan VS, Prakash V, and Singh RD. 1999. Seed and fertilizer management under non-availability of
irrigation at crown root initiation stage in wheat. Crop Res (Hisar) 17(3):286-291.
Sabir MI, Ahmad I, Shah SAH, and Shahzad MA. 2000. Effect of different rates and NP levels on growth and yield of
wheat (Triticum aestivum). J Agric Res 38(4):311-317.
Steel RGD and Torrie JH. 1980. Principles and Procedures of Statistics. 2nd Ed. McGraw Hill Book Co. Inc.
Singapore. Pp. 172-177.
Effect of irrigation at different growth stages on the grain yield of wheat.
Muhammad Aslam, Manzoor Hussain, Lal Hussain Akhtar, Abdul Rashid, Ghulam Hussain, Muhammad Safdar,
Muhammad Arshad, and Sabir Zameer Siddiqi.
Background. Wheat is the most important Rabi cereal crop of Pakistan. Because of deficits in irrigation water in the
rivers, the country is facing long-lasting moisture stress. A plan that utilizes our limited sources of irrigation water in
such a way that country does not suffer food shortage is needed. Ibrahim (1999) obtained grain yields of 4.3, 4.6, and
4.8 t/ha by applying 2, 3, and 4 irrigations, respectively. Naser et al. (1999) obtained the highest yield with two irriga-
tions applied 30 and 50 days after sowing. Kalita et al. (1999) obtained high grain yields from three irrigations. Similar
results have been reported by Lidder et al. (1999), Tripathi et al. (2000), and El-far and Teama (1999). The present study
was planned to define the critical stages of the wheat crop using limited number of irrigation water to obtain an optimum
yield.
Materials and methods. The study involved 15 treatments laid out in a RCBD with three replications (Table 19). Net
plot size was ‘6 m x 1.8 m’. The wheat cultivar Punjnad-I was sown during the first week of December 2000–02.
The recommended fertilizer dose was applied to all the treatments. Punjnad-I was sown during both years on a
well-prepared seed bed with a single-row hand drill in rows 30 cm apart. All other agronomic practices were kept
Table 18. Grain yield in Punjand-1 wheat under various treatment regimes
varying in level of nitrogen and phosphorus fertilizer and number of irriga-
tions.
NP (kg/ha)
Irrigation 0–0 50–50 100–75 150–100 200–125
Three 474 F1,482 E3,383 C3,678 BC 3,822 ABC
Five 558 F2,360 D3,983 A4,178 A4,082 A

88
A n n u a l W h e a t N e w s l e t t e r V o l. 4 9 .
uniform for all treatments. Grain yield/ha was
recorded at harvest. The data were analyzed
statistically using Fisher’s ANOVA and differences
among the treatment means were compared by
LSD (Steel and Torrie 1980).
Results and discussion. One irrigation. One
irrigation was applied at different four growth
stages of wheat crop. Irrigation applied at boot
stage gave the maximum yield compared to other
stages (Table 20). Similar results were reported by
Ibrahim (1999).
Two irrigations. Two irrigations were
applied in six of the combinations. Treatment T10
(boot + milk; 2,676 kg/ha) gave the highest yield
of these treatments. Ibrahim (1999), Naser et al.
(1999), and Lidder et al. (1999) also achieved best
results when irrigation was applied at similar
stages.
Three irrigations.
Three irrigations were applied
in three combinations. Irriga-
tions applied at crown root +
boot + milk stages (T12) gave a
maximum yield of 3,200 kg/ha.
These results are in line with
those of Ibrahim (1999),
Maliwal et al. (2000), Naser et
al. (1999), and Lidder et al.
(1999) who studied similar
growth stages for irrigation and
found that three irrigation
applied at above-mentioned
stages gave the best yield.
Four and five
irrigations. Four and five
irrigations were applied
according to the tradition in the
southern Punjab. Yields of
3,987 and 4,139 kg/ha were
recorded for four and five
irrigations, respectively. Grain
yield declines of 55.6–69.6, 35.4–51.2, 22.7–33.0, and 3.7 % were observed using 1, 2, 3, or 4 irrigations, respectively,
compared to five irrigations. The results are supported by the findings of Naser et al. (1999) and Lidder et al. (1999)
who studied various numbers of irrigations at various growth stages and found that all irrigation treatments increased
yield.
Table 19. Wheat growth stages used to assess the effect of
irrigation for optimum yield.
1. Crown root
2. Tillering
3. Boot
4. Milk
5. Crown root + tillering
6. Crown root+ boot
7. Crown root+ milk
8. Tillering + boot
9. Tillering + milk
10. Boot + milk
11. Crown root + tillering + boot
12. Crown root + boot + milk
13. Tillering + boot + milk
14. Crown root + tillering + boot + milk
15. Crown root + tillering + boot + milk + grain formation
Table 20. Grain yield in Punjnad-I wheat with irrigations applied at various growth
stages.
Irrigations applied at Grain yield (kg/ha)
1. Crown root 1,260 hi
2. Tillering 1,433 ghi
3. Boot 1,836 fgh
4. Milk 1,494 ghi
5. Crown root + tillering 2,018 defg
6. Crown root + boot 2,620 cde
7. Crown root + milk 2,018 efg
8. Tillering + boot 2,273 def
9. Tillering + milk 2,200 def
10. Boot + milk 2,676 cde
11. Crown root + tillering + boot 2,776 cd
12. Crown root + boot + milk 3,200 c
13. Tillering + boot + milk 2,812 cd
14. Crown root + tillering + boot + milk 3,987 b
15. Crown root + tillering + boot + milk + grain formation 4,139 a
Cd1=666.7 Cd2=921.21

89
A n n u a l W h e a t N e w s l e t t e r V o l. 4 9.
Conclusion. Depending on the amount of irrigation water available, the best growth stage for application of available
irrigation water include:
1 irrigation Boot
2 irrigations Boot + milk
3 irrigations Crown root + boot + milk
4 irrigations Crown root + tillering + boot + milk
5 irrigations Crown root + tillering + boot + milk + grain formation
References.
El-Far IA and Teama EA. 1999. Effect of irrigation intervals on productivity and quality of some bread and durum
wheat. Assiut J Agric Sci 30(2):27-41.
Ibrahim SM. 1999. Wheat cultivation under limited irrigation and high water table conditions. Egypt J Soil Sci
39(3):361-372.
Kalita MC, Sarmah NN, and Barkakoty PK. 1999. Irrigation regimes on growth and yield of wheat under different land
situations. J Agric Sci Soc North East India 12(1):18-23.
Lidder RS, Jain MP, and Khan RA. 1999. Effect of irrigation and fertility levels on wheat (Triticum aestivum) cultivars
in deep vertisol. Internat J Trop Agric 17(1/4):131-134.
Maliwal GL, Patel JK, Kaswala RR, Patel ML, Bhatnagar R, and Patel JC. 2000. Scheduling of irrigation for wheat
(Triticum aestivum) under restricted water supply in Normada region. Ind J Agric Sci 70(2):90-92.
Naser HM, Islam MT, Begum HH, and Idris M. 1999. Effects of time and frequency of irrigation on yield of wheat.
Thai J Agric Sci 32(2):205-209.
Steel RGD and Torrie JH. 1980. Principles and Procedures of Statistics. 2nd Ed. McGraw Hill Book Co. Inc.
Singapore. Pp. 172-177.
Tripathi P, Tomar SK, and Adhar S. 2000. Effect of moisture regimes and genotypes on biomass accumulation, radiation
interception and its use in wheat (Triticum aestivum). Ind J Agric Sci 70(2):97-101.
Wheat yield potential—current status and future research strategies in Pakistan.
Muhammad Sarwar Cheema, Muhammad Akhtar, and Liaquat Ali.
Wheat is the staple food for most of the people of Pakistan, and wheat straw is an integral part of the daily rations for
livestock. The cultivation of wheat has spread throughout the four provinces of Pakistan. The wheat-growing area and
production for the year 1999–2000 were 73 % and 78 %, respectively for the province of Punjab, with smaller amounts
in the Sindh (13.5 % and 14.5 %), Northwest Frontier (9.5 % and 5 %), and Baluchistan (4 % and 2.5 %) provinces.
Yield potential. A substantial yield gap has been observed at the experimental stations, progressive growers, and on
farmer’s fields in each province. Six, high-yielding wheat cultivars were sown at three different locations in D.I. Khan,
(Northwest Frontier Province), Pakistan, to explore their yield potential under prevailing climatic conditions. Daman 98
ranked first among all the tested cultivars by producing a grain yield of 12.5 t/ha (Khan et al. 2000). Choudhary and
Mehmood (1998) obtained a maximum grain yield of 7 t/ha with Inqlab-91. Sadiq and Khan (1994) also reported 7 t/ha
yield from Pak 81 in a study on the effects of intercropping and planting pattern on yield and yield components of wheat.
Bajwa et al. (1993) reported the influence of different irrigation regimes on the yield and yield components of the wheat
Pak 81, obtained maximum yield of 6.5 t/ha after the application of four irrigations.
Current status. Pakistan’s average grain yield ranged between 2,053 to 2,490 kg/ha over the last 5 years, 1996–97 to
2000–01 (Table 21). A huge yield gap lies between the experimental yield and the average yield of the country, so there
is great hope for double and even triple the wheat grain yield.
Population and wheat requirements. For 2001, the projected population for Pakistan is estimated to be 140.47 x 10⁶
and wheat production is 19.02 x 10⁶ tons. Domestic consumption requirements have been estimated at 20 x 106 tons.
Pakistan became self-sufficient in wheat by producing 21.08 x 10⁶ tons during the year 1999–2000, which was primarily
due to 25 % increase in support price of wheat. Wheat growers produced about one million tons of surplus wheat grain,
a marginal self sufficiency that can be changed at any time by natural hazards. Therefore, concerted efforts are needed to
maintain increased production that meets future requirements.

90
A n n u a l W h e a t N e w s l e t t e r V o l. 4 9 .
Yield gap. A substantial yield gap has been observed between yield at the experimental stations and in farmers’ fields in
each province. This gap is primarily because of the lack of finances on the part of the majority of farmers for imple-
menting modern technology for wheat production. Thus, we hope for improving wheat production and yield in the
country.
Constraints to production. Like many developing countries, wheat production is confronted with both biophysical
constraints (disease, fertilizer, water, seed, cultivars, cultural practices, and salinity/sodicity) and socioeconomic con-
straints (credit, knowledge, experience, tradition, and institutions.).
Disease. Although several diseases attack wheat, stripe and leaf rusts, loose and flag smuts, Karnal bunt, powdery
mildew, Helminthosporium leaf spots, and foot and root rots are the most important in Pakistan. Other diseases, such as
those caused by Septoria spp., downy mildew, black point, and black chaff, are of minor importance. Breeding programs
try to develop wheat cultivars that are resistant or tolerant to these principal diseases. Measures to minimize their
adverse effects on production also are being investigated.
Insect pests. Fortunately, wheat in not attacked by any serious pests, however, infestations of army worm, Hilothus, and
green aphids have occurred in localized areas.
Drought. About 21 % of total wheat area in Pakistan is rainfed. The screening of plant material and the testing of new
cultivars for drought tolerance are made in rainfed areas or under simulated moisture stress. Some cultivars (Inqlab 91,
Punjnad1, and Iqbal 2000) that were developed for irrigated areas also have proven to be very successful under rainfed
conditions. The testing of new cultivars under both irrigated and rainfed conditions is encouraged.
Salinity/sodicity. At present, 2.4 x 10⁶ ha of land in Pakistan have been rendered saline-sodic. With the continuous use
of low-quality water, this menace increases every year. Wheat yield was found to be reduced by 19 % under moderately
saline-sodic soils.
Lack of nutrients. Experiments on yield constraints in irrigated and rainfed areas indicate that the proper application of
fertilizer is of utmost importance. Yield reductions ranging from 50 to 75 % have been observed without proper fertilizer
use and clearly demonstrate that wheat yields can be substantially increased if fertilizer use is properly regulated in the
country.
Table 21. Area, production, and average yield of the wheat crop in the different provinces of Pakistan
between 1996–97 and 2000–01. Units are for area (x 103 ha), production (x 103 tons), and yield (kg/ha).
Source: 2002 Pakistan Statistical Year Book, Agricultural Statistics of Pakistan, Government of Paki-
stan, Islamabad, pp. 114. NWFP is the Northwest Frontier Province.
Province
Year Pakistan Punjab Sindh NWFP Balochistan
1996–97 Area 8,109.1 5,839.9 1,106.8 842.8 319.6
Production 16,650.5 12,371.0 2,443.9 1,064.4 771.2
Yield 2,053.0 2,119.0 2,208.0 1,263.0 2,413.0
1997–98 Area 8,354.6 5,934.6 1,120.2 918.1 381.7
Production 18,694.0 13,807.0 2,659.4 1,356.0 871.6
Yield 2,238.0 2,326.0 2,374.0 1,477.0 2,283.0
1998–99 Area 8,229.9 5,934.6 1,123.7 857.6 314.0
Production 17,857.6 13,212.0 2,675.1 1,221.8 748.7
Yield 2,169.0 2,227.0 2,381.0 1,425.0 2,384.0
1999–00 Area 8,463.0 6,180.3 1,144.2 806.5 332.0
Production 21,078.6 16,480.3 3,001.3 1,067.8 529.2
Yield 2,490.0 2,667.0 2,623.0 1,324.0 1,594.0
2000–01 Area 8,180.8 6,255.5 810.7 790.3 324.3
Production 19,023.7 15,419.0 2,226.5 164.0 614.2
Yield 2,325.0 2,465.0 2,476.0 967.0 1,893.0

91
A n n u a l W h e a t N e w s l e t t e r V o l. 4 9.
Planting date. More than 50 % of the wheat in Pakistan is planted late, i.e., during the month of December. Planting
date experiments have shown that yield is progressively reduced with delayed planting. Yield was found to be reduced
by 28.8 and 75.8 % when sowing was delayed from November to December and from November to January, respec-
tively,
Weeds. With the introduction of high-yielding and fertilizer-responsive Mexican wheat cultivars during mid 1960s,
weed populations have increased tremendously causing considerable losses in crop yield. No data regarding yield losses
due to weeds is available, however, depending upon the degree of infestation, losses yield are estimated to be between
13–42 %. A number of weed species infest the wheat fields; both grasses and broadleaf weeds. Wild oat (Avena fatua),
canary grass (Phalaris minor), Chenopodium spp., and Convolvulis arvensis has been found to be the major weeds.
When weeds were controlled by the herbicides Dicuran M.A., Tribunil, Graminon, and Arelon, yield increases of 41, 22,
22, and 25 %, respectively, over the weedy controls were found (Ahmed et al. 1987).
Future research strategies. Future strategies for the improvement of wheat will involve more emphasis on breeding
cultivars that possess wider adaptation and can withstand various types of stress (disease, high temperature, cold and
frost, drought, salinity/sodicity, and water logging). Efforts also will be made to develop wheat cultivars with low input
requirements. Improving grain characteristics and milling and baking quality of wheat also will receive greater attention.
References.
Ahmad S, Cheema ZA, Bashir S, and Iqbal M. 1987. Weed management in wheat. Progressive Farming 7(1):33-36.
Anonymous. 2002. Pakistan Statistical Year Book. Agricultural Statistics of Pakistan, Government of Pakistan,
Islamabad. Pp. 114.
Bajwa MA, Chaudhary MH, and Sattar A. 1993. Influence of different irrigation regimes on yield and yield components
of wheat. Pak J Agric Res 14:360-365.
Chaudhary AU and Mehmood R. 1998. Determination of optimum level of fertilizer nitrogen for varieties of wheat.
Pak J Biol Sci 4:351-353.
Khan MA, Hussain I, and Baloch MS. 2000. Wheat yield potential - current status and future strategies. Pak J Biol Sci
3(1):82-86.
Sadiq M and Khan HKA. 1994. Effect of intercropping and planting patterns on yield and yield components of wheat.
Sarhad J Agric 10:351-354.
ITEMS FROM ROMANIA
S.C.A. — AGRICULTURAL RESEARCH STATION
Turda, 3350, str. Agriculturii, 27, jud. Cluj, Romania.
Yield stability and breeding for adaptation in winter wheat.
V. Moldovan, Maria Moldovan, and Rozalia Kadar.
Winter wheat provides a substantially larger amount of the world’s wheat production than does spring wheat because
winter wheat is more productive in those areas where both types can be grown. Thus, winter wheat usually is preferred
over spring wheat in the regions where the climate permits production. The limits of winter wheat adaptation are
established primarily by winter temperature. Thus, the winter survival temperature determines the northern limit and the
winter temperature that is sufficiently low to permit vernalization gives the southern limit of the cropping area. From
this point of view, winter wheat cultivars must have a high enough winter hardiness in northern regions and low require-
ments for vernalization in southern regions to be acceptable to producers.
Improved cultivars substantially contribute to increase wheat production. However, wheat yields in most
production regions seem to be no more than one-half of the potential yield of the cultivars and far below the theoretical

92
A n n u a l W h e a t N e w s l e t t e r V o l. 4 9 .
maximum yields. This difference reflects powerful production constraints that prevent the true genetic potential for yield
to be expressed by the grown cultivars.
Although wheat-breeding programs have some priorities in common, the major objective of increasing the
genetic potential of yield for most, if not for all, can be achieved via breeding for higher yield potential or by diminishing
or eliminating hazards that reduce yield. Actually, wheat breeding seeks to remove yield constraints by developing
cultivars with resistance to disease, insects, lodging, cold, heat, and drought. Other yield constraints can be best dealt
with through improved cultural practices and management. Obviously, some yield constraints are fixed by the environ-
ment and cannot be manipulated.
As a breeding objective, yield represents an extreme example of a quantitative trait being polygenically inher-
ited and subject to environmental influence to a large extent. Studies have shown that the environmental variation
associated with yield often exceeds genotypic variation, which leads to confounding the genotype mean performance
with its true value.
Among breeding priorities, stability of performance may be as important as high yield potential. Therefore,
‘genotype x environment’ interactions are of major importance, because they provide information about the effect of
different environments on cultivar performance and have a key role for assessment of performance stability of the
breeding materials.
Developing a wheat cultivar generally results from the selection of valuable recombinants found in manageable
hybrid populations. During the breeding process, they will be grown in a limited set of environments. Evaluation of
breeding material in a wide range of environments seldom is possible, not to mention the multiple environments encoun-
tered by new cultivars released for commercial production. Testing over as wide a range of environments generally is
essential if widely adapted cultivars are to be identified.
Environments are seldom, if ever, duplicated. Variation in an environment at a single location over years can be
as great as those between locations in one year. Therefore, variations in the ‘genotype x environment’ interaction that are
pertinent to wheat breeding problems are those associated with ‘cultivar x year’, ‘cultivar x location’, and ‘cultivar x
year x location’.
We have discussed stability and adaptation of winter wheat. Yield stability has been defined as the ability of a
cultivar to produce an expected yield at the level of productivity of a certain environment (i.e., the cultivar that has no
‘genotype x environment’ interactions). In practice, the wide variation in yield stability are related to the range in
adaptation and response to production inputs. Therefore, wheat cultivars must have sufficient potential to maintain
competitive yields in various environments and react favorably to conditions or increased production inputs.
That practical wheat breeding can make increases in genetic yield potential without substantial loss in yield
stability and adaptation is of question. Some believe that yield potential and yield stability are more or less independent.
Others say that yield stability is inversely proportional to the sum of squares for the ‘genotype x environment’ interaction
attributable to that cultivar. The fact that one cultivar has significantly superior mean yields than another over a wide
range of environments denotes genetic differences in the behavior of different genotypes. However, high mean yield
alone is not necessarily indicative of high stability and wide adaptation.
Finlay and Wilkinson (1963) pointed out that the desired genotype is the one that produces a high mean yield
over a range of environments and has average yield stability in comparison with other genotypes in the same conditions.
They suggested that each nursery mean yield can be considered as a measure of an environment and, thus, an array of
low- to high-yielding environments becomes available from a given set of ecological trials. The response of a particular
cultivar to this range of environments can be estimated by the regression of yield of each cultivar on the mean yield of
the nursery. The regression coefficient (b) is considered as a parameter of yield stability. So, b = 1 denotes cultivars
with average stability; b > 1 are less stable cultivars, and b < 1 denotes very stable cultivars.
Eberhart and Russel (1966) developed this concept of stability and suggested the use of two stability parameters
when describing the performance of one cultivar over a range of environments. They proposed that the regression of
each cultivar on an environmental index and a function of the squared deviations from regression would provide more
useful estimates of yield stability parameters. The environmental index is a coded deviation of each environment from
the grand mean over a given range of environments. Environmental index is obtained for each environment by subtract-

93
A n n u a l W h e a t N e w s l e t t e r V o l. 4 9.
ing the grand mean of all cultivars over all environments from the mean of all cultivars in each environment. This forces
the regression of the mean of all cultivars on the environmental index to have unit slope (b = 1). Therefore, a stable
cultivar can be defined as one that have above average performance in all environments, a unit regression coefficient (b =
1), and a deviation from regression as small as possible (Sd2 = 0).
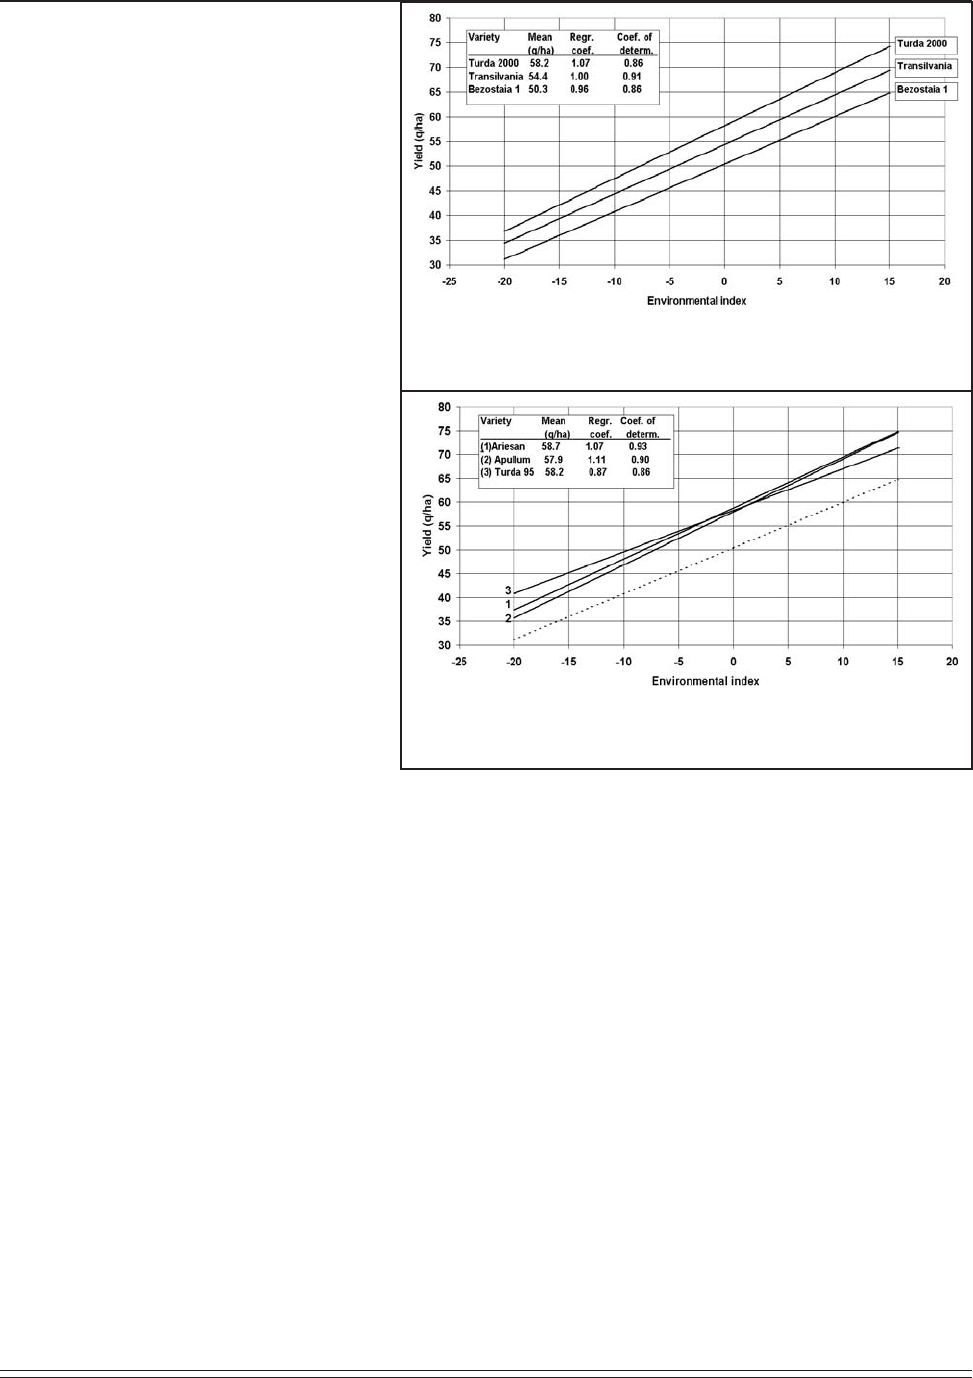
Evaluating yield stability and adaptation of the ARDS Turda winter wheat cultivars.
We evaluated the data from 22 ecological yield trials to examine the contributions of the ARDS Turda winter wheats to
increases in yield and stability of performance in wheat production. The trials are from seven locations and three years
(1998–2000) plus one location with one year (1998); a total of 22 trials. These locations are representative of the diverse
environmental conditions in Romania. Experimental cultivars in each trial did not exceed 25, including the long-term
check Bezostaia 1, used for comparison to newer cultivars and nursery performance over the years. The trials usually
were evaluated in a RCB with six replications. Previous crop, seeding date, and fertilization were different at each
location and conformed to local practices. Because part of cultivars in the nursery are changed annually and may
influence stability parameters, we chose only 11 cultivars that remained in all trials over the experimental years. The 22
trials included 10 Romanian winter wheats plus Bezostaia 1, the check considered to have had a fairly stable yield and
satisfactory adaptation. Five of the 10 Romanian cultivars analyzed were released by the ARDS Turda wheat-breeding
program.
‘Cultivar x year’, ‘cultivar x location’, and ‘cultivar x year x location’ interactions were significant, indicating
that the yield performance of the cultivars varied with the environments.
Stability parameters, computed according to the Eberhart and Russel model, were used to describe the perfor-
mance of cultivars over environments. According to the model, the environmental index as an independent variable (x)
was obtained for each of 22 environments as the mean of those 11 cultivars minus the grand mean (mean of the 11
cultivars in all 22 environments). The mean yield of each cultivar in each environment (y) was than regressed upon the
environmental index. The statistical mean yield, regression coefficient (b), and coefficient of determination (r2) are
currently used to evaluate the stability of yield over environments. We prefer coefficient of determination instead of
deviation from regression because it directly gives predictability of a cultivar in relation to the environmental index.
Although the deviation from regression must be as small as possible (approaching 0), the desired coefficient of determi-
nation is one that approaching 1 when considerable confidence can be attributed on one environment’s measurement of a
cultivar’s performance and adaptation.
Stability parameters for the yield of
the ARDS Turda winter wheats in the 22
ecological trials and the check Bezostaia 1
are presented in Table 1. According to the
statistical model, the mean yields correspond
to an environmental index value of 0.
Directly evaluating the percentage gain in
yield attributed to cultivar improvement is
relative to Bezostaia 1. In our case, this
value was between 8 % for Transilvania and
17 % for Ariesan. At the same time, in
comparison with Bezostaia 1, our cultivars
have had regression coefficient of 1 or
slightly higher, except for Turda 95, which
has a lower value. In addition, coefficient of
determination values equal to or higher than
Bezostaia 1 show that the cultivar response
to environments is predictable to a considerable degree. Turda 95, which has a lower slope of regression (b = 0.87),
seems to be well adapted to suboptimal environmental conditions.
A higher regression coefficient is desirable for high-yielding cultivars because they must be responsive to
favorable conditions or increased cultural input. Above average performance in all types of environments must be
Table 1. Stability parameters for yield of five ARDS Turda winter
wheat cultivars compared with long-term check Bezostaia 1 and
grown in 22 yield trials in northcentral Romania (1998–2000).
Percent mean yield is expressed as a percent of Besostaia 1.
Mean yield Regression Coefficient of
coefficient determination
Cultivar q/ha % (b) (r2)
Transilvania 54.4 108 1.00 0.91
Ariesan 58.7 117 1.07 0.93
Apullum 57.9 115 1.11 0.90
Turda 95 58.2 116 0.87 0.86
Turda 2000 58.2 116 1.07 0.86
Bezostaia 1 50.3 100 0.96 0.86
94
A n n u a l W h e a t N e w s l e t t e r V o l. 4 9 .
maintained. The regression of the yield of
Transilvania (released in 1982) and Turda
2000 (released in 2000) on environmental
indexes compared with the Bezostaia 1 check
are shown in Fig. 1. Differences in the mean
yield of Transilvania and Turda 2000 relative
to Bezostaia 1 demonstrate a continuous yield
advance achieved by our wheat-breeding
program during the last 30 years. The
regression lines of the two cultivars are nearly
parallel with that of Bezostaia 1, indicating
that their superiority is maintained across a
wide range of environments. The slope of
Bezostaia 1 is b = 0.96, whereas the slope of
Transilvania is b = 1 and Turda 2000 is b =
1.07. These cultivars tend to be slightly more
favorable to environments. For these two
cultivars, breeding progress to improve yield
potential was accompanied with improved
stability of performance.
The three other cultivars from our
program, Ariesan, Apullum, and Turda 95, had
different regressions of yield on environmental
indices in the same set of trials; graphically
illustrated in Fig. 2. Ariesan, with the largest
mean yield and a reasonable regression
coefficient (b = 1.07), has the highest coeffi-
cient of determination (0.93) denoting a
strong, predictable response to changes in
environmental conditions. The combination
of increased yield potential with good stability
of performance may explain the wide accep-
tance and popularity of Turda-developed wheats like Ariesan. Turda 95, with a larger mean yield (approaching Ariesan)
but low regression coefficient (b = 0.87), sharply contrasts with the smaller mean yield and high regression coefficient of
Apullum. The coefficients of determination were nearly similar for the two cultivars. The larger mean yield of Turda 95
clearly is associated with its higher yield in the poorer environments, whereas Apullum with a larger regression coeffi-
cient seems to be well adapted in favorable environments. The stability parameters in this study do permit comparisons
among cultivars for average yields, stability of performance as a degree of response to changing environments, and the
predictability of response to specified environments. Such comparisons would be useful for judging the release of
cultivars and making recommendations for suitable production conditions and areas of adaptation for different cultivars.
Conclusions and remarks. The final objective of a winter wheat-breeding program is the release of cultivars combining
high yield potential and quality with stability of performance and adaptation. Breeding for resistance to diseases and
different others biotic and climatic stress promote such stability. The high level of winter hardiness of wheat cultivars is
a major requirement for many winter wheat regions. Many genes condition winter hardiness, but the adaptability and
stability represent more complex breeding characters that are controlled genetically and encompass a large number of
known and unknown morphological, physiological, and biochemical attributes. Therefore, breeding for adaptation must
begin with choosing parents for the crosses. They must be well-adapted genotypes that will give valuable hybrid
combinations for the desired cultivar. During the generations of selection, the breeding material needs to be grown in the
different biotic and climatic conditions with which they will interact to allow the breeder to make sound judgements of
chosen material. In addition, testing breeding material in different simulated conditions such as with pathogen inocula-
tions, aluminum toxicity solutions, and sprouting in a mist cabinet, can help achieve the elements of cultivar adaptation.
New techniques of selection or manipulation of genetic material also can aid in developing high-yielding and stable
cultivars. Previously, we suggested that the pedigree selection method, with only a few reselections, may conserve some
heterogeneity in cultivars and buffer against environmental changes resulting in a good stability of performance (Ann
Fig. 2. Regression of the yields of Ariesan, Apullum, and Turda 95
versus the Besostaia 1 (dashed line) check on environmental indicies
in 22 ecological trials.
Fig. 1. Regression of the yield of Transilvania and Turda 2000
versus the Besostaia 1 check on environmental indicies in 22
ecological trials.

95
A n n u a l W h e a t N e w s l e t t e r V o l. 4 9.
Wheat Newslet 48:113-115). However, we do not exclude the possibility that homozygous genotypes, like pure lines
obtained by double-haploid techniques or other methods, may buffer as any other type of population if selection for
increased stability is applied.
Breeders agree that testing over a wide range of environments is essential if stable and widely adapted cultivars
are to be identified. However, the extensive trial data required for identification stable cultivars becomes available only
in advanced generations, when a cultivar is close to or may be already released. Therefore, the methods for evaluating
yield stability proposed in this study have had a little significant impact in the early generations of selection regarding
breeding wheat for adaptation. Improved evaluation techniques, applied in early generations, should assist in the early
identification of those lines having high yield potential associated with good adaptation in highly variable environments
or in alerting breeders to possible deficiencies in adaptation for other lines.
Based on our results presented here, trends in cultivar response to environments in regional performance
nurseries indicate that breeders must carefully consider the trade-off between maximum yield potential, stability of
performance, and ranges in adaptation during cultivar evaluation. However, convincing breeders to sacrifice high yield
for increased stability and wide adaptation is difficult. Nevertheless, assessing the ‘genotype x environment’ interaction
as a factor in determining the yield potential in the different production conditions will remain the most important tool in
the breeding wheat for yield.
References.
Eberhart SA and Russel WA. 1966. Stability parameters for comparing varieties. Crop Sci 6:36-40.
Finlay KV and Wilkinson GN. 1963. The analysis of adaptation in a plant-breeding programme. Aust J Inst Agric Res
14:742-754.
Bread-making quality research.
Mss. Rozalia Kadar completed her Ph.D. dissertation in December 2002 under the direction of Prof. Dr. Leon S.
Muntean at the University of Agricultural Sciences and Veterinary Medicine Cluj-Napoca. The title of Rozalia’s thesis
was ‘Study of the genotype-environment interaction in achieving of bread-making quality in winter wheat’. Her thesis
research underscores the fact that most wheat quality characteristics are heritable traits and more or less influenced by
environmental conditions and production inputs. The implications of ‘genotype x environment’ interactions in develop-
ment of winter wheat cultivars with improved bread-making quality are discussed.
ITEMS FROM THE RUSSIAN FEDERATION
AGRICULTURAL RESEARCH INSTITUTE OF THE CENTRAL REGION OF NON-
CHENOZEM ZONE
143026, Nemchinovka-1, Moscow region, Russian Federation.
Genetic linkage between endosperm color and caryopsis size in soft wheat hybrids.
V.G. Kyzlasov.
A method for creating a xenia caryopsis color and its inheritance in soft wheat hybrids has been described previously
(Kyzlasov 1998, 2000, 2001). Plants with caryopses of various colors were detected among the progeny with
instaminate flowers. These plants arose through the pollination of a spring soft wheat with pollen from spring barley.
Instead of stamens, this genotype had formed pistils. The segregation of caryopsis color in the F1 hybrid plants was 7
light-colored : 9 pigmented (1.284 light : 1.662 dark). The pigment was produced in the caryopses as the result of

96
A n n u a l W h e a t N e w s l e t t e r V o l. 4 9 .
complementary interaction of two hypostatic genes determining xenias. In the reciprocal cross, the hybrids did not differ
in their segregation pattern (596 light-colored : 819 pigmented ~ 688 light-colored : 843 pigmented).
In the second and subsequent generations of the hybrid populations, the unpigmented caryopses produced light-
colored grain progeny only. The progeny of plants with pigmented caryopses segregated 7 light : 9 dark, 1 light : 3 dark
or all plants produced pigmented caryopses. Both endosperm and pericarp were colored in the pigmented caryopses.
The genes for caryopsis xenia color have an effect on the color of the forming endosperm immediately after fertilization.
This phenomenon is known in maize, pea, barley, and rye.
Our investigation revealed that grain xenias can be mani-
fested in other features, e.g., caryopsis size. The dark caryopses
obtained from crosses between a light-grained line (female) and a
dark-grained line (male) were significantly bigger than those from
hybrids of dark-grained line (female) and a light-grained line (male).
The ratio the 1,000-kernel weight produced by the dark-grained
hybrid to that produced by the light-grained line was (38.8 : 34.8) x
100 = 111.4 % (Table 1).
The use of grain xenia-color genes makes it possible to mark
and select caryopses within a separate spike that are carriers of the
genes determining large grains. Selecting caryopses of different
colors within separate spikes of F1 hybrid plants indicates that dark-
colored caryopses are signifi-
cantly larger than light-colored
caryopses (see Table 2).
The ratio of the weight
of dark to light caryopses was
(37.1 : 33.0) x 100 = 112.4 % on
average. Linkage between grain
color and size was established in
other experiments. For example,
sweet corn (Zea mays
saccharata) and garden pea
(Pisum sativum) also demonstrate linked inheritance of grain size and variety features.
Dark- and light-colored grains taken from the same spike did not differ in their levels of raw protein, K2O, P2O5,
and gliadin proteins. Glutenins cause dark-grained wheat. The dark-grained wheat obtained in our experiments is
recommended for use when studying the inheritance of grain size in hybrids. The wide distribution of grains of different
colors within the same spike indicates that the difference in the size is exclusively a function of genetic factors. The
environmental influences are identical for all the grains of a spike. By backcrossing coarse-grain lines can be created
that will be analogous to the commercial cultivars with the dark-colored endosperm and pericarp.
References.
Kyzlasov VG. 1998. Wheat grain xenia. In: Proc Conf The theoretical and the practical problems of the genetic,
selection and seed-growing of the grain crop. Moscow region, Nemchinovka P. 43.
Kyzlasov VG. 2000. Grain xenia and its heredity by soft wheat hybrids. In: 2nd Cong Vavilov Soc Genet Select, St.
Petersburg. 1:111.
Kyzlasov VG. 2001. Genes controlling xenia development of the caryopsis in soft wheat. Ann Wheat Newslet 47:142.
Table 1. 1,000-kernel weight (g) of different
light- and dark-grained wheat lines and their
F1 hybrids. Minimum significant difference
(P = 0.05) = 2.5 g
Parental lines
Light-grained 38.3
Dark-grained 39.2
F1 hybrids
Light-grained / light-grained 34.8
Light-grained / dark-grained 38.8
Table 2. Range in weight of caryopsis after selection according to endosperm
color. Values for 1,000-kernel weight are in grams.
1,000-kernel weight
Endosperm Average
color 20 25 30 35 40 45 50 1,000-kernel weight
Light 2 13 33 30 19 3 — 33.0 ± 0.6
Dark — 2 16 36 31 14 1 37.1 ± 0.6

97
A n n u a l W h e a t N e w s l e t t e r V o l. 4 9.
AGRICULTURAL RESEARCH INSTITUTE FOR THE SOUTH-EAST REGIONS
Department of Genetics, 7 Toulaikov St., Saratov, 410020, Russian Federation.
The efficacy of the Ut gene from Saratovskaya
57 (Triticum durum subsp. durum) against loose
smut in bread wheat.
A.E. Druzhin.
During two seasons (2001–02), a number of spring bread
wheat lines containing chromatin from T. durum subsp.
durum were studied for resistance to loose smut after
artificial infection. We selected lines with a high level of
resistance to the pathogen. We detected resistance to loose
smut in lines with the spring durum wheat cultivar
Saratovskaya 57 in their pedigree (see Table 1).
Evaluating resistance to loose smut, bunt, and
ergot in spring bread wheat lines containing alien translocations.
A.V. Borozdina.
The Saratov-bred spring bread wheat cultivars and lines containing alien translocations were evaluated under natural
infection by pathogen populations of loose smut, bunt, and ergot. Spring bread wheat lines derived from crossings with
S. cereale; T. turgidum subspp. durum, persicum, and dicoccum; Ag. elongatum; Ag intermedium; and lines with translo-
cations from these species were most susceptible to ergot. The degree of a susceptibility in the lines containing genes
from T. turgidum subsp. durum + Ag. elongatum + S. cereale was higher than lines in lacking rye in their pedigree.
Resistance to loose smut was found in lines with translocations T. turgidum subsp. durum + T. turgidum subsp.
dicoccum + Ag. elongatum (L 836-00), T. turgidum subsp. durum + Ag. elongatum (L 2040 and L 164), T. tudgidum
subsp. durum + Ag. elongatum + Ag. intermedium (L 810-94), T. turgidum subsp. durum + T. turgidum subsp. persicum
(L 589-94), and T. turgidum subsp. durum +Ag. elongatum + S. cereale (L 894-94 and L 255-93).
The study of these lines for resistance to bunt shows that the greatest number of susceptible genotypes in the
groups with translocations from Ag. elongatum, T. turgidum subsp. durum, and their combinations (T. turgidum subsp.
durum + Ag. elongatum) and (T. turgidum subsp. durum + Ag. elongatum + Ag. intermedium). Lines combining resis-
tance to all three diseases were very rare and observed in lines containing T. turgidum subsp. durum + T. turgidum subsp.
persicum line L 589-94.
Genetic control for resistance to leaf rust in spring bread wheat lines derived from crosses with
tetraploid AB-genome species.
S.N. Sibikeev, S.A. Voronina, and V.A. Krupnov.
In the Department of Genetics at ARISER, spring bread wheat lines resistant to leaf rust were obtained from crosses with
T. turgidum subspp. durum, dicoccum, and dicoccoides. These lines were produced by the backcross method. In these
lines, the following ITs to leaf rust were observed: L164 (pedigree: L504/S57//L504, S57 is a spring durum wheat) – IT
= 2–2; L196 (pedigree: S58/T. turgidum subsp. dicoccum*3//S58) – IT = 0;–1; L2870 (pedigree: S55/T. turgidum subsp.
dicoccoides*3//S55) – IT = 0;. Genetic analyses indicated that the resistance in L164 was determined by two recessive
genes, in L196 by two dominant genes, and in L2870 by one dominant gene. Allelism tests detected that these Lr genes
are different from Lr14a and Lr23 and from each other.
Table 1. Reaction of cultivars and lines of spring bread
wheat to race 23 of loose smut during 2001 and 2002.
% of plants sporulating
Cultivar/line 2001 2002
L503 58.3 59.5
L504 64.2 59.3
L222 67.5 59.4
Saratovskaya 58 (S58) 70.3 65.2
L504/S57*2//L504/3/S58 5.8 3.1
L503/S57//L503 5.3 4.7
L503/S57//L503/3/L222 0.0 0.0
Saratovskaya 57 (S57) 0.0 0.0

98
A n n u a l W h e a t N e w s l e t t e r V o l. 4 9 .
The evaluation of spring bread wheat cultivars for resistance to stripe rust in 2002.
S.N. Sibikeev and A.E. Druzhin.
Stripe rust of bread wheat in the Saratov district of the Volga Region of Russia occurs seldom and the severity of the
epidemics is usually weak. Nevertheless, in the southwestern part of the Saratov district, epidemics of this disease were
observed during the last 2 years. A major part of this area is sown with spring bread wheat cultivars L503, L505,
Belyanka, and Dobrynya. L503, L505, and Dobrynya had an IT of 0 and that of Belyanka was a 3. L503, L505, and
Dobrynaya have resistance gene Lr19, and Belyanka has Lr23+Lr14a. Resistance to stripe rust in L503, L505, and
Dobrynya was surprising, because there is no data regarding the resistance of Agropyron translocation with Lr19 to P.
striiformis tritici.
The reaction of the bread wheat cultivars and lines to loose smut and bunt.
A.Yu. Buyenkov, A.E. Druzhin, V.A. Krupnov, Yu.V. Lobachev, and M.R. Abdryaev.
We compared the resistance of bread wheat cultivars and lines to loose smut and bunt in an artificial infection. Fourteen
cultivars and lines bred at ARISER were infected with spores of loose smut and bunt. The initial inoculum of bunt was
collected from the susceptible line L894. Two
pathotypes of loose smut were collected from
cultivars L505 and Saratovskaya 60, which are
susceptible to the named races L 505 and S 60,
respectively.
The reactions of bread wheats and lines
to bunt and loose smut after artificial inoculation
are given in Table 2. Lutescens 62 is resistant to
bunt but is moderately susceptible to race L 505 of
loose smut and highly susceptible to S 60. L235-
01, the line most susceptible to bunt, was resistant
to race L 505 and moderately susceptible to S 60.
L 2040 was resistant to both races of loose smut
but moderately susceptible to bunt (36 %). The
majority of bread wheat lines were more suscep-
tible to bunt than resistant to loose smut (Albidum
188, L502-01, L105, and L 108). In most cases,
the cultivars and lines were more susceptible
when inoculated with race S 60 of loose smut.
Approximately similar degrees of susceptibility to
bunt and race S 60 of loose smut were observed in
L780 and between bunt and races L 505 in L400,
L154, and L199. A correlation was detected
between the percent susceptible to loose smut and
bunt.
The distribution of Puccinia triticina pustules on the flag leaves of Saratov soft spring wheat
cultivars.
O.V. Subkova.
In practice, we are selecting soft spring wheat cultivars for general resistance to leaf rust. Quantative estimations, both in
the field and greenhouse, include four signs that in total are considered as the final expression of a given interaction.
Most methods for estimating pustule distribution contain a number of errors. A wider selection of characteristics is
Table 2. Percent infection of bread wheat cultivars and lines to
bunt and loose smut pathotypes under conditions of artificial
infection in 2002.
% of plants sporulating
Loose smut
Cultivar/line Bunt L 505 S 60
Lutescens 62 8.0 47.0 71.0
L503 19.0 29.0 47.0
Yuogo-vostotchnaya 2 22.0 34.0 48.0
Albidum 188 23.0 45.0 48.0
L400 25.0 29.0 59.0
L181 rq 30.0 47.0 51.0
L502-01 33.0 49.0 77.0
L154 Rq 35.0 35.0 55.0
L2040 36.0 4.0 5.0
L780-01 44.0 11.0 47.0
L199-01 46.0 50.0 38.0
L105-01 61.0 19.0 13.0
L108-01 62.0 22.0 36.0
L235-01 68.0 9.0 36.0

99
A n n u a l W h e a t N e w s l e t t e r V o l. 4 9.
necessary to increase the accuracy. Finding a new phenotypes (up to two) to help determine the various estimations is
desirable.
We visually observed the pustule arrangement on the flag leaves of 12 Saratov soft spring wheat cultivars of the
Ugo-Vostok Scientific Research Institute in the 2000–01 season by sketching. The differences between cultivars were
assessed from pictures of pustule distribution along the leaf blade. Our hypothesis about pustule distribution includes
several points:
in general, in each of the 12 Saratov cultivars, we could determine a typical arrangement from the background
pustule arrangement of the flag leaves and defined this as the abstract picture of pustule arrangement
(aPDP);
each aPDP of a cultivar consists of a definite design type (from 1 up to 9), one of which can be seen only in
single cultivar; others in several; and
a formula describing the pustule arrangement (FDDP) for the resistant and susceptible Saratov wheat cultivars
FDDP includes three traits; the number of dominant designs at the bottom, in the middle, and at the tip of the
flag leaf.
These data are summarized and expressed by the symbol G, with the index n (1–10). These differences in aPDP
are not accidental and are connected with the peculiarities of genotype, plant habit, and the external influences during
epidemic pathogen development.
AGRICULTURAL RESEARCH INSTITUTE FOR THE SOUTH-EAST REGIONS
Department of Genetics, 7 Toulaikov St., Saratov, 410020, Russian Federation.
ALL RUSSIA RESEARCH INSTITUTE OF PHYTOPATHOLOGY
143053, Bol´shie Vyazemy, Moscow region, Russian Federation.
Determining the genotypes of resistant wheat lines using test pathotypes of the Puccinia triticina.
I.F. Lapochkina and E.D. Kovalenko, and A.I. Zhemchuzhina, T.M. Kolomietz, and D.A. Solomatin (Institute of Phyto-
pathology).
Breeding for resistance to the rust fungus is a great problem for many wheat-cultivating countries such as the Russian
Federation, the U.S.A., Canada, Argentina, Brazil, and Australia. One way to solve this problem is to screen for resis-
tance in the world’s wheat germ plasm. After testing common, spring-wheat cultivars grown in the territory of the
former Soviet Union, only 8–9 leaf rust-resistance genes were identified (Singh et al. 1995). The genetic diversity of
winter wheat cultivars is not large; 95 % of the cultivars included in the State Register of Russian Federation in 1998
were the progeny of Bezostaya 1 and Mironovskaya 808 (Martynov and Dobrotvorskaya 2001).
Enriching wheat germ plasm with genes of wild species and establishing new combinations of resistance genes
will increase significantly the efficacy of breeding wheat for immunity. The cytogenetic stock collection created at the
Agriculture Research Institute of Non-Chernozem Zone contains common wheat genotypes with chromosomes added
from Ae. speltoides (over 60 genotypes that are grouped into 16 clusters according to disease resistance and morphologi-
cal traits) (Lapochkina and Volkova 1994; Lapochkina et al. 1998, 2001). The collection also includes hexaploid
genotypes with alien material from Ae. speltoides, Ae. triuncialis, T. kiharae, and S. cereale. Several stable addition lines
of spring wheat obtained by means of wide hybridization with the spring wheat Rodina and the ph1b mutant with Ae.
speltoides and Ae. triuncialis species were used in this research and are described in Table 1.
Lines k-62903 and k-62904 are of the lutescens type. These lines have a long stem (90–100 cm), a lax
multiflowered ear, and anthocyanin-colored anthers. Line k-62905 belongs is a milturun type. This line has a short
stem, lacks wax on the spike, and has short awn-like sprouts on the ear apex. Line 149/00i is characterized by late
ripening, anthocyanin-colored anthers and straw, and waxless spikes. Line 102/00i is T. aestivum subsp. spelta with a
dense spike. This line has anthocyanin-colored anthers and lacks wax. Line 82/00i has a short stem, lax multiflowered
spikes with big glumes, and elongated teeth on the lemma. Line 76/00i is characterized by the presence of the morpho-

100
A n n u a l W h e a t N e w s l e t t e r V o l. 4 9 .
Table 2. The genotypes of the Puccinia triticina pathotypes used in to
identify leaf-rust resistance genes in 13 lines with wheat–alien transfers.
191-7 1,3a,3bg,10,11,14a,14b,15,17,18,21,27+31
238-15 1,2a,2b,2c,3a,3bg,3k,10,11,15,17,18,19,20,21,32,36
242-14 1,2c,3a,3bg,3k,10,11,14a,14b,16,17,18,20,21,25,27+31
245-21 2c, 3a,3bg,3k,10,11,14b,16,17,18,21,27+31
249-6 2b,2c,3a,3bg,3k,10,11,14a,14b,16,17,18,21,26,27+31,32,36
261-7 1,2a,2b,2c,3a,3bg,10,11,14a,14b,15,17,18,20,26
277-23 1,2a,2b,2c,3a,3bg,3k,11,14b,17,18,20,21,25,26,27+31
277-14 1,2a, 2b,2c,3a,3bg,10,11,14a,15,17,18,21,26,27+31
262-6 1,3a,3bg,3k,10,11,14a,14b,16,17,18,20,21,23.25
98-3 1,2a,2b,2c,3a,3bg,3k,11,14a,14b,15,17,18,20,21,26.
270-7 3a,3bg,3k,10,11,14b,15,16,17,18,19,20,21,25,27+31
257-3 1,2a,2b,2c,3a,3bg,3k,11,14a,14b,16,17,18,20,21,26,27+31
277-26 1,2a,2b,2c,3a,3bg,11,14a,14b,17,20,21,26.
258-13 1,2a,2b,2c,3a,3bg,3k,10,11,14a,14b,15,17,18,20,21,27+31,28
269-7 1,2c,3a,3bg,3k,10,11,14b,17,18,20,21.
logical features
of wild species;
thin, anthocya-
nin-colored
straw and low
spike density.
Two telomeric
SPELT 1
repeats are
visualized in the
karyotype of
this line after
FISH (Salina et
al. 2000). Line
87/00i has thin
straw and is
susceptible to
powdery
mildew. Line
72/00i is
characterized by
a light-red spike
color, low spike density, and narrow, lancet-shaped spike scales. This line is resistant to powdery mildew (10 % infec-
tion). Lemmas that adhere to the kernel on the side groove and the existence of a long (over 9 cm) spike are typical of
line 99/00i. The line also is susceptible to powdery mildew (40 % infection). Line 85/01i has a low spike density and
anthocyanin-colored anthers and straw. Line 97/01i has thin straw and the lemma adheres to the kernel. Line 132/01i is
an awned form of T. aestivum.
During the last 5 years, all lines
showed a high level of resistance to leaf
rust inoculation (genotype of the popula-
tion 1, 2a, 2b, 2c, 3bg, 3k, 10, 11, 14a,
14b, 16, 17, 18, 20, 21, 23, 25, 26,
27+31, 30) in the field. Fifteen isolates
collected from the natural
uredopopulations of the pathogen in the
Central, Low-Volga, Middle-Volga,
North-Caucasian, and West-Siberian
regions of the Russian Federation were
used as test cultures. Pathotypes of P.
triticina carried from 12 to 18 virulence
genes (Table 2). Disease symptoms were
estimated according to the 5-point scale
of Mains and Jackson (1926). Infection
types 0, 0; 1, 2, and X- mean that a
sample possesses resistance genes
whereas types 3, 4, and %+ indicate their
absence.
As a rule, the investigated lines were resistant to the pathogen penetration with ITs of 0, 0; or 1, and 2. A
susceptible reaction to some pathotypes suggested that lines k-62905, 149/00i, 82/00i, and 102/00i had a combination of
Lr1+Lr10, Lr10+Lr26, Lr10+Lr26, and Lr27+Lr31 genes, respectively. In addition, lines 82/00i and 102/00i each had
one additional, unidentified resistance gene.
Lines k-62903 and k-62904 presumably have new resistance genes from Ae. speltoides. The alien transloca-
tions and substitutions (T2BL·2SL for k-62903, T1BL·1SS and T5AL·5SL for k-62904, and 7A/7S substitution in k-
62905) were identified previously by differential C-banding of chromosomes in k-62903, k-62904 and k-62905
Table 1. Field reaction to powdery mildew and leaf rust and identification of Lr genes in wheat–
Aegilops lines.
% infection in field Assumed
Line Origin mildew leaf rust resistance
k-62903 Rodina/Ae. speltoides 0 0 juvenile gene(s)
k-62904 Rodina/Ae. speltoides 0 0 juvenile gene(s)
k-62905 Rodina/Ae. speltoides 10 20/2 Lr1 + Lr10
149/00i ph1b/Ae. speltoides 00 Lr10 + Lr26
102/00i Rodina/Ae. speltoides (10 kR) 40 0 Lr27 + Lr31 +
82/00i Rodina/Ae. speltoides (10 kR) 0 0 Lr10 + Lr26 +
76/00i Rodina/Ae.speltoides (10 kR) 0 0 adult-plant gene(s)
87/00i Rodina/Ae.speltoides (10 kR) 30 0 juvenile gene(s)
72/00i Rodina/Ae. speltoides (10 kR) 0 0 juvenile gene(s)
99/00i Rodina/Ae. speltoides (10 kR) 5 0 juvenile gene(s)
85/01i Rodina/Ae. speltoides (10 kR) 0 0 juvenile gene(s)
97/01i Rodina/Ae. speltoides (10 kR) 0 0 juvenile gene(s)
132/01i Rodina/Ae. triuncialis (5 kR) 20 0 Lr28 +

101
A n n u a l W h e a t N e w s l e t t e r V o l. 4 9.
(Lapochkina et al. 1996; Pukhalsky et al. 1999). The presence of resistance genes in these lines probably is related to
these translocations.
When lines 87/00i, 99/00i, 85/01i, and 97/01i were inoculated with leaf rust test pathotypes, they showed only
the resistant-type reaction (0, 0;); suggesting that the resistance genes from Ae. speltoides function in both seedlings and
adult plants. Line 76/00i was susceptible to infection by 11 pathotypes and resistant to four. The presence of APR genes
in this line possibly are related to the presence of Ae. speltoides chromosome 4S in the karyotype. For line 72/00i, the
heterogenic type of reaction (x-) was found in the case of three pathotypes, the 12 remaining pathotypes exhibited a
resistant reaction (0, 0;). We believe that juvenile resistance genes may be present in this line. Lr28 and additional
unidentified resistance genes from Ae. triuncialis were found in line 132/01i.
Conclusions. The testing of 13 wheat–Aegilops lines with leaf rust pathotypes with known genotypes showed
that most lines had juvenile genes of resistance. Line 76/00i with APR genes was identified. All the lines were classified
into three groups: 1) those with unidentified resistance genes from Ae. speltoides (k-62903, k-62904, 72/00i, 85/01i ,
97/01i , 99/00i, 87/00i, 76/00i); 2) those with known genes of resistance (k-62905 and 149/00i); and 3) those with known
resistance genes and an additional unknown resistance gene (82/00i, 102/00i, and 132/01i).
References.
Lapochkina IF. 2001. Genetic diversity of “Arsenal” collection and its use in wheat breeding. In: Abstr Internat Appl
Sci Conf Genetic Resources of Cultural Plants. 13–16 November, 2001, St. Petersburg, Russian Federation. Pp.
133-135.
Lapochkina IF, Solomatin DA, Serezhkina GV, Grishina EE, Vishnyakova KhS, and Pukhalskiy VA. 1996. Common
wheat lines with genetic material from Aegilops speltoides Tausch. Rus J Genet 32(12):1651-1656.
Lapochkina IF and Volkova GA. 1994. Creation of collection of lines spring common wheat, substituted and supple-
mented with chromosomes of Aegilops speltoides Tausch. Rus J Genet 30(suppl):86-87.
Lapochkina IF, Yatchevskaya GL, Kyzlasov VG, Solomatin DA, Vishnyakova KhS, Pogorelova LG, and Lasareva EN.
1998. The production, cytology and practicality of disomic addition lines of T. aestivum-Ae. speltoides. In: Proc 9th
Internat Wheat Genetic Symp (Slinkard AE ed). University Extension Press, Saskatoon, Saskatchewan, Canada.
2:67-69.
Mains EE and Jackson HC. 1926. Physiologic specialization in the leaf rust of wheat, Puccinia tritici Erikss. Phytopath
16(2).
Martynov SP and Dobrotvorskaya TB. 2001. Pedigree-analysis of modern cultivars of winter common wheat. Selektsia
i Semenovodstvo. N 1-2:47-54.
Pukhalski VA, Iordanskaya IV, Badaeva ED, Lapochkina IF, and Bilinskaya EN. 1999. Genetic analysis of the sign
“absence of wax bloom on an ear” of the line of common wheat. Rus J Genet 35(9):1223-1227.
Salina EA, Adonina IG, Efremova TT, Lapochkina IF, and Pshenichnikova TA. 2000. The genome-specific
subtelomeric repeats for study of introgression lines T. aestivum x Ae. speltoides. In: Abstr 11 EWAC Conf, dedi-
cated to the memory of O.I. Maystrenko, 24–28, July, 2000. Pp. 181.
Singh RP, Morgunov A, and Huerta-Espino J. 1995. Genes conferring low seedling reaction to Mexican pathotypes of
Puccnia recondita f. sp. tritici, and adult-plant responses of recent wheat cultivars from the former USSR. Euphytica
81(3):225-234.
INSTITUTE OF COMPLEX ANALYSIS OF REGIONAL PROBLEMS
Karl Marx str., 105 A, kv. 167, Khabarovsk, 680009, Russian Federation.
Technological characteristics of spring wheat cultivars developed in the far-eastern Russian
Federation.
Ivan M. Shindin, Elizoveta N. Meshkova, and Olga V. Lokteva.
The grain market in the far-eastern part of the Russian Federation is mainly imports from abroad and the central region
of the country. The cost is high. Because the far-eastern region has sufficient land and a favorable environment for the
production of spring wheat, the area is completely capable of providing the population of the region with bread and

102
A n n u a l W h e a t N e w s l e t t e r V o l. 4 9 .
bakery products. To solve this important problem, increasing the wheat yield from 1.0–1.2 t/ha to 1.8–2.0 t/ha, extending
the area under cultivation from 200,000 to 450,000–500,000 ha, and having high-quality cultivars is necessary.
In the Russian
Federation, T. aestivum
cultivars are classified
into five groups
according to their grain-
technological character-
istics into the categories
strong, valuable,
medium quality (filler),
satisfactory, and weak
(Table 1).
The term
strong means wheat
with high-quality
protein content that
forms a dough good for
intensive mixing and
long fermentation,
provides for a high
volume of bread, and
has good mixing quality.
The mixing quality is
understood to be the
capability of strong
wheat flour to improve
baking quality of a weak
wheat flour. The higher
the mixing quality of the
flour, the less quantity
of flour is required as a
component of a mixture
(from 50–20 %).
Valuable and medium
(filler) wheats make
high-quality bread, but
they do not improve the
baking quality of weak
cultivars. Flour from
weak wheat when not
combined with a strong
wheat flour is not good
for bread baking.
Wheat quality
problems are of great economic importance. If 100 g of high baking-quality wheat yields 115 kg of bread, then a low
baking-quality wheat will yield only 9l kg (Pumpyansky and Semyonov 1969). Thus, the main importance for obtaining
high-quality bread depends on the cultivar.
The far-eastern region has the proper cultivar resources (Shindin 1996; Shindin and Bochkaryov 2001). In
2002, 13 cultivars of soft spring wheat were released for cultivation; 11 are from breeders in the far east (Amurskaya 75,
Amurskaya 1495, Amurskaya 90, Dalnevostochnaya 10, Zaryanka, Lyra 98, Monakinka, Primorskaya 14, Primorskaya
21, Primorskaya 39, and Kabarovchanka) and two are from other regions (Krasnofimskaya 90 and Priokskaya). Al-
Table 1. Classification of Triticum aestivum cultivars according to bread-making quality.
Good
Quality indicators Strong Valuable filler Satisfactory Weak
grain hardness hard and medium hard — — —
vitreousness, %
(not less than) 60 50 50 40 —
protein content in grain
(not less than) 14 13 12 11 8
gluten content in grain, %
(not less than) 2 ~25 24 22 15
gluten content in
70 % flour output, %
(not less than) 32 29 27 25 20
dough dilution,
pharinograph units,
(not more than 30–60 80 120 150 > 150
valorimetric number
farinograph units,
(not less than) 70–85 55 45 00 < 80
dough deformation,
alveograph units,
(not less than) 280 260 240 180 < 180
dough elasticity
(alveograph), mm
(not less than) 80 70 60 50 < 50
bread output from
100 g of flour, ml
(not less than) 1,200 1,100 900 800 < 800
baking quality mark
(not less than) 4.5 4.0 3.5 3.0 < 3.0

103
A n n u a l W h e a t N e w s l e t t e r V o l. 4 9.
though no strong wheat cultivar is among these wheats, most are good fillers and are of good quality according to their
technological evaluation. All have good agronomic characteristics (high grain yield and resistance to lodging, disease,
sprouting, and shattering). The technological and agronomic characteristics of eight far-eastern cultivars follow.
Amurskaya 5. This cultivar was bred at the former Amur Agroexperimental Station (now the Russian Soybean
Research Institute, Blagoveshensk), which is situated in the Amur region, a main wheat granary in the far-eastern
Russian Federation. The grain is of average size and vitreous (60–78 %). The 1,000-kernel weight is 27–34 g. The 1 L
weight is 750–760 g. Baking quality is good. Amurskaya 5 belongs to the valuable class of wheat cultivars. Grain
protein content is 14.1–17.8 %, gluten content is 27–40 %, and flour strength is 280–411 units as measured by
alveograph. The bread output from l00 g of flour is 620–1,150 ml. Baking quality is 3–4.5. The cultivar is resistant or
moderately resistant to lodging, shattering, and P. graminis. Grain yield is 2–2.5 t/ha.
Amurskayag 90. This cultivar was bred at the Ear Eastern State Agricultura1 University, Blagoveshensk. The
grain is egg-shaped, red, and vitreous with a shallow groove. The 1,000-kernel weight is 32–35 g. According to
technological evaluations, Amurskayag 90 is a satisfactory filler, threshes well, and is resistant to U. tritici and P.
triticina but susceptible to S. nodorum and P. gramminis. Potential yield is 4–4.5 t/ha, with an average yield of 2.5 t/ha.
Dalnevostochnaya 10. This wheat was bred at the Far Eastern Research Institute of Agriculture, Khabarovsk.
The egg-shaped grain is red. The 1,000-kernel weight is 30–38 g. Bread-making quality is medium to good and the
cultivar is a satisfactory filler. Grain vitreousness is 65 %, and protein content is 28.5–37 %. Flour strength is 230–360
units as measured by alveograph and valorimetric number is 50 units as measured by farinograph. The bread output
from 100 g of flour is 650–1,050 ml. Bread-making quality is 2.7–4.1. The cultivar is resistant to lodging and moder-
ately resistant to P. triticina and P. graminis. Commercial yield is 2–2.5 t/ha with a potential yield of 5 t/ha.
Zaryanka. Bred at the Ear Eastern Research Institute of Agriculture, Khabarovsk, Zaryanka has a grain-protein
content of 14–16.7 %, a vitreousness of 60–65 %, gluten of the first-class quality at 28–30 %, and a flour strength of
320–380 units as measured by alveograph. The bread output from l00 g of flour is 960–1,060 ml. The cultivar belongs
to the valuable class. Zaryanka is more resistant to U. tritici, F. graminearum, shattering, and sprouting as compared
with the standard and yields between 2.5–3 t/ha.
Lyra 98. Lyra 98 was bred at the Far Eastern Research Institute of Agriculture, Khabarovsk and released for
growing in the far-eastern region in 2002. Grain protein content is 16–l7 %, vitreousness 60–70 %, gluten content is 30–
38 %, and flour strength is 450–520 units as measured by alveograph. The bread output from l00 g of flour is 1,100–
1,200 ml. This cultivar is resistant to lodging, sprouting, and U. tritici and moderately resistant to F. grameniarum.
Potential yield is 4.6–5.0 t/ha.
Primorskaya 14. Bred at the Primorskey Research Institute of Agriculture, Ussuryisk, this cultivar has red, egg-
shaped grains with a medium groove and of small to average size. The 1,000-kernel weight is 30–36 g. Baking quality
is from satisfactory to good. Vitreousness is 50–78 %, grain protein content is 15–16.8 %, flour gluten is 34.6–39.8 %,
and flour strength is 255–343 units as measured by alveograph. The bread output is 620–1,020 ml with a bread-making
evaluation of 2.6–3.8 marks. Primorskaya 14 is resistant to lodging except in rainy years, resistant to P. graminis, and U.
tritici and moderately susceptible in rainy years to P. triticina and F. graminearum. The commercial yield of
Primorksaya 14 is 2.5 t/ha with a potential yield of 5 t/ha.
Primorskaya 21. This cultivar was bred at the Primorskey Research Institute of Agriculture, Ussuriysk. The
grain is red and oval with a small, narrow groove. The 1,000-kernel weight is 30–42 g. This wheat is of satisfactory
baking quality and a good filler. Grain protein content is 14.7–17.6 %, flour gluten content is 37 %, and flour strength is
270–320 units as measure by alveograph. The bread output from 100 g of flour is 800–1,030 ml. Baking evaluation is
3.6–4 marks. Primorskaya 21 is resistant to lodging and moderately susceptible to P. triticina and F. graminearum.
Average yield is 2.5–3 t/ha with a potential yield of 5 t/ha.
Primorskaya 39. The cultivar was bred at the Primorskey Research Institute of Agriculture, Ussuriysk. The
grain is red, rounded, and vitreous with a medium groove. The 1,000-kernel weight is 30–34g. Baking quality is good to
excellent. Grain protein content is 13–15.9 %, gluten content is 33 %, and flour strength is 440 units as measured by
alveograph. The bread output from l00 g of flour is 810 ml. Baking evaluation is 4.6 marks. Primorskaya 39 is resistant

104
A n n u a l W h e a t N e w s l e t t e r V o l. 4 9 .
to lodging and moderately susceptible to P. triticina and F. graminearum. The average yield is 3.5 t/ha with a potential
yield between 4.5 and 5 t/ha.
Khabarovchanka. This cultivar was bred at the Far Eastern Research Institute of Agriculture, Khabarovsk. The
large, red, egg-shaped grains have a narrow, medium groove. The 1,000-kernel weight is 36–45. Grain protein content
is 14–16 %, grain gluten content is 28–31.5 %, and flour gluten is of the first and second quality at 35.7 %, and flour
strength is between 280–350 units as measured by alveograph. The bread output from l00 g of flour is 900–1,000 ml.
Baking evaluation is 3.6–4.5 marks. Khabarovchanka is highly resistant to lodging, U. tritici, P. graminis, and P.
triticina. This cultivar is of the intensive type and has a good responsiveness to improved growing conditions. Commer-
cial yield is 3–4 t/ha with a potential yield of 5 t/ha.
In the future, this list of cultivars will increase as new cultivars with high value and strength are released by
breeders from the far-eastern region.
References.
Pumpyanskey AY and Semyonova LV. 1969. The improvement of technological characters of Triticum aestivum.
Moscow. P. 87 (in Russian).
Shindin IM. 1996. Spring wheat and barley selection in far eastern Russia. Scientific report, Khakarovsk. P. 55 (in
Russian).
Shindin IM and Bochkaryov YY. 2002. Plant and cultivar resources of agricultural crops in far eastern Russia.
Ussurlysk, Biribidjan. P. 193 (in Russian).
OMSK STATE PEDAGOGICAL UNIVERSITY
Chemico-Biological Faculty, nab. Tuchachevskogo, 14, Omsk, 644099, Russian
Federation.
Chromosome number variations caused by the 2,4-dichlorphenoxyacetic acid in durum wheat
calli and regenerant plants cultivated in vitro.
Natalia A. Kuzmina.
Introduction. Totipotence is a property of plant cells that makes inheriting information following alterations in the
environment and causes the regenerating of plants. The genetic properties of cell populations cultivated on different
artificial media and the possibility to introducing hereditable mutations caused by different mutagenic substances are
very important (Butenko 1964). Auxins, used for the transformation of isolated plant cells and tissues in culture, were
capable of modifying some stages of the mitotic cycle (Gamburg et al. 1990). In addition, the callus tissue itself was
shown to be heterogeneous and genetically unstable, being affected by certain environmental compounds such as light,
temperature, and nutrition (Shamina 1970). Cytogenetic analysis of durum wheat callus tissues described the ploidy
level and revealed a certain genotype and cultivation time (Bennici et al. 1988; Morozova 1991; Yurkova 1989; Yurkova
et al. 1985). We studied variations of the chromosome number in durum wheat callus tissue and regenerated plants as
they relate to some components of the nutrient medium.
Material and methods. Mature seeds of the durum wheat cultivar Altayskaya Niva were used to obtain callus tissues.
The upper part of mature embryos were cut and placed on a nutrient-agar medium. Hamburg medium (B5) (Gamborg et
al. 1968) supplemented with 2,4-dichlorphenoxyacetic acid (2,4-D) in concentrations of 2, 4, or 6 mg/l and Murashige-
Skoog medium (MS) (Murashige and Skoog 1962) supplemented with 2,4-D at 4 mg/l were used to induce callus
growth. Each group consisted of 30–35 explants. Cultivation was in ‘100 x 20-mm’ glass tubes with 10 ml of medium
at 24˚C under continuous fluorescent light. After 6–7 weeks, the calli were transferred to another tube containing the
same medium, but without the hormone supplement, to induce organogenesis. Cytogenetic analysis of the callus tissues
and tissues of the apical root-tip meristem was with temporary squash preparations in acetocarmine. The samples were
treated with 0.1 % colchicine at 4˚C and fixed in a solution of alchohol:acetic acid (3:1). The significance of the
variation between treatments was determined using the Student’s t test (Lakin 1990).

105
A n n u a l W h e a t N e w s l e t t e r V o l. 4 9.
Results and discussion. After the explants were placed on the agar medium containing 2,4-D, callus formation was
observed after 6 weeks of cultivation. Transferring the calli to hormone-free medium caused a range of morphogenic
processes such as the continuous proliferation of nondifferentiated cells (nonmorphogenic callus), the appearance of
rhyzogenesis zones, shoot induction, and formation of somatic embryoids, the beginning of regenerant plants. The
combination and proportion of these processes depended on the auxin concentration in the primary medium (Kuzmina
1997).
The normal
chromosome number was
2n = 28 in the regenerant
plants (Table 1). Greco et
al. (1984) described
chromosome numbers and
Bennici et al. (1988)
identified mosaics in durum
wheat plants regenerated
from the mesocotyl callus.
Reduction in chromosome
number depended on 2,4-D
concentration and was
detected in the roots of
rhyzogenic callus. When
the calli were grown on a
medium supplemented with
4.0 mg/l of 2,4-D, few cells
had reduced chromosome
numbers, but the proportion
of such cells significantly
increased with higher concentrations of 2,4-D. The data clearly demonstrated that a high concentration of 2,4-D causes a
reduction in chromosome number, at least in root-tip cells, because cells of the nonmorphogenic calli had reduced
chromosome number independently of the 2.4-D concentration. This reduction might be explained by mitotic damage
and reduction in mitosis rate, particularly due to loss of the final phases. The incapability of the proliferating cells to
undergo mitosis might be associated with physiological hyperactivity of the cells maintained in an unusual experimental
environment in vitro and with their concurrence for specific regulatory proteins (Gamburg et al. 1990; Shamina 1970;
Yurkova et al. 1985).
The B5 and MS media contained different proportions of a nitrogen salts, NH4NO3, KNO3, and (NH4)2SO4.
Reduced nitrogen (NH+4 and glycine) prevailed in the MS medium, whereas oxygenated nitrogen (NO-3) prevailed in the
B5. Because genetic instability might be caused by different components of the nutrition medium (Shamina 1970), we
compared results obtained with two nutrition media of different mineral compounds (B5 and MS) supplemented with
2,4-D in equal concentrations of 4.0 mg/l (Table 2). The regenerated plants retained normal chromosome number (2n =
28) independent of the medium used. Roots of the rhyzogenic calli maintained on the MS were diploid, whereas cells of
the nonmorphogenic calli had a reduced chromosome number. Only cells of calli maintained on B5 contained reduced
chromosome number (2n = 20 or 22). Root-tip cells of the rhyzogenic calli maintained on the B5 contained either
normal or reduced chromosome number (2n = 26). Increasing the reduced nitrogen in the MS probably diminished the
effect of auxin stress and retracted the chromosome reduction. In one sample, nonmorphogenic calli maintained on MS
medium had a single giant cell with 84 chromosomes (not included into the average calculations). Therefore,
myxoploidy of the cell populations maintained in vitro might be the result of either reduction or multiplication the
chromosome number.
One effect of chromosomal instability on the morphogenetic potency of the cultivated cells is difficult to
estimate. Winfield et al. (1995) reported a correlation between the stability of a cell line karyotype and the rate of
regeneration of the progeny plants, whereas others detected an absence of morphogenesis in the stable lines. The
absence of shoots and regenerant plants in our experiments may be associated with a reduced chromosome number in the
cells of nonmorphogenic and rhyzogenic calli. This point needs additional study.
Table 1. Chromosome numbers of the root and callus cells depending on the 2,4-D
concentration in the B5 medium. Numbers are averages with 95 % confidence limits.
Sample origin 2 mg/l 2,4-D 4 mg/l 2,4-D 6 mg/l 2,4-D
Roots of the regenerant plants 28.0 + 0.0 28.0 + 0.0 —
Roots of the rhyzogenic calli 28.0 + 0.0 27.5 + 1.0 26.2 + 1.8
Cells of the non-morphogenic calli 21.2 + 1.0 21.5 + 1.0 20.5 + 1.3
Table 2. Chromosome numbers of the root and callus cells depending on the proportion
of NO-3 and reduced nitrogen in the nutrition media (MS (Murashigi-Skoog) or B5
supplemented with 2,4-D, 4 mg/l). Numbers are averages with 95 % confidence limits.
Sample origin MS B5
Roots of the regenerant plants 28.0 + 0.0 28.0 + 0.0
Roots of the rhyzogenic calli 28.0 + 0.0 27.5 + 1.0
Cells of the non-morphogenic calli 22.7 + 1.8 21.5 + 1.0

106
A n n u a l W h e a t N e w s l e t t e r V o l. 4 9 .
References.
Bennici A, Caffaro L, Dameri RM, Gastaldo P, and Profumo P. 1988. Callus formation and plantlet regeneration from
immature Triticum durum Desf. Embryos. Euphytica 39:255-263.
Butenko RG. 1964. A culture of isolated tissues and physiology of plant morphogenesis. Nauka. 272 p.
Gamborg OL, Miller RA, and Ojima K. 1968. Nutrient requirements of suspension culture of soybean root cells. Exp
Cell Res 50:151-158.
Gamburg KZ, Rekoslavskaya NI, and Shevtsov SG. 1990. Auxin in plant tissues and cells M.: Nauka. 243 pp.
Greco B, Tanzarella OA, and Blanco A. 1984. Plant regeneration from leaf base callus in durum wheat (Triticum durum
Desf.). Cereal Res Commun 12:171-177.
Kuzmina NA. 1997. Dependence of the durum wheat callusogenesis and regeneration on the concentration of 2.4-D in
the nutrition medium. A regulator of plant growth and development. In: Proc IV Internat Conf, Moscow, 24–26
June, 1997, Moscow. Pp. 302-303.
Lakin GF. 1990. Biometrics. M.:Vysshaya shkola. 352 pp.
Morozova SE. 1991. Stability of the regeneratory properties in a wheat calli. Biology of cultvated cells and plant
biotechnology. M.: Nauka. Pp. 256-259.
Murashige T and Skoog F. 1962. A revised medium for rapid growth and bioassays with tobacco tissue cultures.
Physiol Plant 15:473-497.
Shamina ZB. 1970. Genetics and cytology of tissue culture and a regenerant plants. A culture of isolated organs, tissues
and cells of plant. M.: Nauka. Pp. 129-137.
Winfield MO, Schmitt, Lörz H, Davey MR, and Karp A. 1995. Nonrandom chromosome variation and morphogenic
potential in cell lines of bread wheat (Triticum aestivum L.). Genome 38:869-878.
Yurkova GN. 1989. The current state and the future of an in vitro wheat cultures. Experimental plant genetics in the
improvement of the selection process. Kiev:Naukiva dumka. Pp. 128-139.
Yurkova GN, Levenko BA, and Novozhilov OV. 1985. Ploidy of callus tissue in durum and common wheat. Cytol
Genet 19:264-267.
PRYANISHNIKOV ALL RUSSIAN RESEARCH INSTITUTE OF AGRICULTURE
AND SOIL SCIENCE
Pryanishnikova, 31. Moscow 127550, Russian Federation.
Aluminium tolerance in spring wheat plants at different levels of potassium and low temperature.
N.V. Poukhalskaya and A.I. Gurin.
Aluminum (Al) toxicity is one of the major problems of agriculture worldwide. Some Al-resistant genotypes have been
identified, however, conditions that minimize damage from Al are unclear. Breeding material should possess not only
specific characters but also a set of positive metabolic responses to environmental stresses typical of particular genotype.
On the other hand, we need knowledge of how mineral nutrition and temperature regimes may eliminate the negative
effect of Al toxicity. We investigated the Al tolerance of the spring wheat cultivar L-63/1 at different levels of potassium
and temperatures.
Materials and methods. Seedlings of spring wheat were grown in a water solution in plastic pots (300 ml, 10 plants/
pot). After a 2-day germination (20°C day/18°C night ± 2°C), seedlings were transferred to pots and grown in three
nutrition regimes: (1) H2O + CaSO4 x 10-4 M (control), (2) KCl x 10-3 M + CaSO4 x 10-4 M (low K), and (3) KCl x 10-3 M
+ CaSO4 x 10-4 M (high K). After cooling for 2, 3, and 6 h, the solutions were supplemented with Al+3 (AlCl3, pH = 5.6)
at concentrations of 3 mg/l and 12 mg/l. Two levels of Al+3 were studied in each variant; low (3 mg/l) and high (12 mg/
l). We examined nine variants in total: (1) control; (2) low K; (3) high K; (4) water + low Al level; (5) water + high Al
level; (6) low K + low Al levels; (7) low K + high Al levels; (8) high K + low Al levels; and (9) high K + low Al levels.
The root systems of the plants were dipped in solution during the 10 days. Solutions were replaced every 2 d. On the
sixth day after germination, some of the plants from each treatment were exposed to cold (+8°C) for 2, 3, and 6 h without
light. After a 6-day cold treatment (6 days of reparation), respiration/photosynthesis and linear growth were analyzed in
all plants. The experiment was repeated three times.

107
A n n u a l W h e a t N e w s l e t t e r V o l. 4 9.
Results. Cold treatment showed a positive effect
on root development, increasing the root-system
length (RL) (Table 1). The negative effect of Al+3
was reduced in K+-containing solutions. However,
the RL at low potassium levels was small. There-
fore, the parameter (RL:LL) was the smallest in
variants with low K+.
Minimal RL was formed at low K+. The
ratio of root-system length:seedling length
(RL:SL) also was minimal in this variant. The RL
in plants grown in water essentially decreased (43–
47 %) upon the addition of Al+3 ions to solution
(Table 2).
The addition of Al+3 to the solution
changed respiratory metabolism in the plants. In
the experimental treatment with water, Al+3
decreased respiration intensity by 43-47 % at both
doses. At low K+, respiration intensity decreased
by 20 % at low Al+3 levels and by 34 % at high Al+3
levels. At high K+, the addition of Al+3 to the
solution did not change respiration intensity at 3 mg/ml and decreased the intensity by 39 % at 12 mg/ml. We assume
that the addition of K+ to water solutions reduces Al toxicity. Examination of the reparation period after cold treatment
has shown that the negative effect of Al+3 inhibits growth activation by cold (Table 3). An increase of K+ decreases the
level of Al+3 toxicity
The Al+3 concentration has a greater effect in the presence of K+ in the nutrition medium. The toxic effects of
Al+3 ions by suppressing the
cold reaction of the root
system is manifested by an
increase in length. Opti-
mizing K+ is an essential
prerequisite for decreasing
Al+3 toxicity. In turn, cold
treatment is a factor that is
capable of adaptating plants
to Al+3 toxicity, supported
by our data from respiration
and photosynthesis experi-
ments. In the control plants
grown at room temperature,
Al+3 decreased respiration
and photosynthesis activity
by 30–68 % after day 6
(Table 4). Respiration in
plants kept in the cold
either did not change (in the
presence of K+) or de-
creased by 5–24 %.
Finally, we have shown that
cooling plants significantly
increases the resistance of
respiratory metabolism to
Al+3.
Table 1. The effect of the low temperature on the length of the
root system (cm). LTD05 = 2.43.
Length of cold treatment (h)
K+ level Control 2 3 6
0 48.40 35.4 63.02 53.46
5 x 10⁻³ M 27.27 35.28 38.96 36.30
5 x 10⁻² M 40.92 41.52 62.08 58.38
Table 2. The effect of Al+3 at low and high concentrations on the
root length at different levels of K+ and optimal temperature.
Al level Water Low K High K
0 42.73 ± 1.41 27.80 ± 3.68 43.68 ± 6.60
3 mg/l 22.47 ± 4.20 21.08 ± 4.74 45.18 ± 5.08
12 mg/l 24.41 ± 4.14 18.38 ± 3.82 26.76 ± 4.76
Table 3. The influence of low temperature on the length of root system (cm) at different
K+ levels and Al+3 concentrations.
Cold H2OH
2O+H2O+lowK+lowK+high K+high K+
period (h) (control) low Al+3 high Al+3 low Al+3 high Al+3 low Al+3 high Al+3
0 43.70 22.47 24.41 21.08 18.38 45.18 26.76
2 42.30 26.44 24.02 22.41 21.54 35.59 23.80
3 63.02 23.57 27.10 21.30 17.15 38.10 25.88
6 53.96 22.39 24.28 22.56 20.56 39.38 24.49
Table 4. Variation in respiration and photosynthesis intensity in control plants and after
cold treatment at different K+ and Al+3 levels (% relative to control plants without Al3+).
Cold-treated plants Control plants
Treatment Respiration Photosynthesis Respiration Photosynthesis
H2O+, low Al+3 24 5 44 68
H2O+, high Al+3 18 18 41 47
Low K+, low Al+3 —5 45 57
Low K+, high Al+3 14 10 45 55
High K+, low Al+3 —— — —
High K+, high Al+3 —— 30 42

108
A n n u a l W h e a t N e w s l e t t e r V o l. 4 9 .
SIBERIAN INSTITUTE OF PLANT PHYSIOLOGY AND BIOCHEMISTRY
Siberian Division of the Russian Academy of Sciences, Lermontov str., 132, Irkutsk-33,
P.O Box 1243, Russian Federation, 664033.
The function of different mitochondrial respiratory-chain pathways in winter wheat mitochondria
during short-term cold stress and hardening.
O.I. Grabelnych, S.P. Funderat, T.P. Pobezhimova, A.V. Kolesnichenko, and V.K. Voinikov.
Plant mitochondria have a branched respiratory chain and, in addition to the main cytochrome pathway, have an alterna-
tive pathway that depends on the functioning of alternative cyanide-resistant oxidase (AOX) (Vanlerberghe and McIn-
tosh 1997). Plant mitochondria also are able to oxidize exogenous NAD(P)H because of the presence of additional
NAD(P)H dehydrogenases in their structure (Soole et al. 1990; Soole and Menz 1995; Moller and Rasmusson 1998).
Recently, a number of proteins that effect mitochondrial activity were found and characterized. Among these are plant
uncoupling mitochondrial proteins (plant UCPs) (Ricquier and Bouillaud 2000) and the stress protein CSP 310 (Voinikov
et al. 1998), which cause uncoupling of oxidative phosphorylation in mitochondria. AOX (Takumi et al. 2002), WhUCP
(Murayama and Handa 2000), and CSP 310 (Kolesnichenko et al. 2000) are present in the mitochondria of winter wheat.
Some of these proteins, such as AOX and CSP 310, are induced by cold stress in winter wheat, but others (WhUCP) are
not. Although WhUCP is not induced by cold stress in winter wheat, its homologues in other plant species were shown
to be induced by cold stress (Laloi et al. 1997; Maia et al. 1998; Ito 1999; Nantes et al. 1999). The main functions of
these proteins were established for animals and proposed for plants are thermogenesis, participation in defense against
oxidative stress, and regulation of cell metabolism (Sluse and Jarmuszkiewicz 2002). On the other hand, mechanisms
that control the different electron-transport pathways in mitochondrial respiration under different stress conditions have
not been studied in detail. Using inhibitor analysis that blocks terminal oxidases or respiratory-chain complexes, we
studied the role of individual mitochondrial respiratory chain pathways in total mitochondrial respiration to learn how the
different electron-transport pathways function in cold-resistant, winter wheat mitochondria during short-term cold stress
and hardening.
Materials and methods. Three-day-old etiolated shoots of the winter wheat cultivar Zalarinka were germinated on
moist paper at 26°C. Shoots were cold-stressed at –1°C for 1 h or were hardened at 4°C for 7 days. Mitochondria were
extracted from seedling shoots by differential centrifugation (Pobezhimova et al. 1996). Isolated mitochondria were
resuspended in a medium of 40 mM MOPS-KOH buffer (pH 7.4), 300 mM sucrose, 10 mM KCl, 5 mM EDTA, and 1
mM MgCl2. Mitochondrial activity was recorded polarographically at 27°C using a closed platinum electrode in a 1.4-
ml volume cell (Estabrook 1967). The reaction mixture contained 125 mM KCl, 18 mM KH2PO4, 1 mM MgCl2, and 5
mM EDTA, pH 7.4. 10 mM malate in the presence of 10 mM glutamate, 8 mM succinate in the presence of 5 mM
glutamate and 1 mM NADH were used as oxidation substrates. During succinate and NADH oxidation, 3 mkM rotenone
was added to the incubation medium. During NADH oxidation, 0.06 mM CaCl2 was added to incubation medium. The
concentrations of inhibitors of the respiratory chain were antimycin A (A-A) (20 mkM), BHAM (1 mM), KCN (0.4
mM), and CSP 310 antiserum (1 mg/mL). Polarograms were used to calculate the rates of phosphorylative respiration
(state 3), nonphosphorylative respiration (state 4), respiration control by Chance-Williams (RC), and the ADP:O ratio
(Estabrook 1967). The concentration of mitochondrial protein was analyzed according to Lowry et al. (1951). All
experiments were performed on 3-6 separate mitochondrial preparations. The data obtained were analyzed statistically
and arithmetic means and standard errors were determined.
Results and discussion. We studied the mitochondrial respiratory-chain function of winter wheat during short-term low
temperature stress and hardening using different oxidation substrates. When using succinate and NADH as oxidation
substrates, rotenone, which blocks electron transfer through complex I of the mitochondrial respiratory chain, was added
the mitochondrial-incubation medium. When using malate as oxidation substrate, winter wheat mitochondria isolated
from control seedling shoots were well coupled (Table 1). After short-term low-temperature stress, the rates of state-3
and state-4 respiration increased by 19.2 % and 43.8 %, respectively, and the respiratory-control coefficient (RC)
decreased (17.3 %) when compared to the control (Table 1). This data shows that these mitochondria were uncoupled.
On the other hand, mitochondria isolated from hardened winter wheat seedling shoots had a lower rate of state-3 and
state-4 respiration than the control mitochondria and changes in their RC coefficient and ADP:O ratio were to a lesser
degree (13 % for state 3 and 11 % for state 4) (Table 1). When succinate was used as an oxidation substrate, we found
that neither short-term low-temperature stress nor cold hardening influenced the degree of coupling of isolated mitochon-

109
A n n u a l W h e a t N e w s l e t t e r V o l. 4 9.
dria (Table 1).
When NADH was
the oxidation
substrate, results
were similar to
those of succinate;
no significant
difference between
mitochondria
isolated from
control, stressed,
and hardened
shoots (Table 1).
Thus, cold stress
caused significant
changes only in the
activity of malate-
oxidizing mito-
chondria but did
not influence
succinate- and
NADH-oxidizing mitochondria. Short-term cold stress caused more pronounced changes in mitochondria energetic
activity then cold hardening.
The participation of the main cytochrome and alternative pathways in mitochondrial respiration was studied by
adding an oxidation substrate, mitochondria, and ADP to the polarographic cell. When mitochondria were in state-4
respiration, antimycin A, BHAM, and anti-CSP 310 antiserum or KCN were added to the polarographic cell. We found
that malate-oxidizing mitochondria isolated from control, stressed, and hardened seedling shoots differed in their
reaction to inhibitor addition. Antimycin A in addition to control mitochondria caused ~ 50 % decrease of oxygen
consumption. In mitochondria isolated from stressed plants, this treatment caused only ~ 30 % decrease (Fig. 1A). Cold
shock caused ~ 20 % increase of antimycin A-resistant mitochondrial respiration. In mitochondria isolated from hard-
ened plants, addition of antimycin A caused ~ 65 % decrease in oxygen consumption. Consequent addition of BHAM to
mitochondria isolated from control and hardened plants inhibited oxygen consumption up to 25 % from state-4 respira-
tion but in mitochondria isolated from stressed plants, this treatment inhibited oxygen consumption only up to 33 % (Fig.
1A). Therefore, we can conclude that in control mitochondria about 25 % of the respiration is antimycin A- and BHAM-
resistant and that this part of mitochondria respiration increased during short-term low-temperature stress but was at the
level of the control plants during cold hardening. The residual mitochondrial oxygen consumption was fully inhibited by
consequent addition of anti-CSP 310 antiserum or KCN, so we can conclude that this residual respiration is involved
with CSP 310 function.
Adding antimycin A to succinate-oxidizing mitochondria caused ~ 90 % inhibition of oxygen consumption (Fig.
1B). The consequent addition of BHAM to control mitochondria fully inhibited oxygen consumption. Despite the
absence of cold-shock influence on total mitochondrial activity (Table 1), this treatment caused an increase of antimycin
A-resistant respiration to ~ 20 % of that of state-4 respiration. Consequent addition of BHAM nearly inhibited mito-
chondrial respiration (Fig. 1B). Cold hardening caused an increase of antimycin A-resistant respiration to ~40 % that of
state-4 respiration. This antimycin A-resistant respiration also was nearly inhibited by BHAM addition (Fig. 1B). We
conclude that in succinate-oxidizing winter wheat mitochondria only two electron-transport pathways function, the main
cytochrome pathway and an alternative antimycin A-resistant oxidase. Both cold shock and especially cold hardening
caused an increase in this alternative pathway.
In NADH-oxidizing control winter wheat mitochondria, the addition of antimycin A caused ~ 80 % decrease of
oxygen consumption (Fig. 1C). Consequent BHAM addition fully inhibited oxygen consumption in control mitochon-
dria, but this addition and even the consequent addition of anti-CSP 310 antiserum did not fully inhibit oxygen consump-
tion in mitochondria isolated from stressed plants. The residual respiration in this case was about 10 %. Based on these
data, we concluded that in succinate- and NADH-oxidizing mitochondria the main part of respiration depends on the
functioning of the main cytochrome respiratory chain pathway (77 % and 91 %, accordingly) but only ~ 50 % of
respiration depends on this pathway function in malate-oxidizing mitochondria.
Table 1. The energetic activity of winter wheat mitochondria isolated from control (1), stressed
(2), and hardened (3) shoots analyzed using different oxidizing substrates. Data are presented as
mean + standard error, n = 6–32.
Rate of oxygen uptake,
nMol O2/min/mg of protein Respiration
Substrate Variant State 3 State 4 control ADP:O
10 mM Malate + 1 82.6 + 1.7 32.0 + 1.7 2.60 + 0.15 2.65 + 0.12
10 mM glutamate 2 98.6 + 5.6 46.1 + 2.9 2.15 + 0.06 2.23 + 0.05
3 55.5 + 5.6 24.7 + 2.9 2.25 + 0.06 2.33 + 0.05
8 mM Succinate + 1 66.9 + 1.7 45.5 + 1.8 1.48 + 0.15 1.80 + 0.12
5 mM glutamate 2 69.1 + 5.6 47.5 + 2.9 1.47 + 0.06 1.62 + 0.05
3 63.5 + 3.9 44.4 + 2.7 1.51 + 0.09 1.56 + 0.03
1 mM NADH 1 109.5 + 5.3 96.4 + 5.6 1.14 + 0.04 1.05 + 0.19
2 105.1 + 4.2 83.6 + 6.1 1.27 + 0.06 1.05 + 0.06
110
A n n u a l W h e a t N e w s l e t t e r V o l. 4 9 .
Wheat mitochondria
have different electron trans-
port pathways. One is an
alternative KCN- and antimy-
cin A-resistant oxidase. In
addition to this pathway,
different types of uncoupling
proteins recently were found in
plant mitochondria. The plant
stress protein CSP 310 is one
(Voinikov et al. 1998). Data
obtained from inhibitor
analyses agree with that about
the influence of exogenous
CSP 310 on different mito-
chondrial respiratory-chain
complex function (Grabelnych
et al. 2001). The effect of CSP
310 addition to isolated plant
mitochondria was detected at
complex I function but was not
detected in the functioning of
other respiratory chain com-
plexes. Now, we can show that
the main contribution to
mitochondrial respiration of the
CSP 310-pathway that was
inhibited by anti-CSP 310
addition was detected during
malate oxidation (25 %).
Because antimycin A
addition blocks electron
transfer through Q-cycle, i.e.,
inhibits the main cytochrome
respiratory chain pathway, we
can conclude that residual
mitochondrial respiration
depends on the functioning of
alternative pathways. There-
fore, during malate oxidation,
the main cytochrome pathway
contributes ~ 50 % to the total
mitochondria respiration. The
residual 50 % depends on
alternative oxidase (25 %) and
CSP 310 (25 %) functioning
(Table 2). Cold shock caused
about a two-fold decrease in
the main cytochrome pathway
and increased the contribution
of alternative pathways. On
the other hand, cold hardening
caused an increase in the
cytochrome pathway contribu-
Fig. 1. The effect of different respiratory chain inhibitors on state-4 oxygen uptake
by winter wheat mitochondria isolated from control, stressed (short-term cold
stress), and hardened (hardening) shoots. The inhibitors were added in the
sequence shown reading left to right.
A. 10 mM malate in the presence of 10 mM glutamate used as a substrate of
oxidation (M+SE, n = 3–32).
B. 8 mM succinate in the presence of 5 mM glutamate used as a substrate of
oxidation (M+SE, n = 3–19).
C. 1 mM NADH used as a substrate of oxidation (M+SE, n = 5–14).

111
A n n u a l W h e a t N e w s l e t t e r V o l. 4 9.
tion and decreased the contribution of alternative
pathways in mitochondrial respiration (Table 2).
During succinate oxidation, the main part
of mitochondrial respiration depends on the main
cytochrome pathway function (about 90 %). At
the same time, during succinate oxidation, short-
term low-temperature stress and especially cold
hardening caused a significant increase of
alternative oxidase function. In NADH-oxidizing
winter wheat mitochondria isolated from control
plants, the main part of mitochondrial respiration
also depends on cytochrome pathway function
(about 77 %). Both cold shock and hardening did
not significantly influence the contribution of
different pathways in NADH-oxidizing mitochon-
dria. Concurrently, we also detected an increase
of residual mitochondrial respiration after antimy-
cin A and anti-CSP 310 addition up to 10 % in
these conditions (Table 2). In our opinion, this
fact could depend on the function of external
rotenone-insensitive and antimycin A-insensitive
NADH-cytochrome c reductase (Soole et al.
1990).
Based on our data, we conclude that the
contribution of the different mitochondrial
electron-transport pathways significantly depends
on the oxidized substrate. Short-term cold stress and cold hardening differ in their influence on the different electron
transport pathways in winter wheat mitochondria.
Acknowledgments. The work was possible, in part, with the support of the Russian Foundation of Basic Research
(projects 00-04-48093 and 02-04-06096) and the Siberian Division of Russian Academy of Sciences Youth Grant
(project 78).
References.
Estabrook RW. 1967. Mitochondrial respiratory control and the polarographic measurement of ADP:O ratio. Meth
Enzymol 10:41-47.
Grabelnych OI, Pobezhimova TP, Kolesnichenko AV, and Voinikov VK. 2001. Complex I of winter wheat mitochondria
respiratory chain is the most sensitive to uncoupling action of plant stress-related uncoupling protein CSP 310. J
Therm Biol 26:47-53.
Ito K. 1999. Isolation of two distinct cold-inducible cDNAs encoding plant uncoupling proteins from the spadix of
skunk cabbage (Symplocarpus foetidus). Plant Sci 149:167-173.
Kolesnichenko AV, Zykova VV, Grabelnych OI, Sumina ON, Pobezhimova TP, and Voinikov VK. 2000. Screening of
mitochondrial proteins in winter rye, winter wheat, Elymus, and maize with immunochemical affinity to the stress
protein 310 kD and their intramitochondrial localization in winter wheat. J Therm Biol 25:245-249.
Laloi M, Klein M, Riesmeier JW, Muller-Rober B, Fleury Ch, Bouillaud F, and Ricquier D. 1997. A plant cold-induced
uncoupling protein. Nature 389:135-136.
Lowry OH, Rosebrough NJ, Farr AL, and Randall RJ. 1951. Protein measurement with folin phenol reagent. J Biol
Chem 193:265-275.
Maia IG, Benedetti CE, Leite A, Turcinelli SR, Vercesi AE, and Arruda A. 1998. AtPUMP: an Arabidopsis gene
encoding a plant uncoupling mitochondrial protein. FEBS Lett 429:403-406.
Moller IM and Rasmusson AG. 1998. The role of NADH in the mitochondrial matrix. Trends Plant Sci 3:21-27.
Murayama S and Handa H. 2000. Isolation and characterization of cDNAs encoding mitochondrial uncoupling proteins
in wheat: wheat UCP genes are not regulated by low temperature. Mol Gen Genet 264:112-118.
Nantes IL, Fagian MM, Catisti R, Arruda P, Maia IG, and Vercesi AE. 1999. Low temperature and aging-promoted
expression of PUMP in potato tuber mitochondria. FEBS Lett 457:103-106.
Table 2. The contribution of cytochrome pathway (Cyt) or
alternative pathways with cyanide-resistant alternative oxidase
(AltAOX), CSP 310 (AltCSP310), and outer NADH-dehydrogenase
(NADHouter) to total respiration of winter wheat mitochondria in
control conditions (1), during short-term cold stress (2), and
during hardening (3) using different oxidizing substrates. The
contribution is expressed as a percent of the respiratory rate in
state 4.
Percent contribution
Variant Cyt AltAOX AltCSP310 NADHouter
10 mM malate in the presence of 10 mM glutamate.
1 48.8 26.0 25.2 0.0
2 28.2 38.8 33.0 0.0
3 64.5 10.4 25.1 0.0
8 mM succinate in the presence of 5 mM glutamate.
1 91.6 6.6 1.8 0.0
2 78.3 13.1 8.6 0.0
3 61.6 33.4 4.9 0.0
1 mM NADH.
1 77.2 21.7 0.0 1.1
2 79.4 10.7 0.0 9.9

112
A n n u a l W h e a t N e w s l e t t e r V o l. 4 9 .
Pobezhimova TP, Voinikov VK, and Varakina NN. 1996. Inactivation of complex I of the respiratory chain of maize
mitochondria incubated in vitro by elevated temperature. J Therm Biol 21:283-288.
Ricquier D and Bouillaud F. 2000. The uncoupling protein homologues: UCP1, UCP2, UCP3, StUCP and AtUCP.
Biochem J 345:161-179.
Sluse FE and Jarmuszkiewicz W. 2002. Uncoupling proteins outside the animal and plant kingdoms: functional and
evolutionary aspects. FEBS Lett 510:117-120.
Soole KL, Dry IB, and Wiskich JT. 1990. Oxidation of NADH by plant mitochondria: kinetics and effects of calcium
ions. Physiol Plantarum 78:205-210.
Soole KL and Menz RI. 1995. Functional molecular aspects of the NADH dehydrogenases of plant mitochondria. J
Bioenerg Biomembr 27:397-406.
Takumi S, Tomioka M, Eto K, Naydenov N, and Nakamura C. 2002. Characterization of two non-homoeologous
nuclear genes encoding mitochondrial alternative oxidase in common wheat. Genes Genet Syst 77:81-88.
Vanlerberghe GC and McIntosh L. 1997. Alternative oxidase: from gene to function. Ann Rev Plant Physiol Plant Mol
Biol 48:703-734.
Voinikov V, Pobezhimova T, Kolesnichenko A, Varakina N, and Borovskii G. 1998. Stress protein 310 kD affects the
energetic activity of plant mitochondria under hypothermia. J Therm Biol 23:1-4.
The use of linoleic acid as an oxidation substrate by winter wheat mitochondria.
O.I. Grabelnych, T.P. Pobezhimova, A.V. Kolesnichenko, and V.K. Voinikov.
Free fatty acids (FFA) are effective uncouplers of oxidative phosphorylation depending on their protonophoric activity,
which causes a significant increase in the conductance of the inner mitochondrial membrane. Some data shows that
saturated FFA has less influence on mitochondrial membrane potential then unsaturated FFA (Penzo et al. 2002). In
addition, saturated FFA can regulate mitochondrial uncoupling protein activity (Jezek et al. 1997; Jarmuszkiewicz et al.
1998; Costa et al. 1999; Hourton-Cabassa et al. 2002) and even expression of these proteins (Muzzin et al. 1999;
Sbrassia et al. 2002).
The major FFA catabolic pathway in the cell is β-oxidation, which results in acetyl-CoA that can be completely
oxidized by cell to CO2 and H2O via the Kreb’s Acid Cycle. Intermediates of this cycle are the main mitochondrial
respiration substrate (Schulz 1991). The FFA β-oxidation activity of this pathway significantly increases upon seed
germination but dramatically decreases after photosynthesis establishment and during vegetative growth (Masterson and
Wood 2000). FFA was used as an oxidation substrate during the very early stages of sunflower and lettuce seed germina-
tion (Salon et al. 1988; Raymond et al. 1992) and in potato storage organs (Theologis and Laties 1980). At the same
time, data on the capability of wheat-seedling mitochondria to use FFA as an oxidation substrate and about the participa-
tion of different mitochondrial electron transport pathways in this process are lacking.
Thus, the aim of this study the function of winter wheat mitochondria during oxidizing of FFA and the participa-
tion of different mitochondrial electron-transport pathways in this process.
Materials and methods. Three-day-old, etiolated shoots of winter wheat cultivar Zalarinka were germinated on moist
paper at 26°C. Mitochondria were extracted from seedlings shoots by differential centrifugation (Pobezhimova et al.
1996). The isolated mitochondria were resuspended in the following medium: 40 mM MOPS–KOH buffer (pH 7.4),
300 mM sucrose, 10 mM KCl, 5 mM EDTA, and 1 mM MgCl2. Mitochondrial activity was recorded polarographically
at 27°C using a closed-type, platinum electrode in a 1.4-ml cell (Estabrook 1967). The reaction mixture contained 125
mM KCl, 18 mM KH2PO4, 1 mM MgCl2, and 5 mM EDTA, pH 7.4. Malate (10 mM) in the presence of glutamate (10
mM) and linoleic acid (0.056–750 mkM) were used as oxidation substrates. The concentrations of inhibitors of respira-
tory chain were rotenone (3 mkM), antimycin A (A–A) (20 mkM), BHAM (1 mM), and CSP 310 antiserum (1 mg/ml).
Polarograms were used to calculate the rates of phosphorylative respiration (state 3), nonphosphorylative respiration
(state 4), respiration control by Chance-Williams (RC), and the ADP:O ratio (Estabrook 1967). The concentration of
mitochondrial protein was analyzed by Lowry method (Lowry et al. 1951). All the experiments were performed on three
separate mitochondrial preparations. The data obtained were analyzed statistically and arithmetic means and standard
errors determined.
113
A n n u a l W h e a t N e w s l e t t e r V o l. 4 9.
Results and discussion. The amount of total FFA in winter wheat mitochondria is about 15 ng/mg of mitochondrial
protein (0.056 mkM) and increases to ~40 ng/mg (0.15 mkM) after short-term cold shock (Vojnikov et al. 1983). In our
experiments, we used physiological concentrations of FFA and higher concentrations (1-750 mkM).
In the first set of experiments,
linoleic acid (LA) was added to malate
oxidizing mitochondria in state 4 (Fig.
2, 1). We found that LA did not
influence mitochondrial oxygen uptake
in the range of 0.056–5 mkM. At 10
mkM, LA increased oxygen uptake by
25 %. At 20 mkM, a 87 % increase of
oxygen uptake was detected. Further
increases in the LA concentration in
the mitochondria incubation medium
(20–60 mkM) did not cause further
increases in state-4 respiration. On the
other hand, adding 100 mkM or more
LA caused at least a three-fold increase
in mitochondrial oxygen uptake with a
maximum at 500 mkM. The addition
of 100 mkM LA caused an increase in
the level of state-4 respiration up to
that of state-3 respiration.
Similar results were obtained
when the oxidizing of LA was the only
oxidation substrate for mitochondria (Fig. 2, 2). Physiological FFA concentrations and concentrations up to 5 mkM did
not cause an increase in oxygen uptake by winter wheat mitochondria. At the same time, at a concentration of 10 mkM,
mitochondrial oxygen uptake up to 43 % was detected. Higher LA concentrations caused increases in oxygen uptake by
mitochondria. The maximum oxygen uptake by winter wheat mitochondria was at LA concentration of 500 mkM. The
rate of uncoupled respiration (Fig. 2, 1) and the rate of linoleic acid-supported respiration (Fig. 2, 2) were equal; 50 mkM
LA.
Our data show that wheat mitochondria can successfully use linoleic acid as respiration substrate. Therefore,
we were interested in determining what mitochondrial electron-transport pathways participate in this process. By
looking at the influence of different electron-transport pathway inhibitors on oxygen uptake during 100 mkM LA
oxidation, we found that different mitochondrial electron-transport pathways participate in this process. The data
indicate that ~31 % of oxygen consumption was inhibited by the addition of antimycin A, ~34 % was inhibited by
BHAM addition, ~33 % was inhibited by rotenone addition, and 30 % was inhibited by anti-CSP 310 addition.
During the oxidizing of LA, our data show that electrons can transfer oxygen through all branches of the
electron-transport chain. Because rotenone is a complex-I inhibitor, the part of mitochondrial respiration that is not
inhibited by its addition could deal with the functioning of complex II and different rotenone-insensitive, internal NADH
dehydrogenases (Moller 1997).
Antimycin A addition blocks electron transport through complex III and, after this treatment, only alternative
CN-resistant oxidase (Vanlerberghe and McIntosh 1997) and CSP 310 (Kolesnichenko et al. 2002) still function. These
results agree with data on the influence of BHAM, which is an inhibitor of alternative CN-resistant oxidase and anti-CSP
310 antiserum, and its addition inhibits oxygen consumption dependent on CSP 310 function. Therefore, the LA-
dependent increase in oxygen consumption is involved with the functioning of all branches of mitochondrial electron
transport chain, both phosphorylative and nonphosphorylative.
Hermesh et al. (1998) used very high concentrations (0.5–2 mM) of FFA when studing mitochondrial energetic
activity and proposed that FFA effects depend on the FFA-dependent uncoupling of oxidative phosphorylation. We have
shown that LA concentrations higher than 50 mkM mitochondria change their metabolism to oxidizing LA as an oxida-
0
20
40
60
80
100
120
140
160
00,06 0,15 1 5 10 20 30 40 50 60 75 100 150 200 500 750
Linoleic acid, mkM
Rate of oxygen uptake,
nMol O 2 / min/ mg of protein
1
2
Fig. 2. The influence of linoleic acid on the rate of oxygen uptake in
state-4 (1) and linoleic acid-supported oxygen uptake (2) of winter wheat
mitochondria. 1. 10 mM malate in the presence of 10 mM glutamate used
as a substrate of oxidation (M + SE, n = 3) and 2. linoleic acid used as a
substrate of oxidation (M + SE, n = 3).

114
A n n u a l W h e a t N e w s l e t t e r V o l. 4 9 .
tion substrate, because the rate of LA-supported respiration becomes equal to the uncoupled rate after the addition of LA
respiration during malate oxidation. The function of the main cytochrome pathway in such conditions could depend on
oxidative phosphorylation uncoupling because FFA uncoupling activity causes an increase of oxygen consumption. In
addition to this pathway, other alternative electron-transport pathways function during LA oxidation. Based on our data,
winter wheat mitochondria can use LA as an oxidation substrate. Linoleic acid oxidation in these conditions depends on
the functioning of all electron-transport pathways that exist in plant mitochondria.
Acknowledgment. This work was performed, in part, with the support of the Siberian Division of Russian Academy of
Sciences Youth Grant (project 78).
References.
Costa ADT, Nantes IL, Jezek P, Leite A, Arruda P, and Vercesi AE. 1999. Plant uncoupling mitochondrial protein
activity in mitochondria isolated from tomatoes at different stages of ripening. J Bioenerg Biomembr 31:527-533.
Estabrook RW. 1967. Mitochondrial respiratory control and the polarographic measurement of ADP:O ratio. Methods
Enzymol 10:41-47.
Hermesh O, Kalderon B, and Bar-Tana J. 1998. Mitochondrial uncoupling by long chain fatty acyl analogue. J Biol
Chem 1273:3937-3942.
Hourton-Cabassa C, Mesneau A, Miroux B, Roussaux J, Ricquier D, Zachowski A, and Moreau F. 2002. Alteration of
plant mitochondrial proton conductance by free fatty acids. Uncoupling protein involvement. J Biol Chem
277:41533-41538.
Jarmuszkiewicz W, Almeida AM, Sluse-Goffart CM, Sluse FE, and Vercesi A. 1998. Linoleic acid-induced activity of
plant uncoupling mitochondrial protein in purified tomato fruit mitochondria during resting, phosphorylating, and
progressively uncoupled respiration. J Biol Chem 273:34882-34886.
Jezek P, Costa ADT, and Vercesi AE. 1997. Reconstituted plant uncoupling mitochondrial protein allows for proton
translocation via fatty acid cycling mechanism. J Biol Chem 272:24272-24278.
Kolesnichenko AV, Pobezhimova TP, Grabelnych OI, and Voinikov VK. 2002. Stress-induced protein CSP 310: a third
uncoupling system in plants. Planta 215:279-286.
Lowry OH, Rosebrough NJ, Farr AL, and Randall RJ. 1951. Protein measurement with Folin phenol reagent. J Biol
Chem 193:265-275.
Masterson C and Wood C. 2000. Mitochondrial b-oxidation of fatty acids in higher plants. Physiol Plantarum 109:217-
224.
Moller IM. 1997. The oxidation of cytosolic NAD(P)H by external NAD(P)H dehydrogenases in the respiratory chain
of plant mitochondria. Physiol Plantarum 100:85-90.
Muzzin P, Boss O, and Giacobino JP. 1999. Uncoupling protein 3: its possible biological role and mode of regulation in
rodents and humans. J Bioenerg Biomembr 31:467-473.
Penzo D, Tagliapietra C, Colonna R, Petronilli V, and Bernardi P. 2002. Effects of fatty acids on mitochondria: implica-
tions for cell death. Biochim Biophys Acta 1555:160-165.
Pobezhimova TP, Voinikov VK, and Varakina NN. 1996. Inactivation of complex I of the respiratory chain of maize
mitochondria incubated in vitro by elevated temperature. J Therm Biol 21:283-288.
Raymond P, Spiteri A, Dieuaide M, Gerhardt and Pradet A. 1992. Peroxisomal b-oxidation of fatty acids and citrate
formation by a particulate fraction from early germinating sunflower seeds. Plant Physiol Biochem 30:153-162.
Salon C, Raymond P, and Pradet A. 1988. Quantification of carbon fluxes through the tricarboxylic acid cycle in early
germinating lettuce embryos. J Biol Chem 263:12278-12287.
Sbrassia P, D’Adamo M, Leonetti F, Buongiorno A, Silecchia G, Basso MS, Tamburrano G, Lauro D, Federici M,
Daniele ND, and Lauro R. 2002. Relationship between plasma free fatty acids and uncoupling protein-3 gene
expression in skeletal muscle of obese subjects: in vitro evidence of a causal link. Clinical Endocrinol 57:199-207.
Schulz H. 1991. Beta oxidation of fatty acids. Biochim Biophys Acta 1081:109-120.
Theologis A and Laties GG. 1980. Membrane lipid breakdown in relation to the wound-induced and cyanide-resistant
respiration in tissue slices. Plant Physiol 66:890-896.
Vanlerberghe GC and McIntosh L. 1997. Alternative oxidase: from gene to function. Ann Rev Plant Physiol Plant Mol
Biol 48:703-734.
Vojnikov VK, Luzova GB, and Korzun AM. 1983. The composition of free fatty acids and mitochondrial activity in
seedlings of winter cereals under cold shock. Planta 158:194-198.

115
A n n u a l W h e a t N e w s l e t t e r V o l. 4 9.
Questioning the possible role of D-amino acids in wheat seedlings.
N.I. Rekoslavskaya, R.K. Salyaev, V.M. Sumzova, T.V. Kopytina, and A.M. Sobenin.
The D isomers of different amino acids (alanine, tryptophan, aspartate, glutamate, proline, and other amino acids) and
their derivatives have been detected in plants (Bell 1980), but their possible physiological functions are unknown in
plants. The presence of nonproteinogenic, D-amino acids in seeds and seedlings is believed to protect plant tissues from
pathogens and parasites (Bell 1980).
D-amino acids are actively synthesized by bacteria and low fungi (Davies 1977). Alanine racemase is of great
importance to bacteria because it supplies them with D-alanine from available L-alanine. Therefore, alanine racemase
may be a key enzyme in the synthesis of the protective peptidoglucan layer of the cell wall. In some cases, the D-amino
acids are abundant (Vicario et al. 1987).
Another mechanism by which D-amino acids are formed involves D-amino acid aminotransferase, which
produces a diversity of D-amino acids. Perhaps the synergistic action of the two enzymes racemase and D-amino acid
transferase accounts for the large amount of different D-amino acids that appear in bacterial cells and plant seedlings.
D-alanine and its dipeptide, D-alanyl-D-alanine, make up a considerable part of the nitrogen pool and probably
play a significant part in regulation of nitrogen metabolism in bacteria. D-amino acids are not toxic in plants, perhaps
because of neutralization via malonylation, acetylation, and glycosylation followed by compartmentalization in the
vacuole. The bonding of D-amino acids with malonyl or acetyl moyeties may be hydrolyzed and reveal amino acids in
intact form.
D-alanine and its derivatives in pea seedlings appeared during germination and disappeared on the 8th day of
growth (Ogawa et al. 1973). D-alanyl-D-alanine and D-alanylglycine were found in rice seedlings and leaves, respec-
tively (Manabe 1986; Manabe and Ohira 1983). Free and bound D-aspartic and D-glutamic acids were determined in
pea seedlings (Ogawa et al. 1977). The N-malonyl-D-tryptophan content increased in leaves of tomato, potato, wheat,
and other species during wilting and after drought during the period of recovery after osmotic stress (Rekoslavskaya et
al. 1988).
All of these data would seem to indicate that synthesis of D-amino acids and their further conversion have
ontogenetic, physiologic, and ecologic significance that is still unknown. As for N-malonyl-D-tryptophan, an acceptable
hypothesis is that it functions as a precursor of the plant hormone indoleacetic acid, IAA (Rekoslavskaya et al. 2002). In
reality, D-tryptophan has been demonstrated in a number of cases to be as active or even more active than L-tryptophan
as an auxin substitute (Rekoslavskaya 1986).
Using D-tryptophan as an IAA precursor illustrates the idea that pools of amino acids for nonprotein synthesis
can be created by means of the conversion of L-amino acids to D-amino acids. Direct competition for the amino acid
between nonprotein syntheses and protein synthesis occurs in the process of growth and development.
Thus, the appearance of D-amino acids in plants apparently is nonrandom, uncontrolled, and physiological
meaningless event, but the physiological significance of D-amino acids remains largely unclear and needs detailed study.
We have investigated the content of amino acids in wheat seedlings in relation with some enzyme activities of amino
acids metabolism different from protein biosynthesis have been done. The specific activity of racemase, transaminase,
and UDPG-transferase were estimated in wheat seedlings during the study.
Materials and methods. The spring wheat cultivar Scala was used in this study. Procedures to determine racemase and
transaminase activities were as described by Rekoslavskaya et al. (2002). UDPG-transferase activity was determined
according to the modified method primarily described by Kowalczyk and Bandurski (1991). Briefly, 21 g of leaf, 44 g of
stem, 5.6 g of young kernel, and 35.1 g of root tissue of green wheat shoots were harvested, ground with mortar and
pestle in liquid nitrogen, and extracted with the buffer containing 0.25 M HEPES, 5 mM EDTA Na2, 0.1 %
mercaptoethanol, and 0.025 % Triton X-100, pH 8.5. One mg of phenylmethylsulfonylfluoride was added to the ground
material at the time of extraction in order to prevent protease activity. The homogenate was passed through four layers
of cheesecloth and centrifuged at 10,000 x g for 20 min at 4oC. The activity of UDPG-transferase was estimated in the

116
A n n u a l W h e a t N e w s l e t t e r V o l. 4 9 .
Table 3. Substrate specificity of the enzymes of amino acid metabolism, % to
conversion of tryptophan (Try). Experiments were repeated at least twice.
L- or D- D-amino acid L-amino acid Etioplast Cytosol
amino acid oxidase oxidase racemase racemase Transaminase
Try 100 100 100 100 100
Ala 135 128 583 112 239
Pro 36 43 350 106 152
Met 104 — 310 106 —
Phe 116 129 101 103 124
Val 83 — 455 102 160
Asp 78 — 197 101 116
Asn 65 128 30 100 0
Thr 50 — 480 98 —
Ser 74 71 449 96 454
Arg 43 52 141 96 —
Cys 45 73 179 95 —
Leu 117 130 331 95 146
His 41 84 66 94 96
Glu 48 58 102 94 125
Tyr 95 85 99 90 —
iLeu 86 91 317 89 —
supernatant fraction of each sample. The reaction mixture contained as the substrate 5 mmol of indoleacetic acid (IAA),
5 mmol of UDPG as the cofactor, and in order to prevent the ribosomes activity, 10-4 M CaCl2 were added to 1 ml of
supernatant. The reaction mixture was then incubated for 16 hours at 37oC. The reaction was stopped by adding of 1 ml
of isopropanol. The activity of UDPG-transferase was determined as nmoles of substrate converted during 1 h/mg of
protein. The IAA glucose ester content was determined after passing of reaction mixtures through a DEAE-cellulose
(acetate form) minicolumn (10 x 20 mm) in 6 ml of eluates of 50 % isopropanol. The Ehrlich reagent was used in order
to determine IAA-glucose content with calibration curve made with IAA. A D-amino acids kit was used (Sigma, USA).
L-Amino acids were from Reachim (Russian Federation). The content of amino acids were determined on an amino-acid
analyzer AAA-1 (Microtechna, Czech Republic).
Results and discussion. The amino-acid content of 7-day-old seedling are presented in Fig. 3. The amino acids Glu,
Ala, Val, Pro, Leu, and iLeu had the highest content of > 200 mg/g of fresh weight. The content of Asp was next highest,
but the other amino acids were present at levels below 100 nmol/g of fresh weight. Free Try did not contribute any
significant content of free amino acids, but the sum of free and bound malonyl D-Try content was nearest to the content
of Glu or even greater in seedlings sustaining wilting; 890 nmol/g of fresh weight (Rekoslavskaya et al. 1988).
The appearance of D-amino acids, and especially D-Try, during germination and growth of etiolated seedlings
in the dark was shown previously (Rekoslavskaya et al. 2002). The activity of tryptophan racemase was found in the
cytosol and etioplast fractions of
wheat seedlings. The enzyme
was isolated and some biochemi-
cal characteristics were studied,
but the substrate specificity was
broader and racemase used other
amino acids as substrates (Table
3).
As shown in Table 3,
the chiralic purity of D- or L-
amino acids used were estimated
with D-amino acid oxidase from
hog kidneys (Sigma, USA) or
with L-amino acids oxidase from
snake venom (Sigma, USA).
When D- or L-amino acids were
treated with the enzyme prepara-
tion from wheat seedlings
prepared as described earlier
(Rekoslavskaya et al. 2002), we
observed higher enzyme activi-
ties than in the case of either D-
or L-tryptophan. For example,
the specificity to Ala, Thr, Val, or
Ser was about 5.8 or 4.5 times
higher than to Try. The activity of transaminase was higher if Ala, Ser, Val, and some other amino acids were exploited
in the study in comparison to Try. Therefore, it might be concluded that there was racemase and transaminase with broad
substrate activities in wheat seedlings with some preference to amino acids structurally related to Ala.
About half of the amino acids is in the form of D-enantiomers in etiolated wheat seedlings. The content of D-
and L-amino acids in 7-day-old wheat seedlings were 233.4 ± 34.0 and 194.8 ± 9.2 nmol/100 seedlings, respectively. We
found two pools of amino acids in growing wheat seedlings and question why half of the amino acids in wheat are in a
nonproteinogenic form that is not available for the synthesis of protein.
We tried to explain the appearance of D-Try in wheat seedlings as a creation of nonproteinogenic storage form
for the precursor for IAA biosynthesis when the growth was fast during germination. Nevertheless, free Try was
essential but not the predominant amino acid in wheat seedlings (Fig. 3). Thus, the role of other D-amino acids still
117
A n n u a l W h e a t N e w s l e t t e r V o l. 4 9.
remained obscure. We searched for other
explanations for the possibility of using
nonproteinogenic amino acids for wheat
seedlings, which they possess in order to
survive in ecologically unfavorable
conditions.
Amino acids might be used in
the formation of plant lectins or
phytoagglutenines. Plant lectines may
play the role of antibodies against soil
bacteria and fungi and participate in the
defense response of young seedlings
because the localization of lectins was
found in embryos and other parts of plant.
The binding action of amino acids to a
sugar moiety was provided by UDPG-
transferase. UDPG-transferases are a
widespread and abundant enzyme family
with broad substrate specificity. As a
model system, we used IAA as a substrate in order to evaluate the activity of
UDPG-transferase in wheat shoots, because IAA is a derivative of the amino
acid Try and closely related to it in indole and side chain structure (Table 4).
The activity of UDPG-transferase was high in all parts of the wheat
plant. Therefore, wheat seedlings have a highly active system for balancing the
IAA level that was produced by rapid synthesis from D-Try. As a whole, the
IAA biosynthesis and its metabolism is sufficiently intense to provide for the fast
growth of etiolated seedlings during the heterotrophic period in order to emerge
from the soil and initiate photosynthesis. The D-amino acids, which are not
involved in protein biosynthesis, might participate in the protection of young
seedlings from pathogens, bacteria, and fungi by this very unique manner of joining with glucose or another sugar
moiety. This objective will be the subject of following experiments.
References.
Bell EA. 1980. Non-protein amino acids in plants. In: Enc Plant Physiol 8:403-432.
Davies JS. 1977. Occurrence and biosynthesis of D-amino acids. In: Chemistry and biochemistry of D-amino acids
4:1-27.
Kowalczyk S and Bandurski RS. 1991. Enzymic synthesis of 1-O-(indol-3-ylacetyl)-b-D-glucose. Purification of the
enzyme from Zea mays, and preparation of antibodies to the enzyme. Biochem J 279:509-514.
Manabe H. 1986. Effect of exogenous D-alanine on D-alanyl-D-alanine content in leaf blades of Oryza australiensis
Domin. Plant Cell Physiol 27:573-576.
Manabe H and Ohira K. 1983. Effect of light irradiation on the D-alanylglycine content in rice leaf blades. Plant Cell
Physiol 24:1137-1142.
Ogawa T, Fukuda M, and Kei S. 1973. Occurrence of N-malonyl-D-tryptohan in pea seedlings. BBA 297:60-69.
Ogawa T, Kimoto M, and Sasaoka K. 1977. Identification of D-aspartic acid and D-glutamic acid in pea seedlings.
Agric Biol Chem 41:1811-1812.
Rekoslavskaya NI. 1986. Possible role of N-malonyl-D-tryptophan as an auxin precursor. Biol Plantarum 28:62-67.
Rekoslavskaya NI, Markova TA, and Gamburg KZ. 1988. Appearance of N-malonyl-D-tryptophan in excised leaves
during wilting. J Plant Physiol 132:86-89.
Rekoslavskaya NI, Yurieva OV, Shainyan BA, Kopytina TV, and Salyaev RK. 2002. Wheat racemase and the role of
stereoisomers of N-malonyltryptophan during seed germination. Ann Wheat Newslet 48:141-143.
Vicario PP, Green BG, and Katzen HM. 1987. A single assay for simultaneously testing effectors of alanine racemase
and/or D-alanine. J Antibiot 40:209-216.
Fig. 3. The content of free amino acids in wheat seedlings and en-
dosperm at 7 days.
Table 4. The specific activity of
UDPG-transferase in wheat
shoots, nmol of IAA glucosyl
ester/mg of protein/h.
Leaves 9.08 ± 0.04
Stems 12.18 ± 0.22
Young kernels 7.92 ± 0.53
Roots 15.43 ± 0.18
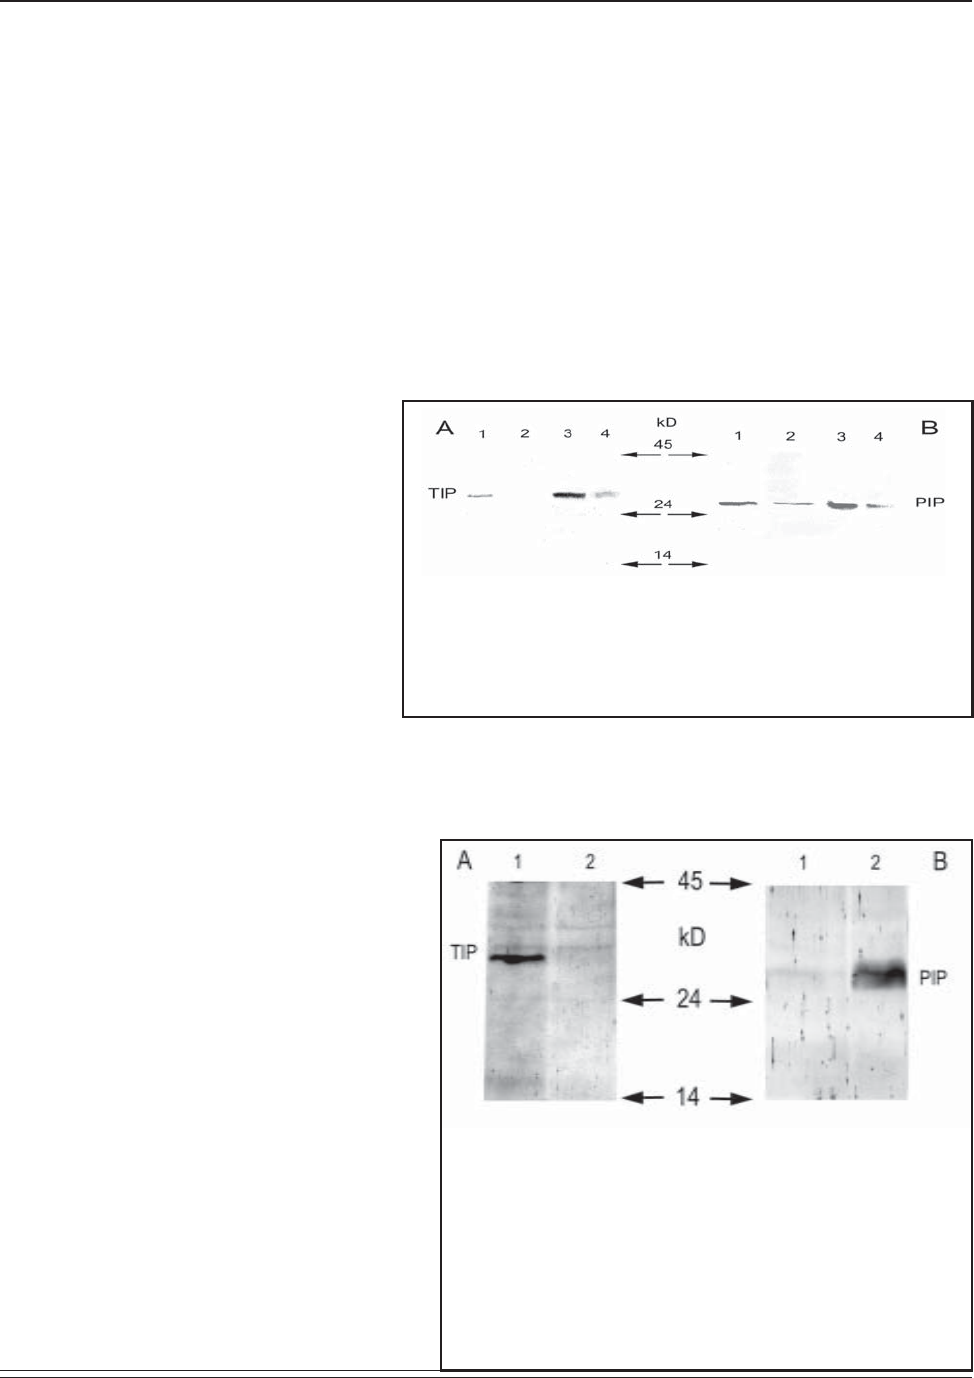
118
A n n u a l W h e a t N e w s l e t t e r V o l. 4 9 .
Changes in the aquaporin content in winter wheat membranes after deadaptation.
G.B. Borovskii, A.Yu. Yakovlev, S.V. Vladimirova, and V.K. Voinikov.
In the past decade, we have discovered that water transport in cells is not directly through membranes but through
numerous channels in the membranes. These channels are formed by proteins adhering to aquaporins. Aquaporins are
found in the plasma and vacuolar membranes in animal and plant cells (Maurel 1997; Connolly et al. 1998). By regulat-
ing the degree of aquaporin phosphorylation, the cell controls the permeability of a membrane to water (Maurel et al.
1997; Kjellbom et al. 1999) and changes in the amount of these proteins shift the range of regulation. During adaptation
to low temperature, membrane permeability increases and water migrates into the intercellular spaces during freezing
(Alberdi and Corcuera 1991). This increase in permeability very likely is associated with an increase of aquaporins in
the membranes. We expect the reverse during deadaptation in the spring. To date, changes in the quantity of water-
channel proteins during deadaptation of overwintered plants has not been investigated.
Materials and methods. The crowns and leaves of winter wheat plants of the cultivar Irkutskaia ozimaia were used in
this study. This genotype is winter hardy and
highly productive under the severe climatic
conditions of eastern Siberia (Borovskii et al.
2001). Crowns, leaves, and soil monoliths
with plants were sampled in the field in
January. Crowns and leaves were used for
membrane-fraction isolation. The remaining
plants in the monoliths were left at room
temperature for 1 month under natural
illumination for de-adaptation. After 1 month,
the crowns and leaves were harvested and the
membrane fraction isolated. We identified
aquaporins inside the microsomal membrane
fraction, because antibodies demonstrated a
high degree of specificity (Fig. 4).
Wheat membranes were isolated by centrifugation at 105,000 g for 1 h. Proteins were dissolved in a sample-
loading buffer at 65°C. Proteins were separated by SDS–PAGE using a mini-Protean II PAGE cell (Bio-Rad, U.S.A.)
according to the manufacturer’s instructions.
Western blotting and immunodetection were as
described by Timmons and Dunbar (1990) using
anti-PIP (plasmalemma-intrinsic protein) and anti-
TIP (tonoplast-intrinsic protein) primary antibodies
(1:1000 dilution), kindly provided by Dr. A.
Schaeffner (Institute of Biochemical Plant Pathol-
ogy, München, Germany) and Dr. C. Maurel
(Institut des Sciences Végétales, Gif-sur-Yvette,
France), respectively.
Results and discussion. We observed a decrease
in aquaporins in both leaves and crowns after
deadaptation of winter wheat (Fig. 5). Plasmale-
mma and tonoplast aquaporins decreased. This
data supports the hypothesis that decreases in
membrane water permeability occur after spring
deadaptation. We assume that the permeability of
membrane to water decreases in plants, because
permeability is associated closely with freezing
resistance. Alternatively, changes in the aquaporin
content of the membrane could be connected with
the start of the next stage plant development after
overwintering plants reinitiate growth.
Fig. 4. Specificity using antibodies against two types of
aquaporins, TIP (tonoplast-intrinsic protein, A) and PIP
(plasmalemma-intrinsic protein, B). Immunoblotting of the proteins
obtained from tonoplast (1) and plasmalemma (2). Arrows and
numerals between the images indicate molecular weight markers.
Fig. 5. Changes in aquaporin content in the membrane
proteins of winter wheat plants after a 1-month deadaptation.
The microsomal fraction was separated from leaves (1, 2) and
crowns (3, 4). Plants were taken from field (1, 3) or left for
30 days under ambient conditions (2, 4). Proteins were
fractionated on 12 % SDS–PAGE gels. Aquaporins were
identified by specific antibodies against TIP (tonoplast-
intrinsic protein, A) and PIP (plasmalemma-intrinsic protein,
B). Arrows and numerals between the images indicate the
molecular size markers.

119
A n n u a l W h e a t N e w s l e t t e r V o l. 4 9.
The aquaporin content culminates after development in the autumn; water exits the cell during freezing. We
know that some aquaporins are strongly induced by ABA (Kaldenhoff and Eckert 1999). This fact indirectly confirmed
our results, because ABA content is high during winter adaptation and decreases under deadaptation in the spring.
Activation of the water channels is useful to expel water and entrance inside under extreme thawing. In our opinion,
regulating the action of water channels under the freezing in the external spaces of the cell is the same mechanisms that
takes place under the water stress (Kjellbom et al. 1999), by stress-increasing of Ca2+ content in the cytoplasm. After
winter, a high aquaporin content is dangerous because Ca2+ content in the cytoplasm increases under any stress.
Changes in the permeability of cell membranes to water are very important for plant adaptation to freezing. The
importance requires a tight control of permeability. Our results suggest that aquaporins are involved in adaptation of
wheat to winter and deadaptaion in spring.
Acknowledgments. The work has been supported by the Russian Foundation of Basic Research (projects 02-04-48728
and 02-04-48599). We sincerely thank Dr. A. Schaeffner and Dr. C. Maurel for gift of antibodies.
References.
Alberdi M and Corcuera LJ. 1991. Cold acclimation in plants. Phytochem 30:3177-3184.
Borovskii GB, Stupnikova IV, Peshkova AA, Dorofeev NV, and Voinikov VK. 2001. Ann Wheat Newslet 47:179-185.
Connolly DL, Shanahan CM, and Weissberg PL. 1998. The aquaporins. A family of water channel proteins. Internat J
Biochem Cell Biol 30:169-172.
Kaldenhoff R and Eckert M. 1999. Features and function of plant aquaporins. J Photochem Photobiol B Biol 52:1-6.
Kjellbom P, Larsson C, Johansson I, Karlsson M, and Johansson U. 1999. Trends Plant Sci 4:308-314.
Maurel C, Kado RT, Guern J, and Chrispeels MJ. 1995. Phosphorylation regulates the water channel activity of the
seed-specific aquaporins a-TIP. EMBO J 14:3028-3035.
Maurel C. 1997. Aquaporins and water permeability of plant membranes. Ann Rev Plant Physiol Plant Mol Biol
48:399-429.
Timmons TM and Dunbar BS. 1990. Protein blotting and immunodetection. Methods Enzymol 182:679-688.
Using urea nitrogen for the nutrition of spring wheat under adverse temperatures.
A.K. Glyanko, N.V. Mironova, and G.G. Vasilieva.
Introduction. Urea is used widely in agriculture and is highly competitive with, and under certain conditions superior
to, mineral forms of N fertilizers in its effect on yield and quality. For example, urea contributes to a greater accumula-
tion of protein, gluten, and indispensable amino acids in wheat grain and other cereals during grain formation and
maturation (Finney et al. 1957; Pavlov 1967; Schlehuber and Tacker 1967; Slukhai and Zrazhevsky 1971; Mitrofanov et
al. 1973; Fox et al. 1986). Urea is taken up rapidly and metabolized by plants (Mokronosov et al. 1966; Pavlov 1967;
Andrews et al. 1984). Urea increases the permeability of membranes and tissues and enhances the uptake, transferal, and
reutilization of nutrients in plants (Mitrofanov et al. 1973; Turley and Ching 1986).
The mechanisms by which ammonium fertilizer and urea nitrogen affect plant metabolism are different
(Tishenko et al. 1991). Thus, the role of urea as a N fertilizer has been studied in relatively sufficient detail, but the
influence of adverse environmental factors on plant nutrition and physiology by this form of nitrogen have not. Over the
last decade, researchers have had a great interest in studying the physiological response of plants to the nitrate and
ammonium forms of N under stress conditions of salinity, low temperature, drought, and inadequate illumination
(Chandra et al. 1986; Hubick 1990; Leidi et al. 1991; Gruz et al. 1993; Glyanko 1995).
Our results are derived from studying physiology of nutrition with urea nitrogen when spring wheat plants were
exposed to a late spring frost (–6, –7°C) and low soil temperature (> 0°C) to compared to using the mineral forms of
nitrogen.
Material and methods. Plant material and growth conditions. Soft spring wheat plants of the cultivar Skala were
grown in containers (eight plants/container) in a growth chamber at the Siberian phytotron (Irkutsk, Russia) at a tempera-
ture of 19 ± 1°C/15 ± 1°C (day/night), illuminated by DRL-700 incandescent lamps. The light intensity was 14 ± 0.5
kLx with a 16-hour daylength. Infrared radiation from the lamps was suppressed by a water screen. The plants were

120
A n n u a l W h e a t N e w s l e t t e r V o l. 4 9 .
grown using a sand–soil mixture with a small amount of total nitrogen (0.009 %). Macro- and microlements were
supplied at half the normal rate into enameled containers filled with dry soil (Grodzinsky and Grodzinsky 1973).
Watering was by weight with distilled water up to 70 % of the moisture capacity of the soil. To guard against any
nitrification of the ammonium, the nitrification inhibitor 2-chlor-6-trichlormetyl pyridine (N-serve) was introduced into
the containers at 1 % of the N dose.
Conditions of the artificial frost. A spring frost condition between –6 and –7°C was produced in a refrigerating
chamber of the phytotron once the plants had reached the three-leaf stage. The chamber was not illuminated during the
frost period. Temperature in the chamber was controlled automatically under a preset program (Kurets 1974). The
program provided for a gradual decrease in temperature within the chamber from the optimum temperature (19 ± 1°C) to
0°C (at the rate of 1°/12 min), followed by a decrease to the minimum subzero temperature (–6 and –7°C) at the rate of
1°/22 min. After a 1.5-hour exposure to temperatures between –6 and –7°C, the temperature was raised to 0°C at the rate
of 1°/12 min. The temperature was raised from 0°C to the optimum temperature at the same rate. The total time of
exposure of the plants to subzero temperature was 6 hr, of which 1.5 hour corresponds to the minimum subzero tempera-
ture. The relative air humidity within the chamber was 85–90 % during the frost. The containers with plants were
placed in holes in plastic foam to avoid freezing the soil during the frost. One and one-half hours after the end of the
frost (the temperature in the chamber was raised to 19°C), both control and experimental plants were fed through their
roots with a mixture of three forms of N, one of which contained labeled 15N. The extra nutrition schemes were variant I,
15NH414NO3 + 14N – urea; variant II, 14NH415NO3 + 14N – urea; and variant III, 14NH414NO3 + 15N – urea.
In variant I, where the label was in the NH4 group, 25.9 mg 15N were introduced in each container and the
enrichment of 15NH4NO3 was 95.31 weight percent of 15N; in variant II, 24.3 mg 15N with an enrichment of NH415NO3 of
89.66 weight percent of 15N; in variant III, 52.3 mg 15N were introduced with a urea enrichment of 93.84 weight percent
of 15N. The total amount of nitrogen that was introduced into the vessels during the extra nutrition was 106.4 mg in the
first two variants and 101.3 mg in variant III.
Soil temperature reduction. To reduce the temperature in the root zone, containers with plants were placed in
thermal chambers through which water at 5 ± 1°C and 19 ± 1°C was passed, maintaining the required soil temperature
(Kurets 1974).
Chemical analyses. Protein in the triturated leaves was precipitated with trichloroacetic acid. Nucleic acids
and other soluble compounds were removed from the protein precipitate (Klyachko et al. 1971). The protein was
digested in concentrated sulfuric acid with a catalyst, selenium (Se). Protein nitrogen was distilled by the micro-Kjeldale
method and determined by the titrimetric method of Ermakov et al. (1987). Samples were analyzed for enrichment of
15N by means of a mass-spectrometer MI-1309. The content of labeled N in samples was determined by a formula for
isotopic dilution (Korenkov 1977). The atomic percent of 15N was converted to weight percent of 15N (Korenkov 1977).
The activities of glucose-6-phosphate dehydrogenase (G-6-PD) and malate dehydrogenase (MD) were determined using
biochemical tests (Boehringer and Soehne GmbH Mannheim, Germany) in cell-free, unpurified root extracts. Urease
activity was determined according to Bollard et al. (1968), and the protein in cell-free preparations was quantified
according to Lowry et al. (1951). The biological and analytical repeatability of assays was fivefold and threefold,
respectively. Results are represented as the arithmetic mean with a standard error. The confidence level of the differ-
ences was evaluated by the Student t-test (tst). Least significant difference for comparing treatment means at the 0.95
probability level.
Results and discussion. Effect of late spring frost. Of 195 plants that underwent frosts, 64 (32 %) had one damaged
leaf, eight had two damaged leaves, and three plants died. Thus, 38 % of the plants showed visually observable dam-
ages.
The sample for quantifying protein was made from the laminas of two plants having no visible damage. The
plants did not show any substantial differences in protein accumulation in their leaves during the first 9 days after the
frost, the absolute content in both control and experimental plants increased by a factor of 1.6 to 1.7. Labeled N is
incorporated into leaf protein at a different rate depending on the form of N-fertilizer (Table 5). For example, 9 days
after the frost, 552.9 µg 15N from urea, 137.0 µg from the ammonium group, and 73.8 µg from the nitrate group were
determined in the protein of the control plants. The percentage of labeled N utilization by the plants from fertilizers
amounted to 1.06, 0.53, and 0.30, for urea, ammonium, and nitrate, respectively. During frost, this remains regular
(Table 5). The difference is that a short exposure to subzero temperature promotes the incorporation into protein of the

121
A n n u a l W h e a t N e w s l e t t e r V o l. 4 9.
label from urea. When compared to control plants, the label incorporation is 115 and 150 % at 3 and 9 days after the
frost, respectively (differences at td>tst).
Label incorporation into protein 1, 3, and 9 days
after the frost also is stimulated from the 15NO3 group. The
confidence level of the differences between the control and
the assays are very high (P > 0.99). With regard to the effect
of frost on the incorporation of the label from the 15NH4
group, a reliable decrease in 15N incorporation into protein on
day 3 is observed (P > 0.95), whereas the differences are
unreliable at 1 and 9 days after the frost (td<tst).
The utilization of labeled N from different forms of
N on day 9 after the frost was 1.58, 0.57 and 0.48%, from
urea, ammonium, and nitrate, respectively. Thus spring
wheat seedlings predominantly utilize urea N in synthesizing
the protein. Temperature stress has a stimulating effect on
this process. The control and experimental plants did not
differ in absolute protein N content in the leaves (Table 5),
suggesting that, during increased catabolic processes such as
after frost, plants are able to shift the state of decay-synthesis
of proteins toward the latter through an intense utilization of
urea N.
The predominant utilization of urea from the mixture
of three forms of N can probably be explained by a couple of
factors. First, the relatively easy uptake of urea by roots.
Second, the fast transport of urea (or its products) to aerial
organs and subsequent use in metabolism.
In comparison with mineral forms of N (NO3- and
NH4+), the mechanism of urea uptake by plants is not yet
understood (Van Beusichem and Neeteson 1982). We
anticipate that urea, as a neutral compound, is taken up by
root cells with a minimum expenditure of energy and a high
proportion is transported to aerial organs in an unchanged
form. Urease activity in wheat roots and seedling leaves
when the plant roots receive extra nutrition of urea provides
some evidence. Activity of urease in leaves increases by a
factor of 2.9, whereas enzyme activity in the roots is uncer-
tain.
Chen and Ching (1988) induced leaf urease activity
when barley plants are sprayed with urea solution. They
detected urease isozymes, which were synthesized only
during the period of an abrupt increase in enzyme activity.
Our data indicate that spring wheat seedlings contain a
sufficiently active constitutive form of urease in their roots
and a less active form in leaves (medium without N). Under
the influence of extra nutrition of plant roots with urea,
urease activity changes little in roots but increases abruptly in
leaves. The latter is likely to be associated with the de novo
synthesis of enzyme.
The reasons for stimulating the uptake of label from urea as an effect of frost are unclear. We determined the
urease and nitrate reductase activity in wheat leaves as an effect of the frost (within 1 and 3 days) and found that the
activity of both enzymes was enhanced. However, we only can explain the presence in cells of a sufficient number of
Table 5. The effect of a late spring frost on 15N uptake by leaf protein during nutrition of wheat from a mixture of different forms of nitrogen.
N-protein content is from the dry weight of two plants.
Within 1 day Within 3 days Within 9 days
N protein 15N content N protein 15N content N protein 15N content
Assay and content Weight % (N protein, content Weight % (N protein, content Weight % (N protein,
variant (mg) (excess 15N) g) (mg) (excess 15N) g) (mg) (excess 15N) g)
Control 4.19 ± 0.36 0.33 14.5 ± 0.70 3.65 ± 0.20 0.95 36.5 ± 2.41 6.08±0.46 2.14 137.0 ± 5.02
I; frost 3.77 ± 0.05 0.42 16.6 ± 0.73 4.11 ± 0.22 0.67 29.0 ± 1.53 6.17 ±0.15 2.29 148.8 ± 7.41
Control 4.46 ± 0.07 0.02 0.90 ± 0.06 4.23 ± 0.33 0.24 11.3 ± 0.83 7.41 ±0.12 0.89 73.8 ± 8.01
II; frost 4.01 ± 0.22 0.05 2.20 ± 0.17 4.19 ± 0.18 0.32 15.0 ± 1.03 6.88 ± 0.18 1.50 115.6 ± 8.15
Control 4.19 ± 0.09 1.12 50.2 ± 4.31 4.23 ± 0.11 4.32 195.5 ± 8.13 7.62 ± 0.16 6.78 552.9 ± 27.00
II; frost 4.45 ± 0.41 1.09 51.9 ± 3.81 4.22 ± 0.15 4.99 225.3 ± 9.41 7.46 ± 0.04 10.37 827.9 ± 41.30

122
A n n u a l W h e a t N e w s l e t t e r V o l. 4 9 .
NH4+ ions needed for the synthesis of amino acids. The mechanism of the effect of low temperature on the transcription-
translation apparatus in leaves when plants are fed with different forms of nitrogen remains to be elucidated.
Reduced temperature effect of soil. Urea as fertilizer behaves in a peculiar fashion at low above-freezing temperatures
in the root zone. We found that after exposure to low temperature (5 ± 1°C), G-6-PD and MD activity increases in roots
by a significantly greater amount when the plants were fed with urea as compared to NO3– and NH4+. The activity of G-
6-PD in the roots by urea is stimulated by 7-fold, as opposed to 3.2- and 3.9-fold for the NO3- and NH4+ N-sources,
respectively. Under normal temperatures, enzyme activity in plants is higher with NO3 nutrition. The stimulating effect
of NO3 on enzymes of the pentose monophosphate pathway of carbohydrate oxidation has been reported (Givan 1979).
The activity of MD at near-freezing temperature increases in roots by 267, 167, and 136 % in variants with urea, NH4+,
and NO3–, respectively. At the optimum temperature in the root zone (19 ± 1°C), however, the activity of these enzymes
during urea nutrition of plants is lower when compared to variants with other nitrogen forms. A possible mechanism to
explaining the stimulation of the G-6-PD and MD activity under stress could be the dissociation of the multidimensional
forms of enzymes into simpler subunits having increased activity. The presence of electrophoretically different forms of
enzymes suggests that under different conditions in the medium the relationship of different molecular forms of enzymes
can change drastically (Petrova et al. 1985), which is responsible for the increase or decrease in enzyme activity.
We observed a greater stimulating of enzyme activity under low-temperature effect in the presence of urea. In
protein chemistry, urea is known as a dissociating agent of proteins (Zolkiewski et al. 1995). At low temperatures,
conditions that allow the penetration of urea to places where compartmentalizing of enzymes may be created in cells and
the molar concentration suffices to have a dissociating effect on enzymes. An alternative explanation for the activation
of the G-6-PD and MD enzymes could be an enhancement, at low temperature, of other processes such as anaplerotic
pathways for the assimilation of carbonic acid during the enzymatic decomposition of urea in plant cells. This pathway
involves enhancing the carboxylation processes with the participation of root phosphoenolpyruvate carboxylase and
other CO2-fixing enzymes resulting in products that are used in the Krebs cycle.
When urea is used to nourish plants in the root zone at low temperature, root growth is enhanced. According to
our data from a water-culture assay, the presence of urea as the only growth source in the nutrient solution causes
enhanced growth of plants if the temperature in the root zone was 5 ± 1°C. This effect of urea on root growth was not
observed in the root zone at the optimum temperature. This assay was repeated in soil-cultured plants. In this case,
nitrogen in the form of different fertilizers was introduced at 42 mg/kg soil (210 mg/container). All other elements were
introduced at one-half the normal concentration. Once seedlings appeared, containers with seedlings were placed in
different temperature conditions and the plants were grown until the third leaf appeared. At optimum soil temperature,
the plants reached the 3-leaf stage within 13–14 days; at low temperature this occurred with in 21–23 days.
Our results showed that at low soil temperature and optimum air temperature (19 ± 1°C), the root dry weight in
the variant with urea was higher when compared to plants grown with the other forms of N. The mean length of roots in
the variant with urea at both the low and optimum temperatures was greater when compared with the other N-sources
(Table 6). The root wet weight during urea nutrition under low temperature conditions in both water and soil culture
approaches or
exceeds that in
the variant
without N.
Nitrogen
deficiency and
phosphorus in
the medium is
known to
promote growth
of the plant root
system (Barber
1979), and the
presence of
these elements
leads to a
decrease in
Table 6. Wet weight of roots and of the aerial portion, and mean length of 15 spring wheat seed
lings as a function of soil temperature and N-form. Air temperature was the same for all variants,
19 ± 1°C.
Temperature
5 ± 1°C 19 ± 1°C
weight of weight of length of weight of weight of length of
roots aerial portion roots roots aerial portion roots
Variant (g) (g) (cm) (g) (g) (cm)
No N (control) 7.3 ± 0.07 2.8 ± 0.17 27 ± 0.6 6.4 ± 0.15 3.2 ± 0.31 29 ±0.5
Ca(NO3)25.6 ± 0.33 4.4 ± 0.39 24 ± 0.4 4.4 ± 0.33 4.7 ± 0.33 19 ± 0.5
(NH4)2SO46.8 ± 0.12 4.2 ± 0.30 24 ± 0.3 4.1 ± 0.07 5.2 ± 0.10 18 ± 0.7
(NH2)2CO 8.7 ± 0.08 6.0 ± 0.52 26 ± 0.5 4.6 ± 0.24 5.5 ± 0.41 22 ± 0.1

123
A n n u a l W h e a t N e w s l e t t e r V o l. 4 9.
intensity of growth. In this case, during urea nutrition under low soil temperature conditions, plant roots behave as in the
variant without N.
The mechanism responsible for enhancing root growth in the absence of N (or phosphorus) in the medium is
unknown. Barber (1979) suggests that a stem-connected feedback mechanism causes an increase in root growth. Such a
mechanism could be a hormonal imbalance in wheat roots during nutrition of plants with urea and other forms of N.
According to our data, the relation between indoleacetic acid and abscisic acid in root tissues of wheat seedlings varies
according to the form of N and soil temperature (Glyanko 1995). Lips (1997) also reported that variation in the balance
between abscisic acid and cytokinins in roots during nitrate and ammonium nutrition has an effect on the growth of roots
and aerial organs and contributes to adaptation of plants to stress effects (salinization or moisture deficiency). Thus,
enhancement of root growth in conditions of near-freezing temperatures is effected under the influence of urea, and
activation of urea N in protein molecules as an effect of frost is manifested by the adaptive and reparative changes in
wheat plants induced by the form of N.
References.
Andrews RK, Blakeley RL, and Zerner B. 1984. Urea and urease. In: Advances in Inorganic Biochemistry (Eichhora
GL and Marzilli LG eds), Elsevier, New York. 6:245-283.
Barber SA. 1979. Uptake of nutrients from soil by plant roots. Physiol Biochem Cultiv Plants 11:209-217 (in Russian).
Bollard EJ, Cook AK, and Turner NA. 1968. Urea as sole source of nitrogen for plant growth. 1. The development of
urease activity in Spirodella eligorriza. Planta 83:1-12.
Chandra R, Radhuver P, and Sirohi GS. 1986. Influence of moisture stress and nitrogen on growth and yield of pea and
sorghum. Ann Arid Zone 25: 225-231.
Chen Y and Ching TM. 1988. Induction of barley leaf urease. Plant Physiol 86:941-945.
Cruz C, Lips SH, and Martins-Loucao MA. 1993. Effect of root temperature on carob growth: nitrate versus ammo-
nium nutrition. J Plant Nutrit 16:1517-1530.
Ermakov AI, Arasimovich VV, and Yarosh NP. 1987. Methods of biochemical investigation of plants. VO
Agropromizdat, Leningrad Pp. 237-238 (in Russian).
Finney KF, Mayer JM, Smith FM, and Fryer HC. 1957. Effect of Pawnee wheat with urea solution on yield, protein
content and protein quality. Agron J 49:341-347.
Fox RH, Kern JM, and Piekieler WP. 1986. Nitrogen fertilizer source, and method and time of application effects on
no-till corn yields and nitrogen uptakes. Agron J 78:741-746.
Givan CV. 1979. Metabolic detoxification of ammonia in tissues of higher plants. Phytochem 18:373-383.
Glyanko AK. 1995. Nitrogen nutrition of wheat at low temperatures. Nauka, Novosibirsk (in Russian).
Grodzinsky AM and Grodzinsky DM. 1973. Concise manual on plant physiology. Naukova Dumka, Kiev (in Russian).
Hubick KT. 1990. Effects of nitrogen source and water limitation on growth, transpiration efficiency and carbon-isotope
discrimination in peanut cultivars. Aust J Plant Physiol 17:1413-1430.
Kurets VK. 1974. The Irkutsk phytotron. Nauka, Novosibirsk (in Russian).
Klyachko N, Yakovleva LA, and Kulaeva ON. 1971. Change in protein synthesis in the cotyledons of pumpkin in
connection with their age. Fiziologiya Rasteniy (Sov Plant Physiol) 18:1225-1231.
Korenkov DA. 1977. Methods of application of nitrogen isotope 15N in agricultural chemistry. Kolos Publishing House,
Moscow (in Russian).
Leidi EO, Soares MIM, Silberbush M, and Lips SH. 1991. Salinity and nitrogen nutrition studies on peanut and cotton
plants. J Plant Nutrit 15:591-604.
Lips SH. 1997. The role of inorganic nitrogen ions in plant adaptation processes. Rus J Plant Physiol 44:421-431.
Lowry OH, Rosenbrough NJ, Farr AL, and Randall RJ. 1951. Protein measurement with the Folin phenol reagent. J
Biol Chem 193:265-275.
Mitrofanov BA, Okanenko AS, and Pochinok KhN. 1973. Effect of urea spray application of winter wheat on intensity
of photosynthesis and grain quality. Physiol Biochem Cultiv Plants 5:232-238 (in Russian).
Mokronosov AT, Ilinych ZG, and Shukolyukova NI. 1966. Assimilation of urea by potato plants. Fiziologiya Rasteniy
(Sov Plant Physiol) 13:798-806.
Pavlov A. 1967. Protein accumulation in wheat and maize grains. Nauka, Moscow (in Russian).
Petrova OV, Kolosha OI, Mishustina PS, and Sukhareva IB. 1985. Enzyme form multiplicity and its modification in
winter wheat in the period of adaptation to low temperatures. Physiol Biochem Cultiv Plants 17:361-366 (in Rus-
sian).
Schlehuber AM and Taker BB. 1967. The growing of wheat. In: Wheat and wheat improvement (Reitz LP and
Quisenberry KS eds). American Society of Agronomy, Madison, WI. Pp. 140-198.

124
A n n u a l W h e a t N e w s l e t t e r V o l. 4 9 .
Slukhai SI and Zrazhevsky MN. 1971. Increase of winter wheat grain quality under condition of irrigation. Physiol
Biochem Cult Plants 3:303-313 (in Russian).
Tishenko NN, Nikitin DB, Magomedov IM, and Moran E. 1991. Effect of nitrate and ammonium forms of nitrogen
fertilizers on sugarcane photosynthesis and growth parameters. Physiol Biochem Cultiv Plants 23:446-452 (in
Russian).
Turley RH and Ching TM. Physiological responses of barley leaves to foliar applied urea- ammonium nitrate. Crop
Sci 26:987-993.
Van Beusichem ML and Neeteson JJ. 1982. Urea nutrition of young maize and sugarbeet plants with emphasis on ionic
balance and vascular transport of nitrognous compounds. Neth J Agric Sci 30:317-330.
Zolkiewski M, Nosworthy NJ, and Ginsburg A. 1995. Urea-induced dissociation and unfolding of dodecametric
glutamine synthetase from Escherichia coli – calorimetric and spectral tudies. Protein Sci 4:1544-1552.
VAVILOV INSTITUTE OF GENERAL GENETICS, RUSSIAN ACADEMY OF
SCIENCES
Gubkin str. 3, 119991 Moscow, Russian Federation.
SHEMYAKIN AND OVCHINNIKOV INSTITUTE OF BIOORGANIC CHEMISTRY,
RUSSIAN ACADEMY OF SCIENCES2
Ul. Miklukho-Maklaya 16/10, Moscow, Russian Federation.
Isolation and characterization of antimicrobial peptides from Triticum kiharae.
T.I. Odintsova and V.A. Pukhalskiy (Vavilov Institute of General Genetics) and Ts.A. Egorov and A.K. Musolyamov
(Shemyakin and Ovchinnikov Institute of Bioorganic Chemistry).
All living organisms have evolved mechanisms with which to defend themselves against pathogen attack. This innate
immunity involving the production of antimicrobial peptides is one of the most ancient and widespread defense strate-
gies. After defense peptides are produced by transcription and translation of a single gene, they can be delivered rapidly
after infection with a limited input of energy and biomass and display differential activity against different types of
microorganisms (Thomma et al. 2002). Different families of antimicrobial peptides have been identified, including
thionins, defensins, lipid-transfer proteins (LTPs), hevein-type peptides, and knottin-type peptides.
We hoped to identify the antimicrobial peptides in T. kiharae, which is highly resistant to most pathogens
infecting cultivated wheat. T. kiharae has been used in our laboratory in crosses to generate lines resistant to such fungal
pathogens as powdery mildew and brown rust.
Materials and methods. The peptide fraction was extracted from T. kiharae flour with 10 % acetic acid (flour to
solution ratio of 1:10) for 1 h at room temperature. The supernatant was lyophilized and subjected to chromatography.
The acid-soluble fraction was separated by gel-exclusion chromatography on a Sephacryl S-100 HR column using 10 %
acetonitrile containing 0.1 % TCA as eluent. The chromatographic fractions were tested for the antifungal activity
against several fungi (Helminthosporium sativum, Alternaria consortiale, Rhizoctonia solani, Botritis cinerea, and
Fusarium culmorum). The active fraction, which caused inhibition of fungal growth and morphological changes, was
separated by reversed-phase high-performance liquid chromatography (RP–HPLC). The HPLC-fractions were tested
against fungi and characterized by mass spectrometry (MS) and sequencing.
Results and discussion. Separation of acid-soluble peptides on a Sephacryl column produced six fractions designated
from A to G. Only fraction D exhibited antifungal activity against most fungi assayed. This fraction was further
separated by RP–HPLC. Several fractions were obtained. Their molecular masses were measured by MS, and N-
terminal sequences identified by automatic sequencing. The peptide masses separated by RP–HPLC are in Table 1.
The N-terminal sequences of all fractions were determined. Two fractions were identified: Fr. 4:
AXQASQLAVXASAILGGTKPSGE and Fr. 5: KSXXK/RSTL

125
A n n u a l W h e a t N e w s l e t t e r V o l. 4 9.
The N-terminal sequence of
fraction 4 coincides with that of LTP;
however, three substitutions at positions 3,
4, and 5 have been observed (Garcia-
Olmedo et al. 1998). Plant LTPs are 90–
95 amino acid polypeptides that have been
identified (at a protein and/or cDNA
levels) in various tissues from a high
number of mono- and dicotyledonous
species. They were found to be distributed
throughout the plant. Antimicrobial
activity of LTPs has been reported for all
members of the family tested. The relative
activities of different LTPs vary between
pathogens, suggesting that they have some
degree of specificity. The mass of LTP
from T. kiharae is lower than that de-
scribed in the literature for other members
of this family.
According to the N-terminal sequence, fraction 5 corresponds to α/β purothionins. The toxicity of thionins to
plant pathogens is known from investigations into the susceptibility to wheat endosperm thionins of phytopathogenic
bacteria in the genera Pseudomonas, Xanthomonas, Agrobacterium, Erwinia, and Corynebacterium. Purified genetic
variants of these thionins differed in activity and showed some degree of specificity. Recent experiments in planta also
are indicative of a defense role for the thionins.
Other fractions obtained by RP–HPLC of T. kiharae peptides were heterogeneous; therefore, their sequencing
produced inconclusive results. Some low-molecular peptides were sequenced directly after the separation of the total
acetic-acid extract on an RP–HPLC column. The sequences obtained were TRQLSLRG and TRQLSPRG. Homologous
proteins were not found in the data banks, so their functions remain unknown.
These results indicate that T. kiharae possesses different types of antimicrobial peptides.
References.
Thomma B, Cammue B, and Thevissen K. 2002. Plant defensins. Planta 216:193-202.
Garcia-Olmedo B, Molina A, Alamillo J, and Rodriguez-Palenzuela P. 1998. Plant defense peptides. Biopolymers
(Peptide Science) 47:479-491.
Distribution of hybrid necrosis genes in common wheat cultivars of Australia.
V.A. Pukhalskiy, S.P. Martynov, and E.N. Bilinskaya.
We studied the necrosis genes in modern cultivars of spring common wheat of Australia. The distribution of hybrid
necrosis genes in the old local cultivars was first investigated by Tsunewaki and Hori (1967, 1968), who showed that the
Ne1 ne2 and ne1 ne2 genotypes prevailed by the end of the 19th and early in the 20th centuries. The available data on the
wheat cultivars of Australia and Oceania indicate that 25.4 % are of the Ne1 ne2 genotype, 18.9 % are ne1 Ne2, and 55.7
% are ne1 ne2 (Pukhalskiy et al. 2000). This genotype distribution resulted from nearly a century of breeding in Austra-
lia. We thought it interesting to investigate this parameter at the end of the 20th century.
Materials and methods. The necrotic genotype was analyzed in 48 Australian cultivars of spring common wheat. The
spring common wheat cultivars Marquillo (Ne1sNe1s ne2ne2 genotype) and Balaganka (ne1ne1 Ne2sNe2s) were used as
testers. Crosses were conducted under field conditions by standard procedures including emasculation and isolation of
spikes. The F1 and F2 hybrids were grown in the field. Hybrid necrosis traits were evaluated at different growth stages.
Table 1. Molecular mass of the RP-HPLC fractions obtained from the
fungicidal fraction D. Prevailing masses are indicated in bold.
Fraction number
1 23457
1,371.6 1,236.5 1,070.6 1,153.5 1,206.8 3,487.9
1,425.6 1,344.8 1,644.8 1,405.8 5,900.9
2,734.0 1,535.8 2,189.0 1,574.8 16,372.1
3,451.3 1,829.1 3,484.1 3,021.2
7,007.2 2,678.6 6,972.4 3,622.0
3,373.3 4,803.5
3,565.6 4,919.6
6,983.2
7,641.9

126
A n n u a l W h e a t N e w s l e t t e r V o l. 4 9 .
Results and discussion. The distribution of the
different necrosis genotypes in Australian wheat
cultivars shows that breeding led to complete
elimination of the Ne1ne2 genotype (Table 2). If
we estimate the ratios of necrotic genotypes in all
46 cultivars (except for cultivars Beulah and Bt-
Schomburgk where the presence of the Ne2 gene is
problematic), the results are as follows: 76.1 % of
cultivars possess the ne1 ne2 genotype and the ne1
Ne2 genotype is found in 23.9 % of cultivars.
The ratios for wheats at the beginning of
the 20th century were different (Tsunewaki et al.
1967). Among 72 cultivars examined, the ne1 ne2
genotype was found in 57 (79.2 %) of the cultivars,
Ne1 ne2 in 14 cultivars (19.4 %), and ne1 Ne2 (1.4
%) only in one cultivar. The ne1 Ne2 genotype
was found in the cultivar Atlas (Tsunewaki et al.
1968). The authors did not indicate whether Atlas
is a winter or a spring cultivar. In all probability,
Atlas was one of the two winter wheat cultivars
studied.
We suppose that the observed changes in
the distribution of hybrid necrosis genes were due
to the Green Revolution and to the wide use of
CIMMYT material in the Australian breeding
programs.
Pedigree analysis of the Australian wheats
using the GRIS 3.5 (Martynov and Dobrotvorskaya
1993) shows the Brazilian landrace Turco as the
source of the Ne2 gene. In addition, this gene
could be derived from the Argentinian landrace
Barleta or the Japanese cultivar Norin 10, the donor
of the short-stem trait, which has the Ne2 gene
from the landrace Mediterranean through the old,
American cultivars Lancaster and Fultz.
Acknowledgment. The authors are grateful to
Michael MacKay, the curator of the Australian
collection of winter cereals, for the seeds of
modern Australian wheat cultivars used in this
study.
References.
Martynov SP and Dobrotvotvorskaya TV. 1993.
Breeding-oriented database on genetical
resources of wheat. Ann Wheat Newslet
39:214-221.
Pukhalskiy VA, Martynov SP, and Dobrotvorskaya
TV. 2000. Analysis of geographical and
breeding-related distribution of hybrid necrosis
genes in bread wheat (Triticum aestivum L.).
Euphytica 114:233-240.
Table 2. Genotype of necrosis genes identified in modern
Australian cultivars of common spring wheat.
AWCC number Cultivar Year of release Genotype
AUS-25046 Cunningham 1990 ne1 ne2
AUS-25139 Lillimur 1990 ne1 ne2
AUS-25418 Angas 1991 ne1 ne2
AUS-25292 Excalibur 1991 ne1 ne2
AUS-25648 Cadoux 1992 ne1 ne2
AUS-25468 Katunga 1992 ne1 ne2
AUS-27166 Pulsar 1992 ne1 Ne2
AUS-25598 Amery 1993 ne1 ne2
AUS-25567 Beulah 1993 ne1?
AUS-25929 Darter 1993 ne1 ne2
AUS-25568 Goroke 1993 ne1 ne2
AUS-25868 Houtman 1993 ne1 Ne2
AUS-25571 Ouyen 1993 ne1 ne2
AUS-25927 Rowan 1993 ne1 ne2
AUS-25923 Stiletto 1993 ne1 ne2
AUS-25597 Stretton 1993 ne1 ne2
AUS-25869 Sunmist 1993 ne1 Ne2
AUS-25870 Sunstate 1993 ne1 Ne2
AUS-25928 Swift 1993 ne1 ne2
AUS-25557 Tasman 1993 ne1 ne2
AUS-25924 Trident 1993 ne1 ne2
AUS-25925 Vectis 1993 ne1 ne2
AUS-25619 Wellstead 1993 ne1 ne2
AUS-25600 Bt-Schomburgk 1994 ne1?
AUS-25575 Cascades 1994 ne1 ne2
AUS-26161 Datatine 1994 ne1 ne2
AUS-25931 Sunland 1994 ne1 ne2
AUS-26160 Tammin 1994 ne1 ne2
AUS-24350 Yarralinka 1994 ne1 ne2
AUS-25558 Pelsart 1994 ne1 ne2
AUS-26169 Tern 1994 ne1 ne2
AUS-26192 Leichhardt 1995 ne1 Ne2
AUS-25607 Arnhem 1996 ne1 Ne2
AUS-27194 Carnamah 1996 ne1 ne2
AUS-27193 Cunderdin 1996 ne1 Ne2
AUS-27189 Kalannie 1996 ne1 ne2
AUS-27188 Perenjori 1996 ne1 ne2
AUS-27191 Petrel 1996 ne1 ne2
AUS-27192 Sunlin 1996 ne1 ne2
AUS-27199 Yanac 1996 ne1 ne2
AUS-27190 Tailorbird 1996 ne1 Ne2
AUS-25601 Frame 1997 ne1 ne2
AUS-25602 Barunga 1997 ne1 ne2
AUS-27203 Krichauff 1998 ne1 ne2
AUS-27647 Diamondbird 1997 ne1 Ne2
AUS-27694 Baxter 1998 ne1 Ne2
AUS-27660 Goldmark 1998 ne1 Ne2
AUS-27661 Silverstar 1998 ne1 ne2

127
A n n u a l W h e a t N e w s l e t t e r V o l. 4 9.
Tsunewaki K and Hori T. 1967. Distribution of necrosis genes in wheat. IV. Common wheat from Australia, Tibet and
Northern Europe. Jap J Genet 42:245-250.
Tsunewaki K and Hori T. 1968. Necrosis genes in common wheat varieties from Australia, Tibet and Northern Europe.
Wheat Inf Serv 26:22-27.
N.I. VAVILOV RESEARCH INSTITUTE OF PLANT INDUSTRY
42, B. Morskaya Str., St. Petersburg, 190000, Russian Federation.
Genealogical analysis of Russian and Ukrainian winter wheat resistant to common bunt.
S.P. Martynov and T.V. Dobrotvorskaya.
Common bunt is one of most serious diseases of bread wheat. This disease is distributed in many regions of the Russian
Federation including the Northern Caucasus, Central Black Soil region, Volga region, and Non-Black Soil zone. Resis-
tance to common bunt in winter wheat was measured by comparing groups of resistant and susceptible cultivars from the
Russian Federation and Ukraine using a genealogical approach.
Data on winter bread wheat cultivars were taken from the database GRIS 3.5 of the Information and Analytical
System of Wheat Genetic Resources (Martynov and Dobrotvorskaya 2000). A set of 199 cultivars with known resis-
tance/susceptibility to common bunt and known pedigrees were divided into resistant (Table 1) and susceptible (Table 2)
groups.
Tracing expanded pedigrees with the aid of the GRIS program has established the probable donors and sources
of resistance to common bunt (Table 1). Except for eight cultivars for which it was impossible to identify the source of
resistance, the source of resistance to common bunt 36 cultivars (82 %) was from local sources mainly A. glaucum via
PPG-599, Crimean, Odessa local cultivar (LV-Odessa) via Zemka, Eliseevskaya rye, and Yaroslav emmer. Other culti-
vars (18 %) received resistance genes both from local and foreign sources; Florence (Bt3) and Oro (Bt4, Bt7). A number
of cultivars have ambiguous estimations of resistance to bunt (marked by an * in Table 1). For example,
Bezenchukskaya 380 is considered resistant in the Lower Volga region but susceptible in other areas. Moskovskaya 70
and 642, Moskovskaya nizkostebelnaya, Chaika, and Yantarnaya 50 are classified as resistant, but data from State
Varietal Trials indicates susceptibility. Skorospelka 1 and 3, from source data, and Odesskaya 12, from State Varietal
Trials, are resistant, but data from the Vavilov Institute identifies them as susceptible. We assume that the conflicting
data are a consequence of the different race compositions of local pathogen populations. Krivchenko (1984) has identi-
fied 37 different pathogen races. Analyzing the geographical distribution of the pathogen races, we identified two groups
appropriate to two conventional regions; north and south of latitude 49°N. Races 1, 9, 15, 17, and 20 comprised the
southern group and 2, 14, 16, 25, 31, 34, and 37 were specific to the northern group. Races 6 and 11 were common to
both groups. We assume that the sources of resistance differ in southern and northern regions. Therefore, we analyzed
groups of resistant and susceptible cultivars divided into southern and northern subgroups (see Tables 1 and 2). Among
the cultivars of the southern area, the basic sources of resistance are the Odessa local variety (LV-Odessa) via Zemka,
selection from Crimean (CI-1435), and foreign sources via Brevor and CIMMYT cultivars. In the northern subgroup,
the number of sources of resistance is more limited; A. glaucum via PPG 599 and Eliseevskaya rye.
In a three-way ANOVA of the matrixes of ancestor contribution (Table 3), we investigated the resistance (factor
A) with two classes (resistance and susceptibility), the region of origin (factor B) with two classes (south and north), and
the original ancestor or hypothetical source of resistance (factor C) with the number of classes (c = 11). The analyzed
sample included 52 resistant cultivars (including 23 from the southern and 29 from the northern regions) and 147
susceptible cultivars (including 88 from the southern and 59 from the northern regions). The data were transformed
through arcsines. The effects of all investigated factors and interactions, except for interaction (A x B) were highly
significant. Highly significant interactions (A x C), (B x C), and (A x B x C) indicate specific differences between the
distribution of the contributions of hypothetical sources of resistance in groups of resistant and susceptible cultivars
occurring from various regions. Differences in the race composition of regional populations of pathogen explain this
fact.

128
A n n u a l W h e a t N e w s l e t t e r V o l. 4 9 .
Table 1. Donors of resistance to common bunt in Russian (RUS) and Ukrainian (UKR) winter wheat cultivars. Culti-
vars marked with an asterisk (*) have conflicting estimates of resistance by different authors.
Country Year of Hypothetical
of origin release Donor of resistance source of resistance
Cultivars bred south of 49°N latitude
Kooperatorka (Bt1) UKR 1929 Sel. Crimean Crimean
Stepnyachka-0496 UKR 1929 Sel. Banatka Kherson Unknown
Odesskaya-12* UKR 1947 Zemka LV-Odessa
Skorospelka-3-B RUS 1955 Kanred Crimean (CI 1435)
Deviz RUS 1978 Skorospelka-3-B, Narodnaya Crimean (CI 1435),
Narodnaya
Odesskaya polukarlikovaya UKR 1980 Odesskaya-12 LV-Odessa
Stepnyak UKR 1982 Odesskaya-12 LV-Odessa
Dneprovskaya-39 UKR 1984 Kanred Crimean (CI 1435)
Prikumskaya-79 RUS 1984 Penjamo-62 (Brevor, Florence, Oro, Yaroslav
Newthatch), Odesskaya-12 emmer, LV-Odessa
Dneprovskaya -1029 UKR 1989 Skorospelka -1* Crimean (CI-1435)
Dneprovskaya -710 UKR 1989 Odesskaya-12, LV- Odessa, Crimean (CI
Skorospelka -3B 1435)
Panna UKR 1990 Chaika*, Skorospelka -1* LV- Odessa, Crimean (CI
1435)
Donchanka UKR 1990 Odesskaya polukarlikovaya, LV- Odessa, Eliseevskaya
Odesskaya-12, RPG-434-154
Donshchina RUS 1992 Skorospelka -3*, Narodnaya Crimean (CI 1435),
Narodnaya
Odesskaya -133 UKR 1993 Brevor Florence, Oro
Donchanka 3 UKR 1995 Brevor Florence, Oro
Delta RUS 1999 Selkirk Crimean (CI 1435),
Yaroslav emmer
Knyajna RUS 1999 Selkirk (?) Crimean (CI 1435),
Yaroslav emmer
Prikumskaya 115 RUS 1999 Mida (U.S.), Odesskaya-12 Florence, LV-Odessa
Prima odesskaya UKR 2000 Odesskaya-12 (?) LV-Odessa
Zernogradka 10 RUS 2001 RPG-424-154, Eliseevskaya, Crimean
Skorospelka –3B (CI 1435)
Zarnitsa RUS 2002 Brevor Florence, Oro
Stanichnaya RUS 2002 Odesskaya-12, Brevor LV-Odessa, Florence, Oro
In the northern region, the contributions of A. glaucum and Eliseevskaya rye are higher in the group of resistant
cultivars. In the southern region, the Odessa local variety prevails among resistant cultivars (Table 4). In the northern
region, the contribution of LV-Odessa is higher in the group of susceptible cultivars, confirming the race specificity of
this resistance source. Yaroslav emmer, in the northern region, and foreign sources (Oro, Florence, Federation, and T.
timopheevii), in the south, are effective, although their contribution is not significant when compared with the group of
susceptible cultivars.
This analysis shows that number of sources of a vertical resistance to bunt used in the winter wheat-breeding
programs in the Russian Federation and Ukraine is not sufficient. The high number of genotypes with identical reaction
to bunt causes genetic uniformity in the cultivars. The narrowing of the genetic diversity from a few identical genes can
cause a change in the pathogen population and increase susceptibility on homogeneous genetic material.
Efficient horizontal (nonracespecific) resistance, which is shown as incomplete resistance to all races of a
pathogen and in varying degrees suppresses its development, also depends on the genetic diversity of the released
cultivars. A study of latent genetic diversity in winter wheat cultivars from the Russian Official List has shown that the

129
A n n u a l W h e a t N e w s l e t t e r V o l. 4 9.
Table 1 (continued). Donors of resistance to common bunt in Russian (RUS) and Ukrainian (UKR) winter wheat
cultivars. Cultivars marked with an asterisk (*) have conflicting estimates of resistance by different authors.
Country Year of Hypothetical
of origin release Donor of resistance source of resistance
Cultivars bred north of 49°N latitude.
Milturum-120 UKR 1929 Sel. Krasnokoloska Krasnokoloska (?)
Moskovskaya-3251 RUS 1929 Sel. Tavtukhi (T. durum) Unknown
RPG-27-36 RUS 1931 Eliseevskaya rye Eliseevskaya rye
RPG-434-154 RUS 1931 Eliseevskaya rye Eliseevskaya rye
PPG-599 (Btz)RUS 1948 Agropyron glaucum A. glaucum
Lgovskaya-873 RUS 1952 Unknown Unknown
Belotserkovskaya-198 UKR 1955 Unknown Unknown
PPG-99 (Btz)RUS 1964 PPG-599 A. glaucum
Kalininskaya-27 RUS 1965 A. glaucum A. glaucum
Kalininskaya-11 (Btz)RUS 1967 A. glaucum A. glaucum
Kharkovskaya-63 UKR 1969 Unknown Unknown
Zarya (Btz)RUS 1978 PPG-599 A. glaucum
Polukarlik-Mytnitskii UKR 1984 Schlanstedter (?) Unknown
Bezenchukskaya yubileinaya RUS 1984 RPG-434-154 Eliseevskaya rye
Yantarnaya-50* (Btz)RUS 1985 Zarya A. glaucum
Moskovskaya nizkostebelnaya* RUS 1990 Zarya A. glaucum
Inna RUS 1991 Zarya A. glaucum
Moskovskaya 642* RUS 1991 Zarya A. glaucum
Moskovskaya 70* RUS 1991 Zarya A. glaucum
Zvezda* RUS 1992 Ag. glaucum A. glaucum
Nemchinovskaya 25 RUS 1992 Zarya A. glaucum
Pamyati Fedina RUS 1993 Zarya A. glaucum
Bezenchukskaya 380* RUS 1994 RPG-434-154 Eliseevskaya rye
Smuglyanka RUS 1998 PV-18, Brevor, RPG-434-154 Florence, Oro, Yaroslav
emmer, Eliseevskaya rye
Povoljskaya 86 RUS 1999 Zarya A. glaucum
Moskovskaya 39 RUS 1999 Yantarnaya -50, Brevor A. glaucum, Florence,
Oro
Guberniya RUS 2000 Unknown Unknown
Tau RUS 2001 Selkirk Crimean (CI 1435),
Yaroslav emmer
Omskaya 4 RUS 2001 RPG-434-154 Eliseevskaya rye
overwhelming majority (96 %) of cultivars recommended for cultivation in the Russian Federation are the descendants of
Bezostaya 1 and/or Mironovsakaya 808. In the Central Black Soil zone and the Northern Caucasus and Middle and
Lower Volga regions, the genetic diversity is acceptable, whereas the Central Non-Black Soil and Volga-Vyatka regions
of the Russian Federation are characterized by low genetic diversity. The majority of cultivars recommended for these
regions are related at the full- and half-sib level.
A key problem of breeding for resistance to bunt is use of the new sources of resistance. In addition to the 11
known resistance genes (Bt1–Bt10 and BtZ), 11 new genes have now been identified. Ukrainian researchers have
identified six new genes; Bt11 from Sel. M-6623, Bt12 and Bt13 from Lutescens 6028, and Bt14 from Erythrospermum
5221 (Novokharka et al. 1990) and Bt15 and Bt16 from Ferrugineum 220/85 (Babayants and Dubinia 1990). CIMMYT
researchers have identified five new genes, which, unfortunately, have been given the same gene designations; Bt11
(from PI-554119), Bt12 (from PI-119333), Bt13 (from Thule III), Bt14 (from Doubbi), and Bt15 (from Carleton)
(Wilcoxson and Saari 1996). In addition, two presumably new genes in lines Erythrospermum 60-89 and Ferrugineum
124-88 were identified (Babayants et al. 1999). Some parental forms of Erythrospermum 5221, Ferrugineum 220/85,

130
A n n u a l W h e a t N e w s l e t t e r V o l. 4 9 .
Erythrospermum 60-89, and Ferrugineum 124-88 are unknown, which does not enable pedigree analysis. We could
analyze the pedigree only of Lutescens 6028 and are now able to explain bunt resistance in this line.
Tracing the transmission of Bt-genes on the expanded pedigrees the has shown that Lutescens 6028 (Selection
101/Manella//Kavkaz) can have genes Bt1, Bt3, Bt4, Bt6, and Bt7 from Selection 101 (Fig. 1) that has the following
Table 2. Russian (RUS) and Ukrainian (UKR) winter wheat cultivars susceptible to common bunt.
Country of Year of Country of Year of
Cultivar origin release Cultivar origin release
Cultivars bred south of 49°N latitude.
Odesskaya 3 UKR 1938 Volgodar RUS 1990
Pervenets RUS 1938 Donetskaya 46 UKR 1990
Voroshilovskaya RUS 1939 Olimpiya 2 RUS 1990
Ferrugineum 622-2 RUS 1939 Khersonskaya 86 UKR 1991
Erythrospermum 161 RUS 1941 Odesskaya 117 UKR 1992
Novoukrainka 83 RUS 1945 Skifyanka RUS 1992
Krymskaya 1 UKR 1946 Tarasovskaya 87 RUS 1992
Gibrid 481 RUS 1948 Yubileinaya 75 UKR 1992
Osetinskaya 4 RUS 1950 Zernogradka 8 RUS 1993
Osetinskaya G-720 RUS 1950 Kolos Dona RUS 1993
Gibrid 491 RUS 1951 Odesskaya 120 UKR 1993
Kubanskaya 131 RUS 1951 Soratnitsa RUS 1993
Kubanskaya 24 RUS 1952 Sfera RUS 1993
Novoukrainka 84 RUS 1953 Fedorovka UKR 1993
Odesskaya 16 UKR 1953 Donskaya yubileinaya RUS 1994
Osetinskaya 3 RUS 1953 Eika RUS 1994
Yubileinaya Osetii RUS 1954 Otrada RUS 1994
Bezostaya 4 RUS 1955 Krasnodarskaya 90 RUS 1995
Lutescens 32 RUS 1965 Leda RUS 1995
Krasnodarskaya 33 RUS 1967 Nika Kubani RUS 1995
Skorospelka 35 RUS 1968 Azau RUS 1997
Donetskaya 5 UKR 1982 Aliza RUS 1997
Krasnodarskaya 57 RUS 1982 Zimorodok RUS 1997
Donskaya polukarlikovaya RUS 1983 Nak RUS 1997
Prikubanskaya RUS 1983 Odesskaya 267 UKR 1997
Dar Zaporojya UKR 1984 Viktoriya Odesskaya UKR 1998
Donetskaya 38 UKR 1984 Don 95 RUS 1998
Zaporojskaya 60 UKR 1984 Jirovka RUS 1998
Zirka UKR 1984 Zernogradka 9 RUS 1998
Olimpiya RUS 1984 Kroshka RUS 1998
Brigantina UKR 1986 Pobeda 50 RUS 1998
Prokofevka UKR 1986 Uskoryanka RUS 1998
Stepnaya 7 RUS 1986 Podarok Donu RUS 1999
Zamena RUS 1987 Dar Zernograda RUS 2000
Zimdar 4 RUS 1987 Donskoi mayak RUS 2000
Peresvet UKR 1987 Starnad 1 RUS 2000
Prometei UKR 1987 Tarasovskaya Ostistaya RUS 2000
Zimdar RUS 1988 Ermak RUS 2001
Birlik RUS 1989 Lira RUS 2001
Mriya Khersona UKR 1989 Prestij RUS 2001
Olviya UKR 1989 Rosinka Tarasovskaya RUS 2001
Prikumskaya 98 RUS 1989 Tarasovskaya 97 RUS 2001
Yunnat Odesskii UKR 1989 Deya RUS 2002
Albatros Odesskii UKR 1990 Selyanka RUS 2002

131
A n n u a l W h e a t N e w s l e t t e r V o l. 4 9.
Table 2 (continued). Russian (RUS) and Ukrainian (UKR) winter wheat cultivars susceptible to common bunt.
Country of Year of Country of Year of
Cultivar origin release Cultivar origin release
Cultivars bred north of 49°N latitude.
Hostianum 237 RUS 1929 Meshinskaya RUS 1989
Erythrospermum 20 430 UKR 1934 Mironovskaya 40 UKR 1989
Hostianum 122 76 RUS 1936 Mironovskaya 61 UKR 1989
Kievlyanka 156 UKR 1936 Omskaya ozimaya RUS 1989
Lesostepka 76 UKR 1937 Kharkovskaya 11 UKR 1989
Svea Pushkinskaya RUS 1937 Komsomolskaya 56 UKR 1990
Saratovskaya 46 131 RUS 1938 Nemchinovskaya 52 RUS 1990
Erythrospermum 118 RUS 1938 Polesskaya 87 UKR 1990
Lutescens 17 UKR 1940 Lgovskaya 167 RUS 1991
Lesostepka 75 UKR 1945 Nemchinovskaya 86 RUS 1991
Sekisovskaya RUS 1949 Kharkovskaya 90 UKR 1991
Lutescens 230 RUS 1951 Mironovskaya 27 UKR 1992
PPG 1 RUS 1951 Mironovskaya >AB8AB0O UKR 1992
PPG 186 RUS 1953 Bazalt RUS 1993
Veselopodolyanskaya 499 UKR 1954 Lutescens 9 RUS 1993
Mironovskaya 808 UKR 1963 Meshinskaya 2 RUS 1993
Mironovskaya N18;59=0O UKR 1971 Mironovskaya poluintensivnayaUKR 1993
Polesskaya 70 UKR 1974 Kharkovskaya 92 UKR 1993
Raduga RUS 1976 Chernozemka 212 RUS 1993
Akhtyrchanka UKR 1978 Bagrationovskaya RUS 1994
Moskovskaya 60 RUS 1979 Veselopodolyanskaya 203 UKR 1995
Mironovskaya 25 UKR 1980 Imeni Rapoporta RUS 1995
Nemchinovskaya 110 RUS 1980 Saratovskaya 90 RUS 1995
Drujba 2 UKR 1981 Kruiz RUS 1998
Lgovskaya 77 RUS 1981 Orenburgskaya 105 RUS 1998
Kinelskaya 4 RUS 1985 Orenburgskaya 14 RUS 1998
Mechta 1 UKR 1985 Kharkovskaya 96 UKR 1999
Polesskaya 85 UKR 1985 Malakhit RUS 2000
Shchedraya Polesya UKR 1987 Ershovskaya 11 RUS 2002
Volgogradskaya 84 RUS 1989
Table 3. Analysis of variance of the contribution of hypothetical sources of
resistance to common bunt for Russian and Ukrainian winter wheat cultivars.
Factor A is the group of resistant cultivars, factor B is the geographical
region of origin, and factor C is the ancestry. * = significance at P < 0.0001.
Source SS Df Ms F
General 71,643.4 2,155
Factor A 246.6 1 246.6 15.88*
Factor B 402.8 1 402.8 25.93*
Factor C 33,766.3 10 3,376.6 217.45*
Interaction (A x B) 5.4 1 5.4 0.35
Interaction (A x C) 597.8 10 59.8 3.85*
Interaction (B x C) 2,784.3 10 278.4 17.92*
Interaction (A x B x C) 1,029.6 10 102.9 6.63*
Error 32,810.6 2,112 15.5
cultivars and genes in its pedigree:
Rex (Bt1 and Bt7), Rio (Bt6), Oro (Bt4
and Bt7), Florence (Bt3), Burt (Bt1,
Bt4, and Bt6), and Brevor (Bt1, Bt3,
Bt4, and Bt6). Novokhatka et al.
(1990) could not explain the results of
segregation of resistance in crosses
between ‘Lutescens 6028/Bt4 (mono-
genic line)’ and ‘Lutescens 6028/(Bt6)
Rio’. The first cross segregated 74:26,
which corresponds to the theoretical
ratio 189:67 (r2 = 0.002) suggesting
four genes (one basic and three
duplicate-complementary genes
(Manjunath and Nadaf 1983). A
segregation of 57:58 was found in the
second cross, corresponding to a
theoretical 121:135 (r2 = 0.24) and

132
A n n u a l W h e a t N e w s l e t t e r V o l. 4 9 .
suggesting four genes
(two basic complemen-
tary and two duplicate-
complementary genes
(Manjunath and Nadaf
1983). Thus, we cannot
prove that the resistance
genes in Lutescens 6028
are nonallelic and
independent from
previously described
genes Bt1, Bt3, Bt4, Bt6,
and Bt7. The high level
of resistance in Lutescens
6028 may come from a
combination of all these
genes.
Our analysis
was made on the basis
from information about
resistance or susceptibil-
ity of winter wheat received from different authors by different techniques with different combinations of races in local
pathogen populations. Therefore, we consider the data on source of resistance and statistical estimations made by
comparing samples of resistant and susceptible cultivars as preliminary. Nevertheless, based on genealogical informa-
tion, the data will be useful in conditions of artificial inoculation with certain races of the pathogen and the use of a
standard set of differentials.
References.
Babayants LT and Dubinina LA. 1990. A novel donor of wheat resistance to bunt (Tilletia carries (DC) Tul., T. laevis
Kuehn.) and its genetical background. Rus J Genet 26(12):2186-2190 (in Russian).
Babayants LT, Dubinina LA, and Yushchenko GM. 1999. Genetical background of resistance to common bunt (Tilletia
carries (DC) Tul.) for new wheat lines. Cytol Genet 33(6):25-30.
Krivchenko VI. 1984. Resistance to bunt for grain crops. Moscow:Kolos. 304 pp. (in Russian).
Manjunath A and Nadaf SK. 1983. A ready reckoner of expected F3 breeding behaviour useful in linkage studies.
Madras Agric J 70(6):360-365.
Martynov SP and Dobrotvorskaya TV. 2000. A study of genetic diversity in wheat using the Genetic Resources Infor-
mation and Analytic System GRIS. Rus J Genet 36:195-202.
Novokhatka VG, Mochalova LI, and Odintsova IG. 1990. New genes in wheat for resistance to common and dwarf
bunt (Tilletia carries (DC) Tul., T. laevis Kuehn., T. controversa Kuehn.). Rus J Genet 26(10):1808-1814 (in
Russian).
Wilcoxson RD and Saari EE eds. 1996. Bunt and smut diseases of wheat: Concepts and methods of disease manage-
ment. CIMMYT, Mexico. 66 pp.
Table 4. Average contribution of hypothetical sources of resistance to common bunt for
Russian and Ukrainian winter wheat cultivars in groups of resistant and susceptible
accessions. Values are followed by letters that indicate significant differences at P < 0.05
by Duncan’s multiple range test.
Cultivars bred Cultivars bred
north of 49°N latitude south of 49°N latitude
Ancestor Genes Resistant Susceptible Resistant Susceptible
Agropyron glaucum BtZ 2.11 b0.42 a0.00 a0.02 a
Eliseevskaya (rye) 1.95 b0.35 a0.09 a0.32 ab
Yaroslav emmer 0.27 a0.17 a0.86 a0.89 a
Tr. timopheevii 0.24 a0.28 a0.98 a0.69 a
Petkus (rye) 0.00 a0.13 a0.17 a0.09 a
LV- Odessa (via Zemka) 0.45 a2.07 b12.05 d7.05 c
Oro Bt4, 7 0.22 a0.47 a0.90 a0.59 a
Florence Bt3 0.18 a0.38 a1.01 a0.55 a
Federation Bt7 0.19 a0.46 a0.82 a0.49 a
Hussar Bt1, 2, 5 0.11 a0.11 a0.35 a0.33 a
133
A n n u a l W h e a t N e w s l e t t e r V o l. 4 9.
Fig. 1. The tracing of sources of resistance to common bunt for line Selection 101 by GRIS. The resistant cultivars are
marked with a symbol , susceptible , and carriers of Bt-genes .

134
A n n u a l W h e a t N e w s l e t t e r V o l. 4 9 .
ITEMS FROM THE REPUBLIC OF SOUTH AFRICA
SMALL GRAIN INSTITUTE
Private Bag X 29, Bethlehem 9700, South Africa.
Plant Breeding – winter and facultative breeding program.
J.C. Aucamp, D.J. Exley, and H.A. Smit.
During 2002 Small Grain Institute released a new bread wheat cultivar named Komati. Komati is a facultative cultivar
with moderate vernalization requirements. The lodging resistance of this tall cultivar is good. Komati has a long
coleoptile (± 9.3 cm) and excellent resistance to preharvest sprouting, which has been confirmed successfully. Another
advantage is the high level of resistance against RWA infestations. Komati is susceptible to stripe rust. Though suscep-
tible, the application of a fungicide is only necessary when conditions are optimal for disease development. The cultivar
has no aluminium tolerance and planting on soils with low pH and high levels of acidification is not recommendable.
Komati is suitable for planting on low to high potential fields. Yields are stable and competitive with the best cultivars
available. Komati has an excellent hectoliter mass and falling number and good protein characteristics and, thus,
produces grain of a supreme grade. The cultivar meets with the set standards for flour extraction, protein quality, water
absorption, and mixing quality required by the milling and baking industries.
Plant Breeding – spring wheat irrigation program.
W.H.P. Boshoff and H.A. Smit.
The Wheat Technical Committee accepted BSP98/8 for final classification. The line will be marketed as Olifants.
Olifants yields above average, which appears stable over environments. Important agronomic characteristics of Olifants
are a medium growth period, good tillering, and strong resistance to lodging. The cultivar has excellent quality charac-
teristics that comply with requirements of the milling and baking industry. Olifants has high levels of resistance to local
foliar diseases including the currently prevailing pathotypes of stripe rust.
Genetic diversity.
T. van A. Bredenkamp and M.V. van Wyk.
The success of a breeding program depends mainly on the genetic diversity available. A constant need exists for the
incorporation of new germ plasm to improve locally adapted lines. Activities of the Small Grain Institute Germplasm
Collection consist of the conservation of small grain crops, namely wheat, barley, oats, triticale, and rye. This collection
is maintained in a cold room facility with a mobile shelving system for medium-term viability at ± 4°C.
International collaboration is of extreme importance because no breeding program can function effectively
without sufficient heritable diversity. Over the years a working relationship has been established between South Africa
and CIMMYT (Mexico), ICARDA (Turkey), Uruguay, and other countries. Wheat, barley, and triticale nurseries and
trials, segregating material, and interspecific crosses are imported annually. These lines are evaluated under quarantine.
Microenvironments conductive to disease development are created artificially ensuring high selection pressure. The
three quarantine sites are Bethlehem in the Free State, Riviersonderend in the Western Cape, and Vaalharts in the
Northern Cape.

135
A n n u a l W h e a t N e w s l e t t e r V o l. 4 9.
Doubled-haploid program.
A.F. Malan and H.A. Smit.
During the 2002 wheat season, several combinations were handled in the DH program. The main purpose of the
program is to enhance the development of pure breeding material of promising combinations identified in the different
breeding programs. The DH process is involved in the spring, winter, and prebreeding programs and assists in develop-
ment of lines with good disease resistance, superior quality aspects, and minor gene characteristics.
In the spring wheat-breeding program, cross combinations were made with special emphasis on stripe rust
resistance. A potential winter breeding lines’ progeny will be tested for agronomic traits, bread-making quality, and
disease resistance. Material from the prebreeding program includes combinations for RWA and leaf rust resistance. All
these DH lines will be tested in extensive field trials during the 2003 season.
Applying molecular and tissue-culture techniques to problems in disease resistance of wheat with
an emphasis on stripe rust.
R. Prins, V.P. Ramburan, and W.H.P. Boshoff (ARC-Small Grain Institute, RSA); L.A. Boyd (Department of Disease and
Stress Biology, John Innes Centre, UK); Z.A. Pretorius (Plant Pathology Department, University of Free State, RSA);
and J.H. Louw (Genetics Department, University of Stellenbosch, RSA).
Adult-plant resistance to stripe rust in the South African wheat cultivar Kariega was assessed in a DH-mapping popula-
tion made from the F1 of a cross between Kariega and the susceptible cultivar Avocet S. A partial linkage map covering
all 21 chromosomes was developed with 208 DNA markers and four alternative loci.
Interesting features of the linkage map include the low polymorphism observed in the D genome and a region
showing segregation distortion on chromosome 4A. The Ltn and Sr26 genes also were mapped in this study. Two major
QTL, together explaining about 55 % of the variation in the trait, were identified on chromosomes 2B and 7D, whereas
minor QTL explaining about 14 % of the variation were identified on chromosomes 1A and 4A. The QTL on 7D appears
to correspond to Yr18, a gene for APR to stripe rust. Markers fairly close to the QTL have been identified and these may
be used to detect the presence of these QTL regions in marker-assisted selection. The APR to stripe rust of Kariega
appears to be controlled by major QTL, in combination with other minor QTL, which is characteristic of APR in general.
The DH population developed and the linkage map constructed are valuable resources for future genetic studies that may
include studying APR, plant-pathogen interactions, and the mapping of additional traits polymorphic in this population.
Previous field trials of genetic material derived from Cappelle Desprez (CD) and Palmiet confirmed the
effectiveness of Yr16 (APR) against the South African pathotypes (6E16- and 6E22-). We know that CD also carries a
T5BS–7BS translocation that is a complicating factor in studying Yr16. Chromosome 2D SSR markers, previously
thought to be associated with Yr16, were tested on various resistant and susceptible lines. The molecular data suggest
that the position of Yr16 on chromosome 2D needs further verification. Various resistant plants were used in backcrosses
to Avocet S and Palmiet and the resulting F1s were used to produce DHs to simplify future genetic studies. These DH
lines will be evaluated for their stripe rust phenotypes in a field trial in 2003.
Preharvest sprouting and falling number.
A. Barnard.
The South African wheat-producing areas, especially the Eastern Free State, are highly subject to the risk of preharvest
sprouting because of summer rainfall that occurs just prior to or during harvest. Because preharvest sprouting is closely
related to falling number (FN), a substantial amount of research is done on both topics.
Thousands of wheat spikes obtained from various commercial and newly released cultivars are evaluated for
preharvest sprouting tolerance with the help of a rain simulator. This information is handed down to the commercial
farmer to enable him to make the right decision regarding his cultivar choice for the coming season. Recently, more

136
A n n u a l W h e a t N e w s l e t t e r V o l. 4 9 .
attention also was given to breeding programs for sprouting resistance with the help of the rain simulator and protein
electrophoresis. This technique is still in developmental and its usefulness still uncertain. Should this technique prove to
be useful, direct crosses can be made and the progeny screened for the presence of the necessary electrophoretic bands,
ensuring that, as sprouting resistance is a polygenic trade, none of the genes will be lost during the breeding program.
Since the incorporation of the FN method within the grading regulations, attention has been given to the
possibility of managing FN within a wheat production system. The effect of early termination of kernel development
(early harvest) on the FN of wheat and the effect of fertilizer on FN are being investigated.
Wheat production in the Summer Rainfall Region.
Because of the importance of cultivar choice in the Summer Rainfall Region, an extensive cultivar-evaluation program is
followed for each of these areas. Different cultivars are planted in each region and these cultivars are evaluated and
characterized in terms of yield reaction and stability in the different areas. Other characteristics that also are evaluated in
this program include important quality specifications such as hectoliter mass, protein content, and falling number. These
characteristics are used in recommending cultivars best suited for each area in the region.
Dryland production. Almost half of the South African wheat production is in cultivation under dryland conditions in
the Summer Rainfall Region. Because of the large variation in climatic conditions and soil types existing in this region,
wheat production is very challenging. Not only are good cultivation and management practices essential for successful
wheat production, but also the correct cultivar choice. The dryland production area is divided primarily into four
homogenous areas where different cultivars, mainly winter and intermediate types, are planted. All cultivar-evaluation
trials planted at 18 sites throughout the Western, Central, and Eastern Free State were successful and reported. Eighteen
entries were included in the trials, seven were from Small Grain Institute, six from Monsanto, and five from PANNAR.
Production under irrigation. Wheat produced under irrigation amounts to about 20 % of the total wheat production of
South Africa and has a stabilizing influence on the total production. Currently, six major irrigation regions exist,
although irrigation farming is expanding into new regions.
Mainly spring wheat cultivars are planted in a total of 44 evaluation trials at 23 localities in the different
irrigation areas. Entries in these trials originated from Small Grain Institute (7) and from Monsanto (4). A durum
cultivar also was included. ANOVA, AMMI analysis, and biplots are used in the interpretation of results and identifying
cultivar adaptation and stability in the different production regions. Results from these trials are available in a detailed
report.
Wheat production in the Winter Rainfall Region.
There are mainly two wheat producing areas in the Winter Rainfall Region:
•The Swartland area stretches from Durbanville in the south to the Sandveld area around Elandsbaai in the
north and from Saldana Bay in the west to the mountain ranges in the east.
• The Rûens or South Coast area, stretches from Botrivier in the west to the Albertina-district in the east and
from Aghullas in the south to the Langeberg mountain range north of Greyton through to Riversdal.
Spring wheat cultivars are grown in these two regions. These cultivars do not require the same amount of cold
to break their dormancy as that of the winter wheats grown in the rest of South Africa. Cultivar choice in the Winter
Rainfall Region is of extreme importance because of the varied climatic differences between cultivation areas. The
yields of available cultivars differ relative to the changing yield-potential conditions that exist in the Winter Rainfall
Region. Other important factors that also need consideration are grain quality, hectoliter mass, and disease susceptibility.
In the Winter Rainfall Region, the cultivar-evaluation program is run jointly by The Small Grain Institute and
The Directorate of Agriculture of the Western Cape. The program consists of 13 sites in the Swartland and 13 sites in the
Rûens, with 11 cultivars included in the trials. Cultivars, from ARC-Small Grain Institute, Monsanto, and PANNAR, are
annually tested for yield potential, quality, disease resistance, and adaptability.

137
A n n u a l W h e a t N e w s l e t t e r V o l. 4 9.
Karnal bunt in South Africa.
K. Naudé.
Karnal bunt was identified for the first time in South Africa in December 2000 in the Douglas irrigation area. Karnal
bunt is caused by the quarantine organism, Tilletia indica, and according to South African regulations, the occurrence
thereof should be reported to the National Department of Agriculture (NDA).
To date, the South African wheat industry has been protected against wheat imports from countries where KB
already occurs. After the identification of KB in South Africa, a KB Task Team was founded with the objective to
compile protocols to limit the spread of the disease in South Africa. These protocols include the testing of all registered
seed units and all commercial grain for the presence of teliospores produced by the fungus. Using quarantine regulations
and permits for the transportation of grain to intake points and mills also are included.
Karnal bunt occurrence in South Africa. As was the case with the 2001–02 wheat-production season, official surveys
were made by the NDA–Directorate Plant Health and Quality (NDA–DPHQ) to test seed and grain for the presence of
KB spores and infected kernels. All seed units of the 2001–02 season tested free of spores and infected kernels. Karnal
bunt spores and infected kernels, however, were found in grain from the Douglas and Koffiefontein areas. Infection also
was found on four farms in the Douglas district, and these farms were placed under quarantine. Results of the 2002–03
season will be available at a later date.
Control of Karnal bunt. At this stage wheat producers are making use of seed free of KB spores. The treatment or
nontreatment of seed with chemical fungicidal seed dressing is done at the producer’s own discretion. In areas where
KB has been identified, spraying twice with Triticonazole is recommended. A first application is done at 25 % ear
emergence, followed by a second application 10 days later. This spraying system is used by most wheat producers in the
Douglas area with the purpose of limiting KB infection to levels lower than 2 %.
The role of ARC–Small Grain Institute (ARC–SGI). The latest information regarding KB and its control is trans-
ferred to producers, agents, and advisors at farmers’ days and during courses on a continual basis. ARC–SGI tests all its
seed and grain at the KB Laboratory at Bethlehem. All ARC–SGI seed required for planting at the more than 90 locali-
ties country wide is washed at the KB Washing Facility according to procedures used by CIMMYT. Fifty lines and
cultivars of ARC–SGI were evaluated by CIMMYT in the 2001–02 season for KB resistance. These lines and cultivars
will be evaluated by CIMMYT again during the 2002–03 season. Planting of less susceptible or resistant cultivars in the
affected areas is regarded as the only sustainable solution for the control of KB.
Research into the utilization of nitrogen by wheat cultivars under irrigation.
W.M. Otto.
The objective of this research was to measure the yield and protein response of irrigated wheat cultivars to nitrogen (N)
management options. Furthermore, the effect of split N applications combined with residual soil mineral N on grain
yield and quality also is determined. The contributions of soil mineral N, plant uptake of N, and biomass development to
N management of the crop also were calculated. The aim is to develop an N management system that the producer can
implement to optimize all the relevant production factors.
The yield and grain protein responses to split applications of N applied at planting, late tillering, and flag-leaf
stages of six commercially available wheat cultivars (SST 876, SST 822, Kariega, Olifants, Baviaans, and Steenbras)
were measured. The trials were planted at Riet River, Vaalharts, Loskop, and Bethlehem.
The tested cultivars differed in response to split applications of applied N, with the magnitude of yield and
protein response linked to the adaptability and growth period of the respective cultivar. Measured residual soil mineral N
influenced yield response to N. A high level of soil mineral N (205 kg N/ha) decreased the response to applied N,
whereas where a low soil mineral N of 60 kg N/ha was measured, significant responses to applied N were found.

138
A n n u a l W h e a t N e w s l e t t e r V o l. 4 9 .
Protein percentage of the grain increased with an application of 40 kg N/ha at the flag-leaf stage. A decrease in
yield of all the tested cultivars was found when the total N rate was applied at planting. The split application of N, where
80–120 kg N/ha applied at planting was followed by 40–80 kg N/ha at late tillering and 40 kg N/ha at the flag-leaf stage,
resulted in the highest yields and protein percentage of the grain. Plant N analysis at the measured growth stages
indicated that the split application of N increased plant N concentration to within the optimal N analysis range, showing
the potential use of this measurement in N management of the crop.
Wheat Quality Laboratory.
A. Barnard, C.W. Miles, K.B. Majola, M.L.T. Moloi, M.M. Raderbe, N.E.M. Mtjale, C.N. Matla, M.M. Mofokeng, M.L.
Dhlamini, and N.M. Mtshali.
One of the main objectives of the Quality Laboratory is to maintain a cost-effective, highly scientific, and objective
quality assessment of Small Grain Institute breeding lines, to incorporate contract work for milling and baking industries
and private companies, and to provide an objective service to wheat producers. To ensure accurate data to researchers
and external parties, the laboratory takes part in quarterly and monthly ring tests. A total of 57,410 analyses were
performed during 2002.
Soil Analyses Laboratory.
L. Visser.
Soil analyses form an essential part of a producer’s success. The laboratory provides this service and plant and water
analyses to external clients and researchers.
During the 2001–02 financial year, the laboratory performed 111,032 tests on 9,329 samples. Fifty-four percent
of these samples were received from external clients such as producers, advisors, and representatives of different
fertilizer companies. During December 2001, the laboratory bought a new Inductive Coupled Plasma Emission Spec-
trometer. The instrument is known for accurate, reliable, and fast results. With this instrument the laboratory can handle
a larger amount of samples/year and also analyze for elements such as sulphur and boron.
The laboratory is also involved in a research project to evaluate the soil fertility status of resource poor areas
where Small Grain Institute operates. The database will help identify trends like increases in soil acidity and also
improve the quality of technology transfer in future.
In order to ensure an accurate and reliable service to all clients, the laboratory runs internal control samples and
also belongs to Agri-LASA, a national control scheme.
During the past year the external income of the laboratory increased by 10 %. The main objective of the
laboratory is to improve on this by rendering an accurate and efficient service to all clients.
Personnel.
Ms. Vicki Tolmay was appointed program manager of Plant Protection replacing Dr. Hugo Smit. Ms. Anri Barnard has
resigned to pursue household duties. Labious Masike replaced Godwin Khorommbi as a researcher of Plant Protection.
Sanesh Raburam joined Crop Science as a research technician. Willem Otto was transferred to Crop Science to handle
the Cultivar Evaluation Programme under irrigation. Pieter Craven and Danie van Niekerk resigned from Small Grain
Institute.
Publications.
Boshoff WHP and Van Niekerk BD. 2002. Resistance in South African and foreign wheat cultivars to pathotypes
6E16A- and 6E22A- of Puccinia striiformis f. sp. tritici. So Afr J Plant Soil 19(1):27-36.

139
A n n u a l W h e a t N e w s l e t t e r V o l. 4 9.
Boshoff WHP, Pretorius ZA, and Van Niekerk BD. 2002. Establishment, distribution and pathogenicity of Puccinia
striiformis f.sp. tritici in South Africa. Plant Dis 86(5):485-492.
De Villiers BL. 2002. Glyphosate absorption and activity may be explained by the physical appearance of the spray
droplet residuals. In: Proc 17th So Afr Weed Sci Soc Cong, 18–21 June 2002, Umhlanga Rocks, South Africa.
Du Preez CC, Kotze E, and Steyn JT. 2001. Influence of wheat residue management practices on potassium distribution
in a Plinthosol. In: Proc 12th World Fertilizer Cong, 3–9 August, 2001, Beijing, China.
Du Preez CC, Steyn JT, and Kotze E. 2001. Long-term effects of wheat residue management practices on some fertility
indicators of an Avalon soil. In: Proc 23rd Natl Cong Soil Sci Soc So Afr, Pretoria, South Africa.
Hatting JL and Kaya HK. 2001. Entomopathogenic nematodes: prospects for biological control in South Africa. In:
Proc 13th Cong So Afr Ent Soc, 2–5 July 2001, Pietermaritzburg, South Africa.
Labuschagne MT, Mamuya IN, and Koekemoer FP. 2002. Canonical variate analysis of breadmaking quality character-
istics in irrigated spring wheat (Triticum aestivum). Cereal Res Commun 30(1-2):195-201.
Maré, R and Tolmay, VL. 2001. Why does annual Russian wheat aphid infestation on wheat fluctuate? In: Proc 13th
Cong So Afr Ent Soc, 2–5 July 2001, Pietermaritzburg, South Africa (Poster presentation).
Ntushelo K and Van Niekerk BD. 2002. Reaction of South African spring wheat cultivars to head blight caused by
Fusarium graminearum. So Afr J Plant Soil 19(1):50-51.
Otto WM and Kilian WH. 2001. Response of soil phosphorus content, growth and yield of wheat to long-term phospho-
rus fertilization in a conventional cropping system. Nutrient Cycling in Agroecosystems 61(3):283-292.
Prinsloo GJ. 2001. Can the parasitoid Aphelinus hordei (Kurdjumov) smell aphid infested wheat plants? In: Proc 13th
Cong So Afr Ent Soc, 2–5 July 2001, Pietermaritzburg, South Africa.
Tolmay VL. 2002. Resistance to biotic and abiotic stress in the Triticeae. Hereditas 135(2-3):239-242.
Tolmay VL. 2002. Economic and social aspects of pest management: pest tolerance in crops. In: Encyc Pest Manage-
ment, Marcel Dekker Inc, New York. Available online at http://www.dekker.com, 3 pp.
Tolmay VL and Maré R. 2001. Mechanisms of resistance to Russian wheat aphid (Diuraphis noxia) in resistant South
African wheat cultivars. In: Proc 13th Cong So Afr Ent Soc, 2–5 July 2001, Pietermaritzburg, South Africa.
Tolmay VL. 2001. Resistance is the key to a successful revolution. In: Proc 4th Internat Triticeae Symp, 10–12
September, 2001, Cordoba, Spain (Invited Keynote speaker for Session D Resistance to Biotic and Abiotic stresses).
UNIVERSITY OF STELLENBOSCH
Department of Genetics, Private Bag X1, Matieland 7602, South Africa.
G.F. Marais, H.S. Roux, A.S. Marais and W.C. Botes.
Triticale breeding.
Three new triticale cultivars will be available for commercial production in 2003, these are Bacchus, a selection from
CIMMYTs 28th ITYN-48 (SUPI 3//HARE 7265/YOGUI 1); Tobie, a selection from the local cross KIEWIET/4/
W.TCL83/HOHI//RHINO 4/3/ARDI 1; and Ibis, also derived from a local cross FLORIDA 201/17th ITSN 238 (=
DURUM WHEAT/BALBO//BOK”S”). Tobie is a very early maturing triticale with high grain yield and excellent
hectoliter mass, whereas Bacchus is a high-yielding, later maturing cultivar. Ibis is a late-maturing, tall straw cultivar
selected specifically for the production of fodder. Two cultivars released at Stellenbosch, Tobie and USGEN19 (late
maturing), also have been released in Ethiopia under the names Sinan and Maynet, respectively, as part of a collaboration
with the Ethiopian Bureau of Agriculture, Amhara Region, and the German G.T.Z. (Technische Zusammenarbeit)
program coördinated by Dr. K. Feldner.
Recurrent selection of wheat.
A recurrent-selection procedure for wheat based on genetic male sterility and hydroponic culture of cut tillers was
continued and further improvements of the technique were made (Fig. 1). The breeding cycle could be reduced to 4
years (1 year for making crosses and 3 years for inbreeding and field evaluating the F4 and F6 male parents). Single-seed
descent steps were introduced to advance from the F1 to the F6 in the course of 2 years. To accomplish this, two addi-
tional plantings (F2 and F3) are made during the summer months in an uncooled greenhouse. The F4 is again planted in
140
A n n u a l W h e a t N e w s l e t t e r V o l. 4 9 .
Fig. 1. Recurrent mass selection scheme for spring wheat.
Reserve
• Select for leaf and stem rust
F1 hybrid seed seedling resistance
• Marker-aided selection ?
Pollinate selected F1 1/2 Msms 1/2 msms
female plants with (Male sterile) (Male fertile)
selected F6 male plants
Harvest 5–10 random F2 seeds/plant
(800–1,000 plants). Plant (single pot)
in greenhouse by 15 October, year 1
(spring).
Harvest single and bulked seeds of each
pot in December, season 1. Make SDS-
sedimentation tests. Plant 5–10 random
F3 seeds/selection in January of year 2
(summer greenhouse).
Plant F4 rows in the field (normal winter
planting), select single plants from superior
rows.
Plant F5 rows in summer (irrigation).
Inoculate and screen for adult-plant
stem rust resistance.
Evaluate as unreplicated F6 plots; micro-mill,
and evaluate mixograph and kernel hardness.
Advanced trials: select for agrotype,
disease resistance, yield, and quality.
Regional tests
Select for resistance
genes and/or
markers.
Year 4 Year 3 Year 2 Year 1

141
A n n u a l W h e a t N e w s l e t t e r V o l. 4 9.
the normal growing season (winter) and the F5 planted under irrigation during the summer. The F6 is used for the first
yield trials (plots) in the third winter. This modification has several advantages. The shorter breeding cycle allows for a
more rapid increase in the frequency of desirable alleles of disease resistance loci. However, properly selecting for
agronomic and quality characteristics of lower heritability is still possible. Inbreeding to the F6 has the same effect as the
use of DH technology but can be achieved at considerably reduced costs. When inbred male parents are selected for
marker or disease-resistance loci, very rapid shifts in the frequency of desirable alleles occur. Once the frequency of the
favorable allele of a number of genes has been raised to 0.70 or higher, a significant proportion of inbreds will have these
genes fixed in their genotypes, i.e., the procedure facilitates gene pyramiding. The advantage of pyramiding genes in
this manner is that there is no yield ceiling as is the case with backcross-based procedures and numerous diverse geno-
types with pyramided genes can be generated over time.
Genetic studies.
In 1993, we initiated a program for transferring leaf rust-resistance genes identified in a collection of wild Triticum
species. We have developed advanced material of 11 sources that show effective resistance to all known local patho-
types of one or more of the diseases leaf, stem, and stripe rusts. These include a subset of six lines in which resistance
(derived from T. turgidum subsp. dicoccoides, Ae. sharonensis, Ae. speltoides, Ae. peregrina, and Ae. kotschyi) appears to
occur on wheat chromosomes and five addition lines with added chromosomes from Ae. peregrina, Ae. umbellulata, Ae.
biuncialis, and Ae. neglecta. In several instances, promising stem rust and/or stripe rust resistance genes were co-
transferred with leaf rust resistance. The stripe rust resistance genes (from T. turgidum, Ae. sharonensis, Ae. speltoides,
Ae. peregrina, Ae. kotschyi, and Ae. biuncialis) also were effective against four Australian pathotypes and appeared to be
novel (evaluations done by Dr. Colin Wellings, University of Sydney). Leaf rust-resistance genes in 10 of the sources
showed promising resistance to commonly occurring Western Canadian pathotypes of the disease (evaluated by Dr.
Brent McCallum, Cereal Research Centre, Winnipeg, Canada). Stem rust-resistance genes from two Ae. speltoides
sources were tested with Western Canadian stem rust pathotypes (Dr. Thomas Fetch, Cereal Research Centre, Winnipeg,
Canada). One source showed resistance to all pathotypes whereas another was susceptible to one of the pathotypes. All
the genes appear to have a wide spectrum of resistance to justify continued introgression into wheat. Preliminary results
would suggest that the Ae. kotschyi-derived genes (leaf and stripe rust resistance) occur on chromosome 2D, whereas leaf
and stripe rust-resistance genes from Ae. sharonensis are on 3B. Resistance from Ae. biuncialis and Ae. neglecta appears
to be on group-3 chromosomes of these species. Some of the resistance genes have preferential transmission and the Ae.
speltoides-derived genes may involve gametocidal effects.
A unique, Th. distichum/ 4x rye hybrid (95M1) with genomes J1dJ2dRR allowed us to identify four Thinopyrum
chromosomes apparently involved with salt tolerance. When 95M1 was pollinated with diploid rye it yielded F1 off-
spring with primarily 21 chromosomes (two complete rye genomes and seven Thinopyrum chromosomes). Apparently,
the closely related homoeologous chromosomes of the J1d and J2d genomes regularly formed bivalents during megasporo-
genesis, and egg cells mostly received a random, yet balanced set of seven Thinopyrum chromosomes. F1 plants were
tested for salt tolerance and a set of 15 highly salt-tolerant F1 plants were selected and maintained as clones for several
years. These plants were C-banded and the Thinopyrum chromosomes in each line were determined. By comparing
segregation patterns, the Thinopyrum chromosomes were grouped into seven homoeologous pairs. For each of four
homoeologous pairs, one of its members occurred at a higher than expected frequency, implying that these chromosomes
are primarily being expressed under salt-stress conditions. The results could be confirmed by backcrossing two of the
most tolerant F1 plants to diploid rye. Although the critical chromosomes can be identified through C-banding, an
attempt also was made to find an RFLP marker for each. RFLP probes, diagnostic for the group 2, 3, 4, and 5
homoeologues of wheat, detected polymorphisms on the respective critical Thinopyrum chromosomes. However, the
preliminary allocation of the critical chromosomes to homoeology groups needs to be confirmed using more and varied
markers. An attempt also was initiated to develop triticale plants with disomic additions of the respective critical
Thinopyrum chromosomes. Disomic addition lines producing the group-3 and 5 RFLPs of two of the target chromo-
somes have been recovered and are being used in attempts to induce translocations to triticale chromosomes.

142
A n n u a l W h e a t N e w s l e t t e r V o l. 4 9 .
ITEMS FROM SPAIN
UNIVERSIDAD POLITECNICA DE MADRID
Departamento de Biotecnologia, E.T.S. Ing. Agronomos.- C. Universitaria, 28040,
Madrid, Spain.
A. Delibes, I. López-Braña, M. J. Montes, and C. González-Belinchón.
UNIVERSIDAD DE LLEIDA
Institut de Recerca i Tecnologia Agroalimentaries (UdL-IRTA).
Rovira Roure, 191-25198 Lleida, Spain.
J.A. Martín-Sánchez, E. Sin, C. Martínez, and A. Michelena.
JUNTA DE EXTREMADURA. SERVICIO DE INVESTIGACION AGRARIA.
Departamento de Fitopatología. Ap. 22 CP. 06080 Badajoz, Spain.
J. del Moral, F. Pérez-Rojas, F. J. Espinal, and M. Senero.
Studies in relation to the Hessian fly-resistance gene (H30) transferred from the wild grass
Aegilops triuncialis to hexaploid wheat.
The transfer line TR-3531 (42 chromosomes), derived from the cross ‘T. turgidum/Ae. triuncialis//T. aestivum’ and
carrying the H. avenae resistance gene Cre7 (Romero et al. 1998), showed a high level of resistance to the M. destructor
biotype prevailing in southwestern Spain. A single, dominant gene (H30) determines the Hessian fly resistance in this
introgression line (Delibes et al. 2001), and its linkage with an isozyme marker (Acph-U1) has been studied. A phos-
phatase marker, resolved into two components, is present in the TR-3531 line, Ae. triuncialis (UC), Ae. umbellulata (U),
and the amphiploid Chinese Spring/Ae. umbellulata (ABDU), but is absent in Ae. caudata (C). Linkage between H30
and the Acph-U1 marker (associated with the U genome) was determined by analyzing 126 individual (TR-3531/H-10-
15) F2 plants. The kernels were cut transversely and the halves without embryos were used to obtain phosphatase
zymograms, an enzymatic system associated in wheat with homoeologous group 4 (Delibes et al. 1997a). The linkage in
this cross is not very tight, which would be consistent with the recombination expected of the ability of the C genome to
suppress the Ph-diploidization mechanism of wheat (Romero et al. 1998).
F2 progeny, derived from crosses between different wheat cultivars from Uniform Hessian Fly Nursery (UHFN
and H-93-33 transfer line) and with other sources of resistance, and TR-3531 were tested for resistance in field condi-
tions in order to determine if the new resistance gene was allelic with the H3, H5, H6, H12, H13, H18, H21, or H27
genes. Although the cultivars from UHFN are effective against Hessian fly in the United States, there is no evidence that
the selected genes confer resistance to biotype present in Azuaga (southwestern Spain). The results and summarized in
Table 1. All UHFN cultivars tested with different genes were resistant to this biotype, except the cultivar Abe with the
gene H5, which showed a inconsistent reaction. The resistance gene H30 in line TR-3531 is nonallelic with respect to
the genes H3, H6, H12, H13, H18, and H21 present in wheat cultivars from UHFN and H27 in the introgression line H-
93-33 (Delibes et al. 1997a and b). Previously, we demonstrated that H30 in TR-3531 line was not allelic with respect
H9 and H11 present in cultivars Ella and Kay, respectively (Delibes et al. 2001).
Advanced lines with the H30 gene were obtained by backcrossing the transfer line and different commercial
wheats (cultivars Anza, Betres, Cajeme, Cartaya, Marius, Rinconada, and Osona) as recurrent parents. In all advanced
lines, the infestation level was higher, but in the same range, than the donor. Several agronomic characteristics were
studied in 16 advanced lines and the results of three of the lines are summarized in the Table 2. The best results were

143
A n n u a l W h e a t N e w s l e t t e r V o l. 4 9.
achieved with the Ma-6
line, which displayed
good agronomic charac-
teristics, in comparison to
the susceptible controls,
for the three traits studied.
Another fact that in-
creases the importance of
this line is that it also
carries the CCN resistance
gene Cre7.
Coöperation with other
institutions. We are
coöperating with Acorex
(Cooperative of
Extremadura farmers).
Financial support. This
work was supported by
grants AGL2001-3824-CO4, PTR 95-0496-OP CO1021001 from CICYT “Comision Interministerial de Ciencia y
Tecnologia” of Spain and IPR99A042 (Junta de Extremadura).
References.
Delibes A, Del Moral J, Martín-Sánchez JA, Mejías A, Gallego M, Casado D, Sin E and López-Braña I. 1997a. Hessian
fly-resistance gene transferred from chromosome 4Mv of Aegilops ventricosa to Triticum aestivum. Theor Appl Genet
94:858-864.
Delibes A, López-Braña I, Martín-Sanchez JA, Sin E, Martínez C, Michelena A, Del Moral J and Mejías A. 1997b.
Transfer of one gene for resistance to Hessian fly (Mayetiola destructor) from Aegilops ventricosa to cultivars of
wheat. Ann Wheat Newslet 43:214-215.
Table 1. Hessian fly reactions of the parents, F1, and F2 populations from crosses between wheats with
different resistance genes and the resistant line TR-3531, a carrier of the H30 gene. Hessian fly reaction of
line R-3531 is 25R:0S. R = resistance and S = susceptibility to Hessian fly. UHFN = Uniform Hessian Fly
Nursery.
Hessian fly reaction
Crosses between cultivars of the UHFN / TR-3531
UHFN No. F1No. F2 X2(1:d.f.)
line plants plants 15:1 ratio
Cultivar or Chromo-
UHFN line Gene some R:S R:S R:S Value Probability (P)
Howell H3 5A 18:0 7:0 154:8 0.46 0.5
Monon H3 5A 19:0 9:0 187:6 3.25 0.05<P<0.1
Caldwell H6 5A 29:0 8:1 218:14 0.02 0.9
841453
H15-1-1-2-5-2 H12 5A 26:1 2:0 95:1 4.45 0.01<P<0.05
86925 RA1-16 H13 6DL 18:2 3:0 140:7 0.55 0.3<P<0.5
Brule H18 —15:4 7:0 141:2 5.74 0.01<P<0.05
KS86HF012-23-6 H21 2BS 19:0 7:0 243:6 6.27 0.01<P<0.05
H-93-33 H27 4Mv21:0 7:0 50:5 0.76 0.3<P<0.5
Table 2. Agronomic characteristics of three advanced lines with the H30 resistance gene
in comparison to three bread wheat cultivars.
Yield Kernels 1,000-kernel
Cultivar or line (g/m2)/spikelet weight (g)
T. aestivum cv. Osona 1,240.57 2.71 29.49
T. aestivum cv. Astral 897.55 1.64 30.17
T. aestivum cv. Adalid 1,687.51 2.65 33.14
Ma6: TR/OS⊗//OS/3/RN/4/OS/5/RN/6/AZ 3⊗1,914.12 3.00 43.37
Ma4: TR/BT⊗//AL/3/MA/4/3*BT 2⊗1,336.08 2.84 27.65
Ma3: TR/3*OS//4*CYÄ/3/CJ 4⊗1,486.86 2.64 32.50
Least significant difference (LSDP<0.05) 409.16 0.47 5.05
Abbreviations used: Ma = advanced lines, TR = TR-353 line, AZ = Anza, BT = Betres, CJ =
Cajeme, CY = Cartaya, MA = Marius, OS = Osona, RN = Rinconada, ⊗ = selfing.

144
A n n u a l W h e a t N e w s l e t t e r V o l. 4 9 .
Delibes A, López-Braña I, Montes MJ, Gómez-Colmenarejo M, Romero D, Andrés MF, Martín-Sánchez JA, Sin E,
Martínez C, Michelena A, del Moral J, and Mejías A. 2001. Transfer of resistance genes to Hessian fly and Cereal
Cyst nematode from Aegilops triuncialis to hexaploid wheat and its use in breeding programs. Ann Wheat Newslet
47:198-200.
Romero MD, Montes MJ, Sin E, López-Braña I, Duce A, Martín-Sánchez JA, Andrés MF and Delibes A. 1998. A cereal
cyst nematode (Heterodera avenae Woll.) resistance gene transferred from Aegilops triuncialis to hexaploid wheat.
Theor Appl Genet 96:1135-1140.
Publications.
Andrés MF, Romero D, Montes MJ and Delibes A. 2001. Genetic relationships and isozyme variability in Heterodera
avenae complex determined by isoelectrofocusing. Plant Pathol 50:270-279.
Andrés MF, Melillo MT, Delibes A, Romero MD and Bleve-Zacheo T. 2001. Changes in wheat root enzymes correlated
with resistance to cereal cyst nematodes. New Phytol 152:343-354.
Andrés MF, Melillo MT, Delibes A, Romero MD and Bleve-Zacheo T. 2001. Biochemical and cytochemical changes in
a resistant wheat/ Aegilops ventricosa introgression line during cereal cyst nematode infection. In: Proc 11th Cong
Mediter Phytopathological Union and 3rd Cong Sociedade Portuguesa de Fitopatologia, Evora (Portugal), 17–20
September.
Andrés MF, Melillo MT, Delibes A, Romero MD and Bleve-Zacheo T. 2002. Biochemical and cytochemical changes in
a resistant wheat/ Aegilops ventricosa introgression line during cereal cyst nematode infection. Phytopath Meditet (in
press).
Delibes A, López-Braña I, Montes MJ, Gómez-Colmenarejo M, Romero MD, Andrés MF, Martín-Sánchez JA, Sin E,
Martínez C, Michelena A, del Moral J and Mejías A. 2001. Transfer of resistance genes to Hessian fly and Cereal
Cyst nematode from Aegilops triuncialis to hexaploid wheat and its use in breeding programs. Ann Wheat Newslet
47:198-200.
Delibes A, López-Braña I, Montes MJ, Gómez-Colmenarejo M, González-Belinchón C, Romero D, Andrés MF, Martín-
Sánchez, JA, Sin, E, Martínez C, and Michelena A. 2002. Differential induction of defence-enzymes and chromo-
somal location of two Heterodera avenae resistance genes transferred to wheat from Aegilops ventricosa. Ann Wheat
Newslet 48:165-167.
Delibes A, López-Braña I, Montes MJ, Gómez-Colmenarejo M, González-Belinchón C, Martín-Sanchéz JA, Sin E,
Martínez C, and Michelena A, del Moral J, Pérez-Rojas F, and Espinal FJ. 2002. Resistance to Hessian fly conferred
by the gene H27. Relationships with other sources of resistance and its effect in some agronomic traits. Ann Wheat
Newslet 48:167-169.
Del Moral J, Delibes A, Martín JA, Pérez-Rojas F, Rubiales D, Merino M, Sin E, Martínez C, Montes MJ, Sereno M and
Campos L. 2001. Selección de una colección de líneas avanzadas de trigo con resistencia a Mayetiola destructor
Say. por su comportamiento frente a los patógenos y accidentes fisiológicos más importantes de este cultivo en la
Campiña Sur de Extremadura. In: Proc II Congr Nac Ent Aplicada, VIII Jornadas Científicas de la S.E.E.A.
Pamplona (Spain), November (in Spanish).
Del Moral, J, Delibes A, Martín-Sánchez JA, Mejías A, López-Braña I, Sin E, Montes MJ, Pérez-Rojas F, Espinal F and
Senero M. 2002. Obtención de líneas de trigo resistentes a Mayetiola destructor say en la campiña sur de
Extremadura. Boletín Sanidad Vegetal 28(4):585-590 (in Spanish).
Martín-Sánchez JA, Gómez-Colmenarejo M, Del Moral J, Sin E, Montes MJ, González-Belinchón C, López-Braña I,
Delibes A. 2002. A new Hessian fly resistance gene (H30) transferred from the wild grass Aegilops triuncialis to
hexaploid wheat. Theor Appl Genet (in press).
Martín-Sánchez JA, Montes MJ, López-Braña I, Romero MD, Sin E, Martínez C, Andrés MF, Gómez-Colmenarejo M,
González-Belinchón C, Delibes A. 2002. Differential induction of defence-enzymes and chromosomal location in
wheat/Aegilops ventricosa introgression lines of Cre2 and Cre5 Heterodera avenae resistance genes. In: Eucarpia
Cereal Sect Meet, Salsomaggiore, Italy, 21–25 November.
Montes MJ. 2001. Transferencia de un gen de resistencia al nematodo de quiste de los cereales, Heterodera avenae,
desde Aegilops triuncialis a trigo hexaploide. Relaciones con otros genes de resistencia. PhD Thesis. Universidad
Politecnica de Madrid, Spain (in Spanish).
Montes MJ, Gómez-Colmenarejo M, Andrés MF, Romero MD, López-Braña I, Delibes A. 2002. Inducción de enzimas
relacionados con el estrés oxidativo en líneas de introgresión trigo/Aegilops portadoras de los genes de resistencia a
Heterodera avenae Cre2, Cre5 y Cre7. In: Proc XI Congr Soc Esp Fitopatología, Almería, Spain, 14–18 October (in
Spanish).

145
A n n u a l W h e a t N e w s l e t t e r V o l. 4 9.
Montes MJ, López-Braña I, Gómez-Colmenarejo M and Delibes A. 2001. Enzimas relacionadas con el estres oxidativo
inducidas en raices de trigos resistentes Heterodera avenae, en respuesta a la infestacion por el nematodo. Congr Soc
Esp Genet, Sevilla, Spain, 19–22 September (in Spanish).
Montes MJ, López-Braña I, Romero, MD, Sin E, Andrés MF, Martín-Sánchez JA, Gómez-Colmenarejo M and Delibes
A. 2002. Comparative study of two Heterodera avenae resistance genes from Aegilops ventricosa. Differences in
defence-enzymes induction and chromosomal location in wheat/Ae. ventricosa introgression lines. In: Proc 4th
Internat Congr Nemat, Tenerife, Spain, 8–13 June.
Ogbonnaya S, Seah I, Delibes A, Jahier J, López-Braña I, Eastwood RF and Lagudah ES. 2001. Molecular-genetic
characterisation of nematode resistance from Aegilops ventricosa and its derivatives in wheat. Theor Appl Genet
102:263-269.
Sin E, Montes MJ, Romero MD, López-Braña I, Andrés MF, Martín-Sánchez JA, Benavente E, Gómez-Colmenarejo M,
Delibes A. 2001. Transferencia del gen de resistencia a Heterodera avenae (Cre7) desde Aegilops triuncialis a trigo
hexaploide. In: Congr Soc Esp Genet, Sevilla, Spain, 19–22 September (in Spanish).
ITEMS FROM TURKEY
CIMMYT AND THE MINISTRY OF AGRICULTURE AND RURAL AFFAIRS
P.K. 39 Emek, 06511 Ankara, Turkey.
H.J. Braun, A.R. Hede, J. Nicol, and B. Akin (CIMMYT–Turkey); M. Keser, N. Bolat, N. Colak, H. Ekiz, S. Taner, S.
Ceri, F. Partigoc, L. Cetin, S. Albustan, F. E. Donmez, Dusunceli, S. Yazar, I. Ozseven, I. Ozturk, and T. Yildirim
(Ministry of Agriculture and Rural Affairs); and M. Mousaad and A. Yahyaoui (ICARDA, Aleppo, Syria).
The International Winter Wheat Program (IWWIP) is a joint program carried out by the Ministry of Agriculture of
Turkey, CIMMYT, and ICARDA. The two main objectives of the program are to develop broadly adapted, disease-
resistant, high-yielding winter wheat germ plasm for the winter and facultative wheat-growing areas in Central and West
Asia and North Africa (CWANA) and to help facilitate germ plasm exchange among the winter wheat-breeding programs
around the world.
Of the 103 million ha of wheat grown in the least-developed countries. Approximately 31 x 106 ha are winter
and facultative wheat, of which 16.5 x 10⁶ ha are sown in CWANA; 13 x 106 ha in China; and 1 x 10⁶ ha in South
America, North Africa, and North Korea. After China, Turkey is the 2nd largest winter wheat grower among the least-
developed countries with 6.6 x 10⁶ ha; followed by Iran with 4 x 10⁶ ha.
News on germ plasm development and cultivar releases.
Since 1980, 27 cultivars from the IWWIP program have been released in CWANA. In 2002 alone, nine cultivars were
released in Afghanistan (1), Georgia (1), Turkey (6), and Uzbekistan (1) (Table 1). Three of these cultivars are targeted
for rainfed areas and five for irrigated/supplementary irrigation conditions. Thirty-four cultivars are presently included
in registration trials in Armenia (6), Georgia (1), Kazakhstan (2), Kyrghyzstan (7), Tajikistan (6), Turkey (5),
Turkmenistan (3), and Uzbekistan (4).
The winter wheat program draws heavily on the winter (W)/spring (S) crosses. A major contribution to the
winter wheat program is made through the spring wheat lines developed at CIMMYT–Mexico, which are crossed with
winter wheats. Many of the most successful CIMMYT spring wheats were derived from W/S crosses. Now, the same is
happening for winter wheat. More than 75 % of the IWWIP lines released or in registration trials are selected from
crosses between winter and spring wheat lines and three-way crosses (winter/spring//winter). These WSW-derived
cultivars are now making their way into registration trials throughout the CWANA region (Fig. 1).
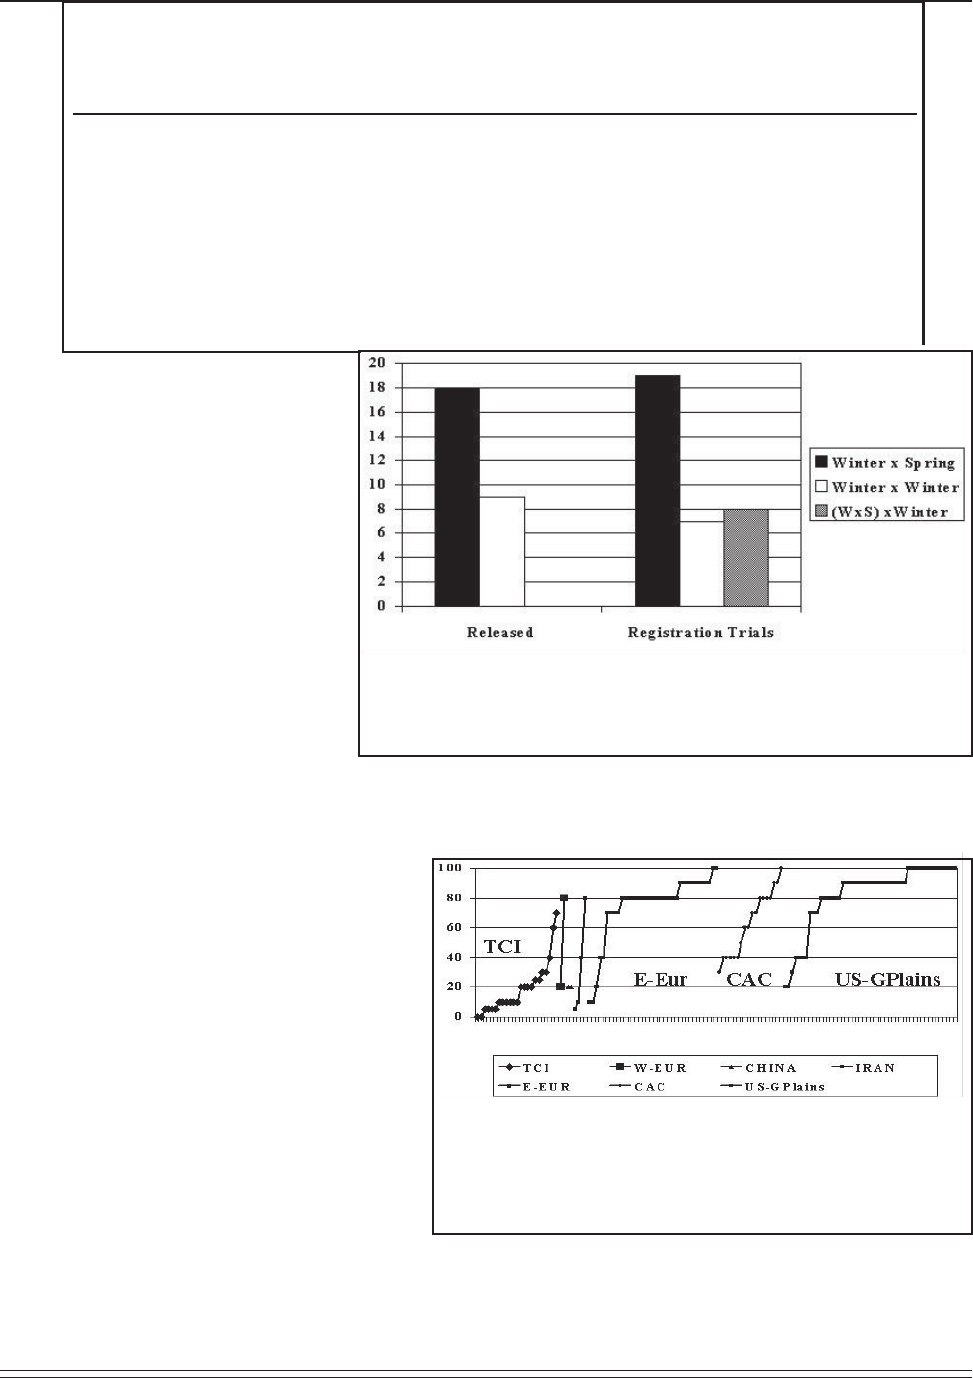
146
A n n u a l W h e a t N e w s l e t t e r V o l. 4 9 .
News on germ plasm exchange:
the case of yellow rust.
The Facultative and Winter Wheat
Observation Nursery (FAWWON) has
served as the main vehicle for facilitating
germ plasm exchange among winter
wheat programs. This nursery consists of
lines developed by the IWWIP program
and of cultivars submitted by national
programs, university programs, or private
companies from countries in CWANA,
western and eastern Europe, China,
South America, and the U.S.A. The 11th
FAWWON consisting of 146 entries was
distributed for planting in the 2001–02
cropping cycle to around 80 coöperators
from more than 40 countries
Yellow rust is one of the most important
leaf diseases for the winter wheat areas in west
and central Asia. Within the last decade, CWANA
countries suffered several major yellow rust
epidemics, with losses up to 50 %. Fig. 2 shows
the maximum yellow rust score from the evalua-
tion of the 11th FAWWON across 10 locations in
Iran (5), Turkey (1), Azerbaijan (1), Tajikistan (1),
Syria (1), and China (1). Characteristically, most
lines developed by the IWWIP program show
good levels of resistance, whereas most other lines
are highly susceptible to yellow rust. The fact that
many yellow rust-susceptible, but otherwise
excellent, lines with highly favorable characteris-
tics will be dismissed by breeders due to yellow
rust susceptibility and, therefore, not utilized by
breeding programs has forced us to think of ways
to restructuring the FAWWON nursery. These
changes will be implemented within the coming
year.
Table 1. International Winter Wheat Program-derived wheat cultivars registered in Central and West Asia
and Northern Africa in 2002.
Country Cultivar Cross Type
Afghanistan Solh02 OK82282//BOW/NKT WS
Georgia Mtsjetslaua 1 TAST/SPRW//ZAR WS
Turkey Soyer ATAY/Galvez WS
Turkey Yildirim ID800994.W/VEE WS
Turkey Daphan JUP/4/CLLF/3II14.53/ODIN//CI14431/WA00477 WS
Turkey Bagco 2002 HN7/Oorfen//BJN8/3/SERI82/4/74CB462/Trapper//Vona WW
Turkey Nenehatun ND/P101/Blueboy
Turkey Sakin PI/FUNO*2//VLD/3/CO723595 WW
Uzbekistan Dostlik YMH/TOB//MCD/3/LIRA WS
Fig 1. Frequency of winter (W)/spring (S), W/W, and W/S//W crosses in
International Winter Wheat Program-derived cultivars registered since
1980 or lines presently in registration trials in Central and West Asia and
Northern Africa.
Fig 2. Maximum scores for resistance to yellow rust across 10
locations in six countries in Central and West Asia and North
Africa of 146 entries in the 11th Facultative and Winter Wheat
Observation Nursery. Entries within each group of origin are
sorted by increasing susceptibility.

147
A n n u a l W h e a t N e w s l e t t e r V o l. 4 9.
Research on root rots and nematodes.
H. Aktas, A. Bagci, N. Bolat, O. Buyuk, C. Cekic, H. Ekiz, I. Gultekin, H. Hekimhan, Y. Kaya, M. Keser, I. Ozseven, M.
Tekeoglu, H. Toktay, B. Tunali, A. Tulek, Zafer Uçkun, A.F. Yildirim, and A. Yorgancilar (Turkish Ministry of Agricul-
ture and Rural Affairs); H.J. Braun, M. Mergoum, J. Nicol, R. Trethowan, M. van Ginkel, and M William (CIMMYT
International); H. Elekcioglu (Cukurova University); E. Sahin (Osman Gazi University); and R. Rivoal (INRA/ENSAR
France).
Since 1998, the Ministry of Agriculture and Rural Affairs in Turkey (MARA) in collaboration with CIMMYT staff based
in Turkey have initiated two key National/International projects. One of these is on cereal nematodes and the other on
cereal root rots. These projects cover a range of research areas including;
– surveys,
– economic importance and population dynamics,
– identifying of sources of resistance, and
– control methods emphasising plant genetic resistance.
Below is a brief summary of some of our findings to date. We very much encourage anyone interested in
collaborating with our program to make contact with us.
Preliminary surveys. These surveys have been conducted on the Central Anatolian Plateau, the major winter wheat-
growing region of Turkey. The objective was to understand the distribution of two economically important cereal
nematodes, cyst (Heterodera spp.), and lesion (Pratylenchus spp.). Seventy-two percent of the root samples and 83 % of
the soil samples contained cysts and in approximately 40 % of soil samples one or both lesion nematodes were found.
Cereal cyst nematode was identified to species level using both traditional morphology and a RFLP PCR-based molecu-
lar method. None of the samples contained H. avenae, the most common cereal cyst nematode documented. Instead, 40
% of the samples contained H. latipons, 32 % H. filipjevi, and 28 % a mix a both species
A range of Fusarium species have been isolated from cereal crown roots with the most frequently isolated
species being F. culmorum, F. nivale, F. psuedograminearum, F. acuminatum, and F. heterosporum.
The taxonomy of cyst nematode is very time consuming and difficult, and work is underway to optimize the
molecular technology to identify the different species of Heterodera. We hope in the near future to relate and collate
survey data with both classical morphology and molecular methods.
In many cases, several species of nematodes and root rots are present in the same soil, suggesting that we are
dealing with a root disease complex and management strategies need to account for this. In addition, zinc deficient soils
are widespread and can be considered part of the problem complex (Cakmak et al. 1999).
To understand the economic importance and population dynamics of both nematodes and root rots, multi-
location and multi-year yield trials are being conducted. Work with root rots is more advanced than with nematodes.
Data from 2-year yield trials with and without root rot inoculation (inoculated as a mix of both Fusarium species and
Bipolaris) indicate that most of the common winter wheat cultivars grown in Turkey are intolerant suffering average
yield losses of 37 %. Furthermore, preliminary data of only 1 year suggests strongly that sources of spring wheat
resistance identified in Australia and confirmed at CIMMYT–Mexico also are resistant and have high tolerance under
field conditions in Turkey. We are in the second year of field testing with nematodes in three locations. Preliminary data
from last year clearly show economic grain loss, with most common winter wheat cultivars being intolerant and suscep-
tible (i.e., allow nematode multiplication) to both the lesion and cyst nematodes. Detailed knowledge is available about
the population dynamics of the lesion nematodes (P. thornei and P. neglectus) and at least one of the species of cyst
nematode (H. avenae). However, little is known about the biology and behavior of other Heterodera species that are
commonly found in winter wheat areas of the world, namely H. filipjevi and H. latipons. In addition to monitoring field-
population dynamics, we also conduct a range of basic biological experiments to identify factors that affect the hatch of
the cysts and to understand the duration of the life cycle and the infection process.
Identification of sources of resistance. A major focus of the work is to screen winter wheat and identify sources of
resistance to both the key nematodes and root rots. Again, this work is more advanced with root rots than nematodes on
winter wheat. Over 100 crosses/year are being made with sources of both nematode and root rot-resistant germ plasm

148
A n n u a l W h e a t N e w s l e t t e r V o l. 4 9 .
(Nicol 2002; Nicol et al. 2001). Spring wheat lines with confirmed root disease resistance also are used in the crossing
program.
A large screening program in the south of Turkey near Konya was established where annually around 2,000
accessions are inoculated with a root rot complex. The best accessions form screening nurseries are further tested in
replicated screening and yield trials. Resistant lines are confirmed based on field trials and greenhouse work. Screening
for nematode resistance concentrates on field screening at present, but work is underway to establish pure nematode
cultures in the laboratory and ultimately screen with individual nematodes under controlled laboratory conditions. With
cyst nematode, more work is required to understand the biology before such screening can be conducted on a larger
scale.
Work within CIMMYT also is utilizing the tools of molecular biology in a MAS strategy. Several markers for
known nematode-resistance genes developed in Australia are optimized and are being used routinely on CIMMYT germ
plasm. However, given the complexity of the nematode in the region we need to confirm the effectiveness of these
known sources of resistance with the range of nematode populations from the region.
Once we have more advanced plant populations (F4/F5) where resistance has been incorporated, we will conduct
confirmation screening to validate the incorporation of resistances using both traditional and molecular tools where
appropriate. As we produce these root disease resistant wheat lines, they will be distributed through the international
nurseries.
Cereal nematodes and root rots can be controlled in several ways. The major emphasis in our program is placed
on using plant genetic resistance. Because resistance alone is probably not the complete answer (as many resistances are
partial), other methods need to be investigated. To control root rots, we will look at the effects of seed treatment with
fungicides, application of microelements (including B, Cu, Fe, Mn, S, and Zn), seed-sowing density, and rotation
experiments of cereals with other non-cereal crops (such as canola and sugar beet). With nematodes, we will look at the
effect of crop rotation and management practices (such a conservation tillage and cultivation) on nematode numbers. As
has been proven in the U.S. and Australia, there is no doubt that agronomic practices have a key role to play in the
control of these pathogens.
Progress to date on breeding for root rot resistance and tolerance.
Extensive field screening over the last 3 years has assessed the resistance of winter wheat germ plasm against root rots
under field conditions. Resistance is defined as a reduction in symptom development of the disease. In Cumra, 40 km
south of Konya, field-observation plots were assessed by inoculating seed with a combination of root rot species
(Fusarium and Bipolaris) and comparing symptom development against uninoculated plots. These lines are now
entering yield trials to assess tolerance (yield loss) and also have been extensively crossed in the IWWIP program. The
best entries after 3-year screening are shown in Table 2. Several of the identified lines are widely grown cultivars such
as Gerek 79, Dagdas, and Katia-1.
Training. The IWWIP program is training Turkish scientists and scientists from the region in the field of soil disease
cereal research. This includes postgraduate training and special courses such as the one planned for June 2003 in Turkey.
Several Australian pathologists will attend this course to provide their expertise and knowledge. The training course is
called ‘Soil Borne Pathogens of Cereals’ and will be from 14–28 June under the coördination of the IWWIP. Participants
will be trained to work with both nematodes and root rots. We are very grateful to the sponsors, principally led by the
ATSE Crawford Fund, CIMMYT, MARA, ICARDA, GRDC, ACIAR, and the Kirkhouse Trust.
Concluding remarks. We believe by conducting this highly focused, complex and difficult research we can clearly
define the soilborne constraints in the winter wheat regions of CWANA and ultimately significantly improve wheat
production and sustainability of the cropping systems in our region. The key to this will involve a breeding approach to
produce high-yielding, quality-adapted germ plasm combined with multiple root disease resistances and microelement
efficiencies, complimented with appropriate management practices. This work is large and encompassing, and we
welcome any collaboration from interested parties.

149
A n n u a l W h e a t N e w s l e t t e r V o l. 4 9.
Publications.
Nicol JM. 2002. Important Nematode Pests of Cereals. In: Bread Wheat Production and Improvement, FAO Plant
Production and Protection Series, FAO, Rome, Italy. Pp. 345-366.
Nicol JM, Rivoal R, Bolat N, Aktas H, Braun HJ, Mergoum M, Yildrim AF, Bagci A, Eleckcioglu H, and Yahyaoui, A.
2002. The frequency and diversity of the cyst and lesion nematode on wheat in the Turkish Central Anatolian Plateau.
Nematology 4(2):272.
Nicol JM, Rivoal R, Trethowan RM, van Ginkel M, Mergoum M, and Singh RP. 2001. CIMMYT’s approach to identify
and use resistance to nematodes and soil-borne fungi, in developing superior wheat germplasm. In: Wheat in a
Global Environment (Bedö Z and Láng L eds.). Kluwer Academic Publishers, Netherlands. Pp. 381-389.
Table 2. Germ plasm with field resistance to the root complex after 3 years of field inocula-
tion experiments in Cumra, Turkey. TK = Turkey, TCI = TURKEY/CIMMYT/ICARDA
IWWIP.
Cross Origin
LOV41//LI7/LE2062 Argentina–TCI
Katea-1 Bulgaria–Sadovo
Dachnaya/LAJ3302 TCI
Bilinmiyen96.7 TCI
Burbot-6 TCI
Zargana-2 TCI
Zargana-3 TCI
ECVD12/KAUZ//Unknown TCI
F12.71/SKA//FKG15/3/F483/4/CTK/VEE TCI
F130L1.12/Attila TCI
KRC66/SERI//KINACI79 TCI
KS82W409/SPN//CA8055 TCI
NEMURA/KAUZ//AGRI/NAC TCI
OK81306//ANB/BUC/3/GRK/7C TCI
OK81306/SITTA//AGRI/NAC TCI
Orkinos-1 TCI
Orkinos-3 TCI
PYN//TAM101/AMI/3/KRC66/SERI TCI
Sultan 95 TCI
TAM200/KAUZ TCI
BEZ/TVR/5/CFN/BEZ//SUW92/CI13645/3/NA160/4/EMU/6/UNA TK–Edirne
BEZ/HAWK//ES14 TK–Eskisehir
Cerco/Alondra TK–Eskisehir
ES 14/Flamura 85 TK–Eskisehir
GEREK79 TK–Eskisehir
BLL2973/Thunderbird TK–Konya
DAGDAS TK–Konya
HAWK/AIRI TK–Konya
PLK70/LIRA”S//30-KZ-1 TK–Konya
TX71A1039-VI*3/AMI(TX81V6603)//MVR16-85 TK–Konya
HARA456/4/61-130/414-44//68111/WARD/3/69T02 TK

150
A n n u a l W h e a t N e w s l e t t e r V o l. 4 9 .
ITEMS FROM THE UKRAINE
INSTITUTE OF PLANT PRODUCTION N.A. V.YA. YURJEV
Moskovsky prospekt, 142, 61060, Kharkiv, Ukraine.
The relationship between glume, lemma, and kernel size in polonoid wheats.
R.V. Rozhkov and O.O. Kushchenko.
Polonoid wheats are species that have the traits of T. turgidum subsp. polonicum, including very long (2.5–4.5 cm or
greater) glumes with a straw-like constituency, long lemmas twice the size of the paleas, well-marked knobs on the
rachis under the glume that are lacking in other wheat species, and long large kernels. The polonoid wheat group
includes the naked species T. turgidum subsp. polonicum, T. petropavlovskyi Udacz. et E.Migusch. (2n = 42), and the
hulled wheat T. ispahanicum Heslot (2n = 28). The last species does not have knobs on the rachis. Watanabe (2001)
determined that the gene for the polonoidy traits are on chromosome 7A in T. polonicum and T. petropavlovskyi and 7B
in T. ispahanicum. thus, the polonoidy may have different genetic nature.
Polonoidy may be of practical interest because glumes are one of the photosynthetic organs that are the young-
est and nearest to the kernel, therefore, they may be a significant reserve for providing kernels with nutrients and
determine kernel size. In 2001 and 2002, we studied the polonoid traits displayed in three polonoid species and their F1
hybrids with T. durum cultivar Kharkivs’ka 19 and T. aestivum cultivar Kharkivs’ka 28. The first and second florets of
the medial spikelet were analyzed in at least 25 spikes for each accession or hybrid. We measured the lemma and palea -
length and width of the glume and the length, width, height, and weight of the grain. Paired correlation coefficients (CC)
and degree of dominance (D) were calculated for these traits.
Tables 1 and 2 list the results of the 2-year study. The two tetraploid polonoid species had CCs between
dimensions of glume, lemma and palea and grain length and weight of the second floret that exceeded the index for first
floret and in most cases were nonsignificant. On the other hand, the CCs between glume, lemma, and palea dimensions
for the second floret were less than those for the first. At the same time, almost all the CCs for first floret are greater
than those for the second in the hexaploid polonoid and were moderately to highly significant. In the Kharkivs’ka 19
and Kharkivs’ka 28 cultivars, the CCs were low to moderate and differences between the first and second florets were
not similar for the different trait pairs.
For the F1 hybrid ‘T. ispahanicum/Kharkivs’ka 19’, the CCs for all trait pairs for the second floret of a spikelet
and the most of them for the first floret were high and significant (from 0.71 to 0.94). The CC for one of the most
interesting trait pairs, glume length–grain length, is very high, significant for the second floret (0.94) and moderately
significant for the first (0.58). The CCs for the another interesting trait pair, glume length–grain weight, is high and
significant for the first (0.84) and second (0.74) florets. The CC values indicate heterosis for all trait pairs on the second
floret and for the most of the trait pairs on first floret in ‘T. ispahanicum/T. durum Kharkivs’ka 19’ hybrids in comparison
to the parental lines.
In the ‘T. polonicum/Kharkivs’ka 19’ F1 hybrid, the CC for glume length–grain length in the first floret is
positive, moderate, and significant. For the other trait pairs including grain length and weight, the CCs were not signifi-
cant, moderate, or low. The CCs between glume, lemma, and palea dimensions are high and positive. These parents also
have low, often negative, CCs, whereas the hybrids have positive moderate, though nonsignificant, CCs as a rule.
In the F1 hybrid ‘T. petropavlovskyi/Kharkivs’ka 28’, nearly all CCs including grain length and weight are
nonsignificant for both the first and second florets. The CCs for glume, lemma, and palea are high and significant.
From the three polonoid species, only T. ispahanicum displays dominance by glume length (D = 0.2) in hybrids
with T. durum cultivar Kharkivs’ka 19. In the two other hybrids, ‘T. polonicum/Kaharkivs’ka 19’ and ‘T.
petropavlovskyi/Kharkivs’ka 28’, this trait is inherited as a recessive (D = –0.2 and –0.4 respectively). For grain length

151
A n n u a l W h e a t N e w s l e t t e r V o l. 4 9.
and weight, dominance of T. polonicum (0.7 and 0.9, respectively), overdominance of T. ispahanicum (1.4 and 2.6
respectively), and recessiveness of T. petropavlovskyi (–0.2 and –0.4, respectively) were observed.
Triticum ispahanicum is dominant over T. durum in lemma length (D = 0.7) and is overdominant for palea
length (3.7). Triticum petropavlovskyi is dominant over T. aestivum for lemma and palea length (the both 1.0) and grain
height (0.3) and is overdominant for grain width (2.0).
Table 1. Correlation coefficients between the morphological traits of spikelets in the polonoid species, T. durum, T. aestivum, and their
F1 hybrids, first floret. Ti = Triticum ispahanicum, Tdp = T. turgidum subsp. polonicum, Tp = T. petropavlovsky, K19 = T. durum subsp.
durum cultivar Kharkivs’ka 19, and K28 = T. aestivum subsp. aestivum cultivar Kharkivs’ka 28. Significant correlations are indicated
with an asterisk (*).
Trait pairs Hybrids and parental forms
Ti F1 Ti/K19 K19 Ttp F1 Ttp/K19 Tp F1 Tp/K28 K28
Glume length–grain length 0.16 0.58 * 0.32 –0.40 0.50 * 0.69 * 0.26 0.21
Glume width–grain length –0.40 0.05 0.08 –0.29 0.38 0.35 –0.02 0.34
Lemma length–grain length 0.35 0.54 0.49 * –0.21 0.42 0.71 * 0.43 * 0.39
Palea length–grain length 0.32 0.32 0.18 –0.18 0.33 0.65 * 0.23 0.47 *
Glume length–grain weight -0.11 0.74 * –0.18 –0.68 * 0.31 0.29 0.20 0.16
Glume width–grain weight 0.13 –0.03 –0.28 –0.72 * 0.30 0.04 –0.26 –0.15
Lemma length–grain weight 0.15 0.68 * –0.01 –0.53 * 0.20 0.39 0.32 0.01
Palea length–grain weight 0.42 0.67 * 0.07 –0.42 –0.11 0.28 0.09 0.49 *
Glume length–glume width 0.48 * 0.36 0.09 0.81 * 0.85 * 0.52 * 0.73 * 0.21
Glume length–lemma length 0.72 * 0.97 * 0.44 * 0.77 * 0.91 * 0.79 * 0.87 * 0.40
Glume length–palea length 0.62 * 0.83 * 0.53 * 0.66 * 0.70 * 0.39 0.71 * 0.27
Lemma length–palea length 0.55 * 0.83 * 0.41 0.60 * 0.71 * 0.55 * 0.78 * 0.06
Table 2. Correlation coefficients between the morphological traits of spikelets in the polonoid species, T. durum, T. aestivum, and their
F1 hybrids, second floret.
Glume length–grain length 0.44 * 0.94 * 0.49 * 0.08 –0.03 0.18 0.42 0.38
Glume width–grain length 0.35 0.71 * 0.15 0.13 –0.01 –0.08 0.21 0.28
Lemma length–grain length 0.63 * 0.84 * –0.03 0.18 0.07 0.37 0.00 0.11
Palea length–grain length 0.39 0.76 * 0.23 0.08 0.18 0.38 –0.12 0.25
Glume length–grain weight 0.04 0.84 * –0.05 –0.20 0.02 –0.28 0.23 0.40
Glume width–grain weight 0.40 0.84 * –0.54 * 0.09 –0.00 0.02 –0.06 0.12
Lemma length–grain weight 0.22 0.85 * –0.20 0.29 0.01 –0.06 –0.05 –0.07
Palea length–grain weight 0.04 0.77 * 0.03 0.17 –0.06 0.05 0.09 0.33
Glume length–glume width 0.41 0.77 * 0.44 * 0.67 * 0.87 * 0.37 0.81 * 0.08
Glume length–lemma length 0.64 * 0.91 * 0.37 0.48 * 0.81 * 0.45 0.78 * –0.12
Glume length–palea length 0.49 * 0.79 * 0.47 * 0.35 –0.17 0.35 0.43 0.17
Lemma length–palea length 0.34 0.92 * 0.58 * 0.44* 0.02 0.71 * 0.64 * 0.57 *

152
A n n u a l W h e a t N e w s l e t t e r V o l. 4 9 .
Kharkivs’ka 19 and Kharkivs’ka 28 dominate at various rates for glume width in hybrids with T. ispahanicum
(D = 0.1) and T. petropavlovskyi (0.7). Triticum durum is dominant over T. ispahanicum for grain width (1.0) and height
(0.5), over T. polonicum for lemma length (0.6) and grain width and height (the both 1.0), and is overdominant for glume
width (2.0) and palea length (3.0). Triticum aestivum is dominant over T. petropavlovskyi in grain height (0.3) and
overdominant for grain width (2.0).
Examining glume length with grain length and weight under the growing conditions at Kharkiv, the ‘T.
ispahanicum/Kharkivs’ka 19 durum’ F1 hybrids are early ripening when compared with the durum parent, T. polonicum,
T. aestivum, T. petropavlovskyi, and their hybrids. The grains of T. ispahanicum have time to fully develop, whereas the
other parental lines and hybrids cease grain filling before maturity, which is caused by hot and dry summer temperatures.
A clear relationship exists between the glume dimensions and grain length and weight in hybrids with T. ispahanicum.
Hence, T. ispahanicum seems to by more perspective source of polonoid complex for wheat breeding, than T.
polonicum and T. petropavlovskyi. Moreover, the F1 hybrids of all the three polonoid species are more adaptive than
their parental forms and, as a rule, CCs are more positive and higher in the hybrids than the parents. Improvement may
be gained in grain size (and other related traits) in T. aestivum and T. durum advanced cultivars by means of addition of
polonoid complex if early ripening genotypes are used.
References.
Watanabe N. 2001. Near isogenic lines of durum wheat cultivar LD222 and the origin of T. petropavlovskyi. In: Proc
Internat Conf on Genetic collections, isogenic and alloplasmic lines. Novosibirsk, Russia, 30 July–3 August, 2001.
Novosibirsk Pp. 62-64.
Sowing dates, rates, and phytosanitary state of winter wheat fields.
Yu.G. Krasilovetz, N.V. Kouzmenko, A.E. Litvinov, and V.A. Tzyganko.
These studies were conducted at the Plant Production Institute named after V.Ya. Yuryev (Eastern Forest-Steppe of
Ukraine) in 2001–02. The soil was a typical weakly leached, medium humus, black earth soil. The agrotechnique was
general use. The three sowing dates were 10–13 September, 20–22 September, 30 September–2 October. The sowing
rate was 4.0–5.0 x 10⁶ viable seeds/hectare. The relationship between the phytosanitary state of winter wheat, the sowing
dates, and the sowing rates was studied by preceding black fallow on a manure background, 30 t/ha along with NPK30
application. Plant damage from disease and cereal flies was studied using conventional methods.
In the experimental years, spread and development of root rots (Helminthosporium and Fusarium) and the
intensity of disease development on winter wheat leaves differed for the sowing dates (Table 3). The later sowing data
had a considerable reduction in spread and development of root rots and leaf infection by Septoria in 2001. Leaf rust
occurred less at the first sowing date than at the other two. Damage by powdery mildew was low. The least amount of
shoot damage by cereal flies was observed at the third sowing date; the highest degree was at the second sowing date.
In 2002, the spread and development of root rots did not vary among different sowing dates. The degree of the develop-
ment of Septoria increased with a delay of the sowing date. Leaf rust and powdery mildew were not observed. Damage
to the shoots of winter wheat by cereal flies was not considerable.
Over 2 years, damage by root rots was reduced considerably at later dates of sowing on average. The intensity
of Septoria infection on the upper leaves of winter wheat planted at the first sowing date was 1.6 times lower compared
with the third date. Leaf rust infection in wheat planted at the second and third dates exceeded that in wheat sown at the
first date on all leaves by 2.5–2.6 times and on the upper leaves by 2.2–2.3 times. The lowest degree of shoots damage
by cereal flies was recorded at the third date of sowing winter wheat and highest at the first date.
A shift in sowing date led to changes in the phytosanitary state of winter wheat and, as a result, to the changes in
yield capacity of the crop. Thus, there was a progressive increase in yield from the first to the third sowing dates in 2001
and, a decreased grain yield with a delay of planting in 2002. On average over 2 years, grain yield increased by 2.6–7.6
c/ha at the third sowing date in comparison with that at the second and first sowing dates.

153
A n n u a l W h e a t N e w s l e t t e r V o l. 4 9.
The effect of sowing rates on the phytosanitary state of winter wheat planting is given in Table 4. In 2001, we
noted that the sowing rate of 4–5 x 10⁶ viable seeds/ha did not differ with respect to the damage by diseases and cereal
flies. The 2002 data showed that an increase in sowing rates from 4–5 x 10⁶ viable seeds increased damage by root rots
and Septoria. Powdery mildew and leaf rust were not factors in 2002.
The spread and development of root rots at the increased sowing rate did not increase considerably on average
over 2 years. Septoria infection on all leaves of the winter wheat plants in these variants was approximately the same as
that of the upper leaves for planting rates with 5 x 10⁶ seeds; exceeding this index compared with a usual rate of 4 x 10⁶
Table 3. Phytosanitary state of winter wheat plants depending on sowing dates.
Root rots at Powdery
tillering (%) Septoria mildew Leaf rust Shoot
damage Grain
Sowing develop- all upper all upper all upper by cereal flies yield
date spread ment layers layer layers layer layers layer (%) (c/ha)
2001
I 34.6 13.2 36.6 7.5 0.3 0.2 5.1 6.6 3.0 48.9
II 23.1 8.6 26.0 3.4 1.1 0.4 13.1 15.1 3.7 60.9
III 12.8 4.6 24.0 3.4 1.4 0.1 13.6 14.5 0.7 72.2
LSD05 — 5.3 — 2.6 0.7 — 7.1 7.2 0.8 —
2002
I 48.7 21.3 46.0 18.2 0.0 0.0 0.0 0.0 2.0 78.6
II 49.7 24.5 52.0 30.6 0.0 0.0 0.0 0.0 0.6 76.7
III 47.0 25.1 53.5 36.7 0.0 0.0 0.0 0.0 0.0 70.6
LSD05 — 6.8 7.8 14.9 ———— 0.8 —
Mean (2001–02)
I 41.7 17.3 41.3 12.9 0.2 0.1 2.6 3.3 2.5 63.8
II 36.4 16.6 39.0 17.0 0.6 0.2 6.6 7.6 2.2 68.8
III 29.9 14.9 38.8 20.1 0.7 0.05 6.8 7.3 0.4 71.4
Table 4. Phytosanitary state of winter wheat on black fallow depending on a sowing rate (N30P30K30).
Root rots at Powdery
tillering (%) Septoria mildew Leaf rust Shoot No. of
damage productiveGrain
Sowing develop- all upper all upper all upper by cereal flies tillers yield
date spread ment layers layer layers layer layers layer (%) (m2)(c/ha)
2001.
4.0 34.6 13.2 36.0 7.5 0.2 0.1 3.5 5.5 2.5 601 47.4
5.0 34.9 13.5 36.6 7.5 0.3 0.2 5.1 6.6 3.0 701 48.9
LSD05 —— ——0.1——— — ——
2002.
4.0 48.7 21.3 46.0 18.2 0.0 0.0 0.0 0.0 2.0 664 78.6
5.0 67.6 27.4 53.4 31.8 0.0 0.0 0.0 0.0 1.2 690 84.6
LSD05 —— 3.43.0———— — ——
Mean (2001–02).
4.0 41.7 17.3 41.0 12.9 0.1 0.05 1.8 2.8 2.3 633 63.0
5.0 51.3 20.5 45.0 19.7 0.2 0.1 2.6 3.3 2.1 696 66.8

154
A n n u a l W h e a t N e w s l e t t e r V o l. 4 9 .
seeds. The variants with different sowing rates did not vary greatly in relation to the damage of shoots by cereal flies. In
winter wheat sowings at 5 x 10⁶ viable seeds/ha, the number of productive tillers increased and, as a result, grain yield
was higher by 3.8 c/ha compared to the yield at 4 x 10⁶ seeds/ha.
Productivity of spring durum wheats at different seeding rates.
O.V. Golik.
Creating new spring durum wheat cultivars demands a variety of agrotechnics for obtaining the highest yield while
maintaining high grain quality. Spring wheat in the Ukraine is grown in risky agricultural conditions. Moisture is the
main limiting factor and an optimal seeding rate is the main factor for greatest yield. According to most authors, crops
with optimal and dense seeding rates ensure the largest grain yield in any agroecological conditions (Makrushin 1985;
Sechnyak et al. 1983). Overgrown plants in thin crop stands have an increased vegetative period and a higher degree of
infection by fungal diseases and pests. Thinning crops promotes weed growth. All of these factors decrease the seed-
sowing quality (Chulkina et al. 2000). Lelli (1980) stated that the productivity potential of a plant is hereditary and
depends on genetically and ecological conditions. Studying the elements of yield structure is a prerequisite of this
potential. Thus, we wanted to investigate and determine optimal seeding rates for new cultivars bred for the conditions
of the eastern Forest-Steppe Region of the Ukraine.
We analyzed the spring durum wheats Kharkovskaya 15 and Kharkovskaya 23 (standards of the Ukrainian state
Service on right protection for plant cultivars), Kharkovskaya 46 (grain quality standard), and Kharkovskaya 19 (lodg-
ing-resistance standard) and the new cultivars Kharkovskaya 27, Kharkovskaya 33, and Kharkovskaya 41 under the
climatic conditions of the eastern Ukraine (Kharkov) between 1998 and 2000. The characters analyzed included
productivity (g/m2), grain yield (%, the ratio weight of kernels to weight of chaff), plant stand (plant/m2), productive
tillering, and 1,000-kernel weight (g) with seeding rates of 3, 4, 5, 6, and 7 x 10⁶ germinating kernels/hectare (MKH).
The humidity varied over the years; 1998 and 1999 were severe droughts and 2000 was optimal but irregular in different
vegetative phases. The 1-m2 plots were replicated three times. The cultivars were sown in an experimental field
following peas. The results are from a three-factor dispersion analysis.
No differ-
ences were observed
for durum wheat with
different seeding rates.
The productivity
exceeded the general
mean (155 g/m2) at
seeding rates of 3, 5,
and 7 MKH (172–175
g/m2) only in 2000.
The least productivity
was 146 g/m2 in 1998.
The highest mean
productivity (170 g/
m2) was found in
Kharkovskaya 33 at 3
MKH (Table 5
represents data for
only for best
(Kharkovskaya 33)
and worst
(Kharkovskaya 19)
cultivars. The
productivity of these
cultivars was equal to
or higher than the
general mean in all
Table 5. The influence of seeding rates on productivity and associated traits in durum wheat
cultivars, 1998–2000. * = reliable in comparison with the means by cultivars, ** = reliable
in comparison with means by experiment (by trait), and *** = reliable means by cultivar.
The mean indices of traits
Seeding Produc- Grain Plant 1,000-
rate tivity yield stand Productive kernel
Cultivar (x 106/ha) (g/m2)(%) plants/m2tillering weight (g)
Kharkovskaya 33 3 183 * 31.4 172 * 0.99 34.5 *
4 157 32.2 197 * 1.00 * 34.6 *
5 184 * 30.6 236 1.00 * 33.5
6 150 29.8 259 * 0.93 31.4 *
7 179 * 31.8 292 * 1.01 * 31.0 *
Mean by cultivar 170 ** 31.2 231 0.99 33.0 **
Kharkovskaya 19 3 113 * 29.6 146 * 0.91 * 32.7 *
4 154 29.7 173 * 0.92 * 33.6
5 135 27.1 * 209 * 0.91 * 32.2 *
6 128 * 29.2 234 0.89 * 31.2 *
7 130 * 28.9 264 * 0.89 * 32.1 *
Mean by cultivar 132 ** 28.9 ** 205 ** 0.90 ** 32.4 **
Mean by experiment 155 30.8 227 0.96 33.9
Least significant difference 5 % 9.4 1.06 11.9 0.037 0.53
155
A n n u a l W h e a t N e w s l e t t e r V o l. 4 9.
variants. The highest value was 233 g/m2 at 7 MKH for Kharkovskaya 33 in 2000. Thus, Kharkovskaya 33 was the
most productive cultivar grown in the climatic conditions of the Ukraine. The basic group of tested wheats
(Kharkovskaya 15, Kharkovskaya 23, Kharkovskaya 27, Kharkovskaya 41, and Kharkovskaya 46) had a productivity
equal to the general mean. The optimal seeding rate was 4 MKH. The productivity of Kharkovskaya 19 was minimal
(100 g/m2 in 1999 at 3 MKH). The optimal seeding rate was 5 MKH.
Grain yield depended more on climactic condition. Few cultivars differentiated and did not depend on seeding
rates. Those exceeding the general mean of 30.8 % for all cultivars in 1998 (35.7 %) were less in 2000 (25.3 %). The
grain yield of Kharkovskaya 23 (33.2 %) and Kharkovskaya 27 (33.5%) reliably exceeded the general mean of
Kharkovskaya 19 (28.9 %) and Kharkovskaya 46 (27.8 %) usually less at all seeding rates. This character of other
varieties was up-to-date of general mean.
The 1,000-kernel weight also depended more on climatic conditions and less on cultivar differences and seeding
rates. This trait always exceeded (34.4–36.5 g) the general mean (33.9 g) in 1998 and 1999 but was lower (30.7 g) in
2000. Kharkovskaya 23 and Kharkovskaya 27 reliably exceeded (35.2–35.3 g) the general mean for all cultivars. Little
difference was observed in the 1,000-kernel weight at different seeding rates.
Variability in productive tillering was similar to 1,000-kernel weight but reliable only in some years (1.03 in
1999, 0.89 in 2000, 0.9 for Kharkovskaya 19, and 1.02 for 3 MKH, compared to the general mean of 0.96. Plant stand
depended on seeding rate (rates of 3 and 4 MKH reliably exceeded the general mean of 227 plant/m2) and equaled 160–
198 plant/m2; 5, 6, and 7, MKH were 237–283 plant/m2. Less reliable were years and cultivar.
Graphics can simplify the dependence estimates of
the tested characters by specific factors. For example,
productivity in specific ecological conditions by different
seeding rates can be represented with the help of a quadratic
surface. If the ecological conditions are a mean value of
productivity during a suitable year, the maximum of the
surface indicates the highest possible display this character
(see Figs. 1 and 2).
Thus, the effect of climatic conditions on traits was
greatest on 1,000-kernel weight, productive tillering, and
grain yield for the variables productivity and plant stand.
The lack of difference in productivity and grain yield and the
minimal difference in 1,000-kernel weight and productive
tillering at different seeding rates indicates the impossibility
for estimating the optimal seeding rate for durum wheat.
Therefore, this question can be solved only for the concrete
cultivar. Kharkovskaya 33 was the most productive with a
mean index of other testing traits. The optimal seeding rate
was 5 MKH. Kharkovskaya 23 and Kharkovskaya 27 had
higher grain yield and 1,000-kernel weight with mean indices
of other testing traits. The optimal seeding rate was 4 MKH.
Kharkovskaya 41 has mean indices for all traits. The optimal
seeding rate was 5 MKH. This cultivar was entered in the
Register of Ukraine for 2003. Kharkovskaya 15 and
Kharkovskaya 46 have most indices of plant stand, productive tillering, and mean other traits. The optimal seeding rate
was 5 MKH. Kharkovskaya 19 had the smallest indices for all tested traits. The optimal seeding rate was 4 MKH.
References.
Chulkina VA, Toropova EYu, Chulkin YuI, and Stezov GYa. 2000. The agrotechtical method of plant protection.
Novosibirsk:UKEA Publishing, 241 pp. (in Russian).
Lelli Ya. 1980. The breeding of wheat. Moscow:Kolos, 383 pp. (in Russian).
Makrushin NM. 1985. Ecological basis of industrial seed-growing of cereals. Moscow: Agro Industrial Publishing, 139
pp. (in Russian).
Sechnyak LK, Kindruk NA, Slusarenko et al. 1983. The ecology of wheat seeds . Moscow:Kolos, 164 pp. (in Russian).
Fig. 1. Productivity
of Kharkovskaya 19
for seeding rates and
climatic conditions,
1998–2000. Mean
productivity of the
cultivar in suitable
years.
Fig. 2. Productivity of
Kharkovskaya 33 for
different seeding rates
and climatic
conditions, 1998–
2000. Mean
productivity of the
cultivar in suitable
years.

156
A n n u a l W h e a t N e w s l e t t e r V o l. 4 9 .
Winter wheat gene pool of the CIMMYT international nurseries for improvement of breeding for
resistance to fungal diseases and productivity in the eastern Forest-Steppe Region of the Ukraine.
V.V. Sotnikov and T.M. Yevlanova.
We conducted a soil-quarantine control on quarantine pathogens and a primary investigation of 164 bread and 30
samples of hard winter wheat from the CIMMYT International Nurseries at the Introductory Quarantine Nursery of the
Plant Production Institute in 2001–02. We looked at the main economical and morphological characters, biological
properties, and resistance to nonquarantine, harmful organisms in order to replenish the stocks of the National Centre for
Plant Genetic Resources of Ukraine and breeding subdivisions of the Institute with a new foreign germ plasm that is
fully free of quarantine pathogens and for the use of highly productive cultivars in breeding. The introductory material
was from the 5th Winter Wheat Observation Nursery for Semi-Arid Areas (5th WON-SA, 102 entries), 6th Facultative
and Winter Wheat Elite Yield Trial for Rainfed Areas (6th EYTRF, 20 entries), 4th Winter Wheat East-European Re-
gional Yield Trial (4th WWEERYT, 42 entries), and 3rd Winter Durum Wheat East-European Regional Yield Trial (3rd
WDEERYT, 30 entries), which contained cultivars from Azerbaijan, Bulgaria, the Czech Republic, Georgia, Hungary,
Iran, Kazakstan, Moldova, Romania, the Russian Federation, Syria, Turkey, the Ukraine, and the U.S.A.
The bread wheat cultivar Albatros odeskiy and the hard wheat Kharkivska 32 were used as local checks. The
degree of damage was estimated after winter according to a 0–9 scale: 0 = death, 1 = very low, and 9 = very high. The
same scale was used to estimate resistance to fungal pathogens in natural conditions where 1 = very high susceptibility, 5
= moderate susceptibility, 6 = moderate resistance, and 9 = very high resistance. Yield was considered very low if it was
less than 76 % of the local checks Albatros odeskiy and Kharkivska 32, low = 76–95 %, average = 96–115 %, high =
116–135 %, and very high > 135 %. Thousand-kernel weight was low if less than 39.0 g, average = 39.0–46.9, high =
47.0–54.0, and very high > 54.0 g. Planting in the 5th WON-SA and 6th EYTRF was done with a hand-sower at the
planting rate of 60 seeds/m in 0.75-m2 plots. Planting of the 4th WWEERYT and 3rd WDEERYT was done with a
tractor-sower SSFK-7 at a planting rate of 6.0 x 10⁶ viable seeds/ha in 8-m2 plots. Vitavax was used as a seed treatment.
Field trials were conducted in arid conditions with a black fallow forecrop. The planting date was very late, 5 October,
2001, or 17 days later than permissible (18.09). Overwintering was satisfactory because of a mild winter. Growth
recovery in the spring began much earlier than in comparison with the mean sowing dates of earlier years. Yield level
was limited by the late sowing date; an outbreak of fungal diseases including powdery mildew, leaf rust (only on the
bread wheats), and Septoria blight; and unfavorable climactic factors including increased daily temperature, hot dry
winds, and the lack of soil moisture from the end of tillering to grain filling. Over that period, rainfall was 84 mm (66 %
of the mean of many years). During a entire vegetative period, rainfall was approximately 260 mm (105 % of the yearly
average). Total rainfall, including winter precipitation, was 408 mm. In spite of these negative effects, the wheats
produced a high grain yield. The average yield capacity of the local checks and control cultivars in the 5th WON-SA and
in the 6th EYTRF nurseries were Albatros odeskiy, 414 g/m2; Donetska 48, 534 g/m2; Kharus, 466 g/m2; Odeska 267,
485 g/m2; Kharkivska 96, 627 g/m2; Tira, 465 g/m2; Gerek 79, 370 g/m2; Dagdas 94, 438 g/m2; Suzen 97, 408 g/m2;
Kirgiz 95, 541 g/m2; and Gun, 244 g/m2.. In the 4th WWEERYT, average yield capacities were Albatros odeskiy, 277 g/
m2; Donetska 48, 335 g/m2; Kharus, 415 g/m2; Myronivska 61, 384 g/m2; Bezostaya 1, 280 g/m2; Seri, 199 g/m2; Jagger,
246 g/m2; and in the 3rd WDEERYT Kharkivska 32, 314 g/m2; Aisberg odeskiy, 284 g/m2; and Kunduru, 177 g/m2.
A mild winter did not permit evaluation of the entries for winter hardiness. A predominant part of the material
had a high degree of wintering (scores of 8–9), with the exception of ‘494J6.11//TRAP#1/BOW’ (wintering score = 4);
Unknown 95-3 (3); ‘FRTL//AGRI/NAC (2)’; ‘Nemura/Kauz//AGRI/NAC (TOP SIEVE95-TOP SIEVE96 TOP
SIEVE97)’ (5.5); all entries from Turkey; the 5th WON-SA nursery; ‘Saulesku #44/TR810200’ (5) from Turkey; the 6th
EYTRF; ‘Brindur/DF 38-86’ (5); ‘DF900-83/WPB881’ (U.S.A) and Altin (4.5); DUT-TA00-22 (1); ‘DICLE74/
HALKALI058’ (5) from Turkey; DYT-CA00-7 (5) from Syria; Turan (1) from Azerbaijan; and the 3rd WDEERYT
nursery.
The heading of the bread wheats for the 5th WON-SA compared to the local check Albatros odeskiy (headed
144 days after 1 January) were 55 % similar and 38 % earlier and 41 % and 59 %, respectively, yielded greater than the
check. In the 6th EYTRF, 70 % were earlier and 30 % were similar and 86 % and 67 %, respectively, yielded greater
than the check. In the 4th WWEERYT, 67 % were similar and 31 % were earlier; the number of entries yielding greater
than the check were 82 % and 69 %, respectively. For the hard wheats, when compared to the check Kharkivska 32 (147
days from 1 January) in the 3rd WDEERYT 43 % were similar, 30 % later, and 27 % earlier and those entries with a
yield of 96 % of the check were 8 %, 11 %, and 50 %, respectively.

157
A n n u a l W h e a t N e w s l e t t e r V o l. 4 9.
Leaf fungal diseases were caused considerable damage. Susceptibility (1–4 scale) was estimated in the nurser-
ies (Table 6). This natural infection permitted differentiation of the material for the degree of resistance to the major
pathogens. A large part of the entries in the 6th EYTRF nursery (83 %) had average or higher grain yields than the
check. In the 4th WWEERYT, yield was 76 %, 45 % in the 5th WON-SA, and 21 % in the 3rd WDEERYT compared to
the check.
We distinguished the following entries that had a combination of useful economic characters and resistance or
moderate susceptibility to leaf disease pathogens. These lines are recommended for further study and possible use in
breeding highly productive cultivars of bread and hard wheats. Unfortunately, most lines of these group have resistance
to two disease pathogens but considerable susceptibility to a third, making their use difficult. The combination of
economical characters given include 1 = mean yield, 2 = high yield, 3 = very high yield, 4 = average 1,000-kernel
weight, 5 = high 1,000-kernel weight, 6 = very high 1,000-kernel weight, 7 = heading ≥ 2 days earlier compared to the
check, and 8 = similar heading date as check.
Moderately susceptible or resistant to powdery mildew and Septoria but highly resistant to leaf rust. CIT90089-
0YC-0YC-0YC-7YC-0YC-1SE-0YC-4YC-0YC (4, 7; pedigree: Weston/VEE) and BDKE930161-0YC-0YC-1YC-
0YC-3YC-0YC (2, 4, 7; pedigree: Haymana75/4/YMH/TOB//MCD/3/LIRA(BDME 9)). Both these lines were from
Turkey and the 5th WON-SA nursery.
Moderately susceptible to powdery mildew and Septoria. MVTD 15-99 (4; Hungary, 3rd WDEERYT nursery,),
CIT932314-0SE-0YC-2YE-0YC-2YK-0YK (1, 4, 8; pedigree: RSK/FKG15//CHAM6/3/FDL4; Turkey, 5th WON-SA,),
and CIT94072-0SE-1YC-0YC (3, 4, 8; pedigree: PYN//TAM101/AMI/3/KRC66/SERI; Turkey, 6th EYTRF).
Moderately susceptible or resistant to powdery mildew and leaf rust. SG-RU 8069 (3, 4, 8; Czechia), Iveta NTA-92/
89-6 (2, 7; Bulgaria); GK Bagoly (1, 4, 8; Hungary), GK Vevecky (2, 4, 8; Hungary), MV Dalma (2, 4, 8; Hungary), GK
Forras (3, 8; Hungary), MV 04-96 (3, 5, 8; Hungary), Turda 2000 (2, 4, 8; Romania), Destin (2, 4, 8; Romania), Efekt (1,
4, 8; Romania), Expres (2, 4, 7; Romania), Manypa (3, 8; Moldova), Strumok (3, 4, 8; Ukraine), Erythrospermum 270 (3,
7; Ukraine), Knjazhna (3, 4; Russia), and Akinci-84 (3, 4, 8; Azerbaijan). All entries were from the 4th WWEERYT
nursery.
Moderately susceptible to Septoria and resistant or moderately susceptible to leaf rust. CIT922411-0SE-0YC-
2YC-0YC-2YC-0YC-3YC-0YC (1, 4, 7; pedigree: CHAM4/TAM200//RSK/FKG15), CIT90089-0YC-0YC-0YC-7YC-
0YC-1SE-0YC-3YC-0YC (1, 4, 7; pedigree: Weston/VEE), CIT937256-0SE-0YC-3YE-0YC-1YC-0YC (2, 4, 8;
pedigree: PLK70/LIRA//Attila/3/AGRI/NAC), CMSW93WM0071-0AP-0YC-8YE-0YC-3YC-0YC (1, 4, 8; pedigree:
FRTL//AGRI/NAC), CIT922229-0SE-0YC-1YC-0YC-7YC-0YC-2YC-0YC (2, 4, 8; pedigree: Necomp1/5/BEZ//TOB/
8156/4/ON/3/TH*6/KF//), and MXTK930076-0SE-0YC-12YE-0YC-4YK-0YK (1, 5, 7; pedigree: 1D13.1/MLT/3/LFN/
SDY//PVN). All entries are from Turkey and the 5th WON-SA nursery. CIT945175-030SE-0YC-7YE-0YC (3, 4, 7;
pedigree: DDZ2141.85.271/ES14//F134.71/NAC) from Turkey and the 6th EYTRF nursery.
Resistant to powdery mildew. ELIDUR (1, 4, 7; Romania) and Perlyna (2, 5, 8; Ukraine) both from the 3rd
WDEERYT nursery; CIT935011-0SE-0YC-3YE-0YC-2YC-0YC (1, 4, 7; pedigree: ES14/130L1.12//MNCH) and
CIT930082-0SE-0YC-3YE-0YC-2YK-0YK (3, 5, 8; pedigree: KARL/Ariesan) both from Turkey and the 5th WON-SA
nursery; ICWH900747-0AP-0YC-0YC-6YC-0YC-9YC-0YC (1, 4, 7; pedigree: Motah-7, Turkey, 6th EYTRF); Demir
(2, 5, 7, Turkey, 4th WWEERYT); Kiziltan (5, 8; Turkey, 3rd WDEERYT); and Ankara 98 (6, 8; Turkey), Yilmaz (5, 8;
Table 6. Overall susceptibility scores of each of the international nurseries investigated in 2001–02.
Powdery mildew Septoria Leaf rust
5th Winter Wheat Observation Nursery for Semi-Arid Regions 70 62 28
6th Elite Yield Trial for Rainfed Regions 90 80 45
4th Winter Wheat East European Regional Yield Trial 36 98 12
3rd Winter Durum East European Regional Yield Trial 17 97 no damage

158
A n n u a l W h e a t N e w s l e t t e r V o l. 4 9 .
Turkey), Brindur/DF 38-86 (1, 4, 7; accession #019006; U.S.A.), Brindur/DF 38-86 (2, 4, 7; accession #019007;
U.S.A.), UVY162/61.130//HC6654/3/AKB/OVI65/4/WPB881 (5, 8; U.S.A.), WPB881/Rodur (1, 4, 8; U.S.A.), and
WPB88/H7092-50B//MI83.84.503 (5; U.S.A.) all entries from the 3rd WDEERYT nursery.
Moderately susceptible to Septoria. CIT922142-0SE-0YC-3YC-0YC-6YC-0YC-1YC-0YC (2, 4, 7; pedigree: JI5418/
MARAS), CIT88088T-0SE-1YC-0YC-2YC-0YC-2YC-0YC-8YC-0YC-1YC-0YC (2, 5, 8; pedigree: Zander-34), and
CMSW93WM0182-0AP-0YC-5YE-0YC-1YC-0YC (1, 4, 8; pedigree: SW89-3218//ASP/BLT) all from Turkey and the
5th WON-SA nursery; and CMSW94WM00586S-03Y-0B-0SE-1YE-0YC (2, 5, 7; pedigree: Saulesku #44/TR810200)
from Turkey and the 6th EYTRF nursery).
Resistant to leaf rust. Capuz (2, 4, 8; Moldova), Kupava (3, 4, 8; Russian Federation), and Kroshka (3, 4, 7; Russian
Federation) all from the 4th WWEERYT nursery; 0YA-0YA-5YC-0YC-6YC-0YC (1, 5, 8; pedigree: BUC/5/Naphal/
CI13449/4/SEL14.53/3/Lancer//ATL66/CMN), CIT922142-0SE-0YC-3YC-0YC-6YC-0YC-2YC-0YC (3, 4, 7; pedi-
gree: JI5418/Maras), CIT932332-0SE-0YC-7YE-0YC-3YK-0YK (2, 5, 7; pedigree: CHAM6//1D13.1/MLT/3/
SHI4414/CROW/4/KVZ/AU//GRK), CIT932282-0SE-0YC-3YE-0YC-3YK-0YK (1, 5, 8; pedigree: Karous-10),
CIT935166-0SE-0YC-4YE-0YC-1YK-0YK (3, 4, 7; pedigree: PLK70/LIRA/5/NAI60/3/14-53/ODIN//CI13441/4/
GRK/6/MNCH), 0YA-0YA-5YC-0YC-4YC-0YC (3, 5, 7; pedigree: BUC/5/NAPHAL/CI13449/4/SEL14.53/3/L//
ATL66/CMN), and CIT935224-0SE-0YC-3YE-0YC-3YC-0YC (3, 5, 8; pedigree: NGDA146/4/YMH/TOB//MCD/3/
LIRA/5/F130L1.12) all from Turkey and the 5th WON-SA nursery; F2.96.24-0SE-0YC-1YE (2, 4, 8; pedigree:
Bilinmiyen96.24), CIT932332-0SE-0YC-1YE-0YC-2YC-0YC (3, 4, 7; pedigree: CHAM6//1D13.1/MLT/3/SHI4414/
CROW/4/KVZ/AU//GRK), and CIT930151-0SE-0YC-9YE-0YC-1YC-0YC (3, 5, 7; pedigree: Jing Dong 1//1D13.1/
MLT) all from Turkey and the 6th EYTRF nursery.
Immunological basis for developing initial material resistant to septoriosis for winter and spring
bread wheat breeding in Ukraine.
S.V. Rabinovich, V.P. Petrenkova, I .M. Chernyaeva, and L.N. Chernobay.
Among the cereal crops, wheat is the major grain grown in Ukraine. The winter wheat area occupies about 7 x 10⁶
hectares; spring wheats occupy 3–3.5 x 10⁵ ha. Resistance to disease pathogens for increasing the yield capacity of
cereal crops in developed countries has become more significant than other traits. The acuteness of the problem will not
decrease in the future as breeding progress for productivity effects a pathogen’s development and accelerates adaptation.
The breeder, however, must take the lead in order to ensure constant sources and donors of disease-resistance genes.
Septoria resistance will play an important role among other diseases. The best results will be achieved only by the use of
resistant material in breeding.
Septoria has been one of the most harmful diseases of wheat during the last decade, although it has been known
since 1907 (Yachevskiy 1908). At present, this disease is widespread all over the regions where wheat is cultivated,
including the Ukraine. The disease symptoms appear as spots, occurring on all above-ground parts of the plant and at all
developmental stages. The disease pathogens in the Eastern Forest-Steppe of Ukraine include S. tritici and S. graminum,
which affect the leaves and leaf sheaths of winter and spring wheats (Boublik et al. 1999).
The ascospores are an additional source of infection, but the pycnospores are of great importance in infecting
and reinfecting plants. Prolonged moisture, mild, windy weather, and precipitation, especially at the heading and
flowering, are favorable to infection. At the Department for the Plant Immunity to Diseases and Pests in the Plant
Production Institute named after V. Ya. Yurjev between 1996–2002, we studied some genotypes from a collection of
breeding material of winter and spring wheats obtained from the National Centre for Plant Genetic Resources of Ukraine
(NC PGRU) and breeding departments of the Institute. Artificial infections for Septoria infection were created according
to known procedures (Anonymous 1989a and b). In the Ukraine, a parasite of the Septoria pathogens at the ascospore
stage has been found in cereals that belongs to the genus Leptosphaeria Ces. et de Not.
The years of the study were characterized by considerable changes in weather conditions, particularly during
plant development; 1997 and 2000 were favorable for plant and pathogen development characterized by increased
moisture and mild temperatures, and 1996, 1998, and 1999 were years of severe drought during the entire vegetative
period of both winter and spring cereals and a reduced level of pathogen development. The weather conditions in 2001

159
A n n u a l W h e a t N e w s l e t t e r V o l. 4 9.
were characterized by increased moisture
at the start of plant vegetation and
flowering stages and severe drought and
heat during grain formation and filling.
Epidemics of the disease in 1997 and
2000 did not require creating artificial
infections.
The maximum infection of
plants amounted to 65–100 %. In 1996,
the pathogen was epidemic among the
leaf diseases. In 1998, Septoria in winter wheat was suppressed at the milk stage. In 1999, fungal pycnidia emerged in
the first week of May on the bottom leaves of plants, spread to the middle and upper leaves, but symptoms were not
found on the flag leaf due to a severe drought (Table 7). In 2001, favorable conditions for disease development in both
winter and spring wheats were produced by artificial infections through use of a local population and a population
received from the Plant Protection Institute (Kyiv). During 1996–2000, we studied the resistance of 1,542 samples of
winter wheat and 1,186 samples of spring wheat. In 2001 with artificial infection, 453 lines of winter wheat and 202
lines of spring wheat were tested.
Table 8. Resistance to Septoria in a collection of winter bread wheats at the Department for Plant Immunity to
Diseases and Pests in the Plant Production Institute named after V.Ya. Yurjev between 1996–2001. Scores are on a
scale of 1–9 where 0 = susceptible, 5 = medium resistance, and 9 = high resistance; — indicates no test.
Resistance score by year
Cultivar Origin 1996 1997 1998 1999 2000 2001
Myronivska 32 Ukraine 5 5 7–6 7 — —
Myronivska 33 Ukraine 9 8 8 7 6 6
Myronivska 64 Ukraine 7 5 7–6 7 — —
Myrich Ukraine 7 — 7–6 7 6 5
Kyivska 7 Ukraine 6 — 8 6 6 5
Luna 3 Ukraine 8 6 6 6 7 —
Lutescence 20191 Ukraine — — 7–6 6 7 6
D 169 Ukraine — — 7 7–6 6 5
Atol Odeskiy (T. durum)Ukraine — — — 8 8 6
Plamya Ukraine 6 — 7–6 7–6 5 5
Don 93 Russia — — 6–5 6 5 5
Smouglyanka Russia — — 6 6 6 6
Knyazhna Russia — — 7–6 7 5 5
Arbatka Russia — — 7 6 6 5
Norman Great Britain — — — 7 8 8–7
Arina Czech Republic 8 6 6 — — —
Ikarus Austria 7 6–7 7 — — —
MV23 Hungary — 6 7–6 6 — —
Granada Germany 8 6 7 — — —
Niclas Germany 8 7 7–8 — — —
Olma Poland — — — 6–7 7 6–7
SMH 2893 Poland — 6 7–6 7 6 —
Panda Poland 7 6–7 6–7 — — —
N92L228 U.S.A — — 7–6 6 6 5
Wakefield U.S.A — — — 6–7 6 5–7
KS91WGRC11 U.S.A — 7 — — 7 6
Charmany U.S.A — 6 7–6 — 7 6
TX90V8727 U.S.A — 6 — 8 — —
Table 7. Maximum infection of cereal crops by Septoria, 1996–2001.
Year of study
Crop 1996 1997 1998 1999 2000 2001
Winter wheat 65.0 100.0 60.0 25.0 100.0 65.0
Spring bread wheat 21.0 100.0 65.0 14.0 100.0 65.0
Spring durum wheat 25.0 100.0 25.0 20.0 65.0 40.0

160
A n n u a l W h e a t N e w s l e t t e r V o l. 4 9 .
Immune or highly resistant lines were not identified, which shows the low adaptation of resistance genes in the
cultivars studied. In the material of the competitive variety trials of the Winter Wheat Breeding Department, two lines
were the most resistant (scores 6–7), Lutescens 159-95 and Erythrospermum 224, and 10 lines were of medium resis-
tance (score 5). The rest of the material from the nursery was susceptible or very susceptible (Chernyaeva and Mouraeva
1992; Dolgova et al. 1997; Rabinovich et al. 1999).
Among samples from the world gene pool of winter wheat, we identified genotypes that maintained resistance
to the pathogen (scores 6–8) including Granada from Germany and Myronivska 33 and Myrich from the Ukraine.
Myrych and Myronivska 33 of Myronivskiy Institute of Wheat n.a. V.M. Remeslo were used as initial material for
developing winter wheat resistant hybrids (see Table 8).
Septoria infection in spring wheat was at a lower degree than that of winter wheat. Spring wheats also were
infected by leaf rust and powdery mildew fungi. We identified medium-resistant breeding lines (scores 5–8) between
1990–96. In 2002, line 97-171 showed medium resistance.
Among the durum wheats, we identified three lines that maintained resistance during 3 years at a level of 6–7;
Leucurum 79, from Kazakhstan, and Hordeifome 1613 and Hordeiforme 1620 from Bulgaria. In 2000, no resistant lines
were identified and only two cultivars, Irridur (U.S.A.) and CD 89239 (Mexico), were medium resistant (score 6).
Both spring bread and winter wheats had high levels of Septoria infection. No immune or resistant lines were
found after many years. Five genotypes were classified to be of medium resistance (score 5; Largo and Oasis (U.S.A.),
and Krasnokutskaya 9, Legenda, and Lutescens 115/85-3 (Russian Federation). In the 2000 epidemic, three lines from
the Samariskiy NIISHK scored 6 (medium resistant); Volgouralskaya, Erythrospermum 1508, and Erythrospermum
1509.
Disease dynamics were investigated to analyze resistance in breeding material in an artificial infection. Resis-
tance was determined by the AUDPC. According to the criteria, the best lines were the winter wheats Lutescence 234-
99, Erythrospermum 293-99, Lutescence 422-2000, and Lutescence 625-2000 with resistance scores of 6. Infection did
not exceed 15 %, with the average indices of resistance at scores 4–5.
Among the NC–PGRU genotypes useful as the sources of resistance were the Ukrainian winter wheats AC-182,
Lutescence 20191, TK 121 Line 2, Perlyna Lisostepu, Myronivska 67, and Myronivska 68; cultivars from Great Britain
Tara, Brigadier, Hussar, and Norman; the U.S. wheats Wakefield, U 1254, KS91WGRC11, and Charmany; the Russian
cultivars Smouglyanka, Douslyk, and Delta; and the Polish cultivar Olma.
References.
Anonymous. 1989a. Methods for estimation of resistance of breeding material and wheat varieties to septoriosis.
Moscow 43 pp.
Anonymous. 1989b. Methods for breeding and estimation of resistance of wheat and barley to diseases in the CEA
member-countries. Prague 321 pp.
Boublik LI, Vasechko GI, Vasyljev VP, et al. 1999. Plant Protection Reference Book (Losovoi MP and Urozhai K eds).
744 pp.
Chernyaeva IM and Mouraeva OV. 1992. Search for sources of resistance for breeding Septoria-resistant varieties of
winter wheat. In: Heads Rept Internat Conf, Scientific bases for stabilization of the production of plant breeding
produce. Jalta (in Ukrainian).
Dolgova OM, Chernyaeva IM, Man’ko OP, and Afons’ka OYu. 1997. Resistance of winter wheat in the Eastern Forest
– Steppes of the Ukraine to Septoria tritici. Ann Wheat Newslet 43:240-241.
Rabinovich SV, Afons’ka OYu, Dolgova OM, and Chernyaeva IN. 1999. Development of wheat cultivars with genetic
protection against diseases–the basis for grain stable production. In: Heads Rept Internat Conf, Scientific bases for
stabilization of the production of plant breeding produce. Kharkiv (in Ukrainian).
Yachevskiy. 1908. Annual news on diseases and damage of cultivated and wild useful plants. S. Petersbourgh. 2,006
pp.
