Z:\s\Manuals\Amac 500 RepSys\ver1.9\RS1 2_VC.WPD Adas500Reporting System Manual V1 91
User Manual:
Open the PDF directly: View PDF ![]() .
.
Page Count: 82
ADAS-500 Reporting System
User’s Manual
Copyright © 2005-2009 ATCO. All Rights Reserved.
Ver 1.91

Adas-500 Reporting System User’s Manual
Table of Contents
Copyright © 2005-2009 ATCO. All Rights Reserved. Page i Revision 1.9
Introduction ........................................................................................1
System Requirements..........................................................................1
What to do Next..............................................................................1
System Installation ...................................................................................2
Installation ..................................................................................2
Installing the Data Collection Module (DCM) .......................................................3
Removing or Uninstalling the Software............................................................3
Getting Started ......................................................................................4
Running the System ...........................................................................4
Screen Layout ...............................................................................5
Main Menu ..........................................................................5
Menu Bar............................................................................6
Scan List ............................................................................7
Data Tabs............................................................................7
General Group.................................................................7
Scan Info Group ...............................................................8
Reporting Group ...............................................................9
Thickness Points Grid .................................................................10
Graphical Data Display ................................................................11
How the System Works .......................................................................12
Typical Scanning Practices and Guidelines.................................................13
Creating Report Files .........................................................................14
ADAS-500 Thickness Data Files (tk) .....................................................14
ADAS-500 Scan Report Files (srf) .......................................................14
Automatic API-653 Calculations .........................................................14
Creating Report Files .........................................................................15
Entering Equipment Information .........................................................16
Entering Inspection Information .........................................................16
Defining Course Information............................................................17
Course Fields.................................................................17
Course Materials .....................................................................17
Adding a New Material .........................................................18
Removing a Material...........................................................18
Assigning a Material to a Course .................................................18
Entering Inspection and Scan Notes ......................................................19
Creating Scans ..............................................................................19
Importing TK Files ...................................................................19
Adding TK File Data in to an Existing Scan ................................................20
How Data is Imported in to the Report File..........................................20
Overwriting Data in the Report File ...............................................20
Entering Scan Information..............................................................21
Data Collection Module ..............................................................................22
Overview and Setup..........................................................................22
DCM Main Window .........................................................................23
Menu Bar .........................................................................................23
Application Status ....................................................................24
Current Position ......................................................................24
Current Thickness ....................................................................24
Scan Specific Information ..............................................................24
Equipment Specific Information .........................................................24
Course Details Grid ...................................................................24
Scan Graph .........................................................................25
Course Summary .....................................................................25
Position Indicator.....................................................................25

Adas-500 Reporting System User’s Manual
Table of Contents
Copyright © 2005-2009 ATCO. All Rights Reserved. Page ii Revision 1.9
Location Grid........................................................................25
Scan Position Controls.................................................................25
Configuration Settings.................................................................26
ATCO USB Interface ..........................................................26
Select.......................................................................26
Using the Data Collection Module ...............................................................27
Scan Parameters ............................................................................27
Data Increment ......................................................................27
Scan Mode..........................................................................27
Starting the DCM............................................................................27
DCM Startup ........................................................................28
Scanning ..................................................................................29
Editing Data ................................................................................30
Deleting Data Points .........................................................................32
Editing Data Points ..........................................................................33
Adding Data Points ..........................................................................33
Data Point Flags.............................................................................34
Scan Review Window ........................................................................35
Modifying Data Points.................................................................38
Setting Data Point Flags ........................................................38
Deleting Data Points ...........................................................38
Data Point Display....................................................................38
Adjusting Data Values.................................................................39
Replacing Data ......................................................................39
Printing Reports ....................................................................................40
Summary Report ............................................................................40
Scan Details Report ..........................................................................40
Critical Area Analysis Report ..................................................................40
Report and Scan Selection .....................................................................40
Report Page Order ...........................................................................41
Print Setup .................................................................................41
Critical Area Report Modes.............................................................42
All Critical Areas..............................................................42
Unacceptable Critical Areas .....................................................42
Controlling Critical Areas .......................................................42
Exporting Data .....................................................................................43
Export Options ..............................................................................43
Data Point Options...........................................................................44
Exporting to Excel ...........................................................................44
API Standard 653 ...................................................................................46
Referenced Sections of API Standard 653 .........................................................46
Calculation of tmin .............................................................46
Thickness Averaging and Critical Areas ..........................................................48
Critical Length L and Thickness Averaging ................................................48
Acceptance Criteria ............................................................48
Determining Maximum Fill Height and Controlling Areas ............................................49
Controlling Areas ....................................................................49
Pass / Fail Criteria .............................................................51

Adas-500 Reporting System User’s Manual
Section 1 Introduction
Copyright © 2005-2009 ATCO. All Rights Reserved. Page 1 Revision 1.9
Introduction
The ADAS-500 Reporting System is a complimentary utility that is shipped with the AMAC-500 Crawler System. The
reporting system is provided free to owners of ATCO’s AMAC-500 Crawler Systems.
This ADAS-500 Reporting System provides reporting capabilities for scan data collected with the ATCO ADAS-500 Data
Logger. The system reads the ADAS-500 data files directly. It can combine several data files in to a single report file which
contains the scan data and information about the inspection and equipment being inspected. The system provides editing
features to review and edit your data. After reviewing data, you can print a series of professional reports.
The system is particularly useful when scanning storage tanks that fall under the American Petroleum Institute (API) Standard
653 Tank Inspection, Repair, Alteration, and Reconstruction. Minimum thickness calculations and analysis are performed
automatically by the system in accordance with Section 2 of the API-653 Standard. For more information on the exact
sections supported, refer to the section titled Analysis Methodology.
System Requirements
The AMAC-500 Reporting System runs under Windows 95,98,ME,2000 and NT. The system has the same minimal system
requirements as the Windows versions it runs in. The system will print to any Windows supported printers. A color printer is
recommended but not required.
What to do Next
If your system meets the requirements listed above, it is suggested that you move to the next section System Installation
Once you install the software, you should procede to the section Getting Started. This section will take you step by step
through the process of creating report files and processing ADAS-500 data.
The sections Reviewing Data and Printing Reports will step you through editing and printing the data collected.
The section Analysis Methodology explains the methods formulas used by the system to calculate API 653 tmin and Thickness
Averaging (Critical Length “L”) values. Prior to reading this section, you should be familiar with Section 2 of API-653.
The last section is a Tutorial. It includes exercises to step you through the processes required to collect, review and print
ADAS-500 data with this reporting system.
Amac-500 Reporting System User’s Manual
Section 2 System Installation
Copyright © 2005-2009 ATCO. All Rights Reserved. Page 2 Revision 1.9
System Installation
If your computer meets the minimum system requirements listed in the previous section, you are ready to install the software.
The installation utility on the distribution diskette must be used to install the software.
Installation
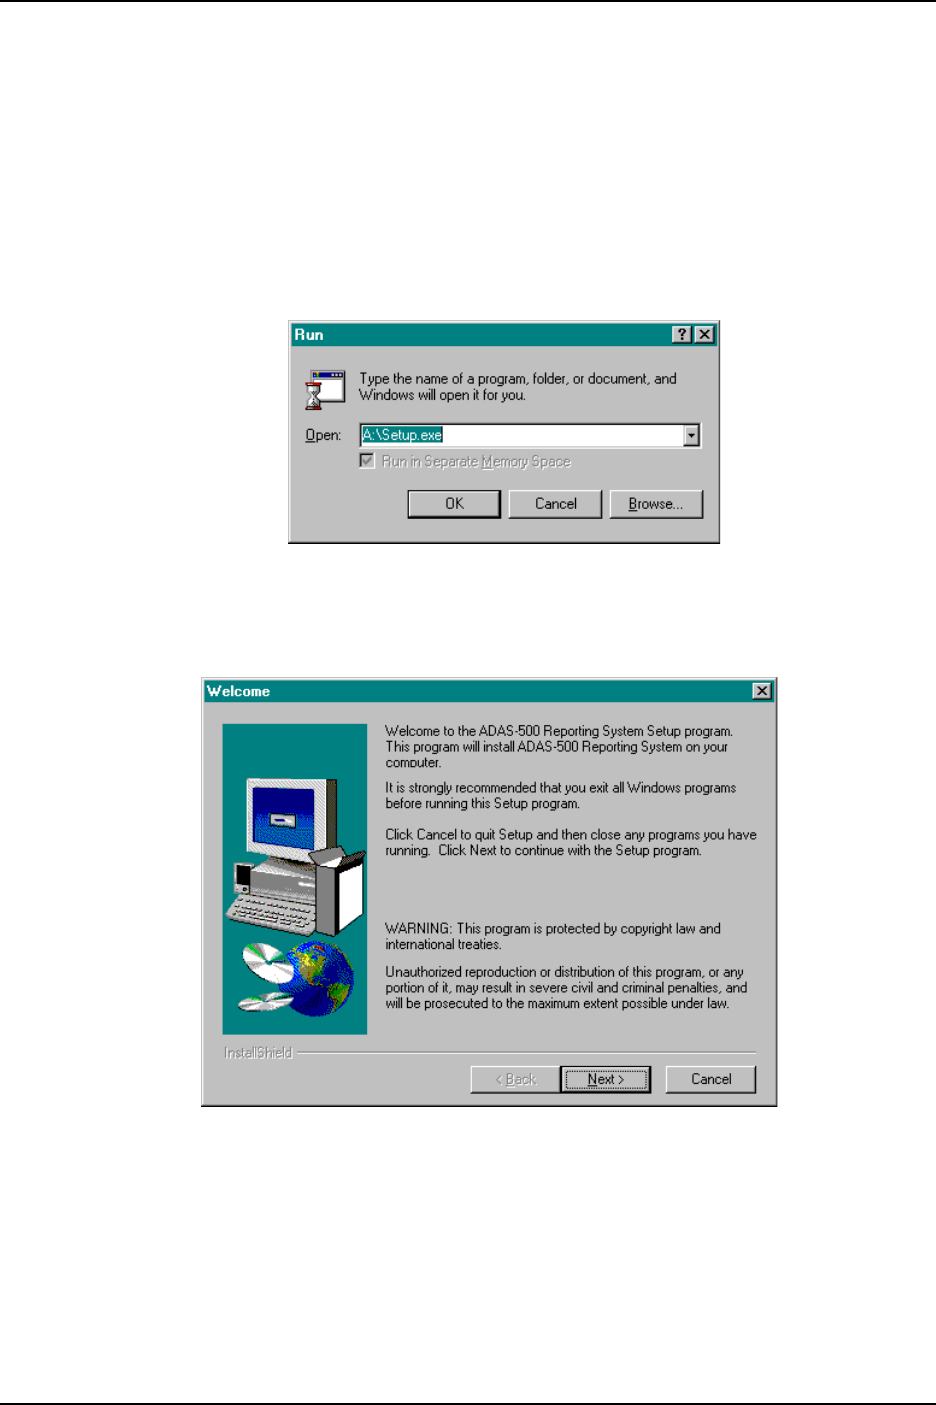
Close all applications you have running in Windows. Place the distribution diskette or cd in drive A: (cd drive)
From the Start menu select Run... The dialog box shown below will appear. Type A:\Setup.exe (or drive letter of the cd
drive) in the edit box and click OK.
The installation utility will run and display the dialog box shown below. Click Next to continue through the installation. The
utility will step you through the process of installation.
When the installation is complete, it will have created the folder below if the default settings were used
C:\Program Files\ATCO\ADAS-500 Reporting System
There should be a menu option under the Start menu:
Start | Programs | ADAS-500 Reporting System
Amac-500 Reporting System User’s Manual
Section 2 System Installation
Copyright © 2005-2009 ATCO. All Rights Reserved. Page 3 Revision 1.9
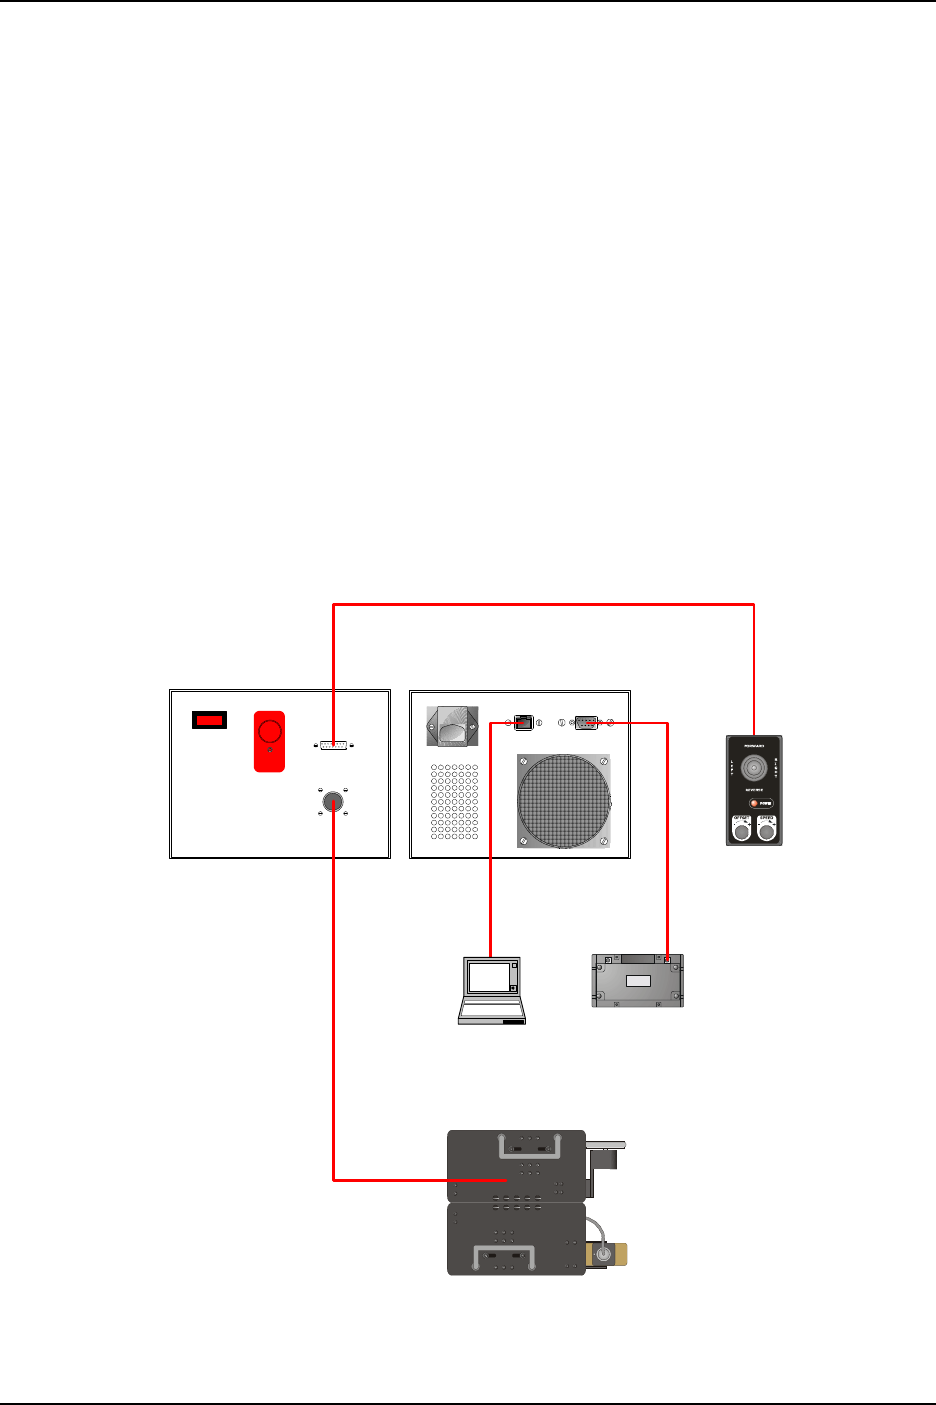
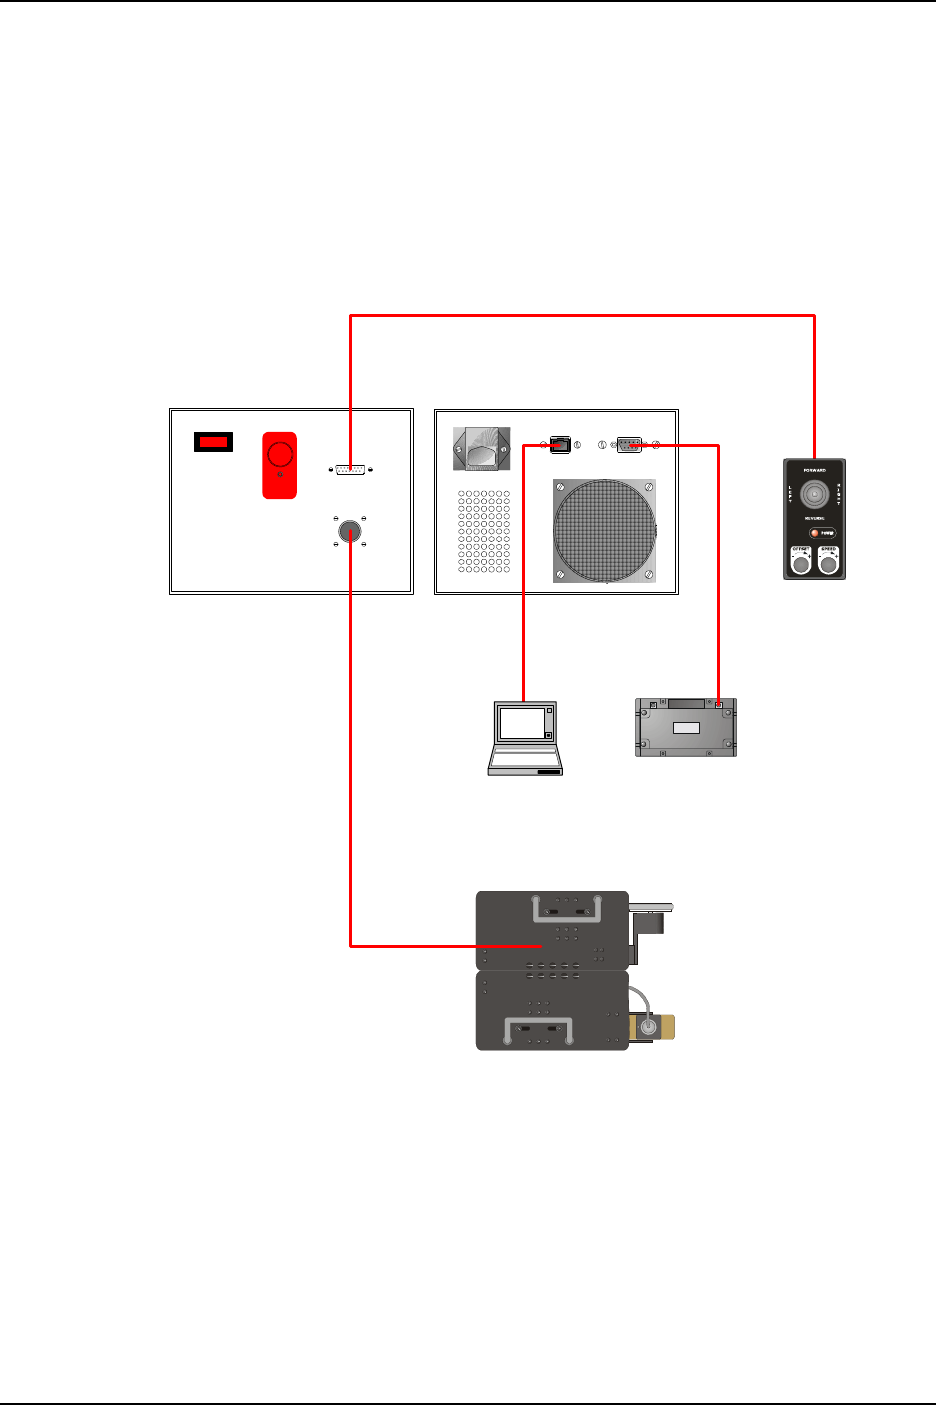
Installing the Data Collection Module (DCM)
The DCM requires an ethernet connection between the computer and the MCU-500. This connection utilizes a standard
Category 5 (Cat 5) ethernet cable with RJ-45 connectors. If you do not have the cable that shipped with the system, you can
use any standard Cat 5 cable. The system does not require a crossover cable, although, one can be used with the system.
The diagram below shows the connections required to use the system. The ethernet connection to the MCU-500 provides
both position and UT data to the DCM. Be sure to set which UT device you are using by clicking on Settings. You can
select either the USN-52 or USN-58. Be sure to set the baud rate for the USN-58 to 115k. Do this by selecting NEXT on
the main menu of the USN-58 and then SER COMM.
Removing or Uninstalling the Software
To remove the ADAS-500 Reporting System from a computer, you should not delete the folders and files manually. Remove
it by selecting Start | Settings | Control Panel.
From the control panel, double click the Add / Remove Programs icon. From the list of applications in the window, select
ADAS-500 Reporting System and click the Add/Remove button.
STOP
OFF ON
REMOTE
CRAWLER
ATCO
PUS
H
MCU-500R
Motor Control Unit
MCU-500R
UT
Scope
Ethernet
Rear Panel
DCM Host
Figure 3 Connecting to the AMAC-500/MCU-500
ADAS-500 Reporting System User’s Manual
Chapter 3 Getting Started
Copyright © 2005-2009 ATCO. All Rights Reserved. Page 4 Revision 1.9
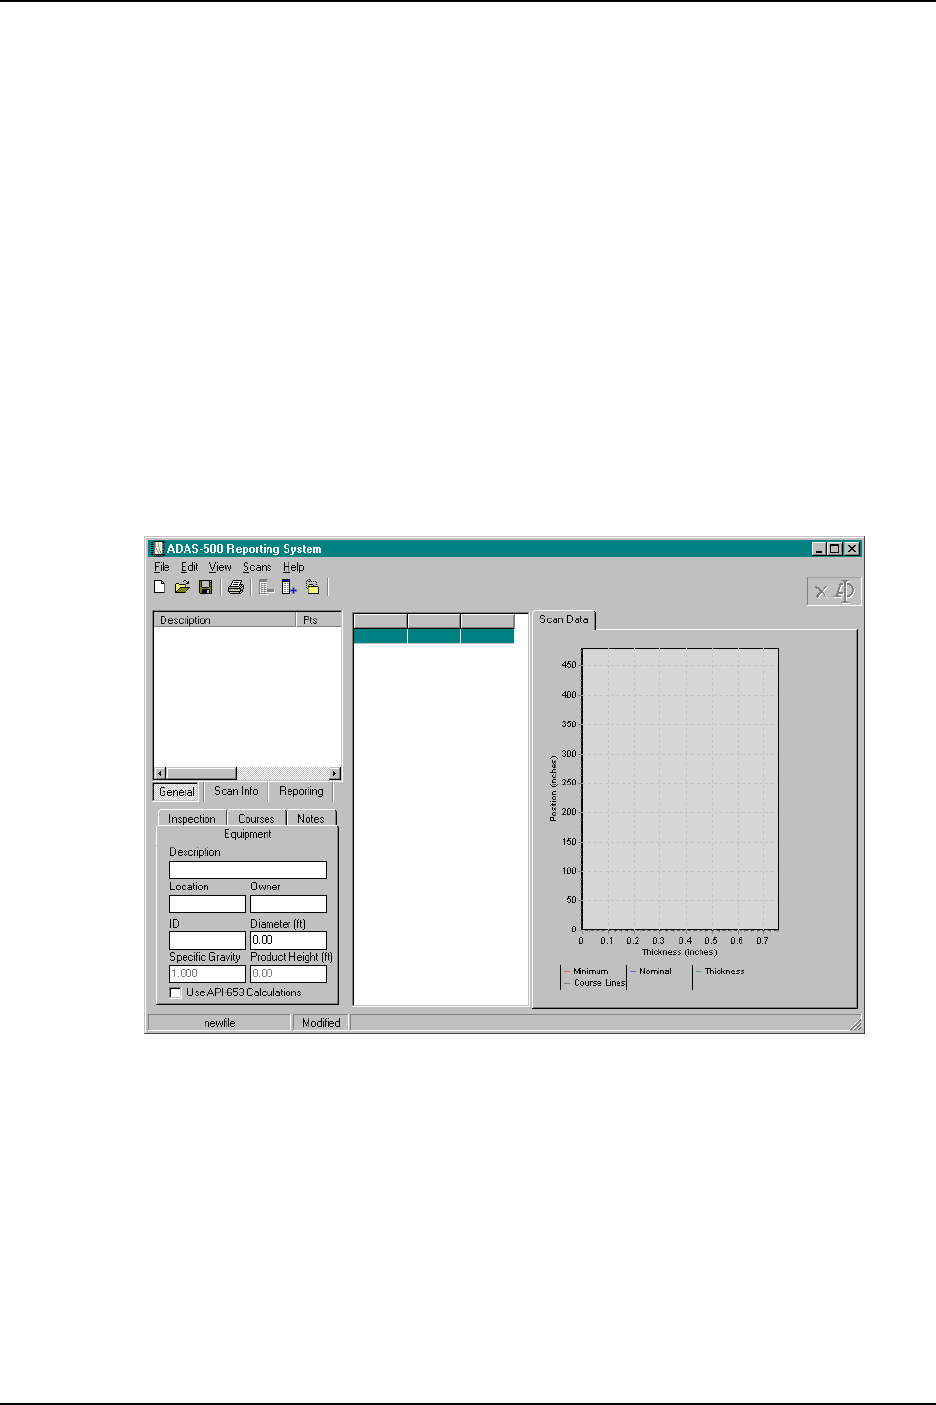
Figure 1 Blank Main Screen
Getting Started
Running the System
The software must be successfully installed before running the system. If you have not installed the software from the
distribution disks at this point, please refer to the previous section and do so now. If the software has been successfully
installed, you are ready to run the ADAS-500 Reporting System.
From the Start menu select Programs | ADAS-500 Reporting System | ADAS-500 Reporting System.
If you do not find the Start menu entry, proceed to the previous section and run the installation as specified. Otherwise,
select the menu option (shown above) and the main screen of the program should appear as shown below.
ADAS-500 Reporting System User’s Manual
Chapter 3 Getting Started
Copyright © 2005-2009 ATCO. All Rights Reserved. Page 5 Revision 1.9
Course
Details
Graphical Data
Display
Menu Bar
Scan
List
Main Menu
Status Bar
Thickness
Points Grid
Data Group
Tabs
Data Tabs
API-653
Calculation Status
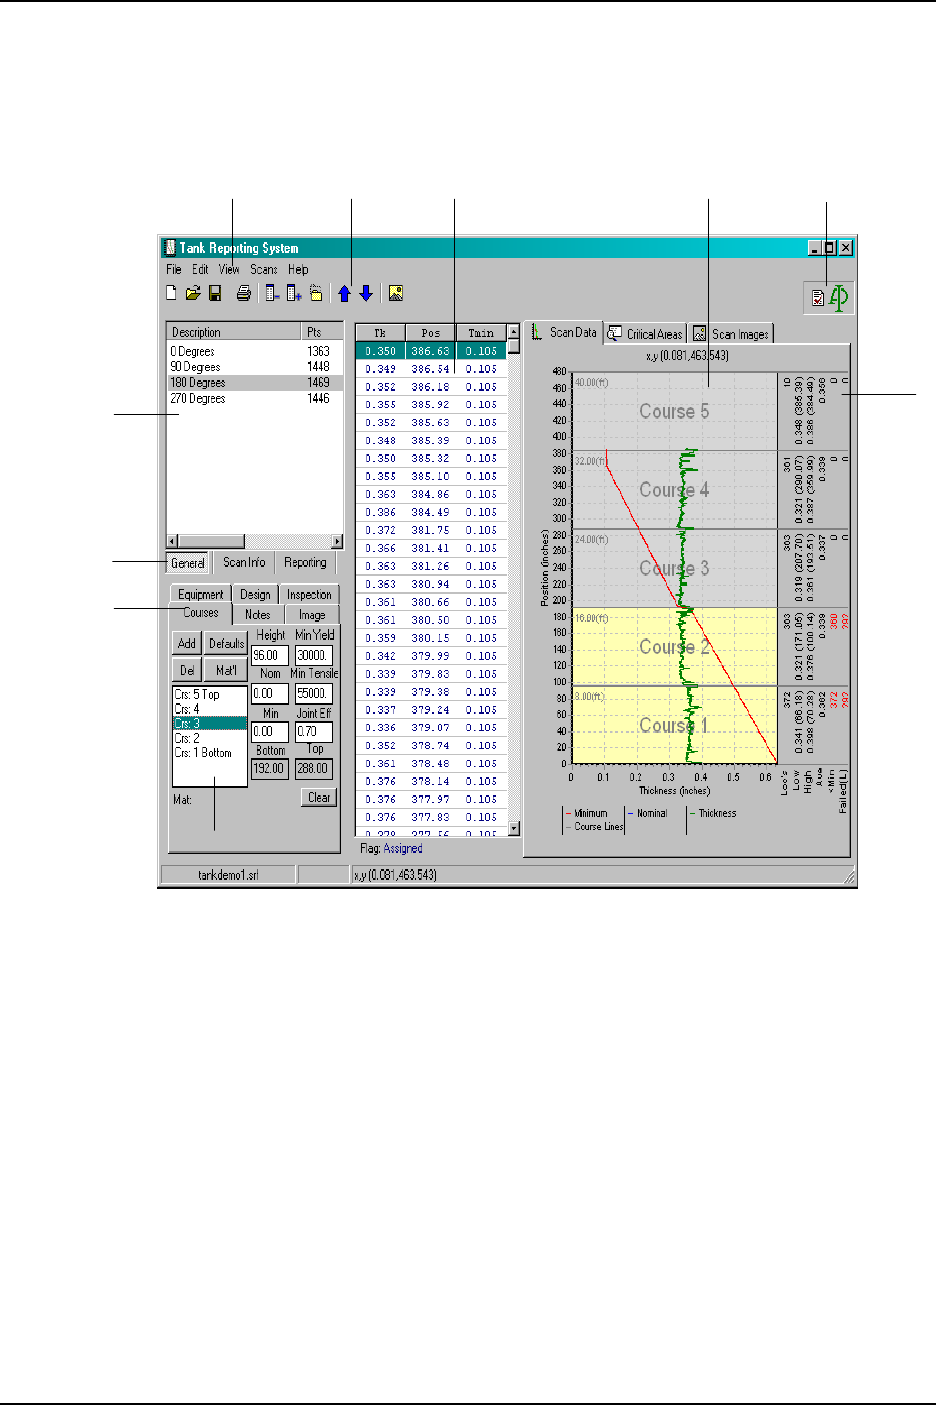
Screen Layout
The figure below shows the main screen of the system and it’s major parts.
Main Menu
The main menu structure is shown below with a short description of each item.
File
New Creates a new blank reporting file
Open Opens an existing reporting file from disk
Reopen Provides a list of most recently used files to open
Import Import a “TK” file as a scan
Save Saves the current file
Save As Saves the current file to a new name
Print Print reports
Print Setup Allows you to select a printer and set basic report options
Exit Close the system down
ADAS-500 Reporting System User’s Manual
Chapter 3 Getting Started
Copyright © 2005-2009 ATCO. All Rights Reserved. Page 6 Revision 1.9
New
File
Save Delete
Scan
Insert TK
File Data
Open
File
Print
Reports
Add
Scan
Figure 3 Menu Bar
Edit
Cut Cut the current selection to the clipboard
Copy Copy the current selection to the clipboard
Paste Paste clipboard contents
Report Settings
Minimum Toggles graphical display of the minimum thickness in the graphs
Course Lines Toggles graphical display of the course lines in the graphs
Grid Lines Toggles graphical display of the grid lines in the graphs
Legend Toggles graphical display of the legend in the graphs
Minimum Color Sets the color for the minimum thickness in the graphs
Thickness Color Sets the color for the thickness in the graphs
Course Color Sets the color for the course lines in the graphs
View
Scan Data Selects the Scan Data graphical view
Course Details Selects the Course Details graphical view
General Info Selects the General data group tab
Scan Info Selects the Scan Info data group tab
Reporting Info Selects the Reporting data group tab
Scans
Add Scan Add a new scan to the scan list
Delete Scan Delete a scan from the scan list
Insert TK File in to Scan Insert data from a “TK” file in to an existing scan
Move Scan Up Move the scan up in the scan list
Move Scan Down Move the scan down in the scan list
Help
Contents Displays the contents page of the help system
About Displays the About dialog which provides version and copyright information
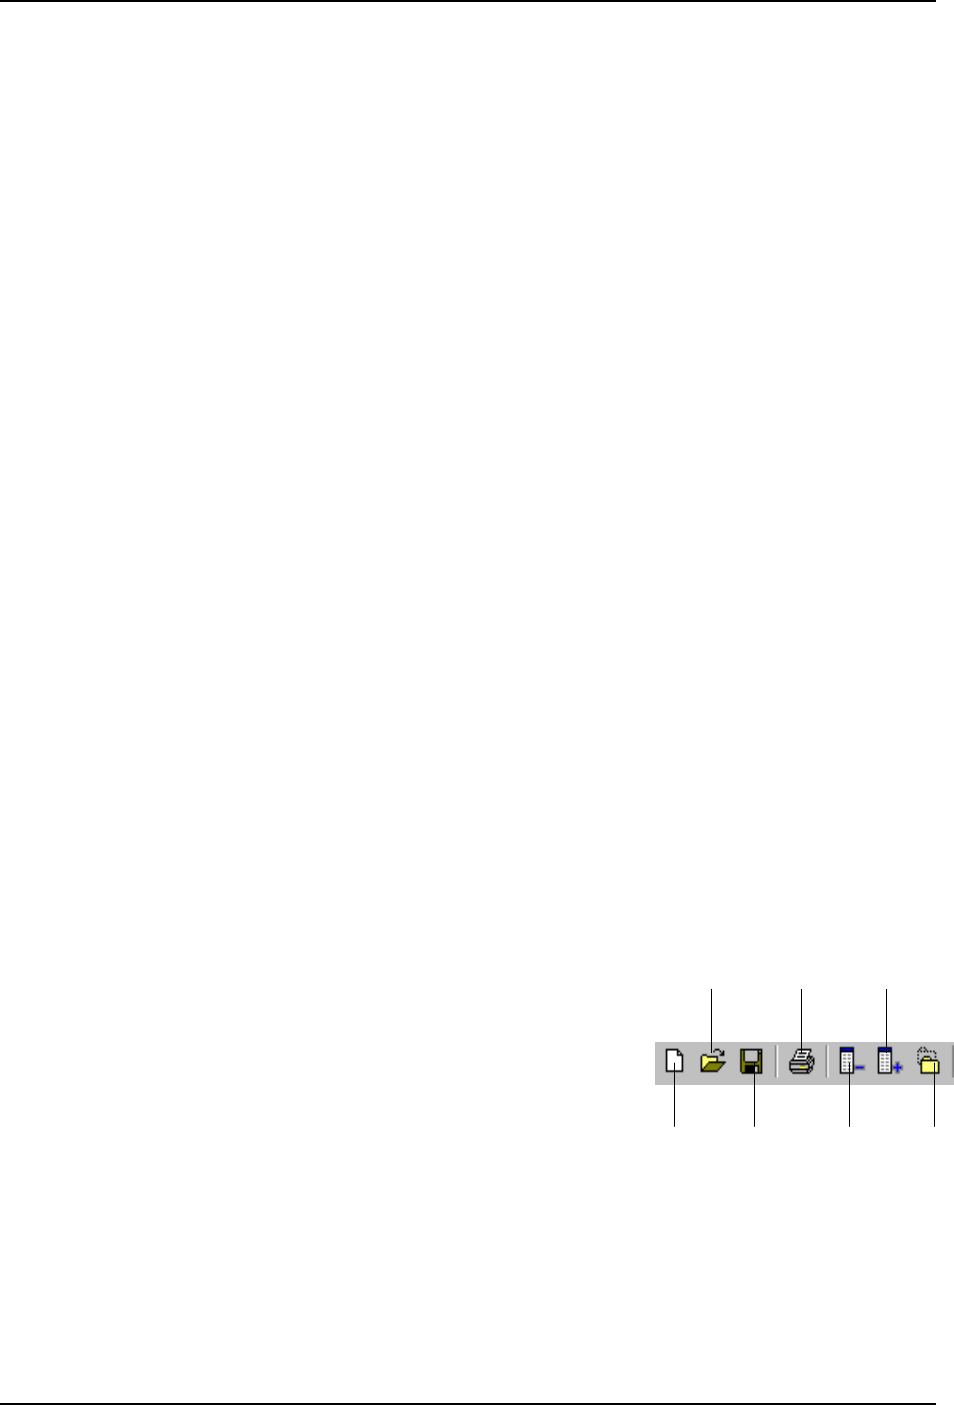
Menu Bar
The menu bar which appears across the top of the main screen below the
main menu provides shortcuts to commonly used commands. The figure
shown to the right shows each menu bar button.
ADAS-500 Reporting System User’s Manual
Chapter 3 Getting Started
Copyright © 2005-2009 ATCO. All Rights Reserved. Page 7 Revision 1.9
Figure 6
Scan
Description
Number of
data points
in the scan
Data Group
Selection Tabs
Data
Tabs
Figure 4 Scan List and Data Tabs
Figure 5 Figure 7
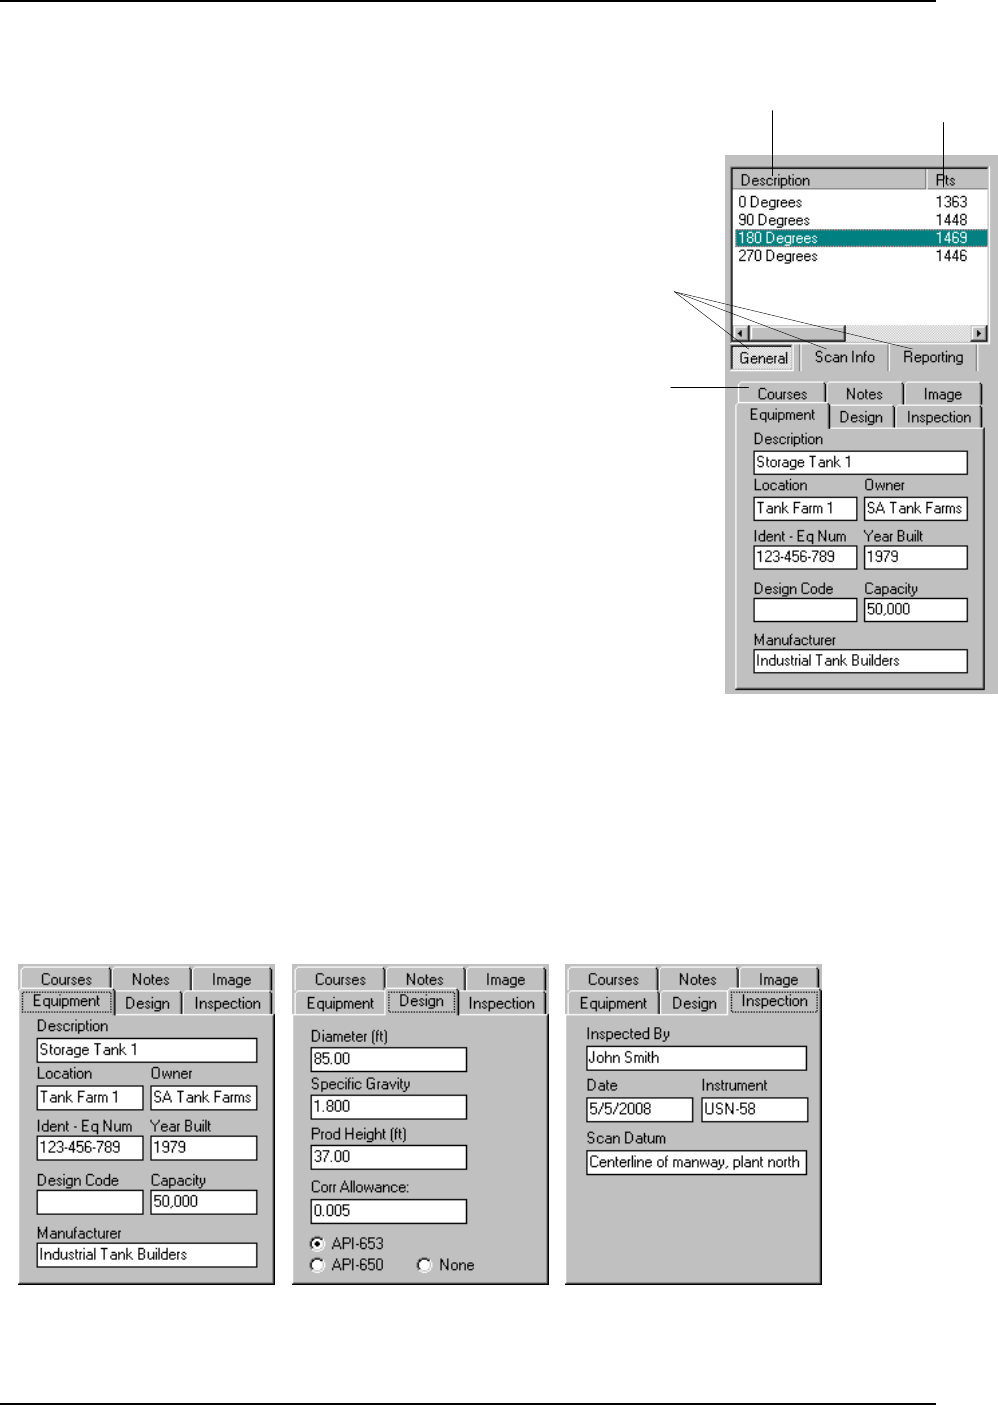
Scan List
The scan list displays the scans in the current report file. Report files can
hold several scans and are usually associated with a single piece of
equipment.
As a scan is selected in the scan list, the graphical display and thickness
data grid display the selected scan data. When reviewing thickness data,
deleting scans or importing data, you must first select the scan in the scan
list. The scan list scrolls to the right to display more information about the
scan such as the number of thickness points, the number less than
minimum, the high and low thickness and the technician name.
Data Tabs
The data tabs are divided in to three basic groups, General, Scan Info and
Reporting. Click the data group tabs at the top to display and edit
information in the appropriate data tabs below.
General Group
This group displays general equipment, inspection, course layout and
comment information.
Equipment information can be edited by clicking the Equipment tab
(shown right). An explanation of the fields will be covered later in this
section. To enter design information such as diameter and capacity, click
the Design tab.
Inspection information can be edited by clicking the Inspection tab
(Figure 5). An explanation of the fields will be covered later in this
section.
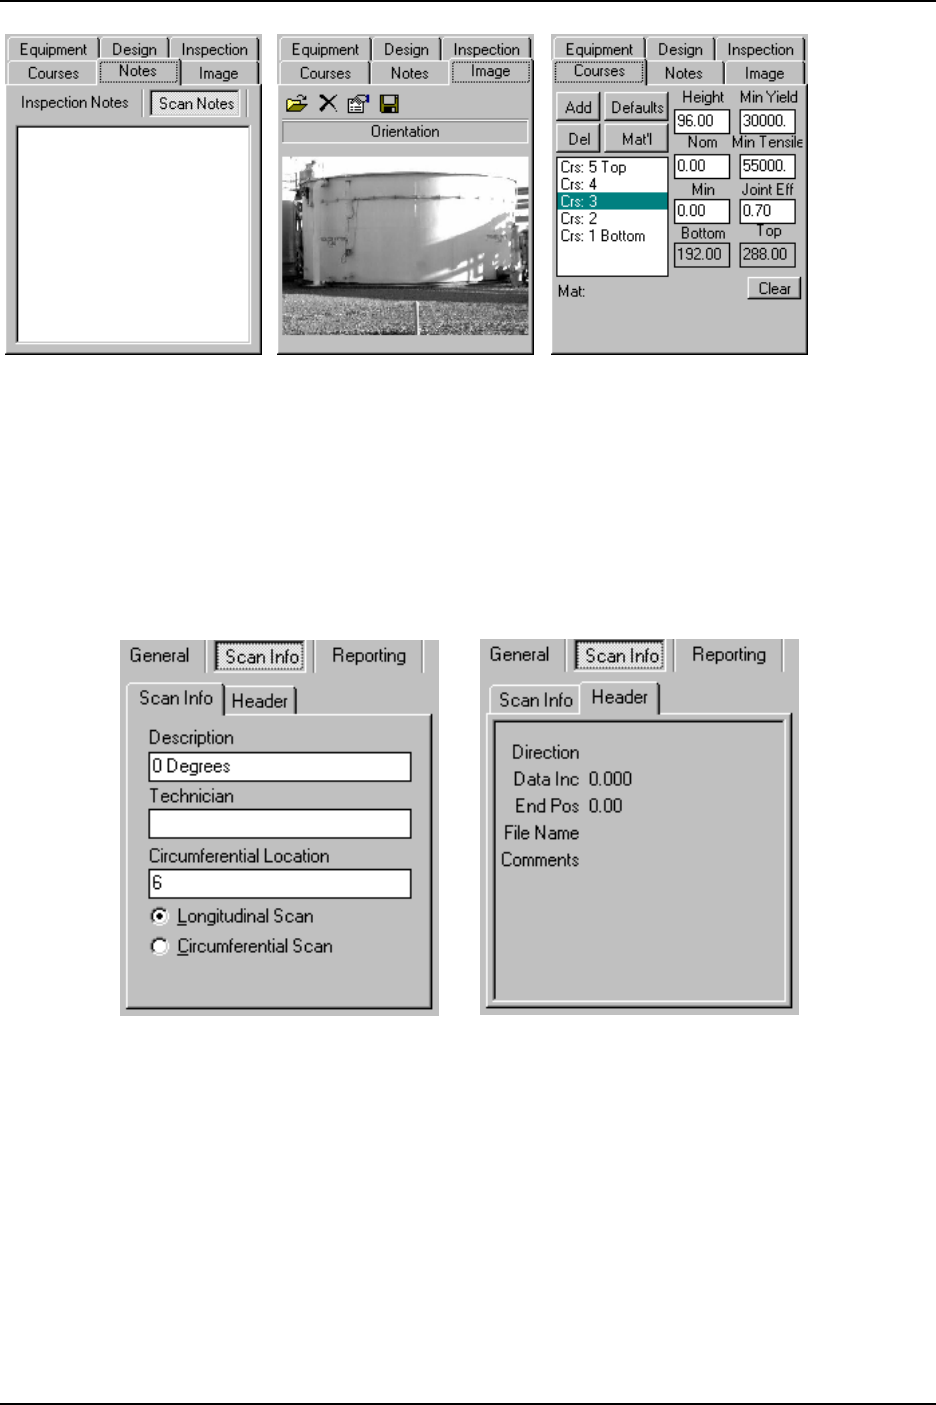
Course definition information is edited by clicking the Courses tab (Figure 8). This is where course height, nominal thickness
and other information is entered. An explanation of the fields will be covered later in this section.
General inspection and scan specific notes are entered by clicking the Notes tab (Figure 8).
ADAS-500 Reporting System User’s Manual
Chapter 3 Getting Started
Copyright © 2005-2009 ATCO. All Rights Reserved. Page 8 Revision 1.9
Figure 10Figure 8 Figure 9
Figure 11 Scan Info Tab Figure 12 Header Tab
Scan Info Group
This group allows you to review or edit scan information and thickness data. To edit general scan information, click the Scan
Info tab (Figure 11).
When scans are imported you are given the opportunity to save header information from the Adas-500 data files (TK). If you
choose to import scan header information, you can review it by clicking on the Header tab (Figure 13).
ADAS-500 Reporting System User’s Manual
Chapter 3 Getting Started
Copyright © 2005-2009 ATCO. All Rights Reserved. Page 9 Revision 1.9
Figure 13 Graph View Tab
Figure 14 Graph Colors Tab
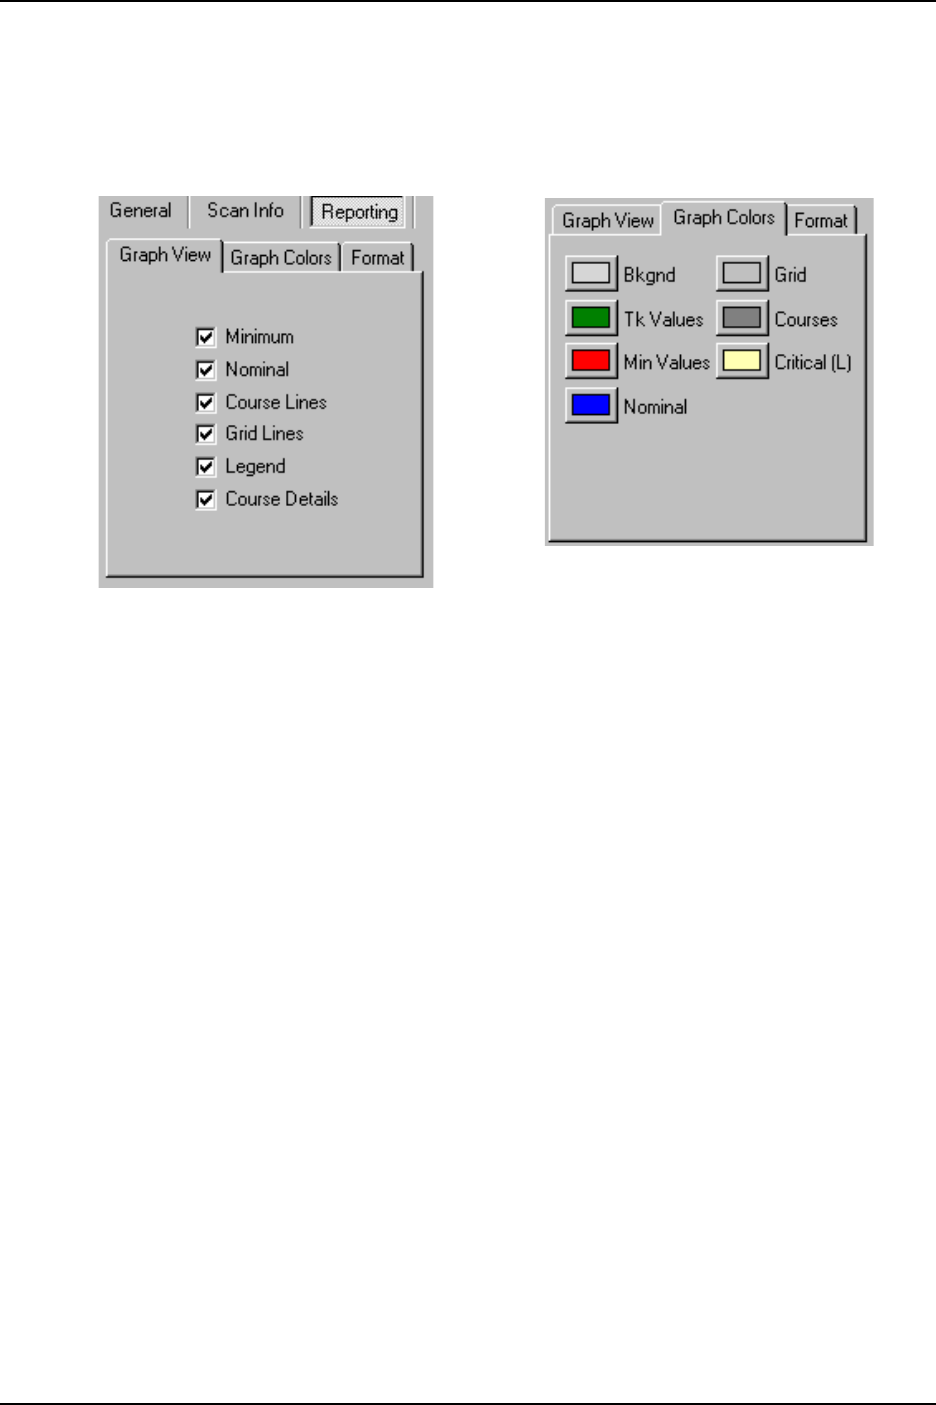
Reporting Group
This group allows you to select various reporting and graph settings. To change the components viewed on the graph such as
minimum and nominal thicknesses, course lines, grid lines, legend and course details, select the Graph View tab (Figure 13).
To change the colors of the graph components, select the Graph Colors tab (Figure 13).
ADAS-500 Reporting System User’s Manual
Chapter 3 Getting Started
Copyright © 2005-2009 ATCO. All Rights Reserved. Page 10 Revision 1.9
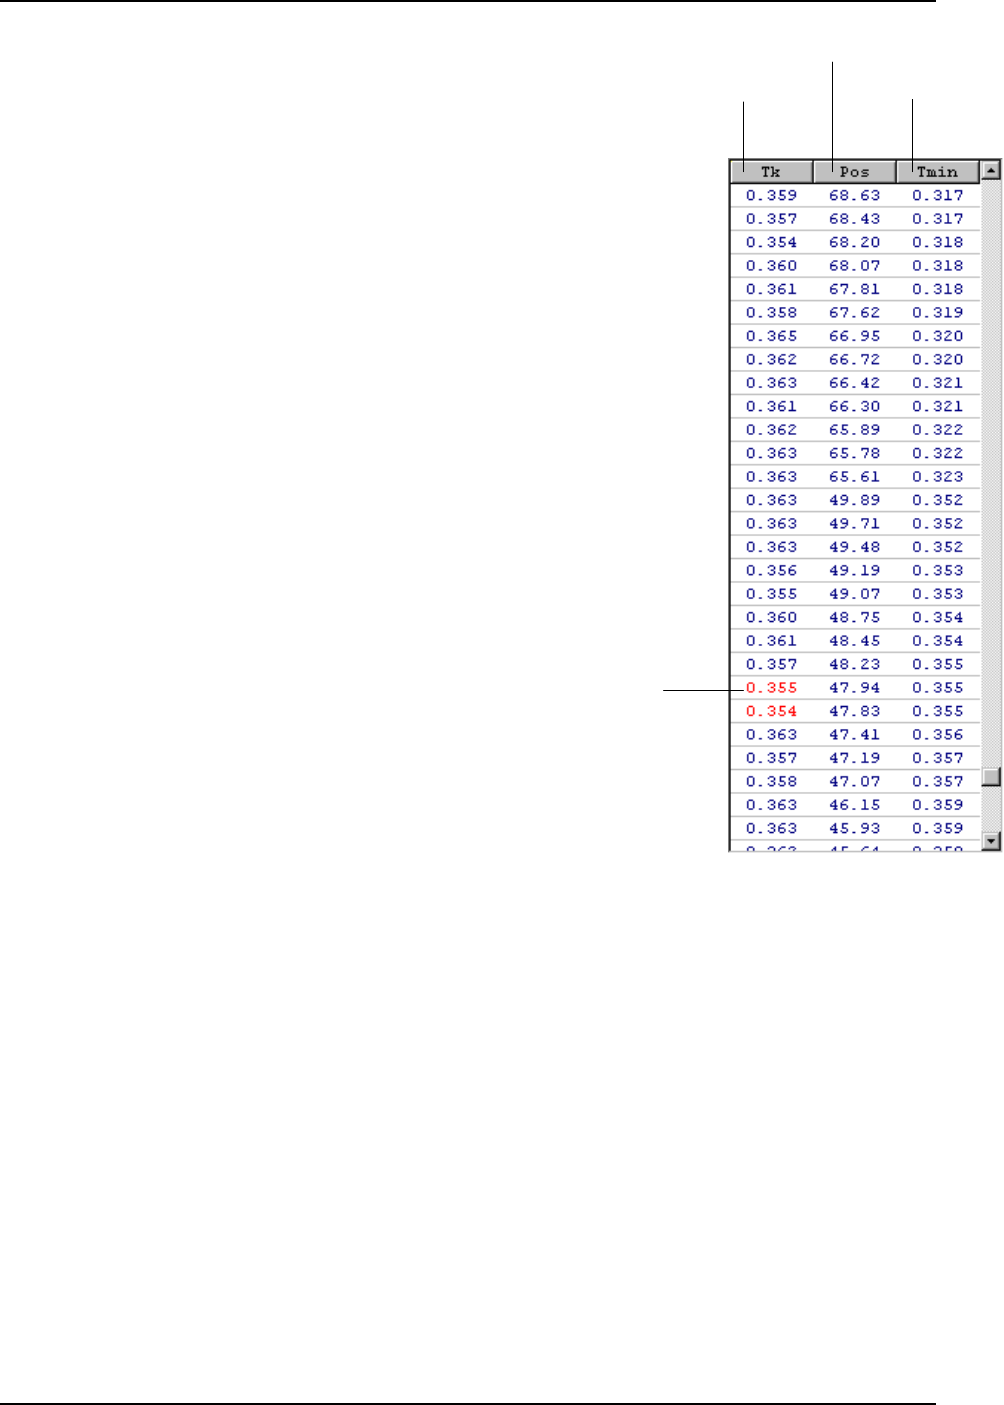
Thickness
Position (Elev)
API-653 Tmin
Thicknesses in
RED are equal or
less than Tmin
Figure 15 Thickness Point Grid
Thickness Points Grid
The thickness points grid (Figure 15) displays the thickness
data of the selected scan. The three columns display the
Thickness, Position and Minimum values for each thickness
point in the scan. The list of thicknesses is sorted by position
with the lowest position at the bottom. The thickness and
position values are obtained directly from the ADAS-500 data
file. The Tmin / Min column displays the API-653 Tmin value
when API-653 calculations are enabled, otherwise the course
minimum value is shown. Thickness values in RED indicate
that the value is at or below the Tmin value.
ADAS-500 Reporting System User’s Manual
Chapter 3 Getting Started
Copyright © 2005-2009 ATCO. All Rights Reserved. Page 11 Revision 1.9
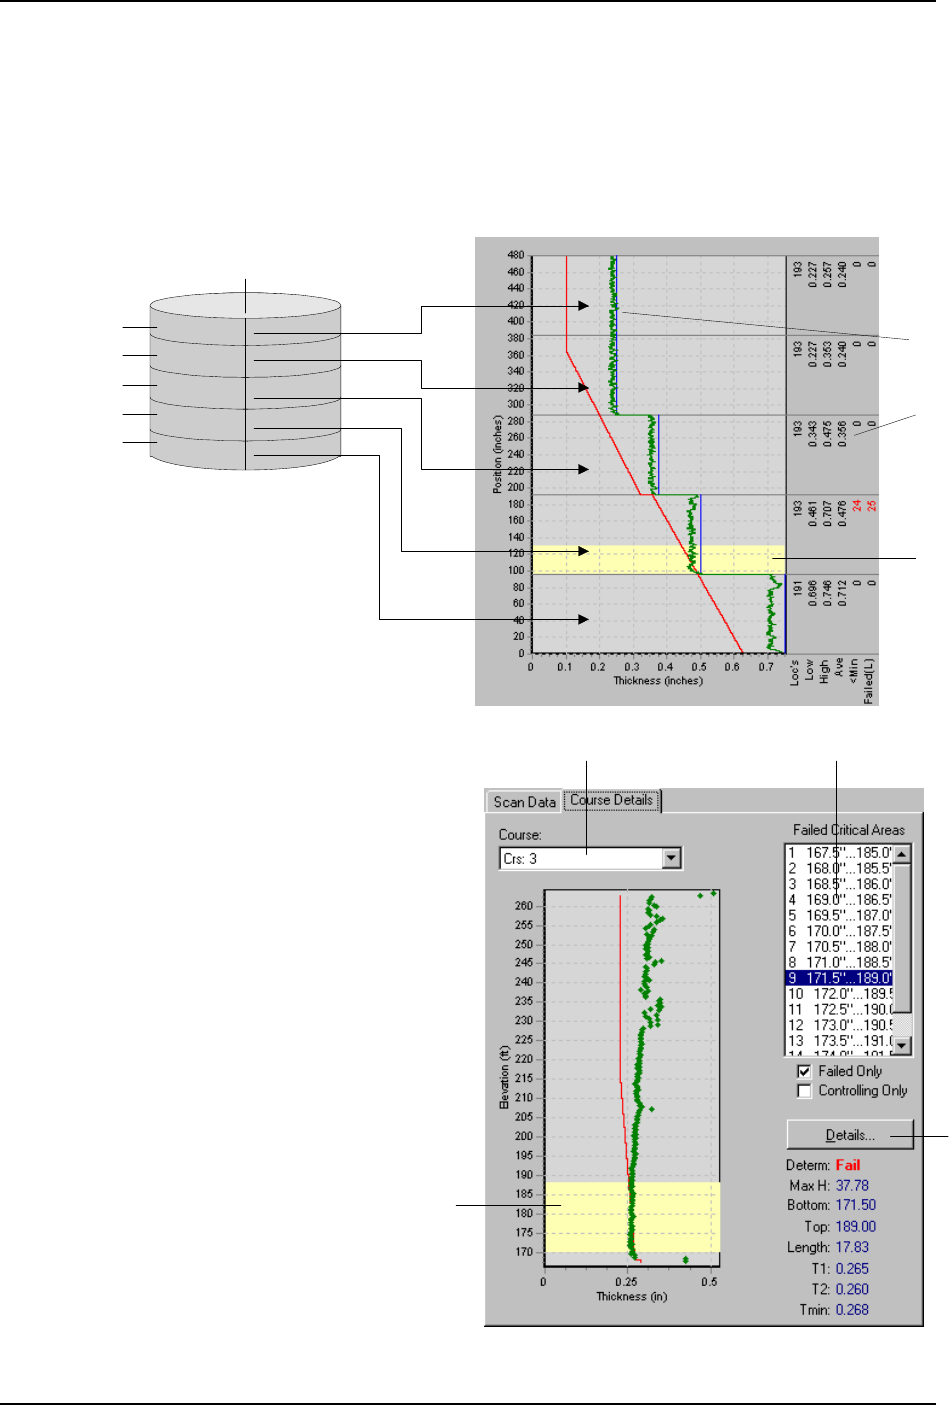
0 degree
Scan
Vertical Storage Tank
Course 1
Course 2
Course 3
Course 4
Course 5
Course
Details
Thickness data
plotted against
Position
Critical
Area(s)
Figure 16 Vertical Storage Graphical Display
Critical
Area
Critical Area List
Course
Selection List
Area
Details
Button
Figure 17 Course Details Graphical Display
Graphical Data Display
You can view the scan data graphically by clicking the Scan Data tab (Figure 16) on the graphical data display. This shows
the entire scan as well as course details. The thickness is plotted against the position (obtained from the ADAS-500 data file).
The graph also plots the minimum (either assigned or API-653 Tmin) and nominal values. The graph shown is typical of a
vertical storage tank (API-653 type). The data is displayed just as it would be oriented on the tank itself.
The right side of the graph displays summarized
scan information for each course. The critical
area shown is calculated automatically and
shows areas of concern on API-653 enabled
inspections. More about the critical areas and
other API-653 calculations can be found in the
section titled Analysis Methodology.
You can view selected course details by
clicking the Critical Areas tab (Figure 17) on
the graphical data display. This shows the scan
data by course. The graph plots the thickness,
position, minimum and nominal values for each
selected course.
Choose a course to view by selecting it from the
Course Selection List. The critical areas for
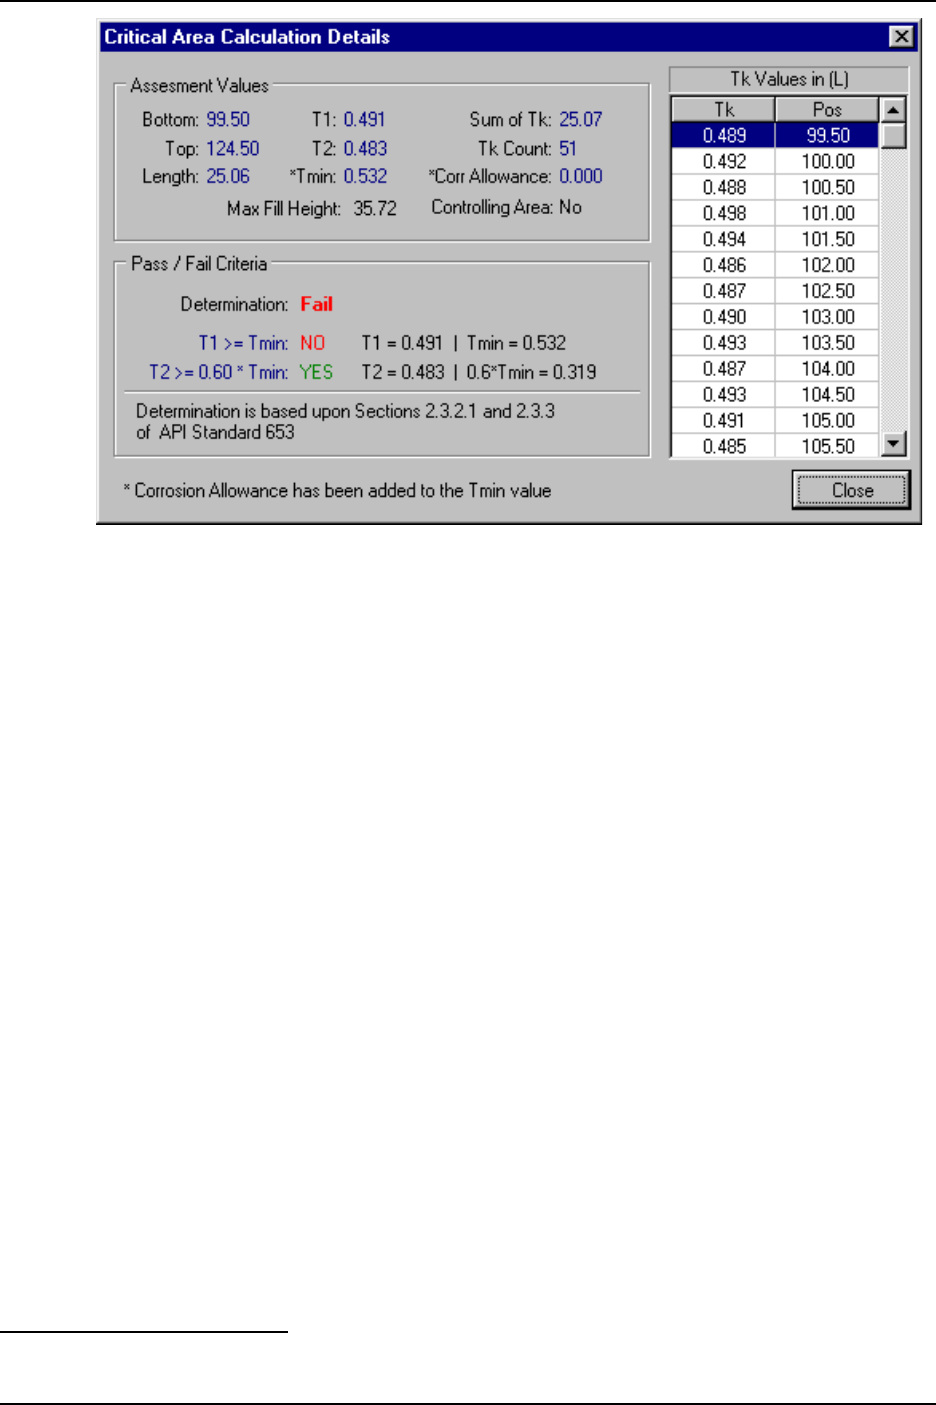
each course is listed in the critical area list. The
area details button displays a dialog box (Figure
18) which shows the details about the selected
critical area. More about the critical areas and
other API-653 calculations can be found in the
section titled Analysis Methodology.
ADAS-500 Reporting System User’s Manual
Chapter 3 Getting Started
1 Typical equipment layout techniques are discussed later in this section and can also be found in the AMAC-500 manual.
Copyright © 2005-2009 ATCO. All Rights Reserved. Page 12 Revision 1.9
Figure 18 Critical Area / Length Details Dialog
How the System Works
The ADAS-500 Reporting System provides a simple and convenient means to produce high quality, professional reports from
data files collected using the ADAS-500 Data Logger or by using the Data Collection Module. If you use the ADAS-500
Data Logger is used to collect data, you can transfer the data to the PC for processing and analysis. If you are using the Data
Collection Module, you can interface directly to the AMAC-500 system and collect the data using the PC.
The ADAS-500 generates are text data files containing basic scan, equipment, thickness and position information for scan
thickness points. Each file contains a single scan. Typically if you are scanning a vertical above ground storage tank (i.e. an
API-653 governed tank) this would be a scan or drop run vertically at the 0,90,180 or 270 degree position1.
The ADAS-500 Reporting System allows you to read the data files (TK) from the ADAS-500 and work with them as an
entire group (such as all four scans of a tank ... 0,90,180 & 270 degrees). Basic information about the equipment and
inspection are entered and saved as a report file with the extension “ srf”. This scan report file (srf) contains all the scan data
obtained from the TK files as well as equipment information and graph color settings and more. It is a convenient way to
group the data in to a single file for a piece of equipment. Once the data is successfully saved in the srf data file, you no
longer need the TK files obtained from the ADAS-500. However, it is good practice to save them at least until the work is
completed. Generally, it is recommended to make a backup copy of the TK files anyway and save them permanently along
with the srf files.
Once you have correctly entered the information required, reviewed the data and set your reporting options, you are ready to
print your reports. The API-653 calculations such as Tmin and Critical Areas are automatically done for you provided that
you enter the basic information required. Note that you should review the API-653 Standard and become familiar with the
formulas used by this reporting system. For more information on how this system performs calculations, refer to the section
titled Analysis Methodology.
ADAS-500 Reporting System User’s Manual
Chapter 3 Getting Started
Copyright © 2005-2009 ATCO. All Rights Reserved. Page 13 Revision 1.9
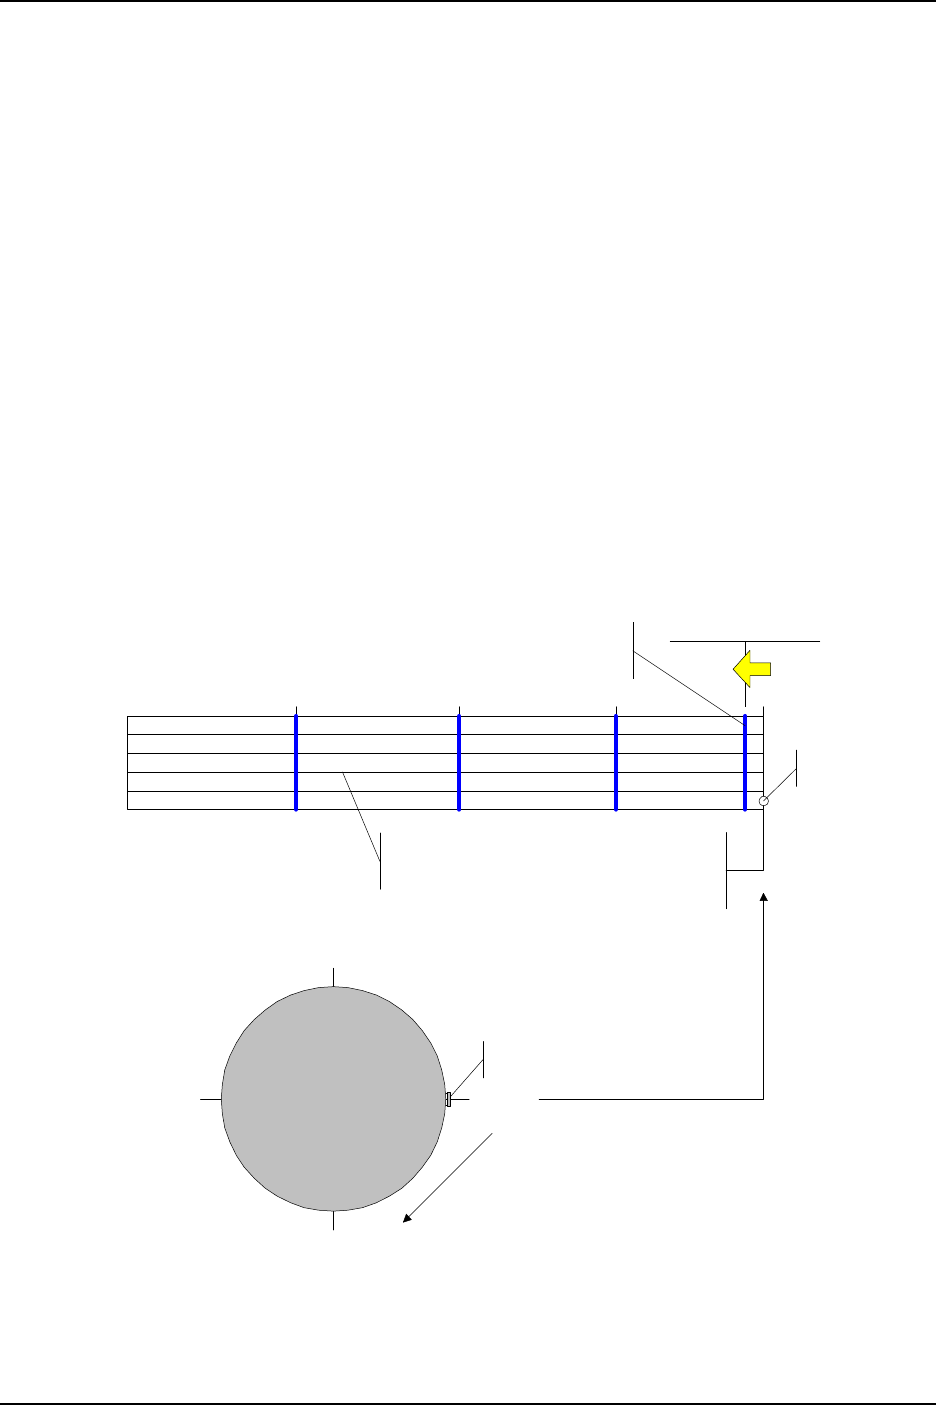
Tank Shell
(external view)
090270 180
Datum or Zero
Reference Point
(typically a manway)
Course (weld)
lines
Typical Vertical Scan
Locations (4)
Manway
Note the 0 degree
scan has been
shifted to clear the
manway
0
90
180
270
Typically, locations are
measured clockwise (looking
down on the tank) from the zero
reference point as shown
Top View
(Tank Roof)
Manway
Figure 19 Typical Scan / Drop Layout on Tanks
Typical Scanning Practices and Guidelines
Before using the ADAS-500 Reporting System you should carefully read this section on scanning practices. There are
several assumptions made by the system that you should be aware of. The methods shown below are accepted as the standard
or typical means of scanning tanks and other equipment.
One of the most important assumptions made by the ADAS-500 Reporting System is the scan location coordinates and layout
methods. For demonstration purposes, let us presume that you are scanning above ground storage tanks, like those covered
by the API-653 Standard. Typically, vertical scans or drops are done around the shell of the tank. Usually there are either 4
or 8 scans depending on the size of the tank. These are usually at the 0, 90, 180 & 270 degree positions (See Figure 19).
The circumferential coordinates are measured around the circumference of the tank. This specifies the location of the scan on
the tank with reference to some datum or zero reference point. This point is typically an easily identifiable object on the tank
such as a manway or nozzle.
The longitudinal coordinates are measured from the bottom of the tank. This is very important because the API-653
calculations performed by the system depend on it. When in the field and scanning with the crawler, be sure to always
measure your position from the bottom of the tank, and not each course. For example, if the first course is 96 inches in
length, a position at 100 inches would fall 4 inches above the top weld line of the bottom course. Refer to the AMAC-500
documentatio
n for more
information
on scan layout
and
coordinates.
ADAS-500 Reporting System User’s Manual
Section 4 Creating Report Files
Copyright © 2005-2009 ATCO. All Rights Reserved. Page 14 Revision 1.9
Creating Report Files
This section will step you through the process of creating report files. It is assumed that you have successfully installed the
ADAS-500 Reporting System and read the section titled Getting Started.
ADAS-500 Thickness Data Files (tk)
The data files (*.tk) produced by the ADAS-500 are text files containing basic scan and equipment information as well as all
thickness and position information for scan thickness points. Each file contains a single scan and are generated automatically
when scanning using the ADAS-500.
ADAS-500 Scan Report Files (srf)
Typically, each piece of equipment inspected will have more than one scan associated with it. The ADAS-500 Reporting
System allows you to combine several scans from tk files in to a single report file. In addition to thickness and position data,
the report file stores equipment design information required to perform automatic calculation of API-653 minimums.
The ADAS-500 Reporting System reads both the Tk and report (srf) data files. The tk files can be read in to the system, but
cannot be saved in the TK format. They are saved as a report file (srf). The remainder of this section will step you through
the process of creating report files.
Automatic API-653 Calculations
Many of the fields for entering data in to the ADAS-500 Reporting System are required in order to automatically calculate
API-653 values. When any of the required variables are not valid or entered, the API-653 Tmin values will not appear in the
Thickness Points Grid and the minimum line will not appear on the graph. The system provides an easy way to determine
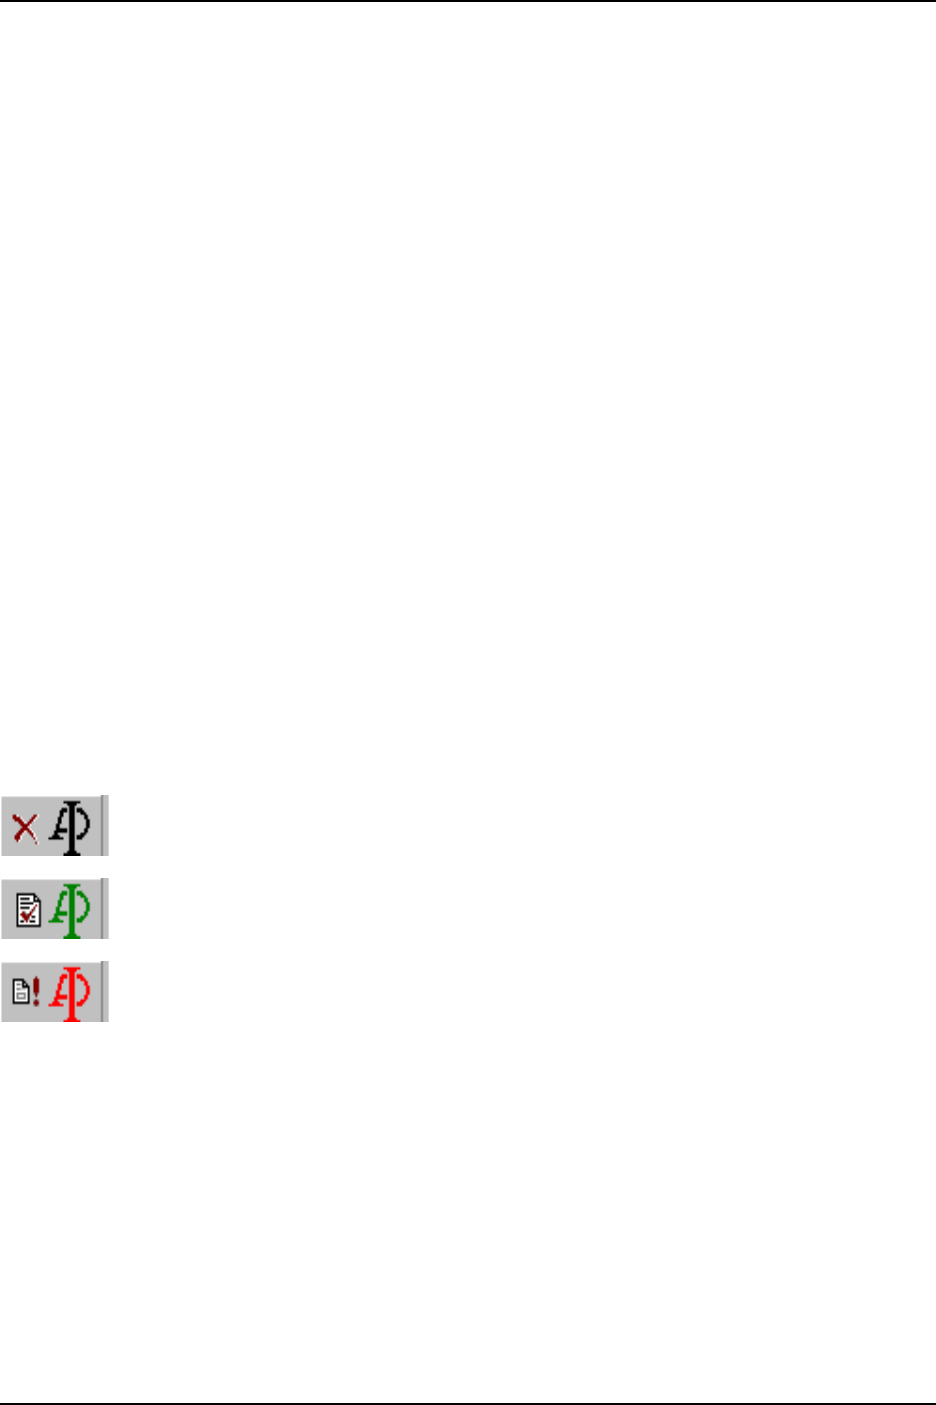
when any of the required values are either missing or invalid. The API-653 Status Indicator (shown below) in the top right
corner of the main window provides you with an easy and fast way to determine which required variables are either not
entered or invalid.
Indicates that API-653 Calculations have been disabled
Indicates that the values of the required fields are entered and valid
Indicates that at least one of the values of the required fields are invalid
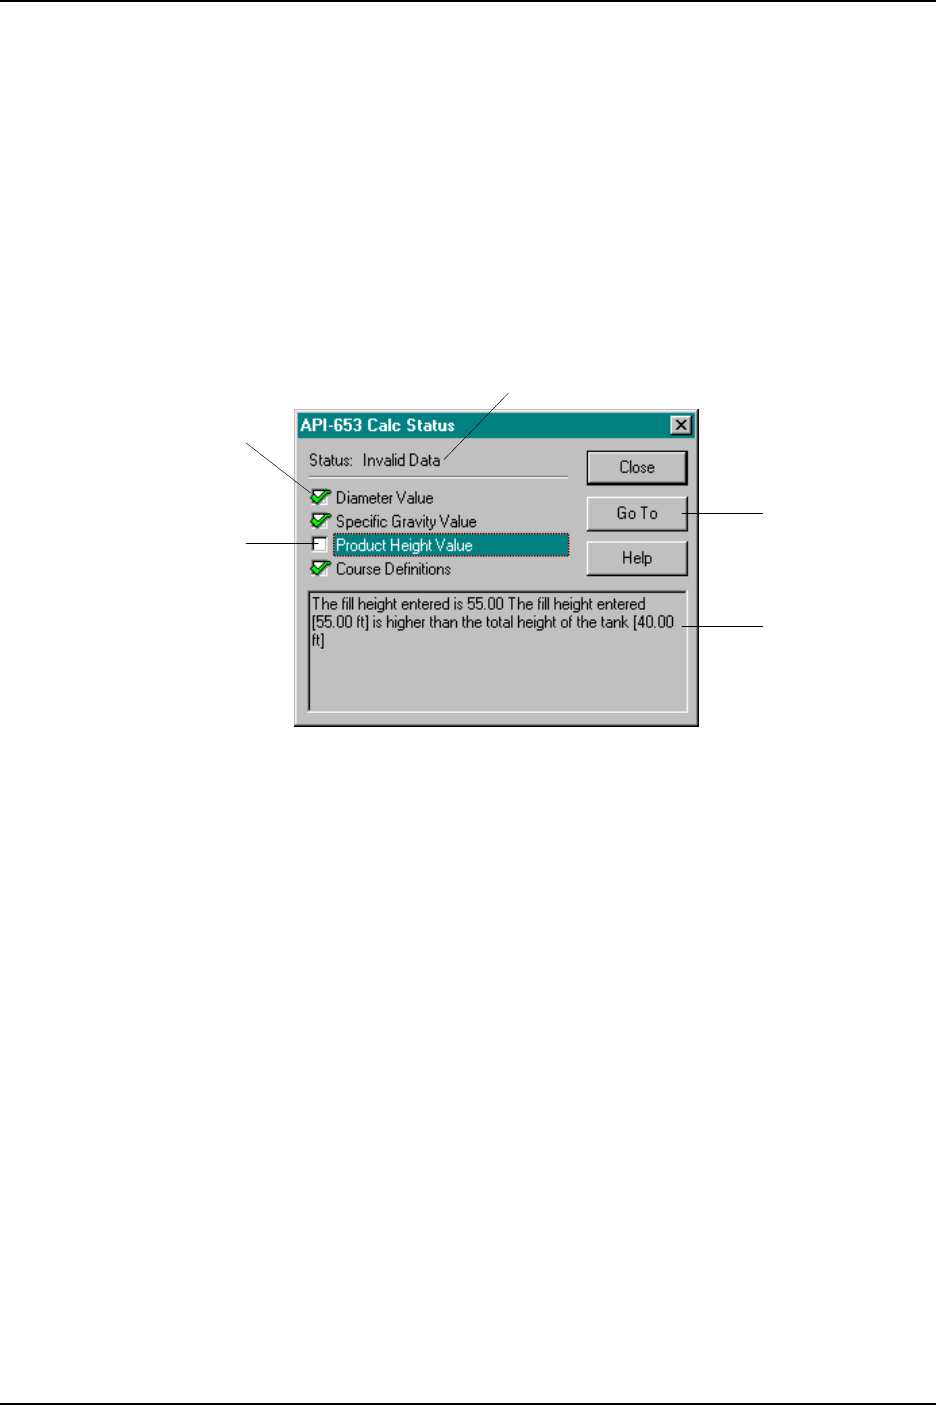
Clicking on the indicator invokes the API-653 Calculation Status dialog (Figure 17). You can quickly identify the fields that
require either changing or entry. The fields with the green checkmark next to them are entered and valid. The fields without
the checkmark require some attention. An explanation is provided at the bottom of the dialog that indicates the reason. To
make changes to the field, highlight it in the list and click the Go To button. Once all fields are entered and valid, a green
API symbol will appear and the Tmin line should appear in the graph.
ADAS-500 Reporting System User’s Manual
Section 4 Creating Report Files
Copyright © 2005-2009 ATCO. All Rights Reserved. Page 15 Revision 1.9
Check indicates the
required value is
entered and valid
No Check indicates
the value is either not
entered or invalid
Click here to go to
the variable that
needs to be changed
or entered
Description of
the error.
Current Status
Figure 17 API-653 Calculation Status Dialog
The validity criteria for the fields are:
Diameter: The value must be greater than zero.
Specific
Gravity: The specific gravity must be greater than zero.
Product
Height: The product height must be greater than zero and less than the tank height.
Course
Definitions: The courses must be defined in order to determine which course the thickness values were from. This is
important since the tmin formula changes depending on course number.
Creating Report Files
When you first run the system, the main screen appears and a blank report file is loaded. At this point, there is no data in the
file and you can start entering information immediately. In the event that you have a file loaded, you can create a blank report
file by selecting the File | New menu option from the Main Menu. If the file you have loaded has been modified, the system
will provide you with an opportunity to save it before clearing it.
ADAS-500 Reporting System User’s Manual
Section 4 Creating Report Files
Copyright © 2005-2009 ATCO. All Rights Reserved. Page 16 Revision 1.9
Figure 18 Equipment Info
Figure 19 Design Info
Figure 20 Inspection Info
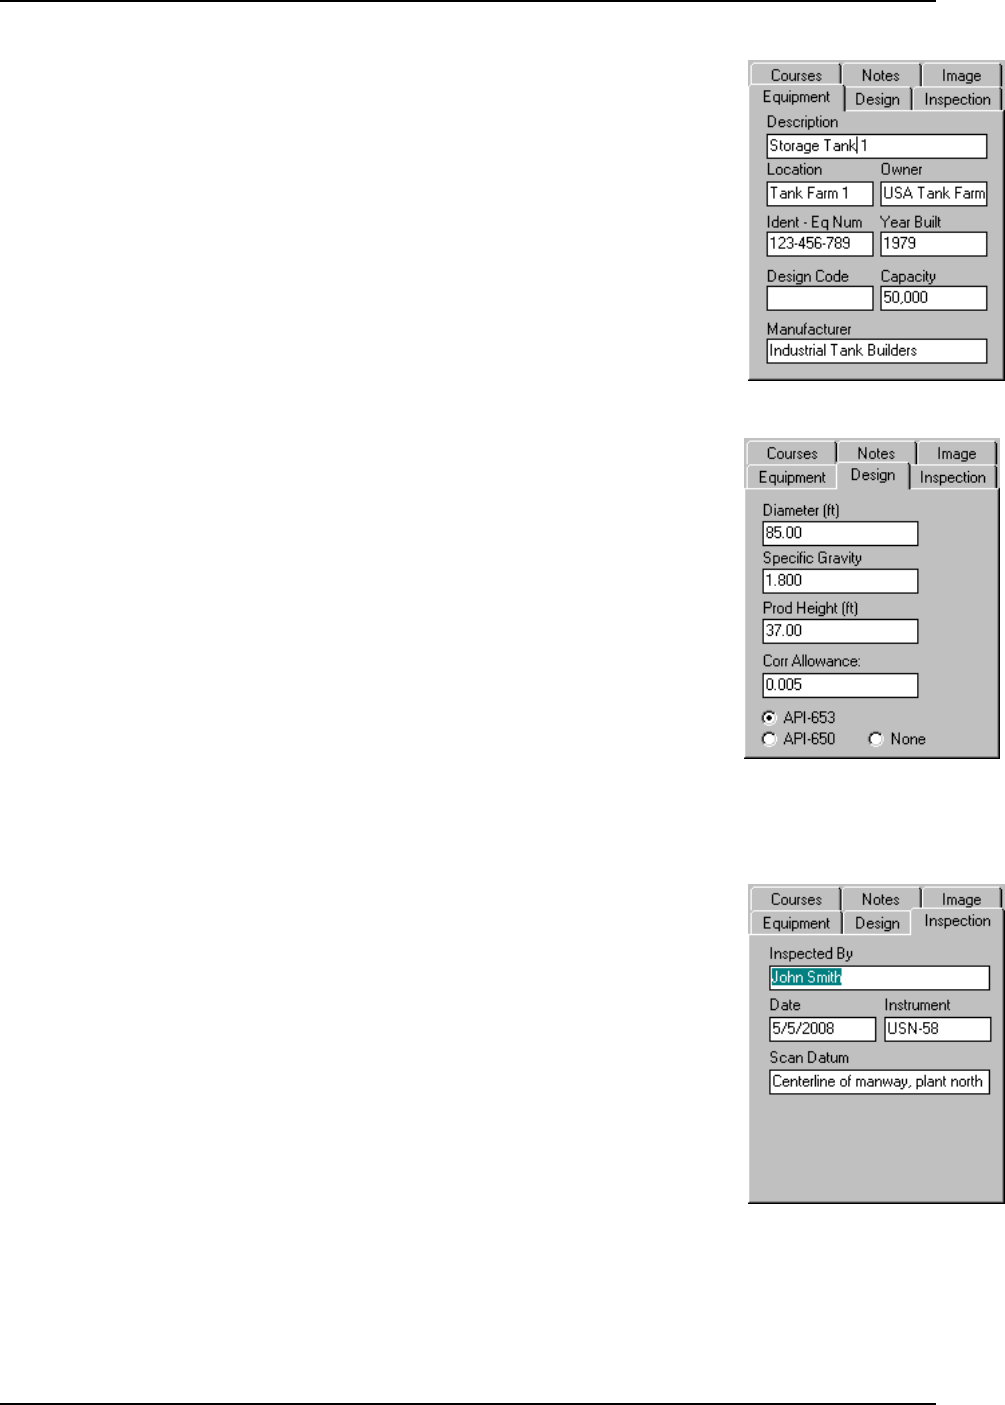
Entering Equipment Information
You must enter certain information about the equipment being inspected in order to use
features like the automatic minimum calculations. To edit equipment information, click the
General group tab, then the Equipment and Design data tabs as shown
Description Description of the equipment being inspected
Location Location of the equipment being inspected
Owner The owner of the equipment being inspected
ID The ID (i.e. Equipment Number) of the equipment being inspected.
Diameter The diameter of the equipment being inspected in feet. (API-653)
Specific Gravity The specific gravity of the liquid contents of the tank (API-653)
Product Height The height of the liquid in the tank in feet. (API-653)
API-653 Use API-653 Tmin Calculations for the equipment being inspected.
API-650 Use API-650 Variable-Design-Point method Tmin Calculations for the
equipment being inspected.
Entering Inspection Information
To edit inspection information, click the General group tab, then the Inspection data tab
as shown.
Inspected By The name of the individual or company performing the inspection
Date The date the inspection was performed
Instrument The UT instrument used to scan
Scan Datum The point of origin for measuring the locations of scans
Corrosion
Allowance The corrosion allowance for the next inspection period. It is added to the
API-653 Tmin values in accordance with Section 2.3.
Defining Course Information
ADAS-500 Reporting System User’s Manual
Section 4 Creating Report Files
Copyright © 2005-2009 ATCO. All Rights Reserved. Page 17 Revision 1.9
Add a New
Course
Delete the
Current
Course
Course List
Set the Course to
the Defaults
Course
Fields
Select the
Material for the
Course
Clear the Material
for the Course
Course Material
Selected
Standard / Material / Grade
Figure 21 Courses Tab
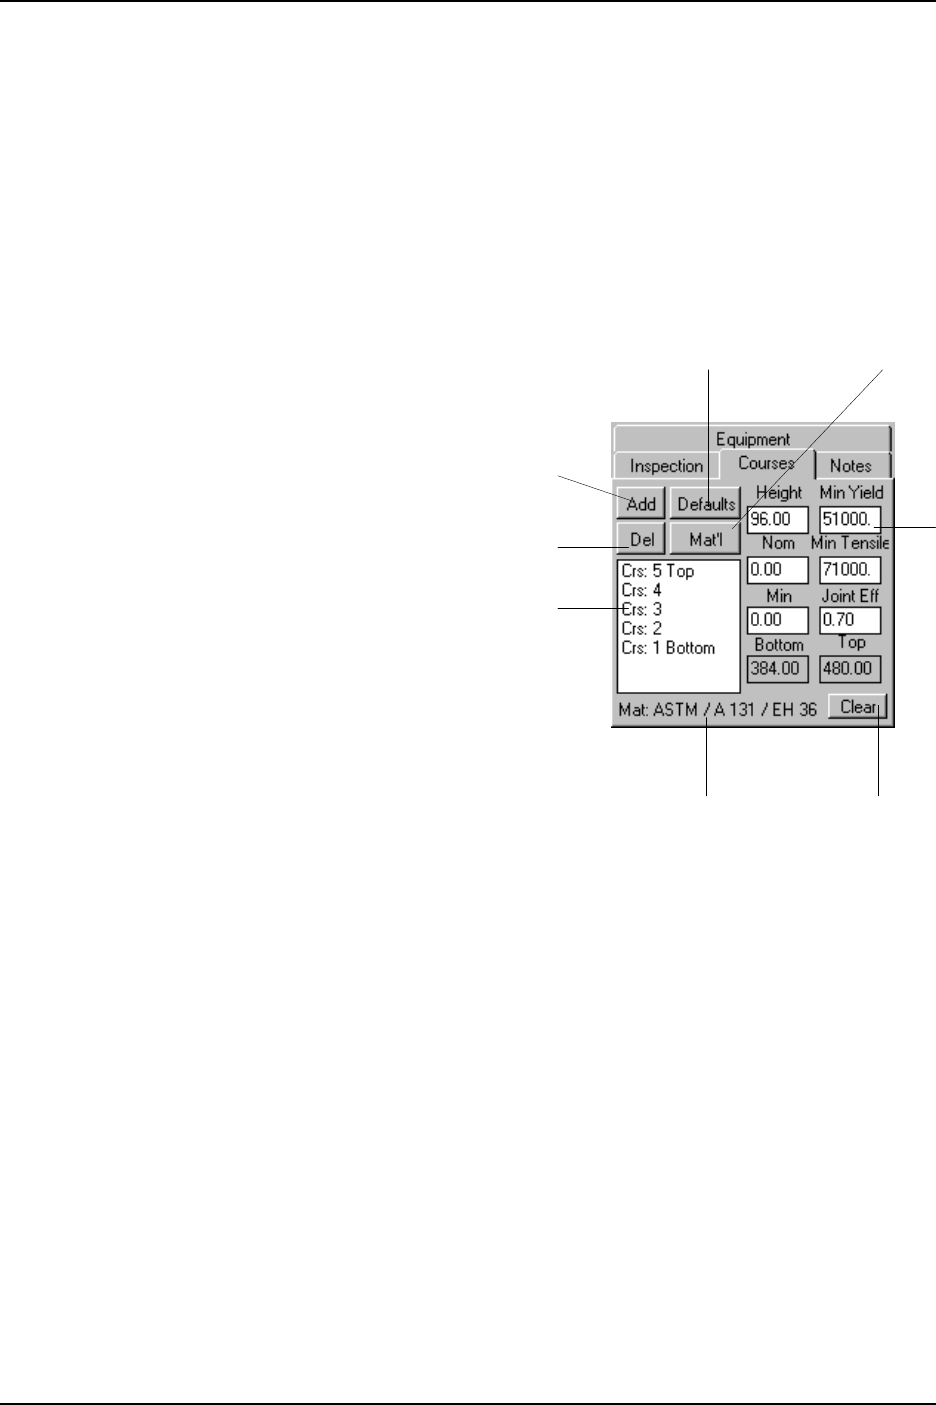
Course information must be defined in order to use the API-653 calculations. Each course is numbered sequentially starting
from the bottom. To define course information click the General group tab, then the Courses data tab as shown in Figure 21.
To add courses to the list, click the Add button. To delete a course from the list, select the course to delete and click the Del
button. To set the course information back to the default values, highlight the courses to change and click the Defaults
button.
Course Fields
To edit the course fields, click on the course and
then the field to be changed. If you need to
change several courses to the same value, select
all the courses desired and then edit the fields.
Height The height of the course in inches
Nom The nominal thickness value for the
course
Min The minimum thickness value for
the course. This value is used for
the minimum when API-653
calculations are disabled.
Min Yield The minimum yield value for the
course per API-653 section 2.3.2.
The default is 30,000.
Min Tensile The minimum tensile value for the
course per API-653 section 2.3.2.
The default is 55,000
Joint Eff The joint efficiency for the bottom
weld of the course per API-653
section 2.3.2. The default is 0.7
Bottom The absolute distance from the
bottom of the tank to the bottom of the selected course (Read only).
Top The absolute distance from the bottom of the tank to the top of the selected course (Read only).
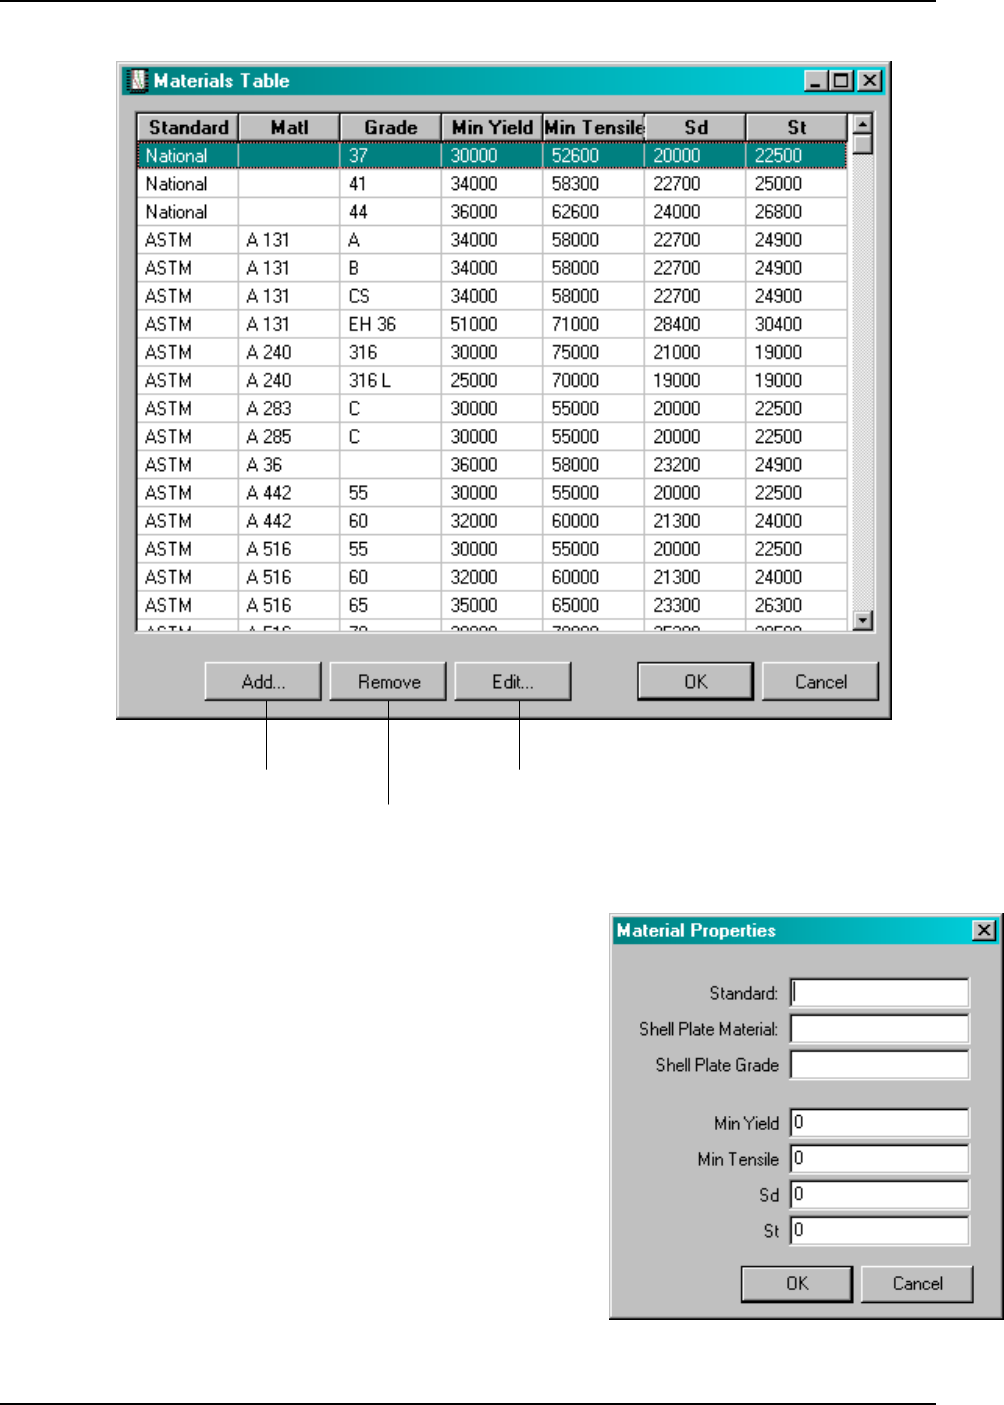
Course Materials
This system provides defaults for the API-653 Min Tensile and Yield values. These defaults are the same as those provided
by API-653 for unknown materials. If you know the material for any of the courses, you can enter them in directly or you can
select them from the Materials Table. This table can be modified if the material you need is not found. To manage the
materials in the list, select the Edit | Materials Table option from the main menu. The Materials Table screen will appear
(Figure 22). Use this screen to add, remove and edit the materials in the table. The file materials.dat contains the material
list. If you enter several materials and change from one system to another, you can take them with you by copying this file
from the program directory.
ADAS-500 Reporting System User’s Manual
Section 4 Creating Report Files
Copyright © 2005-2009 ATCO. All Rights Reserved. Page 18 Revision 1.9
Add a New
Material Remove the
Selected Material
Edit the Selected
Material
Figure 22 Materials Table Screen
Figure 23 Material Properties Dialog
Adding a New Material
Click the Add button in the Materials Table screen (Figure 22). The
Material Properties Dialog will appear (Figure 23). Enter the information
about the material and click OK.
Removing a Material
If you need to remove a material from the Materials Table you can do this
from the Materials Table Screen (Figure 22) by selecting the material in
the list, and click the Remove button.
Assigning a Material to a Course
To assign a material and it’s values to a course, select the course on the
courses tab (Figure 21) and click the Mat’l button. The Select Material
dialog will appear. Select the desired material and click OK. The values
for the material will be assigned to the selected course(s).
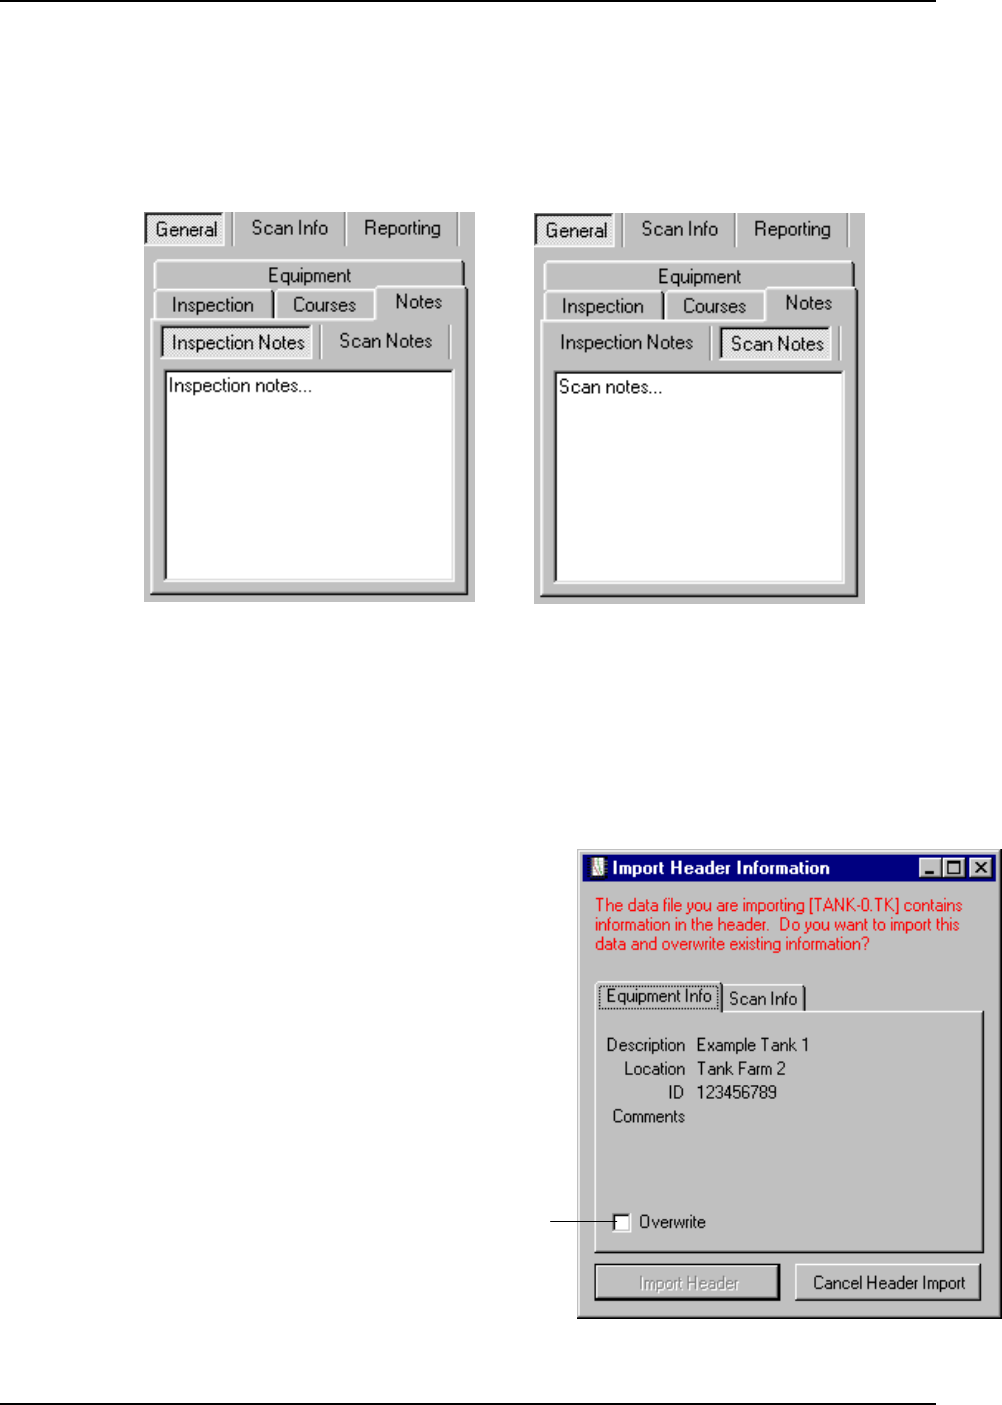
Entering Inspection and Scan Notes
ADAS-500 Reporting System User’s Manual
Section 4 Creating Report Files
Copyright © 2005-2009 ATCO. All Rights Reserved. Page 19 Revision 1.9
Figure 24 Inspection Notes Figure 25 Scan Notes
Check Here to
Import header
data and overwrite
any existing.
Figure 26 Import Header Information Dialog
You can enter inspection and scan notes by clicking the General tab, then the Notes tab as shown below. To enter inspection
notes, click the Inspection Notes tab. To enter scan specific notes, click on the desired scan, and then the Scan Notes tab as
shown below.
Creating Scans
Adding scans to your report file is an easy process. The scans are automatically created when you import tk file data using
the File | Import menu option. In most instances, this will be the method used.
Importing TK Files
Use the File | Import menu option to import TK
files directly in to a new scan. When you select
this option the Import dialog will appear allowing
you to select the TK file to import. You will be
asked Do you want to add these files to the
current file? If you answer Yes, the selected TK
file(s) will be imported to the current report file.
A new scan is added for each TK file imported.
If you answer No, a new report file (srf) will be
created and the selected file(s) will be added to
the new file. If the current file has been changed,
you will be given the opportunity to save it first.
If any header information exists in the TK file,
you will be given the opportunity to import as
well. The Import Header Information dialog will
appear (right). Click the Overwrite checkbox for
each header data category you want to import.
Adding TK File Data in to an Existing Scan
ADAS-500 Reporting System User’s Manual
Section 4 Creating Report Files
Copyright © 2005-2009 ATCO. All Rights Reserved. Page 20 Revision 1.9
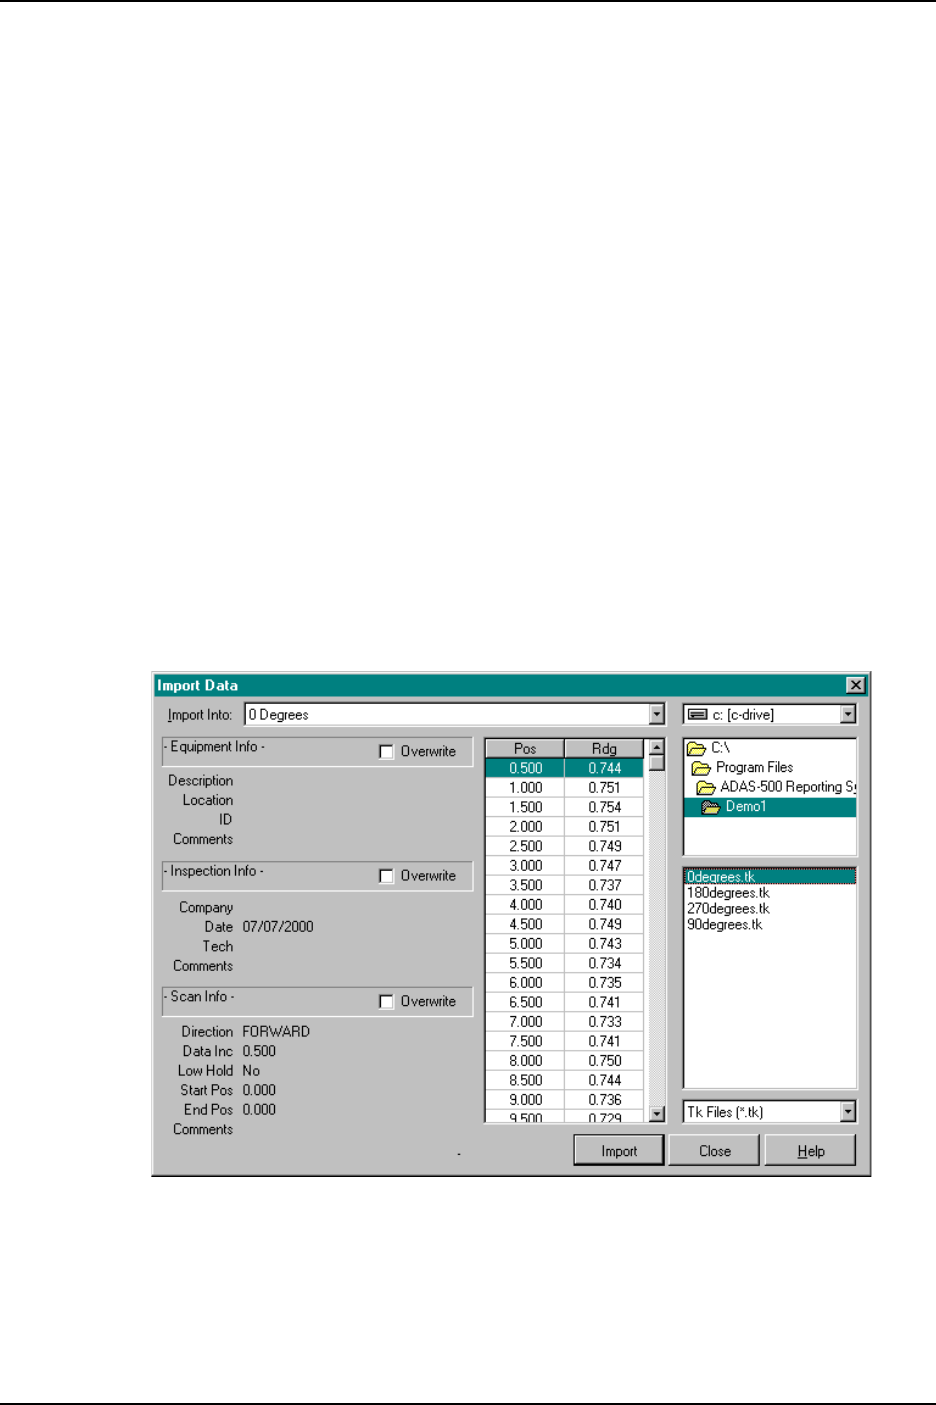
Figure 27 Import Data Dialog
Importing TK files directly (as outlined above) is the most convenient way to add your data to the report file. There are some
instances where you will use the Scans | Insert TK Files in to Scan menu option to insert data from TK files. This usually
occurs when a single scan is spanned across more than one TK file.
Example
When you cannot scan the height of a tank due to an obstruction such as a stiffener, you may save the TK file in the ADAS-
500. Once it has been saved, you cannot add more data to it. Therefore, you must create a new TK file to scan the remainder
of the tank. The scan is now stored in two separate TK files.
To combine these files you can open the first of the TK files using the File | Import menu option (as shown above). Once the
scan has been created in the report file, click on it, and select Scans | Insert TK File in to Scan. The Import Data Dialog will
appear (Figure 27). To import the data, select the TK file and click Import. When the thickness data from the TK file has
been imported, the Import Data Dialog box will close automatically. The data will be imported in to the scan selected in the
Import Into combo box.
How Data is Imported in to the Report File
As data from the TK file is imported in to a scan, it is sorted automatically by Position. When data is imported in to a scan
that already contains thickness points, the new points are sorted with the existing data. Therefore, if you have an existing
thickness point at 10.5" and a new point at 10.75" is imported, it will be place just after the existing point at 10.5". Even if
you import data points at the same position, the new position will be placed next to the existing one. Therefore, if you have
an existing point at 10.5" and you import another at the same position, it will be placed right after the existing one.
Overwriting Data in the Report File
When importing TK file data in the Import Data Dialog, you can overwrite the descriptive (i.e. Equipment Name, Location
and ID etc...) information in the report file by checking the Overwrite check box for each data category. When you import
the data (by clicking the Import button), the data in the report file will be overwritten if Overwrite is checked.
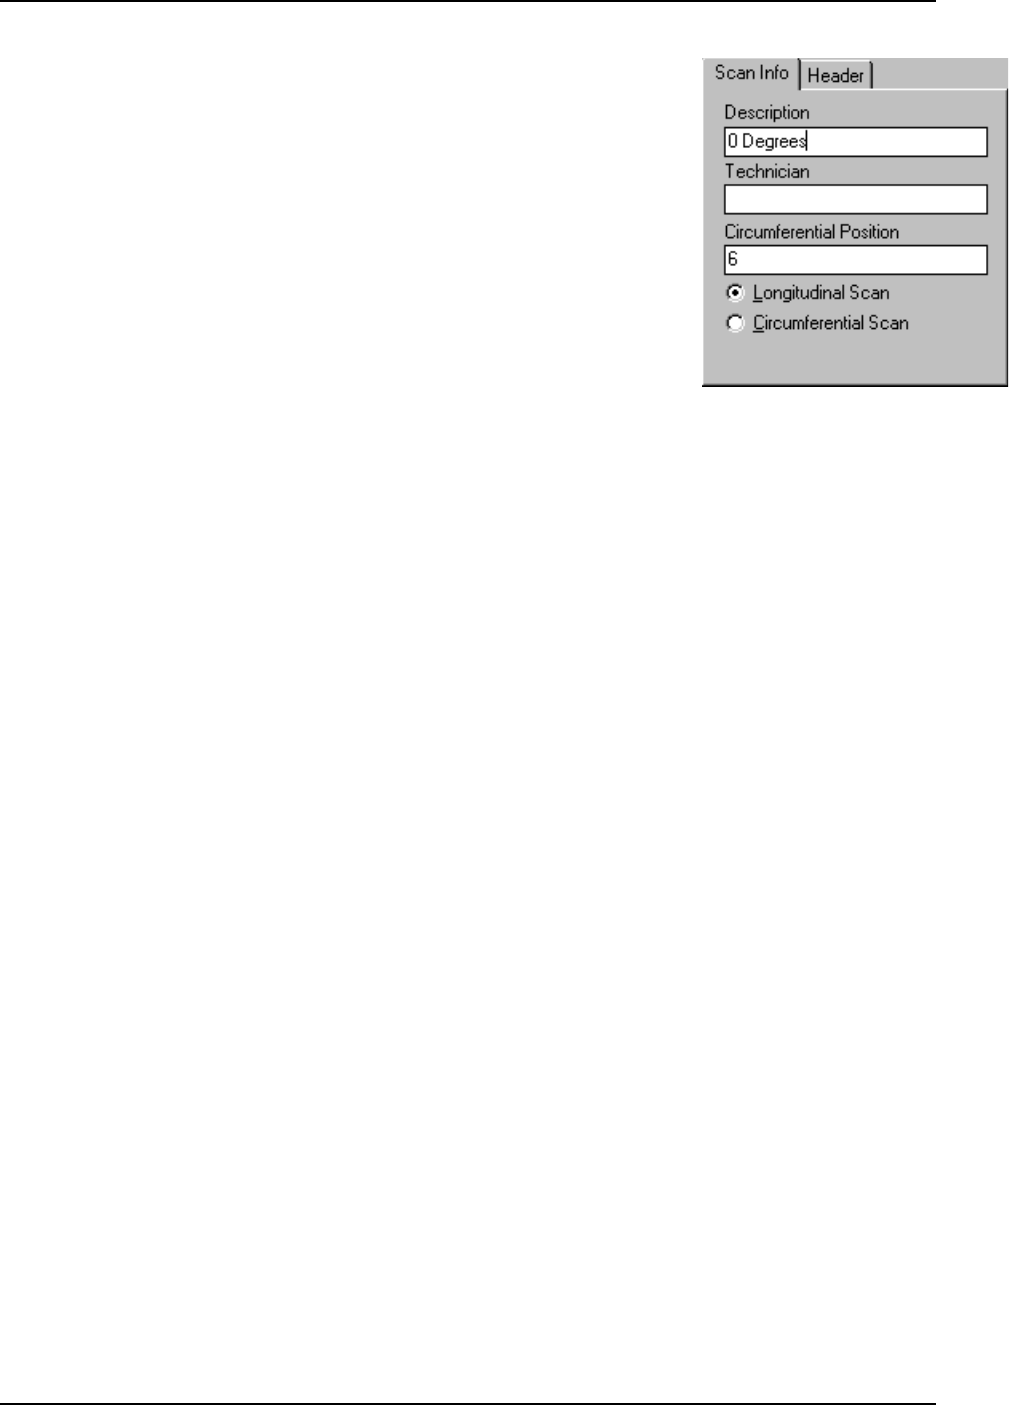
Entering Scan Information
ADAS-500 Reporting System User’s Manual
Section 4 Creating Report Files
Copyright © 2005-2009 ATCO. All Rights Reserved. Page 21 Revision 1.9
Figure 28 Editing Scan Information
You can change scan information by clicking on the scan in the Scan List, and then
clicking the Scan Info tab, then the Scan Info tab as shown in Figure 28.
Description The description of the scan for example the position as
shown in the figure to the right “0 Degrees”.
Technician The technician that created the scan data.
Circumferential
Longitudinal Position The position of the scan. The meaning of the value changes
depending on the type of scan (below). For longitudinal scans,
this field is the circumferential distance from the datum or zero
reference. For circumferential scans, it is the longitudinal
distance from the datum.
Longitudinal Scan Select this type scan when the scan axis is parallel to the
cylindrical axis of the equipment being scanned.
Circumferential Scan Select this type scan when the scan axis runs circumferentially around the cylindrical axis of the
equipment.
ADAS-500 Reporting System User’s Manual
Section 5 Data Collection Module
Copyright © 2005-2009 ATCO. All Rights Reserved. Page 22 Revision 1.9
Data Collection Module
Overview and Setup
The Data Collection Module (DCM) allows you to use your PC to collect data with the AMAC-500. The ADAS-500 Data
Logger is not used when data is collected using the DCM. In order to use the DCM, you must first set up the system and
cabling. The figure below shows the cabling diagram for the AMAC-500 using the DCM with the ATCO Ethernet Interface.
STOP
OFF ON
REMOTE
CRAWLER
ATCO
PUS
H
MCU-500R
Motor Control Unit
MCU-500R
UT
Scope
Ethernet
Rear Panel
DCM Host
Figure 29 Typical Cabling Configuration
ADAS-500 Reporting System User’s Manual
Section 5 Data Collection Module
Copyright © 2005-2009 ATCO. All Rights Reserved. Page 23 Revision 1.9
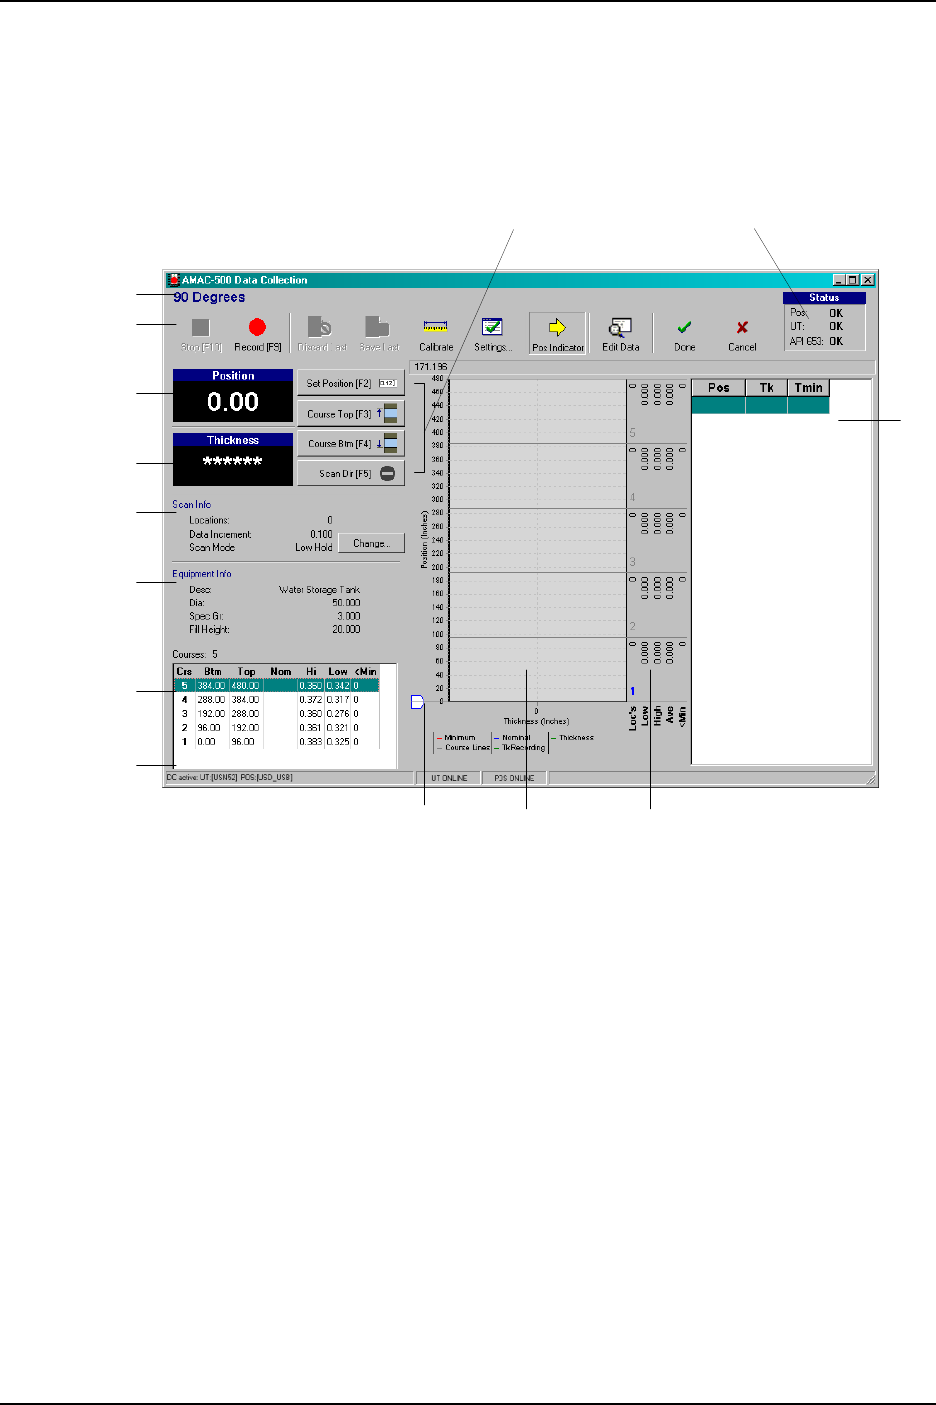
Menu Bar
Scan Description
Current Position
Current Thickness
Scan Specific
Information
Equipment Specific
Information
Course Details
Scan Position
Controls
Application
Status
Status Bar
Scan Graph
Position
Indicator Course
Summary
Location
Grid
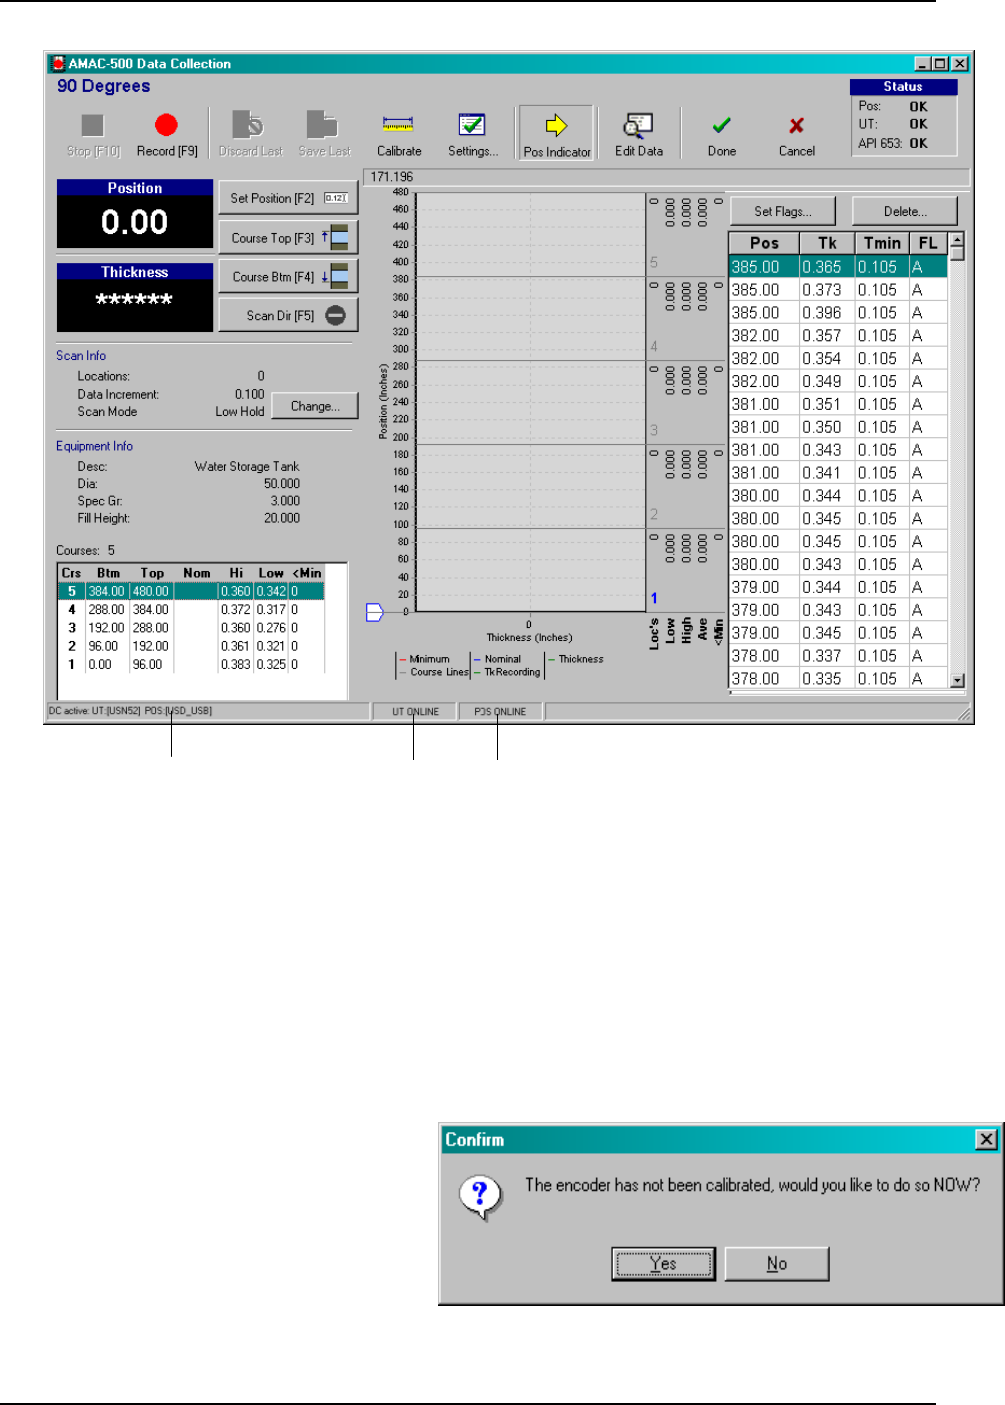
Figure 30 DCM Main Window
DCM Main Window
The Data Collection Module is invoked from within the ADAS-500 Reporting System. Details on running it will be
discussed later in this section. The main window of the DCM is shown below. Prior to using the system, it must be
calibrated to work with the crawler’s encoders. The encoders are the devices on the crawler that provide the software with
the crawler’s position. To calibrate the system’s positioning, refer to the section in the Appendix Calibrating Encoders.
Menu Bar
The Menu Bar spans the top of the application window. The buttons contained in it, and their functions, are listed below::
STOP [F10] - Stops recording mode
RECORD [F9] - Starts recording mode
Discard Last - Discards the last set of locations scanned in to the system
Save Last - Saves the last set of locations scanned in to the system.
Calibrate - Allows you to calibrate the travel distance of the crawler and the application.
Settings - Allows you to change the settings of the application.
Edit Data - Allows you to edit / modify the readings in the scan
Done - When you are finished scanning, select this option to save the data and return to the main application.

ADAS-500 Reporting System User’s Manual
Section 5 Data Collection Module
Copyright © 2005-2009 ATCO. All Rights Reserved. Page 24 Revision 1.9
Cancel - Select this option if you wish to discard any scanned locations and return to the main application.
Application Status
The Application Status area shows the status of the key parts of the application. OK indicates proper working status. ERR
indicates that an error has occurred.
POS Indicates the status of the positioning interface to the AMAC-500 encoders.
UT Indicates the status of the interface to the UT Instrument.
API653 Indicates whether all of the information needed is available to calculate API-653 minimums.
Current Position
The Current Position displays the current position of the AMAC-500 in the scan. This can be changed by using the Scan
Position Controls. This value changes as the crawler moves. In order to get the correct position, you must be sure to
calibrate the position using the Calibrate button on the Menu Bar. If the position is not being displayed, the POS status
shown in the Application Status area will likely be ERR. When this happens, the error will be indicated at the bottom of the
window in the Status Bar.
Current Thickness
The Current Thickness displays the thickness that is coming from the UT Instrument Interface. If the current thickness is not
being displayed, the UT status shown in the Application Status area will likely be ERR. When this happens, the error will
be indicated at the bottom of the window in the Status Bar.
Scan Specific Information
The scan information shown here shows the
Data Increment The interval at which locations are stored in the scan. This value is specified in the ADAS-500 Reporting
System prior to loading this module. It can be changed by selecting the Settings button on the Menu Bar.
Scan Mode The method used to scan (explained previously in this document) This value is specified in the ADAS-500
Reporting System prior to loading this module. It can be changed by selecting the Settings button on the
Menu Bar.
Locations The number of locations currently in the scan
Equipment Specific Information
The equipment specific information displayed here come directly from the information stored in the ADAS-500 Reporting
System. This information cannot be changed in this application. If the information is not correct, it could cause the API-653
Tmin values to be incorrect. If it needs to be changed, exit the application and change it in the Reporting System.
Course Details Grid
Ideally it’s easiest to scan the entire length of the scan in one recording. In some cases, the technique may require you to stop
and reposition the crawler then resume scanning. When this occurs it can be useful to have dimensional information for the
courses. The top and bottom positions of each course, relative to the scan zero reference can help you to set the position of
the crawler at the top or bottom of any course.
Double clicking on a particular course in the Course Details Grid will set the Current Position value to the bottom of that
course. You can also set the position to either the top or bottom of any course by clicking the Course Top or Course Bottom
button in the Scan Position Controls.

ADAS-500 Reporting System User’s Manual
Section 5 Data Collection Module
Copyright © 2005-2009 ATCO. All Rights Reserved. Page 25 Revision 1.9
Scan Graph
The Scan Graph displays data relative to the position on the equipment. The data shown on the graph is the thickness, API-
653 minimum and course weld line location.
Course Summary
The course summary includes:
Course Number - displayed in the lower left corner of each course summary block (Numbered from the bottom).
Loc’s - the number of locations stored in that course
Low - the lowest thickness location found in the course
High - the highest thickness location found in the course
Ave - the average thickness location found in the course
<Min - the number of thickness locations found at or below minimum in the course
Position Indicator
The position indicator represents the location of the Current Position of the crawler. You can click on the arrow and move it
anywhere along the scan to change the current position.
Location Grid
The location grid displays the locations stored in the scan.
Pos - the position of the location relative to the zero reference of the scan.
Tk - the thickness value stored at that location
Tmin - the calculated API-653 minimum value for that location
Scan Position Controls
Set Position [F2] - Allows you to enter the current position.
Course Top [F3] - sets the current position to the top of the current course
Course Bottom [F4] - sets the current position to the bottom of the current course
ADAS-500 Reporting System User’s Manual
Section 5 Data Collection Module
Copyright © 2005-2009 ATCO. All Rights Reserved. Page 26 Revision 1.9
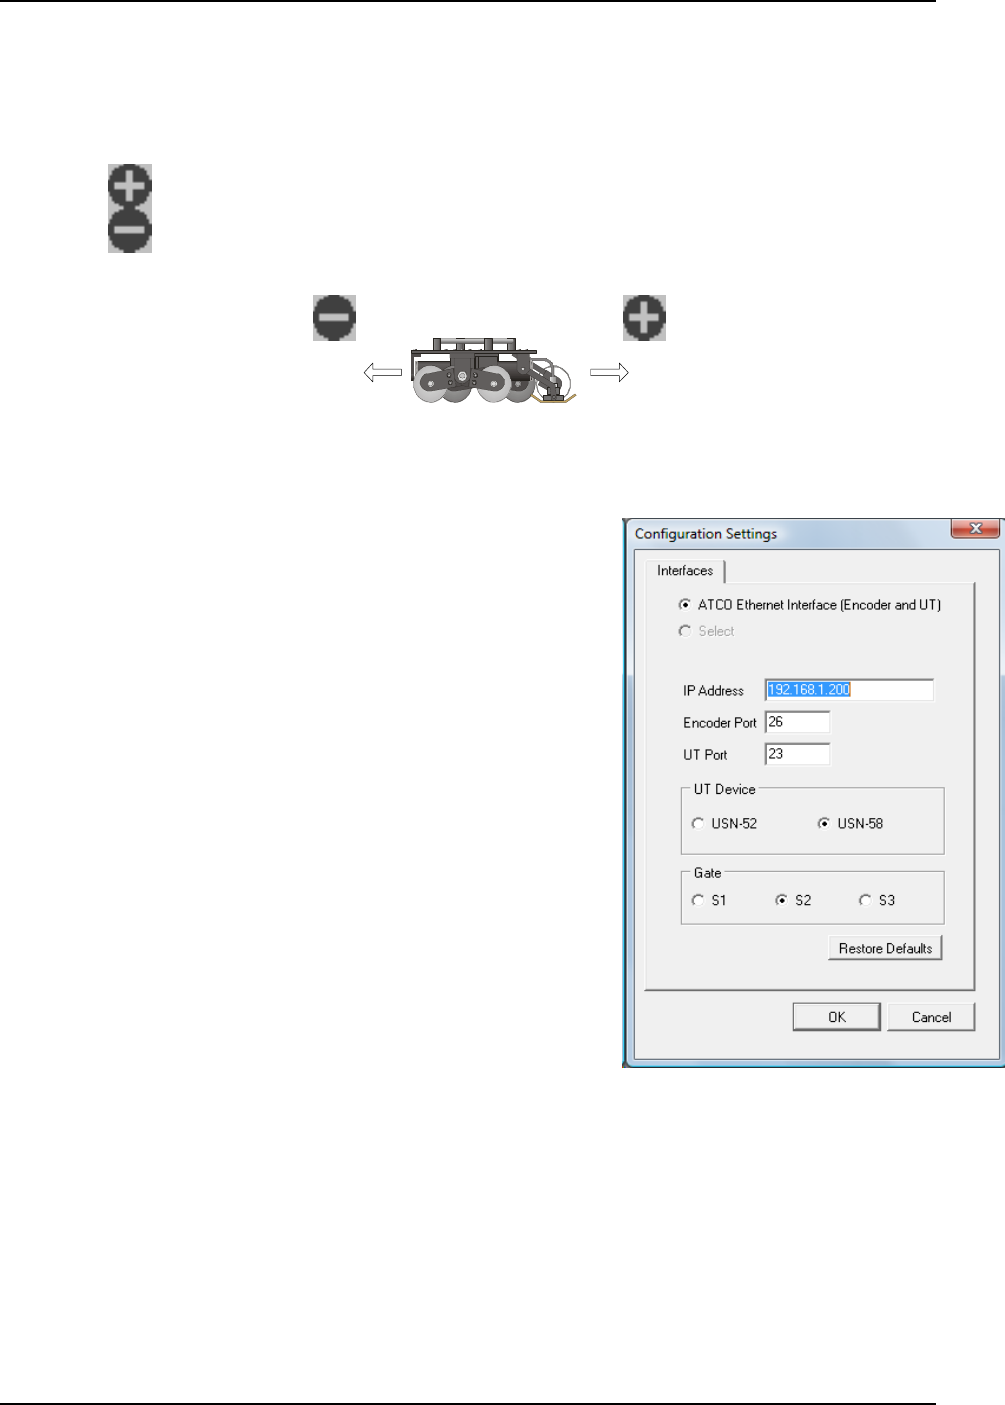
Position
Increases Position
Increases
Figure 30 Scan Direction Indicator
Scan Dir [F5] - allows you to change the direction of the scan relative to the crawler. Positive means that the
crawler position increases when moving forward. Negative means that the crawler position decreases
when moving forward. The button indicates the current setting (see below).
- Indicates that crawler moving forward increases the position.
- Indicates that crawler moving backwards increases the position.
Configuration Settings
The Configuration Settings Dialog allows you to select the settings for the
PC interface. To change the settings, click the Settings button and the
dialog will appear (Figure 31).
ATCO Ethernet Interface
The ATCO Ethernet Interface provides an interface to both the encoder and
UT devices through the single ethernet connection. The Krautkramer USN-
52 and USN-58 are supported.
IP Address*
This is the IP Address of the MCU-500. This setting should not be changed
unless there are more than one of MCU-500s connected to the network.
The default setting is 192.168.1.200.
Encoder Port*
This is the port to use for TCP communication with the Encoder on the
MCU-500. The default setting is 26.
UT Port*
This is the port to use for TCP communication with the UT device on the MCU-500. The default setting is 23.
* Note: Changing this setting without changing the setting on the MCU-500 to match will cause the communications to fail.
Gate Settings
When using the USN-58 you can select the gate to read on the device. The values are the three gates S1, S2 and S3. The
USN-52 does not support this feature.
Figure 31 Configuration Settings
ADAS-500 Reporting System User’s Manual
Section 5 Data Collection Module
Copyright © 2005-2009 ATCO. All Rights Reserved. Page 27 Revision 1.9
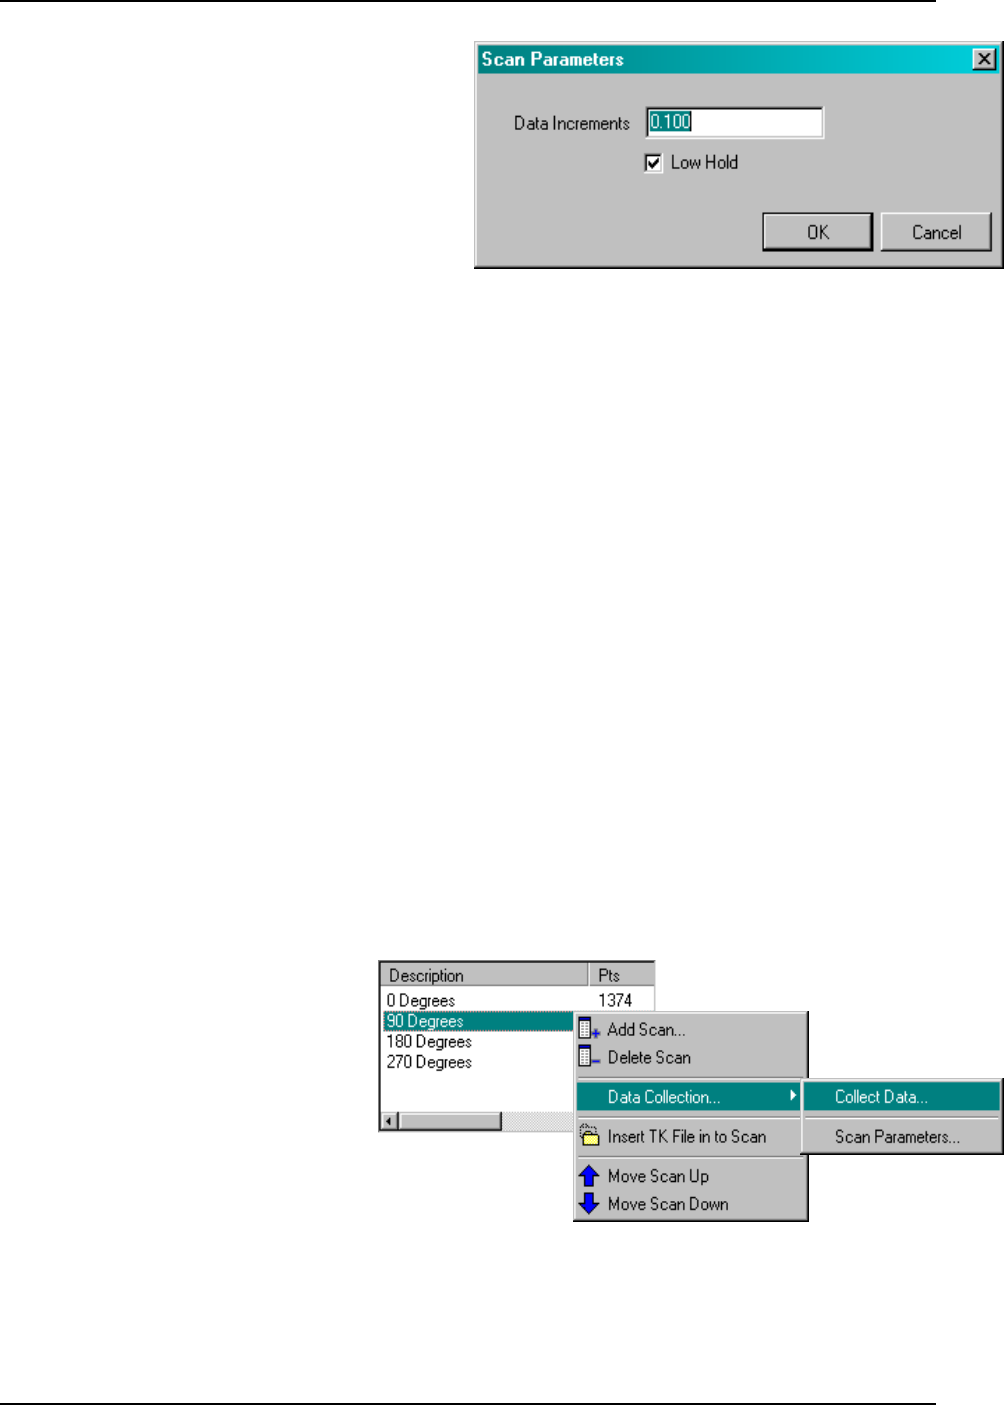
Figure 32 Scan Parameters Dialog
Figure 33 Starting the DCM from the ADAS-500 Reporting System
Using the Data Collection Module
Prior to using the Data Collection Module (DCM) it must
be properly configured (refer to the beginning of this
section for more). Once the system is configured and
calibrated you are ready to collect data. To collect data
using the DCM, you must first create a scan as mentioned
in the previous section Creating Scans. Before scanning
you should become familiar with the scan parameters.
Scan Parameters
The Scan Parameters define how the DCM will collect data while recording. The values are set in the ADAS-500 Reporting
System The parameters that control the behavior of the data collection can be changed if needed. The defaults are:
Data Increment: 0.25"
Scan Mode: Low Hold
Data Increment
The Data Increment controls the interval between the locations. For example, a data increment of 0.25" means that locations
will be stored every quarter inch. At that increment, if you have a 6 inch scan, you will store 4 location per inch and 24 for
the entire scan.
Scan Mode
With the Scan Mode set to Point, the system will store the thickness found at each individual point along the increment. For
example, if you have 0.25" increments the system will store the thickness it finds at each 0.25" interval. If Low Hold is used,
the system will store the lowest thickness it finds along the increment and store it. The advantage of using the Low Hold
mode is that the entire increment is scanned and it is less likely that a thinning area between the data increments will be
missed.
To change the Scan Parameter settings from within the ADAS-500 Reporting System, from the main menu select Data
Collection | Scan Parameters. The Scan Parameters dialog box will appear (Figure 33). These settings will be the defaults
used each time you collect data using the Data Collection Module. Keep in mind, that these values can also be changed from
within the Data Collection Module.
Starting the DCM
To scan using the DCM you must first create
the new scan or you can add data to an
existing one. Select the scan and right click
on it. Select Data Collection | Collect Data
from the menu (Figure 34). The main
window of the DCM will appear (Figure 34).
If the selected scan has locations in it, they
will appear in the DCM. When you scan
areas any readings that exist in those
positions will be overwritten.
ADAS-500 Reporting System User’s Manual
Section 5 Data Collection Module
Copyright © 2005-2009 ATCO. All Rights Reserved. Page 28 Revision 1.9
Figure 35 Message displayed when encoder calibration is required.
Selected
Interfaces UT Interface
Status Position
Interface
Status
Figure 34 DCM Main Window
DCM Startup
When the DCM starts, it will try to connect to the selected interfaces. The interfaces selected will appear at the bottom of the
screen on the Status Bar. The status of each interface is shown in the Status window on the top right corner of the screen.
The online/offline status is shown on the Status Bar for each device (Figure 34).
If the system has not been calibrated to the encoders,
a message will appear allowing you to calibrate. If
you are ready to calibrate the system, select Yes and
the calibration process will begin. If you are not
ready to calibrate, click No and you will be returned
to the ADAS-500 Reporting System.
ADAS-500 Reporting System User’s Manual
Section 5 Data Collection Module
Copyright © 2005-2009 ATCO. All Rights Reserved. Page 29 Revision 1.9
Figure 36 All
Interfaces OK
Scan to top
of course 1
Top of Course 1
Scan remaining
courses
Tank Chine
Figure 37 Scanning Course 1 Inverted
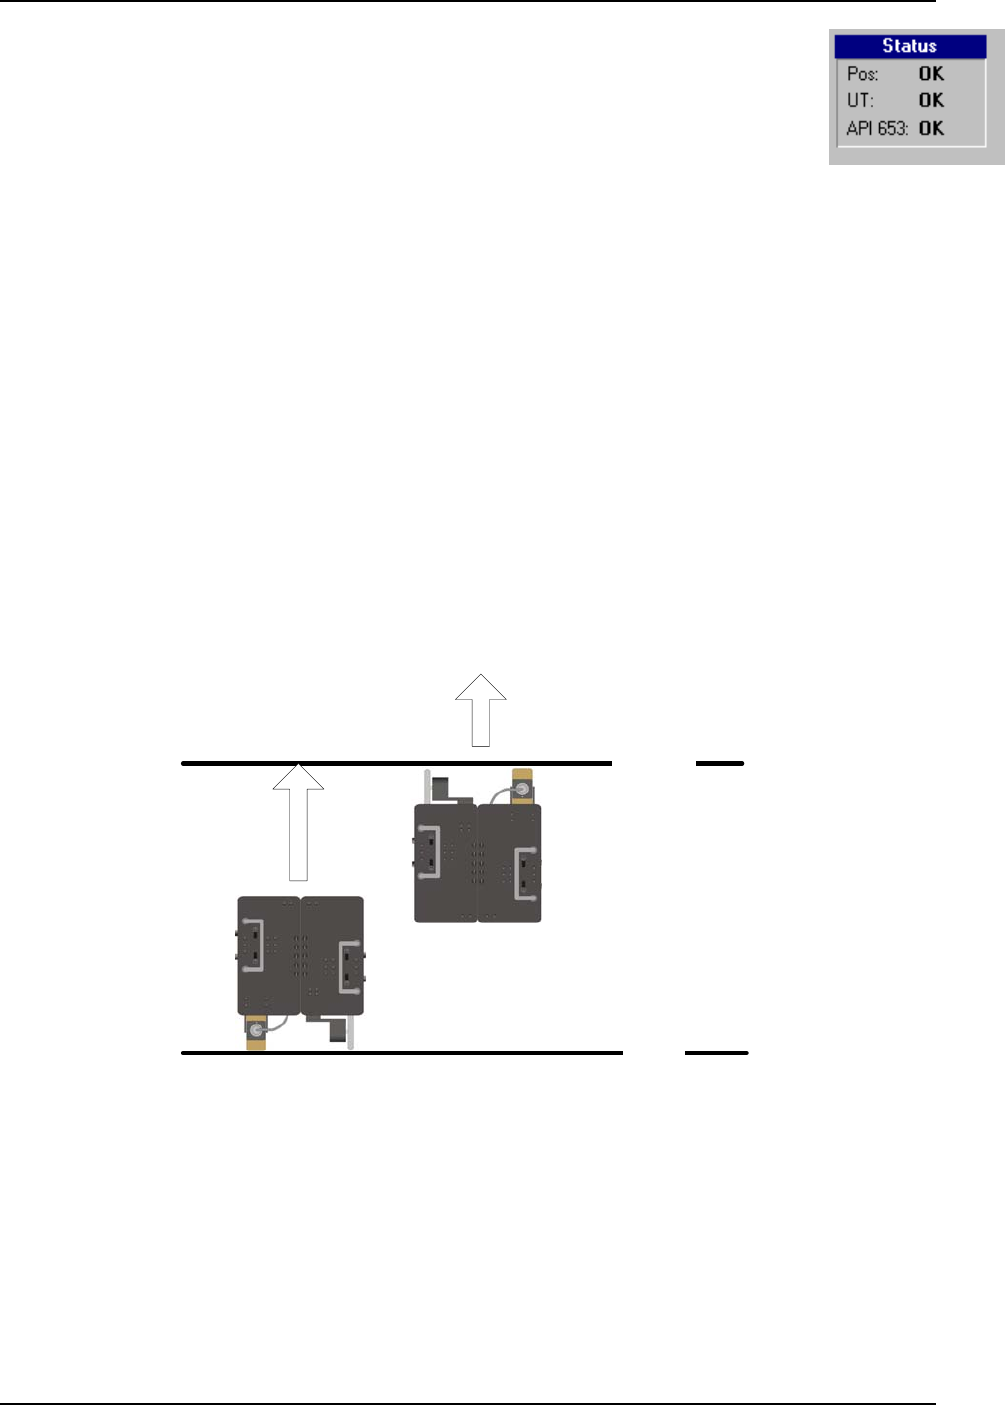
If all data collection interfaces are working properly, the application status window will show all OK.
When there are errors, the device will have an ERR in the Status window. If you are scanning
equipment that requires API-653 calculations and the API-653 status shows an error, then return to
the ADAS-500 Reporting System and correct the problem. Typically this error will occur if the
information required to calculate the tmin values is incomplete (i.e. Tank Diameter, Specific Gravity
etc...). Once the information is correct in the ADAS-500 Reporting System, invoke the DCM again
and the API-653 should display OK in the application status window.
Scanning
Once the interfaces are working properly, you can prepare to collect data with the DCM. For more detailed information on
scanning, refer to the section Scanning Techniques in the AMAC-500 Manual.
Check the Scan Parameters
Before scanning, be sure that the data increment and scan mode are correct. They appear under Scan Info below the Current
Thickness. If the settings are not correct, you can change them by clicking the Change... button. For more on Scan
Parameters refer to that section in this document.
Position the Crawler
Position the crawler at your scan starting point. For more information on positioning and the typical coordinate layout on
tanks refer to the section in this document titled Typical Scanning Practices and Guidelines. Typically, the crawler will be
inverted to scan the first course to reach the area closest to the tank chine (Figure 37). The remaining courses will be scanned
with the crawler moving forward in the positive direction of the scan.
Set the Position in the DCM
Once you’ve positioned the crawler on the equipment, you must set the position in the DCM. To do this, you can click the
Set Position button or press F2. Then, enter the new position and click OK. If the crawler aligned at the bottom of a course,
you can set the position by double clicking on the course in the Course Details grid.
Set the Scan Direction
ADAS-500 Reporting System User’s Manual
Section 5 Data Collection Module
Copyright © 2005-2009 ATCO. All Rights Reserved. Page 30 Revision 1.9
Figure 38 Data Flag Dialog
You must tell the DCM the direction in which the crawler will be scanning. In some cases the crawler will be moving in a
positive direction along a scan while moving in reverse. This typically happens when scanning the bottom course as shown
above. In this case set the scan direction to Reverse (-). Otherwise, when you move the crawler backwards the position will
decrease. If you are moving the crawler forward and the scan direction is positive, select Forward (+) otherwise, select
Reverse (-).
Start Recording
When the crawler is positioned and all settings are correct, you are ready to record data. Click the Record button (or press
F9) and then move the crawler to the end point of your scan. The new locations should appear in the Readings Grid on the
right side of the window as you scan. The Position Indicator should move along the graph showing the scanned area with a
white background.
Saving / Discarding New Data
When the crawler reaches the end of the scan, click the Stop button (or press F10). The newly scanned locations should now
appear in a white background. At this point you can either save or discard the new data. If you want to keep the data, click
the Save Last button. If there are any locations in the area you scanned, they will be overwritten. If there were problems
such as loss of signal you will likely want to discard the data and scan the area over. In these cases click the Discard Last
button, you will be prompted to confirm it and the data will be removed leaving any existing data in the scan.
Once you are finished scanning you can either save any changes to the data or discard them. To save them in the ADAS-500
Reporting System close the DCM by clicking on the Done button. The changes made to the scan will be saved. If you do not
want to save the changes made to the scan, click on the Cancel button.
Editing Data
Setting Data Point Flags
To change the Data Point Flag for several points at once, select the data points in the editing grid and click the Flags button.
The flag selection dialog will appear (right). Select the Data Point Flag and click OK. This will change the value on all
selected points.
Deleting Data Points
To delete points, select them in the grid and click the Delete button.
ADAS-500 Reporting System User’s Manual
Section 5 Reviewing the Data
Copyright © 2005-2009 ATCO. All Rights Reserved. Page 32 Revision 1.9
Suspect
Data
Figure 27 Graphical Presentation
Suspect
Data
Point
After thickness points have been acquired by importing the TK files, you should review the data. There are many conditions
where erroneous data can be obtained and you should thoroughly review the data points prior to printing reports. Typically
the data points around a weld line or other surface anomaly can cause erroneous data. Pay close attention to these areas when
reviewing your data. For quick changes you can review the data from the Main Screen which we will show first below. If
you have more involved review you can use the Scan Review Screen which will be shown later in this section.
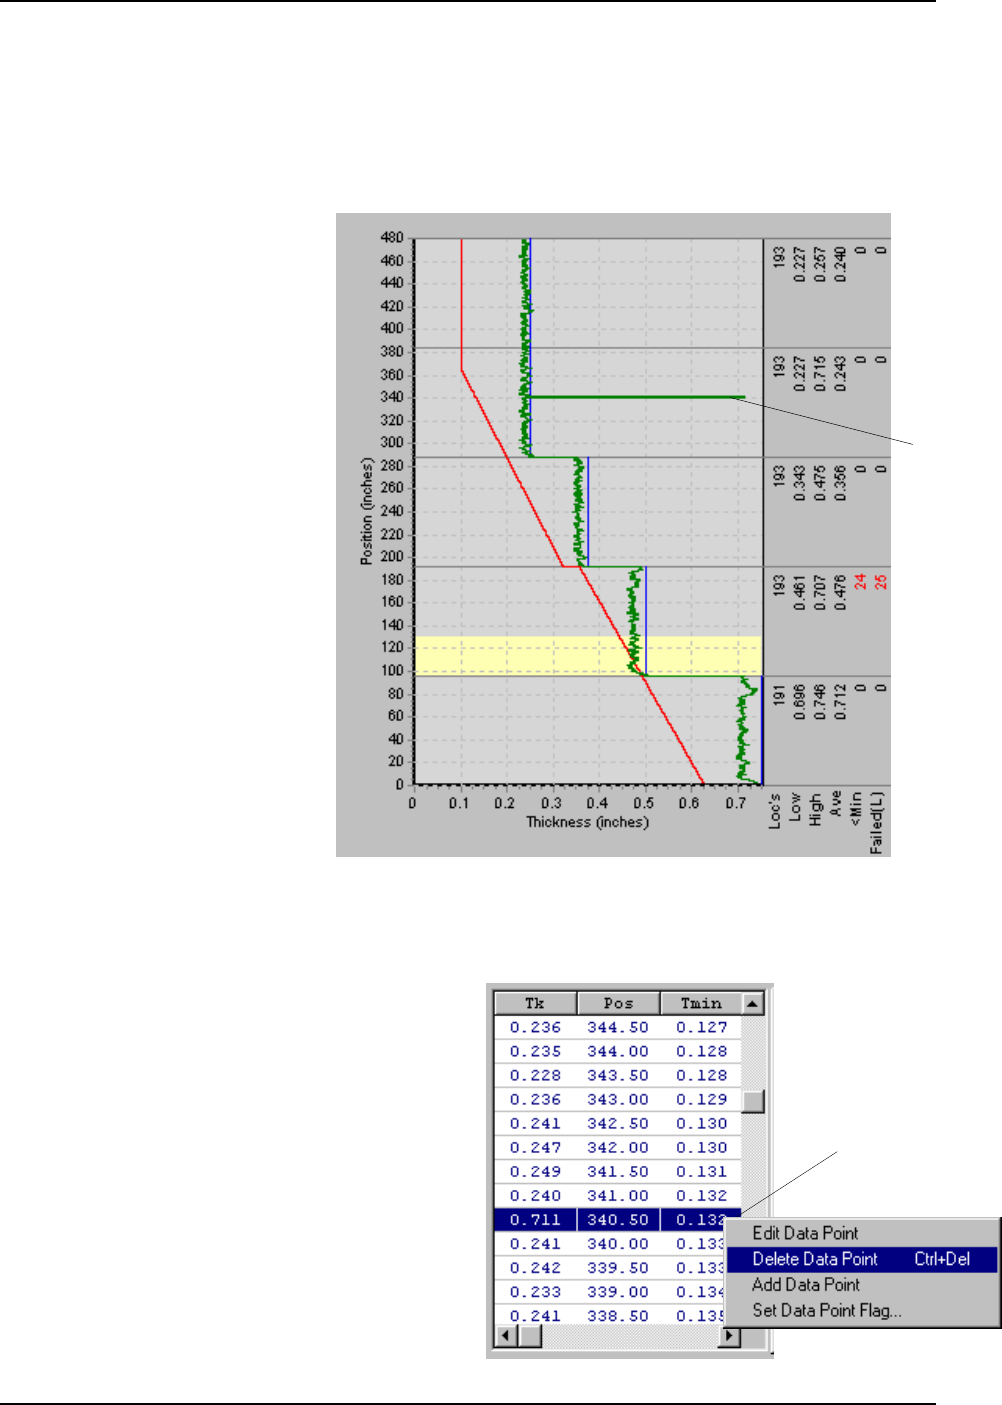
Deleting Data Points
The fastest way to find erroneous data is
to view the graphical presentation.
Suspect data is easy to find. The
example shown below, though
exaggerated, shows a point that is
suspect. It is obvious that this point is
erroneous and should be removed.
.
To remove the data point, click on it in the graph and it will be selected in the Thickness Point Grid (Figure 28). Right click
on the data point in the grid and select Delete Data Point.
ADAS-500 Reporting System User’s Manual
Section 5 Reviewing the Data
Copyright © 2005-2009 ATCO. All Rights Reserved. Page 33 Revision 1.9
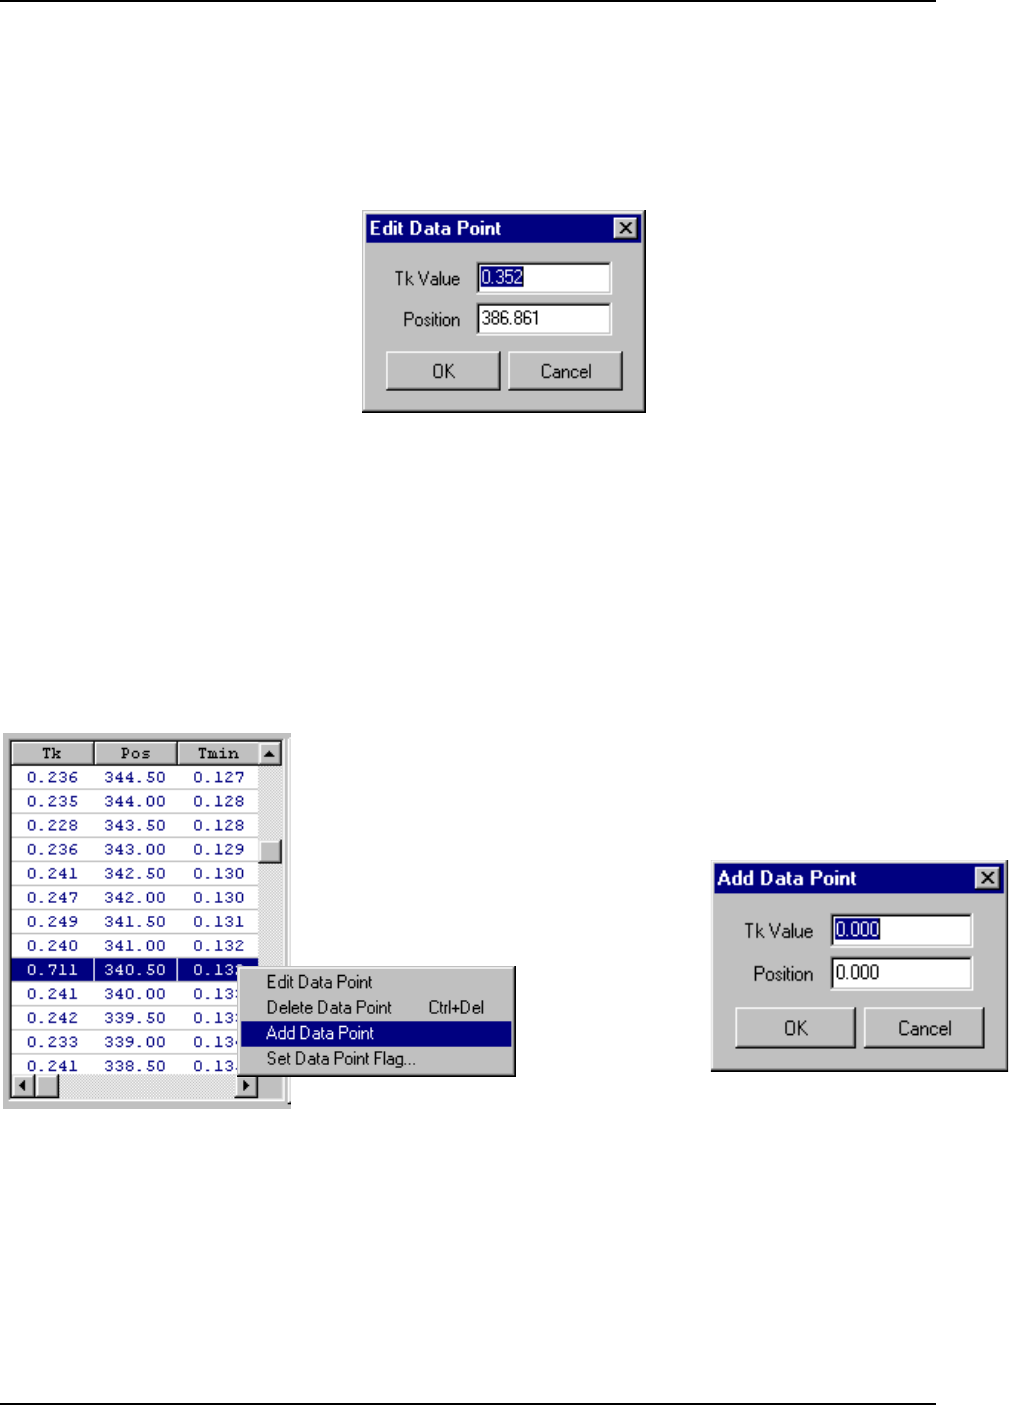
Figure 29 Edit Data Point Dialog
Figure 30 Adding a Data Point
Figure 31 Add Data Point Dialog
Editing Data Points
Existing thickness data points be changed when needed. To change a particular data point, locate it in the Thickness Point
Grid and double click on it. The Edit Data Point dialog will be displayed as shown in Figure 29. To edit another point, select
the point in the Thickness Point Grid and repeat the process.
Adding Data Points
You can add thickness data points to an existing scan. This may be needed when portions of a scan may need to be recorded
manually. To add data points, first select the scan in the Scan List. Next right click in the the Thickness Point Grid (Figure
30 ) and select Add Data Point.
The Add Data Point dialog will appear as shown below in Figure 31. Enter the new thickness and position values then click
OK. The new data point will be added to the selected scan.
ADAS-500 Reporting System User’s Manual
Section 5 Reviewing the Data
Copyright © 2005-2009 ATCO. All Rights Reserved. Page 34 Revision 1.9
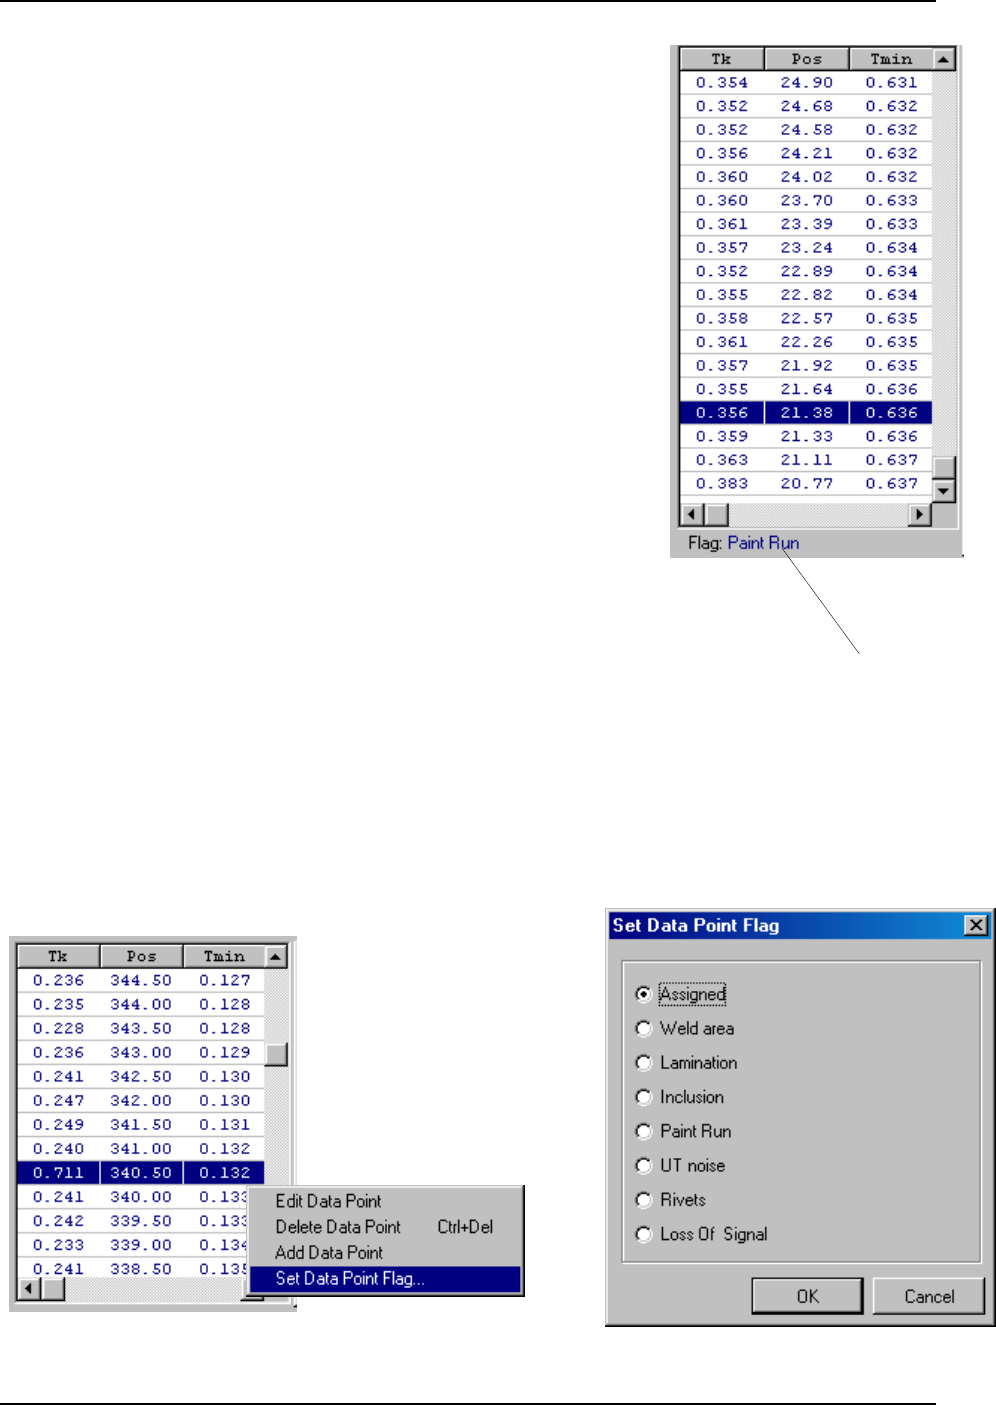
Figure 34 Assigning a Data Point Flag
Figure 33 Setting a Data Point Flag
Data Point Flag
Figure 32 Data Point Flag Display
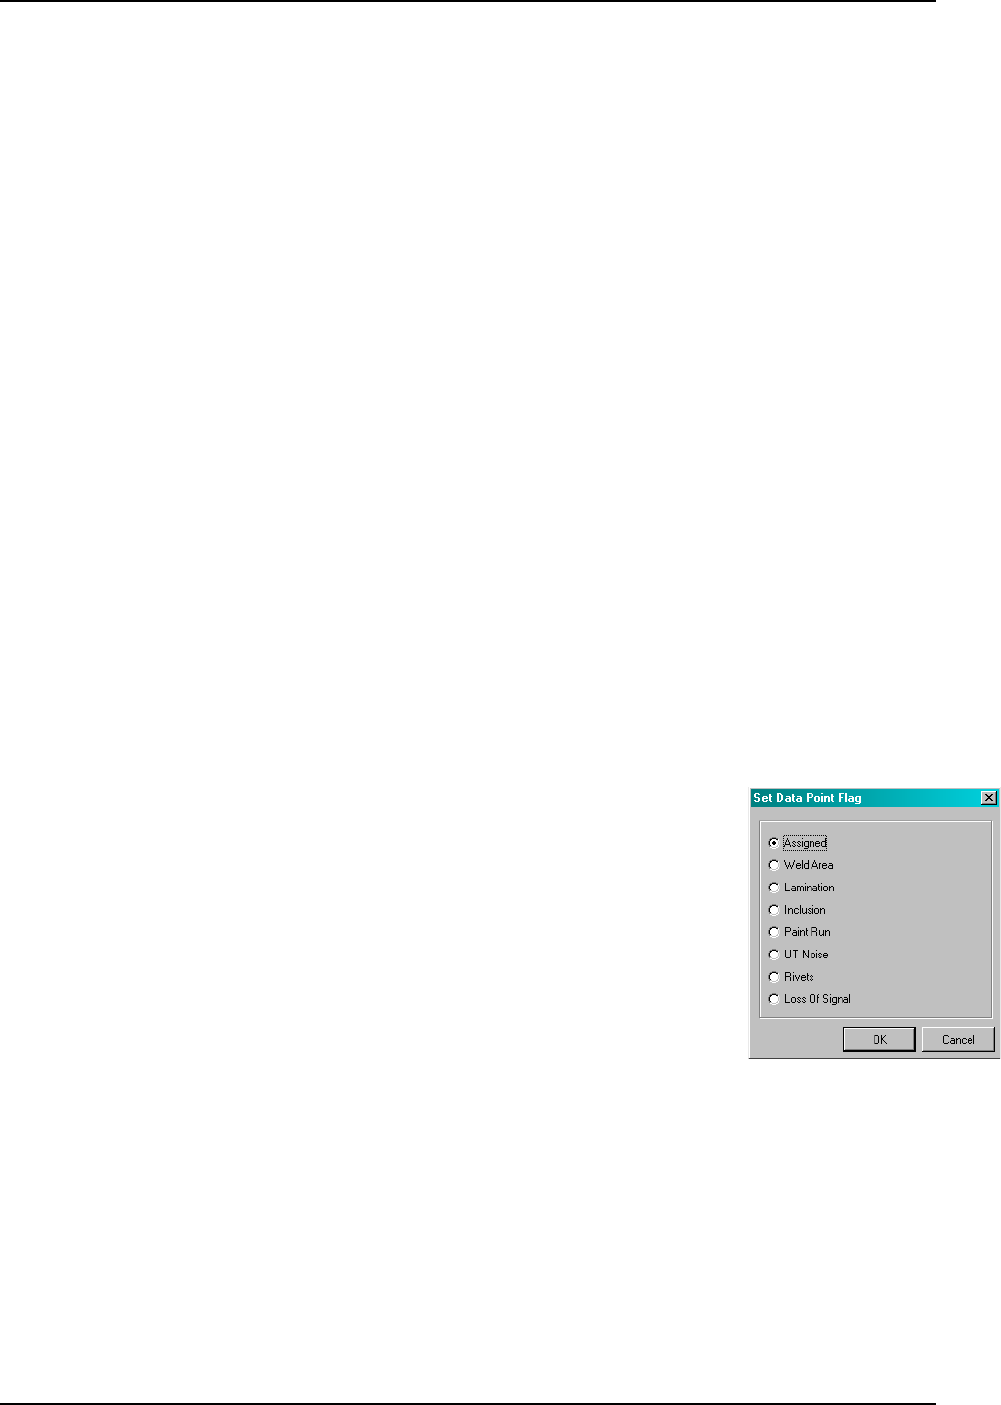
Data Point Flags
Each data point has a flag associated with it. This flag indicates whether or not
the reading is valid. The flag value is displayed below the scan grid (Figure 32).
When the UT system logs a reading as valid, the flag is set to Assigned. Data
points with this value for the flag are the only ones used in display of graphs and
in statistics. When a Loss of Signal occurs, the flag is set to LOS. The ADAS-
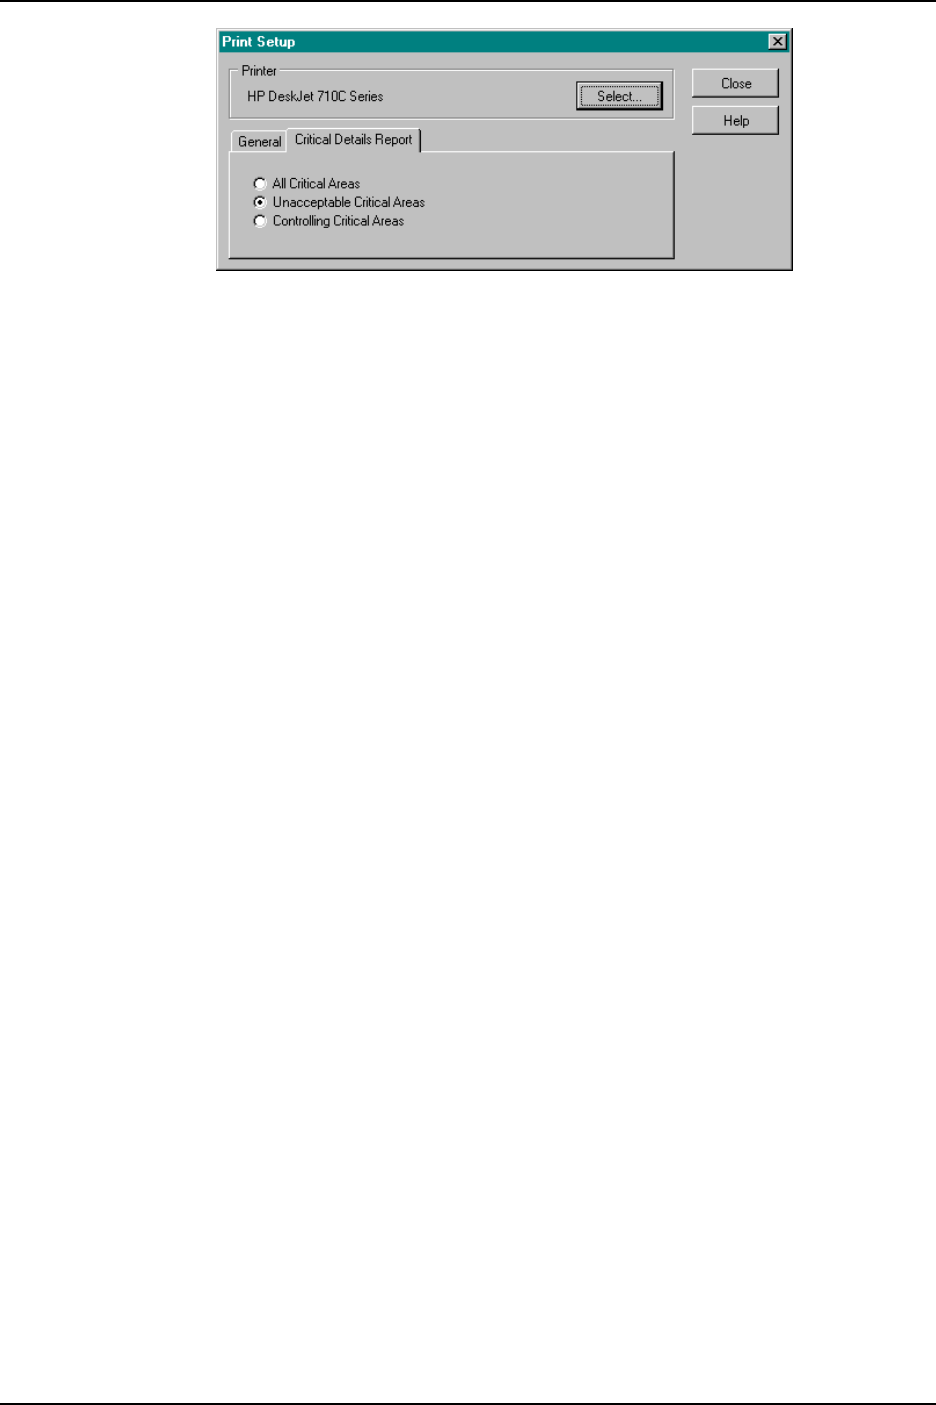
500 Data Logger allows you to assign flags to each data point. You can also set
the flags for a data point using the ADAS-500 Reporting System. To set the flag
of a particular data point, select the data point in the Scan Grid, right click and
select Set Data Point Flag (Figure 33). The Set Data Point Dialog will appear
(Figure 34). Select the appropriate flag and click OK.
ADAS-500 Reporting System User’s Manual
Section 5 Reviewing the Data
Copyright © 2005-2009 ATCO. All Rights Reserved. Page 35 Revision 1.9
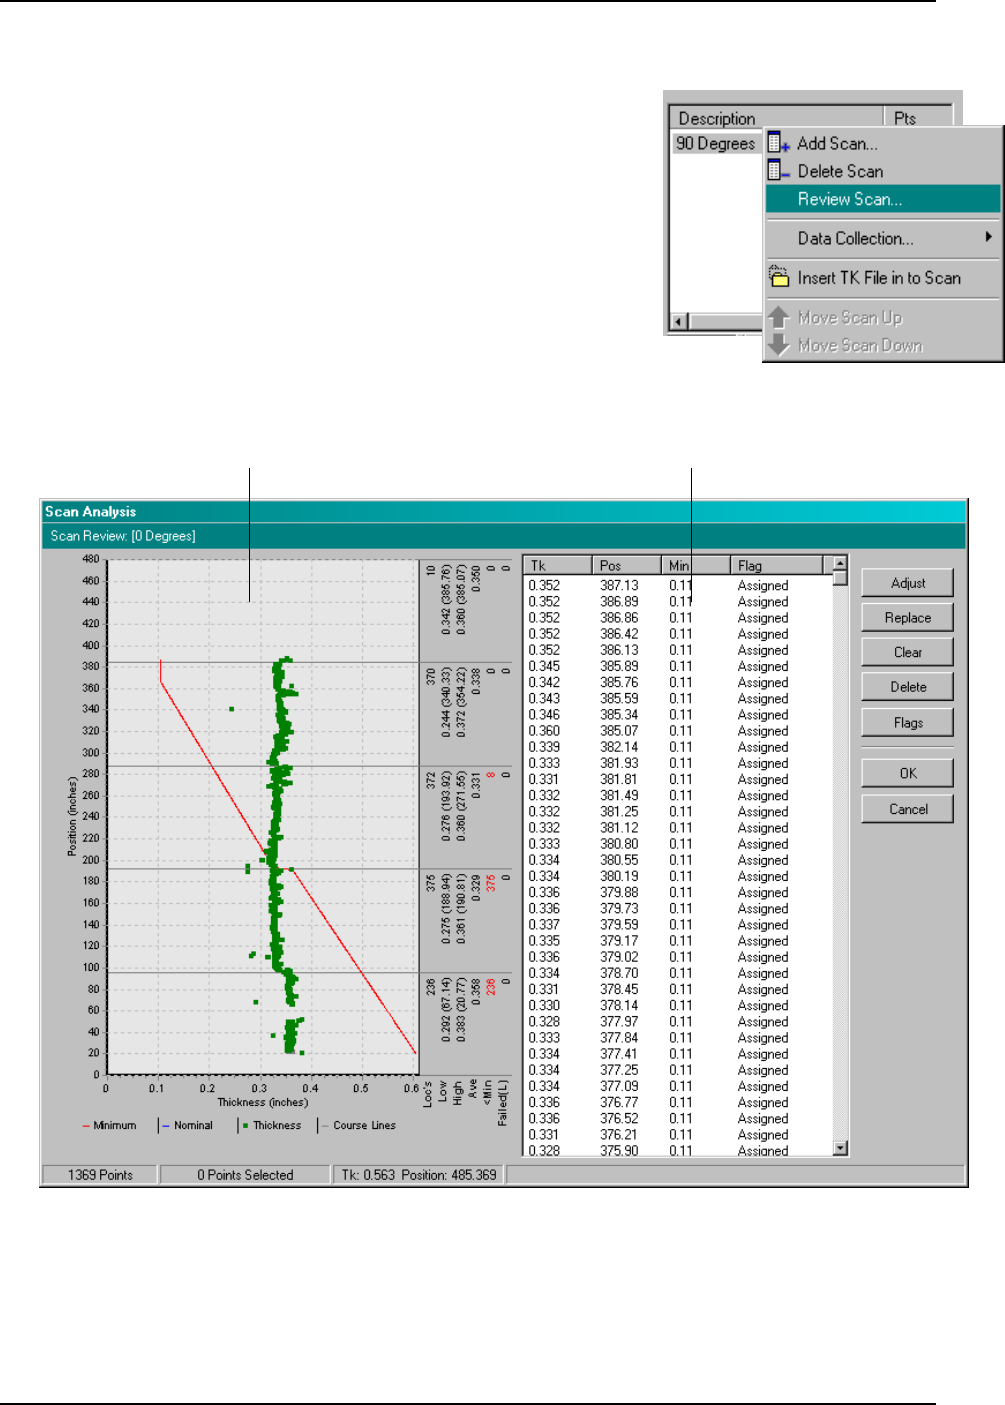
Scan Graph Scan Grid
Figure 36 Scan Review Window
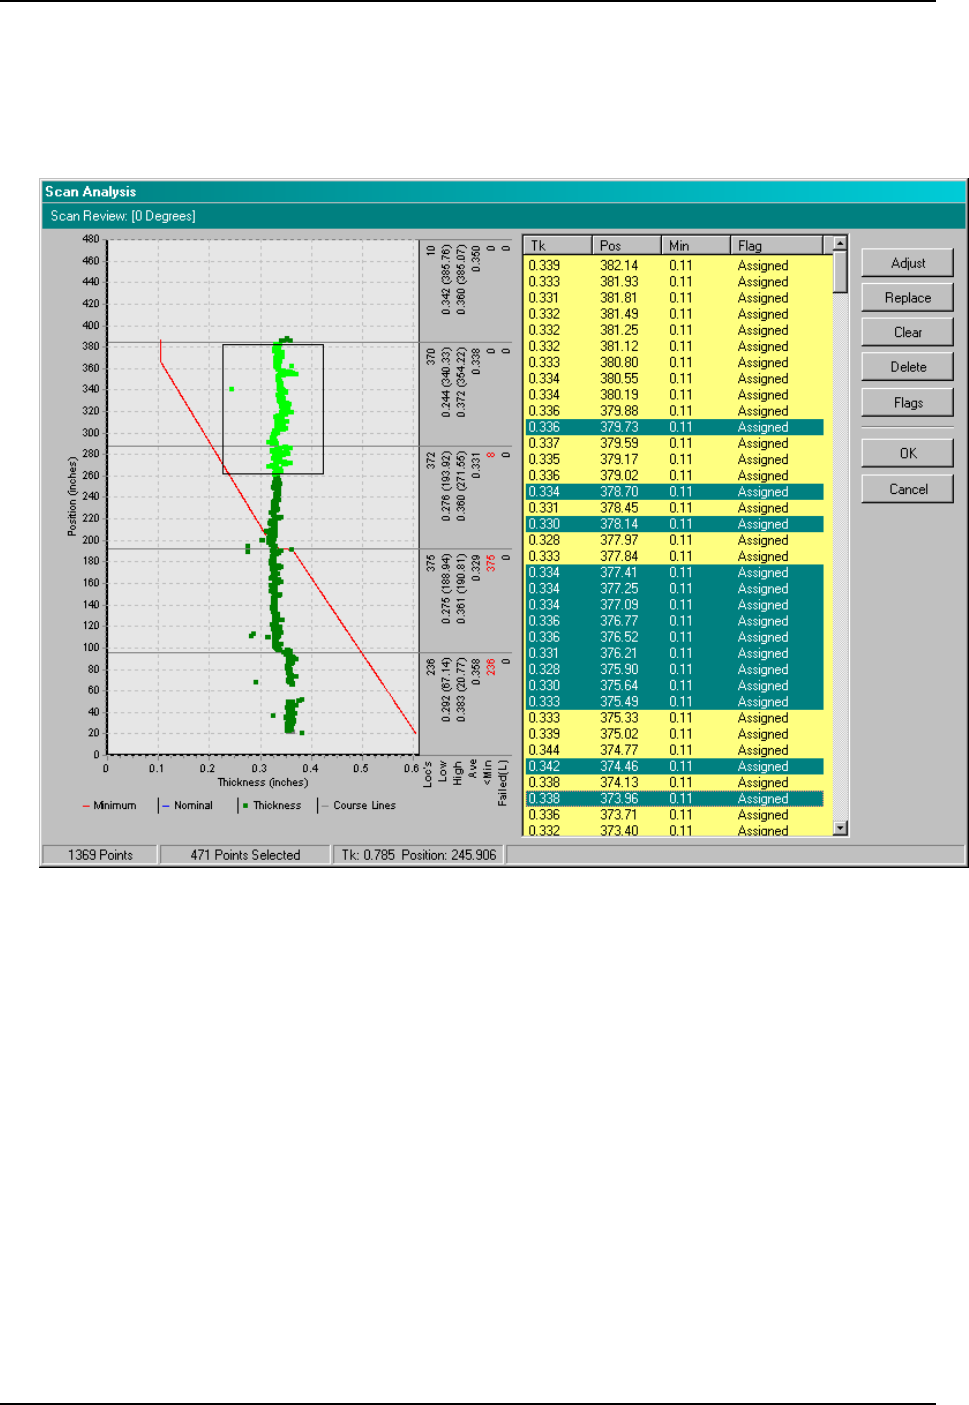
Scan Review Window
The Scan Review Screen is allows you to delete and assign flags to locations in a
scan. To open the Scan Review window select the scan in the Scan List, right
click and select the Review Scan option. You can also open it by double-
clicking on the scan in the Scan List. The Scan Review window will appear as
shown below.
ADAS-500 Reporting System User’s Manual
Section 5 Reviewing the Data
Copyright © 2005-2009 ATCO. All Rights Reserved. Page 36 Revision 1.9
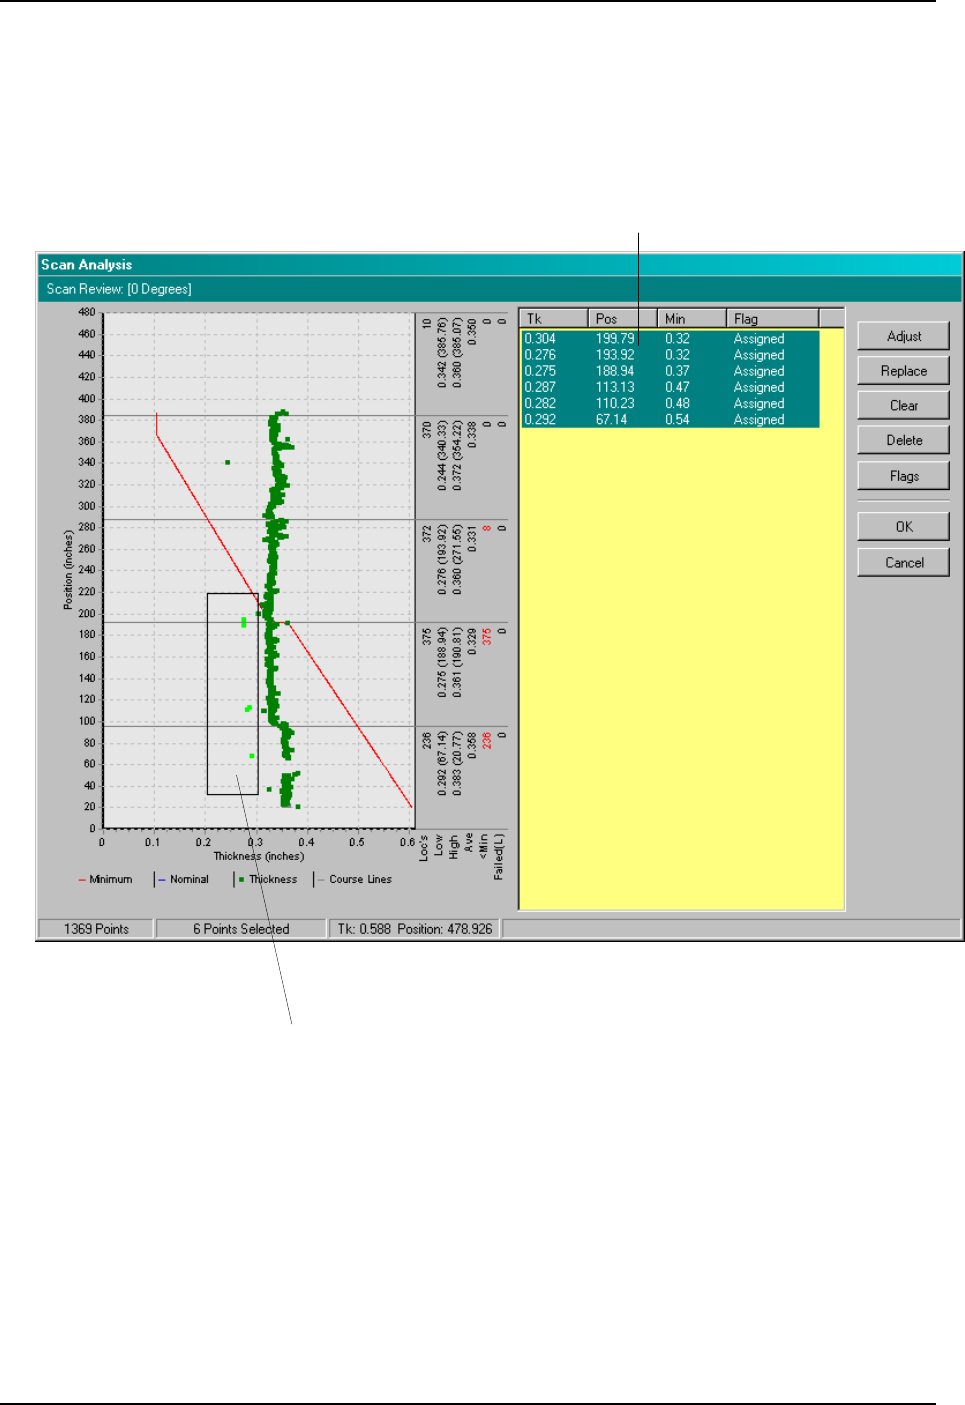
Selected Area
Selected
Locations
Figure 37
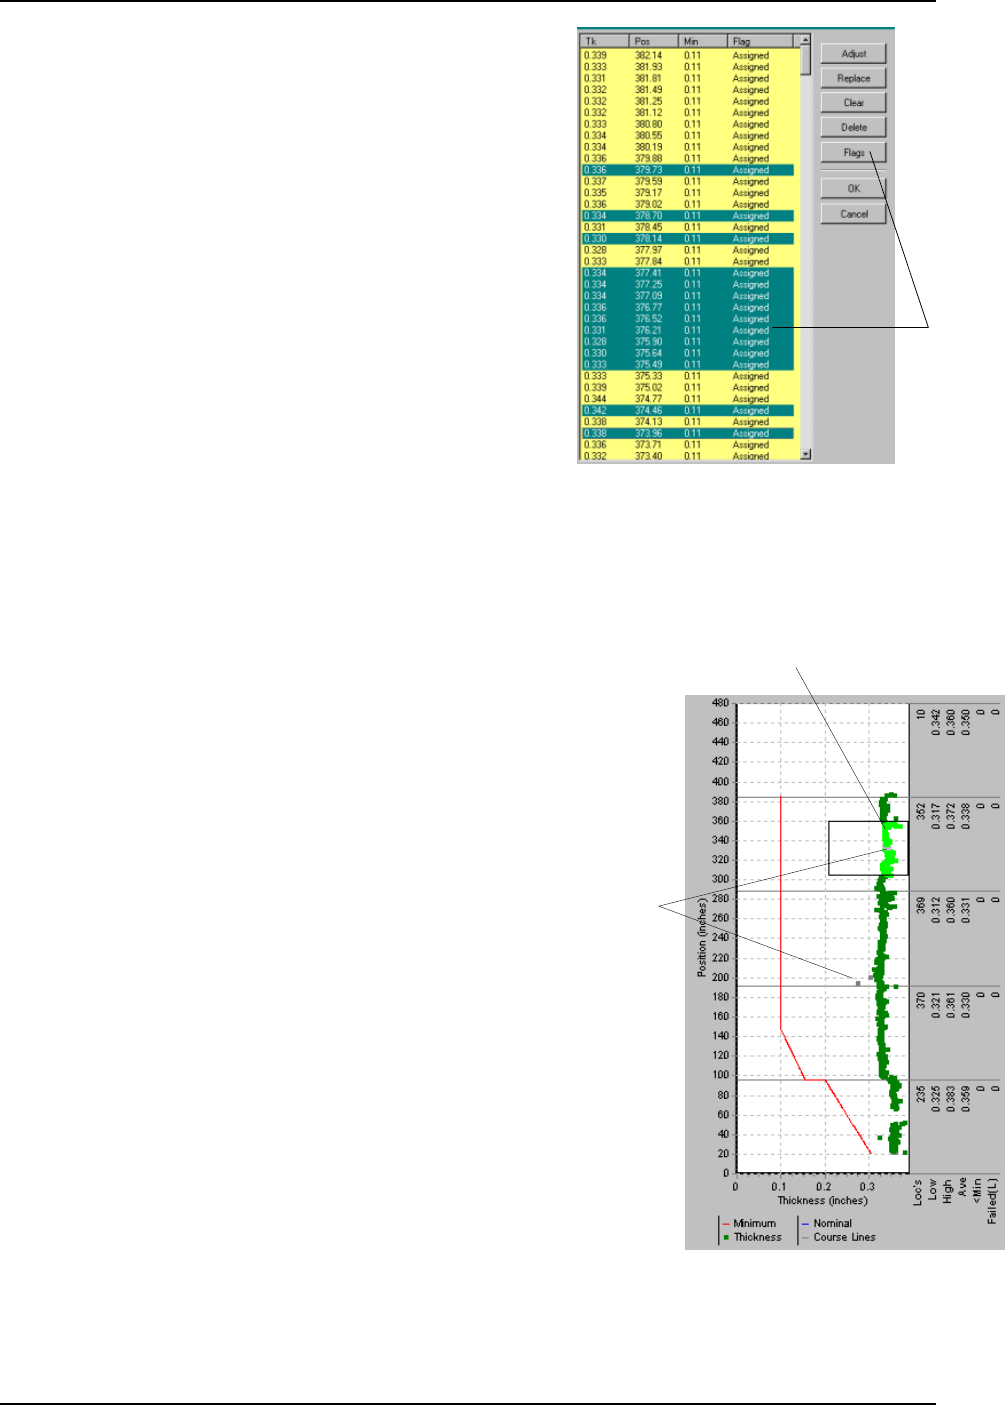
You can delete or change the flags on multiple data points at a time using the Scan Review window. You can graphically
select data points by clicking on the Scan Graph and drawing a box around the data points you want to select (as shown
below). Once you select an area, the scan grid will display only the locations you have selected in the graph. To Clear the
selection and display all the locations in the scan, click the Clear button (or right click in the scan graph).
ADAS-500 Reporting System User’s Manual
Section 5 Reviewing the Data
Copyright © 2005-2009 ATCO. All Rights Reserved. Page 37 Revision 1.9
When you select areas in the Scan Graph (as shown above) all of the locations in the scan grid are selected. You can select
any of the locations within the grid if required as shown below.
ADAS-500 Reporting System User’s Manual
Section 5 Reviewing the Data
Copyright © 2005-2009 ATCO. All Rights Reserved. Page 38 Revision 1.9
Select Data
Locations and
click Flags
Figure 39 Setting Data Point Flags
Reading Flag
Selected Points
Figure 40 Data Point Display
Modifying Data Points
You can modify several data points at a time by selecting them in the
grid. This includes changing the flags and deleting data points.
Setting Data Point Flags
To change the Data Point Flag for several points at once, select the
data points in the grid and click on the desired Data Point Flag (as
shown right). This will change the value on all selected points.
Deleting Data Points
To delete points, select them in the grid (as shown) and click the
Delete button.
Data Point Display
The data points in the Scan Graph are displayed as points rather
than connected lines in the Main Window of the application. This
allows you to easily differentiate between the points making it
easier to select them.
The colors change depending on whether the data point is selected
or not. Not the change in color of the data points within the
selected area on the graph to the right.
The colors are also different on data points that have a flag
assigned other than “Assigned”. These data points do not appear
in the other graphical displays in the application, only the Review
Window.
ADAS-500 Reporting System User’s Manual
Section 5 Reviewing the Data
Copyright © 2005-2009 ATCO. All Rights Reserved. Page 39 Revision 1.9
Will select all points
less than 0.05
Will replace the values with
the New Value of 0.250
Figure 42 Data Replace Dialog
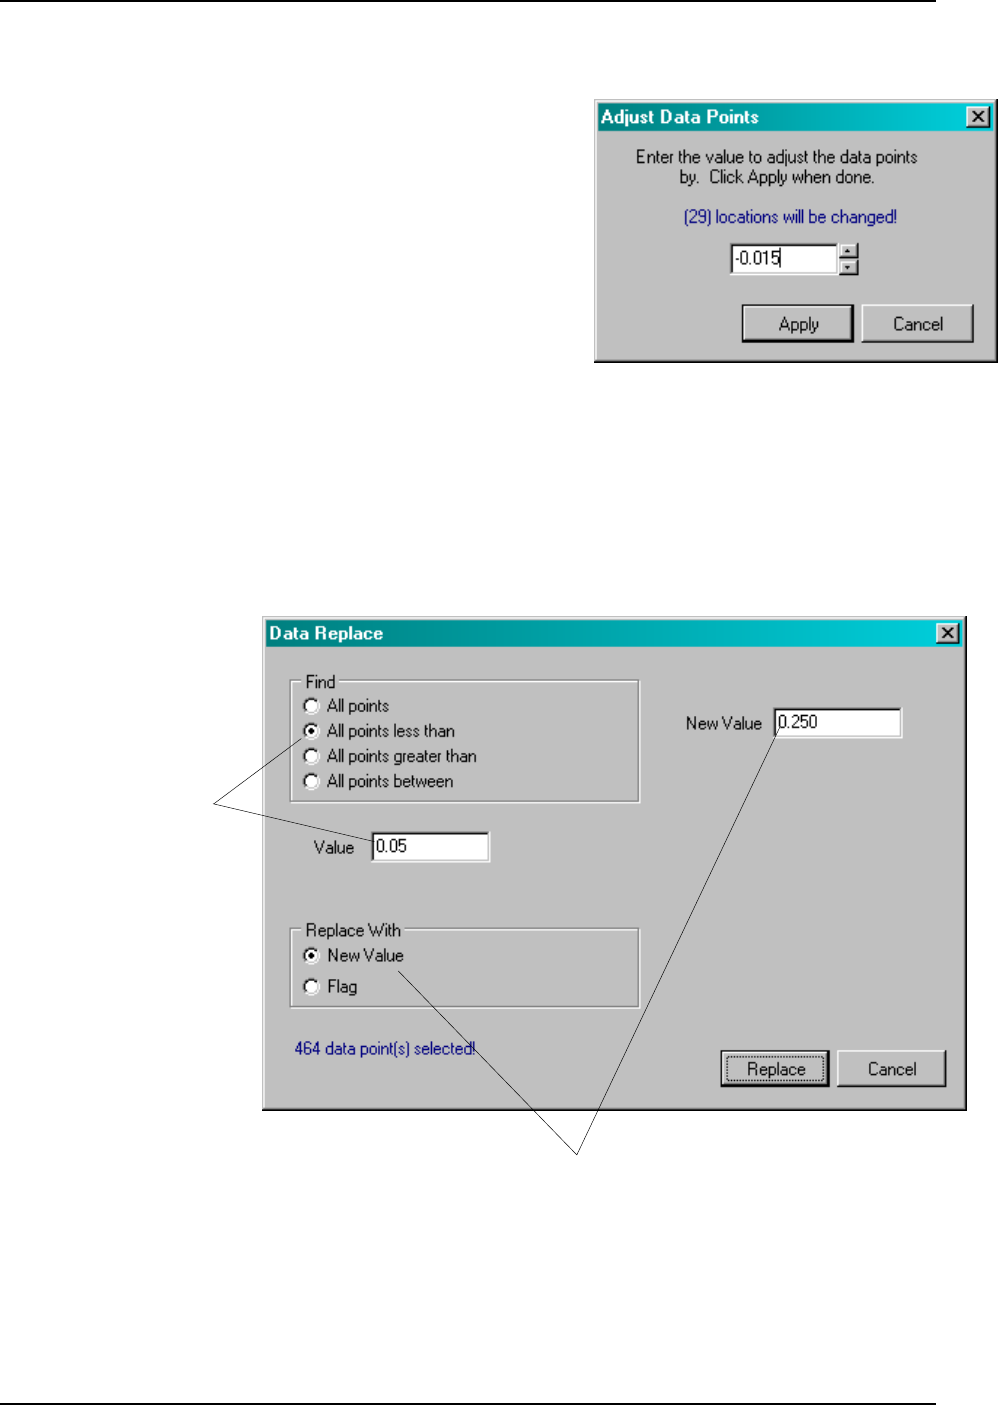
Adjusting Data Values
You can adjust the values of the data in the scan. This is useful in some
circumstances such as removing an average paint thickness amount. To
adjust the data values, select the locations in the grid and click the
Adjust button. The Adjust Data Points dialog will appear (right).
Enter the amount you want to adjust and click the Apply button.
Entering a negative number will subtract from the values and a positive
number will add.
Replacing Data
You can replace values in the scan with either a new value or a flag. Select the data points in the Readings Grid and click the
Replace button. The Data Replace dialog will appear (below). Set the Find criteria which will determine which data points in
the selection will be changed. Select whether you want to replace the value with another numeric value or assign a flag to the
points. This is done by choosing the Replace With option. Click Apply and all data points that fall within the Find settings
will be replaced with the new value or a flag.
ADAS-500 Reporting System User’s Manual
Section 6 Printing Reports
Copyright © 2005-2009 ATCO. All Rights Reserved. Page 40 Revision 1.9
Scan List
General Image
List
Figure 43 Reporting Form
Printing Reports
When your data has been imported and reviewed, you are ready to print reports. The ADAS-500 Reporting System provides
three basic reports Summary, Scan Details and Critical Area Analysis.
Summary Report
The Summary report provides a condensed and global view of the data for all or any selected scans in the report file. The
controlling critical area for the entire report file is displayed as well as statistics which are gathered across all scans and
courses. For more on critical areas refer to the section Analysis Methodology.
Scan Details Report
The Scan Details report provides a detailed view of a single scan. It features a graphical display of the scan and course
summary information in a condensed and easy to read format.
Critical Area Analysis Report
The Critical Area Analysis report provides a detailed view of any or all of the critical areas in a scan. It features a graphical
display of the course, areas and variables (i.e. Tmin, T1, T2 etc...) that make up the critical area calculation. For more on
critical areas refer to the section Analysis Methodology.
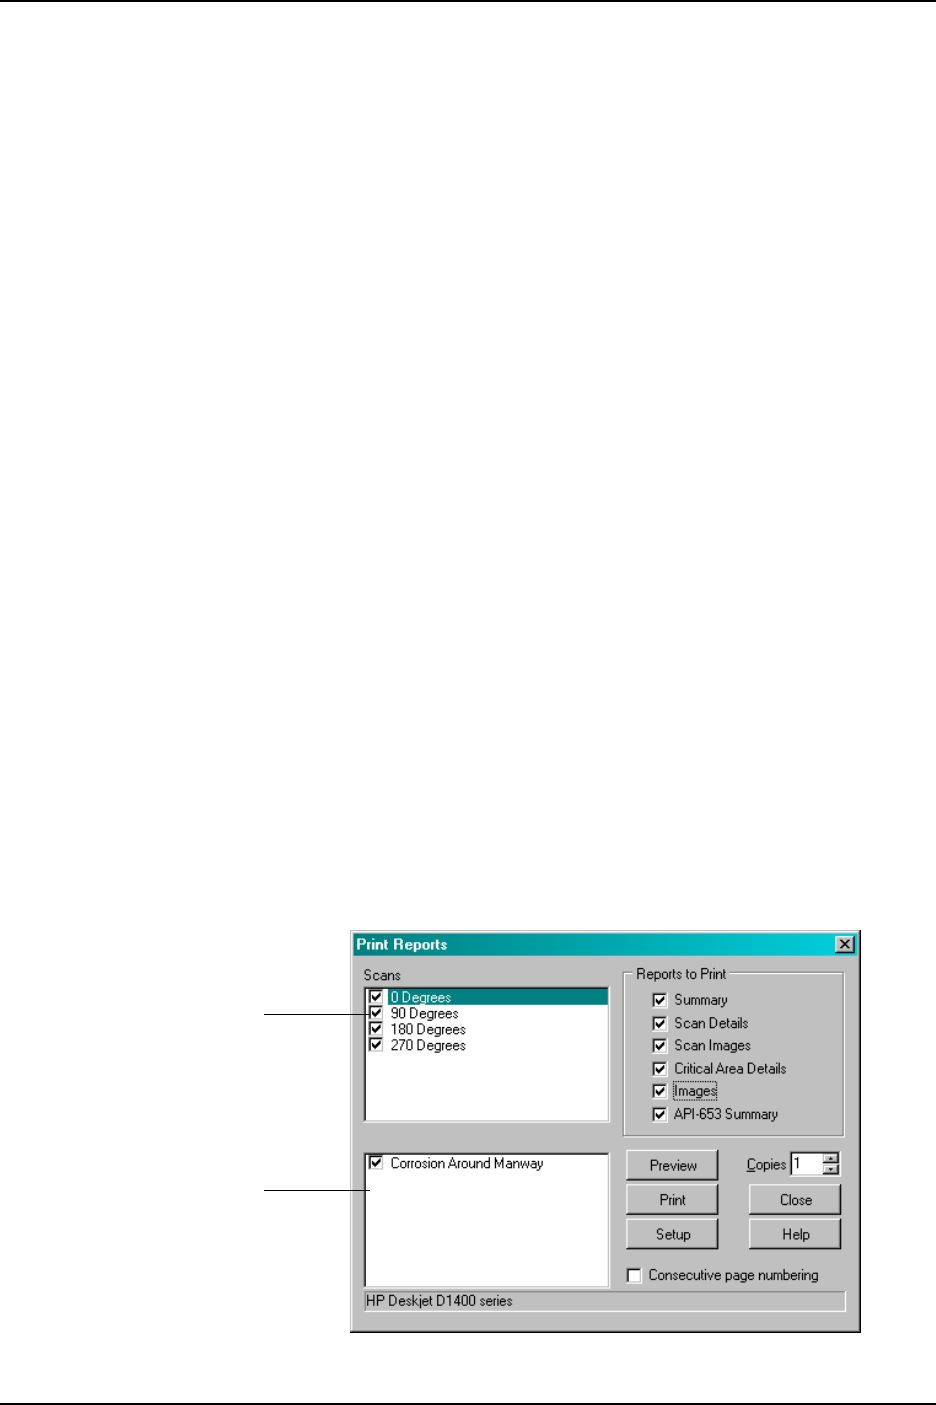
Report and Scan Selection
You select the scan(s) and report(s) to print from the Print Reports dialog (Figure 43). All reports for the entire report file (all
scans) can be printed at one time, or, you can select individual scans and reports as needed.
All scans in the report file are displayed in the list box on the left side of the dialog as shown in Figure 31. You can select or
deselect each scan by clicking on the check box on the left side of the scan description. Only the checked scans will be
printed. By default, when the dialog appears, all scans are checked (selected).
To select the report(s) to print, check the appropriate check box in the Report List shown in Figure 43. Only the selected
reports will be printed. To preview the report(s) before printing, click the Preview button. To send the reports straight to the
printer, click the Print button. To adjust margins and other basic properties of the report, click the Setup button.
Report Page Order
ADAS-500 Reporting System User’s Manual
Section 6 Printing Reports
Copyright © 2005-2009 ATCO. All Rights Reserved. Page 41 Revision 1.9
Summary
Scan
Details
0 Degree Drop
Critical Area
Analysis
0 Degre Drop
Scan
Details
90 Degree Drop
Critical Area
Analysis
90 Degre Drop
Scan
Details
180 Degree Drop
Critical Area
Analysis
180 Degre Drop
Scan
Details
270 Degree Drop
Critical Area
Analysis
270 Degre Drop
Figure 44 Report Printing Order
Figure 45 Print Setup Dialog
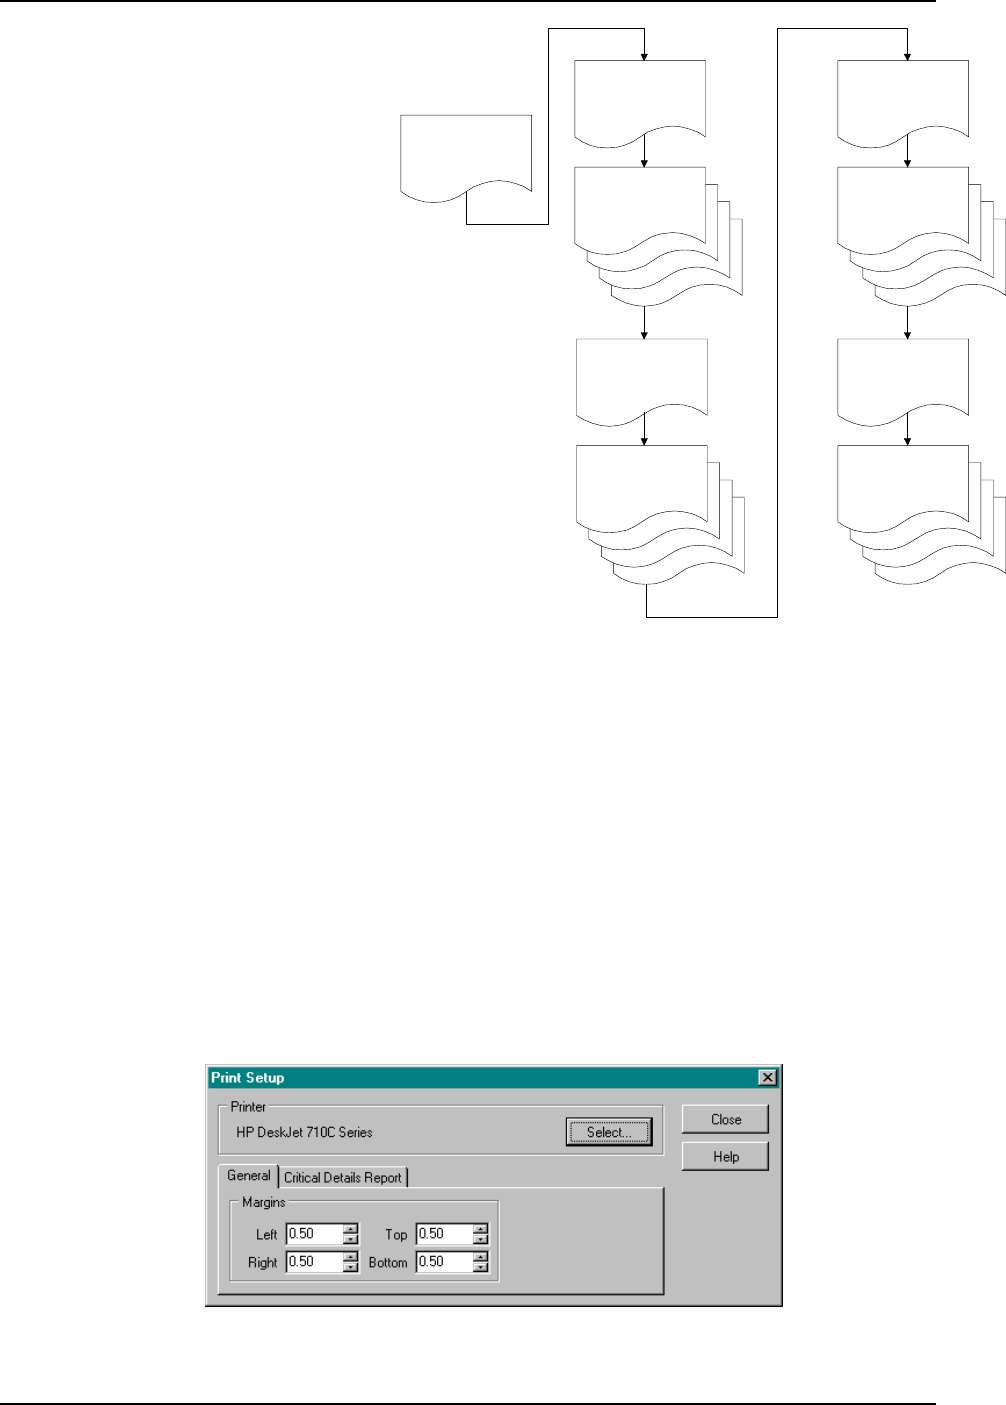
The order in which the report pages are printed
depends on the reports and scans selected.
When the Summary report is selected, it is
printed first and only the selected scans are
used. Then, each scan is printed in the order in
which they appear in the scan list.
The Scan Details and Critical Area Analysis are
reports are printed together for each scan if
selected. The Critical Area Analysis reports can
be one or more pages depending on the print
mode selected and whether or not the report file
contains and Critical Areas. See Critical Area
Report Modes below for details on the print
modes available.
The scans and reports selected as shown in
Figure 43 would produce reports in the order
shown in Figure 44.
The Consecutive page numbering check box
allows you to print reports with page numbering consecutive throughout all scans and reports. If it is checked, page
numbering will start as page 1 for the first page, and continue consecutively throughout all report pages. If it is not checked,
each report (i.e. Summary, Scan Details, Critical Area Analysis) page number will begin at page 1.
Print Setup
To select or change the properties of the printer or to change basic report settings, click the Setup button. The Print Setup
dialog will appear (Figure 45). To change the selected printer or settings, click the Select button. Adjust margins of the
report with the Margins tab shown in Figure 45. To change the Critical Area Analysis print mode, click the Critical Details
Report tab.
ADAS-500 Reporting System User’s Manual
Section 6 Printing Reports
Copyright © 2005-2009 ATCO. All Rights Reserved. Page 42 Revision 1.9
Figure 46 Changing the Critical Area Report Mode
Critical Area Report Modes
Since the ADAS-500 Reporting System can find a large number of Critical Areas in a single scan, there are several modes
available for printing. The Critical Details Report tab shown in Figure 46 allows you to set the mode for printing. (See
Analysis Methodology for more on Critical Areas). This allows you to select just the Critical Area(s) that you want to print.
The three modes are
All Critical Areas
This mode prints all critical areas calculated by the system. This would include all Acceptable, Unacceptable and
Controlling critical areas. Depending on the condition of the tank this could produce a large number of pages.
Unacceptable Critical Areas
This mode prints only the unacceptable critical areas calculated by the system.
Controlling Critical Areas
This mode prints on the controlling critical area of the scan.
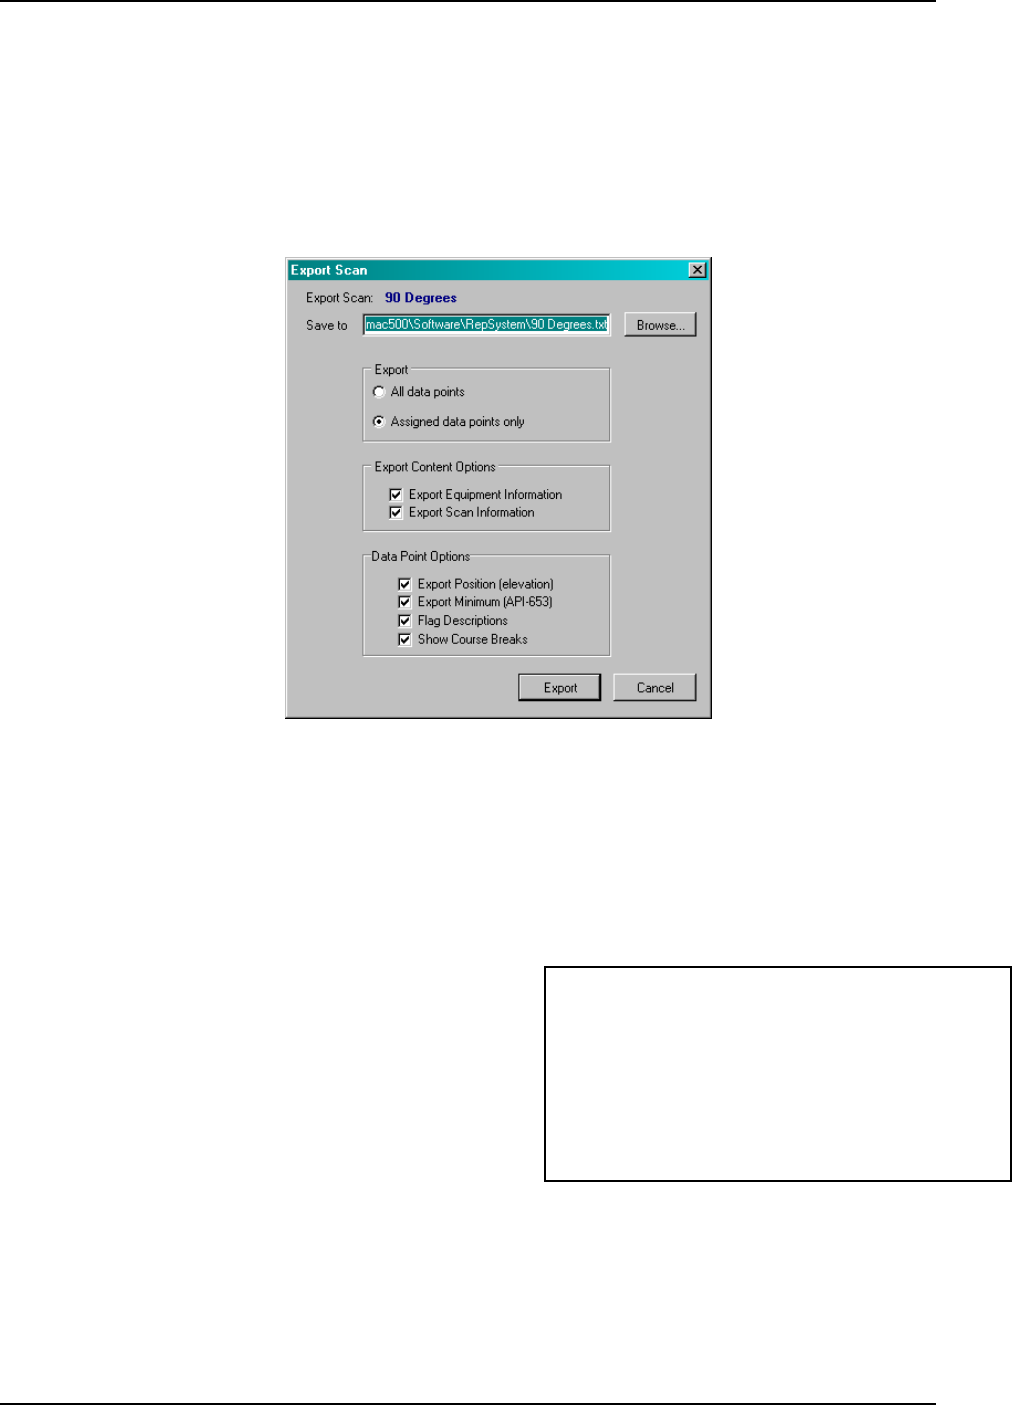
ADAS-500 Reporting System User’s Manual
Section 6 Printing Reports
Copyright © 2005-2009 ATCO. All Rights Reserved. Page 43 Revision 1.9
Figure 47 Export Scan Dialog
Exporting Data
Scan data from the ADAS-500 Reporting System can be exported to a text (ASCII) file for use in other applications like
Excel. There are several options you can select when exporting to get just the data you want. To export a scan, select the
scan in the scan window, right click and select the Export... menu option. The Export Scan dialog will appear (below). The
available exporting options are shown below. The Save To edit is where you enter the name of the destination export file.
Click the Browse button to select use the Save dialog.
Export Options
All data points - exports all data points whether assigned, LOS or flagged.
Assigned data points only - exports only data points that are assigned. This excludes LOS or Flagged data points.
Export Equipment Information - When selected, this
option will export equipment specific information such
as Name, Location, Owner, Diameter and more (shown
right).
[EquipmentInfo]
Name: Water Storage Tank
Owner: ABC Plant
Location : Tank Farm
ID : Test ID
Diameter: 50.00
Height: 480.00
Courses: 5
API 653: YES
Spec Gravity: 3.000
Prod Height: 20.00
Equipment Information Block
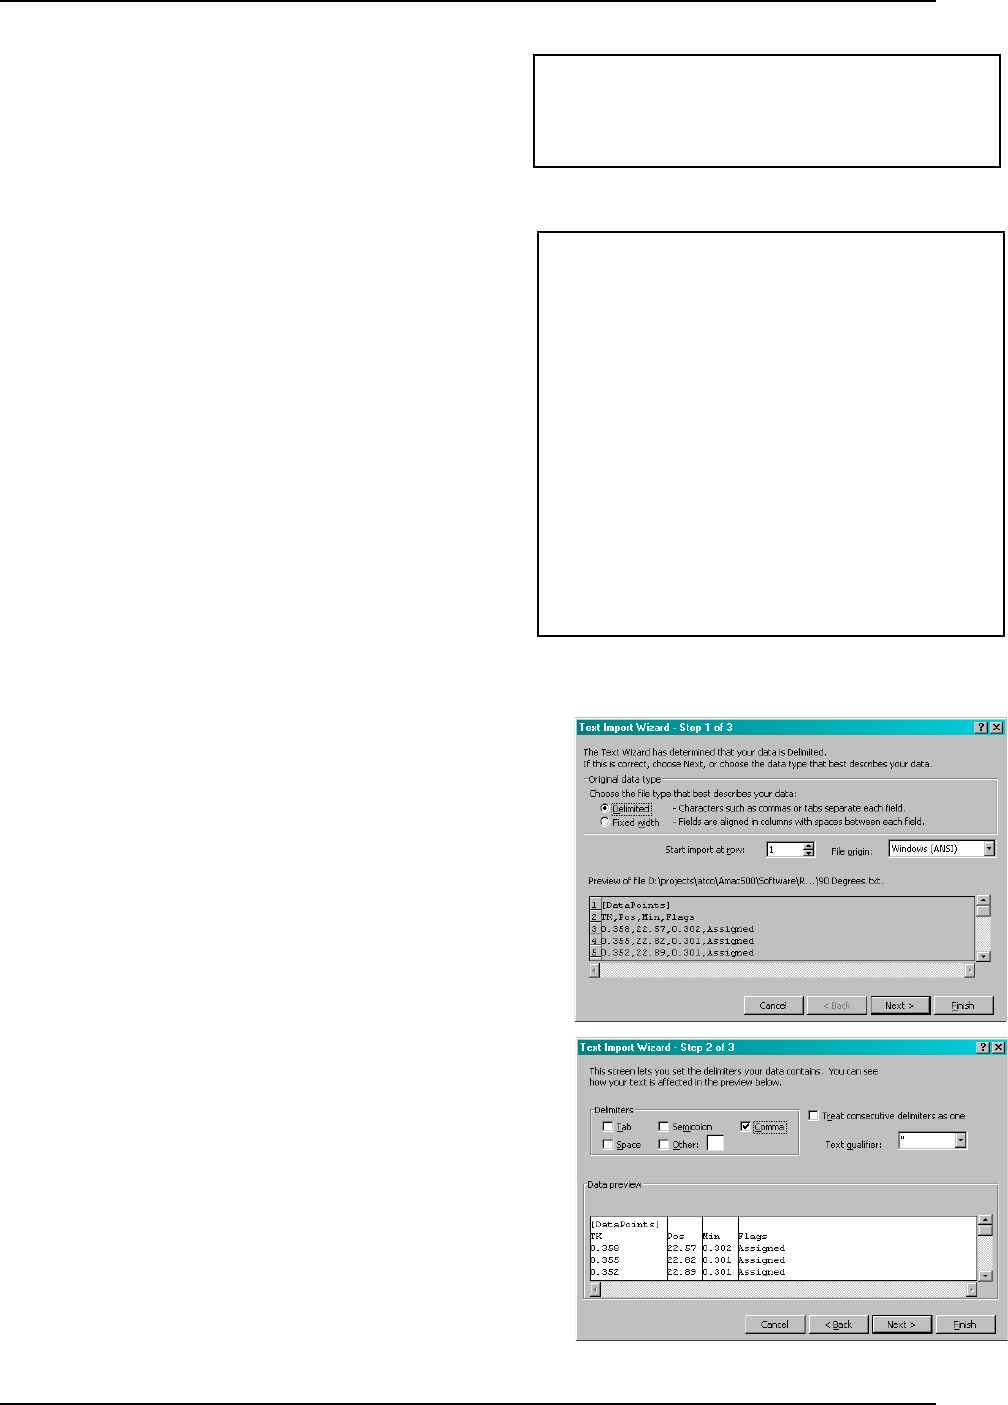
ADAS-500 Reporting System User’s Manual
Section 6 Printing Reports
Copyright © 2005-2009 ATCO. All Rights Reserved. Page 44 Revision 1.9
Export Scan Information - When selected, this
option will export scan specific information such as
Name, Location, Number of data points, .and more
(shown right)..
Data Point Options
The Data Point Options allow you to select what information
to export for each data point. The thickness (TK) is always
exported. You can select whether to export Position, Minimum
and Flag Descriptions for each data point. The format for the
Data Points block is shown to the right.
Exporting to Excel
The exported files can be used for further analysis in Excel. If you
plan to export each attribute of the data point (i.e. Position, Minimum)
in to a column in Excel, the best way to do it is to export the Data
Points only. Do not include the Equipment or Scan Information.
Also, do not include the Course Breaks and the data will appear in
individual columns.
In Excel select the File | Open menu option and open the exported
file. Specify Delimited, as shown right, and click Next.
Select Comma as the delimiter (as shown right) and click Next.
[ScanInfo]
Name: 90 Degrees
Location: 0.00
Vertical/Long: YES
Data Points: 1261
Scan Information Block
[DataPoints]
TK,Pos,Min,Flags
[Course 1]
0.358,22.57,0.302,Assigned
0.355,22.82,0.301,Assigned
0.352,22.89,0.301,Assigned
0.357,23.24,0.301,Assigned
..........
..........
..........
0.332,381.12,0.100,Assigned
0.332,381.25,0.100,Assigned
0.332,381.49,0.100,Assigned
0.331,381.81,0.100,Assigned
0.333,381.93,0.100,Assigned
0.339,382.14,0.100,Assigned
[Course 5]
0.343,385.59,0.100,Assigned
0.342,385.76,0.100,Assigned
0.345,385.89,0.100,Assigned
[DATA END]
Data Points Block
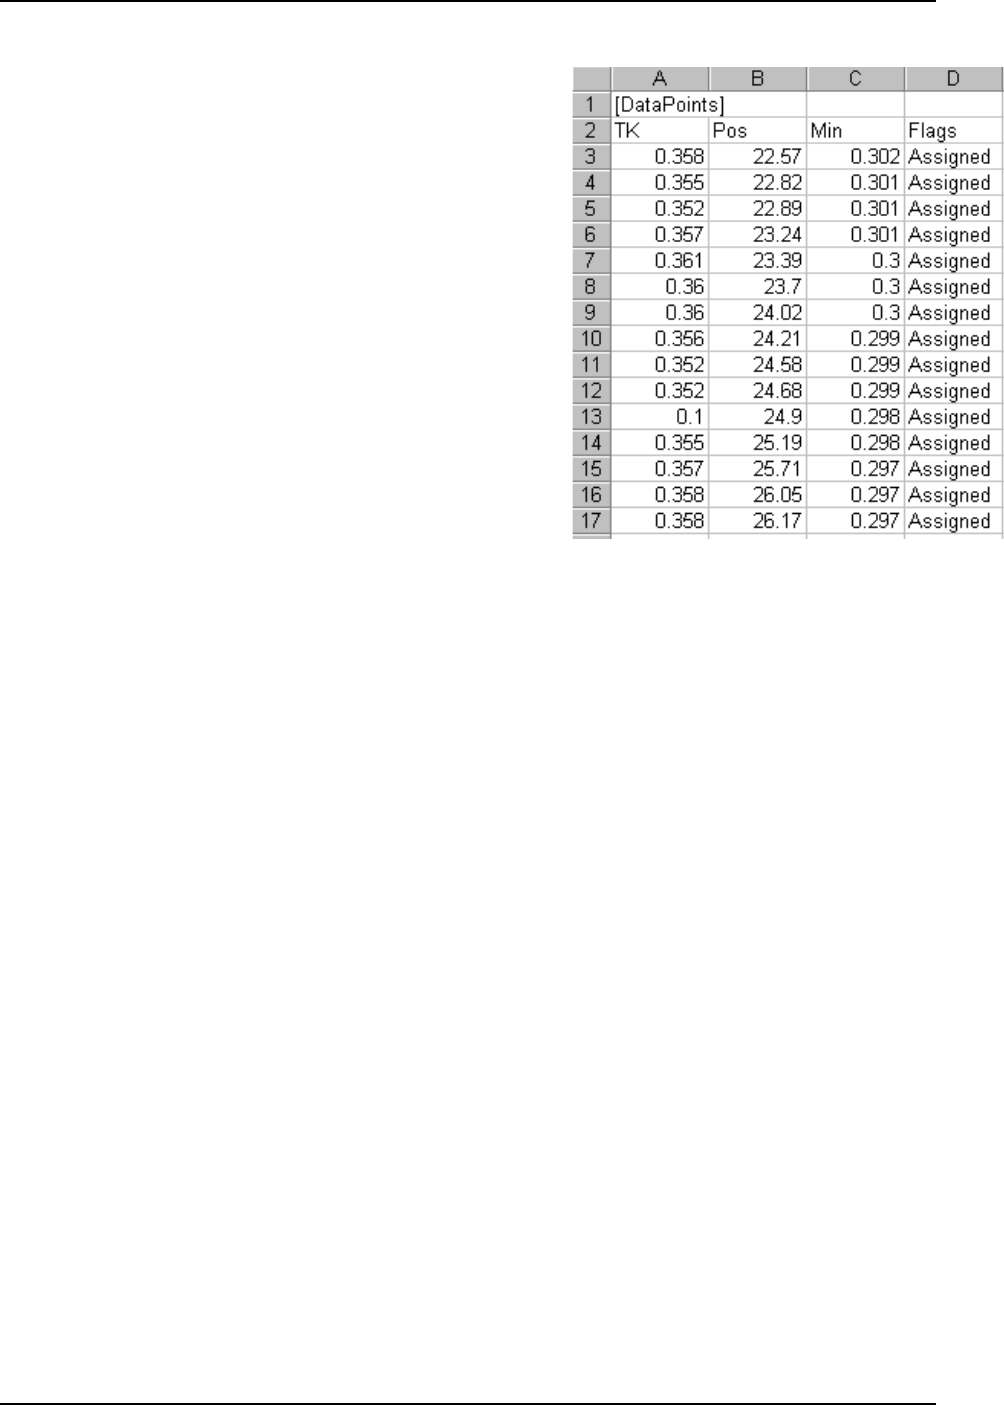
ADAS-500 Reporting System User’s Manual
Section 6 Printing Reports
Copyright © 2005-2009 ATCO. All Rights Reserved. Page 45 Revision 1.9
Click Finish. The data will be placed in the appropriate columns as
shown right.
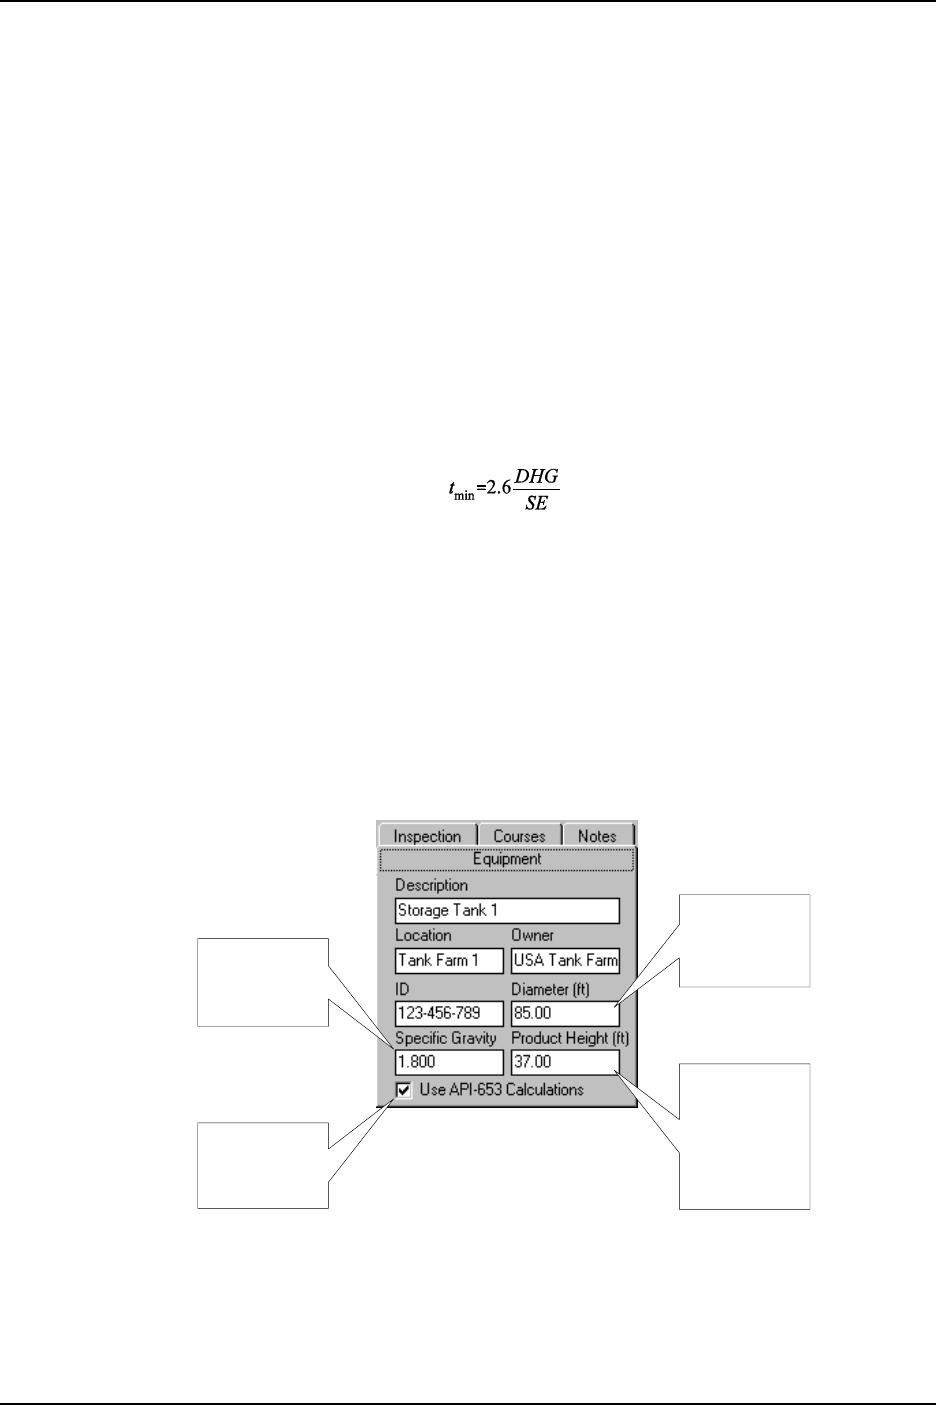
ADAS-500 Reporting System User’s Manual
Section 7 Analysis Methodology
Copyright © 2005-2009 ATCO. All Rights Reserved. Page 47 Revision 1.9
Formula (1) 2.3.3 tmin Value
Diameter of
thetank in feet
variable:
"D"
Specific Gravity
of the contents
variable:
"G"
Height of the liquid
in the tank
variable:
"H"
is
calculated using
the formula shown
below
Enables /
Disables
API-653
Calculations
Figure 63 tmin formula variables obtained from the Equipment tab
API Standard 653
The ADAS-500 Reporting System features automatic calculations for minimum thickness values and thickness averaging
methods defined in the American Petroleum Institute (API) Standard 653, Tank Inspection, Repair, Alteration, and
Reconstruction. To have a thorough understanding of the calculations performed by this system to calculate the various API-
653 minimums and analysis methods, you should be familiar with API Standard 653. This system is written to API Standard
653, Second Edition, December 1999, Addendum 4. You can also use the API Standard 650 Variable-Design-Point method
for calculating tmin values by selecting it on the Equipment tab.
Referenced Sections of API Standard 653
Calculation of tmin
The ADAS-500 Reporting System references Section 2 Suitability for Service, of the API-653 Standard. The paragraphs in
Section 2 used specifically are 2.3.2 and 2.3.3. The primary value calculated by the system is the tmin value referenced in
paragraph 2.3.3 of the standard. The formula used, is shown below.
The variables of the formula are obtained in several sections of the ADAS-500 Reporting System. The variables D, G are
obtained directly from the values entered in to the Equipment tab shown in Figure 63. The H variable is derived using the
Product Height field (Figure 63) and the position of the thickness data point (Figure 64).
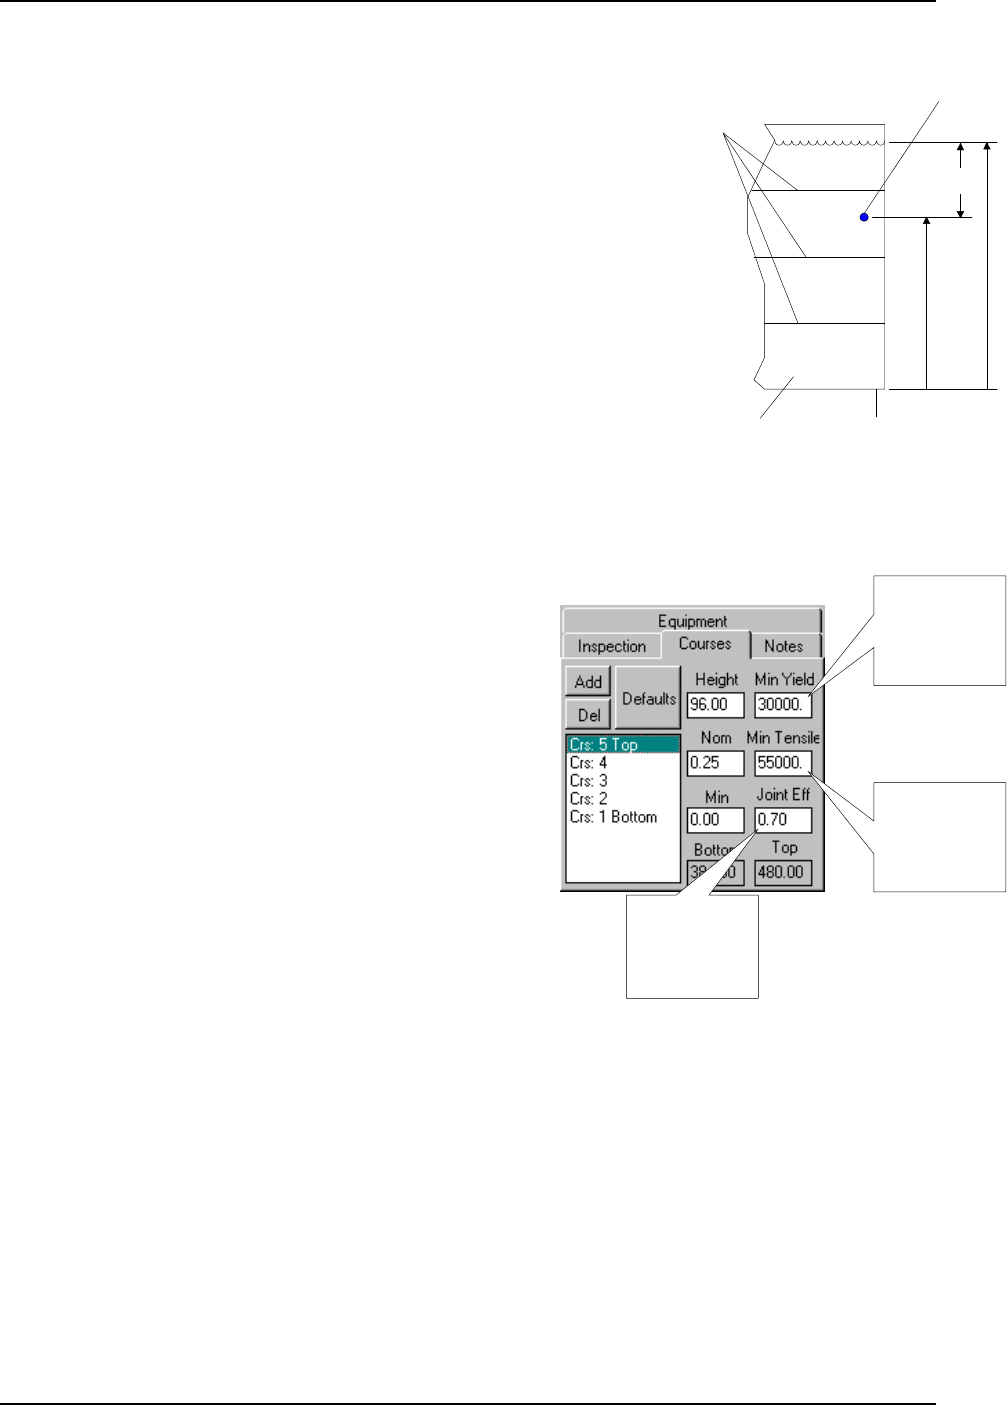
ADAS-500 Reporting System User’s Manual
Section 7 Analysis Methodology
Copyright © 2005-2009 ATCO. All Rights Reserved. Page 48 Revision 1.9
Cutaway
of a Tank
Course
Weld
Lines
Course 1
Course 2
Course 3
Course 4
Tank
Bottom
Product
Height
Thickness
Data Point
Data Point
Position
"H"
Figure 64 Calculation of “H”
Min Yield Value
variable:
"S"
is
calculated using
the this value
Min Tensile Value
variable:
"S"
is
calculated using
the this value
Joint Efficiency
varialbe "E" for the
bottom weld of the
course
Figure 65 Calculation of “S” and “E”
The H variable of the tmin formula for each thickness data point is calculated
by subtracting the Data Point Position (obtained during data acquisition)
from the Product Height (Figure 64).
H = Product Height - Data Point Position
The method used to calculate the H value in the tmin formula requires that all
thickness data point positions are measured from the bottom of the tank.
Refer to Section 2 Typical Scanning Practices and Guidelines for detailed
information on measurement coordinates used in the system.
The S and E variables of the tmin formula are obtained through the
course information entered in the Courses tab (Figure65).
The S variable is calculated in accordance with Paragraph 2.3.3.1
where the minimum Yield and Tensile (Y and T respectively in
Paragraph 2.3.3.1) values for the construction materials are used.
Each course has its own defined minimum yield and tensile values.
The defaults used by the system are the values specified by API-653
when the material properties are unknown.
The E (joint efficiency) variable of the tmin formula is obtained
through the course information. The joint efficiency is only used
close to the weld lines (as specified in paragraph 2.3.3.1). The joint
efficiency entered in the course information (Figure 65) is for the
weld at the bottom of the specified course.
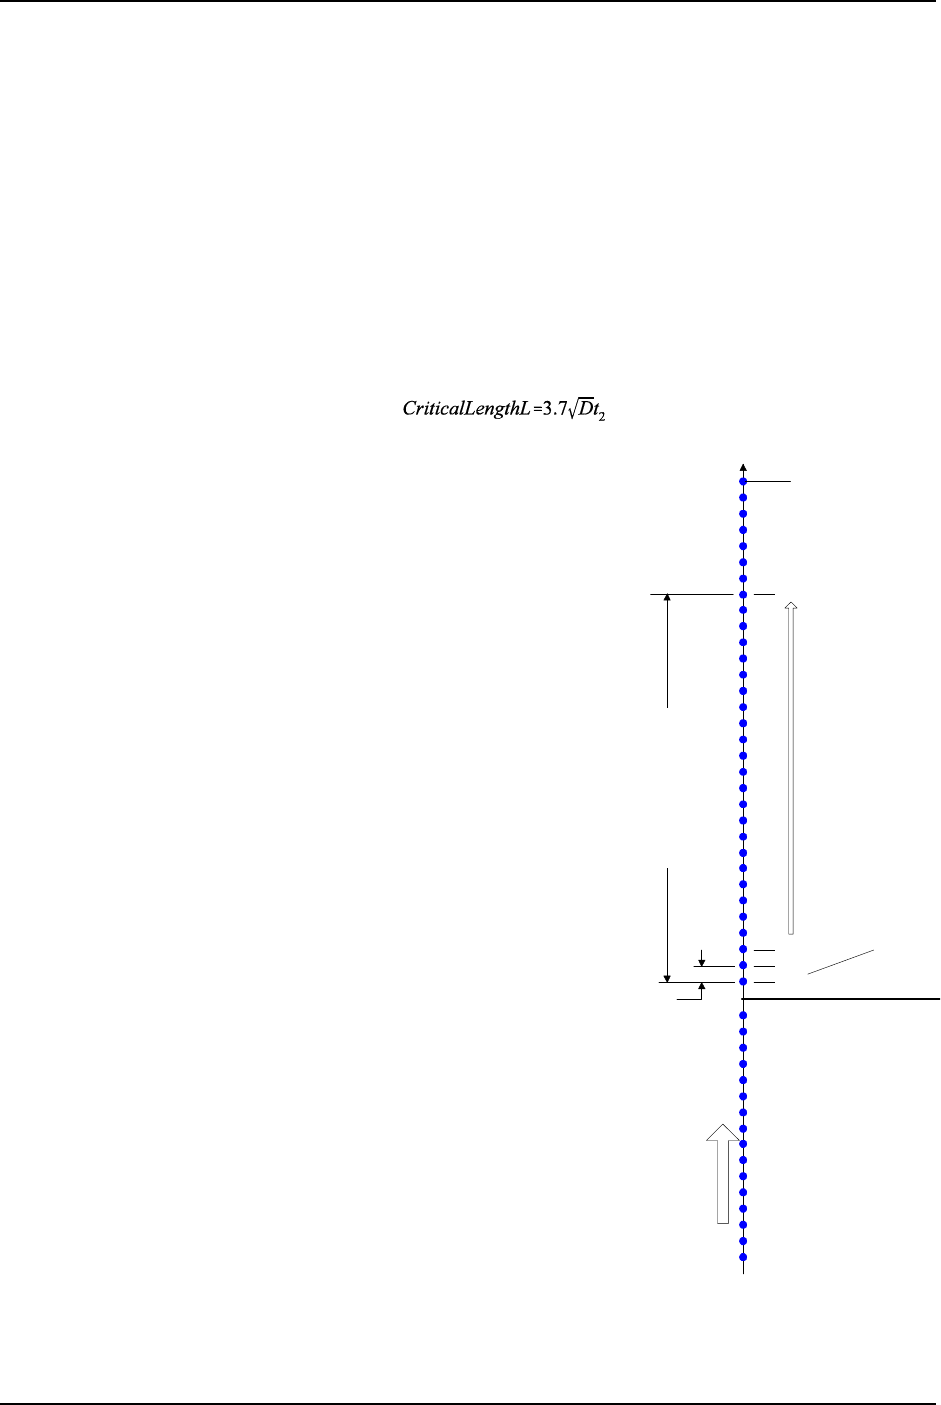
ADAS-500 Reporting System User’s Manual
Section 7 Analysis Methodology
Copyright © 2005-2009 ATCO. All Rights Reserved. Page 49 Revision 1.9
Formula (2) 2.3.2 Critical Length L
Data Increment Course
Weld Line
Critical Length L
Thickness Data
Points
Vertical
Scan
Pt 1
Pt 2
Pt 3
Pt N
tmin point used for
calculatoin
Figure 66 Critical Area Calculation
Thickness Averaging and Critical Areas
API-653 provides a method to calculate whether a corroded/eroded area is acceptable or unacceptable even when the
thickness is less than the tmin value. Whenever a thickness value in a scan is below the tmin value, the ADAS-500 Reporting
System performs automatic thickness averaging to assist you in determining the severity of corrosion/erosion in the area. A
thickness averaging over critical length L is calculated for area and referred to in this system as a Critical Area. This section
will explain how the system calculates these areas.
Critical Length L and Thickness Averaging
As specified in paragraph 2.3.2, you can average the thicknesses in a vertical (longitudinal) plane over an area of maximum
length L. The critical length L is calculated based upon the tank diameter and thickness of the corroded/eroded area. The
formula used to calculate L is shown below. Since averaging is done only in the vertical plane, Critical Areas are only
calculated for longitudinal scans (running vertically up tanks).
The variable D in the formula is the diameter of the tank in feet and
is obtained from the data entered in the Equipment Info tab
(Figure 63). The t2 variable is the lowest thickness found within
the critical area.
When the areas are calculated, each scan and each course is
individually reviewed and calculated. Starting at the first thickness
point (labeled Pt 1 in Figure 66), the system looks up the scan to
determine t2 (the lowest thickness). The system then calculates
critical length L using the equation above. The critical area is
considered to be all of the thickness data points located starting at
Pt 1 to Pt N. The process is repeated, starting at Pt 2 and looking
up the scan. This process is continued until the top of the course is
met.
All scans and courses are reviewed automatically and Critical
Areas are created. Each area is either acceptable or unacceptable
based upon the criteria in paragraph 2.3.2.
t1 - Average thickness over critical length L
t2 - Lowest thickness found over critical length L
tmin - Calculated from the tmin formula
Acceptance Criteria
The area can be found to be acceptable or unacceptable in
accordance with the criteria specified in 2.3.2. The determination
is assuming that any pitting that may be present, is considered to be
widely scattered as specified in 2.3.3.
The criteria is:
t1 must be greater than or equal to tmin
ADAS-500 Reporting System User’s Manual
Section 7 Analysis Methodology
Copyright © 2005-2009 ATCO. All Rights Reserved. Page 50 Revision 1.9
Formula (3) tmin Formula Solved for H
Formula (4) Relationship of H to Product Height and Thickness Point Position
Formula (5) Maximum Recommended Fill Height (Hf)
t2 must be greater than or equal to (0.6 x tmin)
The system will calculate t1 and t2 based upon the thickness values in the scan that reside within the length L. The system
will then compare the values against the tmin as shown in the criteria above. The tmin value calculated for the lowest elevation
point (highest tmin) will be used for the acceptance criteria. The corrosion allowance (Equipment Info tab) is automatically
added to the value of tmin.
Determining Maximum Fill Height and Controlling Areas
When shell thicknesses below tmin are found on a tank the area can be averaged (in accordance with API-653 Paragraph 2.3.2)
to determine whether or not the corroded/eroded area is acceptable. In cases where the averaging does not meet the criteria,
the fluid or product height in the tank can be dropped to a suitable level. API-653 specifies to solve the tmin equation for H to
determine the maximum acceptable fluid or product height for the tank (Formula 3). In order to calculate the maximum
recommended fill height of the fluid Hf we must find the relationship between H and the fluid height Hf and thickness data
point position Pos. The physical relationship is shown in Figure 64 and shown mathematically in Formula 4 below. The
ADAS-500 Reporting System uses formula 5 to calculate the maximum fill height Hf for each unacceptable critical area.
Substituting H in Formula 3 with Hf and Pos in Formula 4 yields
which results in
Controlling Areas
When all Critical Areas have been calculated, the system reviews each unacceptable critical area to determine which area
calculated to the lowest Hf value. The lowest Hf value is meaningful because if the fluid level is lowered to this height, all
ADAS-500 Reporting System User’s Manual
Section 7 Analysis Methodology
Copyright © 2005-2009 ATCO. All Rights Reserved. Page 51 Revision 1.9
Critical
Length
L
Selected
Critical
Area
Calculated
Values for the
Selected Area
Click to View
All of the Area
Details
Click to View
Only Specific
Areas
Thicknesses
API-653
Tmin
Figure 67 Critical Area Details
unacceptable areas would become acceptable. The name given to the Critical Area with the lowest value for Hf is
Controlling Area.
Viewing Critical Areas
You can view any critical areas by clicking the Critical Areas tab (Figure 67). The critical areas found can be selected in
the list box in the upper right corner (Figure 67). As you click on each area, the graphical display highlights the area in the
scan (shown in Yellow in Figure 67.
To look at any particular scan and course, simply select the scan in the Scan List, and select the course from the Course list
shown in Figure 67. The details showing some of the calculated values of the area are shown in the bottom right of the page.
To review all of the details for a particular area, click the Details... button. The Critical Area Calculation Details dialog box
will appear (Figure 69).
When the Unacceptable check box is checked, only Critical Areas that are not acceptable will be shown. If Controlling
check box is checked, only the Controlling Area will be displayed.
ADAS-500 Reporting System User’s Manual
Section 7 Analysis Methodology
Copyright © 2005-2009 ATCO. All Rights Reserved. Page 52 Revision 1.9
Figure 68 Critical Area Calculation Details
The Critical Area Calculation Details dialog shows all of the calculated values and thickness data point values used to obtain
the determination of Acceptable or Unacceptable.
Assessment Values
Bottom The bottom elevation of the area
Top The top elevation of the area
Length The length of the area (critical length L)
T1The average thickness of the area
T2The lowest thickness of the area (used to calculate L in Formula 2)
Tmin The minimum allowable thickness (obtained from Formula 1)
Max Fill Height The maximum recommended fill height (obtained from Formula 5)
Sum of Tk The sum of the thicknesses (used to calculate the average T1)
Tk Count The number of thickness points (used to calculate the average T1)
Corr Allowance The corrosion allowance until the next inspection (as recommended in API-653)
Controlling Area Indicates whether the area shown is the controlling area
Pass / Fail Criteria
Determination Indicates whether the area meets the minimum criteria shown below
T1 > = Tmin Indicates whether T1 >= Tmin is true / false
T2 >= 0.60 * Tmin Indicates whether T2 >= 0.60*Tmin is true / false
ADAS-500 Reporting System
Tutorial

ADAS-500 Reporting System User’s Manual
Section 8 Tutorial
Copyright © 2003-2007 ATCO. All Rights Reserved. Page 52 Revision 1.7
Tutorial
This section is a Tutorial with exercises to assist you in becoming familiar with some of the fundamental tasks required to use the
ADAS-500 Reporting System.
Using the Tutorial
Upon installation, demo data files from the ADAS-500 were installed in a Demo1 folder under the installed folder. If you selected
the defaults when installing the system, the path would be:
C:\Program Files\ATCO\ADAS-500 Reporting System\Demo1
Each exercise depends on successful completion of the previous exercise. The best way to work through this tutorial is to start
with the first exercise Building a Report File and work successively through each.
If the Demo1 folder cannot be found on your system, you may reinstall the software.
Exercise Summary
The following exercises are covered in this tutorial.
Building a Report File
This exercise steps you through the process of building a report file. This includes importing ADAS-500 data and
entering equipment information.
Reviewing Data
This exercise steps you through the process of reviewing data. This includes editing, deleting and adding data points.
Printing Reports
This exercise steps you through the process of printing reports. This includes printing reports for all scans, or individual
reports for selected scans.
ADAS-500 Reporting System User’s Manual
Section 8 Tutorial
Copyright © 2003-2007 ATCO. All Rights Reserved. Page 53 Revision 1.7
Instruction numbers on the Left correspond to
picture numbers on the right
Instruction
Column
Screen Pictures
Column
1
Page Layout
The pages are printed in
landscape format with
instructions in the left column
and software screens in the
right column.
The number of the instruction
in the left column,
corresponds to the screen
picture in the right column.
Conventions Used in the
Tutorial
Text Fonts
Action Text that requires you to perform a task
Explanation text explaining a feature or task
Symbols
Information or an explanation of a feature
Indicates a warning or important item
Signifies the end of a instructional exercise
Indicates the instruction number on the left column of the page
Building Report Files
Tutorial
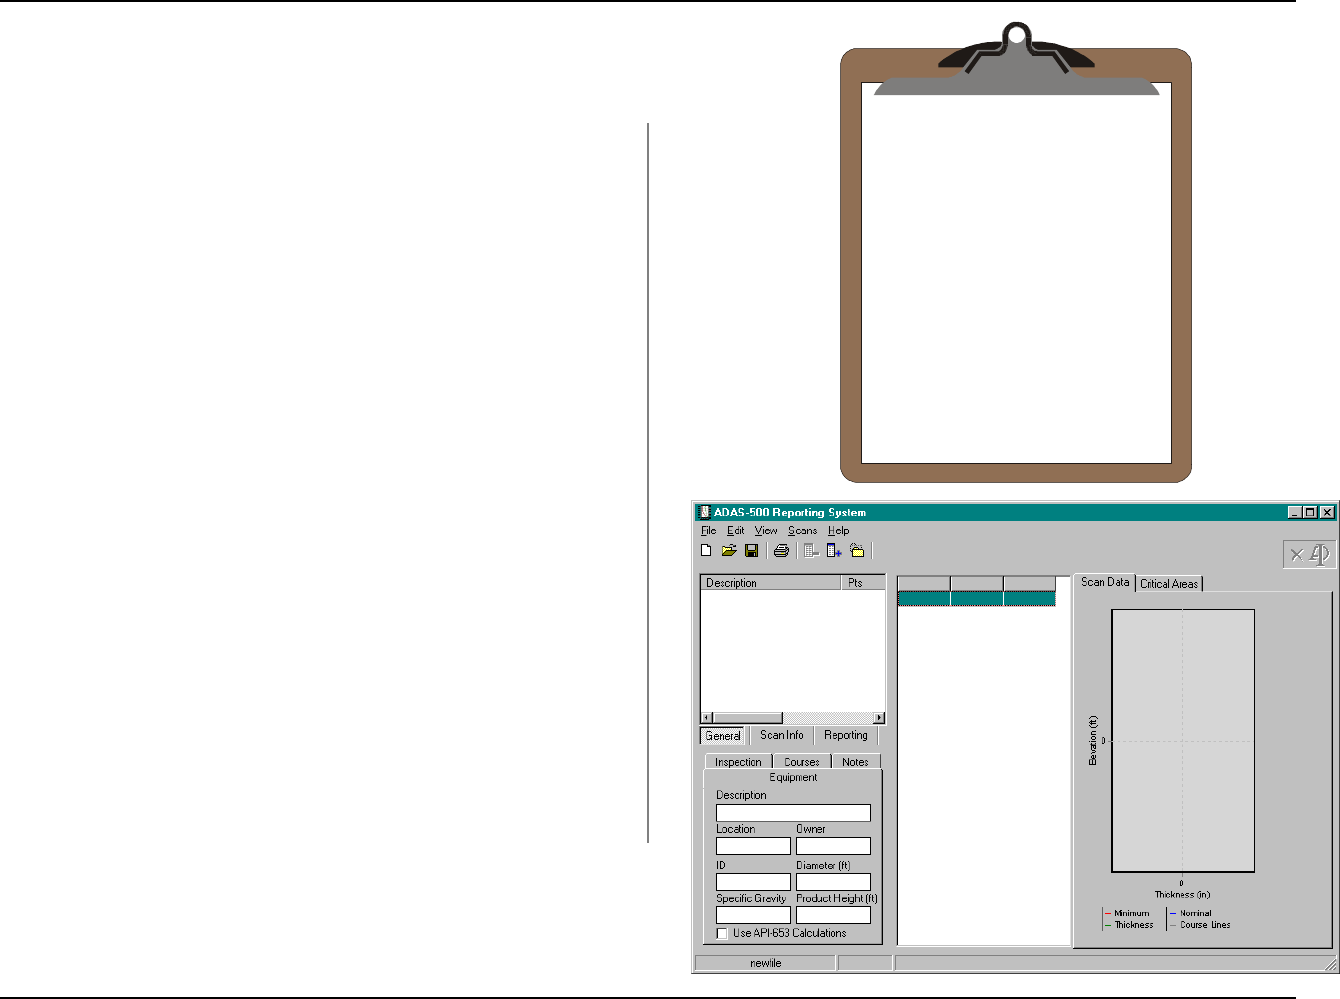
ADAS-500 Reporting System Tutorial
Building a Report File
Copyright © 2003-2007 ATCO. All Rights Reserved. Page 55 Revision 1.7
Equipment:
Location:
ID:
Owner:
Example Tank 1
Tank Farm 2
123456789
US Tank Farm
General Info
API-653: Yes
Diameter: 85 feet
Spec Grav: 1.5
Prod Height: 38 feet
Building a Report File
Let’s use a vertical storage tank as an example The general information about the
tank is shown on the clipboard to the right.
To get started, run the ADAS-500 Reporting Utility as outlined in Running the
ADAS-500 Report Utility. If the system is already running, let’s start with an
empty file. To do this, select File | New from the main menu.
The steps required are:
Step 1 - Enter General Equipment Information
Step 2 - Enter Course Information
Step 3 - Open TK Files from the ADAS-500
Step 1 - Enter General Equipment Information
Let’s enter information about the storage tank we are inspecting.
Click the Equipment tab.
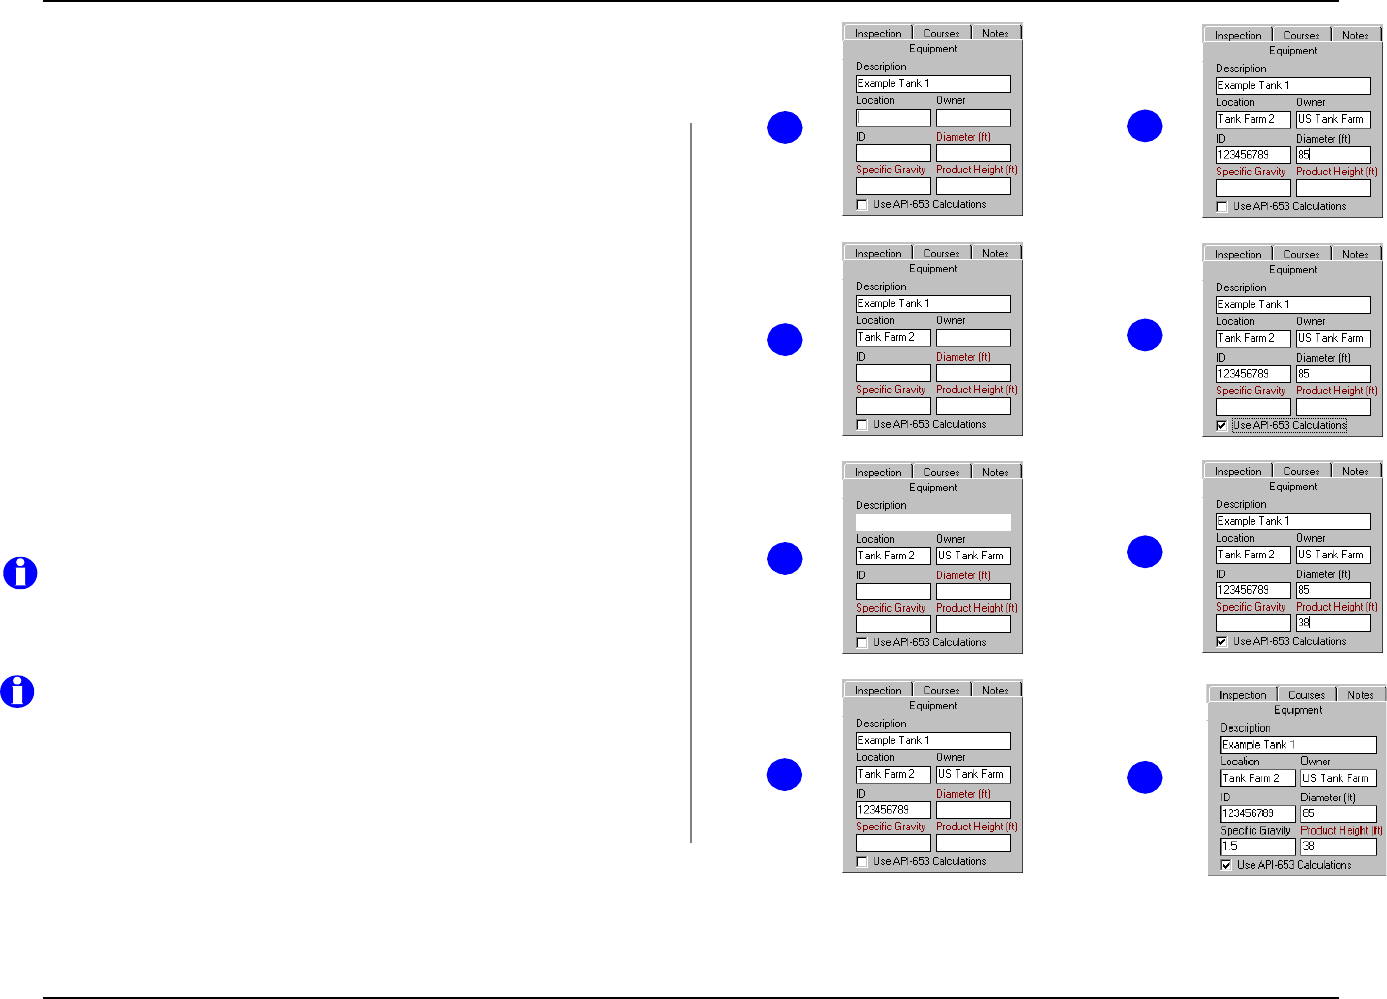
ADAS-500 Reporting System Tutorial
Building a Report File
Copyright © 2003-2007 ATCO. All Rights Reserved. Page 56 Revision 1.7
15
6
2
37
8
4
Click in the Description Edit Box
1. Type Example Tank 1 and press the Tab key to move to the Location
edit box.
2. Type Tank Farm 2 and press the Tab key to move to the Owner edit box.
3. Type US Tank Farm and press the Tab key to move to the ID edit box.
4. Type 123456789 and press the Tab key to move to the Diameter edit
box.
5. Type 85 and press the Tab key to move to the Use API-653
Calculations check box.
Note that Specific Gravity and Product Height are disabled since they are only used when
API-653 Calculations are enabled.
6. Either press the space bar or click the check box to enable the API-653
Calculations.
7. Hold down Shift and press the Tab key to move back up to the Product
Height edit box
Note that holding shift down and pressing tab moves backwards through the fields
8. Type 38 and hold down Shift and press the Tab key to move back to the
Specific Gravity edit box and type 1.5
Note that the Product Height label appears in Red. This occurs because we have not yet
entered the course information to specify the height of the tank.
Save the File
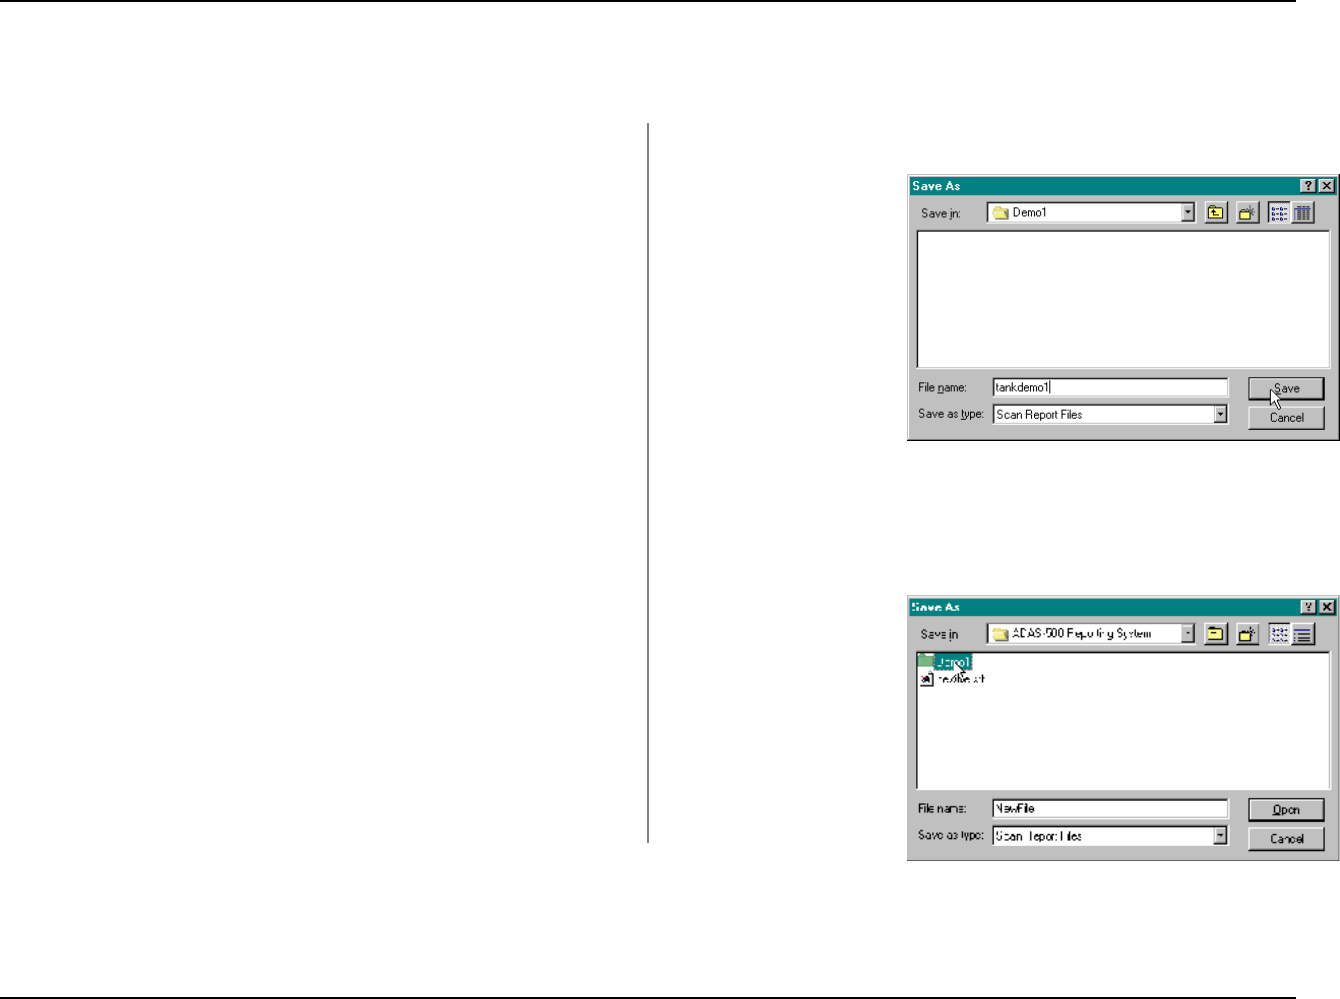
ADAS-500 Reporting System Tutorial
Building a Report File
Copyright © 2003-2007 ATCO. All Rights Reserved. Page 57 Revision 1.7
Let’s save the information we entered. Select File | Save from the main menu.
The Save As dialog will appear (right).
We will save the file to the Demo1 folder that was created during the installation.
You can save it to any location desired. For the purposes of this example, we
will save it to Demo1.
Double click the Demo1 folder.
Enter tankdemo1 in the Filename edit box
Click Save
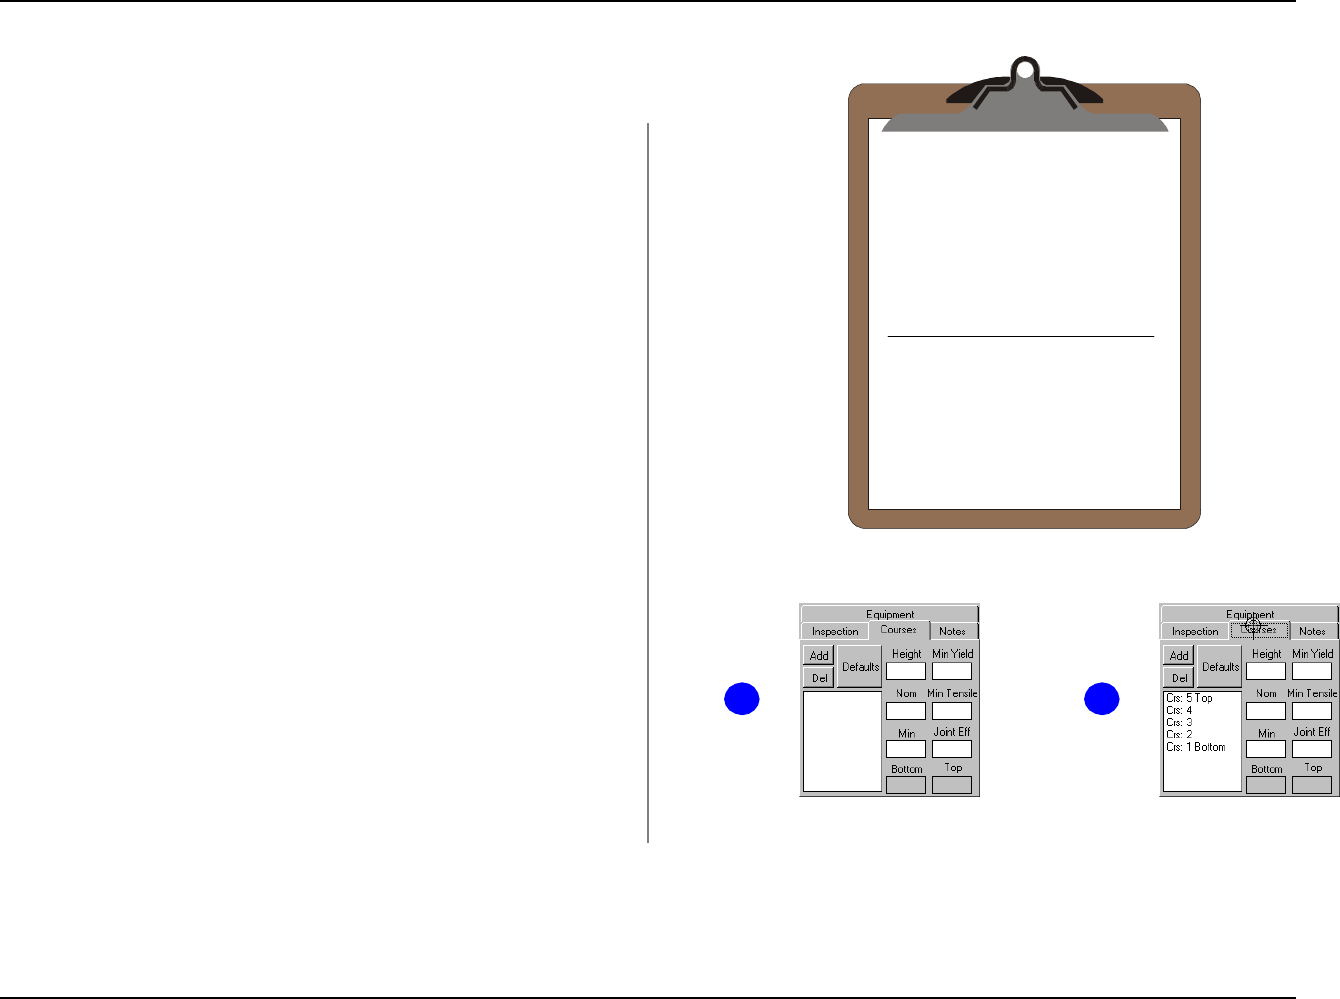
ADAS-500 Reporting System Tutorial
Building a Report File
Copyright © 2003-2007 ATCO. All Rights Reserved. Page 58 Revision 1.7
21
Course Info
Course Height Nom
1
2
3
4
5
96"
96"
96"
96"
96"
0.750
0.500
0.375
0.250
0.250
Use API-653 "Unknown" values for
Min Tensile
Min Yield
Joint Efficiencies
Step 2 - Enter Course Information
The next step is to enter the course information.
The information we need is shown on the clipboard. There are 5 courses. The
height and nominal thicknesses are listed for each. The default values for Min
Tensile, Min Yield and Joint Efficiency are to be used. These values correspond
to the values specified in API-653 when the material is unknown.
1. Click the Courses tab.
2. Click the Add Button 5 times to add 5 courses to the list.
Set the course heights. All courses heights are 96 inches
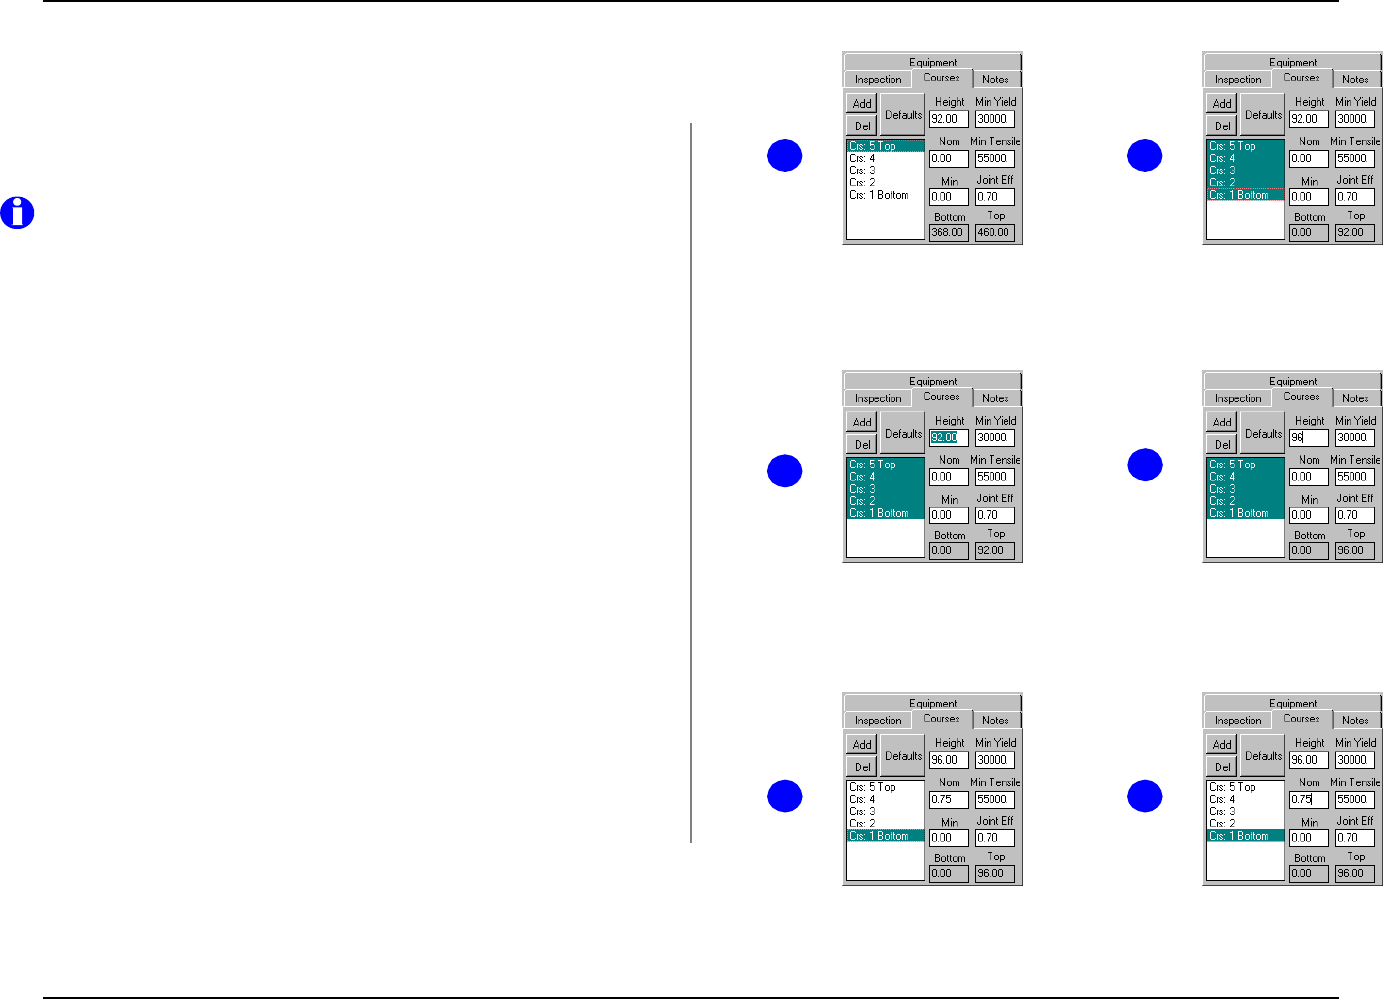
ADAS-500 Reporting System Tutorial
Building a Report File
Copyright © 2003-2007 ATCO. All Rights Reserved. Page 59 Revision 1.7
6
5
43
87
3. Select the top course Crs: 5 Top and hold down the shift key.
4. Click on the bottom course Crs: 1 Bottom
Note that you can select multiple courses to make changes at one time. In this case, all heights
are the same, so you can enter them for all courses.
5. Click in the Height edit box.
6. Type 96 for the course height
Set the nominal values for each course
7. Click on the bottom course Crs: 1 Bottom
8. Double-Click in the Nom edit box and type 0.75
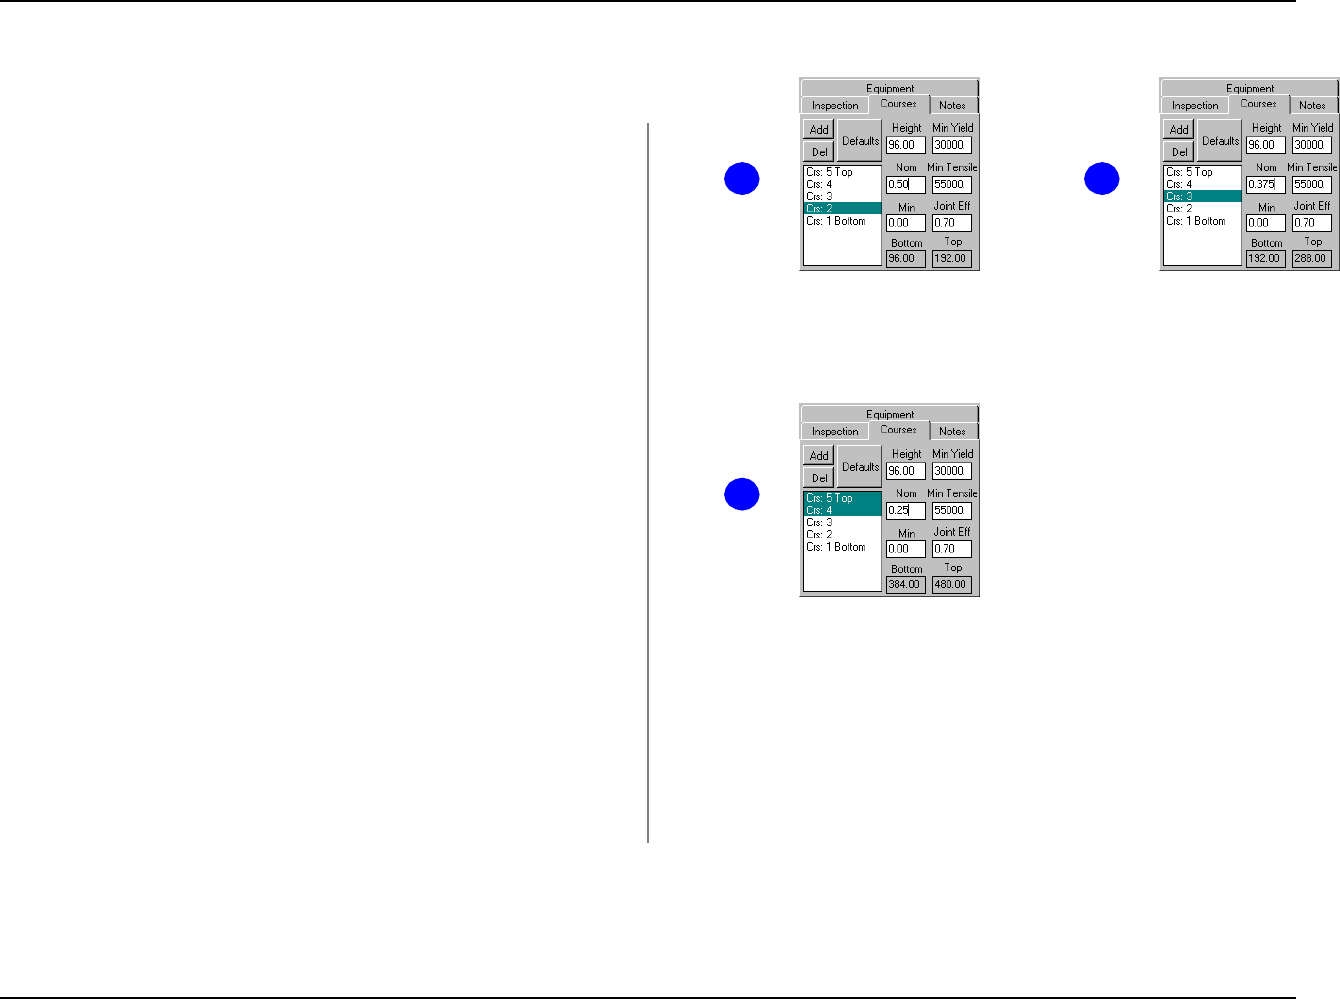
ADAS-500 Reporting System Tutorial
Building a Report File
Copyright © 2003-2007 ATCO. All Rights Reserved. Page 60 Revision 1.7
9 10
11
9. Click on the second course Crs: 2 then Double-Click in the Nom edit box
and type 0.50
10. Click on the third course Crs: 3 then Double-Click in the Nom edit box and
type 0.375
The last two courses (4 and 5) are the same height, so you can select them both
and enter them simultaneously
11. Click on the fourth course Crs: 4. Hold the shift key. Click on the fifth
course Crs: 5 Top Double-Click in the Nom edit box and type 0.25
Entering the course information is complete. Note that when the courses where
created, values for Min Yield, Min Tensile, and Joint Efficiency were given
default values. They are the values specified to use in API-653 when the material
properties are not known.
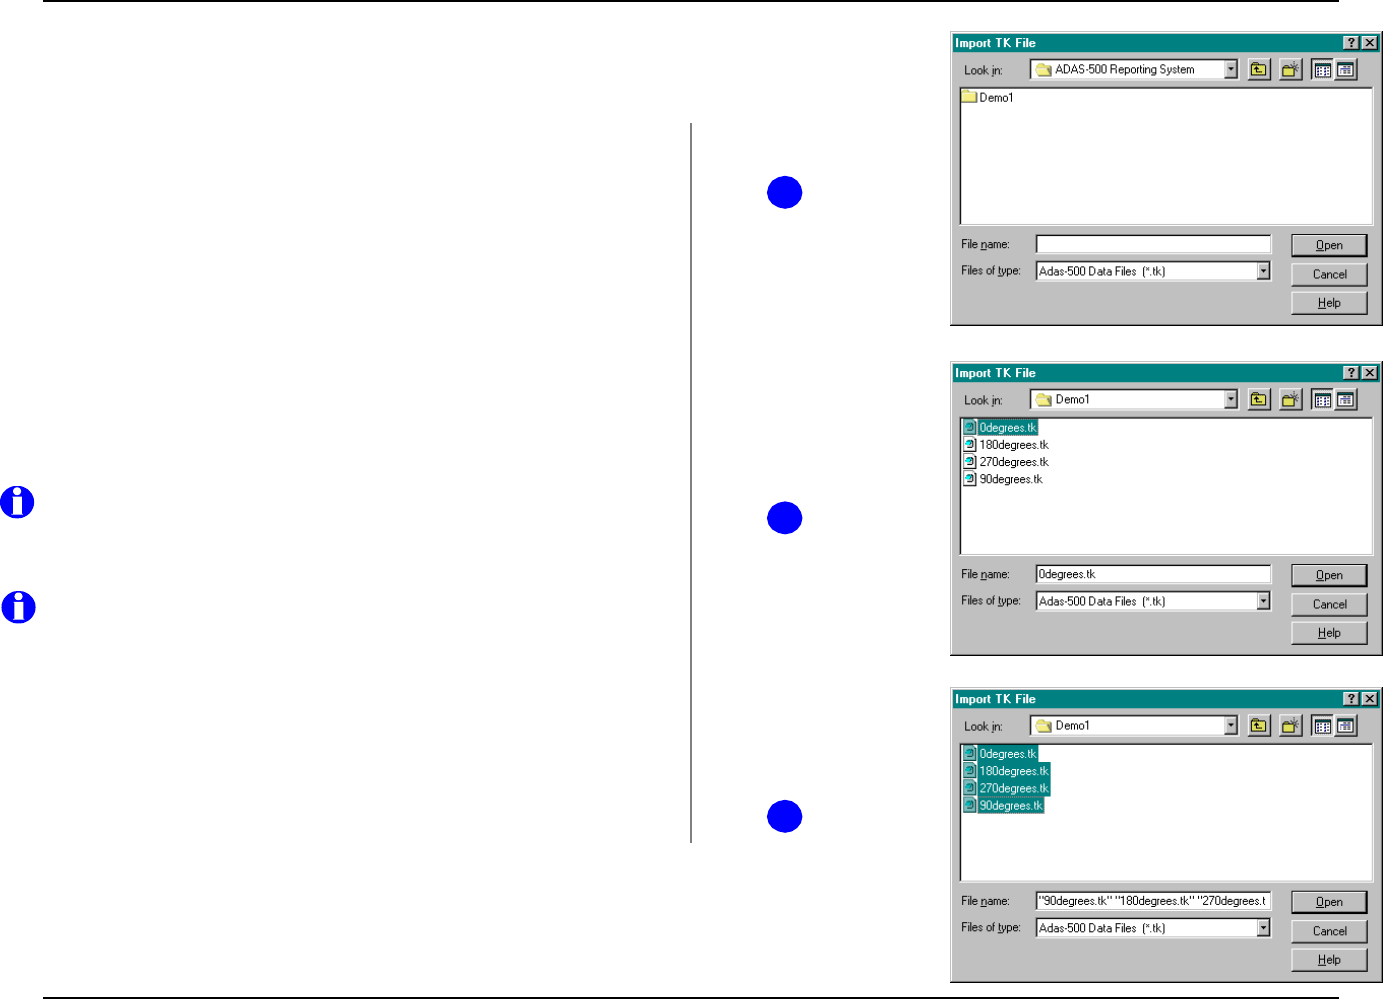
ADAS-500 Reporting System Tutorial
Building a Report File
Copyright © 2003-2007 ATCO. All Rights Reserved. Page 61 Revision 1.7
2
3
4
Open TK Files from the ADAS-500
The next step in building your report file is to retrieve your ADAS-500 data. At
the time the system was installed, sample data files were installed in the Demo1
folder under the installation folder where the ADAS-500 Reporting System was
loaded. The default location is
C:\Program Files\ATCO\ADAS-500 Reporting System
Assuming the files are present on the system, we will import the sample TK files
that were installed with the system.
1. Click File | Import from the main menu.
2. From the Import Dialog, locate the ADAS-500 Reporting System installation
folder
3. Double click the Demo1 folder from the Open Dialog,
The sample TK files should appear. If the TK files shown do not appear as shown, you will
need to re-install the software to continue this session.
4. Select the four TK files as shown.
Note: To select several files in the Import TK File Dialog, click each file while holding the ctrl
key down.
5. Click Open
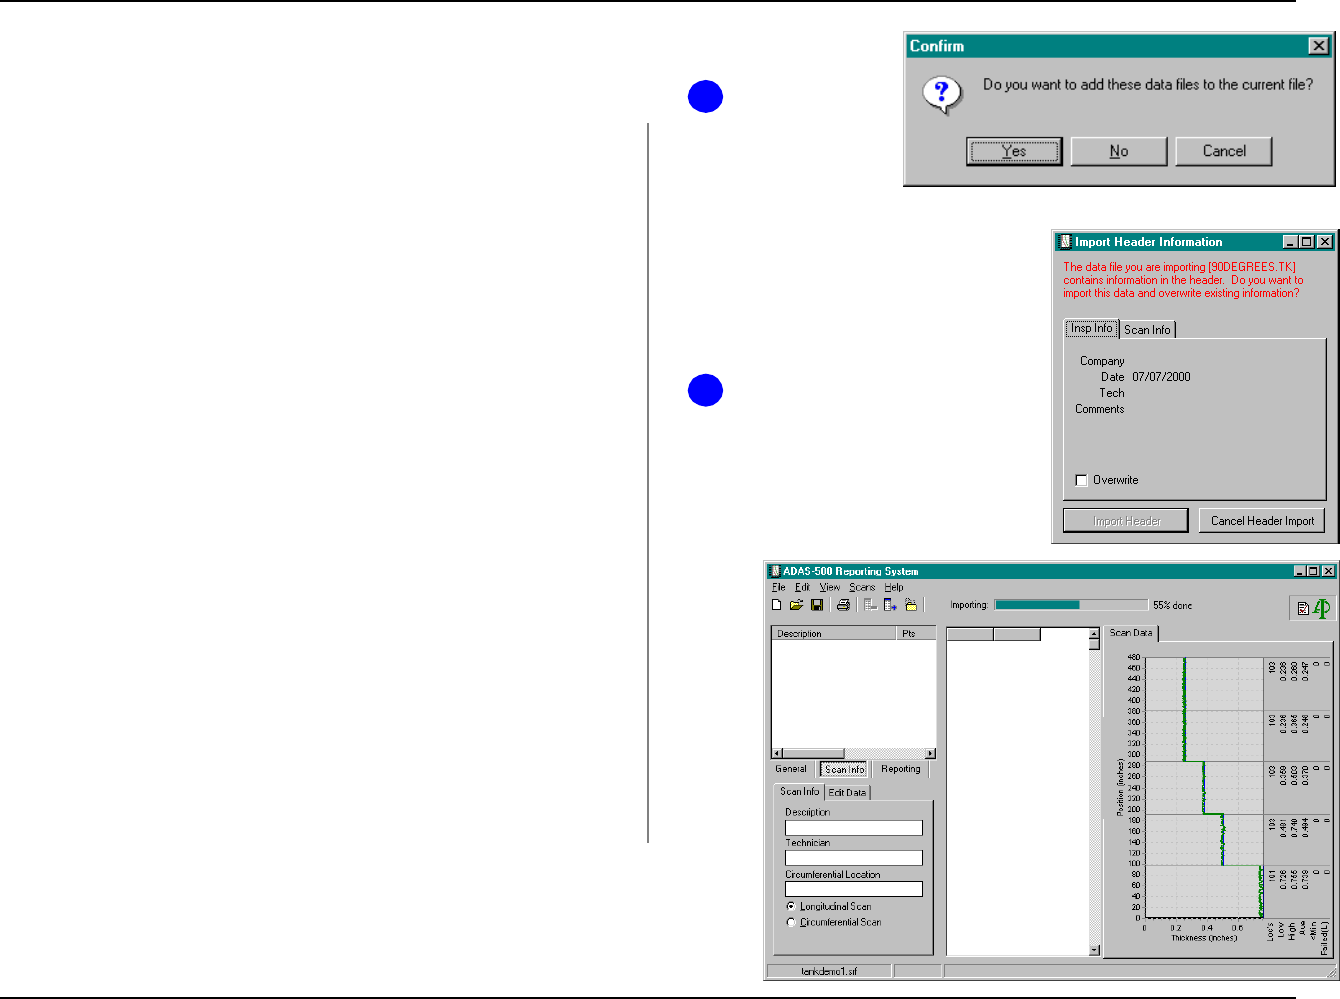
ADAS-500 Reporting System Tutorial
Building a Report File
Copyright © 2003-2007 ATCO. All Rights Reserved. Page 62 Revision 1.7
6
7
You will be asked if you want to add these data files to the current file.
6. Click Yes
7. The Import Header Information dialog will appear for each file imported.
Click Cancel Header Import button for each.
The system will import the files individually.
A scan
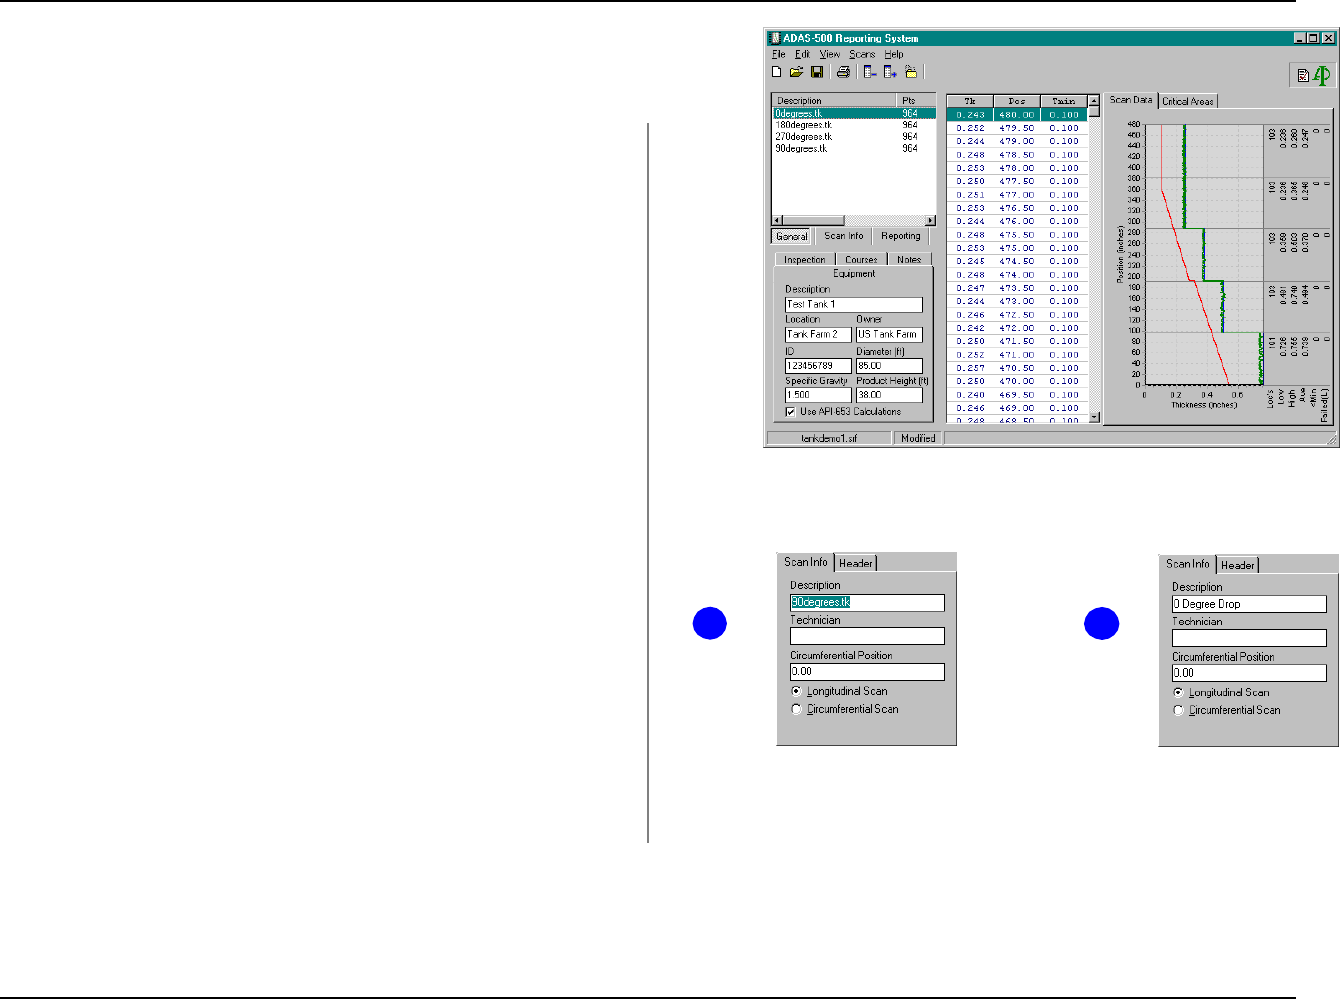
ADAS-500 Reporting System Tutorial
Building a Report File
Copyright © 2003-2007 ATCO. All Rights Reserved. Page 63 Revision 1.7
1
2
will be created for each file. The scans should appear as shown to the right. The
scan description, will be the name of the TK file that it was created from. As you
click on each scan listed in the Scan List, the data points should appear in the
grid and the graph should appear with the API-653 minimum as shown to the
right.
The sample data files are intended to show 4 scans. Each 90 degrees apart
starting at 0 degrees. The samples show a scan at 0, 90, 180 and 270 degrees.
Next, we will edit scan information...
1. Double click on the 0degrees.tk scan.
Note: You can also select the scan in the Scan List and then click the Scan Info data group
tab, then the Scan Info data tab.
2. Type 0 Degree Drop for the new scan description and press the Tab key
to move to the Technician edit box
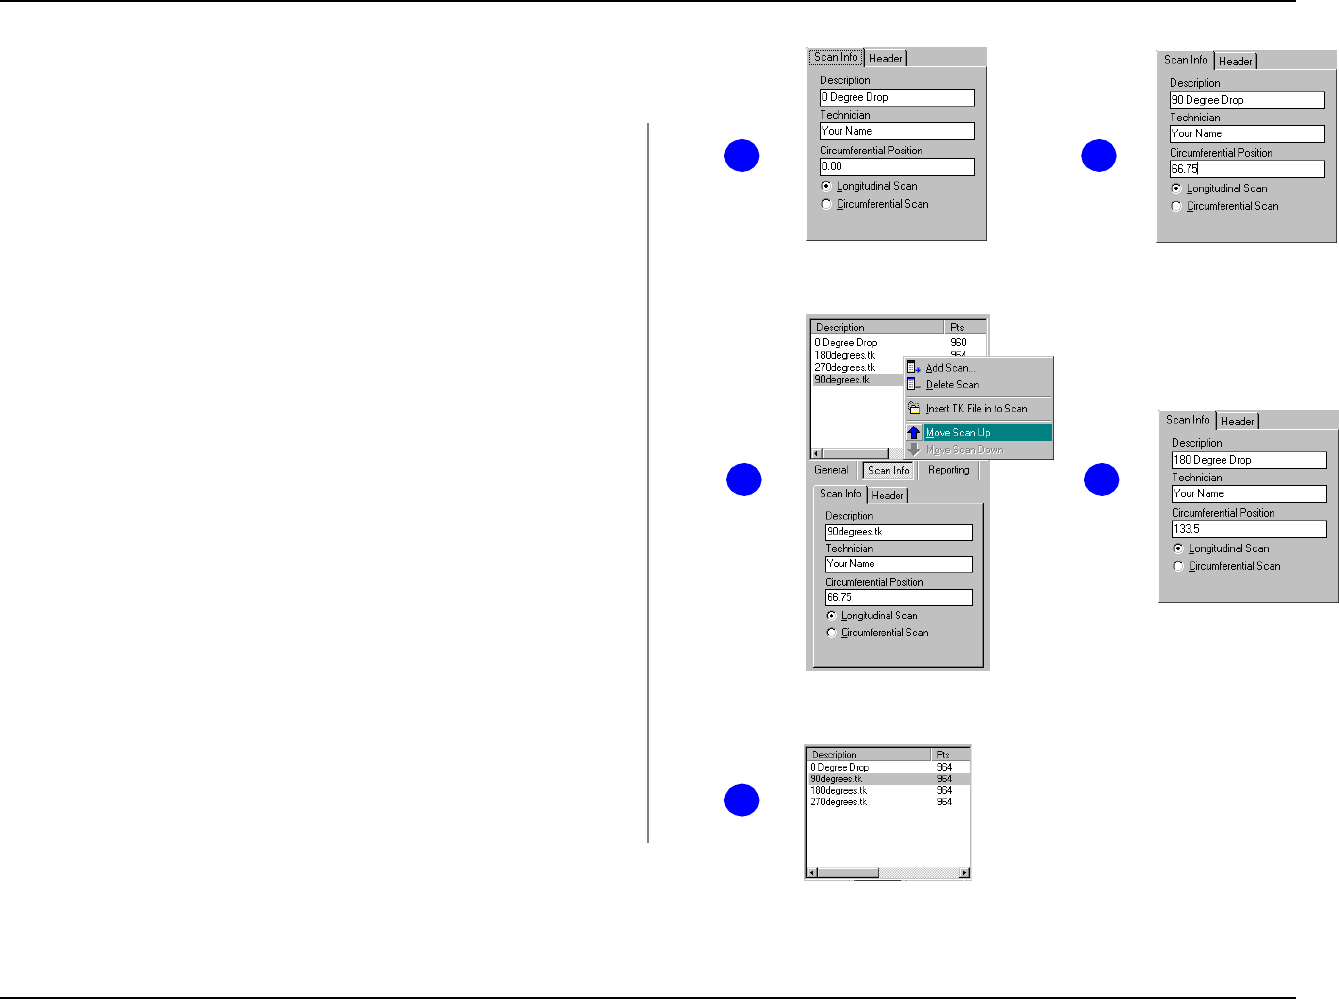
ADAS-500 Reporting System Tutorial
Building a Report File
Copyright © 2003-2007 ATCO. All Rights Reserved. Page 64 Revision 1.7
63
4 7
5
3. Type your name in to the Technician edit box and press the Tab key to
move to the Circumferential Position edit box
Note: The scans we are editing are vertical drops on a vertical storage tank and considered by
the ADAS-500 Reporting System to be Longitudinal scans. For more information on scan types
and coordinates, refer to the sections Creating Report Files, Creating Scans.
The circumferential position for the 0 degree scan is 0. Therefore, we have no
need to edit the value.
The order in which the scans were sorted, placed the 90Degrees.tk at the bottom
of the list. We can change the position of the scan the list will appear in order by
location or degree position. Keep in mind, scan reports are printed in the order
in which the scans appear in the list.
4. Click on the 90degrees.tk scan then, Right Click and click move Scan
Up from the popup menu
5. Repeat step 4 once again until 90degrees.tk is in the correct position
With the scan placed in the correct order, let’s edit the scan information.
6. Double click on the 90degrees.tk scan in the scan list. Type 90 Degree
Drop for the new scan description and press the Tab key to move to the
Technician edit box
Type your name in to the Technician edit box and press the Tab key to
move to the Circumferential Position edit box
Type 66.75 (The circumferential position of the scan in feet)
7. Double click on the 180degrees.tk scan in the scan list. Type 180
Degree Drop for the new scan description and press the Tab key to move
to the Technician edit box
Type your name in to the Technician edit box and press the Tab key to
move to the Circumferential Position edit box
Type 133.5 (The circumferential position of the scan in feet)
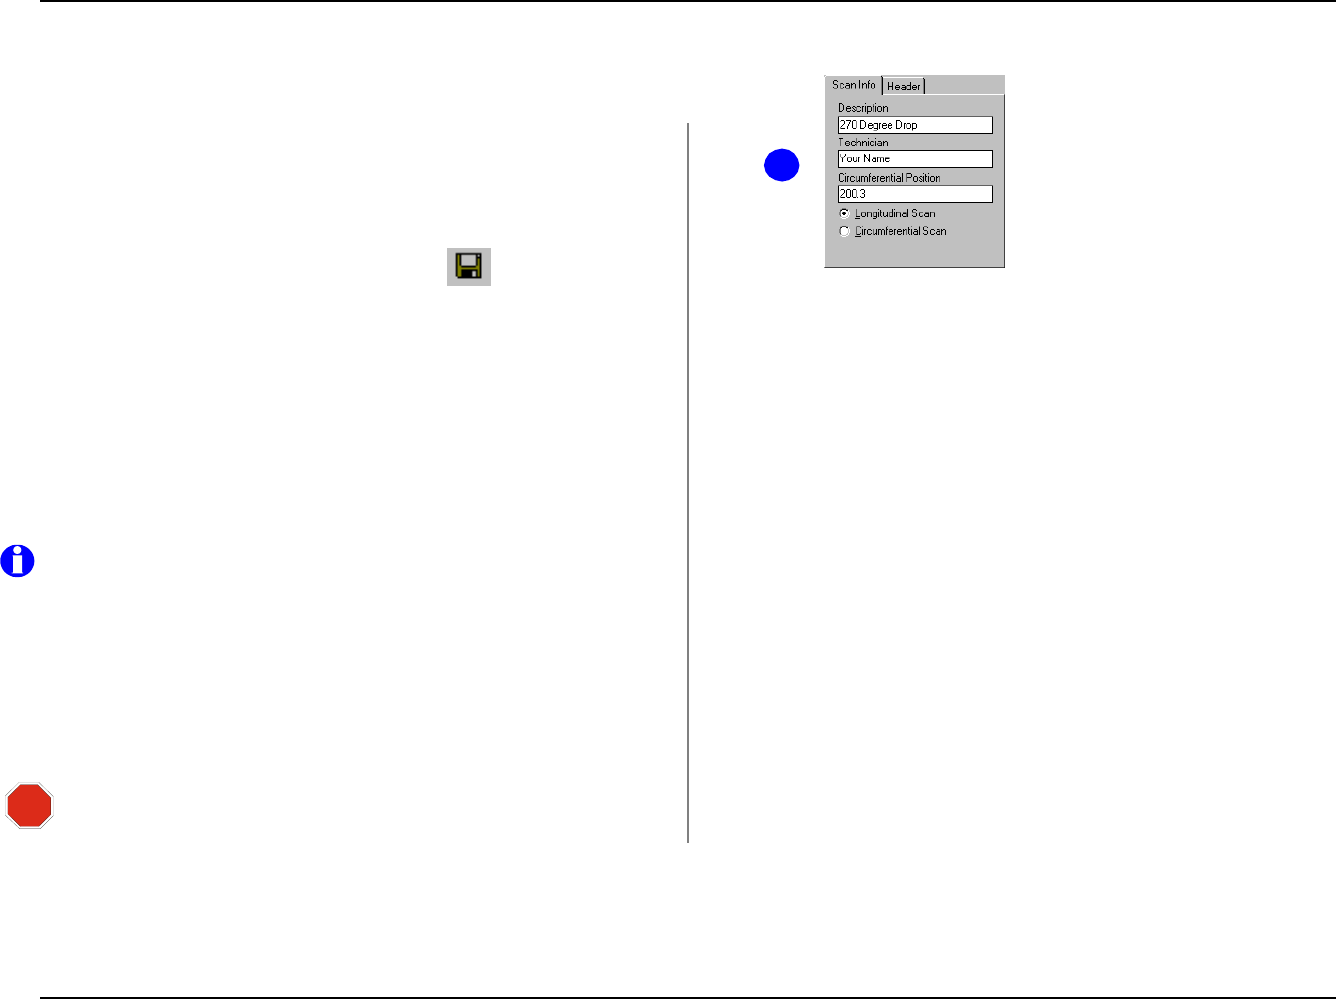
ADAS-500 Reporting System Tutorial
Building a Report File
Copyright © 2003-2007 ATCO. All Rights Reserved. Page 65 Revision 1.7
8
8. Double click on the 270degrees.tk scan in the scan list. Type 270
Degree Drop for the new scan description and press the Tab key to move
to the Technician edit box
Type your name in to the Technician edit box and press the Tab key to
move to the Circumferential Position edit box
Type 200.3 (The circumferential position of the scan in feet)
Click File | Save from the main menu or click the icon from the
menu bar.
Note: The Circumferential Position values are in feet and indicates the
position around the circumference of the tank from the datum point. The
units can be either inches or feet for vertical (longitudinal) scans.
Horizontal scans require that the position be entered in inches only. The
API-653 calculations performed by this system for horizontal
(circumferential) scans are expecting inches.
Reviewing Data
Tutorial
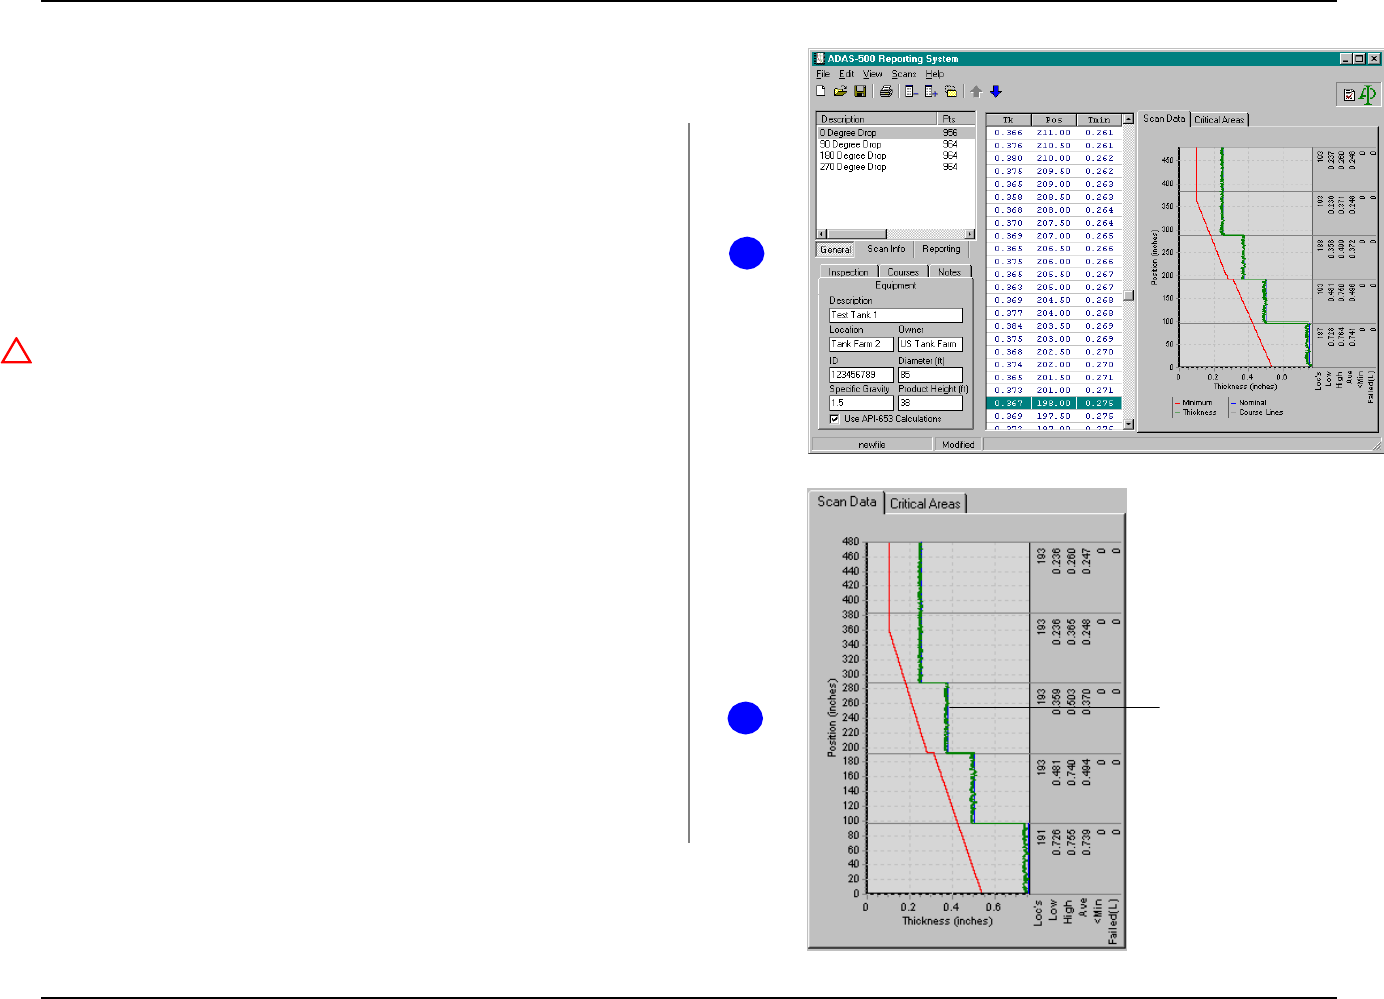
ADAS-500 Reporting System Tutorial
Reviewing Data
Copyright © 2003-2007 ATCO. All Rights Reserved. Page 67 Revision 1.7
1
Uniform
Data
2
Reviewing Data
This section assumes that you have completed the previous sections where data
was loaded from the samples located in the Demo1 folder. If you have not
completed these sections, the please proceed to the section Building a Report
File. Once you have completed the section, return here.
Prior to printing reports, the data should be reviewed. There are occasions where
erroneous readings can be saved so review your data carefully. This session will
step you through the process of reviewing the data and removing any data points
that may be suspect.
The data generated for this tutorial is tightly grouped and anomalies are
exaggerated for simplicity. The focus of this tutorial is to convey the
methods used in the ADAS-500 Reporting System to modify data and not
to analyze it.
This section covers basic data review and modification, and does not set
guidelines for data acquisition and analysis. Experience and knowledge
are essential tools in collection and analysis of data.
1. Load the data file “tankdemo1.srf” created in the previous section
Building a Report File Click on 0 Degree Drop.
The file should appear with the scans as shown to the right.
2. You can instantly find anomalies in the data visually by reviewing the scan
graph. Let’s look at the 0 Degree Drop. The data is tightly grouped in the
0 Degree Drop and does not show any anomalies.
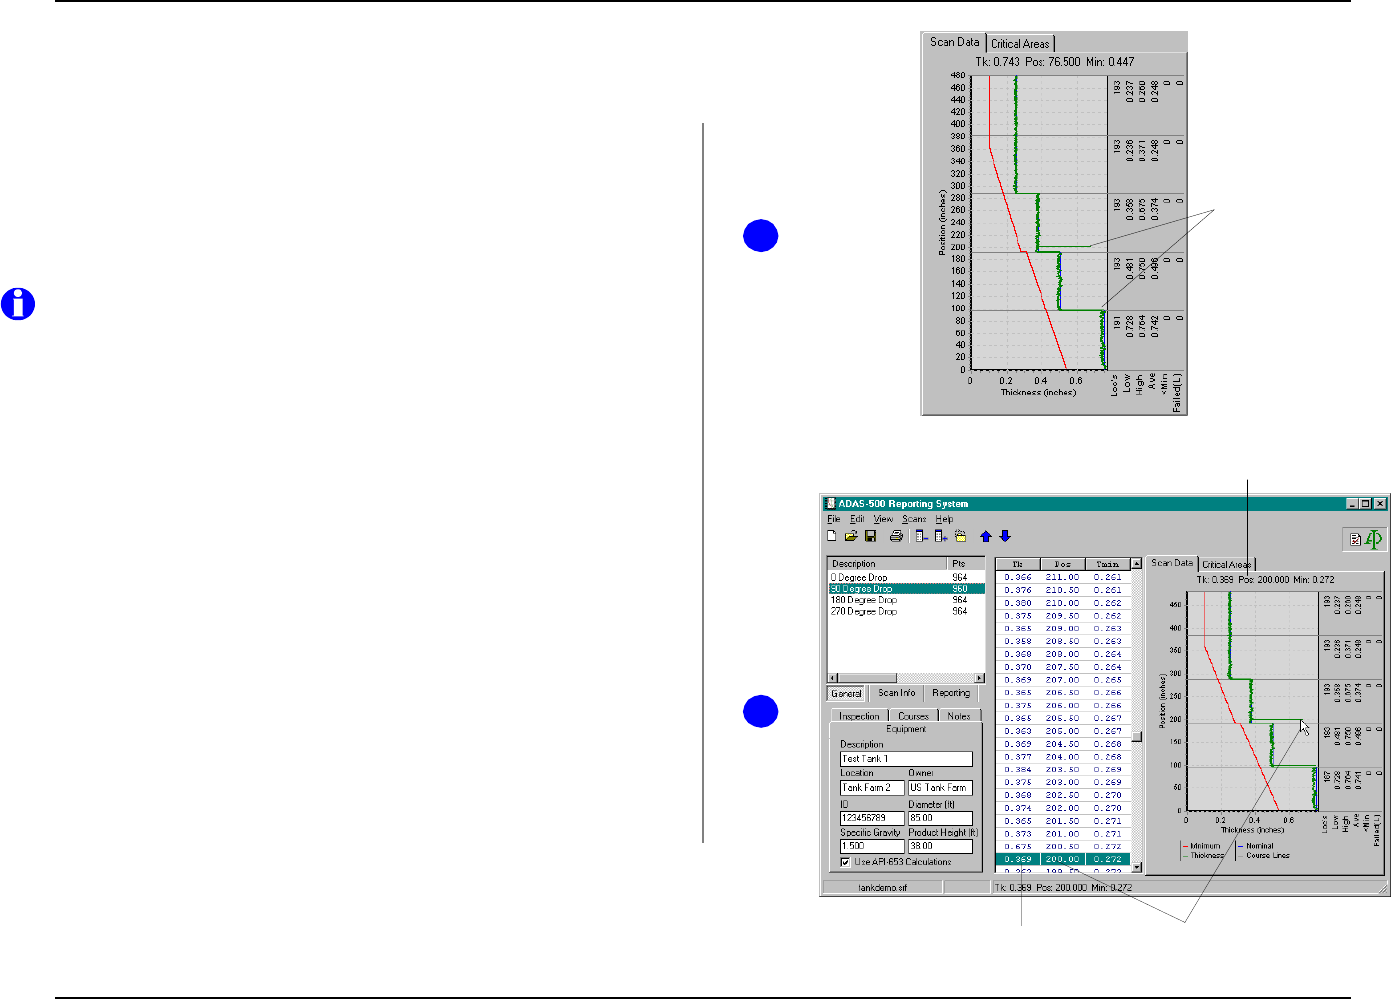
ADAS-500 Reporting System Tutorial
Reviewing Data
Copyright © 2003-2007 ATCO. All Rights Reserved. Page 68 Revision 1.7
Anomolies
3
4
Hover over a data point with the moust to
view the Tk, Position and Minimum value
Click on a data point to select it in
the Data Point Grid
Double Click on a data
point on the graph to edit
data points
3. Click the scan 90 Degree Drop.
The graph shows two anomalies which seem to be out of range of the data
points surrounding them. You can view the value by hovering over it with
your mouse.
4. Position your mouse over the anomaly to view the thickness value.
When the data point information appears above the graph, click with the left mouse button.
The data points grid will move to the data point. If you double click a data point on the graph,
the editor will be invoked allowing you to change the value if needed..
Editing will be covered later in this section. The anomalies found in the scan will
be removed.
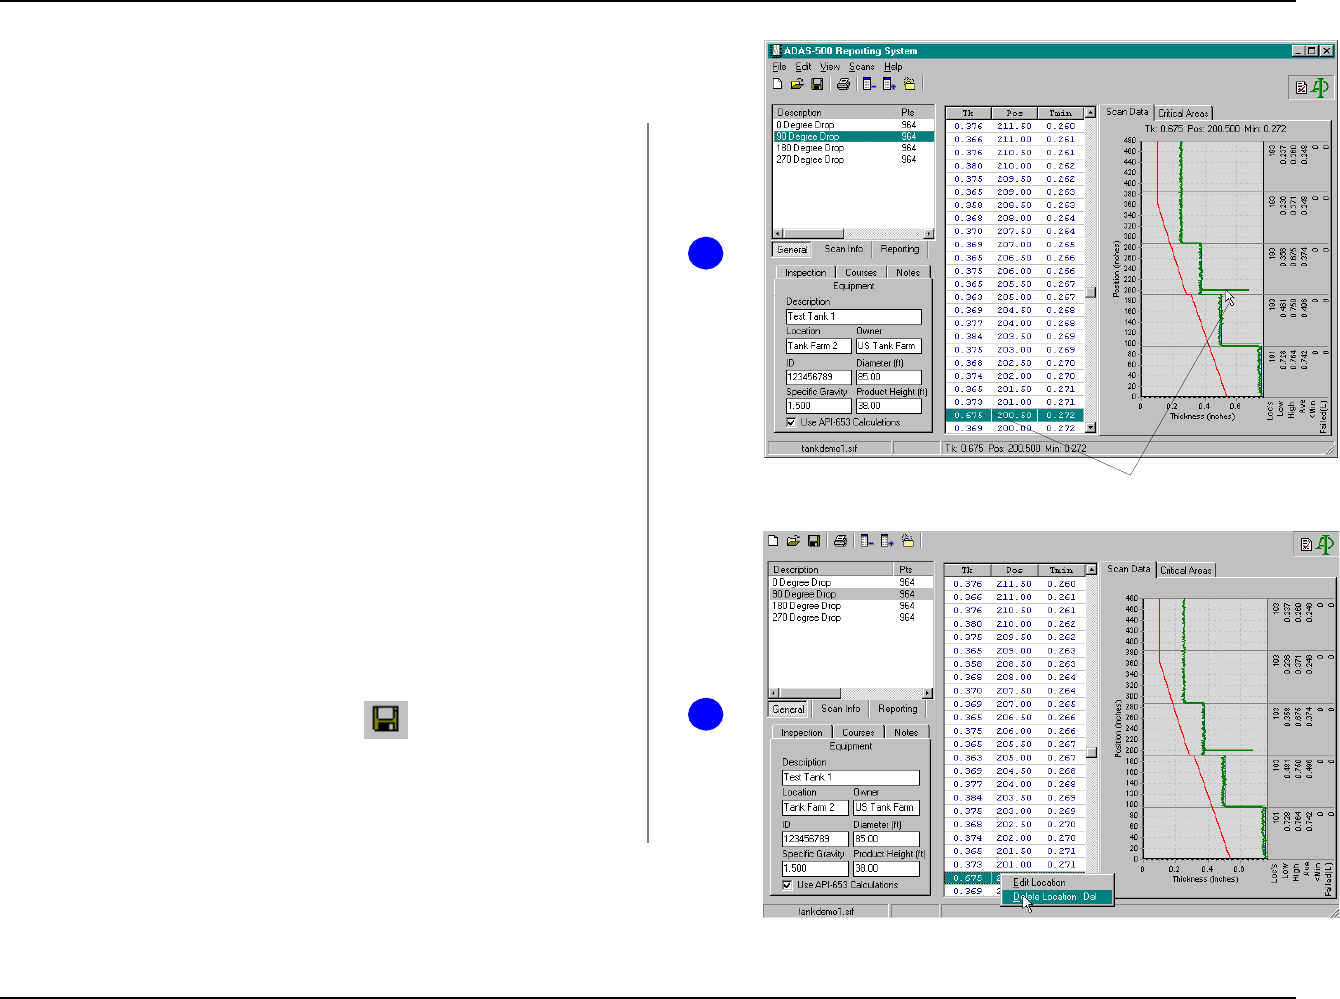
ADAS-500 Reporting System Tutorial
Reviewing Data
Copyright © 2003-2007 ATCO. All Rights Reserved. Page 69 Revision 1.7
Click on a data point to select it in
the Data Point Grid
1
2
Removing a Data Point
When a data point value is found to be invalid, you can remove it. You must first
find it in the data point grid.
1. Hover over the data point with your mouse. When the thickness value
appears above the graph, click on the point.
Click on the data point at 200.5 inches to select it in the data point grid.
The data point will be highlighted in the data point grid.
2. Right click on the data point in the grid and select Delete from the menu.
You will be asked to confirm the deletion.
Click Yes to delete the data point.
Repeat this step for the second anomaly in the scan at 100.0 inches.
Save the File
Click File | Save from the main menu or click the icon from the menu
bar.
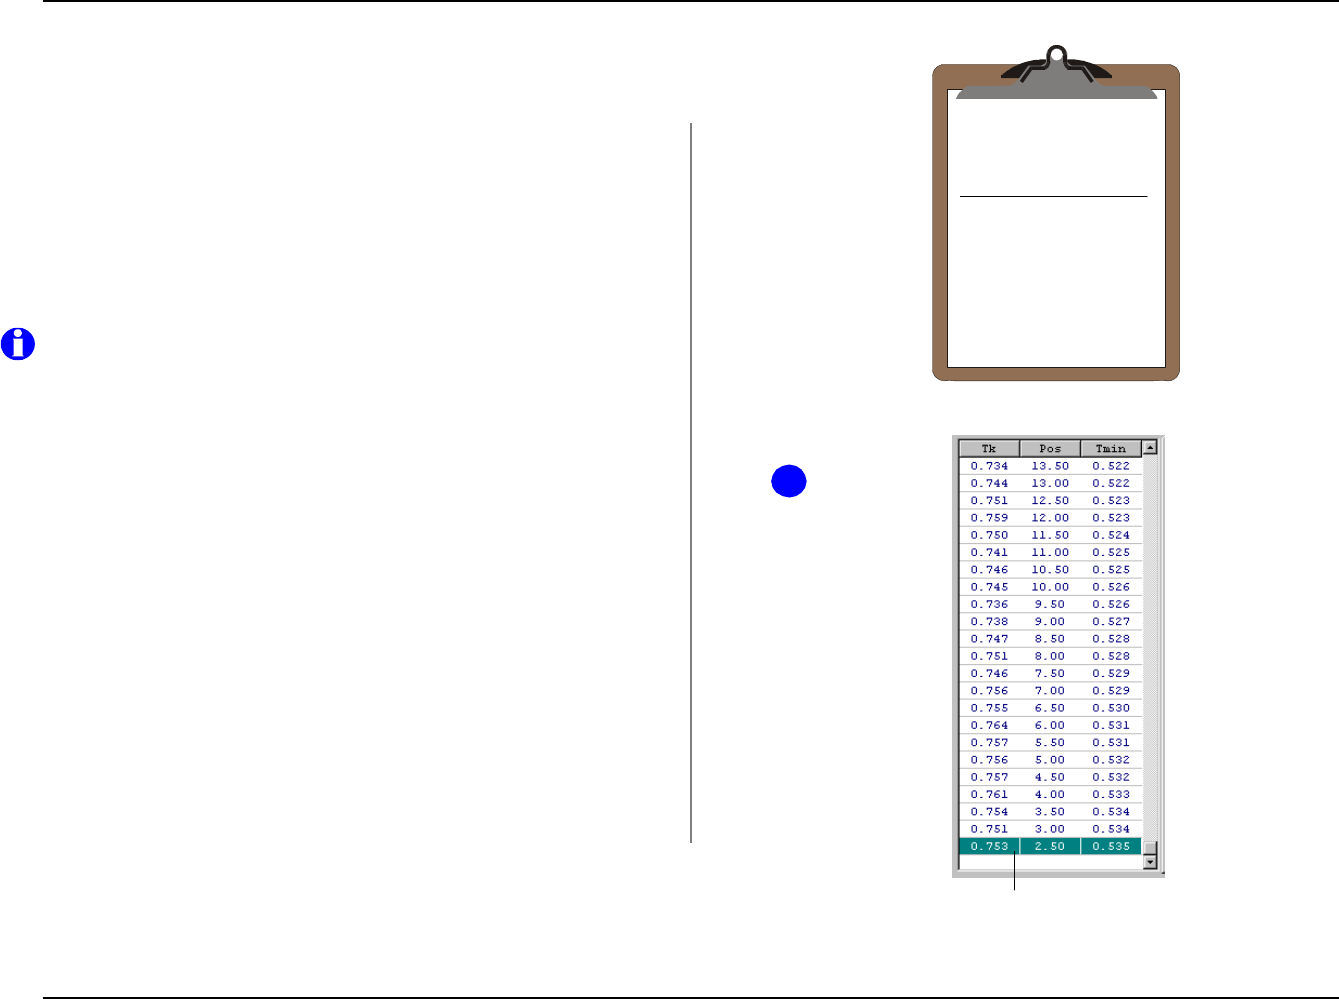
ADAS-500 Reporting System Tutorial
Reviewing Data
Copyright © 2003-2007 ATCO. All Rights Reserved. Page 70 Revision 1.7
Data Points
90 Degree Drop
Data
Point
Position Value
1
2
3
4
0.50"
1.00"
1.50"
2.00"
0.755
0.748
0.753
0.758
1
First Data Point
Adding Data Points
There are instances where you may need to enter thickness data manually. For
this exercise, we will assume that the bottom 2 inches of the scan were scanned
manually. The thickness points are shown on the clipboard to the right.
1. Click the 90 Degree Drop scan
Scroll the data grid to the bottom.
Note that the bottom 2 inches of data points have not been entered. The
first data point is 0.753 at 2.50" elevation. We will need to enter the bottom
2 inches manually.
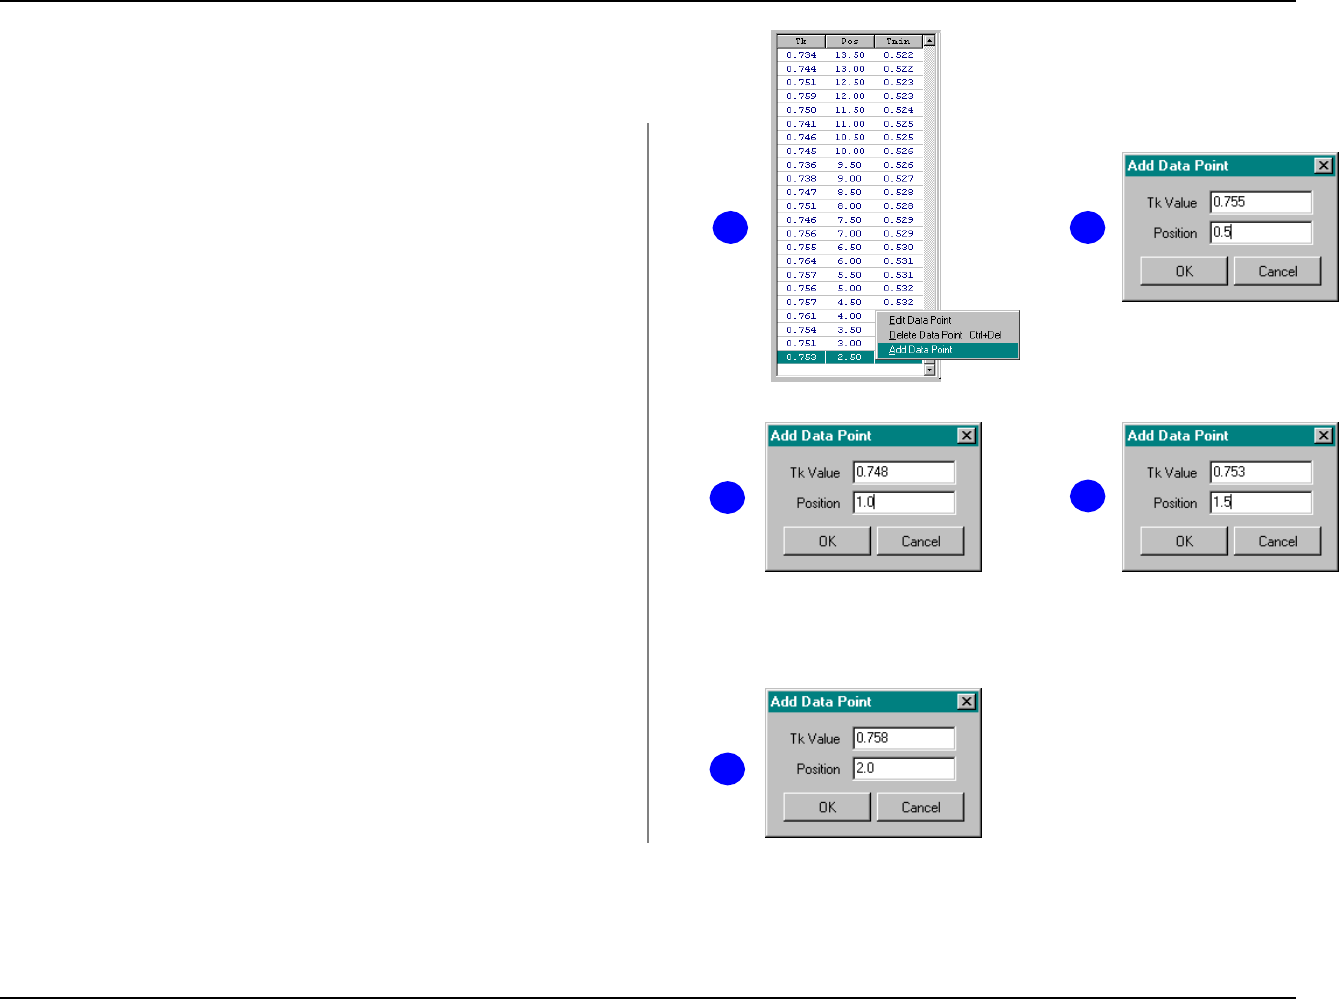
ADAS-500 Reporting System Tutorial
Reviewing Data
Copyright © 2003-2007 ATCO. All Rights Reserved. Page 71 Revision 1.7
32
5
4
6
2. Right Click the in Data Grid
Select the Add Data Point menu option
The Add Data Point dialog will appear.
3. Type 0.755 and press <tab> Thickness Value
Type 0.5 and press <enter> Position
Right Click the in Data Grid again and
select the Add Data Point menu option (Repeat Step 2)
4. Type 0.748 and press <tab> Thickness Value
Type 1.0 and press <enter> Position
Right Click the in Data Grid again and
select the Add Data Point menu option (Repeat Step 2)
5. Type 0.753 and press <tab> Thickness Value
Type 1.5 and press <enter> Position
Right Click the in Data Grid again and
select the Add Data Point menu option (Repeat Step 2)
6. Type 0.758 and press <tab> Thickness Value
Type 2.0 and press <enter> Position
ADAS-500 Reporting System Tutorial
Reviewing Data
Copyright © 2003-2007 ATCO. All Rights Reserved. Page 72 Revision 1.7
Save the File
Click File | Save from the main menu or click the icon from the menu bar.
Printing Reports
Tutorial
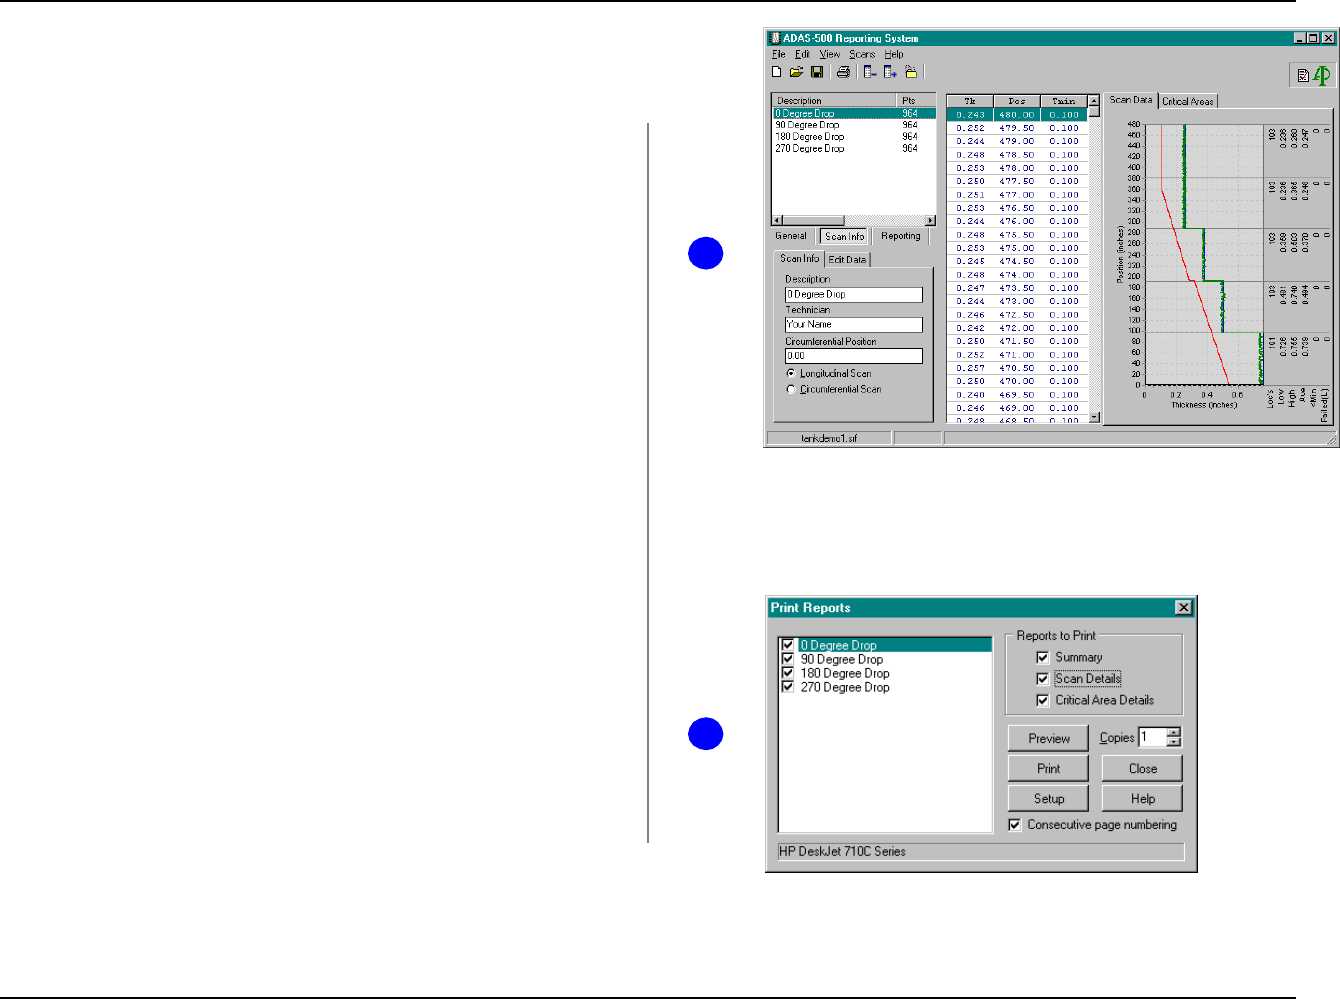
ADAS-500 Reporting System Tutorial
Printing Reports
Copyright © 2003-2007 ATCO. All Rights Reserved. Page 74 Revision 1.7
1
2
Printing Reports
This section of the tutorial will step you through the process of printing reports. Prior to doing the
exercises in this section, you should browse through Section 6 of the manual Printing Reports.
This section assumes that you have completed the previous sections where data was loaded from the
samples located in the Demo1 folder. If you have not completed these sections, the please proceed to
the sections Building a Report File and Reviewing Data Once you have completed these sections,
return here.
The ADAS-500 Reporting System allows you to print reports either individually, or all at once. When
you are printing an entire report for a series of scans, you can do it with a single button click. You
can also print individual reports as required. Browse through Section 6 of the manual Printing
Reports if you are not familiar with the reports generated by the system.
1. Load the data file “tankdemo1.srf” created in the previous section
Building a Report File Click on 0 Degree Drop.
The file should appear with the scans as shown to the right.
Printing All Reports
First we will print all reports at one time.
2. Select File | Print from the main menu. The Print Reports Dialog will
appear.
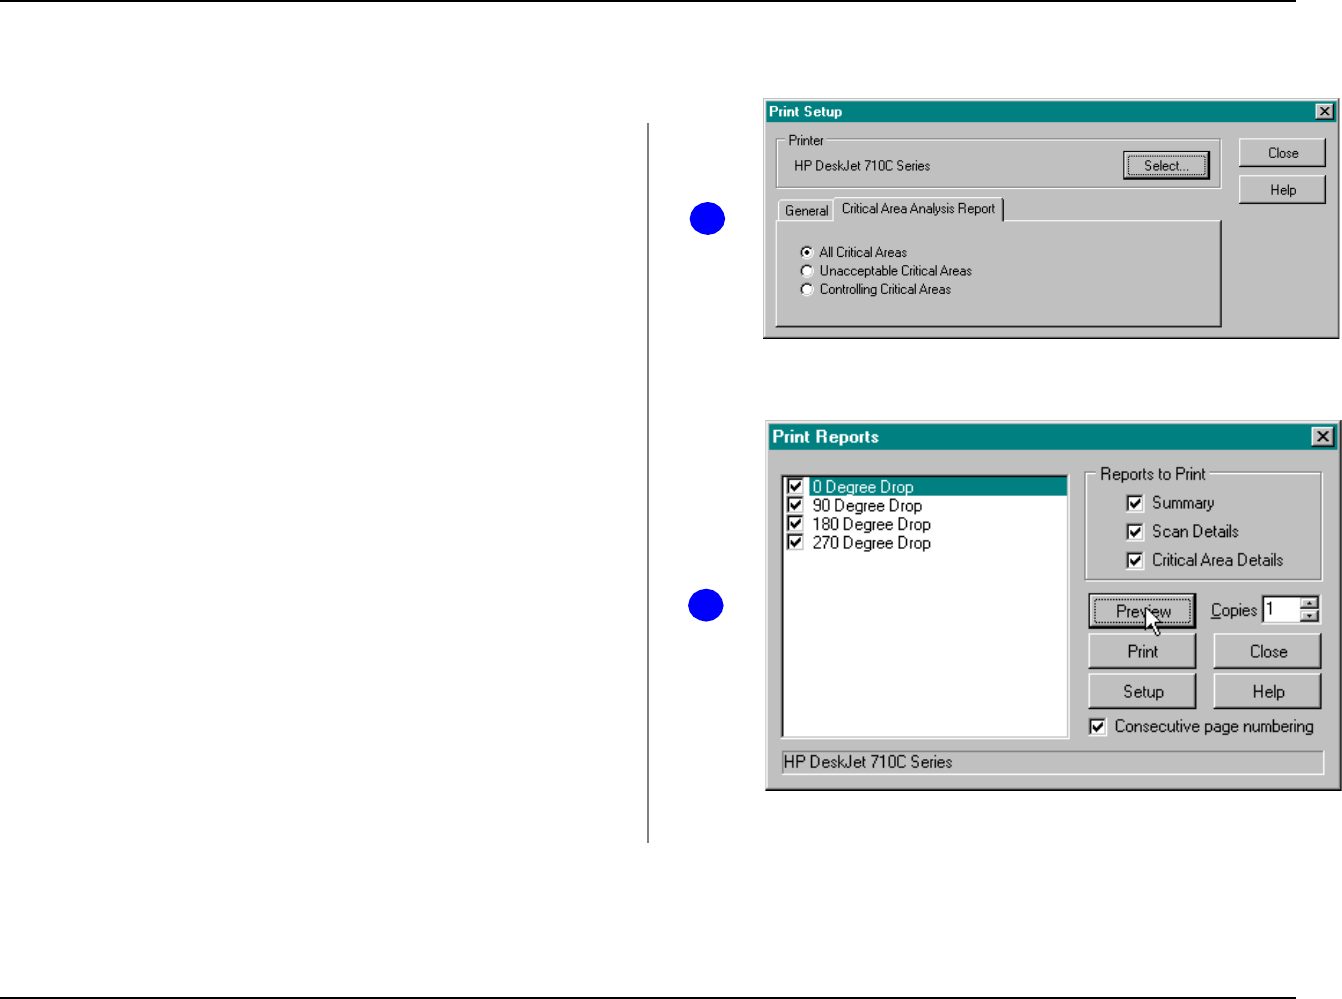
ADAS-500 Reporting System Tutorial
Printing Reports
Copyright © 2003-2007 ATCO. All Rights Reserved. Page 75 Revision 1.7
3
4
If Summary, Scan Details and Critical Area Details are NOT checked, check them now. Be
sure they are all checked as shown in item #2 in the right column above.
By default, all scans will be selected as shown in item #2 above.
3. Click the Setup button. The Print Setup Dialog will appear.
Click the Critical Area Analysis Report tab.
Select All Critical Areas as shown to the right.
Click the Close button.
4. With all scans and reports selected, click the Preview button.
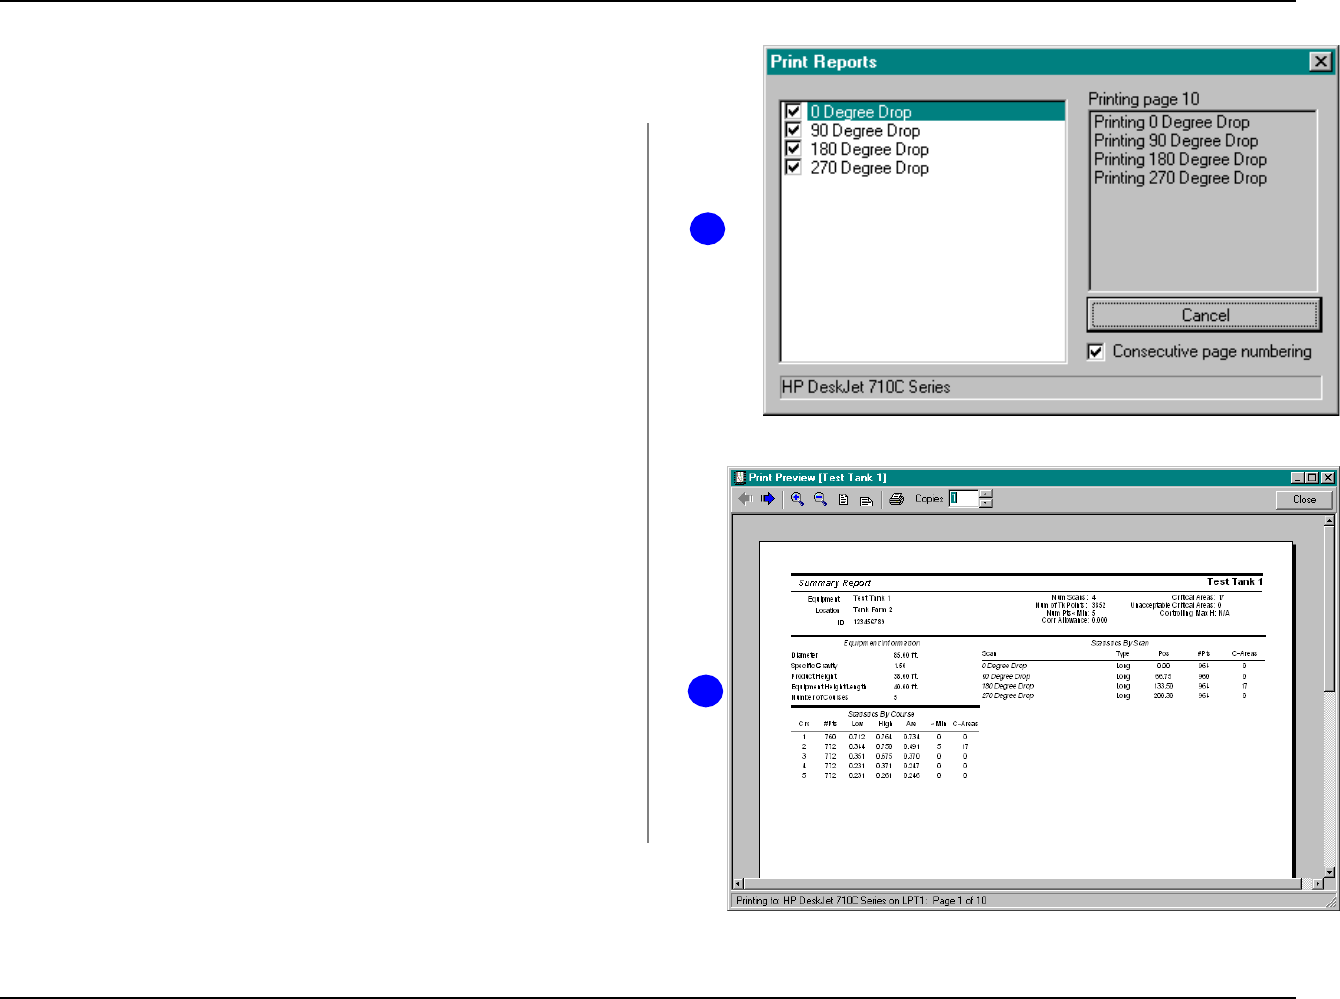
ADAS-500 Reporting System Tutorial
Printing Reports
Copyright © 2003-2007 ATCO. All Rights Reserved. Page 76 Revision 1.7
5
6
5. The system should generate 10 pages.
6. The preview screen will appear with the Summary Report displayed as the
first page.
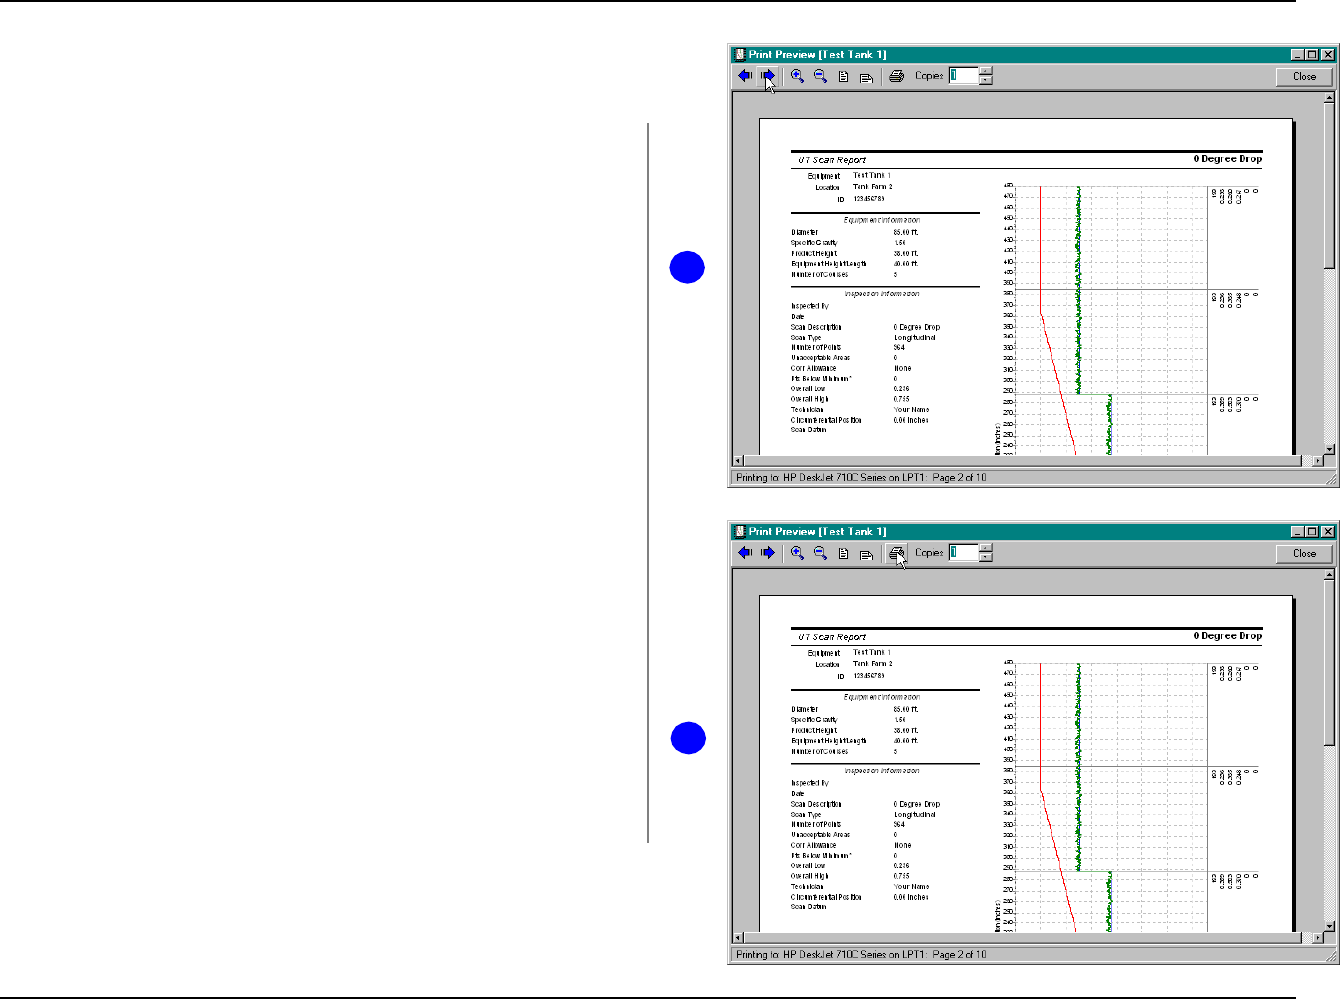
ADAS-500 Reporting System Tutorial
Printing Reports
Copyright © 2003-2007 ATCO. All Rights Reserved. Page 77 Revision 1.7
7
8
7. Click the Right Arrow to view the next page of the report. The Scan
Details Report for the 0 Degree Drop will be displayed.
Review the Printing Reports section of the manual for details on the order in which reports are
printed.
8. If you want to print the 10 pages of the report, click the Print button.
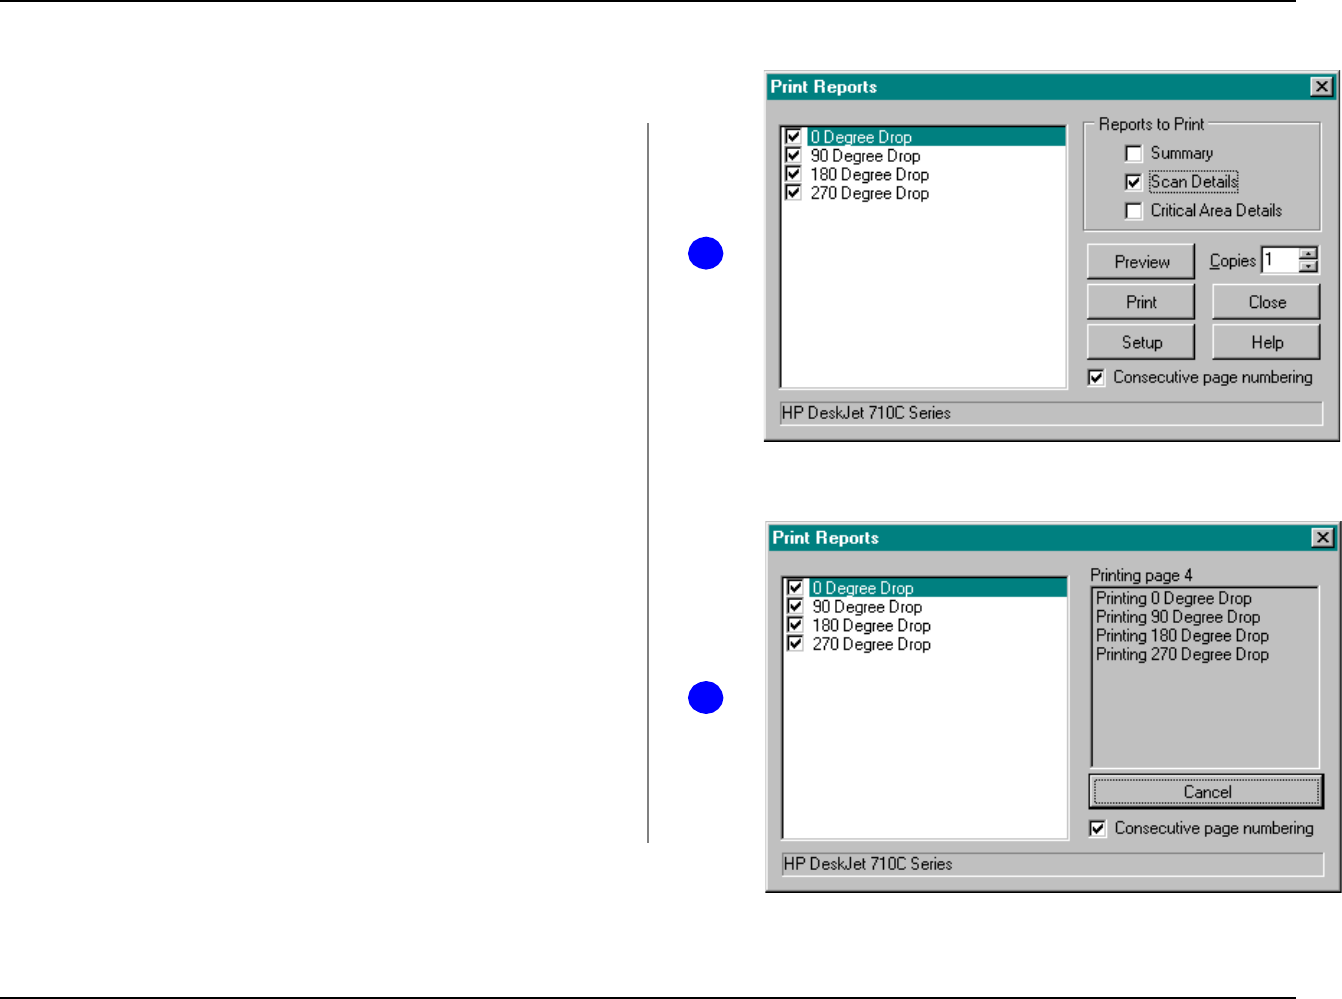
ADAS-500 Reporting System Tutorial
Printing Reports
Copyright © 2003-2007 ATCO. All Rights Reserved. Page 78 Revision 1.7
1
2
Printing Scan Details Reports
In the event you need to print any reports individually, you can select them from the list. You can print
any report, for any of the scans.
1. Select File | Print from the main menu. The Print Reports Dialog will
appear.
Select only the Scan Details report as shown to the right.
Click the Preview button.
2. The system will generate 4 pages.
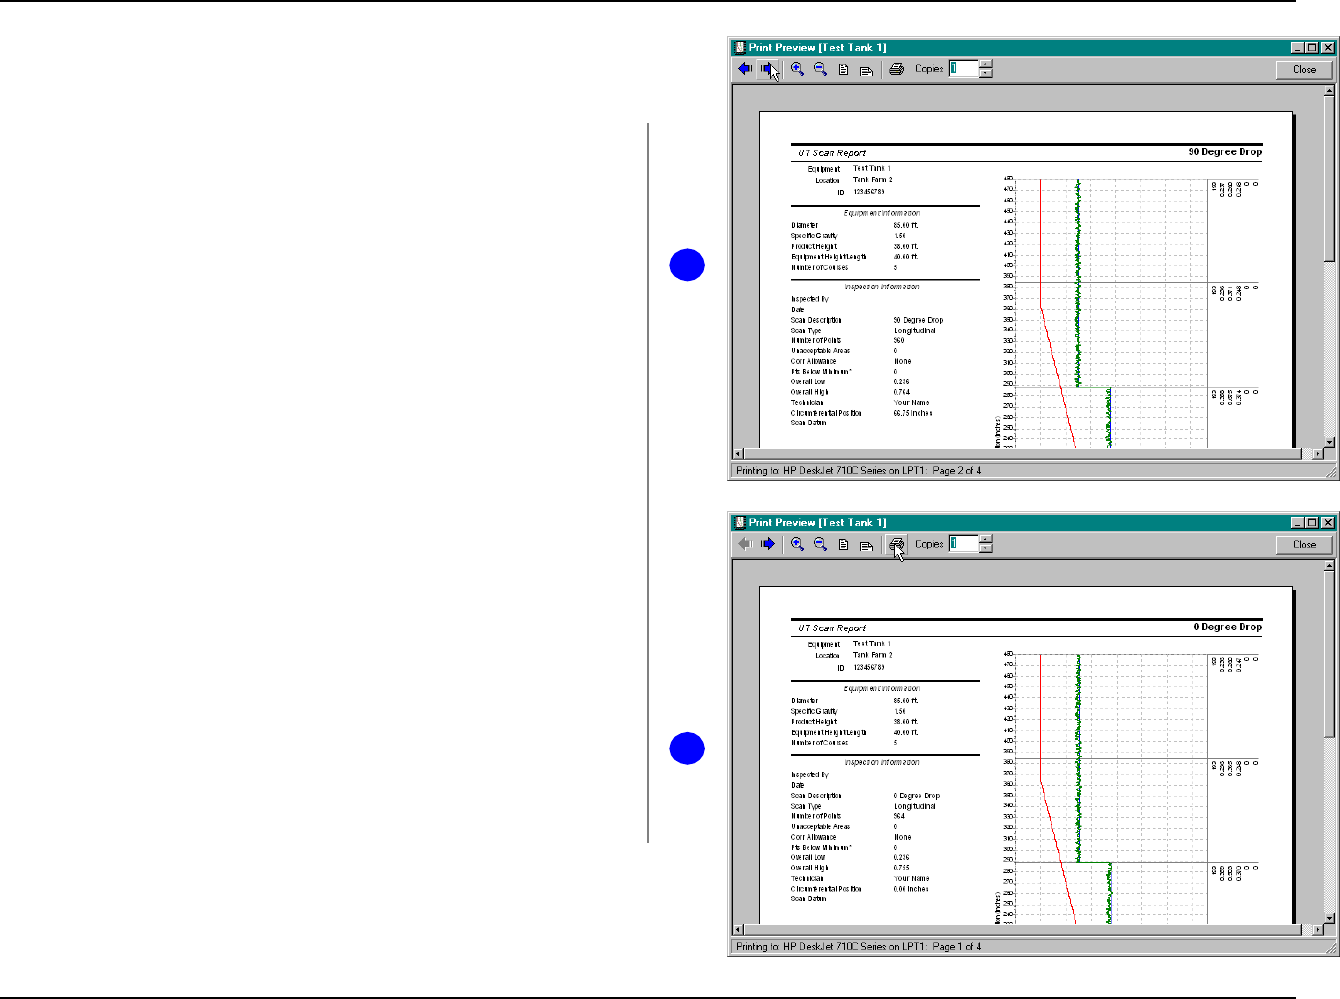
ADAS-500 Reporting System Tutorial
Printing Reports
Copyright © 2003-2007 ATCO. All Rights Reserved. Page 79 Revision 1.7
3
4
A Scan Details report will be printed for each scan. The first page displayed, will be the 0 Degree
Drop Details. The reports are printed in the same order in which they appear in the scan list.
Review the Printing Reports section of the manual for details on the order in which reports are
printed.
3. Click the Right Arrow to view the next page of the report. The Scan
Details Report for the 0 Degree Drop will be displayed.
4. If you want to print the 4 pages of the report, click the Print button.
