Agile Team Tool User Guide
User Manual:
Open the PDF directly: View PDF ![]() .
.
Page Count: 58
Last Updated:
August 8, 2017
IBM Internal Use Only

Page 2
This page left intentionally blank

Page 3
Table of Contents
INTRODUCTION.................................................................................................. 4
WHAT ARE WE MEASURING AND WHY............................................................................................. 5
WHY THESE MEASURES MATTER .................................................................................................... 6
OBJECTIVES ................................................................................................................................. 6
BASIC WORKFLOW OF THE AGILE TEAM TOOL ................................................................................... 7
LAUNCHING THE AGILE TEAM TOOL ................................................................................................. 7
NAVIGATION ...................................................................................................... 8
LEFT COLUMN ............................................................................................................................. 8
CENTER COLUMN ....................................................................................................................... 10
RIGHT COLUMN ......................................................................................................................... 11
CREATING A NEW TEAM ................................................................................... 13
GUIDELINES FOR CREATING A TEAM ............................................................................................... 13
CREATING A TEAM...................................................................................................................... 14
MANAGING YOUR TEAM .............................................................................................................. 19
DELETING A TEAM ...................................................................................................................... 28
ARCHIVING A TEAM .................................................................................................................... 29
CREATING AN ITERATION ................................................................................ 32
ENTERING ITERATION RESULTS ...................................................................................................... 35
CREATING A NEW MATURITY ASSESSMENT ...................................................... 38
VIEWING YOUR AGILE MATURITY ASSESSMENT SUMMARY ................................................................. 43
VIEW A PREVIOUSLY SUBMITTED MATURITY ASSESSMENT .................................................................. 45
APPENDIX A – NOTES ....................................................................................... 46
APPENDIX B – READING THE TRENDS CHARTS ................................................ 47
APPENDIX C – AGILE ROLE CATEGORIES ......................................................... 53
APPENDIX D – TOP THINGS TO KNOW ABOUT THE NEW USER INTERFACE ...... 54
APPENDIX E – API INFORMATION .................................................................... 57

Page 4
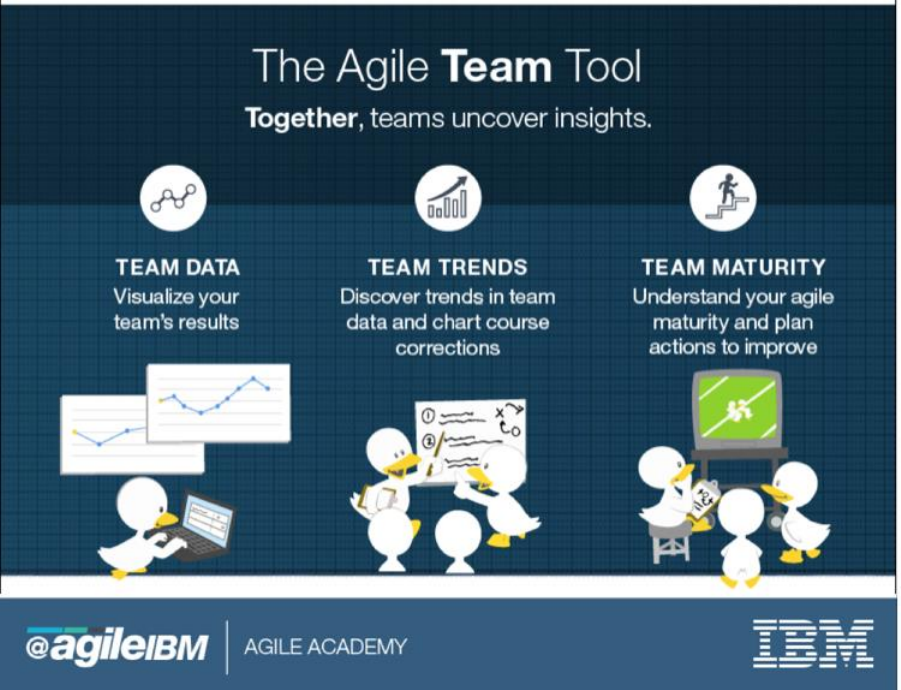
Preface
The Agile Team Tool is a web app that enables teams to track and analyze progress on their
Agile Journey. The application offers a range of features from visualizing team data to
understanding a team’s overall Agile maturity. The Agile Team Tool can be used by all types
of agile teams. This user manual will provide systematic instructions on how to use the
features of the tool.
Introduction
To evolve our Agile Culture, we need to look at how we form our teams, how we distribute
the work and how we measure what matters. The Agile Team Tool has been designed to
help squad teams measure what matters by:
• visualizing and sharing agile team results
• analyzing trends over time, and
• making course corrections needed to improve agile practices
Depending on the type of work your squad performs, you will enter data about your team;
team member names and roles, stories or story points delivered, number of deployments
and defects, team and client satisfaction scores and your squad’s agile maturity. These
measures are typically entered at the end of each iteration.
The iteration results are displayed in a series of graphs in the Trends section of the Home
Page showing trends from one iteration to the next. Squads will use the trended data to
track their agile progress and plan actions to get better.
This user guide will provide not only how-to instructions, but guidelines for the measures
included in the tool. Based on those guidelines, each squad can decide which measures best
fit their type of work and stage of maturity. But, each squad is expected to track their
progress, analyze their results, and continually improve their agile practices.

Page 5
What are we measuring and WHY
Measure
Aggregated
Size of Team per iteration
Yes
Role gaps* – Roles needed in a team but not filled
No
Agile Maturity
Yes
Velocity – No. of units (Story Points) Planned & Delivered Throughput
– No. of units (Stories/Tickets/Cards) Planned & Delivered
Squads can record either Velocity OR Throughput
Yes
No of deployments per iteration
Deployment = Code drop to production
Yes
Quality Measures
Open Defects (bugs in production) per iteration
• (Defects from previous iteration + defects found this iteration)
minus defects resolved = Closing balance
• Team selected quality measures for non-delivery teams*
Yes (defects)
No (non-defect)
Cycle Time of Stories (in days)
• Time in WIP - Time from out of backlog to production
• Time in Backlog - Time Story added to backlog until pulled into
WIP
Yes
Unit Cost per Person Day
Number of Stories or Story Points Delivered per Person Day
No
Net Promotor Score (NPS) – (-100 to +100)
No
Team Satisfaction – (1-4 based on Mood Marbles)
Yes
Client Satisfaction – (1-4) collected during Showcase
Yes
*not currently in the tool

Page 6
Why These Measures Matter
Tracking these measures help agile squads manage their funnel of work and continually get
better by answering:
• Do I have the right number of people and the right skills on my squad? (team size,
role gaps);
• Are the squad’s agile practices improving? (maturity)
• Do I know the capacity of my squad so I can plan my releases and iterations? (velocity
or throughput, number of deployments and defects)
• Does the funnel have the right work and is it flowing through the funnel in a
reasonable time frame? (Average cycle time per story, average backlog cycle time)
• Do I understand the cost of the work so I can estimate the cost and benefit? (stories
or story points per person day)
• Is my squad happy and working well together? (team satisfaction)
• Are we meeting client expectations? (client satisfaction, quality)
OBJECTIVES
After reading this document you should be able to:
1. Launch and navigate all sections of the Agile Team Tool.
2. View team information in the tool.
3. Create a new team.
4. Update an existing team.
5. Create and update iteration results for your squad team.
6. Enter an Agile Maturity Assessment for your team
Comments regarding this publication and its use should be addressed to Bruce Fouts via
Lotus Notes at Bruce Fouts/Atlanta/IBM@IBMUS or via the internet at bfouts@us.ibm.com.
(Until Sep 30, 2017)

Page 7
Basic Workflow of the Agile Team Tool
1. Create your team(s).
2. Add your team members and their associated team role.
3. Associate your Squad team(s) to a ‘parent’ or to a ‘child’ if creating a Parent team.
4. Add iteration information; squad teams only.
5. Track your team’s progress in the Iteration trends area; make course corrections, as
needed.
6. Record periodic maturity assessments for your team.
7. Track actions to improve agile maturity practices.
Launching the Agile Team Tool
All users with an IBM w3id and password can access this tool in ‘Read Only’ mode.
Individuals listed as members of a given team have edit access for that team.
The Agile Team Tool is an internet browser application which can be accessed via the
following URL: http://ibm.biz/AgileTeamTool
• The Agile Team Tool is Single Sign On (SSO) enabled
• Enter your IBM w3id and password if not already logged into SSO
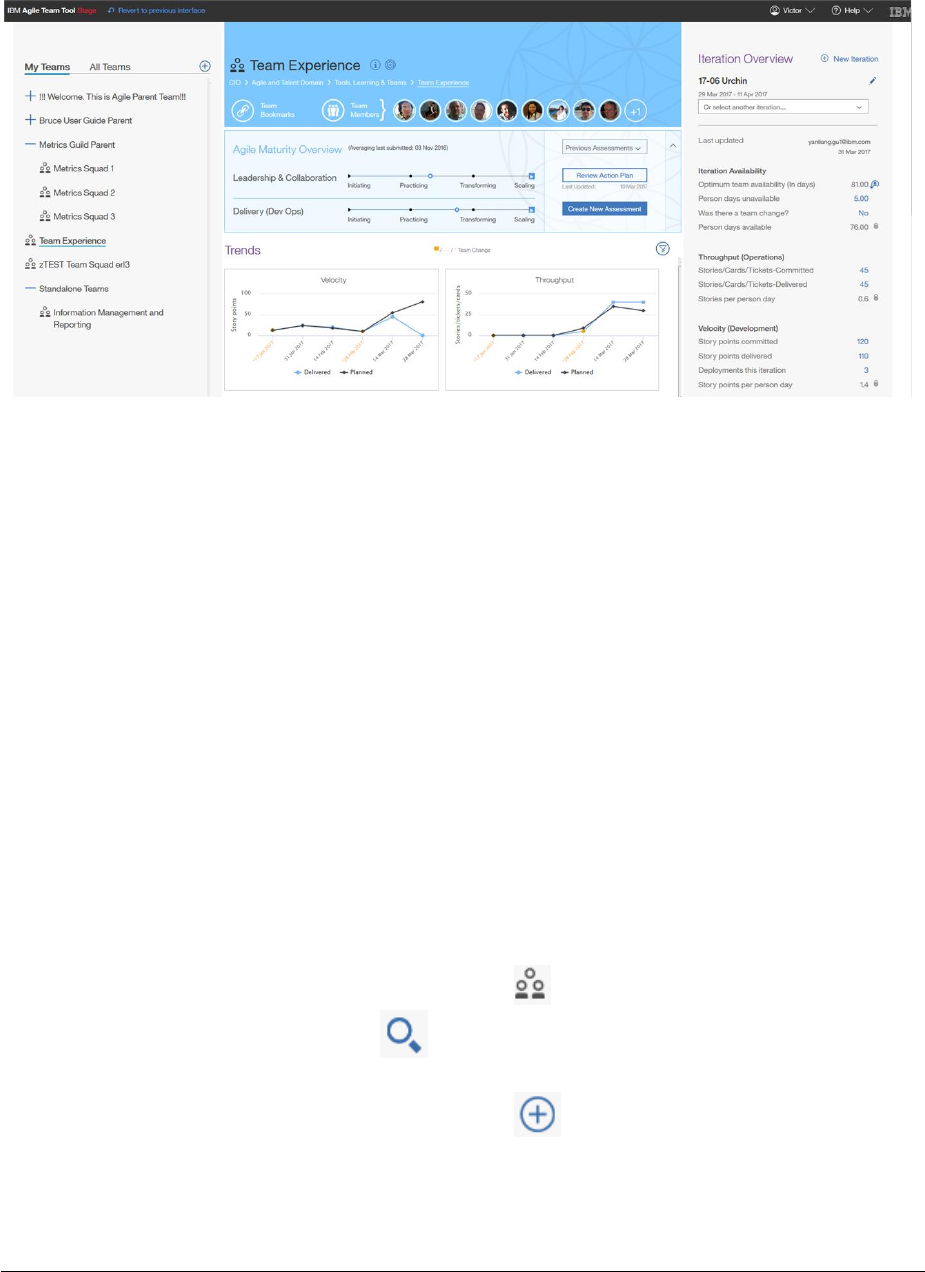
• You will see a screen similar to the one shown on the following page. (See Figure 1)
Page 8
Figure 1
Navigation
When you first log into the tool, you will see that the screen is divided into three columns of
information.
Left Column
• This column has two views; My Teams and All Teams.
• ‘My Teams’, displays only those teams you have edit access for (you are a team
member or a team member on the parent team). This should be your default view if
you are listed as a team member on a team in the Agile Team Tool.
• ‘All Teams’ displays all teams entered into the tool. This will be your default view if
you are NOT listed as a team member on a team in the Agile Team Tool.
• Beside the team names you will notice a series of twisties (+) and indentions
indicating ‘parent’ and ‘child’ relationships. Squad teams, which cannot have child
teams, are indicated by an icon like this one, .
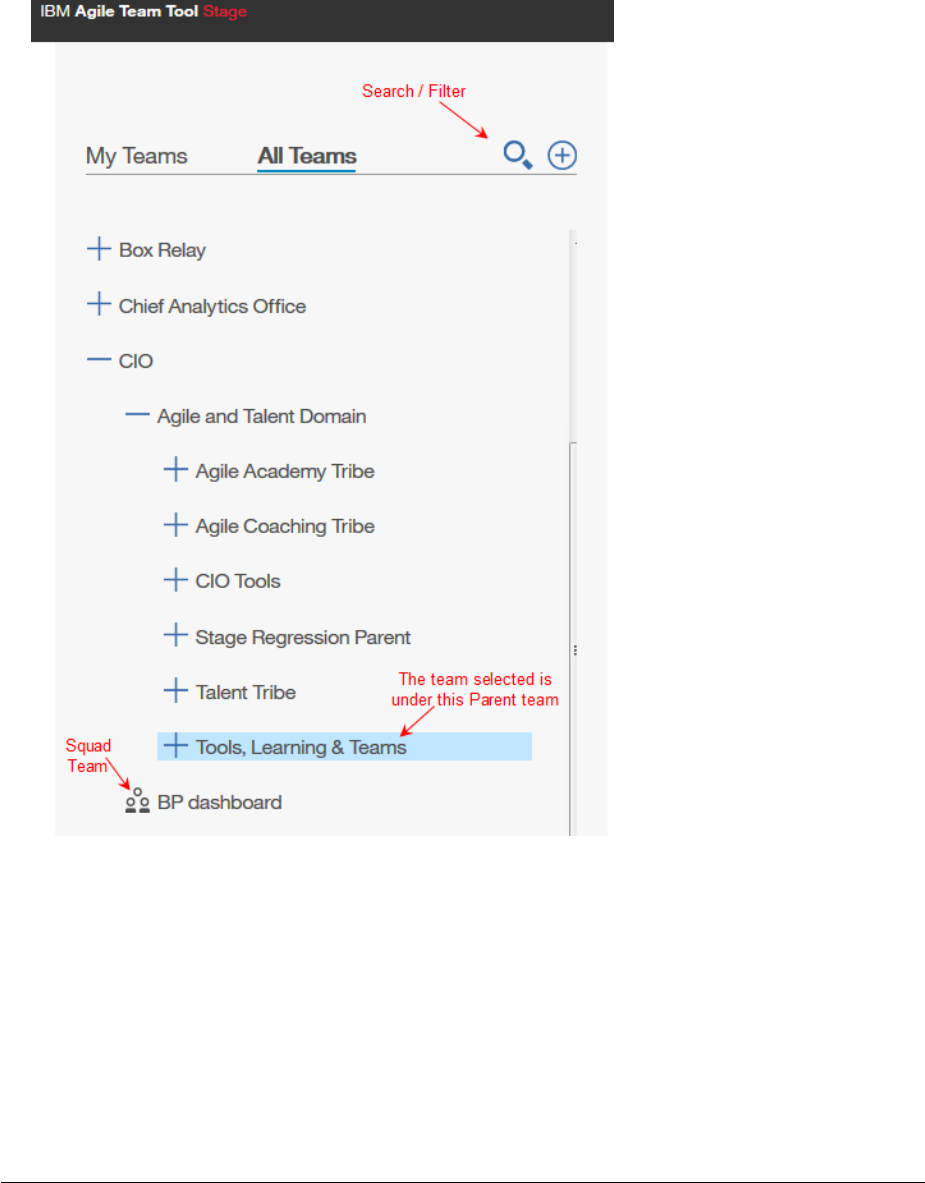
• You will notice a search option in the ‘All Teams’ view where you can filter on
part or all of a team name to quickly find a team. (figure 2)
• You will also notice a ‘create new team’ icon to the far right of this column.
Click this icon to create a new Squad team or Parent team.
Page 9
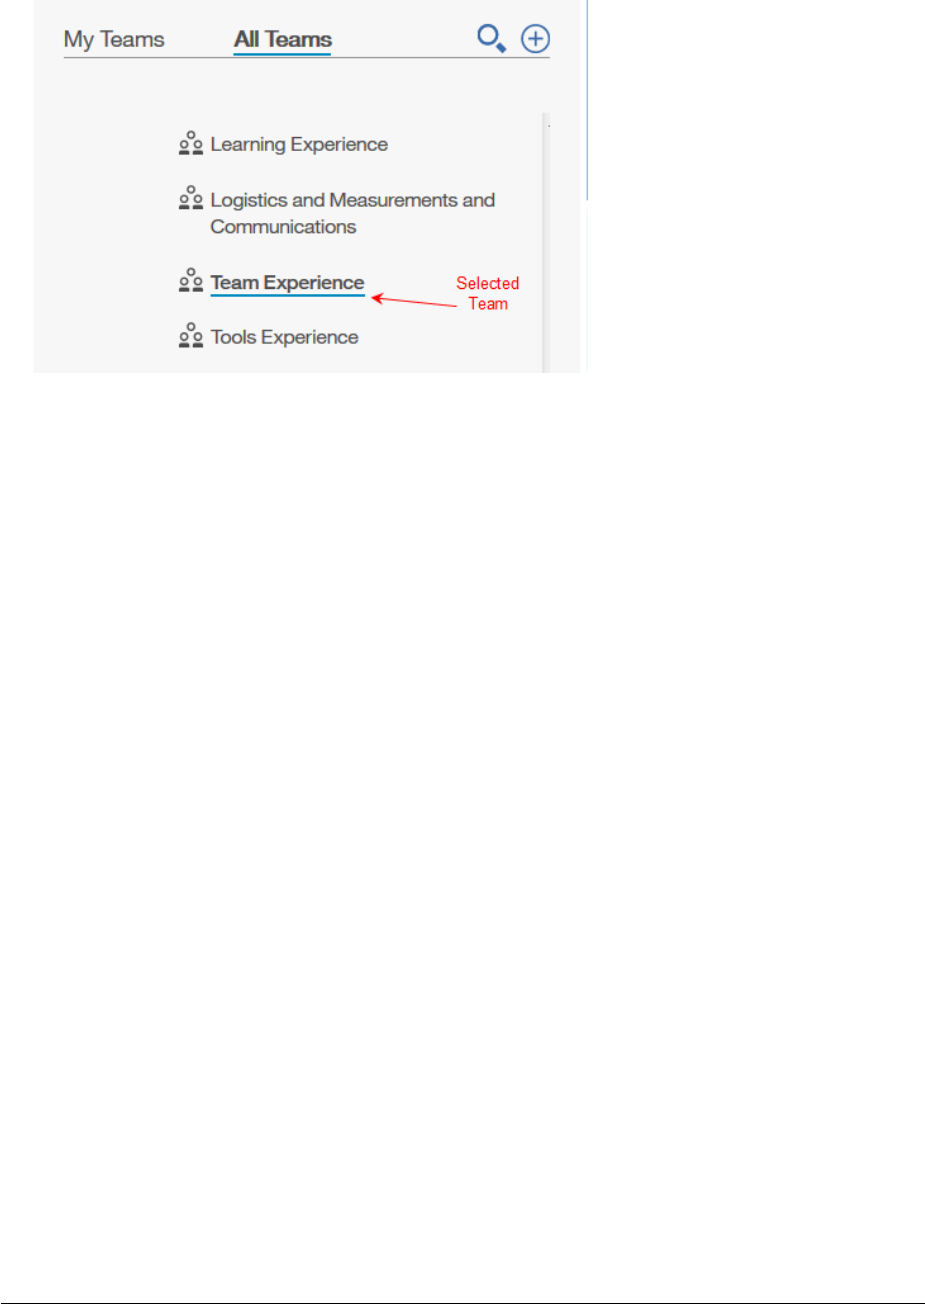
• You will notice a light blue background when a team is selected but the team is not
visible due to the section being collapsed (figure 2). A dark blue line is displayed
under a selected team when the section is expanded. (figure 3)
Figure 2
Page 10
Figure 3
More detail about this section can be found under, Creating a New Team, on page 14.
Center Column
• The center column, to the immediate right of the team name, shows information
about the selected team including:
o Team name and parental hierarchy if it exists
o Team Bookmarks (Important Links)
o Team Members
o Results of the last Maturity Assessment submitted (Squad Teams Only)
o Iteration trends in a graphical format if iteration results have been entered for
the selected squad team or an aggregate for parent teams having child teams
with iteration results. For more information about these charts please refer to
Appendix B – Reading the Trends Charts.
o Maturity assessment trends in a graphical format if any assessments have been
submitted
More detail about this section can be found under, Managing Your Team, on page 19.
Page 11
Right Column
• The far-right column is used to input and display iteration results for squad teams. If
a Parent team is selected in the left column, this area will be blank. (Parent teams do
not enter iteration results or maturity assessments.)
More detail about this section can be found under, Creating an Iteration, on page 32.
Other selections
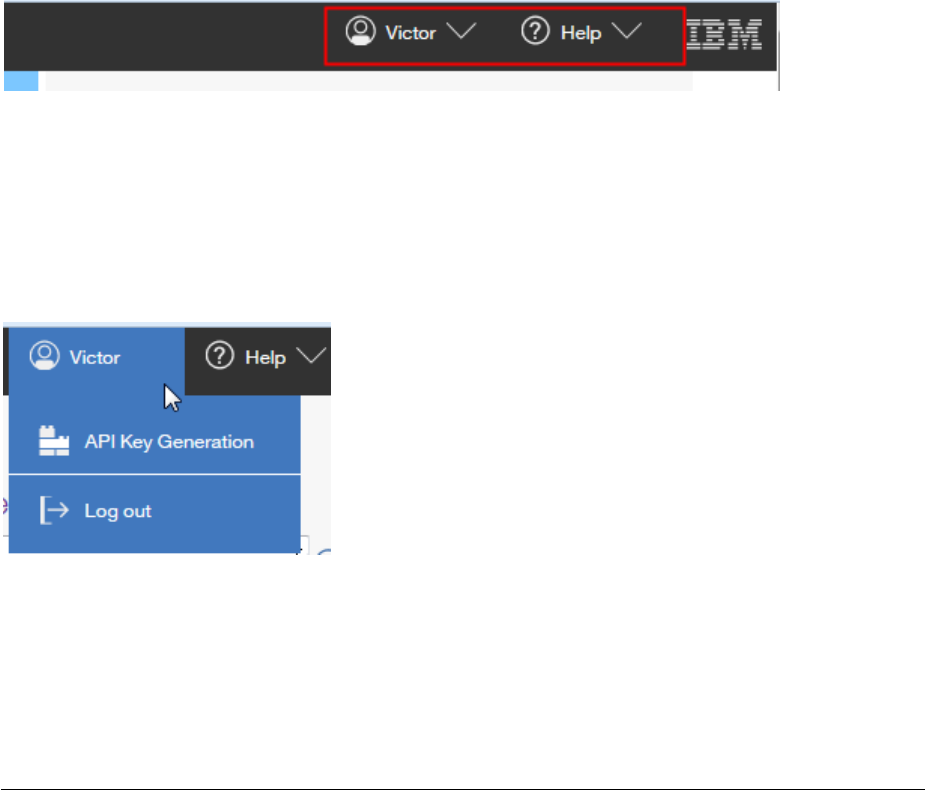
Additional selections can be found in the upper right hand corner of the Agile Team Tool.
(See figure 4)
Figure 4
Your Name: This drop down provides two options.
• Generate an API key for using an external API to
send iteration results to the Agile Team Tool
• Logout of the Agile Team Tool
Figure 5
Page 12
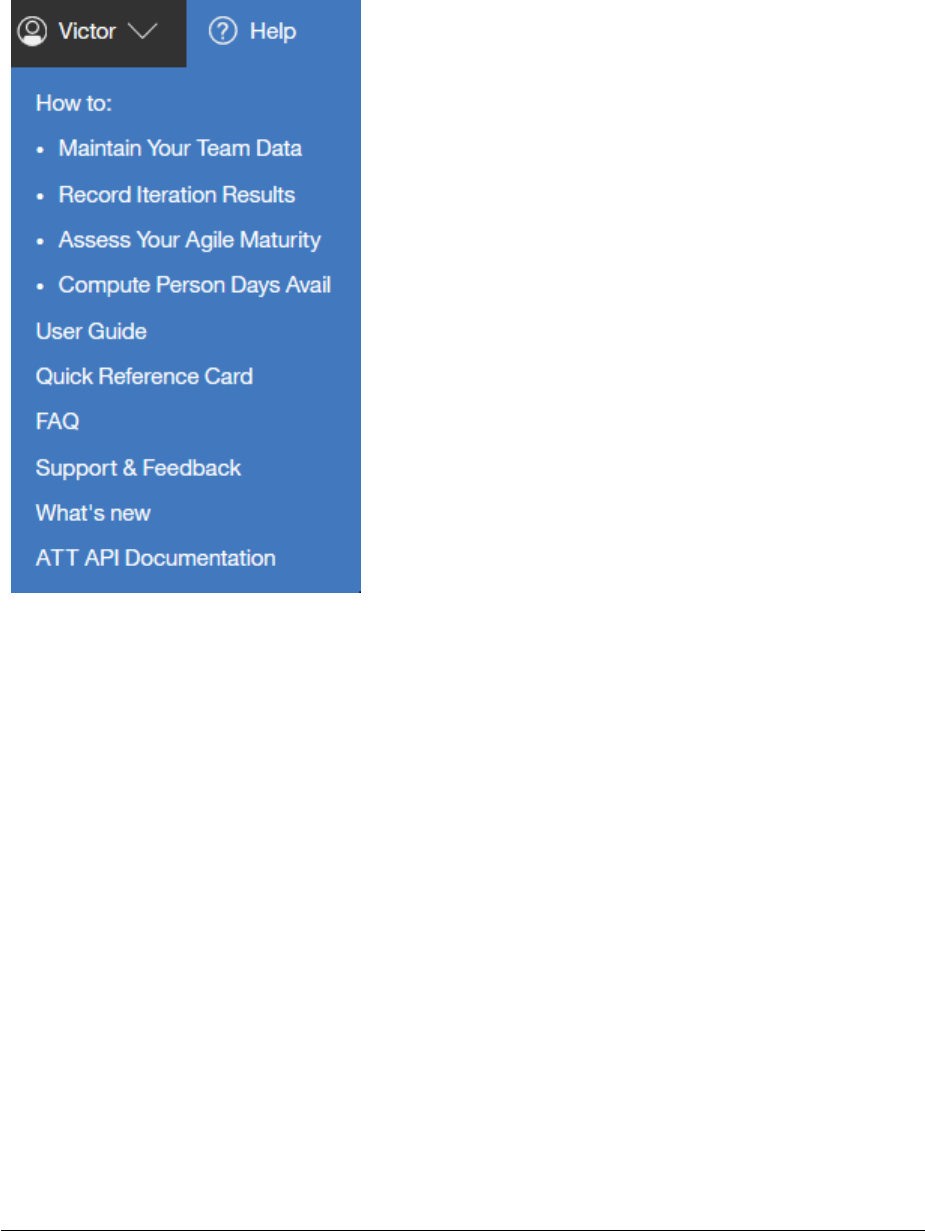
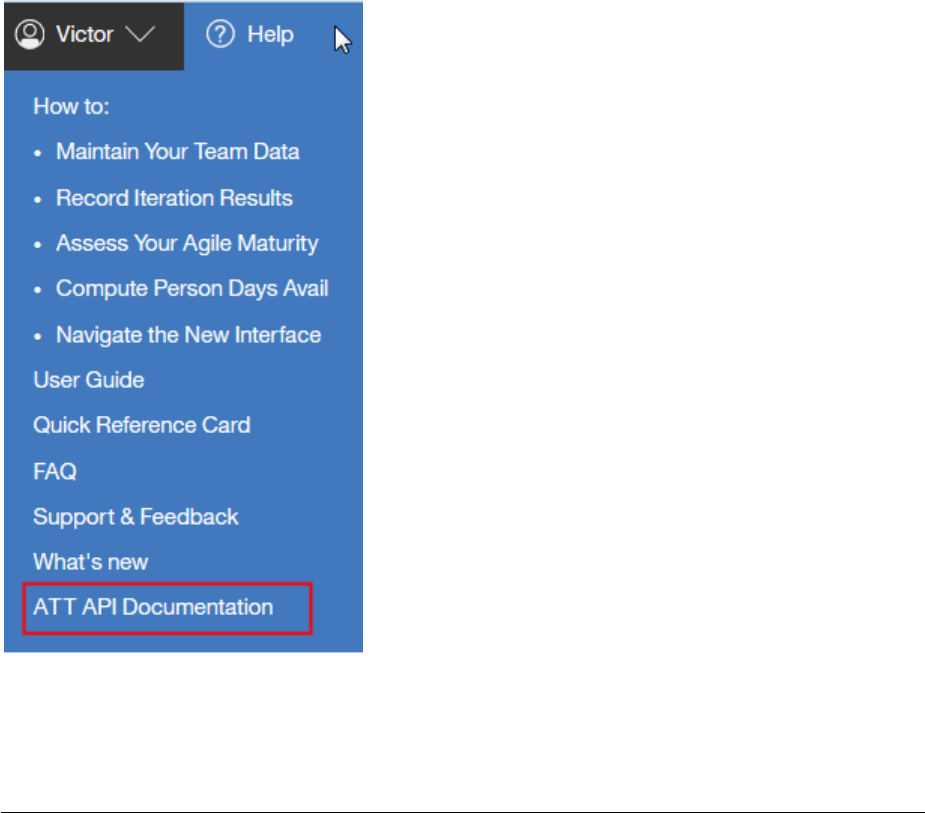
Help: Here is where you will find a variety of resources to assist you with making full use of
the Agile Team Tool.
• ‘How To’ information
• The detailed User Guide (this one)
• Quick Ref Card (a skinny version of the User Guide)
• Frequently Asked Questions
• Feedback option to send an email to the support
team for suggestions or identify any problems
• Community link to see what’s new in the Agile Team
Tool
• API documentation
Figure 6
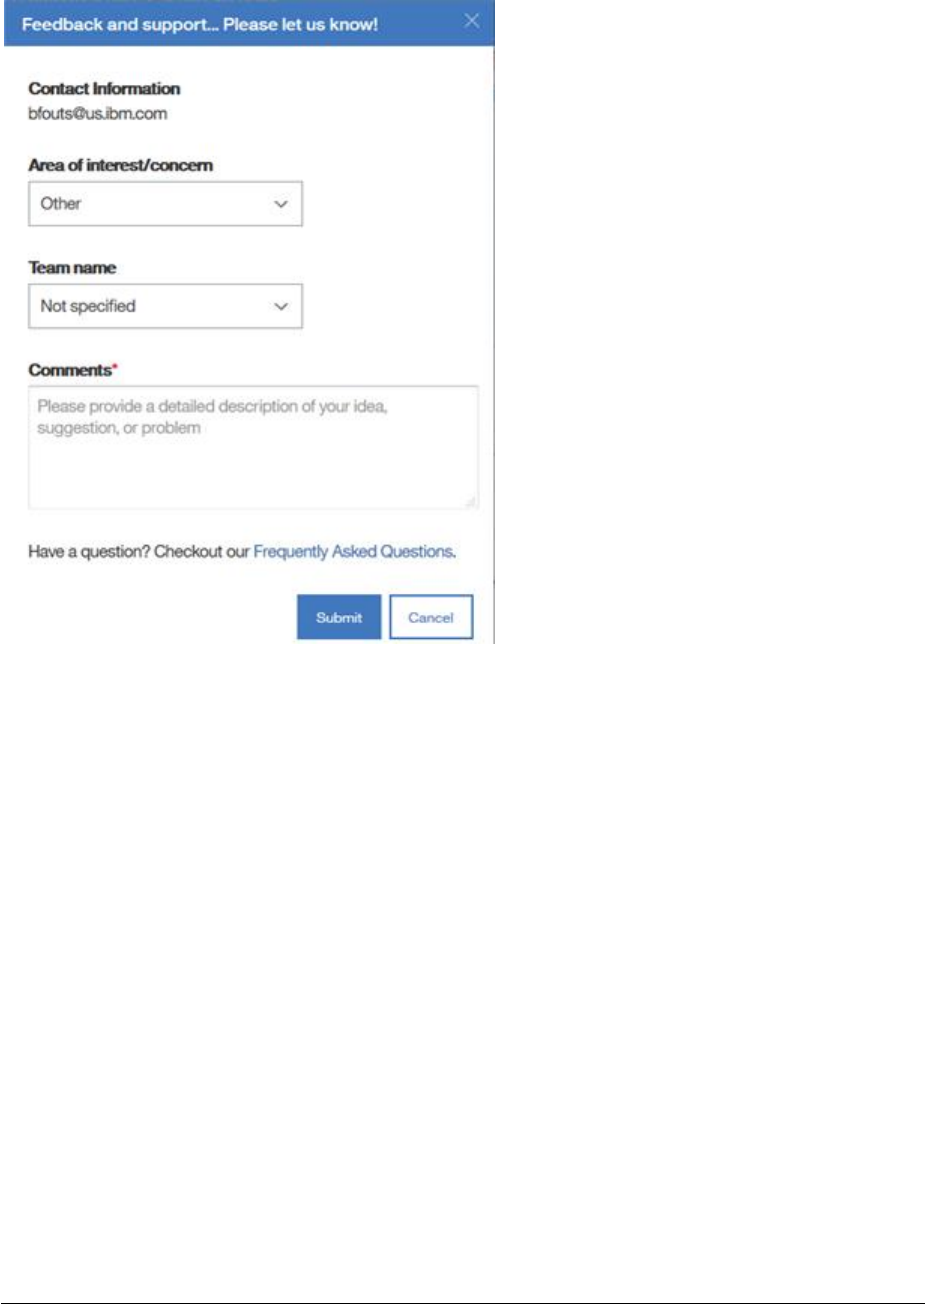
Support & Feedback: Offers the ability to provide direct feedback to the development team
regarding any suggestions or a problem you are having with the tool.
The popup window allows you to specify the area of the tool and team name, if applicable.
(See figure 7, on the next page)
Page 13
Figure 7
Creating a New Team
Guidelines for Creating a Team
• Any user can create a new team
• If you are listed in the team member list you will have edit access for that team.
• If you are listed in the team member list of a parent team you will have edit access
for that team and all child teams under that parent
• A Squad team (Level 1) is the lowest level team in the hierarchy; it cannot have ‘child’
teams.
• Any team can only have one parent team.
• A parent team can have multiple child teams.
Page 14
Suggestion: If creating Parent teams and child (squad) teams as part of an organizational
structure for using the Agile Team Tool, I suggest creating the parent team first and then the
children teams. Select the parent team as you create the child team.
Creating a Team
1. In the left column, in the ‘My Teams’ or ‘All Teams’ view, click on the ‘Create New
Team’ icon in the top right of this column.
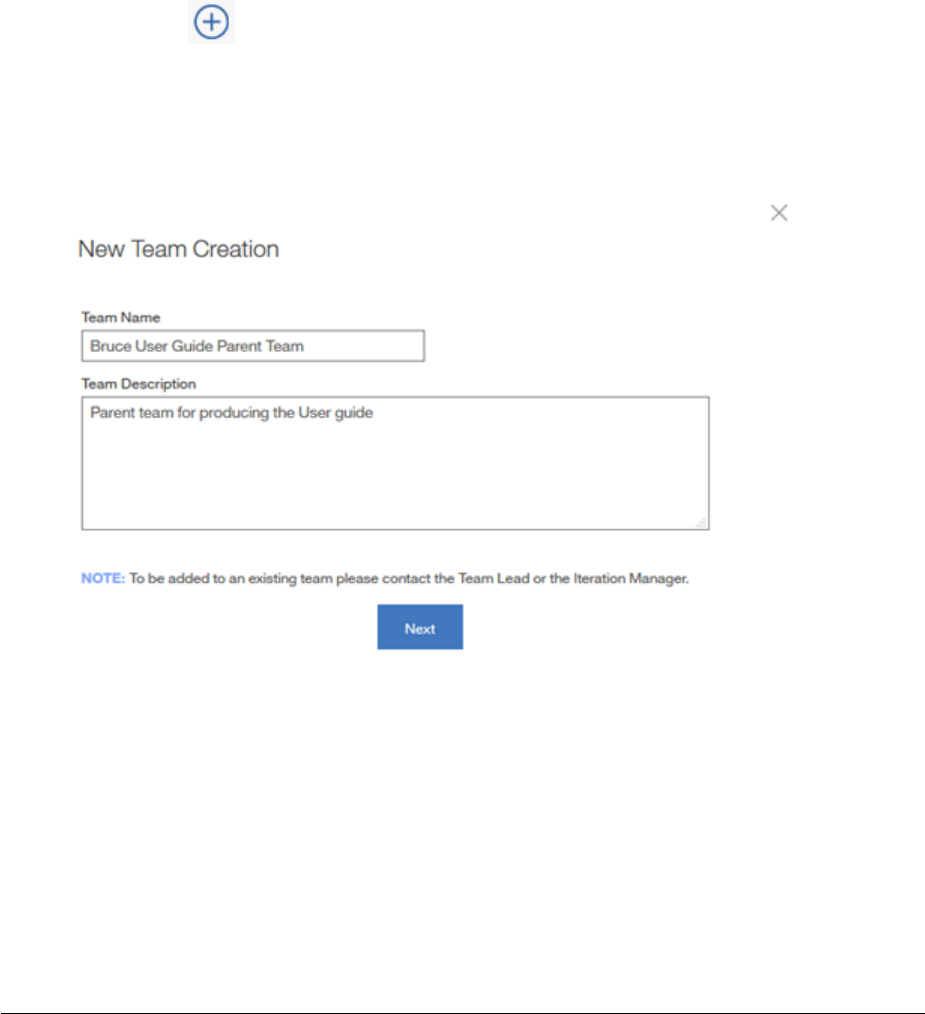
2. A pop up window appears for you to enter the name of the new team and a team
description as shown below in figure 8.
Figure 8
3. Enter the required information and click on ‘Next’. (If the team name you enter is
already in use you will receive a warning message.)
4. In the next pop up, choose to create a Parent team or a Squad team as shown in
figure 9 on the next page.
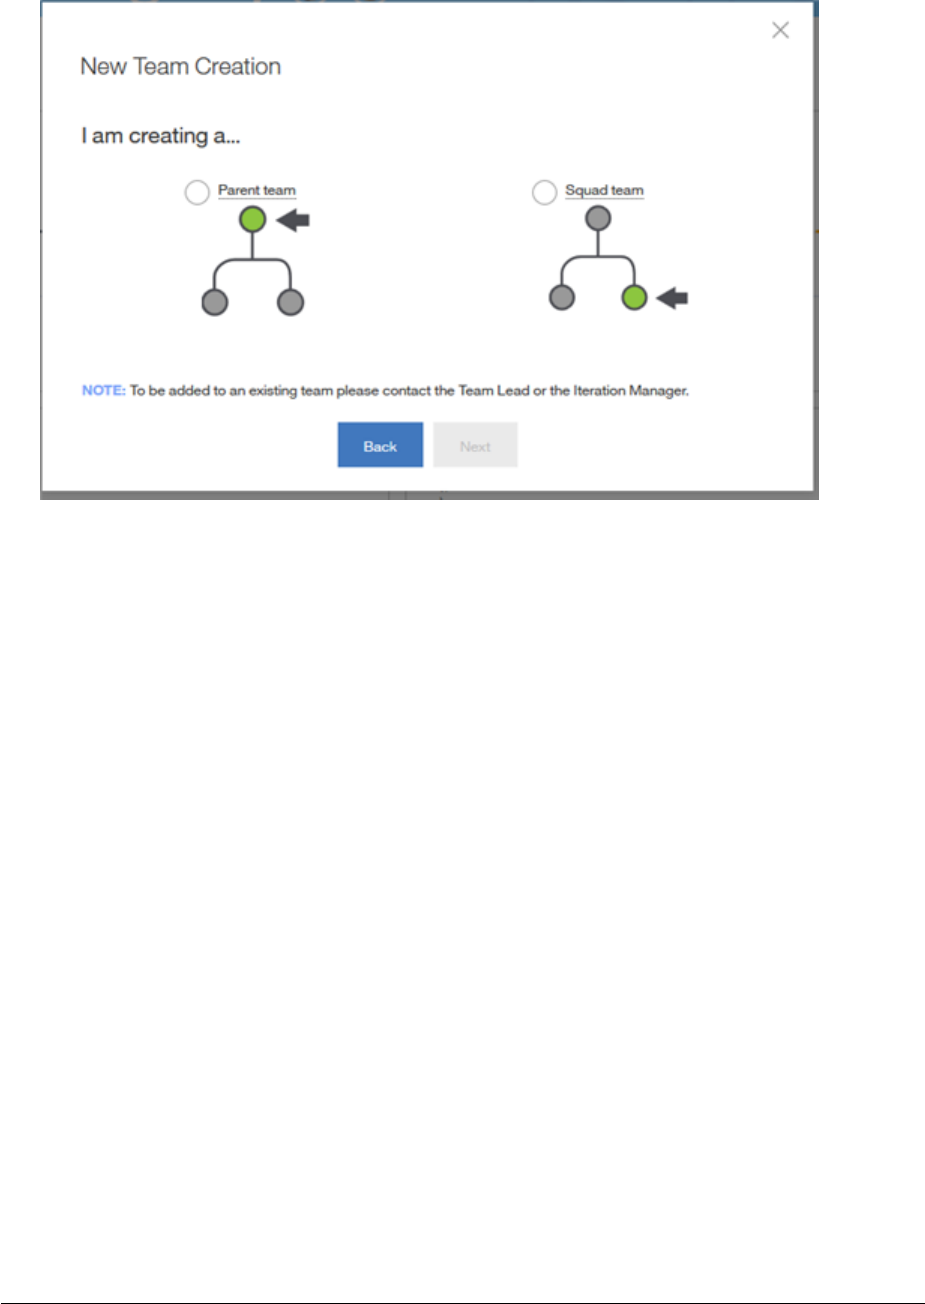
Page 15
Figure 9
5. If creating a Parent team, make the appropriate selection and click on ‘Next’. Go to
step 7. Otherwise, go to step 6.
6. If creating a Squad team, make the appropriate selection and click on ‘Next’. Go to
step 20.
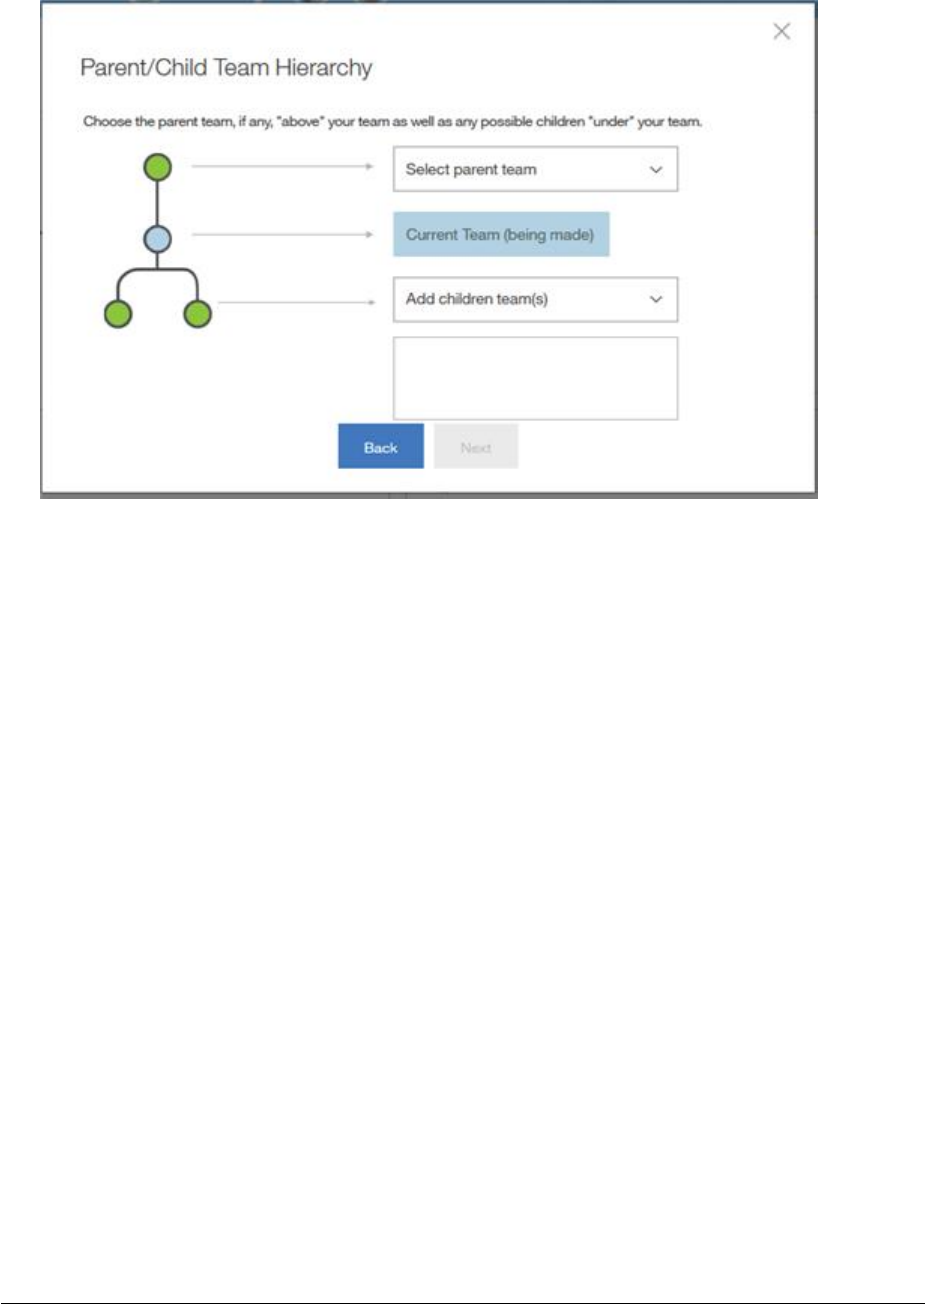
7. You are presented with the Parent/Child team hierarchy screen as shown in figure 10
on the next page.
8. Select a parent team from the drop-down selection. If the team you are creating will
not roll up to another team or it has not yet been created you can skip this step or
select the option for ‘Top tier / Not Listed’.
9. Select any children teams that may roll up to the one you are creating from the drop-
down selection. If the child team has not yet been created or you don’t know the
name you can select ‘Not Listed'.
10. Click on ‘Next’.
Page 16
Figure 10
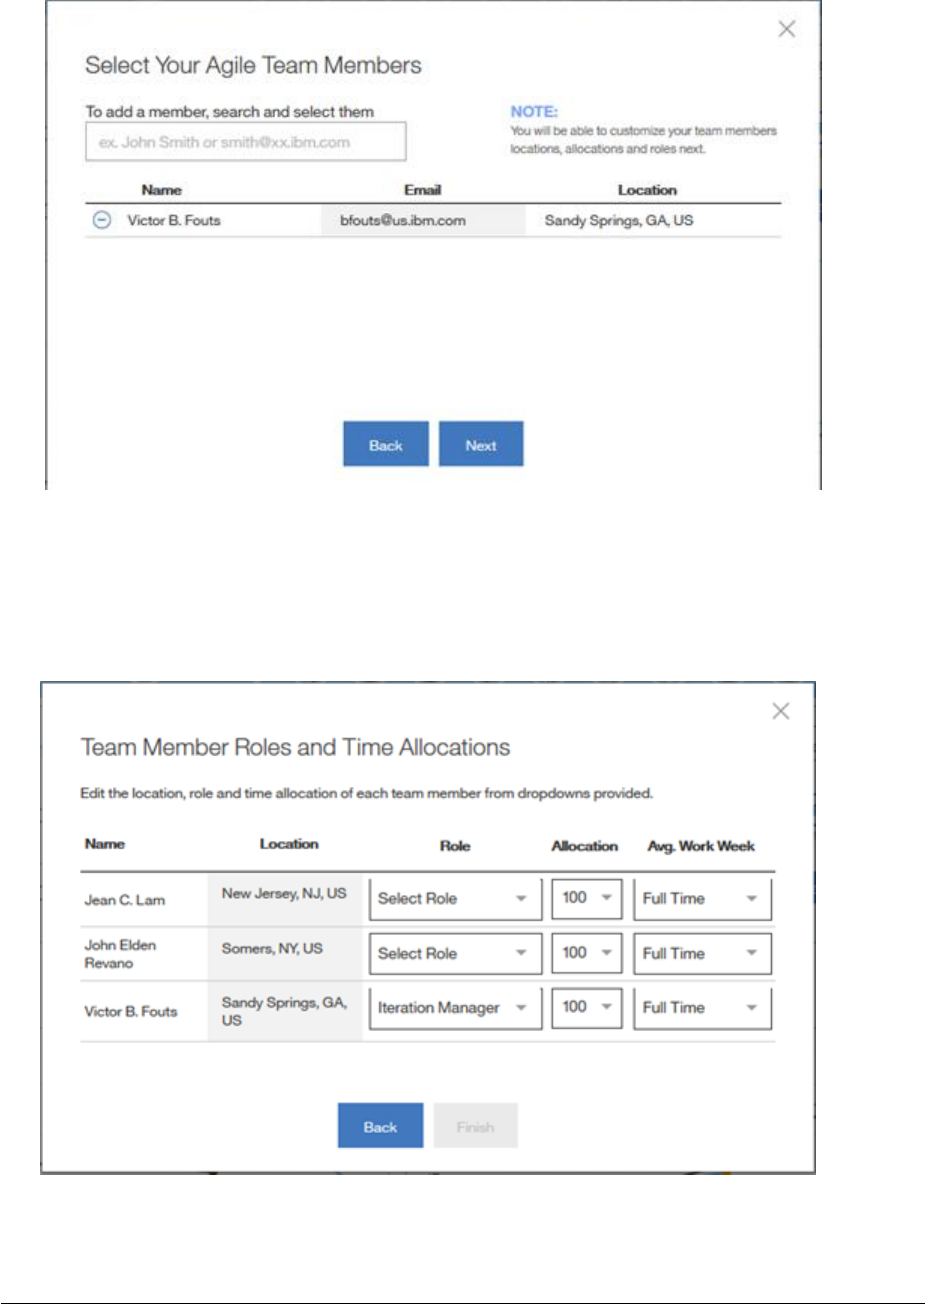
11. The Add Team Members screen appears as shown in figure 11 on the next page. You
will notice that your name is added by default as a team member when you create
the team. You will NOT be allowed to remove your name until you have added at
least one additional team member to the list. There must be at least one member on
the team so that someone can make updates to this team.
12. Enter the name(s) of the team member(s) to be added and select the person from
the list provided as you type in the name. (Do not paste a name in the search box.)
13. The names are added to the list as you select them.
14. When all names have been added click on ‘Next’.
Page 17
Figure 11
15. The member roles and allocation screen appears as shown in figure 12.
Figure 12

Page 18
16. Select the role for each team member and whether the member works a full time or
half-time work week or some % thereof. (This selection is used to determine the
number of person days the team has available for the iteration/sprint.
17. Once all team members have been updated click on ‘finish’.
18. You should receive a confirmation message that you have successfully added your
team. Click OK.
19. Your ‘My Teams’ view should refresh and display the new team you just created. (If
you removed yourself from the member list it will not show in the ‘My Teams’ view
but it should appear in the ‘All Teams’ view.)
20. When you indicate that a squad team is being created you are presented with the
option to select a parent team using a drop-down selection as shown in figure 13
below. If the parent team has not yet been created or you don’t know the name you
can leave this blank. If no parent team is selected, you are basically setting this team
up as a standalone team.
21. Go to steps 11-19 and complete the team setup. Repeat the process for each team
you are establishing in the Agile Team Tool.
r
Figure 13
22. Congratulations, you have set up your team(s).
Page 19
Managing your Team
1. From the team navigation column (left side), select the team you want to
view/update. (Remember, you can ONLY make changes to teams that you are listed
as a team member or you are a member of the parent team.)
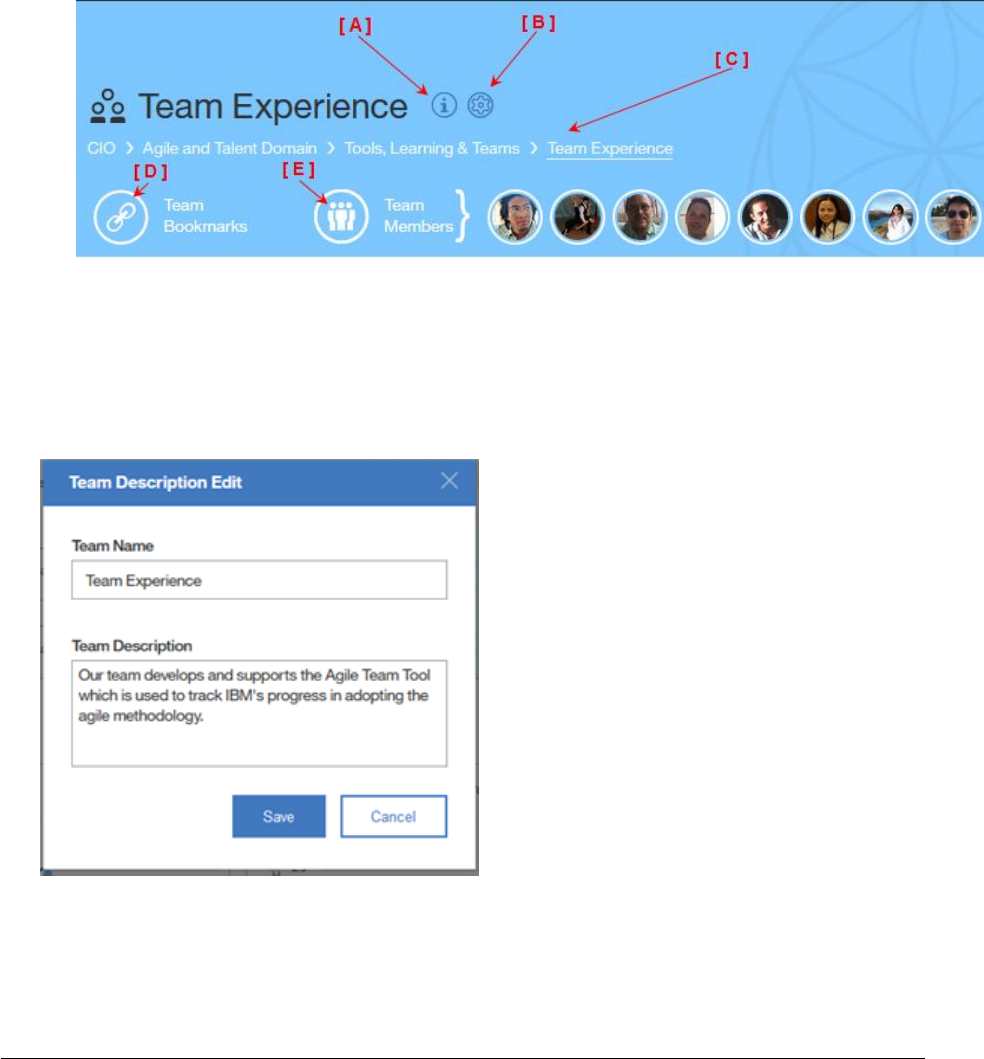
2. Information about the selected team is displayed in the Team Information area at the
top of the center column, figure 14. This figure will be referred to several times in
the next few steps with references to [A] through [E].
Figure 14
3. To view the team description hover your mouse pointer over the ‘Team Information’
icon, [A]. To change the team name or description click the ‘Edit’ button. Make any
necessary changes and click ‘Save’, figure 15.
Figure 15
Page 20
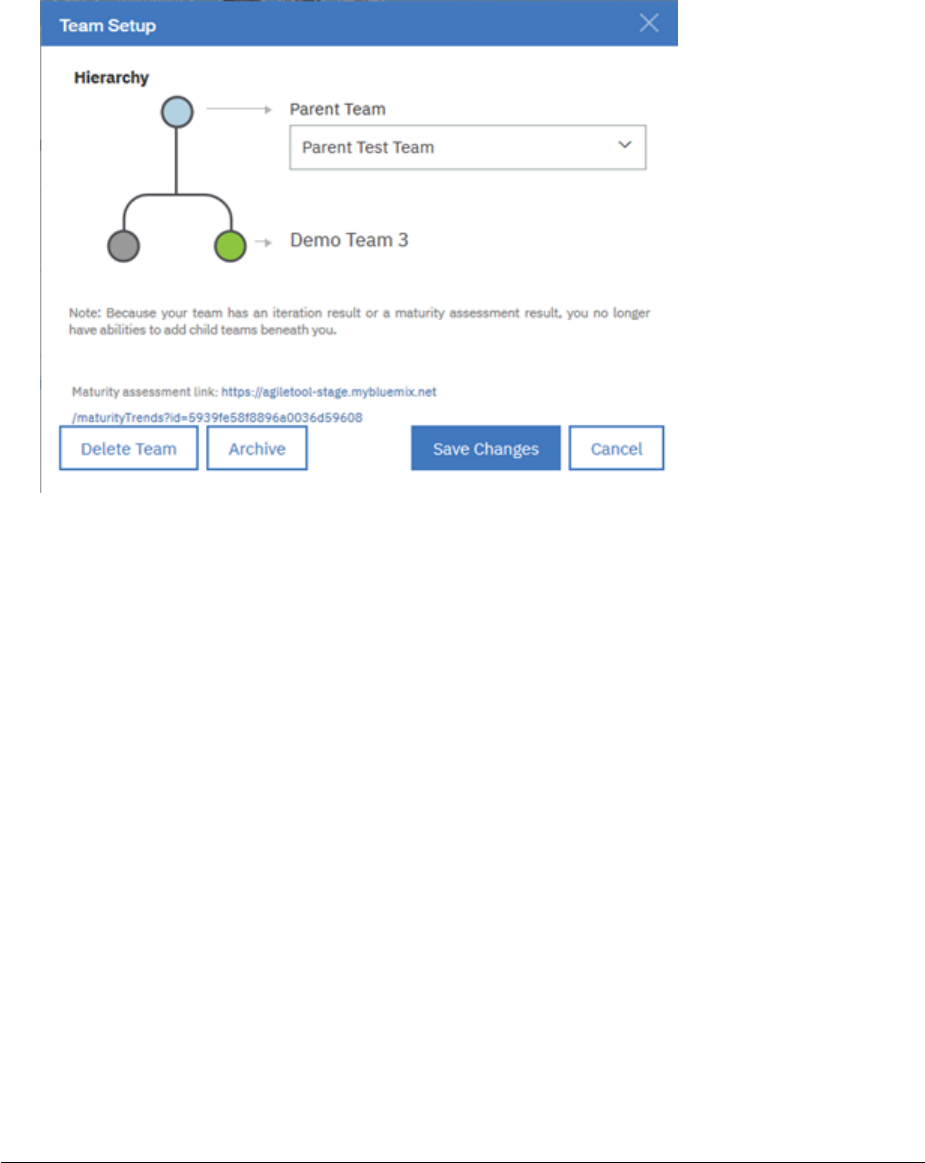
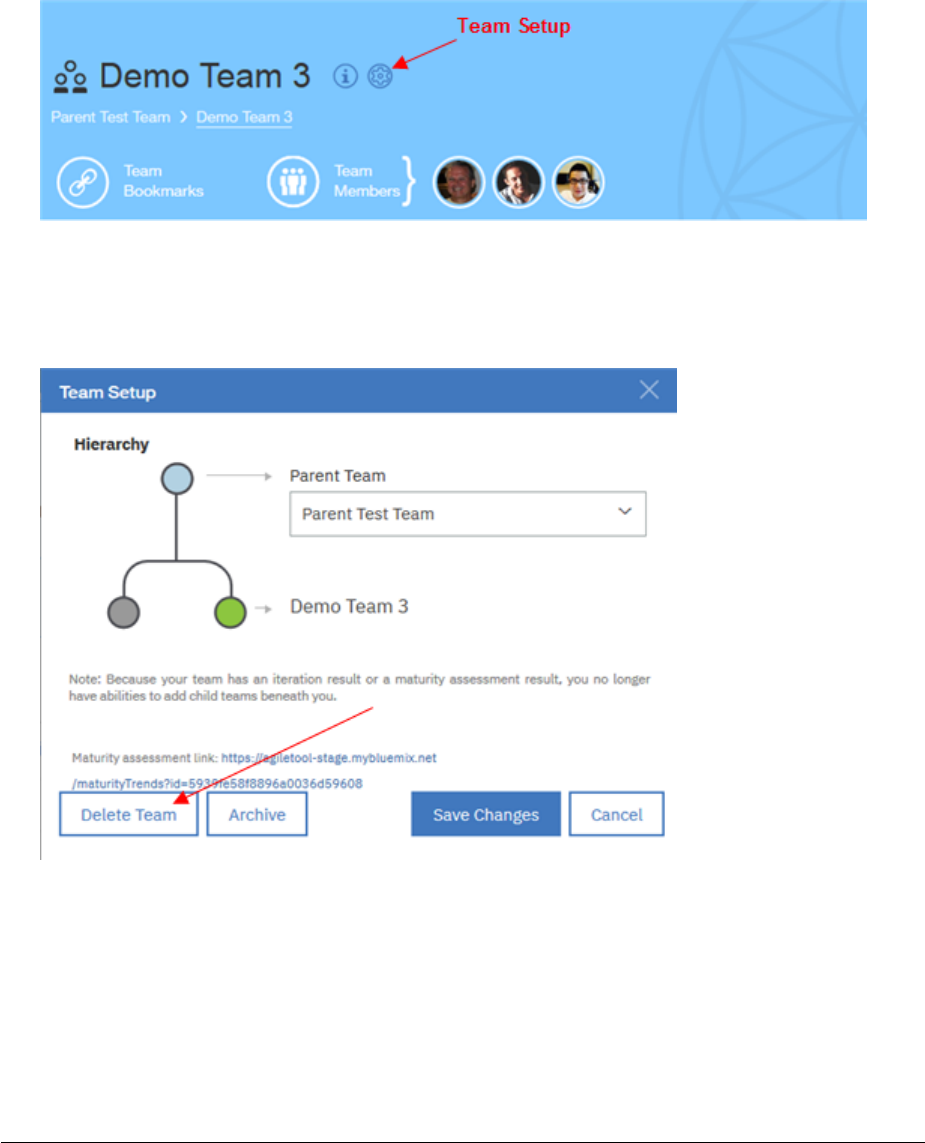
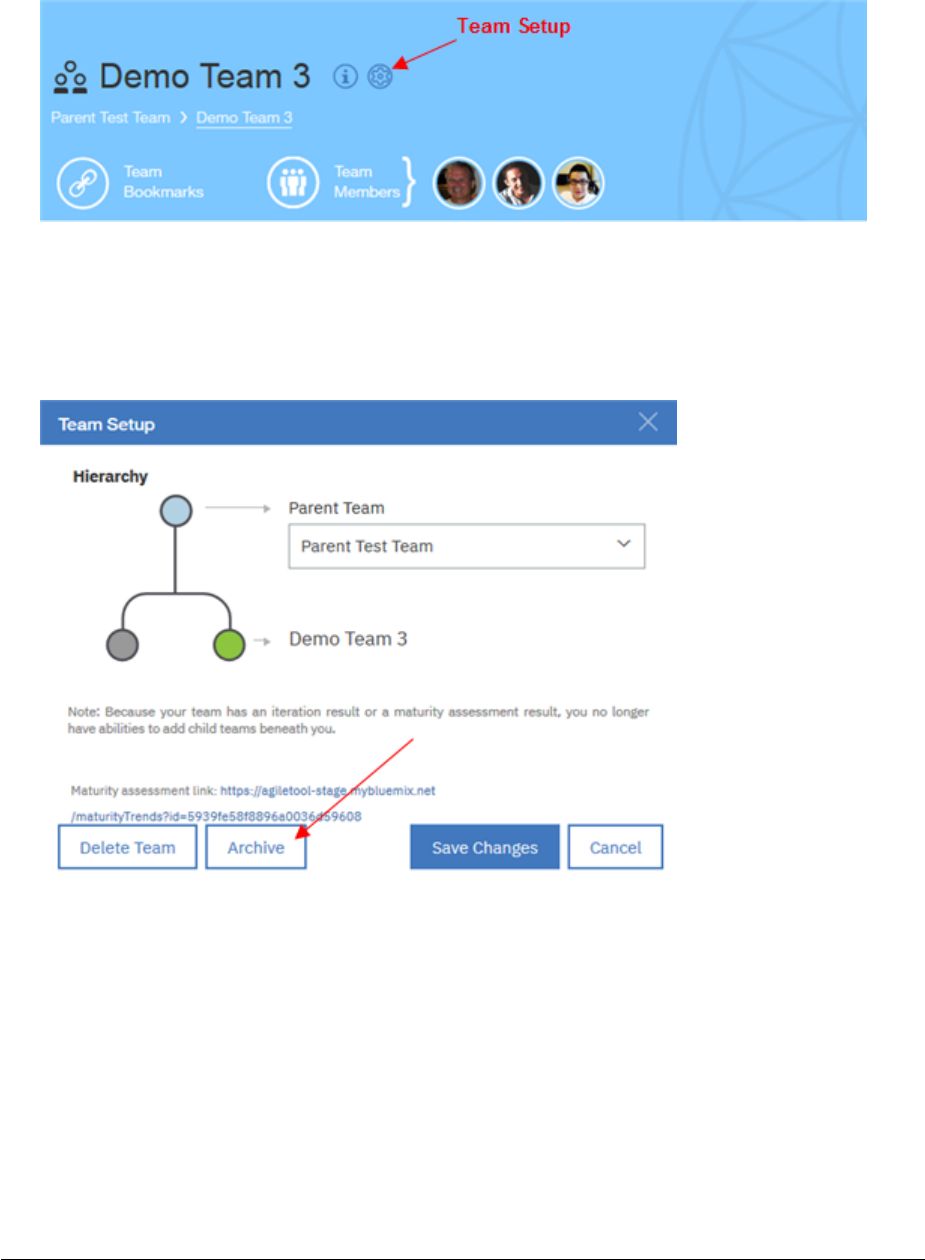
4. To change the parent or child team association click on the ‘Team Setup’ icon, [B].
Make the necessary changes by using the appropriate drop-down selection lists and
click on ‘Save Changes’, figure 16 (squad teams) or figure 17 (parent teams). You can
also delete the team which is discussed in the next section, Deleting a Team.
Figure 16
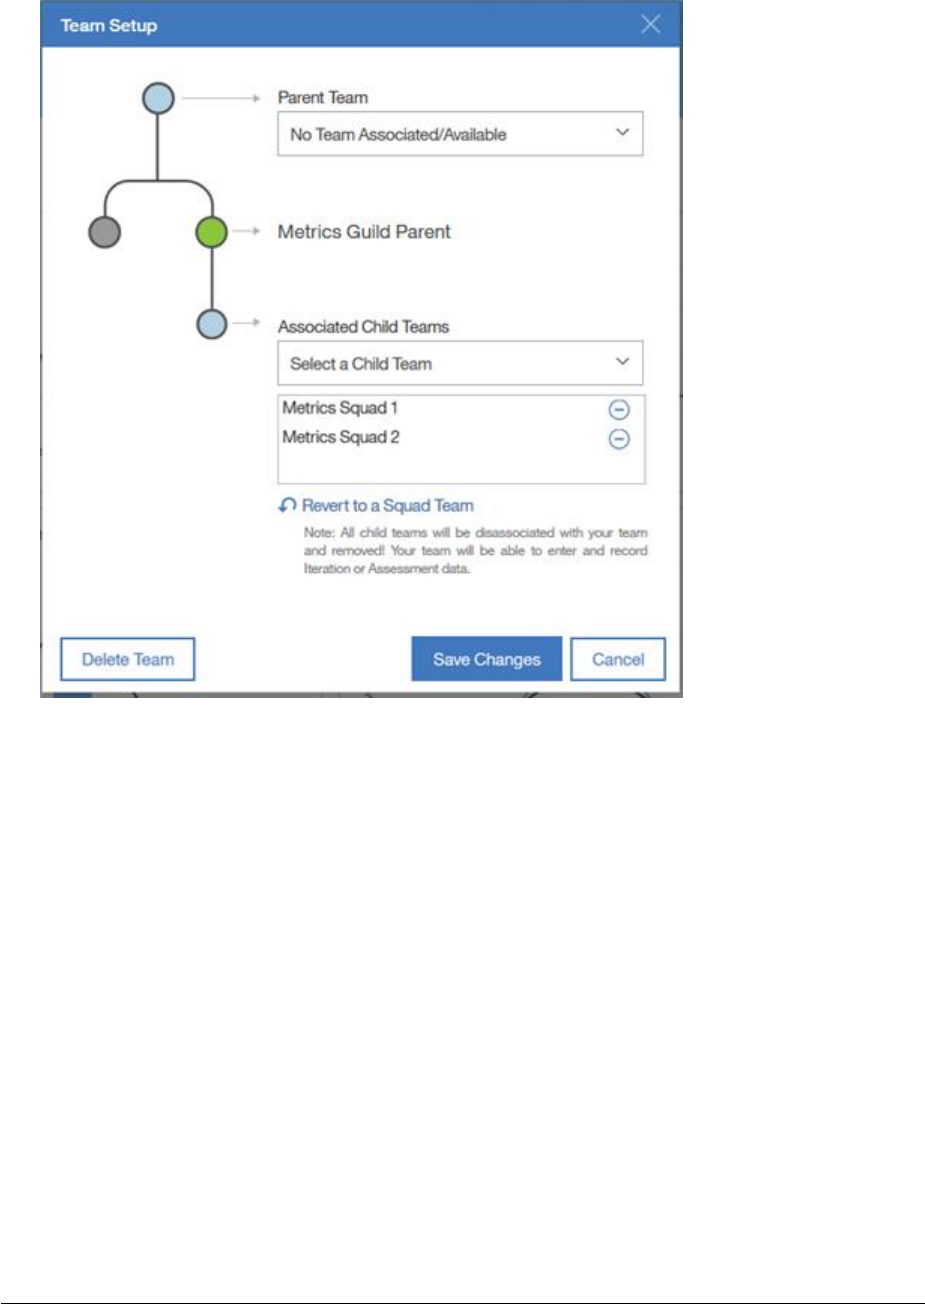
5. It is in the Team Setup area that you add additional child teams to a parent team if
the team is not already associated to another parent team. If you do not see the
team you are looking for in the selection list it is either A) already associated to
another parent team, or B) the team has not been created in the tool, or C) the team
name may have been changed, deleted or archived.
6. It is in the Team Setup area where you can also revert a parent team to a squad team
using the ‘Revert to a Squad Team’ reset icon, figure 17. Warning: If you revert a
parent team to a squad team you will remove all existing child team associations, if
they exist.
Page 21
Figure 17
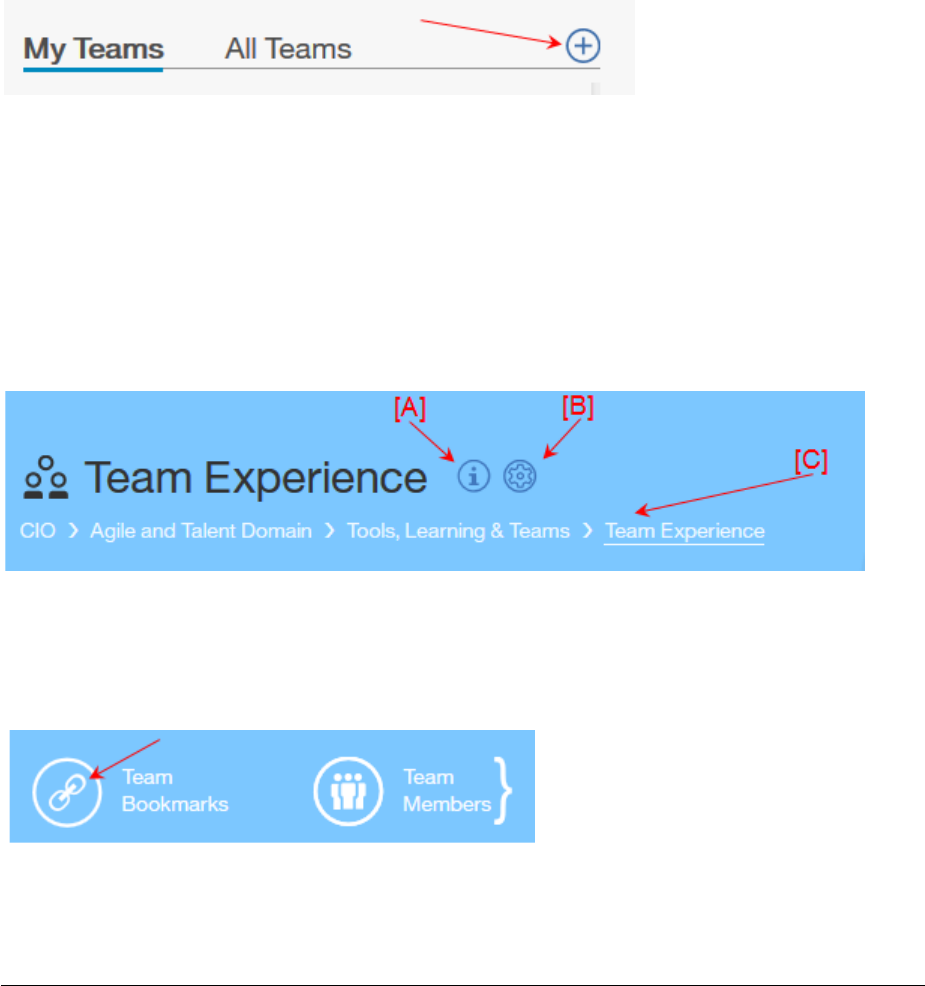
7. [C] The Team hierarchy is easily visible under the team name. If you change the
parent team as explained in the previous bullet the update will be reflected in this
hierarchy.
8. To create bookmarks, formerly called important links, hover your mouse pointer over
the ‘Team Bookmarks’ icon, [D] , and click ‘Add new link’, figure 18. Select a label for
the bookmark from the selection list, paste in or add the URL and click Save, figure
19. To make changes to an existing bookmark, hover over the link and click the ‘Edit
Bookmark’ icon (pencil). Make necessary changes to the label or URL and click Save,
figure 20. You can also click on the ‘Remove Bookmark’ icon if you want to delete
the bookmark all together.

Page 22
Figure 18
Figure 19
Figure 20
Page 23
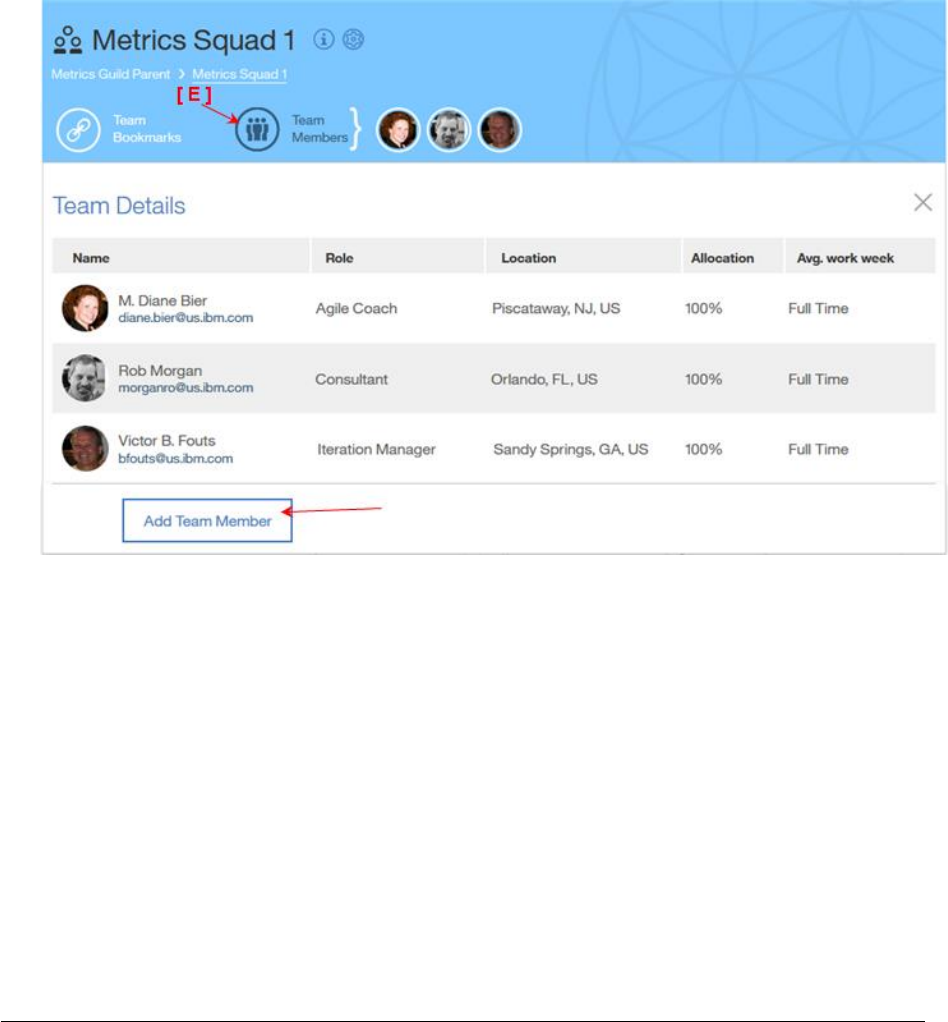
9. To add a team member click the ‘Team Members’ icon, [E] in figure 21 below and
then click ‘Add Team Member’. Enter the person’s name, agile role, allocation %,
and the *Avg work week. Click ‘Add’.
*Note: The Average Work Week indicates whether the team member works a full time, a
half-time work week or some % thereof, i.e. someone working 3 full days a week, 24
hours, would be represented by 60%.) The allocation %, average work week and the
iteration duration is used to determine the number of person days the team has
available for the iteration/sprint.
Figure 21
10. The team member is added to the list.
Page 24
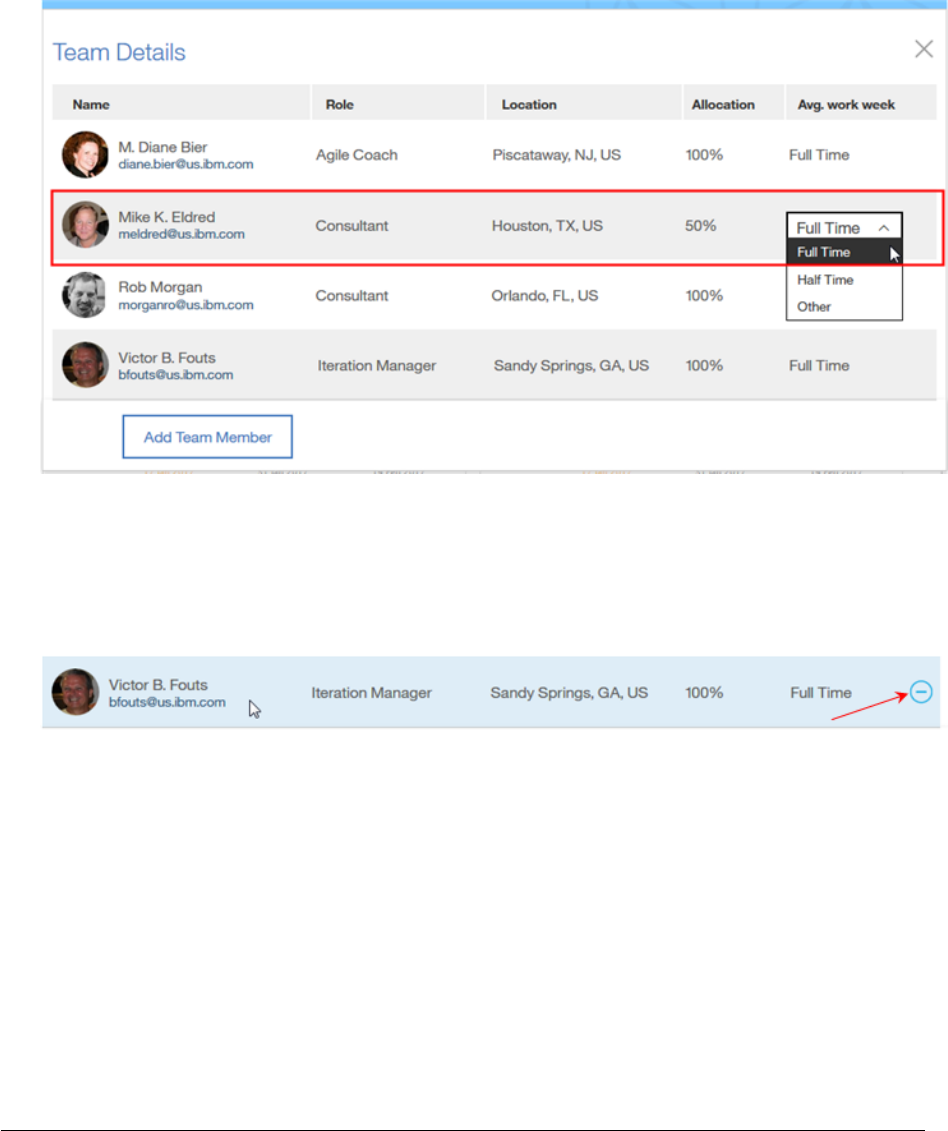
11. To update an existing team member’s Agile role, Allocation % or Average work week
hover your mouse pointer over, or click, the ‘Team Members’ icon. The team
member list appears. Hover over the team member line you want to edit. Edits are
performed by hovering over the field you want to modify and then making a
selection from the provided list or directly entering a new value. See figure 22 below.
Figure 22
12. To remove a team member from the list use the previous steps to display and select
the team member. Click on the ‘Remove member’ icon, figure 23 below.
Figure 23
Page 25
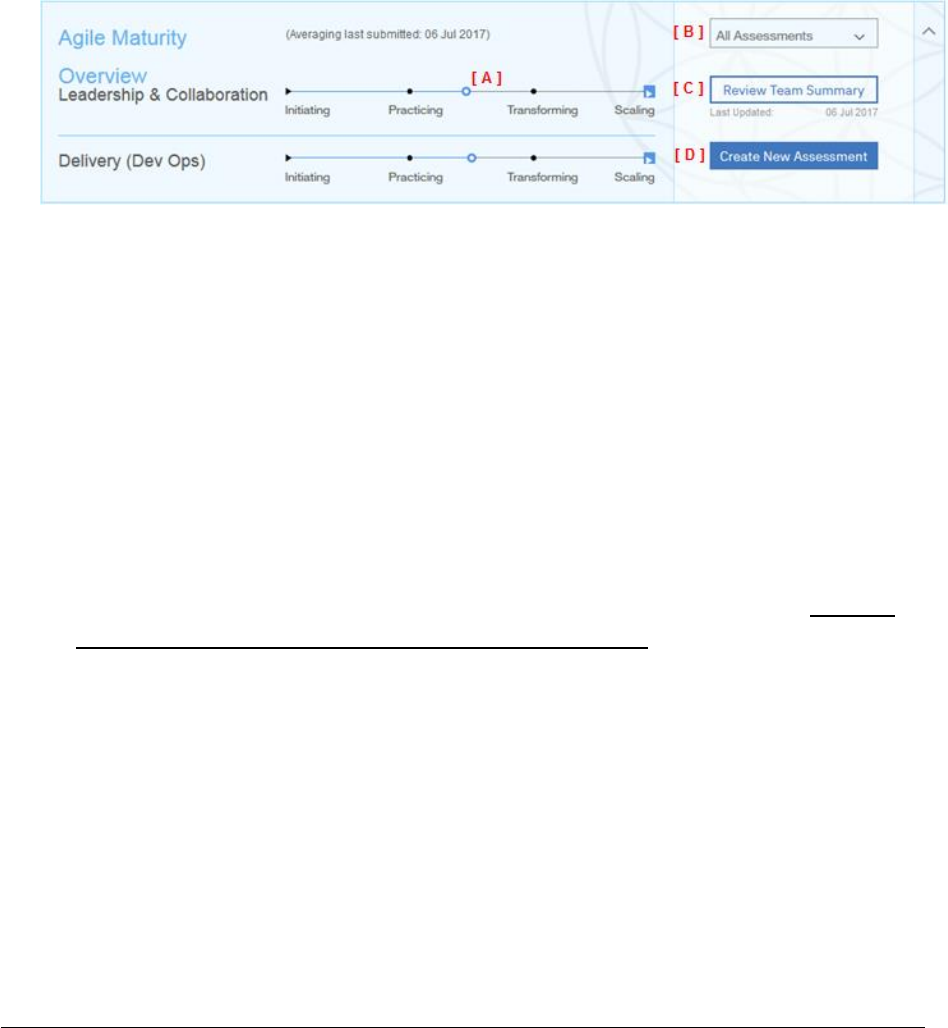
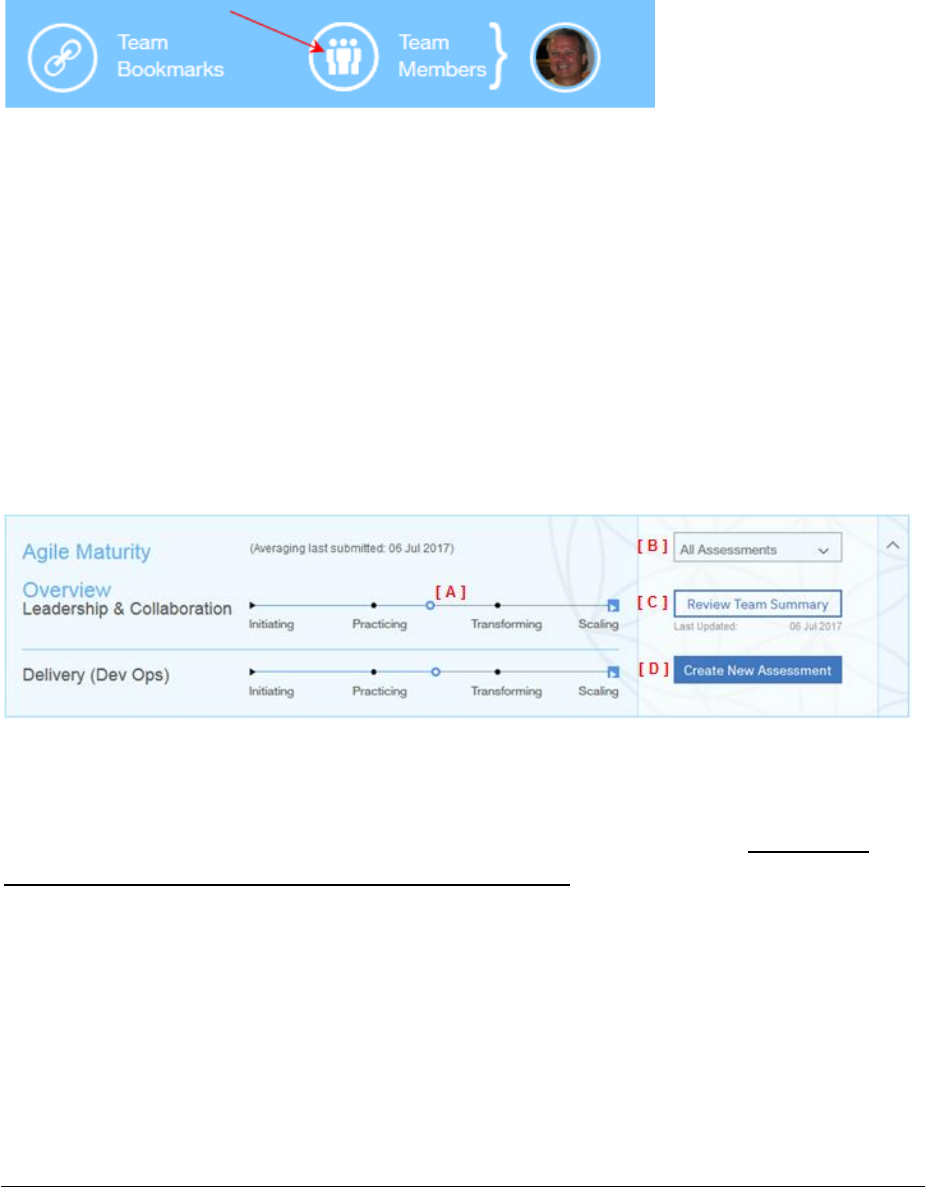
13. Under the team information area you can see the results of the most recently
submitted maturity assessment. (Squad teams only) See figure 24 below.
• [A] Your overall result is dispayed on a sliding scale from Initiating to Scaling.
Information for an assessment in a draft status is not displayed here.
• [B] Previous assessments can easily be selected.
• [C] Reviewing the action plan is as easy as clicking a button.
• [D] If you have edit access you can start a new assessment.
Figure 24
14. Under the maturity overview section is the Trends area that displays iteration and
maturity assessment results for squads in graphical form and enables users to link to
details about those results. By selecting a ‘parent’ team, you can see aggregated
data for the teams that roll up to that parent team.
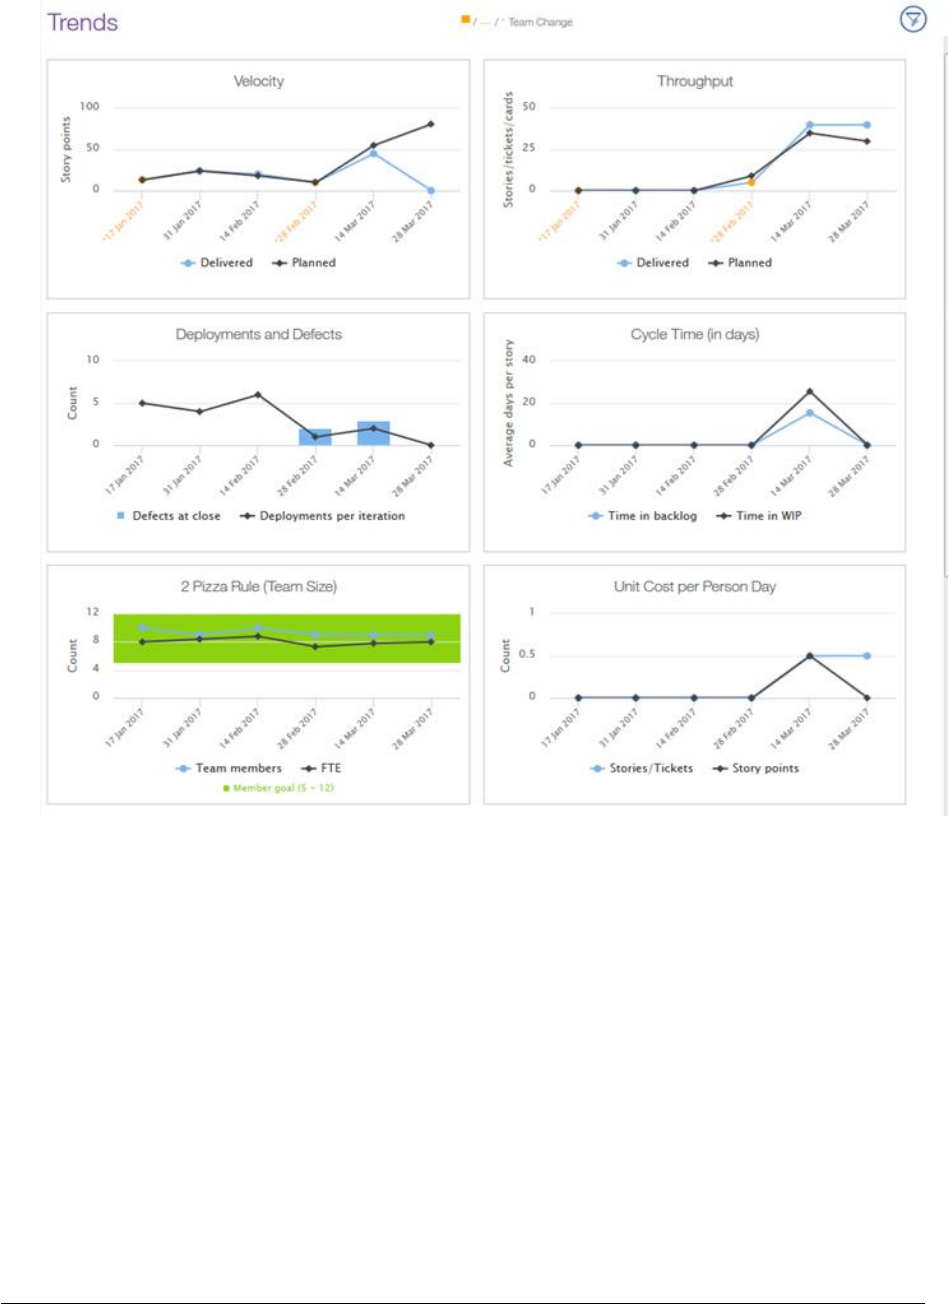
15. A sample of the Squad Team iteration trends is shown in figure 25 on the next page.
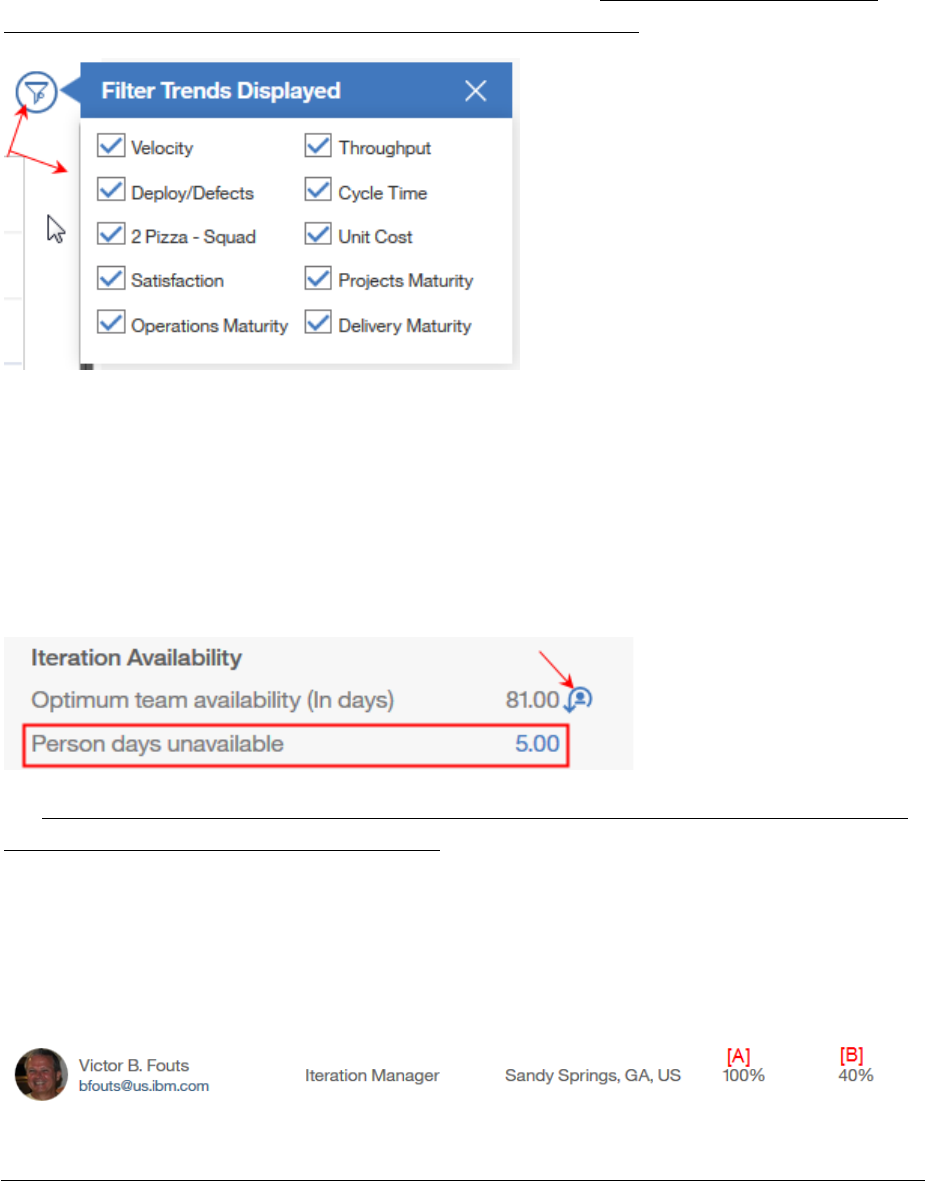
16. If there are graphs in the Trends section that you do not want to display you can click
on the ‘Filter Trends’ icon and deselect them from the list. This will apply to all teams
you select from the team navigation area on the left-hand side. To bring the charts
back, just click the icon and check any graphs you want back in your view. For now,
these filter settings are only saved for the ‘current’ session.
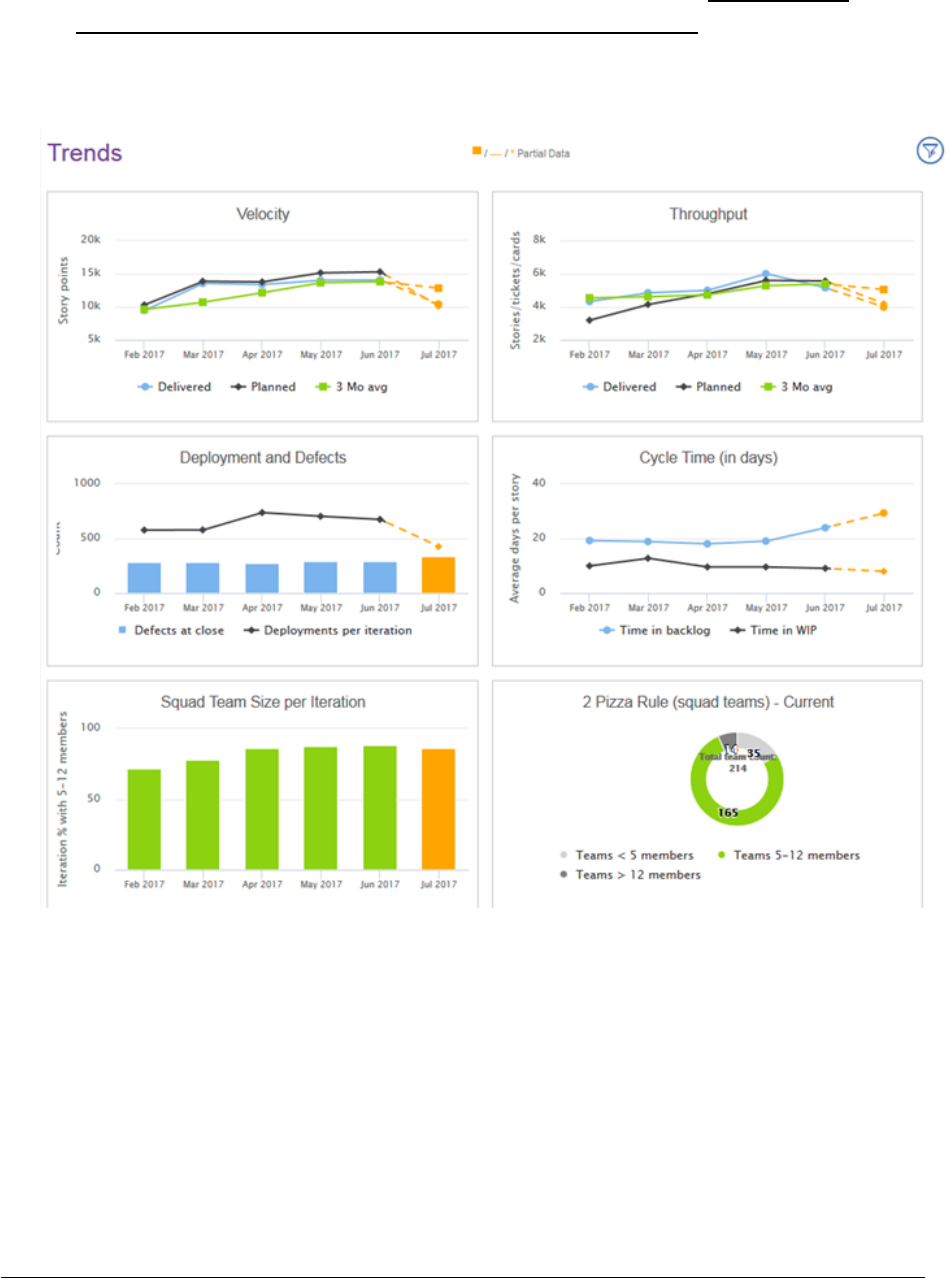
17. The parent team or roll up view looks similar except the periods will be by month
instead of by iteration. See figure 26.
Page 26
Figure 25
18. You can hover over each of the data points to see flyover information about each of
the data points.
19. To see details for a specific iteration, click on the data point and the iteration
information will be displayed in the Iteration Overview section in the right column.
(Squad teams only.) You can also go to the Iteration Overview section and select an
iteration from the drop-down selection.
Page 27
20. For ‘Parent Teams’ containing aggregated data from the squads, the month the
squad data rolls up into is determined by the Iteration End Date of each squad
reporting up to that parent.
Figure 26
Page 28
Deleting a Team
1. From the navigation column in the left column, locate and select the team to be
deleted.
2. In the Team Information section click on the Team Setup icon, figure 27.
Figure 27
3. The ‘Team Setup’ popup appears. Click on the ‘Delete Team’ button, figure 28.
Figure 28

Page 29
4. A confirmation warning appears. Select the ‘Delete’ button to continue with the
deletion; otherwise click ‘Cancel’, figure 29.
Figure 29
5. The team is deleted and removed from the team navigation list in the left column.
Archiving a Team
When a squad team is archived:
a. It is removed from the team navigation view
b. It is no longer counted in the number of squad teams under a parent as part of the
2 Pizza rule circle chart for parents
c. It is no longer considered in the maturity assessment frequency chart that looks at
teams not having an assessment in the last 120 days
d. The metrics will continue to be a part of the parent team's rollup for iteration and
maturity assessment data already submitted
e. The archived squad team will still be listed as a child team when viewing the
associated child teams using the Team Setup function
1. From the navigation column in the left column, locate and select the team to be
archived.
2. In the Team Information section click on the Team Setup icon, figure 30, as shown on
the next page.
Page 30
Figure 30
3. The ‘Team Setup’ popup appears. Click on the ‘Archive’ button, figure 31, as shown
below.
Figure 31
4. A confirmation warning appears. Select the ‘Archive’ button to continue; otherwise
click ‘Cancel’, figure 32.

Page 31
Figure 32
5. The team is archived and removed from the team navigation list in the left column.
Note: It may take several minutes for the following ‘Parent team’ charts to be updated
due to the timing of our ‘snapshot’ job that updates charts every three minutes:
a) The 2 Pizza rule circle graph
b) The ‘Frequency of Maturity Assessment Evaluations’ chart
Page 32
Creating an Iteration
At the end of each iteration it is expected that the Iteration Manager (IM) will create a new
iteration and then enter the results of the team’s most recent iteration into the Iteration
Overview section. This section will focus on the creation of the iteration. To enter iteration
results please see the next section, Entering Iteration Results.
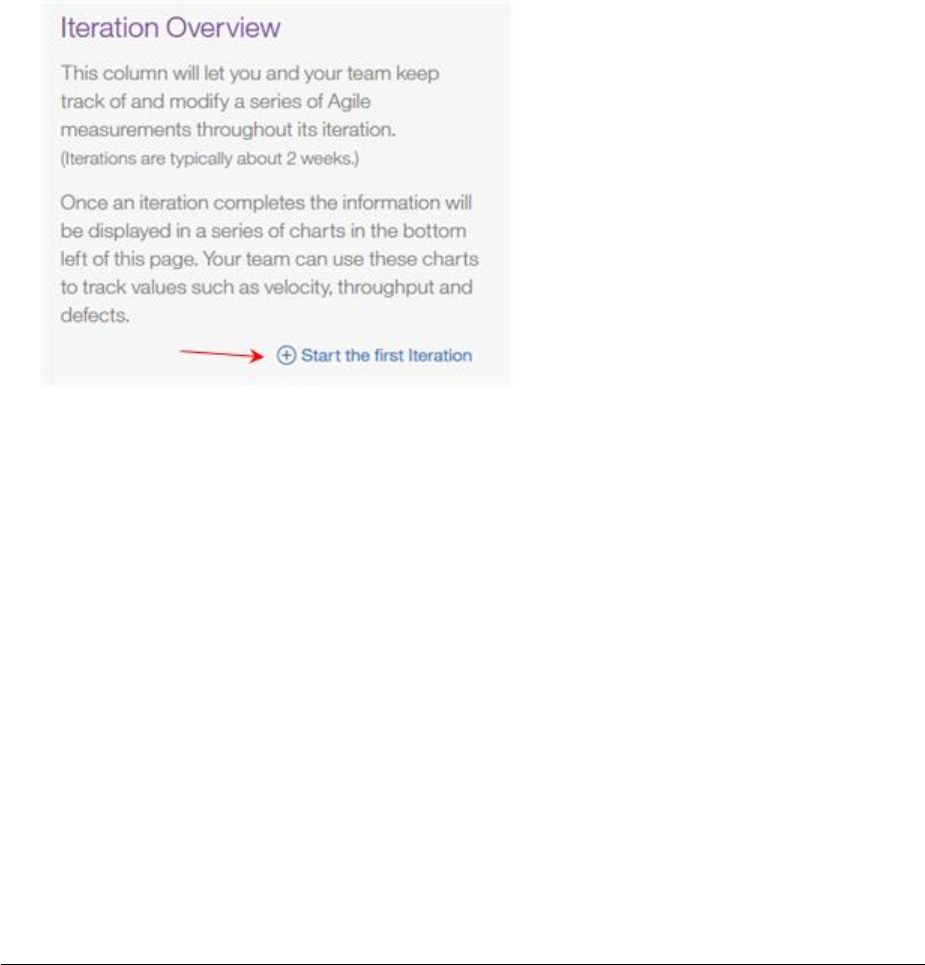
1. If the team has not created at least one iteration you will see something like figure 33
in the Iteration Overview section. If you do not see figure 33 for the selected team
this is NOT the team’s first iteration. Go to step 6.
2. Click on ‘Start the first Iteration’.
Figure 33
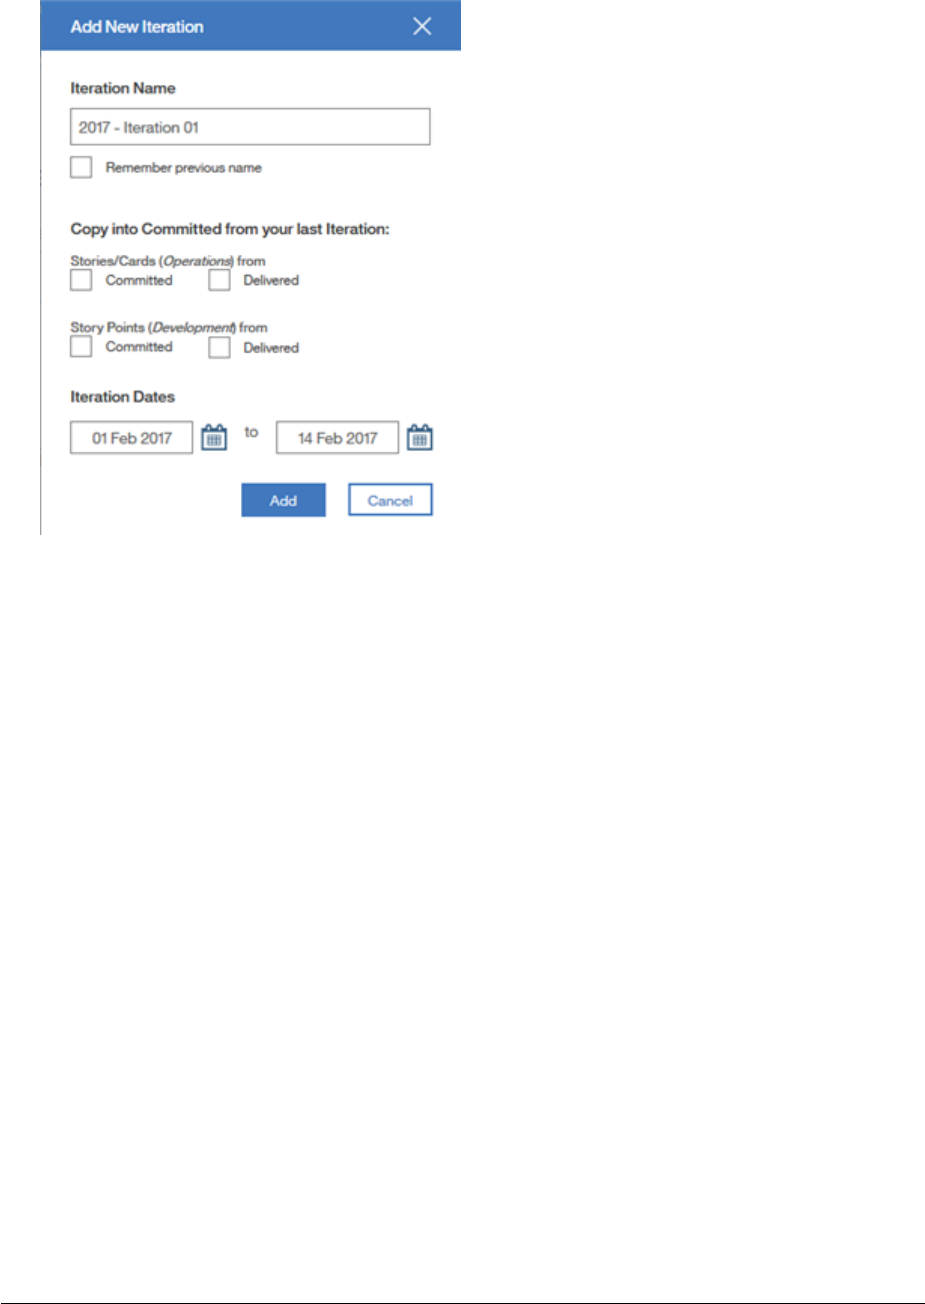
3. The ‘Add New Iteration’ pop up appears as shown in figure 34 on the next page.
4. Enter the name of your first iteration and select the start date for the iteration. You
will notice that when you selected a start date the end date was automatically
populated based on a 2-week iteration. If your team is NOT on a 2-week iteration
you can select a different date. Click ‘Add’. (The other boxes are not relevant for the
very first iteration but they can be used for all iterations following the first one.
More on this later.)
5. A confirmation window appears that you have successfully added iteration
information. Click on OK.
Page 33
Figure 34
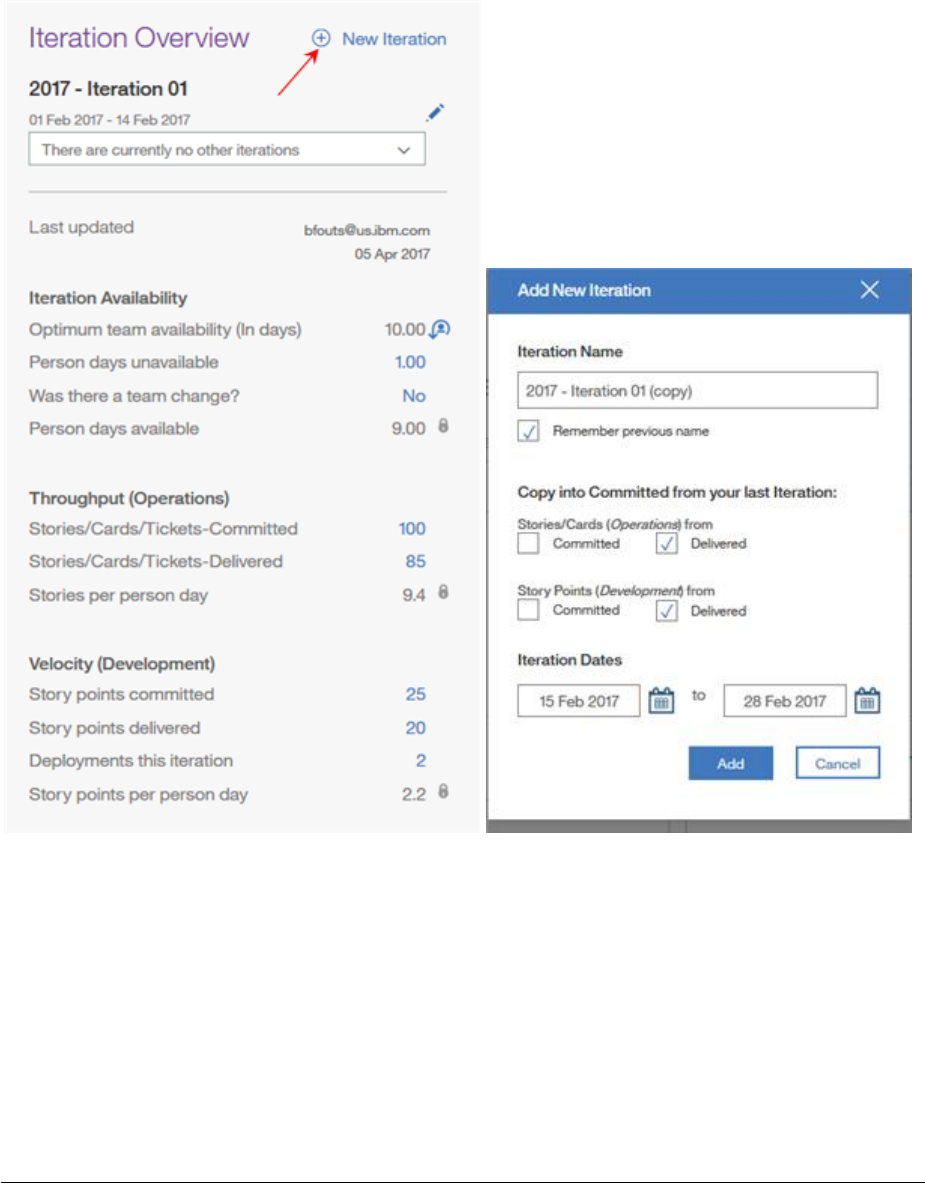
6. If this is NOT the team’s first iteration you will see something like figure 35 shown on
the next page.
7. Click on the ‘New Iteration’ icon in the upper right corner.
8. The ‘Add New Iteration’ pop up appears, figure 36, but you will notice several boxes
already checked and the start & end dates are already populated.
9. The iteration name was copied from the previous iteration with ‘copy’ appended on
the end. You can choose to keep the copied name and make a minor change to it, i.e
change the iteration number to a 2, or uncheck the ‘Remember previous name’ box
and enter a totally different name.
10. Next, you need to decide if you want to copy the Planned or Delivered values of
Stories/Cards and Story Points into your Planned numbers for this new iteration. Click
the appropriate box to copy or you can elect to uncheck the boxes to not copy and
enter the planned values after your planning session.
11. You may have noticed the iteration start date was populated by adding one day to
the end date of the previous iteration. Verify or update your iteration start & end
dates. (The default is for 2-week iterations.)
12. Click on ‘Add’.
Page 34
13. A confirmation window appears that you have successfully added iteration
information. Click on OK.
14. Your Iteration Overview section is updated with the new information.
Figure 35 Figure 36
Page 35
Entering Iteration Results
The previous section focused on the creation of the iteration. In this section, we will focus
on entering iteration results.
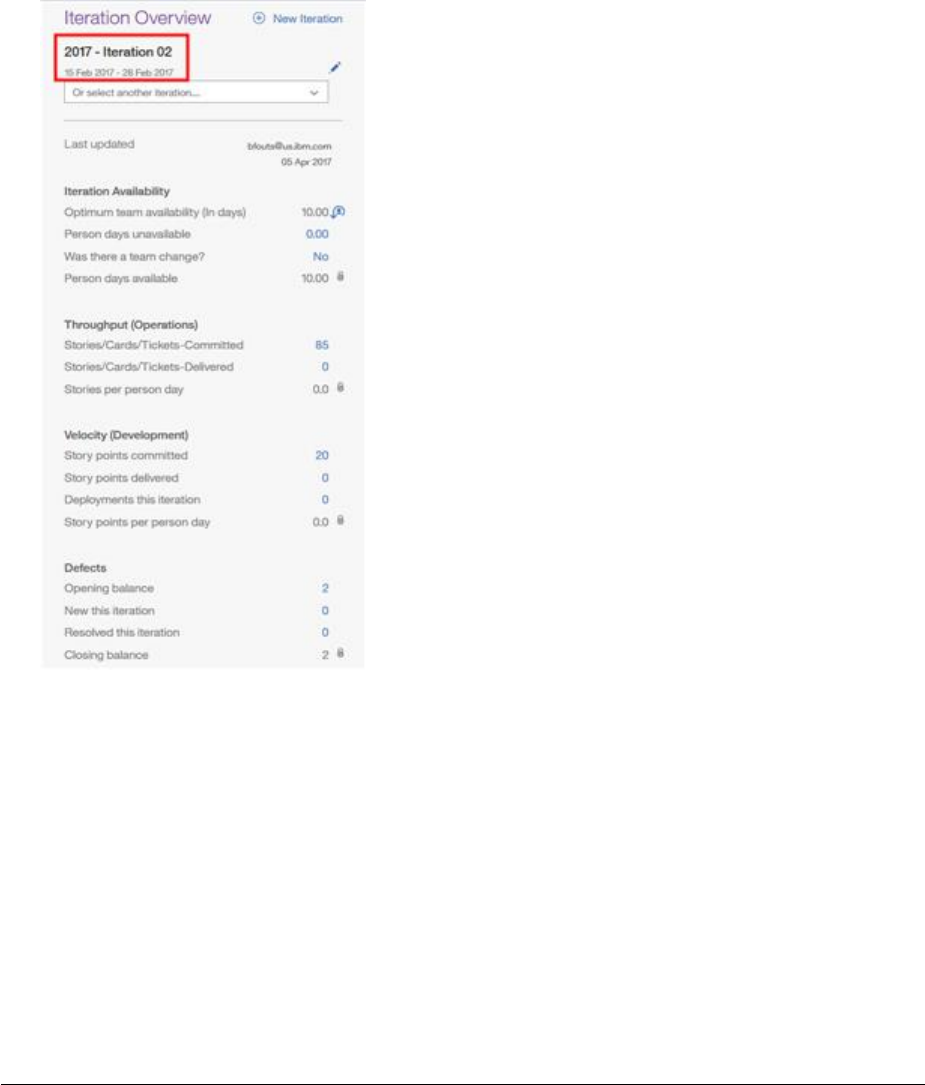
1. In the Iteration Overview section make sure you have the correct iteration selected
for which you want to enter results for. Check the iteration number and the start /
end dates as shown in figure 37 below.
Figure 37
2. With the correct iteration selected, fill in the ‘committed’ fields for your team with
information from your planning session. For assistance, we have provided an
explanation of each field as a ‘flyover’. Move your mouse pointer over each field
name and informational text will appear for an explanation.

Page 36
Committed Guidance:
• If your squad tracks stories, tickets or cards, enter or update committed stories. OR
• If your squad estimates story points, enter or update your committed story points.
• If your squad does end to end activities (for example project and operations work),
you may choose to enter stories and story points but do NOT count them twice. Use
stories/cards/tickets for operations work and story points for the delivery work.
3. At the end of the iteration, complete the remaining fields based on what was
delivered by the team.
Iteration Availability:
• As mentioned earlier in this document, we have introduced the concept of ‘Person
Days’ for each iteration. We compute the optimum team availability, in days, based
on the number of work days (Mon-Fri) in an iteration using the iteration Start / End
Date, each team member’s Allocation % and their Full Time, Part Time status.
• All you have to do is enter the total number of days your team members were
unavailable during the iteration as a whole. If you make changes to your team
structure during the course of an iteration you can reset the Optimum team
availability value by clicking on the ‘Team Reset’ icon.
• Indicate whether there was a Team Change or not.
• The ‘Person days available’ will be calculated for you.
Throughput (Operations):
• If your squad tracks stories / tickets / cards, enter delivered stories.
• The stories per person day will be calculated for you.
Velocity (Development):
• If your squad tracks story points, enter delivered story points.
• Enter the number of deployments this iteration; code promotions to the production
environment.
• The story points per person day will be calculated for you.

Page 37
Defects:
• The Opening balance is typically brought in from the previous iteration’s ‘Closing
balance’ but if this is your first iteration you can enter a value here that represents the
number of defects your team is working to resolve
• Indicate the number of defects discovered in production for the current iteration.
• Indicate the number of defects resolved this iteration.
• The closing balance of defects will be calculated for you.
Cycle Time:
• Enter the Cycle Time in WIP (Work in Progress) for this iteration. (more information
on WIP cycle time is displayed when you hover over the field name as a flyover.)
• Enter the Cycle Time in Backlog for this iteration. (like WIP cycle time, more
information is displayed when you hover over the field name as a flyover.)
Overall Satisfaction:
• Enter your Net Promoter Score (NPS) if you have the means to capture NPS. (more
information on NPS is displayed when you hover over the field name as a flyover.)
• Enter your Client and Team Satisfaction scores for this iteration ranging between 1.0
and 4.0
4. Enter any comments you may want to make about this iteration, i.e. why a team
change, why a drop or increase in velocity, etc.…
** Note ** Your iteration results will not appear in the Trends Charts until the following
criteria is met:
Iteration results (>0) are entered in at least one of the following fields:
I. Stories delivered
II. Story points delivered
III. Deployments
IV. Defects
V. NPS Score
VI. Client sat
VII. Team sat
AND the iteration end date is > or = current date
Page 38
Creating a New Maturity Assessment
Depending on the type of work your team does (Operations or Project) your team will
take one of two assessments for Leadership and Collaboration and if your team delivers
software you should take the Delivery portion of the assessment. The delivery portion is
sometimes referred to as the DevOps assessment.
1. Select your team from the team navigation list in the left column.
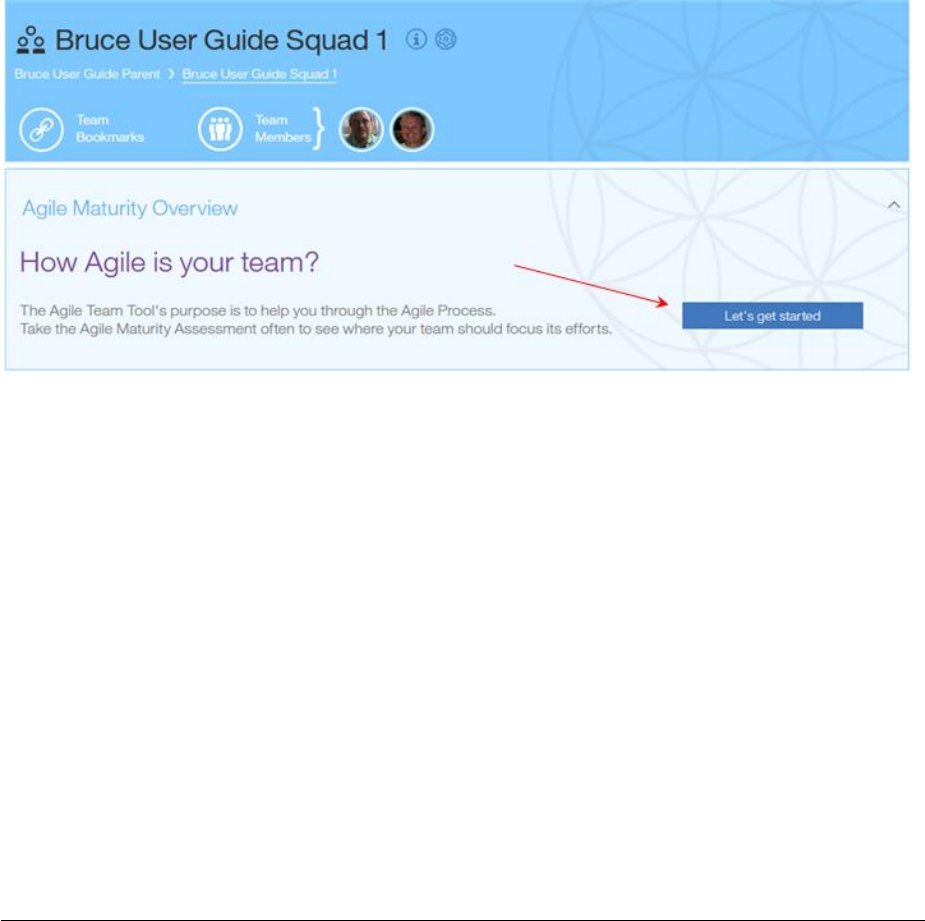
2. If you are creating the very first assessment for your team, the center column of your
home page will look similar to that shown in figure 38 below.
3. Click on ‘Let’s get started’. If this is NOT the very first assessment click on the ‘Create
New Assessment’ button.
Figure 38
4. You will be presented with a pop up asking you to identify the type of work your
team does. See figure 39 on the next page.
5. Read the explanation for each question and make the appropriate selection for your
team.
6. Click on ‘Continue’.

Page 39
Figure 39
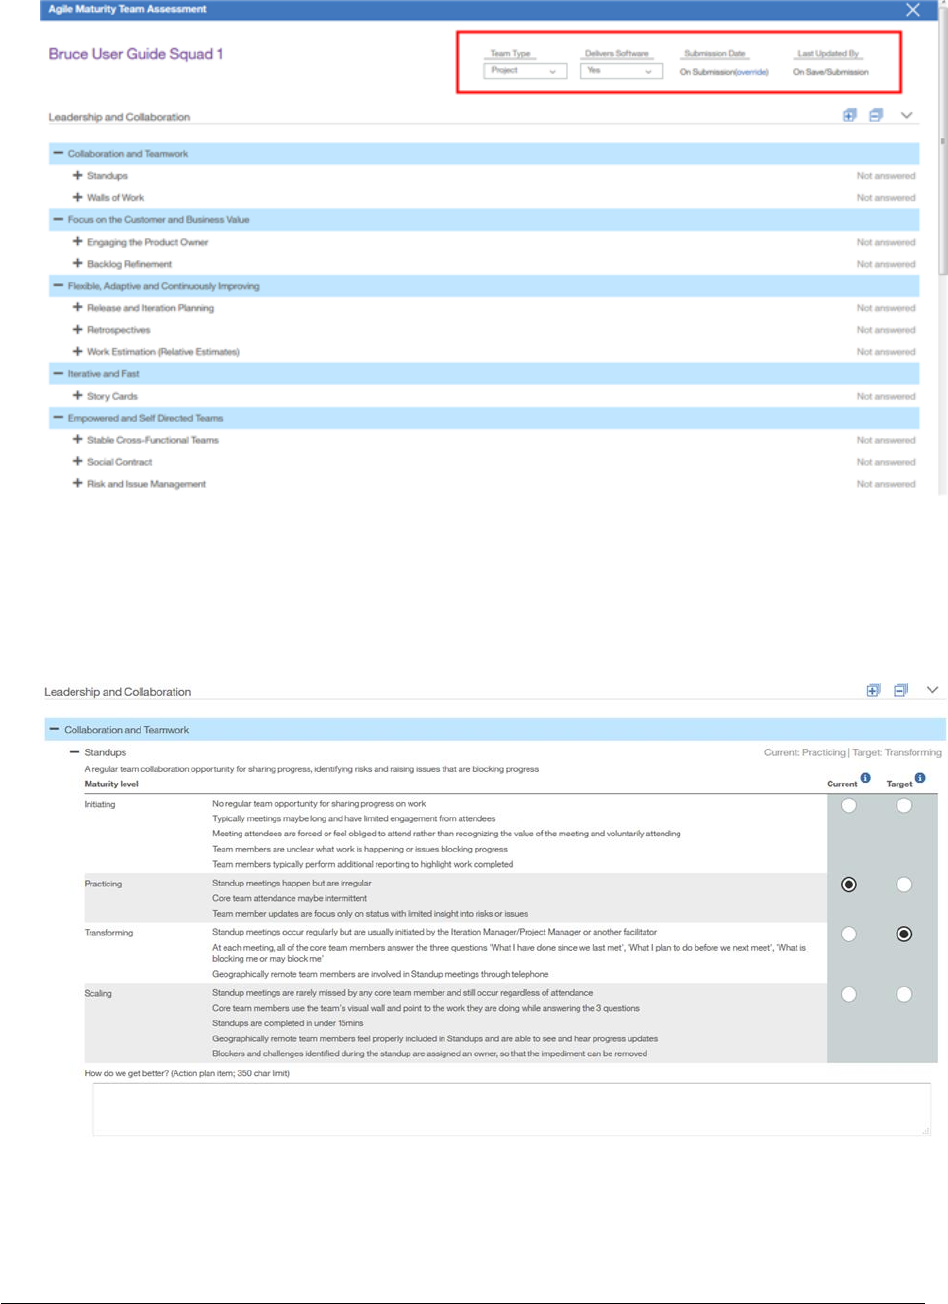
7. The agile maturity assessment appears as a pop up window. See figure 40 on the
next page.
8. You will notice in the top right corner the values you selected in previous steps
regarding the type of work your team does and if your team delivers software. These
values can be changed here if they are not correct.
9. You might notice the submission date has an override function. If you are entering
information for an assessment taken prior to using the Agile Team Tool and you are
entering data for historical and trending purposes, you can click on ‘override’ and
select the actual date your team previously did the assessment.
10. You will also notice that the Agile Principles are expanded but the Agile Practices are
collapsed.
Page 40
Figure 40
11. Expand each practice as you scroll down the list indicating the maturity level of your
team for each practice by clicking the appropriate radio button in the ‘Current’
column. See figure 41 below.
Figure 41
Page 41
12. Once you have selected your team’s current maturity level, select the appropriate
radio button under the ‘Target’ column to indicate the level that the team wants to
attain by the next assessment cycle. See Figure 41 above. (It is recommended that
you schedule assessments every 90 days so the team can improve their maturity
incrementally).
13. For each practice, you have the option to enter an action plan item on how you can
get better. At a minimum, you should enter action items for those practices that are
targeted for improvement.
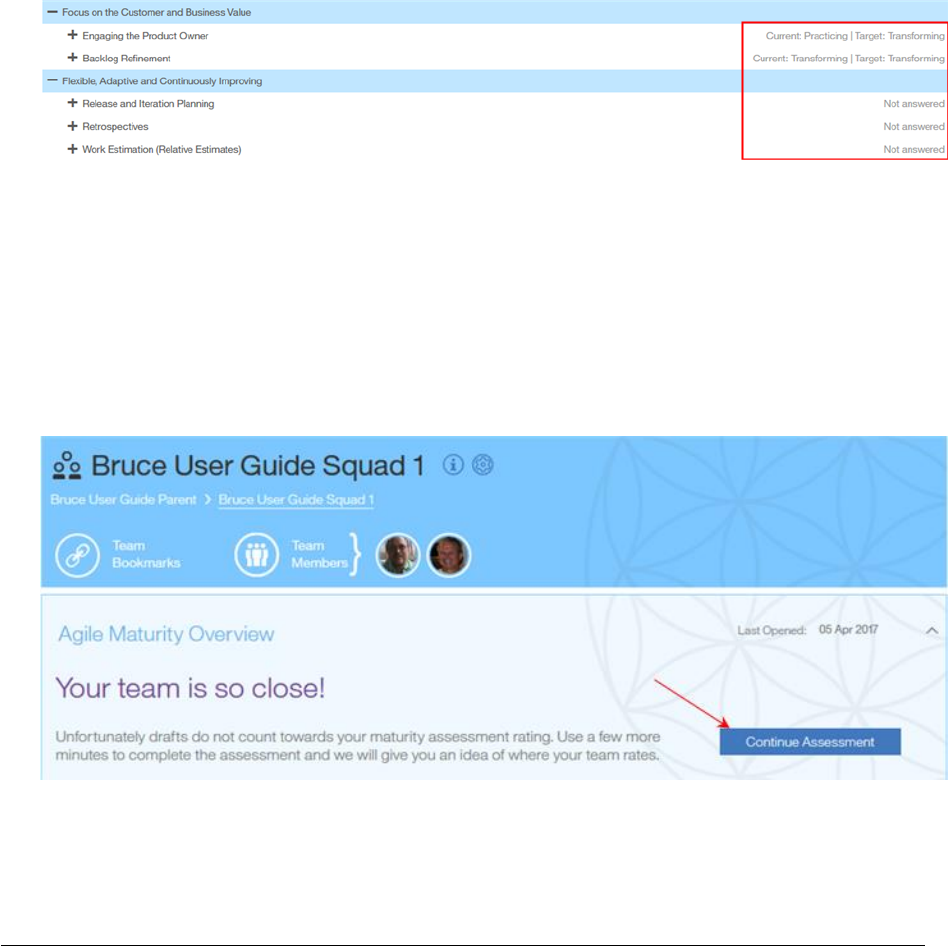
14. As you proceed through the assessment you can easily see which practices you have
responded to and those still left unanswered. See figure 42 below.
Figure 42
15. If you are unable to complete the assessment click on the ‘Save as draft’ button at
the bottom of the window at any time and return later to complete your assessment.
(You may have to scroll down to see the button.) To return to an incomplete
assessment click on the ‘Continue Assessment’ button in the Agile Maturity Overview
section on the main page, see figure 43 below.
Figure 43
Page 42
16. Complete all sections and click the ‘Submit’ button when finished. Once submitted
you can NOT make changes to any of the ‘Current’ and ‘Target’ values. You can only
make updates to the Action Plan once submitted.
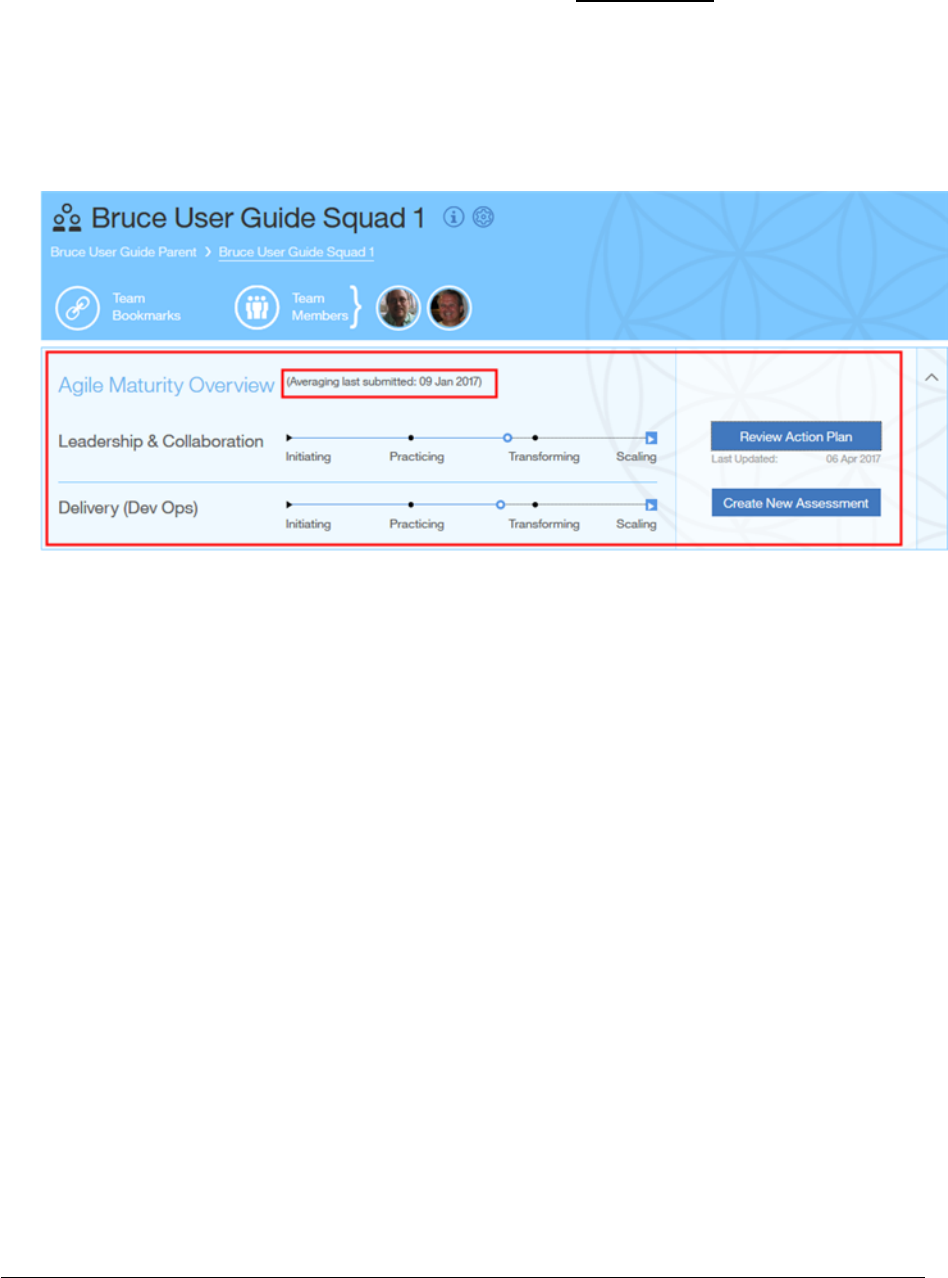
17. Once submitted, the Agile Maturity Overview section will be updated with your
overall assessment results. See figure 44 below. The small red box reflects the date
your assessment was submitted or the override date selected for this assessment.
Figure 44
Page 43
Viewing your Agile Maturity Assessment Summary
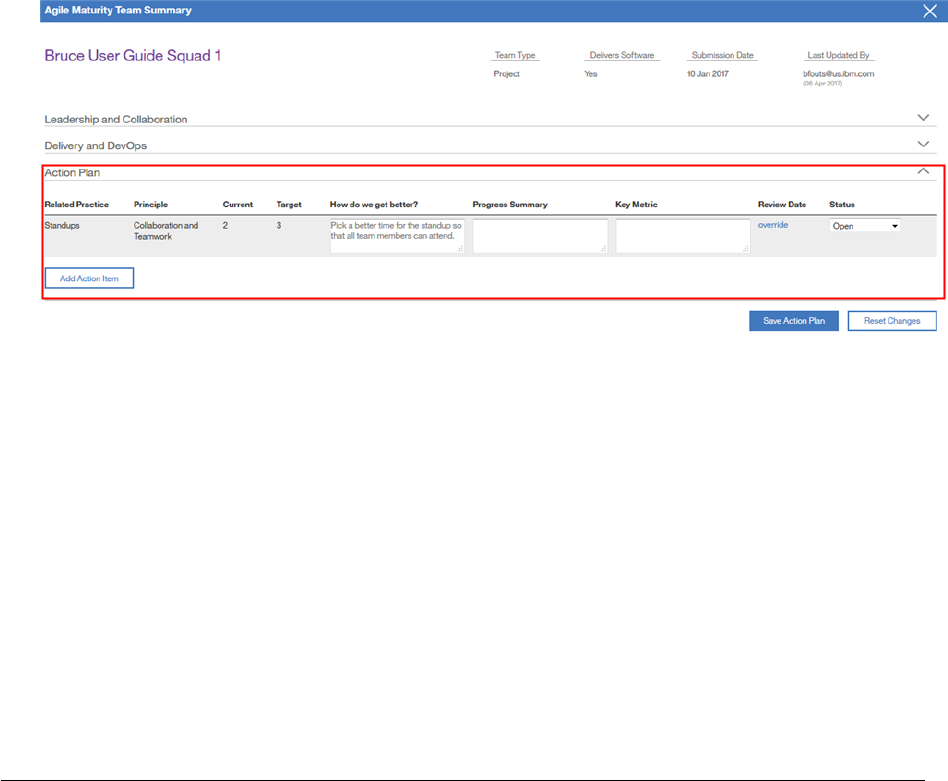
1. To review your Action Plan at any time, click the ‘Review Action Plan’ button. You
will be presented with the ‘Agile Maturity Team Summary’ screen. Your action
plan items will be at the bottom of the page. See figure 45 below.
2. (This view is available once you submit an assessment). You can add additional
line items to the action plan by selecting the ‘Add Action Plan’ button if you wish.
3. Here you can track your progress and close them as they are completed.
4. Key metrics can be defined and recorded. For example, the team may want to get
their standups duration to 15 minutes or less.
5. Review dates for the actions items can be set.
6. Progress can be recorded in the Progress Summary field.
7. Status is tracked in the Status field, i.e. Open, In Progress, Closed.
Figure 45
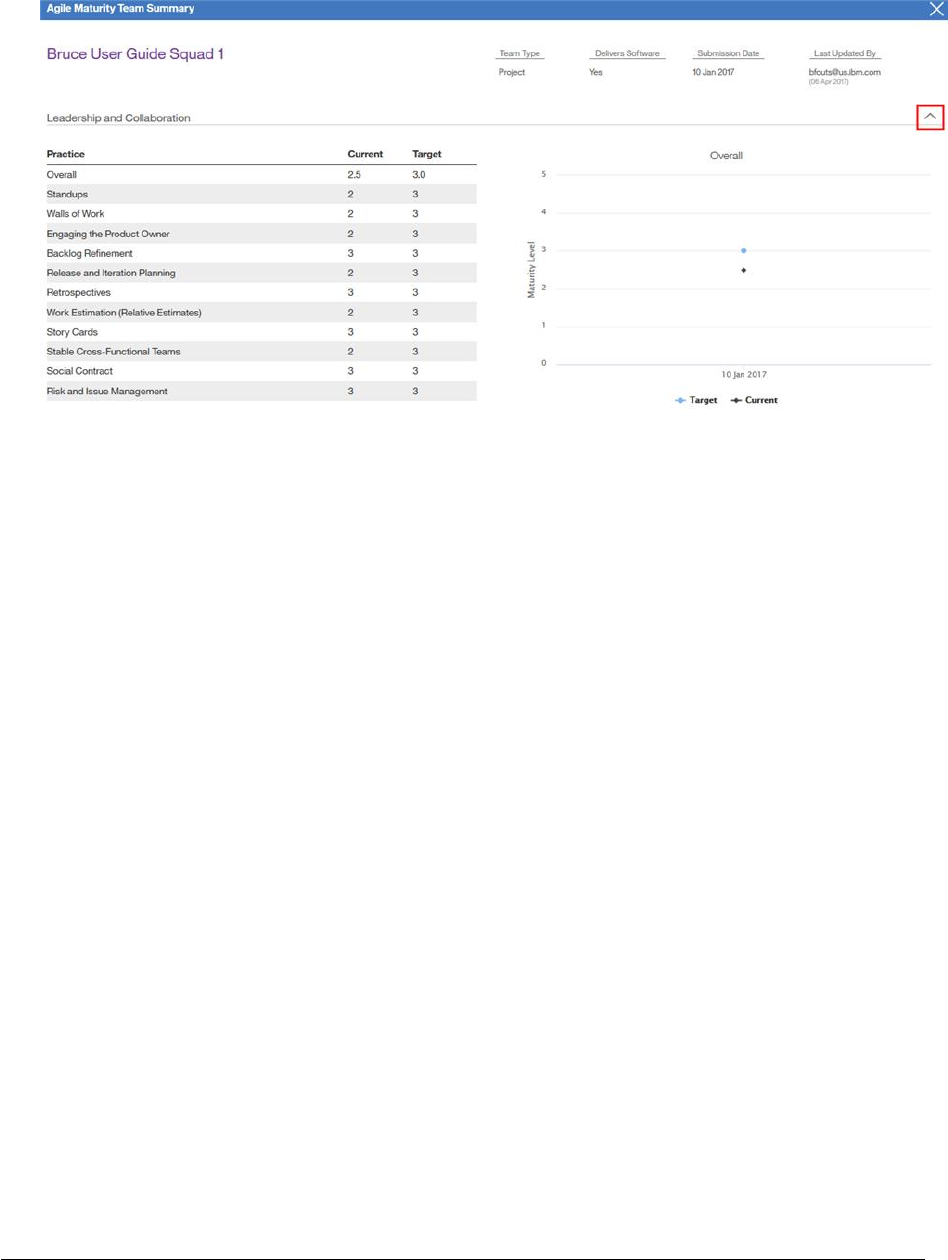
8. To view the summary results of your assessment, expand the collapsed section
for the area you want to view, i.e. Leadership & Collaboration, Delivery &
DevOps, etc.
9. Here you will see the overall summary for the ‘Current’ and ‘Target’ values
submitted for this assessment as well as values for each agile practice. Trends are
charted on the right side as more assessments are submitted. See figure 46 on
the next page.
Page 44
Figure 46
10. By default, the Overall summary values are charted on the line graph.
11. If you want to view the trend for any of the individual practices click on the
Practice name. The graph on the right displays the trend for the selected
practice.
12. To return to the home page close the summary window using the ‘X’ in the upper
right corner.
Page 45
View a Previously Submitted Maturity Assessment
1. Select the team you want to view from the team navigation list in the left column of
the home page.
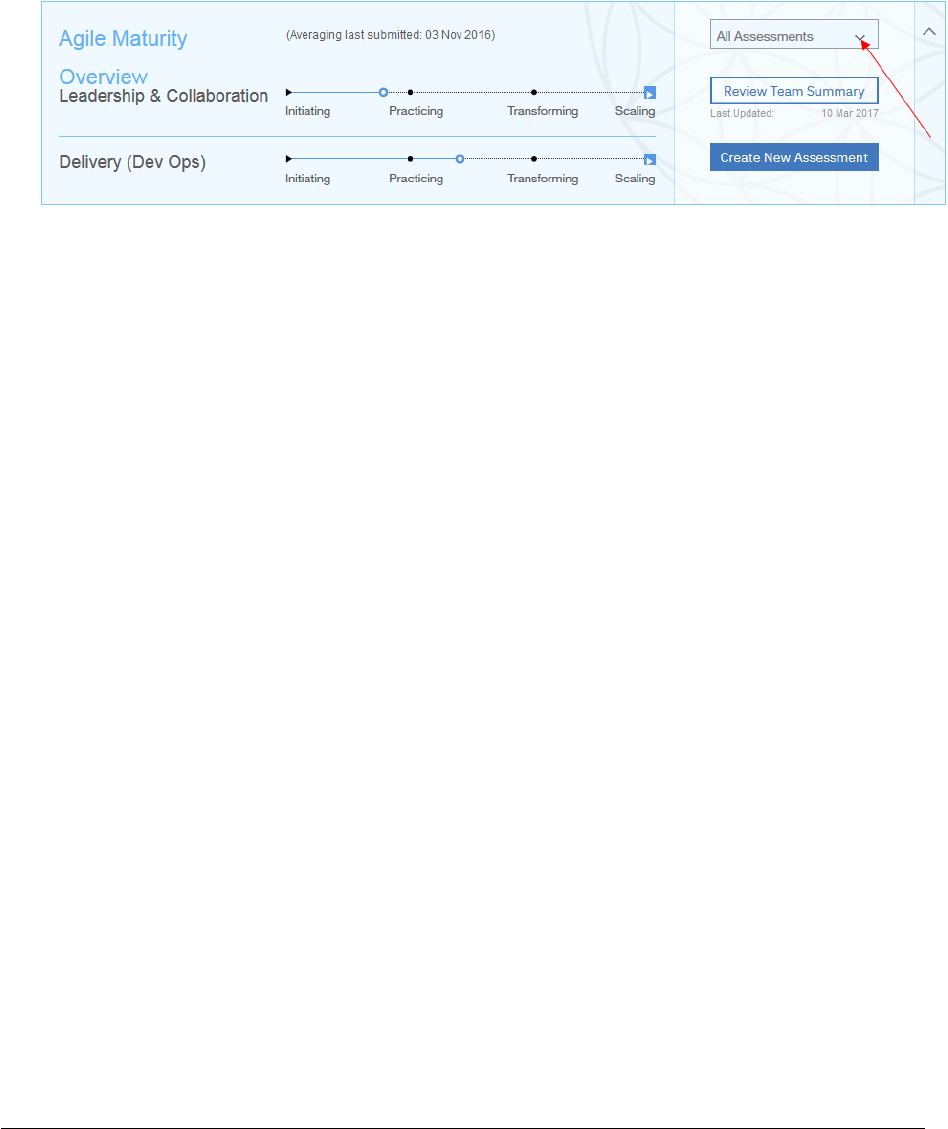
2. In the Agile Maturity Overview section, select an assessment date from the drop-
down list using the ‘All Assessments’ button. See figure 47 below.
Figure 47
3. The linear scale chart is updated with the overall assessment values for the selected
assessment.
4. Click on the ‘Review Team Summary’ button.
5. You are presented with the ‘Agile Maturity Team Summary’ screen.
6. All sections are expanded by default.
7. Scroll down to view the overall summary for the ‘Current’ and ‘Target’ values
submitted for this assessment as well as values for each agile practice. Trends are
charted on the right side as more assessments are submitted. See figure 46 on the
previous page.
8. Click on the practice name to see the trends for that practice.
9. At the bottom, you will see action plan items the team agreed to work on.
10. To return to the main screen, close the summary window using the ‘X’ in the upper
right corner.

Page 46
Appendix A – Notes
• A Squad Team is the lowest level team in the Agile Team Tool hierarchy, i.e. Level 1
• Squads normally report up to a Tribe (Level 2), but it can also be directly associated to a
Level 3 or Level 4 team.
• Tribes report up to a Sub-Domain; Level 3 (CIO statement).
• Sub-Domains report up to a Domain; Level 4 (CIO statement).
• Team members can be on multiple teams.
• A person can be on the team member list more than once, i.e. two different roles at
different allocation % but will only be counted once in the team member count.
o Individuals added to the team member list at 0% allocation are NOT counted
in the 2-Pizza rule chart as part of the ‘core team’.
• A parent team can have multiple teams underneath it but a team (squad or parent) can
have ONLY one parent.
Page 47
Appendix B – Reading the Trends Charts
Parent Teams – Displays the current month minus 5 using ‘Iteration End Date’ for the
reporting period
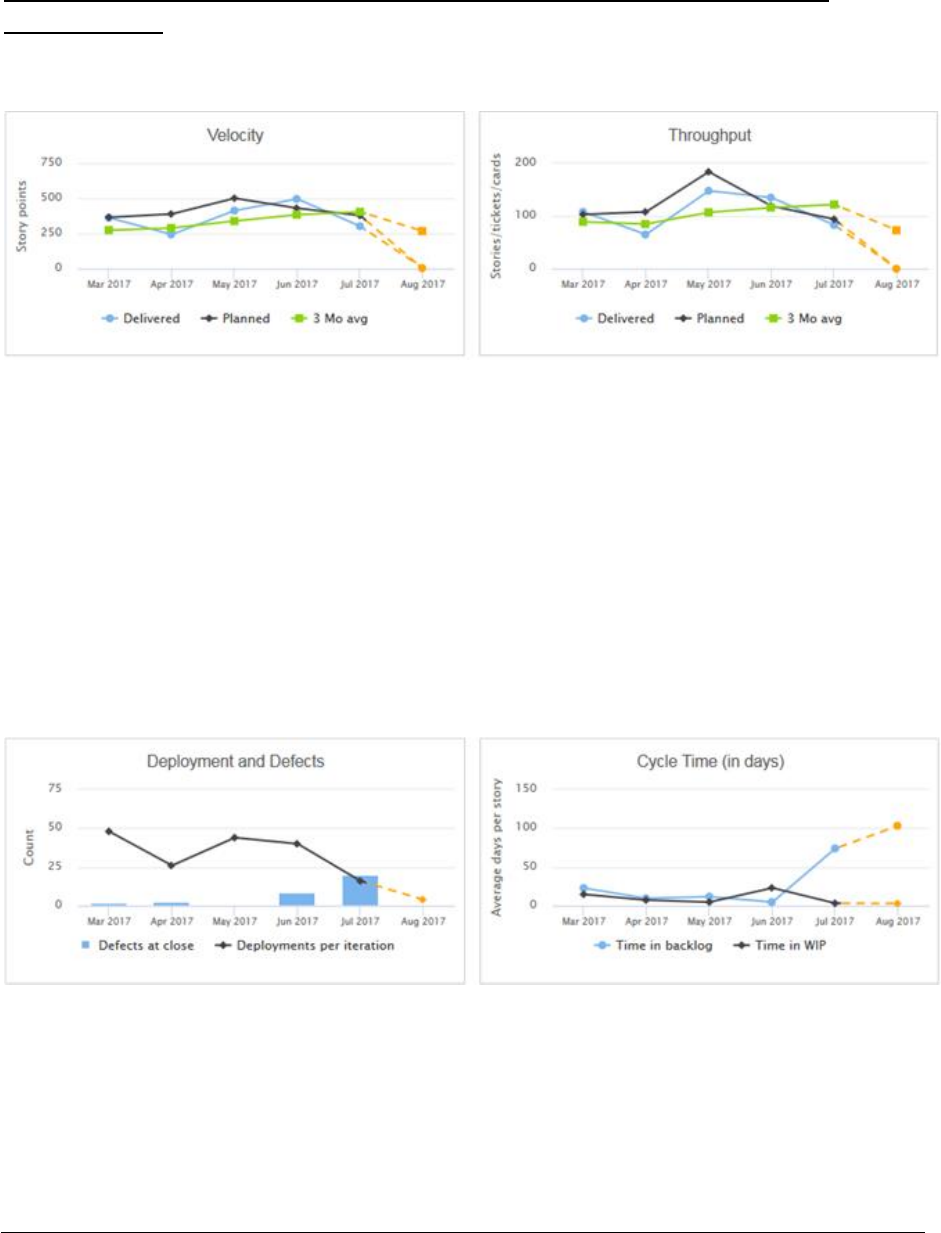
• Velocity and Throughput graphs are displaying a straight rollup of story points
(Velocity) or number of stories (Throughput) for all squad teams rolling up to the
parent team through the parent team hierarchy. We display the Planned number as
well as what was reported as Delivered.
• The green line shows a rolling 3-month average of the Delivered. In the example
above, Jun 2017 is an average of April, May, and June.
Hint: You can click on any of the legend labels, i.e. Planned, and that line is removed from
the chart so that you can more easily see the remaining 2 lines. To bring it back just click on
the legend label again. (You can do this on any of the charts in the Agile Team Tool.)
• Deployments and Defects, like Velocity and Throughput, is a straight rollup of the
number of Deployments and the closing balance of Defects.
o Deployments are considered code drops to the production environment.
o Defects represents the number of all open defects in the production
environment at the end of the reporting period. For Defects, we ONLY look at
a squad team’s last iteration for the reporting period for rolling up the closing
Page 48
balance. For squads with two iterations in the reporting period this
eliminates counting the same defect twice.
• Cycle time reflects the time, measured in days, our stories are either in Backlog or in
Work in Progress. Some squads are not computing and thus not reporting cycle time
yet. For this measurement, we only consider those values > 0 in the calculation.
o There has been much discussion on when the clock starts or stops for each of
these measurements. Some think weekends and holidays should not be
included in the calculation while others think they should. The ‘help-aid’
available in the Agile Team Tool help section (Excel spreadsheet) only uses
‘workdays’ (Mon – Fri) as part of the calculation but this could change with
new direction from the office of the CIO.
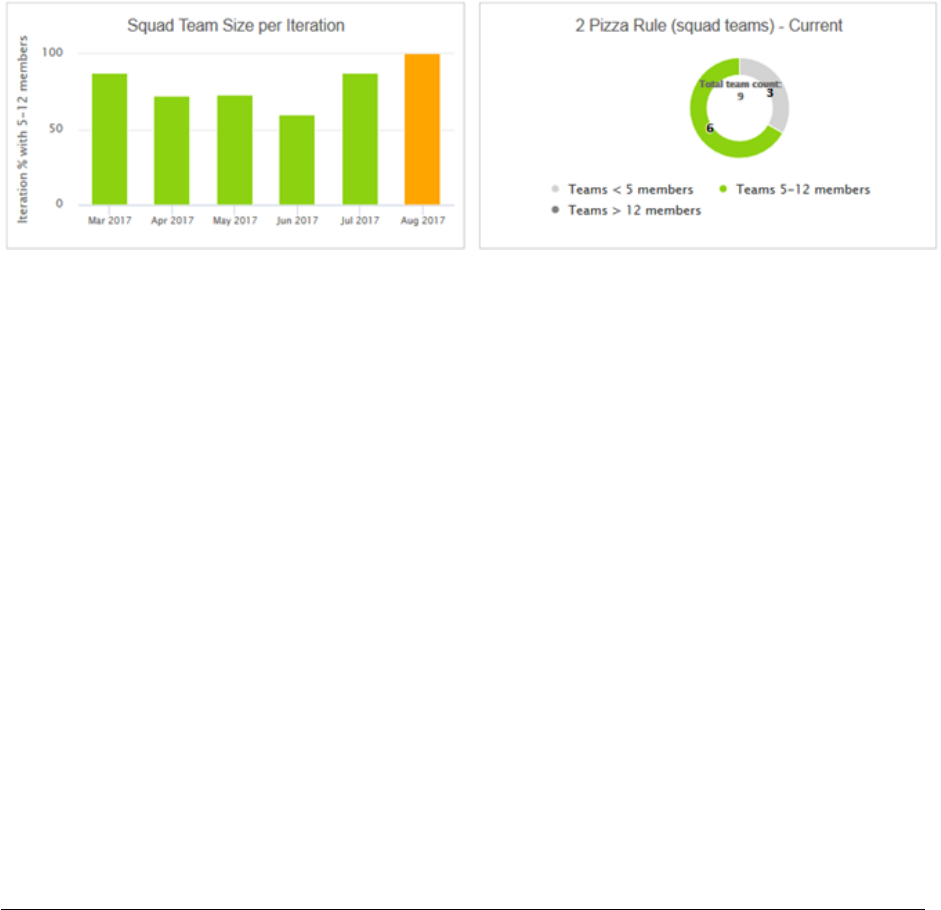
• Squad Team Size per Iteration reflects how often iterations are conducted with the
right size teams.
o Currently, we are considering 5-12 team members as the right size team for
agile adoption. This chart shows you the % of iterations reported having the
right size team at the time it was reported. Ideally, you would want all
iterations (100%) conducted with teams of the right size.
• The 2-Pizza Rule circle chart gives management a view of how many squad teams
report up to this parent team and whether they are the right size. In the example
above, this parent team has 9 squad teams of which 6 are the right size.
o This chart is not based on any reporting period. It reflects the team’s size at
the time you displayed the information in the Agile Team Tool.
Page 49
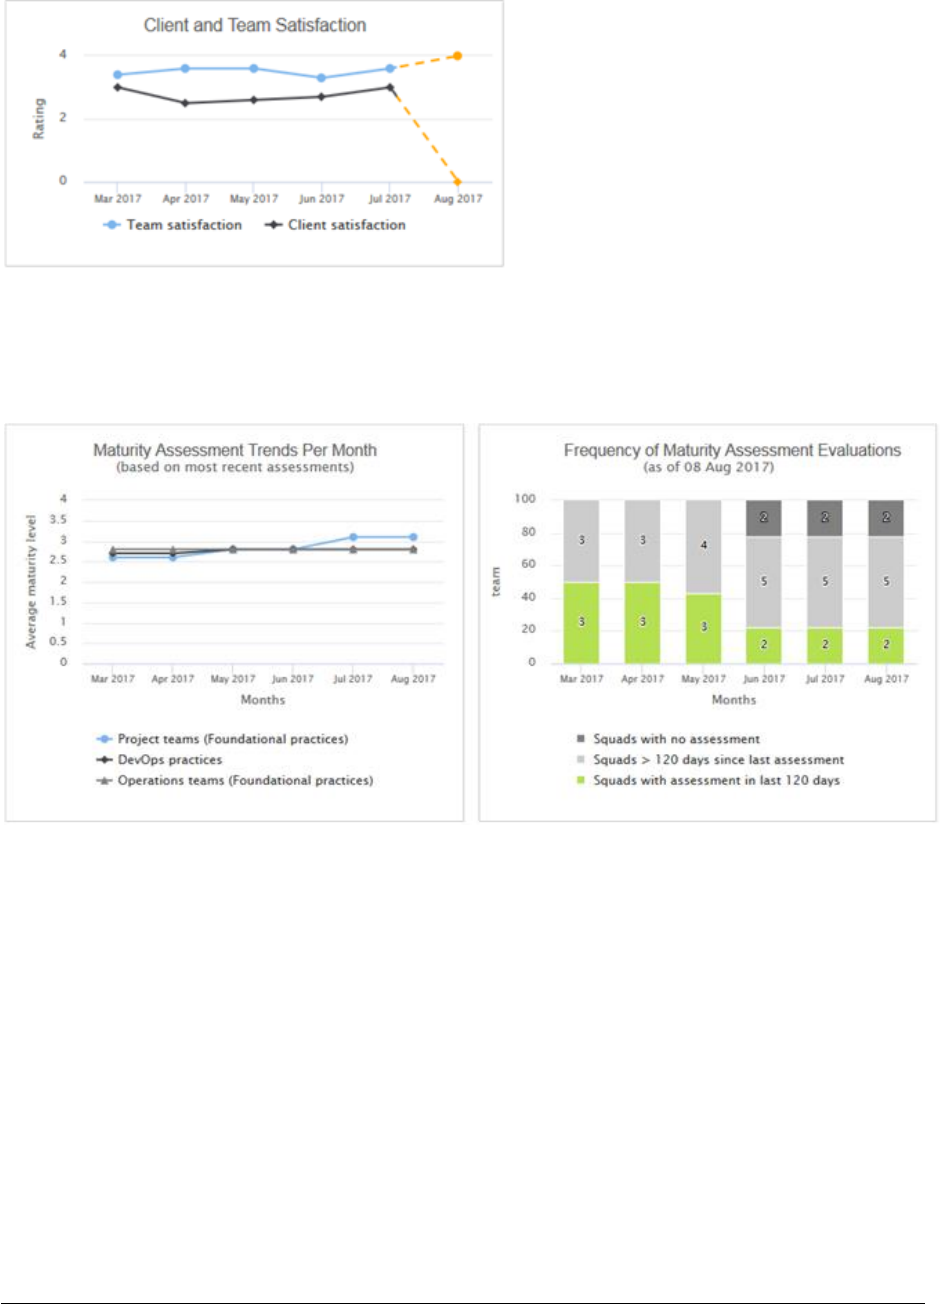
• Client and Team Satisfaction is a rolled-up average of the Client and Team
satisfaction scores reported by each of the squads for the reporting period. Since
these are not required fields, we only consider those values > 0 in the calculation.
• Maturity Assessment Trends Per Month displays the average Overall Current Score
for the most recent assessment taken by the squad teams. The key take-away here is
‘the most recent assessment’. Because assessments are normally taken every 90-120
days it is possible that you might not see much fluctuation for a couple of months at
a time.
o Keep in mind that we have 3 assessment sections; Two for Leadership &
Collaboration (Operations & Project teams) and one for Delivery / Dev Ops.
o Remember, you can toggle the display of the graphed lines if they are difficult
to differentiate.
• Frequency of Maturity Assessment Evaluations lets management know how long it
has been since the squads did a maturity assessment. In the example above, only 2
teams have done an assessment in the last 120 days and 2 teams have not done an
assessment at all.
Page 50
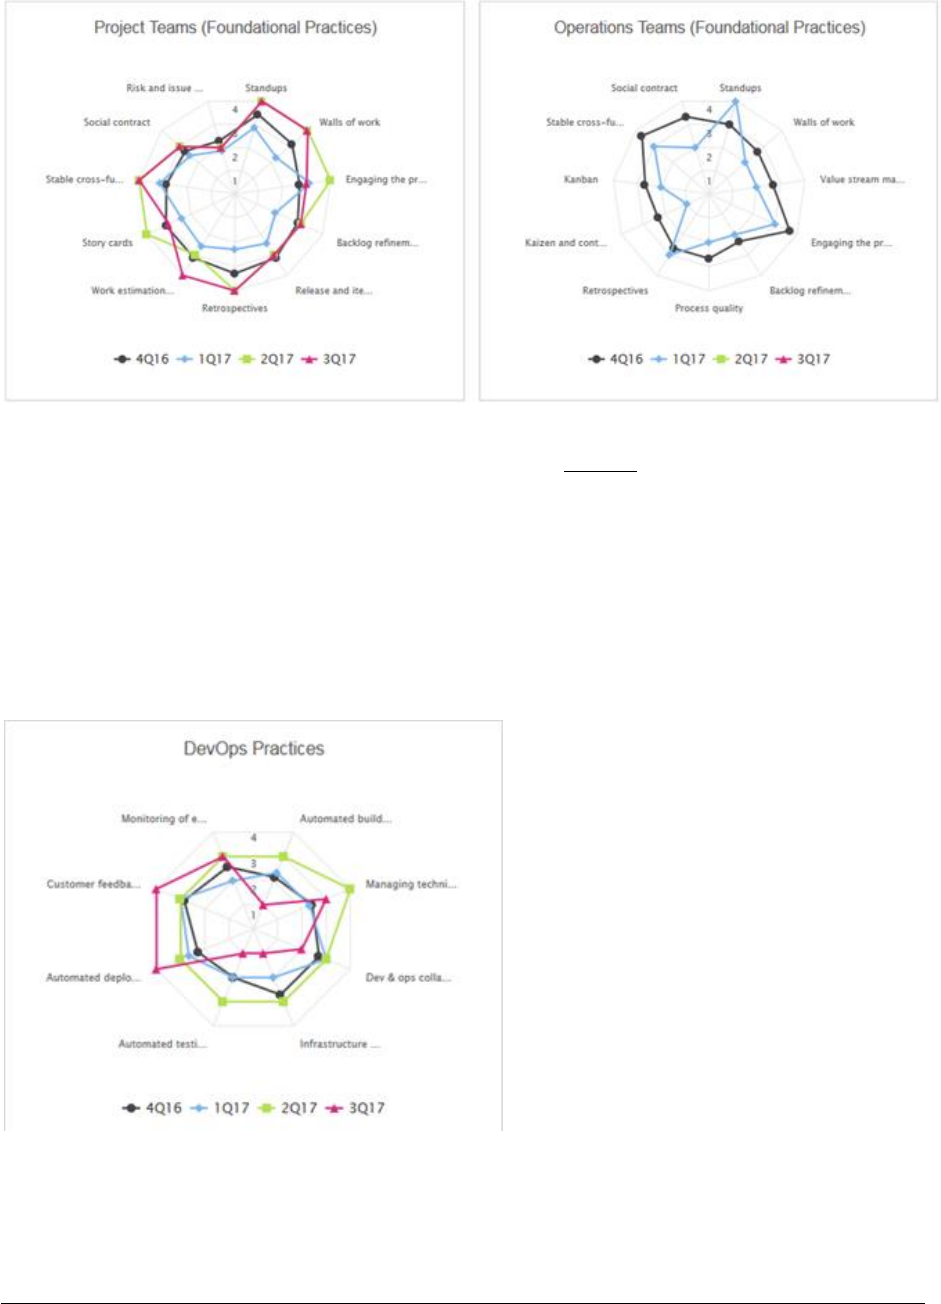
• The maturity assessment ‘spider charts’ show the current overall average score for
each of the foundational practices for assessments submitted for the current quarter
minus 3 so that you have a full year of history.
o It is possible for a parent team to have spider charts for all 3 assessments or
as few as one or two depending on how many operations or project squads
roll up into the parent team.
o Depending on how long your teams have been using the Agile Team Tool it is
possible to not have data to display as far back as the charts allow.
• The DevOps Practices spider chart only appears when squad teams indicate they
deliver software
Page 51
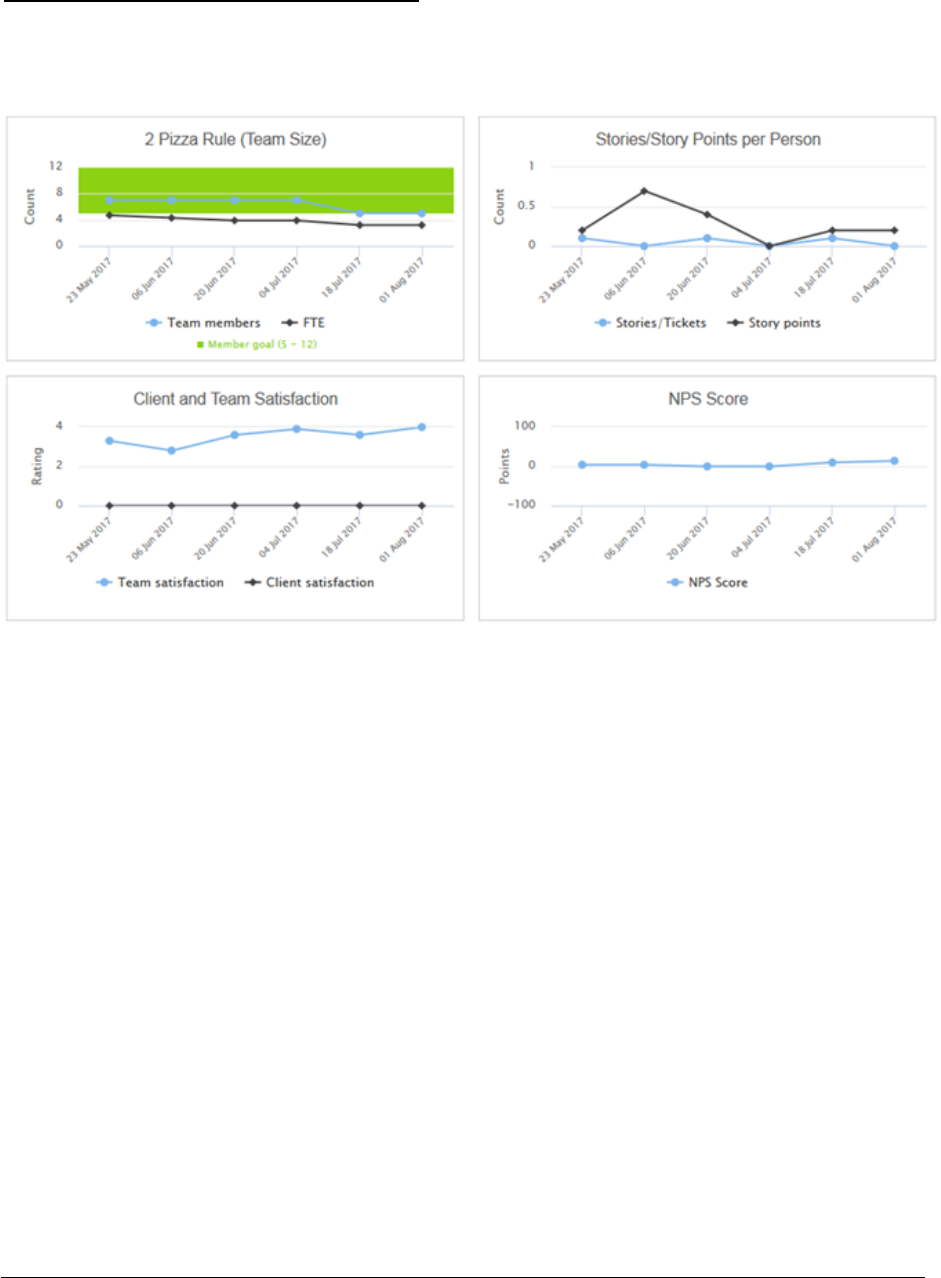
Squad Teams – Display 6 iterations of data
The first four charts (Velocity, Throughput, Deployments & Defects, and Cycle Time) are the
same as for parent teams except we display the 6 most recent completed iterations.
• The 2 Pizza rule chart shows you the team member size in relation to the FTE (Full
Time Equivalent).
o The team member count is calculated using the unique employee serial
number (CNUM) for team members having an allocation % > 0. Members
added to the team at 0% allocation such as first line managers or as an agile
coach are not counted for this chart.
▪ A team member added twice with two different roles and allocation %
is still only counted once… not twice.
o The allocation % is used to determine the FTE.
o The idea for this chart is to have small dedicated teams. If you have 12 team
members and they are all at 50% allocation it would show an FTE of 6 which is
not the best scenario.
• Stories / Story Points per Person reflects the number of stories/story points delivered
per person day during the iteration. We use the allocation % in conjunction with the
length of the iteration and whether the team member works a full-time schedule to
determine the maximum number of person days the iteration has. The iteration
manager can enter the number of unavailable days for vacation, illness, education,
etc into the Agile Team Tool and tool will calculate the number of actual person days
available and then use the number of stories delivered to calculate the stories per
person day.
Page 52
• Client & Team Satisfaction – Same as for the parent team but it’s only at the squad
level.
• NPS score reflects the Net Promoter Score reported by the squad team if they have
the ability to capture the NPS. The NPS can be from +100 to -100. (This not currently
rolled up.)
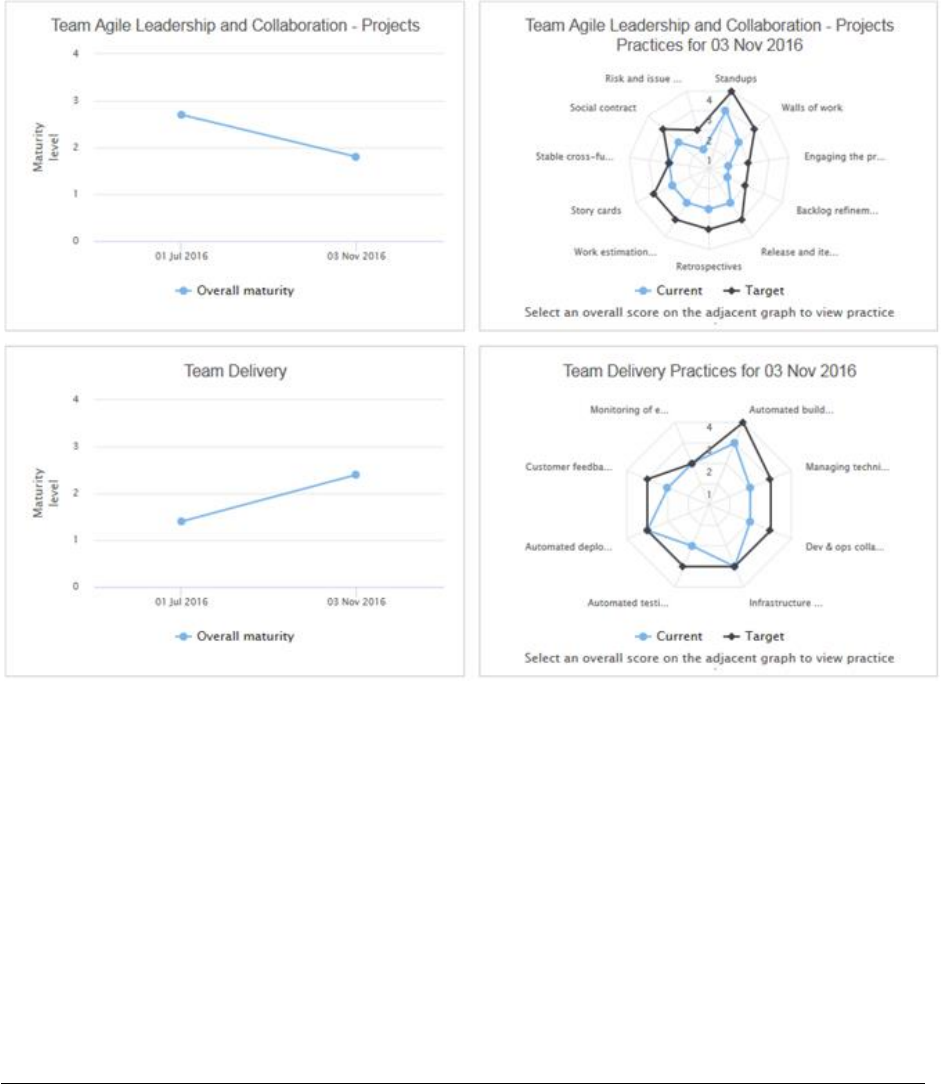
• Squad teams can have one or more of the maturity assessment charts depending on
whether they deliver software or changed from an Operations squad to a Project
squad. These charts represent the current Overall maturity for the last six
assessments submitted if they exist in the Agile Team Tool.
o If you click on the data point for one of the assessment dates in the chart on
the left, the spider chart will reflect the current and target values for that
assessed practice in the chart on the right.

Page 53
Appendix C – Agile Role Categories
• Agile Coach
• Analyst
o Business Analyst
o Business Information Management Specialist
o Data Specialist
o Designer
• Architect
o Application Architect
o Enterprise Architect
o Security Architect
• Consultant
o Business Design Consultant
o IBM Field Enablement Professional
o IT Management Consultant
o Process Excellence & Transformation Professional
o Security Consultant
o Security Specialist
• DBA
o Application Database Administrator
• Developer
o Application Developer
o Portals & Collaboration Solutions Specialist
• Infrastructure
o Infrastructure Architect
o Systems Management Specialist
• Manager
o Business Area Manager
o People Manager
• Operations and Support
o Application Focal Point
o Audit & Compliance Focal
o Business Operations Professional
o Finance Coordinator
o Financial Analyst
o Measurements & Reporting Analyst
o Support Center Representative
• Program & Project Mgmt
o Business Programs Manager
o Delivery Project Executive
o Project Manager
o Technical Team Leader
• Tester
o Test Specialist
• Product Owner
• Iteration Manager
Page 54
Appendix D – Top Things to Know About the New User Interface
(Don’t miss #10)
1) We eliminated the multiple tabs across the top of the page. All primary activities can be
done on a single page through a series of pop-up windows.
2) To create a new team, use the ‘Create new Team’ icon in the team navigation section in
the left column.
3) Seeing your team hierarchy, making changes to your team name or discription as well as
making changes to your parent team or even deleting a team is performed easily from the
team area.
[A] To change the team name or description click the ‘Team Information’ icon
[B] To change the parent team association or to delete a team click on the ‘Team Setup’ icon
[C] The Team hierarchy is easily visible right under the team name
4) To update your bookmarks, formerly called important links, click on the ‘Team Bookmarks’
icon
Page 55
5) To display, edit, add team members as well as their Agile Roles, Allocation % and if they
work Full Time or Part Time, click on the ‘Team Members’ icon. You will notice that all fields
can be updated on the single team member line!
6) Results of your team’s most recently submitted maturity assessment is viewable right
under your team information area.
[A] Your overall result is dispayed on a sliding scale from Initiating to Scaling. Information for
an assessment in a draft status is not displayed here.
[B] Previous assessments can easily be selected.
[C] Reviewing your action plan is as easy as clicking a button.
[D] Easy to start a new assessment.
7) As you enter your iteration information into the Overview section on the right-hand side,
your graphs will be updated as you enter the data and tab to the next field. Assumption:
The current system date is > or = to the iteration end date.
Page 56
8) If there are graphs in the Trends section that you do not want to display you can click on
the ‘Filter Trends’ icon and deselect them from the list. This will apply to all teams you select
from the team navigation area on the left-hand side. To bring the charts back, just click the
icon and then check any graphs you want back in your view. For now, these filter settings
are only saved for the session, not long term, but it is in our plan.
9) We have introduced the concept of ‘Person Days’ for each iteration. We compute the
optimum team availability, in days, based on the number of work days (Mon-Fri) in an
iteration from the iteration Start / End Date, the team member’s Allocation % and their Full
Time, Part Time status. All you have to do is enter the total number of days your team
members were unavailable during the iteration as a whole (red box below). If you make
changes to your team structure during the course of an iteration you can reset the Optimum
team availability value by clicking on the ‘Team Reset’ icon (arrow).
10) Because of number 9 above, it is imperative that you as the iteration Manager ensure the
following are correct for each team member:
[A] Allocation %
[B] Average Work Week ( Full Time, Half Time, or Part Time expressed as a %, i.e if the team
member works 2 full days a week it would be 40% with each full work day representing
20%.)
Page 57
Appendix E – API Information
Our development team has created an API for the Agile Team Tool. We could not possibly
create APIs for all possible combinations of track & plan tools that are available on the free
market but we are working with colleagues to provide APIs for the following:
• Rational Team Concert (RTC) In limited use
• Trello Available as a Power-Up
• Jira Planned
If you are interested in creating your own API to interface with the Agile Team Tool, we have
a link to our API documentation in the Help section of the tool in the upper right corner. See
screen shot below.

Page 58
This page left intentionally blank
