Amazon CloudWatch User Guide Cloud Watch
User Manual:
Open the PDF directly: View PDF ![]() .
.
Page Count: 258 [warning: Documents this large are best viewed by clicking the View PDF Link!]
- Amazon CloudWatch
- Table of Contents
- What is Amazon CloudWatch?
- Getting Set Up
- Getting Started with Amazon CloudWatch
- Using Amazon CloudWatch Dashboards
- Create a Dashboard
- Add or Remove a Graph from a Dashboard
- Move or Resize a Graph on a Dashboard
- Edit a Graph on a Dashboard
- Rename a Graph on a Dashboard
- Add, Edit, or Remove a Text Widget from a Dashboard
- Create a Cross-Region Dashboard
- Switch Between Dashboards
- Link and Unlink Graphs on a Dashboard
- Change the Dashboard Refresh Interval
- Change the Dashboard Time Range, Period, or Time Format
- Viewing, Graphing, and Publishing Metrics
- View Available Metrics
- Search for Available Metrics
- Select and Deselect Metrics
- Get Statistics for a Metric
- Graph Metrics
- Graph a Metric
- Graph a Metric Across Resources
- Graph Several Metrics
- Modify the Date and Time on a Graph
- Modify the Statistic for a Graph
- Modify the Period for a Graph
- Modify a Graph's Title
- Create an Alarm from a Metric on a Graph
- Zoom in to a Graph
- Switch the Y-Axis for a Metric
- Set custom bounds for the Y-Axis on a graph
- Save a Graph
- Publish Custom Metrics
- Creating Amazon CloudWatch Alarms
- Set Up Amazon Simple Notification Service
- Create or Edit an Alarm
- Send Email Based on CPU Usage Alarm
- Send Email Based on Load Balancer Alarm
- Send Email Based on Storage Throughput Alarm
- Create Alarms That Stop, Terminate, Reboot, or Recover an Instance
- Adding Stop Actions to Amazon CloudWatch Alarms
- Adding Terminate Actions to Amazon CloudWatch Alarms
- Adding Reboot Actions to Amazon CloudWatch Alarms
- Adding Recover Actions to Amazon CloudWatch Alarms
- Using the Amazon CloudWatch Console to View the History of Triggered Alarms and Actions
- Amazon CloudWatch Alarm Action Scenarios
- Scenario 1: Stop Idle Development and Test Instances
- Scenario 2: Stop Idle Instances
- Scenario 3: Send Email About Web Servers with Unusually High Traffic
- Scenario 4: Stop Web Servers with Unusually High Traffic
- Scenario 5: Stop an Instance Experiencing a Memory Leak
- Scenario 6: Stop an Impaired Instance
- Scenario 7: Terminate Instances When Batch Processing Jobs Are Complete
- Scenarios Using the Amazon CloudWatch Console
- Monitor Your Estimated Charges Using Amazon CloudWatch
- Logging Amazon CloudWatch API Calls in AWS CloudTrail
- Monitoring Memory and Disk Metrics for Amazon EC2 Linux Instances
- Authentication and Access Control for Amazon CloudWatch
- Amazon CloudWatch Namespaces, Dimensions, and Metrics Reference
- AWS Namespaces
- Amazon API Gateway Dimensions and Metrics
- Auto Scaling Dimensions and Metrics
- AWS Billing and Cost Management Dimensions and Metrics
- Amazon CloudFront Dimensions and Metrics
- Amazon CloudSearch Dimensions and Metrics
- Amazon CloudWatch Events Dimensions and Metrics
- Amazon CloudWatch Logs Dimensions and Metrics
- Amazon DynamoDB Dimensions and Metrics
- Amazon ECS Dimensions and Metrics
- Amazon ElastiCache Dimensions and Metrics
- Amazon EBS Dimensions and Metrics
- Amazon Elastic Compute Cloud Dimensions and Metrics
- Amazon EC2 Spot Fleet Dimensions and Metrics
- Amazon EFS Dimensions and Metrics
- Elastic Load Balancing Dimensions and Metrics
- Amazon EMR Dimensions and Metrics
- Amazon Elasticsearch Service Dimensions and Metrics
- Amazon Elastic Transcoder Dimensions and Metrics
- AWS IoT Dimensions and Metrics
- Amazon Kinesis Streams Dimensions and Metrics
- Amazon Kinesis Firehose Metrics
- AWS Key Management Service Metrics and Dimensions
- AWS Lambda Dimensions and Metrics
- Amazon Machine Learning Dimensions and Metrics
- AWS OpsWorks Dimensions and Metrics
- Amazon Redshift Dimensions and Metrics
- Amazon RDS Dimensions and Metrics
- Amazon Route 53 Dimensions and Metrics
- Amazon Simple Notification Service Dimensions and Metrics
- Amazon SQS Dimensions and Metrics
- Amazon Simple Storage Service Dimensions and Metrics
- Amazon SWF Dimensions and Metrics
- AWS Storage Gateway Dimensions and Metrics
- AWS WAF Dimensions and Metrics
- Amazon WorkSpaces Dimensions and Metrics
- Making API Requests
- Document History
- AWS Glossary

Amazon CloudWatch
User Guide

Amazon CloudWatch User Guide

Amazon CloudWatch User Guide
Amazon CloudWatch: User Guide
Copyright © 2016 Amazon Web Services, Inc. and/or its affiliates. All rights reserved.
Amazon's trademarks and trade dress may not be used in connection with any product or service that is not Amazon's, in any
manner that is likely to cause confusion among customers, or in any manner that disparages or discredits Amazon. All other
trademarks not owned by Amazon are the property of their respective owners, who may or may not be affiliated with, connected to,
or sponsored by Amazon.

Amazon CloudWatch User Guide
Table of Contents
What is Amazon CloudWatch? ........................................................................................................ 1
Architecture .......................................................................................................................... 1
Concepts ............................................................................................................................. 2
Metrics ........................................................................................................................ 3
Namespaces ................................................................................................................ 3
Dimensions .................................................................................................................. 4
Time Stamps ................................................................................................................ 6
Units ........................................................................................................................... 6
Statistics ...................................................................................................................... 7
Periods ........................................................................................................................ 7
Aggregation .................................................................................................................. 8
Alarms ......................................................................................................................... 8
Regions ....................................................................................................................... 9
Supported AWS Services ....................................................................................................... 9
Accessing CloudWatch ......................................................................................................... 13
Regions and Endpoints ........................................................................................................ 13
Limits ................................................................................................................................ 13
Related AWS Services ......................................................................................................... 14
Resources .......................................................................................................................... 15
Getting Set Up ............................................................................................................................ 17
Sign Up for Amazon Web Services (AWS) .............................................................................. 17
Sign in to the Amazon CloudWatch Console ........................................................................... 17
Set Up the Command Line Interface ...................................................................................... 19
Getting Started ........................................................................................................................... 20
Scenario: Monitor Your Estimated Charges Using CloudWatch ................................................... 20
Step 1: Enable Monitoring of Your Estimated Charges ...................................................... 21
Step 2: Create a Billing Alarm ....................................................................................... 21
Step 3: Check Alarm Status .......................................................................................... 25
Step 4: Edit a Billing Alarm ........................................................................................... 26
Step 5: Delete a Billing Alarm ....................................................................................... 26
Scenario: Publish Metrics to CloudWatch ................................................................................ 26
Step 1: Define the Data Configuration ............................................................................ 27
Step 2: Add Metrics to CloudWatch ............................................................................... 27
Step 3: Get Statistics from CloudWatch .......................................................................... 28
Step 4: View Graphs with the Console ........................................................................... 29
Using Dashboards ....................................................................................................................... 30
Create a Dashboard ............................................................................................................ 30
Add or Remove a Graph from a Dashboard ............................................................................ 31
Move or Resize a Graph on a Dashboard ............................................................................... 32
Edit a Graph on a Dashboard ............................................................................................... 32
Rename a Graph on a Dashboard ......................................................................................... 33
Add, Edit, or Remove a Text Widget from a Dashboard ............................................................ 33
Create a Cross-Region Dashboard ........................................................................................ 34
Switch Between Dashboards ................................................................................................. 34
Link and Unlink Graphs on a Dashboard ................................................................................ 34
Change the Dashboard Refresh Interval ................................................................................. 35
Change the Dashboard Time Range, Period, or Time Format ..................................................... 35
Viewing, Graphing, and Publishing Metrics ...................................................................................... 37
View Available Metrics ......................................................................................................... 37
AWS Management Console .......................................................................................... 37
Command Line Tools ................................................................................................... 38
Query API .................................................................................................................. 40
Search for Available Metrics ................................................................................................. 40
Select and Deselect Metrics ................................................................................................. 41
Get Statistics for a Metric ..................................................................................................... 44
iv

Amazon CloudWatch User Guide
Get Statistics for a Specific EC2 Instance ....................................................................... 44
Aggregating Statistics Across Instances .......................................................................... 48
Get Statistics Aggregated by Auto Scaling Group ............................................................. 53
Get Statistics Aggregated by Amazon Machine Image (AMI) ID .......................................... 55
Graph Metrics ..................................................................................................................... 60
Graph a Metric ........................................................................................................... 60
Graph a Metric Across Resources ................................................................................. 61
Graph Several Metrics ................................................................................................. 63
Modify the Date and Time on a Graph ........................................................................... 64
Modify the Statistic for a Graph ..................................................................................... 65
Modify the Period for a Graph ....................................................................................... 66
Modify a Graph's Title .................................................................................................. 67
Create an Alarm from a Metric on a Graph ..................................................................... 68
Zoom in to a Graph ..................................................................................................... 69
Switch the Y-Axis for a Metric ....................................................................................... 70
Set custom bounds for the Y-Axis on a graph .................................................................. 71
Save a Graph ............................................................................................................. 72
Publish Custom Metrics ........................................................................................................ 73
Publish Single Data Points ........................................................................................... 74
Publish Statistic Sets ................................................................................................... 75
Publish the Value Zero ................................................................................................ 75
Creating Alarms .......................................................................................................................... 76
Set Up Amazon Simple Notification Service ............................................................................ 78
AWS Management Console .......................................................................................... 78
Command Line Tools ................................................................................................... 79
Create or Edit an Alarm ....................................................................................................... 80
Send Email Based on CPU Usage Alarm ................................................................................ 82
AWS Management Console .......................................................................................... 82
Command Line Tools ................................................................................................... 84
Send Email Based on Load Balancer Alarm ............................................................................ 84
AWS Management Console .......................................................................................... 84
Command Line Tools ................................................................................................... 86
Send Email Based on Storage Throughput Alarm ..................................................................... 86
AWS Management Console .......................................................................................... 86
Command Line Tools ................................................................................................... 88
Create Alarms That Stop, Terminate, Reboot, or Recover an Instance ......................................... 88
Adding Stop Actions to Amazon CloudWatch Alarms ........................................................ 90
Adding Terminate Actions to Amazon CloudWatch Alarms ................................................. 91
Adding Reboot Actions to Amazon CloudWatch Alarms ..................................................... 93
Adding Recover Actions to Amazon CloudWatch Alarms ................................................... 95
Using the Amazon CloudWatch Console to View the History of Triggered Alarms and
Actions ...................................................................................................................... 97
Amazon CloudWatch Alarm Action Scenarios .................................................................. 97
Monitor Your Estimated Charges ......................................................................................... 101
Enabling the Monitoring of Your Estimated Charges ........................................................ 102
Creating a Billing Alarm .............................................................................................. 103
Editing a Billing Alarm ................................................................................................ 107
Checking Alarm Status ............................................................................................... 108
Deleting a Billing Alarm .............................................................................................. 108
Logging API Calls ...................................................................................................................... 110
CloudWatch Information in CloudTrail ................................................................................... 110
Understanding Log File Entries ............................................................................................ 112
Monitoring Memory and Disk Metrics ............................................................................................ 115
Prerequisites ..................................................................................................................... 116
Getting Started .................................................................................................................. 117
Using the Scripts ............................................................................................................... 118
mon-put-instance-data.pl ............................................................................................. 118
mon-get-instance-stats.pl ............................................................................................ 121
v

Amazon CloudWatch User Guide
Viewing Your Custom Metrics in the AWS Management Console .............................................. 122
Authentication and Access Control ............................................................................................... 123
Authentication ................................................................................................................... 123
Access Control .................................................................................................................. 124
Overview of Managing Access ............................................................................................. 125
Resources and Operations .......................................................................................... 125
Understanding Resource Ownership ............................................................................. 127
Managing Access to Resources ................................................................................... 127
Specifying Policy Elements: Actions, Effects, and Principals ............................................. 128
Specifying Conditions in a Policy ................................................................................. 128
Using Identity-Based Policies (IAM Policies) .......................................................................... 129
Permissions Required to Use the CloudWatch Console ................................................... 129
AWS Managed (Predefined) Policies for CloudWatch ...................................................... 132
Customer Managed Policy Examples ............................................................................ 132
Amazon CloudWatch Permissions Reference ......................................................................... 134
Namespaces, Dimensions, and Metrics Reference .......................................................................... 140
AWS Namespaces ............................................................................................................. 141
Amazon API Gateway Dimensions and Metrics ...................................................................... 142
API Gateway Metrics ................................................................................................. 142
Dimensions for Metrics ............................................................................................... 143
Auto Scaling ..................................................................................................................... 144
Auto Scaling Group Metrics ........................................................................................ 144
Dimensions for Auto Scaling Group Metrics ................................................................... 144
AWS Billing and Cost Management ...................................................................................... 144
AWS Billing and Cost Management Metrics ................................................................... 145
Dimensions for AWS Billing and Cost Management Metrics .............................................. 145
Amazon CloudFront ........................................................................................................... 145
Amazon CloudFront Metrics ........................................................................................ 145
Dimensions for CloudFront Metrics ............................................................................... 146
Amazon CloudSearch ......................................................................................................... 146
Amazon CloudSearch Metrics ...................................................................................... 147
Dimensions for Amazon CloudSearch Metrics ................................................................ 147
Amazon CloudWatch Events ............................................................................................... 147
CloudWatch Events Metrics ........................................................................................ 147
Dimensions for CloudWatch Events Metrics ................................................................... 148
Amazon CloudWatch Logs .................................................................................................. 148
CloudWatch Logs Metrics ........................................................................................... 148
Dimensions for CloudWatch Logs Metrics ...................................................................... 149
Amazon DynamoDB ........................................................................................................... 150
DynamoDB Metrics .................................................................................................... 150
Dimensions for DynamoDB Metrics .............................................................................. 160
Amazon ECS .................................................................................................................... 160
Amazon ECS Metrics ................................................................................................. 160
Dimensions for Amazon ECS Metrics ........................................................................... 161
Amazon ElastiCache .......................................................................................................... 162
Dimensions for ElastiCache Metrics .............................................................................. 162
Host-Level Metrics ..................................................................................................... 162
Metrics for Memcached .............................................................................................. 163
Metrics for Redis ....................................................................................................... 165
Amazon EBS .................................................................................................................... 167
Amazon EBS Metrics ................................................................................................. 167
Dimensions for Amazon EBS Metrics ........................................................................... 169
Amazon EC2 .................................................................................................................... 169
Amazon EC2 Metrics ................................................................................................. 169
Dimensions for Amazon EC2 Metrics ............................................................................ 172
Amazon EC2 Spot Fleet ..................................................................................................... 173
Amazon EC2 Spot Fleet Metrics .................................................................................. 173
Dimensions for Amazon EC2 Spot Fleet Metrics ............................................................. 174
vi

Amazon CloudWatch User Guide
Amazon EFS .................................................................................................................... 174
Amazon CloudWatch Metrics for Amazon EFS ............................................................... 174
Dimensions for Amazon EFS Metrics ............................................................................ 177
Elastic Load Balancing ....................................................................................................... 177
Application Load Balancer Metrics ................................................................................ 177
Metric Dimensions for Application Load Balancers .......................................................... 178
Classic Load Balancer Metrics ..................................................................................... 179
Metric Dimensions for Classic Load Balancers ............................................................... 182
Amazon EMR ................................................................................................................... 182
Amazon EMR Metrics ................................................................................................ 182
Amazon EMR Dimensions .......................................................................................... 190
Amazon ES ...................................................................................................................... 191
Amazon Elasticsearch Service Metrics .......................................................................... 191
Dimensions for Amazon Elasticsearch Service Metrics .................................................... 193
Elastic Transcoder ............................................................................................................. 194
Elastic Transcoder Metrics .......................................................................................... 194
Dimensions for Elastic Transcoder Metrics .................................................................... 195
AWS IoT .......................................................................................................................... 195
AWS IoT Metrics ...................................................................................................... 195
Dimensions for AWS IoT Metrics ................................................................................. 197
Amazon Kinesis Streams .................................................................................................... 197
Basic Stream-level Metrics .......................................................................................... 197
Enhanced Shard-level Metrics ..................................................................................... 201
Dimensions for Amazon Kinesis Metrics ........................................................................ 203
Amazon Kinesis Firehose ................................................................................................... 203
Service-level CloudWatch Metrics ................................................................................ 203
API-Level CloudWatch Metrics ..................................................................................... 204
AWS KMS ........................................................................................................................ 205
AWS KMS Metrics ..................................................................................................... 205
Dimensions for AWS KMS Metrics ............................................................................... 206
AWS Lambda ................................................................................................................... 206
CloudWatch Metrics ................................................................................................... 206
Dimensions for AWS Lambda Metrics ........................................................................... 207
Amazon Machine Learning .................................................................................................. 207
Amazon ML Metrics ................................................................................................... 208
Dimensions for Amazon Machine Learning Metrics ......................................................... 208
AWS OpsWorks ................................................................................................................ 208
AWS OpsWorks Metrics ............................................................................................. 208
Dimensions for AWS OpsWorks Metrics ........................................................................ 210
Amazon Redshift ............................................................................................................... 210
Amazon Redshift Metrics ............................................................................................ 210
Dimensions for Amazon Redshift Metrics ...................................................................... 212
Amazon RDS .................................................................................................................... 212
Amazon RDS Metrics ................................................................................................. 213
Dimensions for RDS Metrics ....................................................................................... 214
Amazon Route 53 .............................................................................................................. 215
Amazon Route 53 Metrics ........................................................................................... 215
Dimensions for Amazon Route 53 Metrics ..................................................................... 216
Amazon SNS .................................................................................................................... 216
Amazon Simple Notification Service Metrics ................................................................... 216
Dimensions for Amazon Simple Notification Service Metrics ............................................. 217
Amazon SQS .................................................................................................................... 218
Amazon SQS Metrics ................................................................................................. 218
Dimensions for Amazon SQS Metrics ........................................................................... 219
Amazon S3 ...................................................................................................................... 220
Amazon S3 CloudWatch Metrics .................................................................................. 220
Amazon S3 CloudWatch Dimensions ............................................................................ 220
Amazon SWF ................................................................................................................... 220
vii

Amazon CloudWatch User Guide
Workflow Metrics ....................................................................................................... 221
Activity Metrics .......................................................................................................... 221
AWS Storage Gateway ....................................................................................................... 222
AWS Storage Gateway Metrics .................................................................................... 222
Dimensions for AWS Storage Gateway Metrics .............................................................. 233
AWS WAF ........................................................................................................................ 233
AWS WAF Metrics ..................................................................................................... 233
Dimensions for AWS WAF .......................................................................................... 234
Amazon WorkSpaces ......................................................................................................... 234
Amazon WorkSpaces Metrics ...................................................................................... 234
Dimensions for Amazon WorkSpaces Metrics ................................................................ 236
Making API Requests ................................................................................................................. 237
Amazon CloudWatch Endpoints ........................................................................................... 237
Query Parameters ............................................................................................................. 237
The RequestId .................................................................................................................. 238
Query API Authentication .................................................................................................... 238
Query API Examples Using Signature Version 2 .................................................................... 240
Query API Error Messages Using Signature Version 2 ............................................................ 242
Available Libraries ............................................................................................................. 243
Document History ...................................................................................................................... 244
AWS Glossary .......................................................................................................................... 250
viii

Amazon CloudWatch User Guide
Architecture
What is Amazon CloudWatch?
Amazon CloudWatch monitors your Amazon Web Services (AWS) resources and the applications you
run on AWS in real-time. You can use CloudWatch to collect and track metrics, which are the variables
you want to measure for your resources and applications. CloudWatch alarms send notifications or
automatically make changes to the resources you are monitoring based on rules that you define. For
example, you can monitor the CPU usage and disk reads and writes of your Amazon Elastic Compute
Cloud (Amazon EC2) instances and then use this data to determine whether you should launch
additional instances to handle increased load. You can also use this data to stop under-used instances
to save money. In addition to monitoring the built-in metrics that come with AWS, you can monitor
your own custom metrics. With CloudWatch, you gain system-wide visibility into resource utilization,
application performance, and operational health.
The rest of this section introduces the key concepts and terms that will help you understand what you
need to do to monitor your resources and applications.
Topics
•Amazon CloudWatch Architecture (p. 1)
•Amazon CloudWatch Concepts (p. 2)
•Supported AWS Services (p. 9)
•Accessing CloudWatch (p. 13)
•Regions and Endpoints (p. 13)
•CloudWatch Limits (p. 13)
•Related AWS Services (p. 14)
•Amazon CloudWatch Resources (p. 15)
The Getting Set Up with CloudWatch section walks you through the process of signing up for AWS
and setting up the AWS and CloudWatch command-line interfaces (CLI). The Getting Started with
CloudWatch section walks you through the process of publishing metrics, getting statistics, and setting
alarms.
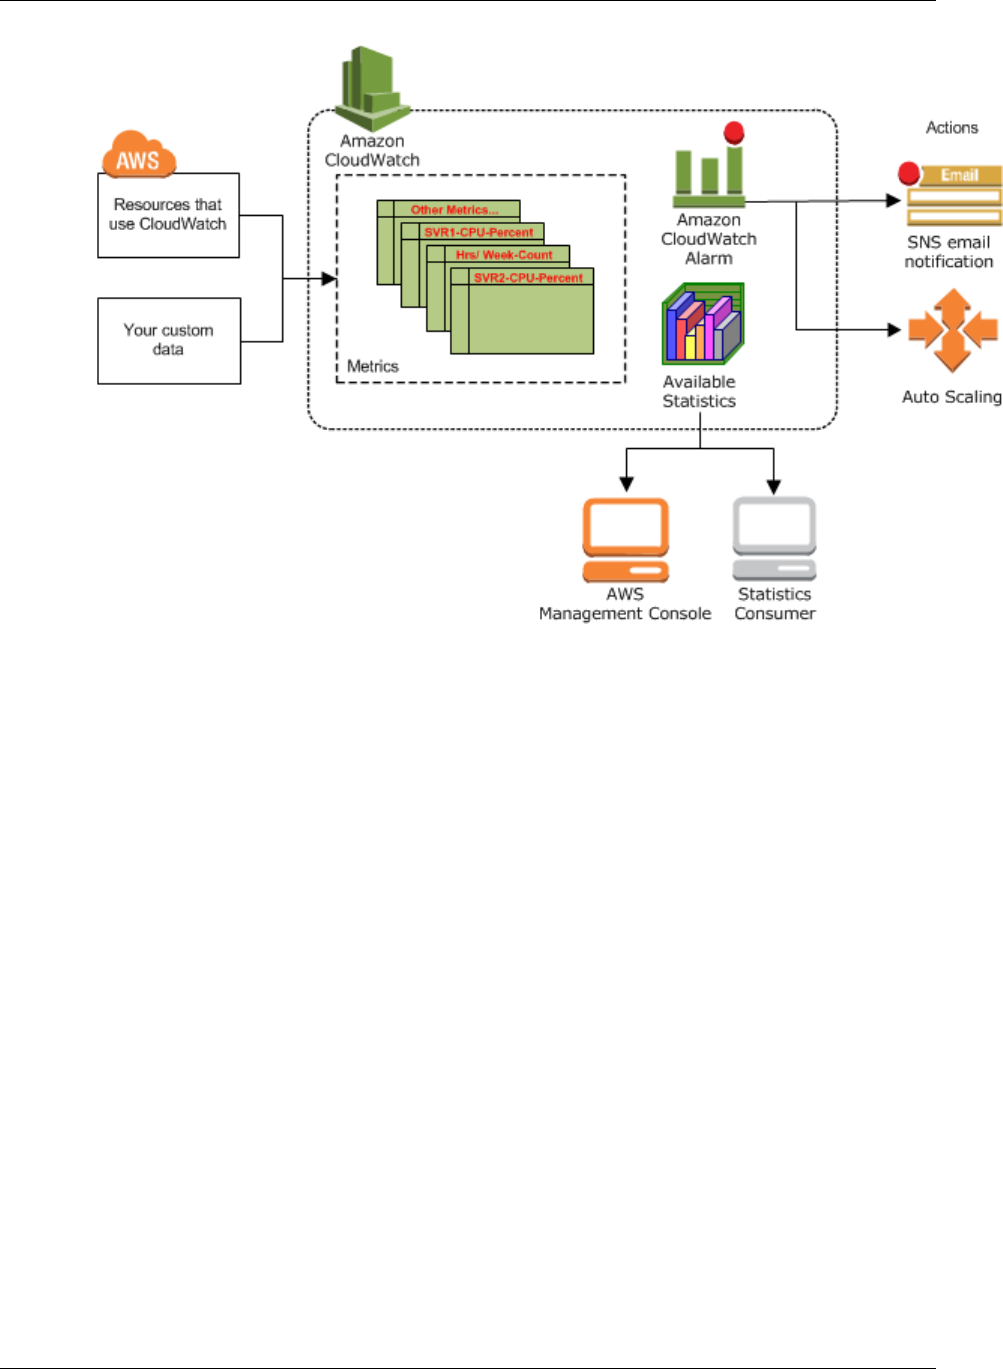
Amazon CloudWatch Architecture
Amazon CloudWatch is basically a metrics repository. An AWS product—such as Amazon EC2—
puts metrics into the repository, and you retrieve statistics based on those metrics. If you put your own
custom metrics into the repository, you can retrieve statistics on these metrics as well.
1
Amazon CloudWatch User Guide
Concepts
You can use metrics to calculate statistics and then present the data graphically in the CloudWatch
console. For more information about the other AWS resources that generate and send metrics to
CloudWatch, see Amazon CloudWatch Namespaces, Dimensions, and Metrics Reference (p. 140).
You can configure alarm actions to stop, start, or terminate an Amazon EC2 instance when certain
criteria are met. In addition, you can create alarms that initiate Auto Scaling and Amazon Simple
Notification Service (Amazon SNS) actions on your behalf. For more information about creating
CloudWatch alarms, see Alarms (p. 8).
Amazon CloudWatch Concepts
The terminology and concepts that are central to your understanding and use of Amazon CloudWatch
are described below.
Topics
•Metrics (p. 3)
•Namespaces (p. 3)
•Dimensions (p. 4)
•Time Stamps (p. 6)
•Units (p. 6)
•Statistics (p. 7)
•Periods (p. 7)
•Aggregation (p. 8)
•Alarms (p. 8)
•Regions (p. 9)
2

Amazon CloudWatch User Guide
Metrics
Metrics
A metric is the fundamental concept in CloudWatch. It represents a time-ordered set of data points that
are published to CloudWatch. These data points can be either your custom metrics or metrics from
other services in AWS. You can retrieve statistics about those data points as an ordered set of time-
series data. Metrics exist only in the region in which they are created. Metrics cannot be deleted, but
they automatically expire in 14 days if no new data is published to them.
Think of a metric as a variable to monitor, and the data points represent the values of that variable over
time. For example, the CPU usage of a particular Amazon EC2 instance is one metric, and the latency
of an Elastic Load Balancing load balancer is another.
The data points themselves can come from any application or business activity from which you collect
data, not just Amazon Web Services products and applications. For example, a metric might be the
CPU usage of a particular Amazon EC2 instance or the temperature in a refrigeration facility.
Metrics are uniquely defined by a name, a namespace, and one or more dimensions. Each data point
has a time stamp, and (optionally) a unit of measure. When you request statistics, the returned data
stream is identified by namespace, metric name, dimension, and (optionally) the unit.
You can use the PutMetricData API action (or the aws cloudwatch put-metric-data
command) to create a custom metric and publish data points for it. You can add the data points in any
order, and at any rate you choose. For more information, see Publish Custom Metrics (p. 73).
CloudWatch stores your metric data for two weeks. You can publish metric data from multiple sources,
such as incoming network traffic from dozens of different Amazon EC2 instances, or requested page
views from several different web applications. You can request statistics on metric data points that
occur within a specified time window.
Related Topics
•PutMetricData (put-metric-data)
•ListMetrics (list-metrics)
•GetMetricStatistics (get-metric-statistics)
•View Available Metrics (p. 37)
Namespaces
CloudWatch namespaces are containers for metrics. Metrics in different namespaces are isolated from
each other, so that metrics from different applications are not mistakenly aggregated into the same
statistics.
Namespace names are strings that you define when you create a metric. The names must be valid
XML characters, typically containing the alphanumeric characters "0-9A-Za-z" plus "."(period), "-"
(hyphen), "_" (underscore), "/" (slash), "#" (hash), and ":" (colon). AWS namespaces all follow the
convention AWS/<service>, such as AWS/EC2 and AWS/ELB.
Note
Namespace names must be fewer than 256 characters in length.
There is no default namespace. You must specify a namespace for each data element you put into
CloudWatch.
Related Topics
•AWS Namespaces (p. 141)
3

Amazon CloudWatch User Guide
Dimensions
•Aggregating Statistics Across Instances (p. 48)
Dimensions
A dimension is a name/value pair that helps you to uniquely identify a metric. Every metric has specific
characteristics that describe it, and you can think of dimensions as categories for those characteristics.
Dimensions help you design a structure for your statistics plan. Because dimensions are part of the
unique identifier for a metric, whenever you add a unique name/value pair to one of your metrics, you
are creating a new metric.
You specify dimensions when you create a metric with the PutMetricData action (or its command
line equivalent put-metric-data). Services in AWS that feed data to CloudWatch also attach
dimensions to each metric. You can use dimensions to filter result sets that CloudWatch queries return.
For example, you can get statistics for a specific Amazon EC2 instance by calling
GetMetricStatistics with the InstanceID dimension set to a specific Amazon EC2 instance ID.
For metrics produced by certain services such as Amazon EC2, CloudWatch can aggregate data
across dimensions. For example, if you call GetMetricStatistics for a metric in the AWS/EC2
namespace and do not specify any dimensions, CloudWatch aggregates all data for the specified
metric to create the statistic that you requested. However, CloudWatch does not aggregate across
dimensions for metrics that you create with PutMetricData or put-metric-data.
Note
You can assign up to ten dimensions to a metric.
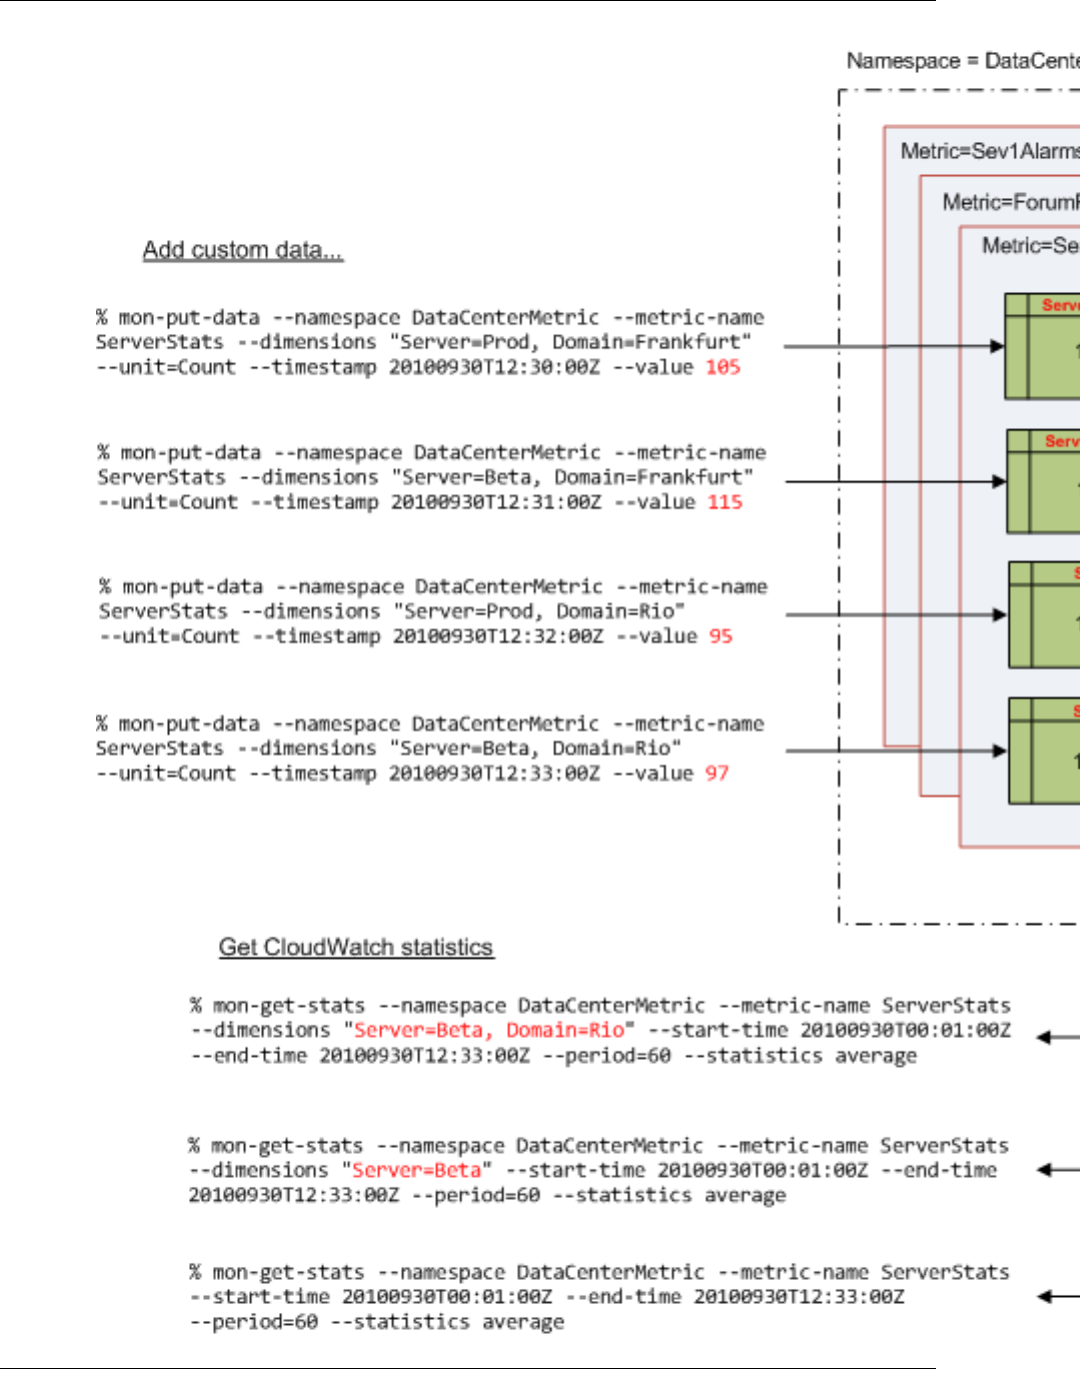
In the figure at the end of this section, the four calls to put-metric-data create four distinct metrics.
If you make only those four calls, you could retrieve statistics for these four dimension combinations:
•Server=Prod,Domain=Frankfurt
•Server=Prod,Domain=Rio
•Server=Beta,Domain=Frankfurt
•Server=Beta,Domain=Rio
You could not retrieve statistics using combinations of dimensions that you did not specifically create.
For example, you could not retrieve statistics for any of the following combinations of dimensions
unless you create new metrics that specify these combinations with additional calls to put-metric-
data:
•Server=Prod,Domain=<null>
•Server=<null>,Domain=Frankfurt
•Server=Beta,Domain=<null>
•Server=<null>,Domain=Rio
•Server=Prod
•Server=Beta
Important
CloudWatch treats each unique combination of dimensions as a separate metric. For
example, each call to put-metric-data in the following figure creates a separate metric
because each call uses a different set of dimensions. This is true even though all four calls
use the same metric name (ServerStats). For information on how this affects pricing, see
the Amazon CloudWatch product information page.
4
Amazon CloudWatch User Guide
Dimensions
5

Amazon CloudWatch User Guide
Time Stamps
Related Topics
•put-metric-data
•get-metric-statistics
•Dimensions for Amazon EC2 Metrics (p. 172)
Time Stamps
With Amazon CloudWatch, each metric data point must be marked with a time stamp. The time stamp
can be up to two weeks in the past and up to two hours into the future. If you do not provide a time
stamp, CloudWatch creates a time stamp for you based on the time the data element was received.
The time stamp you use in the request must be a dateTime object, with the complete date plus hours,
minutes, and seconds. For more information, see http://www.w3.org/TR/xmlschema-2/#dateTime.
For example: 2013-01-31T23:59:59Z. Although it is not required, we recommend that you provide the
time stamp in the Coordinated Universal Time (UTC or Greenwich Mean Time) time zone. When you
retrieve your statistics from CloudWatch, all times reflect the UTC time zone.
Note
CloudWatch alarms check metrics based on the current time in UTC. Custom metrics sent to
CloudWatch with time stamps other than the current UTC time may cause alarms to display
Insufficient Data state or result in delayed alarms.
Units
Units represent your statistic's unit of measure. For example, the units for the Amazon EC2
NetworkIn metric are Bytes because NetworkIn tracks the number of bytes that an instance
receives on all network interfaces.
You can also specify a unit when you create a custom metric. Units help provide conceptual meaning
to your data. Metric data points that specify a unit of measure, such as Percent, are aggregated
separately. The following list provides some of the more common units that CloudWatch supports:
•Seconds
•Bytes
•Bits
•Percent
•Count
•Bytes/Second (bytes per second)
•Bits/Second (bits per second)
•Count/Second (counts per second)
•None (default when no unit is specified)
For a complete list of the units that CloudWatch supports, see the MetricDatum data type in the
Amazon CloudWatch API Reference.
Though CloudWatch attaches no significance to a unit internally, other applications can derive
semantic information based on the unit you choose. When you publish data without specifying a
unit, CloudWatch associates it with the None unit. When you get statistics without specifying a unit,
CloudWatch aggregates all data points of the same unit together. If you have two otherwise identical
metrics with different units, two separate data streams will be returned, one for each unit.
6
Amazon CloudWatch User Guide
Statistics
Statistics
Statistics are metric data aggregations over specified periods of time. CloudWatch provides statistics
based on the metric data points provided by your custom data or provided by other services in AWS
to CloudWatch. Aggregations are made using the namespace, metric name, dimensions, and the data
point unit of measure, within the time period you specify. The following table describes the available
statistics.
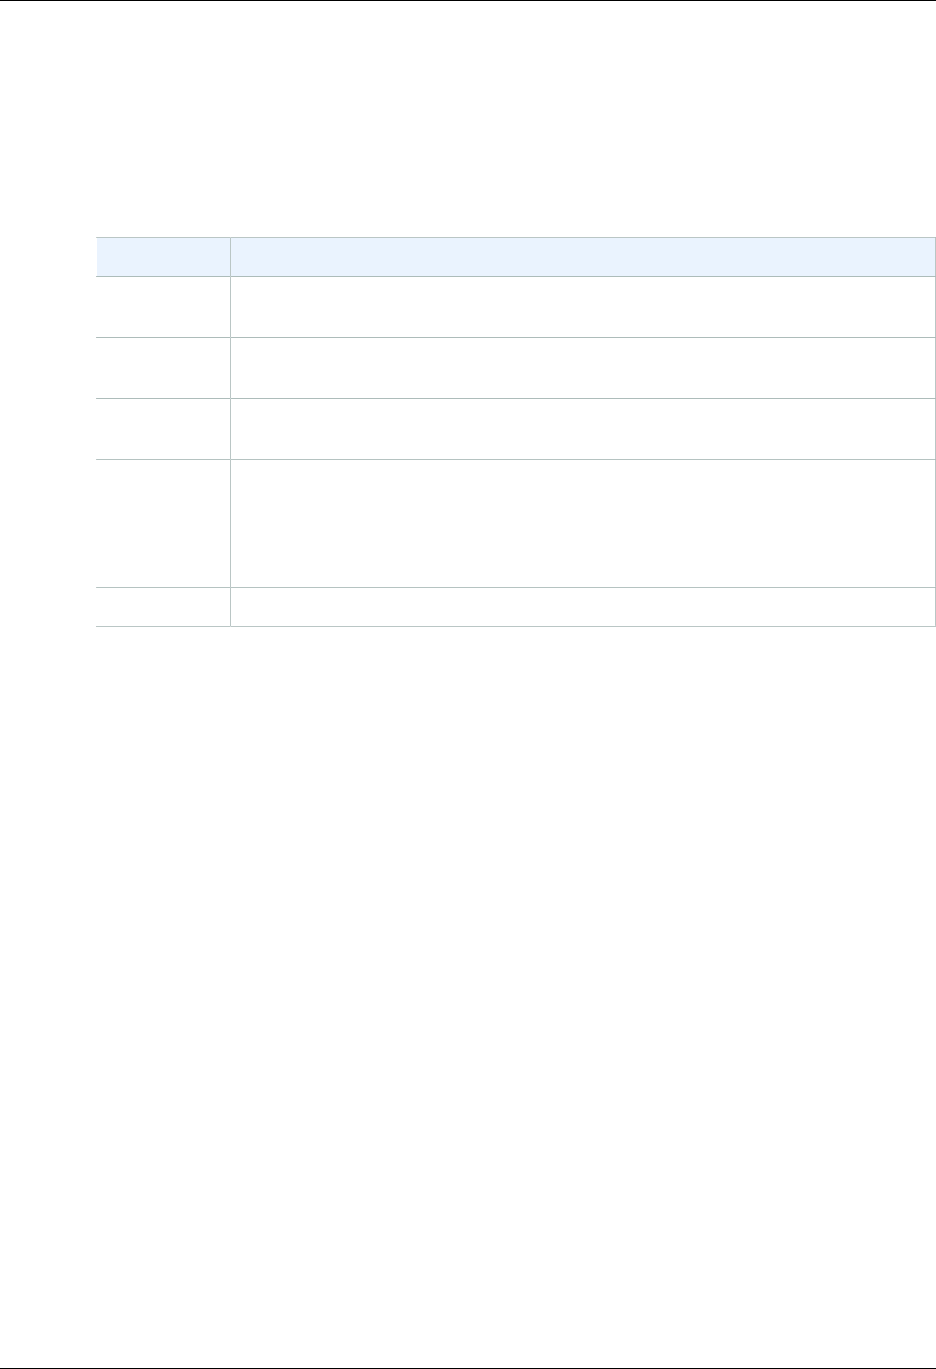
Statistic Description
Minimum The lowest value observed during the specified period. You can use this value to
determine low volumes of activity for your application.
Maximum The highest value observed during the specified period. You can use this value to
determine high volumes of activity for your application.
Sum All values submitted for the matching metric added together. This statistic can be
useful for determining the total volume of a metric.
Average The value of Sum / SampleCount during the specified period. By comparing this
statistic with the Minimum and Maximum, you can determine the full scope of
a metric and how close the average use is to the Minimum and Maximum. This
comparison helps you to know when to increase or decrease your resources as
needed.
SampleCount The count (number) of data points used for the statistical calculation.
You use the GetMetricStatistics API action or the get-metric-statistics command to
retrieve statistics, specifying the same values that you used for the namespace, metric name, and
dimension parameters when the metric values were created. You also specify the start and end times
that CloudWatch will use for the aggregation. The starting and ending points can be as close together
as 60 seconds, and as far apart as two weeks.
Amazon CloudWatch allows you to add pre-calculated statistics using the PutMetricData API action
(or the put-metric-data command) with the StatisticValues (statistic-values) parameter.
Instead of data point values, you specify values for SampleCount, Minimum, Maximum, and Sum
(CloudWatch calculates the average for you). The values you add in this way are aggregated with any
other values associated with the matching metric.
Related Topics
•PutMetricData (put-metric-data)
•GetMetricStatistics (get-metric-statistics)
Periods
A period is the length of time associated with a specific Amazon CloudWatch statistic. Each statistic
represents an aggregation of the metrics data collected for a specified period of time. Although periods
are expressed in seconds, the minimum granularity for a period is one minute. Accordingly, you specify
period values as multiples of 60. For example, to specify a period of six minutes, you would use the
value 360. You can adjust how the data is aggregated by varying the length of the period. A period can
be as short as one minute (60 seconds) or as long as one day (86,400 seconds).
When you call GetMetricStatistics, you can specify the period length with the Period parameter.
Two related parameters, StartTime and EndTime, determine the overall length of time associated
7

Amazon CloudWatch User Guide
Aggregation
with the statistics. The default value for the Period parameter is 60 seconds, whereas the default
values for StartTime and EndTime give you the last hour's worth of statistics.
The values you select for the StartTime and EndTime parameters determine how many periods
GetMetricStatistics will return. For example, calling GetMetricStatistics with the default
values for the Period, EndTime, and StartTime parameters returns an aggregated set of statistics
for each minute of the previous hour. If you prefer statistics aggregated into ten-minute blocks, set
Period to 600. For statistics aggregated over the entire hour, use a Period value of 3600.
Periods are also an important part of the CloudWatch alarms feature. When you create an alarm
to monitor a specific metric, you are asking CloudWatch to compare that metric to the threshold
value that you supplied. You have extensive control over how CloudWatch makes that comparison.
Not only can you specify the period over which the comparison is made, but you can also specify
how many evaluation periods are used to arrive at a conclusion. For example, if you specify three
evaluation periods, CloudWatch compares a window of three datapoints. CloudWatch only notifies
you if the oldest datapoint is breaching and the others are breaching or missing. For metrics that are
continuously emitted, CloudWatch won't notify you until three failures are found. For more information
about alarms, see Alarms (p. 8).
Aggregation
Amazon CloudWatch aggregates statistics according to the period length that you specify in calls to
GetMetricStatistics. You can publish as many data points as you want with the same or similar
time stamps. CloudWatch aggregates them by period length when you get statistics about those data
points with GetMetricStatistics. Aggregated statistics are only available when using detailed
monitoring. In addition, Amazon CloudWatch does not aggregate data across regions.
You can publish data points for a metric that share not only the same time stamp, but also the same
namespace and dimensions. Subsequent calls to GetMetricStatistics returns aggregated
statistics about those data points. You can even do this in one PutMetricData request. CloudWatch
accepts multiple data points in the same PutMetricData call with the same time stamp. You can
also publish multiple data points for the same or different metrics, with any time stamp. The size of
a PutMetricData request, however, is limited to 8KB for HTTP GET requests and 40KB for HTTP
POST requests. You can include a maximum of 20 data points in one PutMetricData request.
For large data sets that would make the use of PutMetricData impractical, CloudWatch allows for
the insertion of a pre-aggregated data set called a StatisticSet. With StatisticSets you give CloudWatch
the Min, Max, Sum, and SampleCount of a number of data points. StatisticSets is commonly used
when you need to collect data many times in a minute. For example, let’s say you have a metric for the
request latency of a web page. It doesn’t make sense to do a PutMetricData request with every web
page hit. We suggest you collect the latency of all hits to that web page, aggregate them together once
a minute and send that StatisticSet to CloudWatch.
Amazon CloudWatch doesn't differentiate the source of a metric. If you publish a metric with the same
namespace and dimensions from different sources, CloudWatch treats this as a single metric. This can
be useful for service metrics in a distributed, scaled system. For example, all the hosts in a web server
application could publish identical metrics representing the latency of requests they are processing.
CloudWatch treats these as a single metric, allowing you to get the statistics for minimum, maximum,
average, and sum of all requests across your application.
Alarms
Alarms can automatically initiate actions on your behalf, based on parameters you specify. An alarm
watches a single metric over a specified time period, and performs one or more actions based on
the value of the metric relative to a given threshold over a number of time periods. The action is a
notification sent to an Amazon Simple Notification Service (Amazon SNS) topic or Auto Scaling policy.
Alarms invoke actions for sustained state changes only. CloudWatch alarms will not invoke actions
8

Amazon CloudWatch User Guide
Regions
simply because they are in a particular state, the state must have changed and been maintained for a
specified number of periods. Alarm actions must reside in the same region as the alarm. For example,
any Amazon SNS message, Auto Scaling policy, etc. invoked by an alarm must exist in the same
region as the alarm and the resource being monitored.
When creating an alarm, select a period that is greater than or equal to the frequency of the metric
to be monitored. For example, basic monitoring for Amazon EC2 instances provides metrics every 5
minutes. When setting an alarm on a basic monitoring metric, select a period of at least 300 seconds
(5 minutes). Detailed monitoring for Amazon EC2 instances provides metrics every 1 minute; when
setting an alarm on a detailed monitoring metric, select a period of at least 60 seconds (1 minute).
Alarms exist only in the region in which they are created. Alarm history is available for the last 14 days.
Related Topics
•PutMetricAlarm
•put-metric-alarm
•Creating Amazon CloudWatch Alarms (p. 76)
For examples that show you how to set up CloudWatch alarms that invoke an Auto Scaling policy and
an Amazon SNS topic, see Creating Amazon CloudWatch Alarms (p. 76).
Regions
Amazon cloud computing resources are housed in highly available data center facilities. To provide
additional scalability and reliability, each data center facility is located in a specific geographical area,
known as a region. Regions are large and widely dispersed geographic locations.
Each Amazon region is designed to be completely isolated from the other Amazon regions. This
achieves the greatest possible failure isolation and stability, and it makes the locality of each Amazon
resource unambiguous. Amazon CloudWatch does not aggregate data across regions. Therefore,
metrics are completely separate between regions.
For more information about the endpoints that represent each region, see Regions and Endpoints in
the Amazon Web Services General Reference.
Supported AWS Services
CloudWatch monitors the following services. As soon as you begin using a service, it automatically
sends metrics to CloudWatch for you.
CloudWatch offers either basic or detailed monitoring for supported AWS products. Basic monitoring
means that a service sends data points to CloudWatch every five minutes. Detailed monitoring means
that a service sends data points to CloudWatch every minute.
Note
If you are using a service that supports both basic and detailed data collection (for example,
Amazon EC2 and Auto Scaling), and you want to access detailed statistics, you must enable
detailed metric collection for that service.
•Amazon API Gateway
Amazon API Gateway sends data to CloudWatch every 5 minutes by default. You can create alarms
using Amazon API Gateway Dimensions and Metrics (p. 142). For more information, see Monitor
API execution with Amazon CloudWatch in the API Gateway Developer Guide.
9

Amazon CloudWatch User Guide
Supported AWS Services
•Auto Scaling
Auto Scaling sends data to CloudWatch every 5 minutes by default. For an additional charge, you
can enable detailed monitoring for Auto Scaling, which sends data to CloudWatch every minute. You
can create alarms using Auto Scaling Dimensions and Metrics (p. 144). For more information, see
Monitor Your Auto Scaling Instances in the Auto Scaling User Guide.
•Amazon CloudFront
Amazon CloudFront sends data to CloudWatch every minute by default. You can create alarms
using Amazon CloudFront Dimensions and Metrics (p. 145). For more information, see Monitoring
CloudFront Activity Using CloudWatch in the Amazon CloudFront Developer Guide.
•Amazon CloudSearch
Amazon CloudSearch sends data to CloudWatch every minute by default. You can create alarms
using Amazon CloudSearch Dimensions and Metrics (p. 146). For more information, see
Monitoring an Amazon CloudSearch Domain with Amazon CloudWatch in the Amazon CloudSearch
Developer Guide.
•Amazon CloudWatch Events
Amazon CloudWatch Events sends data to CloudWatch every minute by default. You can create
alarms using Amazon CloudWatch Events Dimensions and Metrics (p. 147).
•Amazon CloudWatch Logs
Amazon CloudWatch Logs sends data to CloudWatch every minute by default. You can create
alarms using Amazon CloudWatch Logs Dimensions and Metrics (p. 148).
•Amazon DynamoDB
Amazon DynamoDB sends data to CloudWatch every minute for some metrics and every 5 minutes
for other metrics. For more information about these metrics, see Amazon DynamoDB Dimensions
and Metrics (p. 150). For more information about how to monitor DynamoDB, see Monitoring
DynamoDB Tables with Amazon CloudWatch in the Amazon DynamoDB Developer Guide.
•Amazon EC2 Container Service
Amazon EC2 Container Service (Amazon ECS) sends data to CloudWatch every minute. You can
create alarms using Amazon ECS Dimensions and Metrics (p. 160). For more information, see
Amazon ECS CloudWatch Metrics in the Amazon EC2 Container Service Developer Guide.
•Amazon ElastiCache
Amazon ElastiCache sends data to CloudWatch every minute. You can create alarms using Amazon
ElastiCache Dimensions and Metrics (p. 162). For more information, see Viewing Cache Cluster
and Cache Node Metrics in the Amazon ElastiCache User Guide.
•Amazon Elastic Block Store
Amazon Elastic Block Store sends data to CloudWatch every 5 minutes. You can create alarms
using Amazon EBS Dimensions and Metrics (p. 167). For more information, see Monitoring the
Status of Your Volumes in the Amazon EC2 User Guide for Linux Instances.
•Amazon EC2
Amazon Elastic Compute Cloud (Amazon EC2) sends data to CloudWatch every 5 minutes by
default. For an additional charge, you can enable detailed monitoring for Amazon EC2, which sends
data to CloudWatch every minute.
• Amazon EC2 provides CloudWatch metrics for your instances. You can create alarms using
Amazon Elastic Compute Cloud Dimensions and Metrics (p. 169). For more information, see
Monitoring Your Instances in the Amazon EC2 User Guide for Linux Instances.
• Amazon EC2 provides CloudWatch metrics for the Spot instances in your fleet. You can use
Amazon EC2 Spot Fleet Dimensions and Metrics (p. 173) to monitor your Spot fleet. For more
10

Amazon CloudWatch User Guide
Supported AWS Services
information, see CloudWatch Metrics for Spot Fleet in the Amazon EC2 User Guide for Linux
Instances
•Amazon Elastic File System
Amazon Elastic File System sends data to CloudWatch every minute. You can create alarms using
Amazon EFS Dimensions and Metrics (p. 174). For more information, see Monitor Metrics with
CloudWatch in the Amazon Elastic File System User Guide.
•Elastic Load Balancing
Elastic Load Balancing sends data to CloudWatch every minute. You can create alarms using Elastic
Load Balancing Dimensions and Metrics (p. 177). For more information, see Monitor Your Load
Balancer Using Amazon CloudWatch in the Elastic Load Balancing User Guide.
•Amazon EMR
Amazon EMR sends data to CloudWatch every 5 minutes. You can create alarms using Amazon
EMR Dimensions and Metrics (p. 182). For more information, see Monitor Metrics with Amazon
CloudWatch in the Amazon EMR Developer Guide.
•Amazon Elasticsearch Service
Amazon Elasticsearch Service sends data to CloudWatch every minute. You can create alarms
using Amazon Elasticsearch Service Dimensions and Metrics (p. 191). For more information, see
Monitoring Cluster Metrics and Statistics with Amazon CloudWatch in the Amazon Elasticsearch
Service Developer Guide.
•Amazon Elastic Transcoder
Amazon Elastic Transcoder sends data to CloudWatch every minute. You can create alarms
using Amazon Elastic Transcoder Dimensions and Metrics (p. 194). For more information, see
Monitoring Elastic Transcoder in the Amazon Elastic Transcoder Developer Guide.
•AWS IoT
AWS IoT sends data to CloudWatch every minute. You can create alarms using AWS IoT
Dimensions and Metrics (p. 195). For more information, see Monitoring with Amazon CloudWatch
in the AWS IoT Developer Guide.
•Amazon Kinesis Streams
Amazon Kinesis Streams sends data to CloudWatch every minute. You can create alarms using
Amazon Kinesis Streams Dimensions and Metrics (p. 197). For more information, see Monitoring
Amazon Kinesis with Amazon CloudWatch in the Amazon Kinesis Developer Guide.
•Amazon Kinesis Firehose
Amazon Kinesis Firehose sends data to CloudWatch every minute. You can create alarms using
Amazon Kinesis Firehose Metrics (p. 203). For more information, see Monitoring Amazon Kinesis
Firehose with Amazon CloudWatch in the Amazon Kinesis Firehose Developer Guide.
•AWS Key Management Service
AWS Key Management Service sends data to CloudWatch every minute. You can create alarms
using AWS Key Management Service Metrics and Dimensions (p. 205). For more information, see
Monitoring with Amazon CloudWatch in the AWS Key Management Service Developer Guide.
•AWS Lambda
AWS Lambda sends data to CloudWatch every minute. You can create alarms using AWS Lambda
Dimensions and Metrics (p. 206). For more information, see Troubleshooting and Monitoring AWS
Lambda Functions with Amazon CloudWatch in the AWS Lambda Developer Guide.
•Amazon Machine Learning
Amazon Machine Learning sends data to CloudWatch every 5 minutes. You can create alarms using
Amazon Machine Learning Dimensions and Metrics (p. 207). For more information, see Monitoring
11

Amazon CloudWatch User Guide
Supported AWS Services
Amazon Machine Learning with Amazon CloudWatch Metrics in the Amazon Machine Learning
Developer Guide.
•AWS OpsWorks
AWS OpsWorks sends data to CloudWatch every minute. You can create alarms using AWS
OpsWorks Dimensions and Metrics (p. 208). For more information, see Monitoring in the AWS
OpsWorks User Guide.
•Amazon Redshift
Amazon Redshift sends data to CloudWatch every minute. You can create alarms using Amazon
Redshift Dimensions and Metrics (p. 210). For more information, see Monitoring Amazon Redshift
Cluster Performance in the Amazon Redshift Cluster Management Guide.
•Amazon Relational Database Service
Amazon Relational Database Service sends data to CloudWatch every minute. You can create
alarms using Amazon RDS Dimensions and Metrics (p. 212). For more information, see Monitoring
a DB Instance in the Amazon Relational Database Service User Guide.
•Amazon Route 53
Amazon Route 53 sends data to CloudWatch every minute. You can create alarms using Amazon
Route 53 Dimensions and Metrics (p. 215). For more information, see Monitoring Health Checks
Using Amazon CloudWatch in the Amazon Route 53 Developer Guide.
•Amazon Simple Notification Service
Amazon Simple Notification Service sends data to CloudWatch every 5 minutes. You can create
alarms using Amazon Simple Notification Service Dimensions and Metrics (p. 216). For more
information, see Monitoring Amazon SNS with Amazon CloudWatch in the Amazon Simple
Notification Service Developer Guide.
•Amazon Simple Queue Service
Amazon Simple Queue Service sends data to CloudWatch every 5 minutes. You can create alarms
using Amazon SQS Dimensions and Metrics (p. 218). For more information, see Monitoring
Amazon SQS with Amazon CloudWatch in the Amazon Simple Queue Service Developer Guide.
•Amazon Simple Storage Service
Amazon Simple Storage Service sends data to CloudWatch once a day. You can create alarms
using Amazon Simple Storage Service Dimensions and Metrics (p. 220). For more information,
see Monitoring Amazon Simple Storage Service with Amazon CloudWatch in the Amazon Simple
Storage Service Developer Guide.
•Amazon Simple Workflow Service
Amazon Simple Workflow Service sends data to CloudWatch every 5 minutes. You can create
alarms using Amazon SWF Dimensions and Metrics (p. 220). For more information, see Viewing
Amazon SWF Metrics for CloudWatch using the AWS Management Console in the Amazon Simple
Workflow Service Developer Guide.
•AWS Storage Gateway
AWS Storage Gateway sends data to CloudWatch every 5 minutes. You can create alarms using
AWS Storage Gateway Dimensions and Metrics (p. 222). For more information, see Monitoring
Your AWS Storage Gateway in the AWS Storage Gateway User Guide.
•AWS WAF
AWS WAF sends data to CloudWatch every minute. You can create alarms using AWS WAF
Dimensions and Metrics (p. 233). For more information, see Testing Web ACLs in the AWS WAF
Developer Guide.
•Amazon WorkSpaces
12

Amazon CloudWatch User Guide
Accessing CloudWatch
Amazon WorkSpaces sends data to CloudWatch every 5 minutes. You can create alarms using
Amazon WorkSpaces Dimensions and Metrics (p. 234). For more information about how to
monitor Amazon WorkSpaces, see Monitoring Amazon WorkSpaces in the Amazon WorkSpaces
Administration Guide.
Accessing CloudWatch
You can access CloudWatch using any of the following:
• Amazon CloudWatch console
For more information about the CloudWatch console, see Sign in to the Amazon CloudWatch
Console (p. 17).
• AWS Console for Android and iOS
For more information about the AWS Console, see AWS Console for Android and iOS.
• CloudWatch CLI
For information about how to install and configure the Amazon CloudWatch CLI, see Set Up the
Command Line Interface in the Amazon CloudWatch CLI Reference.
• AWS CLI
For information about how to install and configure the AWS CLI, see Getting Set Up with the AWS
Command Line Interface in the AWS Command Line Interface User Guide.
• CloudWatch API
For more information about the CloudWatch API, see Amazon CloudWatch API Reference.
• AWS SDKs
For more information about the AWS SDKs, see Tools for Amazon Web Services.
Regions and Endpoints
You monitor metrics and create alarms in a specific AWS region. You send your CloudWatch requests
to a region-specific endpoint. For a list of supported AWS regions, see Regions and Endpoints in the
Amazon Web Services General Reference.
CloudWatch Limits
CloudWatch has the following limits:
Resource Default Limit
Actions 5/alarm. This limit cannot be changed.
Alarms 10/month/customer for free. 5000/account.
API requests 1,000,000/month/customer for free.
Custom metrics No limit.
13

Amazon CloudWatch User Guide
Related AWS Services
Resource Default Limit
DescribeAlarms 3 transactions per second (TPS). The maximum number of
operation requests you can make per second without being
throttled.
You can request a limit increase.
Dimensions 10/metric. This limit cannot be changed.
GetMetricStatistics 400 transactions per second (TPS). The maximum number
of operation requests you can make per second without
being throttled.
You can request a limit increase.
ListMetrics 25 transactions per second (TPS). The maximum number
of operation requests you can make per second without
being throttled.
You can request a limit increase.
Metric data 2 weeks. This limit cannot be changed.
MetricDatum items 20/PutMetricData request. A MetricDatum object can
contain a single value or a StatisticSet object representing
many values. This limit cannot be changed.
Metrics 10/month/customer for free.
Period One day (86,400 seconds). This limit cannot be changed.
PutMetricAlarm request 3 transactions per second (TPS). The maximum number of
operation requests you can make per second without being
throttled.
You can request a limit increase.
PutMetricData request 8 KB for HTTP GET requests and 40 KB for HTTP POST
requests. PutMetricData can handle 150 transactions per
second (TPS), which is the maximum number of operation
requests you can make per second without being throttled.
You can request a limit increase.
Amazon SNS email notifications 1,000/month/customer for free.
Related AWS Services
The following services are used in conjunction with Amazon CloudWatch:
•Auto Scaling is a web service that enables you to automatically launch or terminate Amazon
Elastic Compute Cloud (Amazon EC2) instances based on user-defined policies, health status
checks, and schedules. You can use a CloudWatch alarm with Auto Scaling to scale Amazon EC2
instances based on demand. For more information, see Scale Based on Demand in the Auto Scaling
Developer Guide.
•Amazon Simple Notification Service (Amazon SNS) is a web service that coordinates and
manages the delivery or sending of messages to subscribing endpoints or clients. You use Amazon
14
Amazon CloudWatch User Guide
Resources
SNS with CloudWatch to send messages when an alarm threshold has been reached. For more
information, see Set Up Amazon Simple Notification Service (p. 78).
•AWS CloudTrail is a web service that enables you to monitor the calls made to the Amazon
CloudWatch API for your account, including calls made by the AWS Management Console,
command line interface (CLI), and other services. When CloudTrail logging is turned on, CloudWatch
will write log files into the Amazon S3 bucket that you specified when you configured CloudTrail.
Each log file can contain one or more records, depending on how many actions must be performed
to satisfy a request. For more information about AWS CloudTrail, see What is AWS CloudTrail? in
the AWS CloudTrail User Guide. For an example of the type of data that CloudWatch writes into
CloudTrail log files, see Logging Amazon CloudWatch API Calls in AWS CloudTrail (p. 110).
•AWS Identity and Access Management (IAM) is a web service that helps you securely control
access to AWS resources for your users. Use IAM to control who can use your AWS resources
(authentication) and what resources they can use in which ways (authorization). For more
information, see What is IAM? in the IAM User Guide.
•Amazon Kinesis Streams is a web service you can use for rapid and continuous data intake and
aggregation. The type of data used includes IT infrastructure log data, application logs, social media,
market data feeds, and web clickstream data. Because the response time for the data intake and
processing is in real time, processing is typically lightweight. For more information, see What is
Amazon Kinesis Streams? in the Amazon Kinesis Streams Developer Guide.
•AWS Lambda is a web service you can use to build applications that respond quickly to new
information. Upload your application code as Lambda functions and Lambda runs your code on high-
availability compute infrastructure and performs all the administration of the compute resources,
including server and operating system maintenance, capacity provisioning and automatic scaling,
code and security patch deployment, and code monitoring and logging. All you need to do is supply
your code in one of the languages that Lambda supports. For more information, see What is AWS
Lambda? in the AWS Lambda Developer Guide.
Amazon CloudWatch Resources
The following table lists related resources that you'll find useful as you work with Amazon CloudWatch.
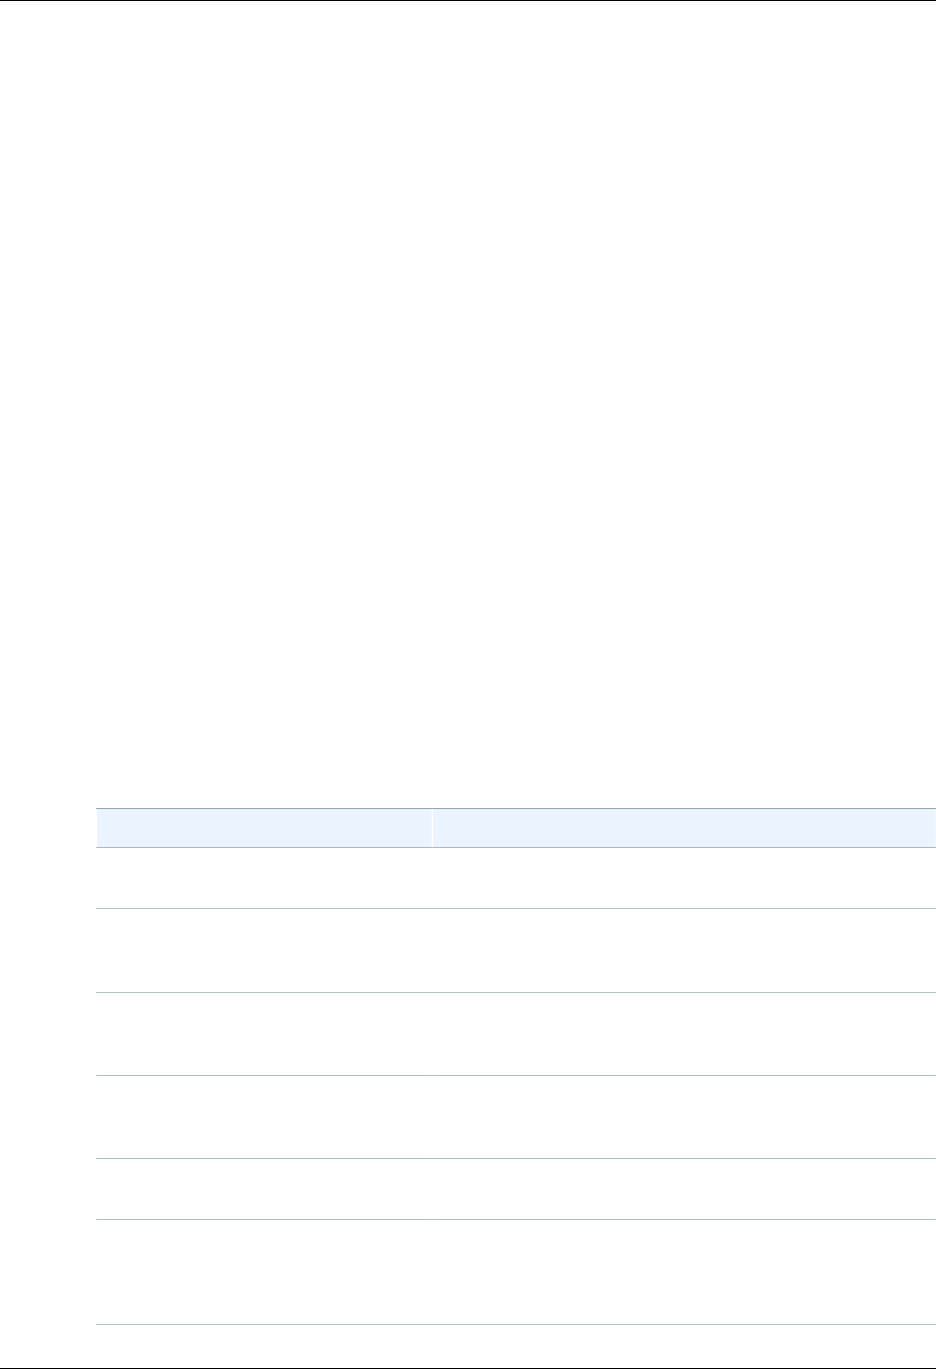
Resource Description
Amazon CloudWatch FAQs The FAQ covers the top questions developers have asked
about this product.
Release notes The release notes give a high-level overview of the
current release. They specifically note any new features,
corrections, and known issues.
AWS Developer Resource Center A central starting point to find documentation, code
samples, release notes, and other information to help you
build innovative applications with AWS.
AWS Management Console The console allows you to perform most of the functions
of Amazon CloudWatch and various other AWS products
without programming.
Amazon CloudWatch Discussion
Forums Community-based forum for developers to discuss
technical questions related to Amazon CloudWatch.
AWS Support The hub for creating and managing your AWS Support
cases. Also includes links to other helpful resources, such
as forums, technical FAQs, service health status, and AWS
Trusted Advisor.
15


Amazon CloudWatch User Guide
Sign Up for Amazon Web Services (AWS)
Getting Set Up
To use Amazon CloudWatch you need an AWS account. Your AWS account allows you to use
services (e.g., Amazon EC2) to generate metrics that you can view in the CloudWatch console, a point-
and-click web-based interface. In addition, you need to install and configure the AWS command line
interface (CLI).
Topics
•Sign Up for Amazon Web Services (AWS) (p. 17)
•Sign in to the Amazon CloudWatch Console (p. 17)
•Set Up the Command Line Interface (p. 19)
Sign Up for Amazon Web Services (AWS)
When you create an AWS account, we automatically sign up your account for all AWS services. You
pay only for the services that you use.
If you have an AWS account already, skip to the next step. If you don't have an AWS account, use the
following procedure to create one.
To sign up for an AWS account
1. Open http://aws.amazon.com/, and then choose Create an AWS Account.
2. Follow the online instructions.
Part of the sign-up procedure involves receiving a phone call and entering a PIN using the phone
keypad.
Sign in to the Amazon CloudWatch Console
To sign in to the Amazon CloudWatch console
1. Sign in to the AWS Management Console and open the CloudWatch console at https://
console.aws.amazon.com/cloudwatch/.
The monitoring dashboard opens. Your dashboard might look something like the following:
17
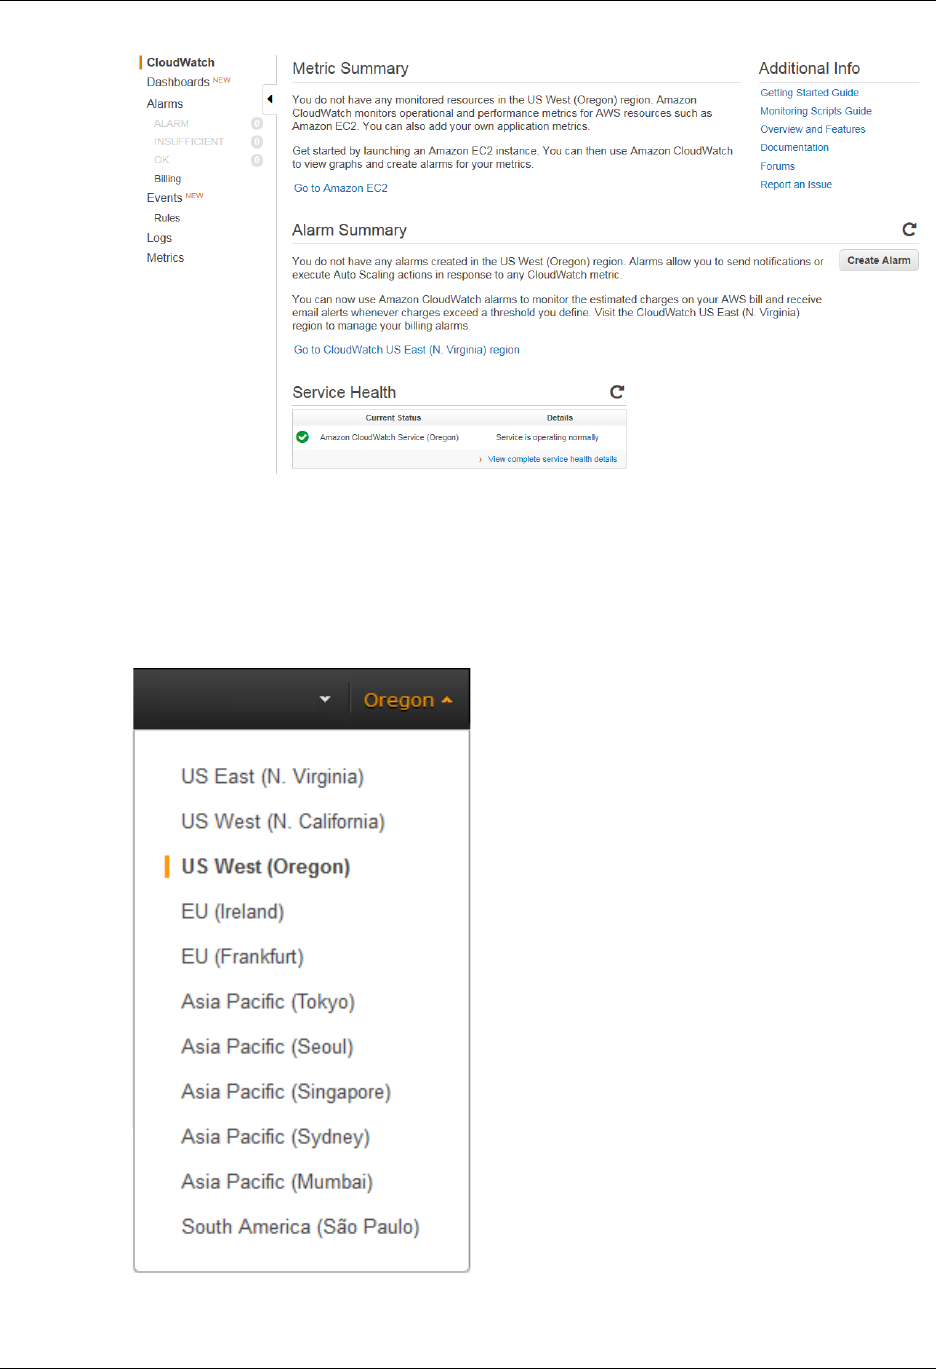
Amazon CloudWatch User Guide
Sign in to the Amazon CloudWatch Console
If you do not have any alarms, the Your Alarms section will have a Create Alarm button. Even if
this is the first time you are using the CloudWatch console, the Your Metrics section could already
report that you are using a significant number of metrics, because several AWS products push free
metrics to Amazon CloudWatch automatically.
2. If necessary, change the region. From the navigation bar, select the region that meets your
needs. For more information, see Regions and Endpoints in the Amazon Web Services General
Reference.
18

Amazon CloudWatch User Guide
Set Up the Command Line Interface
Set Up the Command Line Interface
You can use the Amazon CloudWatch command line interface (CLI) or the AWS CLI with CloudWatch.
The AWS CLI, which is a unified tool for managing multiple AWS services, replaces the CloudWatch
CLI. New CloudWatch features are included only in the AWS CLI. Before you can use either CLI,
however, you have to install and configure them.
For information about how to install and configure the AWS CLI, see Getting Set Up with the AWS
Command Line Interface in the AWS Command Line Interface User Guide.
For information about how to install and configure the Amazon CloudWatch CLI, see Set Up the
Command Line Interface in the Amazon CloudWatch CLI Reference.
19

Amazon CloudWatch User Guide
Scenario: Monitor Your Estimated
Charges Using CloudWatch
Getting Started with Amazon
CloudWatch
The following scenarios show you how to use Amazon CloudWatch. In the first scenario, you use the
CloudWatch console to create a billing alarm that tracks your AWS usage and lets you know when
you have exceeded a certain spending threshold. In the second, more advanced scenario, you use
the AWS command line interface (CLI) to publish a single metric for a hypothetical application named
GetStarted.
•Scenario: Monitor Your Estimated Charges Using CloudWatch (p. 20)
•Scenario: Publish Metrics to CloudWatch (p. 26)
Scenario: Monitor Your Estimated Charges
Using CloudWatch
In this scenario, you create an Amazon CloudWatch alarm that will monitor your estimated Amazon
Web Services (AWS) charges. When you enable the monitoring of estimated charges for your AWS
account, the estimated charges are calculated and sent several times daily to CloudWatch as metric
data that is stored for 14 days. Billing metric data is stored in the US East (N. Virginia) Region and
represents worldwide charges. This data includes the estimated charges for every service in AWS
that you use, as well as the estimated overall total of your AWS charges. You can choose to receive
alerts by email when charges have exceeded a certain threshold. These alerts are triggered by
CloudWatch and messages are sent using Amazon Simple Notification Service (Amazon SNS). For
more information about working with CloudWatch metrics, see Viewing, Graphing, and Publishing
Metrics (p. 37).
Topics
•Step 1: Enable Monitoring of Your Estimated Charges (p. 21)
•Step 2: Create a Billing Alarm (p. 21)
•Step 3: Check Alarm Status (p. 25)
•Step 4: Edit a Billing Alarm (p. 26)
20
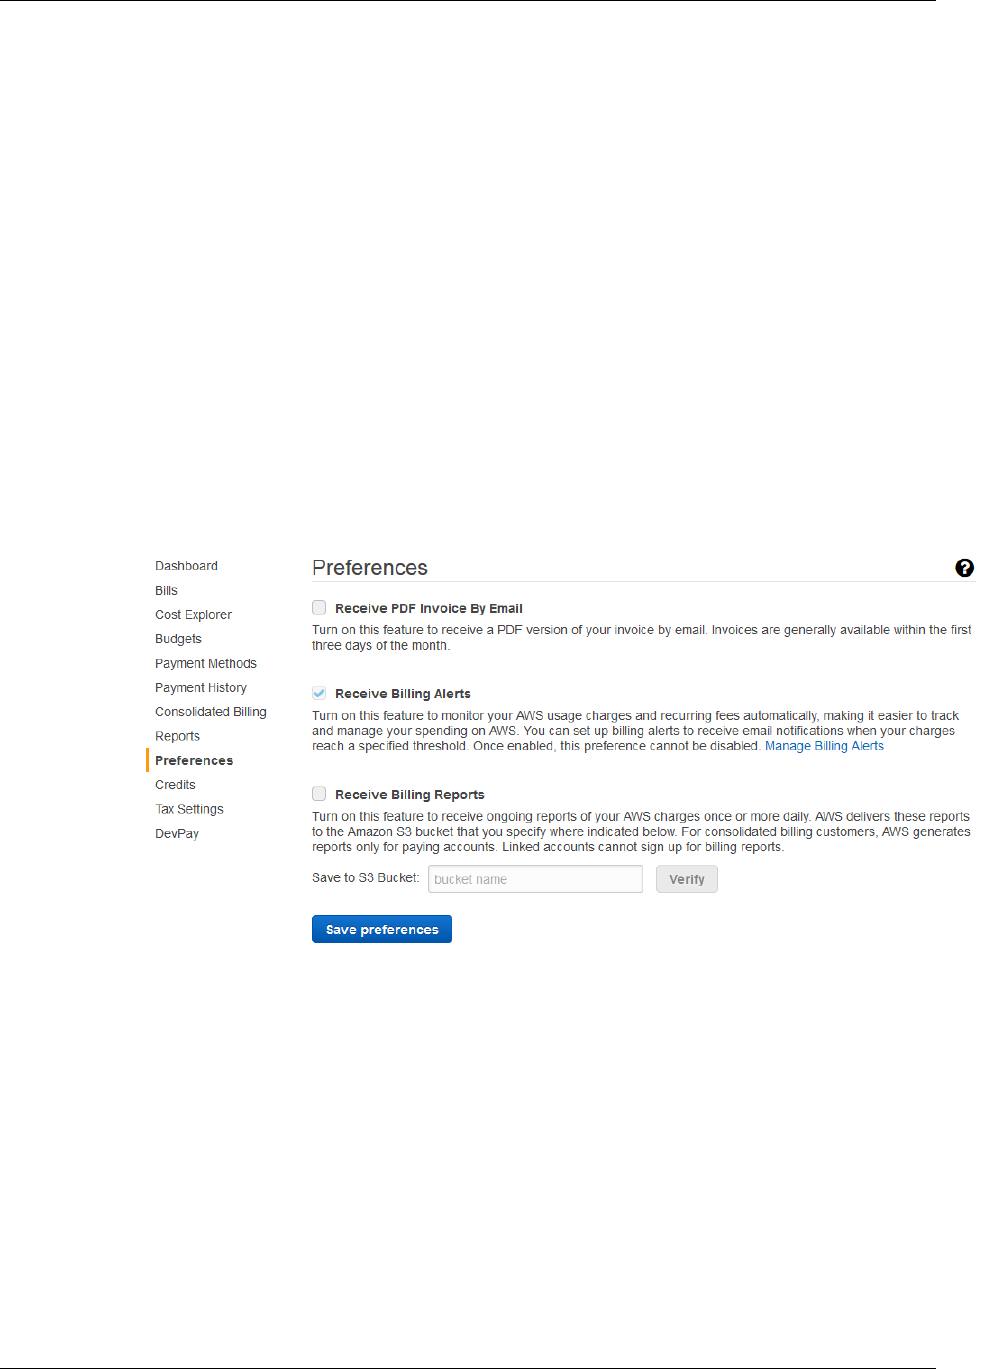
Amazon CloudWatch User Guide
Step 1: Enable Monitoring of Your Estimated Charges
•Step 5: Delete a Billing Alarm (p. 26)
Step 1: Enable Monitoring of Your Estimated
Charges
Before you can create an alarm on your estimated charges, you must enable monitoring of your
estimated AWS charges, which creates metric data that you can use to create a billing alarm. It takes
about 15 minutes before you can view billing data and create alarms. After you enable billing metrics
you cannot disable the collection of data, but you can delete any alarms you have created. You must
be signed in as the account owner (the "root user") to enable billing alerts for your AWS account.
To enable monitoring of your estimated charges
1. Open the Billing and Cost Management console at https://console.aws.amazon.com/billing/home?
#.
2. In the spaces provided, enter your user name and password, and then click Sign in using our
secure server.
3. In the navigation pane, click Preferences, and then select the Receive Billing Alerts check box.
Step 2: Create a Billing Alarm
After you've enabled monitoring of your estimated AWS charges, you can create a billing alarm in
the Amazon CloudWatch console. In this scenario, you'll create an alarm that will send an email
message when your estimated charges for AWS exceed $200. When you enable the monitoring of
your estimated charges for the first time, it takes about 15 minutes before you can view billing data and
set billing alarms.
To create a billing alarm
1. Open the CloudWatch console at https://console.aws.amazon.com/cloudwatch/.
2. If necessary, change the region to US East (N. Virginia). Billing metric data is stored in the US
East (N. Virginia) Region and represent worldwide charges. For more information, see Regions
and Endpoints.
21
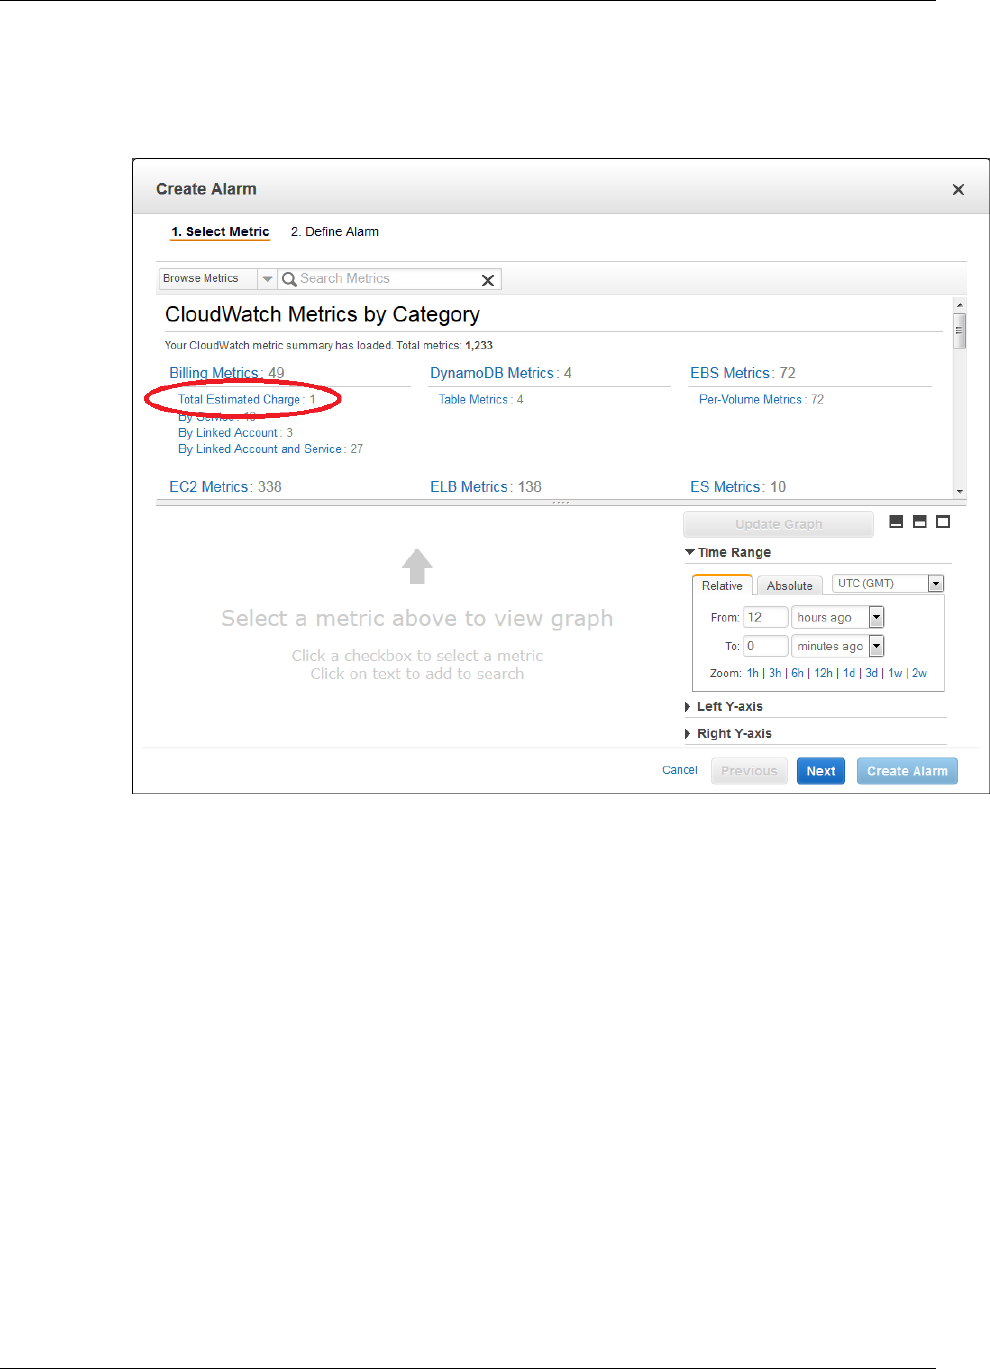
Amazon CloudWatch User Guide
Step 2: Create a Billing Alarm
3. In the navigation pane, click Alarms, and then in the Alarms pane, click Create Alarm.
4. In the CloudWatch Metrics by Category pane, under Billing Metrics, click Total Estimated
Charge.
5. Under Billing > Total Estimated Charge, select the EstimatedCharges metric to view a graph of
billing data in the lower pane.
22
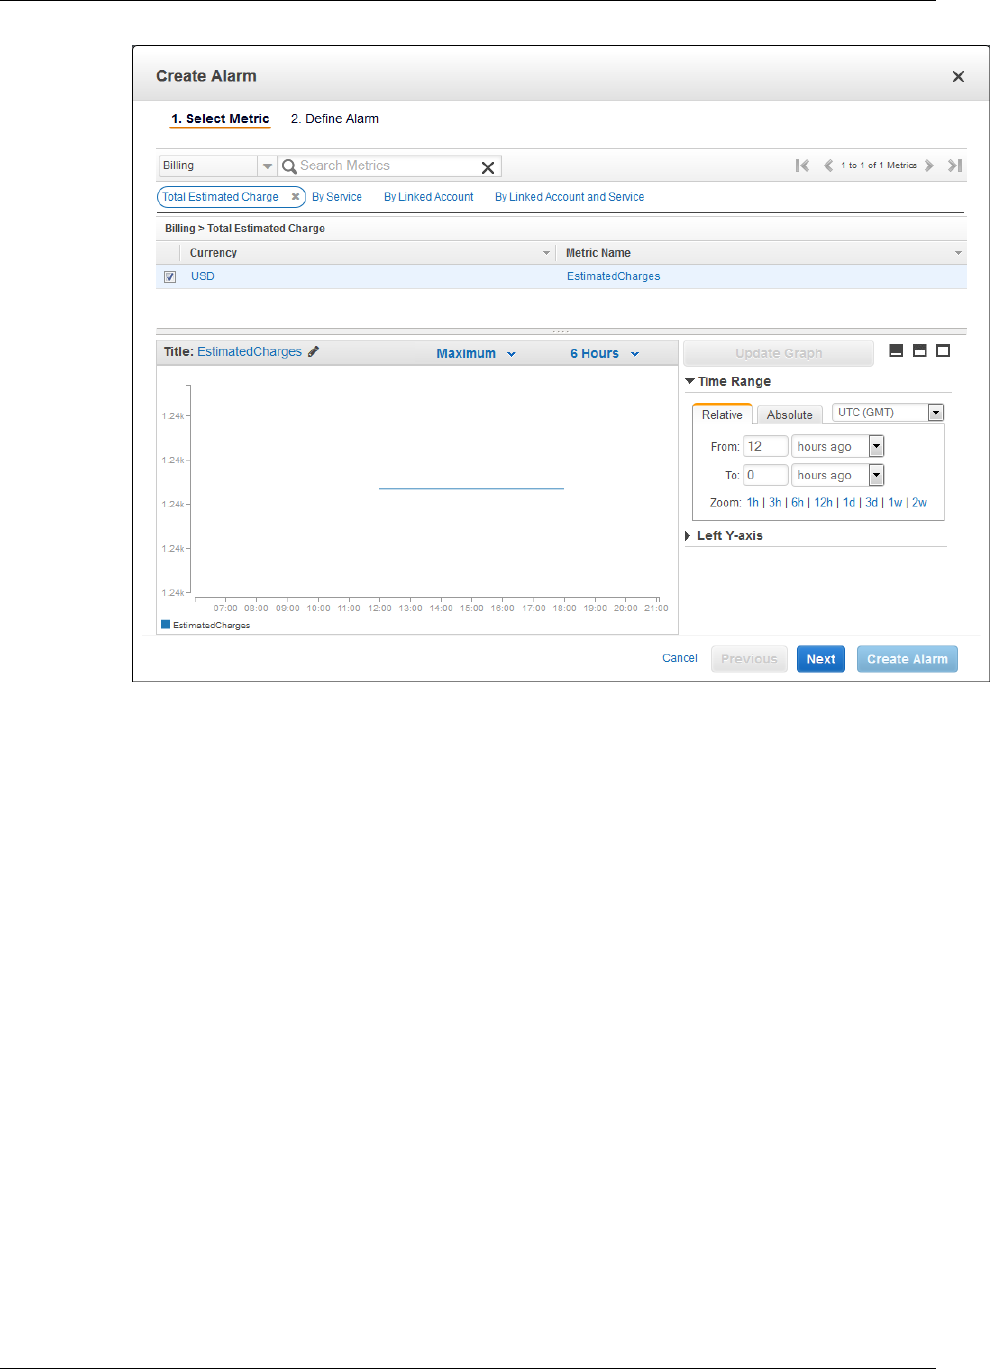
Amazon CloudWatch User Guide
Step 2: Create a Billing Alarm
6. Click Next, and then in the Alarm Threshold pane, in the Name box, type a unique, friendly name
for the alarm (for example, My Estimated Charges).
23
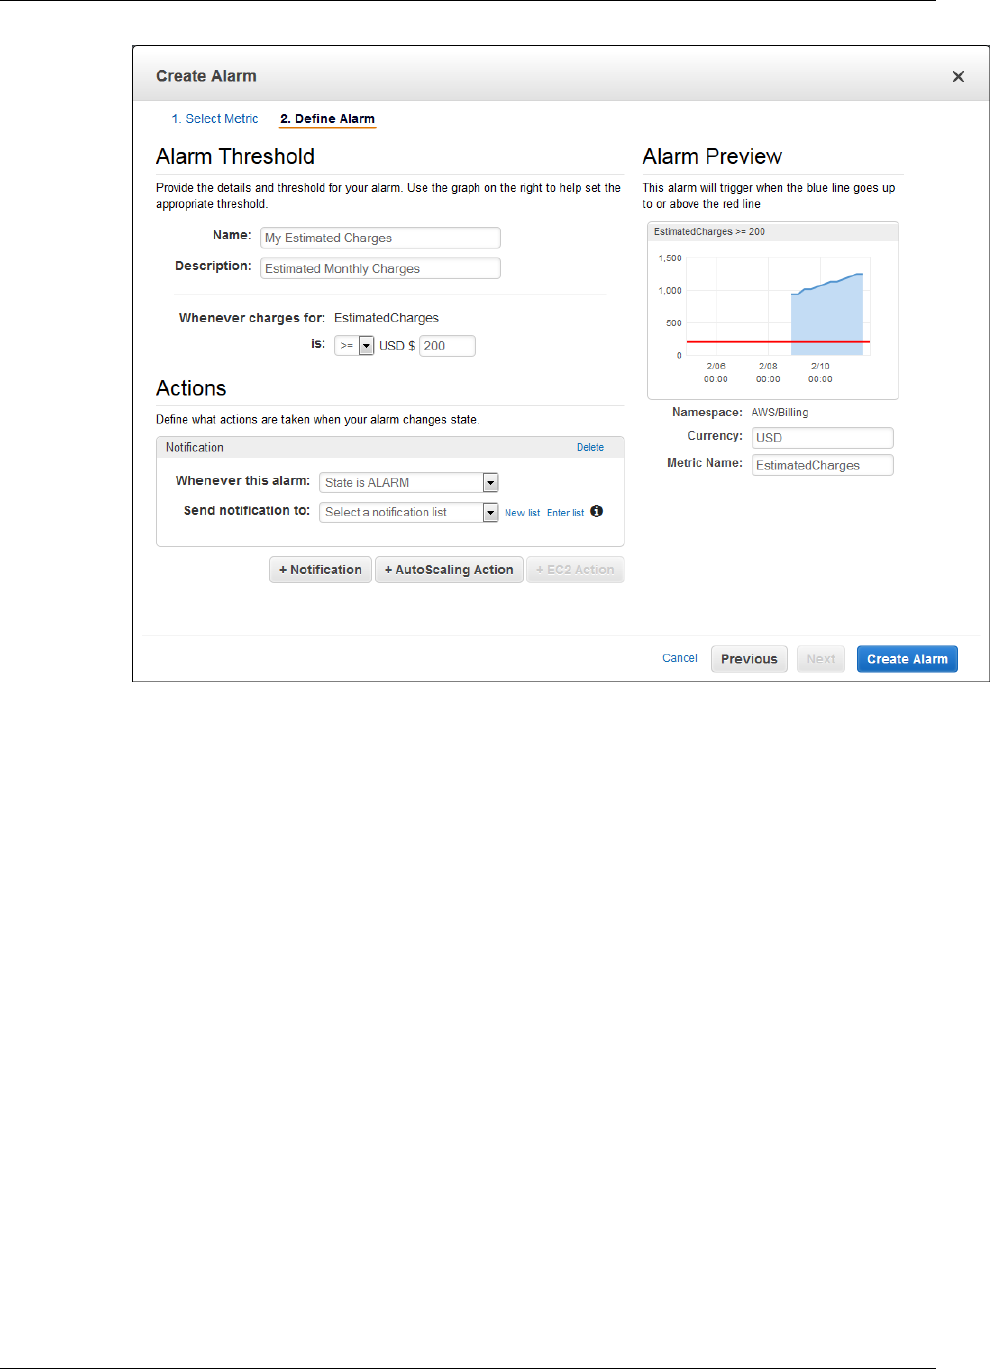
Amazon CloudWatch User Guide
Step 2: Create a Billing Alarm
7. In the Description box, enter a description for the alarm (for example, Estimated Monthly
Charges).
8. Under Whenever charges for, in the is drop-down list, select >= (greater than or equal to), and
then in the USD box, set the monetary amount (for example, 200) that must be exceeded to trigger
the alarm and send an email.
Note
Under Alarm Preview, in the Estimated Monthly Charges thumbnail graph, you can
see an estimate of your charges that you can use to set an appropriate threshold for the
alarm.
9. Under Actions, click Notification, and then in the Whenever this alarm drop-down menu, click
State is ALARM.
10. In the Send notification to box, select an existing Amazon SNS topic.
To create a new Amazon SNS topic, click Create topic, and then in the Send notification to box,
enter a name for the new Amazon SNS topic (for example., CFO), and in the Email list box, enter
the email address (for example, john.stiles@example.com) where email notifications should be
sent.
Note
If you create a new Amazon SNS topic, the email account associated with the topic will
receive a subscription confirmation email. You must confirm the subscription in order to
receive future email notifications when the alarm is triggered.
24
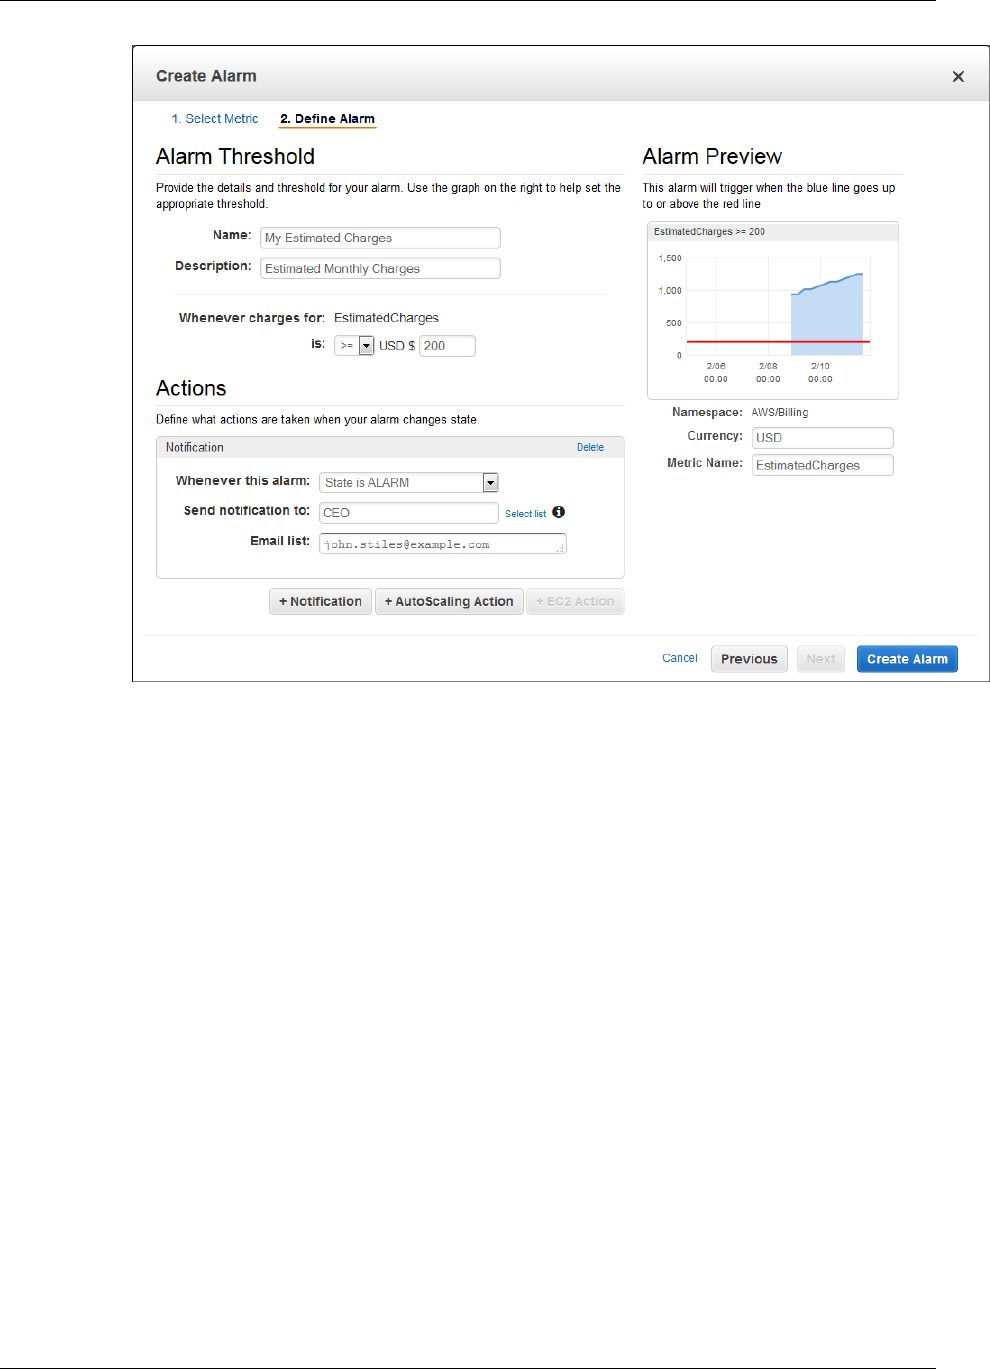
Amazon CloudWatch User Guide
Step 3: Check Alarm Status
11. Click Create Alarm.
Important
If you added an email address to the list of recipients or created a new topic, Amazon
SNS sends a subscription confirmation email to each new address shortly after you
create an alarm. Remember to click the link contained in that message, which confirms
your subscription. Alert notifications are only sent to confirmed addresses.
12. To view your billing alarm in the CloudWatch console, in the navigation pane, under Alarms, click
Billing.
Step 3: Check Alarm Status
Now, check the status of the billing alarm that you just created.
To check alarm status using the CloudWatch console
1. Sign in to the AWS Management Console and open the CloudWatch console at https://
console.aws.amazon.com/cloudwatch/.
2. If necessary, change the region to US East (N. Virginia). Billing metric data is stored in the US
East (N. Virginia) Region and represent worldwide charges. For more information, see Regions
and Endpoints.
3. In the navigation pane, under Alarms, click Billing.
25

Amazon CloudWatch User Guide
Step 4: Edit a Billing Alarm
Step 4: Edit a Billing Alarm
Let's say that you want to increase the amount money you spend with AWS each month to $400. You
can edit your existing billing alarm and increase the dollar amount that must be exceeded before the
alarm is triggered.
To edit a billing alarm using the CloudWatch console
1. Sign in to the AWS Management Console and open the CloudWatch console at https://
console.aws.amazon.com/cloudwatch/.
2. If necessary, change the region to US East (N. Virginia). Billing metric data is stored in the US
East (N. Virginia) Region and represent worldwide charges. For more information, see Regions
and Endpoints.
3. In the navigation pane, under Alarms, click Billing.
4. In the list of alarms, select the check box next to the alarm you want to change, and then click
Modify.
5. Under Alarm Threshold, in the USD box, set the monetary amount (for example, 400) that must
be exceeded to trigger the alarm and send an email, and then click Save Changes.
Step 5: Delete a Billing Alarm
Now that you have enabled billing, and you have created and edited your first billing alarm, you can
delete the billing alarm if you no longer need it.
To delete a billing alarm using the CloudWatch console
1. Sign in to the AWS Management Console and open the CloudWatch console at https://
console.aws.amazon.com/cloudwatch/.
2. If necessary, change the region to US East (N. Virginia). Billing metric data is stored in the US
East (N. Virginia) Region and represent worldwide charges. For more information, see Regions
and Endpoints.
3. In the navigation pane, under Alarms, click Billing.
4. In the list of alarms, select the check box next to the alarm you want to delete, and then click
Delete.
5. In the Delete Alarms dialog box, click Yes, Delete.
Scenario: Publish Metrics to CloudWatch
After you have installed the AWS CLI, you're ready to publish metrics to CloudWatch. In this
scenario, you'll use the put-metric-data command in the AWS CLI to publish a single metric for a
hypothetical application named GetStarted. Then, you'll use the CloudWatch console to view statistical
graphs for this metric. For information about how to install and configure the AWS CLI, see Getting
Set Up with the AWS Command Line Interface in the AWS Command Line Interface User Guide. For
more information about working with CloudWatch metrics, see Viewing, Graphing, and Publishing
Metrics (p. 37).
For more information about the put-metric-data command, see put-metric-data in the AWS
Command Line Interface Reference.
Topics
•Step 1: Define the Data Configuration (p. 27)
26
Amazon CloudWatch User Guide
Step 1: Define the Data Configuration
•Step 2: Add Metrics to CloudWatch (p. 27)
•Step 3: Get Statistics from CloudWatch (p. 28)
•Step 4: View Graphs with the Console (p. 29)
Step 1: Define the Data Configuration
In this scenario, you'll publish data points that track the request latency for the application. Choose
names for your metric and namespace that make sense to you. For this example, name the metric
RequestLatency and place all of the data points into the GetStarted namespace.
You'll publish several data points that collectively represent three hours of latency data. The raw
data comprises fifteen request latency readings distributed over three hours. Each reading is in
milliseconds:
• Hour one: 87, 51, 125, 235
• Hour two: 121, 113, 189, 65, 89
• Hour three: 100, 47, 133, 98, 100, 328
You can publish data to CloudWatch as single data points or as an aggregated set of data points called
a statistic set. You'll publish the data points from hour one as single data points.
Hour Raw Data
1 87
1 51
1 125
1 235
For the data from hours two and three, you'll aggregate the data points and publish a statistic set for
each hour.
Note
You can aggregate metrics to a granularity as low as one minute.
You can publish the aggregated data points to CloudWatch as a set of statistics with four predefined
keys: Sum, Minimum, Maximum, and SampleCount. The key values are shown in the following table.
Hour Raw Data Sum Minimum Maximum SampleCount
2 121, 113, 189, 65, 89 577 65 189 5
3 100, 47, 133, 98, 100, 328 806 47 328 6
Step 2: Add Metrics to CloudWatch
After you have defined your data configuration, you are ready to begin adding data.
Note
When you use the put-metric-data command, you must use a date range within the past
two weeks. There is currently no function to delete data points. CloudWatch automatically
deletes data points with a timestamp more than two weeks old.
27
Amazon CloudWatch User Guide
Step 3: Get Statistics from CloudWatch
To publish data points to CloudWatch
1. Open a command prompt and enter the following commands, but replace the time stamp with a
time stamp that represents two hours in the past in Universal Coordinated Time (UTC).
aws cloudwatch put-metric-data --metric-name RequestLatency --namespace
GetStarted --timestamp 2014-02-14T20:30:00Z --value 87 --unit
Milliseconds
aws cloudwatch put-metric-data --metric-name RequestLatency --namespace
GetStarted --timestamp 2014-02-14T20:30:00Z --value 51 --unit
Milliseconds
aws cloudwatch put-metric-data --metric-name RequestLatency --namespace
GetStarted --timestamp 2014-02-14T20:30:00Z --value 125 --unit
Milliseconds
aws cloudwatch put-metric-data --metric-name RequestLatency --namespace
GetStarted --timestamp 2014-02-14T20:30:00Z --value 235 --unit
Milliseconds
The AWS CLI returns a response only when it cannot execute the command.
2. Enter the second data point, but this time use a time stamp one hour later than the first one in
Universal Coordinated Time (UTC).
aws cloudwatch put-metric-data --metric-name RequestLatency --namespace
GetStarted --timestamp 2014-02-14T21:30:00Z --statistic-values
Sum=577,Minimum=65,Maximum=189,SampleCount=5 --unit Milliseconds
3. Enter the last data point, but this time omit the time stamp to get the current time (the default
value).
aws cloudwatch put-metric-data --metric-name
RequestLatency --namespace GetStarted --statistic-values
Sum=806,Minimum=47,Maximum=328,SampleCount=6 --unit Milliseconds
After adding metrics, you can get statistics.
Step 3: Get Statistics from CloudWatch
Now that you have published metrics to CloudWatch, you are ready to retrieve statistics that are based
on those metrics.
To retrieve statistics with the command line tools
• Specify a --start-time and --end-time far enough in the past to cover the earliest time stamp
that you published.
aws cloudwatch get-metric-statistics --namespace GetStarted --metric-name
RequestLatency --statistics Average --start-time 2014-02-14T00:00:00Z --
end-time 2014-02-15T00:00:00Z --period 60
The AWS CLI returns the following JSON:
{
"Datapoints": [],
"Label": "Request:Latency"
28

Amazon CloudWatch User Guide
Step 4: View Graphs with the Console
}
To see your statistics in a visual format, you can use the CloudWatch console to view graphs.
Step 4: View Graphs with the Console
After you have published metrics to CloudWatch, you can use the CloudWatch console to view
statistical graphs.
To view graphs of your statistics on the console
1. Sign in to the AWS Management Console and open the CloudWatch console at https://
console.aws.amazon.com/cloudwatch/.
2. If necessary, change the region. From the navigation bar, select the region that meets your needs.
For more information, see Regions and Endpoints.
3. In the Navigation pane, click Metrics. CloudWatch Metrics by Category opens in the right pane.
4. In the CloudWatch Metrics by Category pane, in the search box, type RequestLatency.
5. Select the check box next to the RequestLatency metric name. A graph of the metric's data is
displayed in the lower pane.
6. To change the graph, choose different values from the Statistic and Period lists located next to
graph's title.
7. To create an alarm for this metric, under Tools, click Create Alarm.
Congratulations! You've successfully published and viewed custom metrics.
29

Amazon CloudWatch User Guide
Create a Dashboard
Using Amazon CloudWatch
Dashboards
Amazon CloudWatch dashboards are customizable home pages in the CloudWatch console that you
can use to monitor your resources in a single view, even those resources that are spread out across
different regions. You can use CloudWatch dashboards to create customized views of the metrics for
your AWS resources.
With dashboards, you can create the following:
• A single view for selected metrics to help you assess the health of your resources and applications
across one or more regions.
• An operational playbook that provides guidance for team members during operational events about
how to respond to specific incidents.
• A common view of critical resource and application measurements that can be shared by team
members for faster communication flow during operational events.
Topics
•Create a Dashboard (p. 30)
•Add or Remove a Graph from a Dashboard (p. 31)
•Move or Resize a Graph on a Dashboard (p. 32)
•Edit a Graph on a Dashboard (p. 32)
•Rename a Graph on a Dashboard (p. 33)
•Add, Edit, or Remove a Text Widget from a Dashboard (p. 33)
•Create a Cross-Region Dashboard (p. 34)
•Switch Between Dashboards (p. 34)
•Link and Unlink Graphs on a Dashboard (p. 34)
•Change the Dashboard Refresh Interval (p. 35)
•Change the Dashboard Time Range, Period, or Time Format (p. 35)
Create a Dashboard
To get started with CloudWatch dashboards, you must first create a dashboard. You can also create
multiple dashboards to track metrics for your AWS resources.
30

Amazon CloudWatch User Guide
Add or Remove a Graph from a Dashboard
To create a dashboard
1. Open the CloudWatch console at https://console.aws.amazon.com/cloudwatch/.
2. If necessary, change to the region where your resources are located. From the navigation bar,
select the region that meets your needs. For more information, see Regions and Endpoints in the
Amazon Web Services General Reference.
3. In the navigation pane, choose Dashboards.
4. In the content pane, choose Create dashboard.
5. In the Create new dashboard dialog box, type a name for the dashboard and then choose Create
dashboard.
6. Do one of the following:
a. To add a graph to your dashboard, in the Add widget to dashboard dialog box, choose
Metric Graph, choose Configure, and then, in the Add Graph dialog box, select the metrics
to graph, and then choose Save.
b. To add a text block to your dashboard, in the Add widget to dashboard dialog box, choose
Text Widget, choose Configure, and then, in the New text widget dialog box, in the
Markdown field, add and format your text using Markdown, and then choose Create widget.
7. Choose Save dashboard.
Add or Remove a Graph from a Dashboard
You can add graphs containing one or more metrics to your dashboard for the resources you monitor.
You can remove the graphs when they're no longer needed.
To add a graph to a dashboard
1. Open the CloudWatch console at https://console.aws.amazon.com/cloudwatch/.
2. If necessary, change to the region where your resources are located. From the navigation bar,
select the region that meets your needs. For more information, see Regions and Endpoints in the
Amazon Web Services General Reference.
3. In the navigation pane, choose Dashboards.
4. In the contents pane, choose Add widget.
5. In the Add widget to dashboard dialog box, choose Metric graph to add a graph of a metric over
time to your dashboard.
6. Choose Configure, and then in the Add Graph dialog box, select the metric to graph and choose
Save.
7. (Optional) To temporarily make the graph larger, select the graph.
8. (Optional) To view more information about the metric being graphed, hover over the legend.
9. Choose Save dashboard.
To add a graph from an alarm to a dashboard
1. Open the CloudWatch console at https://console.aws.amazon.com/cloudwatch/.
2. If necessary, change to the region where your resources are located. From the navigation bar,
select the region that meets your needs. For more information, see Regions and Endpoints in the
Amazon Web Services General Reference.
3. In the navigation pane, choose Alarms, and then in the contents pane, choose an alarm.
4. In the details pane, click the graph, and then choose Add to Dashboard.
5. In the Add to dashboard dialog box, in the Add to drop-down list, choose the dashboard you
want to add the graph to, and then choose Add to dashboard.
31

Amazon CloudWatch User Guide
Move or Resize a Graph on a Dashboard
6. Choose Save dashboard.
To remove a graph from a dashboard
1. Open the CloudWatch console at https://console.aws.amazon.com/cloudwatch/.
2. In the navigation pane, choose Dashboards.
3. In the contents pane, hover over the graph's title, choose Widget actions and then Delete.
4. Choose Save dashboard.
Move or Resize a Graph on a Dashboard
You can arrange and resize graphs on your dashboard.
To move or resize a graph on a dashboard
1. Open the CloudWatch console at https://console.aws.amazon.com/cloudwatch/.
2. In the navigation pane, choose Dashboards.
3. In the Dashboards list, choose a dashboard.
4. Do one of the following to move, resize, or temporarily make the graph larger:
a. To move the graph, hover over the title of the graph, and then select and drag the graph to a
new location on the dashboard.
b. To resize the graph, select and drag the lower right corner.
c. To temporarily make the graph larger, click the graph. Alternatively, you can hover over the
title of the graph, choose Widget actions and then choose Enlarge.
5. Choose Save dashboard.
Edit a Graph on a Dashboard
You can edit a graph to change the title, statistic, or period, or to add or remove metrics. If you have
multiple metrics displayed on a graph, you can reduce clutter by temporarily hiding the metrics that
don't interest you.
To edit a graph on a dashboard
1. Open the CloudWatch console at https://console.aws.amazon.com/cloudwatch/.
2. In the navigation pane, choose Dashboards.
3. In the Dashboards list, choose a dashboard.
4. Hover over the title of the graph for which to make changes, choose Widget actions, and choose
Edit.
5. In the lower half of the Edit Graph screen, you can change the title, statistic, or period:
a. To change the graph's title, select the title, enter a new title in the field, and then choose
Save.
b. To change the statistic, which is next to the graph's title, choose the Statistic list, and then
choose another value.
c. To change the time period, which is next to the Statistic list, choose the Period list, and then
choose another value.
6. When you're satisfied with your changes, choose Save.
32

Amazon CloudWatch User Guide
Rename a Graph on a Dashboard
To temporarily hide metrics on a graph on a dashboard
1. Open the CloudWatch console at https://console.aws.amazon.com/cloudwatch/.
2. In the navigation pane, choose Dashboards.
3. In the Dashboards list, choose a dashboard.
4. In the graph's footer, hover over the colored square in the legend, and then when it changes to an
X, click it.
5. To restore the metric, click the grayed out square and metric name.
Rename a Graph on a Dashboard
You can change the default name that AWS assigns to a graph on your dashboard.
To rename a graph on a dashboard
1. Open the CloudWatch console at https://console.aws.amazon.com/cloudwatch/.
2. In the navigation pane, choose Dashboards.
3. In the Dashboards list, choose a dashboard.
4. Hover over the title of the graph for which to make changes, choose Widget actions and then
Edit.
5. On the Edit Graph screen, in the lower half of the screen, choose the graph's title.
6. In the Title field, type a new name, choose Save, and then in the lower-right corner of the Edit
Graph screen, choose Save.
Add, Edit, or Remove a Text Widget from a
Dashboard
You can add a text widget, which is a block of text, to your dashboard. You can format the text in the
text widget using Markdown.
To add a text widget to a dashboard
1. Open the CloudWatch console at https://console.aws.amazon.com/cloudwatch/.
2. In the navigation pane, choose Dashboards.
3. In the Dashboards list, select a dashboard, and then choose Add widget.
4. In the Add widget to dashboard dialog box, choose Text widget and then Configure.
5. In the New text widget dialog box, in the Markdown field, add and format your text using
Markdown, and then choose Create widget.
6. Choose Save dashboard.
To edit a text widget on a dashboard
1. Open the CloudWatch console at https://console.aws.amazon.com/cloudwatch/.
2. In the navigation pane, choose Dashboards.
3. In the Dashboards list, choose a dashboard.
4. In the dashboard, hover over the upper-right corner of the text block to edit, choose Widget
actions and then Edit.
5. In the Edit text widget dialog box, update the text as needed, and then choose Update widget.
33

Amazon CloudWatch User Guide
Create a Cross-Region Dashboard
6. Choose Save dashboard.
To remove a text widget from a dashboard
1. Open the CloudWatch console at https://console.aws.amazon.com/cloudwatch/.
2. In the navigation pane, choose Dashboards.
3. In the Dashboards list, choose a dashboard.
4. In the dashboard, hover over the upper-right corner of the text block, choose Widget actions and
then Delete.
5. Choose Save dashboard.
Create a Cross-Region Dashboard
You can monitor multiple resources in different locations on a single dashboard. For example, you
might want to create a dashboard showing CPU utilization for an Amazon EC2 instance located in the
us-west-2 region with your billing metrics, which are located in us-east-1 region.
To create a cross-region dashboard
1. Open the CloudWatch console at https://console.aws.amazon.com/cloudwatch/.
2. If necessary, change to the region where your resources are located. From the navigation bar,
select the region that meets your needs. For more information, see Regions and Endpoints in the
Amazon Web Services General Reference.
3. In the navigation pane, choose Metrics.
4. In the contents pane, select the metric that you want to add to your dashboard.
5. In the lower pane, choose Add to Dashboard.
6. In the Add to dashboard dialog box, in the Add to list, select the dashboard that you want to add
the graph to, and then choose Add to dashboard.
7. To add other regions, metrics, or resources, repeat these steps as needed.
8. Choose Save dashboard.
Switch Between Dashboards
You can switch from one dashboard to another.
To switch between dashboards dashboard
1. Open the CloudWatch console at https://console.aws.amazon.com/cloudwatch/.
2. In the navigation pane, choose Dashboards.
Note
Your most recently accessed dashboard is listed under Dashboards in the navigation
pane.
3. In the Dashboards list, choose a dashboard.
Link and Unlink Graphs on a Dashboard
You can link all of the graphs on your dashboard together, so that when you zoom in or zoom out on
one graph, all of the other graphs zoom in or zoom out at the same time. You can unlink graphs to limit
changes to one graph.
34

Amazon CloudWatch User Guide
Change the Dashboard Refresh Interval
To link or unlink graphs on a dashboard
1. Open the CloudWatch console at https://console.aws.amazon.com/cloudwatch/.
2. In the navigation pane, choose Dashboards.
3. On the Actions menu, do one of the following:
a. To link all graphs together, select Link graphs.
b. To unlink all graphs, clear Link graphs.
Change the Dashboard Refresh Interval
You can change how often the dashboard data is refreshed.
To change the dashboard refresh interval
1. Open the CloudWatch console at https://console.aws.amazon.com/cloudwatch/.
2. In the navigation pane, choose Dashboards.
3. On the Refresh options menu (upper right corner of the console), do one of the following:
a. To automatically refresh the dashboard, select Auto refresh.
b. To change the refresh interval, under Refresh interval, choose 1, 2, 5, or 15 minutes.
Change the Dashboard Time Range, Period, or
Time Format
You can change the time range to display dashboard data over minutes, hours, or days. You can also
change the period to change the granularity of the data presented. In addition, you can change the time
format to display dashboard data in UTC or local time format.
To change the dashboard time range
1. Open the CloudWatch console at https://console.aws.amazon.com/cloudwatch/.
2. In the navigation pane, choose Dashboards.
3. In the Dashboards list, choose a dashboard.
4. On the Minutes, Hours, Days menu (upper right corner of the console), under Time range,
choose a value for Minutes, Hours, or Days.
To change the dashboard period
1. Open the CloudWatch console at https://console.aws.amazon.com/cloudwatch/.
2. In the navigation pane, choose Dashboards.
3. In the Dashboards list, choose a dashboard.
4. On the Minutes, Hours, Days menu (upper right corner of the console), under Period, choose
one of the available options.
To change the dashboard time format
1. Open the CloudWatch console at https://console.aws.amazon.com/cloudwatch/.
2. In the navigation pane, choose Dashboards.
35

Amazon CloudWatch User Guide
Change the Dashboard Time
Range, Period, or Time Format
3. In the Dashboards list, choose a dashboard.
4. On the Minutes, Hours, Days menu (upper right corner of the console), under Time zone, choose
Local or UTC.
36

Amazon CloudWatch User Guide
View Available Metrics
Viewing, Graphing, and
Publishing Metrics
Metrics are data about the performance of your systems. By default, a set of free metrics is provided
for Amazon Elastic Compute Cloud (Amazon EC2) instances, Amazon Elastic Block Store (Amazon
EBS) volumes, Amazon Relational Database Service (Amazon RDS) DB instances, and Elastic Load
Balancing. You can also choose to enable detailed monitoring for your Amazon EC2 instances, or
add your own application metrics. Metric data is kept for a period of two weeks enabling you to view
up-to-the-minute data and also historical data. Amazon CloudWatch can load all the metrics in your
account for search, graphing and alarms with the AWS Management Console. This includes both AWS
resource metrics and application metrics that you provide.
You can use the following procedures to graph metrics in CloudWatch. After you have completed these
procedures, you can then create alarms for a metric. For more information, see Creating Amazon
CloudWatch Alarms (p. 76).
Topics
•View Available Metrics (p. 37)
•Search for Available Metrics (p. 40)
•Select and Deselect Metrics (p. 41)
•Get Statistics for a Metric (p. 44)
•Graph Metrics (p. 60)
•Publish Custom Metrics (p. 73)
View Available Metrics
Only those services in AWS that you're using send metrics to Amazon CloudWatch. You can use the
Amazon CloudWatch console, the list-metrics command, or the ListMetrics API to view the
available metrics.
AWS Management Console
To view available metrics by category
You can view metrics by category. Metrics are grouped first by Namespace, and then by the various
Dimension combinations within each Namespace. For example, you can view all EC2 metrics, or EC2
metrics grouped by instance ID, instance type, image (AMI) ID, or Auto Scaling Group.
37
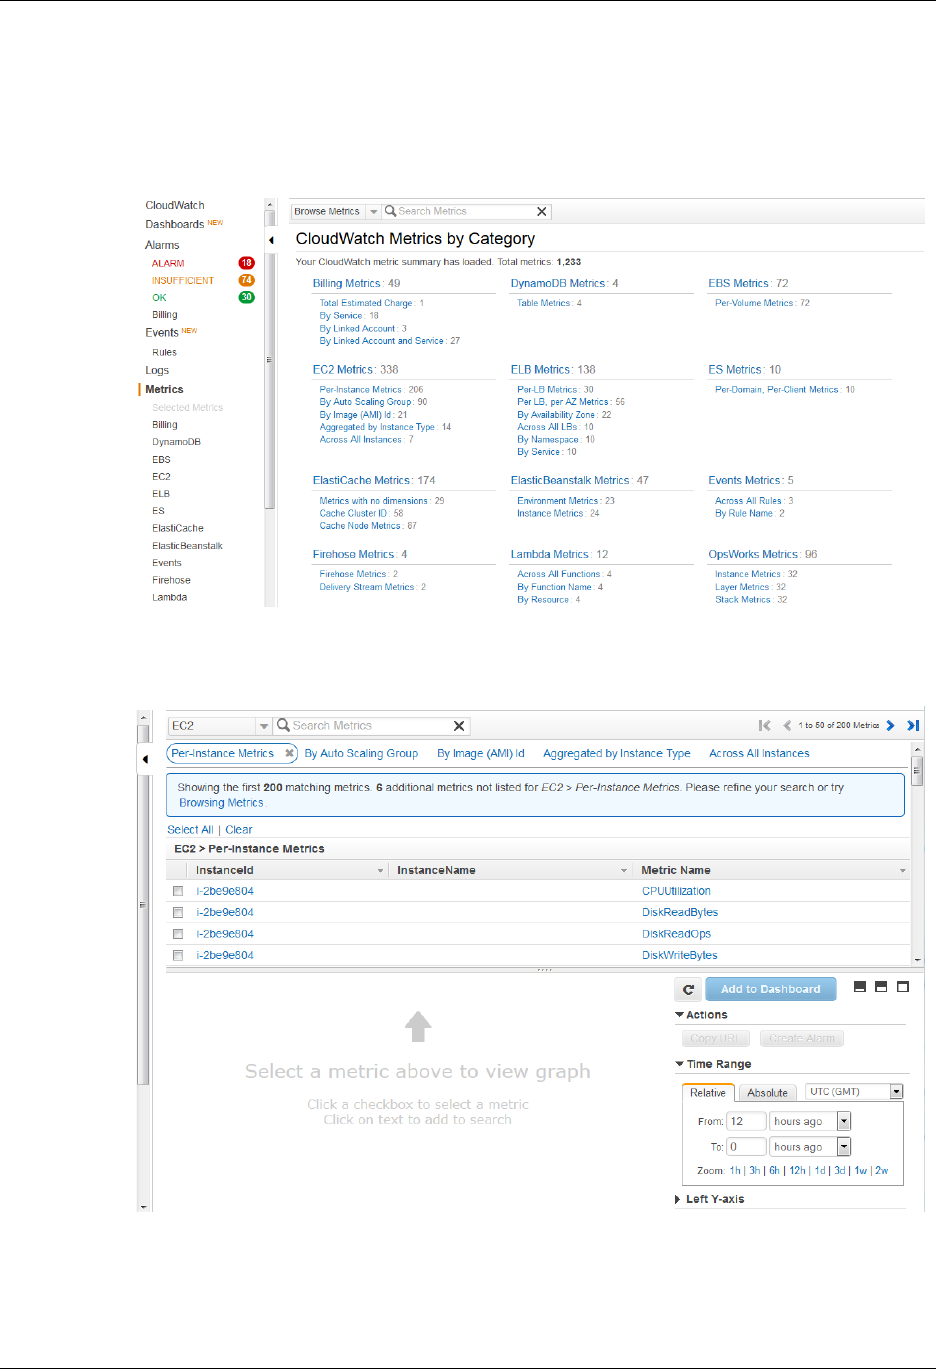
Amazon CloudWatch User Guide
Command Line Tools
1. Open the CloudWatch console at https://console.aws.amazon.com/cloudwatch/.
2. If necessary, change the region. From the navigation bar, select the region that meets your needs.
For more information, see Regions and Endpoints.
3. In the navigation pane, click Metrics.
4. In the CloudWatch Metrics by Category pane, under EC2 Metrics, select Per-Instance Metrics,
and then in the upper pane, scroll down to view the full list of metrics.
Command Line Tools
To list available metrics across multiple Amazon EC2 instances
38

Amazon CloudWatch User Guide
Command Line Tools
• Enter the list-metrics command.
Prompt>aws cloudwatch list-metrics --namespace "AWS/EC2"
The AWS CLI returns the following:
{
"Metrics": [
{
"Namespace": "AWS/EC2",
"Dimensions": [
{
"Name": "InstanceId",
"Value": "i-dd8855ba"
}
],
"MetricName": "DiskReadBytes"
},
{
"Namespace": "AWS/EC2",
"Dimensions": [
{
"Name": "InstanceId",
"Value": "i-0b12b76c"
}
],
"MetricName": "CPUUtilization"
},
{
"Namespace": "AWS/EC2",
"Dimensions": [],
"MetricName": "NetworkIn"
},
{
"Namespace": "AWS/EC2",
"Dimensions": [
{
"Name": "InstanceId",
"Value": "i-e31dbd84"
}
],
"MetricName": "DiskReadOps"
},
{
"Namespace": "AWS/EC2",
"Dimensions": [
{
"Name": "InstanceId",
"Value": "i-13bf6574"
}
],
"MetricName": "DiskWriteBytes"
},
{
"Namespace": "AWS/EC2",
"Dimensions": [
{
39

Amazon CloudWatch User Guide
Query API
"Name": "InstanceId",
"Value": "i-2840c24f"
}
],
"MetricName": "DiskReadOps"
},
{
"Namespace": "AWS/EC2",
"Dimensions": [
{
"Name": "InstanceId",
"Value": "i-9960c1fe"
}
],
"MetricName": "NetworkOut"
}
}
Query API
To determine available metrics across multiple instances
• Call ListMetrics to generate a list of all of your valid metrics.
This returns a list of metrics. An example metric might look like the following:
•MetricName = CPUUtilization
•Dimensions (Name=InstanceId, Value=i-5431413d)
•Namespace = AWS/EC2
Search for Available Metrics
You can search within all the metrics in your account using targeted search terms. Metrics are returned
that have matching results within their Namespace, Metric Name, or Dimensions.
To search for available metrics in CloudWatch
1. Open the CloudWatch console at https://console.aws.amazon.com/cloudwatch/.
2. If necessary, change the region. From the navigation bar, select the region that meets your needs.
For more information, see Regions and Endpoints.
3. In the navigation pane, click Metrics.
40
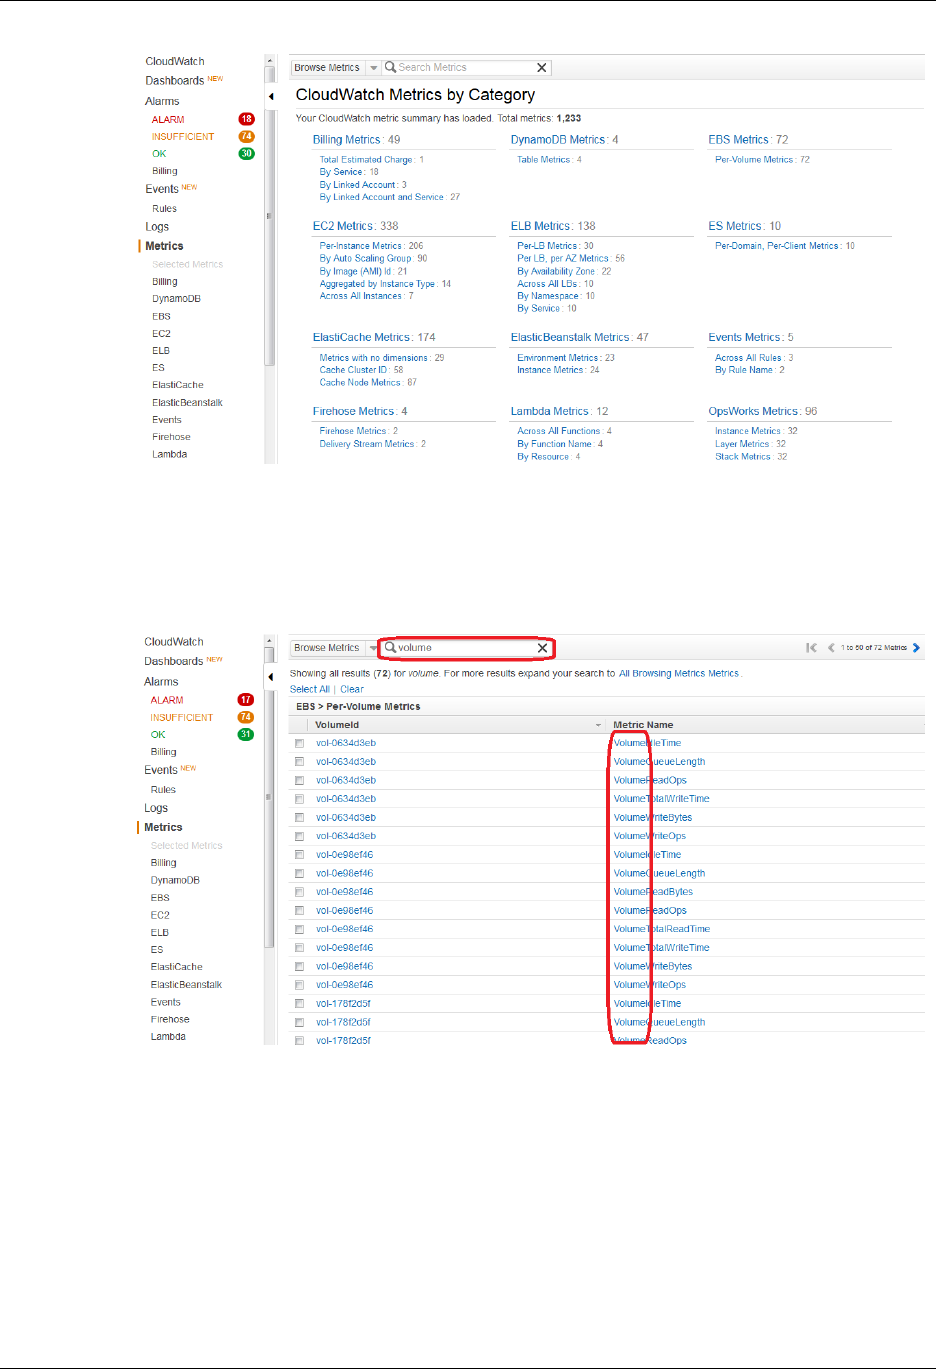
Amazon CloudWatch User Guide
Select and Deselect Metrics
4. In the CloudWatch Metrics by Category pane, in the Search Metrics field, type a search term,
metric name, service name, etc. and press enter.
For example, you can enter volume in the Search Metrics field, which returns all metrics with the
word volume in their name.
Select and Deselect Metrics
You can select and deselect metrics in the CloudWatch console in many different ways. When you
select metrics, they automatically appear in a graph in the details pane, so it's useful to know how to
select or deselect metrics to graph the data you want.
To select or deselect metrics
1. Open the CloudWatch console at https://console.aws.amazon.com/cloudwatch/.
41
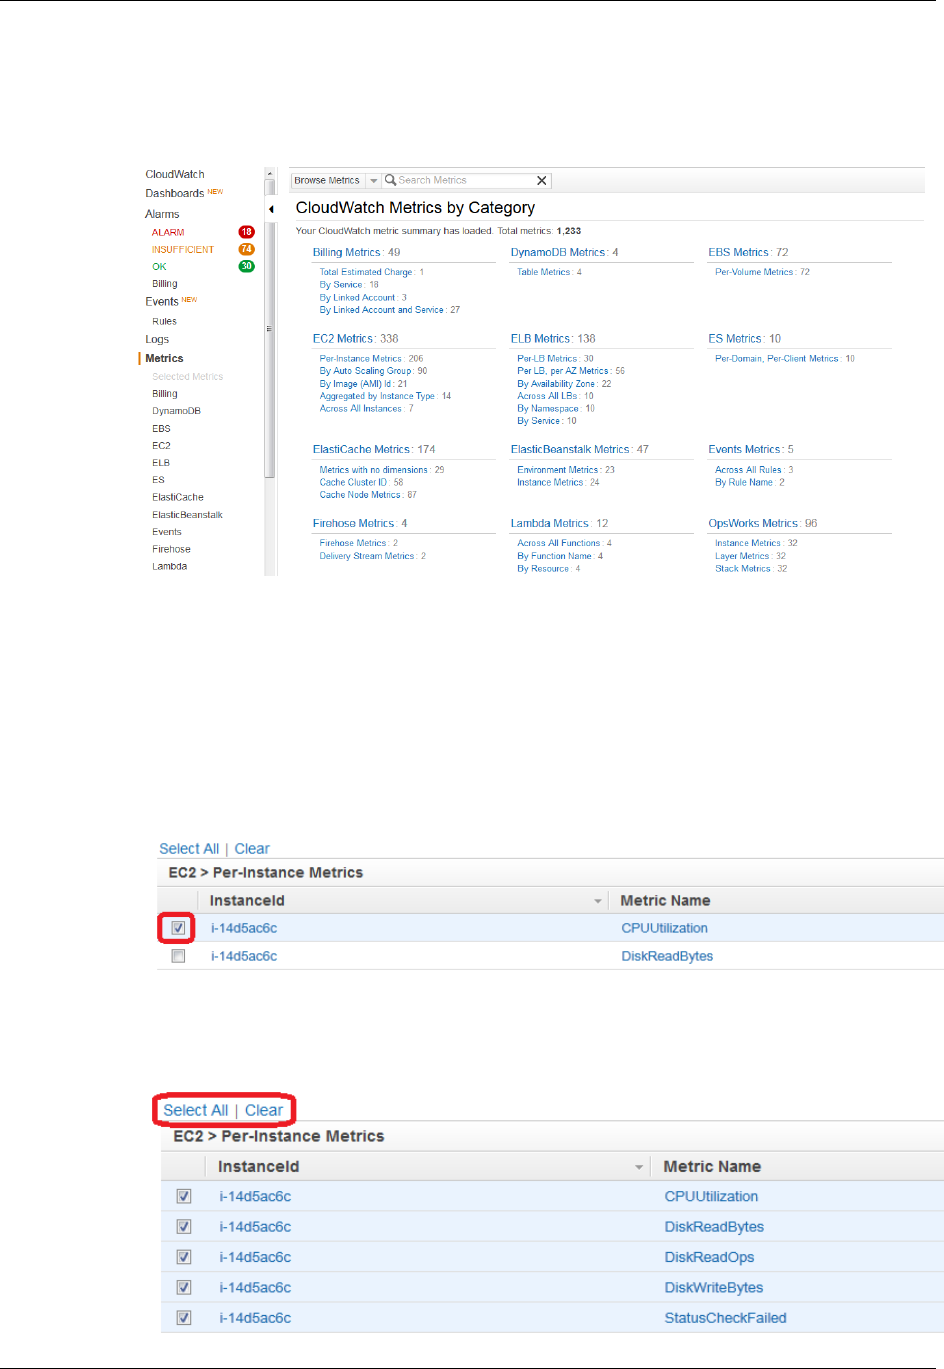
Amazon CloudWatch User Guide
Select and Deselect Metrics
2. If necessary, change the region. From the navigation bar, select the region that meets your needs.
For more information, see Regions and Endpoints.
3. In the navigation pane, click Metrics.
4. In the CloudWatch Metrics by Category pane, select a metrics category or in the Search
Metrics field, type a search term, metric name, service name, and so on and press Enter.
For example, you can enter volume in the Search Metrics field, which returns all metrics with the
word volume in their name.
5. Do one of the following:
• To select or deselect an individual metric, in the results pane, select the check box next to the
resource name and metric.
• To select all metrics in the list, in the results pane, at the top of the list, click Select All.
To deselect all metrics, in the results pane, at the top of the metrics list, click Clear.
• To list all resources that use a metric, in the results pane, in the Metric Name column, click a
metric. 42
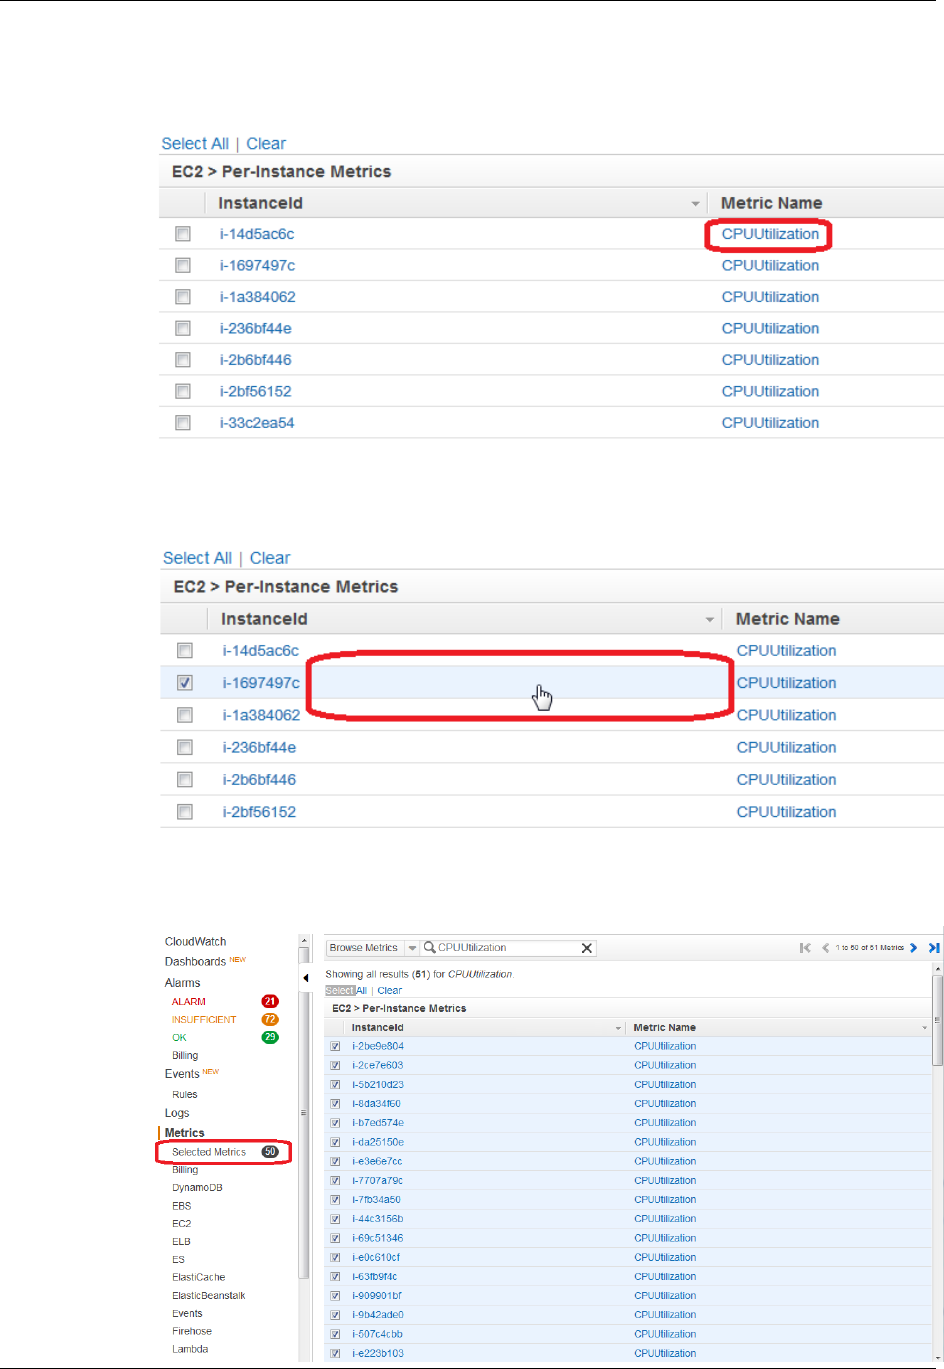
Amazon CloudWatch User Guide
Select and Deselect Metrics
This is useful when you want to see all of these resources on the same graph. For more
information, see Graph a Metric Across Resources (p. 61).
• To deselect all but one metric, in the results pane, in the metrics list, click the space between the
resource type and the metric name of the metric you want to keep selected.
• To view a list of all selected metrics, in the navigation pane, under Metrics, click Selected
Metrics.
43
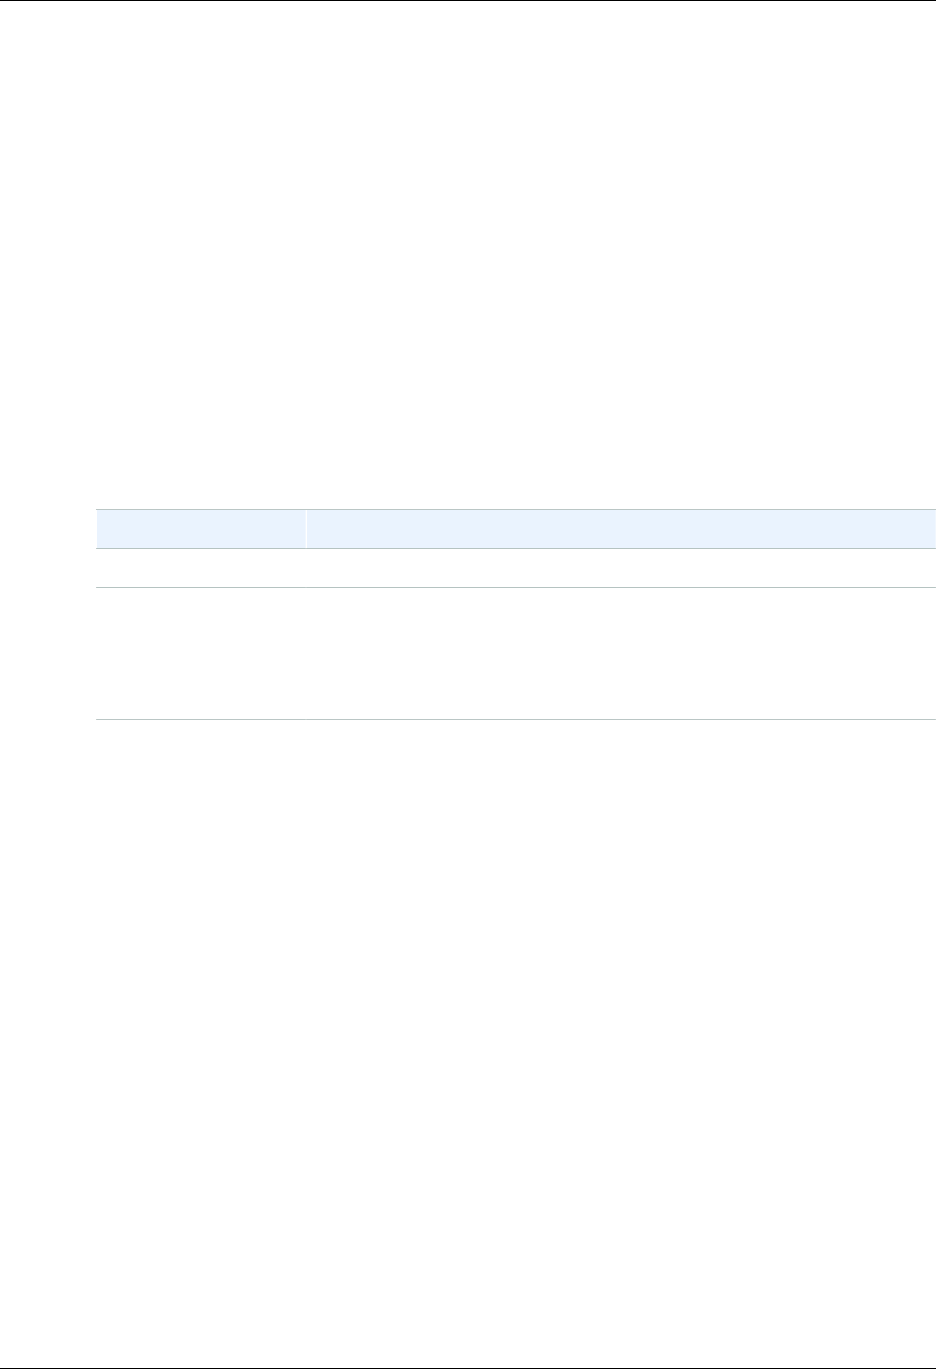
Amazon CloudWatch User Guide
Get Statistics for a Metric
Get Statistics for a Metric
This set of scenarios shows you how you can use the AWS Management Console, the get-metric-
statistics command, or the GetMetricStatistics API to get a variety of statistics.
Note
Start and end times must be within the last 14 days.
Topics
•Get Statistics for a Specific EC2 Instance (p. 44)
•Aggregating Statistics Across Instances (p. 48)
•Get Statistics Aggregated by Auto Scaling Group (p. 53)
•Get Statistics Aggregated by Amazon Machine Image (AMI) ID (p. 55)
Get Statistics for a Specific EC2 Instance
The following table describes the types of monitoring data available for your Amazon EC2 instances.
Monitoring Type Description
Basic Data is available automatically in 5-minute periods at no charge.
Detailed Data is available in 1-minute periods at an additional cost. To get this level
of data, you must specifically enable it for the instance. For the instances
where you've enabled detailed monitoring, you can also get aggregated
data across groups of similar instances.
For information about pricing, go to the Amazon CloudWatch product page.
The following scenario walks you through how to use the AWS Management Console, the get-
metric-statistics command, or the GetMetricStatistics API to determine the maximum
CPU utilization of a specific EC2 instance. For more information about monitoring EC2 instances, see
Monitoring Your Instances with CloudWatch in the Amazon EC2 User Guide for Linux Instances.
Note
Start and end times must be within the last 14 days.
For this example, we assume that you have an EC2 instance ID. You can get an active EC2 instance
ID using the AWS Management Console.
AWS Management Console
To display the average CPU utilization for a specific instance
1. Open the CloudWatch console at https://console.aws.amazon.com/cloudwatch/.
2. If necessary, change the region. From the navigation bar, select the region that meets your needs.
For more information, see Regions and Endpoints.
3. In the navigation pane, click Metrics.
4. In the CloudWatch Metrics by Category pane, select EC2: Metrics.
The metrics available for individual instances appear in the upper pane.
5. Select a row that contains CPUUtilization for a specific InstanceId.
A graph showing average CPUUtilization for a single instance appears in the details pane.
44
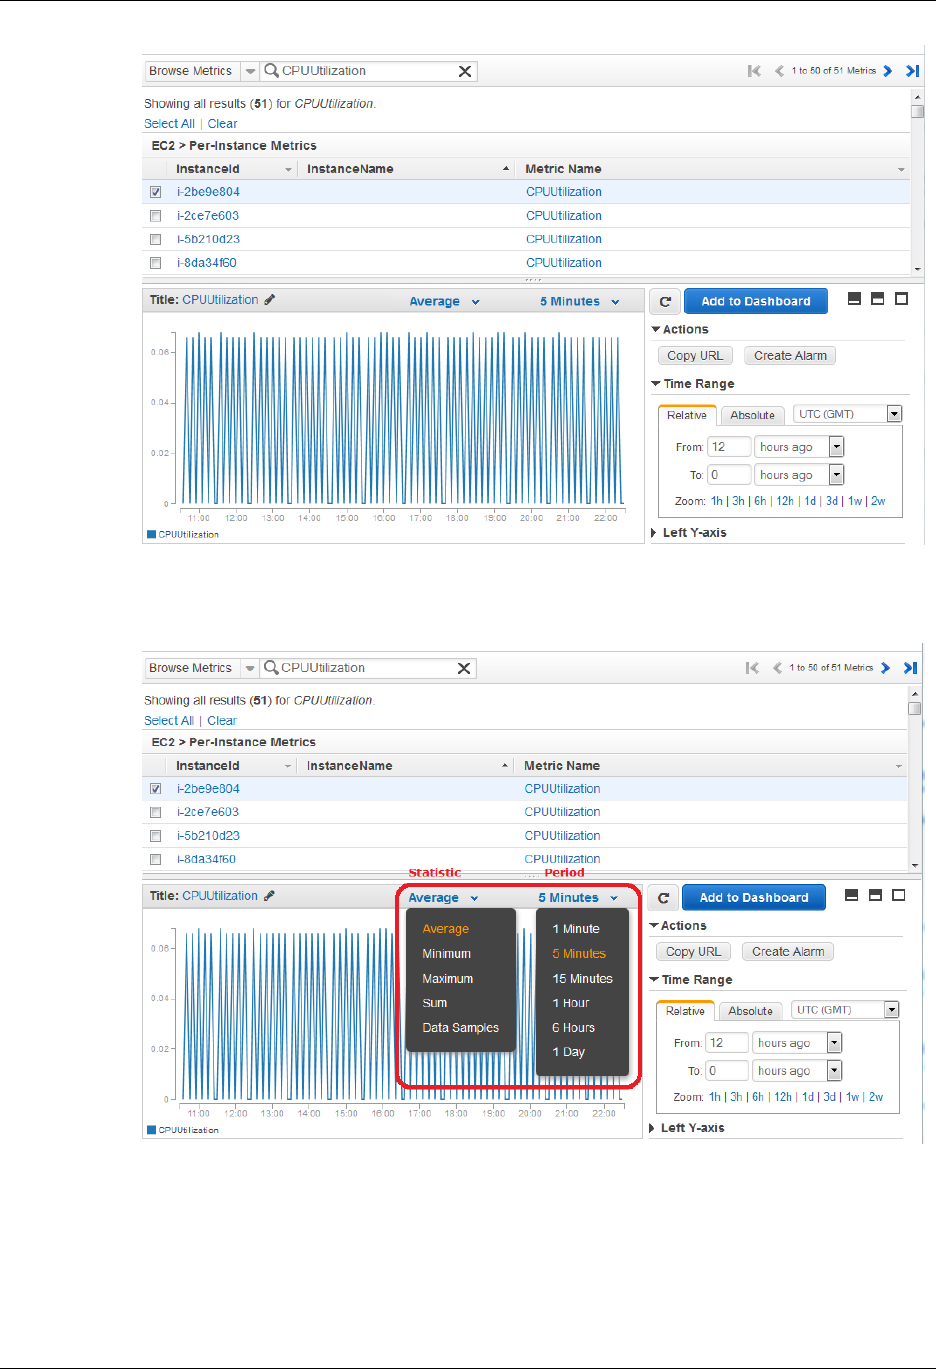
Amazon CloudWatch User Guide
Get Statistics for a Specific EC2 Instance
6. To change the Statistic, e.g., Average, for the metric, choose a different value from the pop-up
list.
7. To change the Period, e.g., 5 Minutes, to view data in more granular detail, choose a different
value from the pop-up list.
45

Amazon CloudWatch User Guide
Get Statistics for a Specific EC2 Instance
Command Line Tools
To get the CPU utilization per EC2 instance
• Enter the get-metric-statistics command with the following parameters
Prompt>aws cloudwatch get-metric-statistics --metric-name CPUUtilization
--start-time 2014-02-18T23:18:00 --end-time 2014-02-19T23:18:00
--period 360 --namespace AWS/EC2 --statistics Maximum --dimensions
Name=InstanceId,Value=<your-instance-id>
The AWS CLI returns the following:
{
"Datapoints": [
{
"Timestamp": "2014-02-19T00:18:00Z",
"Maximum": 0.33000000000000002,
"Unit": "Percent"
},
{
"Timestamp": "2014-02-19T03:18:00Z",
"Maximum": 99.670000000000002,
"Unit": "Percent"
},
{
"Timestamp": "2014-02-19T07:18:00Z",
"Maximum": 0.34000000000000002,
"Unit": "Percent"
},
{
"Timestamp": "2014-02-19T12:18:00Z",
"Maximum": 0.34000000000000002,
"Unit": "Percent"
},
{
"Timestamp": "2014-02-19T02:18:00Z",
"Maximum": 0.34000000000000002,
"Unit": "Percent"
},
{
"Timestamp": "2014-02-19T01:18:00Z",
"Maximum": 0.34000000000000002,
"Unit": "Percent"
},
{
"Timestamp": "2014-02-19T17:18:00Z",
"Maximum": 3.3900000000000001,
"Unit": "Percent"
},
{
"Timestamp": "2014-02-19T13:18:00Z",
"Maximum": 0.33000000000000002,
"Unit": "Percent"
},
{
"Timestamp": "2014-02-18T23:18:00Z",
46

Amazon CloudWatch User Guide
Get Statistics for a Specific EC2 Instance
"Maximum": 0.67000000000000004,
"Unit": "Percent"
},
{
"Timestamp": "2014-02-19T06:18:00Z",
"Maximum": 0.34000000000000002,
"Unit": "Percent"
},
{
"Timestamp": "2014-02-19T11:18:00Z",
"Maximum": 0.34000000000000002,
"Unit": "Percent"
},
{
"Timestamp": "2014-02-19T10:18:00Z",
"Maximum": 0.34000000000000002,
"Unit": "Percent"
},
{
"Timestamp": "2014-02-19T19:18:00Z",
"Maximum": 8.0,
"Unit": "Percent"
},
{
"Timestamp": "2014-02-19T15:18:00Z",
"Maximum": 0.34000000000000002,
"Unit": "Percent"
},
{
"Timestamp": "2014-02-19T14:18:00Z",
"Maximum": 0.34000000000000002,
"Unit": "Percent"
},
{
"Timestamp": "2014-02-19T16:18:00Z",
"Maximum": 0.34000000000000002,
"Unit": "Percent"
},
{
"Timestamp": "2014-02-19T09:18:00Z",
"Maximum": 0.34000000000000002,
"Unit": "Percent"
},
{
"Timestamp": "2014-02-19T04:18:00Z",
"Maximum": 2.0,
"Unit": "Percent"
},
{
"Timestamp": "2014-02-19T08:18:00Z",
"Maximum": 0.68000000000000005,
"Unit": "Percent"
},
{
"Timestamp": "2014-02-19T05:18:00Z",
"Maximum": 0.33000000000000002,
"Unit": "Percent"
},
{
47

Amazon CloudWatch User Guide
Aggregating Statistics Across Instances
"Timestamp": "2014-02-19T18:18:00Z",
"Maximum": 6.6699999999999999,
"Unit": "Percent"
}
],
"Label": "CPUUtilization"
}
The returned statistics are six-minute values for the requested two-day time interval. Each value
represents the maximum CPU utilization percentage for a single EC2 instance.
Query API
To get the CPU utilization per hour for an EC2 instance for a 3-day range
• Call GetMetricStatistics with the following parameters:
•MetricName = CPUUtilization
•Period = 3600
•Statistics list includes Maximum
•Dimensions (Name=InstanceId, Value="<your-instance-id>")
•Namespace = AWS/EC2
•StartTime = 2011-01-09T23:18:00
•EndTime = 2011-01-12T23:18:00
Aggregating Statistics Across Instances
Aggregate statistics are available for the instances that have detailed monitoring enabled. Instances
that use basic monitoring are not included in the aggregates. In addition, Amazon CloudWatch does
not aggregate data across regions. Therefore, metrics are completely separate between regions.
Before you can get statistics aggregated across instances, you must enable detailed monitoring (at
an additional charge), which provides data in 1-minute periods. This scenario shows you how to use
detailed monitoring with either the AWS Management Console, the GetMetricStatistics API,
or the get-metric-statistics command to get the average CPU usage for your EC2 instances.
Because no dimension is specified, CloudWatch returns statistics for all dimensions in the AWS/EC2
namespace. To get statistics for other metrics, see Amazon CloudWatch Namespaces, Dimensions,
and Metrics Reference (p. 140).
Important
This technique for retrieving all dimensions across an AWS namespace does not work for
custom namespaces that you publish to Amazon CloudWatch. With custom namespaces, you
must specify the complete set of dimensions that are associated with any given data point to
retrieve statistics that include the data point.
AWS Management Console
To display average CPU utilization for your Amazon EC2 instances
1. Open the CloudWatch console at https://console.aws.amazon.com/cloudwatch/.
2. If necessary, change the region. From the navigation bar, select the region that meets your needs.
For more information, see Regions and Endpoints.
3. In the navigation pane, click Metrics.
4. In the CloudWatch Metrics by Category pane, under EC2 Metrics, select Across All Instances.
48
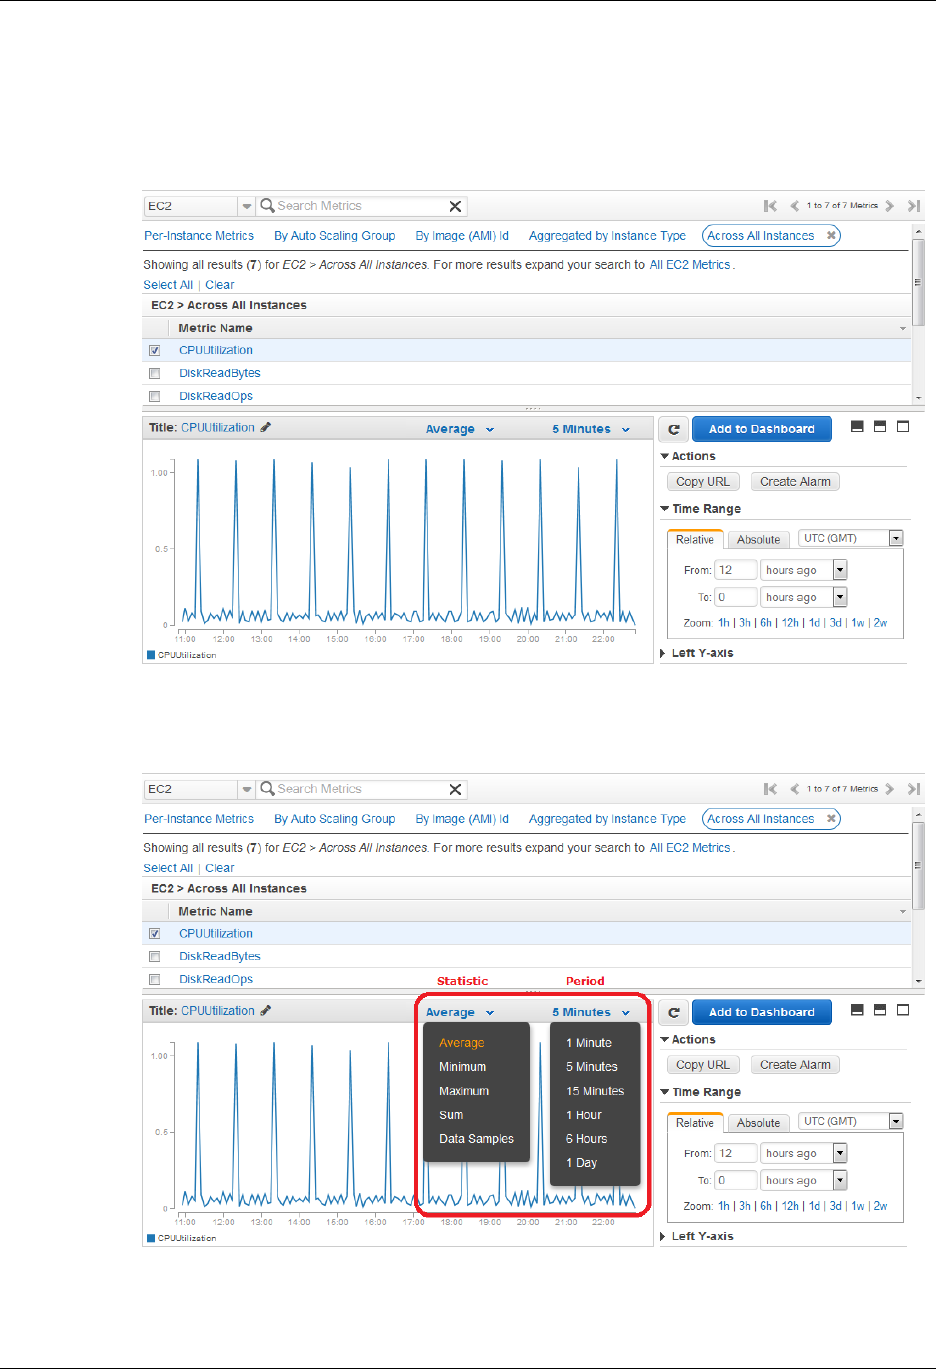
Amazon CloudWatch User Guide
Aggregating Statistics Across Instances
The metrics available across all instances are displayed in the upper pane.
5. In the upper pane, select the row that contains CPUUtilization.
A graph showing CPUUtilization for your EC2 instances is displayed in the details pane.
6. To change the Statistic, e.g., Average, for the metric, choose a different value from the pop-up
list.
7. To change the Period, e.g., 5 Minutes, to view data in more granular detail, choose a different
value from the pop-up list.
49

Amazon CloudWatch User Guide
Aggregating Statistics Across Instances
Command Line Tools
To get average CPU utilization across your Amazon EC2 instances
• Enter the get-metric-statistics command with the following parameters:
Prompt>aws cloudwatch get-metric-statistics --metric-name CPUUtilization
--start-time 2014-02-11T23:18:00 --end-time 2014-02-12T23:18:00 --period
3600 --namespace AWS/EC2 --statistics "Average" "SampleCount"
The AWS CLI returns the following:
{
"Datapoints": [
{
"SampleCount": 238.0,
"Timestamp": "2014-02-12T07:18:00Z",
"Average": 0.038235294117647062,
"Unit": "Percent"
},
{
"SampleCount": 240.0,
"Timestamp": "2014-02-12T09:18:00Z",
"Average": 0.16670833333333332,
"Unit": "Percent"
},
{
"SampleCount": 238.0,
"Timestamp": "2014-02-11T23:18:00Z",
"Average": 0.041596638655462197,
"Unit": "Percent"
},
{
"SampleCount": 240.0,
"Timestamp": "2014-02-12T16:18:00Z",
"Average": 0.039458333333333345,
"Unit": "Percent"
},
{
"SampleCount": 239.0,
"Timestamp": "2014-02-12T21:18:00Z",
"Average": 0.041255230125523033,
"Unit": "Percent"
},
{
"SampleCount": 240.0,
"Timestamp": "2014-02-12T01:18:00Z",
"Average": 0.044583333333333336,
"Unit": "Percent"
},
{
"SampleCount": 239.0,
"Timestamp": "2014-02-12T18:18:00Z",
"Average": 0.043054393305439344,
"Unit": "Percent"
},
{
50

Amazon CloudWatch User Guide
Aggregating Statistics Across Instances
"SampleCount": 240.0,
"Timestamp": "2014-02-12T13:18:00Z",
"Average": 0.039458333333333345,
"Unit": "Percent"
},
{
"SampleCount": 238.0,
"Timestamp": "2014-02-12T15:18:00Z",
"Average": 0.041260504201680689,
"Unit": "Percent"
},
{
"SampleCount": 240.0,
"Timestamp": "2014-02-12T19:18:00Z",
"Average": 0.037666666666666668,
"Unit": "Percent"
},
{
"SampleCount": 240.0,
"Timestamp": "2014-02-12T06:18:00Z",
"Average": 0.037541666666666675,
"Unit": "Percent"
},
{
"SampleCount": 240.0,
"Timestamp": "2014-02-12T20:18:00Z",
"Average": 0.039333333333333338,
"Unit": "Percent"
},
{
"SampleCount": 240.0,
"Timestamp": "2014-02-12T08:18:00Z",
"Average": 0.039250000000000014,
"Unit": "Percent"
},
{
"SampleCount": 239.0,
"Timestamp": "2014-02-12T03:18:00Z",
"Average": 0.037740585774058588,
"Unit": "Percent"
},
{
"SampleCount": 240.0,
"Timestamp": "2014-02-12T11:18:00Z",
"Average": 0.039500000000000007,
"Unit": "Percent"
},
{
"SampleCount": 238.0,
"Timestamp": "2014-02-12T02:18:00Z",
"Average": 0.039789915966386563,
"Unit": "Percent"
},
{
"SampleCount": 238.0,
"Timestamp": "2014-02-12T22:18:00Z",
"Average": 0.039705882352941181,
"Unit": "Percent"
},
51

Amazon CloudWatch User Guide
Aggregating Statistics Across Instances
{
"SampleCount": 240.0,
"Timestamp": "2014-02-12T14:18:00Z",
"Average": 0.082458333333333328,
"Unit": "Percent"
},
{
"SampleCount": 240.0,
"Timestamp": "2014-02-12T05:18:00Z",
"Average": 0.04287500000000001,
"Unit": "Percent"
},
{
"SampleCount": 240.0,
"Timestamp": "2014-02-12T17:18:00Z",
"Average": 0.039458333333333345,
"Unit": "Percent"
},
{
"SampleCount": 240.0,
"Timestamp": "2014-02-12T10:18:00Z",
"Average": 0.083416666666666667,
"Unit": "Percent"
},
{
"SampleCount": 236.0,
"Timestamp": "2014-02-12T00:18:00Z",
"Average": 0.036567796610169498,
"Unit": "Percent"
},
{
"SampleCount": 240.0,
"Timestamp": "2014-02-12T12:18:00Z",
"Average": 0.039541666666666676,
"Unit": "Percent"
},
{
"SampleCount": 240.0,
"Timestamp": "2014-02-12T04:18:00Z",
"Average": 0.043000000000000003,
"Unit": "Percent"
}
],
"Label": "CPUUtilization"
}
Query API
To get average CPU utilization for your Amazon EC2 instances
• Call GetMetricStatistics with the following parameters:
•MetricName = CPUUtilization
•Statistics list includes Average
•Namespace = AWS/EC2
•StartTime = 2011-01-10T23:18:00
52

Amazon CloudWatch User Guide
Get Statistics Aggregated by Auto Scaling Group
•EndTime = 2011-01-12T23:18:00
•Period = 360
The returned statistics are six-minute values for the two-day interval.
Get Statistics Aggregated by Auto Scaling
Group
Aggregate statistics are available for instances that are within an Auto Scaling group. Amazon
CloudWatch does not aggregate data across regions. Therefore, metrics are completely separate
between regions.
This scenario shows you how to use the AWS Management Console, the get-metric-statistics
command, or the GetMetricStatistics API with the DiskWriteBytes metric to retrieve the total
bytes written to disk for one Auto Scaling group. The total is computed for one-minute periods for a 24-
hour interval across all EC2 instances in the specified AutoScalingGroupName.
Note
Start and end times must be within the last 14 days.
AWS Management Console
To display total DiskWriteBytes for an autoscaled EC2 application
1. Open the CloudWatch console at https://console.aws.amazon.com/cloudwatch/.
2. If necessary, change the region. From the navigation bar, select the region that meets your needs.
For more information, see Regions and Endpoints.
3. In the navigation pane, click Metrics.
4. In the CloudWatch Metrics by Category pane, under EC2 Metrics, select By Auto Scaling
Group.
The metrics available for Auto Scaling groups are displayed in the upper pane.
5. Select the row that contains DiskWriteBytes.
A graph showing DiskWriteBytes for all EC2 instances appears in the details pane.
53
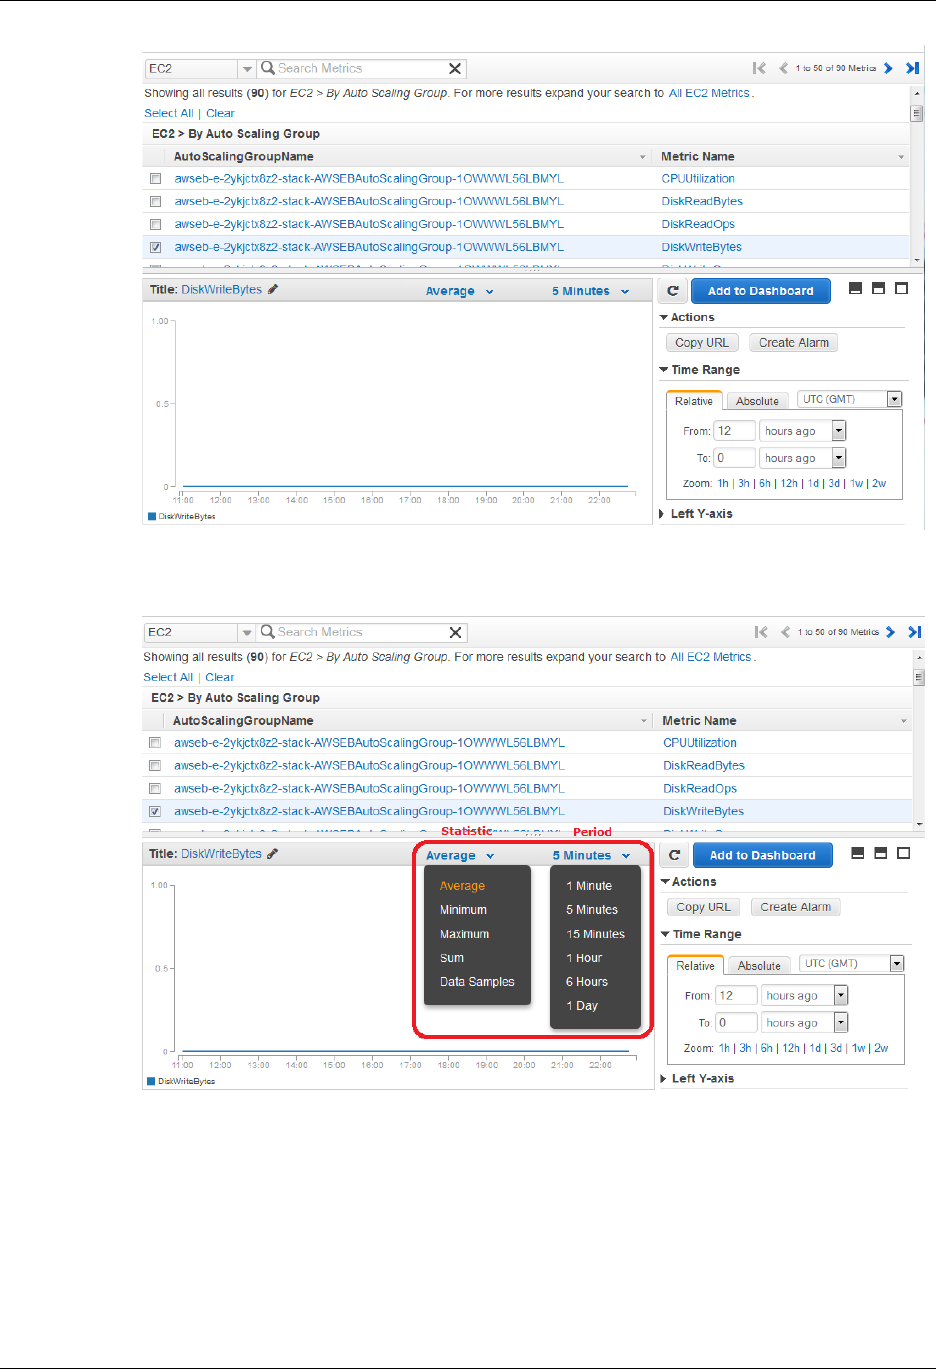
Amazon CloudWatch User Guide
Get Statistics Aggregated by Auto Scaling Group
6. To change the Statistic, e.g., Average, for the metric, choose a different value from the pop-up
list.
7. To change the Period, e.g., 5 Minutes, to view data in more granular detail, choose a different
value from the pop-up list.
Command Line Tools
To get total DiskWriteBytes for an autoscaled EC2 application
• Enter the get-metric-statistics command with the following parameters.
54

Amazon CloudWatch User Guide
Get Statistics Aggregated by
Amazon Machine Image (AMI) ID
Prompt>aws cloudwatch get-metric-statistics --metric-name DiskWriteBytes
--start-time 2014-02-16T23:18:00 --end-time 2014-02-18T23:18:00 --period
360 --namespace AWS/EC2 --statistics "Sum" "SampleCount" --dimensions
Name=AutoScalingGroupName,Value=test-group-1
The AWS CLI returns the following:
{
"Datapoints": [
{
"SampleCount": 18.0,
"Timestamp": "2014-02-19T21:36:00Z",
"Sum": 0.0,
"Unit": "Bytes"
},
{
"SampleCount": 5.0,
"Timestamp": "2014-02-19T21:42:00Z",
"Sum": 0.0,
"Unit": "Bytes"
}
],
"Label": "DiskWriteBytes"
}
Query API
To get total DiskWriteBytes for an autoscaled EC2 application
• Call GetMetricStatistics with the following parameters:
•MetricName = DiskWriteBytes
•Period = 60
•Statistics list includes Sum
•Unit = Bytes
•Dimensions (Name=AutoScalingGroupName, Value=test-group-1)
•Namespace = AWS/EC2
•StartTime = 2011-01-10T23:18:00
•EndTime = 2011-01-11T23:18:00
The statistics returned are one-minute totals for bytes written for the entire Auto Scaling group
over the 24-hour interval.
Get Statistics Aggregated by Amazon Machine
Image (AMI) ID
Aggregate statistics are available for the instances that have detailed monitoring enabled. Instances
that use basic monitoring are not included in the aggregates. In addition, Amazon CloudWatch does
not aggregate data across regions. Therefore, metrics are completely separate between regions.
55
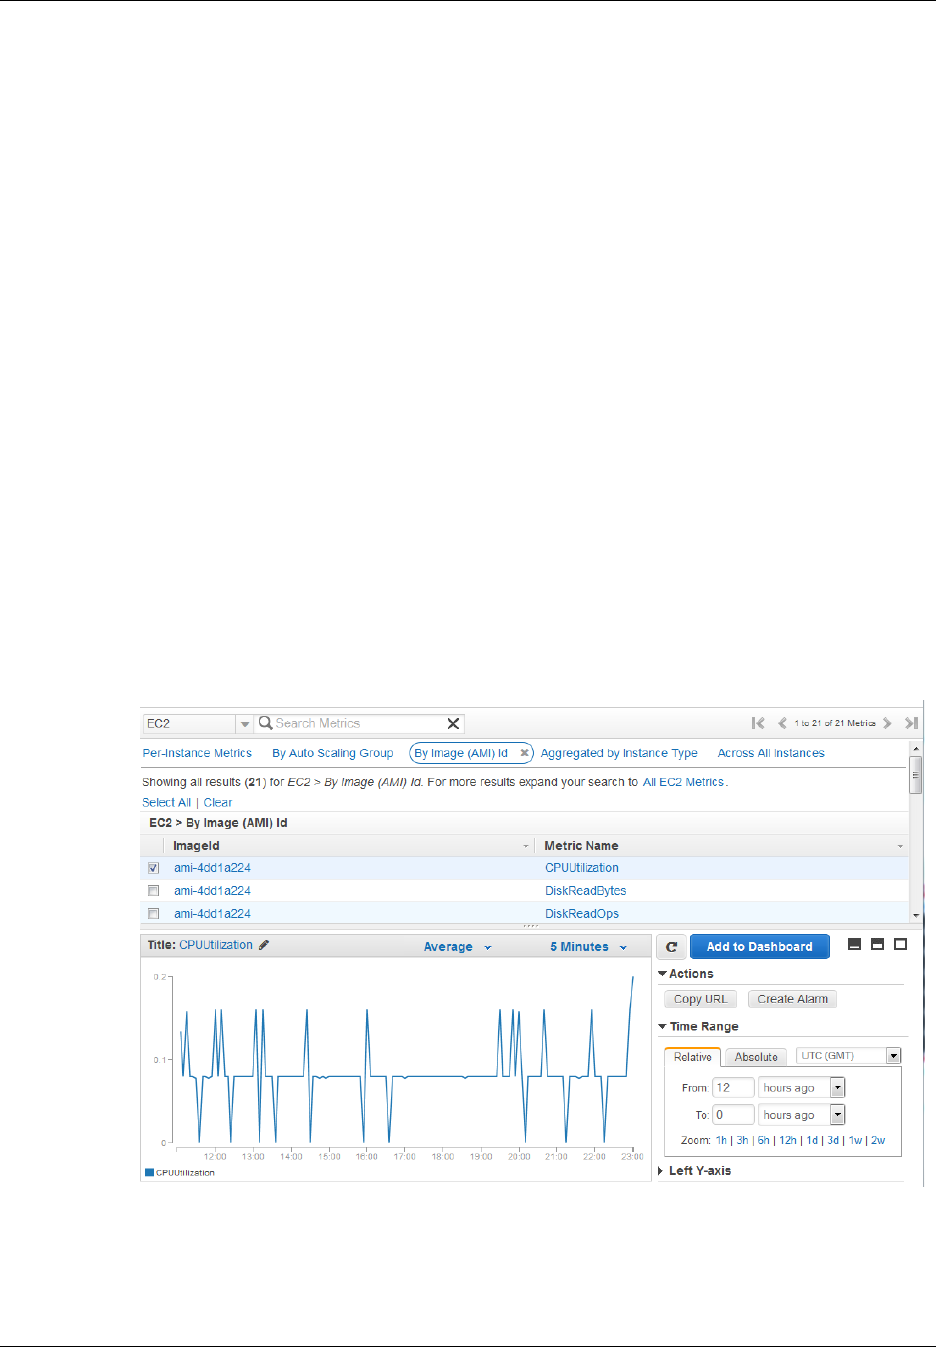
Amazon CloudWatch User Guide
Get Statistics Aggregated by
Amazon Machine Image (AMI) ID
Before you can get statistics aggregated across instances, you must enable detailed monitoring (at an
additional charge), which provides data in 1-minute periods.
This scenario shows you how to use the AWS Management Console, the get-metric-statistics
command, or the GetMetricStatistics API to determine average CPU utilization for all instances
that match a given image ID. The average is over 60-second time intervals for a one-day period.
Note
Start and end times must be within the last 14 days.
In this scenario the EC2 instances are running an image ID of ami-4dd1a224.
AWS Management Console
To display the average CPU utilization for an image (AMI) ID
1. Open the CloudWatch console at https://console.aws.amazon.com/cloudwatch/.
2. If necessary, change the region. From the navigation bar, select the region that meets your needs.
For more information, see Regions and Endpoints.
3. In the navigation pane, click Metrics.
4. In the CloudWatch Metrics by Category pane, under EC2 Metrics, select By Image (AMI) Id.
The metrics available for image IDs appear in the upper pane.
5. Select a row that contains CPUUtilization and an image ID.
A graph showing average CPUUtilization for all EC2 instances based on the ami-4dd1a224
image ID appears in the details pane.
6. To change the Statistic, e.g., Average, for the metric, choose a different value from the pop-up
list.
56
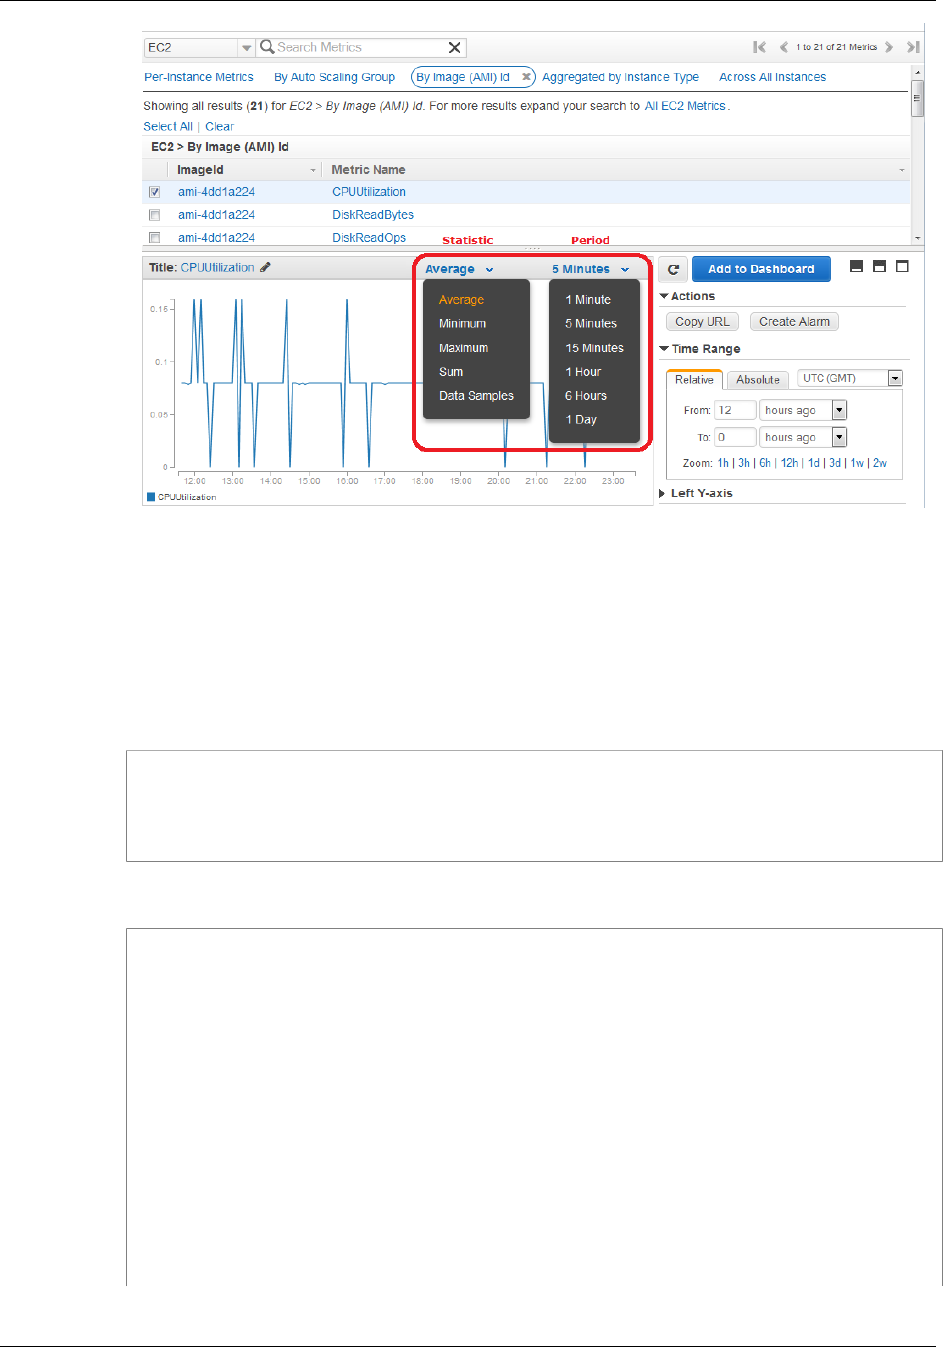
Amazon CloudWatch User Guide
Get Statistics Aggregated by
Amazon Machine Image (AMI) ID
7. To change the Period, e.g., 5 Minutes, to view data in more granular detail, choose a different
value from the pop-up list.
Command Line Tools
To get the average CPU utilization for an image (AMI) ID
• Enter the get-metric-statistics command as in the following example.
Prompt>aws cloudwatch get-metric-statistics --metric-name CPUUtilization
--start-time 2014-02-10T00:00:00 --end-time 2014-02-11T00:00:00 --
period 3600 --statistics Average --namespace AWS/EC2 --dimensions
Name=ImageId,Value=ami-3c47a355
The AWS CLI returns the following:
{
"Datapoints": [
{
"Timestamp": "2014-02-10T07:00:00Z",
"Average": 0.041000000000000009,
"Unit": "Percent"
},
{
"Timestamp": "2014-02-10T14:00:00Z",
"Average": 0.079579831932773085,
"Unit": "Percent"
},
{
"Timestamp": "2014-02-10T06:00:00Z",
"Average": 0.036000000000000011,
"Unit": "Percent"
57

Amazon CloudWatch User Guide
Get Statistics Aggregated by
Amazon Machine Image (AMI) ID
},
{
"Timestamp": "2014-02-10T13:00:00Z",
"Average": 0.037625000000000013,
"Unit": "Percent"
},
{
"Timestamp": "2014-02-10T18:00:00Z",
"Average": 0.042750000000000003,
"Unit": "Percent"
},
{
"Timestamp": "2014-02-10T21:00:00Z",
"Average": 0.039705882352941188,
"Unit": "Percent"
},
{
"Timestamp": "2014-02-10T20:00:00Z",
"Average": 0.039375000000000007,
"Unit": "Percent"
},
{
"Timestamp": "2014-02-10T02:00:00Z",
"Average": 0.041041666666666671,
"Unit": "Percent"
},
{
"Timestamp": "2014-02-10T01:00:00Z",
"Average": 0.041083333333333354,
"Unit": "Percent"
},
{
"Timestamp": "2014-02-10T23:00:00Z",
"Average": 0.038016877637130804,
"Unit": "Percent"
},
{
"Timestamp": "2014-02-10T15:00:00Z",
"Average": 0.037666666666666668,
"Unit": "Percent"
},
{
"Timestamp": "2014-02-10T12:00:00Z",
"Average": 0.039291666666666676,
"Unit": "Percent"
},
{
"Timestamp": "2014-02-10T03:00:00Z",
"Average": 0.036000000000000004,
"Unit": "Percent"
},
{
"Timestamp": "2014-02-10T04:00:00Z",
"Average": 0.042666666666666672,
"Unit": "Percent"
},
{
"Timestamp": "2014-02-10T19:00:00Z",
"Average": 0.038305084745762719,
58

Amazon CloudWatch User Guide
Get Statistics Aggregated by
Amazon Machine Image (AMI) ID
"Unit": "Percent"
},
{
"Timestamp": "2014-02-10T22:00:00Z",
"Average": 0.039291666666666676,
"Unit": "Percent"
},
{
"Timestamp": "2014-02-10T09:00:00Z",
"Average": 0.17126050420168065,
"Unit": "Percent"
},
{
"Timestamp": "2014-02-10T08:00:00Z",
"Average": 0.041166666666666678,
"Unit": "Percent"
},
{
"Timestamp": "2014-02-10T11:00:00Z",
"Average": 0.082374999999999962,
"Unit": "Percent"
},
{
"Timestamp": "2014-02-10T17:00:00Z",
"Average": 0.037625000000000013,
"Unit": "Percent"
},
{
"Timestamp": "2014-02-10T10:00:00Z",
"Average": 0.039458333333333345,
"Unit": "Percent"
},
{
"Timestamp": "2014-02-10T05:00:00Z",
"Average": 0.039250000000000007,
"Unit": "Percent"
},
{
"Timestamp": "2014-02-10T00:00:00Z",
"Average": 0.037625000000000013,
"Unit": "Percent"
},
{
"Timestamp": "2014-02-10T16:00:00Z",
"Average": 0.041512605042016815,
"Unit": "Percent"
}
],
"Label": "CPUUtilization"
}
The operation returns statistics that are one-minute values for the one-day interval. Each value
represents an average CPU utilization percentage for EC2 instances running the specified machine
image.
59

Amazon CloudWatch User Guide
Graph Metrics
Query API
To get the average CPU utilization for an image (AMI) ID
• Call GetMetricStatistics with the following parameters:
•MetricName = CPUUtilization
•Period = 60
•Statistics list includes Average
•Dimensions (Name= ImageId, Value= ami-c5e40dac)
•Namespace = AWS/EC2
•StartTime = 2011-01-10T00:00:00
•EndTime = 2011-01-11T00:00:00
Graph Metrics
You can use the CloudWatch console to graph metric data generated by other AWS services to make
it easier to see the metric activity on your services. You can use the following procedures to graph
metrics in CloudWatch.
Topics
•Graph a Metric (p. 60)
•Graph a Metric Across Resources (p. 61)
•Graph Several Metrics (p. 63)
•Modify the Date and Time on a Graph (p. 64)
•Modify the Statistic for a Graph (p. 65)
•Modify the Period for a Graph (p. 66)
•Modify a Graph's Title (p. 67)
•Create an Alarm from a Metric on a Graph (p. 68)
•Zoom in to a Graph (p. 69)
•Switch the Y-Axis for a Metric (p. 70)
•Set custom bounds for the Y-Axis on a graph (p. 71)
•Save a Graph (p. 72)
Graph a Metric
You can select a metric and create a graph of the data in CloudWatch. For example, you can select
the CPUUtilization metric for an Amazon EC2 instance and display a graph of CPU usage over time for
that instance.
To graph a metric
1. Open the CloudWatch console at https://console.aws.amazon.com/cloudwatch/.
2. If necessary, change the region. From the navigation bar, select the region that meets your
needs. For more information, see Regions and Endpoints in the Amazon Web Services General
Reference.
3. In the navigation pane, click Metrics.
4. In the CloudWatch Metrics by Category pane, use the Search Metrics field and categories to
find a metric using the metric name, AWS resource, or other metadata.
60
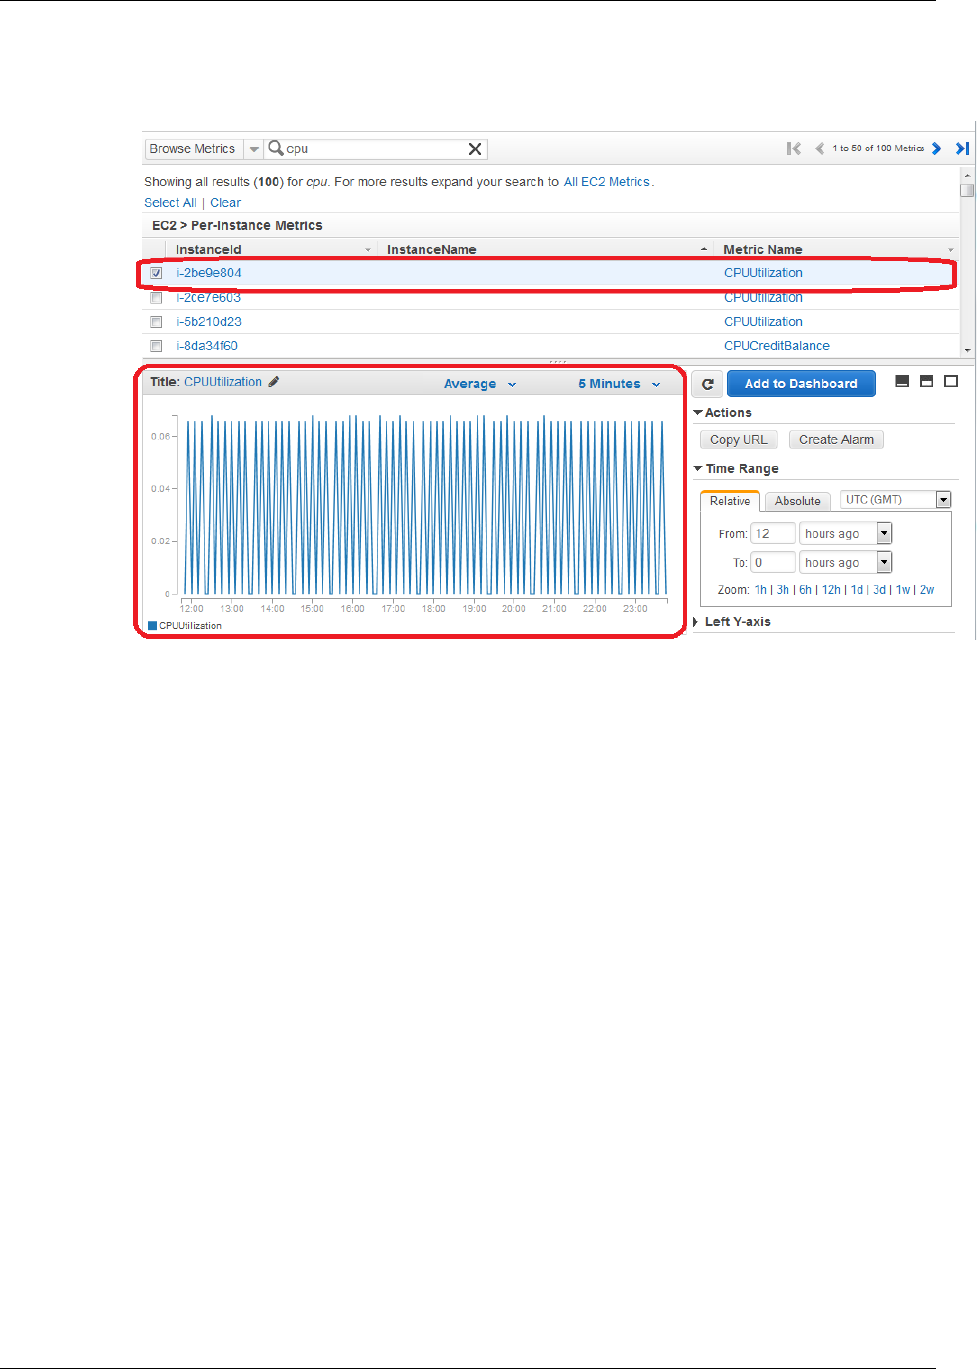
Amazon CloudWatch User Guide
Graph a Metric Across Resources
5. Use the scroll bar and next and previous arrows above the metrics list to page through the full list
of metrics
6. Select the metric to view, for example, CPUUtilization. A graph appears in the details pane.
7. To save this graph and access it later, in the details pane, under Actions, click Copy URL, and
then in the Copy Graph URL dialog box, select the URL and paste it into your browser.
Graph a Metric Across Resources
You can graph a metric across all resources to see everything on one graph. For example, you can
graph the CPUUtilization metric for all Amazon EC2 instances on one graph.
To graph a metric across resources
1. Open the CloudWatch console at https://console.aws.amazon.com/cloudwatch/.
2. If necessary, change the region. From the navigation bar, select the region that meets your needs.
For more information, see Regions and Endpoints.
3. In the navigation pane, click Metrics.
61
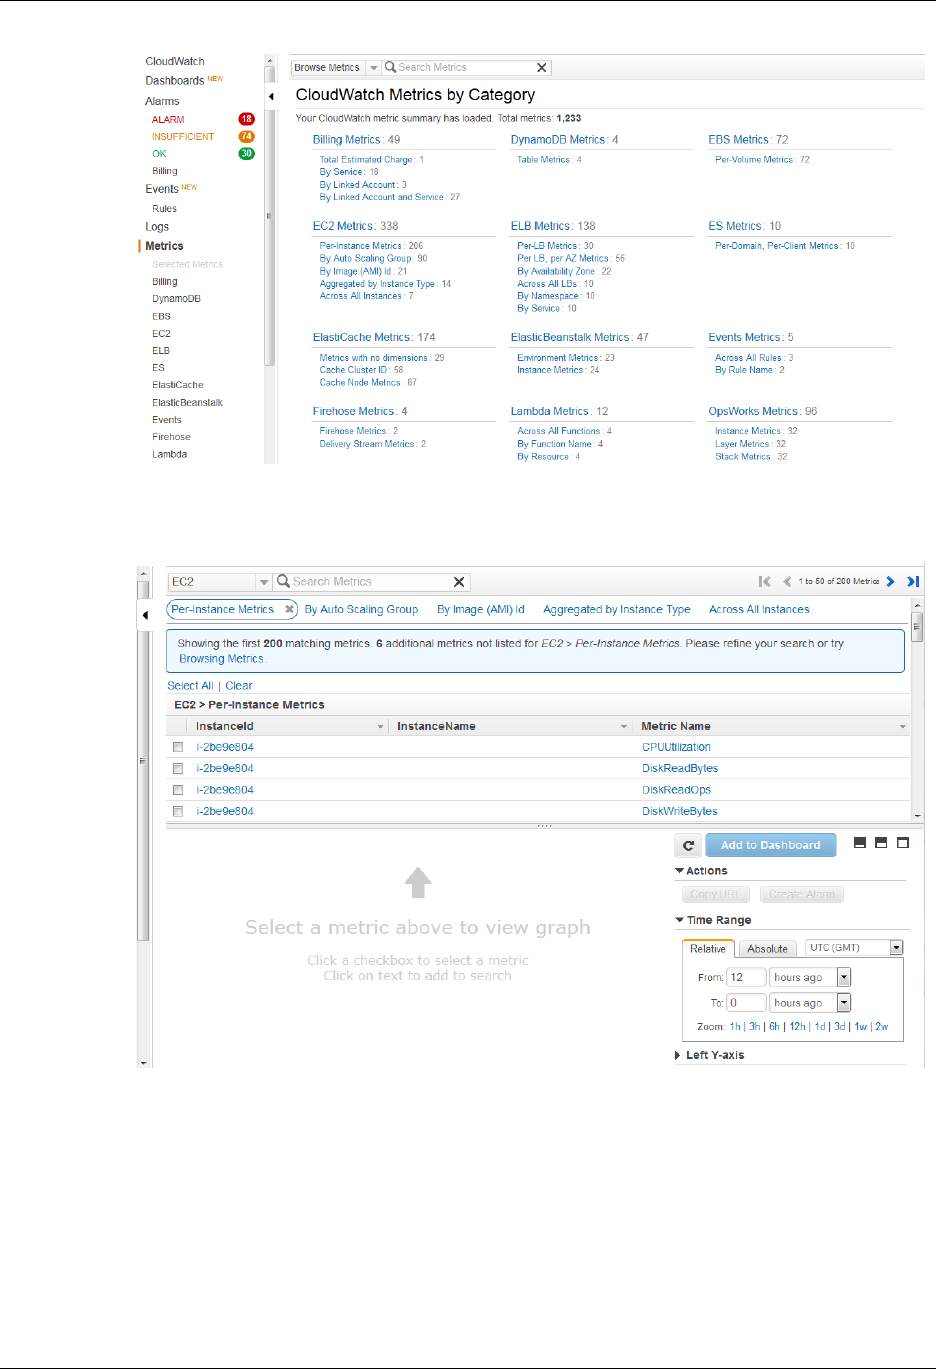
Amazon CloudWatch User Guide
Graph a Metric Across Resources
4. In the CloudWatch Metrics by Category pane, select a metric category. For example, under EC2
Metrics, select Per-Instance Metrics.
5. In the metric list, in the Metric Name column, click a metric. For example CPUUtilization.
6. At the top of the metric list, click Select All.
The graph shows all data for all occurrences of the selected metric. In the example below,
CPUUtilization for all Amazon EC2 instances is shown.
62
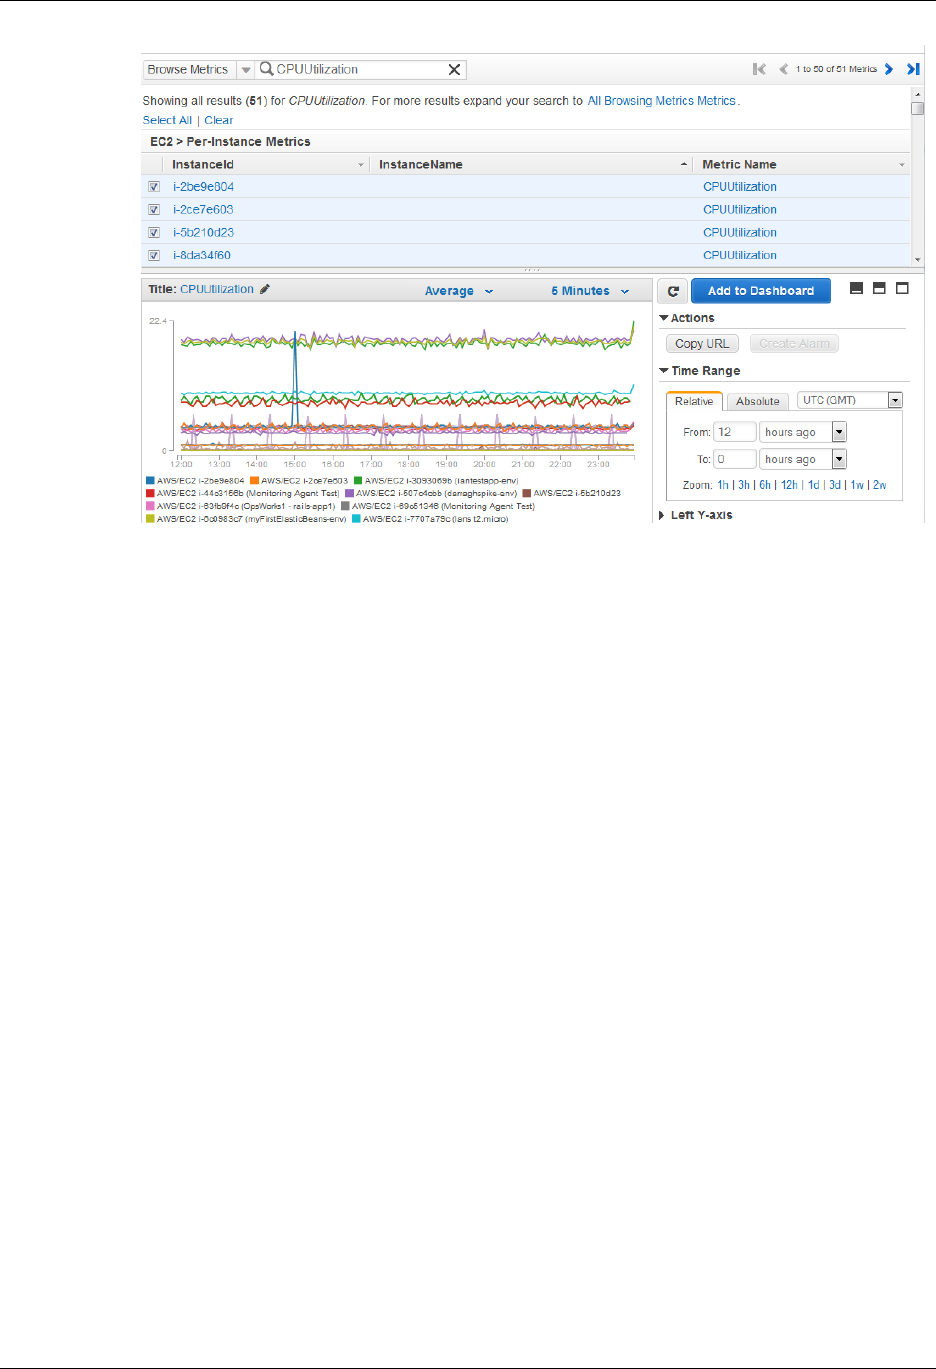
Amazon CloudWatch User Guide
Graph Several Metrics
7. To save this graph and access it later, in the details pane, under Actions, click Copy URL, and
then in the Copy Graph URL dialog box, select the URL and paste it into your browser.
Graph Several Metrics
You can graph several metrics over time on the same graph. For example, you can graph
CPUUtilization and DiskReadBytes for an Amazon EC2 instance and show them together on the same
graph.
To graph several metrics
1. Open the CloudWatch console at https://console.aws.amazon.com/cloudwatch/.
2. If necessary, change the region. From the navigation bar, select the region that meets your
needs. For more information, see Regions and Endpoints in the Amazon Web Services General
Reference.
3. In the navigation pane, click Metrics.
4. In the CloudWatch Metrics by Category pane, use the Search Metrics field and categories to
find a metric using the metric name, AWS resource, or other metadata.
5. Select the check box next to each metric you want to graph. You can add additional metrics by
selecting their check boxes. A line appears on the graph for each check box you select.
63
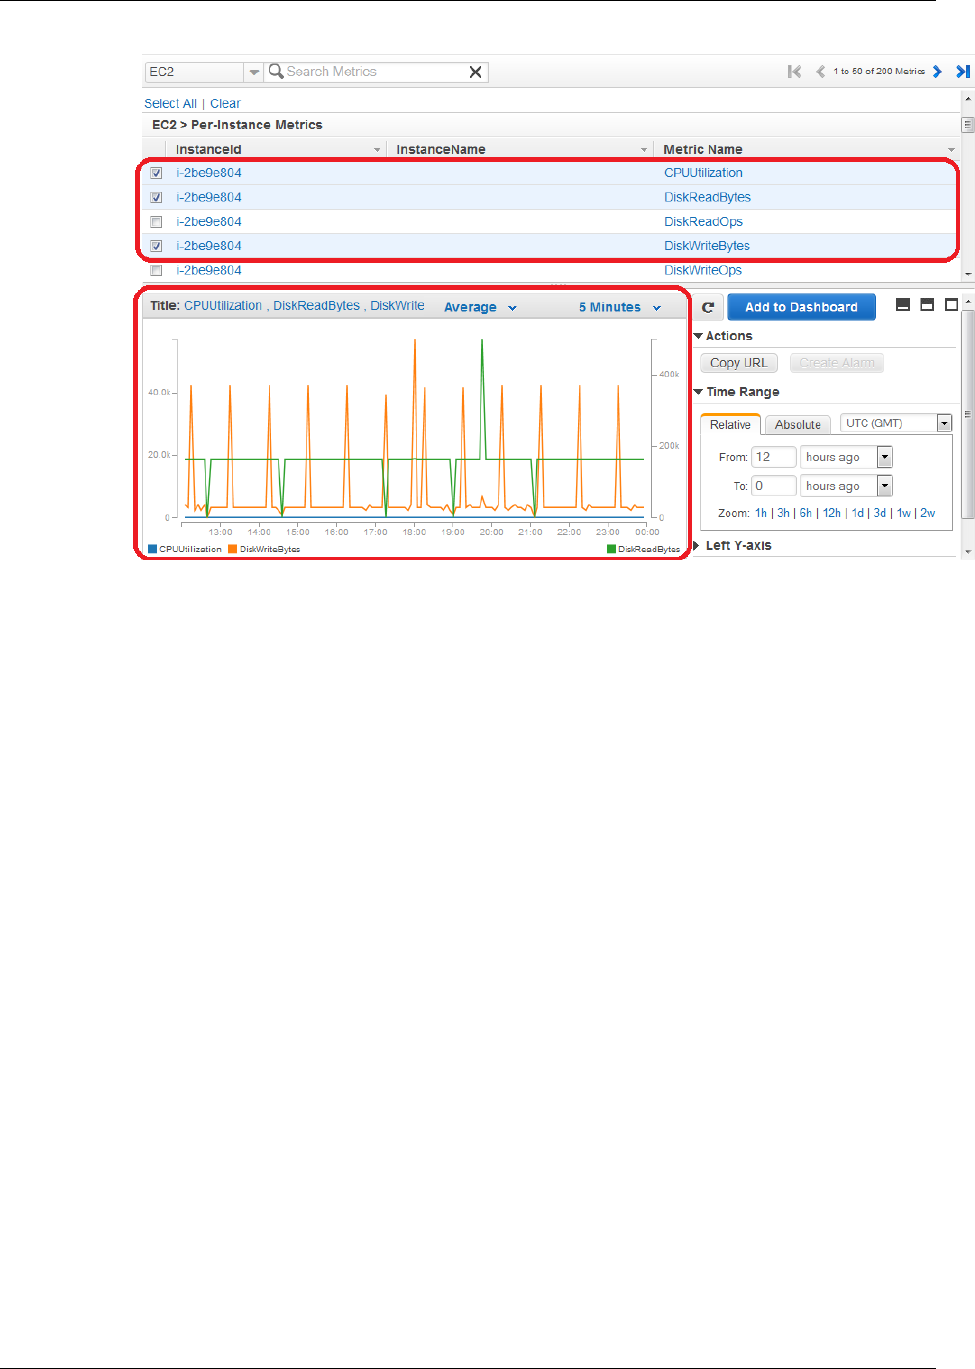
Amazon CloudWatch User Guide
Modify the Date and Time on a Graph
6. To clear your selections and view data for a single metric, click the metric name in the list.
7. To save this graph and access it later, in the details pane, under Actions, click Copy URL, and
then in the Copy Graph URL dialog box, select the URL and paste it into your browser.
Modify the Date and Time on a Graph
You can change the date and time on a graph to view data at different points in time.
To modify the date and time on a graph
1. Open the CloudWatch console at https://console.aws.amazon.com/cloudwatch/.
2. If necessary, change the region. From the navigation bar, select the region that meets your
needs. For more information, see Regions and Endpoints in the Amazon Web Services General
Reference.
3. In the navigation pane, click Metrics.
4. In the CloudWatch Metrics by Category pane, select a category to view available metrics.
5. Select the check box for one or more metrics.
6. In the details pane, in the Time Range section, select a new date range using the From and To
fields.
64
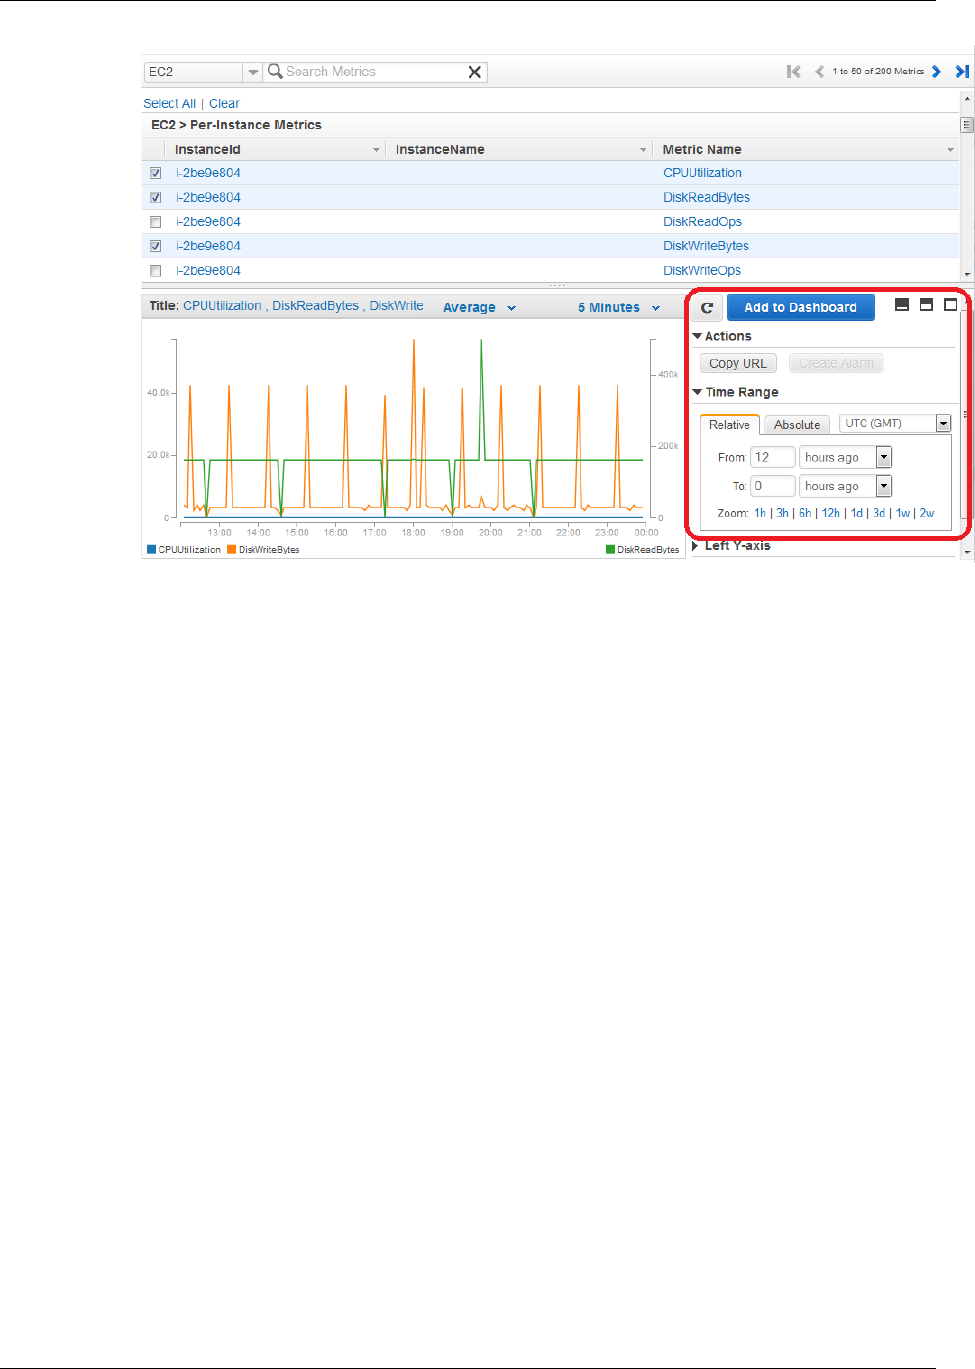
Amazon CloudWatch User Guide
Modify the Statistic for a Graph
7. Click Update Graph or the refresh (circular arrows) button to update the graph with the new date
range.
8. To save this graph and access it later, in the details pane, under Actions, click Copy URL, and
then in the Copy Graph URL dialog box, select the URL and paste it into your browser.
Modify the Statistic for a Graph
CloudWatch supports several different statistics on metrics: Average, Minimum, Maximum, Sum &
Samples. For more information, see Statistics (p. 7).
To modify the statistic for a graph
1. Open the CloudWatch console at https://console.aws.amazon.com/cloudwatch/.
2. If necessary, change the region. From the navigation bar, select the region that meets your
needs. For more information, see Regions and Endpoints in the Amazon Web Services General
Reference.
3. In the navigation pane, click Metrics.
4. In the CloudWatch Metrics by Category pane, select a category to view available metrics.
5. Select the check box for one or more metrics.
6. Next to the graph's title, click the Statistic drop down list and then select a statistic, for example,
Maximum.
The graph updates with the new selection.
65
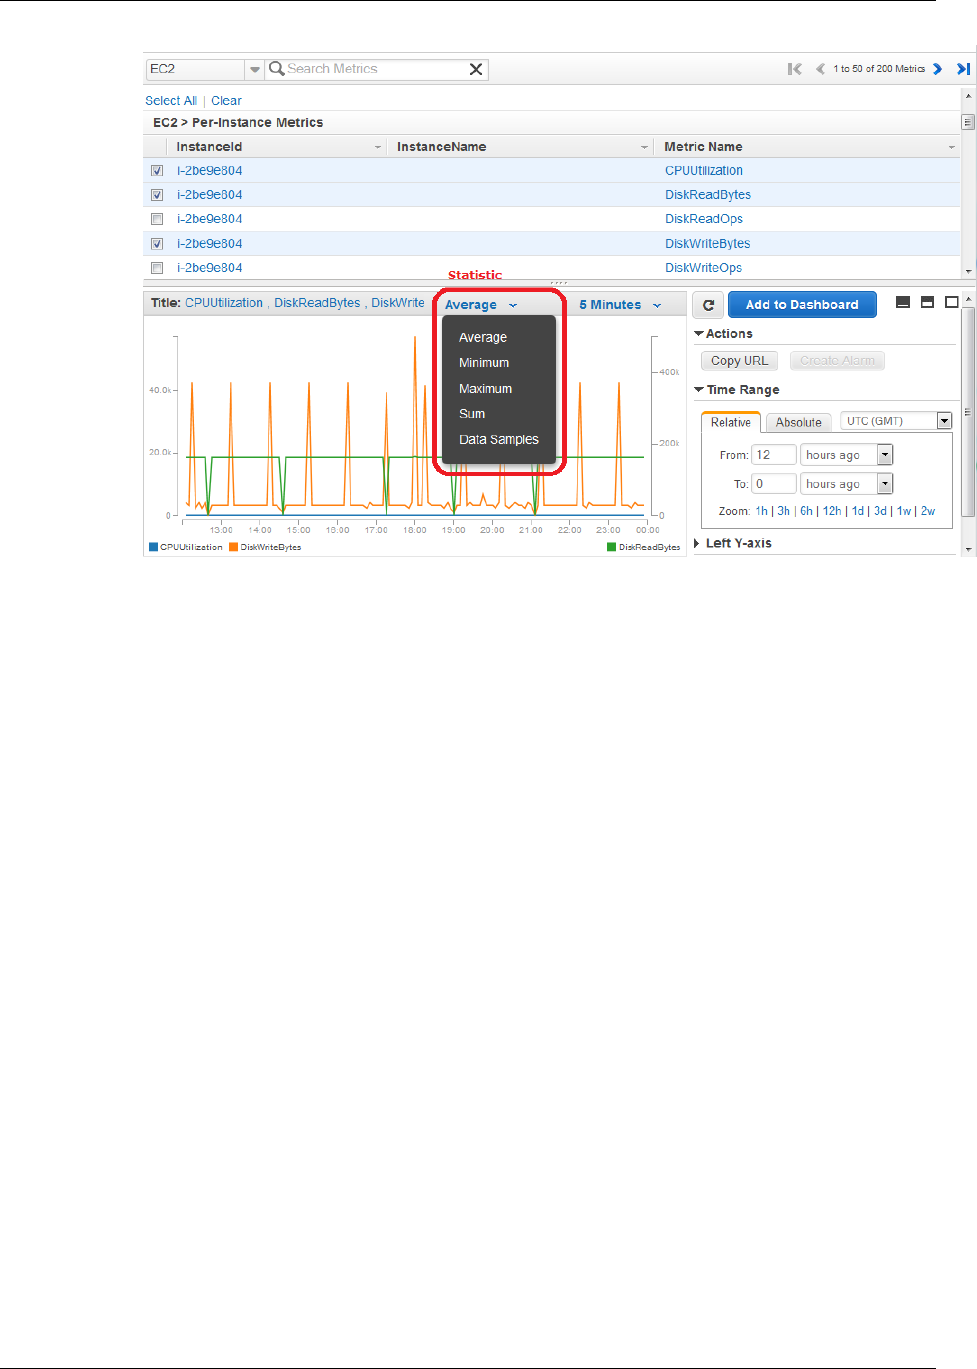
Amazon CloudWatch User Guide
Modify the Period for a Graph
7. To save this graph and access it later, in the details pane, under Actions, click Copy URL, and
then in the Copy Graph URL dialog box, select the URL and paste it into your browser.
Modify the Period for a Graph
CloudWatch enables you to view your data at different granularities. You can view your data using
Period of 1 minute, giving you a very detailed view. This is very useful when troubleshooting, when
viewing narrow bands of time (e.g. 1 hour), and when performing other activities that require the most
precise graphing of time periods. You can also view your data using Period of 1 hour, giving you a less
detailed view. This is very useful when viewing wider bands of time (e.g. 3 days), and allows you to see
trends over time. For more information, see Periods (p. 7).
To modify the period for a graph
1. Open the CloudWatch console at https://console.aws.amazon.com/cloudwatch/.
2. If necessary, change the region. From the navigation bar, select the region that meets your
needs. For more information, see Regions and Endpoints in the Amazon Web Services General
Reference.
3. In the navigation pane, click Metrics.
4. In the CloudWatch Metrics by Category pane, select a category to view available metrics.
5. Select the check box for one or more metrics.
6. Click the Period drop down list and then select a new period, for example, 5 Minutes.
The graph updates with the new selection.
66
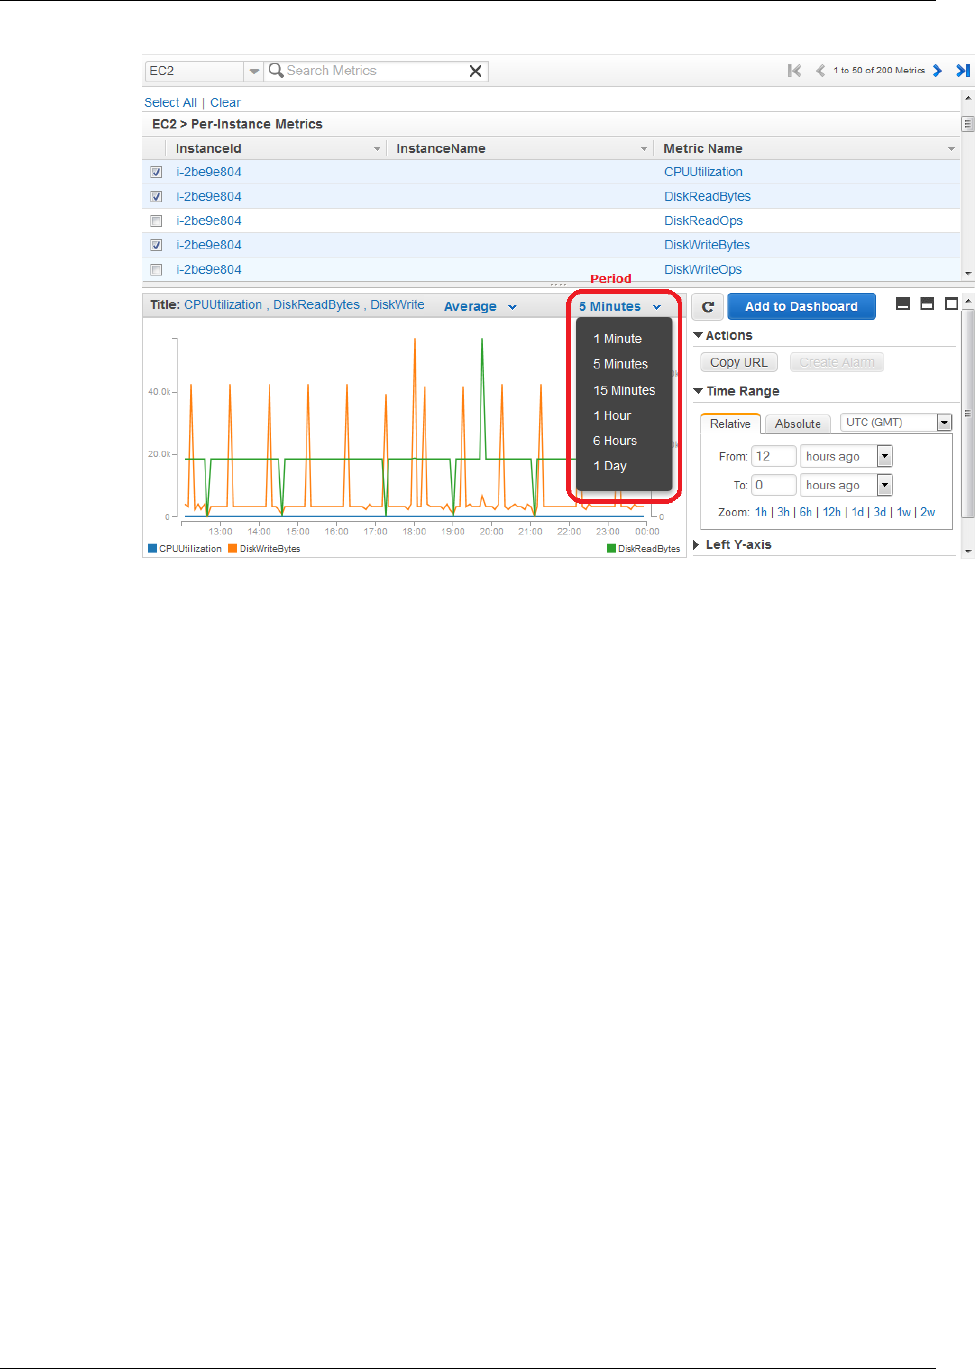
Amazon CloudWatch User Guide
Modify a Graph's Title
7. To save this graph and access it later, in the details pane, under Actions, click Copy URL, and
then in the Copy Graph URL dialog box, select the URL and paste it into your browser.
Modify a Graph's Title
CloudWatch provides a default title for any graph you create. You can edit the title and change it if you
want.
To modify a graph's title
1. Open the CloudWatch console at https://console.aws.amazon.com/cloudwatch/.
2. If necessary, change the region. From the navigation bar, select the region that meets your
needs. For more information, see Regions and Endpoints in the Amazon Web Services General
Reference.
3. In the navigation pane, click Metrics.
4. In the CloudWatch Metrics by Category pane, select a category to view available metrics.
5. Select the check box for one or more metrics.
6. In the details pane, click the title to edit it.
7. In the pop-up box, enter a new title, and then click Save to update the graph's title.
67
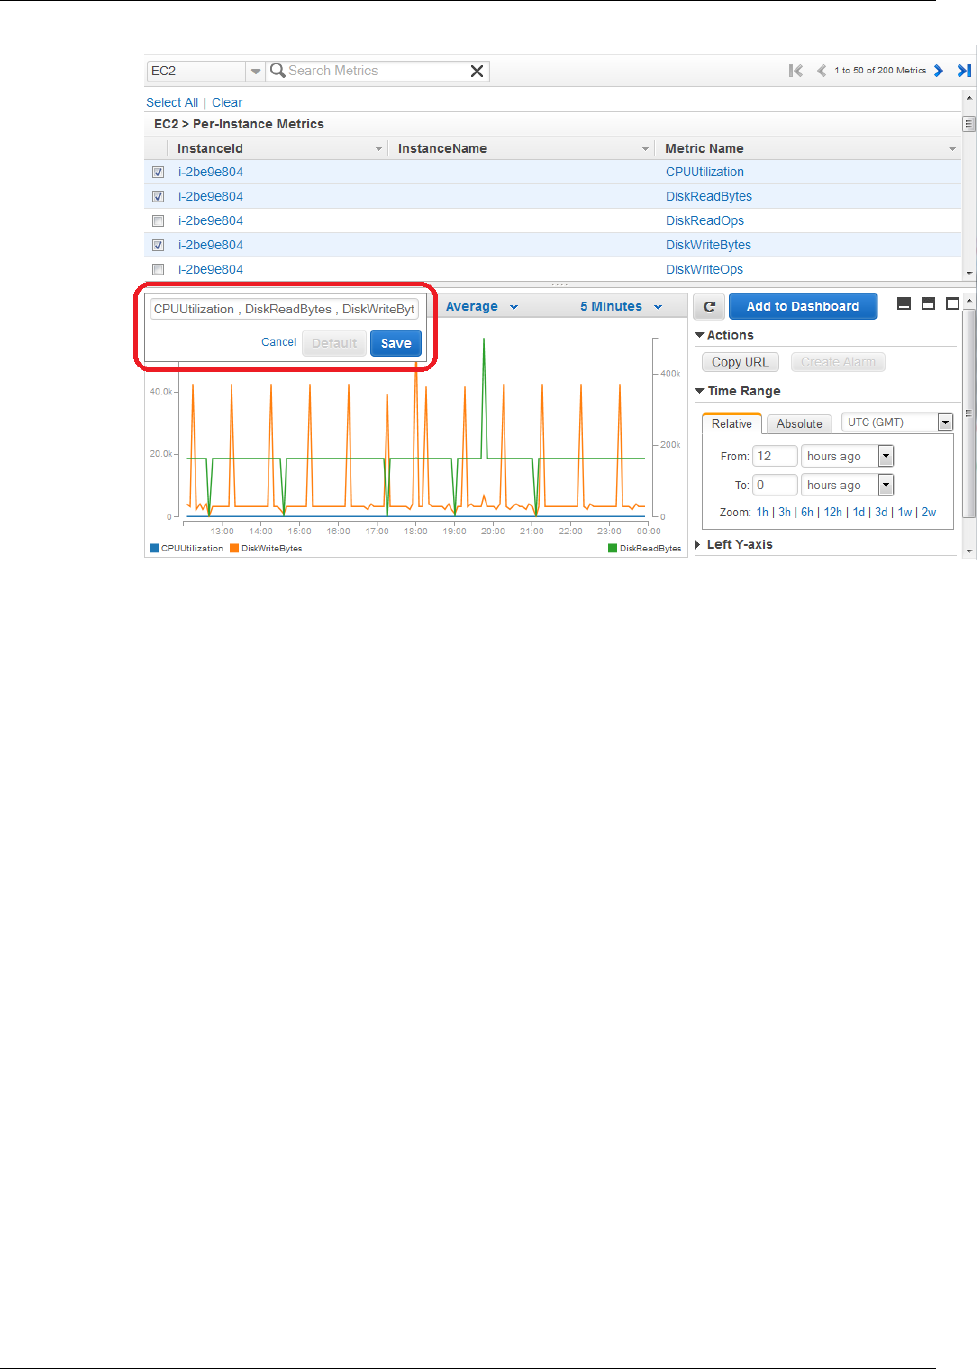
Amazon CloudWatch User Guide
Create an Alarm from a Metric on a Graph
Create an Alarm from a Metric on a Graph
You can graph a metric and then create an alarm from the metric on the graph, which has the benefit of
populating many of the alarm fields for you.
To create an alarm from a metric on a graph
1. Open the CloudWatch console at https://console.aws.amazon.com/cloudwatch/.
2. If necessary, change the region. From the navigation bar, select the region that meets your
needs. For more information, see Regions and Endpoints in the Amazon Web Services General
Reference.
3. In the navigation pane, click Metrics.
4. In the CloudWatch Metrics by Category pane, select a category to view available metrics.
5. Select the check box next to the metric for which you want to create an alarm.
6. In the details pane, under Actions, click Create Alarm, and then complete the alarm fields.
For more information about how to create an alarm, see Creating Amazon CloudWatch
Alarms (p. 76).
68
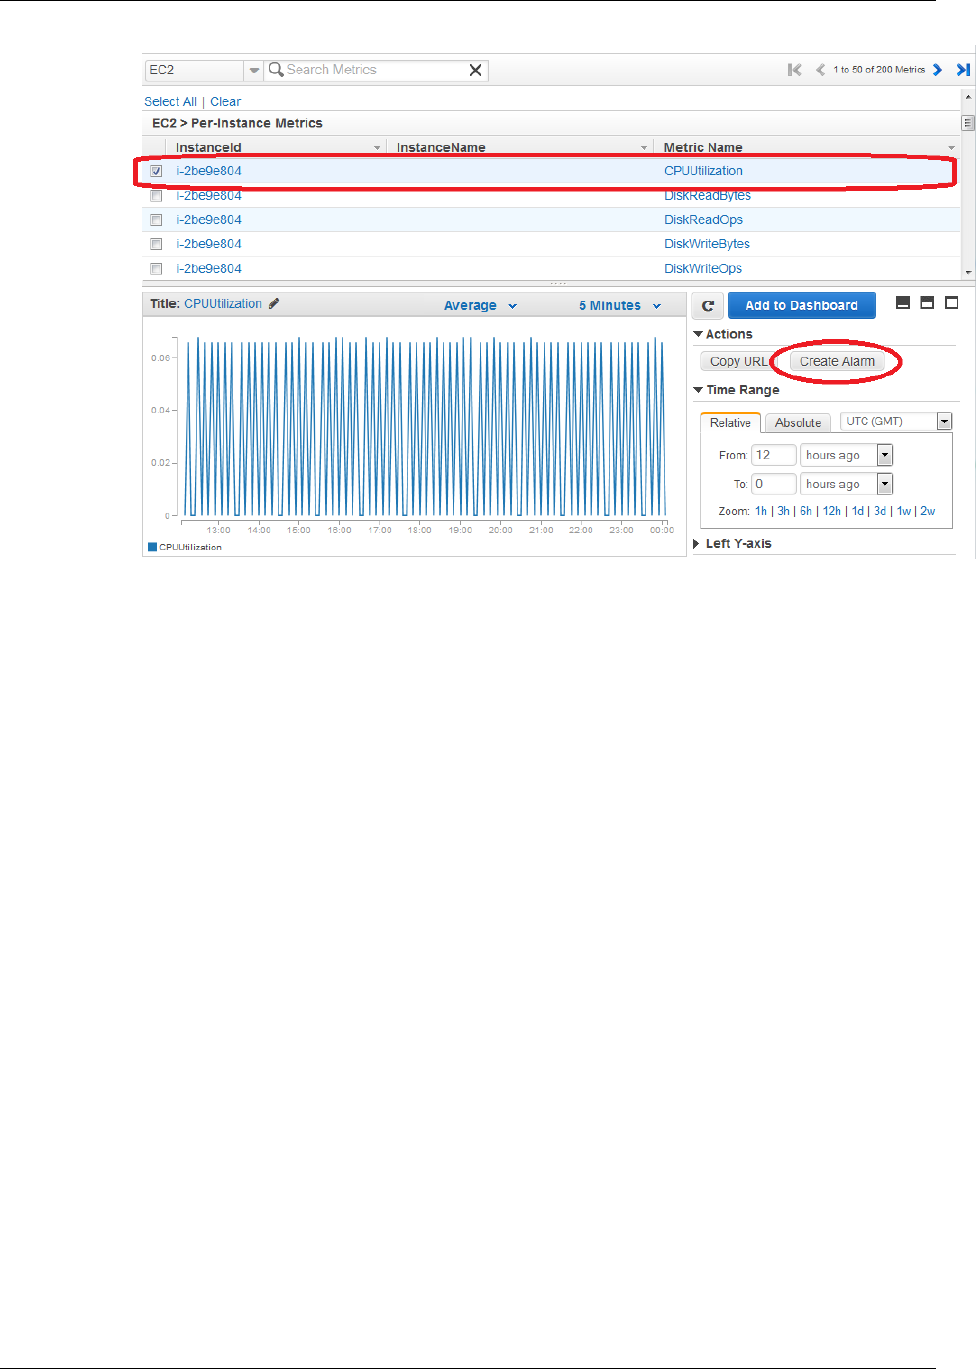
Amazon CloudWatch User Guide
Zoom in to a Graph
Zoom in to a Graph
You can change the granularity of a graph and zoom in to see data over a shorter time period.
To zoom in to a graph
1. Open the CloudWatch console at https://console.aws.amazon.com/cloudwatch/.
2. If necessary, change the region. From the navigation bar, select the region that meets your
needs. For more information, see Regions and Endpoints in the Amazon Web Services General
Reference.
3. In the navigation pane, click Metrics.
4. In the CloudWatch Metrics by Category pane, select a category to view available metrics.
5. Select the check box for one or more metrics.
6. In the details pane, click and drag on the graph area, and then release your mouse button.
The graph updates with the new selection.
69
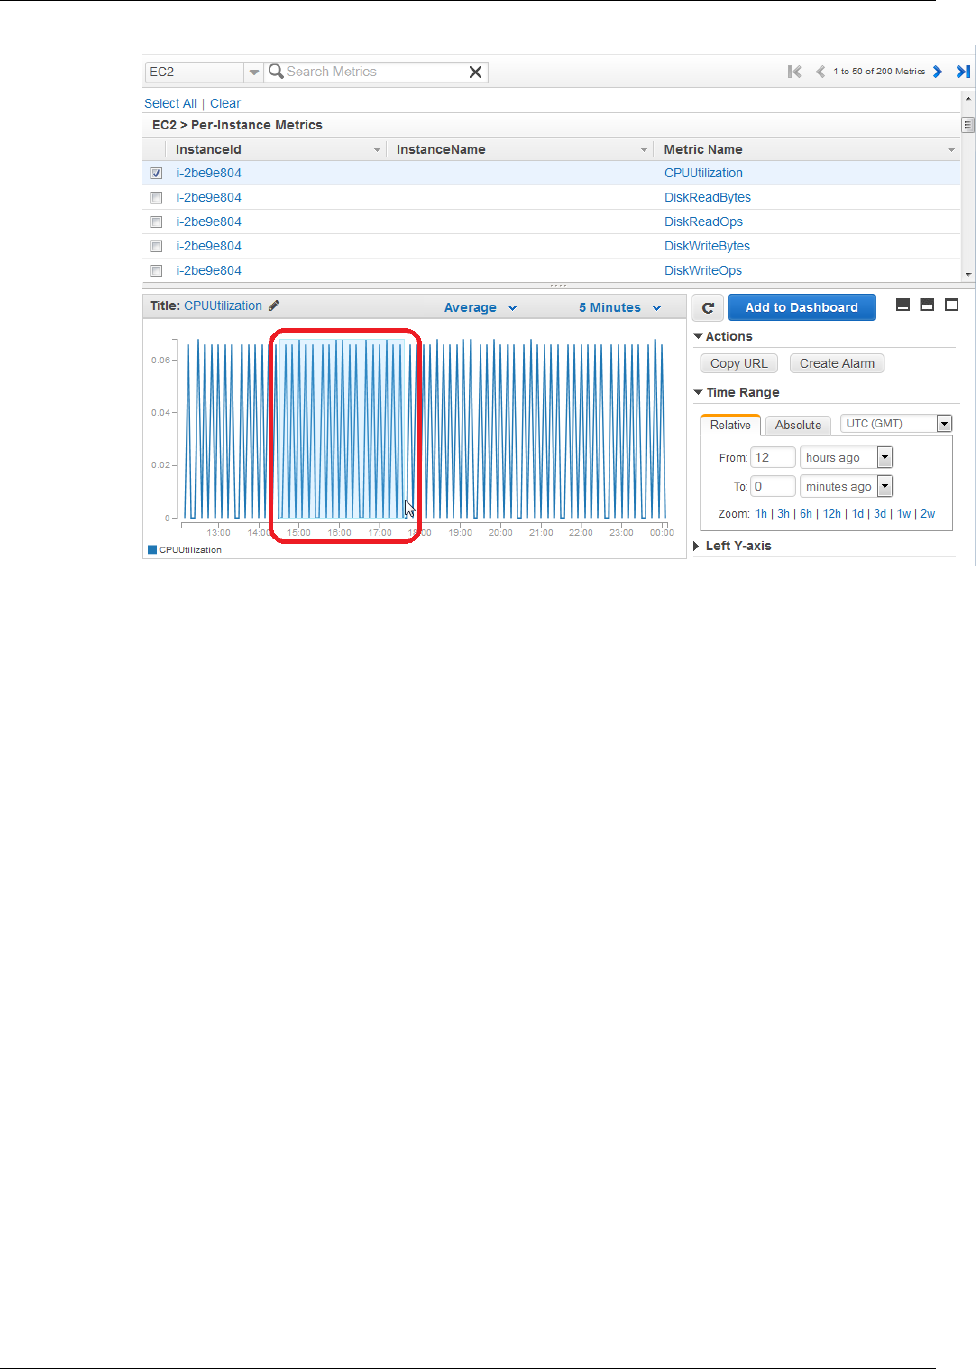
Amazon CloudWatch User Guide
Switch the Y-Axis for a Metric
7. To save this graph and access it later, in the details pane, under Actions, click Copy URL, and
then in the Copy Graph URL dialog box, select the URL and paste it into your browser.
Switch the Y-Axis for a Metric
You can display multiple metrics on a single graph using two different Y-axes. This is particularly useful
for metrics that have different units or that differ greatly in their range of values.
To switch the Y-Axis for a metric
1. Open the CloudWatch console at https://console.aws.amazon.com/cloudwatch/.
2. If necessary, change the region. From the navigation bar, select the region that meets your
needs. For more information, see Regions and Endpoints in the Amazon Web Services General
Reference.
3. In the navigation pane, click Metrics.
4. In the CloudWatch Metrics by Category pane, select a category to view available metrics.
5. Select the check box for one or more metrics.
6. In the details pane, hover over a line on the graph or the legend entry for the metric and a hover
box appears.
7. Click the switch link in the hover box. The metric switches to the opposite axis.
70
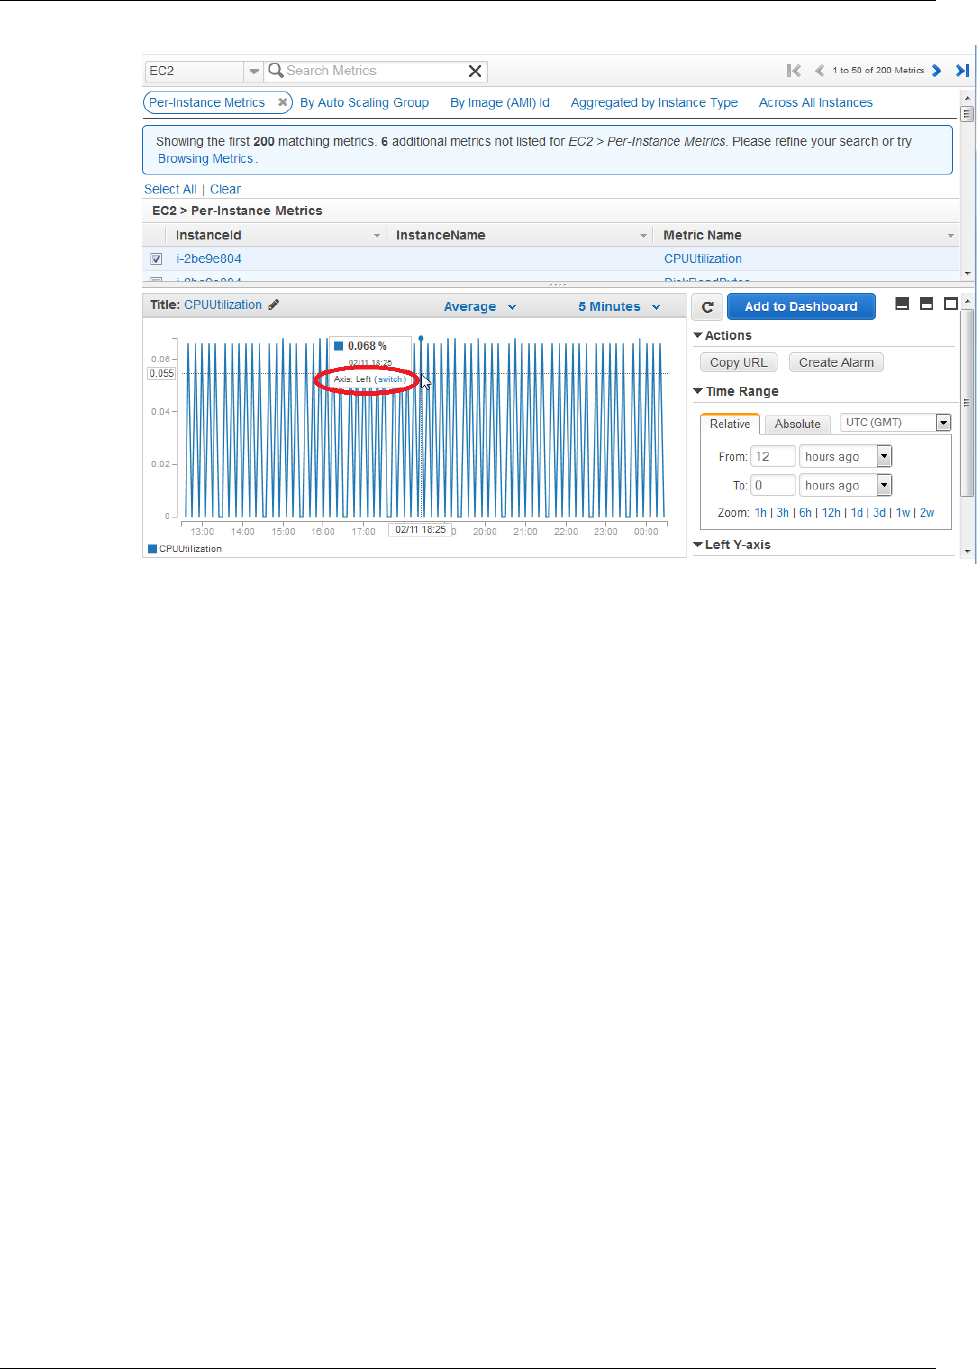
Amazon CloudWatch User Guide
Set custom bounds for the Y-Axis on a graph
Set custom bounds for the Y-Axis on a graph
You can set custom bounds for the Y-axis on a graph to help you see the data better. For example,
you might want to change the bounds on a CPUUtilization graph to 100 percent so that when you look
at the graph, it’s very clear if CPU is low (the plotted line is near the bottom of the graph) or high (the
plotted line is near the top of the graph).
To set custom bounds for the Y-Axis on a graph
1. Open the CloudWatch console at https://console.aws.amazon.com/cloudwatch/.
2. If necessary, change the region. From the navigation bar, select the region that meets your
needs. For more information, see Regions and Endpoints in the Amazon Web Services General
Reference.
3. In the navigation pane, click Metrics.
4. In the CloudWatch Metrics by Category pane, select a category to view available metrics.
5. Select the check box for one or more metrics to automatically graph them.
6. To the right of the graph, expand the Left Y-axis section and enter values into the Min and Max
fields. The value in the Min field must be less than but not equal to the value in the Max field.
71
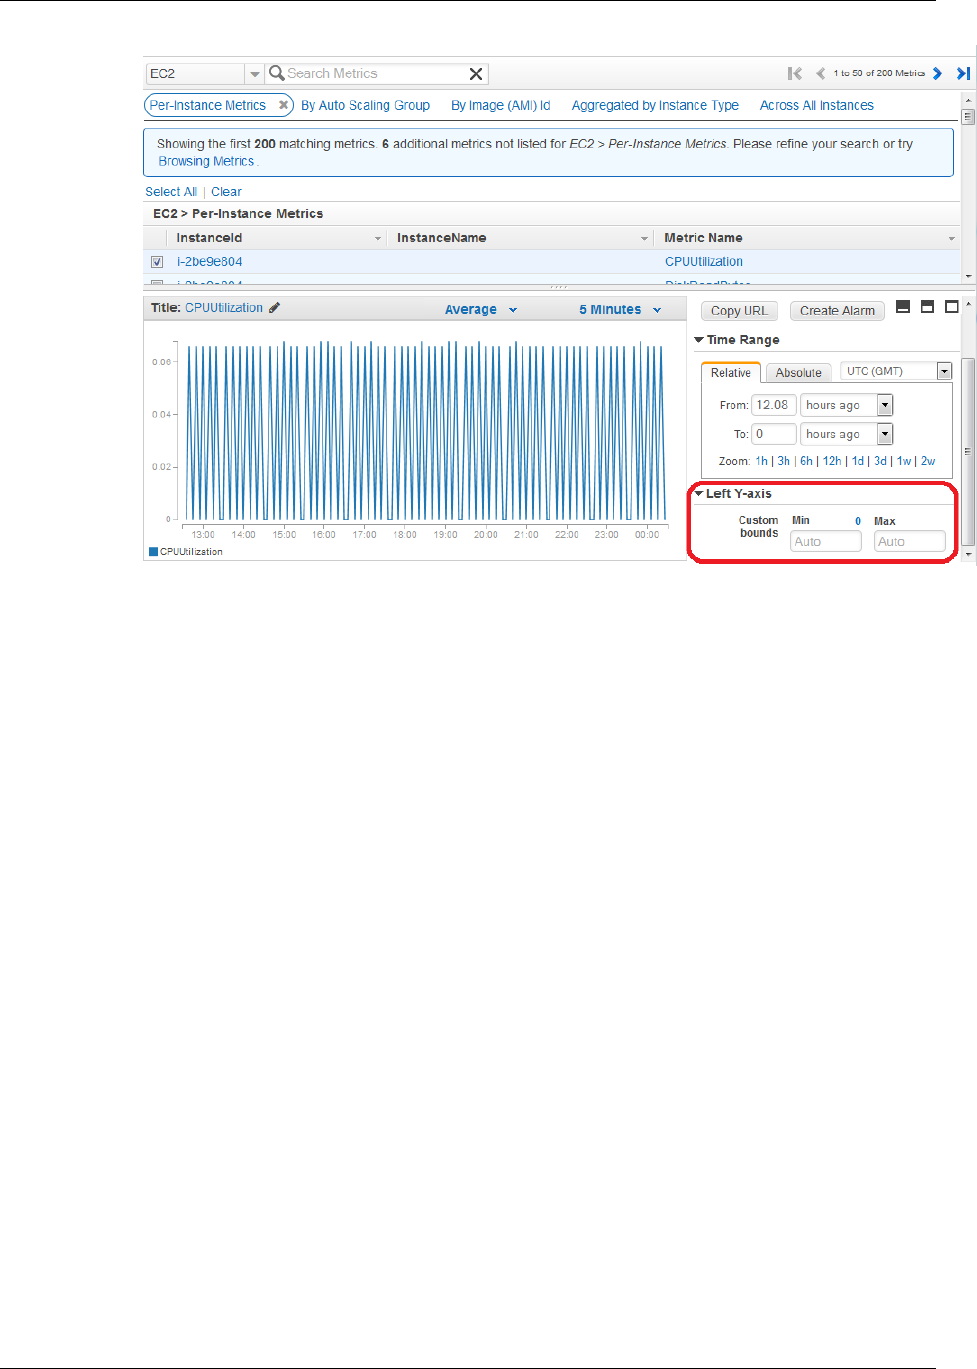
Amazon CloudWatch User Guide
Save a Graph
7. To set custom bounds for the right Y-axis, hover over a line in the graph until the legend appears.
In the legend, click switch.
8. Expand the Right Y-axis section and enter values into the Min and Max fields.
Save a Graph
You can save, or bookmark, a graph to access it later.
To save a graph
1. Open the CloudWatch console at https://console.aws.amazon.com/cloudwatch/.
2. If necessary, change the region. From the navigation bar, select the region that meets your
needs. For more information, see Regions and Endpoints in the Amazon Web Services General
Reference.
3. In the navigation pane, click Metrics.
4. In the CloudWatch Metrics by Category pane, use the Search Metrics field and categories to
find a metric by metric name, AWS resource, or other metadata.
5. Use the scroll bar and next and previous arrows above the metrics list to page through the full list
of metrics
6. Select the metric to view. In the example below, a graph for an Amazon EC2 instance's
CPUUtilization metric is displayed in the details pane.
72
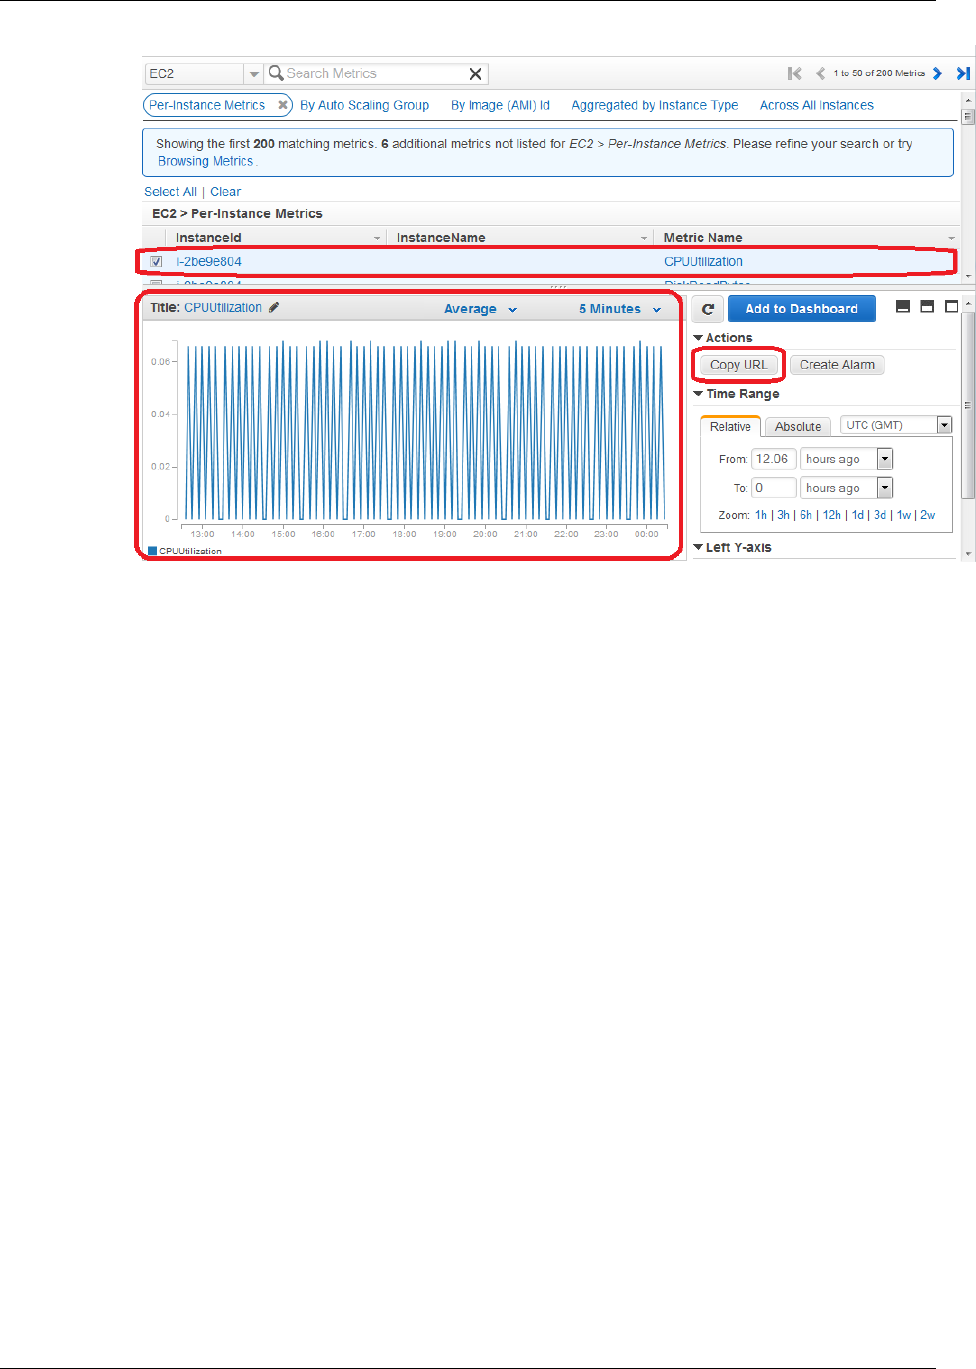
Amazon CloudWatch User Guide
Publish Custom Metrics
7. In the details pane, under Actions, click Copy URL.
8. In the Copy Graph URL dialog box, select the URL and paste it into your browser.
Using your browser, bookmark the page to access it later.
Publish Custom Metrics
You can publish your own metrics to CloudWatch with the put-metric-data command (or its Query
API equivalent PutMetricData). For more information, see put-metric-data in the AWS Command
Line Interface Reference. You can view statistical graphs of your published metrics with the AWS
Management Console.
If you call put-metric-data with a new metric name, CloudWatch creates a new metric for you.
Otherwise, CloudWatch associates your data with the existing metric that you specify.
Note
When you create a new metric using the put-metric-data command, it can take up to
two minutes before you can retrieve statistics on the new metric using the get-metric-
statistics command. However, it can take up to fifteen minutes before the new metric
appears in the list of metrics retrieved using the list-metrics command.
CloudWatch stores data about a metric as a series of data points. Each data point has an associated
time stamp. You can publish one or more data points with each call to put-metric-data. You can
even publish an aggregated set of data points called a statistics set.
Topics
•Publish Single Data Points (p. 74)
•Publish Statistic Sets (p. 75)
•Publish the Value Zero (p. 75)
73

Amazon CloudWatch User Guide
Publish Single Data Points
Publish Single Data Points
To publish a single data point for a new or existing metric, use the put-metric-data command with
one value and time stamp. For example, the following actions each publish one data point:
aws cloudwatch put-metric-data --metric-name PageViewCount --namespace
"MyService" --value 2 --timestamp 2014-02-14T12:00:00.000Z
aws cloudwatch put-metric-data --metric-name PageViewCount --namespace
"MyService" --value 4 --timestamp 2014-02-14T12:00:01.000Z
aws cloudwatch put-metric-data --metric-name PageViewCount --namespace
"MyService" --value 5 --timestamp 2014-02-14T12:00:02.000Z
Note
The put-metric-data command can only publish one data point per call. If you want to run
this example, specify time stamps within the past two weeks.
Although you can publish data points with time stamps as granular as one-thousandth of a second,
CloudWatch aggregates the data to a minimum granularity of one minute. CloudWatch records the
average (sum of all items divided by number of items) of the values received for every 1-minute period,
as well as number of samples, maximum value, and minimum value for the same time period. For
example, the PageViewCount metric from the previous examples contains three data points with time
stamps just seconds apart. CloudWatch aggregates the three data points because they all have time
stamps within a one-minute period.
CloudWatch uses one-minute boundaries when aggregating data points. For example,
CloudWatch aggregates the data points from the previous example because all three data points
fall within the one-minute period that begins at 2014-02-20T12:00:00.000Z and ends at
2014-02-20T12:01:00.000Z.
You can use the get-metric-statistics command to retrieve statistics based on the data points
you have published.
aws cloudwatch get-metric-statistics --metric-name PageViewCount --
namespace "MyService" --statistics "Sum" "Maximum" "Minimum" "Average"
"SampleCount" --period 60 --start-time 2014-02-20T12:00:00.000Z --end-
time 2014-02-20T12:05:00.000Z --output json
CloudWatch returns the following:
{
"Datapoints": [
{
"SampleCount": 3.0,
"Timestamp": "2014-02-20T12:00:00Z",
"Average": 3.6666666666666665,
"Maximum": 5.0,
"Minimum": 2.0,
"Sum": 11.0,
"Unit": "None"
}
],
"Label": "PageViewCount"
}
74

Amazon CloudWatch User Guide
Publish Statistic Sets
Publish Statistic Sets
You can also aggregate your data before you publish to CloudWatch. When you have multiple
data points per minute, aggregating data minimizes the number of calls to put-metric-data. For
example, instead of calling put-metric-data multiple times for three data points that are within three
seconds of each other, you can aggregate the data into a statistic set that you publish with one call:
aws cloudwatch put-metric-data --metric-name PageViewCount --namespace
"MyService" --statistic-value Sum=11,Minimum=2,Maximum=5,SampleCount=3 --
timestamp 2014-02-14T12:00:00.000Z
Publish the Value Zero
When your data is more sporadic and you have periods that have no associated data, you can choose
to publish the value zero (0) for that period or no value at all. You might want to publish zero instead
of no value if you use periodic calls to PutMetricData to monitor the health of your application. For
example, you can set a CloudWatch alarm to notify you if your application fails to publish metrics every
five minutes. You want such an application to publish zeros for periods with no associated data.
You might also publish zeros if you want to track the total number of data points or if you want statistics
such as minimum and average to include data points with the value 0.
75

Amazon CloudWatch User Guide
Creating Amazon CloudWatch
Alarms
You can create a CloudWatch alarm that sends an Amazon Simple Notification Service message
when the alarm changes state. An alarm watches a single metric over a time period you specify, and
performs one or more actions based on the value of the metric relative to a given threshold over a
number of time periods. The action is a notification sent to an Amazon Simple Notification Service topic
or Auto Scaling policy. Alarms invoke actions for sustained state changes only. CloudWatch alarms will
not invoke actions simply because they are in a particular state, the state must have changed and been
maintained for a specified number of periods.
After an alarm invokes an action due to a change in state, its subsequent behavior depends on the
type of action that you have associated with the alarm. For Auto Scaling policy notifications, the alarm
continues to invoke the action for every period that the alarm remains in the new state. For Amazon
Simple Notification Service notifications, no additional actions are invoked.
An alarm has three possible states:
•OK—The metric is within the defined threshold
•ALARM—The metric is outside of the defined threshold
•INSUFFICIENT_DATA—The alarm has just started, the metric is not available, or not enough data is
available for the metric to determine the alarm state
In the following figure, the alarm threshold is set to 3 and the evaluation period is 3. That is, the alarm
invokes its action if the oldest period is breaching and the others are breaching or missing within a time
window of 3 periods. In the figure, this happens with the third through fifth time periods, and the alarm's
state is set to ALARM. At period six, the value dips below the threshold, and the state reverts to OK.
Later, during the ninth time period, the threshold is breached again, but the previous periods are OK.
Consequently, the alarm's state remains OK.
76
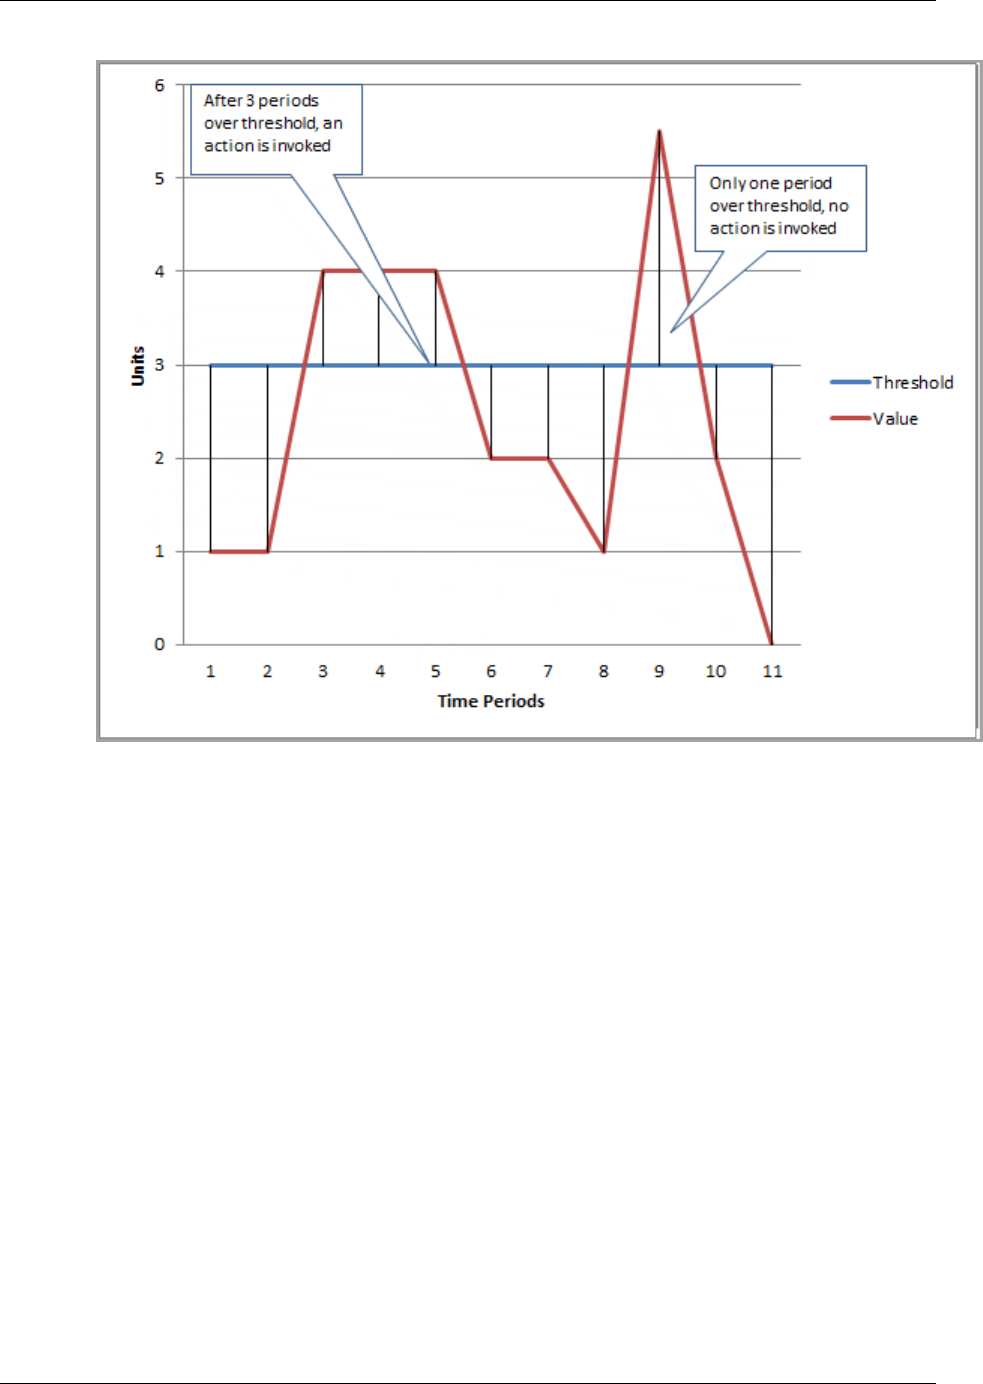
Amazon CloudWatch User Guide
Note
CloudWatch doesn't test or validate the actions you specify, nor does it detect any Auto
Scaling or SNS errors resulting from an attempt to invoke nonexistent actions. Make sure your
actions exist.
Common Features of Alarms
• You can create up to 5000 alarms per AWS account. To create or update an alarm, you use the
PutMetricAlarm API function (mon-put-metric-alarm command).
• You can list any or all of the currently configured alarms, and list any alarms in a particular state
using the DescribeAlarms API (mon-describe-alarms command). You can further filter the list
by time range.
• You can disable and enable alarms by using the DisableAlarmActions and
EnableAlarmActions APIs (mon-disable-alarm-actions and mon-enable-alarm-actions
commands).
• You can test an alarm by setting it to any state using the SetAlarmState API (mon-set-alarm-
state command). This temporary state change lasts only until the next alarm comparison occurs.
• You can create an alarm using the PutMetricAlarm API function (mon-put-metric-alarm
command) before you've created a custom metric. In order for the alarm to be valid, you must
include all of the dimensions for the custom metric in addition to the metric namespace and metric
name in the alarm definition.
• Finally, you can view an alarm's history using the DescribeAlarmHistory API (mon-describe-
alarm-history command). CloudWatch preserves alarm history for two weeks. Each state
transition is marked with a unique time stamp. In rare cases, your history might show more than one
notification for a state change. The time stamp enables you to confirm unique state changes.
77

Amazon CloudWatch User Guide
Set Up Amazon Simple Notification Service
Note
Some AWS resources do not send metric data to CloudWatch under certain conditions.
For example, Amazon EBS may not send metric data for an available volume that is not
attached to an Amazon EC2 instance, because there is no metric activity to be monitored for
that volume. If you have an alarm set for such a metric, you may notice its state change to
Insufficient Data. This may simply be an indication that your resource is inactive, and may not
necessarily mean that there is a problem.
Topics
•Set Up Amazon Simple Notification Service (p. 78)
•Create or Edit an Alarm (p. 80)
•Send Email Based on CPU Usage Alarm (p. 82)
•Send Email Based on Load Balancer Alarm (p. 84)
•Send Email Based on Storage Throughput Alarm (p. 86)
•Create Alarms That Stop, Terminate, Reboot, or Recover an Instance (p. 88)
•Monitor Your Estimated Charges Using Amazon CloudWatch (p. 101)
Set Up Amazon Simple Notification Service
Amazon CloudWatch uses Amazon Simple Notification Service (Amazon SNS) to send email. This
section shows you how to create and subscribe to an Amazon Simple Notification Service topic. When
you create a CloudWatch alarm, you can add this Amazon SNS topic to send an email notification
when the alarm changes state. For more information about Amazon Simple Notification Service, see
the Amazon Simple Notification Service Getting Started Guide.
Note
If you create your CloudWatch alarm with the AWS Management Console, you can skip
this procedure because you can create an Amazon Simple Notification Service topic in the
Configure Actions step in the Create Alarm Wizard.
Topics
•AWS Management Console (p. 78)
•Command Line Tools (p. 79)
AWS Management Console
To set up an Amazon Simple Notification Service topic with the AWS Management Console first you
create a topic, then you subscribe to it. You can then publish a message directly to the topic to ensure
that you have properly configured it.
To create an Amazon Simple Notification Service topic
1. Open the Amazon SNS console at https://console.aws.amazon.com/sns/.
2. If necessary, change the region. From the navigation bar, select the region that meets your needs.
For more information, see Regions and Endpoints.
3. On the SNS dashboard, under Common actions, choose Create Topic.
4. In the Create new topic dialog box, in the Topic name field, enter the topic name MyTopic.
5. Click Create topic.
6. On the Topic details: MyTopic page, copy the Topic ARN for the next task.
78

Amazon CloudWatch User Guide
Command Line Tools
To subscribe to an Amazon Simple Notification Service topic
1. Open the Amazon SNS console at https://console.aws.amazon.com/sns/.
2. If necessary, change the region. From the navigation bar, select the region that meets your needs.
For more information, see Regions and Endpoints.
3. In the navigation pane, choose Subscriptions.
4. On the Subscriptions page, choose Create subscription.
5. In the Create subscription dialog box, in the Topic ARN field, paste the topic ARN you created in
the previous task, for example: arn:aws:sns:us-east-1:111122223333:MyTopic.
6. In the Protocol drop-down list, choose Email.
7. In the Endpoint field, enter an email address you can use to receive the notification, and then click
Create subscription.
8. Go to your email application and open the message from AWS Notifications, and then click the link
to confirm your subscription.
Your web browser displays a confirmation response from Amazon Simple Notification Service.
To publish to an Amazon Simple Notification Service topic
1. Open the Amazon SNS console at https://console.aws.amazon.com/sns/.
2. If necessary, change the region. From the navigation bar, select the region that meets your needs.
For more information, see Regions and Endpoints.
3. In the navigation pane, choose Topics.
4. On the Topics page, choose the topic you want to publish, and then choose Publish to topic.
5. In the
<guillabel>Publish a message</guillabel>
page, in the Subject field, enter a subject line for your message, and in the Message field, enter a
brief message.
6. Click Publish Message.
7. Check your email to confirm that you received the message from the topic.
Command Line Tools
This scenario walks you through how to use the AWS CLI to create an Amazon Simple Notification
Service topic, and then publish a message directly to the topic to ensure that you have properly
configured it. For information about how to install and configure the AWS CLI, see Getting Set Up with
the AWS Command Line Interface in the AWS Command Line Interface User Guide.
To set up an Amazon Simple Notification Service topic
1. Create the topic using the create-topic command. You receive a topic resource name as a
return value:
Prompt>aws sns create-topic --name MyTopic
Amazon Simple Notification Service returns the following Topic ARN:
{
"TopicArn": "arn:aws:sns:us-east-1:111122223333:MyTopic"
}
79

Amazon CloudWatch User Guide
Create or Edit an Alarm
2. Subscribe your email address to the topic using the subscribe command. You will receive a
confirmation email message if the subscription request succeeds.
Prompt>aws sns subscribe --topic-arn arn:aws:sns:us-
east-1:111122223333:MyTopic --protocol email --notification-
endpoint <your-email-address>
Amazon Simple Notification Service returns the following:
{
"SubscriptionArn": "pending confirmation"
}
3. Confirm that you intend to receive email from Amazon Simple Notification Service by clicking the
confirmation link in the body of the message to complete the subscription process.
4. Check the subscription using the list-subscriptions-by-topic command.
Prompt>aws sns list-subscriptions-by-topic --topic-arn arn:aws:sns:us-
east-1:111122223333:MyTopic
Amazon Simple Notification Service returns the following:
{
"Subscriptions": [
{
"Owner": "111122223333",
"Endpoint": "me@mycompany.com",
"Protocol": "email",
"TopicArn": "arn:aws:sns:us-east-1:111122223333:MyTopic",
"SubscriptionArn": "arn:aws:sns:us-
east-1:111122223333:MyTopic:64886986-bf10-48fb-a2f1-d
ab033aa67a3"
}
]
}
5. Publish a message directly to the topic using the publish command to ensure that the topic is
properly configured.
Prompt>aws sns publish --message "Verification" --topic arn:aws:sns:us-
east-1:111122223333:MyTopic
Amazon Simple Notification Service returns the following:
{
"MessageId": "42f189a0-3094-5cf6-8fd7-c2dde61a4d7d"
}
6. Check your email to confirm that you received the message from the topic.
Create or Edit an Alarm
You can create or edit an alarm from the Alarms list in the Amazon CloudWatch console.
80
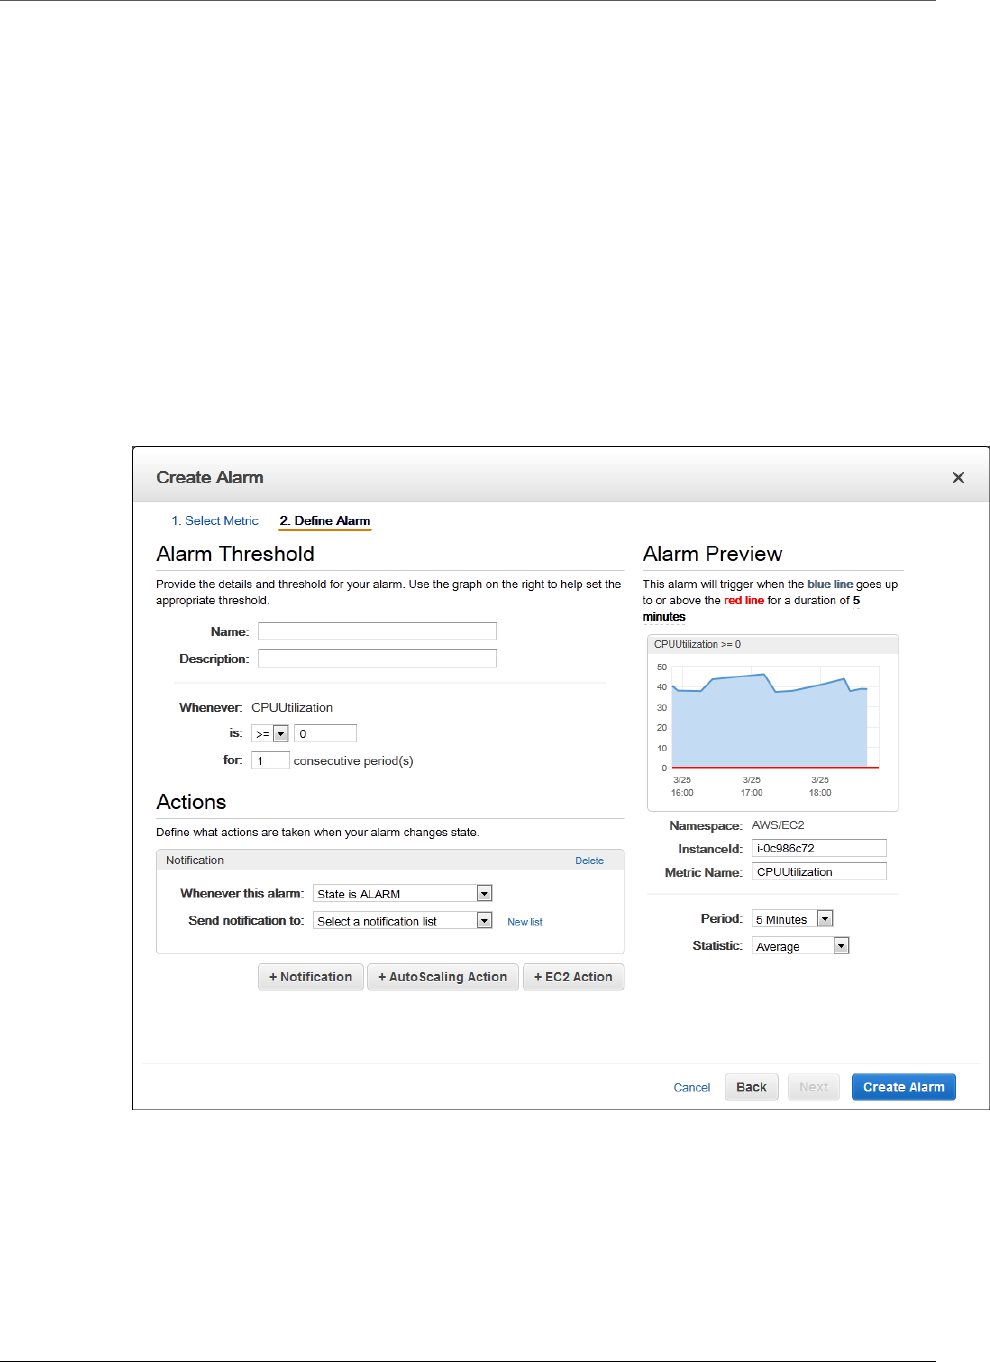
Amazon CloudWatch User Guide
Create or Edit an Alarm
To create an alarm
1. Open the CloudWatch console at https://console.aws.amazon.com/cloudwatch/.
2. If necessary, change the region. From the navigation bar, select the region that meets your
needs. For more information, see Regions and Endpoints in the Amazon Web Services General
Reference.
3. In the navigation pane, click Alarms.
4. Click Create Alarm, and then in the CloudWatch Metrics by Category pane, select a metric
category, for example, EC2 Metrics.
5. Select a metric, (for example, CPUUtilization), and then click Next.
6. Under Alarm Threshold, complete the fields, and then under Actions, select the type of action
you want the alarm to perform when the alarm is triggered.
You can choose specific metrics to trigger the alarm and specify thresholds for those metrics. You
can then set your alarm to change state when a metric exceeds a threshold that you have defined.
For an example of how to create an alarm that sends email, see Creating Amazon CloudWatch
Alarms (p. 76).
7. Click Create Alarm.
To edit an alarm
1. Open the CloudWatch console at https://console.aws.amazon.com/cloudwatch/.
2. If necessary, change the region. From the navigation bar, select the region that meets your
needs. For more information, see Regions and Endpoints in the Amazon Web Services General
Reference.
81

Amazon CloudWatch User Guide
Send Email Based on CPU Usage Alarm
3. In the navigation pane, click Alarms.
4. In the alarms list, select the check box next to the alarm you want to edit, and then click Modify.
5. In the Modify Alarm dialog box, update the alarm as necessary, and then click Save Changes.
To update an email notification list that was created using the CloudWatch console
1. Open the CloudWatch console at https://console.aws.amazon.com/cloudwatch/.
2. If necessary, change the region. From the navigation bar, select the region that meets your
needs. For more information, see Regions and Endpoints in the Amazon Web Services General
Reference.
3. In the navigation pane, click Alarms.
4. In the alarms list, select the check box next to the alarm you want to edit, and then click Modify.
5. In the Email list field, add or update the list of email addresses, and then click Save Changes.
To update an email notification list that was created in the Amazon SNS console
1. Open the Amazon SNS console at https://console.aws.amazon.com/sns/.
2. If necessary, change the region. From the navigation bar, select the region that meets your
needs. For more information, see Regions and Endpoints in the Amazon Web Services General
Reference.
3. In the navigation pane, choose Topics, and then choose the arn for your notification list (topic).
4. Do one of the following:
• To add an email address, choose Create subscription, in Protocol, choose Email, in
Endpoint, type the email address of the new recipient, and then choose Create subscription.
• To remove an email address, choose the Subscription ID, choose Other subscription
actions, and then choose Delete subscriptions.
5. Choose Publish to topic.
Send Email Based on CPU Usage Alarm
This scenario walks you through how to use the AWS Management Console or the command line
tools to create an Amazon CloudWatch alarm that sends an Amazon Simple Notification Service email
message when the alarm changes state from OK to ALARM.
In this scenario, you configure the alarm to change to the ALARM state when the average CPU use of
an EC2 instance exceeds 70 percent for two consecutive five-minute periods.
Topics
•AWS Management Console (p. 82)
•Command Line Tools (p. 84)
AWS Management Console
To create an alarm that sends email based on CPU usage
1. Open the CloudWatch console at https://console.aws.amazon.com/cloudwatch/.
2. If necessary, change the region. From the navigation bar, select the region that meets your needs.
For more information, see Regions and Endpoints.
82
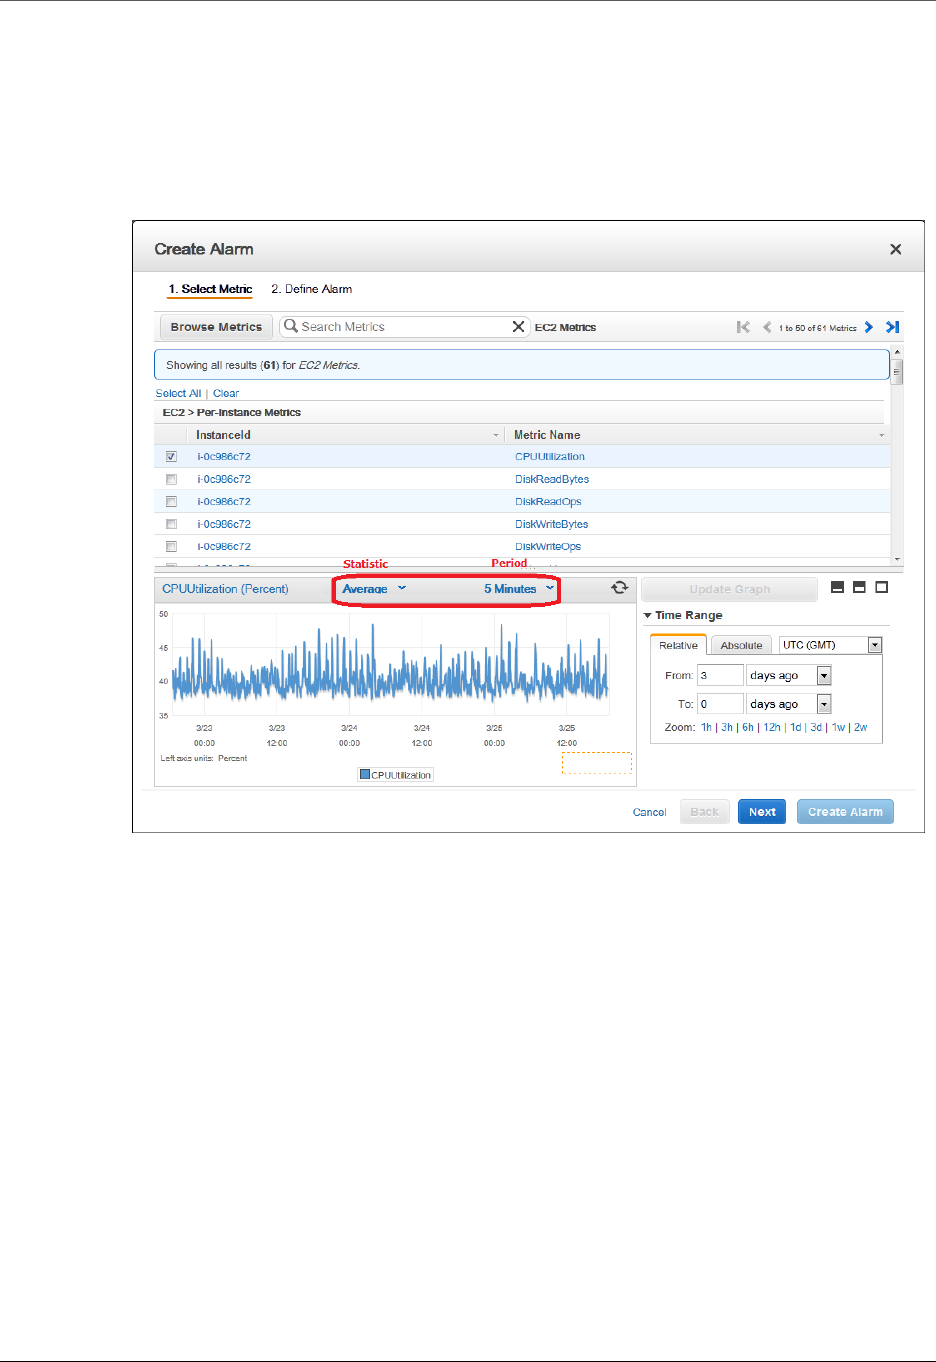
Amazon CloudWatch User Guide
AWS Management Console
3. In the navigation pane, click Alarms.
4. Click Create Alarm, and then in the CloudWatch Metrics by Category pane, select a metric
category, for example, EC2 Metrics.
5. In the list of metrics, select a row that contains CPUUtilization for a specific instance ID.
A graph showing average CPUUtilization for a single instance appears in the lower pane.
6. Select Average from the Statistic drop-down list.
7. Select a period from the Period drop-down list, for example: 5 minutes.
8. Click Next, and then under Alarm Threshold, in the Name field, enter a unique name for the
alarm, for example: myHighCpuAlarm.
9. In the Description field, enter a description of the alarm, for example: CPU usage exceeds 70
percent.
10. In the is drop-down list, select >.
11. In the box next to the is drop-down list, enter 70 and in the for field, enter 10.
A graphical representation of the threshold is shown under Alarm Preview.
12. Under Actions, in the Whenever this alarm drop-down list, select State is ALARM.
13. In the Send notification to drop-down list, select an existing Amazon SNS topic or create a new
one.
14. To create a new Amazon SNS topic, select New list.
In the Send notification to field, enter a name for the new Amazon SNS topic for example:
myHighCpuAlarm, and in the Email list field, enter a comma-separated list of email addresses to
be notified when the alarm changes to the ALARM state.
15. In the navigation pane, click Create Alarm to complete the alarm creation process.
83
Amazon CloudWatch User Guide
Command Line Tools
Command Line Tools
To send an Amazon Simple Notification Service email message when CPU utilization
exceeds 70 percent
1. Set up an Amazon Simple Notification Service topic or retrieve the Topic Resource Name of the
topic you intend to use. For help on setting up an Amazon Simple Notification Service topic, see
Set Up Amazon Simple Notification Service (p. 78).
2. Create an alarm with the put-metric-alarm command. Use the values from the following
example, but replace the values for InstanceID and alarm-actions with your own values.
Prompt>aws cloudwatch put-metric-alarm --alarm-name cpu-mon --alarm-
description "Alarm when CPU exceeds 70%" --metric-name CPUUtilization
--namespace AWS/EC2 --statistic Average --period 300 --threshold
70 --comparison-operator GreaterThanThreshold --dimensions
Name=InstanceId,Value=i-12345678 --evaluation-periods 2 --alarm-
actions arn:aws:sns:us-east-1:111122223333:MyTopic --unit Percent
The AWS CLI returns to the command prompt if the command succeeds.
3. Test the alarm by forcing an alarm state change with the set-alarm-state command.
a. Change the alarm state from INSUFFICIENT_DATA to OK:
Prompt>aws cloudwatch set-alarm-state --alarm-name cpu-mon --state-
reason "initializing" --state-value OK
The AWS CLI returns to the command prompt if the command succeeds.
b. Change the alarm state from OK to ALARM:
Prompt>aws cloudwatch set-alarm-state --alarm-name cpu-mon --state-
reason "initializing" --state-value ALARM
The AWS CLI returns to the command prompt if the command succeeds.
c. Check that an email has been received.
Send Email Based on Load Balancer Alarm
This scenario walks you through how to use the Amazon CloudWatch console or the AWS command
line interface (CLI) to set up an Amazon Simple Notification Service notification and configure an alarm
that monitors load balancer latency exceeding 100 ms.
Topics
•AWS Management Console (p. 84)
•Command Line Tools (p. 86)
AWS Management Console
To create a load balancer alarm that sends email
1. Open the CloudWatch console at https://console.aws.amazon.com/cloudwatch/.
84
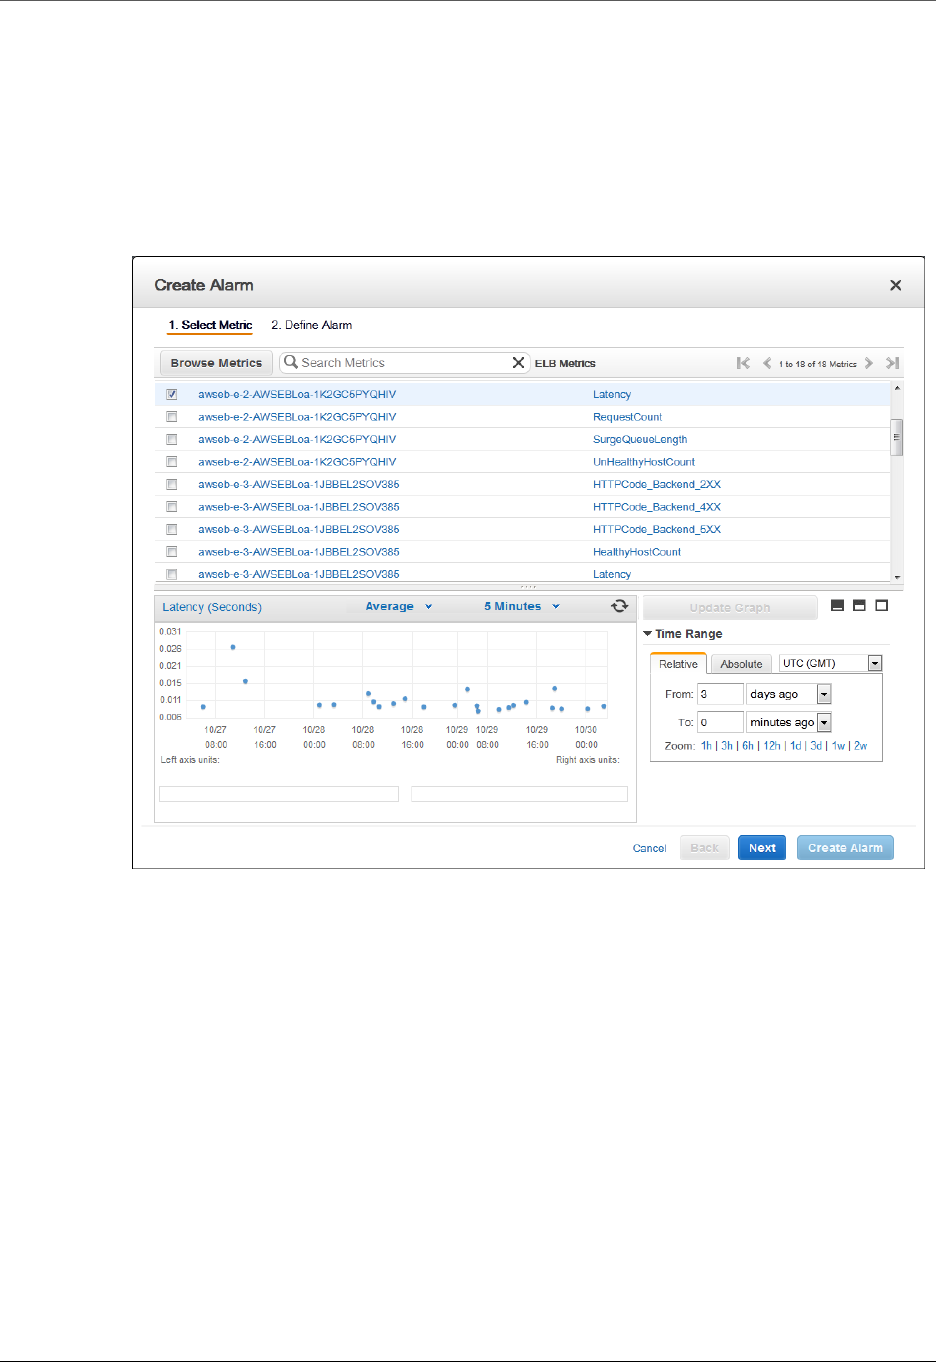
Amazon CloudWatch User Guide
AWS Management Console
2. If necessary, change the region. From the navigation bar, select the region that meets your needs.
For more information, see Regions and Endpoints.
3. In the navigation pane, click Alarms.
4. Click Create Alarm, and then in the CloudWatch Metrics by Category pane, select a metric
category, for example, ELB Metrics.
5. In the list of metrics, select a row that contains Latency for a specific load balancer.
A graph showing average Latency for a single load balancer appears in the lower pane.
6. Select Average from the Statistic drop-down list.
7. Select 1 Minute from the Period drop-down list.
8. Click Next, and then under Alarm Threshold, in the Name field, enter a unique name for the
alarm, for example: myHighCpuAlarm.
9. In the Description field, enter a description of the alarm, for example: Alarm when Latency
exceeds 100s.
10. In the is drop-down list, select >.
11. In the box next to the is drop-down list, enter 0.1 and in the for field, enter 3.
A graphical representation of the threshold is shown under Alarm Preview.
12. Under Actions, in the Whenever this alarm drop-down list, select State is ALARM.
13. In the Send notification to drop-down list, select an existing Amazon SNS topic or create a new
one.
14. To create a new Amazon SNS topic, select New list.
In the Send notification to field, enter a name for the new Amazon SNS topic for example:
myHighCpuAlarm, and in the Email list field, enter a comma-separated list of email addresses to
be notified when the alarm changes to the ALARM state.
85
Amazon CloudWatch User Guide
Command Line Tools
15. In the navigation pane, click Create Alarm to complete the alarm creation process.
Command Line Tools
To send an Amazon Simple Notification Service email message when LoadBalancer
Latency Exceeds 100 Seconds
1. Create an Amazon Simple Notification Service topic. See instructions for creating an Amazon SNS
topic in Set Up Amazon Simple Notification Service (p. 78)
2. Create the alarm.
Prompt>aws cloudwatch put-metric-alarm --alarm-name lb-mon --
alarm-description "Alarm when Latency exceeds 100s" --metric-name
Latency --namespace AWS/ELB --statistic Average --period 60 --
threshold 100 --comparison-operator GreaterThanThreshold --dimensions
Name=LoadBalancerName,Value=my-server --evaluation-periods 3 --alarm-
actions arn:aws:sns:us-east-1:1234567890:my-topic --unit Seconds
The AWS CLI returns to the command prompt if the command succeeds.
3. Test the alarm.
• Force an alarm state change to ALARM:
Prompt>aws cloudwatch set-alarm-state --alarm-name lb-mon --state-reason
"initializing" --state-value OK
Prompt>aws cloudwatch set-alarm-state --alarm-name lb-mon --state-reason
"initializing" --state-value ALARM
The AWS CLI returns to the command prompt if the command succeeds.
• Check that you have received an email notification about the alarm.
Send Email Based on Storage Throughput
Alarm
This scenario walks you through how to use the AWS Management Console or the command line tools
to set up an Amazon Simple Notification Service notification and to configure an alarm that sends email
when EBS exceeds 100 MB throughput.
Topics
•AWS Management Console (p. 86)
•Command Line Tools (p. 88)
AWS Management Console
To create a storage throughput alarm that sends email
1. Open the CloudWatch console at https://console.aws.amazon.com/cloudwatch/.
86
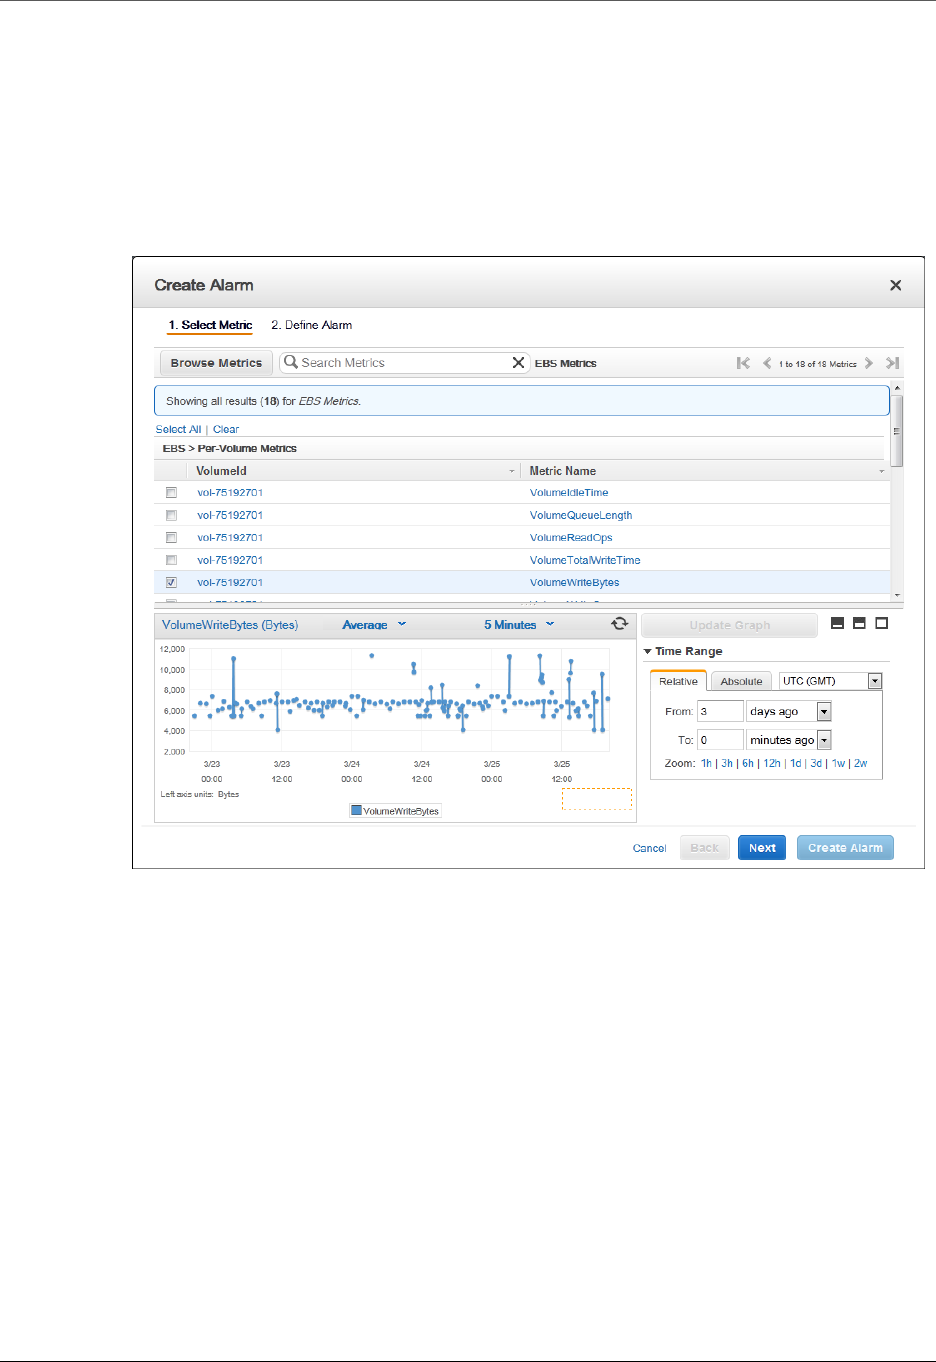
Amazon CloudWatch User Guide
AWS Management Console
2. If necessary, change the region. From the navigation bar, select the region that meets your needs.
For more information, see Regions and Endpoints.
3. In the navigation pane, click Alarms.
4. Click Create Alarm, and then in the CloudWatch Metrics by Category pane, select a metric
category, for example, EBS Metrics.
5. In the list of metrics, select a row that contains VolumeWriteBytes for a specific VolumeId.
A graph showing average VolumeWriteBytes for a single volume appears in the lower pane.
6. Select Average from the Statistic drop-down list.
7. Select 5 Minutes from the Period drop-down list.
8. Click Next, and then under Alarm Threshold, in the Name field, enter a unique name for the
alarm, for example: myHighWriteAlarm.
9. In the Description field, enter a description of the alarm, for example: VolumeWriteBytes
exceeds 100,000 KiB/s.
10. In the is drop-down list, select >.
11. In the box next to the is drop-down list, enter 100000 and in the for field, enter 15.
A graphical representation of the threshold is shown under Alarm Preview.
12. Under Actions, in the Whenever this alarm drop-down list, select State is ALARM.
13. In the Send notification to drop-down list, select an existing Amazon SNS topic or create a new
one.
14. To create a new Amazon SNS topic, select New list.
In the Send notification to field, enter a name for the new Amazon SNS topic for example:
myHighCpuAlarm, and in the Email list field, enter a comma-separated list of email addresses to
be notified when the alarm changes to the ALARM state.
87
Amazon CloudWatch User Guide
Command Line Tools
15. In the navigation pane, click Create Alarm to complete the alarm creation process.
Command Line Tools
To send an Amazon Simple Notification Service email message when EBS exceeds 100
MB throughput
1. Create an Amazon Simple Notification Service topic. See instructions for creating an Amazon SNS
topic in Set Up Amazon Simple Notification Service (p. 78).
2. Create the alarm.
Prompt>aws cloudwatch put-metric-alarm --alarm-name ebs-mon --alarm-
description "Alarm when EBS volume exceeds 100MB throughput" --metric-
name VolumeReadBytes --namespace AWS/EBS --statistic Average --period
300 --threshold 100000000 --comparison-operator GreaterThanThreshold
--dimensions Name=VolumeId,Value=my-volume-id --evaluation-periods
3 --alarm-actions arn:aws:sns:us-east-1:1234567890:my-alarm-topic
--insufficient-data-actions arn:aws:sns:us-east-1:1234567890:my-
insufficient-data-topic
The AWS CLI returns to the command prompt if the command succeeds.
3. Test the alarm.
• Force an alarm state change to ALARM.
Prompt>aws cloudwatch set-alarm-state --alarm-name lb-mon --state-reason
"initializing" --state-value OK
Prompt>aws cloudwatch set-alarm-state --alarm-name lb-mon --state-reason
"initializing" --state-value ALARM
Prompt>aws cloudwatch set-alarm-state --alarm-name lb-mon --state-reason
"initializing" --state-value INSUFFICIENT_DATA
• Check that you have received two email notifications about the alarm.
Create Alarms That Stop, Terminate, Reboot,
or Recover an Instance
Using Amazon CloudWatch alarm actions, you can create alarms that automatically stop, terminate,
reboot, or recover your Amazon Elastic Compute Cloud (Amazon EC2) instances. You can use the
stop or terminate actions to help you save money when you no longer need an instance to be running.
You can use the reboot and recover actions to automatically reboot those instances or recover them
onto new hardware if a system impairment occurs.
Every alarm action you create uses alarm action ARNs. One set of ARNs is more secure because it
requires you to have the EC2ActionsAccess IAM role in your account. This IAM role enables you to
perform stop, terminate, or reboot actions--previously you could not execute an action if you were using
an IAM role. Existing alarms that use the previous alarm action ARNs do not require this IAM role,
however it is recommended that you change the ARN and add the role when you edit an existing alarm
that uses these ARNs.
88

Amazon CloudWatch User Guide
Create Alarms That Stop, Terminate,
Reboot, or Recover an Instance
The EC2ActionsAccess IAM role enables AWS to perform alarm actions on your behalf. When you
create an alarm action for the first time using the Amazon EC2 or Amazon CloudWatch consoles, AWS
automatically creates this role for you.
There are a number of scenarios in which you might want to automatically stop or terminate your
instance. For example, you might have instances dedicated to batch payroll processing jobs or
scientific computing tasks that run for a period of time and then complete their work. Rather than letting
those instances sit idle (and accrue charges), you can stop or terminate them which can help you
to save money. The main difference between using the stop and the terminate alarm actions is that
you can easily restart a stopped instance if you need to run it again later, and you can keep the same
instance ID and root volume. However, you cannot restart a terminated instance. Instead, you must
launch a new instance.
You can add the stop, terminate, reboot, or recover actions to any alarm that is set on an Amazon EC2
per-instance metric, including basic and detailed monitoring metrics provided by Amazon CloudWatch
(in the AWS/EC2 namespace), as well as any custom metrics that include the "InstanceId=" dimension,
as long as the InstanceId value refers to a valid running Amazon EC2 instance.
Permissions
If you are using an AWS Identity and Access Management (IAM) account to create or modify an alarm,
you must have the following permissions:
•ec2:DescribeInstanceStatus and ec2:DescribeInstances — For all alarms on Amazon
EC2 instance status metrics
•ec2:StopInstances — For alarms with stop actions
•ec2:TerminateInstances — For alarms with terminate actions
•ec2:DescribeInstanceRecoveryAttribute and ec2:RecoverInstances — For alarms with
recover actions
If you have read/write permissions for Amazon CloudWatch but not for Amazon EC2, you can still
create an alarm but the stop or terminate actions won't be performed on the instance. However, if you
are later granted permission to use the associated Amazon EC2 APIs, the alarm actions you created
earlier will be performed. For more information, see see Permissions and Policies in the IAM User
Guide.
If you want to use an IAM role to stop, terminate, or reboot an instance using an alarm action, you can
only use the EC2ActionsAccess role. Other IAM roles are not supported. If you are using another IAM
role, you cannot stop, terminate, or reboot the instance. However, you can still see the alarm state and
perform any other actions such as Amazon SNS notifications or Auto Scaling policies.
If you are using temporary security credentials granted using the AWS Security Token Service (AWS
STS), you cannot recover an Amazon EC2 instance using alarm actions.
Contents
•Adding Stop Actions to Amazon CloudWatch Alarms (p. 90)
•Adding Terminate Actions to Amazon CloudWatch Alarms (p. 91)
•Adding Reboot Actions to Amazon CloudWatch Alarms (p. 93)
•Adding Recover Actions to Amazon CloudWatch Alarms (p. 95)
•Using the Amazon CloudWatch Console to View the History of Triggered Alarms and
Actions (p. 97)
•Amazon CloudWatch Alarm Action Scenarios (p. 97)
89

Amazon CloudWatch User Guide
Adding Stop Actions to Amazon CloudWatch Alarms
Adding Stop Actions to Amazon CloudWatch
Alarms
You can configure the stop alarm action using the Amazon EC2 console or the Amazon CloudWatch
console. You can create an alarm that stops an Amazon EC2 instance when a certain threshold has
been met. For example, you may run development or test instances and occasionally forget to shut
them off. You can create an alarm that is triggered when the average CPU utilization percentage has
been lower than 10 percent for 24 hours, signaling that it is idle and no longer in use. You can adjust
the threshold, duration, and period to suit your needs, plus you can add an Amazon Simple Notification
Service (Amazon SNS) notification, so that you will receive an email when the alarm is triggered.
Amazon EC2 instances that use an Amazon Elastic Block Store volume as the root device can be
stopped or terminated, whereas instances that use the instance store as the root device can only be
terminated.
To create an alarm to stop an idle instance using the Amazon EC2 console
1. Open the Amazon EC2 console at https://console.aws.amazon.com/ec2/.
2. If necessary, change the region. From the navigation bar, select the region where your instance is
running. For more information, see Regions and Endpoints.
3. In the navigation pane, under INSTANCES, click Instances.
4. In the contents pane, right-click an instance, select CloudWatch Monitoring, and then click Add/
Edit Alarms.
Or, you can also select the instance, and then in the lower pane on the Monitoring tab, click
Create Alarm.
5. In the Alarm Details for dialog box, click Create Alarm.
6. If you want to receive an email when the alarm is triggered, in the Create Alarm for dialog box,
in the Send a notification to box, select an existing Amazon SNS topic, or click Create Topic to
create a new one.
If you create a new topic, in the Send a notification to box type a name for the topic, and then
in the With these recipients box, type the email addresses of the recipients (separated by
commas). Later, after you create the alarm, you will receive a subscription confirmation email that
you must accept before you will get email for this topic.
7. Select the Take the action check box, and then choose the Stop this instance radio button.
8. If prompted, select the Create IAM role: EC2ActionsAccess check box to automatically create
an IAM role so that AWS can automatically stop the instance on your behalf when the alarm is
triggered.
9. In the Whenever boxes, choose the statistic you want to use and then select the metric. In this
example, choose Average and CPU Utilization.
10. In the Is boxes, define the metric threshold. In this example, enter 10 percent.
11. In the For at least box, choose the sampling period for the alarm. In this example, enter 24
consecutive periods of one hour.
12. To change the name of the alarm, in the Name this alarm box, type a new name.
If you don't type a name for the alarm, Amazon CloudWatch will automatically create one for you.
Note
You can adjust the alarm configuration based on your own requirements before creating
the alarm, or you can edit them later. This includes the metric, threshold, duration, action,
and notification settings. However, after you create an alarm, you cannot edit its name
later.
90

Amazon CloudWatch User Guide
Adding Terminate Actions to
Amazon CloudWatch Alarms
13. Click Create Alarm.
To create an alarm to stop an idle instance using the Amazon CloudWatch console
1. Open the CloudWatch console at https://console.aws.amazon.com/cloudwatch/.
2. If necessary, change the region. From the navigation bar, select the region where your instance is
running. For more information, see Regions and Endpoints.
3. In the navigation pane, click Alarms.
4. Click Create Alarm, and then in CloudWatch Metrics by Category, under EC2 Metrics, select
Per-Instance Metrics.
5. In the list of metrics, select the instance and metric you want to create an alarm for. You can also
type an instance ID in the search box to go the instance that you want.
6. Select Average from the Statistic drop-down list.
7. Select a period from the Period drop-down list, for example: 1 Day.
8. Click Next, and then under Alarm Threshold, in the Name field, enter a unique name for the
alarm, for example: Stop EC2 instance.
9. In the Description field, enter a description of the alarm, for example: Stop EC2 instance
when CPU is idle for too long.
10. In the is drop-down list, select <.
11. In the box next to the is drop-down list, enter 10 and in the for field, enter 1440.
A graphical representation of the threshold is shown under Alarm Preview.
12. Under Actions, click EC2 Action.
13. In the Whenever this alarm drop-down list, select State is ALARM.
14. In the Take this action drop-down list, select Stop this instance.
15. If prompted, select the Create IAM role: EC2ActionsAccess check box to automatically create
an IAM role so that AWS can automatically stop the instance on your behalf when the alarm is
triggered.
16. Click Notification, and then in the Send notification to drop-down list, select an existing Amazon
SNS topic or create a new one.
17. To create a new Amazon SNS topic, select New list.
In the Send notification to field, enter a name for the new Amazon SNS topic for example:
Stop_EC2_Instance, and in the Email list field, enter a comma-separated list of email
addresses to be notified when the alarm changes to the ALARM state.
Important
If you are creating a new topic or adding email addresses to an existing topic, each
email address that you add will be sent a topic subscription confirmation email. You must
confirm the subscription by clicking the included link before notifications will be sent to a
new email address.
18. In the navigation pane, click Create Alarm to complete the alarm creation process.
Adding Terminate Actions to Amazon
CloudWatch Alarms
You can configure the terminate alarm action using the Amazon EC2 console or the Amazon
CloudWatch console. You can create an alarm that terminates an EC2 instance automatically when a
certain threshold has been met (as long as termination protection is not enabled for the instance). For
91

Amazon CloudWatch User Guide
Adding Terminate Actions to
Amazon CloudWatch Alarms
example, you might want to terminate an instance when it has completed its work, and you don't need
the instance again. If you might want to use the instance later, you should stop the instance instead of
terminating it. For information about enabling and disabling termination protection for an instance, see
Enabling Termination Protection for an Instance in the Amazon EC2 User Guide for Linux Instances.
To create an alarm to terminate an idle instance using the Amazon EC2 console
1. Open the Amazon EC2 console at https://console.aws.amazon.com/ec2/.
2. If necessary, change the region. From the navigation bar, select the region where your instance is
running. For more information, see Regions and Endpoints.
3. In the navigation pane, under INSTANCES, click Instances.
4. In the upper pane, right-click an instance, select CloudWatch Monitoring, and then click Add/
Edit Alarms.
Or, select the instance and then in the lower pane, on the Monitoring tab, click Create Alarm.
5. In the Alarm Details for dialog box, click Create Alarm.
6. If you want to receive an email when the alarm is triggered, in the Create Alarm for dialog box,
in the Send a notification to box, select an existing Amazon SNS topic, or click Create Topic to
create a new one.
If you create a new topic, in the Send a notification to box type a name for the topic, and then
in the With these recipients box, type the email addresses of the recipients (separated by
commas). Later, after you create the alarm, you will receive a subscription confirmation email that
you must accept before you will get email for this topic.
7. Select the Take the action check box, and then choose the Terminate this instance radio
button.
8. If prompted, select the Create IAM role: EC2ActionsAccess check box to automatically create
an IAM role so that AWS can automatically stop the instance on your behalf when the alarm is
triggered.
9. In the Whenever boxes, choose the statistic you want to use and then select the metric. In this
example, choose Average and CPU Utilization.
10. In the Is boxes, define the metric threshold. In this example, enter 10 percent.
11. In the For at least box, choose the sampling period for the alarm. In this example, enter 24
consecutive periods of one hour.
12. To change the name of the alarm, in the Name this alarm box, type a new name.
If you don't type a name for the alarm, Amazon CloudWatch will automatically create one for you.
Note
You can adjust the alarm configuration based on your own requirements before creating
the alarm, or you can edit them later. This includes the metric, threshold, duration, action,
and notification settings. However, after you create an alarm, you cannot edit its name
later.
13. Click Create Alarm.
To create an alarm to terminate an idle instance using the Amazon CloudWatch console
1. Open the CloudWatch console at https://console.aws.amazon.com/cloudwatch/.
2. If necessary, change the region. From the navigation bar, select the region where your instance is
running. For more information, see Regions and Endpoints.
3. In the navigation pane, click Alarms.
4. Click Create Alarm, and then in CloudWatch Metrics by Category, under EC2 Metrics, select
Per-Instance Metrics.
92

Amazon CloudWatch User Guide
Adding Reboot Actions to
Amazon CloudWatch Alarms
5. In the list of metrics, select the instance and metric you want to create an alarm for. You can also
type an instance ID in the search box to go the instance that you want.
6. Select Average from the Statistic drop-down list.
7. Select a period from the Period drop-down list, for example: 1 Day.
8. Click Next, and then under Alarm Threshold, in the Name field, enter a unique name for the
alarm, for example: Terminate EC2 instance.
9. In the Description field, enter a description of the alarm, for example: Terminate EC2
instance when CPU is idle for too long.
10. In the is drop-down list, select <.
11. In the box next to the is drop-down list, enter 10 and in the for field, enter 1440.
A graphical representation of the threshold is shown under Alarm Preview.
12. Under Actions, click EC2 Action.
13. In the Whenever this alarm drop-down list, select State is ALARM.
14. In the Take this action drop-down list, select Terminate this instance.
15. If prompted, select the Create IAM role: EC2ActionsAccess check box to automatically create
an IAM role so that AWS can automatically stop the instance on your behalf when the alarm is
triggered.
16. Click Notification, and then in the Send notification to drop-down list, select an existing Amazon
SNS topic or create a new one.
17. To create a new Amazon SNS topic, select New list.
In the Send notification to field, enter a name for the new Amazon SNS topic for example:
Terminate_EC2_Instance, and in the Email list field, enter a comma-separated list of email
addresses to be notified when the alarm changes to the ALARM state.
Important
If you are creating a new topic or adding email addresses to an existing topic, each
email address that you add will be sent a topic subscription confirmation email. You must
confirm the subscription by clicking the included link before notifications will be sent to a
new email address.
18. In the navigation pane, click Create Alarm to complete the alarm creation process.
Adding Reboot Actions to Amazon CloudWatch
Alarms
You can create an Amazon CloudWatch alarm that monitors an Amazon EC2 instance and
automatically reboots the instance. The reboot alarm action is recommended for Instance Health
Check failures (as opposed to the recover alarm action, which is suited for System Health Check
failures). An instance reboot is equivalent to an operating system reboot. In most cases, it takes only
a few minutes to reboot your instance. When you reboot an instance, it remains on the same physical
host, so your instance keeps its public DNS name, private IP address, and any data on its instance
store volumes.
Rebooting an instance doesn't start a new instance billing hour, unlike stopping and restarting your
instance. For more information about rebooting an instance, see Reboot Your Instance in the Amazon
EC2 User Guide for Linux Instances.
Important
To avoid a race condition between the reboot and recover actions, we recommend that you
set the alarm threshold to 3 for 1 minute when creating alarms that reboot an Amazon EC2
instance.
93

Amazon CloudWatch User Guide
Adding Reboot Actions to
Amazon CloudWatch Alarms
To create an alarm to reboot an instance using the Amazon EC2 console
1. Open the Amazon EC2 console at https://console.aws.amazon.com/ec2/.
2. If necessary, change the region. From the navigation bar, select the region where your instance is
running. For more information, see Regions and Endpoints.
3. In the navigation pane, under INSTANCES, click Instances.
4. In the upper pane, right-click an instance, select CloudWatch Monitoring, and then click Add/
Edit Alarms.
Or, select the instance and then in the lower pane, on the Monitoring tab, click Create Alarm.
5. In the Alarm Details for dialog box, click Create Alarm.
6. If you want to receive an email when the alarm is triggered, in the Create Alarm for dialog box,
in the Send a notification to box, select an existing Amazon SNS topic, or click Create Topic to
create a new one.
If you create a new topic, in the Send a notification to box type a name for the topic, and then
in the With these recipients box, type the email addresses of the recipients (separated by
commas). Later, after you create the alarm, you will receive a subscription confirmation email that
you must accept before you will get email for this topic.
7. Select the Take the action check box, and then choose the Reboot this instance radio button.
8. If prompted, select the Create IAM role: EC2ActionsAccess check box to automatically create
an IAM role so that AWS can automatically stop the instance on your behalf when the alarm is
triggered.
9. In the Whenever box, choose Status Check Failed (Instance).
10. In the For at least field, enter 3.
11. In the consecutive period(s) of box, select 1 minute.
12. To change the name of the alarm, in the Name of alarm box, type a new name.
If you don't type a name for the alarm, Amazon CloudWatch will automatically create one for you.
13. Click Create Alarm.
To create an alarm to reboot an instance using the Amazon CloudWatch console
1. Open the CloudWatch console at https://console.aws.amazon.com/cloudwatch/.
2. If necessary, change the region. From the navigation bar, select the region where your instance is
running. For more information, see Regions and Endpoints.
3. In the navigation pane, click Alarms.
4. Click Create Alarm, and then in CloudWatch Metrics by Category, under EC2 Metrics, select
Per-Instance Metrics.
5. In the list of metrics, select the instance and StatusCheckFailed_Instance metric you want to
create an alarm for. You can also type an instance ID in the search box to go the instance that you
want.
6. Select Minimum from the Statistic drop-down list.
Note
This is the only statistic that is currently supported.
7. Select a period from the Period drop-down list, for example: 1 Minute.
8. Click Next, and then under Alarm Threshold, in the Name field, enter a unique name for the
alarm, for example: Reboot EC2 instance.
9. In the Description field, enter a description of the alarm, for example: Reboot EC2 instance
when health checks fail.
94

Amazon CloudWatch User Guide
Adding Recover Actions to
Amazon CloudWatch Alarms
10. In the is drop-down list, select >.
11. In the box next to the is drop-down list, enter 0 and in the for field, enter 3.
A graphical representation of the threshold is shown under Alarm Preview.
12. Under Actions, click EC2 Action.
13. In the Whenever this alarm drop-down list, select State is ALARM.
14. In the Take this action drop-down list, select Reboot this instance.
15. Click Notification, and then in the Send notification to drop-down list, select an existing Amazon
SNS topic or create a new one.
16. To create a new Amazon SNS topic, select New list.
In the Send notification to field, enter a name for the new Amazon SNS topic for example:
Reboot_EC2_Instance, and in the Email list field, enter a comma-separated list of email
addresses to be notified when the alarm changes to the ALARM state.
Important
If you are creating a new topic or adding email addresses to an existing topic, each
email address that you add will be sent a topic subscription confirmation email. You must
confirm the subscription by clicking the included link before notifications will be sent to a
new email address.
17. In the navigation pane, click Create Alarm to complete the alarm creation process.
Adding Recover Actions to Amazon CloudWatch
Alarms
You can create an Amazon CloudWatch alarm that monitors an Amazon EC2 instance and
automatically recovers the instance if it becomes impaired due to an underlying hardware failure or
a problem that requires AWS involvement to repair. Terminated instances cannot be recovered. A
recovered instance is identical to the original instance, including the instance ID, private IP addresses,
Elastic IP addresses, and all instance metadata.
When the StatusCheckFailed_System alarm is triggered, and the recover action is initiated, you
will be notified by the Amazon SNS topic that you selected when you created the alarm and associated
the recover action. During instance recovery, the instance is migrated during an instance reboot, and
any data that is in-memory is lost. When the process is complete, information is published to the SNS
topic you've configured for the alarm. Anyone who is subscribed to this SNS topic will receive an email
notification that includes the status of the recovery attempt and any further instructions. You will notice
an instance reboot on the recovered instance.
Examples of problems that cause system status checks to fail include:
• Loss of network connectivity
• Loss of system power
• Software issues on the physical host
• Hardware issues on the physical host
The recover action is only supported on:
• The C3, C4, M3, M4, R3, T2, and X1 instance types
• Instances in a VPC
• Instances with shared tenancy (the tenancy attribute is set to default)
95

Amazon CloudWatch User Guide
Adding Recover Actions to
Amazon CloudWatch Alarms
• Instances that use Amazon EBS storage exclusively
If your instance has a public IP address, it will retain the same public IP address after recovery.
Important
To avoid a race condition between the reboot and recover actions, we recommend that you
set the alarm threshold to 2 for 1 minute when creating alarms that recover an Amazon EC2
instance.
To create an alarm to recover an instance using the Amazon EC2 console
1. Open the Amazon EC2 console at https://console.aws.amazon.com/ec2/.
2. If necessary, change the region. From the navigation bar, select the region where your instance is
running. For more information, see Regions and Endpoints.
3. In the navigation pane, under INSTANCES, click Instances.
4. In the upper pane, right-click an instance, select CloudWatch Monitoring, and then click Add/
Edit Alarms.
Or, select the instance and then in the lower pane, on the Monitoring tab, click Create Alarm.
5. In the Alarm Details for dialog box, click Create Alarm.
6. If you want to receive an email when the alarm is triggered, in the Create Alarm for dialog box,
in the Send a notification to box, select an existing Amazon SNS topic, or click Create Topic to
create a new one.
If you create a new topic, in the Send a notification to box type a name for the topic, and then
in the With these recipients box, type the email addresses of the recipients (separated by
commas). Later, after you create the alarm, you will receive a subscription confirmation email that
you must accept before you will get email for this topic.
7. Select the Take the action check box, and then choose the Recover this instance radio button.
8. If prompted, select the Create IAM role: EC2ActionsAccess check box to automatically create
an IAM role so that AWS can automatically stop the instance on your behalf when the alarm is
triggered.
9. In the Whenever box, choose Status Check Failed (System).
10. In the For at least field, enter 2.
11. In the consecutive period(s) of box, select 1 minute.
12. To change the name of the alarm, in the Name of alarm box, type a new name.
If you don't type a name for the alarm, Amazon CloudWatch will automatically create one for you.
13. Click Create Alarm.
To create an alarm to recover an instance using the Amazon CloudWatch console
1. Open the CloudWatch console at https://console.aws.amazon.com/cloudwatch/.
2. If necessary, change the region. From the navigation bar, select the region where your instance is
running. For more information, see Regions and Endpoints.
3. In the navigation pane, click Alarms.
4. Click Create Alarm, and then in CloudWatch Metrics by Category, under EC2 Metrics, select
Per-Instance Metrics.
5. In the list of metrics, select the instance and StatusCheckFailed_System metric you want to
create an alarm for. You can also type an instance ID in the search box to go the instance that you
want.
6. Select Minimum from the Statistic drop-down list.
96

Amazon CloudWatch User Guide
Using the Amazon CloudWatch Console to View
the History of Triggered Alarms and Actions
Note
This is the only statistic that is currently supported.
7. Select a period from the Period drop-down list, for example: 1 Minute.
8. Click Next, and then under Alarm Threshold, in the Name field, enter a unique name for the
alarm, for example: Recover EC2 instance.
9. In the Description field, enter a description of the alarm, for example: Recover EC2 instance
when health checks fail.
10. In the is drop-down list, select >.
11. In the box next to the is drop-down list, enter 0 and in the for field, enter 2.
A graphical representation of the threshold is shown under Alarm Preview.
12. Under Actions, click EC2 Action.
13. In the Whenever this alarm drop-down list, select State is ALARM.
14. In the Take this action drop-down list, select Recover this instance.
15. Click Notification, and then in the Send notification to drop-down list, select an existing Amazon
SNS topic or create a new one.
16. To create a new Amazon SNS topic, select New list.
In the Send notification to field, enter a name for the new Amazon SNS topic for example:
Recover_EC2_Instance, and in the Email list field, enter a comma-separated list of email
addresses to be notified when the alarm changes to the ALARM state.
Important
If you are creating a new topic or adding email addresses to an existing topic, each
email address that you add will be sent a topic subscription confirmation email. You must
confirm the subscription by clicking the included link before notifications will be sent to a
new email address.
17. In the navigation pane, click Create Alarm to complete the alarm creation process.
Using the Amazon CloudWatch Console to View
the History of Triggered Alarms and Actions
You can view alarm and action history in the Amazon CloudWatch console. Amazon CloudWatch
keeps the last two weeks’ worth of alarm and action history.
To view the history of triggered alarms and actions
1. Open the CloudWatch console at https://console.aws.amazon.com/cloudwatch/.
2. If necessary, change the region. From the navigation bar, select the region where your instance is
running. For more information, see Regions and Endpoints.
3. In the navigation pane, click Alarms.
4. In the upper pane, select the alarm with the history that you want to view.
5. In the lower pane, the Details tab shows the most recent state transition along with the time and
metric values.
6. Click the History tab to view the most recent history entries.
Amazon CloudWatch Alarm Action Scenarios
You can use the Amazon Elastic Compute Cloud (Amazon EC2) console to create alarm actions that
stop or terminate an Amazon EC2 instance when certain conditions are met. In the following screen
97
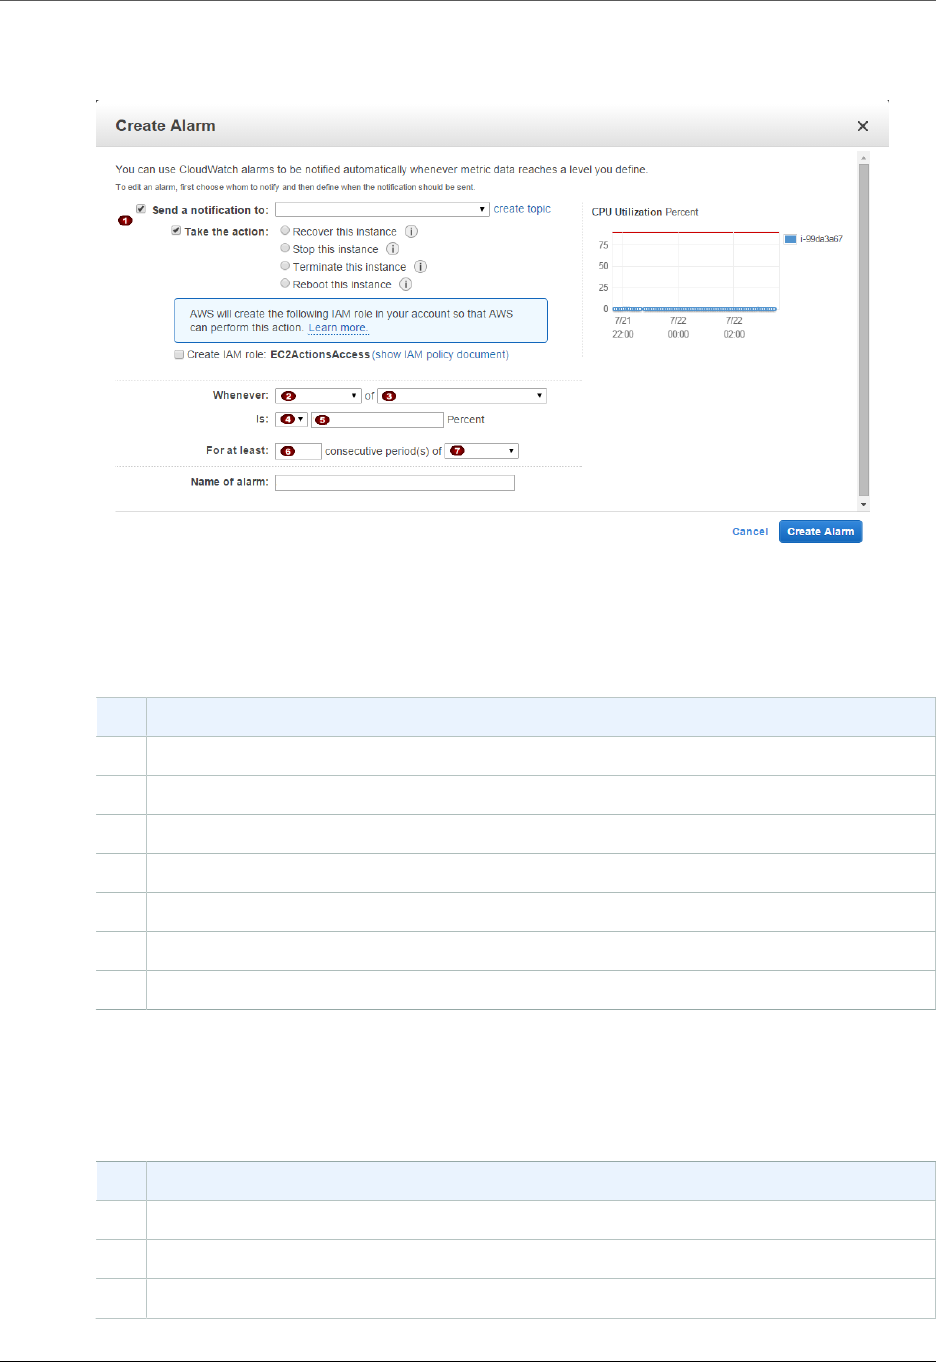
Amazon CloudWatch User Guide
Amazon CloudWatch Alarm Action Scenarios
capture of the console page where you set the alarm actions, we’ve numbered the settings. We’ve also
numbered the settings in the scenarios that follow, to help you create the appropriate actions.
Scenario 1: Stop Idle Development and Test Instances
Create an alarm that stops an instance used for software development or testing when it has been idle
for at least an hour.
SettingValue
Stop
Maximum
CPUUtilization
<=
10%
60 minutes
1
Scenario 2: Stop Idle Instances
Create an alarm that stops an instance and sends an email when the instance has been idle for 24
hours.
SettingValue
Stop and email
Average
CPUUtilization
98
Amazon CloudWatch User Guide
Amazon CloudWatch Alarm Action Scenarios
SettingValue
<=
5%
60 minutes
24
Scenario 3: Send Email About Web Servers with Unusually
High Traffic
Create an alarm that sends email when an instance exceeds 10 GB of outbound network traffic per
day.
SettingValue
Email
Sum
NetworkOut
>
10 GB
1 day
1
Scenario 4: Stop Web Servers with Unusually High Traffic
Create an alarm that stops an instance and send a text message (SMS) if outbound traffic exceeds 1
GB per hour.
SettingValue
Stop and send SMS
Sum
NetworkOut
>
1 GB
1 hour
1
Scenario 5: Stop an Instance Experiencing a Memory Leak
Create an alarm that stops an instance when memory utilization reaches or exceeds 90%, so that
application logs can be retrieved for troubleshooting.
99
Amazon CloudWatch User Guide
Amazon CloudWatch Alarm Action Scenarios
Note
The MemoryUtilization metric is a custom metric. In order to use the MemoryUtilization
metric, you must install the Monitoring Memory and Disk Metrics for Amazon EC2 Linux
Instances (p. 115).
SettingValue
Stop
Maximum
MemoryUtilization
>=
90%
1 minute
1
Scenario 6: Stop an Impaired Instance
Create an alarm that stops an instance that fails three consecutive status checks (performed at 5-
minute intervals).
SettingValue
Stop
Average
StatusCheckFailed_System
>=
1
15 minutes
1
Scenario 7: Terminate Instances When Batch Processing
Jobs Are Complete
Create an alarm that terminates an instance that runs batch jobs when it is no longer sending results
data.
SettingValue
Terminate
Maximum
NetworkOut
<=
100,000 bytes
100
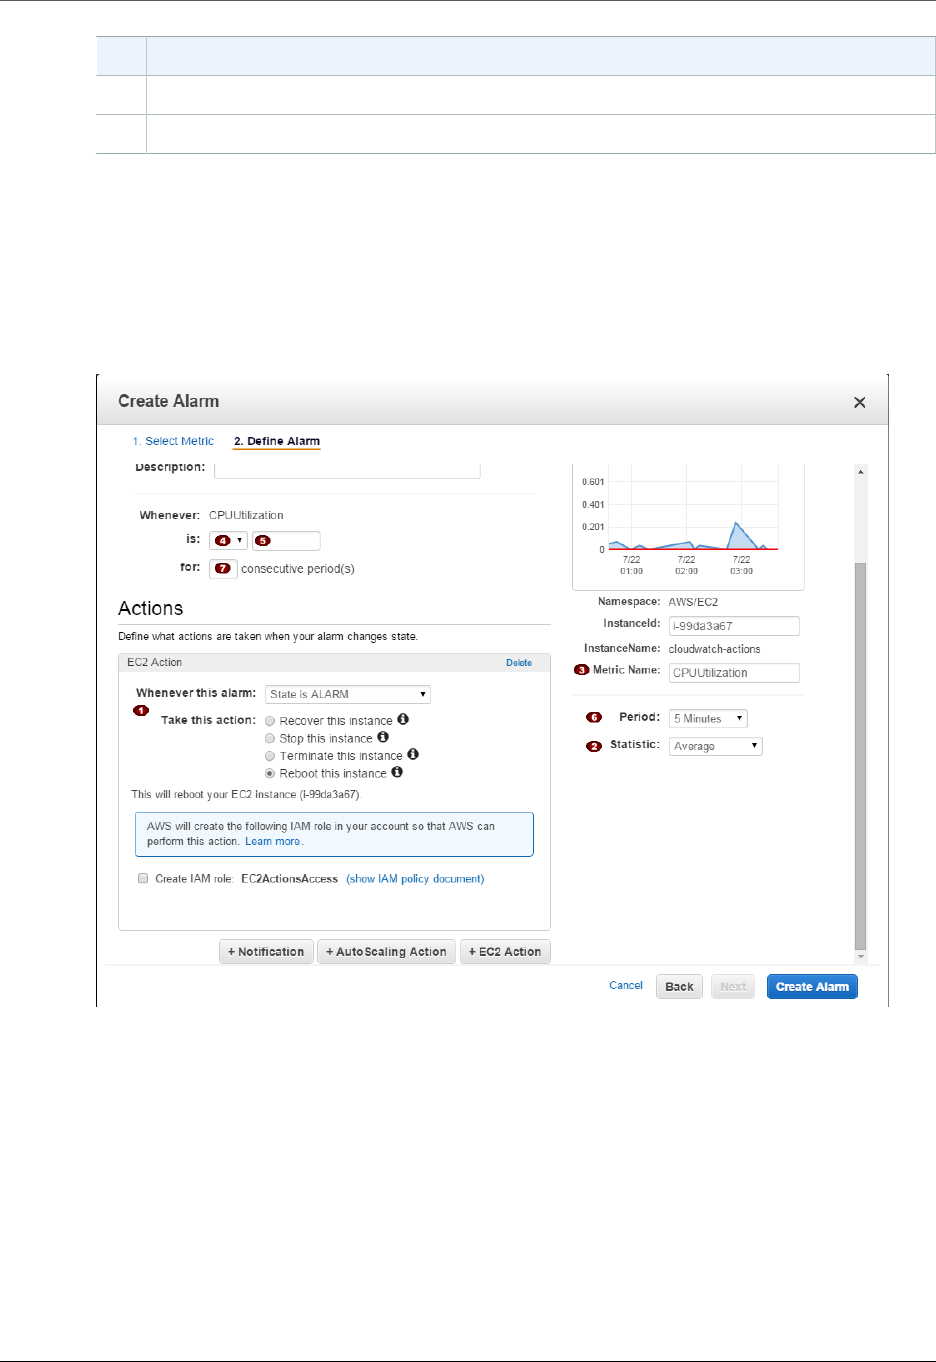
Amazon CloudWatch User Guide
Monitor Your Estimated Charges
SettingValue
5 minutes
1
Scenarios Using the Amazon CloudWatch Console
The previous scenarios can also be performed using the Amazon CloudWatch console. We’ve
numbered the settings on the console to match the numbered settings in the Amazon EC2 console and
the scenarios that we covered earlier, so you can make a comparison and create an alarm with the
appropriate actions.
Monitor Your Estimated Charges Using
Amazon CloudWatch
You can monitor your estimated Amazon Web Services (AWS) charges using Amazon CloudWatch.
When you enable the monitoring of estimated charges for your AWS account, the estimated charges
are calculated and sent several times daily to Amazon CloudWatch as metric data that is stored for
14 days. Billing metric data is stored in the US East (N. Virginia) Region and represent worldwide
charges. This data includes the estimated charges for every service in AWS that you use, as well as
the estimated overall total of your AWS charges. You can choose to receive alerts by email when
101
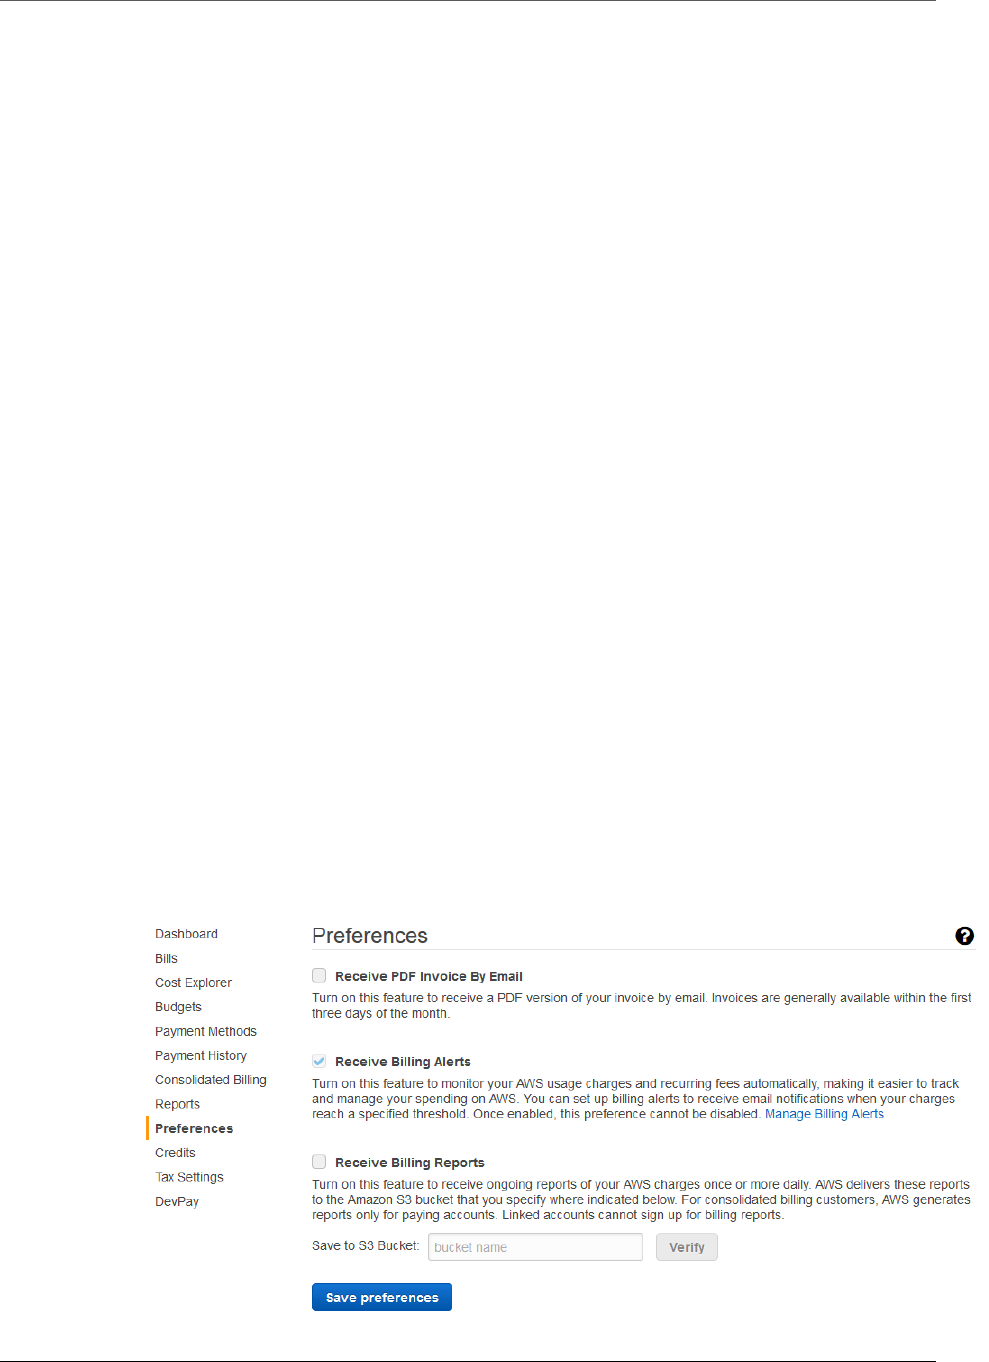
Amazon CloudWatch User Guide
Enabling the Monitoring of Your Estimated Charges
charges have exceeded a certain threshold. These alerts are triggered by Amazon CloudWatch and
are sent using Amazon Simple Notification Service (Amazon SNS) notification.
The metrics are provided free of charge, and you get 10 Amazon CloudWatch alarms and 1,000
Amazon SNS email notifications per customer per month for free. Any additional alarms or email
notifications are priced at standard AWS rates. For more information, see Amazon CloudWatch
Pricing, and Amazon SNS Pricing.
Topics
•Enabling the Monitoring of Your Estimated Charges (p. 102)
•Creating a Billing Alarm (p. 103)
•Editing a Billing Alarm (p. 107)
•Checking Alarm Status (p. 108)
•Deleting a Billing Alarm (p. 108)
Enabling the Monitoring of Your Estimated
Charges
Before you can create an alarm on your estimated charges, you must enable monitoring, which creates
metric data that you can use to create a billing alarm. It takes about 15 minutes before you can view
billing data and create alarms using the Amazon CloudWatch console or command line interface (CLI).
You must be signed in as the account owner (the "root user") to enable billing alerts for your AWS
account. After you enable billing metrics you cannot disable the collection of data, but you can delete
any alarms you have created.
To enable the monitoring of estimated charges
1. Open the Billing and Cost Management console at https://console.aws.amazon.com/billing/home?
#.
2. In the spaces provided, enter your user name and password, and then click Sign in using our
secure server.
3. In the navigation pane, click Preferences, and then select the Receive Billing Alerts check box.
102
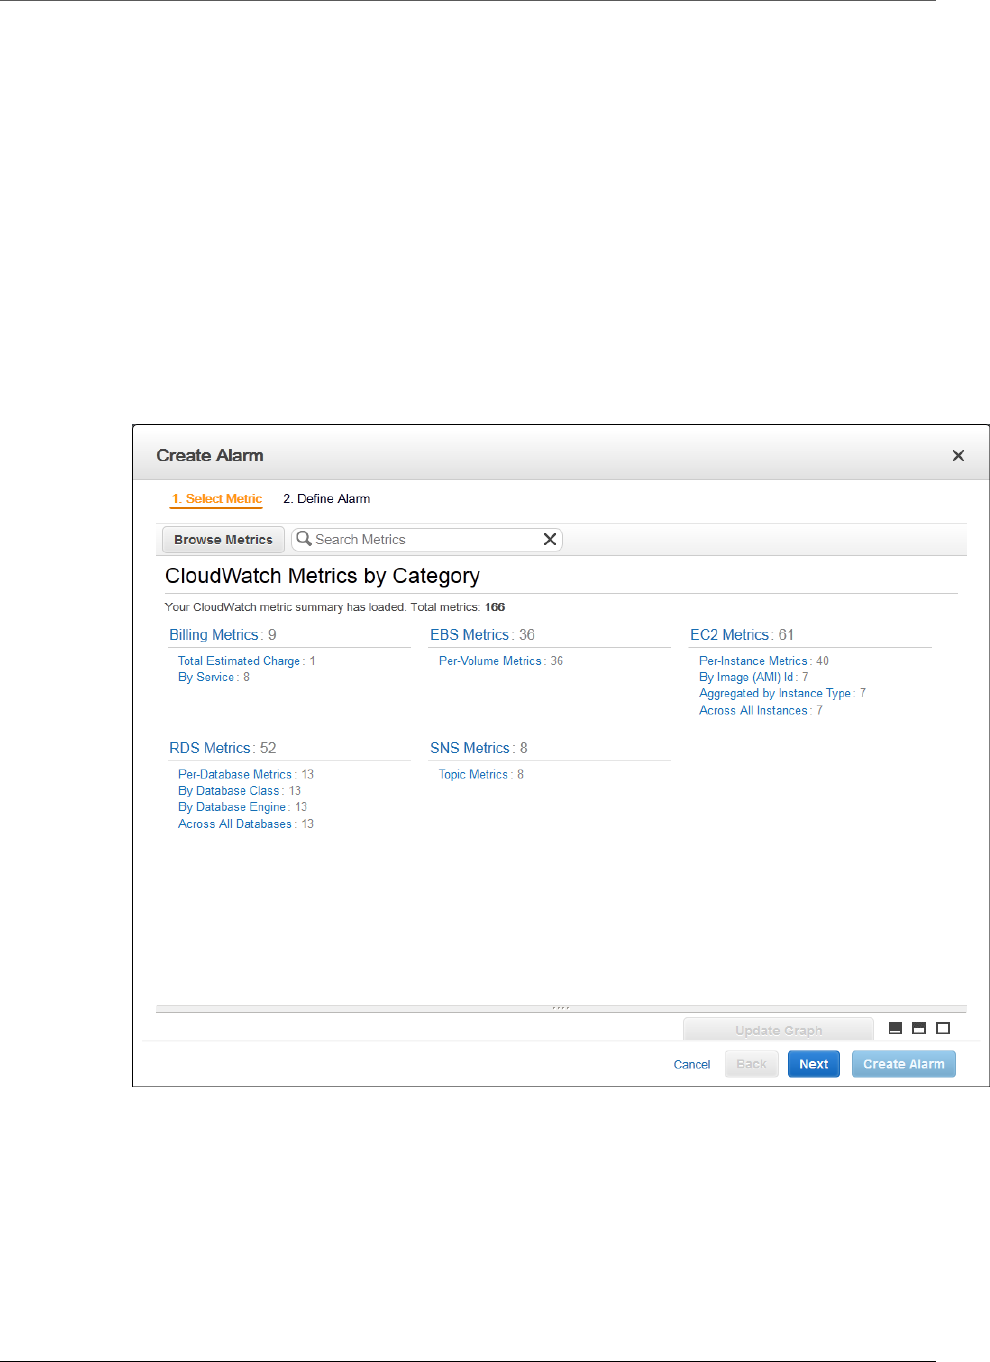
Amazon CloudWatch User Guide
Creating a Billing Alarm
Creating a Billing Alarm
You can use the Amazon CloudWatch console or the AWS command line interface (CLI) to create a
billing alarm. You can apply more than one action to an alarm, or you can set the alarm to be triggered
so that you receive an email when charges for a specified service exceed a certain amount.
To create a billing alarm using the Amazon CloudWatch console
In this example, you can graph your charges for Amazon EC2 over the last 14 days and then set an
alarm that sends email as soon as your charges exceed $200.
1. Open the CloudWatch console at https://console.aws.amazon.com/cloudwatch/.
2. In the navigation pane, click Alarms, and then in the Alarms pane, click Create Alarm.
3. In the CloudWatch Metrics by Category pane, under Billing Metrics, click By Service.
4. Under Billing > By Service, select a service (e.g., Amazon EC2) to view its billing data in a graph
in the lower pane.
103
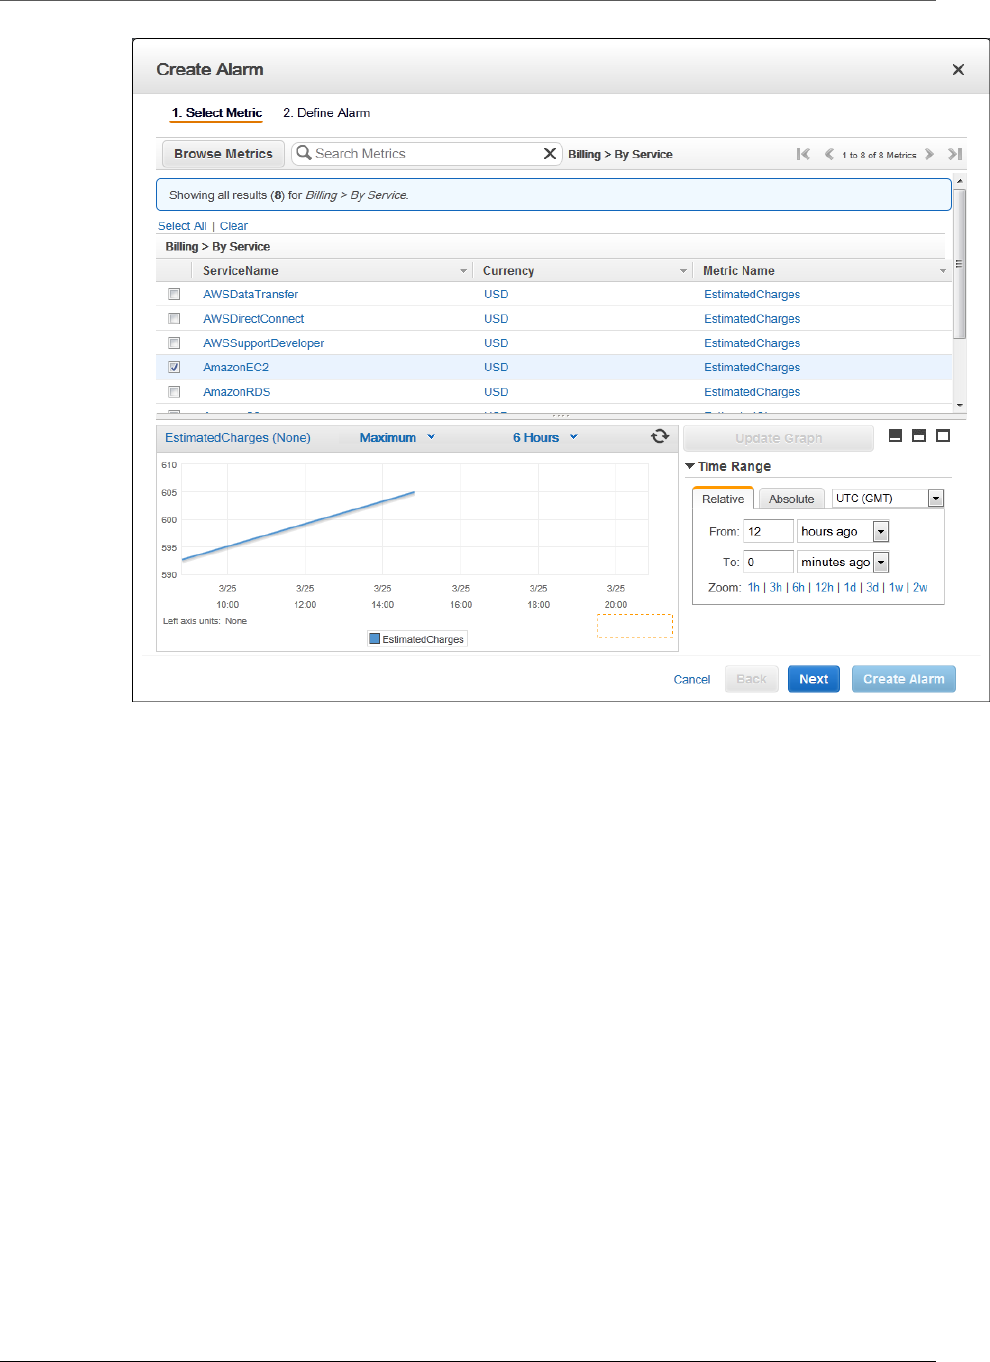
Amazon CloudWatch User Guide
Creating a Billing Alarm
Note
There are several different ways you can view billing data for your account - Total
Estimated Charges, By Service, or By Linked Account. For consolidated billing
accounts, billing data for each linked account can be found by logging in as the paying
account. You can view billing data for total estimated charges and estimated charges by
service for each linked account as well as for the consolidated account.
5. Click Next, and then under Alarm Threshold, in the Name box, enter a unique, friendly name for
the alarm (for example, My Estimated Charges).
104
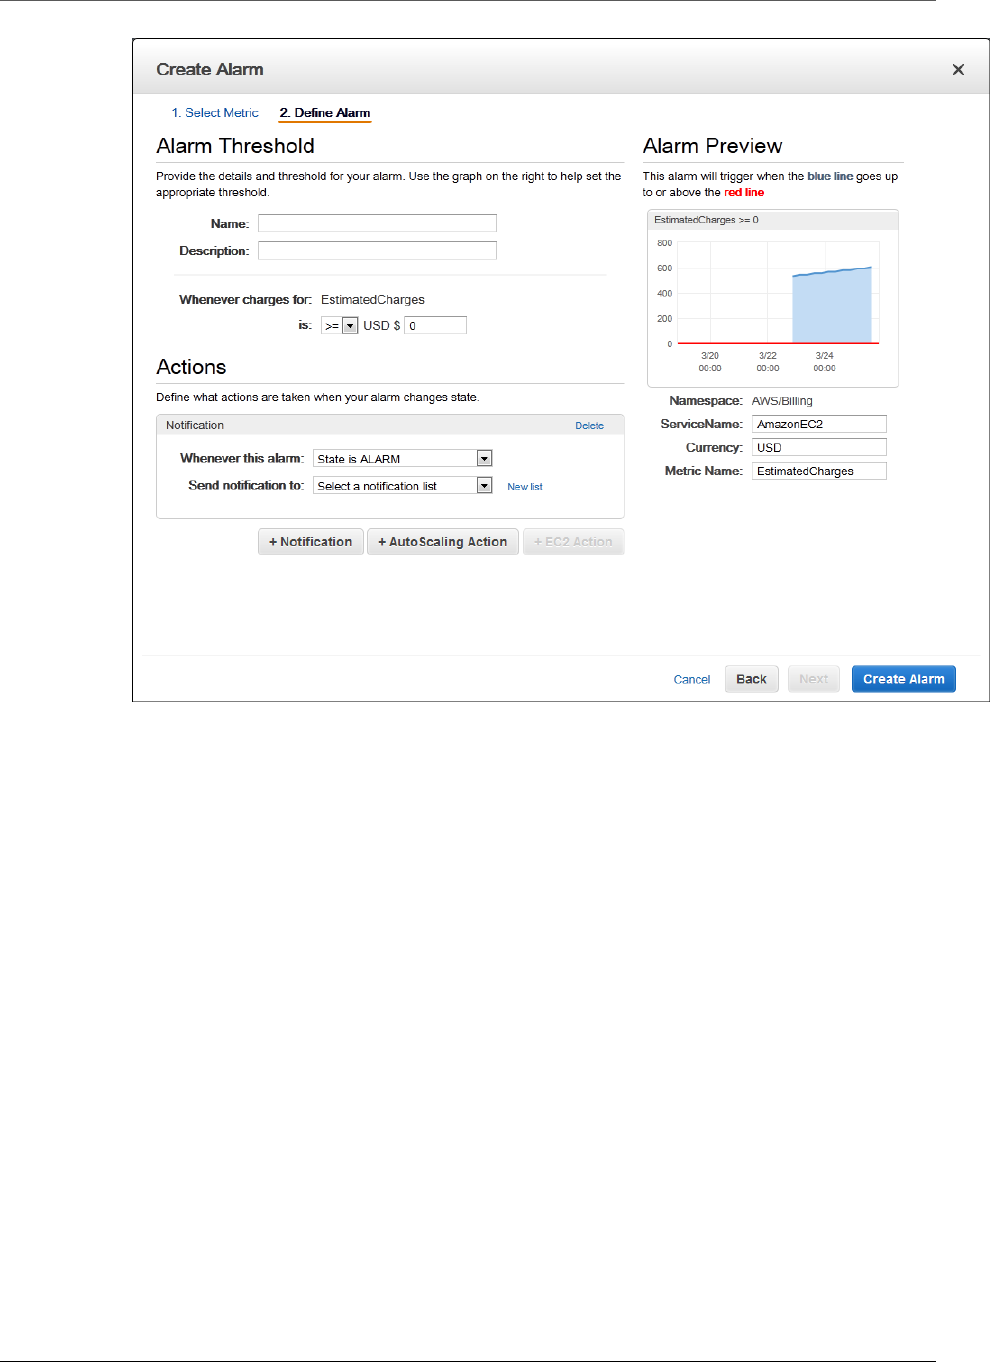
Amazon CloudWatch User Guide
Creating a Billing Alarm
6. In the Description box, enter a description for the alarm (for example, Estimated Monthly
Charges).
7. Under Whenever charges for, in the is drop-down list, select >= (greater than or equal to), and
then in the USD box, set the monetary amount (for example, 200) that must be exceeded to trigger
the alarm and send an email.
Note
Under Alarm Preview, in the Estimated Monthly Charges thumbnail graph, you can
see an estimate of your charges that you can use to set an appropriate threshold for the
alarm.
8. Under Actions, click Notification, and then in the Whenever this alarm drop-down menu, click
State is ALARM.
9. In the Send notification to box, select an existing Amazon SNS topic.
To create a new Amazon SNS topic, click New list, and then in the Send notification to box,
enter a name for the new Amazon SNS topic (for example, CFO), and in the Email list box, enter
the email address (for example, john.stiles@example.com) where email notifications should be
sent.
Note
If you create a new Amazon SNS topic, the email account associated with the topic will
receive a subscription confirmation email. You must confirm the subscription in order to
receive future email notifications when the alarm is triggered.
105
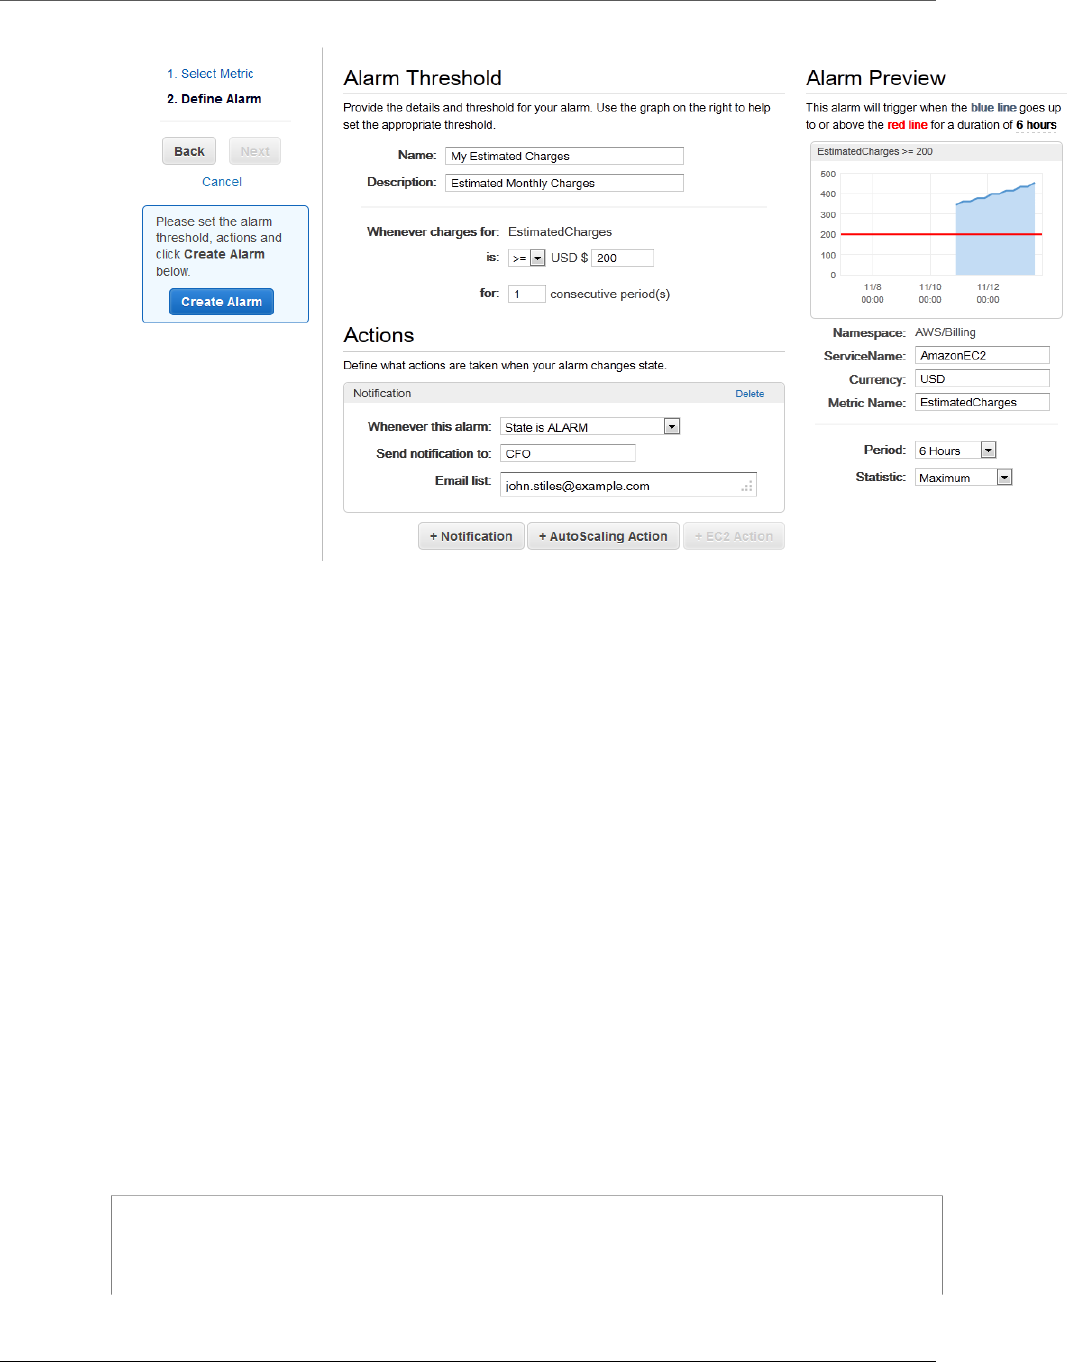
Amazon CloudWatch User Guide
Creating a Billing Alarm
10. Click Create Alarm.
Important
If you added an email address to the list of recipients or created a new topic, Amazon
SNS sends a subscription confirmation email to each new address shortly after you
create an alarm. Remember to click the link contained in that message, which confirms
your subscription. Alert notifications are only sent to confirmed addresses.
11. To view your billing alarm in the CloudWatch console, in the navigation pane, under Alarms, click
Billing.
To create a billing alarm using the CLI
In addition to using the Amazon CloudWatch console, you can also use the AWS command line
interface (CLI) to create a billing alarm for any service in AWS that you're using. You can apply more
than one action to an alarm, or you can set the alarm to be triggered so you receive an email when
charges for a specified service fall below a certain amount.
The example in the following procedure creates an alarm that will send an email message when your
estimated month-to-date charges for Amazon EC2 exceed $50.
1. At a command prompt, type aws cloudwatch list-metrics to view the list of all available
Amazon CloudWatch metrics for the services in AWS that you're using.
2. In the list of metrics, review the billing metrics that have the AWS/Billing namespace. These are the
billing metrics that you can use to create a billing alarm.
3. At the command prompt, enter the following command:
aws cloudwatch put-metric-alarm --alarm-name ec2billing --comparison-
operator GreaterThanOrEqualToThreshold --evaluation-periods 1 --
metric-name EstimatedCharges --namespace AWS/Billing --dimensions
Name=Currency,Value=USD --period 21600 --statistic Maximum --
106

Amazon CloudWatch User Guide
Editing a Billing Alarm
threshold 50 --actions-enabled --alarm-actions arn:aws:sns:us-
east-1:111122223333:NotifyMe
Where:
The --alarm-name is the name that you want to give the alarm.
The --comparison-operator is one of the following values: GreaterThanOrEqualToThreshold,
GreaterThanThreshold, LessThanThreshold, or LessThanOrEqualToThreshold.
The --evaluation-periods are the number of periods over which data is compared to the specified
threshold (e.g., One period equals 6 hours).
The --metric-name is one of the available billing metrics (e.g., EstimatedCharges).
The --namespace is the metric’s namespace (e.g., AWS/Billing).
The --dimensions are associated with the metric (e.g., Currency=USD).
The --period is the time frame (in seconds) in which Amazon CloudWatch metrics are collected. In
this example, you would enter 21600, which is 60 seconds multiplied by 60 minutes multiplied by 6
hours.
The --statistic is one of the following values: SampleCount, Average, Sum, Minimum, or Maximum.
The --threshold is the dollar amount you want to use e.g., 50.
The --actions-enabled indicates that the alarm should perform an action. Use --no-actions-
enabled to disregard the --alarm-actions.
The --alarm-actions is the list of actions to perform when this alarm is triggered. Each action is
specified as an Amazon Resource Name (ARN). In this example, we want the alarm to send us an
email using Amazon SNS.
Note
You can find the ARN for the Amazon SNS topic that the alarm will use in the Amazon SNS
console:
a. Open the Amazon SNS console at https://console.aws.amazon.com/sns/.
b. If necessary, change the region. From the navigation bar, select the region that meets
your needs. For more information, see Regions and Endpoints.
c. On the navigation pane, under My Topics, select the topic you want the alarm to send
mail to.
d. The ARN is located in the Topic ARN field on the Topic Details pane.
Editing a Billing Alarm
You can edit an existing billing alarm and make changes to it using the Amazon CloudWatch console
or the AWS command line interface (CLI).
To edit a billing alarm using the Amazon CloudWatch
console
1. Sign in to the AWS Management Console and open the CloudWatch console at https://
console.aws.amazon.com/cloudwatch/.
107

Amazon CloudWatch User Guide
Checking Alarm Status
2. If necessary, change the region to US East (N. Virginia). Billing metric data is stored in the US
East (N. Virginia) Region and represent worldwide charges. For more information, see Regions
and Endpoints.
3. In the navigation pane, under Alarms, click Billing.
4. In the list of alarms, select the check box next to the alarm you want to change, and then click
Modify.
5. Under Alarm Threshold, in the USD box, set the monetary amount (for example, 400) that must
be exceeded to trigger the alarm and send an email, and then in the navigation pane, click Save
Changes.
To edit a billing alarm using the CLI
1. At a command prompt, type aws cloudwatch describe-alarms, and then press Enter.
2. In the list, locate the alarm you want to edit.
3. At the command prompt, type aws cloudwatch put-metric-alarm --alarm-name <alarm
name>, where <alarm_name> is the name of the alarm you want to edit. Specify all of the
parameters in the alarm you want to edit, and change any of the values as appropriate.
Checking Alarm Status
You can check the status of your billing alarms using the Amazon CloudWatch console or the AWS
command line interface (CLI).
To check alarm status using the Amazon CloudWatch
console
1. Sign in to the AWS Management Console and open the CloudWatch console at https://
console.aws.amazon.com/cloudwatch/.
2. If necessary, change the region to US East (N. Virginia). Billing metric data is stored in the US East
(N. Virginia) Region and represent worldwide charges.
From the navigation bar, select the region that meets your needs. For more information, see
Regions and Endpoints.
3. In the navigation pane, under Alarms, click Billing.
To check alarm status using the CLI
• At a command prompt, type aws cloudwatch describe-alarms, press Enter, and then in the
list, locate the AWS/Billing alarm you want to check.
Deleting a Billing Alarm
You can delete a billing alarm when you no longer need it using the Amazon CloudWatch console or
the AWS command line interface (CLI).
To delete a billing alarm using the Amazon CloudWatch
console
1. Sign in to the AWS Management Console and open the CloudWatch console at https://
console.aws.amazon.com/cloudwatch/.
108

Amazon CloudWatch User Guide
Deleting a Billing Alarm
2. If necessary, change the region to US East (N. Virginia). Billing metric data is stored in the US East
(N. Virginia) Region and represent worldwide charges.
From the navigation bar, select the region that meets your needs. For more information, see
Regions and Endpoints.
3. In the navigation pane, under Alarms, click Billing.
4. In the list of alarms, select the check box next to the alarm you want to delete, and then click Delete.
5. In the Delete Alarms dialog box, click Yes, Delete.
To delete a billing alarm using the CLI
1. At a command prompt, type aws cloudwatch describe-alarms, and then press Enter.
2. In the list, locate the alarm you want to delete.
3. At the command prompt, type aws cloudwatch delete-alarms -–alarm-names
<alarm_name>, where <alarm_name> is the name of the alarm you want to delete.
4. At the Are you sure you want to delete these Alarms? prompt, type Y.
109

Amazon CloudWatch User Guide
CloudWatch Information in CloudTrail
Logging Amazon CloudWatch API
Calls in AWS CloudTrail
AWS CloudTrail is a service that captures API calls made by or on behalf of your AWS account. This
information is collected and written to log files that are stored in an Amazon S3 bucket that you specify.
API calls are logged whenever you use the API, the console, or the AWS CLI. Using the information
collected by CloudTrail, you can determine what request was made, the source IP address the request
was made from, who made the request, when it was made, and so on.
To learn more about CloudTrail, including how to configure and enable it, see the What is AWS
CloudTrail in the AWS CloudTrail User Guide.
Topics
•CloudWatch Information in CloudTrail (p. 110)
•Understanding Log File Entries (p. 112)
CloudWatch Information in CloudTrail
If CloudTrail logging is turned on, calls made to API actions are captured in log files. Every log file entry
contains information about who generated the request. For example, if a request is made to create
or update a CloudWatch alarm (PutMetricAlarm), CloudTrail logs the user identity of the person or
service that made the request.
The user identity information in the log entry helps you determine the following:
• Whether the request was made with root or IAM user credentials
• Whether the request was made with temporary security credentials for a role or federated user
• Whether the request was made by another AWS service
For more information, see the CloudTrail userIdentity Element in the AWS CloudTrail User Guide.
You can store your log files in your bucket for as long as you want, but you can also define Amazon
S3 lifecycle rules to archive or delete log files automatically. By default, your log files are encrypted by
using Amazon S3 server-side encryption (SSE).
110

Amazon CloudWatch User Guide
CloudWatch Information in CloudTrail
If you want to be notified upon log file delivery, you can configure CloudTrail to publish Amazon SNS
notifications when new log files are delivered. For more information, see Configuring Amazon SNS
Notifications for CloudTrail in the AWS CloudTrail User Guide.
You can also aggregate Amazon CloudWatch Logs log files from multiple AWS regions and multiple
AWS accounts into a single Amazon S3 bucket. For more information, see Receiving CloudTrail Log
Files from Multiple Regions and Receiving CloudTrail Log Files from Multiple Accounts in the AWS
CloudTrail User Guide.
When logging is turned on, the following API actions are written to CloudTrail:
CloudWatch
• DeleteAlarms
• DescribeAlarmHistory
• DescribeAlarms
• DescribeAlarmsForMetric
• DisableAlarmActions
• EnableAlarmActions
• PutMetricAlarm
• SetAlarmState
The CloudWatch GetMetricStatistics, ListMetrics, and PutMetricData API actions are
not supported. For more information about all of these actions, see the Amazon CloudWatch API
Reference.
CloudWatch Events
• DeleteRule
• DescribeRule
• DisableRule
• EnableRule
• ListRuleNamesByTarget
• ListRules
• ListTargetsByRule
• PutRule
• PutTargets
• RemoveTargets
• TestEventPattern
For more information about these actions, see the Amazon CloudWatch Events API Reference.
CloudWatch Logs
Request and response elements are logged for these API actions:
• CancelExportTask
• CreateExportTask
• CreateLogGroup
• CreateLogStream
• DeleteDestination
• DeleteLogGroup
111

Amazon CloudWatch User Guide
Understanding Log File Entries
• DeleteLogStream
• DeleteMetricFilter
• DeleteRetentionPolicy
• DeleteSubscriptionFilter
• PutDestination
• PutDestinationPolicy
• PutMetricFilter
• PutRetentionPolicy
• PutSubscriptionFilter
• TestMetricFilter
Only Request elements are logged for these API actions:
• DescribeDestinations
• DescribeExportTasks
• DescribeLogGroups
• DescribeLogStreams
• DescribeMetricFilters
• DescribeSubscriptionFilters
The CloudWatch Logs GetLogEvents, PutLogEvents, and FilterLogEvents API actions are
not supported. For more information about these actions, see the Amazon CloudWatch Logs API
Reference.
Understanding Log File Entries
CloudTrail log files contain one or more log entries. Each entry lists multiple JSON-formatted events.
A log entry represents a single request from any source and includes information about the requested
action, the date and time of the action, request parameters, and so on. The log entries are not an
ordered stack trace of the public API calls, so they do not appear in any specific order. Log file entries
for all API actions are similar to the examples below.
The following log file entry shows that a user called the CloudWatch PutMetricAlarm action.
{
"Records": [{
"eventVersion": "1.01",
"userIdentity": {
"type": "Root",
"principalId": "EX_PRINCIPAL_ID",
"arn": "arn:aws:iam::123456789012:root",
"accountId": "123456789012",
"accessKeyId": "EXAMPLE_KEY_ID"
},
"eventTime": "2014-03-23T21:50:34Z",
"eventSource": "monitoring.amazonaws.com",
"eventName": "PutMetricAlarm",
"awsRegion": "us-east-1",
"sourceIPAddress": "127.0.0.1",
"userAgent": "aws-sdk-ruby2/2.0.0.rc4 ruby/1.9.3 x86_64-linux
Seahorse/0.1.0",
112

Amazon CloudWatch User Guide
Understanding Log File Entries
"requestParameters": {
"threshold": 50.0,
"period": 60,
"metricName": "CloudTrail Test",
"evaluationPeriods": 3,
"comparisonOperator": "GreaterThanThreshold",
"namespace": "AWS/CloudWatch",
"alarmName": "CloudTrail Test Alarm",
"statistic": "Sum"
},
"responseElements": null,
"requestID": "29184022-b2d5-11e3-a63d-9b463e6d0ff0",
"eventID": "b096d5b7-dcf2-4399-998b-5a53eca76a27"
},
..additional entries
]
}
The following log file entry shows that a user called the CloudWatch Events PutRule action.
{
"eventVersion":"1.03",
"userIdentity":{
"type":"Root",
"principalId":"123456789012",
"arn":"arn:aws:iam::123456789012:root",
"accountId":"123456789012",
"accessKeyId":"AKIAIOSFODNN7EXAMPLE",
"sessionContext":{
"attributes":{
"mfaAuthenticated":"false",
"creationDate":"2015-11-17T23:56:15Z"
}
}
},
"eventTime":"2015-11-18T00:11:28Z",
"eventSource":"events.amazonaws.com",
"eventName":"PutRule",
"awsRegion":"us-east-1",
"sourceIPAddress":"AWS Internal",
"userAgent":"AWS CloudWatch Console",
"requestParameters":{
"description":"",
"name":"cttest2",
"state":"ENABLED",
"eventPattern":"{\"source\":[\"aws.ec2\"],\"detail-type\":[\"EC2
Instance State-change Notification\"]}",
"scheduleExpression":""
},
"responseElements":{
"ruleArn":"arn:aws:events:us-east-1:123456789012:rule/cttest2"
},
"requestID":"e9caf887-8d88-11e5-a331-3332aa445952",
"eventID":"49d14f36-6450-44a5-a501-b0fdcdfaeb98",
"eventType":"AwsApiCall",
"apiVersion":"2015-10-07",
"recipientAccountId":"123456789012"
}
113

Amazon CloudWatch User Guide
Understanding Log File Entries
The following log file entry shows that a user called the CloudWatch Logs CreateExportTask action.
{
"eventVersion": "1.03",
"userIdentity": {
"type": "IAMUser",
"principalId": "EX_PRINCIPAL_ID",
"arn": "arn:aws:iam::123456789012:user/someuser",
"accountId": "123456789012",
"accessKeyId": "AKIAIOSFODNN7EXAMPLE",
"userName": "someuser"
},
"eventTime": "2016-02-08T06:35:14Z",
"eventSource": "logs.amazonaws.com",
"eventName": "CreateExportTask",
"awsRegion": "us-east-1",
"sourceIPAddress": "127.0.0.1",
"userAgent": "aws-sdk-ruby2/2.0.0.rc4 ruby/1.9.3 x86_64-linux
Seahorse/0.1.0",
"requestParameters": {
"destination": "yourdestination",
"logGroupName": "yourloggroup",
"to": 123456789012,
"from": 0,
"taskName": "yourtask"
},
"responseElements": {
"taskId": "15e5e534-9548-44ab-a221-64d9d2b27b9b"
},
"requestID": "1cd74c1c-ce2e-12e6-99a9-8dbb26bd06c9",
"eventID": "fd072859-bd7c-4865-9e76-8e364e89307c",
"eventType": "AwsApiCall",
"apiVersion": "20140328",
"recipientAccountId": "123456789012"
}
114

Amazon CloudWatch User Guide
Monitoring Memory and Disk
Metrics for Amazon EC2 Linux
Instances
The Amazon CloudWatch Monitoring Scripts for Amazon Elastic Compute Cloud (Amazon EC2) Linux-
based instances demonstrate how to produce and consume Amazon CloudWatch custom metrics.
These sample Perl scripts comprise a fully functional example that reports memory, swap, and disk
space utilization metrics for a Linux instance. You can download the Amazon CloudWatch Monitoring
Scripts for Linux from the AWS sample code library.
Important
These scripts are examples only. They are provided "as is" and are not supported.
These monitoring scripts are intended for use with Amazon EC2 instances running Linux operating
systems. The scripts have been tested on the following Amazon Machine Images (AMIs) for both 32-bit
and 64-bit versions:
• Amazon Linux 2014.09.2
• Red Hat Enterprise Linux 6.6
• SUSE Linux Enterprise Server 12
• Ubuntu Server 14.04
Note
Standard Amazon CloudWatch free tier quantities and usage charges for custom metrics
apply to your use of these scripts. For more information, see the Amazon CloudWatch pricing
page.
You can use EC2Config on Amazon EC2 instances running Microsoft Windows to monitor memory
and disk metrics by sending this data to CloudWatch Logs. To get started with CloudWatch Logs on an
Amazon EC2 instance running Microsoft Windows, see Sending Performance Counters to CloudWatch
and Logs to CloudWatch Logs in the Amazon EC2 User Guide for Windows Instances.
Contents
•Prerequisites (p. 116)
•Getting Started (p. 117)
•Using the Scripts (p. 118)
•Viewing Your Custom Metrics in the AWS Management Console (p. 122)
115
Amazon CloudWatch User Guide
Prerequisites
Prerequisites
You must perform additional steps on some versions of Linux.
Note
The CloudWatchClient.pm module included in the script package locally caches instance
metadata. If you create an AMI from an instance where you have run the scripts, any
instances launched from this AMI within the cache TTL (default: six hours, 24 hours for Auto
Scaling groups) will emit metrics using the original instance's ID. After the cache TTL time
period passes, the script will retrieve fresh data and the scripts will use the current instance's
ID. To immediately correct this, remove the cached data using: $ rm /var/tmp/aws-mon/
instance-id.
Amazon Linux AMI
If you are running Amazon Linux AMI, version 2014.03 or later, you'll need to add some additional Perl
modules in order for the monitoring scripts to work. Use the following procedures to configure your
server.
To install the scripts for the first time
1. Log on to your Amazon Linux AMI instance.
2. At a command prompt, install the following package:
$ sudo yum install perl-Switch perl-DateTime perl-Sys-Syslog perl-LWP-
Protocol-https
Red Hat Enterprise Linux
If you are running Red Hat Enterprise Linux, you'll need to add some additional Perl modules in order
for the monitoring scripts to work. Use the following procedures to configure your server.
To install the scripts for the first time
1. Log on to your Red Hat Enterprise Linux instance.
2. At a command prompt, install the following packages:
$ sudo yum install perl-Switch perl-DateTime perl-Sys-Syslog perl-LWP-
Protocol-https perl-Digest-SHA -y
$ sudo yum install zip unzip
SUSE Linux Enterprise Server
If you are running SUSE Linux Enterprise Server, you'll need to add some additional Perl modules in
order for the monitoring scripts to work. Use the following procedures to configure your server.
To install the scripts for the first time
1. Log on to your SUSE Linux Enterprise Server instance.
2. At a command prompt, install the following packages:
$ sudo zypper install perl-Switch perl-DateTime
116
Amazon CloudWatch User Guide
Getting Started
$ sudo zypper install –y "perl(LWP::Protocol::https)"
Ubuntu Server
If you are running Ubuntu Server, use the following procedures to configure your server.
To install the scripts for the first time
1. Log on to your Ubuntu Server instance.
2. At a command prompt, install the following packages:
$ sudo apt-get update
$ sudo apt-get install unzip
$ sudo apt-get install libwww-perl libdatetime-perl
For information about connecting to Amazon EC2 Linux instances, see Connect to Your Linux Instance
in Amazon EC2 User Guide for Linux Instances
Getting Started
The following steps show you how to download, uncompress, and configure the Amazon CloudWatch
Monitoring Scripts on an EC2 Linux instance.
To download, install, and configure the script
1. Open a command prompt, move to a folder where you want to store the scripts, and then type the
following:
curl http://aws-cloudwatch.s3.amazonaws.com/downloads/
CloudWatchMonitoringScripts-1.2.1.zip -O
unzip CloudWatchMonitoringScripts-1.2.1.zip
rm CloudWatchMonitoringScripts-1.2.1.zip
cd aws-scripts-mon
The CloudWatchMonitoringScripts-1.2.1.zip package contains these files:
•CloudWatchClient.pm—Shared Perl module that simplifies calling Amazon CloudWatch from
other scripts.
•mon-put-instance-data.pl—Collects system metrics on an Amazon EC2 instance (memory,
swap, disk space utilization) and sends them to Amazon CloudWatch.
•mon-get-instance-stats.pl—Queries Amazon CloudWatch and displays the most recent
utilization statistics for the EC2 instance on which this script is executed.
•awscreds.template—File template for AWS credentials that stores your access key ID and
secret access key.
•LICENSE.txt—Text file containing the Apache 2.0 license.
•NOTICE.txt—copyright notice.
117

Amazon CloudWatch User Guide
Using the Scripts
2. If you already have an AWS Identity and Access Management (IAM) role associated with your
instance, make sure that it has permissions to perform the following operations:
• cloudwatch:PutMetricData
• cloudwatch:GetMetricStatistics
• cloudwatch:ListMetrics
• ec2:DescribeTags
Otherwise, you can create a new IAM role with permissions to perform CloudWatch operations
and associate that role when you launch a new instance. For more information, see Controlling
User Access to Your AWS Account.
3. Optional: If you aren't using an IAM role, update the awscreds.template file that you
downloaded earlier. The content of this file should use the following format:
AWSAccessKeyId=YourAccessKeyID
AWSSecretKey=YourSecretAccessKey
Note
This step is optional if you have already created a file for credentials. You can use an
existing file by specifying its location on the command line when you call the scripts.
Alternatively, you can set the environment variable AWS_CREDENTIAL_FILE to point to
the file with your AWS credentials.
For instructions on how to access your credentials, see Creating, Modifying, and Viewing
User Security Credentials in IAM User Guide.
Using the Scripts
mon-put-instance-data.pl
This script collects memory, swap, and disk space utilization data on the current system. It then makes
a remote call to Amazon CloudWatch to report the collected data as custom metrics.
Options
Name Description
--mem-util Collects and sends the MemoryUtilization metrics in percentages.
This option reports only memory allocated by applications and the
operating system, and excludes memory in cache and buffers.
--mem-used Collects and sends the MemoryUsed metrics, reported in
megabytes. This option reports only memory allocated by
applications and the operating system, and excludes memory in
cache and buffers.
--mem-avail Collects and sends the MemoryAvailable metrics, reported in
megabytes. This option reports memory available for use by
applications and the operating system.
--swap-util Collects and sends SwapUtilization metrics, reported in
percentages.
--swap-used Collects and sends SwapUsed metrics, reported in megabytes.
--disk-path=PATH Selects the disk on which to report.
118

Amazon CloudWatch User Guide
mon-put-instance-data.pl
Name Description
PATH can specify a mount point or any file located on a mount
point for the filesystem that needs to be reported. For selecting
multiple disks, specify a --disk-path=PATH for each one of
them.
To select a disk for the filesystems mounted on / and /home, use
the following parameters:
--disk-path=/ --disk-path=/home
--disk-space-util Collects and sends the DiskSpaceUtilization metric for the selected
disks. The metric is reported in percentages.
--disk-space-used Collects and sends the DiskSpaceUsed metric for the selected
disks. The metric is reported by default in gigabytes.
Due to reserved disk space in Linux operating systems, disk space
used and disk space available might not accurately add up to the
amount of total disk space.
--disk-space-avail Collects and sends the DiskSpaceAvailable metric for the selected
disks. The metric is reported in gigabytes.
Due to reserved disk space in the Linux operating systems, disk
space used and disk space available might not accurately add up
to the amount of total disk space.
--memory-units=UNITS Specifies units in which to report memory usage. If not specified,
memory is reported in megabytes. UNITS may be one of the
following: bytes, kilobytes, megabytes, gigabytes.
--disk-space-
units=UNITS
Specifies units in which to report disk space usage. If not specified,
disk space is reported in gigabytes. UNITS may be one of the
following: bytes, kilobytes, megabytes, gigabytes.
--aws-credential-
file=PATH
Provides the location of the file containing AWS credentials.
This parameter cannot be used with the --aws-access-key-id
and --aws-secret-key parameters.
--aws-access-key-
id=VALUE
Specifies the AWS access key ID to use to identify the caller. Must
be used together with the --aws-secret-key option. Do not use
this option with the --aws-credential-file parameter.
--aws-secret-key=VALUE Specifies the AWS secret access key to use to sign the request
to CloudWatch. Must be used together with the --aws-access-
key-id option. Do not use this option with --aws-credential-
file parameter.
--aws-iam-role=VALUE Specifies the IAM role used to provide AWS credentials. The value
=VALUE is required. If no credentials are specified, the default IAM
role associated with the EC2 instance is applied. Only one IAM
role can be used. If no IAM roles are found, or if more than one
IAM role is found, the script will return an error.
Do not use this option with the --aws-credential-file, --
aws-access-key-id, or --aws-secret-key parameters.
--aggregated[=only] Adds aggregated metrics for instance type, AMI ID, and overall
for the region. The value =only is optional; if specified, the script
reports only aggregated metrics.
119
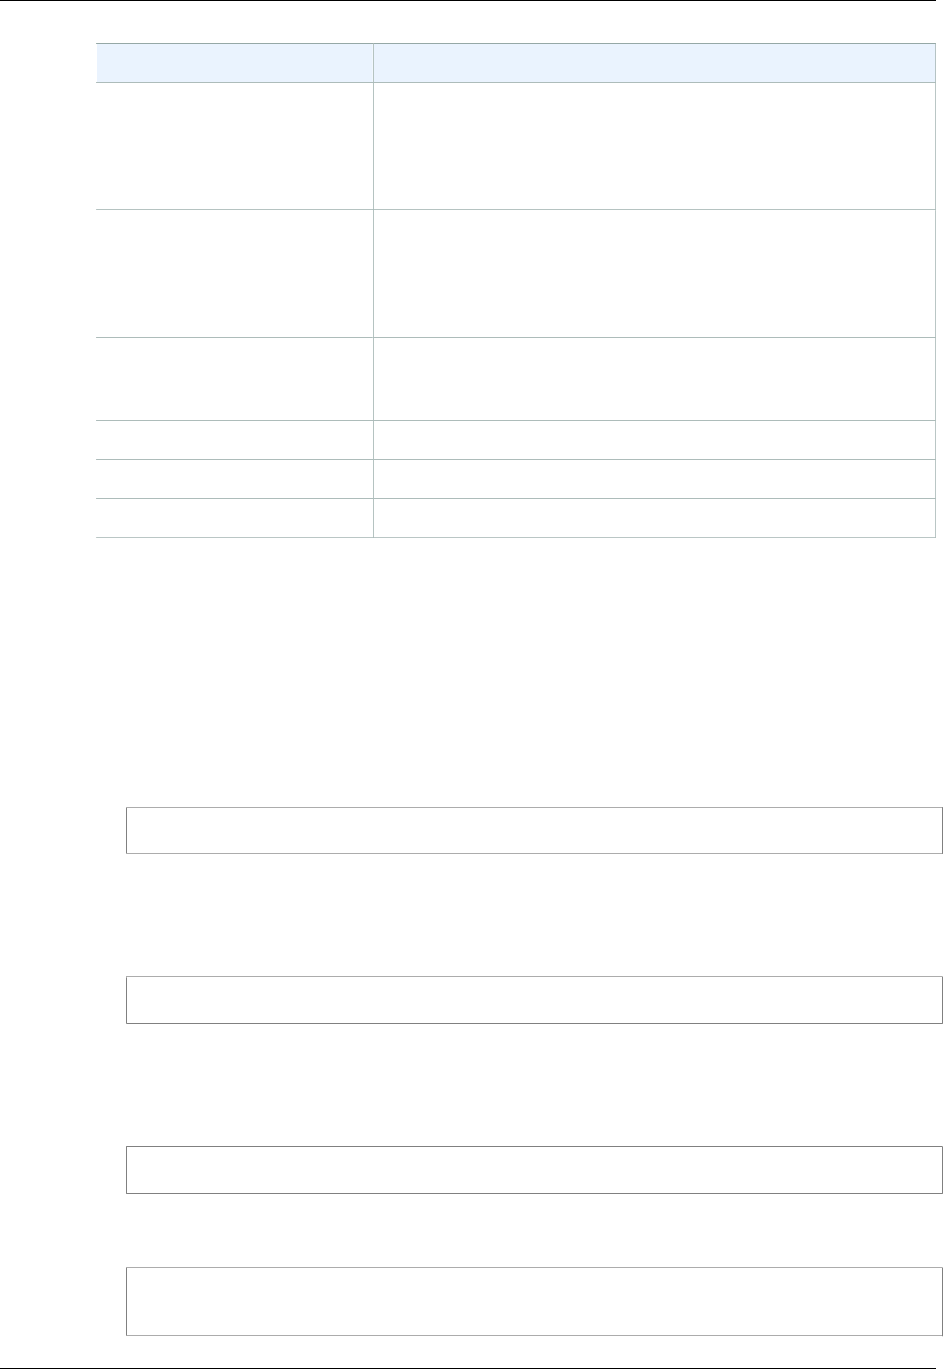
Amazon CloudWatch User Guide
mon-put-instance-data.pl
Name Description
--auto-scaling[=only] Adds aggregated metrics for the Auto Scaling group. The value
=only is optional; if specified, the script reports only Auto Scaling
metrics. The IAM policy associated with the IAM account or role
using the scripts need to have permissions to call the EC2 action
DescribeTags.
--verify Performs a test run of the script that collects the metrics, prepares
a complete HTTP request, but does not actually call CloudWatch
to report the data. This option also checks that credentials are
provided. When run in verbose mode, this option outputs the
metrics that will be sent to CloudWatch.
--from-cron Use this option when calling the script from cron. When this option
is used, all diagnostic output is suppressed, but error messages
are sent to the local system log of the user account.
--verbose Displays detailed information about what the script is doing.
--help Displays usage information.
--version Displays the version number of the script.
Examples
The following examples assume that you have already updated the awscreds.conf file with valid
AWS credentials. If you are not using the awscreds.conf file, provide credentials using the --aws-
access-key-id and --aws-secret-key arguments.
To perform a simple test run without posting data to CloudWatch
• Run the following command:
./mon-put-instance-data.pl --mem-util --verify --verbose
To collect all available memory metrics and send them to CloudWatch
• Run the following command:
./mon-put-instance-data.pl --mem-util --mem-used --mem-avail
To set a cron schedule for metrics reported to CloudWatch
1. Start editing the crontab using the following command:
crontab -e
2. Add the following command to report memory and disk space utilization to CloudWatch every five
minutes:
*/5 * * * * ~/aws-scripts-mon/mon-put-instance-data.pl --mem-util --disk-
space-util --disk-path=/ --from-cron
120
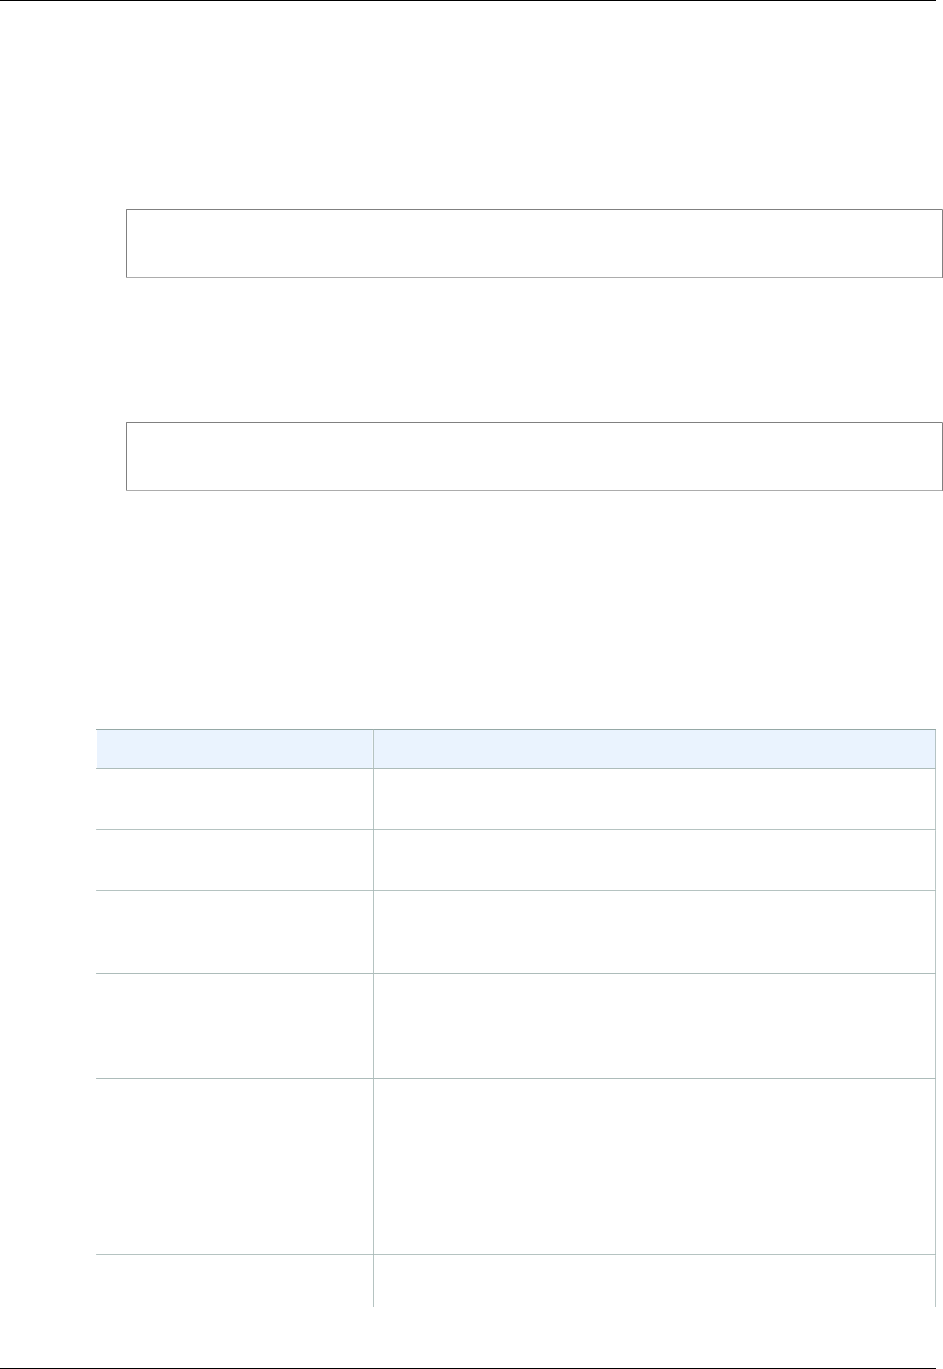
Amazon CloudWatch User Guide
mon-get-instance-stats.pl
If the script encounters an error, the script will write the error message in the system log.
To collect aggregated metrics for an Auto Scaling group and send them to Amazon
CloudWatch without reporting individual instance metrics
• Run the following command:
./mon-put-instance-data.pl --mem-util --mem-used --mem-avail --auto-
scaling=only
To collect aggregated metrics for instance type, AMI ID and region, and send them to
Amazon CloudWatch without reporting individual instance metrics
• Run the following command:
./mon-put-instance-data.pl --mem-util --mem-used --mem-avail --
aggregated=only
mon-get-instance-stats.pl
This script queries CloudWatch for statistics on memory, swap, and disk space metrics within the time
interval provided using the number of most recent hours. This data is provided for the Amazon EC2
instance on which this script is executed.
Options
Name Description
--recent-hours=N Specifies the number of recent hours to report on, as represented
by N where N is an integer.
--aws-credential-
file=PATH
Provides the location of the file containing AWS credentials.
--aws-access-key-
id=VALUE
Specifies the AWS access key ID to use to identify the caller. Must
be used together with the --aws-secret-key option. Do not use
this option with the --aws-credential-file option.
--aws-secret-key=VALUE Specifies the AWS secret access key to use to sign the request
to CloudWatch. Must be used together with the --aws-access-
key-id option. Do not use this option with --aws-credential-
file option.
--aws-iam-role=VALUE Specifies the IAM role used to provide AWS credentials. The value
=VALUE is required. If no credentials are specified, the default IAM
role associated with the EC2 instance is applied. Only one IAM
role can be used. If no IAM roles are found, or if more than one
IAM role is found, the script will return an error.
Do not use this option with the --aws-credential-file, --
aws-access-key-id, or --aws-secret-key parameters.
--verify Performs a test run of the script that collects the metrics, prepares
a complete HTTP request, but does not actually call CloudWatch
121
Amazon CloudWatch User Guide
Viewing Your Custom Metrics in
the AWS Management Console
Name Description
to report the data. This option also checks that credentials are
provided. When run in verbose mode, this option outputs the
metrics that will be sent to CloudWatch.
--verbose Displays detailed information about what the script is doing.
--help Displays usage information.
--version Displays the version number of the script.
Examples
To get utilization statistics for the last 12 hours
• Run the following command:
./mon-get-instance-stats.pl --recent-hours=12
The returned response will be similar to the following example output:
Instance metric statistics for the last 12 hours.
CPU Utilization
Average: 1.06%, Minimum: 0.00%, Maximum: 15.22%
Memory Utilization
Average: 6.84%, Minimum: 6.82%, Maximum: 6.89%
Swap Utilization
Average: N/A, Minimum: N/A, Maximum: N/A
Disk Space Utilization on /dev/xvda1 mounted as /
Average: 9.69%, Minimum: 9.69%, Maximum: 9.69%
Viewing Your Custom Metrics in the AWS
Management Console
If you successfully call the mon-put-instance-data.pl script, you can use the AWS Management
Console to view your posted custom metrics in the Amazon CloudWatch console.
To view custom metrics
1. Execute mon-put-instance-data.pl, as described earlier.
2. Sign in to the AWS Management Console and open the CloudWatch console at https://
console.aws.amazon.com/cloudwatch/.
3. Click View Metrics.
4. In the Viewing list, your custom metrics posted by the script are displayed with the prefix System/
Linux.
122

Amazon CloudWatch User Guide
Authentication
Authentication and Access
Control for Amazon CloudWatch
Access to Amazon CloudWatch requires credentials. Those credentials must have permissions to
access AWS resources, such as retrieving CloudWatch metric data about your cloud resources. The
following sections provide details about how you can use AWS Identity and Access Management (IAM)
and CloudWatch to help secure your resources by controlling who can access them:
•Authentication (p. 123)
•Access Control (p. 124)
Authentication
You can access AWS as any of the following types of identities:
•AWS account root user – When you sign up for AWS, you provide an email address and password
that is associated with your AWS account. These are your root credentials and they provide
complete access to all of your AWS resources.
Important
For security reasons, we recommend that you use the root credentials only to create
an administrator user, which is an IAM user with full permissions to your AWS account.
Then, you can use this administrator user to create other IAM users and roles with limited
permissions. For more information, see IAM Best Practices and Creating an Admin User
and Group in the IAM User Guide.
•IAM user – An IAM user is simply an identity within your AWS account that has specific custom
permissions (for example, permissions to view metrics in CloudWatch). You can use an IAM user
name and password to sign in to secure AWS webpages like the AWS Management Console, AWS
Discussion Forums, or the AWS Support Center.
123

Amazon CloudWatch User Guide
Access Control
In addition to a user name and password, you can also generate access keys for each user. You
can use these keys when you access AWS services programmatically, either through one of the
several SDKs or by using the AWS Command Line Interface (CLI). The SDK and CLI tools use the
access keys to cryptographically sign your request. If you don’t use the AWS tools, you must sign the
request yourself. CloudWatch supports Signature Version 4, a protocol for authenticating inbound
API requests. For more information about authenticating requests, see Signature Version 4 Signing
Process in the AWS General Reference.
•IAM role – An IAM role is another IAM identity you can create in your account that has specific
permissions. It is similar to an IAM user, but it is not associated with a specific person. An IAM
role enables you to obtain temporary access keys that can be used to access AWS services and
resources. IAM roles with temporary credentials are useful in the following situations:
•Federated user access – Instead of creating an IAM user, you can use preexisting user identities
from AWS Directory Service, your enterprise user directory, or a web identity provider. These are
known as federated users. AWS assigns a role to a federated user when access is requested
through an identity provider. For more information about federated users, see Federated Users
and Roles in the IAM User Guide.
•Cross-account access – You can use an IAM role in your account to grant another AWS account
permissions to access your account’s resources. For an example, see Tutorial: Delegate Access
Across AWS Accounts Using IAM Roles in the IAM User Guide.
•AWS service access – You can use an IAM role in your account to grant an AWS service
permissions to access your account’s resources. For example, you can create a role that allows
Amazon Redshift to access an Amazon S3 bucket on your behalf and then load data stored in the
bucket into an Amazon Redshift cluster. For more information, see Creating a Role to Delegate
Permissions to an AWS Service in the IAM User Guide.
•Applications running on Amazon EC2 – Instead of storing access keys within the EC2 instance
for use by applications running on the instance and making API requests, you can use an IAM
role to manage temporary credentials for these applications. To assign an AWS role to an EC2
instance and make it available to all of its applications, you can create an instance profile that
is attached to the instance. An instance profile contains the role and enables programs running
on the EC2 instance to get temporary credentials. For more information, see Using Roles for
Applications on Amazon EC2 in the IAM User Guide.
Access Control
You can have valid credentials to authenticate your requests, but unless you have permissions you
cannot create or access CloudWatch resources. For example, you must have permissions to create
CloudWatch dashboard widgets, view metrics, and so on.
The following sections describe how to manage permissions for CloudWatch. We recommend that you
read the overview first.
•Overview of Managing Access Permissions to Your CloudWatch Resources (p. 125)
•Using Identity-Based Policies (IAM Policies) for CloudWatch (p. 129)
•Amazon CloudWatch Permissions Reference (p. 134)
124

Amazon CloudWatch User Guide
Overview of Managing Access
Overview of Managing Access Permissions to
Your CloudWatch Resources
Every AWS resource is owned by an AWS account, and permissions to create or access a resource
are governed by permissions policies. An account administrator can attach permissions policies to IAM
identities (that is, users, groups, and roles), and some services (such as AWS Lambda) also support
attaching permissions policies to resources.
Note
An account administrator (or administrator user) is a user with administrator privileges. For
more information, see IAM Best Practices in the IAM User Guide.
When granting permissions, you decide who is getting the permissions, the resources they get
permissions for, and the specific actions that you want to allow on those resources.
Topics
•CloudWatch Resources and Operations (p. 125)
•Understanding Resource Ownership (p. 127)
•Managing Access to Resources (p. 127)
•Specifying Policy Elements: Actions, Effects, and Principals (p. 128)
•Specifying Conditions in a Policy (p. 128)
CloudWatch Resources and Operations
CloudWatch doesn't have any specific resources for you to control access to. Therefore, there are
no CloudWatch Amazon Resource Names (ARNs) for you to use in an IAM policy. For example, you
can't give a user access to CloudWatch data for only a specific set of EC2 instances or a specific load
balancer or. Permissions granted using IAM cover all the cloud resources you use or monitor with
CloudWatch. In addition, you can't use IAM roles with the CloudWatch command line tools.
You use an * (asterisk) as the resource when writing a policy to control access to CloudWatch actions.
For example:
{
"Version": "2012-10-17",
"Statement":[{
"Effect":"Allow",
"Action":["cloudwatch:GetMetricStatistics","cloudwatch:ListMetrics"],
"Resource":"*",
"Condition":{
"Bool":{
"aws:SecureTransport":"true"
}
}
}
]
}
For more information about ARNs, see ARNs in IAM User Guide. For information about CloudWatch
Logs ARNs, see Amazon Resource Names (ARNs) and AWS Service Namespaces in the Amazon
Web Services General Reference. For an example of a policy that covers CloudWatch actions, see
Using Identity-Based Policies (IAM Policies) for CloudWatch (p. 129).
125

Amazon CloudWatch User Guide
Resources and Operations
Action ARN (with region) ARN (for use with IAM role)
Stop arn:aws:automate:us-
east-1:ec2:stop arn:aws:swf:us-
east-1:customer-
account:action/actions/
AWS_EC2.InstanceId.Stop/1.0
Note
You must create at
least one stop alarm
using the Amazon
EC2 or CloudWatch
console to create the
EC2ActionsAccess
IAM role. After this IAM
role is created, you
can create stop alarms
using the CLI.
Terminate arn:aws:automate:us-
east-1:ec2:terminate arn:aws:swf:us-
east-1:customer-
account:action/actions/
AWS_EC2.InstanceId.Terminate/1.0
Note
You must create at
least one terminate
alarm using the
Amazon EC2
or CloudWatch
console to create the
EC2ActionsAccess
IAM role. After this IAM
role is created, you can
create terminate alarms
using the CLI.
Reboot n/a arn:aws:swf:us-
east-1:customer-
account:action/actions/
AWS_EC2.InstanceId.Reboot/1.0
Note
You must create at
least one reboot alarm
using the Amazon
EC2 or CloudWatch
console to create the
EC2ActionsAccess
IAM role. After this IAM
role is created, you can
create reboot alarms
using the CLI.
Recover arn:aws:automate:us-
east-1:ec2:recover n/a
126

Amazon CloudWatch User Guide
Understanding Resource Ownership
Understanding Resource Ownership
The AWS account owns the resources that are created in the account, regardless of who created the
resources. Specifically, the resource owner is the AWS account of the principal entity (that is, the root
account, an IAM user, or an IAM role) that authenticates the resource creation request. CloudWatch
does not have any resources that you can own.
Managing Access to Resources
A permissions policy describes who has access to what. The following section explains the available
options for creating permissions policies.
Note
This section discusses using IAM in the context of CloudWatch. It doesn't provide detailed
information about the IAM service. For complete IAM documentation, see What Is IAM? in
the IAM User Guide. For information about IAM policy syntax and descriptions, see AWS IAM
Policy Reference in the IAM User Guide.
Policies attached to an IAM identity are referred to as identity-based policies (IAM polices) and policies
attached to a resource are referred to as resource-based policies. CloudWatch supports only identity-
based policies (IAM policies).
Topics
•Identity-Based Policies (IAM Policies) (p. 127)
•Resource-Based Policies (p. 128)
Identity-Based Policies (IAM Policies)
You can attach policies to IAM identities. For example, you can do the following:
•Attach a permissions policy to a user or a group in your account – To grant a user permissions
to create an CloudWatch resource, such as metrics, you can attach a permissions policy to a user or
group that the user belongs to.
•Attach a permissions policy to a role (grant cross-account permissions) – You can attach an
identity-based permissions policy to an IAM role to grant cross-account permissions. For example,
the administrator in account A can create a role to grant cross-account permissions to another AWS
account (for example, account B) or an AWS service as follows:
1. Account A administrator creates an IAM role and attaches a permissions policy to the role that
grants permissions on resources in account A.
2. Account A administrator attaches a trust policy to the role identifying account B as the principal
who can assume the role.
3. Account B administrator can then delegate permissions to assume the role to any users in
account B. Doing this allows users in account B to create or access resources in account A. The
principal in the trust policy can also be an AWS service principal if you want to grant an AWS
service permissions to assume the role.
For more information about using IAM to delegate permissions, see Access Management in the IAM
User Guide.
Add basic example policy here for illustration
For more information about using identity-based policies with CloudWatch, see Using Identity-Based
Policies (IAM Policies) for CloudWatch (p. 129). For more information about users, groups, roles, and
permissions, see Identities (Users, Groups, and Roles) in the IAM User Guide.
127

Amazon CloudWatch User Guide
Specifying Policy Elements:
Actions, Effects, and Principals
Resource-Based Policies
Other services, such as Amazon S3, also support resource-based permissions policies. For example,
you can attach a policy to an Amazon S3 bucket to manage access permissions to that bucket.
CloudWatch doesn't support resource-based policies.
Specifying Policy Elements: Actions, Effects,
and Principals
For each CloudWatch resource, the service defines a set of API operations. To grant permissions
for these API operations, CloudWatch defines a set of actions that you can specify in a policy.
Some API operations can require permissions for more than one action in order to perform the API
operation. For more information about resources and API operations, see CloudWatch Resources and
Operations (p. 125) and CloudWatch Actions.
The following are the basic policy elements:
•Resource – You use an Amazon Resource Name (ARN) to identify the resource that the policy
applies to. CloudWatch does not have any resources for you to control using policies resources, so
you always use the wildcard character (*) in IAM policies. For more information, see CloudWatch
Resources and Operations (p. 125).
•Action – You use action keywords to identify resource operations that you want to allow or deny. For
example, the cloudwatch:ListMetrics permission allows the user permissions to perform the
ListMetrics operation.
•Effect – You specify the effect, either allow or deny, when the user requests the specific action.
If you don't explicitly grant access to (allow) a resource, access is implicitly denied. You can also
explicitly deny access to a resource, which you might do to make sure that a user cannot access it,
even if a different policy grants access.
•Principal – In identity-based policies (IAM policies), the user that the policy is attached to is the
implicit principal. For resource-based policies, you specify the user, account, service, or other entity
that you want to receive permissions (applies to resource-based policies only). CloudWatch doesn't
support resource-based policies.
To learn more about IAM policy syntax and descriptions, see AWS IAM Policy Reference in the IAM
User Guide.
For a table showing all of the CloudWatch API actions and the resources that they apply to, see
Amazon CloudWatch Permissions Reference (p. 134).
Specifying Conditions in a Policy
When you grant permissions, you can use the access policy language to specify the conditions when a
policy should take effect. For example, you might want a policy to be applied only after a specific date.
For more information about specifying conditions in a policy language, see Condition in the IAM User
Guide.
To express conditions, you use predefined condition keys. There are no condition keys specific to
CloudWatch. However, there are AWS-wide condition keys that you can use as appropriate. For a
complete list of AWS-wide keys, see Available Keys for Conditions in the IAM User Guide.
128

Amazon CloudWatch User Guide
Using Identity-Based Policies (IAM Policies)
Using Identity-Based Policies (IAM Policies)
for CloudWatch
This topic provides examples of identity-based policies that demonstrate how an account administrator
can attach permissions policies to IAM identities (that is, users, groups, and roles) and thereby grant
permissions to perform operations on CloudWatch resources.
Important
We recommend that you first review the introductory topics that explain the basic concepts
and options available to manage access to your CloudWatch resources. For more information,
see Access Control (p. 124).
The sections in this topic cover the following:
•Permissions Required to Use the CloudWatch Console (p. 129)
•AWS Managed (Predefined) Policies for CloudWatch (p. 132)
•Customer Managed Policy Examples (p. 132)
The following shows an example of a permissions policy.
{
"Version": "2012-10-17",
"Statement":[{
"Effect":"Allow",
"Action":["cloudwatch:GetMetricStatistics","cloudwatch:ListMetrics"],
"Resource":"*",
"Condition":{
"Bool":{
"aws:SecureTransport":"true"
}
}
}
]
}
This sample policy has one statement that grants permissions to a group for two CloudWatch actions
(cloudwatch:GetMetricStatisticsdata, and cloudwatch:ListMetrics), but only if the
group uses SSL with the request ("aws:SecureTransport":"true"). For more information about
the elements within an IAM policy statement, see Specifying Policy Elements: Actions, Effects, and
Principals (p. 128) and IAM Policy Elements Reference in IAM User Guide.
Permissions Required to Use the CloudWatch
Console
For a user to work with the CloudWatch console, that user must have a minimum set of permissions
that allows the user to describe other AWS resources in their AWS account. The CloudWatch console
requires permissions from the following services:
• Auto Scaling
• CloudTrail
• CloudWatch
• CloudWatch Events
129

Amazon CloudWatch User Guide
Permissions Required to Use
the CloudWatch Console
• CloudWatch Logs
• Amazon EC2
• Amazon ES
• IAM
• Amazon Kinesis
• Lambda
• Amazon S3
• Amazon SNS
• Amazon SQS
• Amazon SWF
If you create an IAM policy that is more restrictive than the minimum required permissions, the console
won't function as intended for users with that IAM policy. To ensure that those users can still use the
CloudWatch console, also attach the CloudWatchReadOnlyAccess managed policy to the user, as
described in AWS Managed (Predefined) Policies for CloudWatch (p. 132).
You don't need to allow minimum console permissions for users that are making calls only to the AWS
CLI or the CloudWatch API.
The full set of permissions required to work with the CloudWatch console are listed below:
• applicationautoscaling:describeScalingPolicies
• autoscaling:describeAutoScalingGroups
• autoscaling:describePolicies
• cloudtrail:describeTrails
• cloudwatch:deleteAlarms
• cloudwatch:describeAlarmHistory
• cloudwatch:describeAlarms
• cloudwatch:getMetricData
• cloudwatch:getMetricDataForAccounts
• cloudwatch:getMetricStatistics
• cloudwatch:listMetrics
• cloudwatch:putMetricAlarm
• cloudwatch:putMetricData
• ec2:describeInstances
• ec2:describeTags
• ec2:describeVolumes
• es:describeElasticsearchDomain
• es:listDomainNames
• events:deleteRule
• events:describeRule
• events:disableRule
• events:enableRule
• events:listRules
• events:putRule
• iam:attachRolePolicy
• iam:createRole
• iam:getPolicy
• iam:getPolicyVersion
130

Amazon CloudWatch User Guide
Permissions Required to Use
the CloudWatch Console
• iam:getRole
• iam:listAttachedRolePolicies
• iam:listRoles
• kinesis:describeStreams
• kinesis:listStreams
• lambda:addPermission
• lambda:createFunction
• lambda:getFunctionConfiguration
• lambda:listAliases
• lambda:listFunctions
• lambda:listVersionsByFunction
• lambda:removePermission
• logs:cancelExportTask
• logs:createExportTask
• logs:createLogGroup
• logs:createLogStream
• logs:deleteLogGroup
• logs:deleteLogStream
• logs:deleteMetricFilter
• logs:deleteRetentionPolicy
• logs:deleteSubscriptionFilter
• logs:describeExportTasks
• logs:describeLogGroups
• logs:describeLogStreams
• logs:describeMetricFilters
• logs:describeSubscriptionFilters
• logs:filterLogEvents
• logs:getLogEvents
• logs:putMetricFilter
• logs:putRetentionPolicy
• logs:putSubscriptionFilter
• logs:testMetricFilter
• s3:createBucket
• s3:listBuckets
• sns:createTopic
• sns:getTopicAttributes
• sns:listSubscriptions
• sns:listTopics
• sns:setTopicAttributes
• sns:subscribe
• sns:unsubscribe
• sqs:getQueueAttributes
• sqs:getQueueUrl
• sqs:listQueues
• sqs:setQueueAttributes
• swf:createAction
131

Amazon CloudWatch User Guide
AWS Managed (Predefined) Policies for CloudWatch
• swf:describeAction
• swf:listActionTemplates
• swf:registerAction
• swf:registerDomain
• swf:updateAction
AWS Managed (Predefined) Policies for
CloudWatch
AWS addresses many common use cases by providing standalone IAM policies that are created and
administered by AWS. These AWS managed policies grant necessary permissions for common use
cases so that you can avoid having to investigate what permissions are needed. For more information,
see AWS Managed Policies in the IAM User Guide.
The following AWS managed policies, which you can attach to users in your account, are specific to
CloudWatch:
•CloudWatchFullAccess – Grants full access to CloudWatch.
•CloudWatchReadOnlyAccess – Grants read-only access to CloudWatch.
•CloudWatchActionsEC2Access – Grants read-only access to CloudWatch alarms and metrics as
well as Amazon EC2 metadata. Grants access to the Stop, Terminate, and Reboot API actions for
EC2 instances.
Note
You can review these permissions policies by signing in to the IAM console and searching for
specific policies there.
You can also create your own custom IAM policies to allow permissions for CloudWatch actions
and resources. You can attach these custom policies to the IAM users or groups that require those
permissions.
Customer Managed Policy Examples
In this section, you can find example user policies that grant permissions for various CloudWatch
actions. These policies work when you are using the CloudWatch API, AWS SDKs, or the AWS CLI.
Examples
•Example 1: Allow User Full Access to CloudWatch (p. 132)
•Example 2: Allow Read-Only Access to CloudWatch (p. 133)
•Example 3: Stop or Terminate an Amazon EC2 Instance (p. 133)
Example 1: Allow User Full Access to CloudWatch
The following policy allows a user to access all CloudWatch actions, CloudWatch Logs actions,
Amazon SNS actions, and read-only access to Auto Scaling.
{
"Version": "2012-10-17",
"Statement": [
{
"Action": [
132

Amazon CloudWatch User Guide
Customer Managed Policy Examples
"autoscaling:Describe*",
"cloudwatch:*",
"logs:*",
"sns:*"
],
"Effect": "Allow",
"Resource": "*"
}
]
}
Example 2: Allow Read-Only Access to CloudWatch
The following policy allows a user read-only access to CloudWatch and view Auto Scaling actions,
CloudWatch metrics, CloudWatch Logs data, and alarm-related Amazon SNS data.
{
"Version": "2012-10-17",
"Statement": [
{
"Action": [
"autoscaling:Describe*",
"cloudwatch:Describe*",
"cloudwatch:Get*",
"cloudwatch:List*",
"logs:Get*",
"logs:Describe*",
"sns:Get*",
"sns:List*"
],
"Effect": "Allow",
"Resource": "*"
}
]
}
Example 3: Stop or Terminate an Amazon EC2 Instance
The following policy allows an CloudWatch alarm action to stop or terminate an EC2 instance. In the
sample below, the GetMetricStatistics, ListMetrics, and DescribeAlarms actions are optional. It is
recommended that you include these actions to ensure that you have correctly stopped or terminated
the instance.
{
"Version": "2012-10-17",
"Statement": [
{
"Action": [
"cloudwatch:PutMetricAlarm",
"cloudwatch:GetMetricStatistics",
"cloudwatch:ListMetrics",
"cloudwatch:DescribeAlarms"
],
"Sid": "00000000000000",
"Resource": [
"*"
133

Amazon CloudWatch User Guide
Amazon CloudWatch Permissions Reference
],
"Effect": "Allow"
},
{
"Action": [
"ec2:DescribeInstanceStatus",
"ec2:DescribeInstances",
"ec2:StopInstances",
"ec2:TerminateInstances"
],
"Sid": "00000000000000",
"Resource": [
"*"
],
"Effect": "Allow"
}
]
}
Amazon CloudWatch Permissions Reference
When you are setting up Access Control (p. 124) and writing permissions policies that you can
attach to an IAM identity (identity-based policies), you can use the following table as a reference. The
table lists each CloudWatch API operation and the corresponding actions for which you can grant
permissions to perform the action. You specify the actions in the policy's Action field, and you specify
a wildcard character (*) as the resource value in the policy's Resource field.
You can use AWS-wide condition keys in your CloudWatch policies to express conditions. For a
complete list of AWS-wide keys, see Available Keys in the IAM User Guide.
Note
To specify an action, use the cloudwatch: prefix followed by the API operation name.
For example: cloudwatch:GetMetricStatistics, cloudwatch:ListMetrics, or
cloudwatch:* (for all CloudWatch actions).
Tables
•CloudWatch API Operations and Required Permissions
•CloudWatch Events API Operations and Required Permissions
•CloudWatch Logs API Operations and Required Permissions
•Amazon EC2 API Operations and Required Permissions
•Auto Scaling API Operations and Required Permissions
CloudWatch API Operations and Required Permissions for Actions
CloudWatch API Operations Required Permissions (API Actions)
DeleteAlarms cloudwatch:DeleteAlarms
Required to delete an alarm.
DescribeAlarmHistory cloudwatch:DescribeAlarmHistory
Required to view alarm history.
DescribeAlarms cloudwatch:DescribeAlarms
134
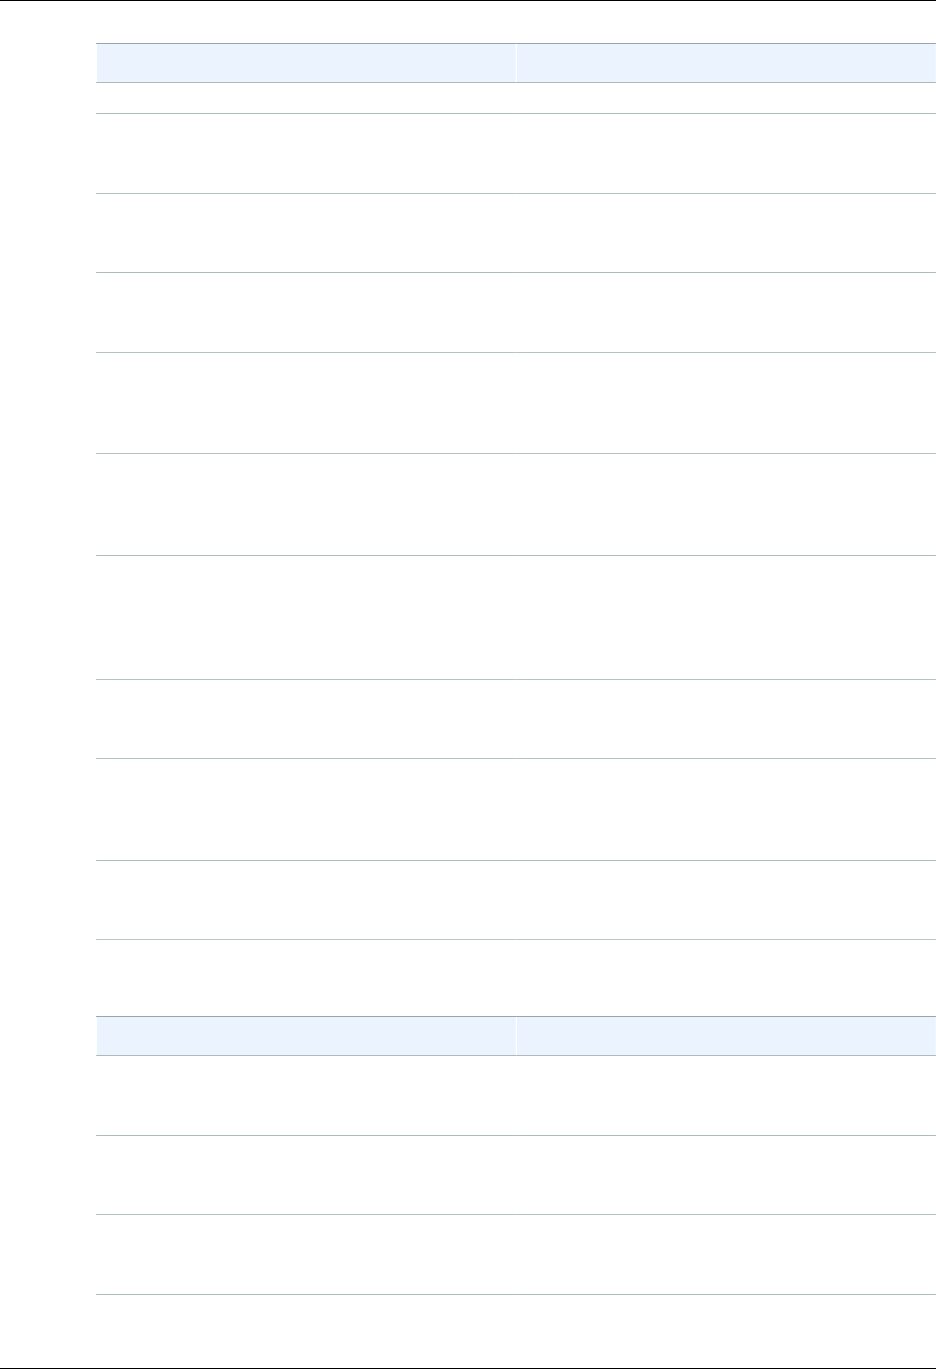
Amazon CloudWatch User Guide
Amazon CloudWatch Permissions Reference
CloudWatch API Operations Required Permissions (API Actions)
Required to retrieve alarm information by name.
DescribeAlarmsForMetric cloudwatch:DescribeAlarmsForMetric
Required to view alarms for a metric.
DisableAlarmActions cloudwatch:DisableAlarmActions
Required to disable an alarm action.
EnableAlarmActions cloudwatch:EnableAlarmActions
Required to enable an alarm action.
GetMetricData cloudwatch:GetMetricData
Required to view or list dashboards and view
metric data in dashboard widgets.
GetMetricStatistics cloudwatch:GetMetricStatistics
Required to view graphs in other parts of the
CloudWatch console and in dashboard widgets.
ListMetrics cloudwatch:ListMetrics
Required to view or search metric names
within the CloudWatch console and in the CLI.
Required to select metrics on dashboard widgets.
PutMetricAlarm cloudwatch:PutMetricAlarm
Required to create or update an alarm.
PutMetricData cloudwatch:PutMetricData
Required to create metrics and create or delete
dashboards.
SetAlarmState cloudwatch:SetAlarmState
Required to manually set an alarm's state.
CloudWatch Events API Operations and Required Permissions for Actions
CloudWatch Events API Operations Required Permissions (API Actions)
DeleteRule events:DeleteRule
Required to delete a rule.
DescribeRule events:DescribeRule
Required to list the details about a rule.
DisableRule events:DisableRule
Required to disable a rule.
EnableRule events:EnableRule
135
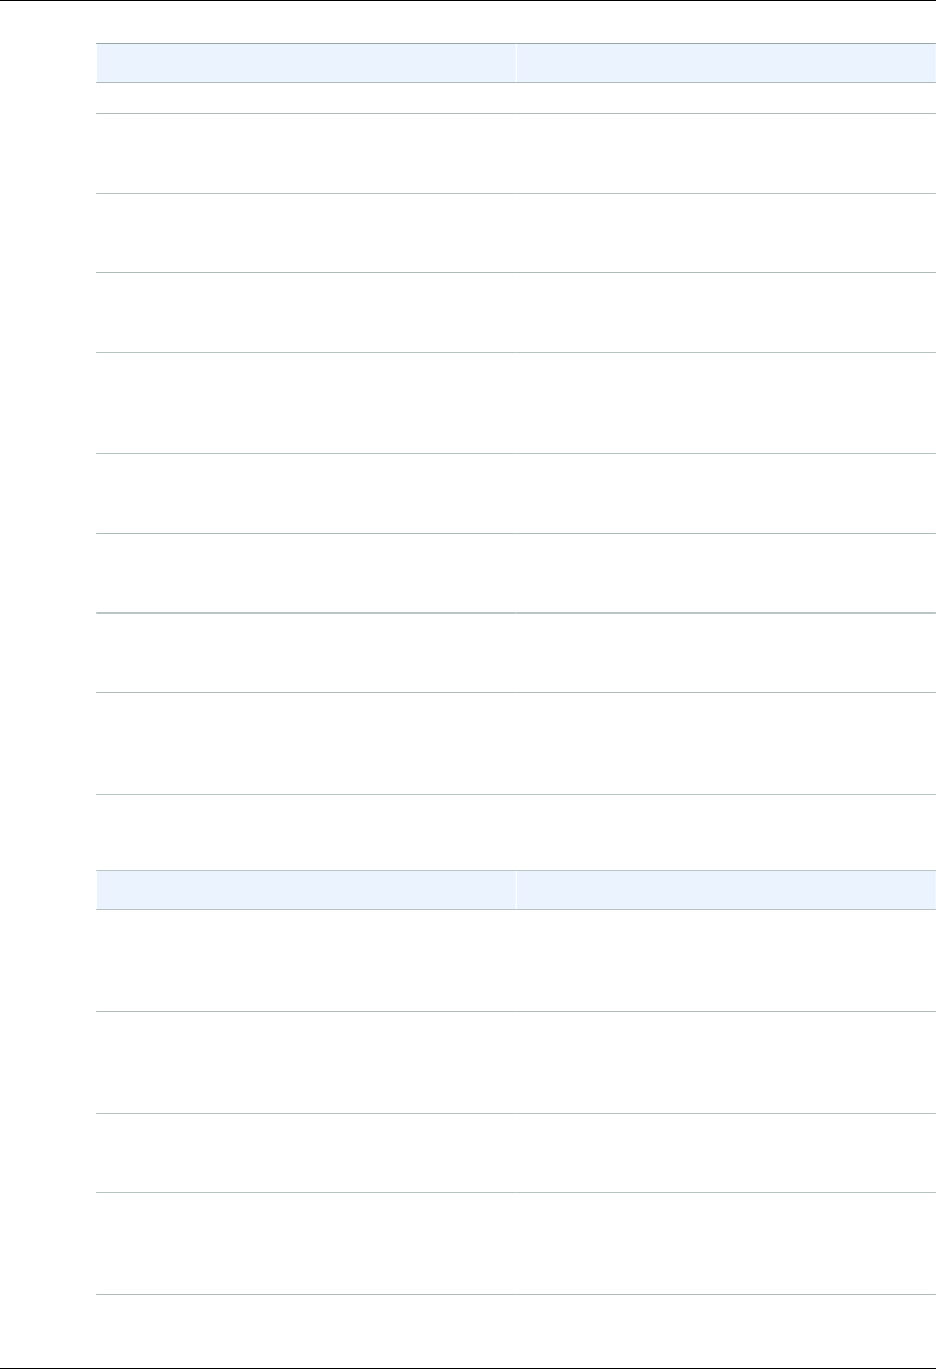
Amazon CloudWatch User Guide
Amazon CloudWatch Permissions Reference
CloudWatch Events API Operations Required Permissions (API Actions)
Required to enable a rule.
ListRuleNamesByTarget events:ListRuleNamesByTarget
Required to list rules associated with a target.
ListRules events:ListRules
Required to list all rules in your account.
ListTargetsByRule events:ListTargetsByRule
Required to list all targets associated with a rule.
PutEvents events:PutEvents
Required to add custom events that can be
matched to rules.
PutRule events:PutRule
Required to create or update a rule.
PutTargets events:PutTargets
Required to add targets to a rule.
RemoveTargets events:RemoveTargets
Required to remove a target from a rule.
TestEventPattern events:TestEventPattern
Required to test an event pattern against a given
event.
CloudWatch Logs API Operations and Required Permissions for Actions
CloudWatch Logs API Operations Required Permissions (API Actions)
CancelExportTask logs:CancelExportTask
Required to cancel a pending or running export
task.
CreateExportTask logs:CreateExportTask
Required to export data from a log group to an
Amazon S3 bucket.
CreateLogGroup logs:CreateLogGroup
Required to create a new log group.
CreateLogStream logs:CreateLogStream
Required to create a new log stream in a log
group.
DeleteDestination logs:DeleteDestination
136

Amazon CloudWatch User Guide
Amazon CloudWatch Permissions Reference
CloudWatch Logs API Operations Required Permissions (API Actions)
Required to delete a log destination and disables
any subscription filters to it.
DeleteLogGroup logs:DeleteLogGroup
Required to delete a log group and any
associated archived log events.
DeleteLogStream logs:DeleteLogStream
Required to delete a log stream and any
associated archived log events.
DeleteMetricFilter logs:DeleteMetricFilter
Required to delete a metric filter associated with
a log group.
DeleteRetentionPolicy logs:DeleteRetentionPolicy
Required to delete a log group's retention policy.
DeleteSubscriptionFilter logs:DeleteSubscriptionFilter
Required to delete the subscription filter
associated with a log group.
DescribeDestinations logs:DescribeDestinations
Required to view all destinations associated with
the account.
DescribeExportTasks logs:DescribeExportTasks
Required to view all export tasks associated with
the account.
DescribeLogGroups logs:DescribeLogGroups
Required to view all log groups associated with
the account.
DescribeLogStreams logs:DescribeLogStreams
Required to view all log streams associated with
a log group.
DescribeMetricFilters logs:DescribeMetricFilters
Required to view all metrics associated with a log
group.
DescribeSubscriptionFilters logs:DescribeSubscriptionFilters
Required to view all subscription filters
associated with a log group.
137
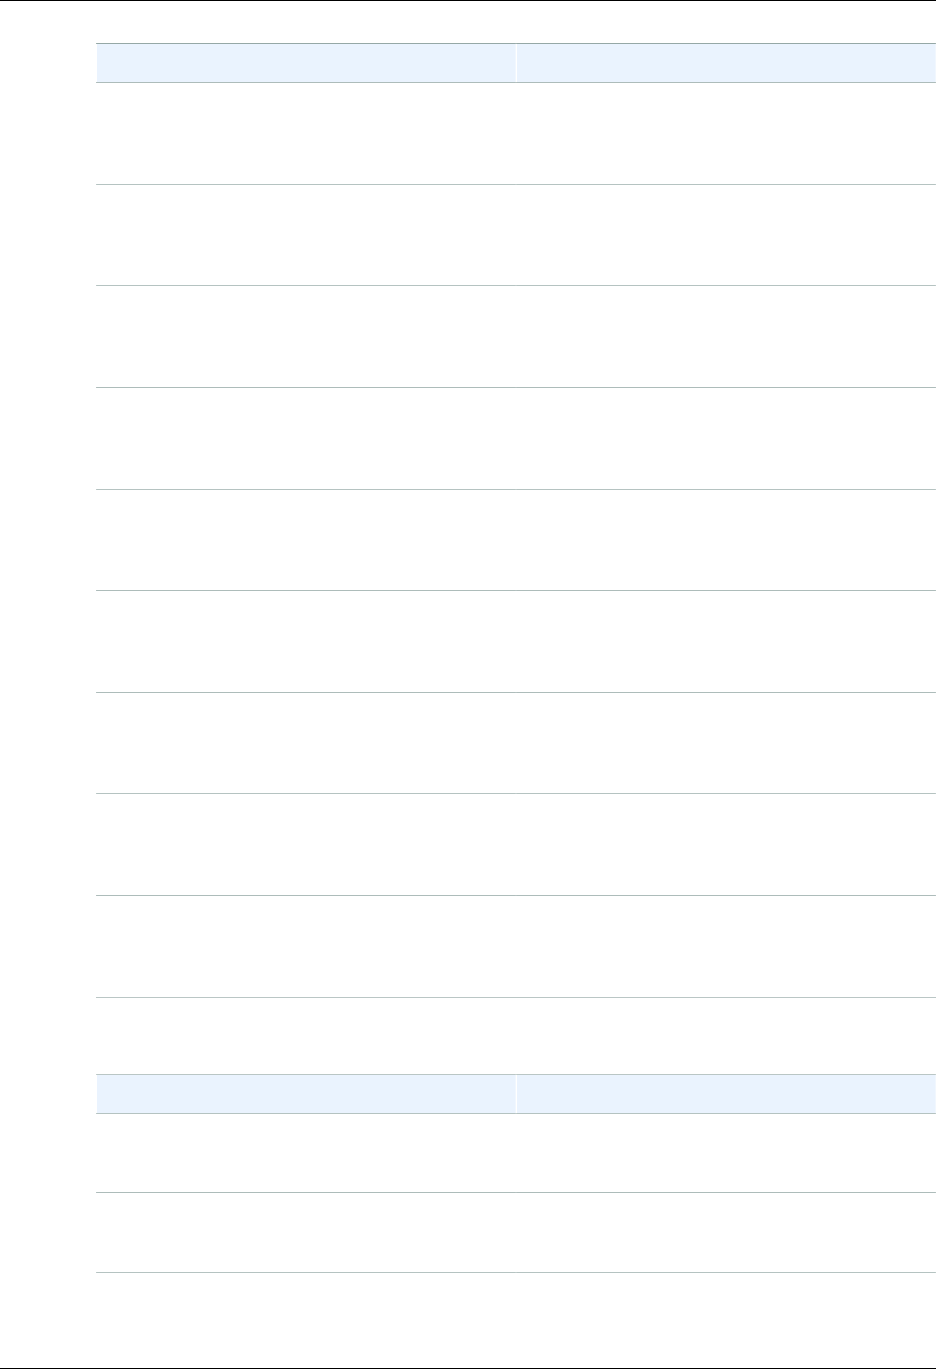
Amazon CloudWatch User Guide
Amazon CloudWatch Permissions Reference
CloudWatch Logs API Operations Required Permissions (API Actions)
FilterLogEvents logs:FilterLogEvents
Required to sort log events by log group filter
pattern.
GetLogEvents logs:GetLogEvents
Required to retrieve log events from a log
stream.
PutDestination logs:PutDestination
Required to create or update a destination log
stream (such as an Amazon Kinesis stream).
PutDestinationPolicy logs:PutDestinationPolicy
Required to create or update an access policy
associated with an existing log destination.
PutLogEvents logs:PutLogEvents
Required to upload a batch of log events to a log
stream.
PutMetricFilter logs:PutMetricFilter
Required to create or update a metric filter and
associate it with a log group.
PutRetentionPolicy logs:PutRetentionPolicy
Required to set the number of days to keep log
events (retention) in a log group.
PutSubscriptionFilter logs:PutSubscriptionFilter
Required to create or update a subscription filter
and associate it with a log group.
TestMetricFilter logs:TestMetricFilter
Required to test a filter pattern against a
sampling of log event messages.
Amazon EC2 API Operations and Required Permissions for Actions
Amazon EC2 API Operations Required Permissions (API Actions)
DescribeInstanceStatus ec2:DescribeInstanceStatus
Required to view EC2 instance status details.
DescribeInstances ec2:DescribeInstances
Required to view EC2 instance details.
RebootInstances ec2:RebootInstances
138

Amazon CloudWatch User Guide
Amazon CloudWatch Permissions Reference
Amazon EC2 API Operations Required Permissions (API Actions)
Required to reboot an EC2 instance.
StopInstances ec2:StopInstances
Required to stop an EC2 instance.
TerminateInstances ec2:TerminateInstances
Required to terminate an EC2 instance.
Auto Scaling API Operations and Required Permissions for Actions
Auto Scaling API Operations Required Permissions (API Actions)
Scaling autoscaling:Scaling
Required to scale an Auto Scaling group.
Trigger autoscaling:Trigger
Required to trigger an Auto Scaling action.
139

Amazon CloudWatch User Guide
Amazon CloudWatch
Namespaces, Dimensions, and
Metrics Reference
This section includes all of the namespaces, dimensions, and metrics that you can use with
CloudWatch. Namespaces are containers for metrics. Metrics, which are time-ordered sets of
data points, are isolated from one another in different namespaces so that metrics from different
applications are not mistakenly aggregated into the same statistics. In addition, each metric has a
dimension, which is a name/value pair that helps you to uniquely identify a metric.
Topics
•AWS Namespaces (p. 141)
•Amazon API Gateway Dimensions and Metrics (p. 142)
•Auto Scaling Dimensions and Metrics (p. 144)
•AWS Billing and Cost Management Dimensions and Metrics (p. 144)
•Amazon CloudFront Dimensions and Metrics (p. 145)
•Amazon CloudSearch Dimensions and Metrics (p. 146)
•Amazon CloudWatch Events Dimensions and Metrics (p. 147)
•Amazon CloudWatch Logs Dimensions and Metrics (p. 148)
•Amazon DynamoDB Dimensions and Metrics (p. 150)
•Amazon ECS Dimensions and Metrics (p. 160)
•Amazon ElastiCache Dimensions and Metrics (p. 162)
•Amazon EBS Dimensions and Metrics (p. 167)
•Amazon Elastic Compute Cloud Dimensions and Metrics (p. 169)
•Amazon EC2 Spot Fleet Dimensions and Metrics (p. 173)
•Amazon EFS Dimensions and Metrics (p. 174)
•Elastic Load Balancing Dimensions and Metrics (p. 177)
•Amazon EMR Dimensions and Metrics (p. 182)
•Amazon Elasticsearch Service Dimensions and Metrics (p. 191)
•Amazon Elastic Transcoder Dimensions and Metrics (p. 194)
•AWS IoT Dimensions and Metrics (p. 195)
•Amazon Kinesis Streams Dimensions and Metrics (p. 197)
140
Amazon CloudWatch User Guide
AWS Namespaces
•Amazon Kinesis Firehose Metrics (p. 203)
•AWS Key Management Service Metrics and Dimensions (p. 205)
•AWS Lambda Dimensions and Metrics (p. 206)
•Amazon Machine Learning Dimensions and Metrics (p. 207)
•AWS OpsWorks Dimensions and Metrics (p. 208)
•Amazon Redshift Dimensions and Metrics (p. 210)
•Amazon RDS Dimensions and Metrics (p. 212)
•Amazon Route 53 Dimensions and Metrics (p. 215)
•Amazon Simple Notification Service Dimensions and Metrics (p. 216)
•Amazon SQS Dimensions and Metrics (p. 218)
•Amazon Simple Storage Service Dimensions and Metrics (p. 220)
•Amazon SWF Dimensions and Metrics (p. 220)
•AWS Storage Gateway Dimensions and Metrics (p. 222)
•AWS WAF Dimensions and Metrics (p. 233)
•Amazon WorkSpaces Dimensions and Metrics (p. 234)
AWS Namespaces
CloudWatch namespaces are containers for metrics. Metrics in different namespaces are isolated from
each other, so that metrics from different applications are not mistakenly aggregated into the same
statistics. All AWS services that provide Amazon CloudWatch data use a namespace string, beginning
with "AWS/". When you create custom metrics, you must also specify a namespace as a container for
custom metrics. The following services push metric data points to CloudWatch.
AWS Product Namespace
Amazon API Gateway AWS/ApiGateway
Auto Scaling AWS/AutoScaling
AWS Billing AWS/Billing
Amazon CloudFront AWS/CloudFront
Amazon CloudSearch AWS/CloudSearch
Amazon CloudWatch Events AWS/Events
Amazon CloudWatch Logs AWS/Logs
Amazon DynamoDB AWS/DynamoDB
Amazon EC2 Container Service AWS/ECS
Amazon ElastiCache AWS/ElastiCache
Amazon Elastic Block Store AWS/EBS
Amazon EC2 AWS/EC2
Amazon EC2 AWS/EC2Spot (Spot Instances)
Amazon Elastic File System AWS/EFS
Elastic Load Balancing AWS/ELB (Classic Load Balancers)
141
Amazon CloudWatch User Guide
Amazon API Gateway Dimensions and Metrics
AWS Product Namespace
Elastic Load Balancing AWS/ApplicationELB (Application Load
Balancers)
Amazon EMR AWS/ElasticMapReduce
Amazon Elasticsearch Service AWS/ES
Amazon Elastic Transcoder AWS/ElasticTranscoder
AWS IoT AWS/IoT
Amazon Kinesis Streams AWS/Kinesis
Amazon Kinesis Firehose AWS/Firehose
AWS Key Management Service KMS
AWS Lambda AWS/Lambda
Amazon Machine Learning AWS/ML
AWS OpsWorks AWS/OpsWorks
Amazon Redshift AWS/Redshift
Amazon Relational Database Service AWS/RDS
Amazon Route 53 AWS/Route53
Amazon Simple Notification Service AWS/SNS
Amazon Simple Queue Service AWS/SQS
Amazon Simple Storage Service AWS/S3
Amazon Simple Workflow Service AWS/SWF
AWS Storage Gateway AWS/StorageGateway
AWS WAF AWS/WAF
Amazon WorkSpaces AWS/WorkSpaces
Amazon API Gateway Dimensions and Metrics
The metrics and dimensions that API Gateway sends to Amazon CloudWatch are listed below. For
more information, see Monitor API Execution with Amazon CloudWatch in the Amazon API Gateway
Developer Guide.
API Gateway Metrics
Amazon API Gateway sends metric data to CloudWatch every minute.
The AWS/ApiGateway namespace includes the following metrics.
Metric Description
4XXError The number of client-side errors captured
142
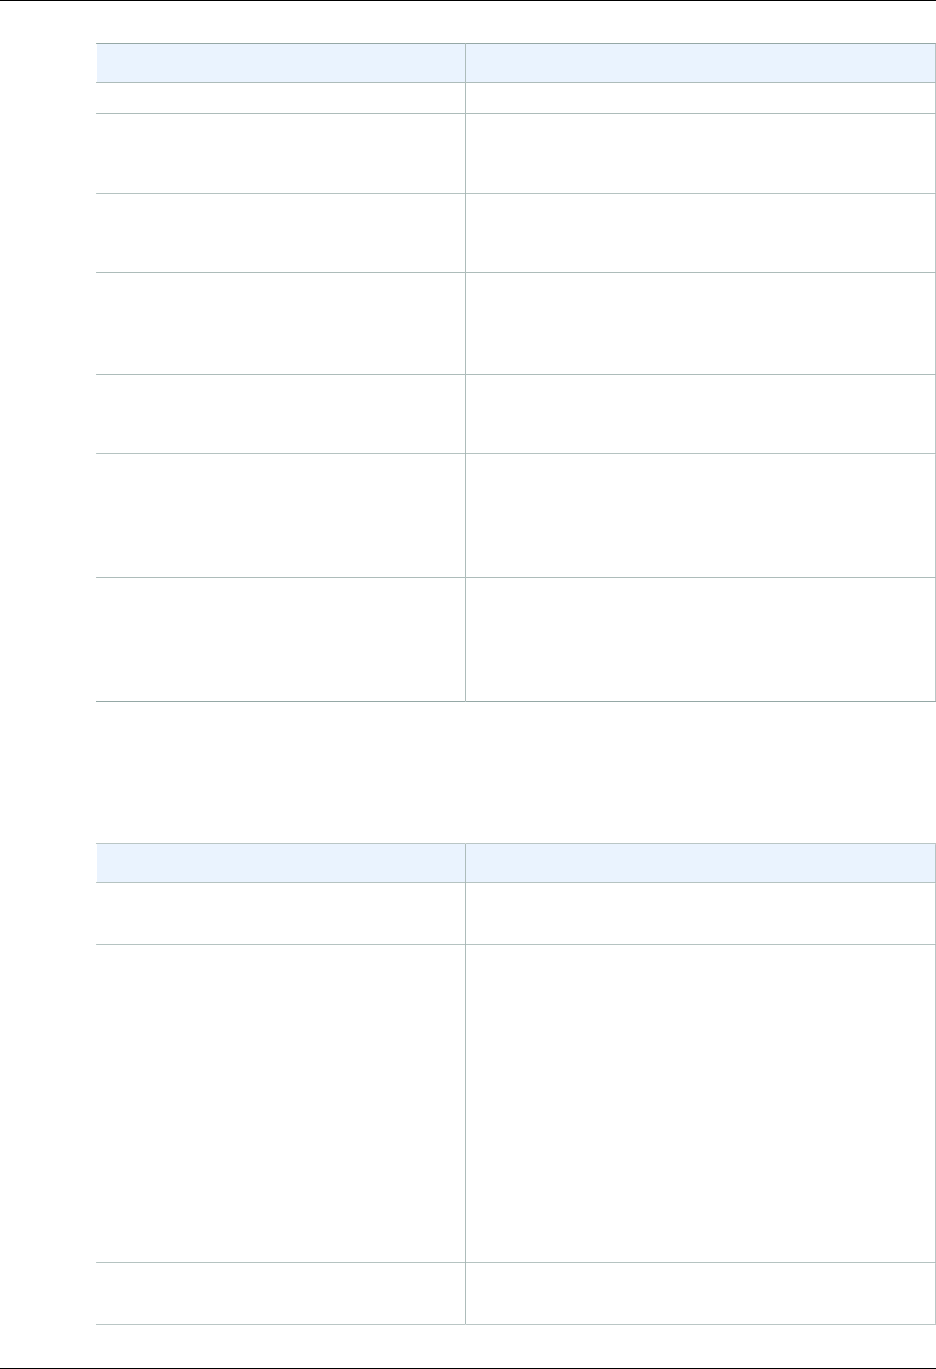
Amazon CloudWatch User Guide
Dimensions for Metrics
Metric Description
Unit: count
5XXError The number of server-side errors captured.
Unit: count
CacheHitCount The number of requests served from the API cache.
Unit: count
CacheMissCount The number of requests served from the back end
when API caching is enabled.
Unit: count
Count The number of calls to API methods.
Unit: count
IntegrationLatency The time between when API Gateway relays a request
to the back end and when it receives a response from
the back end.
Unit: millisecond
Latency The time between when API Gateway receives a
request from a client and when it returns a response to
the client.
Unit: millisecond
Dimensions for Metrics
You can use the dimensions in the following table to filter API Gateway metrics.
Dimension Description
ApiName Filters API Gateway metrics for an API of the specified
API name.
ApiName, Method, Resource, Stage Filters API Gateway metrics for an API method of the
specified API, stage, resource, and method.
API Gateway will not send such metrics unless
you have explicitly enabled detailed CloudWatch
metrics. You can do this in the console by selecting
Enable CloudWatch Metrics under a stage Settings
tab. Alternatively, you can call the stage:update
action of the API Gateway REST API to update the
metricsEnabled property to true.
Enabling such metrics will incur additional charges to
your account. For pricing information, see Amazon
CloudWatch Pricing.
ApiName, Stage Filters API Gateway metrics for an API stage of the
specified API and stage.
143
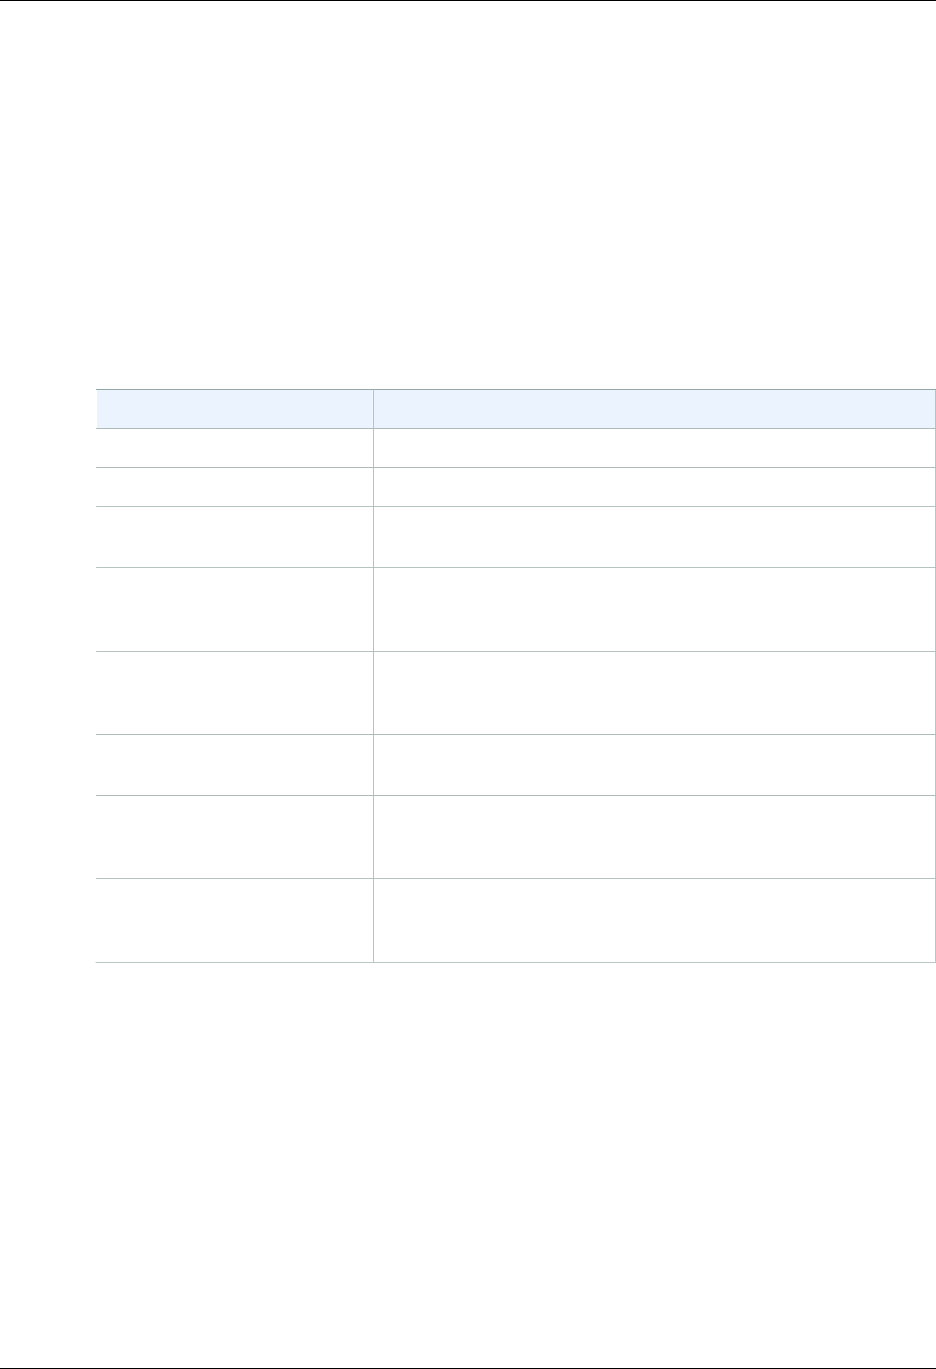
Amazon CloudWatch User Guide
Auto Scaling
Auto Scaling Dimensions and Metrics
Auto Scaling sends metrics for instances and groups to CloudWatch. For Auto Scaling instances,
you can enable detailed (one-minute) monitoring or basic (five-minute) monitoring. For Auto Scaling
groups, you can enable group metrics. For more information, see Monitoring Your Auto Scaling
Instances and Groups in the Auto Scaling User Guide.
Auto Scaling Group Metrics
If you enable group metrics, Auto Scaling sends aggregated data to CloudWatch every minute.
The AWS/AutoScaling namespace includes the following metrics.
The AWS/AutoScaling namespace includes the following metrics.
Metric Description
GroupMinSize The minimum size of the Auto Scaling group.
GroupMaxSize The maximum size of the Auto Scaling group.
GroupDesiredCapacity The number of instances that the Auto Scaling group attempts to
maintain.
GroupInServiceInstances The number of instances that are running as part of the Auto
Scaling group. This metric does not include instances that are
pending or terminating.
GroupPendingInstances The number of instances that are pending. A pending instance is
not yet in service. This metric does not include instances that are
in service or terminating.
GroupStandbyInstances The number of instances that are in a Standby state. Instances in
this state are still running but are not actively in service.
GroupTerminatingInstances The number of instances that are in the process of terminating.
This metric does not include instances that are in service or
pending.
GroupTotalInstances The total number of instances in the Auto Scaling group. This
metric identifies the number of instances that are in service,
pending, and terminating.
Dimensions for Auto Scaling Group Metrics
To filter the metrics for your Auto Scaling group by group name, use the AutoScalingGroupName
dimension.
AWS Billing and Cost Management
Dimensions and Metrics
The AWS Billing and Cost Management service sends metrics to CloudWatch. For more information,
see Monitoring Charges with Alerts and Notifications in the AWS Billing and Cost Management User
Guide.
144
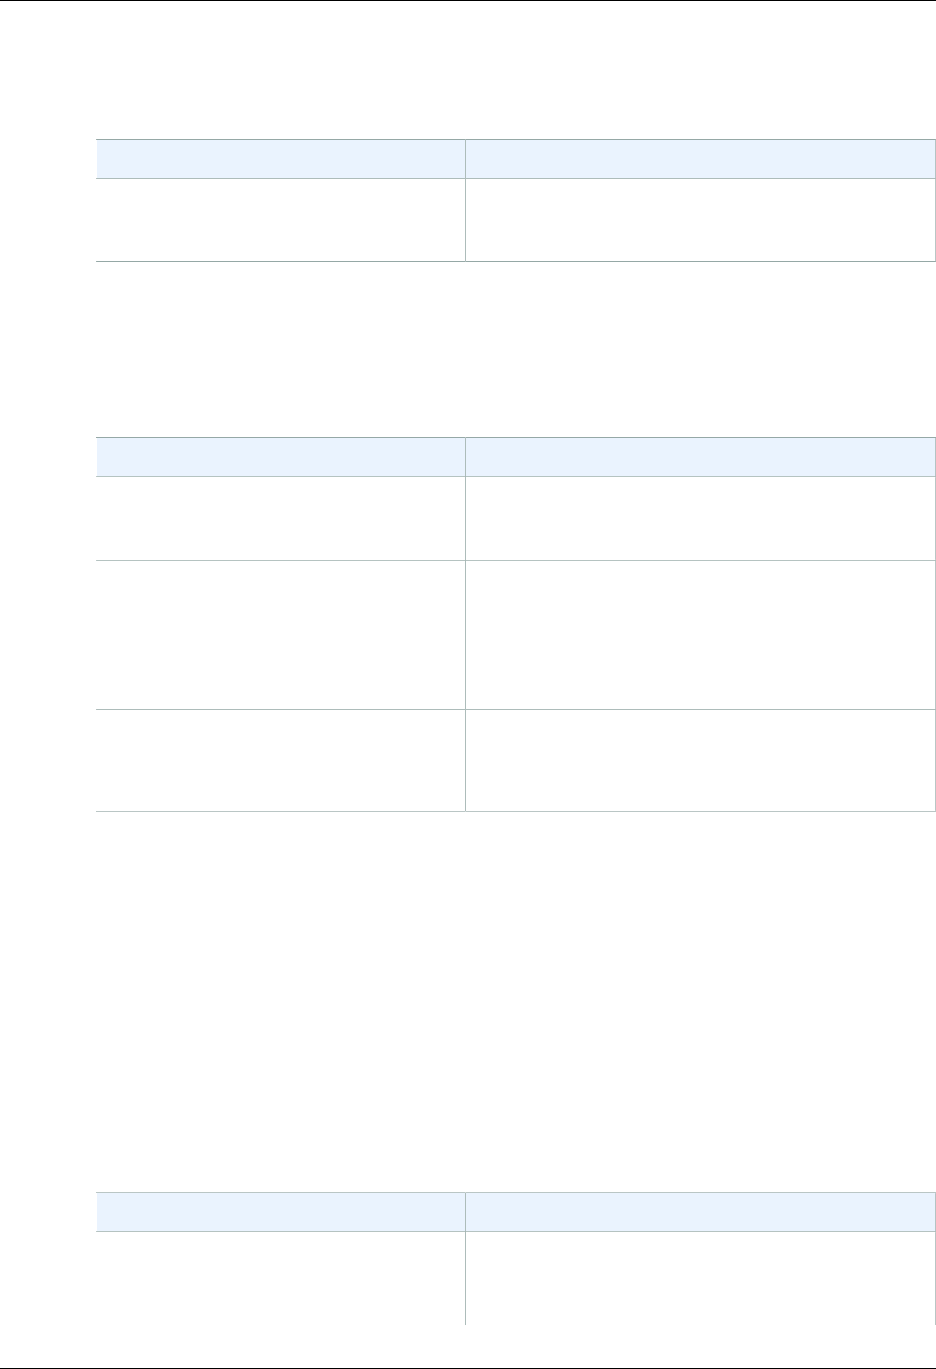
Amazon CloudWatch User Guide
AWS Billing and Cost Management Metrics
AWS Billing and Cost Management Metrics
The AWS/Billing namespace includes the following metrics.
Metric Description
EstimatedCharges The estimated charges for your AWS usage. This can
either be estimated charges for one service or a roll-up
of estimated charges for all services.
Dimensions for AWS Billing and Cost
Management Metrics
Billing and Cost Management supports filtering metrics by the following dimensions.
Dimension Description
ServiceName The name of the AWS service. This dimension is
omitted for the total of estimated charges across all
services.
LinkedAccount The linked account number. This is used for
consolidated billing only. This dimension is included
only for accounts that are linked to a separate paying
account in a consolidated billing relationship. It is
not included for accounts that are not linked to a
consolidated billing paying account.
Currency The monetary currency to bill the account. This
dimension is required.
Unit: USD
Amazon CloudFront Dimensions and Metrics
Amazon CloudFront sends metrics to Amazon CloudWatch for web distributions. Metrics and
dimensions are not available for RTMP distributions. For more information, see Monitoring CloudFront
Activity Using CloudWatch in the Amazon CloudFront Developer Guide.
Amazon CloudFront Metrics
The AWS/CloudFront namespace includes the following metrics.
Note
Only one statistic, Average or Sum, is applicable for each metric. However, all statistics are
available through the console, API, and AWS Command Line Interface. In the following table,
each metric specifies the statistic that is applicable to that metric.
Metric Description
Requests The number of requests for all HTTP methods and for
both HTTP and HTTPS requests.
Valid Statistics: Sum
145
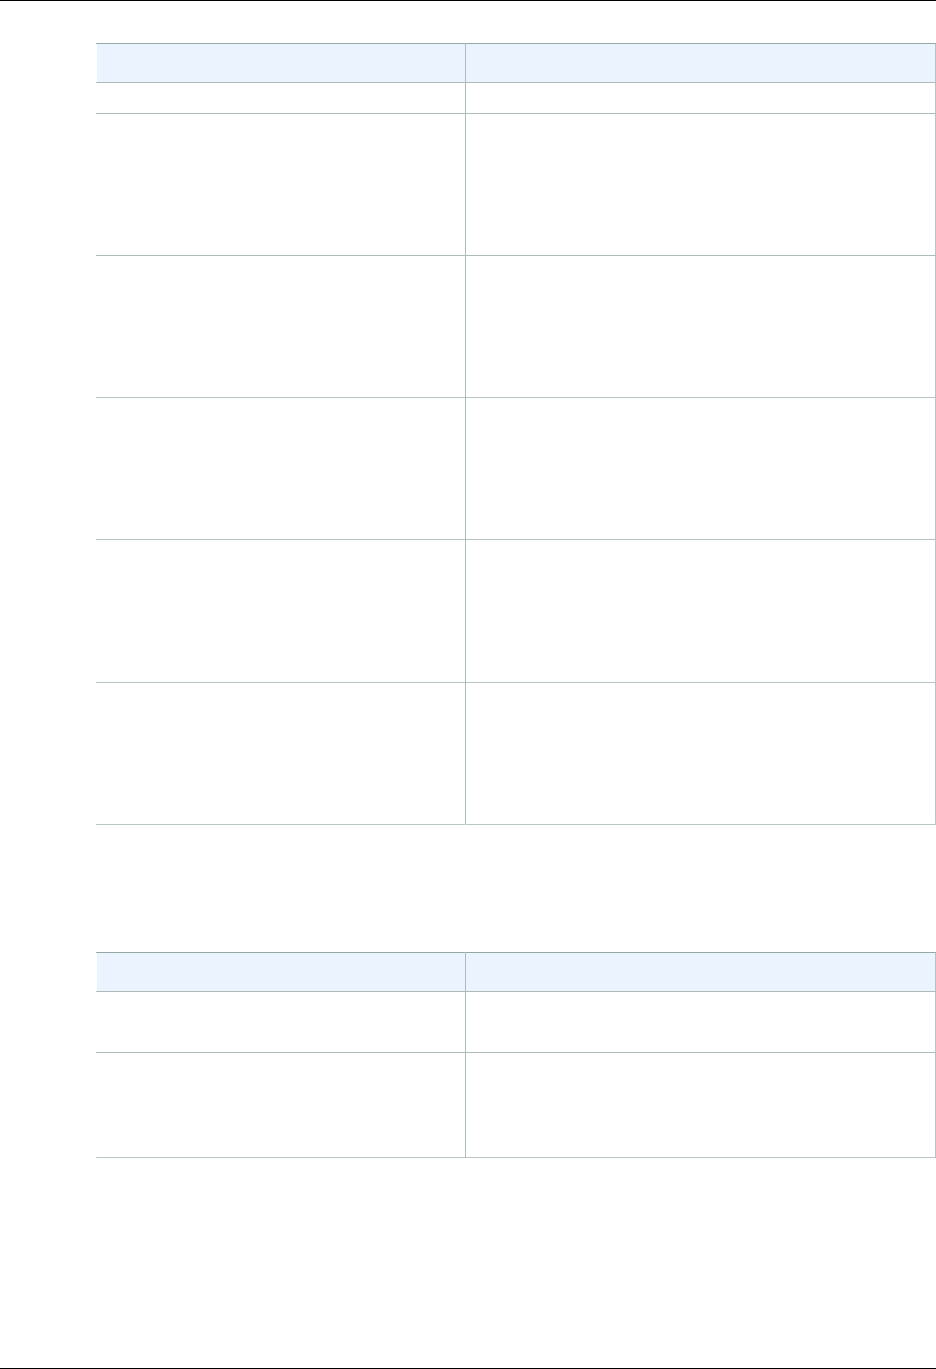
Amazon CloudWatch User Guide
Dimensions for CloudFront Metrics
Metric Description
Units: Count
BytesDownloaded The number of bytes downloaded by viewers for GET,
HEAD, and OPTIONS requests.
Valid Statistics: Sum
Units: Bytes
BytesUploaded The number of bytes uploaded to your origin with
CloudFront using POST and PUT requests.
Valid Statistics: Sum
Units: Bytes
TotalErrorRate The percentage of all requests for which the HTTP
status code is 4xx or 5xx.
Valid Statistics: Average
Units: Percent
4xxErrorRate The percentage of all requests for which the HTTP
status code is 4xx.
Valid Statistics: Average
Units: Percent
5xxErrorRate The percentage of all requests for which the HTTP
status code is 5xx.
Valid Statistics: Average
Units: Percent
Dimensions for CloudFront Metrics
CloudFront metrics use the CloudFront namespace and provide metrics for two dimensions:
Dimension Description
DistributionId The CloudFront ID of the distribution for which you
want to display metrics.
Region The region for which you want to display metrics. This
value must be Global. The Region dimension is
different from the region in which CloudFront metrics
are stored, which is US East (N. Virginia).
Amazon CloudSearch Dimensions and Metrics
Amazon CloudSearch sends metrics to Amazon CloudWatch. For more information, see Monitoring
an Amazon CloudSearch Domain with Amazon CloudWatch in the Amazon CloudSearch Developer
Guide.
146
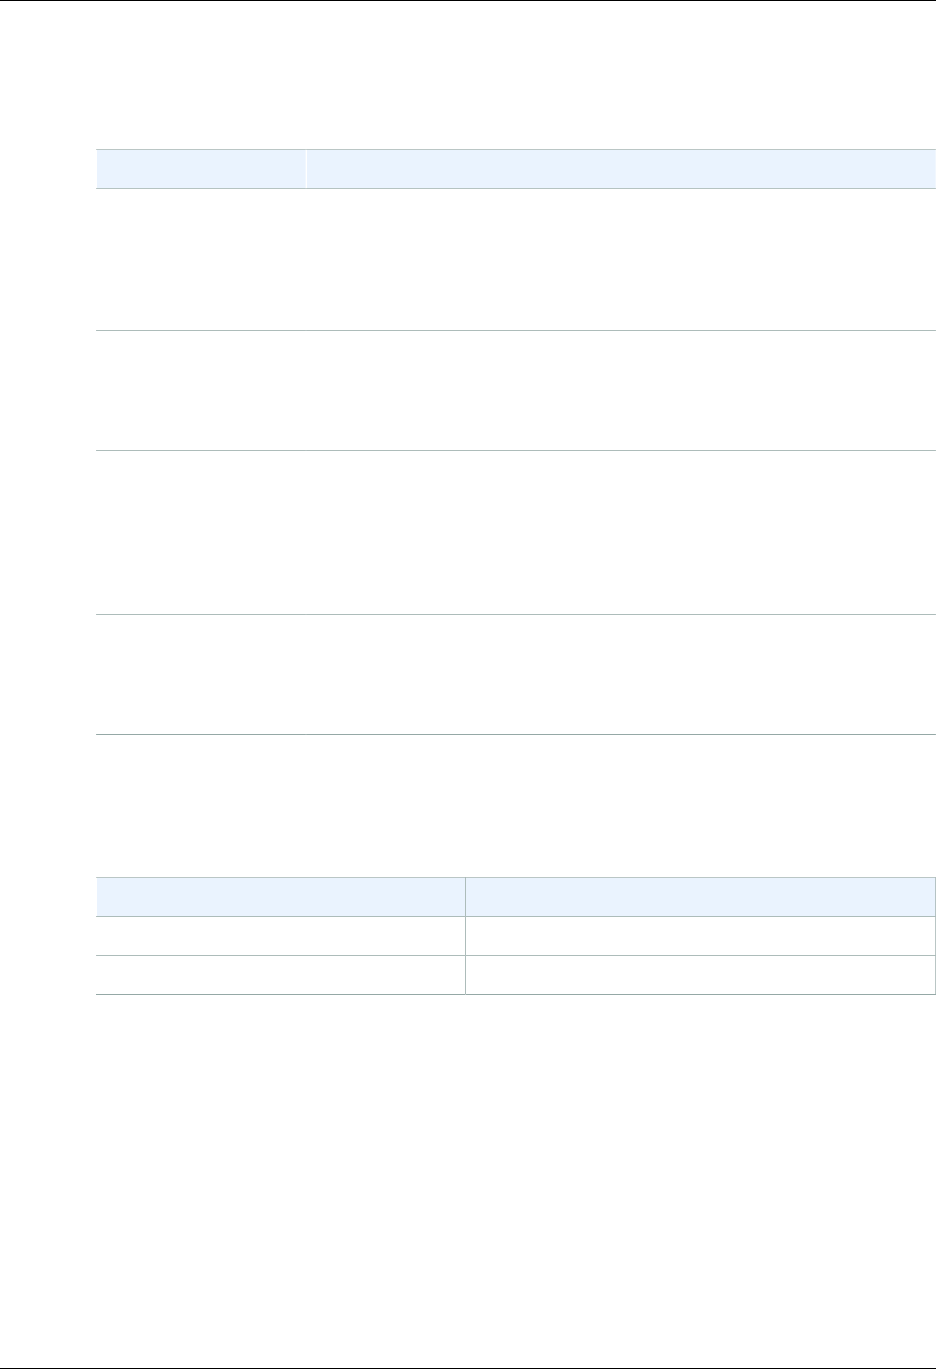
Amazon CloudWatch User Guide
Amazon CloudSearch Metrics
Amazon CloudSearch Metrics
The AWS/CloudSearch namespace includes the following metrics.
Metric Description
SuccessfulRequests The number of search requests successfully processed by a search
instance.
Units: Count
Valid statistics: Maximum, Sum
SearchableDocuments The number of searchable documents in the domain's search index.
Units: Count
Valid statistics: Maximum
IndexUtilization The percentage of the search instance's index capacity that has been
used. The Maximum value indicates the percentage of the domain's index
capacity that has been used.
Units: Percent
Valid statistics: Average, Maximum
Partitions The number of partitions the index is distributed across.
Units: Count
Valid statistics: Minimum, Maximum
Dimensions for Amazon CloudSearch Metrics
Amazon CloudSearch sends the ClientId and DomainName dimensions to CloudWatch.
Dimension Description
ClientId The AWS account ID.
DomainName The name of the search domain.
Amazon CloudWatch Events Dimensions and
Metrics
CloudWatch Events sends metrics to Amazon CloudWatch every minute.
CloudWatch Events Metrics
The AWS/Events namespace includes the following metrics.
147
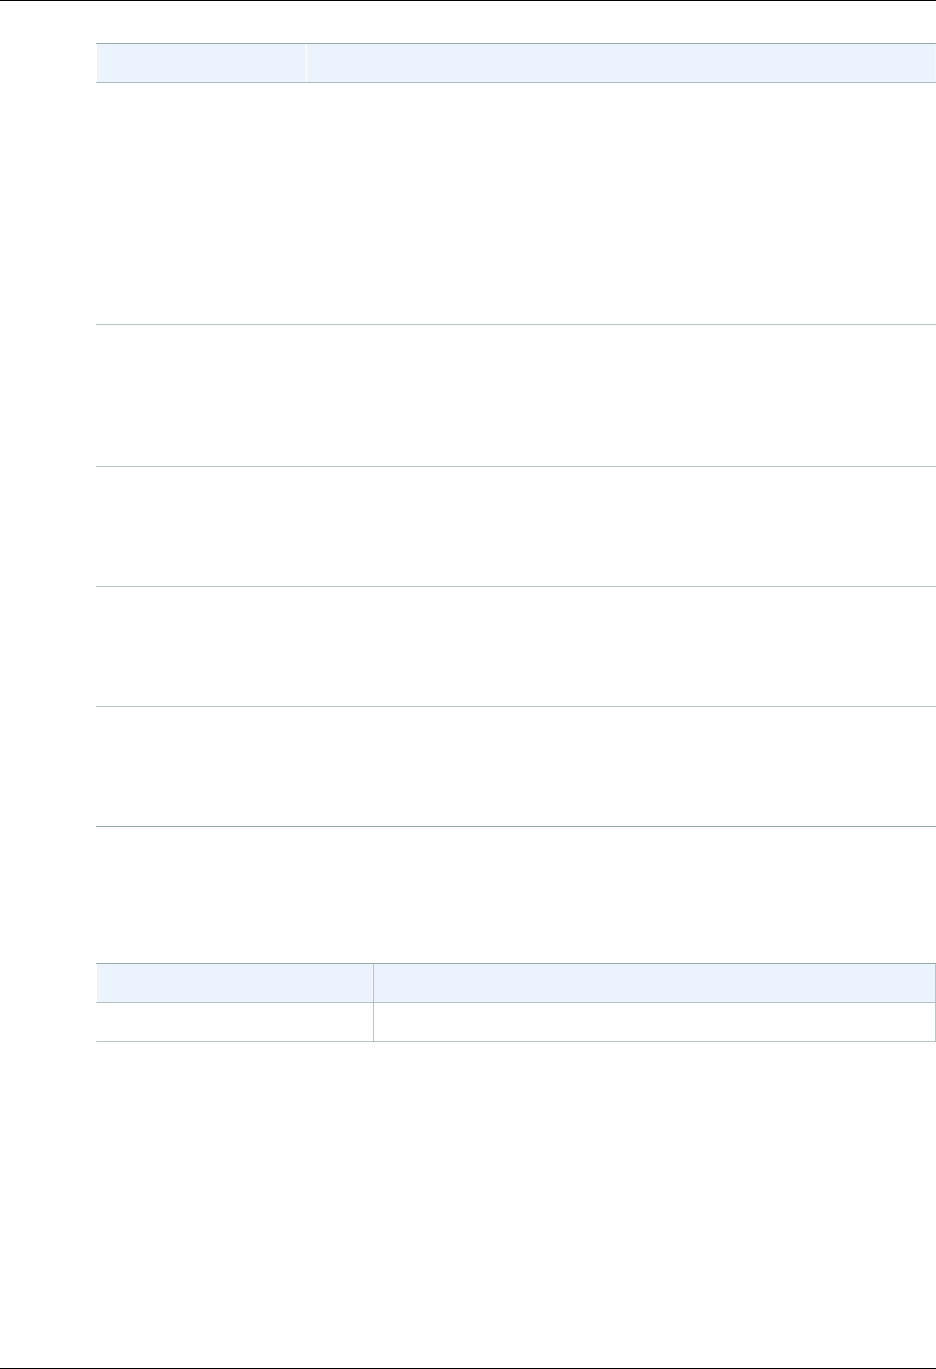
Amazon CloudWatch User Guide
Dimensions for CloudWatch Events Metrics
Metric Description
Invocations Measures the number of times a target is invoked for a rule in response
to an event. This includes successful and failed invocations, but does not
include throttled or retried attempts until they fail permanently.
Note
CloudWatch Events only sends this metric to CloudWatch if it has
a non-zero value.
Valid Dimensions: RuleName
Units: Count
FailedInvocations Measures the number of invocations that failed permanently. This does not
include invocations that are retried or that succeeded after a retry attempt.
Valid Dimensions: RuleName
Units: Count
TriggeredRules Measures the number of triggered rules that matched with any event.
Valid Dimensions: RuleName
Units: Count
MatchedEvents Measures the number of events that matched with any rule.
Valid Dimensions: None
Units: Count
ThrottledRules Measures the number of triggered rules that are being throttled.
Valid Dimensions: RuleName
Units: Count
Dimensions for CloudWatch Events Metrics
CloudWatch Events metrics have one dimension, which is listed below.
Dimension Description
RuleName Filters the available metrics by rule name.
Amazon CloudWatch Logs Dimensions and
Metrics
CloudWatch Logs sends metrics to CloudWatch every minute.
CloudWatch Logs Metrics
The AWS/Logs namespace includes the following metrics.
148

Amazon CloudWatch User Guide
Dimensions for CloudWatch Logs Metrics
Metric Description
IncomingBytes The volume of log events in uncompressed bytes uploaded to CloudWatch
Logs. When used with the LogGroupName dimension, this is the volume of
log events in uncompressed bytes uploaded to the log group.
Valid Dimensions: LogGroupName
Valid Statistic: Sum
Units: Bytes
IncomingLogEvents The number of log events uploaded to CloudWatch Logs. When used with
the LogGroupName dimension, this is the number of log events uploaded
to the log group.
Valid Dimensions: LogGroupName
Valid Statistic: Sum
Units: None
ForwardedBytes The volume of log events in compressed bytes forwarded to the
subscription destination.
Valid Dimensions: LogGroupName, DestinationType, FilterName
Valid Statistic: Sum
Units: Bytes
ForwardedLogEvents The number of log events forwarded to the subscription destination.
Valid Dimensions: LogGroupName, DestinationType, FilterName
Valid Statistic: Sum
Units: None
DeliveryErrors The number of log events for which CloudWatch Logs received an error
when forwarding data to the subscription destination.
Valid Dimensions: LogGroupName, DestinationType, FilterName
Valid Statistic: Sum
Units: None
DeliveryThrottling The number of log events for which CloudWatch Logs was throttled when
forwarding data to the subscription destination.
Valid Dimensions: LogGroupName, DestinationType, FilterName
Valid Statistic: Sum
Units: None
Dimensions for CloudWatch Logs Metrics
The dimensions that you can use with CloudWatch Logs metrics are listed below.
149
Amazon CloudWatch User Guide
Amazon DynamoDB
Dimension Description
LogGroupName The name of the CloudWatch Logs log group for which to display
metrics.
DestinationType The subscription destination for the CloudWatch Logs data, which
can be AWS Lambda, Amazon Kinesis Streams, or Amazon
Kinesis Firehose.
FilterName The name of the subscription filter that is forwarding data from
the log group to the destination. The subscription filter name
is automatically converted by CloudWatch to ASCII and any
unsupported characters get replaced with a question mark (?).
Amazon DynamoDB Dimensions and Metrics
Amazon DynamoDB sends metrics to CloudWatch. For more information, see Monitoring DynamoDB
Tables with Amazon CloudWatch in the Amazon DynamoDB Developer Guide.
DynamoDB Metrics
The following metrics are available from Amazon DynamoDB. Note that DynamoDB only sends metrics
to CloudWatch when they have a non-zero value. For example, the UserErrors metric is incremented
whenever a request generates an HTTP 400 status code. If no HTTP 400 errors were encountered
during a time period, CloudWatch will not provide metrics for UserErrors during that period.
Note
Amazon CloudWatch aggregates the following DynamoDB metrics at one-minute intervals:
•ConditionalCheckFailedRequests
•ConsumedReadCapacityUnits
•ConsumedWriteCapacityUnits
•ReadThrottleEvents
•ReturnedBytes
•ReturnedItemCount
•ReturnedRecordsCount
•SuccessfulRequestLatency
•SystemErrors
•ThrottledRequests
•UserErrors
•WriteThrottleEvents
For all other DynamoDB metrics, the aggregation granularity is five minutes.
Not all statistics, such as Average or Sum, are applicable for every metric. However, all of these values
are available through the Amazon DynamoDB console, or by using the CloudWatch console, AWS
CLI, or AWS SDKs for all metrics. In the following table, each metric has a list of Valid Statistics that is
applicable to that metric.
Metric Description
ConditionalCheckFailedRequestsThe number of failed attempts to perform conditional writes.
The PutItem, UpdateItem, and DeleteItem operations let
150

Amazon CloudWatch User Guide
DynamoDB Metrics
Metric Description
you provide a logical condition that must evaluate to true before
the operation can proceed. If this condition evaluates to false,
ConditionalCheckFailedRequests is incremented by one.
Note
A failed conditional write will result in an HTTP 400
error (Bad Request). These events are reflected in the
ConditionalCheckFailedRequests metric, but not in
the UserErrors metric.
Units: Count
Dimensions: TableName
Valid Statistics:
•Minimum
•Maximum
•Average
•SampleCount
•Sum
ConsumedReadCapacityUnits The number of read capacity units consumed over the specified
time period, so you can track how much of your provisioned
throughput is used. You can retrieve the total consumed read
capacity for a table and all of its global secondary indexes, or for
a particular global secondary index. For more information, see
Provisioned Throughput in Amazon DynamoDB.
Note
Use the Sum statistic to calculate the consumed
throughput. For example, get the Sum value over a
span of one minute, and divide it by the number of
seconds in a minute (60) to calculate the average
ConsumedReadCapacityUnits per second
(recognizing that this average will not highlight any large
but brief spikes in read activity that occurred during that
minute). You can compare the calculated value to the
provisioned throughput value you provide DynamoDB.
Units: Count
Dimensions: TableName, GlobalSecondaryIndexName
Valid Statistics:
•Minimum – Minimum number of read capacity units consumed
by any individual request to the table or index.
•Maximum – Maximum number of read capacity units consumed
by any individual request to the table or index.
•Average – Average per-request read capacity consumed.
•Sum – Total read capacity units consumed. This is the most
useful statistic for the ConsumedReadCapacityUnits metric.
•SampleCount – Number of requests to DynamoDB that
consumed read capacity.
151

Amazon CloudWatch User Guide
DynamoDB Metrics
Metric Description
ConsumedWriteCapacityUnits The number of write capacity units consumed over the specified
time period, so you can track how much of your provisioned
throughput is used. You can retrieve the total consumed write
capacity for a table and all of its global secondary indexes, or for
a particular global secondary index. For more information, see
Provisioned Throughput in Amazon DynamoDB.
Note
Use the Sum statistic to calculate the consumed
throughput. For example, get the Sum value over a
span of one minute, and divide it by the number of
seconds in a minute (60) to calculate the average
ConsumedWriteCapacityUnits per second
(recognizing that this average will not highlight any large
but brief spikes in write activity that occurred during that
minute). You can compare the calculated value to the
provisioned throughput value you provide DynamoDB.
Units: Count
Dimensions: TableName, GlobalSecondaryIndexName
Valid Statistics:
•Minimum – Minimum number of write capacity units consumed
by any individual request to the table or index.
•Maximum – Maximum number of write capacity units consumed
by any individual request to the table or index.
•Average – Average per-request write capacity consumed.
•Sum – Total write capacity units consumed. This is the most
useful statistic for the ConsumedWriteCapacityUnits
metric.
•SampleCount – Number of requests to DynamoDB that
consumed write capacity.
152

Amazon CloudWatch User Guide
DynamoDB Metrics
Metric Description
OnlineIndexConsumedWriteCapacityThe number of write capacity units consumed when adding a
new global secondary index to a table. If the write capacity of
the index is too low, incoming write activity during the backfill
phase might be throttled; this can increase the time it takes to
create the index. You should monitor this statistic while the index
is being built to determine whether the write capacity of the index
is underprovisioned.
You can adjust the write capacity of the index using the
UpdateTable operation, even while the index is still being built.
Note that the ConsumedWriteCapacityUnits metric for the
index does not include the write throughput consumed during
index creation.
Units: Count
Dimensions: TableName, GlobalSecondaryIndexName
Valid Statistics:
•Minimum
•Maximum
•Average
•SampleCount
•Sum
OnlineIndexPercentageProgressThe percentage of completion when a new global secondary
index is being added to a table. DynamoDB must first allocate
resources for the new index, and then backfill attributes from the
table into the index. For large tables, this process might take a
long time. You should monitor this statistic to view the relative
progress as DynamoDB builds the index.
Units: Count
Dimensions: TableName, GlobalSecondaryIndexName
Valid Statistics:
•Minimum
•Maximum
•Average
•SampleCount
•Sum
153

Amazon CloudWatch User Guide
DynamoDB Metrics
Metric Description
OnlineIndexThrottleEvents The number of write throttle events that occur when adding a new
global secondary index to a table. These events indicate that the
index creation will take longer to complete, because incoming
write activity is exceeding the provisioned write throughput of the
index.
You can adjust the write capacity of the index using the
UpdateTable operation, even while the index is still being built.
Note that the WriteThrotttleEvents metric for the index does
not include any throttle events that occur during index creation.
Units: Count
Dimensions: TableName, GlobalSecondaryIndexName
Valid Statistics:
•Minimum
•Maximum
•Average
•SampleCount
•Sum
ProvisionedReadCapacityUnitsThe number of provisioned read capacity units for a table or a
global secondary index.
The TableName dimension returns the
ProvisionedReadCapacityUnits for the table,
but not for any global secondary indexes. To view
ProvisionedReadCapacityUnits for a global
secondary index, you must specify both TableName and
GlobalSecondaryIndex.
Units: Count
Dimensions: TableName, GlobalSecondaryIndexName
Valid Statistics:
•Minimum – Lowest setting for provisioned read capacity. If you
use UpdateTable to increase read capacity, this metric shows
the lowest value of provisioned ReadCapacityUnits during
this time period.
•Maximum – Highest setting for provisioned read capacity. If
you use UpdateTable to decrease read capacity, this metric
shows the highest value of provisioned ReadCapacityUnits
during this time period.
•Average – Average provisioned read capacity. The
ProvisionedReadCapacityUnits metric is published
at five-minute intervals. Therefore, if you rapidly adjust the
provisioned read capacity units, this statistic might not reflect
the true average.
154

Amazon CloudWatch User Guide
DynamoDB Metrics
Metric Description
ProvisionedWriteCapacityUnitsThe number of provisioned write capacity units for a table or a
global secondary index
The TableName dimension returns the
ProvisionedWriteCapacityUnits for the table,
but not for any global secondary indexes. To view
ProvisionedWriteCapacityUnits for a global
secondary index, you must specify both TableName and
GlobalSecondaryIndex.
Units: Count
Dimensions: TableName, GlobalSecondaryIndexName
Valid Statistics:
•Minimum – Lowest setting for provisioned write capacity. If you
use UpdateTable to increase write capacity, this metric shows
the lowest value of provisioned WriteCapacityUnits during
this time period.
•Maximum – Highest setting for provisioned write capacity. If
you use UpdateTable to decrease write capacity, this metric
shows the highest value of provisioned WriteCapacityUnits
during this time period.
•Average – Average provisioned write capacity. The
ProvisionedWriteCapacityUnits metric is published
at five-minute intervals. Therefore, if you rapidly adjust the
provisioned write capacity units, this statistic might not reflect
the true average.
ReadThrottleEvents Requests to DynamoDB that exceed the provisioned read
capacity units for a table or a global secondary index.
A single request can result in multiple events. For example, a
BatchGetItem that reads 10 items is processed as ten GetItem
events. For each event, ReadThrottleEvents is incremented
by one if that event is throttled. The ThrottledRequests metric
for the entire BatchGetItem is not incremented unless all ten of
the GetItem events are throttled.
The TableName dimension returns the ReadThrottleEvents
for the table, but not for any global secondary indexes. To view
ReadThrottleEvents for a global secondary index, you must
specify both TableName and GlobalSecondaryIndex.
Units: Count
Dimensions: TableName, GlobalSecondaryIndexName
Valid Statistics:
•SampleCount
•Sum
155

Amazon CloudWatch User Guide
DynamoDB Metrics
Metric Description
ReturnedBytes The number of bytes returned by GetRecords operations
(Amazon DynamoDB Streams) during the specified time period.
Units: Bytes
Dimensions: Operation, StreamLabel, TableName
Valid Statistics:
•Minimum
•Maximum
•Average
•SampleCount
•Sum
ReturnedItemCount The number of items returned by Query or Scan operations
during the specified time period.
Note that the number of items returned is not necessarily the
same as the number of items that were evaluated. For example,
suppose you requested a Scan on a table that had 100 items, but
specified a FilterExpression that narrowed the results so that
only 15 items were returned. In this case, the response from Scan
would contain a ScanCount of 100 and a Count of 15 returned
items.
Units: Count
Dimensions: TableName
Valid Statistics:
•Minimum
•Maximum
•Average
•SampleCount
•Sum
ReturnedRecordsCount The number of stream records returned by GetRecords
operations (Amazon DynamoDB Streams) during the specified
time period.
Units: Count
Dimensions: Operation, StreamLabel, TableName
Valid Statistics:
•Minimum
•Maximum
•Average
•SampleCount
•Sum
156

Amazon CloudWatch User Guide
DynamoDB Metrics
Metric Description
SuccessfulRequestLatency Successful requests to DynamoDB or Amazon
DynamoDB Streams during the specified time period.
SuccessfulRequestLatency can provide two different kinds of
information:
• The elapsed time for successful requests (Minimum, Maximum,
Sum, or Average).
• The number of successful requests (SampleCount).
SuccessfulRequestLatency reflects activity only within
DynamoDB or Amazon DynamoDB Streams, and does not take
into account network latency or client-side activity.
Units: Milliseconds
Dimensions: TableName, Operation
Valid Statistics:
•Minimum
•Maximum
•Average
•SampleCount
SystemErrors Requests to DynamoDB or Amazon DynamoDB Streams that
generate an HTTP 500 status code during the specified time
period. An HTTP 500 usually indicates an internal service error.
Units: Count
Dimensions: All dimensions
Valid Statistics:
•Sum
•SampleCount
157

Amazon CloudWatch User Guide
DynamoDB Metrics
Metric Description
ThrottledRequests Requests to DynamoDB that exceed the provisioned throughput
limits on a resource (such as a table or an index).
ThrottledRequests is incremented by one if any event within
a request exceeds a provisioned throughput limit. For example,
if you update an item in a table with global secondary indexes,
there are multiple events—a write to the table, and a write to
each index. If one or more of these events are throttled, then
ThrottledRequests is incremented by one.
Note
In a batch request (BatchGetItem or
BatchWriteItem), ThrottledRequests is only
incremented if every request in the batch is throttled.
If any individual request within the batch is throttled, one
of the following metrics is incremented:
•ReadThrottleEvents – For a throttled GetItem
event within BatchGetItem.
•WriteThrottleEvents – For a throttled PutItem or
DeleteItem event within BatchWriteItem.
To gain insight into which event is throttling a request, compare
ThrottledRequests with the ReadThrottleEvents and
WriteThrottleEvents for the table and its indexes.
Note
A throttled request will result in an HTTP 400
status code. All such events are reflected in the
ThrottledRequests metric, but not in the
UserErrors metric.
Units: Count
Dimensions: TableName, Operation
Valid Statistics:
•Sum
•SampleCount
158

Amazon CloudWatch User Guide
DynamoDB Metrics
Metric Description
UserErrors Requests to DynamoDB or Amazon DynamoDB Streams that
generate an HTTP 400 status code during the specified time
period. An HTTP 400 usually indicates a client-side error such
as an invalid combination of parameters, attempting to update a
nonexistent table, or an incorrect request signature.
All such events are reflected in the UserErrors metric, except
for the following:
•ProvisionedThroughputExceededException – See the
ThrottledRequests metric in this section.
•ConditionalCheckFailedException – See the
ConditionalCheckFailedRequests metric in this section.
UserErrors represents the aggregate of HTTP 400 errors for
DynamoDB or Amazon DynamoDB Streams requests for the
current region and the current AWS account.
Units: Count
Dimensions: All dimensions
Valid Statistics:
•Sum
•SampleCount
WriteThrottleEvents Requests to DynamoDB that exceed the provisioned write
capacity units for a table or a global secondary index.
A single request can result in multiple events. For example, a
PutItem request on a table with three global secondary indexes
would result in four events—the table write, and each of the
three index writes. For each event, the WriteThrottleEvents
metric is incremented by one if that event is throttled. For
single PutItem requests, if any of the events are throttled,
ThrottledRequests is also incremented by one. For
BatchWriteItem, the ThrottledRequests metric for the
entire BatchWriteItem is not incremented unless all of the
individual PutItem or DeleteItem events are throttled.
The TableName dimension returns the WriteThrottleEvents
for the table, but not for any global secondary indexes. To view
WriteThrottleEvents for a global secondary index, you must
specify both TableName and GlobalSecondaryIndex.
Units: Count
Dimensions: TableName, GlobalSecondaryIndexName
Valid Statistics:
•Sum
•SampleCount
159
Amazon CloudWatch User Guide
Dimensions for DynamoDB Metrics
Dimensions for DynamoDB Metrics
The metrics for DynamoDB are qualified by the values for the account, table name, global secondary
index name, or operation. You can use the CloudWatch console to retrieve DynamoDB data along any
of the dimensions in the table below.
Dimension Description
GlobalSecondaryIndexName This dimension limits the data to a global secondary index on a
table. If you specify GlobalSecondaryIndexName, you must also
specify TableName.
Operation This dimension limits the data to one of the following DynamoDB
operations:
•PutItem
•DeleteItem
•UpdateItem
•GetItem
•BatchGetItem
•Scan
•Query
•BatchWriteItem
In addition, you can limit the data to the following Amazon
DynamoDB Streams operation:
•GetRecords
StreamLabel This dimension limits the data to a specific stream label. It is
used with metrics originating from Amazon DynamoDB Streams
GetRecords operations.
TableName This dimension limits the data to a specific table. This value can be
any table name in the current region and the current AWS account.
Amazon ECS Dimensions and Metrics
Amazon EC2 Container Service (Amazon ECS) sends metrics to Amazon CloudWatch. For more
information, see Amazon ECS CloudWatch Metrics in the Amazon EC2 Container Service Developer
Guide.
Amazon ECS Metrics
Amazon ECS provides metrics for you to monitor the CPU and memory reservation and utilization
across your cluster as a whole, and the CPU and memory utilization on the services in your clusters.
The AWS/ECS namespace includes the following metrics.
Metric Description
CPUReservation The percentage of CPU units that are reserved by running tasks in the
cluster.
160
Amazon CloudWatch User Guide
Dimensions for Amazon ECS Metrics
Metric Description
Cluster CPU reservation (this metric can only be filtered by ClusterName)
is measured as the total CPU units that are reserved by Amazon ECS
tasks on the cluster, divided by the total CPU units that were registered for
all of the container instances in the cluster.
Units: Percent
MemoryReservation The percentage of memory that is reserved by running tasks in the cluster.
Cluster memory reservation (this metric can only be filtered by
ClusterName) is measured as the total memory that is reserved by
Amazon ECS tasks on the cluster, divided by the total amount of memory
that was registered for all of the container instances in the cluster.
Units: Percent
CPUUtilization The percentage of CPU units that are used in the cluster or service.
Cluster CPU utilization (metrics that are filtered by ClusterName without
ServiceName) is measured as the total CPU units in use by Amazon ECS
tasks on the cluster, divided by the total CPU units that were registered for
all of the container instances in the cluster.
Service CPU utilization (metrics that are filtered by ClusterName and
ServiceName) is measured as the total CPU units in use by the tasks that
belong to the service, divided by the total number of CPU units that are
reserved for the tasks that belong to the service.
Units: Percent
MemoryUtilization The percentage of memory that is used in the cluster or service.
Cluster memory utilization (metrics that are filtered by ClusterName
without ServiceName) is measured as the total memory in use by Amazon
ECS tasks on the cluster, divided by the total amount of memory that was
registered for all of the container instances in the cluster.
Service memory utilization (metrics that are filtered by ClusterName and
ServiceName) is measured as the total memory in use by the tasks that
belong to the service, divided by the total memory that is reserved for the
tasks that belong to the service.
Units: Percent
Dimensions for Amazon ECS Metrics
You can use the dimensions in the following table to refine the metrics returned for your Amazon ECS
resources.
Dimension Description
ClusterName This dimension filters the data you request for all resources in a specified
cluster. All Amazon ECS metrics are filtered by ClusterName.
ServiceName This dimension filters the data you request for all resources in a specified
service within a specified cluster.
161

Amazon CloudWatch User Guide
Amazon ElastiCache
Amazon ElastiCache Dimensions and Metrics
Amazon ElastiCache sends metrics to Amazon CloudWatch. For more information, see Viewing Cache
Cluster and Cache Node Metrics in the Amazon ElastiCache User Guide.
Topics
•Dimensions for ElastiCache Metrics (p. 162)
•Host-Level Metrics (p. 162)
•Metrics for Memcached (p. 163)
•Metrics for Redis (p. 165)
Dimensions for ElastiCache Metrics
All ElastiCache metrics use the AWS/ElastiCache namespace and provide metrics for a single
dimension, the CacheNodeId, which is the automatically-generated identifier for each cache
node in the cache cluster. You can find out what these values are for your cache nodes by using
the DescribeCacheClusters API or describe-cache-clusters command line utility. For more
information, see DescribeCacheClusters in the Amazon ElastiCache API Reference and describe-
cache-clusters in the AWS Command Line Interface Reference.
Each metric is published under a single set of dimensions. When retrieving metrics, you must supply
both the CacheClusterId and CacheNodeId dimensions.
Topics
•Host-Level Metrics (p. 162)
•Metrics for Memcached (p. 163)
•Metrics for Redis (p. 165)
•Which Metrics Should I Monitor?
Host-Level Metrics
The AWS/ElastiCache namespace includes the following host-level metrics for individual cache
nodes.
See Also
•Metrics for Memcached (p. 163)
•Metrics for Redis (p. 165)
Metric Description Unit
CPUUtilization The percentage of CPU utilization. Percent
FreeableMemory The amount of free memory available on the
host. Bytes
NetworkBytesIn The number of bytes the host has read from the
network. Bytes
NetworkBytesOut The number of bytes the host has written to the
network. Bytes
162
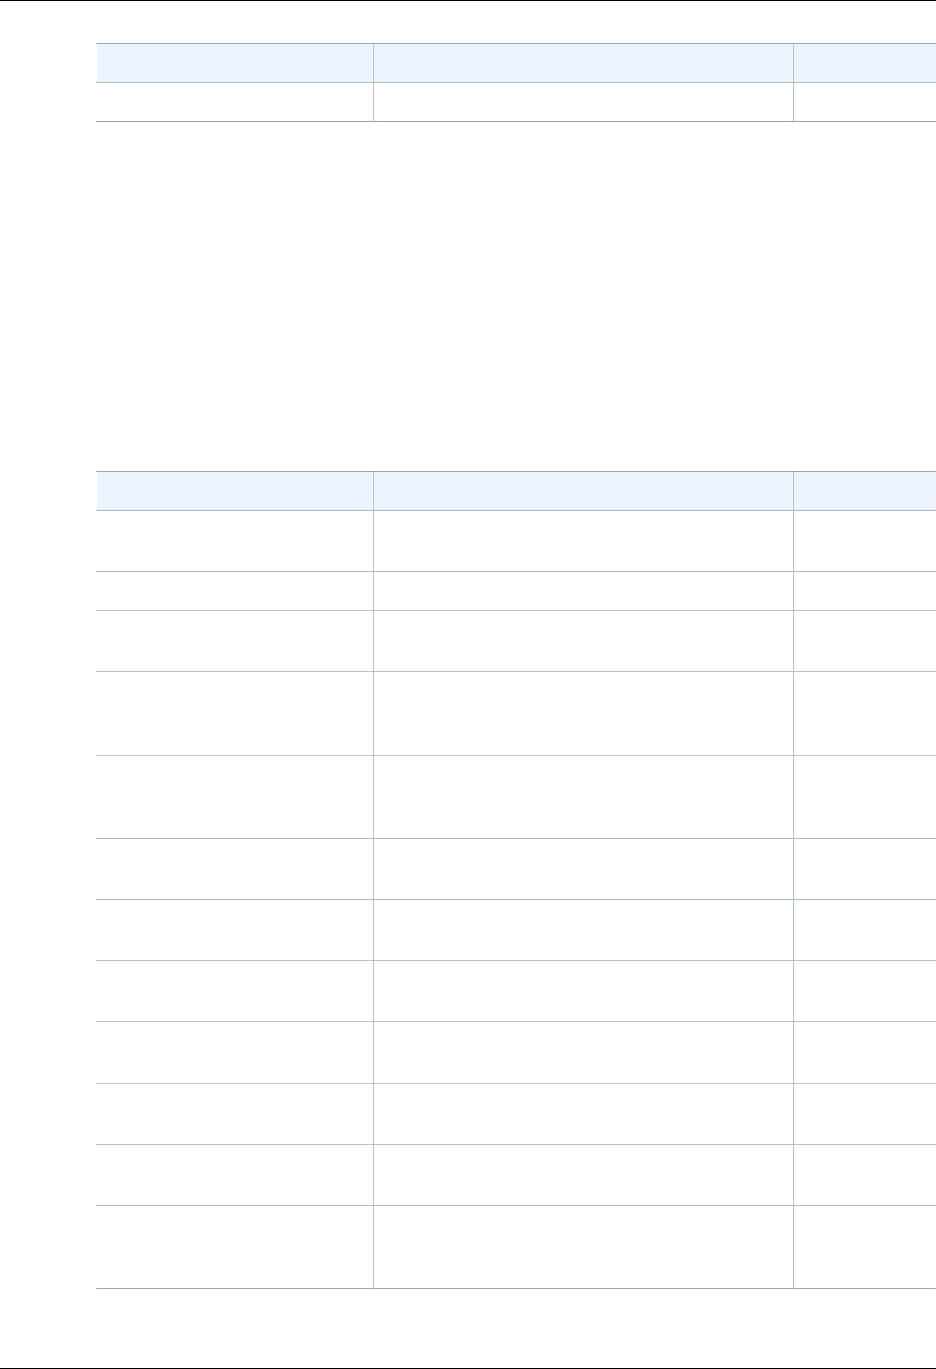
Amazon CloudWatch User Guide
Metrics for Memcached
Metric Description Unit
SwapUsage The amount of swap used on the host. Bytes
Metrics for Memcached
The AWS/ElastiCache namespace includes the following metrics that are derived from the
Memcached stats command. Each metric is calculated at the cache node level.
For complete documentation of the Memcached stats command, go to https://github.com/
memcached/memcached/blob/master/doc/protocol.txt.
See Also
•Host-Level Metrics (p. 162)
Metric Description Unit
BytesReadIntoMemcached The number of bytes that have been read from
the network by the cache node. Bytes
BytesUsedForCacheItems The number of bytes used to store cache items. Bytes
BytesWrittenOutFromMemcachedThe number of bytes that have been written to
the network by the cache node. Bytes
CasBadval The number of CAS (check and set) requests the
cache has received where the Cas value did not
match the Cas value stored.
Count
CasHits The number of Cas requests the cache has
received where the requested key was found and
the Cas value matched.
Count
CasMisses The number of Cas requests the cache has
received where the key requested was not found. Count
CmdFlush The number of flush commands the cache has
received. Count
CmdGet The number of get commands the cache has
received. Count
CmdSet The number of set commands the cache has
received. Count
CurrConnections A count of the number of connections connected
to the cache at an instant in time. Count
CurrItems A count of the number of items currently stored in
the cache. Count
DecrHits The number of decrement requests the cache
has received where the requested key was
found.
Count
163
Amazon CloudWatch User Guide
Metrics for Memcached
Metric Description Unit
DecrMisses The number of decrement requests the cache
has received where the requested key was not
found.
Count
DeleteHits The number of delete requests the cache has
received where the requested key was found. Count
DeleteMisses The number of delete requests the cache has
received where the requested key was not found. Count
Evictions The number of non-expired items the cache
evicted to allow space for new writes. Count
GetHits The number of get requests the cache has
received where the key requested was found. Count
GetMisses The number of get requests the cache has
received where the key requested was not found. Count
IncrHits The number of increment requests the cache has
received where the key requested was found. Count
IncrMisses The number of increment requests the cache has
received where the key requested was not found. Count
Reclaimed The number of expired items the cache evicted to
allow space for new writes. Count
For Memcached 1.4.14, the following additional metrics are provided.
Metric Description Unit
BytesUsedForHash The number of bytes currently used by hash
tables. Bytes
CmdConfigGet The cumulative number of config get requests. Count
CmdConfigSet The cumulative number of config set requests. Count
CmdTouch The cumulative number of touch requests. Count
CurrConfig The current number of configurations stored. Count
EvictedUnfetched The number of valid items evicted from the least
recently used cache (LRU) which were never
touched after being set.
Count
ExpiredUnfetched The number of expired items reclaimed from the
LRU which were never touched after being set. Count
SlabsMoved The total number of slab pages that have been
moved. Count
TouchHits The number of keys that have been touched and
were given a new expiration time. Count
TouchMisses The number of items that have been touched, but
were not found. Count
164
Amazon CloudWatch User Guide
Metrics for Redis
The AWS/ElastiCache namespace includes the following calculated cache-level metrics.
Metric Description Unit
NewConnections The number of new connections the cache has
received. This is derived from the memcached
total_connections statistic by recording the
change in total_connections across a period
of time. This will always be at least 1, due to a
connection reserved for a ElastiCache.
Count
NewItems The number of new items the cache has
stored. This is derived from the memcached
total_items statistic by recording the change
in total_items across a period of time.
Count
UnusedMemory The amount of memory not used by data.
This is derived from the Memcached statistics
limit_maxbytes and bytes by subtracting
bytes from limit_maxbytes.
Because Memcached overhead uses memory
in addition to that used by data, UnusedMemory
should not be considered to be the amount of
memory available for additional data. You may
experience evictions even though you still have
some unused memory.
For more detailed information, see Memcached
item memory usage.
Bytes
Metrics for Redis
The AWS/ElastiCache namespace includes the following Redis metrics.
With the exception of ReplicationLag, these metrics are derived from the Redis info command.
Each metric is calculated at the cache node level.
For complete documentation of the Redis info command, go to http://redis.io/commands/info.
See Also
•Host-Level Metrics (p. 162)
Metric Description Unit
BytesUsedForCache The total number of bytes allocated by Redis. Bytes
CacheHits The number of successful key lookups. Count
CacheMisses The number of unsuccessful key lookups. Count
CurrConnections The number of client connections, excluding
connections from read replicas. Count
Evictions The number of keys that have been evicted due
to the maxmemory limit. Count
165
Amazon CloudWatch User Guide
Metrics for Redis
Metric Description Unit
HyperLogLogBasedCmds The total number of HyperLogLog based
commands. This is derived from the Redis
commandstats statistic by summing all of the pf
type of commands (pfadd, pfcount, pfmerge).
Count
NewConnections The total number of connections that have been
accepted by the server during this period. Count
Reclaimed The total number of key expiration events. Count
ReplicationBytes For primaries with attached replicas,
ReplicationBytes reports the number of
bytes that the primary is sending to all of its
replicas. This metric is representative of the write
load on the replication group. For replicas and
standalone primaries, ReplicationBytes is
always 0.
Bytes
ReplicationLag This metric is only applicable for a cache node
running as a read replica. It represents how far
behind, in seconds, the replica is in applying
changes from the primary cache cluster.
Seconds
SaveInProgress This binary metric returns 1 whenever a
background save (forked or forkless) is in
progress, and 0 otherwise. A background save
process is typically used during snapshots and
syncs. These operations can cause degraded
performance. Using the SaveInProgress
metric, you can diagnose whether or not
degraded performance was caused by a
background save process.
Count
These are aggregations of certain kinds of commands, derived from info commandstats:
Metric Description Unit
CurrItems The number of items in the cache. This is derived
from the Redis keyspace statistic, summing all
of the keys in the entire keyspace.
Count
GetTypeCmds The total number of get types of commands.
This is derived from the Redis commandstats
statistic by summing all of the get types of
commands (get, mget, hget, etc.)
Count
HashBasedCmds The total number of commands that are
hash-based. This is derived from the Redis
commandstats statistic by summing all of the
commands that act upon one or more hashes.
Count
KeyBasedCmds The total number of commands that are
key-based. This is derived from the Redis
commandstats statistic by summing all of the
commands that act upon one or more keys.
Count
166
Amazon CloudWatch User Guide
Amazon EBS
Metric Description Unit
ListBasedCmds The total number of commands that are
list-based. This is derived from the Redis
commandstats statistic by summing all of the
commands that act upon one or more lists.
Count
SetBasedCmds The total number of commands that are
set-based. This is derived from the Redis
commandstats statistic by summing all of the
commands that act upon one or more sets.
Count
SetTypeCmds The total number of set types of commands.
This is derived from the Redis commandstats
statistic by summing all of the set types of
commands (set, hset, etc.)
Count
SortedSetBasedCmds The total number of commands that are sorted
set-based. This is derived from the Redis
commandstats statistic by summing all of the
commands that act upon one or more sorted
sets.
Count
StringBasedCmds The total number of commands that are
string-based. This is derived from the Redis
commandstats statistic by summing all of the
commands that act upon one or more strings.
Count
Amazon EBS Dimensions and Metrics
Amazon Elastic Block Store (Amazon EBS) sends data points to CloudWatch for several metrics.
Amazon EBS General Purpose SSD (gp2), Throughput Optimized HDD (st1) , Cold HDD (sc1), and
Magnetic (standard) volumes automatically send five-minute metrics to CloudWatch. Provisioned IOPS
SSD (io1) volumes automatically send one-minute metrics to CloudWatch. For more information, see
Monitoring the Status of Your Volumes in the Amazon EC2 User Guide for Linux Instances.
Amazon EBS Metrics
Amazon Elastic Block Store (Amazon EBS) sends data points to CloudWatch for several metrics.
Amazon EBS General Purpose SSD (gp2), Throughput Optimized HDD (st1) , Cold HDD (sc1), and
Magnetic (standard) volumes automatically send five-minute metrics to CloudWatch. Provisioned IOPS
SSD (io1) volumes automatically send one-minute metrics to CloudWatch. For more information about
how to monitor Amazon EBS, see Monitoring the Status of Your Volumes in the Amazon EC2 User
Guide for Linux Instances.
The AWS/EBS namespace includes the following metrics.
Metric Description
VolumeReadBytes
VolumeWriteBytes
Provides information on the I/O operations in a specified period of time.
The Sum statistic reports the total number of bytes transferred during
the period. The Average statistic reports the average size of each I/O
operation during the period. The SampleCount statistic reports the total
number of I/O operations during the period. The Minimum and Maximum
statistics are not relevant for this metric. Data is only reported to Amazon
CloudWatch when the volume is active. If the volume is idle, no data is
reported to Amazon CloudWatch.
167

Amazon CloudWatch User Guide
Amazon EBS Metrics
Metric Description
Units: Bytes
VolumeReadOps
VolumeWriteOps
The total number of I/O operations in a specified period of time.
Note
To calculate the average I/O operations per second (IOPS) for the
period, divide the total operations in the period by the number of
seconds in that period.
Units: Count
VolumeTotalReadTime
VolumeTotalWriteTime
The total number of seconds spent by all operations that completed in a
specified period of time. If multiple requests are submitted at the same
time, this total could be greater than the length of the period. For example,
for a period of 5 minutes (300 seconds): if 700 operations completed during
that period, and each operation took 1 second, the value would be 700
seconds.
Units: Seconds
VolumeIdleTime The total number of seconds in a specified period of time when no read or
write operations were submitted.
Units: Seconds
VolumeQueueLength The number of read and write operation requests waiting to be completed
in a specified period of time.
Units: Count
VolumeThroughputPercentageUsed with Provisioned IOPS SSD volumes only. The percentage of I/O
operations per second (IOPS) delivered of the total IOPS provisioned for
an Amazon EBS volume. Provisioned IOPS SSD volumes deliver within 10
percent of the provisioned IOPS performance 99.9 percent of the time over
a given year.
Note
During a write, if there are no other pending I/O requests in a
minute, the metric value will be 100 percent. Also, a volume's I/O
performance may become degraded temporarily due to an action
you have taken (e.g., creating a snapshot of a volume during peak
usage, running the volume on a non-EBS-optimized instance,
accessing data on the volume for the first time).
Units: Percent
VolumeConsumedReadWriteOpsUsed with Provisioned IOPS SSD volumes only. The total amount of read
and write operations (normalized to 256K capacity units) consumed in a
specified period of time.
I/O operations that are smaller than 256K each count as 1 consumed
IOPS. I/O operations that are larger than 256K are counted in 256K
capacity units. For example, a 1024K I/O would count as 4 consumed
IOPS.
Units: Count
168
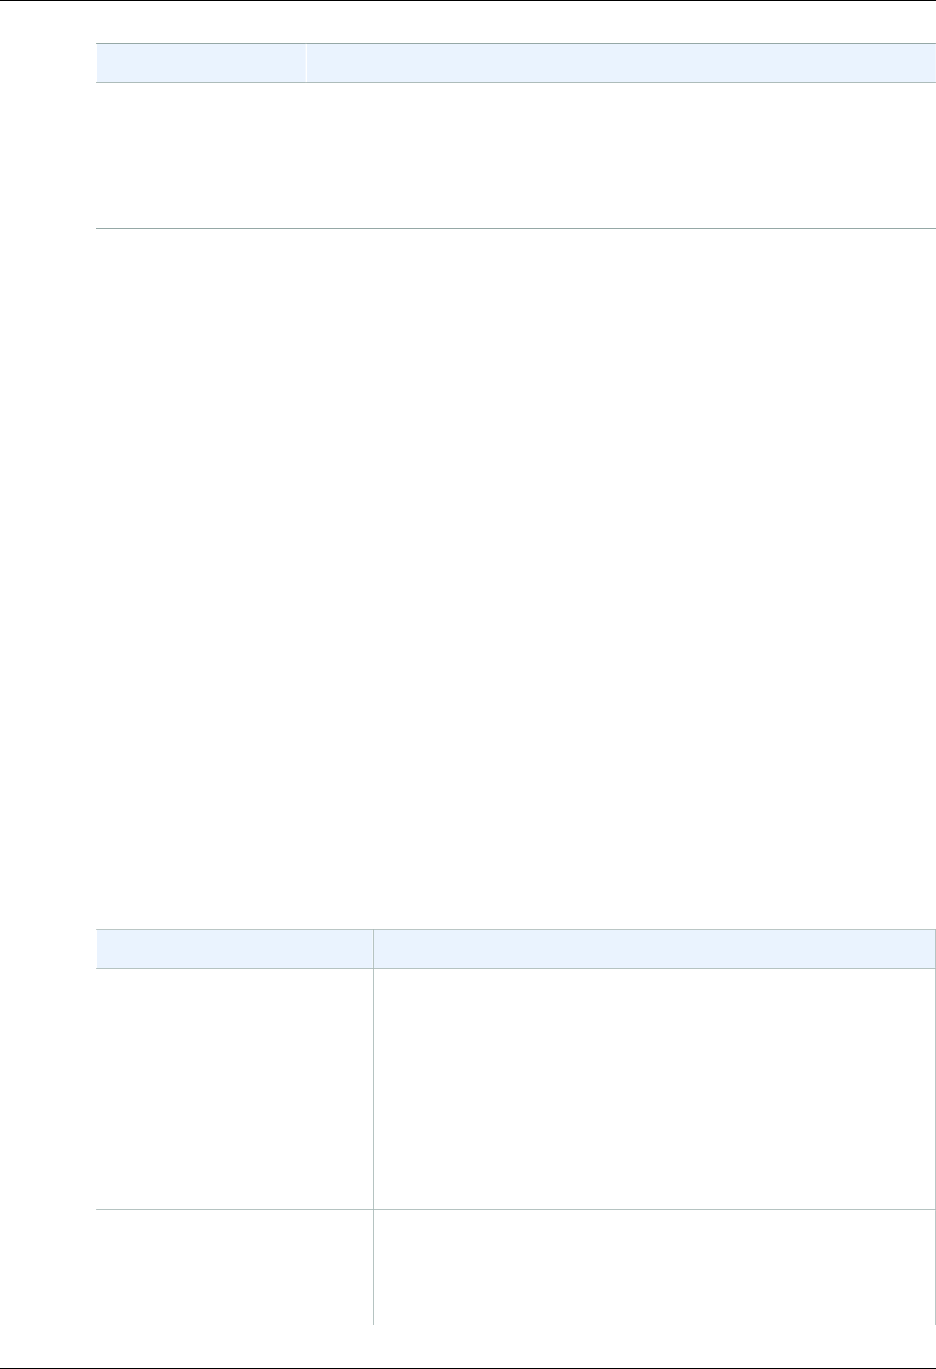
Amazon CloudWatch User Guide
Dimensions for Amazon EBS Metrics
Metric Description
BurstBalance Used with Throughput Optimized HDD (st1) and Cold HDD (sc1) volumes
only. Provides information on the balance available in the burst bucket.
Data is only reported to CloudWatch when the volume is active. If the
volume is not attached, no data is reported.
Units: Percent
Dimensions for Amazon EBS Metrics
The only dimension that Amazon EBS sends to CloudWatch is the Volume ID. This means that all
available statistics are filtered by Volume ID.
Amazon Elastic Compute Cloud Dimensions
and Metrics
Amazon Elastic Compute Cloud (Amazon EC2) sends metrics to CloudWatch for your EC2 instances.
Basic (five-minute) monitoring is enabled by default. You can enable detailed (one-minute) monitoring.
For information about additional metrics for Amazon EC2 instances that are in an Auto Scaling group,
see Auto Scaling Dimensions and Metrics (p. 144).
For more information about how to monitor Amazon EC2, see Monitoring Your Instances with
CloudWatch in the Amazon EC2 User Guide for Linux Instances.
Topics
•Amazon EC2 Metrics (p. 169)
•Dimensions for Amazon EC2 Metrics (p. 172)
Amazon EC2 Metrics
The following metrics are available from each EC2 instance.
The AWS/EC2 namespace includes the following metrics.
Metric Description
CPUCreditUsage (Only valid for T2 instances) The number of CPU credits
consumed during the specified period.
This metric identifies the amount of time during which physical
CPUs were used for processing instructions by virtual CPUs
allocated to the instance.
Note
CPU Credit metrics are available at a 5 minute frequency.
Units: Count
CPUCreditBalance (Only valid for T2 instances) The number of CPU credits that an
instance has accumulated.
This metric is used to determine how long an instance can burst
beyond its baseline performance level at a given rate.
169

Amazon CloudWatch User Guide
Amazon EC2 Metrics
Metric Description
Note
CPU Credit metrics are available at a 5 minute frequency.
Units: Count
CPUUtilization The percentage of allocated EC2 compute units that are currently
in use on the instance. This metric identifies the processing power
required to run an application upon a selected instance.
Note
Depending on the instance type, tools in your operating
system may show a lower percentage than CloudWatch
when the instance is not allocated a full processor core.
Units: Percent
DiskReadOps Completed read operations from all instance store volumes
available to the instance in a specified period of time.
Note
To calculate the average I/O operations per second
(IOPS) for the period, divide the total operations in the
period by the number of seconds in that period.
Units: Count
DiskWriteOps Completed write operations to all instance store volumes available
to the instance in a specified period of time.
Note
To calculate the average I/O operations per second
(IOPS) for the period, divide the total operations in the
period by the number of seconds in that period.
Units: Count
DiskReadBytes Bytes read from all instance store volumes available to the
instance.
This metric is used to determine the volume of the data the
application reads from the hard disk of the instance. This can be
used to determine the speed of the application.
Units: Bytes
DiskWriteBytes Bytes written to all instance store volumes available to the
instance.
This metric is used to determine the volume of the data the
application writes onto the hard disk of the instance. This can be
used to determine the speed of the application.
Units: Bytes
NetworkIn The number of bytes received on all network interfaces by the
instance. This metric identifies the volume of incoming network
traffic to an application on a single instance.
Units: Bytes
170

Amazon CloudWatch User Guide
Amazon EC2 Metrics
Metric Description
NetworkOut The number of bytes sent out on all network interfaces by the
instance. This metric identifies the volume of outgoing network
traffic to an application on a single instance.
Units: Bytes
NetworkPacketsIn The number of packets received on all network interfaces by the
instance. This metric identifies the volume of incoming traffic in
terms of the number of packets on a single instance. This metric is
available for basic monitoring only.
Units: Count
Statistics: Minimum, Maximum, Average
NetworkPacketsOut The number of packets sent out on all network interfaces by the
instance. This metric identifies the volume of outgoing traffic in
terms of the number of packets on a single instance. This metric is
available for basic monitoring only.
Units: Count
Statistics: Minimum, Maximum, Average
StatusCheckFailed A combination of StatusCheckFailed_Instance and
StatusCheckFailed_System that reports if either of the status
checks has failed. Values for this metric are either 0 (zero) or
1 (one.) A zero indicates that the status check passed. A one
indicates a status check failure.
Note
Status check metrics are available at 1 minute frequency.
For a newly-launched instance, status check metric data
is only available after the instance has completed the
initialization state. Status check metrics become available
within a few minutes of the instance being in the running
state.
Units: Count
StatusCheckFailed_InstanceReports whether the instance has passed the Amazon EC2
instance status check in the last minute. Values for this metric are
either 0 (zero) or 1 (one.) A zero indicates that the status check
passed. A one indicates a status check failure.
Note
Status check metrics are available at 1 minute frequency.
For a newly-launched instance, status check metric data
is only available after the instance has completed the
initialization state. Status check metrics become available
within a few minutes of the instance being in the running
state.
Units: Count
171
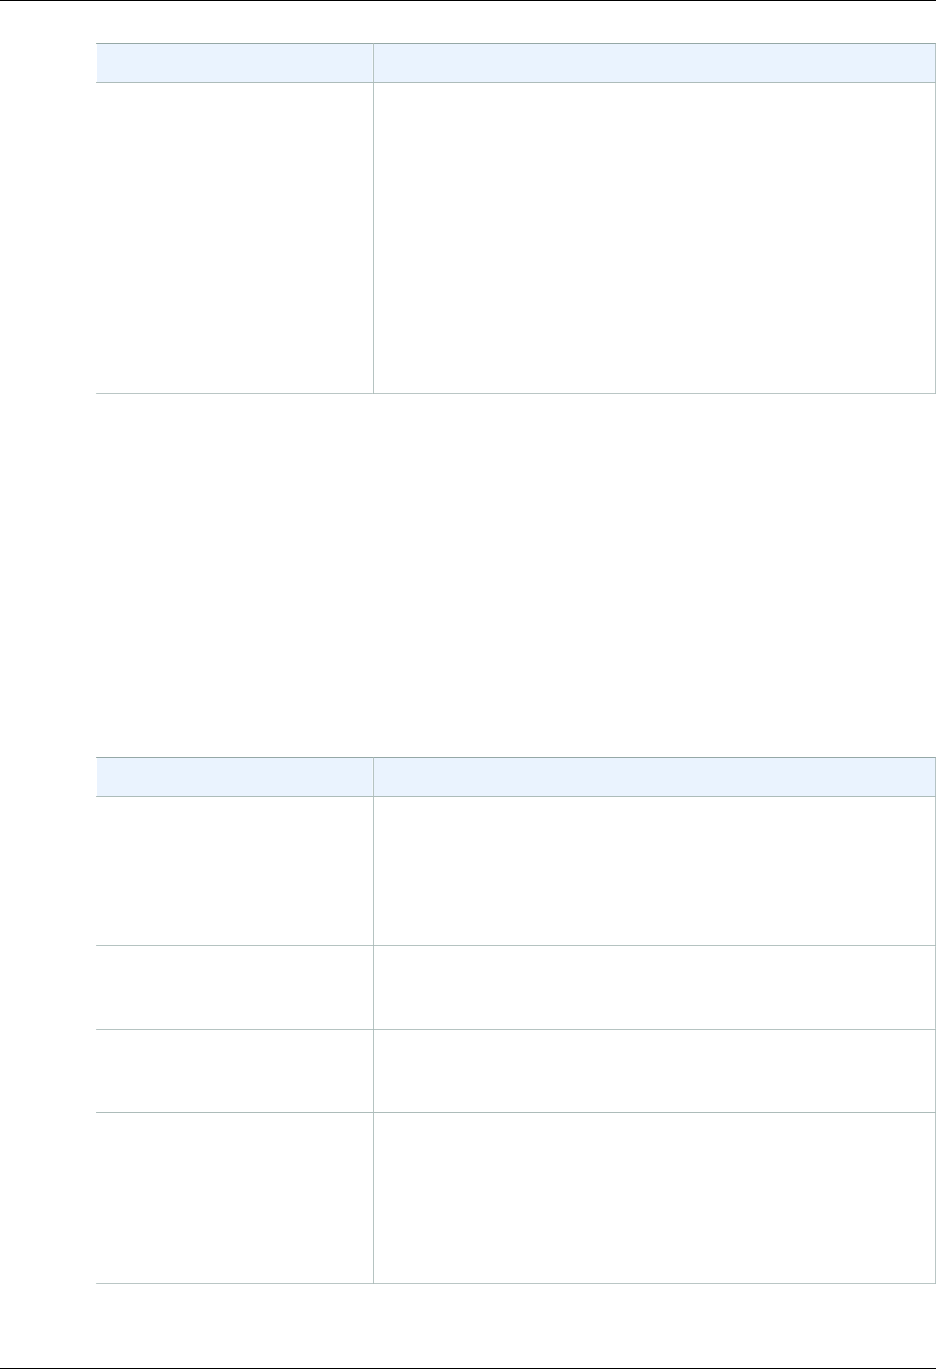
Amazon CloudWatch User Guide
Dimensions for Amazon EC2 Metrics
Metric Description
StatusCheckFailed_System Reports whether the instance has passed the EC2 system status
check in the last minute. Values for this metric are either 0 (zero)
or 1 (one.) A zero indicates that the status check passed. A one
indicates a status check failure.
Note
Status check metrics are available at a 1 minute
frequency. For a newly-launched instance, status check
metric data is only available after the instance has
completed the initialization state. Status check metrics
become available within a few minutes of the instance
being in the running state.
Units: Count
Amazon CloudWatch data for a new EC2 instance typically becomes available within one minute of
the end of the first period of time requested (the aggregation period) in the query. You can set the
period—the length of time over which statistics are aggregated—with the Period parameter. For more
information on periods, see Periods (p. 7).
You can use the currently available dimensions for EC2 instances (for example, ImageId or
InstanceType) to refine the metrics returned. For information about the dimensions you can use with
EC2, see Dimensions for Amazon EC2 Metrics (p. 172).
Dimensions for Amazon EC2 Metrics
If you're using Detailed Monitoring, you can filter the EC2 instance data using any of the dimensions in
the following table.
Dimension Description
AutoScalingGroupName This dimension filters the data you request for all instances in a
specified capacity group. An Auto Scaling group is a collection of
instances you define if you're using Auto Scaling. This dimension
is available only for Amazon EC2 metrics when the instances
are in such an Auto Scaling group. Available for instances with
Detailed or Basic Monitoring enabled.
ImageId This dimension filters the data you request for all instances running
this Amazon EC2 Amazon Machine Image (AMI). Available for
instances with Detailed Monitoring enabled.
InstanceId This dimension filters the data you request for the identified
instance only. This helps you pinpoint an exact instance from
which to monitor data.
InstanceType This dimension filters the data you request for all instances
running with this specified instance type. This helps you categorize
your data by the type of instance running. For example, you
might compare data from an m1.small instance and an m1.large
instance to determine which has the better business value for
your application. Available for instances with Detailed Monitoring
enabled.
172
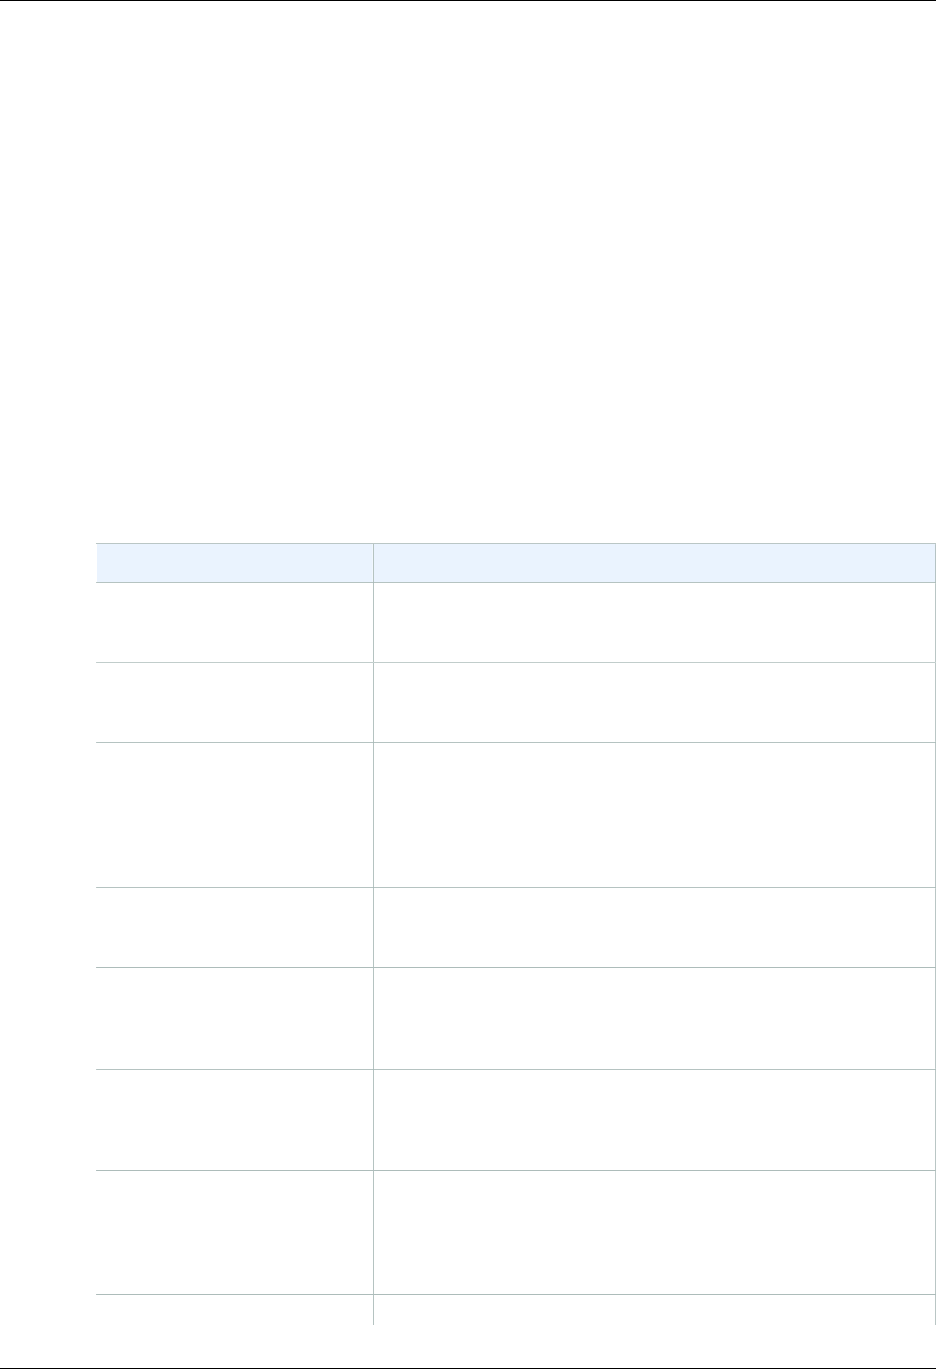
Amazon CloudWatch User Guide
Amazon EC2 Spot Fleet
Amazon EC2 Spot Fleet Dimensions and
Metrics
Amazon Elastic Compute Cloud (Amazon EC2) sends information about your Spot fleet to
CloudWatch. For more information, see CloudWatch Metrics for Spot Fleet in the Amazon EC2 User
Guide for Linux Instances.
Topics
•Amazon EC2 Spot Fleet Metrics (p. 173)
•Dimensions for Amazon EC2 Spot Fleet Metrics (p. 174)
Amazon EC2 Spot Fleet Metrics
The AWS/EC2Spot namespace includes the following metrics, plus the CloudWatch metrics for the
Spot instances in your fleet.
The AWS/EC2Spot namespace includes the following metrics.
Metric Description
AvailableInstancePoolsCountThe Spot Instance pools specified in the Spot Fleet request.
Units: Count
BidsSubmittedForCapacity The capacity for which Amazon EC2 has submitted bids.
Units: Count
EligibleInstancePoolCount The Spot Instance pools specified in the Spot Fleet request where
Amazon EC2 can fulfill bids. Amazon EC2 will not fulfill bids in
pools where your bid price is less than the Spot price or the Spot
price is greater than the price for On-Demand instances.
Units: Count
FulfilledCapacity The capacity that Amazon EC2 has fulfilled.
Units: Count
MaxPercentCapacityAllocationThe maximum value of PercentCapacityAllocation across all
Spot Instance pools specified in the Spot Fleet request.
Units: Percent
PendingCapacity The difference between TargetCapacity and
FulfilledCapacity.
Units: Count
PercentCapacityAllocation The capacity allocated for the Spot Instance pool for the specified
dimensions. To get the maximum value recorded across all Spot
Instance pools, use MaxPercentCapacityAllocation.
Units: Percent
TargetCapacity The target capacity of the Spot Fleet request.
173
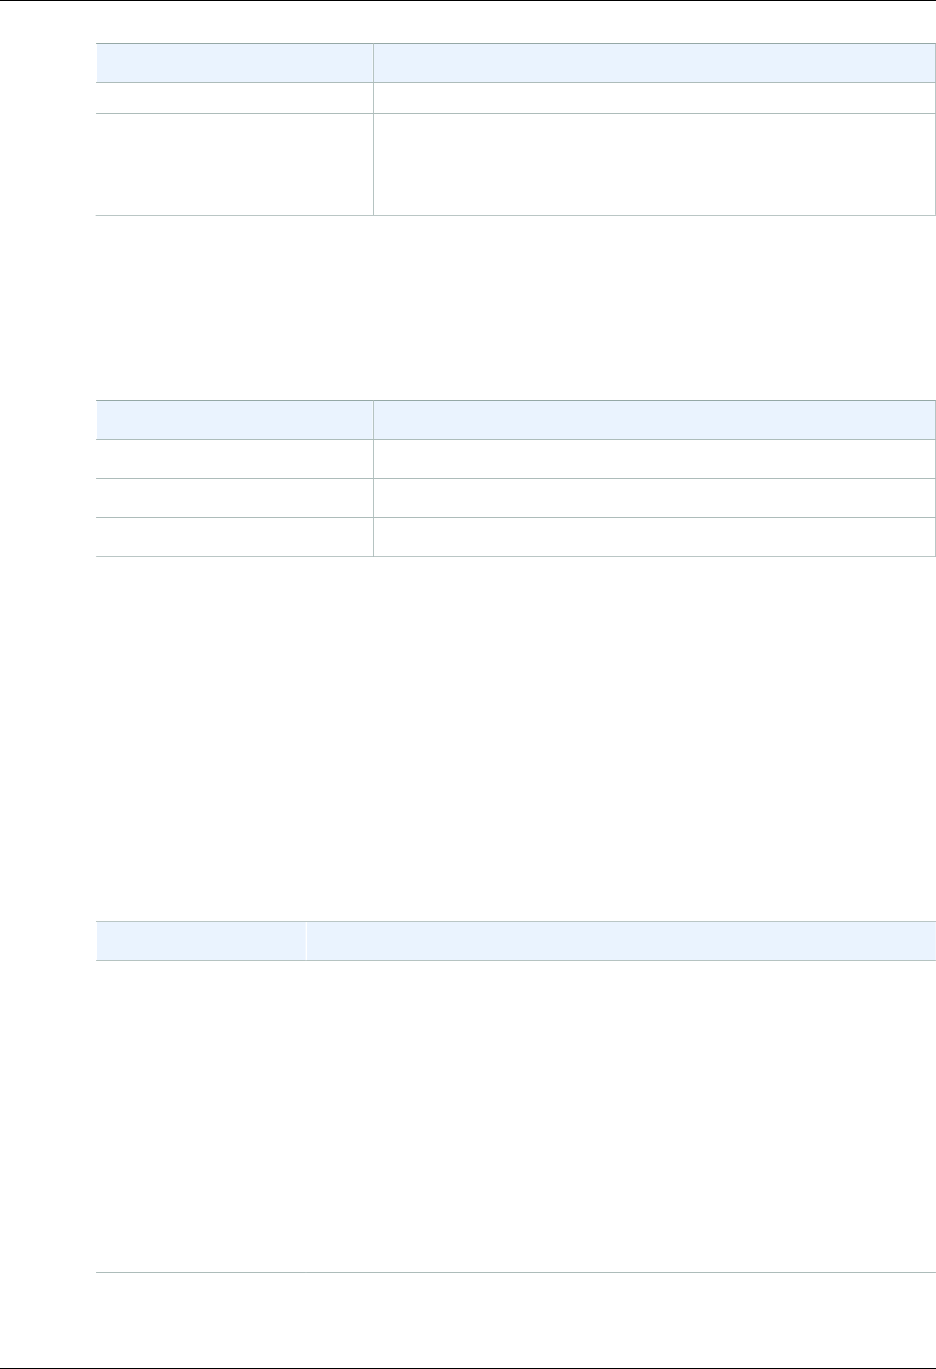
Amazon CloudWatch User Guide
Dimensions for Amazon EC2 Spot Fleet Metrics
Metric Description
Units: Count
TerminatingCapacity The capacity that is being terminated due to Spot Instance
interruptions.
Units: Count
If the unit of measure for a metric is Count, the most useful statistic is Average.
Dimensions for Amazon EC2 Spot Fleet Metrics
You can filter the Amazon EC2 Spot fleet instance data using any of the dimensions in the following
table.
Dimensions Description
AvailabilityZone Filter the data by Availability Zone.
FleetRequestId Filter the data by Spot Fleet request.
InstanceType Filter the data by instance type.
Amazon EFS Dimensions and Metrics
Amazon EFS sends metrics to CloudWatch for every Amazon EFS file system every minute. For more
information, see Monitor Metrics with CloudWatch in the Amazon Elastic File System User Guide.
Topics
•Amazon CloudWatch Metrics for Amazon EFS (p. 174)
•Dimensions for Amazon EFS Metrics (p. 177)
Amazon CloudWatch Metrics for Amazon EFS
The AWS/EFS namespace includes the following metrics.
Metric Description
BurstCreditBalance The number of burst credits that a file system has.
Burst credits allow a file system to burst to throughput levels above a file
system’s baseline level for periods of time. For more information, see
Throughput scaling in Amazon EFS.
The Minimum statistic is the smallest burst credit balance for any minute
during the period. The Maximum statistic is the largest burst credit balance
for any minute during the period. The Average statistic is the average
burst credit balance during the period.
Units: Bytes
Valid statistics: Minimum, Maximum, Average
ClientConnections The number of client connections to a file system. When using a standard
client, there is one connection per mounted Amazon EC2 instance.
174

Amazon CloudWatch User Guide
Amazon CloudWatch Metrics for Amazon EFS
Metric Description
Note
To calculate the average ClientConnections for periods
greater than one minute, divide the Sum statistic by the number of
minutes in the period.
Units: Count of client connections
Valid statistics: Sum
DataReadIOBytes The number of bytes for each file system read operation.
The Sum statistic is the total number of bytes associated with read
operations. The Minimum statistic is the size of the smallest read operation
during the period. The Maximum statistic is the size of the largest read
operation during the period. The Average statistic is the average size of
read operations during the period. The SampleCount statistic provides a
count of read operations.
Units:
• Bytes for Minimum, Maximum, Average, and Sum.
• Count for SampleCount.
Valid statistics: Minimum, Maximum, Average, Sum, SampleCount
DataWriteIOBytes The number of bytes for each file write operation.
The Sum statistic is the total number of bytes associated with write
operations. The Minimum statistic is the size of the smallest write operation
during the period. The Maximum statistic is the size of the largest write
operation during the period. The Average statistic is the average size of
write operations during the period. The SampleCount statistic provides a
count of write operations.
Units:
• Bytes are the units for the Minimum, Maximum, Average, and Sum
statistics.
• Count for SampleCount.
Valid statistics: Minimum, Maximum, Average, Sum, SampleCount
175

Amazon CloudWatch User Guide
Amazon CloudWatch Metrics for Amazon EFS
Metric Description
MetadataIOBytes The number of bytes for each metadata operation.
The Sum statistic is the total number of bytes associated with metadata
operations. The Minimum statistic is the size of the smallest metadata
operation during the period. The Maximum statistic is the size of the largest
metadata operation during the period. The Average statistic is the size
of the average metadata operation during the period. The SampleCount
statistic provides a count of metadata operations.
Units:
• Bytes are the units for the Minimum, Maximum, Average, and Sum
statistics.
• Count for SampleCount.
Valid statistics: Minimum, Maximum, Average, Sum, SampleCount
PercentIOLimit Shows how close a file system is to reaching the I/O limit of the General
Purpose performance mode. If this metric is at 100% more often than
not, consider moving your application to a file system using the Max I/O
performance mode.
Note
This metric is only submitted for file systems using the General
Purpose performance mode.
Units:
• Percent
PermittedThroughput The maximum amount of throughput a file system is allowed, given the
file system size and BurstCreditBalance. For more information, see
Amazon EFS Performance.
The Minimum statistic is the smallest throughput permitted for any
minute during the period. The Maximum statistic is the highest throughput
permitted for any minute during the period. The Average statistic is the
average throughput permitted during the period.
Units: Bytes per second
Valid statistics: Minimum, Maximum, Average
176

Amazon CloudWatch User Guide
Dimensions for Amazon EFS Metrics
Metric Description
TotalIOBytes The number of bytes for each file system operation, including data read,
data write, and metadata operations.
The Sum statistic is the total number of bytes associated with all file
system operations. The Minimum statistic is the size of the smallest
operation during the period. The Maximum statistic is the size of the largest
operation during the period. The Average statistic is the average size of
an operation during the period. The SampleCount statistic provides a
count of all operations.
Note
To calculate the average operations per second for a period,
divide the SampleCount statistic by the number of seconds in the
period. To calculate the average throughput (Bytes per second)
for a period, divide the Sum statistic by the number of seconds in
the period.
Units:
• Bytes for Minimum, Maximum, Average, and Sum statistics.
• Count for SampleCount.
Valid statistics: Minimum, Maximum, Average, Sum, SampleCount
Dimensions for Amazon EFS Metrics
Amazon EFS Dimensions
Amazon EFS metrics use the EFS namespace and provides metrics for a single dimension,
FileSystemId. A file system's ID can be found in the Amazon EFS management console, and it
takes the form of fs-XXXXXXXX.
Elastic Load Balancing Dimensions and
Metrics
Elastic Load Balancing supports two types of load balancers: Classic Load Balancers and Application
Load Balancers. Elastic Load Balancing sends metrics to CloudWatch for both types of load balancers.
Topics
•Application Load Balancer Metrics (p. 177)
•Metric Dimensions for Application Load Balancers (p. 178)
•Classic Load Balancer Metrics (p. 179)
•Metric Dimensions for Classic Load Balancers (p. 182)
Application Load Balancer Metrics
The AWS/ApplicationELB namespace includes the following metrics.
177
Amazon CloudWatch User Guide
Metric Dimensions for Application Load Balancers
Metric Description
ActiveConnectionCountThe total number of concurrent TCP connections active from clients to the
load balancer and from the load balancer to targets.
ClientTLSNegotiationErrorCountThe number of TLS connections initiated by the client that did not establish
a session with the load balancer. Possible causes include a mismatch of
ciphers or protocols.
HealthyHostCount The number of targets that are considered healthy.
HTTPCode_ELB_4XX_CountThe number of HTTP 4XX client error codes that originate from the load
balancer. Client errors are generated when requests are malformed or
incomplete. These requests have not been received by the target. This
count does not include any response codes generated by the targets.
HTTPCode_ELB_5XX_CountThe number of HTTP 5XX server error codes that originate from the load
balancer. This count does not include any response codes generated by
the targets.
HTTPCode_Target_2XX_Count,
HTTPCode_Target_3XX_Count,
HTTPCode_Target_4XX_Count,
HTTPCode_Target_5XX_Count
The number of HTTP response codes generated by the targets. This does
not include any response codes generated by the load balancer.
NewConnectionCount The total number of new TCP connections established from clients to the
load balancer and from the load balancer to targets.
ProcessedBytes The total number of bytes processed by the load balancer.
RejectedConnectionCountThe number of connections that were rejected because the load balancer
could not establish a connection with a healthy target in order to route the
request.
RequestCount The number of requests received by the load balancer.
TargetConnectionErrorCountThe number of connections that were not successfully established between
the load balancer and target.
TargetResponseTime The time elapsed, in seconds, after the request leaves the load balancer
until a response from the target is received. This is equivalent to the
target_processing_time field in the access logs.
TargetTLSNegotiationErrorCountThe number of TLS connections initiated by the load balancer that did not
establish a session with the target. Possible causes include a mismatch of
ciphers or protocols.
UnhealthyHostCount The number of targets that are considered unhealthy.
Metric Dimensions for Application Load
Balancers
To filter the metrics for your Application Load Balancer, use the following dimensions.
Dimension Description
AvailabilityZone Filter the metric data by Availability Zone.
178

Amazon CloudWatch User Guide
Classic Load Balancer Metrics
Dimension Description
LoadBalancer Filter the metric data by load balancer. Specify the load balancer as
follows: app/load-balancer-name/1234567890123456 (see the final portion
of the load balancer ARN).
TargetGroup Filter the metric data by target group. Specify the target group as follows:
targetgroup/target-group-name/1234567890123456 (see the final portion of
the target group ARN).
Classic Load Balancer Metrics
The AWS/ELB namespace includes the following metrics.
Metric Description
BackendConnectionErrorsThe number of connections that were not successfully established between
the load balancer and the registered instances. Because the load balancer
retries the connection when there are errors, this count can exceed the
request rate. Note that this count also includes any connection errors
related to health checks.
Reporting criteria: There is a nonzero value
Statistics: The most useful statistic is sum. Note that average, min, and
max are reported per load balancer node and are not typically useful.
However, the difference between the minimum and maximum (or peak to
average or average to trough) might be useful to determine whether a load
balancer node is an outlier.
Example: Suppose that your load balancer has 2 instances in us-west-2a
and 2 instances in us-west-2b, and that attempts to connect to 1 instance
in us-west-2a result in back-end connection errors. The sum for us-west-2a
includes these connection errors, while the sum for us-west-2b does not
include them. Therefore, the sum for the load balancer equals the sum for
us-west-2a.
HealthyHostCount,
UnHealthyHostCount
The number of healthy and unhealthy instances registered with your load
balancer. A newly registered instance is considered healthy after it passes
the first health check. An instance is considered unhealthy after it exceeds
the unhealthy threshold configured for health checks. An unhealthy
instance is considered healthy again after it meets the healthy threshold
configured for health checks. If cross-zone load balancing is enabled, the
number of healthy instances for the LoadBalancerName dimension is
calculated across all Availability Zones.
Reporting criteria: There are registered instances
Statistics: The most useful statistics are average, min, and max. These
statistics are determined by the load balancer nodes. Note that some load
balancer nodes might determine that an instance is unhealthy for a brief
period while other nodes determine that it is healthy.
Example: Suppose that your load balancer has 2 instances in us-west-2a
and 2 instances in us-west-2b, us-west-2a has 1 unhealthy instance, and
us-west-2b has no unhealthy instances. With the AvailabilityZone
dimension, there is an average of 1 healthy and 1 unhealthy instance in
us-west-2a, and an average of 2 healthy and 0 unhealthy instances in us-
west-2b.
179

Amazon CloudWatch User Guide
Classic Load Balancer Metrics
Metric Description
HTTPCode_Backend_2XX,
HTTPCode_Backend_3XX,
HTTPCode_Backend_4XX,
HTTPCode_Backend_5XX
[HTTP listener] The number of HTTP response codes generated by
registered instances. This count does not include any response codes
generated by the load balancer.
Reporting criteria: There is a nonzero value
Statistics: The most useful statistic is sum. Note that min, max, and
average are all 1.
Example: Suppose that your load balancer has 2 instances in us-west-2a
and 2 instances in us-west-2b, and that requests sent to 1 instance in us-
west-2a result in HTTP 500 responses. The sum for us-west-2a includes
these error responses, while the sum for us-west-2b does not include
them. Therefore, the sum for the load balancer equals the sum for us-
west-2a.
HTTPCode_ELB_4XX [HTTP listener] The number of HTTP 4XX client error codes generated by
the load balancer. Client errors are generated when a request is malformed
or incomplete.
Reporting criteria: There is a nonzero value
Statistics: The most useful statistic is sum. Note that min, max, and
average are all 1.
Example: Suppose that your load balancer has us-west-2a and us-west-2b
enabled, and that client requests include a malformed request URL. As a
result, client errors would likely increase in all Availability Zones. The sum
for the load balancer is the sum of the values for the Availability Zones.
HTTPCode_ELB_5XX [HTTP listener] The number of HTTP 5XX server error codes generated
by the load balancer. This count does not include any response codes
generated by the registered instances. The metric is reported if there are
no healthy instances registered to the load balancer, or if the request rate
exceeds the capacity of the instances (spillover) or the load balancer.
Reporting criteria: There is a nonzero value
Statistics: The most useful statistic is sum. Note that min, max, and
average are all 1.
Example: Suppose that your load balancer has us-west-2a and us-west-2b
enabled, and that instances in us-west-2a are experiencing high latency
and are slow to respond to requests. As a result, the surge queue for the
load balancer nodes in us-west-2a fills and clients receive a 503 error. If
us-west-2b continues to respond normally, the sum for the load balancer
equals the sum for us-west-2a.
Latency [HTTP listener] The time elapsed, in seconds, after the request leaves the
load balancer until the headers of the response are received.
Reporting criteria: There is a nonzero value
Statistics: The most useful statistic is average. Use max to determine
whether some requests are taking substantially longer than the average.
Note that min is typically not useful.
Example: Suppose that your load balancer has 2 instances in us-west-2a
and 2 instances in us-west-2b, and that requests sent to 1 instance in us-
west-2a have a higher latency. The average for us-west-2a has a higher
value than the average for us-west-2b.
180

Amazon CloudWatch User Guide
Classic Load Balancer Metrics
Metric Description
RequestCount The number of requests completed or connections made during the
specified interval (1 or 5 minutes).
[HTTP listener] The number of requests received and routed, including
HTTP error responses from the registered instances.
[TCP listener] The number of connections made to the registered
instances.
Reporting criteria: There is a nonzero value
Statistics: The most useful statistic is sum. Note that min, max, and
average all return 1.
Example: Suppose that your load balancer has 2 instances in us-west-2a
and 2 instances in us-west-2b, and that 100 requests are sent to the load
balancer. There are 60 requests sent to us-west-2a, with each instance
receiving 30 requests, and 40 requests sent to us-west-2b, with each
instance receiving 20 requests. With the AvailabilityZone dimension,
there is a sum of 60 requests in us-west-2a and 40 requests in us-west-2b.
With the LoadBalancerName dimension, there is a sum of 100 requests.
SpilloverCount The total number of requests that were rejected because the surge queue
is full.
[HTTP listener] The load balancer returns an HTTP 503 error code.
[TCP listener] The load balancer closes the connection.
Reporting criteria: There is a nonzero value
Statistics: The most useful statistic is sum. Note that average, min, and
max are reported per load balancer node and are not typically useful.
Example: Suppose that your load balancer has us-west-2a and us-west-2b
enabled, and that instances in us-west-2a are experiencing high latency
and are slow to respond to requests. As a result, the surge queue for the
load balancer node in us-west-2a fills, resulting in spillover. If us-west-2b
continues to respond normally, the sum for the load balancer will be the
same as the sum for us-west-2a.
SurgeQueueLength The total number of requests that are pending routing. The load balancer
queues a request if it is unable to establish a connection with a healthy
instance in order to route the request. The maximum size of the queue is
1,024. Additional requests are rejected when the queue is full. For more
information, see SpilloverCount.
Reporting criteria: There is a nonzero value.
Statistics: The most useful statistic is max, because it represents the peak
of queued requests. The average statistic can be useful in combination
with min and max to determine the range of queued requests. Note that
sum is not useful.
Example: Suppose that your load balancer has us-west-2a and us-west-2b
enabled, and that instances in us-west-2a are experiencing high latency
and are slow to respond to requests. As a result, the surge queue for the
load balancer nodes in us-west-2a fills, with clients likely experiencing
increased response times. If this continues, the load balancer will likely
have spillovers (see the SpilloverCount metric). If us-west-2b continues
to respond normally, the max for the load balancer will be the same as the
max for us-west-2a.
181
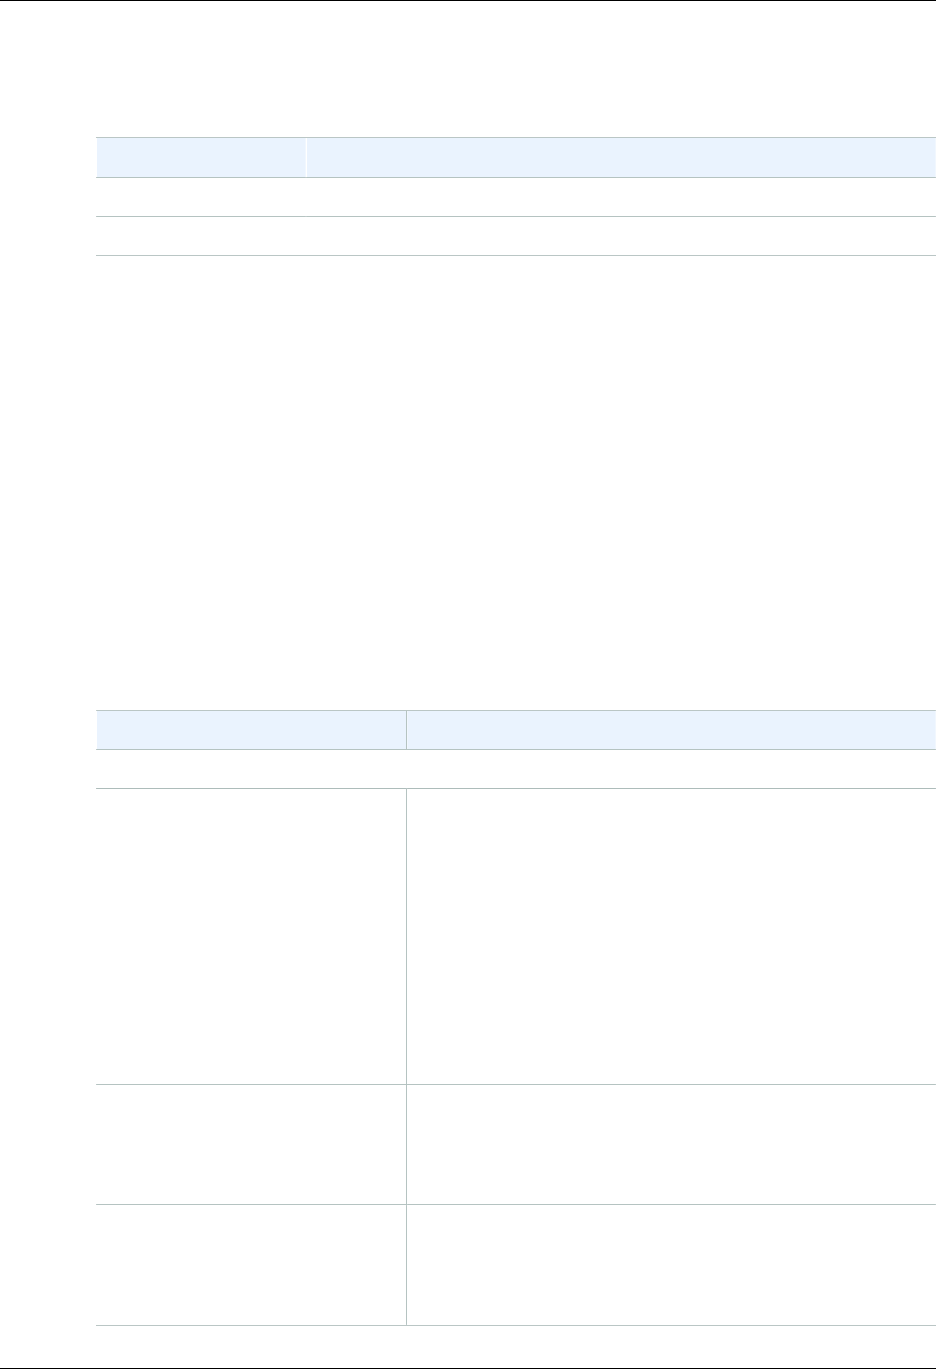
Amazon CloudWatch User Guide
Metric Dimensions for Classic Load Balancers
Metric Dimensions for Classic Load Balancers
To filter the metrics for your Classic Load Balancer, use the following dimensions.
Dimension Description
AvailabilityZone Filter the metric data by the specified Availability Zone.
LoadBalancerName Filter the metric data by the specified load balancer.
Amazon EMR Dimensions and Metrics
Amazon EMR (Amazon EMR) sends metrics to CloudWatch. All Amazon EMR job flows automatically
send metrics in five-minute intervals. Metrics are archived for two weeks; after that period, the data is
discarded. For more information, see Monitor Metrics with Amazon CloudWatch in the Amazon EMR
Developer Guide.
Amazon EMR Metrics
Amazon EMR sends the following metrics to Amazon CloudWatch.
The AWS/ElasticMapReduce namespace includes the following metrics.
Note
Amazon EMR pulls metrics from a cluster. If a cluster becomes unreachable, no metrics are
reported until the cluster becomes available again.
The following are Hadoop 1 metrics:
Metric Description
Cluster Status
IsIdle Indicates that a cluster is no longer performing work, but is still
alive and accruing charges. It is set to 1 if no tasks are running
and no jobs are running, and set to 0 otherwise. This value is
checked at five-minute intervals and a value of 1 indicates only
that the cluster was idle when checked, not that it was idle for
the entire five minutes. To avoid false positives, you should
raise an alarm when this value has been 1 for more than one
consecutive 5-minute check. For example, you might raise an
alarm on this value if it has been 1 for thirty minutes or longer.
Use case: Monitor cluster performance
Units: Boolean
JobsRunning The number of jobs in the cluster that are currently running.
Use case: Monitor cluster health
Units: Count
JobsFailed The number of jobs in the cluster that have failed.
Use case: Monitor cluster health
Units: Count
182

Amazon CloudWatch User Guide
Amazon EMR Metrics
Metric Description
Map/Reduce
MapTasksRunning The number of running map tasks for each job. If you have a
scheduler installed and multiple jobs running, multiple graphs
are generated.
Use case: Monitor cluster progress
Units: Count
MapTasksRemaining The number of remaining map tasks for each job. If you have a
scheduler installed and multiple jobs running, multiple graphs
are generated. A remaining map task is one that is not in any
of the following states: Running, Killed, or Completed.
Use case: Monitor cluster progress
Units: Count
MapSlotsOpen The unused map task capacity. This is calculated as the
maximum number of map tasks for a given cluster, less the
total number of map tasks currently running in that cluster.
Use case: Analyze cluster performance
Units: Count
RemainingMapTasksPerSlot The ratio of the total map tasks remaining to the total map
slots available in the cluster.
Use case: Analyze cluster performance
Units: Ratio
ReduceTasksRunning The number of running reduce tasks for each job. If you
have a scheduler installed and multiple jobs running, multiple
graphs are generated.
Use case: Monitor cluster progress
Units: Count
ReduceTasksRemaining The number of remaining reduce tasks for each job. If you
have a scheduler installed and multiple jobs running, multiple
graphs are generated.
Use case: Monitor cluster progress
Units: Count
ReduceSlotsOpen Unused reduce task capacity. This is calculated as the
maximum reduce task capacity for a given cluster, less the
number of reduce tasks currently running in that cluster.
Use case: Analyze cluster performance
Units: Count
Node Status
183

Amazon CloudWatch User Guide
Amazon EMR Metrics
Metric Description
CoreNodesRunning The number of core nodes working. Data points for this metric
are reported only when a corresponding instance group exists.
Use case: Monitor cluster health
Units: Count
CoreNodesPending The number of core nodes waiting to be assigned. All of the
core nodes requested may not be immediately available; this
metric reports the pending requests. Data points for this metric
are reported only when a corresponding instance group exists.
Use case: Monitor cluster health
Units: Count
LiveDataNodes The percentage of data nodes that are receiving work from
Hadoop.
Use case: Monitor cluster health
Units: Percent
TaskNodesRunning The number of task nodes working. Data points for this metric
are reported only when a corresponding instance group exists.
Use case: Monitor cluster health
Units: Count
TaskNodesPending The number of core nodes waiting to be assigned. All of the
task nodes requested may not be immediately available; this
metric reports the pending requests. Data points for this metric
are reported only when a corresponding instance group exists.
Use case: Monitor cluster health
Units: Count
LiveTaskTrackers The percentage of task trackers that are functional.
Use case: Monitor cluster health
Units: Percent
IO
S3BytesWritten The number of bytes written to Amazon S3.
Use case: Analyze cluster performance, Monitor cluster
progress
Units: Bytes
S3BytesRead The number of bytes read from Amazon S3.
Use case: Analyze cluster performance, Monitor cluster
progress
Units: Bytes
184

Amazon CloudWatch User Guide
Amazon EMR Metrics
Metric Description
HDFSUtilization The percentage of HDFS storage currently used.
Use case: Analyze cluster performance
Units: Percent
HDFSBytesRead The number of bytes read from HDFS.
Use case: Analyze cluster performance, Monitor cluster
progress
Units: Bytes
HDFSBytesWritten The number of bytes written to HDFS.
Use case: Analyze cluster performance, Monitor cluster
progress
Units: Bytes
MissingBlocks The number of blocks in which HDFS has no replicas. These
might be corrupt blocks.
Use case: Monitor cluster health
Units: Count
TotalLoad The total number of concurrent data transfers.
Use case: Monitor cluster health
Units: Count
HBase
BackupFailed Whether the last backup failed. This is set to 0 by default and
updated to 1 if the previous backup attempt failed. This metric
is only reported for HBase clusters.
Use case: Monitor HBase backups
Units: Count
MostRecentBackupDuration The amount of time it took the previous backup to complete.
This metric is set regardless of whether the last completed
backup succeeded or failed. While the backup is ongoing, this
metric returns the number of minutes after the backup started.
This metric is only reported for HBase clusters.
Use case: Monitor HBase Backups
Units: Minutes
TimeSinceLastSuccessfulBackup The number of elapsed minutes after the last successful
HBase backup started on your cluster. This metric is only
reported for HBase clusters.
Use case: Monitor HBase backups
Units: Minutes
185
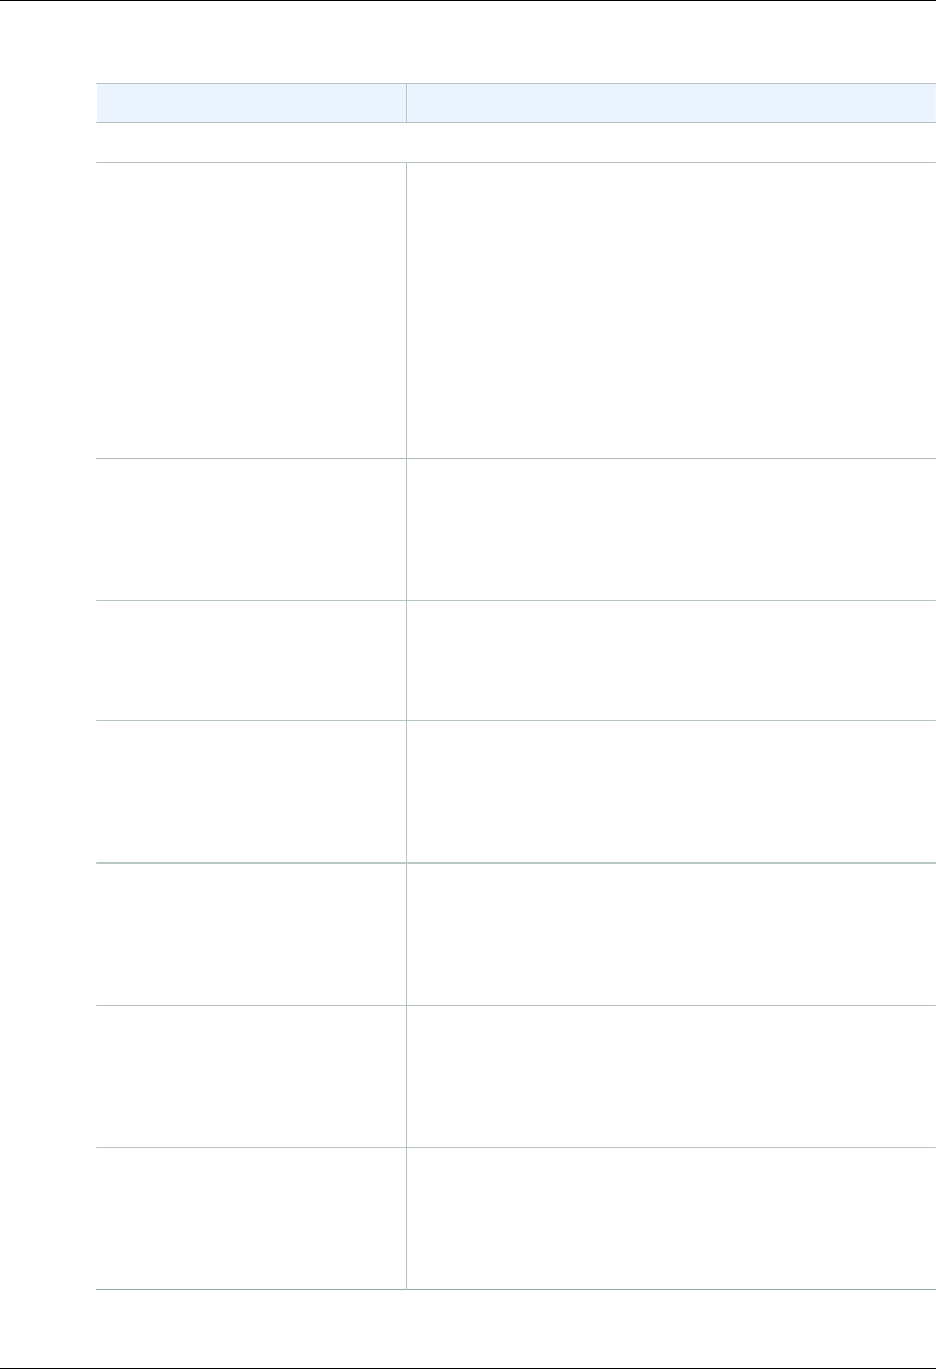
Amazon CloudWatch User Guide
Amazon EMR Metrics
The following metrics are available for Hadoop 2 AMIs:
Metric Description
Cluster Status
IsIdle Indicates that a cluster is no longer performing work, but is still
alive and accruing charges. It is set to 1 if no tasks are running
and no jobs are running, and set to 0 otherwise. This value is
checked at five-minute intervals and a value of 1 indicates only
that the cluster was idle when checked, not that it was idle for
the entire five minutes. To avoid false positives, you should
raise an alarm when this value has been 1 for more than one
consecutive 5-minute check. For example, you might raise an
alarm on this value if it has been 1 for thirty minutes or longer.
Use case: Monitor cluster performance
Units: Boolean
ContainerAllocated The number of resource containers allocated by the
ResourceManager.
Use case: Monitor cluster progress
Units: Count
ContainerReserved The number of containers reserved.
Use case: Monitor cluster progress
Units: Count
ContainerPending The number of containers in the queue that have not yet been
allocated.
Use case: Monitor cluster progress
Units: Count
AppsCompleted The number of applications submitted to YARN that have
completed.
Use case: Monitor cluster progress
Units: Count
AppsFailed The number of applications submitted to YARN that have
failed to complete.
Use case: Monitor cluster progress, Monitor cluster health
Units: Count
AppsKilled The number of applications submitted to YARN that have been
killed.
Use case: Monitor cluster progress, Monitor cluster health
Units: Count
186
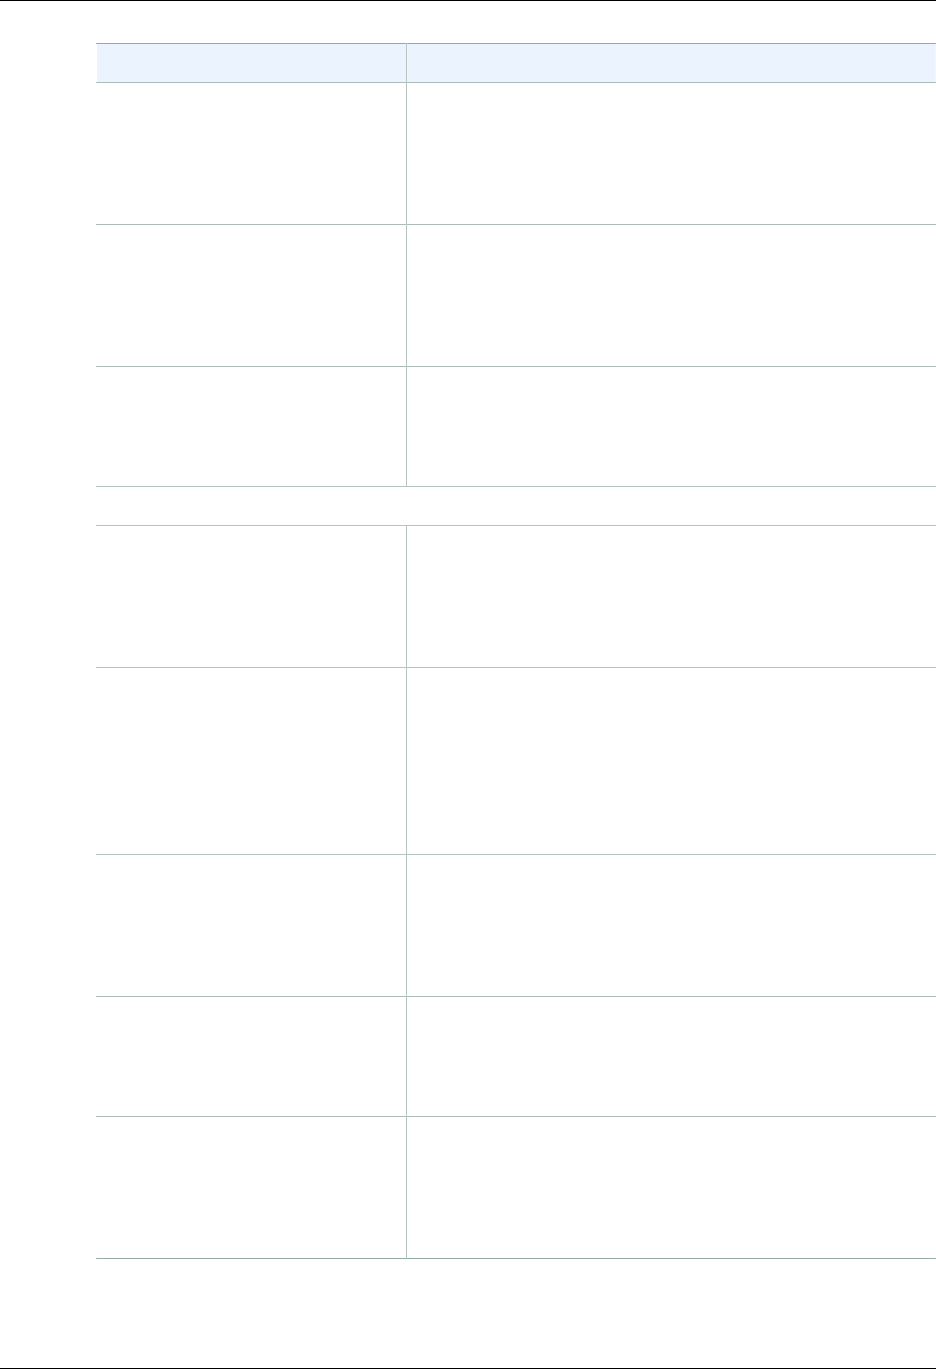
Amazon CloudWatch User Guide
Amazon EMR Metrics
Metric Description
AppsPending The number of applications submitted to YARN that are in a
pending state.
Use case: Monitor cluster progress
Units: Count
AppsRunning The number of applications submitted to YARN that are
running.
Use case: Monitor cluster progress
Units: Count
AppsSubmitted The number of applications submitted to YARN.
Use case: Monitor cluster progress
Units: Count
Node Status
CoreNodesRunning The number of core nodes working. Data points for this metric
are reported only when a corresponding instance group exists.
Use case: Monitor cluster health
Units: Count
CoreNodesPending The number of core nodes waiting to be assigned. All of the
core nodes requested may not be immediately available; this
metric reports the pending requests. Data points for this metric
are reported only when a corresponding instance group exists.
Use case: Monitor cluster health
Units: Count
LiveDataNodes The percentage of data nodes that are receiving work from
Hadoop.
Use case: Monitor cluster health
Units: Percent
MRTotalNodes The number of nodes presently available to MapReduce jobs.
Use ase: Monitor cluster progress
Units: Count
MRActiveNodes The number of nodes presently running MapReduce tasks or
jobs.
Use case: Monitor cluster progress
Units: Count
187
Amazon CloudWatch User Guide
Amazon EMR Metrics
Metric Description
MRLostNodes The number of nodes allocated to MapReduce that have been
marked in a LOST state.
Use case: Monitor cluster health, Monitor cluster progress
Units: Count
MRUnhealthyNodes The number of nodes available to MapReduce jobs marked in
an UNHEALTHY state.
Use case: Monitor cluster progress
Units: Count
MRDecommissionedNodes The number of nodes allocated to MapReduce applications
that have been marked in a DECOMMISSIONED state.
Use ase: Monitor cluster health, Monitor cluster progress
Units: Count
MRRebootedNodes The number of nodes available to MapReduce that have been
rebooted and marked in a REBOOTED state.
Use case: Monitor cluster health, Monitor cluster progress
Units: Count
IO
S3BytesWritten The number of bytes written to Amazon S3.
Use case: Analyze cluster performance, Monitor cluster
progress
Units: Bytes
S3BytesRead The number of bytes read from Amazon S3.
Use case: Analyze cluster performance, Monitor cluster
progress
Units: Bytes
HDFSUtilization The percentage of HDFS storage currently used.
Use case: Analyze cluster performance
Units: Percent
HDFSBytesRead The number of bytes read from HDFS.
Use case: Analyze cluster performance, Monitor cluster
progress
Units: Bytes
188

Amazon CloudWatch User Guide
Amazon EMR Metrics
Metric Description
HDFSBytesWritten The number of bytes written to HDFS.
Use case: Analyze cluster performance, Monitor cluster
progress
Units: Bytes
MissingBlocks The number of blocks in which HDFS has no replicas. These
might be corrupt blocks.
Use case: Monitor cluster health
Units: Count
CorruptBlocks The number of blocks that HDFS reports as corrupted.
Use case: Monitor cluster health
Units: Count
TotalLoad The total number of concurrent data transfers.
Use case: Monitor cluster health
Units: Count
MemoryTotalMB The total amount of memory in the cluster.
Use case: Monitor cluster progress
Units: Bytes
MemoryReservedMB The amount of memory reserved.
Use case: Monitor cluster progress
Units: Bytes
MemoryAvailableMB The amount of memory available to be allocated.
Use case: Monitor cluster progress
Units: Bytes
MemoryAllocatedMB The amount of memory allocated to the cluster.
Use case: Monitor cluster progress
Units: Bytes
PendingDeletionBlocks The number of blocks marked for deletion.
Use case: Monitor cluster progress, Monitor cluster health
Units: Count
189
Amazon CloudWatch User Guide
Amazon EMR Dimensions
Metric Description
UnderReplicatedBlocks The number of blocks that need to be replicated one or more
times.
Use case: Monitor cluster progress, Monitor cluster health
Units: Count
DfsPendingReplicationBlocks The status of block replication: blocks being replicated, age of
replication requests, and unsuccessful replication requests.
Use case: Monitor cluster progress, Monitor cluster health
Units: Count
CapacityRemainingGB The amount of remaining HDFS disk capacity.
Use case: Monitor cluster progress, Monitor cluster health
Units: Bytes
HBase
HbaseBackupFailed Whether the last backup failed. This is set to 0 by default and
updated to 1 if the previous backup attempt failed. This metric
is only reported for HBase clusters.
Use case: Monitor HBase backups
Units: Count
MostRecentBackupDuration The amount of time it took the previous backup to complete.
This metric is set regardless of whether the last completed
backup succeeded or failed. While the backup is ongoing, this
metric returns the number of minutes after the backup started.
This metric is only reported for HBase clusters.
Use case: Monitor HBase Backups
Units: Minutes
TimeSinceLastSuccessfulBackup The number of elapsed minutes after the last successful
HBase backup started on your cluster. This metric is only
reported for HBase clusters.
Use case: Monitor HBase backups
Units: Minutes
Amazon EMR Dimensions
The following dimensions are available for Amazon EMR.
Dimension Description
ClusterId/JobFlowId The identifier for a cluster. You can find this value by
clicking on the cluster in the Amazon EMR console. It
takes the form j-XXXXXXXXXXXXX.
190
Amazon CloudWatch User Guide
Amazon ES
Dimension Description
JobId The identifier of a job within a cluster. You can use this
to filter the metrics returned from a cluster down to those
that apply to a single job within the cluster. JobId takes the
form job_XXXXXXXXXXXX_XXXX.
Amazon Elasticsearch Service Dimensions
and Metrics
Amazon Elasticsearch Service sends data to CloudWatch every minute. You can create alarms
using Amazon Elasticsearch Service Dimensions and Metrics (p. 191). For more information, see
Monitoring Cluster Metrics and Statistics with Amazon CloudWatch in the Amazon Elasticsearch
Service Developer Guide.
Topics
•Amazon Elasticsearch Service Metrics (p. 191)
•Dimensions for Amazon Elasticsearch Service Metrics (p. 193)
Amazon Elasticsearch Service Metrics
The AWS/ES namespace includes the following metrics for clusters.
Metric Description
ClusterStatus.green Indicates that all index shards are allocated to nodes in the cluster.
Relevant statistics: Minimum, Maximum
ClusterStatus.yellow Indicates that the primary shards for all indices are allocated to nodes
in a cluster, but the replica shards for at least one index are not. Note
that single node clusters always initialize with this cluster status because
there is no second node to which a replica can be assigned. You can
either increase your node count to obtain a green cluster status, or you
can use the Amazon ES API to set the number_of_replicas setting for
your index to 0. For more information, see Update Indices Settings in the
Amazon ES documentation.
Relevant statistics: Minimum, Maximum
ClusterStatus.red Indicates that the primary and replica shards of at least one index are not
allocated to nodes in a cluster. For more information, see Red Cluster
Status.
Relevant statistics: Minimum, Maximum
Nodes The number of nodes in the Amazon ES cluster.
Relevant Statistics: Minimum, Maximum, Average
SearchableDocuments The total number of searchable documents across all indices in the cluster.
Relevant statistics: Minimum, Maximum, Average
DeletedDocuments The total number of deleted documents across all indices in the cluster.
191
Amazon CloudWatch User Guide
Amazon Elasticsearch Service Metrics
Metric Description
Relevant statistics: Minimum, Maximum, Average
CPUUtilization The maximum percentage of CPU resources used for data nodes in the
cluster.
Relevant statistics: Maximum, Average
FreeStorageSpace The free space, in megabytes, for all data nodes in the cluster.
Relevant statistics: Minimum
ClusterUsedSpace The total used space, in megabytes, for a cluster. You can view this metric
in the Amazon CloudWatch console, but not in the Amazon ES console.
Relevant statistics: Minimum, Maximum
JVMMemoryPressure The maximum percentage of the Java heap used for all data nodes in the
cluster.
Relevant statistics: Maximum
AutomatedSnapshotFailureThe number of failed automated snapshots for the cluster. A value of 1
indicates that no automated snapshot was taken for the domain in the
previous 36 hours.
Relevant statistics: Minimum, Maximum
CPUCreditBalance The remaining CPU credits available for data nodes in the cluster.
A CPU credit provides the performance of a full CPU core for one
minute. This metrics is available only for the t2.micro.elasticsearch,
t2.small.elasticsearch, and t2.medium.elasticsearch instance types.
Relevant statistics: Minimum
The AWS/ES namespace includes the following metrics for dedicated master nodes.
Metric Description
MasterCPUUtilization The maximum percentage of CPU resources used by the dedicated master
nodes. We recommend increasing the size of the instance type when this
metric reaches 60 percent.
Relevant statistics: Average
MasterFreeStorageSpaceThis metric is not relevant and can be ignored. The service does not use
master nodes as data nodes.
MasterJVMMemoryPressureThe maximum percentage of the Java heap used for all dedicated master
nodes in the cluster. We recommend moving to a larger instance type
when this metric reaches 85 percent.
Relevant statistics: Maximum
192
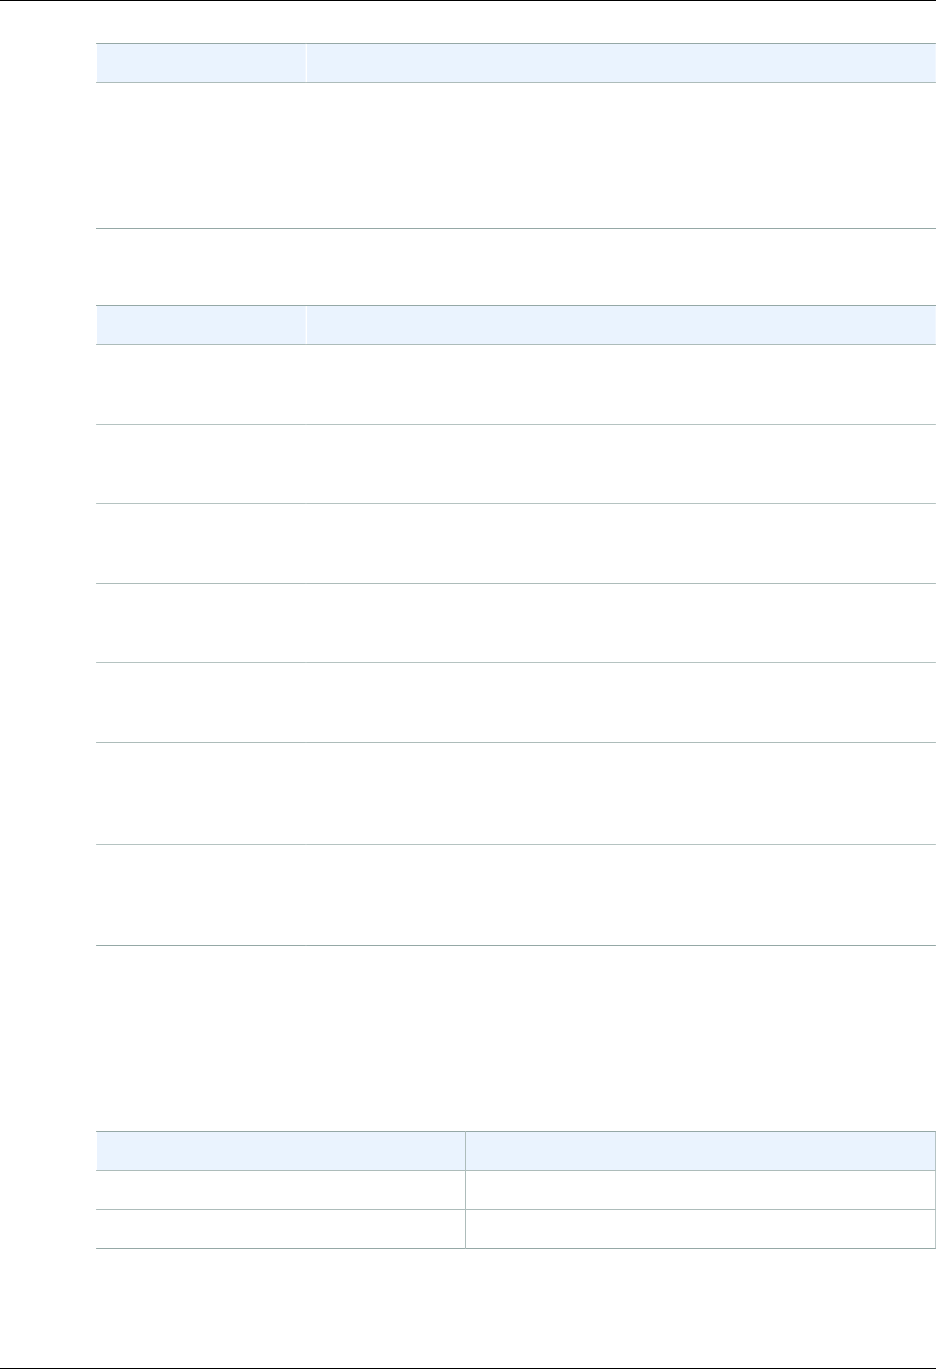
Amazon CloudWatch User Guide
Dimensions for Amazon Elasticsearch Service Metrics
Metric Description
MasterCPUCreditBalanceThe remaining CPU credits available for dedicated master nodes in the
cluster. A CPU credit provides the performance of a full CPU core for
one minute. This metric is available only for the t2.micro.elasticsearch,
t2.small.elasticsearch, and t2.medium.elasticsearch instance types.
Relevant statistics: Minimum
The AWS/EBS namespace includes the following metrics for EBS volumes.
Metric Description
ReadLatency The latency, in seconds, for read operations on EBS volumes.
Relevant statistics: Minimum, Maximum, Average
WriteLatency The latency, in seconds, for write operations on EBS volumes.
Relevant statistics: Minimum, Maximum, Average
ReadThroughput The throughput, in bytes per second, for read operations on EBS volumes.
Relevant statistics: Minimum, Maximum, Average
WriteThroughput The throughput, in bytes per second, for write operations on EBS volumes.
Relevant statistics: Minimum, Maximum, Average
DiskQueueDepth The number of pending input and output (I/O) requests for an EBS volume.
Relevant statistics: Minimum, Maximum, Average
ReadIOPS The number of input and output (I/O) operations per second for read
operations on EBS volumes.
Relevant statistics: Minimum, Maximum, Average
WriteIOPS The number of input and output (I/O) operations per second for write
operations on EBS volumes.
Relevant statistics: Minimum, Maximum, Average
Dimensions for Amazon Elasticsearch Service
Metrics
To filter the metrics, use the following dimensions.
Dimension Description
ClientId The AWS account ID.
DomainName The name of the search domain.
193

Amazon CloudWatch User Guide
Elastic Transcoder
Amazon Elastic Transcoder Dimensions and
Metrics
When you interact with Amazon Elastic Transcoder, it sends the following metrics to CloudWatch every
minute.
Elastic Transcoder Metrics
The AWS/ElasticTranscoder namespace includes the following metrics.
Metric Description
Billed HD Output The number of billable seconds of HD output for a
pipeline.
Valid Dimensions: PipelineId
Unit: Seconds
Billed SD Output The number of billable seconds of SD output for a
pipeline.
Valid Dimensions: PipelineId
Unit: Seconds
Billed Audio Output The number of billable seconds of audio output for a
pipeline.
Valid Dimensions: PipelineId
Unit: Seconds
Jobs Completed The number of jobs completed by this pipeline.
Valid Dimensions: PipelineId
Unit: Count
Jobs Errored The number of jobs that failed because of invalid
inputs, such as a request to transcode a file that is not
in the given input bucket.
Valid Dimensions: PipelineId
Unit: Count
Outputs per Job The number of outputs Elastic Transcoder created for a
job.
Valid Dimensions: PipelineId
Unit: Count
Standby Time The number of seconds before Elastic Transcoder
started transcoding a job.
Valid Dimensions: PipelineId
194

Amazon CloudWatch User Guide
Dimensions for Elastic Transcoder Metrics
Metric Description
Unit: Seconds
Errors The number of errors caused by invalid operation
parameters, such as a request for a job status that
does not include the job ID.
Valid Dimensions: Operation
Unit: Count
Throttles The number of times that Elastic Transcoder
automatically throttled an operation.
Valid Dimensions: Operation
Unit: Count
Dimensions for Elastic Transcoder Metrics
Elastic Transcoder metrics use the Elastic Transcoder namespace and provide metrics for the following
dimension(s):
Dimension Description
PipelineId The ID of a pipeline. This dimension filters the data you
request for an Elastic Transcoder pipeline.
Operation This dimension filters the data you request for the APIs
that Elastic Transcoder provides.
AWS IoT Dimensions and Metrics
When you interact with AWS IoT, it sends the following metrics to CloudWatch every minute.
AWS IoT Metrics
The AWS/IoT namespace includes the following metrics.
AWS IoT sends the following metrics to CloudWatch once per received request.
Metric Description
PublishIn.Success A client published on an MQTT topic successfully.
Valid Dimensions: Protocol
Valid Statistics:1 for success, 0 for failure.
Unit: Count
PublishOut.Success Clients subscribed to an MQTT topic recieved a
published message.
Valid Dimensions: Protocol
195

Amazon CloudWatch User Guide
AWS IoT Metrics
Metric Description
Valid Statistics:1 for success, 0 for failure.
Unit: Count
Subscribe.Success AWS IoT message broker received a request to
subscribe to an MQTT topic.
Valid Dimensions: Protocol
Valid Statistics:1 for success, 0 for failure.
Unit: Count
Ping.Success AWS IoT received a Ping message.
Valid Dimensions: Protocol
Valid Statistics:1 per ping request from the client.
Unit: Count
Connect.Success A client connected to AWS IoT.
Valid Dimensions: Protocol
Valid Statistics: 1 per successful MQTT connection
from the client.
Unit: Count
GetThingShadow.Accepted AWS IoT received a GetThingShadow request.
Valid Dimensions: Protocol
Valid Statistics:1 for success, 0 for failure.
Unit: Count
UpdateThingShadow.Accepted AWS IoT received a UpdateThingShadow request.
Valid Dimensions: Protocol
Valid Statistics:1 for success, 0 for failure.
Unit: Count
DeleteThingShadow.Accepted AWS IoT received a DeleteThingShadow request.
Valid Dimensions: Protocol
Valid Statistics:1 for success, 0 for failure.
Unit: Count
RulesExecuted AWS IoT executed a rule..
Valid Dimensions: Protocol
Valid Statistics:1 for success, 0 for failure.
Unit: Count
196
Amazon CloudWatch User Guide
Dimensions for AWS IoT Metrics
Dimensions for AWS IoT Metrics
Metrics use the namespace and provide metrics for the following dimension(s):
Dimension Description
Protocol The protocol with which the request was made. Valid
values are MQTT or HTTP.
Amazon Kinesis Streams Dimensions and
Metrics
Streams sends metrics to CloudWatch at two levels; the stream level and, optionally, the shard level.
Stream-level metrics are for most common monitoring use cases in normal conditions. Shard-level
metrics are for specific monitoring tasks, usually related to troubleshooting. For more information, see
Monitoring Amazon Kinesis with Amazon CloudWatch in the Amazon Kinesis Developer Guide.
Topics
•Basic Stream-level Metrics (p. 197)
•Enhanced Shard-level Metrics (p. 201)
•Dimensions for Amazon Kinesis Metrics (p. 203)
Basic Stream-level Metrics
The AWS/Kinesis namespace includes the following stream-level metrics.
Streams sends these stream-level metrics to CloudWatch every minute. These metrics are always
available.
Metric Description
GetRecords.Bytes The number of bytes retrieved from the Amazon Kinesis stream, measured
over the specified time period. Minimum, Maximum, and Average statistics
represent the bytes in a single GetRecords operation for the stream in the
specified time period.
Shard-level metric name: OutgoingBytes
Dimensions: StreamName
Statistics: Minimum, Maximum, Average, Sum, Samples
Units: Bytes
GetRecords.IteratorAgeThis metric is deprecated. Use
GetRecords.IteratorAgeMilliseconds.
GetRecords.IteratorAgeMillisecondsThe age of the last record in all GetRecords calls made against an
Amazon Kinesis stream, measured over the specified time period. Age is
the difference between the current time and when the last record of the
GetRecords call was written to the stream. The Minimum and Maximum
statistics can be used to track the progress of Amazon Kinesis consumer
applications. A value of zero indicates that the records being read are
completely caught up with the stream.
197

Amazon CloudWatch User Guide
Basic Stream-level Metrics
Metric Description
Shard-level metric name: IteratorAgeMilliseconds
Dimensions: StreamName
Statistics: Minimum, Maximum, Average, Samples
Units: Milliseconds
GetRecords.Latency The time taken per GetRecords operation, measured over the specified
time period.
Dimensions: StreamName
Statistics: Minimum, Maximum, Average
Units: Milliseconds
GetRecords.Records The number of records retrieved from the shard, measured over the
specified time period. Minimum, Maximum, and Average statistics
represent the records in a single GetRecords operation for the stream in
the specified time period.
Shard-level metric name: OutgoingRecords
Dimensions: StreamName
Statistics: Minimum, Maximum, Average, Sum, Samples
Units: Count
GetRecords.Success The number of successful GetRecords operations per stream, measured
over the specified time period.
Dimensions: StreamName
Statistics: Average, Sum, Samples
Units: Count
IncomingBytes The number of bytes successfully put to the Amazon Kinesis stream over
the specified time period. This metric includes bytes from PutRecord
and PutRecords operations. Minimum, Maximum, and Average statistics
represent the bytes in a single put operation for the stream in the specified
time period.
Shard-level metric name: IncomingBytes
Dimensions: StreamName
Statistics: Minimum, Maximum, Average, Sum, Samples
Units: Bytes
198

Amazon CloudWatch User Guide
Basic Stream-level Metrics
Metric Description
IncomingRecords The number of records successfully put to the Amazon Kinesis stream
over the specified time period. This metric includes record counts from
PutRecord and PutRecords operations. Minimum, Maximum, and
Average statistics represent the records in a single put operation for the
stream in the specified time period.
Shard-level metric name: IncomingRecords
Dimensions: StreamName
Statistics: Minimum, Maximum, Average, Sum, Samples
Units: Count
PutRecord.Bytes The number of bytes put to the Amazon Kinesis stream using the
PutRecord operation over the specified time period.
Dimensions: StreamName
Statistics: Minimum, Maximum, Average, Sum, Samples
Units: Bytes
PutRecord.Latency The time taken per PutRecord operation, measured over the specified
time period.
Dimensions: StreamName
Statistics: Minimum, Maximum, Average
Units: Milliseconds
PutRecord.Success The number of successful PutRecord operations per Amazon Kinesis
stream, measured over the specified time period. Average reflects the
percentage of successful writes to a stream.
Dimensions: StreamName
Statistics: Average, Sum, Samples
Units: Count
PutRecords.Bytes The number of bytes put to the Amazon Kinesis stream using the
PutRecords operation over the specified time period.
Dimensions: StreamName
Statistics: Minimum, Maximum, Average, Sum, Samples
Units: Bytes
PutRecords.Latency The time taken per PutRecords operation, measured over the specified
time period.
Dimensions: StreamName
Statistics: Minimum, Maximum, Average
Units: Milliseconds
199

Amazon CloudWatch User Guide
Basic Stream-level Metrics
Metric Description
PutRecords.Records The number of successful records in a PutRecords operation per Amazon
Kinesis stream, measured over the specified time period.
Dimensions: StreamName
Statistics: Minimum, Maximum, Average, Sum, Samples
Units: Count
PutRecords.Success The number of PutRecords operations where at least one record
succeeded, per Amazon Kinesis stream, measured over the specified time
period.
Dimensions: StreamName
Statistics: Average, Sum, Samples
Units: Count
ReadProvisionedThroughputExceededThe number of GetRecords calls throttled for the stream over the
specified time period. The most commonly used statistic for this metric is
Average.
When the Minimum statistic has a value of 1, all records were throttled for
the stream during the specified time period.
When the Maximum statistic has a value of 0 (zero), no records were
throttled for the stream during the specified time period.
Shard-level metric name: ReadProvisionedThroughputExceeded
Dimensions: StreamName
Statistics: Minimum, Maximum, Average, Sum, Samples
Units: Count
WriteProvisionedThroughputExceededThe number of records rejected due to throttling for the stream over the
specified time period. This metric includes throttling from PutRecord and
PutRecords operations. The most commonly used statistic for this metric
is Average.
When the Minimum statistic has a non-zero value, records were being
throttled for the stream during the specified time period.
When the Maximum statistic has a value of 0 (zero), no records were being
throttled for the stream during the specified time period.
Shard-level metric name: WriteProvisionedThroughputExceeded
Dimensions: StreamName
Statistics: Minimum, Maximum, Average, Sum, Samples
Units: Count
200

Amazon CloudWatch User Guide
Enhanced Shard-level Metrics
Enhanced Shard-level Metrics
The AWS/Kinesis namespace includes the following shard-level metrics.
Amazon Kinesis sends the following shard-level metrics to CloudWatch every minute. These metrics
are not enabled by default. There is a nominal charge for enhanced metrics emitted from Amazon
Kinesis. For more information, see Amazon CloudWatch Pricing.
Metric Description
IncomingBytes The number of bytes successfully put to the shard over the specified time
period. This metric includes bytes from PutRecord and PutRecords
operations. Minimum, Maximum, and Average statistics represent the
bytes in a single put operation for the shard in the specified time period.
Stream-level metric name: IncomingBytes
Dimensions: StreamName, ShardID
Statistics: Minimum, Maximum, Average, Sum, Samples
Units: Bytes
IncomingRecords The number of records successfully put to the shard over the specified
time period. This metric includes record counts from PutRecord and
PutRecords operations. Minimum, Maximum, and Average statistics
represent the records in a single put operation for the shard in the specified
time period.
Stream-level metric name: IncomingRecords
Dimensions: StreamName, ShardID
Statistics: Minimum, Maximum, Average, Sum, Samples
Units: Count
IteratorAgeMillisecondsThe age of the last record in all GetRecords calls made against a shard,
measured over the specified time period. Age is the difference between the
current time and when the last record of the GetRecords call was written
to the stream. The Minimum and Maximum statistics can be used to track
the progress of Amazon Kinesis consumer applications. A value of 0 (zero)
indicates that the records being read are completely caught up with the
stream.
Stream-level metric name: GetRecords.IteratorAgeMilliseconds
Dimensions: StreamName, ShardID
Statistics: Minimum, Maximum, Average, Samples
Units: Milliseconds
OutgoingBytes The number of bytes retrieved from the shard, measured over the specified
time period. Minimum, Maximum, and Average statistics represent the
bytes in a single GetRecords operation for the shard in the specified time
period.
Stream-level metric name: GetRecords.Bytes
Dimensions: StreamName, ShardID
201

Amazon CloudWatch User Guide
Enhanced Shard-level Metrics
Metric Description
Statistics: Minimum, Maximum, Average, Sum, Samples
Units: Bytes
OutgoingRecords The number of records retrieved from the shard, measured over the
specified time period. Minimum, Maximum, and Average statistics
represent the records in a single GetRecords operation for the shard in
the specified time period.
Stream-level metric name: GetRecords.Records
Dimensions: StreamName, ShardID
Statistics: Minimum, Maximum, Average, Sum, Samples
Units: Count
ReadProvisionedThroughputExceededThe number of GetRecords calls throttled for the shard over the specified
time period. This exception count covers all dimensions of the following
limits: 5 reads per shard per second or 2 MB per second per shard. The
most commonly used statistic for this metric is Average.
When the Minimum statistic has a value of 1, all records were throttled for
the shard during the specified time period.
When the Maximum statistic has a value of 0 (zero), no records were
throttled for the shard during the specified time period.
Stream-level metric name: ReadProvisionedThroughputExceeded
Dimensions: StreamName, ShardID
Statistics: Minimum, Maximum, Average, Sum, Samples
Units: Count
WriteProvisionedThroughputExceededThe number of records rejected due to throttling for the shard over the
specified time period. This metric includes throttling from PutRecord and
PutRecords operations and covers all dimensions of the following limits:
1,000 records per second per shard or 1 MB per second per shard. The
most commonly used statistic for this metric is Average.
When the Minimum statistic has a non-zero value, records were being
throttled for the shard during the specified time period.
When the Maximum statistic has a value of 0 (zero), no records were being
throttled for the shard during the specified time period.
Stream-level metric name: WriteProvisionedThroughputExceeded
Dimensions: StreamName, ShardID
Statistics: Minimum, Maximum, Average, Sum, Samples
Units: Count
202

Amazon CloudWatch User Guide
Dimensions for Amazon Kinesis Metrics
Dimensions for Amazon Kinesis Metrics
You can use the following dimensions to filter the metrics for Amazon Kinesis Streams.
Dimension Description
StreamName The name of the Amazon Kinesis stream.
ShardID The shard ID within the Amazon Kinesis stream.
Amazon Kinesis Firehose Metrics
Firehose sends metrics to CloudWatch. For more information, see Monitoring with Amazon
CloudWatch Metrics in the Amazon Kinesis Firehose Developer Guide.
Topics
•Service-level CloudWatch Metrics (p. 203)
•API-Level CloudWatch Metrics (p. 204)
Service-level CloudWatch Metrics
The AWS/Firehose namespace includes the following service-level metrics.
Metric Description
DeliveryToElasticsearch.BytesThe number of bytes indexed to Amazon ES over the specified time period.
Units: Bytes
DeliveryToElasticsearch.RecordsThe number of records indexed to Amazon ES over the specified time
period.
Units: Count
DeliveryToElasticsearch.SuccessThe sum of the successfully indexed records over the sum of records that
were attempted.
DeliveryToRedshift.BytesThe number of bytes copied to Amazon Redshift over the specified time
period.
Units: Bytes
DeliveryToRedshift.RecordsThe number of records copied to Amazon Redshift over the specified time
period.
Units: Count
DeliveryToRedshift.SuccessThe sum of successful Amazon Redshift COPY commands over the sum of
all Amazon Redshift COPY commands.
DeliveryToS3.Bytes The number of bytes delivered to Amazon S3 over the specified time
period.
Units: Bytes
203
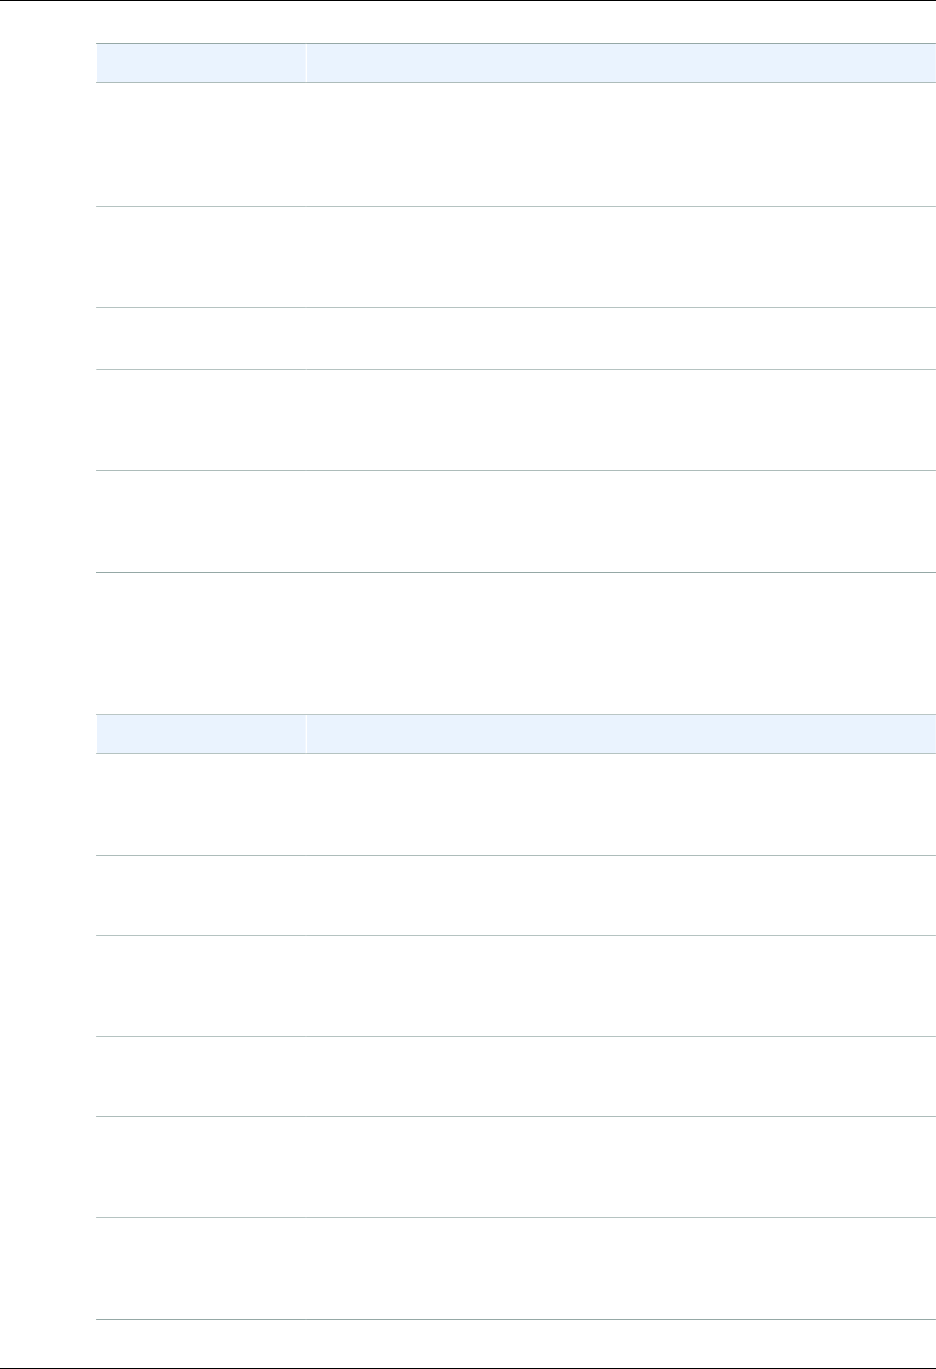
Amazon CloudWatch User Guide
API-Level CloudWatch Metrics
Metric Description
DeliveryToS3.DataFreshnessThe age (from getting into Firehose to now) of the oldest record in
Firehose. Any record older than this age has been delivered to the S3
bucket.
Units: Seconds
DeliveryToS3.RecordsThe number of records delivered to Amazon S3 over the specified time
period.
Units: Count
DeliveryToS3.SuccessThe sum of successful Amazon S3 put commands over sum of all Amazon
S3 put commands.
IncomingBytes The number of bytes ingested into the Firehose stream over the specified
time period.
Units: Bytes
IncomingRecords The number of records ingested into the Firehose stream over the
specified time period.
Units: Count
API-Level CloudWatch Metrics
The AWS/Firehose namespace includes the following API-level metrics.
Metric Description
DescribeDeliveryStream.LatencyThe time taken per DescribeDeliveryStream operation, measured over
the specified time period.
Units: Milliseconds
DescribeDeliveryStream.RequestsThe total number of DescribeDeliveryStream requests.
Units: Count
ListDeliveryStreams.LatencyThe time taken per ListDeliveryStream operation, measured over the
specified time period.
Units: Milliseconds
ListDeliveryStreams.RequestsThe total number of ListFirehose requests.
Units: Count
PutRecord.Bytes The number of bytes put to the Firehose Firehose stream using
PutRecord over the specified time period.
Units: Bytes
PutRecord.Latency The time taken per PutRecord operation, measured over the specified
time period.
Units: Milliseconds
204

Amazon CloudWatch User Guide
AWS KMS
Metric Description
PutRecord.Requests The total number of PutRecord requests, which is equal to total number of
records from PutRecord operations.
Units: Count
PutRecordBatch.BytesThe number of bytes put to the Firehose Firehose stream using
PutRecordBatch over the specified time period.
Units: Bytes
PutRecordBatch.LatencyThe time taken per PutRecordBatch operation, measured over the
specified time period.
Units: Milliseconds
PutRecordBatch.RecordsThe total number of records from PutRecordBatch operations.
Units: Count
PutRecordBatch.RequestsThe total number of PutRecordBatch requests.
Units: Count
UpdateDeliveryStream.LatencyThe time taken per UpdateDeliveryStream operation, measured over
the specified time period.
Units: Milliseconds
UpdateDeliveryStream.RequestsThe total number of UpdateDeliveryStream requests.
Units: Count
AWS Key Management Service Metrics and
Dimensions
When you use AWS Key Management Service (AWS KMS) to import key material into a customer
master key (CMK) and set it to expire, AWS KMS sends metrics and dimensions to CloudWatch every
minute. For more information, see Monitoring with Amazon CloudWatch in the AWS Key Management
Service Developer Guide.
AWS KMS Metrics
The KMS namespace includes the following metrics.
SecondsUntilKeyMaterialExpiration
This metric tracks the number of seconds remaining until imported key material expires. This
metric is valid only for CMKs whose origin is EXTERNAL and whose key material is or was set to
expire. The most useful statistic for this metric is Minimum, which tells you the smallest amount of
time remaining for all data points in the specified statistic period. The only valid unit for this metric
is Seconds.
Use this metric to track the amount of time that remains until your imported key material expires.
When that amount of time falls below a threshold that you define, you might want to take action
such as reimporting the key material with a new expiration date. You can create a CloudWatch
205
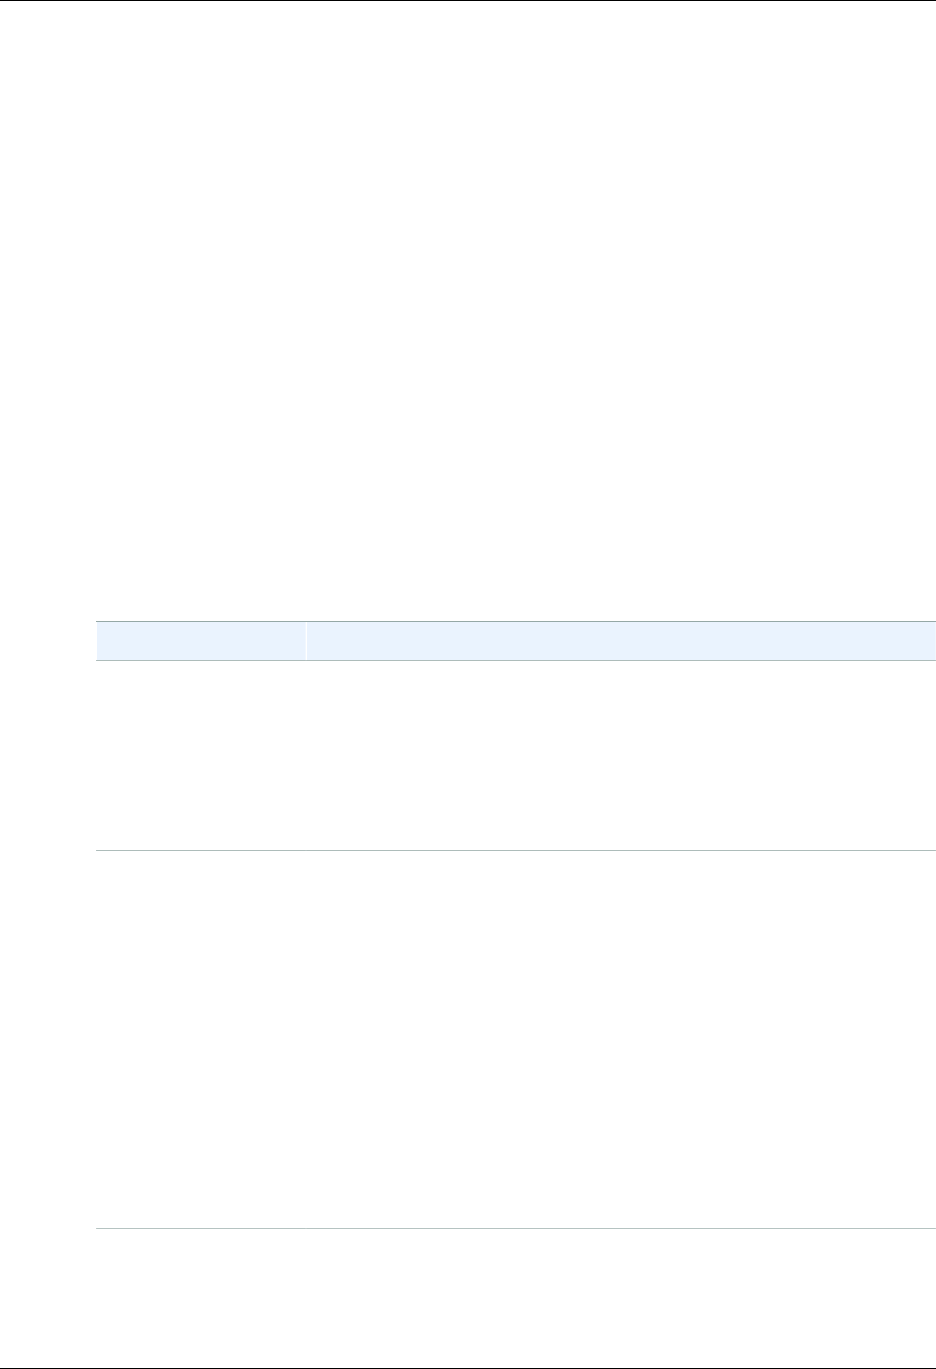
Amazon CloudWatch User Guide
Dimensions for AWS KMS Metrics
alarm to notify you when that happens. For more information, see Creating CloudWatch Alarms to
Monitor AWS KMS Metrics in the AWS Key Management Service Developer Guide.
Dimensions for AWS KMS Metrics
AWS KMS metrics use the KMS namespace and have only one valid dimension: KeyId. You can use
this dimension to view metric data for a specific CMK or set of CMKs.
AWS Lambda Dimensions and Metrics
AWS Lambda sends metrics to CloudWatch every minute. For more information, see Troubleshooting
and Monitoring AWS Lambda Functions with Amazon CloudWatch in the AWS Lambda Developer
Guide.
Topics
•AWS Lambda CloudWatch Metrics (p. 206)
•Dimensions for AWS Lambda Metrics (p. 207)
AWS Lambda CloudWatch Metrics
The AWS/Lambda namespace includes the following metrics.
Metric Description
Invocations Measures the number of times a function is invoked in response to an
event or invocation API call. This replaces the deprecated RequestCount
metric. This includes successful and failed invocations, but does not
include throttled attempts. This equals the billed requests for the function.
Note that AWS Lambda only sends these metrics to CloudWatch if they
have a nonzero value.
Units: Count
Errors Measures the number of invocations that failed due to errors in the function
(response code 4XX). This replaces the deprecated ErrorCount metric.
Failed invocations may trigger a retry attempt that succeeds. This includes:
• Handled exceptions (e.g., context.fail(error))
• Unhandled exceptions causing the code to exit
• Out of memory exceptions
• Timeouts
• Permissions errors
This does not include invocations that fail due to invocation rates
exceeding default concurrent limits (error code 429) or failures due to
internal service errors (error code 500).
Units: Count
Duration Measures the elapsed wall clock time from when the function code starts
executing as a result of an invocation to when it stops executing. This
replaces the deprecated Latency metric. The maximum data point value
possible is the function timeout configuration. The billed duration will be
206
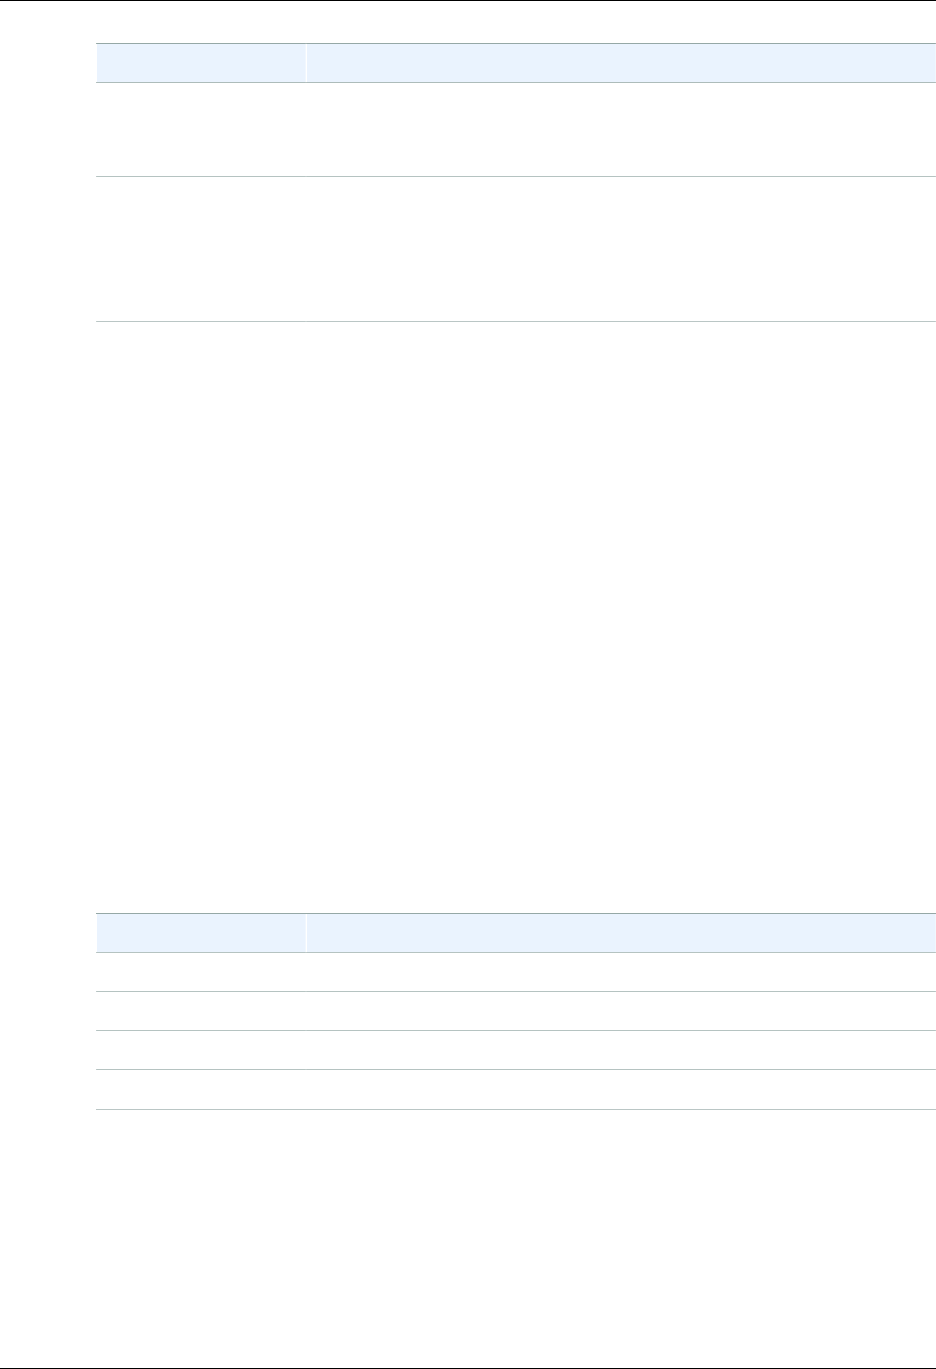
Amazon CloudWatch User Guide
Dimensions for AWS Lambda Metrics
Metric Description
rounded up to the nearest 100 millisecond. Note that AWS Lambda only
sends these metrics to CloudWatch if they have a nonzero value.
Units: Milliseconds
Throttles Measures the number of Lambda function invocation attempts that were
throttled due to invocation rates exceeding the customer’s concurrent
limits (error code 429). Failed invocations may trigger a retry attempt that
succeeds.
Units: Count
Errors/Invocations Ratio
When calculating the error rate on Lambda function invocations, it’s important to distinguish
between an invocation request and an actual invocation. It is possible for the error rate to
exceed the number of billed Lambda function invocations. Lambda reports an invocation
metric only if the Lambda function code is executed. If the invocation request yields a throttling
or other initialization error that prevents the Lambda function code from being invoked,
Lambda will report an error, but it does not log an invocation metric.
• Lambda emits Invocations=1 when the function is executed. If the Lambda function is
not executed, nothing is emitted.
• Lambda emits a data point for Errors for each invoke request. Errors=0 means that there
is no function execution error. Errors=1 means that there is a function execution error.
• Lambda emits a data point for Throttles for each invoke request. Throttles=0 means
there is no invocation throttle. Throttles=1 means there is an invocation throttle.
Dimensions for AWS Lambda Metrics
Lambda data can be filtered along any of the following dimensions in the table below.
AWS Lambda CloudWatch Dimensions
You can use the dimensions in the following table to refine the metrics returned for your Lambda
functions.
Dimension Description
FunctionName Filters the metric data by Lambda function.
Resource Filters the metric data by Lambda function resource.
Version Filters the metric data by Lambda version.
Alias Filters the metric data by Lambda alias.
Amazon Machine Learning Dimensions and
Metrics
Amazon Machine Learning sends metrics to CloudWatch every five minutes. For more information, see
Monitoring Amazon ML with Amazon CloudWatch Metrics in the Amazon Machine Learning Developer
Guide.
207
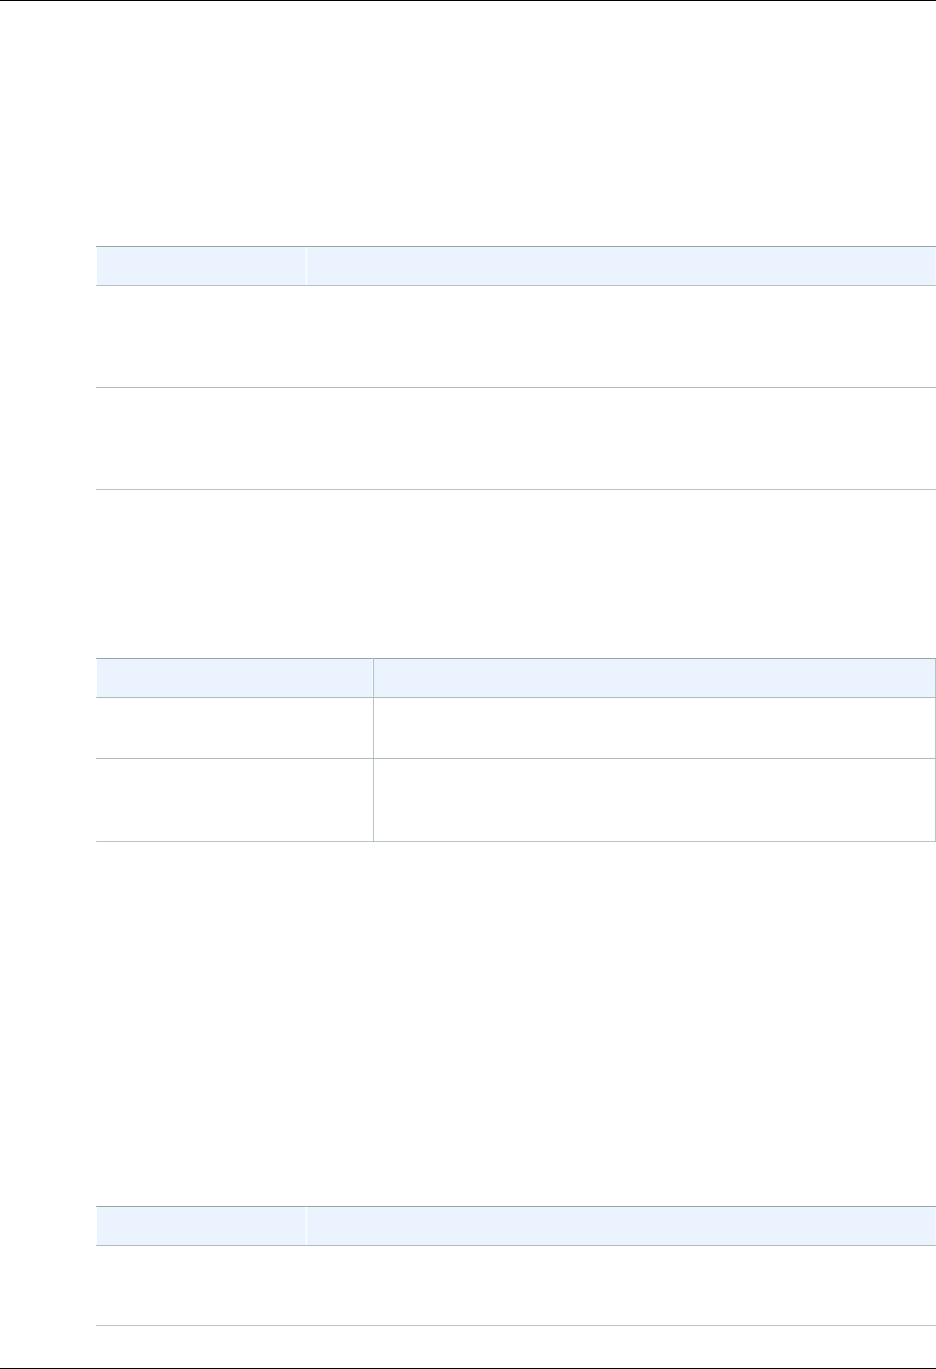
Amazon CloudWatch User Guide
Amazon ML Metrics
Topics
•Amazon ML Metrics (p. 208)
•Dimensions for Amazon Machine Learning Metrics (p. 208)
Amazon ML Metrics
The AWS/ML namespace includes the following metrics.
Metric Description
PredictCount The number of observations received by Amazon ML, measured over the
specified time period.
Units: Count
PredictFailureCount The number of invalid or malformed observations received by Amazon ML,
measured over the specified time period.
Units: Count
Dimensions for Amazon Machine Learning
Metrics
Amazon ML data can be filtered along any of the following dimensions in the table below.
Dimension Description
MLModelId The identifier of an Amazon ML model. All available statistics are
filtered by MLModelId.
RequestMode An indicator specifying whether observations were received as part
of a batch prediction request or as real-time predict requests. All
available statistics are filtered by RequestMode.
AWS OpsWorks Dimensions and Metrics
AWS OpsWorks sends metrics to CloudWatch for each active stack every minute. Detailed monitoring
is enabled by default. For more information, see Monitoring in the AWS OpsWorks User Guide.
Topics
•AWS OpsWorks Metrics (p. 208)
•Dimensions for AWS OpsWorks Metrics (p. 210)
AWS OpsWorks Metrics
The AWS/OpsWorks namespace includes the following metrics.
Metric Description
cpu_idle The percentage of time that the CPU is idle.
Units: Percent
208

Amazon CloudWatch User Guide
AWS OpsWorks Metrics
Metric Description
cpu_nice The percentage of time that the CPU is handling processes with a positive
nice value, which have lower scheduling priority. For information, see nice
(Unix).
Units: Percent
cpu_system The percentage of time that the CPU is handling system operations.
Units: Percent
cpu_user The percentage of time that the CPU is handling user operations.
Units: Percent
cpu_waitio The percentage of time that the CPU is waiting for input/output operations.
Units: Percent
load_1 The load averaged over a 1-minute window.
Units: Unix load units
load_5 The load averaged over a 5-minute window.
Units: Unix load units
load_15 The load averaged over a 15-minute window.
Units: Unix load units
memory_buffers The amount of buffered memory.
Units: Kilobytes
memory_cached The amount of cached memory.
Units: Kilobytes
memory_free The amount of free memory.
Units: Kilobytes
memory_swap The amount of swap space.
Units: Kilobytes
memory_total The total amount of memory.
Units: Kilobytes
memory_used The amount of memory in use.
Units: Kilobytes
procs The number of active processes.
Units: Count
209
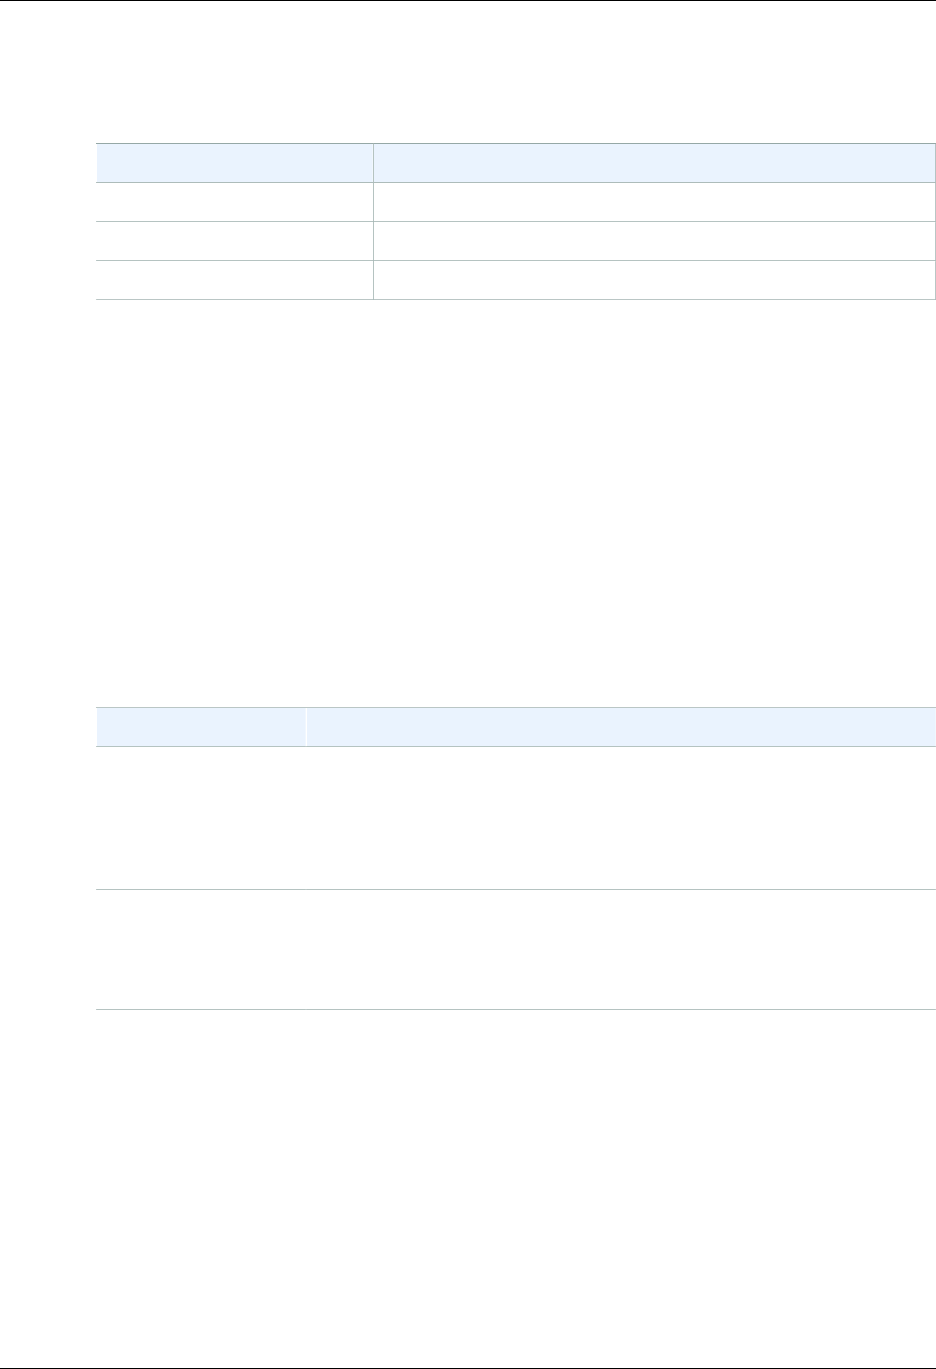
Amazon CloudWatch User Guide
Dimensions for AWS OpsWorks Metrics
Dimensions for AWS OpsWorks Metrics
AWS OpsWorks data can be filtered along any of the following dimensions in the table below.
Dimension Description
StackId Average values for a stack.
LayerId Average values for a layer.
InstanceId Average values for an instance.
Amazon Redshift Dimensions and Metrics
Amazon Redshift sends metrics to CloudWatch for each active cluster every minute. Detailed
monitoring is enabled by default. For more information, see Monitoring Amazon Redshift Cluster
Performance in the Amazon Redshift Cluster Management Guide.
Topics
•Amazon Redshift Metrics (p. 210)
•Dimensions for Amazon Redshift Metrics (p. 212)
Amazon Redshift Metrics
The AWS/Redshift namespace includes the following metrics.
Metric Description
CPUUtilization The percentage of CPU utilization. For clusters, this metric represents an
aggregation of all nodes (leader and compute) CPU utilization values.
Units: Percent
Dimensions: NodeID, ClusterIdentifier
DatabaseConnections The number of database connections to a cluster.
Units: Count
Dimensions: ClusterIdentifier
HealthStatus Indicates the health of the cluster. Every minute the cluster connects to its
database and performs a simple query. If it is able to perform this operation
successfully, the cluster is considered healthy. Otherwise, the cluster is
unhealthy. An unhealthy status can occur when the cluster database is
under extremely heavy load or if there is a configuration problem with
a database on the cluster. The exception to this is when the cluster is
undergoing maintenance. Even though your cluster might be unavailable
due to maintenance tasks, the cluster remains in HEALTHY state. For
more information, see Maintenance Windows in the Amazon Redshift
Cluster Management Guide.
Note
In Amazon CloudWatch this metric is reported as 1 or 0 whereas
in the Amazon CloudWatch console, this metric is displayed with
210

Amazon CloudWatch User Guide
Amazon Redshift Metrics
Metric Description
the words HEALTHY or UNHEALTHY for convenience. When this
metric is displayed in the Amazon CloudWatch console, sampling
averages are ignored and only HEALTHY or UNHEALTHY are
displayed. In Amazon CloudWatch, values different than 1 and
0 may occur because of sampling issue. Any value below 1 for
HealthStatus is reported as 0 (UNHEALTHY).
Units: 1/0 (HEALTHY/UNHEALTHY in the Amazon CloudWatch console)
Dimensions: ClusterIdentifier
MaintenanceMode Indicates whether the cluster is in maintenance mode.
Note
In Amazon CloudWatch this metric is reported as 1 or 0 whereas
in the Amazon CloudWatch console, this metric is displayed
with the words ON or OFF for convenience. When this metric is
displayed in the Amazon CloudWatch console, sampling averages
are ignored and only ON or OFF are displayed. In Amazon
CloudWatch, values different than 1 and 0 may occur because of
sampling issues. Any value greater than 0 for MaintenanceMode
is reported as 1 (ON).
Units: 1/0 (ON/OFF in the Amazon CloudWatch console).
Dimensions: ClusterIdentifier
NetworkReceiveThroughputThe rate at which the node or cluster receives data.
Units: Bytes/seconds (MB/s in the Amazon CloudWatch console)
Dimensions: NodeID, ClusterIdentifier
NetworkTransmitThroughputThe rate at which the node or cluster writes data.
Units: Bytes/second (MB/s in the Amazon CloudWatch console)
Dimensions: NodeID, ClusterIdentifier
PercentageDiskSpaceUsedThe percent of disk space used.
Units: Percent
Dimensions: NodeID, ClusterIdentifier
ReadIOPS The average number of disk read operations per second.
Units: Count/second
Dimensions: NodeID
ReadLatency The average amount of time taken for disk read I/O operations.
Units: Seconds
Dimensions: NodeID
211
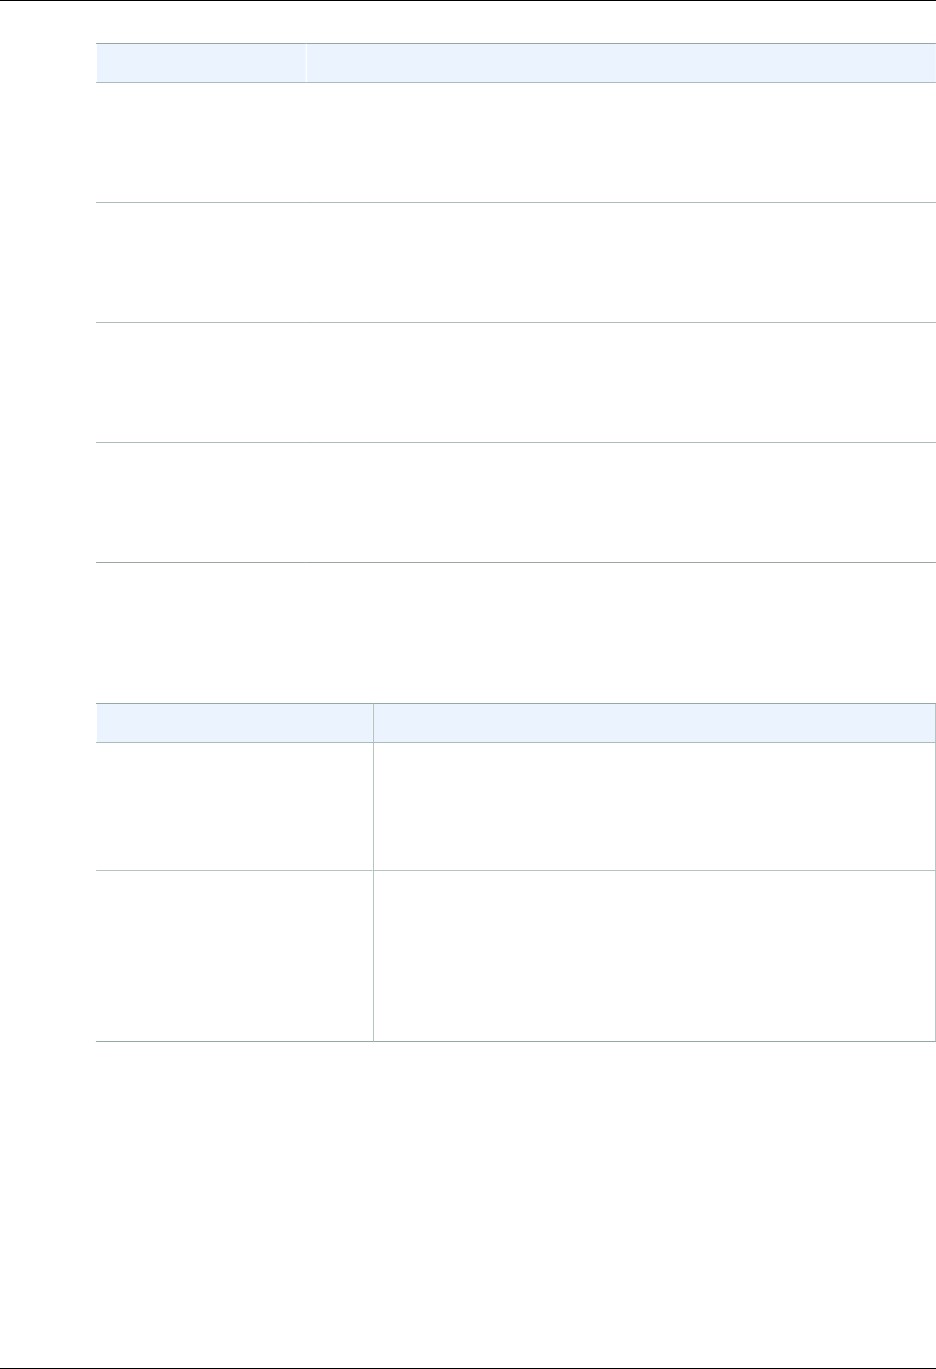
Amazon CloudWatch User Guide
Dimensions for Amazon Redshift Metrics
Metric Description
ReadThroughput The average number of bytes read from disk per second.
Units: Bytes (GB/s in the Amazon CloudWatch console)
Dimensions: NodeID
WriteIOPS The average number of write operations per second.
Units: Count/seconds
Dimensions: NodeID
WriteLatency The average amount of time taken for disk write I/O operations.
Units: Seconds
Dimensions: NodeID
WriteThroughput The average number of bytes written to disk per second.
Units: Bytes (GB/s in the Amazon CloudWatch console)
Dimensions: NodeID
Dimensions for Amazon Redshift Metrics
Amazon Redshift data can be filtered along any of the following dimensions in the table below.
Dimension Description
NodeID Filters requested data that is specific to the nodes of a cluster.
NodeID will be either "Leader", "Shared", or "Compute-N" where
N is 0, 1, ... for the number of nodes in the cluster. "Shared"
means that the cluster has only one node, i.e. the leader node and
compute node are combined.
ClusterIdentifier Filters requested data that is specific to the cluster. Metrics
that are specific to clusters include HealthStatus,
MaintenanceMode, and DatabaseConnections. In general
metrics in for this dimension (e.g. ReadIOPS) that are also metrics
of nodes represent an aggregate of the node metric data. You
should take care in interpreting these metrics because they
aggregate behavior of leader and compute nodes.
Amazon RDS Dimensions and Metrics
Amazon Relational Database Service sends metrics to CloudWatch for each active database instance
every minute. Detailed monitoring is enabled by default. For more information, see Monitoring a DB
Instance in the Amazon Relational Database Service User Guide.
Topics
•Amazon RDS Metrics (p. 213)
•Dimensions for RDS Metrics (p. 214)
212

Amazon CloudWatch User Guide
Amazon RDS Metrics
Amazon RDS Metrics
The AWS/RDS namespace includes the following metrics.
Metric Description
BinLogDiskUsage The amount of disk space occupied by binary logs on the master. Applies
to MySQL read replicas.
Units: Bytes
CPUUtilization The percentage of CPU utilization.
Units: Percent
CPUCreditUsage (Only valid for T2 instances) The number of CPU credits consumed during
the specified period.
This metric identifies the amount of time during which physical CPUs were
used for processing instructions by virtual CPUs allocated to the instance.
Note
CPU Credit metrics are available at a 5 minute frequency.
Units: Count
CPUCreditBalance (Only valid for T2 instances) The number of CPU credits that an instance
has accumulated.
This metric is used to determine how long an instance can burst beyond its
baseline performance level at a given rate.
Note
CPU Credit metrics are available at a 5 minute frequency.
Units: Count
DatabaseConnections The number of database connections in use.
Units: Count
DiskQueueDepth The number of outstanding IOs (read/write requests) waiting to access the
disk.
Units: Count
FreeableMemory The amount of available random access memory.
Units: Bytes
FreeStorageSpace The amount of available storage space.
Units: Bytes
ReplicaLag The amount of time a Read Replica DB instance lags behind the source
DB instance. Applies to MySQL, MariaDB, and PostgreSQL Read
Replicas.
Units: Seconds
SwapUsage The amount of swap space used on the DB instance.
213
Amazon CloudWatch User Guide
Dimensions for RDS Metrics
Metric Description
Units: Bytes
ReadIOPS The average number of disk I/O operations per second.
Units: Count/Second
WriteIOPS The average number of disk I/O operations per second.
Units: Count/Second
ReadLatency The average amount of time taken per disk I/O operation.
Units: Seconds
WriteLatency The average amount of time taken per disk I/O operation.
Units: Seconds
ReadThroughput The average number of bytes read from disk per second.
Units: Bytes/Second
WriteThroughput The average number of bytes written to disk per second.
Units: Bytes/Second
NetworkReceiveThroughputThe incoming (Receive) network traffic on the DB instance, including both
customer database traffic and Amazon RDS traffic used for monitoring and
replication.
Units: Bytes/second
NetworkTransmitThroughputThe outgoing (Transmit) network traffic on the DB instance, including both
customer database traffic and Amazon RDS traffic used for monitoring and
replication.
Units: Bytes/second
Dimensions for RDS Metrics
Amazon RDS data can be filtered along any of the following dimensions in the table below.
Dimension Description
DBInstanceIdentifier This dimension filters the data you request for a specific database
instance.
DBClusterIdentifier This dimension filters the data you request for a specific Amazon
Aurora DB cluster.
DatabaseClass This dimension filters the data you request for all instances in a
database class. For example, you can aggregate metrics for all
instances that belong to the database class db.m1.small
EngineName This dimension filters the data you request for the identified
engine name only. For example, you can aggregate metrics for all
instances that have the engine name mysql.
214
Amazon CloudWatch User Guide
Amazon Route 53
Amazon Route 53 Dimensions and Metrics
Amazon Route 53 sends metrics to CloudWatch. CloudWatch provides detailed monitoring of
Amazon Route 53 by default. Amazon Route 53 sends one-minute metrics to CloudWatch. For more
information, see Monitoring Health Checks Using Amazon CloudWatch in the Amazon Route 53
Developer Guide.
Note
To get Amazon Route 53 metrics using CloudWatch, you must choose US East (N. Virginia)
as the region. Amazon Route 53 metrics are not available if you select any other region. You
can also optionally specify a Region dimension. For more information, see Dimensions for
Amazon Route 53 Metrics (p. 216).
Amazon Route 53 Metrics
The AWS/Route53 namespace includes the following metrics.
Metric Description
ChildHealthCheckHealthyCount For a calculated health check, the number of health checks
that are healthy among the health checks that Amazon
Route 53 is monitoring.
Valid statistics: Average (recommended), Minimum, Maximum
Units: Healthy health checks
ConnectionTime The average time, in milliseconds, that it took Amazon
Route 53 health checkers to establish a TCP connection with
the endpoint. You can view ConnectionTime for a health
check either across all regions or for a selected geographic
region.
Valid statistics: Average (recommended), Minimum, Maximum
Units: Milliseconds
HealthCheckPercentageHealthy The percentage of Amazon Route 53 health checkers that
consider the selected endpoint to be healthy. You can view
HealthCheckPercentageHealthy only across all regions;
data is not available for a selected region.
Valid statistics: Average, Minimum, Maximum
Units: Percent
HealthCheckStatus The status of the health check endpoint that CloudWatch is
checking. 1 indicates healthy, and 0 indicates unhealthy. You
can view HealthCheckStatus only across all regions; data is
not available for a selected region.
Valid statistics: Minimum
Units: none
SSLHandshakeTime The average time, in milliseconds, that it took Amazon
Route 53 health checkers to complete the SSL handshake.
You can view SSLHandshakeTime for a health check either
across all regions or for a selected geographic region.
215
Amazon CloudWatch User Guide
Dimensions for Amazon Route 53 Metrics
Metric Description
Valid statistics: Average (recommended), Minimum, Maximum
Units: Milliseconds
TimeToFirstByte The average time, in milliseconds, that it took Amazon
Route 53 health checkers to receive the first byte of the
response to an HTTP or HTTPS request. You can view
TimeToFirstByte for a health check either across all regions
or for a selected geographic region.
Valid statistics: Average (recommended), Minimum, Maximum
Units: Milliseconds
Dimensions for Amazon Route 53 Metrics
Amazon Route 53 metrics use the AWS/Route53 namespace and provide metrics for
HealthCheckId. When retrieving metrics, you must supply the HealthCheckId dimension.
In addition, for ConnectionTime, SSLHandshakeTime, and TimeToFirstByte, you can optionally
specify Region. If you omit Region, CloudWatch returns metrics across all regions. If you include
Region, CloudWatch returns metrics only for the specified region.
For more information, see Monitoring Health Checks Using CloudWatch in the Amazon Route 53
Developer Guide.
Amazon Simple Notification Service
Dimensions and Metrics
Amazon Simple Notification Service sends data points to CloudWatch for several metrics. All active
topics automatically send five-minute metrics to CloudWatch. Detailed monitoring, or one-minute
metrics, is currently unavailable for Amazon Simple Notification Service. A topic stays active for
six hours from the last activity (for example, any API call) on the topic. For more information, see
Monitoring Amazon SNS with Amazon CloudWatch in the Amazon Simple Notification Service
Developer Guide.
Amazon Simple Notification Service Metrics
The AWS/SNS namespace includes the following metrics.
Metric Description
NumberOfMessagesPublished The number of messages published.
Units: Count
Valid Statistics: Sum
PublishSize The size of messages published.
Units: Bytes
216
Amazon CloudWatch User Guide
Dimensions for Amazon Simple
Notification Service Metrics
Metric Description
Valid Statistics: Minimum, Maximum, Average and
Count
NumberOfNotificationsDelivered The number of messages successfully delivered.
Units: Count
Valid Statistics: Sum
NumberOfNotificationsFailed The number of messages that Amazon SNS failed to
deliver. This metric is applied after Amazon SNS stops
attempting message deliveries to Amazon SQS, email,
SMS, or mobile push endpoints. Each delivery attempt
to an HTTP or HTTPS endpoint adds 1 to the metric.
For all other endpoints, the count increases by 1 when
the message is not delivered (regardless of the number
of attempts). You can control the number of retries
for HTTP endpoints; for more information, see Setting
Amazon SNS Delivery Retry Policies for HTTP/HTTPS
Endpoints.
Units: Count
Valid Statistics: Sum, Average
SMSSuccessRate The rate of successful SMS message deliveries.
Units: Count
Valid Statistics: Sum, Average, Data Samples
Dimensions for Amazon Simple Notification
Service Metrics
Amazon SNS sends the following dimensions to CloudWatch.
Dimension Description
Application Filters on application objects, which represent an app and device
registered with one of the supported push notification services,
such as APNS and GCM.
Application,Platform Filters on application and platform objects, where the platform
objects are for the supported push notification services, such as
APNS and GCM.
Country Filters on the destination country of an SMS message. The country
is represented by its ISO 3166-1 alpha-2 code.
Platform Filters on platform objects for the push notification services, such
as APNS and GCM.
TopicName Filters on Amazon SNS topic names.
SMSType Filters on the message type of SMS message. Can be promotional
or transactional.
217

Amazon CloudWatch User Guide
Amazon SQS
Amazon SQS Dimensions and Metrics
Amazon SQS sends data points to CloudWatch for several metrics. All active queues automatically
send five-minute metrics to CloudWatch. Detailed monitoring, or one-minute metrics, is currently
unavailable for Amazon SQS. A queue stays active for six hours from the last activity (for example, any
API call) on the queue. For more information, see Monitoring Amazon SQS with Amazon CloudWatch
in the Amazon Simple Queue Service Developer Guide.
Amazon SQS Metrics
The AWS/SQS namespace includes the following metrics.
Metric Description
ApproximateAgeOfOldestMessage The approximate age of the oldest non-
deleted message in the queue.
Units: Seconds
Valid Statistics: Average, Minimum,
Maximum, Sum, Data Samples (displays as
Sample Count in the Amazon SQS console)
ApproximateNumberOfMessagesDelayed The number of messages in the queue that
are delayed and not available for reading
immediately. This can happen when the
queue is configured as a delay queue or
when a message has been sent with a
delay parameter.
Units: Count
Valid Statistics: Average, Minimum,
Maximum, Sum, Data Samples (displays as
Sample Count in the Amazon SQS console)
ApproximateNumberOfMessagesNotVisible The number of messages that are "in flight."
Messages are considered in flight if they
have been sent to a client but have not yet
been deleted or have not yet reached the
end of their visibility window.
Units: Count
Valid Statistics: Average, Minimum,
Maximum, Sum, Data Samples (displays as
Sample Count in the Amazon SQS console)
ApproximateNumberOfMessagesVisible The number of messages available for
retrieval from the queue.
Units: Count
Valid Statistics: Average, Minimum,
Maximum, Sum, Data Samples (displays as
Sample Count in the Amazon SQS console)
NumberOfEmptyReceives The number of ReceiveMessage API calls
that did not return a message.
218

Amazon CloudWatch User Guide
Dimensions for Amazon SQS Metrics
Metric Description
Units: Count
Valid Statistics: Average, Minimum,
Maximum, Sum, Data Samples (displays as
Sample Count in the Amazon SQS console)
NumberOfMessagesDeleted The number of messages deleted from the
queue.
Units: Count
Valid Statistics: Average, Minimum,
Maximum, Sum, Data Samples (displays as
Sample Count in the Amazon SQS console)
NumberOfMessagesReceived The number of messages returned by calls
to the ReceiveMessage API action.
Units: Count
Valid Statistics: Average, Minimum,
Maximum, Sum, Data Samples (displays as
Sample Count in the Amazon SQS console)
NumberOfMessagesSent The number of messages added to a
queue.
Units: Count
Valid Statistics: Average, Minimum,
Maximum, Sum, Data Samples (displays as
Sample Count in the Amazon SQS console)
SentMessageSize The size of messages added to a queue.
Units: Bytes
Valid Statistics: Average, Minimum,
Maximum, Sum, Data Samples (displays as
Sample Count in the Amazon SQS console)
Note that SentMessageSize does not
display as an available metric in the
CloudWatch console until at least one
message is sent to the corresponding
queue.
Dimensions for Amazon SQS Metrics
The only dimension that Amazon SQS sends to CloudWatch is QueueName. This means that all
available statistics are filtered by QueueName.
219
Amazon CloudWatch User Guide
Amazon S3
Amazon Simple Storage Service Dimensions
and Metrics
Amazon Simple Storage Service sends data points to CloudWatch for several metrics, such as
object counts and bytes stored, once a day. For more information, see Monitoring Amazon S3 with
CloudWatch in the Amazon Simple Storage Service Developer Guide.
Amazon S3 CloudWatch Metrics
The AWS/S3 namespace includes the following metrics.
Metric Description
BucketSizeBytes The amount of data in bytes stored in a bucket in the Standard storage
class, Standard - Infrequent Access (Standard_IA) storage class, or the
Reduced Redundancy Storage (RRS) class.
Valid storage type filters: StandardStorage, or StandardIAStorage, or
ReducedRedundancyStorage (see StorageType dimension)
NumberOfObjects The total number of objects stored in a bucket for all storage classes
except for the GLACIER storage class.
Valid storage type filters: AllStorageTypes only (see StorageType
dimension)
Amazon S3 CloudWatch Dimensions
The following dimensions are used to filter Amazon S3 metrics.
Dimension Description
BucketName This dimension filters the data you request for the identified bucket
only.
StorageType This dimension filters the data you have stored in a bucket
by the type of storage. The types are StandardStorage for
the Standard storage class, StandardIAStorage for the
Standard_IA storage class, ReducedRedundancyStorage
for the Reduced Redundancy Storage (RRS) class, and
AllStorageTypes. The AllStorageTypes type includes the
Standard, Standard_IA, and RRS storage classes, it does not
include the GLACIER storage class.
Amazon SWF Dimensions and Metrics
Amazon SWF sends data points to CloudWatch for several metrics. Some of the Amazon SWF
metrics for CloudWatch are time intervals, always measured in milliseconds. These metrics generally
correspond to stages of your workflow execution for which you can set workflow and activity timeouts,
and have similar names. For example, the DecisionTaskStartToCloseTime metric measures the
time it took for the decision task to complete after it began executing, which is the same time period for
which you can set a DecisionTaskStartToCloseTimeout value.
220
Amazon CloudWatch User Guide
Workflow Metrics
Other Amazon SWF metrics report results as a count. For example, WorkflowsCanceled, records
a result as either one or zero, indicating whether or not the workflow was canceled. A value of zero
does not indicate that the metric was not reported, only that the condition described by the metric did
not occur. For count metrics, minimum and maximum will always be either zero or one, but average
will be a value ranging from zero to one. For more information, see Viewing Amazon SWF Metrics for
CloudWatch using the AWS Management Console; in the Amazon Simple Workflow Service Developer
Guide.
Workflow Metrics
The AWS/SWF namespace includes the following metrics for Amazon SWF workflows:
Metric Description
DecisionTaskScheduleToStartTimeThe time interval, in milliseconds, between the time that the
decision task was scheduled and the time it was picked up by a
worker and started.
DecisionTaskStartToCloseTime The time interval, in milliseconds, between the time that the
decision task was started and the time it was closed.
DecisionTasksCompleted The count of decision tasks that have been completed.
StartedDecisionTasksTimedOutOnCloseThe count of decision tasks that started but timed out on closing.
WorkflowStartToCloseTime The time, in milliseconds, between the time the workflow started
and the time it closed.
WorkflowsCanceled The count of workflows that were canceled.
WorkflowsCompleted The count of workflows that completed.
WorkflowsContinuedAsNew The count of workflows that continued as new.
WorkflowsFailed the count of workflows that failed.
WorkflowsTerminated the count of workflows that were terminated.
WorkflowsTimedOut The count of workflows that timed out, for any reason.
Dimensions for Amazon SWF Workflow Metrics
Dimension Description
Domain The Amazon SWF domain that the workflow is running in.
WorkflowTypeName The name of the workflow type for this workflow execution.
WorkflowTypeVersion The version of the workflow type for this workflow execution.
Activity Metrics
The AWS/SWF namespace includes the following metrics for Amazon SWF activities:
221
Amazon CloudWatch User Guide
AWS Storage Gateway
Metric Description
ActivityTaskScheduleToCloseTimeThe time interval, in milliseconds, between the time when the
activity was scheduled to when it closed.
ActivityTaskScheduleToStartTimeThe time interval, in milliseconds, between the time when the
activity task was scheduled and when it started.
ActivityTaskStartToCloseTime The time interval, in milliseconds, between the time when the
activity task started and when it was closed.
ActivityTasksCanceled The count of activity tasks that were canceled.
ActivityTasksCompleted The count of activity tasks that completed.
ActivityTasksFailed The count of activity tasks that failed.
ScheduledActivityTasksTimedOutOnCloseThe count of activity tasks that were scheduled but timed out on
close.
ScheduledActivityTasksTimedOutOnStartThe count of activity tasks that were scheduled but timed out on
start.
StartedActivityTasksTimedOutOnCloseThe count of activity tasks that were started but timed out on close.
StartedActivityTasksTimedOutOnHeartbeatThe count of activity tasks that were started but timed out due to a
heartbeat timeout.
Dimensions for Amazon SWF Activity Metrics
Dimension Description
Domain The Amazon SWF domain that the activity is running in.
ActivityTypeName The name of the activity type.
ActivityTypeVersion The version of the activity type
AWS Storage Gateway Dimensions and
Metrics
AWS Storage Gateway sends data points to CloudWatch for several metrics. All active queues
automatically send five-minute metrics to CloudWatch. Detailed monitoring, or one-minute metrics,
is currently unavailable for AWS Storage Gateway. For more information, see Monitoring Your AWS
Storage Gateway in the AWS Storage Gateway User Guide.
AWS Storage Gateway Metrics
The AWS/StorageGateway namespace includes the following metrics.
You can use these metrics to get information about your gateways. Specify the GatewayId or
GatewayName dimension for each metric to view the data for a gateway. Note that these metrics are
measured in 5-minute intervals.
222

Amazon CloudWatch User Guide
AWS Storage Gateway Metrics
Metric Description Gateway-Cached Gateway-Stored Gateway-VTL
CacheHitPercentPercent of
application reads
served from the
cache. This metric
applies only to the
gateway-cached
volume setup. The
sample is taken
at the end of the
reporting period.
Units: Percent
yes no yes
CachePercentUsedPercent use of the
gateway's cache
storage. This metric
applies only to the
gateway-cached
volume setup. The
sample is taken
at the end of the
reporting period.
Units: Percent
yes no yes
CachePercentDirtyPercent of the
gateway's cache
that has not been
persisted to AWS.
This metric applies
only to the gateway-
cached volume
setup. The sample is
taken at the end of
the reporting period.
Units: Percent
yes no yes
CloudBytesDownloadedThe total number of
compressed bytes
that the gateway
downloaded from
AWS during the
reporting period.
Use this metric
with the Sum
statistic to measure
throughput and with
the Samples statistic
to measure input/
output operations per
second (IOPS).
Units: Bytes
yes yes yes
223

Amazon CloudWatch User Guide
AWS Storage Gateway Metrics
Metric Description Gateway-Cached Gateway-Stored Gateway-VTL
CloudDownloadLatencyThe total number of
milliseconds spent
reading data from
AWS during the
reporting period.
Use this metric with
the Average statistic
to measure latency.
Units: Milliseconds
yes yes yes
CloudBytesUploadedThe total number of
compressed bytes
that the gateway
uploaded to AWS
during the reporting
period.
Use this metric
with the Sum
statistic to measure
throughput and with
the Samples statistic
to measure IOPS.
Units: Bytes
yes yes yes
UploadBufferFreeThe total amount of
unused space in the
gateway's upload
buffer. The sample
is taken at the end of
the reporting period.
Units: Bytes
yes no yes
CacheFreeThe total amount
of unused space in
the gateway's cache
storage. The sample
is taken at the end of
the reporting period.
Units: Bytes
yes no yes
UploadBufferPercentUsedPercent use of the
gateway's upload
buffer. The sample
is taken at the end of
the reporting period.
Units: Percent
yes no yes
224

Amazon CloudWatch User Guide
AWS Storage Gateway Metrics
Metric Description Gateway-Cached Gateway-Stored Gateway-VTL
UploadBufferUsedThe total number of
bytes being used in
the gateway's upload
buffer. The sample
is taken at the end of
the reporting period.
Units: Bytes
yes no yes
CacheUsedThe total number of
bytes being used in
the gateway's cache
storage. The sample
is taken at the end of
the reporting period.
Units: Bytes
yes no yes
QueuedWritesThe number of bytes
waiting to be written
to AWS, sampled
at the end of the
reporting period for
all volumes in the
gateway. These
bytes are kept in your
gateway's working
storage.
Units: Bytes
yes yes yes
ReadBytesThe total number
of bytes read from
your on-premises
applications in the
reporting period for
all volumes in the
gateway.
Use this metric
with the Sum
statistic to measure
throughput and with
the Samples statistic
to measure IOPS.
Units: Bytes
yes yes yes
225

Amazon CloudWatch User Guide
AWS Storage Gateway Metrics
Metric Description Gateway-Cached Gateway-Stored Gateway-VTL
ReadTimeThe total number
of milliseconds
spent to do read
operations from
your on-premises
applications in the
reporting period for
all volumes in the
gateway.
Use this metric with
the Average statistic
to measure latency.
Units: Milliseconds
yes yes yes
TotalCacheSizeThe total size of the
cache in bytes. This
metric applies only to
the gateway-cached
volume setup. The
sample is taken
at the end of the
reporting period.
Units: Bytes
yes no yes
WriteBytesThe total number
of bytes written to
your on-premises
applications in the
reporting period for
all volumes in the
gateway.
Use this metric
with the Sum
statistic to measure
throughput and with
the Samples statistic
to measure IOPS.
Units: Bytes
yes yes yes
226

Amazon CloudWatch User Guide
AWS Storage Gateway Metrics
Metric Description Gateway-Cached Gateway-Stored Gateway-VTL
WriteTimeThe total number
of milliseconds
spent to do write
operations from
your on-premises
applications in the
reporting period for
all volumes in the
gateway.
Use this metric with
the Average statistic
to measure latency.
Units: Milliseconds
yes yes yes
TimeSinceLastRecoveryPointThe time since
the last available
recovery point.
Units: Seconds
yes yes no
227

Amazon CloudWatch User Guide
AWS Storage Gateway Metrics
Metric Description Gateway-Cached Gateway-Stored Gateway-VTL
WorkingStorageFreeThe total amount of
unused space in the
gateway's working
storage. The sample
is taken at the end of
the reporting period.
Note
Working
storage
applies
only to the
gateway-
stored
volume
setup. The
upload
buffer
applies to
both the
gateway-
stored and
gateway-
cached
volume
setups. If
you are
working with
both types
of gateway
setups,
you might
find it more
convenient
to use
just the
corresponding
upload
buffer
metric,
UploadBufferFree.
Units: Bytes
no yes no
228

Amazon CloudWatch User Guide
AWS Storage Gateway Metrics
Metric Description Gateway-Cached Gateway-Stored Gateway-VTL
WorkingStoragePercentUsedPercent use of the
gateway's upload
buffer. The sample
is taken at the end of
the reporting period.
Note
Working
storage
applies
only to the
gateway-
stored
volume
setup. The
upload
buffer
applies to
both the
gateway-
stored and
gateway-
cached
volume
setups. If
you are
working with
both types
of gateway
setups,
you might
find it more
convenient
to use
just the
corresponding
upload
buffer
metric,
UploadBufferPercentUsed.
Units: Percent
no yes no
229
Amazon CloudWatch User Guide
AWS Storage Gateway Metrics
Metric Description Gateway-Cached Gateway-Stored Gateway-VTL
WorkingStorageUsedThe total number of
bytes being used in
the gateway's upload
buffer. The sample
is taken at the end of
the reporting period.
Note
Working
storage
applies
only to the
gateway-
stored
volume
setup. The
upload
buffer
applies to
both the
gateway-
stored and
gateway-
cached
volume
setups. If
you are
working with
both types
of gateway
setups,
you might
find it more
convenient
to use
just the
corresponding
upload
buffer
metric,
UploadBufferUsed.
Units: Bytes
no yes no
The following table describes the AWS Storage Gateway metrics that you can use to get information
about your storage volumes. Specify the VolumeId dimension for each metric to view the data for a
storage volume.
230

Amazon CloudWatch User Guide
AWS Storage Gateway Metrics
Metric Description Gateway-Cached Gateway-Stored
CacheHitPercentPercent of application read
operations from the volume
that are served from cache.
This metric applies only
to cached volumes. The
sample is taken at the end
of the reporting period.
When there are no
application read operations
from the volume, this metric
reports 100 percent.
Units: Percent
yes no
CachePercentUsedThe volume's contribution
to the overall percent use
of the gateway's cache
storage. This metric applies
only to cached volumes. The
sample is taken at the end
of the reporting period.
Use the
CachePercentUsed metric
of the gateway to view
overall percent use of the
gateway's cache storage.
Units: Percent
yes no
CachePercentDirtyThe volume's contribution to
the overall percentage of the
gateway's cache that has
not been persisted to AWS.
This metric applies only
to volumes in a gateway-
cached setup. The sample
is taken at the end of the
reporting period.
Use the
CachePercentDirty
metric of the gateway to
view the overall percentage
of the gateway's cache that
has not been persisted to
AWS.
Units: Percent
yes no
231

Amazon CloudWatch User Guide
AWS Storage Gateway Metrics
Metric Description Gateway-Cached Gateway-Stored
ReadBytesThe total number of bytes
read from your on-premises
applications in the reporting
period.
Use this metric with the
Sum statistic to measure
throughput and with the
Samples statistic to
measure IOPS.
Units: Bytes
yes yes
ReadTimeThe total number of
milliseconds spent to do
read operations from your
on-premises applications in
the reporting period.
Use this metric with the
Average statistic to
measure latency.
Units: Milliseconds
yes yes
WriteBytesThe total number of bytes
written to your on-premises
applications in the reporting
period.
Use this metric with the
Sum statistic to measure
throughput and with the
Samples statistic to
measure IOPS.
Units: Bytes
yes yes
WriteTimeThe total number of
milliseconds spent to do
write operations from your
on-premises applications in
the reporting period.
Use this metric with the
Average statistic to
measure latency.
Units: Milliseconds
yes yes
QueuedWritesThe number of bytes waiting
to be written to AWS,
sampled at the end of the
reporting period.
Units: Bytes
yes yes
232
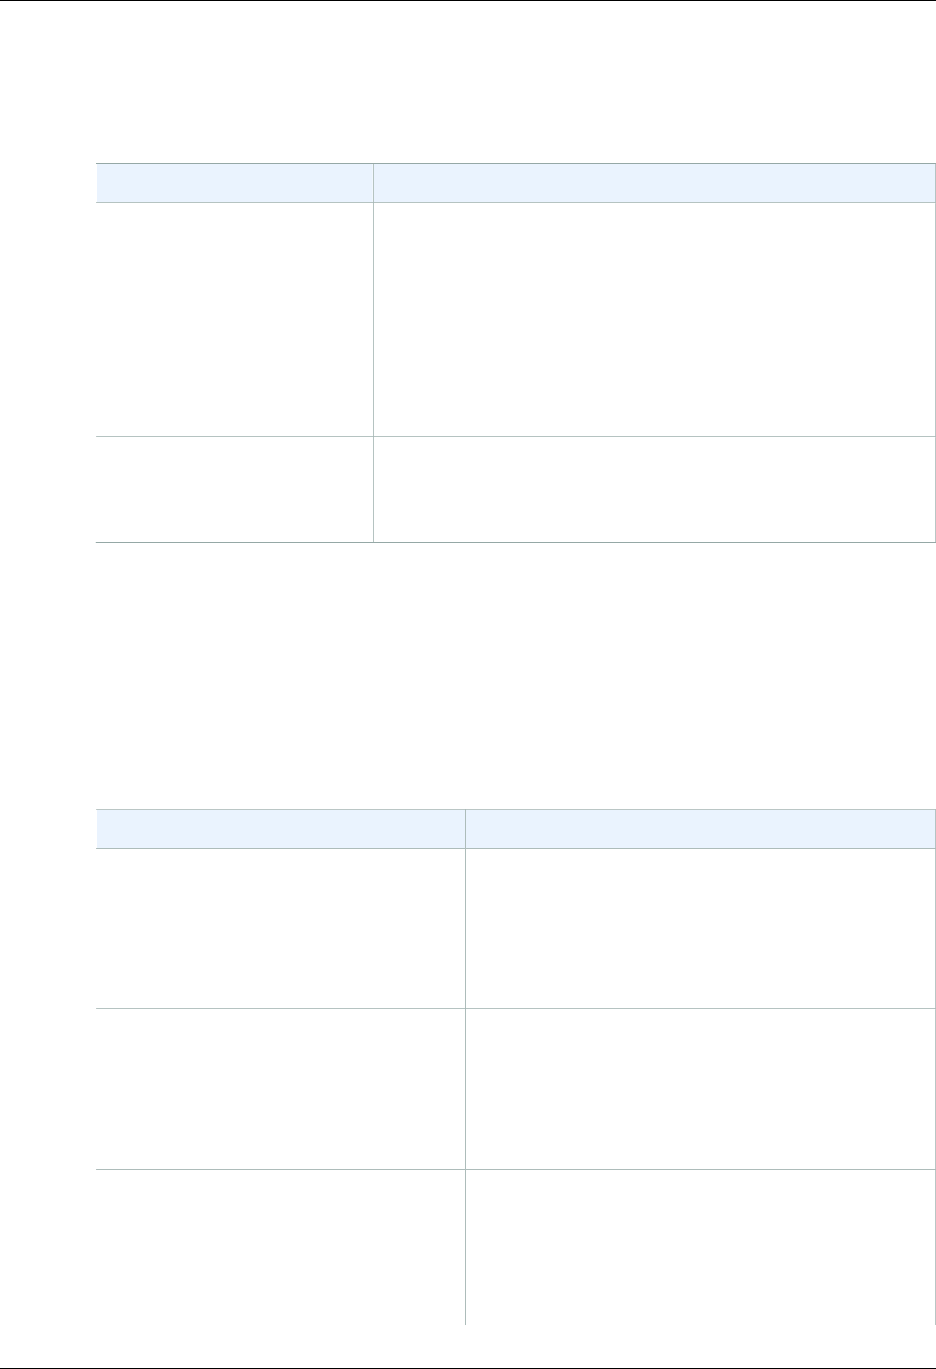
Amazon CloudWatch User Guide
Dimensions for AWS Storage Gateway Metrics
Dimensions for AWS Storage Gateway Metrics
The Amazon CloudWatch namespace for the AWS Storage Gateway service is AWS/
StorageGateway. Data is available automatically in 5-minute periods at no charge.
Dimension Description
GatewayId, GatewayName These dimensions filter the data you request to gateway-specific
metrics. You can identify a gateway to work by its GatewayId or
its GatewayName. However, note that if the name of your gateway
was changed for the time range that you are interested in viewing
metrics, then you should use the GatewayId.
Throughput and latency data of a gateway is based on all the
volumes for the gateway. For information about working with
gateway metrics, see Measuring Performance Between Your
Gateway and AWS.
VolumeId This dimension filters the data you request to volume-specific
metrics. Identify a storage volume to work with by its VolumeId.
For information about working with volume metrics, see Measuring
Performance Between Your Application and Gateway.
AWS WAF Dimensions and Metrics
AWS WAF sends data to CloudWatch every minute. For more information, see Testing Web ACLs in
the AWS WAF Developer Guide.
AWS WAF Metrics
The AWS/WAF namespace includes the following metrics.
Metric Description
AllowedRequests The number of allowed web requests.
Units: Count
Dimensions: Rule, WebACL
Valid statistics: Sum
BlockedRequests The number of blocked web requests.
Units: Count
Dimensions: Rule, WebACL
Valid statistics: Sum
CountedRequests The number of counted web requests.
A counted web request is one that matches all of the
conditions in a particular rule. Counted web requests
are typically used for testing.
Units: Count
233
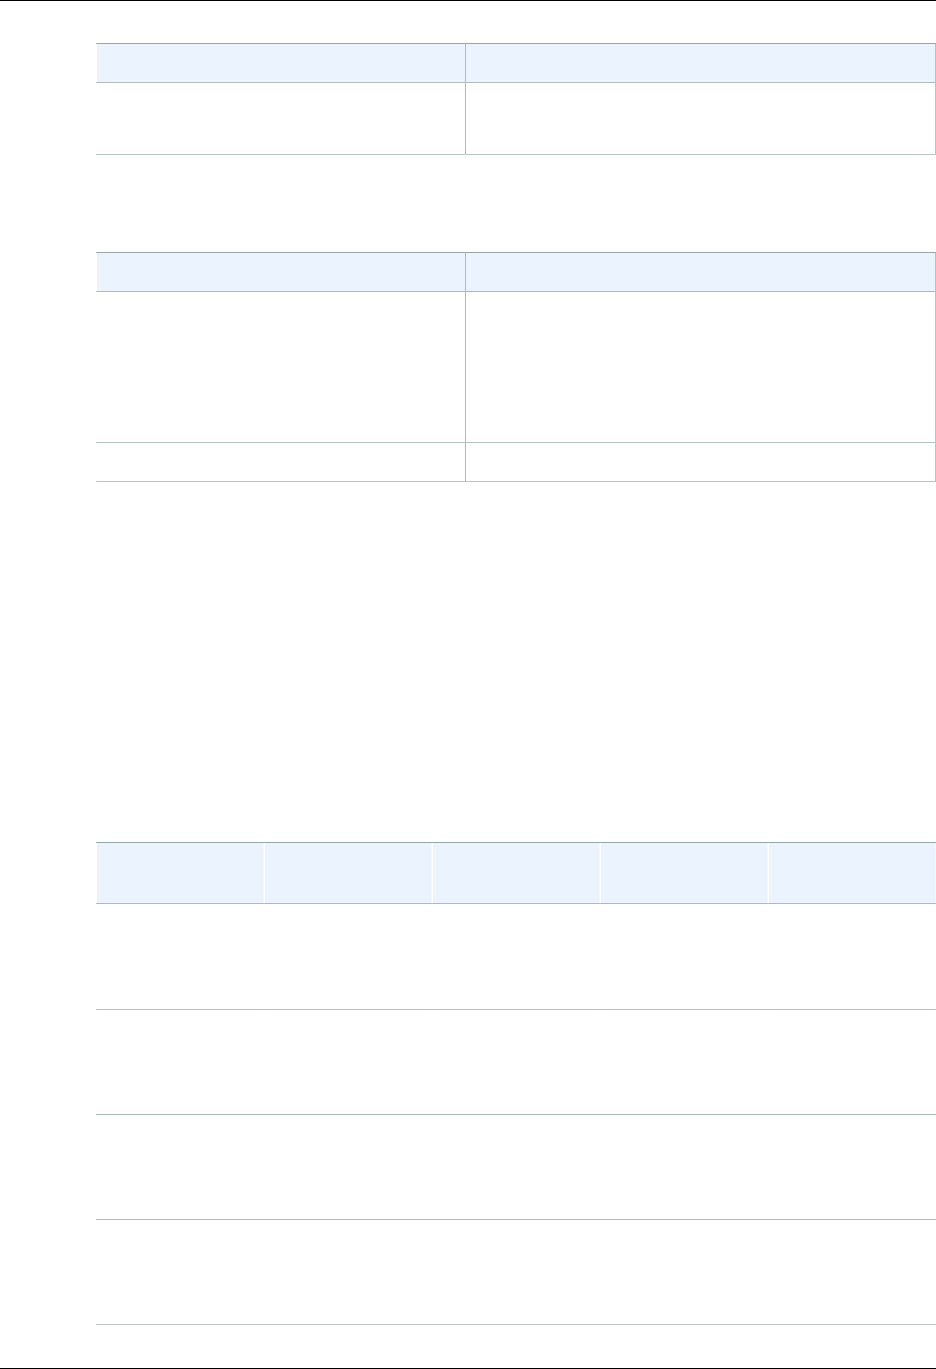
Amazon CloudWatch User Guide
Dimensions for AWS WAF
Metric Description
Dimensions: Rule, WebACL
Valid statistics: Sum
Dimensions for AWS WAF
Dimension Description
Rule The name of the rule, or one of the following:
• ALL, which represents the set of all rules.
• Default_Action, which represents the action assigned
to any request that does not match any rule with
either an allow or block action.
WebACL The name of the web ACL.
Amazon WorkSpaces Dimensions and Metrics
Amazon WorkSpaces sends data points to CloudWatch for several metrics every five minutes (five-
minute metrics). Detailed monitoring, or one-minute metrics, is currently unavailable for Amazon
WorkSpaces. For more information, see Monitoring Amazon WorkSpaces in the Amazon WorkSpaces
Administration Guide.
Amazon WorkSpaces Metrics
The AWS/WorkSpaces namespace includes the following metrics.
Amazon WorkSpaces CloudWatch Metrics
Metric Description Dimensions Statistics
Available Units
Available1The number of
WorkSpaces that
returned a healthy
status.
DirectoryId
WorkspaceId
Average, Sum,
Maximum,
Minimum, Data
Samples
Count
Unhealthy1The number of
WorkSpaces
that returned an
unhealthy status.
DirectoryId
WorkspaceId
Average, Sum,
Maximum,
Minimum, Data
Samples
Count
ConnectionAttempt2
The number
of connection
attempts.
DirectoryId
WorkspaceId
Average, Sum,
Maximum,
Minimum, Data
Samples
Count
ConnectionSuccess2
The number
of successful
connections.
DirectoryId
WorkspaceId
Average, Sum,
Maximum,
Minimum, Data
Samples
Count
234

Amazon CloudWatch User Guide
Amazon WorkSpaces Metrics
Metric Description Dimensions Statistics
Available Units
ConnectionFailure2
The number
of failed
connections.
DirectoryId
WorkspaceId
Average, Sum,
Maximum,
Minimum, Data
Samples
Count
SessionLaunchTime2
The amount
of time it takes
to initiate a
WorkSpaces
session.
DirectoryID
WorkspaceID
Average, Sum,
Maximum,
Minimum, Data
Samples
Second (time)
InSessionLatency2
The round trip
time between
the WorkSpaces
client and the
WorkSpace.
DirectoryID
WorkspaceID
Average, Sum,
Maximum,
Minimum, Data
Samples
Millisecond (time)
SessionDisconnect2
The number of
connections that
were closed,
including user-
initiated and failed
connections.
DirectoryID
WorkspaceID
Average, Sum,
Maximum,
Minimum, Data
Samples
Count
UserConnected3The number of
WorkSpaces
that have a user
connected.
DirectoryID
WorkspaceID
Average, Sum,
Maximum,
Minimum, Data
Samples
Count
Maintenance4The number of
WorkSpaces
that are
currently under
maintenance.
DirectoryID
WorkspaceID
Average, Sum,
Maximum,
Minimum, Data
Samples
Count
1 Amazon WorkSpaces periodically sends status requests to a WorkSpace. A WorkSpace is marked
Available when it responds to these requests, and Unhealthy when it fails to respond to these
requests. These metrics are available at a per-WorkSpace granularity, and also aggregated for all
WorkSpaces in an organization.
2 Amazon WorkSpaces records metrics on connections made to each WorkSpace. These metrics
are emitted after a user has successfully authenticated via the WorkSpaces client and the client then
initiates a session. The metrics are available at a per-WorkSpace granularity, and also aggregated for
all WorkSpaces in a directory.
3 Amazon WorkSpaces periodically sends connection status requests to a WorkSpace. Users are
reported as connected when they are actively using their sessions. This metric is available at a per-
WorkSpace granularity, and is also aggregated for all WorkSpaces in an organization.
4 This metric applies to WorkSpaces that are configured with an AutoStop running mode. If you have
maintenance enabled for your WorkSpaces, this metric captures the number of WorkSpaces that are
currently under maintenance. This metric is available at a per-WorkSpace granularity, which describes
when a WorkSpace went into maintenance and when it was removed.
235

Amazon CloudWatch User Guide
Dimensions for Amazon WorkSpaces Metrics
Dimensions for Amazon WorkSpaces Metrics
Amazon WorkSpaces metrics are available for the following dimensions.
Amazon WorkSpaces CloudWatch Dimensions
Dimension Description
DirectoryId Limits the data you receive to the WorkSpaces in
the specified directory. The DirectoryId value
is in the form of d-XXXXXXXXXX.
WorkspaceId Limits the data you receive to the specified
WorkSpace. The WorkspaceId value is in the
formws-XXXXXXXXXX.
236

Amazon CloudWatch User Guide
Amazon CloudWatch Endpoints
Making API Requests
Query requests used with Amazon CloudWatch are HTTP or HTTPS requests that use the HTTP
verb GET or POST and a Query parameter named Action or Operation. Action is used throughout this
documentation, although Operation is supported for backward compatibility with other AWS Query
APIs.
Topics
•Amazon CloudWatch Endpoints (p. 237)
•Query Parameters (p. 237)
•The RequestId (p. 238)
•Query API Authentication (p. 238)
•Query API Examples Using Signature Version 2 (p. 240)
•Query API Error Messages Using Signature Version 2 (p. 242)
•Available Libraries (p. 243)
Amazon CloudWatch Endpoints
For information about the regions and endpoints used with CloudWatch, see Regions and Endpoints in
the Amazon Web Services General Reference.
Query Parameters
Each query request must include some common parameters to handle authentication and selection
of an action. For more information, see Common Query Parameters in the Amazon CloudWatch API
Reference.
Note
Some API operations take lists of parameters. These lists are specified using the following
notation: param.member.n. Values of n are integers starting from 1. All lists of parameters
must follow this notation, including lists that contain only one parameter. For example, a Query
parameter list looks like this:
&attribute.member.1=this
237

Amazon CloudWatch User Guide
The RequestId
&attribute.member.2=that
The RequestId
In every response from Amazon Web Services (AWS), you will find ResponseMetadata, which
contains a string element called RequestId. This is simply a unique identifier that AWS assigns to
provide tracking information. Although RequestId is included as part of every response, it will not be
listed on the individual API documentation pages to improve readability of the API documentation and
to reduce redundancy.
Query API Authentication
You can send query requests over either HTTP or HTTPS. Regardless of which protocol you use,
you must include a signature in every query request. This section describes how to create the
signature. The method described in the following procedure is known as signature version 2. For more
information about creating and including a signature, see Signing AWS API Requests in the AWS
General Reference.
To create the signature
1. Create the canonicalized query string that you need later in this procedure:
a. Sort the UTF-8 query string components by parameter name with natural byte ordering.
The parameters can come from the GET URI or from the POST body (when Content-Type
is application/x-www-form-urlencoded ).
b. URL encode the parameter name and values according to the following rules:
• Do not URL encode any of the unreserved characters that RFC 3986 defines.
These unreserved characters are A-Z, a-z, 0-9, hyphen ( - ), underscore ( _ ), period ( . ),
and tilde ( ~ ).
• Percent encode all other characters with %XY, where X and Y are hex characters 0-9 and
uppercase A-F.
• Percent encode extended UTF-8 characters in the form %XY%ZA....
• Percent encode the space character as %20 (and not +, as common encoding schemes
do).
Note
Currently all AWS service parameter names use unreserved characters, so you don't
need to encode them. However, you might want to include code to handle parameter
names that use reserved characters, for possible future use.
c. Separate the encoded parameter names from their encoded values with the equals sign ( = )
(ASCII character 61), even if the parameter value is empty.
d. Separate the name-value pairs with an ampersand ( & ) (ASCII character 38).
2. Create the string to sign according to the following pseudo-grammar (the "\n" represents an
ASCII newline character).
StringToSign = HTTPVerb + "\n" +
ValueOfHostHeaderInLowercase + "\n" +
HTTPRequestURI + "\n" +
CanonicalizedQueryString <from the preceding step>
238

Amazon CloudWatch User Guide
Query API Authentication
The HTTPRequestURI component is the HTTP absolute path component of the URI up to, but not
including, the query string. If the HTTPRequestURI is empty, use a forward slash ( / ).
3. Calculate an RFC 2104-compliant HMAC with the string you just created, your Secret Access Key
as the key, and SHA256 or SHA1 as the hash algorithm.
For more information, see http://www.ietf.org/rfc/rfc2104.txt.
4. Convert the resulting value to base64.
5. Use the resulting value as the value of the Signature request parameter.
Important
The final signature you send in the request must be URL encoded as specified in RFC 3986
(for more information, see http://www.ietf.org/rfc/rfc3986.txt). If your toolkit URL encodes
your final request, then it handles the required URL encoding of the signature. If your toolkit
doesn't URL encode the final request, then make sure to URL encode the signature before
you include it in the request. Most importantly, make sure the signature is URL encoded only
once. A common mistake is to URL encode it manually during signature formation, and then
again when the toolkit URL encodes the entire request.
239

Amazon CloudWatch User Guide
Query API Examples Using Signature Version 2
Query API Examples Using Signature Version
2
Example ListMetrics API Request
This example uses the Amazon CloudWatch ListMetrics action.
http://monitoring.amazonaws.com/?SignatureVersion=2
&Action=ListMetrics
&Version=2010-08-01
&AWSAccessKeyId=<Your AWS Access Key Id>
&SignatureVersion=2
&SignatureMethod=HmacSHA256
&Timestamp=2010-11-17T05%3A13%3A00.000Z
The following is the string to sign.
GET\n
monitoring.amazonaws.com\n
/\n
AWSAccessKeyId=<Your AWS Access Key Id>
&Action=ListMetrics
&SignatureMethod=HmacSHA256
&SignatureVersion=2
&Timestamp=2010-11-17T05%3A13%3A00.000Z
&Version=2010-08-01
The following is the signed request.
http://monitoring.amazonaws.com/?Action=ListMetrics
&SignatureVersion=2
&SignatureMethod=HmacSHA256
&Timestamp=2010-11-17T05%3A13%3A00.000Z
&Signature=<URLEncode(Base64Encode(Signature))>
&Version=2010-08-01
&AWSAccessKeyId=<Your AWS Access Key Id>
240

Amazon CloudWatch User Guide
Query API Examples Using Signature Version 2
Example ListMetrics API Request Using NextToken Value
This example uses the Amazon CloudWatch ListMetrics action and the NextToken value to retrieve
more than 500 metrics.
1. Create the string to sign according to the following pseudo-grammar (the "\n" represents an
ASCII newline).
StringToSign = HTTPVerb + "\n" +
ValueOfHostHeaderInLowercase + "\n" +
HTTPRequestURI + "\n" +
CanonicalizedQueryString <from the preceding step>
The HTTPRequestURI component is the HTTP absolute path component of the URI up to but not
including the query string. If the HTTPRequestURI is empty, use a forward slash ( / ).
2. Prepare a string to sign, as in the following example:
GET\n
monitoring.amazonaws.com\n
/\n
AWSAccessKeyId=<Your AWS Access Key Id>
&Action=ListMetrics
&SignatureMethod=HmacSHA256
&SignatureVersion=2
&Timestamp=2010-11-17T05%3A13%3A00.000Z
&Version=2010-08-01
The following are specified in the example:
Action specifies the action to take (e.g., ListMetrics).
AWSAccessKeyId specifies the AccessKeyId for your AWS account (replace <Your AWS Access
Key ID> with your actual AWSAccessKeyId).
SignatureVersion specifies the version of the signature (e.g., 2).
Timestamp2012-09-27T17:06:23.000Z specifies the time stamp of the request (e.g.,
09/27/2012, 17:06:23 ).
Version2010-08-01 specifies the version of the ListMetrics API (e.g., last released on
2010-08-01).
3. Sign the request URL with the string from the previous step. The following example shows the
signed request URL.
http://monitoring.amazonaws.com?SignatureVersion=2
&Action=ListMetrics
&Version=2010-08-01
&Timestamp=2012-09-27T17%3A14%3A01.000Z
&AWSAccessKeyId=<Your AWS Access Key ID>
&Signature=iE68300Pbl%2BDsKM5mFiOhHWEXAMPLE
The following are specified in the example:
Action specifies the action to take (e.g., ListMetrics).
Version=2010-08-01 specifies the version of the ListMetrics API (e.g., last released on
2010-08-01).
Timestamp=2012-09-27T17:06:23.000Z specifies the time stamp of the request (e.g.,
09/27/2012, 17:06:23 ).
AWSAccessKeyId specifies the AccessKeyId for your AWS account (replace <Your AWS Access
Key ID> with your actual AWSAccessKeyId).
Signature specifies the signature for signing the request (e.g.,
<URLEncode(Base64Encode(Signature))>=iE68300Pbl%2BDsKM5mFiOhHWEXAMPLE).
4. Copy the signed request URL to your web browser and press Enter to run the request. You should
get results similar to the following:
<ListMetricsResponse>
<ListMetricsResult>
<Metrics>
<member>
<Dimensions>
<member>
<Name>InstanceId</Name>
<Value>i-8dea01f0</Value>
</member>
</Dimensions>
<MetricName>CPUUtilization</MetricName>
<Namespace>AWS/EC2<Namespace>
</member>
<member>
<Dimensions>
<member>
<Name>InstanceId</Name>
<Value>i-7dee09t3</Value>
</member>
</Dimensions>
<MetricName>CPUUtilization</MetricName>
<Namespace>AWS/EC2<Namespace>
<member>
</member>
</Metrics>
<NextToken>NNNTTT</NextToken>
</ListMetricsResult>
<ResponseMetadata>
<RequestId>8f95da07-08c8-11e2-9cdd-4d93ea583888</RequestId>
</ResponseMetadata>
</ListMetricsResponse>
5. From the output in Step 4, save the NextToken value. In this example it is NNNTTT, but it is
normally a very long string.
6. Prepare the string to sign and include the NextToken=NNNTTT value.
7. Sign the request URL with the string from Step 6. The following example is the signed request
URL. It is similar to the signed request URL in Step 3, except that it has the NextToken=NNNTTT
value.
http://monitoring.amazonaws.com?SignatureVersion=2
&Action=ListMetrics
&Version=2010-08-01
&NextToken=NNNTTT
&Timestamp=2012-09-27T17%3A45%3A14.000Z
&AWSAccessKeyId=<Your AWS Access Key ID>
&Signature=iE68300Pbl%2BDsKM5mFiOhHWEXAMPLE
8. To get the next 500 metrics, copy the signed request URL to your web browser, and press Enter.
You can repeat the request with the same parameters and the new NextToken until you have
retrieved all of the metrics.
241

Amazon CloudWatch User Guide
Query API Error Messages Using Signature Version 2
Query API Error Messages Using Signature
Version 2
Example Error Message When Using the Wrong AWS Secret Access Key to Calculate
the Signature
<ErrorResponse>
<Error>
<Type>Sender</Type>
<Code>SignatureDoesNotMatch</Code>
<Message>
The request signature we calculated does not match the signature you
provided. Check your AWS Secret Access Key and signing method.
Consult the service
documentation for details.
</Message>
</Error>
<RequestId>a9c1a06e-0d80-11e2-ac80-9646d110ca61<RequestId>
</ErrorResponse>
Example Error Message When Using the Wrong AWS AccessKeyID
<ErrorResponse>
<Error>
<Type>Sender</Type>
<Code>InvalidClientTokenId</Code>
<Message>
The security token included in the request is invalid
</Message>
</Error>
<RequestId>5134a3b8-0d82-11e2-9b0a-db3eb46b3dbd</RequestId>
</ErrorResponse>
242

Amazon CloudWatch User Guide
Available Libraries
Example Error Message When Providing Incorrect Parameters
The following example shows how to make a request with the MetricName parameter "TestMetric".
The signed URL looks like this:
http://monitoring.amazonaws.com?SignatureVersion=2
&Action=ListMetrics
&Version=2010-08-01
&MetricName=TestMetric
&Timestamp=2012-09-27T17%3A14%3A01.000Z
&AWSAccessKeyId=<Your AWS Access Key ID>
&Signature=iE68300Pbl%2BDsKM5mFiOhHWEXAMPLE
When you try to retrieve more metrics with the NextToken, you have to provide the same parameters
as in the previous request. If you provide the wrong parameters, provide more parameters, or provide
fewer parameters (assume that the NextToken is correct), you will get the following error:
<ErrorResponse>
<Error>
<Type>Sender</Type>
<Code>InvalidParameterValue</Code>
<Message>Invalid nextToken</Message>
</Error>
<RequestId>cb1c4191-0e5d-11e2-9c15-6f306828daaa<RequestId>
</ErrorResponse>
Available Libraries
AWS provides libraries, sample code, tutorials, and other resources for software developers who prefer
to build applications using language-specific APIs instead of the command-line tools and Query API.
These libraries provide basic functions (not included in the APIs), such as request authentication,
request retries, and error handling so that it is easier to get started. Libraries and resources are
available for the following languages and platforms:
•Android
•iOS
•Java
•PHP
•Python
•Ruby
•Windows and .NET
For libraries and sample code in all languages, see Sample Code & Libraries.
243
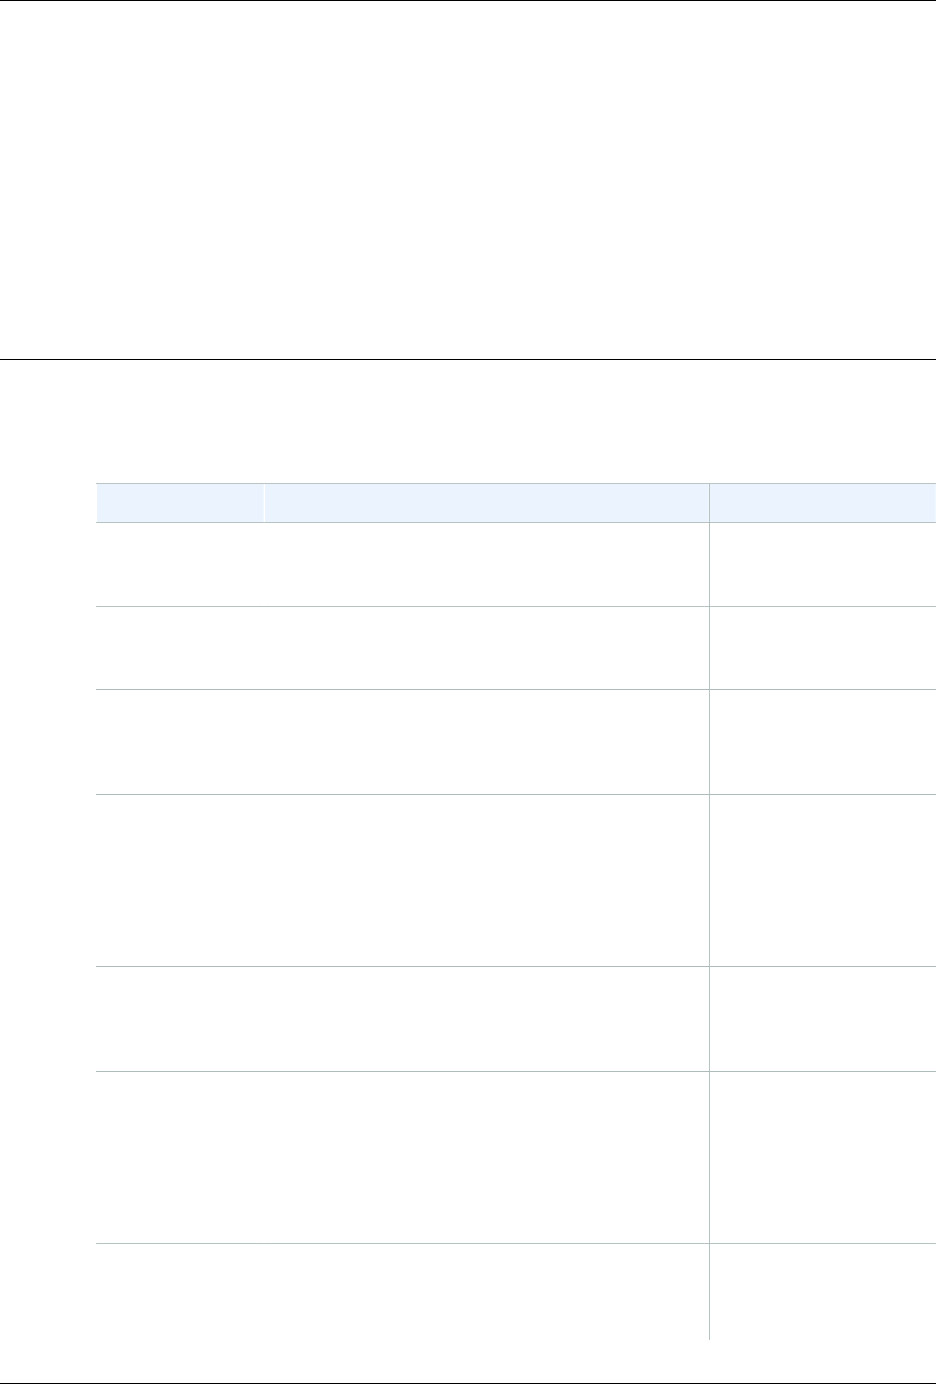
Amazon CloudWatch User Guide
Document History
The following table describes the important changes to the Amazon CloudWatch User's Guide.
Change Description Release Date
Added metrics for
Amazon Elastic
Transcoder
Added metrics for Amazon Elastic Transcoder. For
more information, see Amazon Elastic Transcoder
Dimensions and Metrics (p. 194).
20 September 2016
Added metrics
for Amazon API
Gateway
Added metrics for Amazon API Gateway. For more
information, see Amazon API Gateway Dimensions
and Metrics (p. 142).
9 September 2016
Added metrics
for AWS Key
Management
Service
Added metrics for AWS Key Management Service.
For more information, see AWS Key Management
Service Metrics and Dimensions (p. 205).
9 September 2016
Added metrics
for the new
Application
Load Balancers
supported by
Elastic Load
Balancing
Added metrics for Application Load Balancers.
For more information, see Elastic Load Balancing
Dimensions and Metrics (p. 177).
11 August 2016
Updated Amazon
Elastic Block
Store dimensions
and metrics
Updated Amazon Elastic Block Store dimensions
and metrics. For more information, see Amazon
EBS Dimensions and Metrics (p. 167).
19 April 2016
Updated
Amazon Kinesis
Streams and
added Amazon
Kinesis Firehose
dimensions and
metrics
Updated Amazon Kinesis Streams and added
Amazon Kinesis Firehose dimensions and metrics.
For more information, see Amazon Kinesis Streams
Dimensions and Metrics (p. 197) and Amazon
Kinesis Firehose Metrics (p. 203).
19 April 2016
Added new
NetworkPacketsIn
and
NetworkPacketsOut
Added new NetworkPacketsIn and
NetworkPacketsOut metrics for Amazon EC2. For
more information, see Amazon Elastic Compute
Cloud Dimensions and Metrics (p. 169).
23 March 2016
244
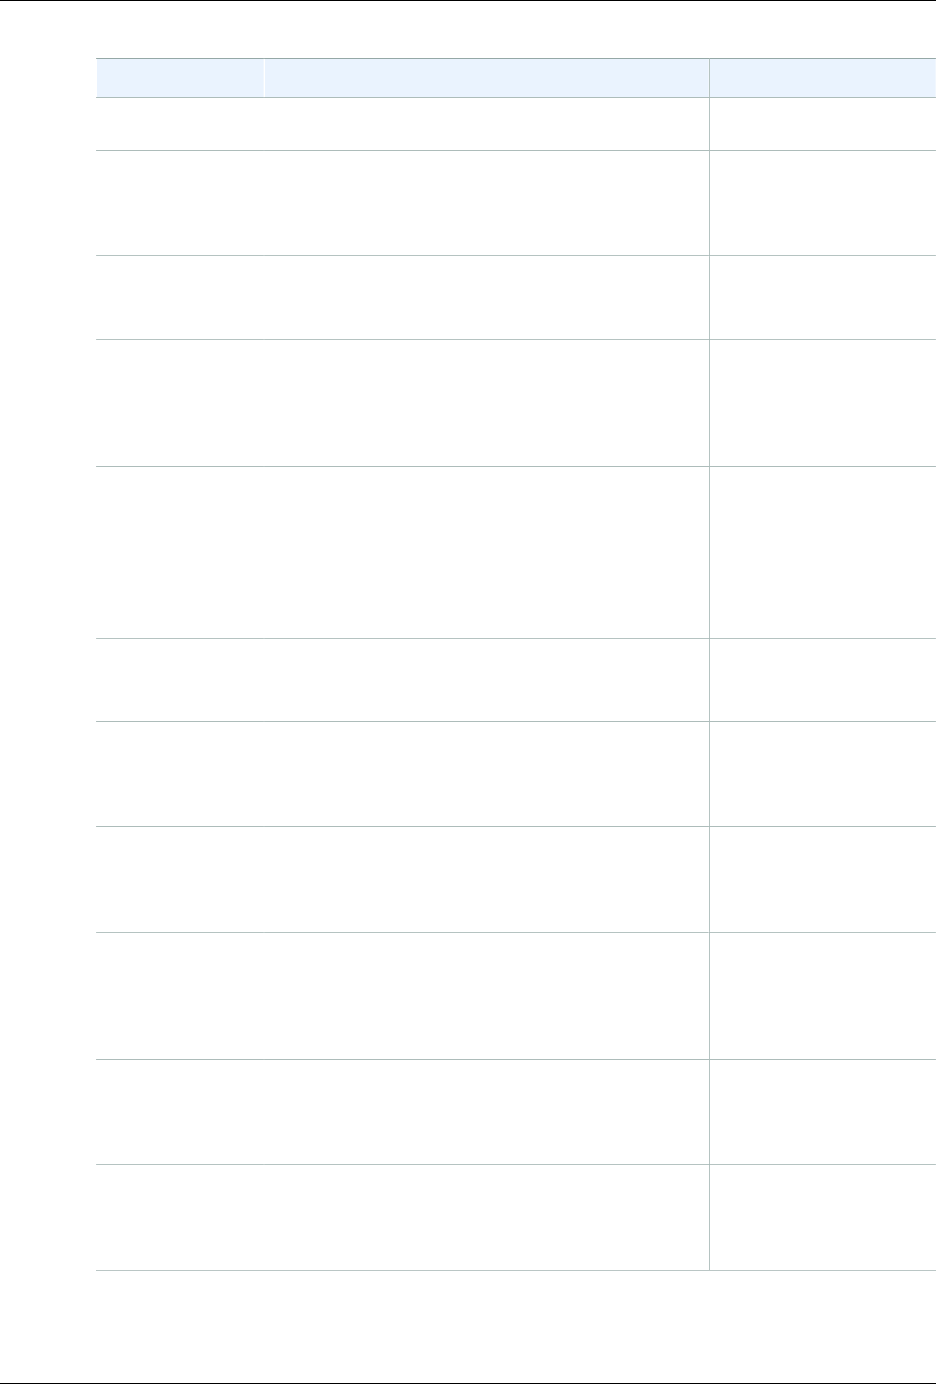
Amazon CloudWatch User Guide
Change Description Release Date
metrics for
Amazon EC2
Added new
metrics for
Amazon EC2
Spot fleet
Added new metrics for Amazon EC2 Spot fleet.
For more information, see Amazon EC2 Spot Fleet
Dimensions and Metrics (p. 173).
21 March 2016
Added new
CloudWatch Logs
metrics
Added new CloudWatch Logs metrics. For more
information, see Amazon CloudWatch Logs
Dimensions and Metrics (p. 148).
10 March 2016
Added Amazon
Elasticsearch
Service and AWS
WAF metrics and
dimensions
Added Amazon Elasticsearch Service and AWS
WAF metrics and dimensions. For more information,
see Amazon Elasticsearch Service Dimensions and
Metrics (p. 191) and AWS WAF Dimensions and
Metrics (p. 233).
14 October 2015
Added support
for CloudWatch
dashboards
Added new topics about how to use CloudWatch
dashboards, which are customizable home pages
in the CloudWatch console that you can use to
monitor your resources in a single view, even those
that are spread out across different regions. For
more information, see Using Amazon CloudWatch
Dashboards (p. 30).
8 October 2015
Added AWS
Lambda metrics
and dimensions
Added AWS Lambda metrics and dimensions. For
more information, see AWS Lambda Dimensions
and Metrics (p. 206).
4 September 2015
Added Amazon
EC2 Container
Service metrics
and dimensions
Added Amazon EC2 Container Service metrics and
dimensions. For more information, see Amazon
ECS Dimensions and Metrics (p. 160).
17 August 2015
Added Amazon
Simple Storage
Service metrics
and dimensions
Added Amazon Simple Storage Service metrics
and dimensions. For more information, see
Amazon Simple Storage Service Dimensions and
Metrics (p. 220).
26 July 2015
Added support for
new reboot alarm
action and new
IAM role for use
with alarm actions
Added the reboot alarm action and new IAM role for
use with alarm actions. For more information, see
Create Alarms That Stop, Terminate, Reboot, or
Recover an Instance (p. 88).
23 July 2015
Added Amazon
WorkSpaces
metrics and
dimensions
Added Amazon WorkSpaces metrics and
dimensions. For more information, see Amazon
WorkSpaces Dimensions and Metrics (p. 234).
30 April 2015
Added Amazon
Machine Learning
metrics and
dimensions
Added Amazon Machine Learning metrics and
dimensions. For more information, see Amazon
Machine Learning Dimensions and Metrics (p. 207).
9 April 2015
245
Amazon CloudWatch User Guide
Change Description Release Date
Support for
Amazon EC2
instance recovery
alarm actions
Updated alarm actions to include new EC2 instance
recovery action. For more information, see Create
Alarms That Stop, Terminate, Reboot, or Recover
an Instance (p. 88).
12 March 2015
Added Amazon
CloudFront
and Amazon
CloudSearch
metrics and
dimensions
Added Amazon CloudFront and Amazon
CloudSearch metrics and dimensions. For more
information, see Amazon CloudFront Dimensions
and Metrics (p. 145) and Amazon CloudSearch
Dimensions and Metrics (p. 146).
6 March 2015
Added Amazon
Simple Workflow
Service metrics
and dimensions
Added Amazon Simple Workflow Service metrics
and dimensions. For more information, see Amazon
SWF Dimensions and Metrics (p. 220).
9 May 2014
Updated guide to
add support for
AWS CloudTrail
Added a new topic to explain how you can use AWS
CloudTrail to log activity in Amazon CloudWatch.
For more information, see Logging Amazon
CloudWatch API Calls in AWS CloudTrail (p. 110).
30 April 2014
Updated guide
to use the new
AWS command
line interface (CLI)
The AWS CLI is a cross-service CLI with a
simplified installation, unified configuration, and
consistent command line syntax. The AWS CLI is
supported on Linux/Unix, Windows, and Mac. The
CLI examples in this guide have been updated to
use the new AWS CLI.
For information about how to install and configure
the new AWS CLI, see Getting Set Up with the AWS
Command Line Interface in the AWS Command
Line Interface User Guide.
21 February 2014
Updated guide
to match
new Amazon
CloudWatch
console
Updated topics to cover the brand new Amazon
CloudWatch console. 29 October 2013
Rewrote Amazon
CloudWatch
Developer's Guide
Rewrote and restructured the Developer's Guide to
include the Getting Started Guide, Getting Setup
section, updated command line interface reference,
and updated/additional procedures for working with
metrics and alarms.
6 September 2013
Added Amazon
Redshift and AWS
OpsWorks metrics
and dimensions
Added Amazon Redshift and AWS OpsWorks
metrics and dimensions. For more information,
see Amazon Redshift Dimensions and
Metrics (p. 210) and AWS OpsWorks Dimensions
and Metrics (p. 208).
16 July 2013
Added Amazon
Route 53 metrics
and dimensions
Added Amazon Route 53 metrics and dimensions.
For more information, see Amazon Route 53
Dimensions and Metrics (p. 215).
26 June 2013
246
Amazon CloudWatch User Guide
Change Description Release Date
Updates
to Amazon
CloudWatch
Monitoring Scripts
for Linux
Added updates to the monitoring scripts for Linux
to add support for AWS Identity and Access
Management (IAM) roles, using reported metrics
with Auto Scaling, and options for aggregated
CloudWatch metrics. For more information, see
Monitoring Memory and Disk Metrics for Amazon
EC2 Linux Instances (p. 115).
22 February 2013
New feature:
Amazon
CloudWatch
Alarm Actions
Added a new section to document Amazon
CloudWatch alarm actions, which you can use
to stop or terminate an Amazon Elastic Compute
Cloud instance. For more information, see Create
Alarms That Stop, Terminate, Reboot, or Recover
an Instance (p. 88).
8 January 2013
Updated EBS
metrics Updated the EBS metrics to include two new
metrics for Provisioned IOPS volumes. For more
information, see Amazon EBS Dimensions and
Metrics (p. 167).
20 November 2012
New billing alerts You can now monitor your AWS charges using
Amazon CloudWatch metrics and create alarms
to notify you when you have exceeded the
specified threshold. For more information, see
Monitor Your Estimated Charges Using Amazon
CloudWatch (p. 101).
10 May 2012
New scripts You can now use the Amazon CloudWatch
Monitoring Scripts for Linux to produce and
consume Amazon CloudWatch custom metrics. For
more information, see Monitoring Memory and Disk
Metrics for Amazon EC2 Linux Instances (p. 115).
24 February 2012
New metrics You can now access six new Elastic Load Balancing
metrics that provide counts of various HTTP
response codes. For more information, see Elastic
Load Balancing Dimensions and Metrics (p. 177).
19 October 2011
New feature You can now access metrics from Amazon EMR.
For more information, see the section called
“Amazon EMR” (p. 182).
30 June 2011
New feature You can now access metrics from Amazon Simple
Notification Service and Amazon Simple Queue
Service. For more information, see the section
called “Amazon SNS” (p. 216) and the section called
“Amazon SQS” (p. 218).
14 July 2011
247
Amazon CloudWatch User Guide
Change Description Release Date
Restructured
Guide Renamed, merged, and moved sections, including
the entire User Scenario section:
•CloudWatch Support for AWS Products is now
Amazon CloudWatch Namespaces, Dimensions,
and Metrics Reference (p. 140)
•List Available Metrics is now the section called
“View Available Metrics” (p. 37)
•Get Statistics on a Metric is now the section called
“Get Statistics for a Metric” (p. 44)
•Create an Alarm that Sends Email is now
Creating Amazon CloudWatch Alarms (p. 76)
01 July 2011
New section Added a section that describes how to use AWS
Identity and Access Management (IAM). 7 June 2011
New Feature Added information about using the PutMetricData
API to publish custom metrics. For more
information, see the section called “Publish Custom
Metrics” (p. 73).
10 May 2011
Updated Content Amazon CloudWatch now retains the history of an
alarm for two weeks rather than six weeks. With this
change, the retention period for alarms matches the
retention period for metrics data.
07 April 2011
New link This service's endpoint information is now located in
the Amazon Web Services General Reference. For
more information, go to Regions and Endpoints in
Amazon Web Services General Reference.
2 March 2011
Updated Content Added information about using the AWS
Management Console to manage CloudWatch. 11 February 2011
Updated Content Added a brief discussion about alarms and Auto
Scaling. Specifically, alarms continue to invoke
Auto Scaling policy notifications for the duration of
a threshold breach rather than only after the initial
breach. For more information, see Alarms (p. 8).
19 January 2011
Updated Content Removed Minimum and Maximum from the list
of valid statistics for the Elastic Load Balancing
RequestCount metric. The only valid statistic for
RequestCount is Sum. For a list of all Elastic Load
Balancing metrics, see Elastic Load Balancing
Dimensions and Metrics (p. 177).
18 January 2011
New feature Added ability to send Amazon Simple Notification
Service or Auto Scaling notifications when a metric
has crossed a threshold. For more information, see
Alarms (p. 8).
02 December 2010
New feature A number of CloudWatch actions now include the
MaxRecords and NextToken parameters which
enable you to control pages of results to display.
02 December 2010
248