Amazon CloudWatch Logs User Guide Cloud Watch
User Manual:
Open the PDF directly: View PDF ![]() .
.
Page Count: 96
- Amazon CloudWatch Logs
- Table of Contents
- What is Amazon CloudWatch Logs?
- Getting Set Up
- Getting Started with CloudWatch Logs
- CloudWatch Logs Agent Prerequisites
- Quick Start: Install and Configure the CloudWatch Logs Agent on an Existing Amazon EC2 Instance
- Quick Start: Install and Configure the CloudWatch Logs Agent on a New Amazon EC2 Instance
- Quick Start: Install the CloudWatch Logs Agent Using AWS OpsWorks and Chef
- Quick Start: Using AWS CloudFormation to Send Log Data to CloudWatch Logs
- Report the CloudWatch Logs Agent's Status
- Start the CloudWatch Logs Agent
- Stop the CloudWatch Logs Agent
- CloudWatch Logs Agent Reference
- Viewing Log Data
- Changing Log Retention
- Searching and Filtering Log Data
- Filter and Pattern Syntax
- Creating Metric Filters
- Listing Metric Filters
- Deleting a Metric Filter
- Search Log Data Using Filter Patterns
- Real-time Processing of Log Data with Subscriptions
- Exporting Log Data in Bulk to Amazon S3
- Streaming CloudWatch Logs Data into the Amazon Elasticsearch Service
- Authentication and Access Control for Amazon CloudWatch Logs
- Logging Amazon CloudWatch Logs API Calls in AWS CloudTrail
- Document History
- AWS Glossary

Amazon CloudWatch Logs
User Guide

Amazon CloudWatch Logs User Guide

Amazon CloudWatch Logs User Guide
Amazon CloudWatch Logs: User Guide
Copyright © 2016 Amazon Web Services, Inc. and/or its affiliates. All rights reserved.
Amazon's trademarks and trade dress may not be used in connection with any product or service that is not Amazon's, in any
manner that is likely to cause confusion among customers, or in any manner that disparages or discredits Amazon. All other
trademarks not owned by Amazon are the property of their respective owners, who may or may not be affiliated with, connected to,
or sponsored by Amazon.

Amazon CloudWatch Logs User Guide
Table of Contents
What is Amazon CloudWatch Logs? ................................................................................................ 1
Features .............................................................................................................................. 1
Related AWS Services .......................................................................................................... 1
Pricing ................................................................................................................................. 2
Concepts ............................................................................................................................. 2
Limits .................................................................................................................................. 3
Getting Set Up ............................................................................................................................. 5
Sign Up for Amazon Web Services (AWS) ................................................................................ 5
Sign in to the Amazon CloudWatch Console ............................................................................. 5
Set Up the Command Line Interface ........................................................................................ 6
Getting Started ............................................................................................................................. 7
CloudWatch Logs Agent Prerequisites ..................................................................................... 7
Quick Start: Install and Configure the CloudWatch Logs Agent on an Existing Amazon EC2
Instance .............................................................................................................................. 8
Step 1: Configure Your IAM Role or User for CloudWatch Logs ............................................ 8
Step 2: Install and Configure CloudWatch Logs on an Existing Amazon EC2 Instance .............. 9
Quick Start: Install and Configure the CloudWatch Logs Agent on a New Amazon EC2 Instance ....... 12
Quick Start: Install the CloudWatch Logs Agent Using AWS OpsWorks and Chef ........................... 14
Step 1: Create Custom Recipes .................................................................................... 15
Step 2: Create an AWS OpsWorks Stack ....................................................................... 16
Step 3: Extend Your IAM Role ...................................................................................... 17
Step 4: Add a Layer .................................................................................................... 17
Step 5: Add an Instance .............................................................................................. 18
Step 6: View Your Logs ............................................................................................... 18
Quick Start: Using AWS CloudFormation to Send Log Data to CloudWatch Logs ........................... 18
Report the CloudWatch Logs Agent's Status ........................................................................... 19
Start the CloudWatch Logs Agent .......................................................................................... 20
Stop the CloudWatch Logs Agent .......................................................................................... 20
CloudWatch Logs Agent Reference ....................................................................................... 20
Agent Configuration File ............................................................................................... 20
Using the CloudWatch Logs Agent with HTTP Proxies ...................................................... 24
Compartmentalizing CloudWatch Logs Agent Configuration Files ........................................ 25
CloudWatch Logs Agent FAQs ...................................................................................... 25
Viewing Log Data ................................................................................................................ 27
Changing Log Retention ....................................................................................................... 27
Searching and Filtering Log Data .................................................................................................. 29
Filter and Pattern Syntax ...................................................................................................... 29
Matching Terms in Log Events ...................................................................................... 30
Matching Terms in JSON Log Events ............................................................................. 30
Using Metric Filters to Extract Values from Space-Delimited Log Events ............................... 30
Using Metric Filters to Extract Values from JSON Log Events ............................................. 32
Creating Metric Filters .......................................................................................................... 35
Example: Counting Log Events ..................................................................................... 36
Example: Count occurrences of the word "Error" .............................................................. 37
Example: Counting HTTP 404 Responses ....................................................................... 38
Example: Find and Count 400-level into 4xx Metric ........................................................... 40
Example: Extract Bytes Transferred from an Apache Log .................................................. 41
Listing Metric Filters ............................................................................................................ 42
Deleting a Metric Filter ......................................................................................................... 43
Search Log Data Using Filter Patterns ................................................................................... 43
Troubleshooting .......................................................................................................... 45
Real-time Processing of Log Data with Subscriptions ........................................................................ 46
Using Subscription Filters ..................................................................................................... 46
Example 1: Amazon Kinesis ......................................................................................... 47
Example 2: AWS Lambda ............................................................................................ 50
iv

Amazon CloudWatch Logs User Guide
Example 3: Amazon Kinesis Firehose ............................................................................ 53
Cross-Account Log Data Sharing with Subscriptions ................................................................. 58
Create a Destination .................................................................................................... 59
Create a Subscription Filter .......................................................................................... 61
Validating the Flow of Log Events .................................................................................. 62
Modifying Destination Membership at Runtime ................................................................. 64
Exporting Log Data in Bulk to Amazon S3 ...................................................................................... 66
Concepts ........................................................................................................................... 66
Exporting Log Data to Amazon S3 Using the AWS CLI ............................................................. 67
Step 1: Create an Amazon S3 Bucket ............................................................................ 67
Step 2: Set Permissions on an Amazon S3 Bucket ........................................................... 67
Step 3: Create an Export Task ...................................................................................... 68
Step 4: Describe Export Tasks ...................................................................................... 69
Step 5: Cancel an Export Task ..................................................................................... 70
Exporting Log Data to Amazon S3 Using the CloudWatch Console ............................................. 70
Step 1: Create an Amazon S3 Bucket ............................................................................ 70
Step 2: Set Permissions on an Amazon S3 Bucket ........................................................... 71
Step 3: Create an Export Task ...................................................................................... 72
Streaming Log Data into Amazon ES ............................................................................................. 73
Step 1: Create an Amazon ES domain ................................................................................... 73
Step 2: Subscribe a Log Group to Amazon ES ........................................................................ 74
Authentication and Access Control ................................................................................................. 75
Authentication ..................................................................................................................... 75
Access Control ................................................................................................................... 76
Overview of Managing Access .............................................................................................. 77
Resources and Operations ........................................................................................... 77
Understanding Resource Ownership .............................................................................. 77
Managing Access to Resources .................................................................................... 78
Specifying Policy Elements: Actions, Effects, and Principals ............................................... 79
Specifying Conditions in a Policy ................................................................................... 80
Using Identity-Based Policies (IAM Policies) ............................................................................ 80
Permissions Required to Use the CloudWatch Console ..................................................... 81
AWS Managed (Predefined) Policies for CloudWatch Logs ................................................ 83
Customer Managed Policy Examples ............................................................................. 83
CloudWatch Logs Permissions Reference ............................................................................... 84
Logging API Calls ....................................................................................................................... 87
CloudWatch Logs Information in CloudTrail ............................................................................. 87
Understanding Log File Entries ............................................................................................. 88
Document History ........................................................................................................................ 90
AWS Glossary ............................................................................................................................ 91
v

Amazon CloudWatch Logs User Guide
Features
What is Amazon CloudWatch
Logs?
You can use Amazon CloudWatch Logs to monitor, store, and access your log files from Amazon
Elastic Compute Cloud (Amazon EC2) instances, AWS CloudTrail, and other sources. You can then
retrieve the associated log data from CloudWatch Logs.
Features
•Monitor Logs from Amazon EC2 Instances in Real-time—You can use CloudWatch Logs to
monitor applications and systems using log data. For example, CloudWatch Logs can track the
number of errors that occur in your application logs and send you a notification whenever the rate
of errors exceeds a threshold you specify. CloudWatch Logs uses your log data for monitoring; so,
no code changes are required. For example, you can monitor application logs for specific literal
terms (such as "NullReferenceException") or count the number of occurrences of a literal term at
a particular position in log data (such as "404" status codes in an Apache access log). When the
term you are searching for is found, CloudWatch Logs reports the data to a CloudWatch metric that
you specify. Log data is encrypted while in transit and while it is at rest. To get started, see Getting
Started with CloudWatch Logs (p. 7).
•Monitor AWS CloudTrail Logged Events—You can create alarms in CloudWatch and receive
notifications of particular API activity as captured by CloudTrail and use the notification to perform
troubleshooting. To get started, see Sending CloudTrail Events to CloudWatch Logs in the AWS
CloudTrail User Guide.
•Archive Log Data—You can use CloudWatch Logs to store your log data in highly durable
storage. You can change the log retention setting so that any log events older than this setting are
automatically deleted. The CloudWatch Logs agent makes it easy to quickly send both rotated and
non-rotated log data off of a host and into the log service. You can then access the raw log data
when you need it.
Related AWS Services
The following services are used in conjunction with CloudWatch Logs:
•AWS CloudTrail is a web service that enables you to monitor the calls made to the CloudWatch
Logs API for your account, including calls made by the AWS Management Console, command line
interface (CLI), and other services. When CloudTrail logging is turned on, CloudWatch will write log
1

Amazon CloudWatch Logs User Guide
Pricing
files into the Amazon S3 bucket that you specified when you configured CloudTrail. Each log file
can contain one or more records, depending on how many actions must be performed to satisfy a
request. For more information about AWS CloudTrail, see What is AWS CloudTrail? in the AWS
CloudTrail User Guide. For an example of the type of data that CloudWatch writes into CloudTrail log
files, see Logging Amazon CloudWatch Logs API Calls in AWS CloudTrail (p. 87).
•AWS Identity and Access Management (IAM) is a web service that helps you securely control
access to AWS resources for your users. Use IAM to control who can use your AWS resources
(authentication) and what resources they can use in which ways (authorization). For more
information, see What is IAM? in the IAM User Guide.
•Amazon Kinesis Streams is a web service you can use for rapid and continuous data intake and
aggregation. The type of data used includes IT infrastructure log data, application logs, social media,
market data feeds, and web clickstream data. Because the response time for the data intake and
processing is in real time, processing is typically lightweight. For more information, see What is
Amazon Kinesis Streams? in the Amazon Kinesis Streams Developer Guide.
•AWS Lambda is a web service you can use to build applications that respond quickly to new
information. Upload your application code as Lambda functions and Lambda runs your code on high-
availability compute infrastructure and performs all the administration of the compute resources,
including server and operating system maintenance, capacity provisioning and automatic scaling,
code and security patch deployment, and code monitoring and logging. All you need to do is supply
your code in one of the languages that Lambda supports. For more information, see What is AWS
Lambda? in the AWS Lambda Developer Guide.
Pricing
When you sign up for AWS, you can get started with CloudWatch Logsfor free using the AWS Free
Tier.
Standard rates apply for logs stored by other services using CloudWatch Logs (for example, Amazon
VPC flow logs and Lambda logs).
For more information, see Amazon CloudWatch Pricing.
Amazon CloudWatch Logs Concepts
The terminology and concepts that are central to your understanding and use of CloudWatch Logs are
described below.
Log Events
A log event is a record of some activity recorded by the application or resource being monitored.
The log event record that CloudWatch Logs understands contains two properties: the timestamp of
when the event occurred, and the raw event message. Event messages must be UTF-8 encoded.
Log Streams
A log stream is a sequence of log events that share the same source. More specifically, a log
stream is generally intended to represent the sequence of events coming from the application
instance or resource being monitored. For example, a log stream may be associated with an
Apache access log on a specific host. When you no longer need a log stream, you can delete it
using the aws logs delete-log-stream command. In addition, AWS may delete empty log streams
that are over 2 months old.
Log Groups
Log groups define groups of log streams that share the same retention, monitoring, and access
control settings. Each log stream has to belong to one log group. For example, a typical log group
organization for a fleet of Apache web servers could be the following: MyWebsite.com/Apache/
access_log, or MyWebsite.com/Apache/error_log.
2
Amazon CloudWatch Logs User Guide
Limits
Metric Filters
Metric filters can be used to express how the service would extract metric observations from
ingested events and transform them to data points in a CloudWatch metric. Metric filters are
assigned to log groups, and all of the filters assigned to a log group are applied to their log
streams.
Retention Settings
Retention settings can be used to specify how long log events are kept in CloudWatch Logs.
Expired log events get deleted automatically. Just like metric filters, retention settings are also
assigned to log groups, and the retention assigned to a log group is applied to their log streams.
CloudWatch Logs Limits
CloudWatch Logs has the following limits:
Resource Default Limit
Batch size 1 MB (maximum). This limit cannot be changed.
CreateLogGroup 500 log groups/account/region.
If you exceed your log group limit, you get a
ResourceLimitExceeded exception.
You can request a limit increase.
Data archiving Up to 5 GB of data archiving for free. This limit cannot be
changed.
DescribeLogStreams 5 transactions per second (TPS/account/region).
If you experience frequent throttling, you can request a limit
increase.
Event size 256 KB (maximum). This limit cannot be changed.
Export task One active (running or pending) export task at a time, per
account. This limit cannot be changed.
FilterLogEvents 5 transactions per second (TPS)/account/region.
This limit can be changed only in special circumstances. If
you experience frequent throttling, contact AWS Support.
For instructions, see AWS Service Limits.
GetLogEvents 10 requests/second/account/region. We recommend
subscriptions if you are continuously processing new data.
If you need historical data, we recommend exporting your
data to Amazon S3.
This limit can be changed only in special circumstances. If
you experience frequent throttling, contact AWS Support.
For instructions, see AWS Service Limits.
Incoming data Up to 5 GB of incoming data for free. This limit cannot be
changed.
Log groups 500/AWS account (maximum).
You can request a limit increase.
3
Amazon CloudWatch Logs User Guide
Limits
Resource Default Limit
Metrics filters 100/log group. This limit cannot be changed.
PutLogEvents 5 requests/second/log stream. This limit cannot be
changed.
The maximum batch size of a PutLogEvents request is
1MB.
1500 transactions/second/account/region. You can request
a limit increase.
Subscription filters 1/log group. This limit cannot be changed.
4

Amazon CloudWatch Logs User Guide
Sign Up for Amazon Web Services (AWS)
Getting Set Up
To use Amazon CloudWatch Logs you need an AWS account. Your AWS account allows you to use
services (e.g., Amazon EC2) to generate logs that you can view in the CloudWatch console, a point-
and-click web-based interface. In addition, you need to install and configure the AWS command line
interface (CLI).
Topics
•Sign Up for Amazon Web Services (AWS) (p. 5)
•Sign in to the Amazon CloudWatch Console (p. 5)
•Set Up the Command Line Interface (p. 6)
Sign Up for Amazon Web Services (AWS)
When you create an AWS account, we automatically sign up your account for all AWS services. You
pay only for the services that you use.
If you have an AWS account already, skip to the next step. If you don't have an AWS account, use the
following procedure to create one.
To sign up for an AWS account
1. Open http://aws.amazon.com/, and then choose Create an AWS Account.
2. Follow the online instructions.
Part of the sign-up procedure involves receiving a phone call and entering a PIN using the phone
keypad.
Sign in to the Amazon CloudWatch Console
To sign in to the Amazon CloudWatch console
1. Sign in to the AWS Management Console and open the CloudWatch console at https://
console.aws.amazon.com/cloudwatch/.
5

Amazon CloudWatch Logs User Guide
Set Up the Command Line Interface
2. If necessary, change the region. From the navigation bar, select the region that meets your
needs. For more information, see Regions and Endpoints in the Amazon Web Services General
Reference.
3. In the navigation pane, choose Logs.
Set Up the Command Line Interface
You can use the AWS CLI with CloudWatch Logs. The AWS CLI, which is a unified tool for managing
multiple AWS services. Before you can use the CLI, however, you have to install and configure it.
For information about how to install and configure the AWS CLI, see Getting Set Up with the AWS
Command Line Interface in the AWS Command Line Interface User Guide.
6

Amazon CloudWatch Logs User Guide
CloudWatch Logs Agent Prerequisites
Getting Started with CloudWatch
Logs
You can publish log data from Amazon EC2 instances running Linux or Windows Server, and logged
events from AWS CloudTrail. CloudWatch Logs can consume logs from resources in any region, but
you can only view the log data in the CloudWatch console in the regions where CloudWatch Logs is
supported. For more information, see Regions and Endpoints in the Amazon Web Services General
Reference.
This section describes the steps necessary for installing the CloudWatch Logs agent on an Amazon
EC2 instance running Amazon Linux, Ubuntu Server, CentOS, or Red Hat Enterprise Linux.
To get started with CloudWatch Logs on an EC2 instance running Microsoft Windows, see Sending
Performance Counters to CloudWatch and Logs to CloudWatch Logs in the Amazon EC2 User Guide
for Windows Instances.
To get started with CloudWatch Logs and logged events in CloudTrail, see Sending CloudTrail Events
to CloudWatch Logs in the AWS CloudTrail User Guide.
CloudWatch Logs Agent Prerequisites
The CloudWatch Logs agent requires Python version 2.6, 2.7, 3.0, or 3.3, and any of the following
versions of Linux:
• Amazon Linux version 2014.03.02 or later
• Ubuntu Server version 12.04, or 14.04
• CentOS version 6, 6.3, 6.4, 6.5, or 7.0
• Red Hat Enterprise Linux (RHEL) version 6.5 or 7.0
• Debian 8.0
Topics
•Quick Start: Install and Configure the CloudWatch Logs Agent on an Existing Amazon EC2
Instance (p. 8)
•Quick Start: Install and Configure the CloudWatch Logs Agent on a New Amazon EC2
Instance (p. 12)
•Quick Start: Install the CloudWatch Logs Agent Using AWS OpsWorks and Chef (p. 14)
7
Amazon CloudWatch Logs User Guide
Quick Start: Install and Configure the CloudWatch
Logs Agent on an Existing Amazon EC2 Instance
•Quick Start: Using AWS CloudFormation to Send Log Data to CloudWatch Logs (p. 18)
•Report the CloudWatch Logs Agent's Status (p. 19)
•Start the CloudWatch Logs Agent (p. 20)
•Stop the CloudWatch Logs Agent (p. 20)
•CloudWatch Logs Agent Reference (p. 20)
•Viewing Log Data (p. 27)
•Changing Log Retention (p. 27)
Quick Start: Install and Configure the
CloudWatch Logs Agent on an Existing
Amazon EC2 Instance
You can use the CloudWatch Logs agent installer on an existing EC2 instance to install and configure
the CloudWatch Logs agent. After installation is complete, the agent confirms that it has started and it
stays running until you disable it.
In addition to the agent, you can also publish log data using the AWS CLI, CloudWatch Logs SDK,
or the CloudWatch Logs API. The AWS CLI is best suited for publishing data at the command line
or through scripts. The CloudWatch Logs SDK is best suited for publishing log data directly from
applications or building your own log publishing application.
Step 1: Configure Your IAM Role or User for
CloudWatch Logs
The CloudWatch Logs agent supports IAM roles and users. If your instance already has an IAM role
associated with it, make sure that you include the IAM policy below. If you don't already have an IAM
role assigned to your instance, you'll need to use your IAM credentials for the next steps because you
cannot assign an IAM role to an existing instance; you can only specify a role when you launch a new
instance.
For more information, see IAM Users and Groups and Managing IAM Policies in IAM User Guide.
To configure your IAM role or user for CloudWatch Logs
1. Open the Identity and Access Management (IAM) console at https://console.aws.amazon.com/
iam/.
2. In the navigation pane, choose Roles, and then for Role Name, select an IAM role.
3. On the Permissions tab, under Inline Policies, choose Create Role Policy.
4. On the Set Permissions page, choose Custom Policy, Select.
For more information about creating custom policies, see IAM Policies for Amazon EC2 in the
Amazon EC2 User Guide for Linux Instances.
5. On the Review Policy page, for Policy Name, type a name for the policy.
6. For Policy Document, paste in the following policy:
{
"Version": "2012-10-17",
"Statement": [
{
"Effect": "Allow",
8
Amazon CloudWatch Logs User Guide
Step 2: Install and Configure CloudWatch
Logs on an Existing Amazon EC2 Instance
"Action": [
"logs:CreateLogGroup",
"logs:CreateLogStream",
"logs:PutLogEvents",
"logs:DescribeLogStreams"
],
"Resource": [
"arn:aws:logs:*:*:*"
]
}
]
}
7. Choose Apply Policy.
Step 2: Install and Configure CloudWatch Logs
on an Existing Amazon EC2 Instance
The process for installing the CloudWatch Logs agent differs depending on whether your Amazon EC2
instance is running Amazon Linux, Ubuntu, CentOS, or Red Hat. Use the steps appropriate for the
version of Linux on your instance.
To install and configure CloudWatch Logs on an existing Amazon Linux instance
Starting with Amazon Linux AMI 2014.09, the CloudWatch Logs agent is available as an RPM
installation with the awslogs package. Earlier versions of Amazon Linux can access the awslogs
package by updating their instance with the sudo yum update -y command. By installing the
awslogs package as an RPM instead of the using the CloudWatch Logs installer, your instance
receives regular package updates and patches from AWS without having to manually reinstall the
CloudWatch Logs agent.
Caution
Do not update the CloudWatch Logs agent using the RPM installation method if you
previously used the Python script to install the agent. Doing so may cause configuration
issues that prevent the CloudWatch Logs agent from sending your logs to CloudWatch.
1. Connect to your Amazon Linux instance. For more information, see Connect to Your Instance in
the Amazon EC2 User Guide for Linux Instances.
If you have trouble connecting, see Troubleshooting Connecting to Your Instance in the Amazon
EC2 User Guide for Linux Instances.
2. Update your Amazon Linux instance to pick up the latest changes in the package repositories.
[ec2-user ~]$ sudo yum update -y
3. Install the awslogs package.
[ec2-user ~]$ sudo yum install -y awslogs
4. Edit the /etc/awslogs/awscli.conf file and in the [default] section, specify the region in
which to view log data and add your credentials.
region = us-east-1
aws_access_key_id = <YOUR ACCESS KEY>
aws_secret_access_key = <YOUR SECRET KEY>
9
Amazon CloudWatch Logs User Guide
Step 2: Install and Configure CloudWatch
Logs on an Existing Amazon EC2 Instance
Note
Adding your credentials here is optional if your instance was launched using an IAM role
or user with the appropriate permissions to use CloudWatch Logs.
5. Edit the /etc/awslogs/awslogs.conf file to configure the logs to track. For more information
about editing this file, see CloudWatch Logs Agent Reference (p. 20).
6. Start the awslogs service.
[ec2-user ~]$ sudo service awslogs start
Starting awslogs: [ OK ]
7. (Optional) Check the /var/log/awslogs.log file for errors logged when starting the service.
8. (Optional) Run the following command to start the awslogs service at each system boot.
[ec2-user ~]$ sudo chkconfig awslogs on
9. You should see the newly-created log group and log stream in the CloudWatch console after the
agent has been running for a few moments.
To view your logs, see Viewing Log Data (p. 27).
To install and configure CloudWatch Logs on an existing Ubuntu Server, CentOS, or
Red Hat instance
If you're using an AMI running Ubuntu Server, CentOS, or Red Hat, use the following procedure to
manually install the CloudWatch Logs agent on your instance.
1. Connect to your EC2 instance. For more information, see Connect to Your Instance in the Amazon
EC2 User Guide for Linux Instances.
If you have trouble connecting, see Troubleshooting Connecting to Your Instance in the Amazon
EC2 User Guide for Linux Instances.
2. Run the CloudWatch Logs agent installer. On the instance, open a command prompt, type the
following commands, and then follow the prompts.
Note
On Ubuntu, run apt-get update before running the commands below.
curl https://s3.amazonaws.com/aws-cloudwatch/downloads/latest/awslogs-
agent-setup.py -O
sudo python ./awslogs-agent-setup.py --region us-east-1
Note
You can install the CloudWatch Logs agent by specifying the us-east-1, us-west-1, us-
west-2, ap-south-1, ap-northeast-2, ap-southeast-1, ap-southeast-2, ap-northeast-1, eu-
central-1, eu-west-1, or sa-east-1 regions.
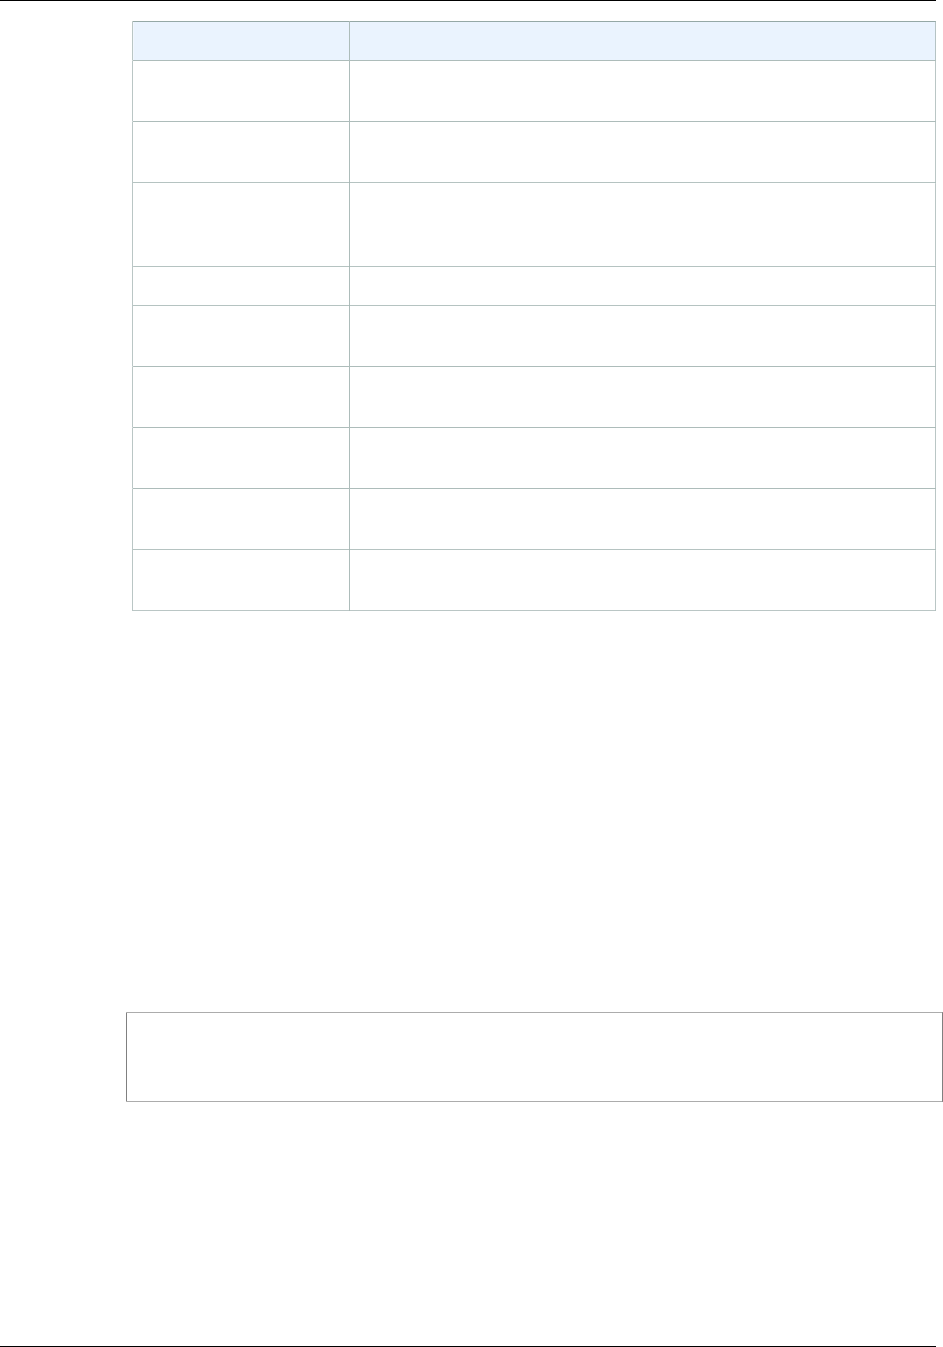
The CloudWatch Logs agent installer requires certain information during set up. Before you start,
you need to know which log file to monitor and its timestamp format. You should also have the
following information ready.
10
Amazon CloudWatch Logs User Guide
Step 2: Install and Configure CloudWatch
Logs on an Existing Amazon EC2 Instance
Item Description
AWS access key ID Press Enter if using an IAM role. Otherwise, enter your AWS access
key ID.
AWS secret access key Press Enter if using an IAM role. Otherwise, enter your AWS secret
access key.
Default region name Press Enter. The default is us-east-1. You can set this to us-east-1,
us-west-1, us-west-2, ap-south-1, ap-northeast-2, ap-southeast-1, ap-
southeast-2, ap-northeast-1, eu-central-1, eu-west-1, or sa-east-1.
Default output format Leave blank and press Enter.
Path of log file to upload The location of the file that contains the log data you want to send.
The installer suggests a path for you.
Destination Log Group
name The name for your log group. The installer suggests a log group
name for you.
Destination Log Stream
name By default, this is the name of the host. The installer suggests a host
name for you.
Timestamp format Specify the format of the timestamp within the specified log file.
Choose custom to specify your own format.
Initial position How data is uploaded. Set this to start_of_file to upload everything in
the data file. Set to end_of_file to upload only newly-appended data.
After you have completed these steps, the installer asks if you want to configure another log
file. You can run the process as many times as you like for each log file. If you have no more
log files to monitor, choose N when prompted by the installer to set up another log. For more
information about the settings in the agent configuration file, see CloudWatch Logs Agent
Reference (p. 20).
Note
Configuring multiple log sources to send data to a single log stream is not supported.
3. You should see the newly-created log group and log stream in the CloudWatch console after the
agent has been running for a few moments.
To view your logs, see Viewing Log Data (p. 27).
4. Optional. If you later need to edit your credentials, in the /var/awslogs/etc/aws.conf file
and in the [default] section, specify the region where you want to view log data and add your
credentials.
region = <REGION>
aws_access_key_id = <YOUR ACCESS KEY>
aws_secret_access_key = <YOUR SECRET KEY>
Note
Adding your credentials here is optional if your instance was launched using an IAM role
or user with the appropriate permissions to use CloudWatch Logs.
11
Amazon CloudWatch Logs User Guide
Quick Start: Install and Configure the CloudWatch
Logs Agent on a New Amazon EC2 Instance
Quick Start: Install and Configure the
CloudWatch Logs Agent on a New Amazon
EC2 Instance
You can use Amazon EC2 user data, a feature of Amazon EC2 that allows parametric information
to be passed to the instance on launch, to install and configure the CloudWatch Logs agent on that
instance. To pass the CloudWatch Logs agent installation and configuration information to Amazon
EC2, you can provide the configuration file in a network location such as an Amazon S3 bucket. You
can launch a new EC2 instance and enable logs by performing the following steps.
To launch a new instance and enable CloudWatch Logs
1. Create an agent configuration file that describes all your log groups and log streams.
Sample agent configuration file for Amazon Linux
[general]
state_file = /var/awslogs/state/agent-state
[/var/log/messages]
file = /var/log/messages
log_group_name = /var/log/messages
log_stream_name = {instance_id}
datetime_format = %b %d %H:%M:%S
Sample agent configuration file for Ubuntu
[general]
state_file = /var/awslogs/state/agent-state
[/var/log/syslog]
file = /var/log/syslog
log_group_name = /var/log/syslog
log_stream_name = {instance_id}
datetime_format = %b %d %H:%M:%S
The agent configuration file describes the log files to monitor and the target log groups and log
streams to upload it to. The agent consumes this configuration file and starts monitoring and
uploading all the log files described in it. For more information about the settings in the agent
configuration file, see CloudWatch Logs Agent Reference (p. 20).
Save it as a text file (for example, awslogs.cfg) either on the AMI's filesystem, in a publicly
accessible http/https location, or an Amazon S3 location (for example, s3://myawsbucket/my-
config-file). For more information about assigning permissions to an Amazon S3 bucket, see
Specifying Resources in a Policy in the Amazon Simple Storage Service Developer Guide.
Note
Configuring multiple log sources to send data to a single log stream is not supported.
2. Open the Identity and Access Management (IAM) console at https://console.aws.amazon.com/
iam/.
3. In the navigation pane, choose Policies, Create Policy.
12

Amazon CloudWatch Logs User Guide
Quick Start: Install and Configure the CloudWatch
Logs Agent on a New Amazon EC2 Instance
4. On the Create Policy page, under Create Your Own Policy, choose Select. For more
information about creating custom policies, see IAM Policies for Amazon EC2 in the Amazon EC2
User Guide for Linux Instances.
5. On the Review Policy page, for Policy Name, type a name for the policy.
6. For Policy Document, paste in the following policy:
{
"Version": "2012-10-17",
"Statement": [
{
"Effect": "Allow",
"Action": [
"logs:CreateLogGroup",
"logs:CreateLogStream",
"logs:PutLogEvents",
"logs:DescribeLogStreams"
],
"Resource": [
"arn:aws:logs:*:*:*"
]
},
{
"Effect": "Allow",
"Action": [
"s3:GetObject"
],
"Resource": [
"arn:aws:s3:::myawsbucket/*"
]
}
]
}
7. Choose Create Policy.
8. In the navigation pane, choose Roles, Create New Role.
9. On the Set Role Name page, enter a name for the role and choose Next Step.
10. On the Select Role Type page, choose Select next to Amazon EC2.
11. On the Attach Policy page, in the table header (next to Filter and Search), choose Policy Type,
Customer Managed Policies.
12. For Customer Managed Policies, select the IAM policy that you created above and choose Next
Step.
13. If you're satisfied with the role, choose Create Role.
For more information about IAM users and policies, see IAM Users and Groups and Managing
IAM Policies in the IAM User Guide.
14. Open the Amazon EC2 console at https://console.aws.amazon.com/ec2/.
15. If necessary, change the region. From the navigation bar, select the region that meets your
needs. For more information, see Regions and Endpoints in the Amazon Web Services General
Reference.
16. Choose Launch Instance.
For more information, see Launching an Instance in Amazon EC2 User Guide for Linux Instances.
17. On the Step 1: Choose an Amazon Machine Image (AMI) page, select the Linux instance type
to launch, and then on the Step 2: Choose an Instance Type page, choose Next: Configure
Instance Details.
13
Amazon CloudWatch Logs User Guide
Quick Start: Install the CloudWatch Logs
Agent Using AWS OpsWorks and Chef
Note
Make sure that cloud-init (http://cloudinit.readthedocs.org/en/latest/index.html) is installed
on your Amazon Machine Image (AMI). Amazon Linux, Ubuntu, and RHEL instances
already include cloud-init, but CentOS and other AMIs in the AWS Marketplace may not.
18. On the Step 3: Configure Instance Details page, for IAM role, select the IAM role that you
created above.
19. Under Advanced Details, for User data, paste in the script and update the -c option with the
location of the configuration file:
#!/bin/bash
curl https://s3.amazonaws.com/aws-cloudwatch/downloads/latest/awslogs-
agent-setup.py -O
chmod +x ./awslogs-agent-setup.py
./awslogs-agent-setup.py -n -r us-east-1 -c s3://myawsbucket/my-config-
file
Note
You can install the CloudWatch Logs agent by specifying the us-east-1, us-west-1, us-
west-2, ap-south-1, ap-northeast-2, ap-southeast-1, ap-southeast-2, ap-northeast-1, eu-
central-1, eu-west-1, or sa-east-1 regions.
20. Make any other changes to the instance, review your launch settings, and then choose Launch.
21. You should see the newly-created log group and log stream in the CloudWatch console after the
agent has been running for a few moments.
To view your logs, see Viewing Log Data (p. 27).
Quick Start: Install the CloudWatch Logs
Agent Using AWS OpsWorks and Chef
You can install the CloudWatch Logs agent and create log streams using AWS OpsWorks and Chef,
which is a third-party systems and cloud infrastructure automation tool. Chef uses "recipes," which you
write to install and configure software on your computer, and "cookbooks," which are collections of
recipes, to perform its configuration and policy distribution tasks. For more information, see Chef.
The Chef recipes examples below show how to monitor one log file on each EC2 instance. The recipes
use the stack name as the log group and the instance's hostname as the log stream name. If you
want to monitor multiple log files, you need to extend the recipes to create multiple log groups and log
streams.
Topics
•Step 1: Create Custom Recipes (p. 15)
•Step 2: Create an AWS OpsWorks Stack (p. 16)
•Step 3: Extend Your IAM Role (p. 17)
•Step 4: Add a Layer (p. 17)
•Step 5: Add an Instance (p. 18)
•Step 6: View Your Logs (p. 18)
14
Amazon CloudWatch Logs User Guide
Step 1: Create Custom Recipes
Step 1: Create Custom Recipes
Create a repository to store your recipes. AWS OpsWorks supports Git and Subversion, or you can
store an archive in Amazon S3. The structure of your cookbook repository is described in Cookbook
Repositories in the AWS OpsWorks User Guide. The examples below assume that the cookbook is
named logs. The install.rb recipe installs the CloudWatch Logs agent. You can also download the
cookbook example (CloudWatchLogs-Cookbooks.zip).
Create a file named metadata.rb that contains the following code:
#metadata.rb
name 'logs'
version '0.0.1'
Create the CloudWatch Logs configuration file:
#config.rb
template "/tmp/cwlogs.cfg" do
cookbook "logs"
source "cwlogs.cfg.erb"
owner "root"
group "root"
mode 0644
end
Download and install the CloudWatch Logs agent:
# install.rb
directory "/opt/aws/cloudwatch" do
recursive true
end
remote_file "/opt/aws/cloudwatch/awslogs-agent-setup.py" do
source "https://s3.amazonaws.com/aws-cloudwatch/downloads/latest/awslogs-
agent-setup.py"
mode "0755"
end
execute "Install CloudWatch Logs agent" do
command "/opt/aws/cloudwatch/awslogs-agent-setup.py -n -r region -c /tmp/
cwlogs.cfg"
not_if { system "pgrep -f aws-logs-agent-setup" }
end
Note
In the above example, replace region with one of the following: us-east-1, us-west-1, us-
west-2, ap-south-1, ap-northeast-2, ap-southeast-1, ap-southeast-2, ap-northeast-1, eu-
central-1, eu-west-1, or sa-east-1.
This recipe uses a cwlogs.cfg.erb template file that you can modify to specify various attributes
such as what files to log. For more information about these attributes, see CloudWatch Logs Agent
Reference (p. 20).
15
Amazon CloudWatch Logs User Guide
Step 2: Create an AWS OpsWorks Stack
[general]
# Path to the AWSLogs agent's state file. Agent uses this file to maintain
# client side state across its executions.
state_file = /var/awslogs/state/agent-state
## Each log file is defined in its own section. The section name doesn't
## matter as long as its unique within this file.
#
#[kern.log]
#
## Path of log file for the agent to monitor and upload.
#
#file = /var/log/kern.log
#
## Name of the destination log group.
#
#log_group_name = kern.log
#
## Name of the destination log stream.
#
#log_stream_name = {instance_id}
#
## Format specifier for timestamp parsing.
#
#datetime_format = %b %d %H:%M:%S
#
#
[<%= node[:opsworks][:stack][:name] %>]
datetime_format = [%Y-%m-%d %H:%M:%S]
log_group_name = <%= node[:opsworks][:stack][:name].gsub(' ','_') %>
file = <%= node[:cwlogs][:logfile] %>
log_stream_name = <%= node[:opsworks][:instance][:hostname] %>
The template gets the stack name and host name by referencing the corresponding attributes in the
stack configuration and deployment JSON. The attribute that specifies the file to log is defined in the
cwlogs cookbook's default.rb attributes file (logs/attributes/default.rb).
default[:cwlogs][:logfile] = '/var/log/aws/opsworks/opsworks-
agent.statistics.log'
Step 2: Create an AWS OpsWorks Stack
1. Open the AWS OpsWorks console at https://console.aws.amazon.com/opsworks/.
2. On the OpsWorks Dashboard, choose Add stack to create an AWS OpsWorks stack.
3. On the Add stack screen, choose Chef 11 stack.
4. For Stack name, enter a name.
5. For Use custom Chef Cookbooks, choose Yes.
6. For Repository type, select the repository type that you use. If you're using the above example,
choose Http Archive.
7. For Repository URL, enter the repository where you stored the cookbook that you created in the
previous step. If you're using the above example, enter https://s3.amazonaws.com/aws-
cloudwatch/downloads/CloudWatchLogs-Cookbooks.zip.
16
Amazon CloudWatch Logs User Guide
Step 3: Extend Your IAM Role
8. Choose Add Stack to create the stack.
Step 3: Extend Your IAM Role
To use CloudWatch Logs with your AWS OpsWorks instances, you need to extend the IAM role used
by your instances.
1. Open the Identity and Access Management (IAM) console at https://console.aws.amazon.com/
iam/.
2. In the navigation pane, choose Policies, Create Policy.
3. On the Create Policy page, under Create Your Own Policy, choose Select. For more
information about creating custom policies, see IAM Policies for Amazon EC2 in the Amazon EC2
User Guide for Linux Instances.
4. On the Review Policy page, for Policy Name, type a name for the policy.
5. For Policy Document, paste in the following policy:
{
"Version": "2012-10-17",
"Statement": [
{
"Effect": "Allow",
"Action": [
"logs:CreateLogGroup",
"logs:CreateLogStream",
"logs:PutLogEvents",
"logs:DescribeLogStreams"
],
"Resource": [
"arn:aws:logs:*:*:*"
]
}
]
}
6. Choose Create Policy.
7. In the navigation pane, choose Roles, and then in the contents pane, for Role Name, select the
name of the instance role used by your AWS OpsWorks stack. You can find the one used by your
stack in the stack settings (the default is aws-opsworks-ec2-role).
Tip
Choose the role name, not the check box.
8. On the Permissions tab, under Managed Policies, choose Attach Policy.
9. On the Attach Policy page, in the table header (next to Filter and Search), choose Policy Type,
Customer Managed Policies.
10. For Customer Managed Policies, select the IAM policy that you created above and choose
Attach Policy.
For more information about IAM users and policies, see IAM Users and Groups and Managing
IAM Policies in the IAM User Guide.
Step 4: Add a Layer
1. Open the AWS OpsWorks console at https://console.aws.amazon.com/opsworks/.
17

Amazon CloudWatch Logs User Guide
Step 5: Add an Instance
2. In the navigation pane, choose Layers.
3. In the contents pane, select a layer and choose Add layer.
4. On the OpsWorks tab, for Layer type, choose Custom.
5. For the Name and Short name fields, enter the long and short name for the layer, and then
choose Add layer.
6. On the Recipes tab, under Custom Chef Recipes, there are several headings—Setup,
Configure, Deploy, Undeploy, and Shutdown, which correspond to AWS OpsWorks lifecycle
events. AWS OpsWorks triggers these events at these key points in instance's lifecycle, which
runs the associated recipes.
Note
If the above headings aren't visible, under Custom Chef Recipes, choose edit.
7. Enter logs::config, logs::install next to Setup, choose + to add it to the list, and then choose Save.
AWS OpsWorks runs this recipe on each of the new instances in this layer, right after the instance
boots.
Step 5: Add an Instance
The layer only controls how to configure instances. You now need to add some instances to the layer
and start them.
1. Open the AWS OpsWorks console at https://console.aws.amazon.com/opsworks/.
2. In the navigation pane, choose Instances and then under your layer, choose + Instance.
3. Accept the default settings and choose Add Instance to add the instance to the layer.
4. In the row's Actions column, click start to start the instance.
AWS OpsWorks launches a new EC2 instance and configures CloudWatch Logs. The instance's
status changes to online when it's ready.
Step 6: View Your Logs
You should see the newly created log group and log stream in the CloudWatch console after the agent
has been running for a few moments.
To view your logs, see Viewing Log Data (p. 27).
Quick Start: Using AWS CloudFormation to
Send Log Data to CloudWatch Logs
AWS CloudFormation enables you to describe your AWS resources in JSON-formatted templates.
With AWS CloudFormation, you can describe and then quickly and consistently provision log groups
and metric filters in CloudWatch Logs. You can also use AWS CloudFormation to install and configure
the CloudWatch Logs agent on EC2 instances. For example, if you have multiple Apache web servers
on EC2 instances, you can write a single AWS CloudFormation template that defines the web server
logs and the information from those logs that you want to monitor. You can then reuse the template for
all of your Apache web servers. For more information, see AWS CloudFormation User Guide.
For more information about CloudWatch resources in AWS CloudFormation, see the
AWS::Logs::LogGroup and AWS::Logs::MetricFilter in the AWS CloudFormation User Guide.
18
Amazon CloudWatch Logs User Guide
Report the CloudWatch Logs Agent's Status
The following template snippet creates a log group and metric filter. The log group retains log events
for 7 days. The metric filter counts the number of 404 occurrences. It sends a metric value of 1 each
time the status code field equals 404.
Example
"WebServerLogGroup": {
"Type": "AWS::Logs::LogGroup",
"Properties": {
"RetentionInDays": 7
}
},
"404MetricFilter": {
"Type": "AWS::Logs::MetricFilter",
"Properties": {
"LogGroupName": {
Ref": "WebServerLogGroup"
},
"FilterPattern": "[ip, identity, user_id, timestamp, request,
status_code = 404, size, ...]",
"MetricTransformations": [
{
"MetricValue": "1",
"MetricNamespace": "test/404s",
"MetricName": "test404Count"
}
]
}
}
For a stack named MyStack, the previous example creates a log group named MyStack-
LogGroup-unique hash and a metric filter named MetricFilter-unique hash. For a complete
sample template that includes an EC2 instance and CloudWatch alarms, see Amazon CloudWatch
Logs Sample in the AWS CloudFormation User Guide.
Report the CloudWatch Logs Agent's Status
To report the agent's status
1. Connect to your EC2 instance. For more information, see Connect to Your Instance in the Amazon
EC2 User Guide for Linux Instances.
If you have trouble connecting, see Troubleshooting Connecting to Your Instance in the Amazon
EC2 User Guide for Linux Instances
2. At a command prompt, type the following command:
sudo service awslogs status
3. Check the /var/log/awslogs.log file for any errors, warnings, or issues with the CloudWatch Logs
agent.
19
Amazon CloudWatch Logs User Guide
Start the CloudWatch Logs Agent
Start the CloudWatch Logs Agent
If the CloudWatch Logs agent did not start automatically after installation, or if you stopped the agent,
you can manually start it.
To start the agent
1. Connect to your EC2 instance. For more information, see Connect to Your Instance in the Amazon
EC2 User Guide for Linux Instances.
If you have trouble connecting, see Troubleshooting Connecting to Your Instance in the Amazon
EC2 User Guide for Linux Instances.
2. At a command prompt, type the following command:
sudo service awslogs start
Stop the CloudWatch Logs Agent
To stop the agent
1. Connect to your EC2 instance. For more information, see Connect to Your Instance in the Amazon
EC2 User Guide for Linux Instances.
If you have trouble connecting, see Troubleshooting Connecting to Your Instance in the Amazon
EC2 User Guide for Linux Instances.
2. At a command prompt, type the following command:
sudo service awslogs stop
CloudWatch Logs Agent Reference
The CloudWatch Logs agent provides an automated way to send log data to CloudWatch Logs for
Amazon EC2 instances running Amazon Linux or Ubuntu. The agent is comprised of the following
components:
• A plug-in to the AWS CLI that pushes log data to CloudWatch Logs.
• A script (daemon) that runs the CloudWatch Logs aws logs push command to send data to
CloudWatch Logs.
• A cron job that ensures that the daemon is always running.
Agent Configuration File
The CloudWatch Logs agent configuration file describes information needed by the aws logs push
command. The agent configuration file's [general] section defines common configurations that apply
to all log streams. The [logstream] section defines the information necessary to send a local file to a
remote log stream. You can have more than one [logstream] section, but each must have a unique
name within the configuration file, e.g., [logstream1], [logstream2], and so on. The [logstream] value
along with the first line of data in the log file, define the log file's identity.
20
Amazon CloudWatch Logs User Guide
Agent Configuration File
[general]
state_file = <value>
logging_config_file = <value>
use_gzip_http_content_encoding = [true | false]
[logstream1]
log_group_name = <value>
log_stream_name = <value>
datetime_format = <value>
time_zone = [LOCAL|UTC]
file = <value>
file_fingerprint_lines = <integer> | <integer-integer>
multi_line_start_pattern = <regex> | {datetime_format}
initial_position = [start_of_file|end_of_file]
encoding = [ascii|utf_8|..]
buffer_duration = <integer>
batch_count = <integer>
batch_size = <integer>
[logstream2]
...
state_file
Specifies where the state file is stored.
logging_config_file
Specifies where the agent logging config file is. This is optional and overrides the default
logging configuration. The file is in Python configuration file format (https://docs.python.org/2/
library/logging.config.html#logging-config-fileformat). Loggers with the following names can be
customized.
cwlogs.push
cwlogs.push.reader
cwlogs.push.publisher
cwlogs.push.event
cwlogs.push.batch
cwlogs.push.stream
cwlogs.push.watcher
The sample below changes the level of reader and publisher to WARNING while the default value
is INFO.
[loggers]
keys=root,cwlogs,reader,publisher
[handlers]
keys=consoleHandler
[formatters]
keys=simpleFormatter
[logger_root]
level=INFO
handlers=consoleHandler
[logger_cwlogs]
level=INFO
21
Amazon CloudWatch Logs User Guide
Agent Configuration File
handlers=consoleHandler
qualname=cwlogs.push
propagate=0
[logger_reader]
level=WARNING
handlers=consoleHandler
qualname=cwlogs.push.reader
propagate=0
[logger_publisher]
level=WARNING
handlers=consoleHandler
qualname=cwlogs.push.publisher
propagate=0
[handler_consoleHandler]
class=logging.StreamHandler
level=INFO
formatter=simpleFormatter
args=(sys.stderr,)
[formatter_simpleFormatter]
format=%(asctime)s - %(name)s - %(levelname)s - %(process)d -
%(threadName)s - %(message)s
use_gzip_http_content_encoding
When set to true (default), enables gzip http content encoding to send compressed payloads to
CloudWatch Logs. This decreases CPU usage, lowers NetworkOut, and decreases put latency.
To disable this feature, add use_gzip_http_content_encoding = false to the [general] section of
the CloudWatch Logs agent configuration file, and then restart the agent.
Note
This setting is only available in awscli-cwlogs version 1.3.3 and later.
log_group_name
Specifies the destination log group. A log group is created automatically if it doesn't already exist.
Log group names can be between 1 and 512 characters long. Allowed characters include a-z, A-Z,
0-9, '_' (underscore), '-' (hyphen), '/' (forward slash), and '.' (period).
log_stream_name
Specifies the destination log stream. You can use a literal string or predefined variables
({instance_id}, {hostname}, {ip_address}), or combination of both to define a log stream name. A
log stream is created automatically if it doesn't already exist.
datetime_format
Specifies how the timestamp is extracted from logs. The timestamp is used for retrieving log
events and generating metrics. The current time is used for each log event if the datetime_format
isn't provided. If the provided datetime_format value is invalid for a given log message, the
timestamp from the last log event with a successfully parsed timestamp is used. If no previous log
events exist, the current time is used.
The common datetime_format codes are listed below. You can also use any datetime_format
codes supported by Python, datetime.strptime(). The timezone offset (%z) is also supported even
though it's not supported until python 3.2, [+-]HHMM without colon(:). For more information, see
strftime() and strptime() Behavior.
%y: Year without century as a zero-padded decimal number. 00, 01, ..., 99
%Y: Year with century as a decimal number.1970, 1988, 2001, 2013
%b: Month as locale's abbreviated name. Jan, Feb, ..., Dec (en_US);
22

Amazon CloudWatch Logs User Guide
Agent Configuration File
%B: Month as locale's full name. January, February, ..., December (en_US);
%m: Month as a zero-padded decimal number. 01, 02, ..., 12
%d: Day of the month as a zero-padded decimal number. 01, 02, ..., 31
%H: Hour (24-hour clock) as a zero-padded decimal number. 00, 01, ..., 23
%I: Hour (12-hour clock) as a zero-padded decimal number. 01, 02, ..., 12
%p: Locale's equivalent of either AM or PM.
%M: Minute as a zero-padded decimal number. 00, 01, ..., 59
%S: Second as a zero-padded decimal number. 00, 01, ..., 59
%f: Microsecond as a decimal number, zero-padded on the left. 000000, ..., 999999
%z: UTC offset in the form +HHMM or -HHMM. +0000, -0400, +1030
Example formats:
Syslog: '%b %d %H:%M:%S', e.g. Jan 23 20:59:29
Log4j: '%d %b %Y %H:%M:%S', e.g. 24 Jan 2014 05:00:00
ISO8601: '%Y-%m-%dT%H:%M:%S%z', e.g. 2014-02-20T05:20:20+0000
time_zone
Specifies the time zone of log event timestamp. The two supported values are UTC and LOCAL.
The default is LOCAL, which is used if time zone can't be inferred based on datetime_format.
file Specifies log files that you want to push to CloudWatch Logs. File can point to a specific
file or multiple files (using wildcards such as /var/log/system.log*). Only the latest file is
pushed to CloudWatch Logs based on file modification time. We recommend that you use
wildcards to specify a series of files of the same type, such as access_log.2014-06-01-01,
access_log.2014-06-01-02, and so on, but not multiple different kinds of files, such as
access_log_80 and access_log_443. To specify multiple different kinds of files, add another log
stream entry to the configuration file so each kind of log files goes to different log group. Zipped
files are not supported.
file_fingerprint_lines
Specifies the range of lines for identifying a file. The valid values are one number or two dash
delimited numbers, such as '1', '2-5'. The default value is '1' so the first line is used to calculate
fingerprint. Fingerprint lines are not sent to CloudWatch Logs unless all the specified lines are
available.
multi_line_start_pattern
Specifies the pattern for identifying the start of a log message. A log message is made of a line
that matches the pattern and any following lines that don't match the pattern. The valid values
are regular expression or {datetime_format}. When using {datetime_format}, the datetime_format
option should be specified. The default value is ‘^[^\s]' so any line that begins with non-whitespace
character closes the previous log message and starts a new log message.
initial_position
Specifies where to start to read data (start_of_file or end_of_file). The default is start_of_file. It's
only used if there is no state persisted for that log stream.
encoding
Specifies the encoding of the log file so that the file can be read correctly. The default is utf_8.
Encodings supported by Python codecs.decode() can be used here.
Caution
Specifying an incorrect encoding might cause data loss because characters that cannot
be decoded are replaced with some other character.
23
Amazon CloudWatch Logs User Guide
Using the CloudWatch Logs Agent with HTTP Proxies
Below are some common encodings:
ascii, big5, big5hkscs, cp037, cp424, cp437, cp500, cp720, cp737, cp775,
cp850, cp852, cp855, cp856, cp857, cp858, cp860, cp861, cp862, cp863,
cp864, cp865, cp866, cp869, cp874, cp875, cp932, cp949, cp950, cp1006,
cp1026, cp1140, cp1250, cp1251, cp1252, cp1253, cp1254, cp1255, cp1256,
cp1257, cp1258, euc_jp, euc_jis_2004, euc_jisx0213, euc_kr, gb2312, gbk,
gb18030, hz, iso2022_jp, iso2022_jp_1, iso2022_jp_2, iso2022_jp_2004,
iso2022_jp_3, iso2022_jp_ext, iso2022_kr, latin_1, iso8859_2, iso8859_3,
iso8859_4, iso8859_5, iso8859_6, iso8859_7, iso8859_8, iso8859_9,
iso8859_10, iso8859_13, iso8859_14, iso8859_15, iso8859_16, johab, koi8_r,
koi8_u, mac_cyrillic, mac_greek, mac_iceland, mac_latin2, mac_roman,
mac_turkish, ptcp154, shift_jis, shift_jis_2004, shift_jisx0213, utf_32,
utf_32_be, utf_32_le, utf_16, utf_16_be, utf_16_le, utf_7, utf_8,
utf_8_sig
buffer_duration
Specifies the time duration for the batching of log events. The minimum value is 5000ms and
default value is 5000ms.
batch_count
Specifies the max number of log events in a batch, up to 10000. The default value is 1000.
batch_size
Specifies the max size of log events in a batch, in bytes, up to 1048576 bytes. The default value is
32768 bytes. This size is calculated as the sum of all event messages in UTF-8, plus 26 bytes for
each log event.
Using the CloudWatch Logs Agent with HTTP
Proxies
You can use the CloudWatch Logs agent with HTTP proxies.
Note
HTTP proxies are supported in awslogs-agent-setup.py version 1.3.8 or later.
To use the CloudWatch Logs agent with HTTP proxies
1. Do one of the following:
a. For a new installation of the CloudWatch Logs agent, run the following commands:
curl https://s3.amazonaws.com/aws-cloudwatch/downloads/latest/awslogs-
agent-setup.py -O
sudo python awslogs-agent-setup.py --region us-east-1 --http-proxy
http://your/proxy --https-proxy http://your-proxy --no-proxy
169.254.169.254
In order to maintain access to the Amazon EC2 metadata service on EC2 instances, use --no-
proxy 169.254.169.254 (recommended). For more information , see Instance Metadata and
User Data in the Amazon EC2 User Guide for Linux Instances.
b. For an existing installation of the CloudWatch Logs agent, edit /var/awslogs/etc/proxy.conf,
and add your proxies:
HTTP_PROXY=
24
Amazon CloudWatch Logs User Guide
Compartmentalizing CloudWatch
Logs Agent Configuration Files
HTTPS_PROXY=
NO_PROXY=
2. Restart the agent for the changes to take effect:
sudo service awslogs restart
Compartmentalizing CloudWatch Logs Agent
Configuration Files
If you're using awslogs-agent-setup.py version 1.3.8 or later with awscli-cwlogs 1.3.3 or later, you can
import different stream configurations for various components independently of one another by creating
additional configuration files in the /var/awslogs/etc/config/ directory. When the CloudWatch Logs
agent starts, it includes any stream configurations in these additional configuration files. Configuration
properties in the [general] section must be defined in the main configuration file (/var/awslogs/etc/
awslogs.conf) and are ignored in any additional configuration files found in /var/awslogs/etc/config/.
Restart the agent for the changes to take effect:
sudo service awslogs restart
CloudWatch Logs Agent FAQs
What kinds of file rotations are supported?
The following file rotation mechanisms are supported:
1. Renaming existing log files with a numerical suffix, then re-creating the original empty log file.
For example, /var/log/syslog.log is renamed /var/log/syslog.log.1. If /var/log/syslog.log.1 already
exists from a previous rotation, it is renamed /var/log/syslog.log.2.
2. Truncating the original log file in place after creating a copy. For example, /var/log/syslog.log is
copied to /var/log/syslog.log.1 and /var/log/syslog.log is truncated. There might be data loss for
this case, so be careful about using this file rotation mechanism.
3. Creating a new file with a common pattern as the old one. For example, /var/log/
syslog.log.2014-01-01 remains and /var/log/syslog.log.2014-01-02 is created.
The fingerprint (source ID) of the file is calculated by hashing the log stream key and the first line
of file content. To override this behavior, the file_fingerprint_lines option can be used. When file
rotation happens, the new file is supposed to have new content and the old file is not supposed to
have content appended; the agent pushes the new file after it finishes reading the old file.
How can I determine which version of agent am I using?
If you used a setup script to install the CloudWatch Logs agent, you can use /var/awslogs/bin/
awslogs-version.sh to check what version of the agent you are using. It prints out the version
of the agent and its major dependencies. If you used yum to install the CloudWatch Logs agent,
you can use "yum info awslogs" and "yum info aws-cli-plugin-cloudwatch-logs" to check the
version of the CloudWatch Logs agent and plugin.
How are log entries converted to log events?
Log events contain two properties: the timestamp of when the event occurred, and the raw log
message. By default, any line that begins with non-whitespace character closes the previous
log message if there is one, and starts a new log message. To override this behavior, the
multi_line_start_pattern can be used and any line that matches the pattern starts a new
log message. The pattern could be any regex or '{datetime_format}'. For example, if the
first line of every log message contains a timestamp like '2014-01-02T13:13:01Z', then the
multi_line_start_pattern can be set to '\d{4}-\d{2}-\d{2}T\d{2}:\d{2}:\d{2}Z'. To simplify the
25

Amazon CloudWatch Logs User Guide
CloudWatch Logs Agent FAQs
configuration, the ‘{datetime_format}' variable can be used if the datetime_format option is
specified. For the same example, if datetime_format is set to '%Y-%m-%dT%H:%M:%S%z', then
multi_line_start_pattern could be simply '{datetime_format}'.
The current time is used for each log event if the datetime_format isn't provided. If the provided
datetime_format is invalid for a given log message, the timestamp from the last log event with a
successfully parsed timestamp is used. If no previous log events exist, the current time is used. A
warning message is logged when a log event falls back to the current time or time of previous log
event.
Timestamps are used for retrieving log events and generating metrics, so if you specify the wrong
format, log events could become non-retrievable and generate wrong metrics.
How are log events batched?
A batch becomes full and is published when any of the following conditions are met:
1. The buffer_duration amount of time has passed since the first log event was added.
2. Less than batch_size of log events have been accumulated but adding the new log event
exceeds the batch_size.
3. The number of log events has reached batch_count.
4. Log events from the batch don't span more than 24 hours, but adding the new log event
exceeds the 24 hours constraint.
What would cause log entries, log events, or batches to be skipped or truncated?
To follow the constraint of the PutLogEvents operation, the following issues could cause a log
event or batch to be skipped.
Note
The CloudWatch Logs agent writes a warning to its log when data is skipped.
1. If the size of a log event exceeds 256 KB, the log event is skipped completely.
2. If the timestamp of log event is more than 2 hours in future, the log event is skipped.
3. If the timestamp of log event is more than 14 days in past, the log event is skipped.
4. If any log event is older than the retention period of log group, the whole batch is skipped.
5. If the batch of log events in a single PutLogEvents request spans more than 24 hours, the
PutLogEvents operation fails.
Does stopping the agent cause data loss/duplicates?
Not as long as the state file is available and no file rotation has happened since the last run. The
CloudWatch Logs agent can start from where it stopped and continue pushing the log data.
Can I point different log files from the same or different hosts to the same log stream?
Configuring multiple log sources to send data to a single log stream is not supported.
What API calls does the agent make (or what actions should I add to my IAM policy)?
The CloudWatch Logs agent requires the CreateLogGroup, CreateLogStream,
DescribeLogStreams, and PutLogEvents operations. If you're using the latest agent,
DescribeLogStreams is not needed. See the sample IAM policy below.
{
"Version": "2012-10-17",
"Statement": [
{
"Effect": "Allow",
"Action": [
"logs:CreateLogGroup",
"logs:CreateLogStream",
"logs:PutLogEvents",
"logs:DescribeLogStreams"
],
"Resource": [
26
Amazon CloudWatch Logs User Guide
Viewing Log Data
"arn:aws:logs:*:*:*"
]
}
]
}
I don't want the CloudWatch Logs agent to create log groups or log streams automatically. How
can I create and delete them and prevent the agent from recreating them?
In your IAM policy, you can restrict the agent to only the following operations:
DescribeLogStreams, PutLogEvents.
What logs should I look into for troubleshooting?
The agent installation log is at /var/log/awslogs-agent-setup.log and the agent log is at /var/log/
awslogs.log.
Viewing Log Data
You can view and scroll through log data on a stream-by-stream basis as sent to CloudWatch Logs by
the CloudWatch Logs agent. You can specify the time range for the log data you want to view.
To view log data
1. Open the CloudWatch console at https://console.aws.amazon.com/cloudwatch/.
2. If necessary, change the region. From the navigation bar, select the region that meets your
needs. For more information, see Regions and Endpoints in the Amazon Web Services General
Reference.
3. In the navigation pane, choose Logs.
4. In the contents pane, for Log Groups, select the log group for which to view data.
5. In the Log Groups > Streams for pane, for Log Streams, choose the log stream name to view
the log data.
6. To change how the log data is displayed, do one of the following:
• To expand all log events, above the list of log entries, choose View options, Expand all.
• To expand all log events and view them as plain text, above the list of log entries, choose View
options, Expand all, Switch to text view.
• To filter the log events, for Filter events, enter the desired search filter. For more information
about how to filter log data, see Searching and Filtering Log Data (p. 29).
• To view log data for a specified date and time range, above the list of log data, choose custom,
and then choose either Absolute to specify a date and time range or Relative to specify log
data for a given number of minutes, hours, days, or weeks.
Note
You can switch between the Local timezone and UTC time.
Changing Log Retention
By default, log data is stored indefinitely. However, you can configure how long you want to store log
data in a log group. Any data older than the current retention setting is automatically deleted. You can
change the log retention for each log group at any time.
To change the logs retention setting
1. Open the CloudWatch console at https://console.aws.amazon.com/cloudwatch/.
27

Amazon CloudWatch Logs User Guide
Changing Log Retention
2. If necessary, change the region. From the navigation bar, select the region that meets your
needs. For more information, see Regions and Endpoints in the Amazon Web Services General
Reference.
3. In the navigation pane, choose Logs.
4. In the contents pane, for Expire Events After, select the retention setting to change.
5. In the Edit Retention dialog box, for New Retention, select the desired log retention, and then
choose OK.
28

Amazon CloudWatch Logs User Guide
Filter and Pattern Syntax
Searching and Filtering Log Data
After the CloudWatch Logs agent begins publishing log data to Amazon CloudWatch, you can begin
searching and filtering the log data by creating one or more metric filters. Metric filters define the terms
and patterns to look for in log data as it is sent to CloudWatch Logs. CloudWatch Logs uses these
metric filters to turn log data into CloudWatch metrics that you can graph or set an alarm on.
Note
Filters do not retroactively filter data. Filters only publish the metric data points for events that
happen after the filter was created. Filtered results return the first 50 lines, which will not be
displayed if the timestamp on the filtered results is earlier than the metric creation time.
Each metric filter is made up of the following key elements:
filter pattern
A symbolic description of how CloudWatch Logs should interpret the data in each log event. For
example, a log entry may contain timestamps, IP addresses, strings, and so on. You use the
pattern to specify what to look for in the log file.
metric name
The name of the CloudWatch metric to which the monitored log information should be published.
For example, you may publish to a metric called ErrorCount.
metric namespace
The destination namespace of the new CloudWatch metric.
metric value
What to publish to the metric. For example, if you're counting the occurrences of a particular term
like "Error", the value will be "1" for each occurrence. If you're counting the bytes transferred the
published value will be the value in the log event.
Topics
•Filter and Pattern Syntax (p. 29)
•Creating Metric Filters (p. 35)
•Listing Metric Filters (p. 42)
•Deleting a Metric Filter (p. 43)
•Search Log Data Using Filter Patterns (p. 43)
Filter and Pattern Syntax
You use metric filters to search for and match terms, phrases, or values in your log events. When a
metric filter finds one of the terms, phrases, or values in your log events, it counts each occurrence in a
29

Amazon CloudWatch Logs User Guide
Matching Terms in Log Events
CloudWatch metric. For example, you can create a metric filter to search for and count the occurrence
of the word ERROR in your log events. Metric filters can also extract values from space-delimited log
events, such as the latency of web requests. You can also use conditional operators and wildcards
to create exact matches. Before you create a metric filter, you can test your search patterns in the
CloudWatch console. The following sections explain the metric filter syntax in more detail.
Matching Terms in Log Events
To search for a term such as ERROR in your log events, you would use ERROR as your metric filter
pattern. You can specify multiple terms in a metric filter pattern, but all terms must appear in your log
events for there to be a match. For example, the filter pattern ERROR would match the following log
event messages:
• [ERROR] A fatal exception has occurred
• Exiting with ERRORCODE: -1
The filter pattern ERROR Exception would match the following log event messages:
• [ERROR] Caught IllegalArgumentException
• [ERROR] Unhandled Exception
The filter pattern "Failed to process the request" would match the following log event messages:
• [WARN] Failed to process the request
• [ERROR] Unable to continue: Failed to process the request
Note
Metric filter terms that include characters other than alphanumeric or underscore must be
placed inside double quotes (""). Metric filters are case sensitive.
Matching Terms in JSON Log Events
You can extract values from JSON log events. To extract values from JSON log events, you need to
create a string-based metric filter. Strings containing scientific notation are not supported. The items in
the JSON log event data must exactly match the metric filter. You might want to create metric filters in
JSON log events to indicate whenever:
• A certain event occurs. For example eventName is "UpdateTrail".
• The IP is outside a known subnet. For example, sourceIPAddress is not in some known subnet
range.
• A combination of two or more other conditions are true. For example, the eventName is
"UpdateTrail" and the recipientAccountId is 123456789012.
Using Metric Filters to Extract Values from
Space-Delimited Log Events
You can use metric filters to extract values from space-delimited log events. The characters between a
pair of square brackets [] or two double quotes ("") are treated as a single field. For example:
127.0.0.1 - frank [10/Oct/2000:13:25:15 -0700] "GET /apache_pb.gif HTTP/1.0"
200 1534
30
Amazon CloudWatch Logs User Guide
Using Metric Filters to Extract Values
from Space-Delimited Log Events
127.0.0.1 - frank [10/Oct/2000:13:35:22 -0700] "GET /apache_pb.gif HTTP/1.0"
500 5324
127.0.0.1 - frank [10/Oct/2000:13:50:35 -0700] "GET /apache_pb.gif HTTP/1.0"
200 4355
To specify a metric filter pattern that parses space-delimited events, the metric filter pattern has to
specify the fields with a name, separated by commas, with the entire pattern enclosed in square
brackets. For example: [ip, user, username, timestamp, request, status_code, bytes].
In cases where you don't know the number of fields, you can use shorthand notification using an
ellipsis (…). For example:
[..., status_code, bytes]
[ip, user, ..., status_code, bytes]
[ip, user, ...]
You can also add conditions to your fields so that only log events that match all conditions would match
the filters. For example:
[ip, user, username, timestamp, request, status_code, bytes > 1000]
[ip, user, username, timestamp, request, status_code = 200, bytes]
[ip, user, username, timestamp, request, status_code = 4*, bytes]
[ip, user, username, timestamp, request = *html*, status_code = 4*, bytes]
CloudWatch Logs supports both string and numeric conditional fields. For string fields, you can use =
or != operators with an asterisk (*).
For numeric fields, you can use the >, <, >=, <=, =, and != operators.
If you are using a space-delimited filter, extracted fields map to the names of the space-delimited fields
(as expressed in the filter) to the value of each of these fields. If you are not using a space-delimited
filter, this will be empty.
Example Filter:
[..., request=*.html*, status_code=4*,]
Example log event for the filter:
127.0.0.1 - frank [10/Oct/2000:13:25:15 -0700] \"GET /index.html HTTP/1.0\"
404 1534
Extracted fields for the log event and filter pattern:
{
"$status_code": "400",
"$request": "GET /products/index.html HTTP/1.0",
"$7": "1534",
"$4": "10/Oct/2000:13:25:15 -0700",
"$3": "frank",
"$2": "-",
"$1": "127.0.0.1"
}
31
Amazon CloudWatch Logs User Guide
Using Metric Filters to Extract
Values from JSON Log Events
Using Metric Filters to Extract Values from JSON
Log Events
You can use metric filters to extract values from JSON log events. The metric filter syntax for JSON log
events uses the following format:
{ SELECTOR EQUALITY_OPERATOR STRING }
The metric filter must be enclosed in curly braces { }, to indicate this is a JSON expression. The metric
filter is contains the following parts:
SELECTOR
Specifies what JSON property to check. Property selectors always start with dollar sign ($), which
signifies the root of the JSON. Property selectors are alphanumeric strings that also support '-' and
'_' characters. Array elements are denoted with [NUMBER] syntax, and must follow a property.
Examples are: $.eventId, $.users[0], $.users[0].id, $.requestParameters.instanceId.
EQUALITY_OPERATOR
Can be either = or !=.
STRING
A string with or without quotes. You can use the asterisk '*' wildcard character to match any text at,
before, or after a search term. For example, *Event will match PutEvent and GetEvent. Event*
will match EventId and EventName. Ev*ent will only match the actual string Ev*ent. Strings that
consist entirely of alphanumeric characters do not need to be quoted. Strings that have unicode
and other characters such as ‘@,‘ ‘$,' ‘\,' etc. must be enclosed in double quotes to be valid.
Metric Filter Examples
{
"eventType": "UpdateTrail",
"sourceIPAddress": "111.111.111.111",
"arrayKey": [
"value",
"another value"
],
"objectList": [
{
"name": "a",
"id": 1
},
{
"name": "b",
"id": 2
}
],
"SomeObject": null,
"ThisFlag": true
}
The above JSON example would be matched by any of these filters:
{ $.eventType = "UpdateTrail" }
Filter on the event type being UpdateTrail.
32

Amazon CloudWatch Logs User Guide
Using Metric Filters to Extract
Values from JSON Log Events
{ $.sourceIPAddress != 123.123.* }
Filter on the IP address being outside the subnet 123.123 prefix.
{ $.arrayKey[0] = "value" }
Filter on the first entry in arrayKey being "value". If arrayKey is not an array this will be false.
{ $.objectList[1].id = 2 }
Filter on the second entry in objectList having a property called id = 2. If objectList is not an array this
will be false. If the items in objectList are not objects or do not have an id property, this will be false.
{ $.SomeObject IS NULL }
Filter on SomeObject being set to null. This will only be true is the specified object is set to null.
{ $.SomeOtherObject NOT EXISTS }
Filter on SomeOtherObject being non-existent. This will only be true if specified object does not exist in
log data.
{ $.ThisFlag IS TRUE }
Filters on ThisFlag being TRUE. This also works for boolean filters which check for FALSE value.
Compound Conditions
You can combine multiple conditions into a compound expression using OR (||) and AND (&&).
Parenthesis are allowed and the syntax follows standard order of operations () > && > ||.
{
"user": {
"id": 1,
"email": "John.Stiles@example.com"
},
"users": [
{
"id": 2,
"email": "John.Doe@example.com"
},
{
"id": 3,
"email": "Jane.Doe@example.com"
}
],
"actions": [
"GET",
"PUT",
"DELETE"
],
"coordinates": [
33
Amazon CloudWatch Logs User Guide
Using Metric Filters to Extract
Values from JSON Log Events
[0, 1, 2],
[4, 5, 6],
[7, 8, 9]
]
}
Examples
{ ($.user.id = 1) && ($.users[0].email = "John.Doe@example.com") }
Matches the JSON above.
{ ($.user.id = 2 && $.users[0].email = "nonmatch") || $.actions[2] = "GET" }
Doesn't match the JSON above.
{ $.user.email = "John.Stiles@example.com" || $.coordinates[0][1] = nonmatch
&& $.actions[2] = nomatch }
Matches the JSON above.
{ ($.user.email = "John.Stiles@example.com" || $.coordinates[0][1] =
nonmatch) && $.actions[2] = nomatch }
Doesn't match the JSON above.
Special Considerations
The SELECTOR must point to a value node (string or number) in the JSON. If it points to an array or
object, the filter will not be applied because the log format doesn't match the filter. For example, both
{$.users = 1} and {$.users != 1} will fail to match a log event where users is an array:
{
"users": [1, 2, 3]
}
Numeric Comparisons
The metric filter syntax supports precise matching on numeric comparisons. The following numeric
comparisons are supported: <, >, >=, <=, =, !=
Numeric filters have a syntax of
{ SELECTOR NUMERIC_OPERATOR NUMBER }
The metric filter must be enclosed in curly braces { }, to indicate this is a JSON expression. The metric
filter is contains the following parts:
SELECTOR
Specifies what JSON property to check. Property selectors always start with dollar sign ($), which
signifies the root of the JSON. Property selectors are alphanumeric strings that also support '-' and
34
Amazon CloudWatch Logs User Guide
Creating Metric Filters
'_' characters. Array elements are denoted with [NUMBER] syntax, and must follow a property.
Examples are: $.latency, $.numbers[0], $.errorCode, $.processes[4].averageRuntime.
NUMERIC_OPERATOR
Can be one of the following: =, !=, <, >, <=, or >=.
NUMBER
An integer with an optional + or - sign, a decimal with an optional + or - sign, or a number in
scientific notation, which is an integer or a decimal with an optional + or - sign, followed by 'e',
followed by an integer with an optional + or - sign.
Examples:
{ $.latency >= 500 }
{ $.numbers[0] < 10e3 }
{ $.numbers[0] < 10e-3 }
{ $.processes[4].averageRuntime <= 55.5 }
{ $.errorCode = 400 }
{ $.errorCode != 500 }
{ $.latency > +1000 }
Metric Filter Value Extraction
You can publish numeric values found in JSON events as metric values to CloudWatch. The following
procedure shows how to publish a metric with the latency found in the JSON request metricFilter:
{ $.latency = * } metricValue: $.latency.
To publish a metric with the latency in a JSON request
1. Open the CloudWatch console at https://console.aws.amazon.com/cloudwatch/.
2. If necessary, change the region. From the navigation bar, select the region that meets your
needs. For more information, see Regions and Endpoints in the Amazon Web Services General
Reference.
3. In the navigation pane, click Logs.
4. In the contents pane, select a log group, and then click Create Metric Filter.
5. On the Define Logs Metric Filter screen, in the Filter Pattern field enter { $.latency = * },
and then click Assign Metric.
6. On the Create Metric Filter and Assign a Metric screen, click Show advanced metric settings.
7. In the Metric Name field, enter myMetric.
8. In the Metric Value field, enter $.latency, and then click Create Filter.
The following log event would publish a value of 50 to the metric myMetric following filter creation.
{
"latency": 50,
"requestType": "GET"
}
Creating Metric Filters
The following examples show how you can create metric filters.
Topics
35
Amazon CloudWatch Logs User Guide
Example: Counting Log Events
•Example: Counting Log Events (p. 36)
•Example: Count occurrences of the word "Error" (p. 37)
•Example: Counting HTTP 404 Responses (p. 38)
•Example: Find and Count 400-level into 4xx Metric (p. 40)
•Example: Extract Bytes Transferred from an Apache Log (p. 41)
Example: Counting Log Events
The simplest type of log event monitoring is to count the number of log events that occur. You might
want to do this to keep a count of all events, to create a "heartbeat" style monitor or just to practice
creating metric filters.
In the following CLI example, a metric filter called MyAppAccessCount is applied to the log group
MyApp/access.log to create the metric EventCount in the CloudWatch namespace YourNamespace.
The filter is configured to match any log event content and to increment the metric by "1".
To create a metric filter using the CloudWatch console
1. Open the CloudWatch console at https://console.aws.amazon.com/cloudwatch/.
2. If necessary, change the region. From the navigation bar, select the region that meets your
needs. For more information, see Regions and Endpoints in the Amazon Web Services General
Reference.
3. In the navigation pane, click Logs.
4. In the contents pane, select a log group, and then click Create Metric Filter.
5. On the Define Logs Metric Filter screen, leave the Filter Pattern field blank.
6. Click Assign Metric, and then on the Create Metric Filter and Assign a Metric screen, in the
Filter Name field, enter MyAppAccessCount.
7. Under Metric Details, in the Metric Namespace field, enter YourNameSpace.
8. In the Metric Name field, enter MyAppAccessEventCount, and then click Create Filter.
To create a metric filter using the AWS CLI
• At a command prompt, remove the backslashes (\) and type this all on one line:
% aws logs put-metric-filter \
--log-group-name MyApp/access.log \
--filter-name MyAppAccessCount \
--filter-pattern "" \
--metric-transformations \
metricName=EventCount,metricNamespace=YourNamespace,metricValue=1
You can test this new policy by posting any event data. You should see two data points published to
the metric EventCount.
To post event data using the AWS CLI
• At a command prompt, remove the backslashes (\) and type this all on one line:
% aws logs put-log-events \
--log-group-name MyApp/access.log --log-stream-name TestStream1 \
--log-events \
36
Amazon CloudWatch Logs User Guide
Example: Count occurrences of the word "Error"
timestamp=1394793518000,message="Test event 1" \
timestamp=1394793518000,message="Test event 2"
timestamp=1394793528000,message="This message also contains an Error"
Example: Count occurrences of the word "Error"
Log events frequently include important messages that you want to count, maybe about the success or
failure of operations. For example, an error may occur and be recorded to a log file if a given operation
fails. You may want to monitor these entries to understand the trend of your errors.
In the example below, a metric filter is created to monitor for the term Error. The policy has been
created and added to the log group MyApp/message.log. CloudWatch Logs publishes a data point to
the CloudWatch custom metric ErrorCount in the MyApp/message.log namespace with a value of "1"
for every event containing Error. If no event contains the word Error, then no data points are published.
When graphing this data in the CloudWatch console, be sure to use the sum statistic.
To create a metric filter using the CloudWatch console
1. Open the CloudWatch console at https://console.aws.amazon.com/cloudwatch/.
2. If necessary, change the region. From the navigation bar, select the region that meets your
needs. For more information, see Regions and Endpoints in the Amazon Web Services General
Reference.
3. In the navigation pane, click Logs.
4. In the contents pane, select a log group, and then click Create Metric Filter.
5. On the Define Logs Metric Filter screen, in the Filter Pattern field, enter Error.
Note
All entries in the Filter Pattern field are case-sensitive.
6. To test your filter pattern, in the Select Log Data to Test list, select the log group you want to test
the metric filter against, and then click Test Pattern.
7. Under Results, CloudWatch Logs displays a message showing how many occurrences of the filter
pattern were found in the log file.
Note
To see detailed results, click Show test results.
8. Click Assign Metric, and then on the Create Metric Filter and Assign a Metric screen, in the
Filter Name field, enter MyAppErrorCount.
9. Under Metric Details, in the Metric Namespace field, enter YourNameSpace.
10. In the Metric Name field, enter ErrorCount, and then click Create Filter.
To create a metric filter using the AWS CLI
• At a command prompt, type:
% aws logs put-metric-filter \
--log-group-name MyApp/message.log \
--filter-name MyAppErrorCount \
--filter-pattern 'Error' \
--metric-transformations \
metricName=EventCount,metricNamespace=YourNamespace,metricValue=1
You can test this new policy by posting events containing the word "Error" in the message.
37
Amazon CloudWatch Logs User Guide
Example: Counting HTTP 404 Responses
To post events using the AWS CLI
• At a command prompt, remove the backslashes (\) and type this all on one line:
% aws logs put-log-events \
--log-group-name MyApp/access.log --log-stream-name TestStream1 \
--log-events \
timestamp=1394793518000,message="This message contains an Error" \
timestamp=1394793528000,message="This message also contains an Error"
Note
Patterns are case-sensitive.
Example: Counting HTTP 404 Responses
Using CloudWatch Logs, you can monitor how many times your Apache servers return a HTTP 404
response, which is the response code for page not found. You might want to monitor this to understand
how often your site visitors do not find the resource they are looking for. Assume that your log records
are structured to include the following information for each log event (site visit):
• Requestor IP Address
• RFC 1413 Identity
• Username
• Timestamp
• Request method with requested resource and protocol
• HTTP response code to request
• Bytes transferred in request
An example of this might look like the following:
127.0.0.1 - frank [10/Oct/2000:13:55:36 -0700] "GET /apache_pb.gif HTTP/1.0"
404 2326
You could specify a rule which attempts to match events of that structure for HTTP 404 errors, as
shown in the following example:
To create a metric filter using the CloudWatch console
1. Open the CloudWatch console at https://console.aws.amazon.com/cloudwatch/.
2. If necessary, change the region. From the navigation bar, select the region that meets your
needs. For more information, see Regions and Endpoints in the Amazon Web Services General
Reference.
3. In the navigation pane, click Logs.
4. In the contents pane, select a log group, and then click Create Metric Filter.
5. On the Define Logs Metric Filter screen, in the Filter Pattern field, enter [IP, UserInfo,
User, Timestamp, RequestInfo, StatusCode=404, Bytes].
6. To test your filter pattern, in the Select Log Data to Test list, select the log group you want to test
the metric filter against, and then click Test Pattern.
7. Under Results, CloudWatch Logs displays a message showing how many occurrences of the filter
pattern were found in the log file.
38
Amazon CloudWatch Logs User Guide
Example: Counting HTTP 404 Responses
Note
To see detailed results, click Show test results.
8. Click Assign Metric, and then on the Create Metric Filter and Assign a Metric screen, in the
Filter Name field, enter HTTP404Errors.
9. Under Metric Details, in the Metric Namespace field, enter YourNameSpace.
10. In the Metric Name field, enter ApacheNotFoundErrorCount, and then click Create Filter.
To create a metric filter using the AWS CLI
• At a command prompt, remove the backslashes (\) and type this all on one line:
% aws logs put-metric-filter \
--log-group-name MyApp/access.log \
--filter-name HTTP404Errors \
--filter-pattern '[ip, id, user, timestamp, request, status_code=404,
size]' \
--metric-transformations \
metricName=ApacheNotFoundErrorCount,metricNamespace=YourNamespace,metricValue=1
In this example, literal characters such as the left and right square brackets, double quotes and
character string 404 were used. The pattern needs to match with the entire log event message for the
log event to be considered for monitoring.
You can verify the creation of the metric filter by using the describe-monitoring-policies command.
You should see output that looks like this:
% aws logs describe-metric-filters --log-group-name MyApp/access.log
{
"metricFilters": [
{
"filterName": "HTTP404Errors",
"metricTransformations": [
{
"metricValue": "1",
"metricNamespace": "YourNamespace",
"metricName": "ApacheNotFoundErrorCount"
}
],
"creationTime": 1399277571078,
"filterPattern": "[ip, id, user, timestamp, request,
status_code=404, size]"
}
]
}
Now you can post a few events manually:
% aws logs put-log-events \
--log-group-name MyApp/access.log --log-stream-name hostname \
--log-events \
timestamp=1394793518000,message="127.0.0.1 - bob [10/Oct/2000:13:55:36 -0700]
\"GET /apache_pb.gif HTTP/1.0\" 404 2326" \
39
Amazon CloudWatch Logs User Guide
Example: Find and Count 400-level into 4xx Metric
timestamp=1394793528000,message="127.0.0.1 - bob [10/Oct/2000:13:55:36 -0700]
\"GET /apache_pb2.gif HTTP/1.0\" 200 2326"
Soon after putting these sample log events, you can retrieve the metric named in the CloudWatch
console as ApacheNotFoundErrorCount.
Example: Find and Count 400-level into 4xx
Metric
As in the previous example, you might want to monitor your web service access logs and monitor the
HTTP response code levels. For example, you might want to monitor all of the HTTP 400-level errors.
However, you might not want to specify a new metric filter for every return code.
The following example demonstrates how to create a metric that includes all 400-level HTTP code
responses from an access log using the Apache access log format from the Example: Counting HTTP
404 Responses (p. 38) example.
To create a metric filter using the CloudWatch console
1. Open the CloudWatch console at https://console.aws.amazon.com/cloudwatch/.
2. If necessary, change the region. From the navigation bar, select the region that meets your
needs. For more information, see Regions and Endpoints in the Amazon Web Services General
Reference.
3. In the navigation pane, click Logs.
4. In the contents pane, select a log group, and then click Create Metric Filter.
5. On the Define Logs Metric Filter screen, in the Filter Pattern field, enter [ip, id, user,
timestamp, request, status_code=4*, size].
6. To test your filter pattern, in the Select Log Data to Test list, select the log group you want to test
the metric filter against, and then click Test Pattern.
7. Under Results, CloudWatch Logs displays a message showing how many occurrences of the filter
pattern were found in the log file.
Note
To see detailed results, click Show test results.
8. Click Assign Metric, and then on the Create Metric Filter and Assign a Metric screen, in the
Filter Name field, enter HTTP4xxErrors.
9. Under Metric Details, in the Metric Namespace field, enter YourNameSpace.
10. In the Metric Name field, enter HTTP4xxErrors, and then click Create Filter.
To create a metric filter using the AWS CLI
• At a command prompt, remove the backslashes (\) and type this all on one line:
% aws logs put-metric-filter \
--log-group-name MyApp/access.log \
--filter-name HTTP4xxErrors \
--filter-pattern '[ip, id, user, timestamp, request, status_code=4*,
size]' \
--metric-transformations \
metricName=HTTP4xxErrors,metricNamespace=YourNamespace,metricValue=1
40
Amazon CloudWatch Logs User Guide
Example: Extract Bytes
Transferred from an Apache Log
You can use the following data in put-event calls to test this rule. If you did not remove the monitoring
rule in the previous example, you will generate two different metrics.
127.0.0.1 - - [24/Sep/2013:11:49:52 -0700] "GET /index.html HTTP/1.1" 404 287
127.0.0.1 - - [24/Sep/2013:11:49:52 -0700] "GET /index.html HTTP/1.1" 404 287
127.0.0.1 - - [24/Sep/2013:11:50:51 -0700] "GET /~test/ HTTP/1.1" 200 3
127.0.0.1 - - [24/Sep/2013:11:50:51 -0700] "GET /favicon.ico HTTP/1.1" 404
308
127.0.0.1 - - [24/Sep/2013:11:50:51 -0700] "GET /favicon.ico HTTP/1.1" 404
308
127.0.0.1 - - [24/Sep/2013:11:51:34 -0700] "GET /~test/index.html HTTP/1.1"
200 3
Example: Extract Bytes Transferred from an
Apache Log
Sometimes, instead of counting, it is helpful to use values within individual log events for metric values.
This example shows how you can create an extraction rule to create a metric that measures the bytes
transferred by an Apache webserver.
This extraction rule matches the seven fields of the log event. The metric value is the value of the
seventh matched token. You can see the reference to the token as "$7" in the metricValue field of
the extraction rule.
To create a metric filter using the CloudWatch console
1. Open the CloudWatch console at https://console.aws.amazon.com/cloudwatch/.
2. If necessary, change the region. From the navigation bar, select the region that meets your
needs. For more information, see Regions and Endpoints in the Amazon Web Services General
Reference.
3. In the navigation pane, click Logs.
4. In the contents pane, select a log group, and then click Create Metric Filter.
5. On the Define Logs Metric Filter screen, in the Filter Pattern field, enter [ip, id, user,
timestamp, request, status_code, size].
6. To test your filter pattern, in the Select Log Data to Test list, select the log group you want to test
the metric filter against, and then click Test Pattern.
7. Under Results, CloudWatch Logs displays a message showing how many occurrences of the filter
pattern were found in the log file.
Note
To see detailed results, click Show test results.
8. Click Assign Metric, and then on the Create Metric Filter and Assign a Metric screen, in the
Filter Name field, enter size.
9. Under Metric Details, in the Metric Namespace field, enter YourNameSpace.
10. In the Metric Name field, enter BytesTransferred
11. In the Metric Value field, enter $size, and then click Create Filter.
Note
If the Metric Value field isn't visible, click Show advanced metric settings.
To create a metric filter using the AWS CLI
• At a command prompt, remove the backslashes (\) and type this all on one line:
41
Amazon CloudWatch Logs User Guide
Listing Metric Filters
% aws logs put-metric-filter \
--log-group-name MyApp/access.log \
--filter-name BytesTransferred \
--filter-pattern '[ip, id, user, timestamp, request, status_code=4*,
size]' \
--metric-transformations \
metricName=BytesTransferred,metricNamespace=YourNamespace,metricValue=
$size
You can use the following data in put-log-event calls to test this rule. This generates two different
metrics if you did not remove monitoring rule in the previous example.
127.0.0.1 - - [24/Sep/2013:11:49:52 -0700] "GET /index.html HTTP/1.1" 404 287
127.0.0.1 - - [24/Sep/2013:11:49:52 -0700] "GET /index.html HTTP/1.1" 404 287
127.0.0.1 - - [24/Sep/2013:11:50:51 -0700] "GET /~test/ HTTP/1.1" 200 3
127.0.0.1 - - [24/Sep/2013:11:50:51 -0700] "GET /favicon.ico HTTP/1.1" 404
308
127.0.0.1 - - [24/Sep/2013:11:50:51 -0700] "GET /favicon.ico HTTP/1.1" 404
308
127.0.0.1 - - [24/Sep/2013:11:51:34 -0700] "GET /~test/index.html HTTP/1.1"
200 3
Listing Metric Filters
You can list all metric filters in a log group.
To list metric filters using the CloudWatch console
1. Open the CloudWatch console at https://console.aws.amazon.com/cloudwatch/.
2. If necessary, change the region. From the navigation bar, select the region that meets your
needs. For more information, see Regions and Endpoints in the Amazon Web Services General
Reference.
3. In the navigation pane, click Logs.
4. In the contents pane, in the list of log groups, in the Metric Filters column, click the number of
filters.
The Log Groups > Filters for screen lists all metric filters associated with the log group.
To list metric filters using the AWS CLI
• At a command prompt, type:
% aws logs describe-metric-filters --log-group-name MyApp/access.log
{
"metricFilters": [
{
"filterName": "HTTP404Errors",
"metricTransformations": [
{
42
Amazon CloudWatch Logs User Guide
Deleting a Metric Filter
"metricValue": "1",
"metricNamespace": "YourNamespace",
"metricName": "ApacheNotFoundErrorCount"
}
],
"creationTime": 1399277571078,
"filterPattern": "[ip, id, user, timestamp, request,
status_code=404, size]"
}
]
}
Deleting a Metric Filter
A policy is identified by its name and the log group it belongs to.
To delete a metric filter using the CloudWatch console
1. Open the CloudWatch console at https://console.aws.amazon.com/cloudwatch/.
2. If necessary, change the region. From the navigation bar, select the region that meets your
needs. For more information, see Regions and Endpoints in the Amazon Web Services General
Reference.
3. In the navigation pane, click Logs.
4. In the contents pane, in the Metric Filter column, click the metric filter you want to delete.
5. On the Logs Metric Filters screen, in the metric filter, click Delete Filter.
6. In the Delete Metric filter dialog box, click Yes, Delete.
To delete a metric filter using the AWS CLI
• At a command prompt, remove the backslashes (\) and type this all on one line:
% aws logs delete-metric-filter --log-group-name MyApp/access.log \
--filter-name YourFilterName
Search Log Data Using Filter Patterns
You can search your log data using the Filter and Pattern Syntax (p. 29) in the Amazon CloudWatch
console, with the CloudWatch Logs commands in the AWS CLI, or with the AWS SDK. You can
search all the log streams within a log group, or search a subset of this data. When each search runs,
it returns up to the first page of data found and a NextToken to retrieve the next page of data or to
continue searching. If no results are returned, you can continue searching.
You can set the time range you want to query to limit the scope of your search. You could start with
a larger range to see where the log lines you are interested in fall, and then shorten the time range to
scope the view to logs in the time range that interest you.
To search your logs using the Amazon CloudWatch console
1. Open the CloudWatch console at https://console.aws.amazon.com/cloudwatch/.
2. If necessary, change the region. From the navigation bar, select the region where your log data is
stored. For more information, see Regions and Endpoints in the Amazon Web Services General
Reference.
43
Amazon CloudWatch Logs User Guide
Search Log Data Using Filter Patterns
3. In the navigation pane, click Logs.
4. In the Log Groups list, click the name of the log group containing the log stream you want to
search.
5. In the Log Streams list, click the name of the log stream you want to search.
6. In the Filter field, enter the metric filter syntax you want to use and then press Enter.
For more information about metric filter syntax and how to search queries, see Filter and Pattern
Syntax (p. 29).
To search all log entries after a given start time using the Amazon CloudWatch console
1. Open the CloudWatch console at https://console.aws.amazon.com/cloudwatch/.
2. If necessary, change the region. From the navigation bar, select the region where your log data is
stored. For more information, see Regions and Endpoints in the Amazon Web Services General
Reference.
3. In the navigation pane, click Logs.
4. In the Log Groups list, click the name of the log group containing the log stream you want to
search.
5. Above the Log Streams list, click Search Events.
6. In the Filter field, enter the metric filter syntax you want to use, select the date and time range
using the date and time fields, and then press Enter.
For more information about metric filter syntax and how to search queries, see Filter and Pattern
Syntax (p. 29).
To search all log entries over a given time range using the AWS CLI
1. To update the AWS CLI with the latest Amazon CloudWatch commands, at a command prompt,
remove the backslashes (\) and type this all on one line:
pip install awscli-cwlogs --upgrade \
--extra-index-url=http://aws-cloudwatch.s3-website-us-
east-1.amazonaws.com/ \
--trusted-host aws-cloudwatch.s3-website-us-east-1.amazonaws.com
aws configure set plugins.cwlogs cwlogs
Note
If you're using pip version 7.0.0 or later, add the --trusted-host parameter to the above
command to install the CloudWatch Logs update to the AWS CLI.
After the installation is complete, continue to step 2.
2. At a command prompt, type:
aws logs filter-log-events --log-group-name <GROUP> [--log-stream-
names <LIST_OF_STREAMS_TO_SEARCH>] [--start-time <UTC_TIMESTAMP>] [--end-
time <UTC_TIMESTAMP>] [--filter-pattern <VALID_METRIC_FILTER_PATTERN>]
The aws logs filter-log-events command can interleave results from different streams
into one set of results. The aws logs filter-log-events command uses the following
parameters:
--log-group-name
Required. Specifies the name of the log group you want to search.
44
Amazon CloudWatch Logs User Guide
Troubleshooting
--log-stream-names
Specifies the log streams to search within the group. By default, all the streams in the group
are searched. To specify more than one log stream, enter each within quotation marks. For
example: "streamName1" "streamName2" "streamName3"
--filter-pattern
The filter pattern to filter for.
--interleaved
Specifies whether log events from all of the streams searched should be interleaved in the
search results.
--start-time
Optional. Specifies the start time for log events you want to search, expressed as the number
of milliseconds since Jan 1, 1970 00:00:00 UTC. If provided, events with a timestamp prior to
this time are not returned.
--end-time
Optional. Specifies the end time for log events that you want to search, expressed as the
number of milliseconds since Jan 1, 1970 00:00:00 UTC. If provided, events with a timestamp
prior to this time are not returned.
--output-format
Optional. Specifies the output format for search results. The default is {logStreamName}
{timestamp} {message}.
To execute a FilterLogEvents request using the AWS CLI
1. At a command prompt, type:
aws logs filter-log-events --log-group-name <GROUP> [--log-stream-
names <LIST_OF_STREAMS_TO_SEARCH>] [--nextToken <NEXT_TOKEN>] [--
start-time <UTC_TIMESTAMP>] [--end-time <UTC_TIMESTAMP>] [--filter-
pattern <VALID_METRIC_FILTER_PATTERN>]
In the above example, --log-group-name <GROUP> is required.
2. To limit search results to those that match the filter pattern you specify, use the --filter-
pattern <VALID_METRIC_FILTER_PATTERN>.
3. To limit your search to a handful of log streams, use the --log-stream-names
<LIST_OF_STREAMS_TO_SEARCH> parameter to list the log stream names to search within the
specified log group.
Troubleshooting
Search takes too long to complete
If you have a lot of log data, searches might take a long time to complete. To speed up a search, you
can do the following:
• Limit the search to just the log streams you are interested it. For example, if your log group has 1000
log streams, but you just want to see three log streams that you know are relevant, you can limit your
search to only those log streams within the log group.
• Use a shorter, more granular time range, which reduces the amount of data to be searched and
speeds up the query.
45

Amazon CloudWatch Logs User Guide
Using Subscription Filters
Real-time Processing of Log Data
with Subscriptions
You can use subscriptions to get access to a real-time feed of log events from CloudWatch Logs and
have it delivered to other services such as an Amazon Kinesis stream or AWS Lambda for custom
processing, analysis, or loading to other systems. To begin subscribing to log events you will need to
create the receiving source, such as an Amazon Kinesis stream, where the events will be delivered.
A subscription filter defines the filter pattern to use for filtering which log events get delivered to your
AWS resource, as well as information about where to send matching log events to. Each subscription
filter is made up of the following key elements:
log group name
The log group to associate the subscription filter with. All log events uploaded to this log group
would be subject to the subscription filter and would be delivered to the chosen Amazon Kinesis
stream if the filter pattern matches with the log events.
filter pattern
A symbolic description of how CloudWatch Logs should interpret the data in each log event, along
with filtering expressions that restrict what gets delivered to the destination AWS resource. For
more information about the filter pattern syntax, see Filter and Pattern Syntax (p. 29).
destination arn
The Amazon Resource Name (ARN) of the Amazon Kinesis stream or Lambda function you want
to use as the destination of the subscription feed.
role arn
An IAM role that grants CloudWatch Logs the necessary permissions to put data into the chosen
Amazon Kinesis stream. This role is not needed for Lambda destinations because CloudWatch
Logs can get the necessary permissions from access control settings on the Lambda function
itself.
Using Subscription Filters
This section provides the following examples for using subscription filters with Amazon Kinesis,
Lambda, and Firehose.
Note
Currently, only one subscription filter is supported per log group.
Contents
46
Amazon CloudWatch Logs User Guide
Example 1: Amazon Kinesis
•Example 1: Amazon Kinesis (p. 47)
•Example 2: AWS Lambda (p. 50)
•Example 3: Amazon Kinesis Firehose (p. 53)
Example 1: Amazon Kinesis
In the following example, a subscription filter gets associated with a log group containing AWS
CloudTrail events to have every logged activity made by "Root" AWS credentials delivered to an
Amazon Kinesis stream called "RootAccess." For more information about how to send AWS CloudTrail
events to CloudWatch Logs, see Sending CloudTrail Events to CloudWatch Logs in the AWS
CloudTrail User Guide.
1. Create a destination Amazon Kinesis stream. At a command prompt, type:
aws kinesis create-stream --stream-name "RootAccess" --shard-count 1
2. Wait until the Amazon Kinesis stream becomes Active. You can use the Amazon Kinesis describe-
stream command to check StreamDescription.StreamStatus property. In addition, take note of
the StreamDescription.StreamARN value as that will be passed to CloudWatch Logs later:
aws kinesis describe-stream --stream-name "RootAccess"
{
"StreamDescription": {
"StreamStatus": "ACTIVE",
"StreamName": "RootAccess",
"StreamARN": "arn:aws:kinesis:us-east-1:123456789012:stream/
RootAccess",
"Shards": [
{
"ShardId": "shardId-000000000000",
"HashKeyRange": {
"EndingHashKey":
"340282366920938463463374607431768211455",
"StartingHashKey": "0"
},
"SequenceNumberRange": {
"StartingSequenceNumber":
"49551135218688818456679503831981458784591352702181572610"
}
}
]
}
}
It may take a minute or two for your stream to show as Active.
3. Create the IAM role that will grant CloudWatch Logs permission to put data into your Amazon
Kinesis stream. First, you'll need to create a trust policy in a file ~/TrustPolicyForCWL.json:
{
"Statement": {
"Effect": "Allow",
"Principal": { "Service": "logs.us-east-1.amazonaws.com" },
47
Amazon CloudWatch Logs User Guide
Example 1: Amazon Kinesis
"Action": "sts:AssumeRole"
}
}
4. Use the create-role command to create the IAM role, specifying the trust policy file. Take note of
the returned Role.Arn value as that will also be passed to CloudWatch Logs later:
aws iam create-role --role-name CWLtoKinesisRole --assume-role-policy-
document file://~/TrustPolicyForCWL.json
{
"Role": {
"AssumeRolePolicyDocument": {
"Statement": {
"Action": "sts:AssumeRole",
"Effect": "Allow",
"Principal": {
"Service": "logs.us-east-1.amazonaws.com"
}
}
},
"RoleId": "AAOIIAH450GAB4HC5F431",
"CreateDate": "2015-05-29T13:46:29.431Z",
"RoleName": "CWLtoKinesisRole",
"Path": "/",
"Arn": "arn:aws:iam::123456789012:role/CWLtoKinesisRole"
}
}
5. Create a permissions policy to define what actions CloudWatch Logs can do on your account.
First, you'll create a permissions policy in a file ~/PermissionsForCWL.json:
{
"Statement": [
{
"Effect": "Allow",
"Action": "kinesis:PutRecord",
"Resource": "arn:aws:kinesis:us-east-1:123456789012:stream/
RootAccess"
},
{
"Effect": "Allow",
"Action": "iam:PassRole",
"Resource": "arn:aws:iam::123456789012:role/CWLtoKinesisRole"
}
]
}
6. Associate the permissions policy with the role using the put-role-policy command:
aws iam put-role-policy --role-name CWLtoKinesisRole --policy-
name Permissions-Policy-For-CWL --policy-document file://~/
PermissionsForCWL.json
7. After the Amazon Kinesis stream is in Active state and you have created the IAM role, you can
create the CloudWatch Logs subscription filter. The subscription filter immediately starts the flow of
real-time log data from the chosen log group to your Amazon Kinesis stream:
48
Amazon CloudWatch Logs User Guide
Example 1: Amazon Kinesis
aws logs put-subscription-filter \
--log-group-name "CloudTrail" \
--filter-name "RootAccess" \
--filter-pattern "{$.userIdentity.type = Root}" \
--destination-arn "arn:aws:kinesis:us-east-1:123456789012:stream/
RootAccess" \
--role-arn "arn:aws:iam::123456789012:role/CWLtoKinesisRole"
8. After you set up the subscription filter, CloudWatch Logs will forward all the incoming log events
that match the filter pattern to your Amazon Kinesis stream. You can verify that this is happening
by grabbing an Amazon Kinesis shard iterator and using the Amazon Kinesis get-records
command to fetch some Amazon Kinesis records:
aws kinesis get-shard-iterator --stream-name RootAccess --shard-id
shardId-000000000000 --shard-iterator-type TRIM_HORIZON
{
"ShardIterator":
"AAAAAAAAAAFGU/
kLvNggvndHq2UIFOw5PZc6F01s3e3afsSscRM70JSbjIefg2ub07nk1y6CDxYR1UoGHJNP4m4NFUetzfL
+wev+e2P4djJg4L9wmXKvQYoE+rMUiFq
+p4Cn3IgvqOb5dRA0yybNdRcdzvnC35KQANoHzzahKdRGb9v4scv+3vaq+f+OIK8zM5My8ID
+g6rMo7UKWeI4+IWiK2OSh0uP"
}
aws kinesis get-records --limit 10 --shard-iterator "AAAAAAAAAAFGU/
kLvNggvndHq2UIFOw5PZc6F01s3e3afsSscRM70JSbjIefg2ub07nk1y6CDxYR1UoGHJNP4m4NFUetzfL
+wev+e2P4djJg4L9wmXKvQYoE+rMUiFq
+p4Cn3IgvqOb5dRA0yybNdRcdzvnC35KQANoHzzahKdRGb9v4scv+3vaq+f+OIK8zM5My8ID
+g6rMo7UKWeI4+IWiK2OSh0uP"
Note
You may need to iterate on the get-records command a few times before Amazon Kinesis
starts to return data.
You should expect to see a response with an array of Amazon Kinesis. The Data attribute in
the Amazon Kinesis record is Base64 encoded and compressed with the gzip format. You can
examine the raw data from the command line using the following Unix commands:
echo -n "<Content of Data>" | base64 -d | zcat
The Base64 decoded and decompressed data is formatted as JSON with the following structure:
{
"owner": "123456789012",
"logGroup": "CloudTrail",
"logStream": "123456789012_CloudTrail_us-east-1",
"subscriptionFilters": [
"RootAccess"
],
"messageType": "DATA_MESSAGE",
"logEvents": [
{
49
Amazon CloudWatch Logs User Guide
Example 2: AWS Lambda
"id":
"31953106606966983378809025079804211143289615424298221568",
"timestamp": 1432826855000,
"message": "{\"eventVersion\":\"1.03\",\"userIdentity\":
{\"type\":\"Root\"}"
},
{
"id":
"31953106606966983378809025079804211143289615424298221569",
"timestamp": 1432826855000,
"message": "{\"eventVersion\":\"1.03\",\"userIdentity\":
{\"type\":\"Root\"}"
},
{
"id":
"31953106606966983378809025079804211143289615424298221570",
"timestamp": 1432826855000,
"message": "{\"eventVersion\":\"1.03\",\"userIdentity\":
{\"type\":\"Root\"}"
}
]
}
The key elements in the above data structure are the following:
owner
The AWS Account ID of the originating log data.
logGroup
The log group name of the originating log data.
logStream
The log stream name of the originating log data.
subscriptionFilters
The list of subscription filter names that matched with the originating log data.
messageType
Data messages will use the "DATA_MESSAGE" type. Sometimes CloudWatch Logs may
emit Amazon Kinesis records with a "CONTROL_MESSAGE" type, mainly for checking if the
destination is reachable.
logEvents
The actual log data, represented as an array of log event records. The "id" property is a
unique identifier for every log event.
Example 2: AWS Lambda
In this example, you'll create a CloudWatch Logs subscription filter that sends log data to your AWS
Lambda function.
1. Create the AWS Lambda function.
Ensure that you have set up the Lambda execution role. For more information, see Step 2.2:
Create an IAM Role (execution role) in the AWS Lambda Developer Guide.
2. Open a text editor and create a file named helloWorld.js with the following contents:
var zlib = require('zlib');
exports.handler = function(input, context) {
var payload = new Buffer(input.awslogs.data, 'base64');
50
Amazon CloudWatch Logs User Guide
Example 2: AWS Lambda
zlib.gunzip(payload, function(e, result) {
if (e) {
context.fail(e);
} else {
result = JSON.parse(result.toString('ascii'));
console.log("Event Data:", JSON.stringify(result, null, 2));
context.succeed();
}
});
};
3. Zip the file helloWorld.js and save it with the name helloWorld.zip.
4. At a command prompt, run the following command, where role-arn is the Lambda execution
role set up in the first step, found in the IAM console under Roles:
aws lambda create-function \
--function-name helloworld \
--zip-file file://file-path/helloWorld.zip \
--role lambda-execution-role-arn \
--handler helloWorld.handler \
--runtime nodejs
5. Grant CloudWatch Logs the permission to execute your function. At a command prompt, run the
following command and substitute account 123456789123 with your own and change the log-
group to be the log group you want to process:
aws lambda add-permission \
--function-name "helloworld" \
--statement-id "helloworld" \
--principal "logs.us-east-1.amazonaws.com" \
--action "lambda:InvokeFunction" \
--source-arn "arn:aws:logs:us-east-1:123456789123:log-
group:TestLambda:*" \
--source-account "123456789123"
6. Create a subscription filter. At a command prompt, run the following command and substitute
account 123456789123 with your own and change the log-group-name to be the log group you
want to process:
aws logs put-subscription-filter \
--log-group-name myLogGroup \
--filter-name demo \
--filter-pattern "" \
--destination-arn arn:aws:lambda:us-
east-1:123456789123:function:helloworld
7. (Optional) Test using a sample log event. At a command prompt, run the following command,
which will put a simple log message into the subscribed stream.
To see the output of your Lambda function, navigate to the Lambda function where you will see
the output in /aws/lambda/helloworld:
aws logs put-log-events --log-group-name myLogGroup --log-stream-
name stream1 --log-events "[{\"timestamp\":<CURRENT TIMESTAMP MILLIS> ,
\"message\": \"Simple Lambda Test\"}]"
51
Amazon CloudWatch Logs User Guide
Example 2: AWS Lambda
You should expect to see a response with an array of Lambda. The Data attribute in the
Lambda record is Base64 encoded and compressed with the gzip format. The actual
payload that Lambda receives is in the following format { "awslogs": {"data":
"BASE64ENCODED_GZIP_COMPRESSED_DATA"} } You can examine the raw data from the
command line using the following Unix commands:
echo -n "<BASE64ENCODED_GZIP_COMPRESSED_DATA>" | base64 -d | zcat
The Base64 decoded and decompressed data is formatted as JSON with the following structure:
{
"owner": "123456789012",
"logGroup": "CloudTrail",
"logStream": "123456789012_CloudTrail_us-east-1",
"subscriptionFilters": [
"RootAccess"
],
"messageType": "DATA_MESSAGE",
"logEvents": [
{
"id":
"31953106606966983378809025079804211143289615424298221568",
"timestamp": 1432826855000,
"message": "{\"eventVersion\":\"1.03\",\"userIdentity\":
{\"type\":\"Root\"}"
},
{
"id":
"31953106606966983378809025079804211143289615424298221569",
"timestamp": 1432826855000,
"message": "{\"eventVersion\":\"1.03\",\"userIdentity\":
{\"type\":\"Root\"}"
},
{
"id":
"31953106606966983378809025079804211143289615424298221570",
"timestamp": 1432826855000,
"message": "{\"eventVersion\":\"1.03\",\"userIdentity\":
{\"type\":\"Root\"}"
}
]
}
The key elements in the above data structure are the following:
owner
The AWS Account ID of the originating log data.
logGroup
The log group name of the originating log data.
logStream
The log stream name of the originating log data.
subscriptionFilters
The list of subscription filter names that matched with the originating log data.
52
Amazon CloudWatch Logs User Guide
Example 3: Amazon Kinesis Firehose
messageType
Data messages will use the "DATA_MESSAGE" type. Sometimes CloudWatch Logs may emit
Lambda records with a "CONTROL_MESSAGE" type, mainly for checking if the destination is
reachable.
logEvents
The actual log data, represented as an array of log event records. The "id" property is a
unique identifier for every log event.
Example 3: Amazon Kinesis Firehose
In this example, you'll create a CloudWatch Logs subscription that sends any incoming log events
that match your defined filters to your Amazon Kinesis Firehose delivery system. Data sent from
CloudWatch Logs to Amazon Kinesis Firehose is already compressed with gzip level 6 compression,
so you do not need to use compression within your Firehose delivery stream.
1. Create an Amazon Simple Storage Service (Amazon S3) bucket. We recommend that you use a
bucket that was created specifically for CloudWatch Logs. If you want to use an existing bucket,
skip to step 2.
At a command prompt, type:
aws s3api create-bucket --bucket my-bucket --create-bucket-configuration
LocationConstraint=us-east-1
Replace us-east-1 with the region that you want to use.
If the bucket was successfully created, the AWS CLI displays the location and name of the bucket:
{
"Location": "/my-bucket"
}
2. Create the IAM role that will grant Amazon Kinesis Firehose permission to put data into your
Amazon S3 bucket.
For more information, see Controlling Access with Amazon Kinesis Firehose in the Amazon
Kinesis Firehose Developer Guide.
First you'll need to create a trust policy in a file ~/TrustPolicyForFirehose.json:
{
"Statement": {
"Effect": "Allow",
"Principal": { "Service": "firehose.amazonaws.com" },
"Action": "sts:AssumeRole",
"Condition": { "StringEquals": { "sts:ExternalId":"account-ID" } }
}
}
Note
Replace account-ID with your account ID.
3. Use the create-role command to create the IAM role, specifying the trust policy file. Take note of
the returned Role.Arn value as that will also be passed to Amazon Kinesis Firehose later:
53
Amazon CloudWatch Logs User Guide
Example 3: Amazon Kinesis Firehose
aws iam create-role \
--role-name FirehosetoS3Role \
--assume-role-policy-document file://~/TrustPolicyForFirehose.json
{
"Role": {
"AssumeRolePolicyDocument": {
"Statement": {
"Action": "sts:AssumeRole",
"Effect": "Allow",
"Principal": {
"Service": "logs.us-east-1.amazonaws.com"
}
}
},
"RoleId": "AAOIIAH450GAB4HC5F431",
"CreateDate": "2015-05-29T13:46:29.431Z",
"RoleName": "FirehosetoS3Role",
"Path": "/",
"Arn": "arn:aws:iam::123456789012:role/FirehosetoS3Role"
}
}
4. Create a permissions policy to define what actions Firehose can do on your account. First, you'll
create a permissions policy in a file ~/PermissionsForFirehose.json:
{
"Statement": [
{
"Effect": "Allow",
"Action": [ "s3:AbortMultipartUpload", "s3:GetBucketLocation",
"s3:GetObject", "s3:ListBucket", "s3:ListBucketMultipartUploads",
"s3:PutObject" ],
"Resource": [ "arn:aws:s3:::my-bucket", "arn:aws:s3:::my-bucket/*" ]
}
]
}
5. Associate the permissions policy with the role using the put-role-policy command:
aws iam put-role-policy --role-name FirehosetoS3Role --policy-
name Permissions-Policy-For-Firehose --policy-document file://~/
PermissionsForFirehose.json
6. Create a destination Firehose delivery stream:
aws firehose create-delivery-stream \
--delivery-stream-name 'my-delivery-stream' \
--s3-destination-configuration \
RoleARN='arn:aws:iam::123456789012:role/
FirehosetoS3Role',BucketARN='arn:aws:s3:::my-bucket'
Replace RoleARN and BucketARN with the role and bucket ARN that you created.
54

Amazon CloudWatch Logs User Guide
Example 3: Amazon Kinesis Firehose
Note
Firehose automatically uses a prefix in YYYY/MM/DD/HH UTC time format for delivered
Amazon S3 objects. You can specify an extra prefix to be added in front of the time
format prefix. If the prefix ends with a forward slash (/), it appears as a folder in the
Amazon S3 bucket.
7. Wait until the stream becomes active. You can use the Firehose describe-delivery-stream
command to check the DeliveryStreamDescription.DeliveryStreamStatus property. In addition,
take note of the DeliveryStreamDescription.DeliveryStreamARN value as that will be passed to
CloudWatch Logs later:
aws firehose describe-delivery-stream --delivery-stream-name "my-delivery-
stream"
{
"DeliveryStreamDescription": {
"HasMoreDestinations": false,
"VersionId": "1",
"CreateTimestamp": 1446075815.822,
"DeliveryStreamARN": "arn:aws:firehose:us-
east-1:123456789012:deliverystream/my-delivery-stream",
"DeliveryStreamStatus": "ACTIVE",
"DeliveryStreamName": "my-delivery-stream",
"Destinations": [
{
"DestinationId": "destinationId-000000000001",
"S3DestinationDescription": {
"CompressionFormat": "UNCOMPRESSED",
"EncryptionConfiguration": {
"NoEncryptionConfig": "NoEncryption"
},
"RoleARN": "delivery-stream-role",
"BucketARN": "arn:aws:s3:::my-bucket",
"BufferingHints": {
"IntervalInSeconds": 300,
"SizeInMBs": 5
}
}
}
]
}
}
It may take a few minutes for your stream to show as active.
8. Create the IAM role that will grant CloudWatch Logs permission to put data into your Firehose
delivery stream. First, you'll need to create a trust policy in a file ~/TrustPolicyForCWL.json:
{
"Statement": {
"Effect": "Allow",
"Principal": { "Service": "logs.us-east-1.amazonaws.com" },
"Action": "sts:AssumeRole"
}
}
9. Use the create-role command to create the IAM role, specifying the trust policy file. Take note of
the returned Role.Arn value as that will also be passed to CloudWatch Logs later:
55
Amazon CloudWatch Logs User Guide
Example 3: Amazon Kinesis Firehose
aws iam create-role \
--role-name CWLtoKinesisFirehoseRole \
--assume-role-policy-document file://~/TrustPolicyForCWL.json
{
"Role": {
"AssumeRolePolicyDocument": {
"Statement": {
"Action": "sts:AssumeRole",
"Effect": "Allow",
"Principal": {
"Service": "logs.us-east-1.amazonaws.com"
}
}
},
"RoleId": "AAOIIAH450GAB4HC5F431",
"CreateDate": "2015-05-29T13:46:29.431Z",
"RoleName": "CWLtoKinesisFirehoseRole",
"Path": "/",
"Arn": "arn:aws:iam::123456789012:role/CWLtoKinesisFirehoseRole"
}
}
10. Create a permissions policy to define what actions CloudWatch Logs can do on your account.
First, you'll create a permissions policy in a file ~/PermissionsForCWL.json:
{
"Statement":[
{
"Effect":"Allow",
"Action":["firehose:*"],
"Resource":["arn:aws:firehose:us-east-1:123456789012:*"]
},
{
"Effect":"Allow",
"Action":["iam:PassRole"],
"Resource":["arn:aws:iam::123456789012:role/
CWLtoKinesisFirehoseRole"]
}
]
}
11. Associate the permissions policy with the role using the put-role-policy command:
aws iam put-role-policy --role-name CWLtoKinesisFirehoseRole --
policy-name Permissions-Policy-For-CWL --policy-document file://~/
PermissionsForCWL.json"
12. After the Amazon Kinesis Firehose delivery stream is in active state and you have created the IAM
role, you can create the CloudWatch Logs subscription filter. The subscription filter immediately
starts the flow of real-time log data from the chosen log group to your Amazon Kinesis Firehose
delivery stream:
aws logs put-subscription-filter \
--log-group-name "CloudTrail" \
--filter-name "RootAccess" \
56
Amazon CloudWatch Logs User Guide
Example 3: Amazon Kinesis Firehose
--filter-pattern "{$.userIdentity.type = Root}" \
--destination-arn "arn:aws:firehose:us-
east-1:123456789012:deliverystream/my-delivery-stream" \
--role-arn "arn:aws:iam::123456789012:role/CWLtoKinesisFirehoseRole"
13. After you set up the subscription filter, CloudWatch Logs will forward all the incoming log events
that match the filter pattern to your Amazon Kinesis Firehose delivery stream. Your data will
start appearing in your Amazon S3 based on the time buffer interval set on your Amazon Kinesis
Firehose delivery stream. Once enough time has passed, you can verify your data by checking
your Amazon S3 Bucket.
aws s3api list-objects --bucket 'my-bucket' --prefix 'firehose/'
{
"Contents": [
{
"LastModified": "2015-10-29T00:01:25.000Z",
"ETag": "\"a14589f8897f4089d3264d9e2d1f1610\"",
"StorageClass": "STANDARD",
"Key": "firehose/2015/10/29/00/my-delivery-
stream-2015-10-29-00-01-21-a188030a-62d2-49e6-b7c2-b11f1a7ba250",
"Owner": {
"DisplayName": "cloudwatch-logs",
"ID": "1ec9cf700ef6be062b19584e0b7d84ecc19237f87b5"
},
"Size": 593
},
{
"LastModified": "2015-10-29T00:35:41.000Z",
"ETag": "\"a7035b65872bb2161388ffb63dd1aec5\"",
"StorageClass": "STANDARD",
"Key": "firehose/2015/10/29/00/my-delivery-
stream-2015-10-29-00-35-40-7cc92023-7e66-49bc-9fd4-fc9819cc8ed3",
"Owner": {
"DisplayName": "cloudwatch-logs",
"ID": "1ec9cf700ef6be062b19584e0b7d84ecc19237f87b6"
},
"Size": 5752
}
]
}
aws s3api get-object --bucket 'my-bucket' --key 'firehose/2015/10/29/00/
my-delivery-stream-2015-10-29-00-01-21-a188030a-62d2-49e6-b7c2-
b11f1a7ba250' testfile.gz
{
"AcceptRanges": "bytes",
"ContentType": "application/octet-stream",
"LastModified": "Thu, 29 Oct 2015 00:07:06 GMT",
"ContentLength": 593,
"Metadata": {}
}
The data in the Amazon S3 object is compressed with the gzip format. You can examine the raw
data from the command line using the following Unix commands:
57
Amazon CloudWatch Logs User Guide
Cross-Account Log Data Sharing with Subscriptions
zcat testfile.gz
Cross-Account Log Data Sharing with
Subscriptions
You can collaborate with an owner of a different AWS account and receive their log events on your
AWS resources, such as an Amazon Kinesis stream (this is known as cross-account data sharing).
For example, this log event data can be read from a centralized Amazon Kinesis stream to perform
custom processing and analysis. Custom processing is especially useful when you collaborate and
analyze data across many accounts. For example, a company's information security group might want
to analyze data for real-time intrusion detection or anomalous behaviors so it could conduct an audit
of accounts in all divisions in the company by collecting their federated production logs for central
processing. A real-time stream of event data across those accounts can be assembled and delivered
to the information security groups who can use Amazon Kinesis to attach the data to their existing
security analytic systems.
Note
Cross-account subscriptions using AWS Lambda is not supported.
To share log data across accounts, you need to establish a log data sender and receiver:
•Log data sender—gets the destination information from the recipient and lets CloudWatch Logs
know that it is ready to send its log events to the specified destination.
•Log data recipient—sets up a destination that encapsulates an Amazon Kinesis stream and lets
CloudWatch Logs know that the recipient wants to receive log data. The recipient then shares the
information about his destination with the sender.
To start receiving log events from cross-account users, the log data recipient first creates a
CloudWatch Logs destination. Each destination consists of the following key elements:
Destination name
The name of the destination you want to create.
Target ARN
The Amazon Resource Name (ARN) of the AWS resource that you want to use as the destination
of the subscription feed.
Role ARN
An AWS Identity and Access Management (IAM) role that grants CloudWatch Logs the necessary
permissions to put data into the chosen Amazon Kinesis stream.
Access policy
An IAM policy document (in JSON format, written using IAM policy grammar) that governs the set
of users that are allowed to write to your destination.
Topics
•Create a Destination (p. 59)
•Create a Subscription Filter (p. 61)
•Validating the Flow of Log Events (p. 62)
•Modifying Destination Membership at Runtime (p. 64)
58
Amazon CloudWatch Logs User Guide
Create a Destination
Create a Destination
The following example creates a destination using an Amazon Kinesis stream called RootAccess, and
a role that enables CloudWatch Logs to write data to it. Lambda cross-account processing is similar,
except you create a Lambda function and use the Amazon Resource Name (ARN) for that function in
place of the Amazon Kinesis stream ARN.
To create a destination
1. Create a destination stream in Amazon Kinesis. At a command prompt, type:
aws kinesis create-stream --stream-name "RootAccess" --shard-count 1
2. Wait until the Amazon Kinesis stream becomes active. You can use the aws kinesis describe-
stream command to check the StreamDescription.StreamStatus property. In addition, take note
of the StreamDescription.StreamARN value because it will be passed to CloudWatch Logs later:
aws kinesis describe-stream --stream-name "RootAccess"
{
"StreamDescription": {
"StreamStatus": "ACTIVE",
"StreamName": "RootAccess",
"StreamARN": "arn:aws:kinesis:us-east-1:123456789012:stream/
RootAccess",
"Shards": [
{
"ShardId": "shardId-000000000000",
"HashKeyRange": {
"EndingHashKey": "34028236692093846346337460743176EXAMPLE",
"StartingHashKey": "0"
},
"SequenceNumberRange": {
"StartingSequenceNumber":
"4955113521868881845667950383198145878459135270218EXAMPLE"
}
}
]
}
}
It might take a minute or two for your stream to show up in the active state.
3. Create the IAM role that will grant CloudWatch Logs the permission to put data into your Amazon
Kinesis stream. First, you'll need to create a trust policy in a file ~/TrustPolicyForCWL.json:
{
"Statement": {
"Effect": "Allow",
"Principal": { "Service": "logs.us-east-1.amazonaws.com" },
"Action": "sts:AssumeRole"
}
}
4. Use the aws iam create-role command to create the IAM role, specifying the trust policy file. Take
note of the returned Role.Arn value because that will also be passed to CloudWatch Logs later:
aws iam create-role \
59
Amazon CloudWatch Logs User Guide
Create a Destination
--role-name CWLtoKinesisRole \
--assume-role-policy-document file://~/TrustPolicyForCWL.json
{
"Role": {
"AssumeRolePolicyDocument": {
"Statement": {
"Action": "sts:AssumeRole",
"Effect": "Allow",
"Principal": {
"Service": "logs.us-east-1.amazonaws.com"
}
}
},
"RoleId": "AAOIIAH450GAB4HC5F431",
"CreateDate": "2015-05-29T13:46:29.431Z",
"RoleName": "CWLtoKinesisRole",
"Path": "/",
"Arn": "arn:aws:iam::123456789012:role/CWLtoKinesisRole"
}
}
5. Create a permissions policy to define which actions CloudWatch Logs can perform on your
account. First, you'll create a permissions policy in a file ~/PermissionsForCWL.json:
{
"Statement": [
{
"Effect": "Allow",
"Action": "kinesis:PutRecord",
"Resource": "arn:aws:kinesis:us-east-1:123456789012:stream/
RootAccess"
},
{
"Effect": "Allow",
"Action": "iam:PassRole",
"Resource": "arn:aws:iam::123456789012:role/CWLtoKinesisRole"
}
]
}
6. Associate the permissions policy with the role using the aws iam put-role-policy command:
aws iam put-role-policy --role-name CWLtoKinesisRole --policy-
name Permissions-Policy-For-CWL --policy-document file://~/
PermissionsForCWL.json
7. After the Amazon Kinesis stream is in the active state and you have created the IAM role, you can
create the CloudWatch Logs destination.
a. This step will not associate an access policy with your destination and is only the first step
out of two that completes a destination creation. Make a note of the DestinationArn that is
returned in the payload:
aws logs put-destination \
--destination-name "testDestination" \
--target-arn "arn:aws:kinesis:us-east-1:123456789012:stream/
RootAccess" \
60
Amazon CloudWatch Logs User Guide
Create a Subscription Filter
--role-arn "arn:aws:iam::123456789012:role/CWLtoKinesisRole"
{
"DestinationName" : "testDestination",
"RoleArn" : "arn:aws:iam::123456789012:role/CWLtoKinesisRole",
"DestinationArn" : "arn:aws:logs:us-
east-1:123456789012:destination:testDestination",
"TargetArn" : "arn:aws:kinesis:us-east-1:123456789012:stream/
RootAccess"
}
b. After step 7a is complete, associate an access policy with the destination. You can put this
policy in the ~/AccessPolicy.json file:
{
"Version" : "2012-10-17",
"Statement" : [
{
"Sid" : "",
"Effect" : "Allow",
"Principal" : {
"AWS" : "234567890123"
},
"Action" : "logs:PutSubscriptionFilter",
"Resource" : "arn:aws:logs:us-
east-1:123456789012:destination:testDestination"
}
]
}
c. This creates a policy that defines who has write access to the destination. This policy must
specify the logs:PutSubscriptionFilter action to access the destination. Cross-account users
will use the PutSubscriptionFilter action to send log events to the destination:
aws logs put-destination-policy \
--destination-name "testDestination" \
--access-policy file://~/AccessPolicy.json
This access policy allows the root user of the AWS Account with ID 234567890123
to call PutSubscriptionFilter against the destination with ARN arn:aws:logs:us-
east-1:123456789012:destination:testDestination. Any other user's attempt to call
PutSubscriptionFilter against this destination will be rejected.
To validate a user's privileges against an access policy, see Using Policy Validator in the IAM
User Guide.
Create a Subscription Filter
After you create a destination, you can share the destination ARN (arn:aws:logs:us-
east-1:123456789012:destination:testDestination) with other cross-account users so that they can
send you their log events. The cross-account users then create a subscription filter on their respective
log groups against this destination. The subscription filter immediately starts the flow of real-time log
data from the chosen log group to the specified destination.
In the following example, a subscription filter is associated with a log group containing AWS CloudTrail
events so that every logged activity made by "Root" AWS credentials delivered to the destination
61
Amazon CloudWatch Logs User Guide
Validating the Flow of Log Events
you created above that encapsulates an Amazon Kinesis stream called "RootAccess". For more
information about how to send AWS CloudTrail events to CloudWatch Logs, see Sending CloudTrail
Events to CloudWatch Logs in the AWS CloudTrail User Guide.
aws logs put-subscription-filter \
--log-group-name "CloudTrail" \
--filter-name "RootAccess" \
--filter-pattern "{$.userIdentity.type = Root}" \
--destination-arn "arn:aws:logs:us-
east-1:123456789012:destination:testDestination"
Note
Unlike the subscriptions example Real-time Processing of Log Data with
Subscriptions (p. 46), in this example you did not have to provide a role-arn. This is
because role-arn is needed for impersonation while writing to an Amazon Kinesis stream,
which has already been provided by the destination owner while creating destination.
Validating the Flow of Log Events
After you create the subscription filter, CloudWatch Logs forwards all the incoming log events that
match the filter pattern to the Amazon Kinesis stream that is encapsulated within the destination stream
called "RootAccess". The destination owner can verify that this is happening by using the aws kinesis
get-shard-iterator command to grab an Amazon Kinesis shard, and using the aws kinesis get-
records command to fetch some Amazon Kinesis records:
aws kinesis get-shard-iterator \
--stream-name RootAccess \
--shard-id shardId-000000000000 \
--shard-iterator-type TRIM_HORIZON
{
"ShardIterator":
"AAAAAAAAAAFGU/
kLvNggvndHq2UIFOw5PZc6F01s3e3afsSscRM70JSbjIefg2ub07nk1y6CDxYR1UoGHJNP4m4NFUetzfL
+wev+e2P4djJg4L9wmXKvQYoE+rMUiFq
+p4Cn3IgvqOb5dRA0yybNdRcdzvnC35KQANoHzzahKdRGb9v4scv+3vaq+f+OIK8zM5My8ID
+g6rMo7UKWeI4+IWiKEXAMPLE"
}
aws kinesis get-records \
--limit 10 \
--shard-iterator
"AAAAAAAAAAFGU/
kLvNggvndHq2UIFOw5PZc6F01s3e3afsSscRM70JSbjIefg2ub07nk1y6CDxYR1UoGHJNP4m4NFUetzfL
+wev+e2P4djJg4L9wmXKvQYoE+rMUiFq
+p4Cn3IgvqOb5dRA0yybNdRcdzvnC35KQANoHzzahKdRGb9v4scv+3vaq+f+OIK8zM5My8ID
+g6rMo7UKWeI4+IWiKEXAMPLE"
Note
You may need to rerun the get-records command a few times before Amazon Kinesis starts to
return data.
You should see a response with an array of Amazon Kinesis records. The data attribute in the Amazon
Kinesis record is Base64 encoded and compressed in gzip format. You can examine the raw data from
the command line using the following Unix command:
62
Amazon CloudWatch Logs User Guide
Validating the Flow of Log Events
echo -n "<Content of Data>" | base64 -d | zcat
The Base64 decoded and decompressed data is formatted as JSON with the following structure:
{
"owner": "123456789012",
"logGroup": "CloudTrail",
"logStream": "123456789012_CloudTrail_us-east-1",
"subscriptionFilters": [
"RootAccess"
],
"messageType": "DATA_MESSAGE",
"logEvents": [
{
"id": "3195310660696698337880902507980421114328961542429EXAMPLE",
"timestamp": 1432826855000,
"message": "{\"eventVersion\":\"1.03\",\"userIdentity\":{\"type
\":\"Root\"}"
},
{
"id": "3195310660696698337880902507980421114328961542429EXAMPLE",
"timestamp": 1432826855000,
"message": "{\"eventVersion\":\"1.03\",\"userIdentity\":{\"type
\":\"Root\"}"
},
{
"id": "3195310660696698337880902507980421114328961542429EXAMPLE",
"timestamp": 1432826855000,
"message": "{\"eventVersion\":\"1.03\",\"userIdentity\":{\"type
\":\"Root\"}"
}
]
}
The key elements in this data structure are as follows:
owner
The AWS Account ID of the originating log data.
logGroup
The log group name of the originating log data.
logStream
The log stream name of the originating log data.
subscriptionFilters
The list of subscription filter names that matched with the originating log data.
messageType
Data messages will use the "DATA_MESSAGE" type. Sometimes CloudWatch Logs may
emit Amazon Kinesis records with a "CONTROL_MESSAGE" type, mainly for checking if the
destination is reachable.
logEvents
The actual log data, represented as an array of log event records. The ID property is a unique
identifier for every log event.
63
Amazon CloudWatch Logs User Guide
Modifying Destination Membership at Runtime
Modifying Destination Membership at Runtime
You might encounter situations where you have to add or remove membership of some users from a
destination that you own. You can use the PutDestinationPolicy action on your destination with new
access policy. In the following example, a previously added account 234567890123 is stopped from
sending any more log data, and account 345678901234 is enabled.
1. Fetch the policy that is currently associated with the destination testDestination and make a note
of the AccessPolicy:
aws logs describe-destinations \
--destination-name-prefix "testDestination"
{
"Destinations": [
{
"DestinationName": "testDestination",
"RoleArn": "arn:aws:iam::123456789012:role/CWLtoKinesisRole",
"DestinationArn": "arn:aws:logs:us-
east-1:123456789012:destination:testDestination",
"TargetArn": "arn:aws:kinesis:us-east-1:123456789012:stream/
RootAccess",
"AccessPolicy": "{\"Version\": \"2012-10-17\", \"Statement\":
[{\"Sid\": \"\", \"Effect\": \"Allow\", \"Principal\": {\"AWS\":
\"234567890123\"}, \"Action\": \"logs:PutSubscriptionFilter\", \"Resource
\": \"arn:aws:logs:us-east-1:123456789012:destination:testDestination
\"}] }"
}
]
}
2. Update the policy to reflect that account 234567890123 is stopped, and that account
345678901234 is enabled. Put this policy in the ~/NewAccessPolicy.json file:
{
"Version" : "2012-10-17",
"Statement" : [
{
"Sid" : "",
"Effect" : "Allow",
"Principal" : {
"AWS" : "345678901234"
},
"Action" : "logs:PutSubscriptionFilter",
"Resource" : "arn:aws:logs:us-
east-1:123456789012:destination:testDestination"
}
]
}
3. Call PutDestinationPolicy to associate the policy defined in the NewAccessPolicy.json file with
the destination:
aws logs put-destination-policy \
--destination-name "testDestination" \
--access-policy file://~/NewAccessPolicy.json
64

Amazon CloudWatch Logs User Guide
Modifying Destination Membership at Runtime
This will eventually disable the log events from account ID 234567890123. Log events from
account ID 345678901234 start flowing to the destination as soon as the owner of account
345678901234 creates a subscription filter using PutSubscriptionFilter.
65

Amazon CloudWatch Logs User Guide
Concepts
Exporting Log Data in Bulk to
Amazon S3
You can export log data from your log groups to an Amazon S3 bucket and use this data in custom
processing and analysis, or to load onto other systems. You can export your data to an Amazon S3
bucket using the Amazon CloudWatch Logs commands in the AWS CLI, or by using the AWS SDK.
To begin the export process, you must create an Amazon S3 bucket to which the log data will be
exported. You can store the exported files in your Amazon S3 bucket and define Amazon S3 lifecycle
rules to archive or delete exported files automatically.
You can export logs from multiple log groups or multiple time ranges to the same Amazon S3 bucket.
To separate log data for each export task, you can specify an Amazon S3 prefix that will be used as
the Amazon S3 key prefix for all exported objects.
Log data can take up to 12 hours to become available for export. For near real-time analysis of log
data, see Real-time Processing of Log Data with Subscriptions (p. 46) instead.
Concepts
Before you begin, become familiar with the following export concepts:
log group name
The name of the log group associated with an export task. The log data in this log group will be
exported to the specified Amazon S3 bucket.
from (timestamp)
A required timestamp expressed as the number of milliseconds since Jan 1, 1970 00:00:00 UTC.
All log events in the log group that were ingested after this time will be exported.
to (timestamp)
A required timestamp expressed as the number of milliseconds since Jan 1, 1970 00:00:00 UTC.
All log events in the log group that were ingested before this time will be exported.
destination bucket
The name of the Amazon S3 bucket associated with an export task. This bucket is used to export
the log data from the specified log group.
66
Amazon CloudWatch Logs User Guide
Exporting Log Data to Amazon S3 Using the AWS CLI
destination prefix
An optional attribute that is used as the S3 key prefix for all exported objects. This helps create a
folder-like organization in your bucket.
Exporting Log Data to Amazon S3 Using the
AWS CLI
In the following example, you use an export task to export all data from a CloudWatch Logs log group
named "my-log-group" to an Amazon S3 bucket named "my-exported-logs."
Step 1: Create an Amazon S3 Bucket
We recommend that you use a bucket that was created specifically for CloudWatch Logs. But if you
want to use an existing bucket, you can skip to step 2.
Note
The Amazon S3 bucket must reside in the same region as the log data that you want to
export. CloudWatch Logs does not support exporting data to Amazon S3 buckets that are
created in a different region. For a list of CloudWatch Logs regions and endpoints, see
Regions and Endpoints in the Amazon Web Services General Reference.
To create an Amazon S3 bucket
• At a command prompt, type the following command:
aws s3api create-bucket --bucket my-exported-logs --create-bucket-
configuration LocationConstraint=us-west-2
For more information about the aws s3api create-bucket command and the
LocationConstraint parameter, see create-bucket in the AWS Command Line Interface
Reference.
Be sure to change us-west-2 to match the region where you are exporting your log data. If the
command is successful, the AWS CLI displays the location and name of the Amazon S3 bucket:
{
"Location": "/my-exported-logs"
}
You can use the Amazon S3 list-buckets command to check that the bucket was created.
Step 2: Set Permissions on an Amazon S3
Bucket
By default, all Amazon S3 buckets and objects are private. Only the resource owner, the AWS account
that created the bucket, can access the bucket and any objects it contains. The resource owner can,
however, choose to grant access permissions to other resources and users by writing an access policy.
To set permissions on an Amazon S3 bucket
1. Create a file named policy.json and add the following access policy to it.
67
Amazon CloudWatch Logs User Guide
Step 3: Create an Export Task
{
"Version": "2012-10-17",
"Statement": [
{
"Action": "s3:GetBucketAcl",
"Effect": "Allow",
"Resource": "arn:aws:s3:::my-exported-logs",
"Principal": { "Service": "logs.us-west-2.amazonaws.com" }
},
{
"Action": "s3:PutObject" ,
"Effect": "Allow",
"Resource": "arn:aws:s3:::my-exported-logs/*",
"Condition": { "StringEquals": { "s3:x-amz-acl": "bucket-
owner-full-control" } },
"Principal": { "Service": "logs.us-west-2.amazonaws.com" }
}
]
}
2. For my-exported-logs, substitute the name of your bucket, and for logs.us-
west-2.amazonaws.com, substitute the CloudWatch Logs endpoint of the region that you plan
use to create your export task. To get a list of supported regions and endpoints, see Regions and
Endpoints in the Amazon Web Services General Reference.
3. Set the policy that you just added as the access policy on your bucket. This policy enables
CloudWatch Logs to export log data to your Amazon S3 bucket. The bucket owner will have full
permissions on all of the exported objects.
aws s3api put-bucket-policy --bucket my-exported-logs --policy file://
policy.json
Caution
If the existing bucket already has one or more policies attached to it, add the statements
for CloudWatch Logs access to that policy or policies. We recommend that you evaluate
the resulting set of permissions to be sure that they are appropriate for the users who will
be accessing the bucket.
Step 3: Create an Export Task
In this step you create the export task for exporting logs from a log group. The aws logs create-
export-task command starts an export task that might take anywhere from a few seconds to a few
hours depending on the size of the data that you want to export.
To create an export task
• At a command prompt, type the following command:
aws logs create-export-task --task-name "my-log-group-09-10-2015" --
log-group-name "my-log-group" --from 1441490400000 --to 1441494000000 --
destination "my-exported-logs" --destination-prefix "export-task-output"
If the command is successful, the AWS CLI displays the ID of the task you created:
{
68
Amazon CloudWatch Logs User Guide
Step 4: Describe Export Tasks
"task-id": "cda45419-90ea-4db5-9833-aade86253e66"
}
Step 4: Describe Export Tasks
You can use the task ID that is returned by the create-export-task command to get the current status of
the task.
To describe export tasks
• At a command prompt, type the following command:
aws logs describe-export-tasks --task-id "cda45419-90ea-4db5-9833-
aade86253e66"
If the command is successful, the AWS CLI displays the following information about the task:
{
"ExportTasks": [
{
"Destination": "my-exported-logs",
"DestinationPrefix": "export-task-output",
"ExecutionInfo": {
"CreationTime": 1441495400000
},
"From": 1441490400000,
"LogGroupName": "my-log-group",
"Status": {
"Code": "RUNNING",
"Message": "Started Successfully"
},
"TaskId": "cda45419-90ea-4db5-9833-aade86253e66",
"TaskName": "my-log-group-09-10-2015",
"To": 1441494000000
}]
}
You can use the describe-export-tasks command in three different ways:
• Without any filters: Returns a paginated list of all of your export tasks in reverse order of creation
time.
• Filter on Task ID: Returns only one export task, if one exists, with the specified ID.
• Filter on Task Status: Returns a list of tasks that satisfy the status filter.
The following example shows you how to apply the "FAILED" status filter:
aws logs describe-export-tasks --status-code "FAILED"
If the command is successful, the AWS CLI displays the following information about the task:
{
"ExportTasks": [
69
Amazon CloudWatch Logs User Guide
Step 5: Cancel an Export Task
{
"Destination": "my-exported-logs",
"DestinationPrefix": "export-task-output",
"ExecutionInfo": {
"CompletionTime": 1441498600000
"CreationTime": 1441495400000
},
"From": 1441490400000,
"LogGroupName": "my-log-group",
"Status": {
"Code": "FAILED",
"Message": "FAILED"
},
"TaskId": "cda45419-90ea-4db5-9833-aade86253e66",
"TaskName": "my-log-group-09-10-2015",
"To": 1441494000000
}]
}
Step 5: Cancel an Export Task
You can cancel an export task if it is in either the PENDING or the RUNNING state.
To cancel an export task
1. At a command prompt, type the following command:
aws logs cancel-export-task --task-id "cda45419-90ea-4db5-9833-
aade86253e66"
2. (Optional) Use the describe-export-task command to verify that the task was canceled
successfully.
Exporting Log Data to Amazon S3 Using the
CloudWatch Console
In the following example, you'll use the Amazon CloudWatch console to export all data from an
Amazon CloudWatch Logs log group named "my-log-group" to an Amazon S3 bucket named "my-
exported-logs."
Step 1: Create an Amazon S3 Bucket
We recommend that you use a bucket that was created specifically for CloudWatch Logs. However, if
you want to use an existing bucket, you can skip to step 2.
Note
The Amazon S3 bucket must reside in the same region as the log data that you want to
export. CloudWatch Logs does not support exporting data to Amazon S3 buckets that are
created in a different region. For a list of CloudWatch Logs regions and endpoints, see
Regions and Endpoints in the Amazon Web Services General Reference.
To create an Amazon S3 bucket
1. Open the Amazon S3 console at https://console.aws.amazon.com/s3/.
70

Amazon CloudWatch Logs User Guide
Step 2: Set Permissions on an Amazon S3 Bucket
2. If necessary, change the region. From the navigation bar, select the region where your
CloudWatch Logs reside. For more information, see Regions and Endpoints in the Amazon Web
Services General Reference.
3. Click Create Bucket, and then in the Bucket Name field, type a name for the bucket.
4. In the Region drop-down list box, select the region where your CloudWatch Logs data resides.
Step 2: Set Permissions on an Amazon S3
Bucket
By default, all Amazon S3 buckets and objects are private. Only the resource owner (the AWS account
that created the bucket) can access the bucket and any objects it contains. However, the resource
owner can choose to grant access permissions to other resources and users by writing an access
policy.
To set permissions on an Amazon S3 bucket
1. In the Amazon S3 console, select the bucket that you created in Step 1.
2. In the results pane, choose Permissions, choose Add bucket policy, and then in the Bucket
Policy Editor dialog box, add the following policy:
{
"Version": "2012-10-17",
"Statement": [
{
"Action": "s3:GetBucketAcl",
"Effect": "Allow",
"Resource": "arn:aws:s3:::my-exported-logs",
"Principal": { "Service": "logs.us-west-2.amazonaws.com" }
},
{
"Action": "s3:PutObject" ,
"Effect": "Allow",
"Resource": "arn:aws:s3:::my-exported-logs/*",
"Condition": { "StringEquals": { "s3:x-amz-acl": "bucket-owner-full-
control" } },
"Principal": { "Service": "logs.us-west-2.amazonaws.com" }
}
]
}
3. For my-exported-logs, substitute the name of your bucket, and for logs.us-
west-2.amazonaws.com, substitute the CloudWatch Logs endpoint of the region that you plan
use to create your export task. To get a list of supported regions and endpoints, see Regions and
Endpoints in the Amazon Web Services General Reference.
4. Click Save to set the policy that you just added as the access policy on your bucket. This policy
enables CloudWatch Logs to export log data to your Amazon S3 bucket. The bucket owner has full
permissions on all of the exported objects.
Caution
If the existing bucket already has one or more policies attached to it, add the statements
for CloudWatch Logs access to that policy or policies. We recommend that you evaluate
the resulting set of permissions to be sure that they are appropriate for the users who will
be accessing the bucket.
71

Amazon CloudWatch Logs User Guide
Step 3: Create an Export Task
Step 3: Create an Export Task
In this step you create the export task for exporting logs from a log group.
To export data to Amazon S3 using the CloudWatch console
1. Open the CloudWatch console at https://console.aws.amazon.com/cloudwatch/.
2. If necessary, change the region. From the navigation bar, select the region that meets your
needs. For more information, see Regions and Endpoints in the Amazon Web Services General
Reference.
3. In the navigation pane, choose Logs.
4. On the Log Groups screen, select a log group, and then on the Actions menu, click Export data
to Amazon S3.
5. On the Export data to Amazon S3 screen, under Define data to export, in the From and To
fields, set the time range for the data you want to export.
6. If your log group has multiple log streams, you can provide a log stream prefix to limit the log
group data to a specific stream. Choose Advanced, and then in the Stream prefix field, enter the
log stream prefix.
7. Under Choose S3 bucket, select the account associated with the Amazon S3 bucket.
8. In the S3 bucket name drop-down list, select an Amazon S3 bucket.
9. To separate log data for each export task, you can specify an Amazon S3 prefix that will be used
as the Amazon S3 key prefix for all exported objects. Choose Advanced, and then in the S3
Bucket prefix field, enter the bucket prefix.
10. Click Export data to export your log data to Amazon S3.
11. To view the status of the log data that you exported to Amazon S3, on the Actions menu, choose
View all exports to Amazon S3.
72
Amazon CloudWatch Logs User Guide
Step 1: Create an Amazon ES domain
Streaming CloudWatch Logs Data
into the Amazon Elasticsearch
Service
You can configure a CloudWatch Logs log group to stream data it receives to your Amazon
Elasticsearch Service (Amazon ES) cluster in near real-time through a CloudWatch Logs
subscription. For more information about subscriptions, see Real-time Processing of Log Data with
Subscriptions (p. 46). The CloudWatch console offers a simple wizard to assist you in setting this up.
For more information about Amazon ES, see What Is Amazon Elasticsearch Service? in the Amazon
Elasticsearch Service Developer Guide.
Note
Streaming large amounts of CloudWatch Logs data into Amazon ES might result in high
usage charges on your AWS bill. We recommend that you monitor your AWS bill to help avoid
higher-than-expected charges. For more information, see Monitor Your Estimated Charges
Using CloudWatch.
Topics
•Step 1: Create an Amazon ES domain (p. 73)
•Step 2: Subscribe a Log Group to Amazon ES (p. 74)
Step 1: Create an Amazon ES domain
In this step, you'll create a new Amazon Elasticsearch Service (Amazon ES) domain with default
settings.
To create an Amazon ES domain
• At a command prompt, type the following command:
aws es create-elasticsearch-domain –-domain-name mydomain
Note
You may want to review your Amazon ES domain settings later, and modify you cluster
configuration based on the amount of data your cluster will be processing.
73

Amazon CloudWatch Logs User Guide
Step 2: Subscribe a Log Group to Amazon ES
Step 2: Subscribe a Log Group to Amazon ES
In this step, you will use the CloudWatch console to subscribe a log group to Amazon Elasticsearch
Service (Amazon ES).
To subscribe a log group to Amazon ES
1. Open the CloudWatch console at https://console.aws.amazon.com/cloudwatch/.
2. If necessary, change the region. From the navigation bar, select the region that meets your
needs. For more information, see Regions and Endpoints in the Amazon Web Services General
Reference.
3. In the navigation pane, click Logs.
4. In the CloudWatch console, select the log group that you want to stream to Amazon ES, click
Actions, and then select Stream to Amazon Elasticsearch Service.
5. On the Start Streaming to Amazon Elasticsearch Service screen, in the Amazon ES cluster
drop-down list, select the cluster you created in Step 1: Create an Amazon ES domain (p. 73),
and then choose Next.
6. Under Lambda Function, in the Lambda IAM Execution Role drop-down list box, select the IAM
role that Lambda should use when executing calls to Amazon ES, and then choose Next.
7. On the Configure Log Format and Filters screen, in the Log Format drop-down list box, select
the log format you want to use.
8. Under Subscription Filter Pattern, enter the terms or pattern you want to find in your log events.
This allows you to limit the data sent to your Amazon ES cluster to only the data you are interested
in. For more information on using filter patterns, see Searching and Filtering Log Data (p. 29).
(Optional): Under Select Log Data to Test, select a log stream and then click Test Pattern to
verify that your search filter is returning the results you expect.
9. Click Next, and then on the Review & Start Streaming to Amazon Elasticsearch Service
screen, edit any of the information as necessary. If you're satisfied with the settings, click Start
Streaming.
74

Amazon CloudWatch Logs User Guide
Authentication
Authentication and Access
Control for Amazon CloudWatch
Logs
Access to Amazon CloudWatch Logs requires credentials that AWS can use to authenticate your
requests. Those credentials must have permissions to access AWS resources, such as to retrieve
CloudWatch Logs data about your cloud resources. The following sections provide details on how
you can use AWS Identity and Access Management (IAM) and CloudWatch Logs to help secure your
resources by controlling who can access them:
•Authentication (p. 75)
•Access Control (p. 76)
Authentication
You can access AWS as any of the following types of identities:
•AWS account root user – When you sign up for AWS, you provide an email address and password
that is associated with your AWS account. These are your root credentials and they provide
complete access to all of your AWS resources.
Important
For security reasons, we recommend that you use the root credentials only to create
an administrator user, which is an IAM user with full permissions to your AWS account.
Then, you can use this administrator user to create other IAM users and roles with limited
permissions. For more information, see IAM Best Practices and Creating an Admin User
and Group in the IAM User Guide.
•IAM user – An IAM user is simply an identity within your AWS account that has specific custom
permissions (for example, permissions to view metrics in CloudWatch Logs). You can use an IAM
user name and password to sign in to secure AWS webpages like the AWS Management Console,
AWS Discussion Forums, or the AWS Support Center.
75

Amazon CloudWatch Logs User Guide
Access Control
In addition to a user name and password, you can also generate access keys for each user. You can
use these keys when you access AWS services programmatically, either through one of the several
SDKs or by using the AWS Command Line Interface (AWS CLI). The SDK and CLI tools use the
access keys to cryptographically sign your request. If you don’t use the AWS tools, you must sign
the request yourself. CloudWatch Logs supports Signature Version 4, a protocol for authenticating
inbound API requests. For more information about authenticating requests, see Signature Version 4
Signing Process in the AWS General Reference.
•IAM role – An IAM role is another IAM identity you can create in your account that has specific
permissions. It is similar to an IAM user, but it is not associated with a specific person. An IAM
role enables you to obtain temporary access keys that can be used to access AWS services and
resources. IAM roles with temporary credentials are useful in the following situations:
•Federated user access – Instead of creating an IAM user, you can use preexisting user identities
from AWS Directory Service, your enterprise user directory, or a web identity provider. These are
known as federated users. AWS assigns a role to a federated user when access is requested
through an identity provider. For more information about federated users, see Federated Users
and Roles in the IAM User Guide.
•Cross-account access – You can use an IAM role in your account to grant another AWS account
permissions to access your account’s resources. For an example, see Tutorial: Delegate Access
Across AWS Accounts Using IAM Roles in the IAM User Guide.
•AWS service access – You can use an IAM role in your account to grant an AWS service
permissions to access your account’s resources. For example, you can create a role that allows
Amazon Redshift to access an Amazon S3 bucket on your behalf and then load data stored in the
bucket into an Amazon Redshift cluster. For more information, see Creating a Role to Delegate
Permissions to an AWS Service in the IAM User Guide.
•Applications running on Amazon EC2 – Instead of storing access keys within the EC2 instance
for use by applications running on the instance and making AWS API requests, you can use an
IAM role to manage temporary credentials for these applications. To assign an AWS role to an
EC2 instance and make it available to all of its applications, you can create an instance profile that
is attached to the instance. An instance profile contains the role and enables programs running
on the EC2 instance to get temporary credentials. For more information, see Using Roles for
Applications on Amazon EC2 in the IAM User Guide.
Access Control
You can have valid credentials to authenticate your requests, but unless you have permissions you
cannot create or access CloudWatch Logs resources. For example, you must have permissions to
create log streams, create log groups, and so on.
The following sections describe how to manage permissions for CloudWatch Logs. We recommend
that you read the overview first.
•Overview of Managing Access Permissions to Your CloudWatch Logs Resources (p. 77)
•Using Identity-Based Policies (IAM Policies) for CloudWatch Logs (p. 80)
•CloudWatch Logs Permissions Reference (p. 84)
76
Amazon CloudWatch Logs User Guide
Overview of Managing Access
Overview of Managing Access Permissions to
Your CloudWatch Logs Resources
Every AWS resource is owned by an AWS account, and permissions to create or access a resource
are governed by permissions policies. An account administrator can attach permissions policies to IAM
identities (that is, users, groups, and roles), and some services (such as AWS Lambda) also support
attaching permissions policies to resources.
Note
An account administrator (or administrator user) is a user with administrator privileges. For
more information, see IAM Best Practices in the IAM User Guide.
When granting permissions, you decide who is getting the permissions, the resources they get
permissions for, and the specific actions that you want to allow on those resources.
Topics
•CloudWatch Logs Resources and Operations (p. 77)
•Understanding Resource Ownership (p. 77)
•Managing Access to Resources (p. 78)
•Specifying Policy Elements: Actions, Effects, and Principals (p. 79)
•Specifying Conditions in a Policy (p. 80)
CloudWatch Logs Resources and Operations
In CloudWatch Logs the primary resources are log groups and destinations. CloudWatch Logs does
not support subresources (other resources for use with the primary resource).
These resources and subresources have unique Amazon Resource Names (ARNs) associated with
them as shown in the following table.
Resource Type ARN Format
Log group arn:aws:logs:region:account-
id:log_group_name
Destination arn:aws:logs:region:account-
id:destination:destination_name
For more information about ARNs, see ARNs in IAM User Guide. For information about CloudWatch
Logs ARNs, see Amazon Resource Names (ARNs) and AWS Service Namespaces in Amazon Web
Services General Reference. For an example of a policy that covers CloudWatch Logs, see Using
Identity-Based Policies (IAM Policies) for CloudWatch Logs (p. 80).
CloudWatch Logs provides a set of operations to work with the CloudWatch Logs resources. For a list
of available operations, see CloudWatch Logs Permissions Reference (p. 84).
Understanding Resource Ownership
The AWS account owns the resources that are created in the account, regardless of who created the
resources. Specifically, the resource owner is the AWS account of the principal entity (that is, the root
account, an IAM user, or an IAM role) that authenticates the resource creation request. The following
examples illustrate how this works:
77

Amazon CloudWatch Logs User Guide
Managing Access to Resources
• If you use the root account credentials of your AWS account to create a log group, your AWS
account is the owner of the CloudWatch Logs resource.
• If you create an IAM user in your AWS account and grant permissions to create CloudWatch Logs
resources to that user, the user can create CloudWatch Logs resources. However, your AWS
account, to which the user belongs, owns the CloudWatch Logs resources.
• If you create an IAM role in your AWS account with permissions to create CloudWatch Logs
resources, anyone who can assume the role can create CloudWatch Logs resources. Your AWS
account, to which the role belongs, owns the CloudWatch Logs resources.
Managing Access to Resources
A permissions policy describes who has access to what. The following section explains the available
options for creating permissions policies.
Note
This section discusses using IAM in the context of CloudWatch Logs. It doesn't provide
detailed information about the IAM service. For complete IAM documentation, see What Is
IAM? in the IAM User Guide. For information about IAM policy syntax and descriptions, see
AWS IAM Policy Reference in the IAM User Guide.
Policies attached to an IAM identity are referred to as identity-based policies (IAM polices) and policies
attached to a resource are referred to as resource-based policies. CloudWatch Logs supports identity-
based policies, and resource-based policies for destinations, which are used to enable cross account
subscriptions. For more information, see Cross-Account Log Data Sharing with Subscriptions (p. 58).
Topics
•Identity-Based Policies (IAM Policies) (p. 78)
•Resource-Based Policies (p. 79)
Identity-Based Policies (IAM Policies)
You can attach policies to IAM identities. For example, you can do the following:
•Attach a permissions policy to a user or a group in your account – To grant a user permissions
to view logs in the CloudWatch Logs, console you can attach a permissions policy to a user or group
that the user belongs to.
•Attach a permissions policy to a role (grant cross-account permissions) – You can attach an
identity-based permissions policy to an IAM role to grant cross-account permissions. For example,
the administrator in Account A can create a role to grant cross-account permissions to another AWS
account (for example, Account B) or an AWS service as follows:
1. Account A administrator creates an IAM role and attaches a permissions policy to the role that
grants permissions on resources in Account A.
2. Account A administrator attaches a trust policy to the role identifying Account B as the principal
who can assume the role.
3. Account B administrator can then delegate permissions to assume the role to any users in
Account B. Doing this allows users in Account B to create or access resources in Account A.
The principal in the trust policy an also be an AWS service principal if you want to grant an AWS
service permissions to assume the role.
For more information about using IAM to delegate permissions, see Access Management in the IAM
User Guide.
The following is an example policy that grants permissions for the logs:PutLogEvents,
logs:CreateLogGroup, and logs:CreateLogStream actions on all resources in us-east-1. For
78
Amazon CloudWatch Logs User Guide
Specifying Policy Elements:
Actions, Effects, and Principals
log groups, CloudWatch Logs supports identifying specific resources using the resource ARNs (also
referred to as resource-level permissions) for some of the API actions. If you want to include all log
groups, you must specify the wildcard character (*).
{
"Version" : "2012-10-17",
"Statement" : [
{
"Sid" : "",
"Effect" : "Allow",
"Principal" : {
"AWS" : "234567890123"
},
"Action" : [
"logs:PutLogEvents",
"logs:CreateLogGroup",
"logs:CreateLogStream",
"Resource" : "arn:aws:logs:us-east-1:*:*"
}
]
}
For more information about using identity-based policies with CloudWatch Logs, see Using Identity-
Based Policies (IAM Policies) for CloudWatch Logs (p. 80). For more information about users,
groups, roles, and permissions, see Identities (Users, Groups, and Roles) in the IAM User Guide.
Resource-Based Policies
CloudWatch Logs supports resource-based policies for destinations, which you can use to enable
cross account subscriptions. For more information, see Create a Destination (p. 59). Destinations
can be created using the PutDestination API, and you can add a resource policy to the destination
using the PutDestination API. The following example allows another AWS account with the
account ID 111122223333 to subscribe their log groups to the destination arn:aws:logs:us-
east-1:123456789012:destination:testDestination.
{
"Version" : "2012-10-17",
"Statement" : [
{
"Sid" : "",
"Effect" : "Allow",
"Principal" : {
"AWS" : "111122223333"
},
"Action" : "logs:PutSubscriptionFilter",
"Resource" : "arn:aws:logs:us-
east-1:123456789012:destination:testDestination"
}
]
}
Specifying Policy Elements: Actions, Effects,
and Principals
For each CloudWatch Logs resource, the service defines a set of API operations. To grant permissions
for these API operations, CloudWatch Logs defines a set of actions that you can specify in a policy.
79

Amazon CloudWatch Logs User Guide
Specifying Conditions in a Policy
Some API operations can require permissions for more than one action in order to perform the API
operation. For more information about resources and API operations, see CloudWatch Logs Resources
and Operations (p. 77) and CloudWatch Logs Permissions Reference (p. 84).
The following are the basic policy elements:
•Resource – You use an Amazon Resource Name (ARN) to identify the resource that the policy
applies to. For more information, see CloudWatch Logs Resources and Operations (p. 77).
•Action – You use action keywords to identify resource operations that you want to allow or deny. For
example, the logs.DescribeLogGroups permission allows the user permissions to perform the
DescribeLogGroups operation.
•Effect – You specify the effect, either allow or deny, when the user requests the specific action.
If you don't explicitly grant access to (allow) a resource, access is implicitly denied. You can also
explicitly deny access to a resource, which you might do to make sure that a user cannot access it,
even if a different policy grants access.
•Principal – In identity-based policies (IAM policies), the user that the policy is attached to is the
implicit principal. For resource-based policies, you specify the user, account, service, or other entity
that you want to receive permissions (applies to resource-based policies only). CloudWatch Logs
supports resource-based policies for destinations.
To learn more about IAM policy syntax and descriptions, see AWS IAM Policy Reference in the IAM
User Guide.
For a table showing all of the CloudWatch Logs API actions and the resources that they apply to, see
CloudWatch Logs Permissions Reference (p. 84).
Specifying Conditions in a Policy
When you grant permissions, you can use the access policy language to specify the conditions when a
policy should take effect. For example, you might want a policy to be applied only after a specific date.
For more information about specifying conditions in a policy language, see Condition in the IAM User
Guide.
To express conditions, you use predefined condition keys. There are no condition keys specific to
CloudWatch Logs. However, there are AWS-wide condition keys that you can use as appropriate. For
a complete list of AWS-wide keys, see Available Keys for Conditions in the IAM User Guide.
Using Identity-Based Policies (IAM Policies)
for CloudWatch Logs
This topic provides examples of identity-based policies in which an account administrator can attach
permissions policies to IAM identities (that is, users, groups, and roles).
Important
We recommend that you first review the introductory topics that explain the basic concepts
and options available for you to manage access to your CloudWatch Logs resources. For
more information, see Overview of Managing Access Permissions to Your CloudWatch Logs
Resources (p. 77).
This topic covers the following:
•Permissions Required to Use the CloudWatch Console (p. 81)
•AWS Managed (Predefined) Policies for CloudWatch Logs (p. 83)
80
Amazon CloudWatch Logs User Guide
Permissions Required to Use
the CloudWatch Console
•Customer Managed Policy Examples (p. 83)
The following is an example of a permissions policy:
{
"Version": "2012-10-17",
"Statement": [
{
"Effect": "Allow",
"Action": [
"logs:CreateLogGroup",
"logs:CreateLogStream",
"logs:PutLogEvents",
"logs:DescribeLogStreams"
],
"Resource": [
"arn:aws:logs:*:*:*"
]
}
]
}
This policy has one statement that grants permissions to create log groups and log streams, to upload
log events to log streams, and to list details about log streams.
The wildcard character (*) at the end of the Resource value means that the statement allows
permission for the logs:CreateLogGroup, logs:CreateLogStream, logs:PutLogEvents,
and logs:DescribeLogStreams actions on any log group. To limit this permission to a specific
log group, replace the wildcard character (*) in the resource ARN with the specific log group ARN.
For more information about the sections within an IAM policy statement, see IAM Policy Elements
Reference in IAM User Guide. For a list showing all of the CloudWatch Logs actions, see CloudWatch
Logs Permissions Reference (p. 84).
Permissions Required to Use the CloudWatch
Console
For a user to work with CloudWatch Logs in the CloudWatch console, that user must have a minimum
set of permissions that allows the user to describe other AWS resources in their AWS account. In order
to use CloudWatch Logs in the CloudWatch console, you must have permissions from the following
services:
• CloudWatch
• CloudWatch Logs
• Amazon ES
• IAM
• Amazon Kinesis
• Lambda
• Amazon S3
If you create an IAM policy that is more restrictive than the minimum required permissions, the console
won't function as intended for users with that IAM policy. To ensure that those users can still use the
CloudWatch console, also attach the CloudWatchReadOnlyAccess managed policy to the user, as
described in AWS Managed (Predefined) Policies for Amazon CloudWatch.
81

Amazon CloudWatch Logs User Guide
Permissions Required to Use
the CloudWatch Console
You don't need to allow minimum console permissions for users that are making calls only to the AWS
CLI or the CloudWatch Logs API.
The full set of permissions required to work with the CloudWatch console are listed below:
• cloudwatch:getMetricData
• cloudwatch:getMetricDataForAccounts
• es:describeElasticsearchDomain
• es:listDomainNames
• iam:attachRolePolicy
• iam:createRole
• iam:getPolicy
• iam:getPolicyVersion
• iam:getRole
• iam:listAttachedRolePolicies
• iam:listRoles
• kinesis:describeStreams
• kinesis:listStreams
• lambda:addPermission
• lambda:createFunction
• lambda:getFunctionConfiguration
• lambda:listAliases
• lambda:listFunctions
• lambda:listVersionsByFunction
• lambda:removePermission
• logs:cancelExportTask
• logs:createExportTask
• logs:createLogGroup
• logs:createLogStream
• logs:deleteLogGroup
• logs:deleteLogStream
• logs:deleteMetricFilter
• logs:deleteRetentionPolicy
• logs:deleteSubscriptionFilter
• logs:describeExportTasks
• logs:describeLogGroups
• logs:describeLogStreams
• logs:describeMetricFilters
• logs:describeSubscriptionFilters
• logs:filterLogEvents
• logs:getLogEvents
• logs:putMetricFilter
• logs:putRetentionPolicy
• logs:putSubscriptionFilter
• logs:testMetricFilter
• s3:listBuckets
82
Amazon CloudWatch Logs User Guide
AWS Managed (Predefined)
Policies for CloudWatch Logs
AWS Managed (Predefined) Policies for
CloudWatch Logs
AWS addresses many common use cases by providing standalone IAM policies that are created and
administered by AWS. Managed policies grant necessary permissions for common use cases so
you can avoid having to investigate what permissions are needed. For more information, see AWS
Managed Policies in the IAM User Guide.
The following AWS managed policies, which you can attach to users in your account, are specific to
CloudWatch Logs:
•CloudWatchLogsFullAccess – Grants full access to CloudWatch Logs.
•CloudWatchLogsReadOnlyAccess – Grants read-only access to CloudWatch Logs.
Note
You can review these permissions policies by signing in to the IAM console and searching for
specific policies there.
You can also create your own custom IAM policies to allow permissions for CloudWatch Logs actions
and resources. You can attach these custom policies to the IAM users or groups that require those
permissions.
Customer Managed Policy Examples
In this section, you can find example user policies that grant permissions for various CloudWatch Logs
actions. These policies work when you are using the CloudWatch Logs API, AWS SDKs, or the AWS
CLI.
Examples
•Example 1: Allow Full Access to CloudWatch Logs (p. 83)
•Example 2: Allow Read-Only Access to CloudWatch Logs (p. 83)
Example 1: Allow Full Access to CloudWatch Logs
The following policy allows a user to access all CloudWatch Logs actions.
{
"Version": "2012-10-17",
"Statement": [
{
"Action": [
"logs:*"
],
"Effect": "Allow",
"Resource": "*"
}
]
}
Example 2: Allow Read-Only Access to CloudWatch Logs
The following policy allows a user read-only access to CloudWatch Logs data.
83
Amazon CloudWatch Logs User Guide
CloudWatch Logs Permissions Reference
{
"Version":"2012-10-17",
"Statement":[
{
"Action":[
"logs:Describe*",
"logs:Get*",
"logs:TestMetricFilter",
"logs:FilterLogEvents"
],
"Effect":"Allow",
"Resource":"*"
}
]
}
CloudWatch Logs Permissions Reference
When you are setting up Access Control (p. 76) and writing permissions policies that you can attach
to an IAM identity (identity-based policies), you can use the following table as a reference. The table
lists each CloudWatch Logs API operation and the corresponding actions for which you can grant
permissions to perform the action. You specify the actions in the policy's Action field, and you specify
a wildcard character (*) as the resource value in the policy's Resource field.
You can use AWS-wide condition keys in your CloudWatch Logs policies to express conditions. For a
complete list of AWS-wide keys, see Available Keys in the IAM User Guide.
Note
To specify an action, use the logs: prefix followed by the API operation name. For example:
logs:CreateLogGroup, logs:CreateLogStream, or logs:* (for all CloudWatch Logs
actions).
CloudWatch Logs API Operations and Required Permissions for Actions
CloudWatch Logs API Operations Required Permissions (API Actions)
CancelExportTask logs:CancelExportTask
Required to cancel a pending or running export
task.
CreateExportTask logs:CreateExportTask
Required to export data from a log group to an
Amazon S3 bucket.
CreateLogGroup logs:CreateLogGroup
Required to create a new log group.
CreateLogStream logs:CreateLogStream
Required to create a new log stream in a log
group.
DeleteDestination logs:DeleteDestination
84
Amazon CloudWatch Logs User Guide
CloudWatch Logs Permissions Reference
CloudWatch Logs API Operations Required Permissions (API Actions)
Required to delete a log destination and disables
any subscription filters to it.
DeleteLogGroup logs:DeleteLogGroup
Required to delete a log group and any
associated archived log events.
DeleteLogStream logs:DeleteLogStream
Required to delete a log stream and any
associated archived log events.
DeleteMetricFilter logs:DeleteMetricFilter
Required to delete a metric filter associated with
a log group.
DeleteRetentionPolicy logs:DeleteRetentionPolicy
Required to delete a log group's retention policy.
DeleteSubscriptionFilter logs:DeleteSubscriptionFilter
Required to delete the subscription filter
associated with a log group.
DescribeDestinations logs:DescribeDestinations
Required to view all destinations associated with
the account.
DescribeExportTasks logs:DescribeExportTasks
Required to view all export tasks associated with
the account.
DescribeLogGroups logs:DescribeLogGroups
Required to view all log groups associated with
the account.
DescribeLogStreams logs:DescribeLogStreams
Required to view all log streams associated with
a log group.
DescribeMetricFilters logs:DescribeMetricFilters
Required to view all metrics associated with a log
group.
DescribeSubscriptionFilters logs:DescribeSubscriptionFilters
Required to view all subscription filters
associated with a log group.
85
Amazon CloudWatch Logs User Guide
CloudWatch Logs Permissions Reference
CloudWatch Logs API Operations Required Permissions (API Actions)
FilterLogEvents logs:FilterLogEvents
Required to sort log events by log group filter
pattern.
GetLogEvents logs:GetLogEvents
Required to retrieve log events from a log
stream.
PutDestination logs:PutDestination
Required to create or update a destination log
stream (such as an Amazon Kinesis stream).
PutDestinationPolicy logs:PutDestinationPolicy
Required to create or update an access policy
associated with an existing log destination.
PutLogEvents logs:PutLogEvents
Required to upload a batch of log events to a log
stream.
PutMetricFilter logs:PutMetricFilter
Required to create or update a metric filter and
associate it with a log group.
PutRetentionPolicy logs:PutRetentionPolicy
Required to set the number of days to keep log
events (retention) in a log group.
PutSubscriptionFilter logs:PutSubscriptionFilter
Required to create or update a subscription filter
and associate it with a log group.
TestMetricFilter logs:TestMetricFilter
Required to test a filter pattern against a
sampling of log event messages.
86

Amazon CloudWatch Logs User Guide
CloudWatch Logs Information in CloudTrail
Logging Amazon CloudWatch
Logs API Calls in AWS CloudTrail
AWS CloudTrail is a service that captures API calls made by or on behalf of your AWS account. This
information is collected and written to log files that are stored in an Amazon S3 bucket that you specify.
API calls are logged whenever you use the API, the console, or the AWS CLI. Using the information
collected by CloudTrail, you can determine what request was made, the source IP address the request
was made from, who made the request, when it was made, and so on.
To learn more about CloudTrail, including how to configure and enable it, see the What is AWS
CloudTrail in the AWS CloudTrail User Guide.
Topics
•CloudWatch Logs Information in CloudTrail (p. 87)
•Understanding Log File Entries (p. 88)
CloudWatch Logs Information in CloudTrail
If CloudTrail logging is turned on, calls made to API actions are captured in log files. Every log file entry
contains information about who generated the request. For example, if a request is made to create
CloudWatch Logs log stream (CreateLogStream), CloudTrail logs the user identity of the person or
service that made the request.
The user identity information in the log entry helps you determine the following:
• Whether the request was made with root or IAM user credentials
• Whether the request was made with temporary security credentials for a role or federated user
• Whether the request was made by another AWS service
For more information, see the CloudTrail userIdentity Element in the AWS CloudTrail User Guide.
You can store your log files in your bucket for as long as you want, but you can also define Amazon
S3 lifecycle rules to archive or delete log files automatically. By default, your log files are encrypted by
using Amazon S3 server-side encryption (SSE).
87

Amazon CloudWatch Logs User Guide
Understanding Log File Entries
If you want to be notified upon log file delivery, you can configure CloudTrail to publish Amazon SNS
notifications when new log files are delivered. For more information, see Configuring Amazon SNS
Notifications for CloudTrail in the AWS CloudTrail User Guide.
You can also aggregate Amazon CloudWatch Logs log files from multiple AWS regions and multiple
AWS accounts into a single Amazon S3 bucket. For more information, see Receiving CloudTrail Log
Files from Multiple Regions and Receiving CloudTrail Log Files from Multiple Accounts in the AWS
CloudTrail User Guide.
When logging is turned on, the following request and response elements are logged for these API
actions in CloudTrail:
• CancelExportTask
• CreateExportTask
• CreateLogGroup
• CreateLogStream
• DeleteDestination
• DeleteLogGroup
• DeleteLogStream
• DeleteMetricFilter
• DeleteRetentionPolicy
• DeleteSubscriptionFilter
• PutDestination
• PutDestinationPolicy
• PutMetricFilter
• PutRetentionPolicy
• PutSubscriptionFilter
• TestMetricFilter
Only Request elements are logged for these API actions:
• DescribeDestinations
• DescribeExportTasks
• DescribeLogGroups
• DescribeLogStreams
• DescribeMetricFilters
• DescribeSubscriptionFilters
The CloudWatch Logs GetLogEvents, PutLogEvents, and FilterLogEvents API actions are
not supported. For more information about these actions, see the Amazon CloudWatch Logs API
Reference.
Understanding Log File Entries
CloudTrail log files contain one or more log entries. Each entry lists multiple JSON-formatted events.
A log entry represents a single request from any source and includes information about the requested
action, the date and time of the action, request parameters, and so on. The log entries are not an
ordered stack trace of the public API calls, so they do not appear in any specific order. Log file entries
for all API actions are similar to the examples below.
88
Amazon CloudWatch Logs User Guide
Understanding Log File Entries
The following log file entry shows that a user called the CloudWatch Logs CreateExportTask action.
{
"eventVersion": "1.03",
"userIdentity": {
"type": "IAMUser",
"principalId": "EX_PRINCIPAL_ID",
"arn": "arn:aws:iam::123456789012:user/someuser",
"accountId": "123456789012",
"accessKeyId": "AKIAIOSFODNN7EXAMPLE",
"userName": "someuser"
},
"eventTime": "2016-02-08T06:35:14Z",
"eventSource": "logs.amazonaws.com",
"eventName": "CreateExportTask",
"awsRegion": "us-east-1",
"sourceIPAddress": "127.0.0.1",
"userAgent": "aws-sdk-ruby2/2.0.0.rc4 ruby/1.9.3 x86_64-linux
Seahorse/0.1.0",
"requestParameters": {
"destination": "yourdestination",
"logGroupName": "yourloggroup",
"to": 123456789012,
"from": 0,
"taskName": "yourtask"
},
"responseElements": {
"taskId": "15e5e534-9548-44ab-a221-64d9d2b27b9b"
},
"requestID": "1cd74c1c-ce2e-12e6-99a9-8dbb26bd06c9",
"eventID": "fd072859-bd7c-4865-9e76-8e364e89307c",
"eventType": "AwsApiCall",
"apiVersion": "20140328",
"recipientAccountId": "123456789012"
}
89
Amazon CloudWatch Logs User Guide
Document History
The following table describes the important changes to the Amazon CloudWatch Logs User's Guide.
Change Description Release Date
Console usability
improvements Improved the experience to make it easier to
search, filter, and troubleshoot. For example, you
can now filter your log data to a date and time
range. For more information, see Viewing Log
Data (p. 27).
29 August 2016
Added AWS
CloudTrail support
for Amazon
CloudWatch
Logs and new
CloudWatch Logs
metrics
Added AWS CloudTrail support for CloudWatch
Logs. For more information, see Logging
Amazon CloudWatch Logs API Calls in AWS
CloudTrail (p. 87).
10 March 2016
Added support for
CloudWatch Logs
export to Amazon
S3
Added support for exporting CloudWatch Logs data
to Amazon S3. For more information, see Exporting
Log Data in Bulk to Amazon S3 (p. 66).
7 December 2015
Added support for
AWS CloudTrail
logged events
in Amazon
CloudWatch Logs
You can create alarms in CloudWatch and receive
notifications of particular API activity as captured
by CloudTrail and use the notification to perform
troubleshooting.
November 10, 2014
Added support
for Amazon
CloudWatch Logs
You can use Amazon CloudWatch Logs to monitor,
store, and access your system, application, and
custom log files from Amazon Elastic Compute
Cloud (Amazon EC2) instances or other sources.
You can then retrieve the associated log data from
CloudWatch Logs using the Amazon CloudWatch
console, the CloudWatch Logs commands in the
AWS CLI, or the CloudWatch Logs SDK. For more
information, see What is Amazon CloudWatch
Logs? (p. 1).
July 10, 2014
90