700 Americantower Investorrelations Towers 101 2Q14
User Manual: 700
Open the PDF directly: View PDF ![]() .
.
Page Count: 73

Introduction to the Tower Industry
and American Tower
As of June 30, 2014

Forward Looking Statements
“Safe Harbor” Statement under the Private Securities Litigation Reform Act of 1995: This
presentation contains forward-looking statements concerning our goals, beliefs, strategies,
future operating results and underlying assumptions. Actual results may differ materially from
those indicated by these forward-looking statements as a result of various important factors,
including those described in the appendix attached hereto, Item 1A of our Form 10-Q for the
quarter ended June 30, 2014 under the caption “Risk Factors” and other filings we make with the
SEC. We undertake no obligation to update the information contained in this presentation to
reflect subsequently occurring events or circumstances. Definitions and reconciliations to GAAP
measures are provided at the end of the presentation.
2

The Tower Asset
Section 1
3
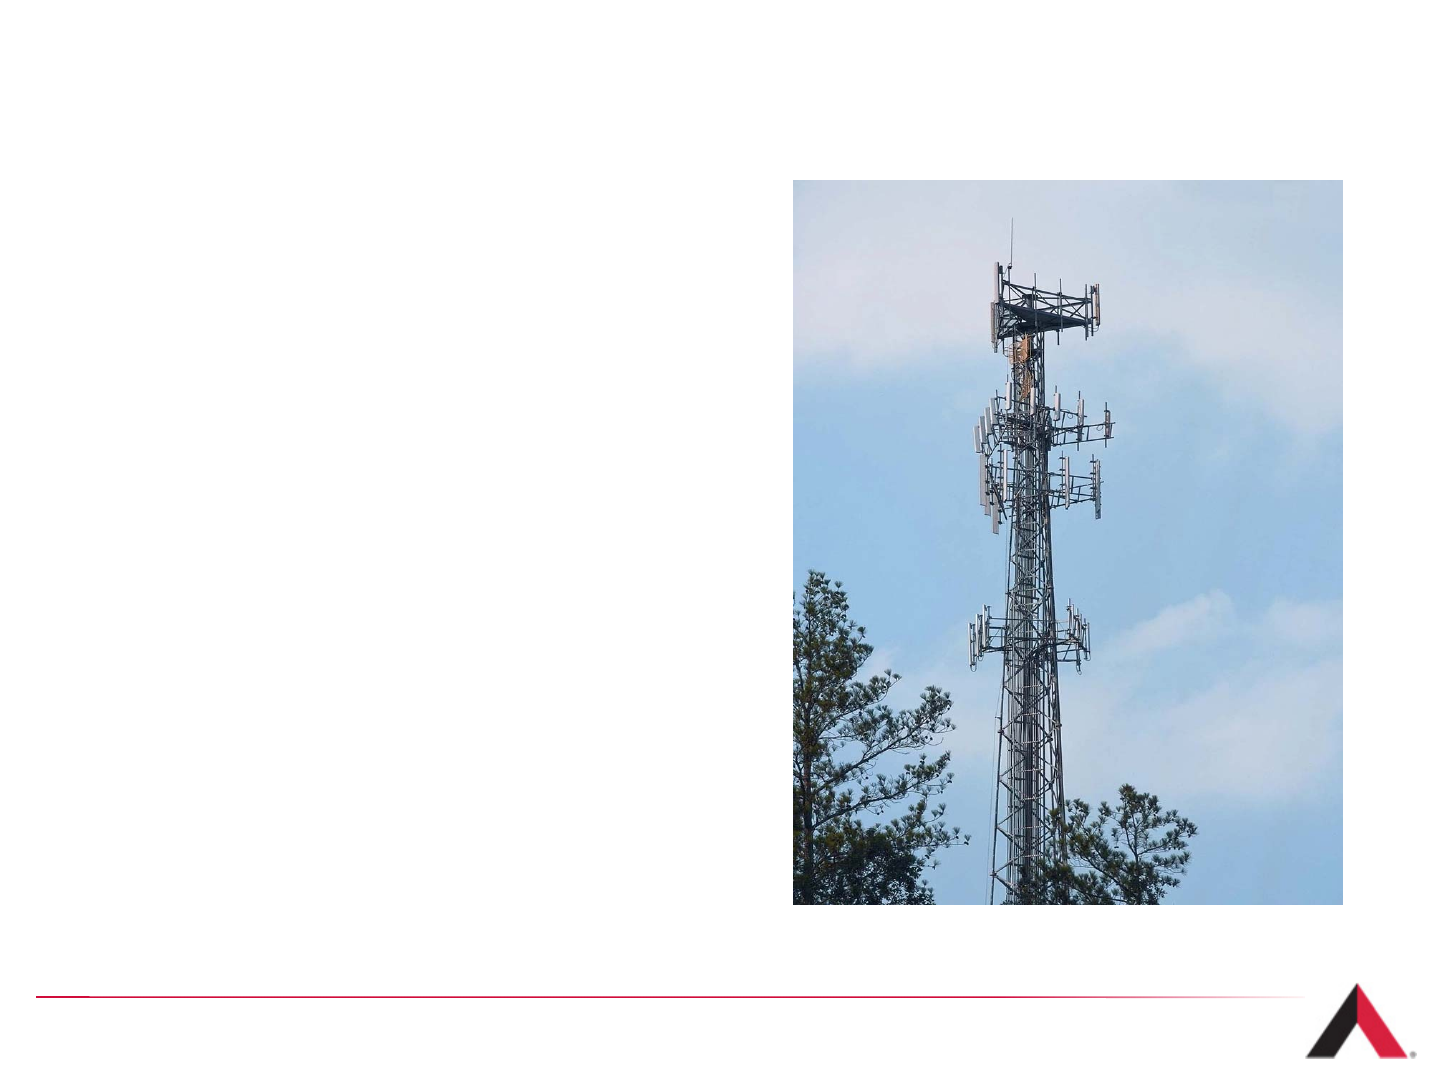
Wireless Tower Basics
What is a tower?
›A vertical structure built on a parcel of land,
designed to accommodate multiple tenants
›Our tenants utilize many different technologies,
including telephony, mobile data, broadcast
television and radio
›Tenants lease vertical space on the tower and
portions of the land underneath for
their equipment
What is found at the tower site?
›Tower company typically owns or leases under
a long-term contract:
›Tower structure
›Ground interest (fee simple or lease)
›Tenant typically owns and operates:
›Equipment, including antenna arrays,
antenna, coaxial cables and base stations
›Equipment shelters
4
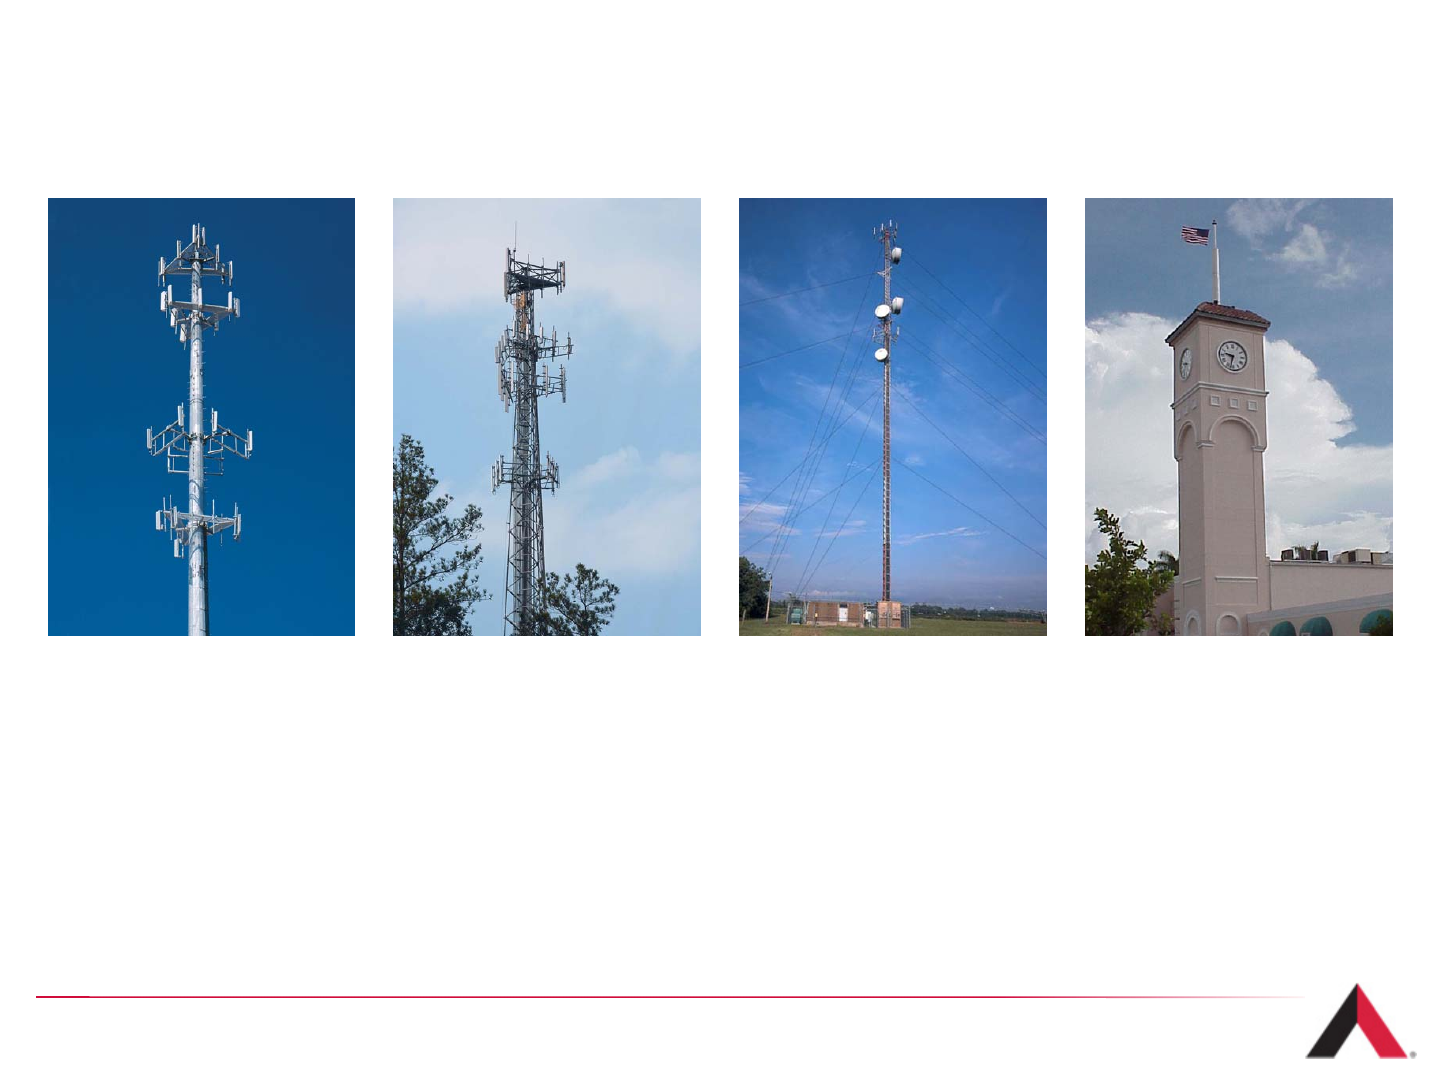
Types of Towers
5
Monopole
›100 - 200 feet
›Typical use: telephony
Lattice
›200 - 400 feet
›Also called self-support
›Typical use: telephony
Guyed
›200 - 2,000 feet
›Typical use: television and
radio broadcasting, paging
and telephony
Stealth
›Range in size
›Generally used to maintain
aesthetic quality of area
›Particularly useful in
areas with strict zoning
regulations

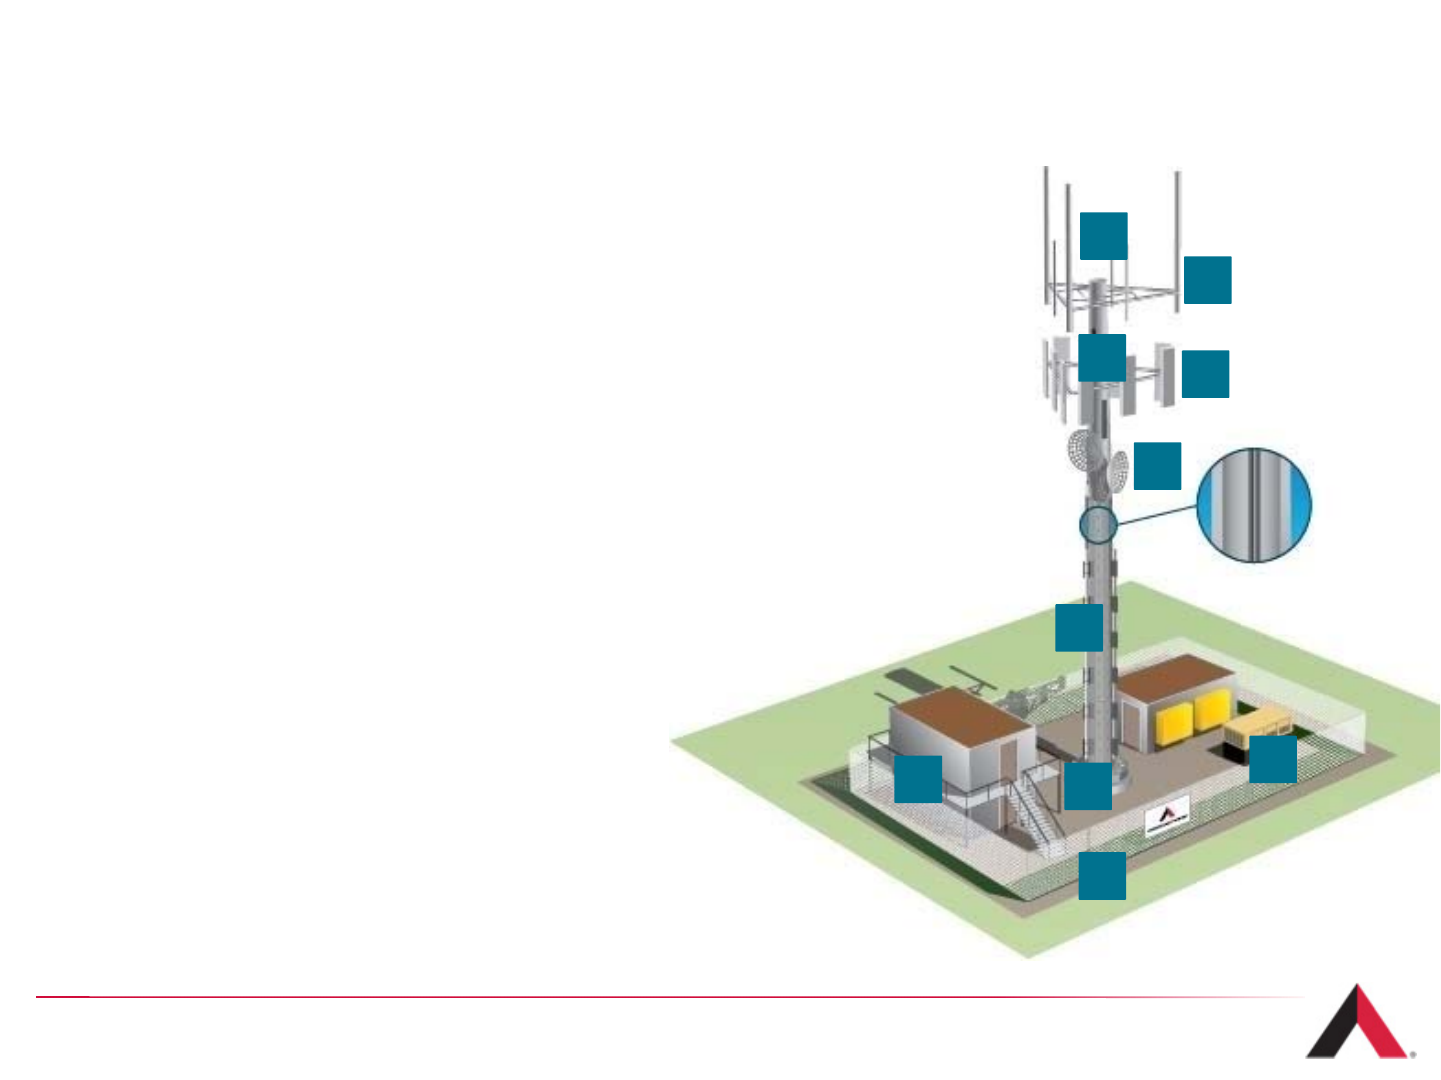
Typical Tower Components
1. Whip Antenna
›A stiff, monopole antenna, usually mounted vertically.
2. Antenna Array
›A platform (typically three sided) where tenants place equipment to provide
signal transmission and reception to a specific area. The number of antennas
necessary per array is determined based on a number of factors, including:
›the number of active subscribers;
›the volume and type of network usage by subscribers
(e.g., average minutes of use, voice versus data);
›the technology being used (e.g.: CDMA, GSM, LTE);
›the type of spectrum currently utilized by the tenant.
3. Port Holes
›Holes cut into the base and top of tower to allow cables
and wiring to pass through the tower structure, from the
base station to the antennas.
4. Panel / Antenna
›Tenant equipment which transmits a signal from the
tower to a mobile device or vice versa.
5. Microwave Dish
›A specific type of antenna, which is used in point-to-point radio, television and
data communications. Also commonly used by wireless carriers for backhaul.
6
1
2
34
5
6
78
9
10
8
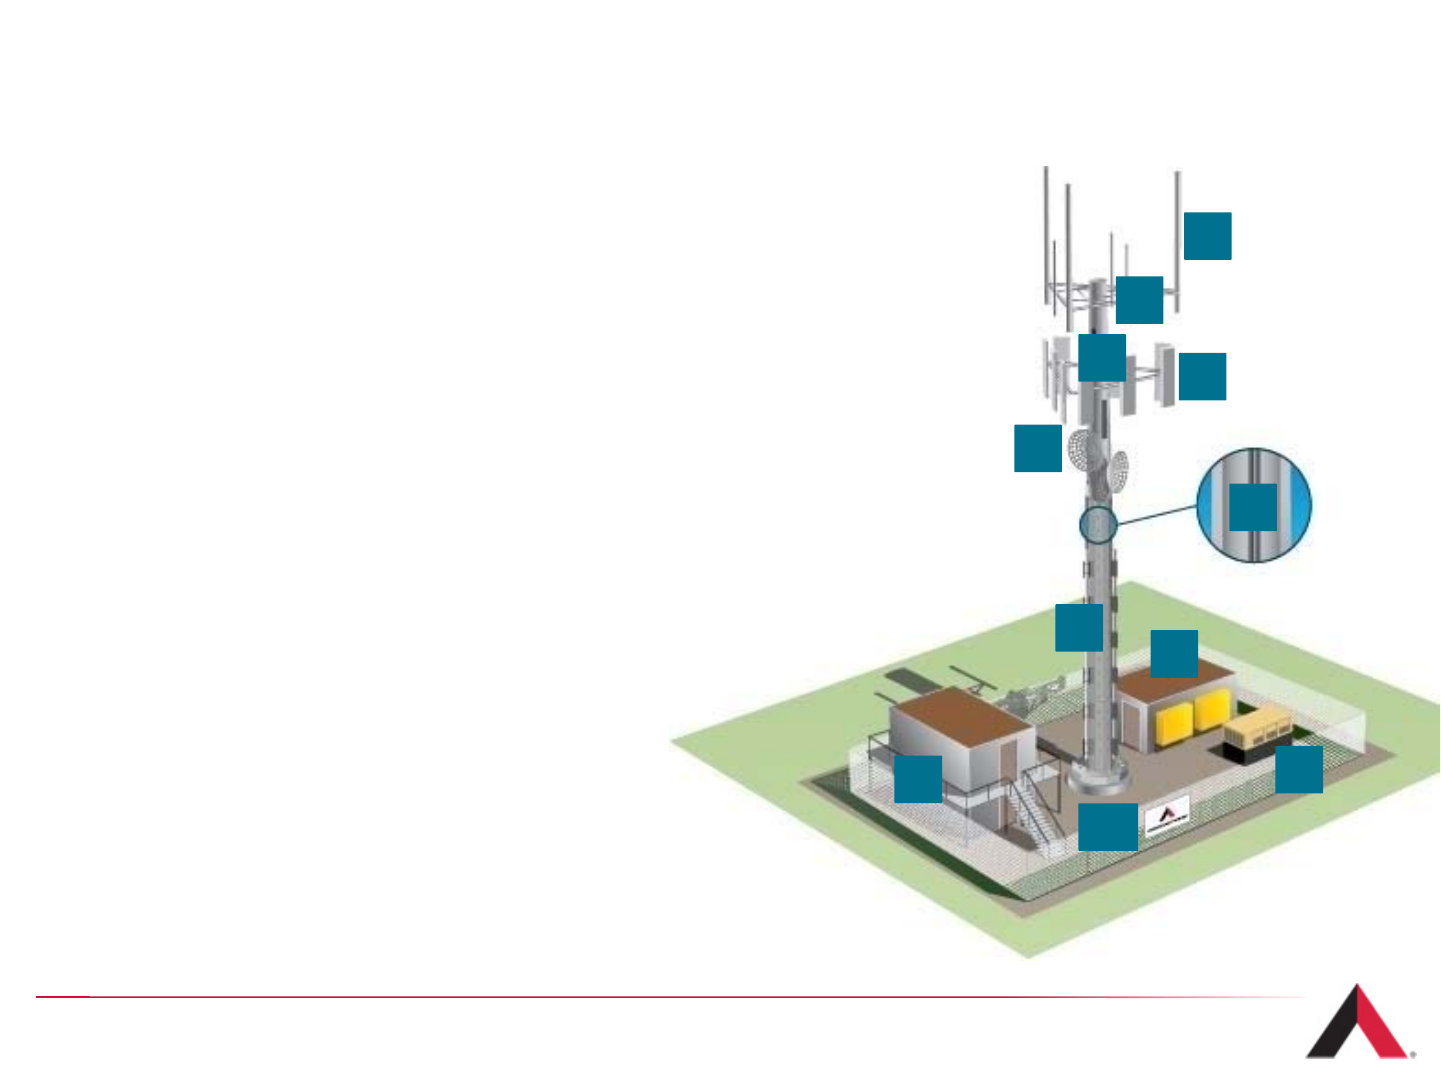
Typical Tower Components (continued)
6. Coaxial Cabling (Fiber)
›Transmission lines that carry the signal received from the antenna to the base
station or vice versa.
7. Reinforcement Bars
›Threaded anchors which are used to reinforce towers to add additional
capacity to accommodate further tenants.
8. Shelters
›Buildings at sites used by our tenants to house communications,
radio and network equipment. Some shelters are designed to be stacked
on top of one another to conserve space at smaller sites.
9. Generator
›Gas or diesel powered generators provide emergency backup
power to keep tenant equipment operational during power outages.
AMT has also introduced Backup Power Solution to allow
multiple tenants to use a single generator.
10. Ground Space
›The area within a site where tenants
lease space from the tower company to place
their shelters and generators.
7
1
2
34
5
6
78
9
8
10
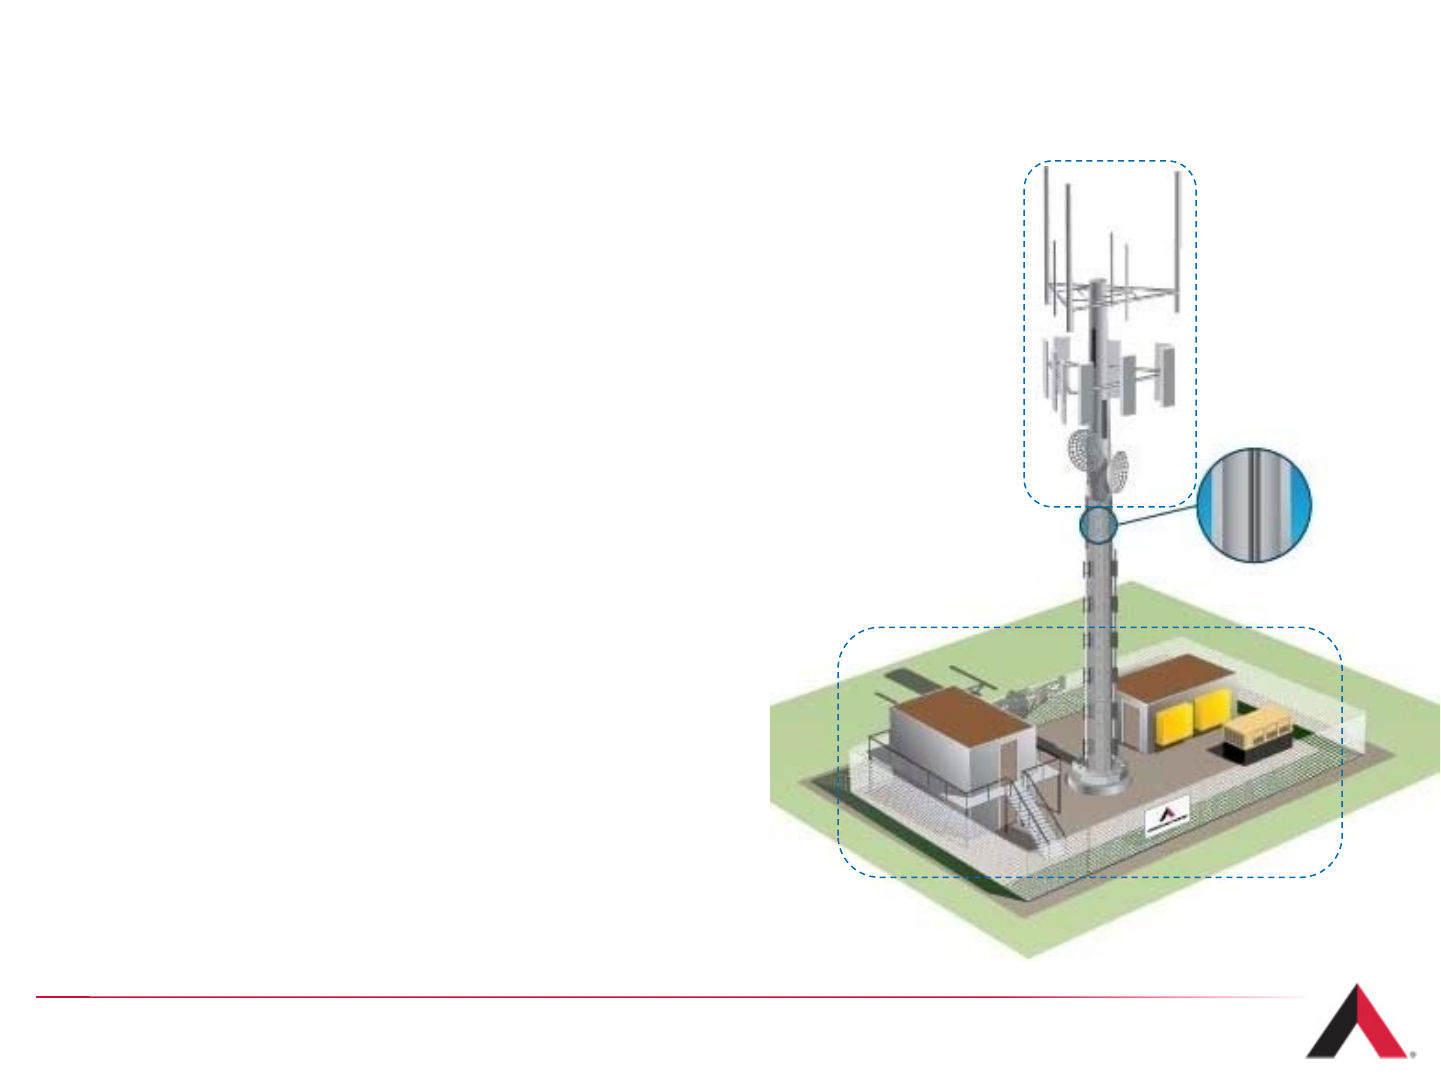
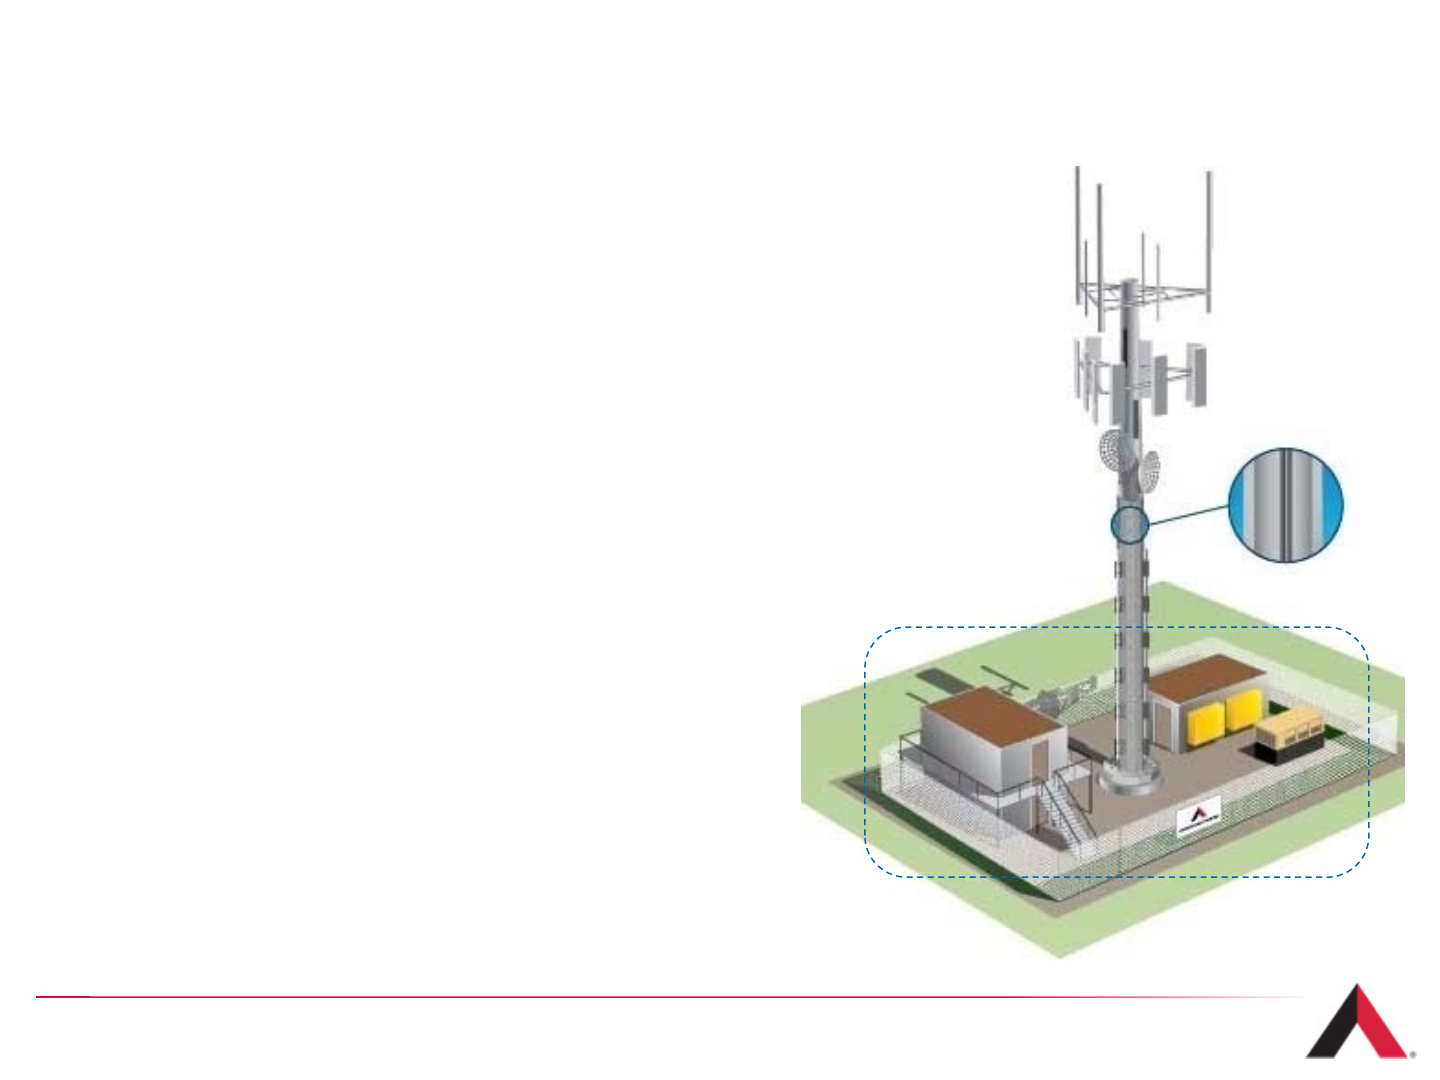
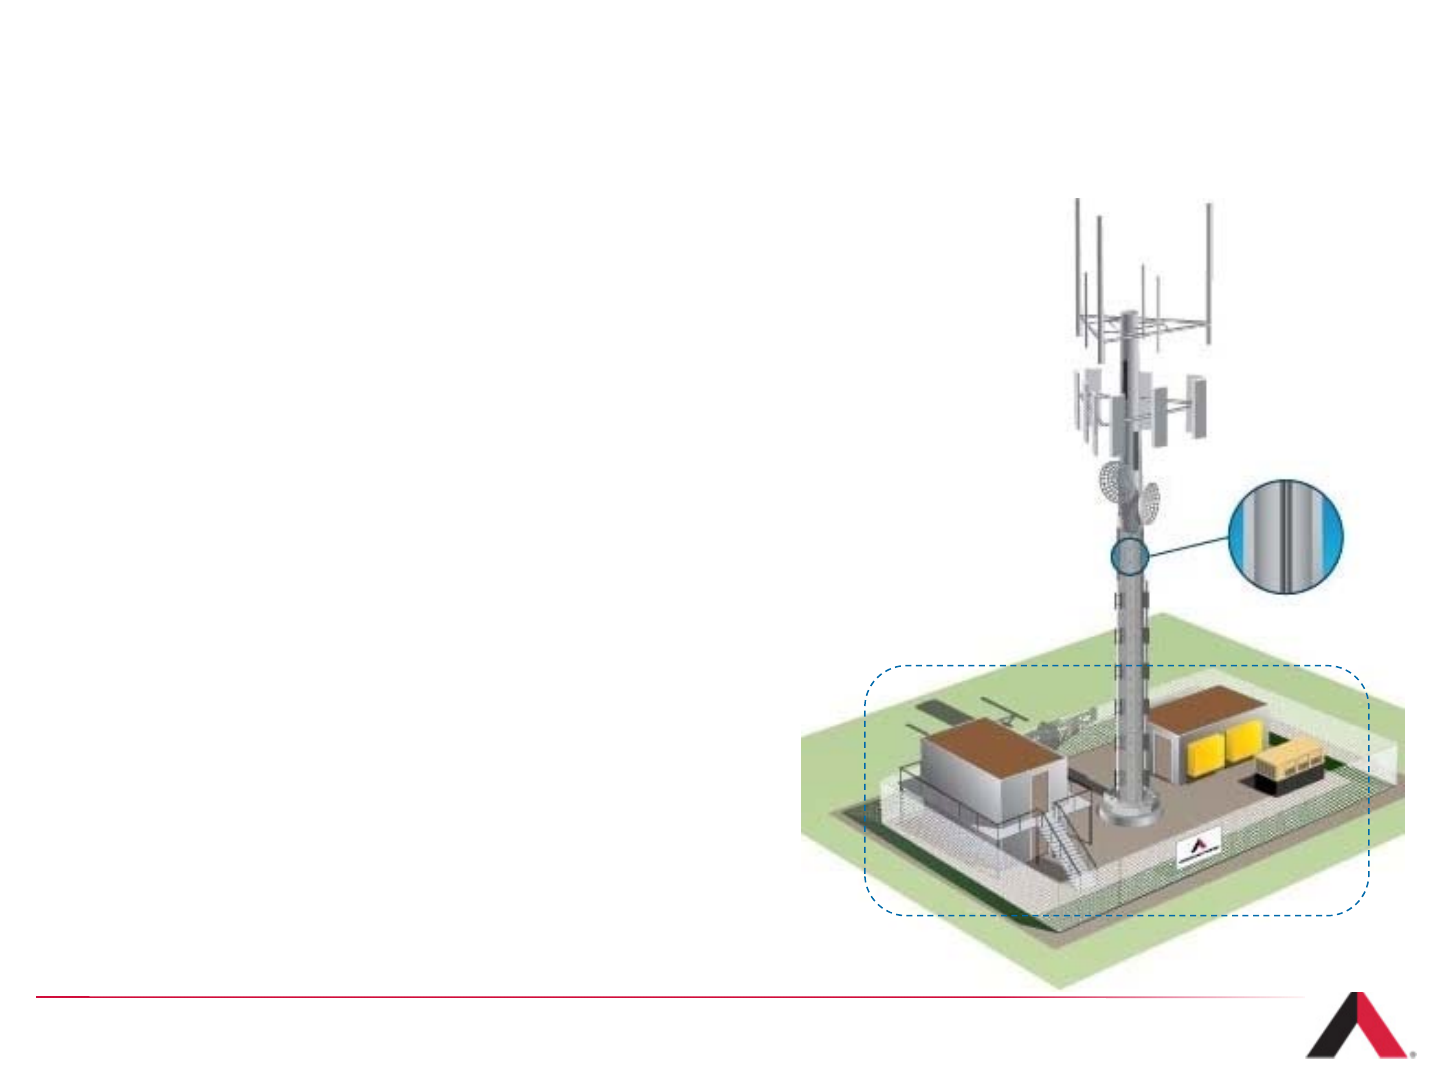
Sample Component Ownership Overview
Owned by American Tower
›Tower structure – our tower sites are typically
constructed with the capacity to support
~4 - 5 tenants
›Land parcel owned or operated pursuant to
a long-term lease by American Tower
›Generators are sometimes owned by American Tower
to help facilitate back-up power for the site’s tenants
8
AMT
Owned by Tenants
›Antenna equipment, including
microwave equipment
›Tenant shelters containing
base station equipment and HVAC,
which tenants own, operate and maintain
›Coaxial cable
AMT
TEN
TEN
TEN
TEN
TEN
TEN
AMT

The Business Model
Section 2
9
Recurring Long-Term Revenue Stream
Revenues
Sources
›Multiple tenants lease vertical space on the tower
and portions of the ground for their
communications equipment
›Rental charges are typically based on:
›Property location
›Leased vertical square footage on the tower
›Weight placed on tower from transmission
equipment and backhaul solutions
›Square footage leased on the ground
10
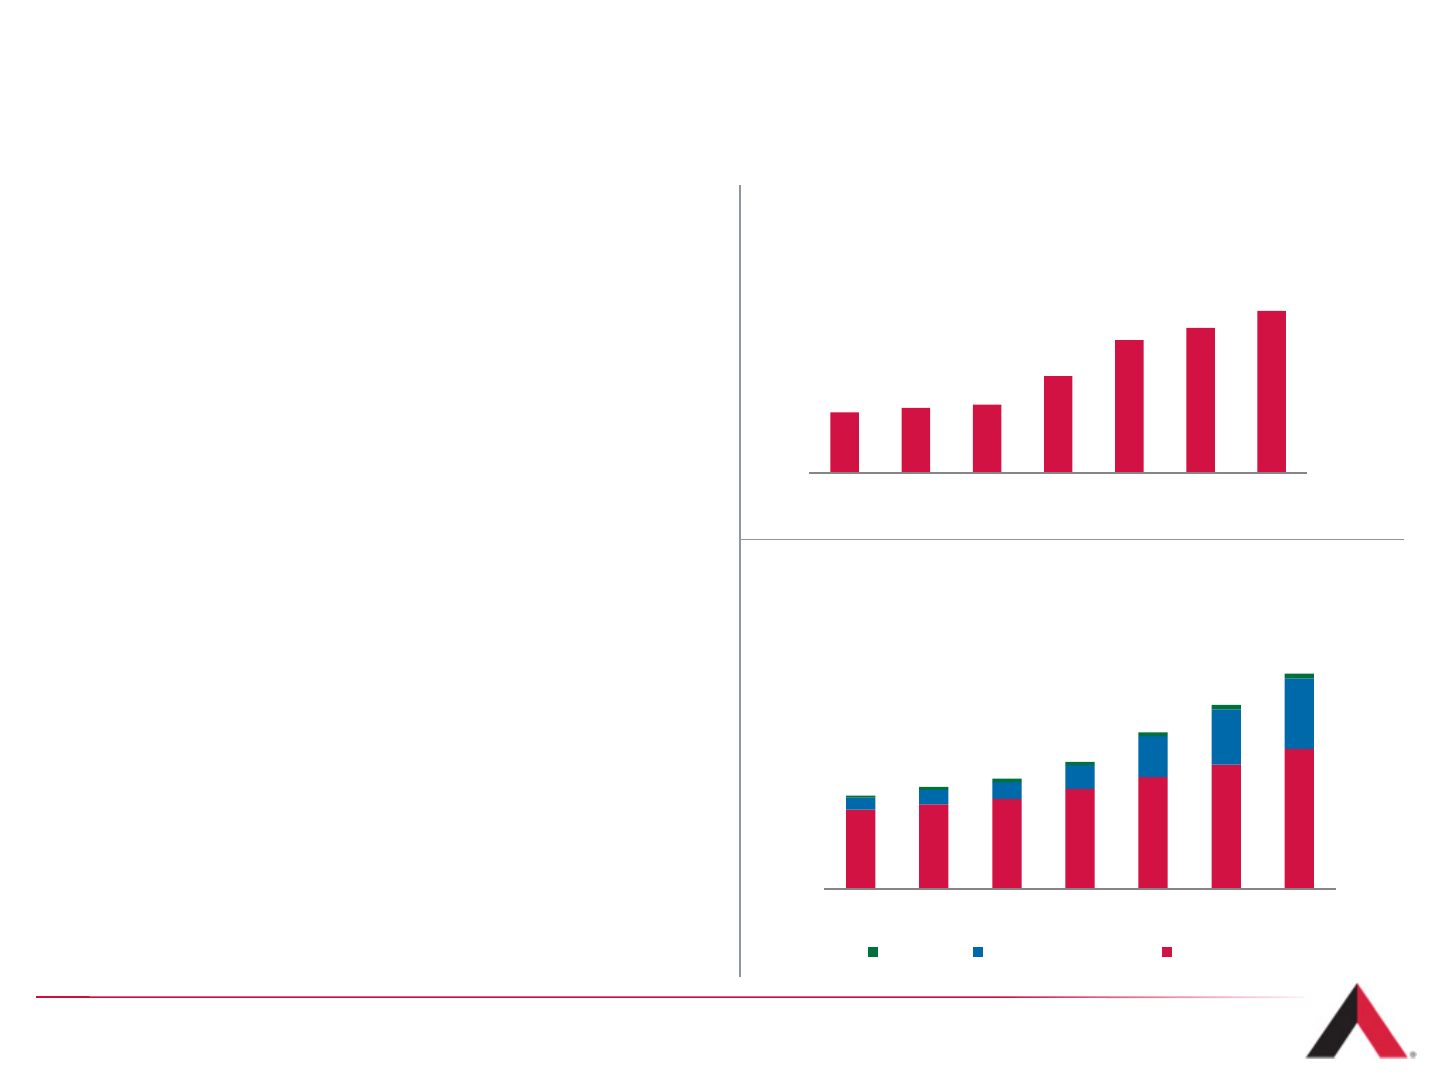
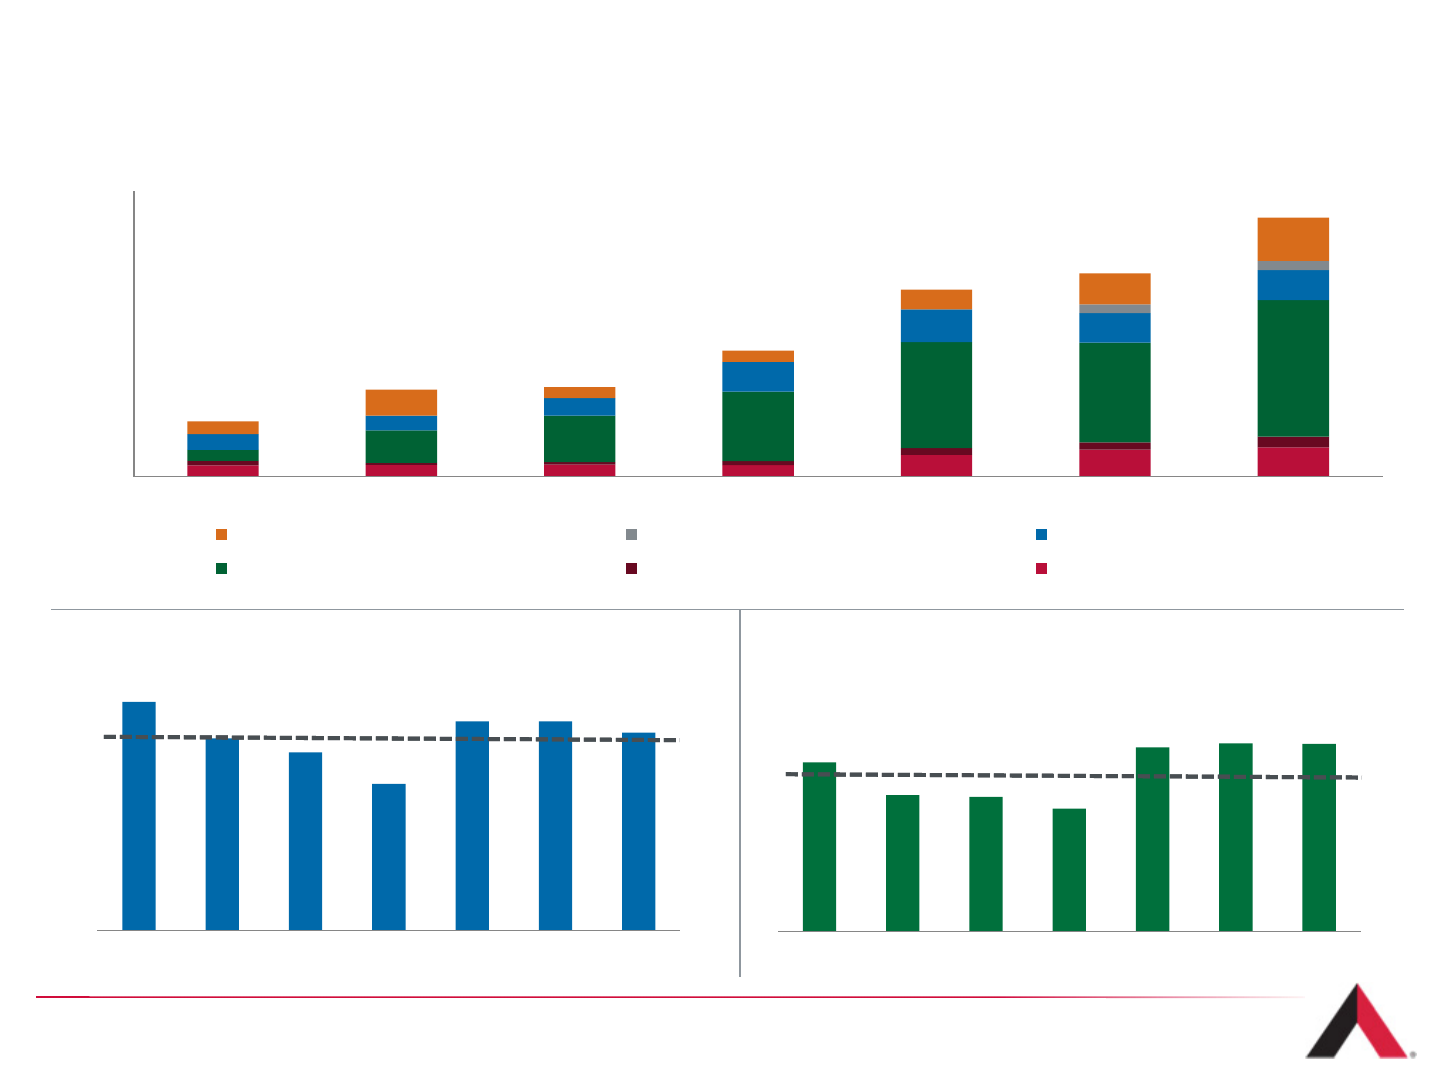
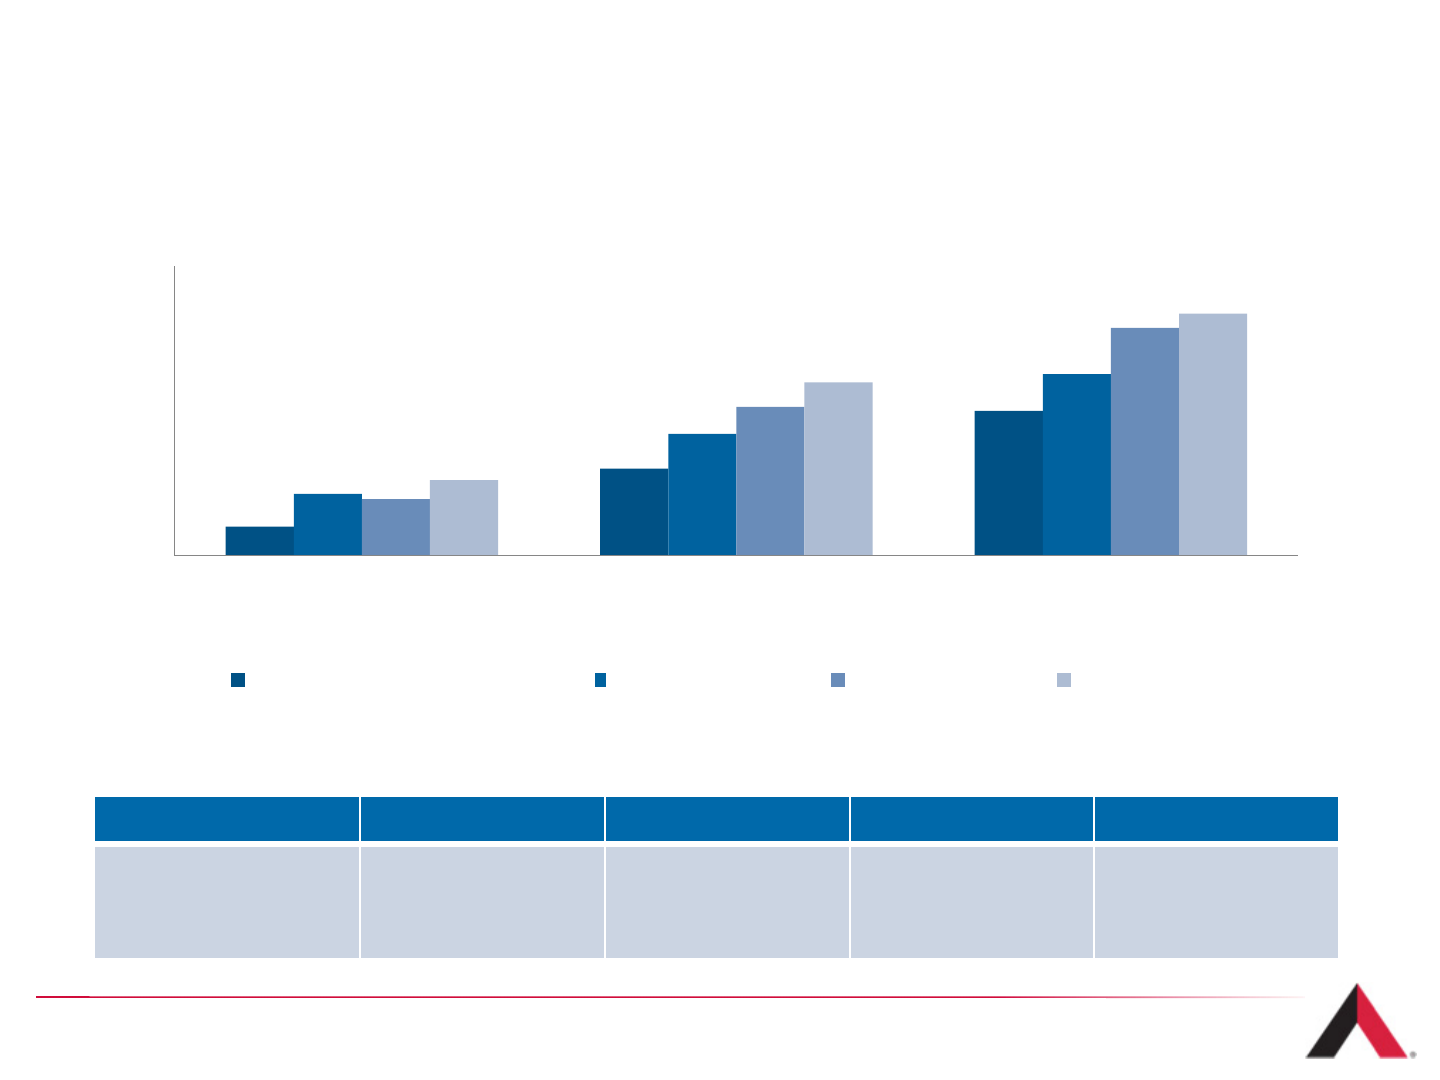
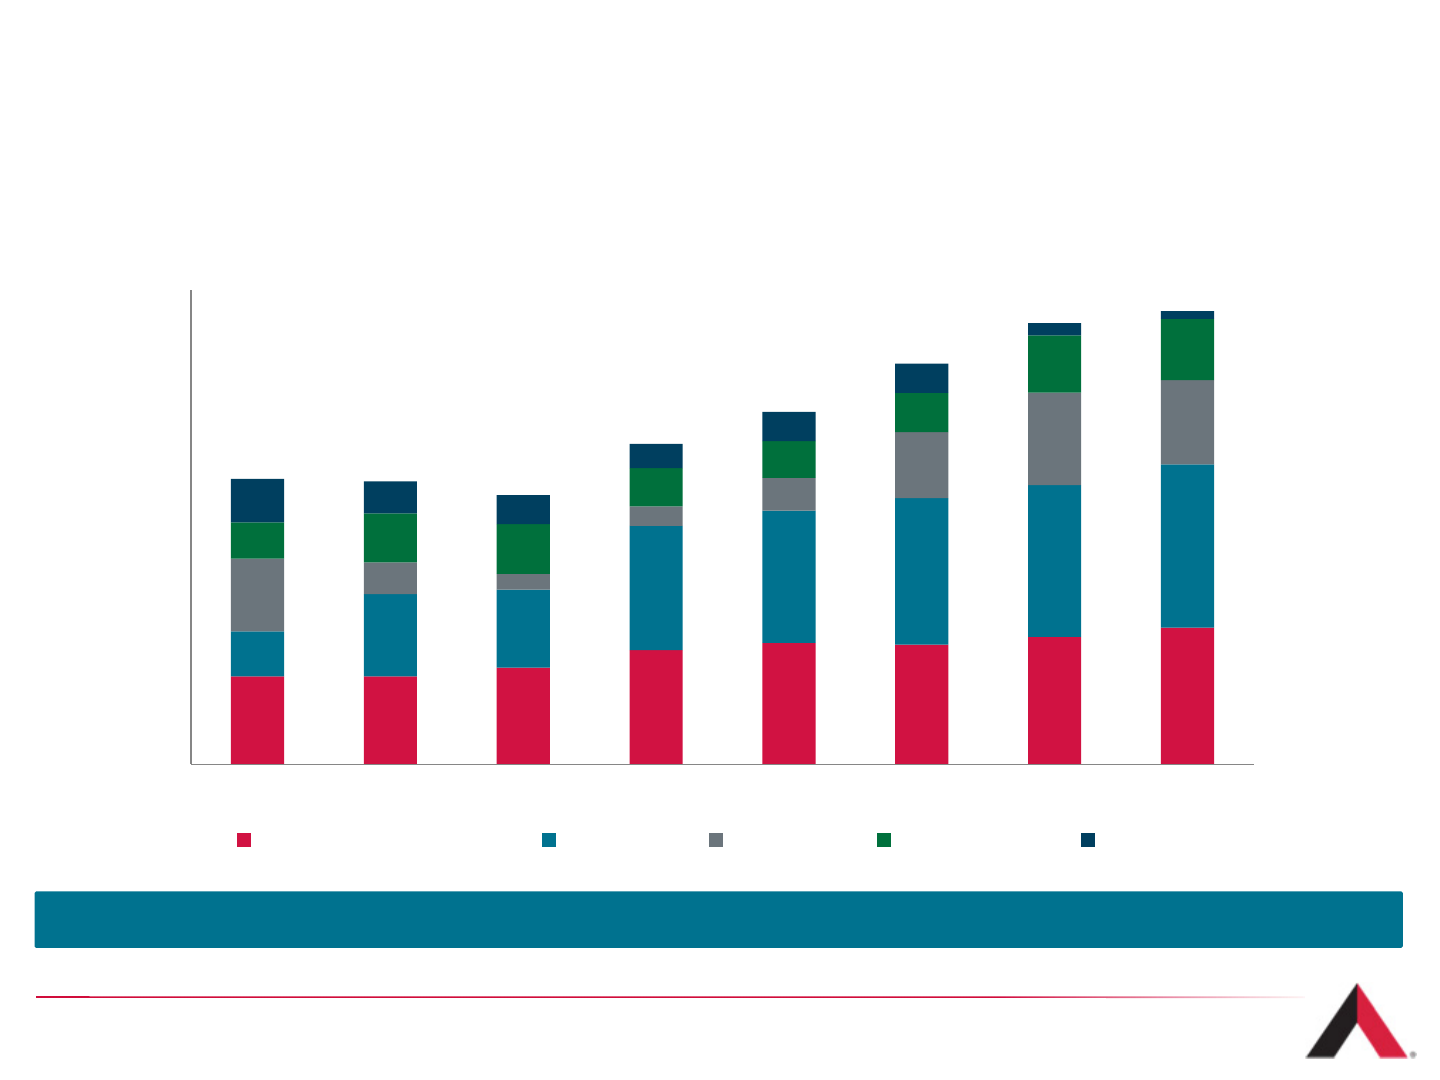
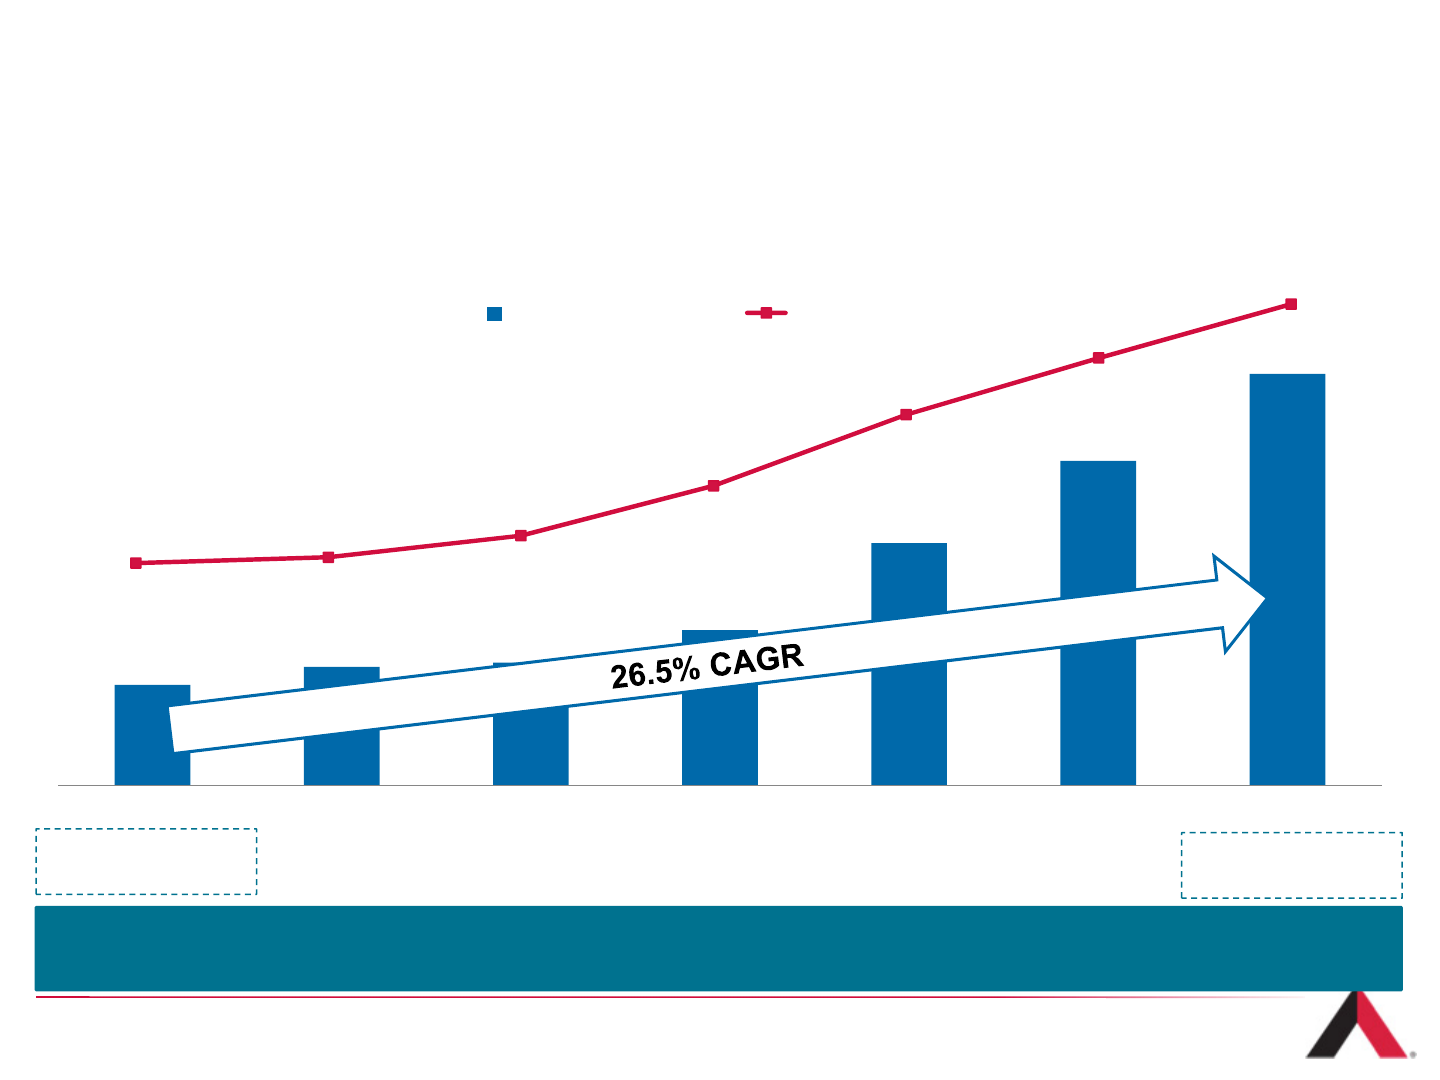
Recurring Long-Term Revenue Stream (Cont.)
11
$8 $9 $10
$14
$19 $20 $23
2007 2008 2009 2010 2011 2012 2013
AMT Non-Cancellable Revenue
Backlog
($ in billions)
2007 2008 2009 2010 2011 2012 2013
Services International R&M Domestic R&M
$1.5 $1.6 $1.7 $2.0 $2.4
$2.9
$3.4
AMT Segment Revenue(1)
($ in billions)
Revenues
Long-Term Customer Leases
›Contracts are typically non-cancellable
›Typical contract terms include an initial term of
10 years with multiple 5-year renewal periods
›Annual lease escalators in the U.S. of
approximately 3%
›Escalations in international markets are
typically based on local inflation rates
›Historically low annual churn of approximately
1 - 2%
(1) “R&M” refers to Rental and Management.
U.S. Operating Cost Structure
Direct Cost of Operations (1)
Sources
›Ground rent
›Monitoring
›Insurance
Land Interest Attributes
›Own ~29% of land under our U.S. sites
›Approximately 68% of sites are on owned land or have a
ground lease with at least 20 years until renewal
›Long-term leases: average remaining ground lease term is
approximately 25 years until final maturity in the U.S.
›Annual lease escalators in the U.S. of approximately
3%
›Selectively purchasing land interests where return
hurdles are met
Fixed Cost Structure of Towers
›Additional tenants result in minimal incremental operating
costs
12
›Real estate taxes
›Utilities and fuel
›Site maintenance
(1) Characteristics as of June 30, 2014
Largely Fixed Operating Cost Structure
International Operating Cost Structure
Direct Cost of Operations (1)
Sources
›Ground rent
›Monitoring
›Insurance
Land Interest Attributes
›Long-term leases: average remaining ground lease term is
approximately ~12 years internationally
›International escalators are typically based on local
inflation indexes
Pass Through
›Our international markets typically pass through a portion
of their operating expenses to the tenant (e.g., ground
rent, fuel)
Fixed Cost Structure of Towers
›Additional tenants result in minimal incremental operating
costs
13
›Real estate taxes
›Utilities and fuel
›Site maintenance
(1) Characteristics as of June 30, 2014
Similar to U.S. Cost Structure but with ability to pass-through expenses to tenant

Low Ongoing Capital Requirements
Capital Expenditure Types:
Revenue-Maintaining Capex:
•Capital Improvements
•Includes spending on lighting systems, fence repairs and ground upkeep. Approximately $500 per tower annually in Latin American
markets, ~$600 in India, ~$700 in EMEA markets and $1,500-$1,750 in the U.S.
•Corporate
•Capital spending primarily on IT infrastructure.
Revenue-Generating Capex:
•Redevelopment
•Capital spending to increase capacity of towers (e.g. height extension, foundation strengthening, etc.).
•Cost is typically shared with the tenant and investment payback period on net capex is typically one to two years.
•Ground Lease Purchases
•Capital spending to purchase land under our sites.
•Discretionary Capital Projects
•Capital spending primarily for the construction of new communications sites and generators
•Start-Up Capital Projects
•Expenditures that are specific to acquisitions and new market launches and that are contemplated in the business cases for these
investments.
14
$-
$100
$200
$300
$400
$500
$600
$700
$800
2007 2008 2009 2010 2011 2012 2013
Redevelopment Start-Up Capital Projects Ground Lease Purchases
Discretionary Capital Projects Corporate Capital Improvements
Historical Capital Spending
15
$1.9
$1.6 $1.5
$1.2
$1.7 $1.7 $1.7
2007 2008 2009 2010 2011 2012 2013
Revenue-Maintaining Capex per Tower
($ in thousands)
Total Capital Expenditures
($ in millions)
3.1%
2.5% 2.4% 2.2%
3.3% 3.4% 3.4%
2007 2008 2009 2010 2011 2012 2013
Revenue-Maintaining Capex
as % of Tower Revenue
Average:
$1.6 Average:
2.9%
Accommodating Additional Tenants
When a tower has reached its initial design capacity, there
remain many ways for us to accommodate future tenant demand.
Redevelopment Capex Examples
1. Height Extension
›Allows for more equipment and more tenants
2. Multiple Antenna Mounting Scenarios
›Options include whips, panels, microwaves and various combinations determined by
internal RF engineering
3. Port Hole Additions
›Additional entry and exit port designs accommodate additional coaxial cables
4. Tower Reinforcements
›Adds structural strength to accommodate additional tenants
5. Strengthened Foundation
›Increases load capacity of the tower
6. Backup Power Generator
›Provided by American Tower, maximizes compound
space
7. Stacked Shelters
›Shelter stacked atop an existing shelter using a steel platform
8. Extended Ground Space
›Where space allows, expanded to accommodate more equipment
16
2
2
3
56
4
8
7
2
1
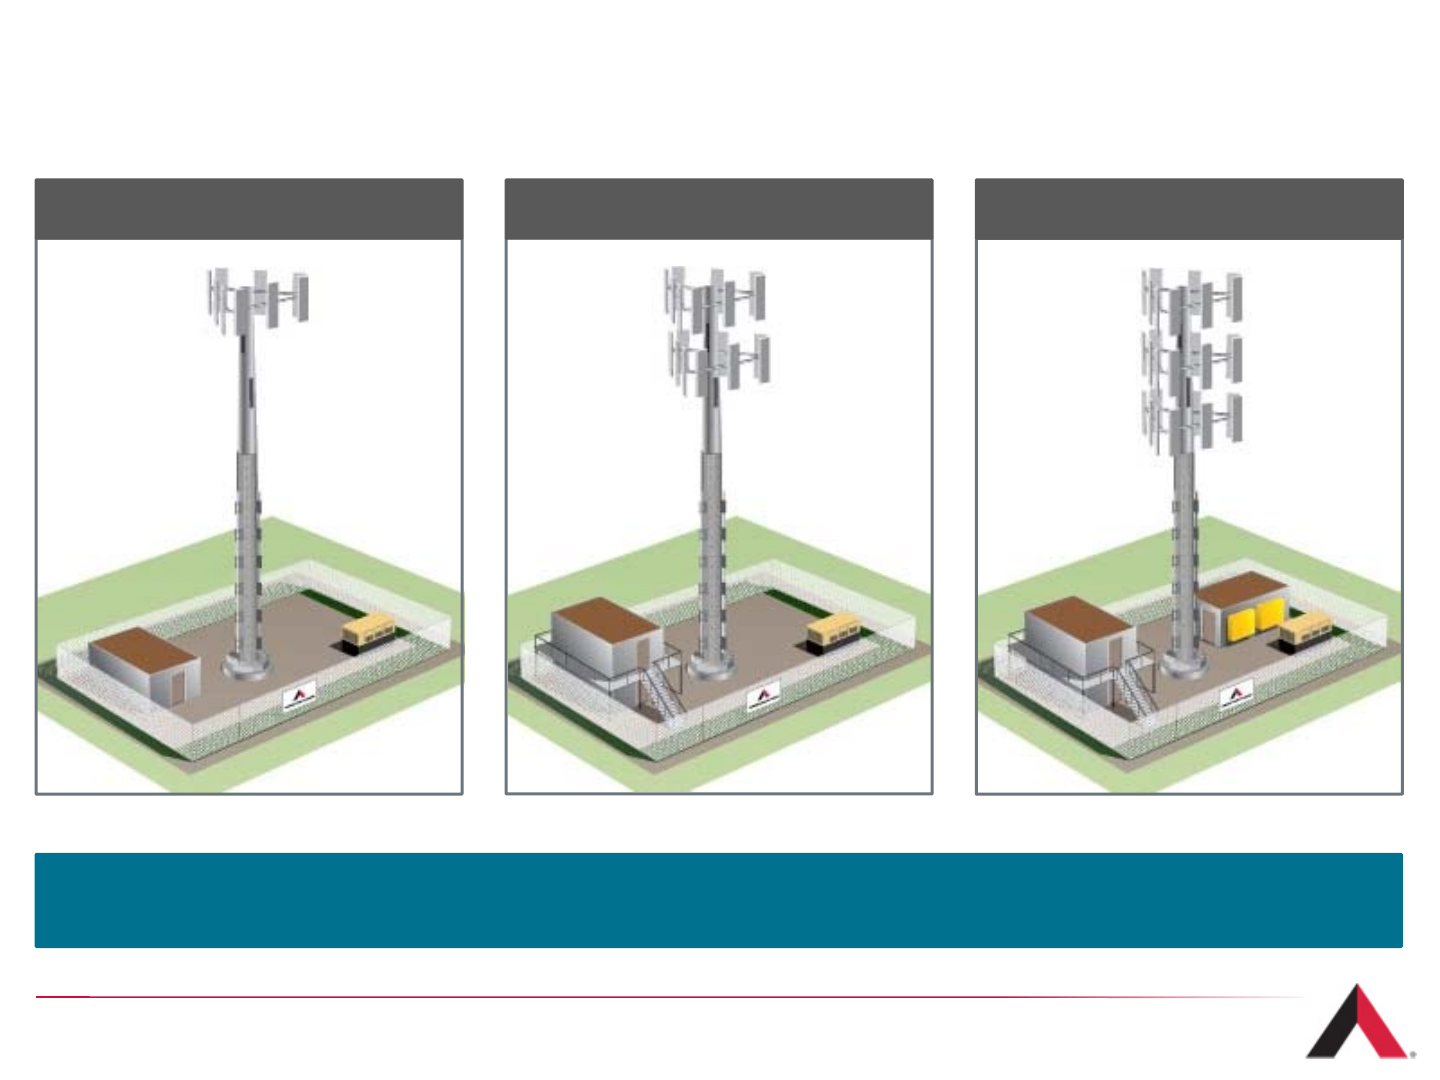
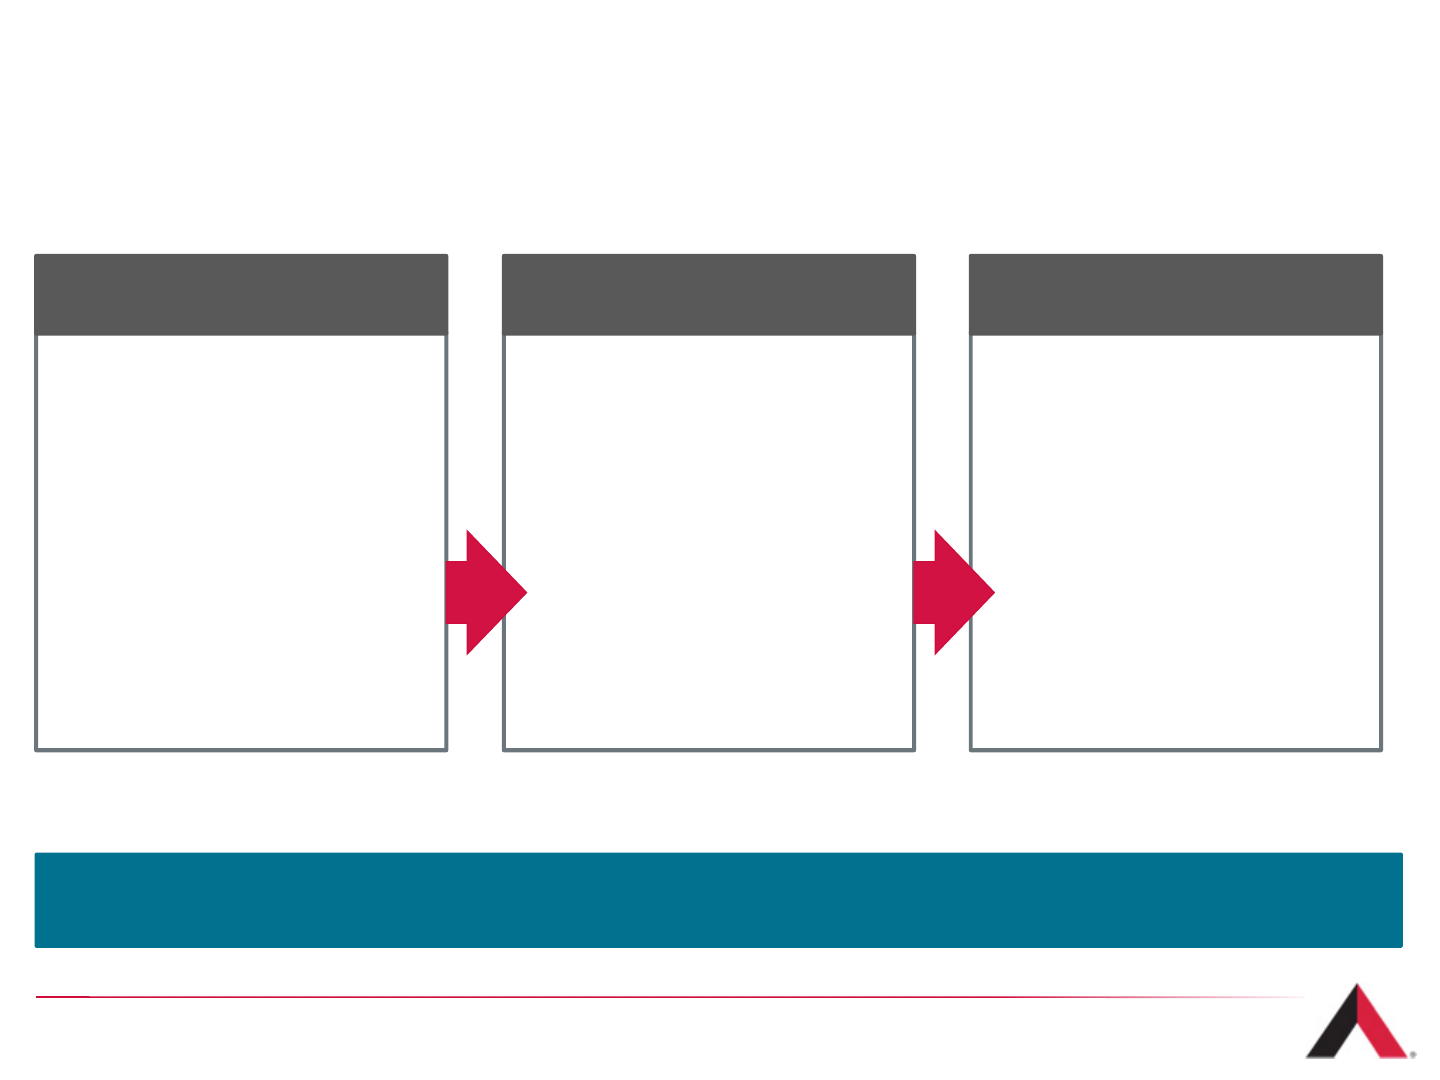
Sample Macro Tower Leasing Scenario
17
Adding tenants, equipment and upgrades results in significantly higher returns, as revenue is
added with minimal incremental cost.
One Tenant Two Tenants Three Tenants
U.S. New Macro Tower Build Economics Drive
Strong ROI(1)
18
(1) For illustrative purposes only. Does not reflect any American Tower financial data.
(2) Calculated as Gross Margin divided by Construction/Upgrade Costs.
One Tenant Two Tenants Three Tenants
Construction/Upgrade Costs ($ in USD) $250,000 — —
Tenant Revenue $20,000 $40,000 $60,000
Operating Expenses
(including ground rent, utility, monitor) $12,000 $13,000 $14,000
Gross Margin $8,000 $27,000 $46,000
Gross Margin (%) 40% 68% 77%
Gross Margin Conversion Rate (%) – 95% 95%
Return on Investment (2) 3% 11% 18%
International New Tower Build Returns on
Investment Typically Exceed U.S. Returns(1)
19
(1) For illustrative purposes only. Does not reflect any American Tower financial data.
(2) Calculated as Gross Margin divided by Construction/Upgrade Costs.
US LatAm Africa India
Typical Tower
Construction
Cost $225-$275K $125-$150k $150-$175k $30-$50k
3%
11%
18%
9%
17%
25%
8%
21%
31%
10%
24%
33%
0%
5%
10%
15%
20%
25%
30%
35%
40%
One Tenant Two Tenants Three Tenants
Sample Return on Investment(2)
Domestic Market LatAm Africa India
LatAm Africa

Business Model Summary
Numerous factors contribute to the success of the tower business model.
›Secure real estate assets
›Strong recurring cash flow characteristics
›Long-term, non-cancellable lease revenues
›Embedded contractual escalators
›High incremental cash flow margins
›Low maintenance CAPEX
›Financially strong tenant base
›Economies of scale
›Replicate established systems and
processes in new markets
›Ability to add additional assets to existing
markets without a need for significant
increase in overhead
›Barriers to entry
›Location-based business, typically with
significant zoning restrictions
›Capital and time intensive to build meaningful
scale
›Consistent U.S. demand
›$25+ billion in annual CAPEX spending by U.S.
service providers over the last few years(1)
›Rapidly increasing wireless data usage and
adoption of advanced wireless devices
›Strong international demand
›Continued deployment of voice and initial data
networks
›Spectrum auctions and new market entrants
›Demand from new technology overlays
(e.g.: 3G and LTE)
20
(1) Source: Wall Street Research.

Technology Overview
Section 3
21
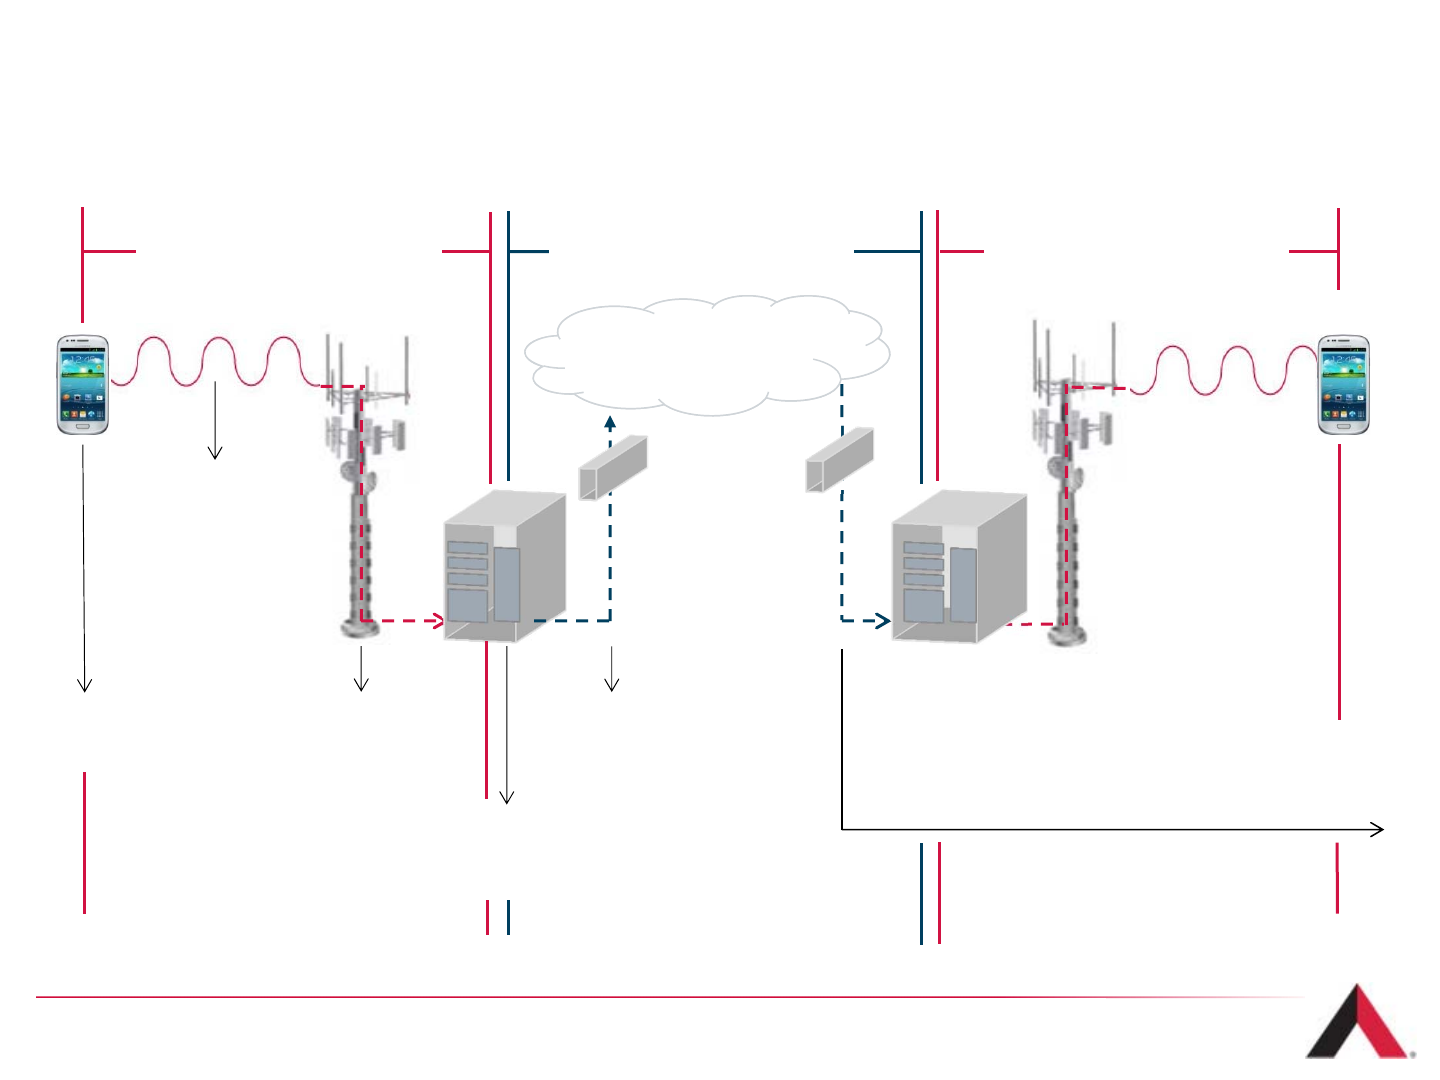
The Mobile Call Sequence
22
7. MOBILE CORE
Call is “switched” and routed
to another tower site closest
to receiving device
1. DEVICE
Call signal starts
at user device
2. SPECTRUM
Call signal travels
via radio wave
spectrum to antenna
on tower
3. TOWER
Spectrum radio waves
travel down tower via
fiber/coaxial cable to
base station 4. BASE STATION
Spectrum radio waves
get translated into
backhaul1
5. BACKHAUL
Call signal travels via
backhaul to market-
level Aggregation
Points
8. PROCESS REVERSES
- Call signal converts from backhaul to spectrum at base station
- Spectrum radio waves travel up fiber/ coaxial cable of tower
- Call signal transmitted from tower antenna via spectrum to device
ANALOGPORTIONOFCALL
[Steps1–4]
DIGITALPORTIONOFCALL
[Steps4–7]
ANALOGPORTIONOFCALL
[Step8]
Wireless Fixed Line Wireless
(1) In some cases the radio has been moved up onto the tower.
6. AGGREGATION
POINTS
Market-level points
that aggregate traffic
before sending on to
the Mobile Core
What is Spectrum?
23
›Spectrum airwaves are licensed to carriers who utilize the spectrum to transmit wireless signals
›The government typically regulates this spectrum and auctions it to wireless carriers for use
›Spectrum is measured in units of “hertz” or Hz
›The three main considerations in evaluating a carrier’s spectrum position include:
1. In which spectrum bands does the carrier hold licenses?
2. How much spectrum (bandwidth) does the carrier have?
3. What type of technology is the carrier deploying on that band of spectrum (i.e. CDMA, HSPA, LTE)?
Spectrum: radio frequency airwaves, needed to transmit analog signals, including wireless
communications signals
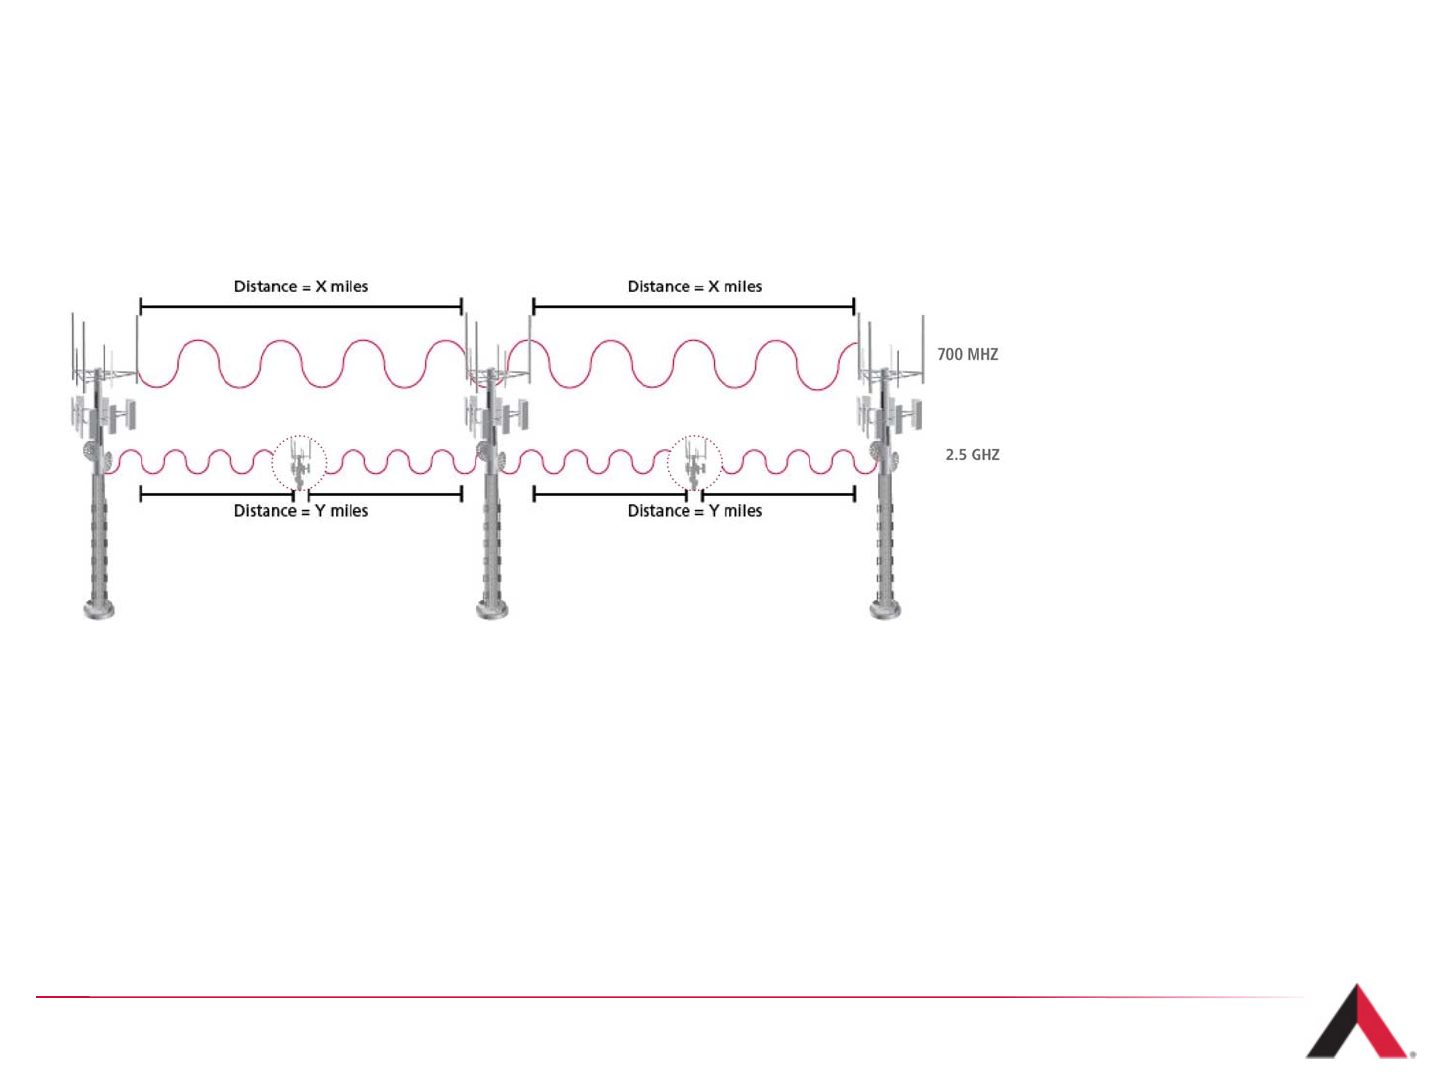
Spectrum Characteristics
›Propagation – radio transmits a signal by driving a current on an antenna; signal
propagates away from antenna as a wave at the speed of light
›Lower-frequency spectrum provides a larger coverage area and better in-building
penetration (“beach front” spectrum)
›Higher-frequency spectrum covers shorter distances (need significantly more cell sites to
get the same level of coverage)
›As spectrum usage increases the distance spectrum can propagate decreases
24
2.5GHz 1.9GHz 1.6GHz 700MHz
(Not to scale)
Radio Spectrum Signal
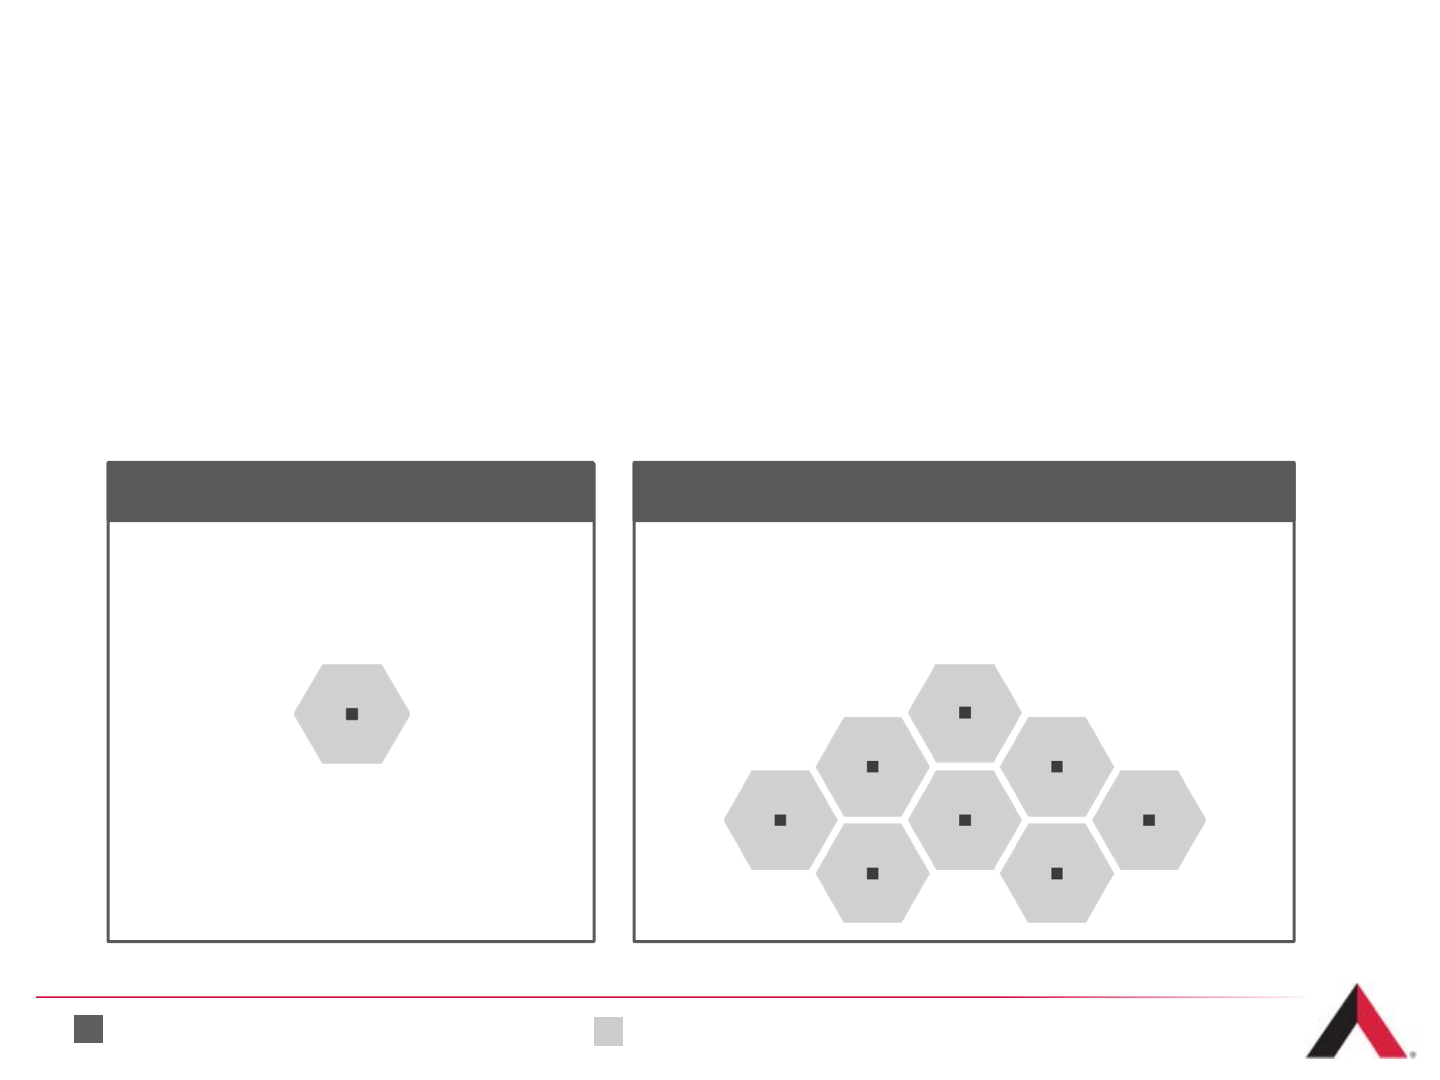
What is a Cell Site?
A cell site is an area within a carrier’s wireless network which is serviced by an
antenna array. Carriers commonly refer to these areas as “rings”.
›Can be located on a tower or alternative structures, such as
rooftops, water towers and church steeples
›One macro tower can support multiple carriers’ cell sites through collocation
25
Cell Site Network
Tower/antenna location Geographic area covered by antenna array
A carrier’s coverage area is dependent upon the
capacity of its equipment and the frequency of
the signal being transmitted.
Cell Site
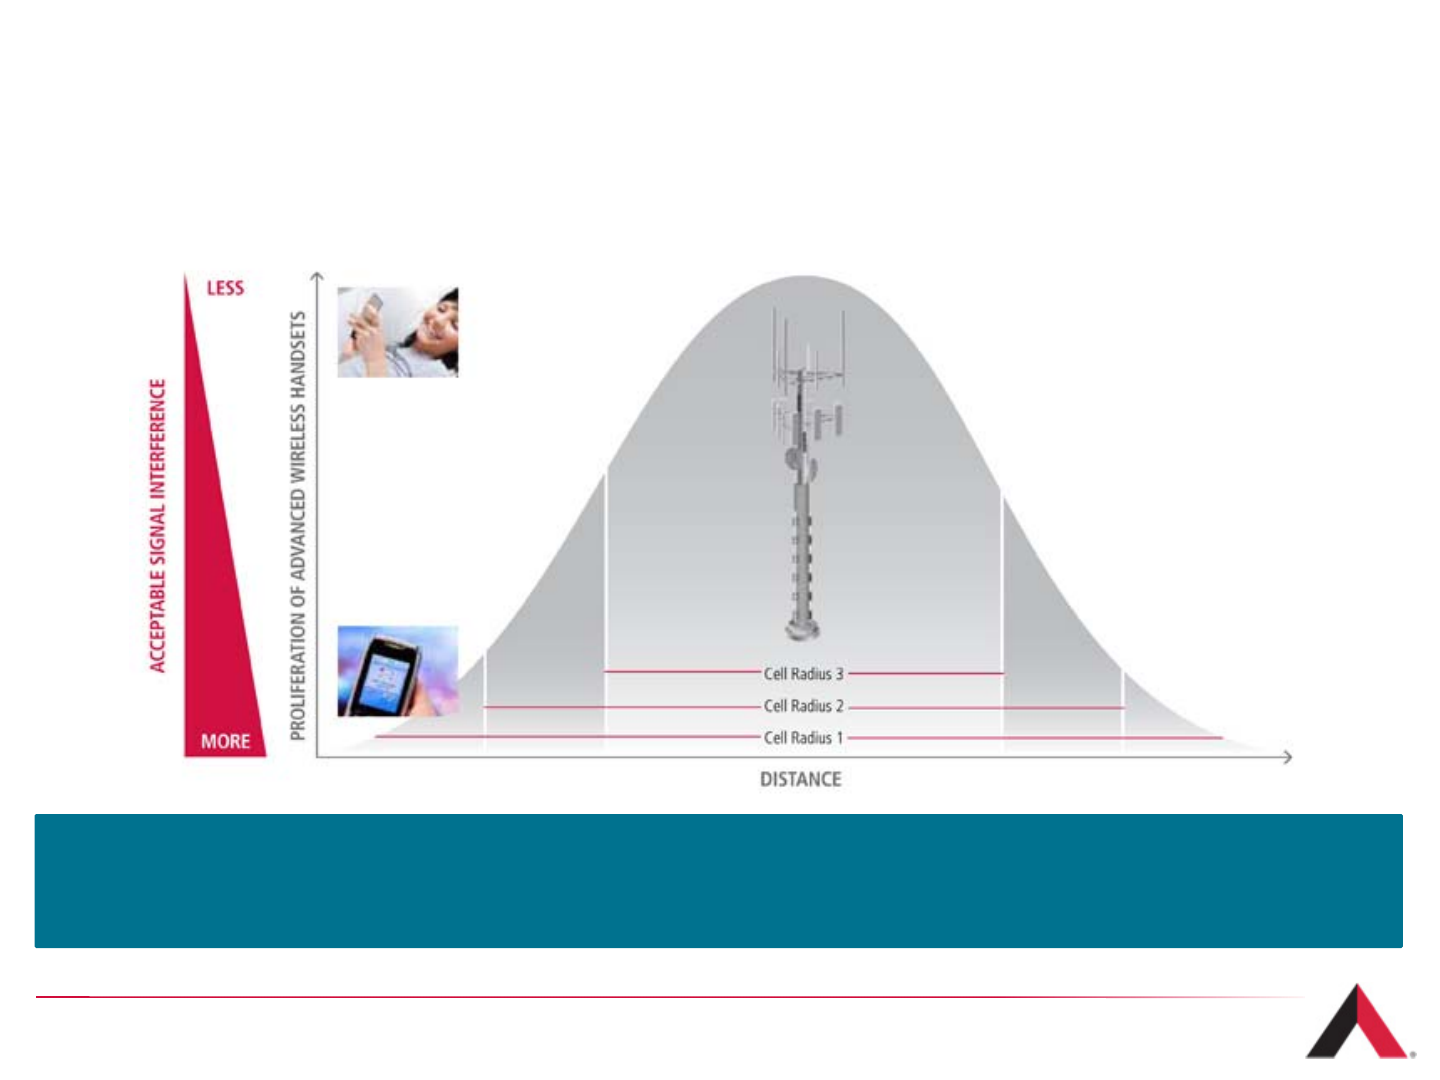
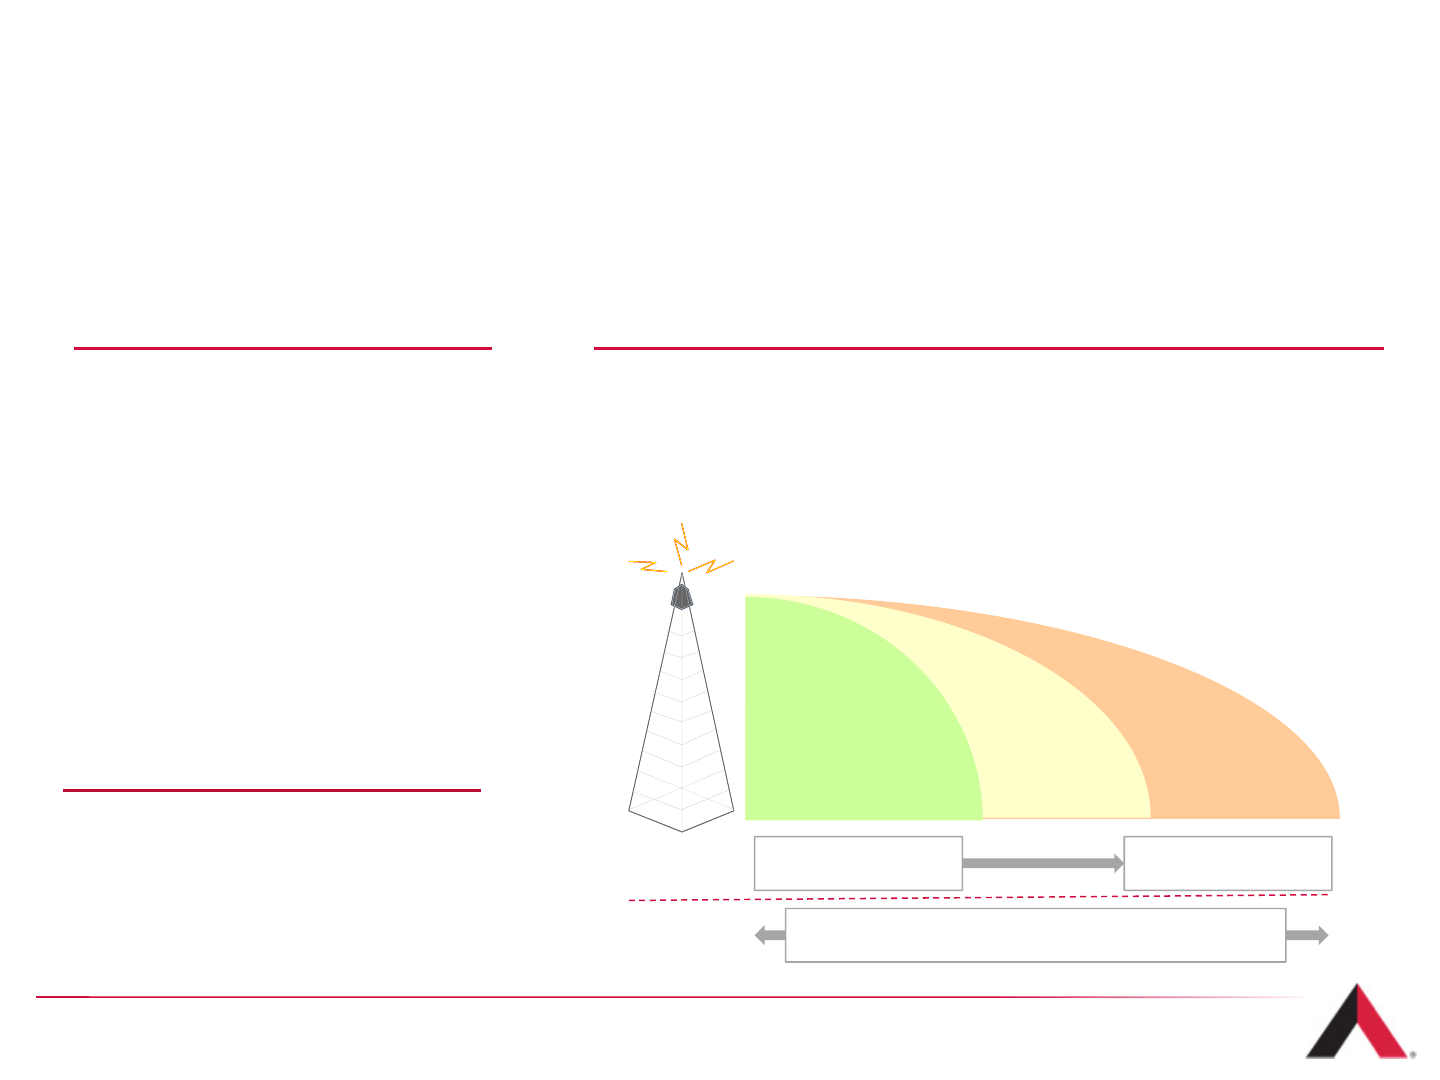
Narrowing Cell Radius
Signal Strength Curve
26
As devices become more advanced, the increasing demand for high-bandwidth applications
and higher quality of service result in a narrower range at which signals can be transmitted. As
a result, carriers are investing in denser networks.
Network Design Evolution
27
New cell site Original cell site
›Quality of voice services
on the rise
›Smartphones introduced
to the market
Network designed for initial
voice and 3G services As data usage rises, the
existing network structure
proves deficient for data
signal propagation
Building new cell sites is
therefore required to create
adequate coverage for
seamless data usage
›Smartphone penetration
on the rise
›New smartphone
handsets introduced
›VoLTE (Voice over LTE)
›Carriers consistently
invest in networks to meet
growing demand
Growing wireless usage results in the need for more cell sites.
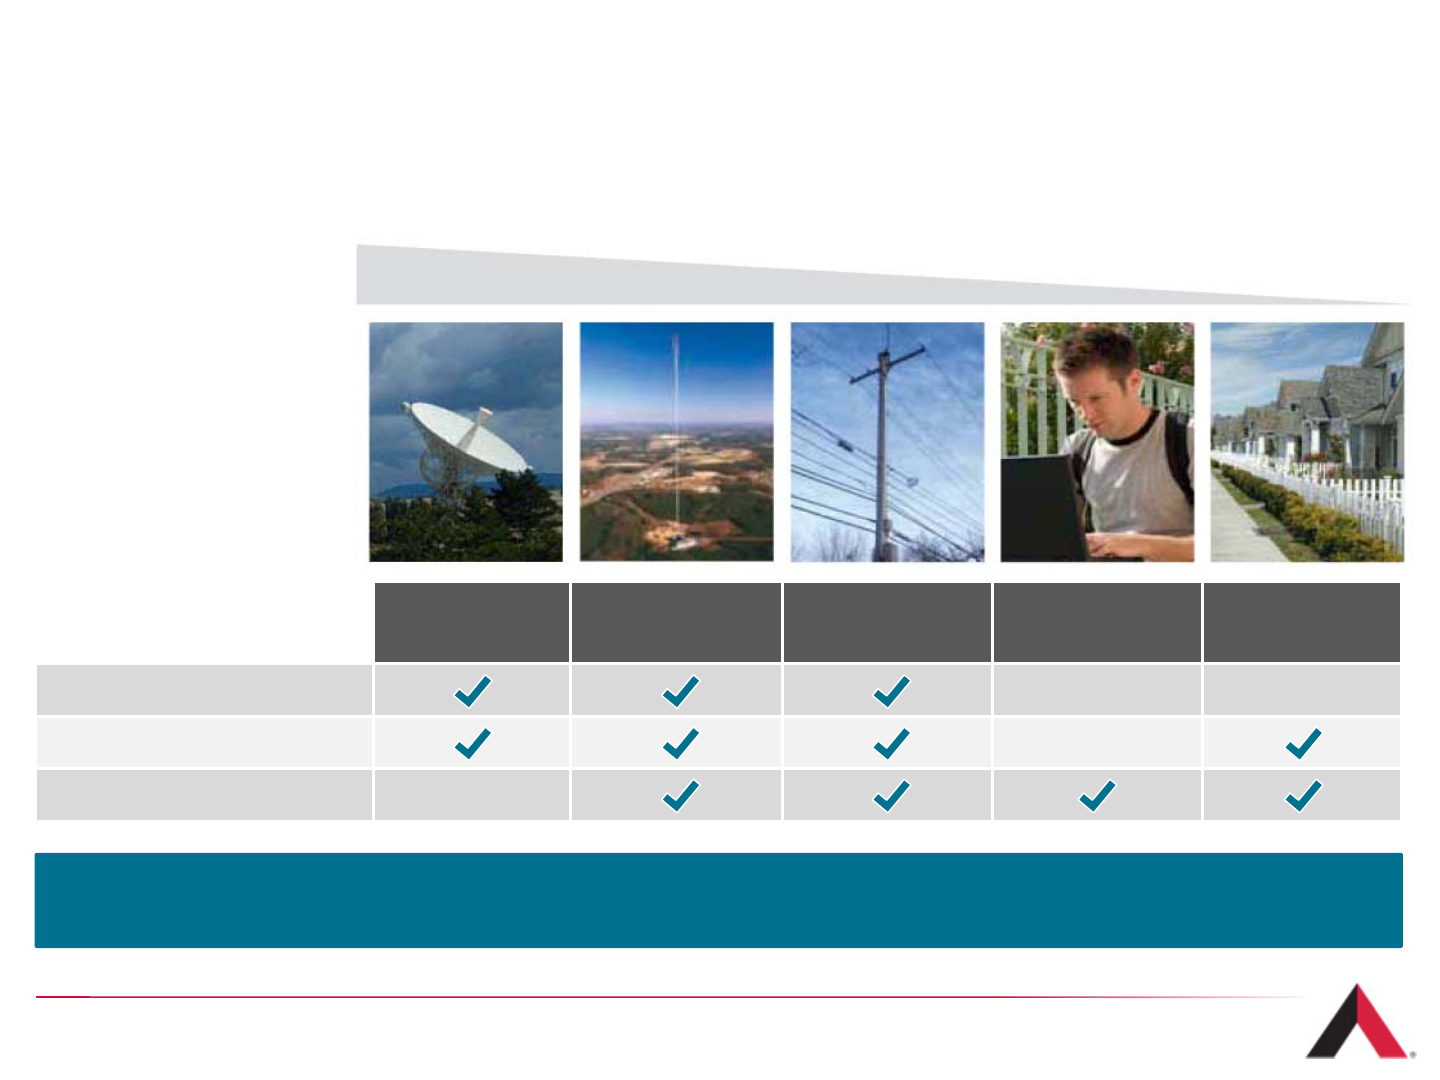
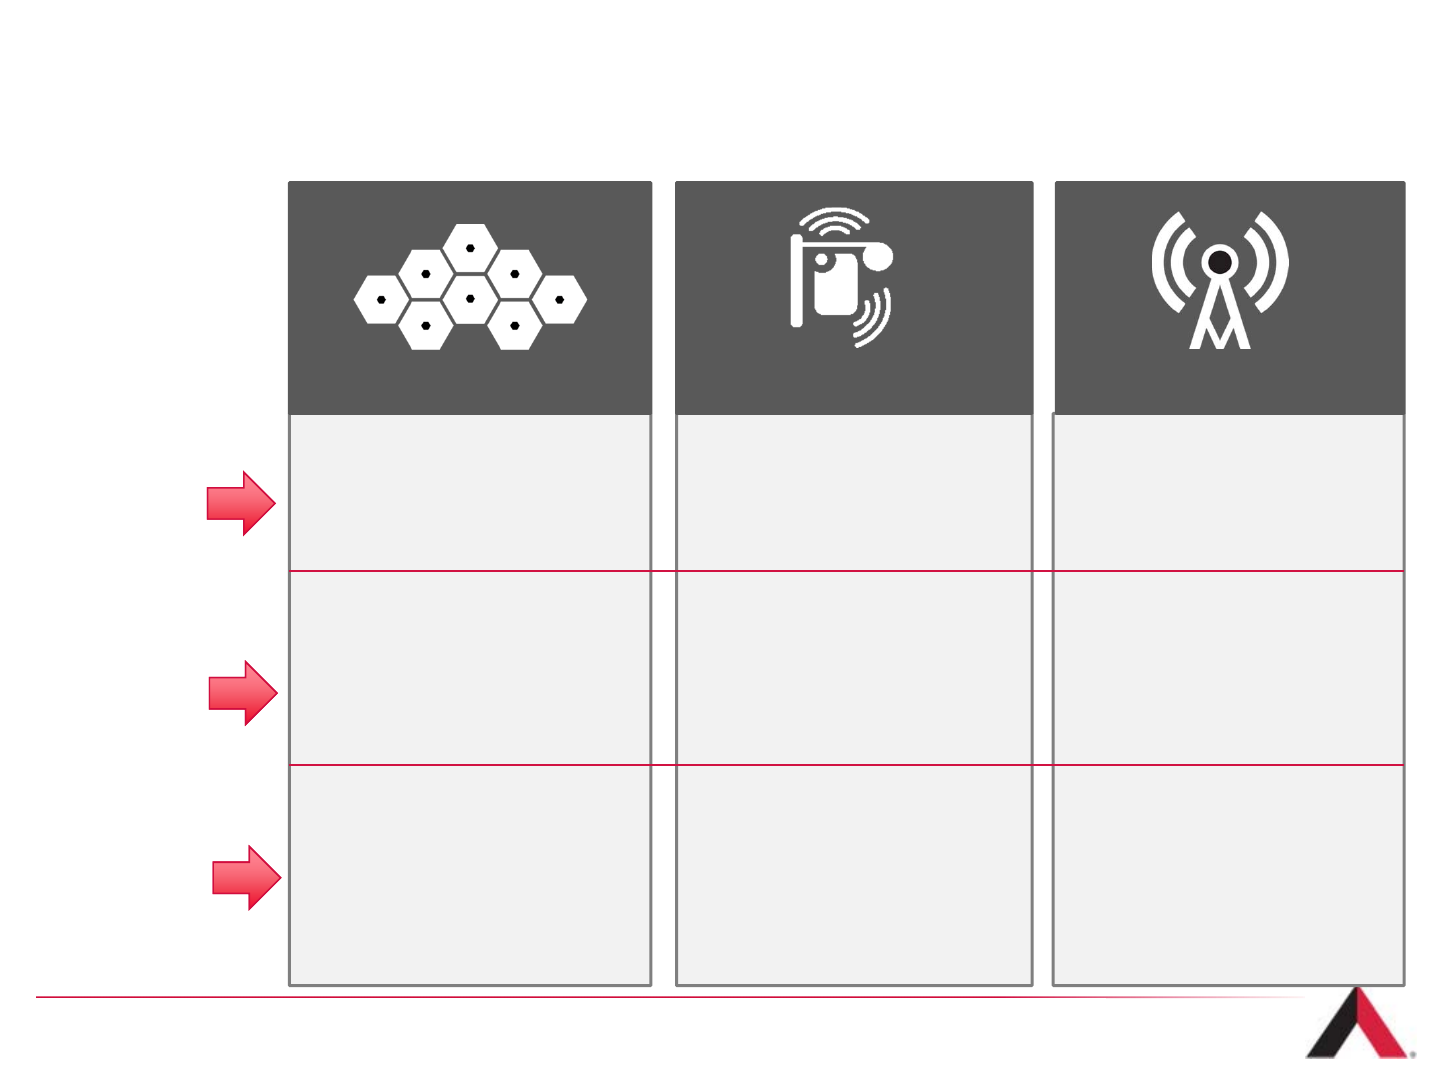
Tower Sites are Preferable in Most Locations
28
Technology Capability
Satellite Tower Sites DAS Network Wi-Fi Small Cell /
Femtocell
Mobility ——
Uses licensed spectrum —
Low latency —
Wide NarrowPopulation Coverage Area
Tower sites continue to be our customers’ preferred solution, as they provide the most
technologically efficient and cost-effective option for coverage and capacity requirements.

Wi-Fi vs. Licensed Spectrum
29
Licensed spectrum allows for exclusive use by licensees with consent of the Federal
Communications Commissions (FCC). Wi-Fi spectrum is unlicensed and it can be used
by any party.
›Disadvantages of using unlicensed Wi-Fi spectrum:
1. Limited Mobility: Unlicensed Wi-Fi spectrum is in the high frequency 2.4 GHz and 5 GHz
bands. This means it is unable to propagate far, requiring significantly more transition
locations to cover an area and limiting its geographic reach.
2. Congestion: Any Wi-Fi capable device is permitted to use unlicensed Wi-Fi spectrum and
as a result, WiFi networks often become congested.
3. Loss of Control: Carriers lose control of their subscribers’ user experience when utilizing
public, unlicensed spectrum.
4. Concentrated in Dense Urban Areas: Because unlicensed spectrum is high frequency and
unable to propagate long distances, it is used predominantly in dense urban areas where
mobility requirements are limited and access points are closer together.
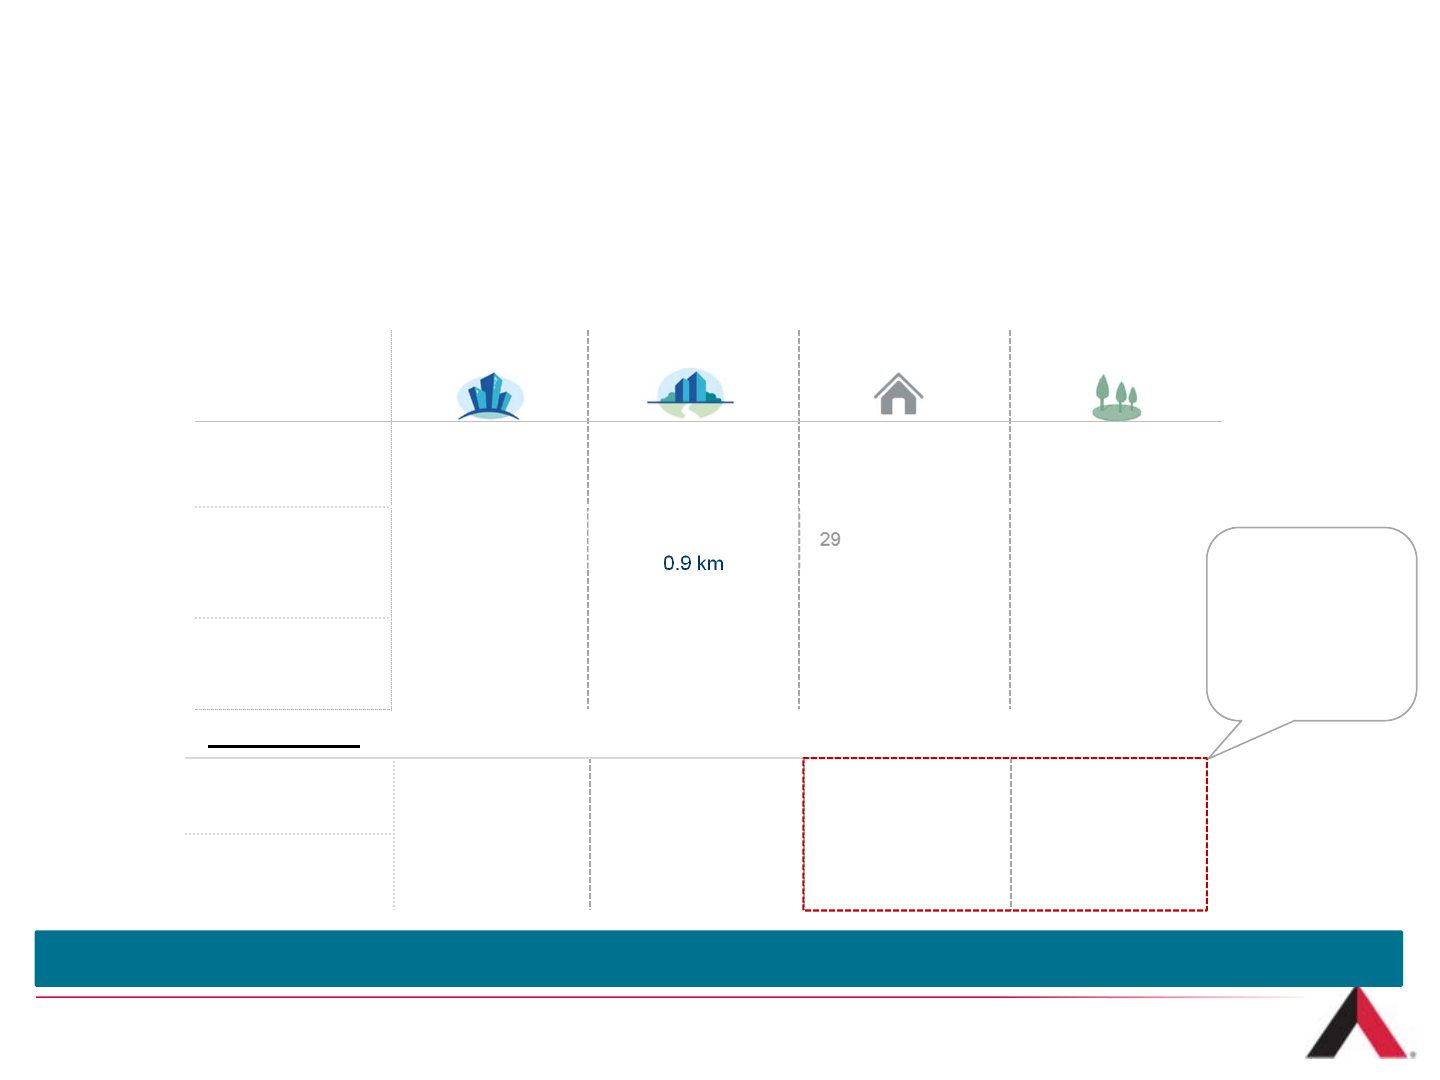
The Morphology View
Morphology is a useful metric to segment tower locations, varying from dense urban
locations to rural locations
Morphologies defined as population density within 1.5km of site location
% of U.S. Area <1% <1% 1% 97%
% of U.S.
Population 3% 13% 54% 30%
Sources: AV&Co. Analysis; U.S. Census Data
Dense Urban Urban Suburban Rural
Population
Density
(pop / sq. km.)
11,500+ 2,900 – 11,500 230 – 2,900 < 230
Tower
Coverage
Radius
(700MHz frequency)
0.7 km 0.9 km 2.5 km 12.6 km
Morphology
Area Typically
Covered >90% >90% 80% ~30%
Example U.S.
84% of the U.S.
population lives
outside of dense
urban and urban
environments
Towers are the preferred solutions in suburban and rural environments
30
DAS and Rooftops Help Fill the Gaps
31
Indoor DAS
›Provides coverage in indoor
venues, such as malls, casinos
and conference centers
where signals from towers
are insufficient
›Neutral-host networks are
readily accessible to collocation
›AMT is the largest independent
provider of IDAS in the U.S.
Outdoor DAS
›Provides coverage in outdoor
venues, such as racetracks
and stadiums where wireless
usage levels tend to be
extremely concentrated
›Allows for multiple carriers to
leverage single installation
›AMT has partnered with
NASCAR and other venues to
install Outdooor DAS systems
Rooftops
›Predominantly located in dense
urban areas where towers
cannot be installed
›Used in combination with DAS
and Wi-Fi to provide coverage
to concentrated user base
›AMT has access to over 22,000
rooftops throughout the country
Indoor and Outdoor Distributed Antenna Systems (IDAS/ODAS) and Rooftop locations help to
provide coverage in areas where macro tower sites are not available.
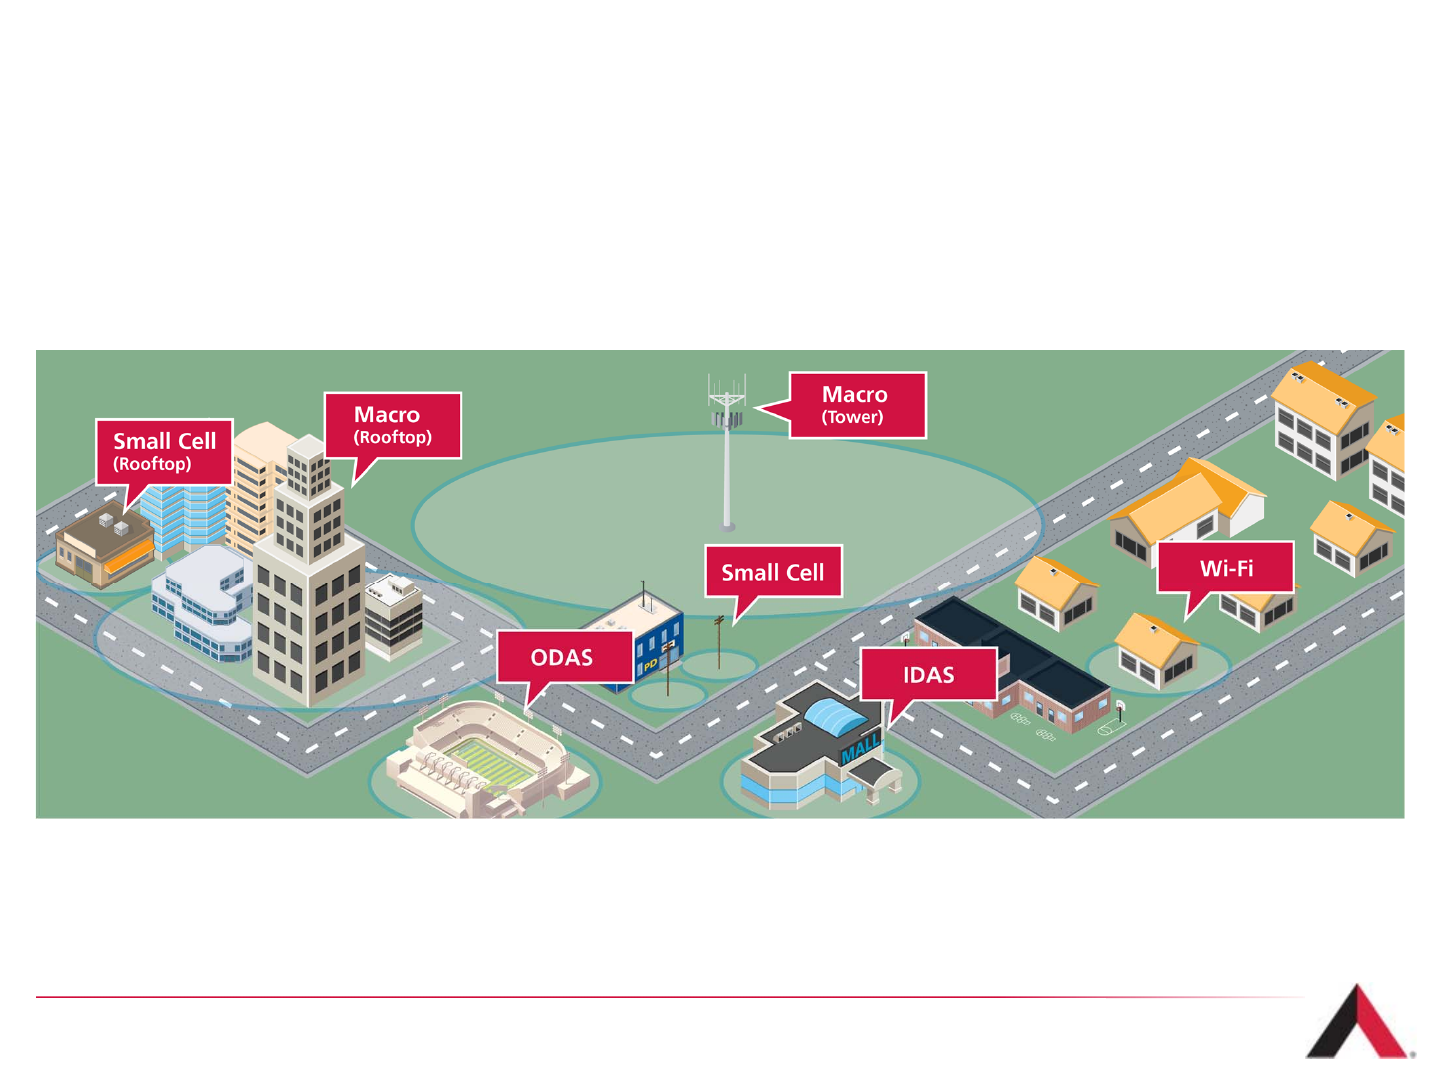
Network Design of the Future
Heterogeneous Networks (HetNets)
Network deployments will consist of multiple layers—traditional macro cell towers
provide a blanket of coverage, while underneath this umbrella, a combination of
other technologies are deployed to increase network capacity, particularly in
dense urban areas.
›Macro sites will continue to provide wide area coverage for high mobility users and are the core of
wireless networks
›Multiple solutions including DAS, Rooftops, Wi-Fi and Small Cell networks will complement the coverage
provided by towers
32

U.S. Demand Drivers
Section 4
33
Carrier Lease / Build Decision(1)
›Significant economic incentive exists for carriers to choose a collocation model over building
their own site
›Significant time to market advantage from leasing space on an existing tower site
›Building a site may involve years of work to secure ground interests and zoning approvals
An Example
›Present value of carrier network build-out alternatives
›Carrier Build Scenario
›$225,000 construction cost, $1,250 monthly operating expenses with 3% annual escalator,
9% Weighted Average Cost of Capital (WACC)
›Tower Lease Scenario
›$1,800 monthly lease with 3.5% annual escalator, 9% WACC
34
Term Carrier Build Tower Lease Savings
5 years $286,638 $89,575 $197,062
10 years $333,798 $158,720 $174,359
15 years $368,070 $212,094 $155,976
20 years $394,433 $253,293 $141,140
(1) For illustrative purposes only. Does not reflect any American Tower financial data.
U.S. Wireless Industry Trends
Over the last decade, advancing technology, rising device penetration and
ramping data usage have led to increased levels of carrier capital expenditures.
35
Sources: Wall Street Research and AV & Co. Analysis
AverageDataUsage:
25 MBperMonth
AverageDataUsage:
1,214MBperMonth
AverageDataUsage:
883MBperMonth
AverageDataUsage:
8MBperMonth
21
883
76
1,332
4,556
29
1,214
95
2,014
5,183
Feature Phone Smartphone M2M Module Tablets Laptops
Year End Mobile Data Usage by Device
U.S. Estimates
(MB per Months)
2012
2013
36
Mobile Network Usage
Handset and Data Estimates
Mobile data usage continues to increase as advanced device penetration rises.
Sources: Altman-Vilandrie & Company analysis and Cisco VNI Mobile Forecast, 2012 and 2013.
42X
63X
217X
42X
69X
178X
4G Adoption – Projected Growth
2013 - 2018
13% 7%
62%
41%
26%
52%
2013 2018
Percent of Total Mobile Connections
U.S. Estimates
2G 3G 4G
37
4G connections are expected to grow at a 28% compound annual growth rate between 2013-
2018, while 2G and 3G connections are projected to decline
Source: 2013 Cisco VNI Mobile Forecast Highlights, 2013 - 2018.
3x3x
U.S. Rapid Wireless Data Adoption
Wireless data consumption is forecasted to grow nearly 10x over just five years.
38
(1) 1 petabyte = ~1.049 x 10⁶gigabytes
(2) Macro supplement
Source: 2013 Cisco VNI Mobile Forecast Highlights, 2013 - 2018.
169
1179
17
319
2013 2018
Macro Network Macro Supplement(2)
Macro Network
Traffic Growth:
Nearly 50% CAGR
The vast majority of mobile data traffic continues to be carried over macro tower networks.
U.S. Mobile Data Traffic Forecast
Petabytes per Month(1)
Network Investment by U.S. Carriers (1)
39
(1) Source: Wall Street Research. Capital spending in $ billions.
$-
$5
$10
$15
$20
$25
$30
$35
2007 2008 2009 2010 2011 2012 2013 2014E
Verizon Wireless AT&T Sprint T-Mobile Others
To keep up with the rapid growth in wireless data usage, carriers need to invest in networks.
Annual Wireless Carrier Capital Spending
4G Technology Migration Continues
40
›Several carriers have
substantially completed
initial 4G coverage builds
›Several other carriers
are still focused on
initial deployments
›Emphasis on achieving
nationwide coverage
Current
›Overlay network and fill
in coverage gaps based
on usage trends
›Urban investment
complemented by
suburban deployment
›Emphasis on
augmenting network
capacity
2 - 5 Years
›Full network migration
›Deploy 4G across all cell
sites
›Fill in sites needed
based on usage trends to
continue with capacity
goals
5 - 10 Years
The rollout of 4G in the U.S. is expected to take the better part of a decade and is expected to
result in long-term, solid demand for communications towers.
VoLTE Adoption Requires More Towers
41
Voice service is currently delivered mainly over 2G and 3G networks while data is
transmitted using 4G/LTE networks. Carriers have now deployed or are deploying
“voice over LTE” or VoLTE to move voice transmission to 4G/LTE networks.
Higher spectral efficiency than
2G/3G for delivering voice
Allows 2G/3G spectrum to be
refarmed to LTE
Reduces opex of maintaining distinct
voice and data networks
Potential for higher quality calls
Simultaneous voice and data
possible (not available on CDMA-LTE
phones today)
Increased battery life for LTE-only
phones vs. dual-radio CDMA-LTE
phones
›Increased cellsite densification
compared to LTE data-only networks
•Example: Moving from a network
designed for data-only (i.e. no voice
support at all) to VoLTE on 700 MHz
spectrum could require ~20% more
cell sites
Benefits of VoLTE
Requirements for VoLTE
Why does VoLTE require network densification?
Voice delivered with quality of service requirements (QoS)
has more stringent capacity requirements than “pure-data”
(e.g. browsing) – this is much more pronounced on the typical
cell edge, where a data session can degrade to a point (but a
voice call can’t)
Data
Session:
VoLTE
Session:
Higher throughput, high
efficiency modulation
scheme used
Lower throughput, more
robust (but less efficient)
modulation scheme used
Capacity requirements for a voice call with some minimum QoS don’t
change whether close to cell site or at cell edge
Source: Altman Vilandrie & Company

International Demand Drivers
Section 5
42
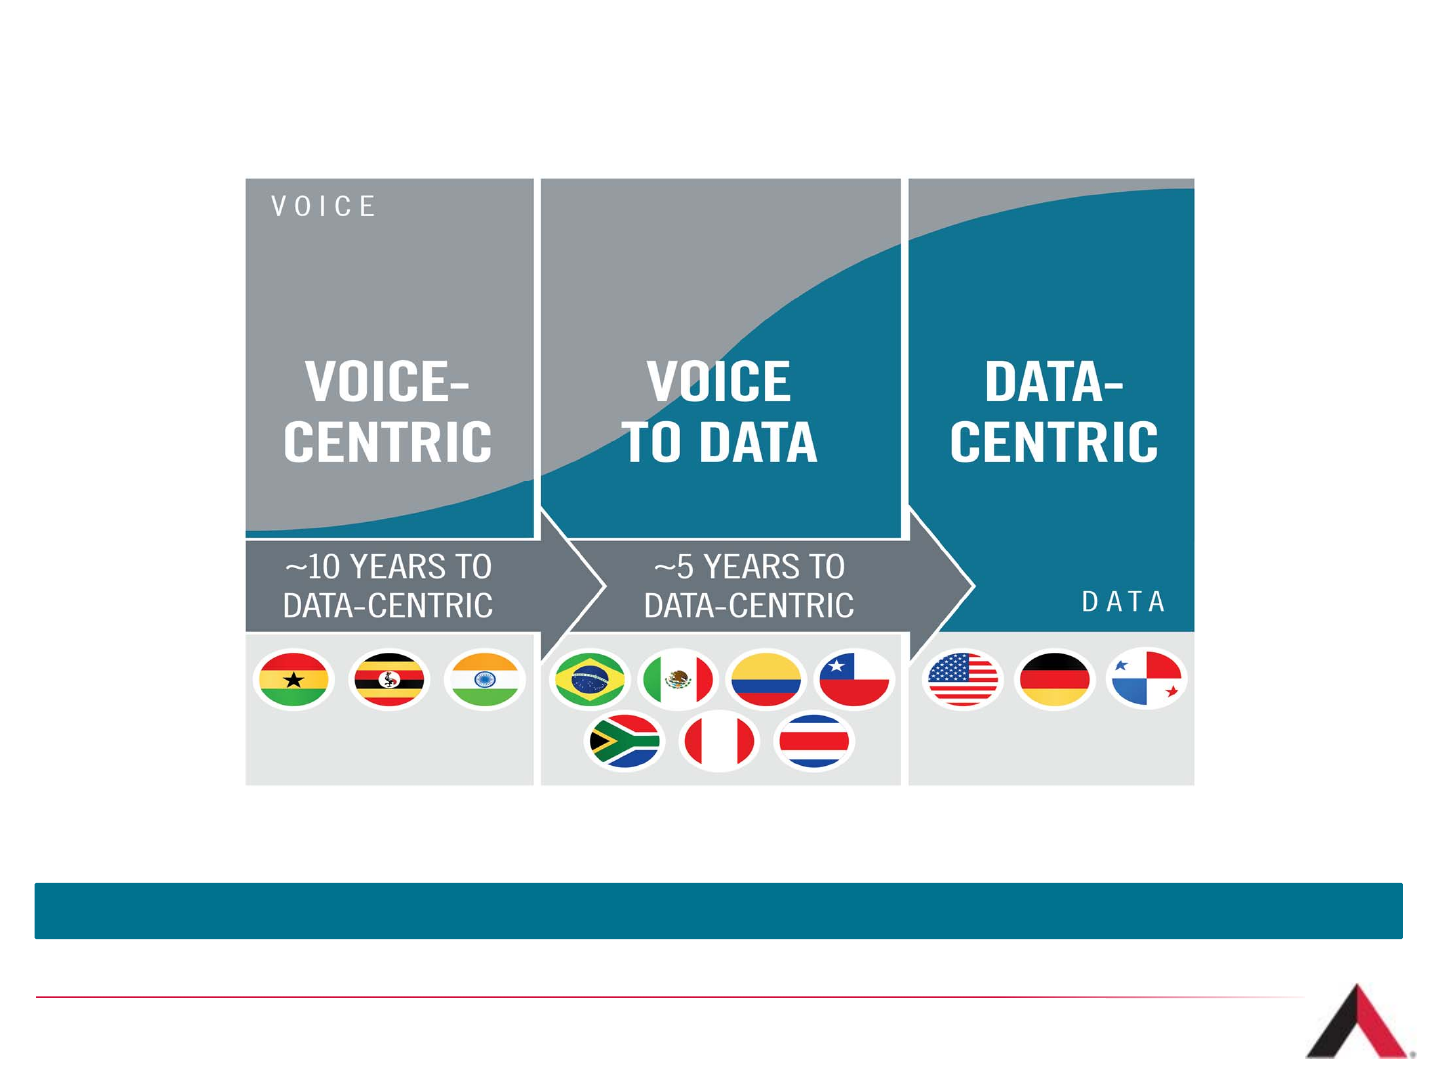
Stages of Global Wireless Market Development
43
Source: Altman Vilandrie & Company
(1) Figure above includes assets in Panama which were sold during Q3 2014.
Our International Markets are in diverse stages of wireless technology deployments
Emerging Rapidly Evolving Advanced(1)
›Nationwide wireless voice
coverage build-
outs continue, with many
areas having no access
to reliable service
›Recent and upcoming
spectrum auctions help
to catalyze incremental
network investment
›Recent and upcoming
spectrum auctions help
to catalyze incremental
network investment
International Wireless Markets
Diverse Demand Drivers
44
›Wireless penetration
continues to increase,
and improving network
quality is key for carriers
to add customers
›Increasing penetration
of smartphones and
other wireless devices
xxx
›Exploding mobile
video/gaming usage,
next generation voice
technology over 4G and
connected homes and
vehicles expected to
drive additional demand
›Lack of fixed-line
infrastructure makes
mobile the cost-
effective choice
for communication
›Carriers are continuing to
invest in denser
3G networks as
usage increases with
initial 4G builds
underway
›4G network coverage
build-outs underway with
densification initiatives
expected to accelerate
over next several years
Coverage Technology Wireless Penetration
Emerging
Rapidly
Evolving
Advanced

Additional International Market Information
45
For more detailed information about our international markets, please refer to the “International
Market Overview” presentation located at:
www.americantower.com/corporateus/investor-relations/company-industry-resources

American Tower Overview
Section 5
46
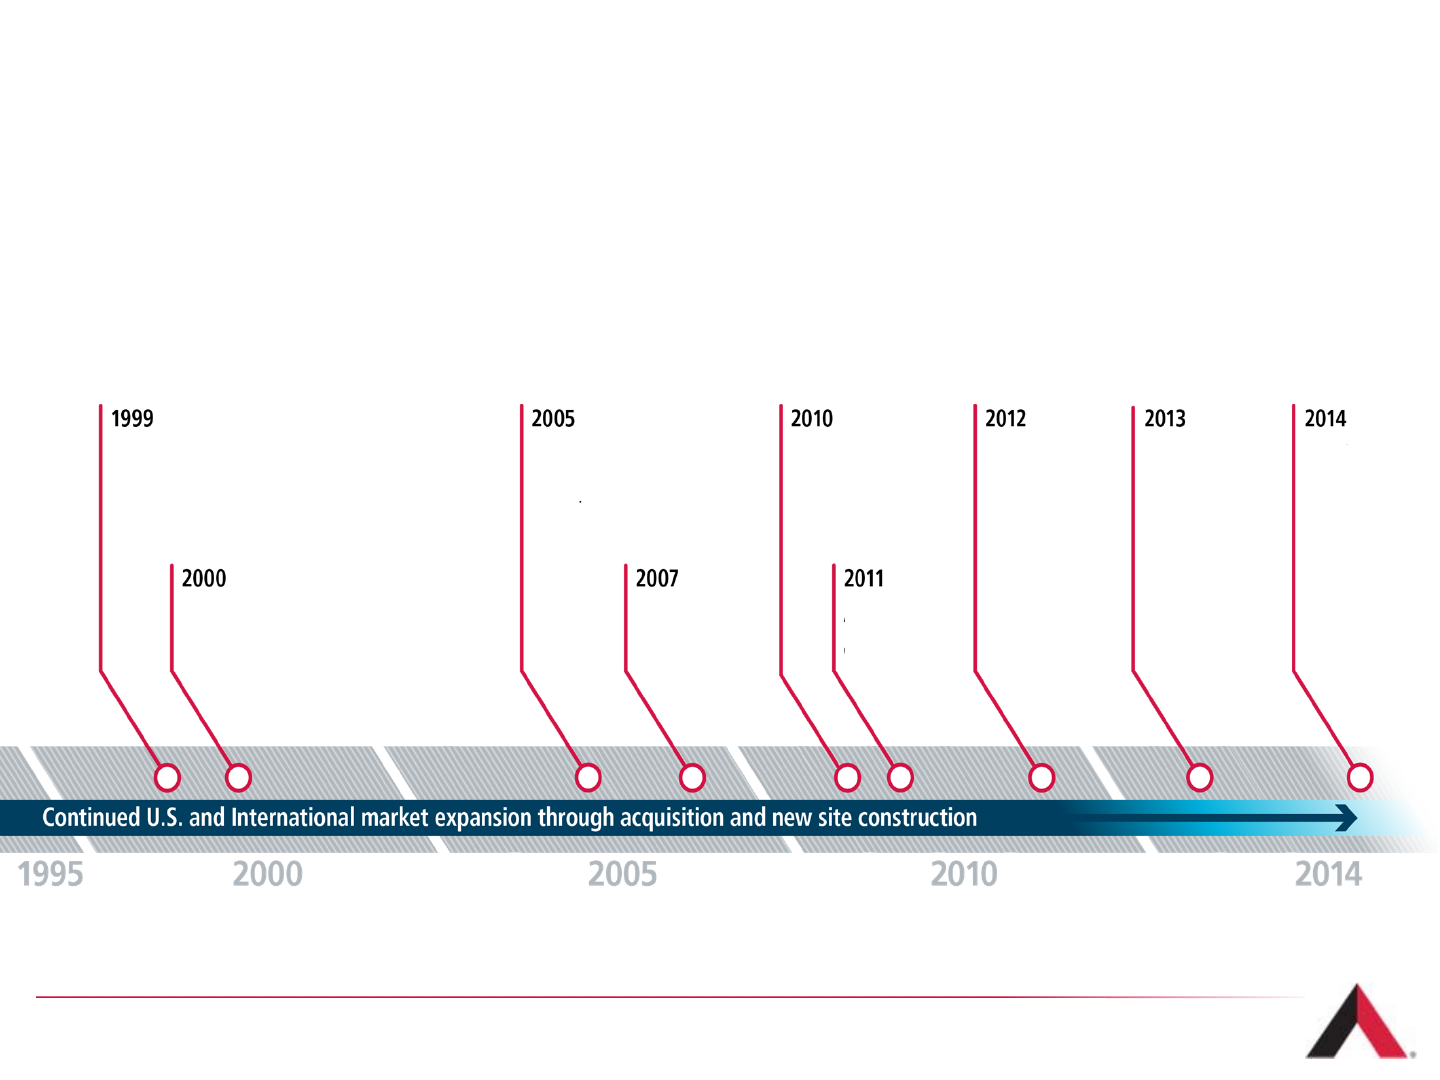
Our History
American Tower (NYSE: AMT) is a leading independent owner, operator and
developer of broadcast and wireless communications real estate.
›Global headquarters located in Boston, Massachusetts
›Global portfolio includes approximately 69,000 owned sites(1)
47
(1) As of June 30, 2014.
American Tower
enters Chile,
Colombia and
Peru
American
Tower enters
Ghana and
South Africa
American Tower
enters Mexico
American Tower
enters Brazil
Merger in the U.S.
with Spectrasite, Inc.
American Tower
enters India
American Tower
begins operating
as a REIT
American
Tower enters
Germany and
Uganda
American Tower
enters Costa
Rica and
Panama
American
Tower acquires
Global Tower
Partners
American
Tower acquires
Richland
Towers
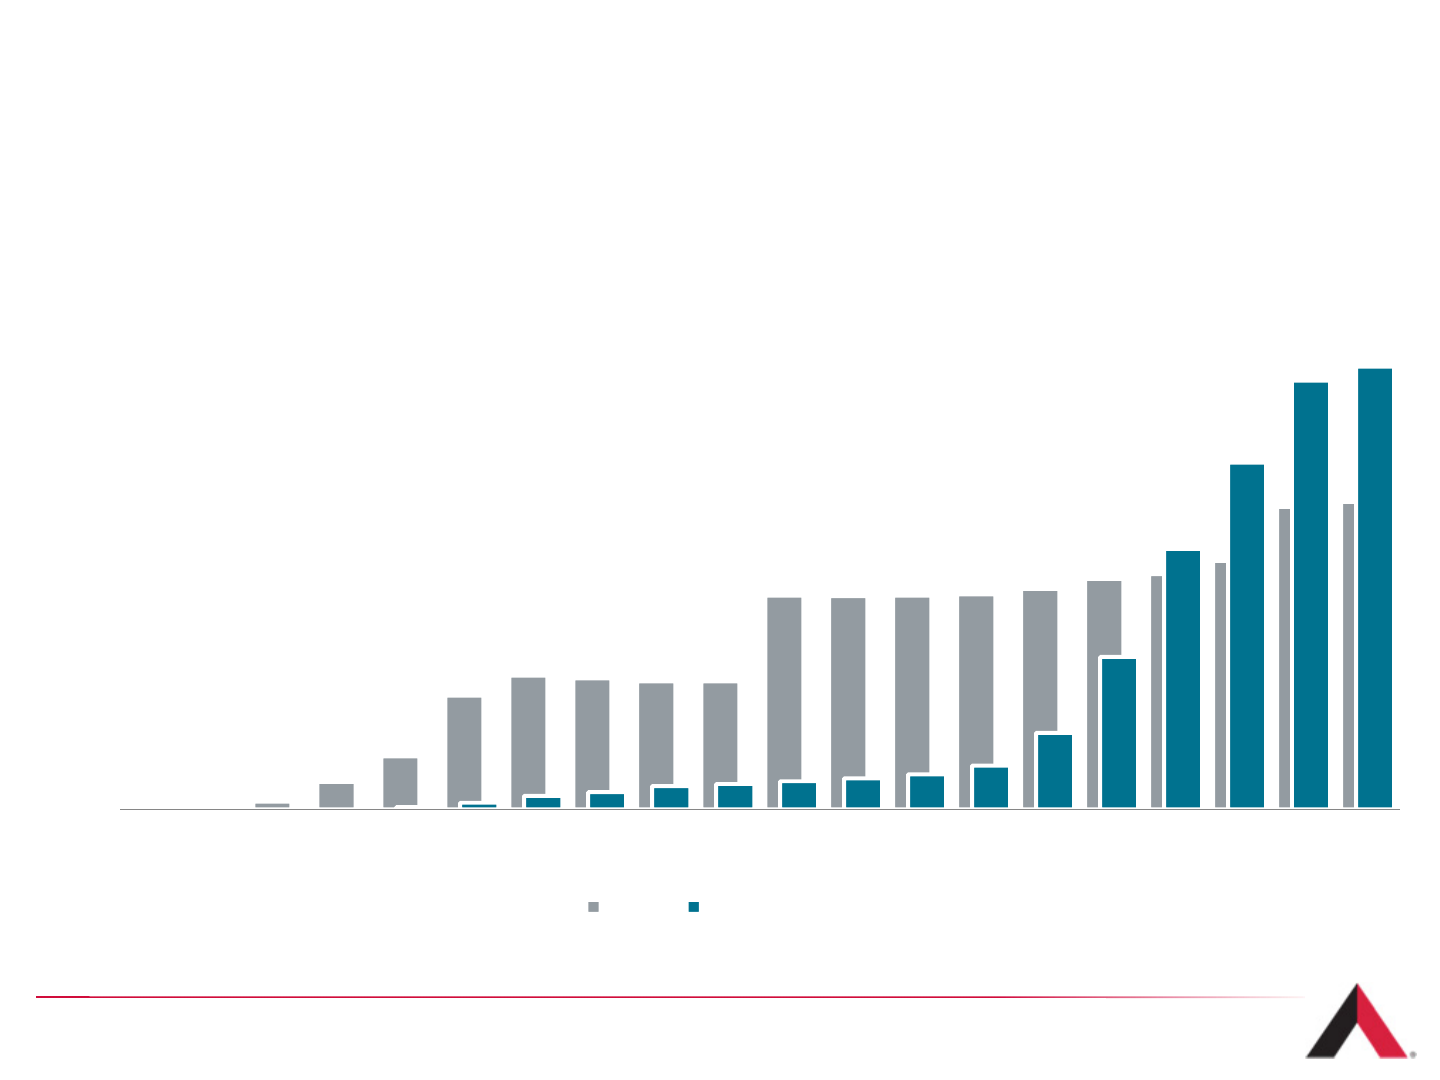
Portfolio of Approximately 69,000 Towers
48
0
5,000
10,000
15,000
20,000
25,000
30,000
35,000
40,000
45,000
1995 1996 1997 1998 1999 2000 2001 2002 2003 2004 2005 2006 2007 2008 2009 2010 2011 2012 2013 2014
U.S. International
Tower Count as of June 30, 2014(1)
(1) Excludes DAS Networks.
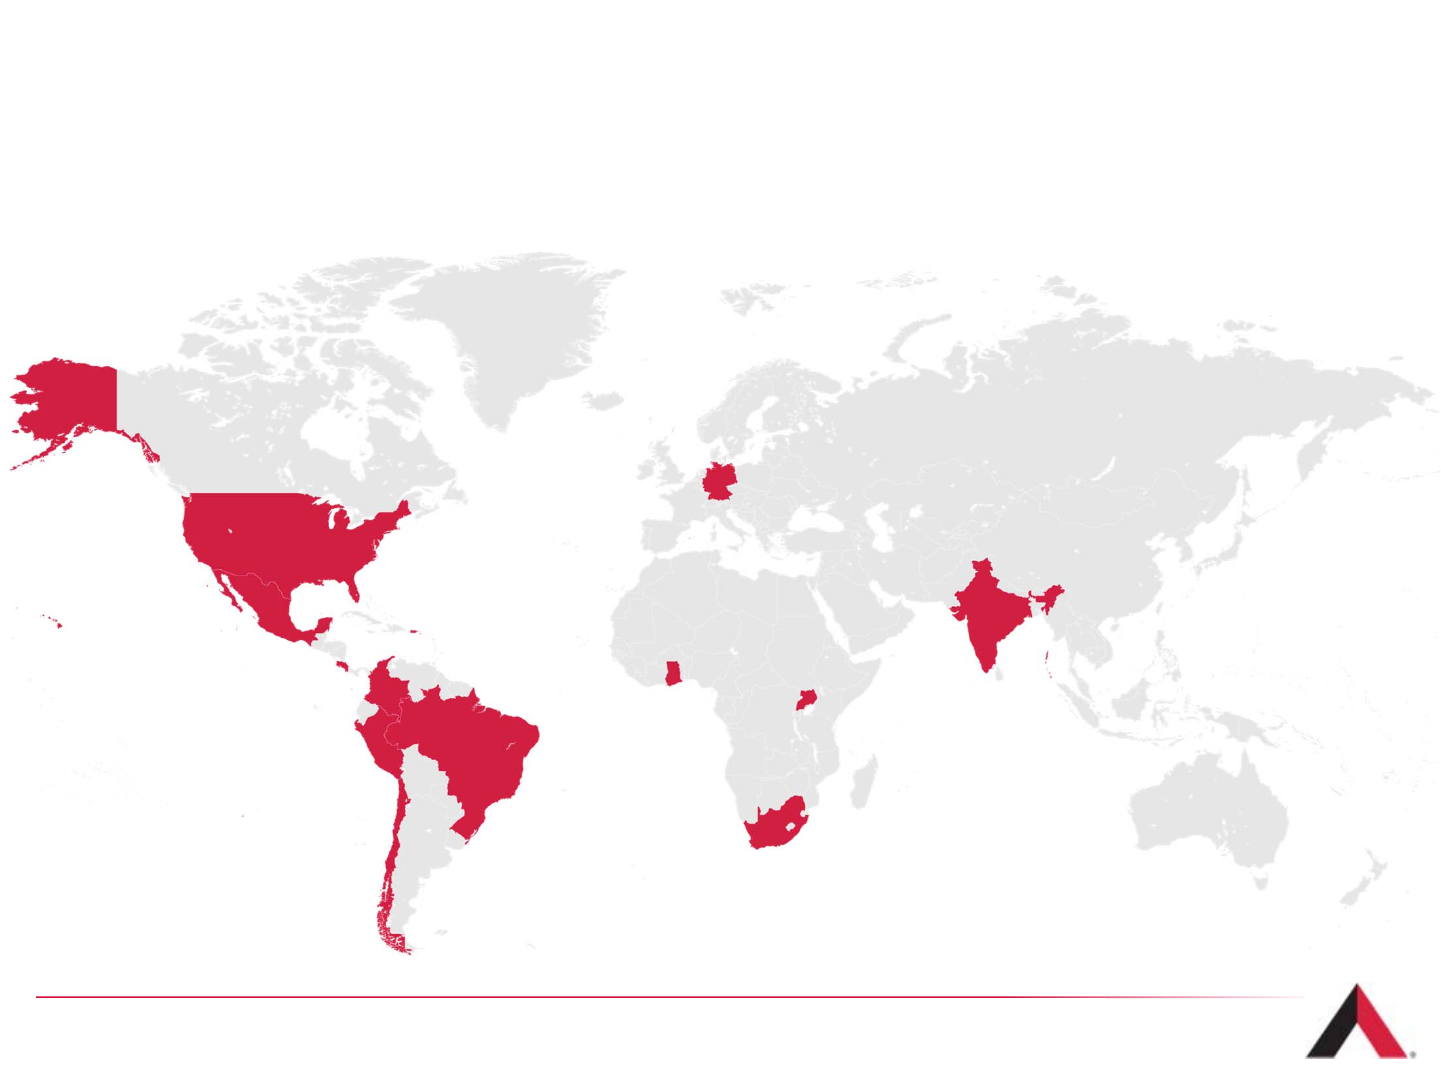
Our Global Presence(1)
49
U.S.
Mexico
Colombia
Peru
Chile
Brazil
South Africa
Ghana
Uganda
India
Germany
Costa Rica
Global Tower Count:
2,800+
Global Employees
(1) As of June 30, 2014. Pro Forma for sale of Panama’s assets during Q3 2014.
28,000+
460
8,600+
490+
1,100+
3,500+
6,900+
1,200+
2,000+
1,900+
1,900+
12,000+
69,000+
Total Sites
1,400+
U.S. Employees
12
Countries
Diversification Strategy Driving Strong Organic Growth
50
8% 7% 9% 10%
8%
14% 14%
16%
2011 2012 2013 1H14
Organic
Core Growth
(in Revenue)
›Our top 10 tenants are expected to invest over $40 billion(2) in wireless capex globally during 2014
›Our ~$23 billion of non-cancellable tenant lease revenue represents 7x our 2013 revenue
›Our disciplined investments and portfolio diversification strategy is driving an acceleration of
Organic Core Growth in revenue
~41%
~59%
Communications Sites(1)
~66%
~34%
Revenue(1)
(1) Characteristics for the quarter ended June 30, 2014
(2) Source: Wall Street Research
Domestic International
Definitions are provided at the end of this presentation.

Global Expansion Considerations
Three Pillar Analysis Approach to New Market Expansion
51
Country Wireless Market Opportunity / Counterparty
›Political stability and rule of law
›Solid macro-economic
fundamentals
›Business environment
›Property rights
›Regulatory environment
›Competitive wireless market
›Three or more
wireless carriers
›Stage of wireless maturity
›Voice penetration
›Data network deployments
›Build-to-suit, merger, acquisition
or joint venture
›Evaluate options based on their
economic benefits as well as
structure
›Future potential
investment/expansion within
region
Long-Term Strategy
52
American Tower remains focused on driving AFFO per share growth while increasing
return on invested capital.
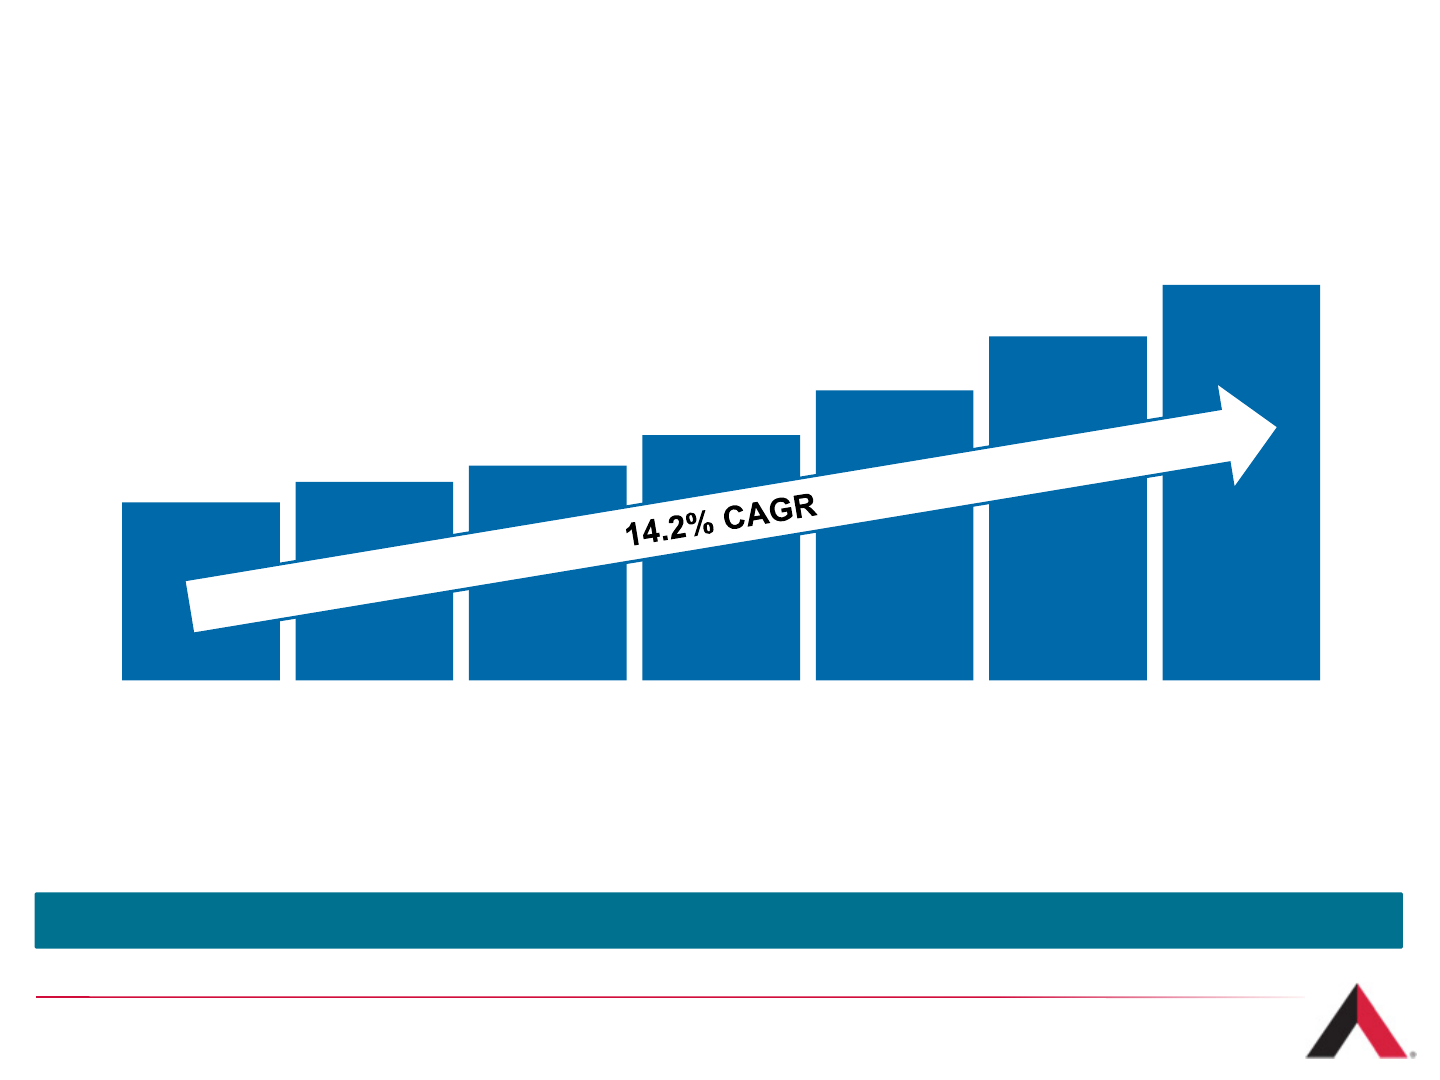
Consistent Revenue Growth
Total Rental & Management Revenue
($ in Millions)
53
$1,426
$3,287
2007 2008 2009 2010 2011 2012 2013
Strong organic core growth and contributions from new assets lead to continued growth in
revenue, both in the U.S. and internationally.
(1)
(1) Reflects the acquisition of Global Tower Partners as of October 1, 2013.
$890 $965 $1,041 $1,178 $1,314
$1,497
$1,680
2007 2008 2009 2010 2011 2012 2013
Operating Profit
19,606
27,739
Tower Count
Strong Domestic Operating Profit Growth
54
Domestic Rental & Management Operating Profit
($ in Millions)
~2.4 Tenants per
Tower ~2.5 Tenants per
Tower
Operating Profit growth has been driven primarily by organic new business commencements.
Definitions are provided at the end of this presentation.
$140 $166 $172 $217
$338
$453
$574
2007 2008 2009 2010 2011 2012 2013
Operating Profit
3,201
39,330
Tower Count
Strong International Operating Profit Growth
55
International Rental & Management Operating Profit
($ in Millions)
~1.8 Tenants per
Tower ~1.6 Tenants per
Tower
Acquisition of primarily single tenant towers positions our international business well for future
organic leasing growth.
Definitions are provided at the end of this presentation.
$979
$2,176
2007 2008 2009 2010 2011 2012 2013
Consistent Adjusted EBITDA Growth
Adjusted EBITDA(1)
($ in Millions)
56
(1) Definitions and reconciliations to GAAP measures are provided at the end of this presentation.
Strong growth with maintenance of high margins
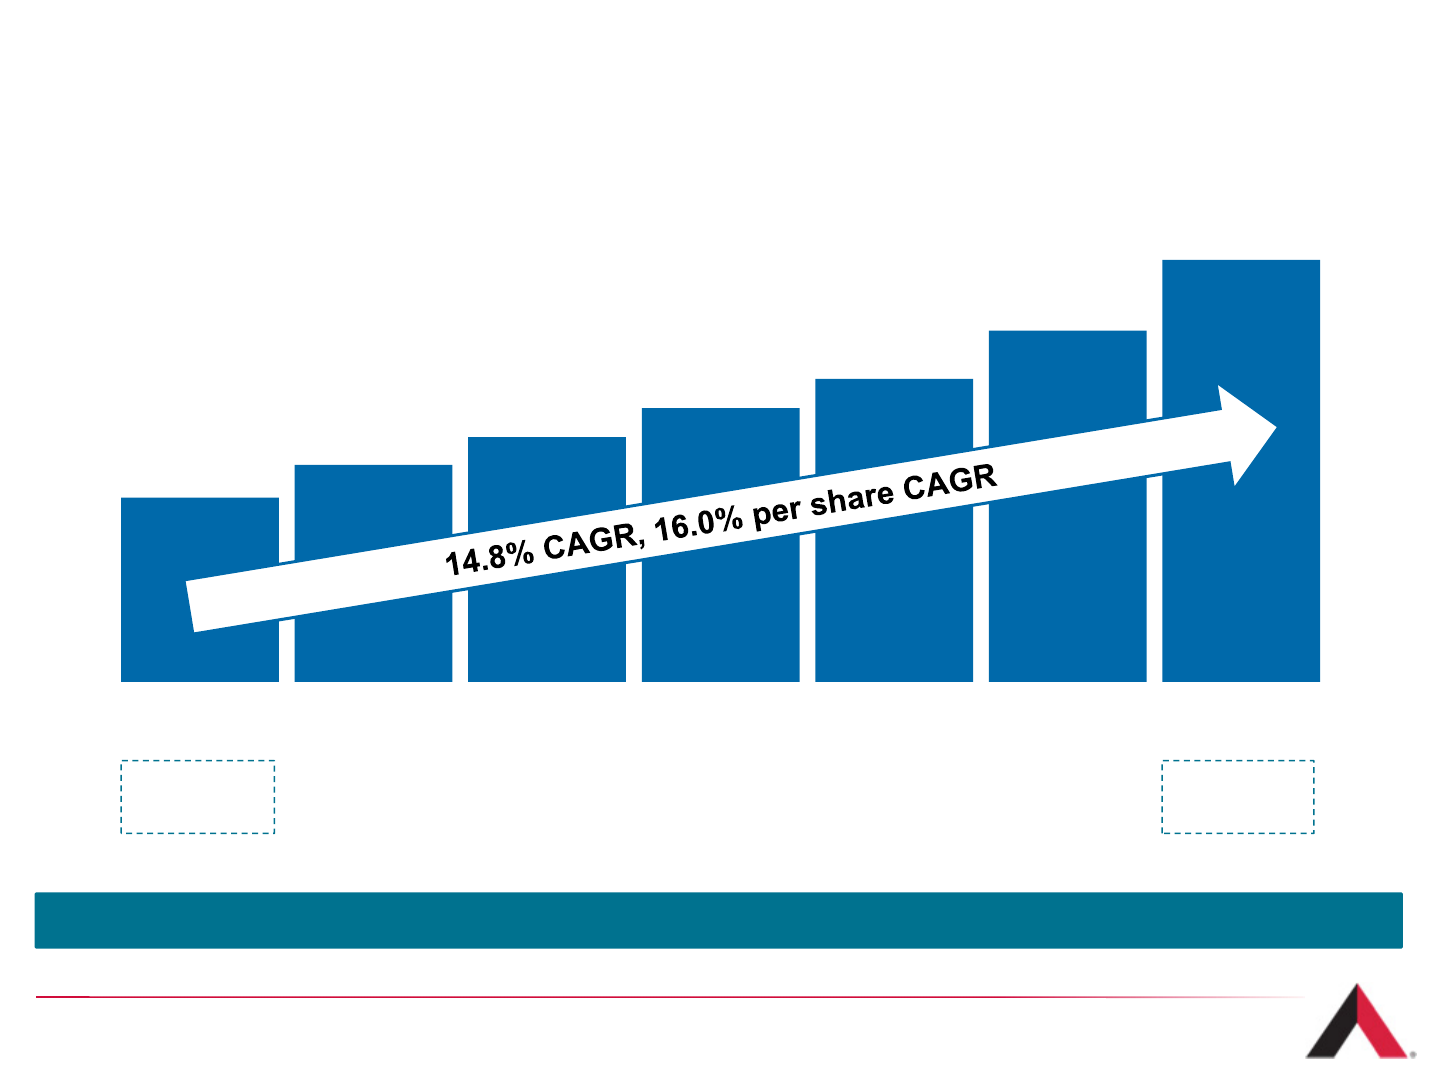
$642
$1,470
2007 2008 2009 2010 2011 2012 2013
Consistent AFFO Growth
Adjusted Funds From Operations
($ in Millions, except per share amounts)
57
$3.68
Per Share
$1.51
Per Share
Targeting to double 2012 AFFO per Share by 2017
Definitions are provided at the end of this presentation.
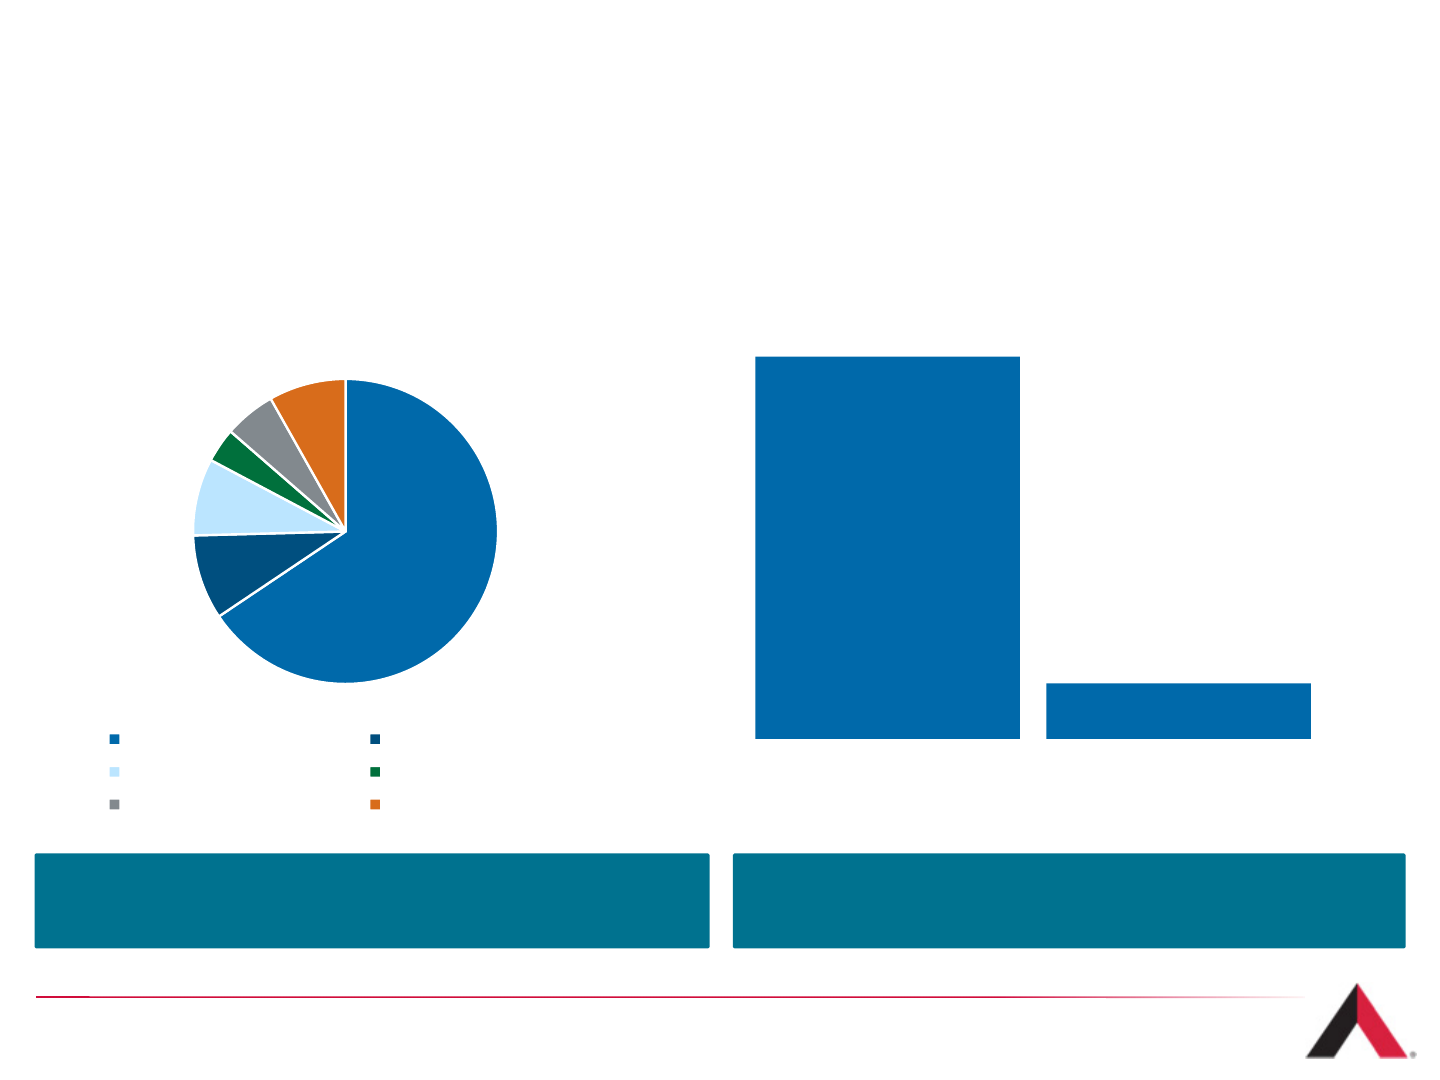
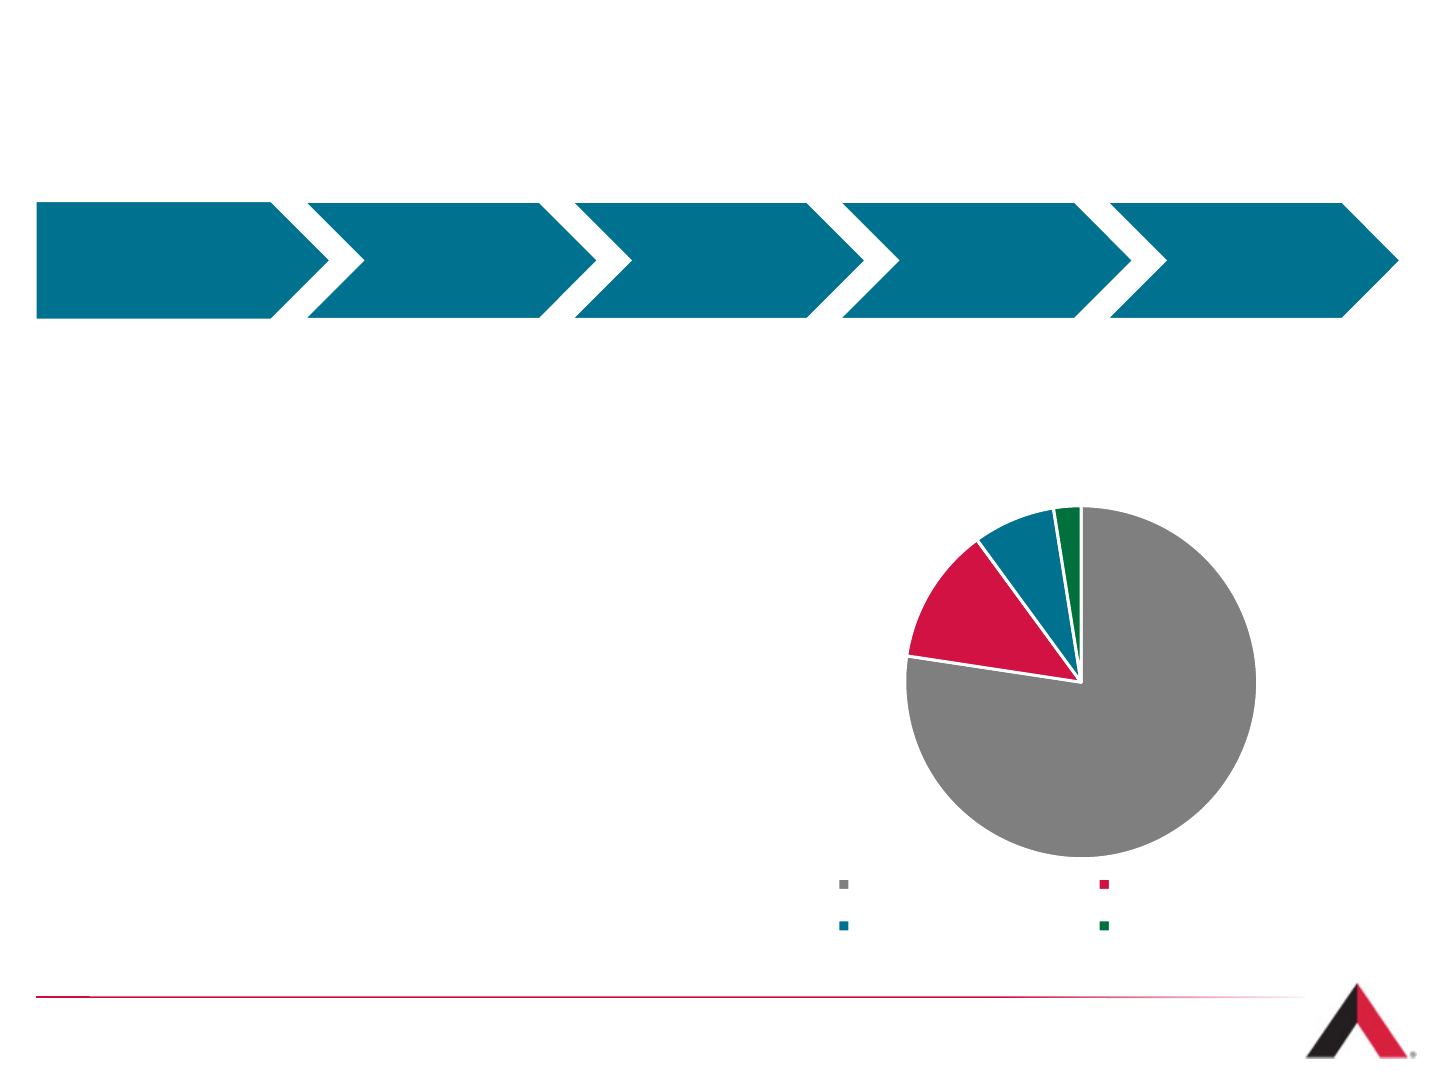
Geographically Diverse, Long-Term Revenue Base
Rental and Management Revenue
by Region(1) Non-Cancellable Tenant Lease Revenue(1)
58
We have diversified our revenue base into
international markets Long-term contracts result in significant,
non-cancellable tenant lease revenue
(1) Characteristics for the quarter ended June 30, 2014.
(2) Includes Chile, Colombia, Peru, Costa Rica and Panama.
(3) Figure above includes assets in Panama which sold during Q3 2014.
66%
9%
8%
4%
5% 8%
Total Revenue by Market
US Mexico
Brazil Other Latin America
India EMEA
~$23B
$3.3B
Non-Cancellable Tenant
Lease Revenue 2013 Rental &
Management Revenue
Non-cancellable
tenant lease
revenue of almost
7x our 2013 rental
& management
segment revenue
(2)(3)
Strong Tenant Profile
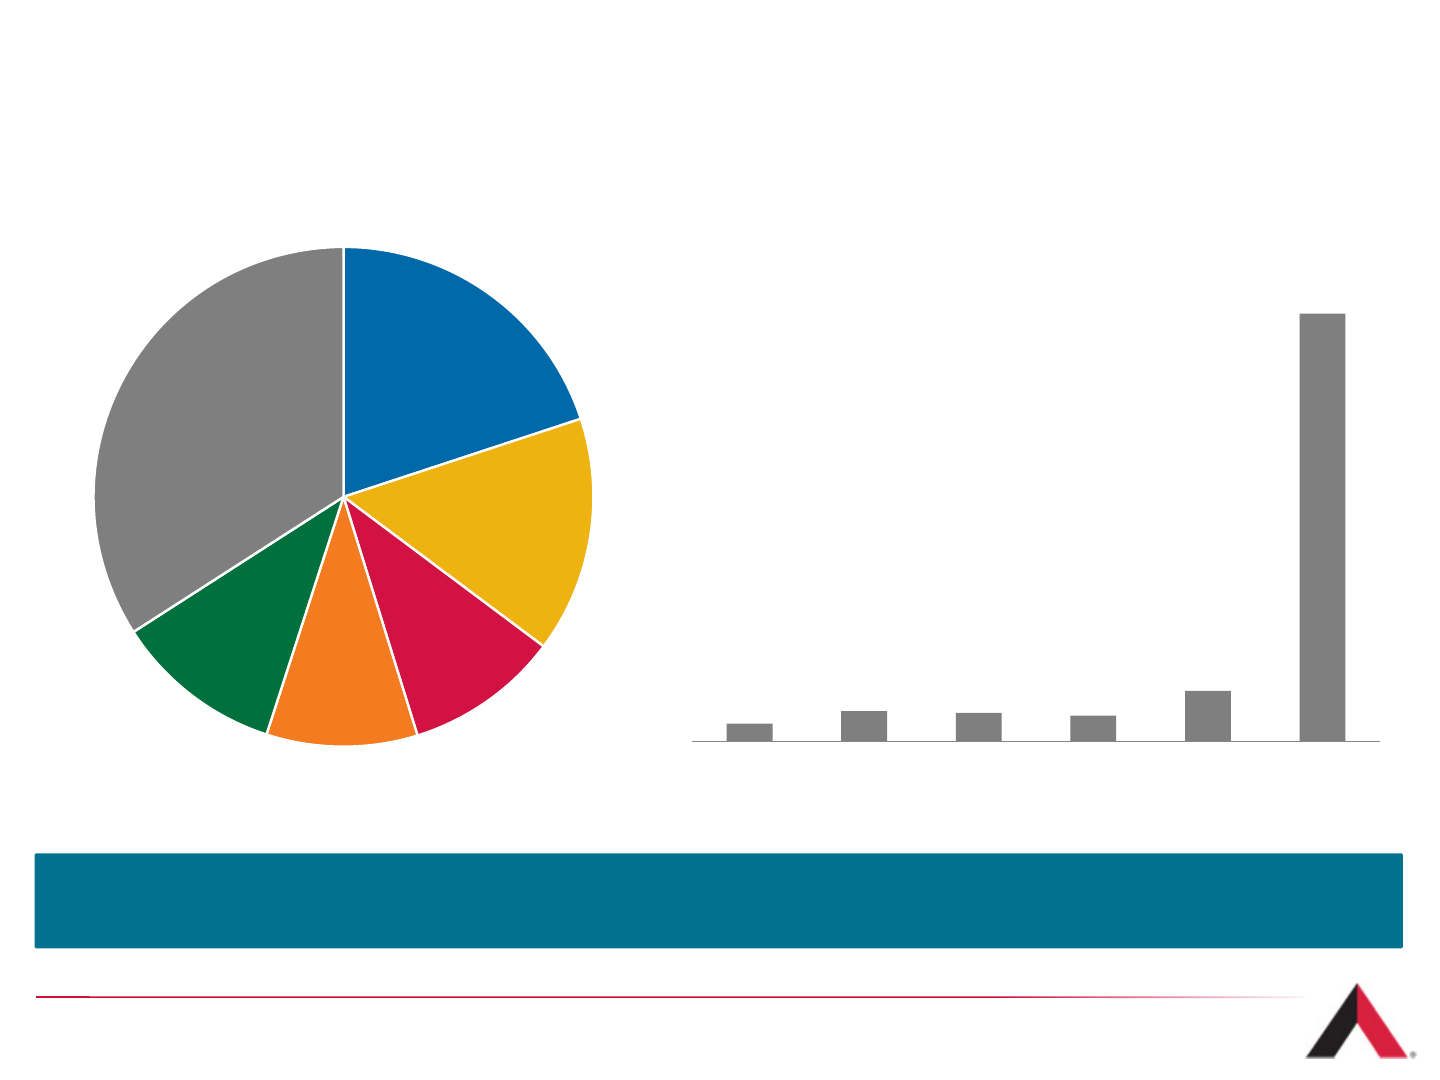
Tower Revenue by Customer (1)
59
(1) Characteristics for the quarter ended June 30, 2014.
AT&T
20%
Sprint-Nextel
15%
Verizon
10%
T-Mobile
10%
Other Domestic
11%
International
34%
3% 5% 5% 4% 9%
74%
2014 2015 2016 2017 2018 2019+
Global Tenant Lease Renewal Schedule(1)
~50% from Investment Grade Tenants
American Tower’s customer base includes the leading wireless carriers in the U.S. as well as
a number of large, multinational carriers in our international markets
Capital Allocation Priorities
›At least 20% dividend growth expected
›Majority of annual CAPEX budget dedicated
to investing in growth
›Low maintenance capital requirements
›Targeted long-term leverage range continues
to be 3 - 5x
›Consistent deployment of additional capital
towards acquisitions and/or
share repurchases
60
Capital Allocation REIT
Distribution CAPEX Target
Leverage
Range
Opportunistic
Acquisitions
$4,462
$725
$435 $145
Acquisitions Capital Expenditures
REIT Distribution Stock Repurchases
Definitions are provided at the end of this presentation.
2013 Capital Allocation
($ in Millions)
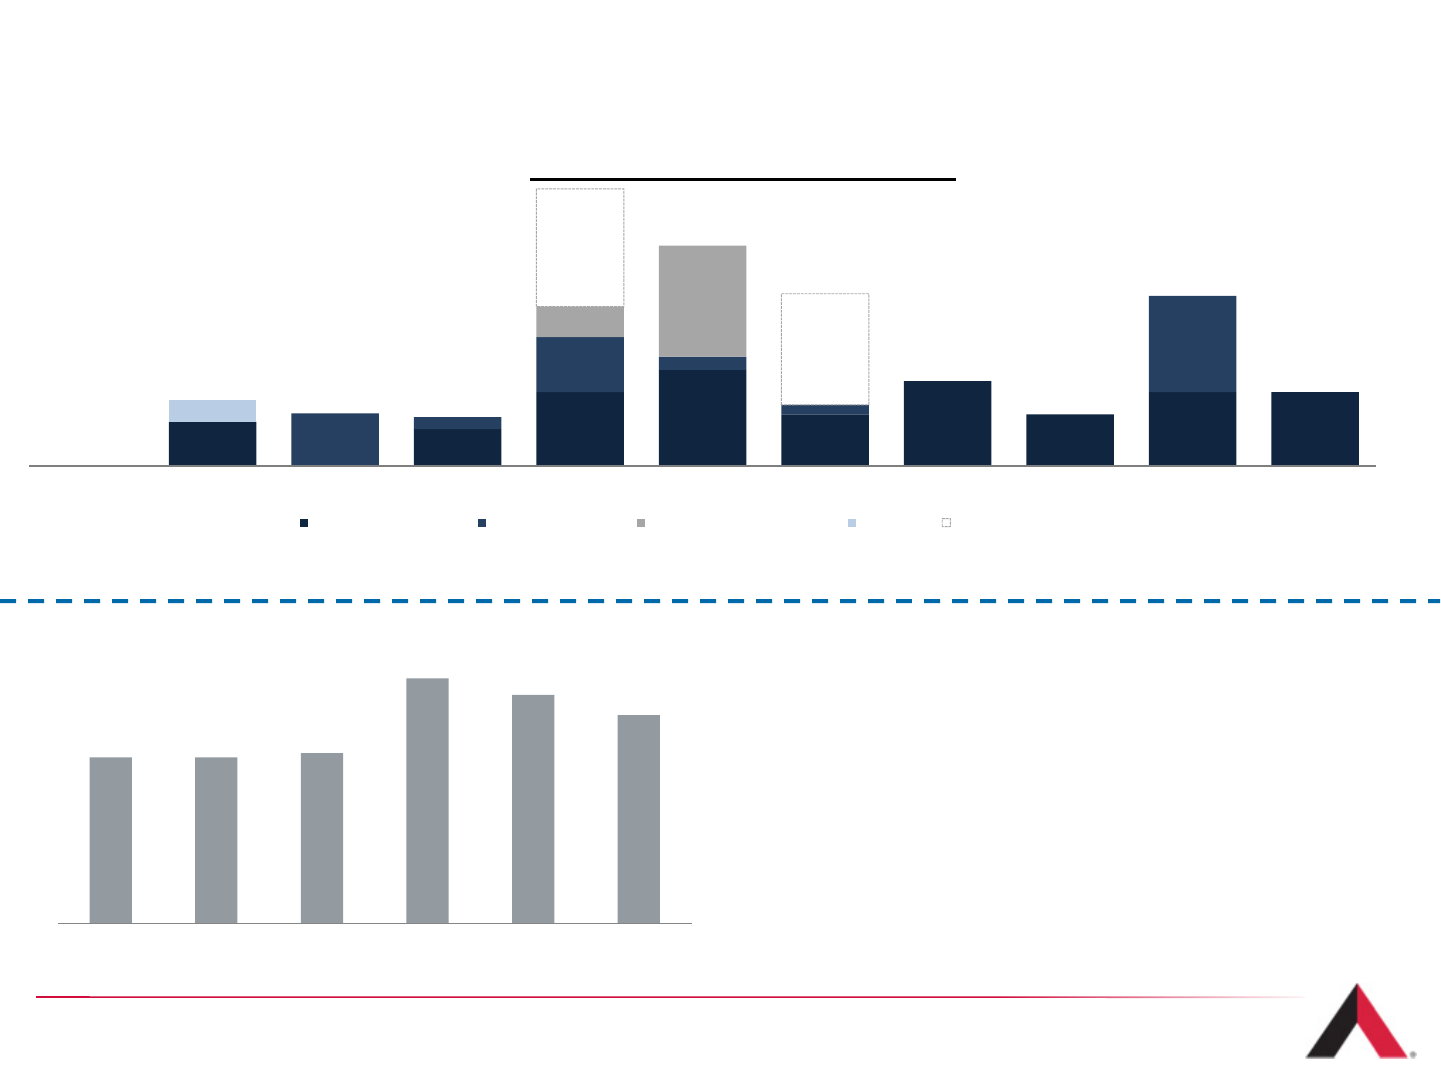
Solid Balance Sheet Position
›Liquidity of ~$3.1 billion as of June 30, 2014
›Expect to de-lever back to within target leverage of 3-5x
range by early 2015
(2) Reflects Net Debt divided by last quarter annualized Adjusted EBITDA.
(3) Pro forma for the $1.5 billion amended and restated revolving credit facility entered into in September 2014, the expiration in September 2014 of the Company’s short-term credit facility entered into in September 2013 and the
Company’s net repayment of $373 million under its 2013 Credit Facility.
Definitions and reconciliations to GAAP measures are provided at the end of this presentation.
4.0x 4.0x 4.1x
5.9x 5.5x 5.0x
1Q13 2Q13 3Q13 4Q13 1Q14 2Q14
Net Leverage Ratio
61
(3)
(2)
(1) Reflects principal balances as of June 30, 2014, pro forma for (i) additional net repayments of $373 million under its 2013 Credit Facility, (ii) the purchase of the $35 million Colombian shareholder loan in July 2014, (iii) the offering of $650 million of senior
notes due 2021 in August 2014, (iv) the repayment in August 2014 of $250 million of securitized notes acquired in connection with the Company’s acquisition of MIP Tower Holdings LLC, (v) the expiration of the Company’s $1 billion short-term credit facility in
September 2014, and (vi) the $1.5 billion amended and restated revolving credit facility entered into in September 2014. Excludes $523 million of other debt, including international loans and capital lease obligations.
$600 $500 $1,000 $1,300 $700 $1,150 $700 $1,000 $1,000
$715 $165
$745 $180
$129
$1,300
$ 410 $ 1,500
$299
$1,590
$1,500
2014 2015 2016 2017 2018 2019 2020 2021 2022 2023 2024
Debt Maturity Schedule ($ millions) (1)
Unsecured Notes Securitizations Unsecured Bank Debt Other Revolver Availability

The American Tower Difference
Our Vision
To be the premier wireless infrastructure provider in the eyes of our employees, customers and
communities, enabling the deployment of advanced services that make wireless communication
possible everywhere.
Our Mission
›Create a customer-focused team environment where employees are respected
and innovation is a state of mind.
›Deliver the highest level of customer service while providing safe,
compliant and quality tower sites.
›Exceed yearly performance goals to create enduring success.
›Pursue meaningful opportunities to grow and strengthen the Company.
62

Commitment to Corporate Responsibility
63
Philanthropy
We take great pride in how our organization, led by teams of
employees, demonstrates our commitment to the communities
where we live and work.
Ethics
Upholding the highest standard of corporate values is critical to
the success of our business. Starting with our executive management
team, our focus on ethical behavior lays the foundation of our
Company’s culture.
Environmental Responsibility
The promotion of shared infrastructure to customers is fundamentally
green. Internally, our environmental awareness programs, focused on
minimizing the impact of materials used in our daily operations, help
ensure that we are doing our part to care for the environment in our
offices and in the field.
People
American Tower’s diverse teams reach far across the globe and our
employees, no matter where they are, understand that respect,
inclusion, teamwork and communication are the cornerstones of
our organization.

Our Core Principles
›Understand our customers' needs and satisfy them.
Work as a team to build lasting customer relationships by understanding their requirements and
exceeding their expectations.
›Hire good people and empower them.
Place the right people in the right positions, develop their talent and skills and provide
opportunities for them to influence outcomes.
›Focus on solutions, not problems.
Begin with the end in mind and involve the right people. Stay positive and work together for
desired results.
›Do what we say we're going to do.
Set realistic expectations. Communicate clearly. Be accountable for your actions.
›Have fun.
Recognize our success, celebrate together and contribute to a positive work environment.
›Play to win.
Put integrity first. Be competitive. Work together as a team to exceed expectations.
64
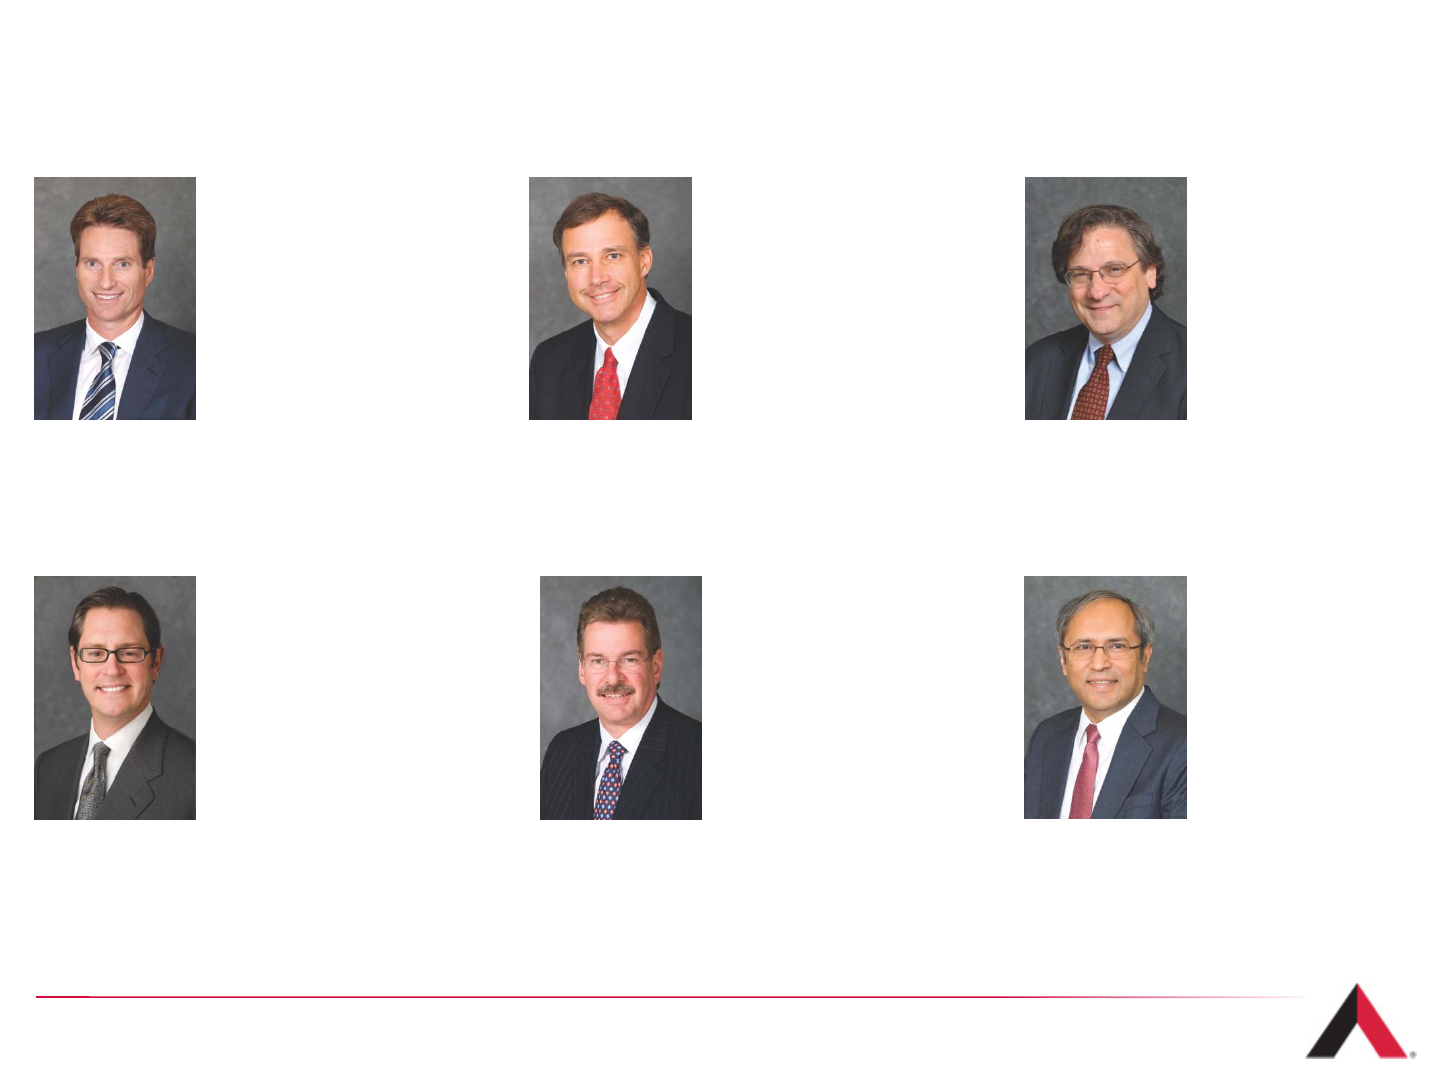
Executive Team
Tom Bartlett
Executive Vice President & Chief
Financial Officer
Ed DiSanto
Executive Vice President, Chief
Administrative Officer & General
Counsel
Hal Hess
Executive Vice President,
International Operations &
President, Latin America &
EMEA
Steven Marshall
Executive Vice President &
President, U.S. Tower Division
Amit Sharma
Executive Vice President
& President, Asia
65
Jim Taiclet
Chairman, President & Chief
Executive Officer
65

Summary
›Strong business model, independent of economic cyclicality
›Leveraging secular growth in global wireless
›High visibility to drivers of revenue and profitability for 2014 and beyond
›Significant investment capacity to fuel strong future growth
›Prudently-maintained balance sheet provides the foundation for future success
›On track to double AFFO/share from 2012 levels by 2017
66
Additional Information
67
For more information on the tower industry and American Tower, please refer to the various
presentations by visiting:
www.americantower.com/corporateus/investor-relations/company-industry-resources
www.americantower.com/corporateus/investor-relations/earnings-materials/index.htm
In addition, please feel free to contact our investor relations team if you have further questions.
Leah Stearns
Vice President,
Investor Relations and Treasurer
617-587-7921
leah.stearns@americantower.com
Igor Khislavsky
Sr. Manager,
Investor Relations
617-587-7915
igor.khislavsky@americantower.com
Kristyn Farahmand
Manager,
Investor Relations
617-375-7545
kristyn.farahmand@americantower.com
Investor Relations Contacts
Margo Williams
Analyst,
Investor Relations
617-375-7589
Margo.williams@americantower.com

Definitions
Adjusted EBITDA: Net income before Income (loss) on discontinued operations, net; Income (loss) from equity method investments;
Income tax provision (benefit); Other income (expense); Loss on retirement of long-term obligations; Interest expense; Interest income; Other
operating income (expense); Depreciation, amortization and accretion; and Stock-based compensation expense.
Adjusted EBITDA Margin: the percentage that results from dividing Adjusted EBITDA by total revenue.
Adjusted Funds From Operations, or AFFO: NAREIT Funds From Operations before (i) straight-line revenue and expense, (ii) stock-
based compensation expense, (iii) the non-cash portion of our tax provision, (iv) non-real estate related depreciation, amortization and
accretion, (v) amortization of deferred financing costs, capitalized interest, debt discounts and premiums and long-term deferred interest
charges, (vi) other income (expense), (vii) loss on retirement of long-term obligations, (viii) other operating income (expense), and
adjustments for (ix) unconsolidated affiliates, and (x) noncontrolling interest, less cash payments related to capital improvements and cash
payments related to corporate capital expenditures.
AFFO per Share: Adjusted Funds From Operations divided by the diluted weighted average common shares outstanding.
Churn: Revenue lost when a tenant cancels or does not renew its lease, and in limited circumstances, such as a tenant bankruptcy,
reductions in lease rates on existing leases.
Core Growth: (Rental and management revenue, Adjusted EBITDA, Gross Margin and Operating Profit) the increase or decrease,
expressed as a percentage, resulting from a comparison of financial results for a current period with corresponding financial results for the
corresponding period in a prior year, in each case, excluding the impact of straight-line revenue and expense recognition, foreign currency
exchange rate fluctuations and material one-time items.
NAREIT FFO: Net income before gains or losses from the sale or disposal of real estate, real estate related impairment charges, real estate
related depreciation, amortization and accretion and dividends declared on preferred stock, and including adjustments for (i) unconsolidated
affiliates and (ii) noncontrolling interest.
NAREIT FFO per Share: Funds From Operations divided by the diluted weighted average common shares outstanding.
Net Leverage Ratio: Net debt (total debt, less cash and cash equivalents) divided by last quarter annualized Adjusted EBITDA.
New Property Core Growth: (Rental and management revenue) the increase or decrease, expressed as a percentage, on the properties
the Company has added to its portfolio since the beginning of the prior period, in each case, excluding the impact of straight-line revenue
and expense recognition, foreign currency exchange rate fluctuations and significant one-time items.
Operating Profit: Gross margin less selling, general, administrative and development expense attributable to the segment, excluding stock-
based compensation expense and corporate expenses. International rental and management segment includes interest income, TV Azteca,
net.
68

Definitions
Operating Profit Margin: Operating profit divided by total revenue.
Organic Core Growth: (Rental and management revenue) the increase or decrease, expressed as a percentage, resulting from a comparison of financial
results for a current period with corresponding financial results for the corresponding period in a prior year, in each case, excluding the impact of straight-
line revenue and expense recognition, foreign currency exchange rate fluctuations, significant one-time items and revenue associated with new properties
that the Company has added to the portfolio since the beginning of the prior period.
Recurring Free Cash Flow: Adjusted EBITDA before straight-line revenue and expense plus interest income less interest expense, cash paid for income
taxes and non-discretionary capital expenditures (redevelopment, capital improvement and corporate capital expenditures).
Recurring Free Cash Flow per Share: Recurring Free Cash Flow divided by the diluted weighted average common shares outstanding.
Segment Gross Margin: segment revenue less segment operating expenses, excluding stock-based compensation expense recorded in costs of
operations; depreciation, amortization and accretion; selling, general, administrative and development expense; and other operating expenses.
International rental and management segment includes interest income, TV Azteca, net.
Segment Gross Margin Conversion Rate: the percentage that results from dividing the change in gross margin by the change in revenue.
Segment Operating Profit: Segment gross margin less segment selling, general, administrative and development expense attributable to the segment,
excluding stock-based compensation expense and corporate expenses. International rental and management segment includes interest income, TV
Azteca, net.
Pass-through Revenues: In several of our international markets we pass through certain operating expenses to our tenants, including in Latin America
where we primarily pass through ground rent expenses, and in India and South Africa, where we primarily pass through fuel costs. We record pass through
as revenue and a corresponding offsetting expense for these events.
Straight-line expenses: We calculate straight-line ground rent expense for our ground leases based on the fixed non-cancellable term of the underlying
ground lease plus all periods, if any, for which failure to renew the lease imposes an economic penalty to us such that renewal appears, at the inception of
the lease, to be reasonably assured. Certain of our tenant leases require us to exercise available renewal options pursuant to the underlying ground lease,
if the tenant exercises its renewal option. For towers with these types of tenant leases at the inception of the ground lease, we calculate our straight-line
ground rent over the term of the ground lease, including all renewal options required to fulfill the tenant lease obligation.
Straight-line revenues: We calculate straight-line rental revenues from our tenants based on the fixed escalation clauses present in non-cancellable
lease agreements, excluding those tied to the Consumer Price Index or other inflation-based indices, and other incentives present in lease agreements with
our tenants. We recognized revenues on a straight-line basis over the fixed, non-cancellable terms of the applicable leases.
69
Reconciliations
70
(Inmillions.Totalsmaynotaddduetorounding.)
RECONCILIATIONOFNETINCOMETOADJUSTED
EBITDA
2007 2008 2009 2010 2011 2012 2013 1Q13 2Q13 3Q13 4Q13 1Q14 2Q14
Netincome $56.6$347.4$247.1$373.6$381.8$594.0$482.2$160.9$84.1$163.2$73.9$193.3$221.7
Loss(income)fromdiscontinuedoperations,net 36.4(111.0) (8.2) (0.0) 0.0$0.0$0.00.00.00.00.00.00.0
Incomefromcontinuingoperations $93.0$236.4$238.9$373.6$381.8$594.0$482.2$160.9$84.1$163.2$73.9$193.3$221.7
Incomefromequitymethodinvestments (0.0) (0.0) (0.0) (0.0) (0.0) ($0.0) $0.00.00.00.00.00.00.0
Incometaxprovision 59.8135.5182.6182.5125.1$107.3$59.519.2(11.4) 15.636.217.621.8
Other(income)expense (20.7) (6.0) (1.3) (0.3) 123.0$38.3$207.5(22.3) 141.729.658.53.716.5
Lossonretirementoflong‐termobligations 35.44.918.21.90.0$0.4$38.735.32.70.00.70.21.3
Interestexpense 235.8253.6249.8246.0311.9$401.7$458.3111.8100.8106.3139.4143.3146.2
Interestincome (10.8) (3.4) (1.7) (5.0) (7.4) ($7.7) ($9.7) (1.7) (1.4) (2.3) (4.2) (2.0) (2.3)
Otheroperatingexpenses 9.211.219.235.958.1$62.2$71.514.35.915.535.913.912.8
Depreciation,amortizationandaccretion 522.9405.3414.6460.7555.5$644.3$800.1185.8184.6184.9244.8245.8245.4
Stock‐basedcompensationexpense 54.654.860.752.647.4$52.0$68.121.017.115.115.024.618.8
ADJUSTEDEBITDA $979.3$1,092.3$1,180.9$1,347.7$1,595.4$1,892.4$2,176.4$524.4$524.0$527.9$600.1$640.5$682.2
Dividedbytotalrevenue $1,456.6 $1,593.5 $1,724.1 $1,985.3 $2,443.5 $2,876.0 $3,361.4 $802.7 $808.8 $807.9 $942.0 $984.1 $1,031.5
ADJUSTEDEBITDAMARGIN 67% 69% 68% 68% 65% 66% 65% 65% 65% 65% 64% 65% 66%
AFFORECONCILIATION (1)
2007 2008 2009 2010 2011 2012 2013 1Q13 2Q13 3Q13 4Q13 1Q14 2Q14
AdjustedEBITDA $979.3$1,092.3$1,180.9$1,347.7$1,595.4$1,892.4$2,176.4$524.4$524.0$527.9$600.1$640.5$682.2
Straight‐linerevenue (69.7) (50.4) (36.3) (105.2) (144.0) (165.8) (147.7) (34.2) (34.4) (37.3) (41.7) (31.2) (33.1)
Straight‐lineexpense 26.727.626.622.331.033.729.77.17.96.38.49.57.9
Cashinterest (227.5) (244.0) (240.4) (237.6) (300.8) (380.6) (435.3) (104.2) (93.4) (99.2) (138.5) (139.9) (143.1)
InterestIncome 10.83.41.75.07.47.79.71.71.42.34.22.02.3
Cashreceived(paid)forincometaxes (2) (35.3) (35.1) (40.2) (36.4) (53.9) (69.3) (51.7) (13.5) (3.6) (6.0) (28.5) (19.1) (16.7)
DividendsDeclaredonpreferredstock ‐‐‐‐‐‐‐‐‐‐‐‐(4.4)
CapitalImprovementCapex (29.2) (32.5) (32.5) (31.4) (60.8) (75.4) (81.2) (15.9) (26.4) (18.7) (20.2) (17.2) (17.2)
CorporateCapex (12.7) (5.6) (8.1) (11.6) (18.7) (20.0) (30.4) (7.5) (9.2) (7.9) (5.8) (5.2) (3.9)
AFFO $642.4$755.8$851.7$952.8$1,055.5$1,222.6$1,469.5$357.8$366.2$367.3$378.2$439.3$473.9
(1) Calculation of AFFO excludes start-up related capital spending in 2012, 2013 and 2014.
(2) 2007 cash tax included in AFFO calculation has been adjusted to exclude a cash tax refund received in 2007 related to the carry back of
certain federal net operating losses.

Risk Factors
71
This presentation contains "forward-looking statements" concerning our goals, beliefs, expectations, strategies, objectives, plans,
future operating results and underlying assumptions, and other statements that are not necessarily based on historical
facts. Examples of these statements include, but are not limited to statements regarding our leverage range, our growth
expectations, including AFFO per share and our REIT distributions, and our expectations regarding the leasing demand for
communications real estate and the wireless industry in general. Actual results may differ materially from those indicated in our
forward-looking statements as a result of various important factors, including: (1) decrease in demand for our communications
sites would materially and adversely affect our operating results, and we cannot control that demand; (2) if our tenants share site
infrastructure to a significant degree or consolidate or merge, our growth, revenue and ability to generate positive cash flows
could be materially and adversely affected; (3) our business is subject to government regulations and changes in current or future
laws or regulations could restrict our ability to operate our business as we currently do; (4) our leverage and debt service
obligations may materially and adversely affect us; (5) if we fail to pay scheduled dividends on our preferred stock, in cash or
common stock, we will be prohibited from paying dividends on our common stock, which may jeopardize our status as a REIT;
(6) increasing competition in the tower industry may materially and adversely affect us; (7) our expansion initiatives involve a
number of risks and uncertainties that could adversely affect our operating results, disrupt our operations or expose us to
additional risk if we are not able to successfully integrate operations, assets and personnel; (8) our foreign operations are subject
to economic, political and other risks that could materially and adversely affect our revenues or financial position, including risks
associated with fluctuations in foreign currency exchange rates; (9) a substantial portion of our revenue is derived from a small
number of tenants, and we are sensitive to changes in the creditworthiness and financial strength of our tenants; (10) we may fail
to realize the growth prospects and cost savings anticipated as a result of our acquisition of MIP Tower Holdings LLC, the parent
company of Global Tower Partners (GTP); (11) new technologies or changes in a tenant’s business model could make our tower
leasing business less desirable and result in decreasing revenues; (12) if we fail to remain qualified as a REIT, we will be subject
to tax at corporate income tax rates, which may substantially reduce funds otherwise available; (13) we may be limited in our
ability to fund required distributions using cash generated through our TRSs; (14) complying with REIT requirements may limit
our flexibility or cause us to forego otherwise attractive opportunities;

Risk Factors
(continued)
72
(15) certain of our business activities may be subject to corporate level income tax and foreign taxes, which reduce our cash
flows and may create deferred and contingent tax liabilities; (16) we may need additional financing to fund capital expenditures,
future growth and expansion initiatives and to satisfy our REIT distribution requirements; (17) if we are unable to protect our
rights to the land under our towers, it could adversely affect our business and operating results; (18) if we are unable or choose
not to exercise our rights to purchase towers that are subject to lease and sublease agreements at the end of the applicable
period, our cash flows derived from such towers will be eliminated; (19) restrictive covenants in the agreements related to our
securitization transactions, our credit facilities and our debt securities could materially and adversely affect our business by
limiting flexibility; (20) we may incur goodwill and other intangible asset impairment charges, which could result in a significant
reduction to our earnings; (21) our costs could increase and our revenues could decrease due to perceived health risks from
radio emissions, especially if these perceived risks are substantiated; (22) we could have liability under environmental and
occupational safety and health laws; and (23) our towers or data centers may be affected by natural disasters and other
unforeseen events for which our insurance may not provide adequate coverage. For additional information regarding factors that
may cause actual results to differ materially from those indicated in our forward-looking statements, we refer you to the
information contained in Item 1A of our Form 10-Q for the quarter ended June 30, 2014. We undertake no obligation to update
the information contained in this presentation to reflect subsequently occurring events or circumstances.

Contact Information
73
Corporate Headquarters
116 Huntington Avenue
Boston, MA 02116
Phone: 617-375-7500
Fax: 617-375-7575
Computershare
P.O. Box 43006
Providence, RI 02940
Phone: 866-201-5087
American Tower Contacts
Transfer Agent
