Multi Agency Radiological Laboratory Analytical Protocols Manual (MARLAP) Analysis
User Manual: Analysis
Open the PDF directly: View PDF ![]() .
.
Page Count: 667 [warning: Documents this large are best viewed by clicking the View PDF Link!]
- MULTI-AGENCY RADIOLOGICAL LABORATORY ANALYTICAL PROTOCOLS MANUAL VOLUME II: CHAPTERS 10-17 AND APPENDIX F
- FOREWORD
- CONTENTS (VOLUME II)
- ACRONYMS AND ABBREVIATIONS
- UNIT CONVERSION FACTORS
- CH 10 FIELD AND SAMPLING ISSUES THAT AFFECT LABORATORY MEASUREMENTS
- CH 11 SAMPLE RECEIPT, INSPECTION, AND TRACKING
- CH 12 LABORATORY SAMPLE PREPARATION
- CH 13 SAMPLE DISSOLUTION
- CH 14 SEPARATION TECHNIQUES
- CH 15 QUANTIFICATION OF RADIONUCLIDES
- CH 16 DATA ACQUISITION, REDUCTION, AND REPORTING FOR NUCLEAR-COUNTING INSTRUMENTATION
- CH 17 WASTE MANAGEMENT IN A RADIOANALYTICAL LABORATORY
- APPENDIX F
- GLOSSARY
- BIBLIOGRAPHIC DATA SHEET
IMPLEMENTATION
PLANNING
ASSESSMENT
MARLAP
Multi-Agency Radiological
Laboratory Analytical Protocols Manual
Volume II: Chapters 10 – 17 and Appendix F
NUREG-1576
EPA 402-B-04-001B
NTIS PB2004-105421
July 2004

Disclaimer
References within this manual to any specific commercial product, process, or service by trade
name, trademark, manufacturer, or otherwise does not necessarily imply its endorsement or
recommendation by the United States Government. Neither the United States Government nor
any agency or branch thereof, nor any of their employees, makes any warranty, expressed or
implied, nor assumes any legal liability of responsibility for any third party’s use, or the results
of such use, of any information, apparatus, product, or process disclosed in this manual, nor
represents that its use by such third party would not infringe on privately owned rights.
NUREG-1576
EPA 402-B-04-001B
NTIS PB2004-105421
Multi-Agency Radiological
Laboratory Analytical Protocols Manual
(MARLAP)
Part II: Chapters 10 – 17
Appendix F
(Volume II)
United States Environmental Protection Agency
United States Department of Defense
United States Department of Energy
United States Department of Homeland Security
United States Nuclear Regulatory Commission
United States Food and Drug Administration
United States Geological Survey
National Institute of Standards and Technology
July 2004
III
JULY 2004 MARLAP
FOREWORD
MARLAP is organized into two parts. Part I, consisting of Chapters 1 through 9, is intended
primarily for project planners and managers. Part I introduces the directed planning process
central to MARLAP and provides guidance on project planning with emphasis on radioanalytical
planning issues and radioanalytical data requirements. Part II, consisting of Chapters 10 through
20, is intended primarily for laboratory personnel and provides guidance in the relevant areas of
radioanalytical laboratory work. In addition, MARLAP contains seven appendices—labeled A
through G—that provide complementary information, detail background information, or concepts
pertinent to more than one chapter. Six chapters and one appendix are immediately followed by
one or more attachments that the authors believe will provide additional or more detailed
explanations of concepts discussed within the chapter. Attachments to chapters have letter
designators (e.g, Attachment “6A” or “3B”), while attachments to appendices are numbered (e.g.,
“B1”). Thus, “Section B.1.1” refers to section 1.1 of appendix B, while “Section B1.1” refers to
section 1 of attachment 1 to appendix B. Cross-references within the text are explicit in order to
avoid confusion.
Because of its length, the printed version of MARLAP is bound in three volumes. Volume I
(Chapters 1 through 9 and Appendices A through E) contains Part I. Because of its length, Part II
is split between Volumes II and III. Volume II (Chapters 10 through 17 and Appendix F) covers
most of the activities performed at radioanalytical laboratories, from field and sampling issues
that affect laboratory measurements through waste management. Volume III (Chapters 18
through 20 and Appendix G) covers laboratory quality control, measurement uncertainty and
detection and quantification capability. Each volume includes a table of contents, list of
acronyms and abbreviations, and a complete glossary of terms.
MARLAP and its periodic revisions are available online at www.epa.gov/radiation/marlap and
www.nrc.gov/reading-rm/doc-collections/nuregs/staff/sr1576/. The online version is updated
periodically and may differ from the last printed version. Although references to material found
on a web site bear the date the material was accessed, the material available on the date cited may
subsequently be removed from the site. Printed and CD-ROM versions of MARLAP are
available through the National Technical Information Service (NTIS). NTIS may be accessed
online at www.ntis.gov. The NTIS Sales Desk can be reached between 8:30 a.m. and 6:00 p.m.
Eastern Time, Monday through Friday at 1-800-553-6847; TDD (hearing impaired only) at 703-
487-4639 between 8:30 a.m. and 5:00 p.m Eastern Time, Monday through Friday; or fax at 703-
605-6900.
MARLAP is a living document, and future editions are already under consideration. Users are
urged to provide feedback on how MARLAP can be improved. While suggestions may not
always be acknowledged or adopted, commentors may be assured that they will be considered
carefully. Comments may be submitted electronically through a link on EPA’s MARLAP web
site (www.epa.gov/radiation/marlap).

V
JULY 2004 MARLAP
CONTENTS (VOLUME II)
Page
List of Figures .............................................................XVIII
List of Tables ............................................................... XX
Acronyms and Abbreviations..................................................XXIII
Unit Conversion Factors .....................................................XXXI
10 Field and Sampling Issues That Affect Laboratory Measurements ................. 10-1
Part A: Generic Issues .................................................... 10-1
10.1 Introduction ...................................................... 10-1
10.2 Field Sampling Plan: Non-Matrix-Specific Issues ......................... 10-3
10.2.1 Determination of Analytical Sample Size ............................ 10-3
10.2.2 Field Equipment and Supply Needs ................................. 10-3
10.2.3 Selection of Sample Containers .................................... 10-4
10.2.3.1 Container Material ........................................ 10-4
10.2.3.2 Container Opening and Closure .............................. 10-5
10.2.3.3 Sealing Containers ........................................ 10-5
10.2.3.4 Precleaned and Extra Containers ............................. 10-5
10.2.4 Container Label and Sample Identification Code ...................... 10-6
10.2.5 Field Data Documentation ........................................ 10-7
10.2.6 Field Tracking, Custody, and Shipment Forms ........................ 10-8
10.2.7 Chain of Custody ............................................... 10-9
10.2.8 Field Quality Control ........................................... 10-10
10.2.9 Decontamination of Field Equipment .............................. 10-10
10.2.10 Packing and Shipping ......................................... 10-11
10.2.11 Worker Health and Safety Plan .................................. 10-12
10.2.11.1 Physical Hazards ........................................ 10-13
10.2.11.2 Biohazards ............................................. 10-15
Part B: Matrix-Specific Issues That Impact Field Sample Collection, Processing, and
Preservation ........................................................ 10-16
10.3 Liquid Samples .................................................. 10-17
10.3.1 Liquid Sampling Methods ....................................... 10-18
10.3.2 Liquid Sample Preparation: Filtration .............................. 10-18
10.3.2.1 Example of Guidance for Ground-Water Sample Filtration ....... 10-19
10.3.2.2 Filters ................................................. 10-21
10.3.3 Field Preservation of Liquid Samples .............................. 10-22
10.3.3.1 Sample Acidification ..................................... 10-22
10.3.3.2 Non-Acid Preservation Techniques .......................... 10-23

Contents
Page
VI
MARLAP JULY 2004
10.3.4 Liquid Samples: Special Cases ................................... 10-25
10.3.4.1 Radon-222 in Water ...................................... 10-25
10.3.4.1 Milk .................................................. 10-26
10.3.5 Nonaqueous Liquids and Mixtures ................................ 10-26
10.4 Solids ......................................................... 10-28
10.4.1 Soils ........................................................ 10-29
10.4.1.1 Soil Sample Preparation .................................. 10-29
10.4.1.2 Sample Ashing ......................................... 10-30
10.4.2 Sediments ................................................... 10-30
10.4.3 Other Solids ................................................. 10-31
10.4.3.1 Structural Materials ...................................... 10-31
10.4.3.2 Biota: Samples of Plant and Animal Products .................. 10-31
10.5 Air Sampling .................................................... 10-34
10.5.1 Sampler Components and Operation .............................. 10-34
10.5.2 Filter Selection Based on Destructive Versus Nondestructive Analysis .... 10-35
10.5.3 Sample Preservation and Storage ................................. 10-36
10.5.4 Special Cases: Collection of Gaseous and Volatile Air Contaminants ..... 10-36
10.5.4.1 Radioiodines ........................................... 10-36
10.5.4.2 Gases ................................................. 10-37
10.5.4.3 Tritium Air Sampling ..................................... 10-38
10.5.4.4 Radon Sampling in Air ................................... 10-39
10.6 Wipe Sampling for Assessing Surface Contamination .................... 10-41
10.6.1 Sample Collection Methods ..................................... 10-42
10.6.1.1 Dry Wipes ............................................. 10-42
10.6.1.2 Wet Wipes ............................................. 10-43
10.6.2 Sample Handling .............................................. 10-44
10.6.3 Analytical Considerations for Wipe Material Selection ................ 10-44
10.7 References ...................................................... 10-45
11 Sample Receipt, Inspection, and Tracking ..................................... 11-1
11.1 Introduction ...................................................... 11-1
11.2 General Considerations ............................................. 11-1
11.2.1 Communication Before Sample Receipt ............................. 11-1
11.2.2 Standard Operating Procedures .................................... 11-3
11.2.3 Laboratory License .............................................. 11-4
11.2.4 Sample Chain-of-Custody ........................................ 11-4
11.3 Sample Receipt ................................................... 11-5
11.3.1 Package Receipt ................................................ 11-5
11.3.2 Radiological Surveying .......................................... 11-6
11.3.3 Corrective Action ............................................... 11-8

Contents
Page
VII
JULY 2004 MARLAP
11.4 Sample Inspection ................................................. 11-8
11.4.1 Physical Integrity of Package and Sample Containers ................... 11-8
11.4.2 Sample Identity Confirmation ..................................... 11-9
11.4.3 Confirmation of Field Preservation ................................. 11-9
11.4.4 Presence of Hazardous Materials ................................... 11-9
11.4.5 Corrective Action .............................................. 11-10
11.5 Laboratory Sample Tracking ........................................ 11-11
11.5.1 Sample Log-In ................................................ 11-11
11.5.2 Sample Tracking During Analyses ................................. 11-11
11.5.3 Storage of Samples ............................................. 11-12
11.6 References ...................................................... 11-13
12 Laboratory Sample Preparation ............................................. 12-1
12.1 Introduction ...................................................... 12-1
12.2 General Guidance for Sample Preparation ............................... 12-2
12.2.1 Potential Sample Losses During Preparation ......................... 12-2
12.2.1.1 Losses as Dust or Particulates ............................... 12-2
12.2.1.2 Losses Through Volatilization ............................... 12-3
12.2.1.3 Losses Due to Reactions Between Sample and Container .......... 12-5
12.2.2 Contamination from Sources in the Laboratory ........................ 12-6
12.2.2.1 Airborne Contamination ................................... 12-7
12.2.2.2 Contamination of Reagents ................................. 12-7
12.2.2.3 Contamination of Glassware and Equipment ................... 12-8
12.2.2.4 Contamination of Facilities ................................. 12-8
12.2.3 Cleaning of Labware, Glassware, and Equipment ...................... 12-8
12.2.3.1 Labware and Glassware .................................... 12-8
12.2.3.2 Equipment ............................................. 12-10
12.3 Solid Samples ................................................... 12-12
12.3.1 General Procedures ............................................ 12-12
12.3.1.1 Exclusion of Material ..................................... 12-14
12.3.1.2 Principles of Heating Techniques for Sample Pretreatment ....... 12-14
12.3.1.3 Obtaining a Constant Weight ............................... 12-23
12.3.1.4 Subsampling ............................................ 12-24
12.3.2 Soil/Sediment Samples ......................................... 12-27
12.3.2.1 Soils .................................................. 12-28
12.3.2.2 Sediments .............................................. 12-28
12.3.3 Biota Samples ................................................ 12-28
12.3.3.1 Food .................................................. 12-29
12.3.3.2 Vegetation ............................................. 12-29
12.3.3.3 Bone and Tissue ......................................... 12-30

Contents
Page
VIII
MARLAP JULY 2004
12.3.4 Other Samples ................................................ 12-30
12.4 Filters .......................................................... 12-30
12.5 Wipe Samples ................................................... 12-31
12.6 Liquid Samples .................................................. 12-32
12.6.1 Conductivity ................................................. 12-32
12.6.2 Turbidity ..................................................... 12-32
12.6.3 Filtration .................................................... 12-33
12.6.4 Aqueous Liquids .............................................. 12-33
12.6.5 Nonaqueous Liquids ........................................... 12-34
12.6.6 Mixtures ..................................................... 12-35
12.6.6.1 Liquid-Liquid Mixtures ................................... 12-35
12.6.6.2 Liquid-Solid Mixtures .................................... 12-35
12.7 Gases .......................................................... 12-36
12.8 Bioassay ........................................................ 12-36
12.9 References ...................................................... 12-37
12.9.1 Cited Sources ................................................. 12-37
12.9.2 Other Sources ................................................. 12-43
13 Sample Dissolution ...................................................... 13-1
13.1 Introduction ...................................................... 13-1
13.2 The Chemistry of Dissolution ........................................ 13-2
13.2.1 Solubility and the Solubility Product Constant, Ksp .................... 13-2
13.2.2 Chemical Exchange, Decomposition, and Simple Rearrangement Reactions . 13-3
13.2.3 Oxidation-Reduction Processes .................................... 13-4
13.2.4 Complexation .................................................. 13-5
13.2.5 Equilibrium: Carriers and Tracers .................................. 13-6
13.3 Fusion Techniques ................................................. 13-6
13.3.1 Alkali-Metal Hydroxide Fusions ................................... 13-9
13.3.2 Boron Fusions ................................................ 13-11
13.3.3 Fluoride Fusions ............................................... 13-12
13.3.4 Sodium Hydroxide Fusion ....................................... 13-12
13.4 Wet Ashing and Acid Dissolution Techniques .......................... 13-12
13.4.1 Acids and Oxidants ............................................ 13-13
13.4.2 Acid Digestion Bombs .......................................... 13-20
13.5 Microwave Digestion .............................................. 13-21
13.5.1 Focused Open-Vessel Systems ................................... 13-21
13.5.2 Low-Pressure, Closed-Vessel Systems ............................. 13-22
13.5.3 High-Pressure, Closed-Vessel Systems ............................. 13-22
13.6 Verification of Total Dissolution ..................................... 13-23
13.7 Special Matrix Considerations ....................................... 13-23

Contents
Page
IX
JULY 2004 MARLAP
13.7.1 Liquid Samples ............................................... 13-23
13.7.2 Solid Samples ................................................ 13-24
13.7.3 Filters ....................................................... 13-24
13.7.4 Wipe Samples ................................................ 13-24
13.8 Comparison of Total Dissolution and Acid Leaching ..................... 13-25
13.9 References ...................................................... 13-27
13.9.1 Cited References .............................................. 13-27
13.9.2 Other Sources ................................................. 13-29
14 Separation Techniques .................................................... 14-1
14.1 Introduction ...................................................... 14-1
14.2 Oxidation-Reduction Processes ....................................... 14-2
14.2.1 Introduction ................................................... 14-2
14.2.2 Oxidation-Reduction Reactions .................................... 14-3
14.2.3 Common Oxidation States ........................................ 14-6
14.2.4 Oxidation State in Solution ...................................... 14-10
14.2.5 Common Oxidizing and Reducing Agents .......................... 14-11
14.2.6 Oxidation State and Radiochemical Analysis ........................ 14-13
14.3 Complexation .................................................... 14-18
14.3.1 Introduction .................................................. 14-18
14.3.2 Chelates ..................................................... 14-20
14.3.3 The Formation (Stability) Constant ................................ 14-22
14.3.4 Complexation and Radiochemical Analysis ......................... 14-23
14.3.4.1 Extraction of Laboratory Samples and Ores .................... 14-23
14.3.4.2 Separation by Solvent Extraction and Ion-Exchange Chromatography 14-23
14.3.4.3 Formation and Dissolution of Precipitates ..................... 14-24
14.3.4.4 Stabilization of Ions in Solution ............................. 14-24
14.3.4.5 Detection and Determination ................................ 14-25
14.4 Solvent Extraction ................................................ 14-25
14.4.1 Extraction Principles ........................................... 14-25
14.4.2 Distribution Coefficient ......................................... 14-26
14.4.3 Extraction Technique ........................................... 14-27
14.4.4 Solvent Extraction and Radiochemical Analysis ...................... 14-30
14.4.5 Solid-Phase Extraction .......................................... 14-32
14.4.5.1 Extraction Chromatography Columns ........................ 14-33
14.4.5.2 Extraction Membranes .................................... 14-34
14.4.6 Advantages and Disadvantages of Solvent Extraction ................. 14-35
14.4.6.1 Advantages of Liquid-Liquid Solvent Extraction ............... 14-35
14.4.6.2 Disadvantages of Liquid-Liquid Solvent Extraction ............. 14-35
14.4.6.3 Advantages of Solid-Phase Extraction Media .................. 14-35

Contents
Page
X
MARLAP JULY 2004
14.4.6.4 Disadvantages of Solid-Phase Extraction Media ................ 14-36
14.5 Volatilization and Distillation ....................................... 14-36
14.5.1 Introduction .................................................. 14-36
14.5.2 Volatilization Principles ........................................ 14-36
14.5.3 Distillation Principles .......................................... 14-38
14.5.4 Separations in Radiochemical Analysis ............................. 14-39
14.5.5 Advantages and Disadvantages of Volatilization ..................... 14-40
14.5.5.1 Advantages ............................................. 14-40
14.5.5.2 Disadvantages .......................................... 14-40
14.6 Electrodeposition ................................................. 14-41
14.6.1 Electrodeposition Principles ..................................... 14-41
14.6.2 Separation of Radionuclides ..................................... 14-42
14.6.3 Preparation of Counting Sources .................................. 14-43
14.6.4 Advantages and Disadvantages of Electrodeposition .................. 14-43
14.6.4.1 Advantages ............................................. 14-43
14.6.4.2 Disadvantages ............................................ 14-43
14.7 Chromatography .................................................. 14-44
14.7.1 Chromatographic Principles ...................................... 14-44
14.7.2 Gas-Liquid and Liquid-Liquid Phase Chromatography ................. 14-45
14.7.3 Adsorption Chromatography ..................................... 14-45
14.7.4 Ion-Exchange Chromatography ................................... 14-46
14.7.4.1 Principles of Ion Exchange ................................ 14-46
14.7.4.2 Resins ................................................. 14-48
14.7.5 Affinity Chromatography ........................................ 14-54
14.7.6 Gel-Filtration Chromatography ................................... 14-54
14.7.7 Chromatographic Laboratory Methods ............................. 14-55
14.7.8 Advantages and Disadvantages of Chromatographic Systems ........... 14-56
14.7.8.1 Advantages ............................................. 14-56
14.7.8.2 Disadvantages .......................................... 14-56
14.8 Precipitation and Coprecipitation .................................... 14-56
14.8.1 Introduction .................................................. 14-56
14.8.2 Solutions .................................................... 14-57
14.8.3 Precipitation .................................................. 14-59
14.8.3.1 Solubility and the Solubility Product Constant, Ksp .............. 14-59
14.8.3.2 Factors Affecting Precipitation ............................. 14-64
14.8.3.3 Optimum Precipitation Conditions .......................... 14-69
14.8.4 Coprecipitation ................................................ 14-69
14.8.4.1 Coprecipitation Processes ................................. 14-70
14.8.4.2 Water as an Impurity ..................................... 14-74
14.8.4.3 Postprecipitation ........................................ 14-74

Contents
Page
XI
JULY 2004 MARLAP
14.8.4.4 Coprecipitation Methods .................................. 14-75
14.8.5 Colloidal Precipitates ........................................... 14-78
14.8.6 Separation of Precipitates ....................................... 14-81
14.8.7 Advantages and Disadvantages of Precipitation and Coprecipitation ...... 14-82
14.8.7.1 Advantages ............................................. 14-82
14.8.7.2 Disadvantages .......................................... 14-82
14.9 Carriers and Tracers ............................................... 14-82
14.9.1 Introduction .................................................. 14-82
14.9.2 Carriers ...................................................... 14-83
14.9.2.1 Isotopic Carriers ......................................... 14-83
14.9.2.2 Nonisotopic Carriers ..................................... 14-84
14.9.2.3 Common Carriers ........................................ 14-85
14.9.2.4 Holdback Carriers ....................................... 14-89
14.9.2.5 Yield of Isotopic Carriers .................................. 14-89
14.9.3 Tracers ...................................................... 14-90
14.9.3.1 Characteristics of Tracers .................................. 14-92
14.9.3.2 Coprecipitation .......................................... 14-93
14.9.3.3 Deposition on Nonmetallic Solids ........................... 14-93
14.9.3.4 Radiocolloid Formation .................................. 14-94
14.9.3.5 Distribution (Partition) Behavior ............................ 14-95
14.9.3.6 Vaporization ............................................ 14-95
14.9.3.7 Oxidation and Reduction .................................. 14-96
14.10 Analysis of Specific Radionuclides ................................... 14-97
14.10.1 Basic Principles of Chemical Equilibrium ........................ 14-97
14.10.2 Oxidation State ............................................ 14-100
14.10.3 Hydrolysis ................................................ 14-100
14.10.4 Polymerization ............................................. 14-102
14.10.5 Complexation ............................................. 14-103
14.10.6 Radiocolloid Interference .................................... 14-103
14.10.7 Isotope Dilution Analysis .................................... 14-104
14.10.8 Masking and Demasking ..................................... 14-105
14.10.9 Review of Specific Radionuclides .............................. 14-109
14.10.9.1 Americium ............................................ 14-109
14.10.9.2 Carbon ............................................... 14-114
14.10.9.3 Cesium ............................................... 14-116
14.10.9.4 Cobalt ................................................ 14-119
14.10.9.5 Iodine ................................................ 14-125
14.10.9.6 Neptunium ............................................ 14-132
14.10.9.7 Nickel ................................................ 14-136
14.10.9.8 Plutonium ............................................. 14-139

Contents
Page
XII
MARLAP JULY 2004
14.10.9.9 Radium ............................................... 14-148
14.10.9.10 Strontium ............................................. 14-155
14.10.9.11 Sulfur and Phosphorus ................................... 14-160
14.10.9.12 Technetium ........................................... 14-163
14.10.9.13 Thorium .............................................. 14-169
14.10.9.14 Tritium ............................................... 14-175
14.10.9.15 Uranium .............................................. 14-180
14.10.9.16 Zirconium ............................................. 14-191
14.10.9.17 Progeny of Uranium and Thorium .......................... 14-198
14.11 References ..................................................... 14-201
14.12 Selected Bibliography ............................................ 14-218
14.12.1 Inorganic and Analytical Chemistry ............................ 14-218
14.12.2 General Radiochemistry ..................................... 14-219
14.12.3 Radiochemical Methods of Separation .......................... 14-219
14.12.4 Radionuclides ............................................. 14-220
14.12.5 Separation Methods ......................................... 14-222
Attachment 14A Radioactive Decay and Equilibrium .......................... 14-223
14A.1 Radioactive Equilibrium ....................................... 14-223
14A.1.1 Secular Equilibrium ..................................... 14-223
14A.1.2 Transient Equilibrium ................................... 14-225
14A.1.3 No Equilibrium ........................................ 14-226
14A.1.4 Summary of Radioactive Equilibria ......................... 14-227
14A.1.5 Supported and Unsupported Radioactive Equilibria ................ 14-228
14A.2 Effects of Radioactive Equilibria on Measurement Uncertainty ......... 14-229
14A.2.1 Issue ................................................. 14-229
14A.2.2 Discussion ............................................ 14-229
14A.2.3 Examples of Isotopic Distribution: Natural, Enriched, and Depleted
Uranium .............................................. 14-231
14A.3 References .................................................. 14-232
15 Quantification of Radionuclides ............................................ 15-1
15.1 Introduction ...................................................... 15-1
15.2 Instrument Calibrations ............................................. 15-2
15.2.1 Calibration Standards ........................................... 15-3
15.2.2 Congruence of Calibration and Test-Source Geometry .................. 15-3
15.2.3 Calibration and Test-Source Homogeneity ........................... 15-5
15.2.4 Self-Absorption, Attenuation, and Scattering Considerations for Source
Preparations ...................................................... 15-5
15.2.5 Calibration Uncertainty .......................................... 15-7
15.3 Methods of Source Preparation ....................................... 15-8

Contents
Page
XIII
JULY 2004 MARLAP
15.3.1 Electrodeposition ............................................... 15-8
15.3.2 Precipitation/Coprecipitation ..................................... 15-11
15.3.3 Evaporation .................................................. 15-12
15.3.4 Thermal Volatilization/Sublimation ................................ 15-15
15.3.5 Special Source Matrices ......................................... 15-16
15.3.5.1 Radioactive Gases ....................................... 15-16
15.3.5.2 Air Filters .............................................. 15-17
15.3.5.3 Swipes ................................................ 15-18
15.4 Alpha Detection Methods .......................................... 15-18
15.4.1 Introduction .................................................. 15-18
15.4.2 Gas Proportional Counting ...................................... 15-20
15.4.2.1 Detector Requirements and Characteristics ..................... 15-20
15.4.2.2 Calibration and Test Source Preparation ...................... 15-25
15.4.2.3 Detector Calibration ..................................... 15-25
15.4.2.4 Troubleshooting ......................................... 15-27
15.4.3 Solid-State Detectors ........................................... 15-29
15.4.3.1 Detector Requirements and Characteristics .................... 15-30
15.4.3.2 Calibration- and Test-Source Preparation ..................... 15-33
15.4.3.3 Detector Calibration ...................................... 15-33
15.4.3.4 Troubleshooting ......................................... 15-34
15.4.3.5 Detector or Detector Chamber Contamination ................. 15-35
15.4.3.6 Degraded Spectrum ...................................... 15-37
15.4.4 Fluorescent Detectors ........................................... 15-38
15.4.4.1 Zinc Sulfide ............................................ 15-38
15.4.4.2 Calibration- and Test-Source Preparation ..................... 15-40
15.4.4.3 Detector Calibration ...................................... 15-41
15.4.4.4 Troubleshooting ......................................... 15-41
15.4.5 Photon Electron Rejecting Alpha Liquid Scintillation (PERALS®) ....... 15-42
15.4.5.1 Detector Requirements and Characteristics .................... 15-42
15.4.5.2 Calibration- and Test-Source Preparation ..................... 15-44
15.4.5.3 Detector Calibration ...................................... 15-45
15.4.5.4 Quench ................................................ 15-45
15.4.5.5 Available Cocktails ...................................... 15-46
15.4.5.6 Troubleshooting ......................................... 15-46
15.5 Beta Detection Methods ............................................ 15-46
15.5.1 Introduction ................................................... 15-46
15.5.2 Gas Proportional Counting/Geiger-Mueller Tube Counting ............. 15-49
15.5.2.1 Detector Requirements and Characteristics .................... 15-49
15.5.2.2 Calibration- and Test-Source Preparation ..................... 15-53
15.5.2.3 Detector Calibration ...................................... 15-54

Contents
Page
XIV
MARLAP JULY 2004
15.5.2.4. Troubleshooting ......................................... 15-57
15.5.3 Liquid Scintillation ............................................ 15-57
15.5.3.1 Detector Requirements and Characteristics .................... 15-58
15.5.3.2 Calibration- and Test-Source Preparation ..................... 15-61
15.5.3.3 Detector Calibration ...................................... 15-62
15.5.3.4 Troubleshooting ......................................... 15-68
15.6 Gamma Detection Methods ......................................... 15-68
15.6.1 Sample Preparation Techniques ................................... 15-70
15.6.1.1 Containers ............................................. 15-71
15.6.1.2 Gases ................................................. 15-71
15.6.1.3 Liquids ................................................ 15-72
15.6.1.4 Solids ................................................. 15-72
15.6.2 Sodium Iodide Detector ......................................... 15-73
15.6.2.1 Detector Requirements and Characteristics .................... 15-73
15.6.2.2 Operating Voltage ....................................... 15-76
15.6.2.3 Shielding .............................................. 15-76
15.6.2.4 Background ............................................ 15-76
15.6.2.5 Detector Calibration ...................................... 15-77
15.6.2.6 Troubleshooting ......................................... 15-77
15.6.3 High Purity Germanium ......................................... 15-78
15.6.3.1 Detector Requirements and Characteristics .................... 15-78
15.6.3.2 Gamma Spectrometer Calibration ........................... 15-82
15.6.3.3 Troubleshooting ......................................... 15-84
15.6.4 Extended Range Germanium Detectors ............................ 15-88
15.6.4.1 Detector Requirements and Characteristics .................... 15-89
15.6.4.2 Detector Calibration ...................................... 15-89
15.6.4.3 Troubleshooting ......................................... 15-90
15.6.5 Special Techniques for Radiation Detection ......................... 15-90
15.6.5.1 Other Gamma Detection Systems ........................... 15-90
15.6.5.2 Coincidence Counting .................................... 15-91
15.6.5.3 Anti-Coincidence Counting ................................ 15-93
15.7 Specialized Analytical Techniques ................................... 15-94
15.7.1 Kinetic Phosphorescence Analysis by Laser (KPA) ................... 15-94
15.7.2 Mass Spectrometry ............................................. 15-95
15.7.2.1 Inductively Coupled Plasma-Mass Spectrometry ............... 15-96
15.7.2.2 Thermal Ionization Mass Spectrometry ....................... 15-99
15.7.2.3 Accelerator Mass Spectrometry ............................ 15-100
15.8 References ..................................................... 15-101
15.8.1 Cited References ............................................. 15-101
15.8.2 Other Sources ................................................ 15-115

Contents
Page
XV
JULY 2004 MARLAP
16 Data Acquisition, Reduction, and Reporting for Nuclear Counting Instrumentation .... 16-1
16.1 Introduction ...................................................... 16-1
16.2 Data Acquisition .................................................. 16-2
16.2.1 Generic Counting Parameter Selection .............................. 16-3
16.2.1.1 Counting Duration ........................................ 16-4
16.2.1.2 Counting Geometry ....................................... 16-5
16.2.1.3 Software .................................................. 16-5
16.2.2 Basic Data Reduction Calculations ................................. 16-6
16.3 Data Reduction on Spectrometry Systems .............................. 16-8
16.3.1 Gamma-Ray Spectrometry ........................................ 16-9
16.3.1.1 Peak Search or Identification ................................. 16-10
16.3.1.2 Singlet/Multiplet Peaks ................................... 16-13
16.3.1.3 Definition of Peak Centroid and Energy ........................ 16-14
16.3.1.4 Peak Width Determination ................................... 16-15
16.3.1.5 Peak Area Determination .................................. 16-17
16.3.1.6 Calibration Reference File ................................. 16-19
16.3.1.7 Activity and Concentration ................................ 16-20
16.3.1.8 Summing Considerations .................................. 16-21
16.3.1.9 Uncertainty Calculation ..................................... 16-22
16.3.2 Alpha Spectrometry ............................................ 16-23
16.3.2.1 Radiochemical Yield ..................................... 16-27
16.3.2.2 Uncertainty Calculation ................................... 16-28
16.3.3 Liquid Scintillation Spectrometry ................................. 16-29
16.3.3.1 Overview of Liquid Scintillation Counting ...................... 16-29
16.3.3.2 Liquid Scintillation Spectra ................................ 16-29
16.3.3.3 Pulse Characteristics ..................................... 16-29
16.3.3.4 Coincidence Circuitry .................................... 16-30
16.3.3.5 Quenching ............................................. 16-30
16.3.3.6 Luminescence ........................................... 16-31
16.3.3.7 Test-Source Vials ........................................ 16-31
16.3.3.8 Data Reduction for Liquid Scintillation Counting ............... 16-31
16.4 Data Reduction on Non-Spectrometry Systems .......................... 16-32
16.5 Internal Review of Data by Laboratory Personnel ........................ 16-36
16.5.1 Primary Review ............................................... 16-37
16.5.2 Secondary Review ............................................. 16-37
16.6 Reporting Results ................................................. 16-38
16.6.1 Sample and Analysis Method Identification ......................... 16-38
16.6.2 Units and Radionuclide Identification .............................. 16-38
16.6.3 Values, Uncertainty, and Significant Figures ......................... 16-39

Contents
Page
XVI
MARLAP JULY 2004
16.7 Data Reporting Packages ........................................... 16-39
16.8 Electronic Data Deliverables ........................................ 16-41
16.9 References ...................................................... 16-41
16.9.1 Cited References .............................................. 16-41
16.9.2 Other Sources ................................................. 16-44
17 Waste Management in a Radioanalytical Laboratory ............................ 17-1
17.1 Introduction ...................................................... 17-1
17.2 Types of Laboratory Wastes ......................................... 17-1
17.3 Waste Management Program ......................................... 17-2
17.3.1 Program Integration ............................................. 17-3
17.3.2 Staff Involvement ............................................... 17-3
17.4 Waste Minimization ................................................ 17-3
17.5 Waste Characterization ............................................. 17-6
17.6 Specific Waste Management Requirements ............................. 17-6
17.6.1 Sample/Waste Exemptions ....................................... 17-9
17.6.2 Storage ....................................................... 17-9
17.6.2.1 Container Requirements ..................................... 17-10
17.6.2.2 Labeling Requirements ..................................... 17-10
17.6.2.3 Time Constraints .......................................... 17-11
17.6.2.4 Monitoring Requirements ................................... 17-11
17.6.3 Treatment .................................................... 17-12
17.6.4 Disposal ..................................................... 17-12
17.7 Contents of a Laboratory Waste Management Plan/Certification Plan ........ 17-13
17.7.1 Laboratory Waste Management Plan ............................... 17-13
17.7.2 Waste Certification Plan/Program ................................. 17-14
17.8 Useful Web Sites ................................................. 17-15
17.9 References ...................................................... 17-17
17.9.1 Cited References .............................................. 17-17
17.9.2 Other Sources ................................................. 17-17

Contents
Page
XVII
JULY 2004 MARLAP
Appendix (Volume II)
Appendix F Laboratory Subsampling ............................................ F-1
F.1 Introduction .......................................................... F-1
F.2Basic Concepts........................................................ F-2
F.3Sources of Measurement Error ........................................... F-3
F.3.1 Sampling Bias .................................................. F-4
F.3.2 Fundamental Error ............................................... F-5
F.3.3 Grouping and Segregation Error .................................... F-6
F.4Implementation of the Particulate Sampling Theory ...........................F-9
F.4.1 The Fundamental Variance ....................................... F-10
F.4.2 Scenario 1 – Natural Radioactive Minerals ........................... F-10
F.4.3 Scenario 2 – Hot Particles ........................................ F-11
F.4.4 Scenario 3 – Particle Surface Contamination ......................... F-13
F.5Summary ........................................................... F-15
F.6References .......................................................... F-16
Glossary .......................................................... End of volume

Contents
Page
XVIII
MARLAP JULY 2004
List of Figures (Volume II)
Figure 10.1 Example of chain-of-custody record .................................. 10-9
Figure 11.1 Overview of sample receipt, inspection, and tracking ..................... 11-2
Figure 12.1 Degree of error in laboratory sample preparation relative to other activities . . . 12-1
Figure 12.2 Laboratory sample preparation flowchart (for solid samples) .............. 12-13
Figure 14.1 Ethylene diamine tetraacetic acid (EDTA) ............................ 14-20
Figure 14.2 Crown ethers ................................................... 14-21
Figure 14.3 The behavior of elements in concentrated hydrochloric acid on cation-exchange
resins ................................................................ 14-52
Figure 14.4 The behavior of elements in concentrated hydrochloric acid on anion-exchange
resins ................................................................ 14-53
Figure 14.5 The electrical double layer. ........................................ 14-79
Figure 14A.1 Decay chain for 238U .......................................... 14-224
Figure 14A.2 Secular equilibrium of 210Pb/210Bi ................................. 14-225
Figure 14A.3 Transient equilibrium of 95Zr/95Nb ................................ 14-226
Figure 14A.4 No equilibrium of 239U/239Np .................................... 14-227
Figure 15.1 Alpha plateau generated by a 210Po source on a GP counter using P-10 gas . . . 15-23
Figure 15.2 Gas proportional counter self-absorption curve for 230Th ................. 15-28
Figure 15.3 Beta plateau generated by a 90Sr/Y source on a GP counter using P-10 gas . . . 15-52
Figure 15.4 Gas proportional counter self-absorption curve for 90Sr/Y ................ 15-56
Figure 15.5 Representation of a beta emitter energy spectrum ....................... 15-65
Figure 15.6 Gamma-ray interactions with high-purity germanium ................... 15-70
Figure 15.7 NaI(Tl) spectrum of 137Cs ......................................... 15-75
Figure 15.8 Energy spectrum of 22Na .......................................... 15-80
Figure 15.9 Different geometries for the same germanium detector and the same sample in
different shapes or position ............................................... 15-83
Figure 15.10 Extended range coaxial germanium detector .......................... 15-88
Figure 15.11 Typical detection efficiencies comparing extended range with a normal coaxial
germanium detector ..................................................... 15-90
Figure 15.12 Beta-gamma coincidence efficiency curve for 131I...................... 15-93
Figure 16.1 Gamma-ray spectrum .............................................. 16-9
Figure 16.2 Gamma-ray analysis flow chart and input parameters .................... 16-11

Contents
Page
XIX
JULY 2004 MARLAP
Figure 16.3 Low-energy tailing ............................................... 16-16
Figure 16.4 Photopeak baseline continuum ..................................... 16-17
Figure 16.5 Photopeak baseline continuum-step function .......................... 16-18
Figure 16.6 Alpha spectrum (238U, 235U, 234U, 239/240Pu, 241Am) ....................... 16-23

Contents
Page
XX
MARLAP JULY 2004
List of Tables (Volume II)
Table 10.1 Summary of sample preservation techniques ........................... 10-25
Table 11.1 Typical topics addressed in standard operating procedures related to sample receipt,
inspection, and tracking ................................................... 11-3
Table 12.1 Examples of volatile radionuclides .................................... 12-4
Table 12.2 Properties of sample container materials ............................... 12-5
Table 12.3 Examples of dry-ashing temperatures (platinum container) ................ 12-23
Table 12.4 Preliminary ashing temperature for food samples ....................... 12-29
Table 13.1 Common fusion fluxes ............................................. 13-7
Table 13.2 Examples of acids used for wet ashing ................................ 13-13
Table 13.3 Standard reduction potentials of selected half-reactions at 25 EC ........... 13-14
Table 14.1 Oxidation states of elements ......................................... 14-8
Table 14.2 Oxidation states of selected elements ................................. 14-10
Table 14.3 Redox reagents for radionuclides .................................... 14-13
Table 14.4 Common ligands ................................................. 14-19
Table 14.5 Radioanalytical methods employing solvent extraction ................... 14-32
Table 14.6 Radioanalytical methods employing extraction chromatography ............ 14-33
Table 14.7 Elements separable by volatilization as certain species ................... 14-37
Table 14.8 Typical functional groups of ion-exchange resins ....................... 14-49
Table 14.9 Common ion-exchange resins ....................................... 14-50
Table 14.10 General solubility behavior of some cations of interest .................. 14-58
Table 14.11 Summary of methods for utilizing precipitation from homogeneous solution . 14-68
Table 14.12 Influence of precipitation conditions on the purity of precipitates .......... 14-69
Table 14.13 Common coprecipitating agents for radionuclides ...................... 14-76
Table 14.14 Coprecipitation behavior of plutonium and neptunium .................. 14-78
Table 14.15 Atoms and mass of select radionuclides equivalent to 500 dpm ........... 14-83
Table 14.16 Masking agents for ions of various metals ........................... 14-106
Table 14.17 Masking agents for anions and neutral molecules ..................... 14-108
Table 14.18 Common radiochemical oxidizing and reducing agents for iodine ........ 14-129
Table 14.19 Redox agents in plutonium chemistry ............................... 14-142
Table 14A.1 Relationships of radioactive equilibria ............................. 14-228
Table 15.1 Radionuclides prepared by coprecipitation or precipitation ................ 15-12
Table 15.2 Nuclides for alpha calibration ....................................... 15-20

Contents
Page
XXI
JULY 2004 MARLAP
Table 15.3 Typical gas operational parameters for gas proportional alpha counting ...... 15-22
Table 15.4 Nuclides for beta calibration ........................................ 15-48
Table 15.5 Typical operational parameters for gas proportional beta counting .......... 15-50
Table 15.6 Typical FWHM values as a function of energy ......................... 15-79
Table 15.7 Typical percent gamma-ray efficiencies for a 55 percent HPGe detector with various
counting geometries ..................................................... 15-83
Table 15.8 AMS detection limits for selected radionuclides ....................... 15-100
Table 16.1 Units for data reporting ............................................ 16-39
Table 16.2 Example elements of a radiochemistry data package ..................... 16-40
Table 17.1 Examples of laboratory-generated wastes ............................... 17-2
XXIII
JULY 2004 MARLAP
ACRONYMS AND ABBREVIATIONS
AC ......... alternating current
ADC ........ analog to digital convertor
AEA ........ Atomic Energy Act
AL ......... action level
AMS........ accelerator mass spectrometry
ANSI ....... American National Standards Institute
AOAC ...... Association of Official Analytical Chemists
APHA....... American Public Health Association
APS ........ analytical protocol specification
ARAR ...... applicable or relevant and appropriate requirement (CERCLA/Superfund)
ASL ........ analytical support laboratory
ASQC....... American Society for Quality Control
ASTM ...... American Society for Testing and Materials
ATD ........ alpha track detector
BGO ........ bismuth germanate [detector]
BNL ........ Brookhaven National Laboratory (DOE)
BOA ........ basic ordering agreement
CAA ........ Clean Air Act
CC ......... charcoal canisters
CEDE ....... committed effective dose equivalent
CERCLA .... Comprehensive Environmental Response, Compensation, and Liability Act of
1980 (“Superfund”)
c.f. ......... carrier free [tracer]
cfm ......... cubic feet per minute
CFR ........ Code of Federal Regulations
CL ......... central line (of a control chart)
CMPO ...... [octyl(phenyl)]-N,N-diisobutylcarbonylmethylphosphine oxide
CMST....... Characterization, Monitoring, and Sensor Technology Program (DOE)
CO ......... contracting officer
COC ........ chain of custody
COR ........ contracting officer’s representative
cpm......... counts per minute
cps ......... counts per second
CRM........ (1) continuous radon monitor; (2) certified reference material
CSU ........ combined standard uncertainty
CV ......... coefficient of variation
CWA ....... Clean Water Act
CWLM ...... continuous working level monitor

Acronyms and Abbreviations
XXIV
MARLAP JULY 2004
d ........... day[s]
D........... homogeneous distribution coefficient
DAAP ....... diamylamylphosphonate
DC ......... direct current
DCGL....... derived concentration guideline level
DHS ........ U.S. Department of Homeland Security
DIN......... di-isopropylnaphthalene
DL ......... discrimination limit
DoD ........ U.S. Department of Defense
DOE ........ U.S. Department of Energy
DOELAP .... DOE Laboratory Accreditation Program
DOT ........ U.S. Department of Transportation
DOP ........ dispersed oil particulate
dpm ........ disintegrations per minute
DPPP ....... dipentylpentylphosphonate
DQA........ data quality assessment
DQI......... data quality indicator
DQO........ data quality objective
DTPA ....... diethylene triamine pentaacetic acid
DVB ........ divinylbenzene
Ee.......... emission probability per decay event
Eβmax ........ maximum beta-particle energy
EDD ........ electronic data deliverable
EDTA....... ethylene diamine tetraacetic acid
EGTA....... ethyleneglycol bis(2-aminoethylether)-tetraacetate
EMEDD ..... environmental management electronic data deliverable (DOE)
EPA ........ U.S. Environmental Protection Agency
ERPRIMS . . . Environmental Resources Program Management System (U.S. Air Force)
ESC ........ expedited site characterization; expedited site conversion
eV.......... electron volts
FAR ........ Federal Acquisition Regulations, CFR Title 48
FBO ........ Federal Business Opportunities [formerly Commerce Business Daily]
FDA ........ U.S. Food and Drug Administration
FEP......... full energy peak
fg .......... femtogram
FOM........ figure of merit
FWHM ...... full width of a peak at half maximum
FWTM ...... full width of a peak at tenth maximum

Acronyms and Abbreviations
XXV
JULY 2004 MARLAP
GC ......... gas chromatography
GLPC ....... gas-liquid phase chromatography
GM ......... Geiger-Mueller [detector]
GP ......... gas proportional [counter]
GUM ....... Guide to the Expression of Uncertainty in Measurement (ISO)
Gy.......... gray[s]
h ........... hour[s]
H0.......... null hypothesis
HA, H1....... alternative hypothesis
HDBP....... dibutylphosphoric acid
HDEHP ..... bis(2-ethylhexyl) phosphoric acid
HDPE ....... high-density polyethylene
HLW ....... high-level [radioactive] waste
HPGe ....... high-purity germanium
HPLC ....... high-pressure liquid chromatography; high-performance liquid chromatography
HTRW ...... hazardous, toxic, and radioactive waste
IAEA ....... International Atomic Energy Agency
ICRU ....... International Commission on Radiation Units and Measurements
ICP-MS ..... inductively coupled plasma-mass spectroscopy
IPPD........ integrated product and process development
ISO ......... International Organization for Standardization
IUPAC ...... International Union of Pure and Applied Chemistry
k........... coverage factor
keV......... kilo electron volts
KPA ........ kinetic phosphorimeter analysis
LAN ........ local area network
LANL ....... Los Alamos National Laboratory (DOE)
LBGR ....... lower bound of the gray region
LCL ........ lower control limit
LCS ........ laboratory control samples
LDPE ....... low-density polyethylene
LEGe ....... low-energy germanium
LIMS ....... laboratory information management system
LLD ........ lower limit of detection
LLNL ....... Lawrence Livermore National Laboratory (DOE)
LLRW ...... low-level radioactive waste
LLRWPA .... Low Level Radioactive Waste Policy Act

Acronyms and Abbreviations
XXVI
MARLAP JULY 2004
LOMI ....... low oxidation-state transition-metal ion
LPC ........ liquid-partition chromatography; liquid-phase chromatography
LS.......... liquid scintillation
LSC ........ liquid scintillation counter
LWL........ lower warning limit
MAPEP ..... Mixed Analyte Performance Evaluation Program (DOE)
MARSSIM . . . Multi-Agency Radiation Survey and Site Investigation Manual
MCA ....... multichannel analyzer
MCL........ maximum contaminant limit
MDA ....... minimum detectable amount; minimum detectable activity
MDC ....... minimum detectable concentration
MDL........ method detection limit
MeV ........ mega electron volts
MIBK ....... methyl isobutyl ketone
min ......... minute[s]
MPa ........ megapascals
MQC ....... minimum quantifiable concentration
MQO ....... measurement quality objective
MS ......... matrix spike; mass spectrometer
MSD........ matrix spike duplicate
MVRM...... method validation reference material
NAA........ neutron activation analysis
NaI(Tl) ...... thallium-activated sodium iodide [detector]
NCP ........ National Oil and Hazardous Substances Pollution Contingency Plan
NCRP ....... National Council on Radiation Protection and Measurement
NELAC ..... National Environmental Laboratory Accreditation Conference
NESHAP .... National Emission Standards for Hazardous Air Pollutants (EPA)
NIM ........ nuclear instrumentation module
NIST........ National Institute of Standards and Technology
NPL ........ National Physics Laboratory (United Kingdom); National Priorities List (United
States)
NRC ........ U.S. Nuclear Regulatory Commission
NRIP ....... NIST Radiochemistry Intercomparison Program
NTA (NTTA) . nitrilotriacetate
NTU ........ nephelometric turbidity units
NVLAP ..... National Voluntary Laboratory Accreditation Program (NIST)
OA ......... observational approach
OFHC....... oxygen-free high-conductivity

Acronyms and Abbreviations
XXVII
JULY 2004 MARLAP
OFPP ....... Office of Federal Procurement Policy
φMR ......... required relative method uncertainty
Pa .......... pascals
PARCC ..... precision, accuracy, representativeness, completeness, and comparability
PBBO ....... 2-(4'-biphenylyl) 6-phenylbenzoxazole
PCB ........ polychlorinated biphenyl
pCi ......... picocurie
pdf ......... probability density function
PE.......... performance evaluation
PERALS..... Photon Electron Rejecting Alpha Liquid Scintillation®
PFA ........ perfluoroalcoholoxil™
PIC ......... pressurized ionization chamber
PIPS ........ planar implanted passivated silicon [detector]
PM ......... project manager
PMT ........ photomultiplier tube
PT.......... performance testing
PTB ........ Physikalisch-Technische bundesanstalt (Germany)
PTFE ....... polytetrafluoroethylene
PUREX ..... plutonium uranium reduction extraction
PVC ........ polyvinyl chloride
QA ......... quality assurance
QAP ........ Quality Assessment Program (DOE)
QAPP ....... quality assurance project plan
QC ......... quality control
rad ......... radiation absorbed dose
RCRA ....... Resource Conservation and Recovery Act
REE ........ rare earth elements
REGe ....... reverse-electrode germanium
rem ......... roentgen equivalent: man
RFP ........ request for proposals
RFQ ........ request for quotations
RI/FS ....... remedial investigation/feasibility study
RMDC ...... required minimum detectable concentration
ROI......... region of interest
RPD ........ relative percent difference
RPM ........ remedial project manager
RSD ........ relative standard deviation
RSO ........ radiation safety officer

Acronyms and Abbreviations
XXVIII
MARLAP JULY 2004
s ........... second[s]
SA ......... spike activity
SC.......... critical value
SAFER ...... Streamlined Approach for Environmental Restoration Program (DOE)
SAM........ site assessment manager
SAP ........ sampling and analysis plan
SEDD ....... staged electronic data deliverable
SI .......... international system of units
SMO........ sample management office[r]
SOP ........ standard operating procedure
SOW........ statement of work
SQC ........ statistical quality control
SPE......... solid-phase extraction
SR.......... unspiked sample result
SRM ........ standard reference material
SSB ........ silicon surface barrier [alpha detector]
SSR ........ spiked sample result
Sv .......... sievert[s]
t½ .......... half-life
TAT ........ turnaround time
TBP ........ tributylphosphate
TC ......... to contain
TCLP ....... toxicity characteristic leaching procedure
TD ......... to deliver
TEC ........ technical evaluation committee
TEDE ....... total effective dose equivalent
TEC ........ technical evaluation committee (USGS)
TES ........ technical evaluation sheet (USGS)
TFM ........ tetrafluorometoxil
™
TIMS ....... thermal ionization mass spectrometry
TIOA ....... triisooctylamine
TLD ........ thermoluminescent dosimeter
TnOA ....... tri-n-octylamine
TOPO ....... trioctylphosphinic oxide
TPO ........ technical project officer
TPP......... technical project planning
TPU ........ total propagated uncertainty
TQM........ Total Quality Management
TRUEX ..... trans-uranium extraction
TSCA ....... Toxic Substances Control Act

Acronyms and Abbreviations
XXIX
JULY 2004 MARLAP
TSDF ....... treatment, storage, or disposal facility
tSIE ........ transfomed spectral index of the external standard
TTA ........ thenoyltrifluoroacetone
U........... expanded uncertainty
uMR ......... required absolute method uncertainty
uc(y) ........ combined standard uncertainty
UBGR ...... upper bound of the gray region
UCL ........ upper control limit
USACE ..... United States Army Corps of Engineers
USGS ....... United States Geological Survey
UV ......... ultraviolet
UWL ....... upper warning limit
V........... volt[s]
WCP........ waste certification plan
XML........ extensible mark-up language
XtGe®....... extended-range germanium
y ........... year[s]
Y........... response variable
ZnS(Ag) ..... silver-activated zinc sulfide [detector]

XXXI
JULY 2004 MARLAP
UNIT CONVERSION FACTORS
To Convert To Multiply by To Convert To Multiply by
Years (y) Seconds (s)
Minutes (min)
Hours (h)
3.16 × 10⁷
5.26 × 10⁵
8.77 × 10³
s
min
h
y 3.17 × 10!8
1.90 × 10!6
1.14 × 10!4
Disintegrations
per second (dps)
Becquerels (Bq) 1.0 Bq dps 1.0
Bq
Bq/kg
Bq/m3
Bq/m3
Picocuries (pCi)
pCi/g
pCi/L
Bq/L
27.03
2.7 × 10!2
2.7 × 10!2
103
pCi
pCi/g
pCi/L
Bq/L
Bq
Bq/kg
Bq/m3
Bq/m3
3.7 × 10!2
37
37
10!3
Microcuries per
milliliter
(µCi/mL)
pCi/L 109pCi/L µCi/mL 10!9
Disintegrations
per minute (dpm)
µCi
pCi
4.5 × 10!7
4.5 × 10!1
pCi dpm 2.22
Gallons (gal) Liters (L) 3.78 Liters Gallons 0.265
Gray (Gy) rad 100 rad Gy 10!2
Roentgen
Equivalent Man
(rem)
Sievert (Sv) 10!2Sv rem 102

10-1
JULY 2004 MARLAP
10 FIELD AND SAMPLING ISSUES THAT AFFECT
LABORATORY MEASUREMENTS
Part A: Generic Issues
10.1 Introduction
This chapter provides guidance to project managers, planners, laboratory personnel, and the
radioanalytical specialists tasked with developing a field sampling plan. It emphasizes those
activities conducted at the time of sample collection and other activities conducted after sample
collection that could affect subsequent laboratory analyses.
A field sampling plan should provide comprehensive guidance for collecting, preparing,
preserving, shipping, and tracking field samples and recording field data. The principal objective
of a well-designed sampling plan is to provide representative samples of the proper size for
analysis. Critical to the sampling plan are outputs of the systematic planning process, which
commonly define the Analytical Protocol Specifications (APSs) and the measurement quality
objectives (MQOs) that must be met. While comprehensive discussions on actual field sample
collection and sampling strategies are beyond the scope of MARLAP, specific aspects of sample
collection methods and the physical preparation and preservation of samples warrant further
discussion because they impact the analytical process and the data quality.
This chapter has two main parts. Part A identifies general elements of a field sampling plan and
provides project planners with general guidance. Part B provides detailed, matrix-specific
guidance and technical data for liquid, solid, airborne, and surface contaminants requiring field
sampling. This information will assist project planners further in the development of standard
operating procedures (SOPs) and training for field personnel engaged in preparation and
preservation of field samples.
The need to specify sample collection methods,
and to prepare and preserve field samples, is
commonly dictated by one or more of the
following:
• The systematic planning process that
identifies the type, quality, and quantity of
data needed to satisfy a decision process;
• The potential alteration of field samples by
physical, chemical, and biological processes
during the time between collection and
Contents
Part A: Generic Issues ...................... 10-1
10.1 Introduction .......................... 10-1
10.2 Field Sampling Plan: Non-Matrix-Specific
Issues............................... 10-3
Part B: Matrix-Specific Issues That Impact Field
Sample Collection, Processing, and
Preservation......................... 10-16
10.3 Liquid Samples ...................... 10-17
10.4 Solids ............................. 10-28
10.5 Air Sampling ....................... 10-34
10.6 Wipe Sampling for Assessing Surface
Contamination ...................... 10-41
10.7 References ......................... 10-45

Field and Sampling Issues That Affect Laboratory Measurements
10-2
MARLAP JULY 2004
analysis;
• Requirements specified by the analytical laboratory pertaining to sample analysis;
• Requirements of analytical methods; and
• Requirements of regulators (e.g., Department of Transportation).
10.1.1 The Need for Establishing Channels of Communication
To design an effective sampling plan, it is critical to obtain the input and recommendations of
representatives of (1) the field sampling team, (2) the health physics professional staff, (3) the
analytical laboratory, (4) statistical and data analysts, (5) quality assurance personnel, and (6)
end-users of data.
Beyond the initial input that assist the project planners in the design of the sampling plan, it is
equally important to maintain open channels of communication among key members of the
project team throughout the process. For example, the analytical laboratory should be provided
with contacts within the field sampling team to ensure that modifications, discrepancies, and
changes are addressed and potential problems may be resolved in a timely manner.
Communication among project staff, field personnel, and the laboratory offer a means to
coordinate activities, schedules, and sample receipt. Project planning documents generated from
the systematic planning process, such as APSs and statements of work (SOWs), should be
consulted, but they cannot address all details. Additional communication will be necessary to
convey information about the number and type of samples the laboratory can expect at a certain
time. Documentation with special instructions regarding the samples should be received before
the samples arrive. This information notifies the laboratory of any health and safety concerns so
that laboratory personnel can implement proper contamination management practices. Health and
safety concerns may affect analytical procedures, sample disposition, etc. The analytical
laboratory should have an initial understanding about the relative number of samples that will be
received and the types of analyses that are expected for specific samples. Furthermore, advance
communications allow laboratory staff to adjust to modifications, discrepancies, and changes.
10.1.2 Developing Field Documentation
The field organization must conduct its operations in such a manner as to provide reliable
information that meets the data quality objectives (DQOs). To achieve this goal, all relevant
procedures pertaining to sample collection and processing should be based on documented
standard operating procedures that may include, but are not limited to, the following activities:
• Developing a technical basis for defining the size of individual samples;

Field and Sampling Issues That Affect Laboratory Measurements
10-3
JULY 2004 MARLAP
• Selecting field equipment and instrumentation;
• Using proper sample containers and preservatives;
• Using consistent container labels and sample identification codes;
• Documenting field sample conditions and exceptions;
• Documenting sample location;
• Tracking, accountability, custody, and shipment forms;
• Legal accountability, such as chain-of-custody record, when required;
• Selecting samples for field quality control (QC) program;
• Decontaminating equipment and avoiding sample cross-contamination;
• Specifying sample packaging, radiological surveys of samples, shipping, and tracking; and
• Documenting the health and safety plan.
10.2 Field Sampling Plan: Non-Matrix-Specific Issues
10.2.1 Determination of Analytical Sample Size
When collecting environmental samples for radiochemical analysis, an important parameter for
field personnel is the mass or volume of an individual sample that must be collected. The
required minimum sample size is best determined through the collective input of project
planners, field technicians, and laboratory personnel who must consider the likely range of the
contaminant concentrations, the type of radiation emitted by constituents or analytes (alpha, beta,
and gamma emitters), field logistics, and the radioanalytical methods that are to be employed. It
is important to have a quantitative understanding of the relationship between sample size and
project specific requirements in order for samples to yield useful data.
10.2.2 Field Equipment and Supply Needs
Before starting field sampling activities, all necessary equipment and supplies should be
identified, checked for proper operation and availability, and—when appropriate—pre-
assembled. Instrumentation and equipment needs will depend not only on the matrix to be
sampled, but also on the accessibility of the matrix and the physical and chemical properties of
radionuclide contaminants under investigation.
In addition to specialized field equipment and instrumentation, field sampling supplies
commonly include, but are not limited to, the following:
• Sampling devices (e.g., trowel, hand auger, soil core sampler, submersible water pump, high
volume air filter, etc.);
• Sampling preparation equipment (e.g., weighing scales, volume measuring devices, soil
screening sieves, water filtering equipment, etc.);

Field and Sampling Issues That Affect Laboratory Measurements
10-4
MARLAP JULY 2004
• Sample preservation equipment and agents (e.g., refrigeration, ice, formaldehyde or acid
additives);
• Personnel protective gear (e.g., respiratory protective devices, protective clothing such as
gloves and booties, life-preservers, etc.);
• Proper writing utensils (e.g., permanent pens and markers);
• Field logbooks and field tracking forms;
• Maps, distance measuring equipment, global positioning systems, or other location-
determining equipment;
• Field sampling flags or paint;
• Chain-of-custody (COC) forms;
• Sample tags, labels, and documents;
• Appropriately labeled sample containers;
• Shipment containers and packing materials that meet national and international shipping
regulations (see Section 10.2.10);
• Shipment forms;
• Analysis request forms identifying the type of radioanalysis to be performed; and
• Items required by the health and safety plan (medical kit, etc.).
10.2.3 Selection of Sample Containers
There are several physical and chemical characteristics to consider when selecting a suitable
container for shipping and storing samples. These include the container material and its size,
configuration, and method for ensuring a proper seal.
10.2.3.1 Container Material
Sample containers must provide reasonable assurance of maintaining physical integrity (i.e.,
against breakage, rupture, or leakage) during handling, transport, and potentially long periods of
storage. The most important factor to consider in container selection is the chemical

Field and Sampling Issues That Affect Laboratory Measurements
10-5
JULY 2004 MARLAP
compatibility between container material and sample. Containers may be made from ordinary
bottle glass, borosilicate glass (such as Pyrex® or Corex®), plastics (e.g., high-density
polyethylene, HDPE), low-density polyethylene, polycarbonate, polyvinyl chloride (PVC),
fluorinated ethylene or propylene (Teflon™), or polymethylpentene. For certain samples, the
choice of containers may require metal construction or be limited to paper envelopes.
10.2.3.2 Container Opening and Closure
A suitable container also should be shaped appropriately for the purpose. For example, a wide-
mouthed container will provide easier access for the introduction and withdrawal of sample
material and eliminate spills or the need for additional tools or equipment (e.g., funnel) that may
become a source of cross contamination among samples.
Equally important is the container’s closure. As a rule, snap-on caps should not be considered for
liquid samples because they do not ensure a proper seal. Even when screw caps are used, it is
frequently prudent to protect against vibration by securing the cap with electrical or duct tape. A
proper seal is important for air samples, such as radon samples. The container cap material, if
different from the container material, must be equally inert with regard to sample constituents.
10.2.3.3 Sealing Containers
Tamper-proof seals offer an additional measure to ensure sample integrity. A simple example
includes placing a narrow strip of paper over a bottle cover and then affixing this to the container
with a wide strip of clear tape (EPA, 1987, Exhibit 5-6 provides examples of custody seals). The
paper strip can be initialed and dated in the field to indicate the staff member who sealed the
sample and the date of the seal. Individually sealing each sample with a custody seal with the
collector’s initials and the date the sample was sealed may be required by the project. The seal
ensures legal defensibility and integrity of the sample at collection. Tamper-proof seals should
only be applied once field processing and preservation steps are completed. Reopening this type
of sealed container in the field might warrant using a new container or collecting another sample.
10.2.3.4 Precleaned and Extra Containers
The reuse of sample containers is discouraged because traces of radionuclides might persist from
initial container use to subsequent use. The use of new containers for each collection removes
doubts concerning radionuclides from previous sampling. New containers might also require
cleaning (ASTM D5245) to remove any plasticizer used in production or to pretreat glass
surfaces. Retaining extra empty containers from a new lot or a special batch of precleaned and
treated containers can provide the laboratory container blanks for use as part of quality control.
Extra containers are also useful for taking additional samples as needed during field collection
and to replace broken or leaking containers.

Field and Sampling Issues That Affect Laboratory Measurements
10-6
MARLAP JULY 2004
10.2.4 Container Label and Sample Identification Code
Each sample can only be identified over the life of a study if a form of permanent identification is
provided with or affixed to the container or available in sample log. The most useful form of
identification utilizes a unique identifier for each sample. Such unique identification codes
ensure the project’s ability to track individual samples. The standard operating procedure (SOP)
that addresses sample identification should describe the method to be used to assure that samples
are properly identified and controlled in a consistent manner. Containers sometimes may be pre-
labeled with identification numbers already in place.
Any identification recorded on a container or a label affixed to the container should remain with
the container throughout sample processing and storage. The identification information should be
written with a permanent marker—especially if the labels are exposed to liquids. Information can
be recorded directly on the container or on plastic or paper tags securely fixed to the container.
However, tags are more likely to become separated from containers than are properly secured
labels.
Labels, tags, and bar codes should be durable enough so no information is lost or compromised
during field work, sample transport, or laboratory processing. Transparent tape can be used to
cover the label once it is completed. The tape protects the label, adds moisture resistance,
prevents tampering with the sample information, and helps secure the label to the container.
The project manager needs to determine if a field-sample identification (ID) scheme may
introduce bias into the analysis process, such as allowing the laboratory to become aware of
trends or locations from the sample identification. This could influence their judgment about the
anticipated result and thereby introduce actions on the part of laboratory personnel that they
would not otherwise take (such as reanalyzing the sample). The project manager needs to
determine the applicability of electronic field data recorders and the issue of electronic signatures
for the project.
A unique identifier can include a code for a site, the sample location at the site, or a series of
digits identifying the year and day of year (e.g., “1997-127” uses the Julian date, and “062296”
describes a month, day, and year). Alternatively, a series of digits can be assigned sequentially by
site, date, and laboratory destination. The use of compass headings and grid locations also
provides additional unique information (e.g., “NW fence, sampled at grid points: A1 through
C25, 072196, soil”). With this approach, samples arriving at a laboratory are then unique in two
ways. First, each sample can be discriminated from materials collected at other sites. Second, if
repeat samples are made at a single site, then subsequent samples from the same location are
unique only by date. Labeling samples sequentially might not be appropriate for all studies. Bar
coding may reduce transcription errors and should be evaluated for a specific project.

Field and Sampling Issues That Affect Laboratory Measurements
10-7
JULY 2004 MARLAP
10.2.5 Field Data Documentation
All information pertinent to field sampling is documented in a log book or on a data form. The
log book should be bound and the pages numbered consecutively, and forms should be page-
numbered and dated. Where the same information is requested routinely, preprinted log books or
data sheets will minimize the effort and will standardize the presentation of data. Even when
standardized preprinted forms are used, all information recorded should be in indelible ink, with
all entry errors crossed out with a single line and initialed. The color of ink used should be
compatible with the need to copy that information. All entries should be dated and signed on the
date of entry. Initials should be legible and traceable, so that it is clear who made the entry.
Whenever appropriate, log or data form entries should contain—but are not limited to—the
following:
• Identification of Project Plan or Sampling Plan;
• Location of sampling (e.g., reference to grid location, maps, photographs, location in a
room);
• Date and time of sample collection;
• Sample matrix (e.g., surface water, soil, sediment, sludge, etc.);
• Suspected radionuclide constituents;
• Sample-specific ID;
• Sample volume, weight, depth;
• Sample type (e.g., grab, composite);
• Sample preparation used (e.g., removal of extraneous matter);
• Sample preservation used;
• Requested analyses to be performed (e.g., gross beta/gamma, gamma spectroscopy for a
specific radionuclide, radiochemical analysis);
• Sample destination, including name and address of analytical laboratory;
• Names of field people responsible for collecting sample;

Field and Sampling Issues That Affect Laboratory Measurements
10-8
MARLAP JULY 2004
• Physical and meteorological conditions at time of sample collection;
• Special handling or safety precautions;
• Results of field radiation measurements, including surveys of sample containers; and
• Signatures or initials of appropriate field personnel. When using initials, ensure that they can
be uniquely identified with an individual.
Labels affixed to individual sample containers should contain key information that forms an
abstract of log book data sheets. When this is not practical, a copy of individual sample data
sheets may be included along with the appropriately ID-labeled sample.
10.2.6 Field Tracking, Custody, and Shipment Forms
A sample tracking procedure must be in place for all projects in order that the proper location and
identification of samples is maintained throughout the process from collection through handling,
preservation, storage, transfer to laboratory, and disposal. The term “tracking” means an
accountability process that meets generally acceptable laboratory practices as described by
accrediting bodies, but is less stringent than a formal chain-of-custody process. Tracking also
develops a record of all individuals responsible for the custody and transfer of the samples.
Chapter 4 (Project Plan Documents) discusses the process of tracking and accountability. Also,
Chapter 11 (Sample Receipt, Inspection, and Tracking) discusses the laboratory process of
tracking.
When transferring the possession of samples, the individuals relinquishing and the individuals
receiving the samples should sign, date, and note the time on the form. A standardized form
should be designed for recording tracking or formal chain-of-custody information related to
tracking sample possession. An example of a COC form is shown in Figure 10.1. Additional
information and examples of custody forms are illustrated by EPA (1987 and 1994). If samples
are to be split and distributed to more than one analytical laboratory, multiple forms will be
needed to accompany sample sets. The sample collector is responsible for initiating the sample
tracking record. The following information is considered minimal for sample tracking:
• Name of project;
• Sampler’s signature;
• Sample ID;
• Sample location
• Date and time sampled;
• Sample type;
• Preservatives;
• Number of containers;
Field and Sampling Issues That Affect Laboratory Measurements
10-9
JULY 2004 MARLAP
• Analysis required;
• Signatures of persons relinquishing, receiving, and transporting the samples;
• Signature for laboratory receipt;
• Method of shipment or carrier and air bill when shipped or shipping manifest identification
upon receipt; and
• Comments regarding the integrity of shipping container and individual samples.
10.2.7 Chain of Custody
The legal portion of the tracking and handling process that ensures legal defensibility from
sample collection to data reporting has become relatively standardized and is referred to as the
CHAIN-OF-CUSTODY RECORD
FIELD
IDENTIFI-
CATION
NUMBER
FIELD
LOCATION DATE TIME
SAMPLED BY:
SAMPLE MATRIX SEQ.
No.
No. of
Containers
Analysis
Required
Water Soil Other
Relinquished by: Date/Time
/
Received by: Date/Time
/
Relinquished by: Date/Time
/
Received by: Date/Time
/
Relinquished by: Date/Time
/
Received by: Date/Time
/
Relinquished by: Date/Time
/
Received by: Date/Time
/
Relinquished by: Date/Time
/
Received by laboratory for field analysis: Date/Time
/
Method of Shipment:
Distribution: Orig. - Accompany Shipment
1 Copy – Survey Coordinator Field Files
FIGURE 10.1—Example of chain-of-custody record

Field and Sampling Issues That Affect Laboratory Measurements
10-10
MARLAP JULY 2004
COC process (APHA, 1998). Guidance is provided in ASTM D4840 and NIOSH (1983). The
level of security required to maintain an adequate chain of custody is that necessary to establish a
“reasonable probability” that the sample has not been tampered with. For court proceedings, the
requirements are established in law. COC procedures are important in demonstrating sample
control when litigation is involved. In many cases, federal, state or local agencies may require
that COC be maintained for specific projects. COC is usually not required for samples that are
generated and immediately tested within a facility or continuous (rather than discrete or integra-
ted) samples that are subject to real- or near-real-time analysis (e.g., continuous screening).
When COC is required, the custody information is recorded on a COC form. Chain-of-custody
documents vary by organization and by project. Communication between field and laboratory
personnel is critical to the successful use of COC. Any error made on a custody form is crossed
out with a single line and dated and initialed. Use of correction ink or obliteration of data is not
acceptable. Inform the laboratory when COC is required before the samples are received (see
Section 11.2.4, “Sample Chain-of-Custody,” for further information). The COC documents are
signed by personnel who collect the samples. A COC record accompanies the shipment and one
or more copies are distributed to the project coordinator or other office(s) where field and
laboratory records are maintained.
10.2.8 Field Quality Control
A project plan should have been developed to ensure that all data are accurate and that decisions
based on these data are technically sound and defensible. The implementation of a project plan
requires QC procedures. QC procedures, therefore, represent specific tools for measuring the
degree to which quality assurance objectives are met. Field QC measures are discussed
comprehensively in ASTM D5283.
While some types of QC samples are used to assess analytical process, field QC samples are used
to assess the actual sampling process. The type and frequency of these field QC samples must be
specified by the project planning process along with being included in the project planning
documents and identified in the sampling plan. Definitions for certain types of field QC samples
can be found in ASTM D5283 and MARSSIM (2000).
10.2.9 Decontamination of Field Equipment
Sampling SOPs must describe the recommended procedure for cleaning field equipment before
and during the sample collection process, as well as any pretreatment of sample containers. The
SOPs should include the cleaning materials and solvents used, the purity of rinsing solution or
water, the order of washing and rinsing, associated personnel safety precautions, and the disposal
of cleaning agents.
Detailed procedures for the decontamination of field equipment used in the sampling of low-

Field and Sampling Issues That Affect Laboratory Measurements
10-11
JULY 2004 MARLAP
activity soils, soil gas, sludges, surface water, and ground water are given in ASTM D5608.
10.2.10 Packing and Shipping
The final responsibility of field sampling personnel is to prepare and package samples properly
for transport or shipment by a commercial carrier. All applicable state and federal shipping
requirements, discussed later in this section, must be followed. When samples must be shipped
by commercial carrier or the U.S. Postal Service, containers must be designed to protect samples
against crushing forces, impacts, and severe temperature fluctuations. Within each shipping
container, the cushioning material (sawdust, rubber, polystyrene, urethane foam, or material with
similar resiliency) should encase each sample completely. The cushioning between the samples
and walls of the shipping containers should have a minimum thickness of 2.5 cm. A minimum
thickness of five centimeters should be provided on the container floor.
Samples should also be protected from the potentially adverse impacts of temperature fluctua-
tions. When appropriate, protection from freezing, thawing, sublimation, evaporation, or extreme
temperature variation may require that the entire interior surface of the shipping container be
lined with an adequate layer of insulation. In many instances, the insulating material also may
serve as the cushioning material.
The requirements for container security, cushioning, and insulation apply regardless of container
material. For smaller volume and low-weight samples, properly lined containers constructed
from laminated fiberboard, plastic, or reinforced cardboard outer walls also may be used.
When samples are shipped as liquids in glass or other breakable sample containers, additional
packaging precautions may have to be taken. Additional protection is obtained when sample
containers are shipped in nested containers, in which several smaller containers (i.e., inner
containers) are packed inside a second larger container (i.e., the outer pack or overpack). To
contain any spills of sample material within the shipping container, it is advisable either to wrap
individual samples or to line the shipping container with absorbent material, such as asbestos-
free vermiculite or pearlite.
For proper packaging of liquid samples, additional guidance has been given by EPA (1987) and
includes the following:
• All sample bottles are taped closed;
• Each sample bottle is placed in a plastic bag and the bag is sealed;
• Each sample bottle may be placed in a separate metal can filled with vermiculite or other
packing material, and the lid taped to the can;

Field and Sampling Issues That Affect Laboratory Measurements
10-12
MARLAP JULY 2004
• The cans are placed upright in a cooler that has its drain plug taped closed, inside and out,
and lined with a plastic bag; and
• The cooler is filled with packing material—“bubble wrap” or cardboard separators may be
used—and closed with sealing tape.
Field screening measurements are made for compliance with U.S. Department of Transportation
regulations, 49 CFR Parts 170 through 189, as well as compliance with the laboratory’s license
from the U.S. Nuclear Regulatory Commission (NRC; 10 CFR Part 71) and Agreement State (if
applicable). International requirements may also apply. See the International Air Transport
Association’s Dangerous Goods Regulations for additional guidance. These regulations not only
set contamination and radiation levels for shipping containers, but also describe the types of
containers and associated materials that are to be used based on the total activity and quantity of
materials shipped. When the samples are screened in the field with survey instrumentation, the
results should be provided to the laboratory. This information should also state the distance used
from the probe to the packing container wall. Measurements normally are made in contact or at
one meter. The readings in contact are most appropriate for laboratory use. The screening
measurements in the field are mainly for compliance with transportation requirements and are
usually in units of exposure. Laboratory license requirements are usually by isotope and activity.
Project planning and communication are essential to ensure that a specific set of samples can be
transported, received, and analyzed safely while complying with applicable rules and regulations.
The external surface of each shipping container must be labeled clearly, contain information
regarding the sender and receiver, and should include the respective name and telephone number
of a contact. When required, proper handling instructions and precautions should be clearly
marked on shipping containers. Copies of instructions, shipping manifest or container inventory,
chain of custody, and any other paperwork that are enclosed within a shipping container should
be safeguarded by placing documents within a sealed protected envelope.
10.2.11 Worker Health and Safety Plan
In some cases, field samples will be collected where hazardous agents or site conditions might
pose health and safety considerations for field personnel. These can include chemical, biological,
and radiological agents, as well as common industrial hazards associated with machinery, noise
levels, and heat stress. The health and safety plan established in the planning process should be
followed. For the U.S. Department of Defense, these plans may include imminent threats to life,
such as unexploded ordnance, land mines, hostile forces, chemical agents, etc. A few of the
hazards particular to field sampling are discussed in the following sections, but these should not
be construed as a comprehensive occupational health and safety program. The Occupational
Safety and Health Administration’s (OSHA) regulations governing laboratory chemical hygiene
plans are located at 29 CFR 1910.1450. These requirements should apply as well to field
sampling.

Field and Sampling Issues That Affect Laboratory Measurements
10-13
JULY 2004 MARLAP
10.2.11.1 Physical Hazards
MECHANICAL EQUIPMENT
Personnel working with hand-held tools (e.g., sledge hammers used for near-surface coring) or
power tools and equipment are subject to a variety of hazards. For example, personnel drilling
monitoring wells are exposed to a variety of potential mechanical hazards, including moving
machinery, high-pressure lines (e.g., hydraulic lines), falling objects, drilling through under-
ground utilities, flying machinery parts, and unsafe walking and working surfaces. The
consequences of accidents involving these physical hazards can range from minor to fatal injury.
At a minimum, workers should be required to wear protective clothing, which includes hard hats,
gloves, safety glasses, coveralls (as an option) and steel-toed safety shoes. Workers required to
climb (e.g., ladders, drilling masts) must be trained according to OSHA standards in the proper
use of devices to prevent falls.
For sampling operations that require drilling, open boreholes and wells must be covered or
secured when unattended, including during crew breaks.
ELECTRICAL HAZARDS
Electric power often is supplied by gasoline or diesel engine generators. Working conditions may
be wet, and electrical shock with possibly fatal consequences may occur. In addition, drilling
operations may encounter overhead or buried electrical utilities, potentially resulting in exposure
to very high voltages, which could be fatal or initiate fires.
All electrical systems used during field operations should be checked for proper grounding
during the initial installation. Temporary electrical power provided to the drill site shall be
protected by ground-fault circuit interrupters.
NOISE HAZARDS
Power equipment is capable of producing sound levels in excess of 85 dB(A), the eight-hour
threshold limit value recommended by the American Conference of Governmental Industrial
Hygienists. Exposure to noise levels in excess of 85 dB(A) for long periods of time can cause
irreversible hearing loss. If noise levels exceed
85dB(A), a controlled area must be maintained
at this distance with a posting at each entrance
to the controlled area to read:
CAUTION
NOISE HAZARD
Hearing Protection Required Beyond This Point

Field and Sampling Issues That Affect Laboratory Measurements
10-14
MARLAP JULY 2004
HEAT STRESS
The use of protective clothing during summer months significantly increases the potential for
personnel to experience heat stress. Adverse effects from heat stress include heat cramps,
dehydration, skin rash, heat edema, heat exhaustion, heat stroke, or death. When heat stress
conditions exist, the following ought to be available:
• A cool and shaded rest area;
• Regular rest breaks;
• An adequate supply of drinking water; and
• Cotton coveralls rather than impermeable Tyvek® coveralls.
CHEMICAL AND RADIOLOGICAL HAZARDS
The health and safety plan should contain information about a site’s potential radionuclides and
hazards that might be encountered during implementation of field sampling and survey
procedures. All field personnel should read the health and safety plan and acknowledge an
understanding of the radiological hazards associated with a site. Site specific training must be
provided that addresses the chemical and radiological hazards likely to be associated with a site.
Field procedures should include either information relating to these hazards or should reference
appropriate sections of the health and safety plan. References related to the use of protective
clothing are given in EPA (1987), DOE (1987, Appendix J), and in 29 CFR 1910, Subpart I.
When procuring environmental solid and liquid samples, unusual characteristics such as color,
suspended material, or number of phases and unusual odors should be noted and a description
should be provided to the on-site safety officer as well as the analytical laboratory. Additional
information concerning field methods for rapid screening of hazardous materials is presented in
EPA (1987). This source primarily addresses the appearance and presence of organic compounds
that might be present on occasions when one is collecting materials to detect radioactivity.
Checking samples for chemical or radiological hazards can be as simple as visual inspection or
using a hand-held radiation meter to detect radiation levels. Adjustments to laboratory proce-
dures, particularly those involving sample handling and preparation, can only be made when
pertinent field information is recorded and relayed to the project planner and to the laboratory. In
some cases, a laboratory might not have clearance to receive certain types of samples (such as
explosives or chemical agents) because of their content, and it will be necessary to divert these
samples to an alternate laboratory. It might be necessary to reduce the volume sampled in order
to meet shipping regulations if high concentrations of radioactivity are present in the samples. In
some cases, the activity of one radionuclide might be much higher than others in the same
sample. Adjustments made on the basis of the radionuclide of higher activity might result in
collection of too little of another radionuclide to provide adequate detection and thus prevent
identification of these radionuclides because of their relatively low minimum detectable
concentrations. These situations should be considered during planning and documented in the

Field and Sampling Issues That Affect Laboratory Measurements
10-15
JULY 2004 MARLAP
appropriate sampling plan document.
10.2.11.2 Biohazards
Precautions should be taken when handling unknown samples in the field. Some examples are
wearing gloves, coveralls or disposable garments, plastic booties, dust masks or other respiratory
protection. Some biohazards may be snakes, ticks, spiders, and rodents (Hanta virus). Prevention
of potential exposure is the goal of a safety program. The type of protective equipment in the
field should be discussed in the planning process and specified in the appropriate plan document.
Since there are many specifics that are site dependent, it is difficult to create a comprehensive
list. But the information is discussed to provide an awareness and starting point for additional
discussion.
PERSONNEL TRAINING AND QUALIFICATION
All field operations that could lead to injury for sample collectors should be performed by
personnel trained to documented procedures. When sampling is conducted in radiologically
controlled areas (RCAs) as defined in regulatory standards (i.e., 10 CFR 20, 10 CFR 835).
Formal training and qualification of field personnel may be required.
Training may require both classroom and practical applications in order to familiarize personnel
with the basic theory of radiation and radioactivity and the basic rules for minimizing external
exposures through time, distance, shielding, and avoidance of internal exposure (by complying
with rules regarding smoking, drinking, eating, and washing of hands). Other topics to cover
include common routes of exposure (e.g., inhalation, ingestion, skin contact); proper use of
equipment and the safe handling of samples; proper use of safety equipment such as protective
clothing, respirators, portable shielding, etc.
Guidance for the training and qualification of workers handling radioactive material has been
issued by the Nuclear Regulatory Commission (see appropriate NRC NUREGs and Regulatory
Guides on training of radiation workers), Department of Energy (1994a–d), and the Institute of
Nuclear Power Operations (INPO 88-010). These and other documents should be consulted for
the purpose of training and qualifying field personnel.
PERSONNEL MONITORING AND BIOASSAY SAMPLING
When conditions dictate the need for personnel monitoring, various methods are commonly
employed to assess external and internal exposure that might have resulted from the inhalation or
ingestion of a radionuclide.
Thermoluminescent dosimeters, film badges, or other personnel dosimeters may be used to
monitor and document a worker’s external exposures to the whole body or extremities. For

Field and Sampling Issues That Affect Laboratory Measurements
10-16
MARLAP JULY 2004
internal exposures, assessment of dose may be based on: (1) air monitoring of the work area or
the worker’s breathing zone; (2) in vivo bioassay (whole-body counting); or (3) in vitro bioassays
that normally involve urinalysis but also may include fecal analysis and nasal smears. For in vitro
bioassays (i.e., urine or fecal), the standard method involves a 24-hour sample collection in a
sealable container. Samples may be kept under refrigeration until laboratory analysis can be
performed to retard bacterial action. (Bioassay sample collection is normally not performed in the
“field.”)
The following guidance documents may be used for personnel monitoring and the collection and
preservation of bioassay samples:
• ANSI/ANS HPS N13.30 (1996), Performance Criteria for Radiobioassay;
• ANSI/ANS HPS N13.14 (1994), Internal Dosimetry Programs for Tritium Exposure—
Minimum Requirements;
• ANSI/ANS HPS 13.22 (1995), Bioassay Programs for Uranium;
• ANSI/ANS HPS 13.42 (1997), Internal Dosimetry for Mixed Fission Activation Products;
• DOE Implementation Guide, Internal Dosimetry Program, G-10 CFR 835/C1—Rev. 1 Dec.
1994a;
• DOE Implementation Guide, External Dosimetry Program, G-10 CFR 835/C2—Rev. 1 Dec.
1994b;
• DOE Implementation Guide, Workplace Air Monitoring, G-10 CFR 835/E2-Rev. 1 Dec.
1994c;
• DOE Radiological Control Manual, DOE/EH-0256T, Rev. 1, 1994d;
• NRC Regulatory Guide 8.9, Acceptable Concepts, Models, Equations, and Assumptions for a
Bioassay Program (September 1993);
• NRC Regulatory Guide 8.11, Applications of Bioassay for Uranium (Revision 1, July 1993);
• NRC Regulatory Guide 8.20, Applications of Bioassay for 125I and 131I (June 1974);
• NRC Regulatory Guide 8.22, Bioassays at Uranium Mills (Revision 1, August 1988);
• NRC Regulatory Guide 8.26, Applications of Bioassay for Fission and Activation Products
(September 1980);
• NRC Regulatory Guide 8.32, Criteria for Establishing a Tritium Bioassay Program (July
1988);
• NCRP (1987), Use of Bioassay Procedures for Assessment of Internal Radionuclides
Deposition; and
• INPO (1988), Guidelines for Radiological Protection at Nuclear Power Stations.
Part B: Matrix-Specific Issues That Impact Field Sample Collection,
Processing, and Preservation
Field processing should be planned in advance so that all necessary materials are available during
field work. Preparing checklists of processing equipment, instruments, and expendable

Field and Sampling Issues That Affect Laboratory Measurements
10-17
JULY 2004 MARLAP
materials—exemplified in part by lists accompanying sampling procedures described by EPA
(1994)—helps this planning effort and serves to organize field methods. Field personnel who
communicate problems should prevent loss of time, effort, and improper sample collection, as
well as documents exactly what equipment, instruments, etc. were used.
The initial steps taken in the field frequently are critical to laboratory analysis performed hours,
days, or even weeks after a sample is obtained. Various sample preparation steps may be required
before samples are packaged and shipped for laboratory analysis. The need for sample processing
and preservation is commonly determined by the sample matrix, the DQOs of the analysis, the
nature of the radionuclide, and the analytical method.
The goal of sample preservation is to maintain the integrity of the sample between the time the
sample is collected and the time it is analyzed, thus assuring that the analysis is performed on a
sample representative of the matrix collected. Sample preservation should limit biological and
chemical actions that might alter the concentration or physical state of the radionuclide
constituents or analytes. For example, cations at very low concentrations can be lost from
solution (e.g., cesium can exchange with potassium in the glass container, and radionuclides can
be absorbed by algae or slime growths in samples or containers that remain in the field for
extended periods). Requirements for sample preservation should be determined during project
planning when analytical protocols are selected. Sample preservation in the field typically
follows or accompanies processing activities. Sample preservatives may be added to sample
collection containers before they are sent to the field.
This section provides matrix-specific guidance that focuses on the preparation and processing of
field samples. In order to assist project planners in developing a sampling plan, a limited
discussion is also provided that describes matrix-specific methods commonly employed for the
collection of field samples. Guidance is presented for only the most common materials or
environmental media, which are generically classified as liquids, solids, and air. In some
instances, a solid material to be analyzed involves particulate matter filtered from a liquid or air
suspension. Because filter media can affect analytical protocols, a separate discussion is provided
that addresses sample materials contained on filter materials, including surface contamination
associated with wipe samples.
10.3 Liquid Samples
Liquid samples typically are classified as aqueous, nonaqueous, or mixtures. Aqueous samples
requiring analysis are likely to represent surface water, ground water, drinking water,
precipitation, tanks and lagoons, and runoff. Nonaqueous liquids may include a variety of
solvents, oils and other organic liquids. Mixtures of liquids represent a combination of aqueous
and nonaqueous liquids or a solid suspended in either aqueous and nonaqueous liquids.
Standardized water sampling procedures are described in numerous documents (APHA, 1998;

Field and Sampling Issues That Affect Laboratory Measurements
10-18
MARLAP JULY 2004
EPA, 1985; EPA, 1987; DOE, 1997; ASTM D3370). Important decisions include the choice of
instrument or tool used to obtain the sample, the sample container material, the need for sample
filtration, and the use of sample preservatives.
10.3.1 Liquid Sampling Methods
The effect of the sample collection process on the sample integrity needs to be understood and
managed. Two examples are dissolved gases and cross-contamination. It may be necessary to
minimize dissolved oxygen and carbon dioxide, which can cause some dissolved metals to
undergo reaction or precipitation.
Sampling is discussed in NAVSEA (1997) and USACE (1995). The latter reference has been
superseded, but the revision does not include sampling. The sampling references listed in
USACE (1995) are:
• U.S. Environmental Protection Agency (EPA). 1984. Characterization of Hazardous Waste
Sites—A Method Manual, Vol. II, Available Sampling Methods, Second Edition, EPA 600-4-
84-076.
• U.S. Environmental Protection Agency (EPA). 1982. Handbook for Sampling and Sample
Preservation of Water and Wastewater, EPA 600-4-82-029.
• U.S. Environmental Protection Agency (EPA). 1986. Compendium of Methods for
Determination of Superfund Field Operation Methods, EPA 600-4-87/006.
• U.S. Environmental Protection Agency (EPA). 1987. A Compendium of Methods for
Determination of Superfund Field Operation Methods, EPA 540-P-87-001a, OSWER
Directive 9355.0-14.
• U.S. Department of the Interior (DOI). 1980. National Handbook of Recommended Methods
for Water for Water-Data Acquisition, Volume I and II.
10.3.2 Liquid Sample Preparation: Filtration
Filtration of a water sample may be a key analytical planning issue and is discussed in Section
3.4.3, “Filters and Wipes.” A decision needs to be made during project planning whether or not
to filter the sample in the field. Filtration of water or other liquids may be required to determine
contaminant concentrations in solubilized form, suspended particulates, or sediment. The method
of filtration will depend on the required sample volume, the amount and size of suspended
particulates, and the availability of portable equipment and resources (e.g., electricity).
The potential need to filter a water sample principally depends on the source of water and the

Field and Sampling Issues That Affect Laboratory Measurements
10-19
JULY 2004 MARLAP
objectives of the project investigation. If, for example, the intent is to assess human exposure
from ingestion of drinking water “at-the-spigot,” unfiltered tap water samples are likely to be
required. Conversely, filtration may be required for water taken from an unlined field monitor
well that is likely to contain significant amounts of particulate matter. These solids are of little
relevance but may interfere with radioanalytical protocols (e.g., sample absorption may occur
during gross alpha or beta counting where the analytical procedure involves the simple
evaporation of a water aliquant on a planchet).
For remote sampling sites, sample processing may be restricted to gravity filtration that requires a
minimum of equipment and resources. Drawing samples through filters by pressure or suction
that is created by syringe, vacuum pump, or aspiration are alternative options. If filter papers or
membranes capture materials that will be retained for analysis, they should be handled with clean
rubber or plastic gloves, forceps, or other instruments to prevent sample contamination.
Each federal agency may have unique guidance to determine the need and process for filtering
samples. One performance-based example is that of EPA, discussed in the next section. This
guidance applies to either the field or laboratory filtration.
10.3.2.1 Example of Guidance for Ground-Water Sample Filtration
After considering whether or not to filter ground-water samples when analyzing for metals, the
Environmental Engineering Committee of EPA’s Science Advisory Board (EPA, 1997)
recommended:
• Several factors could introduce errors in the sampling and analysis of ground water for metals
or metallic radionuclides. Well construction, development, sampling, and field filtering are
among the steps that could influence the metals measured in the ground-water samples. Field
filtering is often a smaller source of variability and bias compared to these other factors.
Therefore, the Agency should emphasize in its guidance the importance of proper well
construction, development, purging, and water pumping rates so that the field filtering
decisions can also be made accurately.
• Under ideal conditions, field-filtered ground-water samples should yield identical metals
concentrations when compared to unfiltered samples. However, under non-ideal conditions,
the sampling process may introduce geological materials into the sample and would require
field filtration. Under such conditions, filtering to remove the geological artifacts has the
potential of removing colloids (small particles that may have migrated as suspended materials
that are mobile in the aquifer). Available scientific evidence indicates that when wells have
been properly constructed, developed, and purged, and when the sample has been collected
without stirring or agitating the aquifer materials (turbidity less than 5 nephelometric
turbidity units, NTU), then field filtering should not be necessary. For Superfund site
assessments, the low-flow sampling technique without filtration is the preferred sampling

Field and Sampling Issues That Affect Laboratory Measurements
10-20
MARLAP JULY 2004
approach for subsequent metal analysis when well construction, well maintenance, and
hydrogeological conditions such as flow rate allow. Under such conditions, the collected
samples should be representative of the dissolved and particulate metals that are mobile in
ground-water systems. The Agency’s proposal to rely on low flow sampling and unfiltered
samples is a conservative approach that favors false positives over false negatives.
• When the turbidity of the sample is high, the situation is different. In-line filtering provides
samples that retain their chemical integrity. Therefore, field filtering of properly collected
ground-water samples should be done when turbidity in the samples is higher than 5 NTU,
even after slow pumping has been utilized to obtain the sample.
They acknowledged, however, that differences in the way wells are installed, their packing
materials, and the techniques used to collect ground-water samples can lead to variability in
analytical results between wells and between individual samples. Filtering a sample can be a way
to remove suspended particles and some colloids that contain metals that would not normally be
in the ground water if the material were not disturbed during sampling. Here, a colloid is defined
as a particle that ranges in size from 0.003 to 10 µm (Puls et al., 1990; Puls and Powell, 1992).
The literature indicates that colloids as large as 2 µm can be mobile in porous media (Puls and
Powell, 1992). Saar (1997) presents a review of the industry practice of filtration of ground-water
samples. For some sites with low hydraulic conductivity the presence of an excess of colloids
presents numerous monitoring challenges and field filtration might be necessary.
The desire to disturb the aquifer as little as possible has led to the use of low-flow sampling of
wells—low-flow purging and sampling occurs typically at 0.1 to 0.3 L/min (Saar, 1997). The
low-flow technique maximizes representativeness by (EPA, 1997):
• Minimizing disturbances that might suspend geochemical materials that are not usually
mobile;
• Minimizing disturbances that might expose new reactive sites that could result in leaching or
adsorption of inorganic constituents of ground water;
• Minimizing exposure of the ground water to the atmosphere or negative pressures, ensuring
that the rate of purging and sampling does not remove ground water from the well at a rate
much greater than the natural ground-water influx; and
• Monitoring indicator parameters to identify when stagnant waters have been purged and the
optimum time for sample collection.
In summary, based on the ability of the low-flow sampling technique to collect representative
samples, EPA suggests that filtering of ground-water samples prior to metals analysis is usually
not required (EPA, 1997).

Field and Sampling Issues That Affect Laboratory Measurements
10-21
JULY 2004 MARLAP
10.3.2.2 Filters
The removal of suspended particles is commonly achieved by filtration. When filtration is
required, it should be done in the field or as soon as practicable. Field filtration permits acid
preservatives to be added soon after collection, which minimizes the adsorption of soluble
contaminants on the container walls and avoids the dissolution of particulate matter which may
not be part of the sample to be analyzed.
An arbitrary size of 0.45 µm has gained acceptance as the boundary between soluble and
insoluble matter (particularly for water in power plant boilers (ASTM D6301). It is the filter pore
size that is commonly recommended by laboratory protocols. Material that may be present in
colloidal form (a second phase in a liquid that is not in solution), can have particles that range
from 0.001 to 2 µm. Such particles may be problematic since they may or may not be filterable
(Maron and Lando, 1974). Thus, there can be no single standard for filter type or pore size, and
every project should establish its own filtration protocol based upon its needs.
The fact that small particles pass through membrane filters has been recognized for some time
(Kennedy et al., 1974). Conversely, as the filters clog, particles an order of magnitude smaller are
retained by these filters (Sheldon and Sutcliffe, 1969). It should be noted, however, that
manufacturers of filters usually specify only what will not pass through the filter; they make no
claims concerning what actually does pass through the filter. Laxen and Chandler (1982) present
a comprehensive discussion of some effects of different filter types. They refer to thin (5 to 10
µm) polycarbonate filters as “screen types,” and thick (100 to 150 µm) cellulose nitrate and
acetate filters as “depth type.” The screen-type filters (e.g., polycarbonate) clog much more
rapidly than the depth type (e.g., cellulose nitrate and acetate) filters. Once the filtration rate
drops, particles that would normally pass through the filter are trapped in the material already
retained. Also, filtering through screen-type filters may take considerable time and may require
suction or pressure to accomplish in a reasonable time. Hence, the use of screen-type filters,
because of their increased propensity to clog, generally is not recommended.
In addition to the difficulty of contending with clogging, Silva and Yee (1982) report adsorption
of dissolved radionuclides on membrane filters. Although these drawbacks cannot be completely
overcome, they are still less than the potential difficulties that arise from not filtering.
Finally, good laboratory practices must be used for field sampling. The most likely sources of
contamination for the filters are improperly cleaned tubing and filter holders and handling the
filters with contaminated fingers. Tubing and holders should be thoroughly cleaned and rinsed
between samples and the entire system should be rinsed several times with the water to be
sampled. Filters should be handled with clean rubber gloves.

Field and Sampling Issues That Affect Laboratory Measurements
10-22
MARLAP JULY 2004
10.3.3 Field Preservation of Liquid Samples
Sample degradation may occur between the time of collection and analysis due to microbial
contaminants or chemical interactions. Although sample degradation cannot destroy or alter the
radiological properties of a contaminant, it can alter the radionuclide’s chemical properties and
its potential distribution within a sample. For example, microbial processes are known to affect
both the chemical state and the distribution of radioelements due to oxidation-reduction
reactions, complexation and solubilization by metabolic compounds, bioaccumulation,
biomylation, and production of gaseous substances such as CO 2, H 2, CH 4, and H2S (Francis,
1985; Pignolet et al., 1989).
The selected field preservation method also should take into account compatibility with the
radionuclides, analytical methods, analytical requirements, and container properties (see Section
10.2.3, “Selection of Sample Containers”). One example that illustrates compatibility with the
analytical method is the addition of HCl to water samples as a preservative for gross alpha and
gross beta analyses. The HCl will corrode stainless steel planchets used in the method. If
laboratory personnel are aware of this, they can include steps to prevent the corrosion. Other
preservation issues for liquid samples are discussed in Table 10.1 (page 10-25). Compatibility
issues should be evaluated during the planning phase and included in the field sampling plan.
10.3.3.1 Sample Acidification
Acidification is the method of choice for preserving most types of water samples. The principal
benefit of acidification is that it keeps many radionuclides in solution and minimizes their
potential for removal by chemical and physical adsorption or by ion exchange. The mode by
which a radionuclide is potentially removed from solution is strongly affected by the radionuclide
and the container material. For example, studies conducted by Bernabee et al. (1980) and Milkey
(1954) demonstrated that the removal of metal ions from solution is dominated by physical (i.e.,
van der Waals) adsorption. Milkey’s conclusion is based on: (1) the observation that the loss of
uranium, lead, and thorium ions from solution was significantly greater for containers made of
polyethylene than of borosilicate glass; and (2) the fact that while adsorption by glass may
potentially involve all three adsorption processes; with polyethylene plastic, there are no valence-
type attractive forces or ions to exchange, and only physical van der Waals adsorption is possible.
Similar observations were reported by: (1) Dyck (1968), who compared long-term adsorption of
silver ions by molded plastic to glass containers; (2) Jackson (1962), who showed that
polyethylene containers absorbed about five times as much 90Sr as glass containers at pH of about
seven; and (3) Martin and Hylko (1987a; 1987b), who reported that greater than 50 percent of
99Tc was adsorbed by polyethylene containers from non-acidified samples.
For sample acidification, either nitric or hydrochloric acid is commonly added until a pH of less
than two (APHA, 1998, Table 7010.1; EPA, 1980, Method 900.0). Other guidance for sample

Field and Sampling Issues That Affect Laboratory Measurements
10-23
JULY 2004 MARLAP
preservation by acidification is summarized below.
In instances of very low-activity samples where container adsorption poses a significant concern,
but where acidification of the sample interferes with the radioanalytical method, the choice of
sample container may be limited to glass or require alternative methods. For example, the use of
acids as a preservative is not recommended for the analysis of tritium (3H), carbon-14 (14C), or
radon in water, and precautions must be taken for the following reasons:
• For radon, sample preservation offers no benefit and is therefore not required for analytical
accuracy. Adding acid also may cause the generation of CO2 in the sample, which could
purge radon gas.
• The addition of acid to a sample containing 14C may result in the production of 14CO 2 and the
loss of 14C from the sample.
• Acid does not have a direct effect on tritium. However, it may affect the cocktail used in
liquid scintillation analysis, or as with HCl, may add significant quench to the cocktail (see
Section 15.5.3, “Liquid Scintillation”).
Although acidification has been shown to effectively reduce the adsorption of technetium by
polyethylene, technetium in the TcO 4
!4 state has been observed to volatilize in strong acid
solutions during evaporation while preparing water samples for gross beta analysis (NAS, 1960).
To hasten evaporation, the planchet is commonly flamed. This dilemma can be resolved by either
precoating planchets with a film of detergent prior to the addition of the acidified water sample
or by passive evaporation of the acidified water sample that avoids the higher temperature
associated with flaming (Blanchard et al., 1993).
10.3.3.2 Non-Acid Preservation Techniques
If a sample contains significant organics, or if contaminants under investigation react with acids
that interfere with the radioanalytical methods, other methods of sample preparation should be
considered.
REFRIGERATION AND FREEZING
The effect of refrigeration or freezing temperatures to arrest microbial activity is a fundamental
concept. Temperatures near the freezing mark or below not only retard or block bacterial growth
but arrest essentially all other metabolic activity. It should, however, be noted that most bacteria
can survive even in extreme temperatures. (Indeed, if a suspension of bacterial cells is frozen
rapidly with no appreciable formation of ice crystals, it can be kept at temperatures as low as
-194 EC for indefinite periods of time with little loss of viability.)

Field and Sampling Issues That Affect Laboratory Measurements
10-24
MARLAP JULY 2004
The choice between refrigeration and freezing is dictated by the potential impacts of ice
formation on sample constituents. Besides physical changes of organic constituents, the initial
formation of ice crystals and the exclusion of any solutes may concentrate the solutes to the point
of precipitation. Quick freezing methods that minimize ice crystal formation are beneficial for
preserving some organic constituents. Quick freezing is commonly done by packing sealed
samples in liquid nitrogen or dry ice. Care must be taken, however, to avoid container breakage
due to sample volume expansion. An air space of a least 10 percent and a container made of
plastic provide reasonable assurance for container integrity.
When refrigeration is employed, attempts should be made to avoid temperatures that could result
in slow freezing and the formation of ice crystals. Optimum refrigeration temperatures for sample
preservation at 4 ± 2 EC can be achieved by packing samples in ice or freeze packs within a
thermally insulated leak-proof container (ASTM D3856; ASTM D3370).
PAPER PULP
The addition of paper pulp, with its adsorptive property and large surface area, can avoid the
adsorption and loss of easily hydrolyzed radionuclides to the container wall over time (Bernabee
et al., 1980). About two grams of finely ground paper pulp are added per liter of acidified sample
at time of collection. The pH should be adjusted to one or less and vigorously shaken. The
sample may be stored in this condition for an extended period of time. To prepare for analysis,
the pulp is removed from solution by filtration and subjected to wet ashing using strong acids
(Chapter 12, Laboratory Sample Preparation). This ashed solution is commonly added to the
original filtrate to make a reconstituted sample solution.
The use of paper pulp and the need for wet ashing, however, pose problems for certain
radioanalytical laboratory protocols and must therefore be thoroughly evaluated.
SULFITE
To prevent the loss of radioiodine from solution, sodium bisulfite (NaHSO3), sodium thiosulfate
(Na2S2O3), or sodium metabisulfite (Na2S2O5) may be used. These compounds are strong
reducing agents and will convert volatile iodine (I2) to nonvolatile iodine (I-). If acid is also
employed to preserve samples for analysis of other radionuclides, it is important to note that acid
will counteract the effectiveness of the reducing agent. For this reason, samples collected for
iodine analyses typically are collected and preserved in a separate container. It should also be
noted that the reducing environment produced by the sulfite-type preservatives may convert iron,
uranium, and other reducible ions or their compounds to a different oxidation state. The
inadvertent change in oxidation state of other radionuclides will have an obvious adverse impact
on radioanalytical measurements that require chemical separation. Section 14.9 has additional
information on carriers and tracers.

Field and Sampling Issues That Affect Laboratory Measurements
10-25
JULY 2004 MARLAP
OTHERS
Other methods that have been used to preserve liquid samples containing organics and biological
materials include chemical preservatives (e.g., formaldehyde and methanol). Table 10.1
summarizes the advantages and disadvantages of these and previously described preservation
methods.
TABLE 10.1—Summary of sample preservation techniques.
Preservation Technique Advantages Disadvantages
Addition of HNO3Reduces pH and inhibits plating of
metals on container walls.
Strong oxidizer that might react with organic
compounds, such as liquid scintillation
cocktails.
14C might be lost as 14CO2.
Addition of HCl Reduces pH and inhibits plating of
metals on container walls.
Chloride forms strong anionic
complexes with Iron and Uranium.
Causes quench in liquid scintillation cocktails.
14C might be lost as 14CO2.
Might cause corrosion of stainless steel
planchets on gross analyses.
Addition of Sulfite Forms a reducing environment to
prevent the volatilization of iodine.
May produce undesirable oxidation states of
iron or uranium.
Addition of
Formaldehyde
Preserves organic samples.
Prevents further biological activity.
May create disposal problems.
Cooling
(Ice at approximately 0
EC)
Preserves organic samples (i.e.,
water, foods).
Reduces dehydration and retains
moisture.
Reduces biological activity.
Ice melts, requiring replacement over time.
Freezing
(Dry Ice at approximately
-78 EC)
Preserves organic samples (i.e.,
water, plant, animal).
Suspends biological activity.
Dry ice sublimates and requires replacement.
May crack sample container if frozen too
quickly.
Addition of Paper Pulp Provides large surface area for
adsorption of metals, thus minimi-
zing adsorption on container walls.
Requires pH to be one or less.
Requires filtration and wet ashing of paper pulp
and combining liquids to make a new solution.
10.3.4 Liquid Samples: Special Cases
In some cases, liquid samples require special handling in order to preserve or retain a volatile or
gaseous radionuclide. The following are examples of specific methods used to recover or
preserve such samples of interest.
10.3.4.1 Radon-222 in Water
Waterborne radon is analyzed most commonly by liquid scintillation methods, although gamma-
ray spectrometry and other methods have been employed or proposed. Liquid scintillation has the

Field and Sampling Issues That Affect Laboratory Measurements
10-26
MARLAP JULY 2004
obvious advantage of being designed for automated sample processing and is, therefore, less
labor intensive or costly. A key to consistency in analytical results is the zero headspace sampling
protocol such as the one described below.
Since radon is inert and nonpolar, it diffuses through plastic more rapidly than glass. The use of
plastic scintillation vials, therefore, leads to significant loss of radon in water (Whittaker, 1989;
Hess and Beasley, 1990). For this reason, it is recommended that the water sample is collected in
a 23 mL glass scintillation vial, capped with a Teflon™ or foil-lined cap.
Samples are collected from a nonaerated faucet or spigot, which has been allowed to flow for
sufficient time so that the sample is representative of the water in the distribution system or well.
The time will vary depending on the source.
10.3.4.1 Milk
Milk commonly is viewed as the food product of greatest potential dose significance for airborne
releases of radionuclides. Due to the animals’ metabolic discrimination, however, only a few
radionuclides have a significant dose impact via the milk pathway, notably 90Sr, 131I, and 137Cs.
To prevent milk from souring or curdling, samples should be refrigerated. Preservation of milk
may also be achieved through the addition of formaldehyde or methanol (DOE, 1987),
methimazole (Harrington et al., 1980), or Thimerosal (EPA, 1994). Analytical procedures for
select radionuclides in milk are well established and should be considered when deciding on a
sample preservation method. Adding formaldehyde to milk samples may require them to be
disposed of as hazardous or mixed wastes.
Due to the volatility and potential loss of 131I (as I2), a known amount of NaI dissolved in water
may be added to the milk sample at time of collection if iodine analysis is required. The NaI not
only serves as a carrier for the chemical separation of radioiodine, but also provides a
quantitative tool for determining any loss prior to analysis (DOE, 1990).
10.3.5 Nonaqueous Liquids and Mixtures
Nonaqueous liquids and mixtures include a wide range of organic fluids or solvents, organic
materials dissolved in water, oils, lubricants, etc. These liquids are not likely to represent
contaminated environmental media or matrices, but most likely represent waste streams that must
be sampled. Nonaqueous waste streams are generated as part of normal operations by nuclear
utilities, medical facilities, academic and research facilities, state and federal agencies, radio-
pharmaceutical manufacturers, DOE weapons complexes, mining and fuel fabrication facilities,
etc. Examples of these nonaqueous liquids and mixtures include waste oils and other lubricants
that are generated routinely from maintenance of equipment associated with nuclear power plant
operations or the production of nuclear fuel and nuclear weapon components; and organic and

Field and Sampling Issues That Affect Laboratory Measurements
10-27
JULY 2004 MARLAP
inorganic solvents, acids, and bases that are used in a variety of medical, research, and industrial
applications.
In addition to the production of nonaqueous liquid wastes from routine operations by these
facilities, large quantities of nonaqueous liquids containing radionuclide contaminants are also
generated by routine facility decontamination efforts and final decontamination associated with
facility decommissioning. For decontamination and decommissioning activities, a wide range of
processes have been developed that employ halogenated organic compounds, such as Freon®,
chloroform, or trichloroethane. Other aggressive chemical decontamination processes involve
dissolution and removal of metal and oxide layers from surfaces using acid solutions (e.g.,
sulfuric acid, nitric acid, phosphoric acids, and oxalic acid). Chemical decontamination also may
use chelating agents in concentrated processes (5 to 25 percent by weight chemical in solution)
and dilute processes (one percent wt. or less chemicals in solution). Examples of chemical
processes that can be used in both concentrated and dilute forms include the low oxidation-state
transition-metal ion (LOMI) and LOMI-nitric permanganate, developed by Dow Chemical
Company and AP/Citron. The reagents used in both the concentrated and dilute processes include
chelating and complexing agents such as ethylene diamine tetraacetic acid (EDTA), diethylene
triamine pentaacetic acid (DTPA), citric acid, oxalic acid, picolinic acid, and formic acid.
Chelating agents and organic acids are used in decontamination formulas because they form
strong complexes with actinides, lanthanides, heavy metals, and transition metals and assist in
keeping these elements in solution.
Generally, these chemical decontamination solutions, once used, are treated with ion-exchange
resins to extract the soluble activity. The ion-exchange decontamination solutions must be
sampled, nevertheless, to assess the amount of residual radioactivity.
The radionuclides that may be encountered with nonaqueous liquids and mixtures depend on
both the nature of the liquid and its usage. The following listing of radionuclides and liquids are
based on published data collected by NRC (1992) and the State of Illinois (Klebe 1998; IDNS
1993-1997), but are not intended to represent a comprehensive list:
• Toluene/xylene/scintillation fluids used by research and clinical institutions: 3H, 14C, 32/33P,
35S, 45Ca, 63Ni, 67Ga, 125/131I, 99Tc, 90Sr, 111In, 123/125I, 147Pm, 201/202Tl, 226/228Ra, 228/230/232Th,
232/234/235/238U, 238/239/241/242Pu, 241Am.
• Waste oils and lubricants from operation of motors, pumps, and other equipment: 3H, 54Mn,
65Zn, 60Co, 134/137Cs, 228/230/232Th.
• Halogenated organic and solvents from refrigeration, degreasing, and decontamination: 3H,
14C, 32/33P, 35S, 54Mn, 58/60Co, 63Ni, 90Sr, 125/129I, 134/137Cs, 226/228Ra, 228/230/232Th, 232/234/235/238U,
238/239/241Pu.

Field and Sampling Issues That Affect Laboratory Measurements
10-28
MARLAP JULY 2004
• Other organic solvents from laboratory and industrial operations and cleaning: 3H, 32/33P, 35S,
45Ca, 125I, U-natural.
• Inorganic and organic acids and bases from extraction processes and decontamination: 3H,
14C, 32/33P, 35S, 54Mn, 67Ga, 125/131I, 60Co, 137Cs, and U-natural.
Due to the large number of potential nonaqueous liquids and the complex mixtures of radionuc-
lide contaminants that may require radiochemical analysis, a comprehensive discussion of sample
preparation and preservation is beyond the scope of this discussion. In most instances, however,
these samples are not likely to require refrigeration or chemical preservatives that protect against
sample degradation.
Some organic solvents and highly acidic or basic liquids may react with plastic containers,
causing brittleness or breakage. In selecting sample containers for these nonaqueous samples, it
is important to assess the manufacturers product specifications, which typically provide
information regarding the container’s resistance to chemical and physical agents. When
nonaqueous samples are stored for long periods of time, containers should be checked routinely.
10.4 Solids
Solid samples consist of a wide variety of materials that include soil and sediment, plant and
animal tissue, metal, concrete, asphalt, trash, etc. In general, most solid samples do not require
preservation, but require specific processing in the field before transporting to the laboratory for
analysis. For example, soil sample field processing may require sieving in order to establish
sample homogeneity. These and other specific handling requirements are described below in the
section on each type of solid sample.
The most critical aspect is the collection of a sufficient amount of a representative sample. One
purpose of soil processing is to bring back only that sample needed for the laboratory. Unless
instructed otherwise, samples received by the laboratory are typically analyzed exactly as they are
received. This means that extraneous material should be removed at the time of sample
collection, if indicated in the appropriate plan document.
In many instances, sample moisture content at the time of collection is an important factor. Thus,
the weights of solid samples should be recorded at the time a sample is collected. This allows one
to track changes in wet weight from field to laboratory. Dry and ash weights generally are
determined at the laboratory.
Unlike liquid samples that may be introduced or removed from a container by simple pouring,
solid samples may require a container that is designed for easy sample placement and removal.
For this reason, large-mouth plastic containers with screw caps or individual boxes with sealable

Field and Sampling Issues That Affect Laboratory Measurements
10-29
JULY 2004 MARLAP
plastic liners are commonly used. The containers also minimize the risk for breakage and sample
cross-contamination.
10.4.1 Soils
ASTM D653 defines soil as: “Sediments or other unconsolidated accumulations of solid particles
produced by the physical and chemical degradation of rocks, and that might or might not contain
organic matter.” ASTM C999 provides generic guidance for soil sample preparation for the
determination of radionuclides. ASTM D4914 and D4943 provide additional information on soil
and rock.
The distribution of radionuclides in soil should be assumed to be heterogeneous. The degree of
heterogeneity is dictated by the radionuclide’s mode of entry into the environment and soil, the
chemical characteristics of the radionuclide contaminant, soil composition, meteorological and
environmental conditions, and land use. For example, soil contamination from an airborne
release of a radionuclide with strong affinity for clay or other mineral constituents of soil likely
will exhibit a gradient with rapidly diminishing concentrations as a function of soil depth (the
parameter associated with this affinity is KD, which is the concentration of the solid phase
divided by the concentration of the liquid phase). Moreover, contamination may be differentially
distributed among soil particles of different sizes. In most cases, because the contaminant is
adsorbed at the surface of soil particles and since the surface-to-volume ratio favors smaller
particles, smaller soil particles will exhibit a higher specific activity when compared to larger
particles. If land areas include areas of farming, tilling of soil will clearly impact the distribution
of surface contamination.
10.4.1.1 Soil Sample Preparation
Extraneous material should be removed at the time of sample collection, if indicated in the
appropriate plan document. The material may have to be saved and analyzed separately,
depending on the project requirements and MQOs. If rocks, debris, and roots are removed from a
soil sample after it arrives at the laboratory, there may be insufficient material to complete all the
requested analyses (see Section 12.3.1.1 “Exclusion of Material”). A sufficient amount of sample
should be collected to provide the net quantity necessary for the analysis. Subsequent drying at
the laboratory may remove a large percentage of the sample weight that is available for analysis.
Field-portable balances or scales may be used to weigh samples as they are collected, further
ensuring sufficient sample weights are obtained. For certain types of samples, the project DQOs
may require maintaining the configuration of the sample, such as core samples where
concentration verses depth will be analyzed.
The project plan should address the impact of heterogeneity of radionuclide distribution in soil.
Some factors to consider that may impact radionuclide distribution are: determining sampling
depth, the need for removal of vegetative matter, rocks, and debris, and the homogenation of soil

Field and Sampling Issues That Affect Laboratory Measurements
10-30
MARLAP JULY 2004
particulates. For example, soil sampling of the top 5 cm is recommended for soils contaminated
by recent airborne releases (ASTM C998); soil depth to 15 cm may be appropriate when
exposure involves the need to monitor the root zone of food crops (MARSSIM, 2000; NRC,
1990). The need for sample field QC, such as splitting, should be evaluated. Some types of field
QC can be used to evaluate the extent of radionuclide homogeneity. In general, no special
preservation measures are required for soil samples; however, preliminary soil sample
preparation involving drying, sieving, homogenizing, and splitting may be performed by a field
laboratory prior to sample shipment to the analytical laboratory.
If volatile elements are suspected to be present with other nonvolatile contaminants, samples
must be split before drying to avoid loss of the contaminant of interest. Dried samples are
homogenized by mortar and pestle, jaw crusher, ball mill, parallel plate grinder, blender, or a
combination of these techniques and sieved to obtain a uniform sample. Sieve sizes from 35 to
200 mesh generally are recommended for wet chemistry procedures. ASTM C999 correlates
various mesh sizes with alternative designations, inclusive of physical dimensions expressed in
inches or in the metric system. In addition, samples for chemical separations are usually ashed in
a muffle furnace to remove any remaining organic materials that may interfere with the
procedures.
10.4.1.2 Sample Ashing
Soil samples that require chemical separation for radionuclide analysis may also be ashed by the
field laboratory. The use of the term “field laboratory” can cause confusion, since no single
definition is possible. It is used here to define a laboratory that is close to the point of sample
collection. It does not imply that there is a distinction in requirements or specifications that
impact quality. For soil samples, ashing is performed in a muffle furnace to remove any organic
materials that may interfere with radiochemical procedures.
10.4.2 Sediments
Sediments of lakes, reservoirs, cooling ponds, settling basins, and flowing bodies of surface
water may become contaminated as a result of direct liquid discharges, wet surface deposition, or
from runoffs associated with contaminated soils. Because of various chemically and physically
binding interactions with radionuclides, sediments serve as integrating media that are important
to environmental monitoring. An understanding of the behavior of radionuclides in the aquatic
environment is critical to designing a sampling plan, because their behavior dictates their
distribution and sampling locations.
In most cases, sediment is separated from water by simple decanting, but samples also may be
obtained by filtering a slurry or through passive evaporation. As noted previously, care must be
taken to avoid cross contamination from sampling by decontaminating or replacing tools and also
from avoiding contact between successive samples. Suitable sample containers include glass or

Field and Sampling Issues That Affect Laboratory Measurements
10-31
JULY 2004 MARLAP
plastic jars with screw caps. The presence of volatile or semi-volatile organic and micro-
organisms may impact the radionuclide concentration, therefore, samples should be kept on ice
while in the field and refrigerated while awaiting radioanalysis. Sediment cores may be sampled,
frozen, and then sectioned.
10.4.3 Other Solids
10.4.3.1 Structural Materials
In some cases, a project plan requires sample analysis of structural materials such as concrete or
steel. Concrete from floors, walls, sidewalks or road surfaces is typically collected by scabbling,
coring, drilling, or chiseling. Depending on the radionuclides of interest and detection methods,
these sample preparations may require crushing, pulverization, and sieving.
Metal associated with structures (e.g., I-beams, rebar) or machines may be contaminated on
exterior or interior surfaces or through activation may become volumetrically contaminated.
Surface contamination may be assessed by swipe samples that provide a measure of removable
contamination (Section 10.6) or by scraping, sandblasting, or other abrasive techniques.
Volumetric contamination is frequently assessed by nondestructive field measurements that rely
on gamma-emitting activation products. However, drill shavings or pieces cut by means of a
plasma arc torch may be collected for further analysis in a laboratory where they can be analyzed
in a low-background environment. In general, these materials require no preservation but, based
on activity/dose-rate levels and sample size and weight, may require proper shielding, engineered
packaging, and shipping by a licensed carrier.
10.4.3.2 Biota: Samples of Plant and Animal Products
The release of radionuclides to the environment from normal facility operations or as the result of
an accident requires the sampling of a wide variety of terrestrial and aquatic biota. For most
biota, sample preservation usually is achieved by icing samples in the field and refrigeration until
receipt by the analytical laboratory. The field sampling plan should describe the type of
processing and preservation required.
Foods may be categorized according to the U.S. Department of Agriculture scheme as leafy
vegetables, grains, tree-grown fruits, etc., and representative samples from each group may be
selected for analysis.
MEAT, PRODUCE, AND DAIRY PRODUCTS
Samples of meat, poultry, eggs, fresh produce, and other food should be placed in sealed plastic
bags and appropriately labeled and preserved by means of ice in the field and refrigeration during
interim storage prior to delivery to the analytical laboratory. All food samples may be reduced to

Field and Sampling Issues That Affect Laboratory Measurements
10-32
MARLAP JULY 2004
edible portions (depending on study objective) for analysis in a manner similar to that for human
consumption (i.e., remove cores, bones, seeds, other nonedible parts) and weighed as received
from the field (i.e., wet weight) within 24 hours. Wet weights are desired, since consumption
data are generally on this basis.
ANIMAL FEED AND VEGETATION
Animal feeds also provide important data for determining radionuclide concentrations in the food
chain. Crops raised for animal feed and vegetation consumed by grazing farm animals may be
sampled. Depending upon radionuclides under investigation and their associated MQOs,
kilogram quantities of vegetative matter may be needed.
As in all terrestrial samples, naturally occurring 40K and the uranium and thorium series
radionuclides contribute to the radiation observed. Deposition of such cosmic-ray-produced
nuclides as 7Be and fallout from nuclear tests also may be present. Properly selected processed
items from commercial sources may be helpful in providing natural and anthropogenic
background data.
TERRESTRIAL WILDLIFE
Wild animals that are hunted and eaten may be of interest for potential dose estimates and
therefore may require sampling. Examples of wildlife that have been used are deer, rabbits, and
rodents that may feed or live in a contaminated site. An estimate of the radionuclide intake of the
animal just before its death may be provided by analyzing the stomach content, especially the
rumen in deer.
AQUATIC ENVIRONMENTAL SAMPLES
In addition to natural radionuclides and natural radionuclides enhanced by human activity, there
are numerous man-made radionuclides that have the potential for contaminating surface and
ground water. The most common of these are fission and activation products associated with
reactor operation and fuel cycle facilities. Radioanalysis of aquatic samples may therefore
include 54Mn, 58Co, 60Co, 65Zn, 95Zr, 90Sr, 134Cs, 137Cs, and transuranics, such as 239Pu.
When surface and ground waters are contaminated, radionuclides may be transferred through a
complex food web consisting of aquatic plants and animals. Aquatic plants and animals, as
discussed here, are any species which derive all or substantial portions of their nourishment from
the aquatic ecosystem, are part of the human food chain, and show significant accumulation of a
radionuclide relative to its concentration in water. Although fish, aquatic mammals, and
waterfowl provide a direct link to human exposure, lower members of the food chain also may be
sampled.

Field and Sampling Issues That Affect Laboratory Measurements
10-33
JULY 2004 MARLAP
FLORA
Aquatic biota such as algae, seaweed, and benthic organisms are indicators and concentrators of
radionuclides—especially 59Fe, 60Co, 65Zn, 90Sr, 137Cs, and the actinides—and can be vectors in
the water-fish-human food chain. As such, they may be sampled upstream and downstream at
locations similar to those described for sediment. Because of their high water content, several
kilograms (wet weight) should be collected per sample. The wet weight of the sample should be
recorded. Enough of the wet sample should be processed so that sufficient sample remains
following the drying process. Both algae (obtained by filtering water or by scraping submerged
substrates) and rooted aquatic plants should be sampled.
FISH AND SHELLFISH
Several kilograms of each fish sample are usually required; this may be one large fish, but
preferably a composite of a number of small ones. Analysis of the edible portions of food fish as
prepared for human consumption is of major interest. Fish may be de-boned, if specified in the
sampling plan. The whole fish is analyzed if it is used for the preparation of a fish meal for
consumption or if only trend indication is required. In a program where fish are the critical
pathway, fish are analyzed by species; if less detail is required, several species with similar
feeding habits (such as bottom feeders, insectivores, or predators) may be collected and the data
grouped. Some species of commercial fish, though purchased locally, may have been caught
elsewhere. Thus, the presence or absence of a radionuclide in a specific fish may not permit any
definite conclusion concerning the presence of the radionuclide in water at that location.
Shellfish, such as clams, oysters, and crabs, are collected for the same reasons as fish, but have
the advantage as indicators of being relatively stationary. Their restricted mobility contributes
substantially to the interpretation and application of analytical results to environmental
surveillance. Edible and inedible portions of these organisms can be prepared separately.
WATERFOWL
Waterfowl, such as ducks and geese, may also concentrate radionuclides from their food sources
in the aquatic environment and serve as important food sources to humans. The migratory
patterns and feeding habits of waterfowl vary widely. Some species are bottom feeders and, as
such, tend to concentrate those radionuclides associated with sediments such as 60Co, 65Zn, and
137Cs. Others feed predominantly on surface plants, insects, or fish.
An important consideration in obtaining a sample from waterfowl is that their exterior surfaces,
especially feathers, may be contaminated. It is important to avoid contaminating the “flesh”
sample during handling. As with other biota samples, analyses may be limited to the edible
portions and should be reported on a wet weight basis.

Field and Sampling Issues That Affect Laboratory Measurements
10-34
MARLAP JULY 2004
10.5 Air Sampling
The measurement of airborne radionuclides as gases or particulates provides a means of
evaluating internal exposure through the inhalation pathways. The types of airborne radioactivity
that may require air sampling are normally categorized as: (1) airborne particulates; (2) noble
gases; (3) volatilized halogens (principally radioiodines); and (4) tritiated water. Depending upon
the source term and the objectives of the investigation, air sampling may be conducted outdoors
as well as indoors on behalf of a variety of human receptors. For example, routine outdoor air
samples may be taken for large population groups living within a specified radius of a nuclear
facility. On the other end of the spectrum, air samples may be taken for a single person or small
group of persons exposed occupationally to a highly localized source of airborne radioactivity.
The purpose of the samples being collected must, therefore, be well defined in terms of sampling
location, field sampling equipment, and required sample volumes. Due to the wide range of
conditions that may mandate air sampling, and the limited scope of this section, only generic
topics of air sampling will be discussed.
10.5.1 Sampler Components and Operation
Common components of air sampling equipment include a sample collector (i.e., filter), a sample
collector holder, an air mover, and a flow-rate measuring device.
The sample holder should provide adequate structural support while not damaging the filter,
should prevent sampled air from bypassing the filter, should facilitate changing the filter, and
should facilitate decontamination. A backup support that produces negligible pressure drop
should be used behind the filter to prevent filter distortion or deterioration. If rubber gaskets are
used to seal the filter to the backing plate, the gasket should be in contact with the filter along the
entire circumference to ensure a good fit.
Air movers or vacuum systems should provide the required flow through the filter and minimize
air flow reduction due to filter loading. Consideration should be given to the use of air movers
that compensate for pressure drop. Other factors to consider should include size, power
consumption, noise, durability, and maintenance requirements.
Each air sampler should be equipped with a calibrated air-flow measuring device with specified
accuracy. To calculate the concentrations of any radionuclide in air collected, it is necessary to
determine the total volume of air sampled and the associated uncertainties. The planning
documents should state who is responsible for making volume corrections. Also, the information
needed for half-life corrections for short-lived radionuclides needs to be recorded. If the mean
flow during a collection period can be determined, the total volume of air sampled can be readily
calculated.

Field and Sampling Issues That Affect Laboratory Measurements
10-35
JULY 2004 MARLAP
Accurate flow measurements and the total integrated sample volume of air can be obtained using
a mass flow meter and a totalizer. This direct technique of air flow measurement becomes
impractical at remote field locations, due to cost and exposure of the flow meter to harsh
environments. Other procedures for the measurement of air flow in sampling systems are
reviewed by Lippmann (1989a). The sample parameters (flow rate, volume, associated
uncertainties, etc.) should be recorded by the sample collector.
The collection medium or filter used depends on the physical and chemical properties of the
materials to be collected and counted. A variety of particulate filters (cellulose, cellulose-
asbestos, glass fiber, membrane, polypropylene, etc.) is available. The type of filter is selected
according to needs, such as high collection efficiency, particle-size selectivity, retention of alpha
emitters on the filter surface, and the compatibility with radiochemical analysis. The criteria for
filter selection are good collection efficiency for submicron particles at the range of face
velocities used, high particle and mass loading capacity, low-flow resistance, low cost, high
mechanical strength, low-background activity, compressibility, low-ash content, solubility in
organic solvents, nonhygroscopicity, temperature stability, and availability in a variety of sizes
and in large quantities. The manufacturer’s specifications and literature should provide a source
for filter collection efficiency. In the selection of a filter material, a compromise must be made
among the above-cited criteria that best satisfies the sampling requirements. An excellent review
of air filter material used to monitor radioactivity was published by Lockhart and Anderson
(1964). Lippmann (1989b) also provides information on the selection of filter materials for
sampling aerosols by filtration. See ANSI HPS N13.1, Annex D and Table D.1, for criteria for
the selection of filters for sampling airborne radioactive particles.
In order to select a filter medium with adequate collection efficiency, it may be necessary to first
determine the distribution of size of airborne particulates. Several methods, including impactors
(e.g., multistage cascade impactor) and electrostatic precipitators, can be used to classify particle
size. Waite and Nees (1973) and Kotrappa et al. (1974) discuss techniques for particle sizing
based on the flow discharge perturbation method and the HASL cyclone, respectively. These
techniques are not recommended for routine environmental surveillance of airborne particulates,
although their use for special studies or for the evaluation of effluent releases should not be
overlooked. Specific data on various filter materials, especially retention efficiencies, have been
reported by several authors (Lockhart and Anderson, 1964; Denham, 1972; Stafford, 1973;
ASTM STP555) and additional information is available from manufacturers.
10.5.2 Filter Selection Based on Destructive Versus Nondestructive Analysis
Pure cellulose papers are useful for samples to be dissolved and analyzed radiochemically, but
the analytical filter papers used to filter solutions are inefficient collectors for aerosols and clog
easily. Cellulose-asbestos filter papers combine fairly high efficiency, high flow rates, high
mechanical strength, and low pressure drops when loaded. They are very useful for collecting
large samples but present difficulties in dissolution, and their manufacture is diminishing because

Field and Sampling Issues That Affect Laboratory Measurements
10-36
MARLAP JULY 2004
of the asbestos. Fiberglass filters can function efficiently at high flow rates, but require fluoride
treatment for dissolution and generally contain sufficient radioactive nuclides to complicate low-
activity analysis. Polystyrene filters are efficient and capable of sustaining high air flow rates
without clogging. They are readily destroyed for analysis by ignition (300 EC) or by wet washing
with oxidizing agents, and also are soluble in many organic liquids. They have the disadvantage
of low mechanical and tensile strength, and they must be handled carefully. Membrane filters are
excellent for surface collection efficiency and can be used for direct alpha spectrometry on the
filter. However, they are fragile and suffer from environmental dust loading. An alternative
choice for radionuclides in the environment is the polypropylene fiber filter. Teflon™ fiber filters
can be efficient, but they should be used with care because of their high ashing temperatures and
difficulties with digestion.
10.5.3 Sample Preservation and Storage
Since particulate air samples are generally dry samples that are chemically and physically stable,
they require no preservation. However, care must be exercised to avoid loss of sample from the
filter medium and the cross contamination among individual samples. Two common methods are
to fold filters symmetrically so that the two halves of the collection surface are in contact, or to
insert the filter into glassine envelopes. Filters should be stored in individual envelopes that have
been properly labeled. Filters may also be stored in special holders that attach on the filter’s edge
outside of the collection surface.
Since background levels of 222Rn and 220Rn progeny interfere with evaluating alpha air samples, a
holdup time of several hours to several days may be required before samples are counted.
Corrections or determinations can also be made for the contribution of radon or thoron progeny
present on a filter (Setter and Coats, 1961).
10.5.4 Special Cases: Collection of Gaseous and Volatile Air Contaminants
Prominent radionuclides that may exist in gaseous states include noble gases (e.g., 131/133Xe, 85Kr),
14C as carbon dioxide or methane, 3H as water vapor, gaseous hydrogen, or combined in volatile
organic compounds and volatilized radioiodines.
10.5.4.1 Radioiodines
The monitoring of airborne iodine, such as 129I and 131I, may be complicated by the probable
existence of several species, including particulate iodine or iodine bound to foreign particles,
gaseous elemental iodine, and gaseous non-elemental compounds of iodine. A well-designed
sampling program should be capable of distinguishing all possible iodine forms. While it may
not always be necessary to differentiate between the various species, care should be taken so that
no bias can result by missing one or more of the possible species. See ANSI HPS N13.1 (Annex
C.3) for information on collection media for radioiodine.

Field and Sampling Issues That Affect Laboratory Measurements
10-37
JULY 2004 MARLAP
In addition to the problems noted above, charcoal cartridges (canisters) for the collection of
radioiodine in air are subject to channeling. Several should be mounted in series to prevent loss
of iodine. Too high a sampling rate reduces both the collection efficiency and retention time of
charcoal filters, especially for the non-elemental forms of iodine (Keller et al., 1973; Bellamy,
1974). The retention of iodine in charcoal is dependent not only on charcoal volume, but also the
length of the charcoal bed. Typical air flow rates for particulate sampling of 30 to 90 L/min (1 to
3 ft3/min) are normally acceptable for environmental concentrations of radioiodine. The method
proposed by the Intersociety Committee (APHA, 1972) for 131I concentrations in the atmosphere
involves collecting iodine in its solid and gaseous states with an “absolute” particulate filter in
series with an activated charcoal cartridge followed by gamma spectrometric analysis of the filter
and cartridge. The Intersociety-recommended charcoal cartridges are e inch (16 mm) diameter
by 1½ inch (38 mm) deep containing 3 g of 12-to-30-mesh KI-activated charcoal. The minimum
detectable level using the Intersociety method is 3.7×10⁻³ Bq/m3 (0.1 pCi/m3). Larger cartridges
will improve retention, permitting longer sampling periods. A more sensitive system has been
described by Baratta et al. (1968), in which concentrations as low as 0.037 Bq/m3 (0.01 pCi/mL)
of air are attainable.
For the short-lived radioiodines (mass numbers 132, 133, 135), environmental sampling is
complicated by the need to obtain a sufficient volume for analysis, while at the same time,
retrieving the sample soon enough to minimize decay (with half-lives ranging from two hours to
21 hours). Short-period (grab) sampling with charcoal cartridges is possible, with direct counting
of the charcoal as soon as possible for gamma emissions.
Because of the extremely long half-life and normally low environmental concentrations,
129I
determinations must usually be performed by neutron activation or mass spectrometry analysis
after chemical isolation of the iodine. For concentrations of about 0.11 Bq/L (3×10⁻¹⁰ µCi/mL),
liquid scintillation counting can be used after solvent extraction (Gabay et al., 1974).
10.5.4.2 Gases
Sampling for radioactive gases is either done by a grab sample that employs an evacuated
chamber or by airflow through a medium, such as charcoal, water, or a variety of chemical
absorbers. For example, radioactive CO2 is most commonly extracted by passing a known
volume of air through columns filled with 3 M NaOH solution. After the NaOH is neutralized
with sulfuric acid, the CO2 is precipitated in the form of BaCO3, which then can be analyzed in a
liquid scintillation counter (NCRP, 1985). An alternative method for collecting noble gases by
compression into high-pressure canisters is described in Section 15.3.5.1, “Radioactive Gases.”
Because noble gases have no metabolic significance, and concern is principally limited to
external exposure, surveillance for noble gases is commonly performed by ambient dose rate
measurements. However, the noble gases xenon and krypton may be extracted from air by
adsorption on activated charcoal (Scarpitta and Harley, 1990). However, depending upon the

Field and Sampling Issues That Affect Laboratory Measurements
10-38
MARLAP JULY 2004
analytical method and instrumentation employed, significant interference may result from the
presence of naturally occurring radioactive gases of 222Rn and 220Rn.
10.5.4.3 Tritium Air Sampling
In air, tritium occurs primarily in two forms: as water vapor (HOT) and as hydrogen gas (HT).
However, if tritiated hydrogen (HT) is a suspected component of an air sample (e.g., from a vent
or stack), the sampling must take place in the emission point of the gas. This is because the high
escape velocity of hydrogen gas causes rapid, isotropic dispersion immediately beyond the
discharge point. Tritiated organic compounds in the vapor phase or attached to particulate matter
occur only occasionally. To measure tritium as HT or in tritiated organic, the gas phase can be
oxidized, converting the tritium to HOT before desiccation and counting. For dosimetric
purposes, the fraction present as HT can usually be neglected, since the relative dose for a given
activity concentration of HOT is 400 times that for HT (NCRP, 1978). However, if HT analysis
is required, it can be removed from the atmosphere by oxidation to water (HOT) using
CuO/MnO2 at 600 EC (Pelto et al., 1975), or with air passed over platinum alumina catalyst
(Bixel and Kershner 1974). These methods also oxidize volatile tritiated organic compounds to
yield tritiated water (ANSI HPS N13.1, Annex H).
A basic system for sampling HOT consists of a pump, a sample collector, and a flow-measuring
or flow-recording device. Air is drawn through the collector for a measured time period at a
monitored flow rate to determine the total volume of air sampled. The total amount of HOT
recovered from the collector is divided by the total volume of air sampled to determine the
average HOT-in-air concentration of the air sampled. In some sampler types, the specific activity
of the water collected is measured and the air concentration is determined from the known or
measured humidity. Some common collectors are cold traps, tritium-free water, and solid
desiccants, such as silica gel, DRIERITE™, or molecular sieve.
Cold traps are usually made of glass and consist of cooled collection traps through which sample
air flows. The trap is cooled well below the freezing point of water, usually with liquid nitrogen.
The water vapor collected is then prepared for analysis, usually by liquid scintillation counting.
Phillips and Easterly (1982) have shown that more than 95 percent HOT collection efficiency can
be obtained using a single cold trap. Often a pair of cold traps is used in series, resulting in a
collection efficiency in excess of 99 percent.
Gas-washing bottles (i.e., “bubblers”) filled with an appropriate collecting liquid (usually tritium-
free water) are used quite extensively for collecting HOT from air. HOT in the sample gas stream
“dissolves” in the collecting liquid. For the effective collection rate to remain the same as the
sample flow rate, the specific activity of the bubbler water must be negligible with respect to the
specific activity of the water vapor. Thus, the volume of air that can be sampled is ultimately
limited by the volume of water in the bubbler. However, except when sampling under conditions
of very high humidity, sample loss (dryout) from the bubbler usually limits collection time rather

Field and Sampling Issues That Affect Laboratory Measurements
10-39
JULY 2004 MARLAP
than the attainment of specific-activity equilibrium. Osborne (1973) carried out a thorough
theoretical and experimental evaluation of the HOT collection efficiency of water bubblers over a
wide range of conditions.
The use of silica gel as a desiccant to remove moisture from air is a common technique for
extracting HOT. The advantage of using silica gel is that lower HOT-in-air concentrations can be
measured, since the sample to be analyzed is not significantly diluted by an initial water volume,
which occurs when a liquid-sampling sink is used. Correcting for dilution is discussed in Rosson
et al. (2000).
10.5.4.4 Radon Sampling in Air
There are three isotopes of radon in nature: 222Rn is a member of the 238U decay chain; 220Rn is a
member of the 232Th decay chain; and 219Rn is a member of the 235U decay chain. Because of the
small relative abundance of the parent nuclides and the short half-lives of 220Rn (55 seconds) and
219Rn (4 seconds), the term “radon” generally refers to the isotope 222Rn. Owing to its ubiquitous
presence in soils, uranium mill tailings, underground mines, etc., and the health risks to large
populations and occupational groups, radon is perhaps the most studied radionuclide.
Consequently, many reports and articles have been published in the scientific literature dealing
with the detection methods and health risks from radon exposures. Many of them appear in
publications issued by the EPA, DOE, NCRP, NAS, and in radiation-related journals, such as
Health Physics and Radiation Research. Given the voluminous amount of existing information,
only a brief overview of the sampling issues that impact laboratory measurements can be
presented here.
Quantitative measurements of radon gas and its short-lived decay products can be obtained by
several techniques that are broadly categorized as grab sampling, continuous radon monitoring,
and integrative sampling. Each method imposes unique requirements that should be followed
carefully. Continuous monitors are not discussed further, since they are less likely to be used by
laboratory analysts. Guidance for radon sample collection was published by EPA’s Radon
Proficiency Program, which was discontinued in October 1998 (EPA 1992; 1993). Additional
sampling methods and materials are also presented in EPA (1994) and Cohen (1989).
In general, EPA’s protocols specify that radon sampling and measurements be made under
standardized conditions when radon and its progeny are likely to be at their highest concentra-
tions and maximum equilibrium. For indoor radon measurement, this implies minimum building
ventilation through restrictions on doors, windows, HVAC systems, etc. Also sampling should
not take place during radical changes in weather conditions. Both high winds and rapid changes
in barometric pressure can dramatically alter a building’s natural ventilation rate. Although
recommended measurements are likely to generate higher than actual average concentrations, the
benefit of a standardized sampling condition is that it is reproducible, least variable, and

Field and Sampling Issues That Affect Laboratory Measurements
10-40
MARLAP JULY 2004
moderately conservative.
The choice among sampling methods depends on whether the measurement is intended as a
short-term, quick-screening measurement or as a long-term measurement that determines average
exposure or integration. In practice, the choice of a measurement system often is dictated by
availability. If alternative systems are available, the cost or duration of the measurement may
become the deciding factor. Each system has its own advantages and disadvantages, and the
investigator must exercise some judgment in selecting the system best suited to the objectives of
the investigation. Brief descriptions of several basic techniques used to sample air for radon and
its progeny are provided below.
GRAB SAMPLING
The term “grab sampling” refers to very short-term sampling. This method consists of evaluating
a small volume of air for either radon or radon decay product concentration. In the radon grab
sampling method, a sample of air is drawn into and subsequently sealed in a flask or cell that has
a zinc sulfide phosphor coating on its interior surfaces. One surface of the cell is fitted with a
window that is put in contact with a photomultiplier tube to count light pulses (scintillations)
caused by alpha disintegrations from the sample interacting with the zinc sulfide coating. The
general terms “flask” or “cell” are used in this discussion. Sometimes they are referred to as
“Lucas cells” (Lucas, 1982). The Lucas cell—or alpha scintillation counter—has specific
attributes, and not all radon cells are Lucas cells.
Several methods for performing such measurements have been developed. However, two
procedures that have been most widely used with good results are the Kusnetz procedure and the
modified Tsivogiou procedure. In brief, the Kusnetz procedure (Kusnetz, 1956; ANSI N13.8)
may be used to obtain results in working levels when the concentration of individual decay
products is not important. Decay products in up to 100 liters of air are collected on a filter in a
five-minute sampling period. The total alpha activity on the filter is counted any time between 40
and 90 minutes after sampling is completed. Counting can be done using a scintillation-type
counter to obtain gross alpha counts for a selected counting time. Counts from the filter are
converted to disintegrations using the appropriate counter efficiency. The disintegrations from
the decay products may be converted into working levels using the appropriate “Kusnetz factor”
for the counting time used.
The Tsivogiou procedure may be used to determine both working level and the concentration of
the individual radon decay products. Sampling is the same as in the Kusnetz procedure.
However, the filter is counted three separate times following collection. The filter is counted
between 2 and 5 minutes, 6 and 20 minutes, and 21 and 30 minutes after sampling is complete.
Count results are interpreted by a series of equations that calculate concentrations of the three
radon decay products and working levels.

Field and Sampling Issues That Affect Laboratory Measurements
10-41
JULY 2004 MARLAP
INTEGRATING SAMPLING DEVICES
By far, the most common technique for measuring radon is by means of integrating devices.
Integrating devices, like charcoal canister and the Electret-Passive Environmental Radon Monitor
(E-PERM®), are commonly employed as short-term integrating devices (two to seven days), while
alpha-track detectors are commonly used to provide measurements of average radon levels over
periods of weeks to months. Only charcoal canisters are discussed below, since they are more
likely to be used by laboratory analysts than electrets and alpha-track detectors.
CHARCOAL CANISTERS
Charcoal canisters are passive devices requiring no power to function. The passive nature of the
activated charcoal allows continual adsorption and desorption of radon. During the measurement
period, the adsorbed radon undergoes radioactive decay. Therefore, the technique does not
uniformly integrate radon concentrations during the exposure period. As with all devices that
store radon, the average concentration calculated using the mid-exposure time is subject to error
if the ambient radon concentration adsorbed during the first half of the sampling period is
substantially higher or lower than the average over the period. The ability of charcoal canisters to
concentrate noble gases or other materials may be affected by the presence of moisture,
temperature, or other gaseous or particulate materials that may foul the adsorption surface of the
charcoal.
10.6 Wipe Sampling for Assessing Surface Contamination
Surface contamination falls into two categories: fixed and loose. The wipe test (also referred to
as “swipes” or “smears”) is the universally accepted technique for detecting removable
radioactive contamination on surfaces (Section 12.5, “Wipe Samples”). It is often a stipulation of
radioactive materials licenses and is widely used by laboratory personnel to monitor their work
areas, especially for low-energy radionuclides that are otherwise difficult to detect with hand-
held survey instruments.” Frame and Abelquist (1999) provide a comprehensive history of using
smears for assessing removable contamination.
The purpose of the wipe test, organizational requirements or regulations, the nature of the
contamination, the surface characteristics, and the radionuclide all influence the conditions for
the actual wipe-test process. The wipe-test process should be standardized to ensure that the
sampling process is consistent. Since surfaces and wipe materials vary considerably, wipe-test
results provide qualitative indication of removable contamination. Fixed contamination will, by
definition, not be removed. Therefore, direct measurements may be necessary to determine the
extent on contamination.
The U.S. Nuclear Regulatory Commission (NRC, 1981) suggests that 100 cm2 areas be wiped

Field and Sampling Issues That Affect Laboratory Measurements
10-42
MARLAP JULY 2004
and lists acceptable levels for surface contamination. However, NRC neither recommends the
collection device nor the manner in which to conduct such surveys, relying instead on
suggestions by the National Committee on Radiation Protection (1964) and the National Council
on Radiation Protection and Measurements (1978).
To maintain constant geometry in an automatic proportional counter, it is important that the wipe
remain flat during counting. Additionally, material that will curl can jam the automatic counter
and cause cross contamination or even destroy the instrument window. When it is necessary to do
destructive analysis on the wipe, it is critical that the wipe can easily be destroyed during the
sample preparation step, and that the residue not cause interference problems.
When wipes are put directly into liquid scintillation cocktail, it is important that the wipe not add
color or react with the cocktail. For maximum counting efficiency, as well as reproducibility, the
wipe either should dissolve in the cocktail or become transparent to the counting system.
10.6.1 Sample Collection Methods
10.6.1.1 Dry Wipes
Dry wipes (smears) for removable surface activity usually are obtained by wiping an area of 100
cm2 using a dry filter paper of medium hardness while applying moderate pressure. A 47 mm
diameter filter typically is used. This filter can be placed into a proportional counter for direct
counting. Smaller filters may be advantageous when the wipe is to be counted using liquid
scintillation counter for low energy beta-emitting radionuclides, such as tritium, 14C, and 63Ni.
The choice of wipe-test media and cocktail is critical when counting low-energy beta-emitting
radionuclides in liquid scintillation counters, because the liquid scintillation counting process
depends on the detection of light produced by the interaction of the radiation with the cocktail.
The filter may absorb energy from the radiation (see “Quench” under Section 15.5.3.3). A filter
that is in the cocktail can prevent light from being seen by both detectors at the same time. If
light is produced and seen by only one of the two detectors typical in liquid scintillation counting
systems, then the count will be rejected as noise. A filter/cocktail combination that produces a
sample that is transparent to the counting system is the best combination for liquid scintillation
counting. Background produced by the filter may also be a consideration.
For surveys of small penetrations, such as cracks or anchor-bolt holes, cotton swabs are used to
wipe the area of concern. The choice of material for wipe-testing for special applications is
critical (Hogue, 2002), and the material selected can significantly affect the efficiency of the
removal of surface radioactivity. Usually, switching wipe test material should be avoided during
a project, when possible. Samples (dry wipes or swabs) are placed into envelopes or other
individual containers to prevent cross-contamination while awaiting analysis. Dry wipes for
alpha and medium- or high-energy beta activity can be evaluated in the field by counting them on
an integrating scaler unit with appropriate detectors; the same detectors utilized for direct

Field and Sampling Issues That Affect Laboratory Measurements
10-43
JULY 2004 MARLAP
measurements may be used for this purpose. However, the more common practice is to return the
dry wipes to the laboratory, where analysis can be conducted using more sensitive techniques.
The most common method for analyzing wipe samples is to use a proportional counter. For very
low-energy beta emissions, wipe samples are commonly analyzed by liquid scintillation
counting.
Additional information on wipe-test counting can be found in ISO (7503-1; 7503-2; 7503-3),
which apply to surfaces of equipment and facilities, containers of radioactive materials, and
sealed sources. Abelquist (1998) discusses using smears to assess the quantity of removable
contamination as it applies to radiological surveys in support of decommissioning, compliance
with DOT shipping criteria, and operational radiological protection programs.
10.6.1.2 Wet Wipes
Although dry wipes are more convenient to handle, and there are fewer chances of cross
contamination, a general limitation of dry wipes is their low recovery of surface contamination.
The low recovery using dry wipes is due to the higher affinity for the surface by the contaminant
than for the filter paper. Several studies have shown that for maximum sensitivity, a wipe
material moistened with a suitable solvent may be indicated. For example, Ho and Shearer
(1992) found that alcohol-saturated swabs were 100 times more efficient at removing
radioactivity than dry swabs.
In another study, Kline et al. (1992) assessed the collection efficiency of wipes from various
surfaces that included vinyl floor tile, plate glass, and lead foil. Two different collection devices,
cotton swabs and 2.5 cm diameter glass fiber filter disks, were evaluated under various collection
conditions. Dry wipes were compared to collections made with the devices dampened with
different amounts of either distilled H2O, 70 percent ethanol, or a working-strength solution of a
multipurpose laboratory detergent known to be effective for removing contaminants from
laboratory glassware (Manske et al., 1990).
The entire area of each square was manually wiped in a circular, inwardly-moving motion with
consistent force. The collection capacity of each device was estimated by wiping progressively
larger areas (multiple grids) and comparing the measured amounts of radioactivity with the
amounts placed on the grids.
Collection efficiency varied with both the wipe method and the surface wipe. Contamination was
removed most readily from unwaxed floor tile and glass; lead foil released only about one-half
the radioactivity. Stainless steel, another common laboratory surface, has contamination retention
properties similar to those of glass.
In most cases, collection was enhanced by at least a factor of two after dampening either the
swabs or filter disks with water. Dampening with ethanol or the detergent produced removals that

Field and Sampling Issues That Affect Laboratory Measurements
10-44
MARLAP JULY 2004
were statistically indistinguishable from samples dampened with an equal amount of water.
The filter disks had a higher collection capacity for removable contaminants than cotton swabs,
nearly doubling the radioactivity removed for each doubling of surface area wiped. Variability
within all methods was high, with coefficients of variation ranging from 2 to 30 percent.
For the moistened wipes, wipe efficiency depended on three factors, including the polarity of the
solvent, the polarity of the contaminant being measured, and the affinity of the compound for the
contaminated surface. For a solvent to readily dissolve a compound (i.e., remove it from the
surface), the solvent and the compound must have similar polarities. Nonpolar solvents include
ethyl acetate and petroleum ether; for polar solvents, water or methanol may be used (Campbell
et al., 1993). There are other factors that influence the affinity of a compound for a surface,
including porosity of the surface and available binding sites on the surface. One important factor
that influences binding capacity is the type of treatment that a surface has received. When
working with a surface treated with a nonpolar wax, such as that used on floor tile, a nonpolar
compound will be adsorbed to the surface, which further limits recovery. Recovery from
absorbent surfaces, such as laboratory bench paper or untreated wood, also may be poor due to
the porous nature of the surface.
10.6.2 Sample Handling
Filter paper or other materials used for wipe tests in the field should be placed in separate
containers that prevent cross contamination during transport and allow for labeling of each
sample. Plastic bags, paper or glassine envelopes, and disposable plastic petri dishes are typically
used to store and transport wipe samples. Field workers can use plastic or rubber gloves and
forceps when applying the wipe material to a surface and during handling as each wipe is placed
into a container. Protection of the sample wipe surface is the main concern when a wipe must be
placed in a container for transport. If a scintillation vial or planchet will be used in the laboratory,
then a field worker may put wipes directly into them. Planchets containing loose or self-sticking
wipes can also be put into self-sealing plastic bags to separate and protect the integrity of the
sample’s surface. Excessive dust and dirt can cause self adsorption or quenching, and therefore
should be minimized.
10.6.3 Analytical Considerations for Wipe Material Selection
Some analytical considerations for selecting wipe materials are included here, because field
sample collection and subsequent sample counting usually occur without such intervening steps
as sample preparation, sample dissolution, or separation. It is critical, therefore, to ensure that the
wipe material used for collection and the actual counting process are compatible. The following
paragraphs offer some general guidance for proportional and liquid scintillation counting. The
final paragraph discusses some key issues that impact dissolution of wipes.

Field and Sampling Issues That Affect Laboratory Measurements
10-45
JULY 2004 MARLAP
The wipe should remain flat during counting in order to maintain optimum counting geometry in
an automatic proportional counter. Wipe material that can curl may jam an automatic counter and
destroy the detector window of the counter, become a source of cross-contamination of samples,
or contaminate the counting system. Most proportional counting systems use two-inch (5 cm)
planchets, and the wipe should fit into the planchet. If not, a subsample will need to be taken, and
subsampling adds additional uncertainty due to sample homogeneity considerations.
When wipes are put directly into a liquid scintillation cocktail, the wipe should not add color or
react with the cocktail. For maximum counting efficiency and reproducibility, the wipe either
should dissolve or become transparent to the counting system. When wipes that have an adhesive
backing are put directly in a liquid scintillation cocktail, the adhesive may not dissolve
completely. Compatibility should be checked before use to prevent problems during actual
sample analysis. Special cocktails are available to dissolve filters, but they may cause a waste-
disposal problem. Since the possible combination of cocktails and filters is large, only general
guidance is provided here. Consult the manufacturer’s specifications for specific guidance.
When it is necessary to do destructive analysis on a wipe, select a wipe that can be destroyed
easily or dissolved during the sample preparation steps, and the residue will not cause
interference problems in the subsequent counting. Some wipes have adhesive backing; the wipe
materials may dissolve easily but the adhesive backing may not. Additional steps would then be
necessary to destroy the adhesive backing. Dissolving glass-fiber wipes may require the use of
hydrofluoric acid. These extra processes can add time or cost to the analysis. See Section 10.5.2
(“Filter Selection Based on Destructive Versus Nondestructive Analysis”), Section 12.5 (“Wipe
Samples”) and Chapter 13 (Sample Dissolution) for additional information.
10.7 References
Abelquist, E.W. 1998. “Use of Smears for Assessing Removable Contamination,” Health
Physics Newsletter, Ops Center, July, pp. 18-19.
American National Standards Institute (ANSI) HPS N13.1. Sampling and Monitoring Releases of
Airborne Radioactive Substances from the Stacks and Ducts of Nuclear Facilities. 1999.
American National Standards Institute/American Nuclear Society (ANSI/ANS) HPS N13.14.
Internal Dosimetry Programs for Tritium Exposure - Minimum Requirements. 1994.
American National Standards Institute/American Nuclear Society (ANSI/ANS) HPS N13.22.
Bioassay Programs for Uranium. 1995.
American National Standards Institute/American Nuclear Society (ANSI/ANS) HPS N13.30.
Performance Criteria for Radiobioassay. 1996.

Field and Sampling Issues That Affect Laboratory Measurements
10-46
MARLAP JULY 2004
American National Standards Institute/American Nuclear Society (ANSI/ANS) HPS N13.42.
Internal Dosimetry for Mixed Fission Activation Products, 1997.
American National Standards Institute (ANSI). N13.8. American National Standard for
Radiation Protection in Uranium Mines. 1973.
American Public Health Association (APHA). 1972. Intersociety Committee for a Manual of
Methods for Ambient Air Sampling and Analysis, Methods of Air Sampling and Analysis.
APHA, Washington, DC.
American Public Health Association (APHA). 1998. Standard Methods for the Examination of
Water and Waste Water, 20th Edition. Washington, DC. Available at: www.standardmethods.
org.
American Society for Testing and Materials (ASTM) STP 555. Instrumentation for Monitoring
Air Quality, 1974. West Conshohocken, Pennsylvania.
American Society for Testing and Materials (ASTM) C998. Sampling Surface Soil for
Radionuclides, 1995. West Conshohocken, Pennsylvania.
American Society for Testing and Materials (ASTM) C999. Soil Sample Preparation for the
Determination of Radionuclides, 1995. West Conshohocken, Pennsylvania.
American Society for Testing and Materials (ASTM) D420. Site Characterization for
Engineering, Design, and Construction Purposes, 1998. West Conshohocken, Pennsylvania.
American Society for Testing and Materials (ASTM) D653. Terminology Relating to Soil, Rock,
and Contained Fluids, 1997. West Conshohocken, Pennsylvania.
American Society for Testing and Materials (ASTM) D3370, Standard Practices for Sampling
Water from Closed Conduits. ASTM, West Conshohocken, Pennsylvania.
American Society for Testing and Materials (ASTM) D3856. Good Laboratory Practices in
Laboratories Engaged in Sampling and Analysis of Water, 1995. West Conshohocken,
Pennsylvania.
American Society for Testing and Materials (ASTM) D3977. Determining Sediment
Concentration in Water Samples, 1997. West Conshohocken, Pennsylvania.
American Society for Testing and Materials (ASTM) D4840. Sampling Chain-of-Custody
Procedures, 1999. West Conshohocken, Pennsylvania.

Field and Sampling Issues That Affect Laboratory Measurements
10-47
JULY 2004 MARLAP
American Society for Testing and Materials (ASTM) D4914. Density of Soil and Rock in Place
by the Sand Replacement Method in a Test Pit, 1999. West Conshohocken, Pennsylvania.
American Society for Testing and Materials (ASTM) D4943. Shrinkage Factors of Soils by the
Wax Method, 1995. West Conshohocken, Pennsylvania.
American Society for Testing and Materials (ASTM) D5245. Cleaning Laboratory Glassware,
Plasticware, and Equipment Used in Microbiological Analyses, 1998. West Conshohocken,
Pennsylvania.
American Society for Testing and Materials (ASTM) D5283. Generation of Environmental Data
Related to Waste Management Activities Quality Assurance and Quality Control Planning
and Implementation, 1997. West Conshohocken, Pennsylvania.
American Society for Testing and Materials (ASTM) D5608. Decontamination of Field
Equipment Used at Low Level Radioactive Waste Sites, 1994. West Conshohocken,
Pennsylvania.
American Society for Testing and Materials (ASTM) D6301. Standard Practice for the
Collection of Samples of Filterable and Nonfilterable Matter in Water. West Conshohocken,
Pennsylvania.
Baratta, E.J., G.E. Chabot, and R.J. Donlen. 1968. “Collection and Determination of Iodine-131
in the Air,” Amk. Ind. Hyg. Assoc. J., 29:159.
Bellamy, R.R. 1974. “Elemental Iodine and Methyl Iodide Adsorption on Activated Charcoal at
Low Concentrations.” Nuclear Safety Volume 15, U.S. Atomic Energy Commission
Technical Information Center, Oak Ridge, Tennessee.
Bernabee, R. P., D. R. Percival, and D. B. Martin. 1980. “Fractionation of Radionuclides in
Liquid Samples from Nuclear Power Facilities,” Health Physics 39, pp. 57-67.
Bixel, J.C. and C.J. Kershner. 1974. “A Study of Catalytic Oxidation and Oxide Adsorption for
Removal of Tritium from Air,” in Proceedings of the 2nd AEC Environmental Protection
Conference page 261, April 16-19, Report No. CONF-740406, WASH-1332 (74).
Blanchard, R.L., R. Leiberman, W.S. Richardson III, and C.L. Wakamo. 1993. “Considerations
of Acidifying Water Samples for Tc-99 Analysis,” Health Physics 65:2, pp. 214-215.
Campbell, J.L., C.R. Santerre, P.C. Farina, and L.A. Muse. 1993. “Wipe Testing for Surface
Contamination by Tritiated Compounds,” Health Phys. 64, pp. 540-544.

Field and Sampling Issues That Affect Laboratory Measurements
10-48
MARLAP JULY 2004
Cohen, B. S. 1989. “Sampling Airborne Radioactivity,” in Air Sampling Instruments for
Evaluation of Atmospheric Contaminants, 7th edition, American Conference of
Governmental Industrial Hygienists, Cincinnati, Ohio.
Dehnam, D.H. 1972. “Effectiveness of Filter Media for Surface Collection of Airborne
Radioactive Particulates,” Health Physics Operational Monitoring Vol. 2, Gordon and
Breach, New York.
Department of Energy (DOE). 1987. The Environmental Survey Manual, Appendices E, F, G, H,
I, J, and K. DOE/EH-0053, Vol. 4 of 4, DOE, Office of Environmental Audit, Washington,
DC.
Department of Energy (DOE). 1990. EML Procedures Manual (HASL-300-Ed.27). G. de
Planque Editor, Environmental Measurements Laboratory.
Department of Energy (DOE). 1994a. Implementation Guide, Internal Dosimetry Program. G-10
CFR 835/C1-Rev. 1.
Department of Energy (DOE). 1994b. Implementation Guide, External Dosimetry Program. G-
10 CFR 835/C2-Rev. 1.
Department of Energy (DOE). 1994c. Implementation Guide, Workplace Air Monitoring. G-10
CFR 835/E2-Rev. 1.
Department of Energy (DOE). 1994d. Radiological Control Manual. DOE/EH-0256T, Rev. 1.
Department of Energy (DOE). 1997. EML Procedures Manual. HASL-300, 28th Edition,
Environmental Measurements Laboratory. Available at www.eml.doe.gov/publications/
procman.cfm.
Department of the Interior (DOI). 1980. National Handbook of Recommended Methods for Water
for Water-Data Acquisition, Volume I and II.
Dyck, W. 1968. “Adsorption of Silver on Borosilicate Glass,” Anal. Chem. 40:454-455.
U.S. Environmental Protection Agency (EPA). 1980. Prescribed Procedures for Measurement of
Radioactivity in Drinking Water. EPA-600/4-80-032, EPA, Environmental Monitoring and
Support Laboratory, Cincinnati, Ohio.
U.S. Environmental Protection Agency (EPA). 1982. Handbook for Sampling and Sample
Preservation of Water and Wastewater. EPA-600/4-82-029, EPA, Washington, DC. (PB83-
124503)

Field and Sampling Issues That Affect Laboratory Measurements
10-49
JULY 2004 MARLAP
U.S. Environmental Protection Agency (EPA). 1984. Characterization of Hazardous Waste
Sites–A Method Manual, Vol. II, Available Sampling Methods. EPA-600-4-84-076, Second
Edition. Office of Emergency and Remedial Response, Washington, DC.
U.S. Environmental Protection Agency (EPA). 1985. Sediment Sampling Quality Assurance
User’s Guide. EPA/600/4-85/048, Environmental Monitoring Systems Laboratory, Las
Vegas, NV. (PB85-233542).
U.S. Environmental Protection Agency (EPA). 1986. Compendium of Methods for Determination
of Superfund Field Operation Methods, EPA 600-4-87/006. Office of Emergency and
Remedial Response, Washington, DC.
U.S. Environmental Protection Agency (EPA). 1987. A Compendium of Superfund Field
Operations Methods. EPA/540/P-87/001. Office of Emergency and Remedial Response,
Washington, DC. (PB88-181557).
U.S. Environmental Protection Agency (EPA). 1989. Indoor Radon and Radon Decay Product
Measurement Protocols. Office of Air and Radiation, Washington, DC.
U.S. Environmental Protection Agency (EPA). 1992. Indoor Radon and Radon Decay Product
Measurement Device Protocols. EPA 402-R-92-004, EPA, Office of Air and Radiation,
Washington, DC. Available at www.epa.gov/iaq/radon/rpp_docs.htm.
U.S. Environmental Protection Agency (EPA). 1993. Protocols for Radon and Radon Decay
Product Measurements in Homes. EPA 402-R-92-003, EPA, Office of Air and Radiation,
Washington, DC. Available at www.epa.gov/iaq/radon/rpp_docs.htm.
U.S. Environmental Protection Agency (EPA). 1994. Routine Environmental Sampling
Procedures Manual For Radionuclides. EPA, Office of Radiation and Indoor Air and
National Air and Radiation Environmental Laboratory, Montgomery, AL.
U.S. Environmental Protection Agency (EPA). 1996. Radon Proficiency Program - Handbook.
EPA 402-R-95-013, EPA, Office of Radiation and Indoor Air, Washington, DC.
U.S. Environmental Protection Agency (EPA). 1997. To Filter or Not to Filter, That is the
Question. EPA Science Advisory Board (SAB), Environmental Engineering Committee,
Special Topics Subcommittee, July 11, 1997. EPA-SAB-EEC-LTR-97-011.
Frame, P.W. and E.W. Abelquist. 1999. Use of Smears for Assessing Removable Contamination.
Operational Radiation Safety, May, 76(5):S57-S66. Available at: www.hps1.org/sections/
rso/ophpinfo/papers.htm.

Field and Sampling Issues That Affect Laboratory Measurements
10-50
MARLAP JULY 2004
Francis, A.J. 1985. Low-Level Radioactive Wastes in Subsurface Soils. Soil reclamation
Processes: Microbiological Analyses and Applications, NY.
Friend, A.G., A.H Story, C.R. Henderson, and K.A. Busch. 1965. Behavior of Certain
Radionuclides Released into Fresh-Water Environments. U.S. Public Health Service
Publication 999-RH-13.
Gabay, J.J., C.J. Paperiello, S. Goodyear, J.C. Daly, and J.M. Matuszek. 1974. “A Method for
Determining Iodine-129 in Milk and Water,” Health Physics 26, p. 89.
Harrington, C.L., R.A. Mellor, R.E. Lockwood, and K.G. Dagenais 1980. “Advantages and
Limitations of Chemical Preservatives for Use in the Radiological Analysis of I-131 in
Environmental Milk Samples, “ Health Physics 40:6, p. 907.
Hess, C.T. and S.M. Beasley. 1990. Setting Up a Laboratory for Radon in Water Measurments.
Radon, Radium and Uranium in Drinking Water, Lewis Publishers, Chelsea, MI.
Ho, S.Y. and D.R. Shearer. 1992. “Radioactive Contamination in Hospitals from Nuclear
Medicine Patients,” Health Physics 62, pp. 462-466.
Hogue, M.G. 2002. “Field Comparison of the Sampling Efficacy of Two Smear Media: Cotton
Fiber and Kraft Paper,” Operational Radiation Safety, 83:2, pp. S45-S47
Illinois Department of Nuclear Safety (IDNS). 1993. 1992 Annual Survey Report. Springfield,
Illinois.
Illinois Department of Nuclear Safety (IDNS). 1994. 1993 Annual Survey Report. Springfield,
Illinois.
Illinois Department of Nuclear Safety (IDNS). 1995. 1994 Annual Survey Report. Springfield,
Illinois.
Illinois Department of Nuclear Safety (IDNS). 1996. 1995 Annual Survey Report. Springfield,
Illinois.
Illinois Department of Nuclear Safety (IDNS). 1997. 1996 Annual Survey Report. Springfield,
Illinois.
Institute of Nuclear Power Operations (INPO). 1988. Guidelines for Radiological Protection at
Nuclear Power Stations. INPO 88-010, Atlanta, Georgia.
International Standards Organization (ISO) 7503-1. Evaluation of Surface Contamination – Part

Field and Sampling Issues That Affect Laboratory Measurements
10-51
JULY 2004 MARLAP
1: Beta-emitters (Maximum Beta Energy Greater than 0.15 MeV) and Alpha-Emitters. 1988,
Geneva, Switzerland.
International Standards Organization (ISO) 7503-2. Evaluation of Surface Contamination – Part
2: Tritium Surface Contamination. 1988, Geneva, Switzerland.
International Standards Organization (ISO) 7503-3. Evaluation of Surface Contamination – Part
3: Isomeric Transition and Electron Capture Emitters, Low Energy Beta-emitters (Eβmax
<0.15 MeV). 1996, Geneva, Switzerland.
Jackson, E.W. 1962. “Prevention of Uptake of Strontium Ions on Glass,” Nature 194:672.
Johnson, B.H. 1980. A Review of Numerical reservoir Hydrodynamic Modeling. U.S. Army
Corps of Engineers, Waterways Experiment Station, Vicksburg, Mississippi.
Keller, J.H., T.R. Thomas, D.T. Pence, and W.J. Maeck. 1973. “An Evaluation of Materials and
Techniques Used for Monitoring Airborne Radioiodine Species,” in Proceedings of the 12th
AEC Air Cleaning Conference. U.S. Atomic Energy Commission, Washington, DC.
Kennedy, V.C., G.W. Zellweger, and B.F. Jones. 1974. “Filter Pore Size Effects on the Analysis
of Al, Fe, Mn, and Ti in Water,” Water Resources Research 10:4, pp. 785-790.
Klebe, M. 1998. Illinois Department of Nuclear Safety. Correspondence of June 12, 1998 to Mr.
J.C. Dehmel, SC&A, Inc., with copies of Tables 4 and 5 from survey questionnaires for the
years of 1994 to 1997.
Kline, R.C, I. Linins, E.L. Gershey. 1992. “Detecting Removable Surface Contamination,”
Health Phys. 62, pp. 186-189.
Kotrappa, P., S.K. Dua, D.P. Bhanti, and P.P. Joshi. 1974. “HASL Cyclone as an Instrument for
Measuring Aerosol Parameters for New Lung Model,” in Proceedings of the 3rd International
Congressional Radiation Protection Association, September 9-14, 1973.
Kusnetz, H.L. 1956. “Radon Daughers in Mine Atmospheres–A Field Method for Determining
Concentrations,” Am. Ind. Hyg. Assoc. Quarterly Vol. 17.
Laxen, D.P.H. and I.M. Chandler. 1982. “Comparison of Filtration Techniques for Size
Distribution in Freshwaters,” Analytical Chemistry, 54:8, pp. 1350-1355.
Lippmann, M. 1989a. “Calibration of Air Sampling Instruments,” in Air Sampling Instruments,
7th Ed., American Conference of Governmental Industrial Hygienists, Cincinnati, OH, pp. 73-
100.

Field and Sampling Issues That Affect Laboratory Measurements
10-52
MARLAP JULY 2004
Lippmann, M. 1989b. “Sampling Aerosols by Filtration,” in Air Sampling Instruments, 7th Ed.,
American Conference of Governmental Industrial Hygienists, Cincinnati, OH, pp. 305-336.
Lockhart, L., R. Patterson and W. Anderson. 1964. Characteristics of Air Filter Media Used for
Monitoring Airborne Radioactivity. Naval Research Laboratory Report NRL-6054,
Washington, DC.
Lucas, H.F. 1982. What is the “Lucas Emanation Method for 226Ra”? Health Physics, 43:2, pp
278-279, [Letters].
Manske, P., T. Stimpfel, and E.L. Gershey. 1990. “A Less Hazardous Chromic Acid Substitute
for Cleaning Glassware,” J. Chem. Educ. 67:A280-A282.
Maron, S.H. and J. B. Lando. 1974. Fundamentals of Physical Chemistry. New York: Macmillan
Publishing Company.
MARSSIM. 2000. Multi-Agency Radiation Survey and Site Investigation Manual, Revision 1.
NUREG-1575 Rev 1, EPA 402-R-97-016 Rev1, DOE/EH-0624 Rev1. August. Available
from www.epa.gov/radiation/marssim/.
Martin, J.E. and J.M. Hylko. 1987a. “Formation of Tc-99 in Low-Level Radioactive Waste
Samples from Nuclear Plants,” Radiation Protection Management, 4:6, pp. 67-71.
Martin, J.E. and J.M. Hylko. 1987b. “Measurement of 99Tc in Low-Level Radioactive Waste
from Reactors Using 99Tc as a Tracer,” Applied Radiation and Isotopes, 38:6, pp. 447-450.
Milkey, R.G. 1954. “Stability of Dilute Solutions of Uranium, Lead, and Thorium Ions,” Anal.
Chem. 26:11, pp. 1800-1803.
National Academy of Sciences (NAS). 1960. The Radiochemistry of Technetium. Office of
Technical Services, Washington, DC.
National Committee on Radiation Protection. 1964. Safe Handling of Radioactive Materials.
NCRP Report 30, Washington, DC.
National Council on Radiation Protection and Measurements (NCRP). 1978. Instrumentation
and Monitoring Methods for Radiation Protection. NCRP Report 57.
National Council on Radiation Protection and Measurements (NCRP). 1985. A Handbook of
Radioactivity Measurements Procedures. NCRP Report 81.
National Council on Radiation Protection and Measurements (NCRP). 1987. Use of Bioassay

Field and Sampling Issues That Affect Laboratory Measurements
10-53
JULY 2004 MARLAP
Procedures for Assessment of Internal Radionuclides Deposition. NCRP Report No. 87.
National Institute for Occupational Safety and Health (NIOSH). 1983. Industrial Hygiene
Laboratory Quality Control-587. NIOSH, Cincinnati, Ohio.
Naval Sea Systems Command (NAVSEA), 1997. Navy Environmental Compliance Sampling
and Field Testing Procedures Manual, NAVSEA T0300-AZ-PRO-010, 10 June 1997
U.S. Nuclear Regulatory Commission (NRC). Acceptable Concepts, Models, Equations, and
Assumptions for a Bioassay Program. NRC Regulatory Guide 8.9. Revision 1, September
1993.
U.S. Nuclear Regulatory Commission (NRC). Applications of Bioassay for Uranium. NRC
Regulatory Guide 8.11. June 1974.
U.S. Nuclear Regulatory Commission (NRC). 1977. Estimating Aquatic dispersion of Effluents
from Accidental and Routine Reactor Releases for the Purpose of Implementing Appendix I.
NRC Regulatory Guide 1.113.
U.S. Nuclear Regulatory Commission (NRC). Applications of Bioassay for I-125 and I-131.
NRC Regulatory Guide 8.20. Revision 1, September 1979.
U.S. Nuclear Regulatory Commission (NRC). Applications of Bioassay for Fission and
Activation Products. NRC Regulatory Guide 8.26. September 1980.
U.S. Nuclear Regulatory Commission (NRC). Bioassays at Uranium Mills. NRC Regulatory
Guide 8.22. Revisoin 1, August 1988.
U.S. Nuclear Regulatory Commission (NRC). Criteria for Establishing a Tritium Bioassay
Program. NRC Regulatory Guide 8.32. July 1988.
U.S. Nuclear Regulatory Commission (NRC). 1981. Radiation Safety Surveys at Medical
Institutions. NRC Regulatory Guide 8.23.
U.S. Nuclear Regulatory Commission (NRC). 1990. Model Feasibility Study of Radioactive
Pathways From Atmosphere to Surface Water. NUREG/CR-5475, Washington, DC.
U.S. Nuclear Regulatory Commission (NRC). 1992. National Profile on Commercially
generated Low-Level Radioactive Mixed Waste. NUREG/CR-5938, Washington, DC.
Osborne, R.V. 1973. “Sampling for Tritiated Water Vapor,” in Proceedings of the 3rd
International Congress. International Radiation Protection Association, CONF-730907-P2,

Field and Sampling Issues That Affect Laboratory Measurements
10-54
MARLAP JULY 2004
1973:1428-1433.
Parker, H.M., R.F. Foster, I.L. Ophel, F.L. Parker, and W.C. Reinig. 1965. “North American
Experience in the Release of Low-Level Waste to Rivers and Lakes,” in Proceedings of the
Third United National International Symposium on the Peaceful Uses of Atomic Energy Vol.
14:62-71.
Pelto, R.H., C.J. Wierdak, and V.A. Maroni. 1975. “Tritium Trapping Kinetics in Inert Gas
Streams,” in Liquid Metals Chemistry and Tritium Control Technology Annual Report ANL-
75-50, p. 35 (Argonne National Laboratory, Lemont, IL).
Phillips, J.E. and C.E. Easterly. 1982. “Cold Trapping Efficiencies for Collecting Tritiated Water
Entrained in a Gaseous Stream,” Rev. Sci. Instrum., 53:1.
Pignolet, L., F. Auvray, K. Fonsny, F. Capot, and Z. Moureau. 1989. “Role of Various
Microorganisms on Tc Behavior in Sediments,” Health Physics, 57:5, pp. 791-800.
Puls, R.W., J.H. Eychaner, and R.M. Powell. 1990. Colloidal-Facilitated Transport of Inorganic
Contaminants in Ground Water: Part I. Sampling Considerations. EPA/600/M-90/023, NTIS
PB 91-168419.
Puls, R. W., and R. M. Powell. 1992. “Transport of Inorganic Colloids Through Natural Aquifer
Material: Implications for Contaminant Transport,” Environmental Science & Technology
26:3, pp. 614-621.
R. Rosson, R. Jakiel, S. Klima, B. Kahn, P.D. Fledderman. 2000. “Correcting Tritium
Concentrations in Water Vapor with Silica Gel,” Health Physics, 78:1, p 68-73. Available at:
www.srs.gov/general/sci-tech/fulltext/ms9800901/ms9800901.html.
Saar, R. A. 1997. “Filtration of Ground Water Samples: A Review of Industry Practice,” GWMR,
Winter, 1997, pp. 56-62.
Scarpitta, S.C. and N.H. Harley. 1990. “Adsorption and Desorption of Noble Gases on Activated
Charcoal. I. 133X Studies in a Monolayer and Packed Bed,” Health Physics 59:4, pp. 383-392.
Setter, L.R. and G.I. Coats. 1961. “The Determination of Airborne Radioactivity,” Industrial
Hygiene Journal, February, pp 64-69.
Sheldon, R.W. and W.H. Sutcliffe. 1969. “Retention of Marine Particles by Screens and Filters,”
Limn. & Ocean 14, pp 441-444.
Silva, R.J. and A.W. Yee. 1982. Geochemical Assessment of Nuclear Waste Isolation: Topical

Field and Sampling Issues That Affect Laboratory Measurements
10-55
JULY 2004 MARLAP
Report, Testing of Methods for the Separation of Soil and Aqueous Phases. Lawrence
Berkeley Laboratory, Report LBL-14696, UC-70.
Stafford, R.B. 1973. Comparative Evaluation of Several Glass-Fiber Filter Media. Los Alamos
Scientific Laboratory, LA-5297.
U.S. Army Corps of Engineers (USACE). 1995. Technical Project Planning Guidance for
Hazardous, Toxic and Radioactive Waste (HTRW) Data Quality Design. Engineer Manual
EM-200-1-2, Appendix H, Sampling Methods.
Waite, D.A. and W.L. Nees. 1973. A Novel Particle Sizing Technique for Health Physics
Application. Battelle, Pacific Northwest Laboratories, BNWL-SA-4658.
Whittaker, E.L., J.D. Akridge, and J. Giovino. 1989. Two Test Procedures for Radon in Drinking
Water: Interlaboratory Collaborative Study. EPA 600/2-87/082, Environmental Monitoring
Systems Laboratory.

11-1
JULY 2004 MARLAP
11 SAMPLE RECEIPT, INSPECTION, AND TRACKING
11.1 Introduction
This chapter provides guidance on laboratory sample receiving and surveying, inspecting,
documenting custody, and assigning laboratory tracking identifiers (IDs). These topics are
presented sequentially in this chapter, but they may be performed in a different order. The
chapter is directed primarily at laboratory personnel (as are all of the Part II chapters), although
the project manager and field personnel need to be aware of the steps involved in sample receipt,
inspection, and tracking. Within MARLAP, the “sample receipt” process includes the surveying
of the package and sample containers for radiological contamination and radiation levels.
“Sample inspection” means checking the physical integrity of the package and samples,
confirming the identity of the sample, confirming field preservation (if necessary), and recording
and communicating the presence of hazardous materials. “Laboratory sample tracking” is a
process starting with logging in the sample and assigning a unique laboratory tracking identifier
(numbers and/or letters) to be used to account for the sample through analyses, storage, and
shipment. Laboratory tracking continues the tracking that was initiated in the field during sample
collection (see Section 10.2, “Field Sampling Plan: Non-Matrix-Specific Issues”).
This chapter focuses on sample receipt, inspection, and tracking of samples in the laboratory
because these are the three modes of initial control and accountability (Figure 11.1). Sample
receipt and inspection activities need to be done in a timely manner to allow the laboratory and
field personnel to resolve any problems (e.g., insufficient material collected, lack of field
preservation, etc.) with the samples received by the laboratory as soon as is practical. Effective
communications between field personnel and the laboratory not only facilitates problem
resolution but also prevents unnecessary delays in the analytical process.
Other relevant issues, including the laboratory’s radioactive materials license conditions and
proper operating procedures, are also discussed because these topics are linked to receipt,
inspection, and tracking activities. The result of the sample receipt and inspection activities is to
accept the samples as received or to perform the necessary corrective action (which may include
rejecting samples). Health and safety information on radiological issues can be found in NRC
(1998a; 1998b).
11.2 General Considerations
11.2.1 Communication Before Sample
Receipt
Before the samples are received, the laboratory
should know the approximate number of
samples that will be received within a specific
Contents
11.1 Introduction .......................... 11-1
11.2 General Considerations ................. 11-1
11.3 Sample Receipt ....................... 11-5
11.4 Sample Inspection ..................... 11-8
11.5 Laboratory Sample Tracking ............ 11-11
11.6 References .......................... 11-13
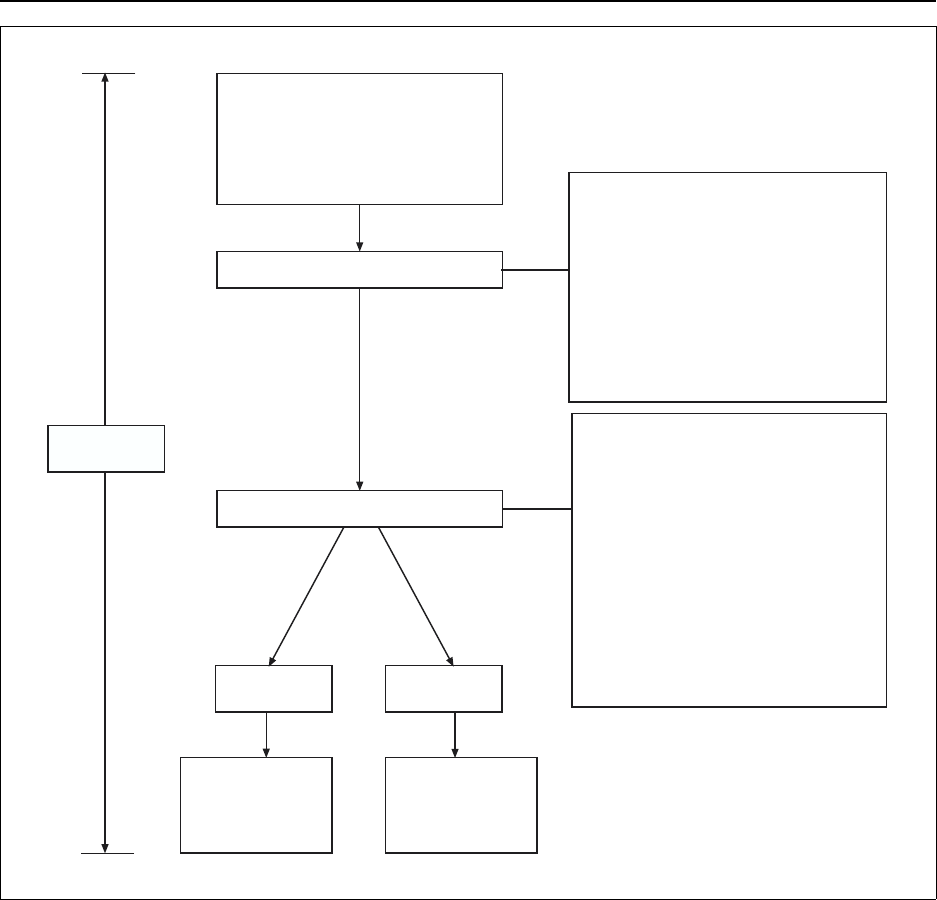
Sample Receipt, Inspection, and Tracking
11-2
MARLAP JULY 2004
Field Sample Shipment
(see Chapter 10)
Tracking Documents
Number and type of samples along
with field sample number
Field processing and preservation
Analysis requested
Sample received in designated area
Authorized user notified for radiological
screening of package
Check for evidence of breakage or
leakage of exterior of shipping
package, then shipping containers.
If found, radiologically survey and
decontaminate if necessary
Radiological survey
License requirements
Chain-of-custody procedures if
required
Sample Receipt
Sample Inspection
In designated rad receiving/prep area:
Check container labels against sample
Check radionuclides requested
against tracking documents
Check tamper seals
Verify preservation against tracking
documents
Check field preparation against
tracking documents
Any discrepancies in the following will
result in corrective action:
Survey limits
Expected radionuclides
Number and type of samples
Tracking Documents
SAMPLE
REJECTED
SAMPLE
ACCEPTED
Laboratory
Tracking
Check with client
relative to sample
disposition
Short-term
sample storage
or sample
prep/analysis
laboratory
FIGURE 11.1 — Overview of sample receipt, inspection, and tracking
period of time and the types of analyses that are expected for the samples. Laboratory personnel
should be provided with a contact in the field and with means of contacting the person
(telephone, FAX, e-mail). The information about the client, points of contact, number of samples,
and types of analyses can be entered into the laboratory information management system (LIMS)
to facilitate communication between the laboratory—in both the sample receipt area and the
project management area—and the project manager. Communication between laboratory
personnel and project staff in the field allows the parties to coordinate activities, schedules, and
sample receipt. In particular, the project manager should provide to the laboratory any special
instructions regarding the samples before shipment of samples. This information serves to notify

Sample Receipt, Inspection, and Tracking
11-3
JULY 2004 MARLAP
the laboratory of health and safety concerns and provides details that will affect analytical
procedures, sample disposition, etc. For example, without this communication, a laboratory
might receive a partial shipment and not realize that samples are missing. Furthermore, advance
communications allow laboratory staff to arrange for special handling or extra storage space
should the need arise.
Planning for the samples to be received at the laboratory starts during the development of the
appropriate plan document and the statement of work (SOW) and continues through the
communication between the project staff in the field and the laboratory. For example, the
laboratory could use its LIMS to generate labels and bar-codes for the appropriate containers to
be used in the field. This process would assist in assigning appropriate sample IDs for the
laboratory tracking system, which starts with sample receipt. The laboratory should instruct the
field staff to place the tracking documents on the inside of the cooler lid for easy access and to
include any other pertinent information (field documentation, field surveying information, etc.).
11.2.2 Standard Operating Procedures
A laboratory should have standard operating procedures (SOPs) for activities related to sample
receipt, inspection, and tracking. Some typical topics that might be addressed in laboratory SOPs
are presented in Table 11.1. For example, the laboratory should have an SOP that describes what
information should be included in the laboratory sample tracking system. Laboratory SOPs
should describe chain-of-custody procedures giving a comprehensive list of the elements in the
program such as signing the appropriate custody forms, storing samples in a secure area, etc.
(ASTM D4840; ASTM D5172; EPA, 1995).
TABLE 11.1 — Typical topics addressed in standard operating procedures related to
sample receipt, inspection, and tracking
Sample
Receipt:
• Order and details for activities associated with receiving shipments of samples
• Surveying methods
Inspection: • Check physical integrity
• Confirm sample identification
• Identify/manage hazardous materials
• pH measurement instructions
• Use the laboratory information management system (LIMS) to assign laboratory sample IDs
Tracking: • Maintain chain of custody and document sample handling during transfer from the field to
the laboratory, then within the laboratory
• Ensure proper identification of samples throughout process
• Procedures to quickly determine location and status of samples within laboratory
Custodian: • Execution of responsibilities of the sample custodian
Forms/Labels: • Examples of forms and labels used to maintain sample custody and document sample
handling in the laboratory

Sample Receipt, Inspection, and Tracking
11-4
MARLAP JULY 2004
The laboratory needs to establish corrective action guidelines (Section 11.3.3) as part of every
SOP for those instances when a nonconformance is noted. Early recognition of a nonconfor-
mance will allow the project manager and the laboratory more options for a quick resolution.
11.2.3 Laboratory License
Laboratories that handle radioactive materials are required (with few exceptions, such as certain
U.S. Department of Energy National Laboratories and Department of Defense laboratories) to
have a radioactive materials license issued by the NRC or the Agreement State in which the
laboratory operates. The radioactive materials license lists the radionuclides that the laboratory
can possess, handle, and store. In addition, the license limits the total activity of specific
radionuclides that can be in the possession of the laboratory at a given time.
The client must have a copy of the current radioactive materials license for the facility to which
the samples are being shipped. The laboratory staff and the project manager all need to be aware
of the type of radionuclide(s) in the samples and the total number of samples to be sent to the
laboratory. This information should be included in the appropriate plan document and SOW prior
to sampling.
The laboratory is required by the license to maintain a current inventory of certain radioactive
materials present in the facility. The radioactive materials license also requires the laboratory to
develop and maintain a radiation protection plan (NRC, 1998b) that states how radioactive
samples will be received, stored, and disposed. The laboratory will designate an authorized user
(NRC, 1998b) to receive the samples. A Radiation Safety Officer (RSO) may be an authorized
user, but not always. NRC (1998b) gives procedures for the receipt of radioactive samples during
working hours and non-working hours.
11.2.4 Sample Chain-of-Custody
Sample chain-of-custody (COC) is defined as a process whereby a sample is maintained under
physical possession or control during its entire life cycle, that is, from collection to disposal
(ASTM D4840—see Section 10.2.7). The purpose of COC is to ensure the security of the sample
throughout the process. COC procedures dictate the documentation needed to demonstrate that
COC is maintained. When a sample is accepted by the laboratory it is said to be in the physical
possession or control of the laboratory. ASTM D4840 states that a sample is under “custody” if it
is in possession or under control so as to prevent tampering or alteration of its characteristics.
If the samples are transferred under COC, the relinquisher and the receiver should sign the
appropriate parts of the COC form with the date and time of transfer (see Figure 10.1). After
receipt and inspection the samples should be kept in a locked area or in an area with controlled
access.

Sample Receipt, Inspection, and Tracking
11-5
JULY 2004 MARLAP
COC is not a requirement for all samples. COC is most often required when the sample data may
be used as legal evidence. The project plan should state whether COC will be required. The
paperwork received with the samples should also indicate whether COC has been maintained
from the time of collection and must be maintained in the laboratory. If the laboratory has been
informed that COC procedures should be followed, but it appears that appropriate COC
procedures have not been followed (before or after sample receipt at the laboratory) or there are
signs of possible sample tampering when the samples arrive, the project manager should be
contacted. The problem and resolution should be documented. Additional information on COC
can be found in EPA (1985).
11.3 Sample Receipt
Laboratory sample receipt occurs when a package containing samples is accepted, the package
and sample containers are surveyed for external surface radiological contamination and radiation
level, and the physical integrity of the package and samples is checked. Packages include the
shipping parcel that holds the smaller sample containers with the individual samples (see Section
11.3.2 on radiological surveying). Also note that topics and activities covered in Section 11.3
appear in a sequence but, in many cases, these activities are performed simultaneously during
initial receiving activities (i.e., package surveying and observation of its physical integrity).
11.3.1 Package Receipt
Some laboratories require arriving samples to go through a security inspection process at a
central receiving area before routing them to the appropriate laboratory area(s). In addition, if
samples are shipped by an air transport carrier, the shipping containers may be subject to airport
security. In these cases, the container housing the samples may be opened and the samples
inspected and reinserted in an order not consistent with the original packaging. In these cases, it
is imperative that each individual sample container have a permanent identifier either in indelible
ink or as a label affixed on the side of the sample container (see Section 10.2.4, “Container Label
and Sample Identification Code”). Within each shipping container, a separate sample packing
slip or tracking documents that lists the samples (by sample ID) for the container should be
included.
Packages should be accepted only at designated receiving areas. Packages brought to any other
location by a carrier should be redirected to the appropriate receiving area. All packages labeled
RADIOACTIVE I, II, or III require immediate notification of the appropriate authorized user (NRC,
1998b).
A sample packing slip or tracking documents is required and must be presented at the time of
receipt, and the approximate activity of the shipment should be compared to a list of acceptable
quantities. If known, the activity of each radionuclide contained in the shipment must be

Sample Receipt, Inspection, and Tracking
11-6
MARLAP JULY 2004
reviewed relative to the total amount of that radionuclide currently on site to ensure that the
additional activity will not exceed that authorized by the NRC or Agreement State in the
laboratory’s license.
Surveying measures described in Section 11.3.2 may indicate that the samples are more
radioactive than expected and that the radiation license limit may be exceeded. The laboratory
should take extra precautions with these samples, but the survey results should be verified. The
federal, state, or local agency should be contacted immediately when verified license limits are
exceeded. The laboratory must respond quickly to stay in compliance with its license.
If the package is not accepted by the laboratory, the laboratory should follow corrective-action
procedures prescribed in the radiation materials license, the appropriate plan document (if this is
a reasonable possibility for the project), and the laboratory’s SOPs. The project manager should
be contacted about possible disposition of any samples.
11.3.2 Radiological Surveying
In addition to ensuring compliance with the laboratory’s license and verifying estimates of radio-
nuclide activity (Section 11.3.1), the radiological surveying of packages during sample receipt
serves to identify and prevent the spread of external contamination. All packages containing
samples for analysis received by the laboratory should be surveyed for external contamination
using a wipe (sometimes referred to as a “swipe”) and for surface exposure rate using the approp-
riate radiation survey meter. Exceptions may include known materials intended for analysis as:
well-characterized samples, bioassays, or radon and associated decay products in charcoal media
(exceptions should be listed in the laboratory SOP). Surveying of packages and sample
containers received in the laboratory should be conducted in accordance with the laboratory’s
established, documented procedures and the laboratory radiation protection and health and safety
plan. The exterior of the package is surveyed first; if there is no evidence of contamination or that
the laboratory licence would be exceeded, the package is opened up and the sample containers
surveyed individually. These procedures should include the action level and appropriate action as
established by the facility. Personnel performing surveying procedures should be proficient in the
use of portable radiation surveying instruments and knowledgeable in radiological contamination
control procedures. Health and safety considerations are affected by the suspected or known
concentrations of radionuclides in a sample or the total activity of a sample.
Radiation surveying is normally conducted using Geiger-Mueller (GM) detectors, ionization
chambers, micro-R meters, or alpha scintillation probes, as appropriate. The laboratory should
refer to any information they obtained before receipt of samples or with the samples, especially
concerning the identity and concentration of radioactive and chemical constituents in the
samples. Radiological surveying needs to be performed as soon as practical after receipt of the
package, but not later than three hours (10 CFR 20.1906) after the package is received at the
licensee’s facility for packages received during normal working hours. For packages received

Sample Receipt, Inspection, and Tracking
11-7
JULY 2004 MARLAP
outside of normal working hours, the surveying must be performed no later than three hours from
the beginning of the next workday.
Survey the exterior of a labeled package for radioactive contamination (10 CFR 20.1906). If the
package is small (less than 100 cm2), the whole package should be wiped (swiped). Wipes are not
always used, but if there is reason to believe that something has leaked, then wipes should be
used. This survey is performed to detect possible violations of Department of Transportation
(DOT) packaging and labeling regulations, as well as to determine the possible presence of
gamma- and some beta-emitting radionuclides that may require special handling. Also, such a
survey can help to avoid introducing a high-activity sample into a low-activity area. NRC
(1998b) gives the following sample model for opening packages containing radioactive material:
• Wear gloves to prevent hand contamination.
• Visually inspect the package for any sign of damage (e.g. crushed, punctured). If damage is
noted, stop and notify the RSO.
• Check DOT White I, Yellow II, or Yellow III label or packing slip for activity of contents, so
shipment does not exceed license possession limits.
• Monitor the external surfaces of a labeled package according to specifications in Table 8.4,
Section 13.14, Item 10 [of NRC, 1998b].
• Open the outer package (following supplier’s directions if provided) and remove packing
slip. Open inner package to verify contents (compare requisition, packing slip and label on
the bottle or other container). Check integrity of the final source container (e.g., inspecting
for breakage of seals or vials, loss of liquid, discoloration of packaging material, high count
rate on smear). Again check that the shipment does not exceed license possession limits. If
you find anything other than expected, stop and notify the RSO.
• Survey the packing material and packages for contamination before discarding. If contamina-
tion is found, treat them as radioactive waste. If no contamination is found, obliterate the
radiation labels prior to discarding in the regular trash.
• Maintain records of receipt, package survey, and wipe test results.
• Notify the final carrier and by telephone, telegram, mailgram, or facsimile, the administrator
of the appropriate NRC Regional Office listed in 10 CFR 20, Appendix D when removable
radioactive surface contamination exceeds the limits of 10 CFR 71.87(i); or external radiation
levels exceed the limits of 10 CFR 71.47.
In addition to these, laboratories may have additional internal notifications or procedures.

Sample Receipt, Inspection, and Tracking
11-8
MARLAP JULY 2004
11.3.3 Corrective Action
The laboratory’s SOPs should specify corrective actions for routine and non-routine sample
problems, including deficiency in sample volume, leaking samples, and labeling errors. The
appropriate corrective action may require consulting the project manager and other laboratory
personnel. Timely response can allow for a broader range of options and minimize the impact of
the sample problem on the project. The laboratory should document the problem, the cause (if
known), the corrective action taken, and the resolution of each problem that requires corrective
action. The documentation should be included in the project files.
11.4 Sample Inspection
After sample receipt, the next steps are to confirm that the correct sample has been sent, to check
that the appropriate field preservation and processing have been performed, and to identify any
hazardous chemicals.
Documents accompanying the samples should be reviewed upon receipt of the samples at the
laboratory. If the proper paperwork is not present, the project manager should be notified. Data
recorded on the paperwork, such as collection dates, sample descriptions, requested analyses, and
field staff personnel, should be compared to data on the sample containers and other documen-
tation. Any deficiencies or discrepancies should be recorded by the laboratory and reported to the
project manager. The documents can provide data useful for health and safety surveying,
tracking, and handling or processing of critical short-lived radionuclides.
11.4.1 Physical Integrity of Package and Sample Containers
Sample containers should be thoroughly inspected for evidence of sample leakage. Leakage can
result from a loose lid, sample container puncture, or container breakage. Packages suspected to
contain leaking sample containers should be placed in plastic bags. The authorized user or alter-
nate authorized user must be notified immediately for assistance. If leakage has occurred, approp-
riate radiological and chemical contamination controls should be implemented. Sample materials
that have leaked or spilled are normally not suitable for analysis and should be properly disposed.
In all cases, the laboratory’s management and project manager should be notified of leaks,
breakage, spills, and the condition of sample materials that remain in the original containers.
Sample containers that have leaked (from a loose lid or puncture) may still hold enough sample
for the requested analyses, so the laboratory should first determine whether sufficient representa-
tive sample remains. The sample is not usually analyzed if its integrity was compromised or is in
doubt. Unless appropriate information is provided in the project plan or SOW, the project
manager should determine whether or not the sample materials can be used for analysis or if new
samples are required.

Sample Receipt, Inspection, and Tracking
11-9
JULY 2004 MARLAP
Packages, cooler chests, or individual sample containers may arrive at the laboratory bearing
custody seals. These seals provide a means to detect unauthorized tampering. When packages or
samples arrive with custody seals, they should be closely inspected for evidence of tampering.
Custody seals are made from material that cannot be removed without tearing. If a custody seal is
torn or absent, sample tampering may have occurred. This evidence of possible tampering is
generally sufficient to preclude use of the sample for laboratory analyses. The project manager
should be notified of the condition of the custody seal to determine if new samples are needed.
Observations regarding the condition of the custody seals should be recorded according to the
laboratory’s standard procedures.
11.4.2 Sample Identity Confirmation
Visual inspection is the means to confirm that the correct sample has been received. Verifying
the identity of a sample is a simple process where the appearance, sample container label, and
chain-of-custody record or tracking documents are compared. If all three sources of information
identify the same sample, then the sample is ready for the next step. If the sample label indicates
the sample is a liquid and the container is full of soil, this discrepancy would indicate nonconfor-
mance. If the sample label states that there is 1,000 mL of liquid and there only appears to be 200
mL in the container, there may be nonconformance. Visual inspection can be used to:
• Verify identity of samples by matching container label IDs and tracking documents;
• Verify that the samples are as described by matrix and quantity;
• Check the tamper seal (if used);
• Verify field preparation (e.g., filtering, removing extraneous material ), if indicated; and
• Note any changes to samples’ physical characteristics that are different than those in the
tracking documents.
11.4.3 Confirmation of Field Preservation
For those liquid samples requiring acid preservation, pH measurements may be performed on all
or selected representative liquid samples to determine if acid has been added. The temperature of
the sample may also be part of field preservation and the actual measured temperature should be
compared to the specified requirements in the documentation.
11.4.4 Presence of Hazardous Materials
The presence of hazardous materials in a sample typically creates the need for additional health
and safety precautions when handling, preparing, analyzing, and disposing samples. If there is

Sample Receipt, Inspection, and Tracking
11-10
MARLAP JULY 2004
documentation on the presence of non-radiological hazardous constituents, the project manager
should notify the laboratory about the presence of these chemicals. These chemical contaminants
should be evaluated by the laboratory to determine the need for special precautions. The
laboratory can also perform preliminary sample surveying for chemical contaminants using
surveying devices such as a photoionization detector for volatile components. The presence of
suspected or known hazardous materials in a sample should be identified, if possible, during
project planning and documented in the plan document and SOW. Visual inspection can also be
used such as checking the color of the sample (e.g., a green-colored water sample may indicate
the presence of high chromium levels). The presence of suspected or known hazardous materials
determined in the field should be communicated to the laboratory prior to the arrival of samples
and noted on documentation accompanying the samples to the laboratory. If no documentation on
non-radiological hazardous constituents is available, the laboratory should review previous
experience concerning samples from the site to assess the likelihood of receiving samples with
chemical contaminants. The laboratory’s chemical hygiene officer and the project manager
should be notified about the presence of potentially hazardous chemical contaminants.
11.4.5 Corrective Action
Visual inspection can also verify whether field sample preparation was performed as stated in
accompanying documentation. Samples that were not filtered in the field or that reacted with the
preservative to form a precipitate may represent a significant problem to the laboratory. If it
appears that the sample was filtered in the field (e.g., there is no corresponding filter or there are
obviously solid particles in a liquid sample), the liquid generally will be analyzed as originally
specified. Laboratory personnel should check the project plan or SOW to see if the filter and
filtered materials require analyses along with the filtered sample. If it appears that the sample was
not filtered in the field (i.e., there is no corresponding filter or there are obviously solid particles
in a liquid sample), sample documentation should be reviewed to determine if a deviation from
the project plan was documented for the sample. It may be appropriate to filter the sample in the
laboratory. The project manager should be notified immediately to discuss possible options such
as filtering the sample at the laboratory or collecting additional samples.
One example of a corrective action for inspection is, if the pH is out of conformance, it may be
possible to obtain a new sample. If it is not possible or practical to obtain a new sample, it may
be possible to acidify the sample in the laboratory.
Visual inspection can serve to check certain aspects of sample collection. For example, if the
SOP states that a soil sample is supposed to have twigs, grass, leaves, and stones larger than a
certain size removed during sample collection and some of this foreign material is still included
as part of the sample, this discrepancy results in a nonconformance.

Sample Receipt, Inspection, and Tracking
11-11
JULY 2004 MARLAP
11.5 Laboratory Sample Tracking
Sample tracking should be done to ensure that analytical results are reported for the “correct”
sample. Sample tracking is a process by which the location and status of a sample can be
identified and documented. The laboratory is responsible for sample tracking starting with receipt
(at which time a unique laboratory sample ID is assigned), during sample preparation, and after
the performance of analytical procedures until final sample disposition. The process of sample
tracking begins the moment a field worker assigns an identification number (based on the
information provided in the appropriate plan document) and documents how materials are
collected. The way samples are transported from the field to the laboratory should be
documented. The sample receipt procedures and documentation should be consistent when
applicable with 10 CFR Part 20 Subpart J, and the client’s requirements as stated in the
appropriate plan document or statement of work.
11.5.1 Sample Log-In
Laboratory sample IDs should be assigned to each sample in accordance with the laboratory’s
SOP on sample codes. Each sample should receive a unique sample ID by which it can be logged
into the LIMS, scheduled for analysis, tracked, and disposed. Information to be recorded during
sample log-in should include the field sample identification number, laboratory sample ID, date
and time samples were collected and received, reference date for decay calculations, method of
shipment, shipping numbers, condition of samples, requested analyses, number and type of each
sample, quality control requirements, special instructions, and other information relevant to the
analysis (e.g., analytical requirements or MQOs) and tracking of samples at the laboratory.
Laboratory sample tracking is a continuation of field sample tracking. Some of this information
may have been entered into the LIMS during the planning phase.
Documents generated for laboratory sample tracking must be sufficient to verify the sample
identity, that the sample may be reliably located, and that the right sample is analyzed for the
right analyte. The documentation should include sample log-in records, the analysis request form,
names of staff responsible for the work, when procedures are completed, and details concerning
sample disposal. The documentation must conform to the laboratory’s SOPs.
During sample log-in, laboratory quality control (QC) samples may be scheduled for the analyses
requested. The type and frequency of QC samples should be provided by the plan document or
SOW and consistent with the laboratory’s SOPs.
11.5.2 Sample Tracking During Analyses
At this point, samples are introduced into the laboratory’s analytical processing system. The
information gathered during surveying, along with the assigned tracking identification, passes to

Sample Receipt, Inspection, and Tracking
11-12
MARLAP JULY 2004
the laboratory where specific preparation and analyses are performed. The sample may be further
subsampled. Each subsample, along with the original sample, requires tracking to account for all
materials handled and processed in the laboratory.
Each set of samples received by the laboratory should be accompanied by documents identifying
the analytes required for each sample. These documents should be reviewed against the project
plan documents or the SOW, which should identify the analytes, matrices, and analytical
requirements and be part of the project documentation prior to the samples being received by the
laboratory. Laboratory management personnel should be notified of any discrepancies. The
requested analyses should be entered into the laboratory’s tracking system. Typically, only one
sample container of sufficient volume or quantity will be provided for a single or multiple set of
different analyses. Each aliquant removed from the original container may require tracking (and
perhaps a different laboratory sample ID).
Aliquants used during the analytical process can be tracked using analysis laboratory notebooks,
forms, or bench sheets that record laboratory sample IDs, analyte, reference date for decay
correction, aliquant size, and designated quality control samples. Bench sheets are loose-leaf or
bound pages used to record information during laboratory work and are used to assist in sample
tracking. Each sheet is helpful for identifying and processing samples in batches that include
designated QC samples. The bench sheet, along with the laboratory log book, can later be used to
record analytical information for use during the data review process. Bench sheets can also be
used to indicate that sample aliquants were in the custody of authorized personnel during the
analytical process.
After receipt, verification of sample information and requested analyses, and assignment of
laboratory sample IDs, the requested analyses can be scheduled for performance in accordance
with laboratory procedures. Using this system, the laboratory can formulate a work schedule, and
completion dates can be projected.
11.5.3 Storage of Samples
If samples are to be stored and analyzed at a later date, they should be placed in a secure area.
Before storage, any special preservation requirements, such as refrigeration or additives, should
be determined.
The laboratory should keep records of the sample identities and the location of the sample
containers. Unused sample aliquants should be returned to the storage area for final disposition.
In addition, for some samples, depending on the level of radioactivity or hazardous constituents
present, the laboratory should record when the sample was disposed and the location of the
disposal facility. These records are necessary to ensure compliance with the laboratory’s license
for radioactive materials and other environmental regulations.

Sample Receipt, Inspection, and Tracking
11-13
JULY 2004 MARLAP
Areas where samples are stored should be designated and posted as radioactive materials storage
areas. Depending on the activity level of the samples, storage areas may require special posting.
If additional storage space or shielding is needed, arrangements that are consistent with the
license should be made with the authorized user. See Chapter 17 for more information on waste
disposal.
11.6 References
American Society for Testing and Materials (ASTM) D4840. Standard Guide for Sampling
Chain-of-Custody Procedures. West Conshohocken, PA.
American Society for Testing and Materials (ASTM) D5172. Standard Guide for Documenting
the Standard Operating Procedures Used for the Analysis of Water. West Conshohocken,
PA.
U.S. Environmental Protection Agency (EPA). 1985. NEIC Policies and Procedures. National
Enforcement Information Center. EPA-300/9-78DDI-R, June.
U.S. Environmental Protection Agency (EPA). 2001. Guidance for the Preparation of Standard
Operating Procedures (SOPS) for Quality-Related Documents (QA/G-6). EPA/240/B-
01/004, March. Available at: www.epa.gov/quality/qa_docs.html.
U.S. Nuclear Regulatory Commission (NRC). 1998a. Procedures for Receiving and Opening
Packages. 10 CFR Part 20.
U.S. Nuclear Regulatory Commission (NRC). 1998b. Consolidated Guidance About Materials
Licenses, Volume 7. (NRC91). NUREG 1556.
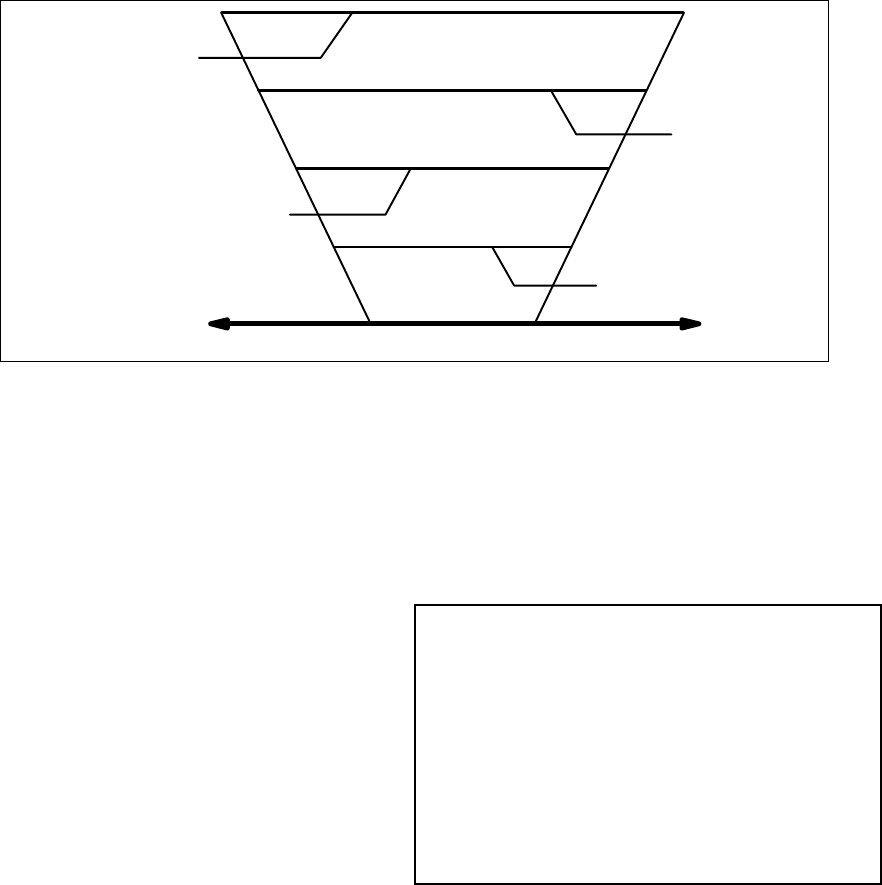
12-1
JULY 2004 MARLAP
Sampling
Concentration, Separation,
Isolation, etc. Steps
Sample
Preparation
Measurement
FIGURE 12.1—Degree of error in laboratory sample preparation relative to other activities
12 LABORATORY SAMPLE PREPARATION
12.1 Introduction
On first impression, sample preparation may seem the most routine aspect of an analytical
protocol. However, it is critical that analysts realize and remember that a measurement is only as
good as the sample preparation that has preceded it. If an aliquant taken for analysis does not
represent the original sample accurately, the results of this analysis are questionable. As a general
rule, the error in sampling and the sample preparation portion of an analytical procedure is
considerably higher than that in the methodology itself, as illustrated in Figure 12.1.
One goal of laboratory sample preparation is to provide, without sample loss, representative
aliquants that are free of laboratory contamination that will be used in the next steps of the
protocol. Samples are prepared in accordance with applicable standard operating procedures
(SOPs) and laboratory SOPs using information provided by field sample preparation (Chapter 10,
Field and Sampling Issues that Affect Laboratory Measurements), sample screening activities,
and objectives given in the appropriate planning documents. The laboratory sample preparation
techniques presented in this chapter include the
physical manipulation of the sample (heating,
screening, grinding, mixing, etc.) up to the
point of dissolution. Steps such as adding
carriers and tracers, followed by wet ashing or
fusion, are discussed in Chapter 13 (Sample
Dissolution) and Chapter 14 (Separation
Techniques).
This chapter presents some general guidance
Contents
12.1 Introduction .......................... 12-1
12.2 General Guidance for Sample Preparation . . 12-2
12.3 Solid Samples ....................... 12-12
12.4 Filters ............................. 12-30
12.5 Wipe Samples ....................... 12-31
12.6 Liquid Samples ...................... 12-32
12.7 Gases .............................. 12-36
12.8 Bioassay ........................... 12-36
12.9 References .......................... 12-37
(After Scwedt, 1997)

Laboratory Sample Preparation
12-2
MARLAP JULY 2004
for sample preparation to avoid sample loss and sample contamination. Due to the physical
nature of the matrix, sample preparation for solids requires the most attention, and therefore is
discussed at great length (Section 12.3). General procedures for preparing solid samples (such as
drying, obtaining a constant weight, grinding, sieving, mixing, and subsampling) are discussed.
Some sample preparation procedures then are presented for typical types of solid samples (e.g.,
soil and sediment, biota, food, etc.). This chapter concludes with specific guidance for preparing
samples of filters (Section 12.4), wipes (Section 12.5), liquids (Section 12.6), gases (Section
12.7), and bioassay (Section 12.8).
12.2 General Guidance for Sample Preparation
Some general considerations during sample preparation are to minimize sample losses and to
prevent contamination. Possible mechanisms for sample loss during preparation steps are
discussed in Section 12.2.1, and the contamination of samples from sources in the laboratory is
discussed in Section 12.2.2. Control of contamination through cleaning labware is important and
described in Section 12.2.3, and laboratory contamination control is discussed in Section 12.2.4.
12.2.1 Potential Sample Losses During Preparation
Materials may be lost from a sample during laboratory preparation. The following sections
discuss the potential types of losses and the methods used to control them. The addition of tracers
or carriers (Section 14.9) is encouraged at the earliest possible point and prior to any sample
preparation step where there might be a loss of analyte. Such preparation steps may include
homogenization or sample heating. The addition of tracers or carriers prior to these steps helps to
account for any analyte loss during sample preparation.
12.2.1.1 Losses as Dust or Particulates
When a sample is dry ashed, a fine residue (ash) is often formed. The small particles in the
residue are resuspended readily by any air flow over the sample. Air flows are generated by
changes in temperature (e.g., opening the furnace while it is hot) or by passing a stream of gas
over the sample during heating to assist in combustion. These losses are minimized by ashing
samples at as low a temperature as possible, gradually increasing and decreasing the temperature
during the ashing process, using a slow gas-flow rate, and never opening the door of a hot
furnace (Section 12.3.1). If single samples are heated in a tube furnace with a flow of gas over
the sample, a plug of glass or quartz wool can be used to collect particulates or an absorption
vessel can be used to collect volatile materials. At a minimum, all ash or finely ground samples
should be covered before they are moved.
Solid samples are often ground to a fine particle size before they are fused or wet ashed to
increase the surface area and speed up the reaction between the sample and the fluxing agent or

Laboratory Sample Preparation
12-3
JULY 2004 MARLAP
acid (see Chapters 13 and 14 on dissolution and separation). Since solid samples are frequently
heterogeneous, a source of error arises from the difference in hardness among the sample
components. The softer materials are converted to smaller particles more rapidly than the harder
ones, and therefore, any loss in the form of dust during the grinding process will alter the
composition of the sample. The finely ground particles are also susceptible to resuspension.
Samples may be moistened carefully with a small amount of water before adding other reagents.
Reagents should be added slowly to prevent losses as spray due to reactions between the sample
and the reagents.
12.2.1.2 Losses Through Volatilization
Some radionuclides are volatile under specific conditions (e.g., heat, grinding, strong oxidizers),
and care should be taken to identify samples requiring analysis for these radionuclides. Special
preparation procedures should be used to prevent the volatilization of the radionuclide of interest.
The loss of volatile elements during heating is minimized by heating without exceeding the
boiling point of the volatile compound. Ashing aids can reduce losses by converting the sample
into less volatile compounds. These reduce losses but can contaminate samples. During the wet
ashing process, losses of volatile elements can be minimized by using a reflux condenser. If the
solution needs to be evaporated, the reflux solution can be collected separately. Volatilization
losses can be prevented when reactions are carried out in a properly constructed sealed vessel.
Table 12.1 lists some commonly analyzed radioisotopes, their volatile chemical form, and the
boiling point of that species at standard pressure. Note that the boiling point may vary depending
upon solution, matrix, etc.
Often the moisture content, and thus, the chemical composition of a solid is altered during
grinding and crushing (Dean, 1995). Decreases in water content are sometimes observed while
grinding solids containing essential water in the form of hydrates, likely as a result of localized
heating. (See Section 12.3.1.2 for a discussion of the types of moisture present in solid samples.)
Moisture loss is also observed when samples containing occluded water are ground and crushed.
The process ruptures some of the cavities, and exposes the water to evaporation. More com-
monly, the grinding process results in an increase in moisture content due to an increase in
surface area available for absorption of atmospheric water. Both of these conditions will affect
the analysis of 3H since 3H is normally present in environmental samples as 3HOH. Analysis for
tritium in soils should avoid these types of sample preparation prior to analysis. Instead, total
water content should be determined separately. Tritium analysis then could be performed by
adding tritium-free (“dead”) water to an original sample aliquant followed by filtration or
distillation.

Laboratory Sample Preparation
12-4
MARLAP JULY 2004
TABLE 12.1 — Examples of volatile radionuclides
Isotope Chemical Form Boiling Point (EC) *
Tritium — 3HH
2O 100E
Carbon — 14CCO2 (produced from CO3
-2 or
oxidation of organic material) -78.5E
Magnesium, calcium, and sodium
carbonates
Natural ores of these metals decompose
between 825E and 1,330E to yield the
respective metal oxides
Iodine — 131I, 129II
2185.2E (sublimes readily)
Cesium — 134Cs, 135Cs,
136Cs, 137Cs
Cs0 (as metal)
Cs2O (as metallic oxide)
(nitrates decompose to oxides)
CsCl (as metallic chloride)
678.4E (melts at 28)
~400E
1290E
Technetium — 99Tc
Tc2O7
TcCl4
TcO2
310.6E
Sublimes above 300E
Sublimes above 900E
[Most Tc compounds sublime above 300E. Tc(VII) is an oxidant that reacts
with organic solvents forming Tc(IV)]
Polonium — 208Po, 209Po,
210Po
Po0
PoCl4
Po(NO3)4 [as a solid]
PoO2
962E
390E
Decomposes to PoO2 above ~150E
Decomposes to Po metal above 500E
Lead — 210Pb, 212Pb, 205Pb
Pb0
PbCl2
Pb(NO3)2
PbO
1744E
950E
Decomposes to oxide above 470E
888E
* The closer the sample preparation temperature is to the boiling point of the compound, the more significant will be
the loss of the material. However, if the objective is to distill the analyte compound from other nonvolatile
materials, then boiling temperature is needed. Sample preparation near the decomposition temperature should be
avoided for those compounds that have a decomposition temperature listed in the table.
Sources: Greenwood and Earnshaw (1984); Windholz (1976); Schwochau (2000); Sneed and Brasted (1958).
Additional elements that volatilize under specific conditions include arsenic, antimony, tin,
polonium, lead, selenium, mercury, germanium, and boron. Chromium can be volatilized in
oxidizing chloride media. Carbon, phosphorus, and silicon may be volatilized as hydrides, and
chromium is volatilized under oxidizing conditions in the presence of chloride. The elements in
Table 12.1 are susceptible to changing oxidation states during sample preparation. Thus, the
pretreatment should be suited to the analyte. The volatility of radionuclides of tritium, carbon,
phosphorus, and sulfur contained in organic or bio-molecules is based on the chemical properties
of those compounds. If such compounds are present, special precautions will be necessary during
sample preparation to avoid the formation of volatile compounds or to capture the volatilized
materials.

Laboratory Sample Preparation
12-5
JULY 2004 MARLAP
12.2.1.3 Losses Due to Reactions Between Sample and Container
Specific elements may be lost from sample materials from interaction with a container. Such
losses may be significant, especially for trace analyses used in radioanalytical work. Adsorption
reactions are discussed in Chapter 10 for glass and plastic containers. Losses due to adsorption
may be minimized by using pretreated glassware with an established hydrated layer. Soaking new
glassware overnight in a dilute nitric or hydrochloric acid solution will provide an adequate
hydrated layer. Glassware that is used on a regular basis will already have established an
adequate hydrated layer. The use of strong acids to maintain a pH less than one also helps
minimize losses from adsorption.
Reactions among analytes and other types of containers are described in Table 12.2. Leaving
platinum crucibles uncovered during dry ashing to heat samples will minimize reduction of
samples to base metals that form alloys with platinum. Porcelain should not be used for analysis
of lead, uranium, and thorium because the oxides of these elements react with porcelain glazes.
Increasing the amount of sample for dry ashing increases the amount of ash, minimizing the loss
of the sample’s trace materials to the container surface.
TABLE 12.2 — Properties of sample container materials
Material Recommended
Use Properties
Borosilicate
Glass
General
applications
Transparent; good thermal properties; fragile; attacked by HF, H3PO4, and
alkaline solutions.
Fused Quartz High temperature
applications
Transparent; excellent thermal properties (up to 1,100 EC); fragile; more
expensive than glass; attacked by HF, H3PO4, and alkaline solutions.
Porcelain High temperature
applications and
pyrosulfate fusion
Used at temperatures up to 1,100 EC; less expensive than quartz; attacked by
HF, H3PO4, and alkaline solutions.
Nickel Molten alkali metal
hydroxide and
Na2O2 fusions
Suitable for use with strongly alkaline solutions. Do not use with HCl.
Platinum High temperature
or corrosive
applications
Virtually unaffected by acids, including HF; dissolves readily in mixtures of
HNO3 and HCl, Cl2 water or Br2 water; adequate resistance to H3PO4; very
expensive; forms alloys with Hg, Pb, Sn, Au, Cu, Si, Zn, Cd, As, Al, Bi, and
Fe, which may be formed under reducing conditions; permeable to H2 at red
heat, which serves as a reducing agent; may react with S, Se, Te, P, As, Sb, B,
and C to damage container; soft and easily deformed, often alloyed with Ir,
Au, or Rh for strength. Do not use with Na2CO3 for fusion.
Zirconium Peroxide fusions Less expensive alternative to platinum; extremely resistant to HCl; resistant to
HNO3; resistant to 50% H2SO4 and 60% H3PO4 up to 100 EC; resistant to
molten NaOH; attacked by molten nitrate and bisulfate; usually available as
Zircaloy—98% Zr, 1.5% Sn, trace Fe, Cr, and Ni. Do not use with KF or HF.

Laboratory Sample Preparation
Material Recommended
Use Properties
12-6
MARLAP JULY 2004
Alumina
(Al2O3)
Acids and alkali
melts at low
temperatures
Resistant to acids and alkali melts; rapidly attacked by bisulfate melts; brittle,
requires thick walled containers.
Polyethylene Sample and reagent
storage
Resistant to many acids; attacked by 16M HNO3 and glacial acetic acid;
begins to soften and lose shape at 60 EC; appreciably porous to Br2, NH3,
H2S, H2O, and HNO3 (aqueous solutions can lose ~1% volume per year when
stored for extended periods of time).
Teflon™Corrosive
applications
Inert to almost all inorganic and organic compounds except F2; porosity to
gases is significantly less than that of polyethylene; safe to use below 250 EC
but decomposes at 300 EC; difficulty in shaping containers results in high
cost; low thermal conductivity (requires long periods of time to heat samples).
Polystyrene Sample and reagent
storage
Only useful for acid solutions < 0.1 M; brittle
The internal surface area of a container, whether used for sample preparation or storage, may
cause loss of analyte. Scratches and abrasions increase the surface area, and their geometry make
loss of analyte likely. Thus, it is important to discard containers that are scratched or abraded on
their interior surfaces.
12.2.2 Contamination from Sources in the Laboratory
Contamination leads to biased data that misrepresent the concentration or presence of
radionuclides in a specific sample. Therefore, laboratory personnel should take appropriate
measures to prevent the contamination of samples. Such precautions are most important when
multiple samples are processed together. Possible sources of contamination include:
• Airborne;
• Reagents (tracers are discussed in Chapter 14);
• Glassware/equipment;
• Facilities; and
• Cross-contamination between high- and low-activity samples.
The laboratory should use techniques that eliminate air particulates or the introduction of any
outside material (such as leaks from aerosols) into samples and that safeguard against using
contaminated glassware or laboratory equipment. Contamination of samples can be controlled by
adhering to established procedures for equipment preparation and decontamination before and
after each sample is prepared. Additionally, the results of blank samples (e.g., sand), which are
run as part of the internal quality assurance program, should be closely monitored, particularly
following the processing of samples with elevated activity.
“Cross-contamination” is the contamination of one sample by another sample that is being

Laboratory Sample Preparation
12-7
JULY 2004 MARLAP
processed concurrently or that was processed prior to the current sample leaving a residue on the
equipment being used. Simply keeping samples covered whenever practical is one technique to
minimize cross-contamination. Another technique is to order the processing of samples
beginning with the lowest contamination samples first. It is not always possible to know the
exact rank of samples, but historical or field screening data may be useful.
Laboratory personnel should be wary of using the same equipment (gloves, tweezers for filters,
contamination control mats, etc.) for multiple samples. Countertops and other preparation areas
should be routinely monitored for contamination.
12.2.2.1 Airborne Contamination
Airborne contamination is most likely to occur when grinding or pulverizing solid samples. Very
small particles (~10 µm) may be produced, suspended in air, and transported in the air before
settling onto a surface. Other sources of potential airborne contamination include samples that
already consist of very small particles, volatile radionuclides (including tritium), or radionuclides
that decay through a gaseous intermediate (i.e., 226Ra decays to 222Rn gas and eventually decays to
210Pb). Therefore, the grinding or pulverizing of solid samples or the handling of samples that
could produce airborne contamination should be carried out under a laboratory hood or ventilated
enclosure designed to prevent dispersal or deposition in the laboratory of contaminated air
particulates. These particles easily can contaminate other samples stored in the area. To prevent
such cross-contamination, other samples should be covered or removed from the area while
potential sources of airborne contamination are being processed.
If contamination from the ambient progeny of 222Rn is a concern, it can be avoided by refraining
from the use of suction filtration in chemical procedures, prefiltering of room air (Lucas, 1967),
and use of radon traps (Lucas, 1963; Sedlet, 1966). The laboratory may have background levels
of radon progeny from natural sources in soil or possibly in its construction materials.
12.2.2.2 Contamination of Reagents
Contamination from radiochemical impurities in reagents is especially troublesome in low-level
work (Wang et al., 1975). Care must be taken in obtaining reagents with the lowest contamina-
tion possible. Due to the ubiquitous nature of uranium and thorium, they and their progeny are
frequently encountered in analytical reagents. For example, Yamamoto et al. (1989) found
significant 226Ra contamination in common barium and calcium reagents. Other problematic
reagents include the rare earths (especially cerium salts), cesium salts that may contain 40K or
87Rb, and potassium salts. Precipitating agents such as tetraphenyl borates and chloroplatinates
may also suffer from contamination problems. In certain chemical procedures, it is necessary to
replace stable carriers of the element of interest with isotopes of another element when it is
difficult to obtain the stable carrier in a contamination-free condition. Devoe (1961) has written
an extensive review article on the radiochemical contamination of analytical reagents.

Laboratory Sample Preparation
12-8
MARLAP JULY 2004
12.2.2.3 Contamination of Glassware and Equipment
Other general considerations in sample preparation include the cleaning of glassware and
equipment (Section 12.2.3). Criteria established in the planning documents or laboratory SOPs
should give guidance on proper care of glassware and equipment (i.e., scratched glassware
increases the likelihood of sample contamination and losses due to larger surface area).
Glassware should be routinely inspected for scratches, cracks, etc., and discarded if damaged.
Blanks and screening should be used to monitor for contamination of glassware.
Whenever possible, the use of new or disposable containers or labware is recommended. For
example, disposable weigh boats can be used to prevent contamination of a balance. Disposable
plastic centrifuge tubes are often less expensive to use than glass tubes that require cleaning after
every use. If non-disposable containers or labware are used, it may be necessary to use new
materials for each new project to reduce the potential for contamination. Blanks can be used to
detect cross-contamination. Periodic rinsing with a dilute solution of nitric acid can aid in
maintaining clean glassware. However, Bernabee et al. (1980) could not easily remove nuclides
sorbed onto the walls of plastic containers by washing with strong mineral acids. They report that
nuclides can be wiped from the walls, showing the importance of the physical action of a brush
to the cleaning process.
12.2.2.4 Contamination of Facilities
In order to avoid contamination of laboratory facilities and possible contamination of samples or
personnel, good laboratory practices must be constantly followed, and the laboratory must be
kept in clean condition. The laboratory should establish and maintain a Laboratory Contamina-
tion Control Program (Section 12.2.4) to avoid contamination of facilities and to deal with it
expeditiously if it occurs. Such a program should address possible samples of varying activity or
characteristics. This minimizes sample cross-contamination through laboratory processing
equipment (e.g. filtering devices, glassware, ovens, etc).
12.2.3 Cleaning of Labware, Glassware, and Equipment
12.2.3.1 Labware and Glassware
Some labware is too expensive to be used only once (e.g., crucibles, Teflon™ beakers, separatory
funnels). Labware that will be used for more than one sample should be subjected to thorough
cleaning between uses. A typical cleaning protocol includes a detergent wash, an acid soak (HCl,
HNO3, or citric acid), and a rinse with deionized or distilled water. As noted in Chapter 10,
scrubbing glassware with a brush aids in removing contaminants.
The Chemical Technician’s Ready Reference Handbook (Shugar and Ballinger, 1996) offers
practical advice on washing and cleaning laboratory glassware:

Laboratory Sample Preparation
12-9
JULY 2004 MARLAP
• Always clean your apparatus immediately after use. It is much easier to clean the glassware
before the residues become dry and hard. If dirty glassware cannot be washed immediately, it
should be left in water to soak.
• Thoroughly rinse all soap or other cleaning agent residue after washing glassware to prevent
possible contamination. If the surface is clean, the water will wet the surface uniformly; if the
glassware is still soiled, the water will stand in droplets.
• Use brushes carefully and be certain that the brush has no exposed sharp metal points that can
scratch the glass. Scratched glassware increases the likelihood of sample contamination and
losses due to larger surface areas. Moreover, scratched glassware is more easily broken,
especially when heated.
Automatic laboratory dishwashers and ultrasound or ultrasonic cleaners are also used in many
radiochemical laboratories. It is important to note that cleaning labware in an automatic
laboratory dishwasher alone may not provide adequate decontamination. Contaminated glassware
may need to be soaked in acid or detergent to ensure complete decontamination. Ultrasonic
cleaning in an immersion tank is an exceptionally thorough process that rapidly and efficiently
cleans the external, as well as the internal, surfaces of glassware or equipment. Ultrasonic
cleaners generate high-frequency sound waves and work on the principle of cavitation, which is
the formation and collapse of submicron bubbles. These bubbles form and collapse about 25,000
times each second with a violent microscopic intensity that produces a scrubbing action (Shugar
and Ballinger, 1996). This action effectively treats every surface of the labware because it is
immersed in the solution and the sound energy penetrates wherever the solution reaches.
EPA (1992) contains a table of glassware cleaning and drying procedures for the various methods
given in the manual (including methods for the analysis of radionuclides in water). The suggested
procedure for cleaning glassware for metals analysis is to wash with detergent, rinse with tap
water, soak for 4 hours in 20 percent (by volume) HNO3 or dilute HNO3 (8 percent)/HCl (17
percent), rinse with reagent water, then air dry. Shugar and Ballinger (1996) suggest treating
acid-washed glassware by soaking it in a solution containing 2 percent NaOH and 1 percent
disodium ethylenediamine tetraacetate for 2 hours, followed by a number of rinses with distilled
water to remove metal contaminants.
More specifically to radionuclides, in their paper discussing the simultaneous determination of
alpha-emitting nuclides in soil, Sill et al. (1974) examined the decontamination of certain
radionuclides from common labware and glassware:
By far the most serious source of contamination is the cell, electrode, and “O” ring used
in the electrodeposition step. Brief rinsing with a strong solution of hydrochloric acid
containing hydrofluoric acid and peroxide at room temperature was totally ineffective in
producing adequate decontamination. Boiling anode and cell with concentrated nitric acid

Laboratory Sample Preparation
12-10
MARLAP JULY 2004
for 10 to 15 minutes removed virtually all of the activity resulting from the analysis of
samples containing less than 500 disintegrations per minute (dpm). When larger
quantities of activity such as the 2.5×10⁴ counts per minute (cpm) used in the material
studies ... had been used, a second boiling with clean acid was generally required.
However, boiling nitric acid precipitates polonium and other procedures have to be used
in its presence. When such high levels of activity have been used, a blank should be run
to ensure that decontamination was adequate before the system is permitted to be used in
the analysis of subsequent low-level samples. Prudence suggests that a separate system
should be reserved for low-level samples and good management exercised over the level
of samples permitted in the low-level system to minimize the number of blanks and full-
length counting times required to determine adequate decontamination.
...Beakers, flasks, and centrifuge tubes in which barium sulfate has been precipitated must
be cleaned by some agent known to dissolve barium sulfate, such as boiling perchloric or
sulfuric acids or boiling alkaline DTPA [diethylenetriaminepentacetate]. This is a
particularly important potential source of contamination, particularly if hot solutions
containing freshly-precipitated barium sulfate are allowed to cool without stirring. Some
barium sulfate post-precipitates after cooling and adheres to the walls so tenaciously that
chemical removal is required. Obviously, the barium sulfate will contain whichever
actinide is present, and will not dissolve even in solutions containing hydrofluoric acid.
Beakers or flasks in which radionuclides have been evaporated to dryness will invariably
contain residual activity which generally requires a pyrosulfate fusion to clean completely
and reliably. Separatory funnels can generally be cleaned adequately by rinsing them with
ethanol and water to remove the organic solvent, and then with hydrochloric-hydrofluoric
acids and water to remove traces of hydrolyzed radionuclides...
However, one should note that current laboratory safety guidelines discourage the use of
perchloric acid (Schilt, 1979).
12.2.3.2 Equipment
In order to avoid cross-contamination, grinders, sieves, mixers and other equipment should be
cleaned before using them for a new sample. Additional cleaning of equipment prior to use is
only necessary if the equipment has not been used for some time. The procedure can be as simple
or as complicated as the analytical objectives warrant as illustrated by Obenhauf et al. (2001). In
some applications, simply wiping down the equipment with ethanol may suffice. Another
practical approach is to brush out the container, and briefly process an expendable portion of the
next sample and discard it. For more thorough cleaning, one may process one or more batches of
pure quartz sand through the piece of solid processing equipment, and then wash it carefully. The
efficacy of the decontamination is determined by monitoring this sand for radionuclide
contamination.

Laboratory Sample Preparation
12-11
JULY 2004 MARLAP
An effective cleaning procedure for most grinding containers is to grind pure quartz sand
together with hot water and detergent, then to rinse and dry the container. This approach
incorporates a safety advantage in that it controls respirable airborne dusts. It is important to note
that grinding containers become more difficult to clean with age because of progressive pitting
and scratching of the grinding surface. Hardened steel containers can also rust, and therefore
should be dried thoroughly after cleaning and stored in a plastic bag containing a desiccating
agent. If rust does occur, the iron oxide coating can be removed by a warm dilute oxalic acid
solution or by abrasive cleaning.
12.2.4 Laboratory Contamination Control Program
The laboratory should establish a general program to prevent the contamination of samples.
Included in the program should be ways to detect contamination from any source during the
sample preparation steps if contamination of samples occurs. The laboratory contamination
control program should also provide the means to correct procedures to eliminate or reduce any
source of contamination. Some general aspects of a control program include:
• Appropriate engineering controls, such as ventilation, shielding, etc., should be in place.
• The laboratory should be kept clean and good laboratory practices should be followed.
Personnel should be well-trained in the safe handling of radioactive materials.
• Counter tops and equipment should be cleaned and decontaminated following spills of
liquids or dispersal of finely powdered solids. Plastic-backed absorbent benchtop coverings
or trays help to contain spills.
• There should be an active health physics program that includes frequent monitoring of
facilities and personnel.
• Wastes should be stored properly and not allowed to accumulate in the laboratory working
area. Satellite accumulation areas should be monitored.
• Personnel should be mindful of the use of proper personnel protection equipment and
practices (e.g., habitual use of lab coats, frequent glove changes, routine hand washing).
• Operations should be segregated according to activity level. Separate equipment and facilities
should be used for elevated and low-level samples whenever possible.
• SOPs describing decontamination and monitoring of labware, glassware, and equipment
should be available.

Laboratory Sample Preparation
12-12
MARLAP JULY 2004
• Concentrated standard stock solutions should be kept isolated from the general laboratory
working areas.
As an example, Kralian et al. (1990) have published the guidelines for effective low-level
contamination control.
12.3 Solid Samples
This section discusses laboratory preparation procedures for solid samples as illustrated in
Figure 12.2. General procedures such as exclusion of unwanted material in the sample; drying,
charring, and ashing of samples; obtaining a constant weight (if required); and homogenization
are discussed first. Examples of preparative procedures for solid samples are then presented.
Solid samples may consist of a wide variety of materials, including:
• Soil and sediment;
• Biota (plants and animals); and
• Other materials (metal, concrete, asphalt, solid waste, etc.).
Before a solid sample is prepared, the specific procedures given in the planning documents
should be reviewed. This review should result in a decision that indicates whether materials other
than those in the intended matrix should be removed, discarded, or analyzed separately. Any
material removed from the sample should be identified, weighed, and documented.
To ensure that a representative aliquant of a sample is analyzed, the sample should first be dried
or ashed and then blended or ground thoroughly (Section 12.3.1.4 and Appendix F, Laboratory
Subsampling). Homogenization should result in a uniform distribution of analytes and particles
throughout the sample. The size of the particles that make up the sample will have a bearing on
the representativeness of each aliquant.
12.3.1 General Procedures
The following sections discuss the general procedures for exclusion of material, heating solid
samples (drying, charring, and ashing), obtaining a constant weight, mechanical manipulation
grinding, sieving, and mixing), and subsampling. Not every step is done for all solid sample
categories (soil/sediment, biota, and other) but are presented here to illustrate the steps that could
be taken during preparation.
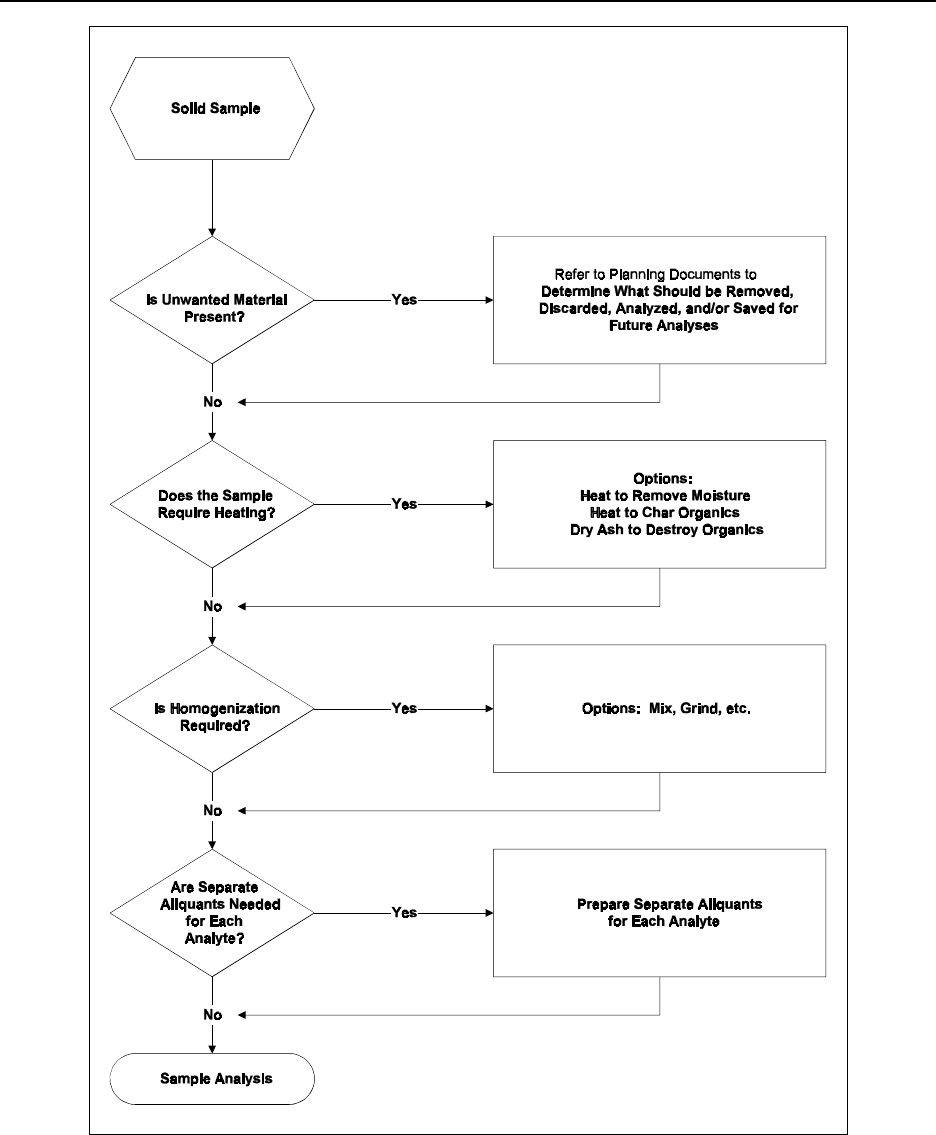
Laboratory Sample Preparation
12-13
JULY 2004 MARLAP
FIGURE 12.2—Laboratory sample preparation flowchart (for solid samples)

Laboratory Sample Preparation
12-14
MARLAP JULY 2004
12.3.1.1 Exclusion of Material
EXCLUSION OF MATERIAL BY SIZE AND COMPOSITION
During solid preparation, some particles may be identified in the sample that are not a part of the
matrix intended for analysis. Examples of such particles are rocks and pebbles or fragments of
glass and plastic. Depending on the specific procedures given in the planning documents on the
constitution of the sample taken, rocks and pebbles can be removed and analyzed separately if
desired. The sample should be weighed before and after any material is removed. Other materials
that are not a part of the required matrix can also be removed and analyzed separately. If analysis
of the material removed is necessary, applicable SOPs should be used to prepare the material for
analysis.
EXCLUSION OF ORGANIC MATERIAL
Leaves, twigs, and grass can easily be collected inadvertently along with samples of soil or
sediment. Because these are not usually intended for analysis, they are often removed and stored
for future analysis, if necessary. The material removed should be identified, if possible, and
weighed.
12.3.1.2 Principles of Heating Techniques for Sample Pretreatment
Applying elevated temperatures during sample preparation is a widely used technique for the
following reasons:
• To remove moisture or evaporate liquids, raise the temperatures to 60 to 110 EC, which will
not significantly alter the physical composition of the sample.
• To prepare a sample containing organic material for subsequent wet ashing or fusion, “char”
the material by heating to medium temperature of 300 to 350 EC (see page 12-19 on
“Charring of Samples”).
• To prepare the sample for subsequent determination of nonvolatile constituents, dry ash at
high temperature of 450 to 750 EC. This may significantly change the physical and chemical
properties of the sample.
Once a decision is made to use elevated temperatures during sample preparation, several
questions should be considered:
• What material should be used for the sample container?
• What should serve as the heat source?

Laboratory Sample Preparation
12-15
JULY 2004 MARLAP
• How quickly should the temperature be raised? (Rate of stepwise temperature increase)
• What is the maximum temperature to which the sample should be exposed?
• How long should the sample be heated at the maximum temperature?
• How quickly should the sample be cooled afterward?
The following sections provide information related to these questions.
Note that there are times during sample preparation when samples should not be heated. For
example, samples to be prepared for 3H or 14C determination should not be heated. Since 3H is
normally present as tritiated water in environmental samples, heating will remove the 3H.
Similarly, 14C is usually present in environmental samples as carbonates or 14CO2 dissolved in
water, and heating will release 14C as a gas. Samples to be analyzed for iodine, mercury,
antimony, or other volatile elements should be heated only under conditions specified in the
planning documents. If both volatile and nonvolatile elements are determined from the same
sample, aliquants of the original sample should be removed for determination of the volatile
elements.
Ovens, furnaces, heat lamps, and hot plates are the traditional means to achieve elevated
temperatures in the laboratory. However, more recently, microwave ovens have added an
additional tool for elevating temperature during sample preparation. Walter et al. (1997) and
Kingston and Jassie (1988) give an overview of the diverse field of microwave-assisted sample
preparation. A dynamic database of research articles related to this topic can be found at the
SamplePrep Web™ at www.sampleprep.duq.edu/index.html. As microwave sample preparation
has developed, numerous standard methods with microwave assistance have been approved by
the American Society for Testing and Materials (ASTM), Association of Official Analytical
Chemists (AOAC), and the U.S. Environmental Protection Agency (EPA). The majority of the
microwave-assisted methods are for acid-dissolution (Chapter 13), but several are for drying
samples.
Alternatives to heating samples include drying them slowly in a vacuum desiccator, air-drying, or
freeze-drying. ASTM D3974 describes three methods of preparing soils, bottom sediments,
suspended sediments, and waterborne materials: (1) freeze-drying; (2) air-drying at room
temperature; and (3) accelerated air-drying.
DRYING SAMPLES
It must be determined at the start of an analytical procedure if the results are to be reported on an
as-received or dry-weight basis. Most analytical results for solid samples should be reported on a

Laboratory Sample Preparation
12-16
MARLAP JULY 2004
dry-weight basis, which denotes material dried at a specified temperature to a constant weight or
corrected through a “moisture” determination made on an aliquant of the sample taken at the
same time as the aliquant taken for sample analysis.
Typically, samples are dried at temperatures of 105 to 110 EC. Sometimes it is difficult to obtain
constant weight at these temperatures, then higher temperatures must carefully be used.
Alternatively, for samples that are extremely heat sensitive and decompose readily, vacuum
desiccation or freeze-drying techniques are applicable.
The presence of water in a sample is a common problem frequently facing the analyst. Water
may be present as a contaminant (i.e., from the atmosphere or from the solution in which the
substance was formed) or be bonded as a chemical compound (i.e., a hydrate). Regardless of its
origin, water plays a role in the composition of the sample. Unfortunately, especially in the case
of solids, water content is variable and depends upon such things as humidity, temperature, and
the state of subdivision. Therefore, the make-up of a sample may change significantly with the
environment and the method of handling.
Traditionally, chemists distinguish several ways in which water is held by a solid (Dean, 1995).
• Essential water is an integral part of the molecular or crystal structure and is present in
stoichiometric quantities, for example, CaC2O4·2H2O.
• Water of constitution is not present as such in the solid, but is formed as a product when the
solid undergoes decomposition, usually as a result of heating. For example, Ca(OH)2 6 CaO
+ H2O.
• Nonessential water is retained by physical forces, is non-stoichiometric, and is not necessary
for the characterization of the chemical composition of the sample.
• Adsorbed water is retained on the surface of solids in contact with a moist environment, and
therefore, is dependent upon the humidity, temperature, and surface area of the solid.
• Sorbed water is encountered with many colloidal substances such as starch, charcoal, zeolite
minerals, and silica gel and may amount to as much as 20 percent or more of the solid.
Sorbed water is held as a condensed phase in the interstices or capillaries of the colloid and it
is greatly dependent upon temperature and humidity.
• Occluded water is entrapped in microscopic pockets spaced irregularly throughout solid
crystals. These cavities frequently occur naturally in minerals and rocks.

Laboratory Sample Preparation
12-17
JULY 2004 MARLAP
• Water also may be present as a solid solution in which the water molecules are distributed
homogeneously throughout the solid. For example, natural glasses may contain several
percent moisture in this form.
Heat Source. There are several choices when heating to dryness. The heat source is often
determined by the amount of time available for drying and the potential for the sample to spatter
or splash during drying. When time is not a primary concern and there is little or no chance of
sample cross-contamination, samples are heated uncovered in a drying oven at the minimum
temperature needed to remove moisture. If time is of concern, samples with high moisture
content usually can be dried or evaporated faster using a hot plate. Heating on a hot plate
significantly increases the chance of cross-contamination by spattering or splashing during
boiling. However, ribbed watch glasses, which cover the sample yet still allow for evaporation,
can be used to minimize cross-contamination in this approach. Samples may also be placed under
a heat lamp. This method reduces the risk of cross-contamination by applying heat to the surface
where vaporization occurs, minimizing splashing during boiling. However, the elevated
temperature is difficult to measure or control, and spattering still may be a problem when the
sample reaches dryness.
Microwave systems may also be used to dry samples. ASTM E1358 and ASTM D4643 use
microwave energy to dry either wood or soil to a constant weight. In a similar fashion, AOAC
Official Methods 985.14 and 985.26 use microwave energy to dry fat from meat or water from
tomato juice. Other examples include Beary (1988), who has compared microwave drying to
conventional techniques using solid standards from the National Institute of Standards and
Technology (coal, clays, limestone, sediment) and foods and food materials (rice and wheat
flour), and Koh (1980) who discusses microwave drying of biological materials.
Container Material. A sample container’s composition typically poses no problem. Borosilicate
glass is generally recommended because it is inexpensive, transparent, reusable, and has good
thermal properties. Platinum, Teflon™ (polytetrafluoroethylene—PTFE), porcelain, or aluminum
foil containers are acceptable and may be preferable in certain situations. Polyethylene and other
plastics of low melting point are only useful in hot water baths or ovens where the temperature is
closely monitored. Polyethylene is affected by heat applied directly to the container. The
properties of several common materials used for sample containers are presented in Table 12.2
(on page 12-5). Note that the sample containers commonly received from the field will be those
suitable for bulk samples rather than containers used during sample preparation. The plan will
identify the type of container material to be used for field activities for samples to be shipped to
the laboratory and the type of container material to be used during the various steps of sample
preparation.
Heating Rate. The heating rate is generally not considered when removing moisture, because the
maximum temperature typically is very low (60 to 110
EC). Samples simply are placed inside the

Laboratory Sample Preparation
12-18
MARLAP JULY 2004
preset oven. Hot plates may be preheated to the desired temperature before heating the sample or
turned on and gradually heated with the sample in place.
Maximum Temperature. The maximum temperature used for drying samples typically is just
above the boiling point of water—105 to 110 EC. Higher temperatures will not dry the samples
significantly faster and may result in accidents or cross-contamination due to uneven heating.
Lower temperatures will not reduce the chance of cross-contamination, but will significantly
increase the drying time. One exception to this rule occurs when the physical form of the sample
needs to be preserved. Many minerals and chemicals have waters of hydration that affect the
structure and may also affect the chemical and physical properties. Samples heated at 60 EC will
retain the waters of hydration in most chemicals and minerals and still provide dry samples in a
reasonable period of time (e.g., 12 to 15 hrs.).
Time. The duration a sample is heated to remove moisture depends on the size of the sample, the
amount of moisture in the sample, the air flow around the sample, and the temperature applied to
the sample. If heating the sample is to provide a constant dry weight, it is more difficult to
determine how long to heat the sample. One convenient approach, especially when working with
numerous samples, is to dry all materials overnight, or occasionally longer. This amount of
heating is usually more than sufficient for drying samples for radiochemical analysis. If time is a
critical factor or if a quantitative assessment of the uncertainty in the sample weight is required
by the planning documents, the sample can be subjected to repeated cycles of drying and
weighing until a series of weights meet the specified requirements (Section 12.3.1.3). For
example, one such requirement might be to obtain three consecutive weights with a standard
deviation less than 5 percent of the mean. While repeated cycles of drying and weighing can
provide a quantitative measure of the uncertainty in the sample weight over time, a single weight
after an overnight drying cycle typically provides a similar qualitative level of confidence with
significantly less working time. Another time-saving step is to use microwave techniques rather
than conventional heating sources during sample preparation (ANL/ACL, 1992; Walter et al.,
1997).
Alternatives to Heating. (1) Vacuum-desiccation. A desiccator is a glass or aluminum container
that is filled with a substance that absorbs water, a “desiccant.” The desiccator provides a dry
atmosphere for objects and substances. Dried materials are stored in desiccators while cooling in
order to minimize the uptake of ambient moisture. The ground-glass or metal rim of the desicca-
tor should be greased lightly with petroleum jelly or silicone grease to improve performance.
Calcium sulfate, sodium hydroxide, potassium hydroxide, and silica gel are a few of the common
desiccants. The desiccant must be renewed frequently to keep it effective. Surface caking is a
signal to renew or replace the desiccant. Some desiccants contain a dye that changes color upon
exhaustion.
Vacuum desiccators are equipped with a side-arm so that they may be connected to a vacuum to
aid in drying. The contents of the sealed evacuated desiccator are maintained in a dry, reduced-

Laboratory Sample Preparation
12-19
JULY 2004 MARLAP
pressure atmosphere. Care must be exercised when applying a vacuum as a rapid pressure
reduction, for high water content samples can result in “boiling” with subsequent sample loss and
potential cross-contamination. The release of vacuum should be accomplished by the slow
introduction of dry or ambient-humidity air into the chamber.
(2) Freeze-drying. Certain substances (i.e., biological materials, pharmaceuticals), which are
extremely heat sensitive and cannot be dried at atmospheric conditions, can be freeze-dried
(Cameron and Murgatroyd, 1996). Freeze-drying, also known as “lyophilization,” is the process
by which substances are frozen, then subjected to high vacuum. Under these conditions, ice
(water) sublimes and other volatile liquids are removed. The non-sublimable material is left
behind in a dry state.
To freeze-dry effectively, dilute solutions are used. In order to increase the surface area, the
material is spread out on the inner surface of the container as it is frozen. Once the solution or
substance to be dried is frozen solid, the primary drying stage begins in which a high vacuum is
applied, and the ice sublimes, desorbing the free ice and some of the bound moisture. During
secondary drying, a prolonged drying stage, the sorbed water that was bound strongly to the
solids is converted to vapor. This can be a slow process, because the remaining bound water has
a lower pressure than the free liquid at the same temperature, making it more difficult to remove.
Secondary drying actually begins during the primary drying phase, but it must be extended after
the total removal of free ice to achieve low levels of residual moisture.
Commercial freeze-drying units are self-contained. Simple units consist of a vacuum pump,
adequate vapor traps, and a receptacle for the material to be dried. More sophisticated models
include refrigeration units to chill the solutions, instrumentation to designate temperature and
pressure, heat and cold controls, and vacuum-release valves. The vacuum pump should be
protected from water with a dry-ice trap and from corrosive gases with chemical gas-washing
towers.
CHARRING OF SAMPLES TO PARTIALLY OXIDIZE ORGANIC MATERIAL
Heating samples at a moderate temperature (300 to 350 EC) is sometimes used as a method of
preparing a sample for subsequent decomposition using wet ashing or fusion techniques. Large
amounts of organic material can react violently or even explosively during decomposition.
Heating the sample to partially oxidize—or “char”—the organic material may limit reactivity
during subsequent preparation.
Heat Source. Heat lamps, muffle furnaces, or hot plates may be used as a heat source for charring
samples. Heat lamps are often selected because they can also be used to dry the sample before
charring. Once dried, the sample can be moved closer to the lamp to raise the temperature and
char the sample (confirmed by visual inspection). Heat lamps also reduce the potential for cross-
contamination by minimizing spattering and splashing. Hot plates can be used similarly to heat

Laboratory Sample Preparation
12-20
MARLAP JULY 2004
lamps. The sample is dried and the temperature is raised to char the sample; however, hot plates
increase the probability of spattering and splashing. Muffle furnaces can be used when the
charring is performed as part of dry ashing instead of part of the drying process. In this case, the
muffle furnace temperature is first raised slowly.
Sample Container. The choice of sample container depends primarily on the next step in the
sample preparation process. When dry ashing or fusing, the sample container will usually be a
platinum or porcelain crucible. Zirconium or nickel crucibles may also be used. If the sample will
be dissolved using wet ashing techniques, the container may be borosilicate glass or a platinum
crucible. Care should be taken to prevent ignition of samples in glass containers. Ignited samples
may burn at temperatures high enough to cause damage to the container and loss of sample.
Polyethylene and Teflon™ generally are not acceptable because of the increased temperature and
risk of melting the container.
Heating Rate. Heating rate becomes a concern when charring samples because of the increased
temperatures. The general rule is to raise the temperature slowly to heat the sample evenly and
prevent large increases in temperature within the sample, which could lead to ignition. Typically,
a rate of 50 to 100 EC per hour is considered appropriate. Samples containing large quantities of
organic material may require slower heating rates.
Maximum Temperature. One of the primary goals of charring a sample is to oxidize the materials
slowly and gently. Gentle oxidation is accomplished by slowly raising the temperature close to
the ignition point and letting the sample smolder. Most organic compounds will char and
decompose in the range of 300 to 350 EC, so this is usually the range of temperatures where
charring takes place. Ignition results in rapid oxidation accompanied by large volumes of
released gases and potential sample loss. This reaction can raise the temperature of the sample to
several hundred degrees above the desired maximum and result in significant losses during off-
gassing. The progress of the reaction can be monitored visually by observing the volume of gas
or smoke released. Thin wisps of smoke are usually allowable; clouds of smoke and flames are
not. Visual inspection is easily accomplished when hot plates or heat lamps are used as heat
sources. Some muffle furnaces are fitted with viewing windows to allow visual inspection. Never
open a muffle furnace just to check on the progress of a reaction. This will cause a sudden
change in temperature, increase the oxygen level and possibly ignite the sample, and disrupt air
currents within the furnace to increase potential sample loss.
Time. The duration required to char a sample depends on the sample size, the amount of organic
material in the sample, the ignition point of the organic material, the temperature of the sample,
and the oxygen supply. Samples usually are heated until smoke begins to appear and allowed to
remain at that temperature until no more smoke is evident. This process is repeated until the
temperature is increased and no more smoke appears. Charring samples may require a significant
amount of time and effort to complete. The duration may be reduced by improving the flow of air
to the sample or mixing HNO3 or nitrate salts with the sample before drying. However, this

Laboratory Sample Preparation
12-21
JULY 2004 MARLAP
approach is recommended only for well-characterized samples, those previously evaluated for the
applicability of this technique, because nitrated organic compounds can oxidize in a violent or
explosive manner.
DRY ASHING SAMPLES
The object of dry ashing is to combust all of the organic material and to prepare the sample for
subsequent treatment using wet ashing or fusion techniques. This procedure involves heating a
sample in an open dish or crucible in air, usually in a muffle furnace to control the temperature
and flow of air. Microwave techniques are also available for dry ashing samples.
Dry ashing is used to determine ash weight as well as nonvolatile constituents. The associated
chemistry is very complex, with oxidizing and reducing conditions varying throughout the
sample and over time. During the combustion process, temperatures in the sample may reach
several hundred degrees above the desired temperature, particularly if there is good air flow at
the beginning of the ashing process (Bock, 1979). Covering samples during heating is not
recommended, especially when using platinum crucibles. The lack of air produces a reducing
atmosphere that results in reduction of metals that alloy with the crucible (Table 12.2 on page 12-
5). This reaction results in loss of sample and potential for contamination of subsequent samples
when using the same crucible.
Heat Source. The traditional heat sources for dry ashing are muffle furnaces or burner flames.
Electronic muffle furnaces are recommended for all heating of platinum crucibles because
burners produce significant levels of hydrogen gas during combustion, and platinum is permeable
to hydrogen gas at elevated temperatures. Hydrogen gas acts as a reducing agent that can result in
trace metals becoming alloyed to the platinum.
Microwave ovens have also proved to be quick and efficient when dry ashing plant tissue
samples, with results comparable to conventional resistance muffle furnaces (Zhang and Dotson,
1998). The microwave units are fitted with ashing blocks (a ceramic insert) that absorb
microwave energy and quickly heats to high temperatures. This, in combination with the
microwave energy absorbed directly by the sample, allows for rapid dry ashing of most materials.
The units are designed for increased air flow that further accelerates combustion of the samples.
Sample Container. Platinum, zirconium, or porcelain are usually used to form crucibles for dry
ashing. Nickel may also be appropriate for some applications (Table 12.2). Platinum generally is
recommended when available and is essentially inert and virtually unaffected by most acids.
Zirconium and porcelain crucibles are resistant to most acids, are more resistant to HCl, and are
significantly less expensive than platinum. Glass and plastic containers should not be used for
dry ashing because the elevated temperatures exceed the melting point of these materials.

Laboratory Sample Preparation
12-22
MARLAP JULY 2004
Crucibles fabricated from ceramic, graphite, and platinum can be used in microwave applica-
tions. Quartz fiber crucibles can accelerate the ashing process since this material rapidly cools
and allows many sample types to be reweighed in 60 seconds or less after removal from the
microwave unit.
Heating Rate. Samples should be dried before dry ashing and placed in an unheated furnace;
then, the furnace temperature is gradually increased. The sample should be spread as thinly and
evenly as possible on the bottom of the container to allow for its equal heating. To ensure even
heating of the sample and to minimize the chance of ignition, the temperature of the furnace is
raised slowly. If the sample was previously charred, a rate of approximately 100 EC per hour is
typical. This rate is slow enough that small amounts of organic material or water can be removed
from the sample without violent reactions. If the sample is not charred and contains a significant
amount of organic material, a slower rate may be necessary to control the oxidation of organic
material.
Maximum Temperature. The maximum temperature is determined by the sample matrix and the
volatility of the elements to be analyzed. Generally, the temperature should be as low as possible
to reduce the loss of volatile compounds, but high enough to ensure complete combustion of the
sample. A minimum temperature of 450 EC is often used to ensure complete combustion (Bock,
1979). The upper limit for dry ashing is usually determined by the sample container and the
elements being analyzed and is generally considered to be 750 EC, but sample-specific conditions
may use temperatures up to 1,100 EC. However, in practice, some components that are normally
considered to be nonvolatile may be lost at temperatures above 650 EC (Bock, 1979). Ashing
aids may be added to samples to accelerate oxidation, prevent volatilization of specific elements,
and prevent reaction between the sample and the container. Examples include adding nitrate
before drying to assist oxidation and loosen the ash during combustion, adding sulfate to prevent
volatilization of chlorides (e.g., PbCl2, CdCl2, NaCl) by converting them to the higher boiling
sulfates, and adding alkaline earth hydroxides or carbonates to prevent losses of anions (e.g., Cl-,
As-3, P-3, B). Table 12.3 lists dry ashing procedures using a platinum container material for
several elements commonly determined by radiochemical techniques.
Time. The duration required to completely combust a sample depends on the size of the sample,
the chemical and physical form of the sample before and after ashing, and the maximum
temperature required to ash the sample. In many cases, it is convenient to place the sample in an
unheated furnace and gradually raise the temperature during the day until the maximum
temperature is achieved. The furnace is then left at the maximum temperature overnight (12
hours). The furnace is allowed to cool during the next day, and samples are removed from a cold
oven. This procedure helps prevent sudden changes in temperature that could cause air currents
that may potentially disturb the ash. An alternative is to leave the sample at maximum
temperature for 24 hours and let the sample cool in the oven the second night to ensure complete
combustion of the sample.

Laboratory Sample Preparation
12-23
JULY 2004 MARLAP
The elapsed time for dry ashing samples can be significant (greater than 36 hours), but the actual
time required by laboratory personnel is minimal.
TABLE 12.3 — Examples of dry-ashing temperatures (platinum container)
Element Temperature/Matrix
Cobalt 450–600 EC for biological material; some losses reported due to reactions with crucible; increased
volume of sample increases volume of ash and limits loss of sample.
Cesium 400–450 EC for food and biological material; CsCl and CsNO3 begin to volatilize when held at
temperatures above 500 EC for any length of time.
Iodine 450–500 EC with an alkaline ashing aid to prevent volatilization; losses reported for temperatures as
low as 450 EC even with alkaline ashing aids added; total volatilization >600 EC.
Lead 450–500 EC acceptable for most samples; bone or coal (lead phosphate) may be ashed as high as
900 EC without significant losses; PbO2 reacts with silica in porcelain glaze at low temperatures;
PbCl2 is relatively volatile and nitrate or sulfate ashing aids have been used to good effect.
Plutonium 450 EC with nitric acid ashing aid for biological material, 550 EC for dust on air filters, 700 EC for
soil; high temperature leads to adsorption onto carbon particles and incomplete dissolution of ash.
Strontium 450–550 EC for plants, 600 EC for meat, 700 EC for milk and bone.
Technetium 725–750 EC for plants treated with ammonia.
Thorium 750 EC for bone.
Uranium 600 EC for coal, 750 EC for biological material; uranium reacts with porcelain glaze resulting in
sample losses.
Source: Bock (1979).
(Note that reducing conditions for platinum containers are given in Table 12.2)
12.3.1.3 Obtaining a Constant Weight
If required, constant weight is obtained by subjecting a sample to repetitive cycles of drying and
weighing until a series of weights meets specified requirements. Project-specific planning
documents or laboratory SOPs should define the acceptance criteria. For example, in Greenberg
et al. (1992), solids are repetitively heated for an hour, then weighed until successive weighings
agree within 4 percent of the mass or within 0.5 mg. In the ASTM guidelines for the preparation
of biological samples (ASTM D4638), an accurately weighed sample (1 to 2 g ± 0.1 mg, 5 to 10
g ± 1 mg, >10 g ± 10 mg) is heated for 2 hours, cooled in a desiccator, and weighed. Drying is
repeated at hourly intervals to attain a constant weight within the same accuracy. The consistent
drying of materials from a large sample set may require a qualitative evaluation of change in the
sample composition. If a qualitative change occurs the drying method may need to be checked for
completeness. One way to do this would be to perform routine dry-to-constant-weight
evaluations on separate samples.
Laboratory conditions and handling of the samples by the analyst during sample weight
determinations can increase the uncertainty of the final sample mass.

Laboratory Sample Preparation
12-24
MARLAP JULY 2004
12.3.1.4 Subsampling
Laboratories routinely receive larger samples than required for analysis. The challenge then
becomes to prepare a sample that is representative and large enough for analysis, but not so large
as to cause needless work in its final preparation. Generally, a raw sample first is crushed to a
reasonable particle size and a portion of the crushed material is taken for analysis. This step may
be repeated with intermittent sieving of the material until an appropriate sample size is obtained.
Then, this final portion is crushed to a size that minimizes sampling error and is fine enough for
the dissolution method (Dean 1995; Pitard, 1993).
French geologist Pierre Gy (1992) has developed a theory of particulate sampling that is
applicable to subsampling in the laboratory. Appendix F summarizes important aspects of the
theory and includes applications to radiochemistry. Some of the important points to remember
include the following:
• For most practical purposes, a subsample is guaranteed to be unbiased only if every particle
in the sample has the same probability of being selected for the subsample.
• The weight of the subsample should be many times greater than the weight of the largest
particle in the sample.
• The variance associated with subsampling may be reduced either by increasing the size of the
subsample or by reducing the particle sizes before subsampling.
• Grouping and segregation of particles tends to increase the subsampling variance.
• Grouping and segregation can be reduced by increment sampling, splitting, or mixing.
Increment sampling is a technique in which the subsample is formed from a number of smaller
portions selected from the sample. A subsample formed from many small increments will
generally be more representative than a subsample formed from only one increment. The more
increments the better. An example of increment sampling is the one-dimensional “Japanese slab-
cake” method (Appendix F, Laboratory Subsampling).
Splitting is a technique in which the sample is divided into a large number of equal-sized
portions and several portions are then recombined to form the subsample. Splitting may be
performed by a manual procedure, such as fractional shoveling, or by a mechanical device, such
as a riffle splitter. A riffle splitter consists of a series of chutes directed alternately to opposite
sides. The alternating chutes divide the sample into many portions, which are then recombined
into two. The riffle may be used repeatedly until the desired sample size is obtained. Riffle
splitters are normally used with free-flowing materials such as screened soils.

Laboratory Sample Preparation
12-25
JULY 2004 MARLAP
Another traditional method for splitting is coning and quartering (Appendix F). Gy (1992) and
Pitard (1993) do not recommend coning and quartering because with similar tools and effort, one
can do fractional shoveling, which is a more reliable method.
If proper techniques and tools are used and adequate care is taken, samples of the sizes typically
encountered in the laboratory can be mixed effectively. However, the effects of mixing tend to be
short-lived because of the constant influence of gravity. Heterogeneous material may begin to
segregate immediately after mixing.
The method and duration needed to mix a sample adequately depends on the volume and type of
material to be mixed. Small volumes can be mixed by shaking for a relatively short time. Large
volumes may require hours. Pitard (1993) describes dynamic and discontinuous processes for
mixing samples including:
• Mechanical mixing of test tube samples is useful for small sample size and can be performed
on many samples at once. Some examples are a pipette shaker with a motor-activated,
rocking controlled motion; a nutator mixer with the test tubes fixed to an oscillating plate;
and a tube rotator where tubes are attached to a rotating plate mounted at an angle.
• Mechanical mixing of closed containers by rotating about a tumbling axis. A turbula
mechanical mixer is an example.
• Magnetic stirrers are commonly used to homogenize the contents of an open beaker.
• V-blenders are used to homogenize samples from several hundred grams to kilogram size.
• Stirrers coupled with propellers or paddles are used to mix large volumes of slurries or pulp.
• Sheet mixing or rolling technique, in which the sample is placed on a sheet of paper, cloth, or
other material, and the opposite corners are held while rolling the sample (see ASTM C702
for aggregates).
• Ball and rod mills homogenize as well as grind the sample (see ASTM C999 for soils).
When dealing with solid samples, it is often necessary to grind the sample to reduce the particle
size in order to ensure homogeneity and to facilitate attack by reagents. Obenauf et al. (2001) is
an excellent resource for information regarding grinding and blending.
For hand grinding, boron carbide mortars and pestles are recommended. For samples that can be
pulverized by impact at room temperature, a shatterbox, a mixer-mill, or a Wig-L-Bug™ is
appropriate, depending on the sample size. For brittle materials—such as wool, paper, dried
plants, wood, and soft rocks—which require shearing as well as impact, a hammer-cutter mill is

Laboratory Sample Preparation
12-26
MARLAP JULY 2004
warranted. For flexible or heat-sensitive samples such as polymers, cereal grains, and biological
materials, cryogenic grinding is necessary. Methods are described below:
• A shatterbox spins the sample, a puck, and a ring inside a dish-shaped grinding container in a
tight, high-speed horizontal circle. Within two to five minutes, approximately 100 grams of
brittle material can be reduced to less than 200 mesh. Shatterboxes are used typically to grind
soils, cement mix, rocks, slags, ceramics, and ores. They have also been used for hundreds of
other materials including dried marsh-grass, pharmaceuticals, fertilizers, and pesticides.
When used in a cryogenic atmosphere, this approach can be used to grind rubber, polymers,
bone, hair, and tissue.
• A mixer-mill grinds samples by placing them in a container along with one or more grinding
elements and imparting motion to the container. The containers are usually cylindrical, and
the grinding elements are ordinarily balls, but may be rods, cylinders or other shapes. As the
container is rolled, swung, vibrated or shaken, the inertia of the grinding elements causes
them to move independently into each other and against the container wall, thus, grinding the
sample. Mixer-mills are available for a wide-range of sample sizes. The length of time
necessary to grind a sample depends on the hardness of the material and the fineness desired
in the final product.
• The Wig-L-Bug™ is an example of a laboratory mill for pulverizing and blending very small
samples, typically in the range of 0.1 to 1 mL.
• A hammer-cutter mill uses high-speed revolving hammers and a serrated grinding chamber
lining to combine both shearing and impact. A slide at the bottom of the hopper feeds small
portions of the sample (up to 100 mL) into the grinding chamber. After the sample is
adequately pulverized, it passes through a perforated-steel screen at the bottom of the
grinding chamber and is then collected. With this approach, dried plants and roots, soils, coal
and peat, chemicals, and soft rocks all grind quickly with little sample loss.
• Many analytical samples—such as polymers, rubber, and tissues that are too flexible or
susceptible to degradation to be impact-ground at room temperature—can be embrittled by
chilling and then pulverized. Samples can be frozen and placed in a traditional grinder, or
alternatively, a freezer mill can be used. In a freezer mill, the grinding vial is immersed in
liquid nitrogen, and an alternating magnetic field shuttles a steel impactor against the ends of
the vial to pulverize the brittle material. Researchers at Los Alamos National Laboratory
developed a method of cryogenic grinding of samples to homogenize them and allow the
acquisition of a representative aliquant of the materials (LANL, 1996).
When samples agglomerate or “cake” during grinding, further particle size reduction is
suppressed. Caking can be caused from moisture, heat, static charge accumulation, the fusing of

Laboratory Sample Preparation
12-27
JULY 2004 MARLAP
particles under pressure, etc. When it occurs, caking is a serious challenge. There are two main
approaches to this problem, slurry grinding and dry grinding.
• In slurry grinding, particles are suspended in solution during grinding. Water, alcohol, or
other liquids are added to the sample before grinding, and have to be removed afterwards.
Slurry grinding is a fairly reliable way of grinding a sample to micron-sized particles, but it is
sloppy and time-consuming.
• Dry grinding is often simpler and quicker, but requires careful matching of the technique to
the sample. If caking is due to moisture, as in many soils or cements, the sample should be
dried before grinding. Grinding aids such as lubricants, antistatic agents, abrasives, and
binding agents can also be used. Examples of grinding aids include dry soap or detergent (a
lubricant), graphite (an antistatic agent as well as a lubricant), polyvinyl alcohol, phenyl
acetate, propylene glycol, and aspirin. For example, propylene glycol (one drop for up to ten
grams of sample) is used for laboratory fine grinding of Portland cement and many minerals.
Grinding efficiency can be improved through intermittent screening of the material. The ground
sample is placed upon a wire or cloth sieve that passes particles of the desired size. The residual
particles are reground and this process is repeated until the entire sample passes through the
screen. Sieves with large openings can be used in the initial stages of sample preparation to
remove unwanted large rocks, sticks, etc.
The analysis of solid samples from the environment contaminated with radioactivity represents a
special challenge. In most cases, the radioactive materials will be from different sources than the
solid sample. Thus the contamination of solid samples with anthropogenic sources of radionuc-
lides will result in a non-uniform particle mix as well as a non-uniform size distribution. This
further emphasizes the need for unbiased subsampling procedures.
12.3.2 Soil/Sediment Samples
For many studies, the majority of the solid samples will be soil/sediment samples or samples that
contain some soil. The definition of soil is given in Chapter 10 (Field and Sampling Issues that
Affect Laboratory Measurements). Size is used to distinguish between soils (consisting of sands,
silts, and clays) and gravels.
The procedures to be followed to process a raw soil sample to obtain a representative subsample
for analysis depend, to some extent, upon the size of the sample, the amount of processing
already undertaken in the field, and more importantly, the radionuclide of interest and the nature
of the contamination. Global fallout is relatively homogeneous in particle size and distribution in
the sample, and therefore, standard preparation procedures should be adequate for this
application. However, when sampling accidental or operational releases, the standard procedures
may be inadequate. Transuranic elements, especially plutonium, are notorious for being present

Laboratory Sample Preparation
12-28
MARLAP JULY 2004
as “hot-spots” ions (Eberhardt and Gilbert, 1980; Sill, 1975) and great care must be employed so
that the subsample taken for analysis accurately represents the total sample. This will depend on
the size and the degree of homogeneity. Multiple subsampling, larger aliquants, and multiple
analysis may be the only techniques available to adequately define the content of radionuclides in
heterogeneous samples. Therefore, it is imperative that the analyst choose a preparation approach
appropriate to the nature of the sample.
12.3.2.1 Soils
ASTM C999 provides guidance on the preparation of a homogenous soil sample from
composited core samples. The soil samples are dried at 110 EC until at constant weight, ground
and mixed in a ball mill, and processed through a U.S. Series No. 35 (500-µm or 32-mesh) sieve.
This method is intended to produce a homogeneous sample from which a relatively small
aliquant (10 g) may be drawn for radiochemical analyses.
A similar procedure for homogenizing soil samples is given in HASL-300 (DOE, 1997).
Unwanted material (e.g, vegetation, large rocks) is removed as warranted, and the sample is
dried. If the sample contains small rocks or pebbles, the entire soil sample is crushed to 6.35 mm,
or the entire sample is sieved through a 12.7-mm screen. The sample is blended, then reduced in
size by quartering. This subsample of soil is processed through a grinder, ball mill, sieve, or
pulverizer until the soil is reduced to <1.3 mm (15 mesh equivalent).
Sill et al. (1974) describe a procedure where they dried raw soil samples for two to three hours at
120 EC and then ground the cooled sample lightly in a mortar and pestle. All rocks larger than ¼
inch (6.25 mm) were removed. The sample was charred at 400 EC for two to three hours, cooled
and passed though a No. 35 U.S. standard sieve, and then blended prior to aliquanting (10.0 g are
taken for the analysis).
12.3.2.2 Sediments
ASTM D3976 is a standard practice for the preparation of sediment samples for chemical
analysis. It describes the preparation of test samples collected from streams, rivers, ponds, lakes,
and oceans. The procedures are applicable to the determination of volatile, semivolatile, and
nonvolatile constituents of sediments. Samples are first screened to remove foreign objects and
then mixed by stirring. The solids are allowed to settle and the supernatant liquid is decanted. To
minimize stratification effects due to differential rates of settling, the sample is mixed again
before aliquanting for drying and analysis.
12.3.3 Biota Samples
ASTM D4638 is a standard guide for the preparation of biological samples for inorganic
chemical analysis. It gives procedures for the preparation of test samples of plankton, mollusks,

Laboratory Sample Preparation
12-29
JULY 2004 MARLAP
fish, and plants. The preparation techniques are applicable for the determination of volatile,
semivolatile, and nonvolatile inorganic compounds in biological materials. However, different
preparation steps are involved for the three classes of inorganic compounds. In the case of
nonvolatile compounds, the first step is to remove foreign objects and most of the occluded
water. For large samples such as fish, samples are homogenized using a tissue disrupter, blender,
or equivalent, and a moisture determination is performed on a one to two gram aliquant. The
samples then are dried by heating in an oven, by dessication, by air drying, by freeze drying, or
by low-temperature drying using an infrared lamp, hot plate, or a low setting on a muffle furnace.
Finally, the samples are dry ashed.
12.3.3.1 Food
The International Atomic Energy Agency offers a guidebook for the measurement of radionuc-
lides in food and the environment, which includes guidance on sample preparation (IAEA, 1989).
Additionally, methods are presented in HASL-300 (DOE, 1997) for the preparation of milk,
vegetables, composite diets, etc. (Table 12.4). These methods involve dry ashing samples
containing non-volatile radionuclides. Initially the samples are completely dried at 125 EC, and
then the temperature is raised slowly over an eight-hour
period to 500 EC. As the samples are heated, they will
reach ignition temperature. It is important to pass
through this ignition temperature range slowly without
sample ignition. With careful adjustment of the ashing
temperature in a stepwise fashion over this eight-hour
interval, sample ignition can be avoided. Table 12.4
lists the ignition temperature ranges for various foods.
Once through the ignition temperature range, the
temperature can be raised more rapidly to 500 EC. The
samples can then be ashed at 500 EC for 16 hours.
Ignition sometimes cannot be avoided if the sample
type contains large amounts of fat. In addition, glowing
of carbonaceous material due to oxidation of carbon
will be evident during the ashing process. If only a
portion of ash is to be used for analysis, it is ground
and sieved prior to aliquanting.
12.3.3.2 Vegetation
There are several DOE site references that contain
examples of sample preparation for vegetation. Los
Alamos National Laboratory (LANL, 1997) recently
grew pinto beans, sweet corn, and zucchini squash in a
field experiment at a site that contained observable
TABLE 12.4 — Preliminary ashing
temperature for food samples
(Method Sr-02-RC, HASL-300 [DOE, 1997])
Material Temp ( EC)
Eggs ............... 150-250
Meat ............... Burning
Fish................ Burning
Fruit (fresh) ......... 175-325
Fruit (canned)........ 175-325
Milk (dry) ........... —
Milk (wet) .......... 175-325
Buttermilk (dry) ...... —
Vegetables (fresh) .... 175-225
Vegetables (canned) . . . 175-250
Root vegetables ...... 200-325
Grass .............. 225-250
Flour............... Burning
Dry beans ........... 175-250
Fruit juices .......... 175-225
Grains.............. 225-325
Macaroni ........... 225-325
Bread .............. 225-325

Laboratory Sample Preparation
12-30
MARLAP JULY 2004
levels of surface gross gamma radioactivity within Los Alamos Canyon. Washed edible and
nonedible crop tissues (as well as the soil) were prepared for analysis for various radionuclides.
Brookhaven National Laboratory has also evaluated the effect of its operation on the local
environment. Their site environmental report (DOE, 1995) gives sample preparation steps for
radionuclide analysis of vegetation and fauna (along with ambient air, soil, sewage effluent,
surface water, and groundwater). HASL-300 (DOE, 1997) also describes sample preparation
techniques for vegetation samples for a variety of radionuclides.
12.3.3.3 Bone and Tissue
Bone and tissue samples can be dry ashed in a muffle furnace (DOE, 1997; Fisenne, 1994;
Fisenne et al.,1980), wet ashed with nitric acid and peroxide (Fisenne and Perry, 1978) or
alternately dry ashed and wet ashed with nitric acid until all visible signs of carbonaceous
material has disappeared (McInroy et al., 1985).
12.3.4 Other Samples
The category “other” includes such matrices as concrete, asphalt, coal, plastic, etc. The sample
preparation procedures applied to soils are generally applicable for the “other” category, except
for more aggressive grinding and blending in the initial step. For example, items such as plastic
or rubber that are too flexible to be impact-ground at room temperature must be ground
cryogenically. They are embrittled by chilling and then pulverized. ASTM C114 describes the
sample preparation steps for the chemical analysis of hydraulic cement, whereas ASTM C702
describes the sample preparation of aggregate samples, and is also applicable to lime and
limestone products as noted in ASTM C50. Additionally, ASTM D2013 describes the
preparation of coal samples for analysis.
12.4 Filters
Filters are used to collect analytes of interest from large volumes of liquids or gases. The exact
form of the filter depends on the media (e.g., air, aqueous liquid, nonaqueous liquid), the analyte
matrix (e.g., sediment, suspended particulates, radon gas), and the objectives of the project (e.g.,
volume of sample passing through the filter, flow rate through the filter, detection limits, etc. (see
Section 10.3.2, “Filtration”).
Filter samples from liquids usually consist of the filter with the associated solid material. For
samples with a large amount of sediment, the solid material may be removed from the filter and
analyzed as a solid. When there is a relatively small amount of solid material, the filter may be
considered as part of the sample for analytical purposes. When large volumes of liquid are
processed at high flow rates, filter cartridges often are used. Typically, the cartridge case is not
considered part of the sample, and laboratory sample preparation includes removing the filter

Laboratory Sample Preparation
12-31
JULY 2004 MARLAP
material and sample from the cartridge case. Any special handling instructions should be
included as SOPs in the planning documents.
Air filters may be particulate filters, which are prepared in the same manner as liquid filters, or
they may be cartridges of absorbent material. Filters that absorb materials are typically designed
for a specific analysis. For example, activated charcoal cartridges are often used to collect
samples of iodine or radon. Silver zeolite cartridges generally are used for sampling iodine
isotopes. These cartridges are often designed to be analyzed intact, so no special sample
preparation is needed. If the cartridges need to be disassembled for analysis, a special SOP for
preparing these samples is usually required.
Homogenization is rarely an issue when preparing filter samples. Typically, the entire filter is
digested and analyzed. However, obtaining a representative sample of a filter does become an
issue when the entire filter is not analyzed. The planning document should give the details of
sample preparation for portions of a filter (e.g., sample size reduction through quartering). Steps
such as using tweezers for holding filters and using individual sample bags should be taken to
prevent the loss of material collected on the filter during handling and processing.
12.5 Wipe Samples
Wipe samples (also referred to as “swipes” or “smears”) are collected to indicate the presence
of removable surface contamination. The removable contamination is transferred from the
surface to the wipe material. The type of filter (paper, membrane, glass fiber, adhesive backing,
etc.) and counting method influence the preparation requirements (Section 10.6, “Wipe Sampling
for Assessing Surface Contamination”).
Wipes are usually counted directly without additional sample preparation. Wipe samples can be
counted directly with a gas flow proportional counter for alpha or beta radioactivity. For gamma-
emitting radionuclides, the wipe also can be counted directly. For very low-energy emissions,
wipe samples are commonly counted by liquid scintillation (see Chapter 15, Quantification of
Radionuclides).
When destructive analysis is required, the techniques in Chapter 13, Sample Dissolution, and
Chapter 14 Separation Techniques, should be followed. Some wipes have adhesive backing that
can complicate digestion and require more aggressive treatment with acid to dissolve. When
counting with liquid scintillation, the compatibility of the processed wipe with the cocktail is an
important consideration.

Laboratory Sample Preparation
12-32
MARLAP JULY 2004
12.6 Liquid Samples
Liquid samples are commonly classified as aqueous, nonaqueous, and mixtures. Aqueous liquids
are most often surface water, groundwater, drinking water, precipitation, effluent, or runoff.
Nonaqueous liquids may include solvents, oils, or other organic liquids. Mixtures may be
combinations of aqueous and nonaqueous liquids, but may include solid material mixed with
aqueous or nonaqueous liquids or both.
Preliminary sample measurements (e.g., conductivity, turbidity) may be performed to provide
information about the sample and to confirm field processing (see measurement of pH to confirm
field preservation in Chapter 11). These measurements are especially useful when there is no
prior historical information available from the sample collection site. In addition, this
information can also be helpful in the performance of certain radiochemical analyses. In many
cases, the results of preliminary measurements can be used to determine the quantity of sample to
be used for a specific analysis.
These preliminary measurements typically require little or no sample preparation. However, they
should be performed on a separate portion of the sample. This avoids any unexpected degrada-
tion of the sample parameters during transport and storage, and allows laboratory analysts to
focus on radiochemical analyses. Using a separate aliquant also helps to prevent cross-
contamination of samples sent to the laboratory or loss of radionuclides through interaction with
field-measuring equipment.
12.6.1 Conductivity
In radiochemistry, conductivity measurements typically are used as a surrogate to estimate
dissolved solids content for gross-alpha and gross-beta measurements. Because the preservation
of samples with acid prevents the measurement of conductivity, the recommendation is to
perform the QC checks for conductivity in the field when the original measurements are
performed. If the sample is not preserved in the field, the measurement can be done in the
laboratory.
ASTM D1125 is the standard test method for determining the electrical conductivity of water.
The method is used for the measurement of ionic constituents, including dissolved electrolytes in
natural and treated water.
12.6.2 Turbidity
The presence of dissolved or suspended solids, liquids, or gases causes turbidity in water.
Measurement of turbidity provides a means to determine if removal of suspended matter is
necessary in order to meet the specifications for liquid samples as given in the plan document.

Laboratory Sample Preparation
12-33
JULY 2004 MARLAP
ASTM D1889 is the standard test method for the determination of turbidity of water and
wastewater in the range from 0.05 to 40 nephelometric turbidity units (NTU). In the ASTM
method, a photoelectric nephelometer is used to measure the amount of light that a sample
scatters when the light is transmitted through the sample. Project planning documents should
specify the acceptable turbidity limit for of aqueous samples for direct sample processing without
removing solids.
12.6.3 Filtration
The filtration of samples is based on the appropriate plan document that should also give the
selection of the filter material to be used. If samples have not been filtered in the field, the
laboratory can perform the filtration. Guidance on filtration of liquid samples is provided in
Section 10.3.2. However, preservatives should not be added until sample filtration has been
performed (if stipulated in the project DQOs). This ensures that insoluble materials in the sample
that might be entrained during sample collection do not affect the analytical results.
12.6.4 Aqueous Liquids
Aqueous liquids are a common matrix analyzed by laboratories, and are often referred to as water
samples. Examples of possible aqueous liquids requiring radionuclide analysis include the
following:
• Drinking water;
• Surface water;
• Ground water;
• Soil pore water;
• Storage tank water;
• Oil production water or brine;
• Trench or landfill leachate; and
• Water from vegetation.
For certain samples that are not filtered, inversion is a form of homogenization. Typically, the
sample is homogenized by inverting the container several times to mix the sample thoroughly. If
there is some air in the container, the passage of air bubbles through the sample will create
sufficient turbulence to mix the sample thoroughly with three or four inversions of the sample
container. If the sample contains zero headspace (so there is no air in the sample container), the
sample should be inverted and allowed to stay inverted for several seconds before the next
inversion. Ten to twenty inversions of the sample container may be required to ensure that the
sample is mixed thoroughly under zero headspace conditions. Simply shaking the container will
not mix the contents as thoroughly as inverting the sample container. Mechanical shakers,
mixers, or rotators may be used to homogenize aqueous samples thoroughly.

Laboratory Sample Preparation
12-34
MARLAP JULY 2004
Filtration and acidification performed in the field is typically the only preparation required for
aqueous liquids (Chapter 10). A general discussion concerning preparation of water samples for
the measurement of radioactivity is presented in NCRP (1976). PNL/ACL (1992) gives a number
of sample preparation methods for various materials, including water samples.
ASTM gives standard test methods for the preparation of water samples for the determination of
alpha and beta radioactivity (ASTM D1943 and D1890, respectively). After collecting the water
sample in accordance with ASTM D3370, the sample is made radioactively homogeneous by
adding a reagent in which the radionuclides present in the sample are soluble in large
concentrations. Acids, complexing agents, or chemically similar stable carriers may be used to
obtain homogeneity. The chemical nature of the radionuclides and compounds present and the
subsequent steps in the method will indicate the action to be taken. Different radiochemical
preparation techniques for freshwater and seawater samples are illustrated in EPA (1979) and for
drinking water in EPA (1980).
12.6.5 Nonaqueous Liquids
Nonaqueous liquids can be substances other than water such as organic solvents, oil, or grease.
Many organic solvents are widely used to clean oil, grease, and residual material from electrical
and mechanical equipment. The resulting waste liquid may contain a significant amount of solid
material. It may be necessary to filter such liquids to determine (1) if the analyte is contained in
the filtrate and is soluble, or (2) if the analyte is contained in the solids and therefore is insoluble.
The appropriate plan document should be reviewed to determine if filtration is necessary. ASTM
C1234 describes the preparation of homogeneous samples from nuclear processing facilities.
Homogenization of nonaqueous samples is accomplished in a manner similar to that for aqueous
samples. Visual inspection is typically used as a qualitative measure of homogeneity in non-
aqueous samples. If a quantitative measure of mixing is desired, turbidity measurements can be
performed after a predetermined amount of mixing (e.g., every 10 inversions, every 2 minutes,
etc.) until a steady level of turbidity is achieved (e.g., 1 to 10 percent variance, depending on the
project objectives—see ASTM D1889, Standard Test Method for Turbidity of Water).
DOE (ANL/ACL, 1995) evaluated sample preparation techniques used for the analysis of oils. In
evaluating the performance of a sample preparation technique, DOE considered the following
qualities to be important:
• Thorough sample decomposition;
• Retention of volatile analytes;
• Acceptable analyte recovery;
• Minimal contamination from the environment or the digestion vessel;
• Low reagent blanks; and
• Speed.

Laboratory Sample Preparation
1 It is often necessary to determine which liquid is aqueous and which liquid is nonaqueous. Never assume that the
top layer is always nonaqueous, or the bottom layer is always aqueous. The density of the bottom layer is always
greater than the density of the top layer. Halogenated solvents (e.g., carbon tetrachloride, CCl4) tend to have
densities greater than about 1 g/mL, so they typically represent the bottom layer. Other organic liquids (e.g., diethyl
ether, oil, etc.) tend to have densities less than 1g/mL, so they typically represent the top layer. Mixtures of organic
liquids may have almost any density. To test the liquids, add a drop of water to the top layer. If the drop dissolves in
the top layer, the top layer is aqueous. If the drop settles through the top layer and dissolves in the bottom layer, the
bottom layer is aqueous.
12-35
JULY 2004 MARLAP
One of the preparation methods involved combustion of oil under oxygen at 25 atm pressure
(ASTM E926) and another used nitric acid decomposition of the oil in a sealed vessel heated
with a microwave (EPA, 1990).
Many nonaqueous liquids present a health hazard (e.g., carcinogenicity) or require special safety
considerations (e.g., flammability). Any special handling requirements based on health and safety
considerations should be documented in the planning documents.
12.6.6 Mixtures
Some common examples of mixtures that may be encountered by the laboratory are water with
lots of total dissolved solids and undissolved solids or water and oil in separate layers. The
following sections discuss preparation procedures for these types of mixtures.
12.6.6.1 Liquid-Liquid Mixtures
When aqueous and nonaqueous liquids are combined, they usually form an immiscible mixture,
such as oil and water.1 In most cases, a separatory funnel helps in separating the liquids into two
samples. Each sample then is analyzed separately. If, in the rare case, both liquids must be
processed together, there is greater difficulty in preparing the combined liquids for analysis.
Obtaining a homogenous aliquant is a key consideration in this case. Often times, the entire
sample should be analyzed. This approach avoids processing problems and yields the desired
result.
12.6.6.2 Liquid-Solid Mixtures
Mixtures of liquids and solids are usually separated by filtering, centrifuging, or decanting, and
the two phases are analyzed separately. If the mixture is an aqueous liquid and a solid, and will
be analyzed as a single sample, the sample is often treated as a solid. Completely drying the
sample followed by dry ashing before any attempt at wet ashing is recommended to reduce the
chance of organic solids reacting with strong oxidizing acids (e.g., H2SO4, HNO3, etc.). If the
mixture includes a nonaqueous liquid and a solid, it is suggested that the phases be separated by

Laboratory Sample Preparation
12-36
MARLAP JULY 2004
filtration and the solid rinsed thoroughly with a volatile solvent such as ethanol or methanol
before continuing with the sample preparation process.
In rare cases where a sample contains a mixture of aqueous liquid, nonaqueous liquid, and solid
material, the sample can be separated into three different phases before analysis. The sample
should be allowed to settle overnight and the liquids decanted. The liquids can then be separated
in a separatory funnel without the solid material clogging the funnel. Each liquid should be
filtered to remove any remaining solid material. The solid should be filtered to remove any
remaining liquid and rinsed with a volatile solvent. This rinse removes any traces of organic
liquids to reduce problems during subsequent dissolution activities. The three phases are then
analyzed separately. If necessary, the results can be added together to obtain a single result for the
mixture after the separate analyses are completed.
12.7 Gases
Sample preparation steps are usually not required for gas samples. Lodge (1988) gives general
techniques, including any necessary sample preparation, for the sampling and storage of gases
and vapors. The determination of the tritium content of water vapor in the atmosphere is one of
the example procedures. ASTM D3442 is a standard test method for the measurement of total
tritium activity in the atmosphere. Sample preparation is covered in this test method.
EPA (1989) may be used to demonstrate compliance with the radionuclide National Emission
Standards for Hazardous Air Pollutants (NESHAP). This document includes references to air
sampling and sample preparation. Table 3-1 of EPA (1989) lists numerous references to
radionuclide air sampling and preparation, including Cehn (1979), Eichling (1983), Allied
Chemical (1982), and Browning et al. (1978).
12.8 Bioassay
Analyses of bioassay samples are necessary to monitor the health of employees involved in
radiological assessment work. Normally these types of samples include urine and fecal
specimens.
Urine samples are typically wet ashed with nitric acid (DOE, 1997) or with nitric acid and
peroxide (RESL, 1982). Alternatively, there are procedures that co-precipitate the target analytes
in urine by phosphate precipitation (Horwitz et al., 1990; Stradling and Popplewell, 1974; Elias,
1997). Fecal samples are normally dry ashed in a muffle furnace (DOE, 1997), or prepared by
lyophilization, “freeze drying” (Dugan and McKibbin, 1993).
It is important to note that although ANSI N13.30 indicates that aliquanting a homogeneous
sample to determine the activity present in the total sample is acceptable, this standard dictates

Laboratory Sample Preparation
12-37
JULY 2004 MARLAP
that the entire sample should be prepared for analysis and the aliquant taken after the sample
preparation has been completed.
12.9 References
12.9.1 Cited Sources
Allied Chemical UF6 Conversion Plant. 1982. “Application for Renewal of Source Material
License: SUB-526, Docket 40-3392,” Metropolis, Illinois.
American National Standards Institute (ANSI) N13.30 Performance Criteria for Radiobioassay.
Health Physics Society. 1996.
Argonne National Laboratory/Analytical Chemistry Laboratory (ANL/ACL). 1992. Innovative
Methods for Inorganic Sample Preparation. April 1992.
Argonne National Laboratory/Analytical Chemistry Laboratory (ANL/ACL). 1995. Preparation
of Waste Oil for Analysis to Determine Hazardous Metals. July.
Association of Official Analytical Chemists International (AOAC) Official Method 985.14.
“Moisture in Meat and Poultry Products,” in Official Methods of Analysis of AOAC
International. P. Cuniff, Ed., Arlington, VA. 1995.
Association of Official Analytical Chemists International (AOAC) Official Method 985.26.
“Solids (Total) in Processed Tomato Products”, In Official Methods of Analysis of AOAC
International. P. Cuniff, Ed.; Association of Official Analytical Chemists International:
Arlington, VA. 1995.
American Society for Testing and Materials (ASTM) C50. Standard Practice for Sampling,
Inspection, Packing, and Marking of Lime and Limestone Products. West Conshohocken,
PA.
American Society for Testing and Materials (ASTM) C114. Standard Test Method for Chemical
Analysis of Hydraulic Cement. West Conshohocken, PA.
American Society for Testing and Materials (ASTM) C702. Standard Practice for Reducing
Samples of Aggregate to Testing Size, Vol 04.02. West Conshohocken, PA.
American Society for Testing and Materials (ASTM) C999. Standard Practice for Soil Sample
Preparation for the Determination of Radionuclides. West Conshohocken, PA.

Laboratory Sample Preparation
12-38
MARLAP JULY 2004
American Society for Testing and Materials (ASTM) C1234. Standard Test Method for
Preparation of Oils and Oily Waste Samples by High-Pressure, High-Temperature Digestion
for Trace Element Determinations. West Conshohocken, PA.
American Society for Testing and Materials (ASTM) D1125. Standard Test Method for
Determining the Electrical Conductivity of Water. West Conshohocken, PA.
American Society for Testing and Materials (ASTM) D1889. Standard Test Method for Turbidity
of Water. West Conshohocken, PA.
American Society for Testing and Materials (ASTM) D1890. Standard Test Method for Beta
Particle Radioactivity of Water. West Conshohocken, PA.
American Society for Testing and Materials (ASTM) D1943. Standard Test Method for Alpha
Particle Radioactivity of Water. West Conshohocken, PA.
American Society for Testing and Materials (ASTM) D2013. Standard Method of Preparing
Coal Samples for Analysis. West Conshohocken, PA.
American Society for Testing and Materials (ASTM) D3370. Standard Practices for Sampling
Water from Closed Conduits. West Conshohocken, PA.
American Society for Testing and Materials (ASTM) D3442. Standard Test Method for Gaseous
Tritium Content of the Atmosphere. West Conshohocken, PA.
American Society for Testing and Materials (ASTM) D3974. Standard Practice for Extraction of
Trace Elements from Sediments. West Conshohocken, PA.
American Society for Testing and Materials (ASTM) D3975. Standard Practice for Development
and Use (Preparation) of Samples for Collaborative Testing of Methods for Analysis of
Sediments. West Conshohocken, PA.
American Society for Testing and Materials (ASTM) D3976. Standard Practice for Preparation
of Sediment Samples for Chemical Analysis. West Conshohocken, PA.
American Society for Testing and Materials (ASTM) D4638. Standard Guide for Preparation of
Biological Samples for Inorganic Chemical Analysis. West Conshohocken, PA.
American Society for Testing and Materials (ASTM) D4643. Standard Test Method for
Determination of Water (Moisture) Content in Soil by the Microwave Oven Method. West
Conshohocken, PA.

Laboratory Sample Preparation
12-39
JULY 2004 MARLAP
American Society for Testing and Materials (ASTM) E926. Standard Practices for Preparing
Refuse-Derived Fuel (RDF) Samples for Analyses of Metals. West Conshohocken, PA.
American Society for Testing and Materials (ASTM) E1358. Standard Test Method for
Determination of Moisture Content of Particulate Wood Fuels Using a Microwave Oven.
West Conshohocken, PA.
Beary, E.S. 1988. “Comparison of Microwave Drying and Conventional Drying Techniques For
Reference Materials.” Anal. Chem Vol. 60, pp. 742-746.
Bernabee, R. P., D. R. Percival, and D. B. Martin. 1980. “Fractionation of Radionuclides in
Liquid Samples from Nuclear Power Facilities.” Health Physics Vol. 39, pp. 57-67.
Bock, R. 1979. A Handbook of Decomposition Methods in Analytical Chemistry. International
Textbook Company, Limited. T. & A. Constable Ltd., Great Britain.
Browning, E.J., K. Banerjee, and W.E. Reisinger. 1978. “Airborne Concentrations of I-131 in a
Nuclear Medicine Laboratory,” Journal of Nuclear Medicine, Vol. 19, pp. 1078-1081.
Cameron, P., and Murgatroyd, K. 1996. Good Pharmaceutical Freeze-Drying Practice.
Interpharm Press.
Cehn, J.I. 1979. A Study of Airborne Radioactive Effluents from the Pharmaceutical Industry,
Fianl Report, Prepared by Teknekron, Inc., for the U.S. EPA Eastern Environmental Research
Facility, Montgomery, AL.
Dean, J.A. 1995. Analytical Chemistry Handbook, McGraw-Hill, Inc., New York.
DeVoe, J.R. 1961. Radioactive Contamination of Materials Used in Scientific Research.
Publication 895, NAS-NRC.
U.S. Department of Energy (DOE). 1995. Brookhaven National Laboratory Site Environmental
Report for Calendar Year 1995, Naidu, J. R., D. E. Paquette, G. L. Schroeder, BNL
December, 1996.
U.S. Department of Energy. 1997 (DOE).EML Procedures Manual (HASL-300-Ed.28), Edited
by N.A. Chieco, Environmental Measurements Laboratory.
Dugan, J.P. and T.T. McKibbin. 1993. “Preparation of Fecal Samples for Radiobioassay by
Lyophilization,” Radioactivity & Radiochemistry 4:3, pp. 12-15.

Laboratory Sample Preparation
12-40
MARLAP JULY 2004
Eberhardt, L.L., and R.O. Gilbert. 1980. “Statistics and Sampling in Transuranic Studies,” in
Transuranic Elements in the Environment , edited by W.C. Hanson, U.S. Department of
Energy. DOE/TIC-22800.
Eichling, J. 1983. “The Fraction of Material Released as Airborne Activity During Typical
Radioiodinations,” Proceedings of the 9th Biennial Conference of Campus Radiation Safety
Officers, University of Missouri-Columbia, June 6-8, 1983.
Elias, G. 1997. “A Rapid Method for the Analysis of Plutonium and Uranium in Urine Samples,”
Radioactivity & Radiochemistry 8:3, pp. 20-24.
U.S. Environmental Protection Agency (EPA). 1979. Radiochemical Analytical Procedures for
Analysis of Environmental Samples; F. B. Johns, P. B. Hahn, D. J. Thome, and E. W.
Bretthauer, EMSL, March 1979.
U.S. Environmental Protection Agency (EPA). 1980. Prescribed Procedures for Measurement of
Radioactivity in Drinking Water. H. L. Krieger and E. L. Whittaker, EPA 600-4-80-032,
August 1980.
U.S. Environmental Protection Agency (EPA). 1989. Background Information Document:
Procedures Approved for Demonstrating Compliance with 40 CFR Part 61, Subpart I. EPA
520-1-89-001, Office of Radiation Programs, October, 1989.
U.S. Environmental Protection Agency (EPA). 1990. Test Methods for Evaluating Solid Waste—
Physical/Chemical Methods. SW-846, Third Edition, Method 3051.
U.S. Environmental Protection Agency (EPA). 1992. Manual for the Certification of
Laboratories Analyzing Drinking Water: Criteria and Procedures. Fourth Edition, EPA 814-
B-92-002, Office of Ground Water and Drinking Water, Cincinnati, Ohio.
Fisenne, I.M. and P. Perry 1978. “The Determination of Plutonium in Tissue by Aliquat-336
Extraction,” Radiochem Radioanal. Letters Vol. 33, pp. 259-264.
Fisenne, I.M., P. Perry and G.A. Welford. 1980. “Determination of Uranium Isotopes in Human
Bone Ash,” Anal. Chem. Vol. 52, pp. 777-779.
Fisenne, I.M. 1994. “Lead-210 in Animal and Human Bone: A New Analytical Method,” Env.
Int. Vol. 20, pp. 627-632.
Greenberg, A.E., L.S. Clesceri, and A.D. Eaton (Eds). 1992. Standard Methods for the
Examination of Water and Wastewater. American Public Health Association.

Laboratory Sample Preparation
12-41
JULY 2004 MARLAP
Greenwood, N. N. and A. Earnshaw. 1984. Chemistry of the Elements. Pergamon Press, Inc.
Elmsford, New York.
Gy, Pierre M. 1992. Sampling of Heterogeneous and Dynamic Material Systems: Theories of
Heterogeneity, Sampling, and Homogenizing. Elsevier, Amsterdam, The Netherlands.
Horwitz, E.P., M.L. Dietz, D.M. Nelson, J.J. LaRosa, and W.D. Fairman 1990. “Concentration
and Separation of Actinides from Urine using a Supported Bifunctional Organophosphorous
Extractant,” Analytica Chimica Acta. Vol. 238, pp. 263-271.
IAEA. 1989. Measurement of Radionuclides in Food and the Environment—A Guidebook.
Technical Reports Series No. 295, International Atomic Energy Agency, Vienna.
Kingston, H.M., and Jassie, L.B. 1988. Introduction to Microwave Sample Preparation: Theory
and Practice, American Chemical Society, Washington, DC.
Koh, T.S. 1980. Anal Chem Vol. 52, pp. 1978-1979.
Kralian, M.A., M.J. Atkins, and S.A. Farber. 1990. “Guidelines for Effective Low-Level
Contamination Control in a Combination Environmental/Radioactive Waste Analysis
Facility,” Radioactivity & Radiochemistry. 1:3, pp. 8-18.
Lodge, J. 1988. Methods of Air Sampling and Analysis. Third Edition, CRC Press, Florida.
LANL. 1996. Application of Cryogenic Grinding to Achieve Homogenization of Transuranic
Waste, Atkins, W. H., LANL-13175.
Los Alamos National Laboratory (LANL). 1997. Radionuclide Concentration in pinto beans,
sweet corn, and zucchini squash grown in Los Alamos Canyon at Los Alamos National
Laboratory, Fresquez, P. R., M. A. Mullen, L. Naranjo, and D. R. Armstrong, May 1997.
Lucas, H.F., Jr. 1963. “A Fast and Accurate Survey Technique for Both Radon-222 and Radium-
226,” The Natural Radiation Environment, Proceedings of the International Symposium,
William Rice University, Houston, TX, 315-319.
Lucas, H.F. 1967. “A Radon Removal System for the NASA Lunar Sample Laboratory: Design
and Discussion,” Argonne National Laboratory Radiological Physics Division Annual
Report, ANL-7360.
McInroy, J.F., H.A. Boyd, B.C. Eutsler, and D. Romero. 1985. “Part IV: Preparation and
Analysis of the Tissue and Bones,” Health Physics, 49:4, pp. 585-621.

Laboratory Sample Preparation
12-42
MARLAP JULY 2004
NCRP Report No. 50. 1976. Environmental Radiation Measurements.
Obenhauf, R.H., R. Bostwick, W. Fithian, M. McCann, J.D. McCormack, and D. Selem. 2001.
SPEX CertiPrep Handbook of Sample Preparation and Handling, SPEX CertiPrep, Inc., 203
Norcross Avenue Metuchen, NJ 08840. Also at http://www.spexcsp.com/spmain/sprep/
handbook/tocprime.htm.
Pacific Northwest Laboratories/Analytical Chemistry Laboratory (PNL/ACL). 1992. Procedure
Compendium. Volume 2: Sample Preparation Methods. PNL-MA-559.
Pitard, F. F. 1993. Pierre Gy’s Sampling Theory and Practice. CRC Press, Inc., Boca Raton, FL.
Second Edition.
RESL Analytical Chemistry Branch Procedures Manual. 1982. U.S. Department of Energy, Idaho
Falls, Idaho, IDO-12096.
Schilt, A. 1979. Perchloric Acid and Perchlorates. The G. Frederick Smith Chemical Company,
Columbus, Ohio.
Schwochau, K. 2000. Technetium: Chemistry and Radiopharmaceutical Applications, Wiley-
VCH (Federal Republic of Germany).
Scwedt, G. 1997. The Essential Guide to Analytical Chemistry (Translation of the revised and
updated German Second Edition. Translated by Brooks Haderlie), John Wiley & Sons,
England.
Sedlet, J. 1966. “Radon and Radium,” in Treatise on Analytical Chemistry, Part II, Vol. IV,
p219-366, edited by I.M. Kolthoff and P.J. Elving, John Wiley & Sons, Inc, New York.
Shugar, G.J. and J.T. Ballinger. 1996. Chemical Technicians’ Ready Reference Handbook.
McGraw-Hill, New York.
Sill, C.W., K.W. Puphal, and F.D. Hindman. 1974. “Simultaneous Determination of Alpha-
Emitting Nuclides of Radium through Californium in Soil,” Anal. Chem 46:12, pp. 1725-
1737.
Sill, C.W. 1975. “Some Problems in Measuring Plutonium in the Environment,” Health Physics.
Vol. 29, pp. 619-626.
Sneed, M.C. and Brasted, R.C. 1958. Comprehensive Inorganic Chemistry, New York: D. Van
Nostrand.

Laboratory Sample Preparation
12-43
JULY 2004 MARLAP
Stradling, G.N. and D.S. Popplewell. 1974. “Rapid Determination of Plutonium in Urine by
Ultrafiltration,” Int. J. Appl. Radiation Isotopes. Vol. 25, p 217.
Walter, P., S. Chalk, and H. Kingston. 1997. “Overview of Microwave-Assisted Sample
Preparation.” Chapter 2, Microwave-Enhanced Chemistry, H. Kingston and S. Haswell,
editors, American Chemical Society, Washington, DC.
Wang, C.H., Willis, D.L., and Loveland W.D. 1975. Radiotracer Methodology in the Biological,
Environmental, and Physical Sciences. Prentice-Hall, Inc., New Jersey.
Windholz, M. 1976. The Merck Index (9th edition), Merck and Co. Inc., New Jersey.
Yamamoto, M., Komura, K., and Ueno, K. 1989. “Determination of Low-Level 226Ra in
Environmental Water Samples by Alpha-Ray Spectrometry,” Radiochimica Acta Vol. 46, pp.
137-142.
Zhang, H. and P. Dotson. 1998. The Use of Microwave Muffle Furnace for Dry Ashing Plant
Tissue Samples. CEM Corporation. Also, Commun. Soil Sci. Plant Anal. 25:9&10, pp. 1321-
1327 (1994).
12.9.2 Other Sources
American Society for Testing and Materials (ASTM) D5245. Standard Practice for Cleaning
Laboratory Glassware, Plasticware, and Equipment Used in Microbiological Analyses. West
Conshohocken, PA.
American Society for Testing and Materials (ASTM) E1157. Standard Specification for
Sampling and Testing of Reusable Laboratory Glassware. West Conshohocken, PA.
U.S. Environmental Protection Agency. 1987. Eastern Environmental Radiation Facility
Radiochemistry Procedures Manual. Compiled and edited by R. Lieberman, EPA 520-5-84-
006, Office of Radiation Programs. August.
Kahn, B. 1973. “Determination of Radioactive Nuclides in Water,” in Water and Water Pollution
Handbook, Vol. 4, p. 1357 (L.L. Ciaccio, Ed.). M. Decker, New York.
Kahn, B., Shleien, B., and Weaver, C. 1972. “Environmental Experience with Radioactive
Effluents From Operating Nuclear Power Plants,” page 559 in Peaceful Uses of Atomic
Energy, Vol. 11 (United Nations, New York).

Laboratory Sample Preparation
12-44
MARLAP JULY 2004
Krahenbuhl, M.P., Slaughter, D.M. 1998. “Improving Process Methodology for Measuring
Plutonium Burden in Human Urine Using Fission Track Analysis,” J. Radioanalytical and
Nuclear Chemistry, 220:1-2, pp. 153-160.
Krieger, H.L. and E.L. Whittaker. 1980. “Prescribed Procedures for Measurement of
Radioactivity in Drinking Water,” Environmental Monitoring and Support Laboratory,
Cincinnati, OH, EPA-600/4-80-032.
Laug, E.P. 1934. Ind. Eng. Chem., Anal Ed. Vol. 13, pp. 419.
McFarland, R.C. 1998a. “Determination of Alpha-Particle Counting Efficiency for Wipe-Test
Samples,” Radioactivity & Radiochemistry. 9:1, pp. 4-8.
McFarland, R.C. 1998b. “Determination of Counting Efficiency for Wipe-Test Samples
Containing Radionuclides that Emit High-Energy Beta Particles,” Radioactivity &
Radiochemistry 9:1, pp. 4-9.
Nichols, S.T. 2001. “New Fecal Method for Plutonium and Americium,” J. Radioanalytical and
Nuclear Chemistry, 250:1, pp. 117-121.
Shugar and Dean. 1990. The Chemist’s Ready Reference Handbook, McGraw-Hill.

13-1
JULY 2004 MARLAP
13 SAMPLE DISSOLUTION
13.1 Introduction
The overall success of any analytical procedure depends upon many factors, including proper
sample preparation, appropriate sample dissolution, and adequate separation and isolation of the
target analytes. This chapter describes sample dissolution techniques and strategies. Some of the
principles of dissolution are common to those of radiochemical separation that are described in
Chapter 14 (Separation Techniques), but their importance to dissolution is reviewed here.
Sample dissolution can be one of the biggest challenges facing the analytical chemist, because
most samples consist mainly of unknown compounds with unknown chemistries. There are many
factors for the analyst to consider: What are the measurement quality objectives of the program?
What is the nature of the sample; is it refractory or is there only surface contamination? How
effective is the dissolution technique? Will any analyte be lost? Will the vessel be attacked? Will
any of the reagents interfere in the subsequent analysis or can any excess reagent be removed?
What are the safety issues involved? What are the labor and material costs? How much and what
type of wastes are generated? The challenge for the analyst is to balance these factors and to
choose the method that is most applicable to the material to be analyzed.
The objective of sample dissolution is to mix a solid or nonaqueous liquid sample quantitatively
with water or mineral acids to produce a homogeneous aqueous solution, so that subsequent
separation and analyses may be performed. Because very few natural or organic materials are
water-soluble, these materials routinely require the use of acids or fusion salts to bring them into
solution. These reagents typically achieve dissolution through an oxidation-reduction process that
leaves the constituent elements in a more soluble form. Moreover, because radiochemists
routinely add carriers or use the technique of isotope dilution to determine certain radioisotopes,
dissolution helps to ensure exchange between the carrier or isotopic tracer and the element or
radioisotope to be determined, although additional chemical treatment might be required to
ensure exchange.
There are three main techniques for sample
decomposition discussed in this chapter: fusion;
wet ashing, acid leaching, or acid dissolution;
and microwave digestion.
The choice of technique is determined by the
type of sample and knowledge of its physical
and chemical characteristics. Fusion and wet
ashing techniques may be used singly or in
combination to decompose most samples
analyzed in radioanalytical laboratories.
Contents
13.1 Introduction .......................... 13-1
13.2 The Chemistry of Dissolution ............ 13-2
13.3 Fusion Techniques .................... 13-6
13.4 Wet Ashing and Acid Dissolution
Techniques ......................... 13-12
13.5 Microwave Digestion ................. 13-21
13.6 Verification of Total Dissolution ........ 13-23
13.7 Special Matrix Considerations .......... 13-23
13.8 Comparison of Total Dissolution and Acid
Leaching ........................... 13-25
13.9 References .......................... 13-27

Sample Dissolution
13-2
MARLAP JULY 2004
Leaching techniques are used to determine the soluble fraction of the radionuclide of interest
under those specific leaching conditions. Different formulas for leaching agents will yield
different amounts of leachable analyte. It should be recognized that the information so obtained
leaves unknown the total amount of analyte present in the sample. Because recent advances in
microwave vessel design (e.g., better pressure control and programmable temperature control)
have allowed for the use of larger samples, microwave dissolution is becoming an important tool
in the radiochemistry laboratory. Leaching and the newer closed-vessel microwave methods
provide assurance that only minimal analyte loss will occur through volatilization.
Because of the potential for injury and explosions during sample treatment, it is essential that
proper laboratory safety procedures be in place, the appropriate safety equipment be available, a
safe work space be provided, and that the laboratory personnel undergo the necessary training to
ensure a safe working environment before any of these methods are used. Review the Material
Data Safety Sheets for all chemicals before their use.
Aspects of proper sample preparation, such as moisture removal, oxidation of organic matter, and
homogenization, were discussed in Chapter 12, Laboratory Sample Preparation. Fundamental
separation principles and techniques, such as complexation, solvent extraction, ion exchange, and
co-precipitation, are reviewed in Chapter 14, Separation Techniques.
There are many excellent references on sample dissolution (e.g., Bock, 1979; Bogen, 1978; Dean,
1995; Sulcek and Povondra, 1989).
13.2 The Chemistry of Dissolution
In order to dissolve a sample completely, each insoluble component must be converted into a
soluble form. Several different chemical methods may need to be employed to dissolve a sample
completely; usually, the tracer is added to the sample at the time of sample dissolution. Initially
the sample may be treated with acids yielding an insoluble residue. The residue may need to be
dissolved using fusion or hydrofluoric acid (HF) and then combined with the original mixture or
analyzed separately. In either case, the tracer/carrier should be added to the sample during the
first step of chemical change (e.g., acid dissolution as above) so that the yield for the entire
process may be determined accurately. An outline of the principles of these chemical methods is
provided in this section, but a complete description is available in Chapter 14, where the
principles are applied to a broader range of topics.
13.2.1 Solubility and the Solubility Product Constant, Ksp
The solubility data of many compounds, minerals, ores, and elements are available in reference
manuals. Solubilities typically are expressed in grams of substance per 100 mL of solvent,
although other units are sometimes used. The information is more complete for some substances

Sample Dissolution
13-3
JULY 2004 MARLAP
than others, and for many substances solubility is expressed only in general terms, such as
“soluble,” “slightly soluble,” or “insoluble.” Many environmental samples consist of complex
mixtures of elements, compounds, minerals, or ores, most of which are insoluble and must be
treated chemically to dissolve completely. In some cases, the sample constituents are known to
the analyst, but often they are not. Solubility data might not be available even for known
constituents, or the available data might be inadequate. Under these circumstances, sample
dissolution is not a simple case of following the solubilities of known substances. For known
constituents with solubility data, the solubilities indicate those that must be treated to complete
dissolution. This, in turn, provides a guide to the method of treatment of the sample. Given the
potential complexity of environmental samples, it is difficult to describe conditions for
dissolving all samples. Sometimes one method is used to dissolve one part of the sample while
another is used to dissolve the residue.
The solubility of many compounds in water is very low, on the order of small fractions of a
grams per 100 mL. The solubility may be expressed by a solubility product constant (K sp), an
equilibrium constant for dissolution of the compound in water (see Section 14.8.3.1, “Solubility
and Solubility Product Constant”). For example, the solubility product constant for strontium
carbonate, a highly insoluble salt (0.0006 g/100 mL), is the equilibrium constant for the process:
SrCO3(s) 6 Sr+2(aq) + CO3
!2(aq)
and is represented by:
Ksp = [Sr+2][CO3
!2] = 1.6×10!9
The brackets indicate the molar concentration (moles/liter) of the respective ions dissolved in
water. The very small value of the constant results from the low concentration of dissolved ions,
and the compound is referred to as “insoluble.” Chemical treatment is necessary sometimes to
dissolve the components of a compound in water. In this example, strontium carbonate requires
the addition of an acid to solubilize Sr+2. The next section describes chemical treatment to
dissolve compounds.
13.2.2 Chemical Exchange, Decomposition, and Simple Rearrangement Reactions
Chemical exchange, decomposition, and simple rearrangement reactions refer to one method for
solubilizing components of a sample. In this chemical process, the sample is treated to convert
insoluble components to a soluble chemical species using chemical exchange (double displace-
ment), decomposition, or simple rearrangement reactions rather than oxidation-reduction
processes or complex formations. Some reagents solubilize sample components using chemical
exchange. Radium or strontium cations in radium or strontium carbonate (RaCO3 or SrCO3)
exchange the carbonate anion for the chloride ion on acid treatment with HCl to produce the
soluble chlorides; the carbonic acid product decomposes to carbon dioxide and water:
RaCO3 + 2 HCl 6 RaCl2 + H2CO3

Sample Dissolution
13-4
MARLAP JULY 2004
H2CO3 6 CO2 + H2O
and the net reaction is as follows:
RaCO3 + 2 HCl 6 RaCl2 + CO2 + H2O
Sodium pyrosulfate fusion, for example, converts zirconia (ZrO2) into zirconium sulfate
[Zr(SO4)2], which is soluble in acid solution by a simple (nonoxidative) rearrangement of oxygen
atoms (Hahn, 1961; Steinberg, 1960):
ZrO2 + 2 Na2S2O7 6 2 Na2SO4 + Zr(SO4)2
Many environmental samples contain insoluble silicates, such as aluminum silicate [Al2(SiO3)3 or
Al2O3 · 3SiO2], which can be converted into soluble silicates by fusion with sodium carbonate:
Al2(SiO3)3 + 4 Na2CO3 6 3 Na2SiO3 + 2 NaAlO2 + 4 CO2
Dissolution of radium from some ores depends on the exchange of anions associated with the
radium cation (sulfate for example) to generate a soluble compound. Extraction with nitric acid is
partly based on this process, generating soluble radium nitrate.
13.2.3 Oxidation-Reduction Processes
Oxidation-reduction (redox) processes are an extremely important aspect of sample dissolution.
The analyte may be present in a sample in several different chemical forms or oxidation states.
As an example, consider a ground-water sample that contains 129I as the analyte. The iodine may
be present in any of the following inorganic forms: I!, I2, IO!, or IO3
!. If the ground water has a
high reduction potential or certain bacteria are present, the iodine also may be present as CH3I. It
is of paramount importance to ensure that all of these different forms of iodine are brought to the
same oxidation state (e.g., to iodate) at the time of first change in redox environment or change in
sample composition. Furthermore, accurate assessment of chemical yield only can be determined
if the tracer or carrier is added prior to a change in chemical form or oxidation state of the analyte
at an initial point in the digestion process. This process is referred to as “equilibration of the
tracer/carrier and analyte.” From this point on during the sample analysis, any loss that occurs to
the analyte will occur to an equal extent for the tracer/carrier, thus allowing the calculation of a
chemical yield for the process.
A redox reaction redistributes electrons among the atoms, molecules, or ions in the reaction. In
some redox reactions, electrons actually are transferred from one reacting species to another. In
other redox reactions, electrons are not transferred completely from one reacting species to
another; the electron density about one atom decreases, while it increases about another atom. A
complete discussion of oxidation and reduction is found in Section 14.2, “Oxidation-Reduction
Processes.”

Sample Dissolution
13-5
JULY 2004 MARLAP
Many oxidizing agents used in sample dissolution convert metals to a stable oxidation state
displacing hydrogen from hydrochloric, nitric, sulfuric, and perchloric acids. (This redox process
often is referred to as nonoxidative hydrogen replacement by an active metal, but it is a redox
process where the metal is oxidized to a cation, usually in its highest oxidation state, and the
hydrogen ion is reduced to its elemental form.) Dissolution of uranium for analysis is an example
of hydrogen-ion displacement to produce a soluble substance (Grindler, 1962):
U + 8 HNO3 6 UO2(NO3)2 + 6 NO2 + 4 H2O
Prediction of the reactivity of a metal with acids is dependent on its position in the electromotive
force series (activity series). A discussion of the series appears in Section 13.4.1, “Acids and
Oxidants.” In general, metals with a negative standard reduction potential will replace hydrogen
and be dissolved. Perchloric acid offers a particular advantage because very soluble metal
perchlorate salts are formed.
Other important oxidizing processes depend on either oxidizing a lower, less soluble oxidation
state of a metal to a higher, more soluble state or oxidizing the counter anion to generate a more
soluble compound. Oxidation to a higher state is common when dissolving uranium samples in
acids or during treatment with fusion fluxes. The uranyl ion (UO2
+2) forms soluble salts—such as
chloride, nitrate, and perchlorate—with anions of the common acids (Grindler, 1962). (Complex-
ion formation also plays a role in these dissolutions; see the next section). Dissolution of oxides,
sulfides, or halides of technetium by alkaline hydrogen peroxide converts all oxidation states to
the soluble pertechnetate salts (Cobble, 1964):
2 TcO2 + 2 NaOH + 3 H2O2 6 2 NaTcO4 + 4 H2O
13.2.4 Complexation
The formation of complex ions (see also Section 14.3, “Complexation”) is important in some
dissolution processes, usually occurs in conjunction with treatment by an acid, and also can occur
during fusion. Complexation increases solubility in the dissolution mixture and helps to mini-
mize hydrolysis of the cations. The solubility of radium sulfate in concentrated sulfuric acid is
the result of forming a complex-ion, Ra(SO4)2
!2. The ability of both hydrochloric and hydro-
fluoric acids to act as a solubilizing agent is dependent on their abilities to form stable complex
ions with cations. Refractory plutonium samples are solubilized in a nitric acid-hydrofluoric acid
solution forming cationic fluorocomplexes such as PuF+3 (Booman and Rein, 1962). Numerous
stable complexes of anions from solubilizing acids (HCl, HF, HNO3, H2SO4, HClO4) contribute
to the dissolution of other elements, such as americium, cobalt, technetium, thorium, uranium,
and zirconium (see Section 14.10, “Analysis of Specific Radionuclides”). The process of fusion
with sodium carbonate to solubilize uranium samples is also based on the formation of
UO2(CO3)2
!4 after the metal is oxidized to U+6 (Grindler, 1962).

Sample Dissolution
13-6
MARLAP JULY 2004
13.2.5 Equilibrium: Carriers and Tracers
Carriers and tracers that are sometimes required for radiochemical separation procedures usually
are added to samples before dissolution in order to subject them to the same chemical treatment
as the analyte. Addition as soon as practical promotes equilibrium with the analyte. The dissolu-
tion process tends to bring the carriers and tracers to the same oxidation state as the analyte and
ensures complete mixing of all the components in solution. Acid mixtures also create a large
hydrogen-ion concentration that minimizes the tendency of cations to hydrolyze and subsequently
form insoluble complexes. Detailed discussions of carriers and tracers as well as radioactive
equilibrium are found in Section 14.9, “Carriers and Tracers,” Section 14.10, “Analysis of
Specific Radionuclides,” and Attachment 14A, “Radioactive Decay and Equilibrium.” The
immediate and final forms of these tracers, carriers, and analytes are crucial information during
the analytical process. During each of the steps in a given separation method, the analyst should
be aware of the expected oxidation states of the analyte and its tendency to hydrolyze, polymer-
ize, and form complexes and radiocolloids, and other possible interactions. Knowledge of these
processes will ensure that the analyst will be able to recognize and address problems if they arise.
13.3 Fusion Techniques
Sample decomposition through fusion is employed most often for samples that are difficult to
dissolve in acids such as soils, sludges, silicates, and some metal oxides. Fusion is accomplished
by heating a salt (the flux) mixed with an appropriate amount of sample. The mixture is heated to
a temperature above the melting point of the salt, and the sample is allowed to react in the molten
mixture. When the reaction is completed, the mixture is allowed to cool to room temperature.
The fused sample is then dissolved, and the analysis is continued. Any residue remaining may be
treated by repeating the fusion with the same salt, performing a fusion with a different salt, acid
treatment, or any combination of the three.
Decomposition of the sample matrix depends on the high temperatures required to melt a flux
salt and the ratio of the flux salt to the sample. For a fusion to be successful, the sample must
contain chemically bound oxygen as in oxides, carbonates, and silicates. Samples that contain no
chemically bound oxygen, such as sulfides, metals, and organics, must be oxidized before the
fusion process.
Samples to be fused should be oven-dried to remove moisture. Samples with significant amounts
of organic material are typically dry ashed or wet ashed before fusion. Solid samples are ground
to increase the surface area, allowing the fusion process to proceed more readily. The sample
must be mixed thoroughly with the flux in an appropriate ratio. Generally, the crucible should
never be more than half-filled at the outset of the fusion process. Fusions may be performed
using sand or oil baths on a hot plate, in a muffle furnace, or over a burner. Crucibles are made of
platinum, zirconium, nickel, or porcelain (Table 13.1). The choice of heat source and crucible

Sample Dissolution
13-7
JULY 2004 MARLAP
material generally depends on the salt used for the fusion.
During fusion, samples are heated slowly and evenly to prevent ignition of the sample before the
reaction with the molten salt can begin. It is especially important to raise the temperature slowly
when using a gas flame because the evolution of water and gases is a common occurrence at the
beginning of the fusion, and hence a source of spattering. The crucible can be covered with a lid
as an added precaution. Sand and oil baths provide the most even source of heat, but they are
difficult to maintain at very high temperatures. Muffle furnaces provide an even source of heat,
but when using them it is difficult to monitor the progress of the reaction and impossible to work
with the sample during the fusion. Burners are used often as a convenient heat source although
they make it difficult to heat the sample evenly.
TABLE 13.1 — Common fusion fluxes
Flux
(mp, EC)
Fusion
Temperature, EC
Type of
Crucible Types of Sample Decomposed
Na2S2O7 (403E) or
K2S2O7 (419E)Up to red heat Pt, quartz,
porcelain
For insoluble oxides and oxide-containing samples,
particularly those of Al, Be, Ta, Ti, Zr, Pu, and the
rare earths.
NaOH (321E)
or
KOH (404E)
450-600ENi, Ag, glassy
carbon For silicates, oxides, phosphates, and fluorides.
Na2CO3 (853) or
K2CO3 (903) 900-1,000ENi
Pt for short
periods (use lid)
For silicates and silica-containing samples (clays,
minerals, rocks, glasses), refractory oxides, quartz,
and insoluble phosphates and sulfates.
Na2O2600ENi; Ag, Au, Zr;
Pt (<500 EC)
For sulfides; acid-insoluble alloys of Fe, Ni, Cr, Mo,
W, and Li; Pt alloys; Cr, Sn, and Zn minerals.
H3BO3250EPt For analysis of sand, aluminum silicates, titanite,
natural aluminum oxide (corundum), and enamels.
Na2B4O7 (878E) 1,000-1,200EPt
For Al2O3; ZrO2 and zirconium ores, minerals of the
rare earths, Ti, Nb, and Ta, aluminum-containing
materials; iron ores and slags.
Li2B4O7 (920E)
or
LiBO2 (845E)
1,000-1,100EPt, graphite
For almost anything except metals and sulfides. The
tetraborate salt is especially good for basic oxides and
some resistant silicates. The metaborate is better
suited for dissolving acidic oxides such as silica and
TiO2 and nearly all minerals.
NH4HF2 (125E) NaF
(992E)
KF (857E)
or
KHF2 (239E)
900EPt
For the removal of silicon, the destruction of silicates
and rare earth minerals, and the analysis of oxides of
Nb, Ta, Ti, and Zr.
Source: Dean (1995) and Bock (1979).
The maximum temperature employed varies considerably and depends on the sample and the
flux. In order to minimize attack of the crucible and decomposition of the flux, excessive
temperatures should be avoided. Once the salt has melted, the melt is swirled gently to monitor
the reaction. The fusion continues until visible signs of reaction are completed (e.g., formation of

Sample Dissolution
13-8
MARLAP JULY 2004
gases, foaming, fumes). It is frequently difficult to decide when heating should be discontinued.
In ideal cases, a clear melt serves to indicate the completeness of sample decomposition. In other
cases, it is not as obvious, and the analyst must base the heating time on past experience with the
sample type.
The melt sometimes is swirled during cooling to spread it over the inside of the crucible. Thin
layers of salt on the sides of the crucible often will crack and flake into small pieces during
cooling. These small fragments are easier to remove and dissolve.
After the sample has returned to room temperature, the fused material is dissolved. The solvent is
usually warm water or a dilute acid solution, depending on the salt. For example, dilute acid
typically would not be used to dissolve a carbonate fusion because of losses to spray caused by
release of CO2. The aqueous solution from the dissolution of the fusion melt should be examined
carefully for particles of undissolved sample. If undissolved particles are present, they should be
separated from solution by centrifugation or filtration, and a second fusion should be performed.
Several types of materials are used for crucibles, but platinum, other metals (Ni, Zr, Ag), and
graphite are most common. Graphite crucibles are a cost-effective alternative to metal crucibles;
they are disposable, which eliminates the need for cleaning and the possibility of cross-sample
contamination. Graphite crucibles are chemically inert and heat-resistant, although they do
oxidize slowly at temperatures above 430 EC. Graphite is not recommended for extremely
lengthy fusions or for reactions where the sample may be reduced. Platinum is probably the most
commonly used crucible material. It is virtually unaffected by most of the usual acids, including
hydrofluoric, and it is attacked only by concentrated phosphoric acid at very high temperatures,
and by sodium carbonate. However, it dissolves readily in mixtures of hydrochloric and nitric
acids (aqua regia), nitric acid containing added chlorides, or chlorine water or bromine water.
Platinum offers adequate resistance toward molten alkali metal, borates, fluorides, nitrates, and
bisulfates. When using a platinum crucible, one should avoid using aqua regia, sodium peroxide,
free elements (C, P, S, Ag, Bi, Cu, Pb, Zn, Se, and Te), ammonium, chlorine and volatile
chlorides, sulfur dioxide, and gases with carbon content. Platinum crucibles can be cleaned in
boiling HNO3, by hand cleaning with sea sand or by performing a blank fusion with sodium
hydrogen sulfate.
Many kinds of salts are used in fusions. The lowest melting flux capable of reacting completely
with the sample is usually the optimum choice. Basic fluxes, such as the carbonates, the
hydroxides, and the borates, are used to attack acidic materials. Sodium or potassium nitrate may
be added to furnish an oxidizing agent when one is needed, as with the sulfides, certain oxides,
ferroalloys, and some silicate materials. The most effective alkaline oxidizing flux is sodium
peroxide; it is both a strong base and a powerful oxidizing agent. Because it is such a strong
alkali, sodium peroxide is often used even when no oxidant is required. Alternatively, acid fluxes
are the pyrosulfates, the acid fluorides, and boric acids. Table 13.1 lists several types of fusions,
examples of salts used for each type of fusion, and the melting points of the salts.

Sample Dissolution
13-9
JULY 2004 MARLAP
SULFATE FUSION is useful for the conversion of ignited oxides to sulfates, but is generally an
ineffective approach for silicates. Sulfate fusion is particularly useful for BeO, Fe2O3, Cr2O3,
MoO3, TeO2, TiO2, ZrO2, Nb2O5, Ta2O5, PuO2, and rare earth oxides (Bock, 1979). Pyrosulfate
fusions are prepared routinely in the laboratory by heating a mixture of sodium or potassium
sulfate with a stoichiometric excess of sulfuric acid:
Na2SO4 + H2SO4 6 [2NaHSO4] 6 Na2S2O7 + H2O
Na2S2O7 6 Na2SO4 + SO38
Na2SO4 etc.
The rate of heating is increased with time until the sulfuric acid has volatilized and a clear
pyrosulfate fusion is obtained. A pyrosulfate melt can be reprocessed if necessary to achieve
complete sample dissolution. The analyst must distinguish between insoluble material that has
not yet or will not dissolve, and material that has precipitated during the final stages of a
prolonged pyrosulfate fusion. In the latter situation the fusion must be cooled, additional sulfuric
acid added, and the sample refused until the precipitated material redissolves and a clear melt is
obtained. Otherwise, the precipitated material will be extremely difficult, if not impossible, to
dissolve in subsequent steps. Platinum or quartz crucibles are recommended for this type of
fusion, with quartz being preferred for analysis of the platinum group metals. After the melt is
cooled and solidified, it should be dissolved in dilute sulfuric or hydrochloric acid rather than in
water to avoid hydrolysis and precipitation of Ti, Zr, etc. Niobium and tantalum may precipitate
even in the presence of more concentrated acid. In order to avoid precipitation of Nb or Ta,
concentrated sulfuric acid, tartaric acid, ammonium oxalate, hydrogen peroxide, or hydrofluoric
acid must be used. Mercury and the anions of volatile acids are largely volatilized during these
fusion procedures.
13.3.1 Alkali-Metal Hydroxide Fusions
Alkali metal hydroxide fusions are used for silicate analysis of ash and slag; for decomposition of
oxides, phosphates, and fluorides (Bock, 1979, pp. 102-108); and for dissolution of soils for
actinide analyses (Smith et al., 1995). Sodium hydroxide (NaOH) generally is used because of its
lower melting point, but potassium hydroxide (KOH) is just as effective. These fusions generally
are rapid, the melts are easy to dissolve in water, and the losses due to volatility are reduced
because of the low temperature of the melt. Nickel, silver, or glassy carbon crucibles are
recommended for this type of fusion. The maximum suggested temperature for nickel crucibles is
600 EC, but silver crucibles can be used up to 700 EC. Generally, crucibles made of platinum,
palladium, and their alloys should not be used with hydroxide fusions because the crucibles are
easily attacked in the presence of atmospheric oxygen. The weight ratio of fusion salt to sample
is normally 5-10:1. Typically, these fusions are carried out below red heat at 450 to 500 EC for
15 to 20 minutes, or sometimes at higher temperatures between 600 to 700 EC for 5 to 10

Sample Dissolution
13-10
MARLAP JULY 2004
minutes. The solidified melt dissolves readily in water; and therefore, this step may be carried out
directly in the crucible, or alternatively in a nickel dish. Under no circumstances should the
dissolution be carried out in a glass vessel because the resulting concentrated hydroxide solution
attacks glass quite readily.
FUSION WITH SODIUM CARBONATE (Na2CO3) is a common procedure for decomposing silicates
(clays, rocks, mineral, slags, glasses, etc.), refractory oxides (magnesia, alumina, beryllia,
zirconia, quartz, etc.), and insoluble phosphates and sulfates (Bogen, 1978). The fusion may
result in the formation of a specific compound such as sodium aluminate, or it may simply
convert a refractory oxide into a condition where it is soluble in hydrochloric acid—this is the
method of choice when silica in a silicate is to be determined, because the fusion converts an
insoluble silicate into a mixture that is easily decomposed by hydrochloric acid (“M” represents a
metal in the equations below):
MSiO3 + Na2CO3 6 Na2SiO3 + MCO3 (or MO + CO2),
followed by acidification to form a more soluble chloride salt,
Na2SiO3 + MCO3 + 4 HCl + x H2O 6 H2SiO3 · x H2O + MCl2 + CO2 + H2O + NaCl.
Carbonate fusions provide an oxidizing melt for the analysis of chromium, manganese, sulfur,
boron, and the platinum group metals. Organic material is destroyed, sometimes violently.
Na2CO3 generally is used because of its lower melting point. However, despite its higher melting
point and hygroscopic nature, K2CO3 is preferred for niobium and tantalum analyses because the
resulting potassium salts are soluble, whereas the analogous sodium salts are insoluble.
The required temperature and duration of the fusion depend on the nature of the sample as well
as particle size. In the typical carbonate fusion, 1 g of the powdered sample is mixed with 4 to 6 g
of sodium carbonate and heated at 900 to 1,000 EC for 10 to 30 minutes. Very refractory
materials may require heating at 1,200 EC for as long as 1 to 2 hours. Silica will begin to react at
500 EC, while barium sulfate and alumina react at temperatures above 700 EC. Volatility could
be a problem at these temperatures. Mercury and thallium are lost completely, while selenium,
arsenic, and iodine suffer considerable losses. Nonsilicate samples should be dissolved in water,
while silicate samples should be treated with acid (Bock, 1979).
Platinum crucibles are recommended for fusion of solid samples even though there is a 1 to 2 mg
loss of platinum per fusion. Attack on the crucible can be reduced significantly by covering the
melt with a lid during the fusion process, or virtually eliminated by working in an inert atmos-
phere. Moreover, nitrate is often added to prevent the reduction of metals and the subsequent
alloying with the platinum crucibles. The platinum crucibles may be seriously attacked by
samples containing high concentrations of Fe2+, Fe3+, Sn4+, Pb2+, and compounds of Sb and As,
because these ions are reduced easily to the metallic state and then form intermetallic alloys with

Sample Dissolution
13-11
JULY 2004 MARLAP
platinum that are not easily dissolved in mineral acids. This problem is especially prevalent when
fusion is carried out in a gas flame. Porcelain crucibles are corroded rapidly and should be
discarded after a single use.
13.3.2 Boron Fusions
Fusions with boron compounds are recommended for analysis of sand, slag, aluminum silicates,
alumina (Al2O3), iron and rare earth ores, zirconium dioxide, titanium, niobium, and tantalum.
Relatively large amounts of flux are required for these types of fusions. The melts are quite
viscous and require swirling or stirring, so they should not be performed in a furnace. Platinum
crucibles should be used for these fusions because other materials are rapidly attacked by the
melt, even though some platinum is lost in each fusion.
BORIC ACID (H3BO3) can be used to fuse a number of otherwise inert substances such as sand,
aluminum silicates, titanite, natural aluminum oxide (corundum), and enamels. Boric acid
fusions generally require 4 to 8 times as much reagent as sample. Initially, the mixture should be
heated cautiously while water is being driven off, then more strongly until gas evolution is
completed, and then more vigorously if the sample has yet to be fully decomposed. Normally, the
procedure is complete within 20 to 30 minutes. The cooled and solidified melt usually is
dissolved in dilute acid. Additionally, boric acid has one great advantage over all other fluxes in
that it can be completely removed by addition of methanol and subsequent volatilization of the
methyl ester.
Because MOLTEN SODIUM TETRABORATE (Na2B4O7) dissolves so many inorganic compounds, it is
an important analytical tool for dissolving very resistant substances. Fusions with sodium tetra-
borate alone are useful for Al2O3, ZrO2 and zirconium ores, minerals of the rare earths, titanium,
niobium, and tantalum, aluminum-containing materials, and iron ores and slags (Bock, 1979).
Relatively large amounts of borax are mixed with the sample, and the fusion is carried out at a
relatively high temperature (1,000 to 1,200 EC) until the melt becomes clear. Thallium, mercury,
selenium, arsenic, and the halogens are volatilized under these conditions. Boric acid can be
removed from the melt as previously described. By dissolving the melt in dilute hydrofluoric
acid, calcium, thorium, and the rare earths can be separated from titanium, niobium, and tantalum
as insoluble fluorides.
LITHIUM METABORATE (Li2B4O7) is well-suited for dissolving basic oxides, such as alumina
(Al2O3), quicklime (CaO), and silicates. Platinum dishes are normally used for this type of fusion,
but occasionally graphite crucibles are advantageous because they can be heated rapidly by
induction, and because they are not wetted by Li2B4O7 melts. The fusion melt typically is
dissolved in dilute acid, usually nitric but sometimes sulfuric. When easily hydrolyzed metal ions
are present, dissolution should be carried out in the presence of ethylenediamine tetracetic acid
(EDTA) or its di-sodium salt in 0.01 M HCl (Bock, 1979).

Sample Dissolution
13-12
MARLAP JULY 2004
LITHIUM METABORATE (LiBO2), or a mixture of the meta- and tetraborates, is a more basic
flux and is better for dissolving highly acidic oxides or very insoluble ones, such as silica (SiO2)
or rutile (TiO2). The metaborate is, however, suitable for dissolving all metal oxides. After the
melt of sample and metaborate are dissolved, hydrogen peroxide should be used to maintain the
titanium in solution.
13.3.3 Fluoride Fusions
Fluoride fusions are used for the removal of silicon, the destruction of silicates and rare earth
minerals, and the analysis of oxides of niobium, tantalum, titanium, and zirconium. Sill et al.
(1974) and Sill and Sill (1995) describe a method using potassium fluoride/potassium pyrosulfate
fusion for determining alpha-emitting nuclides in soil (see Section 13.8, “Comparison of Total
Dissolution and Acid Leaching”). Sulcek and Povondra (1989) describe the isolation of the rare
earth elements and thorium from silicate materials and their minerals, especially monazite,
through potassium hydrofluoride fusion. The silicate matrix is first degraded by evaporation with
HF, then the residue is fused with tenfold excess flux, and finally the melt is digested with dilute
acid. The resulting fluorides (rare earths + Th + Ca + U) are filtered out, dissolved, and further
separated.
Platinum crucibles are recommended for fluoride fusions. Silicon, boron, lead, and polonium are
volatilized during these fusion procedures, and if the temperature is high enough, some
molybdenum, tantalum, and niobium also are lost. Residual fluoride can be a problem for
subsequent analysis of many elements such as aluminum, tin, beryllium, and zirconium. This
excess fluoride usually is removed by evaporation with sulfuric acid.
13.3.4 Sodium Hydroxide Fusion
Burnett et al. (1997) presented a technique that employs sodium hydroxide as the fusion agent in
a 5:1 ratio to the soil. The fusion is performed in an alumina crucible, and deioinized water is
added to the resultant cake. Sufficient iron exists in most samples to from an Fe(OH)3 scavenging
precipitate for the actinides. The addition of sodium formaldehyde sulfoxylate (“Rongalite”)
ensures all actinides are in the +4 or +3 valence state.
13.4 Wet Ashing and Acid Dissolution Techniques
“Wet ashing” and “acid dissolution” are terms used to describe sample decomposition using hot,
concentrated acid solutions. Because many inorganic matrices such as oxides, silicates, nitrides,
carbides, and borides can be difficult to dissolve completely, geological or ceramic samples can
be particularly challenging. Therefore, different acids are used alone or in combination to decom-
pose specific compounds that may be present in the sample. Few techniques will decompose all
types of samples completely. Many decomposition procedures use wet ashing to dissolve the

Sample Dissolution
13-13
JULY 2004 MARLAP
major portion of the sample but leave a minor fraction as residue. Whether or not this residue
requires additional treatment (by wet ashing or fusion) depends on the amount of residue and
whether it is expected to contain the radionuclides of interest. The residue should not be
discarded until all of the results have been reviewed and determined to be acceptable.
13.4.1 Acids and Oxidants
Numerous acids are commonly used in wet ashing procedures. Table 13.2 lists several acids and
the types of compounds they generally react with during acid dissolution. The electromotive
force series (Table 13.3) is a summary of oxidation-reduction half-reactions arranged in
decreasing oxidation strength and is also useful in selecting reagent systems (Dean, 1995).
TABLE 13.2 — Examples of acids used for wet ashing
Acid Typical Uses
Hydrofluoric Acid, HF Removal of silicon and destruction of silicates; dissolves oxides of Nb, Ta,
Ti, and Zr, and Nb, and Ta ores.
Hydrochloric Acid, HCl Dissolves many carbonates, oxides, hydroxides, phosphates, borates, and
sulfides; dissolves cement.
Hydrobromic Acid, HBr Distillation of bromides (e.g., As, Sb, Sn, Se).
Hydroiodic Acid, HI Effective reducing agent; dissolves Sn+4 oxide and Hg+2 sulfide.
Sulfuric Acid, H2SO4
Dissolves oxides, hydroxides, carbonates, and various sulfide ores; hot
concentrated acid will oxidize most organic compounds.
Phosphoric Acid, H3PO4Dissolves Al2O3, chrome ores, iron oxide ores, and slag.
Nitric Acid, HNO3
Oxidizes many metals and alloys to soluble nitrates; organic material
oxidized slowly.
Perchloric Acid, HClO4
Extremely strong oxidizer; reacts violently or explosively to oxidize organic
compounds; attacks nearly all metals.
The table allows one to predict which metals will dissolve in nonoxidizing acids, such as hydro-
chloric, hydrobromic, hydrofluoric, phosphoric, dilute sulfuric, and dilute perchloric acid The
dissolution process is simply a replacement of hydrogen by the metal (Dean, 1995). In practice,
however, what actually occurs is influenced by a number of factors, and the behavior of the
metals cannot be predicted from the potentials alone. Generally, metals below hydrogen in Table
13.3 displace hydrogen and dissolve in nonoxidizing acids with the evolution of hydrogen.
Notable exceptions include the very slow dissolution by hydrochloric acid of lead, cobalt, nickel,
cadmium, and chromium. Also, lead is insoluble in sulfuric acid because of the formation of a
surface film of insoluble lead sulfate.

Sample Dissolution
13-14
MARLAP JULY 2004
TABLE 13.3 — Standard reduction potentials of
selected half-reactions at 25 EC
Half-Reaction E0 (volts) Half-Reaction E0 (volts)
Ag2+ + e! 6 Ag+......................... 1.980 I!
3 + 3e! 6 3I!.................. 0.536
S2O8
2- + 2e! 6 2SO4
2- ..................... 1.96 I2 + 2e! 6 2I!.................. 0.536
Ce4+ + e! 6 Ce3+ ......................... 1.72 Cu+ + e! 6 Cu .................. 0.53
MnO4
! + 4H+ + 3e! 6 MnO2 (s) + 2H2O ...... 1.70 4H2SO3 + 4H+ + 6e! 6 S4O6
2- + 6H2O 0.507
2HClO + 2H+ + 2e! 6 Cl2 + 2H2O ........... 1.630 Ag2CrO4 + 2e! 6 2Ag + CrO4
2- .... 0.449
2HBrO + 2H+ + 2e! 6 Br2 + 2H2O ........... 1.604 2H2SO3 + 2H+ + 4e! 6 S2O3
2- + 3H2O 0.400
NiO2 + 4H+ + 2e! 6 Ni2+ + 2H2O ............ 1.593 UO2
+ + 4H+ + e! 6 U4+ + 2H2O .... 0.38
Bi2O4 (bismuthate) + 4H+ + 2e! 6 2BiO+ + 2H2O 1.59 Cu2+ + 2e! 6 Cu ................ 0.340
MnO4
! + 8H+ + 5e! 6 Mn2+ + 4H2O.......... 1.51 VO2+ + 2H+ + e! 6 V3+ + H2O ..... 0.337
2BrO3
! + 12H+ + 10e! 6 Br2 + 6H2O ......... 1.478 BiO+ + 2H+ + 3e! 6 Bi + H2O ..... 0.32
PbO2 + 4H+ + 2e! 6 Pb2+ + 2H2O............ 1.468 UO2
2+ + 4H+ + 2e! 6 U4+ + 2H2O . . . 0.27
Cr2O7
2- + 14H+ + 6e! 6 2Cr3+ + 7H2O ........ 1.36 Hg2Cl2 (s) + 2e! 6 2Hg + 2Cl!..... 0.2676
Cl2 + 2e! 6 2Cl!......................... 1.3583 AgCl (s) + e! 6 Ag + Cl!......... 0.2223
2HNO2 + 4H+ + 4e! 6 N2O + 3H2O .......... 1.297 SbO+ + 2H+ + 3e! 6 Sb + H2O ..... 0.212
MnO2 + 4H++ 2e! 6 Mn2+ + 2H2O ........... 1.23 CuCl3
2- + e! 6 Cu + 3Cl!......... 0.178
O2 + 4H+ + 4e! 6 2H2O ................... 1.229 SO4
2- + 4H+ + 2e! 6 H2SO3 + H2O . . 0.158
ClO4
! + 2H+ + 2e! 6 ClO!
3 + H2O ........... 1.201 Sn4+ + 2e! 6 Sn2+ ............... 0.15
2IO3
! + 12H+ + 10e! 6 I2 + 3H2O............ 1.19 CuCl + e! 6 Cu + Cl!............ 0.121
N2O4 + 2H+ + 2e! 6 2HNO2................ 1.07 TiO2+ + 2H+ + e- 6 Ti3+ + H2O ..... 0.100
2ICl!
2 + 2e! 6 4Cl! + I2................... 1.07 S4O6
2- + 2e! 6 2S2O3
2- ............ 0.08
Br2 (aq) + 2e! 6 2Br-..................... 1.065 2H+ + 2e! 6 H2................. 0.0000
N2O4 + 4H+ + 4e! 6 2NO + 2H2O ........... 1.039 Hg2I2 (s) + 2e! 6 2Hg + 2I!....... -0.0405
HNO2 + H+ + e! 6 NO + H2O............... 0.996 Pb2+ + 2e! 6 Pb................. -0.125
NO3
! + 4H+ + 3e! 6 NO + 2H2O ............ 0.957 Sn2+ + 2e! 6 Sn................. -0.136
NO3
! + 3H+ + 2e! 6 HNO2 + H2O ........... 0.94 AgI (s) + e! 6 Ag + I!........... -0.1522
2Hg2+ + 2e! 6 Hg2
2+ ...................... 0.911 V3+ + e! 6 V2+ .................. -0.255
Cu2+ + I! + e! 6 CuI (s) ................... 0.861 Ni2+ + 2e! 6 Ni ................. -0.257
OsO4 (s) + 8H+ + 8e! 6 Os + 4H2O .......... 0.84 Co2+ + 2e! 6 Co ................ -0.277
Ag+ + e! 6 Ag........................... 0.7991 PbSO4 + 2e! 6 Pb + SO4
2- ........ -0.3505
Hg2
2+ + 2e! 6 2Hg ....................... 0.7960 Cd2+ + 2e! 6 Cd ................ -0.4025
Fe3+ + e! 6 Fe2+ .......................... 0.771 Cr3+ + e! 6 Cr2+ ................. -0.424
H2SeO3 + 4H+ + 4e! 6 Se + 3H2O ........... 0.739 Fe2+ + 2e! 6 Fe ................. -0.44
HN3 + 11H+ + 8e! 6 3NH4
+................ 0.695 H3PO3 + 2H+ + 2e! 6 HPH2O2 + H2O -0.499
O2 + 2H+ + 2e- 6 H2O2.................... 0.695 U4+ + e! 6 U3+ .................. -0.52
Ag2SO4 + 2e! 6 2Ag + SO4
2- ............... 0.654 Zn2+ + 2e! 6 Zn ................ -0.7626
Cu2+ + Br! + e! 6 CuBr (s)................. 0.654 Mn2+ + 2e! 6 Mn ............... -1.18
2HgCl2 + 2e! 6 Hg2Cl2 (s) + 2Cl!........... 0.63 Al3+ + 3e! 6 Al ................. -1.67
Sb2O5 + 6H+ + 4e! 6 2SbO+ + 3H2O ......... 0.605 Mg2+ + 2e! 6 Mg ............... -2.356
H3AsO4 + 2H+ + 2e! 6 HAsO2 + 2 H2O....... 0.560 Na+ + e! 6 Na .................. -2.714
TeOOH+ + 3H+ + 4e! 6 Te + 2H2O .......... 0.559 K+ + e! 6 K.................... -2.925
Cu2+ + Cl! + e! 6 CuCl (s) ................. 0.559 Li+ + e! 6 Li ................... -3.045
3N2 + 2H+ + 2e! 6 2HN3......... -3.1
Source: Dean, 1995.

Sample Dissolution
13-15
JULY 2004 MARLAP
Oxidizing acids, such as nitric acid, hot concentrated sulfuric acid, or hot concentrated perchloric
acid, are used to dissolve metals whose E0 values are greater than hydrogen. For nitric acid, the
potential of the nitrate ion-nitric oxide couple can be employed as a rough estimate of the solvent
power. For aqua regia, the presence of free chlorine ions allows one to make predictions based
upon the potential of the chlorine-chloride couple, although NOCl also plays a significant role.
Some oxidizing acids exhibit a passivating effect with transition elements such as chromium and
pure tungsten, resulting in a very slow attack because of the formation of an insoluble surface
film of the oxide in the acid (Bogen, 1978). Moreover, oxides are often resistant to dissolution in
oxidizing acids and, in fact, dissolve much more readily in nonoxidizing acids. A common
example is ferric oxide, which is readily soluble in hydrochloric acid but is relatively inert in
nitric acid.
However, insoluble oxides of the lower oxidation states of an element sometime dissolve in
oxidizing acids with concurrent oxidation of the element. For example, UO2 and U3O8 dissolve
readily in nitric acid to produce a solution of uranyl ion (UO2
+2).
HYDROFLUORIC ACID. The most important property of HF is its ability to dissolve silica and
other silicates. For example:
SiO2 + 6HF 6 H2SiF6 + 2H2O
whereby the fluorosilicic acid formed dissociates into gaseous silicon tetrafluoride and hydrogen
fluoride upon heating:
H2SiF6 6 SiF48 + 2HF
HF also exhibits pronounced complexing properties that are widely used in analytical chemistry.
Hydrofluoric acid prevents the formation of sparingly soluble hydrolytic products in solution,
especially of compounds of elements from the IV to VI groups of the periodic table (Sulcek and
Povondra, 1989). In the presence of fluoride, soluble hydrolytic products that are often polymeric
depolymerize to form reactive monomeric species suitable for further analytical operations.
Formation of colloidal solutions is avoided and the stability of solutions is increased even with
compounds of elements that are hydrolyzed easily in aqueous solution (e.g., Si, Sn, Ti, Zr, Hf,
Nb, Ta, and Pa).
HF should never be used or stored in glass, or porcelain containers. Digestion in platinum
containers is preferred, and Teflon™ is acceptable as long as the temperature does not exceed
250 EC. This would occur only with HF if the mix were taken to dryness, because the constant
boiling azeotrope is 112 EC. HF works most effectively when used alone, as all other acids or
oxidizing agents used are less volatile than HF and would cause the HF concentration to be
decreased at elevated temperatures. HF is most effective when used on a solid residue. Samples
should be ground to a fine powder to increase the surface area and moistened with a minimal

Sample Dissolution
13-16
MARLAP JULY 2004
amount of water to prevent losses as dust and spray when the acid is added to the sample. After
the addition of HF, the sample may be allowed to react overnight to dissolve the silicates.
However, heating the solution to 80 EC will allow reaction to occur within 1-2 hours. Because it
is such a strong complexing agent, excess fluoride ion can cause problems with many separation
methods. Residual fluoride is usually removed by evaporation to fumes in a low-volatility acid
(e.g., H2SO4, HNO3, HClO4) or, in extreme cases, excess fluoride ion can be removed by fusing
the residue with boric acid or sodium tetraborate. The fluorides are converted to BF3 that is then
removed by evaporation.
HYDROCHLORIC ACID (HCl) is one of the most widely used acids for sample dissolution because
of the wide range of compounds it reacts with and the low boiling point of the azeotrope
(110 EC); after a period of heating in an open container, a constant boiling 6M solution remains.
HCl forms strong complexes with Au+3, Ti+3, and Hg+2. The concentrated acid will also complex
Fe+3, Ga+3, In+3, and Sn+4. Most chloride compounds are readily soluble in water except for silver
chloride, mercury chloride, titanium chloride, and lead chloride. HCl can be oxidized to form
chlorine gas by manganese dioxide, permanganate, and persulfate. While HCl dissolves many
carbonates, oxides, hydroxides, phosphates, borates, sulfides, and cement, it does not dissolve the
following:
• Most silicates or ignited oxides of Al, Be, Cr, Fe, Ti, Zr, or Th;
• Oxides of Sn, Sb, Nb, or Ta;
• Zr phosphate;
• Sulfates of Sr, Ba, Ra, or Pb;
• Alkaline earth fluorides;
• Sulfides of Hg; or
• Ores of Nb, Ta, U, or Th.
The dissolution behavior of specific actinides by hydrochloric acid is discussed by Sulcek and
Povondra (1989):
“The rate of decomposition of oxidic uranium ores depends on the U(VI)/U(+4) ratio.
The so-called uranium blacks with minimal contents of U(+4) are even dissolved in dilute
hydrochloric acid. Uraninite (UO2) requires an oxidizing mixture of hydrochloric acid
with hydrogen peroxide, chlorate, or nitric acid for dissolution. Uranium and thorium
compounds cannot be completely leached from granites by hydrochloric acid. Natural and
synthetic thorium dioxides are highly resistant toward hydrochloric acid and must be
decomposed in a pressure vessel. Binary phosphates of uranyl and divalent cations, e.g.,
autunite and tobernite, are dissolved without difficulties. On the other hand, phosphates
of thorium, tetravalent uranium, and the rare earths (monazite and xenotime) are only
negligibly attacked, even with the concentrated acid.”
As+3, Sb+3, Ge+3, and Se+4 are volatilized easily in HCl solutions, while Hg+2, Sn+4, and Rh(VII)

Sample Dissolution
13-17
JULY 2004 MARLAP
are volatilized in the latter stages of evaporation. Glass is the preferred container for HCl
solutions.
HYDROBROMIC ACID (HBr) has no important advantages over HCl for sample dissolution. HBr
forms an azeotrope with water containing 47.6 percent by weight of HBr, boiling at 124.3 EC.
HBr is used to distill off volatile bromides of arsenic, antimony, tin, and selenium. HBr can also
be used as a complexing agent for liquid-liquid extractions of gold, titanium, and indium.
HYDROIODIC ACID (HI) is readily oxidized. Solutions often appear yellowish-brown because of
the formation of the triiodide complex (I!
3). HI is most often used as a reducing agent during
dissolutions. HI also dissolves Sn+4 oxide, and complexes and dissolves Hg+2 sulfide. HI forms an
azeotrope with water containing 56.9 percent by weight of HI, boiling at 127 EC.
SULFURIC ACID (H2SO4) is another widely used acid for sample decomposition. Part of its
effectiveness is due to its high boiling point (about 340 EC). Oxides, hydroxides, carbonates, and
sulfide ores can be dissolved in H2SO4. The boiling point can be raised by the addition of sodium
or potassium sulfate to improve the attack on ignited oxides, although silicates will still not
dissolve. H2SO4 is not appropriate when calcium is a major constituent because of the low
solubility of CaSO4. Other inorganic sulfates are typically soluble in water, with the notable
exceptions of strontium, barium, radium, and lead.
Non-fuming H2SO4 does not exhibit oxidizing properties, but the concentrated acid will dissolve
many elements and react with almost all organic compounds. Concentrated sulfuric acid is a
powerful dehydrating agent. Its action on organic materials is a result of removing OH and H
groups (to form water) from adjacent carbon atoms. This forms a black char (residue) that is not
easily dissolved using wet-ashing techniques. Moreover, because of the high boiling point of
H2SO4, there is an increased risk of losses because of volatilization. Iodine can be distilled
quantitatively, and boron, mercury, selenium, osmium, ruthenium, and rhenium may be lost to
some extent. The method of choice is to oxidize the organic substances with HNO3, volatilize the
nitric acid, add H2SO4 until charred, followed by HNO3 again, repeating the process until the
sample will not char with either HNO3 or H2SO4. Dissolution is then continued with HClO4.
Glass, quartz, platinum, and porcelain are resistant to H2SO4 up to the boiling point. Teflon™
should not be used above 250 EC, and, therefore, it is not recommended for applications
involving concentrated H2SO4 that require elevated temperature.
Glass, quartz, platinum, and porcelain are resistant to H2SO4 up to the boiling point. Teflon
decomposes at 300 EC, below the boiling point, and, therefore, is not recommended for
applications involving H2SO4 that require elevated temperature.
PHOSPHORIC ACID (H3PO4) seldom is used for wet ashing because the residual phosphates
interfere with many separation procedures. H3PO4 attacks glass, although glass containers are
usually acceptable at temperatures below 300 EC. Alumina, chromium ores, iron oxide ores, and

Sample Dissolution
13-18
MARLAP JULY 2004
slags can be dissolved in H3PO4. The acid also has been used to dissolve silicates selectively
without attacking quartz.
NITRIC ACID (HNO3) is one of the most widely used oxidizing acids for sample decomposition.
Most metals and alloys are oxidized to nitrates, which are usually very soluble in water, although
many metals exhibit a pronounced tendency to hydrolyze in nitric acid solution. Nitric acid does
not attack gold, hafnium, tantalum, zirconium, and the metals of the platinum group (except
palladium). Aluminum, boron, chromium, gallium, indium, niobium, thorium, titanium, calcium,
magnesium, and iron form an adherent layer of insoluble oxide when treated with HNO3, thereby
passivating the metal surface. However, calcium, magnesium, and iron will dissolve in more
dilute acid.
Complexing agents (e.g., Cl!, F!, citrate, tartrate) can assist HNO3 in dissolving most metals. For
example, Sulcek and Povondra (1989) describe the decomposition of thorium and uranium
dioxides in nitric acid, which is catalytically accelerated by the addition of 0.05 to 0.1 M HF.
They also report that a solid solution of the mixed oxides (Pu, U)O2 or PuO2 ignited at
temperatures below 800 EC behaves analogously.
Although nitric acid is a good oxidizing agent, it usually boils away before sample oxidation is
complete. Oxidation of organic materials proceeds slowly and is usually accomplished by
repeatedly heating the solution to HNO3 fumes. Refluxing in the concentrated acid can help
facilitate the treatment, but HNO3 is seldom used alone to decompose organic materials.
PERCHLORIC ACID (HClO4). Hot concentrated solutions of HClO4 act as a powerful oxidizer, but
dilute aqueous solutions are not oxidizing. Hot concentrated HClO4 will attack nearly all metals
(except gold and platinum group metals) and oxidize them to the highest oxidation state, except
for lead and manganese, which are oxidized only to the +2 oxidation state. Perchloric acid is an
excellent solvent for stainless steel, oxidizing the chromium and vanadium to the hexavalent and
pentavalent acids, respectively. Many nonmetals also will react with HClO4. Because of the
violence of the oxidation reactions, HClO4 is rarely used alone for the destruction of organic
materials. H2SO4 or HNO3 are used to dilute the solution and break down easily oxidized material
before HClO4 becomes an oxidizer above 160 EC.
The concentrated acid is a dangerous oxidant that can explode violently. The following are
examples of some reactions with HClO4 that should never be attempted:
• Heating bismuth metal and alloys with concentrated acid.
• Dissolving metals (e.g., steel) in concentrated acid when gaseous hydrogen is heated.
• Heating uranium turnings or powder in concentrated acid.
• Heating finely divided aluminum and silicon in concentrated acid.
• Heating antimony or Sb+3 compounds in HClO4.
• Mixing HClO4 with hydrazine or hydroxylamine.

Sample Dissolution
13-19
JULY 2004 MARLAP
• Mixing HClO4 with hypophosphates.
• Mixing HClO4 with fats, oils, greases, or waxes.
• Evaporating solutions of metal salts to dryness in HClO4.
• Evaporating alcoholic filtrates after collection of KClO4 precipitates.
• Heating HClO4 with cellulose, sugar, and polyhydroxy alcohols.
• Heating HClO4 with N-heterocyclic compounds.
• Mixing HClO4 with any dehydrating agent.
Perchloric acid vapor should never be allowed to contact organic materials such as rubber
stoppers. The acid should be stored only in glass bottles. Splashed or spilled acid should be
diluted with water immediately and mopped up with a woolen cloth, never cotton. HClO4 should
only be used only in specially designed fume hoods incorporating a washdown system.
Acid dissolutions involving HClO4 should only be performed by analysts experienced in working
with this acid. When any procedure is designed, the experimental details should be recorded
exactly. These records are used to develop a detailed standard operating procedure that must be
followed exactly to ensure the safety of the analyst (Schilt, 1979).
AQUA REGIA. One part concentrated HNO3 and three parts concentrated HCl (by volume) are
combined to form aqua regia:
3HCl + HNO3 6 NOCl + Cl2 + 2H2O
However, the interaction of these two acids is much more complex than indicated by this simple
equation. Both the elemental chlorine and the trivalent nitrogen of the nitrosyl chloride exhibit
oxidizing effects, as do other unstable products formed during the reaction of these two acids.
Coupled with the catalytic effect of Cl2 and NOCl, this mixture combines the acidity and
complexing power of the chloride ions. The solution is more effective if allowed to stand for 10
to 20 minutes after it is prepared.
Aqua regia dissolves sulfides, phosphates, and many metals and alloys including gold, platinum,
and palladium. Ammonium salts are decomposed in this acid mixture. Aqua regia volatilizes
osmium as the tetroxide; has little effect on rhodium, iridium, and ruthenium; and has no effect
on titanium. Oxidic uranium ores with uraninite and synthetic mixed oxides (U3O8) are dissolved
in aqua regia, with oxidation of the U+4 to UO2
+2 ions (Sulcek and Povondra, 1989). However,
this dissolution procedure is insufficient for poor ores; the resistant, insoluble fraction must be
further attacked (e.g., by sodium peroxide or borate fusion) or by mixed-acid digestion with HF,
HNO3, and HClO4.
Oxysalts, such as KMnO4 (potassium permanganate) and K2Cr2O7 (potassium dichromate), are
commonly not used to solubilize or wet ash environmental samples for radiochemical analysis
because of their limited ability to oxidize metals and the residue that they leave in the sample

Sample Dissolution
13-20
MARLAP JULY 2004
mixture. These oxysalts are more commonly used to oxidize organic compounds.
POTASSIUM PERMANGANATE (KMnO4) is a strong oxidizer whose use is limited primarily to the
decomposition of organic substances and mixtures, although it oxidizes metals such as mercury
to the ionic form. Oxidation can be performed in an acid, neutral, or basic medium; near-neutral
or basic solutions produce an insoluble residue of manganese dioxide (MnO2) that can be
removed by filtration. Oxidation in acid media leaves the Mn+2 ion in solution, which might
interfere with additional chemical procedures or analyses. Extreme caution must be taken when
using this reagent because KMnO4 reacts violently with some organic substances such as acetic
acid and glycerol, with some metals such as antimony and arsenic, and with common laboratory
reagents such as hydrochloric acid and hydrogen peroxide.
POTASSIUM DICHROMATE (K2Cr2O7) is a strong oxidizing agent for organic compounds but is not
as strong as KMnO4. K2Cr2O7 has been used to determine carbon and halogen in organic
materials, but the procedure is not used extensively. K2Cr2O7 is commonly mixed with sulfuric
acid and heated as a strong oxidizing agent to dissolve carbonaceous compounds. The Cr+3 ion
remains after sample oxidation and this might interfere with other chemical procedures or
analyses. K2Cr2O7 can react violently with certain organic substances such as ethanol and might
ignite in the presence of boron. Caution also must be observed in handling this oxidizing agent
because of human safety concerns, particularly with the hexavalent form of chromium.
SODIUM BROMATE (NaBrO3) is an oxidizing agent for organic compounds but is not used for
metals. Unlike KMnO4 and K2Cr2O7, the bromate ion can be removed from solution after sample
oxidation by boiling with excess HCl to produce water and Br2. Caution must be observed when
using this oxidizing agent because it can react violently with some organic and inorganic
substances.
13.4.2 Acid Digestion Bombs
Some materials that would not be totally dissolved by acid digestion in an open vessel on a
hotplate, can be completely dissolved in an acid digestion bomb. These pressure vessels hold
strong mineral acids or alkalies at temperatures well above normal boiling points, thereby
allowing one to obtain complete digestion or dissolution of samples that would react slowly or
incompletely at atmospheric pressure. Sample dissolution is obtained without losing volatile
elements and without adding contaminants from the digestion vessel. Ores, rock samples, glass
and other inorganic samples can be dissolved quickly using strong mineral acids such as HF,
HCl, H2SO4, HNO3, or aqua regia.
These sealed pressure vessels are lined with Teflon™, which offers resistance to cross-contamina-
tion between samples and to attack by HF. In all reactions, the bomb must never be completely
filled; there must be adequate vapor space above the contents. When working with inorganic
materials, the total volume of sample plus reagents must never exceed two-thirds of the capacity

Sample Dissolution
13-21
JULY 2004 MARLAP
of the bomb. Moreover, many organic materials can be treated satisfactorily in these bombs, but
critical attention must be given to the nature of the sample as well to possible explosive reactions
with the digestion media.
13.5 Microwave Digestion
Microwave energy as a heat source for sample digestion was first described more than 20 years
ago (Abu-Samra et al., 1975). Its popularity is derived from the fact that it is faster, cleaner, more
reproducible, and more accurate than traditional hot-plate digestion. However, until recently, this
technology has had limited application in the radiochemical laboratory because of constraints on
sample size resulting from vessel pressure limitations. Because of this drawback, microwave
dissolution was not practical for many radiochemical procedures where larger sample sizes are
dictated to achieve required detection limits. However, recent advances in vessel design and
improved detection methods, such as ICP-MS (inductively coupled plasma-mass spectrometry)
and ion chromatography have eliminated this disadvantage, and microwave dissolution is an
important radiochemical tool (Smith and Yaeger, 1996; Alvarado et al., 1996). A series of
articles in Spectroscopy describes recent advances in microwave dissolution technology
(Kammin and Brandt, 1989; Grillo, 1989 and 1990; Gilman and Engelhardt, 1989; Lautensch-
lager, 1989; Noltner et al., 1990), and Dean (1995) presents a synopsis of current microwave
theory and technology. Kingston and Jassie (1988) and Kingston and Haswell (1997) are other
excellent resources for this topic.
The American Society for Testing and Materials (ASTM) has issued several protocols for various
media. ASTM D5258 describes the decomposition of soil and sediment samples for subsequent
analyte extraction; ASTM D4309 addresses the decomposition of surface, saline, domestic, and
industrial waste water samples; and ASTM D5513 covers the multistage decomposition of
samples of cement raw feed materials, waste-derived fuels, and other industrial feedstreams for
subsequent trace metal analysis. A method for acid digestion of siliceous and organically based
matrices is given in EPA (1996).
There are various microwave instruments that may be satisfactory depending on sample
preparation considerations. The three main approaches to microwave dissolution are: focused
open-vessel, low-pressure closed-vessel, and high-pressure closed-vessel. Each has certain
advantages and disadvantages and the choice of system depends upon the application.
13.5.1 Focused Open-Vessel Systems
A focused open-vessel system has no oven but consists of a magnetron to generate microwaves, a
waveguide to direct and focus the microwaves and a cavity to contain the sample (Grillo, 1989).
Because of the open-vessel design, there is no pressure buildup during processing, and reagents
may be added during the digestion program. These systems are quite universal in that any reagent

Sample Dissolution
13-22
MARLAP JULY 2004
and any type of vessel (glass, Perfluoroalcoholoxil™ [PFA], or quartz) can be used.
The waveguide ensures that energy is directed only at the portion of the vessel in the path of the
focused microwaves thereby allowing the neck of the vessel and refluxer to remain cool and
ensuring refluxing action. Because of this refluxing action, the system maintains all elements,
even selenium and mercury. The focused microwaves cause solutions to reach higher
temperatures faster than with conventional hotplates or block-type digesters and do so with
superior reproducibility. An aspirator removes excess acid vapors and decomposition gases.
Depending on the system, up to 20 g of solids or 50 to 100 mL of liquids can be digested within
10 to 30 minutes on average.
13.5.2 Low-Pressure, Closed-Vessel Systems
These systems consist of a microwave oven equipped with a turntable, a rotor to hold the sample
vessels, and a pressure-control module (Grillo, 1990). The PFA vessels used with these systems
are limited to approximately 225 EC, and, therefore, low-boiling reagents or mixtures of reagents
should be used. Waste is minimized in these systems because smaller quantities of acid are
required. Moreover, because little or no acid is lost during the digestion, additional portions of
acid may not be required and blank values are minimized. Additionally, these sealed vessels are
limited to 100 to 300 psi (689 to 2,068 kPa), depending on the model thereby limiting the size of
organic samples utilized. However, inorganic materials such as metals, water and waste waters,
minerals, and most soils and sediments are easily digested without generating large amounts of
gaseous by-products. Typical sample sizes are on the order of 0.5 g for solids and 45 mL for
aqueous samples.
The pressure control module regulates the digestion cycle by monitoring, controlling, and
dwelling at several preferred pressure levels for specified time periods in order to obtain
complete dissolution and precise recoveries in the minimum amount of time. As the samples are
irradiated, temperatures in the vessels rise thereby increasing the pressure. The pressure
transducer will cycle the magnetron to maintain sufficient heat to hold the samples at the
programmed pressure level for a preset dwell time. The vessels are designed to vent safely in
case of excessive internal pressure.
13.5.3 High-Pressure, Closed-Vessel Systems
Recent advances in vessel design have produced microwave vessels capable of withstanding
pressures on the order of 1,500 psi (10 mPa; Lautenschlager, 1989), allowing for larger sample
sizes on the order of 1 to 2 g for soil (Smith and Yaeger, 1996) or 0.5 to 3 g for vegetation
(Alvarado et al., 1996) and, consequently, better detection limits. These high-pressure vessels are
used to digest organic and inorganic substances, such as coals, heavy oils, refractories, and
ceramic oxides, which cannot easily be digested with other techniques. Additionally, vessel
composition continues to improve. Noltner et al. (1990) have demonstrated that

Sample Dissolution
13-23
JULY 2004 MARLAP
Tetrafluorometoxil™ (TFM) vessels exhibit significantly lower blank background values from
residual contamination and reuse than vessels produced with the more traditional PFA. This
lower “memory” results in lower detection limits, a clear advantage for environmental
laboratories.
13.6 Verification of Total Dissolution
Following aggressive acid digestion or fusion, the analyst often must determine if the sample has
indeed been dissolved. This determination is made first through visual inspection for particulate
matter in the acid leachate, post-digestion solution, or dissolved fusion melt. (The analyst should
allow the solution to cool prior to making an assessment of total dissolution.) A hot digestate
may appear to be free from particulate matter. However, upon cooling, finely divided particulate
or colloidal matter may agglomerate, forming a residue. If a residue is observed, this residue
must be physically separated, or the sample digestate must be retreated to ensure a single final
aqueous phase. Sometimes these residues are inconsequential and contain no analyte of interest.
Project-specific requirements will dictate how these residues are handled.
If no particles are readily observed, small undissolved particles that are invisible to the unaided
eye may be present. A method to assess this may be to filter a duplicate cooled solution (see
Section 10.3.2, “Liquid Sample Preparation: Filtration”) and count it using a gamma spectrometer,
alpha spectrometer, or proportional counter. The analyst should focus on the analytes of interest
to assess whether any activity is lost in this residue. Finally, for those cases where the laboratory
has decided to perform an acid leaching, rather than a total dissolution or fusion, it is advisable to
perform total dissolution on a subset of the samples and compare the results to those obtained
from the acid digestion. This check will help to substantiate that the acid leaching approach is
adequate for the particular sample matrix.
13.7 Special Matrix Considerations
13.7.1 Liquid Samples
Aqueous samples usually are considered to be in solution. This may not always be true, and,
based on the objectives of the project, additional decomposition of aqueous samples may be
requested.
Most radiochemical analyses are performed in aqueous solutions. Because nonaqueous liquids
are incompatible with this requirement, these samples must be converted into an aqueous form.
In most cases, the nonaqueous liquid is simply a solvent that does not contain the radionuclide of
interest, and the nonaqueous solvent simply can be removed and the residue dissolved as
described in Sections 13.3 (“Fusion Techniques”) and 13.4 (“Wet Ashing and Acid Dissolution
Techniques”).

Sample Dissolution
13-24
MARLAP JULY 2004
Occasionally, the nonaqueous phase must be analyzed. A procedure for the decomposition of
petroleum products is described by Coomber (1975). There are restrictions on how many
nonaqueous liquids can be disposed of, even as laboratory samples. Evaporation of volatile
solvents may initially be an attractive alternative, but the legal restrictions on evaporating
solvents into the air should be investigated before this method is implemented. Burning flam-
mable liquids such as oil may also initially appear attractive, but legal restrictions on incineration
of organic liquids need to be considered. A liquid-liquid extraction or separation using ion
exchange resin may be the only alternative for transferring the radionuclide of interest into an
aqueous solution. Unfortunately, these methods require extensive knowledge of the sample
matrix and chemical form of the contaminant, which is seldom available. Often, gross
radioactivity measurements using liquid scintillation counting techniques or broad spectrum
direct measurements such as gamma spectroscopy are the only measurements that can be
practically performed on nonaqueous liquids.
13.7.2 Solid Samples
Decomposition of solid samples is accomplished by applying fusion, wet ashing, leaching, or
combustion techniques singly or in some combination. A discussion of each of these techniques
is included in this chapter.
13.7.3 Filters
Air filter samples generally have a small amount of fine particulate material on a relatively small
amount of filter media. In many cases, filters of liquid samples also have limited amounts of
sample associated with the filter material. This situation may initially appear to make the sample
decomposition process much easier, the small amount of sample appears to dissolve readily in a
simple acid dissolution. The ease with which many filters dissolve in concentrated acid does not
always mean that the sample has dissolved, and the fine particles are often impossible to observe
in an acid solution. If the radionuclides of concern are known to be in the oxide form, or if the
chemical form of the contaminants is unknown, a simple acid dissolution will not completely
dissolve the sample. In these cases, the sample may be dry ashed to destroy the filter and the
residue subjected to fusion or other decomposition of oxides in the sample.
13.7.4 Wipe Samples
If oxides and silicates are not present in wipe samples, acid dissolutions are generally acceptable
for sample decomposition. In many cases, it is not the sample but the material from which the
wipe is constructed that causes problems with acid dissolution. Paper wipes are decomposed
easily in sulfuric-nitric solutions or in perchloric nitric solutions or by combustion, and it may be
necessary to dry ash the sample before dissolution. If volatile isotopes are expected, precautions
must be taken to prevent loss when heating (see Section 14.5, “Volatilization and Distillation).
“Sticky” smears can be more difficult to dissolve—the glue can be especially troublesome and

Sample Dissolution
13-25
JULY 2004 MARLAP
should be watched closely if perchloric acid is used. Other materials used for wipe samples
should be evaluated on an individual basis to determine the best method for sample decomposi-
tion. In some cases, the sample will be a problem to decompose as well. Oil and grease are often
collected on wipe samples from machinery, and these samples are usually dry ashed before acid
dissolution to remove the organic material. If large amounts of solid material (i.e., soil, dust, etc.)
are collected with the wipe, it is recommended that the sample be treated as a solid (the analytical
protocol specification or the project manager should be consulted before removing the wipe and
simply analyzing the solid sample).
13.8 Comparison of Total Dissolution and Acid Leaching
Sample dissolution can be one of the biggest challenges facing the analyst because the adequacy
of the dissolution has direct and profound effects on the resultant data. The analyst must balance
numerous factors such as the nature of the sample and the analyte (e.g., is it refractory or
volatile?), the effects of excess reagents during subsequent analyses, the accuracy and precision
requirements for the data, and the costs associated with effort, materials, and waste generation.
Consequently, the question of total dissolution through fusion or digestion, or through acid
leaching, is under constant debate, and it is important for the analyst to be aware of the
limitations of both methods.
The MARLAP process enables one to make a decision concerning the dissolution required
through its process of establishing data quality objectives, analytical protocol specification, and
measurement quality objectives. During this process, all pertinent information is available to the
radioanalytical specialist who then evaluates the alternatives and assists with the decision. The
following discussion on acid leaching focuses on its use for the complete dissolution of the
analyte of interest and not for such procedures as the Environmental Protection Agency’s
“Toxicity Characteristic Leaching Procedure” (TCLP; 40 CFR 261, Appendix II, Method 1311),
which are intended to determine the leachability of a nonradioactive analyte.
“Acid leaching” has no accepted definition, but will be defined here as the use of nitric or
hydrochloric acid to put the radionuclide into solution. The acid concentration may vary up to
and include concentrated acid. Normally, the use of hydrofluoric acid and aqua regia are not
included in this definition. Sample size is usually relatively much larger than that used for fusion.
Although mineral acids might not totally break down all matrices, they have been shown to be
effective leaching solvents for metals, oxides, and salts in some samples. In some cases, leaching
requires fewer chemicals and less time to accomplish than complete sample dissolution. For
matrices amenable to leaching, multiple samples are easily processed simultaneously using a
hotplate or microwave system, and excess reagents can be removed through evaporation.
Complete dissolution of a sample is not necessary if it can be demonstrated confidently that the
radionuclide of interest is completely leached from the sample medium. However, as indicated
by Sill and Sill (1995), this may not always be possible:

Sample Dissolution
13-26
MARLAP JULY 2004
“In many cases, the mono-, di-, and small tervalent elements can be leached fairly
completely from simple solids by boiling with concentrated hydrochloric or nitric acids.
However, even these elements cannot necessarily be guaranteed to be dissolved com-
pletely by selective leaching. If they are included in a refractory matrix, they will not be
removed completely without dissolution of the matrix. If the samples have been exposed
to water over long periods of time, such as with sediments in a radioactive waste pond,
small ions such as divalent cobalt will have diffused deeply into the rock lattice from
which they cannot be removed without complete dissolution of the host matrix. In
contrast, because of its large size, ionic cesium has a marked tendency to undergo isomor-
phous replacement in the lattice of complex silicates from which it too cannot be
removed completely.”
Thus, the results of acid leaching processes should be used with caution.
There are those within the radiochemistry community who contend that total sample dissolution
provides the most analytically accurate and reproducible analyte concentration in the sample. Sill
and Sill (1995), longtime proponents of total dissolution, state:
“Any procedure that fails to obtain complete sample dissolution …will inevitably give
low and erratic results. The large ter-, quadri-, and pentavalent elements are extremely
hydrolytic and form hydroxides, phosphates, silicates, carbides, etc., that are very
insoluble and difficult to dissolve in common acids, particularly if they have been heated
strongly and converted to refractory forms.”
However, there are also disadvantages and challenges associated with the fusion approach.
Fusions are frequently more labor intensive than the leaching approach. More often than not,
single-sample processing requires a dedicated analyst. Large quantities of the flux are generally
required to decompose most substances, often 5 to10 times the sample weight. Therefore,
contamination of the sample by impurities in the reagent is quite possible. Furthermore, the
aqueous solutions resulting from the fusions will have a very high salt content, which may lead to
difficulties in subsequent steps of the analysis, i.e., difficulties of entrainment, partial replace-
ments, etc. The high temperatures associated with some fusion processes increase the danger of
loss of certain analytes by volatilization. Finally, the crucible itself may be attacked by the flux,
once again leading to possible contamination of the sample. The typical sample size for fusions
ranges from typically one to ten grams. The analyst must consider whether this sample is
representative.

Sample Dissolution
13-27
JULY 2004 MARLAP
13.9 References
13.9.1 Cited References
Abu-Samra, A., Morris, J.S., and Koirtyohann, S.R. 1975. “Wet Ashing of Some Biological
Samples in a Microwave Oven,” Analytical Chemistry, 47:8, pp 1475-1477.
Alvarado, J.S., Neal, T.J., Smith, L.L., and Erickson, M.D. 1996. “Microwave Dissolution of
Plant Tissue and the Subsequent Determination of Trace Lanthanide and Actinide Elements
by Inductively Coupled Plasma-Mass Spectrometry,” Analytica Chimica Acta, Vol. 322, pp.
11-20.
American Society for Testing Materials (ASTM) D4309. “Standard Practice for Sample
Digestion Using Closed Vessel Microwave Heating Technique for the Determination of Total
Metals in Water,” in 1994 Annual Book of ASTM Standards, Vol. 11.01, 1996.
American Society for Testing Materials (ASTM) D5258. “Standard Practice for Acid-Extraction
from Sediments Using Closed Vessel Microwave Heating,” in 1992 Annual Book of ASTM
Standards, Vol. 11.02, 1992.
American Society for Testing Materials (ASTM) D5513. “Standard Practice for Microwave
Digestion of Industrial Furnace Feedstreams for Trace Element Analysis,” in 1994 Annual
Book of ASTM Standards, Vol. 11.04, 1994.
Bock, R. 1979. A Handbook of Decomposition Methods in Analytical Chemistry, Halsted Press,
John Wiley and Sons, New York.
Bogen, DC. 1978. “Decomposition and Dissolution of Samples: Inorganic,” in Kolthoff, I.M. and
Elving, P.J., Eds., Treatise on Analytical Chemistry, Part I, Vol. 5, Wiley-Interscience, New
York, pp. 1-22.
Booman, G.L. and Rein, J.E. 1962. “Uranium,” in Kolthoff, I.M. and Elving, P.J., Eds., Treatise
on Analytical Chemistry, Part, Volume 9, John Wiley and Sons, New York, pp. 1-188.
Burnett, W.C., Corbett, D.R., Schultz, M., and Fern, M. 1997. “Analysis of Actinide Elements in
Soils and Sediments,” presented at the 44th Bioassay Analytical and Environmental
Radioactivity (BAER) Conference, Charleston.
Cobble, J.W. 1964. “Technetium,” in Kolthoff, I.M. and Elving, P.J., Eds., Treatise on
Analytical Chemistry, Part II, Volume 6, John Wiley and Sons, New York, pp. 404-434.

Sample Dissolution
13-28
MARLAP JULY 2004
Coomber, D.I. 1975. “Separation Methods for Inorganic Species,” in Radiochemical Methods in
Analysis, Coomber, D.I., Ed., Plenum Press, New York, pp. 175-218.
Dean, J. 1995. Analytical Chemistry Handbook, McGraw-Hill, New York.
U.S. Environmental Protection Agency (EPA). 1996. “Microwave Assisted Digestion of
Siliceous and Organically Based Materials,” in Test Methods for Evaluating Solid Waste,
Physical/Chemical Methods, SW-846, Method 3052. December.
Gibbs, J., Everett, L., and Moore, D. 1978. Sample Preparation for Liquid Scintillation
Counting, Packard Instrument Co., Downers Grove, IL., pp 65-78.
Gilman, L.B., and Engelhardt, W.G. 1989. “Recent Advances in Microwave Sample
Preparation,” Spectroscopy, 4:8, pp. 4-21.
Grillo, A.C. 1989. “Microwave Digestion by Means of a Focused Open-Vessel System,”
Spectroscopy, 4:7, pp. 16-21.
Grillo, A.C. 1990. “Microwave Digestion Using a Closed Vessel System,” Spectroscopy, 5:1, pp.
14, 16, 55.
Grindler, J.E. 1962. The Radiochemistry of Uranium, National Academy of Sciences-National
Research Council (NAS-NS), NAS-NS 3050, Washington, DC.
Hahn, R.B. 1961. “Zirconium and Hafnium,” in Kolthoff, I.M. and Elving, P.J., Eds., Treatise on
Analytical Chemistry, Part II, Volume 5, John Wiley and Sons, New York, pp. 61-138.
Kammin, W.R., and Brandt, M.J. 1989. “The Simulation of EPA Method 3050 Using a High-
Temperature and High-Pressure Microwave Bomb,” Spectroscopy, 4:6, pp. 22, 24.
Kingston, H.M., and Jassie, L.B. 1988. Introduction to Microwave Sample Preparation: Theory
and Practice, American Chemical Society, Washington, DC.
Kingston, H.M., and S.J. Haswell. 1997. Microwave-Enhanced Chemistry: Fundamentals,
Sample Preparation, and Applications, American Chemical Society, Washington, DC.
Lautenschlager, W. 1989. “Microwave Digestion in a Closed-Vessel, High-Pressure System,”
Spectroscopy, 4:9, pp. 16-21.
Noltner, T., Maisenbacher, P., and Puchelt, H. 1990. “Microwave Acid Digestion of Geological
and Biological Standard Reference Materials for Trace Element Analysis by ICP-MS,”
Spectroscopy, 5:4, pp. 49-53.

Sample Dissolution
13-29
JULY 2004 MARLAP
Peng, T. 1977. Sample Preparation in Liquid Scintillation Counting, Amersham Corporation,
Arlington Heights, IL., pp. 48-54.
Schilt, A. 1979. Perchloric Acids and Perchlorates, The G. Frederick Smith Company,
Columbus, Ohio.
Sill, C.W., Puphal, K.W., and Hindman, F.D. 1974. “Simultaneous Determination of Alpha-
Emitting Nuclides from Radium through Californium in Soil,” Analytical Chemistry, 46:12,
pp. 1725-1737.
Sill, C.W. 1975. “Some Problems in Measuring Plutonium in the Environment,” Health Physics,
Vol. 29, pp. 619-626.
Sill, C.W. 1981. “A Critique of Current Practices in the Determination of Actinides,” in
Actinides in Man and Animal, Wren, M.E., Ed., RD Press, Salt Lake City, Utah, pp. 1-28.
Sill, C.W. and Sill, D.S. 1995. “Sample Dissolution,” Radioactivity and Radiochemistry, 6:2, pp.
8-14.
Smith, LL., Crain, J.S., Yaeger, J.S., Horwitz, E.P., Diamond, H., and Chiarizia, R. 1995.
“Improved Separation Method for Determining Actinides in Soil Samples,” Journal of
Radioanaytical Nuclear Chemistry, Articles, 194:1, pp. 151-156.
Smith, L.L. and Yaeger, J.S. 1996. “High-Pressure Microwave Digestion: A Waste-Minimization
Tool for the Radiochemistry Laboratory,” Radioactivity and Radiochemistry, 7:2, pp. 35-38.
Steinberg, E.O. 1960. The Radiochemistry of Zirconium and Hafnium, National Academy of
Sciences-National Research Council (NAS-NRC), NAS-NRC 3011, Washington, DC.
Sulcek, Z., and Povondra, P. 1989. Methods for Decomposition in Inorganic Analysis, CRC
Press, Inc., Boca Raton, Florida.
13.9.2 Other Sources
Bishop, C.T., Sheehan, W.E., Gillette, R.K., and Robinson, B. 1971. “Comparison of a Leaching
Method and a Fusion Method for the Determination of Plutonium-238 in Soil,” Proceedings
of Environmental Symposium, Los Alamos Scientific Laboratory, Los Alamos, NM, U.S.
Atomic Energy Commission, Document LA-4756, December, pp. 63-71.
Burnett, W.C., Corbett, D.R. Schultz, M., Horwitz, E.P., Chiarizia, R., Dietz, M., Thakkar, A.,
and Fern, M. 1997. “Preconcentration of Actinide Elements from Soils and Large Volume
Water Samples Using Extraction Chromatography,” J. Radioanalytical and Nuclear

Sample Dissolution
13-30
MARLAP JULY 2004
Chemistry, 226, pp.121-127.
U.S. Department of Energy (DOE). 1990. EML Procedures Manual, Chieco, N.A., Bogen, DC.,
and Knutson, E.O., Eds., HASL-300, 27th Edition, DOE Environmental Measurements
Laboratory, New York.
U.S. Environmental Protection Agency (EPA). 1992. Guidance for Preforming Site Inspections
Under CERCLA, EPA/540-R-92-021, Office of Solid Waste and Emergency Response,
Washington, DC.
MARSSIM. 2000. Multi-Agency Radiation Survey and Site Investigation Manual, Revision 1.
NUREG-1575 Rev 1, EPA 402-R-97-016 Rev1, DOE/EH-0624 Rev1. August. Available
from www.epa.gov/radiation/marssim/.
Grimaldi, F.S. 1961. “Thorium,” in Treatise on Analytical Chemistry, Kolthoff, I.M. and Elving,
P.J., Eds., Part II, Volume 5, John Wiley and Sons, New York, pp. 142-216.
Kim, G., Burnett, W.C., and Horwitz, E.P. 2000. “Efficient Preconcentration and Separation of
Actinide Elements from Large Soil and Sediment Samples,” Analytical Chemistry, 72, pp.
4882-4887.
Krey, P.W. and Bogen, DC. 1987. “Determination of Acid Leachable and Total Plutonium in
Large Soil Samples,” Journal of Radioanalytical and Nuclear Chemistry, 115:2, pp. 335-355.
Maxwell, S. and Nichols, S.T. 2000. “Actinide Recovery Method for Large Soil Samples,”
Radioactivity and Radiochemistry, 11:4, pp. 46-54.
Noyes, A.A. and Bray, W.C. 1927, reprinted 1943. A System of Qualitative Analysis for the
Rarer Elements, MacMillan, New York.
Sill, C.W. 1975. “Some Problems in Measuring Plutonium in the Environment,” Health Physics,
29, pp. 619-626.
Sill, D.S. and Bohrer, S.E. 2000. “Sequential Determination of U, Pu, Am, Th and Np in Fecal
and Urine Samples with Total Sample Dissolution,” Radioactivity and Radiochemistry, 11:3,
pp. 7-18.
Smith, L.L., Markun, F., and TenKate, T. 1992. “Comparison of Acid Leachate and Fusion
Methods to Determine Plutonium and Americium in Environmental Samples,” Argonne
National Laboratory, ANL/ACL-92/2.

14-1
JULY 2004 MARLAP
14 SEPARATION TECHNIQUES
14.1 Introduction
The methods for separating, collecting, and detecting radionuclides are similar to ordinary
analytical procedures and employ many of the chemical and physical principles that apply to their
nonradioactive isotopes. However, some important aspects of the behavior of radionuclides are
significantly different, resulting in challenges to the radiochemist to find a means for isolation of
a pure sample for analysis (Friedlander et al., 1981).
While separation techniques and principles may be found in standard textbooks, Chapter 14
addresses the basic chemical principles that apply to the analysis of radionuclides, with an
emphasis on their unique behavior. It is not a comprehensive review of all techniques. This
chapter provides: (1) a review of the important chemical principles underlying radiochemical
separations, (2) a survey of the important separation methods used in radiochemistry with a
discussion of their advantages and disadvantages, and (3) an examination of the particular
features of radioanalytical chemistry that distinguish it from ordinary analytical chemistry.
Extensive examples have been provided throughout the chapter to illustrate various principles,
practices, and procedures in radiochemistry. Many were selected purposely as familiar
illustrations from agency procedural manuals. Others were taken from the classical and recent
radiochemical literature to provide a broad, general overview of the subject.
This chapter integrates the concepts of classical chemistry with those topics unique to radio-
nuclide analysis. The first eight sections of the chapter describe the bases for chemical
separations involving oxidation-reduction, complex-ion formation, distillation/volatilization,
solvent extraction, precipitation and coprecipitation, electrochemistry, and chromatography.
Carriers and tracers, which are unique to radiochemistry, are described in Section 14.9 together
with specific separation examples for each of the elements covered in this manual. Section 14.10
also provides an overview of the solution chemistry
and appropriate separation techniques for 17
elements. An attachment at the end of the chapter
describes the phenomenon of radioactive
equilibrium, also unique to radioactive materials.
Because the radiochemist detects atoms by their
radiation, the success or failure of a radiochemical
procedure often depends on the ability to separate
extremely small quantities of radionuclides (e.g.,
10!6 to 10!12 g) that might interfere with detection
of the analyte. For example, isolation of trace
quantities of a radionuclide that will not precipitate
on its own with a counter-ion requires judicious
Contents
14.1 Introduction .................... 14-1
14.2 Oxidation-Reduction Processes ..... 14-2
14.3 Complexation .................. 14-18
14.4 Solvent Extraction .............. 14-25
14.5 Volatilization and Distillation ..... 14-36
14.6 Electrodeposition ............... 14-41
14.7 Chromatography ............... 14-44
14.8 Precipitation and Coprecipitation . . 14-56
14.9 Carriers and Tracers ............ 14-82
14.10 Analysis of Specific Radionuclides . 14-97
14.11 References ................... 14-201
14.12 Selected Bibliography .......... 14-218
Attachment 14A Radioactive Decay and
Equilibrium .................. 14-223

Separation Techniques
14-2
MARLAP JULY 2004
selection of a carrier and careful technique to produce a coprecipitate containing the pure
radionuclide, free of interfering ions.
In detection procedures, the differences in the behavior of radionuclides provide unique oppor-
tunities not available in the traditional analytical chemistry of nonradioactive elements. Radio-
nuclides often can be detected by their unique radiation regardless of the chemical form of the
element. There is also a time factor involved because of the short half-lives of some radionuc-
lides. Traditional procedures involving long digestion or slow filtration cannot be used for short-
lived radionuclides, thereby requiring that rapid separations be developed. Another distinction is
the hazards associated with radioactive materials. At very high activity levels, chemical effects of
the radiation, such as decomposition of solvents (through radiolysis) and heat effects (caused by
interaction of decay particles with the solution), can affect the procedures. Equally important,
even at lower activity levels, is the radiation dose that the radiochemist can receive unless
protected by shielding, ventilation, time, or distance. Even at levels where the health concerns are
minimal, special care needs to be taken to guard against laboratory and equipment contamination.
Moreover, the radiochemist should be concerned about the type and quantity of the waste
generated by the chemical procedures employed, because the costs and difficulties associated
with the disposal of low-level and mixed radioactive waste continue to rise (see Chapter 17,
Waste Management in a Radioanalytical Laboratory).
The past 10 years have seen significant improvements to some of the classical techniques as well
as the development of new methods of radiochemical analysis. Knowledge of these analytical
developments, as well as maintenance of a working familiarity with developing techniques in the
radiochemistry field will further enhance the waste reduction effort.
14.2 Oxidation-Reduction Processes
14.2.1 Introduction
Oxidation and reduction (redox) processes play an important role in radioanalytical chemistry,
particularly from the standpoint of the dissolution, separation, and detection of analytes, tracers,
and carriers. Ion exchange, solvent extraction, and solid-phase extraction separation techniques,
for example, are highly dependent upon the oxidation state of the analytes. Moreover, most
radiochemical procedures involve the addition of a carrier or isotope tracer. There must be
complete equilibration (isotopic exchange) between the added isotope(s) and all the analyte
species present in order to achieve quantitative yields. The oxidation number of a radionuclide
can affect its chemical stability in the presence of water, oxygen, and other natural substances in
solution; reactivity with reagents used in the radioanalytical procedure; solubility in the presence
of other ions and molecules; and behavior in the presence of carriers and tracers. The oxidation
numbers of radionuclides in solution and their susceptibility to change, because of natural or
induced redox processes, are critical, therefore, to the physical and chemical behavior of

Separation Techniques
14-3
JULY 2004 MARLAP
radionuclides during these analytical procedures. The differences in mass number of all
radionuclides of an element are so small that they will exhibit the same chemical behavior during
radiochemical analysis (i.e., no mass isotope effects).
14.2.2 Oxidation-Reduction Reactions
An oxidation-reduction reaction (redox reaction) is a reaction in which electrons are redistributed
among the atoms, molecules, or ions in solution. In some redox reactions, electrons are actually
transferred from one reacting species to another. Oxidation under these conditions is defined as
the loss of electron(s) by an atom or other chemical species, whereas reduction is the gain of
electron(s). Two examples will illustrate this type of redox reaction:
U + 3 F2 6 U+6 + 6 F!1
Pu+4 + Fe+2 6 Pu+3 + Fe+3
In the first reaction, uranium loses electrons, becoming a cation (oxidized), and fluorine gains an
electron (reduced), becoming an anion. In the second reaction, the reactants are already ions, but
the plutonium cation (Pu+4) gains an electron, becoming Pu+3 (reduced), and the ferrous ion (Fe+2)
loses an electron, becoming Fe+3 (oxidized).
In other redox reactions, electrons are not completely transferred from one reacting species to
another; the electron density of one atom decreases while it increases at another atom. The
change in electron density occurs as covalent bonds (in which electrons are shared between two
atoms) are broken or made during a chemical reaction. In covalent bonds between two atoms of
different elements, one atom is more electronegative than the other atom. Electronegativity is the
ability of an atom to attract electrons in a covalent bond. One atom, therefore, attracts the shared
pair of electrons more effectively, causing a difference in electron density about the atoms in the
bond. An atom that ends up bonded to a more electronegative atom at the end of a chemical
reaction loses net electron density. Conversely, an atom that ends up bonded to a less electro-
negative atom gains net electron density. Electrons are not transferred completely to other atoms,
and ions are not formed because the electrons are still shared between the atoms in the covalent
bond. Oxidation, in this case, is defined as the loss of electron density, and reduction is defined
as the gain of electron density. When carbon is oxidized to carbon dioxide by oxygen:
C + O2 6 CO2
the electron density associated with the carbon atom decreases, and that of the oxygen atoms
increases, because the electronegativity of oxygen is greater than the electronegativity of carbon.
In this example, carbon is oxidized and oxygen is reduced. Another example from the chemistry
of the preparation of gaseous uranium hexafluoride (UF6) illustrates this type of redox reaction:

Separation Techniques
14-4
MARLAP JULY 2004
3 UF4 + 2 ClF3 6 3 UF6 + Cl2
Because the order of electronegativity of the atoms increases in the order U < Cl < F, the uranium
atom in uranium tetrafluoride (UF4) is oxidized further as more electronegative fluorine atoms
are added to the metal and shift the electron density away from uranium. Chlorine atoms break
their bonds with fluorine and gain electron density (are reduced) when they bond with each other
instead of the more electronegative fluorine atoms.
In a redox reaction, at least one species is oxidized and at least one species is reduced simul-
taneously; one process cannot occur without the other. The oxidizing agent is defined as the
substance that causes oxidation of another species by accepting electron(s) from it or increasing
in electron density; it is thereby reduced itself. Reducing agents lose electron(s) or electron
density and are therefore oxidized. In the reduction of Pu+4 to Pu+3 by Fe+2, the reducing agent
donates an electron to Pu+4 and is itself oxidized, while Pu+4, the oxidizing agent, accepts an
electron from Fe+2 and is reduced. Generally, the nonmetallic elements are strong oxidizing
reagents, and the metals are strong reducing agents.
To keep track of electrons in oxidation-reduction reactions, it is useful to assign oxidation
numbers to atoms undergoing the changes. Oxidation numbers (oxidation states) are a relative
indication of the electron density associated with an atom of an element. The numbers change
during redox reactions, whether they occur by actual transfer of electrons or by unequal sharing
of electrons in a covalent bond. The number increases as the electron density decreases, and it
decreases as the electron density increases. From the standpoint of oxidation numbers and in
more general terms, oxidation is defined as an increase in oxidation number, and reduction is
defined as the decrease in oxidation number. Different sets of rules have been developed to
assign oxidation numbers to monatomic ions and to each individual atom in polyatomic
molecules. One set of rules is simple and especially easy to use. It can be used to determine the
oxidation number of atoms in many, but not all, chemical species. In this set, the rules for
assigning oxidation numbers are listed in order by priority of application; the rule written first in
the list has priority over the rule below it. The rules are applied in the order in which they come
in the list, starting at the top and proceeding down the list of rules until each atom of each
element, not the element only, in a species has been assigned an oxidation number. Generally, all
atoms of each element in a chemical species will have the same oxidation number in that species.
For example, all oxygen in sulfate are !2. (A specific exception is nitrogen in the cation and
anion in ammonium nitrate, NH4NO3.) It is important to remember that in many cases, oxidation
numbers are not actual electrical charges but only a helpful bookkeeping method for following
redox reactions or examining various oxidation states. The oxidation number of atoms in isolated
elements and monatomic ions are actually the charge on the chemical species. The priority rules
are:
1. The sum of oxidation numbers of all atoms in a chemical species adds up to equal the
charge on the species. This is zero for elements and compounds because they are

Separation Techniques
14-5
JULY 2004 MARLAP
electrically neutral species and are the total charge for a monatomic or polyatomic ion.
2. The alkali metals (the Group IA elements, Li, Na, K, Rb, Cs, and Fr) have an oxidation
number of +1; the alkaline earth metals (the Group IIA elements, Be, Mg, Ca, Sr, Ba, and
Ra) have an oxidation number of +2.
3. Fluorine has an oxidation number of !1; hydrogen has an oxidation number of +1.
4. Oxygen has an oxidation number of !2.
5. The halogens (the Group VIIA elements, F, Cl, Br, I, and At) have an oxidation number
of !1.
6. In binary compounds (compounds containing elements), the oxidation number of the
oxygen family of elements (the Group VIA elements, O, S, Se, Te, and Po) is !2; for the
nitrogen family of elements (the VA elements except N, P, As, and Sb), it is -3.
Applying these rules illustrates their use:
1. The oxidation number of metallic uranium and molecular oxygen is 0. Applying rule one,
the charge on elements is 0.
2. The oxidation number of Pu+4 is +4. Applying rule one again, the charge is +4.
3. The oxidation numbers of carbon and oxygen in CO2 are +4 and !2, respectively.
Applying rule one, the oxidation numbers of each atom must add up to the charge of 0
because the net charge on the molecule is zero. The next rule that applies is rule four.
Therefore, the oxidation number of each oxygen atom is !2. The oxidation number of
carbon is determined by C + 2(!2) = 0, or +4. Notice that there is no charge on carbon
and oxygen in carbon dioxide because the compound is molecular and does not consist of
ions.
4. The oxidation numbers of calcium and hydrogen in calcium hydride (CaH2) are +2 and
!1, respectively. The compound is neutral, and the application of rule one requires that
the oxidation numbers of all atoms add up to 0. By rule two, the oxidation number of
calcium is +2. Applying rule one, the oxidation number of hydrogen is: 2H + 2=0, or !1.
Notice that in this example, the oxidation number as predicted by the rules does not agree
with rule three, but the number is determined by rules one and two, which take
precedence over rule three.
5. The oxidation numbers of uranium and oxygen in the uranyl ion, UO2
+2, are +6 and !2,
respectively. Applying rule one, the oxidation numbers of each atom must add up to the

Separation Techniques
14-6
MARLAP JULY 2004
charge of +2. Rule four indicates that the oxygen atoms are !2 each. Applying rule one,
the oxidation number of uranium is U + 2(!2) = +2, and uranium is +6. In this example,
the charges on uranium and oxygen are not actually +6 and !2, respectively, because the
polyatomic ion is held together through covalent bonds. The charge on the ion is the
result of a deficiency of two electrons.
Oxidation numbers (states) are commonly represented by zero and positive and negative
numbers, such as +4, !2, etc. They are sometimes represented by Roman numerals for metals,
especially the oxidation numbers of atoms participating in covalent bonds or those of polyatomic
ions, such as chromium(VI) in CrO4
!2. In general, elements in solution whose oxidation number
is greater than +4 or less than -4 can exist only as complexed ions in solution. Many of the
transuranic elements can occur in multiple oxidation states, and the transformation from one to
another is a critical step of the separation process. In this chapter, all species whose oxidation
number is greater than +4 will be represented either by their complexed form in solution or by its
symbol with a Roman numeral signifying the oxidation state [UO2
+ or U(V)]. This conforms to
the intent of IUPAC (1990) nomenclature.
14.2.3 Common Oxidation States
The oxidation state for any element in its free state (when not combined with any other element,
as in Cl2 or Ag metal) is zero. The oxidation state of a monatomic ion is equal to the electrical
charge of that ion. The Group IA elements form ions with a single positive charge (Li+1, Na+1,
K+1, Rb+1, and Cs+1), whereas the Group IIA elements form +2 ions (Be+2, Mg+2, Sr+2, Ba+2, and
Ra+2). The halogens generally form !1 ions (F!1, Br!1, Cl!1, and I!1); however, except for fluorine,
the other halogens form oxygen compounds in which several other oxidation states are present
[Cl(I) in HClO and I(V) in HIO3]. For example, iodine can exist as I!1, I2, IO!1, IO3
!1, and IO4
!1.
Oxygen exhibits a !2 oxidation state except when it is bonded to fluorine (where it can be +1 or
+2); in peroxides, where the oxidation state is !1; or in superoxides, where it is -½.
Some radionuclides, such as those of cesium and thorium, exist in solution in single oxidation
states, as indicated by their position in the periodic table. Others, such as technetium and
uranium, can exist in multiple oxidation states. Multiple oxidation states of plutonium are
commonly found in the same solution.
Each of the transition metals has at least two stable oxidation states, except for Sc, Y, and La
(Group IIIB), which exhibit only the +3 oxidation state. Generally, negative oxidation states are
not observed for these metallic elements. The large number of oxidation states exhibited by the
transition elements leads to an extensive, often complicated, oxidation-reduction chemistry. For
example, oxidation states from !1 through +7 have been observed for technetium, although the
+7 and +4 are most common (Anders, 1960). In an oxidizing environment, Tc exists predomin-
antly in the heptavalent state as the pertechnetate ion, TcO4
!1, which is water soluble, but which
can yield insoluble salts with large cations. Technetium forms volatile heptoxides and acid-

Separation Techniques
14-7
JULY 2004 MARLAP
insoluble heptasulfides. Subsequently, pertechnetate is easily lost upon evaporation of acid
solutions unless a reducing agent is present or the evaporation is conducted at low temperatures.
Technetium(VII) can be reduced to lower oxidation states by reducing agents such as bisulfite
(HSO3
!1). This process proceeds through several intermediate steps, some of which are slow;
therefore, unless precautions are taken to maintain technetium in the appropriate oxidation state,
erratic results can occur. The (VII) and +4 ions behave very differently in solution. For instance,
pertechnetate does not coprecipitate with ferric hydroxide, while Tc+4 does.
The oxidation states of the actinide elements have been comprehensively discussed by Ahrland
(1986) and Cotton and Wilkinson (1988). The actinides exhibit an unusually broad range of
oxidation states, of from +2 to +7 in solution. Similar to the lanthanides, the most common
oxidation state is +3 for actinium, americium, and curium. The +4 state is common for thorium
and plutonium, whereas (V) is most common for protactinium and neptunium. The most stable
state for uranium is the (VI) oxidation state.
In compounds of the +3 and +4 oxidation states, the elements are present as simple M+3 or M+4
cations (where “M” is the metal ion); but for higher oxidation states, the most common forms in
compounds and in solution are the oxygenated actinyl ions, MO2
+1 and MO2
+2:
• M+3. The +3 oxidation state is the most stable condition for actinium, americium, and curium,
and it is easy to produce Pu+3. This stability is of critical importance to the radiochemistry of
plutonium. Many separation schemes take advantage of the fact that Pu can be selectively
maintained in either the +3 or +4 oxidation state. Unlike Pu and Np, U+3 is such a strong
reducing agent that it is difficult to keep in solution.
• M+4. The only oxidation state of thorium that is experienced in radiochemical separations is
+4. Pa+4, U+4, and Np+4 are stable, but they are easily oxidized by O
2. In acid solutions with
low plutonium concentrations, Pu+4 is stable. Americium and curium can be oxidized to the
+4 state with strong oxidizing agents such as persulfate.
• M(V). The actinides, from protactinium through americium, form MO2
+1 ions in solution.
PuO2
+1 can be the dominant species in solution at low concentration in natural waters that are
relatively free of organic material.
• M(VI). This is the most stable oxidation state of uranium, which exist as the UO2
+2 species.
Neptunium, plutonium, and americium also form MO2
+2 ions in solution. The bond strength,
as well as the chemical stability toward reduction for these MO2
+2 ions, decrease in the order
U > Np > Pu > Am.
Reactions that do not involve making or breaking bonds, M+3 6 M+4 or MO2
+1 6 MO2
+2, are fast
and reversible, while reactions that involve chemical bond formation, M+3 6 MO2
+1 or
M+4 6 MO2
+2, are slow and irreversible.

Separation Techniques
14-8
MARLAP JULY 2004
Plutonium exhibits redox behavior unmatched in the periodic table. It is possible to prepare
solutions of plutonium ions with appreciable concentrations of four oxidation states, +3, +4, (V),
and (VI), as Pu+3, Pu+4, PuO2
+1, and PuO2
+2, respectively. Detailed discussions can be found in
Cleveland (1970), Seaborg and Loveland (1990), and in Coleman (1965). According to
Cleveland (1970), this polyvalent behavior occurs because of the tendency of Pu+4 and Pu(V) to
disproportionate:
3 Pu+4 + 2 H2O 6 2 Pu+3 + PuO2
+2 + 4H+1
3 PuO2
+1 + 4 H+1 6 Pu+3 + 2 PuO2
+2 + 2 H2O
and because of the slow rates of reaction involving formation or rupture of Pu-O bonds (such as
PuO2
+ and PuO2
2+) compared to the much faster reactions involving only electron transfer. The
distribution depends on the type and concentration of acid used for dissolution, the method of
solution preparation, and the initial concentration of the different oxidation states. In HCl, HNO3,
and HClO4, appreciable concentrations of all four states exist in equilibrium. Seaborg and
Loveland (1990) report that in 0.5 M HCl at 25 EC, the equilibrium percentages of plutonium in
the various oxidation states are found to be as follows:
Pu+3 27.2%
Pu+4 58.4%
Pu(V) ~0.7%
Pu(VI) 13.6%
Apart from the disproportionation reactions, the oxidation state of plutonium ions in solution is
affected by its own decay radiation or external gamma and X-rays. At high levels, radiolysis
products of the solution can oxidize or reduce the plutonium, depending on the nature of the
solution and the oxidation state of plutonium. Therefore, the stated oxidation states of old
plutonium solutions, particularly old HClO4 and H2SO4 solutions, should be viewed with
suspicion. Plutonium also tends to hydrolyze and polymerize in solution, further complicating the
situation (see Section 14.10, “Analysis of Specific Radionuclides”).
Tables 14.1 and 14.2 summarize the common oxidation number(s) of some important elements
encountered in the radioanalytical chemistry of environmental samples and the common
chemical form of the oxidation state.
TABLE 14.1 — Oxidation states of elements
Element
Oxidation
State(1) Chemical Form Notes(2)
Am +3
+4
(V)
(VI)
Am+3
Am+4
AmO2
+1
AmO2
+2
Pink; stable; difficult to oxidize
Pink-red; unstable in acid
Pink-yellow; disproportionates in strong acid; reduced by products of
its own radiation
Rum color; stable

Separation Techniques
Element
Oxidation
State(1) Chemical Form Notes(2)
14-9
JULY 2004 MARLAP
Cs +1 Cs(H2O)x
+1 Colorless; x probably is 6
Co +2
+3
Co(H2O)6
+2
Co(H2O)6
+3
Pink to red; oxidation is very unfavorable in solution
Rapidly reduced to +2 by water unless acidic
Fe +2
+3
Fe(H2O)6
+2
Fe(H2O)6
+3
Green
Pale yellow; hydrolyses in solution to form yellow or brown
complexes
3H+1 3HOH and
3HOH2
+1
Isotopic exchange of tritium is extremely rapid in samples that have
water introduced.
I!1
-1/3
+1
(V)
(VII)
I!1
I3
!1
OI-1
IO3
!1
IO4
!1
Colorless
Brown; commonly in solutions of I!1 exposed to air
Colorless
Colorless; formed in vigorously oxidized solutions
Colorless
Ni +2 Ni(H2O)6
+2 Green
Nb +3
+5
Unknown
HNb6O19
!7
In sulfuric acid solutions of Nb2O5
Po +4
Pu +3
+4
(V)
(VI)
(VII)
Pu(H2O)x
+3
Pu(H2O)x
+4
Pu(H2O)x
+5
or
PuO2
+1
PuO2
+2
PuO5
!3
or PuO4(OH)2
!3
Violet to blue; stable to air and water; easily oxidized to +4
Tan to brown; first state formed in freshly prepared solutions; stable
in 6 M acid; disproportionates in low acidity to +3 and +6
Never observed alone; always disproportionates; most stable in low
acidity
Purple
Yellow-pink; stable but fairly easy to reduce
Green
PuO4(OH)2
!3 more likely form
Ra +2 Ra(H2O)x
+2 Colorless; behaves chemically like Sr and Ba
Sr +2 Sr(H2O)x
+2 Colorless
Tc +4
(V)
(VII)
TcO3
!2
TcO3
!1
TcO4
!1
Th +4 Th(H2O)8
+4 Colorless; at pH>3 forms complex hydrolysis products
U+3
+4
(V)
(VI)
U(H2O)x
+3
U(H2O)8 or 9
+4
UO2
+1
UO2(H2O)5
+2
Red-brown; slowly oxidized by water and rapidly by air to +4
Green; stable but slowly oxidized by air to (VI)
Unstable but more stable at pH 2-4; disproportionates to +4 and (VI)
Yellow; only form stable in solution containing air; difficult to reduce
Zr +4 Zr(H2O)6
+4
Zr4(OH)8(H2O)16
+2
Only at very low ion concentrations and high acidity
At typical concentrations in absence of complexing agents
(1) Most common form is in bold.
(2) Color shades may vary depending on the concentration of the isotope.
Sources: Booman and Rein, 1962; Cotton and Wilkinson, 1988; Emsley, 1989; Greenwood and Earnshaw,
1984; Grinder, 1962; Hampel, 1968; Katzin, 1986; Latimer, 1952; and 1970.

Separation Techniques
14-10
MARLAP JULY 2004
TABLE 14.2 — Oxidation states of selected elements
Element +1 +2 +3 +4 V VI VII VIII
Titanium ""!
Vanadium ""!!
Chromium !!""!
Manganese !"!""!
Iron !!" "
Cobalt !!
Nickel !""
Strontium !
Yttrium !
Molybdenum ""!!!
Technetium ""!""!
Silver !""
Cesium !
Barium !
Lanthanides !
Lead !"
Polonium "!"
Radium !
Actinium !
Thorium !
Protactinium "!
Uranium """!
Neptunium ""!""
Plutonium "!""
Americium !"""
Curium !"
The stable nonzero oxidation states are indicated. The more common oxidation states
are indicated by solid black circles.
Sources: Seaborg and Loveland (1990) and the NAS–NRC monographs listed in the
references.
14.2.4 Oxidation State in Solution
For the short-lived isotopes that decay by alpha emission or spontaneous fission, high levels of
radioactivity cause heating and chemical effects that can alter the nature and behavior of the ions
in solution and produce chemical reactions not observed with longer-lived isotopes. Decompo-
sition of water by radiation (radiolysis) leads to H and OH free radicals and formation of H2 and
H2O2, among other reactive species, and higher oxidation states of plutonium and americium are
produced.
The solutions of some ions are also complicated by disproportionation, the autooxidation-
reduction of a chemical species in a single oxidation state to higher and lower oxidation states.
The processes are particularly dependent on the pH of the solution. Oxidation of iodine, uranium,
americium, and plutonium are all susceptible to this change in solution. The disproportionation

Separation Techniques
14-11
JULY 2004 MARLAP
of UO2
+1, for example, is represented by the chemical equation:
2 UO2
+1 + 4 H+1 º U+4 + UO2
+2 + 2 H2O (K = 1.7×10⁶)
The magnitude of the equilibrium constant reflects the instability of the (V) oxidation state of
uranium in UO2
+1 described in Table 14.1, and the presence of hydrogen ions reveals the
influence of acidity on the redox process. An increase in acidity promotes the reaction.
14.2.5 Common Oxidizing and Reducing Agents
HYDROGEN PEROXIDE. Hydrogen peroxide (H2O2) has many practical applications in the
laboratory. It is a very strong oxidizing agent that will spontaneously oxidize many organic
substances, and water samples are frequently boiled with peroxide to destroy organic compounds
before separation procedures. When hydrogen peroxide serves as an oxidizing reagent, each
oxygen atom changes its oxidation state from !1 to !2. For example, the reaction for the
oxidation of ferrous ion is as follows:
H2O2 + 2H+1 + 2Fe+2 º 2H2O + 2Fe+3
Hydrogen peroxide is frequently employed to oxidize Tc+4 to the pertechnetate:
4 H2O2 + Tc+4 º TcO4
!1 + 4H2O
Hydrogen peroxide can also serve as a reducing agent, with an increase in oxidation state from
-1 to 0, and the liberation of molecular oxygen. For example, hydrogen peroxide will reduce
permanganate ion (MnO4
!1) in basic solution, forming a precipitate of manganese dioxide:
2 MnO4
!1 + 3 H2O2 6 2 MnO29 + 3 O28 + 2 H2O + 2 OH!1
Furthermore, hydrogen peroxide can decompose by the reaction:
2 H2O2 6 2 H2O + O2
This reaction is another example of a disproportionation (auto-oxidation-reduction) in which a
chemical species acts simultaneously as an oxidizing and reducing agent; half of the oxygen
atoms are reduced to O!2, and the other half are oxidized to elemental oxygen (O0) in the
diatomic state, O2.
OXYANIONS. Oxyanions (NO3
!1, Cr2O7
!2, ClO3
!1, and MnO4
!1) differ greatly in their oxidizing
strength, but they do share certain characteristics. They are stronger oxidizing agents in acidic
rather than basic or neutral conditions, and they can be reduced to a variety of species depending
on the experimental conditions. For example, on reduction in acidic solutions, the permanganate

Separation Techniques
14-12
MARLAP JULY 2004
ion accepts five electrons, forming the manganous ion Mn+2:
MnO4
!1 + 5 e!1 + 8 H+1 6 Mn+2 + 4 H2O
In neutral or basic solution, permanganate accepts 3 electrons, and forms manganese dioxide
(MnO2), which precipitates:
MnO4
!1 + 3 e!1 + 4 H+1 6 MnO2 9 + 2 H2O
These oxidizing agents are discussed further in Section 13.4, “Wet Ashing and Acid Dissolution
Techniques.”
NITRITE. Nitrite ion (NO2
!1), plays an important role in the manipulation of Pu oxidation states in
solution. It is capable of oxidizing Pu+3 to Pu+4 and of reducing Pu(VI) to Pu+4. Because most
aqueous processes center around Pu+4, sodium nitrite (NaNO2) is frequently used as a valence
adjuster to convert all Pu to the +4 state. And because the Pu(VI) 6 Pu+4 reaction by nitrite is
slow, another reducing agent, such as the ferrous ion, often is added to increase the rate of
reaction.
PERCHLORIC ACID. The use of perchloric acid (HClO4) as an oxidizing agent is covered in depth
in Section 13.4, “Wet Ashing and Acid Dissolution Techniques.”
METALS IONS. Generally, metals ions (Ti+3, Cr+2, Fe+2, etc.) are strong reducing agents. For
example, both Ti+3 and Cr+2 have been shown to reduce Pu+4 to Pu+3 rapidly in acidic media.
Fe+2 rapidly reduces Np(V) to Np+4 and Pu+4 to Pu+3 in acidic media.
Ti+3 is used extensively as a reducing agent in both inorganic and organic analyses. Ti+3 is
obtained by reducing Ti+4, either electrolytically or with zinc. Ti+4 is the most stable and common
oxidation state of titanium. Compounds in the lower oxidation states (!1, 0, +2, and +3) are quite
readily oxidized to Ti+4 by air, water, or other reagents.
ASCORBIC ACID. Commonly known as vitamin C, ascorbic acid is an important reducing agent
for the radiochemist. Because the ferric ion interferes with the uptake of Am+3 in several popular
extraction schemes, ascorbic acid is used frequently to reduce Fe+3 to Fe+2 to remove this
interference. Ascorbic acid is also used to reduce Pu+4 to Pu+3.
SULFAMIC ACID. Aqueous solutions of this solid material are strongly acidic and act selectively
as oxidizing agents. It is of particular value in its ability to oxidize nitrites to nitrates while not
affecting Pu+3 or Np+4 ions.

Separation Techniques
14-13
JULY 2004 MARLAP
14.2.6 Oxidation State and Radiochemical Analysis
Most radiochemical analyses require the radionuclide be in aqueous solution. Thus, the first step
of an analysis is the complete dissolution of the sample, so that all components remaining at the
end of the process are in a true solution, and chemical equilibration with tracers or carriers can be
established. Dissolution of many samples requires vigorous conditions to release the radionuc-
lides from its natural matrix. Strong mineral acids or strong bases, which also serve as powerful
oxidizing agents, are used in boiling mixtures or under fusion conditions to decompose the
matrix—evaporating portions of the acid or base from the mixture and oxidizing the radionuclide
to a common oxidation state. The final state depends, generally, on the radionuclide, oxidizers
used, and pH of the solution (see notes to Table 14.1, page 14-9). Even water samples might
contain radionuclides at various states of oxidation because of their exposure to a variety of
natural oxidizing conditions in the environment and the pH of the sample.
Once the analyte is in solution, the radionuclide and the tracers and carriers used in the procedure
must be in the same oxidation state to ensure the same chemical behavior (Section 14.10.2,
“Oxidation State”). For radionuclides that can exist in multiple oxidation states, one state must
be achieved; for those such as plutonium, which disproportionates, a reproducible equilibrium
mixture of all oxidation states can be established. Oxidizing or reducing agents are added to the
reaction mixture to establish the required conditions. Table 14.3 contains a summary of several
chemical methods for the oxidation and reduction of select radionuclides.
In some radioanalytical procedures, establishing different states at different steps in the procedure
is necessary to ensure the requisite chemical behavior of the analyte.
TABLE 14.3 — Redox reagents for radionuclides(1)
Redox Reaction Reagent Conditions
Am+3 6 AmO2
+2 Ag+2, Ag+/S2O8
!2
Am+4 6 AmO2
+2 O313 M NH4F
AmO2
+1 6 AmO2
+2 Ce+4 HClO4
O3Heated HNO3 or HClO4
AmO2
+2 6 AmO2
+1 Br!1, Cl!1
Na2CO3Heat to precipitate NaAmO2CO3; dissolve in H+1
AmO2
+2 6 Am+3 I!1, H2O2, NO2
!1, SO2
Am+4 6 Am+3 alpha radiation effects Spontaneous
Co+2 6 Co+3 O3Cold HClO4
O2, H2O2Complexed cobalt
Co+3 6 Co+2 H2O Rapid with evolution of H2
Fe+2 6 Fe+3 O2Faster in base; slower in neutral and acid solution; decreases
with H+1
Ce+4, MnO4
!1, NO3
!1,
H2O2, S2O8
!2
Cr2O7
!2HCl or H2SO4

Separation Techniques
Redox Reaction Reagent Conditions
14-14
MARLAP JULY 2004
Fe+3 6 Fe+2 H2S, H2SO3Excess removed by boiling
Zn, Cd, Al, Ag amalgams
Sn+2, I!1, Cu+1, Ti+3
NH2OH Boiling solution
I!1 6 I2HNO2 (NaNO2 in acid) Does not affect other halides
MnO2 in acid Well suited for lab work
6M HNO3
NaHSO3 or NaHSO3 in H+1
Na2SO3; Na2S2O3
I!1 6 IO3
!1KMnO4
50% CrO3 in 9M H2SO4
I!1 6 IO4
!1NaClO in base
IO4
!1 6 I2NH2OH@HCl
H2C2O49 M H2SO4
IO4
!1 6 I!1NaHSO3 in acid
I2 6 I!1SO2; NaHSO3
Np+3 6 Np+4 Dilute acid
Np+4 6 NpO2
+1 NO2
!1HNO3
Np+4 6 NpO2
+2 MnO4
!1Dilute alkaline
NpO2
+1 6 NpO2
+2 Acid
NpO2
+2 6 NpO5
!3Acid
NpO2
+16 Np+4 Fe+2
Ti+3
Dilute H2SO4
1–2 M HCl
Pu+3 6 Pu+4 BrO3
!1Dilute H+1
Ce+4 HCl or H2SO4 solution
Cr2O7
!2, IO3
!1, MnO4
!1Dilute H+1
NO2
!1HNO3
NO3
!1HNO3 or dilute HCl (100EC)
HNO2
Pu+4 6 PuO2
+2 NaBiO3HNO3
BrO3
!1Dilute HNO3 at 85EC
Ce+4 Dilute HNO3 or HClO4
HOCl (KClO) pH 4.5 at 80EC or 45% K2CO3 at 40EC
MnO4
!1Dilute HNO3
O3Ce+4 or Ag+1 catalyst or dilute H2SO4/60EC
Ag+2 Ag+1/S2O8
!1 in dilute HNO3
Cr2O7
!2Dilute H2SO4
Cl2Dilute H2SO4 at 80EC or dil.HClO4/Cl!1
NO3
!1Dilute HNO3 at 95EC
Ag2O 43% K2CO3 at 75EC
IO3
!
PuO2
+1 6 PuO2
+2 HNO3Dilute; slow
V+3 or Ti+3 HClO4; slow
PuO2
+2 6 PuO2
+1 I!1pH 2
SO2H+1

Separation Techniques
Redox Reaction Reagent Conditions
14-15
JULY 2004 MARLAP
Fe+2 HClO4 or HCl
V+3 or U+4 HClO4
HNO2Dilute HNO3NaNO3
Ag Dilute HCl
PuO2
+2 6 Pu+4 C2O4
!275EC; RT with dilute HCl
I!1HNO3
Fe+2 HCl, HNO3, or H2SO4
Sn+2 HCl/HClO4
H2O2HNO3; continues to Pu+3 in absence of Fe+3
Ti+3 HClO4
Cu2O 45% K2CO3 75EC
HNO2HNO3/75EC
Zn Dilute HCl
PuO2
+1 6 Pu+4 HNO2Slow
NH2OH@HCl Dilute HCl, slow
Pu+4 6 Pu+3 hydroquinone Dilute HNO3
H2/Pt HCl
I!1Dilute HCl
HSO3
!1Dilute HNO3
NH2OH@HCl
Zn Dilute HCl
SO2Dilute HNO3
Ti+3 HCl, dilute H2SO4, or dilute HNO3/H2SO4
ascorbic acid HNO3
U+4 Dilute HClO4
H2S Dilute acid
Tc+4 6 TcO4
!1HNO3
H2O2
O2 (air)
TcO2(hydrated) 6
TcO4
!1
Ce+4
H2O2
TcCl6
!2 6 TcO4
!1H2O2
Cl2
Ce+4
MnO4
_1
TcO4
!1 6 Tc+4 or
TcO2(hyd)
N2H4Dilute H2SO4
NH2OH Dilute H2SO4
Ascorbic acid Dilute H2SO4
Sn+2 Dilute H2SO4
Zn Dilute HCl
Concentrated HCl 6 TcCl6
!2
U+3 6 U+4 ClO4
!1Dilute HClO4
Co+3 complexes Dilute HClO4 or LiClO4

Separation Techniques
Redox Reaction Reagent Conditions
14-16
MARLAP JULY 2004
Cr+3 and Cr+3 complexes Dilute HClO4 or LiClO4
H2O Dilute or concentrated HCl or H2SO4
O2 (air)
U+4 6 UO2
+2 Br2Catalyzed by Fe+3 or Mn+2
BrO3
!1HClO4
Ce+4 Dilute HClO4
ClO3
!1Catalyzed by Fe+2 or V+5
Fe+3
HClO2Phenol
HCrO4
!1
HNO2Catalyzed by Fe+2
HNO3
H2O2
O2
MnO2
UO2
+1 6 UO2
+2 Fe+3
UO2
+2 6 U+4 Cr+2
Eu+2
Np+3
Ti+3
V+2 and V+3
Rongalite (an aqueous
solution of sodium
hydroxymethanesulfonate)
Dilute basic solution
UO2
+2 6 U+3 Zn(Hg)
UO2
+1 6 U+4 Cr+2
H2
Zn(Hg)
(1) Compiled from: Anders, 1960; Bailar et al., 1984; Bate and Leddicotte, 1961; Cobble, 1964; Coleman, 1965;
Cotton and Wilkinson, 1988; Greenwood and Earnshaw, 1984; Hassinsky and Adloff, 1965; Kleinberg and
Cowan, 1960; Kolthoff et al., 1969; Latimer, 1952; Metz and Waterbury, 1962; Schulz and Penneman, 1986;
Weigel, 1986; and Weigel et al., 1986.
One method for the analysis of radioiodine in aqueous solutions illustrates the use of oxidation
and reduction chemistry to bring the radionuclide to a specific oxidation state so that it can be
isolated from other radionuclides and other elements (DOE, 1997, Method RP230). Iodine
species in the water sample are first oxidized to iodate (IO4
!1) by sodium hypochlorite (NaClO),
and then reduced to iodide (I!1) by sodium bisulfite. The iodine is finally oxidized to molecular
iodine (I2) and extracted from most other radionuclides and elements in solution by a nonpolar
organic solvent such as carbon tetrachloride (CCl4) or chloroform (CHCl3) (see Section 14.4,
“Solvent Extraction”).
Plutonium and its tracers can be equilibrated in a reproducible mixture of oxidation states by the
rapid reduction of all forms of the ion to the +3 state, momentarily, with iodide ion (I!1) in acid

Separation Techniques
14-17
JULY 2004 MARLAP
solution. Disproportionation begins immediately, but all radionuclide forms of the analyte and
tracer begin at the same time from the same oxidation state, and a true equilibrium mixture of the
radionuclide and its tracer is achieved. All plutonium radionuclides in the same oxidation state
can be expected to behave the same chemically in subsequent separation and detection
procedures.
In addition to dissolution and separation strategies, oxidation-reduction processes are used in
several quantitation steps of radiochemical analyses. These processes include titration of the
analyte and electrochemical deposition on a target for counting.
The classical titrimetric method is not commonly employed in the quantitation of environmental
level samples because the concentrations of radionuclides in these samples are typically too low
for detection of the endpoint of the titration, even by electrometric or spectroscopic means.
However, the method is used for the determination of radionuclides in other samples containing
larger quantities of long-lived radionuclides. Millimole quantities of uranium and plutonium in
nuclear fuels have been determined by titration using methods of endpoint detection as well as
chemical indicators (IAEA, 1972). In one method, uranium in the (VI) oxidation state is first
reduced to +3 and +4 with Ti+3, then uranium in the +3 state is oxidized to +4 with air bubbles
(Baetsel and Demildt, 1972). The solution is then treated with a slight excess of Ce+4 solution of
known concentration, which oxidizes U+4 to U(VI) (as UO2
+2) while being reduced, as follows:
U+4 + 2 Ce+4 6 U+6 + 2 Ce+3
(U+4 + 2 Ce+4 +2 H2O 6 UO2
+2 + 2 Ce+3 + 4 H+1)
The excess Ce+4 is back-titrated with Fe+2 solution, using ferroin as indicator for the endpoint of
the titration:
Fe+2 + Ce+4 6 Fe+3 + Ce+3
Electrochemical methods are typically used in radiochemistry to reduce ions in solution, plating
them onto a target metal for counting. Americium ions (Am+3) from soil samples ultimately are
reduced from solution onto a platinum electrode by application of an electrical current in an
electrolytic cell (DOE, 1990 and 1997, Method Am-01). The amount of americium on the
electrode is determined by alpha spectrometry.
In some cases, the deposition process occurs spontaneously without the necessity of an applied
current. Polonium and lead spontaneously deposit from a solution of hydrochloric acid onto a
nickel disk at 85 EC (Blanchard, 1966). Alpha and beta counting are used to determine 210Po and
210Pb. Wahl and Bonner (1951) contains a table of electrochemical methods used for the
oxidation and reduction of carrier-free tracers.

Separation Techniques
14-18
MARLAP JULY 2004
Oxidation-reduction chemistry often is used to separate mixtures of transuranics. This is because
mixtures of several transuranics (e.g., U, Pu, Cm) or transition metals will generate different
oxidation states of each element as a result of inter-element redox reactions. An example would
be :
2 H2O + U+4 + 2 Pu+4 6 UO2
2+ + 2 Pu+3 + 4 H+
Thus, when attempting to determine plutonium (as the Pu+4 ion) in a solution containing U+4, it
would be necessary to isolate most of the plutonium from the uranium before Pu+4 can be
analyzed successfully. The isolation would take place using extraction, precipitation, or
chromatographic methods.
14.3 Complexation
14.3.1 Introduction
A complex ion is formed when a metal atom or ion bonds with one or more molecules or anions
through an atom capable of donating one or more electron pairs. A ligand is any molecule or ion
that has at least one electron pair that can be donated to the metal. The bond is called a
coordination bond, and a compound containing a complex ion is a coordination compound. The
following are several examples of the formation of complex ions:
Th+4 + 2 NO3
!1 6 Th(NO3)2
+2
Ra+2 + EDTA-4 * 6 Ra(EDTA)!2
U+4 + 5 CO3
!2 6 U(CO3)5
!6
* EDTA!4 = Ethylene diamine tetraacetate, !1(OOC)2-NH-CH2-CH2-NH-(COO)2
!1
In a fundamental sense, every ion in solution can be considered complexed; there are no free or
“naked” ions. Dissolved ions are surrounded by solvent molecules. In aqueous solutions, the
complexed water molecules, referred to as the inner hydration sphere, form aquo ions that can be
either weakly or strongly bound:
Fe+2 + 6 H2O 6 Fe(H2O)6
+2
From an elementary standpoint, the process of complexation is simply the dynamic process of
replacing one set of ligands, the solvent molecules, with another. The complexation of a metal
ion in aqueous solution with a ligand, L, can be expressed as:
M(H2O)n
+x + L-y 6 M(H2O)n!1Lx-y + H2O

Separation Techniques
14-19
JULY 2004 MARLAP
Successive aquo groups can be replaced by other ligand groups until the complex MLn
x-ny is
formed as follows:
M(H2O)n!1 Lx!y + L!y 6 M(H2O)n!2+ H2O, etc.
L
x- y
2
2
In the absence of other complexing agents, in dilute aqueous solution solvated metal ions are
simply written as M+n for simplicity.
Ligands are classified by the number of electrons they donate to the metal to form coordination
bonds to the metal. If only one atom in the ligand is bonded to the metal, it is called a “unidentate
ligand” (from the Latin word for teeth). It is a categorization of ligands that describe the number
of atoms with electron pairs a ligand has available for donation in complex-ion formation; if two
atoms, bidentate, and so on for tridentate, tetradentate, pentadentate, and hexadentate. The term
“coordination number” is also used to indicate the number of atoms donating electrons to the
metal atom. The coordination number is 10 in U(CO3)5
!6, as illustrated above. EDTA, also
illustrated above, is a hexadentate ligand, because it bonds to the metal through the four oxygen
atoms and two nitrogen atoms. Table 14.4 lists some common ligands arranged by type.
A ligand can be characterized by the nature and basicity of its ligand atom. Oxygen donors and
the fluoride ion are general complexing agents. They combine with any metal ion (cation) with a
charge of more than one. Acetates, citrates, tartrate, and β-diketones generally complex all
metals. Conversely, cyanide (CN!1), the heavy halides, sulfur donors, and—to a lesser extent—
nitrogen donors, are more selective complexing agents than the oxygen donors. These ligands do
not complex the A-metals of the periodic table; only the cations of the B-metals and the
transition metals coordinate to carbon, sulfur, nitrogen, chlorine, bromine, and iodine.
TABLE 14.4 — Common ligands
Ligand Type (1) Examples
Unidentate Water (H2O), halides (X!1), hydroxide (OH!1), ammonia (NH3),
cyanide (CN!1), nitrite (NO2
!1), thiocyanate (SCN!1), carbon
monoxide (CO)
Bidentate Oxalate, ethylene diamine, citrate
Tridentate Diethylene triamine, 1,3,5 triaminocyclohexane
Polydentate 8-hydroxyquinoline, β-diketones (thenoyltrifluoroacetone
[TTA]), ethylene diamine tetraacetic acid (EDTA), diethylene
triamine pentaacetic acid (DTPA)
Organophosphates: (octyl(phenyl)-N,N-diiso-butylcarbamoyl-
methylphosphine oxide [CMPO]); tributylphosphate (TBP),
trioctylphosphinic oxide (TOPO), quaternary amines (tricaprylyl-
methylammonium chloride [Aliquat-336®]), triisooctylamine
(TIOA), tri-n-octylamine (TnOA), macrocyclic polyethers (crown
ethers such as [18]-crown-6), cryptates
Separation Techniques
14-20
MARLAP JULY 2004
C - C C - CC - C
C - C C - C
H - O
H - O
H - O
H - O
..
..
..
..
..
NN
..
..
..
..
O
OO
O
H2
H2H2H2H2
H2
..
..
..
..
..
..
..
..
..
FIGURE 14.1 — Ethylene diamine tetraacetic acid (EDTA)
(1) Ligands are categorized by the number of electron pairs available for donation. Unidentate
ligands donate one pair of electrons; bidentate donate two pairs, etc.
14.3.2 Chelates
When a multidentate ligand is bound to the metal atom or ion by two or more electron pairs,
forming a ring structure, it is referred to as a “chelate” and the multidentate ligand is called a
“chelating agent” or reagent. Chelates are organic compounds containing two, four, or six
carboxylic acid (RCOOH) or amine (RNH2) functional groups. A chelate is effective at a pH
where the acid groups are in the anionic form as carboxylates, RCOO!1, but the nitrogen is not
protonated so that its lone pair of electrons is free for bonding. The chelate bonds to the metal
through the lone pair of electrons of these groups as bi-, tetra-, or hexadentate ligands, forming a
coordination complex with the metal. Binding through multiple sites wraps up the metal in a
claw-like fashion, thus the name chelate, which means claw. Practically all chelates form five- or
six-membered rings on coordinating with the metal. Chelates are much more stable than complex
compounds formed by unidentate reagents. Moreover, if multiple ring systems are formed with a
single metal atom or ion, stability improves. For example, EDTA, a hexadentate ligand, forms
especially stable complexes with most metals. As illustrated in Figure 14.1, EDTA has two donor
pairs from the nitrogen atoms, and four donor pairs from the oxygen atoms.
EDTA forms very stable complexes with most metal atoms because it has
two pairs of electrons available from the nitrogen atoms, and four pairs of
electrons from the oxygen atoms. It is often used as a complexing agent in a
basic solution. Under these conditions, the four carboxylic-acid groups
ionize with the loss of a hydrogen ion (H+1), forming EDTA!4, a stronger
complexing agent. EDTA is often used as a food additive to increase shelf
life, because it combines with transition metal ions that catalyze the
decomposition of food. It is also used as a water softener to remove Ca+2
and Mg+2 ions from hard water.
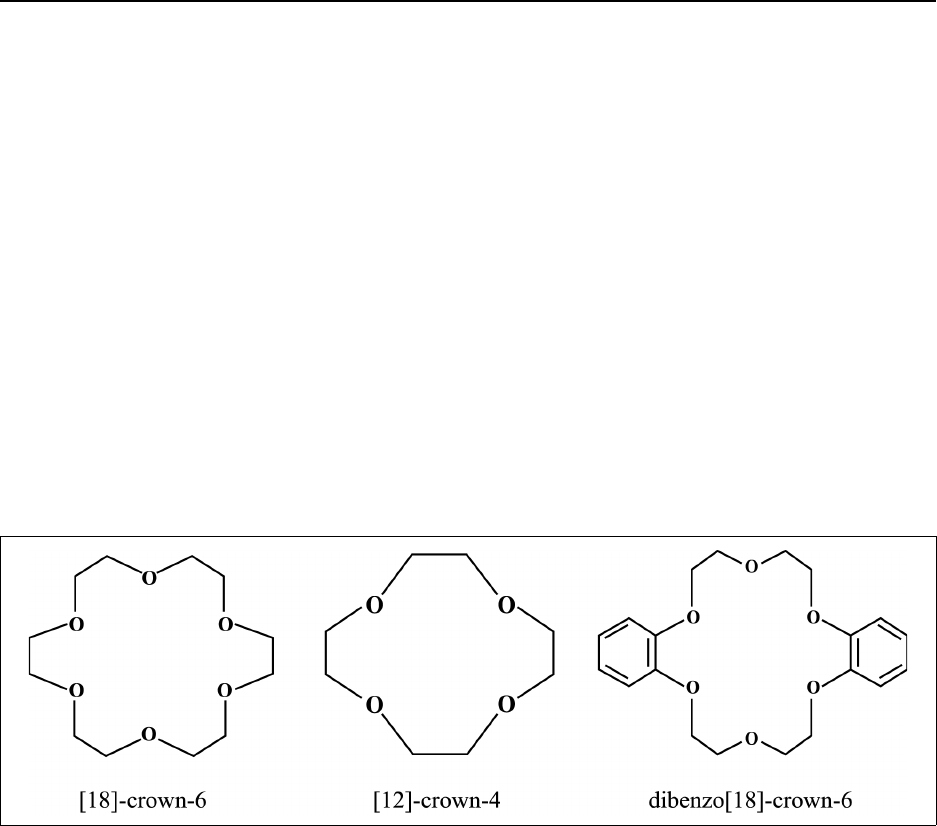
Separation Techniques
14-21
JULY 2004 MARLAP
FIGURE 14.2 — Crown ethers
Various chelating agents bind more readily to certain cations, providing the specificity for
separating ions by selective bonding. Occasionally, the complex is insoluble under the solvent
conditions used, allowing the collection of the complex by precipitation. Selectivity of a chelate
can be partially controlled by adjusting the pH of the medium to vary the net charge on its
functional groups. Different chelates provide specificity through the number of functional groups
available for bonding and the size of claw formed by the molecular structure, providing a select
fit for the diameter of a specific cation. The electron-donating atoms of the chelate form a ring
system with the metal atom when they participate in the coordination bond. In most cases,
chelates form much more stable complexes than unidentate ligands. For example, the complex
ion formed between Ni+2 and the bidentate ligand ethylenediamine (H2N-CH2-CH2-NH2, or en),
Ni(en)3
+2, is almost 108 times more stable than the complex ion formed between the metal ion
and ammonia, Ni(NH3)+2.
Another class of ligands that is becoming increasingly important to the radiochemist doing
laboratory analyses is the macrocyclic polyethers, commonly called crown ethers (Horwitz et al.,
1991 and 1992a; Smith et al., 1996 and 1997). These compounds are cyclic ethers containing a
number of regularly spaced oxygen atoms. Some examples are given in Figure 14.2.
First identified in 1967, crown ethers have been shown to form particularly stable coordination
complexes. The term, “crown ether,” was suggested by the three-dimensional shape of the
molecule. In the common names of the crown ethers, the ring size is given in brackets, and the
number of oxygen atoms follows the word “crown.”
Crown ethers have been shown to react rapidly and with high selectivity (Gokel, 1991; Hiraoka,
1992). This property is particularly significant when a separation requires high selectivity and
efficiency in removing low-level species from complex and concentrated matrices, a situation
frequently encountered in environmental or mixed-waste analyses. Because crown ethers are
multidentate chelating ligands, they have very high formation constants. Moreover, because the
metal ion must fit within the cavity, crown ethers demonstrate some selectivity for metal ions
according to their size. Crown ethers can be designed to be very selective by changing the ring

Separation Techniques
14-22
MARLAP JULY 2004
size, the ring substituents, the ring number, the donor atom type, etc. For example, dibenzo-18-
crown-6 forms a strong complex with potassium; weaker complexes with sodium, cesium, and
rubidium; and no complex with lithium or ammonium, while 12-crown-4, with its smaller cavity,
specifically complexes with lithium.
Other crown ethers are selective for radionuclide ions such as radium and UO2
+2. Addition of 18-
crown-6 to solutions containing NpO2
+2 causes the reduction of neptunium to Np(V) as NpO2
+1,
which is encircled by the ether ligand (Clark et al., 1998).
14.3.3 The Formation (Stability) Constant
The stability of the complex is represented by the magnitude of an equilibrium constant
representing its formation. The complex ion, [Th(NO3)2
+2], forms in two equilibrium steps:
Th+4 + NO3
!1 6 Th(NO3)+3
Th(NO3)+3 + NO3
!1 6 Th(NO3)2
+2
The final equation is:
Th+4 + 2NO3
! 6 Th(NO3)2
+2
The stepwise formation (stability) constants are:
K[Th(NO ) ]
[Th ][NO ]
1
3
3
4
3
1
=
+
+−
and
K[Th(NO ) ]
[Th(NO ) ][NO ]
2
32
2
3
3
3
1
=
+
+−
The overall formation (stability) constant is:
KKK
f
=⋅
+
+−
12
[Th(NO ) ]
[Th ][NO ]
32
2
4
3
12
In the Ni+2 examples cited in the preceding section, the relative stabilities of the complex ions are
represented by the values of K; for Ni(en)3
+2 it is 1018.28, and for Ni(NH3)+2 it is 108.61 (Cotton and
Wilkinson, 1988).
Many radionuclides form stable complex ions and coordination compounds that are important to
the separation and determination steps in radioanalytical chemistry. Formation of a complex
changes the properties of the ion in several ways. For example:

Separation Techniques
14-23
JULY 2004 MARLAP
• Complexation of UO2
+2 with carbonate to form UO2(CO3)3
-4 increases the solubility of the
uranium species in groundwater (Lindsay, 1988).
• Thorium (+2) forms Th(NO3)6
!2 in nitric acid solution (optimally at 7 M) that is the basis for
separation of thorium from other actinides and thorium progeny, because they do not form
anionic complexes under these conditions (Hyde, 1960).
• Radium (+2) forms a very insoluble compound with sulfate (RaSO4) but is soluble in hot
concentrated sulfuric acid because of the formation of Ra(SO4)2
!2 (Kirby and Salutsky, 1964).
In addition, the complex ion in solution is in equilibrium with the free (hydrated) ion, and the
equilibrium mixture might, therefore, contain sufficient concentration of the free ion for it to be
available for other reactions, depending on the stability of the complex ion.
14.3.4 Complexation and Radiochemical Analysis
Property changes also accompany the formation of complex ions and coordination compounds
from simple radionuclide ions. These changes provide a valuable approach in radiochemistry for
isolating, separating, and measuring radionuclide concentrations, and are important in several
areas of radiochemistry.
14.3.4.1 Extraction of Laboratory Samples and Ores
Uranium ores are leached with alkaline carbonates to dissolve uranium as the UO2(CO3)3
!4
complex ion after oxygen is used to convert U+4 to U(VI) (Grindler, 1962). Samples containing
refractory plutonium oxides are dissolved with the aid of a nitric acid-hydrofluoric acid solution
to produce the complex cation PuF+3 and similar cationic fluorocomplexes (Booman and Rein,
1962). Refractory silicates containing niobium (Nb) also yield to fluoride treatment. Potassium
bifluoride (KF2
!1) is used as a low-temperature flux to produce a fluoride complex NbF6
!1
(Willard and Rulfs, 1961; Greenwood and Earnshaw, 1984).
14.3.4.2 Separation by Solvent Extraction and Ion-Exchange Chromatography
Many ion-exchange separations of radionuclides are based on the formation of complex ions
from the metal ions in solution or the displacement of ions bound to an exchanger by complex
formation. Uranium in urine samples, for example, is partly purified by forming a chlorocomplex
of U+4 and UO2
+2 ions, UCl6
!2 and UO2Cl3
!1, that bind preferentially to the anion-exchange
ligands in 7 M HCl. Other cations pass through the column under these conditions. Uranium is
subsequently eluted with 1 M HCl (DOE, 1990 and 1997, Method U-01).
For separation on a larger scale—such as in an industrial setting—chelates are often used in a
column chromatography or filtration unit. They are immobilized by bonding to an inert matrix,

Separation Techniques
14-24
MARLAP JULY 2004
such as polystyrene or an alumina/silica material. A solution containing the ions to be separated
is passed continuously through the column or over the filter, where the select cations are bonded
to the chelate as the other ions pass through. Washing the column or filter with a solution at
alternate pH or ionic strength will permit the elution of the bound cation.
Thorium (+4) is bound more strongly to cation exchangers than most other cations (Hyde, 1960).
The bound thorium is separated from most other ions by washing the column with mineral acids
or other eluting agents. Even the tetrapositive plutonium ion, Pu+4, and the uranyl ion, UO2
+2, are
washed off with high concentrations of HCl because they form chlorocomplexes, PuCl6
!2 and
UO2Cl3
!1, respectively. Thorium is then removed by eluting with a suitable complexing agent
such as oxalate, which reduces the effective concentration of Th+4, reversing the exchange
process. Using oxalate, Th(C2O4)4
!4 forms and the anion is not attracted to the cation exchanger.
14.3.4.3 Formation and Dissolution of Precipitates
A classical procedure for the separation and determination of nickel (Ni) is the precipitation of
Ni+2 with dimethylglyoxime, a bidentate ligand that forms a highly selective, stable chelate
complex with the ion, Ni(C4H7N2O2
!1)2 (DOE, 1997, Method RP300). Uranium in the +4
oxidation state can also be precipitated from acidic solutions with a chelating agent, cupferron
(ammonium nitrosophenylhydroxylamine, C8H5(NO)O!1NH4
+1) (Grindler, 1962). In another
procedure, Co+2 can be selectively precipitated from solution as K3Co(NO2)6. In this procedure,
cobalt, which forms the largest number of complexes of all the metals, forms a complex anion
with six nitrite ligands, Co(NO2)6
!3 (EPA, 1973).
In radiochemical separations and purification procedures, precipitates of radionuclides are
commonly redissolved to release the metal ion for further purification or determination. In the
determination of 90Sr, Sr+2 is separated from the bulk of the solution by direct precipitation of the
sulfate, SrSO4. The precipitate is redissolved by complexation with EDTA, Sr(EDTA)!2, to
separate it from lanthanides and actinides (DOE, 1997, Method RP520). Radium also forms a
very stable complex with EDTA. Solubilization of radium, Ra+2, coprecipitated with barium
sulfate (BaSO4) is used in the 228Ra determination of drinking water by using EDTA (EPA,
1980).
14.3.4.4 Stabilization of Ions in Solution
In some radiochemical procedures, select radionuclides are separated from other elements and
other radionuclides by stabilizing the ions as complex ions, while the other substances are
precipitated from solution. In a procedure extensively used at Oak Ridge National Laboratory
(ORNL), 95Nb is determined in solutions by taking advantage of complex-ion formation to
stabilize the Nb(V) ion in solution during several steps of the procedure (Kallmann, 1964). The
niobium sample and carrier are complexed with oxalic acid in acidic solution to prevent
precipitation of the carrier and to promote interchange between the carrier and 95Nb. Niobium is

Separation Techniques
14-25
JULY 2004 MARLAP
precipitated as the pentoxide after warming the solution to destroy the oxalate ion, separating it
from the bulk of other ions in solution. Niobium is also separated specifically from zirconium by
dissolving the zirconium oxide in hydrofluoric acid.
14.3.4.5 Detection and Determination
Compleximetric titration of metal ions with EDTA using colorimetric indicators to detect the
endpoint can be used for determination procedures. Uranium does not form a selective complex
with EDTA, but this chelate has been used to titrate pure uranium solutions (Grindler, 1962). The
soluble EDTA complex of thorium is the basis of a titrimetric determination of small amounts of
thorium (Hyde, 1960).
Spectrometric determinations are also based on the formation of complex ions. Microgram
quantities of uranium are determined by the absorbance at 415 nm (a colorimetric determination)
of the uranyl chelate complex with dibenzoylmethane, C6H5-CO-CH2-CO-C6H5 (Grindler, 1962).
14.4 Solvent Extraction
14.4.1 Extraction Principles
Solvent extraction has been an important separation technique since the early days of the
Manhattan Project, when scientists extracted uranyl nitrate into diethyl ether to purify the
uranium used in the first reactors. Solvent extraction, or liquid-liquid extraction, is a technique
used both in the laboratory and on the industrial scale. However, current laboratory trends are
away from this technique, mainly because of the costs of materials and because it is becoming
more difficult and costly to dispose of the mixed waste generated from the large volumes of
solvents required. The technique also tends to be labor intensive because of the need for multiple
extractions using separatory funnels. Nonetheless, solvent extraction remains a powerful
separation technique worthy of consideration.
Solvent extraction refers to the process of selectively removing a solute from a liquid mixture
with a solvent. As a separation technique, it is a partitioning process based on the unequal
distribution of the solute (A) between two immiscible solvents, usually water (aq) and an organic
liquid (org):
Aaq W Aorg
The solute can be in a solid or liquid form. The extracting solvent can be water, a water-miscible
solvent, or a water-immiscible solvent; but it must be insoluble in the solvent of the liquid
mixture. Solutes exhibit different solubilities in various solvents. Therefore, the choice of
extracting solvent will depend upon the properties of solute, the liquid mixture, as well as other
requirements of the experimental procedure. The solvents in many applications are water and a

Separation Techniques
14-26
MARLAP JULY 2004
nonpolar organic liquid, such as hexane or diethyl ether, but other solvent pairs are commonly
used. In general terms, the solute to be removed along with impurities or interfering analytes to
be separated are already dissolved in one of the solvents (water, for example). In this example, a
nonpolar organic solvent is added and the two are thoroughly mixed, usually by shaking in a
separatory funnel. Shaking produces a fine dispersion of each solvent in the other that will
separate into two distinct layers after standing for several minutes. The more dense solvent will
form as the bottom layer. Separation is achieved because the solute and accompanying impurities
or analytes have different solubilities in the two solvents. The solute, for example, might
preferentially remain in the aqueous phase, while the impurities or analyte selectively dissolve in
the organic phase. The impurities and analyte are extracted from the aqueous layer into the
organic layer. Alternatively, the solute might be more soluble in the organic solvent and will be
extracted from the aqueous layer into the organic layer, leaving the impurities behind in the
aqueous layer.
14.4.2 Distribution Coefficient
The different solubilities of a solute in the solvent pairs of an extraction system are described by
the distribution or partition coefficient, Kd. The coefficient is an equilibrium constant that
represents the solubility of the solute in one solvent relative to its solubility in another solvent.
Once equilibrium is established, the concentration of solute in one phase has a direct relationship
to the solute concentration in the other phase. This is expressed mathematically by:
K[A ]
[A ]
d
org
aq
=
where [Aorg] and [Aaq] are the concentration of the solute in the organic and aqueous phase
respectively, and Kd is a constant. The concentrations are typically expressed in units of moles/kg
(molality) or g/g; therefore, the constant is unitless. These solubilities usually represent saturated
concentrations for the solute in each solvent. Because the solubilities vary with temperature, the
coefficient is temperature-dependent, but not by a constant factor. Wahl and Bonner (1951)
contains a table of solvent extraction systems for carrier-free tracers containing laboratory
conditions and distribution coefficients.
A distribution coefficient of 90 for a solute in a hexane/water system, for example, means that
the solute is 90 times more soluble at saturation conditions in hexane than in water, but note that
some of the water still contains a small amount of the solute. Solvent extraction selectively
dissolves the solute in one solvent, but it does not remove the solute completely from the other
solvent. A larger coefficient would indicate that, after extraction, more solute would be
distributed in hexane relative to water, but a small quantity would still be in the water. Solvent
extraction procedures often use repeated extractions to extract a solute quantitatively from a
liquid mixture.

Separation Techniques
14-27
JULY 2004 MARLAP
The expression of the distribution law is only a very useful approximation; it is not thermo-
dynamically rigorous, nor does it account for situations in which the solute is involved in a
chemical reaction, such as dissociation or association, in either phase. Consider, for example,
dimerization in the organic phase:
2Aorg W (A)2, org
where the distribution ratio, D, is an alternate form of the distribution coefficient expressed by:
D = ([Aorg]monomer + [Aorg]dimer)/[Aaq]
or
D = ([Aorg] + 2 [(A)2, org]) /[Aaq]
Because the concentration of the monomer that represents the dimeric form of the solute is twice
that of the concentration of the dimer:
[Aorg]dimer = 2 [(A)2, org]
Substitution of Kd produces:
D = Kd (1 + 2 K2 [Aorg])
where K2 is the dimerization constant, K2 = [(A)2, org]/[Aorg]2. Because dimerization decreases the
concentration of the monomer, the species that takes part directly in the phase partition, the
overall distribution increases.
14.4.3 Extraction Technique
There is extensive literature on the topic of extraction techniques, but only a few sources are
listed here. The theory of solvent extraction is covered thoroughly in Irving and Williams (1961),
Lo et al. (1983), and Dean (1995). The journal Solvent Extraction and Ion Exchange is an
excellent source for current advances in this field. A practical discussion on the basics of solvent
extraction is found in Korkisch (1969). The discussion applies to a metallic element in solution
as a cation extracted by a nonpolar solvent:
“In solvent extraction, the element which is to be separated, contained in an aqueous solution,
is converted to a compound which is soluble in an organic solvent. The organic solvent must
be virtually immiscible with water. By shaking the aqueous solution with the organic solvent
(extractant) in a separating funnel, the element is extracted into the organic phase. After
allowing the aqueous and organic phases to separate in the funnel, the organic extract is
removed from contact with the aqueous layer. This single-stage batch extraction method is

Separation Techniques
14-28
MARLAP JULY 2004
employed when Kd is relatively large and for a simple separation it is essential that the
distribution coefficients of the metal ions to be separated be sufficiently different. As in the
case of ion exchange, the effectiveness of separation is usually expressed by means of the
separation factor which is given by the ratio of the distribution coefficients of two different
elements which were determined under identical experimental conditions. This ratio
determines the separability of two elements by liquid-liquid extraction. Separations can only
be achieved if this ratio shows a value which is different from unity and they are clean and
can be quickly and easily achieved where one of the distribution coefficients is relatively
large and the other very small (high separation factor).
“In those extractions where the separation factor approaches unity, it is necessary to employ
continuous extraction or fractionation methods. With the latter techniques distribution,
transfer and recombination of various fractions are performed a sufficient number of times to
achieve separation. In continuous extraction use is made of a continuous flow of immiscible
solvent through the solution or a continuous counter-current flow of both phases. In
continuous extraction the spent solvent is stripped and recycled by distillation, or fresh
solvent is added continuously from a reservoir. Continuous counter-current extraction
involves a process where the two liquid phases are caused to flow counter to each other.
Large-scale separations are usually performed using this technique.
“When employing liquid-liquid extraction techniques, one of the most important
considerations is the selection of a suitable organic solvent. Apart from the fact already
mentioned that it must be virtually immiscible with water, the solubility of the extracted
compound in the solvent must be high if a good separation is to be obtained. Furthermore, it
has to be selective, i.e., has to show the ability to extract one component of a solution in
preference to another. Although the selectivity of a solvent for a given component can be
determined from phase diagrams, it is a little-used procedure in analytical chemistry. The
principal difficulty is simply that too few phase diagrams exist in the literature. The result is
that the choice of an extractant is based on either experience or semi-empirical considera-
tions. As a rule, however, polar solvents are used for the extraction of polar substances from
nonpolar media, and vice versa. Certainly the interactions of solute and solvent will have an
effect on the selectivity of the solvent. If the solute is readily solvated by a given solvent, then
it will be soluble in that solvent. Hydrogen bond formation between solute and solvent
influences solubility and selectivity.
“Almost as important as the selectivity of the extractant is the recovery of the solute from the
organic extract. Recovery can be achieved by distillation or evaporation of the solvent,
provided that the solute is nonvolatile and thermally stable. This technique is, however, less
frequently used than the principle of back extraction (stripping) which involves the treatment
of the organic extract with an aqueous solution containing a reagent which causes the
extracted solute to pass quantitatively into the aqueous layer...

Separation Techniques
14-29
JULY 2004 MARLAP
“In solvent extraction the specific gravity of the extractant in relation to the aqueous phase is
important. The greater the difference in the solvent densities, the faster will be the rate at
which the immiscible layers separate. Emulsions are more easily produced when the densities
of the two solvents are similar. Sometimes troublesome emulsions can be broken by
introducing a strong electrolyte into the system or by the addition of small quantities of an
aliphatic alcohol”
Korkisch (1969) continues:
“Liquid-liquid extraction can be applied to the analysis of inorganic materials in two different
ways.
(a) Where the element or elements to be determined are extracted into the organic phase.
(b) Where the interfering elements are removed by extraction, leaving the element or
elements to be determined in the aqueous phase.
“Solvent extraction separations are mainly dependent for their successful operation upon the
distribution ratio of the species between the organic and aqueous phase and the pH and salt
concentration of the aqueous phase. Much of the selectivity which is achieved in liquid-liquid
extraction is dependent upon adequate control of the pH of the solution. The addition of
masking agents such as EDTA and cyanide can greatly improve selectivity, but they too are
dependent upon the pH of the solution to exert their full effect. In many cases complete
extractions and separations are obtained only in the presence of salting-out agent. An
example is the extraction of uranyl nitrate. In the presence of additional nitrate, the increase
in the concentration of the nitrate ion in the aqueous solution shifts the equilibrium between
the uranyl ion and the nitrate complexes toward the formation of the latter, and this facilitates
a more complete extraction of the uranium into the organic solvent. At the same time, the
salting-out agent has another, more general, effect: as its affinity for water is large, it
becomes hydrated by the water molecules so that the substance to be extracted is really
dissolved in a smaller amount of water, and this is the same as if the concentration in the
solution were increased. As a result, the distribution coefficient between the aqueous and the
organic phases is increased. As a rule the salting-out agent also lowers the solubility of the
extractant in the aqueous phase, and this is often important in separations by extraction. The
efficiency of the salting-out action depends upon the nature and the concentration of the
salting-out agent. For the same molar concentration of the salting-out agent its action
increases with an increase in the charge and decrease in the radius of its cation.”
A hydrated metal ion will always prefer the aqueous phase to the organic phase because of
hydrogen bonding and dipole interaction in the aqueous phase. Therefore, to get the metal ion to
extract, some or all of the inner hydration sphere must be removed. The resulting complex must
be neutrally charged and organophilic. Removal of the hydration sphere is accomplished by

Separation Techniques
14-30
MARLAP JULY 2004
coordination with an anion to form a neutral complex. Neutral complexes will generally be more
soluble in an organic phase. Larger complexing anions favor the solubility in the organic phase.
Extracting agents are thus divided into three classes: polydentate organic anions, neutral organic
molecules, and large organic cations. Many of the multidentate ligands discussed previously are
used in solvent extraction systems.
The radioanalytical procedure for uranium and thorium employs solvent extraction to separate
the analytes before alpha counting (EPA, 1984). An aqueous solution of the two is extracted with
a 10 percent solution of triisooctylamine (TIOA) in para-xylene to remove uranium, leaving
thorium in the water (Grinder, 1962). Each solution is further processed to recover the respective
radionuclides for separate counting.
14.4.4 Solvent Extraction and Radiochemical Analysis
In many purification procedures, separated solutions are used directly in further isolation steps. If
necessary, the substances can be collected by distillation or evaporation of the respective
solvents. In the uranium/thorium procedure described above, the aqueous layer containing
thorium is evaporated, and the thorium is redissolved in an alternate solution before it is purified
further. In other cases, the solution is extracted again to take up the solute in another solvent
before the next step in the procedure. Uranium in TIOA/p-xylene, for example, is extracted back
into a nitric acid solution for additional purification (EPA, 1984).
In some solvent-extraction procedures, more than one extraction step is required for the
quantitative removal of a solute from its original solvent. The solute is more soluble in one
component of the solvent pair, but not completely insoluble in the other component, so
successive extractions of the aqueous solution of the solute by the organic solvent will remove
more and more of the solute from the water until virtually none remains in the aqueous layer.
Extraction of uranium with TIOA/p-xylene, for example, requires two extractions before
quantitative removal is achieved (EPA, 1984). The organic layers containing the uranium are
then combined into one solution for additional processing.
Solvent extraction is greatly influenced by the chemical form (ionic or molecular) of the solute to
be extracted, because different forms of the solute can have different solubilities in the solvents.
In the uranium/thorium procedure described above, uranium is extracted from water by TIOA/
hydrochloric acid, but it is stripped from the amine solution when extracted with nitric acid.
Simply changing the anion of uranium and TIOA from chloride to nitrate significantly alters the
complex stability of uranium and TIOA.
Organic amines are sometimes converted to their cationic forms, which are much more soluble in
water and much less soluble in organic solvents. The amine is converted to the corresponding
ammonium salt by an acid, such as hydrochloric acid:

Separation Techniques
14-31
JULY 2004 MARLAP
RNH2 + HCl 6 RNH3
+1Cl!1
Correspondingly, carboxylic acids are converted to their carboxylates that are more soluble in
water and less soluble in organic solvents. They are produced by treating the carboxylic acid with
a base, such as sodium hydroxide:
RCOOH + NaOH 6 RCOO!1Na+1 + H2O
Multidentate organic anions that form chelates are important extracting agents. These reagents,
such as the β-diketonates and thenoyltrifluoroacetone (TTA) (Ahrland, 1986), are commonly
used for extracting the actinide elements. When the aqueous solution and organic phase come
into contact with one another, the chelating agent dissolves in the aqueous phase, ionizes, and
complexes the metal ion; the resulting metal chelate subsequently dissolves in the organic phase.
A number of organophosphorus compounds are also efficient extractants because they and their
complexes are readily soluble in organic solvents. The actinide MO2
+2 and actinide +4 ions are
very effectively extracted by reagents such as bis(2-ethylhexyl) phosphoric acid (HDEHP) and
dibutylphosphoric acid (HDBP) (Cadieux and Reboul, 1996).
Among the neutral compounds, alcohols, ethers, and ketones have been commonly employed as
extractants. Methyl isobutyl ketone was used in one of the early large-scale processes (the Redox
process) to recover uranium and plutonium from irradiated fuel (Choppin et al., 1995). However,
the most widely used neutral extractants are the organophosphorus compounds such as TBP
(tributylphosphate). The actinide elements thorium, uranium, neptunium, and plutonium easily
form complexes with TBP (Choppin et al., 1995). Salting-out agents such as HNO3 and Al(NO3)3
are commonly employed to increase extraction in these systems. This chemistry is the basis of
the Purex process used to reprocess spent nuclear fuel (Choppin et al., 1995).
An important addition to the Purex process is the solvent extraction procedure known as TRUEX
(Trans Uranium Extraction). This process uses the bifunctional extractant CMPO ([octyl
(phenyl)]-N,N-diisobutylcarbonylmethylphosphine oxide) to remove transuranium elements from
the waste solutions generated in the Purex process. This type of compound extracts actinides at
high acidities, and can be stripped at low acidity or with complexing agents. Many of the recent
laboratory procedures for biological waste and environmental samples are based upon this
approach (see Section 14.4.5.1, “Extraction Chromatography Columns”).
The amines, especially the tertiary and quaternary amines, are strong cationic extractants. These
strong bases form complexes with actinide metal cations. The extraction efficiency improves
when the alkyl groups have long carbon chains, such as in tri-n-octylamine (TnOA) or TIOA.
The pertechnetate ion (TcO4
!1) is also extracted by these cationic extractants (Chen, 1990).
Table 14.5 lists common solvent extraction procedures for some radionuclides of interest and
includes the examples described above.

Separation Techniques
14-32
MARLAP JULY 2004
TABLE 14.5 — Radioanalytical methods employing solvent extraction (1)
Analyte Extraction Conditions (Reference)
89/90Sr From soils and sediments with dicyclohexano-18-crown-6 in trichloromethane with back
extraction with EDTA (Pimpl, 1995)
99TcO4
!From dilute H2SO4 solutions into a 5% TnOA in xylene mixture and back extracted with NaOH
(Golchert and Sedlet, 1969; Chen, 1990); from dilute H2SO4, HNO3, and HCl solutions into a
5% TnOA in xylene (Dale et al., 1996); from HNO3 into 30% TnOA in xylene and back
extracted with NaOH (Hirano, 1989); from dilute H2SO4 solutions into TBP (Holm et al., 1984;
Garcia-Leon, 1990); the tetraphenyl arsonium complex of Tc into chloroform (Martin and
Hylko, 1987); from K2CO3 with methyl ethyl ketone (Paducah R-46); from alkaline nuclear-
waste media with crown ethers (Bonnesen et al., 1995)
210Pb As lead bromide from bone, food, urine, feces, blood, air, and water with Aliquat-336® (DOE,
1990 and 1997, Method Pb-01; Morse and Welford, 1971)
Radium through
Californium
From soil following KF-pyrosulfate fusion and concentration by barium sulfate precipitation
with Aliquat-336® in xylene (Sill et al., 1974)
Actinides From water following concentration by ferric hydroxide precipitation and group separation by
bismuth phosphate precipitation, uranium extracted by TOPO, plutonium and neptunium
extracted by TIOA from strong HCl, and thorium separated from americium and curium by
extraction with TOPO (EPA, 1980, Method 907.0)
And other metals from TOPO (NAS-NS 3102) and from high-molecular weight amines such as
TIOA (NAS-NS 3101).
Uranium and plutonium from HCl with TIOA (Moore, 1958)
From nitric acid wastes using the TRUEX process with CMPO (Horwitz et al., 1985 and 1987)
With various extractive scintillators followed by PERALS® spectrometry (McDowell 1986 and
1992); with HDEHP after extraction chromatography followed by PERALS® spectrometry
(Cadieux and Reboul, 1996)
Thorium From aqueous samples after ion exchange with TTA, TIOA, or Aliquat-336® (DOE, 1997,
Method RP570)
Uranium From waters with ethyl acetate and magnesium nitrate as salting-out agent (EPA, 1980, Method
908.1); with URAEX™ followed by PERALS® spectrometry (Leyba et al., 1995)
From soil, vegetation, fecal ash, and bone ash with Alamine-336 (DOE, 1990 and 1997,
Methods Se-01, U-03)
(1) This list is representative of the methods found in the literature. It is not an exhaustive compilation, nor does it
imply preference over methods not listed.
14.4.5 Solid-Phase Extraction
A technique closely related to solvent extraction is solid-phase extraction (SPE). SPE is a
solvent-extraction system in which one of the phases is made stationary by adsorption onto a
solid support, usually silica, and the other liquid phase is mobile. Small columns or membranes
are used in the SPE approach. Many of the same extracting agents used in solvent extraction can
be used in these systems. SPE is becoming widely accepted as an excellent substitute for liquid-
liquid extraction because it is generally faster, more efficient, and generates less waste.

Separation Techniques
14-33
JULY 2004 MARLAP
14.4.5.1 Extraction Chromatography Columns
Over the past decade, extraction chromatography methods have gained wide acceptance in the
radiochemistry community as new extraction chromatographic resins have become commercially
available, such as Sr, TRU®, and TEVA® resins (Eichrom Technologies, Inc., Darien, IL) (Dietz
and Horwitz, 1993; Horwitz et al., 1991, 1992a, and 1993). These resins are composed of extrac-
tant materials, such as CMPO and 4,4'(5')-bis(t-butylcyclohexano)-18-crown-6, absorbed onto an
inert polymeric support matrix. They are most frequently used in a column rather than a batch
mode.
Another example of the advances in the area is the use of fibrous discs impregnated with high-
molecular-weight chelates that select for certain elements such as Cs, Sr, and Tc (Empore Discs,
3M Company, and the TEVA® Disc, Eichrom Technologies, Inc.). Many of the traditional
methods based upon repetitive precipitations, or solvent extraction in separatory funnels, have
been replaced by this strategy. This approach allows for the specificity of liquid-liquid extraction
with the convenience of column chromatography. Numerous papers detailing the determination
of radionuclides by this technique have been published recently, and examples are cited in Table
14.6.
TABLE 14.6 — Radioanalytical methods employing extraction chromatography (1)
Analyte Ligand Method Citations
Ni-59/63 dimethylglyoxime Aqueous samples (DOE, 1997)
Sr-89/90 4,4'(5')-bis(t-butyl-cyclohexano)-18-
crown-6 in n-octanol
Biological, Environmental, and Nuclear Waste (Horwitz
et al., 1991 and 1992a); Water (ASTM, D5811-95;
DOE, 1997, Method RP500); Urine (Dietz and Horwitz,
1992; Alvarez and Navarro, 1996); Milk (Jeter and
Grob, 1994); Geological Materials (Pin and Bassin,
1992)
Sr-90 octyl(phenyl)-N,N-diisobutyl-
carbamoylmethylphosphine oxide
(CMPO) in tributyl phosphate
Brines (Bunzl et al., 1996)
Y-90 4,4'(5')-bis(t-butyl-cyclohexano)-18-
crown-6 in n-octanol
Medical applications (Dietz and Horwitz, 1992)
Tc-99 Aliquat-336N Low-level radioactive waste (Banavali, 1995); Water
(Sullivan et al., 1993; DOE, 1997, Method RP550)
Pb-210 4,4'(5')-bis(t-butyl-cyclohexano)-18-
crown-6 in isodecanol
Water (DOE, 1997, Method RP280); Geological
materials (Horwitz et al., 1994; Woittiez and Kroon,
1995); complex metal ores (Gale, 1996)
Ra-228 CMPO in tributyl phosphate or HDEHP
impregnated in Amberlite XAD-7
Natural waters (Burnett et al., 1995); Volcanic rocks
(Chabaux, 1994)

Separation Techniques
Analyte Ligand Method Citations
14-34
MARLAP JULY 2004
Rare earths diamyl,amylphosphonate
CMPO in tributyl phosphate and
HDEHP impregnated in Amberlite
XAD-7
CMPO in tributyl phosphate and 4,4'(5')-
bis(t-butyl-cyclohexano)-18-crown-6 in
n-octanol
Actinide-containing matrices (Carney, 1995)
Sequential separation of light rare earths, U, and Th in
geological materials (Pin et al., 1996)
Concomitant separation of Sr, Sm, and Nd in silicate
samples (Pin et al., 1994)
Actinides CMPO in tributyl phosphate Air filters (Berne, 1995); Waters (Berne, 1995); Group-
screening (DOE, 1997, Method RP725); Urine (Horwitz
et al., 1990; Nguyen et al., 1996); Acidic media
(Horwitz, 1993; DOE, 1997); Soil and sludge (Smith et
al., 1995; Kaye et al., 1995); Environmental (Bunzl and
Kracke, 1994)
diamyl,amylphosphonate Acidic media (Horwitz et al., 1992b)
tri-n-octylphosphine oxide [TOPO] and
HDEHP
Environmental and industrial samples (Testa et al.,
1995)
(1) This list is representative of the methods found in the literature. It is not complete, nor does it imply preference
over methods not listed.
14.4.5.2 Extraction Membranes
SPE membranes have also become a popular approach to sample preparation for organic
compounds in aqueous samples over the past decade. As of 1995, 22 methods employing SPE
disks have been accepted by the U.S. Environmental Protection Agency. More recently, disks
have been developed for specific radionuclides, such as technetium, strontium, and radium
(DOE, 1990 and 1997; Orlandini et al., 1997; Smith et al., 1996 and 1997).
These SPE membranes significantly reduce extraction time and reagent use in the processing of
large environmental water samples. Samples typically are processed through the membranes at
flow rates of at least 50 mL/min; a 1 L sample can be processed in as little as 20 minutes.
Moreover, these selective-membranes often can be counted directly, thereby condensing sample
preparation and counting source preparation into a single step. Many of the hazardous reagents
associated with more traditional methods are eliminated in this approach, and these membrane-
based extractions use up to 90 percent less solvent than liquid-liquid extractions. The sorbent
particles embedded in the membrane are extremely small and evenly distributed, thereby
eliminating the problem of channeling that is associated with columns.

Separation Techniques
14-35
JULY 2004 MARLAP
14.4.6 Advantages and Disadvantages of Solvent Extraction
14.4.6.1 Advantages of Liquid-Liquid Solvent Extraction
• Lends itself to rapid and very selective separations that are usually highly efficient.
• Partition coefficients are often approximately independent of concentration down to tracer
levels and, therefore, can be applied to a wide range of concentrations.
• Can usually be followed by back-extraction into aqueous solvents or, in some cases, the
solution can be used directly in subsequent procedures. This also provides significant pre-
analysis concentration of the analyte.
• Wide scope of applications—the composition of the organic phase and the nature of
complexing or binding agents can be varied so that the number of practical combinations is
virtually unlimited.
• Can be performed with simple equipment, but can also be automated.
14.4.6.2 Disadvantages of Liquid-Liquid Solvent Extraction
• Cumbersome for a large number of samples or for large samples.
• Often requires toxic or flammable solvents.
• Can be time consuming, especially if attainment of equilibrium is slow.
• Can require costly amounts of organic solvents and generate large volumes of organic waste.
• Can be affected by small impurities in the solvent(s).
• Multiple extractions might be required, thereby increasing time, consumption of materials,
and generation of waste.
• Formation of emulsions can interfere with the phase-separation process.
• Counter-current process can be complicated and can require complicated equipment.
• Alteration of chemical form can change, going from one phase to the other, thereby altering
the distribution coefficient and effectiveness of the extraction.
• Tracer-levels of analytes can form radiocolloids that cannot be extracted, dissociate into less
soluble forms, or adsorb on the container surface or onto impurities in the system.
14.4.6.3 Advantages of Solid-Phase Extraction Media
• Column/filter extraction may be unattended.
• Column/filter extraction is very selective.

Separation Techniques
14-36
MARLAP JULY 2004
• Generates a low volume of waste, can often be applied to samples dissolved in very acidic
media.
• Requires relatively inexpensive equipment.
• In may cases can be correlated with liquid/liquid extraction.
14.4.6.4 Disadvantages of Solid-Phase Extraction Media
• Extraction columns cannot be reused—a cost factor.
• Any suspended matter may be filtered by the media, carrying contaminants into the next step
of the separation or analysis.
• Flow rate through columns are generally slow (1-3 mL/min).
14.5 Volatilization and Distillation
14.5.1 Introduction
Differences in vapor pressures of elements or their compounds can be exploited for the
separation of radionuclides. Friedlander et al. (1981), describes the process:
“The most straightforward application is the removal of radioactive rare gases from aqueous
solutions or melts by sweeping an inert gas or helium. The volatility of ... compounds ... can
be used to effect separations ... by distillation ... Distillation and volatilization methods often
give clean separations, provided that proper precautions are taken to avoid contamination of
the distillate by spray or mechanical entrapment. Most volatilization methods can be done
without specific carriers, but some nonisotopic carrier gas might be required. Precautions are
sometimes necessary to avoid loss of volatile radioactive substances during the dissolving of
irradiated targets or during irradiation itself.”
Similar precautions are also advisable during the solubilization of samples containing volatile
elements or compounds (Chapter 13, Sample Dissolution).
14.5.2 Volatilization Principles
Volatilization particularly provides a rapid and often selective method of separation for a wide
range of elements (McMillan, 1975). A list of the elements that can be separated by volatilization
and their chemical form(s) upon separation are given in Table 14.7.

Separation Techniques
14-37
JULY 2004 MARLAP
H
abcd
He
a
Li
a
Be B
bc+d
C
bcd
N
abcd
O
abcd
F
abcd
Ne
a
Na
a
Mg Al
d
Si
bd
P
abcd
S
abcd
Cl
abcd
Ar
a
K
a
Ca Sc Ti
d
V
d
Cr
d*
Mn
c*
Fe
d
Co Ni Cu Zn Ga
bd
Ge
bd
As
abcd
Se
bcd
Br
abd
Kr
ad
Rb
a
Sr
d
YZr
d
Nb
d
Mo
d
Tc
cd
Ru
cd
Rh
a
Pd Ag
a
Cd
a
In
a
Sm
bd
Sb
bd
Te
bcd
I
abd
Xe
ad
Cs
a
Ba
a
La*Hf
d
Hf
d
W
d
Re
cd
Os
cd
Ir
d
Pt Au
a
Hg
ad
Tl
a
Pb Bi
ab
Po
ad
At
ab
Rn
ad
Fr
a
Ra Ac**
Ce*Pr Nd Pm Sm Eu Gd Tb Dy Ho Er Tm Yb Lu
Th** Pa
d
U
d
Np
d
Am Cm Bk Cf Es Fm Mv No
Key to volatile form of element: a - Element; b - Hydride; c - Oxide; c* - Permanganic acid; c+ - Boric acid; d - Halides;
d* - Chromyl chloride
(From Coomber, 1975)
TABLE 14.7 — Elements separable by volatilization as certain species

Separation Techniques
14-38
MARLAP JULY 2004
McMillan (1975) states:
“While many of the volatile species are commonly encountered and a large proportion can be
produced from aqueous solutions, a significant number are rarely met. The volatilization of
highly reactive materials and those with high boiling points are only used in special
circumstances, e.g., for very rapid separations. ... Many other volatile compounds have been
used to separate the elements, including sulphides, carbonyls, stable organic complexes ... ,
and fluorinated β-diketones for the lanthanides.
“Separation ... is achieved by differentiation during the volatilization process, fractionation
by transfer, and selective collection. Gaseous evolution can be controlled by making use of
differences in vapor pressure with temperature, adjustment of the oxidation state of the
element in solution or by alteration of the matrix, in order to change the chemical
combination of the element. Once gaseous, additional separation is possible and physical
processes can be adopted such as gas chromatography, zone refining, fractional distillation,
electrostatic precipitation, filtration of condensed phases and low temperature trapping.
Chemical methods used are mainly based on the selective trapping of interfering substances
by solid or liquid reagents. The methods of preferential collection of the species sought are
similar to those used in the transfer stage.”
Both solid and liquid samples can be used in volatilization separations (Krivan, 1986):
“With solid samples, there are several types of separation methods. The most important of
them are ones in which (1) the gas forms a volatile compound with only the trace elements
and not the matrix, (2) the gas forms a volatile compound with the matrix but not the trace
elements, and (3) volatile compounds are formed with both the matrix and the trace elements.
Different gases have been used in separation by volatilization, including inert gases N2, He,
and Ar and the reactive gases H2O, O2, H2, ... F2, and HF. The apparatus usually consists of
three parts: gas regulation and purification, oven with temperature programming and control,
and condensation or adsorption with temperature regulation.
“The radiotracer technique provides the best way to determine the recoveries of trace
elements in the volatilization process and to optimize the separation with respect to the
pertinent experimental parameters.”
14.5.3 Distillation Principles
Distillation is the separation of a volatile component(s) of a mixture by vaporization at the
boiling point of the mixture and subsequent condensation of the vapor. The vapor produced on
boiling the mixture is richer in the more volatile component—the component with the higher
vapor pressure (partial pressure) and correspondingly lower boiling point. The process of
distillation, therefore, essentially takes advantage of the differences in the boiling points of the

Separation Techniques
14-39
JULY 2004 MARLAP
constituents to separate a mixture into its components. It is a useful separation tool if the analyte
is volatile or can be transformed into a volatile compound. Most inorganic applications of
distillation involve batch distillation, whereas most organic applications require some type of
fractional distillation. In a simple batch distillation, the sample solution containing a single
volatile component or components with widely separated boiling points is placed in a distillation
flask, boiling is initiated, and the vapors are then continuously removed, condensed, and
collected. Mixtures containing multiple volatile components require fractional distillation, which
employs repeated vaporization-condensation cycles for separation, and is commonly performed
in a fractionation column for that purpose. The column allows the cycles to occur in one
operation, and the separated component is collected after the last condensation.
Distillation has been widely used for separating organic mixtures but this approach has less
applicability in inorganic analysis (Korkisch, 1969). Korkisch (1969) states: “Nevertheless, some
of the elements of interest to radiochemists can be very effectively separated by distillation as
their volatile chlorides, bromides, and oxides .... [T]hese elements are germanium (Ge), selenium
(Se), technetium (Tc), rhenium (Re), ruthenium (Ru), and osmium (Os).” (Also see DOE, 1997,
Method RP530). Two common analytes determined through distillation, tritium and 226Ra, by
radon emanation are discussed below.
Specific distillation principles are commonly found in chemistry reference and textbooks. For a
theoretical discussion of distillation see Peters (1974) and Perry and Weisberger (1965).
Distillation procedures are discussed for many inorganic applications in Dean (1995) and for less
common radioanalytes in DeVoe (1962) and Kuska and Meinke (1961).
14.5.4 Separations in Radiochemical Analysis
The best known use of distillation in radiochemical analysis is in the determination of tritium
(EPA, 1984; DOE, 1997). Water is the carrier as simple distillation is used to separate tritium
from water or soil samples. For determination of tritium, the aqueous sample is treated with a
small amount of sodium hydroxide (NaOH) and potassium permanganate (KMnO4), and it is then
distilled. The early distillate is discarded, and a portion of the distillate is collected for tritium
determination by liquid scintillation counting. The alkaline treatment prevents other radionuc-
lides, such as radioiodine or radiocarbon, from distilling over with the tritium (3H), and the
permanganate (MnO4
!1) treatment destroys trace organic material in the sample that could cause
quenching during the counting procedure.
Larger samples are distilled using a round-bottom flask, while a MICRO DIST® tube can be used
for smaller samples (DOE, 1997, Method RP580). The distillate can be added directly to a liquid
scintillation cocktail (EPA, 1980, Method 906.0), or further enriched by acid electrolysis (DOE,
1990 and 1997, Method 3H-01) or alkaline electrolysis (DOE, 1990 and 1997, Method 3H-02).
Iodine is separated from aqueous samples by distillation from acidic solutions into alkaline

Separation Techniques
14-40
MARLAP JULY 2004
solutions (EPA, 1973). Iodide (I!1) is added as carrier; but nitric acid (HNO3) as part of the acid
solution, oxidizes the anion to molecular iodine as the mixture is heated for distillation.
One determination of 79Se employs an optional purification step, distillation of the metal as
selenous acid, H2SeO3 (DOE, 1997, Method RP530). The solution is maintained with excess
bromine (Br2) and hydrobromic acid (HBr) to hold the selenium in the oxyacid form during the
distillation. Technetium can be separated from other elements, or can be separated from ruthen-
ium, osmium, or rhenium by distillation of their oxides (Friedlander et al., 1981). Metals are
sometimes distilled in their elemental form—polonium in bismuth or lead (McMillan, 1975).
Radium-226 in solution can be determined by de-emanating its gaseous progeny 222Rn into an
ionization chamber or scintillation cell. Generally, the procedure initially involves the concentra-
tion of radium by coprecipitation with barium sulfate (BaSO4). The barium sulfate is then
dissolved in an EDTA solution, transferred to a sealed bubbler, and stored to allow for the
ingrowth of 222Rn. Following sufficient in-growth, the 222Rn is de-emanated by purging the
solution with an inert gas, such as helium (He) or argon (Ar), and is transferred via a drying tube
to a scintillation cell or ionization chamber. After the short-lived 222Rn progeny have reached
secular equilibrium with the 222Rn (approximately four hours), the sample is counted to determine
alpha activity (EPA, 1980, Method 903.1; DOE, 1990 and 1997, Methods Ra-01 through Ra-07;
Sedlet, 1966; Lucas, 1990).
When processing samples containing radon, care should be taken to guard against the inadvertent
loss of the gas or contamination of the distillation apparatus. Radon can be adsorbed on, or
permeate through, materials used in its handling. Diffusion through rubber and plastic tubing or
through polyethylene bottles has been observed. Because radon is soluble in many organic
compounds, impurities, including greases used in ground-glass connections, can increase
adsorption.
14.5.5 Advantages and Disadvantages of Volatilization
14.5.5.1 Advantages
• Can be very selective, producing clean separations.
• Very rapid, especially with high-vacuum equipment.
• Can be performed from solid or liquid samples.
• Most can be performed without a specific carrier gas.
14.5.5.2 Disadvantages
• Relatively few volatile elements or inorganic compounds are available.
• Atmosphere can alter the nature of a volatile form of the tracer or surface material.

Separation Techniques
14-41
JULY 2004 MARLAP
• Effects of experimental parameters (carrier gas, gas flow, temperature, time, and recovery)
are highly variable.
• Precautions are sometimes necessary to avoid loss of volatile radionuclide substances during
subsequent procedures.
• Some systems require high-temperature, complex equipment.
• Contamination of distillate by carrier, spray, or mechanical entrapment is a potential problem.
14.6 Electrodeposition
14.6.1 Electrodeposition Principles
Radionuclides in solution as ions can be deposited (plated) by electrochemical reactions (redox
reactions) onto an electrode, either by a spontaneous process (produced by a favorable electrode
potential existing between the ion and electrode) or by a nonspontaneous process (requiring the
application of an external voltage (potential) (Section 14.2, “Oxidation-Reduction Processes”).
Spontaneous electrochemical processes are described by the Nernst equation, which relates the
electrode potential of the reaction to the activity of substances participating in a reaction:
E = E0 - RT/nF ln(ap/ar)
where E is the electrochemical potential, E0 is the standard potential for the process, R is the ideal
gas constant, T is the absolute temperature, n is the number of electrons exchanged in the redox
reaction, F is Faraday’s constant, and ap and ar are the activities of the products of the reaction
and the reactants, respectively. The activity (a) of ions in solution is a measure of their molar
concentration (c in moles/L) under ideal conditions of infinite dilution. Expressing the activities
in terms of the product of molar concentrations and activity coefficients, γ (a measure of the
extent the ion deviates from ideal behavior in solution; thus a = γ · c, where γ #1), the Nernst
equation becomes:
E = E0 - RT/nF ln(γpcp/γrcr)
For dilute solutions of electrolytes (#10!2 molar), the activity coefficient is approximately one
(γ.1; it approaches one as the solution becomes more dilute, becoming one under ideal
conditions). Then, the Nernst equation is expressed in terms of the concentrations of ions in
solution, the typical form in which the equation is found in most chemistry textbooks (see also
Section 14.8.3.1, “Solubility and Solubility Product Constant,” for an application of activity to
the solubility product constant):
E = E0 - RT/nF ln(cp/cr)

Separation Techniques
14-42
MARLAP JULY 2004
At concentrations less than 10!6 M, electrodeposition may show considerable deviations from
behavior of macroamounts of elements whose behavior partly depends on the nature and
previous treatment of the electrode (Adolff and Guillaumont, 1993). Inconsistent behavior is the
result of heterogeneity of the surface metal, a very important consideration when electrodeposi-
ting radionuclides at very low concentrations. The spontaneity predicted by the Nernst equation
for macroconcentrations of ions in solution at controlled potential is not always observed for
microconcentrations (Choppin et al., 1995). The activity of radionuclide ions is usually unknown
at low concentrations even if the concentration is known, because the activity coefficient (γ) is
dependent on the behavior of the mixed electrolytic system. In addition, the concentration might
not be accurately known because ions might adsorb on various surfaces, form complexes with
impurities, or precipitate on the electrode, for example. (See Section 14.9.3.7, “Oxidation and
Reduction,” for another application of the Nernst equation.) Separation is limited partly because
electrodeposition from very dilute solutions is slow, but it is also limited because it rarely leads
to complete separation of one element from many others (Coomber, 1975). Overall, the behavior
of an element during an electrochemical process is determined by its electrochemical potential,
which depends on the nature of the ion; its chemical form, its concentration, the general
composition of the electrolyte, the current density, material and design of the electrode, and
construction features of the electrochemical cell (Zolotov, 1990).
Often, trace elements are deposited on a solid cathode, but large separation factors between
micro- and macro-components are required. This condition is met when electrochemically active
metals are the main components or when the analyzed matrix does not contain macro-
components that will separate on the cathode (Zolotov, 1990). Deposition of heavy metals and
actinides can be more difficult to control, for example, because of the decomposition of water
and reactions of cations and anions at electrodes (Adolff and Guillaumont, 1993). In some cases,
deposition of matrix components can be avoided by selection of a suitable medium and
composition of the electrolyte. Overall, the effectiveness of electrodeposition of trace
components depends on the electrode potential, electrode material and its working surface area,
duration of electrolysis, properties of the electrolyte (composition and viscosity), temperature,
and mixing rate (Zolotov, 1990). Even so, published data are empirical for the most part, and
conditions for qualitative reproducible separation are determined for each case. It is difficult,
therefore, to make general recommendations for selecting concentration conditions. It is
advisable to estimate and account for possible effects of different electrolysis factors when
developing separation or concentration methodologies (Zolotov, 1990).
14.6.2 Separation of Radionuclides
Although electrodeposition is not frequently used as a radiochemical separation technique,
several radionuclides [including iron (Hahn, 1945), cadmium (Wright, 1947), and technetium
(Flagg, 1945)] have been isolated by electrodeposition on a metal electrode. Electrodeposition is,
however, the standard separation technique for polonium, copper, and platinum. Polonium is
isolated through deposition on nickel from a strong hydrochloric acid (DOE, 1990 and 1997,

Separation Techniques
14-43
JULY 2004 MARLAP
Method Po-01). This separation is very specific, and, therefore, can be accomplished in the
presence of many other radionuclides. Electrodeposition at a mercury cathode has also been used
to separate technetium from fission products and for group separation of fission products
(Coomber, 1975). Numerous metals have been deposited on thin metal films by electrolysis with
a magnesium cathode. According to Coomber, “Electrodeposition of metals can be sensitive to
the presence of other substances” (Coomber, 1975). Deposition of polonium on silver is inhibited
by iron unless a reducing agent is present; and the presence of fluoride (F!1), trace amounts of
rare earths, can inhibit the deposition of americium. “In many cases the uncertainties of yield can
be corrected by the use of another radioisotope as an internal standard” (Coomber, 1975).
14.6.3 Preparation of Counting Sources
Electrodeposition is primarily used to prepare counting sources by depositing materials uniformly
in an extremely thin layer. Because of potential self-absorption effects, this approach is ideal for
the preparation of alpha sources. Numerous methods have been published for the electro-
deposition of the heavy metals, e.g., the Mitchell method from hydrochloric acid (Mitchell,
1960), the Talvitie method from dilute ammonium sulfate [(NH4)2SO4] (Talvitie, 1972), and the
Kressin method from sodium sulfate-sodium bisulfate media (Kressin, 1977).
Sill and Williams (1981) and Hindman (1983, 1986) contend that coprecipitation is the preferred
method for preparation of sources for alpha spectrometry and that it should be assessed when
electrodeposition is being considered. Also see Section 14.8.4, “Coprecipitation.”
14.6.4 Advantages and Disadvantages of Electrodeposition
14.6.4.1 Advantages
• Highly selective in some cases.
• Deposits material in an extremely thin uniform layer resulting in excellent spectral resolution.
• One of the common methods for preparing actinides for alpha spectrometry.
14.6.4.2 Disadvantages
• Not applicable to many radionuclides.
• Sensitive to the presence of other substances.
• For tracer-level quantities, the process is relatively slow, it seldom leads to complete
separation of one element from many others, and there is usually no direct comparison of
concentration in solution to deposited activity.
• Takes longer than microprecipitation, because it requires evaporation of solutions after
column separation and ashing to remove all organic residue.

Separation Techniques
14-44
MARLAP JULY 2004
• Subject to interference from such metals as Fe or Ti.
• Subject to interference from such ions as fluoride.
14.7 Chromatography
14.7.1 Chromatographic Principles
Chromatography is a separation technique that is based on the unequal distribution (partition) of
substances between two immiscible phases, one moving past the other. A mixture of the
substances (the analytical mixture) in the mobile phase passes over the immobile phase. Either
phase can be a solid, liquid, or gas, but the alternate phase cannot be in the same physical state.
The two most common phase pairs are liquid/solid and gas/liquid. Separation occurs as the
components in the mixture partition between the two phases because, in a properly designed
chromatographic system, the phases are chosen so that the distribution of the components
between the phases is not equal.
With the broad range of choices of phase materials, the number of techniques employed to
establish differential distributions of components between the phases, and the various practical
laboratory methods used to cause the mobile phases to pass over the immobile phases, there are
many chromatographic techniques available in separation chemistry. The names of the
chromatographic techniques themselves partially identify the methods or principles employed
and suggest the variety of applications available using this approach to separation. They include
paper chromatography, ion-exchange chromatography, adsorption chromatography, gas
chromatography, high-pressure liquid chromatography, and affinity chromatography. Each aspect
of chromatography used in separation chemistry will be described below, including the phases
commonly employed, the principles used to establish differential distributions, and the laboratory
techniques employed to run a chromatographic separation.
The most common phase pairs used in chromatography are a mobile liquid phase in contact with
a solid phase. The liquid phase can be a pure liquid, such as water or an organic solvent, or it can
be a solution, such as methyl alcohol, sodium chloride in water, or hexane in toluene. The solid
phase can be a continuous material such as paper, or a fine-grained solid such as silica, powdered
charcoal, or alumina. The fine-grained solid can also be applied to a supporting material, such as
paper, plastic, or glass, to form a coat of continuous material. Alternatively, gas/liquid phase
systems can consist of an inert gas, such as nitrogen or helium, in conjunction with a high-boiling
point liquid polymer coated on the surface of a fine-grained inert material, such as firebrick. This
system is called gas-liquid phase chromatography (GLPC), or simply gas chromatography (GC).
In each system, both phases play a role in the separation by offering a physical or chemical
characteristic that will result in differential distribution of the components of the analytical
mixture being separated. Liquid-liquid phase systems are similar to gas/liquid phase systems in
that one of the liquid phases is bound to an inert surface and remains stationary. These systems

Separation Techniques
14-45
JULY 2004 MARLAP
are often referred to as liquid-partition chromatography or liquid-phase chromatography (LPC),
because they are essentially liquid-liquid extraction systems with one mobile and one immobile
phase (Section 14.4, “Solvent Extraction”).
Differential distributions are established between the separating phases by the combination of
physical and chemical properties of the two phases in combination with those of the components
of the analytical mixture. The properties that are most commonly exploited by separation
chromatography are solubility, adsorption, ionic interactions, complementary interactions, and
selective inclusion. One or more of these properties is acting to cause the separation to occur.
14.7.2 Gas-Liquid and Liquid-Liquid Phase Chromatography
In gas-liquid phase chromatography, the components of the analytical mixture are first converted
to a vapor themselves and added to the flowing gas phase. They are then partitioned between the
carrier gas and liquid phases primarily by solubility differences of the components in the liquid
phase. As the gas-vapor mixture travels over the liquid phase, the more soluble components of
the mixture spend more time in the liquid. They travel more slowly through the chromatography
system and are separated from the less soluble, and therefore faster moving, components. Liquid-
liquid phase chromatography provides separation based on the same principle of solubility in the
two liquid phases, but the separation is performed at ambient temperatures with the components
of the analytical mixture initially dissolved in the mobile phase. Partitioning occurs between the
two phases as the mobile phase passes over the stationary liquid phase.
Gas chromatography has been used to concentrate tritium, and to separate krypton and xenon
fission products and fission-produced halogens (Coomber, 1975). A large number of volatile
metal compounds could be separated by gas chromatography, but few have been prepared.
Lanthanides and trivalent actinides have been separated on glass capillary columns using volatile
double halides formed with aluminum chloride (Coomber, 1975).
14.7.3 Adsorption Chromatography
Adsorption chromatography partitions components of a mixture by means of their different
adsorption characteristics onto the surface of a solid phase and their different solubilities in a
liquid phase. Adsorption phenomena are primarily based on intermolecular interactions between
the chemical components on the surface of the solid and the individual components of the
mixture. They include van der Waals forces, dipole-dipole interactions, and hydrogen bonds.
Silica is a useful adsorption medium because of the ability of its silyl OH groups to hydrogen
bond or form dipole-dipole interactions with molecules in the mixture. These forces compete
with similar intermolecular interactions—between the liquid phase and the components of the
mixture—to produce the differential distribution of the components. This process causes
separation to occur as the liquid phase passes over the solid phase.

Separation Techniques
14-46
MARLAP JULY 2004
Many separations have been performed using paper and thin-layer chromatography. Modified
and treated papers have been used to separate the various valence states of technetium (Coomber,
1975).
14.7.4 Ion-Exchange Chromatography
14.7.4.1 Principles of Ion Exchange
Since the discovery by Adams and Holmes (1935) that synthetic resins can have ion-exchanging
properties, ion exchange has become one of the most popular, predominant, and useful tech-
niques for radiochemical separations, both with and without carriers. There are many excellent
references available in the literature, e.g., Dean (1995), Dorfner (1972), Korkisch (1989), Rieman
and Walton (1970), and NAS monographs (listed in the references, under the author’s name).
The journal, Ion Exchange and Solvent Extraction, reports recent advances in this field of
separation.
Ion-exchange methods are based on the reversible exchange of metal ions between a liquid
phase, typically water, and a solid ionic phase of opposite charge, the resin. The resin competes
with the ion-solvent interactions in the liquid phase, primarily ion-dipole interactions and
hydrogen bonding, to produce the selective partition of ions, causing separation. The solid phase
consists of an insoluble, but permeable, inert polymeric matrix that contains fixed charged groups
(exchange sites) associated with mobile counter-ions of opposite charge. It is these counter-ions
that are exchanged for other ions in the liquid phase. Resins are either naturally occurring sub-
stances, such as zeolites (inorganic silicate polymers) or synthetic polymers. The synthetic resins
are organic polymers with groups containing the exchange sites. The exchange sites are acid or
base groups (amines, phenols, and carboxylic or sulfonic acids) used over a specific pH range
where they are in their ionic form. Typical exchange groups for cations (K+1, Ca+2, and UO2
+2) are
the sulfonate anion, RSO3
!1, or the carboxylate anion, RCOO!1. The quaternary-amine cation,
RNH3
+1, or its derivative, is a common exchange group for anions (Cl!1, OH!1, and UO2(SO4)3
!4).
In a practical description of ion-exchange equilibria, the weight distribution coefficient, Kd, and
the separation factor, α, are significant. The weight distribution coefficient is defined as:
K[C / g ]
[C / mL ]
d
1resin
2 solution
=
where C1 is the weight of metal ion adsorbed on 1 g of the dry resin, and C2 is the weight of
metal that remains in 1 mL of solution after equilibrium has been reached. The separation factor
refers to the ratio of the distribution coefficients for two ions that were determined under
identical experimental conditions:

Separation Techniques
14-47
JULY 2004 MARLAP
Separation factor (α) =
[K ]
[K ]
d,a
d,b
where a and b refer to a pair of ions. This ratio determines the separability of the two ions;
separation will only be achieved if α … 1. The more that α deviates from unity, the easier it will
be to obtain separation.
An example of the separation process is the cation-exchange resin. It is usually prepared for
separation procedures as a hydrogen salt of the exchange group. Separation occurs when an
aqueous solution of other cation (e.g., Na+1, Ca+2, Al+3, or Cs+1) comes in contact with the resin. .
Different ions bond selectively to the exchange group, depending on the separation conditions,
displacing the counter-ion that is present in the prepared resin as follows:
ResinSO3
!1 H+1 + Cs+1 6 ResinSO3
!1Cs+1 + H+1
Diffusion is an important process during ion exchange; the solute ions must penetrate the pores
of the spherical resin beads to exchange with the existing ions. Equilibrium is established
between each ion in the analyte solution and the exchange site on the resin. The ion least tightly
bonded to the exchange site and most solvated in solution spends more time in solution. Selec-
tive bonding is a factor of the size and charge of the ion, the nature of the exchange group, and
the pH and ionic strength of the media. The order of strength of bonding at low acid concentra-
tions for group 1 cations is H+1 or Li+1 < Na+1 < K+1 < Rb+1 < Cs+1 (Showsmith, 1984). Under the
appropriate conditions, for example, Cs+1 will bond exclusively, or Cs+1 and Rb+1 will bond,
leaving the remaining cations in solution. The process can be operated as a batch operation or via
continuous-flow with the resin in an ion-exchange column. In either case, actual separation is
achieved as the equilibrated solution elutes from the resin, leaving select ions bonded to the resin
and others in solution. The ion that spends more time in solution elutes first. The ability to “hold”
ionic material is the resin capacity, measured in units of mg or meq per gram of resin. Eventually,
most of the exchange groups are occupied by select ions. The resin is essentially saturated, and
additional cations cannot bond. In a continuous-flow process, breakthrough will then occur. At
this time, added quantities of select cations (Cs+1 or Cs+1 and Rb+1 in this example) will pass
through the ion-exchange column and appear in the output solution (eluate). No further separa-
tion can occur after breakthrough, and the bonded ions must be remove to prepare the column for
additional separation. The number of bed volumes of incoming solution (eluant) that passes
through a column resin before breakthrough occurs provides one relative measure of the treat-
ment capacity of the resin under the conditions of column use. The bonded cations are displaced
by adjusting the pH of the medium to change the net charge on the exchange groups. This change
alters the ability of the exchange groups to attract ions, thereby replacing the bonded cations with
cations that bond more strongly. More commonly, the resin is treated with a more concentrated
solution of the counter-ion—H+1 in this example. Excess H+1 favors the equilibrium that produces
the initial counter-ion form of the exchange group. This process that returns the column to its

Separation Techniques
14-48
MARLAP JULY 2004
original form is referred to as “regeneration.”
Overall, selectivity of the exchange resin determines the efficiency of adsorption of the analyte
from solution, the ease with which the ions can be subsequently removed from the resin, and the
degree to which two different ions of like charge can be separated from each other. The
equilibrium distribution of ions between the resin and solution depends on many factors, of
which the most important are the nature of the exchanging ions, the resin, and the solution:
• In dilute solutions, the stationary phase will show preference for ions of higher charge.
• The selectivity of ion exchangers for ions increases with the increase of atomic number
within the same periodic group, i.e., Li+ < Na+ < K+ < Rb+ < Cs+.
• The higher the polarizability and the lower the degree of solvation (favored by low charge
and large size), the more strongly an ion will be adsorbed.
• Resins containing weakly acidic and weakly basic groups are highly selective towards H+ and
OH! ions. Ion-exchange resins that contain groups capable of complex formation with
particular ions will be more selective towards those ions.
• As cross-linking is increased (see discussion of resins below), resins become more selective
in their behavior towards ions of different sizes.
• No variation in the eluent concentration will improve the separation for ions of the same
charge; however, for ions of different net charges, the separation does depend on the eluent
concentration.
14.7.4.2 Resins
The most popular ion-exchange resins are polystyrenes cross-linked through divinylbenzene
(DVB). The percentage of DVB present during polymerization controls the extent of cross-
linking. Manufacturers indicate the degree of cross-linking by a number following an X, which
indicates the percentage of DVB used. For instance, AG 1-X8 and AG 1-X2 are 8 percent and 2
percent cross-linked resins, respectively. As this percentage is increased, the ionic groups effec-
tively come into closer proximity, resulting in increased selectivity. However, increases in cross-
linking decrease the diffusion rate in the resin particle. Because diffusion is the rate-controlling
step in column operations, intermediate cross-linking in the range of 4 to 8 percent is commonly
used.
Particle diameters of 0.04-0.3 mm (400 – 50 mesh) are commonly used, but larger particles give
higher flow rates. Difficult separations can require 200 – 400 mesh resins. Decreasing the particle
size reduces the time required for attaining equilibrium; but at the same time, it decreases flow
rate. When extremely small particle sizes are used, pressure must be applied to the system to
obtain acceptable flow rates (see discussion of high pressure liquid chromatography in Section
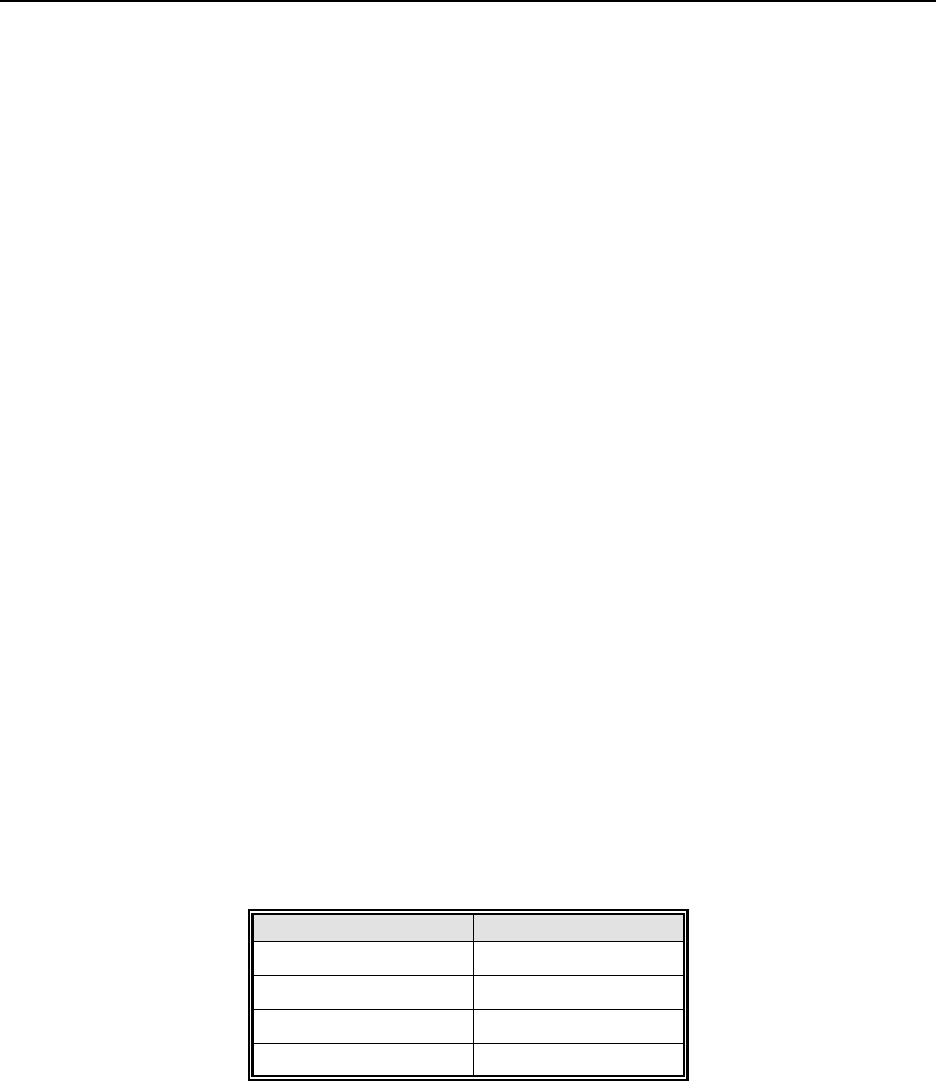
Separation Techniques
14-49
JULY 2004 MARLAP
14.7.7, “Chromatographic Methods”).
Ion-exchange resins are used in batch operations, or more commonly, in column processes in the
laboratory. Columns can be made in any size desired. The diameter of the column depends on the
amount of material to be processed, and the length of the column depends primarily on the
difficulty of separations to be accomplished. Generally, the ratio of column height to diameter
should be 8:1. Higher ratios lead to reduced flow rate; lower ratios might not provide effective
separations.
Some other factors should be considered when using ion-exchange resins:
• Resins should not be allowed to dry out, especially during analysis. Rehydration of dried
resins will result in cracking; these resins should not be used.
• Nonionic and weakly ionic solutes may be absorbed (not exchanged) by the resin. These
materials, if present during analysis, can alter the exchange characteristics of the resin for
certain ions.
• Particulate matter present in the analyte solution may be filtered by the resin. This material
will have several undesired effects, such as decreased flow rate, reduced capacity, and
ineffective separation.
• Organic solvents suspended in the analyte solution from previous separation steps can be
adsorbed by the resin creating separation problems.
Ion exchangers are classified as cationic or anionic (cation exchangers or anion exchangers,
respectively), according to their affinity for negative or positive counter-ions. They are further
subdivided into strongly or weakly ionized groups. Most cation exchangers (such as Dowex-50™
and Amberlite IR-100™) contain free sulfonic acid groups, whereas typical anion exchangers
(such as AG-1™ and Dowex-1™) have quaternary amine groups with replaceable hydroxyl ions
(Table 14.8).
TABLE 14.8 — Typical functional groups
of ion-exchange resins
Cation Exchangers Anion Exchangers
- SO3H- NH
2
- COOH - NHR
- OH - NR2
- SH - NR3
+
R=alkyl group
The sulfonate resins are known as strong acid cation (SAC) resins because the anion is derived
from a strong sulfonic acid (RSO3H). Likewise, the carboxylate resins are known as weak acid
cation (WAC) resins because the anion is derived from a weak carboxylic acid (RCOOH). R in

Separation Techniques
14-50
MARLAP JULY 2004
the formulas represents the inert matrix. The quaternary-amine cation (RNH3
+1) or its derivatives,
represents the common exchange group for anions. Other functional groups can be used for
specific purposes.
Several examples from the literature illustrate the use of ion-exchange chromatography for the
separation of radionuclides. Radium is separated from other alkaline-earth cations (Be+2, Mg+2,
Ca+2, Sr+2, and Ba+2) in hydrochloric solutions on sulfonated polystyrene resins (Kirby and
Salutsky, 1964), or converted to an anionic complex with citrate or EDTA and separated on a
quaternary ammonium polystyrene resin (Sedlet, 1966).
Anion-exchange resins separate anions by an analogous process beginning with a prepared resin,
usually in the chloride form (RNH3
+1Cl!1), and adding a solution of ions. Anion-exchange
chromatography is used in one step of a procedure to isolate thorium for radioanalysis by alpha
counting (EPA, 1984). Thorium cations (Th+4) form anionic nitrate complexes that bind to an
anion-exchange resin containing the quaternary complex, R-CH2-N(CH3)3
+1. Most metal ion
impurities do not form the complex and, as cations, they do not bind to the exchanger, but remain
with the liquid phase. Once the impurities are removed, thorium itself is separated from the resin
by treatment with hydrochloric acid (HCl) that destroys the nitrate complex, leaving thorium in
its +4 state, which will not bind to the anionic exchanger. A selection of commercially available
resins commonly employed in the radiochemistry laboratory is given in Table 14.9.
TABLE 14.9 — Common ion-exchange resins (*)
Resin type &
nominal %
cross-link
Minimum
wet
capacity
meq • mL!1
Density
(nominal)
g • mL!1Description
Anion-exchange resins — gel type — strongly basic — quaternary ammonium functionality
Dowex™, AG™
or Eichrom™
1- X 4
1.0 0.70 Strongly basic anion exchanger with S-DVB matrix for separation
of organic acids, nucleotides, and other anions. Molecular weight
exclusion < 1400.
Dowex, AG or
Eichrom
1- X 8
1.2 0.75 Strongly basic anion exchanger with S-DVB matrix for separation
of inorganic and organic anions with molecular weight exclusion
< 1000. 100–200 mesh is standard for analytical separations.
Anion-exchange resins — gel type — intermediate basicity
Bio-Rex™ 5 1.1 0.70 Intermediate basic anion exchanger with primary tertiary amines
on an polyalkylene-amine matrix for separation of organic acids.
Anion-exchange resins — gel type — weakly basic — polyamine functionality
Dowex or AG
4- X 4
0.8 0.7 Weakly basic anion exchanger with tertiary amines on an acrylic
matrix. Suitable for use with high molecular weight organic
compounds.
Amberlite™
IRA-68
1.6 1.06 Acrylic-DVB with unusually high capacity for large organic
molecules.
Cation-exchange resins - gel type - strongly acidic - sulfonic acid functionality

Separation Techniques
Resin type &
nominal %
cross-link
Minimum
wet
capacity
meq • mL!1
Density
(nominal)
g • mL!1Description
14-51
JULY 2004 MARLAP
Dowex, AG or
Eichrom
50W- X4
1.1 0.80 Strongly acidic cation exchanger with S-DVB matrix for
separation of amino acids, nucleosides and cations. Molecular
weight exclusion is < 1400.
Dowex, AG or
Eichrom
50W- X8
1.7 0.80 Strongly acidic cation exchanger with S-DVB matrix for
separation of amino acids, metal cations, and cations. Molecular
weight exclusion is < 1000. 100–200 mesh is standard for
analytical applications.
Amberlite
IR-120
1.9 1.26 8% styrene-DVB type; high physical stability.
Selective ion-exchange resins
Duolite™ GT-
73
1.3 1.30 Removal of Ag, Cd, Cu, Hg, and Pb.
Amberlite
IRA-743A
0.6 1.05 Boron-specific.
Amberlite
IRC-718
1.0 1.14 Removal of transition metals.
Chelex® 100 0.4 0.65 Weakly acidic chelating resin with S-DVB matrix for heavy metal
concentration.
Eichrom
Diphonix®
Chelating ion-exchange resin containing geminally substituted
diphosphonic groups chemically bonded to a styrenic-based
polymer matrix. Extraordinarily strong affinity for actinides in the
tetra- and hexavalent oxidation states from highly acidic media.
Anion exchanger — macroreticular type — strongly basic — quaternary ammonium functionality
AG MP-1 1.0 0.70 Strongly basic macroporous anion exchanger with S-DVB matrix
for separation of some enzymes, and anions of radionuclides.
Cation-exchange resin — macroreticular type — sulfonic acid functionality
AG MP-50 1.5 0.80 Strongly acidic macroporous cation exchanger with S-DVB
matrix for separation of cations of radionuclides and other
applications.
Microcrystalline exchanger
AMP-1 4.0 Microcrystalline ammonium molybophosphate with cation
exchange capacity of 1.2 meq/g. Selectively exchanges larger
alkali-metal ions from smaller alkali-metal ions, particularly
cesium.
* Dowex is the trade name for Dow resins; AG and Bio-Rex are the trade names for Bio-Rad Laboratories resins;
Amberlite is the trade name of Rohm & Haas resins. MP is the acronym for macroporous resin; S-DVB is the
acronym for styrene-divinylbenzene.
The behavior of the elements on anion- and cation-exchange resins is summarized for several
resins in Faris and Buchanan (1964), Kraus and Nelson (1956), and Nelson et al. (1964). The
behavior in concentrated HCl is illustrated for cations on cation-exchange resins in Figure 14.3
(Dorfner, 1972) and for anions on anion-exchange resins in Figure 14.4 (Dorfner, 1972).
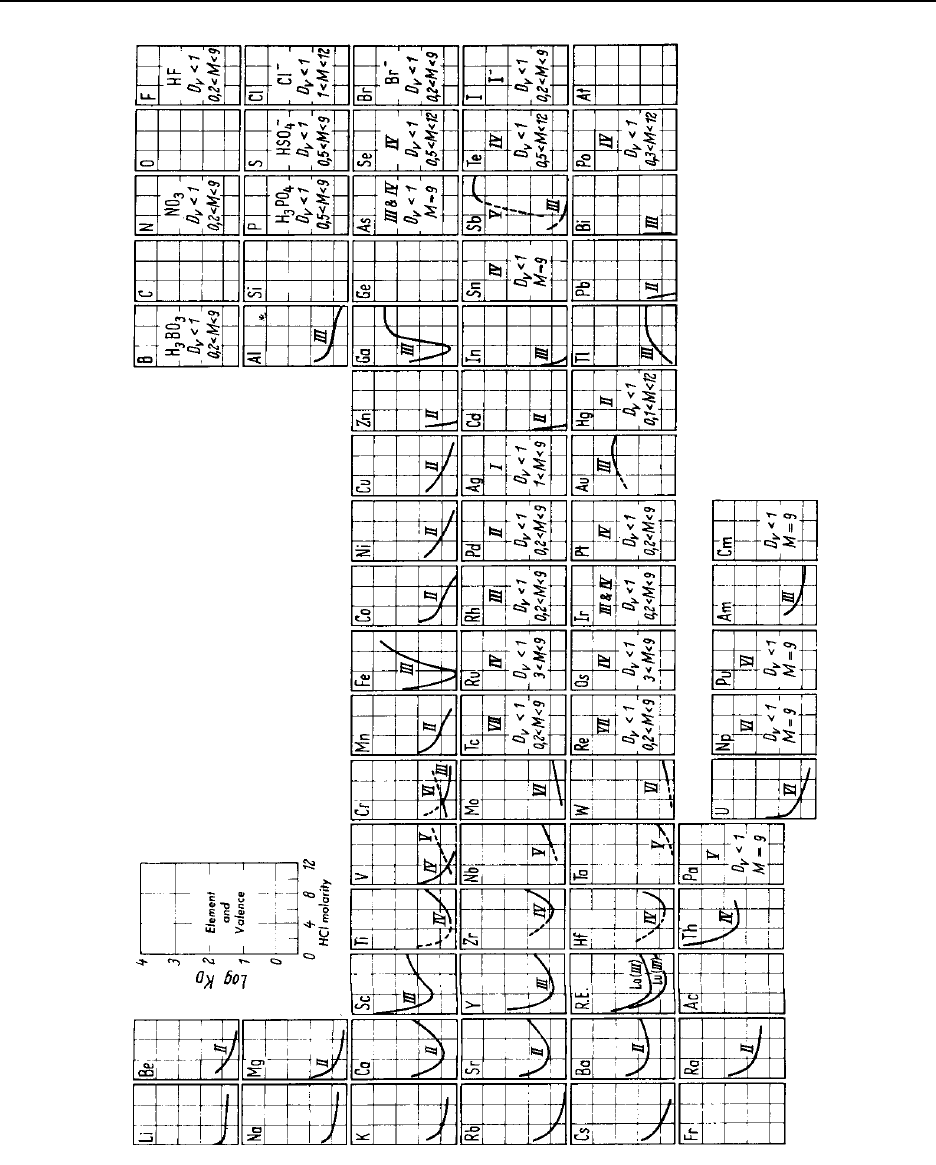
Separation Techniques
14-52
MARLAP JULY 2004
FIGURE 14.3 — The behavior of elements in concentrated
hydrochloric acid on cation-exchange resins
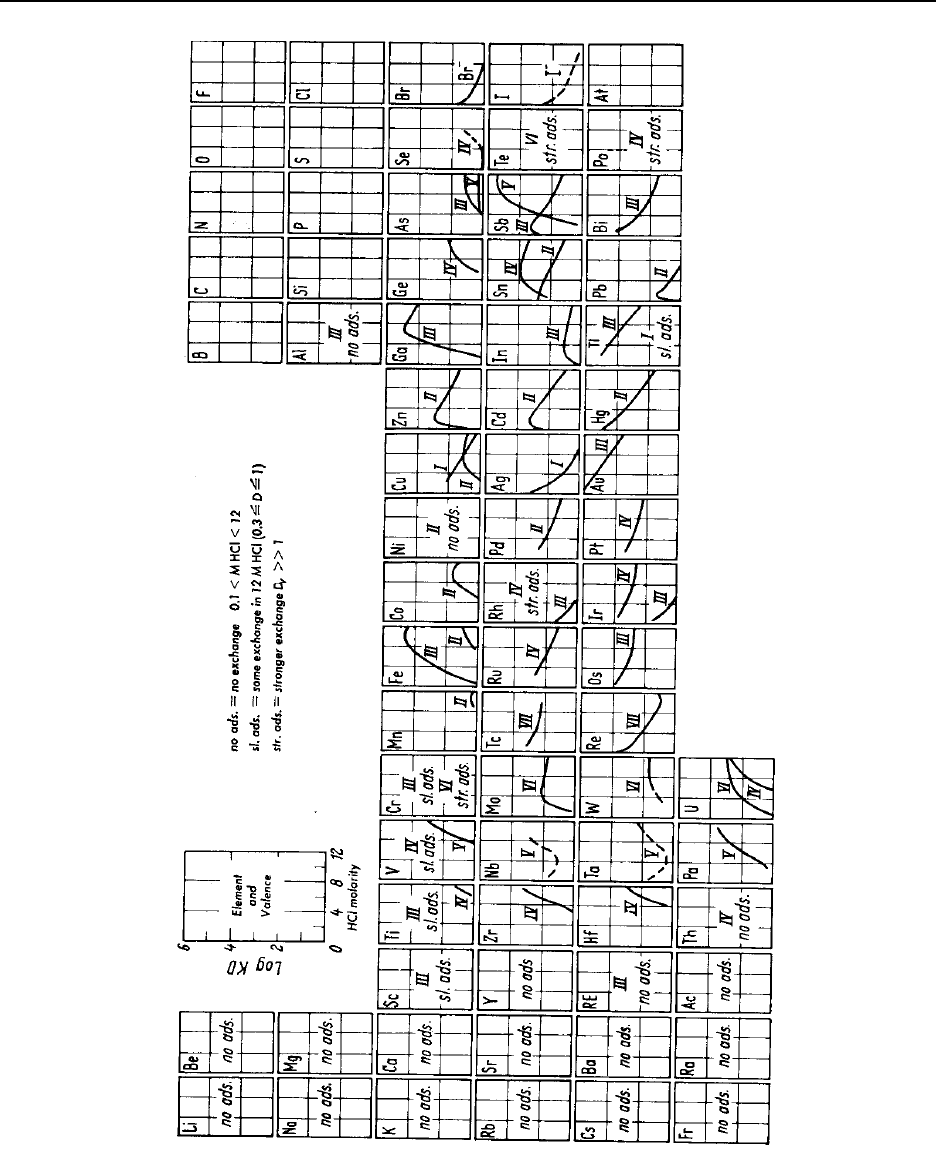
Separation Techniques
14-53
JULY 2004 MARLAP
Figure 14.4 —The behavior of elements in concentrated
hydrochloric acid on anion-exchange resins

Separation Techniques
14-54
MARLAP JULY 2004
14.7.5 Affinity Chromatography
Several newer types of chromatography are based on highly selective and specific attractive
forces that exist between groups chemically bound to an inert solid matrix (ligands) and molecu-
lar or ionic components of the analytical mixture. Affinity chromatography is an example of this
separation technique, which is used in biochemistry to isolate antigenic materials, such as
proteins. The proteins are attracted to their specific antibody that is bonded to a solid matrix.
These attractive forces are often called complementary interactions because they are based on a
lock-and-key type of fit between the two constituents. The interaction is complementary because
the two components match (fit) each other in size and electrical nature.
Crown ethers bonded to solid matrices serve as ligands in a chromatographic separation of
radium ions from aqueous solutions containing other cations (see Section 14.4.5.1, “Extraction
Chromatography Columns”). Even other alkaline-earth cations with the same +2 charge, such as
Sr+2 and Ba+2, offer little interference with radium binding because the cyclic nature of the crown
ether creates a ring structure with a cavity that complements the radius of the radium ion in
solution. In addition, the oxygen atoms of the cyclic ether are inside the ring, allowing these
electron-dense atoms to form effective ion-dipole interactions through water molecules with the
radium cation. Radionuclides analyzed by this method include 89/90Sr, 99Tc, 90Y, and 210Pb.
14.7.6 Gel-Filtration Chromatography
Another physical property that is used to separate molecules by a chromatographic procedure is
the effective size (molecular weight) of the molecule. High molecular-weight ions can also be
separated by this procedure. The method is known by several names, including gel-filtration
chromatography, molecular-sieve filtration, exclusion chromatography, and gel-permeation
chromatography. This technique is primarily limited to substances such as biomolecules with
molecular weights greater than 10,000 daltons (1.657 × 10⁻²⁰ g). In similar types of solutions
(similar solutes and similar concentrations), the molecules or ions have a similar shape and
molecular weight that is approximately proportional to the hydrodynamic diameter (size) of the
molecule or ion. The solid phase consists of a small-grain inert resin that contains microscopic
pores in its matrix that will allow molecules and ions up to a certain diameter, called included
particles, to enter the resin. Larger particles are excluded. Of the included particles, the smaller
ones spend more time in the matrices. Separation of the molecules or ions is based on the fact
that those substances that are excluded are separated in a batch from the included substances,
while those that are included are separated by size. The log of the molecular weight of the
included molecules or ions is approximately inversely proportional to the time the particles spend
in the matrix.

Separation Techniques
14-55
JULY 2004 MARLAP
14.7.7 Chromatographic Laboratory Methods
Chromatographic separations are achieved using a variety of laboratory techniques. Some are
actually quite simple to perform, while others require sophisticated instrumentation. Paper
chromatography employs a solid-liquid phase system that separates molecules and ions with filter
paper or similar material in contact with a developing solvent. The analytical mixture in solution
is spotted at the bottom of the paper and allowed to dry, leaving the analytes on the paper. The
paper is suspended so that a small part of the bottom section is in a solvent, but not so deep that
the dry spots enter the solvent. By capillary action, the solvent travels up the paper. As the
solvent front moves up, the chromatogram is produced with the components of the mixture
partitioning between the liquid phase and the paper. Thin-layer chromatography is similar, but
the paper is replaced by a thin solid phase of separatory material (silica gel, alumina, cellulose,
etc.) coated on an inert support, such as plastic or glass.
Column chromatography can accommodate a larger quantity of both phases and can, therefore,
separate greater quantities of material by accepting larger loads or provide more separating power
with an increased quantity of solid phase. In the procedure, a solid phase is packed in a glass or
metal column and a liquid phase is passed through the column under pressure supplied by gravity
or low-pressure pumping action. For this reason, gravity flow (or pumping the liquid phase under
pressures similar to those generated by gravity flow) is often referred to as low-pressure chroma-
tography. The liquid phase is usually referred to as the eluent and the column is eluted with the
liquid. Column chromatography is the common method used in ion-exchange chromatography.
With column chromatography, separation depends on: (1) type of ion-exchange resin used (i.e.,
cationic, anionic, strong, or weak); (2) eluting solution (its polarity affects ion solubility, ionic
strength affects displacement of separating ions, and pH affects net charge of exchange groups or
their degree of ionization in solution); (3) flow rate, grain size, and temperature, which affect
how closely equilibrium is approached (generally, low flow rate, small grain size, and high
temperature aid the approach to equilibrium and, therefore, increase the degree of separation);
and (4) column dimensions (larger diameter increases column capacity, while increased length
increases separation efficiency by increasing distance between ion bands as they travel through
the column) (Wahl and Bonner, 1951).
Metal columns can withstand considerably more pressure than glass columns. High-pressure
liquid chromatography (HPLC) employs stainless steel columns and solid phases designed to
withstand high pressures without collapsing. The method is noted for its rapid separation times
because of relatively high flow rates under high pressures (up to almost 14 MPa). For this reason,
the acronym HPLC alternatively represents high-performance liquid chromatography. HPLC is
often performed with a liquid-partition technique between an aqueous phase and organic phase,
but gel filtration, ion exchange, and adsorption methods are also employed. In the case of liquid-
partition separations, either a stationary aqueous phase or stationary organic phase is selected.
The former system is referred to as normal phase chromatography and the latter as reversed phase
chromatography, a holdover from the first applications of the technique that employed a

Separation Techniques
14-56
MARLAP JULY 2004
stationary aqueous phase. The aqueous phase is made stationary by adsorption onto a solid
support, commonly silica gel, cellulose powder, or polyacrylamide. An organic stationary phase
is made from particles of a polymer such as polyvinyl chloride or Teflon™. Reversed phase
HPLC has been used to separate individual elements of the lanthanides and actinides and
macroquantities of actinides (Choppin et al., 1995).
Gas/liquid phase systems are also used. During gas-liquid phase chromatography (GLPC—or
simply, gas chromatography [GC]), the gas phase flows over the liquid phase (coated onto an
inert solid) as an inert carrier gas—commonly helium or nitrogen—flows through the system at
low pressure. The carrier gas is supplied from a tank of the stored gas.
14.7.8 Advantages and Disadvantages of Chromatographic Systems
Ion-exchange chromatography is by far the predominant chromatographic method used for the
separation of radionuclides. Its advantages and disadvantages is presented exclusively in this
section.
14.7.8.1 Advantages
• Highly selective.
• Highly efficient as a preconcentration method.
• Works as well with carrier-free tracer quantities as with weighable amounts.
• Produces a high yield (recovery).
• Can separate radionuclides from interfering counter-ions.
• Simple process requiring simple equipment.
• Wide scope of applications.
• Can handle high volumes of sample.
14.7.8.2 Disadvantages
• May require high volume of eluent.
• Usually a relatively slow process, but rapid selective elution processes are known.
• Requires narrow pH control.
14.8 Precipitation and Coprecipitation
14.8.1 Introduction
Two of the most common and oldest methods for the separation and purification of ions in radio-
analytical chemistry are precipitation and coprecipitation. Precipitation is used to isolate and
collect a specific radionuclide from other (foreign) ions in solution by forming an insoluble

Separation Techniques
14-57
JULY 2004 MARLAP
compound. Either the radionuclide is precipitated from solution itself, or the foreign ions are
precipitated, leaving the radionuclide in solution. Sometimes a radionuclide is present in solution
at sub-micro concentrations, i.e., levels so low that the radionuclide will not form an insoluble
compound upon addition of a counter-ion. In these cases, the radionuclide can often be brought
down from solution by coprecipitation, associating it with an insoluble substance that precipitates
from solution. This phenomenon is especially important in gravimetric analysis and radiochemis-
try. In gravimetric analysis, carrying down of impurities is a problem. For radiochemists,
coprecipitation is a valuable tool.
14.8.2 Solutions
Precipitation and coprecipitation provide an analytical method that is applied to ions in solution.
Solutions are simply homogeneous mixtures (a physical combination of substances), which can
be solids, liquids, or gases. The components of a solution consist of a solute and a solvent. The
solute is generally defined as the substance that is dissolved, and the solvent is the substance that
dissolves the solute. In an alternative definition, particularly suitable for liquid components when
it is not clear what is being dissolved or doing the dissolving, the solute is the minor constituent
and the solvent is the major constituent. In any event, the solute and solvent can consist of any
combinations of substances, so long as they are soluble in each other. However, in this chapter,
we are generally referring to aqueous solutions in which a solute is dissolved in water. The terms
below further describe solutions:
• Solubility is defined as the concentration of solute in solution that exists in equilibrium with
an excess of solute; it represents the maximum amount of solute that can dissolve in a given
amount of the solvent. The general solubilities of many of the major compounds of concern
are described in Table 14.10.
• An unsaturated solution is one in which the concentration of the solute is less than the
solubility. When additional solute is added to an unsaturated solution, it dissolves.
• A saturated solution is one that is in equilibrium with an excess of the solute. The
concentration of a saturated solution is equal to the solubility of the solute. When solute is
added to the saturated solution, no more solute dissolves.
• A supersaturated solution is a solution in which the concentration of solute is temporarily
greater than its solubility—an unstable condition. Therefore, when additional solute is added
to a supersaturated solution, solute comes out of solution as solid until the concentration
decreases to that of the saturated solution.

Separation Techniques
14-58
MARLAP JULY 2004
TABLE 14.10 — General solubility behavior of some cations of interest (1)
The Common Cations
Na+1, K+1, NH4
+1, Mg+2, Ca+2, Sr+2, Ba+2, Al+3, Cr+3, Mn+2, Fe+2, Fe+3,
Co+2, Ni+2, Cu+2, Zn+2, Ag+1, Cd+2, Sn+2, Hg2
+2, Hg+2, and Pb+2
There are general rules of solubilities for the common cations found in most basic chemistry texts
(e.g., Pauling, 1970).
Under the class of mainly soluble substances:
• All nitrates (NO3
!) are soluble.
• All acetates (C2H3O2
!) are soluble.
• All chlorides (Cl!), bromides (Br!), and iodides (I!) are soluble, except for those of silver,
mercury, and lead. PbCl2 and PbBr2 are sparingly soluble in cold water, and more soluble in hot
water.
• All sulfates (SO4
!2) are soluble, except those of barium, strontium, and lead. CaSO4, Ag2SO4, and
Hg2SO4 are sparingly soluble.
• Most salts of sodium (Na), potassium (K), and ammonium (NH4+) are soluble. Notable exceptions
are NaSb(OH)6, K3Co(NO2)6, K2PtCl6, (NH4)2PtCL6, and (NH4)3Co(NO2)6.
Under the class of mainly insoluble substances:
• All hydroxides (OH!1) are insoluble, except those of the alkali metals (Li, Na, K, Rb, and Cs),
ammonium, and barium (Ba). Ca(OH)2 and Sr(OH)2 are sparingly soluble.
• All normal carbonates (CO3
!2) and phosphates (PO4
!3) are insoluble, except those of the alkali
metals and ammonium. Many hydrogen carbonates and phosphates are soluble, i.e., Ca(HCO3)2,
Ca(H2PO4)2.
• All sulfides (S!2), except those of the alkali metals, ammonium, and the alkaline-earth metals (Be,
Mg, Ca, Sr, Ba, and Ra), are insoluble. Both aluminum- and chromium sulfide are hydrolyzed by
water, resulting in the precipitation of Al(OH)3 and Cr(OH)3.
• Some cations, such as Ba+2, Pb+2, and Ag+1, form insoluble chromates (CrO4
!2), which can be used
as a basis for separation.
Actinide Elements
The solubility properties of the actinide M+3 ions are similar to those of the trivalent lanthanide ions,
while the behavior of the actinide M+4 ions closely resembles that of Ce+4.
• The fluorides (F
!
), oxalates (C2O4
!
2), hydroxides (OH
!
), and phosphates are insoluble.
• The nitrates, halides (except fluorides), sulfates, perchlorates (ClO4
!
), and sulfides are all soluble.
(1) Solubility data for specific compounds can be found in the CRC Handbook of Chemistry and Physics (CRC,
1999) and in the NAS-NS monographs.

Separation Techniques
14-59
JULY 2004 MARLAP
14.8.3 Precipitation
Precipitation is accomplished by combining a selected ion(s) in solution with a suitable counter-
ion in sufficient concentrations to exceed the solubility of the resulting compound and produce a
supersaturated solution. Nucleation occurs and growth of the crystalline substance then proceeds
in an orderly manner to produce the precipitate (see Section 14.8.3.1, “Solubility and the
Solubility Product Constant, Ksp”). The precipitate is collected from the solvent by a physical
method, such as filtration or centrifugation. A cation (such as Sr+2, for example) will precipitate
from an aqueous solution in the presence of a carbonate anion, forming the insoluble compound,
strontium carbonate (SrCO3), when sufficient concentrations of each ion are present in solution
to exceed the solubility of SrCO3. The method is used to isolate and collect strontium from water
for radioanalysis (EPA, 1984).
A precipitation process should satisfy three main requirements:
• The targeted species should be precipitated quantitatively.
• The resulting precipitate should be in a form suitable for subsequent handling; it should be
easily filterable and should not creep.
• If it is used as part of a quantitative scheme, the precipitate should be pure or of known purity
at the time of weighing for gravimetric analysis.
Precipitation processes are useful in several different kinds of laboratory operations, particularly
gravimetric yield determinations—as a separation technique and for preconcentration—to
eliminate interfering ions, or for coprecipitation.
14.8.3.1 Solubility and the Solubility Product Constant, Ksp
Chemists routinely face challenges in the laboratory as a result of the phenomenon of solubility.
Examples include keeping a dissolved component in solution and coprecipitating a trace-level
analyte from solution.
Solubility equilibrium refers to the equilibrium that describes a solid (s) dissolving in solution
(soln), such as strontium carbonate dissolving in water, for example:
SrCO3(s) º Sr+2 (soln) + CO3
!2 (soln)
or, alternately, a solid forming from solution, with the carbonate precipitating:
Sr+2 (soln) + CO3
!2 (soln) 6 SrCO39 (s)

Separation Techniques
14-60
MARLAP JULY 2004
The solubility product constant, Ksp, is the equilibrium constant for the former process, a solid
dissolving and forming ions in solution. Leussing (1959) explains Ksp in general terms:
“For an electrolyte, MmNn, which dissolves and dissociates according to the equation:
MmNn(s) » MmNn(soln) » mM+n(soln.) + nN-m(soln)
“The equilibrium conditions exists that:
aMmNn(s) = aMmNn(soln) = am
M+n(soln) · an
N!m(soln.)
“[The value a is the activity of the ions in solution, a measure of the molar concentration
(moles/L) of an ion in solution under ideal conditions of infinite dilution.] (Also see Section
14.6.1, “Principles of Electrodeposition,” for a discussion of activity as applied to the Nernst
equation.) [This equation] results in the familiar solubility product expression since the
activity of a solid under given conditions is a constant. Expressing the activities in terms of
the product of molar concentrations and activity coefficients, γ [a measure of the extent the
ion deviates from ideal behavior in solution; thus a = γ · c where γ #1], [this] equation
becomes...
[M+n]m [N-m]n γm
M+n γn
N-m = a constant = Ksp ”
For dilute solutions of electrolytes (#10!2 molar), the activity coefficient is approximately one
(γ.1; it approaches one as the solution becomes more dilute, becoming one under the ideal
conditions of infinite dilution). Then, the solubility product constant is expressed in terms of the
concentrations of ions in solution, the typical form in which the equation is found in most
chemistry textbooks:
Ksp=[M+n]m [N-m]n
For strontium carbonate, Ksp is defined in terms of the concentrations of Sr+2 and CO3
!2:
Ksp = [Sr+2][CO3
!2] = 1.6×10!9
In order for the carbonate to precipitate, the product of the concentration of the ions in solution
representing the ions in the equilibrium expression, the common ions, must exceed the value of
the Ksp. The concentration of each common ion does not have to be equal. For example, if [Sr+2]
is 1×10!6 molar, then the carbonate ion concentration must be greater than 0.0016 molar for
precipitation to occur because (1×10!6) × (0.0016) = 1.6×10!9.
At higher concentrations ($10!2 molar), where the ions in solution deviate from ideal behavior,

Separation Techniques
14-61
JULY 2004 MARLAP
the value of the activity coefficient decreases, and the concentrations of the ions do not
approximate their activities. Under these conditions, the concentrations do not reflect the
behavior of the dissolution equilibrium, and the equation cannot be used for precipitation or
solubility calculations. More complex estimations of activity coefficients must be made and
applied to the general equation (Birkett et al., 1988). Generally, radiochemical separations use an
excess of a precipitating agent. The exact solution concentrations do not need to be known but
they should be high to ensure complete reaction. Practical radiochemical separations performed
based on solubility (either Ksp or coprecipitation phenomenon) are best described by Salutsky
(1959).
Analysts often need to know if a precipitate will form when two solutions are mixed. For
example:
“If a chemist mixes 100 mL of 0.0050 M NaCl with 200 mL of 0.020 M Pb(NO3)2, will lead
chloride precipitate? The ion product, Q, must be calculated and compared to Ksp for the
process:
PbCl2(s) º Pb+2(soln) + 2 Cl!(soln)
“After the two solutions are mixed, [Pb+2] = 1.3×10!2 M (0.2 L × 2.0×10!2 M/0.3 L), and
[Cl!] = 1.7×10!3 M (0.1 L × 5.0×10!3 M/0.3 L). The value for the ion product is calculated
from the expression
Q = [Pb+2] [Cl!]2 or [1.3×10!2] [1.7×10!3]2
Q = 3.8×10!8
“The numerical value for Ksp is 1.6×10!5. Because the ion product Q is less than Ksp, no
precipitate will form. Only when the ion product is greater than Ksp will a precipitate form.”
Conditions in the solution phase can affect solubility. For example, the solubility of an ion is
lower in an aqueous solution containing a common ion, one of the ions comprising the
compound, than in pure water because a precipitate will form if the Ksp is exceeded. This
phenomenon is known as the common ion effect and is consistent with LeChatelier’s Principle.
For example, the presence of soluble sodium carbonate (Na2CO3) in solution with strontium ions
can cause the precipitation of strontium carbonate, because carbonate ions from the sodium salt
contribute to their overall concentration in solution and tend to reverse the solubility equilibrium
of the “insoluble” strontium carbonate:
Na2CO3(s) º 2 Na+1(soln) + CO3
!2(soln)
SrCO3(s) º Sr+2(soln) + CO3
!2(soln)

Separation Techniques
14-62
MARLAP JULY 2004
Alternatively, if a complexing agent or ligand is available that can react with the cation of a
precipitate, the solubility of the compound can be markedly enhanced. An example from Section
14.3.4.3, “Formation and Dissolution of Precipitates,” provides an illustration of this
phenomenon. In the determination of 90Sr, Sr+2 is separated from the bulk of the solution by direct
precipitation of the sulfate (SrSO4). The precipitate is redissolved by forming a complex ion with
EDTA, Sr(EDTA)!2, to separate it from lanthanides and actinides (DOE, 1997, Method RP520):
SrSO4(s) 6 Sr+2(soln) + SO4
!2(soln)
Sr+2(soln) + EDTA!4 6 Sr(EDTA)!2(soln)
Additionally, many metal ions are weakly acidic and hydrolyze in solution. Hydrolysis of the
ferric ion (Fe+3) is a classical example of this phenomenon:
Fe+3 + H2O 6 Fe(OH)+2 + H+1
When these metal ions hydrolyze, producing a less soluble complex, the solubility of the salt is a
function of the pH of the solution, increasing as the pH decreases. The minimum solubility is
found under acidic conditions when the concentrations of the hydrolyzed species become
negligible. As demonstrated by Leussing, the solubility of a salt also depends upon the activity of
the solid phase. There are a number of factors that affect the activity of the solid phase (Leussing,
1959):
• Polymorphism is the existence of a chemical substance in two or more crystalline forms. For
example, calcium carbonate can have several different forms; only one form of a crystal is
stable at a given temperature. At ordinary pressures and temperatures, calcite with a solubility
of 0.028 g/L, is the stable form. Aragonite, another common form of calcium carbonate
(CaCO3), has a solubility of 0.041g/L at these conditions. It is not necessarily calcite that
precipitates when solutions of sodium carbonate and calcium nitrate are mixed. Extremely
low concentrations of large cations, such as strontium, barium, or lead, promote the
precipitation of aragonite over calcite (Wray and Daniels, 1957). On aging, the more soluble
aragonite converts to calcite.
• Various possible hydrates of a solid have different solubilities. For instance, at 25 EC, the
molar solubility of gypsum (CaSO4
.2H2O) is 0.206 and that of anhydrite (CaSO4) is 0.271.
• The solid phase can undergo a reaction with a salt in solution.
• Particle size of a solid can affect its solubility. It has been demonstrated that the solubility of
smaller particles is greater than that of larger particles of the same material.
• Age of a precipitate can affect solubility. For example, Biederman and Schindler (1957) have

Separation Techniques
14-63
JULY 2004 MARLAP
demonstrated that the solubility of precipitated ferric hydroxide [Fe(OH)3] undergoes a four-
fold decrease to a steady state after 200 hours.
• Exchange of ions at the surface of the crystal with ions in the solution can affect the solubility
of a solid. This effect is a function of the amount of surface available for exchange and is,
therefore, greater for a finely divided solid. For example, Kolthoff and Sandell (1933)
observed that calcium oxalate (CaC2O4) can exchange with either sulfate or barium ions:
CaC2O4(s) + SO4
!2(soln) 6 CaSO4(s) + C2O4
!2(soln)
CaC2O4(s) + Ba+2(soln) 6 BaC2O4(s) + Ca+2(soln)
The excess of common ions that appears on the right-hand side of the equations represses the
solubility of calcium oxalate according to the laws of mass action.
Ideally, separation of common ions from foreign ions in solution by precipitation will result in a
pure solid that is easy to filter. This method should ensure the production of a precipitate to meet
these criteria as closely as possible. The physical process of the formation of a precipitate is quite
complex, and involves both nucleation and crystal growth. Nucleation is the formation within a
supersaturated solution of the smallest particles of a precipitate (nuclei) capable of spontaneous
growth. The importance of nucleation is summarized by Salutsky (1959):
“The nucleation processes govern the nature and purity of the resulting precipitates. If the
precipitation is carried out in such a manner as to produce numerous nuclei, precipitation will
be rapid, individual crystals will be small, filtration and washing difficult, and purity low. On
the other hand, if precipitation is carried out so that only a few nuclei are formed, precipita-
tion will be slower, crystals larger, filtration easier, and purity higher. Hence, control of
nucleation processes is of considerable significance in analytical chemistry.”
Once the crystal nuclei are formed, crystal growth proceeds through diffusion of the ions to the
surface of the growing crystal and deposition of those ions on the surface. This crystal growth
continues until supersaturation of the precipitating material is eliminated and equilibrium
solubility is attained.
Thus, the goal is to produce fewer nuclei during precipitation so that the process will occur
slowly, within reasonable limits, and larger crystals will be formed. Impurities result from three
mechanisms: (1) inclusion, either by isomorphous replacement (isomorphic inclusion),
replacement of a common ion in the crystal structure by foreign ions of similar size and charge to
form a mixed crystal, or by solid solution formation (nonisomorphic inclusion), simultaneous
crystallization of two or more solids mixed together; (2) surface absorption of foreign ions; and
(3) occlusion, the subsequent entrapment of adsorbed ions as the crystal grows. Slow growth
gives the isomorphous ion time to be replaced by a common ion that fits the crystal structure

Separation Techniques
14-64
MARLAP JULY 2004
perfectly, producing a more stable crystal. It also promotes establishment of equilibrium
conditions for the formation of the crystal structure so that adsorbed impurities are more likely to
desorb and be replaced by a common ion rather than becoming entrapped. In addition, for a given
weight of the solid that is forming, a small number of large crystals present an overall smaller
surface area than a large number of small crystals. The large crystals provide less surface area for
impurities to adsorb.
14.8.3.2 Factors Affecting Precipitation
Several factors affect the nature and purity of the crystals formed during precipitation. A
knowledge of these factors permits the selection and application of laboratory procedures that
increase the effectiveness of precipitation as a technique for the separation and purification of
ions, and for the formation of precipitates that are easily isolated. These factors, summarized
from Berg (1963) and Salutsky (1959), include the following:
• Rate of precipitation. Formation of large, well-shaped crystals is encouraged through slow
precipitation because fewer nuclei form and they have time to grow into larger crystals to the
detriment of smaller crystals present. Solubility of the larger crystals is less than that of
smaller crystals because smaller crystals expose more surface area to the solution. Larger
crystals also provide less surface area for the absorption of foreign ions. Slow precipitation
can be accomplished by adding a very dilute solution of the precipitant gradually, with
stirring, to a medium in which the resulting precipitate initially has a moderate solubility.
• Concentration of Ions and Solubility of Solids. The rate of precipitation depends on the
concentration of ions in solution and the solubility of the solids formed during the
equilibrium process. A solution containing a low concentration of ions, but sufficient
concentration to form a precipitate, will slow the process, resulting in larger crystal
formation. At the same time, increasing the solubility of the solid, either by selecting the
counter-ion for precipitation or by altering the precipitating conditions, will also slow
precipitation. Many radionuclides form insoluble solids with a variety of ions, and the choice
of precipitating agent will affect the solubility of the precipitate. For example, radium sulfate
(RaSO4) is the most insoluble radium compound known. Radium carbonate (RaCO3) is also
insoluble, but its Ksp is greater than that of radium sulfate (Kirby and Salutsky, 1964).
• Temperature. Precipitation at higher temperature slows nucleation and crystal growth
because of the increased thermal motion of the particles in solution. Therefore, larger crystals
form, reducing the amount of adsorption and occlusion. However, most solids are more
soluble at elevated temperatures, effectively reducing precipitate yield; an optimum
temperature balances these opposing factors.
• Digestion. Extremely small particles, with a radius on the order of one micron, are more
soluble than larger particles because of their larger surface area compared to their volume

Separation Techniques
14-65
JULY 2004 MARLAP
(weight). Therefore, when a precipitate is heated over time (digestion) the small crystals
dissolve and larger crystals grow (“Ostwald ripening”). Effectively, the small crystals are
recrystallized, allowing the escape of impurities (occluded ions) and growth of larger crystals.
This process reduces the surface area for adsorption of foreign ions and, at the same time,
replaces the impurities with common ions that properly “fit” the crystal lattice. Recrystal-
lization perfects the crystal lattice, producing a purer precipitate (see Reprecipitation on page
14-68). Digestion is used in an 131I determination to increase the purity of the lead iodide
(PbI2) crystals (EPA, 1984).
• Degree of Supersaturation. A relatively high degree of supersaturation is required for
spontaneous nucleation, and degree of supersaturation is the main factor in determining the
physical character of a precipitate. Generally, the higher the supersaturation required, the
more likely a curdy, flocculated colloid will precipitate because more nuclei form under
conditions of higher supersaturation and crystal growth is faster. In contrast, the lower the
supersaturation required, the more likely a crystalline precipitate will form because fewer
nuclei form under these conditions and crystal growth is slower. Most perfect crystals are
formed, therefore, from supersaturated solutions that require lower ion concentrations to
reach the necessary degree of supersaturation and, as a result, inhibit the rate of nucleation
and crystal growth. Degree of supersaturation ultimately depends on physical properties of
the solid that affect its formation. Choice of counter-ion will determine the type of solid
formed from a radionuclide, which, in turn, determines the degree of saturation required for
precipitation. Many radionuclides form insoluble solids with a variety of ions, and the choice
of precipitating agent will affect the nature of the precipitate.
• Solvent. The nature of the solvent affects the solubility of an ionic solid (precipitate) in the
solvent. The polarity of water can be reduced by the addition of other miscible solvents such
as alcohols, thereby reducing the solubility of precipitates. Strontium chromate (SrCrO4) is
soluble in water, but it is insoluble in a methyl alcohol (CH3OH)-water mixture and can be
effectively precipitated from the solution (Berg, 1963). In some procedures, precipitation is
achieved by adding alcohol to an aqueous solution, but the dilution effect might reduce the
yield because it lowers the concentration of ions in solution.
• Ion Concentration. The common-ion effect causes precipitation to occur when the
concentration of ions exceeds the solubility-product constant. In some cases, however, excess
presence of common ions increases the solubility of the precipitate by decreasing the activity
of the ions in solution, as they become more concentrated in solution and deviate from ideal
behavior. An increase in concentration of the ions is necessary to reach the activity of ions
necessary for precipitate formation.
• Stirring. Stirring the solution during precipitation increases the motion of particles in solution
and decreases the localized buildup of concentration of ions by keeping the solution
thoroughly mixed. Both of these properties slow nucleation and crystal growth, thus

Separation Techniques
14-66
MARLAP JULY 2004
promoting larger and purer crystals. This approach also promotes recrystallization because
the smaller crystals, with their net larger surface area, are more soluble under these
conditions. Virtually all radiochemical laboratories employ stirring with a magnetic stirrer
during precipitation reactions.
• Complex-Ion Formation. Formation of complex ions can be used to hold back impurities
from precipitating by producing a more soluble form of a solid. The classical example of this
phenomenon is the precipitation of lead (Pb+2) in the presence of silver ions (Ag+1). Chloride
ion (Cl!1) is the precipitating agent that produces insoluble lead chloride (PbCl2). In an excess
of the agent, silver chloride (AgCl) is not formed because a soluble salt containing the
complex ion, AgCl2
!1 is formed. Complex-ion formation is also used to form precipitates (see
Section 14.3, “Complexation”).
• pH Effect. Altering the pH of aqueous solutions will alter the concentration of ions in the
precipitation equilibrium by the common-ion effect, if the hydrogen ion (H+1) or hydroxide
ion (OH!1) is common to the equilibrium. For example, calcium oxalate (CaC2O4) can be
precipitated or dissolved, depending on the pH of the solution, as follows:
Ca+2 + C2O4
!2 6 CaC2O4
Because the oxalate concentration is affected by the hydrogen-ion concentration,
H+1 + C2O4
!2 6 HC2O4
!1,
increasing the hydrogen-ion concentration (lowering the pH) decreases the oxalate ion
concentration by forming bioxalate, which makes the precipitate more soluble. Therefore,
decreasing the hydrogen-ion concentration (raising the pH), therefore, aids precipitation.
Similar effects are obtained with carbonate precipitates:
Sr+2 + CO3
!2 6 SrCO3
H+1 + CO3
!2 6 HCO3
!1
Many metal sulfides are formed in a solution of hydrogen sulfide by generating the sulfide
ion (S!2) at suitable pH:
H2S 6 H+1 + HS!1
HS!1 6 H+1 + S!2
Pb+2 + S!2 6 PbS
The pH can also influence selective formation of precipitates. Barium chromate will

Separation Techniques
14-67
JULY 2004 MARLAP
precipitate in the presence of strontium at pH 4 to 8, leaving strontium in solution. Sodium
carbonate is added and strontium precipitates after ammonia (NH3) is added to make the
solution more alkaline. This procedure is the basis for the separation of radium from
strontium in the radioanalysis of strontium in drinking water (EPA, 1980).
• Precipitation from Homogeneous Solution. Addition of a precipitating agent to a solution of
ions causes a localized excess of the reagent (higher concentrations) to form in the mixture.
The excess reagent is conducive to rapid formation of a large number of small crystals,
producing a precipitate of imperfect crystals that contains excessive impurities. The
precipitate formed under these conditions is sometimes voluminous and difficult to filter.
Localized excesses can also cause precipitation of more soluble solids than the expected
precipitate.
These problems largely can be avoided if the solution is homogenous in all stages of
precipitate formation, and if the concentration of precipitating agent is increased, as slowly as
practical, to cause precipitation from the most dilute solution possible. This increase in
concentration is accomplished, not by adding the precipitating agent directly to the solution,
but rather by generating the agent throughout the solution, starting with a very small concen-
tration and slowly increasing the concentration while stirring. The precipitating agent is
generated indirectly as the result of a chemical change of a reagent that produces the precipi-
tating agent internally and homogeneously throughout the solution. The degree of super-
saturation is low because the concentration of precipitating agent in solution is always
uniformly low enough for nucleation only. This method produces larger crystals with fewer
impurities.
Table 14.11 (Salutsky, 1959) summarizes methods used for precipitate formation from
homogeneous solution. Descriptions of these methods can be found in Gordon et al. (1959).
Some agents are generated by decomposition of a compound in solution. Hydrogen sulfide,
for example, is produced from thioacetamide:
CH3CSNH2 + 2 H2O 6 CH3COO!1 + H2S + NH4
+1
Copper sulfide (CuS) coprecipitates technetium from a homogeneous medium by the
generation of hydrogen sulfide by this method (EPA, 1973). Other agents alter the pH of the
solution (see “pH Effect” on the previous page). Hydrolysis of urea, for example, produces
ammonia, which raises the pH of a solution:
H2NCONH2 + H2O 6 CO2 + 2 NH3

Separation Techniques
14-68
MARLAP JULY 2004
TABLE 14.11 — Summary of methods for utilizing precipitation
from homogeneous solution
Precipitant Reagent Element Precipitated
Hydroxide Urea
Acetamide
Hexamethylenetetraamine
Metal chelate and H2O2
Al, Ga, Th, Fe+3, Sn, and Zr
Ti
Th
Fe+3
Phosphate Triethyl phosphate
Trimethyl phosphate
Metaphosphoric acid
Urea
Zr and Hf
Zr
Zr
Mg
Oxalate Dimethyl oxalate
Diethyl oxalate
Urea and an oxalate
Th, Ca, Am, Ac, and rare earths
Mg, Zn, and Ca
Ca
Sulfate Dimethyl sulfate
Sulfamic acid
Potassium methyl sulfate
Ammonium persulfate
Metal chelate and persulfate
Ba, Ca, Sr, and Pb
Ba, Pb, and Ra
Ba, Pb, and Ra
Ba
Ba
Sulfide Thiocetamide Pb, Sb, Bi, Mo, Cu, and As, Cd, Sn, Hg,
and Mn
Iodate Iodine and chlorate
Periodate and ethylene diacetate
(or ß-hydroxy acetate)
Ce+3 and bromate
Th and Zr
Th and Fe+3
Ce+4
Carbonate Trichloroacetate Rare earths, Ba, and Ra
Chromate Urea and dichromate
Potassium cyanate and dichromate
Cr+3 and bromate
Ba and Ra
Ba, Ra
Pb
Periodate Acetamide Pb
Chloride Silver ammonia complex
and ß-hydroxyethyl acetate
Ag
Arsenate Arsenite and nitrite Zr
Tetrachlorophthalate Tetrachlorophthalic acid Th
Dimethylglyoxime Urea and metal chelate Ni
8-Hydroxyquinoline Urea and metal chelate Al
Fluoride Fluoroboric acid La
Source: Salutsky, 1959.
• Reprecipitation. This approach increases the purity of precipitates. During the initial
precipitation, crystals collected contain only a small amount of foreign ions relative to the
common ions of the crystal. When the precipitate is redissolved in pure solvent, the foreign

Separation Techniques
14-69
JULY 2004 MARLAP
ions are released into solution, producing a concentration of impurities much lower than that
in the original precipitating solution. On reprecipitation, a small fraction of impurities is
carried down with the precipitate, but the relative amount is much less than the original
because their concentration in solution is less. Nevertheless, foreign ions are not eliminated
because absorption is greater at lower, rather than at higher, concentrations. On balance,
reprecipitation increases the purity of the crystals. Reprecipitation is used in the procedure to
determine Am in soil (DOE, 1990 and 1997, Method Am-01). After americium is coprecipi-
tated with calcium oxalate (CaC2O4), the precipitate is reprecipitated to purify the solid.
14.8.3.3 Optimum Precipitation Conditions
There is no single, fixed rule to eliminate all impurities during precipitation (as discussed in the
section above), but over the years, a number of conditions have been identified from practical
experience and theoretical considerations that limit these impurities (Table 14.12). Precipitations
are generally carried out from dilute solutions adding the precipitant slowly with some form of
agitation to a hot solution. Normally, the precipitant is then allowed to age before it is removed
by filtration and washed. Reprecipitation is then commonly performed. Reprecipitation is one of
the most powerful techniques available to the analyst because it increases purity, regardless of the
form of the impurity. Table 14.12 highlights the optimum precipitation conditions to eliminate
impurities.
TABLE 14.12 — Influence of precipitation conditions on the purity of precipitates
Condition
Form of Impurity*
Mixed
Crystals
Surface
Adsorption
Occlusion and
Inclusion
Post-
precipitation
Dilute solutions "++ "
Slow precipitation + + + -
Prolonged digestion - + + -
High temperature - + + -
Agitation + + + "
Washing the precipitate "+""
Reprecipitation + + + "
*Symbols: +, increased purity; -, decreased purity; ", little or no change in purity
Source: Salutsky, 1959.
14.8.4 Coprecipitation
In many solutions, especially those of environmental samples, the concentration of the radionuc-
lide of interest is too low to cause precipitation, even in the presence of high concentrations of its
counter-ion, because the product of the concentrations does not exceed the solubility product.
Radium in most environmental samples, for example, is not present in sufficient concentration to
cause its very insoluble sulfate (RaSO4) to precipitate. The radionuclide can often be brought

Separation Techniques
14-70
MARLAP JULY 2004
down selectively and quantitatively from solution during precipitation of an alternate insoluble
compound by a process called coprecipitation. The insoluble compound commonly used to
coprecipitate radium isotopes in many radioanalytical procedures is another insoluble sulfate,
BaSO4 (EPA, 1984, Method Ra-01; EPA, 1980, Method 900.1). The salt is formed with barium,
also a member of the alkaline earth family of elements with chemical properties very similar to
those of radium. Alternatively, a different salt that is soluble for the radionuclide can be used to
cause coprecipitation. Radium can be coprecipitated with lanthanum fluoride, even though
radium fluoride is soluble itself. For trace amounts of some radionuclides, other isotopic forms of
the element are available that can be added to the solution to bring the total concentration of all
forms of the element to the level that will result in precipitation. For example, to determine 90Sr
in environmental samples, stable strontium (containing no radioisotopes of strontium) is added to
increase the concentration of total strontium to the point that the common ion effect causes
precipitation. The added ion that is present in sufficient concentration to cause a precipitate to
form is called a carrier (Section 14.9, “Carriers and Tracers”). Barium, lanthanum, and stable
strontium, respectively, are carriers in these examples (DOE, 1997, Method RP5001; DOE, 1990
and 1997, Method Sr-02; EPA, 1984, Sr-04). The term carrier is also used to designate the
insoluble compound that causes coprecipitation. Barium sulfate, lanthanum fluoride (LaF3), and
strontium carbonate are sometimes referred to as the carrier in these coprecipitation procedures.
See Wahl and Bonner (1951) for additional examples of tracers and their carriers used for
coprecipitation.
The common definition of coprecipitation is, “the contamination of a precipitate by substances
that are normally soluble under the conditions of precipitation” (Salutsky, 1959). In a very broad
sense, coprecipitation is alternately defined as the precipitation of one compound simultaneously
with one or more other compounds to form mixed crystals (Berg, 1963). Each is present in macro
concentrations (i.e., sufficient concentrations to exceed the solubility product of each). As the
term is used in radiochemistry, coprecipitation is the simultaneous precipitation of one
compound that is normally soluble under the conditions of precipitation with one or more other
compounds that form a precipitate under the same conditions. Coprecipitation of two or more
rare earths as oxalates, barium and radium as sulfates, or zirconium and hafnium as phosphates
are examples of this broader definition (Salutsky, 1959). By either definition, coprecipitation
introduces foreign ions into a precipitate as impurities that would normally be expected to remain
in solution; and precipitation techniques, described in the previous section, are normally used to
maximize this effect while minimizing the introduction of true impurities. As a method to
separate and collect radionuclides present in solution at very low concentration, coprecipitation is
performed in a controlled process to associate the ion of choice selectively with a precipitate,
while excluding other foreign ions that would interfere with the analytical procedure.
14.8.4.1 Coprecipitation Processes
In order to choose the best conditions to coprecipitate an ion selectively, two processes should be
considered. First is precipitation itself and the appropriate techniques employed to minimize

Separation Techniques
14-71
JULY 2004 MARLAP
association of impurities (see Section 14.8.3). Second is coprecipitation mechanisms and the
controlling factors associated with each. Three processes (described above in Section 14.8.3.1,
“Solubility and the Solubility Product Constant”) are responsible for coprecipitation, although
the distinction between these processes is not always clear (Hermann and Suttle, 1961). They
consist of: (1) inclusion, i.e., uptake from solution of an ion similar in size and charge to the solid
forming the precipitate in order to form a mixed crystal or solid solution; (2) surface adsorption;
and (3) occlusion (mechanical entrapment).
Inclusion. If coprecipitation is accomplished from a homogeneous solution allowing the crystals
to form slowly in an orderly manner, then inclusion contributes to the coprecipitation process.
Under these conditions, the logarithmic distribution law applies, which represents the most
efficient coprecipitation method that involves mixed crystals (Salutsky, 1959):
log(Ii/If) = λ log(Pi/Pf)
In the equation, Ii is the concentration of impurity in solution at the start of crystallization and If
is the concentration at the end. P represents the corresponding concentration of the primary ion in
solution. Lambda, λ, is the logarithmic distribution coefficient and is a constant. Values of λ for
some tracers distributed in solid carriers can be found in Wahl and Bonner (1951). Lambda
values greater than one represent removal of a foreign ion by inclusion during coprecipitation.
The larger the value of lambda, the more effective and selective the process for a specific ion.
Lambda is also inversely proportional to the rate of precipitation. Slow precipitation, as
accomplished by homogeneous precipitation, results in larger values and more efficient
coprecipitation. For example, “Actinium [Ac] has been selectively removed from solutions
containing iron and aluminum [Al] through slow oxalate precipitation by the controlled
hydrolysis of dimethyl oxalate” (Hermann and Suttle, 1961). Also, as described in Section
14.8.3.2, “Factors Affecting Precipitation,” technetium is coprecipitated with copper sulfide
(CuS) carrier produced by the slow generation of hydrogen sulfide (H2S) as thioacetamide is
hydrolyzed in water (EPA, 1973).
Generally, λ decreases as the temperature increases; thus, coprecipitation by inclusion is favored
by lower temperature.
Digestion of the precipitate at elevated temperature over lengthy time periods—a process that
promotes recrystallization and purer crystals—will often cause mixed crystals to form by an
alternate mechanism (i.e., homogeneous distribution) that is not as efficient, but which is often as
successful as logarithmic distribution. The equilibrium distribution law is represented by
(Salutsky, 1959):
(I/P)ppt. = D (I/P)soln.
where I represents the amount of impurity and P the amount of primary substance forming the

Separation Techniques
14-72
MARLAP JULY 2004
precipitate. The symbol D is the homogeneous distribution coefficient. Values of D greater than
one represent removal of a foreign ion by inclusion during coprecipitation. Some values of D can
be found in Wahl and Bonner (1951). According to Hermann and Suttle (1961):
“Homogeneous distribution is conveniently obtained at ordinary temperatures by rapid
crystallization from supersaturated solutions with vigorous stirring. Under such conditions
the precipitate first formed is very finely divided, the recrystallization of the minute crystals
is rapid, and each molecule [sic] passes many times between solution and precipitate. If this
process is repeated often enough, an equilibrium between solid and solution is obtained, and
all the resulting crystals grow from a solution of constant composition.”
In either case, optimal results are obtained through inclusion when the precipitate contains an ion
with chemical properties similar to those of the foreign ion, although it is not necessary for the
similarity to exist in every successful coprecipitation. Barium sulfate is very successful in
coprecipitating Ra+2, primarily because radium is in the same chemical family as barium, and has
the same charge and a similar ionic radius. For best results, the radius of the foreign ion should
be within approximately 15 percent of that of one of the common ions in the precipitate
(Hermann and Suttle, 1961).
Surface Adsorption. During surface adsorption, ions are adsorbed from solution onto the surfaces
of precipitated particles. The conditions leading to surface adsorption are described by Salutsky
(1959):
“The surface of a precipitate is particularly active. Ions at the surface of a crystal (unlike
those within the crystal) are incompletely coordinated and, hence are free to attract other ions
of opposite charge from solution.”
Adsorption involves a primary adsorption layer that is held very tightly, and a counter-ion layer
held more loosely. Ions common to the precipitate are adsorbed most strongly at the surface to
continue growth of the crystal. During precipitation of BaSO4, barium ions (Ba+2) and sulfate ions
(SO4
!2) are the primary ions adsorbed. If only one of the common ions remains in solution, then
foreign ions of the opposite charge are adsorbed to maintain electrical neutrality. When barium
sulfate is precipitated from a solution containing excess barium ions, for example, foreign ions
such as Cl!1, if present, are adsorbed after sulfate ions are depleted in the precipitation process.
Foreign ions of the same charge, such as Na+1, are repelled from the surface. Surface adsorption
can be controlled, therefore, by controlling the concentration of ions during precipitation or by
the addition of ions to alter the concentration. A precipitate of silver chloride (AgCl) in excess
Ag+1 repels 212Pb+2, but in a solution containing an equal quantity of the common silver and
chloride ions, approximately 2 percent of 212Pb is adsorbed (Salutsky, 1959). In contrast, almost
86 percent of 212Pb is adsorbed if an iodide solution is added to precipitate the silver ions as silver
iodide (AgI), thereby reducing the concentration of silver ions and making the chloride ion in
excess in the solution. According to the Paneth-Fajans-Hahn adsorption rule, the ion most

Separation Techniques
14-73
JULY 2004 MARLAP
adsorbed will be the one that forms the least soluble compound with an ion of the precipitate. For
example, barium sulfate in contact with a solution containing excess sulfate ions will adsorb ions
of Pb > Ca > K > Na, which reflects the order of solubility of the respective sulfates: thus, PbSO4
< CaSO4 < K2SO4 < Na2SO4 (Salutsky, 1959).
“Because adsorption is a surface phenomenon, the larger the surface area of a precipitate, the
greater the adsorption of impurities” (Salutsky, 1959). For that reason, colloidal crystals
exhibit a high degree of nonspecific adsorption. When a colloid is flocculated by the addition
of an electrolyte, the electrolyte can be adsorbed as an impurity. This interference largely can
be eliminated by aging the precipitate, thereby growing larger crystals and reducing the
surface area. Additionally, nonvolatile impurities can be replaced on the particle by washing
the colloidal precipitate with a dilute acid or ammonium salt solution. Well-formed large
crystals exhibit much less adsorption, and adsorption is not a significant factor in
coprecipitation with these solids. The tendency for a particular ion to be adsorbed depends
on, among other factors, charge and ionic size (Berg, 1963). Large ions with a high charge
exhibit high adsorption characteristics: a high ionic charge increases the electrostatic
attraction to the charged surface, and an ion with a large radius is less hydrated by the
solution and not as attracted to the solution phase.
“The amount of adsorption is also affected by prolonged standing of the precipitate in contact
with the solution. The fraction adsorbed is higher for some tracer ions, while the fraction is
lower for others. Recrystallization occurring during standing decreases the surface area so
that the fraction of tracer carried will decrease unless the tracer is trapped in the growing
crystals ... in which case the fraction carried may increase (Wahl, 1951).”
Adsorption also depends on the concentration of an ion in solution (Berg, 1963). A high
concentration of impurity increases the probability of solute interaction at the solid surface and
favors adsorption. Salutsky (1959) comments on the percent adsorption:
“Generally, the percent adsorption is much greater at low concentrations than at high
concentrations. At very high concentrations of impurity, adsorption reaches a maximum
value, i.e., the adsorption is saturated.”
Occlusion. Occlusion of an impurity within a precipitate results when the impurity is trapped
mechanically by subsequent crystal layers. For that reason, occluded impurities cannot be
physically removed by washing. Occlusion is more prevalent with colloidal precipitates than with
large crystals because of the greater surface area of colloidal solids. Freshly prepared hydroxides
and sulfides commonly contain occluded impurities, but most of them are released upon aging of
the precipitate.
Mechanical entrapment occurs particularly when the precipitating agent is added directly to a
solution. Because of the localized high concentrations of precipitant, impurities are precipitated

Separation Techniques
14-74
MARLAP JULY 2004
that become occluded by the subsequent precipitation of the primary substance. The speed of the
precipitation process also affects the extent of occlusion. Occlusion can be reduced, therefore, by
homogeneous precipitation. Coprecipitation of strontium by barium sulfate, for example, is
accomplished by the homogeneous generation of sulfate by the hydrolysis of dimethylsulfate,
(CH3)2SO4 (Hermann and Suttle, 1961). Digestion also eliminates occluded particles as the solid
is recrystallized. Considerable occlusion occurs during nucleation, and, therefore, reducing the
precipitation rate by lowering the temperature and reducing the number of nuclei formed reduces
the initial coprecipitation by occlusion.
This type of coprecipitation is not limited to solid impurities. Sometimes the solvent and other
impurities dissolved in the solvent become trapped between layers of crystals. This liquid
occlusion is common in numbers of minerals such as quartz and gypsum.
14.8.4.2 Water as an Impurity
In addition to other impurities, all precipitates formed from aqueous solutions contain water
(Salutsky, 1959). This water might be essential water, present as an essential part of the chemical
composition (e.g., MgNH4PO4 @ 6H2O, Na2CO3 @ H2O), or it might be nonessential water.
Nonessential water can be present in the precipitate as hygroscopic water, surface water, or
included water. Hygroscopic water refers to the water that a solid adsorbs from the surrounding
atmosphere. Many colloidal precipitates are highly hygroscopic because of their large surface
areas. Moreover, water can be adsorbed to the surface of the precipitate or included within the
crystal matrix, as described previously.
14.8.4.3 Postprecipitation
Postprecipitation results when a solution contains two ions, one that is rapidly precipitated and
another that is slowly precipitated by the precipitating agent (Kolthoff et al., 1969). The first
precipitate is usually contaminated by the second one. For example, calcium oxalate is a
moderately insoluble compound that can be precipitated quantitatively with time. Because the
precipitation tends to be slow, the precipitate is allowed to remain in contact with the solution for
some time before filtering. Magnesium oxalate is too soluble to precipitate on its own under
normal conditions. As long as the solution contains a predominance of calcium ions, very little
magnesium precipitates. However, as the precipitation of calcium approaches quantitative levels,
the competition of calcium and magnesium ions for adsorption at the surface becomes more
intense. As time progresses, the magnesium oxalate adsorbed on the surface acts as seed to
induce the post-precipitation of a second solid phase of magnesium oxalate (MgC2O4). Once
precipitated, the magnesium oxalate is only slightly soluble and does not redissolve.

Separation Techniques
14-75
JULY 2004 MARLAP
14.8.4.4 Coprecipitation Methods
Selective coprecipitation of a radionuclide with an insoluble compound is primarily accomp-
lished by the judicious selection of the compound that forms the precipitate and the concentration
of solutions used in the precipitate’s formation. Using good precipitation technique minimizes
the coprecipitation of impurities. The compound, then, should maximize coprecipitation of the
select radionuclide while providing a well-formed solid that attracts a minimum of other foreign
ions as impurities. In general, conditions that favor precipitation of a substance in macroamounts
also favor the coprecipitation of the same material from tracer concentrations (i.e., too low for
precipitate formation) with a foreign substance (Friedlander et al., 1981). Wahl and Bonner
(1951) provide a useful summary for coprecipitation of a tracer by a carrier:
“In general a tracer is efficiently carried by an ionic precipitate if: (1) the tracer ion is
isomorphously incorporated into the precipitate, or (2) the tracer ion forms a slightly soluble
or slightly dissociated compound with the oppositely charged lattice ion and if the precipitate
has a large surface with charge opposite to that of the tracer ion (i.e., presence of excess of
the oppositely charged lattice ion).”
Considering the principles of precipitation and coprecipitation, radium is coprecipitated quantita-
tively with barium sulfate using excess sulfate in solution because: (1) radium forms the least
soluble sulfate of the other elements in the alkaline earth family (Paneth-Fajans-Hahn adsorption
rule); (2) the radium ion carries the same charge as the barium ion and is very similar in size
(inclusion); and 3) an excess of sulfate preferentially creates a common-ion layer on the crystal-
line solid of sulfate ions that attracts barium ions and similar ions such as radium (absorption).
For example, in a procedure to determine 226Ra in water samples, radium is coprecipitated as
barium sulfate using 0.36 moles of sulfate with 0.0043 moles of barium, a large excess of sulfate
(EPA, 1984, Method Ra-03).
The isolation of tracers often occurs in two steps: first the tracer is separated by coprecipitation
with a carrier, and then it is separated from the carrier (Hermann and Suttle, 1961). Use of
carriers that can be easily separated from the tracer is helpful, therefore, coprecipitation by
inclusion is not generally used. Coprecipitation by surface adsorption on unspecific carriers is the
most common method employed. Manganese dioxide MnO2, sulfides (MnS), and hydroxides
[Mn(OH)2] are important nonspecific carriers because of their high surface areas. Ferric
hydroxide [Fe(OH)3] is very useful for adsorbing cations, because it forms a very finely divided
precipitate with a negative charge in excess hydroxide ion. Ferric hydroxide is used, for example,
to collect plutonium in solution after it has been isolated from tissue (DOE, 1990 and 1997,
Method Pu-04). Tracers can be separated by dissolving the solid in acid and extracting the iron in
ether (Hermann and Suttle, 1961).
“The amount of ion adsorbed depends on its ability to compete with other ions in solution.
Ions capable of displacing the ions of the radioelements are referred to as holdback carriers

Separation Techniques
14-76
MARLAP JULY 2004
[see Section 14.9.2.4, “Holdback Carriers”]. Highly charged ions, chemical homologs, and
ions isotopic with the radioelement are among the most efficient displacers. Thus, the
addition of a little inactive strontium makes it possible to precipitate radiochemically pure
radiobarium as the nitrate or chloride in the presence of radiostrontium.”
Tables 14.13 and 14.14 provide more details about common coprecipitating agents for
radionuclides.
TABLE 14.13 — Common coprecipitating agents for radionuclides(1)
Radionuclide
Oxidation
State Coprecipitate Carrier(2) Notes
Am +3 hydroxide
iodate
fluoride, oxalate, phosphate,
hydroxide
oxalate
acetate
fluoride, sulfate
acetate
Am+3, Fe+3
Ce+4, Th+4, Zr+4
La+3, Ce+3, Nd+3, Bi+3
Ca+2
Am+4
La+3
UO2
+2
Cs +1 phosphomolybdate,
chloroplatinate, bismuth
nitrate, silicomolybdate
Cs+1
Co +2 hydroxide
potassium cobalt nitrate
1-nitroso-2-napthol
sulfide
Co+2
Co+2
Co+2
Co+2
Fe +3 hydroxide
ammonium pyrouranate
Fe+3
Fe+3
I!1 iodide Pb+2, Ag+1, Pd+2, Cu+2
Ni +2 dimethylglyoxime hydroxide Ni+2
Nb (V) hydroxide, phosphate Nb(V)
Np +4 phosphate Ca+2
Po +4 tellurium
tellurate
selenium
dioxide
hydroxide
sulfide
Te
Pb+2
Se or Se!2
Mn+4
Fe+3, Al+3, La+3
Cu+2, Bi+2, Pb+2
Tellurate reduced with
SnCl2
Pu +3
+4
(VI)
fluoride
sulfate
fluoride
oxalate, iodate
phosphate
sodium uranylacetate
La+3, Nd+3, Ce+3, Ca+2
La+3(K+1)
La+3, Nd+3, Ce+3
Th+4
Zr+2, Bi+3
UO2
+2

Separation Techniques
Radionuclide
Oxidation
State Coprecipitate Carrier(2) Notes
14-77
JULY 2004 MARLAP
Ra +2 hydroxide
sulfate, chromate, chloride,
bromide
oxalate, phosphate
fluoride
Fe+3
Ba+2
Th+4, Ca+2, Ba+2
La+3
Sr +2 carbonate
nitrate
chromate
sulfate
phosphate
hydroxide
Sr+2, Ba+2, Ca+2
Sr+2, Ba+2
Ba+2
Sr+2, Ca+2, Pb+2
Sr+2
Fe+3
Alkaline pH
Tc +4
(VII)
hydroxide
chlorate, iodate,
perruthenate,
tetrafluoroborate
sulfide
Tc+4, Fe+3, Mn+2
(Phenyl)4As+1
Tc+7, Re+7, Cu+2, Cd+2
Th +4 hydroxide
fluoride
iodate
phosphate, peroxide
sulfate
oxalate
Th+4, La+3, Fe+3, Zr+3,
Ac+3, Zn+2
Th+4, La+3, Nd+3, Ce+3
Th+4, Zr+3
Th+4, Bi+3
Ba+2
Ca+2
U +4 cupferron, pyrophosphate,
phosphate, iodate, sulfate,
oxalate
U+4
fluoride La+3, Nd+3
(V) phosphate Zr+3
sulfate Ca+2
(VI) cupferron U(VI) Neutral solution
pyrouranate U(VI) From aqueous NH3, many
ions stay in solution as
NH3 complex
phosphate U(VI), Al+3
peroxide U(VI) Th+4, Zr+3 also
coprecipitate
hydroxide Fe+3 Without carbonate
fluoride Th+4
Zr +4 hydroxide Fe+3
(1) Compiled from: Anders, 1960; Booman and Rein, 1962; Cobble, 1964; EPA, 1973; 1980; 1984; DOE, 1990,
1995, 1997; Finston and Kinsley, 1961, Grimaldi, 1961; Grindler, 1962; Hyde, 1960; Kallmann, 1961;
Kallmann, 1964; Kirby and Salutsky, 1964; Metz and Waterbury, 1962; Sedlet, 1964; Sundermann and
Townley, 1960; and Turekian and Bolter, 1966.
(2) If the radionuclide itself is listed as the carrier, a different isotope would be used to assess recovery.

Separation Techniques
14-78
MARLAP JULY 2004
TABLE 14.14 — Coprecipitation behavior of plutonium and neptunium
Carrier Compound Pu+3 Pu+4 Pu(VI) Np+4 Np(V) Np(VI)
Hydroxides CCCCCC
Calcium fluoride C C C
Lanthanum fluoride C C NC C C NC
Barium sulfate C C NC C NC NC
Phosphates:
Calcium phosphate C C C
Bismuth phosphate C C C NC NC
Zirconium phosphate NC C NC C NC NC
Thorium pyrophosphate NC C NC
Thorium hypophosphate C NC
U+4 hypophosphate C NC
Oxalates:
Lanthanum oxalate C C NC NC
Bismuth oxalate C C NC
Thorium oxalate C C NC C
U+4 oxalate C C NC
Iodates:
Zirconium iodate C NC C
Ceric iodate C NC C
Thorium iodate C NC C NC
Sodium uranyl acetate NC NC C NC Poor C
Zirconium phenylarsenate NC C NC C Poor NC
Thorium peroxide C C
Bismuth arsenate C NC C
“C” indicates nearly quantitative coprecipitation under proper conditions; “NC” indicates that
coprecipitation can be made less than 1–2 percent under proper conditions. [Data compiled from
Seaborg and Katz, Korkisch (1969), and the NAS-NS 3050, 3058 and 3060 monographs.]
14.8.5 Colloidal Precipitates
Many precipitates exhibit colloidal properties, especially when freshly formed (Salutsky, 1959).
The term “colloid state” refers to the dispersion of one phase that has colloidal dimensions (less
than one micrometer, but greater than one nanometer) within a second phase. A colloidal solution
is a colloid in which the second phase is a liquid (also known as a sol). However, in radiochemis-
try, a colloid refers to the dispersion of solid particles in the solution phase. The mixture is not a
true solution: particles of the dispersed phase are larger than typical ions and molecules, and can
often be viewed by a light microscope. Colloidal precipitates are usually avoided in analytical
procedures because they are difficult to filter and to wash. Moreover, the purity of the precipitate
is controlled by the tremendously large surface area of the precipitate and by the localized
electrical character of the colloidal surface.
The stability of colloidal solutions and suspensions is governed by two major forces, one of
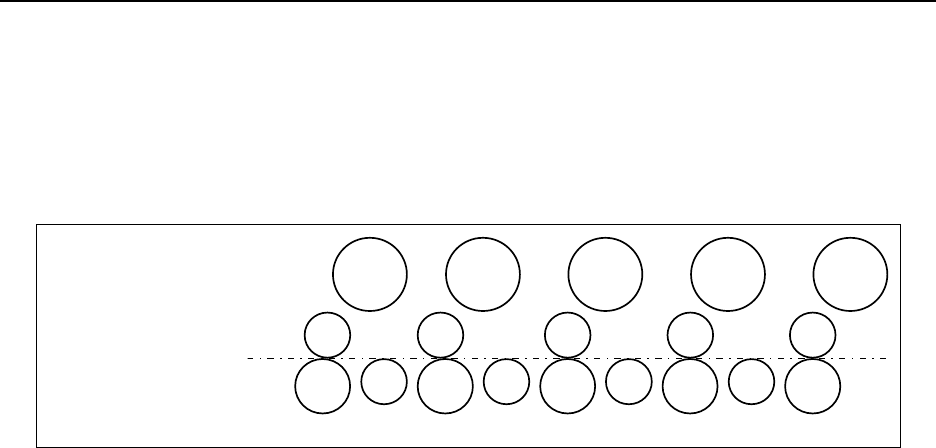
Separation Techniques
14-79
JULY 2004 MARLAP
NO3-NO3-NO3-NO3-NO3-
Ag+Ag+Ag+Ag+Ag+
Ag+
Ag+
Ag+
Ag+
Cl-Cl-Cl-Cl-Cl-
Counter ions
Adsorbed Layer
(Primary Layer)
Ions in surface
FIGURE 14.5 — The electrical double layer: A schematic representation of adsorption of
nitrate counter-ions onto a primary adsorbed layer of silver ions at the surface of a silver
chloride crystal (Peters et al., 1974).
attraction between the particles (van der Waals) and one of repulsion (electrical double layer)
(Salutsky, 1959). This repulsive force is a result of the adsorptive capacity of the colloidal
particles for their own ions. For instance, when silver chloride is precipitated in the presence of
excess silver ions, the particles adsorb silver ions and become positively charged. Then counter-
ions of opposite charge (in this case, nitrate ions) tend to adsorb to the particles to form a second
electrical layer, as illustrated in Figure 14.5.
In a similar fashion, in the presence of a slight excess of alkali chloride, the silver chloride
particles would adsorb chloride ions and become negatively charged. Therefore, precipitates
brought down in the presence of an excess of one of the lattice ions tend to be contaminated with
ions of the opposite charge. Moreover, because all of the particles have the same charge, they
repel each other. If these repulsive forces exceed the attractive van der Waals’ forces, a stable
colloid results, and the tightness with which the counter-ions are held in and with the water layer,
or the completeness with which they cover the primary adsorbed ion layer, determines the
stability of the colloid.
Such adsorption of ions upon the surface of solids in solution is largely, but not entirely, based
upon electrical attraction, otherwise adsorption would not be selective. Recall that there are four
other factors, in addition to magnitude of charge, that affect the preferential adsorption by a
colloid (see Surface Adsorption on page 14-72).
• The Paneth-Fajans-Hahn Law dictates that when two or more types of ions are available for
adsorption, the ion that forms the least soluble compound with one of the lattice ions will be
adsorbed preferentially.
• The ion present in the greater concentration will be adsorbed preferentially.
• Ions with a large radius will be adsorbed more readily than ions with a smaller radius because
the larger ion is less hydrated by the solution and not as attracted to the solution phase.
• The ion that is closer to the same size as the lattice ion will be adsorbed preferentially. For

Separation Techniques
14-80
MARLAP JULY 2004
example, radium ions are adsorbed tightly onto barium sulfate, but not onto calcium sulfate;
radium ions are close in size to barium ions, but are much larger than calcium ions.
If an excess of electrolyte is added to the colloidal solution, the electrical double layer is
destroyed and the particles can agglomerate to form larger particles that can settle to the bottom
of the container, a process known as flocculation (or coagulation). For example, Smith et al.
(1995) used polyethylene glycol to remove colloidal silica from a dissolved-soil solution before
the addition of the sample to an ion-exchange resin. Alternatively, the process whereby
coagulated particles pass back into the colloidal state is known as deflocculation, (or peptiza-
tion). Special precautions should be taken during the washing of coagulated precipitates to assure
that deflocculation does not occur. When coagulation is accomplished through charge
neutralization, deflocculation would occur if the precipitate was washed with water. A solution
containing a volatile electrolyte such as nitric acid should be used instead.
There are two types of colloidal solutions (Salutsky, 1959):
• Hydrophobic colloids show little or no attraction for water. These solutions have a low
viscosity, can be easily flocculated by the addition of an appropriate electrolyte, and yield
precipitates that are readily filterable.
• Hydrophilic colloids have a high affinity for water and are often highly viscous. They are
more difficult to flocculate than hydrophobic colloids, and relatively large amounts of
electrolytes are necessary to cause precipitation. The flocculate keeps water strongly adsorbed
and tends to form jellylike masses that are difficult to filter.
Colloidal precipitations can be a useful separation technique. Because of their great adsorption
capacity, colloidal precipitates are excellent scavengers (collectors) for concentrating trace
substances (Salutsky, 1959). Unspecific carriers such as manganese dioxide, sulfides and
hydrated oxides are frequently used as scavengers. For example, protactinium can be efficiently
scavenged and concentrated on manganese dioxide that is precipitated by adding a manganous
salt to a solution containing permanganate. Ferric hydroxide is commonly used to scavenge
cations (Section 14.8.4.4, “Coprecipitation Methods”). Moreover, scavenging precipitations can
sometimes be used to remove interferences. For example, a radionuclide that is capable of
existing in two oxidation states can be effectively purified by precipitation in one oxidation state,
followed by scavenging precipitations for impurities, while the element of interest is in another
oxidation state. A useful procedure for cerium purification involves repeated cycles of ceric
iodate precipitation, reduction to Ce+3, zirconium iodate [Zr(IO3)4] precipitation to remove
impurities (with Ce+3 staying in solution), and reoxidation to Ce+4.

Separation Techniques
14-81
JULY 2004 MARLAP
14.8.6 Separation of Precipitates
The process of precipitation chemically separates an analyte from contaminants or other analytes.
Precipitation generally is followed by one of two techniques that physically separates the
precipitate: centrifugation or filtration.
Centrifugation is a technique that can be used for precipitates of many different physical forms.
The best way to demonstrate the utility of centrifugation in radiochemical analyses is by
example:
Example of Centrifugation
A method of radium analysis coprecipitates radium with barium using sulfuric acid to isolate
the radium from its progeny. When the precipitation is completed, the mixture is centrifuged.
The supernatant solution contains contaminants and radium progeny and is decanted. The
precipitate is washed, in situ, with an isotonic sulfuric acid solution to maintain the
insolubility of the precipitate, and to further enhance the removal of the contaminants. The
mixture is re-centrifuged and the supernate again decanted.
This example demonstrates that centrifugation separates and purifies the precipitate without
disturbing the mechanical flow of the separation process, and it minimizes the introduction of
new contaminants by using the same glassware. It is noteworthy that there are several instances
of using centrifugation to discard the precipitate and retain the supernate (e.g., the separation of
barium from strontium using chromate). Separation by filtration at this point (not the final
analytical step) would involve transfer onto and subsequent removal from the filter media.
Filtration would be time consuming and risk low yield for the analysis. The speed and capacity of
the centrifuge is dictated by the type of precipitate (e.g., gelatinous, crystalline, amorphous etc.),
the sample size being processed, and the ancillary procedural steps to purify the precipitate.
The final separation of the analyte immediately preceding counting techniques is generally best
suited by using filtration techniques. The physical nature of a precipitate not only affects the
purity of the precipitate, but also the filterability of the precipitate. Large, well-formed crystals
are desirable because they tend to contain fewer impurities, and are also easier to filter and wash.
Many coagulated colloidal precipitates, such as hydrous oxides or sulfides, tend to form slimy
aggregates and to clog the filter during filtration. There are several approaches that can be taken
to improve the physical form of the precipitate (Salutsky, 1959):
• A trace quantity of a hydrophilic colloid can be added to produce complete and rapid
flocculation. For example, gelatin has been used as a sensitizer in the precipitation of zinc
sulfide, hydrous silica, and various other hydrous oxides, as well-coagulated, filterable
precipitates (Salutsky, 1959).

Separation Techniques
14-82
MARLAP JULY 2004
• The slow precipitation techniques described in Section 14.8.3.2, “Factors Affecting
Precipitation,” can be used to produce good precipitates.
• Aging the precipitate can result in a precipitate more amenable to filtration. During aging,
small particles with a larger solubility go into solution, and larger particles grow at the cost of
the smaller ones (see “Digestion” under Section 14.8.3.2, “Factors Affecting Precipitation”).
Ostwald ripening results in a decrease in the number of particles and, therefore, a decrease in
surface area. The speed of aging generally increases with temperature and with the increasing
solubility of the precipitate in the aging media. Shaking can sometimes promote aging,
perhaps by allowing particles to come into contact and to cement together.
14.8.7 Advantages and Disadvantages of Precipitation and Coprecipitation
14.8.7.1 Advantages
• Provides the only practical method of separation or concentration in some cases.
• Can be highly selective and virtually quantitative.
• High degree of concentration is possible.
• Provides a large range of scale (mg to industrial).
• Convenient, simple process.
• Carrier can be removed and procedure continued with tracer amounts of material (e.g., carrier
iron separated by solvent extraction).
• Not energy- or resource-intensive compared to other techniques (e.g., solvent extraction).
14.8.7.2 Disadvantages
• Can be time consuming to digest, filter, or wash the precipitate.
• Precipitate can be contaminated by carrying of ions or postprecipitation.
• Large amounts of carrier might interfere with subsequent separation procedures.
• Coprecipitating agent might contain isotopic impurities of the analyte radionuclide.
• Scavenger precipitates are not as selective and are more sensitive to changes in separation
procedures.
14.9 Carriers and Tracers
14.9.1 Introduction
Radiochemical analysis frequently requires the radiochemist to separate and determine radionuc-
lides that are present at extremely small quantities. The amount can be in the picomole range or
less, at concentrations in the order of 10!15 to 10!11 molar. Analysis of radionuclides using
counting techniques, such as alpha spectrometry, liquid scintillation, proportional counting, or

Separation Techniques
14-83
JULY 2004 MARLAP
gamma spectrometry, allows activities of radionuclides to be determined easily, even though the
number of atoms (and mass percent) of these materials is vanishingly small. Table 14.15 identi-
fies the number of atoms and mass present in several radionuclides, based on an activity of 500
dpm (8.33 Bq).
TABLE 14.15 — Atoms and mass of select radionuclides equivalent to 500 dpm
Radionuclide Half-life*Number of Atoms Mass (g)
Radium-226 1,600 y 6.0 × 10¹¹ 2.3 × 10!10
Polonium-210 138.3 d 1.5 × 1085.0 × 10!14
Lead-212 10.6 h 4.5 × 1051.6 × 10!16
Thallium-208 3.1 min 2.3 × 1038.0 × 10!19
* Half-lives taken from Brookhaven National Laboratory, National Nuclear Science Database (www.nndc.bnl.gov/).
Considering the minute masses of these analytes and their subsequently low concentration in
solution, it is obvious why conventional techniques of analysis, such as gravimetry, spectro-
photometry, titrimetry, and electrochemistry, cannot be used for their quantitation. However, it is
not immediately obvious why these small quantities might present other analytical difficulties.
As described below, the behavior of such small quantities of materials can be seriously affected
by macro constituents in an analytical mixture in a way that may be unexpected chemically.
14.9.2 Carriers
The key to radiochemical analysis of samples with multiple radionuclides is effective separation
of the different analytes. Separations are most easily accomplished when performed on a macro
scale. As described above, however, the analytes are frequently at levels that challenge the
analyst and the conventional methods to perform the separations. The use of a material that is
different in isotopic make-up to the analyte and that raises the effective concentration of the
material to the macro level is referred to as a carrier. In many cases, the carrier is a nonradio-
active isotope of the analyte. Some carriers are stable isotopes of chemically similar elements.
A distinction exists between traditional and radiochemical analyses when referring to macro
amounts. Generally, carriers are present in quantities from a few tenths to several hundred
milligrams of material during the progress of the radiochemical separation.
14.9.2.1 Isotopic Carriers
An isotopic carrier is usually a stable isotope of the analyte. Stable strontium (consisting of
naturally occurring 84Sr, 86Sr, 87Sr, and 88Sr) is frequently used as the carrier in the analysis of 89Sr
and 90Sr. Regardless of the stability of the isotope, the number of protons in the nucleus
ultimately governs the chemical properties of the isotope. Thus, all nuclei that have 38 protons
are strontium and react as strontium classically does.

Separation Techniques
14-84
MARLAP JULY 2004
The purpose of adding a carrier is to raise the chemical concentration of the analyte to the point
where it can be separated using conventional techniques, but for the carrier to perform properly,
it must have the same oxidation state and chemical form as the analyte. It is important then to add
the carrier to the sample as early as possible in chemical process. For example, in the determina-
tion of 131I in milk, the radioiodine might be present as I!1, IO3
!1, CH3I, or I2. The analyst should
assume that all states are present, and treat the sample so that all atoms are brought to a common
oxidation state and chemical form during some step in the procedure, before any separation takes
place. If the final step is precipitation of AgI and the carrier is in the IO3
!1 form, no precipitate
will form because AgIO3 that forms when Ag+1 is added is relatively soluble compared to AgI.
Furthermore, if separations of other radioisotopes are performed before this step, there is the
possibility that quantities of the radioiodine could be trapped in the precipitate with other
separated analytes. When concentrations of these materials are very small, even small losses are
significant. The carrier also functions to prevent losses of the analyte during the separation of
other radionuclides or interfering macro-contaminants. This is another reason that it is essential
to add the carrier prior to any chemical treatment of the sample.
The laws of equilibrium for precipitation, distillation, complexation, and oxidation-reduction will
apply to the entire chemical form of analyte in solution, both carrier and radioisotope. If, for
example, 99.995 percent of all strontium is determined to be precipitated during a radiochemical
procedure, then the amount of stable strontium remaining in solution will be 0.005 percent,
which means that 0.005 percent of the radiostrontium still remains in the solution as well. Losses
such as this occur during any chemical process. Frequently then, carriers are used in radiochemi-
cal analyses not only to raise the chemical concentration of the element, but also to determine the
yield of the process. In order to determine the exact amount of radionuclide that was originally
present in the sample, the yield (sometimes called the recovery) of the radionuclide collected at
the end of the procedure should be known. However, because the amount of analyte at the start of
the procedure is the unknown, the yield should be determined by an alternate method. The mass
of the radioanalyte is insignificant in comparison to the carrier, and measuring the yield of the
carrier (gravimetrically, for example) will allow the calculation of the yield of the analyte.
14.9.2.2 Nonisotopic Carriers
Nonisotopic carriers are materials that are similar in chemical properties to the analyte being
separated, but do not have the same number of protons in their nucleus. Usually these carriers
will be elements in the same family in the periodic table. In the classical separation of radium by
the Curies, the slight difference in solubility of radium chloride versus barium chloride allowed
the tedious fractional crystallization of radium chloride to take place (Hampel, 1968). When
barium is present in macro-quantities and the radium in femtogram quantities, however, the two
may be easily precipitated together as a sulfate.
For several elements, nonisotopic carriers are chosen from a different family of elements, but
they have the same ionic charge or similar crystalline morphology as the analyte. Lanthanum and

Separation Techniques
14-85
JULY 2004 MARLAP
neodymium as +3 ions are frequently used as nonisotopic carriers for U+4 and Pu+4 in their final
separation as insoluble fluorides by the process of coprecipitation (Metz and Waterbury, 1962)
(see also Section 14.8, “Precipitation and Coprecipitation”). The chemical form of the uranium
and plutonium is particularly important for this process; the +4 oxidation state will coprecipitate,
but the (VI) form will not. Uranium(VI) is present in solution as UO2
+2 and, therefore, will not be
coprecipitated with lanthanum fluoride. However, it is very important to note that even though
the precipitation of LaF3 may be quantitative (i.e., >99.995 percent may be precipitated), there is
no measure of how much uranium will also be coprecipitated. Because uranium and lanthanum
are not chemically equivalent, the laws of solubility product constant for lanthanum cannot be
applied to uranium. For these types of processes, separate methods, usually involving a tracer
isotope of the analyte, should be used to determine the chemical yield of the process.
For alpha counting, rare-earth fluorides (such as NdF3) are frequently used to coprecipitate the
transuranic elements (Hindman, 1983 and 1986; Sill and Williams, 1981).
Another group of nonisotopic carriers can be described as general scavengers. Substances with
high surface areas, or the ability to occlude contaminants in their floc, can be used to effect gross
separation of all radionuclides from macro quantities of interfering ions. Ferric hydroxide,
manganese dioxide (MnO2) and sulfides (MnS), and hydrated oxides [Mn(OH)x] are examples of
these nonspecific carriers that have been used in many radiochemical separations to eliminate
gross quantities of interfering substances.
14.9.2.3 Common Carriers
Carriers for specific analytes are discussed below.
Alkaline Earths
STRONTIUM AND BARIUM. Radioisotopes of Sr+2 and Ba+2 will coprecipitate with ferric hydroxide
[Fe(OH)3], while Ca+2 exhibits the opposite behavior and does not coprecipitate with ferric
hydroxide. Lead sulfate (PbSO4) will also carry strontium and barium.
Frequently, inactive strontium and barium are used as carriers for the radionuclides in order to
facilitate separation from other matrix constituents and from calcium. The precipitates used most
frequently in radiochemical procedures are the chromates (CrO4
!2), nitrates (NO3
!1), oxalates
(C2O4
!2), sulfates (SO4
!2), and barium chloride (BaCl2). Several different methods of separation
are identified here:
• Chromate precipitation is used in the classical separation of the alkaline earths. Barium
chromate (BaCrO4) is precipitated from a hot solution buffered to a pH of 4 to minimize
strontium and calcium contamination of the barium precipitate. Ammonium ion (NH4
+1) is
then added to the solution, and strontium chromate (SrCrO4) is precipitated.

Separation Techniques
14-86
MARLAP JULY 2004
• Barium and strontium can be separated from calcium as the nitrates. Fuming nitric acid is
used to increase the nitric acid concentration to 60 percent, conditions at which barium and
strontium nitrate [Ba(NO3)2 and Sr(NO3)2] precipitate and calcium does not.
• Oxalate precipitation does not separate one alkaline earth from another, but it is usually used
to produce a weighable and reproducible form suitable for radioassay. The precipitation is
accomplished from a basic solution with ammonium oxalate [(NH4)2C2O4].
• Barium sulfate (BaSO4) precipitation is generally not used in separation procedures. It is
more common as a final step to produce a precipitate that can be readily dried, weighed, and
mounted for counting. Barium is readily precipitated by slowly adding dilute sulfuric acid
(H2SO4) to a hot barium solution and digesting the precipitate. For the precipitation of
strontium or calcium sulfate (SrSO4 or CaSO4), a reagent such as alcohol should be added to
lower the solubility, and the precipitant must be coagulated by heat.
• Insolubility of barium chloride (BaCl2) in strong hydrochloric acid solution (HCl) is the basis
of the method to separate barium from calcium, strontium, and other elements. The
precipitation is performed either by adding an ether-hydrochloric acid solution or by bubbling
dry hydrogen chloride gas into the aqueous solution.
RADIUM. Radium yields the same types of insoluble compounds as barium: sulfates, chromates,
carbonates (CO3
!2), phosphates (PO4
!3), oxalates, and sulfites (SO3
!2). Hence, Ra coprecipitates
with all Ba compounds and, to a lesser extent, with most Sr and Pb compounds. Barium sulfate
and barium chromate are most frequently used to carry radium. Other compounds that are good
carriers for radium include ferric hydroxide when precipitated at moderately high pH with
sodium hydroxide (NaOH), barium chloride when precipitated from a cold mixed solvent of
water and alcohol saturated with hydrochloric acid, barium iodate (BaIO3) and various insoluble
phosphates, fluorides and oxalates (e.g., thorium phosphate [Th3(PO4)], lanthanum fluoride
(LaF3), and thorium oxalate [Th(C2O4)].
Rare Earths, Scandium, Yttrium, and Actinium
Ferric hydroxide and calcium oxalate (CaC2O4) will coprecipitate radioisotopes of the rare earths
without difficulty.
The rare earths will coprecipitate one with another in almost all of their reactions; one rare earth
can always be used to coprecipitate another. The rare earth hydroxides, fluorides, oxalates, and 8-
hydroxyquinolates in ammoniacal solution are insoluble. Conversely, the rare earth hydroxides
will carry a number of elements that are insoluble in basic solution; the rare earth oxalate will
coprecipitate calcium; and the rare earth fluorides tend to carry Ba and Zr. In the absence of
macro quantities of rare earths, actinium will carry on barium sulfate and lead sulfate (PbSO4).

Separation Techniques
14-87
JULY 2004 MARLAP
Lead
Ferric hydroxide and aluminum hydroxide [Al(OH)3] carry lead very effectively from ammonium
solutions under a variety of conditions. Lead is carried by barium or radium chloride, but not
carried by barium or radium bromide (BaBr2 or RaBr2). This behavior has been used to separate
radiolead isotopes from radium salts. Lead is also carried by barium carbonate (BaCO3), barium
sulfate, radium sulfate, radium chloride, lanthanum carbonate [La2(CO)3], barium chloride, and
silver chromate (Ag2CrO4). Calcium sulfate in the presence of alcohol has also been used to
coprecipitate lead.
Polonium
Trace quantities of polonium are carried almost quantitatively by bismuth hydroxide [Bi(OH)
3]
from ammoniacal solution. Ferric, lanthanum, and aluminum hydroxides have also been used as
carriers for polonium in alkaline solutions. Colloidal platinum and coagulated silver hydroxide
(AgOH) and ferric hydroxide sols have been used to carry polonium. Because of the high
oxidation state of polonium, it is susceptible to being a contaminant in almost any precipitate.
Removal of polonium by electrodeposition on nickel metal is recommended prior to final
precipitation for any gross counting technique (proportional counting and liquid scintillation, for
example).
Actinides
THORIUM. Thorium will coprecipitate with ferric, lanthanum [La(OH)3], and zirconium
hydroxide [Zr(OH)4]. These hydroxide carriers are nonspecific, and therefore, will only remove
thorium from a simple group of contaminants or as a group separation. The ferric hydroxide
precipitation is best carried out at pH 5.5 to 6.
Thorium will coprecipitate quantitatively with lanthanum fluoride from strongly acidic solutions,
providing an effective means to remove small quantities of thorium from uranium solutions.
However, the rare earths will also carry quantitatively, and zirconium and barium radioisotopes
will carry unless macro quantities of these elements are added as holdback carriers (see Section
14.9.2.4, “Holdback Carriers”).
Precipitation of thorium with barium sulfate is possible from strongly acidic solutions containing
high concentrations of alkali metal sulfates; however, this coprecipitation is nonspecific. Other
actinides, lead, strontium, rare earths, bismuth, scandium (Sc), and yttrium will also carry.
Coprecipitation of thorium on hydrogen hypophosphate (HPO3
!2) or phosphate carriers can be
performed from rather strongly acidic solutions. Zirconium phosphate [Zr3(PO4)4] serves as a
good carrier for trace levels of thorium. Moreover, thorium also will carry quantitatively on
zirconium iodate from a strongly acidic solution. If coprecipitation is performed from a strongly

Separation Techniques
14-88
MARLAP JULY 2004
acidic solution and the precipitate is washed with a solution containing iodate, the rare earths and
actinium are eliminated. Cesium(+4) must be reduced to Ce+3 before precipitation so that it does
not carry.
PROTACTINIUM. Protactinium will be carried quantitatively on hydroxide, carbonate, or
phosphate precipitates of tantalum, zirconium, niobium, hafnium, and titanium. It is also carried
by adsorption onto flocculent precipitates of calcium hydroxide [Ca(OH)2)] or ferric hydroxide,
and it is carried by manganese dioxide, which is produced by addition of potassium
permanganate (KMnO4) to a dilute nitric acid (HNO3) solution containing manganese nitrate.
However, titanium and zirconium are also carried under these conditions.
URANIUM. Trace concentrations of uranium can be coprecipitated with any of the common
insoluble hydroxides. When coprecipitating U(VI) with hydroxides at pH 6 to 7, the ammonium
used must be free of carbonate or some of the uranium will remain in solution as the stable
anionic carbonate complex. Hydroxide precipitation is nonspecific, and many other metals will
carry with the uranium.
Uranium(+4) can be coprecipitated as the fluoride or phosphate [UF4 or U3(PO4)4] from relatively
strong acid media; however, U(VI) phosphate [(UO2)3(PO4)2] is precipitated only from very weak
acid solutions (pH 5 to 6) by the addition of carbonate-free ammonium. The rare earths, and other
metals can also coprecipitate under these conditions.
In general, U+4 should behave similarly to Pu+4 and Np+4, and should be carried by lanthanum
fluoride, ceric and zirconium iodates [Ce(IO4)3 and Zr(IO3)4], cesium and thorium oxalates
[Th(C2O4)2], barium sulfate, zirconium phosphate [Zr3(PO4)4], and bismuth arsenate (BiAsO4).
However, U(VI) does not carry with these agents as long as the concentration of either carrier or
that of uranium is not too high.
PLUTONIUM AND NEPTUNIUM. Classically, plutonium and neptunium in their ter- and tetravalent
oxidation states have been coprecipitated with lanthanum fluoride in the method most widely
used for the isolation of femtograms of plutonium. However, large amounts of aluminum
interfere with coprecipitation of plutonium, and other insoluble fluorides, such as the rare earths,
calcium, and U+4, coprecipitate.
AMERICIUM AND CURIUM. Bismuth phosphate (BiPO4), which historically has been used to
precipitate plutonium, will also carry americium and curium from 0.1–0.3 M nitric acid.
Impurities such as calcium and magnesium are not carried under these conditions.
Lanthanum fluoride provides a convenient carrier for Am+3 and Cm+3. A lanthanum fluoride
precipitation is not totally specific, but it can provide a preliminary isolation from the bulk of the
fission products and uranium. Additionally, a lanthanum fluoride precipitation can be used to
separate americium from curium. Am+3 is oxidized to Am(V) in dilute acid with persulfate, and

Separation Techniques
14-89
JULY 2004 MARLAP
fluoride is added to precipitate Cm+3 on lanthanum fluoride.
14.9.2.4 Holdback Carriers
It is often necessary to add holdback carriers to analytical mixtures to prevent unwanted radio-
nuclides from being carried in a chemical process. Coprecipitation of a radionuclide with ferric
hydroxide carries other ions in addition to the analyte, because of its tendency to adsorb other
ions and occlude them in its crystal matrix. The addition of a holdback carrier, a highly charged
ion, such as Co+3, represses counter-ion exchange and adsorption to minimize the attraction of
foreign ions. The amount of a given substance adsorbed onto a precipitate depends on its ability
to compete with other ions in solution. Therefore, ions capable of displacing the radionuclide
ions (the hold-back carrier) are added to prohibit the coprecipitation of the radionuclide. Highly
charged ions, chemical homologs, and ions isotopic with the radionuclide are among the most
efficient holdback carriers. Hence, the addition of inactive strontium makes it possible to precipi-
tate radiochemically pure radiobarium as the nitrate or chloride in the presence of radiostrontium.
Actinium and the rare earth elements can be separated from zirconium and radium by lanthanum
fluoride coprecipitation with the addition of zirconium and barium holdback carriers. Holdback
carriers are used in other processes as well. The extraction of lutetium from water employs
neodymium ions (Nd+3) to avoid adsorption loses (Choppin et al., 1995).
14.9.2.5 Yield of Isotopic Carriers
The use of an isotopic carrier to determine the chemical yield (recovery) of the analyte is a
critical step in the plan of a radiochemical analysis. The analytical method being used to
determine the final amount of carrier will govern the method of separation. If a gravimetric
method is to be used for the final yield determination, the precipitate must have all the
characteristics that would be used for macro gravimetric analysis—easily dried, definite
stoichiometry, nonhygroscopic, etc.
Similarly, the reagent used as source of carrier at the beginning of the analysis must be of
primary-standard quality to ensure that the initial mass of carrier added can be determined very
accurately. For a gravimetric yield determination, the equation would be the following:
Percent Yield mass of carrier in final separation step
mass of carrier added 100
=
×
It should be recognized that the element of interest is the only quantity used in this formula. For
example, if strontium nitrate is used as the primary standard and strontium sulfate is the final
precipitate, both masses should be corrected, using a gravimetric factor, so that only the mass of
strontium is used in the equation in both the numerator and denominator.

Separation Techniques
14-90
MARLAP JULY 2004
Other methods to determine the yield of the carrier include atomic absorption spectrometry, ultra-
violet/visible spectrometry, titrimetry, and potentiometry.
14.9.3 Tracers
The term “tracer”was used classically to express the concentration of any pure radionuclide in
solution that had a mass too small to be measured by an analytical balance (<10!5 to 10!6 g).
More recently, the definition of a tracer has become more pragmatic. The current definition of a
tracer is a known quantity of a radioisotope that is added to a solution of a chemically equivalent
radioisotope of unknown concentration so that the yield of the chemical separation can be
monitored. In general, a tracer is not a carrier, and a carrier is not a tracer.
The analysis of 241Am in an environmental sample provides an example of a radioisotope
employed in a manner consistent with the recent use of the term tracer. In the analytical
procedure, no stable isotope of americium exists to act as a carrier. Femtogram quantities of
243Am can be produced, however, with accurately known activities. If a known quantity of 243Am
in solution is added to the unknown sample containing 241Am at the beginning of the separation
procedure, and if the resulting activity of 243Am can be determined at the end of the procedure,
then the yield of 241Am can be determined accurately for the process. Americium-243 added to
the sample in this example is used as a tracer. A measurable mass of this element was not used,
but a known activity was added through addition of the solution. During the course of the
radiochemical separation, lanthanides may have been used to help carry the americium through
analysis. However, they are not used to determine the yield in this example and would be
considered, therefore, a nonisotopic carrier.
When using a tracer in an analytical method, it is important to consider the availability of a
suitable isotope, its chemical form, its behavior in the system, the amount of activity required, the
form in which it should be counted, and any health hazards associated with it (McMillan, 1975).
Perhaps the most important property of the tracer is its half-life. It is preferable to select an
isotope with a half-life that is long compared to the duration of the experiment. By doing so, one
avoids the problems of having to handle high levels of activity at the beginning of the experiment
and of having to make large decay corrections.
Purity of the tracer is of critical importance. Radionuclide and radiochemical impurities are the
two principal types of impurities encountered. Radionuclide impurity refers to the presence of
radionuclides other than those desired. For instance, it is very difficult to obtain 236Pu tracer that
does not contain a very small quantity of 239Pu. This impurity should be taken into account when
calculating the 239Pu activity levels of samples. Radiochemical impurity refers to the nuclide of
interest being in an undesired chemical form. This type of impurity has its largest effects in
organic tracer studies, where the presence of a tracer in the correct chemical form is essential. For
example, the presence of 32P-labeled pyrophosphate in an orthophosphate tracer could lead to

Separation Techniques
14-91
JULY 2004 MARLAP
erroneous results in an orthophosphate tracer study.
Tracer solutions can also contain other forms of radiochemical impurities. Many tracers are
actinides or other isotopes that have progeny that are radioactive. Tracer solutions are purchased
with known specific activities for the isotopes listed in the solutions. However, from the time of
production of the tracer, ingrowth of progeny radioisotopes occurs. Plutonium-236 is used as a
tracer for 239/240Pu analysis, for example. Plutonium-236 has a half-life of 2.9 years and decays to
232U, which has a half-life of 72 years. After solutions of 236Pu have been stored for about three
years, half of the radionuclide will be converted to 232U. If the solution is then used as a tracer in
a procedure for analysis of uranium and plutonium in soil, erroneously high results would be
produced for the content of uranium if a gross-counting technique is used. Thus, it is important to
consider chemical purification of a tracer solution prior to use to remove unwanted radioactive
progeny.
Tracer analysis is very dependent upon the identical behavior of the tracer and the analyte.
Therefore, tracers should be added to the system as early as possible, and complete isotopic
exchange should be ensured as discussed previously (see Section 14.10, “Analysis of Specific
Radionuclides”). Obvious difficulties arise when a tracer is added to a solid sample, especially if
the sample is subdivided. Unless complete dissolution and isotopic exchange is ensured, results
should be interpreted carefully.
Isotopes selected for tracer work should be capable of being easily measured. Gamma-emitting
isotopes are ideal because they can easily be detected by gamma spectroscopy without being
separated from other matrix constituents. Alpha- and beta-emitting tracers require separation
before counting. Some common tracers are listed below:
• Strontium-85 has a 514 keV gamma ray that can be used to monitor the behavior of strontium
in a system, or for yield determination in a 89Sr/90Sr procedure, as long as the gamma is
accounted for in the beta-counting technique.
• Technetium-99m, with a half-life of 6.02 h and a 143 keV gamma ray, is sometimes used as a
yield monitor for 99Tc determinations. Samples are counted immediately to determine the
chemical recovery, then the 99mTc is allowed to decay before analysis of the 99Tc.
• Europium-152 and 145Sm are frequently used in the development of a new method to estimate
the behavior of the +3 actinides and lanthanides.
• Tritium, 14C, 32P, and 36Cl are frequently used in biological studies. In some of these studies,
the radionuclide is covalently bonded to a molecule. As a result, the chemical behavior of the
radionuclide will follow that of the molecule, not the element.
• Thorium-229 is used for Th determinations, both in alpha spectroscopy and inductively

Separation Techniques
14-92
MARLAP JULY 2004
coupled plasma-mass spectroscopy (ICP-MS).
• Uranium-232 is commonly used as a tracer in alpha spectroscopy, whereas 233U is used
commonly for ICP-MS determinations. It should be noted that 232U decays to 228Th and
therefore this needs to be taken into account when determining other alpha emitters.
• Plutonium-242 and 236Pu are both used as tracers in Pu analyses. However, 236Pu decays to
232U, which needs to be taken into account when analyzing both Pu and U in the same sample
aliquant.
• Americium-243 is employed in the analysis of 241Am and Cm by alpha spectroscopy. It is
assumed that Am and Cm are displaying similar chemical behavior.
14.9.3.1 Characteristics of Tracers
The behavior of tracers is often different from that of elements in normal concentrations. The
chemical form of a radionuclide predominant at normal concentrations, for example, might not
be the primary form at tracer concentrations. Alternatively, a shift in the equilibrium that is partly
responsible for a radionuclide’s chemical behavior might increase or reduce its concentration as a
result of the low tracer concentration. Hydrolysis reactions are influenced particularly by changes
in concentration because water is one of the species in the equilibrium. For example, hydrolysis
of the uranyl ion is represented by (Choppin et al., 1995):
m @ UO2
+2 + p· H2O 6 (UO2)m(OH)p
2m!p + p· H+1
At tracer quantities, the equilibrium will shift to the left as the amount of the uranyl ion
decreases. At 10!3 molar (pH 6), the uranyl ion is 50 percent polymerized; at 10!6 molar, there is
negligible polymerization.
Interactions of radionuclides with impurities present special problems at low concentration.
Difficulties include adsorption onto impurities such as dust, silica, or colloidal or suspended
material, or adsorption onto the walls of the container. Generally, 10!8 to 10!7 moles are needed
to cover a container’s walls; but at tracer concentrations, much less is present (Choppin et al.,
1995). Adsorption depends on (see Surface Adsorption on page 14-72):
• Concentration. A larger percentage is adsorbed at lower tracer concentrations than at higher
concentrations, because a larger surface area is available compared to the amount of tracer
present. Dilution with carrier decreases the amount of tracer adsorbed because the carrier is
competing for adsorption, and the relative amount of tracer interacting with the walls is much
less.
• Chemical State. Adsorption increases with charge on the ion.

Separation Techniques
14-93
JULY 2004 MARLAP
• Nature of the Surface Material. Surfaces that have a negative charge or that contain hydroxyl
groups can interact with cations through electrostatic attraction and hydrogen bonding,
respectively.
• pH. Generally, adsorption decreases with a lower pH (higher hydrogen ion concentration)
because the ions interact with negatively charged surfaces, and hydrogen bonding decreases
their ability to interact with metal ions.
All these processes will reduce the quantity of analyte available for radiochemical procedures
and, therefore, the yield of a procedure. The amount measured by the detection process will be
correspondingly lower, introducing additional uncertainty that would go undetected at normal
concentrations.
However, the adsorption process has been shown to be useful in some instances. For example,
carrier-free Y+3 is quantitatively adsorbed onto filter paper from basic strontium solutions at
concentrations at which yttrium hydroxide, Y(OH)3, will not precipitate. Also, carrier-free Nb has
been adsorbed on glass fiber filters for a fast specific separation technique (Friedlander et al.,
1981).
Specific behavior characteristics of compounds in separation techniques are further described
below. Additional discussion can also be found in the respective sections found earlier in this
document that describe each separation technique.
14.9.3.2 Coprecipitation
Often, the concentration of tracer is so low that precipitation will not occur in the presence of a
counter-ion that, at normal concentrations, would produce an insoluble salt. Under these
conditions, carriers are used to coprecipitate the tracer (coprecipitation is described in
Section 14.8.4).
14.9.3.3 Deposition on Nonmetallic Solids
Radionuclides can be deposited onto preformed ionic solids, charcoal, and ion-exchange resins
(Wahl and Bonner, 1951). The mechanisms of adsorption onto preformed ionic solids are similar
to those responsible for coprecipitation: counter-ion exchange and isomorphous exchange
(Section 14.8, “Precipitation and Coprecipitation”). Adsorption is favored by a large surface area,
charge of the solid and radionuclide, solubility of compound formed between the solid and the
radionuclide, and time of contact; however, it depends, to a large extent, on whether or not the
radionuclide ion can fit into the crystal lattice of the precipitate. Similarly, adsorption onto
charcoal depends on the amount of charcoal and its surface area, time of contact, and nature of
the surface, because it can be modified by the presence of other ions or molecules.

Separation Techniques
14-94
MARLAP JULY 2004
Adsorption of radionuclides, with and without carriers (Friedlander et al., 1981), onto ion-
exchange resins, followed by selective elution, has been developed into a very efficient
separation technique (Wahl and Bonner, 1951) (see Section 14.7.4, “Ion-Exchange
Chromatography”). Friedlander et al. (1981) illustrates this phenomenon:
“Ion-exchange separations generally work as well with carrier-free tracers as with weighable
amounts of ionic species. A remarkable example was the original isolation of mendelevium at
the level of a few atoms ...The transuranium elements in the solution were ... separated from
one another by elution ... through a cation-exchange column.”
14.9.3.4 Radiocolloid Formation
At the tracer level, a radionuclide solution is not necessarily truly homogeneous, but can be a
microparticle (colloid) of variable size or aggregation (Adolff and Guillaumont, 1993). Carrier-
free tracers can become colloidal by two mechanisms:
1. Sorption onto a preexisting colloidal impurity (approximately 0.001 to 0.5 µm), such as
dust, cellulose fibers, glass fragments, organic material, and polymeric metal hydrolysis
products (Adolff and Guillaumont, 1993; Choppin et al., 1995).
2. Polycondensation of a monomeric species consisting of aggregates of 103 to 107
radioactive atoms (Adolff and Guillaumont, 1993).
The presence of radiocolloids in solution can be detected by one or more of the following
characteristics of the solution, which is not typical behavior of a true solution (Adolff and
Guillaumont, 1993):
• The radionuclide can be separated from solution by a physical method such as ultrafiltration
or ultracentrifugation.
• The radionuclide does not follow the laws of a true solution when a chemical gradient
(diffusion, dialysis, isotopic exchange) or electrical gradient (electrophoresis, electrolysis,
electrodialysis) is applied.
• Adsorption on solid surfaces and spontaneous deposition differ from those effects observed
for radionuclides in true solution.
• Autoradiography reveals the formation of aggregates of radioactive atoms.
Several factors affect the formation of radiocolloids (Wahl and Bonner, 1951):
• Solubility of the Tracer. The tendency of the tracer radionuclide to hydrolyze and form an

Separation Techniques
14-95
JULY 2004 MARLAP
insoluble species with another component of the solution favors radiocolloid formation,
while the presence of ligands that form soluble complexes hinders formation; low pH tends
to minimize hydrolysis of metallic radionuclides.
• Foreign Particles. The presence of foreign particles provides sites for the tracer to adsorb
onto their surfaces. Ultrapure water prepared with micropore filters reduces the amount of
foreign particles. However, the preparation of water that is completely free of suspended
particles is difficult.
• Electrolytes. Electrolytes affect the nature (species) of the tracer ions in solution (see Section
14.10, “Analysis of Specific Radionuclides”), as well as the charge on both the radiocolloid
and the foreign particle from which the colloid might have been derived.
• Solvent. Polar and nonpolar solvents can favor the formation of radiocolloids, depending on
the specific radiocolloid itself.
• Time. The amount of radiocolloidal formation generally increases with the age of solution.
14.9.3.5 Distribution (Partition) Behavior
Distribution (partition) coefficients, which reflect the behavior of solutes during solvent
extraction procedures (Section 14.4, “Solvent Extraction”), are virtually independent of
concentration down to tracer concentrations (Friedlander et al., 1981). Whenever the radioactive
substance itself changes into a different form, however, the coefficient naturally changes,
affecting the distribution between phases during extraction or any distribution phenomena, such
as ion-exchange or gas-liquid chromatography (Section 14.7, “Chromatography”). Several
properties of tracer solutions can alter the physical or chemical form of the radionuclide in
solution and alter its distribution behavior (Wahl and Bonner, 1951):
• Radiocolloid formation might concentrate the radionuclide in the alternate phase or at the
interface between the phases.
• Shift in equilibrium during complex-ion formation or hydrolysis reactions can alter the
concentration of multiple radionuclide species in solution (Section 14.9.3.1, “Characteristics
of Tracers”).
14.9.3.6 Vaporization
Radioisotope concentrations that challenge the minimum detectable concentration (MDC) can be
vaporized from solid surfaces or solution (Section 14.5, “Volatilization and Distillation”). Most
volatilization methods of these trace quantities of radionuclides can be performed without
specific carriers, but some nonisotopic carrier gas might be required (Friedlander et al., 1981).

Separation Techniques
14-96
MARLAP JULY 2004
Vaporization of these amounts of materials from solid surfaces differs from the usual process of
vaporization of macroamounts of material, because the surface of the solid is usually not
completely covered with the radionuclide (Wahl and Bonner, 1951). Carrier-free radionuclides at
the surface are bonded with the surface particles instead of with themselves, and the bonds
broken during the process are between the solid and the radioisotope, rather than between the
radioisotope particles themselves. Additionally, the nature of the radioisotope can be altered by
trace quantities of gases such as oxygen and water present in the vacuum. Therefore, the identity
of the radionuclide species vaporizing might be uncertain, and the data from the procedure can be
hard to interpret. The rate of vaporization of radioisotopes also decreases with time, because the
number of radioisotope particles available on the solid surface decreases with time.
Radioisotopes near the MDC and macroquantities of radionuclide solutes should behave very
similarly in vaporization experiments from solution, however, because both are present as a
small fraction of the solution. They are, therefore, surrounded and bonded to solvent molecules
rather than to other solute particles (Wahl and Bonner, 1951). The nature of the solvent, the pH,
and the presence of electrolytes generally affect the solubility of the solute and its vaporization
behavior.
14.9.3.7 Oxidation and Reduction
Some radionuclides exist in only one oxidation state in solution, but others can exist in several
stable states (Tables 14.1 and 14.2). If multiple states are possible, it might be difficult to
ascertain in which state the radionuclide actually exists because the presence of trace amounts of
oxidation or reduction (redox) impurities might convert the radionuclide to a state other than the
one in which it was prepared (Wahl and Bonner, 1951). Excess redox reagents can often be
added to the solution to convert the forms to a fixed ratio and keep the ratio constant during
subsequent procedures.
For a redox equilibrium such as:
PuO2
+2 + 4 H+1 + Hg 6 Pu+4 + Hg+2 + 2 H2O
the Nernst equation is used to calculate the redox potential, E, from the standard potential, E0:
E = E0 ! kT ln([Pu+4][Hg+2]/[PuO2
+2][H+1]4)
where k is a constant for the reaction (R/2F, containing the ideal gas constant, R, and Faraday’s
constant, F) and T is the absolute temperature. Water and metallic mercury (Hg) do not appear in
the equation, because their activity is one for a pure substance. Minute concentrations of ions in
solution exhibit the same redox potential as macroquantities of ions, because E depends on the
ratio of ion concentrations and not their total concentration.

Separation Techniques
14-97
JULY 2004 MARLAP
Electrolysis of some solutions is used for electrodeposition of a carrier-free metal on an electrode
(Choppin et al., 1995) or other substance, leaving the impurities in solution (Friedlander et al.,
1981). The selectivity and efficiency, characteristic of deposition of macroquantities of ions at a
controlled potential, is not observed, however, for these metals. The activity of the ion is not
known, even if the concentration is, because the activity coefficient is dependent on the behavior
of the mixed electrolytic system. In addition, the concentration of the metal in solution might not
be known because losses may occur through adsorption or complexation with impurities.
Electrolytic deposits are usually extremely thin—a property that makes them useful for alpha,
beta, or proportional counting measurements (Wahl and Bonner, 1951).
Deposition by electrochemical displacement is sometimes used for the separation of tracer from
bulk impurities (Friedlander et al., 1981). Polonium and lead spontaneously deposit from a
solution of hydrochloric acid onto a nickel disk at 85 EC (Blanchard, 1966). Alpha and beta
counting is then used to determine 210Po and 210Pb. The same technique is frequently used in low-
level analysis of transuranic elements to remove lead and polonium so that they do not interfere
with the subsequent alpha analysis of the elements. Wahl and Bonner (1951, Table 6F) contains
electrochemical methods used for the oxidation and reduction of carrier-free tracers.
14.10 Analysis of Specific Radionuclides
14.10.1 Basic Principles of Chemical Equilibrium
Radiochemical analysis is based on the assumption that an element reacts the same chemically,
whether or not it is radioactive. This assumption is valid when the element (analyte) and the
carrier/tracer are in the same oxidation state, complex, or compound. The atomic weight of most
elements is great enough that the difference in atomic weight between the radionuclide of interest
and the carrier or tracer will not result in any chemical separation of the isotopes. This assump-
tion might not be valid for the very lightest elements (e.g., H, Li, Be, and B) when mass
fractionation or measuring techniques are used.
It is important to note that “chemical equilibrium” and “radioactive equilibrium” are two distinct
phenomena that come together when performing chemical separations of radionuclides. See
Attachment 14A at the end of this chapter for a thorough discussion of the phenomenon of
“radioactive equilibrium.”
Most radiochemical procedures involve the addition of one of the following:
• A carrier of natural isotopic composition (i.e., the addition of stable strontium carrier to
determine 89/90Sr; EPA, 1980, Method 905.0).
• A stable isotope tracer (i.e., enriched 18O, 15N, and 13C, are frequently used in mass

Separation Techniques
14-98
MARLAP JULY 2004
spectroscopy studies).
• A radionuclide tracer (i.e., the addition of a known quantity of 236Pu tracer to determine 239Pu
by alpha spectroscopy; DOE, 1990 and 1997, Method Pu-02).
To achieve quantitative yields, there must be complete equilibration (isotopic exchange) between
the added isotope and all the analyte species present. In the first example, isotopic exchange of
the carrier with the radiostrontium is achieved and a weighable, stoichiometric compound of the
carrier and radionuclide are produced. The chemical recovery from the separation technique is
determined gravimetrically. Alternatively, a known quantity of a radioactive strontium isotope
(i.e., 85Sr) could be added and determined by the method appropriate for that analysis.
Carriers and tracers are added as soon in the sample preparation process as possible, usually after
the bulk sample is dried and homogenized, but before sample decomposition to ensure that the
chemistry of the carriers or tracers is truly representative of the radioisotope of interest. Thus,
losses occurring during sample preparation steps, before decomposition, are not quantified and
might not be detected, although losses during these earlier steps are usually minimized. Having
the carriers and tracers present during the sample decomposition provides an opportunity to
equilibrate the carrier or tracer with the sample so that the carrier, tracer, and analyte are in the
identical chemical form. While this can initially appear to be rather easy, in some cases it is
extremely difficult. The presence of multiple valence states and the formation of chemical
complexes are two conditions that introduce a host of equilibration problems (Section 14.2.2,
“Oxidation-Reduction Reactions”; Section 14.2.3, “Common Oxidation States”; and Section
14.2.4, “Oxidation State in Solution”). Crouthamel and Heinrich (1971) has an excellent
discussion of the intricacies and challenges associated with attaining true isotopic exchange:
“Fortunately, there are many reactions which have high exchange rates. This applies even
to many heterogeneous systems, as in the heterogeneous catalysis of certain electron
transfer reactions. In 1920, Hevesy, using ThB (212Pb), demonstrated the rapid exchange
between active lead nitrate and inactive lead chloride by the recrystallization of lead
chloride from the homogeneously mixed salts. The ionization of these salts leads to the
chemically identical lead ions, and a rapid isotopic exchange is expected. Similar
reversible reactions account for the majority of the rapid exchange reactions observed at
ordinary temperatures. Whenever possible, the analyst should conduct the isotope
exchange reaction through a known reversible reaction in a homogeneous system. The
true homogeneity of a system is not always obvious, particularly when dealing with the
very low concentrations of the carrier-free isotopes. Even the usually well-behaved alkali-
metal ions in carrier-free solutions will adsorb on the surfaces of their containment
vessels or on colloidal and insoluble material in the solution. This is true especially in the
heavier alkali metals, rubidium and cesium. Cesium ions in aqueous solution have been
observed to absorb appreciably to the walls of glass vessels when the concentrations were
below 10!6 g/mL.”

Separation Techniques
14-99
JULY 2004 MARLAP
The reaction described above can be written as follows:
212Pb(NO3)2(s) + PbCl2(s) 6 Pb(NO3)2 + 212PbCl2
Any of the following techniques may be employed to achieve both chemical and isotopic
equilibration:
• Careful adding, mixing, stirring, shaking, etc., to assure a homogeneous solution and prevent
layering.
• Introducing the carrier or tracer in several different chemical forms or oxidation states,
followed by oxidation or reduction to a single state.
• Treating the carrier or tracer and sample initially with strong oxidizing or reducing agents
during decomposition (e.g., wet ashing or fusion).
• Carrying out repeated series of oxidation-reduction reactions.
• Requiring that, at some point during the sample decomposition, all the species be together in
a clear solution.
Once a true equilibration between carrier or tracer and sample occurs, the radiochemistry
problem shifts from one of equilibration to that of separation from other elements, and ultimately
a good recovery of the radionuclide of interest.
Crouthamel and Heinrich (1971) summarize the introduction to equilibration (isotopic
exchange):
“Probably the best way to give the reader a feeling for the ways in which isotopic
exchange is achieved in practice is to note some specific examples from radiochemical
procedures. The elements which show strong tendencies to form radiocolloids in many
instances may be stabilized almost quantitatively as a particular complex species and
exchange effected. Zirconium, for example, is usually exchanged in strong nitric acid-
hydrofluoric acid solution. In this medium, virtually all the zirconium forms a ZrF6
!2
complex. Niobium exchange is usually made in an oxalate or fluoride acid medium. The
exchange of ruthenium is accomplished through its maximum oxidation state, Ru(VIII)
which can be stabilized in a homogeneous solution and distilled as RuO4. Exchange may
also be achieved by cycling the carrier through oxidation and reduction steps in the
presence of the radioactive isotope. An iodine carrier with possible valence states of !1 to
+7 is usually cycled through its full oxidation-reduction range to ensure complete
exchange. In a large number of cases, isotopic exchange is not a difficult problem;
however, the analyst cannot afford to relax his attention to this important step. He must

Separation Techniques
14-100
MARLAP JULY 2004
consider in each analysis the possibility of both the slow exchange of certain chemical
species in homogenous solution and the possible very slow exchange in heterogeneous
systems. In the latter case, this may consist simply of examining the solutions for
insoluble matter and taking the necessary steps to either dissolve or filter it and to assay
for possible radioactive content.”
Also see the discussion of equilibration of specific radionuclides in Section 14.10.9, “Review of
Specific Radionuclides.”
14.10.2 Oxidation State
Some radionuclides exist in solution in one oxidation state that does not change, regardless of the
kind of chemical treatment used for analysis. Cesium (Cs), radium, strontium, tritium (3H), and
thorium are in the +1, +2, +2, +1, and +4 oxidation states, respectively, during all phases of
chemical treatment. However, several radionuclides can exist in more than one state, and some
are notable for their tendency to exist in multiple states simultaneously, depending on the other
components present in the mixture. Among the former are cobalt, iron, iodine, and technetium,
and among the latter are americium, plutonium, and uranium. To ensure identical chemical
behavior during the analytical procedure, the radionuclide of interest and its carriers and/or
tracers in solution must be converted to identical oxidation states. The sample mixture containing
the carriers and/or tracer is treated with redox agents to convert each state initially present to the
same state, or to a mixture with the same ratio of states. Table 6E in Wahl and Bonner (1951)
provides a list of traditional agents for the oxidation and reduction of carrier-free tracers that is a
useful first guide to the selection of conditions for these radioequilibrium processes.
14.10.3 Hydrolysis
All metal ions (cations) in aqueous solution interact extensively with water, and, to a greater or
lesser extent, they exist as solvated cations (Katz et al., 1986):
Ra+2 + x@H2O 6 Ra(H2O)x
+2
The more charged the cation, the greater is its interaction with water. Solvated cations, especially
those with +4, +3, and small +2 ions, tend to act as acids by hydrolyzing in solution. Simply
stated, hydrolysis is complexation where the ligand is the hydroxyl ion. To some extent, all metal
cations in solution undergo hydrolysis and exist as hydrated species. The hydrolysis reaction for a
metal ion is represented simply as (Choppin et al., 1995):
M+n + m@ H2O 6 M(OH)m
+(n!m) + m@ H+1
Hydrolysis of the ferric ion (Fe+3) is a classical example:

Separation Techniques
14-101
JULY 2004 MARLAP
Fe+3 + H2O 6 Fe(OH)+2 + H+1
Considering the hydrated form of the cation, hydrolysis is represented by:
M(OH2)x
+n 6 M(OH2)x!1(OH)(n!1)+ + H+1
In the latter equation, the hydrated complex ion associated with the hydroxide ion, is known as
the aquo-hydroxo species (Birkett et al., 1988). As each equation indicates, hydrolysis increases
the acidity of the solution, and the concentration of the hydrogen ion (pH) affects the position of
equilibrium. An increase in acidity (increase in H+1 concentration; decrease in pH) shifts the
position of equilibrium to the left, decreasing hydrolysis, while a decrease in acidity shifts it to
the right, increasing hydrolysis. The extent of hydrolysis, therefore, depends on the pH of the
solution containing the radionuclide. The extent of hydrolysis is also influenced by the radius and
charge of the cation (charge/radius ratio). Generally, a high ratio increases the tendency of a
cation to hydrolyze. A ratio that promotes hydrolysis is generally found in small cations with a
charge greater than one (Be+2, for example). The Th+4 cation, with a radius three times the size of
the beryllium ion but a +4 charge, is hydrolyzed extensively, even at a pH of four (Baes and
Mesmer, 1976). It is not surprising, therefore, that hydrolysis is an especially important factor in
the behavior of several metallic radionuclides in solution, and is observed in the transition,
lanthanide, and actinide groups. For the actinide series, the +4 cations have the greatest charge/
radius ratio and undergo hydrolysis most readily. Below pH 3, the hydrolysis of Th4+ is
negligible, but at higher pH, extensive hydrolysis occurs. Uranium (+4) undergoes hydrolysis in
solution at a pH above 2.9 with U(OH)3
+ being the predominant hydrolyzed species. Neptunium
ions undergo hydrolysis in dilute acid conditions with evidence of polymer formation in acidic
solutions less than 0.3 M. The hydrolysis of plutonium is the most severe, often leading to
polymerization (see Section 14.10.4, “Polymerization”). In summary, the overall tendency of
actinides to hydrolyze decreases in the order (Katz et al., 1986):
An+4 > AnO2
+2 > An+3 > AnO2
+1
where “An” represents the general chemical symbol for an actinide.
For some cations, hydrolysis continues past the first reaction with water, increasing the number
of hydroxide ions (OH!1) associated with the cation in the aquo-hydroxo species:
U+4 + H2O 6 U(OH)+3 + H+1
U(OH)+3 +H2O 6 U(OH)2
+2 + H+1
This process can, in some cases, conclude with the precipitation of an insoluble hydroxide, such
as ferric hydroxide. “Soluble hydrolysis products are especially important in systems where the
cation concentrations are relatively low, and hence the range of pH relatively wide over which

Separation Techniques
14-102
MARLAP JULY 2004
such species can be present and can profoundly affect the chemical behavior of the metal” (Baes
and Mesmer, 1976).
Solutions containing trace concentrations of metallic radionuclides qualify as an example of
these systems. The form of hydrolysis products present can control important aspects of chemical
behavior such as (Baes and Mesmer, 1976):
• Adsorption of the radionuclide on surfaces, especially on mineral and soil particles.
• Tendency to coagulate colloidal particles.
• Solubility of the hydroxide or metal oxide.
• Extent of complex formation in solution.
• Extent of extraction from solution by various reagents.
• Ability to oxidize or reduce the radionuclide to another oxidation state.
Thus, a knowledge of the identity and stability of radionuclide ion hydrolysis products is
important in understanding or predicting the chemical behavior of trace quantities of radionuc-
lides in solution (Baes and Mesmer, 1976). As the equilibrium equation indicates, H+1 is
produced as cations hydrolyze. Undesirable consequences of hydrolysis can, therefore, be
minimized or eliminated by the addition of acid to the analytical mixture to reverse hydrolysis or
prevent it from occurring. Numerous steps in radioanalytical procedures are performed at low pH
to eliminate hydrolytic effects. It is also important to know the major and minor constituents of
any sample, because hydrolysis effects are a function of pH and metal concentration. Thus,
maintaining the pH of a high iron-content soil sample below pH 3.0 is important, even if iron is
not the analyte.
14.10.4 Polymerization
The hydrolysis products of radionuclide cations described in the preceding section are
monomeric—containing only one metal ion. Some of these monomers can spontaneously form
polymeric metal hydroxo polymers in solution, represented by formation of the dimer (Birkett
et al., 1988):
2 M(H2O)x!1(OH)+(n!1) 6 [(H2O)x!2M(OH)2M(H2O)x!2]+2(n!1) + 2 H2O
The polymers contain -OH-bridges between the metal ions that, under high temperature,
prolonged aging, and/or high pH, can convert to -O-bridges, leading eventually to precipitation of
hydrated metal oxides. Birkett et al. (1988) states that:
“Formation of polymeric hydroxo species has been reported for most metals, although in
some cases, the predominant species in solution is the monomer. Some metals form only
dimers or trimers, while a few form much larger, higher-molecular-weight polymeric species.

Separation Techniques
14-103
JULY 2004 MARLAP
“Increasing the pH of a metal ion solution, by shifting the position of hydrolysis
equilibrium ..., results in an increased concentration of hydrolyzed species ..., which in turn
causes increased formation of polymeric species ... . Diluting a solution has two opposing
effects on the formation of polymeric species:
“(1) Because dilution of acidic solutions causes a decrease in H+1 concentration (i.e.,
an increase in pH), it causes a shift in the hydrolyzed equilibrium toward
formation of hydrolyzed species.
“(2) On the other hand, dilution decreases the ratio of polymeric to monomeric
complexes in solution. For metals that form both monomeric and polymeric
complexes, this means that monomeric species predominate beyond a certain level
of dilution.”
Because this type of polymerization begins with hydrolysis of a cation, minimizing or
eliminating polymerization can be achieved by the addition of acid to lower the pH of the
analytical solution to prevent hydrolysis (Section 14.10.3, “Hydrolysis”).
14.10.5 Complexation
Many radionuclides exist as metal ions in solution and have a tendency to form stable complex
ions with molecules or anions present as analytical reagents or impurities. The tendency to form
complex ions is, to a considerable extent, an expression of the same properties that lead to
hydrolysis; high positive charge on a +3 or +4 ion provides a strong driving force for the
interaction with ligands (Katz et al., 1986) (Section 14.3, “Complexation”).
Complex-ion formation by a radionuclide alters its form, introducing in solution additional
species of the radionuclide whose concentrations depend on the magnitude of the formation
constant(s). Alternate forms have different physical and chemical properties, and behave
differently in separation techniques, such as extraction or partition chromatography. The behavior
of alternate forms of radionuclides can present problems in the separation scheme that should be
avoided if possible or addressed in the protocol. Some separation schemes, however, take
advantage of the behavior of alternate radionuclide species formed by complexation, which can
alter the solubility of the radionuclides in a solvent or their bonding to an ion-exchange resin
(Section 14.3.4.2, “Separation by Solvent Extraction and Ion-Exchange Chromatography”).
14.10.6 Radiocolloid Interference
The tendency of some radionuclides in solution, particularly tracer levels of radionuclides, to
form radiocolloids, alters the physical and chemical behavior of those radionuclides (see Section
14.9.3.4, “Radiocolloid Formation”). Radioanalytical separations will not perform as expected in
solutions containing radiocolloids, particularly as the solubility of the radionuclide species

Separation Techniques
14-104
MARLAP JULY 2004
decreases.
Solutions containing large molecules, such as polymeric metal hydrolysis products, are more
likely to form radiocolloids (Choppin et al., 1995). “If the solution is kept at sufficiently low pH
and extremely free of foreign particles, sorption and radiocolloid formation are usually avoided
as major problems” (Choppin et al. 1995). If tracer levels of radionuclides are present, trace
impurities become especially significant in the radiochemical procedure, and should be
minimized or avoided whenever possible (Crouthamel and Heinrich, 1971).
Crouthamel and Heinrich (1971) provide some specific insight into radiocolloidal interference in
the equilibration problem:
“The transition metals tend to form radiocolloids in solution, and in these heterogeneous
systems the isotopic exchange reaction between a radiocolloid and inactive carrier added to
the solution is sometimes slow and, more often, incomplete. Elements which show a strong
tendency to form radiocolloids, even in macro concentrations and acid solutions, are titanium,
zirconium, hafnium, niobium, tantalum, thorium, and protactinium, and, to a lesser degree,
the rare earths. Other metals also may form radiocolloids, but generally offer a wider choice
of valence states which may be stabilized in aqueous solutions”
14.10.7 Isotope Dilution Analysis
The basic concept of isotope dilution analysis is to measure the changes in specific activity of a
substance upon its incorporation into a system containing an unknown amount of that substance.
Friedlander et al. (1981), define specific activity:
“Specific activity is defined as the ratio of the number of radioactive atoms to the total
number of atoms of a given element in the sample (N*/N). In many cases where only the
ratios of specific activities are needed, quantities proportional to N*/N, such as activity/mole,
are referred to as specific activity.”
Isotope dilution analysis uses a known amount of radionuclide to determine an unknown mass of
stable nuclide of the same element. For example, isotope dilution can be used to determine the
amount of some inactive material A in a system (Wang et al., 1975). To the system containing x
grams of an unknown weight of the inactive form of A, y grams of active material A* of known
activity D is added. The specific activity of the added active material, S1, is given by:
S1 = D/y
After ensuring isotopic exchange, the mixture of A and A* is isolated, but not necessarily
quantitatively, and purified. The specific activity, S2, is measured. Due to the conservation of
matter,

Separation Techniques
14-105
JULY 2004 MARLAP
S2 = D / (x + y)
and by substituting for S1y for D and rearranging, the amount x of inactive A is given as
x = y (S1/S2 ! 1)
However, this equation is valid only if complete isotopic exchange has occurred, a task not
always easy to achieve.
14.10.8 Masking and Demasking
Masking is the prevention of reactions that are normally expected to occur through the presence
or addition of a masking reagent. Masking reactions can be represented by the general reversible
equation:
A + Ms 6 A @ Ms
where A is the normal reacting molecule or ion, and Ms is the masking agent. The decreased
concentration of A at equilibrium determines the efficiency of masking. An excess of masking
agent favors the completeness of masking, as expected from LeChatelier’s Principle. Feigl (1936)
has described masking reagent and the masking of a reaction:
“... the concentration of a given ion in a solution can be so diminished by the addition of
substances which unite with the ion to form complex salts that an ion product sufficient to
form a precipitate or cause a color reaction is no longer obtained. Thus we speak of the
masking of a reaction and call the reagent responsible for the disappearance of the ions
necessary for the reaction, the masking reagent.”
The concepts of masking and demasking are discussed further in Perrin (1979) and in Dean
(1995).
Masking techniques are frequently used in analytical chemistry because they often provide
convenient and efficient methods to avoid the effects of unwanted components of a system
without having to separate the interferent physically. Therefore, the selectivity of many analytical
techniques can be increased through masking techniques. For example, copper can be prohibited
from carrying on ferric hydroxide at pH 7 by the addition of ammonium ions to complex the
copper ions. Fe3+ and Al3+ both interfere with the extraction of the +3 actinides and lanthanides in
some systems, but Fe3+ can be easily masked through reduction with ascorbic acid, and Al3+ can
be masked through complexation with fluoride ion (Horwitz et al., 1993 and 1994). In another
example, uranium can be isolated on a U/TEVA® column (Eichrom Technologies, Inc., Darien,
IL) from nitric acid solutions by masking the tetravalent actinides with oxalic acid; the tetravalent
actinides are complexed and pass through the column, whereas uranium is extracted (SpecNews,

Separation Techniques
14-106
MARLAP JULY 2004
1993). Strontium and barium can be isolated from other metals by cation exchange from a solu-
tion of water, pyridine, acetic acid and glycolic acid. The other metals form neutral or negative
complexes and pass through the cation column, while strontium and barium are retained
(Orlandini, 1972). Masking phenomena are present in natural systems as well. It has been
demonstrated that humic and fulvic acids can complex heavy metals such that they are no longer
bioavailable and are, therefore, not taken up by plants. Tables 14.16 and 14.17 list common
masking agents.
TABLE 14.16 — Masking agents for ions of various metals
Metal Masking Agent
Ag Br!, citrate, Cl!, CN!, I!, NH3, SCN! S2 O3
!2, thiourea, thioglycolic acid, diethyldithiocarbamate,
thiosemicarbazide, bis(2!hydroxyethyl)dithiocarbamate
Al Acetate, acetylacetone, BF4
!, citrate, C2O4
!2, EDTA, F!, formate, 8-hydroxyquinoline-5-sulfonic acid,
mannitol, 2,3-mercaptopropanol, OH!, salicylate, sulfosalicylate, tartrate, triethanolamine, tiron
As Citrate, 2,3-dimercaptopropanol, NH2OH.HCl, OH!, S2
!2, tartrate
Au Br!, CN!, NH3, SCN!, S2O3
!2, thiourea
Ba Citrate, cyclohexanediaminetetraacetic acid, N,N-dihydroxyethylglycine, EDTA, F!, SO4
!2, tartrate
Be Acetylacetone, citrate, EDTA, F!, sulfosalicylate, tartrate
Bi Citrate, Cl!, 2,3-dimercaptopropanol, dithizone, EDTA, I!, OH!, Na5P3O10, SCN!, tartrate, thiosulfate,
thiourea, triethanolamine
Ca BF4
!, citrate, N,N-dihydroxyethylglycine, EDTA, F!, polyphosphates, tartrate
Cd Citrate, CN!, 2,3-dimercaptopropanol, dimercaptosuccinic acid, dithizone, EDTA, glycine, I!, malonate,
NH3, 1,10-phenanthroline, SCN!, S2O3
!2, tartrate
Cs Citrate, N,N-dihydroxyethylglycine, EDTA, F!, PO4
!3, reducing agents (ascorbic acid), tartrate, tiron
Co Citrate, CN!, diethyldithiocarbamate, 2,3!dimercaptopropanol, dimethylglyoxime, ethylenediamine,
EDTA, F!, glycine, H2O2, NH3, NO2
!, 1,10-phenanthroline, Na5P3O10, SCN!, S2O3
!2tartrate
Cr Acetate, (reduction with) ascorbic acid + KI, citrate, N,N-dihydroxyethylglycine, EDTA, F!, formate,
NaOH + H2O2, oxidation to CrO4
!2, Na5P3O10, sulfosalicylate, tartrate, triethylamine, tiron
Cu Ascorbic acid + KI, citrate, CN!, diethyldithiocarbamate, 2,3-dimercaptopropanol, ethylenediamine,
EDTA, glycine, hexacyanocobalt(III)(3!), hydrazine, I!, NaH2PO2, NH2OH.HCl, NH3, NO!
2, 1,10-
phenanthroline, S!2, SCN! + SO3
!2, sulfosalicylate, tartrate, thioglycolic acid, thiosemicarbazide,
thiocarbohydrazide, thiourea
Fe Acetylacetone, (reduction with) ascorbic acid, C2O4
!2, citrate, CN! 2,3-dimercaptopropanol, EDTA, F!,
NH3, NH2OH.HCl, OH!, oxine 1,10-phenanthroline, 2,2'-bipyridyl, PO4
!3, P2O7
!4, S!2, SCN!, SnCl2,
S2O3
!2, sulfamic acid, sulfosalicylate, tartrate, thioglycolic acid, thiourea, tiron, triethanolamine,
trithiocarbonate
Ga Citrate, Cl!, EDTA, OH!, oxalate, sulfosalicylate, tartrate
Ge F!, oxalate, tartrate
Hf See Zr
Hg Acetone, (reduction with) ascorbic acid, citrate, Cl!, CN!, 2,3-dimercaptopropan-1-ol, EDTA, formate, I!,
SCN!, SO3
!2, tartrate, thiosemicarbazide, thiourea, triethanolamine
In Cl!, EDTA, F!, SCN!, tartrate thiourea, triethanolamine
Ir Citrate, CN!, SCN!, tartrate, thiourea

Separation Techniques
Metal Masking Agent
14-107
JULY 2004 MARLAP
La Citrate, EDTA, F!, oxalate, tartrate, tiron
Mg Citrate, C2O4
!2, cyclohexane-1,2-diaminetetraacetic acid, N,N-dihydroxyethylglycine, EDTA, F!, glycol,
hexametaphosphate, OH!, P2O7
!4, triethanolamine
Mn Citrate, CN!, C2O4
!2, 2,3!dimercaptopropanol, EDTA, F!, Na5P3O10, oxidation to MnO4
!, P2O7
!4,
reduction to Mn+2 with NH2OH.HCl or hydrazine, sulfosalicylate, tartrate, triethanolamine, triphosphate,
tiron
Mo Acetylacetone, ascorbic acid, citrate, C2O4
!2, EDTA, F!, H2O2, hydrazine, mannitol, Na5P3O10,
NH2OH.HCl, oxidation to molybdate, SCN!, tartrate, tiron, triphosphate
Nb Citrate, C2O4
!2, F!, H2O2, OH!, tartrate
Nd EDTA
NH4
+HCHO
Ni Citrate, CN!, N,N-dihydroxyethylglycine, dimethylglyoxime, EDTA, F!, glycine, malonate, Na5P3O10,
NH3 1,10-phenanthroline, SCN!, sulfosalicylate, thioglycolic acid, triethanolamine, tartrate
Np F!
Os CN!, SCN!, thiourea
Pa H2O2
Pb Acetate, (C6H5)4AsCl, citrate, 2,3-dimercaptopropanol, EDTA, I!, Na5P3O10, SO4
!2, S2O3
!2, tartrate, tiron,
tetraphenylarsonium chloride, triethanolamine, thioglycolic acid
Pd Acetylacetone, citrate, CN!, EDTA, I!, NH3, NO2
!, SCN!, S2O3
!2, tartrate, triethanol-amine
Pt Citrate, CN!, EDTA, I!, NH3, NO2
!, SCN!, S2O3
!2, tartrate, urea
Pu Reduction to Pu+4 with sulfamic acid
Rare
Earths
C2O4
!2, citrate, EDTA, F!, tartrate
Re Oxidation to perrhenate
Rh Citrate, tartrate, thiourea
Ru CN!, thiourea
Sb Citrate, 2,3-dimercaptopropanol, EDTA, I!, OH!, oxalate, S!2, S2
!2, S2O3
!2, tartrate, triethanolamine
Sc Cyclohexane-1,2-diaminetetraacetic acid, F!, tartrate
Se Citrate, F!, I!, reducing agents, S!2, SO3
!2, tartrate
Sn Citrate, C2O3
!2, 2,3-dimercaptopropanol, EDTA, F!, I!, OH!, oxidation with bromine water, PO4
!3,
tartrate, triethanolamine, thioglycolic acid
Ta Citrate, F!, H2O2, OH!, oxalate, tartrate
Te Citrate, F!, I!, reducing agents, S!2, sulfite, tartrate
Th Acetate, acetylacetone, citrate, EDTA, F!, SO4
!2, 4-sulfobenzenearsonic acid, sulfosalicylic acid, tartrate,
triethanolamine
Ti Ascorbic acid, citrate, F!, gluconate, H2O2, mannitol, Na5P3O10, OH!, SO4
!2, sulfosalicylic, acid, tartrate,
triethanolamine, tiron
Tl Citrate, Cl!, CN!, EDTA, HCHO, hydrazine, NH2OH.HCl, oxalate, tartrate, triethanolamine
U Citrate, (NH4)2CO3, C2O4
!2, EDTA, F!, H2O2, hydrazine + triethanolamine, PO4
!3, tartrate
V (reduction with) Ascorbic acid, hydrazine, or NH2OH.HCl, CN!, EDTA, H2O2, mannitol, oxidation to
vanadate, triethanolamine, tiron

Separation Techniques
Metal Masking Agent
14-108
MARLAP JULY 2004
W Citrate, F!, H2O2, hydrazine, Na5P3O10, NH2OH.HCl, oxalate, SCN!, tartrate, tiron, triphosphate, oxidation
to tungstate
Y Cyclohexane-1,2-diaminetetraacetic acid, F!
Zn Citrate, CN!, N,N!dihydroxyethylglycine, 2,3-dimercaptopropanol, dithizone, EDTA, F!, glycerol, glycol,
hexacyanoferrate(II)(4!), Na5P3O10, NH3, OH!, SCN!, tartrate, triethanolamine
Zr Arsenazo, carbonate, citrate, C2O!2, cyclohexane-1,2-diaminetetraacetic acid, EDTA, F!, H2O2, PO4
!3,
P2O7
-4, pyrogallol, quinalizarinesulfonic acid, salicylate, SO4
!2 + H2O2, sulfosalicylate, tartrate,
triethanolamine
Sources: Perrin (1979) and Dean (1995)
TABLE 14.17 — Masking agents for anions and neutral molecules
Anion or
Neutral
Molecule Masking Agent
Boric Acid
Br!
Br2
BrO3
!
Chromate(VI)
Citrate
Cl!
Cl2
ClO3
!
ClO4
!
CN!
EDTA
F!
Fe(CN)3
!3
Germanic Acid
I!
I2
IO3
!
IO4
!
MnO4
!
MoO4
!2
NO2
!
Oxalate
Phosphate
S
S!2
Sulfate
Sulfite
SO6
!2
Se and its anions
TeI!
F!, glycol, mannitol, tartrate, and other hydroxy acids
Hg+2
Phenol, sulfosalicylic acid
Reduction with AsO4
!5, hydrazine, sulfite, or thiosulfate
Reduction with AsO4
!5, ascorbic acid, hydrazine, hydroxylamine, sulfite, or thiosulfate
Ca+2
Hg+2, Sb+3
Sulfite
Thiosulfate
Hydrazine, sulfite
HCHO, Hg+2, transition-metal ions
Cu+2
Al+3, Be+2, boric acid, Fe+3, Th+4, Ti+4, Zr+4
AsO4
!5, ascorbic acid, hydrazine, hydroxylamine, thiosulfate
Glucose, glycerol, mannitol
Hg+2
Thiosulfate
Hydrazine, sulfite, thiosulfate
AsO4
!5, hydrazine, molybdate(VI), sulfite, thiosulfate
Reduction with AsO4
!5, ascorbic acid, azide, hydrazine, hydroxylamine, oxalic acid, sulfite, or
thiosulfate
Citrate, F!, H2O2, oxalate, thiocyanate + Sn+2
Co+2, sulfamic acid, sulfanilic acid, urea
Molybdate(VI), permanganate, Al+3
Fe+3, tartrate
CN!, S2!, sulfite
Permanganate + sulfuric acid, sulfur
Cr+3 + heat
HCHO, Hg+2, permanganate + sulfuric acid
Ascorbic acid, hydroxylamine, thiosulfate
Diaminobenzidine, sulfide, sulfite

Separation Techniques
Anion or
Neutral
Molecule Masking Agent
14-109
JULY 2004 MARLAP
Tungstate
Vanadate
Citrate, tartrate
Tartrate
Sources: Perrin (1979) and Dean (1995)
Demasking refers to any procedure that eliminates the effect of a masking agent already present
in solution. There are a variety of methods for demasking, including changing the pH of the
solution and physically removing, destroying, or displacing the masking agent. The stability of
most metal complexes depends on pH, so simply raising or lowering the pH is frequently
sufficient for demasking. Another approach to demasking involves the formation of new
complexes or compounds that are more stable than the masked species. For example, boric acid
commonly is used to demask the fluoride complexes of Sn4+ or Mo6+, and hydroxide is used to
demask the thiocyanate complexes of Fe3+. In addition, it might be possible to destroy the
masking agent in solution through a chemical reaction (i.e., through the oxidation of EDTA in
acidic solutions by permanganate or another strong oxidizing agent).
14.10.9 Review of Specific Radionuclides
The analytical separation and analysis of radionuclides involves several scientific disciplines.
The decay of one radionuclide to another is referred to as “radioactive equilibrium.” A series of
mathematical expressions (derived from the Bateman equations, Friedlander et al., 1981) identify
three separate cases of these equilibria (see Attachment 14A, “Radioactive Decay and
Equilibrium”).
14.10.9.1 Americium
Americium is a metal of the actinide series which is produced synthetically by neutron activation
of uranium or plutonium followed by beta decay.
Isotopes
Twenty isotopes of americium are known, 232Am through 248Am, including three metastable
states. All isotopes are radioactive. Americium-243 and 241Am, alpha emitters, are the longest
lived with half-lives of 7,380 years and 432.7 years, respectively. Americium-241 and 243Am also
undergo spontaneous fission. Americium-242m has a half-life of 141 years, and the half-lives of
the remaining isotopes are measured in hours, minutes, or seconds. Americium-241 is the most
common isotope of environmental concern.

Separation Techniques
14-110
MARLAP JULY 2004
Occurrence
None of the isotopes of americium occur naturally. It is produced synthetically by neutron
bombardment of 238U or 239Pu followed by beta decay of the unstable intermediates. Americium-
241 is found in various plutonium wastes and can be extracted from reactor wastes. Some
industrial ionization sources also contain americium. Decay of 241Pu injected in the atmosphere
during weapons testing contributes to the presence of 241Am.
The silver metal is prepared by reduction of americium fluoride (AmF3) or americium oxide
(AmO2) with active metals at high temperatures and is purified by fractional distillation, taking
advantage of its exceptionally high vapor pressure compared to other transuranium elements.
Kilogram quantities of 241Am are available, but only 10 to 100 g quantities of 243Am are prepared.
Soft gamma emission from 241Am is used to measure the thickness of metal sheets and metal
coatings, the degree of soil compaction, sediment concentration in streams, and to induce X-ray
fluorescence in chemical analysis. As an alpha emitter, it is mixed with beryllium to produce a
neutron source for oil-well logging and to measure water content in soils and industrial process
streams. The alpha source is also used to eliminate static electricity and as an ionization source in
smoke detectors.
Solubility of Compounds
Among the soluble salts are the nitrate, halides, sulfate, and chlorate of americium (Am+3). The
fluoride, hydroxide, and oxalate are insoluble. The phosphate and iodate are moderately soluble
in acid solution. Americium(VI) is precipitated with sodium acetate to produce the hydrate,
NaAmO2(C2H3O2)3@ xH2O.
Review of Properties
The study of the properties of americium is very difficult because of the intense alpha radiation
emitted by 241Am and 243Am, but some properties are known. Americium metal is very ductile
and malleable but highly reactive and unstable in air, forming the oxide. It is considered to be a
slightly more active metal than plutonium and is highly reactive combing directly with oxygen,
hydrogen, and halides to form the respective compounds, AmO2, AmH3, and AmX3. Alloys of
americium with platinum, palladium, and iridium have been prepared by hydrogen reduction of
americium oxide in the presence of the finely divided metals.
Unless the transuranium elements are associated with high-level gamma emission, the principal
toxicological problems associated with the radionuclides are the result of internal exposure after
inhalation or ingestion. When inhaled or ingested, they are about equally distributed between
bone tissue and the liver. At high doses transuranics lead to malignant tumors years later. In
addition, large quantities of 241Am could conceivably lead to criticality problems, producing

Separation Techniques
14-111
JULY 2004 MARLAP
external radiation hazards or neutron exposure from (α,n) reactions. Americium-241 is also a
gamma emitter.
Americium is generally thought to be adsorbed by many common minerals at pH values found in
the environment. Complexation of Am+3 by naturally occurring ligands, however, would be
expected to strongly reduce its adsorption.
Solution Chemistry
Americium can exist in solution in the +3, +4, (V), and (VI) oxidation states. Simple aqueous
ions of Am+3 and AmO2
+2 (VI oxidation state) are stable in dilute acid, but Am+3 is the
predominant oxidation state. Free radicals produced by radiolysis of water by alpha particles
reduce the higher states spontaneously to Am+3. The +3 oxidation state exists as Am(OH)3 in
alkaline solution. Simple tetravalent americium is unstable in mineral acid solutions, dispropor-
tionating rapidly to produce Am+3 and AmO2
+1 [Am(V)] in nitric and perchloric acid solutions. In
contrast, dissociation of Am(OH)4 or AmO2 [both Am+4] in sulfuric acid solutions produces
solutions containing Am+3 and AmO2
+2. Stability is provided by complexation with fluoride ions
and oxygen-containing ligands such as carbonate and phosphate ions. The AmO2
+1 ion also
disproportionates in acid solutions to yield Am+3 and AmO2
+2, but the process for 241Am is so
slow that radiation-induced reduction dominates. Evidence exists for the presence of Am(VII) in
alkaline solutions from the oxidation of AmO2
+2.
OXIDATION-REDUCTION BEHAVIOR. Although disproportionation reactions convert the +4 and
(V) oxidation states into the +3 and (VI) states, radiolysis eventually converts the higher
oxidation state into Am+3. Redox processes are used, however, to produce solutions of alternate
oxidation states and to equilibrate the forms of americium into a common state, usually +3, but
sometimes (VI).
The +4 state is reduced to Am+3 by iodide. In dilute, nonreducing solutions, peroxydisulfate
(S2O8
!2) oxidize both the +3 and (V) states to the (VI) state. Ce+4 and ozone (O3) oxidize the (V)
state to (VI) in perchloric acid solution. Electrolytic oxidation of Am+3 to AmO2
+2 occurs in
phosphoric, nitric, and perchloric acid solutions and solutions of sodium bicarbonate (Na2CO3).
The latter ion is reduced to Am+3 by iodide, hydrogen peroxide, and the nitrite ion (NO2
!1).
COMPLEXATION. The +3 oxidation state forms complexes in the following order of strength (in
aqueous solution): F! > H2PO4
! > SCN! > NO3
! > Cl!. Both Am+3 and Am+4 form complexes
with organic chelants. These are stable in aqueous and organic solvents. Americium (+4) can be
easily reduced unless special oxidizing conditions are maintained. The AmO2
+2 ion also forms
significant complex ions with nitrate, sulfate, and fluoride ions.
HYDROLYSIS. The actinide elements are known for their tendency to hydrolyze and, in many
cases, form insoluble polymers. In the predominant +3 oxidation state in solution, americium,

Separation Techniques
14-112
MARLAP JULY 2004
with its large radius, has the least tendency of the +3 actinides to hydrolyze; yet, hydrolysis is
expected to occur with some polymerization. Hydrolysis that does occur is complicated and
depends on the nature of the cations present and may start at pH values as low as 0.5–1.0. In
contrast, the AmO2
+2, like all actinyl ions, undergoes hydrolysis to an appreciable extent. The
tendency to form polymers of colloidal dimensions, however, appears to be small relative to
other actinide ions in the (VI) oxidation state. Precipitation occurs early on after relatively small
polymeric aggregates form in solution. The strong tendency to form insoluble precipitates after a
small amount of hydrolysis makes characterization of the water-soluble polymers a difficult
problem.
RADIOCOLLOIDS. At trace concentrations, a colloidal form of Am+2 can easily be prepared, so
steps should be taken to avoid its formation during analytical procedures. At high pH ranges,
colloids form from the Am(OH)3, and at lower pH ranges through adsorption of Am+3 onto
foreign particles. Their formation depends on storage time, pH, and ionic strength of the solution.
Dissolution of Samples
Americium is generally dissolved from irradiated reactor fuels, research compounds, and soil,
vegetation, and biological samples. Spent fuel elements may be difficult to dissolve but eventual-
ly yield to digestion with hydrofluoric acid, nitric acid, or sulfuric acid. Aqua regia is used if
platinum is present, and hydrochloric acid with an oxidizing agent such as sodium chlorate.
Perchloric acid, while a good solvent for uranium, reacts too vigorously. Sodium hydroxide-
peroxide is a good basic solvent. Research compounds, usually salts, yield to hot concentrated
nitric or sulfuric acid. Soil samples are digested with concentrated nitric acid, hydrofluoric acid,
or hydrochloric acid. Vegetation and biological samples are commonly wet ashed, and the
residue is treated with nitric acid.
Separation Methods
The separation of americium, particularly from other transuranics, is facilitated by the
exceptional stability of Am+3 compared to the trivalent ions of other actinides, which more
readily convert to higher oxidation states under conditions that americium remains trivalent.
PRECIPITATION AND COPRECIPITATION. Coprecipitation with lanthanum fluoride (LaF3) is
achieved after reduction of higher oxidation states to Am+3. Select oxidation of other transuranic
elements such as neptunium and plutonium to the +4 or VI oxidation states solubilizes these
radionuclides leaving americium in the insoluble form. Although coprecipitation with rare earths
as fluorides or hydroxides from a bicarbonate solution of americium(VI), is used to purify
americium, it is not as effective as ion-exchange procedures. Other coprecipitating agents for
Am+3 include thorium oxalate [Th(C2O4)2], calcium oxalate (CaC2O4), ferric hydroxide
[Fe(OH)3), and lanthanum potassium sulfate [LaK(SO4)2]. Americium (+4) is also coprecipitated
with these reagents as well as with zirconium phosphate [Zr3(PO4)4]. Americium(VI) is not

Separation Techniques
14-113
JULY 2004 MARLAP
coprecipitated with any of these reagents but with sodium uranyl acetate [NaUO2(C2H3O2)2].
SOLVENT EXTRACTION. Organic solvents and chelating agents are available for separating
americium from other radionuclides by selectively extracting either americium or the alternate
radionuclide from aqueous solutions into an organic phase. Tributylphosphate (TBP) in kerosene
or TTA in xylene removes most oxidation states of neptunium and plutonium from Am+3 in the
presence of dilute nitric acid. The addition of sodium nitrate (6 M) tends to reverse the trend
making americium more soluble in TBP than uranium, neptunium, or plutonium radionuclides.
Bis(2-ethylhexyl) phosphoric acid (HDEHP) in toluene is highly effective in extracting Am+3 and
is used in sample preparation for alpha spectroscopic analysis.
Plutonium in the +4 oxidation state can interfere with Am analysis. See Section 14.10.9.8 on
plutonium for a discussion of how to separate americium from plutonium.
ION EXCHANGE. Separation of americium can be achieved by cation-exchange chromatography.
Any of its oxidation states exchange with a cation resin in dilute acid solution, but the higher
oxidation states are not important in cation-exchange separations because they are unstable
toward reduction to the +3 state. Generally, Am+3 is the last tripositive ion among the actinides
eluted from a cation-exchange matrix, although the order may not be maintained under all
conditions. Many eluting agents are available for specific separations. Concentrated hydrochloric
acid, for example, has been used for separating actinides such as americium from the lanthanides.
Anion-exchange chromatography has been widely used for separating americium. Anionic
complexes of Am+3 form at high chloride concentrations, providing a chemical form that is easily
exchanged on an anion-exchange column. The column can be eluted using dilute hydrochloric
acid or a dilute hydrochloric acid/ammonium thiocyanate solution. Anion-exchange separations
of americium are also realized with columns prepared with concentrated nitric acid solutions.
The sequential separation of the actinides is accomplished readily using anion-exchange
chromatography. Americium, plutonium, neptunium, thorium, protactinium, curium, and
uranium can all be separated by the proper application of select acid or salt solutions to the
column.
ELECTRODEPOSITION. Americium can be electrodeposited for alpha spectrometry measurement
on a highly polished platinum cathode. The sample is dissolved in a dilute hydrochloric acid
solution that has been adjusted to a pH of about six with ammonium hydroxide solution using
methyl red indicator. The process runs for one hour at 1.2 amps.
Methods of Analysis
Americium-241 is detected and quantified by alpha or gamma spectrometry, or by gas
proportional counting (GPC). Trace quantities of 241Am are analyzed by GPC, after separation
from interfering radionuclides by solvent extraction, coprecipitation, or ion-exchange
chromatography. The isolated radionuclide is collected and mounted on a planchet or

Separation Techniques
14-114
MARLAP JULY 2004
electroplated onto a platinum electrode for counting by alpha spectrometry. Americium-243 is
added to the analytical solution as a tracer to measure chemical yield. Americium-241 may be
determined directly (i.e., no radiochemical separation) in bulk soil samples by gamma
spectroscopy.
Compiled from: Ahrland, 1986; Baes and Mesmer, 1976; Choppin et al., 1995; Considine
and Considine, 1983; Cotton and Wilkinson, 1988; DOE, 1990 and 1997, 1995; 1997;
Ehmann and Vance, 1991; Greenwood and Earnshaw, 1984; Haissinsky and Adolff, 1965;
Horwitz et al., 1993, 1995; Katz et al., 1986; Lindsay, 1988; Metz and Waterbury, 1962;
NEA, 1982; SCA, 2001; Penneman, 1994; Penneman and Keenan, 1960; Schulz and
Penneman, 1986; Seaborg and Loveland, 1990.
14.10.9.2 Carbon
The chemistry of carbon compounds is too extensive to be summarized here. Fortunately, only
one isotope of carbon, 14C, is significant in analytical separation. This chapter will focus on the
two principal radioisotopes of carbon that are in use: 11C and 14C.
Isotopes
Carbon-11 has a half-life of 20 minutes. It is used for medical diagnoses and is prepared by
proton bombardment of a boron target in an accelerator. The 11C in the target then may be
incorporated as part of a tracer molecule that would be used for the diagnosis. This isotope is also
formed in nuclear reactors by the two reactions, 11B(p, n) 11C and 12C(n, 2n)11C.
The chemical environment in the reactor coolant system is highly reducing (overpressure of
hydrogen gas is used to minimize oxygen formation from radiolysis of water). Thus, the chemical
form of the carbon is most likely 11CH4. The radioisotope decays to 11B by positron emission. It
may be detected by liquid scintillation or gamma ray detection of the 511 keV annihilation peak.
Its short half-life obviates the need for its environmental analysis.
Carbon-14 is also formed as a result of activation in reactor coolant systems of fission reactors
from the following reaction: 17O(n,α)14C. As with 11C, the chemical form will most likely be
14CH4.
Occurrence
Carbon-14 is a naturally occurring radionuclide with a half-life of 5,720 years. It is formed as a
result of 14N(n, p)14C. The nitrogen atoms in the upper atmosphere are bombarded with high-
energy neutrons emitted from the sun. The carbon becomes incorporated as part of a CO2
molecule due to the presence of oxygen and many highly energetic particles and free radicals in
the upper atmosphere. Carbon dioxide freely exchanges with all carbon using organisms in the

Separation Techniques
14-115
JULY 2004 MARLAP
environment. The living organism rapidly reaches a state of equilibrium with the environment
because of the long half-life of the carbon. The rate of radioactive decay of naturally occurring
14C is approximately 780 Bq (13 dpm) per gram of total carbon. However, once an organism dies,
it ceases to exchange that carbon with the environment. Thus, the activity per gram of carbon
would decrease with the characteristic half-life of 14C (as long as the material is undisturbed).
This is the basis for carbon dating of materials.
Solubility and Solution Chemistry
Organic compounds have a vast range of chemical and physical properties. Many of the 14C
containing materials one encounters will be insoluble in aqueous solution, but soluble in some
organic solvents. Carbon is basically tetravalent in all compounds, and forms covalent bonds.
Thus, when using separation techniques involving a carrier, such as CO3
-2, it is necessary to
ensure not only that the sample is dissolved, but that sufficient oxidative power has been
employed to convert the analyte to the same chemical form. Carbon is also unique in that CO2 is
a common oxidation product of carbon and can easily escape from solution. The equilibria
CO2 + H2O 6 HCO3
!1 + H+
HCO3
!1 + H2O 6 CO3
!2 + H+
demonstrate the significant effect that acid concentration can have on the loss of carbon, as CO2,
from solution. This must be taken into consideration whenever processing 14C samples.
Dissolution
Many applications involve 14C as tracers. As discussed later, no sample dissolution may be
needed and analysis by one of the two analytical techniques may proceed directly.
Dissolution of samples containing 14C where other isotopes are present involves the complete
destruction of the organic matter in the sample, and simultaneously not allowing the volatiliza-
tion of the carbon. This is most commonly achieved by permanganate oxidation in a basic
solution. As seen in the equilibrium equations for carbon, in basic solution it is present as the
CO3
!2 species, which is nonvolatile.
Samples also may be prepared by high temperature oxidation, in which the carbon is converted to
CO2. The exit gasses from the combustion process must be directed through a trap which will
remove carbon dioxide. These include such materials as molecular sieve, barium chloride
solutions or Ascarite® columns.

Separation Techniques
14-116
MARLAP JULY 2004
Methods of Analysis
Carbon-14 decays only by β- emission. The Eβmax of this emission is 0.156 MeV. Although it is
detectable by gas proportional counting, the only two methods of analysis commonly used for
this isotope are liquid scintillation and mass spectroscopic analysis. The methods for liquid
scintillation analyses are described in Chapter 15, Quantification of Radionuclides, and Kessler
(1989).
14.10.9.3 Cesium
Cesium is the last member of the naturally occurring alkali metals in Group IA of the Periodic
Table, with an atomic number of 55. Its radiochemistry is simplified because the Group IA
metals form only +1 ions. Elemental cesium is a very soft, silver-white metallic solid in the pure
state with a melting point of only 28.5 EC. It tarnishes quickly to a golden-yellow color when
exposed to small amounts of air. With sufficient air, it ignites spontaneously. It is normally
stored under xylente or toluene to prevent contact with air.
Isotopes
Cesium isotopes of mass number 112 to 148 have been identified. Cesium-133 is the only stable
isotope. Cesium-134, 136Cs and 137Cs are the only isotopes of significance from an environmental
perspective. They are formed from the nuclear fission process. Their half-lives are 2.06 years,
13.2 days, and 30.17 years, respectively. Cesium-135 also is formed as a result of the fission
process. However, it is not a significant isotope, because it is a low-energy (0.21 MeV) beta-only
emitter with a long half-life (2.2×10⁶ years).
Occurrence
Cesium is widely distributed in the Earth’s crust with other alkali metals. In granite and
sedimentary rocks the concentration is less than 7 ppm. In seawater it is about 0.002 ppm, but in
mineral springs the concentration may be greater than 9 mg/L. Cesium-137 is produced in
nuclear fission and occurs in atmospheric debris from weapons tests and accidents. It is a very
important component of radioactive fallout; and because of its moderately long half-life and high
solubility, it is a major source of long-lived external gamma radiation from fallout. It accounts
for 30 percent of the gamma activity of fission products stored for one year, 70 percent in two
years, and 100 percent after five years.
Cesium metal’s most recognized use is in the atomic clock that serves to define the second.
Cesium has been considered as a fuel in ion-propulsion engines for deep space travel and as a
heat-transfer medium for some applications. Cesium-137 has replaced 60Co in the treatment of
cancer and has been used in industrial radiography for the control of welds. Cesium-137 is also
used commercially as a sealed source in liquid scintillation spectrometers. The 661 keV gamma

Separation Techniques
14-117
JULY 2004 MARLAP
ray it emits is used to create an electron (Compton effect) distribution, which allows the degree
of sample quench to be determined.
Solubility of Compounds
Most cesium salts are very soluble in water and dilute acids. Among the salts of common anions,
the notable exceptions are cesium perchlorate and periodate (CsClO4 and CsIO4). Several cesium
compounds of large anions are insoluble. Examples include the following: silicotungstate
[Cs8SiW12O42], permanganate (CsMnO4), chloroplatinate (Cs2PtCl6), tetraphenylborate
[CsB(C6H5)4], alum [CsAl(SO4)2], and cobaltnitrate complex [Cs3Co(NO3)6].
Review of Properties
Cesium is the most active and electropositive of all the metals. It forms compounds with most
inorganic and organic anions; it readily forms alums with all the trivalent cations that are found
in alums. The metal readily ionizes, and in ammonia solutions it is a powerful reducing agent.
When exposed to moist air, it tarnishes initially forming oxides and a nitride and then quickly
melts or bursts into flame. With water the reaction is violent. Cesium reacts vigorously with
halogens and oxygen, and it is exceptional among the alkali metals in that it can form stable
polyhalides such as CsI3. Reaction with oxygen forms a mixture of oxides: cesium oxide (Cs2O),
cesium peroxide (Cs2O2), and cesium superoxide (CsO2). The toxicity of cesium compounds is
generally not important unless combined with another toxic ion.
Cesium-137, introduced into the water environment as cations, is attached to soil particles and
can be removed by erosion and runoff. However, soil sediment particles act as sinks for 137Cs,
and the radionuclide is almost irreversibly bound to mica and clay minerals in freshwater
environments. It is unlikely that 137Cs will be removed from these sediments under typical
environmental conditions. Solutions of high ionic strength as occur in estuarine environments
might provide sufficient exchange character to cause cesium to become mobile in the ecosphere.
Solution Chemistry
The cesium ion exists in only the +1 oxidation state, and its solution chemistry is not complicated
by oxidation-reduction reactions. As a result, it undergoes complete, rapid exchange with carriers
in solution. The cesium ion is colorless in solution and is probably hydrated as a hexaaquo
complex.
COMPLEXATION. Cesium ions form very few complex ions in solution. The few that form are
primarily with nitrogen-donor ligands or beta-diketones. Anhydrous beta-diketones are insoluble
in water, but in the presence of additional coordinating agents, including water, they become
soluble in hydrocarbons. One solvent-extraction procedure from aqueous solutions is based on
chelation of cesium with TTA in hydrocarbon solvents. Cesium is sandwiched between crown

Separation Techniques
14-118
MARLAP JULY 2004
ligands, associated with the oxygen atoms of the ether, in [Cs9(18-C-6)14]+9.
HYDROLYSIS. With the small charge and large radius of the cesium ion, hydrolysis reactions are
inconsequential.
ADSORPTION. When cesium is present in extremely low concentrations, even in the presence of 2
M acid, adsorption on the walls of glass and plastic containers leads to complications for the
radioanalyst. Half the activity of cesium radionuclides, for example, can be lost from acid
solutions stored for one month in these containers. Experiments indicate that addition of 1 µg
cesium carrier per milliliter of solution is sufficient to stabilize acid solutions for six months.
Dissolution of Samples
Radiochemists generally dissolve cesium samples from irradiated nuclear fuel, activated cesium
salts, natural water, organic material, agriculture material, and soils. Nuclear fuel samples are
generally dissolved in HCl, HNO3, HF, or a combination of these acids. Care should be taken to
ensure that the sample is representative if 137Cs has been used as a burn-up monitor. Precautions
should also be taken with these samples to prevent loss of cesium because of leaching or incom-
plete sample dissolution. Most cesium salts dissolve readily in water and acid solutions. In water
samples, the cesium might require concentration, preferably by ion exchange, or by precipitation
or coprecipitation if interfering ions are present. Organic materials are either decomposed by
HNO3 or dry ashed, and the cesium is extracted with hot water or hot acid solution. Extraction
and leaching procedure have been use to assess exchangeable or leachable cesium using
ammonium acetate solutions or acid solutions, but soils are generally completely solubilized in
HNO3, HCl, HF, H2SO4, or a mixture of these acids in order to account for all the cesium in a soil
sample.
Separation Methods
PRECIPITATION AND COPRECIPITATION. Cesium is separated and purified by several precipitation
and coprecipitation methods using salts of large anions. Gravimetric procedures rely on precipita-
tion to collect cesium for weighing, and several radiochemical techniques isolate cesium radio-
nuclides for counting by precipitation or coprecipitation. Cesium can be precipitated, or
coprecipitated in the presence of cesium carrier, by the chlorate, cobaltinitrate, platinate, and
tetraphenylborate ions. Other alkali metals interfere and should be removed before a pure
insoluble compound can be collected. Cesium can be isolated from other alkali metals by
precipitation as the silicotungstate. The precipitate can be dissolved in 6 M sodium hydroxide,
and cesium can be further processed by other separation procedures. The tetraphenylborate
procedure first removes other interfering ions by a carbonate and hydroxide precipitation in the
presence of iron, barium, lanthanum, and zirconium carriers. Cesium is subsequently precipitated
by the addition of sodium tetraphenylborate to the acidified supernatant. Alum also precipitates
cesium from water samples in the presence of macro quantities of the alkali metals. Trace

Separation Techniques
14-119
JULY 2004 MARLAP
quantities of cesium radionuclides are precipitated using stable cesium as a carrier.
ION EXCHANGE. The cesium cation is not retained by anion-exchange resins and does not form a
suitable anion for anion-exchange chromatography. The process is used, however, to separate
cesium from interfering ions that form anionic complexes. Cesium elutes first in these
procedures. Cesium is retained by cation-exchange resins. Because the cesium ion has the largest
ionic radius and has a +1 charge, it is less hydrated than most other cations. Therefore, cesium
has a small hydrated radius and can approach the cation exchange site to form a strong electro-
static association with the ion-exchange resin. Binding of alkali metal ion to cation exchange
resins follows the order: Cs+1 > Rb+1 > K+1 > Na+1 > Li+1. Cesium is generally the last alkali metal
ion to elute in cation-exchange procedures. In some procedures, the process is not quantitative
after extensive elution.
SOLVENT EXTRACTION. Cesium does not form many complex ions, and solvent extraction is not
a common procedure for its separation. One solvent-extraction procedure, however, is based on
chelation of cesium with TTA in a solvent of methyl nitrate/hydrocarbons. Cesium can also be
extracted from fission product solutions with sodium tetraphenylborate in amyl acetate. It can be
stripped from the organic phase by 3 M HCl.
Methods of Analysis
Macroscopic quantities of cesium have been determined by gravimetric procedures using one of
the precipitating agents described above. Spectrochemical procedures for macroscopic quantities
include flame photometry, emission spectroscopy, and X-ray emission.
Gamma ray spectrometry allows detection of 134Cs, 136Cs, and 137Cs down to very low levels. The
gamma ray measured for 137Cs (661 keV) actually is emitted from it progeny 137mBa. However,
because the half-life of the barium isotope is so short (2.5 min) it is quickly equilibrated with its
parent cesium isotope (i.e., secular equilibrium). Cesium-137 is used as part of a group of
nuclides in a mixed radioactivity source for calibration of gamma ray spectrometers. It is also
used in some liquid scintillation spectrophotometers to generate a Compton distribution to
determine the quench.
Compiled from: Choppin et al., 1995; Considine and Considine, 1983; Cotton and
Wilkinson, 1988; Emsley, 1989; EPA, 1973; EPA, 1973; EPA, 1980; Finston and Kinsley,
1961; Friedlander et al., 1981; Hampel, 1968; Hassinsky and Adolff, 1965; Kallmann, 1964;
Lindsay, 1988; Sittig, 1994.
14.10.9.4 Cobalt
Cobalt, atomic number 27, is a silvery-grey, brittle metal found in the first row of the transition
elements in the periodic table, between iron and nickel. Although it is in the same family of

Separation Techniques
14-120
MARLAP JULY 2004
elements as rhodium and iridium, it resembles iron and nickel in its free and combined states.
Isotopes
Cobalt-59 is the only naturally occurring isotope of the element. The other twenty-two isotopes
and their metastable states, ranging from mass numbers 50 to 67, are radioactive. Isotopes with
mass numbers less than 59 decay by positron emission or electron capture. Isotopes with mass
numbers greater than 59 decay by beta and gamma emission. Except for 60Co, the most important
radionuclide, their half-lives range from milliseconds to days. The principal isotopes of cobalt
(with their half-lives) are 57Co (t½ . 272 d), 58Co (t½ . 71 d), and 60Co (t½ . 5.27 y). Isotopes 57
and 58 can be determined by X-ray as well as gamma spectrometry. Isotope 60 is easily
determined by gamma spectrometry.
Occurrence and Uses
The cobalt content of the crust of the Earth is about 30 ppm, but the element is widely distributed
in nature, found in soils, water, plants and animals, meteorites, stars, and lunar rocks. Over 200
cobalt minerals are known. Commercially, the most important are the arsenides, oxides, and
sulfides. Important commercial sources also include ores of iron, nickel, copper, silver, mangan-
ese, and zinc. Cobalt-60 is produced by neutron activation of stable 59Co. Cobalt-56 and 57Co are
prepared by bombardment of iron or nickel with protons or deuterons. Cobalt-58 (formed by
activation of nickel) is now the dominant isotope formed in nuclear power plants during a fuel
cycle, because most power plants have replaced their cobalt-bearing alloys, such as stellite.
Some of the metallic cobalt is isolated from its minerals, but much of the metal is produced
primarily as a byproduct of copper, nickel, or lead extraction. The processes are varied and
complicated because of the similar chemical nature of cobalt and the associated metals.
Since ancient times, cobalt ores has been used to produce the blue color in pottery, glass, and
ceramics. Cobalt compounds are similarly used as artist pigments, inks, cotton dyes, and to speed
the drying of paints and inks. They also serves as catalysts in the chemical industry and for
oxidation of carbon monoxide in catalytic converters. One of the major uses of cobalt is the
preparation of high-temperature or magnetic alloys. Jet engines and gas turbines are
manufactured from metals with a high content of cobalt (up to 65 percent) alloyed with nickel,
chromium, molybdenum, tungsten, and other metals.
Little use if made of pure cobalt except as a source of radioactivity from 60Co. The radionuclide
is used in cancer radiotherapy, as a high-energy gamma source for the radiography of metallic
objects and other solids, as a food irradiation source for sterilization, or as an injectable radio-
nuclide for the measurement of flow rates in pipes. The half-life of 60Co (t½ . 5.2 y), and its
gamma emissions make it a principal contributor to potential dose effects in storage and transport
of radioactive waste.

Separation Techniques
14-121
JULY 2004 MARLAP
Solubility of Compounds
Most simple cobalt compounds contain Co+2, but Co+2 and Co+3 display varied solubilities in
water. To some extent, their solubilities depend on the oxidation state of the metal. For example,
all the halides of Co+2 are soluble but the only stable halide of Co+3, the fluoride, is insoluble. The
sulfates of both oxidation states are soluble in water. The acetate of Co+2 is soluble, but that of
Co+3 hydrolyses in water. The bromate, chlorate, and perchlorate of Co+2 are also soluble.
Insoluble compounds include all the oxides of both oxidation states, Co+2 sulfide, cyanide,
oxalate, chromate, and carbonate. The hydroxides are slightly soluble. Several thousand complex
compounds of cobalt are known. Almost all are Co+3 complexes and many are soluble in water.
Review of Properties
Metallic cobalt is less reactive than iron and is unreactive with water or oxygen in air unless
heated, although the finely divided metal is pyrophoric in air. On heating in air it forms the
oxides, Co+2 oxide (CoO) below 200 EC and above 900 EC and Co+2-Co+3 oxide (Co3O4) between
the temperature extremes. It reacts with common mineral acids and slowly with hydrofluoric and
phosphoric acids to form Co+2 salts and with sodium and ammonium hydroxides. On heating, it
reacts with halogens and other nonmetals such as boron, carbon, phosphorus, arsenic, antimony,
and sulfur.
Cobalt exists in all oxidation states from !1 to +4. The most common are the +2 and +3
oxidation states. The +1 state is found in a several complex compounds, primarily the nitrosyl
and carbonyl complexes and certain organic complexes. The +4 state exist in some fluoride
complexes. Co+2 is more stable in simple compounds and is not easily hydrolyzed. Few simple
compounds are known for the +3 state, but cobalt is unique in the numerous stable complex
compounds it forms.
The toxicity of cobalt is not comparable to metals such as mercury, cadmium, or lead. Inhalation
of fine metallic dust can cause irritation of the respiratory system, and cobalt salts can cause
benign dermatosis. Cobalt-60 is made available in various forms, in sealed aluminum or monel
cylinders for industrial applications, as wires or needles for medical treatment, and in various
solid and solution forms for industry and research. Extreme care is required in handling any of
these forms of cobalt because of the high-energy gamma radiation from the source.
Solution Chemistry
In aqueous solution and in the absence of complexing agents, Co+2 is the only stable oxidation
state, existing in water as the pink-red hexaaquo complex ion, Co(H2O)6
+2. Simple cobalt ions in
the +3 oxidation state decompose water in an oxidization-reduction process that generates Co+2:
4 Co+3 + 2 H2O 6 4 Co+2 + O2 + 4 H+1

Separation Techniques
14-122
MARLAP JULY 2004
Complexation of Co+3 decreases its oxidizing power and most complex ions of the +3 oxidation
state are stable in solution.
COMPLEXATION. Several thousand complexes of cobalt have been prepared and extensively
studied, including neutral structures and those containing complex cations or anions. The +2
oxidation state forms complexes with a coordination of four or six, and in aqueous solution,
[Co(H2O)6]+2 is in equilibrium with some [Co(H2O)4]+2. In alkaline solution Co+2 precipitates as
Co(OH)2, but the ion is amphoteric; and in concentrated hydroxide solutions, the precipitate
dissolves forming [Co(OH)4]!2. Many complexes of the form [Co(X)4]!1 exist with monodentate
anionic ligands such as Cl!1, Br!1, I!1, SCN!1, N3
!1, and OH!1. Many aquo-halo complexes are
known; they are various shades of red and blue. The aquo complex, [Co(H2O)6]+2, is pink.
Chelate complexes are well-known and are used to extract cobalt from solutions of other ions.
Acetylacetone (acac) is used, for example, in a procedure to separate cobalt from nickel. Co+2 and
Ni+2 do not form chelates with the acac, Co+3 does, however, and can be easily extracted.
OXIDATION-REDUCTION BEHAVIOR. Most simple cobalt +3 compounds are unstable because the
+3 state is a strong oxidizing agent. It is very unstable in aqueous media, rapidly reducing to the
+2 state at room temperature. The aqueous ion of Co+2, [Co(H2O)6]+2, can be oxidized, however,
to the +3 state either by electrolysis or by ozone (O3) in cold perchloric acid (HClO4); solutions at
0 EC have a half-life of about one week. Compounds of the Co+3 complex ions are formed by
oxidizing the +2 ion in solution with oxygen or hydrogen peroxide (H2O2) in the presence of
ligands. The Co+3 hexamine complex forms according to:
4 CoX2 + 4 NH4X + 20 NH3 + O2 º 4 [Co(NH3)6]X3 + 2 H2O
HYDROLYSIS. The hydrolysis of the +2 oxidation state of cobalt is not significant in aqueous
media below pH 7. At pH 7, hydrolysis of 0.001 M solution of the cation begins and is
significant at a pH above 9. The hydrolysis of the +3 oxidation state is reminiscent of the
hydrolysis of Fe+3, but it is not as extensive. Hydrolysis of Co+3 is significant at pH 5. In contrast,
the hydrolysis of Fe+3 becomes significant at a pH of about 3.
Dissolution of Samples
Cobalt minerals, ores, metals, and alloys can be dissolved by treatment first with hydrochloric
acid, followed by nitric acid. The insoluble residue remaining after application of this process is
fused with potassium pyrosulfate and sodium carbonate. In extreme cases, sodium peroxide
fusion is used. Biological samples are dissolved by wet ashing, digesting with heating in a
sulfuric-perchloric-nitric acid mixture.

Separation Techniques
14-123
JULY 2004 MARLAP
Separation Methods
PRECIPITATION AND COPRECIPITATION. Cobalt can be precipitated by hydrogen sulfide (H2S),
ammonium sulfide (NH4S), basic acetate (C2H3O2
!1/HO!1), barium carbonate (BaCO3), zinc
oxide (ZnO), potassium hydroxide and bromine (KOH/Br2), ether and hydrochloric acid
[(C2H5)2O and HCl], and cupferron. Cobalt sulfide (CoS) is coprecipitated with stannic sulfide
(SnS2) when low-solubility sulfides are precipitated in mineral acids. Care should be taken to
avoid coprecipitation of zinc sulfide (ZnS).
Cobalt can be separated from other metals by hydroxide precipitation using pH control to
selectively precipitate metals such as chromium, zinc, uranium, aluminum, tin, iron (+3),
zirconium, and titanium at low pH. Cobalt precipitates at pH 6.8, and magnesium, mercury,
manganese, and silver at a pH greater than 7. Cobalt is not be separated from metals such as iron,
aluminum, titanium, zirconium, thorium, copper, and nickel using ammonium hydroxide
(NH4OH) solutions (aqueous ammonia), because an appreciable amount of cobalt is retained by
the hydroxide precipitates of these metals produced using this precipitating agent. Various
precipitating agents can be used to remove interfering ions prior to precipitating cobalt: iron by
precipitating with sodium phosphate (Na3PO4) or iron, aluminum, titanium, and zirconium with
zinc oxide.
The separation of cobalt from interfering ions can be achieved by the quantitative precipitation of
cobalt with excess potassium nitrite (KNO2) to produce K3[Co(NO2)6] (caution: heating
K3[Co(NO2)6] after standing for some time makes it unstable). Ignition can be used to collect the
cobalt as its mixed oxide (Co3O4). Cobalt can also be precipitated with α-nitroso-β-napthol (1-
nitroso-2-napthol) to separate it from interfering metals. Nickel can interfere with this precipita-
tion, but can be removed with dimethylglyoxime. Precipitation of Co+2 as mercury tetracyanato-
cobaltate (+2) {Hg[Co(SCN)4]} also is used, particularly for gravimetric analysis, and
precipitation with pyridine in thiocyanate solution is a quick gravimetric product,
[Co(C5H5N)4](SCN)2.
SOLVENT EXTRACTION. Various ions or chelates have been used in solvent extraction systems to
isolate cobalt from other metals. Separation has been achieved by extracting either cobalt itself
or, conversely, extracting contaminating ions into an organic solvent in the presence of hydro-
fluoric acid (HF), hydrochloric acid, and calcium chloride (HCl/CaCl2), hydrobromic acid (HBr),
hydroiodic acid (HI), or ammonium thiocyanate (NH4SCN). For example, Co+2 has been
separated from Ni+2 by extracting a hydrochloric acid solution containing calcium chloride with
2-octanol. The ion is not extracted by diethyl ether from hydrobromic acid solutions, but it is
extracted from ammonium thiocyanate solutions by oxygen-containing organic solvents in the
presence of Fe+3 by first masking the iron with citrate.
Several chelate compounds have been used to extract cobalt from aqueous solutions. Acetyl-
acetone (acac) forms a chelate with Co+3, but not Co+2, that is soluble in chloroform at pH 6 to 9,

Separation Techniques
14-124
MARLAP JULY 2004
permitting separation from several metals including nickel. Co+2 can be oxidized to Co+3 with
hydrogen peroxide (H2O2) prior to extraction. The chelating agent α-nitroso-β-napthol has also
been used in the separation of Co+3 by solvent extraction. Diphenylthiocarbazone (dithizone) has
been used at pH 8 to extract cobalt into carbon tetrachloride and chloroform after metals that
form dithizonates in acid solution (pH 3-4) have been removed. 8-quinolinol has been used in a
similar manner at pH up to 10. Masking agents added to the system impede the extraction of iron,
copper, and nickel.
ION-EXCHANGE CHROMATOGRAPHY. Anion-exchange resins have been used extensively to
separate cobalt from other metals. The chloro-metal complexes, prepared and added to columns
in molar hydrochloric acid solutions, are eluted at varying concentrations of hydrochloric acid.
Trace amounts of 59Fe, 60Co, and 65Zn and their respective carriers have been separated from
neutron-irradiated biological tissue ash with a chloride system. Cobalt-60 has been eluted carrier-
free from similar samples and columns prepared with hydrobromic acid. Cobalt and contamina-
ted metals in nitric-acid systems behave in a manner similar to hydrochloric-acid systems. Co+2-
cyanide and cyanate complexes have been used to separate cobalt from nickel. The basic form of
quaternary amine resins (the neutral amine form) has been used in the column chromatography of
cobalt. Both chloride- and nitrate-ion systems have resulted in the association of cobalt as a
complex containing chloride or nitrate ligands as well as the neutral (basic) nitrogen atom of the
amine resin. Resins incorporating chelates in their matrix system have been used to isolate
cobalt. 8-quinolinol resins are very effective in separating cobalt from copper.
ADSORPTION CHROMATOGRAPHY. Several inorganic adsorbents such as alumina, clays, and silica
are used to separate cobalt. Complex ions of cobaltamines separate on alumina as well as Co+2
complexes of tartaric acid and dioxane. A complex of nitroso-R-salts are adsorbed onto an
alumina column while other metals pass through the column. Cobalt is eluted with sulfuric acid.
Cobalt dithizonates adsorb on alumina from carbon tetrachloride solutions. Cobalt is eluted with
acetone. The separation of cobalt from iron and copper has been achieved on aluminum
hydroxide [Al(OH)3]. Clay materials—kaolinite, bentonite, and montmorillonite—separate Co+2
from Cu+2. Cu+2 adsorbs and Co+2 elutes with water. Silica gel and activated silica have both been
used as adsorbents in cobalt chromatography.
Organic adsorbents such as 8-hydroxyquinoline and dimethylglyoxime have been used in cobalt-
adsorption chromatographic systems. Powdered 8-hydroxyquinoline separates Co+2 from other
cations and anions, for example, and dimethylglyoxime separates cobalt from nickel. Cobalt-
cyano complexes adsorb on activated charcoal, and cobalt is eluted from the column while the
anionic complexes of metals such as iron, mercury, copper, and cadmium remain on the column.
Numerous paper chromatograph systems employing inorganic or chelating ligands in water or
organic solvents are available to separate cobalt from other metals. In one system, carrier-free
60Co and 59Fe from an irradiated manganese target were separated with an acetone-hydrochloric
solvent.

Separation Techniques
14-125
JULY 2004 MARLAP
ELECTRODEPOSITION. Most electroanalytical methods for cobalt are preceded by isolating the
cobalt from interfering ions by precipitation or ion exchange. The electrolyte is usually an
ammonia solution that produces the hexamine complex of Co+2, Co(NH3)6
+2 in solution.
Reducing agents such as hydrazine sulfate are added to prevent anodic deposits of cobalt and the
oxidation of the Co+2-amine ion. Cobalt and nickel can be separated electrolytically by using an
aqueous solution of pyridine with hydrazine to depolarize the platinum anode. The nickel is
deposited first, and the voltage is increased to deposit cobalt.
Methods of Analysis
Cobalt-57, 58Co, and 60Co maybe concentrated from solution by coprecipitation and determined
by gamma-ray spectrometry. Cobalt-60 is most commonly produced by the neutron activation of
59Co, in a reactor or an accelerator. Cobalt-58 is most commonly produced from the following
reaction in nuclear reactors, 58Ni(n,p)58Co, due to the presence of nickel bearing alloys which
undergo corrosion and are transported through the reactor core. Cobalt-58 is the most significant
contributor to the gamma ray induced radiation fields in these facilities. Cobalt-57 can be
produced by either of the following, 58Ni(n,d)57Co [reactor] or 56Fe(d,n)57Co [accelerator], Cobalt-
57 and 60Co are frequently used as part of a mixed radionuclide source for calibration of gamma
ray spectrometers.
Compiled from: Baes and Mesmer, 1976; Bate and Leddicotte, 1961; Cotton and Wilkinson,
1988; Dale and Banks, 1962; EPA, 1973; Greenwood and Earnshaw, 1984; Haissinsky and
Adloff, 1965; Hillebrand et al., 1980; Larsen, 1965; Latimer, 1952; Lingane, 1966.
14.10.9.5 Iodine
Iodine is a nonmetal, the last naturally occurring member of the halogen series, with an atomic
number of 53. In the elemental form it is a diatomic molecule, I2, but it commonly exists in one
of four nonzero oxidation states: !1 with metal ions or hydrogen; and +1, (V), and (VII) with
other nonmetals, often oxygen. Numerous inorganic and organic compounds of iodine exist,
exhibiting the multiple oxidation states and wide range of physical and chemical properties of the
element and its compounds. Existence of multiple oxidation states and the relative ease of
changing between the !1, 0, and (V) state allows readily available methods for separation and
purification of radionuclides of iodine in radiochemical procedures.
Isotopes
There are 42 known isotopes of iodine, including seven metastable states. The mass numbers
range from 108 to 142. The only stable isotope is naturally occurring 127I. The half-lives of the
radionuclides range from milliseconds to days with the single exception of long-lived 129I (t1/2 .
1.57×10⁷ y). Iodine radionuclides with lower mass numbers decay primarily by electron capture.
The high mass numbers are, for the most part, beta emitters. The significant radionuclides are 123I

Separation Techniques
14-126
MARLAP JULY 2004
(t1/2 . 13.2 h), 125I (t1/2 . 60.1 d, electron capture), 129I (β), and 131I (t1/2 .8 d, β).
Occurrence and Uses
Iodine is widely distributed, but never found in the elemental form. The average concentration in
the Earth’s crust is about 0.3 ppm. In seawater, iodine concentration, in the form of sodium or
potassium iodide, is low (about 50 ppb), but it is concentrated in certain seaweed, especially kelp.
It is also found in brackish waters from oil and salt wells. The sources are saltpeter and nitrate-
bearing earth in the form of calcium iodate, well brine, and seaweed. Iodine is produced from
calcium iodate by extraction of the iodate from the source with water and reduction of the iodate
with sodium bisulfite to iodine. Iodine is precipitated by mixing with the original iodate liquor to
cause precipitation. Iodine can also be obtained from well brine, where the iodide ion is oxidized
with chlorine, and then the volatile iodine is blown out with a stream of air. Sodium or potassium
iodide in seaweed is calcined to an ash with sulfuric acid, which oxidizes the iodide to iodine.
Iodine from any of these processes can be purified by sublimation.
Isotopes of iodine of mass $ 128 may all be formed as a result of fission of uranium and
plutonium. Nuclear reactors and bomb tests are the most significant sources of these radioiso-
topes with the exception of 131I. That isotope is routinely produced for use in medical imaging
and diagnosis. The isotopes released from the other sources represent a short-term environmental
health hazard should there be an abnormal release from a reactor or testing of bombs.
This was the case in 1979 and 1986 when the reactor incidents at Three Mile Island and
Chernobyl caused releases of radioiodines. During the former event, a ban on milk distribution in
the downwind corridor was enforced as a purely preventative measure. In the latter case, signifi-
cant releases of iodines and other isotopes caused more drastic, long term measures for food
quarantine.
Deposits on the surface of plants could provide a quick source of exposure if consumed directly
from fruits and vegetables or indirectly from cow’s milk. It would readily accumulate in the
thyroid gland, causing a short-term exposure of concern. It represent the greatest short-term
exposure after a nuclear detonation and has been released in power plant accidents. Iodine-129,
with of a half-life of more than 15 million years, represent a long-term environmental hazard. In
addition to its long half-life, the environmental forms of iodine in the environment are highly
soluble in groundwater and are poorly sorbed by soil components. It is not absorbed at all by
granite, and studies at a salt repository indicate that 129I would be only one of few radionuclides
that would reach the surface before it decayed. Therefore, research on the fate of 129I that might
be released suggests that the radionuclide would be highly disseminated in the ecosystem.
Iodine-131 is analyzed routinely in milk, soil and water. Iodine-129 is a low energy beta and
gamma emitter, which has a very long half-life (t½ . 1.47×10⁷ y). The most significant concern
for this isotope is in radioactive waste, and its potential for migration due to the chemistry of

Separation Techniques
14-127
JULY 2004 MARLAP
iodine in the environment. Iodine-131 is produced for medical purposes by neutron reaction as
follows: 130Te(n,γ)131Te 6 beta decay 6 131I (t½ . 8 d).
The major use of iodine, iodine radionuclides, and iodine compounds is in medical diagnosis and
treatment. Iodine-123, 125I, and 131I are use for diagnostic imaging of the thyroid gland and the
kidneys. Iodine-131 is used to treat hyperthyroidism and thyroid cancer. Stable iodine in the form
of potassium iodide is added to commercial salt to prevent enlargement of the thyroid (goiter).
Iodine in the form of the hormone thyroxine is also used for thyroid and cardiac treatment and
hormone replacement therapy in iodine deficiency. Iodine radionuclides are used as a tracer in
the laboratory and industry to study chemistry mechanisms and processes and to study biological
activity and processes. Iodine is a bactericide and is used as an antiseptic and sterilization of
drinking water. It is used as a catalyst in chemical processes and as silver iodide in film
emulsions.
Solubility of Compounds
Molecular iodine is only very slightly soluble in water (0.33 g/L), but it is soluble in solutions of
iodide ion, forming I3
!1. It is appreciably soluble in organic solvents. Carbon tetrachloride (CCl4)
or chloroform (CHCl3) are commonly used to extract iodine from aqueous solutions after
alternate forms of the element, typically I!1 and IO3
!1, are converted to I2. The solutions have a
violet color in organic solvents, and iodine dimerizes to some extent in these solutions:
2 I2 º I4
Numerous compounds of iodine are soluble in water. All metallic iodides are soluble in water
except those of silver, mercury, lead, cupurous ion, thallium, and palladium. Antimony, bismuth,
and tin iodides require a small amount of acid to keep them in solution. Most of the iodates and
periodates are insoluble. The iodates of sodium, potassium, rubidium, and the ammonium ion are
soluble in water. Those of cesium, cobaltous ion, magnesium, strontium, and barium are slightly
soluble in water but soluble in hot water. Most other metallic iodates are insoluble.
Review of Properties
Elemental iodine (I2) is a purple-black, lustrous solid at room temperature with a density of 4.9
g/cm3. The brittle crystals have a slightly metallic appearance. Iodine readily sublimes and stored
in a closed clear, colorless container, it produces a violet vapor with an irritating odor. Iodine has
a melting point of 114 EC and a boiling point of 184 EC.
The chemical reactivity of iodine is similar to the other halogens, but it is the least electro-
negative member of the family of elements and the least reactive. It readily reduces to iodide, and
is displaced from its iodides by the other halogens and many oxidizing agents. Iodine combines
directly with most elements to form a large number of ionic and covalent compounds. The

Separation Techniques
14-128
MARLAP JULY 2004
exceptions are the noble gases, carbon, nitrogen, and some noble metals.
The inorganic compounds of iodine can be classified into three groups: (1) iodides, (2)
interhalogen, and (3) oxides. Iodine forms iodides that range from ionic compounds such as
potassium iodide (KI) to covalent compounds such as titanium tetraiodide (TiI4) and phosphorus
triiodide (PI3), depending on the identity of the combining element. More electropositive (less
electronegative) metals (on the left side of the Periodic Table, such as alkali metals and alkaline
earths) form ionic compounds. Less electropositive metals and more electronegative nonmetals
tend to form covalent compounds. Interhalogen compounds include the binary halides, such as
iodine chloride (ICl), iodine trichloride (ICl3), and iodine pentafluoride (IF5), or contain
interhalogen cations and anions, such as ICl2
+1, IF6
+1, I+3, ClIBr!1, ICl4
!1, and I6
!2. Oxygen
compounds constitute the oxides, I2O5 and I4O9 (containing one I+3 cation and three IO3
!1 anions),
for example; the oxyacids, such as hypoiodous acid (HIO) and iodic acid (HIO3); and compounds
containing oxyanions, iodates (IO3
!1) and periodates (IO4
!1) are the common ones.
Organoiodides include two categories: (1) iodides and (2) iodide derivatives with iodine in a
positive oxidation state because iodine is covalently bonded to another, more electronegative
element. Organoiodides contain a carbon iodide bond. They are relatively dense and volatile and
more reactive than the other organohalides. They include the iodoalkanes such as ethyl iodide
(C2H5I) and iodobenzene (C6H5I). Dimethyliodonium (+3) hexafluoroantimonate
[(CH3)2I+3SbF6
-3], a powerful methylating agent, is an example of the second category.
The radionuclides of iodine are radiotoxic, primarily because of their concentration in the thyroid
gland. Toxicity of 129I, if released, is a concern because of its extremely long half-life. Iodine-131,
with a half-life of eight days, is a short-term concern. The whole-body effective biological half-
lives of 129I and 131I are 140 d and 7.6 d, respectively.
Solution Chemistry
OXIDATION-REDUCTION BEHAVIOR. Iodine can exist in multiple oxidation states in solution, but
the radiochemist can control the states by selection of appropriate oxidizing and reducing agents.
In acid and alkaline solutions, the common forms of iodine are: I!1, I2, and IO3
!1. Hypoiodous
acid (HIO) and the hypoiodite ion (IO!1) can form in solution, but they rapidly disproportionate:
5 HIO º 2 I2 + IO3
!1 + H+1 + 2 H2O
3 IO!1 º 2 I!1 + IO3
!1
Iodine itself is not a powerful oxidizing agent, less than that of the other halogens (F2, Cl2, and
Br2), but its action is generally rapid. Several oxidizing and reducing agents are used to convert
iodine into desired oxidation states during radiochemical procedures. These agents are used to
promote radiochemical equilibrium between the analyte and the carrier or tracer or to produce a

Separation Techniques
14-129
JULY 2004 MARLAP
specific oxidation state before separation: I2 before extraction in an organic solvent or I!1 before
precipitation, as examples. Table 14.18 presents oxidizing and reducing agents commonly used
in radiochemical procedures:
Table 14.18 — Common radiochemical oxidizing
and reducing agents for iodine
Redox Process Redox Reagent
I!1 6 I2HNO2(NaNO2 in acid)
I!1 6 IO3
!1MnO2 in acid
I2 6 I- 6 M HNO3
NaHSO3 and NaHSO4 (in acid)
Na2SO3 and Na2S2O3
Fe2(SO4)3 (in acid)
SO2 gas
NaHSO3 and (NH4)2SO3
I!1 6 IO4
!1KMnO4
50% CrO3 in 18N H2SO4
I!1 6 IO4
!1NaClO in base
IO4
!1 6 I2NH2OH·HCl
IO3
!1 6 I2NH2OH·HCl
H2C2O4 in 18N H2SO4
IO4
!1 6 I!1NaHSO3 in acid
Radiochemical exchange between I2 and I!1 in solution is complete within time of mixing and
before separation. In contrast, exchange between I2 and IO3
!1 or IO4
!1 in acid solution and
between IO3
!1 and IO4
!1 in acid or alkaline solution is slow. For radiochemical analysis of iodine,
experimental evidence indicates that the complete and rapid exchange of radioiodine with carrier
iodine can be accomplished by the addition of the latter as I!1 and subsequent oxidation to IO4
!1
by NaClO in alkaline solution, addition of IO4
!1 and reduction to I!1 with NaHSO3, or addition of
one followed by redox reactions first to one oxidation state and then back to the original state.
COMPLEXATION. As a nonmetal, iodine is generally not the central atom of a complex, but it can
act as a ligand to form complexes such as SiI6
!2 and CoI6
!3. An important characteristic of
molecular iodine is its ability to combine with the iodide ion to form polyiodide anions. The
brown triioide is the most stable:
I2 + I!1 º I3
!1
The equilibrium constant for the reaction in aqueous solution at 25 EC is 725, so appreciable
concentrations of the anion can exist in solution, and the reaction is responsible for the solubility
of iodine in iodide solutions.

Separation Techniques
14-130
MARLAP JULY 2004
HYDROLYSIS. Iodine hydrolyzes in water through a disproportionation reaction:
I2 + H2O º H+1 + I!1 + HIO
Because of the low solubility of iodine in water and the small equilibrium constant (k=2.0×10⁻¹³),
hydrolysis produces negligible amounts of the products (6.4×10!6 M) even when the solution is
saturated with iodine. Disproportionation of HIO produces a corresponding minute quantity of
IO3
!1 (see the reaction above). In contrast, in alkaline solution, I2 produces I!1 and IO!1:
I2 + 2 OH!1 º I!1 + IO!1 + H2O
The equilibrium constant favors the products (K = 30), but the actual composition of the solution
is complicated by the disproportionation of IO!1 (illustrated above), giving I!1 and IO3
!1. The
equilibrium constant for the reaction of IO!1 with hydroxide ion is very large (1020), and the rate
of the reaction is very fast at all temperatures. Therefore, the actual products obtained by
dissolving iodine in an alkaline solution are indeed I!1 and IO3
!1, quantitatively, and IO!1 does not
exist in the solution.
Dissolution of Samples
Iodine compounds in rocks are often in the form of iodides that are soluble in either water or
dilute nitric acid when the finely divided ores are treated with one of these agents. Those that are
insoluble under these conditions are solubilized with alkali fusion with sodium carbonate or
potassium hydroxide, followed by extraction of the residue with water. Insoluble periodiates can
be decomposed by cautious ignition, converting them to soluble iodides.
Metals containing iodine compounds are dissolved in varying concentrations of nitric, sulfuric, or
hydrochloric acids. Dissolution can often be accomplished at room temperature or might require
moderation in an ice bath.
Organoiodides are decomposed with a sodium peroxide, calcium oxide, or potassium hydroxide
by burning in oxygen in a sealed bomb. Wet oxidation with mixtures of sulfuric and chromic
acids or with aqueous hydroxide is also used.
Separation Methods
PRECIPITATION. The availability of stable iodine as a carrier and the relative ease of producing
the iodide ion make precipitation a simple method of concentrating and recovering iodine
radionuclides. The two common precipitating agents are silver (Ag+1) and palladium (Pd+2)
cations, which form silver iodide (AgI) and palladium iodide (PdI2), respectively. Silver iodide
can be solubilized with a 30 percent solution of potassium iodide. Palladium precipitates iodide
in the presence of chloride and bromide, allowing the separation of iodide from these halides.

Separation Techniques
14-131
JULY 2004 MARLAP
The precipitating agent should be free of Pd+4, which will precipitate chloride. If Pd+2 iodide is
dried, precaution should be taken as the solid slowly looses iodine if heated at 100 EC. Iodate can
be precipitated as silver iodate, and periodate as lead periodate.
SOLVENT EXTRACTION. One solvent extraction method is commonly used to isolate iodine. After
preliminary oxidation-reduction steps to insure equilibrium of all iodine in solution, molecular
iodine (I2) is extracted from aqueous solutions by a nonpolar solvent, usually carbon tetrachloride
or chloroform. It is not uncommon to add trace quantities of the oxidizing or reducing agent to
the extraction solution to ensure and maintain all iodine in the molecular form. Hydroxylamine is
added, for example, if iodate is the immediate precursor of iodine before extraction.
ION-EXCHANGE CHROMATOGRAPHY. Both cation and anion exchange procedures are used to
separate iodine from contaminants. Cation-exchange chromatography has been used to remove
interfering cations. To remove 137Cs activity, an iodine sample in the iodide form is exchanged on
a cation resin and eluted with ammonium sulfite [(NH4)2SO3] to ensure maintenance of the iodide
form. Cesium cations remain on the resin. Bulk resin also is used, and iodide is washed free of
the resin also with sodium hypochlorite (NaClO) as the oxidizing agent. Anion resins provide for
the exchange of the iodide ion. The halides have been separated from each other on an anion-
exchange column prepared in the nitrate form by eluting with 1 M sodium nitrate. Iodide can also
be separated from contaminants by addition to an anion exchanger and elution as periodate with
sodium hypochlorite. The larger periodate anion is not as strongly attracted to the resin as the
iodide ion. Iodine-131 separation, collection, and analysis is performed by absorbing the
radionuclide on an anion-exchange resin and gamma counting it on the sealed column after
eluting the contaminants.
DISTILLATION. Molecular iodine is a relatively volatile substance. Compared to many
contaminating substances, particularly metal ions in solution, its boiling point of 184 EC is very
low, and the volatility of iodine provides a method for its separation from other substances. After
appropriate oxidation-reductions steps to convert all forms of iodine into the molecular form,
iodine is distilled from aqueous solution into sodium hydroxide and collected by another
separation process, typically solvent extraction. In hydroxide solution, molecular iodine is
converted to a mixture of iodide and hypoiodite ions and then into iodide and periodate ions, and
suitable treatment is required to convert all forms into a single species for additional procedures.
Methods of Analysis
Macroquantities of iodine can be determined gravimetrically by precipitation as silver iodide,
palladium iodide, or cuprous iodide. The last two substances are often used to determine the
chemical yield in radiochemical analyses. Microquantities of 129I and 131I are coprecipitated with
palladium iodide or cuprous iodide using stable iodide as a carrier and counted for quantification.
Iodine-129 usually is beta-counted in a liquid-scintillation system, but it also can be determined
by gamma-ray spectrometry. Iodine-129 can undergo neutron activation and then be measured by

Separation Techniques
14-132
MARLAP JULY 2004
gamma-ray spectrometry from the 130I (t½ . 12.4 h) produced by the neutron-capture reaction.
The method uses conventional iodine valence adjustments and solvent extraction to isolate the
Iodine fraction. Chemically separated 129I is isolated on an anion exchange resin before being
loaded for irradiation. A lower limit of detection (0.03 ng) can be achieved with a neutron flux of
5×10¹⁴ n/cm2·s for 100 seconds. Iodine-129 also can be determined directly by mass spectro-
metry. The measurement limit by this technique is approximately 2 femtograms. Special counting
techniques, such as beta-gamma coincidence, have also been applied to the analysis of 129I.
Iodine-131 is determined by gamma-ray emission. Mass spectrometry has been used for
measurement of 125I and 129I.
Compiled from: Adams, 1995; APHA, 1998; Armstrong et al., 1961; Bailar et al., 1984; Bate
and Stokely, 1982; Choppin et al., 1995; Considine and Considine, 1983; Cotton and
Wilkinson, 1988; DOE, 1990 and 1997, 1997; EPA, 1973; EPA, 1980; Ehmann and Vance,
1991; Greenwood and Earnshaw, 1984; Haissinsky and Adloff, 1965; Kleinberg and Cowan,
1960; Latimer, 1952; Lindsay, 1988; McCurdy et al., 1980; Strebin et al., 1988.
14.10.9.6 Neptunium
Neptunium, atomic number 93, is a metal and a member of the actinide series. The relatively
short half-lives of the neptunium isotopes obviate naturally occurring neptunium from being
detected in environmental samples (except in some rare instances). Thus, all detected isotopes
are produced artificially, principally by neutron bombardment of uranium. Neptunium has six
possible oxidation states: +2, +3, +4, (V), (VI), and (VII). The most stable ionic form of
neptunium is the NpO2
+1 ion. The ionic states of neptunium are similar to that of manganese,
however the chemistry is most closely associated with uranium and plutonium.
Isotopes
There are 17 isotopes of neptunium, which include three metastable states. The mass range of
neptunium isotopes is from 226 to 242. All isotopes are radioactive, and the longest-lived
isotope, 237Np, has a half-life of 2.1×10⁶ years and decays by alpha emission (principal decay
mode) or spontaneous fission (very low probability of occurrence). The most common mode of
decay for the other neptunium isotopes is by β-particle emission or electron capture.
Neptunium is formed in nuclear reactors from two separate neutron-capture reactions with
uranium. Thus the largest quantity of neptunium isotopes are associated with spent nuclear fuel.
In fuel reprocessing, the focus is on the recovery of uranium and plutonium isotopes. Thus the
neptunium isotopes are part of the waste stream from that process.
The short-lived 239Np can be used as a tracer when separated from its parent 243Am. With the half-
life of the americium at 7,370 years, and that of the neptunium is only 2.3 days, tracer quantities
can be successfully removed every 6–10 days from an americium source.

Separation Techniques
14-133
JULY 2004 MARLAP
Occurrences and Uses
Neptunium was the first of the actinides to be produced synthetically (in 1940). Neptunium-239
(t½ . 25 min) resulted from neutron bombardment of natural uranium.
Neptunium-237 is formed as a result of successive neutron capture on a 235U nucleus to form
237U. This uranium isotope has a reasonably short half-life (6.75 d). After a 235U target has been
irradiated with neutrons, most of the 237U activity will have decayed to 237Np after about 30 days
(no radiochemical equilibrium; see Attachment 14A, “Radioactive Decay and Equilibrium”). At
that time, the 237Np may be “milked” from the source.
Neptunium-237 (t½ . 2.1×10⁶ y), is irradiated with neutrons to form 238Np, which decays to 238Pu.
Plutonium-238 is used in space vehicles as a power source because of its superior energy
characteristics. Neptunium-237 can be used in neutron detection equipment because it has a
significant (n,γ) capture cross-section. The 238Np produced has a half-life of 2.1 days with easily
determinable beta or gamma emissions.
Solubility of Compounds
Neptunium solubility is strongly dependent upon oxidation state. The +3 and +4 states form very
insoluble fluorides, while the (V) and (VI) states are soluble. This property is an effective means
of separation of neptunium from uranium. Neptunium (+4) may be carried on zirconium
phosphate precipitate, indicating its insolubility as a phosphate only in that oxidation state.
Neptunium forms two oxides, NpO2 and Np3O8, both of which are soluble in concentrated
hydrochloric, perchloric and nitric acids. The most soluble of the neptunium compounds are
Np(SO4)2, Np(C2O4)2, Np(NO3)5, Np(IO3)4, and (NH4)2Np2O7. Neptunium (+3) compounds are
easily oxidized to Np+4 when exposed to air.
Review of Properties
Neptunium is a silvery, white metal, which is rapidly oxidized in air to the NpO2 compound.
NpF3 is formed by the action of hydrogen and HF on NpO2. NpF4 is formed by the action of
oxygen and HF on NpF3. These reactions, and similar ones for the other halides take place at
~500 EC. All the halides are volatile above 450 EC, with the hexafluoride boiling at 55 EC. All
the halides undergo hydrolysis in water to form the oxo-complex or ions.
Neptunium is found in the environment at very low concentrations due to the short half-lives of
its isotopes and the few reactions through which 237Np, its long-lived isotope, can be formed. The
principal nuclear reactions are identified here:
238U(n, 2n)237U 6 237Np + β!

Separation Techniques
14-134
MARLAP JULY 2004
235U(n,γ) 6 236U(n,γ) 6 237U 6 237Np + β!
Solution Chemistry
Neptunium most closely resembles uranium in its solution chemistry, although it has many
differences that allow it to be easily separated. The +4 and (V) oxidation states are the two most
commonly encountered in chemical and environmental analysis of neptunium.
COMPLEXATION. Neptunium forms complexes with fluorides, oxalates, phosphates, sulfates, and
acetates in the +4 oxidation state at the macro level. However, for chemical separation of
neptunium in concentrations found in environmental samples, the sulfate or the fluoride of the +4
oxidation state can be co-precipitated with BaSO4 or LaF3, respectively.
Neptunium (+4) also forms strong complexes in HCl and HNO3 with the chloride and nitrate
anions. These complexes appear to have similar complexation constants and charge densities as
those of U(VI) and Pu(VI) in the same media. Neptunium(V) forms weak complexes with
oxalate ions. Complexation in basic media with potassium phosphotungstate or lithium
hydroxide has been shown to be a useful method for oxidation-reduction potential measurements
as the individual oxidation states are stabilized significantly.
OXIDATION-REDUCTION. The most stable oxidation state of neptunium in aqueous solution is
(V). Oxidation in basic solution to (VI) can be achieved with MnO4
!, or BrO3
!. Like manganese,
neptunium can form the (VII) state. This can be achieved in basic solution with nitrous oxide,
persulfate, or ozone.
Solutions of Np(V) can undergo disproportionation to yield the (VI) and +4 oxidation states. This
reaction has a small equilibrium constant. However, in sulfuric acid media this may be
accelerated a thousand fold, because sulfates complex with the Np+4 ion, driving the dispropor-
tionation reaction towards completion.
Dissolution of Samples
The dissolution of samples containing neptunium must be rigorous in ensuring complete
dissolution, because no stable isotopes of neptunium exist to act as carriers. High temperature
furnace oxidation of soil, vegetable, and fecal samples will ensure that the neptunium will be in
the (VI) oxidation state. The resultant ash can be dissolved using lithium metaborate or
perchloric acid. At that point it may be selectively reduced to either the (V) or +4 oxidation state,
depending upon the other analytes from which it must be separated.
Separation Methods
PRECIPITATION AND COPRECIPITATION. The only samples that will have a significant amount of

Separation Techniques
14-135
JULY 2004 MARLAP
neptunium will be high-level wastes (HLW) resulting from spent fuel. Thus, for other sample
analyses, the methods of precipitation of neptunium usually involve the use of a co-precipitant. In
this respect, neptunium acts just like uranium. The +4 oxidation state is the one that will co-
precipitate with LaF3. If Np(V) or (VI) are formed, they will not precipitate with fluoride but stay
in solution. This is analogous to the chemistry of the U+4 and U(VI) ions in solution.
Neptunium, like the other actinides, will flocculate with a general precipitating reagent such as
iron hydroxide or titanium hydroxide.
SOLVENT EXTRACTION. Neptunium can be extracted into organic solvents such as methyl
isobutyl ketone (MIBK), TBP, xylene and dibutoxytetraethylene glycol. The +4, (V), and (VI)
oxidation states are extracted using these solvents under a variety of conditions. In all cases, care
must be taken to eliminate or mask any fluorides, oxalates, or sulfates that are present, because
they will have a significant effect on the extraction efficiency. The extraction process is aided by
complex-forming compounds such as TTA, TIOA, trioctylphosphine oxide (TOPO), or
tributylamine (TBA). Several different methods have been developed that use combinations of
these chelates as well. In these instances a synergistic effect has been noted.
ION-EXCHANGE CHROMATOGRAPHY. The four principal neptunium oxidation states are soluble in
dilute to concentrated HCl, HClO4, HNO3, and H2SO4. Although neptunium forms complexes
with these ions in solution the exchange constant for a cation exchange resin is much greater, and
the Np ions are readily removed for the aqueous system. The elution pattern of the oxidation
states is, as with the other transuranics, lowest to highest ionic charge density. Thus the most
strongly retained is the +4:
NpO2
+ < NpO2
2+ < Np3+ < Np4+.
Neptunium can be separated effectively from uranium and plutonium using an anion exchange
method. The plutonium and neptunium are reduced to the +4 state with uranium as (VI) in HCl.
The uranium elutes, while the neptunium and plutonium are retained. The plutonium may then be
reduced to the +3 state using iodide or hydrazine, and will be eluted off the resin in the HCl
solution.
More recently, resin loaded with liquid extractants has been used very successfully to separate
the actinides. Neptunium can be separated selectively from plutonium and uranium using a
TEVA® column, after the neptunium has been reduced to the +4 state using ferrous sulfamate.
This process has been shown to be successful for water, urine, soil, and fecal samples.
Methods of Analysis
Neptunium-237 is the radioisotope most commonly used as a tracer for neptunium recovery. The
principal means of detection of this isotope is alpha spectrometry following a NdF3 or LaF3
coprecipitation step. The 4.78 MeV alpha peak is easily resolved from other alpha emitters

Separation Techniques
14-136
MARLAP JULY 2004
(notably plutonium) whose chemistry is analogous to that of neptunium. The 239Np radioisotope
could also be used as a tracer. It could be isolated from the parent 243Am source, whose
characteristic gamma-ray of 106 keV is used for quantitation. The other neptunium isotopes are
most easily determined after separation and appropriate sample mounting using gas flow
proportional counting.
Compiled from: Horwitz et al., 1995; Morss and Fuger, 1992; Sill and Bohrer, 2000.
14.10.9.7 Nickel
Isotopes
Twenty-four isotopes of nickel exist from mass number 51 to 74. It has five stable isotopes, and
the most significant of its radioisotopes are 63Ni (t½ . 100 y) and 59Ni (t½ . 7.6 × 10⁴ y). All other
isotopes have half-lives of 5 days or less.
Occurrence
Nickel is found in nature as one of two principal ores, pentlandite or pyrrhotite. It is also a
significant constituent of meteorites. It is a silvery white metal used in the production of Invar,
Hastalloy, Monel, Inconel and stainless steels. Its other principal use is in coins. Corrosion
resistant alloys containing nickel are used in the fabrication of reactor components. During the
life cycle of the reactor, the nickel is converted to the two long-lived radionuclides through the
following reactions: 58Ni(n,γ)59Ni and 62Ni(n,γ)63Ni.
The Code of Federal Regulations (Title 10, Part 61) identifies these isotopes as having specific
limits “in activated metal,”because the material must be physically sampled and dissolved in
order to assess the level of contamination of these isotopes in the metal.
Nickel-63 is a key component in the electron-capture detector of gas chromatographic systems.
This technique is used particularly for organic compounds containing chlorine and phosphorus.
Nickel-63 decays by emission of a low-energy beta (Eβmax = 0.066 MeV), which establishes a
baseline current in the detector system. When a compound containing phosphorus or chlorine
passes the source, these elements can “capture an electron.” The response to this event is an
electrical current less than the baseline current, which is converted into a response used to
quantify the amount of material.
Solubility of Compounds
The soluble salts of nickel are chlorides, fluorides, sulfates, nitrates, perchlorates, and iodides.
Nickel sulfide is very insoluble and will dissolve initially from solutions at low pH. However,
upon exposure to air, such solutions will form the very insoluble compound Ni(OH)S. Nickel

Separation Techniques
14-137
JULY 2004 MARLAP
hydroxide is also insoluble (Ksp = 2 × 10!16) and forms a very gelatinous precipitate, which can
scavenge other radionuclides. Thus, avoiding the formation of this compound is very important.
Solutions of neutral pH, where nickel is suspected of being a component, should be treated with
ammonia to maintain the solubility of this metal ion.
Review of Properties
Nickel metal is highly resistant to air or water oxidation. It exists in the +2 oxidation state under
normal conditions. It can be oxidized to the +3 oxidation state, to NiO(OH), by treatment of Ni+2
with aqueous bromine in potassium hydroxide. It can exist as a +4 ion in compounds such as
NiO2 (used in NiCad batteries), by oxidation with strong oxidants such as peroxydisulfate. In the
+4 oxidation state nickel is a very strong oxidant and will react with water in aqueous solutions.
Nickel metal has been used in the radiochemistry laboratory as an electrode for the galvanic
plating of polonium from hydrochloric acid solutions (see Section 14.10.9.17). In these instances,
the polonium is being removed as interference in the alpha analysis of uranium or plutonium.
Solution Chemistry
Acid solutions of macroscopic quantities of nickel are emerald green. This is due to the
formation of the hexaaquonickel complex, which is very stable.
OXIDATION. Nickel metal will readily dissolve in most mineral acids. The exception is in
concentrated nitric acid, where the metal forms a passive oxide layer resistant to normal
oxidation. Under normal laboratory conditions it will only form the +2 ion.
An usual property of nickel metal is that it forms a volatile carbonyl complex (boiling point
50 EC) when treated with carbon monoxide gas at low temperatures. This carbonyl compound
decomposes to nickel metal at 200 EC. Thus, for samples with a high organic content that may be
placed in a furnace for combustion, a high flow of air or oxygen should be assured if nickel is
going to be analyzed for in the residue.
COMPLEXATION. Nickel forms strong complexes with nitrogen containing compounds such as
ammonia, ethylene diamine, EDTA, and diethylenetriamine. The complex with ammonia forms a
deep blue color distinct from the green color of the normal aqueous ion. The nickel ammonia
complex has a large formation constant and is very stable in the pH range 7–10. This particular
property of nickel is used to separate it from other metals and transuranics that may precipitate in
ammonaical solution at this pH.
Nickel forms a weak complex with chloride ion as the tetrachloronicollate (+2) anion. This forms
the basis of its separation from other first row transition elements iron and cobalt. The complex,
Ni+2 + 4Cl! 6 NiCl4
!2, is only stable in solutions greater than 10 M in HCl (see ion exchange

Separation Techniques
14-138
MARLAP JULY 2004
section). Nickel forms complexes with the chelating agent diphenylthiocarbazone, which can be
extracted into organic solvents to form the basis of a separation form other transition metals.
Dissolution of Samples
Samples containing nickel radionuclides are most likely to be corrosion products, pure metals
that have been irradiated, or environmental water or soil samples. Dissolution of nickel and its
compounds from these matrices can be achieved using any combination of concentrated mineral
acids.
Separation Methods
PRECIPITATION. The classical method of nickel determination by gravimetric analysis is through
precipitation with dimethylglyoxime (DMG). This material is very specific to nickel and forms a
crystalline precipitate that is easily dried and weighed. The precipitation is carried out at pH 2-3,
in the absence of other macroscopic metal contaminants. Aluminum, iron, and chromium can
interfere but can be sequestered at pH 7–10 in ammoniacal solution with added citrate or tartrate.
The Ni-DMG precipitate may be dried, weighed, and the mass used as the determination for yield
of added nickel carrier.
SOLVENT EXTRACTION. Among the many solvent extraction methods for nickel, the following
compounds are notably efficient: Cupferron, acetylacetone, TTA, dibenzoylmethane, and
8-hydroxyquinoline. The extractions almost uniformly are most effective at pH 5–10. Unfor-
tunately, in each of these separation techniques, the most effective solvents are chloroform,
benzene, or carbon tetrachloride, all of which have been phased out as analytical aids in
separation analysis.
ION EXCHANGE. Nickel can be separated from other transition metals on an anion exchange
column by dissolution of the sample in 12 M HCl. After the sample is loaded onto the column,
lowering the HCl concentration to 10 M will elute the nickel.
Nickel also can be separated from cobalt in oxalate media using a cation exchange resin. The
cobalt forms an anionic complex with the oxalate while the nickel does not. The cobalt passes
through the resin and the nickel is retained.
Methods of Analysis
The 59Ni and 63Ni isotopes do not emit gamma radiation. Liquid scintillation or proportional
counting after radiochemical separation can determine both isotopes. Nickel-59, as a very thin
test source, also can be determined using a low energy gamma/X-ray detector. It decays by
electron capture, and yields a characteristic X-ray of 6.93 keV. In a 63Ni analysis, if 59Ni is
present in the test source, a correction for the liquid scintillation yield of the 59Ni will be

Separation Techniques
14-139
JULY 2004 MARLAP
necessary. Chemical yield is determined by using a stable carrier and gravimetric analysis or
spectrophotometric techniques.
Compiled from: Cotton and Wilkinson, 1966; Freiser, 1983; Kraus and Nelson, 1958;
Minczewski et al., 1982.
14.10.9.8 Plutonium
Plutonium, with an atomic number of 94, is an actinide and the second element in the transuranic
series. Essentially all plutonium is an artifact, most produced by neutron bombardment of 238U
followed by two sequential beta emissions, but trace quantities of plutonium compounds can be
found in the natural environment. Plutonium radiochemistry is complicated by the five possible
oxidation states that can exist; four can be present in solution at one time.
Isotopes
Plutonium has 18 isotopes with mass numbers ranging from 232 to 247, and all isotopes are
radioactive. Some have a long half-life: the isotope of greatest importance, 239Pu, has a half-life
of 24,110 years, but 242Pu and 244Pu have a half-lives of 376,000 and 76,000,000 years, respec-
tively. Plutonium-238, 240Pu, and 241Pu have a half-lives of 87.74, 6,537, and 14.4 years, respec-
tively. Four of these isotopes decay by alpha emission accompanied by weak gamma rays: 238Pu,
239Pu, 240Pu, and 242Pu. In contrast, 241Pu decays by beta emission with weak gamma rays, but its
progeny is 241Am, an intense gamma emitter. Plutonium-239 and 241Pu are fissile materials—they
can be split by both fast and slow neutrons. Plutonium-240, and 242Pu are fissionable but have
very small neutron fission cross-sections. Plutonium-240 partly decays by spontaneous fission,
although a small amount of spontaneous fission occurs in most plutonium isotopes.
Occurrence and Uses
There are minute quantities of plutonium compounds in the natural environment as the result of
thermal neutron capture and subsequent beta decay of naturally occurring 238U. All plutonium of
concern is an artifact, the result of neutron bombardment of uranium in a nuclear reactor.
Virtually all nuclear power-plants of all sizes and the waste from the plants contain plutonium
because 238U is the main component of fuel used in nuclear reactors. It is also associated with the
nuclear weapons industry and its waste. Virtually all the plutonium in environmental samples is
found in air samples as the result of atmospheric weapons testing. Plutonium in plant and crop
samples is essentially caused by surface absorption.
Plutonium is produced in nuclear reactors from 238U that absorbs neutrons emitted by the fission
of 235U, which is a naturally occurring uranium isotope found with 238U. Uranium-239 is formed
and emits a beta particle to form 239Np that decays by beta emission to form 239Pu. Once started,
the process is spontaneous until the uranium fuel rods become a specific uranium-plutonium

Separation Techniques
14-140
MARLAP JULY 2004
mixture. The rods are dissolved in acid, and plutonium is separated primarily by solvent
extraction, finally producing a concentrated plutonium solution. Pure plutonium metal can be
prepared by precipitating plutonium peroxide or oxalate, igniting the precipitate to PuO2,
converting the oxide to PuF3, and reducing Pu+3 to the metal in an ignited mixture containing
metallic calcium.
Large quantities of 239Pu have been used as the fissile agent in nuclear weapons and as a reactor
fuel when mixed with uranium. It is also used to produce radioactive isotopes for research,
including the study of breeder reactors, and 238Pu is used as a heat source to power instruments
for space exploration and implanted heart pacemakers.
Solubility of Compounds
General solubility characteristics include the insolubility of the hydroxides, fluorides, iodates,
phosphates, carbonates, and oxalates of Pu+3 and Pu+4. Some of these can be dissolved in acid
solution, however. The corresponding compounds of PuO2
+1 and PuO2
+2 are soluble, with the
exception of the hydroxides. The binary compounds represented by the carbides, silicides,
sulfides, and selenides are of particular interest because of their refractory nature. One of the
complicating factors of plutonium chemistry is the formation of a polymeric material by hydroly-
sis in dilute acid or neutral solutions. The polymeric material can be a complicating factor in
radiochemical procedures and be quite unyielding in attempts to destroy it.
Review of Properties
Plutonium metal has some unique physical properties: a large piece is warm to the touch because
of the energy produced by alpha decay, and it exists in six allotropic forms below its melting
point at atmospheric pressure. Each form has unusual thermal expansion characteristics that
prevents the use of unalloyed plutonium metal as a reactor fuel. The delta phase, however, can be
stabilized by the addition of aluminum or gallium and be used in reactors. Chemically, plutonium
can exist in five oxidation states: +3, +4, (V), (VI), and (VII). The first four states can be
observed in solution, and solid compounds of all five states have been prepared. The metal is a
silver-grey solid that tarnishes in air to form a yellow oxide coating. It is chemically reactive
combining directly with the halogens, carbon, nitrogen, and silicon.
Plutonium is a very toxic substance. Outside the body, however, it does not present a significant
radiological hazard, because it emits only alpha, low-energy beta, gamma, or neutron radiation.
Ingested plutonium is not readily absorbed into the body, but passes through the digestive tract
and expelled before it can cause significant harm. Inhaled plutonium presents a significant
danger. Particularly, inhalation of particles smaller than one micron would be a serious threat due
to the alpha-emitting radionuclide being in direct contact with lung tissue. Plutonium would also
be very dangerous if it were to enter the blood stream through an open wound, because it would
concentrate in the liver and bones, leading to damage to the bone marrow and subsequent related

Separation Techniques
14-141
JULY 2004 MARLAP
problems. For these reasons, plutonium is handled in gloveboxes with associated precautions
taken to protect the worker from direct contact with the material. When working with plutonium
in any form, precautions should also be taken to prevent the accumulation of quantities of
fissionable plutonium that would achieve a critical mass, particularly in solution where it is more
likely to become critical than solid plutonium.
Most of the plutonium in the environment is the result of weapons testing. More than 99 percent
of the plutonium from these activities was released during atmospheric tests, but a small portion
was also released during ground tests. An even smaller quantity is released by nuclear fuel
reprocessing plants, some in the ocean, and by nuclear waste repositories. Part of the atmospheric
plutonium, originally part of the weapons, settled to the Earth as an insoluble oxide, locating in
the bottom sediments of lakes, rivers, and oceans or becoming incorporated in sub-surface soils.
The majority of environmental plutonium isotopes are the result of atmospheric nuclear bomb
tests. If the bomb material is made from uranium, the oxide is enriched to high percentages of
235U, the fissile isotope. The 238U isotope does not fission, but absorbs 1–2 neutrons during the
explosion forming isotopes of 239U and 240U. These isotopes beta decay within hours to their
neptunium progeny, which in turn decay to 239Pu and 240Pu. Bombs made from plutonium would
yield higher fractions of 240/241/242Pu.
Plutonium formed as a result of atmospheric tests is most likely to be in the form of a fine
particulate oxide. If as in the case of a low altitude or underground test, there is a soil component,
the plutonium will be fused with siliceous minerals. The behavior of the soluble form of
plutonium would be similar to that released from fuel reprocessing plants and from nuclear waste
sites. Like the insoluble oxide, most of the soluble form is found in sediments and soils, but a
small percentage is associated with suspended particles in water. Both the soluble form of
plutonium and the form suspended on particulate matter are responsible for plutonium transporta-
tion in the environment. Plutonium in soil is found where the humic acid content is high. In non-
humic, carbonate-rich soils, plutonium migrates downward. Migration in the former soil is slow
(#0.1 cm/y) and in the latter it is relatively fast (1–10 cm/y). In subsurface oxic soil, plutonium is
relatively mobile, transported primarily by colloids. In wet anoxic soils, most of the plutonium is
quickly immobilized, although a small fraction remains mobile. The average time plutonium
remains in water is proportional to the amount of suspended material. For this reason, more than
90 percent of plutonium is removed from coastal water, while the residence time in mid-ocean
water where particulate matter is less is much longer.
Solution Chemistry
The equilibration problems of plutonium are among the most complex encountered in radio-
chemistry. Of the five oxidation states that plutonium may have, the first four are present in
solution as Pu+3, Pu+4, PuO2
+1, PuO2
+2. They coexist in dilute acid solution, and sometimes all
four are present in substantial quantities. Problems of disproportionation and auto-oxidation in
freshly prepared solutions also complicate the chemistry of plutonium. The (VII) state can form

Separation Techniques
14-142
MARLAP JULY 2004
in alkaline solutions, and it has been suggested that the ion in solution is PuO5
!3. Plutonium ions
tend to hydrolyze and form complex ions in solution. The +4 ion can form long chain polymers
that do not exhibit the usual chemical behavior of the +4 oxidation state. Finally, the different
oxidation states exhibit radically different chemical behavior. As a result of these effects, it is
possible to mix a plutonium sample with plutonium tracer, subject the mixture to a relatively
severe chemical treatment using hot acids or similar reagents, and still selectively recover
portions of either the tracer or the sample. This characteristic explains the challenge in achieving
reproducible radiochemical results for plutonium.
OXIDATION-REDUCTION BEHAVIOR. Numerous redox agents are available to oxidize and reduce
any of the five states of plutonium to alternate oxidation states. Table 14.19 provides a
convenient method of preparation of each state and illustrates the use of redox reagents in
plutonium chemistry.
Table 14.19 — Redox agents in plutonium chemistry
Oxidation State Form Method of Preparation
+3 Pu+3 Dissolve Pu metal in HCl and reduce Pu+4 with NH2OH, N2H4,
SO2, or by cathodic reduction
+4 Pu+4 Oxidize Pu+3 with hot HNO3; treat Pu+3 or PuO2
+2 with NO2
!1
+4 PuO2@nH2O
(polymer)
Heat Pu+4 in very dilute acid; peptize Pu(OH)4
VPuO
2
+1 Reduce PuO2
+2 with stoichiometric amount of I!1 or ascorbic acid;
electrolytic reduction of PuO2
+2
VI PuO2
+2 Oxidize Pu+4 with hot dilute HNO3 or AgO; ozonize Pu+4 in cold
dilute HNO3 with Ce+3 or Ag+1 catalyst
VII PuO5
!3Oxidize PuO2
+2 in alkali with O3, S2O8
!2 or radiation
Unlike uranium, the +3 oxidation state is stable enough in solution to be useful in separation
chemistry. Disproportionation reactions convert Pu+4 to Pu+3 and PuO2
+2 releasing H+1. The
presence of acid in the solution or complexing agents represses the process. Similarly, PuO2
+1
disproportionates producing the same products but with the consumption of H+1. For this reason,
PuO2
+1 is not predominant in acid solutions. These disproportionation reactions can be involved
in redox reactions by other reagents. Instead of direct oxidation or reduction, the disproportiona-
tion reaction can occur first, followed by direct oxidation or reduction of one of the products.
It is possible to prepare stable aqueous solutions in which appreciable concentrations of the first
four oxidation states exist simultaneously: the +3, +4, (V), and (VI) states. The relative
proportions of the different oxidation states depend on the acid, the acid concentration, the
method of preparation of the solution, and the initial concentrations of each of the oxidation
states. These relative concentrations will change over time and ultimately establish an
equilibrium specific to the solution. In 0.5 M HCl at 25 EC, for example, the equilibrium

Separation Techniques
14-143
JULY 2004 MARLAP
percentages of the four oxidation states prepared from initially pure Pu+4 are Pu+3 (27.2%), Pu+4
(58.4%), Pu(V) (0.7%), and Pu(VI) (13.6%). Freshly prepared plutonium samples are frequently
in the +4 state, while an appreciable amount of the +3 and +6 oxidation states will be present in
long-standing tracer solutions.
A convenient solution to this plutonium equilibration problem takes the form of a two-step
process:
• Boil the combined sample and tracer with a concentrated inorganic acid (e.g., HNO3) to
destroy any +4 polymers that might have formed, and
• Cool and dilute the solution; then rapidly (to avoid reforming polymers) treat the solution
with excess iodide ion (solution turns brown or black) to momentarily reduce all of the
plutonium to the +3 oxidation state.
The solution will immediately start to disproportionate in the acid medium, but the plutonium
will have achieved a true equilibrium starting at a certain time from one state in the solution.
Alpha particles emitted by 239Pu can decompose solutions of the radionuclide by radiolysis. The
radiolysis products then oxidize or reduce the plutonium, depending on the nature of the solution
and the oxidation state of the element. The nature of the anion present greatly influences the rate
of the redox process. For the radiochemist it is important to recognize that for old plutonium
solutions, particularly those in low acidity, the oxidation labeled states are not reliable.
HYDROLYSIS AND POLYMERIZATION. Hydrolysis is most pronounced for relatively small and
highly charged ions such as Pu+4, but plutonium ions in any oxidation state are more easily
hydrolyzed than their larger neptunium and uranium analogues.
Trivalent plutonium tends to hydrolyze more than neptunium or uranium, but the study of its
hydrolysis characteristics has been hindered by precipitation, formation of Pu+4, and unknown
polymerization. In strongly alkaline solutions, Pu(OH)3 precipitates; the solubility product
constant is estimated to be 2×10!20.
Plutonium (+4) exists as a hydrated ion in solutions that are more acidic than 0.3 M H+1. Below
0.3 M, it undergoes much more extensive hydrolysis than any other plutonium species, or at
lower acidities (0.1 M) if the plutonium concentration is lower. Thus, the start of hydrolysis
depends on the acid/plutonium ratio as well as the temperature and presence of other ions. On
hydrolysis, only Pu(OH)+3 is important in the initial phases, but it tends to undergo irreversible
polymerization, forming polymers with molecular weights as high as 1010 and chemical
properties much different from the free ion. Presence of the polymer can be detected by its bright
green color. When Pu+4 hydroxide [Pu(OH)4] is dissolved in dilute acid, the polymer also forms.
Similarly, if a solution of Pu+4 in moderately concentrated acid is poured slowly into boiling

Separation Techniques
14-144
MARLAP JULY 2004
water, extensive polymerization occurs. The colloidal character of the polymer is manifested by
its strong adsorption onto glass, silica, or small bits of paper or dirt. The chemical characteristics
of the polymer, with regard to precipitation, ion-exchange, and solvent extraction, is markedly
different than the chemistry of the common +4 oxidation state of plutonium. Care should be
taken in the laboratory to avoid the formation of these polymers. For instance, these polymers can
be formed by overheating solutions during evaporation. Moreover, diluting an acidic plutonium
solution with water can cause polymerization because of localized areas of low acidity, even
when the final concentration of the solution is too high for polymerization. Therefore, plutonium
solutions should always be diluted with acid rather than water. Polymeric plutonium can also be
formed if insufficient acid is used when dissolving Pu+4 hydroxide.
Immediately after formation, these polymers are easy to decompose by acidification with
practically any concentrated inorganic acid or by oxidation. Because depolymerization is slow at
room temperature and moderate acid concentrations, solutions should be made at least 6 M and
boiled to destroy the polymers. The polymer is rapidly destroyed under these conditions. Adding
strong complexing agents such as fluoride, sulfate, or other strong complexing agents can
increase the rate of depolymerization. However, if the polymers are allowed to “age,” they can be
very difficult to destroy.
The PuO2
+1 ion has only a slight tendency to hydrolyze, beginning at pH 8, but study of the extent
of the process is inhibited by the rapid disproportionation of hydrolyzed plutonium(V).
Hydrolysis of PuO2
+2 is far more extensive than expected for a large +2 ion. Hydrolysis begins at
pH of about 2.7 to 3.3, giving an orange color to the solution that yields to bright yellow by pH 5.
Between pH 5 and 7, dimerizatons seem to occur, and by pH 13 several forms of plutonium
hydroxide have been precipitated with solubility products of approximately 2.5×10!25.
COMPLEXATION. Plutonium ions tend to form complex ions in the following order:
Pu+4 > Pu+3 . PuO2
+2 > PuO2
+1
Divalent anions tend to form stronger complexes, and the order for simple anions with Pu+4 is:
carbonate > oxalate > sulfate > fluoride > nitrate >
chloride > bromide > iodide > perchlorate
Complexation is preferably through oxygen and fluorine rather than nitrogen, phosphorus, or
sulfur. Plutonium also forms complexes with ligands such as phosphate, acetate, and TBP.
Strong chelate complexes form with EDTA, tartrate, citrate, TTA, acetylacetone (acac), and
cupferron. Pu+4 forms a strong complex with fluoride (PuF+3) that is used to solubilize plutonium
oxides and keep it in the aqueous phase during extraction of other elements with organic
solvents. The complex with nitrate, Pu(NO3)6
!2, allows the recovery of plutonium from nuclear

Separation Techniques
14-145
JULY 2004 MARLAP
fuels. Carbonate and acetate complexes prevent precipitation of plutonium from solution even at
relatively high pH.
Dissolution of Samples
Metallic plutonium dissolves in halogen acids such as hydrochloric acid, but not in nitric or
concentrated sulfuric acids. The metal dissolves in hydrofluoric nitric acid mixtures. Plutonium
oxide dissolves with great difficulty in usual acids when ignited. Boiling with concentrated nitric
acid containing low concentrations of hydrofluoric acid or with concentrated phosphoric acid is
used. Fusion methods have also been used to dissolve the oxide as well as other compounds of
plutonium. Plutonium in biological samples is readily soluble, in the case of metabolized
plutonium in excreted samples, or highly refractory, in the case of fallout samples. Most
procedures for fallout or environmental samples involve treatment with hydrofluoric acid or
fusion treatment with a base.
Separation Methods
Extensive work has been done on methods to separate plutonium from other elements. Both
laboratory and industrial procedures have received considerable treatment. The methods
described below represents only a brief approach to separation of plutonium, but they indicate the
nature of the chemistry employed.
PRECIPITATION AND COPRECIPITATION. Macro quantities of plutonium are readily precipitated
from aqueous solution, and the methods are the basis of separating plutonium from other
radionuclides in some procedures. Contamination of other metals can be a problem, however;
zirconium and ruthenium give the most trouble. Plutonium is precipitated primarily as the
hydroxide, fluoride, peroxide, or oxalate. Both Pu+3 and Pu+4 are precipitated from acid solution
by potassium or ammonium hydroxide as hydrated hydroxides or hydrous oxides. On
redissolving in acid, Pu+4 tends to form the polymer, and high concentration of acid is needed to
prevent its formation. Pu+4 peroxide is formed on the addition of hydrogen peroxide to Pu+3, Pu+4,
Pu(V), and Pu(VI) because of the oxidizing nature of hydrogen peroxide. The procedure has been
used to prepare highly pure plutonium compounds from americium and uranium.
Coprecipitation of plutonium can be very specific with the control of its oxidation states and
selection of coprecipitating reagents. Lanthanum fluoride, a classical procedure for coprecipita-
tion of plutonium, will bring down Pu+3 and Pu+4 but not Pu(VI). Only elements with similar
redox and coprecipitation behavior interfere. Separation from other elements as well as
concentration from large volumes with lanthanum fluoride is also important because not many
elements form acid-soluble lanthanum fluoride coprecipitates. Bismuth phosphate (BiPO4) is also
used to coprecipitate Pu+3 and Pu+4. In contrast to lanthanum fluoride and bismuth phosphate,
zirconium phosphate [Zr3 (PO4)4] and an organic coprecipitate, zirconium phenylarsenate
[Zr(C6H5)AsO4], will coprecipitate Pu+4 exclusively.

Separation Techniques
14-146
MARLAP JULY 2004
SOLVENT EXTRACTION. A wide variety of organic extractants have been developed to separate
plutonium from other radionuclides and metals by selectively extracting them from aqueous
media. The extractants, among others, include organophosphorus compounds such as phosphates
(organoesters of phosphoric acid), amines and their quaternary salts, alcohols, ketones, ethers,
and amides. Chelating agents such as TTA and cupferron have also been used. Numerous studies
have been performed on the behavior of these systems. It has been found that the performance of
an extracting system is primarily related to the organic solvent in which the extractant is
dissolved and the concentration of the extractant in the solvent, the nature of the aqueous
medium (the acid present and its concentration [pH] and the presence of salting agents), the
temperature of the system, and the presence and nature of oxidizing agents. One common system,
used extensively in the laboratory and in industrial process to extract plutonium from fission
products, illustrates the use of solvent extraction to separate plutonium from uranium and other
metals. The PUREX process (plutonium uranium reduction extraction) is used in most fuel
reprocessing plants to separate the radionuclides. It employs TBP, tri-n-butyl phosphate
[(C4H9O)3PO], in a hydrocarbon solvent, as the extractant. The uranium fuel is dissolved in nitric
acid as Pu+3, and plutonium is oxidized to Pu+4 and uranium to U(VI) by oxidizing agents.
Plutonium and uranium are extracted into a 30 percent TBP solution, and the organic phase is
scrubbed with nitric acid solution to remove impurities. The plutonium is removed by back-
extracting it as Pu+3 with a nitric acid solution containing a reducing agent.
Solvent extraction chromatography, which uses an inert polymeric material as the support for
adsorbed organic chelating agents, has provided an efficient, easy technique for rapidly
separating plutonium and other transuranic elements. A process using CMPO in TBP and fixed
on an inert polymeric resin matrix has been used to isolate Pu+4. Aliquat-336® also has been used
successfully. All plutonium in the analyte is adjusted to Pu+4, and the column is loaded from 2 M
nitric acid. Plutonium is eluted with 4 M hydrochloric acid and 0.1 M hydroquinone or 0.1 M
ammonium hydrogen oxalate (NH4HC2O4). Environmental samples contain Fe3+ that may
interfere with this process and subsequently interfere with the analysis for plutonium. Ascorbic
acid can be used to reduce Fe+3 to Fe+2, which also reduces Pu+4 to Pu+3. Alternatively, nitrite may
be added after the ascorbic acid, which will not oxidize the iron but will convert the Pu+3 to Pu+4.
This process is an example of selective oxidation-reduction of plutonium and iron, and is used in
many different separation schemes for plutonium, including separation from americium.
ION-EXCHANGE CHROMATOGRAPHY. Ion-exchange chromatography has been used extensively
for the radiochemical separation of plutonium. All cationic plutonium species in noncomplexing
acid solutions readily exchanges onto cation resins at low acid concentrations and desorb at high
acid concentrations. Plutonium in all its oxidation states form neutral or anionic complexes with
various anions, providing an alternate means for eluting the element. Various cation-exchange
resins have been used with hydrochloric, nitric, perchloric, and sulfuric acids for separation of
plutonium from metals including other actinides. The most common uses of plutonium cation-
exchange chromatography is concentrating a dilute solution or separating plutonium from non-
exchangable impurities, such as organic or redox agents.

Separation Techniques
1 It should be noted that any contribution from a tracer into the peak(s) of an analyte of interest must be quantified
properly, and the affected analyte peak result corrected, to avoid a biased result or Type I error (false positive).
14-147
JULY 2004 MARLAP
Anion-exchange chromatography is one of the primary methods for the separation of plutonium
from other metals and the separation of the plutonium oxidation states. On a strong anion-
exchange resin, for example, exchange of the higher oxidation states (+4, V, and VI) occurs at
hydrochloric acid concentrations above 6 M, while elution occurs at 2 M acid. Plutonium (+3)
does not absorb on the column, and Pu(VI) absorbs from 2 to 3 M hydrochloric acid solution.
Plutonium can be separated from other actinides and most other elements by exchanging the
plutonium cations—Pu+4 and Pu(VI)—onto a strong-anion resin from 6 M hydrochloric acid, and
subsequently eluting the plutonium by reducing it to Pu+3. Plutonium (+4) may be separated
effectively on anion exchange resin in 7-8 M nitric acid as the [Pu(NO3)6 ]!2 complex. Uranium
will elute slowly in this media, and sufficient volume must be processed in order to avoid cross
contamination of uranium with plutonium when the plutonium is subsequently eluted. Elution is
achieved at a lower acid concentration, or by reduction to Pu+3.
ELECTRODEPOSITION. Separation methods based on electrodeposition are not common, but one
method for the alpha analysis of plutonium is in use. Plutonium is electrodeposited on a stainless
steel disc from an ammonium sulfate solution at 1.2 amps for one hour. The separation is used
after isolating the radionuclide by extraction chromatography. This technique allows the
plutonium isotopes to be resolved by alpha spectroscopy.
Methods of Analysis
Once isolated, purified, and in solution, 238Pu, 239Pu, 240Pu, and 241Pu are collected for analysis
either by electrodepositon on a platinum or nickel disc or by microprecipitation with lanthanum
or neodymium fluoride. Mass spectrometry also can be used for longer-lived isotopes of
plutonium. Radionuclides of 238Pu, 239Pu, and 240Pu are determined by alpha spectrometry or gas
flow proportional counting. Plutonium-241 measured by gas proportional counting. Plutonium-
236 and 242Pu are used as tracers for measuring chemical yield.
When analyzing most samples containing 238Pu or 239Pu, the analyst can use either 236Pu or 242Pu
as a tracer. However, 242Pu should be avoided as a tracer when analyzing samples that inherently
contain 242Pu, such as waste generated by commercial nuclear reactors. When analyzing samples
that have higher (> 1 Bq) activity levels of 238Pu or 239Pu, most laboratories will use 236Pu as a
tracer because its higher-energy alpha-energy peaks (5.768 and 5.721 MeV) are well separated
from the lower energy peaks of 238Pu (highest alpha energy of 5.499 MeV) or 239Pu. Thus, the
isolated peaks of the 236Pu tracer can be quantified easily,1 and any minimum amount of 236Pu
peak tailing into the lower energy peaks of 238Pu or 239Pu (containing appreciably more counts)
will not significantly affect their quantification. However, when analyzing samples containing
very low concentrations of 238Pu or 239Pu (most environmental samples), 242Pu can be used as a

Separation Techniques
14-148
MARLAP JULY 2004
tracer because its highest peak energy of 4.90 MeV is about 0.2 MeV lower than the lowest peak
energy of 238Pu or 239Pu. For such low activity samples, the 242Pu activity added to the sample
aliquant being processed should be more than the expected 238Pu or 239Pu test source activity.
Therefore, any tailing of the 239Pu alpha peaks into the 242Pu peaks would be minimized.
Compiled from: Baes and Mesmer, 1976; Choppin et al., 1995; Coleman, 1965; Cotton and
Wilkinson, 1988; DOE 1990 and 1997; EPA 1973 and 1980; Maxwell and Fauth, 2000; Metz
and Waterbury, 1962; Seaborg and Loveland, 1990; Weigel et al., 1986.
14.10.9.9 Radium
Radium, with an atomic number of 88, is the heaviest (last) member of the family of alkaline
earth metals, which, in addition, includes beryllium, magnesium, calcium, strontium, and barium.
Radium is the most alkaline and reactive of the series, and exists exclusively as +2 cations in
compounds and solution. All isotopes are radioactive, and essentially all analyses are made by
radioactive measurements or by mass spectrometry.
Isotopes
There are 25 isotopes of radium, from 205Ra to 234Ra. The most important with respect to the
environmental contamination are members of the 238U and 232Th naturally occurring decay series:
226Ra and 228Ra, respectively. Radium-226 (t½ . 1,602 y) is the most abundant isotopic form. A
member of the 238U series, it is produced by alpha emission from 230Th. Radium-226 emits an
alpha particle and, in turn, produces 222Rn, an inert gas that is also an alpha emitter. Radium-226
generates radon at the rate of 0.1 µL per day per gram of radium, and its radioactivity decreases
at the rate of about 1 percent every 25 years. Radium-228 (t ½ . 5.77 y) is produced in the 232Th
decay series by emission of an alpha particle from 232Th itself.
Occurrence
In nature, radium is primarily associated with uranium and thorium, particularly in the uranium
ores—carnotite and pitchblende, where 226Ra is in radioactive equilibrium with 238U and its other
progeny. The widespread dispersal of uranium in rocks and minerals results in a considerable
distribution of radium isotopes throughout nature. Generally found in trace amounts in most
materials, the radium/uranium ratio is about 1 mg radium per 3 kg uranium (1 part radium in
3×10⁶ parts uranium). This leads to a terrestrial abundance of approximately 10!6 ppm: 10!12 g/g
in rocks and minerals. Building materials, such as bricks and concrete blocks for example, that
contain mineral products also contain radium. With leaching from soil, the concentration is about
10!13 g/L in river and streams, and uptake in biological systems produces concentrations of 10-14
g/g in plants and 10!15 g/g in animals.
Uranium ores have been processed with hot mineral acids or boiling alkali carbonate to remove

Separation Techniques
14-149
JULY 2004 MARLAP
radium and uranium. Extracted radium was usually coprecipitated with barium sulfate, converted
to carbonate or sulfide, and solubilized with hydrochloric acid. Separation from barium was
usually accomplished by fractional crystallization of the chlorides, bromides, or hydroxides,
because barium salts are usually slightly more soluble. The free metal has been prepared by
electrolysis of radium chloride solutions, using a mercury cathode. The resulting amalgam is
thermally decomposed in a hydrogen atmosphere to produce the pure metal. The waste streams
from these industrial operations contain radium, primarily as a coprecipitate of barium sulfate.
Because many other natural ores also contain uranium and radium, processing can result in
uranium and its equilibrium progeny appearing in a product or byproduct. Apatite, a phosphate
ore, is used to produce phosphoric acid, and the gypsum byproduct contains all the radium
originally present in the ore.
Radium-226 extracted from ores has historically been used in diverse ways as a source of
radioactivity. It has been mixed with a scintillator to produce luminous paint, and at one time, the
most common use for its salts was radiation therapy. As a source of gamma radiation, radium
activity was enhanced by sealing a radium salt in a capsule that prevented escape of the gaseous
progeny, 222Rn, and allowing the radon to decay into its successive progeny. Two progeny are
214Pb and 214Bi, the principal emitters of gamma radiation in the source. For the most part, radium
has been replaced in medical technology by other sources of radioactivity, but numerous capsules
containing the dry, concentrated substances still exist.
Radium salts are used in various instruments for inspecting structures such as metal castings by
gamma-ray radiography, to measure the thickness of catalyst beds in petroleum cracking units,
and to continuously measure and control the thickness of metals in rolling mills. Radium is also
used for the preparation of standard sources of radiation, as a source of actinium and protac-
tinium, and as a source of ionizing radiation in static charge eliminators. In combination with
beryllium, it is a neutron source for research, in the analysis of materials by neutron activation,
and radio-logging of oil wells.
Radium in the environment is the result of natural equilibration and anthropological activity,
such as mining and processing operations. Radium is retained by many rock and soil minerals,
particularly clay minerals, and migrates only very slowly in through these materials. The decay
progeny of 226Ra, gaseous 222Rn, is an important environmental pollutant and represents the most
significant hazard from naturally occurring radium. Concentration of the alpha-emitting gas in
some occupied structures contributes to the incidence of lung cancer in humans. During the
decay of 226Ra, the recoil of the parent nucleus after it emits an alpha particle, now 222Rn, causes
an increased fraction of radon to escape from its host mineral, a larger fraction than can be
explained by intramineral migration or diffusion.
In groundwater, radium likely encounters dissolved sulfate and/or carbonate anions, which could
precipitate radium sulfate or radium carbonate. Although both salts are relatively insoluble, a
sulfate concentration of 0.0001 M would still allow an equilibrium concentration of about 0.1

Separation Techniques
14-150
MARLAP JULY 2004
ppm Ra+2 to exist in solution. Thus, the insolubilities of either of these salts are not likely to
prevent contamination of the environment.
Radium also contaminates the environment because of past disposal practices of some proces-
sing, milling, and reclamation operations. Radium process tailings have been discovered in land
areas as seams or pockets of insoluble radium compounds, such as barium radium sulfate, or
unprocessed radium (uranium) ore, such as carnotite. Release of solid or liquid process streams
and subsequent mixing with local soil has resulted in intimate contamination of soil particles,
primarily as Ra+2 absorbed onto clay-sized fractions. This form of absorbed radium is tightly
bound to soil but can be extracted partially by hot concentrated acid solutions.
Solubility of Compounds
The solubility of radium compounds can usually be inferred from the solubility of the correspon-
ding barium compound and the trend in the solubilities of the corresponding alkaline earth
compounds. The common water-soluble radium salts are the chloride, bromide, nitrate, and
hydroxide. The fluoride, carbonate, phosphate, biphosphate (hydrogen phosphate), and oxalate
are only slightly soluble. Radium sulfate is the least soluble radium compound known, insoluble
in water and dilute acids, but it is soluble in concentrated sulfuric acid, forming a complex ion
with sulfate anions, Ra(SO4)2
!2.
Radium compounds are essentially insoluble in organic solvents. In most separation procedures
based on extraction, other elements, not radium, are extracted into the organic phase. Exceptions
are known (see “Separation Methods,” below), and crown ethers have been developed recently
that selectively remove radium from an aqueous environment.
Review of Properties
Radium is toxic exclusively because of its radioactive emissions: gamma radiation of the element
itself and beta particles emitted by some of its decay progeny. It concentrates in bones replacing
calcium and causing anemia and cancerous growths. Its immediate progeny, gaseous radon, is an
alpha emitter that is a health threat when inhaled.
Metallic radium is brilliant white and reacts rapidly with air, forming a white oxide and black
nitride. It is an active metal that reacts with cold water to produce radium hydroxide, hydrogen,
and other products. The radium ion in solution is colorless. Its compounds also are colorless
when freshly prepared but darken and decompose on standing because of the intense alpha
radiation. The original color returns when the compound is recrystallized. Alpha emissions also
cause all radium compounds to emit a blue glow in air when sufficient quantities are available.
Radium compounds also are about 1.5 EC higher in temperature than their surroundings because
of the heat released when alpha particles loose energy on absorbance by the compound. Glass
containers turn purple or brown in contact with radium compounds and eventually the glass

Separation Techniques
14-151
JULY 2004 MARLAP
crystallizes and becomes crazed.
Like all alkaline earths, radium contains two valence electrons (7s2) and forms only +2 ions in its
compounds and in solution. The ionic radius of radium in crystalline materials is 152 pm (0.152
nm or 1.52 D), the largest crystalline radius of the alkaline earth cations (Ra+2 > Ba+2 > Sr+2 >
Ca+2 >Mg+2 > Be+2). In contrast, the hydrated ion radius in solution is the smallest of the alkaline
earth cations, 398 pm (Be+2 > Mg+2 > Ca+2 > Sr+2 > Ba+2 > Ra+2). With the smallest charge-to-
crystal-radius ratio among the alkaline earths of 1.32 (+2/1.52), the smallest hydrated radius of
radium is expected, because the ratio represents the least attractive potential for water molecules
in solution.
Solution Chemistry
Existing exclusively in the +2 oxidation state, the chemistry of radium is uncomplicated by
oxidation-reduction reactions that could produce alternate states in solution. It is made even less
complicated by its weak tendency to form complex ions or hydrolyze in solution. These
properties are a reflection of the small charge-to-crystal-radius ratio of 1.32, described above. In
general, radiochemical equilibrium is established with carriers by stirring, followed by either
standing or digesting in the cold for several minutes. Adsorption of trace amounts of radium on
surfaces, however, is an important consideration in its radiochemistry.
COMPLEXATION. Radium, like other alkaline-earth cations, forms few complexes in acid
solution. Under alkaline conditions, however, several one-to-one chelates are formed with
organic ligands: EDTA, diethylene triamine pentaacetic acid (DTPA), ethyleneglycol bis(2-
aminoethylether)-tetraacetate (EGTA), nitrilotriacetate (NTA or NTTA), and citrate. The most
stable complex ion forms with DTPA. The tendency to form complexes decreases as their
crystalline size increases and their charge-crystal-radius ratio decreases. Because crystalline sizes
of the cations are in the order: Ra+2 > Ba+2 > Sr+2 > Ca+2, radium has the least tendency to form
complex ions, and few significant complexes of radium with inorganic anions are known. One
notable exception is observed in concentrated sulfuric acid, which dissolves highly insoluble
radium sulfate (RaSO4) by forming Ra(SO4)2
!2.
Complex-ion chemistry is not used in most radium radiochemical procedures. Complexing
agents are primarily employed as elution agents in cation exchange, in separations from barium
ions by fractional precipitation, and in titration procedures. Alkaline citrate solutions have been
used to prevent precipitation of radium in the presence of lead and barium carriers until complete
isotopic exchange has been accomplished.
HYDROLYSIS. Similar to their behavior complex-ion formation, alkaline earths show less and less
tendency to hydrolyze with increasing size of the ions, and the tendency decreases with
increasing ionic strength of the solution. Therefore, hydrolysis of radium is an insignificant factor
in their solution chemistry.

Separation Techniques
14-152
MARLAP JULY 2004
ADSORPTION. The adsorption of trace amounts of radium on surfaces is an important considera-
tion in its radiochemistry. Although not as significant with radium as with some ions with higher
charges, serious losses from solution can occur under certain conditions. Adsorption on glass is a
particular problem, and adsorption on polyethylene has been reported. Adsorption gradually
increases with increasing pH and depends strongly on the nature of the surface. In the extreme,
up to 50 percent radium has been observed to adsorb onto glass from neutral solution in 20 days,
and 30 percent from 0.13 M hydrochloric acid (HCl). Fortunately, adsorbed radium can be
removed from glass with strong acid.
The presence of insoluble impurities, such as traces of dust or silica, increases adsorption, but
adsorption is negligible from very pure solutions at low pH values. Tracer radium solutions,
therefore, should be free from insoluble impurities, and radium should be completely in solution
before analysis. The solutions should also be maintained in at least 1 M mineral acid or contain
chelating agents. Addition of barium ion as a carrier for radium will probably decrease the
amount of radium adsorption. Radium residues from solubilization of samples that contain silica
or lead or barium sulfates and those that result in two or more separate solutions should be
avoided, because the radium might divide unequally between the fractions. Destruction of silica
with HF, reduction of sulfates to sulfides with zinc dust, and subsequent dissolution of the
residue with nitric acid are procedures used to avoid this problem.
Dissolution of Samples
Soil, mineral, ore samples, and other inorganic solids are dissolved by conventional treatment
with mineral acids and by fusion with sodium carbonate (Na2CO3). Hydrofluoric acid (HF) or
potassium fluoride (KF) is used to remove silica. Up to 95 percent radium removal has been
leached from some samples with hot nitric acid (HNO3), but such simple treatment will not
completely dissolve all the radium in soil, rock, and mineral samples. Biological samples are wet
ashed first with mineral acids or decomposed by heating to remove organic material. The residue
is taken up in mineral acids or treated to remove silica. Any dissolution method that results in
two or more separate fractions should be avoided, because the adsorption characteristics of trace
quantities of radium may cause it to divide between the fractions.
Barium sulfate (BaSO4), often used to coprecipitate radium from solution, can be dissolved
directly into alkaline EDTA solutions. Radium can be repeatedly reprecipitated and dissolved by
alternate acidification with acetic acid and dissolution with the EDTA solution.
Solutions resulting from dissolution of solid samples should be made at least 1 M with mineral
acid before storage to prevent radium from absorbing onto the surface of glass containers.
Separation Methods
COPRECIPITATION. Radium is almost always present in solution in trace amounts, and even the

Separation Techniques
14-153
JULY 2004 MARLAP
most insoluble radium compound, radium sulfate, can not be used to separate and isolate radium
from solution by direct precipitation. Therefore, the cation is commonly removed from solution
in virtually quantitative amounts by coprecipitation. Because radium forms the same types of
insoluble compounds as barium: sulfates (SO4
!2), chromates (CrO4
!2), carbonates (CO3
!2),
phosphates (PO4
!3), oxalates (C2O4
!2), and sulfites (SO3
!2), it coprecipitates with all insoluble
barium compounds, and to a lesser extent with most insoluble strontium and lead compounds.
Barium sulfate and barium chromate are most frequently used to carry radium during coprecipita-
tion. Other compounds that are good carriers for radium include: ferric hydroxide when
precipitated at moderately high pH with sodium hydroxide (NaOH) or ammonium hydroxide
(NH4OH), barium chloride (BaCl2) when precipitated from a cold mixed solvent of water and
alcohol saturated with hydrochloric acid, barium iodate [Ba(IO3)2], and various insoluble
phosphates, fluorides, and oxalates (e.g., thorium phosphate [Th3(PO4)4], lanthanum fluoride
(LaF3), and thorium oxalate [Th(C2O4)2]. Lead sulfate (PbSO4) can be used if a carrier-free
radium preparation is required, because quantitative lead-radium separations are possible while
quantitative barium-radium separations are very difficult.
ION EXCHANGE. Radium has been separated from other metals on both cation- and anion-
exchange resins. Barium and other alkaline earths are separated on cation-exchange columns
under acidic conditions. In hydrochloric acid solutions (3 M), the affinity of the cation for the
exchange site is dominated by ion-dipole interactions between the water molecules of the
hydrated ion and the resin. Ions of smaller hydrated radius (smaller charge-to-crystal-radius ratio)
tend to displace ions of larger hydrated radius. The affinity series is Ra+2 > Ba+2 > Sr+2 > Ca+2,
and radium elutes last. Increasing the acid concentration to 12 M effectively reverses the order of
affinity, because the strong acid tends to dehydrate the ion, and ion-resin affinity is dominated
more by ionic interactions, increasing in the order of increasing crystal radius: Ca+2 > Sr+2 > Ba+2
> Ra+2, and calcium elutes last. Radium has also been separated from tri- and tetravalent ions
because these ions have a much stronger affinity for the cation-exchange resin. Radium with its
+2 charge is only partially absorbed, while trivalent actinium and tetravalent thorium, for
example, will be completely absorbed. Tracer quantities of radium also has been separated from
alkaline earths by eluting a cation-exchange column with chelating agents such as lactate, citrate,
and EDTA; radium typically elutes last, because it forms weaker interactions with the ligands.
Anion-exchange resins have been used to separate radium from other metal ions in solutions of
chelating agents that form anionic complexes with the cations. The affinity for the columns
decreases in the order Ca > Sr > Ba > Ra, reflecting the ability of the metal ions to form stable
complex anions with the chelating agents. The difficult separation of barium from radium has
been accomplished by this procedure. Radium is also separated from metals such as uranium,
polonium, bismuth, lead, and protactinium that form polychloro complex anions. Because radium
does not form a chlorocomplex, it does not absorb on the anion exchanger (carrying a positive
charge), and remains quantitatively in the effluent solution.
Ion-exchange methods are not easily adapted for the separation of macro-scale quantities of

Separation Techniques
14-154
MARLAP JULY 2004
radium, because the intense radiation degrades the synthetic resin and insoluble radium
compounds usually form in the ion-exchange column.
SOLVENT EXTRACTION. Radium compounds have very low solubilities in organic solvents. In
most extraction procedures, other organic-soluble complexes of elements, not radium, are
extracted into the nonaqueous phase, leaving radium in the water. Radium is separated from
actinium, thorium, polonium, lead, bismuth, and thallium, for example, by extracting these
elements as TTA complexes. Radium does not form the complex except at very high pH, and is
not extracted. One notable exception to this generality is the extraction of radium tetraphenyl-
borate by nitrobenzene from an alkaline solution. The presence of EDTA inhibits formation of
the tetraphenylborate, however, and radium is not extracted in the presence of EDTA either.
More recent developments have employed crown ethers to selectively extract radium as a
complex ion from water samples for analysis. Radium-selective extraction membranes have also
been used to isolate radium from solutions.
Methods of Analysis
Radium is detected and quantified by counting either alpha or gamma emissions of the radionuc-
lide or its progeny. Gamma-ray spectroscopy can be used on macro 226Ra samples (approximately
50 g or more) without pretreatment unless 235U, even in very small quantities, is present to inter-
fere with the measured peak. The most sensitive method for the analysis of 226Ra is de-emanation
of 222Rn from the radium source, complete removal, followed by alpha counting the 222Rn and its
progeny. The procedure is lengthy and expensive, however. The radium in a liquid sample is
placed in a sealed tube for a specified time to allow the ingrowth of 222Rn. The radon is collected
in a scintillation cell and stored for several hours to allow for ingrowth of successive progeny
products. The alpha radiation is then counted in the scintillation cell called a Lucas cell. The
primary alpha emissions are from 222Rn, 218Po, and 214Po. Complete retention of radon can also be
accomplished by sealing the radium sample hermetically in a container and gamma-counting.
Radium-228 can also be determined directly by gamma spectroscopy, using the gamma-rays of
its progeny, 228Ac, without concern for interference. Alower detection limit is obtained if the
228Ac is measured by beta counting. In the beta-counting procedure, 228Ra is separated, time is
allowed for actinium ingrowth, the 228Ac is removed by solvent extraction, ion-exchange, or
coprecipitation, and then measured by beta counting.
Radium-224 can be determined by chemically isolating the 212Pb, which is in equilibrium with
the 224Ra. After an appropriate ingrowth period, 212Pb is determined by alpha-, beta-, or gamma-
counting its progeny, 212Bi and 212Po.
Compiled from: Baes and Mesmer, 1976; Choppin et al., 1995; Considine and Considine,
1983; DOE, 1990 and 1997, 1997; EPA, 1984; Friedlander et al., 1981; Green and Earnshaw,

Separation Techniques
14-155
JULY 2004 MARLAP
1984; Hassinsky and Asloff, 1965; Kirby and Salutsky, 1964; Lindsay, 1988; Salutsky, 1997;
Sedlet, 1966; Shoesmith, 1964; Sunderman and Townley, 1960; Turekian and Bolter, 1966;
Vdovenko and Dubasov, 1975.
14.10.9.10 Strontium
Strontium, atomic number 38, is the fourth member of the alkaline-earth metals, which includes
beryllium, magnesium, calcium, strontium, barium, and radium. Like radium, it exists
exclusively in the +2 oxidation state in both compounds and in solution, making its chemistry
simpler than many of the radionuclides reviewed in this section.
Isotopes
Strontium exists in 29 isotopic forms, including three metastable states, ranging in mass number
from 77 to 102. Natural strontium is a mixture of four stable isotopes: 84Sr, 86Sr, 87Sr, and 88Sr.
The lower mass number isotopes decay by electron capture, and the isotopes with higher mass
numbers are primarily beta emitters. The half-lives of most isotopes are short, measured in
milliseconds, seconds, minutes, hours, or days. The exception is 90Sr, a beta emitter with a half-
life of 29.1 years.
Occurrence and Uses
Strontium is found in nature in two main ores, celestite (SrSO4) and strontianite (SrCO3), widely
distributed in small concentrations. Small amounts are found associated with calcium and barium
minerals. The Earth’s crust contains 0.042 percent strontium, ranking twenty-first among the
elements occurring in rock and making it as abundant as chlorine and sulfur. The element ranks
eleventh in abundance in sea water, about 8–10 ppm. The only naturally occurring radioactive
isotopes of strontium are the result of spontaneous fission of uranium in rocks. Other nuclear
reactions and fallout from nuclear weapons test are additional sources of fission products.
Strontium-90 is a fission product of 235U, along with 89Sr, and short-lived isotopes, 91Sr to 102Sr.
Strontium-85 can be produced by irradiation of 85Rb with accelerated protons or deuterons.
The beta emission of 90Sr and its progeny, 90Y (t½ . 64 h), has found applications in industry,
medicine, and research. The radionuclides are in equilibrium in about 25 days. The radiation of
90Y is more penetrating than that of strontium. It is used with zinc sulfide in some luminescent
paints. Implants of 90Sr provide radiation therapy for the treatment of the pituitary gland and
breast and nerve tissue. The radiation from strontium has been used in thickness gauges, level
measurements, automatic control processes, diffusion studies of seawater, and a source of
electrical power. Because 90Sr is one of the long-lived and most energetic beta emitters, it might
prove to be a good source of power in space vehicles, remote weather stations, navigational
buoys, and similar long-life, remote devices. Both 89Sr and 90Sr have been used in physical
chemistry experiments and in biology as tags and tracers. Ratios of 88Sr to 87Sr ratios are used in

Separation Techniques
14-156
MARLAP JULY 2004
geological dating, because 87Sr is formed by decay of long-lived 87Rb.
Solubility of Compounds
Several simple salts of strontium are soluble in water. Among these are the acetate, chloride,
bromide, iodide, nitrate, nitrite, permanganate, sulfide, chlorate, bromate, and perchlorate.
Strontium hydroxide is slightly soluble and is precipitated only from concentrated solutions.
Review of Properties
Strontium is a low-density (2.54 g/cm3) silver-white metal. It is as soft as lead and is malleable
and ductile. Three allotropic forms exit with transition temperatures of 235 and 540 EC. Freshly
cut strontium is silver in appearance, but it rapidly turns a yellowish color on formation of the
oxide in air. It is stored under mineral oil to prevent oxidation.
Strontium isotopes are some of the principal constituents of radioactive fallout following
detonation of nuclear weapons, and they are released in insignificant amounts during normal
operations of reactors and fuel reprocessing operations. Their toxicity is higher, however, than
that of other fission products, and 90Sr represent a particular hazard because of its long half-life,
energetic beta emission, tendency to contaminate food, especially milk, and high retention in
bone structure. Strontium in bone is difficult to eliminate and has a biological half-life of
approximately eleven years (4,000 d).
Strontium occurring in groundwater is primarily in the form of divalent strontium ions. Its
solubility under oxidizing and reducing conditions is approximately 0.001 M (0.15 g/L or 150
g/m3).
Solution Chemistry
Strontium exists exclusively in the +2 oxidation state in solution, so the chemistry of strontium is
uncomplicated by oxidation-reduction reactions that could produce alternate states in solution.
COMPLEXATION. Strontium has little tendency to form complexes. Of the few complexing agents
for strontium, the significant agents in radiochemistry to date are EDTA, oxalate, citrate,
ammoniatriacetate, methylanine-N,N-diacetate, 8-quinolinol, and an insoluble chelate with
picrolonate. The most stable complex ion forms with EDTA. Coordination compounds of
strontium are not common. These chelating agents are used primarily in ion-exchange
procedures. Amine chelates of strontium are unstable, and the β-diketones and alcohol chelates
are poorly characterized. In contrast, cyclic crown ethers and cryptates form stronger chelates
with strontium than with calcium, the stronger chelating metal with EDTA and more traditional
chelating agents. Cryptates are a macrocyclic chelate of the type, N[(CH2CH2O)2CH2CH2]3N, an
octadentate ligand containing six oxygen atoms and two nitrogen atoms as ligand bonding sites

Separation Techniques
14-157
JULY 2004 MARLAP
that encapsulates the cation. It might find use in the extraction chemistry of strontium.
HYDROLYSIS. The tendency of the alkaline-earth cations to hydrolyze decreases as their atomic
number increases. The tendency is greater than that of the corresponding alkali metals, but
hydrolysis of potassium, for example, is insignificant. An indication of the tendency of a cation
to hydrolyze is the solubility of their hydroxides, and the solubility of the alkaline earths
increases with increasing atomic number. Strontium hydroxide is slightly soluble in water (8 g/L
at 20 EC). In comparison, the hydroxide of beryllium, the first element in the alkaline earth
series, has a solubility of approximately 3×10!4 g/L.
Dissolution of Samples
Dissolution of samples for the analysis of strontium is generally simple. Water is used to dissolve
soluble compounds: acetate, bromide, chloride, iodide, chlorate, perchlorate, nitrate, nitrite, and
permangenate. Hydrochloric or nitric acid dissolves the fluoride, carbonate, oxalate, chromate,
phosphate, sulfate, and oxide. Strontium in limestone, cement, soil, bone, and other biological
material can be dissolved from some samples in hot hydrochloric acid. Insoluble silica, if present,
can be filtered or centrifuged. In some cases, soil can be leached to remove strontium. As much
as 99.5 percent of the strontium in some crushed soil samples has been leached with 1 M nitric
acid by three extractions. Soil samples have also been suspended overnight in ammonium acetate
at pH 7 to leach strontium. If leaching is not successful, soil samples can be dissolved by alkali
fusion of the ground powder with potassium hydroxide, nitrate, or carbonate. Strontium is taken
up from the residue in nitric acid. Biological materials such as plant material or dairy products
are solubilized by ashing at 600 EC and taking up milk residue in hot, concentrated hydrochloric
acid and plant residue in aqua regia. Wet ashing can be used by treating the sample with nitric
acid followed by an equal-volume mixture of nitric and perchloric acids. Human and animal bone
samples are ashed at 900 EC and the residue dissolved in concentrated hydrochloric acid.
Separation Methods
PRECIPITATION AND COPRECIPITATION. The common insoluble salts of strontium are the fluoride,
carbonate, oxalate, chromate, and sulfate. Most are suitable for radiochemical procedures, and
strontium separation have the advantage of stable forms of strontium that can be used as a carrier
and are readily available. Precipitation of strontium nitrate in 80 percent nitric acid has been used
to separate stable strontium carrier and 90Sr from its progeny, 90Y, and other soluble nitrates
(calcium, for example). The solubility of strontium chloride in concentrated hydrochloric
solution has been used to separate strontium from barium—barium chloride is insoluble in the
acid. Barium and radium (as coprecipitant) have been removed from strontium by precipitating
barium as the chromate at a carefully controlled pH of 5.5. Strontium chromate will not
precipitate unless the pH is raised. Strontium can also be separated from yttrium by precipitation
of the much less soluble yttrium hydroxide by raising an acid solution of the cations to a pH of
about 8 with ammonium hydroxide. Strontium hydroxide is slightly soluble and will not

Separation Techniques
14-158
MARLAP JULY 2004
precipitate without high concentrations of hydroxide or strontium or both. Carrier-free strontium
is coprecipitated with ferric hydroxide, and lead sulfate is also used.
SOLVENT EXTRACTION. The application of organic solvents for separation of strontium from
other metals has not been extensive. TTA has been used to extract carrier-free strontium at a pH
greater than 10. At pH 5, 90Y is extracted with TTA from strontium, which remains in aqueous
solution. 8-hydroxyquinolinol in chloroform has also been used to extract strontium. The few
procedures that have been available are mainly used to separate the alkaline earths from each
other. A 1:1 mixture of ethyl alcohol and diethyl ether with di-2-ethylhexyl phosphoric acid
extracts calcium from strontium.
In recent years, extraction procedures have been developed based on the complexation of
strontium cations with crown ethers in 1-octanol. Strontium can be extracted with these mixture
from 1 M to 7 M nitric acid solutions. The most advantageous application of strontium extraction
procedures has been found in extraction chromatography. An extraction resin consisting of
4,4'(5')-bis(t-butylcyclohexano)-18-crown-6 (DtBuCH18C6) in 1-octanol on an inert polymeric
matrix is highly selective for strontium nitrate and will separate the cation from many other
metals including calcium, barium, and yttrium. This column is used to separate strontium from
potassium, cerium, plutonium, and neptunium (K+1, Ce+4, Pu+4, Np+4, respectively). The column
is prepared and loaded from 8 M nitric acid. The ions listed above are eluted with 3 M nitric acid
containing oxalic acid. Strontium is eluted with 0.05 M nitric acid.
ION-EXCHANGE CHROMATOGRAPHY. Ion-exchange chromatography is used to separate trace
quantities of strontium, but separation of macro quantities is very time consuming. Strontium is
absorbed on cation-exchange resins, and elution is often based on the formation of a stable
complex. Carrier-free strontium is separated from fission products, including barium, on a
cation-exchange resin and eluted with citrate. In a similar process, strontium was also separated
from other alkaline earths, magnesium, calcium, barium, and radium, eluting with ammonium
lactate at pH 7 and 78 EC. Good separations were also obtained with hydrochloric solutions and
ammonium citrate. Strontium-90 and 90Y are separated on a cation-exchange column, eluting
yttrium with ammonium citrate at pH 3.8 and strontium at pH 6.0. Strontium and calcium have
also been separated in EDTA solutions at pH 5.3. Strontium is retained on the column, and
calcium elutes as the calcium-EDTA complex. Strontium elutes with 3 M hydrochloric acid.
Strontium does not form many anionic complextes, Thus, not many procedures use anion-
exchange chromatography for separation of strontium. Strontium-90 has been separated from 90Y
on an anion-exchange resin pretreated with hydroxide. Strontium is eluted from the column with
water, and yttrium is eluted with 1 M hydrochloric acid. The alkaline earths have been separated
by anion-exchange column pretreated with dilute ammonium citrate, loading the column with the
chloride form of the metals, and eluting with ammonium citrate at pH 7.5.

Separation Techniques
14-159
JULY 2004 MARLAP
Methods of Analysis
Macroquantities of strontium are determined by gravimetric methods and atomic absorption
spectrometry, and emission spectrometry. Strontium is precipitated as strontium carbonate or
sulfate in gravimetric procedures. For atomic absorption analysis, the separated sample is ashed,
and the product is dissolved in hydrochloric acid. Lanthanum is added to the solution to
precipitate interfering anions, phosphate, sulfate, or aluminate, that would occur in the flame.
Strontium-89 and 90Sr are determined by analysis of their beta emissions. With a short half-life of
50.5 d, 89Sr is only found in fresh fission products. Strontium-90 is a beta emitter with a half-life
of 27.7 y. Its progeny is 90Y, which emits beta particles with a half-life of 64.0 h, producing
stable 90Zr. Neither 90Sr nor 90Y is a gamma emitter. Strontium-90 is determined directly from its
beta emission, before 90Y grows in, by beta counting immediately (three to four hours) after it is
collected by precipitation. The chemical yield can be determined gravimetrically by the addition
of stable strontium, after the separation of calcium. Alternatively, 90Sr can be measured from the
beta emission of 90Y while it reaches secular equilibrium (two to three weeks). The 90Y is
separated by solvent extraction and evaporated to dryness or by precipitation, then beta counted.
The chemical yield of the yttrium procedure can be determined by adding stable yttrium and
determining the yttrium gravimetrically. Strontium-89 has a half-life of 50.5 d and is only present
in fresh fission material. If it is present with 90Sr, it can be determined by the difference in
activity of combined 89Sr and 90Sr (combined or total strontium) and the activity of 90Sr. Total
strontium is measured by beta counting immediately after it is collected by precipitation, and
90Sr
is measured by isolating 90Y after ingrowth. Strontium-85 can be used as a tracer for determining
the chemical yield of 90Sr (determined by isolating 90Y), but its beta emission interferes with beta
counting of total strontium and must be accounted for in the final activity.
An alternative method for determining 89Sr and 90Sr in the presence of each other is based on the
equations for decay of strontium radionuclides and ingrowth of 90Y. Combined strontium is
collected and immediately counted to determine the total strontium. During ingrowth, the
mixture is recounted, and the data from the counts are used to determine the amount of 89Sr and
90Sr in the original (fresh) mixture.
Cerenkov radiation counting techniques also may be used for 89/90Sr analysis. When beta particle
energies exceed the speed of light in the medium in which the beta particles are emitted, the
excess energy is emitted in the energy range of 350-600 nm. In water, the energy to be exceeded
is 0.263 MeV. As a practical matter, however, Cerenkov radiation counting is not very useful for
beta energies less than 1 MeV beta maximum (Eβmax) typically found in environmental
laboratories. NCRP (1985) cites a 3 percent detection efficiency for a 204Tl Eβmax of 0.764 MeV,
with corresponding average beta energy of 0.240 MeV. Only at a 143Pr of 0.932 MeV does the
detection efficiency go to 6.2 percent—a detection efficiency of marginal usefulness as a figure
of merit.

Separation Techniques
14-160
MARLAP JULY 2004
The three isotopes that are involved with this analysis are 89Sr (Eβmax = 1.5 MeV), 90Sr (Eβmax = 0.5
MeV), and 90Y (Eβmax = 2.3 MeV). The analysis requires chemical separation of the strontium
from the sample matrix by conventional techniques. Cerenkov counting relies on the beta
energies (the 90Sr beta does not contribute significantly). For example, strontium may be
separated chemically as an oxalate precipitate (after yttrium has been removed by precipitation),
dissolved in nitric acid, and counted immediately (yielding the counts for 89Sr). After about 10
days, the sample would be recounted, yielding a total for 89Sr + 90Y. The value for the 90Y is then
determined by applying spectral interference factors for spectral overlap and appropriate
background subtraction techniques. Alternatively, 90Y can be separated from the strontium
solution after a period of ingrowth and Cerenkov-counted to determine the 90Sr concentration.
Compiled from: Baes and Mesmer, 1976; Banavali et al., 1995; Choppin et al., 1995;
Considine and Considine, 1983; CRC, 1998-99; DOE, 1990 and 1997, 1997; EPA, 1973;
EPA, 1980; Greenwood and Earnshaw, 1984; Hassinsky and Adloff, 1965; NCRP, 1985;
Riley, 1995; Rucker, 1991; Sunderman and Townley, 1960; Turekian and Bolter, 1966.
14.10.9.11 Sulfur and Phosphorus
The radiochemistry of sulfur and phosphorus is somewhat different than most other radioiso-
topes. These two elements are nonmetallic and, like carbon, can be found in many different types
of compounds. These two elements are used most extensively as tracers by incorporation into
organic molecules, generally as covalent-bonded atoms. Thus, they do not react as sulfur or
phosphorus, but as the molecule of which they are a part. They may be present as inorganic
species, which have their own peculiar chemistry.
Isotopes
Sulfur has 17 isotopes, four of which are stable. Only two of the 13 radioisotopes have
significant radiochemical analytical applications. These are 35S (t½ .87.2 d) and 37S (t½ . 5 min).
Sulfur-35 decays only by beta emission with no gamma emission. Sulfur-37 decays by beta
emission with a 3.1 MeV delayed gamma emission.
Phosphorus also has 17 isotopes, only one of which is stable. Its two principal radioisotopes, 32P
(t½ . 14.3 d) and 33P (t½ . 25.3 d), both decay only by beta emission, with no gamma emission.
Occurrence
None of the radioisotopes of sulfur occurs naturally. They are produced by neutron activation of
stable parent isotopes or by accelerator bombardment techniques. Both 32P and 33P are formed
naturally in the upper atmosphere. The steady-state concentration of these radionuclides in
rainwater is about 0.05 Bq/L. They are also produced artificially by accelerator bombardment.

Separation Techniques
14-161
JULY 2004 MARLAP
Solubility and Solution Chemistry
The most stable forms of the two elements in aqueous solutions are sulfate and phosphate.
However, the relatively long half-lives of the radioisotopes of S and P allow them to be
incorporated easily into organic or biomolecules. In these instances, the chemical identity of the
radioisotope is sacrificed for the chemical property of the molecule. For example, 35S may be
incorporated into these species, but each will have a distinct chemical property:
SO4
!2 , S!2 , CH3-S-CH2 -CH2 -C(H)(NH2)(COOH) [methionine]
H-S-CH2-C(H)(NH2)(COOH) [cystine]
If a solution of methionine had added to it methionine labeled with 35S, the radioisotope-
containing molecules would be indistinguishable chemically from the other methionine
molecules. However, if the methionine solution was equilibrated with a solution of 35S!2, no 35S
would be found in the methionine molecules, because methionine does not dissociate to give S!2.
Similarly, for phosphorus the radioisotope could be incorporated into the following species:
PO4
3-, (C8H17)3PO [tri-n-octylphosphine oxide]
H2PO4-{C9H14N5O3} [adenosine-5-phosphoric acid].
Here, the tri-n-octylphosphine oxide is soluble in organic solvents but not in water, while the
other two are readily water-soluble. For the two water-soluble molecules, under conditions of
neutral pH, no exchange of radiophosphorus would be expected between them. However under
certain conditions where the organic molecule could be hydrolyzed, exchange could occur.
Incorporation of the radioisotope into an organic molecule would occur by first forming the
radioisotope by nuclear bombardment, then reacting the activated material with the appropriate
reagents to form the molecule of interest. Attempting to form the radioisotope by activation of
the organic molecule would lead to the destruction of the organic molecule, and the radioisotope
would be part of other (potentially) unknown species. The chemical purity of the final product
would be verified through an independent means such as infrared, nuclear magnetic resonance, or
mass spectrometry. The specific activity of the new molecule then can be calculated by
measuring the activity due to the radioisotope.
OXIDATION-REDUCTION. For each of these elements, the most stable ionic form in aqueous
solution is as the SO4
!2 or the PO4
3- ions (dependent upon pH). Sample oxidation for sulfur
should be performed with care to avoid loss as SO2 or as H2S. This can occur in nitric acid when
sulfides or organic sulfur compounds are present. Oxidation in basic solution using hydrogen
peroxide or permanganate can avoid such losses. Phosphorus does not suffer from this
disadvantage of acid oxidation. Generally, when present as phosphate or sulfate, reduction to
other species will not occur unless powerful reducing agents have been added to the solution.

Separation Techniques
14-162
MARLAP JULY 2004
COMPLEXATION. Neither sulfate nor phosphate are strong complexing agents. This is due to their
negative charge being spread out among many atoms, yielding low charge density. Most
complexing ions are strongly nucleophilic.
Dissolution of Samples
The radioisotopes of phosphorus and sulfur generally are incorporated into in vivo or in vitro
studies of plant or animal tissues. The cost common methods of sample preparation for these
studies usually are maceration/suspension, tissue solubilization, and total oxidation. The method
of maceration is a reduction of the “size” of the sample. The material is suspended in a minimal
amount of fluid, and then a physical means such as a blender, mortar and pestle, or stirring rod is
used to suspend the material in the solvent. The chemical nature of the molecule containing the
radioisotope is unchanged.
Tissue solubilization is the addition of a chemical solvent such as toluene, which dissolves the
tissue in its entirety putting the sample into an organic solvent matrix. The chemical nature of the
molecule containing the radioisotope is unchanged.
Total oxidation is performed most frequently using either peroxide or nitric acid, which removes
all of the organic material as carbon dioxide, and the elements are in solution as phosphate or
sulfate. Care should be taken in this form of sample preparation for sulfur, because it can be
volatilized as SO2 or SO3 vapor.
The molecules of interest having biochemical activity may change chemically during the course
of such studies. Thus, one should consider what the potential decomposition products are, and
how they should be separated from the organic/biomolecules of interest, before preparing the
sample. If an environmental sample were to be analyzed for these radioisotopes, the sample
preparation would need to be total-sample-oxidation, because the type of organic material would
likely be unknown.
Separation Methods
Because many different organic forms exist for these elements, it would be difficult to identify all
of the different separation techniques used to separate them from specific mixtures of other
organic compounds. Generally, the techniques that are used are HPLC, GC, and electrophoresis.
In many instances, separation of the molecules containing the radioisotopes is not necessary,
because the sulfur or phosphorus is the only radioisotope present, having been used as a tracer in
following the reaction progress or products.
PRECIPITATION. Sulfur may be analyzed by sample oxidation followed by barium precipitation.
This takes place at about pH 2 in HCl solution. As with other separation techniques, sample
processing should ensure the elimination of other cations (such as radium or strontium), which

Separation Techniques
14-163
JULY 2004 MARLAP
could be present in environmental samples.
Phosphate is a strong Bronsted-Lowry base. Precipitation of phosphate salts would be carried out
best in basic media. However, most metal salts also form insoluble hydroxides, so this form of
separation is not used frequently. However, if other metal ions are removed, phosphate can be
completely precipitated using calcium ion in basic solution.
ION EXCHANGE. Both phosphate and sulfate may be exchanged easily on anion exchange media.
However, if the anion resin were in the hydroxide form, the exchange would release hydroxide
and potentially cause precipitation of metal ions either on the ion exchange resin or in the eluent.
Thus, converting the anion resin to the nitrate or chloride form prior to separation would permit
the free flow of eluent without precipitation. Such separation will occur on weak base anion
exchangers (such as those used in ion chromatography) or strong base ion exchangers.
Methods of Analysis
All of the radioisotopes of interest of phosphorus and sulfur are beta emitters. The most effective
method of analysis for these isotopes is liquid scintillation. For the analysis of organic/
biomolecules, the scintillation cocktail usually may be added directly to the analyte after one of
the methods of nonoxidative sample preparation described above. In some instances, these
analytes may contain double-labeled compounds. Other radioisotopes, such as 14C or 3H, also
may be incorporated into the molecule. These can also be analyzed directly by liquid scintillation
because of the significant differences in the beta particle energies. Samples of unknown origin
would require oxidation and separation prior to analysis.
14.10.9.12 Technetium
Technetium, atomic number 43, has no stable isotopes. Natural technetium is known to exist but
only in negligibly small quantities resulting from the spontaneous fission of natural uranium.
Technetium is chemically very similar to rhenium, but significant differences exist that cause
them to behave quite differently under certain conditions.
Isotopes
Thirty-one radioisotopes of technetium are known with mass numbers ranging from 86 to 113.
The half-lives range from seconds to millions of years. The lower mass number isotopes decay by
primarily by electron capture and the higher mass number isotopes by beta emission. The
significant isotopes (with half-lives/decay modes) are 95mTc (61 d/electron capture and isomeric
transition), 99mTc (6.01 h/isomeric transition by low-energy γ), and 99Tc (2.13×10⁵ y/β to stable
99Ru). Other long-lived isotopes are 97Tc (2.6×10⁶/electron-capture) and 98Tc (4.2×10⁶ y/β
emission).

Separation Techniques
14-164
MARLAP JULY 2004
Occurrence and Uses
The first synthesis of technetium was through the production of 99Mo by bombardment of 98Mo
with neutrons and subsequent beta decay to 99Tc. Technetium is also a major constituent of
nuclear reactor fission products and has been found in very small quantities in pitchblende from
the spontaneous fission of naturally occurring uranium.
Technetium makes up about 6 percent of uranium fission products in nuclear power plant fuels. It
is recovered from these fuels by solvent extraction and ion-exchange after storage of the fuels for
several years to allow the highly radioactive, short-lived products to decay. Technetium is
recovered as ammonium pertechnetate (NH4TcO4) after its solutions are acidified with
hydrochloric acid, precipitated with sulfide, and the sulfide (Tc2S7) is reacted with hydrogen
peroxide. Rhenium and molybdenum are also removed by extraction with organic solvents. The
metal is obtained by reduction of ammonium pertechnetate with hydrogen at 600 EC.
Potassium pertechnetates (KTcO4) have been used in water (55 ppm) as corrosion inhibitors for
mild carbon steel in aerated distilled water, but currently there is no significant uses of elemental
technetium or its compounds, although technetium and some of its alloys are superconductors.
The corrosion protection is limited to closed systems to prevent release of the radioactive isotope.
Technetium-95m, with a half-life of only 61 days, has been used in tracer work. Technetium-99m
is used in medical diagnosis as a radioactive tracer. As a complex, the amount of 99mTc required
for gamma scanning is very small, so it is referred to as noninvasive scanning. It is used for
cardiovascular and brain studies and the diagnosis of liver, spleen, and thyroid disorders. There
are more than 20 99mTc compounds available commercially for diagnostic purposes. With iodine
isotopes, they are the most frequently used radionuclides for diagnostics. Technetium-99m also
has been used to determine the deadtime of counting detectors.
Solubility of Compounds
The nature of the compounds has not been thoroughly delineated, but ammonium pertechnetate
is soluble in water, and technetium heptoxide forms soluble pertechnetic acid (HTcO4) when
water is added.
Review of Properties
Technetium is a silver-grey metal that resembles platinum in appearance. It tarnishes slowly in
moist air to give the oxyacid, pertechnetic acid (HTcO4). It has a density of 11.5 g/cm3. The metal
reacts with oxygen at elevated temperatures to produce the volatile oxide, technetium heptoxide.
Technetium dissolves in warm bromine water, nitric acid, aqua regia, and concentrated sulfuric
acid, but it is insoluble in hydrochloric and hydrofluoric acids. Technetium forms the chlorides
(TcCl4 and TcCl6) and fluorides (TcF5 and TcF6) by direct combination of the metal with the
respective halogen. The specific halide is obtained by selecting the proper temperature and

Separation Techniques
14-165
JULY 2004 MARLAP
pressure for its formation.
The behavior of technetium in groundwater is highly dependent on its oxidation state. Under
oxidizing conditions, pertechnetate is the predominant species. It is very soluble and only slightly
absorbed to mineral components. For those reasons, it has a relatively high dissemination
potential in natural systems. Under reducing conditions, technetium precipitates as technetium
dioxide (TcO2), which is very insoluble. With the production of 99Tc in fission fuels and
considering its long half-life, the soluble form of the radionuclide is an environmental concern
wherever the fuel is reprocessed or stored. As a consequence, 99Tc would be expected to be one
of the principal contributors to a radioactive release to the environment, even from repositories
with barriers that could retain the radionuclide up to 10,000 years. Studies of a salt repository
indicate that 99Tc is one of the few radionuclides that might reach the surface before it decays.
Solution Chemistry
All oxidation states between !1 and +7 can be expected for technetium, but the important ones in
solution are +4 and +7. The +4 state exist primarily as the slightly soluble oxide, TcO2. It is
soluble only in the presence of complexing ligands; TcCl6
!2, for example, is stable in solutions
with a chloride concentration greater than 1 M. The most important species in solution is the
pertechnetate ion [TcO4
!1 as Tc(VII)], which is readily soluble and easily formed from lower
oxidation states with oxidizing agents such as nitric acid and hydrogen peroxide. There is no
evidence of polymeric forms in solution as a result of hydrolysis of the metal ion.
OXIDATION-REDUCTION BEHAVIOR. Most radioanalytical procedures for technetium are
performed on the pertechnetate ion, TcO4
!1. The ion can be reduced by hydrochloric acid, the
thiocyanate ion (SCN!1), organic impurities, anion-exchange resins, and some organic solvents.
The product of reduction can be TcO2 [Tc+4], although a multiplicity of other products are
expected in complexing media. Even though the +7 oxidation state is easy to reduce, the
reduction process is sometimes slow. Unless precautions are taken to maintain the appropriate
oxidation state, however, erratic results will be obtained during the radioanalytical procedure.
Several examples illustrate the precaution. Dissolution should always be performed under
strongly oxidizing conditions to ensure conversion of all states to the +7 oxidation state because
complications because of slow exchange with carrier and other reagents are less likely to occur if
this state is maintained. Technetium is extracted with various solvents in several radioanalytical
procedures, but the method can be very inefficient because of reduction of the pertechnetate ion
by some organic solvents. The presence of an oxidizing agent such as hydrogen peroxide will
prevent the unwanted reduction. In contrast, TcO4
!1 is easily lost on evaporation of acid solutions
unless a reducing agent is present or evaporation is conducted at a relatively low temperature.
COMPLEXATION. Technetium forms complex ions in solution with several simple inorganic
ligands such as fluoride and chloride. The +4 oxidation state is represented by the TcX6
!2 ion
where X = F, Cl, Br, and I. It is formed from TcO4
!1 by reduction to the +4 state with iodide in

Separation Techniques
14-166
MARLAP JULY 2004
HX. TcF6
!2 is found in HF solutions during decomposition of samples, before further oxidation.
Complex ions formed between organic ligands and technetium in the (V) oxidation state are
known with the general formula, TcO3XLL, where X is a halide and L is an organic ligand. the
ligands typically bond through an oxygen or nitrogen atom. Other organic complexes of the (V)
state have the general formulas: TcOX2L2, TcOX4
!1, and TcOX5
!2.
Dissolution of Samples
Dissolution of samples containing technetium requires two precautions: it is essential that acid
solutions be heated only under reflux conditions to avoid losses by volatilization, and dissolution
should be done only with strongly oxidizing conditions to ensure conversion of all lower
oxidation states to Tc(VII). In addition, problems with slow carrier exchange are less likely for
the (VII) oxidation state. Molybdenum targets are dissolved in nitric acid or aqua regia, but the
excess acid interferes with many subsequent analytical steps. Dissolution in concentrated sulfuric
acid followed by oxidation with hydrogen peroxide after neutralization avoids these problems of
excess acid. Other technetium samples can be dissolved by fusion with sodium peroxide/sodium
hydroxide (Na2O2/NaOH) fluxes.
Separation Methods
PRECIPITATION AND COPRECIPITATION. The various oxidation states of technetium are
precipitated in different forms with different reagents. Technetium(VII) is primarily present in
solution as the pertechnetate anion, and macro quantities are precipitated with large cations such
as thallium (Tl+1), silver (Ag+1), cesium (Cs+1), and tetraphenylarsonium [(C6H5)4As+1]. the
latter ion is the most efficient if ice-bath conditions are used. Pertechnetate is coprecipitated
without interference from molybdenum with these cations and perrhenate (ReO4
!1), perchlorate
(ClO4
!1), periodate (IO4
!1), and tetrafluoroborate (BF4
!1). The salt consisting of tetraphenylar-
senium and the perrhenate froms a coprecipitate fastest, in several seconds. Technetium(VII) can
be precipitated from solution as the heptasulfide (Tc2S7) by the addition of hydrogen sulfide (or
hydrogen sulfide generating compounds such as thioacetamide and sodium thiosulfate) from 4 M
sulfuric acid. Because many other transition metals often associated with technetium also from
insoluble compounds with sulfide, the method is primarily used to concentrate technetium.
Technetium (+4) is carried by ferric hydroxide. The method can be use to separate technetium
from rhenium. The precipitate is solubilized and oxidized with concentrated nitric acid, and iron
is removed by precipitation with aqueous ammonia. Technetium is coprecipitated as the hexa-
chlorotechnetate (+4) (TcCl6
-2) with thallium, and rhenium as the α,α’-dipyridylhexachloro-
rhenate (+4).
Technetium(VI) (probably as TcO4
!2) is carried quantitatively by molybdenum 8-hydroxyquino-
late and by silver or lead molybdate. Tc+3 is carried quantitatively by iron or zinc hydroxide and

Separation Techniques
14-167
JULY 2004 MARLAP
the sulfide, hydroxide, and 8-hydroxyquinolate of molybdenum.
SOLVENT EXTRACTION. Technetium, primarily in the Tc(VII) state (pertechnetate) can be isolated
by extraction with organic solvents, but the principal disadvantage of all extraction systems is the
inevitable introduction of organic material that might reduce the pertechnetate anion and cause
difficulties in subsequent analytical steps. The pertechnetate ion is extracted with pyridine from a
4 M sodium hydroxide solution, but perrhenate and permanganate ions are also extracted. The
anion also extracts into chloroform in the presence of the tetraphenylarsonium ion as tetraphenyl-
arsonium pertechnetate. Extraction is more favorable from neutral or basic sulfate solutions than
chloride solutions. Perrhenate and perchlorate are also extracted but molybdenum does not
interfere. Small amounts of hydrogen peroxide in the extraction mixture prevent reduction of
pertechnetate. Technetium is back-extracted into 0.2 M perchloric acid or 12 M sulfuric acid.
Other organic solvents are have also been used to extract pertechnetate from acid solutions,
including alcohols, ketones, and tributyl phosphate. Ketones and cyclic amines are more effective
for extraction from basic solutions. Tertiary amines and quaternary ammonium salts are more
effective extracting agents than alcohols, ketones, and tributyl phosphate. Back extraction is
accomplished several ways, depending on the extraction system. A change in pH, displacement
by another anion such as perchlorate, nitrate, or bisulfate, or addition of a nonpolar solvent to an
extraction system consisting of an oxygen-containing solvent.
A recent extraction method has been used successfully for extraction chromatography and
extractive filtration. A column material consisting of trioctyl and tridecyl methyl ammonium
chlorides impregnated in an inert apolar polymeric matrix is used to separate 99Tc by loading the
radionuclide as the pertechnetate ion from a 0.1 M nitric acid solution. It is stripped off the
column most readily with 12 M nitric acid. Alternatively, the extraction material is used in a
filter disc, and the samples containing 99Tc are filtered from water at pH 2 and rinsed with 0.01
M nitric acid. Technetium is collected on the disc.
Lower oxidation states of technetium are possible. The thiocyanate complexes of technetium(V)
are soluble in alcohols, ethers, ketones, and trioctylphosphine oxide or trioctylamine
hydrochloride in cyclohexane or 1,2-dichloroethane. Technetium (+4), as TcCl6
!2, extracts into
chloroform in the presence of high concentrations of tetraphenylarsonium ion. Pertechnetate and
perrhenate are both extracted from alkaline solution by hexone (methyl isobutyl ketone), but
reduction of technetium to the +4 state with hydrazine or hydroxylamine results in the extraction
of perrhenate only.
ION-EXCHANGE CHROMATOGRAPHY. Ion-exchange chromatography is primarily performed with
technetium as the pertechnetate anion. Technetium does not exchange on cation resins, so
technetium is rapidly separated from other cations on these columns. In contrast, it is strongly
absorbed on strong anion exchangers and is eluted with anions that have a greater affinity for the
resin. Technetium and molybdenum are separated using ammonium thiocyanate as the eluent. A
good separation of pertechnetate and molybdate has been achieved on an anion-exchange resin in

Separation Techniques
14-168
MARLAP JULY 2004
the phosphate form where the molybdate is preferentially absorbed. Good separation of
pertechnetate and perrhenate are obtained with perchlorate as the eluent.
VOLATILIZATION. The volatility of technetium heptoxide allows the co-distillation of technetium
with acids. Co-distillation from perchloric acid gives good yields, but only a partial separation
from rhenium is achieved. Molybdenum is also carried unless complexed by phosphoric acid.
Separation from rhenium can be achieved from sulfuric acid, but yields of technetium are can be
very poor because of its reduction by trace impurities in the acid. Much more reproducible results
can be obtained in the presence of an oxidizing agent, but ruthenium tetroxide (RuO4) also
distills under these conditions. It can be removed, however, by precipitation as ruthenium dioxide
RuO2. In distillation from sulfuric acid-water mixtures, technetium distills in the low-boiling
point aqueous fraction, probably as pertechnetic acid. Technetium and rhenium are separated
from sulfuric-hydrochloric acid mixtures; pertechnetate is reduced to nonvolatile Tc+4 and
remains in the acid solution. Technetium heptoxide can be separated from molybdenum trioxide
by fractional sublimation at temperatures $ 300 EC.
ELECTRODEPOSITION. Technetium can be electrodeposited as its dioxide (TcO2) from 2 M
sodium hydroxide. The metal is partially separated from molybdenum and rhenium, but
deposition only occurs from low technetium concentrations. Carrier-free 95Tc and 96Tc have been
electrolyzed on a platinum electrode from dilute sulfuric acid. Optimum electroplating of
technetium has been achieved at pH 5.5 in the presence of very dilute fluoride ion. Yields were
better with a copper electrode instead of platinum—about 90 percent was collected in two hours.
Yields of 98–99 percent were achieved for platinum electrodes at pH 2-5 when the plating time
of up to 20 hours was used. In 2 M sulfuric acid containing traces of fluoride, metallic
technetium instead of the dioxide is deposited on the electrode.
Methods of Analysis
Technetium-99 is analyzed by ICP-MS, gas proportional counting, or liquid scintillation from its
beta emission. No gamma rays are emitted by this radionuclide. For ICP-MS analysis, technetium
is stripped from an extraction chromatography resin and measured by the spectral system. The
results should be corrected for interference by 99Ru, if present. For beta analysis, technetium can
be electrodeposited on a platinum disc and beta counted. Alternatively, it is collected by
extraction-chromatography techniques. The resin from a column or the disc from a filtration
system is placed in a liquid scintillation vial and counted. Technetium-99m (t1/2=6.0 h), measured
by gamma-ray spectrometry, can be used as a tracer for measuring the chemical yield of 99Tc
procedures. Conversion electron ejection from the tracer should then be subtracted from the total
beta count when measuring 99Tc. Alternatively, samples are counted immediately after isolation
and concentration of technetium to determine the chemical recovery, then the 99mTc is allowed to
decay before analysis of the 99Tc. A widely used medical application is the technetium generator.
Molybdenum-98 is neutron-irradiated and chemically oxidized to 99MoO4
!2. This solution is ion-
exchanged onto an acid-washed alumina column. After about 1.25 days, the activity of 99mTc has

Separation Techniques
14-169
JULY 2004 MARLAP
grown-in to its maximum concentration. The 99Tc is eluted with a 0.9% solution of NaCl, while
the 99Mo remains on the column. The column may have its 99mTc removed after another 1.25
days, but at a slightly smaller concentration. The 99mTc thus separated is carrier free. This process
historically was referred to as “milking,” and the alumina column was called the “cow.”
Neutron activation analysis methods for technetium have been employed since 1972. A method
was developed and applied for the analysis of 99Tc in mixed fission products. The method
employs chemical separation of 99Tc from most fission products by a cyclohexanone extraction
from a basic carbonate solution. Technetium-99 is stripped into water by addition of CCl4 to the
cyclohexanone phase and then isolated on an anion exchange column. Neutron irradiation of the
isolated 99Tc was made in the pneumatic facility at a high flux beam reactor (e.g., at a flux of
5×10¹⁴ n·cm2/sec for approximately 11 seconds. Thus, after irradiation 99Tc is converted to 100Tc,
which, because of its 15.8 second half-life, requires an automatic process to measure its 540 and
591 keV gamma lines.
Compiled from: Anders, 1960; Bate, 1979; CRC, 1998-99; Choppin et al., 1995; Cobble,
1964; Considine and Considine, 1983; Coomber, 1975; Cotton and Wilkinson, 1988; DOE,
1990 and 1997, 1997; Ehmann and Vance, 1991; Foti et al., 1972a, 1972b; Fried, 1995;
Greenwood and Earnshaw, 1984; Hassinsky and Adloff, 1965; Kleinberg et al., 1960;
Lindsay, 1988; SCA, 2001; Wahl and Bonner, 1951.
14.10.9.13 Thorium
Thorium, with an atomic number of 90, is the second member in the series of actinide elements.
It is one of only three of the actinides—thorium, protactinium, and uranium—that occur in nature
in quantities sufficient for practical extraction. In solution, in all minerals, and in virtually all
compounds, thorium exists in the +4 oxidation state; it is the only actinide exclusively in the +4
state in solution.
Isotopes
There are 24 isotopes of thorium ranging inclusively from 213Th to 236Th; all are radioactive.
Thorium-232, the parent nuclide in the natural decay series, represents virtually 100 percent of
the thorium isotopes in nature, but there are a trace amounts of 227Th, 228Th, 230Th, 231Th, and 234Th
(progeny of 232Th and 235/238U). The remaining isotopes are anthropogenic. The most important
environmental contaminants are 232Th and 230Th (a member of the 238U decay series). They have
half-lives of 1.41×10¹⁰ years and 75,400 years, respectively.
Occurrence and Uses
Thorium is widely but sparsely dispersed in the Earth’s crust. At an average concentration of
approximately 10 ppm, it is over three times as abundant as uranium. In the ocean and rivers,

Separation Techniques
14-170
MARLAP JULY 2004
however, its concentration is about one-thousandth that of uranium (about 10!8 g/L) because its
compounds are much less soluble under environmental conditions. There are six minerals whose
essential element is thorium; thorite (uranothorite) and thorianite are common examples. Several
lanthanum and zirconium minerals are also thorium-bearing minerals; examples include
monazite sand and uraninite. In each mineral, thorium is present as its oxide, thorium dioxide
(ThO2). Monazite sand is the most common commercial mineral, but thorite is also a source of
thorium.
Thorium is extracted from its minerals with hot sulfuric acid or hot concentrated alkali,
converted into thorium nitrate [Th(NO3)4] (its chief commercial compound), extracted with
organic solvents (commonly kerosene containing tributylphosphate), stripped from the organic
phase by alkali solutions, and crystallized as thorium nitrate or precipitated with oxalate. The
metal can be produced by electodeposition from the chloride or fluoride dissolved in fused alkali
halides or by thermoreduction of thorium compounds by calcium (1,000–1,200 EC). Thorium can
also be produced as a by-product in the production of other valuable metals such as nickel,
uranium, and zirconium, in addition to the lanthanides. Unextracted minerals or partially
extracted mill tailings represent some forms of thorium contaminants found in the environment.
Very insoluble forms of thorium hydroxide [Th(OH)4] are other common species found.
Metallic thorium has been used as an alloy in the magnesium industry and as a deoxidant for
molybdenum, iron, and other metals. Because of its high density, chemical reactivity, poor
mechanical properties, and relatively high cost, it is not used as a structural material. Thorium
dioxide is a highly refractory material with the highest melting point among the oxides,
3,390 EC. It has been used in the production of gas mantles, to prevent crystallization of tungsten
in filaments, as furnace linings, in nickel alloys to improve corrosion resistance, and as a catalyst
in the conversion of methanol to formaldehyde. Thorium-232 is a fuel in breeder reactors. The
radionuclide absorbs slow neutrons, and with the consecutive emission of two beta particles, it
decays to 233U, a fissionable isotope of uranium with a half-life of 159,000 years.
Solubility of Compounds
Thorium exists in solution as a highly charged ion and undergoes extensive interaction with
water and with many anions. Few of the compounds are water soluble; soluble thorium
compounds include the nitrate [Th(NO3)4], sulfate [Th(SO4)2], chloride (ThCl4), and perchlorate
[Th(ClO4)4]. Many compounds are insoluble in water and are used in the precipitation of thorium
from solution, including the hydroxide [Th(OH)4], fluoride (ThF4), iodate [Th(IO3)4], oxalate
[Th(C2O4)2], phosphate [Th3(PO4)4], sulfite [Th(SO3)2], dichromate [Th(Cr2O7)2], potassium
hexafluorothorionate [K2ThF6], thorium ferrocyonide (+2) [ThFe(CN)6], and thorium peroxide
sulfate [Th(OO)2SO4].
The thorium ion forms many complex ions, chelates, and solvated species that are soluble in
organic solvents. This property is the basis of many procedures for the separation and purification

Separation Techniques
14-171
JULY 2004 MARLAP
of thorium (see below). For example, certain ions, such as nitrate and sulfate, form large
unsolvated complex ions with thorium that are soluble in organic solvents. Chelates of 1,3-
diketones, such as acetylacetone (acac) and TTA, form neutral molecular chelates with the
thorium ion that are soluble. In addition, many neutral organic compounds have strong solvating
properties for thorium, bonding to the thorium ion in much the same way water solvates the ion
at low pH. TBP, diethyl ether, methyl ethyl ketone, mesityl oxide, and monoalkyl and dialkyl
phosphates are examples of such compounds.
Review of Properties
Thorium is the first member of the actinide series of elements that includes actinium (Ac),
uranium, and the transuranium elements. Thorium is a bright, silver-white metal with a density
above 11 g/cm3. It tarnishes in air, forming a dark gray oxide coating. The massive metal is
stable, but in finely divided form and as a thin ribbon it is pyrophoric and forms thorium oxide
(ThO2). Thorium metal dissolves in hydrochloric acid, is made passive by nitric acid, but is not
affected by alkali. It is attacked by hot water and steam to form the oxide coating and hydrogen,
but its reactions with water are complicated by the presence of oxygen. Thorium has four valence
electrons (6d27s2). Under laboratory conditions, chlorides, bromides, and iodides of the bi- and
trivalent state have been prepared. In aqueous solution and in most compounds, including all
those found in nature, thorium exists only in the +4 oxidation state; its compounds are colorless
in solution unless the anion provides a color. Thorium forms many inorganic compounds in acid
solution.
Solution Chemistry
Because the only oxidation state of thorium in solution is the +4 state, its chemistry is not
complicated by oxidation-reductions reactions that might produce alternate species in solution.
With the +4 charge and corresponding charge-to-radius ratio of 4.0, however, thorium forms very
stable complex ions with halides, oxygen-containing ligands, and chelating agents. Although
Th+4 is large (0.99 D; 0.099 nm; 99 pm) relative to other +4 ions (Ti, Zr, Hf, Ce) and therefore
more resistant to hydrolysis, as a highly charged ion, it hydrolyzes extensively in aqueous
solutions above pH 3 and tends to behave more like a colloid than a true solution. The
concentration of Th+4 is negligible under those conditions. Below pH 3, however, the
uncomplexed ion is stable as the hydrated ion, Th(H2O)8 or 9
+4.
COMPLEXATION. Thorium has a strong tendency to form complex ions in solution. The presence
of HF forms very stable complex ions, for example, with one, two, or three ligands:
Th+4 + HF 6 ThF+3 + H+1
ThF+3 + HF 6 ThF2
+2 + H+1
ThF2
+2 + HF 6 ThF3
+1 + H+1

Separation Techniques
14-172
MARLAP JULY 2004
These complex ions represent the predominant species in solutions containing HF. Stable
complex ions also form with oxygen-containing ligands such as nitrate, chlorate, sulfate,
bisulfate, iodate, carbonate, phosphate, most carboxylate anions, and chelate anions. Some
chelating agents such as salicylate, acetylacetonate (acac), TTA, and cupferron form complexes
that are more soluble in organic solvents, This property is the basis of several radiochemical
isolation methods for thorium. Through the formation of soluble complex ions, chelating agents
found in some industrial wastewater or natural water samples will interfere to varying degrees
with the isolation of thorium by ferric hydroxide [Fe(OH)3] coprecipitation. Alternative isolation
methods should be used, such as coprecipitation from an acidic solution with an alternative
reagent. Protonation of the anionic form of chelates with acid renders them useless as chelating
agents. Other complexing agents also interfere with precipitation by the formation of soluble
ions. Thorium, for example, does not precipitate with oxalate in the presence of carbonate ions.
A procedure for separating thorium from rare-earth ions takes advantage of the formation of a
soluble thorium-EDTA complex that inhibits thorium precipitation when the rare-earth ions are
precipitated with phosphate. The presence of high concentrations of other complexing agents
such as phosphate, chloride, and other anions found in some samples takes thorium into a
completely exchangeable form when it is solubilized in high-concentration nitric acid.
HYDROLYSIS. Beginning at pH 3, thorium ions undergo extensive hydrolysis to form monomeric
and polymeric complexes in solution, leaving little Th+4 in a saturated solution at pH 3
(approximately 5×10!6 M). Tracer solutions containing 234Th can be added at pH 2 to allow
equilibration because it is not likely to occur if part of the thorium is hydrolyzed and bound in
polymeric forms.
The hydrolysis process is complex, depending on the pH of the solution and its ionic strength.
Several species have been proposed: three are polynuclear species, Th2(OH)2
+6, Th4(OH)8
+8, and
Th6(OH)15
+9; and two are monomeric species, Th(OH)+3 and Th(OH)2
+2. The monomeric species
are of minor importance except in extremely dilute solutions, but they become more important as
the temperature increases. The presence of chloride and nitrate ion diminishes hydrolysis,
because the formation of corresponding complex ions markedly suppresses the process. Hydroly-
sis increases with increasing hydroxide concentration (pH), and eventually polymerization of the
species begins. At a pH of about 5, irreversible hydrolysis produces an amorphous precipitate of
thorium hydroxide, a polymer that might contain more than 100 thorium atoms. Just before
precipitation, polymerization slows and equilibration might take weeks or months to obtain.
Routine fuming of a sample containing organic material with nitric acid is recommended after
addition of tracer, but before separation of thorium as a hydroxide precipitate because there is
evidence for lack of exchange between added tracer and isotope already in solution. Complexing
with organic substances in the initial solution or existence of thorium in solution as some
polymeric ion have been suggested as the cause.
ADSORPTION. The insoluble hydroxide that forms in solution above pH 3 has a tendency to

Separation Techniques
14-173
JULY 2004 MARLAP
coagulate with hydrated oxides such as ferric oxide. The high charge of the Th+4cation, high
charge-to-radius ratio, and tendency to hydrolyze all contribute to the ability of thorium to adsorb
on surfaces by ion-exchange mechanisms or chemical adsorption mechanisms. These adsorption
properties greatly affect the interaction of thorium with ion-exchange resins and environmental
media such as soil.
Dissolution of Samples
Thorium samples are ignited first to remove organic materials. Most compounds will decompose
when sintered with sodium peroxide (Na2O2), and most thorium minerals will yield to alternate
sodium peroxide sintering and potassium pyrosulfate (K2S2O7) fusion. It is often necessary to
recover thorium from hydrolysis products produced by these processes. The hydrolysis products
are treated with hydrofluoric acid, and thorium is recovered as the insoluble fluoride. Rock
samples are often dissolved in hydrofluoric acid containing either nitric acid or perchloric acid.
Monazite is dissolved by prolonged sintering or with fuming perchloric or sulfuric acid. Thorium
alloys are dissolved in two steps, first with aqua regia (nitric and hydrochloric acid mixture)
followed by fusion with potassium pyrosulfate. Thorium targets are dissolved in concentrated
nitric acid containing hydrofluoric acid, mantles in nitric or sulfuric acid, and tungsten filaments
with aqua regia or perchloric acid.
Separation Methods
PRECIPITATION AND COPRECIPITATION. Precipitation and coprecipitation are used to separate and
collect thorium from aqueous solutions either for further treatment in an analytical scheme or for
preparation of a sample for counting. Formation of insoluble salts is used to precipitate thorium
from solution; examples include the hydroxide, peroxide, fluoride, iodate, oxalate, and
phosphate, among others. Tracer quantities of thorium are commonly coprecipitated with
lanthanum fluoride (LaF3), neodymium fluoride (NdF3), and cerium fluoride (CeF3) in separation
schemes and to prepare samples for alpha counting. Tracer quantities are also carried with
calcium oxalate [Ca(C2O4)], ferric hydroxide [Fe(OH)3], zirconium iodate [Zr(IO3)4], zirconium
phosphate [Zr3(PO4)4], and barium sulfate (BaSO4).
ION EXCHANGE. The highly charged thorium cation is strongly adsorbed onto cation exchangers
and is more difficult to elute than most other ions. Its strong adsorption property makes it
possible to remove trace quantities of thorium from a large volume of solution onto small
amounts of ion-exchange resin. Washing the resin with mineral acids of various concentrations
separates thorium from less strongly bound cations that elute from the resin. For example, Th+4
remains bonded at all hydrochloric concentrations, allowing other cations to be eluted at different
concentrations of acid. Thorium is eluted by complexing agents such as citrate, lactate, fluoride,
carbonate, sulfate, or oxalate that reduce the net charge of the absorbing species, causing reversal
of the adsorption process.

Separation Techniques
14-174
MARLAP JULY 2004
Anion exchangers are useful for separating thorium, but the contrasting behavior of thorium with
the resin depends on whether hydrochloric or nitric acid is used as an eluent. In hydrochloric
acid, several metal ions, unlike thorium, form negative complexes that can be readily removed
from a thorium solution by adsorption onto the anionic exchanger. Thorium forms positively
charged chlorocation complexes or neutral thorium chloride (ThCl4) in the acid and is not
exchanged onto the resin at any hydrochloric acid concentration. In contrast, thorium forms
anionic complexes in nitric acid solution that adsorb onto the exchanger over a wide range of
nitric acid concentrations, reaching a maximum affinity near 7 M nitric acid. Behavior in nitric
acid solution is the basis for a number of important radiochemical separations of thorium from
rare earths, uranium, and other elements.
ELECTRODEPOSITION. Thorium separated from other actinides by chemical methods can be
electrodeposited for alpha counting from a dilute solution of ammonium sulfate adjusted to a pH
of 2. The hydrous oxide of thorium is deposited in one hour on a highly polished platinum or
stainless-steel disc serving as the cathode of an electrolytic cell. The anode is a platinum-iridium
alloy.
SOLVENT EXTRACTION. Many complexes and some compounds of thorium can be extracted from
aqueous solutions into a variety of organic solvents. The TTA (α-theonyltrifluoroacetone)
complex of metals is widely used in radiochemistry for the separation of ions. Thorium can be
separated from most alkali metal, alkaline earth, and rare earth metals after the complex is
quantitatively extracted into benzene above pH 1. Backwashing the organic solution with dilute
acid leaves the more soluble ions in benzene.
Extraction of nitrates and chlorides of thorium into organic solvents from the respective acid
solutions is widely used for isolation and purification of the element. One of the most common
processes is the extraction of thorium nitrate from a nitric acid solution with TBP. TBP is usually
diluted with an inert solvent such as ether or xylene/toluene to reduce the viscosity of the
mixture. Dilution reduces the extraction effectiveness of the mixture, but the solubility of many
contaminating ions is greatly reduced, increasing the effectiveness of the separation when the
thorium is recovered by backwashing.
Long-chain amine salts have been very effective in carrying thorium in laboratory and industrial
extraction process using xylene/toluene. Complex sulfate anions of thorium are formed in
sulfuric acid that act as the counter ion to the protonated quaternary amine cation. They
accompany the organic salt into the organic phase.
In recent years, solvent extraction chromatography procedures have been developed to separate
thorium. These procedures use extraction chromatography resins that consist of extractant
materials such as Aliquat-336® (tricaprylylmethylammonium chloride or methyltricaprylyl-
ammonium chloride), CMPO in TBP, or DPPP (dipentylpentylphosphonate), also called DAAP
(diamylamylphosphonate), or absorbed onto an inert polymeric material. They are used in a

Separation Techniques
14-175
JULY 2004 MARLAP
column, rather than in the traditional batch mode, and provide a rapid efficient method of
separating the radionuclide with the elimination of large volumes of organic waste.
Methods of Analysis
Chemical procedures are used for the analysis of macroscopic quantities of thorium in solution
after it has been separated by precipitation, ion exchange, extraction, and/or extraction chroma-
tography from interfering ions. Gravimetric determination generally follows precipitation as the
oxalate that is calcined to the oxide (ThO2). Numerous volumetric analyses employ EDTA as the
titrant. In the most common spectrometric method of analysis, thorin, a complex organoarsenic
acid forms a colored complex with thorium that is measured in the visible spectrum.
Trace quantities of thorium are measured by alpha spectrometry after chemical separation from
interfering radionuclides. Thorium-227, 228Th, 230Th, and 232Th are determined by the
measurement of their respective spectral peaks (energies), using 234Th as a tracer to determine the
chemical yield of the procedure. The activity of the tracer is determined by beta counting in a
proportional counter. Thorium-234 also emits gamma radiation that can be detected by gamma
spectrometry; however, the peak can not be measured accurately because of interfering peaks of
other gamma-emitting radionuclides. Thorium-229 is sometimes used as a tracer to determine the
chemical yield of the alpha spectrometric procedure, but it produces considerable recoil that
might contaminate the detector.
Compiled from: Ahrland, 1986; Baes and Mesmer, 1976; Cotton, 1991; Cotton and
Wilkinson, 1988; DOE, 1990 and 1997, 1997; EPA, 1980 and 1984; Greenwood, 1984;
Grimaldi, 1961; Hassinsky and Adloff, 1965; Hyde, 1960; Katzin, 1986; Lindsey, 1988.
14.10.9.14 Tritium
Unlike the elements reviewed in this section, tritium is the only radionuclide of the element
hydrogen. It contains two neutrons and is represented by the symbols 3H, 3T, or simply, T. The
atom contains only one valence electron so its common oxidation state, besides zero, is +1,
although it can exist in the !1 state as a metal hydride.
Occurrence and Uses
Tritium is found wherever hydrogen is found, with and without the other isotopes of the element
(hydrogen and deuterium)—as molecular hydrogen (HT, DT, T2), water (HOT, DTO, T2O), and
inorganic and organic compounds, hydrides and hydrocarbons, respectively, for example. About
99 percent of the radionuclide in nature from any source is in the form of HOT. Natural processes
account for approximately one T atom per 1018 hydrogen atoms. The source of some natural
tritium is ejection from the sun, but the primary source is from bombardment of 14N with cosmic
neutrons in the upper atmosphere:

Separation Techniques
14-176
MARLAP JULY 2004
7
14
0
13
6
12
N + n H C
→+
Most tritium from this source appears as HOT.
Tritium is produced in laboratory and industrial processes by nuclear reactions such as:
1
2
1
2
1
3
1
1
D + D T H
→+
For large-scale production of tritium, 6Li alloyed with magnesium or aluminum is the target of
neutrons:
3
6
0
1
1
3
2
4
Li + n T He
→+
The radionuclide is retained in the alloy until released by acid dissolution of the target. Large
quantities are handled as HT or HOT. HOT is formed from HT when it is exposed to oxygen or
water vapor. A convenient way to store tritium is as the hydride of uranium (UT3). It is formed by
reacting the gas with finely divided uranium and is released by heating the compound above
400 EC.
Tritium is also produced in nuclear reactors that contain water or heavy water from the neutron
bombardment of boron, lithium, and deuterium:
10B(n, T) 2 4He
11B(n, T) 9Be
6Li (n, T) 4He
2H (n,γ) T
and from the fission process as a ternary fission fragment. Significant uses for tritium are in
fission bombs to boost their yield, in thermonuclear weapons (the hydrogen bomb), in lumines-
cent signs, and in night-vision military applications. Tritium bombarded with high-energy
deuterons undergoes fusion to form helium and releases neutrons:
1
3
1
2
2
4
0
1
H + H He n
→+
A tremendous amount of energy is released during the nuclear reaction, much more than the
energy of the bombarding particle. Fusion research on controlled thermonuclear reactions should
lead to an energy source for electrical generation.
Tritium absorbed on metals are a source of neutrons when bombarded with deuterons. Mixed
with zinc sulfide, it produces radioluminescence that is used in luminescent paint and on watch

Separation Techniques
14-177
JULY 2004 MARLAP
dials. Gaseous tritium in the presence of zinc sulfide produces a small, permanent light source
found in rifle sights and exit signs. Tritium is also a good tracer because it does not emit gamma
radiation. Hydrological studies with HOT are used to trace geological water and the movement of
glaciers. It is also used as a tracer for hydrogen in chemical studies and biological research. In
medicine, it is used for diagnosis and radiotreatment.
Review of Properties
Tritium (t½ . 12.3 y) decays by emission of a low-energy beta particle to form 3He, and no
gamma radiation is released. The range of the beta particle is low, 6 mm in air and 0.005 mm in
water or soft tissue.
The physical and chemical properties of tritium are somewhat different than hydrogen or
deuterium because of their mass differences (isotope effects). Tritium is approximately 1.5 times
as heavy as deuterium and three times heavier than hydrogen, and the isotope effect can be large
for mass differences of these magnitudes. In its simple molecular form, tritium exists primarily as
T2 or DT. The oxide form is HOT, DTO, or T2O, with higher molecular weights than water
(H2O). Thus molecules of tritiated water are heavier, and any process such as evaporation or
distillation that produces a phase transition results in isotopic fractionation and enrichment of
tritium in water. In a mixture of the oxides, various mixed isotopic water species are generally
also present because of exchange reactions: in any mixture of H2O, D2O, and T2O, HOT and
DTO are found.
Tritium can be introduced into organic compounds by exposing T2 to the compound for a few
days or weeks, irradiation of the compound and a lithium salt with neutrons (recoil labeling), or it
can be selectively introduced into a molecule by chemical synthesis using a molecular tritium
source such as HOT. Beta radiation causes exchange reactions between hydrogen atoms in the
compound and tritium and migration of the isotope within the molecule. Phenol (C6H5OH), for
example, labeled with tritium on the oxygen atom (C6H5OT) will become C6H4TOH and
C6H4TOT. When tritium samples are stored in containers made from organic polymers such as
polyethylene, the container will adsorb tritium, resulting in a decrease in the concentration of
tritium in the sample. Eventually, the tritium atoms will migrate to the outer surface of the
container, and tritium will be lost to the environment. Catalytic exchange also occurs in tritiated
solutions or solutions containing T2 gas. Exchange is very rapid with organic compounds when
H+1 or OH!1 ions or if a hydrogen-transfer agent such as Pt or Pd is present.
Tritium as HT or HOT will absorb on most metallic surfaces. Penetration at room temperature is
very slow, and the radionuclide remains close to the surface. In the form of HOT, it can be
removed with water, or by hydrogen gas in the form of HT. Heating aids the removal. When
tritium is absorbed at elevated temperatures, it penetrates deeper into the surface. Adsorption
under these conditions will result in enough penetration to cause structural damage to the metal,
especially if the process continues for extended periods. Hydrogenous material such as rubber

Separation Techniques
14-178
MARLAP JULY 2004
and plastics will also absorb tritium. It will penetrate into the material, and hydrogenous
materials are readily contaminated deep into the material, and it is impossible to completely
remove the tritium. Highly contaminated metal or plastic surfaces can release some of the loosely
bound tritium immediately after exposure in a process called outgassing.
Pure T2O can be prepared by oxidation of tritium gas with hot copper oxide (Cu+2) or direct
combination of the gas with oxygen in the presence of an electrical spark. It is never used for
chemical or biological processes because one milliliter contains 2,650 curies. The liquid is self-
luminescent, undergoes rapid self-radiolysis, and considerable radiation damage is done to
dissolved species. For the same reason, very few compounds of pure tritium have ever been
prepared or studied.
Tritium is not a hazard outside the body. Gamma radiation is not released by its decay. The beta
emission is low in energy compared to most beta emitters and readily stopped by the outer layer
of skin. Only ingested tritium can be a hazard. Exposure to tritium is primarily in the form of HT
gas or HOT water vapor, although T2 and T2O may be present. Only about 0.005 percent of the
activity of inhaled HT gas is incorporated into lung tissue, and most is exhaled. In addition,
tritiated water can be absorbed through the skin or wounds unless protective equipment is used.
Tritium is found in tissue wherever hydrogen is found. The biological half-life is about ten days,
but the value varies significantly, depending on exertion rates and fluid intake.
Environmental tritium is formed in the gaseous and aqueous forms, but over 99 percent of tritium
from all sources is found in the environment after exchange with hydrogen in water in the form
of HOT. It is widely distributed in the surface waters of the Earth and makes a minor contribution
to the activity of ocean water. It can also be found in laboratories and industrial sites in the form
of metal hydrides, tritiated pump oil, and tritiated gases such as methane and ammonia.
Tritium found in environmental samples may be either exchangeable in acid media (labile) or
organically bound. In the latter case, combustion of the material is necessary to release the tritium
into an exchangeable form. This is performed usually by adding an oxidizing agent, like KMnO4,
if the contribution of the organic tritium to the total tritium is large.
Separation Methods
DISTILLATION. Tritium in water samples is essentially in the form of HOT. It can be removed
quantitatively from aqueous mixtures by distillation to dryness, which also separate it from other
radionuclides. Volatile iodine radionuclides are precipitated as silver iodide before distillation, if
they are present. The aqueous solution is usually distilled, however, from a basic solution of
potassium permangenate, which will oxidize radionuclides, such as iodine and carbon, and
oxidize organic compounds that might interfere with subsequent procedures, liquid scintillation
counting, for example. Charcoal can also be added to the distillation mixture as an additional
measure to remove organic material. Contaminating tritium in soil samples can be removed by

Separation Techniques
14-179
JULY 2004 MARLAP
distillation from similar aqueous mixtures. All tritium in soil samples might not be recovered by
this method, however, if the tritium is tightly bound to the soil matrix. Tritium also can be
removed by distillation of an azeotrope mixture formed with toluene or cyclohexane. In some
procedures, tritium is initially separated by distillation and then concentrated (enriched) by
electrolysis in an acid or base solution. Recovery of tritium from the electrolytic cell for analysis
is accomplished by a subsequent distillation.
DECOMPOSITION. Organically bound tritium in vegetation, food, and tissue samples can be
removed by combustion. The sample is freeze dried (lyophilized), and the water from the process
is collected in cold traps for tritium analysis. The remaining solid is collected as a pellet, which is
burned at 700 EC in a highly purified mixture of argon and oxygen in the presence of a copper(I)
oxide (Cu2O) catalyst, generated on a copper screen at the temperature of the process. Water
from the combustion process, containing tritium from the pellet, and water from the freeze-
drying process is analyzed for tritium by liquid scintillation counting.
Tritium in HOT can be reduced to TH by heating with metals, such as magnesium, zinc, or
calcium, and analyzed as a gas. Conversely, if tritium is present as HT or T2, it may be oxidized
to HOT by passing the gaseous sample over a platinum, palladium, or nickel catalyst in the
presence of air.
CONVERSION TO ORGANIC COMPOUNDS. Compounds that react readily with water to produce
hydrogen derivatives can be used to isolate and recover tritium that is present in the HOT form.
Organic compounds containing magnesium (Grignard reagents) with relatively low molecular-
weights will react spontaneously with water and produce a gaseous product containing hydrogen
from the water. Tritium from HOT in a water sample will be included in the gaseous sample. It is
collected after formation by condensation in a cold trap and vaporized into a gas tube for
measurement. Grignard reagents formed from butane, acetylene, and methane can be used in this
method. Tritiated butane is produced by the following chemical reaction:
C4H9MgBr + THO 6 C4H9T + Mg(OH)Br
Inorganic compounds can also be use to produce gaseous products:
Al4C3 + 3 HOT + 9 H2O 6 3 CH3T + 4 Al(OH)3
EXCHANGE. Methods to assess tritium in compounds take advantage of exchange reactions to
collect the radionuclide in a volatile substance that can be collected in a gas tube for measure-
ment. Acetone is one compound that easily exchanges tritium in an acid or base medium and is
relatively volatile.

Separation Techniques
14-180
MARLAP JULY 2004
Methods of Analysis
Tritium is collected primarily as HOT along with water (H2O) by distillation and then determined
from its beta emission in a liquid scintillation system. No gamma rays are emitted. The distilla-
tion process is usually performed from a basic solution of potassium permangenate to oxidize
radionuclides and organic compounds, preventing them from distilling over and subsequently
interfering with counting. Charcoal can also be added to the distillation mixture as an additional
measure to remove organic material. Volatile iodine radionuclides can be precipitated as silver
iodide before distillation. Another distillation technique involves the use of cyclohexane to form
an azeotropic (low boiling point) mixture. This technique is sometimes used in analysis of biota
samples. Tritium may be analyzed, indirectly, by mass spectrometry of its progeny, 3He.
Compiled from: Choppin et al., 1995; Cotton and Wilkinson, 1988; DOE, 1994; Demange et
al., 2002; Duckworth, 1995; Greenwood and Earnshaw, 1984; Hampel, 1968; Hassinky and
Adloff, 1965; Kaplan, 1995; Lindsay, 1988; Mitchell, 1961; Passo and Cook, 1994; Surano et
al., 1992.
14.10.9.15 Uranium
Uranium, atomic number 92, is the last naturally occurring member of the actinide series and the
precursor to the transuranic elements. Three isotopes are found in nature, and uranium was the
active constituent in the salts whose study led to the discovery of radioactivity by Becquerel in
1896.
Isotopes
There are 19 isotopes of uranium with mass numbers ranging from 222 to 242. All isotopes are
radioactive with half-lives range ranging from microseconds to billions of years. Uranium-235
(0.72%) and 238U (99.27%) occur naturally as primordial uranium. Uranium-234 has a natural
abundance of 0.0055%, but is present as a part of the 238U decay natural decay chain. The 234U
that was formed at the time the Earth was formed has long since decayed. The half-lives of these
principal isotopes of uranium are listed below.
Isotope
Alpha Decay
Half-Life
Spontaneous Fission
Half-Life
234 2.46 × 10⁵ years 1.42 × 10¹⁶ years
235 7.04 × 10⁸ years 9.80 × 10¹⁸ years
238 4.48 × 10⁹ years 8.08 × 10¹⁵ years
These isotopes have two different decay modes. Each decay mode has its own characteristic half-
life. As seen above the alpha decay mode is the most significant, because it has the shortest half-
life for each of these isotopes.

Separation Techniques
14-181
JULY 2004 MARLAP
Another isotope of uranium of significance is 232U (t½ . 69.8 y). It is used as a tracer in uranium
analyses and is also an alpha emitter so it can be determined concurrently with the major uranium
isotopes by alpha spectrometry.
Uranium-235 and artificially produced 233U are fissionable material on bombardment with slow
(thermal) neutrons. Other uranium radionuclides are fissionable with fast moving neutrons,
charged particles, high-energy photons, or mesons. Uranium-238 and 235U are both parents of
natural radioactive decay series, the uranium series of 238U that eventually decays with alpha and
beta emissions to stable 206Pb and the actinium series of 235U that decays to 207Pb.
Occurrence and Uses
Naturally occurring uranium is believed to be concentrated in the Earth’s crust with an average
concentration of approximately 4 ppm. Granite rocks contains up to 8 ppm or more, and ocean
water contains 0.0033 ppm. Many uranium minerals have been discovered. Among the better
known are uraninite, carnotite, adavidite, pitchblende, and coffinite. The latter two minerals are
important commercial sources of uranium. It is also found in phosphate rock, lignite, and
monazite sands and is commercially available from these sources. The artificial isotope, 233U, is
produced from natural 232Th by absorption of slow neutrons to form 233Th, which decays by the
emission of two beta particles to 233U.
Uranium is extracted from uranium minerals, ores, rocks, and sands by numerous chemical
extraction (leaching) processes. The extraction process is sometimes preceded by roasting the ore
to improve the processing characteristic of the material. The extraction process uses either an
acid/oxidant combination or sodium carbonate treatment, depending on the nature of the ore, to
convert the metal to a soluble form of the uranyl ion. Uranium is recovered from solution by
precipitating the uranate salt with ammonia or sodium hydroxide solution. Ammonium uranate is
known as “yellow cake.” The uranate salt is solubilized to give a uranyl nitrate solution that is
further purified by extraction into an organic phase to separate the salt from impurities and
subsequent stripping with water. It is precipitated as a highly purified nitrate salt that is used to
produce other uranium compounds—uranium trioxide (UO3) by thermal processing or uranium
dioxide (UO2) on reduction of the trioxide with hydrogen. Uranium tetrafluoride (UF4) is
prepared, in turn, from the dioxide by treatment with hydrogen fluoride. The metal is recovered
by fused-salt electrolysis in molten sodium chloride-calcium chloride or reduction with more
active metals such as calcium or magnesium (Ames Process) in an inert atmosphere at 1,000 EC.
Early in the twentieth century, the only use of uranium was in the production of a brown-yellow
tinted glass and glazes; it was a byproduct of the extraction of radium, which was used for
medicinal and research purposes. Since the mid-twentieth century, the most important use of
uranium is as a nuclear fuel, directly in the form of 233U and 235U, fissionable radionuclides, and
in the form of 238U that can be converted to fissionable 239Pu by thermal neutrons in breeder
reactors. Depleted uranium, uranium whose 235U content has been reduced to below about 0.2

Separation Techniques
14-182
MARLAP JULY 2004
percent, the majority of waste from the uranium enrichment process, is used in shielded
containers to transport radioactive materials, inertial guidance devices, gyro compasses,
counterweights for aircraft control surfaces, ballast for missile reentry vehicles, fabrication of
armor-piercing conventional weapons, and tank armor plating. Uranium metal is used as a X-ray
target for production of high-energy X-rays, the nitrate salt as a photographic toner, and the
acetate is used in analytical chemistry.
Solubility of Compounds
Only a small number of the numerous uranium compounds are soluble in water. Except for the
fluorides, the halides of uranium (+3 and +4) are soluble, as are the chloride and bromide of
U(V) [UOX2] and the fluoride, chloride, and bromide of U(VI) [UO2X2]. Several of the uranyl
(UO2+2) salts of polyatomic anions are also soluble in water: the sulfate, bicarbonate, acetate,
thiocyanate, chromate, tungstate, and nitrate. The latter is one of the most water-soluble uranium
compounds.
Review of Properties
Uranium is a dense, malleable and ductile metal that exists in three allotropic forms: alpha, stable
to 688 EC where it forms the beta structure, which becomes the gamma structure at 776 EC. It is
a poor conductor of electricity. The metal absorbs gases and is used to absorb tritium. Uranium
metal tarnishes readily in an oxidation process when exposed to air. It burns when heated to 170
EC, and the finely divided metal is pyrophoric. Uranium slowly decomposes water at room
temperature, but rapidly at 100 EC. Under a flux of neutrons and other accelerated particles,
atoms of uranium are displaced from their equilibrium position in its metallic lattice. With high
temperatures and an accumulation of fission products, the metal deforms and swells, becoming
twisted, porous, and brittle. The problem can be avoided by using some of its alloys, particularly
alloys of molybdenum and aluminum.
Uranium forms a large number of binary and ternary alloys with most metals. It also forms
compounds with many metals: aluminum, bismuth, cadmium, cobalt, gallium, germanium, gold,
indium, iron, lead, magnesium, mercury, nickel, tin, titanium, zinc, and zirconium. Many binary
compounds of the nonmetals are also known: hydrides, borides, carbides, nitrides, silicides,
phosphides, halides, and oxides. Although other oxides are known, the common oxides are UO2,
UO3, and U3O8. Uranium reacts with acids to form the +4 salts and hydrogen. It is very reactive
as a strong reducing agent.
Uranium compounds are toxic at high concentrations. The physiological damage occurs to
internal organs, especially the kidneys. The radioactivity of natural uranium radionuclides is not
of great concern, although it is high for some artificial isotopes. Natural uranium in the
environment is considered a relatively low hazard, however, because of its very long half-life and
low toxicity at minute concentrations.

Separation Techniques
14-183
JULY 2004 MARLAP
Uranium in nature is almost entirely in the +4 and VI oxidation states. It occurs as the oxides,
UO2 and U3O8, in the solid state. In ground water under oxic conditions it exists as UO2
+2 or
complexes of carbonate such as UO2(CO3)3
!4. Complex formation increases its solubility under
all conditions in normal groundwater and even under fairly strong reducing conditions. The
amount associated with particulate matter is small in natural oxic waters. In some waters,
solubility may be limited, however, by formation of an uranyl silicate species. Uranium in
general is poorly absorbed on geologic media under oxic conditions, especially at moderate and
high concentrations and in the presence of high carbonate concentrations. A significant
adsorption occurs at pH above about 5 or 6 because of formation of hydrolytic complexes.
Reduction to the IV oxidation state would increase uptake in the environmental pH range.
Solution Chemistry
The radiochemistry of uranium is complicated because of the multiple oxidation states that can
exist in solution and the extensive complexation and hydrolytic reactions the ions are capable of
undergoing in solution. Four oxidation states are possible: +3, +4, (V) and (VI); the latter two
exist as oxycations: UO2
+1 and UO2
+2, respectively. Their stabilities vary considerably, and the +4
and +6 states are stable in solution under certain conditions; oxidation-reduction reagents are
used to form and maintain these ions in solution. Each ion has different chemical properties, and
those of the +4 and (VI) states have been particularly exploited to stabilize, solubilize, separate,
and collect uranium. The multiple possibilities of oxidation state, complexation, and hydrolysis
should be carefully considered when planning any radiochemical procedures.
OXIDATION-REDUCTION BEHAVIOR. The multiple oxidation states can be exploited during
separation procedures by taking advantage of their different chemical properties. Thorium can be
separated from uranium, for example, by oxidizing uranium in solution to the +6 oxidation state
with 30 percent hydrogen peroxide (H2O2) and precipitating thorium as the hydroxide; in the +6
state, uranium is not precipitated.
The U+3 ion is an unstable form of uranium, produced in perchlorate or chloride solutions by
reduction of UO2
+2 electrochemically or with zinc amalgam. It is a powerful reducing agent, and
is oxidized to U+4 by chlorine or bromine. U+3 is slowly oxidized by water with the release of
hydrogen, and oxygen from air causes rapid oxidation. Aqueous solutions are red-brown and are
stable for several days in 1 M hydrochloric acid, especially if kept cold; rapid oxidation occurs in
more concentrated acid solutions.
The tetrapositive uranous ion, U+4, is produced by dissolving water-soluble salts of the ion in
solution, dissolving uranium metal with sulfuric or phosphoric acid, reduction of UO2
+1 during its
disproportionation reaction, reduction of UO2
+2 by Cr+2 or Ti+3, or oxidation of U+3. The tetraposi-
tive ion is green in solution. The ion is stable, but slowly oxidizes by oxygen from air to the +6
state.

Separation Techniques
14-184
MARLAP JULY 2004
The UO2
+1 ion (V) is extremely unstable in solution and exist only as a transient species,
disproportionating rapidly to U+4 and UO2
+2 according to the following reaction in the absence of
complicating factors (k = 1.7×10⁶):
2 UO2
+1 + 4 H+1 W UO2
+2 + U+4 + 2 H2O
Maximum stability is observed in the pH range 2–4 where the reaction is considerably slower.
Solutions of UO2
+1 are prepared by the dissolution of UCl5 or reduction of UO2
+2 ions
electrochemically or with U+4 ions, hydrogen, or zinc amalgam.
Uranium(VI) is generally agreed to be in the form of the dioxo or uranyl ion, UO2
+2. As the only
oxidation state stable in contact with air, it is very stable in solution and difficult to reduce.
Because of its exceptional stability, the uranyl ion plays a central role in the radiochemistry of
uranium. It is prepared in solution by the dissolution of certain water-soluble salts: nitrate,
halides, sulfate, acetate, and carboxylates; by dissolution of uranium(VI) compounds; and
oxidation of lower-oxidation state ions already in solution, U+4 with nitric acid for example. Its
solutions are yellow in color.
COMPLEXATION. Uranium ions form numerous complex ions, and the solution chemistry of
uranium is particularly sensitive to complexing agents present. Complex-ion chemistry is very
important, therefore, to the radiochemical separation and determination of uranium.
Complexation, for example, provides a method to prevent the removal of uranium ions or its
contaminants from solution and can influence the stability of ions in solution.
Among the oxidation states exhibited in solution, the tendency for formation of anionic
complexes is:
U+4 > UO2
+2 > U+3 > UO2
+1,
while the order of stability of the anionic complexes is represented by:
fluoride > nitrate > chloride > bromide > iodide > perchlorate > carbonate > oxalate > sulfate.
Numerous organic complexes form, including citrate, tartrate, and EDTA, especially with UO2
+2.
There is evidence for only a few complexes of U+3, cupferron and chloride for example. In
contrast, tetrapositive uranium, U+4, forms complexes with a wide variety of anions, and many
are stable: halides—including fluoride (up to eight ligands, UF8
!4)—chloride, and bromide;
thiocyanate; and oxygen-donors, nitrate, sulfates, phosphates, carbonate, perchlorate, and
numerous carboxylates: acetate, oxalate, tartrate, citrate, and lactate. The low charge on UO2
+1
precludes the formation of very stable complexes. Fluoride (from hydrogen fluoride) is notable,
however, in its ability to displace oxygen from the ion, forming UF6
!1—which inhibits

Separation Techniques
14-185
JULY 2004 MARLAP
disproportionation—and precipitating the complex ion from aqueous solution. The uranyl ion,
UO2
+2, readily forms stable complexes with a large variety of inorganic and carboxylate anions
very similar to those that complex with U+4. In addition, numerous organic ligands besides
carboxylates are known that contain both oxygen and nitrogen as donor atoms. Complex-ion
formation must be considered, therefore, during precipitation procedures. Precipitation of
uranium ions is inhibited, for example, in solutions containing carbonate, tartrate, malate, citrate,
hydroxylamine, while impurities are precipitated as hydroxides, sulfides, or phosphates.
Conversely, uranium is precipitated with ammonia, while other ions are kept in solution as
complexes of EDTA.
HYDROLYSIS. Some uranium ions undergo extensive hydrolysis in aqueous solution. The
reactions can lead to formation of polymeric products, which form precipitates under certain
conditions. The tendency of the various oxidation states toward hydrolysis, a specific case of
complexation, is, therefore, in the same order as that of complex-ion formation (above).
Little data are available on the hydrolysis of U+3 ion because it is so unstable in solution.
Qualitative evidence indicates, however, that hydrolysis is about that expected for a +3 ion of its
size—a much weaker acid than most other metals ions of this charge. The U+4 ion is readily
hydrolyzed in solution, but exists as the unhydrolyzed, hydrated ion in strongly acidic solutions.
Hydrolysis begins at pH<1, starting with the U(OH)+3 species. As pH increases, several species
form progressively up to U(OH)5
!1. The U(OH)+3 species predominates at high acidity and low
uranium concentrations, and the concentration of each species increases rapidly with the
temperature of the solution. In less acidic solutions and as the concentration of uranium
increases, a polymeric species forms, probably U6(OH)15
+9. Hydrolytic complexes of high
molecular weight probably form subsequently, culminating in precipitation. Hydrolysis of the
UO2
+1 ion has been estimated to be very low, consistent with the properties of a large, positive
ion with a single charge. Hydrolysis of UO2
+2 begins at about pH 3 and is fairly complicated. In
very dilute solutions, the monomeric species, UO2(OH)+1, forms initially; but the dimerized
species, (UO2)2(OH)2
+2, rapidly becomes the dominant form in solution, existing in a wide range
of uranium concentration and pH. As the pH increases, more complex polynuclear species
become prominent. The presence of complexing agents, such as chloride, nitrate, and sulfate ions
suppress hydrolysis to varying degrees.
Dissolution of Samples
Metallic uranium dissolves in nitric acid to form uranyl nitrate. Large amounts dissolve
moderately rapidly, but fine turnings or powder may react violently with nitric acid vapors or
nitrogen dioxide in the vapor. The presence of oxygen in the dissolution system tends to reduce
the oxides. The rate of dissolution of large amounts of uranium may be increased by the addition
of small amounts of sulfuric, phosphoric, or perchloric acids to the nitric acid solution. Other
common mineral acids such as sulfuric, phosphoric, perchloric, hydrochloric, and hydrobromic
acid are also used to dissolve uranium metal. Simple organic acids in hydrochloric acid dissolve

Separation Techniques
14-186
MARLAP JULY 2004
the metal, and other solvent systems are used: sodium hydroxide and hydrogen peroxide,
bromine in ethyl acetate, and hydrogen chloride in ethyl acetate or acetone. Uranium compounds
are dissolved in numerous solvents and solvent combinations such as water, mineral acids,
organic solvents such as acetone, alcohols, and diethyl ether. Dissolution of uranium from
minerals and ores is accomplished by decomposition of the sample or leaching the uranium.
Grinding and roasting the sample facilitates recovery. Decomposition of the sample can be
accomplished with mineral acids or by fusion or a combination of the two processes. Hydro-
fluoric acid aids the process. The sample can be fused with sodium carbonate, sodium hydroxide,
sodium peroxide, sodium bisulfate, ammonium sulfate, lithium metaborate, and magnesium
oxide. The fused sample is dissolved in water or acid. Acid and alkaline mixtures are used to
leach uranium from minerals and ores. The procedures employ common mineral acids or alkaline
carbonates, hydroxides, and peroxides. Liquid biological samples may also be extracted to
remove uranium, or the solid sample can be ashed by a wet or dry process and dissolved in acid
solution. Wet ashing is carried out with nitric acid and completed with perchloric acid, but
extreme caution should be used when using perchloric acid in the presence of organic material.
Such mixtures have been known to detonate if the perchloric acid is allowed to dry out.
Separation Methods
PRECIPITATION AND COPRECIPITATION. There are a large number of reagents that will precipitate
uranium over a wide pH range. The number of reagents available coupled with the two possible
oxidation states of uranium in solution and the complexing properties of the ions provide many
opportunities to separate uranium from other cations and the two oxidation states from each
other. Precipitation can be inhibited, for example, by the presence of complexing agents that
form soluble complexes. Complexes that form weak complexes with uranium and strong
complexes with other cations allow the separation of uranium by its precipitation while the
complexed cations remain in solution. EDTA has been used in this manner to separate uranium
from many of the transition metals and alkaline earths. In contrast, uranium forms a very strong
soluble complex with carbonate, and this property has been used to keep uranium in solution
while ammonium hydroxide precipitates iron, titanium, zirconium, and aluminum. In a similar
manner, uranium is separated from other cations as they are precipitated as sulfides or phos-
phates. Common precipitating reagents include:
• Ammonium hydroxide, which precipitates uranium quantitatively at pH $ 4;
• Carbonate [however, it will form soluble anionic complexes with U(VI) at pH 5 to 11 while
many other metals form insoluble hydroxides];
• Peroxide;
• Oxalic acid, which completely precipitates uranium (+4) while U(VI) forms a soluble
complex;
• Iodide;
• Iodate;
• Phosphate for U(VI) over a wide pH range;

Separation Techniques
14-187
JULY 2004 MARLAP
• Sulfate;
• Cupferron, which precipitates uranium (+4) from an acidic solution but U(VI) from a neutral
solution; and
• 8-hydroxyquinoline, which forms a quantitatively precipitate with U(VI) only.
Coprecipitation of uranium is accomplished with several carriers. In the absence of carbonate, it
is quantitatively coprecipitated with ferric hydroxide at pH from 5 to 8. Aluminum and calcium
hydroxide are also employed to coprecipitate uranium. Uranium(VI), however, is only partially
carried by metal hydroxides in the presence of carbonate, and the amount carried decreases as the
concentration of carbonate increases. Small amounts of U(VI) coprecipatate with ceric and
thorium fluoride, calcium, zirconium, and aluminum phosphate, barium carbonate, thorium
hexametaphosphate, magnesium oxide, and thorium peroxide. Uranium (+4) is carried on ceric
sulfate, the phosphates of zirconium, bismuth, and thorium, lanthanum and neodymium fluoride,
ceric and zirconium iodates, barium sulfate, zirconium phosphate, and bismuth arsenate.
SOLVENT EXTRACTION. Liquid-liquid extraction is the most common method for the separation
of uranium in radioanalytical procedures. Extraction provides a high-recovery, one-batch process
that is more reproducible than other methods. With the development of extraction chromatog-
raphy, solvent extraction has become a very efficient process for uranium separation. Many and
varied procedures are used to extract uranium from aqueous solutions, but the conditions can be
summarized as: (1) composition of the aqueous phase (form of uranium, type of acid present, and
presence of common cations and anions and of foreign anions); (2) nature of organic phase (type
and concentration of solvent and diluent); (3) temperature; and (4) time of equilibrium.
Extraction processes can be conveniently divided into three systems: those based on (1) oxygen
bonding, (2) chelate formation, and (3) extraction of anionic complexes.
Oxygen-bonding systems are more specific than those based on chelate formation. They employ
organic acids, ethers, ketones, esters, alcohols, organophosphates (phosphoesters), and nitroal-
kanes. Ethers are effective for the extraction of uranyl nitrate from nitric acid solutions. Cyclic
ethers are especially effective, and salting agents such as calcium nitrate increase the effective-
ness. Methyl isobutyl ketone (MIBK or hexone) also effectively extracts uranium as the nitrate
complex. It has been used extensively by industry in the Redox process for extracting uranium
and plutonium from nuclear fuels. Aluminum hydroxy nitrate [AlOH(NO3)2] is an excellent
salting agent for the process and the extraction efficiency is increased by the presence of the
tetrapropylammonium cation [(C3H7)4N+1]. Another common system, used extensively in the
laboratory and in industrial process to extract uranium and plutonium from fission products,
known as the PUREX process, is used in most fuel reprocessing plants to separate the radionuc-
lides. It employs TBP, tri-n-butyl phosphate [(C4H9)3PO], in a hydrocarbon solvent, commonly
xylene/toluene, as the extractant. The uranium fuel is dissolved in nitric acid, and uranium and
plutonium are extracted into a 30 percent TBP solution, forming a neutral complex, UO2(TBP)2.
The organic phase is scrubbed with nitric acid solution to remove impurities, plutonium is
removed by back-extracting it as Pu+3 with a nitric acid solution containing a reducing agent, and

Separation Techniques
14-188
MARLAP JULY 2004
uranium is removed with dilute nitric acid. A complexing agent can also be used as a stripping
agent. Trioctylphosphine oxide is 100,000 times more efficient in extracting U(VI). In both
cases, nitric acid is used both to form the uranium extracting species, uranyl nitrate, and as the
salting agent. Salting with aluminum nitrate produces a higher extraction efficiency but less
specificity for uranium. Specificity depends upon the salt used, its concentration, and the diluent
concentration.
Uranium is also extracted with select chelate forming agents. One of the most common systems
used for uranium is cupferron in diethyl ether or chloroform. Uranium(VI) is not extracted from
acidic media, so impurities soluble in the mixture under acidic conditions can be extracted first.
Uranium(VI) can be reduced to U+4 for subsequent extraction. Other chelating agents used to
extract uranium include 8-hydroxyquinoline, acetylacetone in hexone, or chloroform.
Amines with molecular weights in the 250 to 500 range are used to extract anionic complexes of
U(VI) from acidic solutions. The amine forms a salt in the acidic medium consisting of an
ammonium cation and complex anion, (C10H21)3NH+1 UO2(NO3)!1, for example. Selectivity of the
amines for U(VI) is in the order: tertiary > secondary > primary. An anionic extracting system
used extensively in laboratories and industry consists of triisooctyl amine (TIOA) in xylene/
toluene. Uranium is stripped with sodium sulfate or sodium carbonate solution. A number of
mineral and organic acids have been used with the system: hydrochloric, sulfuric, nitric,
phosphoric, hydrofluoric, acetic oxalic, formic, and maleic acid. Stripping is accomplished with
dilute acid solutions.
Extraction chromatography is a simple and relatively quick method for the separation of uranium
on a highly selective, efficient column system. One separation column consists of a triamyl-
phosphate [(C5H11O)3PO] and diamylamylphosphonate (DAAP) [C5H11O)2(C5H11)PO] mixture in
an apolar polymeric matrix. In nitric acid, uranyl nitrate forms a complex with DAAP that is
soluble in triamylphosphate. Uranium can be separated in this system from many other metal
ions including thorium and the transuranium ions, plutonium, americium, and neptunium. It is
eluted from the column with the addition of oxalate to the eluent. Another extraction chromatog-
raphy column uses CMPO dissolved in TBP and fixed on the resin matrix for isolation of
uranium in nitric acid. Elution occurs with the addition of oxalic acid to the eluent.
ION-EXCHANGE CHROMATOGRAPHY. Both cation- and anion-exchange chromatography have
been used to separate uranium from other metal ions. Both stable forms of uranium, uranium +4
and VI are exchanged onto cation-exchange resins. Uranium (+4) is more strongly exchanged,
and separation of U(VI) (UO2
+2) is limited. On some cation-exchange columns, the ion also tends
to tail into other ion fractions during elution. Exchange increases with temperature, however, and
increasing the pH also increases exchange up to the beginning of formation of hydrolytic
precipitates at pH 3.8. In strong acid solutions, U(VI) is weakly absorbed compared to uranium
(+3 and +4) cations. Using complexing agents can increase specificity by elution of U(VI) with
common complex-forming anions, such as chloride, fluoride, nitrate, carbonate, and sulfate.

Separation Techniques
14-189
JULY 2004 MARLAP
Specificity also may be enhanced by forming EDTA, oxalate, acetate, or sulfate complexes with
cations in the analyte, producing a more pronounced difference in absorption of the ions on the
exchange resin. A general procedure for separating U(VI) from other metals using the first
method is to absorb U(VI) at pH of 1.5 to 2 and elute the metal with acetate solution.
Anion-exchange chromatography of uranium takes advantage of the stable anionic complexes
formed by the various oxidation states of uranium, especially U(VI), with many common anions.
Uranium(VI) forms both anionic or neutral complexes with acetate, chloride, fluoride, carbonate,
nitrate, sulfate, and phosphate. Strong anion-exchange resins are more selective and have a
greater capacity than weak exchangers whose use is more limited. Factors that affect the
separations include uranium oxidation state and concentration; type of anion and concentration;
presence and concentration of other metallic ions and foreign ions; temperature, resin, size,
porosity, and cross-linking. The various oxidation states of uranium and other metal ions
(particularly the actinides), the effect of pH on formation of complexes, and the net charge of the
column are all variables controlling the separation process.
A number of chromatographic systems are available for uranium separation on anion-exchange
resins. In hydrochloric acid, uranium is often exchanged and other cations are not. Uranium(VI)
can be exchanged from concentrated hydrochloric acid while alkali metals, alkaline earths, rare
earths, aluminum, yttrium, actinium, and thorium are washed off the column. In contrast,
uranium, molybdenum, bismuth, tin, technetium, polonium, plutonium and many transition
metals are exchanged on the column, and uranium is eluted exclusively with dilute hydrochloric
acid. Various oxidation states provide another method of separation. U+4 is separated from Pr+4
and Th+4 with 8 M hydrochloric acid. Thorium, plutonium, zirconium, neptunium, and uranium
can be separated individually by exchanging all the ions except thorium from concentrated
hydrochloric acid. Plutonium (+3) elutes with concentrated acid, zirconium at 7.5 M, Np+4 with 6
M hydrochloric acid and 5 percent hydroxylamine hydrochloride, and uranium at 0.1 M acid. U+4
can be separated from U(VI) because both strongly exchangefrom concentrated hydrochloric
acid, but they separate at 6 M acid because U+4 is not exchanged at that concentration.
Uranium(VI) exchanges strongly on an anion-exchange resin in dilute hydrofluoric acid, and the
exchange decreases with increasing acid concentration. Nitric acid provides an excellent method
to purify uranium, because uranium is more strongly exchanged from nitric acid/nitrate solutions
than from chloride/HCl solutions. More selectivity is achieved when acid concentration is low
and nitrate concentrations are high. Exchange is greatest when aluminum nitrate is use as the
source of nitrate. Ethyl alcohol increases exchange significantly.
ELECTRODEPOSITION. Electrochemical procedures have been used to separate metal ions from
uranium in solution by depositing them on a mercury cathode from a sulfuric acid solution, using
5 amps for one hour. Uranium is deposited at a cathode from acetate, carbonate, oxalate, formate,
phosphate, fluoride, and chloride solutions to produce a thin, uniform film for alpha and fission
counting. This is the primary use of electrodeposition of uranium in analytical work. In another
procedure, U(VI) is electroplated on a platinum electrode from the basic solution adjacent to the

Separation Techniques
14-190
MARLAP JULY 2004
cathode that exists in a slightly acidic bulk solution. The conditions of the process should be
carefully controlled to obtain high yields and adherent coatings on the electrode.
VOLATILIZATION. Several halides of uranium and the uranyl ion are volatile and have the
potential for separation by sublimation or fractional distillation. Practically, however, their
volatility is not used to separate uranium in analytical procedures because of technical problems
or the high temperatures that are required for some procedures, but volatilization has been used
in industrial processes. Uranium hexafluoride and uranyl hexafluoride are volatile, and the
property is used to separate 235U from 238U in natural uranium isotope mixtures. Uranium tetra-
chloride and hexachloride are also volatile, and uranium has been isolated from phosphate rock
by heating with a mixture of chlorine and carbon monoxide at 800 EC and collecting the
tetrachloride.
Methods of Analysis
Uranium may be determined by fluorimetry. During the separation and purification process, the
sample is fused at 625 EC in a flux mixture containing potassium carbonate, sodium carbonate,
and sodium fluoride. The residue is exposed to light and its fluorescence is measured. Another
technique related to fluorescence is kinetic phosphorimetry analysis (KPA). Aqueous solutions of
the fully digested sample are exposed to a laser at a specific wavelength, and the
phosphorescence (at a different wavelength) intensity is measured.
Total uranium may be determined by gross alpha analysis. Individual radionuclides of uranium,
234U, 235U, and 238U, can be determined by their alpha-particle emissions. Mass spectrometry also
can be used for longer-lived isotopes of uranium. Uranium radionuclides are collected by
evaporating the sample to dryness on a stainless steel planchet, by microprecipitation with a
carrier, such as lanthanum or cerium fluoride, or electrodeposition on a platinum or stainless-
steel disc. In each of these techniques, care must be taken to ensure that a single oxidation state is
achieved for the uranium prior to the collection technique. Total alpha activity is determined with
a gas-flow proportional counter or an alpha liquid scintillation system. Individual radionuclides
are measured by alpha spectrometry. Alpha emissions from 232U are used as a tracer to determine
chemical recovery.
Neutron activation analysis (NAA) was employed to determine uranium in the hydrogeochemical
samples from Savannah River Plants within the scope of the National Uranium Resource
Evaluation Program sponsored by DOE. Uranium was determined by cyclic activation and
delayed neutron counting of the 235U fission products. The method relied on absolute activation
techniques using the Savannah River Reactor Activation Facility. NAA, followed by delayed-
neutron detection, was commonly used to determine 235U.
Compiled from: Alfassi, 1990; Allard et al., 1984; Ahrland, 1986; Baes and Mesmer, 1976;
ASTM D5174; Bard, 1985; Booman and Rein, 1962; Choppin et al., 1995; Considine and

Separation Techniques
14-191
JULY 2004 MARLAP
Considine, 1983; Cotton and Wilkinson, 1988; CRC, 1998-99; DOE, 1990 and 1997; Echo
and Turk, 1957; EPA, 1973; Ehmann and Vance, 1991; Fritz and Weigel, 1995; Greenwood
and Earnshaw, 1984; Grindler, 1962; Hampel, 1968; Hassinsky and Adloff, 1965; Hochel,
1979; Katz et al., 1986; Katzin, 1986; SCA, 2001; Weigel, 1986.
14.10.9.16 Zirconium
Zirconium, atomic number 40, is a member of the second-row transition elements. It exhibits
oxidation states of +2, +3, and +4, and the +4 state is common in both the solid state and in
solution. It is immediately above hafnium in the periodic table, and both elements have very
similar chemical properties—more so than any other two elements in the periodic table. It is very
difficult, but not impossible, to prepare a sample of zirconium without the presence of hafnium.
Isotopes
There are twenty-nine isotopes of zirconium, including five metastable states, with mass numbers
from 81 through 104. Five are naturally occurring, 90Zr, 91Zr, 92Zr, 94Zr, and 96Zr. The remaining
isotopes have a half-life of milliseconds to days. The lower mass number isotopes decay
primarily by electron capture and the upper mass number isotopes are beta emitters. Zirconium-
95 (t1/2 . 64.0 d) and 97Zr (t1/2 . 16.9 h) are fission products and are beta emitters. Zirconium-93
(t1/2 . 1.53×10⁶y) is a rare fission product, and 98Zr, and 99Zr are short-lived products with half-
lives of 30.7 s and 2.1 s, respectively. All are beta emitters.
Occurrence and Uses
Zirconium is one of the most abundant and widely distributed metals found in the Earth’s crust. It
is so reactive that it is found only in the combined state, principally in two minerals, zircon,
zircon orthosilicate (ZrSiO4), and baddeleyite, mostly zirconium dioxide (ZrO2). Zirkite is a
commercial ore that consists of both minerals. Hafnium is a minor constituent of all zirconium
minerals.
In the production of zirconium metal, zirconium sands, primarily zirconium dioxide, is passed
through an electrostatic separator to remove titanium minerals, a magnetic separator to remove
iron, ileminite, and garnet, and a gravity separator to remove the less dense silica. The recovered
zircon is heated with carbon in an arc furnace to form zirconium cyanonitride, an interstitial
solution of carbon, nitrogen, and oxygen (mostly carbon) in the metal. Silicon evaporates as
silicon monoxide (SiO), becoming silicon dioxide (SiO2) at the mouth of the furnace. The hot
zirconium cyanonitride is treated with chlorine forming volatile zirconium tetrachloride (ZrCl4),
which is purified by sublimation to remove, among other impurities, contaminating oxides. The
chloride is reduced in the Kroll process, along with liquid magnesium under conditions that
produce a metal sponge. The byproduct, magnesium chloride (MgCl2), is then removed by
melting the chloride, draining it off, and removing its residues by vacuum distillation. The

Separation Techniques
14-192
MARLAP JULY 2004
zirconium sponge is crushed, melted into bars, arc-melted in an inert atmosphere, and formed
into ingots. For additional purification, the van Arkel-de Boer process removes all nitrogen and
oxygen. Crude zirconium is heated to 200 EC in an evacuated container containing a small
amount of iodine to form volatile zirconium tetraiodide (ZrI4). A tungsten filament is electrically
heated to 1,300 EC, decomposing the iodide and depositing zirconium on the filament. The
commercial grade of zirconium still contains up to three percent hafnium. To be used in nuclear
reactors, however, hafnium should be removed. Separation is usually accomplished by solvent
extraction of zirconium from an aqueous solution of zirconium tetrachloride as a complex ion
(phosphine oxide, for example), by ion-exchange, fractional crystallization of complex fluoride
salts, distillation of complexes of zirconium tetrachloride with phosphorus pentachloride or
phosphorus oxychloride, or differential reduction of the mixed tetrachlorides (zirconium
tetrachloride is more easily reduced to the nonvolatile trichloride than hafnium tetrachloride.
Zirconium-95 and 97Zr are fission products and are also produced by bombardment of naturally
occurring 94Zr and 96Zr, respectively, with thermal neutrons. Stable 90Zr is a product of the 90Sr
decay chain:
38
90
39
90
40
90
Sr Y Zr
→→+
+
ββ
Zirconium metal and its alloys are highly resistant to corrosion and withstand streams of heated
water under high pressure. These properties, along with their low cross section for thermal
neutrons, make them an important material for cladding uranium fuel elements and as core armor
material in nuclear reactors. It is also used for making corrosive resistant chemical equipment
and surgical instruments and making superconducting magnets. Zirconium compounds are also
used in the ceramics industry as refractories, glazes, and enamels, in cores for foundry molds,
abrasive grits, and components of electrical ceramics. Crystals of zircon are cut and polished to
use in jewelry as simulated diamonds. They are also used in pyrotechnics, lamp filaments, in arc
lamps, cross-linking agents for polymers, components of catalysts, as bonding agents between
metal and ceramics and between ceramics and ceramics, as tanning agents, ion exchangers, and
in pharmaceutical agents as deodorants and antidotes for poison ivy. Zirconium-95 is used to
follow homogenization of oil products.
Solubility of Compounds
The solution properties of zirconium in water are very complex, mainly because of the formation
of colloids and the extensive hydrolysis and polymerization of the zirconium ion. hydrolysis and
polymerization are strongly dependent on the pH of the solution, concentration of the ion, and
temperature. The nitrate, chloride, bromide, iodide, perchlorate, and sulfate of zirconium are
soluble in acid solution, however.

Separation Techniques
14-193
JULY 2004 MARLAP
Review of Properties
Pure zirconium is a grey-white (silvery) lustrous metal with a density of 6.49 g/cm3. It exists in
two allotropic forms, alpha and beta, with a transition temperature of 870 EC. The alpha form is
stabilized by the common impurity oxygen. The amorphous powder is blue-black. Trace amounts
of common impurities (#1 percent), such as oxygen, nitrogen, and carbon, make the metal brittle
and difficult to fabricate. The metal is not considered to be a good conductor of heat and electric-
ity, but compared to other metals it is soft, malleable, and ductile. Zirconium forms alloys with
most metals except mercury, the alkali metals, and the alkaline earths. It can absorb up to ten
percent oxygen and nitrogen. Zirconium is a superconductor at temperatures near absolute zero,
but its superconducting properties improve when the metal is alloyed with niobium and zinc.
Finely divided, dry zirconium (powder and chips) is pyrophoric and extremely hazardous. It is
hard to handle and store and should be moistened for safe use. Note, however, that both wetted
sponge and wet and dry stored scrap have been reported to spontaneously explode. Caution
should also be observed with waste chips produced from machining and cleaning (new)
zirconium surfaces. Both can be pyrophoric. In contrast, zirconium in the bulk form is extremely
resistant to corrosion at room temperature and remains bright and shiny in air. Resistance is
rendered by the formation of a dense, adherent, self-sealing oxide coating. The metal in this form
is resistant to acids, alkalis, and seawater. Without the coating, zirconium dissolves in warm
hydrochloric and sulfuric acids slowly; dissolution is more rapid in the presence of fluoride ions.
The metal is also resistant to high-pressure water streams and high-temperature steam. It also has
a low cross-section to thermal neutrons and is resistant to damage from neutron radiation. These
properties give pure zirconium (without hafnium) very useful as a fabrication material for nuclear
reactors. Zirconium metal alone, however, is not sufficiently resistant to hot water and steam to
meet the needs for use in a nuclear reactor. Alloyed with small percentages of tin, iron, nickel, or
chromium (Zircalloy), however, the metal meets the standards.
The coated metal becomes reactive when heated at high temperature ($ 500 EC) with nonmetals,
including hydrogen, oxygen, nitrogen, carbon, and the halogens, and forms solid solutions or
compounds with many metals. It reacts slowly with hot concentrated sulfuric and hydrochloric
acids, boiling phosphoric acid, and aqua regia. It is also attacked by fused potassium nitrate and
potassium hydroxide, but is nonreactive with aqueous alkali solutions. It is not reactive with
nitric acid. Hydrofluoric acid is the only reagent that reacts vigorously with zirconium.
Zirconium and its compounds are considered to have a low order of toxicity. Most handling and
testing indicate no level of toxicity, but some individuals seem to be allergic to zirconium
compounds. Inhalation of zirconium compound sprays and metallic zirconium dust have
produced inflammatory affects.
Very small quantities of 95Zr have been released to the environment from fuel reprocessing
facilities, atmospheric testing, and the Chernobyl accident. With a half-life of 64 days, the

Separation Techniques
14-194
MARLAP JULY 2004
contamination of the environment is not significant. Zirconium lost from a waste repository
would be expected to move very slowly because of radiocolloidal attraction to surrounding soil
particles. Hydrolysis and polymerization renders most zirconium insoluble in natural water, but
absorption to suspended particles is expected to provide some mobility in an aqueous
environment.
Solution Chemistry
The only important oxidation state of zirconium ions in aqueous solution is +4. The solution
chemistry of zirconium is quite complex, nevertheless, because of the easy formation of colloids
and extensive hydrolysis and polymerization reactions that are strongly dependent on pH and ion
concentration.
COMPLEXATION. Zirconium ions form complexes with numerous substances: fluoride, carbonate,
borate, oxalate, and other dicarboxylic acids, among others. As a large, highly charged, spherical
ion, it exhibits high coordination numbers. One of the important chemical properties of zircon-
ium ions in solution is the formation of a very stable hexafluorozirconate complex, ZrF6
!2. For that
reason, hydrofluoric acid (HF) is an excellent solvent for the metal and insoluble zirconium
compounds. Unfortunately, the fluorocomplex interferes with most separation and determination
steps, and zirconium should be expelled by fuming with sulfuric or perchloric acid before
proceeding with analyses of other radionuclides. The addition of several milliliters of concentra-
ted HF to a cool solution of zirconium carrier and sample will produce initial equilibration;
essentially all the zirconium is present in the +4 oxidation state as a fluoride complex. Note that
addition of HF to solutions above the azeotropic boiling point of the acid (120 EC) serves no
useful purpose and simply evaporates the HF.
Tartrate and citrate ions form stable complexes even in alkaline solutions, and zirconium
hydroxide will not precipitate in their presence (see hydrolysis below). Oxalate forms a complex
that is less stable. The ion, [Zr(C2O4)3]!2, is only stable in acid solution. On addition of base, the
complex is destroyed, and zirconium hydroxide precipitates. Sulfuric acid complexes in strongly
acidic solutions, forming Zr(SO4)3
!2. In concentrated HCl solutions, ZrCl6
!2 is present.
Zirconium ions form chelate complexes with many organic compounds, usually through oxygen
atoms in the compounds. Typical examples are: acetylacetone (acac), EDTA, TTA, salicylic acid,
mandelic acid, cupferron, and 8-hydroxyquinoline.
HYDROLYSIS. Although Zr+4 has a large radius and any +4 cation is extensively hydrolyzed, Zr+4
appears to exist at low ion concentrations (approximately 10!4 M) and high pH. As the Zr+4
concentration increases and the concentration of H+1 decreases, however, hydrolysis and
polymerization occurs, and one or more polymeric species dominates in solution. Amorphous
hydrous oxides are precipitated near pH 2; they are soluble at high pH. Because of hydrolysis,
soluble salts (nitrate, sulfate, perchlorate, acetate, and halides) form acidic solutions when they

Separation Techniques
14-195
JULY 2004 MARLAP
dissolve. The reaction essentially seems to be a direct conversion to the tetranuclear
Zr4(OH)8(H2O)16
+8 ion. There is no convincing evidence for the existence of ZrO+2, thought at one
time to be present in equilibrium with numerous other hydrolysis products. It should be noted,
however, that freshly prepared solutions of zirconium salts might react differently from a solution
left standing for several days. Whatever the actual species in solution at any given time, the
behavior of Zr+4 depends on the pH of the solution, temperature, anion present, and age of
solution. In addition, zirconium compounds formed by precipitation from solution usually do not
have a constant composition because of their ease of hydrolysis. Even under exacting conditions,
it is difficult to obtain zirconium compounds of known, theoretical composition, and on aging,
hydrolysis products becomes more polymeric and polydisperse.
In acidic solutions, trace amounts of zirconium are strongly coprecipitated with most precipitates
in the absence of complexing ions, especially F!1 and C2O4
!2 that form soluble complex ions.
In alkaline solutions, produced by the addition of hydroxide ions or ammonia, a white gelatinous
precipitate of zirconium hydroxide forms. Because the hydroxide is not amphoteric, it does not
dissolve in excess base. The precipitate is not a true hydroxide but a hydrated oxide, ZrO2 · nH2O
where n represents the variable nature of the water content. Freshly prepared zirconium hydrox-
ide is soluble in acid; but as it dries, its solubility decreases. Precipitation is inhibited by tartrate
or citrate ions because Zr+4 forms complexes with these organic anions even in alkaline solutions
(see “Complexation,” on page 14-194, above).
In preparing zirconium solutions, it is wise to acidify the solution with the corresponding acid to
reduce hydrolysis and avoid precipitation of basic salts. During solubilization and radiochemical
equilibrium with a carrier, the tendency of zirconium ions to hydrolyze and polymerize even at
low pH should be kept in mind. Often, the formation of a strong complex with fluoride or TTA is
necessary.
RADIOCOLLOIDS. Radiocolloids of zirconium are adsorbed on practically any foreign matter (e.g.,
dirt, glass, etc.). Their formation can cause problems with dissolution, achieving radiochemical
equilibrium, and analysis. Generally, it is necessary to form a strong complex with fluoride (see
caution above) or TTA.
Dissolution of Samples
Metallic zirconium is dissolved in hydrofluoric acid, hot aqua regia, or hot concentrated sulfuric
acid. Hydrofluoric acid should be removed by fuming with sulfuric acid or perchloric acid
(caution), because fluoride interferes with most separation and analytical procedures. Zirconium
ores, rocks, and minerals are fused at high temperatures with sodium carbonate, potassium
thiosulfate, sodium peroxide, sodium tetraborate, or potassium hydrogen fluoride. The residue is
dissolved in dilute acid or water and might require filtration to collect a residue of zirconia
(impure ZrO2), which is dissolved in acid. As a minor constituent of natural sample or as a result

Separation Techniques
14-196
MARLAP JULY 2004
of formation by nuclear reactions, zirconium typically dissolves during dissolution of the major
constituents. The tendency to polymerize under low concentrations of acid and the formation of
insoluble zirconium phosphates should be considered in any dissolution process. The tendency of
zirconium to polymerize and form radiocolloids makes it important to insure equilibrium with
any carrier added. Generally, formation of strong complexes with fluoride or TTA is necessary.
Separation Methods
PRECIPITATION AND COPRECIPITATION. One of the most insoluble precipitating agents is
ammonium hydrogen phosphate (NH4)2HPO4) in 20 percent sulfuric acid. It has the advantage
that it can be dissolved by hydrofluoric acid, forming hexafluorozirconate. This complex ion also
forms insoluble barium hexafluorozirconate (BaZrF6), a precipitating agent that allows the
precipitation of zirconium in the presence of niobium that is soluble as the heptafluoroniobate
(NbF7
!2). Other precipitating agents include the iodate (from 8 M nitric acid), cupferrate, the
hydroxide, peroxide, selenate, and mandelate. Cupferron is used in sulfuric or hydrochloric acid
solutions. It is one of the few precipitating agents in which fluoride does not interfere, but iron
and titanium, among other cations, are also precipitated. The precipitate can be heated in a
furnace at 800 EC to produce zirconium dioxide for the gravimetric determination of zirconium.
The hydroxide begins to precipitate at pH 2 and is complete at pH 4, depending on the presence
of zirconium complexes. It is not recommended unless other cations are absent, because it
absorbs or coprecipitates almost all other ions. Peroxide is formed from a solution of hydrogen
peroxide in acid. Selenious acid in dilute hydrochloric acid separates zirconium from some of the
transition elements and thorium. Mandelic acid in hot dilute hydrochloric acid quantitatively and
specifically precipitates zirconium (and hafnium) ions. Large amounts of titanium, tin, iron, and
other ions might be partially coprecipitated, but they can be eliminated by reprecipitation.
Trace quantities of zirconium can be strongly coprecipitated by most precipitates from strong
acid solutions that do not contain complex-forming ions. Bismuth and ceric phosphate readily
carries zirconium, and in the absence of holdback carriers, it is almost quantitatively carried by
rare-earth fluorides. Ferric hydroxide and thorium iodate are also effective carriers.
SOLVENT EXTRACTION. Several extractants have been used to selectively remove zirconium from
aqueous solutions; most are organophosphorus compounds. Di-n-butylphosphoric acid (DBPA)
(di-n-butylphosphate) is an extractant for zirconium and niobium. It is effective in extracting
tracer and macro quantities of zirconium from 1 M aqueous solutions of nitric, hydrochloric,
perchloric, and sulfuric acids and in separating it from many other elements. A 0.06 M solution
in di-n-butylether containing three percent hydrogen peroxide extracts more than 95 percent
zirconium but less than one percent niobium. Tin and indium were also extracted by this mixture.
TBP is an excellent solvent for zirconium. It is used pure or with several nonpolar diluents, such
as ethers, xylene/toluene, or carbon tetrachloride. Extractability increases with acid strength. A
0.01 M solution of tri-n-octylphosphine oxide (TOPO) in cyclohexane has been used to separate
zirconium from iron, molybdenum, vanadium, thorium, and hafnium.

Separation Techniques
14-197
JULY 2004 MARLAP
TTA and hexone (methyl isobutyl ketone) are two nonphosphorus extractants employed for
separating zirconium. TTA is highly selective. A 0.5 M solution in xylene separates zirconium
from aluminum, iron, thorium, uranium, and rare earths in a 6 M hydrochloric acid solution. At
tracer levels, the reagent can separate 95Zr from all other fission products. It is also used to
separate zirconium from hafnium. In the analysis of zirconium in zirconium-niobium-tantalum
alloys, hexone separates zirconium from an aqueous solution that is 10 M hydrochloric acid and
6 M sulfuric acid. This is one of the few methods that can be used to separate zirconium from
such metals.
ION-EXCHANGE CHROMATOGRAPHY. Zirconium can be separated from many other cations by
both cation- and anion-exchange chromatography. The technique represents the best laboratory
method for separating zirconium and hafnium. Cation-exchange columns strongly exchange
zirconium ions, but macro quantities of zirconium and hafnium can be purified as aqueous
colloidal solutions of their hydrous oxides on an organic cation-exchange resin. Many cations are
retained on the column, but zirconium and hafnium, under these conditions, are not. The
recovery can be as high as 99 percent with successive passages, but titanium and iron are not
removed. Zirconium and hafnium can be separated on a sulfuric-acid column from 2 M
perchloric acid. Hafnium is eluted first with 6 M HCl. Fluoride complexes of zirconium and
hafnium can be separated from other noncomplexing cations, because the negative complex ions
are not exchanged, and the noncomplexing ions are retained. Zirconium, hafnium, and niobium
are eluted from rare earths and alkaline earths on cation-exchange columns with citrate. The three
elements can be then be separated by the selection of appropriate citrate buffers, but the
separations are not quantitative.
The formation of stable zirconium complexes is the basis of anion-exchange chromatography of
the metal. Separation of zirconium and hafnium from each other and from other cations can be
achieved in hydrochloric-hydrofluoric acid mixtures. Separation of zirconium from hafnium,
niobium, protactinium, and thorium, respectively, is accomplished by selection of the proper
eluting agent. Elution of hafnium first with 9 M hydrochloric acid separates zirconium from
hafnium, for example, while elution with 0.2 M hydrochloric acid/0.01M hydrofluoric acid
recovers zirconium first. Elution with 6-7 M hydrochloric acid separates zirconium from
niobium, in another example.
Methods of Analysis
Zirconium-95 decays with a half-life of 65.5 d, emitting a beta particle accompanied by gamma-
ray emission. After several half-lives, it is in transient equilibrium with its progeny, 95Nb, which
has a half-life of 35.0 d and is also a beta and gamma emitter. The progeny of 95Nb is stable 95Mo.
Fresh samples of 95Zr are analyzed by their gamma-ray emission. Zirconium is collected by
precipitation and filtration. The sample and filter are heated at 800 EC for one hour to decompose
the filter and convert zirconium to its oxide. Zirconium dioxide (ZrO2) is collected by filtration,
dried, and counted immediately.

Separation Techniques
14-198
MARLAP JULY 2004
Compiled from: Baes and Mesmer, 1976; Choppin et al., 1995; Considine and Considine,
1983; Cotton and Wilkinson, 1988; CRC, 1998-99; Ehmann and Vance, 1991; EPA, 1973;
Greenwood and Earnshaw, 1984; Hahn, 1961; Hassinsky and Adloff, 1965; Latimer, 1952;
Steinberg, 1960.
14.10.9.17 Progeny of Uranium and Thorium
The analysis of uranium and thorium isotopes is most frequently performed by alpha spectro-
scopic, liquid scintillation, mass spectrometry, or proportional-counting analysis. The analyst
frequently is focused on the uranium and thorium analytes and can readily forget that the progeny
of these isotopes also are radioactive. In fact, the decay chains may contain 10 to 14 different
isotopes that all decay by beta or alpha emission. The radioactive progeny are analytes of
importance in their own right. Thus, the analytical focus could be on the parent isotopes or on
any of these progeny. It is important not to lose sight of the fact that even after separations the
radioactive decay process continues, and new progeny are formed.
The elements that interfere most (due to their activities) with analysis of transuranics are radium,
radon, actinium, lead, bismuth, and polonium. Radium, radon, and actinium form a group based
on the decay of their isotopes and the relative half-lives of those isotopes. Lead, polonium, and
bismuth form a “group,” which are discussed separately as “contaminants” in the analysis of the
transuranics or radium. There are specific analytical schemes for each of these that are developed
in separate references.
Radium and Radon
Naturally occurring uranium and thorium give rise to the following principal radioisotopes of
radium and radon:
α β β α α α
238U 6 234Th 6234Pa 6234U6230Th 6226Ra 6222Rn [U-1]
α β β α α
232Th 6 228Ra 6228Ac 6228Th 6224Ra 6220Rn [Th-1]
The presence of these isotopes in natural waters, soils, and buildings poses a level of radiological
risk from exposure to gross alpha and beta emitters, which can result from diffusion of the radon
gas or radium solubility. The primordial radium and radon atoms have long since decayed, so
both elements now result from the decay of uranium and thorium.
If these decay chains were unaffected by the environment, secular equilibrium (Attachment 14A,
“Radioactive Decay and Equilibrium”) of uranium, thorium, and all their respective progeny
would have occurred millions of years ago. This would mean that the analysis of the whole decay

Separation Techniques
14-199
JULY 2004 MARLAP
chain could be performed by measuring one radionuclide’s activity and using the Bateman
equations to calculate the other activities. However, the noble gas chemistry of radon and the
differential solubility of the other isotopes cause these chains to be disrupted or “broken.” The
latter part of the decay chain contains the isotopes of polonium, bismuth, and lead and are
sometimes separately identified due to the break in the chain at radon.
Radon is an indoor exposure hazard because it can seep through barriers, such as concrete
foundations. It will form its own radiochemical chain from its decay as parent to isotopes of the
polonium/bismuth/lead group:
[Rn-1]
α αβ β α ββ α
222Rn 6 218Po 6214Pb 6214Bi 6214Po 6210Pb 6210B6210Po 6206Pb
α αβ β α
220Rn 6216Po 6212Pb 6212Bi 6212Po 6208Pb [Rn-2]
The inert characteristic of the radon allows it to transport radioactivity to locations distant from
the source. With chemical characteristics similar to calcium, however, radium will be similarly
mobile in ground water. Thus, the analysis of radium and radon and their isotopes generally is
done separately.
The chemistry of radium is detailed in Section 14.10.9.9. Direct analysis by the methods
described will be satisfactory for large amounts of the material. The activity of radium found in
many environmental or low activity samples represents an analytical challenge. The half-lives of
the radium isotopes are quite long (228Ra . 5.8 y; 226Ra . 1,600 y). Thus, long counting times or
very large samples are needed to achieve statistically relevant values at the minimum detectable
level needed to meet regulatory requirements. Analytical methods have been developed to
perform this task but suffer from large statistical error and from the handling of large samples. To
circumvent these difficulties, indirect analytical techniques have been developed for each of
these isotopes that rely on the chemistry of radium to obtain radiochemical purity, and on the
Bateman equation of parent-progeny relationships to produce the shorter-lived progeny. The
parent activity is determined by mathematical analysis from the progeny activity.
An example is in the analysis of 226Ra. Radium is isolated by coprecipitation with barium as the
sulfate. The precipitate is then dissolved according to the following:
EDTA
Ba/RaSO4 6 Ra/Ba(EDTA)!2 [Rn-3]
The solution of radium complex is immediately transferred to a vessel (called a de-emanation
tube) that is sealed under vacuum. This is a key aspect of the process, because the principal decay
product is a noble gas. The decay of radium occurs according to [U-1] and [Th-1] above.
According to the Bateman equations, after approximately 21 days, full equilibrium is established

Separation Techniques
14-200
MARLAP JULY 2004
for [Rn-1]. Equilibrium for [Rn-2] is achieved in about 2 days. At the end of the equilibration
period, the de-emanation tube is purged slowly with helium into a calibrated phosphorescence
cell for counting. This removes the noble gas from all its progeny and parents, which are non-
volatile. This time, however, equilibration is much shorter (on the order of four hours), and the
analysis includes all of the progeny isotope emanations as well as those of the parents. The
analysis for 222Rn may have to be corrected for 220Rn presence if thorium was a major contributor
to the transuranic composition of the sample.
The remnant solution is used for the analysis of 228Ra by exploiting the rapid achievement of
secular equilibrium (already achieved) with its daughter isotope, 228Ac, which is not volatilized
during the nitrogen purge.
The radium isotopes again are removed by coprecipitation with barium as sulfates, but this time
redissolved by diethylene triamine pentaacetic acid (DTPA).
DTPA 20% Na2SO4 DTPA
(Ba/Ra)SO46[(Ba/Ra)(DTPA)]!36(Ba/Ra)SO4 6[(Ba/Ra)(DTPA)]!3[Rn-4]
This is used to remove any residual 228Ac. The solution of the DTPA complex is stored for a set
period of time (usually about 36 hours), and the radium parent is removed by precipitation. The
supernatant solution contains the actinium daughter. At the time of the separation, the actinium
and radium activities are equal (see Attachment 14A, “Radioactive Decay and Equilibrium”).
The activity of the actinium is determined and back-corrected to determine the radium activity.
Lead, Polonium, and Bismuth
Differential solubility and radon volatility play an important part of the spread of these naturally
occurring radioisotopes in the environment. Looking at [Rn-1], the three most significant
isotopes in this group are 210Pb, 210Bi, and 210Po because of their half-lives. In [Rn-2], the
significant isotope is 212Pb, also because of its half-life. Both of these end-of-the-chain series can
present problems in environmental analyses.
The purpose of the gross analysis is to be able to use a single, simple analysis as part of the
decision process for requiring more complex analysis and dose estimation. The problem with
gross alpha analysis, especially at the environmental level, is that it is subject to many sources of
error. The most significant source of these errors has been shown to be the time between sample
collection and analysis. In this case, elevated alpha activity was not attributed to 226/228Ra, but
instead to 224Ra. Radium-224, its short-lived decay-chain progeny including 212Pb (t½ . 10.6 h),
212Bi (t½ . 1 h), and 212Po (t½ << 1 sec), were causing the variation in the activity. If the samples
were counted too long after acquisition, gross alpha would be high due to the buildup of the
short-lived progeny. Because the half-lives were measured in hours, a consistent time-after-
sample needed to be established to standardize the buildup of the short-lived isotopes

Separation Techniques
14-201
JULY 2004 MARLAP
Similarly, trying to account for the activity from alpha/beta emitters from the [Rn-1] chain is
difficult because 210Pb (t½ .22.6 y) emits very low-energy beta particles and gamma rays and
quickly reaches equilibrium with its bismuth and polonium progeny. An analysis for 210Pb has
been developed that is specific and sensitive. The lead present in the sample is chemically
separated from the bismuth by precipitation. The bismuth is removed by washing, and only the
bismuth produced by the lead decay is measured. This relies on the secular equilibrium
established by 210Pb/210Bi after separation of the lead (Attachment 14A, “Radioactive Decay and
Equilibrium”). The ingrowth of bismuth is allowed, and complexation and precipitation remove
the parent, lead. Yield is determined by the addition of bismuth carrier after the ingrowth period.
The scheme is outlined here.
Ba Carrier + H2SO4 pH 4/EDTA pH 1/H2SO4 Na2CO3
Sample 6 (Ba/Pb)SO46[(Pb)(EDTA)]!2
aq 6PbSO4 9 6 PbCO3 96
(ingrowth begins)
HCl + Bi carrier
6BiOCl 9 + Pb+2
This represents a special exception to adding carrier. Usually, it is added at the beginning of the
analysis. However, in this case, the bismuth carrier would have brought nonequilibrium bismuth
through the analysis, creating an inaccuracy. Thus, adding the bismuth carrier at the end ensures
maximum recovery of only the newly formed isotope.
Compiled from: Bagnall, 1957; EPA, 2000; Parsa, 1998; To, 1993.
14.11 References
Adams, B.A. and Holmes, E.L. 1935. “Absorptive Properties of Synthetic Resins. Part I,”
Journal Soc. Chem. Ind. (London), 54T, pp. T1-T6.
Adams, C. 1995. “Iodine,” McGraw-Hill Multimedia Encyclopedia of Science and Technology,
McGraw-Hill, New York; Software Copyright: Online Computer Systems, Inc.
Adolff, J.-P. and Guillaumont, R. 1993. Fundamentals of Radiochemistry, CRC Press, Boca
Raton, Florida.
Ahrland, S. 1986. “Solution Chemistry And Kinetics of Ionic Reactions,” in Katz, J.J., Seaborg,
G.T., and Morss, L.R., Eds., The Chemistry of the Actinides, Vol. 2, Chapman and Hall,
London, pp. 1480-1546.
Alfassi, Zeev B. 1990 Use of Delayed Neutrons In Activation Analysis, Activation Analysis, Vol.
I, Edit. Z. Alfassi, CRC Press, Inc, Boca Raton, Florida.

Separation Techniques
14-202
MARLAP JULY 2004
Allard, B, Olofsson, U., and Torstenfelt, B. 1984. “Environmental Actinide Chemistry,”
Inorganica Chimica Acta, 94, pp. 205-221.
Alvarez, A. and Navarro, N. 1996. “Method for Actinides and Sr-90 Determination in Urine
Samples,” Applied Radiation and Isotopes, 47:9/10, pp. 869-873.
American Public Health Association (APHA). 1998. Standard Methods for the Examination of
Water and Wastewater, Clesceri, L.S., Greenberg, A.E., Eaton, A.D., Eds., Franson, M.A.,
Mang. Ed., American Public Health Association, Washington, DC.
American Society for Testing Materials (ASTM) D5174. Standard Test Method for Trace
Uranium in Water by Pulsed-Laser Phosphorimetry. West Conshohocken, PA.
American Society for Testing Materials (ASTM) D5811. Standard Test Method for Strontium-90
in Water, 1995. West Conshohocken, PA.
Armstrong, G.W., Gill, H.H., and Rolf, R.F. 1961. “The Halogens,” in Kolthoff, I.M. and Elving,
P.J., Eds., Treatise on Analytical Chemistry, Part II, Vol. 7, John Wiley and Sons, New York,
pp. 335-424.
Anders, E. 1960. The Radiochemistry of Technetium, National Academy of Sciences–National
Research Council (NAS-NS), NAS-NS 3021, Washington, DC.
Baes, C.F. and Mesmer, R.E. 1976. The Hydrolysis of Cations, John Wiley and Sons, New York.
Bagnall, K.W. 1957. Chemistry of the Rare Radioelements: Polonium-Actinium, Butterworths
Scientific Publications, London.
Bailar, J.C., Moeller, T., Kleinberg, J., Guss, C.O., Castellion, M.E., and Metz, C. 1984.
Chemistry, Academic Press, Orlando, Florida.
Banavali, A.D., Moreno, E.M., and McCurdy, D.E. 1992. “Strontium 89/90 Analysis by
EIChroM Column Chemistry and Cerenkov Counting,” presented at the 38th Annual
Conference on Bioassay, Analytical and Environmental Radioactivity, November 2-6, Santa
Fe, NM
Banavali, A.D., Raimondi, J.M., and McCurdy, D.E. 1995. “The determination of technetium-99
in low-level radioactive waste,” Radioactivity and Radiochemistry, 6:3, pp. 26-35.
Bard, A.J., Parsons, R., and Jordan, J. 1985. Standard Potentials in Aqueous Solution, Marcel
Dekker, New York.

Separation Techniques
14-203
JULY 2004 MARLAP
Bate, L.C. 1979. “Determination of Tc-99 In Mixed Fission Products By Neutron Activation
Analysis,” in W.S. Lyon, Ed., Radioelements Analysis–Progress and Problems, Ann Arbor
Science Publishers Inc., p. 175-189.
Bate, L.C. and Leddicotte, G.W. 1961. The Radiochemistry of Cobalt, National Academy of
Sciences–National Research Council, (NAS-NS), NAS-NS 3041, Washington, DC.
Bate, L.C., and Stokely, J.R. 1982. “Iodine-129 separation and determination by neutron
activation analysis,” J. Radioanal. Chem., Vol. 72:1-2, p. 557-570.
Berg, E.W. 1963. Physical and Chemical Methods of Separation, McGraw-Hill, New York.
Berne, A. 1995. Use of Eichrom’s TRU Resin in the Determination of Am, Pu and U in Air Filter
and Water Samples, Environmental Measurements Laboratory. EML-575. December.
Biederman, G. and Schindler, P. 1957. “On the solubility product of precipitated iron (iii)
hydroxide,” Acta Chemica Scandinavia, 11, p. 731-740.
Birkett, J.D., Bodek, I., Glazer, A.E., Grain, C.F., Hayes, D., Lerman, A., Lindsay, D.B., Loreti,
C.P., and Ong, J.H. 1988. “Description of individual processes,” in Bodek, I., Lyman, W.J.,
Reehl, W.F., and Rosenblatt, D.H., Eds., Environmental Inorganic Chemistry, Pergammon,
New York, pp. 2.1 - 2.17-18.
Blanchard, R.L. 1966. “Rapid determination of lead-210 and polonium-210 in environmental
samples by deposition on nickel,” Analytical Chemistry, 38, p. 189-192.
Blumenthal, W.B. 1995. “Zirconium,” McGraw-Hill Multimedia Encyclopedia of Science and
Technology, McGraw-Hill, New York; Software Copyright: Online Computer Systems, Inc.
Bonnesen, P.V., Presley, D.J., Haverlock, T.J., and Moyer, B.A. 1995. “Removal of Technetium
from Alkaline Nuclear-Waste Media by a Solvent-Extraction Process Using Crown Ethers,”
presented at conference identified as CONF-9505101-6, Oak Ridge National Laboratory, Oak
Ridge, Tennessee.
Booman, G.L. and Rein, J.E. 1962. “Uranium,” in Kolthoff, I.M. and Elving, P.J., Eds., Treatise
on Analytical Chemistry, Part II, Vol. 9, John Wiley and Sons, New York, pp. 1-188.
Bunzl, K. and Kracke,W. 1994. “Efficient radiochemical separation for the determination of
plutonium in environmental samples, using a supported, highly specific extractant,” Journal
of Radioanalytical and Nuclear Chemistry, Letters, 186:5, pp. 401-413.
Bunzl, K., Kracke, W., and Meyer, H. 1996. “A Simple Radiochemical Determination of 90Sr in

Separation Techniques
14-204
MARLAP JULY 2004
Brines,” Journal of Radioanalytical and Nuclear Chemistry, Letters, 2112:2, pp. 143-149.
Burnett, W. and Yeh, C.C. 1995. “Separation of protactinium from geochemical materials via
extraction chromatography,” Radioactivity and Radiochemistry, 6:4, pp. 22-26.
Cadieux, J.R., and Reboul, S.H. 1996. “Separation and analysis of actinides by extraction
chromatography coupled with alpha-particle liquid scintillation spectrometry,” Radioactivity
and Radiochemistry, 7:2, pp. 30-34.
Carney, K.P., and Cummings, D.G. 1995. “The Application of Micro-Column Solid Phase
Extraction Techniques for the Analysis of Rare Earth Elements in Actinide Containing
Matrices,” Proceedings of the Third International Conference on Methods and Applications
of Radioanalytical Chemistry in Journal of Radioanalytical and Nuclear Chemistry, Articles,
194:1, pp. 41-49.
Chabaux, F., Othman, D.B., and Brick, J.L. 1994. “A new ra-ba chromatographic separation and
its application to ra mass-spectrometric measurement in volcanic rocks,” Chemical Geology,
Vol. 114, pp. 191-197. Erratum, 1994. Chemical Geology, 116, p. 301.
Chemical Rubber Company (CRC). 1999. Handbook of Chemistry and Physics, CRC Press,
Boca Raton, FL.
Chen, Q., Dahlgaard, H., Hansen, H.J.M., and Aarkrog, A. 1990. “Determination of 99Tc in
environmental samples by anion exchange and liquid-liquid extraction at controlled valency,”
Analytica Chimica Acta, 228, pp. 163-167.
Choppin, G., Rydberg, J., Liljenzin, J.O. 1995. Radiochemistry and Nuclear Chemistry,
Butterworth-Heinemann, Oxford.
Clark, D.L., Keog, D.W., Palmer, P.D., Scott, B.L., and Tait, C.D. 1998. “Synthesis and structure
of the first transuranium crown inclusive complex [NpO2([18]Crown-6)ClO4,” Angew. Chem.
Int. Ed., 37:1/2, pp. 164-166.
Cleveland, J.M. 1970. The Chemistry of Plutonium, Gordon and Breach, Science Publishers, Inc.
New York.
Cobble, J.W. 1964. “Technetium,” in Kolthoff, I.M. and Elving, P.J., Eds., Treatise on
Analytical Chemistry, Part II, Vol. 6, John Wiley and Sons, New York, pp. 404-434.
Coleman, G.H. 1965. The Radiochemistry of Plutonium, National Academy of Sciences–
National Research Council (NAS-NS), NAS-NS 3058, Washington, DC.

Separation Techniques
14-205
JULY 2004 MARLAP
Considine, D.M. and Considine, G.D., Eds. 1983. Van Nostrand’s Scientific Encyclopedia, Van
Nostrand Reinhold, New York.
Coomber, D.I. 1975. “Separation Methods for Inorganic Species,” in Coomber, D.I., Ed., Radio-
chemical Methods in Analysis, Plenum Press, New York, pp. 175-218.
Cotton, F.A. and Wilkinson, G. 1988. Advanced Inorganic Chemistry, John Wiley and Sons,
New York.
Cotton, S. 1991. Lanthanides and Actinides, Oxford University Press, New York.
Crouthamel, C.E. and Heinrich, R.R. 1971. “Radiochemical Separations,” in Kolthoff, I.M. and
Elving, P.J., Eds., Treatise on Analytical Chemistry, Part I, Vol. 9, John Wiley and Sons,
New York, pp. 5467-5511.
Dale, C.J., Warwick, P.E., and Croudace, I.W. 1996. “An optimized method for technetium-99
determination in low-level waste by extraction into tri-n-octylamine,” Radioactivity and
Radiochemistry, 7:3, pp. 23-31.
Dale, J.M. and Banks, C.V. 1962. “Cobalt,” in Treatise on Analytical Chemistry, Kolthoff, I.M.
and Elving, P.J., Eds., Part II, Vol. 2, John Wiley and Sons, New York, pp. 311-376.
Dean, J.A. 1995. Analytical Chemistry Handbook, McGraw-Hill, New York.
Demange, D., Grivet, M., Pialot, H., and Chambaudet, A. 2002. “Indirect tritium determination
by an original He-3 ingrowth method using a standard helium leak detector mass
spectrometer,” Analytical Chemistry, 74, pp. 3183-3189.
DeVoe, J.R. 1962. Application of Distillation Techniques to Radiochemical Separations,
National Academy of Sciences– National Research Council (NAS-NS), NAS-NS 3108,
Washington, DC.
Dietz, M.l., Horwitz, E.P., Nelson, D.M., and Wahlgreen, M.A. 1991. “An improved method for
determining 89Sr and 90Sr in urine,” Health Physics, 61:6, pp. 871-877.
Dietz, M. and Horwitz, E.P. 1992. “Improved chemistry for the production of Y-90 for medical
applications,” Applied Radiation and Isotopes, 43, p. 1093-1102.
Dietz, M.L. and Horwitz, E.P. 1993. “Novel chromatographic materials based on nuclear waste
processing chemistry,” LC-GC, The Magazine of Separtion Science, 11:6.
Echo, M. W., and Turk, E. H. 1957. Quantitative Determination of U-235 by delayed neutron

Separation Techniques
14-206
MARLAP JULY 2004
counting, U.S. AEC Report PTR-143.
U.S. Department of Energy (DOE) 1990 and 1997. EML Procedures Manual, Chieco, N.A.,
Bogen, DC., and Knutson, E.O., Eds., HASL-300, 27th and 28th Editions, DOE
Environmental Measurements Laboratory, New York. Available at www.eml.doe.gov/
publications/procman.cfm.
U.S. Department of Energy (DOE) 1994. Primer on Tritium Safe Handling Practices, DOE-
HDBK-1079-94, Washington, DC.
U.S. Department of Energy (DOE) 1997. DOE Methods for Evaluating Environmental and
Waste Management Samples, Goheen, S.C., McCulloch, M., Thomas, B.L., Riley, R.G.,
Skiarew, D.S., Mong, G.M., and Fadeff, S.K., Eds., DOE/EM-0089T, Rev 2, Addendum 1,
Washington, DC.
Duckworth, H.E. 1995. “Triton,” McGraw-Hill Multimedia Encyclopedia of Science and
Technology, McGraw-Hill, New York; Software Copyright: Online Computer Systems, Inc.
Ehmann, W.D. and Vancd, D.E. 1991. Radiochemistry and Nuclear Methods of Analysis, John
Wiley, New York.
U.S. Environmental Protection Agency (EPA) 1973. Procedures for Radiochemical Analysis of
Nuclear Reactor Aqueous Solutions, Krieger, H.L. and Gold, S., Eds., EPA-R4-73-014, EPA
National Environmental Research Center, Office of Research and Monitoring, Cincinnati,
Ohio.
U.S. Environmental Protection Agency (EPA) 1979. Radiochemical Analytical Procedures for
Analysis of Environmental Samples, Johns, F.B., Hahn, P.B., Thome, D.J., and Bretthauer,
E.W., EMSL-LV-0539-17, Office of Research and Development, Las Vegas, Nevada.
U.S. Environmental Protection Agency (EPA) 1980. Prescribed Procedures for Measurement of
Radioactivity in Drinking Water, Krieger, H.L. and Whittaker, E.L., Eds., EPA-600/4-80-
032, EPA Environmental Monitoring and Support Laboratory, Cincinnati, Ohio.
U.S. Environmental Protection Agency (EPA) 1984. Radiochemistry Procedures Manual,
Liberman, R.E., Ed., EPA-520/5-84-006, EPA Eastern Environmental Radiation Facility,
Office of Radiation Programs, Montgomery, Ala.
U.S. Environmental Protection Agency (EPA) 2000. Maximum contaminant levels for radium-
226, radium-228, and gross alpha particle radioactivity in community water systems. Code
of Federal Regulations, Title 40, Part 141.15, amended in 65 Federal Register 76745,
December 7, 2000.

Separation Techniques
14-207
JULY 2004 MARLAP
Dorfner, K. 1972. Ion Exchangers: Properties and Applications, Ann Arbor Science Publishers,
Ann Arbor, Michigan.
Emsley, J. 1989. The Elements, Clarendon, Oxford.
Faris, J.P. and Buchanan, R.J. 1964. USAEC Report, ANL-6811.
Finston, H.L. and Kinsley, M.T. 1961. The Radiochemistry of Cesium, National Academy of
Sciences–National Research Council (NAS-NS), NAS-NS 3035, Washington, DC.
Feigl, F. 1936. “Organic reagents in inorganic analysis,” Industry and Engineering Chemistry,
Analytical Edition, Vol. 8, pp. 401-410.
Flagg, J.F., and Bleidner, W.E. 1945. “The electrodeposition of element 43 and the standard
potential for the reaction Ma-MaO4,” J. Chemical Physics, 13, pp. 269-276.
Foti, S., Delucchi, E., and V. Akamian, V. 1972a. “Determination of picogram amounts of
technetium-99 by neutron activation analysis,” Anal. Chim. Acta, 60:2, p 261-268.
Foti, S., Delucchi, E., and V. Akamian, V. 1972b. “Determination of picogram amounts of
technetium in environmental samples by neutron activation analysis,” Anal. Chim. Acta, 60:2,
p 269-276.
Freiser, H. 1983. “Reactive Groups as Reagents,” in, Kolthoff, I. and Elving, H., Eds., Treatise
on Analytical Chemistry, Part I, Vol. 3, 2nd Ed. Chapter 29.
Fried, S. 1995. “Technetium,” McGraw-Hill Multimedia Encyclopedia of Science and
Technology, McGraw-Hill, New York; Software Copyright: Online Computer Systems, Inc.
Friedlander,G., Kennedy, J.W., Macias, E.S., and Miller, J.M. 1981. Nuclear and
Radiochemistry, 3rd Ed., John Wiley and Sons, New York.
Gale, N.H. 1996. “A New Method for Extracting and Purifying Lead from Difficult Matrices for
Isotopic Analysis,” Anal. Chim. Acta,, Vol. 332, pp. 15-21.
Garcia-Leon, M. 1990. “Determination and Levels of 99Tc in Environmental and Biological
Samples,” J. Radioanalytical and Nuclear Chemistry, Articles, 138: 1, pp. 171-179.
Gokel, G.W. 1991. Crown Ethers and Cryptands, Monographs in Supramolecular Chemistry,
The Royal Society of Chemistry, London.
Golchert, N.W. and Sedlet, J. 1969. “Radiochemical determination of technetium-99 in

Separation Techniques
14-208
MARLAP JULY 2004
environmental water samples,” Analytical Chemistry, 41:4, pp. 669-671.
Gordon, L., Salutsky, M.L., and Willard, H.H. 1959. Precipitation from Homogeneous Solution,
John Wiley and Sons, New York.
Greenwood, N.N. and Earnshaw, A. 1984. Chemistry of the Elements, Pergamon, Oxford.
Grimaldi, F.S. 1961. “Thorium,” in Kolthoff, I.M. and Elving, P.J., Eds., Treatise on Analytical
Chemistry, Part II, Vol. 5, John Wiley and Sons, New York, pp. 142-216.
Grindler, J.E. 1962. The Radiochemistry of Uranium, National Academy of Sciences–National
Research Council (NAS-NS), NAS-NS 3050, Washington, DC.
Hahn, P.F. 1945. “Radioactive iron procedures-purification, electroplating, and analysis,”
Industry and Engineering Chemistry, Analytical Edition, 17, pp. 45-46.
Hahn, R.B. 1961. “Zirconium and Hafnium,” in Kolthoff, I.M. and Elving, P.J., Eds., Treatise on
Analytical Chemistry, Part II, Vol. 5, John Wiley and Sons, New York, pp. 61-138.
Hampel, C.A., Ed. 1968. The Encyclopedia of the Chemical Elements, Reinhold, New York.
Hassinsky, M. and Adloff, J.-P. 1965. Radiochemical Survey of the Elements, Elsevier, New
York.
Hermann, J.A. and Suttle, J.F. 1961. “Precipitation and Crystallization,” in Kolthoff, I.M. and
Elving, P.J., Eds., Treatise on Analytical Chemistry, Part I, Vol. 3, John Wiley and Sons,
New York, pp. 1367-1410.
Hillebrand, W.F., Lundell, G.E.F., Bright, H.A., and Hoffman, J.I. 1980, Applied Inorganic
Analysis, Krieger Publishing, New York.
Hindman, F.D. 1983. “Neodymium fluoride mounting for α spectrometry determinations of
uranium, plutonium, and americium,” Analytical Chemistry, 55, pp. 2460-2461.
Hindman, F.D. 1986. “Actinide separations for α spectrometry using neodymium fluoride
coprecipitation,” Analytical Chemistry, 58, pp. 1238-1241.
Hirano, S., Matsuba, M., Kamada, H. 1989. “The determination of 99Tc in marine algae,”
Radioisotopes, 38, pp. 186-189.
Hiraoka, M. 1992. Crown Ethers and Analogous Compounds, Elsevier Science Publishers B.V.,
Amsterdam.

Separation Techniques
14-209
JULY 2004 MARLAP
Hochel, R. C. 1979. A High-Capacity Neutron Activation Facility, Radioelements Analysis —
Progress and Problems, Ed. W.S. Lyon, Ann Arbor Science Publishers Inc., p. 343-348.
Holm, E., Rioseco, J., Garcia-Leon, M. 1984. “Determination of 99Tc in environmental samples,”
Nuclear Instruments: Methods of Physics Research, 223, pp. 204-207.
Horwitz, E.P., Chiarizia, R., and Dietz, M.L., 1992a. “A novel strontium-selective extraction
chromatographic resin,” Solvent Extraction and Ion Exchange, 10:2, pp. 313-336.
Horwitz, E.P., Chiarizia, R., Dietz, M.L., Diamond, Essling, A.M., Graczyk, D. 1992b.
“Separation and preconcentration of uranium from acidic media by extraction
chromatography,” Anal. Chim. Acta, 266, pp. 25-37.
Horwitz, E.P., Chiarizia, R., Dietz, M.L., Diamond, H., and Nelson, D.M. 1993. “Separation and
preconcentration of actinides from acidic media by extraction chromatography,” Anal. Chim.
Acta, 281, pp. 361-372.
Horwitz, E.P., Diamond, H., and Martin, K.A. 1987. “The extraction of selected actinides in the
(III) (IV) and (VI) oxidation states from hydrochloric acid by OφD(iB) CMPO: The TRUEX-
chloride process,” Solvent Extraction and Ion Exchange, 5:3, pp. 447-470.
Horwitz, E. P., Dietz, M.L., and Chiarizia, J. 1992. “The application of novel extraction
chromatographic materials to the characterization of radioactive waste solutions,” J.
Radioanalytical and Nuclear Chemistry, 161, pp. 575-583.
Horwitz, E.P., Dietz, M.L., Chiarizia, R., Diamond, H., and Nelson, M. 1995. “Separation and
preconcentration of actinides by extraction chromatography using a supported liquid anion
exchanger: Application to the characterization of high-level nuclear waste solutions,” Anal.
Chim. Acta, 310, pp. 63-78.
Horwitz, E.P., Dietz, M.L., and Fisher, D.E. 1991. “Separation and preconcentration of strontium
from biological, environmental, and nuclear waste samples by extraction chromatography
using a crown ether,” Analytical Chemistry, pp. 522-525.
Horwitz, E.P., Dietz, M.L., Nelson, D.M., Larosa, J.J., and Fairman, W.D. 1990. “Concentration
and separation of actinides from urine using a supported bifunctional organophosphorus
extractant,” Anal. Chim. Acta, 238, pp. 263-271.
Horwitz, E.P., Dietz, M.L., Rhoads, S., Felinto, C., Gale, N.H., and Houghton, J. 1994. “A
lead-selective extraction chromatographic resin and its application to the isolation of lead
from geological samples,” Anal. Chim. Acta, 292, pp. 263-273.

Separation Techniques
14-210
MARLAP JULY 2004
Horwitz, E.P., Kalina, D.G., Diamond, H., and Vandegrift, G.F. 1985. “The TRUEX process–a
process for the extraction of the transuranic elements from nitric acid wastes utilizing
modified PUREX solvents,” Solvent Extraction and Ion Exchange,. 3:1/2, pp. 75-109.
Hyde, E.K. 1960. The Radiochemistry of Thorium, National Academy of Sciences–National
Research Council (NAS-NS), NAS-NS 3004, Washington, DC.
International Atomic Energy Agency (IAEA). 1972. Analytical Chemistry of Nuclear Fuels,
Vienna, Austria.
International Union of Pure and Applied Chemistry (IUPAC). 1990. Nomenclature of Inorganic
Chemistry, Recommendations, G.J. Leigh (ed.). Oxford: Blackwell Scientific Publications.
Irving, H. and Williams, R.J.P. 1961. “Liquid-Liquid Extraction”, in Kolthoff, I.M. and Elving,
P.J., Eds., Treatise on Analytical Chemistry, Part I, Vol. 3, John Wiley and Sons, New York,
pp. 1309-1364.
Jeter, H.W. and Grob, B. 1994. “Determination of radiostrontium in milk samples using an
extraction chromatography column,” Radioactivity and Radiochemistry, 5:3, pp. 8-17.
Kallmann, S. 1961. “The Alkali Metals,” in Treatise on Analytical Chemistry, Kolthoff, I.M. and
Elving, P.J., Eds., Part II, Vol. 1, John Wiley and Sons, New York, pp. 301-446.
Kallmann, S. 1964. “Niobium and Tantalum,” in Treatise on Analytical Chemistry, Kolthoff,
I.M. and Elving, P.J., Eds., Part II, Vol. 6, John Wiley and Sons, New York, pp. 183-406.
Kaplan, L. 1995. “Tritium,” in McGraw-Hill Multimedia Encyclopedia of Science and
Technology, McGraw-Hill, New York; Software Copyright: Online Computer Systems, Inc.
Katz, J.J., Seaborg, G.T., and Morss, L.R. 1986. “Summary and Comparative Aspects of the
Actinide Elements,” in Katz, J.J., Seaborg, G.T., and Morss, L.R., Eds., The Chemistry of the
Actinides, Vol. 2, Chapman and Hall, London, pp. 1121-1195.
Katzin, L.I. 1986. “Thorium,” in Katz, J.J., Seaborg, G.T., and Morss, L.R., Eds., The Chemistry
of the Actinides, Vol. 1, Chapman and Hall, London, pp. 41-101.
Kaye, J.H., Strebin, R.S., and Orr, R.D. 1995. “Rapid, quantitative analysis of americium, curium
and plutonium isotopes in hanford samples using extraction chromatography and
precipitation plating,” J. Radioanalytical and Nuclear Chemistry, 194:1, pp. 191-196.
Kessler, M. 1989. Liquid Scintillation Analysis; Science and Technology [Ed.], Packard
Instrument Company, Meriden, CT.

Separation Techniques
14-211
JULY 2004 MARLAP
Kirby, H.W. and Salutsky, M.L. 1964. The Radiochemistry of Radium, National Academy of
Sciences–National Research Council (NAS-NS), NAS-NS 3057, Washington, DC.
Kleinberg, J., Argersinger, W.J., and Griswald, E. 1966. Inorganic Chemistry, DC. Heath,
Boston.
Kleinberg, J. and Cowan, G.A. 1960. The Radiochemistry of Fluorine, Chlorine, Bromine, and
Iodine, National Academy of Sciences–National Research Council (NAS-NRC), NAS-NRC
3005, Washington, DC.
Kolthoff, I.M. and Sandell, E.B. 1933. “Exchange adsorption and its influence upon the
solubility of precipitates with ionic lattices in electrolyte solution,”J. Am. Chem. Soc., 55, p.
2170-2171.
Kolthoff, I.M., Sandell, E.B., Meehan, E.J., and Bruckenstein, S. 1969. Quantitative Chemical
Analysis, Macmillan, New York.
Korkisch, J. 1969. Modern Methods for the Separation of Rarer Metals, Pergamon Press, New
York.
Korkisch, J. 1989. Handbook of Ion Exchange Resins: Their Applicability to Inorganic
Analytical Chemistry, Vol. I and II, CRC Press, Boca Raton, FL.
Kraus, K.A., and Nelson, F. 1956. “Nuclear Chemistry and the Effects of Irradiation,”
Proceedings of the International Conference on Peaceful Uses of Atomic Energy, 1st Geneva,
Vol. 7, p. 113-167.
Kraus, K.A. and Nelson, F. 1958. Symposium on Ion Exchange and Chromatography in
Analytical Chemistry, ASTM Special Technical Publication No.195, Philadelphia.
Kressin, I.K. 1977. “Electrodeposition of plutonium and americium for high-resolution alpha
spectrometry,” Analytical Chemistry, 49:6, pp. 842-846.
Krivan, V. 1986. “Application of Radoiotracers to Methodological Studies in Trace Element
Analysis, “ in Elving, P.F., Krivan, V., and Kolthoff, E.M., Eds., Treatise on Analytical
Chemistry, John Wiley and Sons, New York, pp. 339-417.
Kuska, Y. and Meinke, W. 1961. Rapid Radiochemical Separations, National Academy of
Sciences–National Research Council (NAS-NS), NAS-NS 3104, Washington, DC.
Larsen, E.M. 1965. Transitional Elements, W.A. Benjamin, New York.

Separation Techniques
14-212
MARLAP JULY 2004
Latimer, W.M. 1952. The Oxidation States of the Elements and Their Potentials in Aqueous
Solutions, Prentice-Hall, Englewood Cliffs, NJ.
Leussing, D.L. 1959. “Solubility,” in Kolthoff, I.M. and Elving, P.J., Eds., Treatise on Analytical
Chemistry, Part I, Vol. 1, John Wiley and Sons, New York, pp. 675-732.
Leyba, J.D., Vollmar, H.S., Fjeld, R.A., Devol, T.A., Brown, D.D., and Cadieux, J.R. 1995.
“Evaluation of a direct extraction/liquid scintillation counting technique for the measurement
of uranium in water,” J. Radioanalytical and Nuclear Chemistry, 194:2, pp. 337-344.
Lindsay, D.B. 1988. “Radionuclides,” in Bodek, I., Lyman, W.J., Reehl, W.F., and Rosenblatt,
D.H., Eds., Environmental Inorganic Chemistry, Pergammon, New York, pp. 9.1 - 9.3-3.
Lingane, J.L. 1966. Analytical Chemistry of Selected Metallic Elements, Reinhold, New York.
Lo, T.C., Baird, H.I., Hanson, C., Eds. 1983. Handbook of Solvent Extraction, Wiley-
Interscience, New York.
Lucas, H.F., Markun, F., and Boulenger, R. 1990. “Methods for Measuring Radium Isotopes:
Emanometry,” in The Environmental Behavior of Radium, Vol 1, Technical Report Series
No. 310, International Atomic Energy Agency, Vienna, pp. 149-172.
Martin, J.E. and Hylko, J.M. 1987. “Measurement of 99Tc in Low-Level Radioactive Waste from
Reactors Using 99mTc as a Tracer,” Applied Radiation and Isotope, 38:6, pp. 447-450.
Marzilli, L. and Marzilli, P.A. 1995. “Cobalt,” McGraw-Hill Multimedia Encyclopedia of
Science and Technology, 1994 and 1996, McGraw-Hill, New York; Software Copyright:
Online Computer Systems, Inc.
Maxwell, S. L. and D. J. Fauth. 2000. “Rapid column extraction methods for urine,”
Radioactivity and Radiochemistry, 11:3, pp. 28-34.
McCurdy, D. E. et al. 1980. “The use of cuprous iodide as a precipitation matrix in the
radiochemical determination of I-131 in milk,” Health Physics, 38, pp. 203-213.
McDowell, W.J. 1986. Alpha Counting and Spectrometry Using Liquid Scintillation Methods,
National Academy of Sciences–National Research Council (NAS-NRC), NAS-NRC 3116,
Technical Information Center, Office of Scientific and Technical Information, U.S.
Department of Energy, Washington, DC.
McDowell, W.J. 1992. “Photon/electron-rejecting alpha liquid scintillation (PERALS)
spectrometry: a review,” Radioactivity & Radiochemistry, 3:2, pp. 26, 28, 30, 35-36, 38-42,

Separation Techniques
14-213
JULY 2004 MARLAP
44-46, 48-50, 52-54.
McMillan, J.W. 1975. “The Use of Tracers in Inorganic Analysis,” in Coomber, D.I., Ed.,
Radiochemical Methods in Analysis, Plenum Press, pp. 297-348.
Metz, C.F. and Waterbury, G.R. 1962. “The Transuranium Actinide Elements,” in Kolthoff, I.M.
and Elving, P.J., Eds., Treatise on Analytical Chemistry, Part II, Vol. 9, John Wiley and Sons,
New York, pp. 189-440.
Minczewski, J., J.Chwastowska, J., and Dybczynski, R. 1982. “Separation and Preconcentration
Methods in Inorganic Trace Analysis,” Ellis Horwood Series in Analytical Chemistry,
Halsted Press.
Mitchell, J. 1961. “Water,” in Kolthoff, I.M. and Elving, P.J., Eds., Treatise on Analytical
Chemistry, Part II, Vol. 1, John Wiley and Sons, New York, pp. 67-206.
Mitchell, R.F. 1960. “Electrodeposition of actinide elements at tracer concentrations”, Analytical
Chemistry, 32, pp. 326-328.
Moore, F.L. 1958. “Liquid-liquid extraction of uranium and plutonium from hydrochloric acid
solution with tri(iso-octyl)amine,” Analytical Chemistry, 30, pp. 908-911.
Morse, R.S., and Welford, G.A. 1971. “Dietary Intake of 210Pb,” Health Physics, 21, pp. 53-55.
Morss, L.R. and J Fuger [Eds]. 1992. Transuranic Elements: A Half Century, Chapter 31,
American Chemical Society, Washington, DC.
National Council on Radiation Protection and Measurements (NCRP). 1985. A Handbook of
Radioactivity Measurement Procedures, Handbook 58, Second Edition, Bethesda, MD, pp.
220-221.
Nelson, F., Murase, T., and Kraus, K.A. 1964. “Ion exchange procedures I. cation exchange in
concentrated HCl and HClO4 solutions,” Journal of Chromatography, 13, pp. 503-535.
Nguyen, S.N., Miller, P.E., Wild, J.F., and Hickman, D.P. 1996. “Simultaneous determination of
237Np, 232Th, and U isotopes in urine samples using extraction chromatography, ICP-MS and
gamma-ray spectroscopy,” Radioactivity and Radiochemistry, 7:3, pp. 16-22.
Nuclear Energy Agency (NEA). 1982. “The Geochemistry of Actinides, in Geological Disposal
of Radioactive Waste: Geochemical Processes, Nuclear Energy Agency, Paris, pp.49-68.
Orlandini, K.A. 1972. “Selective Ion Exchange for the Isolation of Certain Alkaline Earths,” U.S.

Separation Techniques
14-214
MARLAP JULY 2004
Patent No. 3694369, Sept. 26.
Orlandini, K.A., King, J.G., and Erickson, M.D. 1997. “Rapid isolation and measurement of
technetium-99 using 3M Empore™ Technetium Rad Disks,” in Goheen, S.C., McCulloch,
M., Thomas, B.L., Riley, R.G., Skiarew, D.S., Mong, G.M., and Fadeff, S.K., Eds.,
DOE/EM-0089T, DOE Methods for Evaluating Environmental and Waste Management
Samples, Method RS 551, U.S. Department of Energy, Washington, DC.
Paducah Gaseous Diffusion Plant. 1993. “99Tc Determination in Water,” Method R-46.
Parsa, Bahman. 1998. “Contribution of Short-lived Radionuclides to Alpha-Particle Radio-
activity in Drinking Water and their Impact on the Safe Water Drinking Act Regula-
tions,”Radioactivity and Radiochemistry, 9, p. 41-47.
Passo, C.J. and Cook, G.T. 1994. Handbook of Environmental Liquid Scintillation Spectrometry:
A Compilation of Theory and Methods, Packard Instrument Company, Meriden, CT, pp. 4 -
1-6.
Pauling, L. 1970. General Chemistry, Dover, New York.
Penneman, R.A. 1994 and 1996. “Americium,” McGraw-Hill Multimedia Encyclopedia of
Science and Technology, McGraw-Hill, New York; Software Copyright: Online Computer
Systems, Inc.
Penneman, R.A. and Keenan, T.K. 1960. The Radiochemistry of Americium and Curium,
National Academy of Sciences–National Research Council (NAS-NRC), NAS-NRC 3006,
Washington, DC.
Perrin, D.D. 1979. “Masking and Demasking in Analytical Chemistry,” in Kolthoff, I.M. and
Elving, P.J., Eds., Treatise on Analytical Chemistry, 2nd Ed., Part I, Vol. 2, John Wiley and
Sons, New York, pp. 599-643.
Perry, E.S. and Weissberger, A. 1965. “Distillation,” in Perry, E.S. and Weissberger, A., Eds.,
Technique of Organic Chemistry, Second edition, Vol. IV, Wiley-Interscience, New York.
Peters, D.G., Hayes, J.M, and Hieftje, G.M. 1974. Chemical Separations and Measurements:
Theory and Practice of Analytical Chemistry, W.B. Saunders Company, New York.
Pimpl, M. 1995. “89Sr/90Sr-Determination in soils and sediments using crown ethers for Ca/Sr-
separation,” J. Radioanalytical and Nuclear Chemistry, Articles,. 194:2, pp. 311-318.
Pin, C. and Bassin, C. 1992. “Evaluation of a strontium-specific extraction chromatographic

Separation Techniques
14-215
JULY 2004 MARLAP
method for isotopic analysis in geological materials,” Anal. Chim. Acta, 269, pp. 249-255.
Pin, C., Briot, D., Bassin, C., and Poitasson, F. 1994. “ concomitant separation of strontium and
samarium-neodymium for isotopic analysis in silicate samples, based on specific extraction
chromatography,” Anal. Chim. Acta, 298, pp. 209-217.
Pin, C. and Zalduequi, J.F.S. 1997. “Sequential separation of rare-earth elements, thorium and
uranium by miniaturized extraction chromatography: application to isotopic analyses of
silicate rocks,” Anal. Chim. Acta, 339, pp. 79-89.
Rieman, W. and Walton, H. 1970. Ion Exchange in Analytical Chemistry, Pergamon Press, New
York.
Riley, R.F. 1995. “Strontium.” McGraw-Hill Multimedia Encyclopedia of Science and
Technology, McGraw-Hill, New York; Software Copyright: Online Computer Systems, Inc.
Rucker, T. L. 1991. “Calculational Method for the Resolution of 90Sr and 89Sr Counts from
Cerenkov and Liquid Scintillation Counting,” Liquid Scintillation Counting and Organic
Scintillators, pp 529-535, Lewis Publishers.
Salutsky, M.L. 1959. “Precipitates: Their Formation, Properties, and Purity,” in Kolthoff, I.M.
and Elving, P.J., Eds., Treatise on Analytical Chemistry, Part I, Vol. 1, John Wiley and Sons,
New York, pp. 733-766.
Salutsky, M.L. 1997. “Radium,” in McGraw-Hill Encyclopedia of Science and Technology,
Parker, S.P., Ed. in Chief, Vol. 15, McGraw-Hill, New York, pp. 177-179.
Sanford Cohen and Associates, Inc. (SCA) 2001. Laboratory Quality Assurance Plan: Standard
Operating Procedures, Vol. II, S. Cohen and Associates, Inc., Montgomery, Ala.
Schulz, W.W. and Penneman, R.A. 1986. “Americium,” in Katz, J.J., Seaborg, G.T., and Morss,
L.R., Eds., The Chemistry of the Actinides, Vol. 2, Chapman and Hall, London, pp. 887-961.
Seaborg, G. T. and Loveland, W.D. 1990. The Elements Beyond Uranium, John Wiley & Sons,
New York.
Sedlet, J. 1966. “Radon and Radium,” in Kolthoff, I.M. and Elving, P.J., Eds., Treatise on
Analytical Chemistry, Part II, Vol. 4, John Wiley and Sons, New York, pp. 219-316.
Sedlet, J. 1964. “Actinium, Astatine, Francium, Polonium, and Protactinium,” in Kolthoff, I.M.
and Elving, P.J., Eds., Treatise on Analytical Chemistry, Part II, Vol. 6, John Wiley and Sons,
New York, pp. 435-610.

Separation Techniques
14-216
MARLAP JULY 2004
Showsmith, D.W. 1984. “The Behavior of Radium in Soil and Uranium Mill Tailings,” AECL-
7818, Whitshell Nuclear Research Establishment, Tinawa, Manitoba, Canada.
Sill, C.W., Puphal, K.W., and Hindman, F.D. 1974. “Simultaneous determination of alpha-
emitting nuclides of radium through californium in soil,” Analytical Chemistry,. 46:12, pp.
1725-1737.
Sill, C.W. and Williams, R.L. 1981. “Preparation of actinides for alpha spectrometry without
electrodeposition,” Analytical Chemistry, 53, pp. 421-415.
Sill, D.S. and S.E. Bohrer. 2000. “Sequential determination of U, Pu, Am, th, and Np in fecal and
urine samples with total sample dissolution,” Radioactivity and Radiochemistry, 11:3, p. 7.
Sittig, M. 1994 and 1996. “Cesium,” McGraw-Hill Multimedia Encyclopedia of Science and
Technology, McGraw-Hill, New York; Software Copyright: Online Computer Systems, Inc.
Smith, LL., Crain, J.S., Yaeger, J.S., Horwitz, E.P., Diamond, H., and Chiarizia, R. 1995.
“Improved separation method for determining actinides in soil samples,” J. Radioanaytical
Nuclear Chemistry, 194:1, pp. 151-156.
Smith, L.L., Orlandini, K.A., Alvarado, J.S., Hoffmann, K.M., Seely, DC., and Shannon, R.T.
1996. “Application of Empore™ strontium rad disks to the analysis of radiostrontium in
environmental water samples,” Radiochimica Acta, 73, pp. 165-170.
Smith, L.L., Alvarado, J.S., Markun, F.J., Hoffmann, K.M., Seely, DC., and Shannon, R.T. 1997.
“An evaluation of radium-specific, solid-phase extraction membranes,” Radioactivity and
Radiochemistry, 8:1, pp. 30-37.
SpecNews 1993. “Product Overview,” 2:3, Eichrom Technologies, Inc., Darien, IL, p. 3.
Steinberg, E.O. 1960. The Radiochemistry of Zirconium and Hafnium, National Academy of
Sciences–National Research Council (NAS-NRC), NAS-NRC 3011, Washington, DC.
Strebin, R. et al. 1997. “Nickel-59 and Nickel-63 Determination in Aqueous Samples,”DOE
Methods Compendium.
Strebin, R. S. Jr., Brauer, F. P., Kaye, J. H., Rapids, M. S., and Stoffels, J. J. 1988. “Neutron
activation and mass spectrometric measurement of 129I,” J. Radioanal. Nucl. Chem., 127:1, p.
59-73.
Sullivan, T.M., Nelson, D.M., and Thompson, E.G. 1993. “Monitoring for 99Tc in borehole
waters using an extraction chromatographic resin,” Radioactivity and Radiochemistry, 4:2,

Separation Techniques
14-217
JULY 2004 MARLAP
pp. 14-18.
Sunderman, D.N. and Townley, C.W. 1960. The Radiochemistry of Barium, Calcium, and
Strontium, National Academy of Sciences–National Research Council (NAS-NS), NAS-NS
3010, Washington, DC.
Surano, K.A., Hudson, G.B., Failor, R.A., Sims, J.M., Holland, R.C., Maclean, S.C., and
Garrison, J.C. 1992. “Helium-3 mass spectrometry for low level tritium analysis for
environmental samples,” J. Radioanalytical and Nuclear Chemistry, 161:2, pp. 443-453.
Talvitie, N.A. 1972. “Electrodeposition of actinides for alpha spectrometric determination,”
Analytical Chemistry,. 44:2, pp. 280-283.
Testa, C., Desideri, D., Meli, M.A., and Roselli, C. 1995. “New radiochemical procedures for
environmental measurements and data quality control,” J. Radioanalytical and Nuclear
Chemistry, Articles, 194:1, pp. 141-149.
To, Dominic. 1993. “Radiochemical determination of low-level 210Pb in environmental water
samples,”Analytical Chemistry, 65, p. 2701.
Turekian, K.K. and Bolter, E. 1966. “Strontium and Barium,” in Kolthoff, I.M. and Elving, P.J.,
Eds., Treatise on Analytical Chemistry, Part II, Vol. 4, John Wiley and Sons, New York, pp.
153-218.
Vdovenko, V.M. and Dubasov, Yu.V. 1975. Analytical Chemistry of Radium,” in Malament, D.,
Ed., Analytical Chemistry of the Elements, John Wiley and Sons, New York.
Wahl, A.C. and Bonner, N.A. 1951. Radioactivity Applied to Chemistry, John Wiley and Sons,
New York.
Wang, C.H., Willis, D.L., and Loveland, W.D. 1975. Radiotracer Methodology in the Biological,
Environmental and Physical Sciences, Prentice-Hall, New York.
Weigel, F. 1986. “Uranium,” in Katz, J.J., Seaborg, G.T., and Morss, L.R., Eds., The Chemistry
of the Actinides, Vol. 1, Chapman and Hall, London, pp. 169-442.
Weigel, F., Katz, J.J., and Seaborg, G.T. 1986. “Plutonium,” in Katz, J.J., Seaborg, G.T., and
Morss, L.R., Eds., The Chemistry of the Actinides, Vol. 1, Chapman and Hall, London, pp.
499-886.
Weigel, F. 1995. “Plutonium,” McGraw-Hill Multimedia Encyclopedia of Science and
Technology, 1994 and 1996, McGraw-Hill, New York; Software Copyright: Online

Separation Techniques
14-218
MARLAP JULY 2004
Computer Systems, Inc.
Weigel, F. 1995. “Uranium,” McGraw-Hill Multimedia Encyclopedia of Science and
Technology, 1994 and 1996, McGraw-Hill, New York; Software Copyright: Online
Computer Systems, Inc.
Willard, H.H. and Rulfs, C.L. 1961. “Decomposition and Dissolution of Samples: Inorganic,” in
Kolthoff, I.M. and Elving, P.J., Eds., Treatise on Analytical Chemistry, Part I, Vol. 2, John
Wiley and Sons, New York, pp. 1027-1050.
Wright, B.T. 1947. “Recoil of silver nuclei due to d-capture in cadmium,” Physical Review,
71:12, pp. 839-841.
Woittiez, J.R.W. and Kroon, K.J. 1995. “Fast, selective and sensitive methods for the
determination of pb-210 in phosphogypsum and phosphate ore,” J. Radioanalytical and
Nuclear Chemistry, 194:2, pp. 319-329.
Wray, J.L. and Daniels, F. 1957. “Precipation of calcite and aragonite,” J. Am. Chem. Soc., 79,
pp. 2031-2034.
Zolotov, Yu.A. and Kuz’man, N.M. 1990. Preconcentration of Trace Elements, Vol. XXV of
Wilson and Wilson’s Comprehensive Analytical Chemistry, G. Svehla, Ed., Elsevier Science
Publishers, Amsterdam.
14.12 Selected Bibliography
14.12.1 Inorganic and Analytical Chemistry
Baes, C.F. and Mesmer, R.E. 1976. The Hydrolysis of Cations, John Wiley and Sons, New York.
Bard, A.J., Parsons, R., and Jordan, J. 1985. Standard Potentials in Aqueous Solution, Marcel
Dekker, New York.
Bodek, I., Lyman, W.J., Reehl, W.F., and Rosenblatt, D.H., Eds. 1988. Environmental Inorganic
Chemistry, Pergammon, New York.
Cotton, F.A. and Wilkinson, G. 1988. Advanced Inorganic Chemistry, John Wiley and Sons,
New York.
Dean, J.A. 1995, Analytical Chemistry Handbook, McGraw-Hill, New York.

Separation Techniques
14-219
JULY 2004 MARLAP
Dorfner, K. 1972. Ion Exchangers: Properties and Applications, Ann Arbor Science Publishers,
Ann Arbor, Michigan.
Greenwood, N.N. and Earnshaw, A. 1984. Chemistry of the Elements, Pergamon, Oxford.
Karger, B.L., Snyder, L.R., and Horvath, C. 1973. An Introduction to Separation Science, John
Wiley and Sons, New York.
Kolthoff, I.M., Sandell, E.B., Meehan, E.J., and Bruckenstein, S. 1969. Quantitative Chemical
Analysis, The Macmillan Company, New York.
Latimer, W.M. 1952. The Oxidation States of the Elements and Their Potentials in Aqueous
Solutions, Prentice-Hall, Englewood Cliffs, NJ.
Zolotov, Yu.A. and Kuz’man, N.M. 1990. Preconcentration of Trace Elements, Vol. XXV of
Wilson and Wilson’s Comprehensive Analytical Chemistry, G. Svehla, Ed., Elsevier Science
Publishers, Amsterdam.
14.12.2 General Radiochemistry
Adolff, J.-P. and Guillaumont, R. 1993. Fundamentals of Radiochemistry, CRC Press, Boca
Raton, Florida.
Choppin, G., Rydberg, J., Liljenzin, J.O. 1995. Radiochemistry and Nuclear Chemistry,
Butterworth-Heinemann, Oxford.
Coomber, D.I., Ed. 1975. Radiochemical Methods in Analysis, Plenum Press, New York.
Parrington, J.R., Knox, H.D., Breneman, S.L., Feiner, F., and Baum, E.M. 1996. Nuclides and
Isotopes: Chart of the Nuclides. 15th Edition. Lockheed Martin and General Electric.
Wahl, A.C. and Bonner, N.A. 1951, Second Printing: May, 1958. Radioactivity Applied to
Chemistry, John Wiley and Sons, New York.
14.12.3 Radiochemical Methods of Separation
Colle, R. and F.J. Schima, F.J. 1996. “A Quantitative, Verifiable and Efficacious Protocol for
Spiking Solid, Granular Matrices with Radionuclidic Solutions,” Radioactivity and
Radiochemistry, 7:3, pp 32-46.
Crouthamel, C.E. and Heinrich, R.R. 1971. “Radiochemical Separations,” in Kolthoff, I.M. and
Elving, P.J., Eds., Treatise on Analytical Chemistry, Part I, Vol. 9, John Wiley and Sons,

Separation Techniques
14-220
MARLAP JULY 2004
New York, pp. 5467-5511.
Dietz, M.L. and Horwitz, E.P. 1993. “Novel Chromatographic Materials Based on Nuclear Waste
Processing Chemistry,” LC-GC, The Magazine of Separation Science, 11:6, pp. 424-426,
428, 430, 434, 436.
Horwitz, E. P., Dietz, M.L., and Chiarizia, J. 1992. “The application of novel extraction
chromatographic materials to the characterization of radioactive waste solutions,” J.
Radioanalytical and Nuclear Chemistry, 161, pp. 575-583.
14.12.4 Radionuclides
Anders, E. 1960. The Radiochemistry of Technetium, National Academy of Sciences–National
Research Council (NAS-NS), NAS-NS 3021, Washington, DC.
Bate, L.C. and Leddicotte, G. W. 1961. The Radiochemistry of Cobalt, National Academy of
Sciences–National Research Council, (NAS-NS), NAS-NS 3041, Washington, DC.
Booman, G.L. and Rein, J.E. 1962. “Uranium,” in Kolthoff, I.M. and Elving, P.J., Eds., Treatise
on Analytical Chemistry, Part II, Vol. 9, John Wiley and Sons, New York, pp. 1-188.
Cleveland, J.M. 1970. The Chemistry of Plutonium, Gordon and Breach Science Publishers, New
York.
Cobble, J.W. 1964. “Technetium,” in Kolthoff, I.M. and Elving, P.J., Eds., Treatise on
Analytical Chemistry, Part II, Vol. 6, John Wiley and Sons, New York, pp. 404-434.
Coleman, G.H. 1965. The Radiochemistry of Plutonium, National Academy of Sciences–
National Research Council (NAS-NS), NAS-NS 3058, Washington, DC.
Finston, H.L. and Kinsley, M.T. 1961. The Radiochemistry of Cesium, National Academy of
Sciences–National Research Council (NAS-NS), NAS-NS 3035, Washington, DC.
Grimaldi, F.S. 1961. “Thorium,” in Kolthoff, I.M. and Elving, P.J., Eds., Treatise on Analytical
Chemistry, Part II, Vol. 5, John Wiley and Sons, New York, pp. 142-216.
Grindler, J.E. 1962. The Radiochemistry of Uranium, National Academy of Sciences–National
Research Council (NAS-NS), NAS-NS 3050, Washington, DC.
Hahn, R.B. 1961. “Zirconium and Hafnium,” in Kolthoff, I.M. and Elving, P.J., Eds., Treatise on
Analytical Chemistry, Part II, Vol. 5, John Wiley and Sons, New York, pp. 61-138.

Separation Techniques
14-221
JULY 2004 MARLAP
Hyde, E.K. 1960. The Radiochemistry of Thorium, National Academy of Sciences–National
Research Council (NAS-NS), NAS-NS 3004, Washington, DC.
Kallmann, S. 1961. “The Alkali Metals,” in Treatise on Analytical Chemistry, Kolthoff, I.M. and
Elving, P.J., Eds., Part II, Vol. 1, John Wiley and Sons, New York, pp. 301-446.
Kallmann, S. 1964. “Niobium and Tantalum,” Kallmann, S., in Kolthoff, I.M. and Elving, P.J.,
Eds., Treatise on Analytical Chemistry, Part II, Vol. 6, John Wiley and Sons, New York pp.
183-406.
Kirby, H.W. and Salutsky, M.L. 1964. The Radiochemistry of Radium, National Academy of
Sciences–National Research Council (NAS-NS), NAS-NS 3057, Washington, DC.
Kleinberg, J. and Cowan, G.A. 1960. The Radiochemistry of Fluorine, Chlorine, Bromine, and
Iodine, National Academy of Sciences–National Research Council (NAS-NRC), NAS-NRC
3005, Washington, DC.
Metz, C.F. and Waterbury, G.R. 1962. “The Transuranium Actinide Elements,” in Kolthoff, I.M.
and Elving, P.J., Eds., Treatise on Analytical Chemistry, Part II, Vol. 9, John Wiley and Sons,
New York, pp. 189-440.
Schulz, W.W. and Penneman, R.A. 1986. “Americium,” in Katz, J.J., Seaborg, G.T., and Morss,
L.R., Eds., The Chemistry of the Actinides, Vol. 2, Chapman and Hall, London, pp. 887-961.
Seaborg, G. T. and Loveland, W.D. 1990. The Elements Beyond Uranium, John Wiley & Sons,
New York.
Sunderman, D.N. and Townley, C.W. 1960. “The Radiochemistry of Barium, Calcium, and
Strontium,” National Academy of Sciences–National Research Council (NAS-NS), NAS-NS
3010, Washington, DC.
Steinberg, E.O. 1960. The Radiochemistry of Zirconium and Hafnium, National Academy of
Sciences–National Research Council (NAS-NRC), NAS-NRC 3011, Washington, DC.
Sedlet, J. 1966. “Radon and Radium,” in Kolthoff, I.M. and Elving, P.J., Eds., Treatise on
Analytical Chemistry, Part II, Vol. 4, John Wiley and Sons, New York, pp. 219-316.
Turekian, K.K. and Bolter, E. 1966. “Strontium and Barium,” in Kolthoff, I.M. and Elving, P.J.,
Eds., Treatise on Analytical Chemistry, Part II, Vol. 4,John Wiley and Sons, New York, pp.
153-218.

Separation Techniques
14-222
MARLAP JULY 2004
14.12.5 Separation Methods
Berg, E.W. 1963. Physical and Chemical Methods of Separation, McGraw-Hill, New York.
Hermann, J.A. and Suttle, J.F. 1961. “Precipitation and Crystallization,” in Kolthoff, I.M. and
Elving, P.J., Eds., Treatise on Analytical Chemistry, Part I, Vol. 3, John Wiley and Sons,
New York, pp. 1367-1410.
Irving, H. and Williams, R.J.P. 1961. “Liquid-Liquid Extraction”, in Kolthoff, I.M. and Elving,
P.J., Eds., Treatise on Analytical Chemistry, Part I, Vol. 3, John Wiley and Sons, New York,
pp. 1309-1364.
Leussing, D.L. 1959. “Solubility,” in Kolthoff, I.M. and Elving, P.J., Eds., Treatise on Analytical
Chemistry, Part I, Vol. 1, John Wiley and Sons, New York, pp. 675-732.
Maxwell, S. 1997. “Rapid actinide separation methods,” Radioactivity and Radiochemistry, 8:4,
p.36.
Perrin, D.D. 1979. “Masking and Demasking in Analytical Chemistry,” in Kolthoff, I.M. and
Elving, P.J., Eds., Treatise on Analytical Chemistry, 2nd Ed., Part I, Vol. 2, John Wiley and
Sons, New York, pp. 599-643.
Rieman, W. and Walton, H. 1970. Ion Exchange in Analytical Chemistry, Pergamon Press, New
York.
Salutsky, M.L. 1959. “Precipitates: Their Formation, Properties, and Purity,” in Kolthoff, I.M.
and Elving, P.J., Eds., Part Treatise on Analytical Chemistry, I, Vol. 1, John Wiley and Sons,
New York, pp. 733-766.
Willard, H.H. and Rulfs, C.L. 1961. “Decomposition and Dissolution of Samples: Inorganic,”in
Kolthoff, I.M. and Elving, P.J., Eds., Treatise on Analytical Chemistry, Part I, Vol. 2, John
Wiley and Sons, New York, pp. 1027-1050.

14-223
JULY 2004 MARLAP
−
=
dN
dt N
1
11
λ
(14A.1)
−
=
dN
dt N
2
22
λ
(14A.2)
ATTACHMENT 14A
Radioactive Decay and Equilibrium
The rate of decay of a number of atoms, N1, of a radionuclide can be expressed by Equation
14A.1, where λ1 is (ln 2)/t½ for the radionuclide and t is the time during which the change in N1 is
observed:
The radionuclide may decay to a stable nuclide, or to another radionuclide. In the first instance,
the total number of atoms of stable nuclide formed as a result of the decay of N1 eventually will
equal N1.
When the decay product of the original radionuclide is another radionuclide, three distinct
equilibrium relationships exist between the parent and progeny based on the half-lives of the
original and newly formed radionuclides. “Radioactive equilibrium” may be described mathe-
matically by combining the decay-rate equations of two or more radionuclides to relate the
number of atoms of one to any of the others. The three relationships between parent and progeny
are referred to as “secular,” “transient,” and “no equilibrium” (Friedlander et al., 1981).
14A.1 Radioactive Equilibrium
A dynamic condition is initiated when a parent decays to a radioactive progeny. The progeny has
its own decay equation, analogous to Equation 14A.1:
The relationships may become complicated if the progeny gives rise to an isotope that is also
radioactive. In this case, the relationship would become, “parent–1st progeny–2nd progeny.” This
connection of the radionuclides is referred to as a radioactive “decay chain.” When the parent of
the chain is present, some number of atoms of all of the progeny in the chain eventually will be
present as the predecessor radionuclides undergo radioactive decay.
14A.1.1 Secular Equilibrium
Secular equilibrium occurs when half-life of the progeny is much less than the half-life of the
parent. An example, using the parent-progeny relationship between 210Pb (t½ . 22.6 y) and 210Bi
(t½ . 5 d), can be used to demonstrate this case. (For illustrative purposes, ignore the radioactive
progeny of the 210Bi radionuclides).
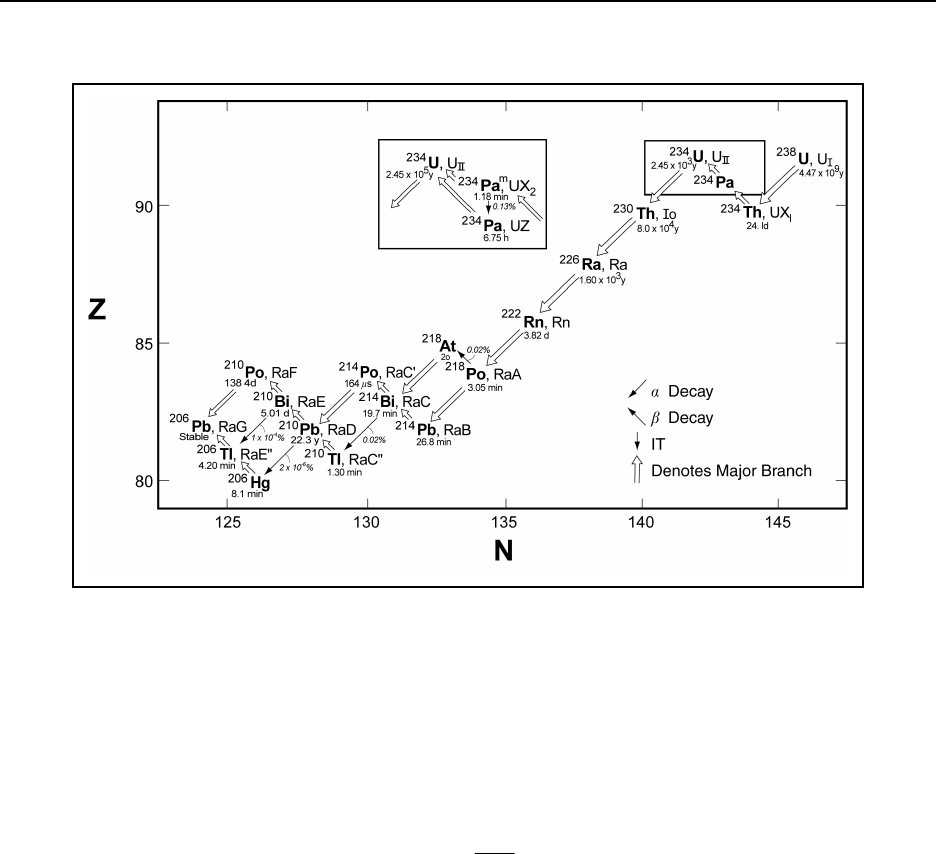
Radiochemical Decay and Equilibrium
14-224
MARLAP JULY 2004
FIGURE 14A.1 — Decay chain for 238U
Figure 14A.1 identifies the entire decay chain from 238U, of which 210Pb and 210Bi are a part.
When a group of atoms of lead are isolated (e.g., radiochemical purity is achieved by
precipitation), no atoms of bismuth are present at the time of isolation (t = 0). From that moment,
the number of atoms of bismuth present can be described by two equations: the rate of decay of
the lead and the rate of decay of the bismuth. For each atom of lead that decays, one atom of
bismuth is produced. Thus a single equation can be developed to show this relationship:
Activity of 210Bi = = λ1N1 - λ2N2(14A.3)
dN
dt
2
This equation can be solved to yield a relationship between the number of atoms of lead and
bismuth at any time t after the isolation of lead. The general equation is:
N2 =[λ1/(λ2 - λ1)]{ – } + (14A.4)
N
1
0
e
t
−λ
1
e
t
-
λ
2
N
2
0
e
t
-
λ
2
Where: N2 = atoms of progeny (bismuth), present at any time t
= atoms of parent (lead), initially present
N
1
0
λ1 = decay constant of parent
λ2 = decay constant of progeny
(From Friedlander et al., 1981)
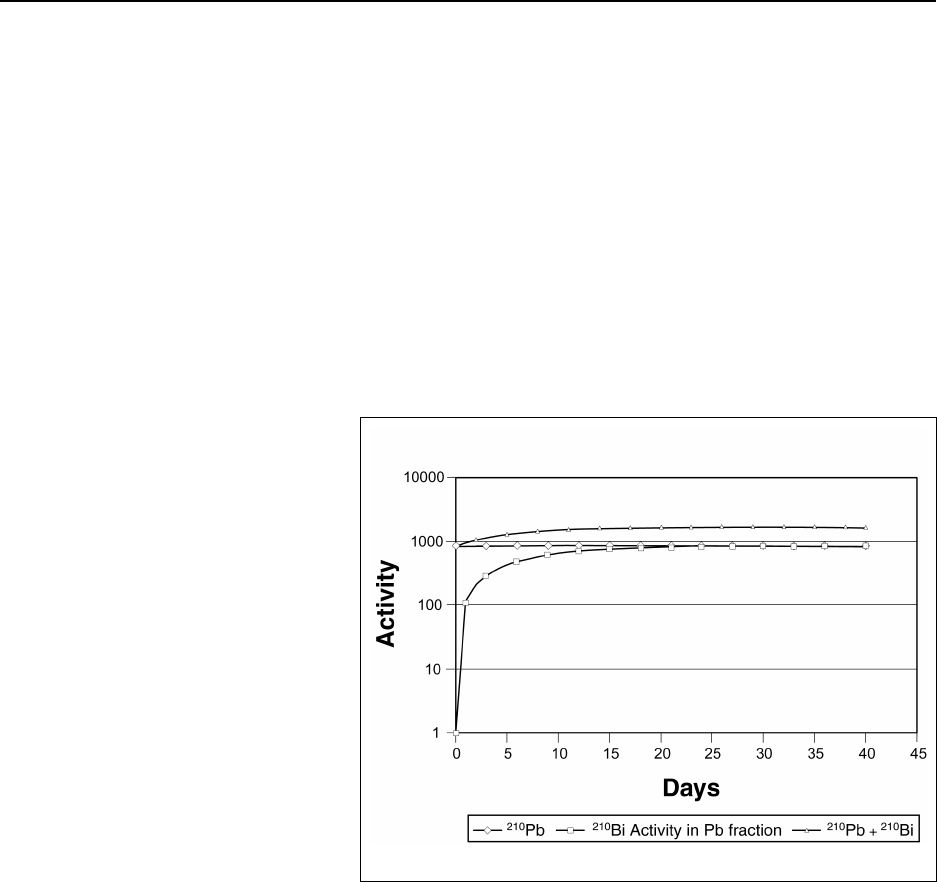
Radiochemical Decay and Equilibrium
14-225
JULY 2004 MARLAP
FIGURE 14A.2 — Secular equilibrium of 210Pb/210Bi
= The number of atoms of progeny present at the time of isolation of parent.
N
2
0
The activity of the progeny (A2) can then be calculated by multiplying both sides of Equation
14A.4 by λ2:
A2 = λ2 N2 =[λ2 λ1/(λ2 - λ1)]{ – } + λ2(14A.5)
N
1
0
e
t
−λ
1
e
2
t
−λ
N
2
0
e
t
-
λ
2
If radiochemical purity is ensured initially, then
= 0 (14A.6)
N
2
0
and the terms including in both Equations 14A.4 and 14A.5 equal zero.
N
2
0
Plotting this relationship as a
function of time yields the graph
shown in Figure 14A.2 for the 210Pb-
210Bi radionuclides. The three
significant aspects of this
relationship are:
• The total activity of the sample
actually increases to a maximum
(until it is . 2APb),
• The activity of the bismuth and
lead are approximately equal
after about seven times the half-
life of bismuth, and
• The activity of bismuth decays
with the half-life of lead after
equilibrium has been established.
14A.1.2 Transient Equilibrium
Transient equilibrium occurs when the half-life of the progeny is less than the half-life of the
parent. This can be demonstrated using the relationship between 95Zr (t½ . 64 d) and 95Nb (t½ .
35 d). Figure 14A.3 identifies the same types of relationships as were seen in the case of secular
equilibrium. For transient equilibrium, the total activity passes through a maximum, and then
decreases with the characteristic half-life of zirconium. Note that the activity of the niobium
exceeds the activity of the zirconium after about 2 half-lives of the niobium. A significant aspect
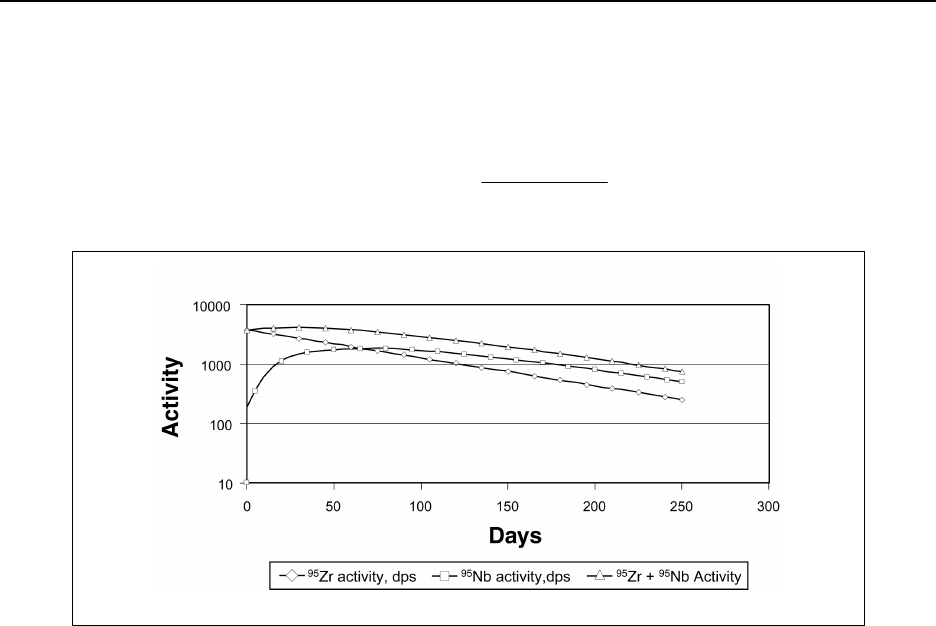
Radiochemical Decay and Equilibrium
14-226
MARLAP JULY 2004
FIGURE 14A.3 — Transient equilibrium of 95Zr/95Nb
of this radioactive equilibrium that occurs at about this time is that the activity curve for the
progeny reaches a maximum value. This can be determined for the general case by taking the
first derivative of Equation 14A.5 and setting it equal to zero (Equation 14A.7):
Amaximum, progeny = (14A.7)
[]
[]
λλ
λλ
12
12
-
-
ln ln
For the example in Figure 14A.3, this occurs at 67 days. When performing low-level analysis,
knowing when this maximum activity occurs can help to achieve a lower minimum detectable
amount of the progeny.
After approximately seven times the half-life of the progeny (in this case 95Nb), the activity of the
progeny decays with the half-life of the parent, similar to the secular equilibrium case. If the 95Nb
were to be separated from the parent at any time, it would decay with its own characteristic half-
life.
14A.1.3 No Equilibrium
The no-equilibrium case occurs when the half-life of the progeny is greater than the half-life of
the parent. Figure 14A.4 demonstrates this example for 239U (t½ . 23.5 min) and 239 Np (t½ . 2.36
d . 3,400 min). The notable characteristic here is the total activity continually decreases after
time zero.
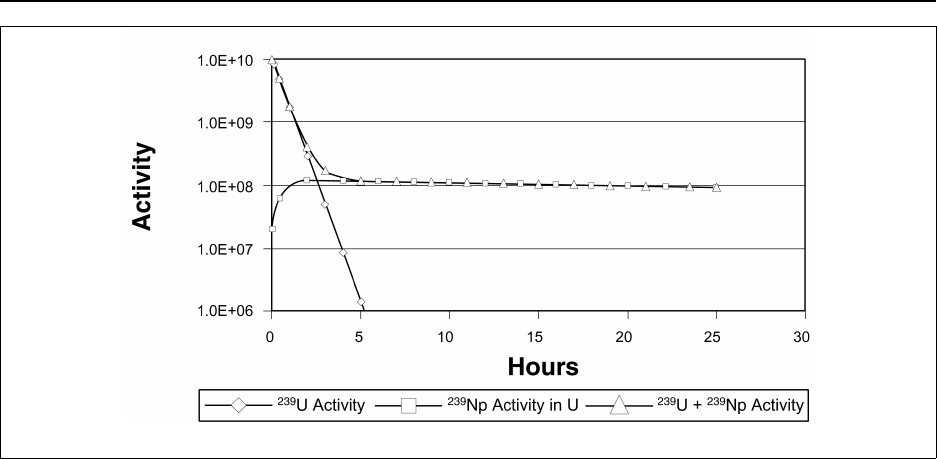
Radiochemical Decay and Equilibrium
14-227
JULY 2004 MARLAP
FIGURE 14A.4 — No equilibrium of 239U/239Np
14A.1.4 Summary of Radioactive Equilibria
In all three cases, Equation 14A.5 is used to calculate the activity of progeny after radiochemical
separation of the parent. The important aspects of the relationship (Table 14A.1) are:
• It allows the analyst to optimize when, and for how long, to count a sample in which a
parent-progeny relationship exists. For the secular and transient radiochemical equilibria, if
approximately seven times the half-life of the progeny has passed, then equilibrium has been
established. Thus for the 90Sr/Y parent-progeny pair, the time to reach maximum activity is
.7×(t½ Yttrium), or about 18 days.
• For the “transient equilibrium” case, a higher progeny activity may be achieved (relative to
the parent), thus improving counting statistics for calculation of the initial parent activity.
• For the “no-equilibrium” case, if approximately seven times the half-life of the parent has
passed, only progeny is left, and the activity of progeny can be related directly to the initial
activity of the parent.
• It provides the analyst with important information about timing of intermediate separation
steps in procedures (e.g., whether or not analysis must proceed immediately or can be set
aside for a certain period of time).

Radiochemical Decay and Equilibrium
14-228
MARLAP JULY 2004
TABLE 14A.1 — Relationships of radioactive equilibria
Type of
Equilibrium
Relationship of
Half-lives
Advantages Other Useful
Examples
Secular Parent >> Progeny If progeny half-life is as short as a
few days, equilibrium is established
in a reasonable time frame for
analysis.
90Sr – 90Y
137Cs – 137mBa
226Ra – 222Rn
228Ra – 228Ac
Transient Parent > Progeny If both half-lives are measured in
hours to days, equilibrium activity
of progeny peaks in a reasonable
time frame for analysis.
222Rn with its decay chain
(for de-emanation analysis)
212Pb – 212Bi
None Parent < Progeny If parent half-life is a day or less, its
activity contributes negligibly after a
week.
131Te – 131I
14A.1.5 Supported and Unsupported Radioactive Equilibria
The connection between parent and progeny has one additional aspect that is significant for
environmental analysis: whether or not the progeny activity is constantly “supported” by the
parent in the sample. When the progeny is constantly supported, it appears to have the half-life of
the parent. However, it can become unsupported, in which case it would decay with its own
characteristic half-life.
For example, consider a soil sample that was contaminated with 3.7 Bq/g (100 pCi/g) of 232Th
(t½ . .4 × 1010 y). One concern about this radionuclide is the dissolution of some of its progeny
into ground water: 228Ra (t½ .5.76 y), 224Ra (t½ .3.66 d) and 220Ra (t½ .55.6 s). Ground-water
pH is normally between 6 and 8. At this pH, and with the crustal concentration of thorium/
radium, the solubility of radium is significantly greater than that of thorium. As 228Ra dissolves in
the ground water, the 232Th parent remains in the soil phase. The ground water will then migrate
with the radium into wells, streams, aquifers, etc. The radium in the ground water is now
“unsupported” because it is no longer in equilibrium with the decay of the thorium.
If we continue to follow the decay chain to 228Th, the insolubility of thorium again “breaks” the
decay chain in the ground water, because it will precipitate. However, its two progeny (224Ra and
220Rn) will continue to be soluble, and thus also be unsupported.
This is important when making decisions about sample shipment method and holding times prior
to analytical separations. If it is assumed that the decay chain is supported, there is no reason to
hasten the onset of the chemical analysis. However in the unsupported case, the half-lives of the
224Ra and 220Ra will affect the ability to achieve project measurement quality objectives and data
quality objectives.

Radiochemical Decay and Equilibrium
14-229
JULY 2004 MARLAP
14A.2 Effects of Radioactive Equilibria on Measurement Uncertainty
14A.2.1 Issue
It is sometimes necessary to ensure that radionuclides have achieved radioactive equilibrium with
their progeny or to establish and correct for disequilibrium conditions. This is particularly
applicable for protocols that involve the chemical separation of long-lived radionuclides from
their progeny, or long-lived progeny from their parents. This is also applicable for nondestructive
assays like gamma spectrometry, where photon emission from progeny may be used to determine
the concentration of a stable parent, or a parent which is radioactive but not a gamma emitter.
14A.2.2 Discussion
Application of Equations 14A.4, 14A.5, 14A.6 and 14A.7 can be shown by example. Radium-
226 (t½ . 1,600 y), is a common, naturally occurring radionuclide in the uranium series. Radium-
226 is found in water and soil, typically in secular equilibrium with a series of shorter-lived
radionuclides beginning with the 222Ra (t½ . 3.8 d) and ending with stable lead. As soon as 226Ra
is chemically separated from its progeny in an analytical procedure (via coprecipitation with
barium sulfate), its progeny begin to re-accumulate. The progeny exhibit a variety of alpha, beta,
and gamma emissions, some of which will be detected when the precipitate is counted. The
activity due to the ingrowth of radon progeny should be considered when evaluating the counting
data (Kirby, 1954). If analysis of radon is performed, the ingrowth of all progeny must be
allowed prior to counting in order to minimize uncertainty. Examining the decay chain (Figure
14A.1) and the respective half-lives of radionuclides through 214Po (for the purposes of the
analysis, the progeny 214Pb ends the decay chain and contributes insignificantly to the total count
rate), it is appropriate to wait about 3 or 4 hours. In some cases, it may be necessary to derive
correction factors for radioactive ingrowth and decay during the time the sample is counting.
These factors are radionuclide-specific and should be evaluated for each analytical method.
Radioactive equilibrium concerns also apply to non destructive assays, particularly for uranium
and thorium series radionuclides. Important radionuclides in these series (e.g., 238U and 232Th)
have photon emissions that are weak or otherwise difficult to measure, while their shorter-lived
primary, secondary or tertiary progeny are easily measured. This allows for the parents to be
quantified indirectly—i.e., their concentration is determined by measuring their progeny and
accounting for the length of time between separation of parent and progeny.
When several radionuclides from one decay chain are measured in a sample, observed activity
ratios can be compared to those predicted by decay and ingrowth calculations, the history of the
sample and other information. For example, undisturbed soil typically contains natural uranium
with approximately equal activities of 238U and 234U, while water samples often have very
different 238U/234U ratios. Data from analysis of ores or materials involved in processing that

Radiochemical Decay and Equilibrium
14-230
MARLAP JULY 2004
could disrupt naturally occurring relationships (i.e., selectively remove elements from the
material) require close attention in this regard.
All numerical methods (electronic and manual) should be evaluated to determine if the approp-
riate correction factors related to equilibrium concerns have been used. This includes a check of
all constants used to derive such correction factors, as well as the use of input data that unambig-
uously state the time of all pertinent events (chemical separation and sample counting). A
specific example is 228Ra analysis with ingrowth of 228Ac. The actinium is separated from the
radium after a measured time and is immediately counted. The half-life of actinium is used to
correct for the decay of actinium atoms during the counting interval and for the time interval
since the separation from radium. Equation 14A.4 is used to calculate the atoms of radium, based
on the number of atoms of actinium, at the time of separation of actinium from radium. The half-
life of radium is used to calculate the radium activity and decay-correct from the sample
preparation time back to the time of sample collection as follows:
NB = Nc/[ε][1-EXP(-λActc)]
and
N0 = NB {EXP(+λActs)}
Where:
Nc is the number of counts accumulated during the counting interval
NB is the number of atoms of actinium at the beginning instant of the count interval
N0 is the number of atoms of actinium decay corrected back to the time of separation from Ra
λAc is the decay constant for actinium
ε is the detector efficiency
tc is the counting interval (clock time)
ts is the time between separation of actinium from radium to the start of the count interval.
Equation 14A.4 is then used to calculate the atoms of radium based on the number of atoms of
actinium that exist at the time actinium is separated from radium. The half-life of radium is used
to calculate the radium activity and decay-correct from the sample preparation time back to the
time of sample collection.
Samples requiring progeny ingrowth should be held for sufficient time before counting to
establish equilibrium. Limits for minimum ingrowth and maximum decay times should be
established for all analytical methods where they are pertinent. For ingrowth, the limits should
reflect the minimum time required to ensure that the radionuclide(s) of interest has accumulated
sufficiently to not adversely affect the detection limit or uncertainty. Conversely, the time for
radioactive decay of the radionuclides of interest should be limited such that the decay factor
does not elevate the minimum detectible concentration or adversely affect the measurement
uncertainty.

Radiochemical Decay and Equilibrium
2 The natural abundance of 235U of 0.72 atom-percent is a commonly accepted average. Actual values from specific
ore samples vary.
3 Enriched and depleted refer primarily to 235U.
14-231
JULY 2004 MARLAP
Samples where equilibrium is incorrectly assumed or calculated will produce data that do not
represent the true sample concentrations. It is difficult to detect errors in equilibrium assumptions
or calculations. Frequently, it takes anomalous or unanticipated results to identify these errors. In
these cases, analysts need to know the sample history or characteristics before equilibrium errors
can be identified and corrected. Some samples may not be amenable to nondestructive assays
because their equilibrium status cannot be determined; in such cases, other analytical methods
are indicated.
14A.2.3 Examples of Isotopic Distribution – Natural, Enriched, and Depleted Uranium
Isotopic distribution is particularly important with respect to uranium, which is ubiquitous in
soils and is also a contaminant in many site cleanups. The three predominant uranium isotopes of
interest are 238U, 234U, and 235U, which constitute 99.2745, 0.0055, and 0.72 atom-percent,
respectively, of natural uranium2, i.e., uranium as found in nature (Parrington et al., 1996). The
ratio of 238U to 234U in undisturbed uranium deposits will be the same as the ratio of
99.2745/0.0055 = 18,050, because all the 234U comes from the decay of 238U (234U originally
present when the Earth was formed has long since decayed).
However, human activities related to uranium typically involve changing the ratio of natural
uranium by separating the more readily fissionable 235U from natural uranium to produce material
“enriched” in 235U, for use in fuel cycle and nuclear weapons related activities. Typical 235U
enrichments range from 2 percent for reactor fuels to greater than 90 percent 235U for weapons.
The enrichment process produces material that is called “DU,” or depleted in uranium (i.e., the
uranium from which the 235U was taken3). The enrichment process also will disrupt the 234U
content, which will change the 238/234U ratio from what is occurring naturally (i.e., 18,050). While
the 235U concentrations of depleted uranium are reduced relative to natural ores, they still can be
measured by several assay techniques. This gives rise to uranium with three distinct distributions
of 238U,235U, and 234U, referred to as “natural,” “enriched,” and “depleted” uranium. Because
238U,235U, and 234U are alpha emitters with considerably different half-lives and specific activity, a
measurement of a sample’s total uranium alpha activity cannot be used to quantify the sample’s
isotopic composition or uranium mass without knowing if the uranium is natural or has been
enriched or depleted in 235U. However, if this information is known, measurement and
distribution of the sample’s uranium alpha activity can be used to infer values for a sample’s
uranium mass and for the activities of the isotopes 238U, 235U, and 234U. This ratio can be
determined directly or empirically using mass or alpha spectrometry, techniques that are time-
and cost-intensive, but which provide the material’s definitive isotopic distribution. It is often

Radiochemical Decay and Equilibrium
14-232
MARLAP JULY 2004
practical to perform mass or alpha spectrometry on representative samples from a site to establish
the material’s isotopic distribution, assuming all samples from a given area are comparable in
this respect. Once established, this ratio can be applied to measurements of uranium alpha
activity to derive activity concentrations for 238U, 234U, and 235U data.
14A.3 References
Friedlander, G., Kennedy, J.W., Macias, E.S., and Miller, J.M. 1981. Nuclear and
Radiochemistry, John Wiley and Sons, New York.
Kirby, H.W. 1954. “Decay and Growth Tables for the Naturally Occurring Radioactive Series.”
Anal. Chem. 26:6, p. 1063-1071.
Parrington, J.R., Knox, H.D., Breneman, S.L., Feiner, F., and Baum, E.M. 1996. Nuclides and
Isotopes: Chart of the Nuclides. 15th Edition. Lockheed Martin and General Electric.

15-1
JULY 2004 MARLAP
15 QUANTIFICATION OF RADIONUCLIDES
Portions of this chapter have been extracted, with permission, from D 3648-95-Standard
Practice for the Measurement of Radioactivity, copyright American Society for Testing and
Materials, 100 Barr Harbor Drive, West Conshohocken, PA 19428. A copy of the complete
standard may be purchased from ASTM (tel: 610-832-9585, fax: 610-832-9555, e-mail:
service@astm.org, website: www.astm.org).
15.1 Introduction
This chapter presents descriptions of counting techniques, instrument calibration, source
preparations, and the instrumentation associated with these techniques, which will help
determine what radioanalytical measurement methods best suit a given need. This chapter also
describes radioanalytical methods based on nuclear-decay emissions and special techniques
specific to the element being analyzed. For example, samples containing a single radionuclide of
high purity, sufficient energy, and ample activity may only require a simple detector system. In
this case, the associated investigation techniques may offer no complications other than those
related to calibration and reproducibility. At the other extreme, samples may require quantitative
identification of many radionuclides for which the laboratory may need to prepare unique
calibration sources. In the latter case, specialized instruments are available. Typically, a
radiochemical laboratory routinely will encounter samples that require a level of information
between these two extremes.
A number of methods and techniques employed to separate and purify radionuclides contained in
laboratory samples, particularly in environmental samples, are described in Chapter 14 (Separa-
tion Techniques), and sample dissolution is discussed in Chapter 13 (Sample Dissolution). This
chapter focuses on the instruments used to detect the radiations from the isolated radionuclides or
the atoms from the separations and purification processes.
A typical laboratory may be equipped with the following nuclear counting instrumentation:
• Gas proportional detectors for alpha and beta-particle counting (GP);
• Sodium iodide or high resolution
germanium detectors for gamma detection
and spectrometry [NaI(Tl) and HPGe];
• Low-energy gamma- or X-ray detectors
[HPGe or Si(Li)];
• Solid-state detectors for alpha spectrometry
(HPGe); and
Contents
15.1 Introduction ......................... 15-1
15.2 Instrument Calibrations ................ 15-2
15.3 Methods of Source Preparation .......... 15-8
15.4 Alpha Detection Methods ............. 15-18
15.5 Beta Detection Methods .............. 15-46
15.6 Gamma Detection Methods ............ 15-68
15.7 Specialized Analytical Techniques ...... 15-94
15.8 References ........................ 15-101

Quantification of Radionuclides
15-2
MARLAP JULY 2004
• Liquid scintillation counters suitable for both alpha- or beta-emitting radionuclides (LSC and
“Photon Electron Rejecting Alpha Liquid Scintillation”—PERALS®).
It may also have the following equipment, which rely on atom- or ion-counting techniques,
molecular methods of analysis, or gamma-ray spectrometry:
• Kinetic Phosphorimeter Analysis (KPA)
• Mass Spectrometric Analyses
– Inductively Coupled Plasma-Mass Spectrometry (ICP-MS)
– Thermal Ionization Mass Spectrometry (TIMS)
– Accelerator Mass Spectrometry (AMS)
• Neutron Activation
15.2 Instrument Calibrations
In this chapter, the term “test source” is used to describe the radioactive material prepared to be
introduced into a measurement instrument, and “laboratory sample” is used to identify the
material collected for analysis. Thus, a test source is prepared from laboratory sample material
for the purpose of determining its radioactive constituents. “Calibration source” means that the
prepared source is for calibrating instruments.
The goal of calibration- or test-source preparations is to maximize detection capability while
minimizing the introduction of bias and uncertainty into the measurement process. To achieve
this goal, calibration sources should be prepared in a manner that provide comparability to test
sources with respect to geometry, composition, and distribution of the test-source material within
a container or on a source mount. This section will provide an overview of the need for
calibration and test-source-correspondence congruence, analyte homogeneity within the source,
corrections for self-absorption and scattering of the emitted radiations, and estimation of
calibration uncertainty. Specific information and guidance relative to these topics can be found in
the subsequent sections of this chapter and in Chapters 13, 14, 19, and 20.
Proper instrument calibrations are essential for the proper identification and quantification of
radionuclides in samples. It is important to initially calibrate the instruments with calibration
sources that are traceable to a national standards body. Once calibrated, the continuing validity of
calibrations should be checked on a periodic basis (Chapter 18, Laboratory Quality Control) as
specified in a laboratory’s quality manual. This is usually done by counting a check source or
some secondary calibration source in an instrument and comparing the results to those previously
obtained when the instrument was known to be in calibration. The frequency and other aspects of
calibrations and verifications may be specified in project planning documents and laboratory
quality documents (Chapter 4, Project Plan Documents) and in analytical statements of work

Quantification of Radionuclides
15-3
JULY 2004 MARLAP
(Chapter 5, Obtaining Laboratory Services). Section 18.5.6 (“Summary Guidance on Instrument
Calibration, Background, and Quality Control”) within Chapter18 provide guidance on the
frequency of instrument calibration and quality controls checks when requirements are not
specified in a statement of work.
15.2.1 Calibration Standards
Instrument calibration should be performed as needed only with sources traceable to a national
standards body such as the National Institute of Science and Technology (NIST) in the United
States (ANSI N42.23). Calibrations of instruments should be made using certified reference
materials of known and documented value and stated uncertainty. These certified reference
materials may be supplied by:
• NIST (www.nist.gov) and the New Brunswick Laboratory (www.nbl.doe.gov) directly;
• A calibration-source supplier whose measurement capabilities or manufacturing processes are
tested periodically by NIST (complies with ANSI N42.22);
• International Atomic Energy Agency (www.www.iaea.org/programmes/aqcs/main_database.
htm);
• Other national standards bodies such as the National Physics Laboratory (NPL) of the United
Kingdom (www.npl.co.uk/) and Physikalisch-Technische bundesanstalt (PTB) of Germany
(www.ptb.de/); or
• A calibration-source supplier who documents derived materials with stated uncertainty, and
whose values has been verified with analytical and measurement systems that have been
tested periodically through an unbroken chain of comparisons to the national standards.
The sections on alpha, beta, and gamma-ray detection methods have subsections (15.4, 15.5, and
15.6) that list the nuclides commonly used for instrument calibrations.
15.2.2 Congruence of Calibration and Test-Source Geometry
For nuclear-decay emission analyses, instrument calibrations generally are performed to establish
the detector counting efficiency of an instrument. The detector counting efficiency establishes the
rate of detected events registered in the detector(s) of a counting system compared to the particle-
or photon-emission rate of the source. Counting efficiencies are specific to the radionuclide
(emission type or energy), the geometrical relationship between the source and detector, and a
number of characteristics of the source material, especially those that affect the absorption and
scattering of the radiation. It is common practice to have several different calibrations on a given
detector in order to accommodate a number of radionuclides, source-to-detector distances, and

Quantification of Radionuclides
15-4
MARLAP JULY 2004
counting containers that a laboratory will be required to employ in order to meet project
analytical requirements and the variety of media encountered.
Where the efficiency of the detector varies with energy, it may be necessary to perform the
calibration at a number of energies and to establish an efficiency curve that covers the range of
energies to be encountered. Some radiation detection instruments require other types of
calibrations. These are discussed under specific instrument calibrations. Generic issues that
govern the conduct of calibrations are discussed below, and specific instrument and test-source
considerations are provided in the appropriate sections in this chapter.
To assure that the instrument calibration is unbiased, calibration sources should be prepared and
counted in a manner that assures that they are virtually identical to the test sources in all respects
that could affect the counting efficiency determination (ANSI N42.23). The geometry, including
the size and shape of the calibration source and counting container (beaker, planchet, vial, etc.)
and source-to-detector distance and alignment, should be controlled. Backscatter, scattering, and
self-absorption present during test-source counting should be duplicated in the calibration
process. The density of the calibration source material should be consistent with that of the test
sources.
When possible, counting efficiency calibrations should be performed using the radionuclide
whose activity is to be determined in test sources. This may not be possible when the radionuc-
lide is not available as a standard reference material or when gross analyses are performed. When
the actual radionuclide is not available, an alternate radionuclide may be selected that has the
same type of particle or photon emission (α, β, or γ) and approximate energy. When calibrating
an instrument in this manner, corrections should be made for any differences between the decay
schemes of the two nuclides. Calibrations used in alternate radionuclides should be verified to
produce satisfactory results.
If any factor could vary that would significantly affect the counting efficiency determination with
respect to measurement quality objectives (MQOs), calibrations should be performed that
simulate this variability over the range expected to be encountered during test-source counting.
An example is the necessity to develop a self-absorption curve for alpha or beta counting to
account for the changing overall counting efficiency because of absorption in the variable source
thickness.
The geometry of a test source should be suitable for the counting instrument and—particularly—
it should be reproducible. The test-source geometry should remain constant from source to source
and with respect to that of the calibration source. This requirement is necessary for performing
accurate measurements of all types of radioactivity and for all types of measurement instruments.

Quantification of Radionuclides
15-5
JULY 2004 MARLAP
15.2.3 Calibration and Test-Source Homogeneity
The calibration and test sources should be prepared in a manner that reduces the nonuniformity
of the material. Any deviation from this requirement can lead to biased results and contribute to
the overall uncertainty of the laboratory results. Source uniformity is related to the physical
nature of the source material. Uniformity of source material relative to its thickness, density
(which can be influenced by water content), and homogeneity is important. Nonuniformity can
result from a variation in the thickness of the source material over its cross sectional area. If
sources are deposited in a nonuniform manner, absorption characteristics will vary from source to
source, and acceptable reproducibility may not be achieved.
Variation in source thickness or density can have a particularly large effect in the measurement of
alpha-particle activity and, because of their smaller mass and charge, a lesser effect in the
measurement of beta-particle activity. Alpha and beta sources that are hygroscopic, once
prepared, often are stored in a desiccator to maintain a constant moisture content. Source
uniformity is relevant to gamma-ray measurements, not because of the absorption of gamma rays,
but because nonuniformity (inhomogeneity) in the distribution of activity throughout a large
source changes the effective detection efficiency. For example, if the gamma-ray-emitting
radionuclides are concentrated in the portion of the test-source container nearest the detector, the
counting efficiency will be greater than if the radionuclides were uniformly distributed
throughout the test source. Since measurements of nonuniform sources are not reproducible,
radioactive sources of all types should be homogeneous.
Liquid sources are more likely to be homogeneous than are solids, particularly if a reference
material has been added to a solid matrix, such as soil. Multiple-phase samples are some of the
least homogeneous matrices. Precipitates and multiple-phase liquid samples cannot provide
consistent results unless particular measures are taken to ensure their homogeneity (e.g., remove
suspended solids, dissolve and recombine, or analyze separately). In order to minimize the
overall uncertainty associated with calibration, care should be taken to assure the reference
material is thoroughly mixed into the calibration source and distributed uniformly throughout its
volume.
15.2.4 Self-Absorption, Attenuation, and Scattering Considerations for Source
Preparations
Alpha and beta particles emitted from a source can be scattered by elastic and inelastic collisions
with nuclei of the source material, degrading the energy of the particle (self-scatter), or if
sufficiently thick, the particle may be absorbed totally by the source (self-absorption). Absorption
and scattering within the source material are less pronounced when measuring gamma rays than
when analyzing for charged particles.
In order to ensure accurate results, it is important that calibration sources for the determination of

Quantification of Radionuclides
15-6
MARLAP JULY 2004
counting efficiency and self-absorption corrections are prepared identically in all aspects to the
expected test sources. Self-absorption increases with the density of the source material and with
the size and charge of the emitted particle. Thus, source thickness is of greater concern for
measuring alpha particles than for beta-particle emissions and has even less importance in
measuring gamma rays, except for low-energy X- or gamma rays. Thus, sources prepared for
alpha-particle measurements should be very thin and uniform for maximum detection capability
and reproducibility.
Because of their much smaller mass, beta particles are scattered more readily in the source
material than alpha particles. Depending on counter geometry, the measured beta-particle count
rate (from sources of equal activity) can increase first as the source thickness increases because
of the scattering of electrons out of the source plane and into the detector (Friedlander et al.,
1981). At greater thicknesses, self-absorption begins to dominate, and the observed count rate
eventually approaches a constant value. When this occurs, the source is said to be “infinitely
thick.” Counting a source at infinite thickness refers to a measurement made with a source
thickness such that further increasing the amount of material added would have no effect on the
count rate. The minimum source thickness required for this type of measurement clearly is not
more than the maximum range R of the particle in the source material, and is often estimated to
be 0.75 R (Friedlander et al., 1981). A scattering/self-absorption factor can be used, however, to
correct the measured count rate (or activity) at a given source mass to that of an infinitely thin
source. For beta counting, this factor is proportional to (1 - e-µx)/µx, where µ is the linear
absorption coefficient for beta particles in the source material, and x is the source thickness
(Friedlander et al., 1981).
The moisture content of the source material will affect the density of the source and the
absorption characteristics of the source. A change in source moisture content will alter the
density and affect the reproducibility of the measurement. Thus, the amount of moisture within
the source should be controlled. The following procedures are often followed in order to maintain
a low and constant moisture content of sources to be counted.
• Sources prepared by precipitation or coprecipitation may be dried with the filter in the
suction-filter apparatus by washing the precipitate with a volatile, nonaqueous solvent.
Acetone or ethanol typically is used for this purpose. The filter with source is removed from
the filtering apparatus, mounted on a planchet, and stored in a desiccator prior to counting.
Alternatively, a wet precipitate on the filter paper may be dried under a heat lamp and
mounted on a planchet. In some cases, the wet precipitate is transferred as a slurry to a
planchet and dried under a heat lamp.
• Electroplated sources are dried by heating on a hot plate, in an oven, or under a heat lamp.
• Laboratory samples analyzed nondestructively usually are dried prior to measurement in
order to control moisture content and help ensure that source characteristics are reproducible.

Quantification of Radionuclides
15-7
JULY 2004 MARLAP
Laboratory samples, such as soil, biota, and vegetation, usually are dried in an oven. When an
even moisture content is important, sources should be maintained in a desiccator.
• Evaporated sources may be flamed and then stored in a desiccator to maintain a constant
moisture content.
Another concern in measuring both alpha and beta particles from deposited sources is back-
scattering: the scattering of particles from the source mount back through the source material and
into the sensitive part of the detector. Backscattered beta particles have degraded energies but can
have the apparent effect of increasing the counting efficiency. This may seem to have the desired
effect of improving the overall counting efficiency, but the percent of backscattered beta particles
from the source should remain constant and be consistent with that of the calibration source. The
magnitude of backscatter is dependent on the beta-particle energy and the thickness, density, and
atomic number of the backing material (Faires and Boswell, 1981). Thus, to reduce the affect of
backscatter on beta-particle measurements, the source often is mounted on a thin, low Z (atomic
number), low density material, such as aluminum foil or thin organic films (Blanchard et al.,
1960). For very precise measurements, a conducting metal film is vaporized onto the organic film
so that any electrical charge build up because of the emission of charged particles can be
eliminated.
As with absorption, backscatter increases with the thickness of the scattering material up to a
saturation level, beyond which it remains constant. The saturation level is reached at a thickness
that is about one-third the maximum range of the scattered particle (Faires and Boswell, 1981).
Therefore, because of the dependency of backscatter on atomic number and thickness, the
backing used for the calibration source should be identical to that used for the source mount. For
example, if the presence of hydrogen chloride in the source requires changing from an aluminum
planchet to platinum, a platinum backing should also be used in counting the calibration source.
15.2.5 Calibration Uncertainty
There are many parameters that may affect the calibration of an instrument and subsequent test-
source results. These parameters may include those associated with the calibration source
(certified value and source purity), the source matrix/mount (nuclide and matrix homogeneity,
self absorption and backscatter), and the measurement process (variability among calibration and
test-source geometry/matrix, source-to-detector positioning, and counting uncertainty).
Quantifying the uncertainty of each parameter during an instrument calibration is extremely
important and a necessity for calculating realistic measurement uncertainties. The uncertainties
(standard uncertainty) in the various parameters affecting the instrument calibration should be
propagated to give a combined standard uncertainty (CSU). The CSU should be documented on
the calibration certificate or report. A detailed discussion on the propagation of uncertainties
applicable to calibration and test-source measurements can be found in Chapter 19. An
instrument calibration certificate/document should include an estimate of the calibration

Quantification of Radionuclides
15-8
MARLAP JULY 2004
uncertainty.
The counting uncertainty associated with a calibration can be reduced by the accumulation of as
many counts as practical during the calibration process. The two controllable factors for
achieving this are the amount of activity in the calibration source and the counting time allocated
for the calibration. As a general rule, sufficient counts should be accumulated to obtain a 1
percent (1 standard deviation) or less net counting uncertainty when calibrating a detector
system. The activity of calibration sources should be limited to an amount that will not lead to
significant dead-time losses and random summing in the instrument being calibrated.
Unaccounted for, dead-time losses and random summing could lead to an efficiency determina-
tion that is biased and artificially low. In addition, one should be aware of the potential for
detector contamination, this is particularly true for semiconductor detectors used for alpha
spectrometry.
15.3 Methods of Source Preparation
This section provide an overview of various commonly used methods used to prepare calibration
and test sources. Source preparation methods specific to the measurement of nuclear decay
emissions (α, β, γ) and atoms or mass also may be found in Sections 15.4, 15.5, and 15.6. The
source preparation categories in this section include electrodeposition, precipitation/coprecipita-
tion, evaporation, thermal volatilization/sublimation, and special source matrices.
15.3.1 Electrodeposition
High-resolution alpha spectrometry requires a very thin, uniform, flat, and nearly massless source
mount. Ideally, the source plate to determine alpha activity by a spectrometer would be a flat
plate coated with a single layer of radioactive atoms and with no foreign material above the layer
to attenuate the alpha radiation (Kressin, 1977). The electrodeposition of radionuclides on a
suitable metallic surface from an aqueous solution often can produce thin and uniform test
sources that approach these ideal conditions. Thus, this technique is very appropriate for
preparing sources of alpha emitters, especially the actinides, which include uranium, plutonium,
thorium, americium, and neptunium (ASTM, D3865; DOE, 1997; EPA, 1979). For certain long-
lived nuclides, such as 232Th, there may be micrograms of the plated nuclide that can affect the
alpha spectrometry resolution.
There are a number of electrolytic cell designs used to electrodeposit radionuclides. The cathode
on which the radionuclide deposits is often a thin metal foil or disc, such as platinum or stainless
steel, or a metal-coated plastic film (Blanchard et al., 1960). The stirring rod, often made of
platinum, serves as the anode of the cell. Deposition of actinides for alpha spectrometry also has
been performed in disposable cells constructed from 20-30 mL polyethylene scintillation vials
and highly polished stainless-steel planchets (Talvite, 1972). Disposal of the plastic cells

Quantification of Radionuclides
15-9
JULY 2004 MARLAP
prevents cross contamination. The composition of the electrolyte and the parameters applied in
the electrodeposition process, such as applied voltage, amperage, current density, and deposition
time, are dependent upon the chemical properties of the element, especially its reduction
potential, and foreign material that might be present. Thus, “each element requires optimization
of its own procedure” (Adloff and Guillaumont, 1993). Deposition time varies from 10 minutes
to two hours.
Actinides and similar elements are extremely hydrolytic and can deposit on the glass cell wall or
anode or precipitate during deposition (Puphal et al., 1983). Electrodeposition typically is
performed, therefore, in electrolytic solutions at low pH (~ 2) to prevent hydrolysis or precipita-
tion. The solution may contain complexing agents (such as fluoride) and chelates (such as
ethylene diamine tetraacetate, or EDTA) to minimize the effect of interfering ions, commonly
encountered in biological and environmental samples (Puphal and Olsen, 1972). The procedure
of Kressin (1972), however, illustrates the admonition of Adloff and Guillaumont cited above:
citrate and fluoride, a chelate and complexing agent, respectively, which interfere with the
electrodeposition of plutonium and americium in his process. Cable et al. (1994) provide
guidance on the optimum conditions for the electrodeposition of actinides, U, Th, Pa, Pu, and
Am.
Electrodeposition is applicable to more than 30 radionuclides. The main advantage of electro-
deposited sources over other methods of preparation is their extremely thin, uniform deposit of a
radionuclide on a plate, which permits high resolution spectrometry; however, the yield is often
not quantitative (Adloff and Guillaumont, 1993). Thus, the yield should be monitored with the
inclusion of a known quantity of another radioisotope of the same element whenever feasible,
which is deposited simultaneously with the analyte. Radioactive sources of the following
elements have been prepared successfully by electrodeposition (Blanchard et al., 1960; DOE,
1997; Johnston et al., 1991):
Actinium Cadmium Gold Lead Promethium Rhenium Strontium Tin
Americium* Cobalt Hafnium Neptunium* Protactinium* Ruthenium Tellurium Uranium*
Antimony Copper Indium Nickel Radium* Selenium Thallium Yttrium
Bismuth Curium* Iron Plutonium* Silver Thorium* Zinc
* primarily alpha-counting applications
Particularly important to environmental analysis is a procedure by which virtually all alpha-
emitting nuclides—radium through californium—can be determined in soil in any combination
on a single sample with few interferences using electrodeposition to prepare the source (Sill et
al., 1974).
Although sources of radioactive isotopes of these elements have been prepared by electro-
deposition, the technique may not be optimal for certain applications. For various reasons, other
methods of test-source preparation may be superior. The presence of other metals sometime

Quantification of Radionuclides
15-10
MARLAP JULY 2004
interferes, the quality of deposition might be poor (flaking), the recovery can be low, the spectral
resolution may be poor, and some procedures require rather elaborate equipment, are expensive,
and are time consuming, thus labor intensive (Sill and Williams, 1981; Hindman, 1986).
Interference will be caused by several factors: (1) “Any element present in the separated fraction
that is able to be electrodeposited will be present on the metal disc”; (2) “Incomplete separation
of rare earth elements or incomplete wet ashing for the removal of organic material will decrease
the efficiency of the electrodeposition and may result in a thick deposit unsuitable for α-spectro-
metry measurement”; and (3) “Samples containing more than 20 µg of U are unsuitable for
measurement by alpha spectrometry because of the thickness of the deposit” (DOE, 1997). When
stainless-steel planchets cannot be used, because of the corrosive nature of the electrolyte, and
platinum is required, the method can be quite expensive and time consuming, since recycling of
the expensive electrode material requires thorough cleaning to prevent cross contamination.
Test sources of actinides are often prepared by electrodeposition with yields of 90 percent and
higher (DOE, 1997; EPA, 1979; Sill et al., 1974; Puphal and Olsen, 1972; Kressin, 1977; Talvite,
1972; Mitchell, 1960; Shinohara and Kohno, 1989). In addition, 54Mn sources have been
successfully prepared by the electrodeposition from mixed-solvent electrolytes onto stainless
steel planchets (Sahoo and Kannan, 1997). ASTM D3865 provides a standard test method
employing electrodeposition for the isotopes of plutonium.
If the redox couple between the metal cathode and the radionuclide to be deposited is positive,
the radionuclide will deposit spontaneously. (One side of the disk may be covered with tape or
acrylic spray so that deposition occurs only on the other.) That is, it will deposit quantitatively
without using any applied potential. Generally, a metal planchet (disk) simply is suspended in the
solution that is stirred with a glass stirring rod for a few hours (Blanchard, 1966; DOE, 1997). An
example of such a spontaneous reaction between polonium and nickel is given below.
Po+4 + 2 Ni º Po + 2 Ni+2 E
o = 0.98 volt
Polonium also will deposit spontaneously on silver planchets. Po-210 is an important naturally
occurring radionuclide that is often included in environmental studies. Spontaneous deposition
onto nickel, silver, or copper disks is the preferred technique for preparing 210Po sources for
measurement.
A similar technique, called internal electrolysis, is preformed by selecting electrodes that have a
large difference in potential. No applied voltage is required for these techniques. A conventional
electrolytic cell containing an acid solution of the radionuclide to be deposited may be used. A
magnesium (Eo = +2.37 volts) strip, for example, is inserted into the electrolyte and connected by
an external circuit to the inert metal cathode (planchet), usually platinum. A spontaneous current
flows and deposition on the cathode will occur. The conditions at the inert cathode are exactly
the same as if an external voltage were applied; however, longer electrolysis times are necessary
to achieve quantitative recoveries. Very thin and uniform sources of 106Ru, 110Ag, 203Hg, 60Co,

Quantification of Radionuclides
15-11
JULY 2004 MARLAP
114In, 51Cr, 198Au, and 59Fe were prepared by this technique, with greater than 96 percent recovery
in all cases (Blanchard et al., 1957; Van der Eijk et al., 1973).
15.3.2 Precipitation/Coprecipitation
Another attractive technique used to mount sources for alpha spectrometry is microprecipitation.
The classical techniques of precipitation utilize milligram to gram quantities of materials in order
to make accurate mass measurements. Since such a relatively large mass of material would have
a significant impact on sample self absorption and alpha peak shape, the classical method cannot
be used. Typically, 0.1 to1.0 µg of a highly insoluble lanthanide (commonly Nd, Ce, or La) is
added to the sample being processed just prior to the final separation of the actinide. This is
followed by the addition of hydrofluoric acid to the solution, which causes precipitation of the
lanthanide and coprecipitation of the actinide (ASTM D3084 and C1163). A quantitative, micro-
pore filter (usually 0.45 µm) is used to separate the precipitate from the supernate. This is
necessary because the low mass and concentration of materials forms a precipitate of fine-sized
particles. The micro-pore filter allows a slower filtration rate yielding a more uniform deposition
of the precipitate in a thin film. Some radiochemists prefer this method to electrodeposition,
maintaining that “The procedure is faster and more reliable than those involving electrodeposi-
tion and gives consistently higher yields” (Sill and Williams, 1981). Hindman (1986) asserts that
the method is “...more rapid, more economical, and more efficient... and yields good decontam-
ination factors, high recoveries, and excellent resolution of the alpha spectra for uranium,
plutonium, americium, and thorium.”
Although sources prepared by coprecipitation are generally thicker than those prepared by
electrodeposition, sufficiently thin sources, even for alpha spectrometry, can be prepared by
controlling the amount of precipitate formed. Actinide sources thinner than 0.5 µg/mm2 can be
prepared by coprecipitation (EPA, 1984a). Thicker sources lead to degraded resolution of the
spectra (Hindman, 1983) and sources produced by any technique that are greater than 10 µg/mm2
lead to attenuation of alpha particles (Adolff and Guiallaumont, 1993). Typical rare-earth carrier
masses for microprecipitated sources range between 25 and 100 µg.
After separations are completed, a slurried precipitate is poured quantitatively through a filtering
apparatus collecting the precipitate on a small (e.g., 25 mm dia.) filter. Vacuum filtration often is
used to speed the operation and is required for efficient source preparation. With suction applied,
the precipitate typically is washed with water and then ethyl alcohol (sometimes acetone) to dry
the precipitate. The filter is removed from the filtering apparatus and mounted on a metal
planchet, commonly with double-stick tape or a glue stick, and stored in a desiccator to await
counting. Self adhesive planchets are also used effectively. Any 222Rn progeny that collects on the
filter during the filtration process will decay in a short period of time and not affect the
measurement. Samples with radionuclides listed in Table 15.1 have been prepared for
quantitative analysis by coprecipitation or precipitation.

Quantification of Radionuclides
15-12
MARLAP JULY 2004
TABLE 15.1 — Radionuclides prepared by coprecipitation or precipitation
Radionuclide Carrier References
32P* MgNH4PO4a
51Cr* BaCrO4a
89/90Sr* SrCO3a,b,c
90Y* Y2(C2O4)3a,b,c
131I* PdI2a,b,c
137Cs* Cs2PtCl6b
147Pm Nd2(C2O4)3a
210Bi* BiOCl a
226Ra BaSO4b
Th Ce(IO4)4d
Th LaF3a,b
ULaF
3 (NdF3) a,b,f
Np LaF3b
Pu LaF3(NdF3) a,b,d,f
Am LaF3(NdF3) a,b,d,f
Cm LaF3b
Th Ce(OH)2e
Np Ce(OH)2e
Pu Ce(OH)2e
Am Ce(OH)2e
Cm Ce(OH)2e
U* UF3e
a EPA (1984a) c DOE (1997) e Sill (1981)
b EPA (1980) d Hindman (1983) f Hindman (1986)
* precipitation
It should be emphasized that precipitated sources should be thoroughly dry before measurement,
otherwise, self-absorption and scattering will change with time as water evaporates. Also,
sources are often covered with a “thin film,” such as Mylar™ or Formvar™, to avoid test-source
loss and contamination of counting equipment. A thin film may also be made by preparing a
solution of colloidion and isoamyl acetate. When a 1:1 solution of this mixture is dispersed on
distilled water, a thin film is created that can be placed over the source to prevent contamination.
Care should be taken to avoid excessive handling of the source that can change the physical
nature of the co-precipitate, producing an uneven thickness.
15.3.3 Evaporation
When a high degree of uniformity of the deposit is not a requirement for the measurement,
sources can be prepared by simple evaporation under a heat lamp (Bleuler and Goldsmith, 1952).

Quantification of Radionuclides
15-13
JULY 2004 MARLAP
This procedure is easy, fast, and adequate for many types of measurements. Water samples for
gross alpha and beta screening measurements are often prepared by this method (EPA, 1980;
EPA, 1984a). An aliquant of the water laboratory sample is evaporated on a hot plate until only a
few milliliters remain. The concentrated solution that remains is then transferred quantitatively
with a pipette to a tared stainless-steel planchet, usually 50 mm in diameter, and evaporated to
dryness under a heat lamp or in an oven. The planchet, with the evaporated test source, may then
be flamed over a burner until dull red to reduce the amount of solids present and to convert the
matrix to an oxide. (Insoluble hydroxides, which are often bulky and gelatinous, are prime
candidates for ashing, as the oxide formed is much firmer, more uniform, and better defined.)
The test source is cooled, weighed, and counted for alpha and beta particles in a proportional
counter. Planchets containing evaporated solids may not be flamed if volatile radionuclides
(such as Cs, Po, or I) are to be measured.
A commonly encountered problem occurs when most of the solids in an evaporated source
deposit in a ring around the edge. Techniques to improve uniformity include the addition of a
wetting agent, such as tetraethylene glycol or a 5 percent insulin solution (Shinohara and Kohno,
1989), freeze-drying the sample, or precipitating and settling the active material prior to evapora-
tion (Friedlander et al., 1981; Van der Eijk and Zehner, 1977). The wetting agent is pipetted onto
the spot to be covered by the test source, then removed with the pipette. That remaining can be
dried under a heat lamp. A known quantity of the laboratory sample is then pipetted onto the spot
and dried under a heat lamp. Additional portions of the sample may be added and evaporated.
Sample spreading on the planchet, as it is heated, can result in depositing test-source material on
the planchet walls or in the flow of the liquid over the edge of a flat, lipless planchet. Such
spreading can be controlled or restricted by outlining the desired source area with a wax pencil.
Metal planchets often are constructed with a small lip around their circumference that retains the
test source on the planchet. Source spreading during evaporation has been restricted by electro-
spraying a silica gel suspension onto a thin film to produce a circular pad. The radioactive source
solution is dropped onto the circle and evaporated to dryness (Chen et al., 1989).
EPA’s (1980) prescribed Method 900.0 for measuring gross alpha and beta radioactivity in
drinking water requires that the sample aliquant be limited to what will produce 5 mg/cm2 of
solids on the planchet. Thus, for a 50.8 mm planchet (~20 cm2), an aliquant containing 100 mg of
nonvolatile dissolved solids is the maximum test-source mass.
APHA (1998) emphasizes that some low-energy alpha particles (< 8 MeV) will be stopped if
covered by only 4 mg/cm2 of sample solids. For gross beta-particle counting, a solids thickness of
10 mg/cm2 or less is recommended. Mills et al. (1991) successfully used water sample
conductivity to estimate the concentration of dissolved matter in a water sample. The maximum
water sample volume that could be evaporated to meet the EPA solids limit of 5 mg/cm2 can be
calculated from this conductivity measurement.

Quantification of Radionuclides
15-14
MARLAP JULY 2004
After a radionuclide in solution has been purified by chemical techniques, i.e., impurities
removed, the solution can be transferred to a planchet and evaporated to dryness, as described
above. Evaporation of a laboratory sample after purification is used by the EPA to measure 228Ac
in the analysis for 228Ra (EPA, 1984a), and sources of thorium, isolated from marine carbonates,
have been prepared by evaporation for measurement by alpha spectrometry (Blanchard et al.,
1967). Measured count rates of identified radionuclides, for which absorption curves have been
prepared, can be adjusted for self absorption in evaporated test sources.
In the case of all dry sources, steps should be taken to prevent solids from exiting the planchet,
which will affect the measurement and may contaminate the detector. Sources consisting of
loose, dry material, or with a tendency to flake, may be covered with thin plastic or immobilized
by evaporating a few drops of a lucite-acetone solution on the solid deposit (PHS, 1967a).
The use of metal planchets for mounting sources is very common for most alpha, beta and
gamma counting techniques. A wide variety of planchets made of platinum, nickel, aluminum,
and stainless steel can be obtained in various sizes. It is normally not of great importance which
type is used as long as several factors are considered (PHS, 1967a). Some factors that should be
considered in selecting a planchet are:
• CHEMICAL REACTIVITY. The metal planchet should be inert to the chemicals in the test
source, as corrosion of the planchet surface radically alters test-source absorption and
geometry characteristics.
• RADIOACTIVITY. The metal comprising the planchet should contain minimal radioactivity
and, although this is generally not a serious problem, the planchet background should be
measured and corrections applied as necessary for each batch of planchets used.
• SIZE. Two-inch (5 cm) planchets (assuming the detector is at least that large) are often
preferred for gross alpha/beta counting to expedite and simplify the evaporation of liquid
samples and provide a greater surface area for solid samples, while 1-inch (2.5 cm) planchets
are generally used for alpha spectrometry test sources.
• CONFIGURATION. Planchets can be procured in high-walled and low-walled configurations,
each with a flat or ribbed bottom. Flat-bottomed planchets are preferred for swipes, air
particulate filter samples, and test-source precipitates (or microprecipitates) on filter papers.
Ribbed-bottomed planchets, made with a series of raised (ribbed) concentric rings, are
typically used for evaporated and chemical precipitate test sources. Precipitates or evaporated
residue test sources prepared in a ribbed-bottom planchet that was rotated under a heat lamp
tend to be more uniformly distributed compared to sources prepared in a flat-bottomed
planchet. The user normally selects a low-walled (3.2 mm wall height) or a high-walled (6.4
mm) planchet depending on the amount of sample to be placed in the planchet and the
possibility of the test source creeping up the side of the planchet.

Quantification of Radionuclides
15-15
JULY 2004 MARLAP
• COST. Platinum planchets should not be used if stainless-steel ones are adequate for the
purpose.
It is usually impractical to reuse planchets, and it is generally not recommended. Except for those
made of platinum, planchets are inexpensive, and it is not cost effective to clean the planchets
and ensure they are not contaminated from the prior test source. Platinum planchets are quite
expensive and usually can be cleaned effectively in acid and recounted prior to reuse to ensure
that they are not contaminated.
15.3.4 Thermal Volatilization/Sublimation
Vacuum thermal volatilization or sublimation is often used when very thin and uniform sources
are required (Blanchard et al., 1957; Friedlander et al., 1981). The disadvantages of this
technique are that it is time consuming and the recoveries are often less than 50 percent
(NAS/NRC 1962).
The apparatus used to perform this procedure consists of a demountable vacuum chamber that
contains either a ribbon filament, often with a shallow trough, or a crucible. The collector plate is
usually mounted less than a couple of centimeters away. The source solution is first evaporated
onto the filament. As the required temperature of the filament is reached, the trough in the
filament tends to collimate the sublimed material onto the collecting plate, increasing the
recovery of the sample.
Pate and Yaffe (1956) designed a system for volatilizing radionuclides from a crucible heated
with electrical resistance wire. Their design resulted in nearly 100 percent yields on thin
collecting films, and made it possible to prepare thin and uniform sources containing a known
aliquant of a stock solution (NAS/NRC, 1962).
For very thin sources, it is necessary either to swing the collector plate away or have it covered
during initial heating in order to burn off impurities at low temperatures without volatilizing
them onto the source mount. Separation from contaminants can be accomplished at the time of
source preparation by considering differences in vapor pressure and carefully controlling the
temperature (Coomber, 1975). The temperature at which a radionuclide will volatilize depends
on the compound in which it exists, e.g., as a hydride, oxide, or halide. Sources have been
prepared by thermal volatilization/sublimation for radioisotopes of manganese, chromium,
cobalt, rhodium, arsenic, silver, ruthenium, technetium, and many others (Blanchard et al., 1957;
Coomber, 1975). See Section 13.5, “Volatilization and Distillation,” for further discussion of this
topic with examples.
A technique called vacuum evaporation has been used to prepare thin, uniform radioactive
sources (Van der Eijk, 1973). Radioactive substances are volatilized by heating a solution in an

Quantification of Radionuclides
15-16
MARLAP JULY 2004
oven under reduced pressure. Yields, usually rather low, can be improved by using a collimating
oven.
15.3.5 Special Source Matrices
15.3.5.1 Radioactive Gases
Gaseous radionuclides most often measured include tritium, both as a vapor (3HOH) and in the
elemental form (3H-H), 14CO2, and the noble gases, 37Ar, 41Ar, 85Kr, 222Rn, 131mXe, and 133Xe.
Tritiated water vapor often is collected by condensation from a known volume of air (EPA,
1984b). The air is drawn first through a filter to remove all particulates and then through a cold
trap submerged in a dry-ice/alcohol bath. A measured aliquant of the collected water is analyzed
by liquid scintillation spectrometry (EPA, 1984b). Tritiated water vapor is sometimes collected
by pulling air through a trap containing materials like silica gel (SC&A, 1994) or through a
molecular sieve. After collection, the water is distilled from the silica gel, collected, and counted
in a liquid scintillation spectrometer.
Gaseous products of oxidation or combustion can be trapped in a suitable media, such as water
for 3H, ethanolamine for 14C, peroxide for 35S, and then analyzed by liquid scintillation spectro-
metry (NCRP, 1978). For this method, it is very important to de-aerate the liquid prior to
introducing the gas, and the temperature should be carefully controlled since gas solubilities are
temperature dependent (NCRP, 1978), generally inversely proportional to the temperature.
Although not as common nor convenient as liquid scintillation spectrometry, a gaseous radionuc-
lide can be measured in an internal proportional counter as a component of the counter-filling
gaseous mixture, usually argon, methane, or an argon-methane mixture (Friedlander et al., 1981;
NAS/NRC, 1962; Bleuler and Goldsmith, 1952). For example, tritiated water can be reduced to
hydrogen gas (3H2) by passing water vapor over a bed of hot zinc, and sodium carbonate can be
converted to carbon dioxide (14CO2) with an acid (NCRP, 1978). These gases then can be mixed
with a counting gas and introduced into the proportional-counter chamber. The major
disadvantage of this technique is that it requires a gas handling system.
Concentrations of radioactive noble gases in the effluents of some nuclear facilities are suf-
ficiently high that source preparation simply involves filling an evacuated vessel with the gaseous
sample or flushing the vessel sufficiently to ensure a 100 percent exchange (EPA, 1984b). The
counting geometries (efficiencies) of the collection vessels can be determined, allowing the
collected test sources to be measured directly in the vessels by gamma-ray spectrometry.
For environmental samples collected downwind of a nuclear facility, concentrating the nuclides
in the gaseous sample is nearly always required prior to measurement. One example is the “Penn
State Noble Gas Monitor,” which was designed to measure low concentrations of radioactive

Quantification of Radionuclides
15-17
JULY 2004 MARLAP
noble gases (Jabs and Jester, 1976; Jester and Hepburn, 1977). Samples of environmental air are
compressed in high-pressure bottles to about 20,800 kPa (~ 3,000 psig), providing a sample
volume of 2.3 m3. The inlet air to the compressor passes through a scrubbing train that contains
particulate filters and activated charcoal to remove radioiodine. The noble-gas measurement
system consists of a spherical 14.69 L, high-pressure, stainless steel vessel with a reentrant well
in its base to permit insertion of a Ge detector connected to a spectrometry system. The vessel is
surrounded with 5 cm (2 inches) of lead shielding.
There may be occasions when radioiodine is discharged into the atmosphere in several chemical
forms. A molecular species filtering system, described by EPA (1990), collects four primary
species of iodine on separate cartridges so that they can be measured individually. Air is pulled
first through a particulate filter and then through the cartridges placed in series. The normal order
of the four cartridges in the filtering system is: (1) cadmium iodide media (CdI2) for I2 retention;
(2) 4-iodophenol (I @ C6H4 @ OH) on alumina for HOI retention; (3) silver-salt (AgX) loaded
zeolite or impregnated charcoal for organic iodine retention; and (4) charcoal for a breakthrough
monitor. Air, at a calibrated flow, is passed through the system at a rate of 28 to 56 L/min (1–2
ft3/min). When the sample-collection period is complete, the cartridges are separated, and the
activities of each are measured separately by direct counting of the individual cartridges using
gamma-ray spectrometry.
15.3.5.2 Air Filters
Air filters containing particulates may be counted directly by a proportional or scintillation
detector. Minimal source preparation is normally required for directly counted filters. Some
project plans may require that the mass of the particulates on filters be determined. If so required,
the filters are weighed on receipt and the net particulate mass calculated by subtracting the mass
of an average filter mass or, if pre-weighed, the beginning filter mass.
Actual preparation may be limited to a reduction of the size of the filter and placing it in the
appropriate counting container, e.g., a planchet. If the filter is of the correct size and shape to fit
directly in a counting container, no preparation may be required. Since particulate matter is
deposited on the surface of the filter medium, care should be exercised in handling, particularly
during size reduction, so that particulate material is not removed.
Because potentially contaminated material is relatively easily removed from a filter surface,
caution is necessary to avoid contamination of detectors. If a filter is to be gamma counted it can
remain in the envelope or plastic bag in which it is received for counting. The filter may be
placed in such an enclosure if not received in that manner. The size of the filter may be reduced
by simply folding the filter to a standard size for gamma counting.
When specific alpha- and beta-emitting nuclide analyses are required (e.g., Pu, U, Th, Am, Sr),
the filter media along with the particulate material are usually ashed or dissolved and processed

Quantification of Radionuclides
15-18
MARLAP JULY 2004
as any digestate by the procedure used in the laboratory.
15.3.5.3 Swipes
Swipes (also called “smears”) are collected to determine the level of removable surface contam-
ination. They are normally taken on a filter or fabric pad by rubbing it over a predetermined
surface area, nominally 100 cm2. Swipes are routinely counted directly in a proportional counter
or liquid scintillation counter for alpha and beta activity determination. The size of the swipe is
selected to allow it to be placed in a standard-size planchet for counting. If elevated beta
radioactivity is identified, a swipe may be gamma counted to determine the contributing
radionuclide. Elevated alpha activity may require isotopic analyses for identification.
The precaution given in the previous section concerning contamination for air filters applies as
well to swipes. All swipes should be treated as if they are contaminated until proven otherwise.
In some cases swipes may be wetted with water or alcohol prior to collection of the sample.
When counted in a gas proportional counter, wet swipes should be allowed to air dry prior to
counting in order to avoid self-absorption of the alpha and beta particles by the liquid remaining
on the swipe (see Section 10.6.1 for further information on swipes). Ensuring that the swipes are
dry before counting is important for gross alpha counting measurements. Wet swipes, especially
those used to detect removable tritium contamination, normally can be counted using a liquid
scintillation without sample preparation. In this instance, it is important that the swipe material
be translucent to the radiation emitted by the fluor.
15.4 Alpha Detection Methods
15.4.1 Introduction
When compared to other radioactive particle emissions (such as beta particles), alpha (α)
particles are relatively massive. As a result, alpha particles expend their energy over short
distances and typically exhibit limited penetration into materials. Alpha particles are also
characterized by an intense, high rate of energy loss while passing through matter (see ICRU,
1992, for a discussion of dose equivalents and linear energy transfer). The high rate of energy
loss produces dense ionization or intense scintillation which is used to differentiate alpha radio-
activity from other types of radiations (beta and photon emissions). Practically, this high rate of
loss of energy when passing through matter, requires more stringent sample processing and final
sample mounting for alpha counting than is necessary for other types of radioactive counting
sources. Examples of direct alpha counting to determine total alpha activity are given in ASTM
C799, D1943, and D3084.
Alpha radioactivity normally can be measured by several types of detectors in combination with
suitable electronic components. The alpha detection devices most widely used are ionization

Quantification of Radionuclides
15-19
JULY 2004 MARLAP
chambers, proportional counters, solid-state (silicon) semiconductor detectors/spectrometers, and
scintillation counters (plastic, ZnS phosphor-photomultiplier tube combination, or a liquid
cocktail). The associated electronic components in all cases include high-voltage power supplies,
preamplifiers, amplifiers, pulse discrimination, scalers, and recording devices. For spectrometry
systems, an analog-to-digital converter (ADC) and a multichannel analyzer (MCA) would be
included in the list of components.
Accurate alpha particle measurements will depend on a number of parameters. The most
important of these parameters are:
• Test-source geometry;
• Self absorption;
• Absorption in air and detector window;
• Coincidence losses; and
• Backscatter.
These parameters are discussed in detail in the literature (Blanchard et al., 1960; Hallden and
Fisenne, 1963) and can be measured or corrected for in many cases by holding conditions
constant during the counting of test and calibration sources. In addition, many of these
parameters are discussed in Sections 15.2 and 15.3 on the preparation of sources.
Alpha-particle counters typically have low backgrounds and, in many cases, high efficiencies (10
to 100 percent). Because of their short range (about 20 µm) in common materials, only alpha
particles from radionuclides in materials very near the sensitive volume of the detector will be
detected. Alpha particles from radionuclides in materials farther away from the sensitive volume
of the detector, e.g., detector shields, vacuum chambers, source mounts, structural materials, etc.,
will not be detected. However, some counters are easily contaminated internally and care should
be taken to avoid contamination. These include internal gas flow proportional counters and solid-
state detectors. Controls should be put in place that minimize the potential for, and detect the
presence of, contamination. Solid-state detectors operated in a vacuum may become contamina-
ted because of recoil from sources (Merritt et al., 1956, Sill and Olson, 1970). Some alpha
detectors are sensitive to beta radiation (Blanchard et al., 1960; Hallden and Fisenne, 1963). In
these cases, electronic discrimination is often used to eliminate or reduce the effect of the smaller
resulting voltage pulses because of beta particles. A discussion of alpha-particle attenuation can
be found in Sections 15.2 and 15.3.
Alpha calibration standards are available from NIST or a commercial vendor (complying with
ANSI N42.22) that supplies NIST-traceable sources. Among the radionuclides available are
230Th, 241Am, 235U, 239Pu, 228Th, 238U, and 226Ra (Table 15.2). Other radionuclides are also
available. It is critical that calibration sources be prepared in the same precise geometry and
manner as the test sources. The calibration source may be procured as a solution and then
prepared in the appropriate counting geometry, or the source may be procured directly in the
Quantification of Radionuclides
15-20
MARLAP JULY 2004
appropriate geometry, such as an electroplated standard.
TABLE 15.2 — Nuclides for alpha calibration
Purpose Nuclide Reference
Specific Nuclide and Gross Alpha 239Pu, 241Am, 210Po, 228Th, 230Th, 226Ra,
233U, 235U, and Unat
ASTM D3648
40 CFR 141.25(a)
Gross Alpha 241Am EPA ,1980
Gross Alpha 241Am, 237Np, and Unat ASTM D1943
Gross Alpha 241Am, 239Pu, 230Th, and Unat APHA (1998), Method 7110
15.4.2 Gas Proportional Counting
The gas proportional (GP) counter is one of the most widely used alpha-particle detection
systems. GP counting methods are often referred to as “gross alpha” detection methods because
the detector does not differentiate nuclides based on alpha particle energy. GP counters are
available in both “windowed” and “internal” (or “windowless”) configurations. Both types of GP
counters use a special counting gas during operation. Internal GP counters have the detector
configured so that there is no window between the test source and the counting chamber.
Although windowless GP counters previously have been considered impractical for routine
operations, modern windowless counters have been engineered to optimize detector
geometry/efficiency while minimizing contamination. Because the efficiency of these systems
can be greater compared to the windowed GP detectors, their use should be considered when
determining the appropriate system for alpha particle measurements. Windowed GP counters
have a thin membrane (Mylar™ or other special materials) window between the test source and
the counting chamber. Windowed GP counters are available commercially with window
thicknesses between 0.08 and 0.50 mg/cm2.
There are several types of commercially available GP counters. These include sequential multiple
sample (test source) GP counters and multiple detector single sample (test source) GP counters.
Each type of counter can be operated to detect alpha and beta emissions, either separately or
simultaneously. Normally, between 50 and 100 prepared test sources can be loaded into a
sequential multiple sample (test source) GP counter and counted sequentially for a standard
counting interval. A multiple detector unit, also referred to as a “shelf” unit, typically has
provisions for four detectors per shelf. These multi-detector units can be “networked” together in
groups up to 64 counting chambers.
15.4.2.1 Detector Requirements and Characteristics
As an incident alpha particle enters the sensitive volume of the GP detector, primary ionization
occurs through the interaction of the particle with the fill gas. The secondary electrons produced
through these interactions are accelerated toward the anode as a result of the bias (volts DC)

Quantification of Radionuclides
15-21
JULY 2004 MARLAP
applied to the system. In proportional counters, the free electrons gain sufficient kinetic energy
during acceleration to produce secondary ionization as they migrate toward the positive anode.
This effect, known as “gas multiplication,” is used to amplify (about 1,000 times) the number of
gas ions initially produced and the electrical charge (electrons from ionization process) collected
at the anode. As with ionization chambers, the charge collected at the anode (through a resistor-
capacitor [RC] circuit) results in a change in the voltage potential and the generation of a voltage
pulse. As a result of gas multiplication, the voltage pulse produced is considerably larger than the
pulse produced in an ionization chamber. When operated at the correct detector high voltage
bias, the magnitude of the voltage pulse produced is proportional to the original number of ion
pairs formed by the incident particle.
The most common counting gas used in commercial units is a purified 90 percent argon and 10
percent methane gas mixture referred to as “ P-10.” However, a mixture of 4 percent isobutane
and 96 percent methane, and pure methane, also have been used with success. The operating
voltage of a detector using pure methane is nearly twice the operating voltage for P-10 gas.
Commercial manufacturers of gas proportional counters recommend a P-10 gas purity
specification that limits the concentrations of hydrogen, nitrogen, oxygen, carbon monoxide,
carbon dioxide, moisture, ethane and methane. Windowed-type detectors may be a sealed type
that has a finite amount of the counting gas in the sensitive volume of the detector or a gas flow
type wherein the gas flows continuously through the sensitive volume of the detector.
Commercial units typically use a gas flow type detector operating with a flow rate of
approximately 50 mL per minute.
Gas proportional detectors generally are constructed of stainless steel, oxygen free/high
conductivity (OFHC) copper, or aluminum. Commercial GP counters have detectors with
diameters between 25.4 mm and 133 mm. Most commercially available automated GP counters
have a detector size of 57.2 mm (2.25 inches). Test-source mounts, normally stainless steel
planchets, accommodate test sources of similar diameters and heights up to 9 mm. The
manufacturer’s specifications for a GP counter of either type should include performance
estimates of a background count rate, length and slope of the voltage plateau, and efficiency of
counting a specified electrodeposited calibration source, along with the type of gas used in the
tests. For a windowed GP counter, the window thickness is important and the user may want to
compromise on the thickness for both alpha and beta counting applications. A thin window is
needed for counting nuclides having alpha and low-energy beta emissions. Common window
thicknesses offered by the manufacturers include 0.08 and 0.50 milligrams per square centimeter.
For GP alpha-particle counting, typical values for the important operational parameters are
provided in Table 15.3.
One instrument manufacturer has engineered a windowless GP counter available as a sequential
multiple sample (test source) or a multiple detector single sample (test source) GP counter. The
units available typically have lower alpha background and higher detector efficiency
specifications compared to windowed GP counters.

Quantification of Radionuclides
15-22
MARLAP JULY 2004
Windowed efficiency (0.8&0.5 mg/cm 2thickness)&100 ×count rate
αemission rate
TABLE 15.3 — Typical gas operational parameters for gas proportional alpha counting
Background count rate (57 mm diameter detector) 3–10 counts/hour or 0.83 to 2.8×10⁻³ cps
Length of voltage plateau 300–800 V DC using P-10 gas
Slope of voltage plateau for well-designed detector 1–2.5%/100 V for an electroplated source
49–51% for an electroplated source
Windowless detector efficiency&100 ×count rate
α
emission
rate
including backscatter
30–40% for an electroplated source
SHIELDING
The purpose of shielding is to reduce the background count rate of a measurement system.
Shielding reduces the background count rate by absorbing some of the components of cosmic
radiation and radiations emitted from materials in the surroundings of the measurement system.
Ideally, the material used for shielding should itself be free of any radioactive material that might
contribute to the background. In practice, this is difficult to achieve as most construction
materials contain at least some naturally radioactive species (such as 40K, members of the
uranium and thorium series, etc.). However, most alpha detectors are quite insensitive to the
electromagnetic components of cosmic and other environmental radiations. In addition, when
properly operated, the alpha particle detector or detection system will be insensitive to, or will
electronically discriminate against, beta particles. Because of their short range, alpha particles
from outside sources will not penetrate the active area of the alpha detector. Therefore, a
minimum amount of shielding is necessary for alpha particle GP counting of test sources.
However, most low-background GP systems are used for beta-particle measurements as well and,
as such, shielding is needed to reduce the beta background count rate.
BACKGROUND
Most of the commercial GP counting systems have passive detector shielding and active cosmic
guard (anti-coincidence counting detectors/circuits) systems to reduce a detector’s background.
However, these background reduction methods are more applicable to beta-particle measure-
ments than to alpha-particle measurements. This is because the short range of alpha particles in
common materials (about 20 µm) allows only alpha particles from radionuclides in materials
near the sensitive volume of the detector to be detected. To reduce the alpha (and beta)
background, the detector manufacturers purposely construct detectors from materials that have a
minimum amount of naturally occurring radioactivity, e.g., trace amounts of uranium and
thorium.
The alpha particle background for gas proportional counters will depend upon detector size. For
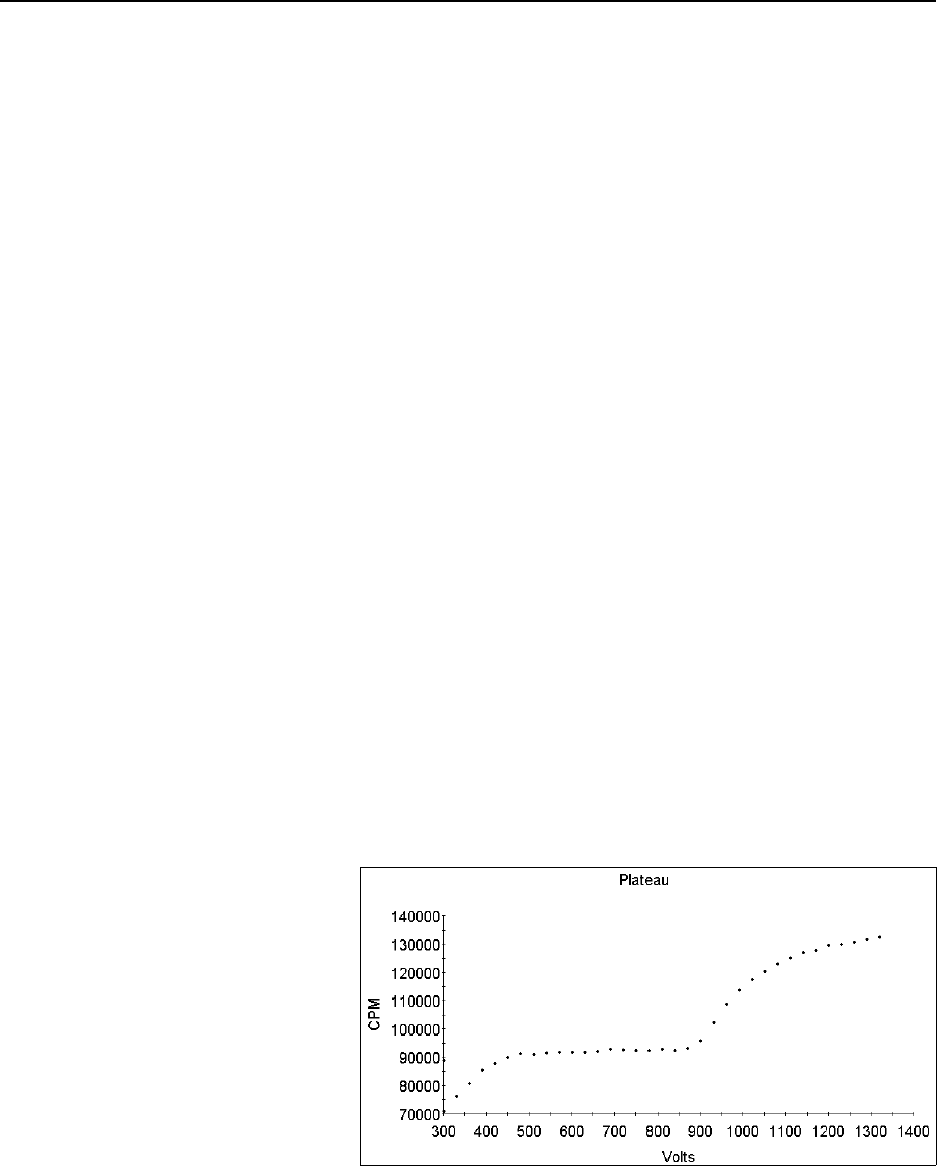
Quantification of Radionuclides
15-23
JULY 2004 MARLAP
FIGURE 15.1 — Alpha plateau generated by a 210Po source on
a GP counter using P-10 gas
some commercial units with a 57.2 mm diameter detector with a 0.08 mg/cm2 window thickness
using P-10 gas, the alpha background count rate is typically under 6 counts per hour (0.1 counts
per minute [cpm]). Alpha background count rates of 3 counts per hour (0.05 cpm) may be
obtained for commercial GP counters with different detector specifications.
OPERATING VOLTAGE
The operating voltage of a gas proportional counter used in the alpha-particle counting mode
depends on the counting gas used, the amplifier and voltage discriminator settings and the mode
of alpha particle discrimination—voltage pulse height discrimination or simultaneous alpha and
beta particle counting. The configuration of the ionization collection wires within the detector
chamber also affects the operating voltage. However, most commercial manufacturers have
standardized on a particular configuration. Currently, the most common counting gas used in
commercial windowed type GP units is P-10.
Prior to the operation of a gas proportional counter, the operating voltage of the detector must be
determined in conjunction with the other operating parameters. Normally, the manufacturer of
the unit recommends the voltage discriminator and amplifier gains settings. The user typically
places an electroplated alpha source into the counting position and increases the detector bias
voltage in discrete 25 or 50 V DC increments while recording the observed source count rate at
each voltage setting. Figure 15.1 illustrates a typical voltage response curve for a commercial
windowed type gas proportional counter detector using P-10 counting gas and a massless 210Po
source (Canberra, 2002). Notice that the count rate levels off after about 500 V DC to form a
plateau that extends to about 900 V DC. For most commercial GP units, the slope of this plateau
should be 2.5 percent (or less) per 100 volts. For Figure 15.1, the detector operating voltage for
alpha counting would be approximately 550 to 600 V DC. Note that on the beta (beta plus alpha)
plateau region of approximately 1200 VDC, there is a 35 percent increase in the 210Po count rate.
When using the separate alpha plateau then beta (plus alpha) plateau-counting modes, the
increase in the alpha-particle count rate on the beta plateau must be determined at the alpha and
beta plateau voltages selected
during calibration (i.e., determining
the ratio of the alpha-particle count
rate on the beta plateau to the
alpha-particle count rate on the
alpha plateau). For test-source
measurements, the observed beta-
particle count rate must be adjusted
for the alpha-particle count rate on
the beta plateau by applying a
correction factor using this ratio.
The observed increase in the alpha
count rate on the beta plateau varies

Quantification of Radionuclides
15-24
MARLAP JULY 2004
according to the alpha emitting nuclide. The difference between the count rates on the two
plateaus will be accentuated for nuclides that have both alpha and photon emissions, e.g., 241Am.
For the simultaneous alpha and beta counting mode, the detector operating voltage is located on
the beta-particle plateau (Section 15.5.2.1). For this counting mode, the voltage discriminator
setting for alpha detection is set so that only a small fraction (less than 1 percent) of the beta
detection events will be registered as alpha detection events.
CROSSTALK — REGISTRATION OF BETA PULSES AS ALPHA PULSES
Modern proportional counters are capable of differentiating between alpha and beta interactions
in the detector. This is accomplished by identifying the two types of particles based on the
resultant voltage pulse heights from their interactive events in the detector. As discussed
previously, the interaction of an alpha particle with the counting gas generates substantially more
primary ionization events and, thus, a higher resultant voltage pulse compared to a beta particle.
Those voltage pulses whose heights exceed an experimentally established alpha voltage
discriminator level are registered as alpha counts and those falling below this level are recorded
as beta counts. The dynamic range of the voltage separation between the alpha and beta voltage
pulses varies by detector design and manufacturer. For some GP counters, depending on the beta
particle energy and voltage (pulse) discriminator setting, some small fraction—usually less than 1
percent for a 90Sr/Y (Eβmax = 2.28 MeV) massless point source counted in the simultaneous
counting mode—of the detected beta particles may be recorded as alpha particles. This misclassi-
fication of alpha and beta measurement events (counts) is referred to as “crosstalk” or “spill-
over.” The degree of spillover varies according to detector design and GP counter manufacturer.
For some commercial GP counters, crosstalk may occur for both modes of GP counting, i.e.,
alpha then beta plateau counting and simultaneous alpha and beta counting. For electroplated
beta particle sources, the crosstalk is minimum for both counting modes when the voltage (pulse)
discriminator is properly set. The beta-to-alpha crosstalk should be evaluated for all applications
(i.e., test sources that are massless and not massless).
For both types of counting modes (plateau counting or simultaneous alpha/beta counting), correc-
tions should be made to the alpha-particle count rate to remove the portion contributed by beta
particles when significant beta activity is present (greater than 1 percent of the alpha activity).
Since the fraction of the beta counts occurring in the alpha channel depends on the beta particle
energy and source mass, a crosstalk curve should be developed. The same beta emitting radio-
nuclide selected for the beta particle self-absorption curve should be used for the crosstalk
determination. The crosstalk curve would relate the fraction of beta particles counted as alpha
particles as a function of source mass. A crosstalk response curve is generated by recording the
alpha counts from the beta self-absorption determination at all source masses and plotting the
crosstalk fraction (beta count rate in the alpha channel/beta count rate beta channel) as a function
of source mass (Section16.4, “Data Reduction on Non-Spectrometry Systems”). Alpha count

Quantification of Radionuclides
15-25
JULY 2004 MARLAP
rates then can be corrected for the influence of the beta particles at all source thicknesses.
15.4.2.2 Calibration and Test Source Preparation
Calibration and test sources for proportional counters are usually prepared by electrodeposition,
coprecipitation, or evaporation, as described in Section 15.3. For internal counters, since the
source is placed within the detector, care should be exercised in source preparation to avoid the
inclusion of chemicals that may react with the detector materials. Likewise, any spillage of
source material can result in contamination of the detector.
The absorption of alpha particles in the source material (self-absorption) should be addressed
when preparing a test source for counting. Self-absorption is primarily a function of source
thickness (ts) and the range (Rs) of the alpha particles in the source material. For a uniformly
thick source, the fraction of alpha particles absorbed by the source increases proportionately to
ts/2Rs, when ts < Rs (NCRP, 1985). Thus, to approach absolute counting in either 2π or 4π
counting geometries, test sources should be prepared as thinly and uniformly as possible.
Electrodeposited sources provide the most uniform sources for evaluating these parameters.
Another method sometimes used for alpha-emitting test sources in ionization and GP counters is
to perform the count at infinite thickness (Sections 15.2 and 15.3). The count rate of a test source
at infinite thickness usually is related to the count rate of a calibration source prepared and
measured in the exactly the same manner. However, this application is best used when the
calibration is for a well known single nuclide source or a source term wherein the multiple
nuclide concentration ratios do not vary substantially. The method is less accurate when applied
to a mixture of nuclides having different alpha energies and varying concentrations.
Backscatter from alpha sources increases with the atomic number of the backing or source
material and with decreasing alpha energy (NAS/NRC, 1962). Scattering of alpha particles from
the source material itself is not a significant problem, and scattering from the source backing has
only a small affect for very thin sources (NCRP, 1978). When stainless-steel planchets are used,
the increase in a count rate because of alpha backscatter is only about 2 percent (PHS, 1967a).
15.4.2.3 Detector Calibration
Gas proportional counters should be calibrated according to their intended use (i.e., nuclide
specific or gross alpha measurement applications). Gross alpha measurements, as the name
implies, are nonspecific to a given alpha-emitting nuclide or the isotopes of an element (uranium
or radium) and typically require no chemical separations or purification steps. The most common
applications for gross alpha measures are health physics swipes for contamination surveys, air
particulate filter papers from air monitoring programs and evaporated surface or ground waters
onto a metal planchet. For gross alpha measurements, the instrument’s calibration is related to a
reference nuclide, typically one that is specified by a laboratory client, measurement quality

Quantification of Radionuclides
15-26
MARLAP JULY 2004
objectives or by regulatory requirements. Typical alpha-emitting reference nuclides include
241Am, 237Np, 210Po, 239Pu, 228 Th, 230Th, and Unat.
Calibrations for alpha particle measurements can be accomplished for either the alpha plateau
counting mode or the simultaneous alpha and beta counting mode. However, for both modes of
operation, calibration sources should be prepared in a manner identical to the method used for
test-source mounting. This may include massless or electroplated sources, microprecipitated
(< 200 µg) sources and low mass (1–125 mg) sources. For accurate results for both counting
modes, alpha-particle self-absorption curves and crosstalk corrections should be developed
during calibration of the GP counter.
Calibration sources prepared for calibrating counters for a specific nuclide measurement should
contain a radionuclide of similar alpha energy and be measured under identical conditions as the
test sources to be measured (ASTM D3648). Alpha calibration standards are available from a
national standards body such as NIST or as NIST-traceable sources from a commercial vendor
that complies with ANSI N42.22. The source may be procured as a solution and then prepared in
the appropriate counting geometry, or the source may be procured directly in the appropriate
geometry, such as an electroplated standard. See Table 15.2 (Section 15.4.1) for a list of available
for alpha-emitting nuclide calibration sources.
The counting efficiency (ε) is determined by counting a calibration source to accumulate
sufficient net counts (approximately 10,000) to provide a relative (1σ) counting uncertainty of
about 1 percent and dividing the resultant net count rate (cps) by the alpha emission rate of the
source (α/s). The alpha emission rate is determined by the source activity (Bq) times the alpha
abundance per disintegration:
ε'Measured Net Count Rate (cps)
Bq × fractional αabundance
For a nuclide-specific or reference-nuclide counting efficiency, the same equation is used but
without the alpha abundance factor. The uncertainty of the detector efficiency factor can be
calculated using the methods described in Chapter 19 (Measurement Uncertainty).
For health physics swipes and air particulate filter samples (test sources), a calibration source is
prepared by spiking an unused filter with the appropriate calibration solution. For health physics
swipes, the entire surface of the filter paper may be spiked. However, only the active area of an
air filter paper is spiked with the calibration solution. The retainer ring and gasket holding down
the filter determines the active area to be spiked. Depending on the filter composition (e.g., glass
fiber filter), the filter matrix may cause some wicking of the solution away from the surface. In
order to prevent the wicking effect, the surface of the filter may be sprayed with an acrylic
lacquer and dried prior to spiking the surface.

Quantification of Radionuclides
15-27
JULY 2004 MARLAP
Attenuation or self-absorption corrections may be necessary for alpha counting. Attenuation
corrections should be made whenever the test-source matrix differs from that of the calibration
source. For example, when a gross-alpha analysis is performed on an evaporated water sample of
some thickness and an electroplated standard was used for the calibration, attenuation corrections
will have to be made. Alpha-particle attenuation corrections generally will be necessary with a
test-source density thickness greater than about 1 mg/cm2.
In cases where finite test-source thicknesses are unavoidable, alpha-source measurements can be
adjusted to account for self-absorption (PHS, 1967a). In order to determine the change in
counting efficiency as a function of source thickness or mass, a self-absorption curve must be
developed. Calibration sources containing a known amount of the radionuclide of interest are
prepared in varying thicknesses (masses) and counted. Absorption curves for gross alpha-particle
measurements most often are constructed using reference material containing one of the nuclides
listed above. The absorption curve is constructed by counting planchets containing varying mass
of material but with a known amount (sometimes constant) of added radioactivity. A curve is
generated by plotting the efficiency at a given source thickness divided by the efficiency at
“zero” thickness versus source mass (mg) or density thickness in µg/cm2 or mg/cm2 (NCRP,
1978). Thus, the efficiency relative to the “zero thickness” efficiency can be read directly from
this curve for any measured test-source thickness. Test sources prepared for gross measurement
are counted in the exact geometry as those used to prepare the absorption curve. The material
forming the matrix for the self-absorption calibration source should, when possible, be identical
to that expected in the test sources to be analyzed. Based on the test-source mass or density
thickness in units of µg/cm2 or mg/cm2, the correction factor determined from the absorption
curve is applied to the test-source count, yielding the count rate equivalent to an infinitely thin
source.
Most radioanalytical laboratories use a more simplified method to generate a self-absorption
curve. A self-absorption curve typically is generated by determining the counting efficiency as a
function of source mass in milligrams or mg/cm2 without normalization to the “zero thickness”
efficiency. Figure 15.2 illustrates a typical self-absorption curve for 230Th in a dry residue
generated from evaporated tap water.
15.4.2.4 Troubleshooting
Various problems may arise when counting calibration or test sources on a GP counter. These
may include instrumentation or test-source preparation related issues. Instrumentation related
problems should be identified through the instrument’s operational quality control checks that
include periodic detector response and background measurements. Section 18.5.6 (“Summary
Guidance on Instrument Calibration, Background, and Quality Control”) within Chapter18
provides the recommended frequencies for these types of quality control (QC) measurements for
a GP counter. Instrumentation problems may arise from electronic component failure or changes,
a low flow rate of counting gas delivered to the detector, impure or wrong gas mixture,
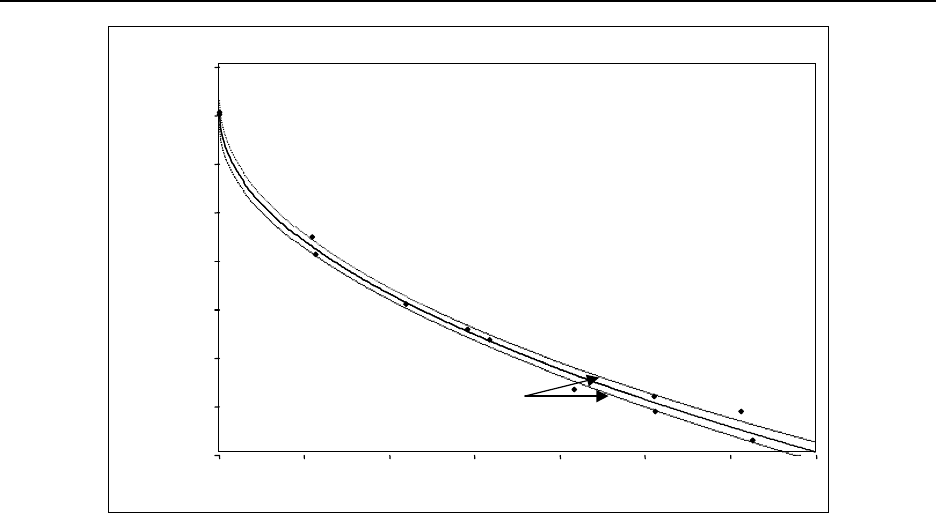
Quantification of Radionuclides
15-28
MARLAP JULY 2004
Fitted equation: y = 0.453 - 0.0417 x0.5
020 40 60
Precipitate Weight (mg)
0.10
0.15
0.20
0.25
0.30
0.35
0.40
0.45
0.50
Fractional Detection Efficiency
95% confidence limits
FIGURE 15.2 — Gas proportional counter self-absorption curve for 230Th
malfunction of guard ring, harsh operating environment such excessive temperature and
humidity, poor electrical power with excessive noise or radio frequency interference and
grounding effects. Identification of an intermittent problem, such as electrical noise, is generally
more difficult than identifying a consistent problem such as an instrument component failure.
Detector contamination from highly radioactive samples or loose material on a test source (air
particulate filters or swipes) may lead to inaccurate results if an increased detector background is
not quantified and subtracted from subsequent test-source measurements.
Inaccurate results can occur from the misuse of a specific nuclide detector calibration or if the
test sources are prepared differently than the calibration sources. For example, using an alpha
self-absorption curve based on a nuclide(s) having a low-energy alpha(s) (e.g., natural uranium)
to calculate the activity in test sources containing nuclides of higher alpha energies (e.g., 226Ra
plus progeny) may produce inaccurate results. It is important that a laboratory and its client
decide cooperatively on the reference nuclide for gross alpha measurements as well as the
chemical composition of the calibration sources to generate the self-absorption curve. Some
clients may want the laboratory to use the gross alpha reference nuclide that the nationally
recognized performance evaluation programs incorporate into their gross alpha test samples.
Inaccurate results also may occur when an alpha detector efficiency factor for a massless
calibration source is applied to air particulate and swipe test sources. The magnitude of the
inaccuracy depends on many factors affecting alpha self absorption, including the depth of filter
penetration by particles, which is a function of flow rate and the type of filter material (e.g.,
membrane, glass fiber, Teflon®, cotton), and dust or material loading. Dust loading of air filters is

Quantification of Radionuclides
15-29
JULY 2004 MARLAP
a function of the airborne dust concentration, air flow, and sampling duration. For most
environmental surveillance programs monitoring airborne contaminants, the air flow and
sampling duration are limited to prevent significant and undesired dust loading. When there is
minimal dust loading on a filter, such as from short-duration sampling at relatively low flow
rates, only a small reduction in the counting efficiency because of alpha self-absorption may be
observed. Loysen (1969) indicated alpha self-absorption losses to be about 6 percent for glass
and membrane (5 µm pose size) filters used to collect radon progeny, typically in a 20 L sample
collected over a 10-minute interval. McFarland (1998) found that air filter and swipe sample
results could be “under reported” by applying a detector efficiency factor for electroplated
sources to these sample matrices. In the study, the GP detector efficiency for an electroplated
241Am source was 0.485, while the detector efficiency for clean and slightly dirty (5-6 mg) swipe
samples was 0.292 and 0.243, respectively. For Mylar®-covered simulated air filters, detector
efficiencies of 0.229 and 0.199 were observed for Mylar coatings of 0.5 and 0.85 mg/cm2,
respectively. A discussion and recommendations on the analysis of health physics smear samples
by GP counting can be found in ANSI N25.25, Annex B.5.
15.4.3 Solid-State Detectors
Semiconductor detectors used for charged particle spectrometric applications provide many
advantages compared with the other alpha detectors. These include good energy resolution,
stability or minimal drift in energy response, excellent signal timing characteristics, very thin
entrance window to minimize particle energy losses, and simplicity of operation (Knoll, 1979).
Solid-state or semiconductor detectors used for alpha counting are essentially solid-state ioniza-
tion chambers. The ionization of the gas in an ionization chamber by alpha particles produces
electron-ion pairs, while in a semiconductor detector electron-hole pairs are produced. The
liberated charge is collected by an electric field and amplified by a charge-sensitive amplifier.
There are three technologies used by manufacturers for the production of solid-state alpha
detectors made of silicon: diffused junction, surface barrier, and ion-implanted. The detectors can
be made partially depleted or totally depleted. These detectors are mostly made of n-type base
material. Currently, the majority of semiconductor detectors in use for alpha spectrometric
applications are the ion-implanted detector. The semiconductor material must have a high enough
resistivity to give the required depletion depth. The depletion depth is the sensitive depth of a
detector where charged particles interact with the semiconductor material particle to produce
electron-hole pairs and must be thick enough to absorb all of the energy of an alpha particle. The
interaction of photons with this thin depletion layer is normally negligible. Since the detector
shows a linear response with particle energy, any interactions of beta particles with the detector
can be eliminated by electronic discrimination.
When a reverse bias voltage is applied to a semiconductor detector, a leakage current is
generated. The leakage current of silicon diodes doubles for every 5.5–7.5 EC rise in ambient
temperature. Because the preamplifier high voltage bias resistor adds noise, it is necessarily of

Quantification of Radionuclides
15-30
MARLAP JULY 2004
high value, typically 100 megaohm. Since a surface barrier detector can have a leakage current in
the tenths of microampere, the voltage drop across the bias resistor can be substantial. A couple
of degrees rise in the temperature will significantly increase this voltage drop, thereby reducing
the voltage at the detector. This bias change can be enough to affect the overall gain of the
detector-preamplifier by a substantial amount. The ion-implanted detector, on the other hand, has
leakage currents in the nanoampere range and thus does not produce a substantial voltage drop
across the bias resistor. The system is therefore not as strongly dependent on temperature.
The semiconductor is of special interest in alpha counting where spectrometric measurements
may be made since the average energy required to produce an electron-hole pair in silicon is 3.6
eV and in germanium is 2.96 eV (Gilmore and Hemingway, 1995) compared to the 25 to 30 eV
needed to produce an ion pair in a gridded ionization chamber. Consequently, silicon detectors
provide much improved resolution and also normally have lower background count rates. In
addition, the rise time of a voltage pulse is very fast (~10 ns) and the voltage pulse height does
not vary with count rate. (Mann et al., 1991)
15.4.3.1 Detector Requirements and Characteristics
An alpha-particle spectrometry system typically consists of a solid-state detector in a vacuum
chamber, high voltage detector bias supply, charge-sensitive preamplifier, amplifier, ADC, and a
digital memory storage device. In older systems, the ADC and the digital memory storage device
were combined into a multichannel analyzer unit. More recent systems use a computer for the
memory storage device. In some multiple detector spectrometry units, the ADC contains a
multiplexer to acquire each detector’s spectrum and to control the operational aspects of each
detector. Alpha-spectrometry systems normally are operated to cover the energy range between 3
and 8 MeV for most long-lived nuclides. However, typical systems can be operated from 0 to 10
MeV. For example, the upper energy range can be extended to10 MeV for quantifying short-lived
nuclides such as 212Po and 214Po. An alpha spectrometry system’s gain can be selected according
to the application and system components but a gain of about 10 keV per channel is common.
There are several commercial manufacturers of alpha spectrometry systems, alpha detectors and
electronic components.
Four parameters normally are specified when selecting a detector for charged-particle spectro-
metry. These include resolution, active area, depletion depth, and background. Commercial
manufacturers (ORTEC, 2002; Canberra, 2002) have produced a selection of detectors that vary
in these four parameters. For most alpha spectrometric applications, a depletion depth in silicon
of approximately 100 µm is sufficient. If the detector is used for other charged particle applica-
tions (beta or proton), detectors having a depletion depth of 500 µm and greater are available. For
alpha particle spectrometry applications, the resolution of a detector increases in a nonlinear
fashion as the active detector area increases. Although commercially available detectors are
available with an active area between 25 and 3,000 mm2, a typical alpha-spectrometry detector
has a 450 mm2 active area.

Quantification of Radionuclides
15-31
JULY 2004 MARLAP
The full-width-half-maximum (FWHM) resolution of an alpha spectrometry system using
commercially available detectors depends on several parameters that include; inherent energy
resolution of the detector, charge carrier statistics, incomplete charge collection and variations in
the energy loss in the dead layer, i.e., entry window thickness. The noise contributions from the
nondetector system components to the energy spectrum is minimal for most alpha spectrometry
systems.
The quoted resolution specification by a manufacturer is based on an ultra-thin source measured
in a vacuum at a source-to-detector distance of 1.5 times the detector’s active diameter. Typical
detector resolutions, as measured for the 5,486 keV alpha line of 241Am, vary from 15–50 keV for
detector areas between 50–2,000 mm2. For a nominal detector size of 450 mm2 with a 100 µm
depletion depth, a typical detector resolution is about18 to 20 keV. Manufacturers have also
produced “ruggedized” ion-implanted contact detectors whose detector surface characteristics
permit cleaning in case of contamination. The resolution of these ruggedized detectors is similar
to the other detector types or about 20 keV. Some general characteristics and requirements for the
detector operation are described below.
OPERATING VOLTAGE
Silicon semiconductor alpha detectors operate at a low reverse bias voltage condition, normally
between 50–100 volts DC. The voltage bias supply should be highly regulated to prevent noise
and loss of resolution. The polarity of the bias depends on the type of detector, e.g., surface
barrier, etc. To avoid possible damage, a voltage bias should not be applied to the detector while
exposed to light. Many commercially available multiple detector units have an interlock system
for each vacuum chamber that removes the detector bias if the chamber is opened to the
atmosphere.
BACKGROUND AND SHIELDING CONSIDERATIONS
Because of their insensitivity to beta and photon radiations, semiconductor alpha detectors with
thin depletion depths are not shielded against external background radiations. The depletion
depth of an alpha detector is too thin to develop significant pulses from the interactions from
cosmic or gamma rays. Without a shielding requirement, multiple alpha detectors can be
mounted in close proximity. Multiple detector units typically have eight detectors, each enclosed
in separate vacuum chambers
Following manufacture, the background of an alpha semiconductor detector is nearly negligible.
Several factors contribute to the low background characteristic. First, the inherent naturally
occurring radioactivity in the ultra-pure semiconductor silicon material of the detector is
extremely low. Since the surface area of the detector is small and the contact electrodes are
extremely thin, there is only a small amount of material that is available to contribute to the
detector background. However, only alpha particles from radionuclides in materials near the

Quantification of Radionuclides
15-32
MARLAP JULY 2004
sensitive volume of the detector will be detected. The detector manufacturers purposely construct
detectors from materials that have a minimum amount of naturally occurring radioactivity, such
as trace amounts of uranium and thorium. A nominal background specification (ORTEC, 2002)
for energies above 3 MeV is less than 1.2 counts per day per cm2 of active detector area, or less
than 24 counts per day for a 450 mm2 surface area detector. Typical observed backgrounds may
range from 8–13 counts per day for an energy window between 3–8.2 MeV. Burnett (1994) has
reported a typical background for new Planar Implanted Passivated Silicon (PIPS) detectors of
the order of 6 counts per day (0.004 cpm) for a 3 to 8 MeV energy region and about 1 count per
day (0.001 cpm) under individual regions of interest of about 300 keV.
VACUUM
In order to obtain the best alpha peak resolution, a solid-state detector is operated in a near
vacuum condition to eliminate the alpha-particle energy degradation from interactions with air
molecules prior to striking the detector face. In addition, surface barrier detectors are operated
(with bias voltage applied) in a near vacuum to prevent damage of the surface layer. (Mann et al.,
1991) There are several different vacuum chamber designs manufactured for alpha spectrometry
applications. However, all units are light tight and have some type of gasket seal to prevent
vacuum degradation. Because of the very thin entry window, the detector is very light sensitive
and the bias voltage should not be applied when the detector is exposed to light. (Knoll, 1979).
Older single detector chamber units were essentially large stainless steel vacuum bells with
provisions for the high voltage bias and signal connectors. More recent vacuum chambers are of
a smaller configuration and have several shelves to position the test-source mount at different
distances from the detector face. Many commercially available multiple detector units have an
interlock system for each vacuum chamber that removes the detector bias if the chamber is
opened to the atmosphere.
Traditional silicon surface barrier (SSB) alpha detectors typically are operated under a near
vacuum that is less than 500 µm Hg. These systems have bias voltage “cut- outs” to protect the
detector if the pressure exceeds this value. The balance of air pressure to protect the detector
from recoil contamination and loss of spectral resolution limits the range of pressures under
which these detector systems have worked. Vacuum pumps are available to permit detector
chambers to reach less than 6.7 Pa (50 µm Hg) and, by continuously running the pump, maintain
that level indefinitely. In some vacuum systems, an electronic air pressure sensing device is used
to monitor the internal pressure in a chamber and to control the operation of the vacuum pump.
The PIPS style alpha detectors can be operated at pressures from 1 to 20,000 µm. Higher
pressures prevent recoil contamination. Where recoil is not a concern, the operator can lower
pressure to achieve the desired spectral resolution. Burnett (1994) has provided detailed
information on the optimum air pressure needed to maintain good spectral resolution and to
maintain low detector backgrounds for alpha spectrometry systems.

Quantification of Radionuclides
15-33
JULY 2004 MARLAP
15.4.3.2 Calibration- and Test-Source Preparation
For best results, the calibration and test sources should be isotopically pure and nearly massless.
Some radiochemists prefer test sources that have been electroplated to make a lower mass
(Puphal and Olson, 1972), while others prefer preparing test sources using a microprecipitation
technique. Microprecipitation as fluorides has been reported with only slight loss of resolution
(Sill and Williams, 1981; Hindman, 1983).
Alpha-energy spectra of very high resolution are attainable with semiconductor detectors if the
prepared test source is essentially massless, #1 µg/mm2 (Herpers, 1986). As the thickness of the
test source increases, the spectral energy is degraded because of self-absorption, which broadens
the peak and forms a tail on the lower-energy side (Section 16.3.2, “Alpha Spectrometry”). The
alpha-energy spectral degradation will increase as the source thickness increases, raising the
possibility of overlapping peaks with a loss of spectrum integrity. Thus, it is of utmost impor-
tance to prepare very thin and uniform alpha test sources for spectrometry. This may be accomp-
lished by electrodeposition or coprecipitation (ASTM D3084), if reagents are controlled so that
only small (microgram) quantities of precipitate are recovered. ASTM D3865 provides a
standard method for the electrodeposition of the plutonium isotopes with subsequent counting by
semiconductor detectors. For example, in the coprecipitation of actinide test sources for spectral
analysis, source thicknesses of 0.4–1 µg/mm2 (0.04–0.1 mg/cm2) are achieved routinely, which is
quite adequate for producing well-defined alpha spectral peaks (EPA, 1984a). From a practical
point-of-view, FWHM resolutions of 53 keV can be achieved with microprecipitates of about100
µg (0.20 µg/mm2) for nuclides having well-defined and separated alpha peaks. Sill and Williams
(1981) have prepared actinides, with the exception of uranium, on a 25 mm membrane filter
(0.1µm porosity) with 50 µg of a strongly alkaline solution of EDTA. Resolutions near 70 keV
were typical for this microprecitate mass.
15.4.3.3 Detector Calibration
Calibration sources may be prepared by either electrodeposition or coprecipitation. These sources
can be prepared by the laboratory or purchased from commercial sources. Because of their
durability and stability, electrodeposited calibration sources are often chosen. However, more
recent radioanlytical methods are preparing calibration and test sources using coprecipitation that
involves microgram quantities of BaSO4, NdF3, CeF3, etc. Refer to Chapter 14 for electrodeposi-
tion and coprecipitation methods. It is important that the area of deposition be consistent with
that of test sources to be counted and that there are no significant impurities present (ASTM
D3084). See additional discussion on alpha spectrometer calibrations in Section 16.3.2.
Semiconductor detectors used for alpha spectrometry require both efficiency and energy calibra-
tions. Calibration sources, traceable to NIST, often are prepared with multiple radionuclides so
they may be used for both types of calibration (ASTM D3084). Sources containing 234U, 238U,

Quantification of Radionuclides
15-34
MARLAP JULY 2004
239Pu, and 241Am have been used for this purpose. When mixed-nuclide calibration sources are
used, the average counting efficiency is often calculated using the efficiencies of the individual
radionuclides. Some alpha spectrometry analysis programs calculate an average efficiency where
the individual radionuclide efficiency is weighted by the uncertainty in its determination. Other
radionuclide combinations may be used, but in addition to the requirement for traceability for the
disintegration value, the energies of the radionuclides should be known with a high degree of
certainty. In selecting an appropriate mixture of radionuclides, one should consider energy range,
peak overlap, unresolved secondary alpha peaks, alpha emission abundance, ingrowth of decay
progeny, useful life of the source (decay), potential for detector contamination (210Po volatility),
nuclide availability, and practicality of preparing the multi-nuclide source.
Calibration or QC sources having volatile radionuclides or extremely high activities should be
avoided or their use minimized to prevent contamination.
15.4.3.4 Troubleshooting
A number of factors can influence alpha spectrometry results or cause a detector to malfunction.
These include a poor detector chamber vacuum, attenuation or self absorption, detector con-
tamination, and other radionuclide interferences. Attenuation or self-absorption corrections need
not be made if constant massless test sources are used for test and calibration source counting. If
constant mass cannot be maintained, then spectral degradation adjustments (increase or decrease
region-of interest window size) and/or corrections (subtraction of counts from interfering peak)
may have to be made in order to produce accurate results. When there is a single peak, or when
peaks are well-separated, the region-of interest window size may be increased in order to
integrate the entire peak. When peaks begin to overlap because of the degradation in resolution,
the region-of interest window for the upper energy peak may be decreased, but the detector
efficiency factor must be adjusted accordingly. The spectral interference in the lower energy peak
from the widened upper peak must be estimated and removed. These actions generally will
increase the relative uncertainty of the analysis.
Some commercially available alpha spectrometry systems have detailed troubleshooting
protocols that cover resolution and vacuum leakage problems based on monitoring the leakage
current and vacuum during operation. A resolution problem generated by excessive electronic
noise can be evaluated by comparing a newly acquired resolution of a pulser peak to the
manufacturer’s detector specification. A sudden increase in the leakage current of a detector also
indicates a problem. An increase in the air pressure in the detector chamber from a defective
gasket seal may be sufficient to degrade a spectrum.
Microprecipitation of CeF3 and NdF3 require the precipitation in an excess of hydrofluoric acid
(HF). In order to prevent damage to a solid-state detector, it is important that all traces of HF be
neutralized or removed from the test source before the test source is inserted into the alpha

Quantification of Radionuclides
15-35
JULY 2004 MARLAP
detector chamber. Removal of residual HF involves multiple washes of the microprecipitate after
filtration. In addition, a NH4OH chamber has been used to neutralize residual HF on test sources.
If left unchecked, the HF damage is typically progressive over time.
Individual electrical line conditioners or uninterruptible power supplies as well as supplemental
air conditioning can be provided in the counting rooms to maintain electrical and environmental
stability. Additionally, humidity control is recommended by the detector manufacturers and can
be provided easily in most environments. Temperature and humidity may be recorded with a
chart recorder.
Detector contamination can also be a problem in some cases and, therefore, detector backgrounds
should be checked periodically. Contaminated detectors will have higher background counts.
Even when test-source spectra are corrected for the presence of contamination, the higher back-
ground results in higher minimum detectable amounts (MDAs). The next section covers detector
contamination in detail.
15.4.3.5 Detector or Detector Chamber Contamination
Detector contamination can be a problem, so detector backgrounds should be checked after
receipt of the detector from the manufacturer and periodically thereafter (see Section 18.5.6,
“Summary Guidance on Instrument Calibration, Background, and Quality Control). Detector
contamination may occur quickly or may be a gradual process related to the number of sources
analyzed. Even when source spectra are corrected for the presence of contamination, the higher
peak background results in a higher minimum detectable activity.
After manufacture, the background for semiconductor alpha detectors is very low, typically
ranging from 8 to 17 counts per day (1×10⁻⁴ to 2×10⁻⁴ cps) over a 3 to 8 MeV energy range. The
detector background may increase after use because of contamination principally from two
mechanisms: atom recoil or volatilization of atoms on the test or calibration sources counted in a
near vacuum. Recoil contamination takes place when fragments from the test or calibration
source travels to the detector and are implanted in the detector surface by the recoil energy
imparted to the nucleus of an alpha-emitting atom. The energy of the fragments may be sufficient
to implant them in the detector so that they cannot be removed nondestructively. The recoil
fragment of the primary alpha-emitting nuclide may be a single decay product or a string of
progeny decay products. Since the specific activity is inversely proportional to the half-life for a
fixed number of atoms, recoil will produce the most background activity when relatively short-
lived progenies are produced. However, if the half-lives in question are very short (up to a few
hours), they will decay away quickly enough to be of little concern in alpha spectrometry.
Particularly serious are those cases that involve transfer of recoil progeny with half-lives from
days to weeks, short enough that a reasonable amount of parent activity will produce a significant
amount of recoil contamination and long enough that decay back to normal background levels
will require an inappropriately long time. In addition, the effect is chronic: similar recoil-

Quantification of Radionuclides
15-36
MARLAP JULY 2004
producing test sources counted in the same chamber will produce a long-term build-up of
detector background which could eventually become serious.
Some common examples of decay-chains that produce recoil contamination include 228Th, 229Th,
and 226Ra. It is important to realize that even beta-emitting nuclides ejected by alpha recoil can
contribute to alpha background if they subsequently decay to alpha emitters. For example, the
direct progeny of 229Th is 225Ra which decays by beta emission to the alpha producing progeny
225Ac.
The degree and rate of contamination from recoil atoms will vary according to the activity of the
source, source-to-detector distance and the frequency of source measurement. The closer the
source is to the detector, the more likely contamination will occur. It is strongly recommended
that energy and efficiency calibration sources have nuclides that are different from the nuclides
measured in the test sources. If this is unavoidable, limit the frequency of usage and the counting
time to reduce detector contamination from the calibration sources.
Sill and Olson (1970) minimized the contamination caused by recoil by operating a chamber at a
lower pressure equivalent to a 12 µg/cm2 absorber between the test source and detector and
applying a low differential voltage (6 V DC) between the test-source mount and the detector. The
authors reported a 1,000-fold reduction in contamination with only a decrease in resolution of
1–2 keV. Burnett (1994) has provided detailed information on maintaining low detector
backgrounds for alpha spectrometry systems, including the optimum air pressure needed to
maintain a 12 or 16 µg/cm2 absorber for various source-to-detector distances. Manufacturers
have incorporated these concepts into commercially available detector chamber systems.
Contamination of detectors by polonium isotopes, such as 210Po (t½ . 138.4 d), may occur by
some other process than alpha recoil. Note that 210Po, the last radioactive member of the 238U
decay series, is the daughter of 210Bi, a beta-emitter. The transfer of polonium from a source to a
silicon detector has been attributed to “aggregate” recoil and inherent “volatilization” of
polonium at low pressure. Whatever the actual mechanism, it is clear that polonium activity is
indeed transferred to detectors. Detector contamination by volatilization is a very serious
problem with long-lived 210Po and even worse when working with 209Po (t½ . 102 y) as a yield
tracer. In order to reduce detector contamination, calibration or QC sources having volatile
radionuclides should be avoided or their use minimized when possible.
Manufacturers warn that nonruggedized surface-barrier detectors cannot be cleaned to remove
contamination. However, manufacturers have produced certain types of detectors that may be
decontaminated. These include the ruggedized detectors and detectors that have ion-implanted
contact immediately under the silicon surface. Swabbing the surface with a cotton swab wetted
with a chemical cleaning agent followed by blow drying with clean nitrogen gas is the recom-
mended cleaning process for these detectors. A detector chamber may be cleaned by the same
process.

Quantification of Radionuclides
15-37
JULY 2004 MARLAP
15.4.3.6 Degraded Spectrum
A spectrum is considered degraded when the peak resolution has deteriorated from the ideal or
desired resolution to the extent that nuclide qualification or quantification difficulties arise. For
most analytical methods, a peak resolution of 20 to 70 keV is attainable for electrodeposited
sources and microprecipitated mounts. A degraded spectrum may be related to several causes that
include: a detector or electronic component problem, accumulation of dirt or film on the detector
surface, a poor or degraded calibration- or test-source mount, an excess amount of material on
the test or calibration source or a degraded vacuum from a detector chamber leak.
Electronic noise in a spectrometry system, depending on its severity, may lead to poorer
resolution and a broadening of alpha peaks. The noisy component (preamplifier, amplifier, bias
supply, etc.) of a system may be identified using a pulser, an oscilloscope, or a component
replacement process. Detector manufacturers recommend the identification of a noise generated
resolution problem by comparing a newly acquired resolution of a pulser peak to the
manufacturer’s detector specification.
Contamination of a detector surface from dirt or oils from the hand, etc., can lead to the
degradation of a spectrum. The severity of the degradation will depend on the extent of the areal
contamination and depth of the material.
An air leak from a defective detector chamber gasket seal can increase the detector air pressure
sufficiently to degrade a spectrum. However, the air pressure in the chamber usually has to
exceed 1 mm Hg before spectral degradation occurs.
Probably the most prevalent cause of a degraded spectrum is from an undesired excess of
material that has been electroplated or microprecitated on a calibration- or test-source mount. As
the thickness of the test source increases, the alpha spectral energy is degraded because of a self-
absorption, which broadens the peak and forms a tail on the lower-energy side. This broadening
results in poor resolution and difficulties in resolving peaks in a spectrum. The resolution needed
for a given analysis depends on the number and closeness of the alpha peaks expected in the
spectrum. In most cases, multiple alpha emitting isotopes or nuclides are electroplated or
coprecipitated on the same counting mount. For these cases, a better resolution is needed
compared to a simple one peak spectrum. For most microprecipitate/coprecipitate mounting
methods, a final mass less than 130 µg is typical. An additional 60–100 µg of material on a
mount can degrade an alpha spectrum to the point where peak interference corrections may be
necessary depending on the closeness of the peaks. Most laboratories will develop test-source
spectrum resolution cutoff values above which a test-source mount will be reprocessed or the
sample re-analyzed. It should be remembered that the observed resolution for a spectrum may
vary according to the nuclide’s alpha emission decay scheme (e.g., the uranium isotopes have
multiple alpha emissions that are very close in energies).

Quantification of Radionuclides
15-38
MARLAP JULY 2004
Some improvement in the peak resolution will be observed if the source-to-detector distance is
increased. However, this results in a lower counting efficiency and, thus, longer counting times to
meet a desired detection level.
15.4.4 Fluorescent Detectors
In a scintillation counter, the alpha particle transfers its energy to a scintillator such as zinc
sulfide (silver activated). The energy transfer to the scintillator results in the production of light
at a wavelength characteristic to the scintillator, and with an intensity proportional to the energy
imparted from the alpha particle. In the alpha counter, the scintillator medium is placed in close
proximity to the cathode of a photomultiplier tube (PMT) where light photons from the scintilla-
tor strike its photocathode, and electrons are emitted. The photoelectrons are passed through a
series of dynodes resulting in the multiplication of electrons at each stage of the PMT. After
amplification, a typical scintillation event will give rise to 107 to 1010 electrons, which is
sufficient to serve as a signal charge for the scintillation event. The electrons are collected across
an RC circuit, which results in a change in potential across a capacitor, thus giving rise to a pulse
used as the electronic signal of the initial scintillation event.
The alpha counter size is typically limited by the PMT size, with the most common having a
diameter of 51 mm. Two types of systems may be employed. In the first, the phosphor is optical-
ly coupled to the PMT and is either covered with a thin (<1 mg/cm2) opaque window or enclosed
in a light-proof sample changer. With the test source placed as close as possible to the scintilla-
tor, efficiencies approaching 40 percent may be obtained. The second system employs a bare
PMT housed in a light-proof assembly. The test source is mounted in contact with a disposable
zinc sulfide disk and placed on the PMT for counting. This system gives efficiencies approaching
50 percent, is associated with a slightly lower background, and less chance of counter
contamination.
Other than for analyzing 226Ra, alpha-scintillator detectors have a limited application and are not
used routinely in most radioanalytical laboratories. However, a major advantage of alpha
scintillation counting is that the test source or mount need not be conducting. However, they are
used extensively in remote laboratory locations for health physics applications that involve the
measurement of alpha activity on air particulate filters and swipes. Commercially manufactured
portable survey detector counting systems are available for these applications.
15.4.4.1 Zinc Sulfide
Silver-activated zinc sulphide is the most commonly used inorganic scintillator for alpha-particle
counting. ZnS(Ag) has a wavelength of the maximum photon emission of 450 nm and a decay
constant of 0.25 µs (Knoll, 1979). For practical purposes, the preamplifier/amplifier time
constants should expect a pulse duration of 10 µs (Watt and Ramsden, 1964). Compared to other
inorganic scintillators such as NaI(Tl), ZnS(Ag) has a very high scintillation efficiency.

Quantification of Radionuclides
15-39
JULY 2004 MARLAP
ZnS is available only as a polycrystalline powder, which limits its application to various detector
configurations. In addition, light transmission through thicknesses of 25 mg/cm2 thickness
becomes limited because of the opacity of the multicrystalline layer to its own luminescence
(Knoll, 1979).
DETECTOR REQUIREMENTS AND CHARACTERISTICS
An alpha counting system consists of a ZnS(Ag)-phosphor transparent screen and a PMT housed
in a light-tight housing coupled to a preamplifier/amplifier/scaler counter. As a precaution, the
housing for the PMT should be made with a voltage cutoff switch to remove the high voltage
from the PMT when the housing is opened. It is desirable to have a separate screen coated with
the ZnS(Ag) rather than coating the PMT with the phosphor. The glass on the PMT has inherent
naturally occurring nuclides that may increase the background by as much as a factor of two.
Laboratories can fabricate their own detector screens by spraying the ZnS(Ag) phosphor as a
pigment onto one side of a Mylar™ film (HASL 300, DOE 1997). ZnS(Ag) may be obtained as a
Sylvania Type 130® or Dupont 1101® phosphor. Different batches of ZnS(Ag) may vary in
characteristics and inherent background. As such, it is recommended that each batch be tested
before use. A thin (clear) Persex® sheet material has been used in addition to the Mylar™. Other
techniques for fabricating ZnS(Ag) phosphor screen have been reported by Watt and Ramsden
(Watt and Ramsden, 1964).
Previously, phosphor screens were commercially available as discs (24, 49, or 51 mm diameter)
or 305 mm wide strips. However, because of the recent low demand for their use, the
commercially available source supply for the phosphor screens is limited (vendors can be found
by conducting an the Internet search for “ZnS scintillator screens”). ZnS(Ag) screens are
commercially available in 216×279 mm sheets and two sizes of discs (47 to 50.8 mm diameter
and 38 to 44 mm diameter).
The ZnS(Ag) thickness on the phosphor screen is typically between 8–16 mg/cm2. Thicknesses
greater than 10 mg/cm2 do not enhance the detection efficiency of the phosphor screen since the
alpha particles from most naturally occurring nuclides are absorbed in this thickness (Watt and
Ramsden, 1964). In addition, it is most desirable to limit the thickness of the phosphor screen in
order to reduce any inherent background from the ZnS(Ag).
In one application for alpha-gamma coincidence counting of the radium isotopes, a small amount
of ZnS(Ag) powder was added to a solution of suspended Ba(Ra)SO4, filtered (0.4 µm pore size),
and dried. The filter paper was mounted on a 25.4 mm diameter plastic mount, covered with a
thin clear Mylar™ sheet, and counted on a PMT. Maximum alpha particle detection efficiency
was obtained when the ZnS(Ag) to BaSO4 mass ratio was about 2.4 for a typical final counting
mass of about 64 mg, or about 13 mg/cm2 (McCurdy and Mellor, 1981). This phosphor/test-
source configuration has the advantage of a nearly 4π geometry efficiency and a low background.

Quantification of Radionuclides
15-40
MARLAP JULY 2004
OPERATING VOLTAGE
The operating high voltage of the ZnS counting system varies according to the size and
characteristics of the PMT employed and the voltage discriminator setting of the scaler unit. The
operating voltage is determined by developing a voltage versus count rate curve for a calibrated
source. Similar to a gas proportional counter, a voltage plateau will be observed after a certain
applied voltage. A system having a 89 mm (3.5 inch) diameter PM tube and a plateau length of
200 V DC was reported having a 2–3 percent slope per 100 V DC (PHS, 1967b). The operating
voltage is selected at stable point above the knee of the voltage plateau. The voltage plateau will
vary according to the PMT size. However, most PMTs for this application will be operated below
2,000 V DC.
SHIELDING
A ZnS(Ag) alpha detection system is normally constructed and operated without shielding from
cosmic or terrestrial radiations. The lack of a shielding requirement simplifies the fabrication of a
light-tight PMT housing and the cost of the system.
BACKGROUND
In general, the background of an unshielded ZnS(Ag) detector counting system is quite low. For
an unshielded thin layer of ZnS(Ag) on a thin plastic disc responding to an energy range of 0.1 to
6 MeV, the background is between one and a few counts per minute. For a 51 mm PMT with the
phosphor coupled to the tube, typical background values of 0.006 cps may be obtained. With a
disposable phosphor mounted on the test source, a background count rate of 0.003 cps can be
obtained.
15.4.4.2 Calibration- and Test-Source Preparation
A source mount shaped like a washer, with one side enclosed with a transparent ZnS(Ag) screen,
is an arrangement often used. The test source to be counted is placed in the hole of the “washer,”
in contact with the ZnS(Ag) screen. The other side of the test-source mount is sealed, generally
with wide transparent tape, securing the test source within the source mount. The test source is
then placed on an appropriately sized PMT and counted. Because of the availability of large
PMTs, sources up to 5 inches (12.5 cm) in diameter can be prepared for measurement (PHS,
1967a). Thin and thick test sources may be analyzed with a phosphor screen scintillation counter.
Infinitely thick test sources have been analyzed for 226Ra and decay products by a scintillation
counter (NCRP, 1978). A filter or planchet mount may be used for radiochemical methods that
use coprecipitation or precipitation as the final product, e.g., radium isotopes with BaSO4.
Because the alpha particle emitted from a source interacts with the phosphor screen, as it does
with an internal proportional counter, the description concerning self-absorption and scatter of
alpha particles during analysis in a proportional counter (see Section 15.4.2.2 on page 15-25)

Quantification of Radionuclides
15-41
JULY 2004 MARLAP
may be applied to counting source mounts with a ZnS(Ag) scintillation counter. Additional
advantages of this counting arrangement are the very low backgrounds that are achievable and
the small potential for permanently contaminating the counter, because the zinc sulfide screens
can be replaced.
A test source may be prepared by mixing ZnS(Ag) with a precipitate containing the alpha-
emitting nuclide. In an application for isotopic radium analysis (McCurdy and Mellor, 1981), a
test-source mount was prepared by sandwiching a mixture of Ba(Ra)SO4 precipitate and ZnS(Ag)
on a filter paper between two Mylar™ sheets on a Spex™ counting mount. The counting mount
was placed on a small PMT and count for alpha activity. This phosphor-test-source configuration
can result in almost 100 percent counting efficiency if the precipitate and phosphor mass ratio is
properly maintained, and the total test-source mass kept below about 15 mg/cm2.
15.4.4.3 Detector Calibration
A ZnS(Ag) alpha detection system may have an efficiency for an electrodeposited calibration
source of 45 to 50 percent. The considerations related to calibrations discussed for proportional
counters (Section 15.4.2.3) apply equally to a scintillation counter calibration. A basic difference
between alpha particle scintillation counting and GP counting is the final calibration/test-source
mounting scheme. In order to take advantage of the high efficiency of detection, the source
mount should be placed against the ZnS(Ag) screen and coupled to the PMT. Only certain
mounting schemes permit such source mount configurations. A source/phosphor screen adhered
to or inserted into metal planchet typically used for GP counting can be also be used.
15.4.4.4 Troubleshooting
Since the alpha scintillation counting system is relatively simple, problems related to the
electronic components are easily evaluated with an oscilloscope. Lack of signal may be from a
PM tube failure, loss of detector bias voltage, or a malfunction of a preamplifier or amplifier.
Care should be taken to ensure that the PM tube is protected from physical abuse or exposure to
the light while operating. Most scintillation counting systems will have an electrical interlock on
the detector bias supply that will be activated (removes bias from the detector) when the light-
tight PMT housing is opened or removed.
Problems encountered with the preparation of calibration and test sources for alpha particle
scintillation counting are similar to those for gross alpha counting by gas proportional counters.
Nonuniformity of the phosphor on a scintillation screen as well as the possible variability in the
counting efficiency of the individual scintillator screens within a production batch may cause
variability in the test-source results.

Quantification of Radionuclides
15-42
MARLAP JULY 2004
15.4.5 Photon Electron Rejecting Alpha Liquid Scintillation (PERALS®)
The PERALS spectrometry system combines liquid scintillation counting with pulse shape
discrimination to significantly reduce background counts from photo-electrons produced by
ambient background gamma rays and to eliminate interferences from beta emitters in the test-
source/scintillation cocktail. PERALS® is unique because of its specifically fabricated test-
source/detector geometry configuration that uses a silicone oil light-coupling fluid between the
PMT face and a test source (10 × 75 mm borosilicate glass culture tubes). McDowell (1992)
provides a complete description and some radioanalytical applications of the PERALS system. A
0.5 MeV beta particle and a 5 MeV alpha particle will produce approximately the same amount
of light in the scintillator and thus the same voltage pulse height. However, the alpha generated
voltage pulses decay much slower than a beta produced voltage pulse. This is because the alpha
particle energy deposition takes the fluor to a triplet excited state. Typically, beta particles
deposit energy such that the fluor only is excited to the singlet state, which undergoes rapid
decay. The de-excitation from triplet state takes about 35 ns. Thus, the beta and alpha pulses can
be differentiated. Once the PMT voltage pulses are amplified and shaped, the decay of the light-
generated voltage pulse is evaluated, and an analog output pulse is generated that is proportional
to the decay of the light produced by the particle. Rejection of the beta–gamma spectrum is
accomplished by setting a 10-turn-potentiometer pulse-shape discriminator (PSD) below the
alpha spectrum as acquired from the “pulse shape” spectra. In order to reject exceeding large
output voltage pulses, a voltage pileup rejection potentiometer is set. The output pulse is fed to a
MCA or an ADC/computer combination.
Many laboratories have had success using the PERALS counting system in conjunction with the
use of extractive scintillators cocktails that are readily available. Dacheux and Aupiais (1997)
presented an evaluation of the PERALS counting system in comparison to typical alpha spectro-
metry for 232Th, 234/238U, 237Np, 238/239Pu, 241/243Am and 244/248Cm in aqueous solutions. The authors
found that the PERALS extractive scintillator method equaled or bettered detection limits for the
nuclides evaluated compared to alpha spectrometric methods.
15.4.5.1 Detector Requirements and Characteristics
PERALS can be a stand-alone unit or mounted into a triple width standard nuclear instrumenta-
tion module (NIM). The unit requires an external or optional internal DC power supply (~ mA)
for operation with a photomultiplier tube. PERALS also requires an external multichannel
analyzer (MCA) or an ADC with computer combination. The PERALS output is connected to the
MCA or ADC for spectrometry applications. The unipolor output pulse is less than + 10 V
(adjustable) and has a dwell time of 1.5 µs. Typical alpha peak resolution typically is less than
300 keV (FWHM) or about 5 percent when used in conjunction with extractive scintillators
formulated for a number of radionuclides of interest. Dewberry (1997) has reported a PERALS
system FWHM resolution of 130 keV for uranium analyses using URAEX® extractive
scintillator.

Quantification of Radionuclides
* 2-(4'-biphenylyl) 6-phenylbenzoxazole
15-43
JULY 2004 MARLAP
OPERATING VOLTAGE
The PERALS NIM module has an optional internal high-voltage power supply that provides bias
to the detector. The operating voltage is normally +500 V DC. An external power supply may be
used if the power supply can provide 1 mA at the required +500 V DC. Circuitry is provided for
both internal and external bias supply options to disable the high voltage from the PMT when the
sample chamber is opened.
SHIELDING
As with other alpha particle detectors, there is no need for substantial shielding from cosmic and
terrestrial radiations. The PERALS® unit mounts in a standard unshielded NIM or an aluminum
case. However, the manufacturer uses “mu-metal” (Ni-Fe-Mo alloy) to shield the PMT from
external magnetic interference.
BACKGROUND
The PERALS unit exhibits excellent detector background characteristics. Normally, the detector
background of a scintillator for the 4.0 to 7.0 MeV energy range is about 0.00002 cps (0.001
cpm) with high purity extractive scintillators without reagents. For the same energy range, a
reagent background is about a factor of ten higher.
As a result of the low background achieved and a detection efficiency near 100 percent, the
figure of merit (efficiency2/background) and minimum detectable activity are better for the
PERALS system compared to other types of alpha particle counting units. Typical detection
limits for the alpha emitters may range from 0.0005–0.024 Bq/L depending on the sample
volume, interferences and counting time of the test source.
DARK ADAPTATION OF SOURCES
Test sources prepared in a recommended extractive scintillator and counted in a PERALS system
do not have to be dark adapted prior to the measurements. The liquid scintillation cocktail
selected by the manufacturer, (e.g., PBBO* scintillator in toluene) does not have the normal light
sensitivity/luminescence characteristics found in other cocktails used by a typical liquid
scintillation counting system.
CHANNEL OVERLAP
In a typical commercial liquid scintillation counting system that distinguishes between alpha and

Quantification of Radionuclides
15-44
MARLAP JULY 2004
beta particle interactions in a cocktail by voltage pulse height, there may be alpha pulses regis-
tered as beta pulses and vise versa. This false registration of the alpha or beta pulses is known as
“crosstalk.” Normally, crosstalk becomes more severe as the level of quenching of the test-source
increases (see Section 15.4.5.4, “Quench”). As a result of the photon-electron rejection circuitry,
voltage pulses from beta particles and photon-generated electrons are not registered (less than 0.1
percent) and cannot overlap into the alpha pulse region.
15.4.5.2 Calibration- and Test-Source Preparation
Some actinides (U and Th) and transuranics (Np, Pu, Am, and Cm) have been measured by a
procedure that involves extraction scintillation techniques (Passo and Cook, 1994). An extraction
agent, e.g., bis(2-ethylhexyl) phosphoric acid (HDEHP), is mixed either with a toluene or a di-
isopropylnaphthalene (DIN) based cocktail. The alpha emitting nuclide in an aqueous sample is
extracted into an organic extractant–scintillator mixture and counted by the PERALS system.
A manufacturer has combined an organic extractant with a scintillator to produce six cocktails
that can be used for a variety of alpha emitting nuclides and counted by a liquid scintillation
counter, preferably the PERALS. A specific method for uranium in drinking water using an
extractive scintillator and the PERALS system has undergone an interlaboratory comparison
study that has been published by ASTM as D6239. The PERALS system had sufficient spectral
resolution to resolve the alpha peaks of 234U and 238U and to estimate the 234U : 238U activity ratio.
In addition, a 232U yield tracer may be resolved. Duffey et al. (1997) have published a detailed
method for the analysis of uranium in drinking water using the PERALS system that includes the
results of the ASTM method.
Dacheux and Aupiais (1997), in their evaluation of the PERALS® counting system in comparison
to typical radiochemistry: alpha spectrometry for 232Th, 234,/238U, 237Np, 238, 239Pu, 241/243Am, and
244/248Cm in aqueous solutions used the extractive scintillators of ALPHAEX α
®, URAEX α
® and
THOREX α
®. The authors provide a sequential method of separating the thorium, uranium,
plutonium, americium, neptunium, and curium elements, including the oxidation-reduction steps
for proper elemental extraction into the extractive scintillators. A similar study for 239Pu in
aqueous solutions using ALPHAEX α and THOREX α was reported by Aupiais (1997). Using the
method described, a detection limit of 4.8×10⁻⁴ Bq/L was quoted for a 24 hour counting interval
and a 250 mL sample. Recommendations as to use of tracers for 232Th, 234/238U, 238,/239Pu and
244/248Cm are provided based on the ~ 300 keV alpha peak resolution of the instrument.
Escobar et al., has used the RADAEX α
® extractive scintillator cocktail for the analysis of 226Ra
in water samples by a typical (non-PERALS) LS counting system (Escobar et al., 1999) for
sample volumes greater than 19 mL. The authors followed the manufacturer’s recommendations
for sample preparation prior to extracting the radium into the extractive scintillator. Sample
dissolved radon interference, which is extracted with the radium, was eliminated by heating and

Quantification of Radionuclides
15-45
JULY 2004 MARLAP
stirring the samples for one hour at 60 EC. Accurate results were obtained for 226Ra concentra-
tions in the range of 0.38–2.36 Bq/L in the presence of 230Th and 210Po added interferences. A
detection limit of 0.024 Bq/L was quoted for a one liter sample and a 12,000 s counting time.
In addition to the use of PERALS® for the analysis of the long-lived alpha emitting radionuclides
in water, other reported applications include high-level waste samples (Dewberry et al., 1998)
and airborne uranium (Metzger et al., 1997). Additional references to radioanalytical methods
may be obtained from the manufacturer.
15.4.5.3 Detector Calibration
The settings and calibration of a PERALS unit are established by the manufacturer prior to
delivery. The calibration is performed using a 226Ra reference source (with cocktail) so that the 6
MeV 218Po alpha particle produces a 6 volt output pulse for input into an analog-to-digital
convertor/computer or multichannel analyzer. A detection efficiency of about 99 percent and a
FWHM resolution less than 300 keV can be obtained for most applications when calibrated. If a
tracer is to be used, the alpha energy of its emission should be sufficiently different from the
alpha energy of the nuclide of interest to prevent peak interferences requiring corrections, e.g.,
greater than 700 keV.
15.4.5.4 Quench
Two types of quenching may be encountered in liquid scintillation counting: chemical or color
quenching. Color quenching results in a reduction of the scintillation intensity (as seen by the
photomultiplier tubes) because of absorption of the fluor scintillation by colored materials
present in the cocktail. This results in fewer photons per quanta of particle energy reaching the
PMT and a reduction in counting efficiency. Chemical quenching results in a reduction in the
scintillation intensity because of the presence of materials in the scintillation solution that
interfere with the process leading to the production of light resulting in fewer photons per quanta
of particle energy and a reduction in counting efficiency.
In order to minimize the effects of oxygen quenching, the test-source/scintillation-cocktail
combination is sparged with toluene-saturated argon. The manufacturer has developed methods
or recommends methods that minimize color quenching of the test sources. The ferric ion is a
known color-quenching agent (also for the standard LSC and LS cocktails) that shifts the energy
spectrum to a lower energy. A yellow test-source color exhibits the most color quenching.
Removal of the Fe+3 ion or reducing it to Fe+2 (e.g., addition of ascorbic acid) prior to the addition
of the extractive scintillator to the sample is recommended. The Fe+2 ion is not extracted into the
extractive scintillator.
In order to determine the extent of any color quenching, a test-source spectrum should be com-
pared to a spectrum obtained from spiking the extractive scintillator with the nuclide of interest.

Quantification of Radionuclides
15-46
MARLAP JULY 2004
15.4.5.5 Available Cocktails
Currently, six proprietary extractive scintillators are available to the user for analyzing the more
important long-lived naturally occurring or manmade alpha emitting nuclides. The commercially
available extractive scintillators include: ALPHAEXα
®, POLEX α
®, RADAEX α
®, THOREX α
®,
and URAEX α
®. In addition to the above elements, the extractive scintillator RADON α
® also has
been developed for radon. The extractants used usually have distribution coefficients greater than
1,000. The quantitative recovery of a nuclide in a test solution will depend on both the distribu-
tion coefficient and the volume ratio of extractive scintillator to aqueous solution. The use and
selection of the extractive scintillator is based on the valence state of the nuclide in the test
solution. Controlled aqueous ionic phase conditions must be established to ensure maximum
nuclide extraction and unquenched counting conditions. These conditions vary considerably from
an acidic media, an acidic sulfate media, or a basic nitrate media.
15.4.5.6 Troubleshooting
The manufacturer has provided a troubleshooting section within the instrument instruction
manual that primarily deals with the electronic aspects and setup of the PERALS® spectrometer.
In addition, the manual contains several sections on sample preparation, radiochemical
procedures, alpha-emitting nuclide measurements, coincidence measurements and theory of
operation. Not all of the items discussed in Section 15.5.3.4 on liquid scintillation counting
troubleshooting apply to PERALS® because of its uniqueness (e.g., LS cocktail dark adaption).
However, certain aspects of LS sample quenching apply to both applications even though
sparging of the test-source/LS cocktail with toluene-saturated argon is unique to PERALS.
Specific information on troubleshooting of the procedures and instrumentation can be obtained
from the manufacturer.
15.5 Beta Detection Methods
15.5.1 Introduction
Radioactive decay by beta particle emission is generally accompanied by one or more gamma-ray
emissions; the latter normally is much easier to identify and quantify. Beta-particle counting
typically is more difficult, because of the additional source preparation and associated complica-
tions resulting from the effects of backscatter, scattering, and absorption in the source material
(NAS/NRC, 1962). Since beta particles are not emitted monoenergetically, there is additional
difficulty in obtaining quantitative measurements. Guidance on beta particle counting can be
found in industry standards (ASTM D1890; D3648; E1329) and publications (NCRP, 1978;
Knoll, 1989; Lapp and Andrews, 1964; Price, 1989; PHS, 1967a; Mann et al., 1991; Wang and
Willis, 1965; Watt and Ramsden,1964).

Quantification of Radionuclides
15-47
JULY 2004 MARLAP
Accurate beta-particle measurements will depend upon the degree and extent to which the
various parameters that affect the measurement process under considerations are evaluated. For
beta particle counting, the items that should be considered include:
• Beta-particle energy or energies, including conversion electrons;
• Radiation detector characteristics;
• Material and geometry (including source-to-detector distance) of the final source mount;
• Form and thickness of final source for analysis; and
• Radionuclide purity of final source.
For certain beta-detection methods, beta-particle attenuation in the air/detector window, self
absorption and backscatter corrections to the detector efficiency may be necessary depending on
the beta-particle energy, detection system and final source form. Various beta-detection systems,
such as liquid scintillation, have been developed to minimize the need for such corrections but
these systems may have characteristics that require other type of detector efficiency corrections,
e.g., color or chemical quenching. The potential of detector contamination from test-source
measurements is a function of the type of detector used and the stability of the final test-source
composition. The inherent beta-particle background of the various detection systems should be
evaluated and its contribution removed from the test-source measurement result. Many of these
items are discussed in Sections 15.2 and 15.3 on the preparation of sources.
The radiation detectors used for beta-particle measurements include an end window Geiger-
Mueller tube, gas proportional chamber, liquid scintillation counter, plastic scintillators, and
solid-state detectors. Each of these detectors is discussed in subsequent subsections. The end
window Geiger-Mueller tube, plastic scintillators, and solid-state detectors have limited
laboratory applications for beta-particle detection. Since the end-window Geiger-Mueller tube
and gas proportional counters have similar characteristics and operational requirements, these
two beta-particle detectors are discussed in the same subsection.
“Gross” beta counting of evaporated samples, wherein a multitude of beta-emitting radionuclides
may exist, is typically used for screening of water samples. The application of such methods may
be targeted for a specific radionuclide or a category of radionuclides, such as the naturally
occurring nuclides or a specific radionuclide in a facility effluent. However, extreme caution
should be applied to the interpretation and use of such results without a full specific radionuclide
characterization of the water source under investigation. This type of analysis is to be considered
“gross” and, in most cases and for a variety of sound technical reasons, the gross measurement
result does not equal the sum of the radionuclides contained in the sample.
When specific radiochemistry is performed the beta-emitting radionuclide of interest will be
isolated, concentrated and converted to a desired final chemical and physical form. Under these
circumstances, the beta detection system should be calibrated for the radionuclide, chemical
composition of the final test-source form and the range of final test-source masses expected from
Quantification of Radionuclides
15-48
MARLAP JULY 2004
chemical recovery.
The beta particle measurement system should be calibrated with standards traceable to a national
standards body such as NIST and its subsequent performance held to established measurement
quality requirements through the use of instrument QC checks (Section 18.5.6, “Summary
Guidance on Instrument Calibration, Background, and Quality Control”). In addition, appropriate
instrument QC should be established for background, voltage plateau, quenching, resolution, and
alpha-beta crosstalk (Section 18.5.4.2, “Self-Absorption, Backscatter, and Crosstalk”).
Certain aqueous beta-emitting radionuclide calibration standards and sources are available from
NIST or from a radioactive source manufacturer (complies with ANSI N42.22) that supplies
NIST-traceable standards. The long-lived pure beta-emitting radionuclides available from NIST
include: 3H, 14C, 63Ni, 129I, 89Sr, 90Sr, 99Tc, 228Ra, and 241Pu. The majority of the gamma-emitting
radionuclides also emit beta particles in the nuclear transformation process. Refer to Table 15.4
for the availability of known beta-emitting radionuclides. Contact a radioactive source
manufacturer that supplies NIST-traceable standards for the availability of other pure beta or
beta/gamma-emitting radionuclides (ANSI N42.15).
TABLE 15.4 — Nuclides for beta calibration
Purpose Nuclide Reference
Specific Nuclide
Analyses
3H, 14C, 63Ni, 89Sr, 90Sr (also 90Y), 99Tc,
129I, 131I, 228Ra (also 228Ac), and 241Pu Various Methods
Gross Beta 137Cs ASTM D3648
Gross Beta 137Cs EPA, 1980
Gross Beta 137Cs ASTM D1890
Gross Beta 137Cs and 90Sr/Y APHA (1998), Method 7110
Beta detectors should be calibrated according to their intended use, i.e., nuclide specific or gross
beta measurement applications. An example of detector calibration for the specific radionuclide
of 90Sr can be found in ASTM D5811. Gross beta measurements, as the name implies, are non-
specific to a given beta-emitting nuclide and typically require no chemical separations or purifi-
cation steps. The most common applications for gross beta measures are health physics swipes
for contamination surveys, air particulate filter papers from air monitoring programs, and
evaporated surface or ground water onto a metal planchet. For gross beta-particle measurements,
the instrument’s calibration is related to a reference nuclide, typically one that is specified by a
laboratory client, measurement quality objectives, or by regulatory requirements. Typical beta-
emitting reference nuclides for gross beta analyses include 137Cs, 90Sr/Y, 99Tc, or 40K. Table 15.4
lists beta emitting calibration standards for beta analysis referenced in various national standards.
Aqueous radioactive standards can be prepared in the appropriate geometry for LS or Cerenkov
counting or through chemical processing, precipitated, electroplated, or evaporated as a final test-

Quantification of Radionuclides
15-49
JULY 2004 MARLAP
source form for counting by a GP, plastic, or solid-state beta-detection system.
15.5.2 Gas Proportional Counting/Geiger-Mueller Tube Counting
The end-window Geiger-Mueller (GM) tube and the GP counting chamber are the two most
prevalent types of detectors used for field and laboratory beta particle counting applications.
However, because of its dual use for alpha and beta particle counting, the GP (chamber) counter
is used almost exclusively by radioanalytical laboratories. The end-window GM tube counter
cannot differentiate between alpha and beta particles because of its operating characteristics. In
other words, the total number of ion pairs produced to generate a voltage pulse is independent of
the primary ionization (alpha or beta particle interaction), which initiated the detection event. The
end-window GM counter is typically used with a survey meter for field or laboratory applications
such as the beta measurements of surface contamination, health physics swipes, air filters and
soil measurements. Several types of commercially available GP counters are described in Section
15.4.2, on page 15-20.
15.5.2.1 Detector Requirements and Characteristics
Beta particles entering the sensitive region of the detector produce ionization that is converted
into an electrical pulse suitable for counting. The number of pulses per unit time is directly
related to the disintegration rate of the test source by an overall efficiency factor. This factor
combines the effects of test-source-to-detector geometry, test-source self-shielding, backscatter,
absorption in air and in the detector window (if any), and detector efficiency. Because most of
these individual components in the overall beta-particle detection efficiency factor vary with beta
energy, the situation can become complex when a mixture of beta emitters is present in the
sample. The overall detection efficiency factor may be empirically determined with prepared
standards of composition identical to those of the test-source specimen, or an arbitrary efficiency
factor can be defined in terms of a single calibration source, such as 137Cs or another nuclide.
Gross counts can provide only a very limited amount of information and therefore should be used
only for screening purposes or to indicate trends.
For both window-type gas proportional and end-window GM counters, the thickness of the
detector window should be selected to reduce transmission losses from beta particle absorption in
the window. The severity of the beta absorption in the window is a function of beta-particle
energy and window material and thickness. Estimates of the transmission of beta particles
through GM tube walls and windows have been evaluated by Price (1964). These transmission
loss estimates are also applicable to the thickness of a window on a GP detector. For 14C with a
maximum beta energy of 154 keV, the transmission through a 4 and 0.9 mg/cm2 window
thickness would be approximately 35 and 79 percent, respectively. For the same window
thicknesses, the transmission of beta particles from 64Cu with a 580 keV Eβmax would be about 87
and 97 percent, respectively. Most commercially available gas proportional counters offer
detector windows that are thinner than 0.09 mg/cm2 (e.g., 0.08 mg/cm2).

Quantification of Radionuclides
15-50
MARLAP JULY 2004
Various GP counter characteristics, including detector size, counting gas, window thickness,
restrictions on size of test-source mounts, etc., are presented in Section 15.4.2.1. Typical values
for the important operational parameters for GP beta-particle counting are provided in Table
15.5.
TABLE 15.5 — Typical operational parameters for gas proportional beta counting
Background count rate 24–50 counts/hour ( 0.007 to 0.014 cps)
Length of voltage plateau 200 V DC using P-10 gas
Slope of voltage plateau for well-designed detector 2.5%/100 V DC for an electroplated source
#60% for an electroplated 90Sr/Y source
Windowless detector efficiency &100 ×count rate
αemission rate including backscatter
#45% for an electroplated 90Sr/Y source
including backscatter
At least one instrument manufacturer has engineered a windowless GP counter available as either
a sequential multiple sample (test source) GP counters and multiple detector single sample (test
source) GP counters. The units available typically have lower beta background and higher
detector efficiency specifications compared to the windowed GP counters.
SHIELDING
Most GP systems used for beta particle measurements have shielding to reduce the beta back-
ground count rate. Shielding reduces the beta background by absorbing some of the components
of cosmic radiation and radiations emitted from materials in the surroundings of the measure-
ment system. Ideally, the material used for the shielding should itself be free of any radioactive
material that might contribute to the background.
Commercially available low-background GP systems typically have 102 mm of lead surrounding
the test-source and cosmic-guard (anti-coincidence detection system) detectors. For a sequential
sample GP counting system, the lead shielding may weigh several hundred kilograms depending
on the shielding configuration. With the shielding included, a sequential sample GP counting
system may weigh up to 360 kg. Portable GP counting systems with less shielding are available
but their beta-particle backgrounds are higher.
BACKGROUND
The GP detector’s beta background is principally due to the secondary electrons generated from
the interaction of cosmic radiation and photon radiations emitted from materials in the
surroundings, including the detector shield and housing. Some contribution to the background
also may come from beta particles originating in the materials surrounding the detector that may
Windowed efficiency (0.5 mg/cm 2thickness) &100× count rate
αemission rate

Quantification of Radionuclides
15-51
JULY 2004 MARLAP
enter the sensitive volume of the detector.
Most of the commercial GP counting systems have passive detector shielding and active cosmic
guard (anti-coincidence counting detectors/circuits) components to reduce a detector’s beta
background. The efficiency of the cosmic guard to reject coincident high-energy cosmic radiation
is greater than 99 percent. The anti-coincidence detector surrounds, or is in close proximity to,
the primary counting chamber and detects interaction events that are caused by radiations from
cosmic rays and the inherent radioactivity in the building and surrounding materials. The anti-
coincidence circuitry prevents detector events from being registered that have occurred simul-
taneously in both the primary test-source-counting and coincidence-counting detectors. Without
shielding and anti-coincidence counting detector/circuitry, the background of a GP counter
operating at the beta plateau would be about 50 cpm.
The beta-particle background for a GP counting system will depend upon detector size. For some
commercial units with a 57.2 mm diameter detector and a 0.08 mg/cm2 window thickness using
P-10 gas, the beta-particle background count rate commonly is about 51 counts per hour (0.85
cpm). A background of 24 counts per hour (0.4 cpm) also may be obtained for some commercial
units. These background values apply to GP counting systems with passive lead shielding and
active cosmic guard background reduction components.
OPERATING VOLTAGE
The operating voltage of a GP counter used in the beta-particle counting mode depends on the
counting gas used, the amplifier and voltage discriminator settings, and the mode of beta-particle
discrimination, i.e., voltage pulse height discrimination or simultaneous alpha- and beta-particle
counting. A generic discussion on these parameters is provided on page 15-23 for GP counting
systems .
Prior to the operation of a gas proportional counter, the operating voltage of the detector must be
determined in conjunction with the other operating parameters. Normally, the manufacturer of
the unit recommends the voltage discriminator and amplifier gains settings. The user typically
places an electroplated beta source into the counting position and increases the detector bias
voltage in discrete 25 or 50 V DC increments while recording the observed source count rate at
each voltage setting. Figure 15.3 illustrates a typical voltage response curve for a commercial
window type gas proportional counter detector using P-10 counting gas and a massless 90Sr/Y
source (Canberra, 2002). The operating plateau for beta counting is between 1,400–1,600 V DC.
For most commercial GP units, the slope of this plateau should be # 2.5 percent per 100 volts
over a 200-volt range. When using the separate alpha plateau then beta (plus alpha) plateau
counting modes, the alpha count rate on the beta plateau must be determined at the alpha and
beta plateau voltages selected during calibration, (i.e., determining the ratio of the alpha-particle
count rate on the beta plateau to the alpha-particle count rate on the alpha plateau). For test-
source measurements, the observed beta-particle count rate must be adjusted for the alpha-
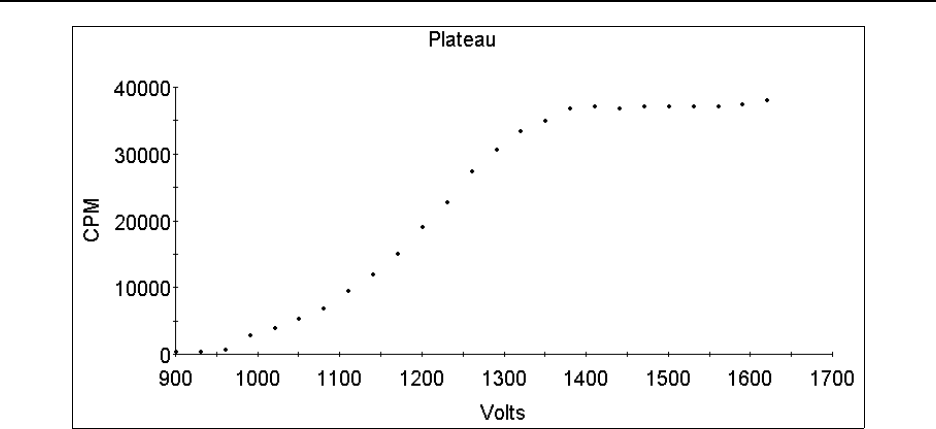
Quantification of Radionuclides
15-52
MARLAP JULY 2004
FIGURE 15.3 — Beta plateau generated by a 90Sr/Y source on a GP counter using
P-10 gas
particle count rate on the beta plateau by applying a correction factor using this ratio. The
observed increase in the alpha-particle count rate on the beta plateau varies according to the
alpha-emitting nuclide. The difference between the count rates on the two plateaus will be
accentuated for nuclides that have both alpha and photon emissions, e.g., 241Am.
For the simultaneous alpha and beta counting mode, the detector operating voltage is located on
the beta particle plateau. For this counting mode, the voltage discriminator setting for alpha
detection is set so that only a small fraction (less than 1.0 percent) of the alpha detection events
will be registered as beta detection events.
15.5.2.1.4 CROSSTALK — REGISTRATION OF ALPHA PULSES AS BETA PULSES
Modern proportional counters are capable of electronically discriminating between alpha and
beta interactions in the detector. As discussed on page 15-24, this differentiation is accomplished
by identifying the two types of particles based on the resultant voltage pulse heights from their
interactive events in the detector. Those pulses whose heights exceed an experimentally
established voltage (pulse) discriminator level are registered as alpha counts and those falling
below this level are recorded as beta counts. The dynamic range of the voltage separation
between the alpha and beta voltage pulses varies by detector design and manufacturer. If the
voltage discriminator is not properly set, a fraction of high-energy beta particles may be recorded
as alpha particles. In addition, severely degraded alpha particles, because of their self absorption
in a test source of significant masses, may be recorded as beta particles. This missclassification
of alpha and beta counts is referred to as “crosstalk.” The degree of spillover varies according to
detector design and GP counter manufacturer.

Quantification of Radionuclides
15-53
JULY 2004 MARLAP
For some commercial GP counters, crosstalk may occur for both modes of GP counting, i.e.,
alpha then beta plateau counting and simultaneous alpha and beta counting. For electroplated
beta particle sources, the crosstalk is minimum for both counting modes when the voltage (pulse)
discriminator is properly set. However, certain alpha emitting radionuclides 230Th, 235U, 238U,
241Am, 238Pu, 239Pu) have multiple low-energy conversion electron/photon emissions that may be
registered as beta particles. The user should review the decay scheme of the nuclide of interest to
gain a perspective on the extent of the possible alpha-to-beta crosstalk.
For both counting modes, corrections should be made to the beta count rate to remove the portion
contributed by alpha particles. Since the fraction of the alpha counts occurring in the beta channel
depends on the source mass, a crosstalk curve should be developed. This can be accomplished
concurrently with the self-absorption calibration for the alpha emitting radionuclide selected. A
crosstalk response curve is generated by recording the beta counts from the alpha self-absorption
determination at all source masses and plotting the crosstalk fraction (alpha-particle count rate in
beta channel/alpha count rate in alpha channel) as a function of source mass (Section17.4, “Data
Reduction on Non-Spectrometry Systems”). Beta-particle count rates then can be corrected for
the influence of the alpha particles at all source thicknesses.
15.5.2.2 Calibration- and Test-Source Preparation
For specific nuclide beta particle counting by a gas proportional counter, chemical separations
are typically performed to isolate the radionuclide of interest from other beta emitting radio-
nuclides. Beta measurements are performed on chemically isolated pure beta emitters (beta decay
not accompanied by a gamma-ray) and also in cases when better detection capabilities (increased
sensitivity) are required to meet detection limits, such as, 89Sr, 90Sr, 99Tc, 131I, 134Cs, and 137Cs
(EPA, 1980). Test sources measured in a proportional counter are usually prepared by electro-
deposition, coprecipitation, or evaporation (Blanchard et al., 1960). The comments on chemical
reactivity of source-contained materials and contamination given in Section 15.3 apply.
Test- and calibration-source preparation techniques and applications for GP counting are
presented in Section 15.3. These preparation techniques have been presented in a fairly generic
manner but with identification of the applications to alpha and beta counting. Refer to the section
for information on preparing test and calibration sources for beta particle radionuclides
applicable to gas proportional counting.
Preparation of beta calibration and test sources by precipitation/coprecipitation applicable to gas
proportional counting also is discussed in Section 15.3. The techniques include precipitation of
the radionuclide with the element of interest (e.g., Cu131I) and co-precipitation of a radionuclide
with a chemically similar element that forms a precipitate (e.g., NdF3 – 239Pu). Table 15.1 (page
15-12) provides a listing of the common precipitates and coprecipitates used for both beta- and
alpha-emitting radionuclides.

Quantification of Radionuclides
15-54
MARLAP JULY 2004
15.5.2.3 Detector Calibration
Calibrations for beta particle measurements can be accomplished for either the beta (plus alpha)
plateau counting mode or the simultaneous alpha and beta counting mode. However, for both
modes of operation, calibration sources should be prepared in a manner identical to the method
used for test-source mounting. This may include massless or electroplated sources, micro-
precipitated (less than 200 µg) sources and low-mass (1–125 mg) sources. For accurate results,
beta self-absorption curves (for both operating modes) and crosstalk corrections (simultaneous
counting mode) during the source calibration should be developed.
Beta-particle attenuation should be considered for windowed GP counting applications. Beta-
particle attenuation can result from the interaction of a beta particle with the air, detector
window, or the matrix atoms of the final test source. Beta-particle air attenuation is a function of
the distance between the test source (or sample) and the detector’s particle-entrance window.
Under most applications for beta-particle counting, this factor typically is insignificant compared
to the other sources of beta-particle attenuation. Consideration of the detector’s window thick-
ness and its beta-particle attenuation becomes important when evaluating low-energy beta
particles, such as 14C. Normally, the air and detector window attenuation factors are determined
as a combined beta attenuation-efficiency factor that includes the test-source self-absorption for a
given application. In most applications, a backscatter factor for the material composition (Z
value) of the final test-source mount is included into a combined attenuation-backscatter-
efficiency factor or—more simply—the combined detector efficiency correction factor.
Beta-particle counting systems should be calibrated with the specific radionuclide under investi-
gation or a surrogate radionuclide of similar beta energy having a comparable final test-source
composition and configuration. However, it should be mentioned that moderate to severe calibra-
tion biases may occur depending on the severity of the departure from the chemical composition
of the final test-source matrix and the beta energy of a surrogate. For this reason, using an
surrogate radionuclide is discouraged unless the availability of the radionuclide of interest is non-
existent. Corrections between the surrogate and radionuclide of interest should be determined
and applied to test-source results, as appropriate. For electroplated plated test sources, a
correction factor needs to be determined if the plating material of the surrogate is not the same as
that used for the test sources.
Certain aqueous beta-emitting radionuclide calibration standards and sources are available from
NIST or from a commercial radioactive source manufacturer that complies with ANSI N42.22.
Refer to Section 15.4 for the availability of known beta/gamma-emitting radionuclides. Contact a
radioactive source manufacturer for the availability of other NIST-traceable pure beta- or beta/
gamma-emitting radionuclides (ANSI N42.15).
The counting efficiency (ε) is determined by counting a calibration source to accumulate
sufficient net counts (approximately 10,000) to provide a relative (1σ) counting uncertainty of

Quantification of Radionuclides
15-55
JULY 2004 MARLAP
ε'Measured Net Count Rate (cps)
Bq× fractional βabundance
about 1 percent and dividing the resultant net count rate (cps) by the beta-emission rate of the
source (β/s). The beta emission rate is determined by the source activity (Bq) times the beta
abundance per disintegration.
For a nuclide specific or reference nuclide counting efficiency, the same equation is used but
without the beta abundance factor. The uncertainty of the detector efficiency factor can be
calculated using the methods described in Chapter 19.
For health physics swipes and air particulate filter samples, a calibration source is prepared by
spiking an unused filter with the appropriate calibration solution. For health physics swipes, the
entire surface of the filter may be spiked. However, only the active area of an air filter is spiked
with the calibration solution. The retainer ring and gasket holding down the filter determines the
active area to be spiked. Depending on the filter composition (e.g., glass fiber filter), the filter
matrix may cause some wicking of the solution away from the surface. In order to prevent the
wicking effect, the surface of the filter may be sprayed with an acrylic lacquer and dried prior to
spiking the surface.
Self-absorption of beta particles is not as pronounced as with alpha particles, because the charge
and mass of beta particles are significantly smaller. Scattering, and particularly backscatter from
the source mount, is much more pronounced for beta counting than for alpha counting
(Blanchard et al., 1957). To reduce scatter, plastic mountings are often used to mount sources for
beta counting (EPA, 1980). The effects resulting from self-absorption and scattering can be
minimized by preparing test sources in a standardized constant thickness, or using a correction
factor based on an empirical calibration curve for different thicknesses (Friedlander et al., 1981;
Tsoulfanidis, 1983). If test sources of varying mass are to be counted for beta activity determina-
tion, a self-absorption curve should be prepared. The method used is identical to that described
under alpha calibration for proportional counters, except that a beta-emitting reference material is
used.
Instrument calibration for a specific nuclide measurement should be calibrated with the radio-
nuclide of interest. In some cases, a radionuclide whose beta emission has the same energy as the
nuclide of interest may be used as long as the self-absorption characteristics are similar. An
example is the calibration of the GP counter for 228Ac (βavg = 404 keV) by using 89Sr (βavg = 589
keV) (EPA, 1980).
In cases where finite test-source thicknesses are unavoidable, beta-source measurements can be
adjusted to account for self-absorption (PHS, 1967a). Typical applications for such self-
absorption curves include SrCO3 (89Sr and 90Sr), Cu131I, and gross-beta analysis. In order to
determine the change in counting efficiency as a function of source thickness or mass, a self-
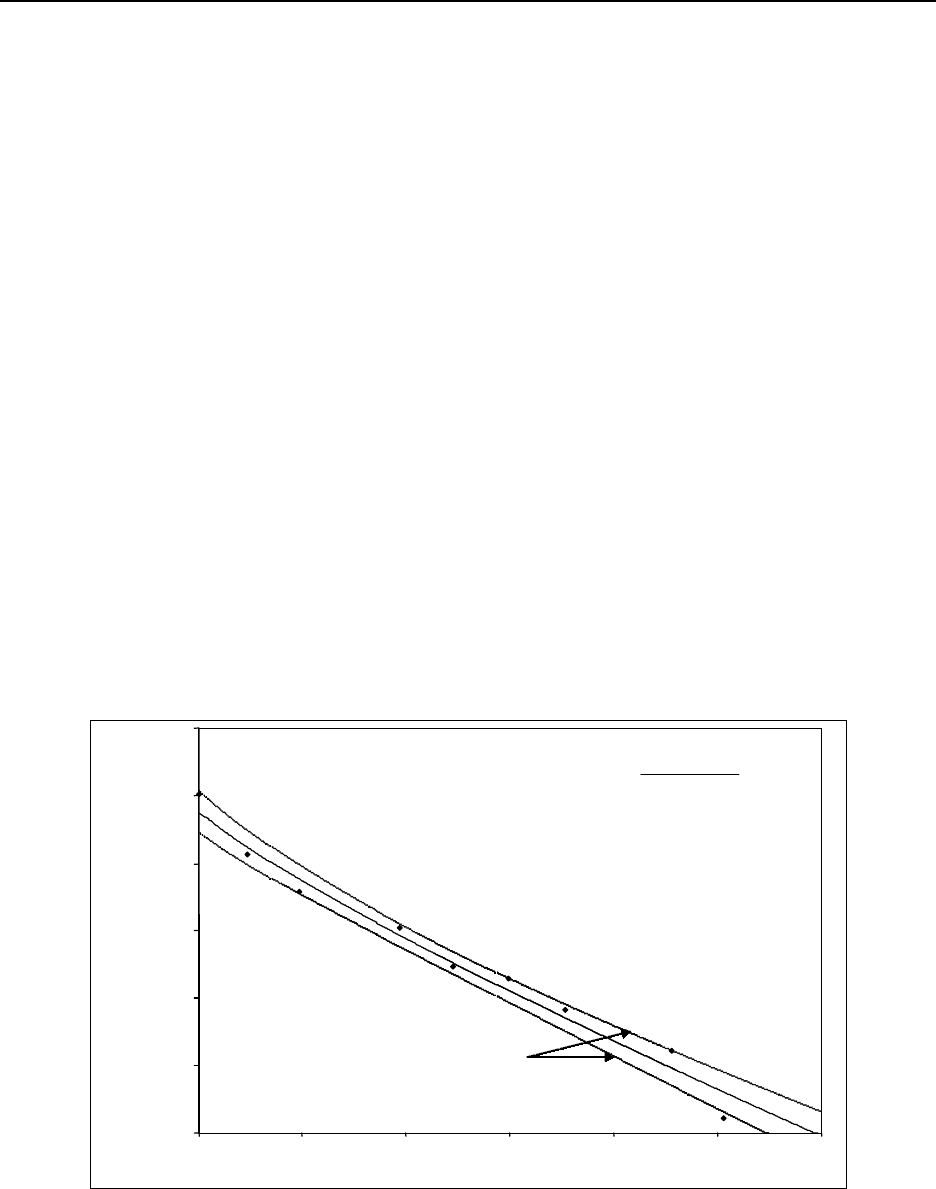
Quantification of Radionuclides
15-56
MARLAP JULY 2004
Fitted equation: y = 0.449 - 0.00237 x
0100 200 300
Precipitate Weight (mg)
0.325
0.350
0.375
0.400
0.425
0.450
0.475
Fractional Detection Efficiency
95% confidence limits
ln(x)
FIGURE 15.4 — Gas proportional counter self-absorption curve for 90Sr/Y
absorption curve should be developed. Calibration sources containing a known amount of the
radionuclide of interest are prepared in varying thicknesses (mass) and counted. Self-absorption
curves for gross beta-particle measurements are constructed most frequently using reference
material containing 137Cs, 90Sr/Y, 99Tc, or 40K. The self-absorption curve is constructed by
counting planchets containing varying mass of material but with a known amount (sometimes
constant) of added radioactivity. A discussion on the preparation of a self-absorption curve that
relates the self-absorption factor to a zero-thickness efficiency is discussed in Section 15.4.2.3,
“Detector Calibration.” Most radioanalytical laboratories generate a self-absorption curve by
determining the counting efficiency as a function of source mass in milligrams or mg/cm2
without normalization to the “zero thickness” efficiency. Test sources prepared for gross beta
measurement are counted in the exact geometry as those used to prepare the absorption curve.
The material forming the matrix for the self-absorption calibration source should, when possible,
be identical to that expected in the test sources to be analyzed. For the lower to intermediate beta
particle energies, the detector efficiency factor is a function of beta energy, final sample mass and
source composition. For beta particles having a maximum beta energies greater than 1,500 keV,
the detector efficiency factor is nearly constant over a final sample mass range of 0 to 5 mg/cm2.
For sufficiently thick sources, the number of beta particles interacting with the detector will reach
a limit and the count rate becomes independent of the source thickness.
Figure 15.4 illustrates a typical self-absorption curve for 90Sr/Y in a dry residue generated from
evaporated tap water. Note that this self-absorption curve is multi-component, where the
resulting curve is a composite of the self-absorption effects of the low-energy 90Sr (Eβmax = 546
keV) and the high-energy 90Y (Eβmax = 2.28 MeV).

Quantification of Radionuclides
15-57
JULY 2004 MARLAP
15.5.2.4. Troubleshooting
Various problems that may arise when counting calibration or test sources on a GP counter are
discussed in Section 15.4.2.4. These may include both instrumentation- and test-source prepara-
tion related issues. Instrumentation related problems should be identified through the
instrument’s operational quality control checks that include periodic detector response and
background measurements. Section 18.5.6 (“Summary Guidance on Instrument Calibration,
Background, and Quality Control”) in Chapter 18 provides guidance on the frequency for these
types of QC measurements for a GP counter.
Inaccurate results can occur from the misuse of a specific nuclide detector calibration or if the
test sources are prepared differently than the calibration sources. It is important that a laboratory
and its client cooperatively decide on the nuclide of interest for gross beta measurements as well
as the chemical composition of the self-absorption curve that may be used. Some clients may
want the laboratory to use the gross beta reference nuclide that the nationally recognized
performance evaluation programs incorporate into their gross-alpha test samples. Inaccurate
results also will occur when a beta-detector efficiency factor for a massless calibration source is
applied as the detection efficiency for air particulate filter or swipe test sources. These test
sources normally have some amount of radioactivity/particle penetration into the fibers of the
filter or swipe material and may contribute to self absorption depending on the beta energy.
15.5.3 Liquid Scintillation
When beta measurements involving pure beta emitters of low energy are required, they are often
performed using liquid scintillation spectrometry, because sample preparation is easy and
counting efficiencies are relatively high (Herpers, 1986). Although it is the preferred method for
measuring low-energy, pure beta-emitting radionuclides, (e.g., 3H, 14C, 35S, and 63N) it is a well-
established procedure for measuring numerous other beta-emitting radionuclides, including 45Ca,
32P, 65Zn, 141Ce, 60Co, 89Sr, 55Fe, 87Rb, 147Pm, and 36Cl (Hemingway, 1975).
Liquid scintillation counting (LSC) avoids many sources of error associated with counting a solid
source, such as self-absorption, backscattering, loss of activity during evaporation because of
volatilization or spattering, and variable detection efficiency over a wide beta-energy range. In
addition to the improvement in the detection capability offered by LSC over other beta counting
techniques, sample preparation time and counting times may be significantly shorter. Sample
preparation involves only adding a soluble or dispersable sample aliquant to a scintillation cock-
tail to form a liquid test source. Because every radioactive atom is essentially surrounded by
detector molecules, the probability of detection is quite high. Radionuclides having maximum
beta energies of 200 keV or more are detected with essentially 100 percent efficiency. Liquid
scintillation can, at times, be disadvantageous because of chemiluminescence, phosphorescence,
quenching, or high backgrounds (especially in older instruments). However, better coincidence
circuitry and use of certain types of shielding (e.g., bismuth germanate) have been able to reduce

Quantification of Radionuclides
15-58
MARLAP JULY 2004
backgrounds in newer instruments.
The observed count rate for a liquid-scintillation test or calibration source is directly related to
the beta (plus conversion electron) or positron emission rate in most cases. The important
exception is beta emitters whose maximum energy is below 200 keV. Low-energy beta emitters,
such as tritium (3H, Eβmax = 18 keV) or 14C (Eβmax = 156 keV), have a significant number of
emissions that have energies in the range of 0.7 to 4 keV. Beta-particle energy is converted to
photons through interaction with the solvent and fluor. It takes about 150 eV to produce one
photon. Thus, a 150 keV beta particle will produce about 1,000 photons. These photons are then
detected by the PMTs in the LSC instrument. The PMTs are arranged so that the test or calibra-
tion source is positioned between them. Thus, when a nuclear decay event produces photons,
each of the PMTs will detect about half of them. If these photons are produced from the same
decay event within the source, it is likely that they will occur in each detector within about 20 ns
of each other. The electronic circuitry of the detectors is established such that only those events
that yield counts in each PMT within 20 ns are recorded are recorded as valid counts. This is the
coincidence function of the LSC instrument. The calibration of liquid scintillation counting
detectors is given in ASTM E181. In this energy range, the efficiency of producing a photon in
the cocktail is poor because of two reasons: an inability to exceed the necessary quantum
threshold and pulse-summation effects. Thus, the overall efficiency of detection in an
unquenched sample approaches about 65 percent for 3H and 94 percent for 14C.
15.5.3.1 Detector Requirements and Characteristics
For measurements in which data are expressed relative to a defined standard, the individual
correction factors cancel whenever sample composition, sample mass, and counting
configuration and geometry remain constant during the standardization and tests.
Liquid scintillation counting systems use an organic phosphor as the primary detector. This
organic phosphor is dissolved in an appropriate solvent that achieves a uniform dispersion (this
combination is commonly referred to as the “cocktail”). A second organic phosphor often is
included in the liquid scintillation cocktail as a wavelength shifter. The sample then is added to
this cocktail to form the test source. The beta particles interact with the solvent and primary
phosphor to produce photons. The wavelength shifter efficiently absorbs the photons of the
primary phosphor and re-emits them at a longer wavelength more compatible with the photo-
multiplier tube. Most liquid-scintillation counting systems use two photomultiplier tubes in
coincidence. The coincidence counting arrangement minimizes spurious noise pulses that occur
in a single photomultiplier tube and thus provides lower background. The requirement that both
photomultiplier tubes respond to each event has a slight affect on the overall detection efficiency
of Eβmax>200 keV; however, system response to Eβmax<200 keV will be significant.
Another approach to LSC without the use of organic phosphors is Cerenkov counting. When a
high-velocity charged particle passes through an optically transparent dielectric medium whose

Quantification of Radionuclides
15-59
JULY 2004 MARLAP
FOM '(Efficiency of the sample detection)2
Detector blank background
index of refraction is greater than one, excess radiation is released in the ultraviolet range of
energies. This is known as “Cerenkov radiation” (Kessler, 1986). In order to produce Cerenkov
radiation, the condition β · n > 1 must be met; where n is the refractive index of the medium and
β is the ratio of the particle velocity in the medium to light velocity in a vacuum (Knoll, 1979).
Wavelength shifters are usually employed to convert the ultraviolet Cerenkov radiation to the
visible range. Although Cerenkov counting efficiencies are about 20 to 50 percent (Scarpitta and
Fisenne, 1996), lower than when organic phosphors are used, mixed waste disposal may be
eliminated.
The assessment of the effectiveness of the overall system detection is based on the figure of merit
(FOM) concept. This is a numerical value that is used to describe the entire counting system
(cocktail plus detector). The FOM generally is obtained by the following formula:
Thus, the larger the FOM, the lower will be the limit of detection. A lower blank background, a
more efficient cocktail, or a better photon detection system can achieve a larger FOM.
OPERATING VOLTAGE
The voltage of the detector is established based on the characteristics of the PMT. This is usually
about 1,000 volts DC. The voltage of the PMT should not be changed because this would affect
the overall quantum yield of photoelectrons produced by the decay event. Generally the voltage is
a fixed parameter by the instrument manufacturer and not adjustable by the user.
SHIELDING
Most liquid scintillation units come with the sample chamber enclosed within the instrument.
The manufacturers have provided a mechanism (usually a source “elevator”) by which the source
is moved into a shielded position (chamber) between the two PMTs. No additional shielding is
usually required for LSC instruments. However, building location and room materials of cons-
truction can affect the overall background that the LSC instrument experiences. Instruments are
constructed with standard shielding materials to account for routine background radiation. The
potential for other than routine background radiation should be assessed prior to selecting a
location for the instrument. Shielding from UV-visible radiation is discussed under the section on
dark adaptation.
BACKGROUND
There are several different sources of background radiation that could affect liquid scintillation
analysis:

Quantification of Radionuclides
15-60
MARLAP JULY 2004
• Building construction materials;
• Reagents used in analysis (this is the blank and is usually assessed separately from
background” radiation);
• Scintillation vials;
• Presence of an energy source (reactor or accelerator);
• Presence of other radionuclides that have beta or gamma emissions that are contaminating the
sample or test source under analysis;
• Stray light into the instrument; and
• Scintillation cocktail (this is the blank and is usually assessed separately from background
radiation).
Although there is some capability to differentiate certain beta-particle energies, there is a wide
overlap in beta particle spectra. Thus, background counts that take into account the process—as
well as the instrument, reagents, and scintillation vials—should be performed routinely. Routine
monitoring of background is significantly different for LSC with respect to other detection
methods because the cocktail is the primary detector. For example, any component of the sample
(chemical or physical) that can affect the cocktail and is not reproduced in the background test-
source measurement can introduce additional uncertainty. Controls should be in place to identify
and correct variations in background measurements. Variations of background and background
quench also should be monitored for potential impact on results.
Another way to help achieve low backgrounds is to use scintillation-grade organic phosphors and
solvents prepared from materials containing low concentrations of 14C, such as petroleum. The
counting vials may be made of low-potassium glass or plastic to minimize counts because of 40K.
Liquid scintillation provides a fixed geometry from a given size counting vial and liquid volume.
DARK ADAPTATION
The photomultiplier tubes are sensitive to any light which they detect. Stray room light will cause
a signal leading to a higher background. The instruments are constructed so that they are light
tight, and interior surfaces are generally black to prevent light transmission by these surfaces
from stray light.
Chemiluminescence, the production of light by a chemical reaction with a molecule, can be
troublesome in liquid scintillation counting. However, the duration of chemiluminescence is
generally short, and waiting a few minutes after mixing the reagents will allow the effect to
dissipate before counting starts. Phosphorescence, the emission of light caused by photon
interaction with a molecule, will cease a short time after being placed in the dark. This is referred
to as being “dark adapted” (Faires and Boswell, 1981).
The two factors which can produce the phosphorescent effect on the cocktail are external UV
light and heat. Each of these work by a similar mechanism. Energy is transferred to the fluor

Quantification of Radionuclides
15-61
JULY 2004 MARLAP
(either by UV excitation or heat) and the fluor excites/de-excites yielding photons in the
detection range of the PMT. These events can contribute to the total background and increase the
detection limit of the analysis or could lead to falsely elevated sample results. Interference from
UV light from lamps or the sun is avoided by dark adapting the source in the LSC vial for at least
30 minutes prior to analysis. To avoid differences in background because of thermal excitation,
most instruments have internal thermostats to maintain constant temperature during the analysis.
These instrument characteristics allow sufficient time for phosphorescent and luminescent states,
unrelated to the radioactivity measurement, to undergo de-excitation prior to counting the source.
CHANNEL OVERLAP
The traditional concept of “channel” for liquid scintillation was an energy range that correspon-
ded to the majority of the energy distribution of a particular radionuclide’s beta particle distribu-
tion. Counting in “channel 1” indicated tritium, or “channel 2” indicated 14C. The size of the
channel was determined by setting discriminator levels. The amount of quench in a test source
would cause a spillover of the higher energy distribution beta particles to the lower channels.
Also, the high energy distribution of a lower energy beta could cross into the higher energy beta
channel. This was referred to as “channel overlap.” In older instruments, the sample-channel-
ratio method was used to separate the components. Recent advances in liquid scintillation
instruments have made it easier to eliminate or account for this overlap. Similar to gamma
spectrometers, liquid scintillation units now divide the energy output of the PMT into more
discrete channels (usually about 1,000). Mathematical modeling of the spectrum shape based on
these discrete channels allows more refined techniques to be used to account for channel overlap.
15.5.3.2 Calibration- and Test-Source Preparation
Gaseous radionuclides most often measured include tritium, both as a vapor (3HOH) and in the
elemental form (3H-H), 14CO2, and the noble gases, 37Ar, 41Ar, 85Kr, 222Rn, 131mXe, and 133Xe.
Tritiated water vapor is often collected by condensation from a known volume of air (EPA
1984b). The air is drawn first through a filter to remove all particulates and then through a cold
trap submerged in a bath at sub-zero temperatures. A measured aliquant of the collected water is
analyzed by liquid scintillation spectrometry (EPA, 1984b). Tritiated water vapor sometimes is
collected by pulling air through a trap containing materials like silica gel (SC&A, 1994) or
through a molecular sieve. After collection, the water is distilled from the silica gel, collected,
and counted in a liquid scintillation spectrometer.
Gaseous products of oxidation or combustion can be trapped in a suitable media, such as water
for 3H, ethanolamine for 14C, peroxide for 35S, and then analyzed by liquid scintillation spectro-
metry (NCRP, 1978). For this method, it is very important to de-aerate the liquid prior to
introducing the gas since gaseous components may cause quench. The temperature should be
carefully controlled since gas solubilities are generally inversely proportional to the temperature
(NCRP, 1978).

Quantification of Radionuclides
15-62
MARLAP JULY 2004
Tritium is the radionuclide most often measured by liquid scintillation counting (DOE, 1997;
EPA 1979; Lieberman and Moghissi, 1970). The primary step in preparing water samples for
counting is distillation in the presence of an oxidizing agent, such as KMnO4, to separate the
tritium labeled water from dissolved solids, including interfering radionuclides, and any organic
material that may be present. An aliquant of the distillate is then mixed with a cocktail and
counted in a liquid scintillation spectrometer. To measure tritium in samples of other matrices,
the water in the sample can be removed and collected by distillation as an azeotrope, for
example, n-hexane or cyclohexane (Moghissi, 1981; EPA, 1979). An aliquant of the collected
water is then mixed with a liquid scintillator and counted as described above for water samples.
Tritium can be concentrated in a sample of water if lower detection limits are required. The
concentration process, electrolysis, uses the isotopic effect caused by the mass difference (three
times) between 1H and 3H (DOE, 1997; EPA, 1984a). Tritium becomes enriched in the liquid
phase as electrolysis continues. Generally, 50 mL of the laboratory sample is placed in an
electrolysis cell and a current of about three amps applied. Electrolysis is continued until the
volume reaches about 5 mL. More sample can be added to the cell during the electrolysis, if
greater sensitivity is necessary for the measurement. The concentrated laboratory sample is then
distilled in the presence of an oxidizing agent, such as KMnO4, and treated like a water sample
(see above).
Environmental and biological samples also can be analyzed for total 3H (that contained in both
the water and fibrous fractions) by quantitatively combusting the laboratory sample, collecting
the water formed, and analyzing it by liquid scintillation spectrometry (DOE, 1997). In another
case, both 3H and 14C can be measured simultaneously (EPA, 1984b). The laboratory sample first
is freeze-dried to remove and collect the water fraction. The tritium in the water is measured
directly by liquid scintillation spectrometry. The fibrous (freeze-dried) material is combusted and
the H2O and CO2 are collected. As before, the 3H in the water is measured directly by liquid
scintillation spectrometry, while the 14C is first converted to benzene or captured as CO2 and then
counted by liquid scintillation spectrometry.
15.5.3.3 Detector Calibration
When the quenching of a group of test sources is predictable, e.g., distilled drinking water (EPA,
1980; ASTM D4107), a counting efficiency is determined for the group by placing a known
quantity of reference material in the source medium and scintillation solution under identical
conditions (vials and volumes) as the test-source medium.
Except for test sources with very predictable amounts of quenching, it is necessary to determine a
counting efficiency for each laboratory test source. Two methods of determining counting
efficiency are available: internal standardization and external standardization (NCRP, 1978).
Internal standardization for quench correction is by the method of standard additions. This

Quantification of Radionuclides
15-63
JULY 2004 MARLAP
involves the counting of two aliquants of the sample, one being the sample and the other is an
identical aliquant that has been spiked with a known amount of the radionuclide being
determined. The degree of quench then can be determined from the spiked aliquant and applied
to the unspiked aliquant (DOE, 1995). This method does not require a curve for correction but
decreases throughput because two test-source counts are required. For these reasons, the use of
an external standard is the more widely used technique to correct for quenching (Horrocks,
1973).
One external standard method is called the “external-standard channels-ratio” (Baillie, 1960;
Higashimura et al., 1962). In this method, a series of vials is prepared containing a known
amount of reference material and varying amounts of the medium being evaluated. Windows in
the energy spectrum are set for a high- and low-energy region. The vials are counted and the
ratios of low-to-high count rates are recorded for each quenched source. A quench curve is then
prepared by plotting the ratios of low-to-high energies as a function of counting efficiency. The
efficiency of an unknown test source can then be determined from its low-to-high energy ratio
during counting.
The second external-standard method employs an external gamma-ray source that generates
Compton electrons in the scintillation solution. A quench curve is then prepared by plotting a
parameter obtained from the external standard spectrum against counting efficiency (Kessler,
1989).
QUENCH
Quenching, which is probably the most prevalent interference in liquid scintillation counting, can
be defined as anything which interferes with the conversion of radionuclide decay energy to
photons emitted from the sample vial, resulting in a reduction of counting efficiency. Two types
of quenching may be encountered in liquid scintillation counting: chemical or color quenching.
Color quenching results in a reduction of the scintillation intensity (as seen by the PMTs)
because of absorption of the fluor scintillation by colored materials present in the cocktail. Thus,
a reduction in counting efficiency occurs after the particle energy has been transferred to the
fluor. Chemical quenching results in a reduction in the scintillation intensity because of the
presence of materials in the scintillation solution that interfere with the process energy transfer to
the fluor also leading to a reduction in counting efficiency. Chemical quenching results in a
reduction in the scintillation intensity because of the presence of materials in the scintillation
solution that interfere with the process leading to the production of light resulting in fewer
photons per quanta of particle energy and a reduction in counting efficiency. Suspended solids
and opaque materials also will cause quench in the cocktail, because they physically obstruct the
light path to the PMTs.
One can have all three types of quenching present in a test source. Although the mechanisms of
chemical and color quenching may be different, they both affect the number of photons reaching

Quantification of Radionuclides
15-64
MARLAP JULY 2004
the detector. Therefore, the measured sample counts should be corrected for quenching effects so
that the radioactivity in the test source can be quantified. Some of the stronger chemical
quenching agents are alkyl bromides, iodides, nitrates, mercaptans, and ketones (NCRP, 1978).
Yellow provides the most significant quench.
The quantitative measure of quench can be seen in the beta particle spectrum of the quenched
versus unquenched test source. Not only does quench reduce the total number of photon events
received by the detectors, but it also shifts the distribution of the events to lower energy. This
causes the Eβmax, as well as the other mathematical characteristics of the beta curve, to shift to
lower energies.
Quench may play an important role in the analysis for surface contamination levels of low-energy
beta-only emitters, such as 3H, 14C, 63Ni, 135Cs, etc. As discussed in Section 10.6, swipes are used
for assessing gross surface contamination levels. Thus, chemical separations or sample cleanups
are not usually performed, and the entire swipe will be inserted into the scintillation vial. Several
different parameters affecting quench will also affect determining the consistency of the results if
direct analysis of the swipe is used. Some of these factors are:
• Material from the surface analyzed which dissolves in the cocktail yielding either a chemical
or color quench;
• Insoluble detritus that can become suspended in the cocktail, interfering with the emitted
fluor radiation reaching the PMT;
• Adhesives or adsorbent materials used in the swipe material itself may react with the fluor, or
may interfere with the transfer of energy to the fluor; and
• The degree of transparency of the swipe material to the counting system (i.e., the photons
emitted by the fluor may be absorbed by the swipe material).
When this type of analysis is being performed, either a dry or wet swipe could be used. However,
the analyst should ensure that the conditions cited above are accounted for by performing a test
of the particular swipe and the surface type to assess their affect on quench.
COMPENSATION FOR QUENCH
Most liquid scintillation spectrometers manufactured after about 1965 have a method of asses-
sing the quench level in a solution compared to the standard, allowing for correction of the
quench. Historically, quench was accounted for by establishing a quench curve for the instrument
or by using standard additions. A quench curve is made by taking a standard and analyzing
several replicates under conditions of varying amounts of added “quench” agent. Typically, any
strong color agent could be used as the quench.
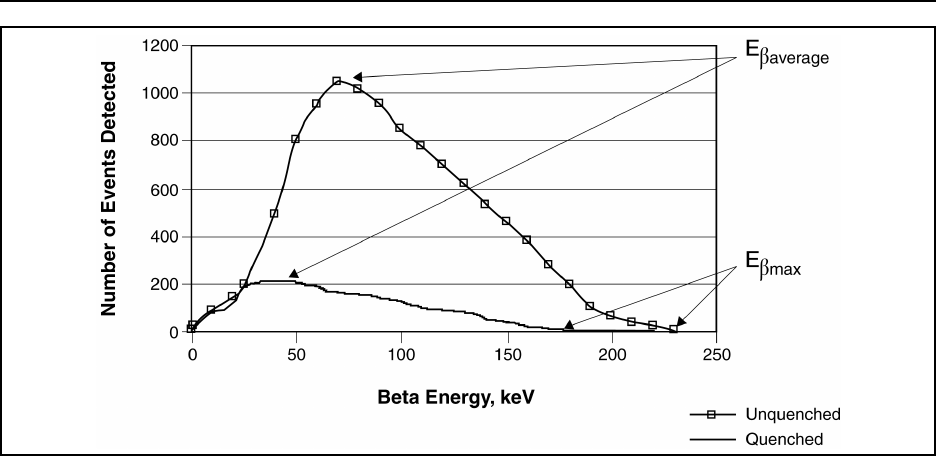
Quantification of Radionuclides
15-65
JULY 2004 MARLAP
FIGURE 15.5 — Representation of a beta emitter energy spectrum
Figure 15.5 shows the effect that quench would have on the beta spectrum. Note first that the
average beta energy is shifted to a lower energy. Second, the total number of events at each
energy is lower than the unquenched source.
Historical quench corrections include channels ratio, external standard, and internal standardiza-
tion. More recent methods are the H-number and tSIE methods. One of the methods used to
assess the quench is the H-Number technique (Horrocks, 1970). Fundamentally, the beta-particle
spectrum generated in the cocktail by a standard external gamma source (137Cs) is analyzed over
the energy range of the instrument. Each energy interval receives a number of counts
corresponding to the generated Compton events (these are significantly greater than the test-
source output pulses because of the gamma intensity). The inflection point of the beta curve at
the high end of the energy distribution is assigned a channel number for that solution with no
added quench. Increasing levels of quench shifts this inflection point to lower channel numbers.
The quench is a measure of the change in the channel number of the inflection point compared to
the unquenched solution.
Another method uses the transformed spectral index of the external (tSIE) standard (Kessler,
1989). This technique uses the energy distribution of the entire spectrum as generated by an
external 133Ba source when it is exposed to the cocktail. The accumulation of this energy
spectrum takes a few seconds and the events produced are far greater than those of the test source
because of the intensity of the 133Ba source. The effects of the radioactivity in the sample are
independent of this measurement.
The manner in which quench affects the electron distribution produced by the external source

Quantification of Radionuclides
15-66
MARLAP JULY 2004
will be the same for standards and samples, since quench is the interference of energy transfer.
With environmental samples, the degree of quench for all practical purposes is independent of
the material that causes the quench (“quench is quench,” regardless of the cause).
The fluors used in cocktails are susceptible to excitation by both light (artificial room light or
sunlight) and heat. Furthermore, these materials also will have phosphorescent states, which can
have significant lifetimes (minutes). It is important to ensure that the standards for quench-curve
preparation and the sample are “dark adapted” for the same period of time prior to their analysis.
This allows all of the phosphorescent states to de-excite and not add to the measured counts, and
helps to ensure that the interference form other sources of excitation are minimized.
The level of quench affects the measurement uncertainty of the analysis in two ways. First, it
decreases the net count rate of the test source. Since the relative measurement uncertainty is
directly proportional to the square root of the counts, the relative uncertainty increases. This
uncertainty can be directly quantified. Second, the measure of quench itself is not exact and will
be characterized by a Gaussian distribution at a specific quench for a specific test source.
Additionally, the quench function is generally exponential. This means that the determination of
quench in an individual test source is made from a smoothed curve. Unless a specific effort is
made to assess this uncertainty component, it is not accounted for in most software analysis of
the final calculation. Minimizing the quench will minimize the increase in the combined standard
uncertainty of the measurement.
Beta particles, unlike alpha and gamma rays, are emitted in a continuum up to an Eâmax (Figure
15.5). The continuum covers a wide range of energies, so that different beta-emitting radioiso-
topes having different energies may have overlapping energy continua. The average beta particle
energy is roughly one-third of the Eâmax. This energy generally has the highest population of all
the beta particle energies emitted by that particular radionuclide. As an example 90Sr has an Eâmax
of 546 keV and 89Sr has an Eâmax of 1,490 keV. Their beta-particle spectra overlap significantly.
They cannot be separated chemically. Neither of these two isotopes is a strong gamma emitter.
Thus, the analysis of these two beta emitters sometimes is performed indirectly, using liquid
scintillation, by using the ingrowth of 90Y and mathematically solving for the initial
concentrations of 89Sr and 90Sr.
A liquid scintillation spectrometer detects beta-particle events as a result of beta energy transfer
into a liquid medium, which promotes the formation of photons in the UV/visible energy region.
The transfer is an indirect process. The beta particle distributes its energy through solvent
“excimers” to an organic fluor, which de-excites by releasing the UV/visible photons. Any
component of the cocktail that affects the energy transfer process will have a significant effect on
the analysis. Other controllable aspects of the cocktail are:
• The ratio of the sample volume to solvent-to-fluor volume;
• Preparation of the quench curve;

Quantification of Radionuclides
15-67
JULY 2004 MARLAP
• Stability of the cocktail; and
• Dark adaption of the cocktail.
Each analytical procedure for scintillation analysis should find the sample-to-fluor volume that
provides the maximum response. Part of this process is that the analyst is ensuring that sufficient
fluor exists to convert the beta particles to UV/visible region photons (i.e., scintillator capacity).
Once this ratio is established, a quench curve is made using the same ratio of sample-to-fluor
solution.
The most significant aspect of liquid scintillation analysis is accounting for quench in the sample
and standards to the same extent (or by an equivalent methodology), so that the analytical results
are reproducible and accurate.
Beta and alpha particles both will induce a fluorescent spectrum in the liquid scintillation
cocktail. The beta spectra originate at zero energy and cover a large range of energies. The alpha-
particle distribution is much different, in part because of the discrete energy distribution.
Although the liquid scintillation process has transformed the original energy of the beta particles
to a measurable quantity on this spectrometer, the distribution of the actual beta-particle energies
is exactly the same as the distribution of the UV light detected by the spectrometer. It is difficult
to distinguish one beta emitter from another for this reason of continuous beta-particle energy,
unless the beta-particle energies are very different. Alpha analysis using liquid scintillation is less
complicated because of the distinct energy emitted by the alpha particles. The signal from the
alpha particles can be distinguished from that of the beta because of the delay time for the fluor
excited state to decay. Because alphas have such a significant energy directly imparted to the
fluor, a triplet state of the excited electron is achieved.
This state must first decay to the singlet electron state before fluorescence can occur, as in beta
interactions. The ∆t for this process is about 35 ns, so it can be segregated electronically from
any beta signal. The problems of quench will occur in alpha as in beta spectroscopy, since
quench occurs not with the actual radioactive decay mode, but with the energy transfer from the
fluor to the detector. Refer to section 15.4.5 (“Photon Electron Rejecting Alpha Liquid Scintil-
lation”) for details about a method of performing alpha analysis in liquid scintillation media.
COCKTAIL
The liquid scintillation cocktail is the combination of the scintillator (primary and secondary) and
solvent. The combination of the cocktail with radionuclide solutions is referred to as the “test
source” or “calibration source.” The scintillators are organic materials which over time can
undergo decomposition. As with other organic compounds of this type, they are light and heat
sensitive. Thus, it is important to protect them from light and heat to minimize their degradation
during laboratory storage.

Quantification of Radionuclides
15-68
MARLAP JULY 2004
The test source also will be susceptible to degradation because of changes in temperature and
addition of chemicals from the sample. It is therefore important to know how much sample to
add to the fluor solution and how long it can be stored without degradation.
The ratio of fluor solution to sample (which comprises the cocktail) should be optimized for each
radionuclide and sample type analyzed. This can be done by first selecting a final volume of the
cocktail that will fill a vial to 80-90 percent of its volume. Then, make several combinations by
varying the ratio of a standard radionuclide to the fluor solution so that the final volume is
constant. Count all the vials for the same time period and find the ratio that achieves the highest
relative count rate.
15.5.3.4 Troubleshooting
There are many areas involving the processing of a sample by liquid scintillation analysis where
errors can be introduced. Identified here are some of the more common problems that have been
experienced with suggestions on how to correct them:
• Routine background check is above upper control limit on QC charts
– Insufficient dark-adapt time
– Light leak has developed into the instrument
– Contamination of the fluor solution with a radionuclide calibration solution
• Routine QC check of test source (using a flame-sealed, unquenched source) is below lower
control limit
– Wrong channel or range selected
– Smudges on scintillation vial
– Decay correction not used or improperly applied
• Test-source count rate appears to change during count interval
– Cocktail separation has occurred during the count interval
– Background has changed during the count interval
– Insufficient dark adapt period
– Temperature change of instrument
• Instrument check with unquenched source yields low readings
– Source not fully inserted into instrument
– Decay correction not used or improperly applied
• Test-source or QC count rate is unusually high
– Contamination in cocktail from another radionuclide or higher concentration
– Insufficient dark adaptation
15.6 Gamma Detection Methods
This section describes the measurement of gamma-ray activity. Since gamma radiation is a

Quantification of Radionuclides
15-69
JULY 2004 MARLAP
penetrating form of radiation, it can be used for nondestructive measurements of samples of any
form and geometry as long as calibration sources of the same form and geometry are available.
Radionuclides separation followed by sample digestion can be used to improve the detection
capability of gamma-ray-remitting analytes by concentrating the analyte and reducing
interferences. Attenuation of gamma radiation is generally small, but because of variations in
sample density, sample thickness, container shape, or container thickness, it must be corrected
either by using calibration sources that match the sample/container densities and containers or by
appropriate mathematical formulas (Modupe et al., 1993; Venkataraman et al., 1999):
Photons interact with matter in one of three ways:
• Photoelectric effect, where all energy is transferred to an electron in the absorber matrix;
• Compton scattering, where an electron in the absorber matrix is scattered and only part of the
initial photon energy is transferred to that electron; and
• Pair production, where the photon energy is converted to positron-electron pair in the vicinity
of a nucleus.
For the photoelectric effect, the entire gamma energy is transformed into a detector pulse,
eventually resulting in the full-energy peak (FEP) observed in the gamma spectrum. The
Compton scattering effect is seen as continuous, broad band radiation (referred to as the
“Compton continuum”), which terminates at the Compton edge. This is a distinct decrease in the
recorded counts in the continuum. This edge occurs between 150 and 250 keV below the FEP.
The remainder of the energy is carried away by the scattered gamma ray. Pair production requires
a minimum gamma ray energy of 1,022 keV, since the sum of the rest masses of a positron-
electron pair is this amount.
The energy of the gamma ray in the pair production effect is split between the formation of the
positron and electron. The positron is a very short-lived particle and annihilates an electron in the
absorber matrix. This annihilation process creates two 511 keV photons. These may or may not
be detected by the detector. The energy spectrum recorded from this event may have five distinct
peaks that appear to be gamma rays: the FEP (1,275 keV), a single escape peak (FEP-511 at 765
keV), a double escape peak (FEP-1,022 at 254 keV), a 511 keV peak, and a sum peak (FEP+511
at 1,786 keV). Figure 15.8 (page 15-80) shows some of these additional peaks.
The extent to which each of these effects is seen depends upon the gamma ray energy, the sample
matrix, and the detector material. The mass attenuation coefficient is a measure of the probability
that a gamma ray will interact with the absorbing medium. Figure 15.6 shows the relative mass
attenuation coefficients of each of the three predominant photon interactions with high-purity
germanium.
Since different radionuclides emit distinct and discrete spectra of gamma radiation, the use of an
energy discriminating system provides identification and quantification of all the components
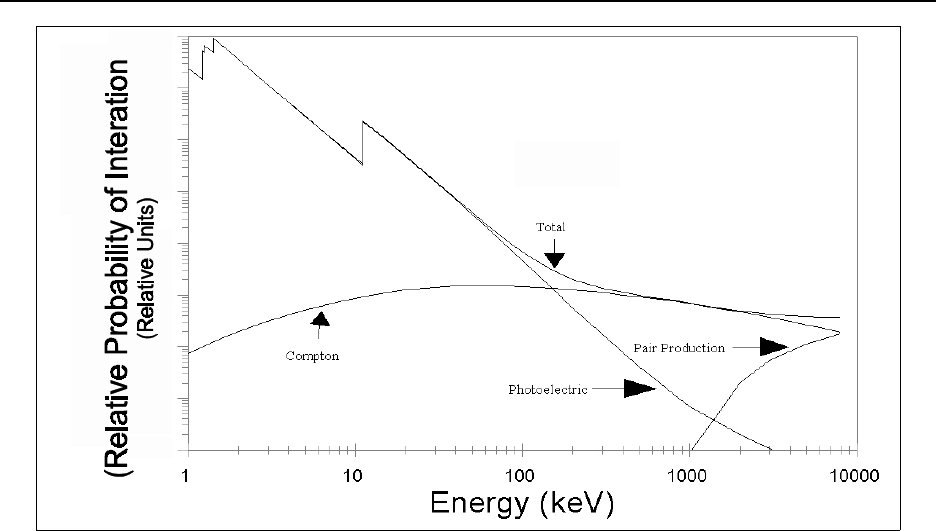
Quantification of Radionuclides
15-70
MARLAP JULY 2004
FIGURE 15.6 — Gamma-ray interactions with high-purity germanium
present in a mixture of radionuclides. General information on gamma-ray detectors and gamma
counting is covered in the literature (Friedlander et al., 1981; ICRU, 1992; Knoll, 1989). Recent
applications of gamma counting are given in several ASTM Test Methods (ASTM C758, C759,
D3649).
Gamma counting is generally carried out using solid detectors since a gas-filled detector will not
provide adequate stopping power for energetic gammas. The more commonly used solid
detectors are discussed in this section.
15.6.1 Sample Preparation Techniques
Important considerations in preparing calibration sources for gamma-ray spectrometry are
geometry (shape), size, and homogeneity (uniformity) of the source. Calibration sources can be in
any reproducible shape or size, but the radionuclides need to be uniformly distributed throughout.
A counting container that allows the source to surround the detector, thus maximizing the
geometrical efficiency, is referred to as a “Marinelli” or “reentrant” beaker (Hill et al., 1950). It
consists of a cylindrical sample container with an inverted well in the bottom of the beaker that
fits over the detector.
Two important advantages of gamma-ray spectrometry are the ability to measure more than one
radionuclide simultaneously and the elimination or reduction of sample dissolution and
radionuclide separations (i.e., gamma-ray spectrometry can be a nondestructive sample analysis).

Quantification of Radionuclides
15-71
JULY 2004 MARLAP
15.6.1.1 Containers
Source configurations for nondestructive analyses generally are selected to optimize counting
efficiency for the particular sample type and its expected activity. This also means that the
containers are selected to minimize attenuation of the particular gamma rays, and to have
sufficient integrity to keep the sample intact. For quantitative analysis, the calibration and test
sources (samples) are counted in the same type of container. Different types of containers might
be used for qualitative analyses.
15.6.1.2 Gases
Sample containers for gasses will generally have a provision so that the container may either be
evacuated (using a vacuum pump) or purged (having sufficient sample so that the container may
be flushed with approximately 10 sample volumes). This is generally accomplished using inlet
and outlet isolation valves. These may be constructed of either plastic, stainless steel, or glass.
These containers are then brought to atmospheric pressure, which minimizes losses because of
pressure differential, during storage, transport and counting. Analysis at pressures other than
atmospheric may be made, however, a correction using the ideal gas laws needs to be made.
Sample containers for gaseous or atmospheric samples may use concentration devices to enhance
the detection limits for certain radionuclides. A concentrated sample matrix, such as a solid,
represents the aerosol collected. The detector calibration needs to be performed with a matrix and
source container that matches the test source and container. Examples of this are:
• Charcoal canisters (aluminum cans that contain inlet and outlet retention elements and are
filled with charcoal and may be impregnated with potassium iodide, KI or triethylene diamine
[TEDA]), used for iodine or noble gas collection.
• Molecular species filtering (EPA, 1990) that collects four primary species of iodine on
separate cartridges so that they can be measured individually. Air is pulled first through a
particulate filter and then through the cartridges placed in series.
• Zeolite canisters (aluminum cans that contain inlet and outlet retention elements and are
filled with silver-alumino-silicate materials) for iodine collection.
In each of these cases the distribution of the radionuclide on the medium most likely will not be
uniform. This is especially true for the filled canisters where the flow inlet end will have a
significantly higher loading than the outlet, unless the medium has gone to saturation. The
positioning of the sample container on the detector in a reproducible geometry to that of the
standard becomes very important for these types of samples.

Quantification of Radionuclides
15-72
MARLAP JULY 2004
15.6.1.3 Liquids
Containers normally used for liquid analysis are:
• Marinelli beakers of 0.25 to 4 L to measure liquid sources (water, milk, and food samples
blended to a uniform slurry);
• Plastic bottles of standard sizes such as 250, 500, or 1,000 mL; or
• Scintillation size vials (20 mL) for samples of more significant activity.
If greater counting efficiency is required, the source size can be reduced, allowing a greater
amount of the laboratory sample to be counted and in a more favorable geometry. Examples of
such processes are:
• Reducing the volume of water samples by evaporation;
• Reducing the volume of water samples by coprecipitating the desired radionuclides and
collecting them on filter paper; and
• Concentrating the radionuclide on a resin.
It should be noted that the final sample configuration should not only be homogeneous, but
should also match the geometry of the standard used to calibrate the detector.
A radionuclide in solution may be purified by chemical techniques (i.e., impurities removed),
after which the solution can be transferred to a planchet and evaporated to dryness, as described
above. Evaporation of a laboratory sample after purification is used by the EPA to measure 228Ac
in the analysis for 228Ra (EPA, 1984a), and sources of thorium, isolated from marine carbonates,
have been prepared by evaporation for measurement (Blanchard et al., 1957). For the analysis of
test sources having significant solids containing low-energy gamma emitters, absorption curves
can be prepared. Solid samples may need to be air-equilibrated prior to counting to ensure that a
consistent moisture film is present, which is accounted for by self-absorption measurements in
standards and samples.
In the case of all dry sources, steps should be taken to prevent solids from exiting the test-source
mount or container, which will affect the measurement and, in time, contaminate the detector.
15.6.1.4 Solids
A variety of containers are used for solids analysis such as:
• Cylindrical plastic containers of various volumes, such as the 400 mL “cottage-cheese
container,” and Marinelli containers;
• Planchets and plastic culture dishes of various diameters to measure precipitates, air filters,
etc.;

Quantification of Radionuclides
15-73
JULY 2004 MARLAP
• Aluminum cans (like the “tuna can” configuration) of a standardized volume into which solid
sources can be compressed, and sealed, if desired, to retain volatile materials; and
• 47 mm (2 inch) diameter, 0.45 µm pore size particulate filters, which are enclosed in a petri-
style dish after sample collection.
Sometimes, other samples may be reduced in volume by:
• Reducing the size of vegetation samples by compression into a large pellet or by ashing, if
volatile radionuclides are not of interest; and
• Reducing the size of filter samples by digestion or ashing, if volatile radionuclides are not of
interest.
Many of the sizes of these containers have been retained for historical consistency (PHS, 1967a).
Solid samples analyzed directly by gamma-ray spectrometry do not need to be dried prior to
analysis as do samples for alpha or beta counting. However, it is important that the sample and
standard geometries match, and that the sample water content should be known so that dry-
weight concentration can be calculated.
15.6.2 Sodium Iodide Detector
Sodium iodide has a high density, which makes it an attractive solid material for detecting high-
energy gamma radiation. The crystal is activated with 0.1–0.2 percent thallium to improve its
scintillation characteristics in the visible range. In scintillators such as NaI(Tl), the gammas
interact by excitation of electrons in the valence (or bound) states of the atoms to an excited state
called the conduction band. Energy is released as light (visible and UV) photons when the
electrons return to the valence band. These scintillations are easily detected and amplified into
useable electrical pulses by a photomultiplier tube. The NaI(Tl) detector is the recommended
detector for gross-gamma or single-radionuclide counting because of its high efficiency and room
temperature operation.
15.6.2.1 Detector Requirements and Characteristics
The sodium iodide crystal usually is sealed in an aluminum enclosure called a “can.” The crystal
is hygroscopic and sensitive to shock and fracture. The geometry of the detector “can” may be
flat or well shaped, but numerous shapes have been made for specific applications. One of the
most common sizes for the detectors is the 7.5×7.5 cm (3×3 inch), but they can come in many
sizes, including some specially constructed to contain several hundred pounds of the scintillator.
The well-shaped detectors are of higher efficiency for the same volume of detector. This
particular characteristic allows almost a 100 percent efficiency (so-called 4π geometry) for low-
energy gamma-emitting test sources that can fit inside the well.

Quantification of Radionuclides
15-74
MARLAP JULY 2004
A gamma energy of 300 eV will release about ten light photons when it interacts with the crystal.
This is the minimum energy necessary to create a photoelectron at the first dynode of the PMT.
The PMT is optically coupled to the base of the NaI(Tl) detector to minimize any loss of photons,
and maximizing efficiency. The size of the final voltage pulse (referred to as the “pulse height”)
received from the PMT is directly related to the energy of the gamma which interacted with the
sodium iodide crystal. Electronic circuitry connected to the PMT output can perform pulse-
height-analysis (PHA). This is merely counting the number of events with a certain pulse height.
The output of the PHA can then be stored using a multichannel analyzer (MCA which is
subsequently displayed on a screen), or summed over a specified energy range (this device
usually referred to as a “scaler” or a “single channel analyzer,” SCA).
The following components complete the NaI(Tl) gamma-ray spectrometry system:
• HIGH-VOLTAGE POWER SUPPLY. 1,000 to 3,000 volts DC regulated to 0.1 percent with a
ripple of not more than 0.01 percent.
• PRE-AMPLIFIER/AMPLIFIER. The combination shapes and linearly amplifies the PMT output to
a maximum of 10 volts.
• MULTI-CHANNEL ANALYZER (MCA). The amplifier output is directed to the PHA. The PHA
will sort the individual events and send them to discrete energy registers so that a count vs.
energy graph can be displayed. The system usually has a low energy cut off to eliminate low
energy background signals which will increase MCA processing time.
• SINGLE CHANNEL ANALYZER (SCA). A single-channel discrimination system is set with a
lower and upper level discriminator (LLD and ULD). The lower limit is usually referred to as
the “threshold” and the difference between the two limits is the “window.” Only those pulses
from the amplifier within the window will be sent to the scaler. Any pulses lying outside the
preset limits are rejected. The scaler takes the sum of all counts within the window for a pre-
set time. The SCA application of a NaI(Tl) detector commonly is used to analyze gamma-ray
emitters (such as 85Sr) when they are used to monitor chemical yield.
• BETA ABSORBER. A beta absorber of 3–6 mm of aluminum, beryllium, or poly(methyl
methacrylate) should completely cover the upper face of the detector to prevent betas from
reaching the detector.
Figure 15.7 is a gamma-ray spectrum of 137Cs collected using a NaI(Tl) detector. The features of
note in this spectrum are:
• The FEP at 661 keV;
• The Compton edge at about 470 keV;
• The backscatter peak from the detector shielding at about 215 keV;
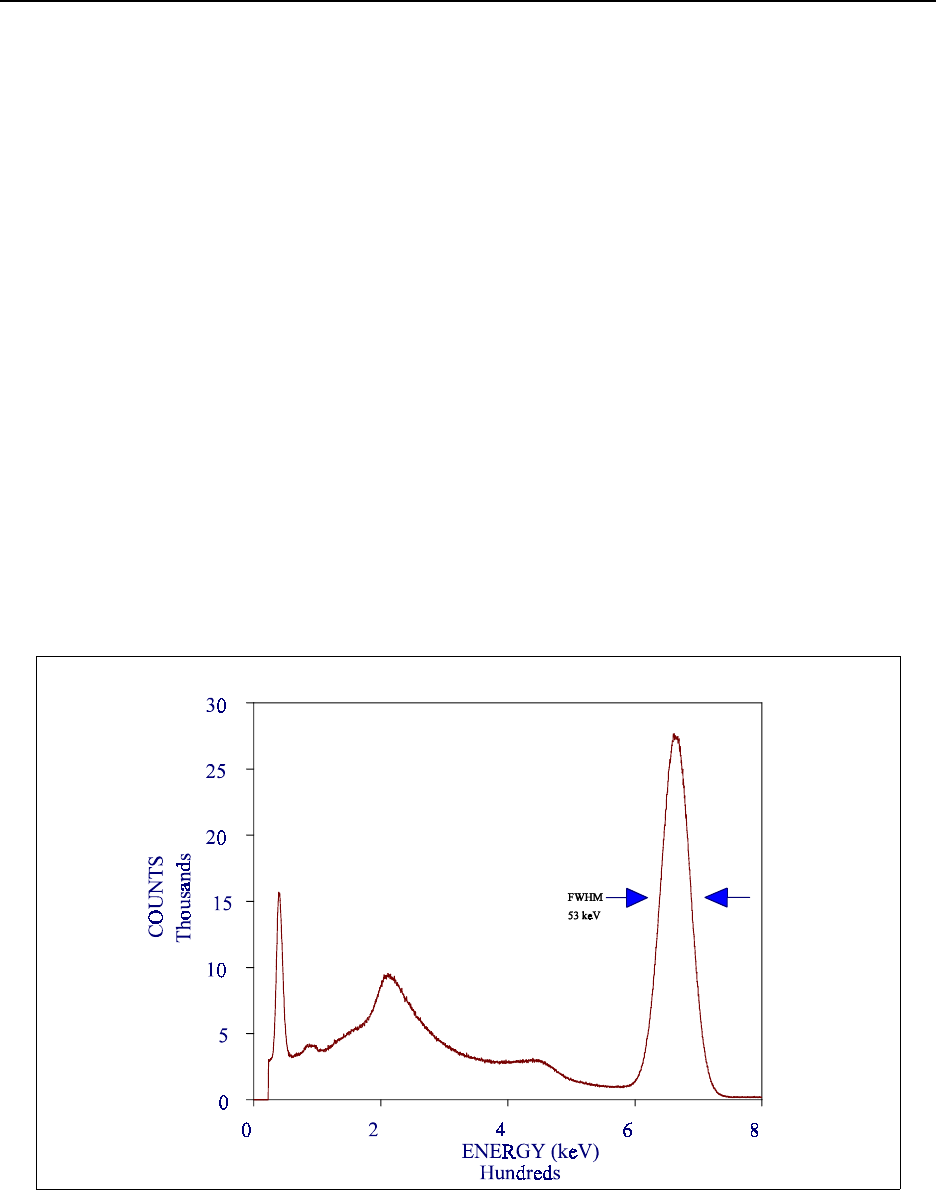
Quantification of Radionuclides
15-75
JULY 2004 MARLAP
FIGURE 15.7 — NaI(Tl) spectrum of 137Cs
• A broad peak at about 35–40 keV as a result of the photoelectric absorption of the 37.4 keV
barium K-shell X-ray (from the Cs decay) and the 35 keV iodine K-shell X-ray (from the
iodine in the detector); and
• The FWHM of about 53 keV.
One characteristic of a detector which helps to define its utility is the peak-to-Compton ratio.
This is the number of maximum counts in the peak centroid channel of the FEP divided by the
average number of counts in the Compton edge (ANSI/IEEE 325). For example, the peak-to-
Compton ratio for 137Cs would be the maximum counts in the 661 keV peak (assumed to be the
peak centroid channel) divided by the mean counts per channel between the 440 and 490 keV
Compton region. In Figure 15.7, this value is about 9.
Another characteristic is the FWHM of the detector. FWHM is the width of the peak at one half
of the counts in the peak centroid. This characteristic is based on the range of energy levels
available for the electrons to de-excite from after they have been promoted into the conduction
band. Because the NaI(Tl) operates at room temperature this represents a broad range of energies.
The value for the 661 keV peak here is about 53 keV. The FWHM varies slightly as a function of
gamma ray energy for a NaI(Tl) detector.
A low-energy peak around 35 keV may be present as a result of the gamma-ray interaction with
an iodine K-shell electron through the photoelectric effect. When the K-shell is filled by the

Quantification of Radionuclides
15-76
MARLAP JULY 2004
Auger effect, the resultant release of 28 keV may be delayed enough from the original electron
signal to be detected as a separate event. An additional feature (not discernable in this spectrum)
is a small peak 28 keV less than the FEP, which is referred to as the “iodine escape peak.” This
effect is most prominent with gamma ray energies less than 150 keV. Superimposed on the low
energy peak is also the X-ray emission from the decay of cesium.
Finally, the wide band at about 215 keV results from gamma rays emitted from the sample
interacting with the detector shielding (usually lead) through the Compton effect. The Compton
effect radiation is backscattered from the shielding to the detector. For gamma radiation in the
range of 600–3,000 keV this backscatter area is from 180 to about 250 keV.
15.6.2.2 Operating Voltage
The crystal itself does not have a voltage applied to it. The voltage requirement is for the PMT.
This depends on the manufacturer of the PMT, and ranges from 1,000–3,000 V DC. The
remainder of the components of the system can be fed off of a 120 V AC power source. The
power supply to the entire spectrometer should be on a filtered and regulated line.
15.6.2.3 Shielding
For most applications, NaI(Tl) detectors are shielded to reduce the X-ray and gamma-ray
background from nonsample sources. However, the amount and type of shielding will depend on
the particular application. For low-level environmental sample analyses, a typical arrangement is
about a 13-cm thick lead shield (rectangular or cylindrical configuration) with its inner surfaces
lined with cadmium then copper (or a thick copper sheet) to reduce lead X-rays and backscatter
photons originating from the shield walls.
15.6.2.4 Background
Detectors have a certain background counting rate from naturally occurring radionuclides and
cosmic radiation from the surroundings and from the radioactivity in the NaI(Tl) itself. The
background counting rate will depend on the amounts of these types of radiation and on the
sensitivity of the detector to the radiations. The most significant source of background for the
sodium iodide detection system is the PMT. Thermionic noise is the spontaneous emission of
electrons from the photocathode in the PMT, leading to a final pulse. This noise results in a
background rate of about 50 cpm per cm3 of crystal over the entire energy range. However this
value is specific for each PMT used and may increase with PMT age.
Another contribution to the background can come from the PMT material itself. For low level
counting applications, a quartz PMT rather than an ordinary glass PMT will yield lower count
rates because of reduced levels of 40K and 232Th.

Quantification of Radionuclides
15-77
JULY 2004 MARLAP
Shielding can also be a source of background radiation. Old lead should be used, since the
contribution from naturally occurring 210Pb (t½ . 22 y) and its progeny will lead to bremsstrah-
lung radiation from beta decay in the energy range <100 keV. Steel processed after World War II
may contain small quantities of 60Co.
15.6.2.5 Detector Calibration
Standards used for calibration of the NaI(Tl) detector should allow all of the photopeaks to be
analyzed within a reasonable period of time (i.e., hours) and achieve less than 1 percent counting
uncertainty (for the net peak area) in each photopeak used for calibration.
For a NaI(Tl) detector, the energy calibration should be checked on a periodic basis (weekly to
monthly), using individual source energy standards (generally one radionuclide per source with
only 2-5 gamma rays). This ensures that the individual gamma ray can be seen because of the
wide energy resolution of the NaI(Tl) detector. The plot of gamma ray energy vs. channel number
should yield a linear graph over the energy range used.
15.6.2.6 Troubleshooting
The three parameters that routinely should be checked and recorded are:
• Energy calibration (keV/channel),
• Counting efficiency (count rate/emission rate), and
• Gamma-ray peak resolution (FWHM).
With the exception of a complete detector or electronic component failure (no pulses are detected
at the amplifier or PMT output), degradation of gamma-ray peak resolution will be the first
indication that a detector is not performing properly or that electronic noise has been introduced
into the counting system by electronic components, such as the pre-amplifier, amplifier, or MCA.
Any indications that the detector efficiency is not within statistical limits of expected values
should be recorded, and corrective action taken, because this is the parameter used to convert the
observed count rate to a test-source activity. The energy calibration either should be recorded
with the sample spectral data or the amplifier gain should be adjusted daily to a previously
established constant value.
Sodium iodide gamma-ray spectrometry systems are extremely sensitive to both electronic and
environmental conditions. Temperature changes can cause spectral shifts and improper nuclide
identifications because of incorrect energy calibrations. Excessive humidity in the environment
of the detection system can cause high-voltage arcing, which results in poor peak resolution or
complete system failure. Poorly conditioned NIM power can introduce electronic noise that also
will result in degraded peak resolution. Positioning and routing of cables among the detector,
electronics, MCA, computers, and monitors may be important when evaluating electronic noise.

Quantification of Radionuclides
15-78
MARLAP JULY 2004
A nonreproducible count rate sometimes may be traced back to degraded cable connections or
cracked insulation. These problems may be caused by bending, pinching, or compression of the
cable during installation, or when moving shielding for the detector.
15.6.3 High Purity Germanium
The high purity germanium detectors (HPGe) have almost completely replaced the older lithium-
drifted germanium detector. HPGe detectors have less than 1×10¹⁰ impurity atoms per cubic
centimeter of germanium. The biggest advantages of HPGe detectors is that they may be warmed
to room temperature without damaging the crystal, and the energy resolution is much improved
over the lithium-drifted germanium detectors. Crystal sizes of more than 200 cm3 can be made
that significantly improves their efficiency over older style detectors as well.
15.6.3.1 Detector Requirements and Characteristics
HPGe detectors are maintained within an evacuated metal container (usually aluminum) referred
to as the “can.” The detector crystal inside the can is in thermal contact with a metal rod called a
“cold finger.” The combination of metal container and cold finger is called the “cryostat.” The
cold finger extends past the vacuum boundary of the cryostat into a dewar flask that is filled with
liquid nitrogen. The immersion of the cold finger into the liquid nitrogen maintains the HPGe
crystal at a constant low temperature. This helps to ensure the reproducibility of the electronic
measurement as well as reduce spurious detector events (thermionic background).
In semiconductor detectors such as high-purity germanium the gamma photons produce electron-
hole pairs and the electrons are collected by an applied electrical field. Detectors may have
several different configurations and the location of the sensitive region of the detector is a
function of how the detector was prepared. A common configuration is the cylindrical form in
which the active detection region is a concentric cylinder within the entire detector crystal. This
is referred to as a coaxial configuration. Additional information on the configuration and
applications of HPGe detectors may be found at www.ortec-online.com, www.pgt.com, and
www.canberra.com. A charge-sensitive pre-amplifier is used to detect the charge produced in the
crystal, and produce an electrical pulse suitable for direct amplification. The detector pre-
amplifier usually is an integral part of the detector/cold finger assembly in order to minimize the
electronic noise and signal loss because of lengths of cable.
The output pulses from the pre-amplifier are directly proportional to the amount of energy
deposited, which could either be total and included in the photopeak, or fractional and included
in the continuum or escape peaks, in the detector by the incident photon.
Overall detector performance can be affected by count rate because reduced time constants are
required which will cause some loss of resolution. When a photon interaction takes place (an
event is detected), charge carriers in the form of holes and electrons are produced. The electrical
Quantification of Radionuclides
15-79
JULY 2004 MARLAP
field produced by the detector’s high voltage bias supply causes these carriers to be swept toward
the P (positive) and N (negative) layers of the detector. The time it takes the carriers to travel to
the electrodes is called the “charge collection time.” At very high count rates the detector contin-
ues to respond to events but the detection system may not produce reliable data. If a second (or
third) event takes place while the first set of charge carriers are still in transit, the energy from the
second event may not be recorded because of the detector insensitivity during the charge transfer
to the electrodes. This phenomenon is known as detector “dead time.” Generally the detector
dead time is small compared to the ADC dead time. The ADC dead time is larger since it is
processing and sorting all the signals from the detector. Another common event at high count
rates is two gammas interacting with the detector simultaneously, their charge pulses getting
added together, causing a sum peak. (See Section 15.6.3.3, “Troubleshooting,” for a discussion
of dead time problems.)
The description for electronic equipment associated with the HPGe detector is similar to the
descriptions for the NaI(Tl) detector. The controls on electronic noise and voltage for each
component is much more stringent for the HPGe detector.
Displayed spectra for HPGe detectors have different characteristics from the NaI(Tl) described in
the previous section. HPGe efficiencies are lower for detectors equal in size to a NaI(Tl).
However the energy resolution of the HPGe is much superior to that of the NaI(Tl). The energy
required to cross the band gap in a germanium detector is on the order of 3 eV per event
compared with 300 for NaI(Tl). Figure 15.8 shows the gamma spectrum for 22Na. The FWHM of
the gamma peaks here is about 2 keV, compared with the 60-70 keV for the NaI(Tl) detector.
This characteristic is a function of energy and the Table 15.6 identifies how the FWHM will
change for a particular detector as a function of energy.
TABLE 15.6 — Typical FWHM values as a function of energy
Energy, keV 100 600 1300
FWHM, keV 1.3 1.8 2.1
Peak-height-to-Compton ratio is another spectral parameter which is much improved for HPGe
over NaI(Tl). The value for HPGe is between 30 and 50, compared to 9 for the NaI(Tl) detector.
OPERATING VOLTAGE
The germanium detector has a voltage applied directly to the crystal as opposed to the NaI(Tl)
which has voltage applied to the PMT. The voltage for the HPGe is 1,000–5,000 V DC. The
voltage supply unit for the detector should be on a line conditioner so that small variations in line
voltage are normalized to a constant voltage. The line conditioner will also prevent power surges
to the detector crystal which could destroy or severely alter its detection capabilities.
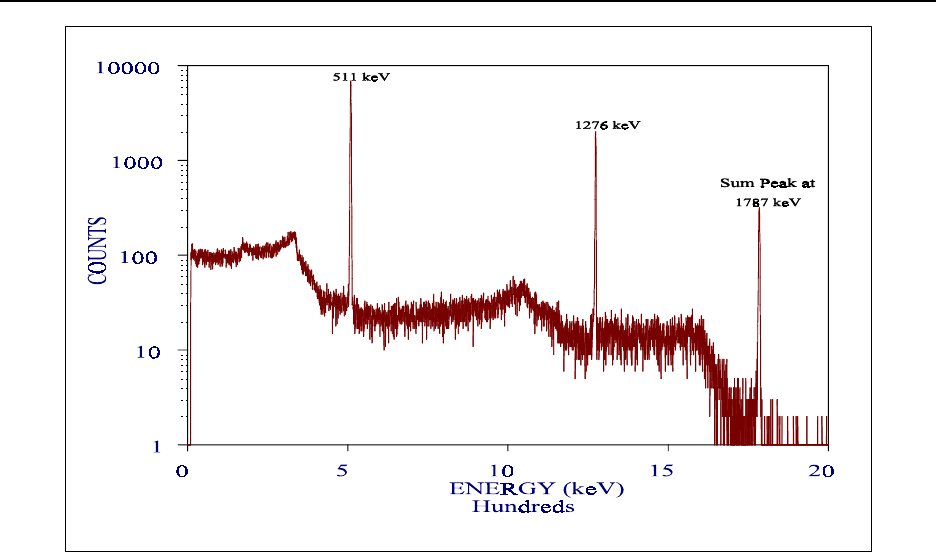
Quantification of Radionuclides
15-80
MARLAP JULY 2004
FIGURE 15.8 — Energy spectrum of 22Na
Powering up a detector needs to be performed in a controlled manner at 50-100 volts/second to
minimize shock to the detector crystal and maintain its performance (this is more critical for the
initial 500 volts). Following this powering up a short equilibration period should be allowed prior
to performing detector calibrations or QC checks. This period is somewhat detector-specific.
SHIELDING
Detectors need to be shielded from external radiation, such as naturally occurring radionuclides
emitted from building materials (particularly concrete). Shielding should be constructed of “old
lead,” and steel members should be used with caution, because steel fabricated after World War
II may contain traces of 60Co. The inner surfaces of these shields typically are lined with
cadmium then copper (or a thick copper sheet) to reduce lead X-rays and backscatter photons
originating from the shield walls.
BACKGROUND
Detectors have a certain background count rate from naturally occurring radionuclides, cosmic
radiation, and the radioactivity in the detection equipment. Because of the processing of the
germanium to remove impurities it has become a negligible source of background radiation. The
specific background gamma radiation will depend on the amounts of the nuclides present and on
the sensitivity of the detector to the specific gamma rays.

Quantification of Radionuclides
15-81
JULY 2004 MARLAP
Ideally, the material used for shielding should itself be free of any radioactive material that might
contribute to the background. In practice, this is difficult to achieve as most construction
materials contain at least some naturally radioactive species (such as 40K, members of the
uranium and thorium series, etc.). The thickness of the shielding material should be such that it
will absorb most of the soft components of cosmic radiation. This will reduce cosmic-ray
background by approximately 25 percent. Cosmic-ray interactions in lead shields will produce
lead X-rays that are shielded typically by cadmium and copper liners. Such a shield is referred to
as a “graded shield.” Six millimeters of OFHC copper also can be used to reduce the cosmic-ray
produced lead X-rays without the cadmium liner. Shielding of beta- or gamma-ray detectors with
anti-coincidence systems can further reduce the cosmic-ray or Compton-scattering background
for very low-level counting.
The gamma-ray background spectrum for a germanium detector has two specific features. The
first is the general shape of the background counts versus energy function. The shape can be
described as a 1/(Eγ), or hyperbolic. Part of this response is because of the decrease in detector
efficiency as energy increases. The second feature is the presence of a 0.511 MeV peak corres-
ponding to annihilation radiation. This is because of the interaction of high energy gamma/
cosmic radiation with the lead shielding via the pair production effect. The size of this peak
should be constant (in terms of counts per unit time) as long as radionuclides with gamma
energies greater than 1.02 MeV are not present in the sample being counted. This peak and the
general background can change under some unusual conditions (like solar flares, or the 11-year
sun spot cycle).
TEMPERATURE AND HUMIDITY
Humidity can have significant effects on the many cable connections that germanium detection
systems have. The change in moisture can affect cable connection impedance, which ultimately
can affect peak shape. The counting room should be maintained at 40-60 percent relative
humidity.
There are two separate temperature effects that can be seen. The first deals with the detector
itself. The band gap in the germanium crystal is affected by the absolute temperature, so it is
maintained at -196 EC using a cryostat. The cryostats are designed to have minimum thermal
leakage. However, each crystal responds to different cryostat temperatures from low levels of
liquid nitrogen in the dewar in which the cryostat is immersed. Many of the newer systems have
low-level monitors that alert the analyst to replenish the supply of liquid nitrogen. For those that
do not have feature, addition of liquid nitrogen to the dewar should take place routinely (usually
about every 1–2 weeks). The detector should be allowed to equilibrate for at least one hour after
the refill before it is used for analytical work.
The other temperature effect is that of the room environment on the electronics. Although the
detector and the electronics may be on a conditioned line, the instability of temperature in the

Quantification of Radionuclides
15-82
MARLAP JULY 2004
room can cause the pre-amplifier, amplifier, and ADC/PHA portions of the system to respond
erratically. The temperature of the room should be maintained in the 21–27 EC range.
15.6.3.2 Gamma Spectrometer Calibration
Most HPGe gamma-ray spectrometry systems are calibrated with mixed gamma-ray sources in a
similar matrix and with the same geometric form as the samples to be analyzed. This requires the
purchase of several different calibration sources. Commercial calibration sources of single or
mixed gamma-ray emitters in a matrix of known chemical composition and density can be
prepared in user-supplied containers. Calibrations based upon these sources can then be adjusted
to correct for any differences in composition and density between the calibration source and the
test source (Modupe et al., 1993).
Counting efficiencies are determined by measuring a known quantity of the radionuclide(s) of
interest within a similar matrix and with the same source-detector configuration as the sources
requiring analysis (NCRP, 1978; ASTM, D3649). This eliminates any effect that might be caused
by differences in standard and sample characteristics, e.g., density, moisture content, shape, and
size. Efficiency curves may be prepared for a detector by measuring a variety of standardized
sources having different photopeak energies under identical conditions as the unknown test
source (Coomber, 1975; ANSI, 1991).
MARLAP recommends that calibration data for gamma-ray spectrometry calibration be obtained
from the National Nuclear Data Center at Brookhaven National Laboratory (www.nndc.bnl.gov/
nndc/nudat/). Data required for calibration are the half-life of the radionuclide, its gamma-ray
branching ratio, and the probability of producing conversion electrons. These are readily
available for common radionuclides, including 210Pb, 241Am, 109Cd, 57Co, 58Co 141Ce, 139Ce, 203Hg,
51Cr, 113Sn, 85Sr, 137Cs, 54Mn, 88Y, 65Zn, 60Co, and 40K. For more information on gamma-ray
spectrometry calibration, see ANSI 42.14 (also see Section 16.3.1.6 on gamma calibration.)
Figure 15.9 shows an example of three different geometries that may be used for gamma
counting the same sample configuration. It is necessary to calibrate each geometry for the
detector since the distance from the detector has a significant effect on the number of photons
that intersect the detector. This relationship is more significant for geometries or shapes that are
close to the detector’s active volume.
Table 15.7 shows the efficiency of different sample container configurations for a gamma-ray
detector. The efficiencies cited are for a sample container placed in contact with the germanium
detector surface. Counting efficiencies were obtained using a 55 percent HPGe detector (55
percent relative to a NaI(Tl) detector of 7.5×7.5 cm.).
Recently, calibrations of gamma-ray detectors using computer software and sample geometry
modeling have been shown to be accurate when compared to a traditional mixed gamma ray
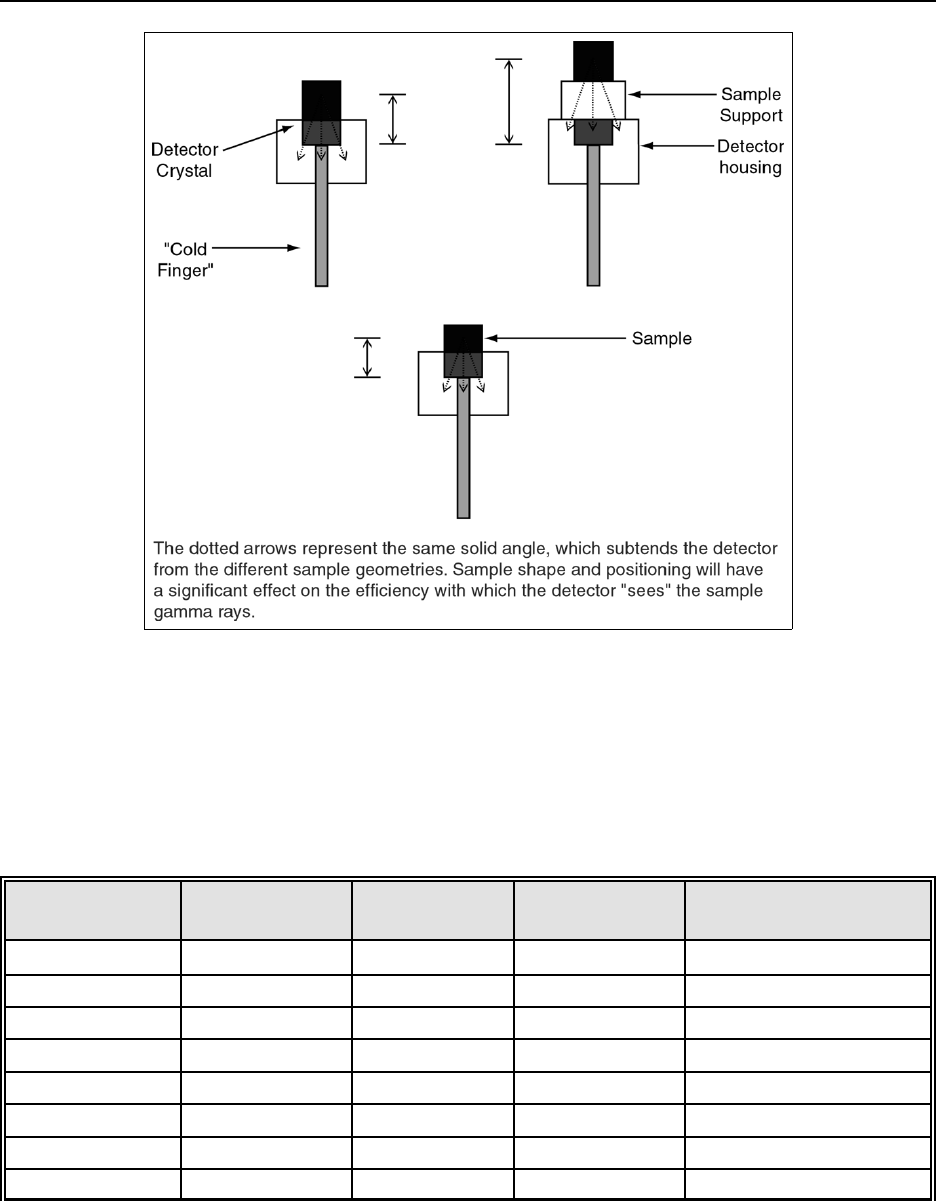
Quantification of Radionuclides
15-83
JULY 2004 MARLAP
FIGURE 15.9 — Different geometries for the same germanium
detector and the same sample in different shapes or position
source calibration (Mitchell, 1986; Hensley et al., 1997). An analytical advantage of this system
is that the analyst may be able to analyze a smaller portion of an unknown than the size and shape
used for a traditional calibration.
TABLE 15.7 — Typical percent gamma-ray efficiencies for a 55 percent HPGe detector*
with various counting geometries
Energy (keV) Filter Paper 50 cm3
Planchet
90 cm3
Al Can
600 cm3
Marinelli Beaker
60 15.6 14.6 11.6 5
88 15.2 14.2 11.3 7.4
122 15.1 12.6 10.2 8.4
166 12 9.6 8 7.9
279 9.3 7.4 6 6.1
392 7.2 5.5 4.5 4.8
514 5.4 4.2 3.5 3.8
662 4.7 3.6 3 3.1
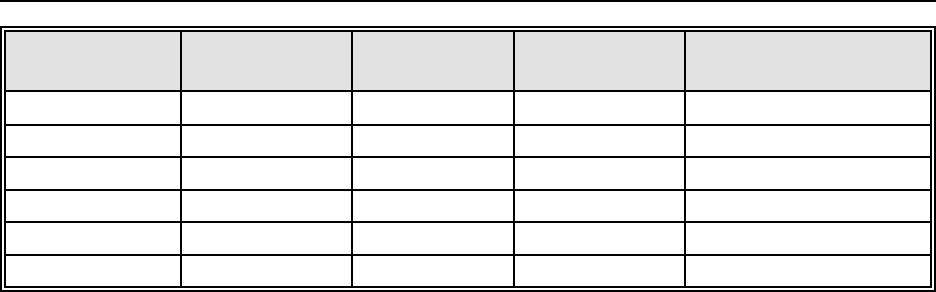
Quantification of Radionuclides
Energy (keV) Filter Paper 50 cm3
Planchet
90 cm3
Al Can
600 cm3
Marinelli Beaker
15-84
MARLAP JULY 2004
835 3.9 2.9 2.4 2.7
898 3.1 2.4 2.1 2.2
1115 3 2.3 1.9 2.1
1173 2.6 2 1.7 1.8
1333 2.3 1.8 1.5 1.6
1836 1.7 1.3 1.2 1.3
*Although the counting efficiencies listed above were obtained with a 55 percent HPGe detector, the calculation of
counting efficiencies by extrapolation for detectors with different relative efficiencies is not possible. This is
because detectors with the same relative efficiency may be of significantly different dimensions thus producing a
detector/sample solid angle very different than what was used to prepare this table.
15.6.3.3 Troubleshooting
Troubleshooting can fall into two separate arenas. One for the electronic performance of the
system and the second for interpretation of the gamma-ray results. The former usually involves
the assessment of routinely measured parameters and careful examination of the system hardware
when measurements are out of the norm. The latter involves a more fundamental understanding
of the interactions of radiation with matter and detectors, and may require deductive reasoning.
ELECTRONIC MECHANICAL EFFECTS
Gamma-ray spectrometry systems have many parameters that should be monitored routinely to
establish the characteristics of the system. The following should be monitored on an appropriate
frequency (as discussed in Section 18.5.6 of Chapter 18, Laboratory Quality Control):
• Peak centroid of standards vs. channel number;
• FWHM of peaks for at least three energies over the range of 100–2,000 keV; and
• Detector efficiency of a separate source (not the calibration source) with energies at high and
low keV values.
These parameters form the basis for identifying problems with the detection system. Some
examples of how these parameters are used to determine the cause of problems are listed here:
• FWHM of 1,173 keV peak normally is 2.0 keV and now is 3.0 keV. Peak broadening can be
a sign of low liquid nitrogen level in the dewar or warming of the cryostat. This type of effect
can occur when cryostat refills are based on routine, without consideration for sudden
changes in ambient temperature.
• Centroid of 662 keV peak has continued to shift steadily towards lower channel numbers:

Quantification of Radionuclides
15-85
JULY 2004 MARLAP
The spectroscopy amplifier may be aging and needs replacement.
• Spectrum collection appears erratic (stop and go): Moisture condensation on cable
connections can be creating variable impedance problems. Check room humidity.
• Low energy “pile-up” on a quality-control or background count appears higher than normal:
Room temperature may have increased causing an increase in thermionic/electronics noise.
• Efficiency of 121 keV peak is consistent but lower than normally expected for several days in
a row. Look at the test-source positioning method used in the system. Often the same detector
uses plexiglass sample platforms and Marinelli beakers without the platform. If the test-
source platform has not been repositioned the same as it was for the calibration source
(considering that rotational positions on the detector surface are different), efficiency will be
affected.
RANDOM AND COINCIDENCE (CASCADE) SUM PEAKS
At high count rates, random sum peaks may occur. Two gamma-ray interactions may occur
within the resolving time of the detector and electronics and are summed and seen as one pulse.
For a detector of resolving time, t, and a count rate of A counts per unit time, the time window
available for summing is 2At (since the count summed could occur as early as t before or as late
as t after the other count) and the probability of another count at any time is simply A. Therefore,
the sum count rate will be 2A2t in unit time. Random summing is strongly dependent on the
count rate A. If summing occurs, it can be reduced by increasing the sample to detector distance.
Therefore, if a 2,000 keV event arrives while a 1,000 keV event is in transit, the detector would
see a single 3,000 keV event, producing a random sum peak, and not recording counts for the
individual 2,000 and 1,000 keV gamma events. When the detector starts reporting more sum
peaks than valid events, you have exceeded its count rate capability. Random pulse summing or
pulse pileup can also cause peak shape and risetime problems. But the real upper limit to a
detector throughput is pulse summing. This problem can be reduced or eliminated by reducing
the number of events the detector sees (by moving the sample further away), collimating the
sample, or using a smaller, less-efficient detector (the smaller the detector the shorter the charge
collection time, which means a higher count rate limit). Modern electronics, both conventional
analog and digital (pre-amplifiers, amplifiers, and analog-to-digital converters) are capable of
processing 100,000 cps without any significant loss of peak resolution. This is because of the
very short time constants (resolving time) these systems are capable of producing. Peak shifts
also may occur with high count rates and short time constants.
Well counters that have very high efficiencies are prone to summing, because for a given source
strength, the count rate is higher than for a detector of lower efficiency. For moderate and high
source strengths, the trade-off is a poor one; the well counter is best suited for low-level work
where its high efficiency is an important advantage.

Quantification of Radionuclides
15-86
MARLAP JULY 2004
Cascade summing may occur when nuclides that decay by a gamma cascade are counted. In this
instance, a radionuclide in an excited state emits a gamma ray and de-excites to a lower energy
level. The lifetime of the lower energy level is so short that the emission of a subsequent gamma
ray from that state is anisotropic with respect to the first emission (the nuclear relaxation time
between events is too short, and the gamma rays are emitted in the same direction from the
nucleus). The second gamma ray is seen by the detector in the same timeframe as the first gamma
ray. Co-60 is an example; 1,173.2 keV and 1,332.5 keV from consecutive, excited state, decay
events may interact with the detector simultaneously, giving a 2,505.7 keV sum peak. Another
example of cascade summing occurs when counting 22Na close to the detector (Figure 15.8). The
positron emitted by 22Na creates a 511 keV gamma ray. When this gamma ray interacts with the
detector in the same time frame as the emitted gamma ray following the positron emission, a
1,786 keV sum gamma ray is observed (511 + 1,275 keV). Cascade summing may be minimized
by increasing the source-to-detector distance
ESCAPE PEAKS
Gamma-ray interaction with solid materials results in pair production formation (β+ and β-) when
the energy of the incident gamma is greater than 1,022 keV. However, the β+ particle can create
certain artifacts by the way it interacts with matter. Once formed, the β+ has a very short lifetime.
It loses all of its kinetic energy to detector electrons in a time frame commensurate with the
original event. When the β+ particle annihilates it forms two 511 keV gamma rays. If both of
these gamma rays escape the detector without interacting, a peak 1,022 keV lower than the FEP
is seen. Sometimes only one of the gamma rays will escape the detector, and a peak at 511 keV
lower than the FEP is realized. These two artifacts are referred to as double and single escape
peaks, respectively.
The size of these peaks relative to the FEP is dependent only on the detector material and no
other characteristics. The ratio to the FEP is constant and thus these peaks are usually only seen
after very long count times or with very high activity samples.
MULTIPLETS AND INTERFERING GAMMA RAYS
A distinct advantage of using an HPGe detector is that it may be possible to analyze a sample for
gamma emitters without radiochemical separation steps. This is possible because of the better
resolution (FWHM) of the gamma-ray spectrometry system and the improvement in software,
which can resolve gamma-ray peaks within a few keV of each other. For example, using a HPGe
detector spectrometry system, the 1,115.5 keV photopeak of 65Zn easily can be resolved from the
1,120.5 keV photopeak of 46Sc. However, difficulties arise in quantifying the area under each
photopeak when the two photopeaks are not separated by more than an energy differential
equivalent to the FWHM peak resolution at that energy. When the differential of two gamma-ray
energies is less than twice the FWHM, a single composite peak (wider than normal) may be
observed in a spectrum. The composite peak is known as a “doublet” or “multiplet.” The

Quantification of Radionuclides
15-87
JULY 2004 MARLAP
resolution and quantification of photopeaks of a multiplet requires special software subroutines.
In the previous example with 65Zn and 46Sc, a 214Bi photopeak at 1,120.3 keV would form a
multiplet peak with the 1,120.5 keV 46Sc photopeak because the difference between the gamma-
ray energies is less than the FWHM at 1,120 keV. In this example, a sufficient quantity of 214Bi
would generate an interfering gamma-ray photopeak for the 46Sc photopeak, the analyte of
interest. If an interfering gamma-ray peak is present, the analyst can employ one of three things:
• Find an alternate gamma line for the radionuclide where no interfering gamma ray exists;
• Allow the activity of the interfering gamma ray to decay (if it is shorter-lived) and then count
the radioisotope of interest; or
• Perform radiochemical separation.
Many radionuclides emit more than one gamma ray. However, each gamma ray may not be
emitted with each radionuclide decay event. This fraction of time that a gamma ray is emitted
may be known as the fractional abundance or branching ratio. When a gamma ray is used to
identify a radionuclide, and the radionuclide has other gamma rays that it emits, these other
gamma rays should be present in the gamma ray spectrum (corrected for efficiency) in the same
fractional ratio for the theoretical case. If this is not the case, then an interfering gamma ray may
be present. For example, a gamma ray is found at 241 keV and potentially identified as 88Kr. The
fractional abundance of this line is 0.003. Kr-88 also has a gamma ray at 196 keV with a fraction-
al abundance of 0.26. If this gamma ray is not present, or not present in the correct ratio, then an
interfering gamma most likely exists. In this particular instance a likely candidate is 214Pb (241.9
keV).
SPECTRUM DEGRADATION
Troubleshooting gamma ray spectra problems can be difficult. Gamma ray shape and positioning
are the key characteristics that help to identify problems. The shape of a gamma-ray photopeak
may appear to be Gaussian. However, it is best described by three different curves. A low-energy
exponential, a middle Gaussian (about the centroid), and a high energy exponential (more drastic
drop in events per energy than the low energy exponential). Upon close examination, the true
gamma-ray peak will always appear to be “leaning” towards the low energy end. Listed here are
some parameters that when changed cause specific effects that may be easily corrected. Some of
these effects may take place during a sample count. If this happens, the effects may be more
difficult to sort out.
Temperature. Changes in room temperature will affect the electronics for the amplifier and MCA
units. The most common effect that can be seen from this is that the FWHM of the peak will
increase (the peak will upon close up examination appear to be a true Gaussian). Usually this is
most pronounced when the room temperature increases more than 3-4 EC. Maintaining the count
room at a constant and moderate temperature will avoid this problem.
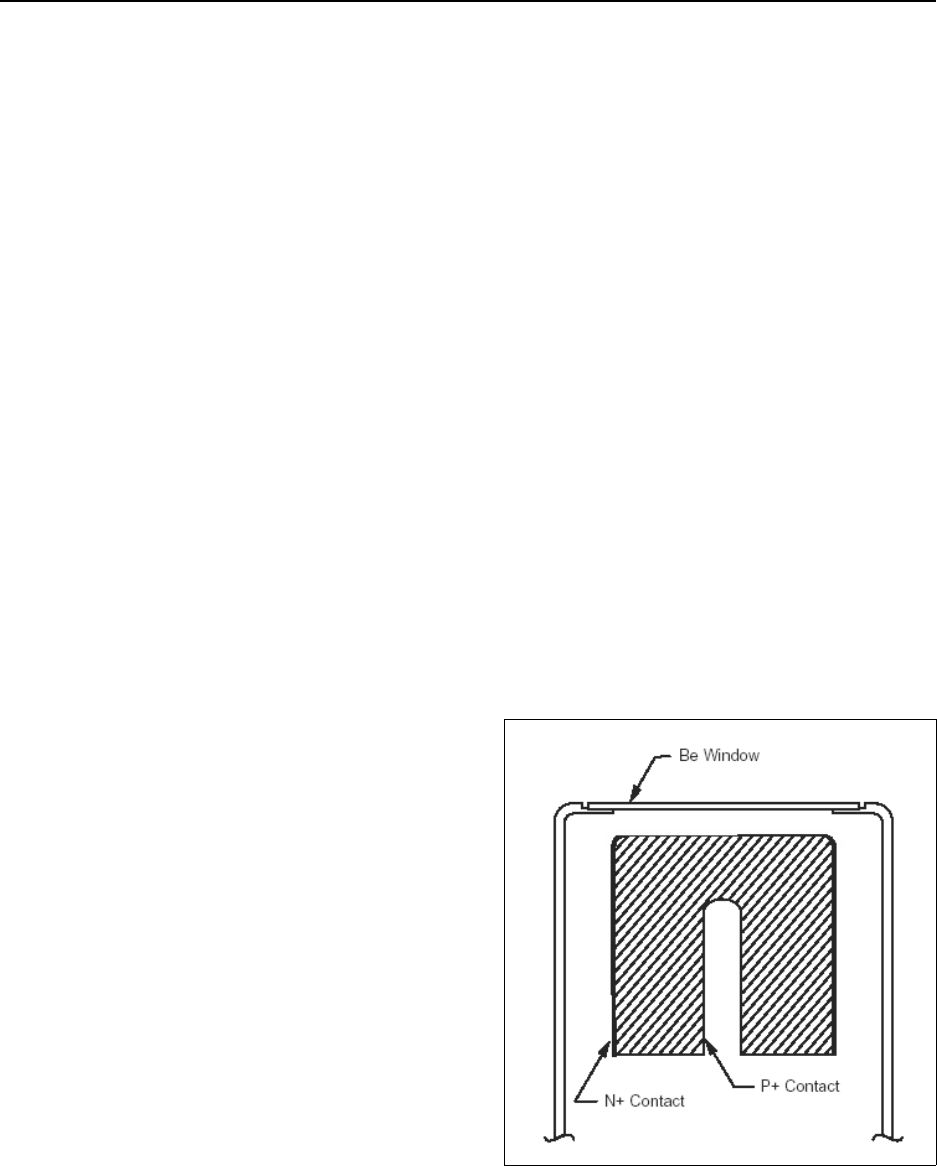
Quantification of Radionuclides
15-88
MARLAP JULY 2004
FIGURE 15.10 — Extended range coaxial
germanium detector
Humidity. Moisture within the gamma-ray detection system results from condensation on
connectors. This can have irreproducible effects, because the heat generated by the electronics
can cause the condensed moisture to evaporate. A common effect observed, which is related to
humidity, is an irregular peak shape. A test or calibration source known to have only one gamma
ray may appear to be a multiplet if humidity is effecting the system.
Voltage shifts. Changes in the 120 V AC power to the high-voltage power unit, which are not
compensated for by a line conditioner, will cause the peaks to move. Thus gamma rays may
appear at energies several keV different from where they are expected. The software will identify
the gamma rays as radionuclides, but they will be unfamiliar to the analyst. This is the key to
check line voltage changes. This may or may not cause a change in the FWHM since voltage
changes may only occur at discrete times (the so called “5 o’clock effect”).
Low Liquid Nitrogen. Gamma-ray FWHM will begin to increase and the low-energy pile up
pulse rate will increase. The obvious fix is to add more liquid nitrogen to the dewar. However, if
this happens unexpectedly (i.e., in between normal fillings), cryostat integrity or thermal contacts
should be checked.
Vibration. High frequency vibration can establish electronic variations in the signals between the
amplifier and ADC. One common effect is that the FWHM of the peaks will increase. Another
effect is that “new” peaks that do not correspond to known radionuclides may appear. The
vibration may be transmitted to the preamplifier/amplifier through the detector shielding or
through the cryostat. Dampeners such as foam or rubber may help to reduce this problem.
15.6.4 Extended Range Germanium Detectors
The extended-range germanium detectors are
constructed slightly differently than the normal
HPGe coaxial detectors. Normally, the lithium-
diffused junction (which is on the outside surface
of the crystal) is about 0.5–1.5 mm thick. Also,
these detectors will be encased in an aluminum
detector housing. The combination of these two
factors effectively shields the sensitive area of the
detector from gamma rays with energies below
about 40 keV. The extended range detector is a
coaxial germanium detector having a unique thin-
window contact on the top surface and a thin
beryllium cryostat window, which extends the
useful energy range down to 3 keV. The physical
characteristics of the extended-range detector are
shown in Figure 15.10.

Quantification of Radionuclides
15-89
JULY 2004 MARLAP
15.6.4.1 Detector Requirements and Characteristics
The FWHM of this detector at 22 keV ranges from 0.7 (for a low efficiency detector) to 1.2 keV
(for the higher efficiency detectors). The beryllium window allows for the passage of the low-
energy gammas ray to the active detector area. This makes the handling of samples at the detector
surface very important. It also means that if the sample container has a higher Z value than
beryllium, the container may provide more shielding from gamma rays than the detector window.
Voltage requirements of the detector are similar to the HPGe detectors, and are specified by the
manufacturer. The shielding requirements for this type of detector will be the same as for the
standard coaxial detector. It is important to note, however, that since the range is extended into
the X-ray region of elements down to aluminum, it would not be unrealistic to see X-rays from
the interaction of sample gamma rays with materials of construction of the sample container, etc.
Similarly, the total background at low energies will be affected significantly, because the detector
window will allow a greater number of photons to reach the detector surface (as beryllium does
not shield as much as the traditional aluminum detector barriers). This also means that the ADC
dead time may increase significantly because of the increased number of photons being processed
by the system. Dead time increases should be monitored closely, because they will affect the
quality of the peak shapes. Temperature and humidity considerations for these type detectors are
similar to those of the standard HPGe detectors.
15.6.4.2 Detector Calibration
Calibration of extended-range germanium detectors is the same as for normal coaxial germanium
detectors (Section 15.6.3.2, “Gamma Spectrometer Calibration”). However, since the active area
allows quantification of gamma rays down to about 3 keV, additional gamma emitters with peaks
in the range of 60 down to about 5 keV need to be used to perform calibration. One of the
radionuclides that can serve this purpose is 109Cd, which has a gamma peak at 88 keV and silver
Kα X-rays (the electron capture decay converts the cadmium nucleus to a silver nucleus before
the electron cascade) at 22 keV. One of the important characteristics of the detector is that the
ratio of the 22 to 88 keV peak intensities should be about 20:1 for a properly operating system.
Figure 15.11 shows a calibration curve for the extended range compared to the normal coaxial
detector. The extended range detector has a discontinuity at 11 keV because of the germanium K-
shell absorption edge.
Coincidence summing of X- and gamma-rays emitted from certain radionuclides should be
considered during detector calibration. In many cases, radionuclide-specific calibrations are
required, because coincidence summing effects for certain radionuclides having high X-ray
emission rates produce lower than expected efficiencies for the gamma-ray energy.
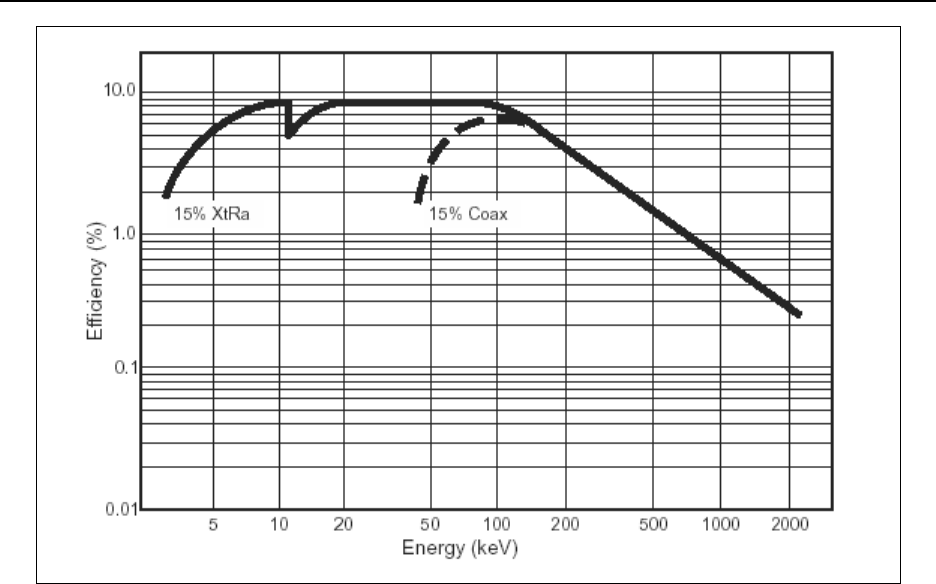
Quantification of Radionuclides
15-90
MARLAP JULY 2004
FIGURE 15.11 —Typical detection efficiencies comparing extended range with a normal
coaxial germanium detector
15.6.4.3 Troubleshooting
Troubleshooting information in Section 15.5.3.3 (“Detector Calibration”) applies to this detector
as well. It should be noted, however, that because an extended range of energies is available,
additional random sum peaks may be encountered that will be close in energy to the principal
gamma rays. For example, if the source has 60Co (1,332 and 1,173 keV peaks) and 109Cd (22 keV
peak) present, at high count rates additional peaks may be observed at 1,354 and 1,195 keV.
15.6.5 Special Techniques for Radiation Detection
15.6.5.1 Other Gamma Detection Systems
A variety of other methods and detectors are in use to analyze gamma radiation. Although they
do not find general use in the analytical community, they are noted here.
OTHER GERMANIUM DETECTORS
The low-energy germanium (LEGe) detector has a thin beryllium window and a small detector

Quantification of Radionuclides
15-91
JULY 2004 MARLAP
volume. The intent is to focus on the gamma-ray energies in the 10–200 keV range. The small
volume reduces the efficiency to higher energy gamma rays allowing good resolution of low-
energy gamma rays.
The reverse electrode germanium (REGe) detector changes the positioning of the N- and P-type
materials on the detector crystal. The P-type material is on the outer periphery of the crystal
where the significant interaction of the gamma rays with the crystal occur. This P-type junction is
less susceptible to radiation damage. Thus, the REGe is best suited for high activity samples.
MIXED ELEMENT DETECTORS
Bismuth germanate (Bi4Ge3O12, or BGO) is a very effective gamma-ray absorber because of the
high average Z value from the bismuth. A BGO detector acts similarly to a scintillation detector
but has only about 15 percent of the efficiency of a comparable size NaI(Tl). Its advantage over
the NaI(Tl) detector is that it is nonhygroscopic and shock insensitive. Its major use is for when a
high photopeak fraction needs to be measured (i.e., it yields a high peak-to-Compton ratio).
Cesium iodide crystals have the highest light output of all known scintillators. However because
light output is not well matched to the sensitivity of the photocathode of PMTs the yield for
gamma rays is only about 45 percent of the NaI(Tl) type detectors.
Cadmium-zinc-telluride detectors do not have energy resolutions as good as HPGe, but are better
than NaI(Tl) detectors. Their biggest advantage is their ability to operate at room temperature.
Generally they are used for high activity sources since their size is generally small.
15.6.5.2 Coincidence Counting
In coincidence counting, two or more radiation detectors are used together to measure the same
test source, and only those nuclear events or counts that occur simultaneously in all detectors are
recorded. The coincidence counting technique finds considerable application in studying radio-
active-decay schemes, but in the measurement of radioactivity, the principal uses are for the
standardization of radioactive sources and for counter background reduction.
Coincidence counting is a very powerful method for absolute disintegration rate measurement
(Friedlander et al., 1981; IAEA, 1959). Both alpha and beta emitters can be standardized if their
decay schemes are such that β–γ, γ–γ, β–β, α–β, α–γ, or α–X-ray coincidence occur in their
decay. Gamma-gamma coincidence counting with the source placed between two sodium iodide
crystals, is an excellent method of reducing the background from Compton scattered events. Its
use is limited, of course, to counting radionuclides that emit two photons in cascade (which are
essentially simultaneous), either directly as in 60Co, by annihilation of positrons as in 65Zn, or by
immediate emission of a gamma ray following electron capture decay. Non-coincident pulses of

Quantification of Radionuclides
15-92
MARLAP JULY 2004
any energy in either one of the crystals will be canceled, including cosmic-ray photons in the
background and degraded or Compton scattered photons from higher energy gamma rays in the
test source. Thus, the method reduces interference from other gamma emitters in the test source.
When two multichannel analyzers are used to record the complete spectrum from each crystal,
singly and in coincidence, then the complete coincident gamma-ray spectrum can be obtained
with one measurement. The efficiency for coincidence counting is low since it is the product of
the individual efficiencies in each crystal, but the detection limit is generally improved because
of the large background reduction (Nielsen and Kornberg, 1965). This technique is often referred
to as “two-parameter” or “multidimensional” gamma-ray spectrometry.
Additional background improvement is obtained if the two crystals are surrounded by a large
annular sodium iodide or plastic scintillation crystal connected in anti-coincidence with the two
inner crystals. In this case a gamma ray that gives a pulse, but is not completely absorbed in one
of the two inner crystals, and also gives a pulse in the surrounding crystal, is canceled electroni-
cally (Perkins, 1965; Nielsen and Kornberg, 1965). This provides additional reduction in the
Compton scattering background. Germanium detectors may be used in place of the inner sodium
iodide crystals for improved resolution and sensitivities (Cooper et al., 1968). An example of an
assay for plutonium content using passive thermal-neutron coincidence counting is given in
ASTM C1207. Another example of passive thermal-neutron coincidence counting using a
moveable californium source is given in ASTM C1316.
Coincidence counters normally are employed in radioanalytical laboratories for special purposes:
• For low-level measurements when the sensitivity of a beta- or gamma-counting system is
inadequate,
• When spectrometric applications are needed to discern the emissions from several isotopes
whose activities are very small; or
• For the standardization of radioactive sources by absolute counting (coincidence means).
Beta-gamma coincidence counting systems have been developed for the low-level measurement
of 131I in milk samples (McCurdy et al., 1980; Paperiello and Matuszek, 1975). The β-γ coinci-
dence counting system reported by McCurdy et al. (1980) consisted of a 25.4 mm diameter, 1
mm thick Pilot B plastic scintillator optically coupled to a photomultiplier tube by a 12.5 mm
plastic light pipe. The beta detector PMT was contained in an aluminum housing that inserted
into a 100 × 100 mm NaI(Tl) well gamma-ray detector. The beta-gamma detectors were shielded
by 100 mm of lead. The outputs from both detectors were coupled to separate timing single
channel analyzers (TSCA) that produced fast positive digital logic output pulses when a detector
signal satisfied the SCA voltage (energy) window. Since the decay time of the voltage pulse from
the plastic scintillator detector is faster compared to a NaI detector pulse, the logic pulse of the
beta scintillator was delayed by 200 ns. A coincidence pulse analyzer and a scaler were used to
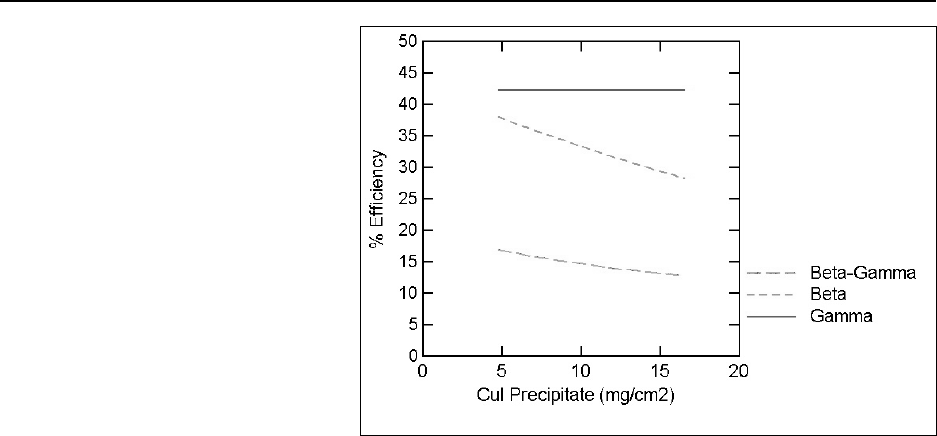
Quantification of Radionuclides
15-93
JULY 2004 MARLAP
FIGURE 15.12 — Beta-gamma coincidence efficiency curve
for 131I
detect and record the coincident
beta and gamma events from the
detected decay emissions of 131I.
The coincidence counting system
had a β-γ coincidence background
for 131I of 0.00045 cps (0.027 cpm)
and a detection limit of 0.4 pCi/L
for a 1,300 second counting
interval. Figure 15.12 shows the
detector efficiency plots for a beta-
gamma coincidence counting
system (McCurdy et al., 1980).
A α-γ coincidence counting system
for the alpha emitting isotopes of
radium has been reported by
McCurdy et al. (1981). The same β-
γ coincidence counting system used for the 131I application was also used for the analysis of 228Ra
but the gamma-ray window was set for the gamma-ray photopeak for 228Ac, the short-lived decay
product of 228Ra. For the α-γ coincidence counting application, the timing of output pulses of the
TSCAs was changed to accommodate the long decay time of the alpha voltage pulse generated
from the ZnS(Ag) alpha scintillator positioned next to the beta detector. The radium was
coprecipitated with BaSO4 and powdered ZnS(Ag) added to the final precipitate to form a 4π
alpha detector. The Pilot B plastic scintillator was found to be transparent to the wavelength of
the ZnS(Ag) light output. The gamma TSCA energy window was set for the 186 keV line of
226Ra. The α-γ coincidence background was essentially zero for the 186 keV window over days to
a week counting interval.
15.6.5.3 Anti-Coincidence Counting
Substantial background reduction can be achieved in beta and gamma counters by surrounding or
covering the test-source detector with another detector also sensitive to beta or gamma radiation,
and connecting them electronically so that any pulse appearing in both detectors at the same time
is canceled and not recorded as a count. This is referred to as anti-coincidence shielding, and is
used for obtaining very low backgrounds. This type of counter was used for many years in
directional studies of cosmic rays, and was first applied to reducing the background of beta
counters by Libby (1955) in his study of natural 14C. The thick metal shielding (lead or iron)
ordinarily used to reduce cosmic-ray and gamma-ray background should also be present, and is
placed outside the anti-coincidence shielding.
Anti-coincidence shielding of gamma-ray detectors operates in a similar way, and is particularly
useful in reducing the Compton continuum background of gamma rays (Nielson, 1972). Gamma

Quantification of Radionuclides
15-94
MARLAP JULY 2004
rays that undergo Compton scattering and produce a pulse in both the detector and the anti-
coincidence shield are canceled electronically. Ideally, only those gamma rays that are completely
absorbed in the test-source detector produce a count that is recorded with the total energy of the
gamma ray (FEP). There are second-order effects that prevent complete elimination of Compton
scattering, but the improvement is substantial (Perkins, 1965; Cooper et al., 1968).
15.7 Specialized Analytical Techniques
Certain methods employing analyte detection techniques other than nuclear-decay emissions have
been successfully used for the measurement of medium to long-lived radionuclides. Two of the
three methods to be described determine the number of atoms or the mass of the radionuclide(s)
of interest. The other method involves neutron activation of a limited number of the long-lived
nuclides. As a result of the unavailability of a neutron source, neutron activation analysis is
typically outside the capability of most radioanalytical laboratories.
15.7.1 Kinetic Phosphorescence Analysis by Laser (KPA)
Lasers can be used to excite uranium (ASTM D5174) and lanthanide complexes in solution.
During or following excitation, the complex relaxes to a lower energy state by emitting photons
of light that can be detected. The amount of light produced is proportional to the uranium or
lanthanide element concentration.
The emitted light can be either fluorescence or phosphorescence. In either case, the detector is at
right angles to the laser excitation. Fluorescent light is emitted immediately following (<10-4 sec)
the excitation of the complex. With phosphorescence, however, the emitted light is delayed,
following the excitation. This enables the light source to be pulsed and the measurement to occur
when the laser source is off, thus providing improved signal-to-noise over fluorescence. The light
signal from organic material will decay promptly (since they have a relatively short lifetime) and
will not be available to the detector, which is gated off. A pulsed nitrogen dye laser (0.1 to 0.5
mW range) often is used as the source, but other lasers can be used. Chloride and other ions can
cause interference and may need to be removed before measurement.
KPA measures the rate of decay of the uranium or lanthanide characteristic energy. Measure-
ments are taken at fixed time intervals. In aqueous solution, the uranium or the lanthanide
element is complexed to reduce quenching and increase the lifetime of the complex.
An excellent reference describing the theoretical and functional aspects of a KPA unit and its
application to the measurement of the uranyl ion in aqueous solutions has been written by Brina
and Miller (1992) The authors reported a detection limit for UO2
+2 in aqueous solutions as 1 ng/L
and a linear response from the detection limit to 5 mg/L. Experiences using a KPA unit for a
variety of matrices that include water, urine, dissolved air filters, stack scrubber samples, soil,

Quantification of Radionuclides
15-95
JULY 2004 MARLAP
nuclear fuel reprocessing solutions and synthetic lung fluid were also reported. Matrices other
than water may require dilution, preliminary sample dissolution and/or possibly chemical
processing before analysis by a KPA unit. Consideration should be given to ensuring that the
chemical yield for such processes is quantitative. Standard addition with internal standards may
be needed for certain complex matrices.
There are several types of interferences that should be considered when using this method. The
interferences can be differentiated into five categories: light absorption agents, such as yellow
solutions and ferric iron; lumiphors, such as oils and humic acid; quenching agents, including
alcohols, halides (except fluoride), and certain metals; competing reactions; and HCl. Chlorides
interfere in the analysis by quenching the uranyl phosphorescence. Chemical interferences must
be removed or their concentration reduced significantly by dilution to avoid inaccurate results.
KPA can be used to measure total uranium in water at concentrations greater than 0.05 µg/L
(0.05 ppb). Samples above the KPA dynamic range of about 400 ppm can be diluted with dilute
HNO3 (1+19) prior to analysis. For the ASTM D5174 method, a 5 mL sample aliquant is pipetted
into a glass vial, concentrated HNO3 and H2O2 are added and the solution heated to near dryness.
The residual is dissolved in 1 mL of dilute nitric acid, diluted with 4 mL of H2O and a
complexant is added. The 5 mL sample is analyzed by the KPA unit. Some reagents may have
relatively short shelf life and need to be ordered accordingly. An interlaboratory study conducted
for ASTM D5174 measured bias under 0.5 percent and between-laboratory precision (six
laboratories) of 12 percent at a testing level of 2.25 ppb. For an individual laboratory, the relative
precision was found to be about 4 percent at this level.
An automated KPA has also been applied to monitor uranium in stack filters and probe washes at
a nuclear facility (Mann et al., 2002). The KPA was adapted to incorporate an automatic sampler
and syringe pump permitting the unattended analysis of 60 samples. Methods were developed to
eliminate interferences from inorganic and organic compounds. The reported detection limit was
better than 1 ppb. Typical precision was about 5 percent.
Ejnik et al. (2000) have reported using KPA for the determination of uranium in urine. In this
application, the researchers processed 10 mL of urine by successive and multiple dry (450 EC for
4 hours) and wet (HNO3 and H2O2) ashing treatments prior to sample analysis. A detection limit
of 50 ng/L and an observed concentration range between 110 and 45,000 ng/L were reported for
this application.
15.7.2 Mass Spectrometry
Mass spectrometry is being used more frequently for the analysis of medium- to long-lived
radionuclides. There are three types of mass spectrometers being used today for the radioanalyti-
cal applications including radiobioassay, process and waste stream characterization, effluent
analysis and environmental sample analyses. The most readily available mass spectrometer for a

Quantification of Radionuclides
15-96
MARLAP JULY 2004
radioanalytical laboratory is an inductively coupled plasma-mass spectrometer (ICP-MS). Some
of the various ICP-MS units commercially available include single- and multi-collector
magnetic-sector ICP-MS and quadrupole ICP-MS. These bench-top units are commercially
available at a reasonable price. The other two types of mass spectrometers (accelerator mass
spectrometers and thermal ionization mass spectrometers—see Sections 15.7.2.2 and 15.7.2.3)
typically are found at national laboratories and universities or institutes, are expensive, and
require special facilities including a clean-room environment for certain applications. Instrument
descriptions and application references for mass spectrometry can be found in several sources
(McDowell, 1963; Date and Gray, 1989; Platzner, 1997; de Laeter, 2001).
Time-of-flight plasma mass spectrometers have just recently appeared on the market. They have
not yet compiled a historical record of performance that would permit reliable comparison with
the ICP-MS. Similarly, Fourier-transform mass spectrometers are primarily used for research and
cannot yet be considered practical for routine radiochemical analysis.
15.7.2.1 Inductively Coupled Plasma-Mass Spectrometry
ICP-MS is one of the most versatile and sensitive atomic spectroscopy techniques available. It
can be used to determine the concentrations of over 70 elements. The detection limit of the
technique extends down to the parts-per-billion range in soils and to the parts-per-trillion range in
waters. This sensitivity makes ICP-MS an attractive complement to nuclear-decay emission-
counting techniques in the radiochemical analysis laboratory. General references describing ICP-
MS instrumentation, advantages and limitations of the methodology, and the potential
applications of ICP-MS to radionuclide measurements include Date and Gray (1989), Platzner
(1997), ASTM (STP1291), ASTM (STP1344), and Ross et al. (1993).
For very long-lived radionuclides (those with half-lives over 10,000 years, e.g., 234/235/238 U,
239/240/244Pu, 99Tc, 129I, 237Np), ICP-MS may be faster and more sensitive than nuclear-decay
emission analyses. In addition, sample preparation for ICP-MS can avoid some of the analyte
separation and purification steps required for nuclear-decay emission analyses, providing an
additional dimension of time savings. Another important feature of ICP-MS is its ability to
provide isotopic distribution information (e.g., 238U vs. 235U and 239Pu vs. 240Pu). This information
is frequently useful in determining the age or origin of materials (ASTM C758, C759, C799).
Typically, ICP-MS can typically detect femtograms (10-15 g) of a nuclide. Depending on the
nuclide and required detection limit, the radioanalytical front-end chemistry may have to be
conducted in a clean room or clean hood environment. In addition, high purity reagents may be
required for certain radionuclides (e.g., uranium isotopes).
For more sophisticated measurements, at substantially higher cost, an ICP-MS with magnetic
sector, instead of quadrupole detection can be applied. Sector instruments are capable of resol-
ving species of very similar mass. For example, 99Tc might be resolved from a contamination of
99Ru with a high-resolution mass spectrometric detector. More typically, high resolution instru-

Quantification of Radionuclides
15-97
JULY 2004 MARLAP
ments are employed for their higher signal/noise ratio, and therefore superior detection limits.
The isotopic discrimination capabilities of ICP-MS make possible the calibration technique
known as isotope dilution. In this procedure, a sample is analyzed for one isotope after having
been spiked with a different isotope of the same element (e.g., analysis of 235U might involve
spiking with 233U). The spiked sample is carried through all preparation and analysis steps; in this
way, any matrix or procedural effects that might influence the 235U signal will influence the 233U
signal to precisely the same extent. Final quantification relies on measuring the ratio of unknown
(here the 235U signal) to the known (233U) signal. Isotope dilution is a way of generating highly
precise and accurate data from a mass spectrometer and has been used in the characterization of
many certified reference materials.
For environmental sample analysis, the elements or radionuclide of interest are normally concen-
trated and isolated chemically. However, for the measurement of uranium in ground and surface
water, where the natural levels may be much greater than the instrument’s detection limit, the
samples may be diluted and then analyzed under certain conditions. Currently, there are two
ASTM methods for the analysis of 99Tc, 230Th, and 232/234/235/238U in soils, C1310 and C1345.
Natural background uranium concentrations in soil is between 3 and 5 µg/g in most geographical
regions. The background thorium concentrations are slightly higher. The detection limits for
uranium and thorium by the C1345 method are well below the background concentrations of
these elements. The method described in C1310 has reported detection limits in soil for 99Tc,
230Th and 234U as 12, 4, 0.7 Bq/kg, respectively. In addition, Uchida and Tagami (1999) proposed
a rapid separation method using an extraction chromatographic resin for 99Tc in sea- and ground
water that has a detection limit of 0.3 mBq/L for 2 L samples. They also reported an ICP-MS
method for the analysis of 99Tc in soil that was used to measure the 99Tc levels from worldwide
fallout at concentrations of 5–30 mBq/kg dry (Tagami and Uchida, 1999). Ihsanullah and East
(1993) published methods for the analysis of 99Tc by ICP-MS for environmental media including
water, soil, and marine algae with an ICP-MS detection limit of 0.004 ppb (2.52 mBq/mL).
ICP-MS has been used to analyze 239Pu and 240Pu in ocean sediment (Petullo et al., 1994). The
analysis involved dissolution of a 20 g sample, followed by precipitation of the actinides,
dissolution of the precipitate, and anion exchange for Pu isolation. A 242 Pu tracer was used for
the chemical yield determination. Reported detection limits for 239Pu and 240Pu were 30 mBq/kg
and 80 mBq/kg, respectively.
More recent environmental applications include the analysis of nuclides with intermediate half
lives, including 90Sr (Taylor et al., 2002) and 226Ra (Kim et al., 1999; Lariviere, et al., 2002) in
environmental media, and 135/137Cs (Epov et al., 2002) in waste waters. Lariviere et al. (2002)
reported for 226Ra a detection limit of 7.4 Bq/L (0.2 nCi/L) without elemental pre-concentration
methods to remove interferences and 0.2 pg/L (0.007 Bq/L or 0.2 pCi/L) with a 50 times pre-
concentration and elemental isolation. Their method required low sample volume (25 mL), had
rapid chemistry (30 minutes) using extraction (extractant resin) chromotography, and a two

Quantification of Radionuclides
15-98
MARLAP JULY 2004
minute/sample instrument measurement. Kim et al. (2002), using their chemical concentration
and isolation methods, reported detection limits for water and soil of 0.00019 Bq/L and
0.75 Bq/kg, respectively.
ICP-MS has also been used for radiobioassay applications for 239Pu and isotopic uranium in urine
samples. The Brookhaven National Laboratory used ICP-MS to measure the 239Pu concentration
in urine samples from Marshall Island residents. Inn et al. (2001) evaluated the capabilities of
BNL to analyze urine samples by ICP-MS in an intercomparison study to measure 239Pu in
synthetic urine. In the study, BNL pre-concentrated and isolated the plutonium in the synthetic
urine through established and validated chemical techniques prior to analysis by mass spectro-
metry. Pu-242 was used as a yield monitor with each analysis. For four testing levels between
18.5 nBq/mL (18.5 µBq/L) and 278 nBq/mL (278 µBq/L), the mean of the BNL replicate (five
samples) measurements for the four test levels had biases ranging from -6.8 to -20 percent. The
1σ precision for the five replicate measurements per test level was under 13 percent for all levels.
The detection level was calculated to be 1,600 nBq per 200 g sample.
Lawrence Livermore National Laboratory (LLNL) has used ICP-MS coupled with chemical
concentration (phosphate coprecipitation) and isolation to analyze isotopic uranium in urine
samples (Hotchandani and Wong, 2002). A 233U yield monitor was used with each sample
(200–1500 mL). ASTM C1379 provides a test method for the analysis of urine for 235U and 238U
by ICP-MS. Ejnik, et al. (2000) reported 235U detection limits of 14 ng /L for natural uranium and
50 ng/L for depleted uranium (uranium with 0.2 percent 235U) in urine, given a uranium detection
limit of 0.1 ng/L. The researchers were able to determine correctly and accurately the 235U : 238U
isotopic ratio for depleted and natural uranium in 10 mL urine samples having total uranium
concentrations between 150 and 45,000 ng/L. The 10 mL samples had been treated by multiple
and comprehensive dry and wet-ashing processes prior to analysis.
Nguyen et al. (1996.) reported a method for the simultaneous determination of 237Np, 232Th and
the uranium isotopes in urine samples using extraction chromatographic sample preparation
(TRU column) in conjunction with ICP-MS. They reported detection limits , using pre-concen-
tration methods for 1/10 daily urinary excretion volume, of 13 µBq (8 x 10⁻⁴ dpm), 1.7 nBq
(1×10⁻⁷ dpm), 33 nBq (2×10⁻⁶ dpm), and 7 nBq (4×10⁻⁷ dpm) for 237Np, 232Th, 235U, and 238U,
respectively.
Lee et al. (1995) conducted an intercomparison study to evaluate the capability of the various
alpha spectrometric and mass spectrometric methods for determining 237Np in artificial urine
samples. For this study, results from 10 different methods were evaluated in terms of bias and
precision at two concentration levels (50 mBq/kg and 3.3 mBq/kg) as well as detection limits. At
the time of the study, the best detection limit reported for alpha spectrometric and mass spectro-
metric methods were very similar (0.1 mBq/kg). However, the range of the reported detection
limits was more consistent for the alpha spectrometric methods compared to the mass
spectrometric methods.

Quantification of Radionuclides
15-99
JULY 2004 MARLAP
15.7.2.2 Thermal Ionization Mass Spectrometry
Thermal ionization mass spectrometers (TIMS) rely on ionization from a heated filament rather
than on a plasma. They provide more precise measurements than routine quadrupole ICP-MS but
require substantially more operator involvement, leading to markedly reduced sample throughput
compared to ICP-MS units. In addition, because of the design of most TIMS units, a limit of four
samples per batch can be analyzed sequentially without reloading another set of samples. TIMS
systems exist at the national laboratories and the National Institute of Standards and Technology.
These units are large and are usually considered too expensive for commercial laboratory
operations. In addition, facilities housing TIMS may have ventilation systems equivalent to a
Class 100 clean room, depending on the application. In some cases, the initial radioanalytical
chemistry is conducted in a class 100 clean room or hood.
TIMS has been successfully applied to the analysis of 239Pu, 240Pu, 235U and 238U in a variety of
matrices. However, initial radioanalytical methods must be performed to isolate and concentrate
the radionuclides from the initial sample. A radionuclide or isotopes in the concentrated solution
would be electrodeposited on the filament used in the TIMS. For 239Pu, Los Alamos National
Laboratory (LANL) electrodeposits plutonium from a purified sample onto a TIMS filament with
dihydrogen dinitro-sulfato-platinate. A larger quantity of platinum is then electrodeposited over
the plutonium to provide a diffusion barrier that dissociates plutonium molecular species and
provides high ionization efficiency. Detection limits in the femtogram range are typical, resulting
in a 239Pu concentration of 600 nBq/200 g sample (Inn et al., 2001). In a recent interlaboratory
comparison study evaluating the capabilities of mass spectrometric methods for the analysis of
ultra low quantities of 239Pu and 240Pu in urine (McCurdy et al., 2002), LANL’s TIMS method
had an estimated detection limit of 6 µBq/L. For 240Pu in the samples, the detection limit was
estimated to be 20 µBq/L. LANL observed good precision (about 4 percent relative standard
deviation) for 239Pu test levels at 28 µBq/L and above. The 240Pu measurements were less precise
than the 239Pu measurements, 11.9 percent and 21.2 percent respectively for 32 and 16 µBq/L.
TIMS has been used to evaluate the isotopic ratio of 238U : 235U in urine samples. In a study
reported by D’Agostino et al. (2002), five participating laboratories were provided 12 synthetic
urine samples (1 kg each) containing varying amounts of natural and/or depleted urine. Various
mass spectrometers were used, including sector-field ICP-MS, quadrupole ICP-MS, and TIMS.
The TIMS and quadrupole ICP-MS had similar detection limits: 0.1 pg for total uranium (based
on 238U) and about 15 pg for a 238U : 235U ratio of 138 (natural abundance). The TIMS was able to
measure 238U : 235U ratios in ranges between 138 and 220 for three test levels of 25 to 100 ng/kg,
100 to 350 ng/kg and greater than 350 ng/kg.
Additional information and radionuclide measurement applications of TIMS can be found on the
Los Alamos National Laboratory and Savannah River Site websites, http://pearl1.lanl.gov/
bioassay/tims.htm and http://srs.gov.

Quantification of Radionuclides
15-100
MARLAP JULY 2004
15.7.2.3 Accelerator Mass Spectrometry
Accelerator mass spectrometry (AMS) systems are routinely used by a limited number of
national laboratories, universities and institutes rather than commercial or government
radioanalytical laboratories. These systems are technically sophisticated, expensive and fairly
large, requiring extensive laboratory space and facilities. Currently in North America, five
organizations have AMS systems primarily for earth science, bioscience and environmental
studies. The organizations include Woods Hole Oceanographic Institution, University of
Toronto, Purdue University, University of Arizona, and LLNL.
In AMS, negative ions made in an ion source are accelerated electrostatically through a field of
millions of volts. The accelerated ions pass through a thin carbon film or a gas to destroy all
molecular species. After passing through a low- or high-energy mass spectrometer and various
filters, the resulting ions slow to a stop and dissipate their energy in a gas ionization detector. The
identity of the individual ions is determined from the ions’ rates of deceleration, with the lighter
ions decelerating more rapidly than the heavier ions. For AMS analysis, solid samples in the 0.1
to 1 mg mass range are pressed into sample holders.
AMS has been used for geological, biological, and environmental applications for several
decades. In the1980s, AMS replaced the traditional method of scintillation counting for precise
radiocarbon dating. A 14C detection limit of 200 nBq (5×10⁴ atoms) is typical. Tritium, used
extensively as a tracer in biological and oceanographical research, can be analyzed routinely by
AMS with a detection limit of 20,000 nBq. AMS can be used to measure the following low-mass
cosmogenic radionuclides for earth science applications: 10Be, 26Al, 32Si, 36Cl and 41Ca. In
addition, 63Ni, 129I, and 239/240 Pu are routinely analyzed by AMS at LLNL. Table 15.8 (McAninch,
1999) provides the detection limits for these radionuclides.
TABLE 15.8 — AMS detection limits for selected radionuclides
Nuclide Detection Limit (nBq) Detection Limit (105 atoms)
3H 20,000 1
14C 200 0.5
10Be 4 3
26Al 1 0.4
36Cl 3 0.3
41Ca 200 8
63Ni 45,000 2
90Sr* ~100,000 ~7
99Tc* ~30,000 ~600
129I1 1
239/240*Pu ~1,000 ~10
* proposed

Quantification of Radionuclides
15-101
JULY 2004 MARLAP
McAninch and Hamilton (1999) compares the capabilities of the various mass spectrometric
methods and fission tract analysis for the analysis of 239Pu and the other actinide elements. The
report includes a description of the facilities at the LLNL Center for AMS as well as the
detection methods used. Additional information can be obtained online at http://cams.llnl.gov.
Recently, AMS has been used in radiobioassay to measure the 239Pu in urine samples. McCurdy
et al. (2002) evaluated LLNL’s AMS technology for 239//240Pu bioassay measurements during an
interlaboratory comparison study. LLNL’s AMS method had an estimated detection limit of 6
µBq/L. For 240Pu in the samples, the detection limit was estimated to be 15 µBq/L. LLNL
observed good precision (under 2 percent relative standard deviation) for 239Pu test levels at 28
µBq/L and above. The 240Pu measurements were less precise than the 239Pu measurements, about
27 percent for 16 µBq/L and above test levels.
15.8 References
15.8.1 Cited References
Adolf, J.P. and Guillaumont, R. 1993. Fundamentals of Radiochemistry, CRC Press, Boca
Raton, FL.
Alfassi, Z. B. 1990 Use of Delayed Neutrons In Activation Analysis, Vol. I, Z. Alfassi (Ed.),
CRC Press, Inc., Boca Raton, Florida.
American National Standards Institute (ANSI) N42.14. “Calibration and Use of Germanium
Spectrometers for Measurement of Gamma-Ray Emitting Radionuclides,” 1991, New York.
American National Standards Institute (ANSI) N42.15. “American National Standard
Performance Verification of Liquid-Scintillation Systems,” 1990, New York.
American National Standards Institute (ANSI) N42.22. “American National Standard. Trace-
ability of Radioactive Sources to the National Institute of Standards and Technology (NIST)
and Associated Instrument Quality Control,” New York.
American National Standard Institute (ANSI) N42.23. “American National Standard Measure-
ment and Associated Instrumentation Quality Assurance for Radioassay Laboratories,” 2003,
New York.
American National Standards Institute (ANSI) N42.25. “American National Standard Calibration
and Usage of Alpha/Beta Proportional Counters,” 1997, New York

Quantification of Radionuclides
15-102
MARLAP JULY 2004
American National Standard Institute/Institute of Electrical and Electronics Engineers,
(ANSI/IEEE) 325. Standard Test Procedures for Germanium Gamma-Ray Detectors, 1996,
New York.
American Public Health Association (APHA). 1998. Standard Methods for the Examination of
Water and Waste Water, 20th Edition. Washington, DC. Available at: www.standardmethods.
org.
American Society for Testing and Materials (ASTM) C758. Standard Test Methods for
Chemical, Mass Spectrometric, Spectrochemical, Nuclear, and Radiochemical Analysis of
Nuclear-Grade Plutonium Metal. West Conshohocken, PA.
American Society for Testing and Materials (ASTM) C759. Standard Test Methods for
Chemical, Mass Spectrometric, Spectrochemical, Nuclear, and Radiochemical Analysis of
Nuclear-Grade Plutonium Nitrate Solutions. West Conshohocken, PA.
American Society for Testing and Materials (ASTM) C799. Standard Test Methods for
Chemical, Mass Spectrometric, Spectrochemical, Nuclear, and Radiochemical Analysis of
Nuclear-Grade Uranyl Nitrate Solutions. West Conshohocken, PA.
American Society for Testing and Materials (ASTM) C1207. Standard Test Method for
Nondestructive Assay of Plutonium in Scrap and Waste by Passive Neutron Coincidence
Counting. West Conshohocken, PA.
American Society for Testing and Materials (ASTM) C1310 Standard Test Method for
Determining Radionuclides in Soils by Inductively Coupled Plasma Mass Spectrometry
Using Flow Injection Preconcentration. West Conshohocken, PA.
American Society for Testing and Materials (ASTM) C1316. Standard Test Method for
Nondestructive Assay of Nuclear Material in Scrap and Waste by Passive-Active Neutron
Counting Using a 252. West Conshohocken, PA.
American Society for Testing and Materials (ASTM) C1345 Standard Test Method for Analysis
of Total and Isotopic Uranium and Total Thorium in Soils by Inductively Coupled Plasma-
Mass Spectrometry. West Conshohocken, PA.
American Society for Testing and Materials (ASTM) D1890. Standard Test Method for Beta
Particle Radioactivity of Water. West Conshohocken, PA.
American Society for Testing and Materials (ASTM) D1943. Standard Test Method for
Alpha Particle Radioactivity of Water. West Conshohocken, PA.

Quantification of Radionuclides
15-103
JULY 2004 MARLAP
American Society for Testing and Materials (ASTM) D3084. Standard Practice for Alpha
Particle Spectrometry of Water). West Conshohocken, PA.
American Society for Testing and Materials (ASTM) D3648, Standard Practices for the
Measurement of Radioactivity. West Conshohocken, PA.
American Society for Testing and Materials (ASTM) D3649. Standard Test Method for High-
Resolution Gamma-Ray Spectrometry of Water. West Conshohocken, PA.
American Society for Testing and Materials (ASTM) D3865. Standard Test Method for
Plutonium in Water. West Conshohocken, PA.
American Society for Testing and Materials (ASTM) D5811. Standard Test Method for
Strontium-90 in Water. West Conshohocken, PA.
American Society for Testing and Materials (ASTM) E181. Standard Test Methods for Detector
Calibration and Analysis of Radionuclides. West Conshohocken, PA.
American Society for Testing and Materials (ASTM) E1005. Standard Test Method for
Application and Analysis of Radiometric Monitors for Reactor Vessel Surveillance, E706
(IIIA). West Conshohocken, PA.
American Society for Testing and Materials (ASTM) STP1291. Applications of Inductively
Coupled Plasma-Mass Spectrometry to Radionuclide Determinations. West Conshohocken,
PA.
American Society for Testing and Materials (ASTM) STP1344. Applications of Inductively
Coupled Plasma-Mass Spectrometry to Radionuclide Determinations, Vol. 2. West
Conshohocken, PA.
Aupiais, J. 1997. “Alpha Liquid Scintillation Measurement of Plutonium in Solution Spiked by
236Pu.” J. Radioanal. Nucl. Chem. 218:2, pp.201-207.
Baillie, L.A. 1960. “Determination of Liquid Scintillation Counting Efficiency by Pulse Height
Shift,” Int. J. Appl. Radiat. Isot., 8:1.
Bate, L.C. 1979. Determination of Tc-99 In Mixed Fission Products By Neutron Activation
Analysis, Radioelements Analysis — Progress and Problems, Ed. W.S. Lyon, Ann Arbor
Science Publishers Inc., pp. 175-189.
Bate, L.C., and Stokely, J.R. 1982. “Iodine-129 Separation and Determination By Neutron
Activation Analysis,” J. Radioanal. Chem., 72:1/2, pp. 557-570.

Quantification of Radionuclides
15-104
MARLAP JULY 2004
Blanchard, R.L., B. Kahn, and R.D. Birkhoff. 1957. “The Preparation of Thin, Uniform Sources
for a Beta-Ray Spectrometer,” Oak Ridge National Laboratory Report, ORNL-2419, Oak
Ridge, TN.
Blanchard, R.L., B. Kahn, and R.D. Birkhoff. 1960. “The Preparation of Thin, Uniform,
Radioactive Sources by Surface Adsorption and Electrodeposition,” Health Phys., 2, pp. 246-
255.
Blanchard, R.L. 1966. “Rapid Determination of Lead-210 and Polonium-210 in Environmental
Samples by Deposition on Nickel,” Analytical Chemistry, 38, pp. 189.
Blanchard, R.L., M.H. Cheng, and H.A. Potratz. 1967. “Uranium and Thorium Series Disequilib-
ria in Recent and Fossil Marine Molluscan Shells,” J. Geophys. Res., 72, pp. 4745-4757.
Bleuler, E. and G.J. Goldsmith. 1952. Experimental Nucleonics, Rinehart & Company, New
York, pp 38-39.
Bogen, D.C., and G. A. Welford. 1971. Application of Liquid Scintillation Spectrometry for
Total Beta and Alpha Assay, Proceedings of the International Symposium of Rapid Methods
for Measuring Radioactivity in the Environment, LAEA-SM-14/3, p. 383.
Brina, R. and A.G. Miller. 1992. “Direct Detection of Trace Levels of Uranium by Laser-Induced
Kinetic Phosphorimetry,” Analytical Chemistry, 64, pp. 1413-1418.
Browne, E., R.B., Firestone, and V.S. Shirley. 1986. Table of Radioactive Isotopes, John Wiley
and Sons, Inc., New York.
Burnett, W.C. 1994. Maintaining Low Detector Backgrounds in Alpha Spectrometry, Canberra
Industries Technical Brief, March 31. Canberra Nuclear, Inc., 800 Research Parkway,
Meriden, CT 06450.
Cable, P., W. Burnett, D. Hunley, J. Winne, W. McCabe, and R. Ditchburn. 1994. “Investigating
the Chemical and Physical Controls on Electrodeposition for Alpha Spectrometry.” 40th
Annual Conference on Bioassay, Analytical, and Environmental Radiochemistry (BAER),
Cincinnati, Ohio.
Campion, P. J., J.G.V., Taylor, and J.S. Merritt. 1960. “The Efficiency Tracing Technique for
Eliminating Self-Absorption Errors in 4-π Beta Counting,” Int. J. Appl. Radiation and
Isotopes, 8, p. 8.
Canberra. 2002. Personal communication. Canberra Technologies, Inc., 800 Research Parkway,
Meriden, CT 06450.

Quantification of Radionuclides
15-105
JULY 2004 MARLAP
Chen, Q.J., S.P., Nielson, and A. Aarkrog. 1989. “Preparation of Thin Alpha Sources by
Electrospraying for Efficiency Calibration Purposes,” Radioanal. Nucl. Chem., 135:2, pp.
117-123.
Coomber, D.I. 1975. Radiochemical Methods in Analysis, Plenum Press, New York.
Cooper, J. A., L.A. Ranticelit, R.W., Perkins, W.A., Hailer, and A.L. Jackson. 1968. An Anti-
Coincidence Shielded Ge(Li) Gamma-Ray Spectrometer and Its Application to Neutron
Activation Analyses, Report BNWL-SA-2009, Pacific Northwest Laboratory, Richland,
Wash.
Crouthamel, C. E., F. Adams, and R. Dams. 1970. Applied Gamma-Ray Spectrometry, 2nd
Edition. New York: Pergamon Press.
Curtis, M. L., J.W. Heyd, R.G. Olt, and J.F. Eichelberger. 1955. Nucleonics, 13, p. 38.
Dacheux, N. and J. Aupiais. 1997. “Determination of Uranium, Thorium, Plutonium,
Americium, and Curium Ultratraces by Photon Electron Rejecting α Liquid Scintillation,”
Anal. Chem., 69:13, pp. 2275-2282.
D’Agostino, P. A., E.A. Ough, S.E. Glover, and A.L. Vallerand. 2002. Determination of Natural
and Depleted Uranium in Urine at the ppt Level: An Interlaboratory Analytical Exercise. Los
Alamos National Laboratory Report LA-UR-02-5973.
Date, A.R. and A.L. Gray. 1989. Applications of Inductively Coupled Plasma Mass
Spectrometry. (Editors) New York: Chapman and Hall Publishers.
Decker, K.M., and C.G. Sanderson. 1992. “A Reevaluation of Commercial IBM PC Software for
the Analysis of Low Level Environment Gamma-Ray Spectra,” Int. J. Appl. Radiat. Isot.,
43:1/2, p.323.
Decker, K. M., C. G. Sanderson, and P.D. Greenlaw. 1996. Report of the Department of Energy
Office of Environmental Management Gamma Spectrometry Data Validation Program,
EML-586, Environmental Measurements Laboratory, New York, NY.
DeFilippis, S. 1990. “Activity Analysis in Liquid Scintillation Counting,” Radioactivity and
Radiochemistry, 1:4, p. 22.
De Laeter, J.R. 2001. Applications of Inorganic Mass Spectrometry. New York: John Wiley and
Sons.

Quantification of Radionuclides
15-106
MARLAP JULY 2004
Dewberry, R.A. 1997. “Measurement of Uranium Total Alpha-Particle Activity by Selective
Extraction and Photon/Electron-Rejection Alpha Liquid Scintillation (PERALS®) Spectros-
copy,” Radioactivity and Radiochemistry, 8:2, pp. 35-43.
Dewberry, R.A., D.P. DiPrete, and W.T. Boyce. 1998. “Total Alpha-Particle and Total Pu
Measurements in High Beta-Particle Activity Savannah River Site High-Level Waste
Samples,” Radioactivity and Radiochemistry, 9:1, pp. 26-35.
U.S. Department of Energy (DOE). 1995. DOE Methods for Evaluating Environmental and
Waste Management Samples, Goheen, S.C. et al. (Ed.), DOE/EM- 0089T.
U.S. Department of Energy (DOE). 1997. EML Procedures Manual, Chieco, Nancy A. (ed.),
HASL-300, 28th Edition, DOE Environmental Measurements Laboratory, New York.
Duffey, J. M., R.L. Metzger, B.J. Jessop, and G.K. Schweitzer. 1997. “Development of a Rapid
Procedure for the Measurement of Uranium in Drinking Water by PERALS Spectrometry,” J.
Radioanalytical and Nuclear Chemistry, 221:1-2, pp. 115-122.
Echo, M.W., and E.H. Turk. 1957. Quantitative Determination of U-235 by delayed neutron
counting, U.S. AEC Report PTR-143.
Ejnik, J.W., A.J. Carmichael, M.M. Hamilton, M. McDiarmid, K. Squibb, P. Boyd, and W.
Tardiff. 2000. “Determination of the Isoptopic Compositioon of Uranium in Urine by
Inductively Coupled Plasma Mass Spectrometry,” Health Physics Journal, 78:2.
U.S. Environmental Protection Agency (EPA). 1979. Radiochemical Analytical Procedures for
Analysis of Environmental Samples, Johns, F.B., Hahn, P.B., Thome, D.J., and Bretthauer,
E.W., EMSL-LV-0539-17, Environmental Monitoring and Support Laboratory, Las Vegas,
NV.
U.S. Environmental Protection Agency (EPA). 1980. Prescribed Procedures for Measurement of
Radioactivity in Drinking Water, Krieger, H.L. and Whittaker, E.L., Eds., EPA 600-4-80-032,
EPA Environmental Monitoring and Support Laboratory, Cincinnati, OH.
U.S. Environmental Protection Agency (EPA). 1984a. Radiochemistry Procedures Manual,
Lieberman, R.E., Ed., EPA 520-5-84-006, EPA Eastern Environmental Radiation Facility,
Office of Radiation Programs, Montgomery, AL.
U.S. Environmental Protection Agency (EPA). 1984b. An Airborne Radioactive Effluent Study at
the Savannah River Plant, EPA 520-5-84-012, Office of Radiation Programs, Eastern
Environmental Protection Agency, Montgomery, AL.

Quantification of Radionuclides
15-107
JULY 2004 MARLAP
U.S. Environmental Protection Agency (EPA). 1990. Standard Operating Procedures - Field
Operations and Emergency Activities, Office of Radiation and Indoor Air, National Air and
Radiation Environmental Laboratory, Montgomery, AL.
Epov, V.N., D. Lariviere, V. Taylor, R.D. Evans, and R.J. Cornett. 2002. “Comparison of
Different Preconcentration and Separation Techniquies for the Determination of 135Cs and 137
Cs by ICP-MS,” 48th Annual Radiobioassay and Radiochemical Measurements Conference,
Knoxville, TN, November 14.
Escobar, V.T. Gomez, F. Vera, and J.C. Lozano. 1999. “Extractive Procedure for 226Ra
Determination in Aqueous Samples by Liquid Scintillation Counting,” Radioactivity and
Radiochemistry, 10:1, pp. 17-21.
Faires, R.A. and G.J. Boswell. 1981. Radioisotope Laboratory Techniques, Butterworth & Co.
Publishers, Ltd., London.
Flynn, K. F., L. E. Glendenin, and V. Prodi. 1971. Absolute Counting of Low Energy Beta
Emitters Using Liquid Scintillation Counting Techniques in Organic Scintillators and Liquid
Scintillation Counting, D. L. Horrocks and Chim-Tzu Peng, Eds., Academic Press, New
York, p. 687.
Foti, S., E. Delucchi, and V. Akamian, V. 1972a. Determination of Picogram Amounts of
Technetium-99 by Neutron Activation Analysis. Anal. Chim. Acta, 60:2, p 261-268.
Foti, S., E. Delucchi, and V. Akamian, V. 1972b. Determination of Picogram Amounts of
Technetium in Environmental Samples by Neutron Activation Analysis. Anal. Chim. Acta,
60:2, p 269-276.
Friedlander, G., J.W. Kennedy, E.S. Macias, and J.M. Miller. 1981. Nuclear and Radiochemistry,
3rd Ed., John Wiley and Sons, New York.
Gilmore, G. and J.D. Hemingway. 1995. Practical Gamma-Ray Spectrometry, John Wiley,
Chichester.
Hallden, N.A., and I.M. Fisenne. 1963. “Minimizing Self-Absorption in 4-π Counting,” Int. J.
Appl. Radiation and Isotopes, 14, p. 529.
Heath, R.L. 1964. Scintillation Spectrometry Gamma-Ray Spectrum Catalog, IDO 16880, and
ANCR- 1000.

Quantification of Radionuclides
15-108
MARLAP JULY 2004
Hemingway, J.D. 1975. “Measurement Techniques and Instrumentation,” International Review
of Chemistry – Radiochemistry, Inorganic Chemistry, Series Two, 8, A.G. Maddock (ed.),
University Park Press, Baltimore, MD.
Hensley, W.K., A.D. McKinnon, H.S. Miley, M.E. Panisko, and R.M. Savard. 1997. SYNTH for
Windows, Pacific Northwest National Laboratory, Richland, WA.
Herpers, U. 1986. “Radiation Detection and Measurement,” in Treatise on Analytical Chemistry,
Elving, P.J., Krivan, V., and Kolthoff, I.M., Eds., Part I, 2nd Edition, 14, John Wiley and
Sons, New York, pp. 123-192.
Higashimura, T., O. Yamada, N. Nohara, and T. Shicei. 1962. “External standard method for the
determination of the efficiency in liquid scintillation counting,” Int. J. Appl. Radiat. Isot., 13,
p. 308.
Hill, R.F., G.F., Hine, and L. D. Marinelli. 1950. “The Quantitative Determination of Gamma-
Ray Radiation in Biological Research,” Am. Jour. Roentg., 63, pp. 160-169.
Hindman, F.D. 1983. “Neodymium Fluoride Mounting for Alpha Spectrometric Determination
of Uranium, Plutonium, and Americium,” Analytical Chemistry, 55, pp. 2460-2461.
Hindman, F.D. 1986. “Actinide Separations for α Spectrometry Using Neodymium Fluoride
Coprecipatation,” Analytical Chemistry, 58, pp. 1238-1241.
Hochel, R.C. 1979. A High-Capacity Neutron Activation Facility, Radioelements Analysis —
Progress and Problems, Ed. W.S. Lyon, Ann Arbor Science Publishers Inc., pp. 343-348.
Horrocks, D.L. 1964. “Alpha Particle Energy Resolution in a Liquid Scintillator,” Review of
Scientific Instruments, 55, pp. 334.
Horrocks, D.L. 1970. Applications of Liquid Scintillation Counting, Academic Press.
Horrocks, D.L. 1973. “Measuring Tritium With Liquid Scintillator Systems,” in Tritium,
Moghissi, A.A. and Carter, M.W., Eds., Messenger Graphics, Publishers, Las Vegas, NV,
pp. 150-151.
Hotchandani, M., and C. Wong. 2002. “FemtoCurie U Detemination by ICPMS,”48th Annual
Radiobioassay and Radiochemical Measurements Conference, Knoxville, TN, November 14.
International Atomic Energy Agency (IAEA). 1959. Metrology of Radionuclides, Proceedings of
a Symposium, Oct. 14-16, Vienna.

Quantification of Radionuclides
15-109
JULY 2004 MARLAP
International Commission on Radiation Units and Measurements (ICRU).1992. Measurement of
Dose Equivalents from External Photon and Electron Radiations. Report 47.
Inn, K., D.E. McCurdy, L. Kuruvilla, N. Barss, R. Pietrzak, E. Kaplan, W. Inkret, W. Efurd, D.
Rokop, D. Lewis, P. Gautier, and R. Bell. 2001. “Intercomparison Study of Inductively
Coupled Plasma Mass Spectrometry, Thermal Ionization Mass Spectrometry and Fission
Track Analysis of µBq Quantities of 239Pu in Synthetic Urine,” J. Radio. and Nuclear Chem.,
249:1, pp. 121 -131.
Ihsanullah and B.W. East. 1993. “Chemical Recoveries of Technician-99 for Various Procedures
Using Inductively Coupled Plasma–Mass Spectrometry,” Radioactivity and Radiochemistry,
4:4, pp.14-19.
Jabs, R.H and W.A. Jester. 1976. “Development of Environmental Monitoring System for
Detection of Radioactive Gases,” Nuclear Tech., 30, pp. 24-32.
Jester, W.A. and F.J. Hepburn. 1977. “A Ge(Li) System for the Monitoring of Low Level
Radioactive Gases,” Trans. ANS, 26, p. 121.
Johnston, P.N., J.R. Moroney, and P.A. Burns. 1991. “Preparation of Radionuclide “Sources” for
Coincident High-Resolution Spectrometry with Low-Energy Photons and Electrons or Alpha
Particles,” Int. J. Appl. Radiat. Isot., 3, pp. 245-249.
Kessler, M. 1986. Cerenkov Counting, Packard Application Bulletin, No. 7. Packard Instrument
Co., Downers Grove, IL.
Kessler, M.J. 1989. Liquid Scintillation Analysis, Publication Number 169-3052, Rev. G,
Packard Instrument Co., Downers Grove, IL.
Kim, Y.-J., C.-K, Kim, C.-S., Kim , J.-Y. Yun, and B.-H.n Rho. 1999. “Determination of 226Ra in
Environmental Samples Using High-Resolution Inductively Coupled Plasma Mass Spectro-
metry,” J. Radioanalytical and Nuclear Chemistry, 240:2, pp. 613-618.
Knoll, G.F. 1979. Radiation Detection and Measurement, 1st Edition. New York: John Wiley &
Sons.
Knoll, G. F. 1989. Radiation Detection and Measurement, 2nd Edition. New York: John Wiley &
Sons.
Kressin, I.K. 1977. “Electrodeposition of Plutonium and Americium for High Resolution α
Spectrometry,” Analytical Chemistry, 49:6, pp.842-845.

Quantification of Radionuclides
15-110
MARLAP JULY 2004
Lapp, R.E. and H.L. Andrews. 1964. Nuclear Radiation Physics, 3rd Edition. Englewood Cliffs:
Prentice Hall.
Lariviere, D., V.N., Epov, R.D. Evans, and R. J. Cornett. 2002. “Determination of Radium-226
in Environmental Samples by ICP-MS after Extraction Chromatography,” 48th Annual
Radiobioassay and Radiochemical Measurements Conference, Knoxville, TN, November 15.
Lee, S., C. Hutchinson, J.M. Robin, K.G.W. Inn, and M. Thein. 1995. “An Intercomparison
Study of Neptunium-237 Determination in Artificial Urine Samples,” Health Physics
Journal, 68:3, pp. 350-358.
Libby, W.F. 1955. Radiocarbon Dating, 2nd Ed., University of Chicago Press.
Lieberman, R. and A.A. Moghissi. 1970. “Low-Level counting by Liquid Scintillation, II.
Application of Emulsions in Tritium Counting,” Int. J. Appl. Radiat. Isot., 21, p. 319.
Loysen, P. 1969. “Errors in Measurement of Working Level,” Health Physics, 16, pp. 629-635.
McAninch, J.E. 1999. “Accelerator Mass Spectrometry for the Measurement of Long-lived
Radionuclides,” Workshop on Standards, Intercomparisons, and Performance Evaluations
for Low-level and Environmental Radionuclide Mass Spectrometry and Atom Counting,
Counsel of Ionizing Radiation and Measurements, National Institute of Standards and
Technology, Gaithersburg, MD April 13-15.
McAninch, J.E. and T.F. Hamilton. 1999. Measurement of Plutonium and Other Actinide
Elements at the Center for Accelerator Mass Spectrometry: A Comparative Assessment of
Competing Techniques. Lawrence Livermore National Laboratory UCRL-ID-133118,
February.
McFarland, R.C. 1998. “Comparison of Alpha and Beta Calibration Standards for Air Filter and
Wipe-Test Analyses: Does Your Analysis Seriously Under-Report the Activity?”
Radioactivity and Radiochemistry, 9:3, pp 8-14.
Mann, W.B., A. Rytz, and A. Spernol. 1991. Radioactivity Measurements, Principles and
Practice. New York: Pergamon Press (previously published in Applied Radiation and
Isotopes, 38:8, 1988, pp. 717-937).
Mann, D.K., G.E. Clark, and D. Davies. 2002. “Use of an Automated Kinetic Phosphorescence
Analyzer (KPA) to Monitor Uranium in Stack Filters and Probe Washes at the Y-12 National
Security Complex,” 48th Annual Radiobioassay and Radiochemical Measurements
Conference, Knoxville, TN, November 14.

Quantification of Radionuclides
15-111
JULY 2004 MARLAP
McCurdy, D.E., R.A. Mellor, R.W. Lambdin, and M.E. McLain, Jr. 1980. “The Use of Cuprous
Iodide as a Precipitation Matrix in the Radiochemical Determination of Iodine-131,” Health
Physics, 38, pp. 203-213.
McCurdy, D.E. and R.A. Mellor, 1981. “The Application of Coincidence Counting Techniques
to the Determination of Radium-226 and Radium-228,” Analytical Chemistry, 53, pp. 2212.
McCurdy, D.E., Z. Lin, K. Inn, R. Bell, S. Wagner, W. Efurd, T. Hamilton, T. Brown, and A.
Marchetti. 2002. “Second Interlaboratory Comparison for the Analysis of Pu-239 in Synthetic
Urine at the µBq (~100 aCi) Level,” 29th Annual Meeting of the Federation of Analytical
Chemistry and Spectroscopy Societies, Providence, RI, October 14.
McDowell, C.A. 1963. Mass Spectrometry. (Editor) New York: McGraw-Hill Book Co.
McDowell, W.J. 1992. “Photon/Electron-Rejecting Alpha Liquid Scintillation (PERALS)
Spectrometry: A Review,” Radioactivity and Radiochemistry, 3:2.
Merritt, J. S., J.G.V. Taylor, and P.J. Campion. 1956. “Self-Absorption in Sources Prepared for
4-π Counting,” Canadian Journal of Chemistry, 37, p. 1109.
Metzger, R., D. Wichers, J. Vaselin, and P. Velasquez. 1997. “Solubility Characterization of
Airborne Uranium From An In Situ Uranium Processing Plant,” Health Physics Journal,
72:3, pp. 418-422.
Mills, W.G., C.A. White, and E. Fonseca. 1991. “A Practical Approach to Efficient Sample
Preparation for Gross-Alpha Measurements in Water,” Radioactivity and Radiochemistry,
2:3, pp. 8-12.
Mitchell, R.F. 1960. “Electrodeposition of Actinide Elements at Tracer Concentrations,”
Analytical Chemistry, 32, pp. 326-328.
Mitchell, D.J. 1986. Sodium Iodide Detector Ananlysis Software (SIDAS), Sandia Report
SAND86-1473, Sandia National Laboratories, Albuquerque, NM.
Modupe, O.O., K.M. Decker, C.G. Sanderson. 1993. “Determination of Self-Absorption
Corrections by Computation in Routine Gamma-Ray Spectrometry for Typical
Environmental Samples,” Radioactivity and Radiochemistry, 4:1, p.38.
Moghissi, A.A. 1971. Low Level Counting by Liquid Scintillation, Organic Scintillators and
Liquid Scintillation Counting, Academic Press, New York, NY.

Quantification of Radionuclides
15-112
MARLAP JULY 2004
Moghissi, A.A. 1981. “Application of Cyclohexane in Separation of Water from Biological and
Environmental Samples,” Health Phys., 41, p. 413.
National Academy of Sciences-National Research Council (NAS/NRC). 1962. Detection and
Measurement of Nuclear Radiation, O’Kelley, G.D., NAS-NS 3105, Washington, DC.
National Council on Radiation Protection and Measurement (NCRP). 1978. A Handbook of
Radioactivity Measurements Procedures, Report No. 58, Washington, DC.
Nielson, J.M. 1972. Gamma Ray Spectrometry in Physical Methods of Chemistry, A.
Weissberger and B. W., Rossiter, eds. Vol. I, Part 11I D, Chap. X, John Wiley and Sons, Inc.
New York, N.Y.
Nielsen, J. M., and H. A. Kornberg. 1965. Multidimensional Gamma-Ray Spectrometry and Its
Use in Biology, Radioisotope Sample Measurement Techniques in Medicine and Biology.
Proceedings of a Symposium, May 24-28, International Atomic Energy Agency, Vienna, p. 3.
Nguyen, S. N., P.E. Miller, J.F. Wild, and D.P. Hickman. 1996. “Simultaneous Determination of
237Np, 232Th,and U Isotopes in Urine Samples Using Extraction Chromotography, ICP-MS
and Gamma Spectrometry.” Lawrence Livermore National Laboratory Report UCRL-JC-
121222, March 15; also in, Radioactivity and Radiochemistry, 7:3, pp 16-30.
ORTEC/Ametek. 2002 Personal communication. Advanced Measurement Technology, Inc., 801
S. Illinois Avenue, Oak Ridge, TN 37831-0895.
Overman, R.T., and H. M. Clark. 1960. Radioisotope Techniques, McGraw-Hill Book Co., Inc.,
New York, NY.
Paperiello, C.J. and J.E. Matuszek. 1975. “β-γ Coincidence System for Environmental 131I,” in
IEEE Trans. Nucl. Sci. NS22, 22:1, pp. 642-644.
Passo, C.J. and G. T. Cook. 1994. Handbook of Environmental Liquid Scintillation
Spectrometry, PACKARD (Canberra) Instrument Company, Meriden, CT.
Perkins, R.W. 1965. “An Anti-Coincidence Shielded Multidimensional Gamma-Ray
Spectrometer,” Nuclear Instruments and Methods, 33, p. 71.
Petullo, C.F., J. Jeter, D. Cardenas, R. Stimmel, D.E. Dobb, and D.C. Hillman.1994.
“Application of Inductively Coupled Plasma-Mass Spectrometry (ICP-MS) for the Analysis
of Plutonium-239 in Ocean Sediment,” Waste Management Conference, Tucson, AZ.
Platzner, I.T. 1997. Modern Isotope Ratio Mass Spectrometry. New York: John Wiley and Sons.

Quantification of Radionuclides
15-113
JULY 2004 MARLAP
Price, W. J. 1964. Nuclear Radiation Detection, 2nd Edition. New York: McGraw-Hill.
Protean Instrument Corporation, 231 Sam Rayburn Parkway, Lenoir City, TN 37771. 2001
Product Literature
U.S. Public Health Service (PHS). 1967a. Common Laboratory Instruments for Measurement of
Radioactivity, Environmental Health Series-Radiological Health, Interlaboratory Technical
Advisory Committee, Report No. 2, Rockville, MD, pp. 19-27, 78.
U.S. Public Health Service (PHS) 1967b. Radioassay Procedures for Environmental Samples,
National Center for Radiological Health, Rockville, MD.
Puphal, K.W. and D.R. Olsen. 1972. “Electrodeposition of Alpha-Emitting Nuclides from a
Mixed Oxalate-Chloride Electrolyte,” Analytical Chemistry, 44:2, pp. 284-289.
Puphal, K.W., T.D. Filer, and G.J. McNabb. 1983. “Electrodeposition of Actinides in a Mixed
Oxalate-Chloride Electrolyte,” Analytical Chemistry, 56:1, pp. 114-116.
Ross, R.R., J.R. Noyce, and M.M. Lardy. 1993. “Inductively Coupled Plasma-Mass
Spectrometry: An Emerging Method for Analysis of Long-Lived Radionuclides,”
Radioactivity and Radiochemistry, 4:1, pp. 24-37.
S. Cohen & Associates (SC&A). 1994. Routine Environmental Sampling Procedures Manual
For Radionuclides, Prepared for the U. S. Environmental Protection Agency, Office of
Radiation and Indoor Air, under Contract No. 68D20155, Work Assignment No. 2-25.
Sahoo, P. and S.E. Kannan. 1997. “Preparation of an Electrodeposited Source of 54Mn,”
Radiochimica Acta 76:4, pp. 185-190.
Scarpitta, S.C. and I.M. Fisenne, 1996. “Cerenkov Counting as a Complement to Liquid
Scintillation Counting,” Int. J. Appl. Radiat. Isot. 47:8, pp. 795-800.
Sanderson, C.G. 1969. “Determination of 226Ra and 228Th in Food, Soil, and Biological Ash by
Multidimensional Coincidence Gamma-Ray Spectrometer,” Health Physics 16:6, pp. 747-
753.
Sanderson, C.G. 1988. “An Evaluation of Commercial IBM PC Software for the Analysis of Low
Level Environment Gamma-Ray Spectra,” Environment International, 14, pp.379.
Sanderson, C.G. and K. M. Decker. 1993. “A Mixed Gamma-Ray Standard for Calibrating
Germanium Well Detectors,” Radioactivity and Radiochemistry, 4:2, p.36.

Quantification of Radionuclides
15-114
MARLAP JULY 2004
Shinohara, N. and N. Kohno. 1989. “Rapid Preparation of High-Resolution Sources for Alpha-
Ray Spectrometry of Actinides in Spend Fuel,” Int. J. Appl. Radiat. Isot., 40:1, pp. 41-45.
Sill C.W. and D.G. Olson. 1970. “Sources and Prevention of Recoil Contamination of Solid State
Alpha Detectors,” Anal. Chem. 42, pp. 1596-1607.
Sill, C.W., K.W., Puphal, and F.D. Hindman. 1974. “Simultaneous Determination of Alpha-
Emitting Nuclides of Radium through Californium in Soil,” Analytical Chemistry, 46:12, pp.
1725-1737.
Sill, C.W. and R.L. Williams. 1981. “Preparation of Actinides for Alpha Spectrometry Without
Electrodeposition,” Anal. Chem. 53, pp. 412-415.
Strebin, R.S. Jr., F.P. Brauer, J.H. Kaye, M.S. Rapids, and J.J. Stoffels. 1988. “Neutron
Activation and Mass Spectrometric Measurement of 129I,” J. Radioanal. Nucl. Chem., 127:1,
pp. 59-73.
Tagami, K. and S. Uchida. 1999. “Use of a Combustion Apparatus for Low-Level 99Tc
Separations from Soil Samples,” Radioactivity and Radiochemistry, 10:2, pp. 30- 34.
Talvite, N.A. 1972. “Electrodeposition of Actinides for Alpha Spectrometric Determination,”
Analytical Chemistry, 44:2, pp. 280-283.
Taylor, V., R.D. Evans, and R.J. Cornett. 2002. “Determination of Sr-90 in Environmental
Samples by Ion Chromatography and ICP-MS,” 48th Annual Radiobioassay and
Radiochemical Measurements Conference, Knoxville, TN, November 14.
Tsoulfanidis, N. 1983. Measurement and Detection of Radiation, McGraw-Hill Book Company,
New York.
Uchida, S. and K. Tagami. 1999. “A Rapid Separation Method for Determination of Tc-99 in
Environmental Waters by ICP-MS,” Radioactivity and Radiochemistry, 10:2, pp. 23-29.
Van der Eijk, W., W. Oldenhof, and W. Zehner. 1973. “Preparation of Thin Sources, A Review,”
Nucl. Instr. And Meth., 112, 343-351.
Van der Eijk, W. and W. Zehner. 1977. “Preparation of Thin Sources for Absolute Beta
Counting,” Radiochimica Acta, 24, 205-210.
Venkataraman, R., F. Bronson, V. Atrashkevich, B.M. Young, and M. Field, 1999. “Validation
of in situ Object Counting System (ISOCS) Mathematical Efficiency Calibration Software,”
Nuclear Instruments and Methods in Physics Research (A), 422, p. 450.

Quantification of Radionuclides
15-115
JULY 2004 MARLAP
Wang, C.H. and D.L. Willis. 1965. Radiotracer Methodology in Biological Science, Englewood
Cliffs: Prentice-Hall.
Watt, D.E. and D. Ramsden. 1964. High Sensitivity Counting Techniques. New York: Pergamon
Press.
15.8.2 Other Sources
Amano, H., A. Kasal, and T. Matsunaga. 1985. “Simultaneous Measurement of Radon and its
Progeny in Cave Air by Liquid Scintillation Techniques and Alpha Spectrometry,” Health
Phys., 49:3, pp. 509-511.
Bell, C.G. and F.N. Hayes. 1958. Liquid Scintillation Counting, New York: Pergamon Press.
Birks, J.B. 1964. The Theory and Practice of Scintillation Counting, New York: Pergamon Press.
Bransome, E., Jr., 1970. The Current Status of Liquid Scintillation Counting, Ed., Greene and
Straiton, New York.
Currie, L.A. 1968. “Limits for Qualitative Detection and Quantitative Determination,” Analytical
Chemistry, 40:3, pp. 586-593.
U.S. Environmental Protection Agency (EPA). 1972. Environmental Radioactivity Surveillance
Guide, ORP/SID 72-2.
U.S. Environmental Protection Agency (EPA). 1978. Radon In Water Sampling Program,
Eastern Environmental Radiation Facility, EPA/EERF-Manual-78-1.
U.S. Environmental Protection Agency (EPA). 1987. Interim Protocols for Screening and
Follow Up Radon and Radon Decay Product Measurements, Office of Radiation Programs,
Washington, DC., EPA 520-1-86-014-1.
Flynn, K.F., and L.E. Glendenin. 1959. “Half-Life and B-Spectrum of Rubidium-87,” Physics
Review, 116, p. 744.
Flynn, K.F., E. Glendenin, E.P. Steinberg, and P.M. Wright. 1964. “Pulse Height-Energy
Relations for Electrons and a-Particles in a Liquid Scintillator,” Nuclear Instruments and
Methods, 27, p. 13.
U.S. Government Printing Office (GPO). 1952. Tables for the Analyses of B Spectra, National
Bureau of Standards Applied Mathematics Series Reports No. 13, Washington, DC.

Quantification of Radionuclides
15-116
MARLAP JULY 2004
Gunnick, R., L.J. Colby, and J.W. Cobble. 1959. Analytical Chemistry, 31, p. 796.
Harley, J.H., N.A. Hallden, and I.M. Fisenne. 1962. “Beta Scintillation Counting with Thin
Plastic Phosphors,” Nucleonics, NUCLA, 20, p. 59.
Hoppes, D.D. 1990. “Demonstrated Measurement Traceability for Nuclear Power
Radiochemistry Departments,” Radioactivity and Radiochemistry., 1, p 9.
ICRP 1994. Gamma-Ray Spectrometry in the Environment, Report 53.
Jarrett, A.A. Statistical Methods Used in the Measurement of Radioactivity with Some Useful
Graphs and Nomographs, AECU 262.
Katz and Penfelt. 1952. Reviews, Modern Physics, 24, p. 28.
Lawson and Cork. 1940. Physics Review, 57, p. 982.
McDowell, W.J. 1986. Alpha Counting and Spectrometry Using Liquid Scintillation Methods.
National Academy of Sciences, Nuclear Science Series on Radiochemical Techniques, NAS-
NS-3116, NTIS: DE86007601, 108 pp.
McFarland, R.C. 1990. “Geometric Considerations in the Calibration of Germanium Detectors
for Filter-Paper Counting,” Radioactivity and Radiochemistry, 1:2.
McFarland, R.C. 1991. “Coincidence Summing Considerations in the Measurement of
Radionuclides on Filter Papers Using Germanium gamma-Ray Spectroscopy,” Radioactivity
and Radiochemistry, 2:2, pp 6-9.
McFarland, R.C. 1991. “Coincidence-Summing Considerations When Using Marinelli-Beaker
Geometries in Germanium Gamma-Ray Spectrometry,” Radioactivity and Radiochemistry,
2:3.
McFarland, R.C. 1997. “Determination of Beta Particle Counting Efficiency for Wipe-Test
Samples,” Radioactivity and Radiochemistry, 8:3.
Mitchell, D. J. 1988. Gamma Detector Response and analysis Software (GADRAS), Sandia
Report SAND88-2519, Sandia National Laboratories, Albuquerque, NM.
Moghissi, A.A., E.W. Bretthauer, and E.H. Compton. 1973. “Separation of Water from
Biological and Environmental Samples for Tritium Analysis,” Analytical Chemistry, 45, pp.
1565-1566.

Quantification of Radionuclides
15-117
JULY 2004 MARLAP
Morel, J., B. Chauvenet, and A Kadachi. 1983. “Coincidence-Summing Corrections in Gamma-
Ray Spectrometry for Normalized Geometries,” Int. J. Appl. Radiat. Isot., 34:8, pp. 1115-
1122.
Pate, B.D. and L. Yaffe. 1956. “Disintegration-rate determination by 4π Counting, Pt. IV. Self-
absorption correction: General Method and Application to Ni63 β- Radiation,” Can. J. Chem.,
34, p. 265.
Schima, F.J. and D.D. Hoppes. 1983. “Tables for Cascade-Summing Corrections in Gamma-Ray
Spectrometry,” Int. J. Appl. Radiat. Isot. 34:8, pp.1109-1114.
Sill, C.W., and D.G. Olson. 1956. “Sources and Prevention of Recoil Contamination of Solid-
State Alpha Detector,” Analytical Chemistry, 42, p. 1956.
Yoshida, M., H. Miyahara, and W. Tamaki. 1977. “A Source Preparation for 4πβ-Counting With
an Aluminum Compound,” Int. J. Appl. Radiat. Isot., 28, pp. 633-640.

1 The term “test source” means the radioactive material prepared to be introduced into a measurement instrument,
and “laboratory sample” means the material received by the laboratory for analysis. Thus, a test source is prepared
from laboratory sample material in order to determine its radioactive constituents. A “calibration source” is a source
prepared for the purpose of calibrating instruments.
16-1
JULY 2004 MARLAP
16 DATA ACQUISITION, REDUCTION, AND REPORTING
FOR NUCLEAR-COUNTING INSTRUMENTATION
16.1 Introduction
This chapter provides information and guidance, primarily for laboratory personnel, on data
acquisition, reduction, and reporting for nuclear-counting instrumentation processes. Its intent is
to provide an understanding of the many operational parameters that should be addressed in order
that the data developed and reported are compliant with project planning documents (Chapter 4),
considered valid (Chapter 8, Radiochemical Data Verification and Validation), and usable for
their intended purposes (Chapter 9, Data Quality Assessment). These processes are all linked and
each is dependent upon the results of its predecessor. The material presented is intended to
provide an overview of the processes that are used in all radiochemistry laboratories, but are by
no means performed in the same way in all laboratories.
In this chapter, data acquisition refers to the results produced by nuclear-counting instrumen-
tation. This chapter will provide guidance for laboratory personnel on selecting and applying the
operational parameters related to instrumentation and the determination of the radioactivity
contained in the test source.1 Parameters that are applicable to counting for essentially all
radiation detection instrumentation are discussed in Section 16.2, and those that are specific to a
given type of instrumentation are covered in the appropriate section describing that instrument.
Detailed descriptions of the instruments discussed in this chapter are provided in Chapter 15,
Quantification of Radionuclides.
Once test sources have been prepared and counted using laboratory measurement instruments
(Chapter 15), the basic information generated
by the instrument should be processed and
reduced to data that can be reviewed, verified,
validated, and interpreted in accordance with
project planning documents and analytical
statements of work (SOWs; also see Chapters 5,
Obtaining Laboratory Services, and 7, Evalua-
ting Methods and Laboratories). Data reduction
is primarily mathematical in nature while data
reporting involves the presentation of the
results of the data acquisition and reduction
Contents
16.1 Introduction ......................... 16-1
16.2 Data Acquisition ..................... 16-2
16.3 Data Reduction on Spectrometry Systems . 16-8
16.4 Data Reduction on Non-Spectrometry
Systems ........................... 16-32
16.5 Internal Review of Data by Laboratory
Personnel .......................... 16-36
16.6 Reporting Results ................... 16-38
16.7 Data Reporting Packages .............. 16-39
16.8 Electronic Data Deliverables ........... 16-41
16.9 References ........................ 16-41

Data Acquisition, Reduction, and Reporting for Nuclear Counting Instrumentation
16-2
MARLAP JULY 2004
processes and nonmathematical information necessary to interpret the data (e.g., sample
identification and method of analysis).
Data reduction may be as simple as a division of the counts by the counting time, the sample
aliquant weight or volume, and the detector efficiency, thereby producing the radionuclide
concentration. On the other hand, it may also require more complicated processing such as the
fitting of an analytical function, or the unfolding of a differential spectrum (Tsoulfanidis, 1983).
In any case, the reduction process should continue by calculating the combined standard
uncertainty (Chapter 19, Measurement Uncertainty).
The output of some laboratory instruments is highly simplistic and consists only of the number of
nuclear decay events recorded by the detector in the time interval allocated for the measurement.
An example of this might be a proportional counter whose only output is from an electronic
scaler, and the available data consist of total counts or count rate. On the other extreme, some
laboratory counting instruments with computer components produce outputs consisting of
radionuclide concentration, uncertainty, and other information. Examples of these types of data
reducing instruments are alpha- and gamma-spectrometry and liquid-scintillation systems.
ANSI N42.23 contains an outline of a minimal data report. Most project-specific planning
documents or analytical SOWs require that the radiochemical data produced by laboratories be
submitted in a specific format and form (i.e., electronic or hard copy, or both). In some cases, the
requirements are minimal and may consist of a data report that gives only the sample identifier
information, accompanied by the radionuclide concentration and its associated uncertainty. Many
projects require much more supporting information, primarily to assist in the data validation
process. Support material can include information on calibration, background determination,
sample processing, sample receipt, quality-control sample performance, raw-counting data, and
chain-of-custody records.
This chapter gives an overview of data acquisition, reduction, and reporting in radiochemical
laboratories. The material presented is intended to be descriptive rather than prescriptive, since
these processes vary greatly between laboratories; depending upon the equipment, personnel,
project requirements, and the methods and analyses being performed.
16.2 Data Acquisition
Data acquisition in this context refers to the process of collecting the basic information produced
by nuclear-counting instrumentation. These data may be produced in hard copy or electronic
format, or visually displayed for the operator to record. As previously stated, this can be simply
the number of counts detected by the instrument within the allotted counting time or as
conclusive as the identification of the radionuclides contained in the sample along with their
concentrations and associated uncertainties.

Data Acquisition, Reduction, and Reporting for Nuclear Counting Instrumentation
16-3
JULY 2004 MARLAP
Following generation, data requiring further processing may be transferred electronically or
manually to the next data-reduction step. Electronic transfer should be employed as often as
possible, as long as the software process has been verified and validated to perform correctly in
this function. Software responsible for electronic data transfer should be validated and verified
initially, and any changes verified and validated. A manual recheck of some portion of the data
analysis should be performed on a routine basis (e.g., annually).
The reliability of the data generated also depends upon the proper operation of the instrumenta-
tion and the associated data reduction programs. Data quality further depends upon the correct
input of associated information by laboratory personnel.
16.2.1 Generic Counting Parameter Selection
Instrument operators have choices, provided by instrument manufacturers, in the setup and
operation of nuclear counting instruments. These selections can affect the quality and applica-
bility of the data. Some selections can be made on a one-time basis and left unadjusted for the
processing of all samples and others require the operator to reevaluate the settings, possibly for
each test source counted. In some cases adjustments can be made following counting during the
processing of the derived information. Some adjustments can only be made before counting or by
extending the counting time. In making the proper selection, there are some overall considera-
tions relative to the project requirements, as specified in project planning documents or in the
analytical SOW. Other operator decisions depend on the nature of the test source itself. Caution
should be exercised when changing operational parameters so that the calibrations (counting
efficiency, energy, self absorption, etc.) performed on the instrument remain valid. For example,
changing the source container or holder may affect the counting efficiency and/or background.
Determining the appropriate operating conditions requires that the operator have a thorough
understanding of the counting process and the instruments and their operation for the production
of valid and useable data. In addition, the operator should be cognizant of the measurement
quality objectives (MQOs) that have been established.
Some of the factors that affect operational parameter selection are related to project requirements.
Planning documents and the analytical SOW may specify the limits on measurement uncertainty
and detection capability. In order to achieve compliance with the limits, adjustments to instru-
ment operating parameters (e.g., count times) may be required for some or all the samples
received. The number of samples received during a time period may make it mandatory for
adjustments to be made in order to meet these requirements while complying with project-
defined turnaround times.
Factors that may affect the selection of operational parameters include:
• Project and External
Nproject requirements for uncertainty, detection capability, and quantification capability

Data Acquisition, Reduction, and Reporting for Nuclear Counting Instrumentation
16-4
MARLAP JULY 2004
Nlaboratory backlog, radiological holding time, and sample turnaround times
• Sample Characteristics
Nexpected sample radionuclide concentration
Ninterfering radionuclides
Ninterfering stable constituents (e.g., liquid scintillation counting quenching)
Namount of sample available
Nphysical characteristics of the test source (e.g., density)
Nhalf-life of the radionuclide of interest
• Analytical Process
Nchemical separation process leading to test-source generation
• Instrumentation
Ninstrument adjustments available and their limits
Nconditions and limits of an instrument’s calibration
Ntime availability of instruments
Ncounting efficiency
Ncalibration geometries available
Taking into consideration the above, the operator has control over and should select certain
parameters for all radiation measurements. The selection of the basic parameters should be
carefully planned in advance to assure that the project requirements are met. The laboratory’s
selection of parameters during the planning process may require alteration as the process of
sample analysis is actually taking place due to unavoidable changes in the samples and sample
characteristics throughout the duration of the study.
16.2.1.1 Counting Duration
The standard uncertainty of a measurement with total number of observed counts, N, using
Poisson counting statistics, equals the square root of N (as further explained in Chapter 19). The
relative fractional uncertainty of the measurement of N is then . The expected value of N is
1/ N
proportional to the length of the counting period; so, increasing the counting duration, which is a
controllable factor, can reduce the relative uncertainty of the measured counts. The analyst then
should select counting durations for the sample and the blank that are sufficient to meet the
project objectives for detection capability and method uncertainty. An alternative to selecting the
counting duration, available on many radiation counting instruments, is to count until a preset
number of counts is obtained.
Note that the overall measurement uncertainty for the final analytical result usually depends on
many factors besides the counting uncertainty; so there is a limit to the improvement that can be
made by adjusting counting times alone.

Data Acquisition, Reduction, and Reporting for Nuclear Counting Instrumentation
16-5
JULY 2004 MARLAP
16.2.1.2 Counting Geometry
The counting efficiency of a radiation detector depends upon (among other things) the geometry
of the source and detector arrangement, i.e., the solid angle subtended at the detector by the
source (see Chapter 15, Quantification of Radionuclides). A given radiation detector may have
the counting efficiency established for several geometries. The geometry selected among those
available may depend upon the amount of sample available, the quantification requirements for
the analysis, the radionuclide concentration in the sample, the dictates of the radioanalytical
method, the physical characteristics of the sample, the nature and energy of the decay process,
and the characteristics of the detector.
The choices to be made relative to geometry selection are usually the type of test-source
container, the source mounting, and the source-to-detector distance. Choices are to be made
among those for which the detector has an established efficiency calibration.
16.2.1.3 Software
The use of properly developed and documented computer software for data acquisition and
reduction can enhance the quality of laboratory data. Guidance on software documentation can be
found in EPA (1995). Caution should be exercised in the selection and use of undocumented
programs and those which may not have been tested in laboratories performing analyses similar
to those for which MARLAP has been developed. For example, a spectral analysis program may
accurately identify and quantify the radionuclides in test sources containing higher levels of
radioactivity (which produce spectra with well-defined peaks, easily distinguishable from
background) but may be inaccurate for samples with environmental radionuclide levels.
When selecting software, one should thoroughly review the data reduction algorithms. The user
should not blindly accept the notion that all software performs the calculations in an appropriate
manner without this review. When evaluating software, it is often helpful to review the software
manual, particularly in regard to the algorithms used in the calculations. While it may not be
necessary that the user understand in detail all the calculations performed by highly complex
software programs, the user should understand the overall scheme of analysis and reduction in
order to assure data meet quality objectives and reporting requirements. This understanding is
also beneficial in assuring that user-defined parameters are properly selected.
The output of some instruments is very basic, consisting primarily of counting data (total counts
or count rate). These data should be manipulated by external systems to convert them to the form
required by planning documents. The external system that performs the calculations may be a
calculator or a computer with the appropriate software to reduce the data to usable terms. In
either case, additional information relative to the processing of the sample should be input along
with the counting data (counting time, total counts, and background counts). This information
may include laboratory sample identifier (ID), collection date, sample mass or volume processed,
instrument counting efficiency, and chemical yield.

Data Acquisition, Reduction, and Reporting for Nuclear Counting Instrumentation
16-6
MARLAP JULY 2004
RC'CG&CB
g@V@Y@KC@e&λt1(16.1)
For computer (processor) based systems, some of this information is generated and processed
internally and the remainder is manually entered or electronically transferred from the Laboratory
Information Management System (LIMS) or some other adjunct system where it has previously
been stored. It is becoming increasingly common for much or all of this adjunct information to be
transferred to the counting instrument by reading a bar code affixed to the test source to be
counted. In this manner, the information that has previously been entered into a LIMS is
electronically transferred to the counting instrument. For hand calculations, these data are simply
entered into the calculations.
The software data reduction and reporting functions should be verified to perform as expected.
For example:
• Manual calculations and software calculations performed on the same raw data should
produce the same analytical results; and
• Calculation of activity using secondary/tertiary gamma rays of a radionuclide should
consistently validate the activity determined from the primary gamma ray.
16.2.2 Basic Data Reduction Calculations
The equations used for data reduction depend on the analytical methods used. The following
equations are provided as examples to illustrate the basic principles involved in data reduction.
Following counting, the radionuclide concentration may be calculated:
where:
RC= radionuclide concentration at a reference time (i.e., time of collection) (Bq/L or
Bq/g)
CG= gross counting rate (source + background) (cps)
CB= counting rate of the blank (cps)
g= detector efficiency for the radionuclide being measured (cps or Bq)
V= volume or mass analyzed (L or g)
Y= chemical yield (when appropriate)
e= base of natural logarithm
λ= radioactive decay constant for the radionuclide (reciprocal time units)
t1= time lapse from sample collections to beginning of source count (units consistent
with λ)
KC= correction for decay during counting and is:

Data Acquisition, Reduction, and Reporting for Nuclear Counting Instrumentation
2 If several half-lives of the radionuclide elapse between sampling and analysis, decay-correcting the result to the
time of sampling increases both the measured concentration and its uncertainty. When a result that is statistically
indistinguishable from zero is decay-corrected in this manner, the corrected result may be positive, negative, or zero,
but the magnitude is often so large that it causes concern to data users. See Attachment 14A, “Radioactive Decay
and Equilibrium.”
16-7
JULY 2004 MARLAP
KC'1&e&λtC
λtC
(16.2)
RC'CG&CB
Ee@ge@V@Y@KC@e&λt1(16.3)
where:
tC= clock time ( total time during which counting occurs) of counting (units consistent
with λ). Clock time, live time, and dead time are discussed below.
Equation 16.1 calculates the radionuclide concentration at the time of sample collection. It
compensates for the fact that short-lived radionuclides may experience significant reduction in
activity during counting, when the counting duration is a significant fraction of the half-life.2 For
long-lived radionuclides (t½ > 100 times the counting time), the term KC approaches unity and
may be ignored. The efficiency used in this equation may be obtained from the specific radio-
nuclide whose concentration, RC, is to be determined or it may be obtained from an efficiency
curve that plots detector efficiency against energy. In the latter case, the emission probability per
decay event, Ee, (also called “abundance,” “percent abundance,” or “branching ratio”) of the
particle or photon being counted must be considered. This is required because the energy
dependent efficiency, ge, is developed in terms of the fraction of particles or photons detected
divided by the number emitted at that energy. Thus, if the radionuclide emission being
determined during the counting of a test source has an abundance less than 100 percent, an
adjustment should be made to Equation 16.1, as shown in Equation 16.3:
Most modern instrument systems contain software to perform data manipulations that convert
basic counting information to a form that can be compared to the project data quality objectives,
or at least to begin or promote this process. Certain sample-specific information should be
manually entered or transferred to the system electronically in order to perform the necessary
calculations.
“Live time” is the time period that the analyst chooses to count the sample. “Dead time” is the
period that the counting system is unable to process multiple detection events within the
resolving time of the analog-to-digital converter (ADC) plus storage in the correct memory
channel. All counting systems have some dead time. Live time plus dead time is called “clock
time.” For environmental samples, or when using gamma spectroscopy or liquid scintillation

Data Acquisition, Reduction, and Reporting for Nuclear Counting Instrumentation
16-8
MARLAP JULY 2004
% Dead Time 'Clock Time&Live Time
Live Time × 100 (16.4)
systems, dead time is usually negligible, because decay events (even with multiple radionuclides
present) randomly occur far enough apart (Canberra, 1993). In these cases, the live time is the
same as elapsed time (elapsed time sometimes is referred to as “real” or “clock” time). However,
as the sample activity increases, the probability of two decay events happening within a short
time of each other also increases. When the first event is being processed by the ADC, the ADC
will not accept another pulse until the output of the ADC is stored in the correct memory channel
(the period of dead time). If a second event occurs during the detection and count-system analysis
of the first event, the second event is not counted. Some counting systems counting systems
compensate for this by using the “preset time,” which does not advance during this detector
processing period. (Preset time thus is synonymous with live time.) Many systems have meters
that indicate percent dead time. This can be expressed by Equation 16.4.
Increasing the live time by this percentage yields the clock time. Although clock time and live
time are very close, clock time should always be used in ingrowth or decay calculations,
especially with radionuclides whose half-lives are significant with respect to the counting
interval.
The best method of compensating for high dead time samples is to either dilute the sample or use
less of it for the analysis. High dead times can cause other problems with the counting systems
such as peak shaping and signal recognition, which can affect results.
16.3 Data Reduction on Spectrometry Systems
Software is available for resolving alpha, gamma (including X-rays), and liquid scintillation
spectra and for performing the attendant functions such as calibration, energy alignment,
background acquisition and subtraction, and quality control (QC) functions.
Spectroscopic analysis for alpha particles and gamma rays is performed to identify and quantify
radionuclides in samples. Since these emissions occur at discrete energies, spectrometry is useful
for these purposes and can be applied to the analysis of a wide range of radionuclides. Energy
spectra are produced when a detector absorbs a particle or photon and produces a signal that is
proportional to the energy absorbed. The resulting signal is digitized by an analog-to-digital
converter and processed by a multichannel analyzer. A differential spectrum is produced, where
the number of events within an incremental energy, ∆E, is recorded on the y axis and the energy
is represented on the x axis (Tsoulfanidis, 1983). In this way, radionuclides can be identified by
the characteristic energies of their emissions and quantified because the area under the full
energy peak is proportional to the emission rate of the source being analyzed and to the count
time.
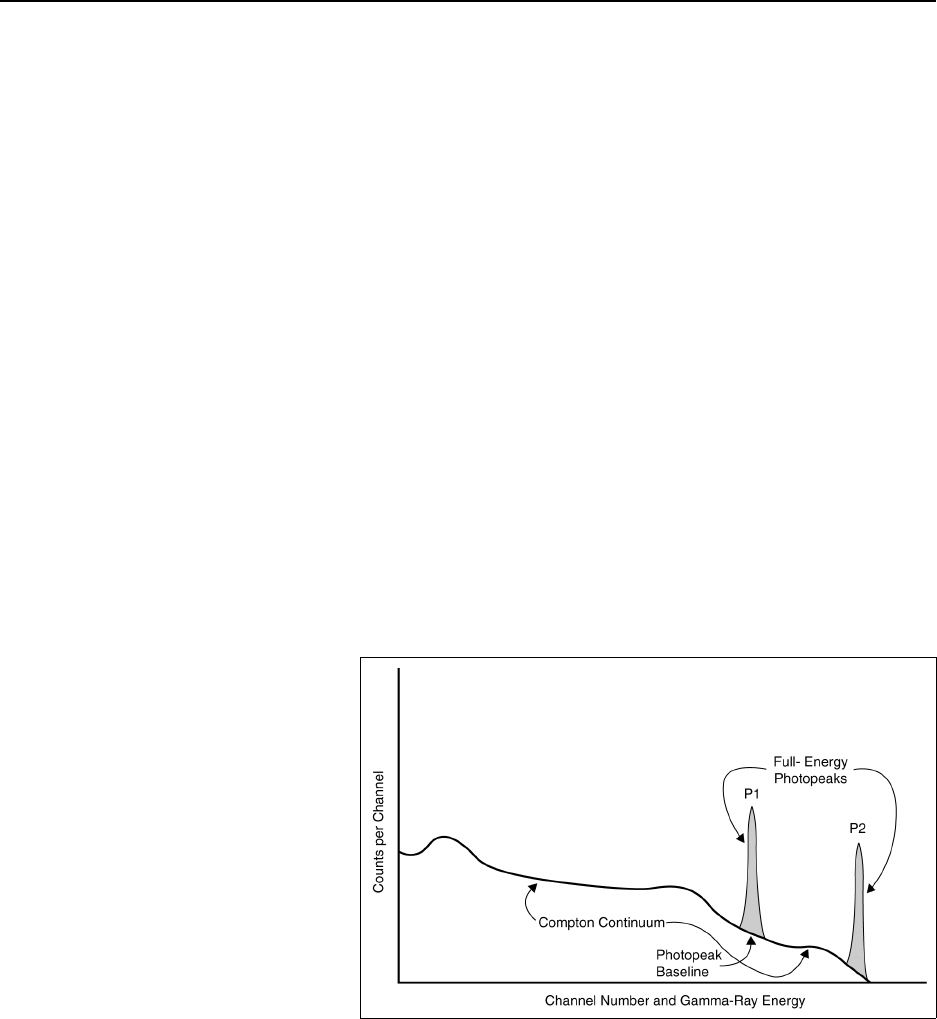
Data Acquisition, Reduction, and Reporting for Nuclear Counting Instrumentation
16-9
JULY 2004 MARLAP
FIGURE 16.1 — Gamma-ray spectrum
The spectra for alpha and gamma emitters are quite different, due to the differences in the way
these two types of radiation interact with matter in transferring their energy to the detector
material. The process of resolving the spectra into its contributing components is referred to as
spectral analysis (NCRP, 1978) and unfolding (Tsoulfanidis, 1983). Computer programs for
analyzing alpha and gamma spectra are available from several sources (Decker and Sanderson,
1992). A method of performance testing of gamma analysis software is given in ANSI N42.14.
16.3.1 Gamma-Ray Spectrometry
Gamma-ray spectrometry on environmental samples requires the use of gamma spectral analysis
software for any reasonable degree of accuracy and detection capability. (Reference to gamma
rays and their detection in this context also includes X-rays from radionuclide decay.) This is due
to the potentially large number of photopeaks to resolve, the low level of radioactivity in most
environmental samples, and the relatively low detection limits and stringent QC requirements of
most project-specific planning documents. Spectral analysis by manual techniques is only
practical when the number of radionuclides is limited and the contributing radionuclides are
predictable. An example is the analysis of milk samples for gamma-emitting radionuclides,
where the milk production process in the cow restricts the number of radionuclides in the milk
product (Hagee et al., 1960; USPHS, 1967).
Gamma rays interact with matter in three ways: by photoelectric effect, Compton scattering, or
pair production (Tsoulfanidis, 1983). These interactions within a gamma detector (usually high-
purity germanium or sodium iodide;
see Chapter 15) result in varying
amounts of the gamma-ray energy
being absorbed. Only one—the
photoelectric—results in the total
energy being absorbed in a single
interaction. The photopeaks in
Figure 16.1 result from the
processing of the detector signal
through the linear circuitry and the
multichannel analyzer.
As can be seen in the figure, a
lower-energy photopeak (P1) may
be displaced upward by combining
with the accumulated counts from the Compton continuum, generated from other possible
higher-energy photopeaks (P2) and background radiation. Each photopeak has a basic Gaussian
shape (Gilmore and Hemingway, 1995). It may be described with the baseline counts removed
from each peak channel (Quittner, 1972) by:

Data Acquisition, Reduction, and Reporting for Nuclear Counting Instrumentation
16-10
MARLAP JULY 2004
f(x)'Ae&(x&p)2/2σ2(16.5)
where:
f(x) = the expected number of counts in any channel x
x= the channel number
A= the peak amplitude (counts in the centroid channel)
p= the peak centroid channel
σ= the standard deviation of the Gaussian peak
(The width of the peak is related to the full-width at half-maximum [FWHM] of the detector, Γ,
where Γ = 2.355 σ. The area under the peak is N = 1.064 A Γ.)
The photopeak is the key element in gamma-ray spectrometry in that its location on the energy
axis provides a means for radionuclide identification, and the area of the photopeak is
proportional to the number of photoelectric events detected. This becomes the basis for
radionuclide identification and quantification.
The fundamental purposes of gamma-ray computer-based spectral analysis programs are to
identify the photopeaks in a spectrum and to measure the true area under the photopeaks. It
should do this in the presence of natural background, a potentially large number of sometimes
overlapping photopeaks, and a great number of Compton-scattering events. Once these initial
tasks have been performed, the computer program uses this information to determine the
radionuclide mix that contributed the complex spectrum and the individual concentrations in the
sample being analyzed.
Most computer programs for gamma-spectral analysis are provided by equipment manufacturers,
although some are supplied by independent providers. There are significant differences in the
structure of the programs. However, they all perform similar functions, which are given below
and illustrated in Figure 16.2.
16.3.1.1 Peak Search or Identification
There are two basic methods of gamma spectral analysis. The first method is to allow the
analysis software to determine the existence of the peaks and their energy. The second method is
often referred to as a “library directed” search, where the operator identifies the peak energy
locations, e.g., regions of interest, to be searched for discernable peaks. The latter method may be
more sensitive (Gilmore and Hemingway, 1995) but, taken alone, will fail to identify and report
unspecified radionuclides. If the confirmation of the existence of a particular radionuclide is
required, the second method should be employed. Most software programs allow either approach
to be activated and used for each analysis. If only the regions of interest technique is used to
assess the concentration of a radionuclide, it is still important to assess the presence of other
radionuclides. For example, when determining 134Cs (at the 604.7 keV peak), a false positive
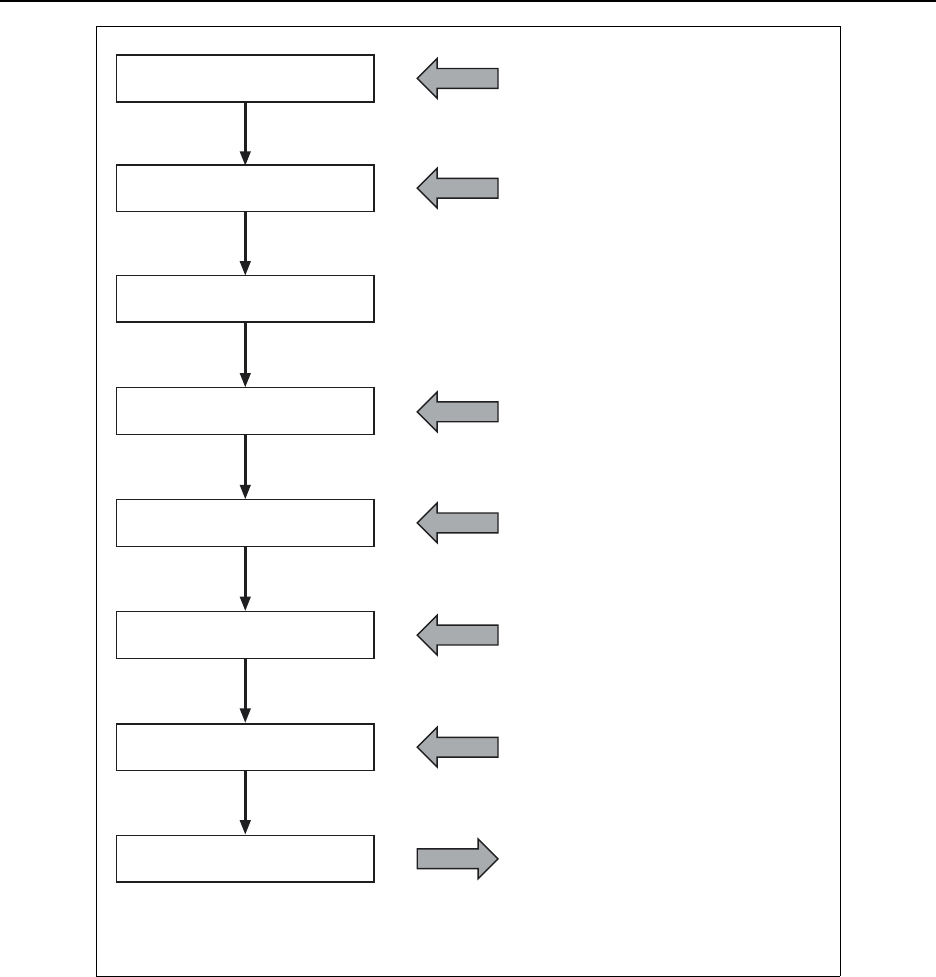
Data Acquisition, Reduction, and Reporting for Nuclear Counting Instrumentation
16-11
JULY 2004 MARLAP
Define Sample Parameters
Define Acquisition Parameters
Acquire Spectrum
Locate Peak Energies
Determine Net Peak Areas
Nuclide Identification
Activity Correction
Report
Sample ID, Batch ID, Nuclides of Interest,
Volume/Weight w/uncertainty, Sample
Geometry, Wet/Dry Ratio, Reference Date,
QC Batch Index, Activity and Mass/Volume
Units, Sample Collection Start/Stop
Bias Voltage, ADC Gain, Amplifier Gain,
Shaping Times, Filter Parameters, Energy
Calibration, Shape Calibration, Acquisition
Presets
Search Region, Threshold/Sensitivity,
Tolerance, Regions of Interest, Library
Peak Area Region, Continuum Parameters,
Background Subtraction, Peak Rejection
Criteria, Fitting Parameters, Multiplet
Resolution Parameters
Nuclide Identification Region, Library,
Tolerance, Threshold/Sensitivity, Efficiency
Calibration, Decay Correction
Parameters
Interference Library, True Coincidence
Library, Efficiency/Geometry Parameters,
Peak-to-Total Calibration
Corrected Nuclide Concentrations,
Measurement Uncertainties, MDC
Calculations, List of Unidentified Peaks,
Quality Assurance Tracking, Action Level
Monitoring
(Adapted from Gilmore and Hemingway, 1995; ORTEC/Ametec, 2002; Canberra, 2002.)
FIGURE 16.2 — Gamma-ray analysis flow chart and input parameters
result or high bias might be realized for the 134Cs, if 125Sb (606.6 keV) were present.
A most important function performed by an analysis program is the identification of true
photopeaks. In the programs available, this is achieved in one of the four ways discussed below.
Many spectral analysis programs allow the operator to select among two or more of the four
methods for peak identification. Selection of the most accurate and sensitive method depends on
the radionuclides present in the source, detection capability requirements for individual

Data Acquisition, Reduction, and Reporting for Nuclear Counting Instrumentation
16-12
MARLAP JULY 2004
radionuclides, the number of radionuclides present, the nature of the background spectrum, the
degree to which the radionuclide mix can be predicted, and the activities of the radionuclides.
The selection of a particular peak search method can be determined by experience with similar
sample types and past performance, particularly on performance evaluation (known) samples.
REGIONS OF INTEREST (ROI) METHOD
This is the simplest form of peak identification, but can only be used when the radionuclides
present in the sample are known and when the analysis system has been compensated for gain
drift. ROI analysis involves the establishment of predetermined energy regions, at least one for
each radionuclide present. Once the spectrum has been acquired, the number of counts in each
region is summed after subtracting the photopeak baseline (Figure 16.1). This method of spectral
analysis may be more applicable to alpha rather than gamma-ray spectrometry.
GAUSSIAN FUNCTION DERIVATIVE METHOD
As previously stated, the photopeak has a basic Gaussian shape; in reality it is collected, stored,
and presented in a histogram format. Mathematically, it is represented by an exponential on the
low- and high-energy sides and Gaussian in the middle. The most widely used peak identification
technique was proposed by Mariscotti (1967). This technique uses derivatives of the Gaussian
function to assess the presence of a photopeak. For most low-level radioactivity, this peak search
method may provide the best peak detection capability with the fewest false peak identifications
or omissions of true peaks.
CHANNEL DIFFERENTIAL METHOD
This method searches for a number of channels where the counts are significantly greater than the
preceding channels, and then looks for the expected decrease in counts corresponding to the
backside of the prospective photopeak. This method works relatively well for large, well-defined
peaks, but is limited for poorly defined peaks with counts barely above the background baseline
of the peak (Gilmore and Hemingway, 1995).
CORRELATION METHOD
In this method, a search function is scanned across the spectrum. Each channel count, over the
width of the search function, is multiplied by the corresponding value of the search function. The
sum of these products is then made a point on a correlation spectrum. A correction for the base-
line contribution leaves only positive counts within a photopeak. Although the scan function is
normally Gaussian in form, other forms may be applied (Gilmore and Hemingway, 1995).
Spectral analysis programs usually have some user selected peak acceptance criteria. The
acceptance criteria may be based on peak shape, width uncertainty, or the number of standard

Data Acquisition, Reduction, and Reporting for Nuclear Counting Instrumentation
16-13
JULY 2004 MARLAP
deviations above the background to be subtracted. Care is required in selection of the values for
these acceptance criteria. If the values are too high, valid photopeaks remain undetected. If the
values selected are too low, radionuclides may be reported that are not present in the samples.
Knowledge of the sample origin and experience with using the analysis program on similar
samples to those being processed is useful in establishing values for these user-selected para-
meters. Peak searches may be standard or directed (Canberra, 1994). In a standard search, all
identified peaks are assigned to a radionuclide according to the nuclide energy values contained
in a radionuclide energy library. In a directed search, the user specifies the energies and radio-
nuclides over which the search is performed. If reporting a specific radionuclide is required, the
directed search is appropriate; however, some radionuclides could go unreported if only a
directed search is performed. Nuclides with multiple gamma rays may have several (but not all)
gamma rays identified in the library. Depending upon user-selected criteria in the software, peak
matches to library listings may be for a single line of the nuclide or multiple lines. An example is
60Co, with gamma rays of equal intensity at 1,173 and 1,332 keV. A software option may be
selected so that both gamma rays must be found for the positive identification of the 60Co radio-
nuclide. In this case, if only one of the peaks was found (as can occur for very low radionuclide
concentrations), 60Co would not be listed in the final analysis report.
In order to identify gamma peaks and radionuclides correctly, the user should select a radio-
nuclide-energy library corresponding to the correct sample matrix or to those radionuclides in the
sample based on the origin of the sample (e.g., SOW- or project-identified radionuclide list, soil
samples, power plant effluent samples, etc.). For example, a radionuclide energy library for soil
samples will include the gamma-ray energies associated with the radionuclides in the naturally
occurring uranium and thorium decay chains. However, using this library to evaluate spectra for
reactor coolant water samples having short-lived fission or activation products would be
inappropriate, because some observed gamma peaks may not be identified and other observed
gamma peaks may be misidentified as naturally occurring radionuclides. A radionuclide energy
library may also be tailored according to the half-life of the expected radionuclides. Use of such a
library avoids identification of a radionuclide whose half life would prohibit its presence in a
sample.
16.3.1.2 Singlet/Multiplet Peaks
A peak is referred to as a singlet or multiplet according to whether it is composed of a single
photopeak or multiple photopeaks, respectively. “Deconvolution” is the term given to the process
of resolving a multiplet into its components (Gilmore and Hemingway, 1995). The ability of a
spectral analysis program to perform this function may well be the deciding point for its
selection. It is particularly important if the laboratory has analyses in which one of the critical
radionuclides has only one gamma ray whose energy is very near to that of another radionuclide
expected to be present in all or most samples.
There are three primary ways that programs deal with the problem of resolving multiplets. The

Data Acquisition, Reduction, and Reporting for Nuclear Counting Instrumentation
16-14
MARLAP JULY 2004
Centroid 'jCii
jCi
(16.6)
first method is with a deconvolution algorithm, which is based on the peak shape being the
composite of multiplet Gaussian distributions. The second method uses the gamma-ray library to
anticipate where peaks occur within a multiplet. The disadvantage of the first is in dealing with
small ill-defined peaks and the second cannot, of course, resolve peaks not included in the
library. The third method, peak stripping, again depends on defining all radionuclides whose
gamma rays contribute to the multiplet. In peak stripping, one of the interfering gamma ray’s
contribution is subtracted from the multiplet area by using another of its gamma rays to estimate
the peak shape and size in the multiplet area. The remaining peak is, presumably, that of the
interfered radionuclide, which can then be identified and quantified. This method requires that
one of the interfering radionuclides have a second gamma emission that identifies and tentatively,
for the purpose of removing its contribution, quantifies it.
In some cases, the uncertainty of multiplet deconvolution can be avoided by selecting energies of
gamma rays that are not interfered with, even though they may have lower abundances. The
increase in uncertainty due to the lower number of accumulated counts may well overcome the
uncertainty of deconvolution (Gilmore and Hemingway, 1995).
16.3.1.3 Definition of Peak Centroid and Energy
Once a peak has been detected, the centroid of the peak will be defined, since it will rarely be
located at exactly a whole channel number. The centroid will be used to represent the gamma-ray
energy and should be calculated to the fraction of a channel. An algorithm used to calculate the
centroid value may be expressed as (Gilmore and Hemingway, 1995):
where Ci is the number of counts in the ith channel.
In order to assign a gamma-ray energy value to the peak centroid channel position, the analysis
program refers to a previously established energy calibration file. The detector's response to the
full range of gamma energies should be established by counting one or more sources having a
number of well-defined gamma rays over the range of energies emitted by the radionuclides in
the calibration source. This calibration source most often is a “mixed-nuclide source” with
certified emission rates, so that it also may be used for an efficiency calibration. The mixed-
nuclide source is counted on the detector, being sure to accumulate sufficient counts in the peaks
to obtain good statistical precision, and an energy-versus-channel relationship is established. The
operator will be required to provide information on the peaks to be used and their exact energies.
With modern spectrometry systems, the relationship between energy and channel number is
nearly linear. Both linear and quadratic fits have been included in available spectral analysis
programs.

Data Acquisition, Reduction, and Reporting for Nuclear Counting Instrumentation
16-15
JULY 2004 MARLAP
w'a%bE (16.7)
16.3.1.4 Peak Width Determination
In order to calculate the area under the peak, an estimate of the peak width is required, unless the
analysis program is operating in the region-of-interest mode. The width of a photopeak is
normally quoted in terms of its FWHM (see also Section 18.5.3.2, “Peak Resolution and
Tailing”). For a discussion of peak width (resolution) and the factors affecting it, see Chapter 15.
There are several ways to determine the peak boundary. These are:
(1) A Gaussian shape is assumed and some number of standard deviations (2 or 3) are allowed
on each side of the peak centroid.
(2) A standard width for each peak, based on its energy, is used.
(3) A five-point moving average is used to determine a minimum on each side of the peak, which
is set as the peak limits.
Each method has strengths and weaknesses, but all struggle with ill-defined (small number of
counts) peaks. Once the peak limits are defined, determining the area under the peak is
accomplished by summing the counts per channel for the channels contained in the peak and
subtracting the baseline (Figure 16.1).
The determination of FWHM requires an assumption of peak shape, and for gamma-ray spectro-
metry, the peak shape is assumed to be a Gaussian function. In addition, the peak width increases
with the energy of the gamma ray, so some function should be defined for the analysis program
to determine the width based on the energy of the peak. This relationship, in practice, is found to
be nearly linear (Gilmore and Hemingway, 1995) and described by:
where:
w= width of the peak
E= the energy
a, b= empirical constants
For spectra developed by high-purity germanium semiconductors (HPGe) and alpha solid state
detectors, it may be more appropriate to assume a peak shape that is a modification of the
Gaussian function to allow for the low energy tailing observed in these spectra. This type of
tailing is illustrated in Figure 16.3. Some spectroscopy programs have algorithms to fit peaks
with lower energy tailing.
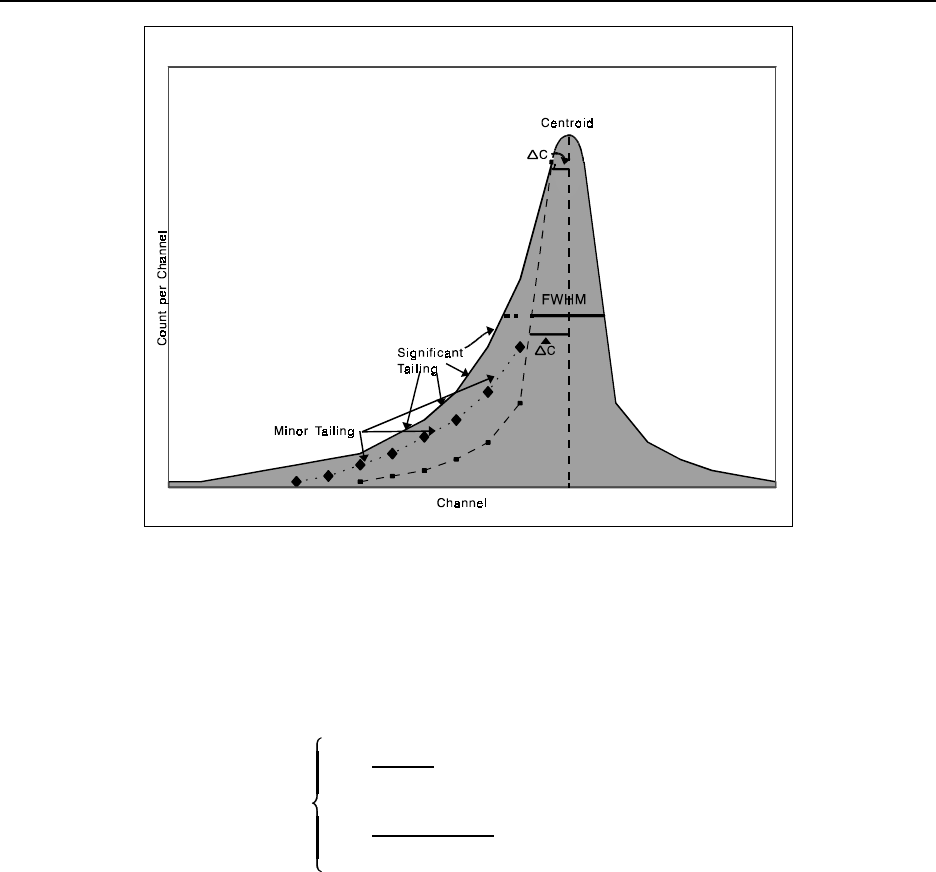
Data Acquisition, Reduction, and Reporting for Nuclear Counting Instrumentation
16-16
MARLAP JULY 2004
FIGURE 16.3 — Low-energy tailing
y(x)'Ae
&(x&p)2
2σ2,x$p&∆C
Ae
∆C(2x&2p%∆C)
2σ2,x<p&∆C
(16.8)
(16.9)
When the “tailing” peak fit option is selected, the software algorithm for peak fitting changes
from the pure Gaussian form to a dual fit. The channels in the peak not affected by the tailing are
included in the Gaussian fit (Equation 16.8), and those that are affected by tailing are modified
according to Equation 16.9 (Koskelo et al., 1996):
where:
x= the channel number
A= the peak amplitude
p= the peak centroid channel
∆C= the tailing factor (the distance from the centroid to the point where the tailing
joins the Gaussian peak)
σ= the standard deviation of the Gaussian peak (. FWHM / 2.355)
It should be noted that tailing may have many causes:
• Electronics temperature changes due to room temperature variation;
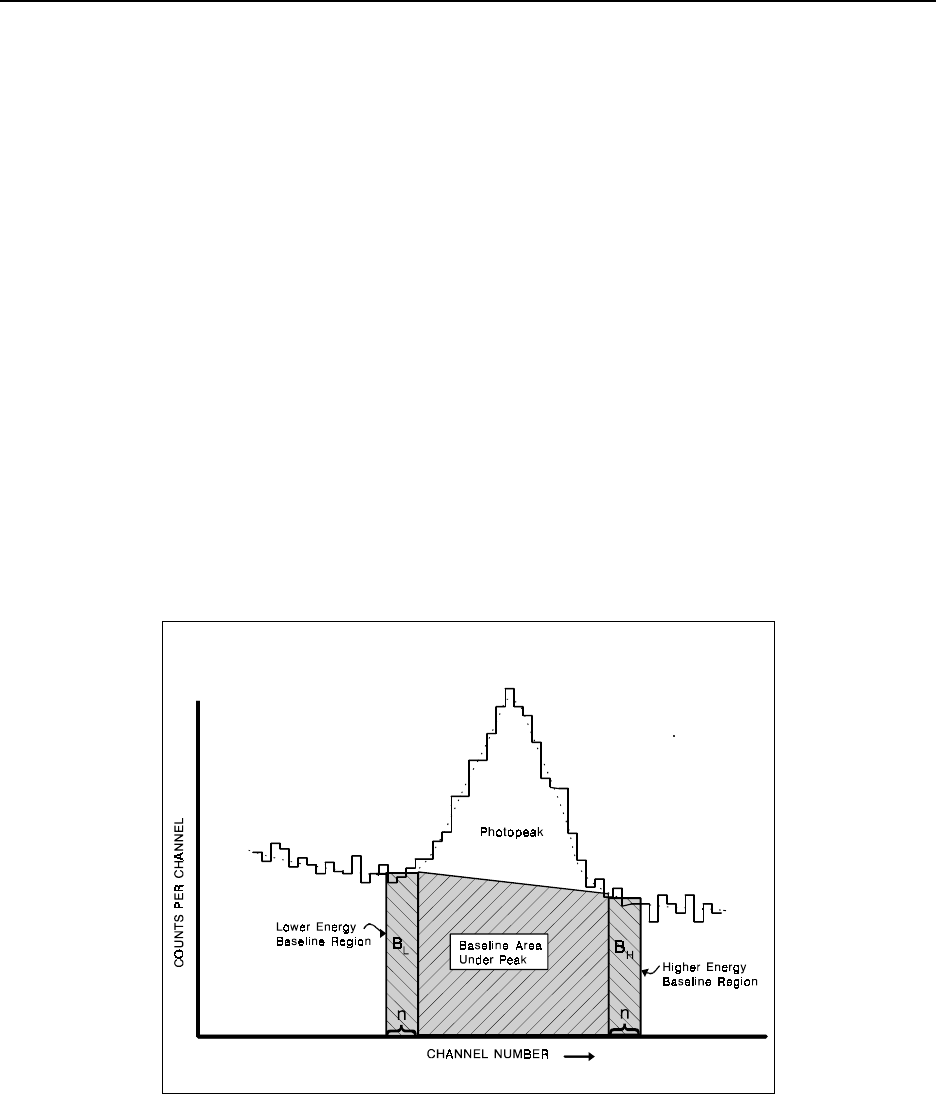
Data Acquisition, Reduction, and Reporting for Nuclear Counting Instrumentation
16-17
JULY 2004 MARLAP
FIGURE 16.4 — Photopeak baseline continuum
• Interferences from other gamma rays whose energies are <1 FWHM from the centroid;
• Phonic interference from vibration (e.g., a turbine);
• Detector degradation; or
• Detector temperature changes due to liquid nitrogen level.
These concerns should be corrected rather than trying to compensate for them mathematically
using a correction factor.
16.3.1.5 Peak Area Determination
For single peaks sitting on a Compton continuum, two methods of peak area determination are
available. The less complex method is the addition (integration) of the number of counts per
channel in each of the channels considered to be within the peak limits, and subtracting the
natural background and Compton contribution to those same channels (Baedecker, 1971; Loska,
1988). However, this is rarely simple since the photopeak is usually offset by a baseline
continuum whose contribution is not easily determined. While the background may be subtracted
by the spectrometry program, the Compton continuum will be estimated by the software and then
subtracted. This estimation is often based on the number of counts per channel in those channels
immediately above and below the photopeak region as shown in Figure 16.4 (after Gilmore and
Hemingway, 1995).
The baseline contribution is then estimated as:
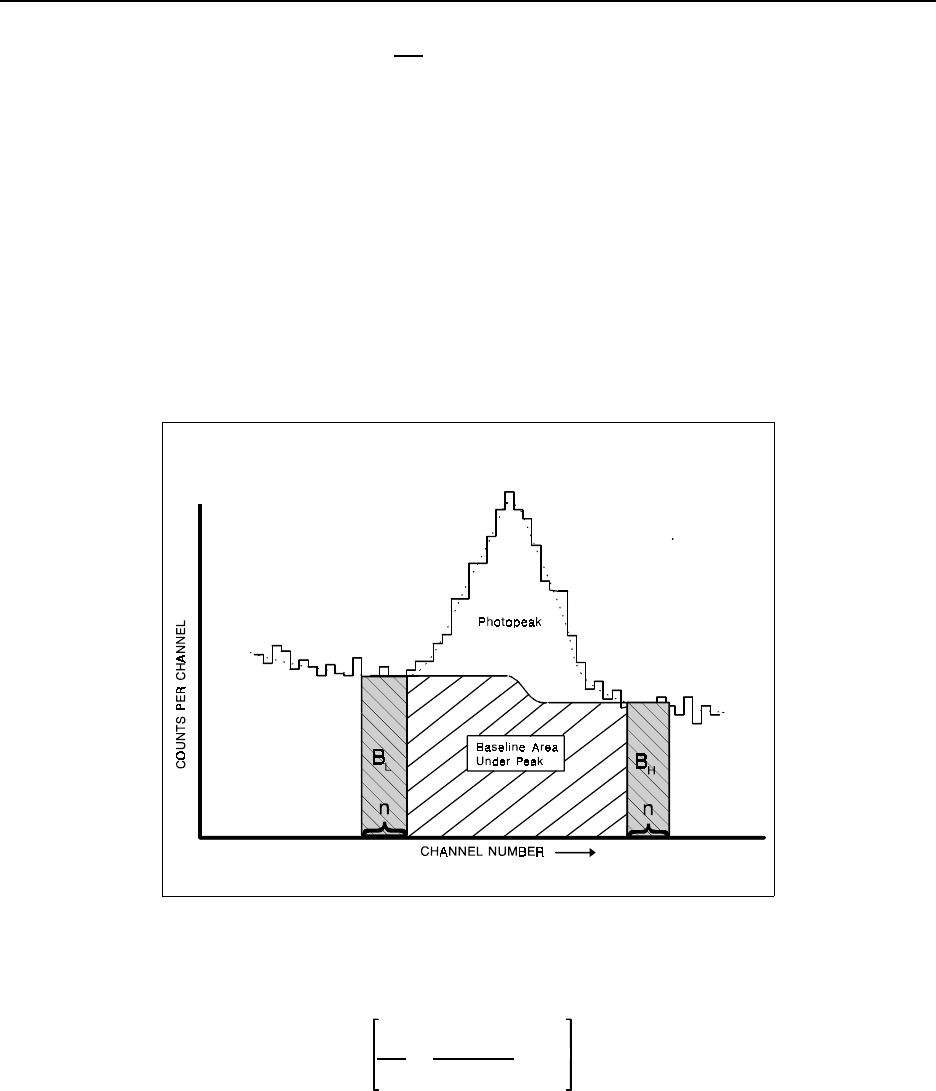
Data Acquisition, Reduction, and Reporting for Nuclear Counting Instrumentation
16-18
MARLAP JULY 2004
B'N
2n(BL%BH)(16.11)
FIGURE 16.5 — Photopeak baseline continuum-step function
B'j
N
i'1
BL
n
%BH&BL
nG j
i
j'1
yj(16.12)
where:
B= the number of counts attributed to the baseline
N= number of channels in the peak
n= the number of baseline channels considered on each side of the peak for calculating
BL and BH
BL= the sum of the number of counts in the baseline region on the low-energy side
BH= the sum of the number of counts in the baseline region on the high-energy side
In practice, the baseline continuum appears to have a step beneath the peak (Gilmore and
Hemingway, 1995), as illustrated in Figure 16.5.
This type of function is estimated by:
where:
B= the number of counts attributed to the baseline
BL= sum of counts in the baseline region on the low-energy side

Data Acquisition, Reduction, and Reporting for Nuclear Counting Instrumentation
16-19
JULY 2004 MARLAP
BH= sum of counts in the baseline region on the high-energy side
yj= counts per channel in channel j
G= gross counts in the peak
N= number of channels in the peak
n= number of channels in each of the two baseline regions
The second peak area determination method is the least-squares method, which fits a theoretical
peak shape plus background shape to the channels surrounding the peak (Kruse and Spettel,
1982; Helmer and McCullough, 1983). Background is often subtracted prior to the fitting process
(Loska and Ptasinski, 1994).
16.3.1.6 Calibration Reference File
Both energy and efficiency calibrations are required for gamma-spectrometric analysis. These
calibrations require a source whose gamma-ray emission rate is known and traceable to a national
standard, and whose gamma-ray energies are well-defined. “Mixed radionuclide” standards,
containing eight or more gamma-ray energies (from a variety of radionuclides) are commercially
available for performing these spectrometric calibrations. Information required for proper energy
and efficiency calibrations include:
• Radionuclide;
• Activity at the analysis date and time (or a specified reference date);
• Analysis date and time;
• Half-life;
• Energy;
• Energy tolerance (energy window expressed as ± keV);
• Gamma-ray emission per decay event (or “branching ratio”);
• Emission-rate uncertainty; and
• Desired activity units.
This information usually is included on the calibration source certificate provided by the
manufacturer. Calibration files are created using the software and methods prescribed by the
instrument manufacturer. One of the factors important to efficiency and energy calibrations that
results from this process is the FWHM. This is a function of gamma-ray energy and is used in
assessing peak shapes and areas in different regions of the energy spectrum. The values for
FWHM from the gamma rays in the standard are also used to establish acceptable tolerance
limits for gamma rays in the analyte corresponding to the energy regions of the calibration
source.

Data Acquisition, Reduction, and Reporting for Nuclear Counting Instrumentation
16-20
MARLAP JULY 2004
g'Cr
D(16.13)
ln g'j
n
i'0
bi@[ln E]i(16.14)
16.3.1.7 Activity and Concentration
In order to convert the counts under a photopeak to activity, an efficiency calibration should be
performed on the detector for each test-source geometry. Since the efficiency varies with energy,
the detector should be calibrated over the range of energies to be used and a calibration curve
developed for the detector. In constructing an efficiency calibration curve, only calibration
sources with singlet peaks and well-known abundances should be selected. The efficiency, at a
specific energy, is simply the number of counts determined in a photopeak of known energy
divided by the number of gamma rays emitted by the source in the same time period, or:
where:
g= efficiency (cps or γps)
Cr= cps measured under the area of the photopeak
D= gamma-ray emission rate of source (γps)
The efficiency versus energy curve developed in most gamma software packages is in the form of
a polynomial. One such form is:
where:
g= full peak efficiency
n= degree of the polynomial
bi= coefficient as determined by calculation
E= the energy of the photopeak
The efficiency curve for HPGe detectors is comprised of three distinct regions: a low-energy
curve (up to about 120 keV), a middle-energy curve (from about 120 to 661 keV), and a high-
energy curve (> 661 keV). Frequently, manufacturer-installed software can be used to generate a
single continuous efficiency curve from the three separate regions.
This efficiency curve is maintained in the calibration file of the spectral analysis program to be
applied to each analysis. An efficiency curve should be maintained for each test-source geometry
to be used for the calibrated detector.
To obtain the activity in the test source, the net counts (background subtracted) in the photopeak,
as determined by the software through the process described above, is divided by the geometry-
specific efficiency. The activity units are converted to those selected by the operator and
corrected for decay to the time of collection. Based on sample-aliquant size/volume information

Data Acquisition, Reduction, and Reporting for Nuclear Counting Instrumentation
16-21
JULY 2004 MARLAP
AT'Ae2Rτ(16.15)
supplied by the operator, sample concentration is calculated and reported.
16.3.1.8 Summing Considerations
Summing refers to the summing of the energy of two or more gamma rays when they interact
with the detector within the resolving time of the spectrometer’s electronics. There are two types
of summing: (1) Random summing, where two unrelated gamma rays are detected at the same
time, and (2) true coincidence summing, which is due to the simultaneous emission of several
gamma rays by a radionuclide and their subsequent detection by the gamma detector.
Random summing, sometimes referred to as “pile-up,” is due to gamma-ray emissions from
different atoms being detected almost simultaneously. If two gamma rays interact with the
detector within the charge collection time of the detector or the resolving time of the amplifier, a
count will occur in a single channel somewhere else in the spectrum equal to the sum of the two
deposited energies. Random summing can occur for any pair of events, such as photoelectric with
photoelectric, photoelectric with Compton, and Compton with Compton. Since this occurs
randomly in nature, the probability of random summing increases with the square of the total
count rate. Random summing can be reduced by the use of pile-up rejection circuitry, which
examines the pulse shape of detector signals and rejects those that are distorted by summing
(Gilmore and Hemingway, 1995). However, even with pile-up rejection random summing will
still be present. A mathematical correction for random summing is given by:
where:
AT= the true peak area (counts)
A= the observed peak area (counts)
R= the mean count rate of the total spectrum (cps)
τ= the resolving time of the electronics (s)
If unknown, the resolving time can be estimated by a method similar to that described in Gilmore
and Hemingway (1995).
True coincidence summing is a source of error when a source contains nuclides that emit several
gamma rays nearly simultaneously. Coincidence summing is geometry dependent and increases
as the source is positioned closer to the detector. Thus, the use of multi-gamma-ray calibration
sources for close geometry efficiency calibrations must be done with caution. True coincidence
summing also increases with detector volume and is very prevalent in a “well” detector. The use
of a detector with a thin entry window opens the possibility of coincidence summing with X-rays.
Since coincidence summing is independent of count rate, it is a mistake to assume that the
measurement of environmental media is immune from errors caused by this phenomena.
True coincidence summing can result in the loss of counts from photopeaks that are in

Data Acquisition, Reduction, and Reporting for Nuclear Counting Instrumentation
16-22
MARLAP JULY 2004
uc'u2
P%u2
V%u2
g%u2
U%u2
F%u2
D(16.16)
coincidence, and an apparent loss in the number of events detected at those energies. The sum
peak also may be an emitted gamma ray. In this case, it would appear that more counts are
present than expected at the sum-peak energy based on other peaks from the same radionuclide.
The use of single gamma-ray-emitting radionuclides is recommended, to the extent possible, for
developing calibration curves for detectors at close geometries. In practice, even when the
efficiencies are determined in this manner, errors in analyzing for nuclides emitting more than
one gamma ray still exist. When a multi-emitting gamma-ray source is to be measured with
minimum bias, it may be necessary to perform an efficiency calibration with the specific
radionuclide to be measured in the specific geometry desired.
In theory it is possible to mathematically correct for true coincidence summing; however, for
complicated decay schemes, the task is daunting (Gilmore and Hemingway, 1995). Some data
have been published that give correction factors for coincidence summing for a number of
radionuclides (Debertin and Helmer, 1988). Unfortunately they only apply to the particular
detector and geometries for which they were developed.
16.3.1.9 Uncertainty Calculation
The various components of uncertainty in the determination of the source activity should be
propagated to obtain the combined standard uncertainty. The sources of uncertainty in the gamma
spectral analysis include those associated with the determination of the net peak area, which
includes the standard uncertainties of the gross counts, the background counts, and any
interference from other gamma radionuclides present; the uncertainty associated with the
unfolding of multiplets; the detector efficiency, which includes uncertainties of the net peak area,
the calibration source emission rate, and decay correction factor; and uncertainty in the
determination of the sample volume or mass.
where:
uc= combined standard uncertainty
uP= component of combined standard uncertainty due to the net peak area determination
uV= uncertainty component for the volume or mass determination
ug= uncertainty component for the efficiency determination
uU= uncertainty component for the unfolding routine for multiplets
uF= uncertainty in the branching factor from the decay scheme for the radioactive
emission being measured
uD= uncertainty in the decay constant of the radionuclide
Each of these factors may have a number of components of uncertainties included, for example,
the net peak uncertainty:
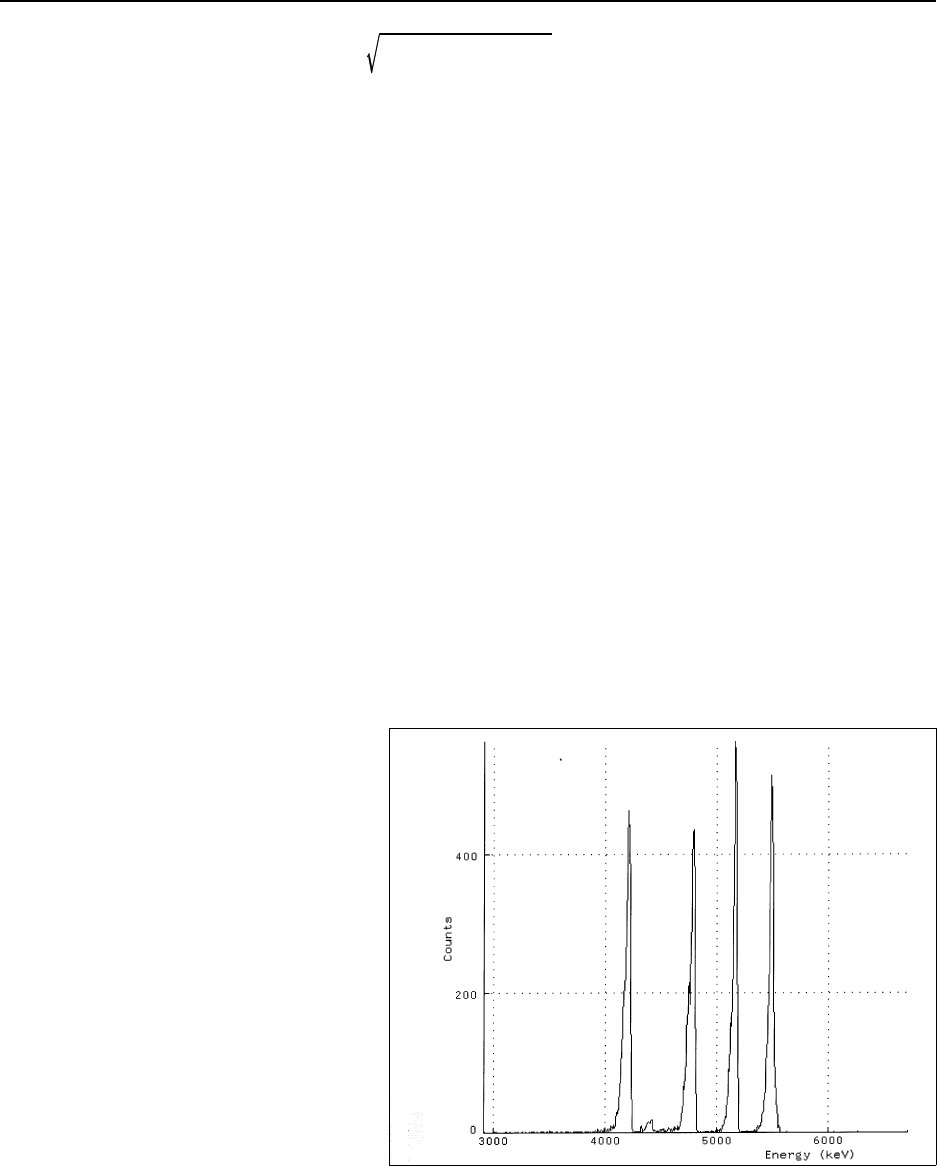
Data Acquisition, Reduction, and Reporting for Nuclear Counting Instrumentation
16-23
JULY 2004 MARLAP
uP'u2
G%u2
B%u2
E%u2
I(16.17)
FIGURE 16.6 — Alpha spectrum
(238U, 235U, 234U, 239/240Pu, 241Am)
where:
uG= the uncertainty component for the gross counts in the peak
uB= the uncertainty component for the baseline subtraction
uE= the uncertainty component for the background peak subtraction
uI= the uncertainty component for the coincidence summing correction
The calculations of combined standard uncertainty typically are performed by the gamma-ray
spectrometry software. It should be noted that not every available software package will
incorporate all the listed uncertainty contributions listed.
16.3.2 Alpha Spectrometry
This section deals with alpha-spectrum reduction as applied to semiconductor detectors. The
range of alpha particles in air is only a few centimeters, and their energy degrades significantly
only after a few millimeters. Therefore, alpha spectrometry is conducted in a partial vacuum and
on extremely thin sources prepared by electrodeposition or coprecipitation. Typically, an alpha
spectrometry system is set up to generate spectra from such thin sources that cover an alpha
energy range between 4 and 10 MeV (see Chapter 15).
The number of full energy peaks is usually not large, three to four, in an alpha spectrum, and they
are normally well separated in energy. This, coupled with the fact that the test source subjected to
counting has gone through a chemical separation (Chapter 14), makes the radionuclide identifica-
tion relatively simple when compared
to gamma-ray spectrometry. However,
it is still of great benefit to have alpha
spectrometry software to identify
radionuclides, subtract background,
perform calibrations and energy
alignments, determine radiochemical
yields, and perform and track QC
functions. In production laboratories
where hundreds of alpha spectra may
be generated each week, it is almost
imperative that alpha spectra are
resolved by properly designed
computer software. An alpha spectrum
produced by a semiconductor detector
by the counting of a thin source
containing 234U, 238U, 239Pu, and 241Am
is shown in Figure 16.6.

Data Acquisition, Reduction, and Reporting for Nuclear Counting Instrumentation
16-24
MARLAP JULY 2004
The shape of each of the five peaks in the figure appears superficially Gaussian but actually
differs from the pure Gaussian model for a number of reasons. One reason is that each of the
alpha-emitting radionuclides emits alpha particles at more than one energy. So, each apparent
peak is actually a combination of several peaks, whose energies are too close together to be
resolved by the spectrometer. A second reason is that each peak has a low-energy tail caused by
degradation of the energies of alpha particles as they pass through matter. Very thin, flat, nearly
massless sources tend to produce the smallest tails. A third reason is that some peaks also have
noticeable high-energy tails, which can be caused by the summing of alpha-particle energies with
the energies of conversion electrons associated with the alpha decay. Note that the baseline for all
the alpha peaks is essentially zero. An alpha-particle spectrum differs from a gamma-ray
spectrum in that it does not have a background component comparable to the Compton
continuum.
Spectral analysis programs usually have routines to identify full-energy peaks. In the case of
alpha spectrometry, because the number of alpha peaks is limited and their energies are well
known, a simple ROI-type of analysis usually is performed. Peak-fitting programs are available
and may be beneficial when peak overlap is of concern. The alpha-peak deconvolution
algorithms should take into account the low-energy tailing (Equation 16.9). The algorithms that
account for tailing are modified Gaussian functions and require a peak-shape calibration where a
number of well-defined singlet peaks covering the full energy range are acquired. The calibration
program then calculates the tail-parameter values (see the discussion on tailing in Section
16.3.1.4, “Peak Width Determination”). These programs should be applied with caution to
spectra where the peak tails are misshapen or non-normal. The uncertainty due to the fitting
algorithm can create unexpected results. The goodness-of-fit at the top of the alpha peak and at
the low-energy tail should be reviewed carefully before accepting their results. If the algorithm is
not providing reasonable results, the analyst may choose to seek alternatives to these algorithms
to improve spectral resolution. These may include counting the sample at a distance farther from
the detector or performing additional chemical separations to improve radiochemical purity.
Alpha peaks are normally sitting on the baseline (no background continuum) and display
minimal overlapping for well-prepared sources. For a given analysis (Pu, U, Am, Th, and etc.),
ROIs are established for all energies of the alpha emissions in the source being counted and the
count rate in a given ROI represents the emission rate of the alpha whose energy falls within that
ROI. However, it is important to establish QC limits for the alpha resolution parameter for the
test sources being analyzed. For example, the alpha resolution should be held to less than 90–100
keV FWHM in order to prevent significant overlapping between the 243Am tracer (11 percent at
5.233 MeV and 88 percent at 5.274 MeV) and the 241Am peaks (13 percent at 5.443 MeV and 85
percent at 5.486 MeV). The test source typically is counted to achieve at least 1,000 counts (3
percent uncertainty) in the 243Am tracer peak, which should be sufficient to estimate the alpha
resolution. A laboratory may remount (microprecipitation method) or replate (electroplate
method) the test source if the resolution exceeds an established QC limit.

Data Acquisition, Reduction, and Reporting for Nuclear Counting Instrumentation
16-25
JULY 2004 MARLAP
Given these qualifications, the spectral analysis software performs essentially the same functions
as for gamma analysis, described above. The programs may also perform system control
function, e.g., maintaining vacuum in the chambers. Databases related to procedures, chemical
tracers, and efficiency and energy calibration standards are normally maintained for calculation,
documentation, and QC purposes. The general analysis sequence for alpha spectrometry is
discussed briefly below.
If a standard reference material is used for a tracer in each sample and an accurate determination
of the yield is not required, an efficiency calibration is not necessary. In some cases, the
laboratory may perform an energy and efficiency calibration for an alpha spectrometry analysis.
This requires the operator to establish a calibration certificate file for the program to reference. It
should refer to this file for both energy and efficiency calibrations. Calibration sources are
necessary for performing the required calibrations, and the appropriate certificate information
should be entered into the certificate files in order to perform the calibrations and to analyze test
sources. This information should be supplied with calibration sources. Calibration sources,
consisting of three to four radionuclides, are available in the form of plated discs from several
commercial suppliers.
Information typically required by the analysis program consists of the following:
• Radionuclide
• Activity at the analysis date and time (or a specified reference date)
• Analysis date and time
• Half-life
• Energy
• Energy tolerance (energy window expressed as ± keV)
• Alpha-particle emission per decay event (or “branching ratio”)
• Emission rate uncertainty
• Activity units desired
This information should be entered for each of the radionuclides included in the calibration
source. Once the library file has been established, an energy calibration can be performed as
directed by the software program. Some projects may require the reporting of the detector
efficiency and chemical yield separately for each sample. For such cases, a one-time, initial
calibration typically is determined and reported for each detector in use. When a calibration
source contains several radionuclides with certified activities, a weighted mean efficiency should
be calculated for the full-energy peaks and used as the alpha efficiency for a given detector
(Chapter 15). The weighting factor would be the inverse of the variance (one over the square of
the combined standard uncertainty) in the calculated detector efficiency for a radionuclide
(Chapter 19).
The efficiency for alpha particles varies only slightly with energy, within the range of alpha

Data Acquisition, Reduction, and Reporting for Nuclear Counting Instrumentation
3 For short-lived alpha-emitting radionuclides (e.g., 224Ra), a correction factor is needed for decay during counting.
See Attachment 14A, “Radioactive Decay and Equilibrium.”
16-26
MARLAP JULY 2004
RCi
'CRi
ge@V@e&λit1
(16.18)
energies usually encountered (4-10 MeV). While the calibration source may contain several
certified radionuclides, during an efficiency calibration, the mean efficiency for the full-energy
peaks may be calculated and used as the alpha efficiency for a given detector (Chapter 15).
Once the alpha spectrometry system has been calibrated and a spectrum of a test source acquired,
either a peak search is performed to identify alpha peaks or, if operating in a ROI mode, the
counts in the ROI are determined. ROIs to be used for a given analysis are established prior to the
spectrum acquisition by selecting an analysis protocol where the radionuclides and their alpha
energies are preestablished.
In the ROI mode, the counts accumulated during the preset counting duration in each of the
designated regions are corrected for background contribution and, in some cases, for reagent
blank activity. If a tracer has been added to the test source, the counts in the tracer ROI are
summed, background-corrected, and the effective efficiency (yield times counting efficiency)
determined using certificate information previously entered by the operator or from a protocol
file. The yield, if required, is then computed by the use of an efficiency that has been determined
previously during an efficiency calibration process. The radionuclide concentration is then
calculated by3:
where:
= radionuclide concentration of the radionuclide at time of collection (Bq/L or Bq/g)RCi= net count rate in the designated ROI for the radionuclide (cps)CRi
ge= effective efficiency (ε · Y) for the tracer (cps or Bq)
V= volume or mass analyzed (L or g)
e= base of natural logarithm
λi= radioactive decay constant for the radionuclide (reciprocal time units)
t1= time lapse from sample collection to beginning of source count (units consistent
with λi)
Following the spectrum acquisition process, spectral analysis programs may either automatically
process the data and present the results, or they may store the spectral data and await interaction
from the operator for processing. In either case, post-acquisition review of the analysis results is
recommended. This review may include the following items:

Data Acquisition, Reduction, and Reporting for Nuclear Counting Instrumentation
16-27
JULY 2004 MARLAP
Y'AR
AS
(16.19)
• Assuring that the alpha peaks fall within the ROIs;
• Confirming the absence of unexpected peaks (contamination);
• Verifying that there are no interfering peaks;
• Confirming that peak centroids are within requirements (energy alignment);
• Verifying that all requirements are met with regard to FWHM (if possible) and chemical
yield; and
• Checking units and sample aliquant information.
The FWHM of a given peak may depend greatly on the source preparation. However, since an
ROI-type of peak search is normally used, and the limits of the peak determined by the setting of
the ROI rather than some algorithm, the peak width definition is not significantly affected by
reasonable peak broadening. As a precautionary measure, the above review of each test-source
spectrum assures that the peaks appear within the ROIs. Alpha spectrometry analysis software
allows for the adjustment of the ROIs to account for peak broadening and slight displacement. A
review of the FWHM of the alpha peaks, as calculated by the software, will also reveal peak
broadening due to matrix effects and poor test-source preparation.
16.3.2.1 Radiochemical Yield
Alpha spectrometry test sources are usually prepared by radiochemical separation and the
chemical yield may be less than 100 percent. Therefore, a radiochemical tracer, which is an
isotope of the radioactive species for which the analysis is being performed, may be added to the
sample prior to preparation and radioanalysis. The tracer is normally a certified standard solution
whose recovered activity is determined during the alpha spectrometric analysis in the same
manner as the activities of the isotopes for which the analysis is being performed. The
radiochemical yield is then calculated by the spectral analysis program according to:
where:
Y= radiochemical yield
AR= calculated activity recovered
AS= certified activity added (decay corrected to time of counting)
The calculation of the chemical yield is normally performed by the alpha spectrometry analysis
software using operator input information relative to the alpha energy and abundance, activity,
uncertainty, and date of certification of the radiochemical tracer.
For some types of radionuclide analyses, no suitable alpha-emitting radionuclide may be
available for use as a chemical yield tracer. In this case, the chemical yield may be determined by
some other method, such as beta counting, and the resulting yield value provided to the alpha
Data Acquisition, Reduction, and Reporting for Nuclear Counting Instrumentation
16-28
MARLAP JULY 2004
uc(RCi)'u2(CRi)
g2
eV2e&2λit1
%R2
Ci
u2(V)
V2
%u2(ge)
g2
e
(16.20)
uc(RCi)'u2(CRi)
g2Y2V2e&2λit1
%R2
Ci
u2(V)
V2
%u2(g)
g2
%u2(Y)
Y2
%2u(g,Y)
g@Y
(16.21)
analysis program so the source activity may be calculated from the alpha spectrometry data.
When a certified reference material is used for the chemical tracer, the effective efficiency is
measured for each test source. If the chemical yield is to be reported, an independent measure of
the counting efficiency should be made.
16.3.2.2 Uncertainty Calculation
The calculation of the combined standard uncertainty for alpha spectrometry is similar to that for
gamma-ray spectrometry as reported in Section 16.3.1.8 above. One additional source of
uncertainty that should be taken into account for alpha spectrometry is that associated with the
determination of radiochemical yield. Since a tracer is added to the sample and the yield
determined by a counting process, the uncertainty involved in this analysis should be accounted
for in the total uncertainty. The uncertainty of the yield determination involves that associated
with the net count of the tracer, the counting efficiency, and that of the emission rate of the tracer
material. The combined standard uncertainty of the radionuclide concentration, , is given byRCi
either
or
where:
= net count rate in the designated ROI for the radionuclide (cps)CRi
g= the alpha counting efficiency
Y= the chemical yield
ge= effective efficiency (ε · Y) for the tracer (cps or Bq)
V= volume or mass analyzed (L or g)
e= base of natural logarithm
λi= the radioactive decay constant for the radionuclide (reciprocal time units)
t1= time lapse from sample collection to beginning of source count (units consistent
with λi)
u(@)denotes the standard uncertainty of a quantity
u(@,@) denotes the covariance of two quantities
The two uncertainty equations are equivalent. However, when the yield is determined using an
alpha-emitting tracer, Equation 16.20 generally is easier to implement.

Data Acquisition, Reduction, and Reporting for Nuclear Counting Instrumentation
16-29
JULY 2004 MARLAP
16.3.3 Liquid Scintillation Spectrometry
16.3.3.1 Overview of Liquid Scintillation Counting
All modern counters are computer controlled for data acquisition, spectral unfolding, data
reduction, sample changer control, external quench correction, and performing the various other
functions associated with liquid scintillation counting.
Liquid scintillation has traditionally found its primary use in the analysis of low-energy beta
emitters, such as 3H and 14C. In spite of the complicating factors of high background and
quenching (Section 15.4.5.4), procedures for other beta- and alpha-emitting radionuclides have
been developed over the years (Holm et al., 1984; Harvey and Sutton, 1970).
Liquid scintillation has also been applied to the simultaneous analysis of alpha and beta emitters
in environmental media (Leyba, 1992). Discrimination between alpha and beta radiation is based
on differences in the fluorescence decay pulses. Pulse height is proportional to particle energy,
and high counting efficiency results from 4π (4-pi) geometry and the absence of test-source self-
attenuation (McDowell and McDowell, 1993). Because of these characteristics, liquid
scintillation counting can be utilized as an alternative to proportional counting (Section 16.4) and
alpha semiconductor counting (Section 16.3.2).
16.3.3.2 Liquid Scintillation Spectra
The amount of light produced by alpha and beta particles in a liquid scintillation cocktail is
proportional to the particle energy. Beta spectra convey the energy continuum from zero to their
maximum energy. Alpha liquid scintillation spectra are similar in shape to those obtained by
semiconductor spectroscopy, but with greatly decreased resolution. Because alpha particles are
only about one-tenth as efficient as beta particles in producing scintillation light pulses, there is
an overlap of alpha and beta spectra (Passo and Kessler, 1992; McDowell and McDowell, 1993).
Gamma radiation interactions within the scintillation cocktail depend on energy and path length,
with lower energy gamma rays being more efficient in transferring their energy. Gamma events
are recorded in the same energy range as alpha and beta particles; therefore, discrimination
between alpha, beta, and gamma radiation based solely on scintillation spectra is not possible
(Passo and Kessler 1992; McDowell and McDowell, 1993).
16.3.3.3 Pulse Characteristics
Excited triplet and singlet energy states are formed by the fluor molecules when ionizing
radiation interacts with the scintillation cocktail. The excited singlet states dissipate their energy
very rapidly and produce short lifetime decay pulses, whereas triplet states lose their energy more
slowly, resulting in longer lifetime pulses. Because alpha particles have a higher linear energy

Data Acquisition, Reduction, and Reporting for Nuclear Counting Instrumentation
16-30
MARLAP JULY 2004
transfer than gamma or beta radiation, they produce a higher ratio of triplet to singlet excitation
states and therefore have a longer pulse duration. Differences in the decay time and shape of the
decay pulse are the basis for discriminating alpha particles from beta and gamma radiation in
liquid scintillation counting (Passo and Kessler 1992; Passo and Cook 1994).
16.3.3.4 Coincidence Circuitry
Most modern liquid scintillation counters employ two photomultiplier tubes 180 degrees apart
for the detection of pulses. The light produced when ionizing radiation in the test source interacts
with the scintillation cocktail is emitted in all directions. A sample event should therefore
produce electronic pulses in both photomultiplier tubes simultaneously, or in coincidence.
Electronic noise pulses are produced randomly by the photomultiplier tubes, but the probability
that both tubes will produce noise pulses simultaneously is very low. An electronic gate can be
set to allow only pulses that are in coincidence to be registered. The rejection of random pulses
keeps background counts produced by electronic noise to a minimum. Similarly, the probability
of background radiation (such as cosmic radiation) yielding an event in both photomultiplier
tubes is remote due to the coincidence circuitry.
16.3.3.5 Quenching
Quenching is discussed in detail in Section 15.4.5.4. Chemical quenching reduces the amount of
energy transferred to the fluor molecules. Halogens, water, solvents, some acids, and oxygen are
common agents that cause a decrease in the counting efficiency.
Color quenching is caused by impurities not removed during test-source preparation or by carrier
compounds such as iron chloride. Photons emitted from the fluor molecules are absorbed,
reducing the amount of light reaching the photomultiplier tubes.
Quenching causes a shift in the scintillation spectrum to lower energies and a reduction in the
number of counts. Quenching has a minimal impact on alpha counting, but significantly increases
as the energy of the beta particle decreases.
The most common method for monitoring sample quench is through the analysis of a Compton
spectrum generated by gamma rays interacting with the sample-scintillation cocktail. After the
test source is loaded into the counter, it is irradiated by an external gamma emitting source
located in the instrument. The test-source spectrum is collected and compared with factory or
user-generated quench standards stored in the instrument library. Both color and chemical
quenching cause a shift to lower energies, but the color quench broadens the spectrum as well.
The efficiency of the test source is extrapolated and applied to normalize the test-source count
rate.

Data Acquisition, Reduction, and Reporting for Nuclear Counting Instrumentation
4 For a discussion of liquid scintillation efficiency determination, see Section 15.5.3.
16-31
JULY 2004 MARLAP
16.3.3.6 Luminescence
Photoluminescence is produced by ultraviolet light from the environment reacting with the
scintillation cocktail. The effect can be minimized by dark adapting the test sources prior to
counting.
Chemiluminescence is produced by reactions between the scintillation cocktail and chemicals
introduced from the test-source preparation. To minimize this effect, oxidizers and alkaline
conditions should be avoided.
Both photoluminescence and chemiluminescence cause random scintillation events. At low
levels, the coincidence gate should reject most of their contribution. However, at very high
levels, the probability increases that two events may pass through the gate. Manufacturers use a
method of spectral stripping to correct for the false counts, but it is best to avoid the conditions
that create the problem.
16.3.3.7 Test-Source Vials
Glass test-source vials contain naturally occurring impurities such as 40K, Th, and U. Their
contribution appears at the lower energy portion of the spectrum. Plastic vials have a lower
background, but they should be compatible with the liquid scintillation cocktail being used.
Teflon™ vials are also available from most manufacturers.
16.3.3.8 Data Reduction for Liquid Scintillation Counting
Liquid scintillation counters normally provide minimal data reduction in their output. Basic data
include the counting duration, count rate in one or more selected windows, and the date and time
of counting initiation. A blank source (background), having a similar quench factor as the test
sources, normally is counted with each counting batch and the output will provide the count rate
of the blank to be subtracted from each test source.
The detecting efficiency will also be provided by the output information. Its form of presentation
in the output will depend on the calibration/counting (quench correction) method for determining
detector efficiency4. If the internal (standards addition) method is used, the data generated by the
counter must be further manipulated in order to develop the counting efficiencies for each test
source. When using the external-standards method (quench curve), the scintillation spectrometer
will apply the quench corrected efficiency and give the test sample disintegration rate by applying
the corrected efficiency.

Data Acquisition, Reduction, and Reporting for Nuclear Counting Instrumentation
16-32
MARLAP JULY 2004
AC'CG&CB
gqV(16.22)
A'CG&CB
g(16.23)
The radionuclide or gross concentration is provided by the following equation:
where:
CG= gross counting rate (source + background) (cps)
CB= counting rate of the blank (cps)
gq= radionuclide quench-corrected counting efficiency for the specific radionuclide (cps
or Bq)
AC= radionuclide or gross concentration (Bq/L or Bq/g)
V= volume or mass analyzed (L or g)
16.4 Data Reduction on Non-Spectrometry Systems
Proportional counters are primarily used for counting of test sources for alpha and beta emitters.
Proportional counters may have entry windows for allowance of the emitted radiation into the
active portion of the detector or they may be windowless. These instruments are described in
Chapter 15. They are used for the determination of specific radionuclides, following chemical
separation to isolate the radionuclide, and for nonspecific (gross) analyses. Counters are equipped
to count alpha and beta simultaneously in a given source and report the activity of both.
The basic information obtained from a determination in a proportional counter is the number of
counts recorded in the detector within the allotted counting duration. However, modern
proportional counters take the data reduction process to the point of finality, i.e., producing the
test-source concentration and associated counting uncertainty, providing automatic instrument
background subtraction, and correcting for source self-absorption and alpha/beta crosstalk.
The instruments may also have protocols for developing the correction factors for self-absorption
and for crosstalk. In addition, they should have the capacity to track and evaluate the periodic QC
checks (check source and background) performed on the instrument.
The basic equation used to calculate test-source activity is:
where:
A= the activity of the radionuclide or gross activity (Bq)
CG= the gross counting rate (source + background) (cps)
Data Acquisition, Reduction, and Reporting for Nuclear Counting Instrumentation
16-33
JULY 2004 MARLAP
AC'CG&CB
gV(16.24)
uc(AC)'u2(CG)%u2(CB)
g2V2
%A2
C
u2(g)
g2
%u2(V)
V2
(16.25)
gm'a0%a1m%a2m2%a3m3(16.26)
CB= the instrument background counting rate (cps)
g= the gross or radionuclide counting efficiency (cps or Bq)
And the radionuclide or gross concentration is provided by the following equation:
where:
AC= radionuclide or gross concentration (Bq/L or Bq/g)
V= the volume or mass analyzed (L or g)
The associated combined standard uncertainty is given by:
The above simple equations apply to counting either pure alpha or beta emitters and when no
correction for self-absorption is necessary (weightless sources). Modifications should be made in
the activity and concentration calculations when both alpha and beta particles are emitted by the
source, and when absorption and scattering within the source cause a reduction in the effective
efficiency.
Self-absorption factors are applied for sources where the self-absorption of the alpha or beta
particle is sufficient to affect the overall efficiency (Chapter 15). Commercially available
proportional counters have a protocol for developing the self-absorption correction factors. These
protocols process the data generated by counting a series of alpha calibration sources and a series
of beta calibration sources, which both have varying masses of material, from “zero” to the
maximum to be encountered in test sources (Chapter 15). The instrument is programmed to then
fit the data to a mathematical function so the counting efficiency correction factor can be applied
at any test-source mass within the range covered by the calibration source masses. A cubic
polynomial is one option used for both alpha and beta counting efficiencies. A cubic polynomial
has the form
where:
m= is the residual mass of the test source
gm= the counting efficiency at mass m
ai= constants determined by the data fit
The combined standard uncertainty of gm is given by

Data Acquisition, Reduction, and Reporting for Nuclear Counting Instrumentation
16-34
MARLAP JULY 2004
uc(gm)'u2(a0)%j
3
i'1
m2iu2(ai)%2j
2
i'0
j
3
j'i%1
mi%ju(ai,aj)%(a1%2a2m%3a3m2)2u2(m)(16.27)
gm'gzero e&am (16.28)
uc(gm)'e&am a2u2(m)%u2(gzero)%m2u2(a)&2mu(gzero,a)(16.29)
When the identities of the alpha or beta emitting radionuclides are unknown, an additional
component of uncertainty is needed to account for the dependence of the counting efficiency (and
self-absorption) on the unknown particle energy.
Another option that is often used for the beta counting efficiency is an exponential curve, which
has the form
where:
m= is the residual mass of the test source
gm= the counting efficiency at mass m
gzero= the “zero” mass counting efficiency
a= constant determined by the data fit
Then the combined standard uncertainty of gm is:
Again, an additional uncertainty component may be needed when the identity of the beta-emitting
radionuclide is unknown.
Crosstalk, sometimes called “spill over,” refers to the misclassification of alpha- and beta-
produced counts in a proportional counter that is designed to count both particles simultaneously.
It occurs when counts produced by alpha interactions in the detector are registered as beta counts
and vice versa. In order to accurately record the alpha and beta activities of sources containing
radionuclides emitting both particles, corrections should be made for crosstalk.
The number of alpha interactions registered as beta counts will increase as the source self-
absorption increases. The opposite is true for beta crosstalk, in that the number of beta
interactions falsely designated as alpha counts decreases with source self-absorption. Thus,
crosstalk correction factors vary with test-source mass and should be developed for the range of
test-source masses to be encountered. Commercially available proportional counters have
established programs to assist in the establishment of alpha and beta crosstalk factors. The
algorithms to correct for crosstalk are presented below.
The alpha-in-beta crosstalk, Χα, is defined as:

Data Acquisition, Reduction, and Reporting for Nuclear Counting Instrumentation
16-35
JULY 2004 MARLAP
Χα'β
α%β(16.30)
Χβ'α
α%β(16.31)
α'αd&αdΧα%βdΧβ(16.32)
β'βd&βdΧβ%αdΧα(16.33)
αd'α&Χβ(α%β)
1&Χα&Χβ
(16.34)
βd'β&Χα(α%β)
1&Χα&Χβ
(16.35)
uc(αd)'u2(Χα)α2
d%u2(Χβ)(αd&α&β)2%u2(α)(1&Χβ)2%u2(β)Χ2
β
1&Χα&Χβ
(16.36)
uc(βd)'u2(Χβ)β2
d%u2(Χα)(βd&α&β)2%u2(β)(1&Χα)2%u2(α)Χ2
α
1&Χα&Χβ
(16.37)
The respective counts in the alpha channel (α) and those in the beta channel (β) counts are
measured with a pure alpha-emitting source. Likewise, the beta-in-alpha crosstalk, Χβ, is:
The respective alpha (α) and beta (β) count rates are measured with a pure beta-emitting source.
The relationship between Χα and Χβ is given by:
Equation 16.32 states that the recorded alpha count rate, α, consists of the actual alpha count rate,
αd, (the total alpha count rate in both the alpha and beta channels due to only alpha interactions),
minus those alpha interactions recorded in the beta channel, plus those beta counts recorded in
the alpha channel. Equation 16.33 is the equivalent of Equation 16.32 for beta counts. Solving
the equations simultaneously for αd and βd gives:
Their associated combined standard uncertainties are:
Since crosstalk factors vary with radionuclide, additional uncertainty components may be needed

Data Acquisition, Reduction, and Reporting for Nuclear Counting Instrumentation
16-36
MARLAP JULY 2004
when the identities of the alpha and beta emitting radionuclides are unknown.
Processors execute many other functions for instruments that do not perform spectrometry. These
instruments include proportional counters, scintillation detectors, ionization chambers, and
special instruments (Chapter 15). The functions performed by processors may include instrument
control (sample change, gas flow control, etc.) and the calculations necessary to convert the basic
counting information to final form data or to some intermediate step.
Data reduction functions that may be performed for scintillation detectors, ionization chambers,
and special instruments include the following:
• Determining background and subtraction;
• Converting total counts to counts per second;
• Calculating activity using calibration data;
• Calculating concentration using activity and operator input data;
• Performing efficiency calibrations;
• Calculating counting and total uncertainty;
• Determining crosstalk and corrections;
• Determining self-absorption corrections;
• Determining radioactive decay corrections; and
• Performing QC functions (efficiency and background verification).
The output of manual systems usually requires further reduction to render it usable. The
information generated by processor-based systems may also need further processing.
These additional calculations may be performed using a calculator or by a computer using
general or custom software programs. The data may be electronically transferred to the
processing computer by a local area network (LAN) or on a computer disk. In some cases the
processing software may be part of the LIMS.
16.5 Internal Review of Data by Laboratory Personnel
The final review of analytical data by the laboratory should be according to the laboratory quality
manual or other documented procedures to ensure that the data meets specified requirements. All
final inspections and reviews of data should be performed, documented and archived. The review
of analytical data may be performed on two levels: primary and secondary. Different people
should perform these two levels. Primary and secondary reviewers should be designated by
management.

Data Acquisition, Reduction, and Reporting for Nuclear Counting Instrumentation
16-37
JULY 2004 MARLAP
16.5.1 Primary Review
Some elements to consider in the primary review are:
• Verifying that all tests requested were performed for all samples
NTarget radionuclides
NSample preservation
NRequired sample preparation (filtration of liquid samples, drying of soils, etc.
• Comparing the actual sample (radiological) holding times to the holding times specified in
the analytical methods; holding-time exceedences should be documented in the final report
• Verifying that the appropriate method was selected and performed
• Determining that the target radionuclides were correctly identified
• Verifying that data inputs for calculations were correct
NExamining the calibration curve to determine that the criteria specified in the analytical
method were met (or verifying radiotracer activity used)
NDates and times for reference/sample, analysis, ingrowth/decay, chemical separation
NSample volumes/mass, detector backgrounds or analytical blanks, radionuclide half life,
etc.
• Checking for errors in transcription and data inputs for calculations (such as rounding
procedures and correction factors)
• Checking, by independent hand calculations when possible and at a specified frequency,
automated data results for correct quantification
• Reviewing measurements results for reasonableness
• Verifying that measurement results meet MQO requirements
• Examining QC sample results for acceptable performance
• Verifying that the analyst's notebook and/or project file—
Naccurately captures the final results
Nis readable
Ndocuments any deviations from the analytical method
Ncontains the analyst’s initials or signature (written or electronic) and the completion date
of the analyses
16.5.2 Secondary Review
The secondary review includes many of the same considerations as the primary review; however,
there are additional aspects that may be addressed:
• Verifying that a primary review has been conducted
• Verifying that the correct analytical method was performed
• Verifying that the correct software was used to calculate the measurement results
• Examining computerized printouts for completeness
• Examining the final results, including QC sample results to determine if all relevant data

Data Acquisition, Reduction, and Reporting for Nuclear Counting Instrumentation
16-38
MARLAP JULY 2004
have been included
• Preparing or reviewing the Case Narrative to be included in the data package
• Verifying that all required signatures are included
16.6 Reporting Results
Quality planning documents will give the level of data reporting required. This level will vary
from simply reporting the analytical results to a complete reporting of all measurements,
calibration data, documentation of the performance of laboratory processes, provision of certain
instrument counting reports, and QC sample results and analysis. Another way of viewing this is
as a tiered approach where preliminary studies or site surveys may only require a minimum of
data reporting, while a final site survey may require a detailed reporting of the results. The
necessary elements for data reporting are connected to the purpose for which the data will be
used (data quality objectives).
MARLAP recommends that the reported value of a measurement result: (1) be reported directly
as obtained, with appropriate units, even if it is are negative, (2) be expressed in an appropriate
number of significant figures, and (3) include an unambiguous statement of the uncertainty. The
appropriate number of significant figures is determined by the magnitude of uncertainty in the
reported value. Each reported measurement result should include the value and an estimate of the
combined standard uncertainty (ANSI N42.23) or the expanded uncertainty.
16.6.1 Sample and Analysis Method Identification
Sample data are normally reported by sample number, including both the field (project) and
laboratory assigned identifiers. In addition, the submitting laboratory should be identified as well
as the analysis method (ANSI N42.23). Other information that can assist in the review and
interpretation of the data may be requested. This could include sample collection date (decay
correction reference date), analysis date, chain-of-custody (COC) number, and site or project
name.
16.6.2 Units and Radionuclide Identification
The individual radionuclides should be identified or, for gross analyses, the category, e.g., gross
alpha/beta, should be reported. For gross alpha and beta measurements, it is common practice to
cite the “reference” radionuclide used to calibrate the detector or generate the detector efficiency
factors from self absorption curves (e.g., 137Cs for gross beta analyses). In some cases, the
reference radionuclide will be specified by the project manager. The citation to the reference
radionuclide should be made on the analytical reports submitted by the laboratory.
Reporting units are likely specified by project planning documents. If not specified, when

Data Acquisition, Reduction, and Reporting for Nuclear Counting Instrumentation
16-39
JULY 2004 MARLAP
Matrix In Non-SI Units In SI Units Conversion Factor From
Non-SI to SI Units
Airborne Particulates and Gas pCi m–3 Bq m–3 3.70×10⁻²
Liquids pCi L–1 Bq L–1 3.70×10⁻²
Solids pCi g–1 Bq g–1 37
Surfaces dpm/100 cm2Bq/100 cm21.67×10–2
TABLE 16.1 — Units for data reporting
possible, the International System of Units (SI) is preferred. However, since regulatory
compliance levels are usually quoted in traditional radiation units, it may be appropriate to report
in both SI and traditional units with one being placed within a parenthesis. Both the SI and non-
SI units are shown in Table 16.1 for common matrices.
16.6.3 Values, Uncertainty, and Significant Figures
The value, as measured, including zero and negative numbers, and the measurement uncertainty
(either expanded uncertainty or the combined standard uncertainty) should be reported in the
same units (Chapter 19). In general, environmental radiation measurements seldom warrant more
than two or three significant figures for the reported value, and one or two significant figures for
the uncertainty. MARLAP recommends that the measurement uncertainty be rounded to two
significant figures, and that both the value and uncertainty be reported to the resulting number of
decimal places (see Sections 19.3.7 and 19.3.9). For example, a value of 0.8961 pCi/L with an
associated measurement uncertainty of 0.0234 should be reported as 0.896 ± 0.023 pCi/L. The
minimum detectable concentration (MDC) should be reported to two significant figures (ISO,
1995; ANSI N42.23). It should be noted that rounding should only occur in reporting the final
results.
16.7 Data Reporting Packages
Project planning documents (Chapter 4) and analytical statements of work (Chapter 7, Evaluating
Methods and Laboratories) usually define the requirements of the final data submission. The
reporting of laboratory data may vary according to laboratory, SOW, or data validation require-
ments. If the laboratory has been requested to report the results for several radionuclides (as
many as 20 in some applications) for each sample ID, the results for the required radionuclides
may be reported together on a single report form. (An exception to this is the reporting of results
from gamma-ray analyses.) Many projects will specify a data package of reports and supporting
information necessary to describe, document, and define the analytical process. Table 16.2
provides a fairly comprehensive list of elements that might be included in a radiochemical data
package, although not all will be applicable to a single data package and some are only applicable
during an audit.

Data Acquisition, Reduction, and Reporting for Nuclear Counting Instrumentation
16-40
MARLAP JULY 2004
TABLE 16.2 — Example elements of a radiochemistry data package
General Information
• Table of contents (especially for large packages)
• Laboratory name
• Client name
• Identification of project, SOW, etc.
• Identification of the sample batch
• A complete list of samples, including:
– Client sample ID
– Laboratory sample ID
– Sample matrix
– Collection date(s)
– Date of receipt by laboratory
• Verification of field sample preservation
• Signed acknowledgment of data package
completeness
Supporting laboratory documentation, such as copies of:
• Relevant logbook pages
• Standard certificates
• Bench sheets
• Instrument printouts, spectrum graphs
• Control charts and QC reports (including instrument
QC)
Batch-Specific Information
• Unambiguous identification of the sample preparation and analytical procedures
• Narrative describing how samples were received and processed
• Notes of problems encountered (e.g., shipping problems, QC failures, deviations from the SOW or SOPs)
• Explanations of terms, acronyms, other aspects of the report that may be unclear to the client
• Identification of all preparation batches
• Identification of analyst(s), either by batch or by sample
• QC linkages (which QC samples go with which samples)
Analysis-Specific Information
(For each test performed on an actual sample or QC sample)
• Laboratory sample ID
• Preparation batch ID
• Size of sample aliquant
• Which portion or fraction of sample was tested (if applicable; e.g., filtrate, undissolved solids)
• Chemical yield (if appropriate), with uncertainty
For Each Instrumental Analysis For Each Analyte Measured
• Instrument ID
• Type and description
• Date of most recent calibration
• Duration of analysis
• Description of test-source geometry
• Analyte identifier
• Measured result
• Measurement unit
• Uncertainty (with coverage factor)
• Critical value
• Minimum detectable concentration
• Reference dates and times (for decay and ingrowth
corrections)
QC-Sample Information Chain-of-Custody Information
• Type of QC sample (matrix spike, etc.)
• Numerical value of performance indicator
• Pass-or-fail evaluation
• Chain-of-custody or other tracking documents
provided with samples or generated by the laboratory
identifying the dates and times of the sample history

Data Acquisition, Reduction, and Reporting for Nuclear Counting Instrumentation
16-41
JULY 2004 MARLAP
16.8 Electronic Data Deliverables
Many project planning documents and SOWs require that laboratory data be delivered in
electronic format, commonly called electronic data deliverables (EDD). This allows the data to
be transferred directly into a project database or, in some cases, into validation/review programs,
and avoids transcription errors. Many of the elements in Table 16.2 may be reported
electronically, but the record structure may vary in terms of database compatibility, field length,
field order, and field name. Because there is no universal structure for EDDs, the laboratory may
be required to produce them in various formats.
EDDs may be transmitted by direct electronic transfer, e-mail, or on removable media (disks,
tapes, cartridges, CD-ROMs, removable hard drives). More information may be found at the
following websites:
• The U.S. Department of Energy’s Environmental Management Electronic Data Deliverable
(EMEDD) may be found at ersmo.inel.gov/edd/.
• The U.S. Environmental Protection Agency’s Environmental Data Registry is available at
www.epa.gov/edr/.
• The U.S. Air Force Environmental Resources Program Management System (ERPRIMS)
website (www.afcee.brooks.af.mil/ms/msc_irp.asp) also provides useful information on
environmental databases and EDDs.
One EDD that promises to become a widely adopted format is the Staged Electronic Data
Deliverable (SEDD) being developed jointly by the U.S. Army Corps of Engineers and the U.S.
Environmental Protection Agency. SEDD is based on XML (eXtensible Mark-up Language)
technology, which is a World Wide Web Consortium (www.w3.org) standard. SEDD will be
adaptable for use with any agency or program database format through the use of parsers that
transfer data from SEDD to the appropriate database elements. With the widespread adoption of
SEDD, laboratories should need to produce only one type of EDD. Information on SEDD can be
found at www.epa.gov/superfund/programs/clp/sedd.htm.
16.9 References
16.9.1 Cited References
American National Standards Institute (ANSI) N42.14. Calibration and Use of Germanium
Spectrometers for Measurement of Gamma-Ray Emitting Radionuclides, 1991, New York.

Data Acquisition, Reduction, and Reporting for Nuclear Counting Instrumentation
16-42
MARLAP JULY 2004
American National Standard Institute (ANSI) N42.23. “Measurement and Associated
Instrumentation Quality Assurance for Radioassay Laboratories.” 2003.
Baedecker, P. A. 1971. “Digital Methods of Photopeak Integration in Activation Analysis,”
Analytical Chemistry, 43, p. 405.
Canberra. 1993. “A Practical Guide to High Count Rate Germanium Gamma Spectroscopy,”
NAN0013. Canberra Industries, Inc., 800 Research Parkway, Meriden, CT 06450.
Canberra. 1994. VMS Spectroscopy Applications Package User's Manual, Canberra Nuclear,
Inc., 800 Research Parkway, Meriden, CT 06450.
Debertin, K. and Helmer, R.G. 1988. Gamma- and X-ray Spectrometry with Semiconductor
Detectors, North Holland, Amsterdam.
Decker, K. M. and Sanderson, C.G. 1992. “A Reevaluation of Commercial IBM PC Software for
the Analysis of Low Level Environmental Gamma-Ray Spectra,” Int. J. Appl. Radiat. Isot.,
43:1/2, p. 323.
U.S. Environmental Protection Agency (EPA). 1995. Good Automated Laboratory Practices.
Directive 2185, Office of Information Resources Management, Research Triangle Park, NC.
Available at: www.epa.gov/irmpoli8/irm_galp/index.html.
Gilmore, G. and Hemingway, J.D. 1995. Practical Gamma-Ray Spectrometry, Chichester: John
Wiley.
International Standards Organization (ISO) 1995. Guide to the Expression of Uncertainty in
Measurement (GUM). International Standards Organization, Geneva, Switzerland.
Hagee, G.R., Karches, G.J., and Goldin, A.S. 1960. “Determination of I-131, Cs-137, and Ba-140
in Fluid Milk by Gamma Spectroscopy,” Talanta, 5, p. 36.
Harvey, B.R. and Sutton, G.A. 1970. “Liquid Scintillation Counting of Nickel-63,” Intl. J. Appl.
Rad. Isot., 21, pp. 519-523.
Helmer, R.G. and McCullough, C.M. 1983. “Gauss VII, a Computer Program for the Analysis of
Gamma-Ray Spectra From Ge Semiconductor Spectrometers,” Nucl. Instr. and Meth., 206,
Loska, L., p. 477.
Holm, E., Rioseco, J., Garcia-Leon, M. 1984. “Determination of 99Tc in Environmental
Samples,” Nuclear Instruments: Methods of Physics Research, 223, pp. 204-207.

Data Acquisition, Reduction, and Reporting for Nuclear Counting Instrumentation
16-43
JULY 2004 MARLAP
Koskelo, M.J., Burnett, W.C., and Cable, P.H. 1996. “An Advanced Analysis Program For
Alpha-particle Spectrometry,” Radioactivity & Radiochemistry, 7:1, pp. 18-27.
Kruse, H. and Spettel, B. 1982. “A Combined Set of Automatic and Interactive Programs for
INAA,” J. Radioanalytical Chemistry, 70, p. 427.
Leyba, J.D. 1992. Gross Alpha/beta Determination by Liquid Scintillation Counting,
Westinghouse Savannah River Company, WSRC-TR-92-079.
Loska, L. 1988. “A Modification of the Total Peak Area Method for Gamma Ray Spectra,” Int. J.
Appl. Radiat. Isot., 39, p. 475.
Loska, L. and Ptasinski, J. 1994. “A Simple Method for Peak-area Determination of Multiplets,”
Radioactivity & Radiochemistry, 5:4, p. 26.
Mariscotti, M.A. 1967. “A method for automatic identification of peaks in the presence of
background and its application to spectrum analysis,” Nuclear Instruments and Methods, 50,
pp. 309-320.
McDowell, J. and McDowell, B.L. 1993. “The Growth of a Radioanalytical Method: Alpha
Liquid Scintillation Spectrometry,” In, Noakes, J. E., Schoenhofer, F. and Polach, H.A., Eds.,
Liquid Scintillation Spectrometry 1992, Tucson: Radiocarbon.
National Council on Radiation Protection and Measurements (NCRP). 1978. A Handbook of
Radioactivity Measurements Procedures, Report No. 58, p. 159.
Passo, C.J. And Kessler, M. 1992. The Essentials of Alpha/Beta Discrimination, Packard
Instrument Corporation, Meriden, CT.
Passo, C.J. and Cook, G.T. 1994. Handbook of Environmental Liquid Scintillation Spectrometry:
A Compilation of Theory and Methods, Packard Instrument Company, Meriden, CT.
Quittner, P. 1972. Gamma-Ray Spectroscopy, with Particular Reference to Detector and
Computer Evaluation Techniques, London: Adam Hilger Ltd., 111 pp.
Tsoulfanidis, N. 1983. Measurement and Detection of Radiation, New York: McGraw-Hill.
U.S. Public Health Service (USPHS). 1967. Radioassay Procedures for Environmental Samples,
Publication No. 999-RH-27.

Data Acquisition, Reduction, and Reporting for Nuclear Counting Instrumentation
16-44
MARLAP JULY 2004
16.9.2 Other Sources
American National Standards Institute (ANSI) N42.25. American National Standard Calibration
and Usage of Alpha/Beta Proportional Counters, 1997, New York.
American National Standard Institute/Institute of Electrical and Electronics Engineers,
(ANSI/IEEE) 325. Standard Test Procedures for Germanium Gamma-Ray Detectors, 1996,
New York.
American Society for Testing and Materials (ASTM) D3648, Standard Practices for the
Measurement of Radioactivity, 1995. West Conshohocken, PA.
American Society for Testing and Materials (ASTM) D3649. Standard Test Method for High-
Resolution Gamma-Ray Spectrometry of Water, 1991. West Conshohocken, PA.
American Society for Testing and Materials (ASTM) E181. Standard Test Methods for Detector
Calibration and Analysis of Radionuclides, 1993. West Conshohocken, PA.
Browne, E. and Firestone, R.B. 1986. Table of Radioactive Isotopes, New York: Wiley.
Dewberry, A. 1997. “Measurement of Uranium Total Alpha-particle Activity by Selective
Extraction and Photon/Electron-Rejecting Liquid Scintillation (PERALS) spectrometry,”
Radioactivity and Radiochemistry, 8:2.
U.S. Environmental Protection Agency (EPA). 1980. Upgrading Environmental Radiation Data–
Health Society Committee Report HPSR-1 (1980), Watson, J.E., Chairman, EPA 520-1-80-
012, Office of Radiation Programs, Washington, DC.
Escobar, G., Tome, F.V., and Lozano, J.C. 1999. “Extractive Procedure for Radium-226
Determination in Aqueous Samples by Liquid Scintillation Counting,” Radioactivity and
Radiochemistry, 10:1.
Galloway, R. B. 1993. “Correction for sample thickness in activity determination by gamma-ray
spectrometry,” Radioactivity & Radiochemistry, 4:3, p. 32.
Harbottle, G. 1993. “A Marinelli Beaker Modified for Easier Mathematical Modeling for Self-
absorption in Environmental Radioactivity Measurements,” Radioactivity & Radiochemistry,
4:3, p. 20.
International Atomic Energy Agency (IAEA). 1991. X-Ray and Gamma-Ray Standards for
Detector Calibration, IAEA-TECDOC-619, Vienna.

Data Acquisition, Reduction, and Reporting for Nuclear Counting Instrumentation
16-45
JULY 2004 MARLAP
Killian, E.W., Koeppen, L.D., and Fermec, D.A. 1994. “Quality-assurance Techniques Used with
Automated Analysis of Gamma-ray Spectra,” Radioactivity & Radiochemistry, 5:4, p. 34.
Kocher, D.C. 1981. Radioactive Decay Tables, U.S. Department of Energy Report DOC/TIC-
11029.
Koskelo, M.J., W.C. Burnett, and P. H. Cable. 1996. “An Advanced Analysis Program for
Alpha-Particle Spectrometry,” Radioactivity and Radiochemistry, 7:1.
Knoll, G.F. 1989. Radiation Detection and Measurement, 2nd Edition, New York: John Wiley.
Nuclear Data Sheets, Orlando: Academic Press.
Oxford Instruments Inc. 1995. LB4100-W - Low Background System, Version 1.10.
Shirley, V.S. and Lederer, C.M. 1978. Table of Isotopes, 7th Edition, New York: Wiley
Interscience.
Yule, H.P. 1995. “Could Your Gamma-ray Spectrum Analysis Reports Survive an Audit?”
Radioactivity & Radiochemistry, 6:4, p. 4.

17-1
JULY 2004 MARLAP
17 WASTE MANAGEMENT IN A RADIOANALYTICAL
LABORATORY
17.1 Introduction
This chapter presents information on the management of radioactive waste generated during
analytical processes. Federal, state, and local laws stringently regulate radioactive waste and
impose severe consequences for violations. Management of waste in compliance with such
regulations is, therefore, critical to the laboratory’s sustained operation. Many—but not all—
applicable regulations are addressed in this chapter. A laboratory waste management plan that
details procedures for the management of radioactive waste should be implemented before
radioactive materials are accepted for processing.
The following sections provide background information on managing radioactive waste and
identifies issues that should be considered when preparing a laboratory-waste management plan.
While MARLAP otherwise is consistent in using SI units, this chapter uses whichever units are
in the referenced regulations. Sections 17.2 through 17.5 provide general guidance for managing
waste in a radioanalytical laboratory. Descriptions of the types of wastes that may be produced in
a radioanalytical laboratory are provided in Section 17.2. Section 17.3 reviews various
approaches that have been used to achieve effective laboratory-waste management programs.
Waste minimization programs are discussed in Section 17.4. Waste characterization is reviewed
briefly in Section 17.5. Some of the specific regulatory requirements that apply to laboratory
waste management are provided in Section 17.6. A proposed outline for a waste management
plan is provided in Section 17.7, and Section 17.8 suggests a number of useful online resources
related to the management of laboratory waste.
17.2 Types of Laboratory Wastes
The types of wastes generated and the waste management issues the laboratory may face are
determined by the analytical processes used in
the laboratory and the characteristics of the
samples analyzed. A laboratory that performs
only one or two analytical processes may
produce only a few waste streams, while a
multiservice laboratory that performs a
variety of processes may produce many waste
streams. Waste streams produced by radio-
analytical procedures can include radioactive
and nonradioactive wastes. A laboratory
waste stream is defined as all wastes that are
produced by a given analytical process. Table
Contents
17.1 Introduction ..........................17-1
17.2 Types of Laboratory Wastes .............17-1
17.3 Waste Management Program ............17-2
17.4 Waste Minimization ...................17-3
17.5 Waste Characterization .................17-6
17.6 Specific Waste Management Requirements . 17-6
17.7 Contents of a Laboratory Waste Management
Plan/Certification Plan ................17-13
17.8 Useful Web Sites .....................17-15
17.9 References ..........................17-16
Waste Management in a Radioanalytical Laboratory
17-2
MARLAP JULY 2004
Waste Example of Laboratory Generation
(Not Inclusive)
Dry solid waste Gloves, glassware, pipette tips, plastic vials generated through
analytical processes
Organic solvent waste (used solvents,
analytical processes)
Used solvents, degreasers in cleaning operations, liquid
scintillation fluid
Acidic wastes Solutions from analytical processes (filtrates, supernates)
Waste oil Used oil from vacuum pumps
Sample Unused sample from analytical process
Sample residue Processed sample residue from analytical processes (precipitate,
filters, planchets)
Reagent chemicals Unused, expired, or surplus reagent chemicals
Sanitary waste Sewage
Sludge waste Water treatment
Sharps Analytical processes (gas chromatography)
Various metal wastes/radioactive sources Laboratory equipment
Biohazardous waste
Fecal, urine, bloodborne pathogen waste, animal carcasses, body
parts, tissues generated from bioassay, tissue or other biological
analyses
Toxic Substances Control Act (TSCA)
waste
Analytical processes on polychlorinated biphenyls (PCB), asbestos,
chlorinated dioxins/furans
Radioactive waste Analytical processes, radioactive standards, radioactive solutions,
dry waste, aqueous waste
Resource Conservation and Recovery Act
(RCRA) hazardous waste
Analytical processes generating characteristic and listed waste as
defined per 40 CFR 261 (used solvents, reagent chemicals, acidic
waste, etc.)
Mixed waste Analytical processes generating any combination of radioactive
wastes and RCRA or TSCA wastes
TABLE 17.1 — Examples of laboratory-generated wastes
17.1 provides a list of wastes that may be generated by a laboratory.
17.3 Waste Management Program
EPA (1996) provides useful guidance for the laboratory to develop a waste management plan.
This report reviews various approaches that have been taken to achieve effective laboratory
waste-management programs. It reviews a number of articles and books that detail the
experiences of laboratories that manage radioactive wastes. This section draws significantly from
that report.

Waste Management in a Radioanalytical Laboratory
17-3
JULY 2004 MARLAP
17.3.1 Program Integration
Successful waste management programs integrate important components, such as administration,
regulatory requirements, training, record keeping, treatment, waste minimization, and prevention.
Individual management options, taken in isolation, may not be as effective as a more comprehen-
sive approach to waste management (EPA, 1996). Reviewing all aspects of waste management in
the laboratory should reveal the interactions among the component areas, providing insights that
allow improvements to the program as a whole without creating unknown negative effects.
17.3.2 Staff Involvement
All levels of management, scientists, and technicians should be involved actively in developing
and implementing the waste management program, because each brings a valuable and unique
perspective to the waste management issue. Senior management must be committed to main-
taining a current and effective waste management plan because of the significant costs of waste
management and because of the serious civil and criminal penalties associated with noncom-
pliance. Program and project managers provide perspective on such issues as returning samples
to a site, waste management cost recovery, and data quality objectives. These managers are also
familiar with a full range of waste management alternatives. Laboratory environmental, safety,
and health personnel are essential to the process, because they typically interface with regulators
to ensure that waste management practices are fully compliant. Input from laboratory supervisors,
scientists, and technicians is necessary because they generate waste at the bench level and have
firsthand process knowledge of how various waste streams are produced. These individuals also
have to implement the waste management plan on a daily basis and can provide valuable
feedback on improving the waste management system.
Waste generation planning is essential to proper waste management. U.S. Department of Energy
(DOE) Order 435.1 endorses the concept of waste life-cycle management to reduce the amount of
radioactive waste generated. “Waste life cycle” is the life of a waste from generation through
storage, treatment, transportation, and disposal. For waste generated from a new project or
activity, consideration of the waste begins in the planning stage of the project or activity.
17.4 Waste Minimization
Minimizing waste actively reduces the amount of waste to be managed and is a critical part of a
waste management plan. An integrated approach to laboratory waste management necessarily
implies pollution prevention. The term “pollution prevention” is an encompassing term for any
technique, process, or procedure that minimizes waste. Broadly defined, pollution prevention
refers to activities that keep pollutants from being created in any media (i.e., control pollution at
the source). There are many strong benefits to pollution prevention including safety, waste
minimization, efficiency, regulatory compliance, reduction in liability, and cost reduction.

Waste Management in a Radioanalytical Laboratory
17-4
MARLAP JULY 2004
Pollution prevention techniques are a critical component of prudent laboratory practices and have
been incorporated into many laboratory waste management procedures (EPA, 1996).
Management options that address waste minimization may result in the most substantial cost
savings. Two important areas to review when seeking to minimize laboratory waste are the
processes and definitions that the laboratory uses to identify and categorize waste. A laboratory
may define and manage various categories of wastes and may develop a hierarchy of waste
streams similar to the one described in Table 17.1. Properly categorizing waste at the point of
production will help to ensure health, safety, and regulatory compliance. This process also will
help to avoid unnecessary, costly, and inappropriate treatment, storage, and disposal. However,
proper categorization of waste streams can be difficult, requiring knowledge of the chemical and
radiological characteristics of the wastes, the production process, and a thorough understanding
of all applicable regulations and regulatory guidance. Waste management regulations were
written primarily to regulate industrial production facilities and commercial storage, treatment,
and disposal facilities; their application to laboratories may not be readily apparent. The
laboratory waste management plan should require that each waste stream be identified prior to
generation, so that waste minimization steps may be taken and production of unknown wastes
avoided.
The processes and definitions that a laboratory uses to determine that a waste is radioactive or
nonradioactive have a great influence on the amount of radioactive waste that a laboratory must
manage. The regulations offer little or no guidance for establishing that a waste is nonradioactive,
therefore it may be up to the laboratory to make this determination. Laboratory management
should develop clear guidelines to make this determination. The guidelines must comply with
requirements specified by the agency that issues the laboratory’s license for radioactive materials,
because waste considered nonradioactive in one state may be considered radioactive in another.
Once the waste has been properly categorized (e.g., 10 CFR Part 61 or DOE O 435.1), the
laboratory can prioritize the review of waste streams for elimination, reduction, or modification.
A waste-stream schematic or flow diagram that lists waste-stream characteristics and
management pathways can be a useful tool in reviewing waste-stream management. Various
management options that have been used to achieve waste-stream minimization include the
following:
REGULATORY. Some wastes may be exempted from regulations because of the production
process, level of contaminants, volume of waste produced, or management option chosen. For
example, some hazardous wastes may be disposed in an industrial wastewater discharge if their
contaminants are below established regulatory levels and if the discharge is regulated under the
Clean Water Act. Also, a hazardous waste generator that produces less than 100 kg of waste in a
month may be considered a conditionally exempt small quantity generator and thus be exempt
from many of the requirements of RCRA (40 CFR 261.5). Some radioactive waste may be
managed as nonradioactive if the total level of radioactivity is below an exempt or de minimis

Waste Management in a Radioanalytical Laboratory
17-5
JULY 2004 MARLAP
level, or if the activity for specific radionuclides is below established levels (10 CFR 61
20.2005). For certain licensees, radioactive wastes are released into the environment as gaseous
and liquid effluents in accordance with 10 CFR Part 61 20.2001(a)(3) and specific license
conditions.
METHOD SELECTION. The analytical method selected for the analysis of radioactive material
determines the type and volume of waste generated. When two methods achieve the required
measurement quality objectives of the project, the laboratory may select the method that
produces the most easily managed waste (see Chapter 6, Selection and Application of an
Analytical Method).
PRODUCT SUBSTITUTION. In an analytical method, it may be possible to replace a hazardous
reagent with a nonhazardous reagent and still meet all health, safety, and data quality objectives.
In addition, substituting a short-lived radionuclide for a long-lived radionuclide may ultimately
result in a reduction of radioactive waste.
SAMPLE VOLUME COLLECTED. Excess sample material should not be collected. Personnel should
only collect enough sample material for the planned analysis and any reserve needed for re-
analysis or potential future use. Reserve volume should be minimized with advance planning.
SAMPLE/REAGENT VOLUME. It may be possible to reduce the amount of sample and/or reagents
used in a method. It may also be possible to convert a method to a microscale method that uses
significantly less sample and reagents than the original method.
REAGENT PROCUREMENT CONTROLS. Often, the quantities of chemicals purchased by a
laboratory are determined by the price discounts available on larger quantities instead of by the
amount of chemical required. The real cost of chemicals should be recognized as the initial
purchase price plus any disposal costs (lifetime costs). It should be noted that disposal costs of
excess chemicals can easily exceed the initial purchase costs. Procurement procedures for
hazardous material should be implemented to determine if a nonhazardous substitute is available.
Rotating chemical stock (first in, first out) may help avoid expiration of the chemical shelf life.
REUSE OF MATERIALS. Some materials may be recovered from the analytical process and reused
in subsequent analyses. For example, distillation of certain used organic solvents may purify
them sufficiently for reuse.
DECAY IN STORAGE. Because the level of radioactivity decreases with time, it may be possible to
store a short-lived radionuclide until the natural-decay process reduces the radioactivity to a level
at which the waste can be considered nonradioactive for waste management purposes. Laboratory
management should be aware that RCRA storage limitations might impact the feasibility of this
option.

Waste Management in a Radioanalytical Laboratory
17-6
MARLAP JULY 2004
WASTE STREAM SEGREGATION. Segregating wastes by the appropriate category allows them to
be managed by the most cost-effective option. Combining highly regulated waste streams with
less stringently regulated waste streams usually requires the total waste stream to meet the most
stringent waste management requirements. For example:
• Nonhazardous waste mixed with hazardous waste must be managed as hazardous waste.
• Nonradioactive waste mixed with radioactive waste must be managed as radioactive waste.
• Hazardous waste mixed with radioactive waste must be managed in compliance with the
requirements of the Atomic Energy Act (AEA), RCRA, and TSCA.
17.5 Waste Characterization
Laboratory wastes should be characterized properly to assure compliance with applicable federal,
state, and local regulations, and to determine appropriate means of disposal. Waste container
contents should be characterized adequately during waste generation and packaging. Characteri-
zations should address the type of material and the physical and chemical characteristics of the
waste. Minimum waste characterization criteria may be specified for the radioactive waste
generated (e.g., DOE M 435.1-1, Ch. IV, Sec. I and NRC criteria specified in 10 CFR Part 61 for
commercial low-level radioactive waste sites).
Three basic methods of characterization are denoted here: (a) process knowledge; (b) chemical
characterization through laboratory analysis; and (c) activities. Factual process knowledge (e.g.,
from a process waste assessment) influences the amount of sampling required to characterize
waste correctly .
A generic laboratory waste management plan should be established to describe the waste life
cycle. This plan should characterize each waste stream and establish a waste-stream profile, so
that the waste stream can be managed properly. The profiled waste stream may only require a
periodic partial characterization, based on the profile and regulatory status.
17.6 Specific Waste Management Requirements
This section provides general guidance on the storage, treatment, and disposal of radioactive
waste generated within a laboratory. It should not be used as definitive guidance for managing
radioactive waste. Laboratory managers are encouraged to review the complete regulatory
requirements in developing a waste management plan to fit the compliance and operational needs
of the laboratory. Laboratory managers may choose to have an environmental compliance
specialist assist with developing the waste management plan, because waste management
requirements can be complex and contradictory.
Radioactive waste is regulated under AEA, administered by the Nuclear Regulatory Commission

Waste Management in a Radioanalytical Laboratory
17-7
JULY 2004 MARLAP
(NRC). Thirty-two states are NRC Agreement States (www.hsrd.ornl.gov/nrc/) and have the
authority and the regulatory programs in place to regulate radioactive materials management in
accordance with 10 CFR Part 61. Some wastes may also be regulated under RCRA, TSCA, or
both, administered by EPA. Most states have been granted authority to administer the mixed
waste rules under RCRA. Although many of the state hazardous waste laws are very similar to
the federal RCRA regulations, important differences may exist. This chapter focuses only on the
federal requirements, therefore, to ensure compliance with all applicable regulations, laboratory
management is strongly encouraged to review state and local regulations when developing a
waste management plan. Wastes that are regulated as radioactive under AEA and as hazardous
under RCRA or TSCA are termed “mixed wastes.” Laboratories that generate mixed waste must
satisfy both NRC, which regulates the radioactive component, and EPA, which regulates the
hazardous component. Mixed-waste management is difficult due to the complex regulatory
framework and the lack of approved treatment and disposal options for these wastes (also see
“Mixed Waste Exemption” within Section 17.6.1). Other laws, such as the Clean Water Act and
the Clean Air Act, are not summarized in this chapter. However, they may also have some impact
on the management of radioactive waste.
Federal regulatory requirements for waste management are found in Titles 10 and 40 of the Code
of Federal Regulations. The following citations address specific areas that regulate the manage-
ment of waste generated by a laboratory.
NRC REQUIREMENTS FOR RADIOACTIVE WASTE. Title 10 CFR 20, Standards for Protection
Against Radiation, and 10 CFR 61, Licensing Requirements for Land Disposal of Radioactive
Waste, address issues that may apply to management of radioactive waste in the laboratory.
LICENSE. Each laboratory that handles radioactive materials must be licensed by NRC, a NRC
Agreement State, or be operating under a site-wide license held by DOE. Radioactive materials
license issued by NRC or an Agreement State may provide additional requirements that affect the
management of waste. DOE-owned laboratories might be required to comply with DOE orders
that regulate the management of radioactive wastes (such as O 435.1 or 5820.2a ).
DOE REQUIREMENTS FOR RADIOACTIVE WASTE. Any generator of DOE radioactive waste and
radioactive recyclable materials shall have a Waste Certification Plan (WCP). This plan provides
assurance that appropriate sections of the acceptance criteria of the waste and applicable RCRA
waste analysis requirements are met (DOE Order 5820.2A). The radioactive waste generator
requirements are to ensure the development, review, approval, and implementation of a program
for waste generation planning, characterization, certification, and transfer. This program shall
address characterization of waste, preparation of waste for transfer, certification that waste meets
the receiving facility’s radioactive waste acceptance requirements, and transfer of waste
(DOE M 435.1-1).
RCRA REQUIREMENTS FOR HAZARDOUS WASTE. Laboratories that generate hazardous waste

Waste Management in a Radioanalytical Laboratory
17-8
MARLAP JULY 2004
must meet detailed and specific requirements for the storage, treatment, and disposal of that
waste. Some of the regulatory requirements vary with the total amount of hazardous waste
generated each month, thus it is important that the laboratory understand how to properly
categorize its operation (small quantity exempt generator, small quantity generator, or large
quantity generator). Generator status is a regulatory issue that may vary among states. RCRA
regulations for generators found in 40 CFR list requirements in the following sections:
• 40 CFR 261, Identification and Listing of Hazardous Waste, describes what is, and what is
not, hazardous waste and how to determine if a waste is considered hazardous under RCRA.
• 40 CFR 262, Standards Applicable to Generators of Hazardous Waste, establishes
management requirements for generators of hazardous waste.
• 40 CFR 262.34, Accumulation Time, provides specific time and volume limitations on the
storage of hazardous waste.
• 40 CFR 262.40, Recordkeeping and Reporting, lists requirements a generator must meet in
documenting and reporting hazardous waste management activities.
TSCA REQUIREMENTS FOR PCB WASTE. The primary TSCA regulations that normally apply to
an analytical laboratory relate to PCB wastes. Laboratory wastes containing PCBs at concentra-
tions of 50 ppm or greater, or are derived from PCB waste samples with concentrations of 50
ppm or greater, are considered PCBs and are subject to the following regulations:
• 40 CFR 761.60, Disposal Requirements, describes requirements for the disposal of PCB
waste.
• 40 CFR 761.61, Polychlorinated Biphenyls (PCBs) Manufacturing, Processing, Distribution
in Commerce, and Use Prohibitions, establishes prohibitions of, and requirements for, the
manufacture, processing, distribution in commerce, use, disposal, storage, and marking of
PCBs and PCB items.
• 40 CFR 761.65, Storage and Disposal, describes time limits for storage and storage
requirements of PCB waste.
• 40 CFR 761.64, Disposal of Wastes Generated as a Result of Research and Development
Activities ... and Chemical Analysis of PCBs, provides regulatory exclusion for some PCB
analytical samples.

Waste Management in a Radioanalytical Laboratory
17-9
JULY 2004 MARLAP
17.6.1 Sample/Waste Exemptions
Laboratory samples and certain mixed wastes may be exempted or excluded from certain
regulatory provisions. Management should evaluate those regulations to determine if they affect
their waste management practices. Three examples are provided below.
RCRA ANALYTICAL SAMPLE/TREATABILITY SAMPLE EXCLUSIONS. Under 40 CFR 261.4(d), a
sample of solid waste or a sample of water, soil, or air, which is collected for the sole purpose of
testing to determine its characteristics or composition, is not subject to certain RCRA regulations
if the laboratory is meeting the conditions specified in 40 CFR 261.4. Similarly, samples
undergoing treatability studies, and the laboratory or testing facility conducting such treatability
studies, are not subject to certain portions of RCRA [40 CFR 261.4(e)]. However, once a
material can no longer be considered a sample, it becomes waste and is subject to RCRA
requirements.
POLYCHLORINATED BIPHENYL (PCB) SAMPLE EXCLUSION. Portions of samples used in a
chemical extraction and analysis method for PCBs, and extracted for purposes of determining the
presence of PCBs or concentration of PCBs, are unregulated for PCB disposal (40 CFR 761.64).
All other PCB wastes from laboratory operations must be disposed in accordance with 40 CFR
761.61. Radioactive PCB waste may be exempt from the one year time limit for storage if the
waste is managed in accordance with all other applicable federal, state, and local laws and
regulations for the management of radioactive material (40 CFR 761.65).
MIXED WASTE EXEMPTION. Regulations issued in 2001 increased the flexibility of facilities to
manage low-level mixed waste (LLMW) by reducing the dual regulation of LLMW under both
RCRA and AEA (EPA, 2001). LLMW is exempted from RCRA requirements during storage,
treatment, manifest, transportation, and disposal requirements when certain specified conditions
are met. Under this conditional exemption, the waste remains subject to manifest, transport, and
disposal requirements under NRC (or NRC Agreement States) for low-level radioactive waste.
These exemptions, which only apply to certain wastes, do not apply to DOE facilities.
17.6.2 Storage
Regulatory requirements for the storage of radioactive, hazardous, or PCB waste vary by the type
of waste, and typically address the waste storage area, type of acceptable waste containers, length
of time the waste may be stored, marking the storage area and the containers, and waste
monitoring. Significant civil and criminal penalties exist for storing waste improperly or for a
longer time than allowed. The following sections summarize some of these requirements.
However, laboratory management is encouraged to review the regulations in depth so they may
develop a waste management plan that meets the compliance and operational needs of the
laboratory.

Waste Management in a Radioanalytical Laboratory
17-10
MARLAP JULY 2004
In the case of DOE analytical contract laboratories, low-level radioactive waste (LLRW) that has
an identified path to disposal shall not be stored longer than one year prior to disposal, except for
the purpose of radioactive decay. LLRW that does not have an identified path to disposal shall be
characterized as necessary to meet the data quality objectives and minimum characterization
requirements to ensure safe storage and to facilitate disposal (DOE M 435.1-1).
17.6.2.1 Container Requirements
RADIOACTIVE WASTE. NRC has container requirements for LLRW. Refer to 10 CFR Part 61 for
Class B and C requirements. For disposal, NRC requires the use of a high integrity container
approved by NRC. These requirements may not apply to radioanalytical laboratories processing
low-level radioactive samples.
RCRA HAZARDOUS WASTE. 40 CFR 265.170-177 provides requirements for the use and
management of containers storing hazardous waste. In summary, this section requires that
containers be in good condition, be compatible with the waste stored, be closed at all times
except when adding or removing waste, and be inspected weekly, in the case of 90-day
accumulation areas, for signs of corrosion or leakage.
PCB WASTE. 40 CFR 761.65 details TSCA requirements for the storage of PCB waste, including
the physical constraints of the storage area and the type of containers acceptable for storing liquid
and nonliquid PCB wastes. Laboratory PCB waste and samples returned to the sample collector
or submitted to a disposal facility when sample use is terminated may be exempt from the storage
requirements of 40 CFR 761.65.
17.6.2.2 Labeling Requirements
RADIOACTIVE WASTE. Radioactive waste storage areas should be posted with signs and labeled
in accordance with 10 CFR 20.1901-1906, Precautionary Procedures. This section specifies
requirements for caution signs, labeling, signals, controls, and the storage of licensed material in
unrestricted areas.
RCRA HAZARDOUS WASTE. Hazardous waste containers must be labeled with the words
“Hazardous Waste” and, in the case of a 90-day accumulation area, the date upon which the
waste accumulation began 40 CFR 262.34(a)(4)(c)(ii).
PCB WASTE. 40 CFR 761.40 and 761.45 provides requirements for marking and labeling PCB
containers and the PCB storage area (40 CFR 761.50).

Waste Management in a Radioanalytical Laboratory
17-11
JULY 2004 MARLAP
17.6.2.3 Time Constraints
RADIOACTIVE WASTE. NRC regulations in Title 10 of the Code of Federal Regulations do not
specifically establish a maximum amount of time that one may store radioactive waste. A
facility’s NRC or Agreement State radioactive materials license may address this issue.
RCRA-HAZARDOUS WASTE. A generator may store hazardous waste up to 90 days, 180 days, or
270 days depending on its status as defined by the regulations or the distance the generator is
from the disposal facility (40 CFR 262.34). A generator may accumulate as much as 55 gallons
of hazardous waste or one quart of acutely hazardous waste in containers at or near the point of
generation where wastes initially accumulate, which is under the control of the operator of the
process generating the waste (40 CFR 262.34). The storage time clock (90, 180, or 270 days)
does not begin until the waste volume exceeds 100 kg, or whenever waste is stored in a 90-day
accumulation area.
PCB WASTE. Radioactive PCB waste may be exempt from the one-year time limit for PCB
storage if the waste is managed in accordance with all other applicable federal, state, and local
laws and regulations for the management of radioactive material (40 CFR 761.65). According to
40 CFR 761.65(a)10, certain PCB waste containers may be exempt from 40 CFR 761.65 if the
containers are disposed within 30 days.
17.6.2.4 Monitoring Requirements
RADIOACTIVE WASTE. Radioactive waste storage areas should be surveyed and personnel should
be monitored in accordance with 10 CFR 20.1901-1906, Precautionary Procedures. These
sections specify the requirements for surveys, personnel monitoring, and storage of licensed
material in unrestricted areas. 10 CFR 20.1101 and 10 CFR 20.1201 address permissible doses,
levels, and concentrations of airborne radioactivity that would apply to radioactive waste storage
areas.
RCRA HAZARDOUS WASTE. The owner or operator of a hazardous waste storage area must
inspect areas in which containers are stored, at least weekly, looking for leaks and deterioration
caused by corrosion or other factors (40 CFR 265.174). 40 CFR 262.34 address requirements for
Prevention and Preparedness, Contingency Plans, and Emergency Procedures that may apply to a
laboratory that stores RCRA waste.
PCB WASTE. All PCB containers in storage shall be checked for leaks at least once every 30 days
[40 CFR 761.65(c)(5)].

Waste Management in a Radioanalytical Laboratory
17-12
MARLAP JULY 2004
17.6.3 Treatment
Radioactive and mixed waste may require treatment to meet one or more objectives prior to final
disposal. Treatment involves the physical or chemical processes that result in a waste form that is
acceptable for disposal or further treatment. Treatment objectives include: (1) producing a waste
form acceptable for land disposal; (2) volume/mobility reduction through possible solidification
or sizing; (3) producing a waste more amenable for further treatment; or (4) separating radio-
active components from RCRA or TSCA components. Another treatment objective is to convert
a radioactive RCRA regulated waste to a radioactive non-RCRA waste. Special permits may be
required from regulatory agencies prior to the treatment of waste.
Radioactive wastes may require treatment to meet the waste characteristics provided in 10 CFR
61.56. The following types of treatment have been used to meet those requirements:
• Non-solid radioactive waste may be treated with various solidification agents (such as
cement, asphalt, or polymers) to immobilize waste or sludge not otherwise acceptable for
disposal. LLRW may be absorbed onto a porous material, such as silica, vermiculite, or
organic materials to reduce the liquid volume.
• Dry radioactive waste may be treated with compaction or super-compaction to reduce the
waste volume.
• Some radioactive waste items may be decontaminated for unrestricted release by removal of
surface radioactivity through chemical or physical means. The residue from the
decontamination of a surface may require disposal as a radioactive waste.
• The relatively short half-lives of some radionuclides warrant storing the waste for a period of
time. Once the levels of radioactivity are undetectable or below an accepted de minimis level,
the waste may be disposed as a nonradioactive waste or in accordance with license
conditions.
• Supernates may be disposed in a sewage system, but the pH must be above 2 and below 12 to
allow the supernate solutions to be exempt from RCRA regulations. Elementary neutraliza-
tion is allowed in the laboratory under RCRA, but state regulations may require registration
of the laboratory as an elementary neutralization unit before neutralization and disposal take
place.
17.6.4 Disposal
The disposal of radioactive waste is regulated by NRC in accordance with 10 CFR 20.2001,
which requires that waste be disposed at a licensed LLRW site. Radioactive waste that is mixed
with waste regulated under RCRA or TSCA is also subject to disposal requirements of the

Waste Management in a Radioanalytical Laboratory
17-13
JULY 2004 MARLAP
respective regulations. Mixed waste must go to a facility that is licensed under both of the
appropriate laws. For example, radioactive RCRA waste cannot go to a RCRA landfill that is not
licensed under the Low Level Radioactive Waste Policy Act (LLRWPA), nor can it be disposed
at a LLRW site that is not licensed under RCRA.
In some cases, radioactive material may be disposed in a sanitary-sewage system if the require-
ments of 10 CFR 20.2003 are met. This section provides specific limits on the quantity of radio-
nuclides that can be discharged into a sewage system. Discharges into a sewage system may also
be regulated by the Clean Water Act. For example, media used for liquid scintillation counting,
containing tritium (3H) or carbon-14 (14C) in concentrations of 0.05 µCi/g or less may be
disposed as if it were not radioactive. Also, animal tissue containing 3H or 14C at levels less than
or equal to 0.05 µCi/g may be disposed without regard to radioactivity (10 CFR 20.2005).
The DOE also regulates the disposal of radioactive waste. Under DOE M 435.1-1, all radioactive
waste generators must have a waste certification program to ensure that the waste acceptance
criteria for the radioactive disposal facility are met. An outline of a waste certification plan is
contained in the following section.
17.7 Contents of a Laboratory Waste Management Plan/Certification Plan
17.7.1 Laboratory Waste Management Plan
A laboratory waste management plan describes the waste generated by the analytical laboratory.
Each section of the plan is usually divided into two parts—one addressing the needs of the
laboratory analyst and the second addressing the needs of the waste management personnel. An
outline of a generic plan might be:
1. Recyclable Wastes
2. Sanitary Wastes/Industrial Wastes
3. Radioactive Wastes
4. Hazardous and Mixed Wastes
• Satellite Accumulation Area operations
• 90-day Accumulation Area operations
Within each section, the laboratory should delineate the types of waste that fall into each
category. Also, within the section for laboratory analysts, the disposal of the waste should be
clearly defined (e.g., paper in recyclable waste bin, unknown waste to environmental and/or
waste personnel). The waste management section should describe the process used by the waste
management personnel to dispose of the waste.

Waste Management in a Radioanalytical Laboratory
17-14
MARLAP JULY 2004
17.7.2 Waste Certification Plan/Program
The general outline for waste certification plans described below was taken from DOE M 435.1-
1 Ch. IV, Sec. J (1-3):
CERTIFICATION REQUIREMENTS. The waste certification program shall designate the officials
who have the authority to certify and release waste for shipment and to specify the documen-
tation required for waste generation, characterization, shipment, and certification. The program
shall provide requirements for auditing, retrieving and storing required documentation, including
records retention.
CERTIFICATION BEFORE TRANSFER. LLRW shall be certified as meeting waste acceptance
requirements before it is transferred to the facility receiving the waste.
MAINTAINING CERTIFICATION. LLRW that has been certified as meeting the waste acceptance
requirements for transfer to a storage, treatment, or disposal facility shall be managed in a
manner that maintains its certification status.
A general outline for a laboratory waste certification plan should include:
1. FACILITY NAME AND LOCATION. Provide the name and the physical location of the
facility.
2. ORGANIZATION. Describe the organizational structure for the facility’s operation, quality
assurance program, and waste management program.
3. CONTENTS OF WASTE CERTIFICATION PLAN. Provide a detailed table of contents,
including list of tables, figures, and appendices as appropriate.
4. FACILITY RECYCLABLE AND WASTE MINIMIZATION STRATEGY. Identify the wastes and
waste streams the facility has targeted for recycling and waste minimization (i.e., source
reduction through product replacement).
5. DUTIES AND RESPONSIBILITIES OF MANAGEMENT AND WASTE MANAGEMENT
PERSONNEL. Provide a description of the positions at the laboratory, including primary
and secondary responsibilities and line of reporting.
6. QUALIFICATION REQUIREMENTS AND TRAINING OF WASTE MANAGEMENT PERSONNEL.
Describe the training and qualification program implemented for the environmental and
waste personnel. No specialized certification (e.g., certified hazardous materials manager,
professional engineer) is needed unless specified by the job description or standard
operation procedures.

Waste Management in a Radioanalytical Laboratory
17-15
JULY 2004 MARLAP
7. QUALIFICATIONS OF PROCEDURES AND EQUIPMENT USED IN WASTE MANAGEMENT.
Describe all equipment used in the waste management processes and procedures.
8. RECYCLABLE MATERIAL AND WASTE SEGREGATION CONTROL. Describe the process of
segregating various types of waste streams, especially in regards to radioactive and non-
radioactive wastes.
9. PACKAGING, HANDLING AND STORAGE CONTROL. Describe the process of packaging,
handling, and storing waste at the facility. This would include drum inspections, cipher-
locked storage, etc.
17.8 Useful Web Sites
Listed below are useful federal web sites relevant to the management of laboratory waste. Due to
the nature of the Internet, these addresses may change in the future.
Federal and State Government Regulation and Program References
www.epa.gov/docs/epacfr40/find-aid.info/state/
Environmental Laws and Regulations, Full Text (U.S. Code)
More than a dozen major statutes or laws form the legal basis for the programs of the
Environmental Protection Agency (EPA). The full text of these laws and the U.S. Code
Citation for each environmental law can be accessed through the following address.
www.epa.gov/epahome/lawreg.htm
Environmental Regulations in Federal Register
Full text of all Federal Register documents issued by EPA, as well as selected documents issued
by other Departments and Agencies. Notices, meetings, proposed rules, and regulations are
divided into twelve topical categories for easy access (e.g., air, water, pesticides, toxics, and
waste).
www.epa.gov/fedrgstr/
State and Federal Agency Contact List for Mixed Waste Regulations
www.epa.gov/rpdweb00/mixed-waste/mw_pg6e.htm
States and Territories Where EPA Regulates Mixed Waste
www.epa.gov/rpdweb00/mixed-waste/mw_pg6a.htm
States and Territories With EPA Authorization to Regulate Mixed Waste
www.epa.gov/rpdweb00/mixed-waste/mw_pg6b.htm

Waste Management in a Radioanalytical Laboratory
17-16
MARLAP JULY 2004
State Solid and Hazardous Waste Web Sites
www.epa.gov/epaoswer/osw/stateweb.htm
RCRA State Authorization, By State and Program Element
www.epa.gov/epaoswer/hazwaste/state/index.htm
NRC Agreement States
www.hsrd.ornl.gov/nrc/
DOE Mixed Waste Policies
www.directives.doe.gov/
EPA Mixed Waste Home Page
www.epa.gov/rpdweb00/mixed-waste/index.html
Mixed Waste Glossary
www.epa.gov/radiation/mixed-waste/mw_pg5.htm#AEA
Guidance on the Definition and Identification of Commercial Mixed Low Level Radioactive and
Hazardous Waste
www.epa.gov/rpdweb00/mixed-waste/mw_pg25.htm
Current Mixed Waste Treatment, Storage, or Disposal Facilities (TSDFs)
www.epa.gov/rpdweb00/mixed-waste/mw_pg11a.htm
NRC/EPA Draft Storage Guidance
www.epa.gov/radiation/mixed-waste/mw_pg27.htm
Mixed Waste Shipping and Transportation
www.epa.gov/rpdweb00/mixed-waste/mw_pg10.htm
Mixed Waste Pollution Prevention
www.epa.gov/rpdweb00/mixed-waste/mw_pg23.htm
Pollution Prevention, EPA Home Page
www.epa.gov/epahome/p2pgram.htm
Radioactive Waste Disposal
www.nrc.gov/waste.html

Waste Management in a Radioanalytical Laboratory
17-17
JULY 2004 MARLAP
17.9 References
17.9.1 Cited References
U.S. Department of Energy (DOE). Order O 435.1: Radioactive Waste Management. July 1,
1999. Available at: www.directives.doe.gov/pdfs/doe/doetext/neword/435/o4351.html.
U.S. Department of Energy (DOE). M 435.1-1. Radioactive Waste Management Manual. Office
of Environmental Management. July 9, 1999. Available at: www.directives.doe.gov/pdfs/doe/
doetext/neword/435/m4351-1.html.
U.S. Environmental Protection Agency (EPA). 1996. Profile and Management Options for EPA
Laboratory Generated Mixed Waste. Office of Radiation and Indoor Air, Washington, DC.
EPA 402-R-96-015. August. Available at: www.epa.gov/radiation/mixed-waste/mw_pg7.
htm#lab_mix.
U.S. Environmental Protection Agency (EPA). 2001. Changes to 40 CFR 266 (Storage, Treat-
ment, Transportation, and Disposal of Mixed Waste), Federal Register 66:27217-27266, May
16.
17.9.2 Other Sources
U.S. Environmental Protection Agency (EPA). 2002. RCRA Orientation Manual. Office of Solid
Waste, Washington, DC. EPA530-R-02-016. 259 pp. Available at: www.epa.gov/epaoswer/
general/orientat/.
Lewandowski, Joseph J., Alan A. Moghissi. 1995. “Management of Mixed Waste at a Teaching,
Research, and Health Care Facility,” Proceedings of the 3rd Biennial Symposium of Mixed
Waste, Baltimore, MD, August.
Linens, Ilona, Robert C. Klein, Edward L. Gershey. 1991. “Management of Mixed Waste from
Biomedical Research,” Health Physics, 61:3, pp. 421-426.
Lorenzen, William A. 1995. Operational Aspects of Harvard University’s Waste Management
Program, pp. 415-420, August.
Methe, Brian M. 1993. “Managing Radioactively Contaminated Infectious Waste at a Large
Biomedical Facility,” Health Physics, 64:2, pp. 187-191.
McCamey, R.B. 1995. “Building a Mixed-Waste Prevention Program at Comanche Peak,”
Radwaste Magazine, May, pp. 21-28.

Waste Management in a Radioanalytical Laboratory
17-18
MARLAP JULY 2004
National Research Council. 1995. Prudent Practices in the Laboratory; Handling and Disposal
of Chemicals, National Academy Press, Washington, DC.
National Council on Radiation Protection and Measurements (NCRP). 2002. Risk-Based
Classification of Radioactive and Hazardous Chemical Wastes, 7910 Woodmont Avenue,
Suite 400, Bethesda, MD 20814-3095.
U.S. Nuclear Regulatory Commission/U.S. Environmental Protection Agency (NRC/EPA). 1995.
Low-Level Mixed Waste Storage Guidance, Federal Register 60:40204-40211, August 7.
Party, E. and E.L. Gershey. 1989. “Recommendations for Radioactive Waste Reduction in
Biomedical/Academic Institutions,” Health Physics, 56:4, pp. 571-572.
Reinhardt, Peter A. (editor), Leonard K. Leigh, Peter C. Ashbrook. 1996. Pollution Prevention
and Waste Minimization in Laboratories, Boca Raton Press.
Ring, Joseph, William Lorenzen, Frank Osborne, Jacob Shapiro. 1995. Bio-Medical Radioactive
Waste Management, July 19.
Todisco, L.R. and L.R. Smith. 1995. “A Manufacturer’s Perspective on Low-Level Mixed Waste
Treatment, Storage, and Disposal,” E.I. DuPont and Company, Inc., NEN Products,
Proceedings of the 3rd Biennial Symposium of Mixed Waste, Baltimore, MD, August.

F-1
JULY 2004 MARLAP
APPENDIX F
LABORATORY SUBSAMPLING
F.1 Introduction
In most cases a sample that arrives at the laboratory cannot be analyzed in its entirety. Usually
only a small subsample is taken for analysis, and the analyte concentration of the subsample is
assumed to be approximately equal to that of the sample itself. Obviously a subsample cannot be
perfectly representative of a heterogeneous sample. Improper subsampling may introduce a sig-
nificant bias into the analytical process. Even when done properly, subsampling increases the
variability of the measured result. There are simple methods for controlling the bias, but esti-
mating and controlling the random variability is less straightforward.
French geologist Pierre Gy has developed a theory of particulate sampling for applications in
mining exploration and development (Gy, 1992), and his work has been promoted in the United
States by Francis Pitard (Pitard, 1993). The basic concept of the theory is that the variability in
the analyte concentration of a laboratory sample depends on the mass of the sample and the
distribution of particle types and sizes in the material sampled. The particulate sampling theory
developed by Gy is applicable to the sampling of soils and radioactive waste (EPA, 1992a and
1992b). In this appendix, the theory is applied in qualitative and quantitative approaches to the
subsampling of particulate solids in the radiation laboratory.
There are many examples of the use of Gy’s theory in the mining industry (Assibey-Bonsu, 1996;
Stephens and Chapman, 1993; Bilonick, 1990; Borgman et al., 1996), and a computer program
has been developed for its implementation (Minkkinen, 1989). The theory has recently been
adapted for use in environmental science. To date, most environmental applications have been in
laboratory and field sampling for hazardous chemicals in Superfund cleanups (Borgman et al.,
1994; Shefsky, 1997), and there are several applications of the theory that involve mixed
radioactive and hazardous wastes (Tamura, 1976).
In principle, particulate sampling theory applies to materials of any type, since even gases and
liquids are composed of particles (molecules). However, sampling large numbers of randomly
distributed molecules in a fluid presents few
statistical difficulties; so, the theory is more
often applied to particulate solids.
One of the most likely applications of Gy’s
theory in the radiation laboratory is the sub-
sampling of soils. Natural soils are complex
mixtures of different particle types, shapes,
densities, and sizes. Soil particles range from
Contents
F.1 Introduction .......................... F-1
F.2 Basic Concepts ....................... F-2
F.3 Sources of Measurement Error ........... F-3
F.4 Implementation of the Particulate Sampling
Theory .............................. F-9
F.5 Summary ........................... F-15
F.6 References.......................... F-16

Laboratory Subsampling
F-2
MARLAP JULY 2004
fine clays at less than 4 µm diameter to coarse sand that ranges over 2 mm in diameter, spanning
about 4 orders of magnitude. Contaminants may be absorbed or chemically combined into the
soil matrix, adsorbed onto the surfaces of particles, or may occur in discrete particles that are not
bound to the soil matrix. Contaminant particles in soil can vary in size from fine airborne
deposits of less than 1 µm diameter to relatively large pellets. These factors and others, including
radionuclide half-lives, significantly affect the sampling problem.
F.2 Basic Concepts
This appendix applies Gy’s sampling theory to subsampling. To avoid confusion, the terms “lot”
and “sample” will be used here instead of “sample” and “subsample,” respectively. There may be
several subsampling stages at the laboratory, and all of the stages must be considered. At any
stage of sampling, the lot is the collection of particles from which a portion is to be taken, and
the sample is the portion taken to represent the lot.
In Gy’s theory, the chemical or physical component whose proportion in a lot is of interest is
called the critical component. In the context of radiochemistry, the critical component may be a
radionuclide, but, if the chemical form of the radionuclide is known, it may be more useful to
consider the critical component to be a chemical compound. Certain applications of Gy’s theory
require knowledge of the density, so the physical form of the compound may also be important.
In the limited context of this appendix, however, the critical component will be identified with
the analyte, which is usually a radionuclide.
The proportion of critical component by mass in a lot, sample, or particle is called the critical
content. In the context of radiochemistry, the critical content is directly related to the activity
concentration of the analyte, but it is expressed as a dimensionless number between 0 and 1.
Many of the mathematical formulas used in Gy’s sampling theory are equally valid if the critical
content is replaced everywhere by analyte concentration. All the formulas in this appendix will
be expressed in terms of analyte concentration, not critical content.
The sampling error of a sample S is defined, for our purposes, as the relative error in the analyte
concentration of the sample, or (zS ! zL) / zL, where zS is the analyte concentration of the sample
and zL is the analyte concentration of the lot. If the sample is the entire lot, the sampling error is
zero by definition.
A lot may be heterogeneous with respect to many characteristics, including particle size, density,
and analyte concentration. Of these, analyte concentration is most important for the purposes of
this appendix. A lot may be considered perfectly homogeneous when all particles have the same
concentration of analyte.

Laboratory Subsampling
1 ASTM D5956 uses the terms “compositional heterogeneity” and “distributional heterogeneity.”
2 A state of random heterogeneity exists when the distributional heterogeneity is zero. A state of nonrandom hetero-
geneity exists when the distributional heterogeneity is positive.
3 The term “representativeness” is also like “accuracy” inasmuch as it is used with different meanings by different
people. The definition provided here is MARLAP’s definition.
F-3
JULY 2004 MARLAP
The term “heterogeneity” is commonly used with more than one meaning. Gy attempts to clarify
the concepts by distinguishing between two types of heterogeneity. The constitutional hetero-
geneity of a lot is determined by variations among the particles without regard to their locations
in the lot. It is an intrinsic property of the lot itself, which cannot be changed without altering
individual particles. The distributional heterogeneity of a lot depends not only on the variations
among particles but also on their spatial distribution.1 Thus, the distributional heterogeneity may
change, for example, when the material is shaken or mixed. In Gy’s theory, both constitution
heterogeneity and distributional heterogeneity are quantitative terms, which are defined mathe-
matically.
Heterogeneity is also sometimes described as either “random” or “nonrandom” (ASTM D5956).
Random heterogeneity is exhibited by well-mixed material, in which dissimilar particles are
randomly distributed. Nonrandom heterogeneity occurs when particles are not randomly distrib-
uted, but instead are stratified. There is a natural tendency for a randomly heterogeneous lot to
become more stratified when shaken, bounced, or stirred. The same material may exhibit both
random and nonrandom heterogeneity at different times in its history.2
In MARLAP’s terminology, the representativeness of a sample denotes the closeness of the ana-
lyte concentration of the sample to the analyte concentration of the lot. A sample is representative
if its analyte concentration is close to the analyte concentration of the lot, just as a measured
result is accurate if its value is close to the value of the measurand. Representativeness may be
affected by bias and imprecision in the sampling process, just as accuracy may be affected by
bias and imprecision in the measurement process.3
The concept of representativeness is related to the question of heterogeneity. If a lot is completely
homogeneous, then any sample is perfectly representative of the lot, regardless of the sampling
strategy, but as the degree of heterogeneity increases, it becomes more difficult to select a
representative sample.
F.3 Sources of Measurement Error
The total variance of the result of a measurement is the sum of the variances of a series of error
components, including errors produced in the field and in the laboratory. Errors in the laboratory
may be characterized as those associated with (sub)sampling and those associated with sample
preparation and analysis.

Laboratory Subsampling
F-4
MARLAP JULY 2004
Note that the practical significance of any error, including sampling error, depends on its magni-
tude relative to the other errors. If a crude analytical procedure is used or if there is a relatively
large counting uncertainty, the sampling error may be relatively unimportant. In other cases the
sampling error may dominate. If the standard uncertainty from either source is less than about
one-third of the standard uncertainty from the other, the smaller uncertainty component contrib-
utes little to the combined standard uncertainty.
This appendix focuses only on sampling errors, which include:
• Sampling bias;
• The fundamental error; and
• Grouping and segregation errors.
The following sections define the three types of sampling errors and present methods for con-
trolling or quantifying them. (See Chapter 19, Measurement Uncertainty, for a more general
discussion of laboratory measurement errors.)
F.3.1 Sampling Bias
Sampling bias is often related to distributional heterogeneity. When there is a correlation
between the physical properties of a particle and its location in the lot, care is required to avoid
taking a biased sample. For example, if the analyte is primarily concentrated at the bottom of the
lot, the analyte concentration of a sample taken from the top will be biased low. Situations like
this may occur frequently in environmental radiochemical analysis, since anthropogenic
radionuclides are often concentrated in some of the smallest particles, which tend to settle to the
bottom of the container.
Sampling bias can be controlled by the use of “correct” sampling procedures. A sampling pro-
cedure is called “correct” if every particle in the lot has the same probability of being selected for
the sample. As a practical rule, a sample is guaranteed to be unbiased only if the sampling
procedure is correct.
RULE 1: A sample is guaranteed to be unbiased only if every particle in the lot has the same
probability of selection.
The preceding rule is not being followed, for example, if particles on the bottom or in recesses of
the container are never selected.

Laboratory Subsampling
4 A sample is unbiased if E(ZS / mS) = zL, where ZS is the total analyte activity in the sample, mS is the sample mass,
zL is the analyte activity concentration of the lot, and E(@) denotes expected value. Equal selection probabilities
guarantee only that E(ZS) / E(mS) = zL.
F-5
JULY 2004 MARLAP
Actually the rule stated above is only approximately true.4 It is invalid if the sample consists of
only a few particles, or if only a few particles in the lot contain most of the mass. Therefore, a
second practical rule of sampling is that the sample must be many times larger (by mass) than the
largest particle of the lot.
RULE 2: The sample must be many times larger (by mass) than the largest particle of the lot.
Grouping of particles should also be minimized. If the particles form clumps, the effective num-
ber of particles in the lot is actually the number of clumps. For this reason, it is usually necessary
to do some preparation of the material before sampling. Typical preparation steps in the labora-
tory include drying, grinding, sieving, and mixing, as described in Chapter 12.
F.3.2 Fundamental Error
When a sample is taken, the existence of constitutional heterogeneity in a lot leads to an unavoid-
able sampling error, called the fundamental error. Its variance, called the fundamental variance,
is a property of the lot and the size of the sample. It represents the smallest sampling variance
that can be achieved without altering individual particles or taking a larger sample. The funda-
mental variance is not affected by homogenizing, or mixing, and exists even when the sampling
procedure is correct. It cannot be eliminated, but it can be reduced either by increasing the size of
the sample or by reducing the particle sizes before sampling (e.g., by grinding).
RULE 3: The fundamental variance may be reduced by:
• Taking a larger sample or
• Reducing the particle sizes (grinding) before sampling
This theoretical minimum sampling variance is only achieved in practice when the lot is in a state
of pure random heterogeneity (and the sampling is performed correctly). If there is nonrandom
heterogeneity at the time of sampling, the total sampling variance will be larger than the
fundamental variance.
Either method for reducing the fundamental variance may be difficult or costly to implement in
some situations. When large objects or consolidated materials are contained in the lot, particle
size reduction for every lot may be unrealistically expensive. Not all materials are amenable to
particle size reduction (e.g., steel). If available, knowledge of the expected contamination types
and distributions may be used to reduce the need for particle size reduction. For example, it may

Laboratory Subsampling
F-6
MARLAP JULY 2004
be known that large objects in the lot are relatively free of analyte. If so, then such objects might
be removed or analyzed separately using different methods, depending on the project objectives.
When particle size reduction is required and trace levels of contamination are expected in the lot,
complete decontamination of grinding or milling equipment is required to avoid the possibility of
cross-sample contamination. The equipment should be constructed of non-contaminating
materials that are compatible with the chemical components of the lot. Glass, ceramic and stain-
less steel are typical materials. Particle size reducers, such as ball mills and ceramic plate
grinders, require dried samples and thorough decontamination. Mechanical splitters may be
difficult to decontaminate. A grinding blank may be analyzed to check for contamination of the
grinding equipment (see Section 12.3.1.4, “Subsampling”)
Contamination from airborne sources (e.g., stack releases or incinerator emissions), leaching
(e.g., stored mill tailings), or from weathering of contaminated surfaces tends to be dispersed and
deposited as many fine particles. In these cases, as long as the particles of the matrix are small
relative to the sample size (Rule 2), grinding the material is unlikely to make dramatic differ-
ences in the fundamental variance, but the variance tends to be small because of the large number
of contaminant particles.
If the lot contains only a few contaminant particles, all of which are very small, the fundamental
variance may remain large even after extensive grinding. However, the analytical procedure may
be amenable to modifications that permit larger samples to be processed. For example, dissolu-
tion of a large solid sample may be followed by subsampling of the solution to obtain the amount
needed for further analysis. Since liquid solutions tend to be more easily homogenized than
solids, subsampling from the solution contributes little to the total sampling error.
If neither reducing the particle size nor increasing the sample size is feasible, more innovative
analytical techniques may have to be considered.
F.3.3 Grouping and Segregation Error
Since the analyte is often more closely associated with particles having certain characteristics
(e.g., small or dense), it may become concentrated in one portion of the lot or in clumps spread
throughout the lot. Such effects tend to increase distributional heterogeneity.
The existence of distributional heterogeneity leads to a sampling error called the grouping and
segregation error. The grouping and segregation variance is not as easily quantified as the
fundamental variance, but there are methods for reducing its magnitude.
Although the traditional approach to reducing the grouping and segregation error is mixing, or
homogenizing, the material, Gy and Pitard warn that homogenizing heterogeneous materials is
often difficult, especially if a large quantity is involved. Using improper methods, such as

Laboratory Subsampling
5 This statement assumes the stratification is such that a single large increment is likely to have no more
constitutional heterogeneity than any of the n smaller increment.
F-7
JULY 2004 MARLAP
stirring, may actually tend to increase segregation, and, even if a degree of homogeneity is
achieved, it is likely to be short-lived, because of the constant influence of gravity. Agitation of
particulate matter during transport and handling also tends to produce segregation of particles by
size, shape, and density. During these processes, the denser, smaller, and rounder particles tend to
settle to the bottom of the container, while less dense, larger, and flatter particles tend to rise to
the top.
RULE 4: The effects of homogenizing heterogeneous solid material tend to be short-lived
because of the constant influence of gravity. Denser, smaller, and rounder particles tend to
settle to the bottom of a container, while less dense, larger, and flatter particles tend to rise to
the top.
Some homogenization of solid material is usually required before sampling to reduce clumping.
However, since complete homogenization is difficult and likely to be short-lived at best, Gy and
Pitard recommend sampling procedures to reduce not the distributional heterogeneity itself, but
its effects on the grouping and segregation error. Gy classifies sampling procedures into two
categories: (1) increment sampling, and (2) splitting. Increment sampling involves extracting a
number of small portions, called increments, from the lot, which are combined to form the
sample. Splitting involves dividing the lot into a large number of approximately equal-sized
portions and recombining these portions into a smaller number of potential samples. One of the
potential samples is then randomly chosen as the actual sample.
A sample composed of many increments will generally be more representative than a sample
composed of a single increment. For example, if a 25-gram sample is required, it is better to take
five 5-gram increments, selected from different locations in the sample, than to take a single 25-
gram increment.
RULE 5: A sample composed of many increments taken from different locations in the lot is
usually more representative than a sample composed of a single increment.
The variance reduction achievable by increment sampling depends on the distributional hetero-
geneity of the lot. If the lot is in a state of pure random heterogeneity, increment sampling pro-
vides no benefit. On the other hand, if the lot is highly stratified, the standard deviation of the
analyte concentration of a small composite sample formed from n independent increments may
be smaller by a factor of than the standard deviation for a sample composed of a single
1/ n
increment.5 Variance reductions intermediate between these two extremes are most likely in prac-
tice.
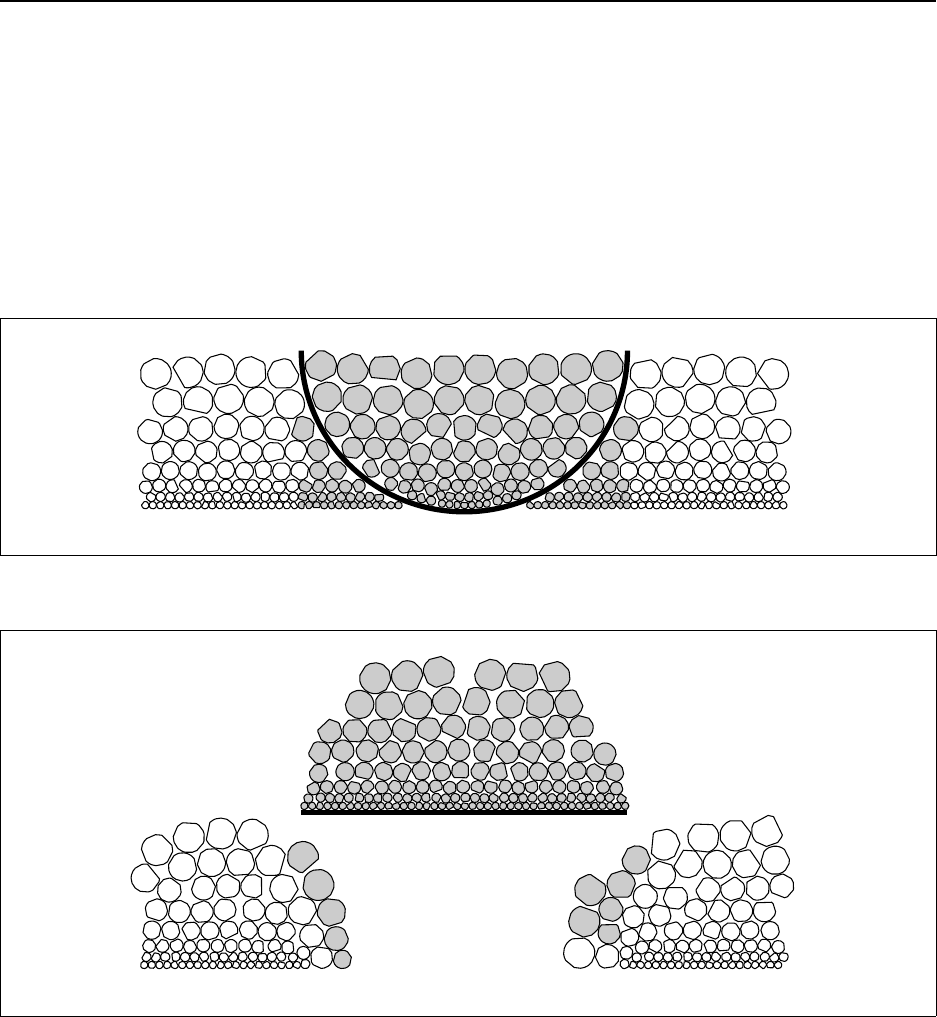
Laboratory Subsampling
F-8
MARLAP JULY 2004
FIGURE F.1 — Incorrect increment delimitation using a round scoop
FIGURE F.2 — Incorrect increment extraction using a spatula
Figures F.1 and F.2 illustrate what Gy calls “increment delimitation error” and “increment
extraction error,” respectively. One method for extracting increments is the one-dimensional
“Japanese slab-cake” method (Gy, 1992; Pitard, 1993). First, the material in the lot is spread out
into an elongated pile with roughly constant width and height. Then a scoop or spatula is used to
delimit and extract evenly spaced cross-sections from the pile. A flat-bottomed scoop should be
used for this purpose to avoid leaving particles at the bottom of the pile. Ideally it should also
have vertical sides, as shown in Figure F.3, although such scoops may not be commercially
available. If a spatula is used, its width must be much larger than the largest particles to be
sampled, since particles will tend to fall off the edges (Figure F.2).
Splitting may be performed correctly by mechanical splitters, such as riffle splitters and sectorial
splitters, or it may be performed manually by “fractional shoveling” (or “fractional scooping” in
the laboratory). Fractional shoveling involves removing small portions of equal size from the lot
and depositing them into two or more empty containers (or piles), cycling through the containers
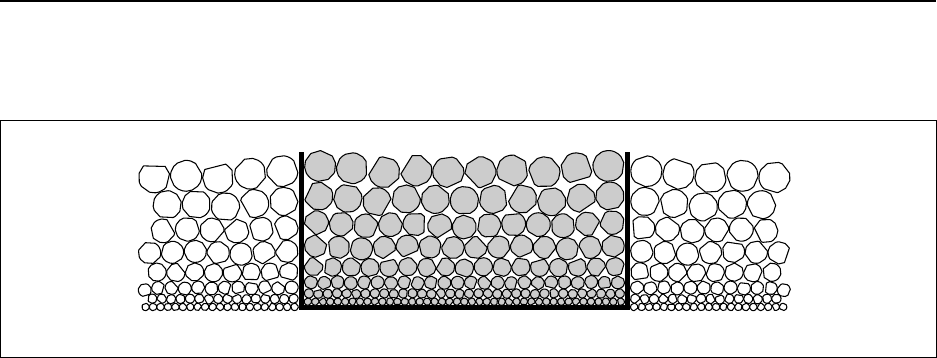
Laboratory Subsampling
F-9
JULY 2004 MARLAP
FIGURE F.3 — Correct increment delimitation using a rectangular scoop
in order, and repeating the process until all the material has been deposited. When this process is
complete, one container is chosen at random to be the sample.
The traditional “coning and quartering” method for splitting, although correct, is not recommen-
ded because it produces a subsample from too few increments. With this method, the material is
mixed by forming it into a cone, adding a fraction of the sample at a time to the apex of the cone.
After the entire sample is mixed in this way, the cone is flattened into a circular layer. Next the
circular layer of material is divided into quarters and two opposite quarters are discarded. This
process may be repeated until a suitable sample size is obtained (Shugar and Dean, 1990).
Homogenization may also be achieved with some types of grinding equipment, such as a ring-
and-puck mill.
According to Gy, small quantities of solid material, up to a few kilograms, can be homogenized
effectively in the laboratory. He recommends the use of a jar-shaker for this purpose and states
that immediately after the lot is shaken, the sample may be taken directly from the jar using a
spatula (Gy, 1992). Although Pitard recognizes the possibility of homogenizing small lots in the
laboratory using a mechanical mixer that rotates and tumbles a closed container, he also states
that homogenizing heterogeneous materials is often “wishful thinking” and recommends the one-
dimensional Japanese slab-cake procedure instead (Pitard, 1993).
F.4 Implementation of the Particulate Sampling Theory
DISCLAIMER: Gy’s theory is currently the best-known and most completely developed theory of
particulate sampling, but the problem is a difficult one, and the mathematical approaches
offered may not give satisfactory results for all purposes. Quantitative estimates of the funda-
mental variance are often crude. Conservative assumptions are sometimes needed to permit
mathematical solutions of the equations, leading to upper bounds for the fundamental variance
which may be significantly overestimated. It appears that the theory has not been applied pre-
viously to sampling for radiochemical analysis, and no data are available to demonstrate the

Laboratory Subsampling
F-10
MARLAP JULY 2004
σ2
FE '1
mS
&1
mL
j
N
i'1
(zi&zL)2
z2
L
m2
i
mL
(F.1)
limits of its applicability. Until such data are available, MARLAP recommends the theory only
for rough estimates of the uncertainty due to subsampling and as a guide to the factors that are
important in subsampling and how their impact on the uncertainty might be mitigated.
F.4.1 The Fundamental Variance
Gy’s sampling theory leads to the following equation for the fundamental varianceσ2
FE
(Gy, 1992; Pitard, 1993):
Here
mSis the mass of the sample;
mLis the mass of the lot;
Nis the number of particles in the lot;
ziis the analyte concentration of the ith particle;
zLis the analyte concentration of the lot; and
miis the mass of the ith particle.
Equation F.1 is usually of only theoretical interest because it involves quantities whose values
cannot be determined in practice; however, it is the most general formula for the fundamental
variance and serves as a starting point for the development of more useful approximation
formulas, which are derived using known or assumed properties of the lot.
F.4.2 Scenario 1 – Natural Radioactive Minerals
Gy has derived a practical formula for the fundamental variance based on the following assump-
tions (Gy, 1992):
• The analyte concentration (actually the critical content) of a particle does not depend on its
size. More precisely, if the lot is divided into fractions according to particle size and density,
the analyte concentration of each fraction is a function of particle density but not size.
• The distribution of particle sizes is unrelated to density. That is, if the lot is divided into
fractions by density, each fraction has approximately the same distribution of particle
diameters.
The first of these assumptions is often violated when environmental samples are analyzed for
anthropogenic radionuclides, because in these cases, the analyte concentration of a particle tends
to be inversely related to its size. The second assumption may also be violated when nonnatural
Laboratory Subsampling
6 Gy (1992) and Pitard (1993) provide more information about the coefficient k. MARLAP presents only a brief
summary of Scenario 1 because of the difficulty of estimating k.
7 Equation F.3 also may be understood to say that the fundamental standard deviation is inversely proportional to the
square root of the number of particles in the sample.
F-11
JULY 2004 MARLAP
σFE '1
mS
&1
mL
kd3(F.2)
σFE 'kd3
mS
(F.3)
materials are involved. However, when natural materials are analyzed for naturally occurring
radionuclides, both assumptions may be valid.
Under the two stated assumptions, the fundamental standard deviation σFE is related to the mass
of the lot mL, the mass of the sample mS, and the maximum particle diameter d by the equation
where the value of the coefficient k depends on the characteristics of the material.6 The
“maximum” diameter d is defined as the length of the edge of a square mesh that retains no more
than a specified fraction of oversize by mass. Thus, it is not the size of the largest particle in the
lot. Gy has found it most convenient to let d be the size of a square mesh that retains only 5
percent oversize, and his definition will be assumed here. According to Gy, this value of d also
tends to be the approximate size of the largest particles that are easily identifiable by sight.
When mS is much smaller than mL, which is often the case, the fundamental standard deviation is
given more simply by
This formula implies that, to reduce the fundamental standard deviation by half, one may either
increase the sample size mS by a factor of 4 or reduce the maximum particle size d by a factor of
0.52/3
= 0.63.7
F.4.3 Scenario 2 – Hot Particles
As noted, the assumptions of Scenario 1 are often violated when environmental media are
analyzed for anthropogenic radionuclides, because there is usually a correlation between particle
size and radionuclide concentration. However, another approximation formula (not due to Gy)
may be used if the analyte occurs only in a minuscule fraction of the particles (i.e., “hot par-
ticles”).
It is assumed that:
Laboratory Subsampling
8 A more complete formula is , where
k
G, kG, and dG
σFE '1
mS
&1
mL
zmax &zL
2zmax
zmax &zL
zL
k
Hk2
Hd3
H%
k
Gk2
Gd3
G
1/2
describe the zero-activity particles. Equation F.4 is obtained when zmax is much greater than zL, which happens when
the mass of high-activity material is very small.
9 The factor k equals the square root of Gy’s “size distribution factor” g. Gy recommends the value g = 0.25 by
default for most uncalibrated materials of interest in the mining industry, but no assumption is made here that the
same default value is appropriate for hot particles. If all the particles have the same size, g = 1.
F-12
MARLAP JULY 2004
σFE 'k1
mS
&1
mL
zmax
k
Hd3
H
2zL
(F.4)
σFE 'kzmax
k
Hd3
H
2zLmS
(F.5)
σFE .mL
mSnL
(F.6)
• The maximum analyte concentration of a particle zmax is known;
• Every particle in the lot has concentration 0 or zmax (approximately); and
• The high-activity particles make up a small fraction of the lot both by number and by mass.
Under these assumptions the fundamental standard deviation σFE is described by the equation8
where
mSis the sample mass;
mLis the mass of the lot;
k
His the average density of a high-activity particle;
dHis the maximum diameter of a high-activity particle, defined as in Scenario 1; and
kis a dimensionless factor.
The value of the factor k depends on the distribution of sizes of the high-activity particles but is
most likely to lie between 0.5 and 1.9
When mS is much smaller than mL, Equation F.4 reduces to
If all the high-activity particles have approximately the same mass and the sample mass is much
smaller than the mass of the lot, then Equation F.5 may be rewritten in the simple form
Laboratory Subsampling
F-13
JULY 2004 MARLAP
where nL is the number of hot particles in the lot. Equation F.6 can also be derived from the fact
that the number of hot particles in a small sample can be modeled by a Poisson distribution,
whose mean and variance are numerically equal (Chapter 19, Measurement Uncertainty). The
fundamental standard deviation equals the coefficient of variation of the Poisson distribution,
which is large when the mean is small.
EXAMPLE F.1
A 1-kilogram lot of soil contains approximately 1 of 240Pu occurring as hot particles ofBq / g
relatively pure plutonium dioxide (240PuO2, density
k
H = 11.4 , specific activityg/cm3
zmax = 7.44 × 10⁹ ) with “maximum” diameter dH = 10!3 cm (10 µm). Assume theBq / g
distribution of particle sizes is such that k . 0.5. What is the fundamental standard deviation
for a 1-gram sample?
According to Equation F.5,
σFE '0.5 7.44×10⁹Bq / g 11.4 g/ cm310&3cm 3
2 × (1 Bq / g) × (1 g)
.3.3
Thus, the fundamental standard deviation is about 330 percent, indicating that a 1-gram
sample probably is inadequate.
If all the hot particles had the same size, then k would equal 1 and the fundamental standard
deviation would be about 650 percent.
When the presence of a small number of hot particles makes it impossible to reduce the funda-
mental standard deviation to an acceptable value by ordinary means (grinding the material or
increasing the sample size), then more innovative methods may be required. For example, the
entire lot may be spread into a thin layer and an autoradiograph made to locate the hot particles.
Then, if necessary, a biased sample containing essentially all of the hot particles may be taken
and analyzed, and the measured result corrected for sample size to obtain the average analyte
concentration of the lot.
F.4.4 Scenario 3 – Particle Surface Contamination
A third approximation formula may be used if the contaminant occurs in tiny particles (e.g.,
colloidal particles or molecules) which adhere randomly to the surfaces of larger host particles of
the matrix and cannot be selected without their hosts. In this case the total mass of the contam-
inant particles is assumed to be negligible. If the contaminant particles are also extremely
numerous, so that many of them adhere to a typical host particle, then the analyte concentration
Laboratory Subsampling
10 The formula for σFE given here describes the variability of the total surface area in a sample. A more complete
expression includes a term for the variability of the analyte concentration per unit area, but this term is negligible if
the number of contaminant particles is sufficiently numerous.
F-14
MARLAP JULY 2004
σFE 'k1
mS
&1
mL
k
d3
2(F.7)
σFE 'k
k
d3
2mS
(F.8)
of a particle tends to be inversely proportional to its diameter. In this case the fundamental
variance depends primarily on the characteristics of the host particles.10
Under the stated assumptions, the fundamental standard deviation σFE for typical soils is given by
where
mSis the sample mass;
mLis the mass of the lot;
k
is the average particle density;
dis the “maximum” particle diameter, as defined for Scenario 1; and
kis a dimensionless factor.
The value of the factor k may vary from lot to lot but is always less than 1 and is usually less than
0.5.
When the sample mass is small, Equation F.7 reduces to
The fundamental standard deviation σFE calculated using Equation F.8 is never greater than
, which is the square root of the ratio of the “maximum” particle mass to the
k
d3/2mS
k
d3/2
mass of the sample mS. So, as long as the sample is much heavier than the heaviest particle in
the lot, the fundamental variance in Scenario 3 tends to be small. As in Scenario 1, reducing the
fundamental standard by half requires either increasing the sample mass mS by a factor of 4 or
reducing the particle diameter by a factor of 0.63. However, note that grinding may cause the
assumptions underlying Equation F.8 to be violated if the contaminant is not redistributed onto
the newly created particle surfaces.
Laboratory Subsampling
F-15
JULY 2004 MARLAP
EXAMPLE F.2
Suppose a 1-kilogram lot of soil contains 90Sr, which is expected to adhere randomly to the
surfaces of the particles. The maximum particle diameter d is found to be approximately
0.2 cm. If nothing more is known about the distribution of particles sizes, what is the maxi-
mum fundamental standard deviation for a 1-gram sample?
Assuming the density of the soil particles is
k
= 2.675 , Equation F.8 with k = 1 givesg/cm3
the solution
σFE '(2.675 g/cm3)(0.2 cm)3
2×(1 g)
'0.10 or 10 percent.
Note that since k is usually less than 0.5, the fundamental standard deviation is more likely to
be less than 5 percent.
F.5 Summary
Results derived from particulate sampling theory provide sampling protocols that help to control
sampling errors, including sampling bias, fundamental error, and grouping and segregation
errors. Some of the important conclusions are listed below.
• For most practical purposes, a sample is guaranteed to be unbiased only if all particles in the
lot have the same probability of selection.
• The sample mass should be many times greater than the heaviest particle in the lot, and
clumping of particles should be minimized (e.g., by drying and sieving).
• The fundamental variance, which is considered to be the minimum achievable sampling
variance, may be reduced by increasing the size of the sample or reducing the particle sizes
(grinding) before sampling.
• Grouping and segregation of particles, which occur because of the particles’ differing
physical characteristics and the influence of gravity, tend to increase the sampling variance.
• Grouping and segregation errors can be reduced by increment sampling or by splitting. The
more increments, the better.
• Correct sampling requires tools and procedures that ensure each particle in the lot has the
same probability of selection. Any sampling tool or procedure that prefers certain particles
(e.g., because of their density, size, or shape) may produce a sampling bias.

Laboratory Subsampling
F-16
MARLAP JULY 2004
• Small quantities of particulate material can be homogenized effectively in the laboratory
using mechanical mixers that rotate and tumble a closed container, but the effects of mixing
tend to be short-lived.
• Estimation of the fundamental variance requires either knowledge or assumptions about the
characteristics of the material being analyzed. Quantitative estimates may be crude.
F.6 References
American Society for Testing and Materials (ASTM) D5633. Standard Practice for Sampling
with a Scoop. West Conshohocken, Pennsylvania.
American Society for Testing and Materials (ASTM) D5956. Standard Guide for Sampling
Strategies for Heterogeneous Wastes. West Conshohocken, Pennsylvania.
Assibey-Bonsu, W. 1996. “Summary of present knowledge on the representative sampling of ore
in the mining industry.” Journal of The South African Institute of Mining and Metallurgy
96:6, pp. 289–293.
Bilonick, Richard A. 1990. “Gy’s particulate material sampling theory.” ASTM Special Tech-
nical Publication n 1097, pp. 75–92.
Borgman, L.; Anderson-Sprecher, R.; Gerow K.; and Flatman, G. 1994. “Cost-effective selection
of a sampling plan for spatially distributed hazardous waste.”
Borgman, L. E.; Kern, J. W.; Anderson-Sprecher R.; Flatman, G. T. 1996. “The sampling theory
of Pierre Gy: Comparisons, implementation, and applications for environmental sampling.”
Principles of Environmental Sampling. 2nd ed.
Gy, Pierre M. 1992. Sampling of Heterogeneous and Dynamic Material Systems: Theories of
Heterogeneity, Sampling, and Homogenizing. Amsterdam: Elsevier.
U.S. Environmental Protection Agency (EPA). 1992a. Preparation of Soil Sampling Protocols:
Sampling Techniques and Strategies. Office of Research and Development. EPA/600/R-
92/128, Washington, DC.
U.S. Environmental Protection Agency (EPA). 1992b. Characterizing Heterogenous Wastes.
EPA Office of Research and Development, EPA/600/R-92/033. U.S. Department of Energy,
Office of Technology Development.

Laboratory Subsampling
F-17
JULY 2004 MARLAP
Minkkinen, P. 1989. “A computer program for solving sampling problems.” Chemometrics and
Intelligent Laboratory Systems, pp. 189–194.
Pitard, Francis. 1993. Pierre Gy’s Sampling Theory and Sampling Practice: Heterogeneity,
Sampling Correctness, and Statistical Process Control, 2nd ed., CRC Press, Boca Raton, FL.
Shefsky, S. 1997. “Sample handling strategies for accurate lead-in-soil measurements in the field
and laboratory.” International Symposium of Field Screening Methods for Hazardous Wastes
and Toxic Chemicals, Las Vegas, NV.
Shugar and Dean. 1990. The Chemist’s Ready Reference Handbook. New York: McGraw-Hill.
Stephens, A.J.; Chapman, G. J. 1993. “Optimisation of Sampling Procedures at the Fimiston
Open Pit, Kalgoorie” Conference Series—Australasian Institute of Mining and Metallurgy, 5,
pp. 85-194.
Tamura, T. 1976. “Physical and Chemical Characteristics of Plutonium in Existing Contaminated
Soils and Sediments.” Proceedings of the Symposium on Transuranic Nuclides in the
Environment, International Atomic Energy Agency Publication ST1/PUB/410, Vienna.
( ) Indicates the section in which the term is first used in MARLAP.
Italicized words or phrases have their own definitions in this glossary.
JULY 2004 MARLAP
i
GLOSSARY
absorption (10.3.2): The uptake of particles of a gas or liquid by a solid or liquid, or uptake of
particles of a liquid by a solid, and retention of the material throughout the external and internal
structure of the uptaking material. Compare with adsorption.
abundance (16.2.2): See emission probability per decay event.
accreditation (4.5.3, Table 4.2): A process by which an agency or organization evaluates and
recognizes a program of study or an institution as meeting certain predetermined qualifications or
standards through activities which may include performance testing, written examinations or
facility audits. Accreditation may be performed by an independent organization, or a federal,
state, or local authority. Accreditation is acknowledged by the accrediting organizations issuing
of permits, licences, or certificates.
accuracy (1.4.8): The closeness of a measured result to the true value of the quantity being
measured. Various recognized authorities have given the word accuracy different technical
definitions, expressed in terms of bias and imprecision. MARLAP avoids all of these technical
definitions and uses the term “accuracy” in its common, ordinary sense, which is consistent with
its definition in ISO (1993a).
acquisition strategy options (2.5, Table 2.1): Alternative ways to collect needed data.
action level (1.4.9): The term action level is used in this document to denote the value of a
quantity that will cause the decisionmaker to choose one of the alternative actions. The action
level may be a derived concentration guideline level (DCGL), background level, release criteria,
regulatory decision limit, etc. The action level is often associated with the type of media, analyte
and concentration limit. Some action levels, such as the release criteria for license termination,
are expressed in terms of dose or risk. See total effective dose equivalent (TEDE) and committed
effective dose equivalent (CEDE).
activity, chemical (a) (10.3.5): (1) A thermodynamic quantity used in place of molal
concentration in equilibrium expressions for reactions of real (nonideal) solutions. Activity
indicates the actual behavior of ions in solution as a result of their interactions with the solvent
and with each other. Ions deviate from ideal behavior as their concentration in solution increases
and are not as effective in their chemical and physical behavior as their molar concentration
would indicate. Thus, their effective concentration, a, is less than their stoichiometric
concentration, c. (2) A measure of the effective molal concentration, c, in moles/Kg, of an ion
under real (nonideal) solution conditions.

Glossary
( ) Indicates the section in which the term is first used in MARLAP.
Italicized words or phrases have their own definitions in this glossary.
MARLAP JULY 2004
ii
activity, of radionuclides (A) (2.5.4.1): Mean rate of nuclear decay occurring in a given quantity
of material.
activity coefficient (γ) (14.6.1): (1) A fractional number that represents the extent that ions
deviate from ideal behavior in solution (see activity, chemical). The activity coefficient multiplied
times the molal concentration of ions in solution equals the chemical activity: a = γ · c, where γ
#1; thus, the activity coefficient is a correction factor applied to molal concentrations. At infinite
dilution where behavior is ideal, γ = 1.0, but it decreases as the concentration of ions increases.
(2) The ratio of effective (apparent) concentration of an ion in solution to the stoichiometric
concentration, γ = a/c.
adsorption (6.5.1.1): Uptake of particles of a gas, liquid, or solid onto the surface of another
substance, usually a solid. Compare with absorption.
adsorption chromatography (14.7.1): A chromatographic method that partitions (separates)
components of a mixture through their different adsorption characteristics on a stationary solid
phase and their different solubilities in a mobile liquid phase.
affinity chromatography (14.7.1): A chromatographic method that partitions (separates) proteins
and nucleic acids in a mobile phase based on highly selective, very specific complementary
bonds with antibody groups (ligands) that are chemically bonded to an inert solid matrix acting
as the stationary phase.
aliquant (3.3.1.2): A representative portion of a homogeneous sample removed for the purpose
of analysis or other chemical treatment. The quantity removed is not an evenly divisible part of
the whole sample. An “aliquot” (a term not used in MARLAP) by contrast, is an evenly divisible
part of the whole.
alternate analyte (2.5): Analyte whose concentration, because of an established relationship
(e.g., secular equilibrium) can be used to quantitatively determine the concentration of a target
analyte. An alternate analyte may be selected for analysis in place of a target analyte because of
ease of analysis, lower analytical costs, better methodologies available, etc. (see alternate
radionuclide).
alternate radionuclide (3.3.4): An “easy-to-measure” radionuclide that is used to estimate the
amount of a radionuclide that is more difficult or costly to measure. Known or expected
relationships between the radionuclide and its alternate can be used to establish a factor for
amount of the hard-to-measure radionuclide (see alternate analyte).

Glossary
( ) Indicates the section in which the term is first used in MARLAP.
Italicized words or phrases have their own definitions in this glossary.
JULY 2004 MARLAP
iii
alternative hypothesis (H1 or HA) (2.5, Table 2.1): One of two mutually exclusive statements
tested in a statistical hypothesis test (compare with null hypothesis). The null hypothesis is
presumed to be true unless the test provides sufficient evidence to the contrary, in which case the
null hypothesis is rejected and the alternative hypothesis is accepted.
analyte (1.4.7): The component (e.g., a radionuclide or chemical compound) for which a sample
is analyzed.
analysis (3.3.1): Analysis refers to the identification or quantification process for determining a
radionuclide in a radionuclide/matrix combination. Examples of analyses are the measurement
of 3H in water, 90Sr in milk, 239Pu in soil, etc.
analytical data requirements (1.1): Measurement performance criteria used to select and decide
how the laboratory analyses will be conducted and used for the initial, ongoing, and final
evaluation of the laboratory’s performance and the laboratory data. The project-specific
analytical data requirements establish measurement performance criteria and decisions on how
the laboratory analyses will be conducted (e.g., method selection, etc.) in a performance-based
approach to data quality.
analytical method (1.4.6): A major component of an analytical protocol that normally includes
written procedures for sample digestion, chemical separation (if required), and counting (analyte
quantification through radioactive decay emission or atom-counting measurement techniques.
Also called laboratory method.
analytical performance measure (2.3.3): A qualitative or quantitative aspect of the analysis,
initially defined based on the analyte, its desired detection level and the sample matrix. See also
measurement quality objectives.
analytical plan (9.6.3): The portion of the project plan documents that addresses the optimized
analytical design and other analytical issues (e.g., analytical protocol specifications, standard
operating procedures).
analytical process (1.3): The analytical process is a general term used by MARLAP to refer to a
compilation of actions starting from the time a sample is collected and ending with the reporting
of data. These are the actions that must be accomplished once a sample is collected in order to
produce analytical data. These actions typically include field sample preparation and preserva-
tion, sample receipt and inspection, laboratory sample preparation, sample dissolution, chemical
separations, preparation of samples for instrument measurements, instrument measurements,
data reduction, data reporting, and the quality control of the process.

Glossary
( ) Indicates the section in which the term is first used in MARLAP.
Italicized words or phrases have their own definitions in this glossary.
MARLAP JULY 2004
iv
analytical protocol (1.4.3): A compilation of specific procedures/methods that are performed in
succession for a particular analytical process. With a performance-based approach, there may be
a number of appropriate analytical protocols for a particular analytical process. The analytical
protocol is generally more inclusive of the activities that make up the analytical process than is
the analytical method. See also analytical process.
analytical protocol specification (APS) (1.4.10): The output of a directed planning process that
contains the project’s analytical data needs and requirements in an organized, concise form. The
level of specificity in the APSs should be limited to those requirements that are considered
essential to meeting the project’s analytical data requirements to allow the laboratory the
flexibility of selecting the protocols or methods that meet the analytical requirements.
anion (13.2.2): An ion with a negative charge.
anion exchanger (14.7.4.2): An ion-exchange resin consisting of chemical groups, bonded to an
inert matrix, with a net positive charge. The positive species are electrostatically bonded to
negative, labile ions bonded to an inert matrix. Anions in solution replace the labile ions on the
exchanger by forming electrostatic bonds with the charged groups. The strength of attraction,
which depends on the charge, size, and degree of solvation of the anion, provides a means for
separating analyte ions.
aqueous samples (10.3.1): Samples for which the matrix is water, including surface water,
groundwater, drinking water, precipitation, or runoff.
arithmetic mean (¯x ) (1.4.8): The sum of a series of measured values, divided by the number of
values. The arithmetic mean is also called the “average.” If the measured values are denoted by
x1, x2, …, xN, the arithmetic mean is equal to (x1 + x2 + @@@ + xN) / N. (See also expectation and
sample mean.)
assessment team (9.4): A team of data assessors (or qualified data assessor) who are technically
competent to evaluate the project’s activities and the impact of these activities on the quality and
usability of data.
audit (5.3.8): An assessment to provide assurance that a selected laboratory is capable of or is
fulfilling the specifications of the request for proposals or statement of work. A pre-award audit
verifies that a laboratory has the ability that it can meet the analytical requirements of the request
for proposals or statement of work. After the award, an audit of a laboratory will assess the
performance of the laboratory to verify that it is complying with statement of work and

Glossary
( ) Indicates the section in which the term is first used in MARLAP.
Italicized words or phrases have their own definitions in this glossary.
JULY 2004 MARLAP
v
contractual requirements. Thus, the examination of logbooks, charts, or other documentation that
are produced as the work progresses.
authoritative sample collection approach (9.6.2.1): An approach wherein professional
knowledge is used to choose sample locations and times.
auto-oxidation-reduction (disproportionation) (14.2.3): An oxidation-reduction reaction in
which a single chemical species acts simultaneously as an oxidizing and reducing agent.
average (6.5.1.1): See arithmetic mean.
background, anthropogenic (3.3.1): Background radiation levels caused by radionuclides in the
environment resulting from human activities, such as the atmospheric testing of nuclear weapons.
background, environmental (3.3.1): See background level. The presence of naturally occurring
radiation or radionuclides in the environment.
background, instrument (6.5.5.3): Radiation detected by an instrument when no source is
present. The background radiation that is detected may come from radionuclides in the materials
of construction of the detector, its housing, its electronics and the building as well as the
environment and natural radiation.
background level (2.5): This term usually refers to the presence of radioactivity or radiation in
the environment. From an analytical perspective, the presence of background radioactivity in
samples needs to be considered when clarifying the radioanalytical aspects of the decision or
study question. Many radionuclides are present in measurable quantities in the environment.
Natural background radiation is due to both primordial and cosmogenic radionuclides.
Anthropogenic background is due to radionuclides that are in the environment as a result of
human activities, for example, the atmospheric testing of nuclear weapons.
basic ordering agreement (BOA) (5.1): A process that serves to pre-certify potential analytical
service providers. A list of approved laboratories is assembled and contacted as needed to
support specific needs. A task order is used to define a specific scope of work within a BOA.
batch processing (6.4): A procedure that involves preparing a group of individual samples
together for analysis in such a way that allows the group to be associated with a set of quality
control samples.

Glossary
( ) Indicates the section in which the term is first used in MARLAP.
Italicized words or phrases have their own definitions in this glossary.
MARLAP JULY 2004
vi
becquerel (Bq) (1.4.9): Special name for the SI derived unit of activity (of radionuclides), equal
to one nuclear transformation per second. The traditional unit is the curie (Ci). The relationship
between these units is 3.7×10¹⁰ Bq = 1 Ci.
bias (of an estimator) (1.4.8): If X is an estimator for the true value of parameter θ, then the bias
of X is µX ! θ, where µX denotes the expectation of X.
bias (of measurement) (1.4.8): See systematic error.
bias (of a measurement process) (1.4.8): The bias of a measurement process is a persistent
deviation of the mean measured result from the true or accepted reference value of the quantity
being measured, which does not vary if a measurement is repeated. See also bias (of an
estimator) and bias (of measurement).
bioassay (10.2.11.2): A procedure to monitor internal radiation exposure by performing in vitro
or in vivo measurements, primarily urine analysis, fecal analysis, or whole-body counting.
blind sample (18.4.2): A sample whose concentration is not known to the analyst. Blind samples
are used to assess analytical performance. A double-blind sample is a sample whose concentra-
tion and identity as a sample is known to the submitter but not to the analyst. The double-blind
sample should be treated as a routine sample by the analyst, so it is important that the double-
blind sample is identical in appearance to routine samples.
blunder (7.4.1.1): A mistake made by a person performing an analytical task that produces an a
significant error in the result.
branching ratio (7.2.2.2): See emission probability per decay event.
breakthrough (14.7.4.1): Appearance of certain ions in the output solution (eluate) of an ion-
exchange column. These ions are not bonded to the exchange groups of the column because the
groups are already occupied by these or other ions, and the resin is essentially saturated.
calibration (1.4.8): The set of operations that establish, under specified conditions, the
relationship between values indicated by a measuring instrument or measuring system, or values
represented by a material measure, and the corresponding known value of a measurand.
calibration source (15.1): A prepared source, made from a certified reference material
(standard), that is used for calibrating instruments.

Glossary
( ) Indicates the section in which the term is first used in MARLAP.
Italicized words or phrases have their own definitions in this glossary.
JULY 2004 MARLAP
vii
carrier (14.1): (1) A stable isotopic form of a tracer element or nonisotopic material added to
effectively increase the quantity of a tracer element during radiochemical procedures, ensuring
conventional behavior of the element in solution. (2) A substance in appreciable amount that,
when associated with a tracer of a specified substance, will carry the tracer with it through a
chemical or physical process, or prevent the tracer from undergoing nonspecific processes due to
its low concentration (IUPAC, 1995). A stable isotope of a radionuclide (usually the analyte)
added to increase the total amount of that element so that a measurable mass of the element is
present.
carrier-free tracer (14.2.6): (1) A radioactive isotope tracer that is essentially free from stable
(nonradioactive) isotopes of the element in question. (2) Addition of a specific, nonradioactive
isotope of an element to change the measured isotopic abundance of the element in the sample.
Such materials are usually designated as nonisotopic material or marked with the symbol “c.f.”
(see radiotracer).
carrier gas (14.5.1): An inert gas, such as nitrogen or helium, serving as the mobile phase in a
gas-liquid chromatographic system. The carrier gas sweeps the sample in through the system.
cation (13.2.2): An ion with a positive charge.
cation exchanger (14.3.4.2): An ion-exchange resin consisting of chemical groups, bonded to an
inert matrix, with a net negative charge. The negative species are electrostatically bonded to
positive, labile ions. Cations, in solution, replace the labile ions on the exchanger by forming
electrostatic bonds with the charged groups. The strength of attraction, which depends on the
charge, size, and degree of solvation of the cation, provides a means for separating analyte ions.
Cerenkov radiation (14.10.9.10): Cerenkov radiation is emitted in the ultraviolet spectrum when
a fast charged particle traverses a dielectric medium (like water) at a velocity exceeding the
velocity of light in that medium. It is analogous to the “sonic boom” generated by a craft
exceeding the speed of sound.
certified reference material (CRM) (1.6, Figure 1.3): A reference material, accompanied by a
certificate, one or more of whose property values are certified by a procedure which establishes
its traceability to an accurate realization of the unit in which the property values are expressed,
and for which each certified value is accompanied by an uncertainty at a stated level of
confidence (ISO, 1992).
chain-of-custody (1.4.10): Procedures that provide the means to trace the possession and
handling of a sample from collection to data reporting.

Glossary
( ) Indicates the section in which the term is first used in MARLAP.
Italicized words or phrases have their own definitions in this glossary.
MARLAP JULY 2004
viii
check source (15.2): A material used to validate the operability of a radiation measurement
device, sometimes used for instrument quality control. See calibration source, test source, and
source, radioactive.
chelate (14.3.2): A complex ion or compound that consists of a ligand bonded (coordinated) to a
metal atom or ion through two or more nonmetal atoms forming a ring structure with the metal
atom or ion. Ligands may be inorganic ions, such as Cl, F, or carbonate, or organic compounds
of two, four, or six functional groups containing atoms of S, N, O, or P.
chelating agent (14.3.2): The compound containing the ligand that forms a chelate with metal
atoms or ions.
chemical separations (1.1): The removal of all undesirable materials (elements, compounds,
etc.) from a sample through chemical means so that only the intended analyte is isolated and
measured.
chemical speciation (2.5): The chemical state or form of an analyte in a sample. When the
chemical species of the analyte in a sample from a new project varies from the chemical species
for which an analytical method was validated, then the method should be altered and revalidated.
chromatography (6.6.3.4): A group of separation techniques based on the unequal distribution
(partition) of substances between two immiscible phases, one moving past the other. The mobile
phase passes over the surfaces of the stationary phase.
coagulation (14.8.5): (1) The process in which colloidal particles or macromolecules come
together to form larger masses (see colloid and colloidal solution). (2) Addition of an excess
quantity of electrolyte to a colloidal solution neutralizing the electrical bilayer of the colloidal
particles and permitting their agglomeration to form larger particles that easily settle (precipitate).
Also called “flocculation.”
coefficient of variation (CV) (19.5.2.2): The coefficient of variation of a nonnegative random
variable is the ratio of its standard deviation to its mean.
coefficient of thermal (volume) expansion (19E.3): ratio of the change in volume (of a material)
per unit volume to the change in temperature, at constant pressure. If V denotes volume, ρ
denotes density, and T denotes temperature, then the coefficient of thermal expansion, β, is given
by

Glossary
( ) Indicates the section in which the term is first used in MARLAP.
Italicized words or phrases have their own definitions in this glossary.
JULY 2004 MARLAP
ix
β'1
V
dV
dT
'&1
ρ
dρ
dT .
collectors (14.8.5): Substances used for the unspecific concentration of trace substances.
Colloidal precipitates are excellent collectors because of their great adsorption capacity.
Unspecific carriers such as manganese dioxide, sulfides, and hydrated oxides are frequently used
as collectors (also called “scavengers”).
colloid (13.2.5): Any form of matter with at least one dimension that is less than one micron but
more than one nanometer. This dimension is larger in size than that of a true solution but smaller
than particles of an ordinary suspension. They are too small to be observed by a light microscope
but larger than molecular size. Colloidal particles are usually aggregates of hundreds or
thousands of smaller molecules or macromolecules.
colloidal solution (13.4.1): Sometimes called a “colloidal dispersion.” (1) A mixture formed
from the dispersion of one phase (dispersed phase) within a second phase (continuous phase) in
which one phase has colloidal dimensions. A colloidal solution contains dispersed particles with
a very high surface-area-to-mass ratio and, thus, a great adsorption capacity. The solution will not
usually settle by gravity since the colloidal particles are very small and charged by attraction of
ions to their surfaces, but they will pass through ordinary filter paper. (2) In radiochemistry, a
colloidal solution refers to the dispersion of solid particles in the solution phase. (The mixture is
not a true solution because particles of the dispersed phase are larger than typical ions and
molecules.)
column chromatography (14.3.4.2): A chromatographic procedure employing a solid phase
packed in a glass or metal column. A liquid phase is passed through the column under pressure
supplied by gravity or pumping action. Column chromatography can accommodate larger
quantities of materials than other methods of chromatography and, thus, can separate larger
loads. It can also provide more separating power with an increased ratio of solid phase to analyte.
combined standard uncertainty (1.4.7): Standard uncertainty of an output estimate calculated by
combining the standard uncertainties of the input estimates. See also expanded uncertainty and
uncertainty (of measurement). The combined standard uncertainty of y is denoted by uc(y).
combined variance (19.3.3): The square of the combined standard uncertainty. The combined
variance of y is denoted by u2
c(y).

Glossary
( ) Indicates the section in which the term is first used in MARLAP.
Italicized words or phrases have their own definitions in this glossary.
MARLAP JULY 2004
x
committed effective dose equivalent (CEDE) (2.5.2.1): The sum of the committed dose
equivalent to various tissues in the body, each multiplied by the appropriate weighting factor
(MARSSIM, 2000). CEDE is expressed in units of sievert (Sv) or rem. See action level, dose
equivalent, and total effective dose equivalent.
common ion (14.8.3.1): Ions that appear in the equilibrium expressions of reactions. The term is
often used to refer to an additional source of the reacting ions.
common-ion effect (14.8.3.1): An increase in concentration of ions participating in a reaction
because of the addition of one of the ions from another source causing a shift in the equilibrium
of the reaction.
comparability (1.4.11): A measure of the confidence with which one data set can be compared to
another. Comparability is one of the five principal data quality indicators, which are qualitative
and quantitative descriptors used in interpreting the degree of acceptability or utility of data.
completeness (1.4.11): A measure of the amount of valid data obtained from a measurement
system compared to the amount that was expected to be obtained under correct, normal
conditions. Completeness is one of the five principal data quality indicators. See also
comparability.
complex (13.2.4): Another name for a coordination compound.
complex ion (13.2.4): An ion formed when a metal atom or ion forms coordination bonds with
one or more nonmetal atoms in molecules or anions. Examples are Th(NO3)2
+2, Ra(EDTA)!2,
U(CO3)5
!6, and Fe(H2O)6
+2.
compliance (8.2.2.2): In terms of data, compliance means that the data passes numerical quality
control tests based on parameters or limits derived from the measurement quality objectives
specified in the statement of work.
component (of combined standard uncertainty) (19.2): The component of the combined
standard uncertainty of an output estimate, uc(y), generated by the standard uncertainty of an
input estimate, u(xi), is the product of the standard uncertainty, u(xi), and the absolute value of
the sensitivity coefficient, My / Mxi. The uncertainty component generated by u(xi) may be denoted
by ui(y).
concentration range (2.5, Table 2.1): The minimum and maximum concentration of an analyte
expected to be present in a sample for a given project. While most analytical protocols are

Glossary
( ) Indicates the section in which the term is first used in MARLAP.
Italicized words or phrases have their own definitions in this glossary.
JULY 2004 MARLAP
xi
applicable over a fairly large range of concentration for the radionuclide of interest, performance
over a required concentration range can serve as a measurement quality objective for the protocol
selection process and some analytical protocols may be eliminated if they cannot accommodate
the expected range of concentration.
conceptual site model (2.3.2): A general approach to planning field investigations that is useful
for any type of environmental reconnaissance or investigation plan with a primary focus on the
surface and subsurface environment.
consistency (8.4.2): Values that are the same when reported redundantly on different reports or
transcribed from one report to another.
control chart (18.1): A graphical representation of data taken from a repetitive measurement or
process. Control charts may be developed for various characteristics (e.g., mean, standard
deviation, range, etc.) of the data. A control chart has two basic uses: 1) as a tool to judge if a
process was in control, and 2) as an aid in achieving and maintaining statistical control. For
applications related to radiation detection instrumentation or radiochemical processes, the mean
(center line) value of a historical characteristic (e.g., mean detector response), subsequent data
values and control limits placed symmetrically above and below the center line are displayed on a
control chart. See statistical control.
control limit (3.3.7.3): Predetermined values, usually plotted on a control chart, which define the
acceptable range of the monitored variable. There can be both upper and lower limits; however,
when changes in only one direction are of concern, only one limit is necessary. When a measured
value exceeds the control limits, one must stop the measurement process, investigate the
problem, and take corrective action.” See warning limit.
coordination bond (14.3.1): (1) The chemical bond between the nonmetal atoms of a ligand and
a metal atom or ion, which forms a coordination compound or complex ion. The bond is formed
when the ligand donates one or more electron pairs to the metal atom or ion. (2) In more general
terms, a covalent bond formed in which one atom donates both of the shared electrons; often
called a coordination-covalent bond.
coordination compound (14.3.1): A compound containing coordination bonds in a molecule or
ion; also called a “complex.”
coordination number (14.3.1): (1) The number of nonmetal atoms donating electrons to a metal
atom or ion in the formation of a complex ion or coordination compound. For example, the

Glossary
( ) Indicates the section in which the term is first used in MARLAP.
Italicized words or phrases have their own definitions in this glossary.
MARLAP JULY 2004
xii
coordination number is five in U(CO3)5
!6 (2) The number of atoms, ions, molecules, or groups
surrounding an atom or ion in a coordination compound, complex ion, or crystal structure.
coprecipitation (14.1): A process used to precipitate a radionuclide that is not present in
sufficient concentration to exceed the solubility product of the radionuclide and precipitate. A
stable ion, chemically similar to the radionuclide, is added in a quantity sufficient to precipitate
and carry with it the radionuclide.
core group (core team) (2.4.1): A subgroup of the project planning team, which includes the
project manager and other key members of the project planning team, who meet at agreed upon
intervals to review the project’s progress, respond to unexpected events, clarify questions raised,
revisit and revise project requirements as necessary, and communicate the basis for previous
assumptions.
correction (8.2.1): A value algebraically added to the uncorrected result of a measurement to
compensate for a systematic effect.
correction factor (8.5.1.12): A numerical factor by which the result of an uncorrected result of a
measurement is multiplied to compensate for a systematic effect.
corrective action reports (8.2.2.2): Documentation of required steps taken to correct an out of
control situation.
correctness (8.4.2): The reported results are based on properly documented and correctly applied
algorithms.
correlate (18.4.5): Two random variables are correlated if their covariance is nonzero.
correlation coefficient (19.3.3): The correlation coefficient of two random variables is equal to
their covariance divided by the product of their standard deviations.
cosmogenic radionuclide (3.3.1): Radionuclides that result from the collision of cosmic-ray
particles with stable elements in the atmosphere, primarily atmospheric gases. See background,
environmental.
counting efficiency (15.2.2): The ratio of the events detected (and registered) by a radiation
detection system to the number of particle or photons emitted from a radioactive source. The
counting efficiency may be a function of many variables, such as radiation energy, source
composition, and source or detector geometry.

Glossary
( ) Indicates the section in which the term is first used in MARLAP.
Italicized words or phrases have their own definitions in this glossary.
JULY 2004 MARLAP
xiii
counting error (19.3.5): See counting uncertainty; error (of measurement). MARLAP uses the
term counting uncertainty to maintain a clear distinction between the concepts of measurement
error and uncertainty.
counting uncertainty (18.3.4): Component of measurement uncertainty caused by the random
nature of radioactive decay and radiation counting.
count rate (14A.2.2): The number of decay particles detected per unit time of a source.
Generally the count rate is uncorrected for detector efficiency. The count rate divided by the
detector efficiency for a specific particle and energy will yield the source activity.
count time (2.5): The time interval for the counting of a sample or source by a radiation detector.
Depending upon the context used, this can be either the “clock” time (the entire period required
to count the sample), or “live” time (the period during which the detector is actually counting).
Live time is always less than or equal to clock time.
covariance (19.3.3): The covariance of two random variables X and Y, denoted by Cov(X,Y) or
σX,Y, is a measure of the association between them, and is defined as E([X
!
µX][Y
!
µY]).
coverage factor (1.4.7): The value k multiplied by the combined standard uncertainty uc(y) to
give the expanded uncertainty, U.
coverage probability (19.3.6): Approximate probability that the reported uncertainty interval will
contain the value of the measurand.
critical level (20B.1): See critical value.
critical value (SC) (3B.2): In the context of analyte detection, the minimum measured value (e.g.,
of the instrument signal or the analyte concentration) required to give confidence that a positive
(nonzero) amount of analyte is present in the material analyzed. The critical value is sometimes
called the critical level or decision level.
cross-contamination (3.4, Table 3.1): Cross-contamination occurs when radioactive material in
one sample is inadvertently transferred to an uncontaminated sample, which can result from
using contaminated sampling equipment and chemicals, and improperly cleaned glassware,
crucibles, grinders, etc. Cross-contamination may also occur from spills, as well as airborne
dusts of contaminated materials.

Glossary
( ) Indicates the section in which the term is first used in MARLAP.
Italicized words or phrases have their own definitions in this glossary.
MARLAP JULY 2004
xiv
crosstalk (7.4.2.2): A phenomenon in gas-proportional counting or liquid-scintillation counting
when an emission of an alpha particle is recorded as a beta particle count or vice versa. This is
due to the ionization effects of the particles at different energies.
cumulative distribution function (19A.1): See distribution function.
curie (Ci) (1.4.9): Traditional non-SI unit of activity (of radionuclides), equal to 3.7 × 10¹⁰ Bq.
Because the curie is such a large value, the more common unit is the picocurie (pCi), equal to
10!12 Ci.
data assessment (2.1): Assessment of environmental data consists of three separate and
identifiable phases: data verification, data validation, and data quality assessment.
data collection activities (1.3): Examples of data collection activities include site-characteriza-
tion activities, site cleanup and compliance-demonstration activities, decommissioning of nuclear
facilities, remedial and removal actions, effluent monitoring of licensed facilities, license
termination activities, environmental site monitoring, background studies, routine ambient
monitoring, and waste management activities.
data life cycle (1.4.1): A useful and structured means of considering the major phases of projects
that involve data collection activities. The three phases of the data life cycle are the planning
phase, the implementation phase, and the assessment phase.
data package (1.4.11): The information the laboratory should produce after processing samples
so that data verification, validation, and quality assessment can be done (see Chapter 16, Section
16.7).
data qualifier (8.1): Data validation begins with a review of project objectives and requirements,
the data verification report, and the identified exceptions. If the system being validated is found
to be in control and applicable to the analyte and matrix, then the individual data points can be
evaluated in terms of detection, imprecision, and bias. The data are then assigned data qualifiers.
Validated data are rejected only when the impact of an exception is so significant that a datum is
unreliable.
data quality assessment (1.1): The scientific and statistical evaluation of data to determine if
data are the right type, quality, and quantity to support their intended use.

Glossary
( ) Indicates the section in which the term is first used in MARLAP.
Italicized words or phrases have their own definitions in this glossary.
JULY 2004 MARLAP
xv
data quality assessment plan (1.4.1, Figure 1.1): A project plan document that describes the
data quality assessment process including data quality assessment specifications, requirements,
instructions, and procedures.
data quality indicator (DQI) (3.3.7): Qualitative and quantitative descriptor used in interpreting
the degree of acceptability or utility of data. The principal DQIs are precision, bias,
representativeness, comparability, and completeness. These five DQIs are also referred to by the
acronym PARCC—the “A” refers to accuracy rather than bias.
data quality objective (DQO) (1.4.9): DQOs are qualitative and quantitative statements derived
from the DQO process that clarify the study objectives, define the most appropriate type of data
to collect, determine the most appropriate conditions from which to collect the data, and specify
tolerable limits on decision error rates. Because DQOs will be used to establish the quality and
quantity of data needed to support decisions, they should encompass the total uncertainty
resulting from all data collection activities, including analytical and sampling activities.
data quality objective process (1.6.3): A systematic strategic planning tool based on the scientific
method that identifies and defines the type, quality, and quantity of data needed to satisfy a
specified use. DQOs are the qualitative and quantitative outputs from the DQO process.
data quality requirement (2.1): See measurement quality objective.
data reduction (1.1): The processing of data after generation to produce a radionuclide
concentration with the required units.
data transcription (8.5): The component of the analytical process involving copying or recording
data from measurement logs or instrumentation.
data usability (1.4.11): The scientific and statistical evaluation of data sets to determine if data
are of the right type, quality, and quantity to support their intended use (data quality objectives).
The data quality assessor integrates the data validation report, field information, assessment
reports, and historical project data to determine data usability for the intended decisions.
data validation (1.1): The evaluation of data to determine the presence or absence of an analyte
and to establish the uncertainty of the measurement process for contaminants of concern. Data
validation qualifies the usability of each datum (after interpreting the impacts of exceptions
identified during data verification) by comparing the data produced with the measurement quality
objectives and any other analytical process requirements contained in the analytical protocol
specifications developed in the planning process.

Glossary
( ) Indicates the section in which the term is first used in MARLAP.
Italicized words or phrases have their own definitions in this glossary.
MARLAP JULY 2004
xvi
data validation plan (1.4.1, Figure 1.1): A project plan document that ensures that proper
laboratory procedures are followed and data are reported in a format useful for validation and
assessment, and will improve the cost-effectiveness of the data collection process.
data verification (1.2): Assures that laboratory conditions and operations were compliant with
the statement of work, sampling and analysis plan, and quality assurance project plan, and
identifies problems, if present, that should be investigated during data validation. Data
verification compares the material delivered by the laboratory to these requirements
(compliance), and checks for consistency and comparability of the data throughout the data
package and completeness of the results to ensure all necessary documentation is available.
decay chain (3.3.8): A decay chain or “decay series” begins with a parent radionuclide (also
called a “parent nuclide”). As a result of the radioactive decay process, one element is
transformed into another. The newly formed element, the decay product or progeny, may itself be
radioactive and eventually decay to form another nuclide. Moreover, this third decay product may
be unstable and in turn decay to form a fourth, fifth or more generations of other radioactive
decay products. The final decay product in the series will be a stable element. Elements with
extremely long half-lives may be treated as if stable in the majority of cases. Examples of
important naturally occurring decay chains include the uranium series, the thorium series, and the
actinium series. See radioactive equilibrium.
decay emissions (6.2): The emissions of alpha or beta particles (β+ or β!) or gamma rays from an
atomic nucleus, which accompany a nuclear transformation from one atom to another or from a
higher nuclear energy state to lower one.
decay factor (14A.2.2): Also referred to as the “decay-correction factor.” The factor that is used
to compensate for radioactive decay of a specific radionuclide between two points in time.
decay series (3.3.4): See decay chain.
decision error rate (1.4.9): The probability of making a wrong decision under specified
conditions. In the context of the DQO process, one considers two types of decision errors (Type I
and Type II). The project planning team determines the tolerable decision error rates.
decision level (20.2.2): See critical value.
decision performance criteria (2.1): Another way to express the concept of using directed
project planning as a tool for project management to identify and document the qualitative and
quantitative statements that define the project objectives and the acceptable rate of making

Glossary
( ) Indicates the section in which the term is first used in MARLAP.
Italicized words or phrases have their own definitions in this glossary.
JULY 2004 MARLAP
xvii
decision errors that will be used as the basis for establishing the quality and quantity of data
needed to support the decision. See data quality objective.
decision rule (2.3.3): The rule developed during directed planning to get from the problem or
concern to the desired decision and define the limits on the decision error rates that will be
acceptable to the stakeholder or customer. Sometimes called a “decision statement.” The
decision rule can take the form of “if …then…” statements for choosing among decisions or
alternative actions. For a complex problem, it may be helpful to develop a decision tree, arraying
each element of the issue in its proper sequence along with the possible actions. The decision
rule identifies (1) the action level that will be a basis for decision and (2) the statistical parameter
that is to be compared to the action level.
decision tree (2.5.3): See decision rule. Also referred to as a “logic flow diagram” or “decision
framework.”
decision uncertainty (1.4.7): Refers to uncertainty in the decisionmaking process due to the
probability of making a wrong decision because of measurement uncertainties and sampling
statistics. Decision uncertainty is usually expressed as by the estimated probability of a decision
error under specified assumptions.
decommissioning (1.3): The process of removing a facility or site from operation, followed by
decontamination, and license termination (or termination of authorization for operation) if
appropriate. The process of decommissioning is to reduce the residual radioactivity in structures,
materials, soils, groundwater, and other media at the site to acceptable levels based on acceptable
risk, so that the site may be used without restrictions.
deconvolution (8.5.1.11): The process of resolving multiple gamma-spectral peaks into
individual components.
deflocculation (14.8.5): The process whereby coagulated particles pass back into the colloidal
state. Deflocculation may be accomplished by adding a small amount of electrolyte to produce
the electrical double-layer characteristic of colloidal particles. Also called “peptization.” Also see
coagulation and colloidal solution.
degrees of freedom (6A.2): In a statistical estimation based on a series of observations, the
number of observations minus the number of parameters estimated. See effective degrees of
freedom.

Glossary
( ) Indicates the section in which the term is first used in MARLAP.
Italicized words or phrases have their own definitions in this glossary.
MARLAP JULY 2004
xviii
dentate (14.3.1): Term used to categorize ligands that describes the number of nonmetal atoms
with electron pairs used by a ligand for coordinate bond formation (unidentate, bidentate, etc.).
derived concentration guideline level (DCGL) (2.5.2.1): A derived radionuclide-specific activity
concentration within a survey unit corresponding to the release criterion. DCGLs are derived
from activity/dose relationships through various exposure pathway scenarios.
descriptive statistics (9.6.4.1): Statistical methods that are used to determine and use the mean,
mode, median, variance, and correlations among variables, tables, and graphs to describe a set of
data.
detection capability (1.4.7): The capability of a measurement process to distinguish small
amounts of analyte from zero. It may be expressed in terms of the minimum detectable
concentration.
detection limit (2.5, Table 2.1): The smallest value of the amount or concentration of analyte
that ensures a specified high probability of detection. Also called “minimum detectable value.”
deviation reports (9.2.2.2): Documentation of any changes from the analysis plan that may affect
data utility.
digestion (6.6): (1) Heating a precipitate over time; used to form larger crystals after initial
precipitation. (2) The dissolution of a sample by chemical means, typically through the addition
of a strong acid or base.
directed planning process (1.2): A systematic framework focused on defining the data needed to
support an informed decision for a specific project. Directed planning provides a logic for setting
well-defined, achievable objectives and developing a cost-effective, technically sound sampling
and analysis design that balances the data user’s tolerance for uncertainty in the decision process
and the available resources for obtaining data to support a decision. Directed planning helps to
eliminate poor or inadequate sampling and analysis designs.
disproportionation (autoxidation-reduction) (14.2.3): An oxidation-reduction reaction in which
a chemical species is simultaneously oxidized and reduced.
dissolve (6.5.1.1): To form a solution by mixing a solute with a solvent. The particles of the
solute solvent mix intimately at the atomic, molecular, and ionic levels with the particles of the
solvent, and the solute particles are surrounded by particles of the solvent.

Glossary
( ) Indicates the section in which the term is first used in MARLAP.
Italicized words or phrases have their own definitions in this glossary.
JULY 2004 MARLAP
xix
distillation (12.2.1.2): Separation of a volatile component(s) of a liquid mixture or solution by
boiling the mixture to vaporize the component and subsequent condensation and collection of the
components as a liquid.
distribution (3B.2): The distribution of a random variable is a mathematical description of its
possible values and their probabilities. The distribution is uniquely determined by its distribution
function.
distribution (partition) coefficient (15.4.5.5): An equilibrium constant that represents the ratio of
the concentration of a solute distributed between two immiscible solvents.
distribution function (19A.1): The distribution function, or cumulative distribution function, of a
random variable X is the function F defined by F(x) = Pr[X # x].
dose-based regulation (2.3.2): A regulation whose allowable radionuclide concentration limits
are based on the dose received by an individual or population.
dose equivalent (2.5.2.1): A quantity that expresses all radiations on a common scale for
calculating the effective absorbed dose. This quantity is the product of absorbed dose (grays or
rads) multiplied by a quality factor and any other modifying factors (MARSSIM, 2000). The
“quality factor” adjusts the absorbed dose because not all types of ionizing radiation create the
same effect on human tissue. For example, a dose equivalent of one sievert (Sv) requires 1 gray
(Gy) of beta or gamma radiation, but only 0.05 Gy of alpha radiation or 0.1 Gy of neutron
radiation. Because the sievert is a large unit, radiation doses often are expressed in millisieverts
(mSv). See committed effective dose equivalent and total effective dose equivalent.
duplicates (1.4.8): Two equal-sized samples of the material being analyzed, prepared, and
analyzed separately as part of the same batch, used in the laboratory to measure the overall
precision of the sample measurement process beginning with laboratory subsampling of the field
sample.
dynamic work plan (4.4.2): A type of work plan that specifies the decisionmaking logic to be
used in the field to determine where the samples will be collected, when the sampling will stop,
and what analyses will be performed. This is in contrast to a work plan that specifies the number
of samples to be collected and the location of each sample.
effective degrees of freedom (νeff) (6A.2): A parameter associated with a combined standard
uncertainty, uc(y), analogous to the number of degrees of freedom for a Type A evaluation of
standard uncertainty, which describes the reliability of the uncertainty estimate and which may

Glossary
( ) Indicates the section in which the term is first used in MARLAP.
Italicized words or phrases have their own definitions in this glossary.
MARLAP JULY 2004
xx
be used to select the coverage factor for a desired coverage probability. The number of effective
degrees of freedom is determined using the Welch-Satterthwaite formula.
efficiency (2.5.4.2): See counting efficiency.
electrodeposition (14.1): Depositing (plating or coating) a metal onto the surface of an electrode
by electrochemical reduction of its cations in solution.
electronegativity (14.2.2): The ability of an atom to attract electrons in a covalent bond.
electron density (13.2.3): A term representing the relative electron concentration in part of a
molecule. The term indicates the unequal distribution of valence electrons in a molecule.
Unequal distribution is the result of electronegativity differences of atoms in the bonds of the
molecule and the geometry of the bonds; the results is a polar molecule.
eluant (14.7.4.1): A liquid or solution acting as the moving phase in a chromatographic system.
eluate (14.7.4.1): The liquid or solution that has passed over or through the stationary phase in a
chromatographic system. The eluate may contain components of the analyzed solution, analytes,
or impurities. In column chromatography, it is the liquid coming out of the column. The process
is referred to as “eluting.”
emission probability per decay event (Ee) (16.2.2): The fraction of total decay events for which a
particular particle or photon is emitted. Also called the “branching fraction” or “branching ratio.”
emulsion (14.4.3): (1) A colloidal solution in which both the dispersed phase and continuous
phase are immiscible liquids (2) A permanent colloidal solution in which either the dispersed
phase or continuous phase is water, usually oil in water or water in oil. See gel.
environmental compliance (4.2): Agreement with environmental laws and regulations.
environmental data collection process (2.1): Consists of a series of elements (e.g., planning,
developing project plan documents, contracting for services, sampling, analysis, data
verification, data validation, and data quality assessment), which are directed at the use of the
data in decisionmaking.
error (of measurement) (1.4.7): The difference between a measured result and the value of the
measurand. The error of a measurement is primarily a theoretical concept, since its value is never
known. See also random error, systematic error, and uncertainty (of measurement).

Glossary
( ) Indicates the section in which the term is first used in MARLAP.
Italicized words or phrases have their own definitions in this glossary.
JULY 2004 MARLAP
xxi
estimator (18B.2): A random variable whose value is used to estimate an unknown parameter, θ,
is called an estimator for θ. Generally, an estimator is a function of experimental data.
exception (8.2.3): A concept in data verification meaning a failure to meet a requirement.
excluded particles (14.7.6): Chemical components in a gel-filtration chromatographic system
that do not enter the solid-phase matrix during separation; these components spend less time in
the system and are the first to be eluted in a single fraction during chromatography.
exclusion chromatography (14.7.6): See gel-filtration chromatography.
excursion (1.6.2): Departure from the expected condition during laboratory analysis.
expanded uncertainty (1.4.7): “The product, U, of the combined standard uncertainty of a
measured value y and a coverage factor k chosen so that the interval from y ! U to y + U has a
desired high probability of containing the value of the measurand” (ISO, 1995).
expectation (19.2.2): The expectation of a random variable X, denoted by E(X) or µX, is a
measure of the center of its distribution (a measure of central tendency) and is defined as a
probability-weighted average of the possible numerical values. Other terms for the expectation
value of X are the expected value and the mean.
expected value (18.3.2): See expectation.
expedited site characterization (2.3.2): A process used to identify all relevant contaminant
migration pathways and determine the distribution, concentration, and fate of the contaminants
for the purpose of evaluating risk, determining regulatory compliance, and designing remediation
systems.
experimental standard deviation (6A.2): A measure of the dispersion of the results of repeated
measurements of the same quantity, given explicitly by
s(qk)'1
n&1j
n
k'1
(qk&¯q)2
where q1, q2, …, qn are the results of the measurements, and is their arithmetic mean (ISO,¯q
1993a).

Glossary
( ) Indicates the section in which the term is first used in MARLAP.
Italicized words or phrases have their own definitions in this glossary.
MARLAP JULY 2004
xxii
external assessment (4.2): Part of the evaluation process used to measure the performance or
effectiveness of a system and its elements. As an example, this could be information (audit,
performance evaluation, inspection, etc.) related to a method’s development, validation, and
control that is done by personnel outside of the laboratory and is part of the laboratory quality
assurance program.
extraction chromatography (14.4.4): A solid-phase extraction method performed in a
chromatographic column that uses a resin material consisting of an extractant absorbed onto an
inert polymeric support matrix.
false acceptance (20.2.2): See Type II decision error.
false negative (20.2.1): See Type II decision error. MARLAP avoids the terms “false negative”
and “false positive” because they may be confusing in some contexts.
false positive (14.10.9.9): See Type I decision error. MARLAP avoids the terms “false negative”
and “false positive” because they may be confusing in some contexts.
false rejection (20.2.1): See Type I decision error.
femtogram (fg) (6.5.5.5): Unit of mass equal to 10-15 grams.
flocculation (14.8.5): See coagulation and deflocculation.
formation constant (14.3.2): The equilibrium constant for the formation of a complex ion or
coordination molecule. The magnitude of the constant represents the stability of the complex.
Also called “stability constant.”
fractional distillation (14.5.2): Separation of liquid components of a mixture by repeated
volatilization of the liquid components and condensation of their vapors within a fractionation
column. Repeated volatilization and condensation produces a decreasing temperature gradient up
the column that promotes the collection of the more volatile components (lower boiling point
components) at the upper end of the column and return of the less volatile components at the
lower end of the column. The process initially enriches the vapors in the more volatile
components, and they separate first as lower boiling point fractions.
fractionation column (14.5.3): A distillation column that allows repeated volatilization and
condensation steps within the length of the column, accomplishing fractional distillation of
components of a mixture in one distillation process by producing a temperature gradient that

Glossary
( ) Indicates the section in which the term is first used in MARLAP.
Italicized words or phrases have their own definitions in this glossary.
JULY 2004 MARLAP
xxiii
decreases up the length of the column (see fractional distillation). The column is designed with
plates or packing material inside the column to increase the surface area for condensation.
frequency plots (9.6.3): Statisticians employ frequency plots to display the imprecision of a
sampling and analytical event and to identify the type of distribution.
fusion (1.4.10): See sample dissolution.
full width of a peak at half maximum (FWHM) (8.5.11): A measure of the resolution of a
spectral peak used in alpha or gamma spectrometry: the full peak-width energy (FW) at one-half
maximum peak height (HM).
full width of a peak at tenth maximum (FWTM) (15.1): A measure of the resolution of a
spectral peak used in alpha or gamma spectrometry: the full peak-width energy (FW) at one-tenth
maximum peak height (TM).
gas chromatography (GC) (14.5.2): See gas-liquid phase chromatography.
gas-liquid phase chromatography (GLPC) (14.7.1): A chromatographic separation process
using a mobile gas phase (carrier gas) in conjunction with a low-volatility liquid phase that is
absorbed onto an inert, solid-phase matrix to produce a stationary phase. The components of the
analytical mixture are vaporized and swept through the column by the carrier gas.
gel (14.7.4.2, Table 14.9): (1) A colloidal solution that is highly viscous, usually coagulated into
a semirigid or jellylike solid. (2) Gelatinous masses formed from the flocculation of emulsions.
gel-exclusion chromatography (14.7.6): See gel-filtration chromatography.
gel-filtration chromatography (14.7.6): A column chromatographic separation process using a
solid, inert polymeric matrix with pores that admit molecules less than a certain hydrodynamic
size (molecular weight) but exclude larger molecules. The excluded molecules are separated
from the included molecules by traveling only outside the matrix and are first eluted in bulk from
the column. The included molecules, depending on size, spend different amounts of time in the
pores of matrix and are separated by size.
general analytical planning issues (3.3): Activities to be identified and resolved during a
directed planning process. Typically, the resolution of general analytical planning issues
normally results, at a minimum, in an analyte list, identified matrices of concern, measurement

Glossary
( ) Indicates the section in which the term is first used in MARLAP.
Italicized words or phrases have their own definitions in this glossary.
MARLAP JULY 2004
xxiv
quality objectives, and established frequencies and acceptance criteria for quality control samples.
graded approach (2.3): A process of basing the level of management controls applied to an item
or work on the intended use of the results and the degree of confidence needed in the quality of
the results. MARLAP recommends a graded approach to project planning because of the
diversity of environmental data collection activities. This diversity in the type of project and the
data to be collected impacts the content and extent of the detail to be presented in the project
plan documents.
gray region (1.6.3): The range of possible values in which the consequences of decision errors
are relatively minor. Specifying a gray region is necessary because variability in the target
analyte in a population and imprecision in the measurement system combine to produce
variability in the data such that the decision may be “too close to call” when the true value is very
near the action level. The gray region establishes the minimum distance from the action level
where it is most important that the project planning team control Type II errors.
GUM (1.4.7): Guide to the Expression of Uncertainty in Measurement (ISO, 1995).
half-life (T½ or t½) (1.4.8): The time required for one-half of the atoms of a particular radionuc-
lide in a sample to disintegrate or undergo nuclear transformation.
heterogeneity (2.5): (1) “Spatial heterogeneity,” a type of distributional heterogeneity, refers to
the nonuniformity of the distribution of an analyte of concern within a matrix. Spatial hetero-
geneity affects sampling, sample processing, and sample preparation. See homogenization. (2)
The “distributional heterogeneity” of a lot depends not only on the variations among particles but
also on their spatial distribution. Thus, the distributional heterogeneity may change, for example,
when the material is shaken or mixed. (3) The “constitutional” (or “compositional”) hetero-
geneity of a lot is determined by variations among the particles without regard to their locations
in the lot. It is an intrinsic property of the lot itself, which cannot be changed without altering
individual particles.
high-level waste (HLW) (1.3): (1) irradiated reactor fuel; (2) liquid wastes resulting from the
operation of the first-cycle solvent extraction system, or equivalent, and the concentrated wastes
from subsequent extraction cycles, or equivalent, in a facility for reprocessing irradiated reactor
fuel; (3) solids into which such liquid wastes have been converted.
high-pressure liquid chromatography (HPLC) (14.7.7): A column chromatography process
using various solid-liquid phase systems in which the liquid phase is pumped through the system
at high pressures. The process permits rapid, highly efficient separation when compared to many

Glossary
( ) Indicates the section in which the term is first used in MARLAP.
Italicized words or phrases have their own definitions in this glossary.
JULY 2004 MARLAP
xxv
other chromatographic systems and is, therefore, also referred to as “high-performance liquid
chromatography.”
holdback carrier (14.8.4.4): A nonradioactive carrier of a radionuclide used to prevent that
particular radioactive species from contaminating other radioactive species in a chemical
operation (IUPAC, 2001).
homogeneous distribution coefficient (D) (14.8.4.1): The equality constant in the equation
representing the homogeneous distribution law. Values of D greater than one represent removal
of a foreign ion by inclusion during coprecipitation (see homogeneous distribution law).
homogeneous distribution law (14.8.4.1): A description of one mechanism in which
coprecipitation by inclusion occurs (the less common mechanism). The amount of ion
coprecipitating is linearly proportional to the ratio of the concentration of the ion in solution to
the concentration of the coprecipitating agent in solution. Equilibrium between the precipitate
and the solution is obtained (during digestion) and the crystals become completely homogeneous
with respect to the foreign ions (impurities) (see homogeneous distribution coefficient and
digestion).
homogenization (3.4, Table 3.1): Producing a uniform distribution of analytes and particles
throughout a sample.
hydration (14.3.1): Association of water molecules with ions or molecules in solution.
hydration sphere (14.3.1): Water molecules that are associated with ions or molecules in
solution. The inner-hydration sphere (primary hydration sphere) consists of several water
molecules directly bonded to ions through ion-dipole interactions and to molecules through
dipole-dipole interactions including hydrogen bonding. The outer hydration sphere (secondary
hydration sphere) is water molecules less tightly bound through hydrogen bonding to the
molecules of the inner-hydration sphere.
hydrolysis: (1) A chemical reaction of water with another compound in which either the
compound or water is divided. (2) A reaction of water with ions that divides (lyses) water
molecules to produce an excess of hydrogen ions or excess of hydroxyl ions in solution (an acidic
or basic solution). Cations form complex ions with hydroxyl ions as ligands producing an acidic
solution: Fe+3 + H2O 6 Fe(OH)+2 + H+1. Anions form covalent bonds with the hydrogen ion
producing weak acids and a basic solution: F!1 + H2O 6 HF + OH!1.

Glossary
( ) Indicates the section in which the term is first used in MARLAP.
Italicized words or phrases have their own definitions in this glossary.
MARLAP JULY 2004
xxvi
hypothesis testing (2.5, Table 2.1): The use of statistical procedures to decide whether a null
hypothesis should be rejected in favor of an alternative hypothesis or not rejected (see also
statistical test).
immobile phase (14.7.1): See stationary phase.
imprecision (1.4.8): Variation of the results in a set of replicate measurements. This can be
expressed as the standard deviation or coefficient of variation (relative standard deviation)
(IUPAC, 1997). See precision.
included particle (14.7.6): The chemical forms that are separated by gel-filtration chroma-
tography. They enter the solid-phase matrix of the chromatographic system and are separated by
hydrodynamic size (molecular weight), eluting in inverse order by size.
inclusion (14.7.1): Replacement of an ion in a crystal lattice by a foreign ion similar in size and
charge to form a mixed crystal or solid solution. Inclusion is one mechanism by which ions are
coprecipitated with another substance precipitating from solution.
in control (1.6.2): The analytical process has met the quality control acceptance criteria and
project requirements. If the analytical process is in control, the assumption is that the analysis
was performed within established limits and indicates a reasonable match among matrix, analyte,
and method.
independent (19.2.2): A collection of random variables X1, X2, …, Xn is independent if Pr[X1 #
x1, X2 # x2, …, Xn # xn] = Pr[X1 # x1 ] @ Pr[X2 # x2] @@@ Pr[Xn # xn] for all real numbers x1, x2, …, xn.
Intuitively, the collection is said to be independent if knowledge of the values of any subset of
the variables provides no information about the likely values of the other variables.
inferential statistics (9.6.4.1): Using data obtained from samples to make estimates about a
population (inferential estimations) and to make decisions (hypothesis testing). Sampling and
inferential statistics have identical goals: to use samples to make inferences about a population
of interest and to use sample data to make defensible decisions.
inner (primary) hydration sphere (14.3.1): See hydration sphere.
input estimate (3A.5): Measured value of an input quantity. See output estimate.

Glossary
( ) Indicates the section in which the term is first used in MARLAP.
Italicized words or phrases have their own definitions in this glossary.
JULY 2004 MARLAP
xxvii
input quantity (6.5.5.1): Any of the quantities in a mathematical measurement model whose
values are measured and used to calculate the value of another quantity, called the output
quantity. See input estimate.
interferences (1.4.9): The presence of other chemicals or radionuclides in a sample that hinder
the ability to analyze for the radionuclide of interest. See method specificity.
ion-exchange chromatography (6.6.2.3): A separation method based on the reversible exchange
of ions in a mobile phase with ions bonded to a solid ionic phase. Ions that are bonded less
strongly to the solid phase (of opposite charge) are displaced by ions that are more strongly
bonded. Separation of analyte ions depends on the relative strength of bonding to the solid phase.
Those less strongly bonded ions are released from the solid phase earlier and eluted sooner.
ion-product (14.8.3.1): The number calculated by substituting the molar concentration of ions
that could form a precipitate into the solubility-product expression of the precipitating
compound. The ion-product is used to determine if a precipitate will form from the concentration
of ions in solution. If the ion-product is larger than the solubility-product constant, precipitation
will occur; if it is smaller, precipitation will not occur.
isomeric transition (14.10.9.12): The transition, via gamma-ray emission (or internal conver-
sion), of a nucleus from a high-energy state to a lower-energy state without accompanying
particle emission, e.g., 99mTc ÷ 99Tc + γ.
isotope (3.3.4): Any of two or more nuclides having the same number of protons in their nuclei
(same atomic number), but differing in the number of neutrons (different mass numbers, for
example 58Co, 59Co, and 60Co). See radionuclide.
isotope dilution analysis (14.10.7): A method of quantitative analysis based on the measurement
of the isotopic abundance of an element after isotopic dilution of the test portion.
key analytical planning issue (1.6.1): An issue that has a significant effect on the selection and
development of analytical protocols or an issue that has the potential to be a significant
contributor of uncertainty to the analytical process and ultimately the resulting data.
laboratory control sample (2.5.4.2): A standard material of known composition or an artificial
sample (created by fortification of a clean material similar in nature to the sample), which is
prepared and analyzed in the same manner as the sample. In an ideal situation, the result of an
analysis of the laboratory control sample should be equivalent to (give 100 percent of) the target

Glossary
( ) Indicates the section in which the term is first used in MARLAP.
Italicized words or phrases have their own definitions in this glossary.
MARLAP JULY 2004
xxviii
analyte concentration or activity known to be present in the fortified sample or standard material.
The result normally is expressed as percent recovery. See also quality control sample.
Laboratory Information Management System (LIMS) (11.2.1): An automated information
system used at a laboratory to collect and track data regarding sample analysis, laboratory quality
control operability information, final result calculation, report generation, etc.
laboratory method (6.2): Includes all physical, chemical, and radiometric processes conducted at
a laboratory in order to provide an analytical result. These processes may include sample
preparation, dissolution, chemical separation, mounting for counting, nuclear instrumentation
counting, and analytical calculations. Also called analytical method.
law of propagation of uncertainty (19.1): See uncertainty propagation formula.
level of confidence (1.4.11): See coverage probability.
ligand (14.3.1): A molecule, atom, or ion that donates at least one electron pair to a metal atom
or ion to form a coordination molecule or complex ion. See dentate.
linearity (7.2.2.5): The degree to which the response curve for a measuring device, such as an
analytical balance, follows a straight line between the calibration points. The linearity is usually
specified by the maximum deviation of the response curve from such a straight line.
liquid chromatography (LC) (14.7.1): A chromatographic process using a mobile liquid-phase.
liquid-phase chromatography (LPC) (14.7.1): A chromatographic process in which the mobile
and stationary phases are both liquids. Separation is based on relative solubility between two
liquid phases. The stationary phase is a nonvolatile liquid coated onto an inert solid matrix or a
liquid trapped in or bound to a solid matrix. Also called “liquid-partition chromatography.”
logarithmic distribution coefficient (λ) (14.8.4.1): The equality constant in the equation
representing the Logarithmic Distribution Law. Values of λ greater than one represent removal of
a foreign ion by inclusion during coprecipitation, and the larger the value, the more effective and
selective the process is for a specific ion. Generally, the logarithmic distribution coefficient
decreases with temperature, so coprecipitation by inclusion is favored by lower temperature.
Logarithmic Distribution Law (14.8.4.1): A description of one mechanism by which
coprecipitation by inclusion occurs (the more common mechanism). The amount of ion
coprecipitated is logarithmically proportional to the amount of primary ion in the solution during

Glossary
( ) Indicates the section in which the term is first used in MARLAP.
Italicized words or phrases have their own definitions in this glossary.
JULY 2004 MARLAP
xxix
crystallization. Crystal are grown in a slow and orderly process, such as precipitation from
homogeneous solution, and each crystal surface, as it is formed, is in equilibrium with the
solution. As a result, the concentration of a foreign ion (impurity) varies continuously from the
center to the periphery of the crystal (see logarithmic distribution coefficient).
logic statement (2.6): The output from the directed planning process about what must be done to
obtain the desired answer.
lower limit of detection (LLD) (14.10.9.5): (1) “The smallest concentration of radioactive
material in a sample that will yield a net count, above the measurement process (MP) blank, that
will be detected with at least 95 percent probability with no greater than a 5 percent probability of
falsely concluding that a blank observation represents a ‘real’ signal” (NRC, 1984). (2) “An
estimated detection limit that is related to the characteristics of the counting instrument” (EPA,
1980).
low-pressure chromatography (14.7.1): Column chromatography in which a liquid phase is
passed through a column under pressure supplied by gravity or a low-pressure pump.
Lucas cell (10.5.4.4): A specially designed, high-efficiency cell for the analysis of radon gas with
its progeny. The cell is coated with a zinc sulfide phosphor material that releases ultraviolet light
when the alpha particles from radon and its progeny interact with the phosphor.
Marinelli beaker (6.5.3): A counting container that allows the source to surround the detector,
thus maximizing the geometrical efficiency. It consists of a cylindrical sample container with an
inverted well in the bottom that fits over the detector. Also called a “reentrant beaker.”
MARLAP Process (1.4): A performance-based approach that develops Analytical Protocol
Specifications, and uses these requirements as criteria for the analytical protocol selection,
development, and evaluation processes, and as criteria for the evaluation of the resulting
laboratory data. This process, which spans the three phases of the data life cycle for a project, is
the basis for achieving MARLAP’s basic goal of ensuring that radioanalytical data will meet a
project’s or program’s data requirements or needs.
masking (14.4.3): The prevention of reactions that are normally expected to occur through the
presence or addition of a masking agent (reagent).
masking agent (14.4.3): A substance that is responsible for converting a chemical form, which
would have otherwise participated in some usual chemical reaction, into a derivative that will not
participate in the reaction.

Glossary
( ) Indicates the section in which the term is first used in MARLAP.
Italicized words or phrases have their own definitions in this glossary.
MARLAP JULY 2004
xxx
matrix of concern (1.4.10): Those matrices identified during the directed project planning
process from which samples may be taken. Typical matrices include: surface soil, subsurface
soil, sediment, surface water, ground water, drinking water, process effluents or wastes, air
particulates, biota, structural materials, and metals.
matrix-specific analytical planning issue (3.1): Key analytical planning issue specific to that
matrix, such as filtration and preservation issues for water samples.
matrix spike (3.3.10): An aliquant of a sample prepared by adding a known quantity of target
analytes to specified amount of matrix and subjected to the entire analytical procedure to
establish if the method or procedure is appropriate for the analysis of the particular matrix.
matrix spike duplicate (MSD) (9.6.3): A second replicate matrix spike prepared in the
laboratory and analyzed to evaluate the precision of the measurement process.
Maximum Contaminant Level (MCL) (2.5.2.1): The highest level of a contaminant that is
allowed in drinking water. MCLs are set as close as feasible to the level believed to cause no
human health impact, while using the best available treatment technology and taking cost into
consideration. MCLs are enforceable standards.
mean (1.4.8): See expectation (compare with arithmetic mean and sample mean).
mean concentration (2.5.2.3): A weighted average of all the possible values of an analyte
concentration, where the weight of a value is determined by its probability.
measurand (1.4.7): “Particular quantity subject to measurement”(ISO, 1993a).
measurement performance criteria (1.2): See measurement quality objectives.
measurement process (1.3): Analytical method of defined structure that has been brought into a
state of statistical control, such that its imprecision and bias are fixed, given the measurement
conditions (IUPAC, 1995).
measurement quality objective (MQO) (1.4.9): The analytical data requirements of the data
quality objectives are project- or program-specific and can be quantitative or qualitative. These
analytical data requirements serve as measurement performance criteria or objectives of the
analytical process. MARLAP refers to these performance objectives as measurement quality
objectives (MQOs). Examples of quantitative MQOs include statements of required analyte
detectability and the uncertainty of the analytical protocol at a specified radionuclide concentra-

Glossary
( ) Indicates the section in which the term is first used in MARLAP.
Italicized words or phrases have their own definitions in this glossary.
JULY 2004 MARLAP
xxxi
tion, such as the action level. Examples of qualitative MQOs include statements of the required
specificity of the analytical protocol, e.g., the ability to analyze for the radionuclide of interest
given the presence of interferences.
measurement uncertainty (1.4.7): See uncertainty (of measurement).
measurement variability (2.5.2.2): The variability in the measurement data for a survey unit is a
combination of the imprecision of the measurement process and the real spatial variability of the
analyte concentration.
median (9.6.4.1): A median of a distribution is any number that splits the range of possible
values into two equally likely portions, or, to be more rigorous, a 0.5-quantile. See arithmetic
mean.
method (1.4.5): See analytical method.
method blank (Figure 3.3): A sample assumed to be essentially target analyte-free that is carried
through the radiochemical preparation, analysis, mounting and measurement process in the same
manner as a routine sample of a given matrix.
method control (6.1): Those functions and steps taken to ensure that the validated method as
routinely used produces data values within the limits of the measurement quality objectives.
Method control is synonymous with process control in most quality assurance programs.
method detection limit (MDL) (3B.4): “The minimum concentration of a substance that can be
measured and reported with 99 percent confidence that the analyte concentration is greater than
zero … determined from analysis of a sample in a given matrix containing the analyte”
(40 CFR 136, Appendix B).
method performance characteristics (3.3.7): The characteristics of a specific analytical method
such as method uncertainty, method range, method specificity, and method ruggedness.
MARLAP recommends developing measurement quality objectives for select method
performance characteristics, particularly for the uncertainty (of measurement) at a specified
concentration (typically the action level).
method range (1.4.9): The lowest and highest concentration of an analyte that a method can
accurately detect.

Glossary
( ) Indicates the section in which the term is first used in MARLAP.
Italicized words or phrases have their own definitions in this glossary.
MARLAP JULY 2004
xxxii
method ruggedness (1.4.9): The relative stability of method performance for small variations in
method parameter values.
method specificity (1.4.9): The ability of the method to measure the analyte of concern in the
presence of interferences.
method uncertainty (3.3.7): Method uncertainty refers to the predicted uncertainty of the result
that would be measured if the method were applied to a hypothetical laboratory sample with a
specified analyte concentration. Although individual measurement uncertainties will vary from
one measured result to another, the required method uncertainty is a target value for the
individual measurement uncertainties, and is an estimate of uncertainty (of measurement) before
the sample is actually measured. See also uncertainty (of measurement).
method validation (5.3): The demonstration that the radioanalytical method selected for the
analysis of a particular radionuclide in a given matrix is capable of providing analytical results to
meet the project’s measurement quality objectives and any other requirements in the analytical
protocol specifications. See project method validation.
method validation reference material (MVRM) (5.5.2): Reference materials that have the same
or similar chemical and physical properties as the proposed project samples, which can be used
to validate the laboratory’s methods.
metrology (1.4.7): The science of measurement.
minimum detectable amount (MDA) (3B.3): The minimum detectable value of the amount of
analyte in a sample. Same definition as the minimum detectable concentration but related to the
quantity (activity) of a radionuclide rather than the concentration of a radionuclide. May be
called the “minimum detectable activity” when used to mean the activity of a radionuclide (see
ANSI N13.30 and N42.23).
minimum detectable concentration (MDC) (2.5.3): The minimum detectable value of the analyte
concentration in a sample. ISO refers to the MDC as the minimum detectable value of the net
state variable. They define this as the smallest (true) value of the net state variable that gives a
specified probability that the value of the response variable will exceed its critical value—i.e.,
that the material analyzed is not blank.
minimum detectable value (20.2.1): An estimate of the smallest true value of the measurand that
ensures a specified high probability, 1 ! β, of detection. The definition of the minimum

Glossary
( ) Indicates the section in which the term is first used in MARLAP.
Italicized words or phrases have their own definitions in this glossary.
JULY 2004 MARLAP
xxxiii
detectable value presupposes that an appropriate detection criterion has been specified (see
critical value).
minimum quantifiable concentration (MQC) (3.3.7): The minimum quantifiable concentration,
or the minimum quantifiable value of the analyte concentration, is defined as the smallest
concentration of analyte whose presence in a laboratory sample ensures the relative standard
deviation of the measurement does not exceed a specified value, usually 10 percent.
minimum quantifiable value (20.2.7): The smallest value of the measurand that ensures the
relative standard deviation of the measurement does not exceed a specified value, usually 10
percent (see also minimum quantifiable concentration).
mixed waste (1.3): Waste that contains both radioactive and hazardous chemicals.
mobile phase (14.7.1): The phase in a chromatographic system that is moving with respect to the
stationary phase; either a liquid or a gas phase.
moving phase (14.7.1): See mobile phase.
net count rate: (16.3.2): The net count rate is the value resulting form the subtraction of the
background count rate (instrument background or appropriate blank) from the total (gross) count
rate of a source or sample.
nonaqueous samples (10.3.5): Liquid-sample matrices consisting of a wide range of organic/
solvents, organic compounds dissolved in water, oils, lubricants, etc.
nonconformance (5.3.7): An instance in which the contractor does not meet the performance
criteria of the contract or departs from contract requirements or acceptable practice.
nuclear decay (15.3): A spontaneous nuclear transformation.
nuclear counting (1.6): The measurement of alpha, beta or photon emissions from
radionuclides.
nuclide (1.1): A species of atom, characterized by its mass number, atomic number, and nuclear
energy state, providing that the mean half-life in that state is long enough to be observable
(IUPAC, 1995).

Glossary
( ) Indicates the section in which the term is first used in MARLAP.
Italicized words or phrases have their own definitions in this glossary.
MARLAP JULY 2004
xxxiv
nuclide-specific analysis (3.3.8.3): Radiochemical analysis performed to isolate and measure a
specific radionuclide.
null hypothesis (H0) (2.5, Table 2.1): One of two mutually exclusive statements tested in a
statistical hypothesis test (compare with alternative hypothesis). The null hypothesis is presumed
to be true unless the test provides sufficient evidence to the contrary, in which case the null
hypothesis is rejected and the alternative hypothesis is accepted.
occlusion (14.8.3.1): The mechanical entrapment of a foreign ion between subsequent layers
during crystal formation. A mechanism of coprecipitation.
Ostwald ripening (14.8.3.2): Growth of larger crystals during precipitation by first dissolving
smaller crystals and allowing the larger crystals to form.
outer (secondary) hydration sphere (14.3.1): See hydration sphere.
outlier (9.6.4.1): A value in a group of observations, so far separated from the remainder of the
values as to suggest that they may be from a different population, or the result of an error in
measurement (ISO, 1993b).
output estimate (3A.5): The calculated value of an output quantity (see input estimate).
output quantity (19.3.2): The quantity in a mathematical measurement model whose value is
calculated from the measured values of other quantities in the model (see input quantity and
output estimate).
oxidation (6.4): The increase in oxidation number of an atom in a chemical form during a
chemical reaction. Increase in oxidation number is a result of the loss of electron(s) by the atom
or the decrease in electron density when the atom bonds to a more electronegative element or
breaks a bond to a less electronegative element.
oxidation-reduction (redox) reaction (10.3.3): A chemical reaction in which electrons are
redistributed among the atoms, molecules, or ions in the reaction.
oxidation number (6.4): An arbitrary number indicating the relative electron density of an atom
or ion of an element in the combined state, relative to the electron density of the element in the
pure state. The oxidation number increases as the electron density decreases and decreases as the
electron density increases.

Glossary
( ) Indicates the section in which the term is first used in MARLAP.
Italicized words or phrases have their own definitions in this glossary.
JULY 2004 MARLAP
xxxv
oxidation state (6.4): See oxidation number.
oxidizing agent (10.5.2): The chemical species in an oxidation-reduction reaction that causes
oxidation of another chemical species by accepting or attracting electrons. The oxidizing agent is
reduced during the reaction.
paper chromatography (14.7.1): A chromatographic process in which the stationary phase is
some type of absorbent paper. The mobile phase is a pure liquid or solution.
parameter of interest (2.5, Table 2.1): A descriptive measure (e.g., mean, median, or proportion)
that specifies the characteristic or attribute that the decisionmaker would like to know and that
the data will estimate.
PARCC (3.3.7): “Precision, accuracy, representativeness, comparability, and completeness.” See
data quality indicators.
parent radionuclide (3.3.4): The initial radionuclide in a decay chain that decays to form one or
more progeny.
partition (distribution) coefficient: See distribution coefficient.
peptization: See deflocculation.
percentile (19A.1): If X is a random variable and p is a number between 0 and 1, then a 100pth
percentile of X is any number xp such that the probability that X < xp is at most p and the
probability that X # xp is at least p. For example, if x0.95 is a 95th percentile of X then Pr[X < x0.95]
# 0.95 and Pr[X # x0.95] $ 0.95. See quantile.
performance-based approach (1.2): Defining the analytical data needs and requirements of a
project in terms of measurable goals during the planning phase of a project. In a performance-
based approach, the project-specific analytical data requirements that are determined during a
directed planning process serve as measurement performance criteria for selections and decisions
on how the laboratory analyses will be conducted. The project-specific analytical data
requirements are also used for the initial, ongoing, and final evaluation of the laboratory’s
performance and the laboratory data.
performance-based approach to method selection (6.1): The process wherein a validated
method is selected based on a demonstrated capability to meet defined quality and laboratory
performance criteria.

Glossary
( ) Indicates the section in which the term is first used in MARLAP.
Italicized words or phrases have their own definitions in this glossary.
MARLAP JULY 2004
xxxvi
performance evaluation program (5.3.5): A laboratory’s participation in an internal or external
program of analyzing performance testing samples appropriate for the analytes and matrices
under consideration (i.e., performance evaluation (PE) program traceable to a national standards
body, such as the National Institute of Standards and Technology in the United States).
performance evaluation sample (3.3.10): Reference material samples used to evaluate the
performance of the laboratory. Also called performance testing (PT) samples or materials.
performance indicator (1.6.2): Instrument- or protocol-related parameter routinely monitored to
assess the laboratory’s estimate of such controls as chemical yield, instrument background,
uncertainty (of measurement), precision, and bias.
performance testing (PT): See performance evaluation program.
picocurie (pCi) (1.4.9): 10-12 curie.
planchet (10.3.2): A metallic disk (with or without a raised edge) that is used for the analysis of
a radioactive material after the material has been filtered, evaporated, electroplated, or dried.
Evaporation of water samples for gross alpha and beta analysis often will take place directly in
the planchet.
Poisson distribution (18.3.2): A random variable X has the Poisson distribution with parameter λ
if for any nonnegative integer k,
Pr[X'k]'λke&λ
k!
In this case both the mean and variance of X are numerically equal to λ. The Poisson distribution
is often used as a model for the result of a nuclear counting measurement.
polymorphism (14.8.3.1): The existence of a chemical substance in two or more physical forms,
such as different crystalline forms.
postprecipitation (14.8.4.3): The subsequent precipitation of a chemically different species upon
the surface of an initial precipitate; usually, but not necessarily, including a common ion
(IUPAC, 1997).
precision (1.4.8): The closeness of agreement between independent test results obtained by
applying the experimental procedure under stipulated conditions. Precision may be expressed as
the standard deviation (IUPAC, 1997). See imprecision.

Glossary
( ) Indicates the section in which the term is first used in MARLAP.
Italicized words or phrases have their own definitions in this glossary.
JULY 2004 MARLAP
xxxvii
prescribed methods (6.1): Methods that have been selected by the industry for internal use or by
a regulatory agency for specific programs. Methods that have been validated for a specific
application by national standard setting organizations, such as ASTM, ANSI, AOAC, etc., may
also be used as prescribed methods by industry and government agencies.
primary (inner) hydration sphere (14.3.1): See hydration sphere.
primordial radionuclide (3.3.1): A naturally occurring radionuclide found in the earth that has
existed since the formation (~4.5 billion years) of the Earth, e.g., 232Th and 238U.
principal decision (2.7.3): The principal decision or study question for a project is identified
during Step 2 of the data quality objectives process. The principal decision could be simple, like
whether a particular discharge is or is not in compliance, or it could be complex, such as
determining if an observed adverse health effect is being caused by a nonpoint source discharge.
principal study question (2.7.3): See principal decision.
probabilistic sampling plan (9.6.2.3): Using assumptions regarding average concentrations and
variances of samples and matrix by the planning team during the development of the sampling
plan.
probability (1.4.7): “A real number in the scale 0 to 1 attached to a random event” (ISO, 1993b).
The probability of an event may be interpreted in more than one way. When the event in question
is a particular outcome of an experiment (or measurement), the probability of the event may
describe the relative frequency of the event in many trials of the experiment, or it may describe
one’s degree of belief that the event occurs (or will occur) in a single trial.
probability density function (pdf) (19A.1): A probability density function for a random variable
X is a function f(x) such that the probability of any event a # X # b is equal to the value of the
integral . The pdf, when it exists, equals the derivative of the distribution function.
Ib
af(x)dx
process knowledge (1.4.10): Information about the radionuclide(s) of concern derived from
historical knowledge about the production of the sampled matrix or waste stream.
progeny (3.3.4): The product resulting from the radioactive disintegration or nuclear
transformation of its parent radionuclide. See decay chain.
project method validation (6.1): The demonstrated method applicability for a particular project.
See method validation.

Glossary
( ) Indicates the section in which the term is first used in MARLAP.
Italicized words or phrases have their own definitions in this glossary.
MARLAP JULY 2004
xxxviii
project narrative statement (4.3): Description of environmental data collection activities, such as
basic studies or small projects, which only require a discussion of the experimental process and
its objectives. Other titles used for project narrative statements are quality assurance narrative
statement and proposal quality assurance plan. Basic studies and small projects generally are of
short duration or of limited scope and could include proof of concept studies, exploratory
projects, small data collection tasks, feasibility studies, qualitative screens, or initial work to
explore assumptions or correlations.
project plan documents (1.1): Gives the data user’s expectations and requirements, which are
developed during the planning process, where the Analytical Protocol Specifications (which
include the measurement quality objectives) are documented, along with the standard operating
procedures, health and safety protocols and quality assurance/quality control procedures for the
field and laboratory analytical teams. Project plan, work plan, quality assurance project plan,
field sampling plan, sampling and analysis plan, and dynamic work plan are some of the names
commonly used for project plan documents.
project planning team (2.1): Consists of all the parties who have a vested interest or can
influence the outcome (stakeholders), such as program and project managers, regulators, the
public, project engineers, health and safety advisors, and specialists in statistics, health physics,
chemical analysis, radiochemical analysis, field sampling, quality assurance, quality control,
data assessment, hydrology and geology, contract management, and field operation. The project
planning team will define the decision(s) to be made (or the question the project will attempt to
resolve) and the inputs and boundaries to the decision using a directed planning process.
project quality objectives (2.1): See decision performance criteria and data quality objective.
project specific plan (4.3): Addresses design, work processes, and inspection, and incorporates,
by citation, site-wide plans that address records management, quality improvement, procurement,
and assessment.
propagation of uncertainty (15.2.5): See uncertainty propagation.
protocol (1.4.3): See analytical protocol.
protocol performance demonstration (3.1): See method validation.
qualifiers (8.1): Code applied to the data by a data validator to indicate a verifiable or potential
data deficiency or bias (EPA, 2002).

Glossary
( ) Indicates the section in which the term is first used in MARLAP.
Italicized words or phrases have their own definitions in this glossary.
JULY 2004 MARLAP
xxxix
quality assurance (QA) (1.3): An integrated system of management activities involving
planning, implementation, assessment, reporting, and quality improvement to ensure that a
process, item, or service is of the type and quality needed and expected.
quality assurance project plan (QAPP) (1.4.11): A formal document describing in detail the
necessary quality assurance, quality control, and other technical activities that must be
implemented to ensure that the results of the work performed will satisfy the stated performance
criteria. The QAPP describes policy, organization, and functional activities and the data quality
objectives and measures necessary to achieve adequate data for use in selecting the appropriate
remedy.
quality control (QC) (1.4.3): The overall system of technical activities whose purpose is to
measure and control the quality of a process or service so that it meets the needs of the users or
performance objectives.
quality control sample (1.4.3): Sample analyzed for the purpose of assessing imprecision and
bias. See also blanks, matrix spikes, replicates, and laboratory control sample.
quality control test (8.5.1): Comparison of quality control results with stipulated acceptance
criteria.
quality indicator (2.5.4.2): Measurable attribute of the attainment of the necessary quality for a
particular environmental decision. Precision, bias, completeness, and sensitivity are common
data quality indicators for which quantitative measurement quality objectives could be
developed during the planning process.
quality system (9.2.2.3): The quality system oversees the implementation of quality control
samples, documentation of quality control sample compliance or noncompliance with
measurement quality objectives, audits, surveillances, performance evaluation sample analyses,
corrective actions, quality improvement, and reports to management.
quantification capability (1.4.9): The ability of a measurement process to quantify the
measurand precisely, usually expressed in terms of the minimum quantifiable value.
quantification limit (20.2.1): See minimum quantifiable value.
quantile (6.6.2, Table 6.1): A p-quantile of a random variable X is any value xp such that the
probability that X < xp is at most p and the probability that X # xp is at least p. (See percentile.)

Glossary
( ) Indicates the section in which the term is first used in MARLAP.
Italicized words or phrases have their own definitions in this glossary.
MARLAP JULY 2004
xl
quench (7.2): A term used to describe the process in liquid-scintillation counting when the
production of light is inhibited or the light signal is partially absorbed during the transfer of light
to the photocathode.
radioactive (1.1): Exhibiting radioactivity, or containing radionuclides.
radioactive decay (3A.4): “Nuclear decay in which particles or electromagnetic radiation are
emitted or the nucleus undergoes spontaneous fission or electron capture.” (IUPAC, 1994)
radioactive equilibrium (3.3.4): One of three distinct relationships that arise when a radionuclide
decays and creates progeny that are also radioactive: (1) secular equilibrium occurs when half-life
of the progeny is much less than the half-life of the parent (for a single progeny, the total activity
reaches a maximum of about twice the initial activity, and then displays the characteristic half-
life of the parent—usually no change over normal measurement intervals); (2) transient equilib-
rium occurs when the half-life of the progeny is less than the half-life of the parent (for a single
progeny, total activity passes through a maximum, and then decreases with the characteristic
half-life of the parent); and (3) no equilibrium occurs when the half-life of the progeny is greater
than the half-life of the parent (total activity decreases continually after time zero).
radioactivity (2.5.4.1): The property of certain nuclides of undergoing radioactive decay.
radioanalytical specialist (2.1): Key technical experts who participate on the project planning
team. Radioanalytical specialists may provide expertise in radiochemistry and radiation/nuclide
measurement systems, and have knowledge of the characteristics of the analytes of concern to
evaluate their fate and transport. They may also provide knowledge about sample transportation
issues, preparation, preservation, sample size, subsampling, available analytical protocols, and
achievable analytical data quality.
radiochemical analysis (5.3.5): The analysis of a sample matrix for its radionuclide content,
both qualitatively and quantitatively.
radiocolloid (14.4.6.2): A colloidal form of a radionuclide tracer produced by sorption of the
radionuclide onto a preexisting colloidal impurity, such as dust, cellulose fibers, glass fragments,
organic material, and polymeric metal hydrolysis products, or by polycondensation of a
monomeric species consisting of aggregates of a thousand to ten million radioactive atoms.
radiological holding time (6.5): The time required to process the sample. Also refers to the time
differential between the sample collection date and the final sample counting (analysis) date.

Glossary
( ) Indicates the section in which the term is first used in MARLAP.
Italicized words or phrases have their own definitions in this glossary.
JULY 2004 MARLAP
xli
radiolysis (14.1): Decomposition of any material as a result of exposure to radiation.
radionuclide (1.1): A nuclide that is radioactive (capable of undergoing radioactive decay).
radionuclide of interest (1.4.10): The radionuclide or target analyte that the planning team has
determined important for a project. Also called radionuclide of concern or target radionuclide.
radiotracer (6.5.2): (1) A radioactive isotope of the analyte that is added to the sample to
measure any losses of the analyte during the chemical separations or other processes employed
in the analysis (the chemical yield). (2) A radioactive element that is present in only extremely
minute quantities, on the order of 10!15 to 10!11 Molar.
random effect (3A.4): Any effect in a measurement process that causes the measured result to
vary randomly when the measurement is repeated.
random error (3A.4): A result of a measurement minus the mean that would result from an
infinite number of measurements of the same measurand carried out under repeatability
conditions (ISO, 1993a).
random variable (19.3.1): The numerical outcome of an experiment, such as a laboratory
measurement, that produces varying results when repeated.
reagent blank (12.6.5): Consists of the analytical reagent(s) in the procedure without the target
analyte or sample matrix, introduced into the analytical procedure at the appropriate point and
carried through all subsequent steps to determine the contribution of the reagents and of the
involved analytical steps.
recovery (2.5.4.2): The ratio of the amount of analyte measured in a spiked or laboratory control
sample, to the amount of analyte added, and is usually expressed as a percentage. For a matrix
spike, the measured amount of analyte is first decreased by the measured amount of analyte in
the sample that was present before spiking. Compare with yield.
redox (13.2.3): An acronym for oxidation-reduction.
reducing agent (13.4.1, Table 13.2): The chemical in an oxidation-reduction reaction that
reduces another chemical by providing electrons. The reducing agent is oxidized during the
reaction.

Glossary
( ) Indicates the section in which the term is first used in MARLAP.
Italicized words or phrases have their own definitions in this glossary.
MARLAP JULY 2004
xlii
reducing; reduction (13.4.1, Table 13.2): The decrease in oxidation number of an atom in a
chemical form during a chemical reaction. The decrease is a result of the gain of electron(s) by an
atom or the increase in electron density by an atom when it bonds to a less electronegative
element or breaks a bond to a more electronegative element.
regulatory decision limit (2.5.2.1): The numerical value that will cause the decisionmaker to
choose one of the alternative actions. An example of such a limit for drinking water is the
maximum contaminant level (MCL). See action level.
rejected result (8.3.3): A result that is unusable for the intended purpose. A result should only be
rejected when the risks of using it are significant relative to the benefits of using whatever
information it carries. Rejected data should be qualified as such and not used in the data quality
assessment phase of the data life cycle.
relative standard deviation (RSD) (6.5.5.2): See coefficient of variation.
relative standard uncertainty (3.3.7.1.2): The ratio of the standard uncertainty of a measured
result to the result itself. The relative standard uncertainty of x may be denoted by ur(x).
relative variance (19A.1): The relative variance of a random variable is the square of the
coefficient of variation.
release criterion (1.3): A regulatory limit expressed in terms of dose or risk. The release criterion
is typically based on the total effective dose equivalent (TEDE), the committed effective dose
equivalent (CEDE), risk of cancer incidence (morbidity), or risk of cancer death (mortality), and
generally can not be measured directly.
repeatability (of results of measurement) (6.6): The closeness of the agreement between the
results of successive measurements of the same measurand carried out under the same
“repeatability conditions” of measurement. “Repeatability conditions” include the same
measurement procedure, the same observer (or analyst), the same measuring instrument used
under the same conditions, the same location, and repetition over a short period of time.
Repeatability may be expressed quantitatively in terms of the dispersion characteristics of the
results (Adapted from ISO, 1993a.).
replicates (3.3.10): Two or more aliquants of a homogeneous sample whose independent
measurements are used to determine the precision of laboratory preparation and analytical
procedures.

Glossary
( ) Indicates the section in which the term is first used in MARLAP.
Italicized words or phrases have their own definitions in this glossary.
JULY 2004 MARLAP
xliii
representativeness (2.5.4): (1) The degree to which samples properly reflect their parent
populations. (2) A representative sample is a sample collected in such a manner that it reflects
one or more characteristics of interest (as defined by the project objectives) of a population from
which it was collected. (3) One of the five principal data quality indicators (precision, bias,
representativeness, comparability, and completeness).
reproducibility (of results of measurement) (6.4): The closeness of the agreement between the
results of measurements of the same measurand carried out under changed conditions of
measurement. A valid statement of reproducibility requires specification of the conditions
changed. The changed conditions may include principle of measurement, method of
measurement, observer (or analyst), measuring instrument, reference standard, location,
conditions of use, and time. Reproducibility may be expressed quantitatively in terms of the
dispersion characteristics of the results. Results are usually understood to be corrected results.
(Adapted from ISO, 1993a.).
request for proposals (RFP) (5.1): An advertisement from a contracting agency to solicit
proposals from outside providers during a negotiated procurement. See statement of work.
required minimum detectable concentration (RMDC) (8.5.3.2): An upper limit for the minimum
detectable concentration required by some projects.
resin (14.4.5.1): A synthetic or naturally occurring polymer used in ion-exchange chromatog-
raphy as the solid stationary phase.
resolution (8.5.1.11): The peak definition of alpha, gamma-ray, and liquid-scintillation
spectrometers, in terms of the full width of a peak at half maximum (FWHM), which can be used
to assess the adequacy of instrument setup, detector sensitivity, and chemical separation
techniques that may affect the identification, specification, and quantification of the analyte.
response variable (20.2.1): The variable that gives the observable result of a measurement—in
radiochemistry, typically a gross count or count rate.
robustness (5.3.9): The ability of a method to deal with large fluctuations in interference levels
and variations in matrix. (See method ruggedness.)
ruggedness (1.4.9): See method ruggedness.

Glossary
( ) Indicates the section in which the term is first used in MARLAP.
Italicized words or phrases have their own definitions in this glossary.
MARLAP JULY 2004
xliv
sample mean '
j
N
i'1
xi
N
sample (1.1): (1) A portion of material selected from a larger quantity of material. (2) A set of
individual samples or measurements drawn from a population whose properties are studied to
gain information about the entire population.
sample descriptors (8.5.1.1): Information that should be supplied to the laboratory including
sample ID, analytical method to be used, analyte, and matrix.
sample digestion (1.4.6): Solubilizing an analyte or analytes and its host matrix. Acid digestion,
fusion, and microwave digestion are some common sample digestion techniques.
sample dissolution (1.1): See sample digestion.
sample management (2.7.2): Includes administrative and quality assurance aspects covering
sample receipt, control, storage, and disposition.
sample mean (9.6.4.2): An estimate of the mean of the distribution calculated form a statistical
sample of observations. The sample mean equals the sum of the observed values divided by the
number of values, N. If the observed values are x1, x2, x3,…, xN, then the sample mean is given by
sample population (3.3.7.1.2): A set of individual samples or measurements drawn from a
population whose properties are studied to gain information about the entire population.
sample processing turnaround time (5.3.6): The time differential from the receipt of the sample
at the laboratory to the reporting of the analytical results.
sample tracking (1.4.5): Identifying and following a sample through the steps of the analytical
process including: field sample preparation and preservation; sample receipt and inspection;
laboratory sample preparation; sample dissolution; chemical separation of radionuclides of
interest; preparation of sample for instrument measurement; instrument measurement; and data
reduction and reporting.
sample variance (9.6.4.2): An estimate of the variance of a distribution calculated from a
statistical sample of observations. If the observed values are x1, x2, x3,…, xN, and the sample mean
is , then the sample variance is given by:¯x

Glossary
( ) Indicates the section in which the term is first used in MARLAP.
Italicized words or phrases have their own definitions in this glossary.
JULY 2004 MARLAP
xlv
s2'1
N&1j
N
i'1
(xi&¯x)2
sampling and analysis plan (SAP) (1.5): See project plan documents.
saturated solution (14.8.2): A solution that contains the maximum amount of substance that can
dissolve in a prescribed amount of solvent at a given temperature. The dissolved substance is in
equilibrium with any undissolved substance.
scale of decision (2.5, Table 2.1): The spatial and temporal bounds to which the decision will
apply. The scale of decision selected should be the smallest, most appropriate subset of the
population for which decisions will be made based on the spatial or temporal boundaries.
scavengers (14.8.5): See collectors.
screening method (6.5.5.3): An economical gross measurement (alpha, beta, gamma) used in a
tiered approach to method selection that can be applied to analyte concentrations below an
analyte level in the analytical protocol specifications or below a fraction of the specified action
level.
secondary (outer) hydration sphere (14.3.1): See hydration sphere.
self absorption (6.4): The absorption of nuclear particle or photon emissions within a matrix
during the counting of a sample by a detector.
sensitivity (2.5.4.2): (1) The ratio of the change in an output to the change in an input. (2) The
term “sensitivity” is also frequently used as a synonym for “detection capability.” See minimum
detectable concentration.
sensitivity analysis (2.5.4): Identifies the portions of the analytical protocols that potentially have
the most impact on the decision.
sensitivity coefficient (19.4.3): The sensitivity coefficient for an input estimate, xi, used to
calculate an output estimate, y = f(x1,x2,…,xN), is the value of the partial derivative, Mf / Mxi,
evaluated at x1, x2, …, xN. The sensitivity coefficient represents the ratio of the change in y to a
small change in xi.

Glossary
( ) Indicates the section in which the term is first used in MARLAP.
Italicized words or phrases have their own definitions in this glossary.
MARLAP JULY 2004
xlvi
separation factor (14.4.3): In ion-exchange chromatography, the ratio of the distribution
coefficients for two ions determined under identical experimental conditions. Separation factor
(α) = Kd,1/Kd,2. The ratio determines the separability of the two ions by an ion-exchange system;
separation occurs when α…1.
serial correlation (9.6.4.1): When the characteristic of interest in a sample is more similar to that
of samples adjacent to it than to samples that are further removed, the samples are deemed to be
correlated and are not independent of each other (i.e., there is a serial correlation such that
samples collected close in time or space have more similar concentrations than those samples
further removed.).
sigma (σ) (3A.3): The symbol σ and the term “sigma” are properly used to denote a true standard
deviation. The term “sigma” is sometimes used informally to mean “standard uncertainty,” and
“k-sigma” is used to mean an expanded uncertainty calculated using the coverage factor k.
significance level (α) (6A.2): In a hypothesis test, a specified upper limit for the probability of a
Type I decision error.
smears (10.6.1): See swipes.
solid-phase extraction (SPE) (14.4.5): A solvent extraction system in which one of the liquid
phases is made stationary by adsorption onto a solid support. The other phase is mobile (see
extraction chromatography).
solid-phase extraction membrane (14.4.5): A solid-phase extraction system in which the
adsorbent material is embedded into a membrane producing an evenly distributed phase, which
reduces the channeling problems associated with columns.
solubility (14.2.1): The maximum amount of a particular solute that can be dissolved in a
particular solvent under specified conditions (a saturated solution) without precipitating.
Solubility may be expressed in terms of concentration, molality, mole fraction, etc.
solubility equilibrium (14.8.3.1): The equilibrium that describes a solid dissolving in a solvent to
produce a saturated solution.
solubility-product constant (14.8.3.1): The equilibrium constant (Ksp) for a solid dissolving in a
solvent to produce a saturated solution.

Glossary
( ) Indicates the section in which the term is first used in MARLAP.
Italicized words or phrases have their own definitions in this glossary.
JULY 2004 MARLAP
xlvii
solute (10.3.3.2): The substance that dissolves in a solvent to form a solution. A solute can be a
solid, liquid, or gas. In radiochemistry, it is commonly a solid or liquid.
solution (10.2.9): A homogeneous mixture of one substance with another, usually a liquid with a
gas or solid. The particles of the solute (molecules, atoms, or ions) are discrete and mix with
particles of the solvent at the atomic, ionic, or molecular level.
solvent (10.2.9): The substance that dissolves the solute to form a solution. The solvent can be a
solid, liquid, or gas; but in radiochemistry, it is commonly a liquid.
solvent extraction (10.5.4.1): A separation process that selectively removes soluble components
from a mixture with a solvent. The process is based on the solubility of the components of the
mixture in the solvent when compared to their solubility in the mixture. In liquid-liquid
extraction, the process is based on an unequal distribution (partition) of the solute between the
two immiscible liquids.
source, radioactive (3.3.4): A quantity of material configured for radiation measurement. See
also calibration source, check source, and test source.
spatial variability (2.5.2.2): The nonuniformity of an analyte concentration over the total area of
a site.
specificity (1.4.9): See method specificity.
spike (1.4.8): See matrix spike.
spillover (15.4.2.1): See crosstalk.
spurious error (18.3.3): A measurement error caused by a human blunder, instrument
malfunction, or other unexpected or abnormal event.
stability constant (14.3.2): See formation constant.
stakeholder (2.2): Anyone with an interest in the outcome of a project. For a cleanup project,
some of the stakeholders could be federal, regional, state, and tribal environmental agencies with
regulatory interests (e.g., Nuclear Regulatory Commission or Environmental Protection Agency);
states with have direct interest in transportation, storage and disposition of wastes, and a range of
other issues; city and county governments with interest in the operations and safety at sites as
well as economic development and site transition; and site advisory boards, citizens groups,

Glossary
( ) Indicates the section in which the term is first used in MARLAP.
Italicized words or phrases have their own definitions in this glossary.
MARLAP JULY 2004
xlviii
licensees, special interest groups, and other members of the public with interest in cleanup
activities at the site.
standard deviation (3A.3): The standard deviation of a random variable X, denoted by σX, is a
measure of the width of its distribution, and is defined as the positive square root of the variance
of X.
standard operating procedure (SOP) (4.1): Routine laboratory procedures documented for
laboratory personnel to follow.
standard reference material (SRM) (6A.1): A certified reference material issued by the
National Institute of Standards and Technology (NIST) in the United States. A SRM is certified
by NIST for specific chemical or physical properties and is issued with a certificate that reports
the results of the characterization and indicates the intended use of the material.
standard uncertainty (1.4.7): The uncertainty of a measured value expressed as an estimated
standard deviation, often call a “1-sigma” (1-σ) uncertainty. The standard uncertainty of a value
x is denoted by u(x).
statement of work (SOW) (1.4.11): The part of a request for proposals, contract, or other
agreement that describes the project’s scope, schedule, technical specifications, and performance
requirements for all radioanalytical laboratory services.
stationary phase (14.7.4.1): The phase in a chromatographic system that is not moving with
respect to the mobile phase. The stationary phase can be a solid, a nonvolatile liquid coated onto
an inert matrix, or a substance trapped in an inert matrix.
statistical control (1.4.8): The condition describing a process from which all special causes have
been removed, evidenced on a control chart by the absence of points beyond the control limits
and by the absence of nonrandom patterns or trends within the control limits. A special cause is a
source of variation that is intermittent, unpredictable, or unstable. See control chart, in control,
and control limits.
statistical parameter (2.5, Table 2.1): A quantity used in describing the probability distribution
of a random variable” (ISO, 1993b).
statistical test (4.6.2.3): A statistical procedure to decide whether a null hypothesis should be
rejected in favor of the alternative hypothesis or not rejected.” This also can be called a
hypothesis test.

Glossary
( ) Indicates the section in which the term is first used in MARLAP.
Italicized words or phrases have their own definitions in this glossary.
JULY 2004 MARLAP
xlix
subsample (12.3.1.4): (1) A portion of a sample removed for testing. (2) To remove a portion of
a sample for testing.
subsampling factor (19.5.12): As used in MARLAP, a variable, FS, inserted into the
mathematical model for an analytical measurement to represent the ratio of the analyte
concentration of the subsample to the analyte concentration of the original sample. The
subsampling factor is always estimated to be 1 but has an uncertainty that contributes to the
combined standard uncertainty of the measured result.
surface adsorption (14.8.3.3, Table 14.12): (1) Adsorption of particles of a substance onto the
surface of another substance. (2) A mechanism of coprecipitation in which ions are adsorbed
from solution onto the surfaces of precipitated particles.
survey (2.3.2): “An evaluation of the radiological conditions and potential hazards incident to the
production, use, transfer, release, disposal, or presence of radioactive materials or other sources
of radiation. When appropriate, such an evaluation includes the a physical survey of the location
of radioactive material and measurements or calculations of levels of radiation, or concentrations
of quantities of radioactive material present” (Shleien, 1992). A survey is a semiquantitative
measure of the gross radiological conditions of a material or area (for dose and contamination). A
screen is a qualitative assessment to determine the type of radionuclides (alpha, beta, gamma)
and the relative amount (high, medium, low) of each that might be present.
survey unit (2.5.2.4): A geographical area consisting of structures or land areas of specified size
and shape at a remediated site for which a separate decision will be made whether the unit attains
the site-specific reference-based cleanup standard for the designated pollution parameter. Survey
units are generally formed by grouping contiguous site areas with a similar use history and the
same classification of contamination potential. Survey units are established to facilitate the
survey process and the statistical analysis of survey data. (MARSSIM, 2000)
suspension (10.3.3.2): A mixture in which small particles of a solid, liquid, or gas are dispersed
in a liquid or gas. The dispersed particles are larger than colloidal particles and produce an
opaque or turbid mixture that will settle on standing by gravity and be retained by paper filters.
See colloids and colloidal solution.
swipes (10.6.1): A filter pad used to determine the level of general radioactive contamination
when it is wiped over a specific area, about 100 cm2 in area. Also called smears or wipes.
systematic effect (3A.4): Any effect in a measurement process that does not vary randomly when
the measurement is repeated.

Glossary
( ) Indicates the section in which the term is first used in MARLAP.
Italicized words or phrases have their own definitions in this glossary.
MARLAP JULY 2004
l
systematic error (3A.4): The mean value that would result from an infinite number of measure-
ments of the same measurand carried out under repeatability conditions minus a true value of the
measurand (ISO, 1993a).
systematic planning process (1.4.2): See directed planning process.
target analyte (3.3.1): A radionuclide on the target analyte list. Also called radionuclide of
interest or “radionuclide of concern.” See analyte.
target analyte list (3.3.1): A list of the radionuclides of concern for the project.
target radionuclide (18.4.1): See radionuclide of interest.
technical evaluation committee (TEC) (5.3.9): A team of technical staff members that assists in
the selection of a contract laboratory by reviewing proposals and by auditing laboratory facilities.
technical proposal (5.5.1.): A document, submitted by a laboratory bidding on a contract, which
addresses all of the technical and general laboratory requirements within a request for proposals
and statement of work.
temporal trend (2.5, Table 2.1): Effects that time have on the analyte concentration in the matrix
or sample. The temporal boundaries describe the time frame the study data will represent (e.g.,
possible exposure to local residents over a 30-year period) and when samples should be taken
(e.g., instantaneous samples, hourly samples, annual average based on monthly samples, samples
after rain events).
tests of detection (8.3.1): Tests of detection determine the presence or absence of analytes.
Normally, only numerous quality control exceptions and failures in one or more of the tests of
detection and uncertainty are sufficient reason to reject data.
tests of unusual uncertainty (8.3.1): Part of the validation plan that specifies the level of
measurement uncertainty considered unusually high and unacceptable.
test source (14.10.9.7): The final radioanalytical processing product or matrix (e.g., precipitate,
solution, filter) that is introduced into a measurement instrument. A test source is prepared from
laboratory sample material for the purpose of determining its radioactive constituents. See
calibration source, check source, and source, radioactive.

Glossary
( ) Indicates the section in which the term is first used in MARLAP.
Italicized words or phrases have their own definitions in this glossary.
JULY 2004 MARLAP
li
thin-layer chromatography (14.7.3): A chromatographic process in which a thin layer of a
stationary phase in coated onto a solid support such as a plastic or glass plate. The stationary
material is an absorbing solid and the mobile phase is a liquid.
tolerable decision error rates (2.3.3): The limits on decision error rates that will be acceptable
to the stakeholder/customer.
tolerance limit (18.3.3): A value, that may or may not have a statistical basis, which is used as
the measure of acceptable or unacceptable values. A tolerance limit is sometimes referred to as a
“Go/No Go” limit. See warning limit, control chart.
total effective dose equivalent (TEDE) (2.5.2.1): The sum of the effective dose equivalent (for
external exposure) and the committed effective dose equivalent (for internal exposure). TEDE is
expressed in units of sievert (Sv) or rem (MARSSIM, 2000). See action level, dose equivalent,
and total effective dose equivalent.
total propagated uncertainty (TPU) (19.2): See combined standard uncertainty, which is the
preferred term.
traceability (8.5.1.5): “Property of the result of a measurement or the value of a standard
whereby it can be related to stated references, usually national or international standards, through
an unbroken chain of comparisons all having stated uncertainties” (ISO, 1993a).
tracer (1.4.8): See radiotracer.
Type A evaluation (of uncertainty) (19.3.3): “Method of evaluation of uncertainty by the
statistical analysis of series of observations” (ISO, 1995).
Type B evaluation (of uncertainty) (19.3.3): “Method of evaluation of uncertainty by means
other than the statistical analysis of series of observations” (ISO, 1995); any method of
uncertainty evaluation that is not a Type A evaluation.
Type I decision error (2.5.3): In a hypothesis test, the error made by rejecting the null hypothesis
when it is true. A Type I decision error is sometimes called a “false rejection” or a “false
positive.”
Type II decision error (2.5.3): In a hypothesis test, the error made by failing to reject the null
hypothesis when it is false. A Type II decision error is sometimes called a “false acceptance” or
a “false negative.”
Glossary
( ) Indicates the section in which the term is first used in MARLAP.
Italicized words or phrases have their own definitions in this glossary.
MARLAP JULY 2004
lii
uncertainty (1.4.7): The term “uncertainty” is used with several shades of meaning in MARLAP.
In general it refers to a lack of complete knowledge about something of interest; however, in
Chapter 19 it usually refers to “uncertainty (of measurement).”
uncertainty (of measurement) (3.3.4): “Parameter, associated with the result of a measurement,
that characterizes the dispersion of the values that could reasonably be attributed to the
measurand” (ISO, 1993a).
uncertainty interval (19.3.6): The interval from y ! U to y + U, where y is the measured result
and U is its expanded uncertainty.
uncertainty propagation (19.1): Mathematical technique for combining the standard
uncertainties of the input estimates for a mathematical model to obtain the combined standard
uncertainty of the output estimate.
uncertainty propagation formula (first-order) (19.4.3): the generalized mathematical equation
that describes how standard uncertainties and covariances of input estimates combine to produce
the combined standard uncertainty of an output estimate. When the output estimate is calculated
as y = , where f is a differentiable function of the input estimates x1, x2, …, xN, thef(x1,x2,...,xN)
uncertainty propagation formula may be written as follows:
.u2
c(y)'j
N
i'1
Mf
Mxi
2
u2(xi)%2j
N&1
i'1
j
N
j'i%1
Mf
Mxi
Mf
Mxj
u(xi,xj)
This formula is derived by approximating the function by a first-order Taylor poly-f(x1,x2,...,xN)
nomial. In the Guide to the Expression of Uncertainty of Measurement, the uncertainty propaga-
tion formula is called the “law of propagation of uncertainty” (ISO, 1995).
unsaturated solution (14.8.2): A solution whose concentration of solute is less than that of a
saturated solution. The solution contains less solute than the amount of solute will dissolve at the
temperature of the solution, and no solid form of the solute is present.
validation (1.1): See data validation.
validation criterion (2.5.4.2): Specification, derived from the measurement quality objectives
and other analytical requirements, deemed appropriate for evaluating data relative to the project’s
analytical requirements. Addressed in the validation plan.

Glossary
( ) Indicates the section in which the term is first used in MARLAP.
Italicized words or phrases have their own definitions in this glossary.
JULY 2004 MARLAP
liii
validation flags (1.4.11): Qualifiers that are applied to data that do not meet the acceptance
criteria established to assure data meets the needs of the project. See also data qualifier.
validation plan (2.7.4.2): An integral part of the initial planning process that specifies the data
deliverables and data qualifiers to be assigned that will facilitate the data quality assessment.
variance (9.6.2.3): The variance of a random variable X, denoted by Var(X), , or V(X), is
σ2
X
defined as E[(X ! µX)2],where µX denotes the mean of X. The variance also equals E(X2) ! µX
2.
verification (1.2): See data verification.
volatility (10.3.4.1): The tendency of a liquid or solid to readily become a vapor (evaporates or
sublimes) at a given temperature. More volatile substances have higher vapor pressures than less
volatile substances.
volatilization (10.3.3.2, Table 10.1): A separation method using the volatility of liquids or solids
to isolate them from nonvolatile substances, or to isolate a gas from a liquid.
warning limit (3.3.7.3): Predetermined values plotted on a control chart between the central line
and the control limits, which may be used to give an early indication of possible problems with
the monitored process before they become more significant. The monitored variable will
occasionally fall outside the warning limits even when the process is in control; so, the fact that a
single measurement has exceeded the warning limits is generally not a sufficient reason to take
immediate corrective action. See tolerance limit.
weight distribution coefficient (14.7.4.1): In ion-exchange chromatography, the ratio of the
weight of an ion absorbed on one gram of dry ion-exchange resin to the weight of the ion that
remains in one milliliter of solution after equilibrium has been established. The ratio is a measure
of attraction of an ion for a resin. Comparison of the weight distribution coefficient for ions in an
analytical mixture is a reflection of the ability of the ion-exchange process to separate the ions
(see separation factor).
Welch-Satterthwaite formula (19C.2): An equation used to calculate the effective degrees of
freedom for the combined standard uncertainty of an output estimate when the number of
degrees of freedom for the standard uncertainty of each input estimate is provided (ISO, 1995).
work plan (1.6.1): The primary and integrating plan document when the data collection activity
is a smaller supportive component of a more comprehensive project. The work plan for a site
investigation will specify the number of samples to be collected, the location of each sample, and

Glossary
( ) Indicates the section in which the term is first used in MARLAP.
Italicized words or phrases have their own definitions in this glossary.
MARLAP JULY 2004
liv
the analyses to be performed. A newer concept is to develop a dynamic work plan that specifies
the decisionmaking logic used to determine where the samples will be collected, when the
sampling will stop, and what analyses will be performed, rather than specify the number of
samples to be collected and the location of each sample.
year: (1) Mean solar or tropical year is 365.2422 days (31,556,296 seconds) and is used for
calculations involving activity and half-life corrections. (2) Calendar year, i.e., 12 months, is
usually used in the regulatory sense when determining compliance.
yield (1.6.2): The ratio of the amount of radiotracer or carrier determined in a sample analysis to
the amount of radiotracer or carrier originally added to a sample. The yield is an estimate of the
analyte during analytical processing. It is used as a correction factor to determine the amount of
radionuclide (analyte) originally present in the sample. Yield is typically measured gravi-
metrically (via a carrier) or radiometrically (via a radiotracer). Compare with recovery.
Sources
American National Standards Institute (ANSI) N13.30. Performance Criteria for Radiobioassay.
1996.
American National Standards Institute (ANSI) N42.23. Measurement and Associated
Instrumentation Quality Assurance for Radioassay Laboratories. 2003.
U.S. Environmental Protection Agency (EPA). 1980. Upgrading Environmental Radiation Data,
Health Physics Society Committee Report HPSR-1, EPA, 520/1-80-012, EPA, Office of
Radiation Programs, Washington, DC.
U.S. Environmental Protection Agency (EPA). 2002. Guidance on Environmental Data
Verification and Data Validation (EPA QA/G-8). EPA/240/R-02/004. Office of
Environmental Information, Washington, DC. Available at www.epa.gov/quality/
qa_docs.html.
International Organization for Standardization (ISO). 1992. Guide 30: Terms and Definitions
Used in Connection with Reference Materials. ISO, Geneva, Switzerland.
International Organization for Standardization (ISO). 1993a. International Vocabulary of Basic
and General Terms in Metrology. 2nd Edition. ISO, Geneva, Switzerland.

Glossary
( ) Indicates the section in which the term is first used in MARLAP.
Italicized words or phrases have their own definitions in this glossary.
JULY 2004 MARLAP
lv
International Organization for Standardization (ISO). 1993b. Statistics – Vocabulary and
Symbols – Part 1: Probability and General Statistical Terms. ISO 3534-1. ISO, Geneva,
Switzerland.
International Organization for Standardization (ISO). 1995. Guide to the Expression of Uncer-
tainty in Measurement. ISO, Geneva, Switzerland.
International Organization for Standardization (ISO). 1997. Capability of Detection – Part 1:
Terms and Definitions. ISO 11843-1. ISO, Geneva, Switzerland.
International Union of Pure and Applied Chemistry (IUPAC). 1994. “Nomenclature for
Radioanalytical Chemistry.” Pure and Applied Chemistry, 66, p. 2513-2526. Available at
www.iupac.org/publications/compendium/R.html.
International Union of Pure and Applied Chemistry (IUPAC). 1995. Nomenclature in Evaluation
of Analytical Methods Including Detection and Quantification Capabilities. Pure and Applied
Chemistry 67:10, pp. 1699–1723. Available at www.iupac.org/reports/1993/6511uden/
index.html.
International Union of Pure and Applied Chemistry (IUPAC). 1997. Compendium of Chemical
Terminology: The Gold Book, Second Edition. A. D. McNaught and A. Wilkinson, eds.
Blackwell Science. Available at www.iupac.org/publications/compendium/index.html.
International Union of Pure and Applied Chemistry (IUPAC). 2001. Nomenclature for Isotope,
Nuclear and Radioanalytical Techniques (Provisional Draft). Research Triangle Park, NC.
Available at www.iupac.org/reports/provisional/abstract01/karol_310801.html.
MARSSIM. 2000. Multi-Agency Radiation Survey and Site Investigation Manual, Revision 1.
NUREG-1575 Rev 1, EPA 402-R-97-016 Rev1, DOE/EH-0624 Rev1. August. Available
from www.epa.gov/radiation/marssim/.
U.S. Nuclear Regulatory Commission (NRC). 1984. Lower Limit of Detection: Definition and
Elaboration of a Proposed Position for Radiological Effluent and Environmental
Measurements. NUREG/CR-4007. NRC, Washington, DC.
Shleien, Bernard, ed. 1992. The Health Physics and Radiological Health Handbook. Silver
Spring, MD: Scinta Inc.

BIBLIOGRAPHIC DATA SHEET
(See instructions on the reverse)
NRC FORM 335
(2-89)
NRCM 1102,
3201, 3202
U.S. NUCLEAR REGULATORY COMMISSION 1. REPORT NUMBER
(Assigned by NRC, Add Vol., Supp., Rev.,
and Addendum Numbers, if any.)
NUREG-1576, Vol. 2
EPA 402-B-04-001B
NTIS PB2004-105421
DATE REPORT PUBLISHED
MONTH
July
YEAR
2004
4. FIN OR GRANT NUMBER
2. TITLE AND SUBTITLE
Multi-Agency Radiological Laboratory Analytical Protocols Manual (MARLAP),
Volume II: Chapters 10-17 and Appendix F
5. AUTHOR(S) 6. TYPE OF REPORT
7. PERIOD COVERED (Inclusive Dates)
8. PERFORMING ORGANIZATION - NAME AND ADDRESS (If NRC, provide Division, Office or Region, U.S. Nuclear Regulatory Commission, and mailing address; if contractor,
Department of Defense, Washington, DC 20301-3400 Food and Drug Administration, Rockville, MD 20857
9. SPONSORING ORGANIZATION - NAME AND ADDRESS (If NRC, type "Same as above"; if contractor, provide NRC Division, Office or Region, U.S. Nuclear Regulatory Commission,
Same as above
provide name and mailing address.)
and mailing address.)
10. SUPPLEMENTARY NOTES
Rateb (Boby) Abu-Eid, NRC Project Manager
11. ABSTRACT (200 words or less)
The Multi-Agency Radiological Laboratory Analytical Protocols (MARLAP) manual provides guidance for the planning,
implementation, and assessment of projects that require the laboratory analysis of radionuclides. MARLAP's goal is to provide
guidance for project planners, managers, and laboratory personnel to ensure that radioanalytical laboratory data will meet a
project's or program's data requirements. The manual offers a framework for national consistency in the form of a
performance-based approach for meeting data requirements that is scientifically rigorous and flexible enough to be applied to a
diversity of projects and programs. The guidance in MARLAP is designed to help ensure the generation of radioanalytical data
of known quality, appropriate for its intended use. Examples of data collection activities that MARLAP supports include site
characterization, site cleanup and compliance demonstration, decommissioning of nuclear facilities, emergency response,
remedial and removal actions, effluent monitoring of licensed facilities, environmental site monitoring, background studies, and
waste management activities.
MARLAP is organized into two parts. Part I, Volume 1, is intended for project planners and managers, provides the basic
framework of the directed planning process as it applies to projects requiring radioanalytical data for decision making. Part II,
Volumes 2 and 3, is intended for laboratory personnel.
12. KEY WORDS/DESCRIPTORS (List words or phrases that will assist researchers in locating the report.)
Multi-Agency Radiological Laboratory Analytical Protocols, MARLAP, radiological , laboratory,
laboratory sample, analytical protocols, performance-based approach, planning, measurement,
quality assurance, survey(s), decommissioning, statistics, waste management,
radioanalytical laboratory services, data validation, data quality assessment, data collection
14. SECURITY CLASSIFICATION
13. AVAILABILITY STATEMENT
unlimited
(This Page)
unclassified
(This Report)
unclassified
15. NUMBER OF PAGES
16. PRICE
NRC FORM 335 (2-89) This form was electronically produced by Elite Federal Forms, Inc.
3.
Department of Energy, Washington, DC 20585-0119 National Institute of Standards and Technology, Gaithersburg, MD 20899
Department of Homeland Security, Washington, DC 20528 Nuclear Regulatory Commission, Washington, DC 20555-0001
Environmental Protection Agency, Washington, DC 20460-0001 U.S. Geological Survey, Reston, VA 20192
